Sangeeta Shroff Jayanti Kajale Prashant Bansode - DSpace ...
101
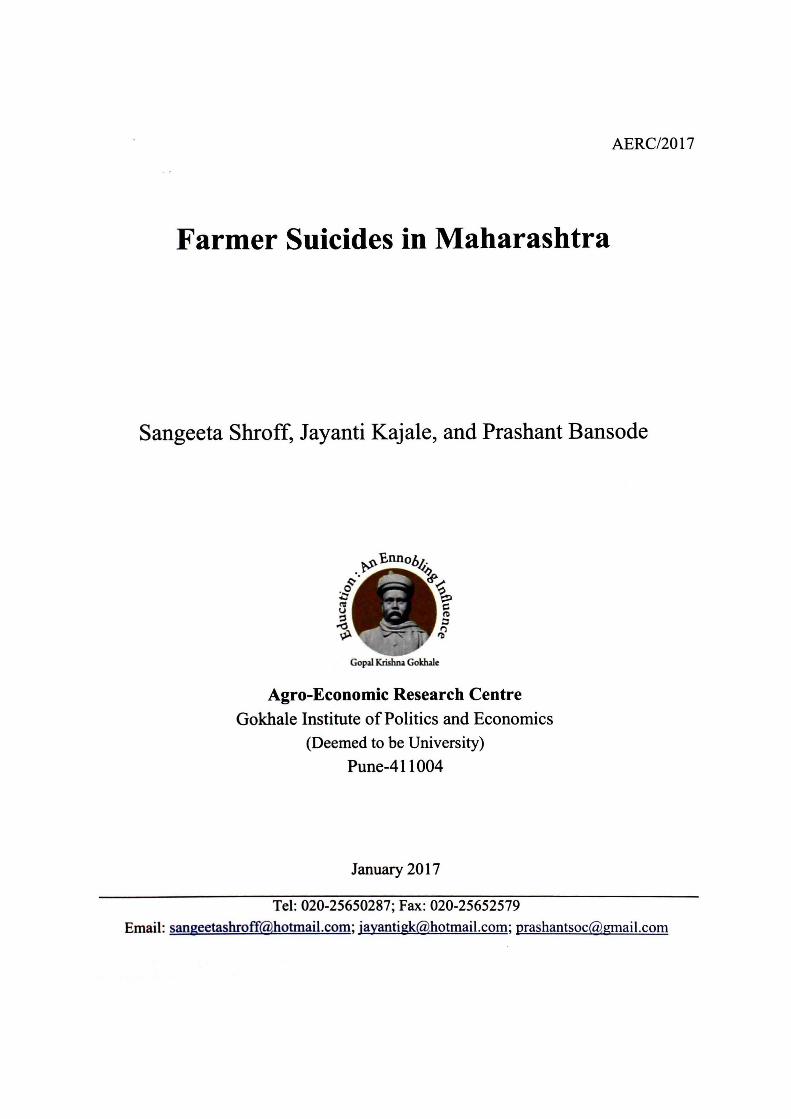
Gopal Krishna Gokhale Farmer Suicides in Maharashtra Division wise Number of Suicides in 2015-16 1400 .--------------- 1200 1 000 800 600 400 200 0 Aurangabad A mrcwati N ashik N agpur Ko tl apur D ivision D ivision D ivision D ivision D ivision D ivision • GIPE- -0517 2017 ute Economics (Deemed to be University) Pune- 411004 Sangeeta Shroff Jayanti Kajale Prashant Bansode January 2017 I ,,
-
Upload
khangminh22 -
Category
Documents
-
view
0 -
download
0
Transcript of Sangeeta Shroff Jayanti Kajale Prashant Bansode - DSpace ...

Gopal Krishna Gokhale
Farmer Suicides in Maharashtra
Division wise Number of Suicides in 2015-16 1400 .---------------
1200
1000
800
600
400
200
0 Aurangabad Amrcwati N ashik N agpur Pun~ Kotlapur
Division Division Division Division Division Division
•
GIPE- -0517 2017 ute
Economics (Deemed to be University) Pune- 411004
Sangeeta Shroff Jayanti Kajale Prashant Bansode
January 2017
I ,,
AERC/2017
Farmer Suicides in Maharashtra
Sangeeta Shroff, Jayanti Kajale, and Prashant Bansode
Gopal Krishna Gokhale
Agro-Economic Research Centre Gokhale Institute of Politics and Economics
(Deemed to be University)
Pune-411 004
January 2017
Tel: 020-25650287; Fax: 020-25652579
Email: [email protected]; [email protected]; [email protected]

Foreword
Indian agriculture is currently passing through a period of severe crisis and the overall scenario in
this sector is that of stagnation, underperformance and lack of dynamism. The Eleventh Plan target
growth of 4 percent in the agricultural sector could not be achieved and the Twelfth Plan , has not shown
any encouraging picture. The data from 70th Round of NSSO reveal that farmers cannot solely depend
upon farming to meet their consumption requirements and in case of 70 percent of households, the
monthly per household consumption expenditure was higher than income.
In view of the above agrarian crisis, a study on suicides by farmers in Maharashtra was
undertaken. The findings of the study revealed that suicides were concentrated in Marathwada and
Aurangabad region which every year, together, accounted for more than 70 percent of suicides in the
state. Field level data from suicide prone districts for 2015-16 revealed that the deceased households
suffered negative net returns of Rs. 27301/- per acre and there were several cases when sample
households suffered from total crop loss but had incurred huge cost of cultivation. Crop failure was often
accompanied by fall in prices due to imports or high output in other regions and hence farmers suffered
from yield loss, price fall and high cost of cultivation. This state of affairs has led to indebtedness of
farmers who borrow heavily from informal sources and out of total borrowing of sample farmers, 61.08
percent was from informal sources. The expenditure of a sample household exceeded income by Rs
60,335/-.
The main policy implications that emerged from the study was that top priority must be given to
water shed strategies and irrigation. Marathwada is a water stressed region and continuous drought has led
to ground water depletion. Besides, there are natural calamities such as hailstorms which cause pest attack
and hence there is a need to install automated weather stations. Allied activities and rural non-farm
income must also be promoted.
The findings of the study will certainly be useful to policy makers. I thank Sangeeta Shroff,
Jayanti Kajale and Prashant Bansode for undertaking this study.
Gokhale Institute of Politics and Economics, (Deemed to be University Under section 3 of the UGC Act, 1956), Pune -411004
Rajas Parchure, Professor and Officiating Director, January,2017

Acknowledgements
This report titled 'Farmer Suicides in Maharashtra' was conducted by the Agro-Economic
Research Centre of Gokhale Institute of Politics and Economics, Pune, at the initiative of the
Ministry of Agriculture, Cooperation and Farmers Welfare, Government of India, New Delhi.
The report was coordinated by ADRTC, Institute for Social and Economic Change, Bangalore.
We therefore thank the ADRTC, especially Dr. A.V. Manjunatha who coordinated the study and .
Dr. Maruthi, Head of the centre for their sincere effort and cooperation in coordinating the
report. A workshop was also conducted by ADRTC, from which we greatly benefitted while
completing the report. Our sincere thanks to Shri P.C. Bodh and Shri Rakesh Kumar from
Ministry of Agriculture, Cooperation and Farmers Welfare for their wholehearted support in all
matters related to this study. We also thank all other AERCs who participated in the workshop
for useful comments.
The study could be completed due to the co-operation and support received by us from
several officials in the Institute. We would like to thank Prof. Rajas Parchure, Officiating
Director, for giving us an opportunity to undertake this project and the motivation provided for
completing the work. We also thank Mr. Rajesh Bhatikar, Registrar, for providing all the
infrastructural support and cooperation during the course of the study.
For writing the report, information had to be collected from various officials. We are
grateful to the office of the Department of Relief and Rehabilitation, Government of Maharashtra
and all the Divisional Commissioners of Maharashtra for providing the secondary data on
suicides by farmers.
We thank all the respondent households for patiently responding to our questionnaire even
in their grief and despair. Along with us, the field investigators Mr. S. S. Dete and Mr. Ravindra
Gaikwad collected the primary data. Mr. Ravindra Gaikwad also inputted the data. We thank
them for their hard work. We also thank Mr. Anil Memane, Ms. Rukaiya Khan, and Mr. V arun
Miglani for research assistance towards preparation of the report. Finally, we thank our
colleagues and staff of the office, computer centre and library for their co-operation.
Gokhale Institute of Politics and Economics, (Deemed to be University Under section 3 of the UGC Act, 1956), Pune -411004
ii
Sangeeta Shroff, Jayanti Kajale, and Prashant Bansode January, 2017
Content
Chapter Chapter Page No. No.
Foreword i Acknowledgements ii Contents iii-iv List of Tables v List of Boxes vi List of Figures vi List of Annexures vi List of Abbreviations vii
1 Introduction 1-13 1.1 Background 1 1.2 Review of Literature 3 1.3 Main Objectives and Scope of the Study: 10 1.4 Data and Methodology 10 1.5 Organisation of the Report 13
2 Farmers' Suicide Scenario 14-35 2.1 Introduction 14 2.2 Intensity of Farmers' Suicide: 14 2.3 Procedure adopted and criteria for compensation 17 2.4 Payment of Compensation and Measures to Prevent Suicides by 18
Farmers 2.5 Summary 22
3 Analysis of Primary Data 36-49 3.1 Introduction 36 3.2 Socio-Economic Profile of the Victims 36 3.3 Socio-Economic Profile of Victims' Family 38 3.4 Characteristics of operational holdings 39 3.5 Sources of Irrigation 40 3.6 Leasing of Land 40 3.7 Sources of Income and Items of Expenditure 41 3.8 Cropping Pattern and Returns to Cultivation 43 3.9 Credit Availed 45 3.10 Summary 48
4 Causes and Effects of Suicides-based on primary survey 50-73 4.1 Introduction 50 4.2 Symptoms observed and cause of suicide 51 4.3 Impact of suicides on family members 69 4.4 Suggestions from families to avert suicides in future 70 4.5 Summary 72
iii
Chapter Chapter Page No. No.
5 Conclusions and Policy Implications 74-82 5.1 Introduction 74 5.2 Objectives and Methodology 75 5.3 Major Findings 76 5.4 Policy Suggestions 80
Executive Summary 83-87 References 88-90 Annexure I 91
IV

List of Tables
Table No-. Table Page No. 1.1 District wise selection of Households of Suicide Victims 12 2.1 District -wise details of farmers' suicides in Maharashtra (July 2015 to 15
June 2016) 2.2 Month-Wise Number of Farmers' Suicide in Maharashtra (July 2015 to 16
June 2016) 2.3 District-wise details of compensation (July 2015 to June 2016} 19 3.1 Socio-economic profile of victim 37 3.2 Socio-Economic Profile of victims' family_ 39 3.3 Characteristics of operational holdings (Acres per sample 40
household) 3.4 Source-wise distribution of irri_gated area 40 3.5 Rental value of leased-in and leased-out land 41 3.6 Net income and expenditure during 2015-16 42 3.7 Cropping Pattern of Sample households 44 3.8 Details on credit of sample households 45 4.1 Symptoms observed~ fami!Y members before suicide 51 4.2 Social causes of suicide 52 4.3 Farming related causes of suicides 56 4.3(A) Comparison of Yield (per acre in quintals) and Price (Per quintal) i 58
2013-14 (Normal Year for Monsoons) in Maharashtra with that of sample farmers in 2015-16_(Qrought Year)
4.3(B) Comparison of Cost of Production Per Quintal of selected crops 60 of Sample farmers and MSP for 2015-16
4.4 Indebtedness related causes of suicides 64 4.5 Ranking of the social, farming and indebted causes of suicides 67 4.6 Impact on Household after committing suicide 69 4.7 Suggestions to prevent the suicides in future 71
v

List of Boxes
Box Title Page No. No.
1 Suicide case revealing expenditure regularly exceeding income 43 2 Mounting debt caused suicide 47 3 Pressure of social obligations triggered suicides 53 4 Agricultural income unable to sustain health expenses 55 5 Sharing of agricultural income induced stress 55 6 Victim suggested that only water can solve their problems 71
List of Figures
Figure Title Page No. No. 1.1 Sample Districts 13 2.1 Division wise Number of Suicides in 2015 24 2.2 Division wise Suicide for per lakh hectare of GCA and NSA for 2015 28 2.3 Region wise suicide per lakh hectare of GCA and NSA, 2015 29 2.4 Division-wise Percentage share of number of suicides in 2015-16 29
List of Annexures
Annexures Title Page No. No.
2.1 Division wise Number of Suicides in Maharashtra 23 2.2 Division wise Suicide for per lakh hectare of GCA and NSA 24 2.3 District wise Number of Suicides in Maharashtra 25 2.4 District wise suicide for per lakh hectare of GCA and NSA in 26
Marathwada 2.5 District wise suicide for per lakh hectare of GCA and NSA in 27
Vidharbha 2.6 Regionwise suicide per lakh hectare of GCA and NSA 28 2.7 District wise Month wise Number of Suicides (20 15-16) 30 2.8 District wise Month wise (Percentage) ofSuicides(2015-16) 31 2.9 Number of Eligible Cases for Compensation (Division wise) 32 2.10 Number of Eligible Cases for Compensation in Marathwada (District 33
wise) 2.11 Number of Eligible Cases for Compensation in Vidharbha (District 34
wise) 2.12 Scheme -wise and Grantor-wise Amount Received and Expenditure 35
under PM Package as on May 31, 2009
vi

List of Abbreviations
OVA Gross Value Added
NSSO National Sample Survey Organization
GoM Government ofMaharashtra
NSA Net Sown Area
GCA Gross Cropped Area
PM Prime Minister
MSP Minimum Support Price
AAY Antyodaya Anna Yojana
ha hectares
Qtls Quintals
llli Household
RRBs Regional Rural Banks
vii
1.1 Background:
Chapter 1
Introduction
Indian agriculture is currently passing through a period of severe crisis. While
this sector has experienced technological interventions which contributed to self
sufficiency in foodgrains, diversification to commercial and horticultural crops and
also promotion of dairy, poultry and other allied activities, the overall scenario in this
sector is that of stagnation, underperformance and lack of dynamism. The
contribution of agriculture to gross value added (GVA) in 2015-16 was 16.1 percent
(Government of India, 2016a). While as per 2011 census, the workforce engaged in
this sector is 54.6 percent. As per the Agricultural Census 2010-11, the average size
of holding is fast declining and is presently 1.16 hectares with 66.8 percent of
holdings being marginal and 18 percent being small and therefore constituting 84.8
percent of total holdings (Government of India, 2014). The Eleventh Plan target
growth of 4 percent per annum for the agricultural sector could not be achieved as the
average growth rate turned out to be 3.67 percent per annum while that of the
economy as a whole was 7.9 per cent. Again the Twelfth Plan (2012-17) for
agriculture, which is now in its last year, has again not shown any encouraging
picture. The growth in 2013-14 as against 2012-13 was 4.2 per cent while it was -0.2
percent in 2014-15 as against in 2013-14. It improved to a miniscule 1.1 percent in
2015-16 as against 2014-15. The overall growth of the economy during each year of
twelfth Plan was however around 7 percent (Government of India, 2016a).
Although, slower growth of GV A in agriculture compared to other sectors
is expected, the main failure has been the inability to reduce the dependence of the
workforce on agriculture significantly leading to marginalization of land holdings
coupled with low productivity in agriculture.
The productivity per worker in agriculture in 2011-12, (calculated from
data in Agricultural Statistics at a glance 2014, Directorate of Economics and
Statistics) for most states varies between Rs. 10,769 in Orissa to about 38288 in Uttar
Pradesh. In Maharashtra the productivity per worker is Rs. 20,754. However in
Gujarat it is Rs. 54,537 and higher in states such as Punjab where it is Rs. 97,370,
1
possibly due to availability of irrigation. With such low productivity from agriculture,
the households have to resort to wage income, allied activities and non-farm business
for their survival. The data from the 70th Round of National Sample Survey
Organization (NSSO) reveal that during the period July 2012 to June 2013, at the All
India level, the average monthly income per agricultural household was Rs. 6,426 out
of which 47.9 percent was from cultivation, 32.9 percent from wage/salary, 11.9
percent from livestock and 8 percent from non-farm business. It is therefore clear that
farmers cannot solely depen<:l upon farming to meet their consumption requirements.
Infact even after earning . income from other sources, in case of 70 percent of
households, the monthly per household consumption expenditure was higher than that
of income. Incase of 32 percent of households in the NSSO (70th Round) survey the
consumption expenditure was higher than income by 30 percent, while in case of 35
percent of households, the expenditure was higher by 14 percent. These households
obviously had marginal holdings and could not meet their consumption expenditure
even with other sources of income. The net investment in productive assets across all
sample households in the NSSO survey during the corresponding period, indicated
that it was only Rs. 513 per household which is negligible. Further, the agricultural
sector is also witnessing a decline in public sector investment. The share of public
sector expenditure as percent of Plan Outlay which was 4.4 percent in Ninth Plan,
declined to 3.9 percent in Tenth Plan and further to 3.7 percent in Eleventh Plan
(Government of India, 2015).
Lack of investment in agriculture is an important cause of low returns
which in turn is causing indebtedness. The 70th Round of NSSO which also collected
data on indebtedness of farmers reveals that 51.9 percent of households in India are
indebted and in several states this percentage is higher. Highest incidence of
indebtedness was observed in Andhra Pradesh (92.9 percent of households), followed
by Telangana (89.1 percent) and Tamil Nadu (82.5 percent). The percent of
households indebted was also higher than national average in major states such as
Karnataka (77.3 percent), Rajasthan (61.8 percent) and Maharashtra (57.3 percent).
The average amount of outstanding loan per agricultural household was Rs. 47,000
and higher than national average in 50 percent of states. At the All India level, about
60 percent of the outstanding loans were taken from institutional sources while 25.8
percent were taken from agricultural/professional moneylenders.
2

The Situation Assessment Surveys of the NSSO (2005) had also observed
the worsening situation of farming households and noted that about 40 percent
f~ers' households in the country did not like farming because it is unprofitable,
risky, lacks social status and given an option would like to choose another profession.
The crisis in the agricultural sector thus had certain features such as deceleration in
growth rates in this sector, declining share of agriculture in GV A, falling public
investment, low or negative returns, marginalization of land holdings and low
opportunities for rural non farm employment leading to disguised employment in this
sector, etc. All these features in the agricultural sector have impoverished the farmers
and caused distress. One of the tragic manifestations of the crisis is the large
number of suicides committed by farmers in several states of India. Till 1995 the
government did not have any separate record on farmers' suicides. However, since
then the government began to register cases of farmers' suicides separately in the
National Crime Record Bureau. The number of farmers' suicide which was 10720 in
1995, has been increasing over the years and peaked in 2004 at 18241. The wave of
suicides is prominent in states such as Maharashtra, Andhra Pradesh, Karnataka,
Madhya Pradesh and even Punjab. The spate of suicides among farming community
has continued till date and the problem has been so alarming that it has attracted
nationwide attention and been the cause of serious debates in the state as well as
Union Legislatures. These debates have raised a series of questions about the
distressful conditions of farmers and the state of the agricultural economy. Hence, it
has become a matter of great policy concern giving rise to the need to undertake
studies on the causes of suicides.
1.2 Review of Literature :
The issue of agrarian distress and consequent suicides among farmers
provoked the government to conduct surveys and initiate reports on the causes of
suicides as well as remedial measures. At the same time a large number of scientific
research studies have also been conducted to probe into the socio-economic and other
causes of suicides in different parts of the country. Rasal (2012) provides a detailed
review of literature covering several studies on causes of suicides among farmers,
starting with the first study conducted in 1998 till 2008. The first incidence of
farmer's suicide was reported from a rubber growing farmer in Kerala in 1986 and
followed by a few other such cases. Such cases however did not attract much
3
attention. However, since the 1990s, the spate of farmers' suicide spread to several
states such as Karnataka, Andhra Pradesh, Maharashtra and even Punjab. The
situation was so serious that the then Hon''ble Prime Minister of India, after visiting
suicide affected districts, announced a rehabilitation package in 2006. Even till date,
the issue on farmers' suicide continues to be an important topic of research and a
major cause of concern for policy framers.
The initial study conducted by Assadi (1998), probed into the causes of
suicides among farmers in Northern Karnataka and the major signs of rural distress.
The heavy losses incurred· by farmers were due to crop failure and also mounting
debts to the money lender. Many farmers who committed suicide were market
oriented and earned profits by cultivating crops such as tur, chillies and tomatoes.
This encouraged them to increase area under such crops and the bumper harvest led to
crash in prices. There was no intervention by government to lift the produce when
price~ crashed as legislation seldom worked. In certain years, failure of monsoons or
even floods or unseasonal rains, washed off the crop. Another factor that increased the
cost of cultivation was purchase of spurious inputs such as pesticides borrowing from
money lenders and this added to the debt burden of the cultivator. Peasants who had
leased in land were unable to pay the landlord the share of produce due to him. They
again borrowed from money lenders huge amounts at very high rates of interest.
Finding that they are unable to repay the loan and the perpetual threat of losing their
land and thereby losing their social existence haunt them and thus push the peasants
into the extreme step.
Though the above study by Assadi ( 1998) is very brief and deals with
northern districts of Karnataka, it captures major causes of suicides among farming
community which have similar relevance in other states and till date. Another study in
Karnataka, Vasavi (1999) noted that even if farmers have access to inputs they do not
have appropriate extension services and sometimes purchase poor quality inputs
which increases their cost of cultivation. Yet another study in Karnataka by
Deshpande (2002) observed that change in cropping pattern from foodgrains to
commercial crops, increase in cost of cultivation, lack of institutional support was the
root cause of agrarian distress. Most of the farmers who committed suicides were
small and marginal and belonged to backward communities. There was dominance of
4
middlemen in price determination and also other factors such as high consumption
expenditure due to social obligations.
Revathi (1998) focused on some missing issues such as lack of irrigation
facilities in Andhra Pradesh. Farmers wanted to invest in private sources of irrigation
and made huge investment in digging or deepening wells for which they borrowed
from non-institutional sources at exorbitant rates of interest. Another study in Andhra
Pradesh (Parthasarathy & Shameen 1998) observed a number of factors such as
adverse rainfall and instability of yield, unremunerative prices, rise in cost of
cultivation, indiscriminate use of pesticides, inaccessability to institutional sources of
credit and growth of lease holdings made farmers vulnerable and thus caught in a debt
trap. According to Ratnam (2002) social factors also played a role in suicides as
victims belonged to nuclear families and lacked emotional support. Their low level of
literacy made them fall a prey to false information from pesticide dealers and they
were further exploited by traders and did not receive the price that they expected.
Mohan Rao (2004) in his study noted that farmers committing suicide were small and
marginal and shifted themselves to cash crops due to occasional benefits received
from these crops but which also increased their risk. There was also low degree of
social integration amongst these farmers. Similar observations were made in studies
by Murlidharan Rao and Venkata Siva Redy (2004), Nazeeruddin (2004),
Chandrashekhar and Ghosh (2004), Ratna Reddy and Galab (2005) and several other
studies where erratic rainfall, debt, crop failure, spurious inputs, unfavorable output
prices, failure ·of public extension services and public investment and increasing
consumption expenditure have all played their role in making the condition of farmers
adverse.
In early 2000s suicide among farmers began to attract nationwide attention
and even headlines of media reports. In 2000-01 and 2002-03 the highest rate of
suicide was observed in Karnataka while in 2004-05 the rate was highest in Andhra
Pradesh. In Maharashtra there was a suicide epidemic in 2006 concentrated in the
Vidarbha region of the state. Studies by Mohanty (2001) and Mitra and Shroff(2007)
revealed that suicides were high in states where cotton is an important crop.
Technology (popularity of Bt Cotton) which increased cost of production as well as
liberalization in agricultural trade policies of the government by bringing cotton under
Open General License and reducing import tariff made India's cotton economy
5

susceptible to price shocks from the world market While usage of Bt seeds does
increase yield, it was not enough to compensate for the increase in cost of production.
Cotton is mainly a rainfed crop in Maharashtra and in years when monsoons fail, the
farmers experience huge crop loss. Farmers in Maharashtra cultivate cotton at the
mercy of the monsoons and are thus highly vulnerable. In drought conditions, they
experience crop loss due to falling yields which is not compensated by higher prices
due to loss of competitiveness in a global market. Thus farmers suffer from low yield,
low price and high cost of production which finally push him into debt which is a
proximate cause for suicide.
The suicide epidemic in Maharashtra in 2006 pushed the government into
conducting a number of inquiries (Dandekar et al., 2005; Jadhav, 2008; Mishra, 2006;
Planning Commission, 2006). The study by Dandekar et al. (2005) was carried out in
the major suicide belt comprising of Vidarbha, Marathwada and Khandesh of
Maharashtra. Repeated crop failure, inability to cope up with the rising cost of
cultivation, unremenurative prices and consequent indebtedness forced the farmers to
commit suicide. The study revealed that more than failure of monsoons, it was pest
attack and spurious seeds alongwith high dosage of fertilizers between 2001 and 2004
which not only increased cost but also polluted the ecosystem. The Minimum Support
Price fixed by the government did not always cover cost of production and also
farmers lacked access to government agencies to dispose off their produce when
required. Farmers are also found to be defaulters in repayment of loans from
institutional sources and forced to go to private moneylenders who charge a rate of
interest of 36 to 72 percent per annum. There is also absence of rural non-farm
opportunities and those farmers who faced repeated crop failures and accumulated
loans were mainly the ones who took an extreme step. The Planning Commission
(2006) report also made similar observations regarding the causes of suicides among
farmers. The Report also concluded that Vidarbha and Marathwada face a backlog for
irrigation which increased upto 60 percent in 2002 but was 38 percent in 1984. This
accounts for low productivity and finally low capacity of farmers to repay their loans.
The Committee therefore recommended long term as well as short term policy
measures such as distribution of quality seeds, extension services, waiver of
institutional loans, water harvesting and conservation, procurement and pricing
policies, crop insurance, etc. The study by Mishra (2006) on the basis of an analysis
6

of Ill suicide cases, identified the socio-economic stressors in order of frequency as
indebtedness, deterioration of economic status, conflict with other members of family,
CJ;"Qp failure, decline in social position, burden of daughter or sister's marriage, suicide
in a nearby village, addictions, change in behavior of deceased, dispute with
neighbors/others, health problem, a recent death in the family, history of suicide in
family and other family members being ill. A statistical exercise comprising suicide
case with non-suicide control once again confirmed that indebtedness and absence of
productive asset are significant risk factors. Farmers are vulnerable to yield and price
shocks in case of cotton farmers. Given the seriousness of the problem of agrarian
distress, a report (Jadhav, 2008) was submitted to Government of Maharashtra to
frame an action plan for the agricultural development of Maharashtra against the
background of farmers' suicides. While the report observed like most studies that
indebtedness is the main reason for economic distress, it also noted that farming in
Vidarbha is no longer financially viable mainly due to grossly inadequate irrigation
facilities, acute shortage of electric pump-sets and inadequate supply of institutional
credit. In addition to irrigation backlog, Vidarbha traditionally has had a very large
backlog in electric pumpset connections. As-a result, even where wells or lakes had
enough storage of water, farmers could not use the water for agricultural purposes due
to unavailability of electric pumpsets. A similar situation was with respect to bank
credit. In 1995, the institutional credit to agriculture in Vidarbha was 22 percent of
total credit to Maharashtra but in 2005, this share declined to 13 percent. Despite lack
of irrigation facilities, the cropping pattern has remained largely unchanged and mono
cropping rather than diversification was undertaken. Even in years when farmers
experienced good yields, the prices for their produce was not favorable thus leading to
low incomes. Farmers did not have access to supplementary activities during natural
calamities and this caused economic distress. Coupled with this were mental stress
from banks and unauthorized moneylenders for repayment of their dues which caused
extreme frustration followed by suicide. The lteport therefore recommended a
package of practices such as promotion of irrigation facilities, supply of credit,
moneylender free village, reasonable prices for produce and price awareness.
Infrastructure should be strengthened and employment guarantee schemes should be
created while crop insurance should be strengthened.
7
Since suicide among farmers was hype at a time when Bt cotton was also
approved for commercialization, i.e in mid-2000, studies Gruere, Mehta-Bhatt, and
Sengupta (2008) have conducted a detailed study and reviewed the evidence in order
to observe if Bt cotton played a role in being the cause of suicides among farmers.
The study noted that Bt cotton has contributed to increase in yield of cotton in India
and also brought about reduction in use of pesticide despite bringing about an increase
in overall cost of cultivation. There were however certain regions where Bt did not
show encouraging results mainly because of lack of irrigation in the event of failure of
monsoons, fall in cotton prices, lack of suitable extension services with respect to use
of Bt seeds and also use of unbranded spurious seeds. Other factors have also played a
major role in Andhra Pradesh and Maharashtra which were the hotspots of suicide
such as poor credit delivery system and availability of toxic pesticides. Perhaps Bt can
be linked only to specific cases of suicides but is neither a necessary nor specific
condition for suicide among farmers. Another study, Guha (2012) studied the facts
and factors on suicides among farmers in Maharashtra and India. The study concluded
that suicide occur due to international, national and local factors. International factors
include negative effects of globalization due to imported agricultural goods being
purchased rather than domestic and also price volatility due to integration with world
markets. Indian farmers are unable to compete with other countries in the world
market. At the national level, although there are several government schemes and
package for farmers who committed suicide, it has hardly reduced the spate of
suicides. Local factors such as weather, lack of irrigation and social factors have
contributed to bringing about distress among farmers.
Farmers' suicide has always been highest in Maharashtra and hence a
recent study was conducted Shroff, Kajale and Bodkhe (2015) to observe the cause of
agrarian distress in Mahrashtra. It was observed that more than half the area under
Kharif crops is under cotton and soyabean and both these crops are becoming
unremunerative. Suicides are also more prominent in Marathwada and Vidarbha
where both cotton and soyabean are major crops. Maharashtra is a high cost state and
in case of crops such as jowar and cotton, the Minimum Support Price is not covered.
Market prices hover around support level and farmers are unable to cover their cost of
production. In case of soyabean there is drastic fall in yield to the extent of 80 percent
in certain drought years and field observations revealed that farmers did not even
8
harvest the crop because the cost of hiring labor would exceed the value of harvest.
The irrigated area under cotton is barely 3 percent, while in case of soyabean it is 0.4
p~rcent. Thus in years when there is drought and failure of monsoons, farmers do not
have even protective irrigation which leads to sharp fall in yield. The study noted that
policy must be directed towards increase in irrigation coverage so that yield potential
can be realized.
While lack of irrigation is also considered to be a major cause of suicides
in states such as Maharashtra, the same phenomenon was observed in irrigated states
such as Punjab and Haryana. Jodhka (2006) observed that in Punjab there was
tendency of farmers to borrow for unproductive purposes such as social functions
which pushed the farmers into a debt trap and thereby suicide. In Haryana, the socio
economic reasons for suicides was probed by Ahlawat, (2003) and it was observed
that 91 percent of the deceased farmers were living in nuclear families and perhaps
had less social support. Crop failure was also experienced due to water logging and
pest attack and cost of cultivation increased. This coupled with rise in consumption
expenditure in order to maintain their status in society forced them to borrow from
private sources which they were unable to repay. The cause of agrarian crisis in
Kerala was pointed towards the loss of competitiveness of the main commercial crop,
i.e. rubber in a global market (Mohanakumar and Sharma 2006). Farmers borrowed at
high interest rates for both agricultural as well as social purposes to bridge their gap
between income and expenditure and found it difficult to repay and thus caught in a
debt trap.
To conclude, from the review of literature, it appears that a large number
of factors - social, economic and institutional, have been responsible for distress
among farming community. Agriculture in several years no longer seems to be a
profitable enterprise due to rising cost of cultivation coupled with low yields and low
prices. This leads to low farm revenue and poor repaying capacity of loans and a
vicious circle is created into which the farmer is trapped. Social isolation and certain
government rescue operations have also not helped to salvage the situation.
9
1.3 Main Objectives and Scope of the Study:
In the above section it was observed that a large number of studies on
suicides among farmers since nearly last two decades have been conducted. The
studies deal with different states, cover various causes and suggest various
interventions. However, given the magnitude of the problem leading to frantic
discussions in Union and State Legislatures, yet another study is being conducted with
the following objectives :
1. To analyse the incidence and spread of suicides among farmers in the state of
Maharashtra;
2. To study the socio-economic profile, cropping pattern and profitability of
victim farm households;
3. To study the causes leading to farmers' suicides including production and
market risks, sociological, psychological and other family related factors
responsible for farmer suicides;
4. To recommend suitable policies to eliminate the occurrence of incidence of
farmers' suicides.
The study will focus in the major regions in the state of Maharashtra where
suicides are concentrated.
1.4 Data and Methodology :
The study deals with both secondary as well as primary data. Secondary
data has been collected in order to understand the trend in the incidence of suicides
since 2001. The data on incidence of suicides is also collected across districts and
divisions of Maharashtra, in order to capture the concentration of such incidents. The
district wise list of the deceased · farmers was obtained from the Agriculture
Department (Divisional Office) of Government of Maharashtra Further, the
households which suffered from the occurrence of suicides were also entitled to
compensation by the government if it was observed that indebtedness or crop loss or
any factor related to farming was the main cause of suicide. Therefore the data on
10

those eligible for compensation out of total suicide cases among farmers has also been
collected.
Primary data has been collected from 50 agricultural households which
had an incidence of suicide. After selecting districts which were hotspots for suicides,
a structured questionnaire was addressed to them. The que'stionnaire firstly attempted
to capture the agricultural status of the household and then try and probe into the
causes. Hence primary data has been collected on family size, level of education,
social group, cropping pattern, size of holding, source of irrigation, cost of cultivation,
etc. In order to observe the extent of agrarian distress, the loan borrowed from
institutional as well as non-institutional sources is observed and also the extent of
indebtedness. Besides income from agriculture, the income of farmers from other
sources was also observed. By and large questions were addressed to observe the
socio-economic causes of suicides and also the impact of suicide on the household.
After collecting data from sample households, it was neatly tabulated in order to
observe the socioeconomic characteristics of the households and main trigger factors.
The districts selected were those where suicides were concentrated in
2015-16 which is the reference year of the study. The districts selected are from
Aurangabad division which had a share of 37.43 percent in number of suicides in
2015-16 and Amravati division where the share was 34.45 percent. Thus these two
divisions together accounted for 71.88 percent of suicides in Maharashtra. The five
districts selected were Beed, Yavatmal, Amravati, Nanded and Aurangabad which
together accounted for 38.85 percent of suicides among farmers in Maharashtra. The
list of districts and sample size is indicated in Table 1.1.
11

Table 1.1 : District wise selection of Households of Suicide Victims
Sr Name of selected
Name of No.of District {and Number Name of village Victims'familie
no. of suicide households ) select Tauka
s Interviewed 1 Beed (16) Beed Ravalsgoan 1
Beed 2 Navgan Rajuri 1
Gevrai Sakshal Pimpri 1 Ambejogai Vadgoan 1
Kodari 1 Kej Sun gao an 1
Jadhav Javla 1 ShirurGhat 1 Dhanegoan 1 Jawalban 1 Sadola 1 satephal 1 Malegoan 1 Gotegoan 1
2 Yavatmal (10) Darvha Chani 1 ChiKhali 1 Morghavan 1
Yavatmal Pandhari 1 Ghodkhindi 2 Yavali 1 Varud - 1 Kamathwada 1 Rui Wai 1
3 Amravati (9) Amravati NanduraBu. 1 Anjangoan Bari 1 Badnera Valgoan 2 Shirasgaon Kasaba 1
Chandurbaza Masod 2 r Karajgaon 2
4 Nanded (8) Hadagaon Kharatwadi 1 Kharbi 1
Nanded Daryapur 1 Sugav (khu.) 2 Dhanora 1 Sugav (bu.) 1
Ardhapur Belsar 1 5 Aurangabad (7) Aurangabad Pimpriraja 1
Pimpri Bk 1 Harshi BK. 1 Thergaon 1
Paithan Dawarundi 2 Hanuman Nagar 1
Total Sample Size of 5 50 districts
12

Fi ure 1.1: Sam le Districts and Number of Suicides Districtwise
c:::::J Sample Districts
1.5 Organisation of the Report
After an introductory chapter, the incidence and intensity of suicides is
observed in chapter 2. The number of cases eligible for compensation is also
indicated across districts and over the years. Chapter 3 is an analysis of primary data
with respect to the socio-economic profile of the victim and the household. In chapter
4 an attempt is made to study the causes of suicides. Finally in chapter 5 the broad
conclusions and issues to be addressed by policy are discussed.
13

2.1 Introduction:
Chapter2
Farmers' Suicide Scenario
The state of Maharashtra is one of the top economic performers with
respect to per capita income which is 1.5 times that of all India (20 13-14)
(Government ofMaharashtra [GoM], 2016). The relatively high per capita income in
the state, however, conceals the enormous urban-rural contrast and the regional
disparities in per capita income. This gets reflected from the fact that in 2013-14, the
per capita district domestic product for Mumbai was 1.6 times that of state average.
Only 18 percent of districts, three in Konkan region (Mumbai, undivided Thane and
Raigad), in addition to Pune, Nagpur and Kolhapur had per capita income above state
average. The remaining 82 percent of districts have per capita district domestic
product below state average and in case of 41 percent of these districts, it is below
national average. It is in these districts that agriculture is the main economic activity.
Although on an average, 52.71 percent of workforce is engaged in agriculture in the
state, which is below national average, the disaggregated picture presents an entirely
different scenario. In case of 50 percent of the districts mainly concentrated in
Vidarbha and Marathwada regions of the state, the share of workforce in agriculture is
above 70 percent and in case 76 percent of districts, the share of workforce in
agriculture is above 60 percent. Their contribution to state domestic product is also
very low in comparison with state average which clearly speaks of agriculture being
economically unviable or even loss making enterprise. This situation has worsened
over the years and the agrarian distress has manifested into suicide among farmers. In
order to understand the causes of suicides, it is first of all necessary to note the
regions and districts where suicides are concentrated as it will facilitate an in depth
study into the major issues related with distress among farmers.
2.2 Intensity of Farmers' Suicide:
Maharashtra is broadly divided into 6 regions. Suicides among farmers
however do not occur in a big way in all regions but are only concentrated in some
regions. In Table 2.1 we have indicated the incidence of suicides according to districts
in the state.
14

Table 2.1 : District -wise details of farmers' suicides in Maharashtra (July 2015 to June 2016)
No. of No. of No. of
Percentage farmers' farmers' No. of farmers'
farmers' suicide per suicide per suicide per lakh suicide
to state total lakhhaof lakhha. Of farming families
District NSA GCA Aurangabad 172 5.12 25.29 15.96 32.45 Jalana 116 3.45 20.35 13.26 28.29 Parbhani 123 3.66 25.63 14.39 35.34 Hingoli 52 1.SS 15.76 9.03 24.41 Nanded 195 5.80 27.78 22.67 33.51 Beed 287 8.54 38.22 27.73 44.09 Latur 132 3.93 25.43 17.98 33.93 Osmanabad 181 5.39 38.76 19.05 50.84 Aurangabad
37.43 27.96 18.07 36.16 Division 1258 Amravati 348 10.35 46.34 35.37 83.86 Akola 197 5.86 45.81 28.97 81.40 Yavatmal 304 9.04 35.76 30.63 80.21 Buldhana 206 6.13 30.88 21.50 47.91 Washim 103 3.06 27.47 19.36 52.55 Amravati Division 1158 34.45 37.68 32.66 69.68 Nashik 117 3.48 13.45 11.85 18.20 Dhule 80 2.38 18.60 14.76 33.90 Nandurbar 8 0.24 2.76 2.19 5.44 Jalgaon 202 6.01 23.76 17.38 46.01 Nashik Division 407 12.11 16.68 13.31 27.78 Nagpur 61 1.81 11.09 9.52 22.68 Wardha 1SS 4.61 43.06 33.33 79.08 Bhandara 67 1.99 37.22 26.59 30.59 Gondia 36 1.07 20.00 15.13 15.13 Chandra pur 95 2.83 20.65 17.82 31.25 Gadchorili 11 0.33 6.47 5.14 8.15 Nagpur Division 425 12.65 22.37 18.14 31.23 Ahmednagar 156 4.64 14.44 10.52 16.32 Pune 22 0.65 2.39 1.89 2.96 Sola pur 47 1.40 4.60 3.97 7.01 Pune Division 69 2.05 2.28 1.80 2.91 Sa tara 16 0.48 2.96 2.37 1.86 Sangli 21 0.62 3.56 2.90 3.90 Kolhapur 7 0.21 1.63 1.11 1.10 Kolhapur Division 44 1.31 2.82 2.16 2.16 Maharashtra 3361 100 19.38 14.44 24.53
... Source: Office ofDlVlstonal Conumsstoner of Government ofMaharashtra (Unpublished Data) and Land Utilization Statistics (GoM)
It can be observed from Table 2.1 that in 2015-16 the highest share of
number of suicides in Maharashtra was in Aurangabad division (37.43 percent),
followed by Amravati Division (34.45 percent). However, the picture undergoes a
change when the number of suicides per lakh hectare ofNSA and GCA as well as per
lakh farming families is observed. While the number of suicides per lakh hectare of
NSA was 37.68 in Amravati division, it was 27.96 in Aurangabad division while with
respect to GCA the corresponding figures were 32.66 in Amravati division and 18.07
15

in Aurangabad division. A similar observation was made with respect to suicides per
lak.h farming families where it was 69.68 for Amravati division and 36.16 for
Aurangabad division.
From Annexure 2.1, it can also be observed that in Maharashtra suicides
which were 62 in number in 2001 increased to 2376 in 2006, i.e increase by 38 times
and a little more than half was contributed by Amravati division. While this figure did
show some decline in the following years, it touched a higher peak in 2015 and was
3228, the highest in India. The share of Aurangabad which was 15.91 percent in 2006
now showed a massive rise to 35.01 percent.
In Table 2.2, the number of suicides in Maharashtra in 2015-16 (month
wise) is indicated. It can be observed that in 2015-16 the state witnessed 3361 number
of suicides and the highest number of suicides were in the month of October (10.24
percent), followed by August (10.12 percent).
Table 2.2 Month-Wise Number of Farmers' Suicide in Maharashtra (July 2015 to June 2016)
Month Number of farmers' Percent to total Suicides number of farmers'
suicides July 2015 272 8.08
August2015 340 10.12
September 2015 324 9.64
October 2015 344 10.24
November 2015 293 8.72
December 2015 321 9.54
January 2016 240 7.14
February 2016 214 6.37
March2016 259 7.71
April2016 263 7.83
May2016 254 7.56
June 2016 237 7.05
Total 3361 100 . . . ..
Source: Office ofDtvtstonal Comnuss10ner ofMaharashtra (Unpublished Data)
16
2.3 Procedure adopted and criteria for compensation:
In the above section, the incidence of suicides among farmers in
Maharashtra with the Vidarbha region being the epicenter of a major farmer suicide
crisis, followed by Marathwada region. Given the seriousness of the problem and the
level of distress which led several farmers to take the extreme step, several
compensation measures both at the individual level as well as for the agricultural
sector as a whole have been implemented.
In early years of the 2000 decade, whenever a suicide case was brought to
the notice of the Divisional Commissioner, an enquiry was carried out by Tahsildars
or Sub Divisional Officers to ascertain the causes of suicide. If it was established that
indebtedness of the farmer from a fmancial institutional was the primary cause for
suicide, the case was treated as a suicide due to agricultural indebtedness. The
government stated that although it had no formal scheme for providing assistance to
families of farmers who committed suicide, an amount of Rs. 1 lakh is provided on a
discretionary basis from the Chief Minister's Relief Fund. The criterion applicable
was that agricultural indebtedness should be established as the cause of suicide. Those
who were found to be ineligible for compensation was because it was observed that
they had not taken loan from formal institutional source, did not own land either in his
name or in the name of his family, was addicted to alcohol, had conflicts or had
accidental death.
While assistance to the deceased farmer was provided from the Chief
Minister's Relief Fund, as mentioned above, a policy decision was made on 23 rd
January 2006 by the state government to constitute a separate and independent
Committee for each District with the Collector as its head. Further, the assistance will
not be from the Chief Minister's Relief Fund, but from Social Security and Welfare
Fund which is a regular budgetary head. The Committee will consist of (i) A
representative of agriculturists; (ii) A representative of non-governmental
organizations; (iii) The Chief Executive officer of the Zilla Parishad; (iv) the
superintendent of Police (v) the superintending Agricultural Officer. All cases relating
to suicide by farmers are to be considered at the district level by the committee
constituted for each district and the disbursement of assistance is to be made strictly
by the committee from the funds available at its disposal. The state government
further submitted that initially assistance was being given only to those cases which
17
satisfied a triple test namely (i) the deceased farmer should be an agriculturist; (ii) the
deceased farmer should have been indebted to a fmancial institution that had
disbursed a loan to him; and (iii) there should have been pressure for the recovery or
repayment of the loan at the behest ofthe creditor. However, on 27th February, 2006,
a policy decision was taken by the state government to broaden the criterion for
providing fmancial assistance to families of those farmers who had committed
suicide. Under the new criteria, the deceased farmer is to be presumed to be an
agriculturist, if any member in the family holds agricultural land. All such cases will
be considered to be eligible where the loan has been obtained by any member of the
family of the deceased farmer from a Nationalized Bank, a Cooperative Bank,
Cooperative Credit Society or licensed Money lender and where on account of non
payment of loan installments, there are outstanding overdues. In view of the changed
criterion, the state government had agreed to reconsider all cases that were found to
be ineligible and assistance declined from 1st January 2001 (The Secretary, All India
Bio Dynamic and Organic Farming Association vs the Principal Secretary,
Government ofMaharashtra, 2006)
2.4 Payment of Compensation and Measures to Prevent Suicides by Farmers :
The number of cases eligible for compensation and the percentage to total
suicides is indicated in Table 2.3 for each district in the state. The compensation
package was Rs. 1 lakh per family where suicide took place, out of which Rs. 30,000
was paid in cash and Rs. 70,000 was deposited in the bank as a Fixed Deposit.
From Table 2.3, it can be observed that on an average, in the state of
Maharashtra, 65.74 percent of families where suicide was committed received
compensation. In Aurangabad division where maximum number of suicides was
committed, the number of families which received compensation was 67.41 percent
while the corresponding figure for Amravati was 60.45. In western Maharashtra
where the number of suicides was relatively negligible, in three districts, namely
Pune, Solapur and Kolhapur, all families where suicide was committed received ·
compensation.
Discussions with the bereaved families revealed that in addition to the
compensation of Rs 1 lakh, they also received seed and fertilizer as some
compensation in kind.
18
Table 2.3 District-wise details of compensation (July 2015 to June 2016)
Number of Percent of families Total amount of Compensation families compensated to total compensation in paid per family
District compensated farmers' suicides lakhs (Lakhs) Aurangabad 125 72.67 125 1
Jalana 60 51.72 60 1
Parbhani 73 59.35 73 1
Hingoli 46 88.46 46 1
Nanded 117 60.00 117 1
Beed 220 76.66 220 1
Latur 94 71.21 94 1
Osmanabad 113 62.43 113 1
Auangabad 1 Division 848 67.41 848
Amravati 214 61.49 214 1
Akola 134 68.02 134 1
Yavatmal 143 47.04 143 1
Buldhana 154 74.76 154 1
Washim 55 53.40 55 1
Amravati 1 Division 700 60.45 700
Nashik 95 81.20 95 1
Dhule 64 80.00 64 1
Nandurbar 7 87.50 7 1
Jalgaon 144 71.29 144 1
Nashik 1 Division 310 76.17 310
Nagpur 29 47.54 29 1
Wardha 124 80.00 124 1
Bhandara 52 77.61 52 1
Gondia 14 38.89 14 1
Chandrapur 56 58.95 56 1
Gadchiroli 1 9.09 1 1
Nagpur 1 Division 276 64.94 276
Ahmednagar 76 48.72 76 1
Pune 22 100.00 22 1
Sola pur 47 100.00 47 1
Pone 1 Division 145 64.44 145
Sa tara 7 43.75 7 1
Sangli 19 90.48 19 1
Kolhapur 7 100.00 7 1 Kolhapur 1 Division 33 75.00 33 Maharashtra 2312 65.74 2312 1
0 0
Source: Department ofRehefand rehab1htat10n, Government ofMaharashtra (Unpublished data)
19

The above mentioned package was that of the state government. However,
in 2006 when there was virtually a suicide epidemic in Maharashtra and infact this
issue was receiving considerable social and public policy attention, a package was
also announced by central government. Concerned by farmers' suicides in some parts
of the country, the Hon'ble Prime Minister of India, after visiting some parts of the
Vidarbha region in Maharashtra, announced a rehabilitation package on July 1, 2006
to mitigate the distress of farmers in the identified districts. This compensation
package included credit related schemes as well as measures to improve the
productivity of crops and thus augment farm incomes (Kalamkar and Shroff, 2011 ).
The credit related measures included three sub schemes, viz. debt relief to
the farmers (re-schedulement of loans) over a period of three to five years with one
year moratorium, interest waiver and credit flow. The entire interest on overdue loans
to farmers as on July 1, 2006 was waived and farmers had no past interest burden as
on that date. Other features of the package were to increase area under irrigation,
undertake a massive seed replacement programme with 50 percent subsidy, and
promote watershed development and horticulture development. Area under micro
irrigation in the form of drip and sprinkler was to be increased as it is also an
important form of irrigation. Under the Prime Minister (PM) package an effective and
efficient extension service mechanism was to be encouraged in order to empower the
farmers with new technologies. Finally subsidiary income activities such as livestock
and fisheries were also to be promoted. The total amount allocated for various
schemes under PM package is indicated in Annexure 2.12. It can be observed from
Annexure 2.12 that highest allocation (64.5 percent) was under assured irrigation
facilities for the purpose of major, medium and minor irrigation projects. Besides
provision was also made for micro irrigation, check dams watershed and rain water
harvesting. This clearly indicates the crying need for protective irrigation in case of
failure of monsoons.
Further, with a view to alleviate the sufferings of debt stressed families of
farmers in the six affected districts ofVidarbha, a sum ofRs. 50 lakhs for each district
was placed at the disposal of the respective district collectors. Therefore a sum of Rs.
3 crore was received from Prime Minister's National Relief Fund during 2006-08 and
Rs. 3.60 crore was also received from Chief Minister's Relief Fund during 2008-09 as
20

ex-gratia Relief Fund. This ex-gratia assistance was given to 9,555 farmers, out of
which 7341 farmers received health assistance and 2214 farmers received educational
assistance. About 20 percent assistance was provided for education and 80 percent
assistance for health.
Besides overall state and central schemes, a ·number of other schemes were
also introduced and implemented by the government at the district level to arrest
suicides among the farming community. It was observed that spate of suicides among
farmers was highly concentrated in the districts of Y avatmal and Osmanabad and
more or less peaked in 2015. Thus the Yavatmal district administration submitted a
proposal to the state government which in turn issued a Government Resolution on
July 24th, 2015, wherein it resolved to make two districts- Osmanabad and Yavatmal ,
suicide free in two years. The government recommended to the district administration
to launch a project "Baliraja Chetana Abhiyan" with the purpose of creating mass
awarenf!SS among the distressed farmers across the districts with respect to
government sponsored schemes for the overall welfare of farmers so as to prevent
them from taking any extreme steps. The state allotted Rs. 32 crore annually for the ·
implementation of the scheme to be carried out in the district in the next three years.
The scheme is implemented by the village level committee headed by the sarpanch of
the village and overall supervision is to be done by the district level committee. The
scheme entails mass marriages for the daughters of farmers, counseling to minimize
the mental stress of the farmers, boost the morale of the farmers through health care
camps, training to educated youths for setting up small industrial units and
encouraging the farmers to join the village based cooperative credit societies
(Abraham, 2016). Initiatives under this scheme included spreading awareness of
success stories among farmers, facilitating marketing of agricultural produce, setting
up of skill development centres, restructuring of defaulted crop loan and provision of
fresh crop loan. Further, allocation was also made towards irrigation projects, farm
wells and energy connections. The village level committees headed by the sarpanch
also had Rs. 1 lakh each to help the families of farmers for meeting expenses related
to health, education and loap installments which were major causes of distress.
Other measures undertaken by the government were awareness of crop
insurance, maintaining soil health cards so as to improve productivity, promoting
irrigation, and also launching of schemes for accident insurance of farmers. Farmers
21

were also given two bags of seed and some other inputs for which they did not have to
make payment.
2.5 Summary:
In the last two decades the state, like many other states has been suffering
from underperformance in the agricultural sector due to crop failure and
unsatisfactory farm prices. This state of affairs has caused agrarian crisis and led to a
spate of suicides among farmers. The state of Maharashtra is divided into 6 regions.
However, the suicides are concentrated mainly in the regions of Vidarbha and
Marathwada. If we consider the period from 2001 to 2016, it can be observed that
50.55 percent of total suicides in the state are in the division of Amravati, followed by
Aurangabad division where it was 20.36 percent. The year wise picture however
reveals that in 2015, the share of Amravati was 36.52 percent and that of Aurangabad
was 35.01 percent, thus indicating rapid rise in distress in Aurangabad division. In
Amravati division, it was observed that Yavatmal had maximum number of suicides.
The data with respect to suicides per lak.h hectare indicate that in Vidarbha region in
2015 the suicides were 39.14 per lak.h hectare NSA and 29.22 per lak.h hectare GCA.
In Marathwada the corresponding figure was 25.16 and 16.27. In Marathwada region,
a number of districts showed an alarming rise in number of suicides from 2014 to
2015.
Given the magnitude of the problem and crisis in the state in the
agricultural sector, certain relief and compensation packages had to be implemented
by the state and central government. The state government had a compensation
package wherein Rs. 1 lak.h was given to families who were eligible. The data indicate
that in 2006 which experienced high incidence of suicides, less than half or 43.64
percent of farmers received compensation and this share was only 39.46 percent in
Amravati division which had 54.5 percent of suicide cases. With change in criteria for
compensation, where the deceased was presumed to be an agriculturist if any member
of the family had agricultural land, the share in Amravati division for those eligible ·
for compensation increased to 60.31 percent in 2015 and was 57.03 percent for the
state.
Besides providing for Rs. 1 lak.h compensation to the family of the
deceased, several socio-economic welfare schemes were also launched at the district
22

and village level to improve the welfare of farmers and reduce distress levels. Further,
in 2006, when there was a sudden spurt in suicides in Maharashtra, there were several
measures through Prime Minister's Relief Fund to enable the farmers to reschedule
loans, waiving of interest, ex-gratia payment and also other measures to strengthen
delivery of inputs.
Overall, it can be observed that while the situation related to agrarian
distress is acute, the government is making all round efforts to compensate the family
of the deceased as well as implement schemes so that farmers can access all inputs . .
and thus improve his productivity.
Annexure 2.1 : Division wise Number of Suicides in Maharashtra Suicide Cases 2001 to 2016
Sr.No. Year Konkan Nashik Pone Aurangabad Amravati Nagpur Maharashtra
1 2001 0 10 0 0 49 3 62
(0) (16.13) (0) (0) (79.03) (4.84) (100)
2 2002 0 2 1 9 80 30 122
(0) (1.64) (0.82) (7.38) (65.57) (24.59) (100)
3 2003 0 2 3 14 134 27 180
(0) (1.11) (1.67) (7.78) (74.44) (15) (100)
4 2004 0 38 9 95 418 80 640
(0) (5.94)_ (1.41) (14.84) (65.31) (12.5} (100)
5 2005 0 33 19 58 419 80 609
(0) (5.42) (3.12) (9.52) (68.8) (13.14) (100)
6 2006 3 212 121 378 1295 367 2376
(0.13) (8.92) (5.09) (15.91) (54.5) (15.45)_ _(100)
7 2007 0 183 123 327 1119 324 2076
JO) (8.82) (5.92) (15.75) (53.9) (15.61} (100)
8 2008 2 172 120 285 1061 326 1966
(0.1) (8.75) (6.1) (14.5) (53.97) (16.58) (100)
9 2009 0 125 91 228 905 256 1605
(0) (7.79) 5.67) (14.21) (56.39) (15.95) (100)
10 2010 4 123 67 191 1051 305 1741
(0.23) (7.06) 3.85) (10.97) (60.37) (17.52) (100)
11 2011 3 172 36 169 886 252 1518
(0.2) (11.33) 2.37) (11.13) (58.37) (16.6) (100)
12 2012 4 202 35 198 841 193 1473
(0.27) (13.71) 2.38) (13.44) (57.09) (13.1) (100)
13 2013 0 170 37 207 705 177 1296
(0) (13.12} (2.85) (15.97) (54.4) (13.66) (100)
14 2014 4 283 23 574 828 269 1981
(0.2) (14.2~ 1.16) (28.98) (41.8) (13.58) (100)
15 2015 2 459 96 1130 1179 362 3228
(0.06) (14.22) (2.97) (35.01) (36.52) (11.21) (100)
16 2016 0 449 72 985 1011 318 2835 (0) (15.83) 2.54) (35.74) (34.11) (11.22) (100)
Total 2001 22 2600 849 4770 11843 3348 23432
to (0.09) (11.09) (3.62) (20.36) (50.55) (14.29) (100) 2016
• 0 Note. Ftgure m bracket are percentage to total sutctdes m Maharashtra Source: Department of Relief and Rehabilitation, Government ofMaharasht:ra, Murnbai
23
A
Fi re 2.1: Division wise Number of Suicides in 2015-16
1400
1200
1000
800
600
400
200
0
Division wise Number of Suicides in 2015-16
Aurangabad Division
Amravati Nashik Division Nagpur Division Pune Division Division
fGCA dNSA 2 2 n· · · s .. d ~ I kh h t nnexure . lVISIOn WISe met e or per a ec are o an . .
Kolhapur Division
Konkan Nashik 'Pone Aurangabad Amravati Nagpur Mabarasbtra
Per Per Per Per Per Per Per Per Per Per Per Per Per Per
lakb lakb lakb lakb lakb lakb lakb lakb lakb lakb lakb lakb lakb Year
haof haof haof haof haof haof haof haof haof haof haof haof haof lakbha
GCA NSA GCA NSA GCA NSA GCA NSA GCA NSA GCA NSA GCA ofNSA
2001 0.00 0 0.32 0.41 0.00 0 0.00 0 1.25 1.58 0.14 0.16 0.28 0.35
2002 0.00 0 0.06 0.08 0.03 0.03 0.14 0.2 2.01 2.58 1.41 1.58 0.54 0.69
2003 0.00 0 0.06 0.08 0.08 0.10 0.22 0.31 3.33 4.32 1.27 1.42 0.80 1.02
2004 0.00 0 1.21 1.55 0.25 0.29 1.51 2.08 10.45 13.49 3.72 4.21 2.88 3.67
2005 0.00 0 1.02 1.34 0.51 0.61 0.92 1.27 10.60 13.6 3.78 4.23 2.61 3.48
2006 0.34 0.37 6.58 8.61 3.27 3.91 6.00 8.3 32.77 42.02 17.33 19.42 10.17 13.58
2007 0.00 0 5.68 7.43 3.32 3.97 5.19 7.18 28.32 36.31 15.30 17.15 8.88 11.87
2008 0.23 0.24 5.59 6.99 3.21 3.88 4.31 6.26 26.78 34.43 14.25 17.25 8.69 11.24
2009 0.00 0 4.06 5.08 2.44 2.96 3.45 5.04 22.84 29.39 11.19 13.47 7.10 9.21
2010 0.45 0.49 4.00 5 1.79 2.2 2.89 4.22 26.53 34.15 13.33 16.07 7.70 10.01
2011 0.34 . 0.37 5.54 6.99 0.95 1.18 2.44 3.73 21.75 28.8 10.64 13.25 6.55 8.72
2012 0.45 0.49 6.63 8.21 0.93 1.15 2.83 4.37 20.54 27.29 8.20 10.15 6.37 8.47
2013 0.00 0 5.58 6.91 0.98 1.23 2.96 4.58 17.22 22.87 7.52 9.31 5.61 7.47
2014 us 0.48 9.26 11.56 0.61 0.76 8.05 12.69 20.00 26.83 11.39 14.12 8.47 11.41
2015 0.23 0.24 15.01 18.76 2.50 3.17 16.22 25.1 28.42 38.27 15.38 18.98 13.87 18.61
2016 0 0 14.68 18.35 1.87 2.38 14.14 21.87 24.37 32.81 13.51 16.67 12.18 16.34 . . -. . .
Souml. Calculated from data from DqJartment of Relief and Rchabllitanon, GoM along Wltb data on GCA and NSA from Land UtJhzanon Statistics, GoM
24
Annexure2.3: District wise Number of Suicides in Maharashtra Districts 2001 2002 2003 2004 2005 2006 2007 2008 2009 2010 20ll 2012 2013 2014 2015 2016
Aurangabac 0 0 0 13 4 32 16 17 II 2 0 2 4 56 144 141
(0) (0) (0) (2.03) (0.66) (1.35) (0.77) (0.86) (0.69) (0.11) (0) (0.14) (0.31) (2.83) (4.46) (4.97)
Jalna 0 5 8 19 6 39 25 20 2 4 6 6 8 32 83 73
(0) (4.1) (4.44) (2.97) (0.99) (1.64) (1.2) (1.02) (0.12) (0.23) (0.4) (0.41) (0.62) (1.62) (2.57) (2.57)
Parbhani 0 2 4 6 10 51 28 18 28 22 23 35 17 70 104 91
(0) (1.64) (2.22) (0.94) (1.64) (2.15) (1.35) (0.92) (1.74) (1.26) (1.52) (2.38) (1.31) (3.53) (3.22) (3.21)
Hingoli 0 0 0 7 6 21 16 12 9 2 5 3 2 31 41 48
(0) (0) (0) (1.09) (0.99) (0.88) (0.77) (0.61) (0.56) (0.11) (0.33) (0.2) (0.15) (1.56) (1.27) (1.69)
Nanded 0 0 2 29 11 60 72 59 60 55 33 39 46 118 190 167
(0) (0) (1.11) (4.53) (1.81) (2.53) (3.47) (3) (3.74) (3.16) (2.17) (2.65) (3.55) (5.96) (5.89) (5.89)
Beed 0 0 0 II 12 124 95 86 88 79 73 91 98 152 301 208
(0) (0) (0) (1.72) (1.97) (5.22) (4.58) (4.37) (5.48) (4.54) (4.81) (6.18) (7.56) (7.67) (9.32) (7.34)
Latur 0 0 0 5 6 17 23 23 8 4 4 0 3 44 106 107
(0) (0) (0) (0.78) (0.99) (0.72) (1.11) (1.17) (0.5) (0.23) (0.26) (0) (0.23) (2.22) (3.28) (3.77)
Osmanabad 0 2 0 5 3 34 52 50 22 23 25 22 29 71 164 150
(0) (1.64) (0) (0.78) (0.49) (1.43) (2.5) (2.54) (1.37) (1.32) (1.65) (1.49) (2.24) (3.58) (5.08) (5.29)
Total 0 9 14 95 58 378 327 285 228 191 169 198 207 574 1133 985
Marathwad (0) (7.38) (7.78) (14.84) (9.52) (15.91) (15.75) (14.5) (14.21) (10.97) (11.13) (13.44) (15.97) (28.98) (35.1) (34.74)
Amravati II 20 41 101 102 270 265 264 220 283 254 190 167 209 306 308
(17.74) (16.39) (22t-78) (15.78) (16.75) (11.36) (12.76) (13.43) (13.71) (16.26) (16.73) (12.9) (12.89) (10.55) (9.48) (10.86)
Akola 6 7 21 46 43 174 125 165 136 200 177 178 136 156 . 195 148
(9.68) (5.74) (11.67) (7.19) (7.06) (7.32) (6.02) (8.39) (8.47) (11.49) (11.66) (12.08) (10.49) (7.87) (6.04) (5.22)
Yavatmal 17 38 52 142 167 360 359 311 325 309 240 238 231 266 386 226
(27.42) (31.15) (28.89) (22.19) (27.42) (15.15) (17.29) (15.82) (20.25) (17.75) (15.81) (16.16) (17.82) (13.43) (11.96) (7.97)
Buldhana 8 9 14 85 81 306 193 195 103 137 126 153 Ill Ill 189 217
(12.9) (7.38) (7.78) (13.28) (13.3) (12.88) (9.3) (9.92) (6.42) (7.87) (8.3) (10.39) (8.56) (5.6) (5.86) (7.65)
Washim 7 6 6 44 26 185 177 126 121 122 89 83 60 88 108 89
(11.29) (4.92) (3.33) (6.88) (4.27) (7.79) (8.53) (6.41) (7.54) (7.01) (5.86) (5.63) (4.63) (4.44) (3.35) (3.14)
Wardha 3 24 14 29 26 154 128 87 100 126 113 109 100 134 164 121
(4.84) (19.67) (7.78) (4.53) (4.27) (6.48) (6.17) (4.43) (6.23) (7.24) (7.44) (7.4) (7.72) (6.76) (5.08) (4.27)
Total 52 104 148 447 445 1449 1247 1148 1005 1177 999 951 805 964 1348 I 109
Vidharbha (83.87) (85.25) (82.22) (69.84) (73.07) (60.98) (60.07) (58.39) (62.62) (67.6) (65.81) (64.56) (62.11) (48.66) (41.76) (39.12)
Total
Vidharbha 52 113 162 542 503 1827 1574 1433 1233 1368 1168 1149 1012 1538 2481 2094
& (83.87) (92.62) (90) (84.69) (82.59) (76.89) (75.82) (72.89) (76.82) (78.58) (76.94) (78) (78.Q9) (77.64) (76.86) (73.86)
Marathwad
Rest of 10 9 18 98 106 549 502 533 372 373 350 324 284 443 747 741
Maharashtn (16.13) (7.38) (10) (15.31) (17.41) (23.11) (24.18) (27.11) (23.18) (21.42) (23.06) (22) (21.91) (22.36) (23.14) (26.14)
Maharashtn 62 122 180 640 609 2376 2076 1966 1605 1741 1518 1473 1296 1981 3228 2835
(100) (100) (100) (100) (100) (100) (100) (100) (100) (100) (100) (100) (100) (100) (100) (100) ..
Note: Figures m Bracket are percentage to Maharashtra; Source : Department of Relief and Rehabilitation, GoM
25

Annexure 2. 4 . ri :Dtst • id f, I kh h t ct WISe SUIC e or per a ec are o f GCA d NSA • M th d an 10 ara wa a Distri Total
CIS Aunneabad Jain a Parbhanl Hinl!oli Nanded Beed Latur Osmanabad Marathwada Suicide Suicide Suicide Suicide Suicide Suicide Suicide Suicide Suicide Suicide Suicide Suicide Suicide Suicide Suicide Suicide Suicide Suicide per 1akh per1akh per1akh per 1akh per lakh per lakh per1akh per1akh per1akh per1akh per lakh per1akh per1akh per1akh per1akh per1akh per1akh per1akh
GCA NSA GCA NSA GCA NSA GCA NSA GCA NSA GCA NSA GCA NSA GCA NSA GCA NSA
2001 0.00 0.00 0.00 0.00 0.00 0.00 0.00 0.00 0.00 0.00 0.00 0.00 0.00 0.00 0.00 0.00 0.00 0.00
2002 0.00 0.00 0.68 0.85 0.24 0.41 0.00 0.00 0.00 0.00 0.00 0.00 0.00 0.00 0.27 0.41 0.14 0.20
2003 0.00 0.00 1.04 1.37 0.48 0.82 0.00 0.00 0.24 0.28 0.00 0.00 0.00 0.00 0.00 0.00 0.22 0.31
2004 1.29 1.87 2.46 3.28 0.95 1.23 1.50 2.12 2.81 4.11 1.03 1.44 0.70 0.96 0.67 1.03 1.47 2.08
2005 0.38 0.58 0.82 1.04 1.19 2.04 1.15 1.82 1.34 1.56 1.34 1.58 0.83 1.15 0.42 0.63 0.92 1.27
2006 3.04 4.64 5.32 6.15 6.09 10.42 4.02 6.37 7.32 8.52 13.85 16.31 2.35 3.26 4.75 7.11 6.00 8.30
2007 1.52 2.32 3.41 4.32 3.34 5.72 3.07 4.86 8.78 10.22 10.61 12.50 3.17 4.40 7.26 10.87 5.19 7.18
2008 1.60 2.46 2.57 3.46 2.14 3.68 2.35 3.64 6.68 8.37 8.79 11.31 3.11 4.40 6.05 10.45 4.31 6.26
2009 1.04 1.59 0.26 0.35 3.32 5.80 1.77 2.72 6.79 8.53 9.00 11.74 1.08 1.54 2.66 4.59 3.45 5.04
2010 0.19 0.29 0.51 0.70 2.61 4.55 0.39 0.61 6.23 7.82 8.08 10.55 0.54 0.77 2.78 4.80 2.89 4.22
2011 0.00 0.00 0.75 1.05 2.57 4.76 0.94 1.52 3.48 4.66 7.21 9.15 0.52 0.77 2.78 5.22 2.44 3.73
2012 0.17 0.29 0.76 1.05 3.92 7.25 0.57 0.91 4.11 5.50 9.00 12.16 0.00 0.00 2.44 4.60 2.83 4.37
2013 0.35 0.58 1.01 1.41 1.90 3.52 0.38 0.61 4.85 6.49 9.69 13.09 0.39 0.58 3.21 6.13 2.96 4.58
2014 4.85 8.16 4.05 5.63 7.83 14.50 5.38 9.36 12.44 .16.66 14.63 20.14 5.65 8.43 7.45 15.06 8.05 12.69
2015 13.36 21.14 9.48 14.50 12.16 21.65 7.12 12.45 22.11 27.05 29.08 40.09 14.43 20.44 17.25 35.09 16.27 25.16 2016 12.15 19.22 7.65 11.70 9.7 17.28 7.29 12.75 17.57 21.49 18.93 27.9 13.47 19.08 14.52 29.53 14.14 21.88 . . ..
Source : Calculated from data from Dept of Rehef and Rehabibtatton. GOM and data on land Utthzation Stattsttcs, GoM.
26
Annexure 2 .5 DIStrict WISe SUlCI e or per a ec are o • 'd (i I kh h t an ID I ar f GCA d NSA. V'dh bh a
Amravati A kola Yavatmal Buldhana Washim
Wardha Total Vidharbha Districts
Suicide per Suicide per Suicide per Suicide per Suicide per Suicide per Suicide per Suicide per Suicide per Suicide per Suicide per Suicide per Suicide per Suicide per lakh ha lakh ha lakh ha lakh ha lakh ha lakhha lakhha lakh ha lakhha lakhha lakh ha lakh ha lakhha lakh ha GCA NSA GCA NSA GCA NSA GCA NSA GCA NSA GCA NSA GCA NSA
2001 1.07 1.47 1.10 1.37 1.74 2.00 0.96 1.17 1.29 1.84 0.78 0.82 1.21 1.50
2002 1.94 2.67 1.28 1.60 3.89 4.47 1.06 1.31 1.04 1.58 6.25 6.57 2.38 3.00
2003 3.91 5.47 3.80 4.82 5.32 6.12 1.65 2.05 1.02 1.58 3.64 3.82 3.36 4.27
2004 9.00 13.43 8.47 10.58 10.50 16.75 8.79 12.72 8.58 11.61 4.61 7.96 8.72 12.97 2005 9.52 13.56 8.17 9.89 17.11 19.70 9.67 12.12 4.82 6.86 6.76 7.13 10.26 12.91 2006 25.19 35.90 33.08 40.01 36.88 42.47 36.52 45.78 34.29 48.81 . 40.02 42.25 33.42 42.04 2007 24.73 35.24 23.76 28.74 36.78 42.35 23.03 28.87 32.81 46.70 33.26 35.12 28.76 36.18 2008 26.83 35.09 27.85 38.03 31.85 36.75 21.71 29.14 24.66 33.36 18.96 23.86 25.97 33.33 2009 22.36 29.26 22.95 31.36 33.29 38.47 11.47 15.39 23.68 32.04 21.79 27.46 22.73 29.20 2010 28.76 37.68 33.76 46.06 31.65 36.60 15.25 20.47 23.87 32.29 27.46 34.58 26.62 34.21 2011 25.81 33.82 28.32 40.85 24.34 28.21 13.34 18.82 16.64 23.56 24.00 31.01 21.98 28.99 2012 19.31 25.30 27.78 41.08 23.98 27.98 16.25 22.86 15.52 21.97 23.15 29.91 20.83 27.59 2013 16.97 22.24 21.23 31.39 23.27 27.15 11.79 16.58 11.22 15.88 21.24 27.44 17.63 23.36 2014 21.24 27.81 23.03 36.03 26.69 31.12 11.70 16.58 16.47 23.28 28.56 36.93 20.91 27.95 2015 31.09 40.72 28.66 45.10 38.89 45.16 19.73 28.34 20.28 28.77 35.27 45.12 29.22 39.14 2016 28.95 37.93 18.37 28.91 20.45 23.75 20.25 29.08 14.19 17.58 21.07 26.96 24.04 32.20 . . . . . . Source . Calculated from data from Dept of Rehef and Rehabthtatton , GoM and data on land Utthzatton Stattsttcs, GoM .
27

A 26 R . nnexure . e2]onWise suicide per lakh hectare of GCA and NSA . . . - Vidbarbha and Maratbwada Rest of Maharashtra Maharashtra
Suicide Suicide per Suicide per
Suicide per Suicide per Suicide per lakh ha perlakh lakh ha Years lakhbaGCA lakh haNSA lakhha GCA NSA haGCA NSA
2001 0.49 0.64 0.09 0.10 0.28 0.35
2002 1.05 1.42 0.08 0.09 0.54 0.69
2003 1.50 2.01 0.16 0.19 0.80 1.02
2004 4.68 6.77 0.51 1.04 2.88 3.67
2005 4.73 6.29 0.83 1.12 2.61 3.48
2006 17.18 22.84 4.31 5.78 10.17 13.58
2007 14.80 19.68 3.94 5.29 8.88 11.87
2008 12.98 17.92 4.61 5.61 8.69 11.24
2009 11.17 15.47 3.21 3.93 7.10 9.21
2010 12.39 17.18 3.22 3.95 7.70 10.01
2011 10.19 14.65 2.99 3.71 6.55 8.72
2012 9.93 14.41 2.81 3.44 6.37 8.47
2013 8.75 12.71 2.46 3.03 5.61 7.47
2014 13.10 19.29 3.81 4.72 8.47 11.41
2015 21.43 31.22 6.39 7.95 13.87 18.61
2016 18.08 26.35 5.82 7.25 12.18 16.34 ..
Source: Calculated from data from Dept of Relief and Rehabilitation, GoM and data on Land Ut1hzat10n Statistics, GoM.
Fi ure 2.2: Division wise Suicide for er lakh hectare of GCA and NSA for 2015-16
80 ~-------------------------------------------------------
20
10
0 Aurangabad Amravati
Division Division Nashik Division
Nagpur Division
Pune Division
Kolhapur Maharashtra Division
•No. of farmers' suicide per Iakh ha ofNSA •No. offanners' suicide per lakh ha OfGCA
• No. of farmers' suicide per lakh fanning families
28

Fi ure 2.3: Re ·on wise suicide er lakh hectare ofGCA and NSA, 2015-16
35 ~--------------------------------------------------------
30 +---------------------------------
25 +---------------------------------
20 -t---
15 +---
10 +---
5 +---
0 Suicide per lakh GCA Suicide per lakh NSA
• Vidharvha and Marathwada • Rest of Maharashtra
Fi ure 2.4: Division-wise Percenta e share of number of suicides in 2015-16
2.05 1.31
• Aurangabad • Arnravati • Nashik • Nagpur • Pune • Kolhapur
29

Annexure 2.7: District wise Month wise Number of Suicides (2015-16) July Aug Sept Oct Nov Dec Jan Feb Mar Apr May June Total
15 15 15 15 15 15 16 16 16 16 16 16 2015-16 Aurangabad 8 15 21 17 16 13 11 20 15 11 16 9 172 Jalana 9 14 4 12 8 17 16 9 6 8 8 5 116 Parbhani 7 7 11 15 12 24 8 3 8 10 10 8 123 Hingoli 2 5 4 5 3 3 3 6 9 6 3 3 52 Nanded 13 19 27 18 15 16 14 12 12 19 18 12 195 Beed 25 25 41 32 33 17 11 19 17 18 25 24 287 Latur 11 13 6 10 12 16 13 10 14 14 11 2 132 Osmanabad 10 20 12 26 8 18 13 11 8 16 15 24 181 Aurangabad Division 85 118 126 135 107 124 89 90 89 102 106 87 1258 Amravati 36 41 22 27 23 32 39 21 28 31 25 23 348 Akola 13 21 27 26 22 9 11 18 20 12 9 9 197 Yavatmal 34 45 31 40 21 34 20 14 11 21 21 12 304 Buldhana 15 16 22 21 22 11 9 16 22 16 18 18 206 Washim 8 13 12 12 16 3 9 7 8 6 4 5 103 Amravati Division 106 136 114 126 104 89 88 76 89 86 77 67 1158 Nashik 13 12 9 5 11 12 3 5 10 5 18 14 117 Dhule 2 5 6 8 10 10 5 2 8 6 8 10 80 Nandurbar 1 0 0 2 0 0 0 0 1 4 0 0 8 Jalgaon 21 22 16 22 12 26 10 9 15 15 15 19 202 Nashik Division 37 39 31 37 33 48 18 16 34 30 41 43 407 Nagpur 9 5 4 3 7 6 4 2 6 4 3 8 61 Wardha 14 23 21 18 7 18 10 7 5 11 8 13 ISS Bhandara 5 3 5 9 4 8 10 4 4 5 4 6 67 Gondia 3 1 2 4 4 3 5 1 2 4 3 4 36 Chandrapur 3 9 8 2 12 11 7 12 10 9 6 6 95 Gadchorili 0 1 1 1 2 0 3 0 2 0 1 0 11 Nagpur Division 34 42 41 37 36 46 39 26 29 33 25 37 425 Ahmednagar 13 15 9 13 13 13 15 9 11 14 15 16 156 Pune 0 2 0 4 6 3 0 1 0 4 1 1 22
Solapur 8 3 7 3 4 8 3 2 6 2 0 1 47 Pune Division 8 s 7 7 10 11 3 3 6 6 1 2 69 Sa tara 1 0 0 0 0 1 3 2 6 2 0 1 16 Sangli 0 0 4 0 3 2 0 1 4 3 4 0 21 Kolhapur 1 0 1 2 0 0 0 0 2 1 0 0 7 Kolbapur Division 2 0 s 2 3 3 3 3 12 6 4 1 44 Maharashtra 272 340 324 344 293 321 240 214 259 263 254 237 3361
... Source: Office of Dtvtstonal Commtsstoners Government of Maharashtra (Unpublished Data)
30
Annexure 2.8 :District wise Month wise {Percenta2e of Suicides {2015-16) July Aug Sept Oct Nov Dec Jan Feb Mar Apr May June Total
15 15 15 15 15 15 16 16 16 16 16 16 2015 -16
Aurangabad 2.94 4.41 6.48 4.94 5.46 4.05 4.58 9.35 5.79 4.18 6.30 3.80 5.12
Jalana 3.31 4.12 1.23 3.49 2.73 5.30 6.67 4.21 2.32 3.04 3.15 2.11 3.45
Parbhani 2.57 2.06 3.40 4.36 4.10 7.48 3.33 . 1.40 3.09 3.80 3.94 3.38 3.66
Hingoli 0.74 1.47 1.23 1.45 1.02 0.93 1.25 2.80 3.47 2.28 1.18 1.27 1.55
Nanded 4.78 5.59 8.33 5.23 5.12 4.98 5.83 5.61 4.63 7.22 7.09 5.06 5.80
Beed 9.19 7.35 12.65 9.30 11.26 5.30 4.58 8.88 6.56 6.84 9.84 10.13 8.54
Latur 4.04 3.82 1.85 . 2.91 4.10 4.98 5.42 4.67 5.41 5.32 4.33 0.84 3.93
Osmanabad 3.68 5.88 3.70. 7.56 2.73 5.61 5.42 5.14 3.09 6.08 5.91 10.13 5.39 Aurangabad
31.25 34.71 38.89 39.24 36.52 38.63 37.08 42.06 34.36 38.78 41.73 36.71 37.43 Division
Amravati 13.24 12.06 6.79 7.85 7.85 9.97 16.25 9.81 10.81 11.79 9.84 9.70 10.35
Akola 4.78 6.18 8.33 7.56 7.51 2.80 4.58 8.41 7.72 4.56 3.54 3.80 5.86
Yavatmal 12.50 13.24 9.51 11.63 7.17 10.59 8.33 6.54 4.25 7.98 8.27 5.06 9.04
Buldhana 5.51 4.71 6.79 6.10 7.51 3.43 3.75 7.48 8.49 6.08 7.09 7.59 6.13
Washim 2.94 3.82 3.70 3.49 5.46 0.93 3.75 3.27 3.09 2.28 1.57 2.11 3.06 Amravati
38.97 40.00 35.19 36.63 35.49 27.73 36.67 35.51 34.36 32.70 30.31 28.27 34.45 Division
Nashik 4.78 3.53 2.78 1.45 3.75 3.74 1.25 2.34 3.86 1.90 7.09 5.91 3.48
Dhule 0.74 1.47 1.85 2.33 3.41 3.12 2.08 0.93 3.09 2.28 3.15 4.22 2.38
Nandwbar 0.37 0.00 0.00 0.58 0.00 0.00 0.00 0.00 0.39 1.52 0.00 0.00 0.24
Jalgaon 7.72 6.47 4.94 6.40 4.10 8.10 4.17 4.21 5.79 5.70 5.91 8.02 6.01 Nashik
13.60 11.47 9.57 10.76 11.26 14.95 7.50 7.48 13.13 11.41 16.14 18.14 12.11 Division
Nagpur 3.31 1.47 1.23 0.87 2.39 1.87 1.67 0.93 2.32 1.52 1.18 3.38 1.81
Wardha 5.15 6.76 6.48 5.23 2.39 5.61 4.17 3.27 1.93 4.18 3.15 5.49 4.61
Bhandara 1.84 0.88 1.54 2.62 1.37 2.49 4.17 1.87 1.54 1.90 1.57 2.53 1.99
Gondia 1.10 0.29 0.62 1.16 1.37 0.93 2.08 0.47 0.77 1.52 1.18 1.69 1.07
Chandrapur 1.10 2.65 2.47 0.58 4.10 3.43 2.92 5.61 3.86 3.42 2.36 2.53 2.83
Gadchorili 0.00 0.29 0.31 0.29 0.68 0.00 1.25 0.00 0.77 0.00 0.39 0.00 0.33 Nagpur
12.50 12.35 12.65 10.76 12.29 14.33 16.25 12.15 11.20 12.55 9.84 15.61 12.65 Division
Ahmednagar 4.78 4.41 2.78 3.78 4.44 4.05 6.25 4.21 4.25 5.32 5.91 6.75 4.64
Pune 0.00 0.59 0.00 1.16 2.05 0.93 0.00 0.47 0.00 1.52 0.39 0.42 0.65
Solapur 2.94 0.88 2.16 0.87 1.37 2.49 1.25 0.93 2.32 0.76 0.00 0.42 1.40
Pune Division 2.94 1.47 2.16 2.03 3.41 3.43 1.25 1.40 2.32 2.28 0.39 0.84 2.05
Satara 0.37 0.00 0.00 0.00 ·o.oo 0.31 1.25 0.93 2.32 0.76 0.00 0.42 0.48
Sangli 0.00 0.00 1.23 0.00 1.02 0.62 0.00 0.47 1.54 1.14 1.57 0.00 0.62
Kolhapur 0.37 0.00 0.31 0.58 0.00 0.00 0.00 0.00 0.77 0.38 0.00 0.00 0.21 Kolhapur
0.74 0.00 1.54 0.58 1.02 0.93 1.25 1.40 4.63 2.28 1.57 0.42 1.31 Division
Maharashtra 100 100 100 100 100 100 100 100 100 100 100 100 100
Source: Calculated from Table 2.5 (C)
31

Annexure 2.9: Number of Eligible Cases for Compensation (Division wise) .. Suicide Cases 2001 to 2016
Year Konkan Nashik Pune Aurangabad Amravati Nagpur Maharashtra
2001 0 0 0 0 30 2 32
(0) (0) (0) (0) (61.22) (66.67) (51.61)
2002 0 1 1 2 57 18 79
(0) (50) (100) (22.22) (71.25) (60) (64.75)
2003 0 0 1 3 85 17 106 (0) (0) (33.33) (21.43) (63.43) (62.96) (58.89)
2004 0 12 7 50 237 41 347 (0) (31.58) (77.78) (52.63) (56.7) (51.25) (54.22)
2005 0 20 14 27 257 49 367
_(0) (60.61) (73.68}_ (46.55) (61.34)_ (61.25) (60.26)
2006 3 131 75 160 511 157 1037
(100) (61.79) (61.98) (42.33) (39.46) (42.78) (43.64)
2007 0 133 74 189 307 138 841
_(0) (72.68) (60.1~)- (57.8) (27.44}_ _(42.59) (40.51)
2008 2 101 66 174 324 92 759
(100) (58.72) (55) (61.05) (30.54) (28.22) (38.61)
2009 0 67 48 124 247 106 592 (0) (53.6) (52.75) (54.39) (27.29) (41.41) (36.88)
2010 4 84 33 115 251 135 622
(100) (68.29) (49.25) (60.21) (23.88) (44.26) .(35.73)
2011 3 99 14 82. 327 112 637 (100) (57.56) . (38.89) (48.52) (36.91) (44.44) (41.96)
2012 2 117 14 118 377 104 732
(50) (57.92) (40) (59.6) (44.83) (53.89) (49.69)
2013 0 86 13 115 329 122 665 (0) (50.59) (35.14) (55.56) (46.67} (68.93) (51.31)
2014 2 120 6 430 522 170 1250 _(50) (42.4) (26.09) (74.91) (63.04) (63.2) (63.1)
2015 2 187 16 711 711 214 1841 (100) (40.74) (16.67) (62.92) (60.31) (59.12) (57.03)
2016 0 221 23 654 427 177 1502 (0) (49.22) (31.94) (66.39) (42.23) (55.66) (52.98) 18 1379 405 2954 4999 1654 11225
Total _(81.82) (51.46) (47.7) (60.73) (41.75) (48.45) (47.90) .. ... Note: F1gure m brackets IS percentage to total swc1de cases m the DIVISion
32
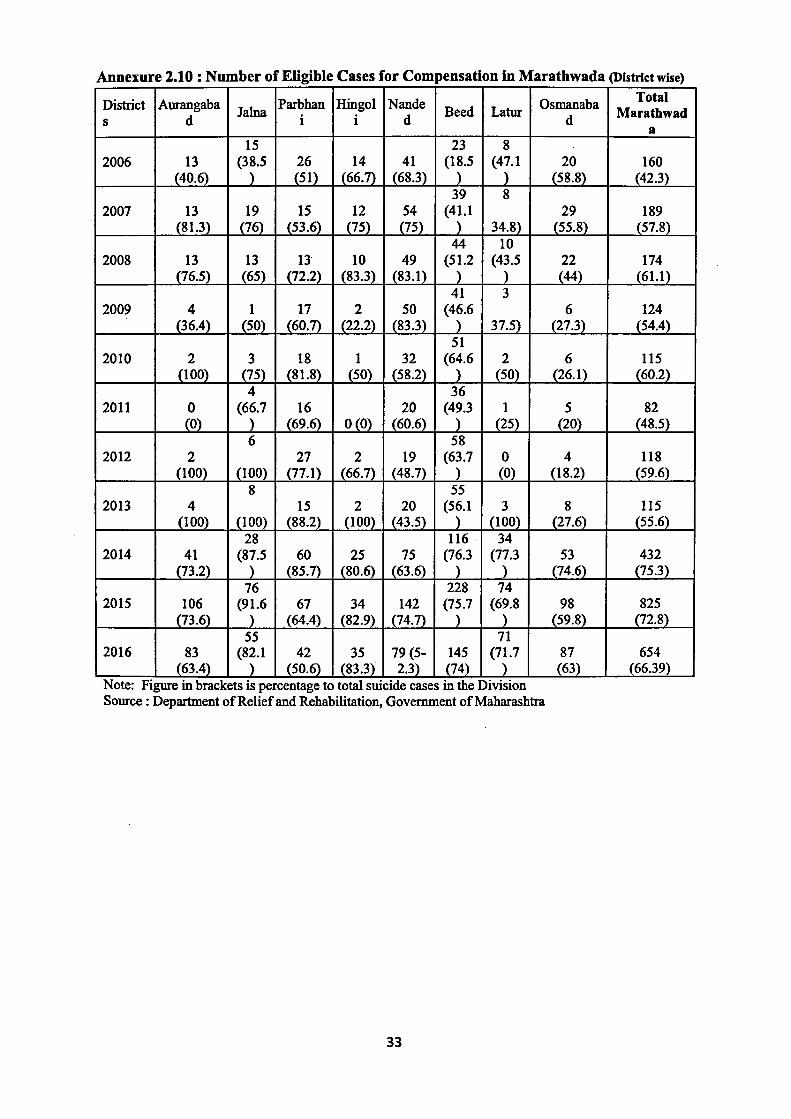
Annexure 2.10 : Number of Eligible Cases for Compensation in Marathwada (District wise)
District Aurangaba Jalna
Parbhan Hingol Nande Beed Latur
Osmanaba s d i i d
IS 23 8 2006 13 (38.5 26 14 41 (18.5 (47.1
(40.6) ) (51) (66.7) (68.3) ) ) 39 8
2007 13 19 15 12 54 (41.1 (81.3) (76) (53.6) (75) (75) ) 34.8)
44 10 2008 13 13 13" 10 49 (51.2 (43.5
(76.5) (65) (72.2) (83.3) (83.1) ) ) 41 3
2009 4 1 17 2 50 (46.6 (36.4) (50) (60.7) (22.2) (83.3) ) 37.5)
51 2010 2 3 18 1 32 (64.6 2
(100) (75) (81.8) (50) (58.2) ) (50) 4 36
2011 0 (66.7 16 20 (49.3 1 (0) ) (69.6) 0 (0) (60.6) ) (25)
6 58 2012 2 27 2 19 (63.7 0
(100) (100) (77.1) (66.7) (48.7) ) (0) 8 55
2013 4 15 2 20 (56.1 3 (100) _{100) (88.2)_ (100) (43.5) ) (100)
28 116 34 2014 41 (87.5 60 25 75 (76.3 (77.3
(73.2) ) (85.7) (80.6) (63.6) ) ) 76 228 74
2015 106 (91.6 67 34 142 (75.7 (69.8 (73.6) ) (64.4) (82.9) (74.7) ) )
55 71 2016 83 (82.1 42 35 79 (5- 145 (71.7
(63.4) ) (50.6) (83.3) 2.3) (74) ) ... Note: Ftgure m brackets is percentage to total swcide cases m the Dtvtston Source : Department of Relief and Rehabilitation, Government ofMaharashtra
33
d
20 (58.8)
29 (55.8)
22 (44)
6 (27.3)
6 (26.1)
5 (20)
4 (18.2)
8 (27.6)
53 (74.6)
98 (59.8)
87 (63)
Total Marathwad
a
160 (42.3)
189 (57.8)
174 (61.1)
124 (54.4)
115 (60.2)
82 (48.5)
118 (59.6)
115 (55.6)
432 (75.3)
825 (72.8)
654 (66.39)
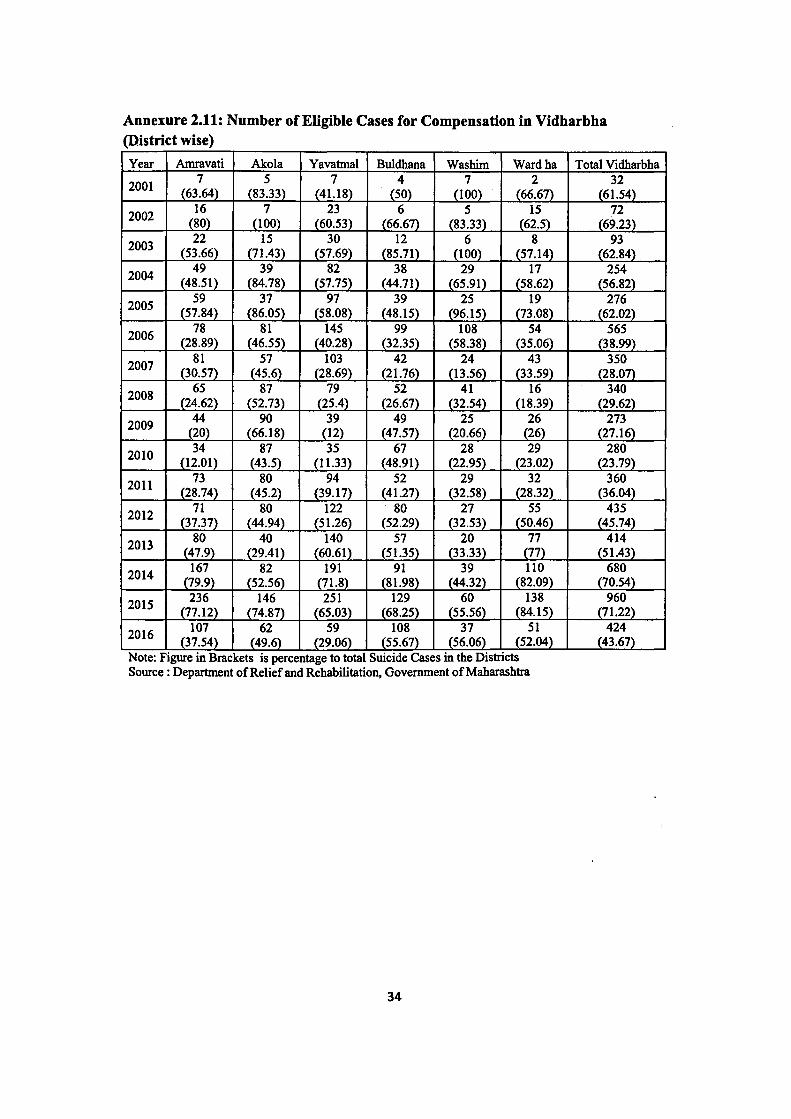
Annexure 2.11: Number of Eligible Cases for Compensation in Vidharbha (District wise)
Year Arnravati Akola Yavatmal Buldhana Washim Wardha
2001 1 5 1 4 1 2
(63.64) . (83.33) (41.18) (50) (100) . (66.61)
2002 16 1 23 6 5 15
(80) (100) (60.53) (66.61) (83.3n (62.5)
2003 22 15 30 12 6 8
(53.66) (11.43) (51.6~ 1_85.11)_ (100) _{51.14)_
2004 49 39 82 38 29 11
(48.51) (84.18) (51.15) (44.11) (65.91) (58.62)
2005 59 31 91 39 25 19
(51.84) (86.05) (58.08) (48.15_1 J96.15)_ l_13.0!U_
2006 18 81 145 99 108 54
(28.89) (46.55) (40.28) (32.35) (58.38) (35.06)
2001 81 51 103 42 24 43
(30.51) (45.6) (28.69) (21.16) (13.5~ _[33.5~
2008 65 81 19 52 41 16
_(24.62) (52.13) (25.4)_ _(26.61) (32.54) 1_18.3~
2009 44 90 39 49 25 26
(20) (66.18) (12) (41.51) (20.66) (26)
2010 34 81 35 61 28 29
_(12.01) (43.5) o1.3n _(48.91} _(22.95) 1_23.0~
2011 13 80 94 52 29 32
(28.14) (45.2) (39.11) (41.21) (32.58) _(28.32)
2012 71 80 122 80 21 55
(31.31) (44.94) (SLID _{52.22)_ J32.sn (50.46)
2013 80 40 140 51 20 71
(41.9) (29.41) (60.61) (51.35) (33.33) _(1TI_
2014 161 82 191 91 39 110
(19.9) (52. 56) (11.8) (81.98) (44.32) .(82.09)
2015 236 146 251 129 60 138
(17.12) (14.81) (65.03) (68.25) _(55.5~ (84.15)
2016 101 62 59 108 31 51
(31.54) (49.6) (29.06) (55.61) (56.06) _(52.04_} .. Note: Ftgure m Brackets ts percentage to total Swctde Cases m the Dtstncts Source: Department ofReliefand Rehabilitation, Government ofMaharashtra
34
Total Vidharbha 32
(61.54) 72
.i69.2n 93
_(62.84) 254
(56.82) 216
_(62.0~
565 (38.99)
350 _(28.07}_
340 _(29.62)_
213 (21.16)
280 _(23.1~
360 (36.04)
435 (45.11)_
414 J5t.4n
680 (10.54)
960 (11.2~
424 _(43.67}_
Annexure 2.12 : Scheme -wise and Grantor-wise Amount Received and E d" d PM P k M 31 2009 xpen Iture un er ac a2e as on ay
' Particular Total Amount received Total Expenditure allocation (Rs. in Crore) Expenditure %to total
(Rs.in ~ABARD Centre State
(Rs. in allocation Crore)
Govt. Govt. Total Crore)
Interest Waiver 712 0.00 355.17 412.46 767.63 837.50 117.63 Assured Irrigation
2,177 223.96 1,276.88 1,140.4 2641.24 2,641.24 121.32 Facilities Micro-Irrigation 78 0.00 93.66 18.88 112.54 103.32 132.46 Check dams 180 . 60.00 0.00 120.0 180 162.53 90.29 Watershed Development 54 18.65 0.00 0.00 18.65 18.65 34.54 Programme Rain Water
6 0.00 6.00 0.00 6.0 6.00 100.00 Harvesting Extension
3 0.00 11.06 0.44 11.5 10.44 348.00 Services (ATMA) Seed Replacement/ 180 0.00 143.98 0.00 143.98 143.98 79.99 Distribu~ion
Horticulture Development 225 0.00 115.26 0.00 115.26 112.20 49.87 (NHM) Subsidiary Income
135 0.00 50.97 9.95 60.92 59.05 43.74 Activities I
Total 3,750 302.61 2,052.98 1,702.13 4057.72 4,094.91 109.20 ..
Source: Office ofVasantrao Natk Sheti Swalamban MtssiOn, Amravat1
35

3.1 Introduction:
Chapter3
Analysis of Primary Data
The issue of agrarian distress manifesting itself into suicides by farmers
provoked the government to conduct grassroot level studies so as to understand the
economic, social and other causes of suicides and finally undertake remedial
measures. The state of Maharashtra in recent years has been showing highest number
of suicides when compared to other states. However, as observed earlier, these
suicides are concentrated mainly in certain regions of Vidarbha and Marathwada.
While suicides among farmers in different parts of the country began attracting
nationwide attention since late 1990s and early 2000s, the problem was considered
alarming in Maharashtra in 2006. There was a huge jump in the number of suicides in
Maharashtra in the state from 609 in 2005 to 2376 in 2006. Since then the figure has
always been four digit but the composition across regions showed change indicating
that this phenomenon began spreading to more districts. In 2006 while the share of
Marathwada region in total suicides was 15.91 percent that of Vidarbha region was
60.98 percent. However, the scenario in Marathwada began to change in 2014 and
share of suicides in state was 28.98 percent which further increased to 35 percent in
2015. In Marathwada, the suicides were more concentrated in Beed, Nanded,
Aurangabad and Osmanabad districts as these districts started showing severe signs of
distress.
Given the intensity of the problem, primary data through field survey was
conducted so that households having a victim could be addressed with a questionnaire
and suitable causes could be ascertained. However, before observing the various
causes of suicides, it is important to understand the socio-economic profile of the
sample households, characteristics of operational holdings, cropping pattern, credit
availed, etc. Hence in this chapter field level data collected from 50 suicide,
households has been tabulated and presented
3.2 Socio-Economic Profile of the Victims:
It is important to relate the socio-economic profile of the victim with
causes of suicides. In Table 3.1 the same has been indicated.
36
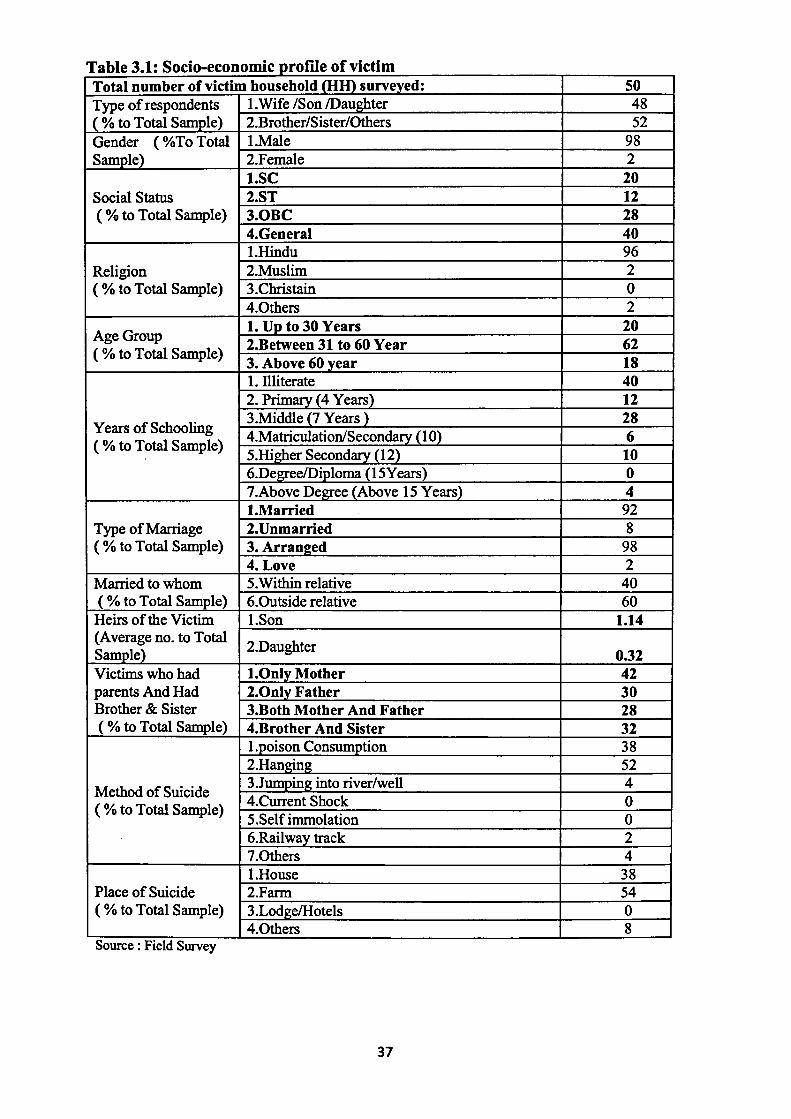
31 s . fll f . ti Table . OCIO-eCODOIDIC pro eo VIC m . . Total number of victim household (HH) surveyed: 50 Type of respondents 1. Wife /Son /Daughter 48 (%to Total Sample) 2.Brother/Sister/Others 52 Gender (%ToTotal 1.Male 98 Sample) 2.Female 2
1.SC 20 Social Status 2.ST 12 (%to Total Sample) 3.0BC 28
4.General 40 1.Hindu 96
Religion 2.Muslim 2 (%to Total Sample) 3.Christain 0
4.0thers 2
Age Group 1. Up to 30 Years 20 2.Between 31 to 60 Year 62
(%to Total Sample) 3. Above 60 year 18 1. llliterate 40 2. Primary (4 Years) 12
Years of Schooling 3.Middle (7 Years) 28 4.Matriculation/Secondary (1 0) 6
(%to Total Sample) 5.Higher Secondary (12) 10 6.Degree/Diploma (15Y ears) 0 ?.Above Degree (Above 15 Years) 4 1.Married 92
Type of Marriage 2.Unmarried 8 (%to Total Sample) 3. Arran2ed 98
4. Love 2 Married to whom 5.Within relative 40 (%to Total Sample) 6.0utside relative 60
Heirs of the Victim 1.Son 1.14 (Average no. to Total
2.Daughter Sample) 0.32 Victims who had 1.0nly_ Mother 42 parents And Had 2.0nly Father 30 Brother & Sister 3.Both Mother And Father 28 (%to Total Sample) 4.Brother And Sister 32
l.poison Consumption 38 2.Hanging 52
Method of Suicide 3.Jumping into river/well 4
(%to Total Sample) 4.Current Shock 0 5.Self immolation 0 6.Railway track 2 ?.Others 4 l.House 38
Place of Suicide 2.Farm 54 (%to Total Sample) 3.Lodge/Hotels 0
4.0thers 8 Source : Fteld Survey
37
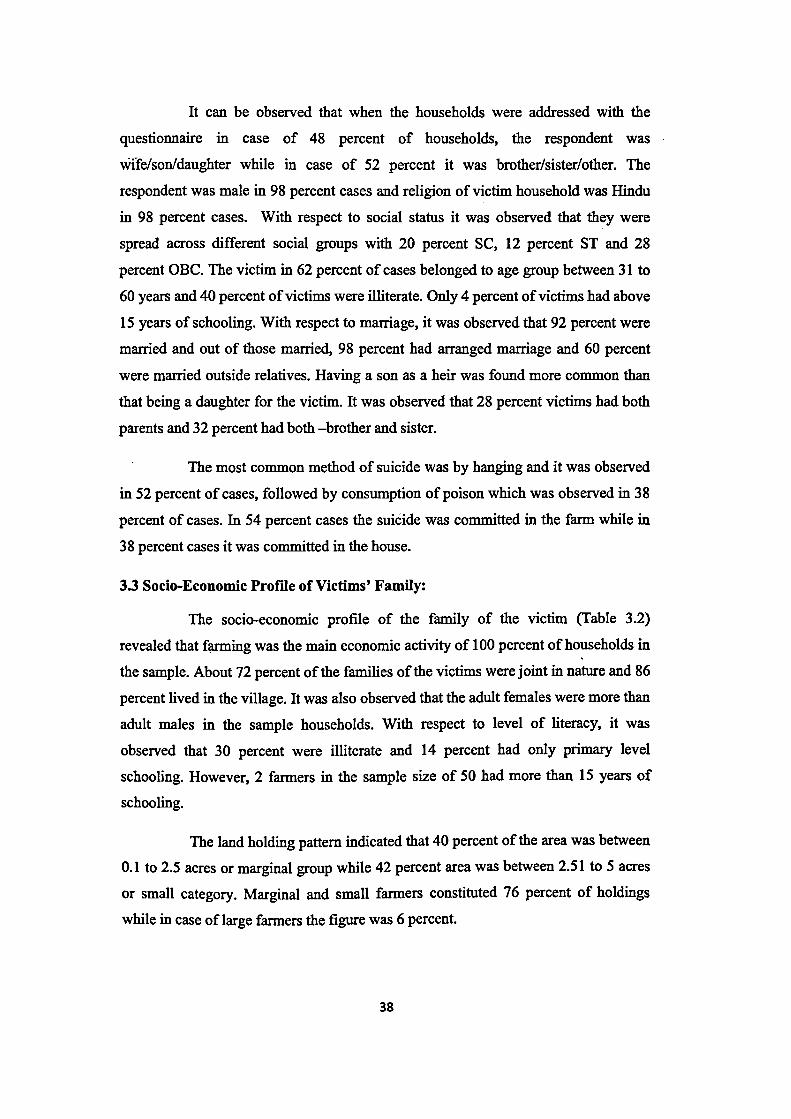
It can be observed that when the households were addressed with the
questionnaire in case of 48 percent of households, the respondent was
Wife/son/daughter while in case of 52 percent it was brother/sister/other. The
respondent was male in 98 percent cases and religion of victim household was Hindu
in 98 percent cases. With respect to social status it was observed that they were
spread across different social groups with 20 percent SC, 12 percent ST and 28
percent OBC. The victim in 62 percent of cases belonged to age group between 31 to
60 years and 40 percent of victims were illiterate. Only 4 percent of victims had above
15 years of schooling. With respect to marriage, it was observed that 92 percent were
married and out of those married, 98 percent had arranged marriage and 60 percent
were married outside relatives. Having a son as a heir was found more common than
that being a daughter for the victim. It was observed that 28 percent victims had both
parents and 32 percent had both -brother and sister.
The most common method of suicide was by hanging and it was observed
in 52 percent of cases, followed by consumption of poison which was observed in 38
percent of cases. In 54 percent cases the suiCide was committed in the farm while in
38 percent cases it was committed in the house.
3.3 Socio-Economic Profile of Victims' Family:
The socio-economic profile of the family of the victim {Table 3.2)
revealed that farming was the main economic activity of 100 percent of households in
the sample. About 72 percent of the families of the victims were joint in nature and 86
percent lived in the village. It was also observed that the adult females were more than
adult males in the sample households. With respect to level of literacy, it was
observed that 30 percent were illiterate and 14 percent had only primary level
schooling. However, 2 farmers in the sample size of 50 had more than 15 years of
schooling.
The land holding pattern indicated that 40 percent of the area was between
0.1 to 2.5 acres or marginal group while 42 percent area was between 2.51 to 5 acres
or small category. Marginal and small farmers constituted 76 percent of holdings
while in case of large farmers the figure was 6 percent.
38
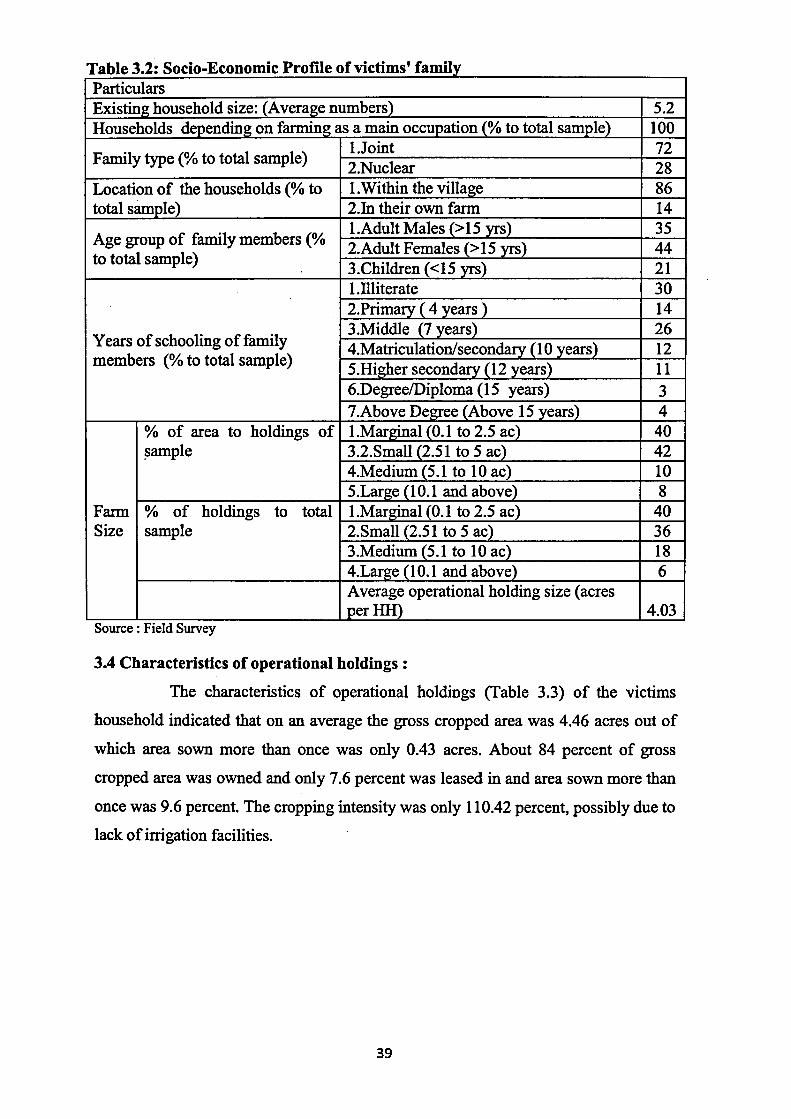
Table 3.2: OCIO- CODOIDIC ro eo VIC ms am 1y S . E . p fll f "ti 'f il Particulars Existing household size: (Average numbers) 5.2 Households depending on fanning as a main occu_l)_ation _(_% to total samJ!lel 100
Family type (% to total sample) l.Joint 72 2.Nuclear 28
Location of the households (% to I. Within the village 86 total sample) 2.In their own farm 14
Age group of family members (% l.Adult Males (> 15 ~ 35 2.Adult Females (> 15 yrs) 44
to total sample) 3.Children (<15 yrs) 21 l.llliterate 30 2.Primary _ _( 4 _years l 14 3.Middle (7 years) 26
Years of schooling of family 4.Matriculation/secondary (10 years) 12 members (% to total sample) 5.Higher secondary (12year~ 11
6.Degree/Diploma (15 years) 3 7.Above Degree (Above 15 _year~ 4
% of area to holdings of l.Mar_g!!!_al_(_O.l to 2.5 a~ 40 ~ample 3.2.Small (2.51 to 5 ac) 42
4.Medium (5.1 to 10 ac) 10 5.Lar_ge _(_10.1 and above) 8
Farm % of holdings to total l.Marginal (0.1 to 2.5 ac) 40 Size sample 2.Small (2.51 to 5 ac) 36
3.Medium (5.1 to 10 ac) 18 4.Large (10.1 and above) 6 Average operational holding size (acres perHH) 4.03
Source : Fteld Survey
3.4 Characteristics of operational holdings :
The characteristics of operational holdings (Table 3.3) of the victims
household indicated that on an average the gross cropped area was 4.46 acres out of
which area sown more than once was only 0.43 acres. About 84 percent of gross
cropped area was owned and only 7.6 percent was leased in and area sown more than
once was 9.6 percent. The cropping intensity was only 110.42 percent, possibly due to
lack of irrigation facilities.
39
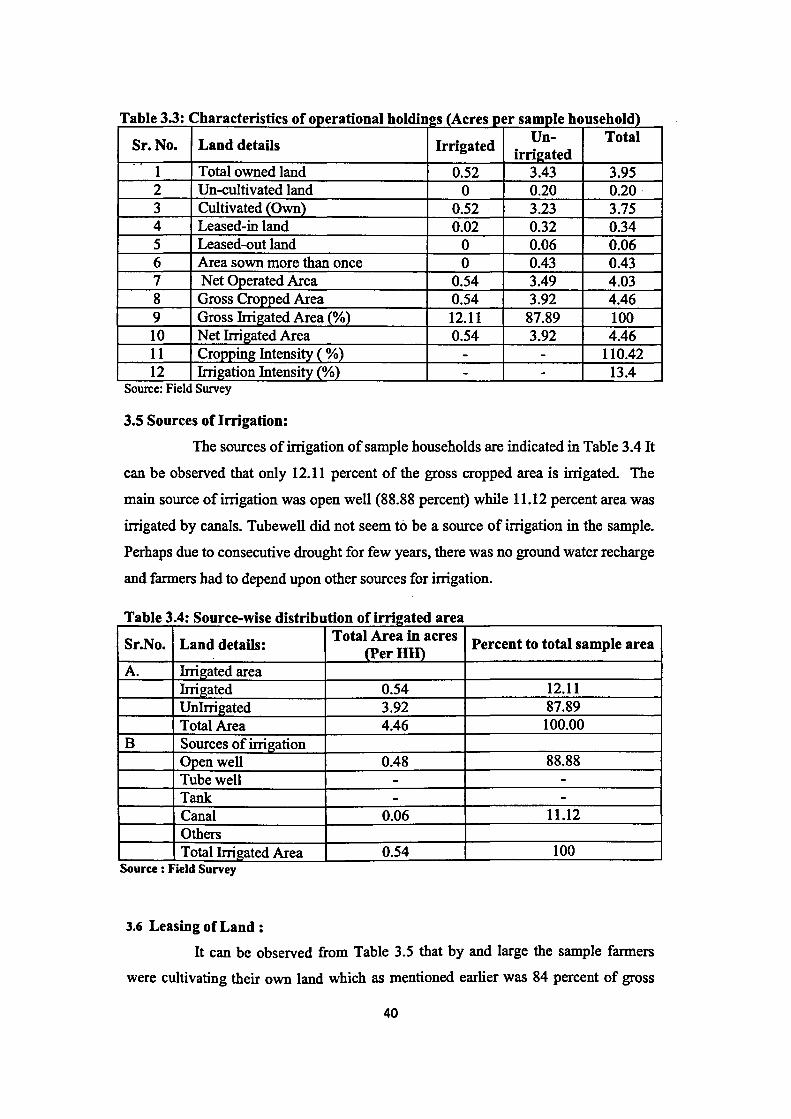
Table 3.3: Characteristics of operational holdin2s (Acres per sample household)
Sr. No. Land details Irrigated Un- Total
irrigated 1 Total owned land 0.52 3.43 3.95 2 Un-cultivated land 0 0.20 0.20 3 Cultivated (Own) 0.52 . 3.23 3.75 4 Leased-in land 0.02 0.32 0.34 5 Leased-out land 0 0.06 0.06 6 Area sown more than once 0 0.43 0.43 7 Net Operated Area 0.54 3.49 4.03 8 Gross Cropped Area 0.54 3.92 4.46 9 Gross Irrigated Area (%) 12.11 87.89 100 10 Net Irrigated Area 0.54 3.92 4.46 11 Cropping Intensity ( %) - - 110.42 12 Irrigation Intensity(%) - - 13.4
Source: Fteld Survey
3.5 Sources of Irrigation:
The sources of irrigation of sample households are indicated in Table 3.4 It
can be observed that only 12.11 percent of the gross cropped area is irrigated. The
main source of irrigation was open well (88.88 percent) while 11.12 percent area was
irrigated by canals. Tubewell did not seem to be a source of irrigation in the sample.
Perhaps due to consecutive drought for few years, there was no ground water recharge
and farmers had to depend upon other sources for irrigation.
T bl 3 4 S a e • : . d. .b . f. . ource-Wise IStri ution o Irngate d area
Sr.No. Land details: Total Area in acres Percent to total sample area
(Perllll) A. Irrigated area
Irrigated 0.54 12.11 Unlrrigated 3.92 87.89 Total Area 4.46 100.00
B Sources of irrigation .Open well 0.48 88.88 Tube well - -Tank - -Canal 0.06 11.12 Others Total Irrigated Area 0.54 100
Source : Faeld Survey
3.6 Leasing of Land :
It can be observed from Table 3.5 that by and large the sample farmers
were cultivating their own land which as mentioned earlier was 84 percent of gross
40

cropped area. Only a negligible portion of gross cropped area of 0.34 acres or 7.6
percent was leased in out of which 94 percent was unirrigated. The rental value for
irrigated land was 23 percent higher than for unirrigated. It may be noted that that the
rent for leased in land varied widely across districts and was observed to be higher in
Vidarbha than in Marathwada. While the rent for leased in land in Y avatmal was Rs.
10,000 per acre, it was observed to be only Rs. 3,000 per acre in Beed. This is
possibly because Beed is normally a severe drought prone district of Marathwada and
for two consecutive years, viz. 2014-15 and 2015-16 the rainfall was barely 50
percent of normal. Yavatmal however falls in assured rainfall region and hence
benefits from higher rent. Discussion with household members revealed that due to
severe drought there was huge fall in prices of land and not much demand for leasing
in land. Absence of water is likely to lead to crop failure and farmers are thus not in a
position to lease in land for cultivation.
Table 3.5: Rental value of leased-in and leased-out land Sr.No
Particulars Irrigate
Unirrigated . d A Leased-
Area in acres per HH 0.02
m 0.32 Rental value paid per acre in Rs. 8000 6000
B Leased-Area in acres per HH
0 out 0.06
Rental value received per acre in 0 50 percent of Rs. output
Source : Field Survey
3. 7 Sources of Income and Items of Expenditure:
The sources of income from agriculture, allied and other activities is
indicated in Table 3.6 along with consumption pattern for 2015-16. The field survey
indicates that sample households on an average had a negative income from
agriculture to the tune ofRs. 32,716. However, being mainly small farmers, they had
to resort to other sources of income such as allied activities, wages, etc. from which
they earned Rs. 30,990 per household on an average. The huge negative income from
agriculture clearly indicates crop failure and high cost of cultivation. In 2015-16,
Marathwada suffered from severe drought and the region received 60 percent of
normal rainfall. Districts such as Beed and Nanded which are included in our sample
suffered from around 50 percent deficient rainfall and a similar pattern was observed
in 2014-15.
41

With respect to consumption expenditure, it was observed that 70 percent
was for food and 30 percent for non-food items. Due to negative income from
agnculture, the expenditure of the household exceeded that of income by Rs. 60,335.
This forces them to borrow from informal sources such as moneylenders who charge
an interest rate of about 25 percent per annum. Thus a vicious circle is perpetuated
and farmers are unable to invest in agriculture. Almost all farmers in the sample
responded that their income had reduced coupled with rising expenditure since the last
five years.
T bl 3 6 N t. d d"tu d . 2015 16 a e . e mcomean expen 1 re urm2 -. . % of Illi to total sample who
Sr. Amount in
mentioned that the income has No Source
Rs.Perllli reduced I expenditure increased
. over the last 5 years (% to each re~ective source~
A INCOME Reduced Increased 1 Agriculture -32716 98 -2 Agriculture wage income 14874 98 2
3 Dairy and animal 70 20 husbandry 5956.
4 Poultry 360 100 -5 Fishery - -6 Service (salary and 100 -
pension) 8600 7 Self-business - -8 Others 1200 100 -
Total income (A) -1726
B CONSUMPTION EXPENDITURE
1 Food 43583 100 -2 Non-food 18478 100 -
Total expenditure (B) 62061
c Surplus I Deficit ( + I -) -60335 A-B
Source : F1eld Survey
It was also observed from NSSO (70th Round, July 2012- June 2013) that
in case of All India, 70 percent of households owned upto 2.5 acres of land and had a
consumption expenditure which was greater than household income and only 21
percent of their income was earned from crop husbandry. However across households
it was observed that the expenditure was lower than income by about 3 percent which
is not a very encouraging figure. The corresponding figure for Maharashtra across all
households was 12 percent However, considering that 2015-16 was a year of severe
42
drou~t and three fourths of the farmers in the sample were marginal or small, it
resulted in them having a negative income from agriculture which was higher than
their income from other sources.
Box 1 : Suicide case revealing expenditure regularly exceeding income:
A 45 year old victim (Navgaon Rajuri village in Beed taluka ) with no formal schooling, had just one acre ofrainfed land with four dependents comprising of his mother, wife and two daughters. The dryland did not give any yield due to drought conditions in the village and therefore the wife of the decease<,l worked as farm labor for 4 months on a daily wage rate of Rs. 100, thus earning a total income ofRs. 12000. The total annual expenditure of the family was however Rs. 45,000. The economic condition of the family was worsening year by year due to repeated droughts which forced the deceased to borrow from relatives in order to manage the household expenses. The amount borrowed was Rs. 50,000 from informal sources. The household was in the BPL category but it was revealed that they hardly ever received their entitlement from the ration shop. The household therefore cultivated bajra in their marginal piece of land but often lost the entire crop and could never even recover the cost of cultivation. Besides, education expenses of the victim's school going daughters which would later be followed by expenses for their marriage was a deep cause of concern and stress. With regular droughts and limited wage income, the victim found no ray of hope to come out ofthe vicious circle. It seemed that the economic and social condition of the family would only worsen with crop failure and increasing needs of the family to maintain two growing up daughters. Though the victim showed no signs of introvert behavior, to the utter shock of his family, he was found hanging himself in his farm.
Source : Field Survey
3.8 Cropping Pattern and Returns to Cultivation:
It is important to observe the cropping pattern of sample households, their
cost of cultivation and net returns. The same is indicated in Table 3.7. The cropping
pattern reveals that soyabean and cotton were the major crops of the sample
households and together constituted 62.78 percent of the gross cropped area of the
sample households. Taking together both kharif and rabi foodgrains, it was observed
that they constituted 33.63 percent of gross cropped area with cereals constituting
20.40 percent and pulses constituting 13.23 percent area. There were a few farmers in
the sample who cultivated horticultural crops such as orange.
43

Table 3. 7 Croppin2 Pattern of Sample households (1) (2) (3) (4) (5) (6) (7) (8) (9) (10) (11) (12) (13)
Name of No. of Total Cultivated %of Total Total Yield Average Gross Cost of Net Net returns the Crop HHWho Acres area in cultivated Production Production per price returns cultivation returns perHH(Rs.)
have acres (per Area to (Qtls) in Qtls per acre received per per acre per cultivated HH) GCA HH in qtls per qtl. acre acre
Rs.
Group 1
Jowar 12 23 0.46 10.31 32.3 2.69 1.4 1017 1428 9115 -7687 -14733
Tur 20 21.3 0.42 9.42 33.5 1.68 1.57 5056 7952 13102 -5150 -5485
Cotton 27 72 1.44 32.29 135.2 5 1.88 4866 9137 9825 -688 -1833
Soya bean 30 68 1.36 30.49 113 3.77 1.66 3245 5392 8949 -3557 -8061
Total 89 184.3 3.68 82.51
Group II
Bajara 6 6.9 0.14 3.14 15 2.5 2.17 983 2137 8551 -6414 -7376
Udid 1 0.5 0.01 0.22 0 0 0
Mung 2 2.5 0.05 1.12 0.3 0.15 0.12 2500 300 3600 -3300 -4125 Other Crop 5 8 0.16 3.59 104.5 20.9 13.06 1580 20639 14750 5889 9422
Total 14 17.9 0.36 8.07
Group III Rabi Jowar 6 11 0.22 4.93 11 1.83 1 1033 1033 3272 -2239 . -4106
Wheat 4 4.5 0.09 2.02 13 3.25 2.89 2050 5924 10444 -4520 -5087
Gram 3 5.5 0.11 2.47 12 4 2.18 4167 9092 2727 6365 11668
Total 13 21 0.42 9.42 Source : F1eld Survey; Note : Based on our sample, a household on an average cult1vates 0.46 acres as md1cated m column 4. Across all crops the net returns per acre 1s Rs -27301 per acre and per household the net returns are Rs -32716.
44

The net returns to farmers indicate that farming is a totally unremunerative
and unviable economic activity. Farmers made losses from all crops except gram and
some horticultural crop. Maximum loss was incurred for cereals, kharif jowar and
followed by bajra. Taking across all crops the net returns were Rs. -27,301 per acre
and Rs. -32,716 per household. Thus households made negative returns from farming.
3.9 Credit Availed:
Farmers borrow credit for their agricultural as well as consumption
purposes and resort to both formal and informal sector. In Table 3.8 the amount of
credit borrowed, outstanding and other relevant details are indicated.
Table 3.8: Details on credit of sample households
Purpose ofborrowing Non-farming
%of No. of Farming purposes borrowing
[borrowin5 purposes
Dutstanding Average lffiwho Sr Source of No. of
credit lffi as a
No. oflffi Amount
llli as a Amount amount: interest paid the
no %to total borrowed borrowed Rslllli rate installments
as a %to %to sample
borrowings perlffi
borrowing perllli as per
(Rs) lffis
(Rs) schedule
1 Institutional
A Co-op. 38 100 40211 0 0 38605 6 0 Society/bank Commercial
B bank incl. 20 90 78300 10 40000 74300 5 0 RRBs
c Others 28 86 103750 14 37500 90000 5 0 2 Non-institutional
A Landlord 6 67 27500 33 500000 118333 25 0
B Moneylender 6 67 82000 33 300000 154667 25 0
Traders and c commission 0 0 0 0 0 0 - 0
agents
D Relatives
46 39 239444 61 155357 96304 25 0 and friends
E Others 4 0 0 100 125000 125000 11.5 0 (specify) Grand Total (Average 95200 225074 99601 borrowed)
Source : Fteld Survey
It can be observed from Table 3.8 that all farmers in the sample borrowed
from cooperative banks while 90 per cent also borrowed from commercial banks.
However, the loan from cooperative society was only for the purpose of farming. Out
of total institutional credit, it was observed that little less than half or 46.68 per cent
45
:
was borrowed from private banks or sources other than cooperative or commercial
banks. Overall, it appears that credit from cooperative societies was not enough to
meet the finance of farmers and only 18 percent of the amount borrowed from formal
sources was from cooperative banks.
Besides borrowing from formal sources, the sample households further
borrowed from non-institutional sources to meet their credit requirements for farming.
Out of total borrowing from informal sources for agriculture, the most important
source seemed to be relatives and friends which constituted 68.62 percent of total
informal credit. Moneylenders were the next important source as 23.50 percent of
credit requirement for agriculture from informal sources was met from them.
From Table 3.8 we can also observe that out of total credit from formal
and informal sources for farming, the sample households on an average borrowed Rs.
95,200 out of which 61.08 percent was from informal sources while 38.92 was from
formal sources. The interest rate charged by informal sources is far higher than that of
formal sources but apparently farmers in the. sample due to heavy indebtedness have
been forced to resort to informal sector. It may be noted that at the macro level or for
the country as a whole due to various credit policy measures, over the plan periods,
there has been an impressive growth in institutional finance for agriculture. The share
of non-institutional sources for agricultural credit, as observed in NSSO reports,
which was as high 89.8 percent in 1951, declined to 43.8 percent in 1981, and was 36
percent in 2013 (cited in Hoda and Terway, 2015). However, with respect to our
sample farmers a reverse picture seems to emerge as 61.08 percent of credit for
agriculture is from informal sources while 38.92 percent is from formal sources. It
was observed in the previous section that farmers in the sample have negative returns
while cultivating most crops and hence they may become defaulters in the formal
credit channel and forced to meet their requirements through informal channels.
Besides borrowing for agricultural operations, it was also observed that.
sample households borrowed huge sums for non-farming purposes. Further, it can be
observed that this amount was borrowed mainly from non-institutional sources which
constituted 87.5 percent of total borrowing. Out of total borrowing from non
institutional sources, landlords and moneylenders were the most important source and
constituted nearly three fourths or 74 percent of informal credit borrowed for non-
46
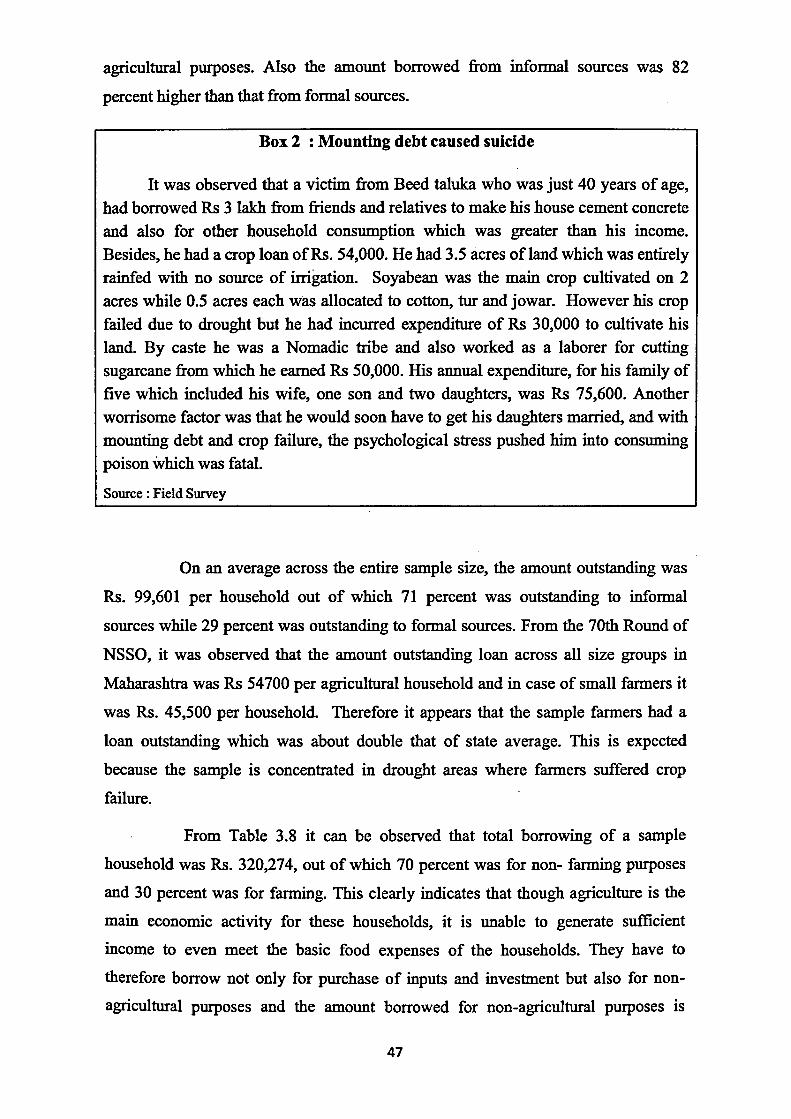
agricultural purposes. Also the amount borrowed from informal sources was 82
percent higher than that from formal sources.
Box 2 : Mounting debt caused suicide
It was observed that a victim from Beed taluka who was just 40 years of age,
had borrowed Rs 3 lakh from friends and relatives to make his house cement concrete
and also for other household consumption which was greater than his income.
Besides, he had a crop loan ofRs. 54,000. He had 3.5 acres ofland which was entirely
rainfed with no source of irrigation. Soyabean was the main crop cultivated on 2
acres while 0.5 acres each Was allocated to cotton, tur and jowar. However his crop
failed due to drought but he had incurred expenditure of Rs 30,000 to cultivate his
land. By caste he was a Nomadic tribe and also worked as a laborer for cutting sugarcane from which he earned Rs 50,000. His annual expenditure, for his family of
five which included his wife, one son and two daughters, was Rs 75,600. Another
worrisome factor was that he would soon have to get his daughters married, and with
mounting debt and crop failure, the psychological stress pushed him into consuming poison which was fatal.
Source : Field Survey
On an average across the entire sample size, the amount outstanding was
Rs. 99,601 per household out of which 71 percent was outstanding to informal
sources while 29 percent was outstanding to formal sources. From the 70th Round of
NSSO, it was observed that the amount outstanding loan across all size groups in
Maharashtra was Rs 54700 per agricultural household and in case of small farmers it
was Rs. 45,500 per household. Therefore it appears that the sample farmers had a
loan outstanding which was about double that of state average. This is expected
because the sample is concentrated in drought areas where farmers suffered crop
failure.
From Table 3.8 it can be observed that total borrowing of a sample
household was Rs. 320,274, out of which 70 percent was for non- farming purposes
and 30 percent was for farming. This clearly indicates that though agriculture is the
main economic activity for these households, it is unable to generate sufficient
income to even meet the basic food expenses of the households. They have to
therefore borrow not only for purchase of inputs and investment but also for non
agricultural purposes and the amount borrowed for non-agricultural purposes is
47

observed to be much higher than that for agricultural purposes. Thus a vicious circle
is created and farmers are caught in a debt trap.
3.10 Summary:
The phenomenon of farmers' suicides which has drawn considerable
attention by policy framers has assumed epidemic proportions in certain years,
especially in the state of Maharashtra. The spiraling of number of suicides which
increased from 62 in Maharashtra in 2001 to as high as 3228 in 2015 is clearly a
symptom of agrarian distress and the impoverished condition of farmers. Agriculture
is still the mainstay of the economy, atleast with respect to employment and
underperformance of this sector which is ultimately manifesting itself to farmers
committing suicide is therefore a grave issue and major cause of concern.
In order to get field level information on the cause of distress, families of
victims were surveyed. Before probing into causes of distress, the socio-economic
profile of farmers was observed. The socio-economic profile indicated that 62 percent
of those who committed suicide were in the _age group between 31 and 60 years and
40 percent were illiterate. About 72 percent of the households were joint in nature and
86 percent lived in the village. The average size of holding of the sample households
was 4.46 acres and 40 percent of the holdings were marginal. The cropping intensity
was as low as 110.42 percent and only 12.11 percent of gross cropped area was
irrigated.
The cropping pattern of the sample households indicated that soyabean and
cotton were the dominant crops followed by Kharif jowar. The net returns from all
crops except gram and horticulture were negative and on the whole across all crops,
the net returns were Rs. -27,301 per acre. This clearly revealed that agriculture which
was the main economic activity of the households is unviable. The expenditure of
households of sample households was greater than income due to huge losses incurred
in cultivation. On an average a sample household faced a deficit income of Rs. -,
60,335 in the year 2015-16.
48
With huge negative income from agriculture, farmers were forced to
borrow from informal sources at exorbitant rates of interest. Out of total credit
borrowed for farming from formal and informal sources it was observed that 61.08
percent was from informal sources. The amount borrowed for non-farming purposes
was 2.36 times that borrowed for farming purposes and this amount was borrowed
mainly from informal sources.
While the macro level data for the country as a whole indicates that over
the decades the share of fo!ffial credit is much higher than informal sources, our
primary survey showed a reverse picture. Farmers were relying heavily on informal
sector at very high rates of interest for both farming and non-farming purposes with
no repaying capacity. Negative returns from agriculture and mounting debt burden has
culminated in severe distress conditions for the agricultural sector.
49

Chapter4
.. Causes and Effects of Suicides-based on Primary survey
4.1 Introduction:
A large number of studies have been undertaken to analyze the causes of
suicides among farmers. The studies vary in style and temper and have been
conducted in different parts of the country. Within a state also, the suicides are
concentrated in certain regions and explained by several economic and social factors.
In some cases even to political factors contribute to distress as some regions in a state
are neglected while other regions show better development and per capita incomes. In
chapter 1, a detailed review of literature was presented in which an attempt was made
to observe the causes of suicides in different regions of the country. The number of
suicides among farmers started to get media attention and also among policy makers
since late nineties and early 2000s. However, till date, the issue is alive as the number
is increasing, atleast in some states, and the issue is normally not an individual case
but an outcome of the overall distressful and impoverished condition of farmers.
Given that agriculture is an important sector for the economy, not only in
terms of employment but also as a catalyst of growth for the secondary and tertiary
sector, it is necessary to study the complex picture of agrarian distress. Therefore both
the central as well as state governments have time and again initiated studies related
to this issue. This study is one more such attempt and related to the state of
Maharashtra.
A primary grass root study for the state of Maharashtra is especially
important because the number of suicides is persisting since the last one and half
decade or so. Since 2006 when the figure touched a height to 2376 from 609 in 2005,
the figure has always been four digits. A new height of 3228 suicides in 2015 was
reached from 1981 suicides in 2014 which again served as a cause of panic in the
agricultural sector. Further, in the state of Maharashtra, suicides have been always,
concentrated in Vidarbha region where cotton was a major crop. However, in 2014
and 2015 the districts of Marathwada also began showing signs of distress with rising
number of suicides in the region. In 2013, the share of Marathwada region in total
number of suicides in the state was 15.97 percent which jumped to 28.98 percent in
2014 and further increased to 35.1 percent in 2015. The corresponding figures in
50

Vidarbha are 62.11 percent in 2013, which declined to 48.66 percent in 2014 and
further declined to 41.76 percent in 2015. Thus the increasing number of suicides in
Marathwada brought down the share of Vidarbha, though in absolute terms the
number of suicides in Vidarbhha increased by 2.45 times in 2015 as compared to
2013.
In view of the above, a field level survey was conducted in selected
districts of Marathwada and Vidarbha where households which had a victim were
visited and addressed with a. questionnaire. By and large, it is well known that crop
failure and consequent indebtedness have been the major trigger factors. However,
this coupled with social and cultural factors have led to the extreme step. Therefore
the questionnaire is an attempt to capture all causes and not only the economic causes
in isolation.
4.2 SYJl:lpfoms observed and cause of suicide:
The act of suicide may not be a single factor but a combination of many
factors which is likely to cause change of bt?~~vior of the victim. Hence, we tried to
observe if the victim displayed any symptoms (Table 4.1) before the final act.
T bl 41 S b a e • : ~ymptoms o serve dbf:mil b b ti • "d ,y a lymem ers e ore sulCI e Percent of HH
Sr.No Symptoms enquired who answered
Yes to total sample
I Was victim mingling with his/her own family member? 44 2 Was victim mingling with his/her own community? 43 3 Was victim mingling with his/her neighboring 42
households/friends? 4 Was victim consuming food regularly? 43 5 Was victim sleeping adequately during nights? 42
Source : F1eld Survey
From Table 4.1, it can be observed that in a little less than half the sample
size, the overall social behavior of the victim did not show major signs that he would
put an end to his life. In other words, he did not isolate himself from society and also
had undisturbed sleep and regular meals. More than half the cases in the sample
however experienced lack of social integration. In a study Mohanty (2005) where
sociological paradigm of suicides developed by Durkheim was also used as a model
for understanding suicides, it was noted that the greater the social isolation, the lesser
51
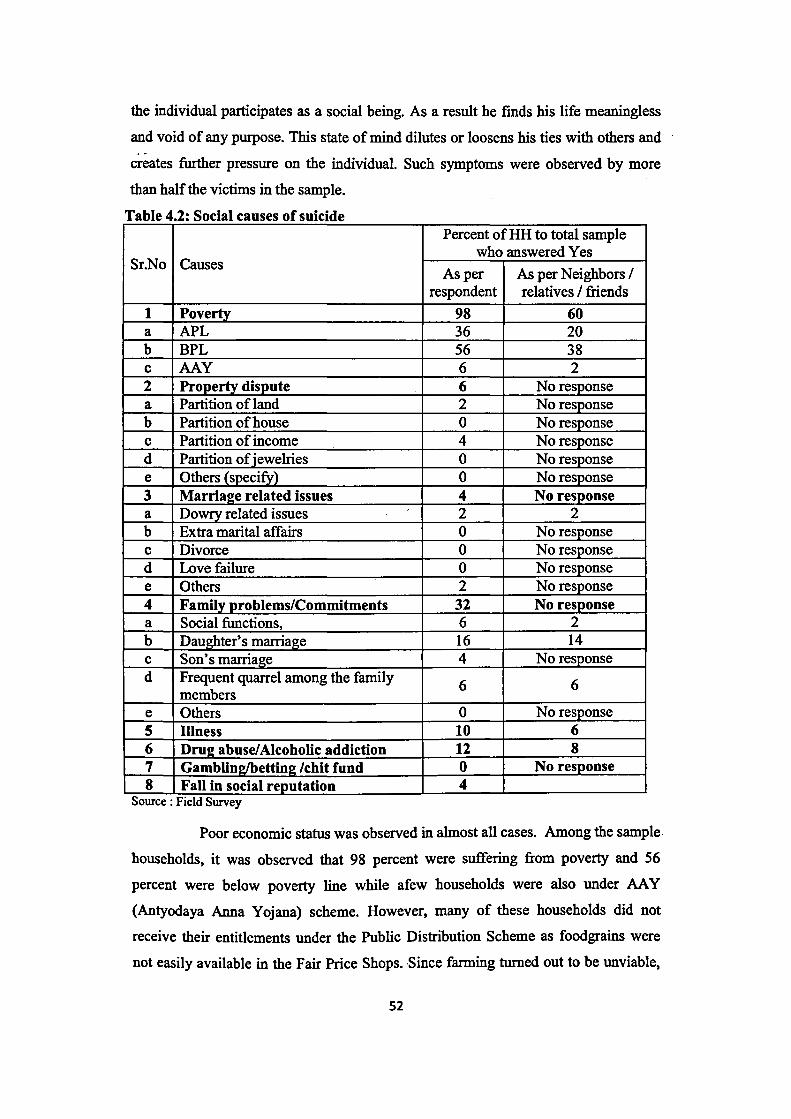
the individual participates as a social being. As a result he fmds his life meaningless
and void of any purpose. This state of mind dilutes or loosens his ties with others and
creates further pressure on the individual. Such symptoms were observed by more
than half the victims in the sample.
Table 4.2: Social causes of suicide Percent of HH to total sample
who answered Yes Sr.No Causes
Asper As per Neighbors I respondent relatives I friends
1 Poverty 98 60 a APL 36 20 b BPL 56 38 c AAY 6 2 2 Property dispute 6 No response a Partition of land 2 No response b Partition of house 0 No response c Partition of income 4 No response d Partition of jewelries 0 No response e Others (specify) 0 No response 3 Marria2e related issues 4 No response a Dowry related issues 2 2 b Extra marital affairs 0 No response c Divorce 0 No response d Love failure 0 No response e Others 2 No response 4 Family problems/Commitments 32 No response a Social functions, 6 2 b Daughter's marriage 16 14 c Son's marriage 4 No response d Frequent quarrel among the family
6 6 members
e Others 0 No response s Illness 10 6 6 Drug abuse/Alcoholic addiction 12 8 7 GamblinWbettin2/cbit fund 0 No response 8 Fall in social reputation 4
Source : Field Survey
Poor economic status was observed in almost all cases. Among the sample
households, it was observed that 98 percent were suffering from poverty and 56
percent were below poverty line while afew households were also under AA Y
(Antyodaya Anna Yojana) scheme. However, many of these households did not
receive their entitlements under the Public Distribution Scheme as foodgrains were
not easily available in the Fair Price Shops. ·Since farming turned out to be unviable,
52
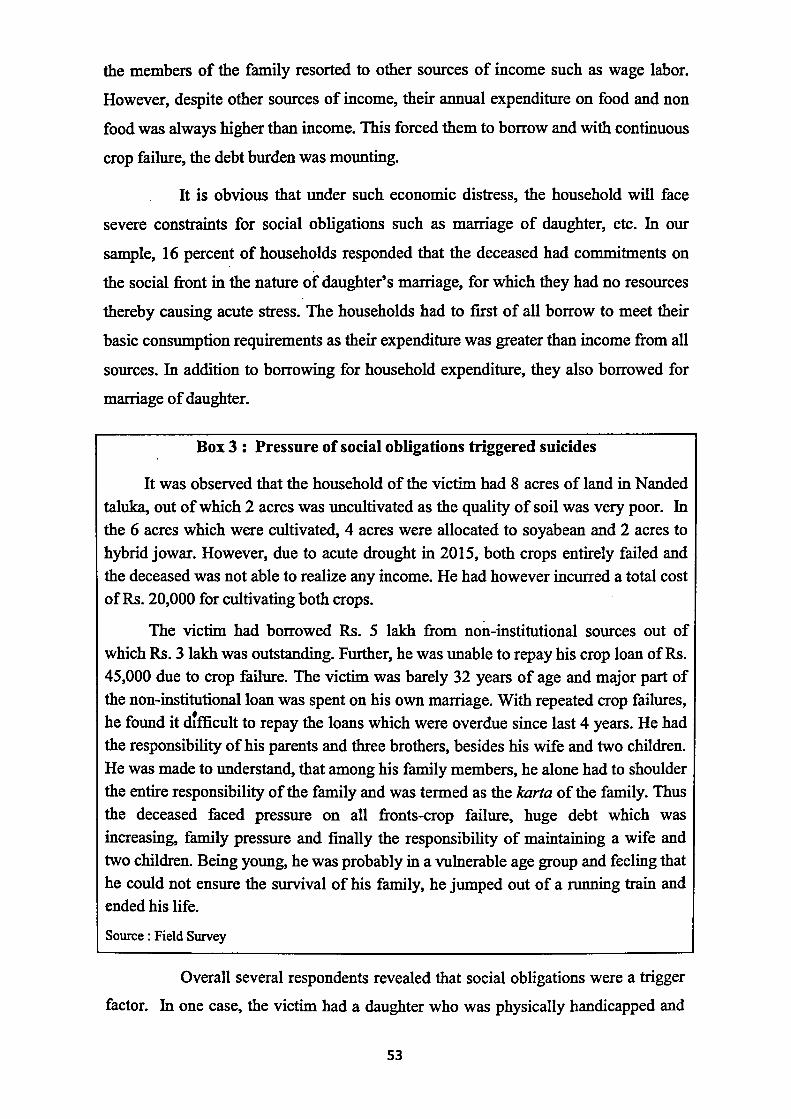
the members of the family resorted to other sources of income such as wage labor.
However, despite other sources of income, their annual expenditure on food and non
food was always higher than income. This forced them to borrow and with continuous
crop failure, the debt burden was mounting.
It is obvious that under such economic distress, the household will face
severe constraints for social obligations such as marriage of daughter, etc. In our
sample, 16 percent of households responded that the deceased had commitments on
the social front in the nature of daughter's marriage, for which they had no resources
thereby causing acute stress. The households had to first of all borrow to meet their
basic consumption requirements as their expenditure was greater than income from all
sources. In addition to borrowing for household expenditure, they also borrowed for
marriage of daughter.
Box 3 : Pressure of social obligations triggered suicides
It was observed that the household of the victim had 8 acres of land in Nanded taluka, out of which 2 acres was uncultivated as the quality of soil was very poor. In the 6 acres which were cultivated, 4 acres were allocated to soyabean and 2 acres to hybrid jowar. However, due to acute drought in 2015, both crops entirely failed and the deceased was not able to realize any income. He had however incurred a total cost of Rs. 20,000 for cultivating both crops.
The victim had borrowed Rs. 5 lakh from non-institutional sources out of which Rs. 3 lakh was outstanding. Further, he was unable to repay his crop loan ofRs. 45,000 due to crop failure. The victim was barely 32 years of age and major part of the non-institutional loan was spent on his own marriage. With repeated crop failures, he found it dtfficult to repay the loans which were overdue since last 4 years. He had the responsibility of his parents and three brothers, besides his wife and two children. He was made to understand, that among his family members, he alone had to shoulder the entire responsibility of the family and was termed as the karta of the family. Thus the deceased faced pressure on all fronts-crop failure, huge debt which was increasing, family pressure and finally the responsibility of maintaining a wife and two children. Being young, he was probably in a vulnerable age group and feeling that he could not ensure the survival of his family, he jumped out of a running train and ended his life.
Source : Field Survey
Overall several respondents revealed that social obligations were a trigger
factor. In one case, the victim had a daughter who was physically handicapped and
53

this caused him stress as neither was it possible to make her work in the field, nor was
it possible to get her married.
Other than poverty and lack of resources for social commitments, farmers
themselves are sometimes irresponsible and indulge in drug addiction and abuse of
alcohol. This was observed in 12 percent of the sample households. In one case the
victim, 60 years of age, had only 1.25 acres of rainfed land which he cultivated with
his two sons and earned a marginal income. He therefore resorted to other sources of
income such as wage income, in order to meet the requirements of his family. It was
revealed that the wife of the victim was suffering from mental disorder for which he
had to incur medical expenses. Besides, the deceased was unable to cope up with the
unsound behavior of his wife and therefore resorted to consumption of alcohol which
added to his expenditure. His overall expenditure for household, medical treatment
and alcohol kept mounting and thus worsening his economic condition. This forced
him to borrow from friends and relatives but he had no repayment capacity. All these
events pushed him into suicide which he committed by hanging himself.
There were cases (1 0 percent in our sample) when chronic illness had
added to the frustration of the deceased. Property disputes were also observed to be a
cause of stress in 6 percent of the sample and in 2 cases there were disputes over
partition of income. Two households in the sample (4 percent) noted that the deceased
faced a fall in social reputation as there was constant pressure from friends and
relatives asking for repayment of loan taken. However, continuous crop failure was
leaving them with negative income and the value of their land was also declining as
there was no source of water. Thus economic conditions created a feeling of fall in
social reputation which contributed to the extreme step.
While social stressors do play an important role in causing suicides among
farmers, quite often they are linked to economic reasons which have largely been
responsible for agrarian distress. Therefore in Table 4.3, the farming related causes of
suicides are probed which enable us to observe the major causes of economic distress.'
It can be observed from Table 4.3 that 72 percent households suffered failure of crop
due to pests and diseases while 50 percent had crop failure due to natural calamities
such as drought.
54

Box 4 : Agricultural income unable to sustain health expenses
Chronic illness was observed in case of an 85 year old widow (Chandu Bazar taluka in Amravati district) who owned 5 acres of unirrigated land. Being aged, she hired labor to cultivate her land on which cotton and tur were cultivated. The net
income from cultivation was used by her to meet her expenses. However, failure of monsoons led to crop loss and she was unable to pay wages to the labor that she hired. Though she had four sons, they maintained distant relations from her and were not
even aware of the amount of her health and other expenses. It was her grandson who provided some clues about her·social and economic condition. Finally it appeared that chronic illness, old age, health expenses and isolation from family made her life
meaningless and she ended it by consuming poison in her house.
There was yet another case of a 70 year old deceased farmer (Valgaon taluka in Amravati district) who leased out his 2 acre land, as he suffered from major illness. His wife who was illiterate and his only married daughter were unable to look after the agricultural operations. Besides suffering from major ailments he also had to undergo by pass surgery for which he borrowed from a nationalized bank. His illness was so severe that he was totally dependent upon other family members which created severe psychological stress. He was facing problems in dealing with his tenants to whom he had leased out land. He realized that his expenditure on health was increasing and it could not be managed from his rental income. Being totally dependent on his family for his basic needs and unable to cultivate his own land, he put an end to his life by hanging himself in his house.
Source: Field Survey
Box 5 : Sharing of agricultural income induced stress
The victim was 40 years old, lived in a joint family of 9 members with 3 acres irrigated and 4 acres of rainfed land, in Kaij taluka of Beed district. The family also owned a grocery shop for which they had taken a loan of Rs. 2 lakhs. While family income was Rs. 1.10 lakh, the expenditure was Rs. 1.44 lakhs. Income was short of expenditure and there were frequent quarrels in the family over the sharing of income. The family was unable to use a part. of the income to repay the loan of the grocery shop as it had to be shared among so many members. The victim was under stress as he had to repay the loan, but he did not receive any support from the family to set aside some portion of the income for repaying the installments. When he found it difficult to convince the family members on the increasing debt and could also fmding the family atmosphere not conducive, he choose to end his life.
Source: Field Survey
55
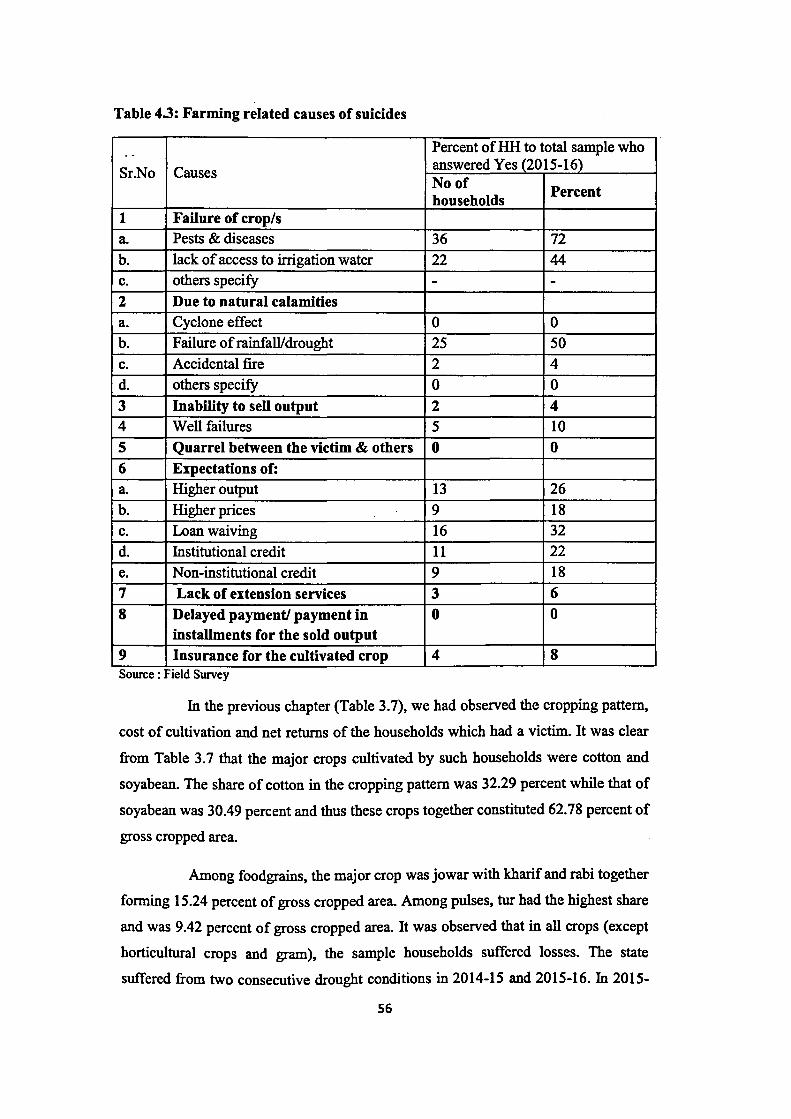
Table 4.3: Farming related causes of suicides
.. Percent of HH to total sample who
Sr.No Causes answered Yes (20 15-16) No of
Percent households
1 Failure of crop/s a. Pests & diseases 36 72 b. lack of access to irrigation water 22 44 c. others specify - -2 Due to natural calamities a. Cyclone effect 0 0 b. Failure ofrainfaWdrought 25 50 c. Accidental fire 2 4 d. others specify 0 0
3 Inability to sell output 2 4 4 Well failures 5 10
5 Quarrel between the victim & others 0 0 6 Expectations of: a. Higher output 13 26
b. Higher prices 9 18
c. Loan waiving 16 32
d. Institutional credit 11 22
e. Non-institutional credit 9 18
7 Lack of extension services 3 6 8 Delayed payment/ payment in 0 0
installments for the sold output 9 Insurance for the cultivated crop 4 8 Source : F1eld Survey
In the previous chapter (Table 3.7), we had observed the cropping pattern,
cost of cultivation and net returns of the households which had a victim. It was clear
from Table 3.7 that the major crops cultivated by such households were cotton and
soyabean. The share of cotton in the cropping pattern was 32.29 percent while that of
soyabean was 30.49 percent and thus these crops together constituted 62.78 percent of
gross cropped area.
Among food grains, the major crop was jowar with kharif and rabi together
forming 15.24 percent of gross cropped area. Among pulses, tur had the highest share
and was 9.42 percent of gross cropped area. It was observed that in all crops (except
horticultural crops and gram), the sample households suffered losses. The state
suffered from two consecutive drought conditions in 2014-15 and 2015-16. In 2015-
56
16, the deficit in rainfall was 27 percent in the state but the magnitude was greater in
Marathwada region where the deficit was 40 percent. Districts such as Beed where
suicides almost doubled from 152 in 2014 to 301 in 2015 faced a major brunt as it
received only half the normal rainfall in 2014 -15 and 2015-16. A somewhat similar
situation was observed in Nanded.
It was observed in Table 3.7 that out of 50 sample households, the number
that cultivated soyabean was 30 or 60 percent. The cultivation of soyabean was
negligible in 1990s and it constituted only 7.27 percent of area under oilseeds in .
Maharashtra. However, this crop gained popularity over the years and its share
jumped to 75.23 percent of area under oilseeds in TE 2010-11 and occupies 88.16
percent of oilseeds area in 2014-15 (Government of India, 20 16b ). Soyabean replaced
area not only under other oilseeds but also other kharif crops such as jowar, paddy,
etc. However, despite farmers having preference for soyabean crop in view of it
being short duration and having potential to yield higher returns as compared to other
crops, the point to note is that farmers can get positive returns only in years of normal
monsoons or in case of protective irrigation. However, 2015-16 was a drought year
and it was observed that out of 30 households in the sample cultivating soyabean,
there were nine households which suffered from total crop failure and on an average
across the 30 households, the yield was 70 percent less than normal. Further, the
lower yield was not compensated by higher price of the produce.
A similar situation arose with respect to cotton. It was observed that 54
percent of households cultivated this crop. The yield per acre of sample households
was observed to be 1.88 quintals per acre against a normal yield of about 4.02 quintals
per acre in a normal year. Thus farmers over the years have switched their cropping
pattern from foodgrains to commercial crops in the hope of getting higher returns.
However, continuous drought with absence of protective irrigation has resulted in
huge crop failure. In our sample of suicide households, it was observed that 27
households cultivated cotton and three households experienced complete crop failure.
In fact with respect to every crop cultivated, there have been some households which
have experienced total crop loss. Highest losses (negative returns) were observed with
respect to jowar. In case ofkharifjowar which was cultivated by 12 households, the
net returns per household were Rs. -14,733 and there were four households which
suffered from total crop failure. In case of rabi jowar, which was cultivated by six
57

households a total crop failure was observed by 3 or 50 percent households. Farmers
reserve some part of their land for subsistence crops such as jowar, but in the event of
total crop failure of such crops, their day to day survival be~omes difficult, besides
having the burden of debt and several social obligations .. Tur is another crop which
had potential for high returns to farmers but in 2015-16 farmers made losses in this
crop also. The only crops where farmers made positive returns was in gram and
cultivation of horticultural crops such as orange.
In order to further look into the huge economic losses incurred by farmers
we have compared the per quintal yield per acre and price per quintal for major crops
cultivated by sample households with that in 2013-14 which was a year with normal
monsoons (Table 4.3 A)
Table 4.3 (A): Comparison of Yield (per acre in quintals) and Price (Per quintal) in 2013-14 (Normal Year for Monsoons) in Maharashtra with that of sample farmers in 2015-16 (Drought Year)
Crop 2013-14 Sample farmers Percentage difference in yield and ( Normal Year) 2015-16 price of sample farmers with that
(Drought Year) in 2013-14 Yield Price Yield Price Yield Price
Kharif Jowar 5.68 1700 1.4 1017 -75 -40.12
Tur 3.67 7800 1.57 5056 -57 -35.12
Cotton 4.02 4600 1.88 4866 -53.24 5.78
Soyabean 5.46 3500 1.66 3245 -69.60 -7.29
Bajra 4.18 1500 2.17 983 -48 -34.46
Moong 2.13 6000 0.12 2500 -94.34 -58.33
Wheat 5.9 2000 2.89 2050 -51.02 2.50
Gram 3.6 3000 2.18 4167 -39.44 38.90
Source : F1eld survey for sample farmers and for 2013-14 the y.eld figures are calculated from data obtained from Commissionerate of Agriculture, GoM and price data is obtained from website agmarknet. nic. in.
By and large there are three factors on which the remuneration of a crop
depends - its yield, its price and cost of cultivation. It can be observed from Table 4.3
(A) that the difference in yield which were obtained by sample farmers in 2015-16 is
far lower or even less than half, for certain crops as compared to 2013-14 when the
state had a normal monsoon. Severe drought conditions in 2015-16 brought about
58

sharp fall in yield of major crops and there were several cases when there was total
crop failure or negligible yield. The state in general and regions such as Marathwada
and Vidarbha in particular suffer from acute shortage of protective irrigation. Barely
0.4 percent of soyabean crop is irrigated, while in case of cotton it is 3 percent. Pulses
are cultivated on low quality land and entirely dependent upon rainfall.
The situation becomes further hopeless because this fall in yield has also
been accompanied by fall in prices in case of several crops. Rise in price of food
grains is a sensitive issue and government has to make all round efforts to stabilize the
prices to keep inflation low. Further, if there is a drought in one state, the yield may
not be adverse in other states and hence prices may not show upward trend. Any
shortfall in production of pulses or edible oils is compensated by increase in imports
as there is a steady demand for these commodities. Therefore farmers are faced in a
situation where both the yield level as well as the price is low. In case of moong, it
can be observed that the price received is even lower than the Minimum Support
Price. Lack of water leads to low quality produce which does not fetch an appropriate
price and in some cases the government agencies are not present in the market to lift
the produce at the appropriate time.
Finally farmers are constantly faced by increasing cost of cultivation. Low
yields obviously translate to higher cost per quintal and the per quintal cost is far
higher than the Minimum Support Price (MSP) fixed for 2015-16 as indicated in
Table 4.3 (B). In case of all crops indicated below, which more or less comprise the
major cropping pattern of the sample farmers, it can be observed that farmers faced
cost of production per quintal far higher than Minimum Support Price. In case of
certain crops such as kharif jowar, bajra and moong the farmers received prices lower
than MSP. It is possible that their produce was rejected on grounds of quality or
absence of government agencies or even distress sales due to which the price received
by sample farmers was lower than MSP.
59

Table 4.3 (B) Comparison of Cost of Production Per Quintal of selected crops of S I t: d MSP ~ 201 6 amp.e armers an or 5-1 C(op Cost of Production MSP Percentage by which
of Sample farmers (Rs. per quintal ) cost of sample (Rs. per quintal) farmersishigherthan
MSP Kharif jowar 6511 1570 315 Tur 8345 4625 80.43 Cotton 5226 4100 27.46 Soyabean 5391 2600 107.35 Bajra 3940 1275 209.02 Wheat 3613 1625 122.34 Source: Table3.7 for sample farmers and Gol (2016b) forMSP
With commercialization of agriculture and shift in cropping pattern from
low value coarse cereals to cash crops such as cotton and soyabean, farmers have
hope of higher returns. They invest in seeds fertilizers, pesticides and other inputs
having expectation of higher returns. In case of cotton especially, since 2006 in
Maharashtra, Bt cotton which has high seed cost, gained popularity. Cotton is a major
crop in Maharashtra and contributes to about one-third of the area of the country. In
the sample ofhouseholds also where suicides were committed, cotton was observed to
be a major crop occupying maximum share in gross cropped area (32.29 percent).
However, farmers, who cultivate cotton, are subject to risk, as this crop is highly
susceptible to several pests and insects due to which consumption of pesticide was
high. However, a key development that took place in the cotton sector in early 2000
was the introduction of Bt technology, and area under Bt cotton began increasing
rapidly throughout the country including Maharashtra. The notable feature of this
technology is that farmers benefit from pesticide reduction as these seeds are resistant
to insects and pests such as bollworms. This eventually protects the yield of farmers.
After adoption of Bt, the country did experience increase in yields and the average
yield in the country which was 302 kgs per hectare is presently (2015-16) 504 kgs per
hectare (Cotton Corporation of India, 2016a). Though the seed cost is relatively high
(Rs. 800 for a packet of 450 grams) there is widespread adoption in view of higher
yields and several states in India such as Punjab, Gujarat, etc. experienced the same.
The story ofMaharashtra was however slightly different. While the yield of cotton did
go up in the state, the jump was not phenomenal. The yield which was 274 kgs per
hectare in 2006-07 is presently (20 15-16) about 342 kgs per hectare while the
corresponding figure for neighboring state Gujarat is 622 kgs per hectare. Perhaps the
60
state cannot reap the full potential of this technology due to lack of irrigation
facilities. At the same time it is a very input intensive technology with high cost of
cultivation. In case of failure of monsoons or improper timing, distribution and
quantity of rainfall, the seeds may not germinate. It was revealed by a respondent
from a suicide household in Beed district that the deceased had purchased several
bags of Bt cotton seeds as he was encouraged by pre monsoon showers. However, it
turned out to be a year of severe drought and the household experienced total crop
failure. Sample households also revealed that there were sometimes unseasonal rains
which caused pest attacks oil the crop and also lowered the quality of the crop. In
Yavatmal district where cotton is a major crop, some respondents revealed that even
though Bt seeds had reduced bollworms, there were other pests and insects which
attacked the crop and thus substantially reduced yield levels.
From the above, it is clear that Bt cotton is a technology that has gained
popularity and virtually the entire area under cotton in the country as well as in
Maharashtra is now under these seeds. However, the cost burden to the farmer is also
high especially when there is lack of irrigation and the crop is entirely dependent upon
monsoons. Further, while Bt is resistant to some pests such as boll worm~ it is often
attacked by other pests which again forces the farmer to spend on pesticides. The
seeds are costly and during times of shortage due to lack of extension services, the
farmers end up buying spurious seeds. In Maharashtra, the yield increase after usage
of Bt seeds has been dwarfed by the high cost of cultivation coupled with
unsatisfactory prices. The wholesale price index for raw cotton (2004-05= 1 00) which
was 225.19 in 2011-12 declined to 206.04 in 2012-13. This was possibly due to
intervention policy by the government which brought about a ban on exports of cotton
which resulted in increased supplies in the domestic market and thus fall in prices.
While the price index increased to 236.53 in 2013-14, there was again a drop to
206.078 in 2014-15 (Government of India, 2016c). The main reason for decline in
prices was huge fall in exports of cotton from 116.96 lakh bales in 2013-14 to 57.72
lakh bales in 2014-15 (Cotton Corporation of India, 2016b), i.e. a decline of 51
percent in exports. The decline in exports was mainly due to the policy of China to
limit imports and support its domestic economy. As India depends on export demand
to sustain prices, the same did not happen in 2014-15 and farmers suffered from huge
61

decline in prices. Government agencies had to step in to purchase raw cotton at MSP
and therefore come to the rescue of growers.
Just as the green revolution brought about self sufficiency in foodgrains,
there was also dynamism in the cotton economy due · to introduction of hybrid
varieties which were high yielding and in the recent past it was the Bt seeds which
became popular by virtue of these seeds being resistant to certain pests. The area
under cotton which was 7.67 million hectares in 2002-03 increased to 13.08 million
hectares in 2014-15. The corresponding figures for Maharashtra were 2.8 million
hectares in 2002-03 which increased to 4.2 million hectares in 2014-15 (Government
of India, 2016b). Factors such as technology and favorable price in several years
motivated the farmers to increase the area under cotton. However, cotton cultivation is
still dependent upon monsoons and farmers suffer in drought years due to crop failure.
This coupled with fall in prices, even below MSP in 2014-15, left them with negative
returns. Such a situation has happened repeatedly and brought about distress in the
cotton economy. Discussion with farmers indicates that they live in hope of atleast a
good crop and favorable prices, once in a few years which will help them to improve
their economic condition. However, the picture that emerges is that drought
conditions have been more common than an exception and input prices have shown a
rising trend especially labor costs. Farmers are also operating in an open economy
framework and any yield risk causing crop loss may not be compensated by rise in
price if the world supply is comfortable and international prices are ruling low.
Government intervention such as ban on exports also plays its own role in bringing
about fall in prices as was experienced in certain years of bumper crop. Thus adverse
situations such as high input cost, low yield and low prices can be a trigger factor for
suicide.
Since returns from agriculture are often unremunerative, farmers aie firstly
unable to repay their loan from both institutional and informal sources. Further, they
borrow for meeting their consumption requirements as in some cases besides cash
crops, even their foodgrain crops are destroyed. Added to this are their social
obligations, medical expenses, etc. which adds to their debt burden. There have been
instances when loans to farmers have been partly waived off by the government
Several farmers are of the view that government should write off their loans as they
fmd it impossible to repay their loans. In 2006, when there was a severe waive of
62

suicides in certain states especially Maharashtra, the government had implemented a
Prime Minister's Rehabilitation Package. Under this scheme, there was interest
waiver and the overdue loans to farmers as on July 1st 2006 were waived off and all
farmers had no past interest burden and were immediately eligible for fresh loan from
banking system. This scheme was followed by another scheme in 2008-09 budget
when a debt waiver and debt relief scheme was announced in the budget (Reserve
Bank of India, 2008). Given such concessions in the past, the farmers often have hope
and expectations that the government will rescue them from repaying their loans.
However, when their expectations do not materialize, and they fmd all avenues to
repay choked, they bring an end to their lives.
In certain cases farmers had availed of loans to dig a well which involves
considerable capital expenditure. But with no recharge of groundwater and continuous
drought, their investment turned out to be dead with no returns. With no source to
repay the loans, the debt trap fuelled into a death trap.
By and large several factors are at play, which have contributed to agrarian
crisis. While failure of monsoons or even unseasonal or excess rain does cause crop
failure, it creates a huge vicious circle as farmers experience negative income. This
makes them defaulters in the institutional credit structure and they are forced to
borrow from informal sources, not only for investment but also for consumption
purposes. With repeated such cycles, their debt burden mounts up and there is no door
which is open for them to salvage the situation. They make investment in agriculture,
in the hope of substantial returns atleast in certain years but continuous droughts have
only aggravated the situation. Farmers also suffer from poor extension services and
often purchase spurious inputs from unauthorized dealers. This leads to crop failure.
Diversification to allied activities such as livestock has its own problems due to non
availability of fodder. Even if farmers want to sell their livestock, there is no demand
and· the price offered is negligible. The same situation arises with respect to land.
Though farmers are reluctant to sell their land, failure of monsoons for consecutive
years, brings down the price of land. Thus even land which is their only asset and
source of social status no longer seems attractive and the solution they find is to end
their lives.
63

Repeated failure of crops has made the farmer a defaulter in the formal
credit channel and his credit requirements have been largely supplemented by loans
from informal sources (Table 3.8).
Table 4.4: Indebtedness related causes of suicides Percent of llli to total
Sr.No Causes sample who answered Yes
(2015-16) Number Percent
1 Indebtedness- Institutional & Non-Institutional
a. Due to crop loan 31 62 b. Due to farm equipment loan 7 14 c. Due to non-agricultural loan 9 18 d. Due to non-institutional loan 8 16 2 Due to pressure from institutional sources 6 12 3 Due to pressure from non-institutional sources
7 14 (mainly money lenders)
Source: F1eld Survey
It was observed in Table 3.8 in the previous chapter that farmers had
choked all avenues of credit. Besides coop_erative societies and commercial banks,
they have also borrowed from private banks. Crop loan seemed to be a major cause of
indebtedness and due to crop failure the farmers were unable to repay it. Non
institutional sources of credit were resorted to, even for the purpose of farming.
Added to this was the loan availed for non-agricultural purposes, perhaps to meet their
social obligations. The interest rate charged by non-institutional sources was also
exorbitant. Members of the household where suicides had been committed revealed
that the victim received repeated reminders to repay the loan. In fact, the father of the
victim also had the taped message on the phone which revealed regular reminders by
the bank informing him about his installment which was overdue. After receiving
several such calls, the victim perhaps found no source of repaying the loan and
hanged himself to death. The victim's father whose land was in Paithan taluka of
Aurangabad district kept emphasizing on failure of monsoons and acute shortage of
water for farming. He also added that due to scarcity of water, the value of his land
had registered a sharp decline and there was no demand for land in the village.
From the above, it can be observed that several socio-economic factors are
at play which fmally pushes the farmer to end his life. Therefore after conducting the
64

survey across 50 households which had an instance of suicide, it was decided to rank
the causes. The same is observed in Table 4.5.
Among the social causes of suicides, poverty was raked first. It was
observed that 56 percent of households were below poverty line and also 6 percent of
households who belonged to AA Y category. However, discussions with households
revealed that AA Y did not function efficiently. The supply of grain was extremely
irregular and also of poor quality. In certain cases, the families did not get rations for
three continuous months. In order to maintain some degree of self-sufficiency,
households had allocated a small portion of their land to jowar, but they suffered
complete crop failure and hence found their day to day survival a great burden.
Social obligations are an important part of rural life and farmers follow
traditional customs and rituals for which they require credit. The burden of coping up
with social commitments was the second major social cause of suicides. Farmers
make huge economic losses in cultivation which adds to their debt burden and fmding
no source of fmance for important obligations like marriage of daughter, etc. are
forced to end their lives. With spread of alcohol shops in rural areas and to escape
from the pressure of debt and other such factors, some respondents revealed that the
victim had succumbed to alcohol and related activities. Other factors were illness,
property disputes, etc. Some of the deceased had chronic illness but could not afford
medical treatment and unable to cope up with the suffering may have taken the
extreme step. Fall in social reputation was also observed in case of two of the
deceased farmers. The respondent revealed that the victim was unable to bear the
humiliation of not having the resources to pay the debt or meet his social obligations.
This created a kind of psychological pressure on the victim which made him feel that
his status in society was lowered and this fall in reputation in his village defmitely
served as a trigger factor.
It is expected that crop failure will rank first as the farming related cause
of distress and suicide. Agriculture is becoming a very risky economic activity and
crop failures are not occasional but a regular feature due to severe drought. While
failure of monsoons play a major role in loss of kharif crop, unseasonal rain also
contributes to major crop destruction. In Marathwada there was unseasonal rain and
hailstorm in end of February and early March 2014, which damaged standing crops
like rabi jowar, wheat, gram and vegetables. From our sample also, certain households
65

revealed that they had completely lost their rabi crop and even their sweet lime
orchards were uprooted. Infact discussions with officials in agriculture department
revealed that crops in thousands of hectares of land had been destroyed and the
damage was irreparable. This casualty was further aggravated as there was severe
drought in the following two years. There were dry spells in september 2014 when
some rainfall is needed to ensure proper growth of soyabean crop. However this did
not happen and farmers lost the crop. Again 2015-16 was a year of deficit rainfall, and
farmers suffered from yields far below normal while in several cases there was total
crop failure. Overall, it can be observed that Marathwada, had experienced severe
drought in 2012-13 which had completely wiped out the kharif crop. In the following
season of 2013-14, there were hailstorms and unseasonal rain which destroyed the
rabi crop. Again in 2014-15 and 2015-16 there was deficit in rainfall and many
districts had even less than 50 percent of normal rainfall. Allied activities such as
livestock also could not add to supplementary income as there was no fodder for
cattle. Farmers were unable to feed the cattle and at the same time were unable to sell
them or could sell them only at a very low price. Thus year after year, the crisis was
aggravated with the region reeling under severe drought conditions and manifesting
itself in the form of suicides among farmers with the number increasing rapidly each
year. The number of suicides in Marathwada in 2014 was 2.8 times and in 2015 it was
5.5 times that of 2013. The share of total suicides of Marathwada in the state
according increased from 15.97 percent in 2013 to 35.1 percent in 2015. Thus suicides
in Marathwada began catching up with Vidarbha which was considered to be the main
epicenter for suicides and where suicides were mainly concentrated since the issue
began gaining attention with government as well as media. In 2001, the share of
suicides in Vidarbha in the state was 83.87 percent and the share each year was atleast
two third of state total, till2014 and 2015 when suicide toll in Marathwada showed a
rapid rise.
In view of crop failure which is also accompanied by fall in prices, farmers
have been shifting and diversifying their cropping pattern. They have shifted their
cropping pattern from kharif jowar to cash crops such as cotton soyabean and
vegetables in the hope of favorable returns but were unable to realize the same. In
Marathwada region, the farmers took to cultivation of sweet lime in a big way which
involves capital expenditure. Many horticultural crops require investment in orchards
66

and have a gestation period of three to five years before the fruiting stage. Thus area
under fruit crops began to increase in view of them being considered as high value
crops. However, extreme drought conditions caused some of the orchards to dry up
and the huge capital expenditure added to the debt of farmers. Farmers had
expectations of high output as well as high prices from horticultural crops but instead
found their plants wither away. Shortage of water brings about a huge increase in the
price of a tanker and further, the tanker dealers fmd it difficult to send the tanker to
the interiors which do not even have fair weather roads. In case the crop is insured,
the amount received is not enough to repay his loans and even insurance claims are
not received in time.
T bl 4 5 R kin fth a e • . an l2 0 e SOCia, armm2an me e causes o SUlCI es . . I f: d. d bt d f . "d
Causes Sr.No Causes Ranking as per answer
1 Poverty 1 2 Family problems/Commitments Property
2 dispute
Social· 3 Drug abuse/ Alcoholic addiction 3 4 lllness 4
causes 5 Property Dispute 5 6 Marriage related issues 6 7 Fall in social reputation 7 8 Gambling/betting /chit fund 8 1 Failure of crop/s 1 2 Due to natural calamities 2 3 Expectations of:higher output, higher prices,
loan waiving, institutional credit , non- 3 institutional
Farming 4 Well failures 4 related causes 5 Insurance for the cultivated crop 5
6 Lack of extension services 6 7 Inability to sell output 7 8 Delayed payment/ payment in installments for
the sold output 8
9 Quarrel between victim and others 9 1
Indebtedness- Institutional & Non-Institutional 1 Indebtedness related 2 Due to pressure from non-institutional sources 2 causes (mainly money lenders)
3 Due to pressure from institutional sources 3 Source : Fteld Survey
67

Another risk involved in cultivating vegetables and fruits is that sometimes
there is a bumper harvest. In such an event there is a price crash and farmers do not
even fmd it worthwhile to sell the produce in the regulated market as the market price
does not even cover their transport cost. Although the government fixes a Minimum
Intervention price for certain horticultural crops, the scheme is not always
implemented and government agencies do not enter the market to pick up the produce.
Thus farmers diversify their cropping pattern with the expectation of good returns in
terms of output and prices, but their expectations more often than not seem to fail,
leaving them with marginal or negative returns.
After making losses in farming and debt burden increasing farmers expect
a loan waiver scheme from the government so that they are again eligible for credit.
While such schemes have been announced due to acute distress, the government
cannot always do so as it would greatly add to the fiscal deficit. Therefore when all
expectations fail and no source of rescue for the farmer he is pushed into ending his
life.
Marathwada is a ram starved region and the water crisis has forced
thousands of farmers to make their own arrangements for protective irrigation. Hence,
other than farming operations, farmers took loans for an underground bore well in the
hope that they would be able to meet their water requirements. However, when the
entire exercise failed as underground water was totally drained out, another debt trap
was created for the farmer. In Marathwada region, there is severe depletion in ground
water levels with no scope for extraction of water. Failure of monsoons on a
continuous basis leaves no scope for recharge of groundwater and other sources such
as check dams and reservoirs become dysfunctional with no water. Thus well failure
is also an important cause of suicide.
Another factor that plagues agriculture is lack of appropriate extension
services. Farmers sometimes sow the crop at the wrong time, use spurious seeds
which do not germinate or do not get their soil tested. Unless suitable extension
services are provided, they are likely to make a loss on their investment. They often
select the fertilizer which costs the least and use it in the wrong proportion and even
spray an over dose of pesticides. This increases the cost of cultivation and destroys
68
the crop. About three households in the sample complained about lack of extension
services which led to crop loss.
Failure of crops has been a major cause of indebtedness as the farmer
becomes a defaulter in the formal channel of credit and resorts to informal channel at
exorbitant rates of interest. The households of the deceased revealed that the victim
was often preoccupied with tension of repayment of loan. Several sources of credit
were tapped and diverse methods such as diversification of cropping pattern, allied
activities, digging a well were attempted in the hope of reasonable returns. But with
no respite, the burden of debt kept mounting. They had also borrowed from relatives
and money lenders and the pressure of being unable to return their loan made them
end their lives. Even regular reminders from the bank served as a pressure for the
deceased and repeated calls only led them to commit suicide.
4.3 Impact of suicides on family members:
The act of suicide would naturally cause an adverse impact on the lives of
the survivors. Another vicious circle is created as the economic impact of the suicide
creates a psychological impact and the children often become vulnerable. Hence in
Table 4.6 an attempt has been made to observe the hardship faced by the family after
the suicide was committed. In 44 percent of cases, it was observed that there was no
earning member because it was mainly the victim who knew about the agricultural
operations. The other members of the household were not in a position to continue
with farming as the deceased was the sole decision maker or the Kart a of the family.
In some cases the spouse was totally illiterate and children were not adults and were
therefore not in a position to continue with agricultural operations ..
T bl 4 6 I t H h ld fi • "d a e . mpac on ouse o a ter comm1ttin1 SUlCI e . . Sr.No After effect
Percent of llli to total sample who answered Yes
1 Agricultural activities stopped 20 2 No earning member 44 3 Schooling of the children stopped 14 4 Land sold 2 5 House sold 0 6 Other assets sold 2 7 Postponement of son/daughter's marriage 0 8 Family member/s fell seriously ill 10 9 Family member/s under depression 18 10 Insecurity in the family 22 11 Others 0 . Source : Field Survey
69
A visit to several households where suicide had been committed clearly
displayed the gloom and helplessness in the household There was a strong feeling of
insecurity and depression within the family and in certain cases the wife of the victim
refused to speak as she felt that life is meaningless. Some members revealed that they
pleaded to their neighbors who also suffered from agrarian distress not to take this
step as the family would be denied of happiness forever and would be left in a state of
trauma. Some of the wives of the deceased revealed that times were very difficult
when their spouse was alive but now the problems have multiplied. Although most
households revealed that they had received compensation as prescribed by policy,
some members felt that they would not be able to deal with the amount deposited in
the bank at the time of maturity. Many of the wives of the deceased did not have
banking habits and their children were too small to deal with such issues.
There were 7 cases when schooling of children was discontinued and at a
very early age they had to start working in the farms. However, children in several
households which had a victim were sent to charitable schools in distant places. While
this is a positive sign and hope for the family, in some cases the other members of the
family were living in a distant village, were illiterate and thus found it difficult to
communicate with the children once they had left for school. With increase in suicides
among farmers in Marathwada, some institutions made attempts to bring about
educational rehabilitation of the children by relocating them and providing them
opportunity to go to school with suitable facilities. It was unfortunate to learn that in
some cases the widow of the deceased stated that to free herself of her responsibilities
she would get her daughters married very early and perhaps even before the legal age
of marriage. Therefore while there was no response with respect to postponement of
son/daughter's marriage among our sample households, an opposite response was
received which clearly indicated a helpless situation in certain households.
4.4 Suggestions from families to avert suicides in future :
At the end of the detailed survey regarding socio-economic causes and
impact of suicides among farmers, it was felt necessary to hear suggestions from the
households as to measures to prevent such actions. The same is indicated in Table 4. 7.
It is clear that a major cause for agrarian distress was severe and repeated
droughts in the state. The households revealed that the main problem was acute
70
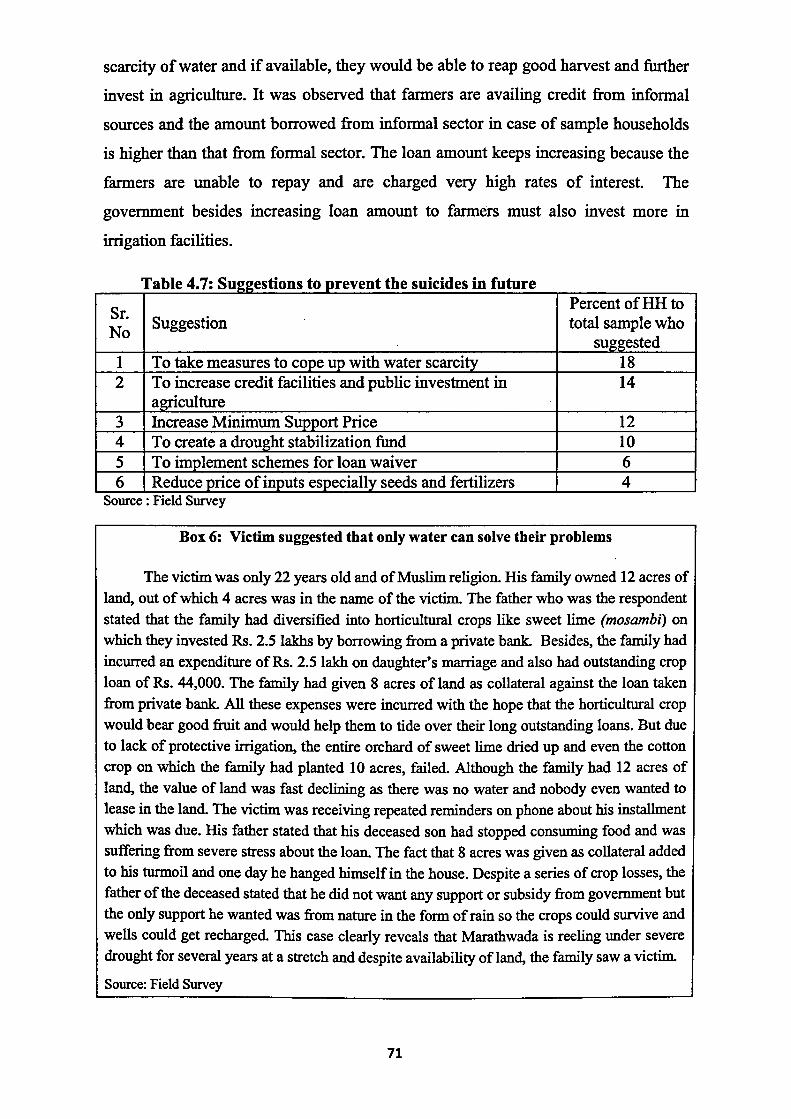
scarcity of water and if available, they would be able to reap good harvest and further
invest in agriculture. It was observed that farmers are availing credit from informal
sources and the amount borrowed from informal sector in case of sample households
is higher than that from formal sector. The loan amount keeps increasing because the
farmers are unable to repay and are charged very high rates of interest. The
government besides increasing loan amount to farmers must also invest more in
irrigation facilities.
T bl 4 7 S ti t tth • "d • ti tu a e . ugges ons o preven e sulCI es m u re . . Sr.
Percent of HH to
No Suggestion total sample who
suggested 1 To take measures to cope up with water scarcity 18 2 To increase credit facilities and public investment in 14
agriculture 3 Increase Minimum Support Price 12 4 To create a drought stabilization fund 10 5 To implement schemes for loan waiver 6 6 Reduce price of inputs especially seeds and fertilizers 4
Source : Field Survey
Box 6: Victim suggested that only water can solve their problems
The victim was only 22 years old and of Muslim religion. His family owned 12 acres of
land, out of which 4 acres was in the name of the victim. The father who was the respondent
stated that the family had diversified into horticultural crops like sweet lime (mosambi) on which they invested Rs. 2.5 lakhs by borrowing from a private bank. Besides, the family had
incurred an expenditure ofRs. 2.5lakh on daughter's marriage and also had outstanding crop loan of Rs. 44,000. The family had given 8 acres of land as collateral against the loan taken
from private bank. All these expenses were incurred with the hope that the horticultural crop would bear good fruit and would help them to tide over their long outstanding loans. But due to lack of protective irrigation, the entire orchard of sweet lime dried up and even the cotton crop on which the family had planted 10 acres, failed. Although the family had 12 acres of
land, the value of land was fast declining as there was no water and nobody even wanted to lease in the land. The victim was receiving repeated reminders on phone about his installment which was due. His father stated that his deceased son had stopped consuming food and was suffering from severe stress about the loan. The fact that 8 acres was given as collateral added
to his turmoil and one day he hanged himself in the house. Despite a series of crop losses, the father of the deceased stated that he did not want any support or subsidy from government but the only support he wanted was from nature in the form of rain so the crops could survive and wells could get recharged. This case clearly reveals that Marathwada is reeling under severe drought for several years at a stretch and despite availability of land, the family saw a victim.
Source: Field Survey
71

Many households felt that the MSP announced by the government does not
cover their cost of production and must be increased. Other suggestions indicated that
the price of inputs such as seeds and fertilizers must be reduced and loans of farmers
should be written off so that the debt burden does not exist.
4.5 Summary:
The field survey after addressing an extensive questionnaire to 50
households which experienced a suicide victim clearly bought about the causes and
impact of suicides. While a little less than half the victims concealed their
psychological stress, more than half showed signs of stress and restless behavior.
Among the social causes, poor economic status was observed to be most
important as 98 percent of households surveyed were poor. The BPL families and
those under AA Y scheme mentioned that they did not receive their entitlements for
months at a stretch and the food crops cultivated by them failed. Added to the
economic distress was the need to fulfill their social commitments such as daughter's
marriage for which they had to resort to mainly informal sources of fmance with no
repaying capacity. In some cases, farmers were irresponsible and indulged in alcohol
as they were unable to cope up with their social and economic responsibilities. There
were also 5 cases where chronic illness and medical expenses added to the debt ·
burden and served as a major trigger factor.
Crop failure is a major economic reason for leading to suicides. There
were several cases in the sample when the household lost the entire crop with negative
returns to the family. The farmers suffered on all three fronts - low yield or no yield,
low prices for the produce and rising cost of cultivation. In several cases farmers
could not even cover their cost of cultivation.· Cotton and soyabean are major crops in
Vidarbha and Marathwada and accordingly even the suicide households had adopted
this cropping pattern. However, with no protective irrigation and huge deficit in
rainfall, there was crop loss coupled with huge cost of cultivation. Poor monsoons
also led to depleting water tables and those households which invested in a well did
not fmd water but only the debt burden rising.
72
All the above factors have drained the repaying capacity of farmers which
made them defaulter in both the formal as well as informal credit channels. In the
informal channel the interest rate is normally 25 percent per annum which squeezes
the farmer and in the event of being unable to repay only keeps increasing.
Suicide in the family causes huge impact which is not only economic but
also psychological. In 44 percent of cases there was no earning member as other
members were illiterate or not yet adults and in 20 percent cases the agricultural
activities had stopped. Some Qf the wives of the deceased revealed that times were
difficult when the spouse was alive but now problems have increased manifold. There
were cases when schooling was discontinued and children had to start working on the
farms. In some cases there were attempts to bring educational rehabilitation for the
children but they were separated from their families and communication was difficult.
Many of the wives of the deceased did not have banking habits and the children were
too small to deal with such issues.
Suggestions made by households which experienced a victim felt that
water scarcity should be dealt with on a war footing. Public investment in agriculture
must be stepped up, the minimum support price must atleast cover cost of production
and credit on easier terms must be made available. If these issues are taken care of,
farming may not prove to be unviable.
73
Chapter 5
Conclusions and Policy Implications
5.1 Introduction:
Indian agriculture is currently passing through a period of severe crisis and
the overall scenario in this sector is that of stagnation, underperformance and lack of
dynamism. The contribution of agriculture to gross domestic product (GOP) is
presently 14 percent (2015-16) while workforce engaged in this sector is 54.6 percent
(20 11 census). The average size of holding is fast declining and is presently 1.16
hectares with 84.8 percent of holdings being marginal and small. The Eleventh Plan
target growth of 4 percent per annum for the agricultural sector could not be achieved
as the average growth rate turned out to be 3.67 percent per annum while that of the
economy as a whole was 7.9 per cent. Again the Twelfth Plan (2012-17) for
agriculture, which is now in its last year has again not shown any encouraging picture.
The growth in 2013-14 as against 2012-13 was 4.2 per cent while it was -0.2 percent
in 2014-15 as against in 2013-14. It improved to a miniscule 1.1 percent in 2015-16 as
against 2014-15. The overall growth of the economy during each year of twelfth Plan
was however around 7 percent.
The data from the 70th Round of National Sample Survey Organization
reveal that during the period July 2012 to June 2013, at the All India level, the
average monthly income per agricultural household was Rs 6426/- out ofwhich only
4 7.9 percent was from cultivation and hence farmers cannot solely depend upon
farming to meet their consumption requirements. lnfact even after earning income
from other sources, in case of 70 percent of households, the monthly per household
consumption expenditure was higher than that of income.
The Situation Assessment Surveys of the National Sample Survey
Organization (2005) had also observed the worsening situation of farming households
and noted that about 40 percent farmers' households in the country did not like
farming because it is unprofitable, risky, lacks social status and given an option would
like to choose another profession. The crisis in the agricultural sector thus had certain
features such as deceleration in growth rates in this sector, declining share of
agriculture in GOP, falling public investment, low or negative returns,
74

marginalization of land holdings and low opportunities for rural non farm
employment leading to disguised employment in this sector, etc. All these features in
the agricultural sector have impoverished the farmers and caused distress. One of the
tragic manifestations of the crisis is the large number of suicides committed by
farmers in several states of India.
The number of farmers' suicide which was 10720 in 1995, has been
increasing over the years and peaked in 2004 at 18241. The wave of suicides is
prominent in states such as Maharashtra, Andhra Pradesh, Karnataka, Madhya
Pradesh and even Punjab. ~e spate of suicides among farming community has
continued till date and the problem has been so alarming that it has attracted
nationwide attention and been the cause of serious debates in the state as well as
Union Legislatures. These debates have raised a series of questions about the
distressful conditions of farmers and the state of the agricultural economy.
5.2 Objectives and Methodology:
Given the seriousness of the issue on agrarian distress ultimately leading to
suicides among farmers, the Ministry of Agriculture, Cooperation and Farmers
Welfare sponsored a study on farmer suicides in Maharashtra so that a grassroot level
understanding on causes of suicides could be observed. The objectives of the study
are:
1. To analyse the incidence and spread of suicides among farmers in the state of
Maharashtra;
2. To study the socio-economic profile, cropping pattern and profitability of victim
farm households;
3. To study the causes leading to farmers' suicides including production and market
risks, sociological, psychological and other family related factors responsible for
farmer suicides;
4. To recommend suitable policies to eliminate the occurrence of incidence of
farmers' suicides.
Primary data has been collected from 50 agricultural households which
had an incidence of suicide. After selecting districts which were hotspots for suicides,
a structured questionnaire was addressed to them. The questionnaire firstly attempted
75

to capture the agricultural status of the household and then try and probe into the
causes. Hence primary data has been collected on family size, level of education,
~~cial group, cropping pattern, size of holding, source of irrigation, cost of cultivation, ·
net returns, etc. In order to observe the extent of agrarian distress, the loan borrowed
from institutional as well as non institutional sources is observed and also the extent
of indebtedness. Questions were also addressed to observe the socio-economic causes
of suicides.
The data from official unpublished records of the government reveal that
suicides are concentrated in Vidarbha and Marathwada. While share of suicides have
always dominated in Vidarbha, the share of Marathwada has been increasing
gradually in the recent years. Therefore districts selected for primary survey are from
the regions ofMarathwada (Beed, Nanded and Aurangabad) and Vidarbha (Yavatmal
and Amravati).
5.3 Major Findings:
1. The highest incidence of suicides is in Amravati division. In fact in 2001 when
the state witnessed a relatively low incidence of suicides (62) among farming
community, as much as 79 percent were observed in Amravati division ( 49).
However, over the years the number of suicides in the division kept increasing
and was as high as 1179 in 2015 (36.52 percent), i.e an increase by 24 times.
2. Aurangabad division which had negligible suicides in early 2000 showed a
rapid rise to 1130 in 2015 in and caught up with Amravati division with a
share of35.01 in 2015. Thus both these divisions together accounted for 71.53
percent of suicides in Maharashtra.
3. Another way of observing the incidence of suicide among farmers according
to divisions of the state was by calculating the number of suicides per lakh
hectare of NSA and GCA. While the number of suicides in Maharashtra in
2015-16 was 19.38 per lakh hectare of NSA and 14.44 per lakh hectare of
GCA, the corresponding figures for Amravati division was 37.68 and 32.66
and that for Aurangabad was 27.96 and 18.07. Suicides were thus concentrated
in these two regions.
4. The government of Maharashtra provided compensation to deceased families
where indebtedness was the main cause of suicide and about 65.74 percent of
76
families in 2015-16 were given compensation of Rs 1 lakh, out of which Rs
30,000/- was paid in cash and Rs 70,000/- was kept in the bank as fixed
deposit.
5. The socio-economic profile of the household of the victim revealed that
farming was the main economic activity of 100. percent of households in the
sample. About 72 percent of the families of the victims were joint in nature
and 86 percent lived in the village. With respect to level of literacy, it was
observed that 30 perce11:t were illiterate and 14 percent had only primary level
schooling. However, ~ farmers in the sample size of 50 had more than 15
years of schooling. The land holding pattern indicated that 40 percent of the
area was between 0.1 to 2.5 acres or marginal group while 42 percent area was
between 2.51 to 5 acres or small category. Marginal and small farmers
constituted 76 percent of holdings while in case of large farmers the figure
was 6 percent. The characteristics of operational holdings of the victims'
household indicated that on an average the gross cropped area was 4.46 acres
out of which area sown more than once was only 0.43 acres. The cropping
intensity was only 110.42 percent, possibly due to lack of irrigation facilities.
Only 12.11 percent of the area was irrigated while 87.89 percent was
unirrigated. The cropping pattern of the sample households revealed that
soyabean and cotton together constituted 62.78 percent of the gross cropped
area of sample households while the share of foodgrains was 33.63 percent
and few farmers in the sample cultivated horticultural crops.
6. The field survey indicates that sample households on an average had a negative
income from agriculture to the tune of Rs 32716/-. However, they earned
income from various sources such as allied activities, wages, etc which
amounted to Rs 30990/- per household on an average. The huge negative
income from agriculture clearly indicates crop failure and high cost of
cultivation. In 2015-16, Marathwada suffered from severe drought and the
region received 60 percent of normal rainfall. Districts such as Beed and
Nanded which are included in our sample suffered from around 50 percent
deficient rainfall and a similar pattern was observed in 2014-15. The net
returns to farmers indicate that farming is totally unremunerative and unviable
economic activity. Farmers made losses from all crops except gram and some
77
horticultural crop. Maximum loss was incurred for cereals -kharif jowar and
followed by bajra. Taking across all crops the net returns were Rs -27301/
per acre and Rs - 32716 per household. Thus households made negative
returns from farming.
7. With respect to credit, it was observed that an average amount from formal and
informal sources together of Rs 95200/- was borrowed for farming purposes
while Rs 225074/- was borrowed for non-farming purposes. The average
amount outstanding per household was Rs 99601.
8. The social related causes showed that poverty ranked first, followed by family
problems. Many households did not receive their entitlements through PDS.
Due to crop failure, their expenditure was higher than income and they had to
resort to borrowing, leading to indebtedness as they had no repaying capacity.
9. Crop failure ranked first as the farming related cause of distress and suicide. It
was observed that out of 50 sample households, the number that cultivated
soyabean was 30 or 60 percent. The cultivation of soyabean was negligible in
1990s and it constituted only 7.27 percent of area under oilseeds in
Maharashtra. However, this crop gained popularity over the years and its share
jumped to 75.23 percent of area under oilseeds in TE 2010-11 and occupies
88.16 percent of oilseeds area in 2014-15. Soyabean replaced area not only
under other oilseeds but also other kharif crops such as jowar, paddy, etc.
However, 2015-16 was a drought year and it was observed that out of 30
households in the sample cultivating soyabean, there were nine households
which suffered from total crop failure and on an average across the 30
households, the yield was 70 percent less than normal. Further, the lower yield
was not compensated by higher price of the produce.
10. A similar situation arose with respect to cotton and other crops. It was
observed that 54 percent of households cultivated this crop. The yield per acre
of sample households was observed to be 1.88 quintals per acre against a
normal yield of about 4.02 quintals per acre in a normal year. Thus farmers
over the years have switched their cropping pattern from foodgrains to
commercial crops in the hope of getting higher returns. However, continuous
drought with absence of protective irrigation has resulted in huge crop failure.
78
In our sample of suicide households, it was observed that 27 households
cultivated cotton and three households experienced complete crop failure. In
fact with respect to every crop cultivated, there have been some households
which have experienced total crop loss. Highest losses were observed with
respect to jowar. In case of kharif jowar which was cultivated by 12
households, the net returns per household was Rs- 14733/- and there were
four households which suffered from total crop failure. In case of rabi jowar,
which was cultivated by six households a total crop failure was observed by 3
or 50 percent households. Farmers reserve some part of their land for
subsistence crops such as jowar, but in the event of total crop failure of such
crops, their day to day survival becomes difficult, besides having the burden of
debt and several social obligations. Tur is another crop which had potential for
high returns to farmers but in 2015-16 farmers made losses in this crop also.
The only crops where farmers made positive returns was in gram and
cultivation of horticultural crops such as orange. Further, farmers are also
operating in an open economy framework and any yield risk causing crop loss
may not be compensated by rise in price if the world supply is comfortable
and international prices are ruling low. Government intervention such as ban
on exports also plays its own role in bringing about fall in prices as was
experienced in certain years of bumper crop. Thus adverse situations such as
high input cost, low yield and low prices can be a trigger factor for suicide.
11. The act of suicide gave rise to another vicious circle as the economic impact of
the suicide gave rise to a psychological impact. In 44 percent cases of the
sample, there was no earing member while in 20 percent of cases the
agricultural activities had stopped. There was a strong feeling of insecurity and
depression within the family members who felt that their problems had now
multiplied. There were 7 cases when schooling of children was discontinued
while in certain cases there was intervention to bring about educational
rehabilitation by charitable institutions.
79
5.4 Policy Suggestions:
The following policy suggestions emerge from our study :
1. The number of suicides in Maharashtra is concentrated in Vidarbha and
Marathwada which together have always accounted for more than 70 percent
of suicides in the state. The cropping pattern in both these regions reveal that
35 percent area is under cotton while 40 percent is under soyabean and hence
together constitute 75 percent of area under kharif crops. A similar picture was
observed with respect to our sample farmers. Both crops are commercial crops
and farmers have switched over to these crops with the hope of getting higher
returns. However, they are rainfed crops as only 0.4 percent of soyabean and 3
percent area under cotton are irrigated. Failure of monsoons thus brings about
a drastic fall in yield. There was decline in yield in soyabean from 1349 kgs
per hectare in 2013-14 to 655 kgs per hectare in 2014-15 due to failure of
monsoons in 2014-15. A similar situation arose in 2015-16. In case of cotton
also the yield declined from 358 kgs per hectare in 2013-14 to 285 kgs per
hectare in 2014-15 (Government of India, 2015). The adoption ofBt cotton is
very sensitive to lack of irrigation and in case of inadequate rainfall has made
cotton a high risk and high cost of cultivation crop. This clearly emphasizes
the need for protective irrigation. Marathwada is a water stressed region and
due to continuous drought, ground water is not being recharged. The
government officials emphasized that Maharashtra is facing three types of
drought - meteorological drought due to poor monsoons, ground water
depletion which signals a hydrological drought and the end result is a fall in
yield which causes agricultural drought (https;//ruralindiaonline.org). Thus top
priority has to therefore be given for watershed strategies and completion of
irrigation projects, so that water is available in case of dry spells after sowing.
Water saving technologies such as drip irrigation must also be promoted and
cultivation of water guzzling crops like sugarcane may be discouraged.
2. Besides low rainfall, even unseasonal rainfall, erratic rainfall, hailstorms and
extreme heat have destroyed crops through pest attacks. Hence there is need to
install automated weather stations so that farmers are alerted on natural
80

calamities and can take precautionary measures. In view of the huge losses in
crops such as soyabean and cotton, ( 48 percent of soyabean crop was infested
by pests in 2008-09) the Government of Maharashtra launched the Crop Pest
Surveillance Project (CROPSAP) from 2009-10 season. The main objective of
the project was to develop a scientific approach to pest surveillance and
monitoring and also to guide the farmers on Integrated Pest Management and
Integrated Nutrient Management (darpg.gov.in). Under this scheme, there is
dissemination of pest management advisories to farmers through short
message services (SMS) for several crops such as soyabean, cotton, tur, etc.
However, it appears that such programmes have had only limited success and
the pace of implementation is slow. Farmers must be encouraged to register
for advisory services so as to prevent crop loss by taking corrective steps at the
appropriate time.
3. Farmers also lack extension services with respect to availability of new
varieties of seeds which give higher yield. Their soil is also not tested and
hence the appropriate fertilizer and the correct dose is not applied. Farmers
must therefore maintain their soil health cards so that proper nutrient
management is maintained. Schemes of the government must therefore be
strongly propagated so that they can reach all beneficiaries.
4. In the absence of institutional finance due to default the farmers normally
borrow from informal sources at exorbitant rates of interest which they are
unable to repay. Hence the government must ensure that institutional fmance
and crop insurance do not put the farmers into a debt trap.
5. Maharashtra is a high cost state and in certain cases the MSP does not cover
cost of production. Further, in the event of price falling below support level,
there are cases when state agencies do not immediately appear to mop up the
produce. Hence these issues must be addressed so that farmers can cope up
with high cost of production as well as bumper crop in some cases.
6. In order to earn supplementary income, farmers often diversify to allied
activities such as dairy, poultry, etc. However, in drought years there is
scarcity of fodder and with inadequate camps to supply water and fodder they
are forced to sell the animals at rock bottom prices. Hence all round efforts
must be made to ensure that such a situation does not arise and there are
enough fodder camps so that cattle do not perish.
81

7. Rural non farm employment must be promoted and other employment
guarantee schemes implemented by government must be in place so that
farmers can benefit from them.
8. Besides interventions by the government, it is also important for social
organizations to play a role in rehabilitating the survivors of the families by
ensuring education to children of victims, mass marriages, counseling, etc.
There were few cases in the sample when the victim after suicide attempts
such as consuming poison or burning himself, did not immediately die and
was rushed to hospital. The victim while struggling for life owned up that he
regretted his act and wanted to live though it was too late. Hence the
households having distress must be educated on the value of their contribution
towards the socioeconomic development of their family and society at large.
9. Primary health care and support system to vulnerable farmers must be
strengthened so that illness does not serve as a trigger factor to an already
indebted farmer.
It is now a decade since the PM's rehabilitation package for farmers in
suicide prone districts was implemented. The gram panchayats in the village
had given due publicity to the programme and farmers had availed of relief
measures such as interest waiver, irrigation facilities, horticulture
development, animal husbandry, etc. However, despite remedial measures, the
capacity of the farmers to cope up with drought is not mitigated and agrarian
distress continues to be a prominent issue among policy makers. The
economic, social and environmental constraints which are the cause of this
distress must therefore be addressed in a more comprehensive manner so as to
ensure that farmers become self-reliant. While promoting irrigation facilities
to water stressed Maharashtra is the top priority, equally important are
strengthening all other input supplies, maintaining efficiency in marketing and
creating a sound infrastructure with respect to weather forecasting, electricity,
rural roads, etc. The real answer thus lies in increasing productivity of crops
and their proper marketing accompanied by rural non-farm employment so as
to reduce the burden of the workforce in the agricultural sector.
82

Executive Summary
Background :
Indian agriculture is currently passing through a period of severe crisis and
the overall scenario in this sector is that of stagnation, underperformance and lack of
dynamism. The Eleventh Plan target growth of 4 percent per annum for the
agricultural sector could not be achieved as the average growth rate turned out to be
3.67 percent per annum while that of the economy as a whole was 7.9 per cent. Again
the Twelfth Plan (2012-17) for agriculture, which is now in its last year has again not
shown any encouraging picture. The growth in 2013-14 as against 2012-13 was 4.2
per cent while it was -0.2 percent in 2014-15 as against in 2013-14. It improved to a
miniscule 1.1 percent in 2015-16 as against 2014-15. The overall growth of the
economy during each year of twelfth Plan was however around 7 percent.
The 70th Round ofNSSO data reveals that even after earning income from
other sources, in case of 70 percent of households, the monthly per household
consumption expenditure was higher than that of income. One of the tragic
manifestations of the crisis is the large number of suicides committed by farmers in
several states of India.
Objectives and Methodology:
The issue on agrarian distress ultimately leading to suicides among farmers, was
serious and hence discussed repeatedly among policy makers. Therefore, the Ministry
of Agriculture, Cooperation and Farmers Welfare sponsored a study on farmer
suicides in Maharashtra so that a grassroot level understanding on causes of suicides
could be observed. The objectives of the study are:
• To analyse the incidence and spread of suicides among farmers in the state
of Maharashtra;
• To study the socio-economic profile, cropping pattern and profitability of
victim farm households;
• To study the causes leading to farmers' suicides including production and
market risks, sociological, psychological and other family related factors
responsible for farmer suicides;
83

• To recommend suitable policies to eliminate the occurrence of incidence
of farmers' suicides.
Primary data has been collected from 50 agricultural households which
had an incidence of suicide. After selecting districts which were hotspots for suicides,
a structured questionnaire was addressed to them. The questionnaire firstly attempted
to capture the agricultural status of the household and then try and probe into the
causes. Hence primary data has been collected on family size, level of education,
social group, cropping pattern, size of holding, source of irrigation, cost of cultivation,
net returns, etc. In order to observe the extent of agrarian distress, the loan borrowed
from institutional as well as non institutional sources is observed and also the extent
of indebtedness. Questions were also addressed to observe the socio-economic causes
of suicides.
The data from official unpublished records of the government reveal that
suicides are concentrated in Vidarbha and Marathwada. While share of suicides have
always dominated in Vidarbha, the share of Marathwada has been increasing
gradually in the recent years. Therefore districts selected for primary survey are from
the regions ofMarathwada (Beed, Nanded and Aurangabad) and Vidarbha (Yavatmal
and Amravati).
Findings:
• The highest incidence of suicides in 2015-16 was observed m
Aurangabad division which constituted 37.43 percent of suicides m
Maharashtra. The corresponding figure for Amravati division was 34.45
percent and thus 71.88 percent of suicides in the state were from these
two divisions.
• Another way of observing the incidence of suicide among farmers
according to divisions of the state was by calculating the number of
suicides per lakh hectare ofNSA and GCA. While the number of suicides
in Maharashtra in 2015-16 was 19.38 per lakh hectare ofNSA and 14.44
per lakh hectare of GCA, the corresponding figures for Amravati division
was 37.68 and 32.66 and that for Aurangabad was 27.96 and 18.07.
Suicides were thus concentrated in these two regions.
84

• The government of Maharashtra provided compensation to deceased
families where indebtedness was the main cause of suicide and about
65.74 percent of families in 2015-16 were given compensation of Rs 1
lakh, out of which Rs 30,000/- was paid in cash and Rs 70,000/- was kept
in the bank as fixed deposit.
• The socio-economic profile of the household of the victim revealed that
farming was the main economic activity of 100 percent of households in
the sample. The cropping intensity was only 110.42 percent, possibly due
to lack of irrigation facilities. Only 12.11 percent of the area was irrigated
while 87.89 percent was unirrigated.
• The cropping pattern of the sample households revealed that soyabean
and cotton together constituted 62.78 percent of the gross cropped area of
sample households while the share of foodgrains was 33.63 percent and
few farmers in the sample cultivated horticultural crops.
• The field survey indicates that sample households on an average had a
negative income from agriculture to the tune of Rs 32716/-. However,
they earned income from various sources such as allied activities, wages,
etc which amounted toRs 30990/- per household on an average.
• With respect to consumption expenditure, it was observed that 70 percent
was for food and 30 percent for non-food items. Due to negative income
from agriculture, the expenditure of the household exceeded that of
income by Rs 60335/-. This forces them to borrow from informal sources
such as moneylenders who charge interest of about 25 percent per annum.
• With respect to credit, it was observed that an average amount from
formal and informal sources together of Rs 95200/- was borrowed for
farming purposes while Rs 225074/- was borrowed for non-farming
purposes. The average amount outstanding per household was Rs 99601.
• The social related causes showed that poverty ranked first, followed by
family problems. Many households did not receive their entitlements
through PDS.
• Crop failure ranked first as the farming related cause of distress and
suicide. In fact with respect to every crop cultivated, there have been
some households which have experienced total crop loss. Adverse
85

situations such as high input cost, low yield and low prices were a trigger
factor for suicide.
• In 44 percent cases of the sample, there was no earing member while in
20 percent of cases the agricultural activities had stopped. There was a
strong feeling of insecurity and depression within the family members
who felt that their problems had now multiplied. There were 7 cases
when schooling of children was discontinued while in certain cases there
was intervention ~o bring about educational rehabilitation by charitable
institutions.
Policy Suggestions:
The following policy suggestions emerge from our study :
• The number of suicides in Maharashtra is concentrated in Vidarbha
and Marathwada which together have always accounted for more than
70 percent of suicides in the state. The cropping pattern in both these
regions reveal that 35 percent area is under cotton while 40 percent is
under soyabean and hence together constitute 75 percent of area under
kharif crops. A similar picture was observed with respect to our sample
farmers. Both crops are commercial crops and farmers have switched
over to these crops with the hope of getting higher returns. However,
they are almost entirely rainfed crops and failure of monsoons brings
about a drastic fall in yield. This clearly emphasizes the need for
protective irrigation. Marathwada is a water stressed region and due to
continuous drought, ground water is not being recharged. Thus top
priority has to be given for watershed strategies and completion of
irrigation projects, so that water is available in case of dry spells after
sowing. Water saving technologies such as drip irrigation must also be
promoted and cultivation of water guzzling crops like sugarcane may
be discouraged.
• Besides low rainfall, even unseasonal rainfall, erratic rainfall,
hailstorms and extreme heat have destroyed crops through pest attacks.
Hence there is need to install automated weather stations so that
86

farmers are alerted on natural calamities and can take precautionary
measures.
• Extension services with respect to availability of new varieties of seeds
which give higher yield must be provided to farmers and they must
also be encouraged to test their soil.
• State agencies must be active in their purchase operations in case
prices fall below MSP.
• Fodder must be made available during drought years so that farmers
can earn supplementary income from allied activitie~.
• Rural non farm employment must be promoted.
• Social organizations must play a role in rehabilitating the survivors of
the family by ensuring education to children of deceased, mass
marriages, counseling, etc.
It is now a decade since the PM's rehabilitation package for farmers in
suicide prone districts was implemented. The gram panchayats in the village
had given due publicity to the programme and farmers had availed of relief
measures such as interest waiver, irrigation facilities, horticulture
development, animal husbandry, etc. However, despite remedial measures, the
capacity of the farmers to cope up with drought is not mitigated and agrarian
distress continues to be a prominent issue among policy makers. The
economic, social and environmental constraints which are the cause of this
distress must therefore be addressed in a more comprehensive manner so as to
ensure that farmers become self-reliant. While promoting irrigation facilities
to water stressed Maharashtra is the top priority, equally important are
strengthening all other input supplies, maintaining efficiency in marketing and
creating a sound infrastructure with respect to weather forecasting, electricity,
rural roads, etc. The real answer thus lies in increasing productivity of crops
and their proper marketing accompanied by rural non-farm employment so as
to reduce the burden of the workforce in the agricultural sector.
87
References
Abraham, T. (2016, May 19). Baliraja Chetana Abhiyan helps arrest suicide rate in · - Yavatmal. Times of India.
Ahlawat, S. R. (2003). Sociology of Agrarian crises: Peasant Suicides and Emerging Challenges. Man and Development, 25(3), 97-110.
Assadi, M. (1998). Farmers Suicides: Sings of Distress in Rural Economy. Economic and Political Weekly, 33(14), 747-48.
Chandrashekhar, C. P., & Ghosh, J. (2005, August 30). The Burden of Farmers' Debt. The Hindu Business Line.
Cotton Corporation of India. (2016a). Statisitcs. Retrieved from http://cotcorp.gov.in/statistics.aspx#area
Cotton Corporation of India. (2016b). Statisics: Cotton Exports by India- 2005--06 onwards. Retrieved from http://cotcorp.gov.in/statistics.aspx?pageid=7#cotton3
Dandekar, A., Narawades, S., Rathod, R., Ingle, R., Kulkarni, V., & Sateppa, Y ... (2005). Causes of Farmer Suicides in Maharashtra: An Enquiry: Final Report Submitted to the Mumbai High Court. Tata institute of Social Sciences, Mumbai.
Deshpande, R. S. (2002). Suicide by Fariners in Karnataka: Agrarian Distress and Possible Alleviatory Steps. Economic and Political Weekly, 3 7(25), 2601-10.
Government of India. (2014). Agriculture Census 2010-11: All India Report on Number and Area of Operational Holdings. Agriculture Census Division, Department of Agriculture and Co-operation, Minsitry of Agriculture, Governmment of India.
Government of India. (2015). Agricultural Statistics at a Glance 2014. Delhi: Government of India, Ministry of Agriculture & Farmers Welfare, Directorate of Economics and Statistics.
Government of India. (2016a, November). Key Economic Indicators. Retrieved December 14, 2016, from Office of the Economic Adviser, Govt. of India, Ministry of Commerce & Industry: http://www.eaindustry.nic.in/key _economic _indicators/Key_ Economic_ Indicat ors.pdf
Government of India. (2016b). Agricultural Statistics at a Glance 2015. Delhi: Government of India, Ministry of Agriculture & Farmers Welfare, Directorate of Economics and Statistics.
Government of India. (20 16c ). Wholesale Price Index. Retrieved December 2016, from Office of the Economic Adviser, Govt. of India, Ministry of Commerce & Industry: http://www .eaindustry.nic.inldisplay _data. asp
88

Government of India. (n.d.). Crop SAP Case study. Retrieved from Department of Administrative Reforms And Public Grievances, Govt. of lnida: http://darpg.gov.in/sites/default/files/Crop%20SAP%20case%20study.pdf
Gruere, G., Mehta-Bhatt, P., & Sengupta, D. (2008). Bt cotton and farmer suicides in India: Reviewing the evidence. International Food Policy Research Institute.
Guha, J. (2012). Farmer Suicides in Maharashtra, India: Facts, Factors, and Possible Fixes. Honors Scholar Theses, Paper 235, University of Connecticut- Storrs.
Hoda, A., & Terway, P. (2015). Credit Policy for Agriculture in India-An Evaluation. Indian Council For Research On International Economic Relations.
Jadhav, N. (2008). Farmer's suicide and debt waiver: An action plan for agricultural development of Maharashtra.
Jodhka, S. S. (2006). Beyond 'crises': Rethinking contemporary Punjab agriculture. Economic and Political Weekly, 41(26), 1530-1537.
Kakodkar, P. (2015, March 22). 40% rise in farmer suicides in Maharashtra. Retrieved from Times of India: http:/ /timesofmdia.indiatimes.com/india/40-risein-farmer-suicides-in-Maharashtra/articleshow/46649733.cms
Kalamkar, S. S., & Shroff, S. (2011). PM rehabilitation package for farmers in Suicide-Prone Districts of Maharashtra. Allied Publishers Private Limited: New Delhi.
Mishra, S. (2006). Suicides of farmers in Maharashtra. Indira Gandhi Institute of Development Research, Mumbai.
Mitra, S., & Shroff, S. (2007). Farmers' Suicides in Maharashtra. Economic and Political Weekly, 42(49), 73-77.
Mohan Rao, R. M. (2004). Suicide Among Farmers :A Study of Cotton Growers. Concept Publishing Co.
Mohanak:umar, S., & Sharma, R. K. (2006). Analysis of farmer suicides in Kerala. Economic and Political Weekly, 41(16), 1553-1558.
Mohanty, B. B. (2001). Suicides of Farmers in Maharashtra: A Socio-economic Analysis. Review of Development and Change(6), 146-88.
Mohanty, B. B. (2005). 'We are Like the Living Dead': Farmer Suicides in Maharashtra, Western India. The Journal of Peasant Studies, 32(2), 243-276.
Murlidharan Rao, B., & Venkata Siva Reddy, G. (2004). Crisis in Agriculture and Farmers' Distress: With particular reference to farmers' suicide in Anantpur district of Andhra Pradesh.
Nazeeruddin, M. (2004). Farmers' Suicides in Rayalaseem Region of Andhra Pradesh.
89
NSSO. (2005). Situation Assessment Survey of Farmers - Access to Modern Technology for Farming, 59th Round (January - December 2003). New Delhi: Ministry of Statistics and Programme & Implementation, Go I.
· NSSO. (2014). Situation Assessment Survey of Agricultural Households, January -December 2013, NSS 70th Round New Delhi: Ministry of Statistics and Programme Implementation (MOSPI), Government of India.
Parthasarathy, G., & Shameen. (1998). Suicides of Cotton Farmers in Andhra Pradesh : An exploratory Study. Economic and Political Weekly, 33(13).
Planning Commission. (2006). Report of Fact Finding Team on Vidharbha. Retrieved from Planning Commission, Government of India: http://planningcommission.gov.in/reports/genrep/rep_vidarbha.pdf
Rasal, 0. J. (2012). A study of socioeconomic risk factors identification and analysis of farmers suicides: A case of Maharashtra. Unpublished Ph. D. Thesis, Tilak Maharashtra Vidyapeeth, Pune.
Ratna Reddy, V., & Galab, S. (2005). Agrarian Crisis: Looking Beyond the Debt Trap. Economical and Political Weekly, 41(19), 1838-1841.
Ratnam, C. (2008). Market imperfections and Farmers' Distress in Andhra Pradesh. In S. M. Jharwal (Ed.), Glimpses of Indian Agriculture: Macro and Micro Aspects: A set of 2 Volumes (pp. 779-784).
Reserve Bank of India. (2008, May 23). Index to RBI Circulars: Agricultural Debt Waiver and Debt Relief Scheme, 2008. Retrieved from https://m.rbi.org.in/scripts/BS _ CircularlndexDisplay.aspx?Id=4190
Revathi, E. (1998). Farmers' Suicides: Missing Issues. Economic and Political Weekly, 33(20).
Shroff, S., Kajale, J., & Bodke, N. (2015, December). Agrarian Distress: Case of Maharashtra. Agricultural Situation in India, LXXII(9), 58-66.
The Secretary, All India Bio Dynamic and Organic Farming Association vs the Principal Secretary, Government ofMaharashtra. (2006). 2006 (3) BomCR 867. Retrieved from https://indiankanoon.org/doc/1465785/?type=print
Vasavi, A. R. (1999). Agrarian Distress: Market, State and Suicides. Economic and Political Weekly, 34(32), 2263-68.
90

Annexure I
Comments on the report received from Institute for Social and Economic Change, Bangalore, and Action Taken by Authors
1. Table 2.2 on month-wise number of suicides in Maharashtra from July 2015 to June 2016, and Table 2.3 showing district wise details of compensation, has been suitably indicated. All other tables are put in Annexure at the end of chapter 2.
2. Corrections have been made in Table 3.1 and Table 3.2.
3. Table 4.3 is presented for 2015-16 as the samples are from households where a suicide was committed in 2015-16.
4. Table 4.3 (A) and Table 4.3 (B) along with discussions are retained in chapter 4 as these tables relate to causes of suicides which are discussed in chapter 4.
5. All tables are removed from chapter 5 and only broad conclusions and policy suggestions are presented.
91

Publication 44
Gopal Krishna Gokhale
Gokhale Institute of Politics and Economics (Deemed to be University) Pune- 411004
846, Shivajinagar, BMCC Road, Deccan Gymkhana, Pune 4
Ph.~o. :020-25650287, 25675008, 25654288, 25654289, 25
Fax : 020-25652579
Website : www.gipe.ac.in