Sandwaves on the Southeast Vietnam Shelf recorded by high resolution seismic profiles: formation and...
12
RESEARCH ARTICLE Sandwaves on the Southeast Vietnam Shelf recorded by high resolution seismic profiles: formation and mechanism Viet Dung BUI (✉) 1,2 , Schimanski ALEX 2 , Stattegger KARL 2 , Van Phach PHUNG 1 , The Tiep NGUYEN 1 , Tien Hai NGUYEN 1 , Trung Thanh NGUYEN 1 , Truong Thanh PHI 1 1 Institute for Marine Geology and Geophysics, 18 Hoang Quoc viet, Hanoi, Vietnam 2 Institutes of Geosciences, Kiel University, D-24118, Kiel, Germany © Higher Education Press and Springer-Verlag 2008 Abstract The application of high resolution seismic data using boomer sound source has revealed a wide distribu- tion of large-scale bedforms (sandwaves) on the Southeast Vietnam continental shelf. Bedforms that are a few meters high in wave height and hundreds of meters long in wavelength are primarily developed in the inner shelf (20–40 m) and considered to be formed under the present- day marine hydrodynamic conditions. Those bedforms developed in the deeper water (120 m) of the northernmost part of the continent can be interpreted as the relict morphological features formed during the latest sea-level lowstand of the late Pleistocene period. Two sediment transport paths have been identified on the basis of the bedform’ s leeward orientation: northeast-southwest (along- shore) and north-south (cross-shore). A quantitative bottom current map is constructed from sandwave dimensions, surface sediments and measurement data. The strongest current velocities that gradually decrease toward the southwest are indicated by large sandwaves in the north (field B). Water depth, surficial sediment composition and bottom current are three factors that control the develop- ment of bedforms. Keywords bedforms, sandwaves, bottom currents, Southeast Vietnam Shelf 1 Introduction Seabed sediments are transported as bedforms formation of various spatial scales and shapes in response to a changing marine climate. Bedforms are therefore often seen on the continental shelves where sediment supply and hydro- dynamic forces play an important role in controlling the sediment transport processes. To better understand bed- forms evolution, we will fill in our knowledge-gap on sedimentation on the continental shelves and hydrody- namic features. Previous researches of the study area were primarily focused on the Mekong Delta in relation to the Holocene sedimentary evolution (Nguyen et al., 2000; Ta et al., 2001; Ta et al., 2002) or sediment dynamic processes of their tributaries (Wolanski et al., 1996). Of note, there are significant research results offshore on the southern Sunda Shelf (Hanebuth et al., 2000; Hanebuth et al., 2002) and along the Vietnamese coast (Schimanski and Statteger, 2005). However, information about bedforms formation on the Southeast (SE) Vietnam Shelf remains poor presently. Here, we present a detailed analysis of bedforms dynamics and an explanation on the basis of our survey on the SE Vietnam Shelf. The aims of the present study are therefore to 1) identify the spatial distribution of large-scale bedforms (sandwaves) and their characteristics; 2) diagnose the bedforms dynamics with special reference to acting hydrodynamic regimes and sediment supply, and 3) physical controls on the formation of bedforms. 2 Study area The SE Vietnam Shelf is situated in the southern part of the Vietnamese Shelf. It is bordered by a 600 km long coastline to the west, the South China Sea, and the gulf of Thailand to the southwest (Fig. 1). The shelf morphology comprises some distinctive features. To the east, there is a long and narrow continental slope 50 km wide oriented from north to south, with an average gradient of about 15º. The con- tinental slope is limited by the 300 to 1000 m isobath. The shelf-break is located approximately at the water depth of 200 m (Ninh, 2003). The continental shelf develops as a huge gentle plain (average gradient 0.1º–0.2º) that widens Received October 7, 2007; accepted July 11, 2008 E-mail: [email protected] Front. Earth Sci. China 2009, 3(1): 9–20 DOI 10.1007/s11707-009-0002-z
-
Upload
independent -
Category
Documents
-
view
3 -
download
0
Transcript of Sandwaves on the Southeast Vietnam Shelf recorded by high resolution seismic profiles: formation and...
RESEARCH ARTICLE
Sandwaves on the Southeast Vietnam Shelf recorded by highresolution seismic profiles: formation and mechanism
Viet Dung BUI (✉)1,2, Schimanski ALEX2, Stattegger KARL2, Van Phach PHUNG1, The Tiep NGUYEN1,Tien Hai NGUYEN1, Trung Thanh NGUYEN1, Truong Thanh PHI1
1 Institute for Marine Geology and Geophysics, 18 Hoang Quoc viet, Hanoi, Vietnam2 Institutes of Geosciences, Kiel University, D-24118, Kiel, Germany
© Higher Education Press and Springer-Verlag 2008
Abstract The application of high resolution seismic datausing boomer sound source has revealed a wide distribu-tion of large-scale bedforms (sandwaves) on the SoutheastVietnam continental shelf. Bedforms that are a few metershigh in wave height and hundreds of meters long inwavelength are primarily developed in the inner shelf(20–40 m) and considered to be formed under the present-day marine hydrodynamic conditions. Those bedformsdeveloped in the deeper water (120 m) of the northernmostpart of the continent can be interpreted as the relictmorphological features formed during the latest sea-levellowstand of the late Pleistocene period. Two sedimenttransport paths have been identified on the basis of thebedform’s leeward orientation: northeast-southwest (along-shore) and north-south (cross-shore). A quantitative bottomcurrent map is constructed from sandwave dimensions,surface sediments and measurement data. The strongestcurrent velocities that gradually decrease toward thesouthwest are indicated by large sandwaves in the north(field B). Water depth, surficial sediment composition andbottom current are three factors that control the develop-ment of bedforms.
Keywords bedforms, sandwaves, bottom currents,Southeast Vietnam Shelf
1 Introduction
Seabed sediments are transported as bedforms formation ofvarious spatial scales and shapes in response to a changingmarine climate. Bedforms are therefore often seen on thecontinental shelves where sediment supply and hydro-dynamic forces play an important role in controlling the
sediment transport processes. To better understand bed-forms evolution, we will fill in our knowledge-gap onsedimentation on the continental shelves and hydrody-namic features. Previous researches of the study area wereprimarily focused on the Mekong Delta in relation to theHolocene sedimentary evolution (Nguyen et al., 2000; Taet al., 2001; Ta et al., 2002) or sediment dynamic processesof their tributaries (Wolanski et al., 1996). Of note, there aresignificant research results offshore on the southern SundaShelf (Hanebuth et al., 2000; Hanebuth et al., 2002) andalong the Vietnamese coast (Schimanski and Statteger,2005). However, information about bedforms formation onthe Southeast (SE) Vietnam Shelf remains poor presently.Here, we present a detailed analysis of bedforms dynamicsand an explanation on the basis of our survey on the SEVietnam Shelf.The aims of the present study are therefore to 1) identify
the spatial distribution of large-scale bedforms (sandwaves)and their characteristics; 2) diagnose the bedformsdynamics with special reference to acting hydrodynamicregimes and sediment supply, and 3) physical controls onthe formation of bedforms.
2 Study area
The SE Vietnam Shelf is situated in the southern part of theVietnamese Shelf. It is bordered by a 600 km long coastlineto the west, the South China Sea, and the gulf of Thailandto the southwest (Fig. 1). The shelf morphology comprisessome distinctive features. To the east, there is a long andnarrow continental slope 50 km wide oriented from north tosouth, with an average gradient of about 15º. The con-tinental slope is limited by the 300 to 1000 m isobath. Theshelf-break is located approximately at the water depth of200 m (Ninh, 2003). The continental shelf develops as ahuge gentle plain (average gradient 0.1º–0.2º) that widens
Received October 7, 2007; accepted July 11, 2008
E-mail: [email protected]
Front. Earth Sci. China 2009, 3(1): 9–20DOI 10.1007/s11707-009-0002-z

to the south and southwest.There are numerous incised river channels recorded on
the shelf, which is considered as the relict of paleo-MekongRivers filled in with deglacial sediments (Schimanski andStattegger, 2005). The surface sediments of the SE VietnamShelf are primarily composed of the relict sands derivedfrom the paleo-Mekong river in the period of lowstand sealevel during the late Pleistocene – early Holocene(Schimanski and Stattegger, 2005). They developed as ahuge sandy plain covering most of the continental shelf.The tropical monsoon climate dominates in the region.
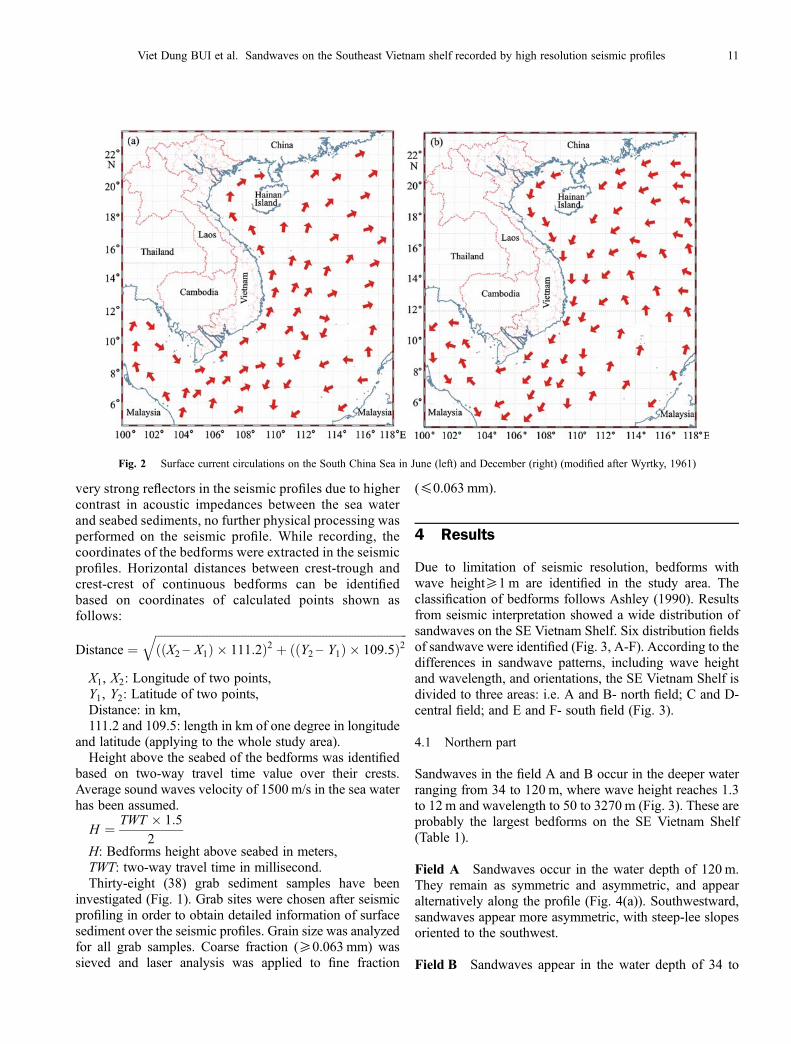
Hydrodynamic circulations are chiefly driven by seasonallyreversing winds, blowing strongly from the northeastduring winter (November to April) and weakly from thesouthwest during summer (June to September) (Ninh,2003). As a result of the reversing wind system, a cyclonicgyre forms in the winter and an anti-cyclonic gyre in thesummer (Ninh , 2003). On the SE Vietnam Shelf, therealways exists along-shore reversal flow (NE-SW direction)(Fig. 2), driven by the predominant monsoon winds (Wyr-tky, 1961; Long et al., 1981; Lanh et al., 1990). There arecomplex tide regimes in the study area (Ninh, 2003). FromVung Tau to the north, diurnal tide is well developed, and
in contrast, semidiurnal tide dominates in the southern partfrom Vung Tau to Camau. Storms affect this area annually,although the intensity is weaker than the northern and thecentral Vietnamese Shelf.
3 Material and methods
Two datasets are used for the present study: seismic profilesand surficial sediment samples. Data were collected duringthe cruise VG9 (2005). About 350 km seismic profiles wereacquired using a single channel seismic reflection boomersystem. Profiles ran parallel to, and perpendicular to thecoastline, which were positioned at the water depthsbetween 20 and 120 m (Fig. 1). The average speed of thevessel was 4 knots. The boomer source produces a widebandwidth with working frequency of 0.3 to 22 kHz,resulting in a sediment penetration of 20 –150 m, depend-ing on sediment lithology. It could achieve a maximumresolution of 0.2 m (www.nautiknord.de). The frequencyhigh/low pass filtering was applied to the whole recordeddata. Since this study focuses only on the seabed surfacesedimentary structures that were generally recorded as
Fig. 1 Regional map of the South East Vietnam Shelf Bathymetry modified after Que et al. (2005). Seismic profiles (red lines) and grabsediment samples (yellow circles). Black lines indicate seismic profiles employed in this paper.
10 Front. Earth Sci. China 2009, 3(1): 9–20
very strong reflectors in the seismic profiles due to highercontrast in acoustic impedances between the sea waterand seabed sediments, no further physical processing wasperformed on the seismic profile. While recording, thecoordinates of the bedforms were extracted in the seismicprofiles. Horizontal distances between crest-trough andcrest-crest of continuous bedforms can be identifiedbased on coordinates of calculated points shown asfollows:
Distance ¼ffiffiffiffiffiffiffiffiffiffiffiffiffiffiffiffiffiffiffiffiffiffiffiffiffiffiffiffiffiffiffiffiffiffiffiffiffiffiffiffiffiffiffiffiffiffiffiffiffiffiffiffiffiffiffiffiffiffiffiffiffiffiffiffiffiffiffiffiffiffiffiffiffiffiffiffiffiffiffiffiffiffiffiffiffiffiffiððX2 – X1Þ � 111:2Þ2 þ ððY2 – Y1Þ � 109:5Þ2
q
X1, X2: Longitude of two points,Y1, Y2: Latitude of two points,Distance: in km,111.2 and 109.5: length in km of one degree in longitude
and latitude (applying to the whole study area).Height above the seabed of the bedforms was identified
based on two-way travel time value over their crests.Average sound waves velocity of 1500 m/s in the sea waterhas been assumed.
H ¼ TWT � 1:5
2H: Bedforms height above seabed in meters,TWT: two-way travel time in millisecond.Thirty-eight (38) grab sediment samples have been
investigated (Fig. 1). Grab sites were chosen after seismicprofiling in order to obtain detailed information of surfacesediment over the seismic profiles. Grain size was analyzedfor all grab samples. Coarse fraction (≥0.063 mm) wassieved and laser analysis was applied to fine fraction
(≤0.063 mm).
4 Results
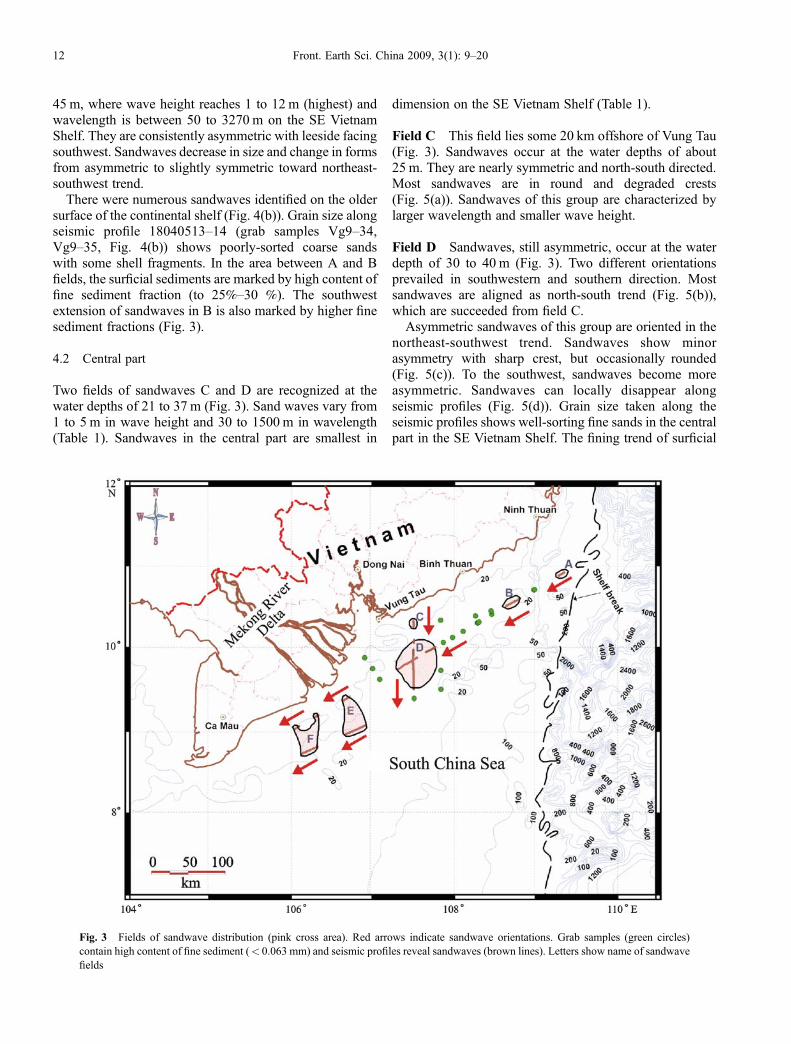
Due to limitation of seismic resolution, bedforms withwave height≥1 m are identified in the study area. Theclassification of bedforms follows Ashley (1990). Resultsfrom seismic interpretation showed a wide distribution ofsandwaves on the SE Vietnam Shelf. Six distribution fieldsof sandwave were identified (Fig. 3, A-F). According to thedifferences in sandwave patterns, including wave heightand wavelength, and orientations, the SE Vietnam Shelf isdivided to three areas: i.e. A and B- north field; C and D-central field; and E and F- south field (Fig. 3).
4.1 Northern part
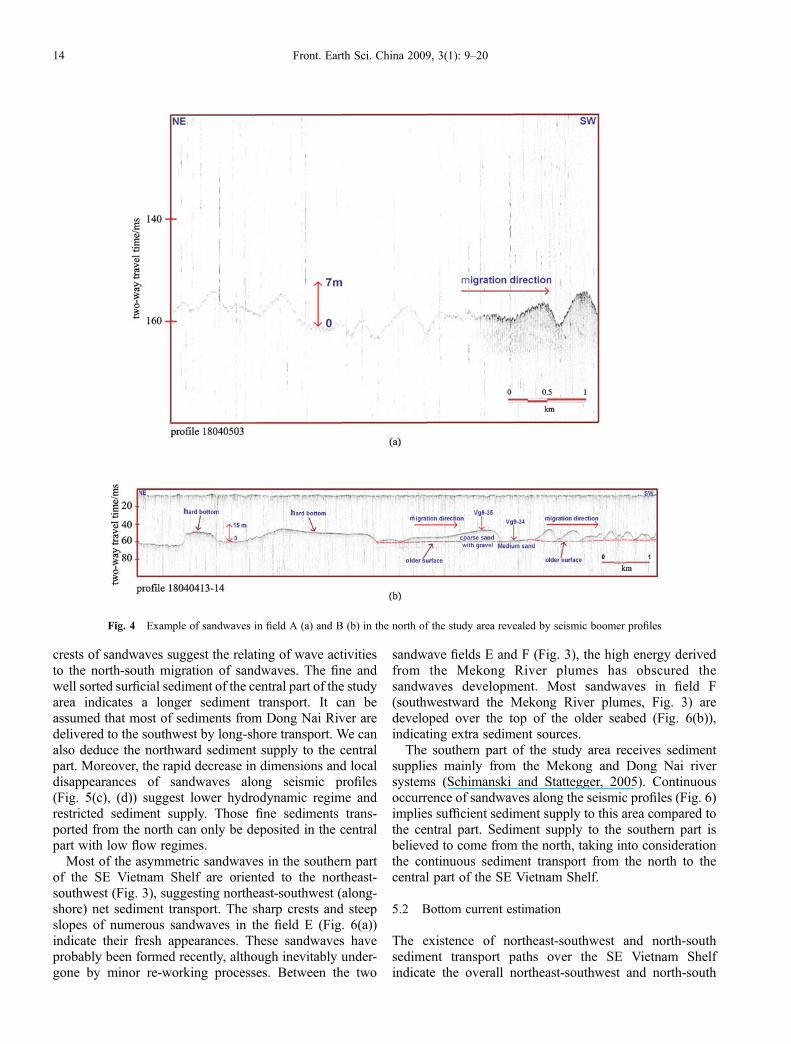
Sandwaves in the field A and B occur in the deeper waterranging from 34 to 120 m, where wave height reaches 1.3to 12 m and wavelength to 50 to 3270 m (Fig. 3). These areprobably the largest bedforms on the SE Vietnam Shelf(Table 1).
Field A Sandwaves occur in the water depth of 120 m.They remain as symmetric and asymmetric, and appearalternatively along the profile (Fig. 4(a)). Southwestward,sandwaves appear more asymmetric, with steep-lee slopesoriented to the southwest.
Field B Sandwaves appear in the water depth of 34 to
Fig. 2 Surface current circulations on the South China Sea in June (left) and December (right) (modified after Wyrtky, 1961)
Viet Dung BUI et al. Sandwaves on the Southeast Vietnam shelf recorded by high resolution seismic profiles 11
45 m, where wave height reaches 1 to 12 m (highest) andwavelength is between 50 to 3270 m on the SE VietnamShelf. They are consistently asymmetric with leeside facingsouthwest. Sandwaves decrease in size and change in formsfrom asymmetric to slightly symmetric toward northeast-southwest trend.There were numerous sandwaves identified on the older
surface of the continental shelf (Fig. 4(b)). Grain size alongseismic profile 18040513–14 (grab samples Vg9–34,Vg9–35, Fig. 4(b)) shows poorly-sorted coarse sandswith some shell fragments. In the area between A and Bfields, the surficial sediments are marked by high content offine sediment fraction (to 25%–30 %). The southwestextension of sandwaves in B is also marked by higher finesediment fractions (Fig. 3).
4.2 Central part
Two fields of sandwaves C and D are recognized at thewater depths of 21 to 37 m (Fig. 3). Sand waves vary from1 to 5 m in wave height and 30 to 1500 m in wavelength(Table 1). Sandwaves in the central part are smallest in
dimension on the SE Vietnam Shelf (Table 1).
Field C This field lies some 20 km offshore of Vung Tau(Fig. 3). Sandwaves occur at the water depths of about25 m. They are nearly symmetric and north-south directed.Most sandwaves are in round and degraded crests(Fig. 5(a)). Sandwaves of this group are characterized bylarger wavelength and smaller wave height.
Field D Sandwaves, still asymmetric, occur at the waterdepth of 30 to 40 m (Fig. 3). Two different orientationsprevailed in southwestern and southern direction. Mostsandwaves are aligned as north-south trend (Fig. 5(b)),which are succeeded from field C.Asymmetric sandwaves of this group are oriented in the
northeast-southwest trend. Sandwaves show minorasymmetry with sharp crest, but occasionally rounded(Fig. 5(c)). To the southwest, sandwaves become moreasymmetric. Sandwaves can locally disappear alongseismic profiles (Fig. 5(d)). Grain size taken along theseismic profiles shows well-sorting fine sands in the centralpart in the SE Vietnam Shelf. The fining trend of surficial
Fig. 3 Fields of sandwave distribution (pink cross area). Red arrows indicate sandwave orientations. Grab samples (green circles)contain high content of fine sediment (< 0.063 mm) and seismic profiles reveal sandwaves (brown lines). Letters show name of sandwavefields
12 Front. Earth Sci. China 2009, 3(1): 9–20
sediments reduces toward northeast-southwest.In between C and D, no sandwaves are revealed although
grain size appears to be very coarse sands. Out of field D,surficial sediments are mostly muddy and silty (Fig. 3).
4.3 Southern part
Two sandwave fields E and F are revealed off the Mekongriver plumes (Fig. 3). They are distributed at the waterdepth of 21 to 30 m. Sandwave dimensions vary from 1 to6m in wave height and 80 to 1600m in wavelength (Table 1).
Field E Sandwaves develop northeast of the MekongRiver (Fig. 6(a)), occur at the water depth of 27 to 30 m,and are highly asymmetric, aligned in northeast-southwestdirection. They are sharp in crest, with steeper slopes. Themaximum lee slope reaches to 9.5.
Field F This field develops southwest of the MekongRiver (Fig. 6(b)). Sandwaves are basically revealed in theshallow water ranging from 21 to 25 m. They are morerounded in troughs and gentler in slope compared to that inthe field E. Most sandwaves are asymmetric and orientedtoward the northeast-southwest. Sandwaves of this groupare identified to migrate on the older surface.
5 Discussion
Sandwave distribution and orientation can indicate netsediment transport, which is closely associated to sand-waves migration and magnitude of sediment transport aswell (Dyer, 1986). Leeward direction can delineate overallsediment transport directions (Aliotta and Perillo, 1987;Harris, 1988). Symmetric bedforms are considered sta-tionary and related to the area where net sediment transportis zero (McCave, 1971). Sandwave occurrences can be alsolinked to extreme marine events (Harris and Collins, 1984),and later reworking processes under returned normalmarine climate setting (Fenster et al., 1990). There is a
proportion between dimension of sandwaves and the actingflow currents, and therefore the larger dimension ofsandwaves seems closely related to stronger marinedynamical events (Flemming, 1978).
5.1 Sediment supplies and overall transport paths
Sandwaves on the SE Vietnam Shelf show a wide range indimensions and patterns that reflect the difference inhydrodynamic conditions and sediment availabilities.Most sandwaves with asymmetric nature and lee slope
oriented northeast-southwest in the northern part except forthose in the field A demonstrate northeast-southwest(along-shore) sediment transport path (Fig. 3). Sandwavesof field A recorded in the deep water of 120 m are thoughtto be the relict sand features formed in the late Pleistocenelower sea-level stand, since the present-day sea bottomcurrents in this field is far weaker than forming sandwaves(see detail calculations in the following part).Large-scale sandwaves can be associated with strong
marine hydrodynamic conditions and abundant sedimentsupply in this area. In seismic profile 18040413-14(Fig. 4(b)), the observed sandwaves over the older surfacecould indicate in-situ erosional sediment sources. Out ofthe sandwave fields, the high contents of fine surficialsediments have prevented the development of sandwaves(Fig. 3). The fact that coarse and poorly sorted sedimentsare not generally transported far from the source ofsediment suggests proximal sediment sources, probablydelivered from small rivers in the southern edge of theTruong Son mountain (Schimanski and Stattegger, 2005),in addition to those from in-situ sources.Two sediment transport paths toward the southwest
(along-shore) and the south (cross-shore) can be proposedby the orientation of sandwaves lee slope in the central partof the study area (Fig. 5). The variable sandwaveasymmetry suggests inconsistence of sediment transportmagnitude. Numerous slightly symmetric sandwavesrevealed zero net sediment transport and inactive state ofsandwaves as well. The round and degraded troughs and
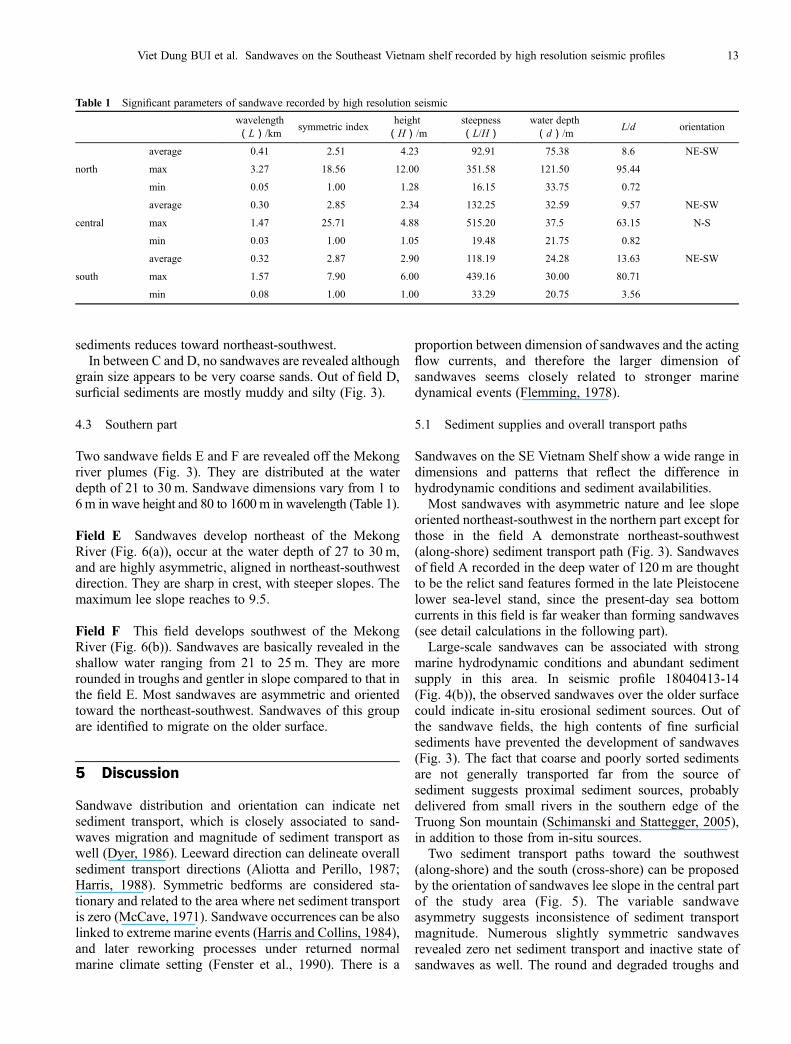
Table 1 Significant parameters of sandwave recorded by high resolution seismic
wavelength(L)/km
symmetric indexheight
(H)/msteepness(L/H)
water depth(d)/m
L/d orientation
north
average 0.41 2.51 4.23 92.91 75.38 8.6 NE-SW
max 3.27 18.56 12.00 351.58 121.50 95.44
min 0.05 1.00 1.28 16.15 33.75 0.72
central
average 0.30 2.85 2.34 132.25 32.59 9.57 NE-SW
max 1.47 25.71 4.88 515.20 37.5 63.15 N-S
min 0.03 1.00 1.05 19.48 21.75 0.82
south
average 0.32 2.87 2.90 118.19 24.28 13.63 NE-SW
max 1.57 7.90 6.00 439.16 30.00 80.71
min 0.08 1.00 1.00 33.29 20.75 3.56
Viet Dung BUI et al. Sandwaves on the Southeast Vietnam shelf recorded by high resolution seismic profiles 13
crests of sandwaves suggest the relating of wave activitiesto the north-south migration of sandwaves. The fine andwell sorted surficial sediment of the central part of the studyarea indicates a longer sediment transport. It can beassumed that most of sediments from Dong Nai River aredelivered to the southwest by long-shore transport. We canalso deduce the northward sediment supply to the centralpart. Moreover, the rapid decrease in dimensions and localdisappearances of sandwaves along seismic profiles(Fig. 5(c), (d)) suggest lower hydrodynamic regime andrestricted sediment supply. Those fine sediments trans-ported from the north can only be deposited in the centralpart with low flow regimes.Most of the asymmetric sandwaves in the southern part
of the SE Vietnam Shelf are oriented to the northeast-southwest (Fig. 3), suggesting northeast-southwest (along-shore) net sediment transport. The sharp crests and steepslopes of numerous sandwaves in the field E (Fig. 6(a))indicate their fresh appearances. These sandwaves haveprobably been formed recently, although inevitably under-gone by minor re-working processes. Between the two
sandwave fields E and F (Fig. 3), the high energy derivedfrom the Mekong River plumes has obscured thesandwaves development. Most sandwaves in field F(southwestward the Mekong River plumes, Fig. 3) aredeveloped over the top of the older seabed (Fig. 6(b)),indicating extra sediment sources.The southern part of the study area receives sediment
supplies mainly from the Mekong and Dong Nai riversystems (Schimanski and Stattegger, 2005). Continuousoccurrence of sandwaves along the seismic profiles (Fig. 6)implies sufficient sediment supply to this area compared tothe central part. Sediment supply to the southern part isbelieved to come from the north, taking into considerationthe continuous sediment transport from the north to thecentral part of the SE Vietnam Shelf.
5.2 Bottom current estimation
The existence of northeast-southwest and north-southsediment transport paths over the SE Vietnam Shelfindicate the overall northeast-southwest and north-south
Fig. 4 Example of sandwaves in field A (a) and B (b) in the north of the study area revealed by seismic boomer profiles
14 Front. Earth Sci. China 2009, 3(1): 9–20
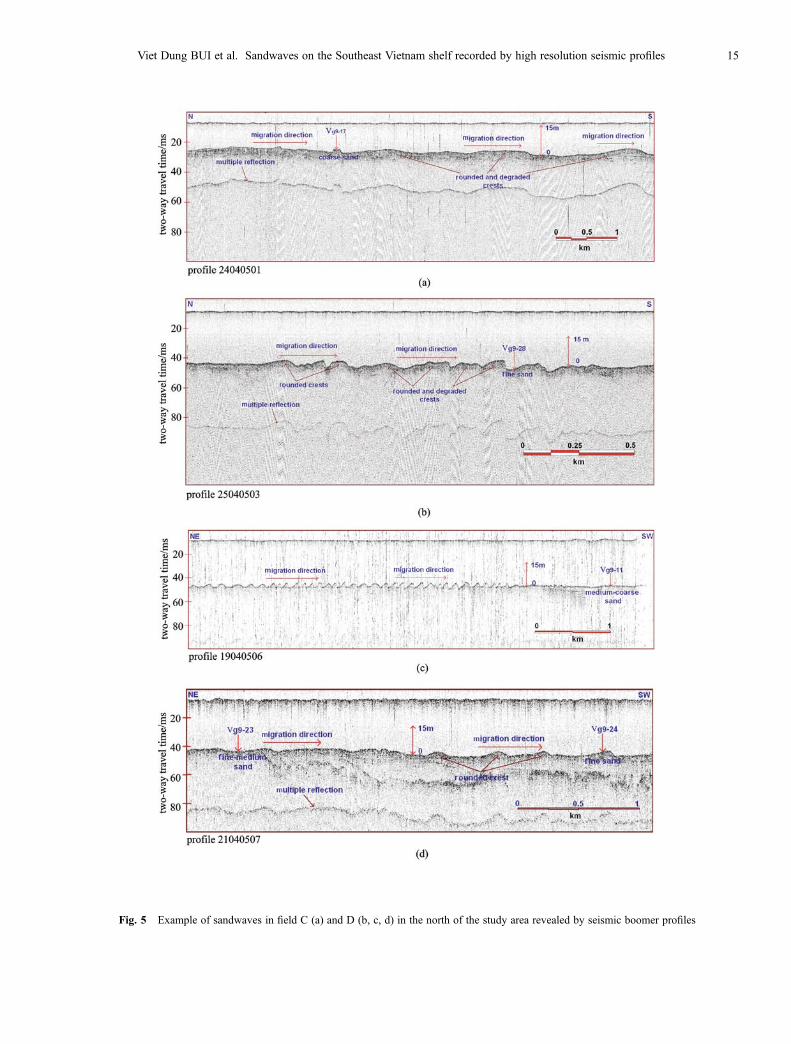
Fig. 5 Example of sandwaves in field C (a) and D (b, c, d) in the north of the study area revealed by seismic boomer profiles
Viet Dung BUI et al. Sandwaves on the Southeast Vietnam shelf recorded by high resolution seismic profiles 15

near bottom flow current, overwhelmed by the prevailingmonsoon regimes in this area.The flow current for initiating bedforms can be estimated
from the following equations:
U� � D
υ¼ 1:117� g � D3
υ2
� �1=2
– 2:087
(Allen, 1972; Allen andHomewood, 1984); (1)
U�: shear velocity /(m$sK1),D: grain size /m,υ: kinematics viscosity /(m2$sK1) ,g: the acceleration due to gravity /(m$sK2).The logarithmic velocity distribution for turbulent flow
is assumed:
UðzÞ ¼ U��ln
z
z0, (2)
U(z): flow velocity at height z above the bed /(m$sK1),қ: the constant of Von Karman’s coefficient (0.4),z: height above the bed corresponding to the water
depth /m,z0: zero velocity level (U = 0 at z ¼ z0) /m.
The bottom roughness for the bed covered by thebedforms is estimated based on the relationship:
z0 ¼ 2� HH
L
� �1:4
(Wooding et al:, 1973); (3)
H: waveheight of bedform /m,L: wave length of bedform /m.Bottom current in field A is interpolated from measure-
ment data in station 1 (Table 3), since no grab sample isavailable. Taking the maximum near-bottom currentvelocity of 0.76 m/s measured at the depth of 90 m instation 1 (Table 3) as standard value and assuming thelogarithmic decreasing velocity profile for the near–bedboundary layer, we can deduce an average value of 0.4 m/sfor the flow current at the depth of 120 m in field A.In fields E and F, since there are no sediment samples as
well as measurement data, the bottom current is notdiscussed here.
5.3 Controlling factors for sandwave formation
The ratios of wavelength/wave height of the three areas onthe SE Vietnam Shelf are gentler and most of values liebelow the equilibrium ratio trend of global scale by
Fig. 6 Example of sandwaves in field E (a) and F (b) in the north of the study area revealed by seismic boomer files
Table 2 Estimated bottom currents for different parts on the SE Vietnam Shelf.
area d50/µm U*/(m$sK1) Hmax/m Lmax/m z0/m z/m U/(m$sK1)
northfield A 1.00 0.4
field B 438.6 0.07 12.00 3270 0.009348 1.00 0.8
field C 249.1 0.05 4.50 1468.33 0.002724 1.00 0.69
central field D (N-S) 249.1 0.05 4.35 967.31 0.004504 1.00 0.63
field D (NE-SW) 249.1 0.05 4.88 805.6 0.007668 1.00 0.57
16 Front. Earth Sci. China 2009, 3(1): 9–20
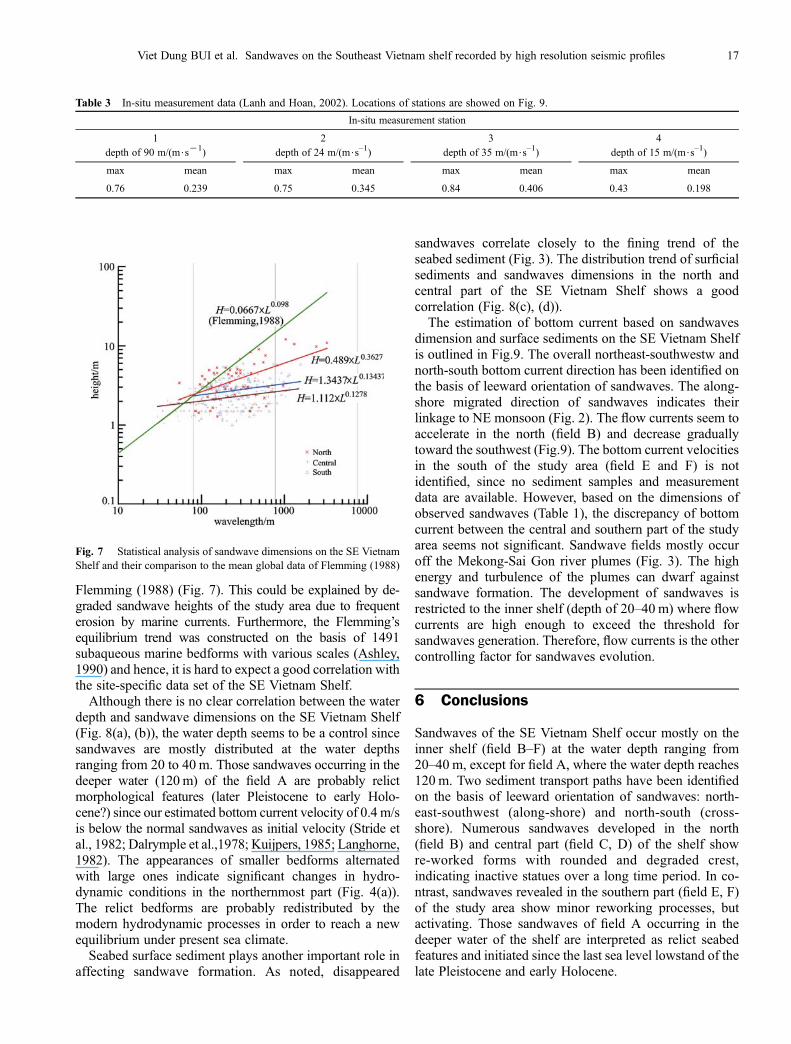
Flemming (1988) (Fig. 7). This could be explained by de-graded sandwave heights of the study area due to frequenterosion by marine currents. Furthermore, the Flemming’sequilibrium trend was constructed on the basis of 1491subaqueous marine bedforms with various scales (Ashley,1990) and hence, it is hard to expect a good correlation withthe site-specific data set of the SE Vietnam Shelf.Although there is no clear correlation between the water
depth and sandwave dimensions on the SE Vietnam Shelf(Fig. 8(a), (b)), the water depth seems to be a control sincesandwaves are mostly distributed at the water depthsranging from 20 to 40 m. Those sandwaves occurring in thedeeper water (120 m) of the field A are probably relictmorphological features (later Pleistocene to early Holo-cene?) since our estimated bottom current velocity of 0.4 m/sis below the normal sandwaves as initial velocity (Stride etal., 1982; Dalrymple et al.,1978; Kuijpers, 1985; Langhorne,1982). The appearances of smaller bedforms alternatedwith large ones indicate significant changes in hydro-dynamic conditions in the northernmost part (Fig. 4(a)).The relict bedforms are probably redistributed by themodern hydrodynamic processes in order to reach a newequilibrium under present sea climate.Seabed surface sediment plays another important role in
affecting sandwave formation. As noted, disappeared
sandwaves correlate closely to the fining trend of theseabed sediment (Fig. 3). The distribution trend of surficialsediments and sandwaves dimensions in the north andcentral part of the SE Vietnam Shelf shows a goodcorrelation (Fig. 8(c), (d)).The estimation of bottom current based on sandwaves
dimension and surface sediments on the SE Vietnam Shelfis outlined in Fig.9. The overall northeast-southwestw andnorth-south bottom current direction has been identified onthe basis of leeward orientation of sandwaves. The along-shore migrated direction of sandwaves indicates theirlinkage to NE monsoon (Fig. 2). The flow currents seem toaccelerate in the north (field B) and decrease graduallytoward the southwest (Fig.9). The bottom current velocitiesin the south of the study area (field E and F) is notidentified, since no sediment samples and measurementdata are available. However, based on the dimensions ofobserved sandwaves (Table 1), the discrepancy of bottomcurrent between the central and southern part of the studyarea seems not significant. Sandwave fields mostly occuroff the Mekong-Sai Gon river plumes (Fig. 3). The highenergy and turbulence of the plumes can dwarf againstsandwave formation. The development of sandwaves isrestricted to the inner shelf (depth of 20–40 m) where flowcurrents are high enough to exceed the threshold forsandwaves generation. Therefore, flow currents is the othercontrolling factor for sandwaves evolution.
6 Conclusions
Sandwaves of the SE Vietnam Shelf occur mostly on theinner shelf (field B–F) at the water depth ranging from20–40 m, except for field A, where the water depth reaches120 m. Two sediment transport paths have been identifiedon the basis of leeward orientation of sandwaves: north-east-southwest (along-shore) and north-south (cross-shore). Numerous sandwaves developed in the north(field B) and central part (field C, D) of the shelf showre-worked forms with rounded and degraded crest,indicating inactive statues over a long time period. In co-ntrast, sandwaves revealed in the southern part (field E, F)of the study area show minor reworking processes, butactivating. Those sandwaves of field A occurring in thedeeper water of the shelf are interpreted as relict seabedfeatures and initiated since the last sea level lowstand of thelate Pleistocene and early Holocene.
Fig. 7 Statistical analysis of sandwave dimensions on the SE VietnamShelf and their comparison to the mean global data of Flemming (1988)
Table 3 In-situ measurement data (Lanh and Hoan, 2002). Locations of stations are showed on Fig. 9.
In-situ measurement station
1depth of 90 m/(m$sK1)
2depth of 24 m/(m$s–1)
3depth of 35 m/(m$s–1)
4depth of 15 m/(m$s–1)
max mean max mean max mean max mean
0.76 0.239 0.75 0.345 0.84 0.406 0.43 0.198
Viet Dung BUI et al. Sandwaves on the Southeast Vietnam shelf recorded by high resolution seismic profiles 17
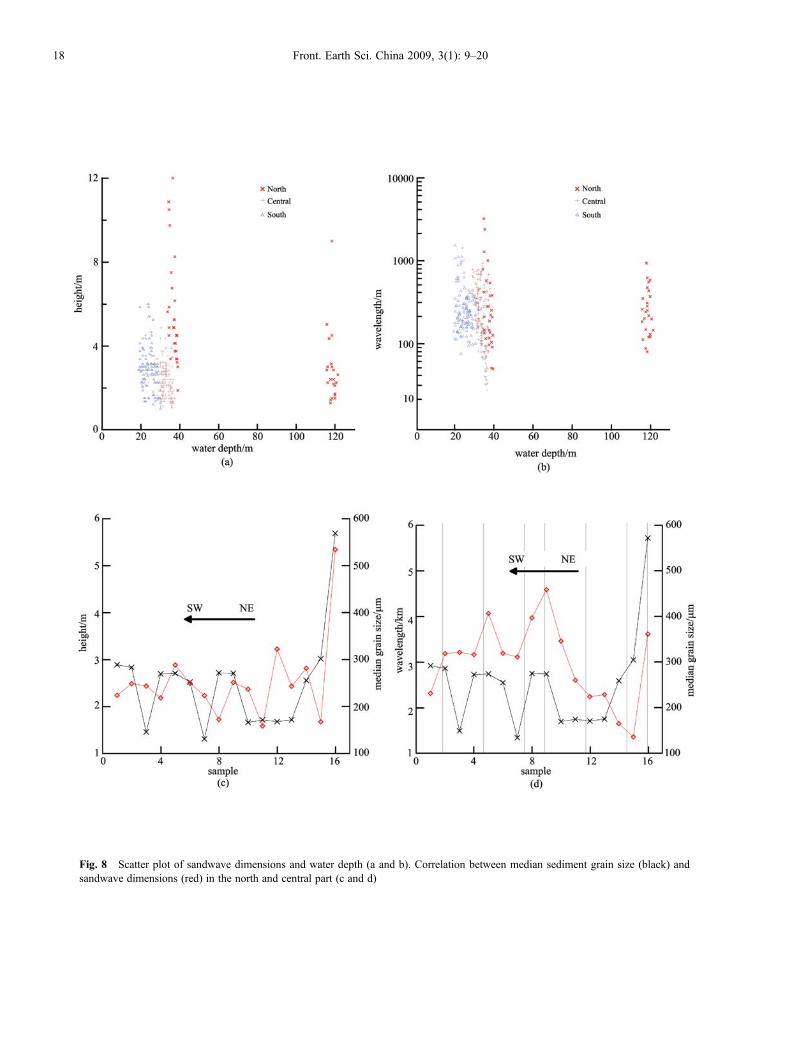
Fig. 8 Scatter plot of sandwave dimensions and water depth (a and b). Correlation between median sediment grain size (black) andsandwave dimensions (red) in the north and central part (c and d)
18 Front. Earth Sci. China 2009, 3(1): 9–20
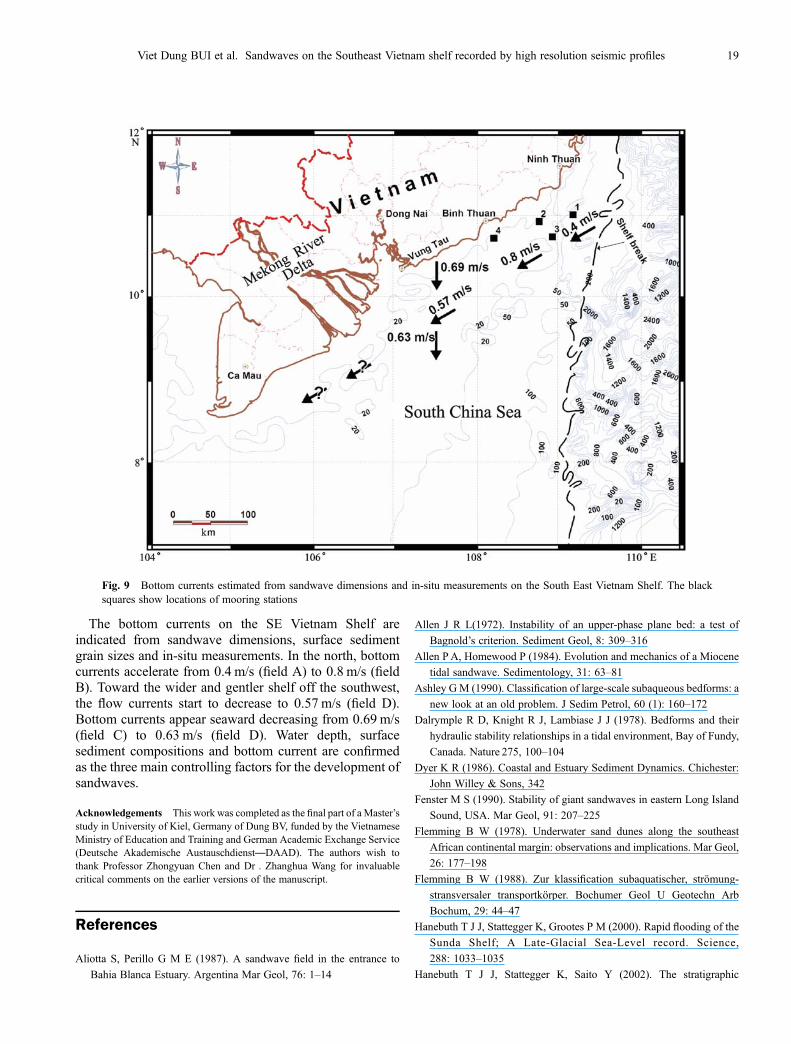
The bottom currents on the SE Vietnam Shelf areindicated from sandwave dimensions, surface sedimentgrain sizes and in-situ measurements. In the north, bottomcurrents accelerate from 0.4 m/s (field A) to 0.8 m/s (fieldB). Toward the wider and gentler shelf off the southwest,the flow currents start to decrease to 0.57 m/s (field D).Bottom currents appear seaward decreasing from 0.69 m/s(field C) to 0.63 m/s (field D). Water depth, surfacesediment compositions and bottom current are confirmedas the three main controlling factors for the development ofsandwaves.
Acknowledgements This work was completed as the final part of a Master’sstudy in University of Kiel, Germany of Dung BV, funded by the VietnameseMinistry of Education and Training and German Academic Exchange Service(Deutsche Akademische Austauschdienst—DAAD). The authors wish tothank Professor Zhongyuan Chen and Dr . Zhanghua Wang for invaluablecritical comments on the earlier versions of the manuscript.
References
Aliotta S, Perillo G M E (1987). A sandwave field in the entrance to
Bahia Blanca Estuary. Argentina Mar Geol, 76: 1–14
Allen J R L(1972). Instability of an upper-phase plane bed: a test of
Bagnold’s criterion. Sediment Geol, 8: 309–316
Allen PA, Homewood P (1984). Evolution and mechanics of a Miocene
tidal sandwave. Sedimentology, 31: 63–81
Ashley GM (1990). Classification of large-scale subaqueous bedforms: a
new look at an old problem. J Sedim Petrol, 60 (1): 160–172
Dalrymple R D, Knight R J, Lambiase J J (1978). Bedforms and their
hydraulic stability relationships in a tidal environment, Bay of Fundy,
Canada. Nature 275, 100–104
Dyer K R (1986). Coastal and Estuary Sediment Dynamics. Chichester:
John Willey & Sons, 342
Fenster M S (1990). Stability of giant sandwaves in eastern Long Island
Sound, USA. Mar Geol, 91: 207–225
Flemming B W (1978). Underwater sand dunes along the southeast
African continental margin: observations and implications. Mar Geol,
26: 177–198
Flemming B W (1988). Zur klassification subaquatischer, strömung-
stransversaler transportkörper. Bochumer Geol U Geotechn Arb
Bochum, 29: 44–47
Hanebuth T J J, Stattegger K, Grootes P M (2000). Rapid flooding of the
Sunda Shelf; A Late-Glacial Sea-Level record. Science,
288: 1033–1035
Hanebuth T J J, Stattegger K, Saito Y (2002). The stratigraphic
Fig. 9 Bottom currents estimated from sandwave dimensions and in-situ measurements on the South East Vietnam Shelf. The blacksquares show locations of mooring stations
Viet Dung BUI et al. Sandwaves on the Southeast Vietnam shelf recorded by high resolution seismic profiles 19
architecture of the central Sunda Shelf (SE Asia) recorded by shallow-
seismic surveying. Geo-Marine Letters, 22: 86–94
Harris P T, Collins M B (1984). Side-scan sonar investigation into
temporal variation in sandwave morphology: Helwick Sands, Bristol
Channel. Geo-Mar Lett, 4: 91–97
Harris P T (1988). Large-scale bedforms as indicators of mutually
evasive sand transport and the sequential infilling of wide-mouthed
estuaries. Sedim Geol, 57: 273–298
Kuijpers A, 1985. Current-induced bedforms in the Danish Straits
between Kattegat and Baltic Sea. Meyniana, 37, 97–127
Langhorne, D.N (1982). A study of the dynamics of a marine sand wave.
Spec Publ Int Assoc Sedimentol, 6, 571–594
Lanh VV, Hoan DV (2002). The Southward cold current along the coast
of central Vietnam. Collection of Marine Research Works, XII: 19–32
Lanh V V, Phung P (1990). Hydrographic structure and hydrodynamic of
the East Vietnam Sea and adjacent areas. In: The average seasonal
flow current. Part A, Chapter 4, National project 48B. Nha Trang
Long B H, Sam T, Vinh N K (1981). Study the physical hydrography
charecteristics of the Thuan Hai-Minh Hai sea, The general
investigation of Thuan Hai-Minh Hai coastal zone. Nha Trang
McCave I N (1971). Sandwaves in the North Sea off the coast of Holland.
Mar Geol, 10: 199–225
Nguyen V L, Ta T K O, Tateishi M (2000). Late Holocene depositional
environments and coastal evolution of the Mekong River Delta,
Southern Vietnam. Journal of Asian Earth Sciences, 18(4): 427–439
Ninh P V (Ed.) (2003). South China Sea Monograph. Vol II
–Meteorology, Marine Hydrology and Hydrodynamics, Hanoi
National University Publisher, Hanoi, 565 (in Vietnamese)
Que B C (Ed) (2005). Reconstruct map of natural and environment
characteristics of Vietnam sea and adjacent areas. National research
project KC09–02
Schimanski A, Stattegger K (2005). Deglacial and Holocene Evolution of
the Vietnam Shelf: Stratigraphy, Sediments and Sea-level change.
Mar Geol, 214: 365–387
Stride A H (1982). Offshore Tidal Sands. London: Chapman & Hall, 222
Ta T K O, Nguyen V L, Tateishi M, Kobayashi I, Saito Y (2001).
Sedimentary facies, diatom and foraminifer assemblages in a late
Pleistocene-Holocene incised-valley sequence from the Mekong
River delta, Bentre Province, southern Vietnam; the BT2 core.
Journal of Asian Earth Sciences, 20(1): 83–94
Ta T K O, Van Lap Nguyen, Masaaki Tateishi, Iwao Kobayashi,
Susumu Tanabe, Yoshiki Saito (2002). Holocene delta evolution
and sediment discharge of the Mekong River, southern Vietnam.
Quaternary Science Reviews, 21(16–17), 1807–1819
Wolanski E, Nguyen N H, Le T D, Nguyen H N, Nguyen N T (1996).
Fine-sediment Dynamics in the Mekong River Estuary, Vietnam.
Estuarine Coastal and Shelf Science, 43: 565–582
Wooding R A, Bradley E F, Marshall J K (1973). Drag due to regular
arrays of roughness elements of varying geometry. Boundary Layer
Meteorol, 5: 285–308
Wyrtky K (1961). Physical oceanography of the South Asian waters.
Scientific results of marine investigations of the South China Sea
and the Gulf of Thailand. NAGA Report. Scripps Institute of
Oceanography, CA, 1–115
20 Front. Earth Sci. China 2009, 3(1): 9–20