Sandboxed, Online Debugging of Production Bugs for SOA ...
211
Sandboxed, Online Debugging of Production Bugs for SOA Systems Nipun Arora Submitted in partial fulfillment of the requirements for the degree of Doctor of Philosophy in the Graduate School of Arts and Sciences COLUMBIA UNIVERSITY 2018
-
Upload
khangminh22 -
Category
Documents
-
view
2 -
download
0
Transcript of Sandboxed, Online Debugging of Production Bugs for SOA ...

Sandboxed, Online Debugging of Production Bugs for SOASystems
Nipun Arora
Submitted in partial fulfillment of the
requirements for the degree
of Doctor of Philosophy
in the Graduate School of Arts and Sciences
COLUMBIA UNIVERSITY
2018

c©2018
Nipun Arora
All Rights Reserved

ABSTRACT
Sandboxed, Online Debugging of Production Bugs for SOASystems
Nipun Arora
Software debugging is the process of localizing, and finding root-cause of defects that were observed in a
system. In particular, production systems bugs can be the result of complex interactions between multiple
system components and can cause faults either in the kernel, middleware or the application itself. Hence
it is important, to be able to gain insight into the entire workflow of the system, both breadth-wise (across
application tiers and network boundaries), and depth wise (across the execution stack from application to
kernel).
In addition to the inherent complexity in debugging, it is also essential to have a short time to bug
diagnosis to reduce the financial impact of any error. Recent trends towards DevOps, and agile software
engineering paradigms further emphasize the need of having shorter debug cycles. DevOps stresses on
close coupling between software developers and operators, and to merge the operations of both. Similarly,
agile programming has shorter development cycles called sprints, which focus on faster releases, and quick
debugging. This trend is also reflected in the frequency of releases in modern SOA services, for instance
Facebook mobile has 2 releases a day, and Flickr has 10 deployment cycles per day.
Existing debugging mechanisms provide light-weight instrumentation which can track execution flow in
the application by instrumenting important points in the application code. These are followed by inference
based mechanisms to find the root-cause of the problem. While such techniques are useful in getting a
clue about the bug, they are limited in their ability to discover the root-cause (can point out the module or
component which is faulty, but cannot determine the root-cause at code, function level granularity). Another
body of work uses record-and-replay infrastructures, which record the execution and then replay the execution
offline. These tools generate a high fidelity representative execution for offline bug diagnosis, at the cost of a
relatively heavy overhead, which is generally not acceptable in user-facing production systems.
Therefore, to meet the demands of a low-latency distributed computing environment of modern service

oriented systems, it is important to have debugging tools which have minimal to negligible impact on the
application and can provide a fast update to the operator to allow for shorter time to debug. To this end, we
introduce a new debugging paradigm called live debugging. There are two goals that any live debugging
infrastructure must meet: Firstly, it must offer real-time insight for bug diagnosis and localization, which is
paramount when errors happen in user-facing service-oriented applications. Having a shorter debug cycles
and quicker patches is essential to ensure application quality and reliability. Secondly, live debugging should
not impact user-facing performance for non bug triggering events. Most bugs which impact only a small
percentage of users. In such scenarios, debugging the application should not impact the entire system and
other users who are not triggering the bug.
With the above-stated goals in mind, we have designed a framework called Parikshan1, which leverages
user-space containers (OpenVZ/ LXC) to launch application instances for the express purpose of debugging.
Parikshan is driven by a live-cloning process, which generates a replica (debug container) of production
services for debugging or testing, cloned from a production container which provides the real output to the
user. The debug container provides a sandbox environment, for safe execution of test-cases/debugging done
by the users without any perturbation to the execution environment. As a part of this framework, we have
designed customized-network proxy agents, which replicate inputs from clients to both the production and
test-container, as well safely discard all outputs from the test-container. Together the network proxy, and
the debug container ensure both compute and network isolation of the debugging environment, while at the
same time allowing the user to debug the application. We believe that this piece of work provides the first
of it’s kind practical real-time debugging of large multi-tier and cloud applications, without requiring any
application down-time, and minimal performance impact.
The principal hypothesis of this dissertation is that, for large-scale service-oriented-applications (SOA) it
is possible to provide a live debugging environment, which allows the developer to debug the target application
without impacting the production system. Primarily, we will present an approach for live debugging of
production systems. This involves discussion of Parikshan framework which forms the backbone of this
dissertation. We will discuss how to clone the containers, split and isolate network traffic, and aggregate it for
communication to both upstream and downstream tiers, in a multi-tier SOA infrastructure. As a part of this
description, we will also show case-studies demonstrating how network replay is enough for triggering most
bugs in real-world applications. To show this, we have presented 16 real-world bugs, which were triggered
1Parikshan is the sanskrit word for testing

using our network duplication techniques. Additionally, we present a survey of 220 bugs from bug reports of
SOA applications which were found to be similar to the 16 mentioned above.
Secondly, we will present iProbe a new type of instrumentation framework, which uses a combination
of static and dynamic instrumentation, to have an order-of-magnitude better performance than existing
instrumentation techniques. The iProbe tool is the result of our initial investigation towards a low-overhead
debugging tool-set, which can be used in production environments. Similar to existing instrumentation tools,
it allows administrators to instrument applications at run-time with significantly better performance than
existing state-of-art tools. We use a novel two-stage process, whereby we first create place-holders in the
binary at compile time and instrument them at run-time. iProbe is a standalone tool that can be used for
instrumenting applications, or can be used in our debug container with Parikshan to assist the administrator
in debugging.
Lastly, while Parikshan is a platform to quickly attack bugs, in itself it’s a debugging platform. For the
last section of this dissertation we look at how various existing debugging techniques can be adapted to live
debugging, making them more effective. We first enumerate scenarios in which debugging can take place:
post-facto - turning livedebugging on after a bug has occurred, proactive - having debugging on before a bug
has happened. We will then discuss how existing debugging tools and strategies can be applied in the debug
container to be more efficient and effective. We will also discuss potential new ways that existing debugging
mechanisms can be modified to fit in the live debugging domain.

Table of Contents
List of Figures . . . . . . . . . . . . . . . . . . . . . . . . . . . . . . . . . . . . . . . . . . . . . vi
List of Tables . . . . . . . . . . . . . . . . . . . . . . . . . . . . . . . . . . . . . . . . . . . . . viii
1 Introduction 1
1.1 Definitions . . . . . . . . . . . . . . . . . . . . . . . . . . . . . . . . . . . . . . . . . . . . 4
1.2 Problem Statement . . . . . . . . . . . . . . . . . . . . . . . . . . . . . . . . . . . . . . . 6
1.3 Requirements . . . . . . . . . . . . . . . . . . . . . . . . . . . . . . . . . . . . . . . . . . 7
1.4 Scope . . . . . . . . . . . . . . . . . . . . . . . . . . . . . . . . . . . . . . . . . . . . . . 8
1.4.1 Service Oriented Applications . . . . . . . . . . . . . . . . . . . . . . . . . . . . . 8
1.4.2 Non-Crashing Bugs . . . . . . . . . . . . . . . . . . . . . . . . . . . . . . . . . . . 8
1.4.3 Native Applications . . . . . . . . . . . . . . . . . . . . . . . . . . . . . . . . . . . 8
1.5 Proposed Approach . . . . . . . . . . . . . . . . . . . . . . . . . . . . . . . . . . . . . . . 9
1.6 Hypothesis . . . . . . . . . . . . . . . . . . . . . . . . . . . . . . . . . . . . . . . . . . . 10
1.7 Assumptions . . . . . . . . . . . . . . . . . . . . . . . . . . . . . . . . . . . . . . . . . . 11
1.7.1 Resource Availability . . . . . . . . . . . . . . . . . . . . . . . . . . . . . . . . . . 11
1.8 Outline . . . . . . . . . . . . . . . . . . . . . . . . . . . . . . . . . . . . . . . . . . . . . 11
2 Background and Motivation 13
2.1 Recent Trends . . . . . . . . . . . . . . . . . . . . . . . . . . . . . . . . . . . . . . . . . . 13
2.1.1 Software development trends . . . . . . . . . . . . . . . . . . . . . . . . . . . . . . 13
2.1.2 Microservice Architecture . . . . . . . . . . . . . . . . . . . . . . . . . . . . . . . 15
2.1.3 Virtualization, Scalability and the Cloud . . . . . . . . . . . . . . . . . . . . . . . . 16
2.2 Current debugging of production systems . . . . . . . . . . . . . . . . . . . . . . . . . . . 16
i

2.3 Motivating Scenario . . . . . . . . . . . . . . . . . . . . . . . . . . . . . . . . . . . . . . . 18
2.4 Summary . . . . . . . . . . . . . . . . . . . . . . . . . . . . . . . . . . . . . . . . . . . . 19
3 Parikshan 20
3.1 Introduction . . . . . . . . . . . . . . . . . . . . . . . . . . . . . . . . . . . . . . . . . . . 20
3.2 Parikshan . . . . . . . . . . . . . . . . . . . . . . . . . . . . . . . . . . . . . . . . . . . . 22
3.2.1 Clone Manager . . . . . . . . . . . . . . . . . . . . . . . . . . . . . . . . . . . . . 23
3.2.2 Network Proxy Design Description . . . . . . . . . . . . . . . . . . . . . . . . . . 26
3.2.3 Debug Window . . . . . . . . . . . . . . . . . . . . . . . . . . . . . . . . . . . . . 29
3.2.4 Divergence Checking . . . . . . . . . . . . . . . . . . . . . . . . . . . . . . . . . . 30
3.2.5 Re-Synchronization . . . . . . . . . . . . . . . . . . . . . . . . . . . . . . . . . . . 31
3.2.6 Implementation . . . . . . . . . . . . . . . . . . . . . . . . . . . . . . . . . . . . . 32
3.3 Discussion and Limitations . . . . . . . . . . . . . . . . . . . . . . . . . . . . . . . . . . . 33
3.3.1 Non-determinism . . . . . . . . . . . . . . . . . . . . . . . . . . . . . . . . . . . . 33
3.3.2 Distributed Services . . . . . . . . . . . . . . . . . . . . . . . . . . . . . . . . . . 34
3.3.3 Overhead in Parikshan . . . . . . . . . . . . . . . . . . . . . . . . . . . . . . . . . 34
3.4 Evaluation . . . . . . . . . . . . . . . . . . . . . . . . . . . . . . . . . . . . . . . . . . . . 35
3.4.1 Live Cloning Performance . . . . . . . . . . . . . . . . . . . . . . . . . . . . . . . 36
3.4.2 Debug Window Size . . . . . . . . . . . . . . . . . . . . . . . . . . . . . . . . . . 41
3.4.3 Network Duplication Performance Overhead . . . . . . . . . . . . . . . . . . . . . 44
3.5 Summary . . . . . . . . . . . . . . . . . . . . . . . . . . . . . . . . . . . . . . . . . . . . 50
4 Is network replay enough? 52
4.1 Overview . . . . . . . . . . . . . . . . . . . . . . . . . . . . . . . . . . . . . . . . . . . . 52
4.2 Applications Targeted . . . . . . . . . . . . . . . . . . . . . . . . . . . . . . . . . . . . . . 53
4.2.1 MySQL . . . . . . . . . . . . . . . . . . . . . . . . . . . . . . . . . . . . . . . . . 54
4.2.2 Apache HTTPD Server . . . . . . . . . . . . . . . . . . . . . . . . . . . . . . . . . 54
4.2.3 Redis . . . . . . . . . . . . . . . . . . . . . . . . . . . . . . . . . . . . . . . . . . 54
4.2.4 Cassandra . . . . . . . . . . . . . . . . . . . . . . . . . . . . . . . . . . . . . . . . 55
4.2.5 HDFS . . . . . . . . . . . . . . . . . . . . . . . . . . . . . . . . . . . . . . . . . . 55
4.3 Case Studies . . . . . . . . . . . . . . . . . . . . . . . . . . . . . . . . . . . . . . . . . . . 56
ii

4.3.1 Semantic Bugs . . . . . . . . . . . . . . . . . . . . . . . . . . . . . . . . . . . . . 56
4.3.2 Performance Bugs . . . . . . . . . . . . . . . . . . . . . . . . . . . . . . . . . . . 62
4.3.3 Resource Leaks . . . . . . . . . . . . . . . . . . . . . . . . . . . . . . . . . . . . . 68
4.3.4 Concurrency Bugs . . . . . . . . . . . . . . . . . . . . . . . . . . . . . . . . . . . 72
4.3.5 Configuration Bugs . . . . . . . . . . . . . . . . . . . . . . . . . . . . . . . . . . . 77
4.4 A survey of real-world bugs . . . . . . . . . . . . . . . . . . . . . . . . . . . . . . . . . . 80
4.5 Summary . . . . . . . . . . . . . . . . . . . . . . . . . . . . . . . . . . . . . . . . . . . . 85
5 iProbe 86
5.1 Introduction . . . . . . . . . . . . . . . . . . . . . . . . . . . . . . . . . . . . . . . . . . . 86
5.2 Design . . . . . . . . . . . . . . . . . . . . . . . . . . . . . . . . . . . . . . . . . . . . . . 89
5.2.1 ColdPatching Phase . . . . . . . . . . . . . . . . . . . . . . . . . . . . . . . . . . 89
5.2.2 HotPatching Phase . . . . . . . . . . . . . . . . . . . . . . . . . . . . . . . . . . . 90
5.2.3 Extended iProbe Mode . . . . . . . . . . . . . . . . . . . . . . . . . . . . . . . . . 93
5.3 Trampoline vs. Hybrid Approach . . . . . . . . . . . . . . . . . . . . . . . . . . . . . . . . 94
5.4 Implementation . . . . . . . . . . . . . . . . . . . . . . . . . . . . . . . . . . . . . . . . . 96
5.4.1 iProbe Framework . . . . . . . . . . . . . . . . . . . . . . . . . . . . . . . . . . . 97
5.5 FPerf: An iProbe Application for Hardware Event Profiling . . . . . . . . . . . . . . . . . . 98
5.6 Discussion: Safety Checks for iProbe . . . . . . . . . . . . . . . . . . . . . . . . . . . . . 99
5.7 Evaluation . . . . . . . . . . . . . . . . . . . . . . . . . . . . . . . . . . . . . . . . . . . . 101
5.7.1 Overhead of ColdPatch . . . . . . . . . . . . . . . . . . . . . . . . . . . . . . . . . 101
5.7.2 Overhead of HotPatching and Scalability Analysis . . . . . . . . . . . . . . . . . . 102
5.7.3 Case Study: Hardware Event Profiling . . . . . . . . . . . . . . . . . . . . . . . . . 103
5.8 Summary . . . . . . . . . . . . . . . . . . . . . . . . . . . . . . . . . . . . . . . . . . . . 106
6 Applications of Live Debugging 107
6.1 Overview . . . . . . . . . . . . . . . . . . . . . . . . . . . . . . . . . . . . . . . . . . . . 107
6.2 Live Debugging using Parikshan . . . . . . . . . . . . . . . . . . . . . . . . . . . . . . . . 108
6.3 Debugging Strategy Categorization . . . . . . . . . . . . . . . . . . . . . . . . . . . . . . . 111
6.3.1 Scenario 1: Post-Facto Analysis . . . . . . . . . . . . . . . . . . . . . . . . . . . . 111
6.3.2 Scenario 2: Proactive Analysis . . . . . . . . . . . . . . . . . . . . . . . . . . . . . 113
iii
6.4 Existing Debugging Mechanisms and Applications . . . . . . . . . . . . . . . . . . . . . . 113
6.4.1 Execution Tracing . . . . . . . . . . . . . . . . . . . . . . . . . . . . . . . . . . . 113
6.4.2 Statistical Debugging . . . . . . . . . . . . . . . . . . . . . . . . . . . . . . . . . . 115
6.4.3 Staging Record and Replay . . . . . . . . . . . . . . . . . . . . . . . . . . . . . . . 115
6.4.4 A-B Testing . . . . . . . . . . . . . . . . . . . . . . . . . . . . . . . . . . . . . . . 118
6.4.5 Interactive Debugging . . . . . . . . . . . . . . . . . . . . . . . . . . . . . . . . . 118
6.4.6 Fault Tolerance Testing . . . . . . . . . . . . . . . . . . . . . . . . . . . . . . . . . 120
6.5 Budget Limited, Adaptive Instrumentation . . . . . . . . . . . . . . . . . . . . . . . . . . . 120
6.5.1 Proactive: Modeling Budgets . . . . . . . . . . . . . . . . . . . . . . . . . . . . . . 121
6.5.2 Extended Load-balanced duplicate clones . . . . . . . . . . . . . . . . . . . . . . . 124
6.5.3 Reactive: Adaptive Instrumentation . . . . . . . . . . . . . . . . . . . . . . . . . . 124
6.5.4 Automated Reactive Scores . . . . . . . . . . . . . . . . . . . . . . . . . . . . . . 126
6.6 Summary . . . . . . . . . . . . . . . . . . . . . . . . . . . . . . . . . . . . . . . . . . . . 126
7 Related Work 128
7.1 Related Work for Parikshan . . . . . . . . . . . . . . . . . . . . . . . . . . . . . . . . . . . 128
7.1.1 Record and Replay Systems: . . . . . . . . . . . . . . . . . . . . . . . . . . . . . . 128
7.1.2 Decoupled or Online Analysis . . . . . . . . . . . . . . . . . . . . . . . . . . . . . 129
7.1.3 Live Migration and Cloning . . . . . . . . . . . . . . . . . . . . . . . . . . . . . . 130
7.1.4 Monitoring and Analytics . . . . . . . . . . . . . . . . . . . . . . . . . . . . . . . 131
7.2 Related Work for iProbe . . . . . . . . . . . . . . . . . . . . . . . . . . . . . . . . . . . . 131
7.2.1 Source Code or Compiler Instrumentation Mechanisms . . . . . . . . . . . . . . . . 131
7.2.2 Run-time Instrumentation Mechanisms . . . . . . . . . . . . . . . . . . . . . . . . 132
7.2.3 Debuggers . . . . . . . . . . . . . . . . . . . . . . . . . . . . . . . . . . . . . . . 133
7.2.4 Dynamic Translation Tools . . . . . . . . . . . . . . . . . . . . . . . . . . . . . . . 133
8 Conclusions 134
8.1 Contributions . . . . . . . . . . . . . . . . . . . . . . . . . . . . . . . . . . . . . . . . . . 134
8.2 Future Directions . . . . . . . . . . . . . . . . . . . . . . . . . . . . . . . . . . . . . . . . 135
8.2.1 Immediate Future Directions . . . . . . . . . . . . . . . . . . . . . . . . . . . . . . 136
8.2.2 Possibilities for Long Term . . . . . . . . . . . . . . . . . . . . . . . . . . . . . . . 137
iv

Bibliography 137
Appendix 152
A Active Debugging 153
A.1 Overview . . . . . . . . . . . . . . . . . . . . . . . . . . . . . . . . . . . . . . . . . . . . 153
A.2 Description . . . . . . . . . . . . . . . . . . . . . . . . . . . . . . . . . . . . . . . . . . . 154
B Survey of Real World Bugs 156
B.0.1 Apache Buglist and details . . . . . . . . . . . . . . . . . . . . . . . . . . . . . . . 156
B.0.2 MySQL Buglist and details . . . . . . . . . . . . . . . . . . . . . . . . . . . . . . . 169
v

List of Figures
2.1 Devops software development process . . . . . . . . . . . . . . . . . . . . . . . . . . . . . 14
2.2 An example of a microservice architecture for a car renting agency website . . . . . . . . . 15
2.3 Live Debugging aims to move debugging part of the lifecycle to be done in parallel to the
running application, as currently modeling, analytics, and monitoring is done . . . . . . . . 17
2.4 Workflow of Parikshan in a live multi-tier production system with several interacting services.
When the administrator of the system observes errors in two of it’s tiers, he can create a
sandboxed clone of these tiers and observe/debug them in a sandbox environment without
impacting the production system. . . . . . . . . . . . . . . . . . . . . . . . . . . . . . . . . 19
3.1 High level architecture of Parikshan, showing the main components: Network Duplicator,
Network Aggregator, and Cloning Manager. The replica (debug container) is kept in sync
with the master (production container) through network-level record and replay. In our
evaluation, we found that this light-weight procedure was sufficient to reproduce many real
bugs. . . . . . . . . . . . . . . . . . . . . . . . . . . . . . . . . . . . . . . . . . . . . . . . 23
3.2 External and Internal Mode for live cloning: P1 is the production, and D1 is the debug
container, the clone manager interacts with an agent which has drivers to implement live
cloning. . . . . . . . . . . . . . . . . . . . . . . . . . . . . . . . . . . . . . . . . . . . . . 24
3.3 Suspend time for live cloning, when running a representative benchmark . . . . . . . . . . . 37
3.4 Live Cloning suspend time with increasing amounts of I/O operations . . . . . . . . . . . . 38
3.5 Reduction in median brownout times in Google Compute Platforms based on recent improve-
ments till March 2013 . . . . . . . . . . . . . . . . . . . . . . . . . . . . . . . . . . . . . . 40
3.6 Simulation results for debug-window size. Each series has a constant arrival rate, and the
buffer is kept at 64GB. . . . . . . . . . . . . . . . . . . . . . . . . . . . . . . . . . . . . . 43
vi

3.7 Performance impact on network bandwidth when using network duplication. The above chart
shows network bandwidth performance comparison of native execution, with proxy . . . . . 45
3.8 Latencies in all different modes for wikipedia trace . . . . . . . . . . . . . . . . . . . . . . 49
4.1 Metadata description for a Apache semantic bug . . . . . . . . . . . . . . . . . . . . . . . . 82
4.2 Description for a Apache semantic bug based on user report and comments . . . . . . . . . 83
4.3 Metadata for a performance bug in MySQL . . . . . . . . . . . . . . . . . . . . . . . . . . 83
4.4 Description for a performance bug . . . . . . . . . . . . . . . . . . . . . . . . . . . . . . . 84
5.1 The Process of ColdPatching. . . . . . . . . . . . . . . . . . . . . . . . . . . . . . . . . . . 90
5.2 Native Binary, the State Transition of ColdPatching and HotPatching. . . . . . . . . . . . . 91
5.3 HotPatching Workflow. . . . . . . . . . . . . . . . . . . . . . . . . . . . . . . . . . . . . . 92
5.4 Traditional Trampoline based Dynamic Instrumentation Mechanisms. . . . . . . . . . . . . 95
5.5 Overview of FPerf : Hardware Event Profiler based on iProbe. . . . . . . . . . . . . . . . . 98
5.6 Overhead of iProbe “ColdPatch Stage” on SPEC CPU 2006 Benchmarks. . . . . . . . . . . 102
5.7 Overhead and Scalability Comparison of iProbe HotPatching vs. SystemTap vs. DynInst
using a Micro-benchmark. . . . . . . . . . . . . . . . . . . . . . . . . . . . . . . . . . . . 103
5.8 The number of different functions that have been profiled in one execution. . . . . . . . . . 104
5.9 Overhead Control and Number of Captured Functions Comparison. . . . . . . . . . . . . . 105
6.1 Staged Record and Replay using Parikshan . . . . . . . . . . . . . . . . . . . . . . . . . . 116
6.2 Traditional A-B Testing . . . . . . . . . . . . . . . . . . . . . . . . . . . . . . . . . . . . . 118
6.3 Parikshan applied to a mid-tier service . . . . . . . . . . . . . . . . . . . . . . . . . . . . . 121
6.4 External and Internal Mode for live cloning: P1 is the production, and D1 is the debug container.122
6.5 This figure shows how queuing theory can be extended to a load balanced debugging scenario.
Here each of the debug container receive the requests at rate λ, and the total instrumentation
is balanced across multiple debug containers. . . . . . . . . . . . . . . . . . . . . . . . . . 125
7.1 Advantages of iProbe over existing monitoring frameworks DTrace/SystemTap and DynInst 132
A.1 Debugging strategies for offline debugging . . . . . . . . . . . . . . . . . . . . . . . . . . . 153
A.2 Debugging Strategies for Active Debugging . . . . . . . . . . . . . . . . . . . . . . . . . . 155
vii

List of Tables
3.1 Approximate debug window sizes for a MySQL request workload . . . . . . . . . . . . . . 42
3.2 httping latency in micro-seconds for direct, proxy and duplication modes for HTTP HEAD
requests . . . . . . . . . . . . . . . . . . . . . . . . . . . . . . . . . . . . . . . . . . . . . 47
3.3 File download times when increasing file size in the debug-container. Please note the file size
is not increased for the proxy and direct communication. The last column shows the time
taken for downloading the file from the debug container. . . . . . . . . . . . . . . . . . . . 48
3.4 Snapshot of the first four latencies of GET/POST requests(secondss) from wikipedia, and the
overhead of proxy compared to direct mode, and duplication over proxy mode . . . . . . . . 48
3.5 Average time to finish mysqlslap queries on a sample database . . . . . . . . . . . . . . . . 50
4.1 List of real-world production bugs studied with Parikshan . . . . . . . . . . . . . . . . . . . 53
4.2 Survey and classification of bugs . . . . . . . . . . . . . . . . . . . . . . . . . . . . . . . . 80
5.1 Experiment Platform. . . . . . . . . . . . . . . . . . . . . . . . . . . . . . . . . . . . . . . 104
B.1 Details of bug categories for apache . . . . . . . . . . . . . . . . . . . . . . . . . . . . . . 157
B.2 Apache Bug List . . . . . . . . . . . . . . . . . . . . . . . . . . . . . . . . . . . . . . . . 157
B.3 Categories and count of mysql bugs . . . . . . . . . . . . . . . . . . . . . . . . . . . . . . 168
B.4 MySQL buglist . . . . . . . . . . . . . . . . . . . . . . . . . . . . . . . . . . . . . . . . . 169
viii

Acknowledgments
First and foremost, I would like to thank my advisor, Gail Kaiser, who has provided me invaluable
guidance and wisdom in all matters related to my research and publishing. I truly appreciate the support, and
am thankful for the flexibility and patience over the years in providing guidance in my research efforts.
I would also like to thank Franjo Ivancic, who has been a constant source of support and provided valuable
feedback to my half-baked ideas. A special thank you to Jonathan Bell, who provided insightful critique, and
ideas which helped in re-shaping and significantly improving the work presented in this thesis. I would also
like to thank Swapneel Sheth, and Chris Murphy who provided valuable support in terms of direction and
practical experience during my initial years of the PhD.
The work described here has been supported by the Programming Systems Laboratory, and several
members and associates of the PSL lab. I would like to thank Mike Su, Leon Wu, Simha Sethumadhavan,
Ravindra Babu Ganapathi, and Jonathan Demme, and many others whom I had the pleasure to work with. I
also had the pleasure of supervising a number of graduate students who have helped in testing out several
early stage prototypes of different projects I was involved in.
I would also like to acknowledge my co-workers at NEC Labs America, I have had the pleasure to work
with several extremely intelligent academicians, and have gained a lot from my experience in working with
them. In particular, I would like to thank Abhishek Sharma for providing valuable feedback and insight in my
ideas towards budget-allocation. I would also like to thank - Hui Zhang, Junghwan Rhee, Cristian Lumezanu,
Vishal Singh, Qiang Xu and several interns. I would also like to thank Kai Ma for his work towards the
implementation of FPerf, an application of iProbe.
Last but most important, I would like to thank my wife, my parents and my sister for sticking with me,
and their emotional support and encouragement.
ix

To my parents, and my sister for their unwavering support, and tomy wife for her constant encouragement and the final push.
x
CHAPTER 1. INTRODUCTION
Chapter 1
Introduction
Although software bugs are nothing new, the complexities of virtualized environments coupled with large
distributed systems have made bug localization harder. The large size of distributed systems means that any
downtime has significant financial penalties for all parties involved. Hence, it is increasingly important to
localize and fix bugs in a very short period of time.
Existing state-of-art techniques for monitoring production systems [McDougall et al., 2006; Park and
Buch, 2004; Prasad et al., 2005] rely on light-weight dynamic instrumentation to capture execution traces.
Operators then feed these traces to analytic tools [Barham et al., 2004; Zhang et al., 2014] to connect logs in
these traces and find the root-cause of the error. However, dynamic instrumentation has a trade-off between
granularity of tracing and the performance overhead. Operators keep instrumentation granularity low, to
avoid higher overheads in the production environment. This often leads to multiple iterations between
the debugger and the operator, to increase instrumentation in specific modules, in order to diagnose the
root-cause of the bug. Another body of work has looked into record-and-replay [Altekar and Stoica, 2009;
Dunlap et al., 2002; Laadan et al., 2010; Geels et al., 2007a] systems which capture the log of the system, in
order to faithfully replay the trace in an offline environment. Replay systems try and capture system level
information, user-input, as well as all possible sources of non-determinism, to allow for in-depth post-facto
analysis of the error. However, owing to the amount of instrumentation required, record-and-replay tools deal
with an even heavier overhead, making them impractical for real-world production systems.
The high level goal of this thesis is to present tools and techniques which can help to reduce the time to
bug localization, and can be applied in live running production service systems. Our initial efforts focused on
having the minimum possible instrumentation in the production system, which could at the same time be
1

CHAPTER 1. INTRODUCTION
dynamically turned on or off. We developed iProbe (see chapter 5) an intelligent instrumentation tool, which
combined the advantages of static instrumentation and dynamic instrumentation to give an order of magnitude
better performance in terms of overhead compared to existing state-of-art tools [McDougall et al., 2006;
Prasad et al., 2005; Buck and Hollingsworth, 2000; Luk et al., 2005]. iProbe uses placeholders added in the
application binary at compile time, which can be leveraged to insert instrumentation when the application is
actually running. In comparison, most current tools use trampoline based techniques (see DTrace [McDougall
et al., 2006], SystemTap [Prasad et al., 2005], Dyninst [Buck and Hollingsworth, 2000]), or just in time
execution (PIN [Luk et al., 2005], Valgrind [Nethercote and Seward, 2007]), requiring complex operations to
allow for safe execution and incurs a much higher overhead. Our compilation driven place-holders allow
us to leverage pre-existing space in the binary to safely insert instrumentation and achieve a much better
performance.
However, in the process of our experiments we realized one critical limitation of instrumentation based
techniques - instrumentation and monitoring is always done within the code, and hence is sequentially
executed. Since instrumentation will always directly impact the performance of production applications,
it needs to be limited to allow for good user experience. A better way to approach this problem is to
decouple debugging instrumentation and application performance, so that there is no direct impact of the
instrumentation on the production application. This thesis is centered around the idea of a new debugging
paradigm called “live debugging”, whereby developers can debug/instrument the application while isolating
the impact of this instrumentation from the user-facing production application. The key idea behind this
approach is to give faster time-to-bug localization, deeper insight into the health and activity within the
system, and to allow operators to dynamically debug applications without fear of changing application
behavior. We leverage existing work in live migration and light-weight user-space container virtualization, to
provide an end-to-end workflow for debugging. Our system replicates the application container into a clone
which can be used solely for the purpose of debugging the application.
Our work is inspired by three key observation: Firstly, we observe that most service-oriented appli-
cations(SOA) are launched on cloud based infrastructures. These applications use virtualization to share
physical resources, maintained by third-party vendors like Amazon EC2 [Amazon, 2010], or Google com-
pute [Krishnan and Gonzalez, 2015] platforms. Furthermore, there is an increasing trend towards light-weight
user-space container virtualization, which is less resource hungry, and makes sharing physical resources
easier. Frameworks like docker [Merkel, 2014] allow for scaled out application deployment, by allowing
2

CHAPTER 1. INTRODUCTION
each application service instance to be launched in it’s own container. For instance, an application server, and
a database server making up a web-service, can be hosted on their own containers, thereby sandboxing each
service, and making it easier to scale out.
Secondly, we observe a trend towards Dev-ops [Httermann, 2012] by the software engineering industry.
DevOps stresses on close coupling between software developers and operators, in order to have shorter
release cycles (Facebook web has 2 releases a day, and one mobile release every 4 weeks and Flickr has 10
deployment cycles per day [Rossi, 2014; Allspaw J., 2009]). This re-emphasizes the need to have a very short
time to diagnose and fix a bug especially in service oriented application. We believe by providing a means to
observe the application when the bug is active, we will significantly reduce the time to bug localization.
Lastly, our key insight is that for most service-oriented applications (SOA), a failure can be reproduced
simply by replaying the network inputs passed on to the application. For these failures, capturing very
low-level sources of non-determinism (e.g. thread scheduling or general system calls, often with high
overhead) is unnecessary to successfully and automatically reproduce the buggy execution in a development
environment. We have evaluated this insight by studying 16 real-world bugs, which we were able to trigger by
only duplicating and replaying network packets. Furthermore we categorized 220 bugs from three real-world
applications, finding that most were similar in nature to the 16 that were reproduced, suggesting that our
approach would be applicable to them as well.
This thesis will make the following contributions:
First, in Chapter 3 we will present a framework for “live debugging” applications while they are running
in the production environment. This will involve a description of our system called Parikshan1, which
allows real-time debugging without any impact on the production service. We provide a facility to sandbox
the production and debug environments so that any modifications in the debug environment do not impact
user-facing operations. Parikshan avoids the need of large test-clusters, and can target specific sections of a
large scale distributed application. In particular, Parikshan allows debuggers to apply debugging techniques
with deeper granularity instrumentation, and profiling without worrying that the instrumentation will impact
the production application performance.
In chapter 4 we will present details of our case-study presenting real-world bugs which were triggered
by network input alone, and which show why using Parikshan would be enough to capture most real-world
bugs. Each case study presents a different variety of bugs from the following classes: performance, semantic,
1Parikshan is the Sanskrit word for testing
3

CHAPTER 1. INTRODUCTION
non-deterministic, configuration and resource leak. We believe that these bugs form the most common
classification of bugs in service oriented applications.
In chapter 5 we will present a dynamic instrumentation mechanism called iProbe. As explained earlier,
chronologically iProbewas our first tool developed towards achieving the goal of a low-overhead production
debugging. iProbe uses a novel two-stage design, and offloads much of the dynamic instrumentation
complexity to an offline compilation stage. It leverages standard compiler flags to introduce “place-holders”
for hooks in the program executable. Then it utilizes an efficient user-space “HotPatching” mechanism
which modifies the functions to be traced and enables execution of instrumented code in a safe and secure
manner. iProbe can be used as a standalone instrumentation tool or can be used in the debug container
with Parikshan for further assisting the debugger to localize the bug.
In the final chapter 6 of this thesis we focus on applications of live debuggging. In particular we discuss
several existing techniques and how they can be coupled with live debugging. We discuss step-by-step
scenarios where debugging on the fly can be helpful, and how it can be applied. We also briefly introduce a
new technique called budget limited instrumentation technique for live debugging. This technique leverages
existing work on statistical debugging, and queuing theory to lay a statistical foundation for allocating buffer
sizes and various configuration parameters. It proposes a reactive mechanism to adapt to the overhead of
instrumentation bounds using sampling techniques.
The rest of this chapter is organized as follows. Firstly in section 1.1 we define terms and terminologies
used in the rest of this thesis. Section 1.2 further defines the scope of our problem statement, definitions, and
classifications of the bugs. Section 1.3 illustrates the requirements this thesis must meet. Next, in section 1.4
we define the scope of the techniques presented in this thesis. Section 1.5 briefly goes over the proposed
approach presented in this thesis. In section 1.6 we give the hypothesis of this thesis. Section 1.7 lists some
of the assumptions made in this thesis, and section 1.8 gives an outline of the organization of the rest of this
document.
1.1 Definitions
Before we further discuss the problem statement, requirements, and approach,this section first formalizes
some of the terms used throughout this thesis.
• Live Debugging For the purpose of this thesis, we define live debugging as a mechanism to debug
4
CHAPTER 1. INTRODUCTION
applications on the fly while the production services are running and serving end-users.
• The development environment refers to a setting (physical location, group of human developers,
development tools, and production and test facilities) in which software is created and tested by
software developers and is not made available to end users. The debugging process in the development
environment can be interactive, and can have a high overhead.
• A production environment, or use environment, refers to a setting in which software is no longer
being modified by software developers and is being actively being used by users. Applications in
production cannot have a high instrumentation/debugging overhead, as it is detrimental to the users.
• An error, also referred to as a defect or bug, is the deviation of system external state from correct
service state.
• A fault is the adjudged or hypothesized cause of an error.
• A failure is an event that occurs when the delivered functionality deviates from correct functionality.
A service fails either because it does not comply with the functional specification, or because this
specification did not adequately describe the system function.
• DevOps is a software development method that stresses communication, collaboration (information
sharing and web service usage), integration, automation and measurement of cooperation between
software developers and other information-technology (IT) professionals. DevOps acknowledges the
interdependence of software development and IT operations. It aims to help an organization rapidly
produce software products and services and to improve operations performance quality assurance.
• Development/Operational Phase Development phase is the phase where the application is being
developed. The process involves testing, and debugging and iterative development such as adding bug
fixes etc. Operational phase is where the application is being operated and used by active users
• Downstream Servers For a given application or service, the downstream server is the server which
sends it a request.
• Upstream Servers For a given application or service, the upstream servers are servers which process
it’s requests and send it responses.
5

CHAPTER 1. INTRODUCTION
• Production Container This is the container in which the original production service is hosted and
where all incoming requests are routed.
• Debug Container This is a replica of the production container, where a copy of the production service
is running. The debug container is used for debugging purposes, and provides the live debugging
service.
• Replica A replica is a clone of a container, with an exact clone of the file system and the processes
running in the container. For the purpose of this thesis debug container and replica refer to the same
thing.
• Service Oriented Applications Service oriented applications are applications which offer transactional
services via network input, and provide responses on the network as well.
1.2 Problem Statement
Despite advances in software engineering bugs in applications are inevitable. The complexity of distributed
and large scale applications, with an increased emphasis on shorter development cycles has made debugging
more difficult. The key challenge of debugging modern applications is twofold: firstly, the complexity due to
a combination of distributed components interacting together, and secondly fast debugging of applications to
assure a short-time-to debug.
We have observed that while several debugging techniques exist, most of them focus on localizing errors
in the development phase. Production level debugging techniques are ad-hoc in nature, and generally rely on
unstructured logs printed as exceptions or transaction events using print outs from within the application.
While such logs are good, and can often give contextual information to the developer or the operator, they are
meant to provide an indication to only expected errors. Furthermore, they do not provide a systematic way to
localize such bugs.
More systematic approaches such as record-and-replay systems offer a complete picture of the running
production systems. These tools capture the exact state, and execution of the system, and allow for it to
be faithfully replayed offline. This saves the debugger hours of effort in re-creating the bug, it’s input and
application state. However, in order to capture such detailed information, there is a high performance penalty
on the production systems. This is often unacceptable in real-world scenarios, which is why such techniques
6

CHAPTER 1. INTRODUCTION
have only found limited use.
We further observe that debugging is an iterative process. While systematic approaches can provide a
complete picture, developer insight is paramount. The debugging process usually involves several iterations
where the debugger uses clues present in error logs, system logs, execution traces etc. to understand and
capture the source of the error. This process can have an impact on real-world applications, hence traditionally
the debugging and the production phase are kept completely separate.
Production level dynamic program instrumentation tools [McDougall et al., 2006; Prasad et al., 2005;
Park and Buch, 2004] enable application debugging, and live insights of the application. However, these are
executed inline with the program execution, thereby incurring an overhead. The perturbations and overhead
because of the instrumentation could restrict the tools from being used in production environments. Thus
we require a solution which allows operators/developers to observe, instrument, test or fix service oriented
applications in parallel with the production. The techniques and mechanisms in this thesis will aim to
provide a live debugging environment, which allows debuggers a free reign to debug, without impacting the
user-facing application.
1.3 Requirements
Our solution should meet the following requirements.
1. Real-Time Insights: Observing application behavior as the bug presents itself will allow for a quick
insight and shorter time to debug. Any solution should allow the debugger to capture system status as
well as observe, whatever points he wishes in the execution flow.
2. Sanity and Correctness: If the debugging is to be done in a running application with real users, it
should be done without impacting the outcome of the program. The framework must ensure that any
changes to the application’s state or to the environment does not impact the user-facing production
application.
3. Language/Application Agnostic: The mechanisms presented should be applicable to any language,
and any service oriented application (our scope is limited to SOA architectures).
4. Have negligible performance impact The user of a system that is conducting tests on itself during
execution should not observe any noticeable performance degradation. The tests must be unobtrusive to
the end user, both in terms of functionality and any configuration or setup, in addition to performance.
7

CHAPTER 1. INTRODUCTION
5. No service interruption: Since we are focusing our efforts on service oriented systems, any solution
should ensure that there is not impact on the service, and the user facing service should not be
interrupted.
1.4 Scope
Although we present a solution that is designed to be general purpose and applicable to a variety of applica-
tions, in this thesis we specifically limit our scope to the following:
1.4.1 Service Oriented Applications
The traditional batch-processing single node applications are fast disappearing. Modern day devices like
computers, IOT’s, mobile’s and web-browsers rely on interactive and responsive applications, which provide
a rich interface to it’s end-users. Behind the scenes of these applications are several SOA applications working
in concert to provide the final service. Such services include storage, compute, queuing, synchronization,
application layer services. One common aspect of all of these services is the fact that they get input from
network sources. Multiple services can be hosted on multiple machines(many-to-many deployment), and
each of them communicates with the other as well as the user using the network. The work presented in this
thesis leverages duplication of network based input to generate a parallel debugging environment. In this
sense, the scope of the applications targeted in this thesis are limited to service oriented applications, which
gather input through the network.
1.4.2 Non-Crashing Bugs
In this thesis, we have primarily focused on continuous debugging in parallel with the production application.
We have looked at a variety of bugs - performance, resource leak, concurrency, semantic, configuration etc.
However, we also try to debug an active problem in the application.
Hence, although a bug which immediately crashes, can still be investigated using Parikshan, it would
not be an ideal use-case scenario. On the other hand non-crashing bugs such as performance slow-downs,
resource leaks which stay in the application long enough, fault tolerant bugs, which do not crash the entire
system or similar non-crashing concurrency, semantic and configuration bugs, can be investigated in parallel
to the original applications thereby reducing the investigation time, and the time to fix the bug.
8

CHAPTER 1. INTRODUCTION
1.4.3 Native Applications
One of the tools presented in this thesis is iProbe- an intelligent hybrid instrumentation tool. iProbe uses
place-holders inserted at compile time in the binary, and leverages them to dynamically patch them at the
run-time. In it’s current implementation iProbe’s techniques can be only applied on native applications.
Managed and run-time interpreted languages such as Java, and .NET can also theoretically have a similar
approach built in, but that is out of the scope of this thesis.
1.5 Proposed Approach
Analyzing the executions of a buggy software program is essentially a data mining process. Although several
interesting methods have been developed to trace crashing bugs (such as memory violations and core dumps),
it is still difficult to analyze non-crashing bugs. Studies have shown that several bugs in large-scale systems
lead to either a changed/inconsistent output, or impact the performance of the application. Examples of this
are slow memory leaks, configuration, or performance bugs, which do not necessarily stop all services, but
need to be fixed quickly so as to avoid degradation in the QoS.
Existing approaches towards debugging production bugs mostly rely on application logs, and transaction
logs which are inserted within the application by the developer himself, to give an idea of the progress of
the application, and to guide the debugger towards errors. While these logs provide valuable contextual
information, they can only be used for expected bug scenarios. Furthermore, often they provide incomplete
information, or are just triggered as exceptions without providing a complete trace. Modern applications
also contain a level of fault tolerance, which means that applications are likely to continue to spawn worker
threads and provide service despite faults which happen at run-time. This often means that the debugger loses
the context of the application.
Other more systematic debugging techniques have been used in record-and-replay techniques which
allow operators to faithfully capture the entire execution as well as the status of the operating system as well
as the application. This allows the debuggers to carefully debug the application offline and understand the
root-cause of the bug. However, an obvious disadvantage of such techniques is that the recording overhead
can be relatively high, especially in unpredictable worst-case scenarios (for e.g. spikes in user requests etc.).
This makes the use of such techniques impractical for most real-world production systems.
Researchers have also studied non-systematic inference based techniques, which allow for lightweight
9

CHAPTER 1. INTRODUCTION
tracing or capturing application logs in distributed applications, and then threading them together to form
distributed execution flows. These inference techniques [Barham et al., 2004; Marian et al., 2012; Wang et
al., 2012; Zhang et al., 2014; Sambasivan et al., 2011] do not add much overhead to the production system, as
they typically use production instrumentation tools, or existing application logs. However, owing to the low
amount of instrumentation and data captured, these tools focus on finding faults at higher granularity(module,
library, component, node etc.) instead of the root-cause of the error at a code level (function, class, object
etc.). Additionally most of these tools use logs from pre-instrumented binaries, thereby limiting them to
expected bugs/error patterns.
We propose a paradigm shift in debugging service oriented applications, with a focus on debug-
ging applications running in the production environment. We call this technique “live debugging”: this
technique will provide real-time insights into running systems, and allow developers to debug applications
without fearing crashes in the production application. We believe that this will in turn lead to much shorter
time to bug resolution, hence improving application reliability, and reducing financial costs in case of er-
rors. In this thesis we present an end-to-end work-flow of localizing production bugs, which includes a
framework for live debugging, new live debugging techniques, and mechanisms to make applications
live debugging friendly.
1.6 Hypothesis
The principal hypothesis we test in this thesis is as follows:
It is possible to have sandboxed, on-the-fly debugging parallel to the production application for service
oriented applications with negligible overhead on the production environment and no discernable impact to
user-facing services.
In order to test this, we have developed the following technologies:
1. A framework for sandboxed, online debugging of production bugs with no overhead (Parikshan)
2. An intelligent compiler assisted dynamic instrumentation tool (iProbe)
3. Applications of live on-the-fly debugging
10

CHAPTER 1. INTRODUCTION
1.7 Assumptions
The work presented in this thesis is designed so that it can be applied in the most generic cases. However, the
implementation and some of the design motivation make some key assumptions which are presented in this
section:
1.7.1 Resource Availability
One of the core insight driving our live debugging technology is the increasing availability of compute
resources. With more and more applications being deployed on cloud infrastructure, in order to ease scaling
out of resources and sharing of compute power across multiple services - The amount of computing power
available is flexible and plentiful. Several existing services like Amazon EC2 [Amazon, 2010] and Google
Compute [Krishnan and Gonzalez, 2015] provide infrastructure-as-a-service and form the backbone of several
well known cloud services.
Parikshan assumes cheap and ample resource availability for most modern day services, and ease of
scalability. We leverage this abundance of resources, to utilize unused resources for debugging purposes. As
mentioned earlier, Parikshan uses unused containers to run a replica of the original production service, solely
for the purpose of debugging. While it is difficult to quantify, we believe that the advantage of on-the-fly
debugging and quick bug isolation outweighs the cost of these extra resources.
1.8 Outline
The rest of this thesis is organized as follows:
• Chapter 3 discusses the design and implementation of the Parikshan framework which enables live
debugging. In this chapter we will first give a brief motivation, and discuss the overall design, and how
our framework fits into service-oriented applications. We then go into a detailed explanation of the
design of each of the components of network request duplication as well as our live cloning algorithm.
We follow this up with implementation details, and evaluation scenarios using both simulation results
and real-world experiments which show the performance of our framework.
• Chapter 4 we discuss case-studies involving 16 real-world bugs, from 5 well known service oriented
application. We show how network input replay is enough to capture most real-world bugs (concurrency,
11

CHAPTER 1. INTRODUCTION
performance, semantic, resource leak, and mis-configuration). In addition, to further help our claim,
we did a survey of 220 real-world bugs which we manually classified and found were similar to the 16
bugs stated above.
• Chapter 5 introduces iProbe a novel hybrid instrumentation technique. We first begin with an
explanation of iProbe’s design, which is split in a two phase process - ColdPatching and HotPatching.
This is explained in stateful diagrams to show how the code is modified at different states in the
binary. We then show safety considerations of iProbe and this is followed by an extended design
which shows how iProbe can be applied to applications without compile time modifications as
well. Next we compare iProbe’s approach with traditional trampoline executions. We then follow
this with the implementation, and a short description of fperf which is a application of iProbe for
hardware monitoring. We follow this up with evaluation of iProbe which shows iProbe’s overhead
in cold-patching and hot-patching phase, and it’s comparison with traditional tools.
• While the previous two chapters build the base for live debugging, Chapter 6 discusses how these
tools can be leveraged to do real-world debugging. In the first part of this chapter, we discuss several
important advantages and limitations, which must be kept in mind when using Parikshan to debug
applications. Then we discusss existing debugging techniques which can be used in tandem with live
debugging to provide a more effective means for localizing the bug. We also introduce a new technique
called adaptive debugging. Adaptive debugging extends existing work on statistical debugging in
Parikshan to increase or decrease the degree of instrumentation in order to improve the statistical odds
of localizing the bug.
• In chapter 8, we conclude this thesis, highlighting the contributions of our techniques. Additionally,
this chapter also includes several future work possibilities that can arise from this thesis including some
short-term future work and long-term possibilities.
12

CHAPTER 2. BACKGROUND AND MOTIVATION
Chapter 2
Background and Motivation
2.1 Recent Trends
Parikshan is driven by some recent trends in the industry towards faster bug resolution and quicker devel-
opment, and scaled deployment. In this section we discuss three such trends in the industry which are of
particular relevance to Parikshan.
2.1.1 Software development trends
Software development paradigms have evolved over the years from a more documentation oriented process to
quicker and faster releases. The software development industry is working towards faster evolving softwares,
rather than building monolithic softwares for long term uses. Similarly software development no longer
follows strict regimented roles of developer, administrator/operator, tester etc, instead new paradigms are
being developed which encourage cross-functionalities.
One recent trend in software development processes is agile [Martin, 2003] and extreme [Beck, 2000]
programming development paradigms. Compared to traditional waterfall model [Petersen et al., 2009], both
agile and extreme programming focus on faster response to changing customer demands, and a quicker
delivery time. Agile programming for instance works on the principle of very short development cycles called
-scrums. At the end of each scrum, there should be a working software product that can be readily deployed.
The work-items are generally short, and goal oriented, and a scrum will usually last at most 2 weeks.
Agile development focuses on shorter development cycle, to apply patches, bug-fixes and having a
leaner team/operations. Parikshan’s live-debugging capability is yet another tool to facilitate faster software
13

CHAPTER 2. BACKGROUND AND MOTIVATION
development and debugging, by allowing developers to debug their applications in parallel to the one deployed
in production. We believe agile development can be tied up with Parikshan to have an end-to-end quick test,
debug, and deploy strategy and make application development an even more lean process.
Figure 2.1: Devops software development process
Another trend in software development is cross-functional development and production application man-
agement called Devops [Allspaw J., 2009]. Devops is a term used to refer to a set of practices that emphasizes
the collaboration and communication of both software developers and other information-technology (IT)
professionals (operators/administrators) while automating the process of software delivery and infrastructure
changes. The key in devops is the close collaboration of developers and operators, and an interchangable
role (i.e. developers are also operators for real-time critical systems), or alternatively having developers and
operators being active in the entire software cycle (including QA and operations). The old view of operations
tended towards the Dev side being the makers and the Ops side being the people that deal with the creation
after its birth the realization of the harm that has been done in the industry of those two being treated as
siloed concerns is the core driver behind DevOps.
The driving force behind this change, where expensive resources(developers), are applied on what is
traditionally managed by operators(with lower expertise or understanding of the software) - is to have faster
responses and a shorter time to debug. This necessity of having a shorter time to debug, and the availability of
developers in the operation stage is one of the trend which motivates live debugging. Clearly developers who
have much better understanding of the source code (having written it themselves), will be able to debug the
application faster as long as they have some degree of visibility and debug-capability within the application.
14

CHAPTER 2. BACKGROUND AND MOTIVATION
We believe that Parikshan’s livedebugging framework will allow such developers to debug their application in
an isolated yet parallel environment, which clones in real-time the behavior without impacting the production.
This will greatly reduce development overhead by giving crucial insight and make the feedback cycle shorter.
This will shorten the time to debug, and will easily fit into a debugging paradigm in an already increasing
trend of devops..
2.1.2 Microservice Architecture
Figure 2.2: An example of a microservice architecture for a car renting agency website
As applications grow in size they grow more and more complex with several interacting modules. With
15

CHAPTER 2. BACKGROUND AND MOTIVATION
iterative improvements in every release applications tend to grow in code-size with large obsolete code-bases,
un-productive technology, and which is difficult to maintain or modify owing to it’s size and complexity.
Many organizations, such as Amazon, eBay, and Netflix, have solved this problem by adopting what is
now known as the Microservices Architecture pattern. Instead of building a single monstrous, monolithic
application, the idea is to split your application into set of smaller, interconnected services.
A service typically implements a set of distinct features or functionality, such as order management,
customer management, etc. Each microservice is a mini-application that has its own hexagonal architecture
consisting of business logic along with various adapters. Some microservices would expose an API thats
consumed by other microservices or by the applications clients. Other microservices might implement a web
UI. At runtime, each instance is often a cloud VM or a Docker container.
Figure 2.2 shows the micro-service architecture of a car renting agency website. Each functional area is
implemented as it’s own independent service. Moreover, the web application is split into a set of simpler web
applications (such as one for passengers and one for drivers in our taxi-hailing example). This makes it easier
to deploy distinct experiences for specific users, devices, or specialized use cases.
2.1.3 Virtualization, Scalability and the Cloud
Modern day service oriented applications, are large and complex systems, which can serve billions of users.
Facebook has 1.79 billion active users every month, and Google search has approximately 1.71 billion users,
similarly twitter, netflix, instagram, and several other such websites have a huge base of users.
2.2 Current debugging of production systems
Before moving forward with a new software debugging paradigm, we want to discuss the current state-of-art
debugging mechanisms followed in the industry. The software development cycle consists of the following
four components - software development, monitoring, modeling & analytics, and software debugging.
Here monitoring involves getting periodic statistics or insight regarding the application, when deployed in
the production environment, either using instrumentation within the application or using periodic sampling of
resource usage in the system. Monitoring gives an indication regarding the general health of the system, and
can alert the user incase anything has gone wrong. System level default tools provided by most commodity
operating systems, like process monitors in linux, mac and windows, provide a high level view of real-time
16

CHAPTER 2. BACKGROUND AND MOTIVATION
resource usage in the system. On the other hand, software event monitoring tools like nagios, ganglia, and
rsyslog [Enterprises, 2012; Massie et al., 2004; Matulis, 2009] aggregate logs and provide a consolidated
view of application operations a cluster of machines to the administrator. On the other hand, tools like
SystemTap [Prasad et al., 2005], DTrace [McDougall et al., 2006] allow operators to write customized
instrumentation and dynamically patch them into applications to allow for a much deeper understanding of
the system (albeit at higher overheads).
Modeling and analytics is generally a follow up step, which uses the output of monitoring and can provide
useful insights using the monitoring data in real-time to highlight outliers and unexpected behavior. Tools
like loggly [loggly, ], ELK [ElasticSearch, ], Splunk [splunk, ], allow operators to search logs in real-time, as
well as provide statistical analytics for different categories of logs. Academic tools like vpath [Tak et al.,
2009], magpie [Barham et al., 2004], spectroscope [Sambasivan et al., 2011], appinsight [Ravindranath et al.,
2012], amongst others can stitch events together to give a much more detailed transaction flow analysis.
+ +
Monitoring Modeling and Analytics
Currently Executed Concurrenty for Software Development
Debugging
Live Debugging aims to bring software debugging
in the “live” lifecycle by doing on-the-fly debugging
in parallel
Figure 2.3: Live Debugging aims to move debugging part of the lifecycle to be done in parallel to the running
application, as currently modeling, analytics, and monitoring is done
As can be seen in figure 2.3, both monitoring and analytics happen in real-time in parallel to production
applications. However, without any interaction with the running application these techniques are only limited
17

CHAPTER 2. BACKGROUND AND MOTIVATION
to realizing that the production system has a bug, and potentially localizing the error. The actual root-cause
extraction unfortunately currently relies on offline debugging. Parikshan aims to move the debugging process
from an offline process to a completely or partially online (real-time) process in order to shorten time to
debugging. In some cases our framework can also be used for patch testing and fix validation. In the next
section we will see a real-world motivation scenario for Parikshan.
2.3 Motivating Scenario
Consider the complex multi-tier service-oriented system shown in Figure 2.4 that contains several interacting
services (web servers, application servers, search and indexing, database, etc.). The system is maintained
by operators who can observe the health of the system using lightweight monitoring that is attached to the
deployed system. At some point, an unusual memory usage is observed in the glassfish application server,
and some error logs are generated in the Nginx web server. Administrators can then surmise that there is a
potential memory leak/allocation problem in the app-server or a problem in the web server. However, with a
limited amount of monitoring information, they can only go so far.
Typically, trouble tickets are generated for such problems, and they are debugged offline. However using
Parikshan, administrators can generate replicas of the Nginx and Glassfish containers as Nginx-debug and
glassfish-debug. Parikshan’s network duplication mechanism ensures that the debug replicas receive the
same inputs as the production containers and that the production containers continue to provide service
without interruption. This separation of the production and debug environment allows the operator to use
dynamic instrumentation tools to perform deeper diagnosis without fear of additional disruptions due to
debugging. Since the replica is cloned from the original potentially “buggy” production container, it will
also exhibit the same memory leaks/or logical errors. Additionally, Parikshan can focus on the “buggy” parts
of the system, without needing to replicate the entire system in a test-cluster. This process will greatly reduce
the time to bug resolution, and allow real-time bug diagnosis capability.
The replica can be created at any time: either from the start of execution, or at any point during execution
that an operator deems necessary, allowing for post-facto analysis of the error, by observing execution traces
of incoming requests (in the case of performance bugs and memory leaks, these will be persistent in the
running system). Within the debug replica, the developer is free to employ any dynamic analysis tools to
study the buggy execution, as long as the only side-effect those tools is on execution speed.
18

CHAPTER 2. BACKGROUND AND MOTIVATION
Cloned test containers & network duplication
Debug output
1. Zero Overhead 2. Live debugging 3. Same system state 4. Less resources used 5. Fast time to debug
Tier 1 Tier 2 Tier 3 Tier 4 Tier 5 Tiers n
User observes error & creates
sandbox clones
Live production
system
Sandbox
cloned debug system
Figure 2.4: Workflow of Parikshan in a live multi-tier production system with several interacting services.
When the administrator of the system observes errors in two of it’s tiers, he can create a sandboxed clone of
these tiers and observe/debug them in a sandbox environment without impacting the production system.
2.4 Summary
In this chapter we first discussed some recent software trends which motivated the development of Parikshan,
and show that it complements as well as is driven by the current direction of industry. We then discussed
the current state-of-art practices followed in the industry for most production applications, and showed the
current limitation in doing real-time debugging. We then discussed a motivation scenario highlighting a
real-world use-case for Parikshan, and how livedebugging could hypothetically take place.
19

CHAPTER 3. PARIKSHAN
Chapter 3
Parikshan
3.1 Introduction
Rapid resolution of incident (error/alert) management [Lou et al., 2013] in online service-oriented sys-
tems [Newman, 2015; Borthakur, 2008; Lakshman and Malik, 2010; Carlson, 2013] is extremely important.
The large scale of such systems means that any downtime has significant financial penalties for all parties
involved. However, the complexities of virtualized environments coupled with large distributed systems have
made bug localization extremely difficult. Debugging such production systems requires careful re-creation of
a similar environment and workload, so that developers can reproduce and identify the cause of the problem.
Existing state-of-art techniques for monitoring production systems rely on execution trace information.
These traces can be replayed in a developer’s environment, allowing them to use dynamic instrumentation and
debugging tools to understand the fault that occurred in production. On one extreme, these monitoring systems
may capture only very minimal, high level information, for instance, collecting existing log information and
building a model of the system and its irregularities from it [Barham et al., 2004; Erlingsson et al., 2012;
Kasikci et al., 2015; Eigler and Hat, 2006]. While these systems impose almost no overhead on the production
system being debugged (since they simply collect log information already being collected, or have light-weight
monitoring), they are limited in the kind of bugs that can be reported as they only have pre-defined log-points
as reference . On the other extreme, some monitoring systems capture complete execution traces, allowing the
entire application execution to be exactly reproduced in a debugging environment [Altekar and Stoica, 2009;
Dunlap et al., 2002; Laadan et al., 2010; Geels et al., 2007a]. Despite much work towards minimizing
the amount of such trace data captured, overheads imposed by such tracing can still be unacceptable for
20

CHAPTER 3. PARIKSHAN
production use: in most cases, the overhead of tracing is at least 10%, and it can balloon up to 2-10x overhead.
[Patil et al., 2010; Wang et al., 2014].
We seek to allow developers to diagnose and resolve bugs in production service-oriented systems without
suffering any performance overhead due to instrumentation. Our key insight is that for most service-oriented
systems, a failure can be reproduced simply by replaying the network inputs passed to the application. For
these failures, capturing very low-level sources of non-determinism (e.g. thread scheduling or general system
calls, often with very high overhead) is unnecessary to successfully and automatically reproduce the buggy
execution in a development environment. We evaluated this insight by studying 16 real-world bugs (see
Section 4.3), which we were able to trigger by only duplicating and replaying network packets. Furthermore,
we categorized 220 bugs from three real world applications, finding that most of these were similar in nature
to the 16 that we reproduced. This suggests that our approach would be applicable to the bugs in our survey
as well (see Section 4.4).
Guided by this insight, we have created Parikshan, which allows for real-time, online debugging of
production services without imposing any instrumentation performance penalty. At a high level, Parikshan
leverages live cloning technology to create a sandboxed replica environment. This replica is kept isolated from
the real world so that developers can modify the running system in the sandbox to support their debugging
efforts without fear of impacting the production system. Once the replica is executing, Parikshan replicates
all network inputs flowing to the production system, buffering and feeding them (without blocking the
production system) to the debug system. Within that debug system, developers are free to use heavy-weight
instrumentation that would not be suitable in a production environment to diagnose the fault. Meanwhile, the
production system can continue to service other requests. Parikshan can be seen as very similar to tools such
as Aftersight [Chow et al., 2008] that offload dynamic analysis tasks to replicas and VARAN [Hosek and
Cadar, 2015] that support multi-version execution, but differs in that its high-level recording level (network
inputs, rather than system calls) allows it to have significantly lower overhead. A more detailed description of
Aftersight and VARAN can be found in section 7.1.2.
Parikshan focuses on helping developers debug faults online — as they occur in production systems. We
expect Parikshan to be used in cases of tricky bugs that are highly sensitive to their environment, such as
semantic bugs, performance bugs, resource-leak errors, configuration bugs, and concurrency bugs. Parikshan
can be used to diagnose and resolve both crashing and non-crashing bugs. A non-crashing bug the production
system remains running even after a bug is triggered, for instance, to continue to process other requests. A
21

CHAPTER 3. PARIKSHAN
crashing bug on the other hand leads to system fault and crashes, unable to process any further requests. We
present a more detailed explanation of these categories in Section 4.3.
We leverage container virtualization technology (e.g., Docker [Merkel, 2014], OpenVZ [Kolyshkin,
2006]), which can be used to pre-package services so as to make deployment of complex multi-tier sys-
tems easier (i.e. DockerHub [DockerHub, ; Boettiger, 2015] provides pre-packaged containers for storage,
web-server, database services etc.). Container based virtualization is now increasingly being used in prac-
tice [Bernstein, 2014]. In contrast to VM’s, containers run natively on the physical host (i.e. there is no
hypervisor layer in between), this means that there is no additional overhead, and near-native performance for
containers [Felter et al., 2015; Xavier et al., 2013]. While Parikshan could also be deployed using VM’s,
container virtualization is much more light weight in terms of resource usage.
The key benefits of our system are:
• No instrumentation impact on production: While existing approaches have focused on minimizing
the recording overhead. Parikshan uses novel non-blocking network duplication to avoid any overhead
at all in the production environment due to the instrumentation itself. While there may be a negligible
run-time overhead (<2%) because asynchronous memory copy operation in network forwarding, there is
no direct impact of instrumentation on production service. Hence debuggers can have higher granularity
instrumentation without impacting production.
• Sandbox debugging: Parikshan provides a cloned sandbox environment to debug the production appli-
cation. This allows a safe mechanism to diagnose the error, without impacting the functionality of the
application.
• Capture large-scale context: Allows capturing the context of large scale production systems, with long
running applications. Under normal circumstances capturing such states is extremely difficult as they need
a long running test input and large test-clusters.
The rest of this chapter is organized as follows. In section 3.2, we explain the design and implementation
of the Parikshan framework and each of it’s internal components. Next in section 3.3 we discuss some
key aspects and challenges when using Parikshan in real-world systems. This is followed by evaluation in
section 3.4, and a summary in section 3.5.
22

CHAPTER 3. PARIKSHAN
AsynchronousForwarder
DownstreamComponents
BufferManager
Produc:onContainer
DebugContainer
Pass-throughForwarder
UpstreamComponents
Pass-throughForwarder
AsynchronousForwarder
Network Duplicator Network Aggregator
BufferManager
DummyReader DummyReader
Live Cloned
Clients/User Requests etc.
Storage/Database Services etc.
Process P1 Process P2 Process P3 Process P4
Process P1 Process P2 Process P3 Process P4
Legend: Duplicator Legend: Aggregator
Clone Manager
Figure 3.1: High level architecture of Parikshan, showing the main components: Network Duplicator,
Network Aggregator, and Cloning Manager. The replica (debug container) is kept in sync with the master
(production container) through network-level record and replay. In our evaluation, we found that this
light-weight procedure was sufficient to reproduce many real bugs.
3.2 Parikshan
In Figure 3.1, we show the architecture of Parikshan when applied to a single mid-tier application server.
Parikshan consists of 3 modules: Clone Manager: manages “live cloning” between the production containers
and the debug replicas, Network Duplicator: manages network traffic duplication from downstream servers
to both the production and debug containers, and Network Aggregator: manages network communication
from the production and debug containers to upstream servers. The network duplicator also performs the
important task of ensuring that the production and debug container executions do not diverge. The duplicator
and aggregator can be used to target multiple connected tiers of a system by duplicating traffic at the beginning
and end of a workflow. Furthermore, the aggregator module is not required if the debug-container has no
upstream services.
3.2.1 Clone Manager
Live migration [Mirkin et al., 2008; Clark et al., 2005; Gebhart and Bozak, 2009] refers to the process of
moving a running virtual machine or container from one server to another, without disconnecting any client or
process running within the machine (this usually incurs a short or negligible suspend time). In contrast to live
23

CHAPTER 3. PARIKSHAN
P1
NAT
D1
NAT
Clone Manager
Agent Agent
To/From Duplicator
P1 D1
Clone Manager
Agent
To/From Duplicator
External Mode Internal Mode
IP namespace 2
IP namespace 1
Figure 3.2: External and Internal Mode for live cloning: P1 is the production, and D1 is the debug container,
the clone manager interacts with an agent which has drivers to implement live cloning.
migration where the original container is destroyed, the “Live Cloning” process used in Parikshan requires
both containers to be actively running, and be still attached to the original network. The challenge here is to
manage two containers with the same identities in the network and application domain. This is important, as
the operating system and the application processes running in it may be configured with IP addresses, which
cannot be changed on the fly. Hence, the same network identifier should map to two separate addresses, and
enable communication with no problems or slowdowns.
We now describe two modes (see Figure 3.2) in which cloning has been applied, followed by the algorithm
for live cloning:
• Internal Mode: In this mode, we allocate the production and debug containers to the same host node.
This would mean less suspend time, as the production container can be locally cloned (instead of
24

CHAPTER 3. PARIKSHAN
streaming over the network). Additionally, it is more cost-effective since the number of servers remain
the same. On the other hand, co-hosting the debug and production containers could potentially have
an adverse effect on the performance of the production container because of resource contention.
Network identities in this mode are managed by encapsulating each container in separate network
namespaces [LWN.net, ]. This allows both containers to have the same IP address with different
interfaces. The duplicator is then able to communicate to both these containers with no networking
conflict.
• External Mode: In this mode we provision an extra server as the host of our debug-container (this
server can host more than one debug-container). While this mechanism can have a higher overhead
in terms of suspend time (dependent on workload) and requires provisioning an extra host-node,
the advantage of this mechanism is that once cloned, the debug-container is totally separate and
will not impact the performance of the production-container. We believe that external mode will be
more practical in comparison to internal mode, as cloning is likely to be transient, and high network
bandwidth between physical hosts can offset the slowdown in cloning performance. Network identities
in external mode are managed using NAT [Srisuresh and Egevang, 2000] (network address translator)
in both host machines. Hence both containers can have the same address without any conflict.1
Algorithm 1 describes the specific process for cloning some production container P1 from Host H1 to
replica D1 on Host H2.
Step 6 here is the key step which determines the suspend time of cloning. It is important to understand
that the live cloning process before this step does not pause the production container and is doing a synch
of the file system on the fly. Step 2 ensures that the majority of the pages between the production machine
and the machine containing the debug container, are in synch. The suspend time of cloning depends on the
operations happening within the container between step 2 and step 4 (the first and the second sync), as this
will increase the number of dirty pages in the memory, which in turn will impact the amount of memory that
needs to be copied during the suspend phase. This suspend time can be viewed as an amortized cost in lieu of
instrumentation overhead. We evaluate the performance of live cloning in Section 3.4.1.
1Another additional mode can be Scaled Mode: This can be viewed as a variant of the external mode, where we can execute
debug analysis in parallel on more than one debug-containers each having its own cloned connection. This will distribute the
instrumentation load and allow us to do more analysis concurrently, without overflowing the buffer. We aim to explore this in the
future.
25

CHAPTER 3. PARIKSHAN
Algorithm 1 Live cloning algorithm using OpenVZ
1. Safety checks and pre-processing (ssh-copy-id operation for password-less rsync, checking pre-existing
container ID’s, version number etc.)
2. Create and synchronize file system of P1 to D1
3. Set up port forwarding, duplicator, and aggregator
4. Suspend the production container P1
5. Checkpoint & dump the process state of P1
6. Since step 2 and 5 are non-atomic operations, some files may be outdated. A second sync is run when
the container is suspended to ensure P1 and D1 have the same state
7. Resume both production and debug containers
3.2.2 Network Proxy Design Description
The network proxy duplicator and aggregator are composed of the following internal components:
• Synchronous Passthrough: The synchronous passthrough is a daemon that takes the input from a source
port, and forwards it to a destination port. The passthrough is used for communication from the production
container out to other components (which is not duplicated).
• Asynchronous Forwarder: The asynchronous forwarder is a daemon that takes the input from a source
port, and forwards it to a destination port, and also to an internal buffer. The forwarding to the buffer is
done in a non-blocking manner, so as to not block the network forwarding.
• Buffer Manager: Manages a FIFO queue for data kept internally in the proxy for the debug-container. It
records the incoming data, and forwards it a destination port.
• Dummy Reader: This is a standalone daemon, which reads and drops packets from a source port, or
optionally saves them for divergence checking (see section 3.2.4)
3.2.2.1 Proxy Network Duplicator:
To successfully perform online debugging, both production and debug containers must receive the same input.
A major challenge in this process is that the production and debug container may execute at different speeds
26

CHAPTER 3. PARIKSHAN
(debug will be slower than production): this will result in them being out of sync. Additionally, we need
to accept responses from both servers and drop all the traffic coming from the debug-container, while still
maintaining an active connection with the client. Hence simple port-mirroring and proxy mechanisms will
not work for us.
TCP is a connection-oriented protocol and is designed for stateful delivery and acknowledgment that each
packet has been delivered. Packet sending and receiving are blocking operations, and if either the sender or the
receiver is faster than the other the send/receive operations are automatically blocked or throttled. This can be
viewed as follows: Let us assume that the client was sending packets at XMbps (link 1), and the production
container was receiving/processing packets at YMbps (link 2), where Y < X . Then automatically, the speed
of link 1 and link 2 will be throttled to YMbps per second, i.e the packet sending at the client will be throttled
to accommodate the production server. Network throttling is a default TCP behavior to keep the sender and
receiver synchronized. However, if we also send packets to the debug-container sequentially in link 3 the
performance of the production container will be dependent on the debug-container. If the speed of link 3 is Z
Mbps, where Z < Y , and Z < X , then the speed of link 1, and link 2 will also be throttled to Z Mbps. The
speed of the debug container is likely to be slower than production: this may impact the performance of the
production container.
Our solution is a customized TCP level proxy. This proxy duplicates network traffic to the debug container
while maintaining the TCP session and state with the production container. Since it works at the TCP/IP
layer, the applications are completely oblivious to it. To understand this better let us look at Figure 3.1: Here
each incoming connection is forwarded to both the production container and the debug container . This is a
multi-process job involving 4 parallel processes (P1-P4): In P1, the asynchronous forwarder sends data from
client to the production service, while simultaneously sending it to the buffer manager in a non-blocking
send. This ensures that there is no delay in the flow to the production container because of slow-down in
the debug-container. In P2, the pass-through forwarder reads data from the production and sends it to the
client (downstream component). Process P3, then sends data from Buffer Manager to the debug container,
and Process P4 uses a dummy reader, to read from the production container and drops all the packets
The above strategy allows for non-blocking packet forwarding and enables a key feature of Parikshan,
whereby it avoids slowdowns in the debug-container to impact the production container. We take the advantage
of an in-memory buffer, which can hold requests for the debug-container, while the production container
continues processing as normal. A side-effect of this strategy is that if the speed of the debug-container is too
27

CHAPTER 3. PARIKSHAN
slow compared to the packet arrival rate in the buffer, it may eventually lead to an overflow. We call the time
taken by a connection before which the buffer overflows its debug-window. We discuss the implications of
the debug window in Section 3.2.3.
3.2.2.2 Proxy Network Aggregator:
The proxy described in Section 3.2.2.1 is used to forward requests from downstream tiers to production
and debug containers. While the network duplicator duplicates incoming requests, the network aggregator
manages incoming “responses” for requests sent from the debug container. Imagine if you are trying to debug
a mid-tier application container, the proxy network duplicator will replicate all incoming traffic from the client
to both debug and the production container. Both the debug container and the production, will then try to
communicate further to the backend containers. This means duplicate queries to backend servers (for instance,
sending duplicate ‘delete’ messages to MySQL), thereby leading to an inconsistent state. Nevertheless, to
have forward progress the debug-container must be able to communicate and get responses from upstream
servers. The “proxy aggregator” module stubs the requests from a duplicate debug container by replaying the
responses sent to the production container to the debug-container and dropping all packets sent from it to
upstream servers.
As shown in Figure 3.1, when an incoming request comes to the aggregator, it first checks if the connection
is from the production container or debug container. In process P1, the aggregator forwards the packets to
the upstream component using the pass-through forwarder. In P2, the asynchronous forwarder sends the
responses from the upstream component to the production container, and sends the response in a non-blocking
manner to the internal queue in the buffer manager. Once again this ensures no slow-down in the responses
sent to the production container. The buffer manager then forwards the responses to the debug container
(Process P3). Finally, in process P4 a dummy reader reads all the responses from the debug container and
discards them (optionally it can also save the output for comparison, this is explained further in section 3.2.4).
We assume that the production and the debug container are in the same state, and are sending the same
requests. Hence, sending the corresponding responses from the FIFO queue instead of the backend ensures:
(a) all communications to and from the debug container are isolated from the rest of the network, (b) the
debug container gets a logical response for all it’s outgoing requests, making forward progress possible, and
(c). similar to the proxy duplicator, the communications from the proxy to internal buffer is non-blocking to
ensure no overhead on the production-container.
28

CHAPTER 3. PARIKSHAN
3.2.3 Debug Window
Parikshan’s asynchronous forwarder uses an internal buffer to ensure that incoming requests proceed directly
to the production container without any delay, regardless of the speed at which the debug replica processes
requests. The incoming request rate to the buffer is dependent on the client, and is limited by how fast the
production container manages the requests (i.e. the production container is the rate-limiter). The outgoing
rate from the buffer is dependent on how fast the debug-container processes the requests.
Instrumentation overhead in the debug-container can potentially cause an increase in the transaction
processing times in the debug-container. As the instrumentation overhead increases, the incoming rate of
requests may eventually exceed the transaction processing rate in the debug container. If the debug container
does not catch up, it can lead to a buffer overflow. We call the time period until buffer overflow happens the
debug-window. The length of the debug-window depends on the size of the buffer, the incoming request rate,
and the overhead induced in the debug-container. For the duration of the debugging-window, we assume
that the debug-container faithfully represents the production container. Once the buffer has overflown, the
debug-container may be out of sync with the production container. At this stage, the production container
needs to be re-cloned, so that the replica is back in sync with the production and the buffer can be discarded. In
case of frequent buffer-overflows, the buffer size needs to be increased or the instrumentation to be decreased
in the replica, to allow for longer debug-windows.
The debug window size also depends on the application behavior, in particular how it launches TCP
connections. Parikshan generates a pipe buffer for each TCP connect call, and the number of pipes are
limited to the maximum number of connections allowed in the application. Hence, buffer overflows happen
only if the requests being sent in the same connection overflow the queue. For webservers, and application
servers, the debugging window size is generally not a problem, as each request is a new “connection.” This
enables Parikshan to tolerate significant instrumentation overhead without a buffer overflow. On the other
hand, database and other session based services usually have small request sizes, but multiple requests can be
sent in one session which is initiated by a user. In such cases, for a server receiving a heavy workload, the
number of calls in a single session may eventually have a cumulative effect and cause overflows.
To further increase the debug window, we propose load balancing debugging instrumentation overhead
across multiple debug-containers, which can each get a duplicate copy of the incoming data. For instance,
debug-container 1 could have 50% of the instrumentation, and the rest on debug-container 2. We believe such
a strategy would significantly reduce the chance of a buffer overflow in cases where heavy instrumentation
29

CHAPTER 3. PARIKSHAN
is needed. Section 3.4.2 explains in detail the behavior of the debug window, and how it is impacted by
instrumentation.
3.2.4 Divergence Checking
To understand divergence between the production and the debug container, we look at the following questions:
• Can production and debug container diverge?
Database operations, web-servers, application-servers for most typical scenarios generate the same
output as long as the state of the machine and the input request is the same. Since the production
and debug containers both start from the same state, and have received the same inputs, they should
continue to keep giving the same output. However, it is possible for the two containers to diverge
largely because of the following reasons:
– A non-deterministic bug in the deployed application can cause different execution schedules
in the production and debug-container resulting in divergent outputs. If parallelism is properly
handled output should still be deterministic regardless of the execution orders. However, in case
of a concurrency bug, it is possible that the bug is triggered in one of the containers and not the
other, leading to divergence.
– Another possible source of divergence is internal non-determinism due to timing, or random
number generators. For instance internal system timestamps or random generated id’s could
be included in the output values from an SOA application. However for most applications, we
believe that the semantically relevant output would not be relevant on internal non-deterministic
outputs.
– User instrumentation itself in the debug-container can cause divergence, by either changing
the state or execution ordering etc. We recommend Parikshan users to use instrumentation for
monitoring purposes alone, and have largely non-invasive instrumentation, which would not
lead to a state change. Most debugging techniques only try and understand the execution and
logic flow by observing/monitoring rather than changing state. Additionally, service-oriented
applications maintain a FIFO ordering for incoming requests. Hence, transactions are executed in
the order they are received. We found this to be the case in all the services we experimented on.
30

CHAPTER 3. PARIKSHAN
• Can we measure and monitor divergence?
To understand and capture this divergence, we offer an optional feature2 in Parikshan to capture and
compare the network output of the production-container with the debug-container received in the proxy.
Instead of discarding the network output from the debug container, we asynchronously take the hash of
the output, and compare it to the production containers corresponding output. This gives us a black-box
mechanism to check the fidelity of the replica based on its communication with external components.
Divergence checking, can be customized for each application, and different fields of the output can
potentially be discarded for comparing the output. Essentially, the degree of acceptable divergence is
dependent on the application behavior, and the operator’s wishes. For example, an application that
includes timestamps in each of its messages (i.e. is expected to have some non-determinism) could
perhaps be expected to have a much higher degree of acceptable divergence than an application that
should normally be returning deterministic results. Developers can use domain knowledge to design a
better divergence checker depending on what part of the output “must be” the same.
• How can we manage divergence, so as to continue faithful debugging?
Once the production and debug container have diverged, Parikshan’s debug replica can be re-synced
with the production container to get it back to the same state. This process of re-syncing can be
periodically repeated or triggered when divergence is discovered to make the debug-container faith-
fully represent the production execution. We discuss re-synchronization in further detail in the next
section 3.2.5
3.2.5 Re-Synchronization
As described in the last section it is possible for the production and debug containers to diverge. To manage
this divergence, and for the debug-container to faithfully represent the production application it is necessary
to re-synchronize the production container with the debug-container. Re-synchronization can be optimized
by using a COW [contributors, 2017] file system such as BTRFS [Rodeh et al., 2013], which can track deltas
from the initial live clone snapshot. This optimizes the re-synchronization process, as the only parts of the
system snapshot that need to be checked are the deltas from the last snapshot (we assume the snapshot is a
synch point when the production and debug-containers were live cloned).
2It is important to note that this feature is optional, and for better performance the packets can simply be dropped
31

CHAPTER 3. PARIKSHAN
This process of re-synchronization can be triggered in three different ways based on operator requirements:
• Periodically: Periodically check for divergence of the deltas, for the debug-container to have a high
fidelity representation of the production-container. Periodic re-synchronization ensures higher fidelity,
but may lead to un-necessary synchronizations, even though the containers have the same state.
• Divergent Output: Generally we care about output determinism, and as long as the output of the
two containers do not diverge (see section 3.2.4), there is no need for re-synchronization. Once the
output has diverged, the containers need to be re-synchronized for the debug-container to represent
the production container. To ensure such synchronization, the outputs from both containers must be
tracked, which puts a recording overhead on the production system in the proxy.
• Buffer Overflow: To avoid having any overhead for checking divergence in the system output, we
can trigger re-synchronization on buffer overflows. Buffer overflow is an indicator that the production
and debug containers have definitely diverged. The debugging in this scenario is “optimistic”, as the
production and debug containers could have divergent states even before the overflow. However unlike
the other two modes, there is no overhead because of periodic synchronization, and production output
recording.
3.2.6 Implementation
The clone-manager and the live cloning utility are built on top of the user-space container virtualization
software OpenVZ [Kolyshkin, 2006]. Parikshan extends VZCTL 4.8 [Furman, 2014] live migration facil-
ity [Mirkin et al., 2008], to provide support for online cloning. To make live cloning easier and faster, we used
OpenVZ’s ploop devices [OpenVZ, ] as the container disk layout. The network isolation for the production
container was done using Linux network namespaces [LWN.net, ] and NAT [Srisuresh and Egevang, 2000].
While Parikshan is based on light-weight containers, we believe that Parikshan can easily be applied to heavier-
weight, traditional virtualization software where live migration has been further optimized [Svard et al., 2015;
Deshpande and Keahey, 2016].
The network proxy duplicator and the network aggregator was implemented in C/C++. The forwarding in
the proxy is done by forking off multiple processes each handling one send/or receive a connection in a loop
from a source port to a destination port. Data from processes handling communication with the production
32

CHAPTER 3. PARIKSHAN
container, is transferred to those handling communication with the debug containers using Linux Pipes [Bovet
and Cesati, 2005]. Pipe buffer size is a configurable input based on user-specifications.
3.3 Discussion and Limitations
Through our case studies and evaluation, we concluded that Parikshan can faithfully reproduce many real
bugs in complex applications with no running-overhead. However, there may be several threats to the validity
of our experiments. For instance, in our case study, the bugs that we selected to study may not be truly
representative of a broad range of different faults. Perhaps, Parikshan’s low-overhead network record and
replay approach is less suitable to some classes of bugs. To alleviate this concern, we selected bugs that
represented a wide range of categories of bugs, and further, selected bugs that had already been studied in
other literature, to alleviate a risk of selection bias. We further strengthened this studied with a follow-up
categorization of 220 bugs in three real-world applications, finding that most of those bugs were semantic
in nature, and very few were non-deterministic, and hence, having similar characteristics to those 16 that
we reproduced. The following are some underlying limitations and assumptions regarding Parikshan’s
applicability:
3.3.1 Non-determinism
Non-determinism can be attributed to three main sources (1) system configuration, (2) application input,
and (3) ordering in concurrent threads. Live cloning of the application state ensures that both applications
are in the same “system-state” and have the same configuration parameters for itself and all dependencies.
Parikshan’s network proxy ensures that all inputs received in the production container are also forwarded to
the debug container. However, any non-determinism from other sources (e.g. thread interleaving, random
numbers, reliance on timing) may limit Parikshan’s ability to faithfully reproduce an execution. While our
current prototype version does not handle these, we believe there are several existing techniques that can be
applied to tackle this problem in the context of live debugging. However, as can be seen in our case-studies
above, unless there is significant non-determinism, the bugs will still be triggered in the replica, and can
hence be debugged. Approaches like statistical debugging [Liblit, 2004], can be applied to localize bug.
Parikshan allows debugger to do significant tracing of synchronization points, which is often required as an
input for constraint solvers [Flanagan and Godefroid, 2005; Ganai et al., 2011], which can go through all
33
CHAPTER 3. PARIKSHAN
synchronization orderings to find concurrency errors. We have also tried to alleviate this problem using our
divergence checker (Section 3.2.4)
3.3.2 Distributed Services
Large-scale distributed systems are often comprised of several interacting services such as storage, NTP,
backup services, controllers and resource managers. Parikshan can be used on one or more containers and
can be used to clone more than one communicating . Based on the nature of the service, it may be (a). Cloned,
(b). Turned off or (c). Allowed without any modification. For example, storage services supporting a replica
need to be cloned or turned off (depending on debugging environment) as they would propagate changes from
the debug container to the production containers. Similarly, services such as NTP service can be allowed to
continue without any cloning as they are broadcast based systems and the debug container cannot impact it in
anyway. Furthermore, instrumentation inserted in the replica, will not necessarily slowdown all services. For
instance, instrumentation in a MySQL query handler will not slowdown file-sharing or NTP services running
in the same container.
3.3.3 Overhead in Parikshan
The key motivation of Parikshan is to remove all potential overheads such that instrumentation in the debug-
container does not impact performance of the production application. We wish to clarify certain aspects
which may lead to questions regarding overheads in the mind of the reader:
• Container virtualization: Based on recent studies, user-space container virtualization give near native
performance [Felter et al., 2015; Xavier et al., 2013]. User-space containers essentially leverage process
level isolation and do not have a full just-in-time virtualization stack. Since several existing SOA
applications are deployed in virtualized cloud environments (including full virtualization), we believe
that there is no additional overhead from Parikshan as far as container virtualization is concerned
• Network Forwarding: Another potential source of overhead is network forwarding due to in-memory
copy of the data packets being forwarded to the debug-container. To evaluate (see section 3.4.3.2) the
overhead we looked at how network overhead can impact bandwidth and latency in both raw TCP
requests (micro-benchmarks), as well as how it impacted a few real-world applications (wikibench,
and mysql). When compared to SOA applications with proxies, we found that the impact in both
34
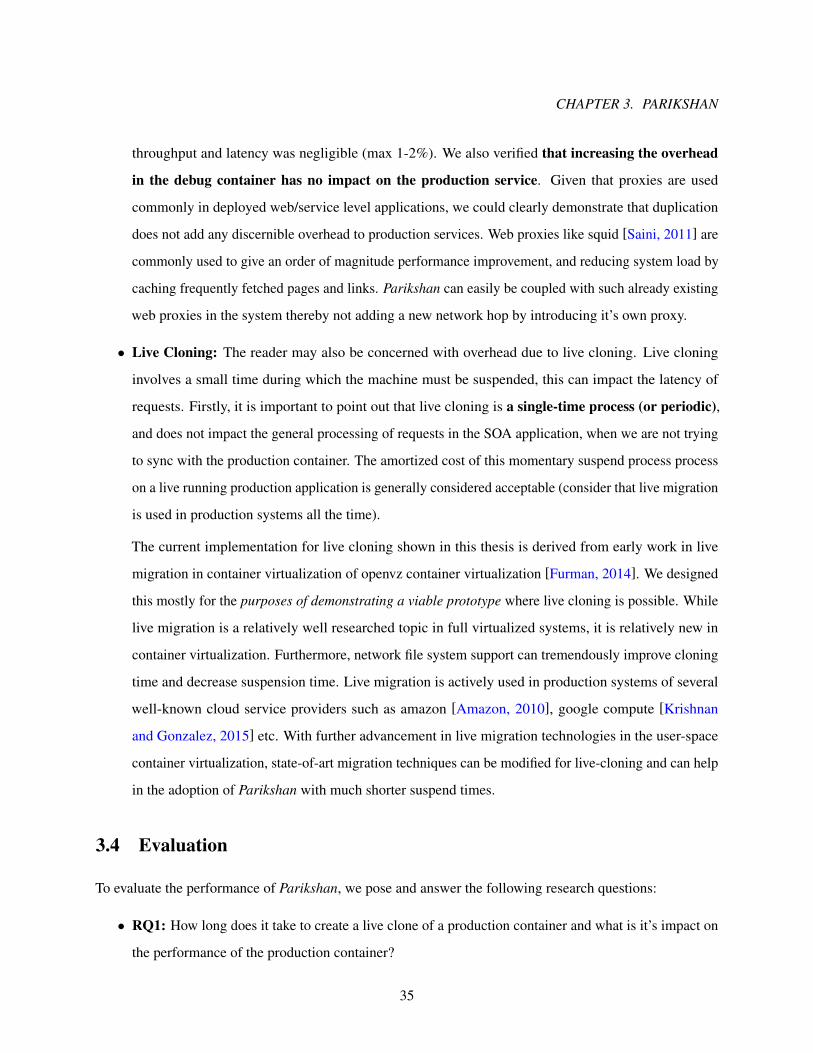
CHAPTER 3. PARIKSHAN
throughput and latency was negligible (max 1-2%). We also verified that increasing the overhead
in the debug container has no impact on the production service. Given that proxies are used
commonly in deployed web/service level applications, we could clearly demonstrate that duplication
does not add any discernible overhead to production services. Web proxies like squid [Saini, 2011] are
commonly used to give an order of magnitude performance improvement, and reducing system load by
caching frequently fetched pages and links. Parikshan can easily be coupled with such already existing
web proxies in the system thereby not adding a new network hop by introducing it’s own proxy.
• Live Cloning: The reader may also be concerned with overhead due to live cloning. Live cloning
involves a small time during which the machine must be suspended, this can impact the latency of
requests. Firstly, it is important to point out that live cloning is a single-time process (or periodic),
and does not impact the general processing of requests in the SOA application, when we are not trying
to sync with the production container. The amortized cost of this momentary suspend process process
on a live running production application is generally considered acceptable (consider that live migration
is used in production systems all the time).
The current implementation for live cloning shown in this thesis is derived from early work in live
migration in container virtualization of openvz container virtualization [Furman, 2014]. We designed
this mostly for the purposes of demonstrating a viable prototype where live cloning is possible. While
live migration is a relatively well researched topic in full virtualized systems, it is relatively new in
container virtualization. Furthermore, network file system support can tremendously improve cloning
time and decrease suspension time. Live migration is actively used in production systems of several
well-known cloud service providers such as amazon [Amazon, 2010], google compute [Krishnan
and Gonzalez, 2015] etc. With further advancement in live migration technologies in the user-space
container virtualization, state-of-art migration techniques can be modified for live-cloning and can help
in the adoption of Parikshan with much shorter suspend times.
3.4 Evaluation
To evaluate the performance of Parikshan, we pose and answer the following research questions:
• RQ1: How long does it take to create a live clone of a production container and what is it’s impact on
the performance of the production container?
35

CHAPTER 3. PARIKSHAN
• RQ2: What is the size of the debugging window, and how does it depend on resource constraints?
• RQ3: What is the performance overhead of our network duplicator on a service oriented applications?
In particular how does forwarding packets to the debugger impact latency, bandwidth and throughput
of the application? Does slowdown in debug container impact production service?
We evaluated the internal mode on two identical VM’s with an Intel i7 CPU, with 4 Cores, and 16GB
RAM each in the same physical host (one each for production and debug containers). We evaluated the
external mode on two identical host nodes with Intel Core 2 Duo Processor, 8GB of RAM. All evaluations
were performed on CentOS 6.5.
3.4.1 Live Cloning Performance
As explained in Section 3.2, a short suspend time during live cloning is necessary to ensure that both
containers are in the exact same system state. The suspend time during live cloning can be divided in 4 parts:
(1) Suspend & Dump: time taken to pause and dump the container, (2) Pcopy after suspend: time required
to complete rsync operation (3) Copy Dump File: time taken to copy an initial dump file. (4) Undump &
Resume: time taken to resume the containers. To evaluate “live cloning”, we ran a micro-benchmark of I/O
operations, and evaluated live-cloning on some real-world applications running real-workloads.
3.4.1.1 Real world applications and workloads:
To begin to study the overhead of live cloning, we performed an evaluation using five well-known applications.
Figure 3.3 presents the suspended times for five well-known applications when cloning a replica with
Parikshan. We ran the httperf [Mosberger and Jin, 1998a] benchmark on Apache and thttpd to compute max
throughput of the web-servers, by sending a large number of concurrent requests. Tradebeans and Tradesoap
are both part of the dacapo [Blackburn et al., 2006] benchmark “DayTrader” application. These are realistic
workloads, which run on a multi-tier trading application provided by IBM. PetStore [PetStore, ] is also a well
known J2EE reference application. We deployed PetStore in a 3-tier system with JBoss, MySQL and Apache
servers, and cloned the app-server. The input workload was a random set of transactions which were repeated
for the duration of the cloning process.
As shown in Figure 3.3, for Apache and Thttpd the container suspend time ranged between 2-3 seconds.
However, in more memory intensive application servers such as PetStore and DayTrader, the total suspend
36
CHAPTER 3. PARIKSHAN
Basic
Apach
e
Thttpd
TradeB
eans
TradeS
oap
PetStor
e
0
5
10
Tim
e(se
cond
s)Suspend & Dump Pcopy after suspend
Copy Dump File Undump & Resume
Figure 3.3: Suspend time for live cloning, when running a representative benchmark
time was higher (6-12 seconds). Nevertheless, we did not experience any timeouts or errors for the requests
in the workload3. However, this did slowdown requests in the workload. This shows that short suspend times
are largely not visible or have minimal performance impact to the user, as they are within the time out range
of most applications. Further, a clean network migration process ensures that connections are not dropped,
and are executed successfully. We felt that these relatively fast temporary app suspensions were a reasonable
price to pay to launch an otherwise overhead-free debug replica. To further characterize the suspend time
imposed by the live cloning phase of Parikshan, we created a synthetic micro-benchmark to push Parikshan
towards its limit.
3In case of packet drops, requests are resent both at the TCP layer, and the application layer. This slows down the requests for the
user, but does not drop them
37

CHAPTER 3. PARIKSHAN
103 104
5
10
15
I/O ops(Kbps)
Tim
e(s
ecs)
read-internalMode read-externalModewrite-internalMode write-externalMode
Figure 3.4: Live Cloning suspend time with increasing amounts of I/O operations
3.4.1.2 Micro Benchmark using I/O operations:
The main factor that impacts suspend time is the number of “dirty pages” in the suspend phase, which have
not been copied over in the pre-copy rsync operation (see section 3.2.1). To understand this better, we use fio
(flexible I/O tool for Linux) [Axboe, 2008], to gradually increase the number of I/O operations while doing
live cloning. We run the fio tool to do read and writes of random values with a controlled I/O bandwidth.
Additionally, we ensure that the I/O job being processed by fio is long enough to last through the cloning
process.
As shown in figure 3.4, read operations have a much smaller impact on suspend time of live cloning
compared to write operations. This can be attributed to the increase of “dirty pages” in write operations,
whereas for read, the disk image remains largely the same. The internal mode is much faster than the external
mode, as both the production and debug-container are hosted in the same physical device. We believe, that
38

CHAPTER 3. PARIKSHAN
for higher I/O operations, with a large amount of “dirty-pages”, network bandwidth becomes a bottleneck:
leading to longer suspend times. Overall in our experiments, the internal mode is able to manage write
operation up to 10 Mbps, with a total suspend-time of approx 5 seconds. Whereas, the external mode is only
able to manage up to 5-6 Mbps, for a 5 sec suspend time.
3.4.1.3 State-of-the-art live migration techniques
The live-cloning technique presented in this thesis is a prototype system to show a proof-of-concept imple-
mentation based on standard pre-copy live migration provided through the CRIU project [criulive, ]. Live
Migration implementation depends on several factors apart from the algorithm implementation, this includes
network-bandwidth, hardware support, file-systems etc. In this sub-section we discuss the performance
of state-of-art techniques in both real-world services and the academia. This will give us an idea of the
performance of live cloning when leveraging ideal hardware/softwares and network infrastructures.
In particular among enterprise IAAS service providers Google Compute uses live migration for mainte-
nance purposes, and provides it as a service to it’s users in it’s Google Compute Engine Platform. While it is
difficult to find any detailed evaluation studies for these platforms, Google Platform Engineers have shown
that blackout times (live migration suspend time) have steadily decreased and the median live migration
blackout times is now approximately 0.2s (March 2016) [googleblog, ]. Since Parikshan focuses on SOA
applications, we also looked into empirical evidence of live migration performance on real-world workloads -
RightScale a cloud management platform company tested GCE to see what performance users can expect,
and if live migration downgrades user-experience for SOA applications. The setup included 2 load balancers,
10 php webservers, and a master/slave pair of mysql. Google engineers were asked to do live migration while
a real-world workload was simulated on this setup. As per application logs there was no discernable impact
of live migration on the http requests [googleanectodal, ]. As per description from the blog the only way that
the authors came to know about the migration was because Google informed them that the machines were
migrated twice.
Apart from Google Compute, RedHat Enterprise Services also offer zero-downtime seamless live
migration as a service in user-space containers. A youtube demo video demonstrates CRIU being leveraged
to seamlessly transfer a container with a video being streamed [criulive, ], with no impact on the streaming
39

CHAPTER 3. PARIKSHAN
Figure 3.5: Reduction in median brownout times in Google Compute Platforms based on recent improvements
till March 2013
service. RHEL plans to introduce this live migration as a service to the next docker engine. Open source
IAAS solutions such as OpenStack [openstack, ] (which offers a multitude of compute hosting alternatives
(Xen, KVM, LXC)) also offers live migration depending on the compute service. Additionally LXD, and
OpenVZ (we have used OpenVZ) which are user-space container services are also introducing live migration
as an option. Video streaming, and gaming which are low latency applications are often considered as the
gold-standard for live migration, and based on several youtube videos current state-of-art live migration
demos support both uninterrupted user-experience when live migration is going on in the background. Studies
have shown that live migration actual downtime may vary considerably between applications, ranging from as
low as 60 ms when migrating a Quake game server [quakegame, ] to up to 3 seconds in case of particular HPC
benchmarks. While streaming and game services show that live migration can provide seamless low-latency
live migration, we could not find production level data for real-world deployments showing live migration
capability at stressed out workloads (the blog from RightScale earlier could be considered an instance of a
real-world workload with live migration, and the same for Google Compute’s overall down-time statistics).
A relatively older 2009 study [Voorsluys et al., 2009] on the cost of virtual machine live migration on
40

CHAPTER 3. PARIKSHAN
SLA guarantees of cloud services (web 2.0 services) has shown that in most cases service availability and
responsiveness during live migration is acceptable where it is governed by strict SLA guarantees. The results
showed that in an instance of a nearly oversubscribed system (serving concurrently 600 users) despite a
downtime of nearly 3 seconds the SLA guarantee for the 90% percentile was met and there was not disruption
of service. While a more stringent 99% percentile SLA can still be met when the workload is slightly less
(500 concurrent users). A more recent piece of work [Lee et al., 2016] shows that significant optimization
(upto 98%) can be done in the performance of live migration for back-and-forth live migration. This is a
common use-case when live migration is used for fault tolerance to turn over to a backup system. Parikshan
has a similar back-forth scenario where the debug container is often updated from the production container in
case of divergence. Essentially, similar optimizations could be used to reduce migration time and complexity
to do live migration after the initial live migration has been performed.
To answer RQ1, live cloning introduces a short suspend time in the production container dependent
on the workload. Write intensive workloads will lead to longer suspend times, while read intensive
workloads will take much less. Suspend times in real workload on real-world systems vary from
2-3 seconds for webserver workloads to 10-11 seconds for application/database server workloads.
Compared to external mode, internal mode had a shorter suspend time. A production-quality imple-
mentation could reduce suspend time further by rate-limiting incoming requests in the proxy, or using
copy-on-write mechanisms and faster shared file system/storage devices already available in several
existing live migration solutions.
3.4.2 Debug Window Size
To understand the size of the debug-window and it’s dependence on resources, we did some experiments
on real-world applications, by introducing a delay while duplicating the network input. This gave us some
real-world idea of buffer overflow and it’s relationship to the buffer size and input workload. Since it was
difficult to observe systematic behavior in a live system to understand the decay rate of the debug-window, we
also did some simulation experiments, to see how soon the buffer would overflow for different input criteria.
Experimental Results: We call the time taken to reach a buffer overflow the “debug-window”. As explained
earlier, the size of this debug-window depends on the overhead of the “instrumentation”, the incoming
workload distribution, and the size of the buffer. To evaluate the approximate size of the debug-window, we
41

CHAPTER 3. PARIKSHAN
Input Rate Debug Window Pipe Size Slowdown
530 bps, 27 rq/s 8 4096 1.8x
530 bps, 27 rq/s 8 sec 4096 3x
530 bps, 27 rq/s 72 sec 16384 3x
Pois., λ = 17 rq/s 16 sec 4096 8x
Pois., λ = 17 rq/s 18 sec 4096 5x
Pois.,λ = 17 rq/s 8 65536 3.2x
Pois.,λ = 17 rq/s 376 sec 16384 3.2x
Table 3.1: Approximate debug window sizes for a MySQL request workload
sent requests to both a production and debug MySQL container via our network duplicator. Each workload
ran for about 7 minutes (10,000 “select * from table” queries), with varying request workloads. We also
profiled the server, and found that is able to process a max of 30 req/s4 in a single user connect session. For
each of our experiments, we vary the buffer sizes to get an idea of debug-window. Additionally, we generated
a slowdown by first modeling the time taken by MySQL to process requests (27 req/s or 17req/s), and then
putting an approximate sleep in the request handler.
Initially, we created a connection and sent requests at 90% of the maximum request rate the server was
able to handle (27 req/s). We found that for overheads up-to 1.8x (approx) we experienced no buffer overflows.
For higher overheads the debug window rapidly decreased, primarily dependent on buffer-size, request size,
and slowdown.
We then sent requests at about 60% of the maximum request rate i.e. average 17 req/s. The requests
were sent at varying intervals using a poisson distribution. This varies the inter-request arrival time (this is
similar to production requests under normal workloads) and let’s the cloned debug-container catch up with
the production container during idle time-periods in between request bursts. We observed, that compared to
earlier experiments, there was more slack in the system. This meant that our system was able to tolerate a
much higher overhead (3.2x) with no buffer overflows.
Our experiments showed that idle time between requests can be used by the debug container to catch up
4Not the same as bandwidth, 30 req/s is the maximum rate of sequential requests MySQL server is able to handle for a user
session
42

CHAPTER 3. PARIKSHAN
to the production container. Most production systems run much below the maximum capacity, this would
allow the debug container to catch up to the production container thereby allowing for long debug windows.
400 500 600 700
0
100
200
300
Overhead(in percentage)
Deb
ugW
indo
w(i
nho
urs)
arrival 4MB/sarrival 2MB/sarrival 1MB/s
Figure 3.6: Simulation results for debug-window size. Each series has a constant arrival rate, and the buffer
is kept at 64GB.
Simulation Results: In our next set of experiments, we simulate packet arrival and service processing for a
buffered queue in SOA applications. We use a discrete event simulation based on an MM1 queue, which
is a classic queuing model based on Kendall’s notation [Kendall, 1953], and is often used to model SOA
applications with a single buffer based queue. Essentially, we are sending and processing requests based on
a Poisson distribution with a finite buffer capacity. In our simulations (see Figure 3.6), we kept a constant
buffer size of 64GB, and iteratively increased the overhead of instrumentation, thereby decreasing the service
processing time. Each series (set of experiments), starts with an arrival rate approximately 5 times less than
the service processing time. This means that at 400% overhead, the system would be running at full capacity
43

CHAPTER 3. PARIKSHAN
(for stable systems SOA applications generally operate at much less than system capacity). Each simulation
instance was run for 1000000 seconds or 277.7 hours. We gradually increased the instrumentation by 10%
each time, and observed the hitting-time of the buffer (time it takes for the buffer to overflow for the first
time). As shown there is no buffer overflow in any of the simulations until the overhead reaches around
420-470%, beyond this the debug-window decreases exponentially. Since beyond 400% overhead, the system
is over-capacity, the queue will start filling up fairly quickly. This clarifies the behavior we observed in our
experiments, where for lower overheads (1.8-3.2x) we did not observe any overflow, but beyond a certain
point, we observed that the buffer would overflow fairly quickly. Also as shown in the system, since the
buffer size is significantly larger than the packet arrival rate, it takes some time for the buffer to overflow
(several hours). We believe that while most systems will run significantly under capacity, large buffer sizes
can ensure that our debug-container may be able to handle short bursts in the workload. However, a system
running continuously at capacity is unlikely to tolerate significant instrumentation overhead.
To answer RQ2, we found that the debug-container can stay in a stable state without any buffer
overflows as long as the instrumentation does not cause the service times to become less than the
request arrival rate. Furthermore, a large buffer will allow handling of short bursts in the workload
until the system returns back to a stable state. The debug-window can allow for a significant slow-
down, which means that many existing dynamic analysis techniques [Flanagan and Godefroid, 2005;
Nethercote and Seward, 2007], as well as most fine-grained tracing [Erlingsson et al., 2012;
Kasikci et al., 2015] can be applied on the debug-container without leading to an incorrect state.
3.4.3 Network Duplication Performance Overhead
As explained in section 3.3.3, a potential overhead in Parikshan is the network level duplication and
forwarding. For each packet received by the duplicator it is copied to the outgoing buffer of connections to
both the production and the debug container. The communication to the production and the debug container
is done in parallel, using non-blocking I/O. This ensures that packet forwarding to the debug-container has
a negligible impact on packet-forwarding to production. Another potential overhead can be because of the
extra-hop introduced by a proxy. This is easily avoided by coupling our network duplication with existing
44

CHAPTER 3. PARIKSHAN
proxies in the deployed application. Proxies are commonly used in most SOA applications, for security, and
performance purposes [Saini, 2011] (they allow caching which gives significant performance boosts).
Figure 3.7: Performance impact on network bandwidth when using network duplication. The above chart
shows network bandwidth performance comparison of native execution, with proxy
In this section, we have focused on the end-to-end performance overhead of a system running with
the debug container and duplicating the network traffic. For our testing purposes, we have run each of the
experiments in the following three modes :
• Native: In this mode we only run the client and the server without any proxy or any external network
forwarding.
• Proxy Only: In this mode we have a proxy which is forwarding packets from the client to the server,
without any duplication.
• Duplication: Here we have Parikshan’s network duplicator, which is forwarding packets from the
client to the server, as well as to the debug container.
The server and the proxy run on the same physical machine, in each of the the three modes. The
client, as well as the debug container are run on a different physical machines to avoid resource contention.
45

CHAPTER 3. PARIKSHAN
Additionally, all components are in the same local subnet.
We divide our evaluation into two parts, first into micro-benchmarks which focus on raw TCP level
connection performances, such as impact on bandwidth and latency. Next we look at the impact on two
real-world applications - MediaWiki [Barrett, 2008], and MySQL [MySQL, 2001].
3.4.3.1 Micro-benchmark - Bandwidth and Latency
In order to understand the overhead that our duplicator can have on network performance, we look at how
much the network forwarding of TCP packets is impacted by duplication in the proxy. This can be in two
different aspects, firstly throughput (or bandwidth), and secondly latency.
Network Bandwidth: To understand the impact of network duplication on the bandwidth between a client
and a server we run a micro-benchmark using iperf [Tirumala et al., 2005] - a well known tool for performing
network throughput measurements. It can test either TCP or UDP communication throughput measurements.
To perform an iperf test the user must establish both a server (to discard traffic) and a client (to generate
traffic).
Figure 3.7 shows the bandwidth of native execution compared to that with a proxy forwarding packets
and a duplicator, which also sends packets to the debug container apart from the production container. The
maximum bandwidth which can be supported by the native execution was found to be 941Mb/s, with a
standard deviation of 2Mb/s, the setup with the proxy had no discernible difference and had the exact same
performance over 10 execution runs. When duplicating packets to the debug container as well, the perfor-
mance comes down slightly to 938, with a standard deviation of 3Mb/s. This was an average slowdown of
less than 0.5%, when compared to production and debug containers. We believe this difference in bandwidth
is negligible for most practical applications and will not impact application end-to-end performance.
Network Latency: Network latency is the end-to-end round trip time for the completion of any request. It is
important to maintain the best possible latency, as often SOA applications are user-facing and any slow-down
in latency impacts user-experience. Once again to measure Parikshan’s duplication’s impact on network
latency, we consider the three modes given above: native, proxy only, and duplication.
We first used httping [Aivazov and Samkharadze, 2012] to measure latency of an http HEAD request and
observe the difference in the performance in all three modes. Unlike GET requests, HEAD requests leaves
46

CHAPTER 3. PARIKSHAN
the data and only gets the header information of the packet requested. Hence, it is important to note that we
are primarily looking at local network performance for HTTP HEAD requests, rather than back-end server
processing time. Table 3.2 shows the latencies observed for the three modes in microseconds:
Direct Proxy Duplication
0.5 0.904 0.907
Table 3.2: httping latency in micro-seconds for direct, proxy and duplication modes for HTTP HEAD
requests
As can be seen the latencies observed by the client, when running with only the proxy, compared to with
network duplication were found to be almost equal. The difference in the latencies between direct and proxy
can be attributed to the extra-hop between the proxy and the production container.
Since ping requests do not process any data, we followed up with measurements of page fetch requests,
where we fetched a random 1MB file from a thttpd webserver [Poskanzer, 2000] using the wget [GNU-OS,
2016] http download tool. In order to measure the impact of slowdown in the debug container on the latency
observed by the client, we kept the file url the same and increased the file size in the debug container. This
emulates a gradual slow-down in the debug-container, and allows us to observe it’s impact on the client.
Table 3.3 shows our results with different file sizes in the debug container. The first column shows the size of
the file being fetched in the debug-container, and the last column shows the average time taken to download
the file. As can be seen the time taken to download the file, from the debug container gradually increases
as the file size is increased. However, the download time from our duplication proxy, when duplicating the
request to the debug container does not change. This shows that a slow-down in the debug-container does
not negatively impact the client facing latencies. This demostrates Parikshan’s key advantage in avoiding
instrumentation overhead impact on end-users.
3.4.3.2 End-to-end overhead in real-world applications
In this section we look at end-to-end performance, of network duplication when seen in the context of a
real-world application.
47

CHAPTER 3. PARIKSHAN
File Size Direct Proxy Duplication Debug Container
1MB 0.015s 0.017s 0.017s 0.0165
10MB – – 0.0168s 0.094s
100MB – – 0.0174s 0.898s
Table 3.3: File download times when increasing file size in the debug-container. Please note the file size is
not increased for the proxy and direct communication. The last column shows the time taken for downloading
the file from the debug container.
Latency
Figure 3.8: Latencies in all different modes for wikipedia trace
Firstly we re-created a scaled down deployment of Wikipedia [Wikipedia, 2016a], a well known free
online open-source encyclopedia. The wikipedia database and application called mediawiki [Barrett, 2008] is
an open-source LAMP (Linux, apache, mysql and PHP stack) application and allows developers to create
their own wiki websites. We leverage wikipedia traces and dumps available through the wikibench [van
Baaren, 2009] database 5 to re-create the wikipedia application and database in one of our containers. Once
the website was created we used a small sample set of wikipedia HTTP requests traces from 2008, and
5Please note this database dump does not have most of the wiki images so most of the HTTP requests in our traces, which are
image specific had to be filtered out. Several post requests, which need user log-ins were also filtered out. Hence, we looked at only
48

CHAPTER 3. PARIKSHAN
Direct Proxy DuplicationProxy
Overhead
Duplication
Overhead
0.29702582 0.306969121 0.306230625 3.347 -0.2405
0.061174009 0.06154608 0.062500115 6.08 1.55
0.05342713 0.056767733 0.055644723 6.25 -1.97825
0.054240793 0.054382414 0.054373268 0.261 -0.0168
Table 3.4: Snapshot of the first four latencies of GET/POST requests(secondss) from wikipedia, and the
overhead of proxy compared to direct mode, and duplication over proxy mode
compared the latency of about 500 HTTP requests in three modes of deployment as we have explained before
: Native, Proxy and Duplication. We then compared the average change in latencies for each requests.
Table 3.4 gives a snapshot of 4 such URL’s and it’s latencies. The second last column gives the overhead
of proxy compared to direct communication, whereas the second gives the percentage difference between the
duplicate mode as compared to proxy mode. We found that the proxy was generally slower than the direct
connection, the slowdown ranged from 1-8%, more importantly we found that when comparing the latencies
in the duplication mode to our proxy mode, the overhead was negligible and in most cases was less that 2%.
Accounting for some variance because of caching, we believe the overhead in a realistic system running with
a debugging container will have negligible impact to a similar system running with only a proxy.
Apart from wikipedia traces we also looked into mysql-server. Mysqlslap is a diagnostic program
designed to emulate client load for a MySQL server, and to report the timing of each stage. It works as
if multiple clients are accessing the server. The mysqlslap tool runs several iterations of the queries over
multiple different parallel connections, and gives an average distribution of the response time for running all
queries. The queries and the test database used is a sample employee database initially provided by Siemens
Corporate Research. The database contains about 300,000 employee records with 2.8 million salary entries.
The export data is 167 MB, which is not huge, but heavy enough to be non-trivial for testing.
We used 5 sample queries, which create 20 concurrent connections, and iterate each of the queries from
each of the concurrent threads in 10 iterations. The mysqlslap reports the average number of seconds to run
all queries. As is shown below in table 3.5, the average amount of time to run all the queries in each of the
three modes was found to have minimal difference between the proxy and the duplication modes.
the requests from the traces which were successful based on the data snapshot available
49

CHAPTER 3. PARIKSHAN
Modes mysqlslap
Direct 8.220s
Proxy 8.230s
Duplication 8.232s
Table 3.5: Average time to finish mysqlslap queries on a sample database
To answer RQ3, we first separated the overhead comparisons between that due to duplication, and that
due to an extra-hop because of a proxy. We were able to verify that the performance in terms of both
latency and throughput of the duplicator when compared to a similar system with only a proxy is
nearly the same (<2%). The overhead in terms of latency of the proxy vs native communication on
was less than 8% depending on the size of the request and the request processing time in the server.
We also verified that slowdown in the debug container does not have any impact on production
service.
3.5 Summary
Parikshan is a novel framework that uses redundant cloud resources to debug production SOA applications
in real-time. Compared to existing monitoring solutions, which have focused on reducing instrumentation
overhead, our tool decouples instrumentation from the production container. This allows for high level
instrumentation, without impacting user experience.
We demonstrated a proof of concept live cloning process, and were able to show that the impact on
network bandwidth was less than 0.5% and for network latency was less than 0.3%. We also ran Parikshan
on some real world workloads on systems like Wikipedia to show it’s real world applicability.
50

CHAPTER 4. IS NETWORK REPLAY ENOUGH?
Chapter 4
Is network replay enough?
4.1 Overview
Several existing record and replay systems have a high performance overhead as they record events, at a low
level of non-determinism to enable deterministic replay. However, most bugs in service oriented application
do not require such low level of recording. In this chapter, we show that most bugs found in real-world SOA
applications can be triggered by network level replay.
To validate this insight, we selected sixteen real-world bugs, applied Parikshan, reproduced them in a
production container, and observed whether they were also simultaneously reproduced in the replica. For
each of the sixteen bugs that we triggered in the production environments, Parikshan faithfully reproduced
them in the replica.
We selected our bugs from those examined in previous studies [Lu et al., 2005; Yuan et al., 2014],
focusing on bugs that involved performance, resource-leaks, semantics, concurrency, and configuration. We
have further categorized these bugs whether they lead to a crash or not, and if they can be deterministically
reproduced. Table 4.1 presents an overview of our study.
In the rest of this chapter we discuss the bug-reproduction technique in each of these case-studies in
further detail.
51

CHAPTER 4. IS NETWORK REPLAY ENOUGH?
Bug Type Bug ID Application Symptom/CauseDeterm-
inisticCrash Trigger
Performance
MySQL #15811 mysql-5.0.15 Bug caused due to multiple calls in a loop Yes No Repeated insert into table
MySQL #26527 mysql-5.1.14 Load data is slow in a partitioned table Yes No Create table with partition and load
data
MySQL #49491 mysql-5.1.38 calculation of hash values inefficient Yes No MySql client select requests
Concurrency
Apache #25520 httpd-2.0.4 Per-child buffer management not thread
safe
No No Continuous concurrent requests
Apache #21287
httpd-
2.0.48,
php-4.4.1
Dangling pointer due to atomicity viola-
tion
No Yes Continuous concurrent request
MySQL #644 mysql-4.1 data-race leading to crash No Yes Concurrent select queries
MySQL #169 mysql-3.23 Race condition leading to out-of-order
logging
No No Delete and insert requests
MySQL #791 mysql-4.0 Race - visible in logging No No Concurrent flush log and insert re-
quests
Semantic
Redis #487 redis-2.6.14 Keys* command duplicate or omits keys Yes No Set keys to expire, execute specific
reqs
Cassandra #5225 cassandra-1.5.2 Missing columns from wide row Yes No Fetch columns from cassandra
Cassandra #1837 cassandra-0.7.0 Deleted columns become available after
flush
Yes No Insert, delete, and flush columns
Redis #761 redis-2.6.0 Crash with large integer input Yes Yes Query for input of large integer
Resource LeakRedis #614 redis-2.6.0 Master + slave, not replicated correctly Yes No Setup replication, push and pop
some elements
Redis #417 redis-2.4.9 Memory leak in master Yes No Concurrent key set requests
ConfigurationRedis #957 redis-2.6.11 Slave cannot sync with master Yes No Load a very large DB
HDFS #1904 hdfs-0.23.0 Create a directory in wrong location Yes No Create new directory
Table 4.1: List of real-world production bugs studied with Parikshan
4.2 Applications Targeted
In our case-studies we have targeted the following applications: MySQL, Apache, Redis, Cassandra, HDFS.
Apart from this we have also tried Parikshan on PetStore [PetStore, ] a J2EE JBOSS [Jamae and Johnson,
2009] multi-tier application. We also did a survey of 220 real-world bugs, and found them similar to the bugs
presented in this case study (more details regarding the survey can be found at section 4.4). In this section we
explain the applications that have been used in the bug case-studies.
52

CHAPTER 4. IS NETWORK REPLAY ENOUGH?
4.2.1 MySQL
MySQL [MySQL, 2001] is a well known open-source database application for structured SQL queries.
MySQL is most commonly deployed as a standalone centralized server, and can also be deployed as a cluster
service with several servers sharing the data. It allows for atomic updates with strict consistency models,
so there is a single point of query, and is usually queried using customized MYSQL protocol, which is
avialable in several mysql libraries or clients in different languages. Several modern websites and transaction
systems are built on MySQL. Other softwares which are very similar in deployment to MySQL are Oracle
DB [Loney, 2004], and PostgrepSQL [Momjian, 2001].
In our examples we have used the native mysql client application provided with the mysql community
server distribution. When using mysql, you can either use an anonymous user, a registered user or an admin.
We have used the default mysql/mysql user or anonymous user to run our queries.
4.2.2 Apache HTTPD Server
Apache httpd server [Fielding and Kaiser, 1997] is the most well known webservers with millions of active
websites being hosted on it. It responds to HTTTP requests from user-facing browsers, and sends responses
from downstream applications to be rendered back in the browser. Webservers can run standalone, multi-tier
in a load-balanced fashion or can act as proxies for security purposes. Other softwares which are similar to
apache are nginx [Reese, 2008], and thttpd [Poskanzer, 2000] amongst many others.
Connections to Apache HTTPD servers are made through browsers. For our testing, we have typically
used wget [GNU-OS, 2016] or httpref [Mosberger and Jin, 1998b] command line utilities to run single or
multiple workloads of http queries.
4.2.3 Redis
Redis [Carlson, 2013] is an open-source, in-memory, networked key-value storage service. The name Redis
means Remote Dictionary Server. Redis is often ranked the most popular key-value database, and has also
been ranked the #4 NoSQL database in user satisfaction and market presense based on it’s reviews. It is very
light-weight and is commonly used in containers. Redis maps keys to types of values, and can support many
abstract data types apart from strings (e.g. lists, sets, hash tables etc.). It is also often used as a queuing
system. Other similar softwares include BerkleyDB [Olson et al., 1999], and memcached [Fitzpatrick, 2004]
53

CHAPTER 4. IS NETWORK REPLAY ENOUGH?
Redis provides bindings for several languages, and has several client libraries available. For our experi-
ments we have used the redis-cli client given with the default distribution.
4.2.4 Cassandra
Cassandra [Lakshman and Malik, 2010] is a well known wide column store NoSQL database, designed
to handle large amounts of data across many commodity servers, providing high availability with no
single point of failure. Cassandra offers robust support for clusters spanning multiple datacenters, with
asynchronous masterless replication allowing low latency operations for all clients. Other similar systems
include MongoDB [Banker, 2011], HBase [George, 2011] etc.
Installing the correct version of cassandra which has this bug as well as it’s dependencies is a little tricky.
The re-compilation of the version which has the bug is significantly difficult as some of the dependency
libraries are no longer available using simply their Apache IVY build files. We provide these libraries as a
part of our package in github project. We also provide a python script for the cassandra client to trigger the
bug conditions. We use the standard python cassandra client for our testing.
4.2.5 HDFS
The Hadoop distributed file system (HDFS) [Borthakur, 2008] is a distributed, scalable, and portable file
system written in Java for the Hadoop framework. A Hadoop cluster has nominally a single namenode plus a
cluster of datanodes, although redundancy options are available for the namenode due to its criticality. Each
datanode serves up blocks of data over the network using a block protocol specific to HDFS. The file system
uses TCP/IP sockets for communication. Clients use remote procedure call (RPC) to communicate between
each other. HDFS stores large files (typically in the range of gigabytes to terabytes[64]) across multiple
machines. It achieves reliability by replicating the data across multiple hosts. Other similar systems include
Ceph [Weil et al., 2006], Lustre [Yu et al., 2007].
In our implementation we use HDFS binary client which comes pre-packaged with Hadoop. We deployed
a two node cluster with one master and and two slaves. The master as primary name-node, and one of the
slaves as the secondary name-node.
54

CHAPTER 4. IS NETWORK REPLAY ENOUGH?
4.3 Case Studies
4.3.1 Semantic Bugs
The majority of the bugs found in production SOA systems can be categorized as semantic bugs. These
bugs often happen because an edge condition was not checked during the development stage or there was
a logical error in the algorithm etc. Many such errors result in an unexpected output or possibly can crash
the system. We recreated 4 real-world production bugs from Redis [Carlson, 2013] queuing system, and
Cassandra [Lakshman and Malik, 2010] a NoSQL database.
4.3.1.1 Redis #761
In this subsection we describe the Redis #761 semantic bug
Cause of the error:
The Redis #761 is an integer overflow error. This error is triggered, when the client tries to insert and store
a very large number. This leads to an unmanaged exception, which crashes the production system. Integer
overflow, is a common error in several applications. We classify this as a semantic bug, which could have
been fixed with an error checking condition for large integers.
Steps for reproduction:
1. Start a redis service with log level set to verbose. Setting loglevel to verbose ensures that we can
view whatever is going on inside the service. This is our production container.
2. Create a live clone of the service mapped to a parallel debug container which will be used to visualize
debugging
3. Start cloning the incoming traffic to both the production container and the debug container asyn-
chronously using Parikshan’s network duplicator
4. Send the following request through the redis client:
zinterstore out 9223372036854775807 zset zset2
55

CHAPTER 4. IS NETWORK REPLAY ENOUGH?
This tries to set the variable to the integer in the request, and leads to an integer overflow error. The
integer overflow error is simultaneously triggered both in the production and the debug containers.
Since this is a crashing bug, both the production and debug containers crash once the bug is triggered.
How to debug with Parikshan
Debugging such a bug could be done by having recording or logging turned on for record and replay
infrastructures in the debug container before the bug happened (or at all times). This debugging scenario is
described further in Staged Record and Replay (see section 6.4.3). This would remove any instrumentation
overhead from the production container, and the bug would be triggered both in the debug and production
container leading to a crash. Replaying the recorded logs will significantly reduce the amount of time to fix
this bug.
Advantage
The key advantage here is that the instrumentation overhead of record-and-replay can be avoided using
staged recording.
Alternative mechanisms without Parikshan
Without Parikshan, the bug could be debugged using a record-replay on the production system itself,
which would add overhead and impact user-experience (depends on instrumentation overhead). Alternatively,
debuggers could find the root-cause by analyzing the integer overflow exception to find the root-cause of the
bug, which along with trial and error could potentially help in fixing the error.
4.3.1.2 Redis #487
In this subsection we describe the Redis #487 semantic bug
Cause of the error:
Redis #487 is a bug reported by the user where expired keys were still being retained in Redis, despite them
being deleted by the user. The error is a semantic bug because of an unchecked edge condition. While this
error does not lead to any exception or any error report in application logs, it gives the user a wrong output.
In the case of such logical errors, the application keeps processing, but the internal state can stay incorrect.
The bug impacts only clients who set keys, and then expire them.
56

CHAPTER 4. IS NETWORK REPLAY ENOUGH?
Steps for reproduction:
1. Start a redis service with log level set to verbose. Setting loglevel to verbose ensures that we can
view whatever is going on inside the service. This is our production container.
2. Create a live clone of the service mapped to a parallel debug container which will be used to visualize
debugging
3. Start cloning the incoming traffic to both the production container and the debug container asyn-
chronously using Parikshan’s network duplicator
4. flush all keys using flushall command
5. set multiple keys using set key value command
6. expire a key from one of them using expire s 5 command
7. run the keys * command. This will list keys which should have expired
At the end it can be seen that the expired keys can be listed and accessed in both the production and
debug container. This is a persistent error, which does not impact most other aspects of the service. The
debug container can be used to look at the transactional logs, and have further instrumentation to understand
the root cause of the error.
How to debug with Parikshan
Redis #487 can be debugged using Parikshan, by either using a proactive staged record and replay, where
recording has already been turned on for the container . Alternatively, Parikshan can also be useful for a
post-facto analysis of the bug (analyzing the bug in debug container after it has been triggered). Since the
machine is still running but not crashed yet, a debugger could reason about the machine by running more
flush/expire key queries (they do not need to be queries being sent by the user), and instrument and get the
path of execution in the codebase. This can help quickly isolate the error. Since the running state has been
”cloned”, and the bug itself is persistent it gives a quick mechanism to debug the error.
Advantage
57

CHAPTER 4. IS NETWORK REPLAY ENOUGH?
For proactive approach, Parikshan helps to avoid instrumentation overhead imposed by monitoring for a
record-replay system. On the other hand for post-facto approach, the main advantage of Parikshan is that it
gives a quick debug environment which clones the original system state.
Alternative mechanisms without Parikshan
Under normal circumstances the user would have to re-create the application state in a test-environment
where this bug could be re-created based on transaction logs (or better yet, a snapshot of the VM could be
taken and re-started offline in a way similar to live cloning). The disadvantage would be that there would be
valuable time lost in re-creating this environment, a feature automated in Parikshan.
4.3.1.3 Cassandra #5225
In this subsection we describe the Cassandra #5225 semantic bug
Cause of the error:
This error happens when a user requests columns from an extremely wide row. The output of the query,
has missing columns when requesting specific columns. The data is still in the table, just that it might not be
returned to the user. Taking closer look, Cassandra is reading from the wrong column index. A problem was
found with the index checking algorithm, whereby the order in which data was being read to be indexed had
some unhandled edge cases
Steps for reproduction:
1. Start a cassandra service in the production container
2. Use Parikshan’s live cloning facility to create a clone of cassandra in the debug-container.
3. Connect to cassandra using a python client
4. Insert a large number of columns into cassandra (so that it is a wide row). For our testing we used
pycassa python cassandra client. The following code shows column insertion.
if need_to_populate:
58

CHAPTER 4. IS NETWORK REPLAY ENOUGH?
print "inserting ..."
for i in range(100000):
cols = dict((str(i * 100 + j), ’value%d’ % (i * 100 + j)) for
j in range(100))
CF1.insert(’key’, cols)
if i % 1000 == 0:
print "%d%%" % int(100 * float(i) / 100000)
5. Fetch the columns in a portion of ranges.The following is an example code
for i in range(1000):
cols = [str(randint(0, 99999)) for i in range(3)]
expected = len ( set( cols ) )
results = CF1.get(’key’, cols)
if len(results) != expected:
print "Requested %s, only got %s" % (cols, results.keys())
6. At the end of this test case you can observe that some columns were dropped in the response to the
client.
How to debug with Parikshan
This is a tricky bug to re-create as the bug is triggered by an edge condition when a large number of
columns are inserted. The error can be ideally found by doing post-facto analysis of the live clone by first
capturing incoming requests, and their responses in the debug container once the error has been reported.
An initial understanding of the kind of requests which are failing, can lead to debuggers issuing their own
requests, and tracing the execution through the application (using a debugger, or heavy instrumentation). This
will help localize the bug.
Advantage
Similar to previous bugs, post-facto analysis can be easily done by re-creating the state of the machine
and tracing incoming requests to see which kind of requests are failing. The debug container also provides a
safe environment to debug (execute requests etc) to find execution traces and localize the problem.
59

CHAPTER 4. IS NETWORK REPLAY ENOUGH?
Alternative mechanisms without Parikshan
Since this bug is dependent on the system state it’s difficult to know what led to certain queries failing.
Alternative mechanisms would require taking a snapshot, and then running queries which were reported to
have failed.
4.3.1.4 Cassandra #1837
In this subsection we describe the Cassandra #1837 semantic bug
Cause of the error:
The main symptom of this error was that deleted columns become available again after doing a flush.
With some domain knowledge, a developer found the error. This happens because of a bug in the way deleted
rows are not properly interpreted once they leave the memory table (memtable). Hence, the flush operation
does not correctly delete the data. Thus querying for the data after the operation continues to shows content
even after deletion.
Steps for reproduction:
1. Start a cassandra service in the production container
2. Use Parikshan’s live cloning facility to create a clone of cassandra in the debug-container.
3. Using cassandra’s command line client, insert columns into cassandra without flushing
4. delete the inserted column
5. flush the columns so that the deletion should be committed
6. query for the columns in the table
7. observe that the columns have not been deleted and are retained.
Once again we have provide dockerized containers for Cassandra, as well as execution scripts for the
client.
How to debug with Parikshan
60

CHAPTER 4. IS NETWORK REPLAY ENOUGH?
Similar to previous semantic bugs, staged record-and-replay or a post-facto analysis can be used to find
out the root-cause. One of the advantages of this bug is that once the system state is reached all future flush
requests result in the same behavior. Hence, an execution trace on subsequent flush queries executed in the
debug container can help in finding the root-cause (i.e. that the delete query has not properly marked the
columns for deletion).
Advantage
Post-facto analysis can be easily done by re-creating the state of the machine and tracing incoming
requests to see which kind of requests are failing. The debug container also provides a safe environment to
debug (execute requests etc) to find execution traces and localize the problem.
Alternative mechanisms without Parikshan
Alternative mechanisms would require either a record-replay system, or taking a snapshot, and then
running queries which were reported to have failed.
4.3.1.5 Summary
Broadly, the major advantage that Parikshan provides in most semantic bugs is two-fold:
• Firstly it provides a mechanism to do staged-record and replay thereby removing the overhead of a
normal record-replay system from the production environment.
• For post-facto analysis (starting the debug container after the bug was observed), it allows the debugger
to observe incoming requests, dig deeper into the system state and run execution trace/ system debugger
on suspect queries. This adhoc trial and error process may help in localizing the root cause much faster.
It can be argued that the advantage in some sense is limited in semantic bugs, as staged record-replay has
a cost of an extra machine (as well as potentially re-cloning).
4.3.2 Performance Bugs
These bugs do not lead to crashes but cause significant impact to user satisfaction. A casestudy [Jin et al.,
2012] showed that a large percentage of real-world performance bugs can be attributed to uncoordinated
61

CHAPTER 4. IS NETWORK REPLAY ENOUGH?
functions, executing functions that can be skipped, and inefficient synchronization among threads (for
example locks held for too long etc.). Typically, such bugs can be caught by function level execution tracing
and tracking the time taken in each execution function. Another key insight provided in [Jin et al., 2012] was
that two-thirds of the bugs manifested themselves when special input conditions were met, or execution was
done at scale. Hence, it is difficult to capture these bugs with traditional offline white-box testing mechanisms.
4.3.2.1 MySQL #26527
In this subsection we describe the MySQL #26527 performance bug
Cause of the error:
This error has to do with a caching problem for large inserts where large amount of data in a partitioned
table. It was reported that inserting data with LOAD DATA INFILE is very slow with partitioned table and
sometimes crawls to a stop. The reason behind the error was found to be that MySQL uses a handler function
to prepare caches for large inserts. As high availability partitioner didn’t allow these caches for underlaying
tables, the inserts were much slower.
Steps for reproduction:
1. Start an instance of the MySQL server in the production container
2. Using Parikshan’s live cloning capability create a clone of the production container. This is our
debug container
3. Start network duplicator to duplicate network traffic to both the production and debug containers
4. connect to the production container using mysqlclient
5. using mysql-client run the following query
CREATE TABLE t1 (
f1 int(10) unsigned NOT NULL DEFAULT ’0’,
f2 int(10) unsigned DEFAULT NULL,
f3 char(33) CHARACTER SET latin1 NOT NULL DEFAULT ’’,
f4 char(15) DEFAULT NULL,
62

CHAPTER 4. IS NETWORK REPLAY ENOUGH?
f5 datetime NOT NULL DEFAULT ’0000-00-00 00:00:00’,
f6 char(40) CHARACTER SET latin1 DEFAULT NULL,
f7 text CHARACTER SET latin1,
KEY f1_idx (f1),
KEY f5_idx (f5)
) ENGINE=MyISAM DEFAULT CHARSET=utf8;
6. Inserting 64 GB of data takes more than 1 day with this setup. This can be observed with both
production and debug containers running in sync, hence the slow performance can be also monitored
in the debug container.
How to debug with Parikshan
While technically, this is a performance bug, MySQL bug #26527 happens for an edge condition where a
large amount of data is being uploaded to the database. This is an unusual query and the future queries in the
system are unlikely to be impacted by this particular bug. Since only edge cases are impacted, Parikshan’s
main advantage would be in providing either a staged record-replay or a post-facto analysis of the system state,
where the problem query can be re-run (given that the debugger has some idea of under what circumstances
the slow-down was observed).
Advantage
The major advantage in this scenario is that Parikshan can provide a safe debugging environment for
performance profiling of queries or alternatively a staged record-replay with no instrumentation overhead on
production.
Alternative mechanisms without Parikshan
Since the bug is quite difficult to re-create unless a record replay system has been running, this bug is
likely to be debugged based on trial and error, and using user bug reports as the initial guide.
4.3.2.2 MySQL #49491
In this subsection we describe the MySQL #49491 performance bug
63

CHAPTER 4. IS NETWORK REPLAY ENOUGH?
Cause of the error:
It was reported that the calculation of MD5 and SHA1 hash values using the built-in MySQL functions
does not seem to be as efficient, and takes too long.There seem to be two factors that determine the
performance of the hash generation:
• computation of the actual hash value (binary value)
• conversion of the binary value into a string field
The run time of the hash computation depends on the length of the input string whereas the overhead of
the binary-to-string conversion can be considered as a fixed constant as it will always operate on hash values
of 16 (MD5) or 20 (SHA1) bytes length. The impact of the binary-to-string conversion will become more
visible with shorter input strings than with long input strings. For short input strings it seems that more time
is spent in the binary-to-string conversion than in the actual hash computation part.1
Steps for reproduction:
1. Start an instance of the MySQL server in the production container
2. Using Parikshan’s live cloning capability create a clone of the production container. This is our
debug container
3. Start network duplicator to duplicate network traffic to both the production and debug containers
4. connect to the production container using mysqlclient
5. Run a select query from the client on the users database:
select count(\*) from (select md5(firstname) from users) sub limit
1G
6. The time observed for this query is reported as a performance bug by the reporter. This can be
viewed both in the production container and the debug container
1A patch provided by a developer improved the performance by an order of magnitude. However for the purposes of our
discussion, we have limited ourselves to bug-recreation
64

CHAPTER 4. IS NETWORK REPLAY ENOUGH?
How to debug with Parikshan
Parikshan is significantly helpful in debugging this bug. Since the bug is a persistent performance
problem, Parikshan’s debug container can be used to do performance profiling and to find which queries are
problematic. A significant percentage of the incoming user-input could potentially be impacted by the hash
computation, thereby impacting performance. Performance profiles at functional granularity in a post-facto
analysis can significantly reduce the amount of effort spent in debugging this error.
Advantage
Post-facto analysis in such performance bugs which are persistent and impact a significant percentage of
incoming queries are easily debugged using performance profiling.
Alternative mechanisms without Parikshan
Without Parikshan the debugger is limited to use bug reports to recreate the bug in an offline environment
(this could be tricky). Alternatively performance profiling could be turned on in the production container to
capture the root-cause which would impact application performance.
4.3.2.3 MySQL #15811
In this subsection we describe the MySQL #15811 performance bug
Cause of the error:
For one of the bugs in MySQL #15811, it was reported that some of the user requests which were
dealing with complex scripts (Chinese, Japanese), were running significantly slower than others. To evaluate
Parikshan, we re-created a two-tier client-server setup with the server (container) running a buggy MySQL
server and sent queries to the production container with complex scripts (Chinese). These queries were
asynchronously replicated, in the debug container. To further investigate the bug-diagnosis process, we also
turned on execution tracing in the debug container using SystemTap [Prasad et al., 2005]. This gives us the
added advantage, of being able to profile and identify the functions responsible for the slow-down, without
the tracing having any impact on production.
65

CHAPTER 4. IS NETWORK REPLAY ENOUGH?
Steps for reproduction:
1. Start an instance of the MySQL server in the production container
2. Using Parikshan’s live cloning capability create a clone of the production container. This is our
debug container
3. Start network duplicator to duplicate network traffic to both the production and debug containers
4. connect to the production container using mysqlclient
5. Create a table with default charset as latin1:
create table t1(c1 char(10)) engine=myisam default
charset=latin1;
6. Repeat the following line several times to generate a large dataset
insert into t1 select * from t1;
7. Now create a mysqldump of the table
8. Load this table back again, and observe a significant slow response for large table insert requests.
This is magnified several times when using complex scripts
How to debug with Parikshan
This is a persistent stateless bug, similar to the bug shown earlier MySQL#15811 and impacts a significant
percentage of queries. Based on user bug reports it can be observed that only queries of complex character
sets have a slowdown. In a post-facto analysis of the bug, execution traces (function level profiling) of mysql
for incoming queries can help in localizing the error to the root-cause function.
Advantage
Parikshan provides a significant advantage in quickly resolving and finding the root-cause of the error by
providing an easy and quick cloned debug environment where incoming queries can be observed.
Alternative mechanisms without Parikshan
66

CHAPTER 4. IS NETWORK REPLAY ENOUGH?
Without Parikshan the debugger would have to record incoming queries and have instrumentation turned
on in the production container adding an unnecessary overhead. Alternatively, the debugger would have to
use a trial and error to recreate the problem in an offline debug environment based on user-bug reports.
4.3.2.4 Summary
In summary for performance bugs Parikshan can be immensely useful especially in the sub-categories of
performance bugs which are persistent in nature (i.e. keep impacting future queries), and a significant
percentage of the incoming queries are likely to be impacted. In this scenario, the debugger can look into
the root-cause by doing function level profiling or execution tracing and find the root-cause. This will be a
post-facto analysis, and will potentially be much faster than creating a debug environment where the bug is
re-created.
4.3.3 Resource Leaks
Resource leaks can be either memory leak or un-necessary zombie processes. Memory leaks are common
errors in service-oriented systems, especially in C/C++ based applications which allow low-level memory
management by users. These leaks build up over time and can cause slowdowns because of resource shortage,
or crash the system. Debugging leaks can be done either using systematic debugging tools like Valgrind,
which use shadow memory to track all objects, or memory profiling tools like VisualVM, mTrace, or PIN,
which track allocations, de-allocations, and heap size. Although Valgrind is more complete, it has a very high
overhead and needs to capture the execution from the beginning to the end (i.e., needs application restart).
On the other hand, profiling tools are much lighter and can be dynamically patched to a running process.
4.3.3.1 Redis #417
In this subsection we describe the Redis #417 resource leak bug
Cause of the error:
It was reported that when two or more databases are replicated, and atleast one of them is >=db10,
a resource leak was being observed. This was because the replication feed for the slaves created static
67

CHAPTER 4. IS NETWORK REPLAY ENOUGH?
connection objects which are allocated and freed when replication is being done from db (0-9). However, for
database ID values greater than 10, the objects are dynamically created and never freed. This was leaving
stale memory and leading to a memory leak in redis. Although the bug is visible in the verbose logs, it is
difficult to pick out the root-cause of the bug.
Steps for reproduction:
1. Start a redis service with log level set to verbose. Setting loglevel to verbose ensures that we can
view whatever is going on inside the service. This is our production container.
2. Also start a slave along with the master for a two node redis deployment
3. Create a live clone of the service mapped to a parallel debug container which will be used to visualize
debugging
4. Start cloning the incoming traffic to both the production container and the debug container asyn-
chronously using Parikshan’s network duplicator
5. Execute the following commands concurrently from the redis-client
redis-cli -r 1000000 set foo bar
redis-cli -n 15 -r 1000000 set foo bar
6. After the two sets, check the master debug container, you can observe the tremendous increase of
memory usage - this shows the memory leak.
How to debug with Parikshan
This is a two-node setup where we run the production container with a slave for replication, and a
memory profile of the system shows a memory leak. The bug happens in a particular state of the machine
when the redis database has is doing replication. Given that we already have the state of the database where
the bug is happening, in a post-facto analysis the resource leak can be observed in a memory profile and an
execution trace can help localize the error.
Advantage
One of the major advantages of Parikshan in this scenario is that it can replicate part of a two node cluster,
without having to create a distributed test bed. Secondly since the bug is a slow memory leak, it will not
68

CHAPTER 4. IS NETWORK REPLAY ENOUGH?
lead to an immediate out-of-memory error. This allows the debugger to use Parikshan after the bug was
triggered/reported, and find the root-cause using execution tracing or memory profiling of functions in the
debug container.
The overhead of memory profiling could potentially be high, but since the bug impacts most incoming
requests, overflowing the debug window should not be a problem as long as we can capture some representa-
tive execution traces.
Alternative mechanisms without Parikshan
In an alternative scenario, a debugger would have to create a distributed environment and use trial-and-
error based on user bug reports to localize the error.
4.3.3.2 Redis #614
In this subsection we describe the Redis #614 resource leak bug
Cause of the error:
The debugger reported replication bug while attempting to use Redis as a reliable queue with a Lua script
pushing multiple elements onto the queue. It appears the wrong number of RPOP operations are sent to the
slave instance, resulting in the queue on the slave growing unbounded, out of sync with master.
Steps for reproduction:
1. Start a redis service with log level set to verbose. Setting loglevel to verbose ensures that we can
view whatever is going on inside the service. This is our production container.
2. Also start a slave along with the master for a two node redis deployment
3. Create a live clone of the service mapped to a parallel debug container which will be used to visualize
debugging
69

CHAPTER 4. IS NETWORK REPLAY ENOUGH?
4. Start cloning the incoming traffic to both the production container and the debug container asyn-
chronously using Parikshan’s network duplicator
5. Send data via the producer, the following ruby code is an example
def run
puts "Starting producer"
loop do
puts "Inserting 4 elements..."
@redis.eval(@script, :keys => [’queue’])
sleep 1
end
end
6. Data is consumed via a consumer, the following ruby code is an example
def run
puts "Starting consumer #{@worker_id}"
@redis.del(@worker_id)
loop do
element = @redis.brpoplpush(’queue’, @worker_id)
puts "Got element: #{element}"
@redis.lrem(@worker_id, 0, element)
end
end
7. The verbose log in both the production container and the debug container shows an increasing
memory footprint
[3672] 01 Sep 21:39:59.596 - 1 clients connected (0 slaves),
557152 bytes in use
[3672] 01 Sep 21:40:04.642 - DB 8: 1 keys (0 volatile) in 4 slots
HT.
[3672] 01 Sep 21:40:04.642 - 1 clients connected (0 slaves),
557312 bytes in use
[3672] 01 Sep 21:40:09.687 - DB 8: 1 keys (0 volatile) in 4 slots
70

CHAPTER 4. IS NETWORK REPLAY ENOUGH?
HT.
[3672] 01 Sep 21:40:09.687 - 1 clients connected (0 slaves),
557472 bytes in use
How to debug with Parikshan
Debugging this particular bug will require to create a clone of both the production and the debug container
(simply cloning the production container may be enough as well), and looking at a growing memory profile
in isolation. This bug is a slow growing memory leak that happens because of a bug in the blocking queue
which is a part of the replication logic. Any update operations in the master container will lead to the bug
being triggered and memory profile increasing in the master. Once the bug is reported the debugger can
generate the cloned environment, and do execution tracing of incoming requests. This will help the debugger
localize the issue in the function profile.
Advantage
The advantage in debugging this bug with Parikshan is that it provides the debugger a fast mechanism to
localize the error.
Alternative mechanisms without Parikshan
Without Parikshan debuggers need to look up the bug reports, and try to recreate the error. This would be
a trial and error mechanism, which could take considerably longer than localizing it with Parikshan.
4.3.3.3 Summary
Similar to performance bugs, Parikshan provides a significant advantage in resolving resource leaks especially
slowly growing resource leaks. Debuggers can look at function level profile, and execution traces to localize
the error. Furthermore, a debugger like gdb can be attached to do a step by step execution to find the error
interactively.
4.3.4 Concurrency Bugs
One of the most subtle bugs in production systems are caused due to concurrency errors. These bugs are hard
to reproduce, as they are non-deterministic, and may or may not happen in a given execution. Unfortunately,
71

CHAPTER 4. IS NETWORK REPLAY ENOUGH?
Parikshan cannot guarantee that if a buggy execution is triggered in the production container, an identical
execution will trigger the same error in the debug container. However, given that the debug container is a
live-clone of the production container, and that it replicates the state of the production container entirely, we
believe that the chances of the bug also being triggered in the debug container are quite high. Additionally,
the debug container is a useful tracing utility to track thread lock and unlock sequences, to get an idea of the
concurrency bug. The bugs here are taken from the bugbench database [Lu et al., 2005]
4.3.4.1 Apache #25520
In this subsection we describe the Apache #25520 concurrency bug
Cause of the error:
It was reported that when logs are configured to have buffering turned on, the log lines show up as
corrupted, when serving at a very high volume using the worker mpm. The problem appears to be that the
per-child buffer management is not thread-safe. There is nothing to prevent memcopy operations in buffered
log writers by different threads from overlapping.
Steps for reproduction:
1. Install an httpd service in the production container( install it with configuration –with-mpm=worker -
this will set apache in multi-thread instead of multi-process mode).
2. Configure httpd with conf/httpd.conf having:
BufferdLogs on
and subsequently start the httpd service in the production container
3. Create a live clone of the service mapped to a parallel debug container which will be used to visualize
debugging
4. Start cloning the incoming traffic to both the production container and the debug container asyn-
chronously using Parikshan’s network duplicator
5. Send concurrent requests from the client as follows:
72

CHAPTER 4. IS NETWORK REPLAY ENOUGH?
./httperf --server=<your-httpd-server-name>
--uri=/index.html.cz.iso8859-2 --num-conns=100 --num-calls=100
./httperf --server=<your-httpd-server-name> --uri=/index.html.en
--num-conns=100 --num-calls=100
6. If this bug manifests itself, it can be seen in the access logs. Access logs get corrupted, and multiple
logs are thrown out in the same line or they overwrite each other making no semantic sense and
having bad formatting. In our experiments, we were able to see the anomaly in both production
container and debug container simultaneously most of the time.
It should be noted that in this bug, it is not important that the same order should trigger this datarace
condition. Simply the presence of a datarace(visible through log corruption) is enough to indicate the error,
and can be a starting point for the debugger in the debug container. This is a bug that is persistent in the
system and does not cause a crash.
4.3.4.2 Apache #21287
In this subsection we describe the Apache #21287 concurrency bug
Cause of the error:
It was reported that there are no mutex lock protection in a reference pointer cleanup operation. This
leads to an atomicity violation which can cause a dangling pointer and lead to an apache crash.
Steps for reproduction:
1. Install an httpd service in the production container with the following options - (mpm-worker,
enabled caching, enabled mem caching)
2. Configure and install php service with your httpd server in the production container
3. Create a live clone of the service mapped to a parallel debug container which will be used to visualize
debugging
73

CHAPTER 4. IS NETWORK REPLAY ENOUGH?
4. Start cloning the incoming traffic to both the production container and the debug container asyn-
chronously using Parikshan’s network duplicator
5. Run multiple httperf commands concurrently in the client
./httperf --server=<your-httpd-server-name>
--uri=/pippo.php?variable=1111 --num-conns=1000
--num-calls=1000
6. If the bug manifests, you will observe a crash within 10 seconds of sending the message. In our
experiments we were able to observe this bug in multiple execution in both production container
and debug container simultaneously.
4.3.4.3 MySQL #644
In this subsection we describe the MySQL #644 concurrency bug
Cause of the error:
This bug is caused by one thread’s write-read access pair interleaved by another thread’s write access.
As a result, the read access mistakenly gets an wrong value and leads to program misbehavior. We used a
sqlreplay utility provided in bugbench to recreate this bug. It eventually leads to a system crash
Steps for reproduction:
1. Start an instance of the MySQL server in the production container
2. Using Parikshan’s live cloning capability create a clone of the production container. This is our
debug container
3. Start network duplicator to duplicate network traffic to both the production and debug containers
4. connect to the production container using runtran provided in the bugbench database
./runtran --repeat --seed 65323445 --database test --trace
populate_db.txt --monitor pinot --thread 9 --host localhost 30
360 1 results
74

CHAPTER 4. IS NETWORK REPLAY ENOUGH?
5. If the error happens it leads to a system crash
4.3.4.4 MySQL #169
In this subsection we describe the MySQL #169 concurrency bug
Cause of the error:
It was reported that the Writing to binlog was not a transactional operation and there was a data-race. This
leads to binlog showing that operations happen in a different order than how they were actually executed
Steps for reproduction:
1. Start an instance of the MySQL server in the production container
2. Using Parikshan’s live cloning capability create a clone of the production container. This is our
debug container
3. Start network duplicator to duplicate network traffic to both the production and debug containers
4. connect to the production container using mysqlclient
suppose we have a table named ’b’ with schema: (id int) in database ’test’. Run the following
requests:
./mysql -u root -D test -e ’delete from b’ &
./mysql -u root -D test -e ’insert into b values (1)’ &
5. You will see detection log entry and the insert log entry is out of order in the binlog index.
4.3.4.5 MySQL #791
In this subsection we describe the MySQL #791 concurrency bug
Cause of the error:
This bug is caused by one thread’s write-write access pair interleaved by another thread’s read access. As
a result, the read access mistakenly gets an intermediate value and leads to program misbehavior.
75

CHAPTER 4. IS NETWORK REPLAY ENOUGH?
Steps for reproduction:
1. Start an instance of the MySQL server in the production container
2. Using Parikshan’s live cloning capability create a clone of the production container. This is our
debug container
3. Start network duplicator to duplicate network traffic to both the production and debug containers
4. connect to the production container using mysqlclient
./mysql -u root -e ’flush logs’;
./mysql -u root -D test -e ’insert into atab values(11)’;
If the bug is triggered you will observe that the insert is NOT recorded in mysql bin log.
How to debug concurrency bugs with Parikshan Concurrency bugs are non-deterministic in nature,
hence Parikshan cannot guarantee that if a bug is observed in the production system it will be observed in the
replica (or vice-versa). A way to overcome this is to use a staged record-replay mechanism (described in
further detail in section 6.4.3). Once a bug has been reported the staged recording can be replayed and several
third-party tools can be used to check through all possible thread interleavings in order to search for the bug.
“Search” through thread interleavings during replay phase to find the correct thread schedule which
triggered the concurrency bug is a common technique used by existing replay tools. In one of our previous
papers [Ganai et al., 2011] we have used DPOR (dynamic partial order reduction) to search through possible
interleavings in TCP communication syscall records. Please see section 6.4.3 for more details regarding
staged record replay.
4.3.5 Configuration Bugs
Configuration errors are usually caused by wrongly configured parameters, i.e., they are not bugs in the
application, but bugs in the input (configuration). These bugs usually get triggered at scale or for certain edge
cases, making them extremely difficult to catch.
4.3.5.1 Redis #957
In this subsection we describe the Redis #957 configuration bug
76

CHAPTER 4. IS NETWORK REPLAY ENOUGH?
Cause of the error:
A user reported an error, which eventually turned out to be misconfiguration error on his part. The
client in Redis is scheduled to be closed ASAP for overcoming of output buffer limits in the masters log file.
Essentially, it happens the DB is configured to be larger than the client-output-buffer-limit. The connection
with the slave times out and it’s unable to sync because of the large data. While the bug is partially a semantic
bug, as it could potentially have checks and balances in the code. The root cause itself is a lower output buffer
limit. Once again, it can be easily observed in our debug-containers that the slave is not synced, and can be
investigated further by the debugger.
Steps for reproduction:
1. Start a redis service with log level set to verbose. Setting loglevel to verbose ensures that we can
view whatever is going on inside the service. This is our production container.
2. configure redis using :
client-output-buffer-limit slave 256mb 64mb 60
3. Create a live clone of the service mapped to a parallel debug container which will be used to visualize
debugging
4. Start cloning the incoming traffic to both the production container and the debug container asyn-
chronously using Parikshan’s network duplicator
5. Load a very large DB into master
You will observe that the connection to the slave is lost on syncing
How to debug with Parikshan
For the configuration error described above Parikshan can only be useful if used for staged record-replay
before the bug is triggered on the production container. The main reason for this is that once the bug is itself
triggered the connection to the slave is lost, and it’s a fatal error - i.e. future progress may be halted.
Advantage
Using staged record-replay may assist in localizing the cause of the error, and at the same time there will
be no overhead on the production service.
77

CHAPTER 4. IS NETWORK REPLAY ENOUGH?
Alternative mechanisms without Parikshan
Potentially, record-replay infrastructures could be used to catch the execution trace of the bug, and replay
it offline. When replaying the error causing execution trace, the debugger can look into function level profiles
and see where the crash is happening. Capturing execution traces will add an overhead on the production
service which can be avoided via Parikshan.
4.3.5.2 HDFS #1904
In this subsection we describe the HDFS #1904 configuration bug
Cause of the error:
This is sort of a semantic and configuration bug both. It was reported that HDFS crashes if a mkdir
command is given through the client in a non-existent folder.
Steps for reproduction:
1. Install hadoop and configure secondary namenode with fs.checkpoint.period set to a small value (eg
3 seconds)
2. Format filesystem and start HDFS
3. Create a live clone of the service mapped to a parallel debug container which will be used to visualize
debugging
4. Start cloning the incoming traffic to both the production container and the debug container asyn-
chronously using Parikshan’s network duplicator
5. Run the following command through the client
hadoop fs -mkdir /foo/bar;
sleep 5 ;
echo | hadoop fs -put - /foo/bar/baz
Secondary Name Node will crash with the following trace on the next checkpoint. The primary NN
also crashes on next restart
78

CHAPTER 4. IS NETWORK REPLAY ENOUGH?
ERROR namenode.SecondaryNameNode: Throwable Exception in doCheckpoint:
ERROR namenode.SecondaryNameNode: java.lang.NullPointerException: Panic:
parent does not exist
How to debug with Parikshan
While Parikshan could be useful for this bug, however this configuration bug happens right at the startup
for simple makefile/makedir commands, following up with a crash of the system. A staged record-replay on
Parikshan can help to recreate the namenode and capture the error offline.
Alternative mechanisms without Parikshan
Simply getting the configuration and recreating the debug environment will easily allow the debugger to
understand the bug.
4.3.5.3 Summary
Parikshan can be useful for configuration bugs depending on the nature of the bug. However, alternate
mechanisms apart from Parikshan where the bug is simply triggered by re-using the same configuration file
might also help localize the bug as well thereby reducing the advantage of livedebugging.
4.4 A survey of real-world bugs
Category Apache MySQL HDFS
Performance 3 10 6
Semantic 37 73 63
Concurrency 3 7 6
Resource Leak 5 6 1
Total 48 96 76
Table 4.2: Survey and classification of bugs
In the last section we have presented 16 concrete bugs as case-studies for Parikshan, which demonstrate
79

CHAPTER 4. IS NETWORK REPLAY ENOUGH?
how Parikshan can be used in various circumstances. In order to further understand Parikshan’s applicability
for bugs found in Service Oriented Architecture, we did a survey of bug reports from three well known SOA
applications - Apache, MySQL and HDFS.
Since all three applications are open-source softwares, the bug reports are done by system administrators
facing problems and reporting them to bug tracking repositories maintained by each of the applications.
Typically bug reports contain a brief descriptions of the symptoms of the bug, a description of the system
in which it has been installed (Linux version etc.), as well as the input required to re-create the bug. This
follows a discussion using “comments” by both the bug reporter and developers of the application who try to
re-create the bug or assist in some way by giving directions to resolve the bug. If the reported error requires a
fix in the software a patch will be made and attached to the bug report.
Bug Classifications: We have classified these bugs into the following categories: Performance, Semantic,
Concurrency, and Resource Leak based on the bug-report description, and the patch fix, to-do action item for
the bug. Further sub-categorization of apache bugs has been explained in the appendix B.0.1, along with
a list of all the apache bugs used for this survey, their ID, a summary description and categorization. In
appendix B.0.2 we provide a detailed list of all mysql bugs, and a short table with further subcategorization
of all the bugs used in this survey. Subcategories in the appendix include - Uncategorized, skipped bugs,
Documentation, Feature Requests, Build Issues, Fault Tolerance, Recovery etc.
Classification Process and Bug Reports: At a high level, we have filtered out all bugs which belonged to
non-production components - like documentation, installation failure, compilation failure. Then, we manually
went through each of the bug-reports, filtering out the ones which were mislabeled or were reported based on
code-analysis, or did not have a triggering test report (essentially we focused only on bugs that happened
during production scenarios). Furthermore, any bug description which could not be clearly categorized was
also filtered out.
To understand how bug reports are described, let us look at Apache bug 46268 report as an example.
Figure 4.1 shows the bug description for bug report, and is divided in two different aspects: first meta data
which explains the status of the bug, the specific component of the application that this bug appears in, the
version and potentially the hardware or operating system on which the bug was observed.
The second part of the bug report (see figure 4.2) has a bug description and comment section. Here is
the initial description by the user who observed the bug, and potentially ways to recreate the error and the
symptoms of the bug. In this example the user explains that he had difficulty in making the regex library to
80

CHAPTER 4. IS NETWORK REPLAY ENOUGH?
Figure 4.1: Metadata description for a Apache semantic bug
work, in later comments it was explained that this was indeed a bug in the packaging and a different library
should have been used and was fixed in later versions. We have primarily manually looked into these bug
descriptions to categorize whether this is a semantic, concurrency, performance, or resource leak bug. For
cases where this information was not clear or properly explained we have skipped the bug entirely.
As another example, next we discuss a performance bug in mysql. Figure 4.3 shows the meta data
information in the bug report. This gives the title of the bug, when the report was submitted, name of the
reporter, severity, status and version of MySQL that this bug impacts. As can be seen from the meta-data itself,
the severity is S5(Performance). Which itself indicates that the reporter believes this to be a performance bug
(please note not all performance bugs are labelled so in the meta-data itself). Based on the subject it seems
like there is a slow down related to memcached requests.
However, a more detailed explanation of the bug is provided in the bug description section (see figure 4.4)
where the reporter describes the symptoms, and gives a step-by-step process on how to repeat the bug, along
with a suggested fix. The bug is caused by repeating create and free calls for each request, which is expensive.
Since mysql clients share transaction objects across multiple queries, the reporter believes this should be
81

CHAPTER 4. IS NETWORK REPLAY ENOUGH?
Figure 4.2: Description for a Apache semantic bug based on user report and comments
Figure 4.3: Metadata for a performance bug in MySQL
supported in InnoDB -memcached plugin as well. A comparison between memchached-get vs select shows a
bad performance overall from memcached. In the follow up comments it was shown that the request was
accepted and the performance bug was fixed for this plugin.
As can be seen in the previous bug, it is possible to think of this bug as a feature request since the system
is actually working. This is a subjective analysis and really depends on how you want to look at your bug
classification. For our bug classification, we have classified performance improvements as performance bugs
(as is reported in bugzilla), and semantic changes where a new feature is being suggested as a feature request
instead of a semantic bug. All such feature requests have been filtered out and are not considered in this study.
In apache approximately, 38% of bugs were skipped, and about 14% could not be categorized. Around 8%
were feature requests, and another 8% were bugs that actually required documentation updates. Approximately
82

CHAPTER 4. IS NETWORK REPLAY ENOUGH?
Figure 4.4: Description for a performance bug
7% were related to build issues. In MySQL we selected 102 bugs from 450 bug cases about 60% of those
which were discarded were not focused on the main component, and we took a random selection of bugs
from the rest. In MySQL we found two new categories related to fault tolerance and replication (2% each).
One of the core-insights provided by this survey was that amongst the bugs falling into our 4 major
categories most bugs (93%) triggered in production systems are deterministic in nature (everything but
concurrency bugs), among which the most common ones are semantic bugs (80%). This is understandable,
as they usually happen because of unexpected scenarios or edge cases, that were not thought of during
testing. Recreation of these bugs depend only on the state of the machine, the running environment (other
components connected when this bug was triggered), and network input requests, which trigger the bug
scenario. Parikshan is a useful testing tool for testing these deterministic bugs in an exact clone of the
production state, with replicated network input. The execution can then be traced at a much higher granularity
than what would be allowed in production containers, to find the root cause of the bug.
On the other hand, concurrency errors, which are non-deterministic in nature make up for less than 7%
83

CHAPTER 4. IS NETWORK REPLAY ENOUGH?
of the production bugs. Owing to non-determinism, it is possible that the same execution is not triggered.
However concurrent points can still be monitored and a post-facto search of different executions can be
done to find the bug [Flanagan and Godefroid, 2005; Thomson and Donaldson, 2015] to capture these
non-deterministic errors. This process is further described in the section on staged record and replay (see
section 6.4.3).
To answer RQ3, we found that almost 80% of bugs were semantic in nature, a significant percentage
of these (approx 30-40%) were persistent bugs while less than 6% of the bugs are non-deterministic.
About 13-14% of bugs are performance and resource-leak bugs, which are also generally persistent in
the system.
4.5 Summary
In chapter 4 we demonstrated that network replay is enough to trigger real-world SOA bugs. We first
presented 16 real-life bug cases from 5 different categories of bugs: Semantic, Performance, Resource Leaks,
Concurrency, and Configuration Bugs. These bugs spanned several well known open-source softwares. For
each of these bugs, we presented it’s symptoms and how they were re-created using parikshan’s network
duplication. Further we also presented a survey of 220 bugs from 3 well known applications, where we
manually classify the bugs in these systems to the above given categories. The bugs discussed in this chapter
are a representative of real world bugs for SOA applications. Based on the sample of bugs and a study
of similar bugs found from well known SOA applications, we believe that network duplication is enough
to capture most bugs, and trigger them in Parikshan’s debug container. A significant percentage of both
semantic and most performance bugs are persistent in nature, which make them easier to debug in the debug
container. While in this chapter, we have primarily shown that real-world bugs can indeed be triggered in the
debug container, the actual process of debugging of several of these bugs is discussed in further detail last
chapter 6 of this thesis.
84

CHAPTER 5. IPROBE
Chapter 5
iProbe
5.1 Introduction
As explained in section 1, our initial investigation towards low-overhead on-the-fly debugging involved
investigating instrumentation strategies which would allow us to dynamically instrument the application, with
the least possible overhead. Intuitively the least possible overhead of any instrumentation in an application is
possible when it was already a part of the source-code, and not added as an after-thought when required for
instrumentation. However, source-code level instrumentation is “always on” and has an overhead all the time
on the application. Hence, our goal was to have a production system tracing tool with zero-overhead when it
is not activated and the least possible overhead when it is activated (ideally source code level instrumentation
should have the least overhead as it would not have any overhead inserted by the tool itself). At the same
time, it should be flexible enough so as to meet versatile instrumentation needs at run-time for management
tasks such as trouble-shooting or performance analysis.
Over the years researchers have proposed many tools to assist in application performance analytics [Luk
et al., 2005; Stallman et al., 2002; McDougall et al., 2006; Prasad et al., 2005; Desnoyers and Dagenais, 2006;
McGrath, 2009; Linux Manual Ptrace, ; Buck and Hollingsworth, 2000]. While these techniques provide
flexibility, and deep granularity in instrumenting applications, they often trade in considerable complexity in
system design, implementation and overhead to profile the application. For example, binary instrumentation
tools like Intel’s PIN Instrumentation tool [Luk et al., 2005], DynInst [Buck and Hollingsworth, 2000] and
GNU debugger [Stallman et al., 2002] allow complete blackbox analysis and instrumentation but incur a
heavy overhead, which is unacceptable in production systems. Inherently, these tools have been developed
85

CHAPTER 5. IPROBE
for the development environment, hence are not meant for a production system tracer. Production system
tracers such as DTrace [McDougall et al., 2006] and SystemTap [Prasad et al., 2005] allow for low overhead
kernel function tracing. These tools are optimized for inserting hooks in kernel function/system calls, and can
monitor run-time application behavior over long time periods. However, they have limited instrumentation
capabilities for user-space instrumentation, and incur a high overhead due to frequent kernel context-switches
and complex trampoline mechanisms.
Software developers often utilize program print statements, write their own loggers, or use tools like
log4j [Gupta, 2003] or log4c [Goater, 2015] to track the execution of their applications. Those manually
instrumented probe points can easily be deployed without additional libraries or kernel support, and have a
low overhead to run without impacting the application performance noticeably. However, they are inflexible
and can only be turned on/off at compile-time or before starting the execution. Besides, usually only a small
subset of functions is chosen to avoid larger overheads.
While the rest of the thesis talks about Parikshan, which decouples instrumentation from the production
service, in this chapter, we will introduce iProbe our initial foray into developing a light-weight dynamic
instrumentation tool. We evaluated iProbe on micro-benchmark and SPEC CPU 2006 benchmarks, where
it showed an order of magnitude performance improvement in comparison to SystemTap [McGrath, 2009]
and DynInst [Buck and Hollingsworth, 2000] in terms of tracing overhead and scalability. Additionally, the
instrumented applications incur negligible overhead when iProbe is not activated.
The main idea in iProbe design is a two-stage process of run-time instrumentation called offline and and
online stages, which avoids several complexities faced by current state-of-the-art mechanisms [McDougall et
al., 2006; Prasad et al., 2005; Buck and Hollingsworth, 2000; Luk et al., 2005] such as instruction overwriting,
complex trampoline mechanisms, and code segment memory allocation, kernel context switches etc. Most
existing dynamic instrumentation mechanisms rely on a trampoline based design, and generally have to make
several jumps to get to the instrumentation function as they not only do instrumentation but also simulate the
instructions that have been overwritten. Additionally, they have frequent context-switches as they use kernel
traps to capture instrumentation points, and execute the instrumentation. The performance penalty imposed
by these designs are unacceptable in a production environment.
Our design avoids any transitions to the kernel which generally causes higher overheads, and is completely
in user space. iProbe can be imagined as a framework which provides a seamless transition from an
instrumented binary to a non-instrumented binary. We use a hybrid 2-step mechanism which offloads
86

CHAPTER 5. IPROBE
dynamic instrumentation complexities to an offline development stage, thereby giving us a much better
performance. The following are the 2 stages of iProbe:
• ColdPatch: We first prepare the target executable by introducing dummy instructions as “place-
holders” for hooks during the development stage of the application. This can be done in 3 different
ways: Primarily, we can leverage compiler based instrumentation to introduce our “place-holders”.
Secondly we can allow users to insert macros for calls to instrumentation functions which can be turned
on and off at run-time. Lastly we can use static binary rewriter to insert place-holders in the binary
without any recompilation. iProbe uses binary parsers to capture all place-holders in the development
stage and generates a meta-data file with all possible probe points created in the binary.
• HotPatch: We then leverage these place-holders during the execution of the process to safely re-
place them with calls to our instrumentation functions during run-time. iProbe uses existing tools,
ptrace [Linux Manual Ptrace, ], to modify the code segment of a running process, and does safety
check to ensure correctness of the executing process. Using this approach in a systematic manner we
reduce the overhead of iProbe while at the same time maintaining a relatively simple design.
In iProbe, we propose a new paradigm in development and packaging of applications, wherein
developers can insert probe points in an application by using compiler flag options, and applying our
ColdPatch. An iProbe-ready application can then be packaged along with the meta-data information and
deployed in the production environment. iProbe has negligible effect on the application’s performance when
instrumentation is not activated, and low overhead when instrumentation is activated. We believe this is an
useful feature as it requires minimal developer effort, and allows for low overhead production-stage tracing
which can be switched on and off as required. This is desirable in long-running services for both debugging
and profiling usages.
iProbe can be used individually as a stand-alone tool for instrumentation purposes, which can
assist debuggers in capturing execution traces from production service oriented applications. Alternatively, it
can also be used to complement Parikshan in the debug container to help us debug applications as a useful
instrumentation utility. MySQL bug#15811 presented in section 4.3.2.3 is an example of a bug, debugged
using iProbe in Parikshan’s debug container.
As an application of iProbe we also demonstrate a hardware event profiling tool (called FPerf ). In
FPerf we leverage iProbe’s flexibility and scalability to realize a fine-grained performance event profiling
87

CHAPTER 5. IPROBE
solution with overhead control. In the evaluation, FPerf was able to obtain function-level hardware event
breakdown on SPEC CPU2006 applications while controlling performance overhead (under 5%).
As explained in section 1, despite the advancements made in iProbe, it still cannot scale out in order to
provide high granularity of instrumentation with low-overhead. Essentially, like all other instrumentation
and monitoring tools iProbe’s performance overhead is also directly proportional to the amount of
instrumentation (instrumentation points, how frequently they are triggered), the user puts in the target
software. This core limitation in iProbe led to the development of Parikshan, which decouples the user-
facing production service from the instrumentation put by the user. In particular for SOA applications, this
allows higher level granularity at a low cost and almost negligible impact to the end-user.
The rest of the chapter is organized as following. Section 5.2 discusses the design of iProbe framework,
explaining our ColdPatching, and HotPatching techniques; we also discuss how safety checks are enforced
by iProbe to ensure correctness, and some extended options in iProbe for further flexibility. Section 5.3
compares traditional trampoline based approaches with our hybrid approach and discusses why we perform,
and scale better. Section 5.4 explains the implementation of iProbe, and describes FPerf a tool developed
using iProbe framework. In section 5.7 we evaluate the iProbe prototype, and section 5.8 summarizes this
chapter.
5.2 Design
In this section we present the design of iProbe. Additionally, we then explain some safety checks imposed by
iProbe that ensure the correctness of our instrumentation scheme. Finally, we discuss extended iProbe modes,
static binary rewriting and user written macros, which serve as alternatives to the default compiler-based
scheme to insert instrumentation in the pre-processing stage of iProbe.
The first phase of our instrumentation is an offline pre-processing stage to make the binaries ready for
runtime instrumentation. We call this phase ColdPatching. The second phase is the an online HotPatching
stage which instruments the monitored program dynamically at runtime without shutting down and restarting
the program. Next, we present the details of each phase.
88

CHAPTER 5. IPROBE
Compile with
Instrumentation
flag
Hot Patchable
Binary
List of
Instrumentation
Points
Search & Replace
functions with NOP
Figure 5.1: The Process of ColdPatching.
5.2.1 ColdPatching Phase
ColdPatching is a pre-processing phase which generates the place-holders for hooks to be replaced with the
calls for instrumentation. This operation is performed offline before any execution by statically patching the
binary file. This phase is composed of three internal steps that are demonstrated in Figure 5.1.
• Firstly, iProbe uses compiler techniques to insert instrumentation calls at the beginning and end of each
function call. The instrumentation parameters, are decided on the basis of the design of the compiler
pass. The current implementation by default passes callsite information and the base stack pointer as
they can be used to inspect and form execution traces. Calls to the these instrumentation functions
must be cdecl calls so that stack correctness can be maintained, this is discussed in further detail in
Section 5.6.
• Secondly, iProbe parses the executable and replaces all instrumentation calls with a NOP instruction
which is a no-operation or null instruction. This generates instructions in the binary which does
no-operation, hence has a negligible overhead, and acts as an empty space for iProbe to be overwritten
at run-time.
• Thirdly, iProbe parses the binary and gathers meta-data regarding all the target instrumentation points
into a probe-list. Optionally, iProbe can strip away all debug and symbolic information in the binary
89

CHAPTER 5. IPROBE
<Basic Block
Begin>
<func_foo>:
push %EBP
pop
inc
….
…
…
pop
<Basic Block End>
Native binary
<Basic Block Begin>
<func_foo>:
push %EBP
call <foo_begin>
pop
inc
….
…
…
call <foo_end>
pop
<Basic Block End>
<Basic Block Begin>
<func_foo>:
push %EBP
NOP <90>
pop
inc
….
…
…
NOP <90>
pop
<Basic Block End>
<Basic Block Begin>
<func_foo>:
push %EBP
call<begin_instr>
pop
inc
….
….
call<end_instr>
pop
<Basic Block End>
Compiled with
instrumentation flag
Replaced by NOP
OpCode
NOP replaced in run
time by calls to
instrumentation
functions
Figure 5.2: Native Binary, the State Transition of ColdPatching and HotPatching.
making it more secure and light-weight. The probe-list is securely transferred to the run-time interface
of iProbe and used to probe the instrumentation points. Hence iProbe does not have to rely on debug
information at run-time to HotPatch the binaries.
5.2.2 HotPatching Phase
Once the application binary has been statically patched (i.e., ColdPatched), instrumentation can be applied
at runtime. Compared to existing trampoline approaches, iProbe does not overwrite any instructions in the
original program, or allocate additional memory when patching the binaries, and still ensures reliability. In
order to have a low overhead, and minimal intrusion of the binary, iProbe avoids most of the complexities
involved in HotPatching such as allocation of extra memory in the code segment or scanning code segments
to find instrumentation targets in an offline stage. The process of HotPatching is as follows:
• Firstly, iProbe loads the relevant instrumentation functions in a shared library to the code-segment
of the target process. This along with allocation of NOPs in the ColdPatching phase allows iProbe to
avoid allocation of memory for instrumentation in the code segment.
• The probe-list generated in the ColdPatching phase is given to our run-time environment as a list of
90

CHAPTER 5. IPROBE
T1: Interrupt
T2: Resume
Shared
Memory
Logger
T3: Interrupt
T4: Resume
HotPatch :
Instrument
HotPatch :
Un Instrument
Figure 5.3: HotPatching Workflow.
target probe points in the executable. iProbe can handle stripped binaries due to previous knowledge of
the target instructions in the ColdPatching.
• As shown in Figure 5.3, in our instrumentation stage, our HotPatcher attaches itself to the target process
and issues an interrupt (time T1). It then performs a reliability check (see Section 5.6), and subsequently
replaces the NOP instructions in each of the target functions, with a call to our instrumentation function.
This is a key step which enables iProbe to avoid the complexity of traditional trampoline [UKAI, ;
Bratus et al., 2010] by not overwriting any logical instructions (non-NOP) in the original code. Since the
place-holders (NOP instructions) are already available, iProbe can seamlessly patch these applications
without changing the size or the runtime footprint of the process. Once the calls have been added
iProbe releases the interrupt and let normal execution proceed (time T2).
• At the un-instrumentation stage the same process is repeated, with the exception that the target functions
91

CHAPTER 5. IPROBE
are again replaced with a NOP instruction. The period between time T2 and time T3 is our monitoring
period, wherein all events are logged to a user-space shared memory logger.
State Transition Flow: Figure 5.2 demonstrates the operational flow of iProbe in the example to instrument
the entry and exit of the func foo function. The left most figure represents the instructions of a native binary.
As an example, it shows three instructions (i.e., push, pop, inc) in the prolog and one instruction (i.e., pop) in
the epilog of the function func foo. The next figure shows the layout of this binary when it is compiled
with the instrumentation option. As shown in the figure, two function calls, foo begin and foo end are
automatically inserted by the compiler at the start and end of the function respectively. iProbe exploits these
two newly introduced instructions as the place-holders for HotPatching. The ColdPatching process overwrites
two call instructions with NOPs. At runtime, the instrumentation of func foo is initiated by HotPatching
those instructions with the call instructions to the instrumentation functions: begin instrument and
end instrument. This is illustrated in the right most figure in Figure 5.2.
Logging Functions and Monitoring Dispatchers : The calls from the target function to the instrumenta-
tion function are generally defined in the coldpatch stage by the compiler. However, iProbe also provides
monitoring dispatchers which are common instrumentation functions that are shared by target functions.
Our default instrumentation passes the call site information, and the function address of the target function
as parameters to the dispatchers. Each monitoring event can be differentiated by these dispatchers using a
quick hashing mechanism representing the source of each dispatch. This allows iProbe to uniquely define
instrumentation for each function at run-time, and identify its call sites.
5.2.3 Extended iProbe Mode
As iProbe ColdPatching requires compiler assistance, it is unable to operate on pre-packaged binary applica-
tions. Additionally, compiler flags generally have limited instrumentation flexibility as they generally operate
on a programming language abstraction(eg. function calls, loops etc.). To provide further flexibility, iProbe
provides a couple of extended options for ColdPatching of the application
5.2.3.1 Static Binary Rewriting Mode
In this mode we use a static binary rewriter to insert instrumentation in a pre-packaged binary. Once all
functions are instrumented, we use a ColdPatching script to capture all call sites to the instrumentation
functions and convert them to NOP instruction. While this mode allows us to directly operate on binaries, a
92

CHAPTER 5. IPROBE
downside is that our current static binary instrumentation technique also uses mini-trampoline mechanisms.
As explained in Section 5.3 static binary rewriters use trampoline based mechanisms which induces minimum
two jumps. In the ColdPatch phase, we convert calls to the instrumentation function to NOPs, however
the jmp operations to the trampoline function, and simulation of the overwritten instructions still remain.
The downside of this approach has a small overhead even when instrumentation is turned off. However, in
comparison to pure dynamic instrumentation approach it reduces the time spent in HotPatching. This is
especially important if the number of instrumentation targets is high, and the target binary is large, as it will
increase the time taken in analyzing the binaries. Additionally, if compiler options cannot be changed for
certain sections of the program (plugins/3rd party binaries), iProbe can still be applied using this extended
feature.
Our current implementation uses the dyninst [Buck and Hollingsworth, 2000] and cobi [Mussler et al.,
2011] to do static instrumentation. This allows us to provide the user a configuration file and template which
can be used to specify the level of instrumentation (e.g., all entry and exit points for instrumentation), or
names of specific target functions, and the instrumentation to be applied to them. Subsequently in ColdPatch
we generate our meta-data list, and use it to HotPatch and apply instrumentation at run-time.
5.2.3.2 Developer Driven Macros
Compiler assisted instrumentation may not provide complete flexibility (usually works on abstractions, such
as enter/exit of functions), hence for further flexibility, iProbe provides the user with a header file with calls
to macros which can be used to add probe points in the binary. A call to this macro can be placed as required
by the developer. The symbol name of the macro is then used in the ColdPatch stage to capture these macros
as probe points, and convert them to NOPs. Since the macros are predefined, they can be safely inserted
and interpreted by ColdPatcher. The HotPatching mechanism is very much the same, using the probe list
generated by ColdPatch.
5.3 Trampoline vs. Hybrid Approach
In this section we compare the advantages of our approach compared to traditional trampoline based dynamic
instrumentation mechanisms. We show the steps followed in trampoline mechanisms, and why our approach
has a significant improvement in terms of overhead. The basic process of dynamic instrumentation based on
93

CHAPTER 5. IPROBE
foo(){
jmp();
}
jmp(){
….foo fix…
foo_instr();
}
foo_instr(){
}
Trap Handler
(in kernel)
Trampoline Function
Figure 5.4: Traditional Trampoline based Dynamic Instrumentation Mechanisms.
trampoline can be divided into 4 steps
• Inspection for Probe Points: This step inspects and generates a binary patch for the custom instru-
mentation to be inserted to the target binaries, and find the target probe points which are the code
addresses to be modified.
• Memory Allocation for Patching: Appropriate memory space is allocated for adding the patch and
the trampoline code to the target binary.
• Loading and Activation of a Patch: At run-time the patch is loaded into the target binary, and
overwrites the probe point with a jump instruction to a trampoline function and subsequently to the
instrumentation function.
• Safety and Reliability Check: To avoid illegal instructions, it is necessary to check for safety and
reliability at the HotPatch stage, and that the logic and correctness of the previous binary remains.
One of the key reasons for better performance of iProbe as compared to traditional trampoline based
94

CHAPTER 5. IPROBE
designs is the avoidance of multiple jumps enforced in the trampoline mechanism. For instance, Figure
5.4 shows the traditional trampoline mechanism used in existing dynamic instrumentation techniques. To
insert a hook for the function foo(), dynamic instrumentation tools overwrite target probe point instructions
with a jump to a small trampoline function (jmp()). Note that the overwritten code by jmp should be
executed somewhere to ensure the correctness of the original program. The trampoline function executes the
overwritten instructions (foo fix) before executing the actual code to be inserted. Then this trampoline
function in turn makes the call to the instrumentation function (foo instr). Each call instruction can
potentially lead to branch mispredictions in the code cache and cause high overhead. Additionally tools like
DTrace, and SystemTap [McDougall et al., 2006; Prasad et al., 2005] have the logger in the kernel space, and
cause a context switch in the trampoline using interrupt mechanisms.
In comparison iProbe has a NOP instruction which can be easily overwritten without resulting in any
illegal instructions, and since overwriting is not a problem trampoline function is not required. This makes
the instrumentation process simple resulting in only a single call instruction at all times.
In addition pure binary instrumentation mechanisms need to provide complex guarantees of safety and
reliability and hence may lead to further overhead. Since the patch and trampoline functions overwrite
instructions at run-time correctness check must be made at HotPatch time so that an instruction overwrite does
not result in an illegal instruction, and that the instructions being patched are not currently being executed.
While this does not enforce a run-time overhead it does enforce a considerable overhead at the HotPatch
stage.
Again iProbe avoids this overhead by offloading this process to the compiler stage, and allocating memory
ahead of time.
Another important advantage of our hybrid approach as compared to the trampoline approach is that pure
dynamic instrumentation techniques are sometimes unable to capture functions from the raw binary. This can
often be because some compiler optimizations may inherently hide function calls boundaries in the binary. A
common example of this is inline functions where functions are inlined to avoid the creation of a stack frame
and concrete calls to these functions. This may be done explicitly by the user by defining the function as
inline or implicitly by the compiler. Since our instrumentation uses compiler assisted binary tracing, we are
able to use the users definition of functions in the source code to capture entry and exit of functions despite
such optimizations.
95

CHAPTER 5. IPROBE
5.4 Implementation
The design of iProbe is generic and platform agnostic, and works on native binary executables. We built a
prototype on Linux which is a commonly used platform for service environments. In particular, we used a
compiler technique based gcc/g++ compiler to implement the hook place holders on standard Linux 32 bit
and 64 bit architectures. In this section we first show the implementation of the iProbe framework, and then
discuss the implementation of FPerf a tool built using iProbe.
5.4.1 iProbe Framework
As we presented in the previous section, the instrumentation procedure consists of two stages.
ColdPatch: In the first phase the place holders for hooks are created in the target binary. We implemented
this by compiling binaries using the -finstrument-functions flag. Note that this can be done simply
by appending this flag to the list of compiler flags (e.g., CFLAG, CCFLAG, CXXFLAGS) and most of
cases it works without interfering with user code.
In details this compiler option places function calls to instrumentation functions after the entry and before
the exit of every function. This includes inline functions (see second state in Figure 5.2). Subsequently,
our ColdPatcher uses a binary parser to read through all the target binaries, and search and replace the
instruction offsets containing the instrumentation calls with NOP instructions (instruction 90). Symbolic and
debug information is read from the target binary using commonly available objdmp tools; This information
combined with target instruction offsets are used to generate the probe list with the following information:
<Instr Offset, Entry\Exit Point, Meta-Data>
The first field is the instruction offset from the base address, and the second classifies if the target is an entry
or an exit point of the function. The meta-data here specifies the file, function name, line number etc.
HotPatching: In the run-time phase, we first use the library interposition technique, LD PRELOAD, to
preload the instrumentation functions in the form of a shared library to the execution environment. The
HotPatcher then uses a command line interface which interacts with the user and provides the user an option
to input the target process and the probe list. Next, iProbe collects the base addresses of each shared library
and the binary connected to the target process from /proc/pid/maps. The load address and offsets from
the probe-list are then used to generate a hash of all possible probing points. iProbe then use the meta-data
96

CHAPTER 5. IPROBE
Hardware
counter
accessapplication
monitoring
iProbe
functions
iProbe shared library
Control daemon
Hardware
event
selectiondata
Table writeread
control
blockwrite read
Shared memory
Application
process
Overhead
control
on/offiProbe HotPatch
Figure 5.5: Overview of FPerf : Hardware Event Profiler based on iProbe.
information to provide users a list of target functions and their respective file information. It takes as input
the list of targets and interrupts the target process. We then use ptrace functionality to patch the target
instructions with calls to our instrumentation functions, and release the process to execute as normal. The
instrumentation from each function is registered and logged by a shared memory logger. To avoid any locking
overhead, we have a race free mechanism which utilizes thread local storage to keep all logs, and a buffered
logging mechanism.
5.5 FPerf: An iProbe Application for Hardware Event Profiling
We used iProbe to build FPerf, an automatic function level hardware event profiler. FPerf uses iProbe to
provide an automated way to gather hardware performance information at application function granularity.
Hardware counters provide low-overhead access to a wealth of detailed performance information related
to CPU’s functional units, caches and main memory etc. Using iProbe’s all function profiling, we capture
97

CHAPTER 5. IPROBE
the hardware performance counters at the entry and exit of each function. To control the perturbation on
applications and the run-time system, FPerf also implements a control mechanism to constraint the function
profiling overhead within a budget configured by users.
Figure 5.5 summarizes FPerf implementation. It includes a control daemon and an iProbe shared
library with customized instrumentation functions. The iProbe instrumentation functions access hardware
performance counters (using PAPI[Mucci et al., 1999] in the implementation) at the entry and exit of a
selected target function to get the number of hardware events occurring during the function call. We define
this process as taking one sample. Each selected function has a budget quota. After taking one sample, the
instrumentation functions decrease the quota for that application function by one. When its quota reaches
zero, iProbe does not take sample anymore for that function.
The daemon process controls run-time iProbe profiling through shared memory communication. There
are two shared data structures for this purpose: a shared control block where the daemon process passes
to the iProbe instrumentation functions the profiling quota information, and a shared data table where the
iProbe instrumentation functions record the hardware event information for individual function calls. When
iProbe is enabled, i.e., the binary is HotPatched, daemon periodically collects execution data. We limit the
total number of samples we want to collect in each time interval to restrict the overhead. This limitation is
important because in software execution, the function call happens very frequently. For example, even with
test data size input, the SPEC benchmarks generate 50MB-2GB trace files if we log the records for each
function call. Functions that are frequently called will get more samples. Each selected function cannot take
more samples than its assigned quota. The only exception happens when one function has never been called
before; we assign a minimum one sample quota for each selection function. And we pick a function with
quota that has not been used up, and decrease the quota of it by one. The above overhead control algorithm is
a simplified Leaky Bucket algorithm [Tanenbaum, 2003] originally for traffic shaping in networks. Other
overhead control algorithms are also under consideration.
The control daemon also enables/disables the iProbe HotPatching based on user-defined application
monitoring rules. Essentially, this is an external control role on when and what to trace a target application
with iProbe. A full discussion of the hardware event selection scheme and monitoring rule design is beyond
the scope of this document.
98

CHAPTER 5. IPROBE
5.6 Discussion: Safety Checks for iProbe
Safety and reliability of the instrumentation technique is a big concern for most run-time instrumentation
techniques. One of the key advantages of iProbe is that because of its hybrid design reliability and correctness
issues are handled in a better way inherently. In this section we discuss how our HotPatch can achieve such
properties in details.
HotPatch check against Illegal instructions: Unlike previous techniques iProbe relies on compiler
correctness to ensure safety and reliability in its binary mode. To ensure correctness in our ColdPatching phase,
we convert call instructions to instrumentation functions with NOP instruction. This does not in any way effect
the correctness of the binary, except that instrumentation calls are not made. To ensure run-time correctness,
iProbe uses a safety check when it interrupts the application while HotPatching. Our safety check pass ensures
that the program counters of all threads belonging to the target applications do not point to the region of code
that is being overwritten (i.e. NOP instructions are not overwritten while they are being executed. This check
is similar to those from traditional Ptrace[Linux Manual Ptrace, ] driven debuggers etc [Yamato et al., 2009;
UKAI, ]. Here we use the Ptrace GETREGS() call to inspect the program counter, and if it is currently
pointing to the target NOP instructions, we allow the execution to move forward before applying the HotPatch.
Unlike existing trampoline oriented mechanisms iProbe has a small NOP code segments equal to the length
of a single call instruction that it overwrites with instrumentation calls, this means that the check can be
performed in a fast and efficient manner. It is also important to have this check for all threads which share the
code-segment, hence the checking must be able to access the process memory map information, and interrupt
all the relevant threads.
Safe parameter passing to maintain stack consistency: An important aspect for instrumentation is
the information passed along to the instrumentation function via the parameter values. Since the instrumenta-
tion calls are defined by the compiler driven instrumentation, the mechanism in which the parameters passed
are decided based on the calling convention used by the compiler.
Calling conventions can be broadly classified in two types: caller clean-up based, and callee clean-up based.
In the former the caller is responsible to pop the parameters passed to function, and hence all parameter
related stack operations are performed before and after the call instruction inside the code segment of the
caller. In the later however, the callee is responsible to pop the parameters passed to it. Since parameters are
generally passed using the stack it is important to remove them properly to mantain stack consistency.
99

CHAPTER 5. IPROBE
To ensure this iProbe enforces that all calls that are made by the static compiler instrumentation must
be cdecl [Wikipedia, 2016b] calls where the caller performs the cleanup as compared to std calls, where
the callee performs it. As the stack cleanup is automatically performed, it maintains stack consistency, and
there is a negligible impact in performance due to the redundant stack operations. Alternatively for std call
convention, push instructions could also be converted to NOPs and HotPatched at run-time, we do not do so
as a design choice.
Address Space Layout Randomization: Another issue that iProbe addresses is ASLR (address space
layout randomization), a security measure used in most environments which randomizes the loading address
of executables and shared libraries. However, since iProbe assumes the full access to the target system, the
load addresses are easily available. HotPatcher uses the process id of the target to find all load addresses of
each binary/shared library and uses them as base offsets to generate correct instruction pointer addresses.
5.7 Evaluation
In this section we evaluate various aspects of iProbe. Initially, we show the overhead of iProbe on SPEC
CPU 2006 benchmarks[Henning, 2006], we then showcase iProbe vs a normal mode, the binary generated
with initial -finstrument-function flag, and the ColdPatched version of the same binary. Since iProbe is also
geared towards monitoring large scale systems, we also show the overhead of iProbe ”ColdPatched” binaries
in terms of throughput in apache httpd server, and the mysql database. Then we present the overhead for
”HotPatching” itself wherein we measure the time taken by iProbe to patch the functions in a live session.
Lastly, we compare scalability of iProbe compared to existing state of the art technique SystemTap [Prasad et
al., 2005]
5.7.1 Overhead of ColdPatch
The SPEC INT CPU benchmarks 2006 [Henning, 2006] is a widely used benchmark in academia, industry and
research as relevant representation of real world applications. We tested iProbe on 8 benchmark applications
shown in Figure 5.6. The first column shows the execution of a normal binary compiled without any
instrumentation or debug flags. The next column shows the execution time of the corresponding binary
compiled using the instrumentation flags (Note here the instrumentation functions are dummy functions).
Lastly, we show the overhead of a ColdPatched iProbe binary with NOP instead of the call instruction. Each
100

CHAPTER 5. IPROBE
benchmark application was executed ten times using SPEC benchmark tools. The overhead for a ColdPatched
binary was found to be less than five percent for all applications executed, and 0-2 percent for four of the
benchmarks. The overhead here is basically because of the NOP instructions that are placed in the binary
as place-holders for the HotPatching. In most non-compute intensive applications (e.g., apache, mysql) we
have observed the overhead to be negligible (less than one percent), with no observable effect in terms of
throughput. Further reduction of the overhead can be achieved by reducing the scope of the functions which
are prepared for function tracing by iProbe; for example only using place holders in selected components that
need to be further inspected. Negligible overhead of ColdPatching process of iProbe shows that applications
can be prepared for instrumentation (HotPatching) without adversly effecting the usage of the application.
0
10
20
30
40
50
60
70
80
90
bzip2 sjeng perlbench mcf hmmer gobmk h264ref astar
Tim
eTaken(seconds)
Normal Instrumented Cold Patched
Figure 5.6: Overhead of iProbe “ColdPatch Stage” on SPEC CPU 2006 Benchmarks.
5.7.2 Overhead of HotPatching and Scalability Analysis
We compared iProbe with UTrace (User Space Tracing in SystemTap) [McGrath, 2009], and DynInst [Buck
and Hollingsworth, 2000] on a x86 64, dual-core machine with Ubuntu 12.10 kernel. To test the scalability
of these tools, we designed a micro-benchmark and tested the overhead for an increasing amount of events
instrumented. We instrumented a dummy application with multiple calls to an empty function foo, the
instrumentation function in the cases simply increases a global counter for each event triggered (entry and exit
of foo). Tools were written using all three frameworks to instrument the start and end of the target function
101

CHAPTER 5. IPROBE
and call the instrumentation function.
Figure 5.7 shows our results when applying iProbe and SystemTap on this micro-benchmark. To test
the scalability of our the tools, we have increased the number of calls made to foo exponentially (increase
by multiples of 10). We found that iProbe scales very well and is able to keep the overhead to less than five
times for millions of events (108) generated in less than a second (normal execution) for entry as well as exit
of the function. While iProbe executed in 1.5 seconds, the overhead observed in SystemTap is around 20
minutes for completion of a subsecond execution, while DynInst takes about 25 seconds.
As explained in Section 5.3, tools such as DynInst use a trampoline mechanism, hence have a minimum
of 2 call instructions for each instrumentation. Additionally SystemTap uses a context switch to switch to the
kernel space over and above the traditional trampoline mechanism, resulting in the high overhead, and less
scalability observed in our results.
5.7.3 Case Study: Hardware Event Profiling
5.7.3.1 Methodology
In this section, we present preliminary results on FPerf. The purpose of this evaluation is for the illustration of
iProbe as a framework for lightweight dynamic application profiling. Towards it, we will discuss the results
in the context of two FPerf features in hardware event profiling:
• Instrumentation Automation: FPerf automates hardware event profiling on massive functions in
modern software. This gives a wide and clear view of application performance behaviors.
• Profiling Automation: FPerf automates the profiling overhead control. This offers a desired
monitoring feature for SLA-sensitive production systems.
While there are many other important aspects on FPerf to be evaluated such as hardware event information
accuracy and different overhead control algorithms, we focus on the above two issues related to iProbe.
Our testbed setup is described in Table 5.1. The server uses an Intel CoreTM i5 CPU running at 3.3GHz,
and runs Ubuntu 11.10 Linux with 3.0.0-12 kernel. FPerf uses PAPI 5.1.0 for hardware performance counter
reading, and the traced applications are SPEC CPU2006 benchmarks.
102

CHAPTER 5. IPROBE
Figure 5.7: Overhead and Scalability Comparison of iProbe HotPatching vs. SystemTap vs. DynInst using a
Micro-benchmark.
Table 5.1: Experiment Platform.
CPU Intel CoreTM i5-2500 CPU 3.3GHz
OS Ubuntu 11.10
Kernel 3.0.0-12
Hardware eventPAPI 5.1.0
access utility
Applications SPEC CPU2006
103

CHAPTER 5. IPROBE
0
50
100
150
200
250
300
350
gobmk h.264 hmmer povray sjeng
Nu
mb
er o
f d
iffe
re
nt
fun
cti
on
s t
hat
have b
een
used
in
on
e e
xecu
tio
n
VTune
Actual
Figure 5.8: The number of different functions that have been profiled in one execution.
5.7.3.2 Instrumentation Automation
Existing profilers featuring hardware events periodically (based on time or events) sample the system-wide
hardware statistics and stitch the hardware information to running applications (e.g. Intel VTune [Intel,
2011]). Such sampling based profilers work well to identify and optimize hot code, but with the possibility
of missing interesting application functions yet not very hot. In sharp contrast, FPerf is based on iProbe
framework, it inserts probe functions when entering and exiting each target function. Therefore, FPerf can
catch all the function calls in application execution. In Figure 5.8, we use VTune and FPerf (without budget
quota) to trace SPEC workloads with test data set. VTune uses all default settings. We find that VTune misses
certain functions. For example, on 453.povray VTune only captures 12 different functions in one execution.
In contrast, FPerf does not misses any function because it records data at enter/exit of each function. Actually,
there are 280 different functions have been used in this execution. having the capability to profile all functions
or any subset in the program is desirable. For example, [Jovic et al., 2011] reported that in deployment
environment, non-hot functions (i.e., functions with low call frequency) might cause performance bugs as
well.
FPerf leverages iProbe’s all-function instrumentation and functions-selection utility to achieve instrumen-
tation automation.
104

CHAPTER 5. IPROBE
0.95
1
1.05
1.1
1.15
slow-down
Budget 200 5000
0
500
1000
1500
2000
slow-down
No budget
(a) Slow-down with Overhead Control (b) Slow-down with No Overhead Control
0
50
100
150
200
mcf milc soplex hmmer libquantum
nu
mb
er
of
fun
cti
on
s
Budget 200 5000
0
250
500
750
1000
mcf milc soplex hmmer libquantum
nu
mb
er o
f fu
ncti
on
s
No budget
(c)Limited Budget Profile Functions (d) Profiled Functions with No Budgeting
Figure 5.9: Overhead Control and Number of Captured Functions Comparison.
5.7.3.3 Profiling Automation
We tested the measured performance overhead and the number of captured functions of FPerf with different
overhead budget. As shown in Figure 5.9, the Y axis of Figure 5.9 (a) and (b) is slow-down, which is defined
as the execution time with tracing divided by the execution time without tracing. The Y axis of Figure 5.9 (c)
and (d) is the number of profiled functions. The “budget” legend is the total number of samples we assign
FPerf to take. With no budgeting, FPerf records hardware counter values at every enter/exit points of each
function. From Figure 5.9 (b) and (d), no budgeting can capture all the functions but with large 100x-1000x
slow-downs. In contrast, FPerf showed its ability to control the performance overhead under 5% in Figure 5.9
(a). Of course, FPerf had the possibility to miss functions, as when the budget is too tight, we only sample a
limited number of function enter/exit points.
FPerf leverages iProbe’s scalability property (predictable low overhead) to achieve the automation on
realizing a low and controllable profiling overhead.
105

CHAPTER 5. IPROBE
5.8 Summary
Flexibility and performance have been two conflicting goals for the design of dynamic instrumentation tools.
iProbe offers a solution to this problem by using a two-stage process that offloads much of the complexity
involved in run-time instrumentation to an offline stage. It provides a dynamic application profiling framework
to allow for easy and pervasive instrumentation of application functions and selective activation. We presented
in the evaluation that iProbe is significantly faster than existing state-of-the-art tools, and scales well in large
application software.
As stated earlier iProbe is still limited in the sense that the overhead of iProbe depends on the amount
of instrumentation and the instrumentation points. Similar to other monitoring and instrumentation tools, this
makes it impossible to use for higher granularity monitoring or debugging scenarios which can potentially
impact production services. The results of our experiments with iProbe motivated us to create Parikshan,
which instead of simply reducing the instrumentation overhead, de-couples the instrumentation problem from
the user-facing production service. Instrumentation in Parikshan’s debug container has no impact on the
production container, and allows debuggers to instrument with higher overheads.
iProbe can still be used as a standalone debugging tool as well as within the debug container in
Parikshan for assisting debuggers to do execution tracing and thereby catching the error. It’s low overhead
can help in an increased and longer debug window as compared to other instrumentation tools.
106

CHAPTER 6. APPLICATIONS OF LIVE DEBUGGING
Chapter 6
Applications of Live Debugging
6.1 Overview
In the sections until now, we have introduced a framework for live debugging, a tool for pre-packaging
binaries to make them live debugging friendly. We now discuss some applications of live debugging in
the real-world, and how it can be used for actual debugging with existing tools or by modifying existing
mechanisms.
The debug container allows debuggers to apply any ad-hoc technique used in offline debugging. However,
in order for us to have continuous debugging, it is essential to allow forward progress of the execution in the
debug container. Furthermore, the divergence due to instrumentation should not stop forward-progress in
the debug-container. For instance, traditional monitoring approaches such as execution traces, memory or
performance profiling, which do not change the state or logic of the executing component can be directly
applied to the debug-container with little chance of debug container diverging. The debug container in this
case offers the advantage of allowing for a much higher instrumentation overhead compared to what would be
generally allowed in production services. Similarly the debug container can be used as a staging mechanism
for record-replay on demand to ensure deterministic execution. It is essential however, that none of them
functionally modifies the application or else makes any modifications such that forward progress is impossible.
Compared to other approaches with heavier impact like step-by-step execution in interactive debugging
tools, or alternatively dynamic instrumentation through tools like Valgrind [Nethercote and Seward, 2007] or
PIN [Luk et al., 2005] which require a controlled debugging environment, Parikshan’s debug container is a
safe blackbox which allows debugging or monitoring without any impact on production services.
107

CHAPTER 6. APPLICATIONS OF LIVE DEBUGGING
This chapter is divided in the following key parts: Firstly, in section 6.2, we discuss the advantages and
limitations of Parikshan in real-world settings. We highlight certain key points that the debugger must be
aware of when debugging applications with Parikshan, so that he can do reliable and fast debugging. In
section 6.3, we classify debugging production applications in two high level debugging scenario categories:
post-facto, and proactive analysis. We leverage these classifications to explain how different techniques can
be applied in Parikshan and the limitations of our system. Next we list some existing debugging technologies,
like statistical debugging, execution tracing, record and replay etc. to explain how they can be either directly
applied or modified slightly and applied with the Parikshan framework to significantly improve their analysis.
Lastly, in section 6.5 we introduce budget-limited adaptive instrumentation. Which focuses further on how
to allow for continuous debugging with the maximum information gain. One of the key criteria for successful
statistical debugging is to have higher instrumentation rates, to make the results more statistically significant.
There is a clear trade-off between instrumentation vs performance overhead for statistical instrumentation.
A key advantage of using this with Parikshan is that we can provide live feedback based buffer size and
bounded overheads, hence squeezing the maximum advantage out of statistical debugging without impacting
the overhead. We evaluate the slack available in each request for instrumentation without risking a buffer
overflow and getting out of sync of the production container. Budget limited instrumentation is inspired from
statistical debugging [Liblit et al., 2005], and focuses on a two-pronged goal of bounding the instrumentation
overhead to avoid buffer overflows in Parikshan, and simultaneously have maximum feedback regarding
information gained from real-time instrumentation.
6.2 Live Debugging using Parikshan
The following are some key advantages of Parikshan that can be leveraged for debugging user-facing
applications on the fly:
• Sandboxed Environment: The debug container runs in a sandboxed environment which is running
in parallel to the real production system, but any changes in the debug container are not reflected to
the end-user. This is a key advantage in several debugging techniques which are disruptive, and can
change the final output.
Normal debugging mechanisms such as triggering a breakpoints or patching in a new exception/asser-
tion to figure out if a particular “condition” in the application system state is breaking the code, cannot
108

CHAPTER 6. APPLICATIONS OF LIVE DEBUGGING
be done in a production code as it could lead to a critical system crash. On the other hand, Parikshan’s
debug containers are ideal for this scenario as they will allow developers to put in a patches without
any fear of system failure.
• Minimal impact on production system: The most novel aspect of Parikshan is that it has negligible
impact of instrumentation on the production system. This means that high-overhead debugging
techniques can be applied on the debug-container incurring a negligible slow-down in production
containers.
Debugging techniques like record-replay tools which have traditionally high recording overheads can
generally not be applied in production systems. However, Parikshan can be used to decouple the
recording overhead from production, and can allow for relatively higher overhead recording with more
granularity. Section 3.4.3.2 discusses evaluation results demonstrating Parikshan’s negligible impact
on production services.
• Capturing production system state: One of the key factors behind capturing the root-cause of any
bug is to capture the system state in which it was triggered. Parikshan has a live-cloning facility that
clones the system state and creates a replica of the production. Assuming that the bug was triggered in
the production, the replica captures the same state as the production container.
• Compartmentalizing large-scale systems context: Most real-world services are deployed using a
combination of several SOA applications, each of them interacting together to provide an end-to-end
service. This could be a traditional 3 tier commerce system, with an application layer, a database layer
and a web front-end, or a more scaled out social media system with compute services, recommendation
engines, short term queuing systems as well as storage and database layers. Bugs in such distributed
systems are particularly difficult to re-create as they require the entire large-scale system to be re-
created in order to trigger the bug. Traditional record-replay systems if used are insufficient as they are
usually focused on a small subset of applications.
Since, our framework leverages network duplication, Parikshan can allow looking at applications in
isolation and capturing the system state as well as the input of the running application, without having
to re-create the entire buggy infrastructure. In a complex multi-tier system this is a very useful feature
to localize the bug.
109

CHAPTER 6. APPLICATIONS OF LIVE DEBUGGING
Above we summarized some of the advantages of using Parikshan, next we look at some of the things an
operator should keep in mind when using Parikshan for debugging purposes:
• Continuous Debugging and Forward Progress: The debug-container is where one can do debugging
runs in parallel to the production container. This is done by first making a live replica of the system
followed by duplicating and sending the network input to the debug container. In a way the debug
container still communicates with the entire system although it’s responses are dropped. To ensure
forward progress in the debug container, it is essential that the debug container is in-sync with
the production container, so that the responses, and the requests from the network are the expected
responses for forward progress in the application running on the debug container.
Take for instance, a MySQL [MySQL, 2001] service running in the production container and debug
container. If during our debugging efforts we modify the state of the debug service such that the
MySQL database is no longer in synch with the production service, then any future communication
from the network could lead to the state of the debug-container to further diverge from the production.
Additionally, depending on the incoming requests or responses the debug application may crash or not
have any forward progress.
No forward-progress does not necessarily mean that debugging cannot take place, however for further
debugging, once the machine has crashed it needs to be re-cloned from the production container.
• Debug Window: As explained earlier, most debugging mechanisms generally require instrumentation
and tracking execution flow. This means that the application will spend some compute cycles in
logging instrumentation points thereby having a slow-down. While Parikshan avoids slow-down in the
production environment, there will be some slow-down in the debug-container.
The amount of time till which the production container remains in synch with the debug container is
called the debug-window(see section 3.2.3). The window time depends on the overhead, the size of
the buffer and the incoming request rate. If a buffer overflow happens because the debug-window has
finished, the debug container needs to be re-synced with the production container.
In our experiments, we have observed, that Parikshan is able to accommodate significant overhead (an
order of magnitude depending on workload) without incurring a buffer overflow. Administrators or
debuggers using Parikshan should keep the overhead of their instrumentation in mind when debugging
in Parikshan. production container can always be re-cloned to start a new debugging session.
110
CHAPTER 6. APPLICATIONS OF LIVE DEBUGGING
• Non-determinism:
One of the most difficult bugs to localize are non-deterministic bugs. While Parikshan is able to capture
system non-determinism by capturing the input, it is unable to capture thread non-determinism. Most
service-oriented applications have a large number of threads/processes, which means that different
threading schedules can happen in the production container as compared to the debug-container. This
means, that a specific ordering of events that caused a bug to be triggered in the production container,
may not happen in the debug-container.
There are multiple ways that this problem can be looked at. Firstly, while it’s difficult to quantify, for all
the non-deterministic cases in our case-studies, we were able to trigger the bug in both the production
and the replica. In the case where the bug is actually triggered in the debug container, the debugging
can take place as usual for other other bugs. If that is not the case, there are several techniques which
provide systematic “search” [Park et al., 2009; Ganai et al., 2011] for different threading schedules
based on a high granularity recording of all potential thread synchronization points, and read/write
threads. While such high granularity recording is not possible in the production container, it can
definitely be done in the debug container without any impact on the production service.
6.3 Debugging Strategy Categorization
Based on our case-studies, and survey of commonly seen SOA bugs we classify the following scenarios
for live debugging. In each of the scenarios we explain how different categories of bugs can be caught or
analyzed.
6.3.1 Scenario 1: Post-Facto Analysis
In this scenario, the error/fault happens without live debugging having been turned on i.e. the service is
only running in the production container, and there is no replica. Typically light-weight instrumentation or
monitoring is always turned on in all service/transaction systems. Such monitoring systems are very limited
in their capabilities to localize the bug, but they can indicate if the system is in a faulty state.
For our post-facto analysis, we use such monitoring systems as a trigger to start live debugging once
faulty behavior is detected. The advantage of such an approach is that debugging resources are only used
on-demand, and in an otherwise normal system only the production container is utilizing the resources.
111

CHAPTER 6. APPLICATIONS OF LIVE DEBUGGING
There are three kind of bugs that can be considered in this kind of situation:
• Persistent Stateless Bugs:
This is the ideal scenario for Parikshan. Persistent bugs are those that persist in the application and are
long running. They can impact either some or all the requests in a SOA application. Common examples
of such bugs are memory leak, performance slow-down, semantic bugs among others. Assuming they
are statistically significant, persistent bugs will be triggered again and again by different requests.
We define stateless bugs here as bugs which do not impact the state of the system, hence not impacting
future queries. For instance read only operations in the database are stateless, however a write operation
which corrupts or modifies the database is stateful, and is likely to impact and cause errors in future
transactions.
Hence, such bugs are only dependent on the current system state, and the incoming network input.
Once such a bug is detected in the production system, Parikshan can initiate a live cloning process and
create a replica for debugging purposes. Assuming similar inputs which can trigger the bug are sent by
the user, the bug can be observed and debugged the debug container.
• Persistent Stateful Bugs:
Stateful bugs are bugs which can impact the system state and change it such that any such bug impacts
future transactions in the production container as well. For instance in a database service a table may
have been corrupted, or it’s state changed so that certain transactions are permanently impacted. While
having the execution trace of the initial request which triggered a faulty state is useful, the ability to
analyze the current state of the application is also extremely useful in localizing the error.
Creating a live clone after such an error and checking the responses state of future impacted transaction,
as well as the current state of the database can be a good starting point towards resolving the error.
• Crashing Bugs:
Crashing bugs are bugs that lead to a crash in the system thereby stopping the service. Unhandled
exceptions, or system traps are generally the cause of such crashes. Unfortunately Parikshan has
limited utilization for post-facto analysis of a crashing bug. Since Parikshan is not turned “on” at the
time of the crash, any post-facto analysis for creating a debug container is not possible.
112

CHAPTER 6. APPLICATIONS OF LIVE DEBUGGING
6.3.2 Scenario 2: Proactive Analysis
Proactive analysis is the scenario where the user starts debugging when the system is performing normally and
their is no bug. This is the same as monitoring a production server, except that in this case the instrumentation
is actually present in the debug container.
Compared to traditional monitoring, one possible use-case is to use the debug container to do high
granularity monitoring at all times. This is extremely useful to have if you expect to have higher overheads
of instrumentation, which are unacceptable in the production environment. Since the debug container
can have much higher instrumentation without any performance penalty on the production container, the
instrumentation can be easily put there, and stay active at all times. Another useful feature is the case where
the debugger needs to put in breakpoints or assertions which can cause the system to crash. It is not possible
to put such assertions, in active systems, but they can be put in debug container to trigger future analysis.
Proactive recording is basically use to track bugs that could happen in the future as the transaction or
request which causes the failure is caught as well, as well as the system state. Once a bug is caught, the
cause can be independently explored in the debug container. It is useful for both stateless and stateful bugs,
we do not differentiate between them here as even in the case of a stateful bug, debugging is always turned
on. Proactive approaches can be compared to existing approaches like statistical debugging [Liblit et al.,
2005] which use active statistical profiling to compare between successful and buggy runs, to isolate the
problem. We discuss statistical debugging in section 6.4.2 and present an advanced approach based on
the same in section 6.5. Other proactive body of work include record-replay infrastructures, which record
production systems, and can replay the execution if a bug is discovered. In section 6.4.3, we have discussed
another variant of proactive debugging called “staged record-and-replay”, which is an advanced record-replay
technique that can be applied with the help of Parikshan.
6.4 Existing Debugging Mechanisms and Applications
6.4.1 Execution Tracing
One of the most common techniques to debug any application is execution tracing. Execution tracing gives a
trace log of all the functions/modules executed when an input is received. This helps the debugger in looking
at only those execution points and makes it easier to reason out what is going wrong.
113

CHAPTER 6. APPLICATIONS OF LIVE DEBUGGING
Execution tracing can happen at different granularity: for instance an application can be monitored at
function level granularity (only entry and exit of function is monitored), or for deeper understanding at
read/write, synchronization point or even instruction level granularity. Depending on how much granularity
the tracing is done at the overhead may be unacceptable for production systems.
Parikshan allows users to de-couple execution tracing from production execution by putting their instru-
mentation in the debug container. As mentioned earlier, this allows for higher level instrumentation at no
cost to the production environment.
6.4.1.1 CaseStudy: Execution Tracing
We now look into MySQL bug#15811 (see also section 4.3), this is a performance bug which happens
when dealing with complex scripts (Japanese, Chinese etc.). Let us look at how a debugger would go about
finding the root cause of such a bug. Firstly, let us say that a high level report of the bug is provided by
the user of a deployed production server. The report states that a certain category of queries are having
higher than expected transaction latencies. The user reports this as a potential bug and asks for it to be
investigated. Based on the user report, a post-facto MySQL replica is created for debugging and analysis
by the developer/debugger. The debugger then uses SystemTap tracing tool [Prasad et al., 2005] to trace
the execution of the application. This instrumentation is optionally triggered whenever the input queries
are found to be “chinese”. This can be easily done in MySQL by setting trigger points when the language
specification in the query is read inside MySQL query parser.
Since the bug reported is a performance bug, the developer must first find out which module and
specifically which function is the cause of the bug. To find the time taken in each function, function-level
begin and exit instrumentation is added and the timestamp for each function is collected as log evidence.
This detailed evidence allows the debugger to localize and find the root-cause of the error inside the
“my strcasecmp()” function in comparison to the time taken by the function for latin based queries. Once
the performance bug, has been localized. The debug-container can then be dis-connected from the proxy
(alternatively proxy input forwarding can be stopped). Now, some of the “read-only” queries which triggered
this bug can be re-sent to the MySQL database, and a step-by-step execution can be followed inside this
function using deeper instrumentation to further understand the code execution.
In our experiments for localizing this bug, we found that function level instrumentation for profiling
time-spent in each function can take from 1.5x to 1.8x overhead. This is clearly un-acceptable in production
114

CHAPTER 6. APPLICATIONS OF LIVE DEBUGGING
systems. However, the Parikshan framework allows for capturing such execution traces without impacting
user-facing performance of the MySQL database. While such persistent bugs can be debugged offline, it may
be argued that such bugs can also be debugged in an offline debugging environment. However, given no
previous knowledge Parikshan gives a valuable “first-attack” mechanism to debug unknown problems.
6.4.2 Statistical Debugging
Statistical debugging aims to automate the process of isolating bugs by profiling several runs of the pro-
gram and using statistical analysis to pinpoint the likely causes of failure. The seminal work on sta-
tistical debugging [Liblit et al., 2005], has lead to several advanced approaches [Chilimbi et al., 2009;
Arumuga Nainar and Liblit, 2010; Song and Lu, 2014], and is now a well established debugging methedology.
The core mechanism of statistical debugging is to have probabilistic profiling, by sampling execution
points and comparing the execution traces for failed and successful transactions. It then uses statistical models
to identify path profiles that are strongly predictive of failure. This can be used to iteratively localize the bug
causing execution, and can then be manually analyzed by Parikshan.
Statistical debugging relies on the sampling frequency of the instrumentation, which can be decreased
to reduce the instrumentation overhead. However, the instrumentation frequency needs to be statistically
significant for such testing to be successful. Unfortunately, overhead concerns in the production environment
can limit the frequency of statistical instrumentation. In Parikshan, the buffer utilization can be used to
control the frequency of such statistical instrumentation in the debug-container. This would allow the user to
utilize the slack available in the debug-container for instrumentation to it’s maximum, without leading to an
overflow. Thereby improving the efficiency of statistical testing.
Statistical debugging is one of the systematic bug localization approaches that can be directly applied in
the debug container, with the added advantage that the amount of instrumentation that can be applied in the
debug-container is much higher than production containers. Apart from regular semantic bugs, previous body
of works have shown that statistical debugging is useful in detecting a variety of other bugs like concurrency
bugs [Jin et al., 2010], and performance [Song and Lu, 2014].
6.4.3 Staging Record and Replay
One well known sub-category of debugging service-oriented applications are record-replay infrastructures.
In the past decade there have been numerous record-and-replay infrastructures [Park et al., 2009; Geels et
115

CHAPTER 6. APPLICATIONS OF LIVE DEBUGGING
Produc'onServices
DebugContainer
Instrumenta'on/RecordingTools
------------------------------------------------------------
Live Cloning
Staged Recording
OfflineSearchandReplay
Captured Log in Record Phase
Figure 6.1: Staged Record and Replay using Parikshan
al., 2007b; Saito, 2005; Mickens et al., 2010; Dunlap et al., 2002; Guo et al., 2008a; Laadan et al., 2010;
Viennot et al., 2013] which have been introduced in academia. The core focus of these techniques is to
faithfully reproduce the execution trace and allow for offline debugging. However, in order to faithfully
reproduce the exact same instrumentation, the recording phase must record a higher granularity of execution.
Unfortunately, this means a higher overhead at the time of recording in the production system. Such recording
overhead is usually unacceptable in most production systems.
Record and replay can be coupled with the debug container to avoid any overhead on the production
container. This is done by staging the recording for record-and-replay in the debug container instead of the
production, and then replaying that for offline analysis. In figure 6.1 we show how the production system can
first be “live-cloned”. A copy of the container’s image can be stored/retained for future offline replay - this
incurs no extra overhead as taking a live snapshot is a part of the live-cloning process. Recording can then be
started on the debug container, and logs collected here can be used to do offline replay.
We propose that Parikshan provides a viable alternative to traditional record-replay techniques, whereby
116

CHAPTER 6. APPLICATIONS OF LIVE DEBUGGING
a high granularity recording can be done on the debug container instead of the production container. The
amount of recording granularity ( or the amount of recording overhead) will depend on the workload of
the system, and how much idle time to the debug container has to catch up to the production container.
Admittedly, non-determinism can lead to different execution flows in the debug container v.s. the production
container (with low probability as the system is a clone of the original). Hence simply replaying an execution
trace in the debug container, may not lead to the same execution which triggers the bug. However several
existing record-and-replay techniques offer search capabilities to replay and search through all possible
concurrent schedules which could have triggered a non-deterministic error [Flanagan and Godefroid, 2005;
Ganai et al., 2011]. For instance PRES [Park et al., 2009] which uses a execution sketch of synchronization
record points which are used to guide search in the replay phase and try different threading schedules. For
doing search, feedback from previous replay executions is used to eliminate the threading schedules that have
already been tried.
6.4.3.1 CaseStudy: Staged Record-Replay
To show a use-case for staged record-replay we look at Redis bug #761 (see also section 4.3). As explained
earlier this Redis bug is an integer overflow error. Let us look at how a debugger would go about finding
the root cause of such a bug. Imagine that we are doing staged record-replay, whereby the debug container
is getting duplicated network inputs, and the debug container is “recording” the execution in parallel by
activating commodity record-replay tools.
The bug happens over a period of time when a request happens for an addition/storage of a large integer,
which leads to an integer overflow error. The execution trace of this bug will be captured in the “record” log
of the debug container, and can be replayed offline for debugging purposes. Since the bug is a crashing bug,
the execution can be replayed and a debugger can be attached to the execution in the replay mode. Ideally, the
transaction which has caused the error, is the last network input. This transaction can be executed step-by-step
with roll-back to localize the error point.
Under normal conditions, this recording would have caused an overhead on the production container.
Parikshan decouples it’s staged recording and can proceed without any overhead to the production system.
Recording overhead differs for different tools, and is often impractical for production software. However, by
decoupling recording instrumentation from the production container, we can record at high granularities all
the time, and replay whenever a bug is observed.
117

CHAPTER 6. APPLICATIONS OF LIVE DEBUGGING
6.4.4 A-B Testing
Figure 6.2: Traditional A-B Testing
A/B testing (sometimes called split testing) is comparing two versions of a web page to see which one
performs better. You compare two web pages by showing the two variants (let’s call them A and B) to similar
visitors at the same time. User operations in A can then be compared to user scenario’s in B to understand
which is better, and how well it was received. Typically A/B testing is done to test and verify beta releases
and optimizations, and how they impact the user. A/B Testing can be extended in Parikshan by leveraging the
debug container for evaluating patches for performance optimization or functional improvements. These
patches must be functionally similar and have same network level input/output to ensure forward progress.
Parikshan can thereby provide limited insight into beta releases before they are introduced in production.
6.4.5 Interactive Debugging
The most common debugging tools used in the development environment are interactive debuggers. Debug-
ging tools like gdb [Stallman et al., 2002], pdb, or eclipse [D’Anjou, 2005], provide intelligent debugging
options for doing interactive debugging. This includes adding breakpoints, watch-points, stack-unrolling
etc. The downside to all of these techniques is that not only do they incur a performance overhead, they
118

CHAPTER 6. APPLICATIONS OF LIVE DEBUGGING
need to stop the service or execution to allow interactive debugging. Once a process has been attached to
a debugger, a shadow process is also attached to it and the rest of the execution follows with just-in-time
execution, allowing the debugger to monitor the progress step-by-step therefore making it substantially easier
to catch the error. Clearly, such techniques are meant for development environment and cannot be applied to
production environments.
However this can be easily applied towards the debug container, where the execution trace can be
observed once a breakpoint has been reached. While this does mean that the replica will not be able to service
any more requests (except for those that have been buffered), the request which is inside the breakpoint will
be processed. Generally breakpoint and step-by-step execution monitoring is used for a limited scope of
execution within a single transaction. Once, finished future transactions can also be debugged after doing a
re-sync by applying live cloning again.
6.4.5.1 CaseStudy: Interactive Debugging
As mentioned earlier, the downside of interactive debugging is that it puts significant overhead on the running
program. This is because debuggers can do step-by-step execution on breakpoints, and can exactly map the
execution of given training requests. Let us look at a memory leak example from Redis bug #417. The bug
shows itself as an increasing memory footprint ( or a leak), which can be easily observed from any monitoring
software by looking at the amount of memory being consumed by the Redis server. Once the bug is reported,
the developer can trigger a live-clone in Parikshan and create a debug container.
Since this bug is a slow-increasing memory leak it does not lead to an imminent crash (crash could take
a few days). Monitoring software and periodic memory or file process snapshots in the debug-container
(use of lsof command, or vsz) can tell us that stale connections are left from the master to the slave. This
indicates to the debugger that the problem is likely in replication logic of master. We then put a breakpoint in
the replication source code at the point when a connection is created. This “breakpoint” will be triggered
whenever a replication is triggered (replication is triggered periodically), and will allow the debugger to step-
by-step execute the process. Parikshan debug-containers can manage significant overhead before they diverge
from the production container. However, once step-by-step execution is triggered it is ideally going to allow
the debugger access to only those transactions currently in the proxy buffer (depending on the application,
transactions and buffer-size, the buffer could have several transactions). The step-by-step execution, will
give a detailed understanding to the user of the transaction that is being currently executed, and can also be
119

CHAPTER 6. APPLICATIONS OF LIVE DEBUGGING
used for those which are in the buffer. The step-by-step inspection will allow the debugger to see that the
connection was not closed at the end of the periodic replication process (which is causing the leak). The error
was caused because of a condition which was skipping the “connection close” logic when db was configured
>=10.
6.4.6 Fault Tolerance Testing
One of the places that Parikshan can be applied is for fault tolerance testing. To motivate this let us look at
Netflix’s current testing model. Netflix has a suite of real-time techniques [Basiri et al., 2016] for testing
fault-tolerance of it’s systems. Amongst them, chief is chaos monkey [Tseitlin, 2013], which uses fault
injection in real production systems to do fault tolerance testing. It randomly injects time-outs, resource
hogs etc. in production systems. This allows Netflix to test the robustness of their system at scale, and avoid
large-scale system crashes. The motivation behind this approach is that it’s nearly impossible to create a
large-size test-bed to have a realistic fault tolerance testing for the scale of machines that Netflix has. Chaos
Monkey allows Netflix to do it’s fault tolerance testing at a small cost to the customer experience, while
avoiding fatal crashes which could lead to longer downtimes. The obvious downside of this approach is that
the service becomes temporarily unavailable and re-sets, or forces a slow-down on the end-user experience
(this may or may not be visible to the user).
Since Parikshan can be run in a live system, it can be attached to a scaled out large-system, and can allow
users to test for faults in an isolated environment, by creating a sub-set of debug container container nodes
where the fault will be injected. The only limitation being that the fault-injections should be such that the
impact of these faults can be isolated to the targeted debug container systems, or a sub-domain of a network
which has been cloned, and the tolerance built into the system can be tested (it would be too expensive to
clone the entire deployment). This allows for fault tolerance testing, and at the same time hiding it’s impact
from the end-user.
6.5 Budget Limited, Adaptive Instrumentation
As explained in section 3.2, the asynchronous packet forwarding in our network duplication results in a debug
window. The debug window is the time before the buffer of the debug-container overflows because of the
input from the user. The TCP connection from end-users to production-containers are synchronized by default.
120

CHAPTER 6. APPLICATIONS OF LIVE DEBUGGING
Client Produc.on Container
λ µ1
TCP buffer for the production container
Figure 6.3: Parikshan applied to a mid-tier service
This means that the rate of incoming packets is limited by the amount of packets that can be processed by
the production container. On the other hand, packets are forwarded asynchronously to an internal-buffer in
the debug-container. The duration of the debug window is dependent on the incoming workload, the size
of the buffer, and the overhead/slowdown caused due to instrumentation in the debug-container. Each time
the buffer is filled, requests are dropped, and the debug-container can get out of sync with the production
container. To get the debug-container back in sync, the container needs to be re-cloned. While duplicating
the requests has negligible impact on the production container, cloning the production container can incur a
small suspend time(workload dependent).
The duration of the debug window can be increased by reducing the instrumentation. At the same time
we wish to increase the maximum information that can be gained out of the instrumentation to do an effective
bug diagnosis. Essentially for a given buffer size and workload, there is a trade-off between the information
gain due to more instrumentation and the duration of the debug window. Hence our general objective is to
increase the information gain through instrumentation while avoiding a buffer overflow.
We divide this task into pro-active and re-active approaches which can complement each other. Firstly,
we pro-actively assign budgets using queuing theory. Using a poisson distribution for average processing
time of each request and the inter-arrival time of requests, we can find expected buffer sizes for a reasonable
debug-window length. Secondly, we propose a reactive mechanism, whereby buffer utilization can be
continuously monitored and the instrumentation sampling can be exponentially reduced if the buffer is near
capacity.
6.5.1 Proactive: Modeling Budgets
In this section we model the testing window by using concepts well used in queuing theory (for the sake of
brevity we will avoid going into too much detail, readers can find more about queuing theory models [Gne-
121

CHAPTER 6. APPLICATIONS OF LIVE DEBUGGING
Client Proxy Server Produc2on
Container
λ
Debug Container
µ1
µ2
TCP buffer for the production container
Custom proxy buffer for the debug container
Cloned Debug Container
Production container serving
the user
Figure 6.4: External and Internal Mode for live cloning: P1 is the production, and D1 is the debug container.
denko and Kovalenko, 1989]). Queues in a SOA application can be modeled as a M/M/1/K queue (Kendall’s
notation [Kendall, 1953]). The standard meanings associated with each of these letters are summarized below.
A represents the inter-arrival time distribution
B represents the service time distribution
C gives the number of servers in the queue
D gives the maximum number of jobs that can be there in the queue.
E represents the Queueing Discipline that is followed. The typical ones are First Come First Served
(FCFS), Last Come First Served (LCFS), Service in Random Order (SIRO) etc. If this is not given then
the default queueing discipline of FCFS is assumed.
The different possible distributions for A and B above are:
M exponential distribution
D deterministic distribution
Ek Erlangian (order k)
G General
Figure 6.3 represents a simple client-server TCP queue in an SOA architecture based on the M/M/1/K
queue model. An M/M/1/K queue, denotes a queue where requests arrive according to a poisson process
122

CHAPTER 6. APPLICATIONS OF LIVE DEBUGGING
with rate λ, that is the inter-arrival times are independent, exponentially distributed random variables with
parameter λ . The service times are also assumed to be independent and exponentially distributed with
parameter µ. Furthermore, all the involved random variables are supposed to be independent of each other.
In the case of a blocking TCP queue common in most client-server models, the incoming request rate
from the client is throttled based on the request processing time of the server. This ensures that there is no
buffer-overflows in the system.
In Parikshan, this model can be extended to a cloned model as shown in figure 6.4. The packets to both
the production and the debug cloned containers are routed through a proxy which has internal buffer to
account for slowdowns in request processing in the debug container. Here instead of the TCP buffer, we focus
on the request arrival and departure rate to and from the proxy duplicators buffer. The incoming rate remains
the same as λ, as the requests are asynchronously forwarded to both containers without any slowdown.
To simplify the problem, we identify the following variables:
This is the maximum capacity at which the production container can process requests
µ1 = processing time for requests of original container (6.1)
This is the maximum capacity at which the debug container can process requests
µ2 = processing time for requests of debug container (6.2)
Taking the above two equations, the overhead can be modeled as follows
µ3 = µ1 − µ2 = slowdown of debug compared to original (6.3)
The remaining processing time for both the production container and the debug container is going to be
the same. Since the TCP buffer in the production container is a blocking queue, we can assume that any buffer
overflows in the proxy buffer are only caused because of the instrumentation overhead in the debug-container,
which is accounted for by µ3.
Without going into the theoretical basis, Kendall’s notation and queuing theory suggest that for a stable
queue with a bounded buffer the incoming rate of requests should be less than the outgoing rate. Once
the incoming rate is more than the outgoing rate from the queue, the queue follows brownian motion, and
exponentially fills up. Hence for our debug system to be stable the goal still remains to allocate debugging
overhead such that:
123

CHAPTER 6. APPLICATIONS OF LIVE DEBUGGING
λ < µ2 (6.4)
The equation above gives us the basis to build certain guidlines for the instrumentation overhead
guarantees in the debug containers, and how to create the buffer. As can be easily understood, that if
the rate of incoming requests (λ) to the production container itself is continuously equal to µ1 (i.e. it’s
maximum capacity), then intuitively there is no “slack” available to debug container to catch up to the
production container. However for production services, which generally run far below the maximum capacity,
there will be significant opportunity for instrumentation in the debug container, without impacting the user
performance. This debug container uses the idle time in between requests to catch up to the production
container, thereby remaining in synch.
The advantage of the of our internal buffer in the duplication proxy in this scenario, is that it provides a
lengthy debug window in the case of a spike in the workload. Once the debug container starts lagging behind
the production container, the requests start piling in the internal buffer. Spikes are generally short, bursty
and infrequent, hence given some idea of the spike in the workload the operator can set the buffer size and
instrumentation such that he can avoid the overflow.
6.5.2 Extended Load-balanced duplicate clones
Our model can be further extended into a load-balanced instrumentation model as shown in figure 6.5. This is
useful when the debugging needs to be higher, but we have a lower overhead bound through only one clone.
Here we can balance the instrumentation across more than one clones, each of which receive the same input.
They can together contribute towards debugging the error, as well as increase the amount of instrumentation
that can be done without incurring an overhead. Hence, if earlier we had enough slack in the “production
system” to have a 2x overhead instrumentation in the debug container, with an extra replica, the amount
instrumentation can be potentially raised to 4x overhead, each managing some part of the instrumentation.
As explained earlier, the overhead in each of load balanced debug containers should ensure that it can
process the incoming request rate.
6.5.3 Reactive: Adaptive Instrumentation
Adaptive instrumentation reduces or increases sampling rate of the dynamic instrumentation in order to
decrease the overhead. This allows the debug-container time to catch up to the production container without
124

CHAPTER 6. APPLICATIONS OF LIVE DEBUGGING
Client Proxy Server
Produc2on Container
λ Debug
Container
µ1
µ2
TCP buffer for the production container
Custom proxy buffer for the debug container
Debug Container
µi
.
.
Optional: Load-balanced
duplicate proxy clones
Load-balanced duplicate proxy
clones
Cloned Debug Container
Figure 6.5: This figure shows how queuing theory can be extended to a load balanced debugging scenario.
Here each of the debug container receive the requests at rate λ, and the total instrumentation is balanced
across multiple debug containers.
causing a buffer overflow.
A mechanism similar to TCP’s network congestion avoidance mechanisms can be applied on the monitor-
ing buffer. We also derive inspiration from statistical debugging [Song and Lu, 2014; Chilimbi et al., 2009;
Liblit et al., 2005], which shows how probabilistically instrumenting predicates, can assist in localizing and
isolating the bug. Predicates can be branch conditionals, loops, function calls, return instructions and if
conditionals. Predicates provide significant advantages in terms of memory/performance overheads. Instead
of printing predicates, they are usually counted, and a profile is generated. This reduces the amount of
instrumentation overhead, and several predicates can easily be encoded in a small memory space. Similar
techniques have also been applied for probabilistic call context encoding in-order to capture execution profiles
with low overhead.
The sampling rate of instrumentation in the debug-container can be modified based on the amount of
buffer usage. The following are the key components of adaptive instrumentation:
• Buffer Monitoring: The first step involves monitoring the buffer usage of the network duplicator.
If the buffer usage is more than a certain threshold, the sampling rate of instrumentation can be
125

CHAPTER 6. APPLICATIONS OF LIVE DEBUGGING
exponentially decreased. This would increase the idle time in the debug container allowing it to catch
up to the production and reducing the buffer usage.
• Controller: The controller allows debuggers to control the sampling rate of instrumentation. The
sampling rate can be controlled for each predicate. Similar to statistical debugging the predicates with
lower frequency can have higher sampling rates, and predicates with higher frequency can have lower
sampling rates. This ensures overall better information gain in any profile collected.
6.5.4 Automated Reactive Scores
A statistical record is maintained for each predicate, and the overall success of execution is captured by
the error log. We assume worker-thread model, where we are able to associate the success/failure of the
transaction by associating process-ids and error log transaction ids. The instrumentation cost for each
instrumentation profile can be as follows.
i=n∑i=1
xi = InstrumentationScore(x) ∗ StatisticalScore(x) (6.5)
Each predicate is given a total score based on the following parameters:
• Statistical Importance Score: The statistical importance score defines the importance of each predi-
cate as an indicator for isolating the bug.The main idea is derived from statistical debugging work done
by Liblit et Al
• Instrumentation Overhead Score: Adaptive score keeping track of counters of each predicate. Can
be used as a weighing mechanism for figuring out the total cost.
Hence Parikshan can be combined with standard statistical debugging techniques to manage the instru-
mentation overhead such that it does not exceed the debug window or the debug container does not lag to far
behind the production container. While an actual implementation is beyond the scope of this thesis, the above
discussion presents some grounds on how this solution can be designed.
6.6 Summary
In this section we have discussed how Parikshan can be applied in real-world bugs and how a developer can
actually do debugging of production systems. To explain the process better we first categorized the debugging
126

CHAPTER 6. APPLICATIONS OF LIVE DEBUGGING
scenarios into two distinct categories: post-facto, and proactive debugging. We have then described several
existing debugging tools which can be applied in Parikshan’s debug-container to make debugging more
efficient and effective. Lastly, we introduced a budget limited adaptive debugging technique which can be
used to model “allowed” instrumentation overhead for continuous debugging in the debug container.
127

CHAPTER 7. RELATED WORK
Chapter 7
Related Work
7.1 Related Work for Parikshan
7.1.1 Record and Replay Systems:
Record and Replay [Altekar and Stoica, 2009; Dunlap et al., 2002; Guo et al., 2008b; Geels et al., 2007a;
Veeraraghavan et al., 2012] has been an active area of research in the academic community for several years.
In diagnosing the source of a bug, we often need to re-execute the program many times and expect the
program to deterministically exhibit the same erroneous behavior, which can be enforced by deterministic
replay. Other potential applications include online program analysis, fault tolerance, performance prediction,
and intrusion analysis. These systems can be divided into two phases: a recording phase, which records
and logs the execution traces of a running system, and a replay phase, which replays these logs so that the
execution can be debugged offline in a development environment. The advantage is that production bugs can
be captured and debugged later on.
Deterministic replay can faithfully reproduce a program execution on demand, which greatly facilitates
cyclic debugging. Hence, deterministic replay is widely accepted as an important aspect of a debugging
program (especially parallel program). These systems offer highly faithful re-execution in lieu of performance
overhead. For instance, ODR [Altekar and Stoica, 2009] reports 1.6x, and Aftersight [Chow et al., 2008]
reports 5% overhead, although with much higher worst-case overheads. Parikshan avoids run-time overhead,
but its cloning suspend time may be viewed as an amortized cost in comparison to the overhead in record-
replay systems. Parikshan can be also imagined as a live network record and replay, where the debug
128

CHAPTER 7. RELATED WORK
container is replaying the execution using network logs which are stored in the buffer. Another advantage of
this approach is that it reduces the recording log overhead which may be a concern for some record-replay
systems. A key difference between Parikshan and other approaches is that the primary use-case of Parikshan
is to allow live on-the-fly debugging.
Further recording in record-replay systems can be considered to be at different levels - library level,
system call level, and vmm read/write level. From an implementation point-of-view record-replay systems
have been implemented at different layers - at user-space layer, system call layer, virtual machine layer.
Recent approaches in record and replay have been extended to mobile softwares [Hu et al., 2015; Qin et al.,
2016], and browsers [Chasins et al., 2015]. Parikshan can be considered similar to user-space layer recording
of only network input.
7.1.2 Decoupled or Online Analysis
Broadly we categorize decoupled analysis as work where parallel execution similar to Parikshan has been
employed to gather execution insights. For instance, among record and replay systems, the work most closely
related to ours is Aftersight [Chow et al., 2008]. Similar to Parikshan, aftersight records a production system
and replays it concurrently in a parallel VM. While both Aftersight and Parikshan allow debuggers an almost
real-time diagnosis facility, Aftersight suffers from recording overhead in the production VM. The average
slow-down in Aftersight is 5% and can balloon upto 31% to 2.6x for worst-case scenario. While in it’s normal
mode, aftersight requires the replica virtual machine to catch up with the original. Although, aftersight also
has mode which allows it to proceed with divergence, this removes the overhead required for catching up to
the original execution - Parikshan mainly differs in it’s philosphy with aftersight, while aftersight focuses
more on determinism and synchronization between the production and debug VM, Parikshan focuses more
on parallel execution and debugging, while allowing for more divergence without any recording overhead.
Another recent work called, VARAN [Hosek and Cadar, 2015] is an N-version execution monitor that
maintains replicas of an existing app, while checking for divergence. Parikshan’s debug containers are
effectively replicas: however, while VARAN replicates applications at the system call level, Parikshan’s lower
overhead mechanism does not impact the performance of the master (production) app. Unlike lower-level
replay based systems, Parikshan tolerates a greater amount of divergence from the original application: i.e.,
the replica may continue to run even if the analysis slightly modifies it.
Another category, online program analysis monitors and checks the data flow and control flow of program
129

CHAPTER 7. RELATED WORK
execution on the fly [Goodstein et al., 2015; Ganai et al., 2012]. For example, taint analysis, which is a
representative online program analysis technique, tracks each memory location in the address space of the
program to identify whether its value is tainted (i.e., directly or indirectly relying on suspicious external
input). If tainted data is used in sensitive ways (e.g., changing the control flow), the taint analyzer will
raise an error. Online program analysis is widely regarded as an effective technique to debug programs and
defend security attacks. However, online program analysis is not efficient, especially when the analysis is
performed at instruction granularity. Many online program analysis techniques may even bring over a 10
times slowdown on commodity computer systems [Newsome, 2005].
REPFRAME [Cui et al., 2015] is another tool which provides an efficient and transparent framework that
decouples execution and analysis by constructing multiple equivalent executions. REPFRAME leverages a
fault tolerant technique ( transparent state machine replication), which runs the same software on a set of
machines or replica’s, and ensures that all the replicas see the same sequence of input and process these inputs
with the same efficient thread interleavings automatically. This is achieved by leveraging a technique called
transparent state machine replication and deterministic multi-threading to ensure that the same execution
is followed by the replicas. Unlike Parikshan, deterministic multi-threading in all replicas ensures that the
same execution is done in all replica’s and analysis can be parallelized (i.e. non-determinism is not an issue).
However the core focus on REPFRAME is dynamic analysis of code execution as an offline process instead
of an in-production system.
7.1.3 Live Migration and Cloning
Live migration of virtual machines facilitates fault management, load balancing, and low-level system
maintenance for the administrator. Most existing approaches use a pre-copy approach that copies the
memory state over several iterations, and then copies the process state. This includes hypervisors such as
VMWare [Nelson et al., 2005], Xen [Clark et al., 2005], and KVM [Kivity et al., 2007]. VM Cloning, on the
other hand, is usually done offline by taking a snapshot of a suspended/ shutdown VM and restarting it on
another machine. Cloning is helpful for scaling out applications, which use multiple instances of the same
server. There has also been limited work towards live cloning. For example Sun et al. [Sun et al., 2009] use
copy-on-write mechanisms, to create a duplicate of the target VM without shutting it down. Similarly, another
approach [Gebhart and Bozak, 2009] uses live-cloning to do cluster-expansion of systems. However, unlike
Parikshan, both these approaches starts a VM with a new network identity and may require re-configuration
130

CHAPTER 7. RELATED WORK
of the duplicate node.
Back-and-forth live migration [Lee et al., 2016], which means a running VM migrates between two
physical machines back and forth. Traditional methods treat each migration as a single event, so the VM
releases its system resources on the source site after migration. However, many resources can be kept
to mitigate the cost of the next migration back to the machine. Parikshan’s process of live cloning from
production to debug-container is similar to back and forth migration. The total migration time can be saved
up to 99% for some applications.
7.1.4 Monitoring and Analytics
Multi-tier production systems are often deployed in a number of machines/containers in scalable cloud
infrastructure, and have active monitoring and analysis. In the past few years several products are used for
live analytics [Enterprises, 2012; Barham et al., 2004; Tak et al., 2009], which are able to give insights by
doing high level monitoring based on application logs.
Magpie [Barham et al., 2004] is a system for monitoring and modeling server workload. Magpie coalesces
windows system event logs into transactions using detailed knowledge of application semantics supplied
by the developer. XTrace [Fonseca et al., 2007] and Pinpoint [Chen et al., 2004] both trace the path of
a request through a system using a special identifier attached to each individual request. This identifier is
then used to stitch various system events together. GWP [Ren et al., 2010], Dapper [Sigelman et al., 2010],
Fay [Erlingsson et al., 2012], Chopstix [Bhatia et al., 2008] are distributed tracing systems for large scale
data centers. Fay and Chopstix leverage sketch, a probabilistic data structure for metric collection, and dapper
and GWP use sampling for recording a profile. While most of these systems can give a good indication of
the presense of an error, and some can even help localize the critical path of a bug, often debugging itself
requires modification which cannot be done in these systems. The Parikshan framework can be triggered
using alerts from such live analysis frameworks. This can avoid usage of resources for debug container all
the time, instead it can only be used once an analytic framework has found a problem. The debug container
can then be used for finding the root-cause of the error.
131

CHAPTER 7. RELATED WORK
Figure 7.1: Advantages of iProbe over existing monitoring frameworks DTrace/SystemTap and DynInst
7.2 Related Work for iProbe
7.2.1 Source Code or Compiler Instrumentation Mechanisms
Source code instrumentation is one of the most widely available mechanisms for monitoring. In essence, users
can insert debug statements with runtime flags to dump and inspect program status with varying verbosity
levels. The log4j [Gupta, 2003] and log4c [Goater, 2015] frameworks are commonly used libraries to perform
program tracing in many open source projects in the source code level. Additionally compilers have several
inbuilt profilers which can be used along with tools such as gprof and jprof to gather statistics about program
execution. While source code techniques allow very light weight instrumentation, by design they are static
and can only be changed at the start of application execution. iProbe on the other hand offers run-time
instrumentation that allows dynamic decisions on tracing with comparable overhead.
7.2.2 Run-time Instrumentation Mechanisms
There are several kernel level tracing tools such as DTrace, LTTng, SystemTap [McDougall et al., 2006;
Desnoyers and Dagenais, 2006; Prasad et al., 2005] developed by researchers over the years. iProbe differs
from these approaches mainly in two ways: Firstly, all of these approaches use a technique similar to software
interrupt to switch to kernel space and generate a log event by overwriting the target instructions. They then
execute the instrumentation code, and either generate a trampoline mechanism or re-execute the overwritten
132

CHAPTER 7. RELATED WORK
target instructions and then jump back to the subsequent instructions. As shown in Figure.7.1 this introduces
context-switches between user-space and the kernel, causing needless overhead. iProbe avoids this overhead
by having a completely user-space based design. Secondly, all these approaches require to perform complex
checks for correctness which can cause unnecessary overhead at both hotpatching, and when running an
instrumented binary.
Fay [Erlingsson et al., 2012] is a platform-dependent approach which uses the empty spaces at the start of
the functions available in Windows binaries for instrumentation. To ensure the capture of the entry and exit of
functions, Fay calls the target function within its instrumentation thereby introducing an extra stack frame for
each target instrumentation. This operation is similar to a mini-trampoline and hence incurs an overhead. Fay
logs function execution in the kernel space and hence also has a context-switch overhead. iProbe avoids
such overhead by introducing markers at the beginning and end of each function using a
Another well known tool is DynInst[Buck and Hollingsworth, 2000]. This tool provides a rich dynamic
instrumentation capability and has pure back box solution towards instrumentation of any application.
However, as shown in Figure.7.1 it is also based on traditional trampoline mechanisms, and induces a high
overhead because of unnecessary jump instructions. Additionally it can have higher overhead because of
complex security checks. Other similar trampoline based tools like kaho and katana[Bratus et al., 2010;
Yamato et al., 2009] have also been proposed, but they focus more towards patching binaries to add fixes to
correct a bug.
7.2.3 Debuggers
Instrumentation is a commonly used technique in debugging. Many debuggers such as gdb [Stallman et
al., 2002] and Eclipse have breakpoints and watchpoints which can stop the execution of programs and
inspect program conditions. These features are based on various techniques including ptrace and hardware
debugging support (single step mode and debug registers). While they provide such powerful instrumentation
capabilities, there are in general not adequate for beyond the debugging purposes due to overwhelming
overhead.
7.2.4 Dynamic Translation Tools
Software engineering communities have been using dynamic translation tools such as Pin [Luk et al., 2005]
and Valgrind [Nethercote and Seward, 2007] to inspect program characteristics. These tools dynamically
133

CHAPTER 7. RELATED WORK
translate program code before execution and allow users to insert custom instrumentation code flexibly.
They are capable to instrument non-debug binaries and provide versatile tools such as memory checkers and
program profilers. However, similar to debuggers, they are generally considered as debugging tools and their
overhead is significantly higher than runtime tracers.
134

CHAPTER 8. CONCLUSIONS
Chapter 8
Conclusions
8.1 Contributions
The core of the material presented in this thesis is based on techniques for debugging applications on the
fly in parallel to production services (we call this live debugging). In contrast to existing techniques which
have instrumentation overhead, our technique does not incur any overhead, and keeps the debugging and
production environment isolated.
The following are the contributions made in this thesis:
• We presented a general framework called Parikshan (see chapter 3), which allows debuggers faster
time to bug resolution at negligible overhead in parallel to a production application. The system
first creates a live replica (clone) of a running system, and uses this replica specifically for debugging
purposes. Next we duplicate and send network inputs to both the production application and the
replica using a customized network proxy. As stated previously our main emphasis is to isolate any
changes or slow-down in the replica from the user-facing production service, hence never impacting
user-experience. In our experiments, we have shown that the debug container can manage significant
slow-down, while still faithfully representing the execution of the production container. We believe that
the increased granularity of instrumentation and the ability to instrument in an isolated environment,
will be valuable to administrators and significantly reduce time to bug localization.
• We have presented case-studies (see chapter 4) which demonstrate that network input is enough
to capture most bugs in service oriented applications. We used a network duplication proxy, and
135

CHAPTER 8. CONCLUSIONS
re-created 16 real-world bugs from several well known service applications (Apache, MySQL, Redis,
HDFS, and Cassandra). The purpose of this study was to show that if the network input was duplicated
and sent to both the production service and it’s replica(debug container), the bug will be triggered in
both for most common bugs. We chose bugs from the following categories: semantic, resource leak,
concurrency, performance and mis-configuration. To show that these categories represent most of the
bugs found in service systems, we did a survey of 220 bugs reported in three well known applications
(MySQL, Apache, and Hadoop), and manually categorized the bugs we found.
• We have presented a novel hybrid instrumentation tool called iProbe (see chapter 5), as part of
our tool-set to enable debugging applications. Similar to existing techniques iProbe allows run-time
binary instrumentation of execution points (functions entry, exit etc.), with significantly less overhead.
iProbe de-couples the process of run-time instrumentation into offline (static) and online (dynamic)
stages (hence called hybrid instrumentation). This avoids several complexities faced by current state-
of-the-art mechanisms such as instruction overwriting, complex trampolines, code segment memory
allocation and kernel context switches. We used a custom micro-benchmark to compare the overhead
of iProbe in comparison to well known instrumentation tools systemtap [Prasad et al., 2005] and
dyninst [Buck and Hollingsworth, 2000], and found an order of magnitude better performance at
heavier profiling.
• In chapter 6, we have presented applications for live debugging, where we discuss several existing
approaches which can be applied in the Parikshan framework to make them more effective. Apart
from existing tools, we have also introduced the design of two new applications. Firstly, we have
discussed a budget-limited instrumentation approach for debugging applications in parallel to
production services. This approach provides the debugger guidelines for maximum instrumentation
overhead allowed so as to avoid buffer overflows in Parikshan, and subsequently longer un-interrupted
debugging opportunities for the user. Secondly, we have introduced active-debugging, which allows
debuggers to evaluate fixes, and performance patches in parallel to a production service. This
leverages Parikshan’s isolated debug container to not just debug but actually test application in a “live”
environment.
136

CHAPTER 8. CONCLUSIONS
8.2 Future Directions
There are a number of interesting future work possibilities, both in the short term and further into the future.
8.2.1 Immediate Future Directions
• Improve live cloning performance: The current protoype of livecloning is based on container virtual-
ization and previous efforts in live migration in OpenVZ [Kolyshkin, 2006]. However, our implementa-
tion is limited by the performance of the current level of performance of current live migration efforts.
Live migration is a nascent research topic in user-space container level virtualization, however there
has been significant progress in live-migration in virtual machine virtualization.
One key limitation in the current approach is that it has been built using rsync [Tridgell and Mack-
erras, 1996] functionality. This is much slower than current state-of-the-art techniques in full VM
virtualization, which rely on network file systems to synchronization images asynchronously [Palevich
and Taillefer, 2008]. Other optimizations include post-copy migration [Hines et al., 2009] which does
lazy migration - the idea is to do on-demand transfer of pages by triggering a network page fault.
This reduces the time that the target container is suspended, and ensures real-time performance. The
current implementation in Parikshan uses the traditional pre-copy migration [Clark et al., 2005], which
iteratively syncs the two images to reduce the suspend time.
Live cloning can be used in two scenarios, either with a fresh start where the target physical machines
do not have a copy of the initial image. However, more commonly once the first live clone has been
finished, the target is to reduce the suspend time of subsequent live cloning requests. This is different
from live migration scenario’s. For instance, future research can focus on specifically on reducing
this downtime by keeping track of the “delta” from the point of the detection of divergence. This will
reduce the amount of page faults in a post-copy algorithm, and can potentially improve live cloning
performance compared to migration.
• Scaled Mode for live-debugging: One key limitation of live-debugging is the potential for memory
overflow. The period till a buffer overflow happens in the proxy, is called the debug window. It is
critical for continuous debugging that the debug window be as long as possible. The size of this window,
depends on the instrumentation overhead, the amount of workload, and the buffer size itself.
137

CHAPTER 8. CONCLUSIONS
Hence, it may be possible that at times for very heavy instrumentation or workload, the debug window
becomes too short to be of practical use. To counter this it is Parikshan can be extend to create multiple
replica’s instead of just one. The framework can then be extended to load-balance the instrumentation
in different containers, and generate a merged profile to be viewed by the debugger. Scaling can be
dynamic such that it is dependent on spikes in workload. Workload of most systems are generally
periodic in the sense a website might have more hits during 9am-5pm, but almost none at midnight.
• Live Cloning in Virtual Machines There are two different kinds of virtualization technologies: user-
space or container based virtualization, or full stack VM virtualization. In our implementation in
Parikshan, we have used user-space containers as they are more light weight, and a full VM would
have a higher overhead and take more resources. However overall the full VM virtualization is more
mature, and has much better migration technology. This leads us to believe that live cloning if applied
using virtual machines would be much faster, and would make Parikshan available in most traditional
cloud service providers which still allocate resources using VM’s.
8.2.2 Possibilities for Long Term
• Collaborative Debugging: Parikshan provides debug container, which are isolated from the production
container. The network input for the production service is duplicated in the debug container, which
can be viewed by the user. Our framework can be extended to create multiple replica’s instead of just
one for the purpose of debugging. Each replica is isolated from the other and can be assigned to a
developer. For critical bugs, with faster resolution required it may be possible for two developers to
work on their own debug container and collabarate on a bug being triggered by the same input.
• New live debugging primitives and interactive debugging features Live debugging or debugging
on the fly introduced in this thesis, allows developers to peek into the execution of an application while
it’s also running in the production. Since we are applying live debugging in a production environment,
it may be possible to think of newer primitives for debugging. For instance watchpoints for variables,
with each having their own bounded overhead: hence they would be observed with given probability.
Another could potentially be triggers for auto-creating a debug-container, if a condition is reached in
the production code or production service monitoring software
• Evaluate impact on the software development process: As described earlier, we expect live debug-
138

CHAPTER 8. CONCLUSIONS
ging to change the software development cycle and aid faster bug resolution. In particular in Chapter 6,
we have discussed several applications of Parikshan. These include using existing debugging method-
ologies, which can be applied either before a bug happens or after it occurs (pre and post-facto). An
evaluation or survey of real-life users, about what features were useful, and a quantitative evaluation of
Parikshan’s speedup towards bug resolution would further help understand our framework’s usefulness.
139

BIBLIOGRAPHY
Bibliography
[Aivazov and Samkharadze, 2012] Vitali Aivazov and Roman Samkharadze. End-to-end packet delay in the
network. Automated Control Systems, pages 128–134, 2012.
[Allspaw J., 2009] Hammond P. Allspaw J. 10+ deploys per day: Dev and ops cooperation at flickr. OReilly
Velocity Web Performance and Operations Conference, 2009.
[Altekar and Stoica, 2009] Gautam Altekar and Ion Stoica. ODR: output-deterministic replay for multicore
debugging. In Proceedings of the ACM SIGOPS 22nd symposium on Operating systems principles, pages
193–206. ACM, 2009.
[Amazon, 2010] EC2 Amazon. Amazon elastic compute cloud (amazon ec2). Amazon Elastic Compute
Cloud (Amazon EC2), 2010.
[Arumuga Nainar and Liblit, 2010] Piramanayagam Arumuga Nainar and Ben Liblit. Adaptive bug isolation.
In Proceedings of the 32nd ACM/IEEE International Conference on Software Engineering-Volume 1,
pages 255–264. ACM, 2010.
[Axboe, 2008] Jens Axboe. Fio-flexible io tester. uRL: http://freecode. com/projects/fio, 2008.
[Banker, 2011] Kyle Banker. MongoDB in action. Manning Publications Co., 2011.
[Barham et al., 2004] Paul Barham, Austin Donnelly, Rebecca Isaacs, and Richard Mortier. Using Magpie
for request extraction and workload modelling. In OSDI, volume 4, pages 18–18, 2004.
[Barrett, 2008] Daniel J Barrett. MediaWiki. ” O’Reilly Media, Inc.”, 2008.
[Basiri et al., 2016] Ali Basiri, Niosha Behnam, Ruud de Rooij, Lorin Hochstein, Luke Kosewski, Justin
Reynolds, and Casey Rosenthal. Chaos engineering. IEEE Software, 33(3):35–41, 2016.
140
BIBLIOGRAPHY
[Beck, 2000] Kent Beck. Extreme programming explained: embrace change. addison-wesley professional,
2000.
[Bernstein, 2014] David Bernstein. Containers and cloud: From lxc to docker to kubernetes. IEEE Cloud
Computing, 1(3):81–84, 2014.
[Bhatia et al., 2008] Sapan Bhatia, Abhishek Kumar, Marc E Fiuczynski, and Larry L Peterson. Lightweight,
high-resolution monitoring for troubleshooting production systems. In OSDI, pages 103–116, 2008.
[Blackburn et al., 2006] Stephen M Blackburn, Robin Garner, Chris Hoffmann, Asjad M Khang, Kathryn S
McKinley, Rotem Bentzur, Amer Diwan, Daniel Feinberg, Daniel Frampton, Samuel Z Guyer, et al. The
dacapo benchmarks: Java benchmarking development and analysis. In ACM Sigplan Notices, volume 41,
pages 169–190. ACM, 2006.
[Boettiger, 2015] Carl Boettiger. An introduction to docker for reproducible research. ACM SIGOPS
Operating Systems Review, 49(1):71–79, 2015.
[Borthakur, 2008] Dhruba Borthakur. Hdfs architecture guide. HADOOP APACHE PROJECT http://hadoop.
apache. org/common/docs/current/hdfs design. pdf, page 39, 2008.
[Bovet and Cesati, 2005] Daniel P Bovet and Marco Cesati. Understanding the Linux kernel. ” O’Reilly
Media, Inc.”, 2005.
[Bratus et al., 2010] S. Bratus, J. Oakley, A. Ramaswamy, S.W. Smith, and M.E. Locasto. Katana: Towards
patching as a runtime part of the compiler-linker-loader toolchain. International Journal of Secure Software
Engineering (IJSSE), 1(3):1–17, 2010.
[Buck and Hollingsworth, 2000] Bryan Buck and Jeffrey K. Hollingsworth. An api for runtime code patch-
ing. Int. J. High Perform. Comput. Appl., 14(4):317–329, November 2000.
[Carlson, 2013] Josiah L Carlson. Redis in Action. Manning Publications Co., 2013.
[Chasins et al., 2015] Sarah Chasins, Shaon Barman, Rastislav Bodik, and Sumit Gulwani. Browser record
and replay as a building block for end-user web automation tools. In Proceedings of the 24th International
Conference on World Wide Web, WWW ’15 Companion, pages 179–182, New York, NY, USA, 2015.
ACM.
141

BIBLIOGRAPHY
[Chen et al., 2004] Yen-Yang Michael Chen, Anthony Accardi, Emre Kiciman, David A Patterson, Armando
Fox, and Eric A Brewer. Path-based failure and evolution management. PhD thesis, University of
California, Berkeley, 2004.
[Chilimbi et al., 2009] Trishul M Chilimbi, Ben Liblit, Krishna Mehra, Aditya V Nori, and Kapil Vaswani.
Holmes: Effective statistical debugging via efficient path profiling. In Proceedings of the 31st International
Conference on Software Engineering, pages 34–44. IEEE Computer Society, 2009.
[Chow et al., 2008] Jim Chow, Tal Garfinkel, and Peter M Chen. Decoupling dynamic program analysis from
execution in virtual environments. In USENIX 2008 Annual Technical Conference on Annual Technical
Conference, pages 1–14, 2008.
[Clark et al., 2005] Christopher Clark, Keir Fraser, Steven Hand, Jacob Gorm Hansen, Eric Jul, Christian
Limpach, Ian Pratt, and Andrew Warfield. Live migration of virtual machines. In Proceedings of the 2nd
conference on Symposium on Networked Systems Design & Implementation-Volume 2, pages 273–286.
USENIX Association, 2005.
[contributors, 2017] Wikipedia contributors. Copy-on-write — wikipedia, the free encyclopedia, 2017.
[Online; accessed 13-January-2018].
[criulive, ] Live migration in criu. https://criu.org/Live_migration. Accessed: 2017, Nov 14.
[Cui et al., 2015] Heming Cui, Rui Gu, Cheng Liu, and Junfeng Yang. Repframe: An efficient and trans-
parent framework for dynamic program analysis. In Proceedings of the 6th Asia-Pacific Workshop on
Systems, APSys ’15, pages 13:1–13:9, New York, NY, USA, 2015. ACM.
[D’Anjou, 2005] Jim D’Anjou. The Java developer’s guide to Eclipse. Addison-Wesley Professional, 2005.
[Deshpande and Keahey, 2016] Umesh Deshpande and Kate Keahey. Traffic-sensitive live migration of
virtual machines. Future Generation Computer Systems, 2016.
[Desnoyers and Dagenais, 2006] M. Desnoyers and M.R. Dagenais. The lttng tracer: A low impact perfor-
mance and behavior monitor for gnu/linux. In OLS (Ottawa Linux Symposium), pages 209–224. Citeseer,
2006.
[DockerHub, ] Build ship and run anywhere. https://www.hub.docker.com/.
142

BIBLIOGRAPHY
[Dunlap et al., 2002] George W Dunlap, Samuel T King, Sukru Cinar, Murtaza A Basrai, and Peter M Chen.
Revirt: Enabling intrusion analysis through virtual-machine logging and replay. ACM SIGOPS Operating
Systems Review, 36(SI):211–224, 2002.
[Eigler and Hat, 2006] Frank Ch Eigler and Red Hat. Problem solving with systemtap. In Proc. of the
Ottawa Linux Symposium, pages 261–268. Citeseer, 2006.
[ElasticSearch, ] ElasticSearch. Elasticsearch.
[Enterprises, 2012] Nagios Enterprises. Nagios, 2012.
[Erlingsson et al., 2012] Ulfar Erlingsson, Marcus Peinado, Simon Peter, Mihai Budiu, and Gloria Mainar-
Ruiz. Fay: Extensible distributed tracing from kernels to clusters. ACM Trans. Comput. Syst., 30(4):13:1–
13:35, November 2012.
[Felter et al., 2015] Wes Felter, Alexandre Ferreira, Ram Rajamony, and Juan Rubio. An updated perfor-
mance comparison of virtual machines and linux containers. In Performance Analysis of Systems and
Software (ISPASS), 2015 IEEE International Symposium On, pages 171–172. IEEE, 2015.
[Fielding and Kaiser, 1997] Roy T. Fielding and Gail Kaiser. The apache http server project. IEEE Internet
Computing, 1(4):88–90, 1997.
[Fitzpatrick, 2004] Brad Fitzpatrick. Distributed caching with memcached. Linux journal, 2004(124):5,
2004.
[Flanagan and Godefroid, 2005] Cormac Flanagan and Patrice Godefroid. Dynamic partial-order reduction
for model checking software. In Proceedings of the 32Nd ACM SIGPLAN-SIGACT Symposium on
Principles of Programming Languages, POPL ’05, pages 110–121, New York, NY, USA, 2005. ACM.
[Fonseca et al., 2007] Rodrigo Fonseca, George Porter, Randy H Katz, Scott Shenker, and Ion Stoica. X-
trace: A pervasive network tracing framework. In Proceedings of the 4th USENIX conference on Networked
systems design & implementation, pages 20–20. USENIX Association, 2007.
[Furman, 2014] Mark Furman. OpenVZ Essentials. Packt Publishing Ltd, 2014.
[Ganai et al., 2011] Malay K. Ganai, Nipun Arora, Chao Wang, Aarti Gupta, and Gogul Balakrishnan. Best:
A symbolic testing tool for predicting multi-threaded program failures. In Proceedings of the 2011 26th
143

BIBLIOGRAPHY
IEEE/ACM International Conference on Automated Software Engineering, ASE ’11, pages 596–599,
Washington, DC, USA, 2011. IEEE Computer Society.
[Ganai et al., 2012] Malay Ganai, Dongyoon Lee, and Aarti Gupta. Dtam: dynamic taint analysis of multi-
threaded programs for relevancy. In Proceedings of the ACM SIGSOFT 20th International Symposium on
the Foundations of Software Engineering, page 46. ACM, 2012.
[Gebhart and Bozak, 2009] A. Gebhart and E. Bozak. Dynamic cluster expansion through virtualization-
based live cloning, September 10 2009. US Patent App. 12/044,888.
[Geels et al., 2007a] Dennis Geels, Gautam Altekar, Petros Maniatis, Timothy Roscoe, and Ion Stoica.
Friday: Global comprehension for distributed replay. In NSDI, volume 7, pages 285–298, 2007.
[Geels et al., 2007b] Dennis Geels, Gautam Altekar, Petros Maniatis, Timothy Roscoe, and Ion Stoica.
Friday: Global comprehension for distributed replay. In NSDI, volume 7, pages 285–298, 2007.
[George, 2011] Lars George. HBase: The Definitive Guide: Random Access to Your Planet-Size Data. ”
O’Reilly Media, Inc.”, 2011.
[Gnedenko and Kovalenko, 1989] Boris Vladimirovich Gnedenko and Igor Nikolaevich Kovalenko. Intro-
duction to queueing theory. Birkhauser Boston Inc., 1989.
[GNU-OS, 2016] GNU-OS. Introduction to gnu wget, 2016. [Online; accessed 20-November-2016].
[Goater, 2015] CL Goater. Log4c: Logging for c library, 2015.
[Goodstein et al., 2015] Michelle L Goodstein, Phillip B Gibbons, Michael A Kozuch, and Todd C Mowry.
Tracking and reducing uncertainty in dataflow analysis-based dynamic parallel monitoring. In 2015
International Conference on Parallel Architecture and Compilation (PACT), pages 266–279. IEEE, 2015.
[googleanectodal, ] Google compute engine live migration passes the test.
https://www.rightscale.com/blog/cloud-industry-insights/
google-compute-engine-live-migration-passes-test. Accessed: 2017, Nov
14.
[googleblog, ] Lessons learned from a year of using live migration in production on google cloud.
https://cloudplatform.googleblog.com/2016/04/lessons-learned
144

BIBLIOGRAPHY
nolinkurl-from-a-year-of-using-live-migration-in-production-on-Google-Cloud.html
Accessed: 2017, Nov 14.
[Guo et al., 2008a] Zhenyu Guo, Xi Wang, Jian Tang, Xuezheng Liu, Zhilei Xu, Ming Wu, M Frans
Kaashoek, and Zheng Zhang. R2: An application-level kernel for record and replay. In Proceedings of
the 8th USENIX conference on Operating systems design and implementation, pages 193–208. USENIX
Association, 2008.
[Guo et al., 2008b] Zhenyu Guo, Xi Wang, Jian Tang, Xuezheng Liu, Zhilei Xu, Ming Wu, M Frans
Kaashoek, and Zheng Zhang. R2: An application-level kernel for record and replay. In Proceedings of
the 8th USENIX conference on Operating systems design and implementation, pages 193–208. USENIX
Association, 2008.
[Gupta, 2003] S. Gupta. Logging in Java with the JDK 1.4 Logging API and Apache log4j. Apress, 2003.
[Henning, 2006] John L. Henning. Spec cpu2006 benchmark descriptions. SIGARCH Comput. Archit. News,
34(4):1–17, September 2006.
[Hines et al., 2009] Michael R Hines, Umesh Deshpande, and Kartik Gopalan. Post-copy live migration of
virtual machines. ACM SIGOPS operating systems review, 43(3):14–26, 2009.
[Hosek and Cadar, 2015] Petr Hosek and Cristian Cadar. Varan the unbelievable: An efficient n-version
execution framework. In Proceedings of the Twentieth International Conference on Architectural Support
for Programming Languages and Operating Systems, ASPLOS ’15, pages 339–353, New York, NY, USA,
2015. ACM.
[Httermann, 2012] Michael Httermann. DevOps for developers. Apress, 2012.
[Hu et al., 2015] Yongjian Hu, Tanzirul Azim, and Iulian Neamtiu. Versatile yet lightweight record-and-
replay for android. In Proceedings of the 2015 ACM SIGPLAN International Conference on Object-
Oriented Programming, Systems, Languages, and Applications, OOPSLA 2015, pages 349–366, New
York, NY, USA, 2015. ACM.
[Intel, 2011] Intel. Vtune amplifier. http://www.intel.com/software/products/vtune, 2011.
145

BIBLIOGRAPHY
[Jamae and Johnson, 2009] Javid Jamae and Peter Johnson. JBoss in action: configuring the JBoss applica-
tion server. Manning Publications Co., 2009.
[Jin et al., 2010] Guoliang Jin, Aditya Thakur, Ben Liblit, and Shan Lu. Instrumentation and sampling
strategies for cooperative concurrency bug isolation. In ACM Sigplan Notices, volume 45, pages 241–255.
ACM, 2010.
[Jin et al., 2012] Guoliang Jin, Linhai Song, Xiaoming Shi, Joel Scherpelz, and Shan Lu. Understanding
and detecting real-world performance bugs. In Proceedings of the 33rd ACM SIGPLAN Conference on
Programming Language Design and Implementation, PLDI ’12, pages 77–88, New York, NY, USA, 2012.
ACM.
[Jovic et al., 2011] Milan Jovic, Andrea Adamoli, and Matthias Hauswirth. Catch me if you can: perfor-
mance bug detection in the wild. In OOPSLA, 2011.
[Kasikci et al., 2015] Baris Kasikci, Benjamin Schubert, Cristiano Pereira, Gilles Pokam, and George
Candea. Failure sketching: A technique for automated root cause diagnosis of in-production failures. In
Proceedings of the 25th Symposium on Operating Systems Principles, SOSP ’15, pages 344–360, New
York, NY, USA, 2015. ACM.
[Kendall, 1953] David G. Kendall. Stochastic processes occurring in the theory of queues and their analysis
by the method of the imbedded markov chain. Ann. Math. Statist., 24(3):338–354, 09 1953.
[Kivity et al., 2007] Avi Kivity, Yaniv Kamay, Dor Laor, Uri Lublin, and Anthony Liguori. kvm: the linux
virtual machine monitor. In Proceedings of the Linux Symposium, volume 1, pages 225–230, 2007.
[Kolyshkin, 2006] Kirill Kolyshkin. Virtualization in linux. White paper, OpenVZ, 3:39, 2006.
[Krishnan and Gonzalez, 2015] SPT Krishnan and Jose L Ugia Gonzalez. Google compute engine. In
Building Your Next Big Thing with Google Cloud Platform, pages 53–81. Springer, 2015.
[Laadan et al., 2010] Oren Laadan, Nicolas Viennot, and Jason Nieh. Transparent, lightweight application
execution replay on commodity multiprocessor operating systems. In ACM SIGMETRICS Performance
Evaluation Review, pages 155–166. ACM, 2010.
[Lakshman and Malik, 2010] Avinash Lakshman and Prashant Malik. Cassandra: a decentralized structured
storage system. ACM SIGOPS Operating Systems Review, 44(2):35–40, 2010.
146

BIBLIOGRAPHY
[Lee et al., 2016] Kuan-Hsin Lee, I-Cheng Lai, and Che-Rung Lee. Optimizing back-and-forth live migration.
In Proceedings of the 9th International Conference on Utility and Cloud Computing, UCC ’16, pages
49–54, New York, NY, USA, 2016. ACM.
[Liblit et al., 2005] Ben Liblit, Mayur Naik, Alice X Zheng, Alex Aiken, and Michael I Jordan. Scalable
statistical bug isolation. ACM SIGPLAN Notices, 40(6):15–26, 2005.
[Liblit, 2004] Benjamin Robert Liblit. Cooperative Bug Isolation. PhD thesis, University of California,
Berkeley, December 2004.
[Linux Manual Ptrace, ] Ptrace:linux process trace: http://linux.die.net/man/2/ptrace.
[loggly, ] loggly. Loggly.
[Loney, 2004] Kevin Loney. Oracle database 10g: the complete reference. McGraw-Hill/Osborne, 2004.
[Lou et al., 2013] Jian-Guang Lou, Qingwei Lin, Rui Ding, Qiang Fu, Dongmei Zhang, and Tao Xie.
Software analytics for incident management of online services: An experience report. In Automated
Software Engineering (ASE), 2013 IEEE/ACM 28th International Conference on, pages 475–485. IEEE,
2013.
[Lu et al., 2005] Shan Lu, Zhenmin Li, Feng Qin, Lin Tan, Pin Zhou, and Yuanyuan Zhou. Bugbench:
Benchmarks for evaluating bug detection tools. In Workshop on the evaluation of software defect detection
tools, volume 5, 2005.
[Luk et al., 2005] Chi-Keung Luk, Robert Cohn, Robert Muth, Harish Patil, Artur Klauser, Geoff Lowney,
Steven Wallace, Vijay Janapa Reddi, and Kim Hazelwood. Pin: building customized program analysis tools
with dynamic instrumentation. In Proceedings of the 2005 ACM SIGPLAN conference on Programming
language design and implementation, PLDI ’05, pages 190–200, New York, NY, USA, 2005. ACM.
[LWN.net, ] LWN.net. Network namespaces. https://lwn.net/Articles/580893/.
[Marian et al., 2012] Tudor Marian, Hakim Weatherspoon, Ki-Suh Lee, and Abhishek Sagar. Fmeter:
Extracting indexable low-level system signatures by counting kernel function calls. In ACM/IFIP/USENIX
International Conference on Distributed Systems Platforms and Open Distributed Processing, pages
81–100. Springer, 2012.
147

BIBLIOGRAPHY
[Martin, 2003] Robert Cecil Martin. Agile software development: principles, patterns, and practices.
Prentice Hall PTR, 2003.
[Massie et al., 2004] Matthew L Massie, Brent N Chun, and David E Culler. The ganglia distributed
monitoring system: design, implementation, and experience. Parallel Computing, 30(7):817–840, 2004.
[Matulis, 2009] Peter Matulis. Centralised logging with rsyslog. Canonical Technical White Paper, 2009.
[McDougall et al., 2006] Richard McDougall, Jim Mauro, and Brendan Gregg. Solaris (TM) Performance
and Tools: DTrace and MDB Techniques for Solaris 10 and OpenSolaris (Solaris Series). Prentice Hall
PTR, 2006.
[McGrath, 2009] R. McGrath. Utrace. Linux Foundation Collaboration Summit, 2009.
[Merkel, 2014] Dirk Merkel. Docker: lightweight linux containers for consistent development and deploy-
ment. Linux Journal, 2014(239):2, 2014.
[Mickens et al., 2010] James W Mickens, Jeremy Elson, and Jon Howell. Mugshot: Deterministic capture
and replay for javascript applications. In NSDI, volume 10, pages 159–174, 2010.
[Mirkin et al., 2008] Andrey Mirkin, Alexey Kuznetsov, and Kir Kolyshkin. Containers checkpointing and
live migration. In Proceedings of the Linux Symposium, pages 85–92, 2008.
[Momjian, 2001] Bruce Momjian. PostgreSQL: introduction and concepts, volume 192. Addison-Wesley
New York, 2001.
[Mosberger and Jin, 1998a] David Mosberger and Tai Jin. httperfa tool for measuring web server perfor-
mance. ACM SIGMETRICS Performance Evaluation Review, 26(3):31–37, 1998.
[Mosberger and Jin, 1998b] David Mosberger and Tai Jin. httperfa tool for measuring web server perfor-
mance. ACM SIGMETRICS Performance Evaluation Review, 26(3):31–37, 1998.
[Mucci et al., 1999] Philip J. Mucci, Shirley Browne, Christine Deane, and George Ho. Papi: A portable
interface to hardware performance counters. In In Proceedings of the Department of Defense HPCMP
Users Group Conference, pages 7–10, 1999.
148

BIBLIOGRAPHY
[Murphy et al., 2009] Christian Murphy, Gail Kaiser, Ian Vo, and Matt Chu. Quality assurance of software
applications using the in vivo testing approach. In Proceedings of the 2009 International Conference on
Software Testing Verification and Validation, ICST ’09, pages 111–120, Washington, DC, USA, 2009.
IEEE Computer Society.
[Mussler et al., 2011] Jan Mussler, Daniel Lorenz, and Felix Wolf. Reducing the overhead of direct applica-
tion instrumentation using prior static analysis. In Proceedings of the 17th international conference on
Parallel processing - Volume Part I, Euro-Par’11, pages 65–76, Berlin, Heidelberg, 2011. Springer-Verlag.
[MySQL, 2001] AB MySQL. Mysql, 2001.
[Nelson et al., 2005] Michael Nelson, Beng-Hong Lim, Greg Hutchins, et al. Fast transparent migration for
virtual machines. In USENIX Annual Technical Conference, General Track, pages 391–394, 2005.
[Nethercote and Seward, 2007] Nicholas Nethercote and Julian Seward. Valgrind: a framework for heavy-
weight dynamic binary instrumentation. In PLDI ’07, 2007.
[Newman, 2015] Sam Newman. Building Microservices. ” O’Reilly Media, Inc.”, 2015.
[Newsome, 2005] James Newsome. Dynamic taint analysis for automatic detection, analysis, and signature
generation of exploits on commodity software. In Proceedings of the Network and Distributed System
Security Symposium (NDSS), 2005.
[Olson et al., 1999] Michael A Olson, Keith Bostic, and Margo I Seltzer. Berkeley db. In USENIX Annual
Technical Conference, FREENIX Track, pages 183–191, 1999.
[openstack, ] Openstack: Opensource platform for building private and public clouds.
https://www.openstack.org.
[OpenVZ, ] OpenVZ. Ploop: Containers in a file. http://openvz.org/Ploop.
[Palevich and Taillefer, 2008] John H Palevich and Martin Taillefer. Network file system, October 21 2008.
US Patent 7,441,012.
[Park and Buch, 2004] Insung Park and R Buch. Event tracing for windows: Best practices. In Int. CMG
Conference, pages 565–574, 2004.
149

BIBLIOGRAPHY
[Park et al., 2009] Soyeon Park, Yuanyuan Zhou, Weiwei Xiong, Zuoning Yin, Rini Kaushik, Kyu H Lee,
and Shan Lu. Pres: probabilistic replay with execution sketching on multiprocessors. In Proceedings of
the ACM SIGOPS 22nd symposium on Operating systems principles, pages 177–192. ACM, 2009.
[Patil et al., 2010] Harish Patil, Cristiano Pereira, Mack Stallcup, Gregory Lueck, and James Cownie. Pin-
play: a framework for deterministic replay and reproducible analysis of parallel programs. In Proceedings
of the 8th annual IEEE/ACM international symposium on Code generation and optimization, pages 2–11.
ACM, 2010.
[Petersen et al., 2009] Kai Petersen, Claes Wohlin, and Dejan Baca. The waterfall model in large-scale
development. In International Conference on Product-Focused Software Process Improvement, pages
386–400. Springer, 2009.
[PetStore, ] Java PetStore. 2.0 reference application. petstore 2.0.
[Poskanzer, 2000] Jef Poskanzer. thttpd-tiny/turbo/throttling http server. Acme Labs, February, 2000.
[Prasad et al., 2005] V. Prasad, W. Cohen, F. C. Eigler, M. Hunt, J. Keniston, and B. Chen. Locating system
problems using dynamic instrumentation. In Proceedings of the 2005 Ottawa Linux Symposium (OLS),
2005.
[Qin et al., 2016] Zhengrui Qin, Yutao Tang, Ed Novak, and Qun Li. Mobiplay: A remote execution based
record-and-replay tool for mobile applications. In Proceedings of the 38th International Conference on
Software Engineering, ICSE ’16, pages 571–582, New York, NY, USA, 2016. ACM.
[quakegame, ] Quake Video Game. https://en.wikipedia.org/wiki/Quake_(video_
game).
[Ravindranath et al., 2012] Lenin Ravindranath, Jitendra Padhye, Sharad Agarwal, Ratul Mahajan, Ian
Obermiller, and Shahin Shayandeh. Appinsight: mobile app performance monitoring in the wild. In
Presented as part of the 10th USENIX Symposium on Operating Systems Design and Implementation
(OSDI 12), pages 107–120, 2012.
[Reese, 2008] Will Reese. Nginx: the high-performance web server and reverse proxy. Linux Journal,
2008(173):2, 2008.
150
BIBLIOGRAPHY
[Ren et al., 2010] Gang Ren, Eric Tune, Tipp Moseley, Yixin Shi, Silvius Rus, and Robert Hundt. Google-
wide profiling: A continuous profiling infrastructure for data centers. IEEE Micro, pages 65–79, 2010.
[Rodeh et al., 2013] Ohad Rodeh, Josef Bacik, and Chris Mason. Btrfs: The linux b-tree filesystem. ACM
Transactions on Storage (TOS), 9(3):9, 2013.
[Rossi, 2014] Chuck Rossi. Release engineering, facebook inc, 04 2014. Keynote address by Chuck Rossi
for an invited talk at the International Workshop for Release Engineering [Accessed: 2017 01 02].
[Saini, 2011] Kulbir Saini. Squid Proxy Server 3.1: Beginner’s Guide. Packt Publishing Ltd, 2011.
[Saito, 2005] Yasushi Saito. Jockey: a user-space library for record-replay debugging. In Proceedings of the
sixth international symposium on Automated analysis-driven debugging, pages 69–76. ACM, 2005.
[Sambasivan et al., 2011] Raja R Sambasivan, Alice X Zheng, Michael De Rosa, Elie Krevat, Spencer
Whitman, Michael Stroucken, William Wang, Lianghong Xu, and Gregory R Ganger. Diagnosing
performance changes by comparing request flows. In NSDI, 2011.
[Sigelman et al., 2010] Benjamin H. Sigelman, Luiz Andr Barroso, Mike Burrows, Pat Stephenson, Manoj
Plakal, Donald Beaver, Saul Jaspan, and Chandan Shanbhag. Dapper, a large-scale distributed systems
tracing infrastructure. Technical report, Google, Inc., 2010.
[Song and Lu, 2014] Linhai Song and Shan Lu. Statistical debugging for real-world performance problems.
In ACM SIGPLAN Notices, volume 49, pages 561–578. ACM, 2014.
[splunk, ] splunk. Splunk.
[Srisuresh and Egevang, 2000] Pyda Srisuresh and Kjeld Egevang. Traditional ip network address translator
(traditional nat). Technical report, rfc editor, 2000.
[Stallman et al., 2002] R.M. Stallman, R. Pesch, and S. Shebs. Debugging with gdb: The gnu source-level
debugger for gdb version 5.1. 1. Free Software Foundation, 51, 2002.
[Sun et al., 2009] Yifeng Sun, Yingwei Luo, Xiaolin Wang, Zhenlin Wang, Binbin Zhang, Haogang Chen,
and Xiaoming Li. Fast live cloning of virtual machine based on xen. In Proceedings of the 2009 11th
IEEE International Conference on High Performance Computing and Communications, HPCC ’09, pages
392–399, Washington, DC, USA, 2009. IEEE Computer Society.
151

BIBLIOGRAPHY
[Svard et al., 2015] Petter Svard, Benoit Hudzia, Steve Walsh, Johan Tordsson, and Erik Elmroth. Principles
and performance characteristics of algorithms for live vm migration. ACM SIGOPS Operating Systems
Review, 49(1):142–155, 2015.
[Tak et al., 2009] Byung-Chul Tak, Chunqiang Tang, Chun Zhang, Sriram Govindan, Bhuvan Urgaonkar,
and Rong N Chang. vPath: Precise discovery of request processing paths from black-box observations of
thread and network activities. In USENIX Annual technical conference, 2009.
[Tanenbaum, 2003] Andrew S. Tanenbaum. Computer Networks, Fourth Edition. Prentice Hall PTR, 2003.
[Thomson and Donaldson, 2015] Paul Thomson and Alastair F. Donaldson. The lazy happens-before rela-
tion: Better partial-order reduction for systematic concurrency testing. In Proceedings of the 20th ACM
SIGPLAN Symposium on Principles and Practice of Parallel Programming, PPoPP 2015, pages 259–260,
New York, NY, USA, 2015. ACM.
[Tirumala et al., 2005] Ajay Tirumala, Feng Qin, Jon Dugan, Jim Ferguson, and Kevin Gibbs. Iperf: The
tcp/udp bandwidth measurement tool. htt p://dast. nlanr. net/Projects, 2005.
[Tridgell and Mackerras, 1996] Andrew Tridgell and Paul Mackerras. “the rsync algorithm,”australian
national university. Technical report, Technical report, TR-CS-96-05, 1996.
[Tseitlin, 2013] Ariel Tseitlin. The antifragile organization. Commun. ACM, 56(8):40–44, August 2013.
[UKAI, ] Fumitoshi UKAI. Livepatch: http://ukai.jp/software/livepatch/.
[van Baaren, 2009] Erik-Jan van Baaren. Wikibench: A distributed, wikipedia based web application
benchmark. Master’s thesis, VU University Amsterdam, 2009.
[Veeraraghavan et al., 2012] Kaushik Veeraraghavan, Dongyoon Lee, Benjamin Wester, Jessica Ouyang,
Peter M. Chen, Jason Flinn, and Satish Narayanasamy. Doubleplay: Parallelizing sequential logging and
replay. ACM Trans. Comput. Syst., 30(1):3:1–3:24, February 2012.
[Viennot et al., 2013] Nicolas Viennot, Siddharth Nair, and Jason Nieh. Transparent mutable replay for
multicore debugging and patch validation. In ACM SIGARCH computer architecture news, volume 41,
pages 127–138. ACM, 2013.
152

BIBLIOGRAPHY
[Voorsluys et al., 2009] William Voorsluys, James Broberg, Srikumar Venugopal, and Rajkumar Buyya.
Cost of virtual machine live migration in clouds: A performance evaluation. In Proceedings of the 1st
International Conference on Cloud Computing, CloudCom ’09, pages 254–265, Berlin, Heidelberg, 2009.
Springer-Verlag.
[Wang et al., 2012] Chengwei Wang, Infantdani Abel Rayan, Greg Eisenhauer, Karsten Schwan, Vanish
Talwar, Matthew Wolf, and Chad Huneycutt. Vscope: middleware for troubleshooting time-sensitive data
center applications. In ACM/IFIP/USENIX International Conference on Distributed Systems Platforms
and Open Distributed Processing, pages 121–141. Springer, 2012.
[Wang et al., 2014] Yan Wang, Harish Patil, Cristiano Pereira, Gregory Lueck, Rajiv Gupta, and Iulian
Neamtiu. Drdebug: Deterministic replay based cyclic debugging with dynamic slicing. In Proceedings of
annual IEEE/ACM international symposium on code generation and optimization, page 98. ACM, 2014.
[Weil et al., 2006] Sage A Weil, Scott A Brandt, Ethan L Miller, Darrell DE Long, and Carlos Maltzahn.
Ceph: A scalable, high-performance distributed file system. In Proceedings of the 7th symposium on
Operating systems design and implementation, pages 307–320. USENIX Association, 2006.
[Wikipedia, 2016a] Wikipedia. Wikipedia the free encyclopedia, 2016. [Online; accessed 20-November-
2016].
[Wikipedia, 2016b] Wikipedia. X86 calling conventions — wikipedia, the free encyclopedia, 2016. [Online;
accessed 22-December-2016].
[Xavier et al., 2013] Miguel G Xavier, Marcelo V Neves, Fabio D Rossi, Tiago C Ferreto, Timoteo Lange,
and Cesar AF De Rose. Performance evaluation of container-based virtualization for high performance
computing environments. In 2013 21st Euromicro International Conference on Parallel, Distributed, and
Network-Based Processing, pages 233–240. IEEE, 2013.
[Yamato et al., 2009] K. Yamato, T. Abe, and M.L. Corpration. A runtime code modification method for
application programs. In Proceedings of the Ottawa Linux Symposium, 2009.
[Yu et al., 2007] Weikuan Yu, Jeffrey Vetter, R Shane Canon, and Song Jiang. Exploiting lustre file joining
for effective collective io. In Cluster Computing and the Grid, 2007. CCGRID 2007. Seventh IEEE
International Symposium on, pages 267–274. IEEE, 2007.
153

BIBLIOGRAPHY
[Yuan et al., 2014] Ding Yuan, Yu Luo, Xin Zhuang, Guilherme Renna Rodrigues, Xu Zhao, Yongle Zhang,
Pranay U Jain, and Michael Stumm. Simple testing can prevent most critical failures: An analysis of
production failures in distributed data-intensive systems. In 11th USENIX Symposium on Operating
Systems Design and Implementation (OSDI 14), pages 249–265, 2014.
[Zhang et al., 2014] Hui Zhang, Junghwan Rhee, Nipun Arora, Sahan Gamage, Guofei Jiang, Kenji Yoshi-
hira, and Dongyan Xu. CLUE: System trace analytics for cloud service performance diagnosis. In Network
Operations and Management Symposium (NOMS), 2014 IEEE, pages 1–9. IEEE, 2014.
154

APPENDIX A. ACTIVE DEBUGGING
Appendix A
Active Debugging
Figure A.1: Debugging strategies for offline debugging
A.1 Overview
In this section, we introduce active debugging whereby developers can apply a patch/fix or apply a test in
the debug container. active debugging ensures that any modifications in the debug container does not lead
to a state change in the production container. This will enable the debugger to fix/patch or run test-cases
in the debug-container while ensuring forward progress and in sync with production. We are inspired from
155

APPENDIX A. ACTIVE DEBUGGING
existing perpetual invivo testing frameworks like INVITE [Murphy et al., 2009](which also provides partial
test-isolation), in the production environment. We currently restrict fldebugging to patches/and test-cases
only bring about local changes, and not global changes in the application.
A.2 Description
In Figure A, we show the traditional mechanism of testing or validating patch/fixes in an application. In
offline environments, developers apply patches and run the relevant inputs to verify that the patch works
correctly. This is an interactive process, which allows one to verify the result and corrections before applying
it to the production system. Several cycles of this process is required, which may be followed by staged
testing to ensure correctness before applying the update to the production.
Active Debugging (see figure A.2) allows debuggers to apply fixes, modify binaries and apply hotpatches
to applications. The main idea is to do a fork/exec, or parallel execution of an unmodified application.
The unmodified binary continues execution without any change in the input. The debug-container should
ideally mimic the behavior of the production, so as to allow for forward progress in the application as the
debug-container will receive the same input as production. The target process will be forked at the call of the
testing function, the forked process can then be tested, the input can be transformed, or alternatively the same
input can be used to validate any test-condition. At the end of the execution the test-process output can be
checked and killed. The advantage of this technique is that any tests/fixes can be validated in the run-time
environment itself. This reduces the time to fix and resolve the error. The tests and fixes should have a local
impact and should not be allowed to continue
For Java programs, since there is no fork, we can utilize a JNI call to a simple native C program which
executes the fork. Performing a fork creates a copy-on-write version of the original process, so that the
process running the unit test has its own writable memory area and cannot affect the in-process memory of
the original. Once the test is invoked, the application can continue its normal execution, while the unit test
runs in the other process. Note that the application and the unit test run in parallel in two processes; the test
does not block normal operation of the application after the fork is performed.
The fork-exec design of test-isolation ensures that the “in-process” memory of the process execution
is effectively isolated. The production/debug containers are completely isolated hence the test does not
impact the production in any way. To ensure further isolation, we can allow the test fork to only call wrapper
156

APPENDIX A. ACTIVE DEBUGGING
Figure A.2: Debugging Strategies for Active Debugging
libraries which allow write operations in a cloned cow filesystem. This can be done using a COW supported
file-system with cloning functionality which are supported in ZFS and BTRFS. For instance BTRFS provides
a clone operation that atomically creates a copy-on-write snapshot of a file. By cloning the file system does
not create a new link pointing to an existing inode; instead it creates a new inode that initially shares the
same disk blocks with the original file. As a result cloning works only within the boundaries of the same
BTRFS file system, and modifications to any of the cloned files are not visible to the original file and vice
versa. This will of-course mean that we will constrain the debug/production environment to the File System
of our choice. All test-cases in the debug-container share the test file system.
157

APPENDIX B. SURVEY OF REAL WORLD BUGS
Appendix B
Survey of Real World Bugs
In this appendix, we present details of MySQL and Apache bug list, with labels and further subcategorizations.
This is a follow up of section 4.4.
B.0.1 Apache Buglist and details
Table B.1 shows the apache table categories list. Apart from the categories mentioned earlier in section 4.4
the following further categories have been added here as a more detailed categories:
• Feature Request These were bugs that were actually requests for new features or significant improve-
ments in existing features.
• Uncategorized Bugs categorized as uncategorized were those that we were unable to categorize into
any of our categories, mostly because the description was insufficient.
• Skipped These bugs were skipped, either at random or after a look at the short topic summarization.
• Documentation These bugs required further explanation in the documentation
• Build Issue These were more related to build issues
The following table B.2 is the detailed list of apache bugs with the categorization and short summarization
of each bug along with the bug ID.
158

APPENDIX B. SURVEY OF REAL WORLD BUGS
Table B.1: Details of bug categories for apache
Category Count
Semantic 37
Feature Request 14
Performance 3
Resource Leak 5
Concurrency 3
Startup/Config 7
Uncategorized 25
Skipped 70
Documentation 14
Build Issue 5
Total 183
Table B.2: Apache Bug List
Bug
ID
Component Summary Category
8117 core Apache stops accepting requests Semantic
21975 mod rewrite mod rewrite RewriteMap from external
program gets “confused”
Concurrency
33398 Other Need to be able to set “scheme” for SSL
offloading
feature requests
37331 Documentation FAQ update: bad hyperlinks Skipped
33110 Other ab is limited to SSL version 2 Skipped
42898 Documentation RewriteRule Pattern is applied to URL
path not to URL
Skipped
35465 core 10038 socket select failed Skipped
159

APPENDIX B. SURVEY OF REAL WORLD BUGS
36506 Documentation Documentation “RewriteOptions in-
herit” will also inherit “RewriteEngine
On”
Skipped
43233 Documentation possible typos in some files under ht-
docs/manual/
Skipped
41815 core Apache won’t start if log file too big Startup/Config
39516 mod include Nested Include directives fail, 1.3.35
new regression
Startup/Config
48091 Documentation Search doesn’t work Semantic
46268 mod rewrite Local back-reference in RewriteCond
pattern does not work
Semantic
49484 core Remove custom IE6+ workaround from
config file
feature requests
38177 mod log forensic module use of assert() vs. ap assert()
introduces eprintf() gcc-ism?
Skipped
33824 core binding to an invalid ip address in Linux Startup/Config
46306 core If-Modified-Since: and If-None-Match:
incorrect result
Semantic
49701 Documentation Link to 2.2 Documentation from 1.3
documentation do not work
Skipped
35194 core LimitRequestBody is not considered, if
a Action Handler is called
Skipped
35296 core PATCH: fix ap auth nonce(). Skipped
32635 Documentation Incorrect expression Skipped
39789 Other ab does not handle 304 Not Modified
correctly in a keep-alive connection
Semantic
33466 Documentation Error in french version of the docs for Skipped
34114 Documentation Apache could interleave log entries
when writing to a pipe.
Concurrency
160
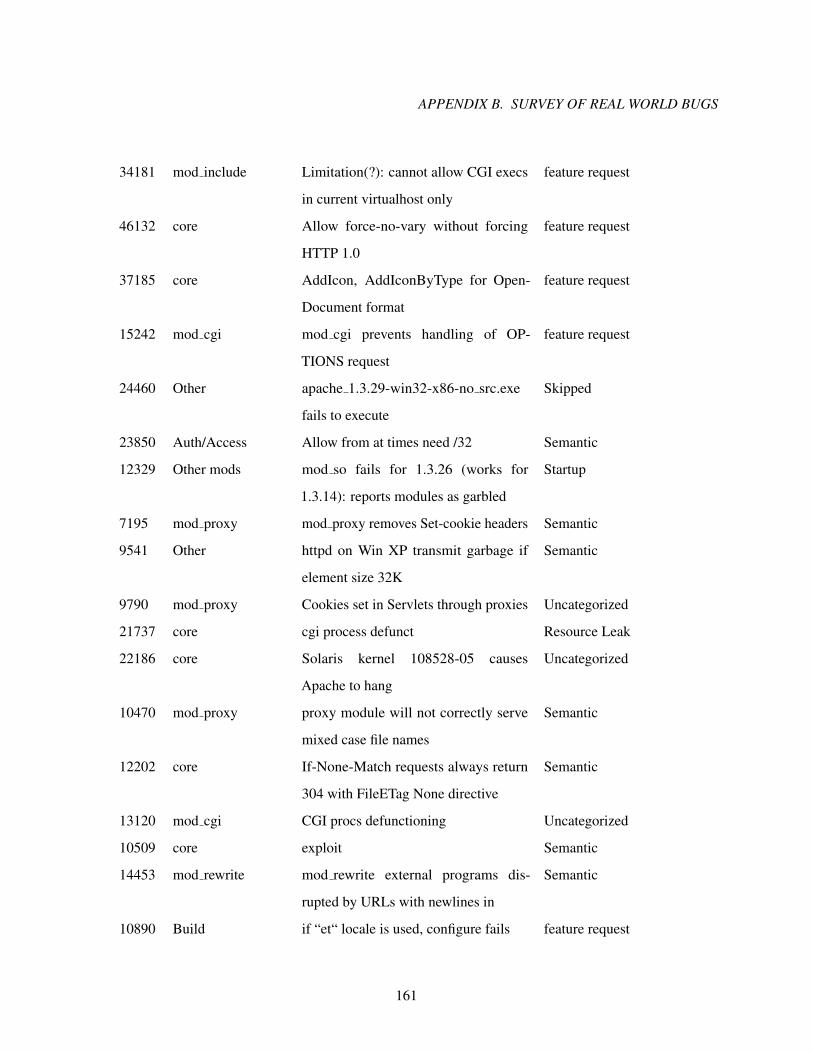
APPENDIX B. SURVEY OF REAL WORLD BUGS
34181 mod include Limitation(?): cannot allow CGI execs
in current virtualhost only
feature request
46132 core Allow force-no-vary without forcing
HTTP 1.0
feature request
37185 core AddIcon, AddIconByType for Open-
Document format
feature request
15242 mod cgi mod cgi prevents handling of OP-
TIONS request
feature request
24460 Other apache 1.3.29-win32-x86-no src.exe
fails to execute
Skipped
23850 Auth/Access Allow from at times need /32 Semantic
12329 Other mods mod so fails for 1.3.26 (works for
1.3.14): reports modules as garbled
Startup
7195 mod proxy mod proxy removes Set-cookie headers Semantic
9541 Other httpd on Win XP transmit garbage if
element size 32K
Semantic
9790 mod proxy Cookies set in Servlets through proxies Uncategorized
21737 core cgi process defunct Resource Leak
22186 core Solaris kernel 108528-05 causes
Apache to hang
Uncategorized
10470 mod proxy proxy module will not correctly serve
mixed case file names
Semantic
12202 core If-None-Match requests always return
304 with FileETag None directive
Semantic
13120 mod cgi CGI procs defunctioning Uncategorized
10509 core exploit Semantic
14453 mod rewrite mod rewrite external programs dis-
rupted by URLs with newlines in
Semantic
10890 Build if “et“ locale is used, configure fails feature request
161

APPENDIX B. SURVEY OF REAL WORLD BUGS
7572 mod proxy mod proxy does not reset timer when
reading from client
Performance
14518 mod rewrite QUERY STRING parts not incorpo-
rated by mod rewrite
Uncategorized
39490 core Wildcards (*) are ignored in Include di-
rective since 1.3.35
Startup/Config
10073 core upgrade from 1.3.24 to 1.3.26 breaks
include directive
Startup/Config
10453 Auth/Access Backward-compatible GET requests
broken in 1.3.26
Semantic
9647 mod proxy win 1.3.24 broke mod proxy when con-
necting to aspx page on IIS
Uncategorized
13053 Build build of apache fails regardless of build-
ing static or shared
Skipped
11668 mod proxy mod proxy & mod rewite generate a
invalid http response
Performance
14887 Build Empty Makefile when building (./con-
figure)
Build Issue
10240 mod proxy mod proxy sending wrong answer for
requests to cached partial content
Semantic
9181 mod headers Unable to set headers on non-2XX re-
sponses.
feature request
7492 mod rewrite Rewritemap mismerges paths (c:/ not
recognized as rooted)
Uncategorized
9497 mod proxy mod proxy does not maintain the re-
quest field (old bug #6841)
Semantic
27896 core Access violation in Apache with long
directory path
Uncategorized
162

APPENDIX B. SURVEY OF REAL WORLD BUGS
31858 Auth/Access regular expression matching broken on
amd64
Semantic
28880 Documentation Backreference in RedirectMatch always
inserts $1 at the end of destination url
Semantic
10128 mod proxy mod proxy, no-cache and 304 Semantic
31911 mod rewrite RewriteRule problem in 1.3.32 Semantic
31344 core mod rewrite PATH INFO issue in
1.3.31 - not in 1.3.29
Semantic
30627 core possible bug in handling ALARM sig-
nals on Solaris 9
Concurrency
9365 mod proxy Change in behaviour of ProxyPass and
ProxyPassReverse
Semantic
28218 core errors in regular expressions for Loca-
tionMatch cause silent failures
Uncategorized
25036 Documentation man pages for ab and apachectl say sec-
tion number (1) not (8)
Documentation
10961 core Redirect inside of Directory XYZ does
not pass environment back to the
browser
Semantic
29517 Documentation fix ’en-uk’ to read ’en-gb’ Documentation
18337 Documentation AddModule order important within
apache configure file
feature request
8176 core logic error in reclaim child processes
function called during shutdown
Resource Leak
37798 mod mime Add quite popular CHM extension to
mime.types
feature request
17897 core mod cgi broken on acl based file sys-
tems
Uncategorized
163

APPENDIX B. SURVEY OF REAL WORLD BUGS
13290 mod cgi unknown extensions do not reset Ad-
dHandler matches
Documentation
29667 mod proxy Proxy detects local URI as remote for
vhosts not running on default port
Uncategorized
10449 Other suexec allows environment variables
not in the safe list
feature request
28293 Other Wrong filesize in directory listing feature request
9076 Auth/Access ’satisfy any’ without AuthType set
causes 500
Semantic
14600 core Apache does not show or send files
mounted from a NetWare server.
Uncategorized
27811 Documentation SSI tutorial has mystery reference to
“last article”
Documentation
16661 Other mods use of strstr() in spot cookie() mis-
identifies cookies
Uncategorized
30920 core Digest authentication via mod digest no
longer works in 1.3.31.
Uncategorized
8449 Documentation SSI howto documentation bug: “ctime”
should be “strftime”
Documentation
26079 mod mime RealMedia files reported as RealAudio Semantic
10156 Build Apache HTTPD 1.3 needs to learn
about Caldera OpenUNIX 8
Startup/Config
26462 mod rewrite RewriteMap urlmap txt of same age get
confused between vhosts
Semantic
17564 Other mods Somtimes mod negotiation fails select
right variant
Uncategorized
19512 Auth/Access AllowOverride doesn’t work in Loca-
tion, but there’s no error
Uncategorized
164

APPENDIX B. SURVEY OF REAL WORLD BUGS
14629 core Listen with IP address, no port, uses
first octet as port
Uncategorized
9446 Documentation Cosmetical fix of httpd.conf comments Documentation
30996 Documentation Documentation for mod auth digest
needs update (compatible browsers)
Documentation
10092 Build Windows Installer 2.0 not compatable
with 1.3.26 msi
Build Issue
13351 Other FancyIndexing-generated HTML-code
not valid as HTML 4.01
Uncategorized
16435 Documentation TRACE not working in Limit Documentation
22276 core segfault in new connection with un-
usual vhost config
Security/Semantic
10096 Documentation Module identifier for mod actions incor-
rect
Uncategorized
16908 Other mods mod mime magic incorrectly handles
unrecognized files
Uncategorized
11988 Documentation force-response-1.0 ingored if request
uses HTTP/1.1
Documentation
14976 mod proxy ProxyPass segfault on ftp:// urls Semantic
29577 core 1.3.31 does no longer discard POST
data on denied access
Semantic
28876 Documentation RLimit directives are working in .htac-
cess file.
Documentation
32097 Build Wrong compilation flags when build on
not yet released FreeBSD 6.0
Build Issue
8329 Other mods mime magic gives 500 and no error log
on Microsoft .ANI cursor files
Uncategorized
10259 core charset always being added to Content-
Type on redirects
Uncategorized
165

APPENDIX B. SURVEY OF REAL WORLD BUGS
14648 mod rewrite mod rewrite does not proxy included
requests
Semantic
23871 core ap SHA1 broken on 64-bit Uncategorized
16937 Auth/Access Broken(?) 401 response from Apache
1.3.27 when digest auth required
Semantic
16013 mod autoindex Fooling mod autoindex + IndexIgnore Semantic
22805 core file descriptors are erroneously closed Resource Leak
15577 Documentation bug in auth how-to perl code Documentation
17720 Other please add application/ogg mimetype feature request
7180 Documentation Broken link in the documentation at
mod/core.html
Documentation
21443 Other mods compilation of mod auth db.c fails for
Berkeley DB version 4
Build Issue
29313 mod log forensic mod log forensic cause segmentation
faults
Skipped
20127 core PID file paths different on starting and
stopping using apachectl
Skipped
15011 core Apache processes not timing out on So-
laris 8
Skipped
24165 Other mods mod access docs SetEnvIf uses regex Semantic
18631 mod proxy Empty header fix rolled out Uncategorized
16984 Build suexec.c error Build Issue
12617 mod proxy Incorrect comparisons in support/ro-
tatelogs.c
Semantic
29403 Documentation foo.fr.html, language en – should be
fr
Documentation
12072 core Apache hangs when run with ssl-
support on 64bit Linux for zSeries
Uncategorized
166

APPENDIX B. SURVEY OF REAL WORLD BUGS
8037 Documentation documentation of Script directive does
not define arguments well enough
Documentation
18634 mod proxy Expediate Pragma:no-cache rolled out Skipped
27266 Documentation ErrorHeader headers being added to 200
code responses
Skipped
12386 Documentation CustomLog: piping to gzip does not
work as documented
Skipped
10561 core Possible over-zealous protocol check-
ing
Skipped
7234 Other mods RewriteMap broken Skipped
7796 Build Support XHTML media type (RFC
3236) in default install
Skipped
12074 Build Compilation fails due to a Isinf not
found
Skipped
28491 core Largefiles with Partial Content and
Content-Range Header
Skipped
10186 core HTTP-Version in request line is pre-
sumed case sensitive
Semantic
30877 Auth/Access htpasswd clears passwd file on Sun
when /var/tmp is full
Semantic
9889 Other apache problem under OpenBSD 3.1 lat-
est stable.
Skipped
23472 core httpd.conf-dist has the wrong language
code and MIME charset for Korean
Skipped
27501 Documentation Incorrect credit and link for “Getting
More out of Apache” tutorial
Skipped
12395 mod rewrite “RewriteEngine off” forbidden if “Op-
tions -FollowSymLinks”
Skipped
167

APPENDIX B. SURVEY OF REAL WORLD BUGS
24821 mod cgi memory handling very slow if cgi-script
needs big chunk of memory.
Resource Leak
12704 Documentation Error in AcceptMutex description Skipped
13683 Documentation Virtual host missing from RemoveType
context
Skipped
9424 Documentation Typo in the Auth Howto Skipped
12706 Build test char.h doesn’t get created on fast
build machine
Skipped
10980 Documentation Trivial documentation error (anchor) Skipped
16398 Documentation Mozilla does support Digest auth now Skipped
9977 Other suexec uses strerror(), which is not in
SunOS4
Skipped
22194 core .conf directory confuses (and crashes)
httpd.
Skipped
27812 Documentation duplicate ssi.html.html shows up in
search results
Skipped
12722 Documentation Very minor issue with the description
of the Run Time Config Cmd: Header
Skipped
16795 Documentation ErrorDocument does not work in Inter-
net Explorer
Skipped
8889 Documentation Broken links in
http://httpd.apache.org/dev/apidoc/
Skipped
14442 Documentation Satisfy example wrong Skipped
12822 Documentation documentation suggests insecure file
permissions
Skipped
18628 mod proxy Obsolete comment re-committed Skipped
7422 Build –with-layout=RedHat is not current Skipped
8927 Documentation DefaultType defaults to “text/plain” not
to “text/html” as per the documentation
Skipped
168

APPENDIX B. SURVEY OF REAL WORLD BUGS
20763 Documentation suggestion for docs Skipped
17006 Documentation original and rewritten URLs transposed Skipped
29409 Documentation Include Wildcard added in 1.3.27 Skipped
12966 Documentation typo in FilesMatch syntax in french doc-
umentation
Skipped
10038 Other ab benchmaker hangs on 10K https
URLs with keepalive
Skipped
17866 core Bogus: “cannot use a full URL in a 401
ErrorDocument directive” ?
Semantic
7252 Documentation Should fopen() in this example really be
ap pfopen ()?
Skipped
22061 Documentation About alias mapping the / Skipped
9012 Build apxs ignores IfDefined ... tags when
placing LoadModule lines
Skipped
11626 Documentation Bug report URL incorect Skipped
26326 Other Issue in the Redirect clause feature request
27542 mod proxy multiple-homed Web hosts - con re-
fused to first IP doesn’t fall through to
second
Semantic
12712 core [PATCH] Include conf.d/*.conf Uncategorized
25268 Other video/vnd.mpegurl mxu m4u in
mime.types and mime.types-dist
Skipped
24442 core UseCanonical enhancement Skipped
9648 Documentation User CGI FAQ should mention suexec
problem
Skipped
32070 Other RFE: add more bugzilla Platform op-
tions (AMD64, IA64)
Skipped
14358 Other rotatelogs using TZ settings Skipped
25772 mod rewrite REMOTE PORT Skipped
169

APPENDIX B. SURVEY OF REAL WORLD BUGS
27023 mod proxy Cookie could not delivered if the cookie
made before proxy module.
Skipped
9537 core Additional ServerTokens Skipped
29640 core Changes to apache core to allow sorted
array elements
Skipped
23902 core Add .dmg to application/octet-stream in
mime.types
Skipped
31483 mod mime add svgz in mime.types file Skipped
22529 Documentation RewriteRule problem when the URI is
the same as the document root
Skipped
12695 Documentation FD SIZESET info as requested Skipped
17462 mod rewrite Prevent mod rewrite from deadlooping Performance
7628 Other daemontools patch no longer applies
cleanly to 1.3.24
Skipped
19339 mod cgi stdin on CGI opened in text mode Skipped
35023 mod rewrite mod rewrite memory leak Resource Leak
Table B.3: Categories and count of mysql bugs
Category Count
Semantic 73
Performance 10
Resource-Leak 6
Concurrency 7
Startup/Config 2
Fault Tolerance 2
Replication 2
170

APPENDIX B. SURVEY OF REAL WORLD BUGS
B.0.2 MySQL Buglist and details
Table B.3 shows the mysql table categories list. Apart from the categories mentioned earlier in section 4.4 the
following further categories have been added here as a more detailed categories:
• Fault Tolerance Bugs in mysql cluster deployment related to fault tolerance
• Replication Bug in mysql cluster deployment related to replication
Below is a table B.4 with a list of all the bugs and their categories, all bugs which have not been
categorized were skipped at random or because they could not be categorized.
Table B.4: MySQL buglist
ID Summary Category
71156 FTBFS: ft2build.h: No such file or directory Build
71155 Unit test test promote is failing
71154 Can’t see full Model Name in Workbench 6 Home
71149 Assertion fails in create tmp field Semantic
71148 I believe this is nonsense
71147 Where is the list?
71141 Invisible schema list on dark GTK theme
71131 Poor error message in CallableStatement.java
71129 Binary data output from XML-RPC calls
71128 Command “mysqlfabric manage start” hangs on Win-
dows
71127 Checkpoint routine can lead to deadlock
71126 Command “mysqlfabric” not recognized on Win-
dows platform
71125 A server must belong to a single group
71124 callproc function with bytes parameters
71121 Postgres To MySQL migration failed
71119 Workbench crashes and quits after first application
load171

APPENDIX B. SURVEY OF REAL WORLD BUGS
71118 MEM agent: do not report a missing master.info file
if using TABLE replication
71113 Executable bit set for example config files
71112 Various test suite files have execute bit set but aren’t
executable
71109 Documentation for attributes as part of
COM CHANGE USER is missing
71106 Label for cancel button is not displayed correctly
71104 error on database start activate crashing recovery. startup
71103 Wrong syntax is used as example in the manual
71102 Unknown column ’no’ in ’field list’ in
MySql.Data.Entity Migration column rename
71097 Wrong results for a simple query with GROUP BY semantic
71095 Wrong results with PARTITION BY LIST
COLUMNS()
semantic
71094 ssl.cmake related warnings
71092 InnoDB FTS introduced new mutex sync level in
5.6.15, broke UNIV SYNC DEBUG
concurrency
71089 CMake warning when generating Makefile
71084 Wrong java.sql.Date stored if client and server time
zones differ
semantic
71076 st intersects works improperly semantic
71072 Please, make sure Launchpad sources are updated
before announcing release
71071 MySQL installer hangs on installati on (community
editions)
71070 kill of truncate table will lead to binary log written
while rows remains
semantic
71054 ‘HELP SHOW‘ still contains removed statements
172

APPENDIX B. SURVEY OF REAL WORLD BUGS
71050 json extract returning same column twice if key
names are not fully distinct.
semantic
71047 shutdown hang if semisync is enabled and slave abort replication
71045 Wrong default value is displayed for “thread stack”
option on 64-bit OS
71038 Add an option for custom collations detection performance
71037 can not start mysql when no Previous gtids log event
in the binlog
71036 Error on changing varchar(5000) to text
71032 !NULL and NOT NULL
71029 TRUNCATE command still active
71028 error result when “count + distinct + case when” need
merge walk
semantic
71025 Docs for mysqldump’s –single-transaction option are
misleading in 5.5/5.6
71022 mysqldbcompare fails check on same view on differ-
ent schema name
semantic
71017 mysqldump creates useless metadata locks semantic
71015 Typo in manual (mutxes- mutexes)
71014 two many times of memset decreate the performance
under heavy insert
resource-leak
71010 sql/sql resolver.cc refers to partition engine fields
when building without it
71004 Only ONE table from a database won’t import semantic
71003 Please refresh and remove events after closing them
70993 bad x on close on MySQL-workbench
70991 Manual seems to recommend IDEMPOTENT mode
for all cases of master-master
173

APPENDIX B. SURVEY OF REAL WORLD BUGS
70983 Assertion ‘0’ fails on creating a temporary table via
trigger
semantic
70982 Table created as INNODB, dropped, recreated as
myISAM, subsequent select fails
70978 Can’t drop multiple views
70977 MySQL Workbench crashes very very often when
you try to rename index or fk
semantic
70972 Multiple Selection Bug
70970 Cursor goes to the end of table’s comment field if it’s
already populated
70969 Shadow declaration of OperationNotSupportedEx-
ception in RowDataDynamic
70967 Crashes on right click
70965 Togglable Sidebar/panels buttons wrongly selected
at startup
70954 Fabric should use a better default TCP port
70952 MYSQLTEST MAN PAGE CONTAINS INTER-
NAL DIRECTORY NAME
70946 Driver Returns Wrong Length for Output Parameter
Streams
70942 accounts table shows NULL users and hosts
70941 Invalid SQL query when eager loading two nested
collections
semantic
70939 psi keys were incorrectly passed to function
set psi keys
70936 innochecksum.exe cannot handle =4G files (and
prints wrong error message)
70934 I typed “dbssc qc mysql56” and saw the following
information
174

APPENDIX B. SURVEY OF REAL WORLD BUGS
70932 MySQL Workbench Patches ( build fixes, removal of
deprecated glib functions )
70930 count distinct get error result semantic
70927 Connector/J COM CHANGE USER handling is bro-
ken
semantic
70925 Importing tables with GUID to excel - exception semantic
70924 Server object does not have a clean design to repre-
sent scaling out servers
70922 MySQL binlog error causing slave replication to exit replication
70920 Mysql Workbench repeatdly crashes at startup
70912 Autocomplete won’t go away sometimes
70906 when the mysql server is running, i start it again,the
pid file will be deleted
70904 can’t create a new view in the model
70903 Forward Engineer SQL Script disregards “Do Not
Create Users” instruction
70899 unnecessary buf flush list() during recovery performance
70898 Manual declares size in KB valid for inn-
odb data file path, but it does not work
70896 MySQL Workbench does not export stored routines
70888 NullReferenceException when try to save entity with
TINYINT or BIGINT as PK
70885 Mouse flickering between mouse pointer and “Text
Cursor”
70879 Error Code: 1785 when executing simple UPDATE
statement
70878 mysql-replication-listener compiler warnings patch
70873 No (online) documentation – please always install
“doclib” module.
175

APPENDIX B. SURVEY OF REAL WORLD BUGS
70872 segmentation fault (crash) on adding new table to
empty EER diagram
70867 Wrong OS error number reported in error log during
failure at startup
70866 sql/rpl slave.cc
70860 –tc-heuristic-recover option values are broken
70859 -DWITH EXAMPLE STORAGE ENGINE=1 is ig-
nored
semantic
70855 MySQL Workbench CE 6.0.7 crashes when launch-
ing
70854 Tc log page size should be unflushable or server
crashes if 2 XA SEs installed
semantic
70852 Poor grammar in docs
70848 Reduce the work inside critical section in my fopen()
and my register filename()
performance
70841 When picking colors in EER Diagram for layers and
tables MySQL Workbench crashes
70839 JSON VALID allows to have two elements with the
same key
70836 ALTER IGNORE TABLE behavior
70835 Incorrect SQLException subclass thrown for query
interrupted
semantic
70830 Coverity analysis results and patches
70828 UNION syntax missing required parentheses
70819 SHOW ENGINE INNODB MUTEX does NOT work
with timed mutex properly
semantic
70817 Inconsistent behaviour of NULL with binary strings
70814 /etc/init.d/mysql does not recognize pid-file under
[mysqld safe] in my.cnf
176

APPENDIX B. SURVEY OF REAL WORLD BUGS
70810 missing “event” permission in Users and Privileges
manager
70795 Entity Framework migration with Foreign Key fails
70789 Wrong verb
70784 Adjust documentation and possibly defaults for sync
info
70780 Creating custom graphs documentation error in
MySQL Enterprise Monitor 3.0
70776 semi-sync may segfault when turned off
70772 Mysql workbench crashes when opening a connec-
tion
70770 Wrong/Obsolete product names on the MySQL Yum
repository download page
70768 Persistent optimizer statistics often causes
LOCK open stalls
concurrency
70763 declare handler demo should show warning
70762 Yum installation documentation uses incorrect prod-
uct name/branding
70759 NDB API Example programs do not compile
70757 InnoDB Memcached leaks memory if inn-
odb api enable binlog = 1
resource-leak
70753 MySQLWorkBench crashes upon launch on Mac OS
10.8.4
70747 All round buggy table “Inserts”
70745 Add authentication plugin info to mysqluserclone
70744 SHOW GRANTS should indicate a authentication
plugin
70743 Instruction for pam authentication plugin should en-
able cleartext plugin
177

APPENDIX B. SURVEY OF REAL WORLD BUGS
70741 InnoDB background stats thread is not properly doc-
umented
70738 PAM configuration for pam authentication plugin
doesn’t work
70733 Partition examples should include a primary key
70729 InnoDB Buffer Pool Usage screen text should be
modified
70728 InnoDB Buffer Pool Usage Graph doc does not re-
flect actual behavior
70727 updating same row multiple times not working
70722 ’ The method or operation is not implemented. ’
when using LINQ with OrderBy.
70711 mysqlbinlog prints invalid SQL from relay logs when
GTID is enabled
semantic
70710 The login-path option is missing from mysql(1) man-
page
70705 Performance impact of row constructors is not prop-
erly documented
70701 DatabaseMetaData.getSQLKeywords() doesn’t
match MySQL 5.6 reserved words
70696 Restriction on FK parents being Unique key not doc-
umented
70695 MySQL Connections non visible but clickable
70694 MYSQLFABRIC IS NOT EXECUTABLE ON WIN-
DOWS
70693 agent looking in the wrong place for the master de-
tails
70691 MEM3 agent seems to populate
mysql.inventory.name with ’hostId’ not ’hostid’
178

APPENDIX B. SURVEY OF REAL WORLD BUGS
70688 ndbinfo offline variable undocumented
70685 incorrectly printed binlog dump information
70683 The description is wrong for –server-public-key-
path=file name
70682 The description for –version-check in the summary
table is wrong
70672 MySQL-devel package missing incluse/mysql/hash.h
70671 Wrong UI for ENUM type on Model User defined
types
70669 Slave can’t continue replication after master’s crash
recovery
fault-tolerance
70668 Installation instructions for mono should mention
dmcs
70664 mysql embedded mysql stmt execute return “mal-
formed communication packet” error
semantic
70662 Memory leak using 5.2.6 ODBC connector resource-leak
70658 Add description of options that control optimizer
trace
70657 SELECT DISTINCT...GROUP BY returns wrong
results in some cases
semantic
70648 mysqldbcopy copy routines after view semantic
70647 -DWITH DEBUG=1 has more effects than -
DCMAKE BUILD TYPE=Debug
70642 Bad memory access when get out params. semantic
70641 5.6 partitions use much more memory than 5.1 semantic
70640 –slave-skip-errors won’t skip missing database/table
70639 THR LOCK mutex is used before being initialized
70634 ’make test’ does not work
179

APPENDIX B. SURVEY OF REAL WORLD BUGS
70628 Wrong instrumentation interface for
mysql cond timedwait
70622 error result when use between...and againest bigint
unsigned
semantic
70616 planet.mysql.com removing posts
70614 Documentation typo
70608 This query returns a row in 5.5 but not 5.6 or current
5.7
semantic
70602 .Net connector does not add auto increment to bigint
columns
70601 Dashboard: startup can be very slow, not clear when
initialisation complete
70600 monitor shutdown does not give enough time to shut-
down tomcat
70596 ProgrammingError: Character set ’utf8mb4’ unsup-
ported.
70595 MySQL Installer 1.3 can’t download Server 5.1
70591 Coverity analysis results and patches
70590 Installation of MySql for Visual Studio Failed
70588 Index merge used on partitionned table can return
wrong result set
semantic
70583 INSERT ON DUPLICATE KEY UPDATE failing
after MySQL 5.6 upgrade.
70577 Read/Write mutexes on Binlog delegate classes are
not counted on perf schema
70574 JSON MERGE treats document without opening
bracket as valid
70573 Typo in README for JSON MERGE
180

APPENDIX B. SURVEY OF REAL WORLD BUGS
70570 JSON VALID allows two-hex-digit while standard
allows only four-hex-digit
70569 JSON VALID allows mixed case in the keyword
names
70568 JSON VALID treats invalid values as valid
70567 JSON VALID is too strict for some of objects
70564 future group master log pos not set properly
70553 EXPLAIN UPDATE shows “Using join buffer” while
it is not used
70552 host cache size value is ignored
70550 Data mismatch between C NDB API and MySQL
CLI.
70547 AccessViolationException when using GetSchema
API
70545 Missing support for read-only transactions
70542 MySQL does not compile on OSX 10.9 GM
70537 No users created under MySQL system database for
RPM based installation
70536 can’t use LOGICAL CLOCK if gtid is enabled
70530 dashboard: Improve logging of failed login attempts
70529 executemany() INSERT INTO fails w/o VALUES
(e.g. INSERT .. SELECT)
semantic
70523 logging of the MEM agent is very verbose and does
not give functional info
70519 Workbench omitting new lines
70518 Null reference exception when drawing layer under
tables
70516 Conditional include of sys/resource.h uses incorrect
guard define
181

APPENDIX B. SURVEY OF REAL WORLD BUGS
70515 Workbench cannot handle fractional timestamp
70512 Windows source installation fails in trying to use /etc
70507 MEM should treat a rebuilt MySQL server as a con-
tinuation of the previous one
70506 Routine Groups “expanded” variable not honoured
70505 clarify default 18085 port usage and bind locally if
no remote access needed
70504 service manager user is configured with unnecessary
access to bundled server
70502 Documentation on required MySQL grants is not
very cleaer
70494 st distance() function not documented
70488 Eine externe Komponente hat eine Ausnahme aus-
gelst
70486 When using json replace(), ’}’ of the end disappear.
70483 Server gets segmentation fault if compiled -O2
70482 Trying to create a FK relationship using InnoDB
tables the EER incorrectly adds
semantic
70451 Password Validation Plugin doesn’t play nice with
the GRANT and REVOKE commads
70450 Manual does NOT list all kinds of inefficient queries
over FEDERATED tables
70443 mysql client program ignores my.ini settings
70439 SQL Result Set can no longer be edited (Invalid “read
only” status)
70438 “Omit Schema Qualifier” option doesn’t apply to
GRANT statements
70436 Incorrect mapping of windows timezone to Olson
timezone
182

APPENDIX B. SURVEY OF REAL WORLD BUGS
70430 Race condition between purge coordinator and Inn-
oDB monitor crash on shutdown
70429 list handling incorrect in mysql prune stmt list() resource-leak
70427 when using multi-threaded slave, gtid executed does
not report the latest transa
70426 mismatch between slave worker info and replication
70423 performance schema.replication execute status by worker
wrong thread ID
semantic
70422 ODBC 5.2.5 dmg installer fails on OSX 10.8.5
70421 MySQL Workbench Action Output doesn’t auto
scroll
70420 are these uses of BTR MODIFY TREE needed?
70418 “New” MSI installer - platform confusion
70417 rw lock x lock func nowait() calls
os thread get curr id() mostly needlessly
concurrency
70414 redundant code in ReplSemiSyncMas-
ter::updateSyncHeader
70412 Windows Installer: default configuration file error -
innodb autoextend encremen
70411 Choosing “Copy Query for Matches” on “Search
Table Data” result row causes crash
70410 DDL queries increases rpl semi sync master yes tx
by a value of 2
70409 MySqlSessionStateStore : exception “Duplicate en-
try”
70408 Mysql installer: convert to commercial license
70403 No useful error message when memcached fails to
start due to lack of memory
resource-leak
183

APPENDIX B. SURVEY OF REAL WORLD BUGS
70402 new deprecation warnings introduce unwanted per-
formance degradation side-effect
performance
70398 MySQL Installer installs service with ’forward
slashes’ in registry
70397 SHOW ENGINE PERFORMANCE SCHEMA STA-
TUS doesn’t work in Workbench
70393 MySQL JSON UDFs: json extract only accepts
string arguments
70392 MySQL JSON UDFs binary is called
libmy json udf.so but DDL uses libmy json.so
70391 uninstall and install semi-sync plugin causes slaves
to break
70390 have csv and have partitioning documentation is
swapped
70388 Unable to change font in query result window
70381 Setting null in selection the various fields in grid data
result.
70377 fields of type TIME(3) don’t read milliseconds
70369 Undocummented behavior of InnoDB tables using
CHAR data type
70366 Trigger editor reverts last changes when trigger editor
tab looses focus
70365 Cannot save empty script in Workbench
70360 an independent instance with semisync enabled still
need ack from slave
semantic
70355 External Component Has Thrown An Exception
70351 ALTER TABLE ADD CONSTRAINT xxx FOR-
EIGN KEY adds two constraints
semantic
184

APPENDIX B. SURVEY OF REAL WORLD BUGS
70341 Key lengths lead to incomplete result sets; unhinted
scans prefer such indexes
70339 mysqlindexcheck not displaying best/worst report for
tables with no data
semantic
70338 autocomplete popup window freezes on screen
70333 InnoDB Fulltext search doesn’t find records when
savepoints are involved
70332 Crash when failing to establish a database connection
via SSH
70330 Typo in mysqlfrm manual entry
70329 excessive memory usage when querying INFORMA-
TION SCHEMA.INNODB FT INDEX
semantic
70327 Assersion error when setting future binlog file/pos
with semisync
70325 Query history not restored after restart of MySQL
Workbench
70324 AttributeError: str object has no attribute decode
70323 Workbench unhandled exception if audit.log file miss-
ing
70313 Missing delimiter ; after routine in Workbench for-
ward engeneer
70311 fts: Duplicate FTS DOC ID value on table / Cannot
find index FTS DOC ID INDEX in
concurrency
70310 “Forward Engineer - SQL Create Script” bug with
privileges
70309 Crash on start
70308 RACE CONDITION CAN CAUSE MYSQLD TO
REMOVE SOCKET FILE ERRANTLY
185

APPENDIX B. SURVEY OF REAL WORLD BUGS
70307 Another deadlock on FLUSH TABLES WITH
READ LOCK + SHOW SLAVE STATUS
concurrency
70298 [ERROR] InnoDB: Failed to set O DIRECT on file semantic
70290 Exception Populated : Unknown system variable
’transaction’
semantic
70284 Workbench 6.0.7.1 Crashes after – New Model – Add
New Diagram
70282 MySQL Notifier opens and gives an error message
“High Severity Error”
70281 sql safe updates documentation needs improvement
70279 incomplete source archive
70277 last argument of LOAD DATA ... SET ... statement
repeated twice in binlog
70274 Out-of-place stanza in docs
70271 weird errors with CHARSET=gbk
70262 Workbench 6 crashes down while starting up
70260 Table disappears when ALTERing with foreign key
checks off
semantic
70258 Requirement for PROCESS privilege not docu-
mented
70257 Could not change a trigger name
70246 workbench synchronize and reverse engineer is not
working
70244 “Error getting DDL for object” on alter table with
triggers
70241 innodb metrics::INDEX MERGE defined but not set semantic
70236 Use count: Wrong count for key at 0x27547278, 3
should be 4
70232 “Search table data” function fails
186
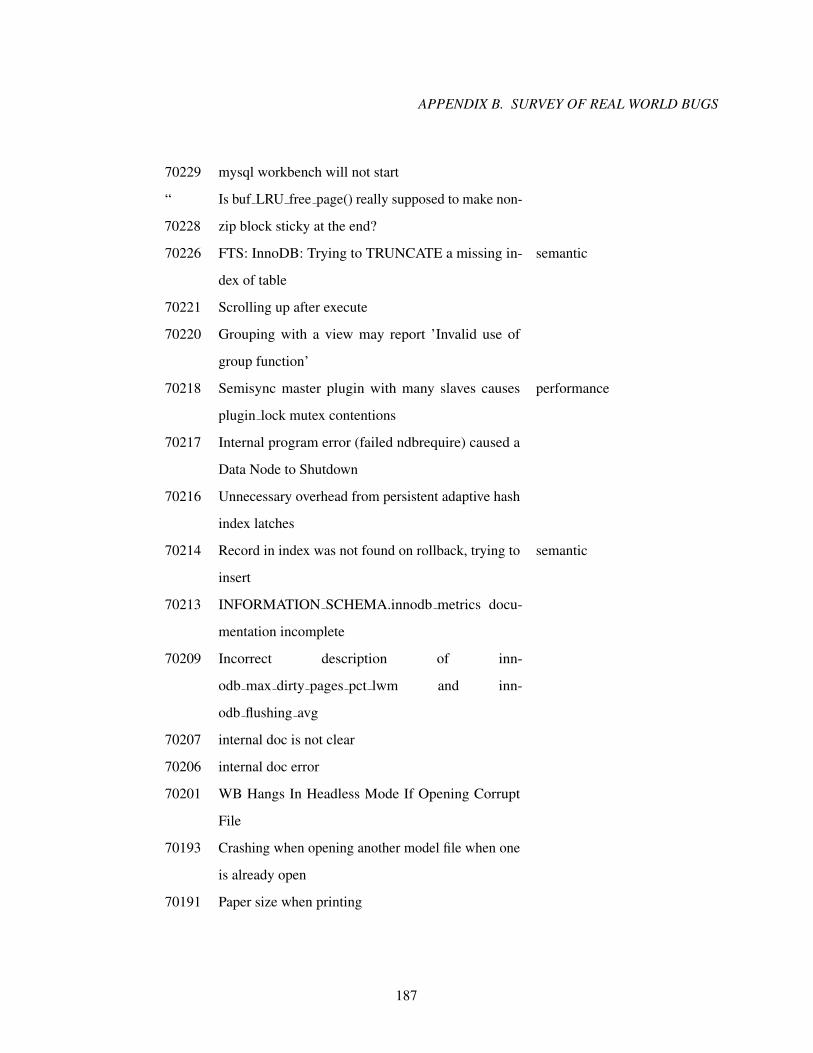
APPENDIX B. SURVEY OF REAL WORLD BUGS
70229 mysql workbench will not start
“
70228
Is buf LRU free page() really supposed to make non-
zip block sticky at the end?
70226 FTS: InnoDB: Trying to TRUNCATE a missing in-
dex of table
semantic
70221 Scrolling up after execute
70220 Grouping with a view may report ’Invalid use of
group function’
70218 Semisync master plugin with many slaves causes
plugin lock mutex contentions
performance
70217 Internal program error (failed ndbrequire) caused a
Data Node to Shutdown
70216 Unnecessary overhead from persistent adaptive hash
index latches
70214 Record in index was not found on rollback, trying to
insert
semantic
70213 INFORMATION SCHEMA.innodb metrics docu-
mentation incomplete
70209 Incorrect description of inn-
odb max dirty pages pct lwm and inn-
odb flushing avg
70207 internal doc is not clear
70206 internal doc error
70201 WB Hangs In Headless Mode If Opening Corrupt
File
70193 Crashing when opening another model file when one
is already open
70191 Paper size when printing
187

APPENDIX B. SURVEY OF REAL WORLD BUGS
70189 Alter table on large table produces error invalid
map/setT iterator
70186 MySql Workbench 6.0 home page missing on startup
– no Administer Server section
70179 Workbench 6.0 CE keeps crashing upon opening
70178 InnoDB FTS Information Schema plugins cannot be
loaded when built as Shared Lib
70174 unhandled exception TreeNodeRef set int for client
connections with large time
70172 trx create() and trx free() are called at every mem-
cached get request
performance
70170 Database with dot “.” in name gets split.
70168 MySQL Community Server 5.6 Installer for windows
crash on 64 bits Win 7 Prof
70167 Impossible to disable MASTER AUTO POSITION
with gtid mode=OFF
70163 Application freezes up to 10 seconds
70159 Debug Routine throw data too long for column ’pvar-
name’ at row 1 error
semantic
70158 select error sqlstate -37000 –used powerbuilder12.5
and Mysql ODBC 5.2.4
70152 mysql upgrade fails on a server with disabled Inn-
oDB
70150 Incorrectly reports the active configuration file
70140 Reentrant call exception in Workbench when insert-
ing new row
70139 Performance of “ALTER TABLE...” queries performance
70138 New-line auto-indent
188

APPENDIX B. SURVEY OF REAL WORLD BUGS
70132 Execution of SHOW and DESCRIBE statements
doesn’t affect “Queries per Second”
70129 ROW FORMAT=COMPACT issues
70127 mysql-workbench 5.2.47 Segfaults All Over The
Place
70125 Timestamp and datetime with microseconds still not
supported in MWB 6.0
70124 Timestamp and datetimes self-incompatible during
replication
70123 MySQL utilities not available for OS X
70122 Model looses typed data entry when switching tabs
to query tool
70119 Mouse cursor flashes in SQL Editor
70118 ifconfig is deprecated in favor of iproute on modern
Linux
70117 Syntax error in MySQL 5.5, 5.6, 5.7 Reference Man-
ual
70116 Workbench SQL Additons pane blank/missing key-
words
70113 Memory leak in SQLPrepare with queries that use
parameters
resource-leak
70107 Workbench
70103 MySQL Connector Python 1.0.10 Download URL
404
70100 Error in C# example code
70097 “Duplicate” button in Manage Server Connections
does not work
70095 export - Alter table - doesnt show up
189

APPENDIX B. SURVEY OF REAL WORLD BUGS
70089 Error msg when check/uncheck Schema on “Selec-
tion Database Objects to Import”
70087 InnoDB can not use the doublewrite buffer properly fault-tolerance
70074 mysql secure installation only works within $HOME
70072 Copy paste fields from one table to another in model-
ing
70071 Contradicting statements about OS support for win-
dows authentication plugin
70070 List of supported Windows OS’es not updated
70066 Can’t Open Workbench 6.0.6 on OS X 10.8.4 after
Upgrade from 5.2.47
70063 create table is slower in 5.6
70062 sql mode option file cannot set to null
70059 EER modelling - can’t update Routine Groups
70058 Getting mysqld –help as root exits with 1
70057 Option Fields are cut because of GUI problem
70055 Expiration time ignored
70050 Community MySQL utilities includes both commer-
cial and GPL readme files
70049 Commercial Workbench download links to commu-
nity utilities
70046 Typo: boostrap
70041 Cannot use Chinese character in the connection string
for the database
semantic
70040 Cannot create database with Chinese characters semantic
70039 Fix for bug #20964 was a breaking change
70038 Wrong select count distinct with a field included in
two-column unique key
semantic
70035 Save snapshot of open editors on close doesn’t work
190

APPENDIX B. SURVEY OF REAL WORLD BUGS
70034 version information mismatch in README-
innodb memcached
semantic
70033 Wrong build information on innodb/memcached
70031 SQL File Names are not shown in WB on Mac
70028 P S threads.INSTRUMENTED not set according to
setup actors
70026 Auto reconnect does not work with 5.6 libmysqlclient
70025 Update on P S setup consumers and threads through
JOIN only updates first row
70024 MySQL Workbench 6.0.6 Setup crashes on Windows
Server 2012 Standard x64
70022 MySQL workbench loses connections list
70021 Poor execution of a plan with unnecessary “range
checked for each record”
performance
70018 PFS Overhead on frequent connect/disconnect performance
70016 Workbench crashes when right-clicking on a function
70014 MySQL crashes on explain with JSON formatting
(debug builds)
semantic
70009 Can’t install mysql 5.6 on Oracle Linux 6.4
70007 Missing tables in InnoDB dictionary cause assertion
and restart of MySQL
semantic
70005 MySQL 5.5.33 issue with section 14.4.4.3. Identify-
ing the File Format in Use
70004 Workbench 6.0.6 freezes in Server Status Tab
70003 MySQL Admin ’Options Files’ has duplicated items,
new Defaults needs adjusts
70001 Partitioned tables do not use ICP - severe perfor-
mance loss after partitioning
semantic
69995 Wrong bug# in changelog item ...
191

APPENDIX B. SURVEY OF REAL WORLD BUGS
69993 innodb tries to access tablespace that does not exist
or is just being dropped
69990 CREATE TIME and UPDATE TIME are wrong for
partitioned tables
semantic
69989 wrong DBUG ENTER string in
THD::increment questions counter
69982 STATS SAMPLE PAGES clause is not documented
in the manual
69972 INSERT Rows with Unmatched Value on LIST Par-
titionin Results in No Rows Inserted
69969 Failing assertion: prebuilt-trx-conc state == 1 from
subselect
concurrency
69965 Add new table, right-click causes error
69958 “AUTO INCREMENT” is not a serial number.
69957 “AUTO INCREMENT” is not a serial number.
69956 Attaching a MySQL table in MS Access fails if the
table has an umlaut in name
semantic
69954 4-way deadlock: zombies, purging binlogs, show
processlist, show binlogs
concurrency
69950 Visual Studio 2010 crashes when reading rows from
any table in Server Explorer
semantic
69943 Transactions skipped on slave after “stop/start slave”
using GTID replication
semantic
69941 Inaccurate doc in reference manual for SSL perfor-
mance
69938 ‘Got temporary error 899 ’Rowid already allocated’
from NDBCLUSTER’
semantic
69937 Cannot delete index that belongs to foreign key when
another index exists
192

APPENDIX B. SURVEY OF REAL WORLD BUGS
69934 Cannot edit default schema privileges for test and
test %
69933 workbench crashes
69932 Fulltext search using words with apostrophe (’) does
not work on INNODB tables
semantic
69928 “statement/com” event meaning is unclear semantic
69922 Unknown column Extent1... semantic
69919 Surface Pro - Modeling diagrams crash system on
open
69918 Please add ’bit depth’ to version string
69915 statement/com/Query counter doesn’t increment semantic
69913 temporary-files.html ignores –slave-load-tmpdir
69911 MEM page for “Editing Built-in Rules” has incorrect
image
69908 MyISAM FTS queries with LIMIT clause, but no
WHERE clause, return too few rows
semantic
69907 Error(1030): Got error -1 from storage engine semantic
69903 Stack corruption in vio io wait on Mac OS X semantic
69902 slave asserts after 5.6 upgrade
69900 Workbench hangs when trying to open context menu
for a column in the live edit
69899 GRANT fails to set empty password for existing user semantic
69898 change master() invokes ha innobase::truncate() in a
DML transaction
69895 mysql 5.6.13 i386 ships with 64bit libraries
69894 Is MySQL 5.1.71 released?
69892 innodb stats interferes with innodb force recovery
and drop/create tables
69884 Test for bug 69883
193

APPENDIX B. SURVEY OF REAL WORLD BUGS
69882 Cannot decrease auto increment value even when
table is empty
semantic
69878 More foolish installer issues .. SIGH
69876 Unable to get the database encoded name in MySQL
5.6
69873 Replication stop with “Error in Xid log event: Com-
mit could not be completed”
69865 Wrong default MESSAGE TEXT values for SIG-
NALs are listed in the manual
69864 Need to add a lock to access connections member in
ENV structure
69861 LAST INSERT ID is replicated incorrectly if repli-
cation filters are used
semantic
69855 Official way to build with Valgrind (documentation)
69854 Gmock download extraction issue
69852 cmake build instructions errors
69850 “Close other tabs” function does not close all tabs
69848 mysql 5.6 slave out of memory error ?
69847 btr cur optimistic update() incorrectly documented
to allow thr == NULL arg
69846 ICP does not work on UNIQUE indexes
69844 Problem with scripts/mysql install db –user=mysql
69841 SELECT COUNT(DISTINCT a,b) incorrectly
counts rows containing NULL
semantic
69840 SQL Query Duration Appears incorrect
69833 Bad interaction between MIN/MAX and “HAVING
SUM(DISTINCT)”: wrong results
semantic
69832 Replicated Servers - ConnectionString Breaking
Change
194
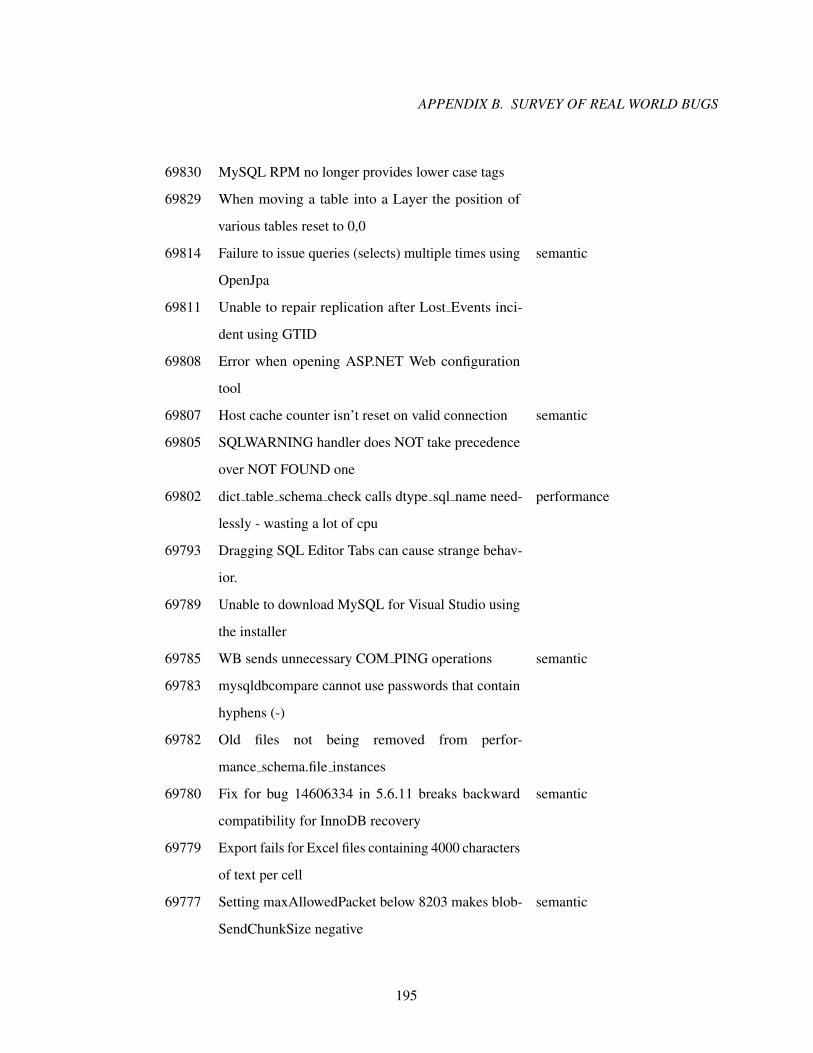
APPENDIX B. SURVEY OF REAL WORLD BUGS
69830 MySQL RPM no longer provides lower case tags
69829 When moving a table into a Layer the position of
various tables reset to 0,0
69814 Failure to issue queries (selects) multiple times using
OpenJpa
semantic
69811 Unable to repair replication after Lost Events inci-
dent using GTID
69808 Error when opening ASP.NET Web configuration
tool
69807 Host cache counter isn’t reset on valid connection semantic
69805 SQLWARNING handler does NOT take precedence
over NOT FOUND one
69802 dict table schema check calls dtype sql name need-
lessly - wasting a lot of cpu
performance
69793 Dragging SQL Editor Tabs can cause strange behav-
ior.
69789 Unable to download MySQL for Visual Studio using
the installer
69785 WB sends unnecessary COM PING operations semantic
69783 mysqldbcompare cannot use passwords that contain
hyphens (-)
69782 Old files not being removed from perfor-
mance schema.file instances
69780 Fix for bug 14606334 in 5.6.11 breaks backward
compatibility for InnoDB recovery
semantic
69779 Export fails for Excel files containing 4000 characters
of text per cell
69777 Setting maxAllowedPacket below 8203 makes blob-
SendChunkSize negative
semantic
195

APPENDIX B. SURVEY OF REAL WORLD BUGS
69776 Long table and column comments are not handled
properly
69773 Generate SSL certs documentation: unique Common
Names required
69770 P S.HOSTS table shows NULL hosts for unauthenti-
cated client connections
69769 Removing connection requires relaunch of Work-
Bench
69767 Windows Installer does not allow for custom path
like in individual components
69766 InnoDB complains “There was a problem in convert-
ing partition in charset ...
semantic
196