San José Community College 2025 Updated Facilities Master ...
340
Prepared for: San José/Evergreen Community College District, 4750 San Felipe Road, San José, California 95135 Prepared By: Impact Sciences, Inc. 555 12th Street, Suite 1650 Oakland, California 94607 San José Community College 2025 Updated Facilities Master Plan Volume II - Appendices Draft Environmental Impact Report SCH No. 2012082028 February 2013
-
Upload
khangminh22 -
Category
Documents
-
view
1 -
download
0
Transcript of San José Community College 2025 Updated Facilities Master ...

Prepared for:San José/Evergreen Community College District,
4750 San Felipe Road, San José, California 95135
Prepared By:Impact Sciences, Inc.
555 12th Street, Suite 1650Oakland, California 94607
San José Community College2025 Updated Facilities Master Plan
Volume II - Appendices
Draft Environmental Impact ReportSCH No. 2012082028
February 2013

San José City College
2025 Updated Facilities Master Plan
Draft Environmental Impact Report
SCH No. 2012082028
Volume II
Appendices
Prepared for:
San José/Evergreen Community College District
4750 San Felipe Road
San José, California 95135
Prepared by:
Impact Sciences, Inc.
555 12th Street, Suite 1650
Oakland, California 94607
February 2013
Impact Sciences, Inc. i San Jose City College 2025 Updated Facilities Master Plan Draft EIR
0461.003 February 2013
TABLE OF CONTENTS
Section Page
1.0 INTRODUCTION...................................................................................................................................1.0-1
2.0 EXECUTIVE SUMMARY ......................................................................................................................2.0-1
3.0 PROJECT DESCRIPTION......................................................................................................................3.0-1
4.0 ENVIRONMENTAL IMPACT ANALYSIS ........................................................................................4.0-1
4.1 Aesthetics ..................................................................................................................................4.1-1
4.2 Air Quality ................................................................................................................................4.2-1
4.3 Greenhouse Gas Emissions.....................................................................................................4.3-1
4.4 Land Use and Planning ...........................................................................................................4.4-1
4.5 Noise ..........................................................................................................................................4.5-1
4.6 Public Services ..........................................................................................................................4.6-1
4.7 Transportation and Traffic......................................................................................................4.7-1
4.8 Utilities and Service Systems..................................................................................................4.8-1
5.0 ALTERNATIVES ....................................................................................................................................5.0-1
6.0 OTHER CEQA CONSIDERATIONS ...................................................................................................6.0-1
7.0 LIST OF PREPARERS ............................................................................................................................7.0-1
Appendices (CD inside back cover)
1.0 Notice of Preparation, Initial Study, and Scoping Comments
4.2 Air Quality Worksheets
4.3 Greenhouse Gas Emissions Worksheets
4.5 Noise Modeling Output
4.7 Traffic Impact Analysis

APPENDIX 1.0
Notice of Preparation, Initial Study, and Scoping Comments

Notice of Preparation


Initial Study

SAN JOSÉ CITY COLLEGE
2025 FACILITIES MASTER PLAN
Draft Initial Study
The following Initial Study has been prepared in compliance with CEQA.
Prepared For:
San José/Evergreen Community College District
4750 San Felipe Road
San José, California 95135
Contact: Mr. Douglas Smith, Vice Chancellor of Administrative Services
Prepared By:
Impact Sciences, Inc.
555 12th Street, Suite 1650
Oakland, California 94607
(510) 267-0494
Contact: Elizabeth Purl
August 2012

Impact Sciences, Inc. i San Jose City College 2025 Facilities Master Plan
0461.003 August 2012
TABLE OF CONTENTS
Section Page
INTRODUCTION.......................................................................................................................................................1
Initial Study...................................................................................................................................................1
Anticipated Project Approvals ...................................................................................................................1
Public and Agency Review .........................................................................................................................1
Organization of the Initial Study................................................................................................................2
I. PROJECT INFORMATION.........................................................................................................................3
II. PROJECT LOCATION AND DESCRIPTION ..........................................................................................4
III. ENVIRONMENTAL FACTORS POTENTIALLY AFFECTED ............................................................14
IV. DETERMINATION: ...................................................................................................................................15
V. EVALUATION OF ENVIRONMENTAL IMPACTS.............................................................................16
1. Aesthetics.................................................................................................................................................17
2. Agriculture and Forestry Resources ....................................................................................................19
3. Air Quality...............................................................................................................................................21
4. Biological Resources...............................................................................................................................23
5. Cultural Resources .................................................................................................................................26
6. Geology and Soils...................................................................................................................................29
7. Greenhouse Gas Emissions ...................................................................................................................32
8. Hazards and Hazardous Materials ......................................................................................................33
9. Hydrology and Water Quality..............................................................................................................37
10. Land Use and Planning .......................................................................................................................41
11. Mineral Resources ................................................................................................................................42
12. Noise.......................................................................................................................................................43
13. Population and Housing .....................................................................................................................45
14. Public Services ......................................................................................................................................46
15. Recreation ..............................................................................................................................................48
16. Transportation/Traffic..........................................................................................................................50
17. Utilities and Service Systems ..............................................................................................................52
18. Mandatory Findings of Significance ..................................................................................................54
VI. SUPPORTING INFORMATION SOURCES...........................................................................................55
VII. INITIAL STUDY PREPARERS .................................................................................................................56
Impact Sciences, Inc. ii San Jose City College 2025 Facilities Master Plan
0461.003 August 2012
LIST OF FIGURES
Figure Page
1 Regional and Site Location..........................................................................................................................7
2 San Jose City College 2025 Facilities Master Plan ....................................................................................8
3 Recommended Demolition/Removal Plan................................................................................................9
4 Recommended Vehicular Circulation Plan.............................................................................................10
5 Recommended Pedestrian Circulation Plan ...........................................................................................11
6 Recommended Landscape Improvements..............................................................................................12
7 Surrounding Land Uses.............................................................................................................................13
Impact Sciences, Inc. 1 San Jose City College 2025 Facilities Master Plan
0461.003 August 2012
INTRODUCTION
Initial Study
Pursuant to Section 15063 of the California Environmental Quality Act (CEQA) Guidelines (Title 14,
California Code of Regulations, Sections 15000 et seq.), an Initial Study is a preliminary environmental
analysis that is used by the lead agency as a basis for determining whether an Environmental Impact
Report (EIR), a Mitigated Negative Declaration, or a Negative Declaration is required for a project. The
State CEQA Guidelines require that an Initial Study contain a project description, description of
environmental setting, identification of environmental effects by checklist or other similar form,
explanation of environmental effects, discussion of mitigation for significant environmental effects,
evaluation of the project’s consistency with existing, applicable land use controls, and the names of
persons who prepared the study.
The purpose of this Initial Study is to evaluate the potential environmental impacts of the proposed San
José City College (SJCC) 2025 Facilities Master Plan (FMP) and to determine what level of additional
environmental review, if any, is appropriate. As shown in the Determination in Section IV of this
document and based on the analysis contained in this Initial Study, it has been determined that the
proposed SJCC 2025 FMP could result in potentially significant impacts; therefore, preparation of an EIR
is appropriate.
Anticipated Project Approvals
The San José/Evergreen Community College District (SJECCD) will prepare an EIR that fully evaluates
the environmental effects associated with the implementation of the proposed 2025 FMP. Necessary
project approvals are anticipated to include, but are not limited to, consideration of the following by the
SJECCD Board of Trustees (anticipated in spring/summer 2011/2012):
Certification of the SJCC 2025 FMP EIR and
Approval of the proposed SJCC 2025 FMP.
Public and Agency Review
The Notice of Preparation (NOP) and this Initial Study will be circulated for public and agency review
from August 7, 2012 through September 7, 2012. Copies of the Initial Study are available during normal
operating hours at the District office at the address below and online at http://www.sjcc.edu. Comments
on the NOP/Initial Study must be received by 5:00 PM on September 7, 2012. They may be e-mailed to
[email protected] or sent to:
San José/Evergreen Community College District
Administrative Services
4750 San Felipe Road
San José, California 95135
Attn: Douglas Smith, Vice Chancellor
Impact Sciences, Inc. 2 San Jose City College 2025 Facilities Master Plan
0461.003 August 2012
A public scoping meeting for the SJCC 2025 FMP EIR will be held on Tuesday, August 28, 2012 in the
Student Center, Room SC204, on the SJCC campus at 2100 Moorpark Avenue, San Jose, from 6:00 PM to
7:00 PM. The public and agency review period for the Draft EIR is anticipated to commence in autumn
2012.
Organization of the Initial Study
This Initial Study is organized into the following sections.
Section I – Project Information: provides summary background information about the proposed
project, including project location, lead agency, and contact information.
Section II – Project Location and Description: includes a description of the proposed project,
including the need for the project, the project’s objectives, and the elements included in the project.
Section III – Environmental Factors Potentially Affected: identifies what environmental resources, if
any, would involve at least one significant or potentially significant impact that cannot be reduced to
a less than significant level.
Section IV – Determination: indicates whether impacts associated with the proposed project would
be significant, and what, if any, additional environmental documentation is required.
Section V – Evaluation of Environmental Impacts: contains the Environmental Checklist form for
each resource. The checklist is used to assist in evaluating the potential environmental impacts of the
proposed project. This section also presents an explanation of all checklist answers.
Section VI – Supporting Information Sources: lists references used in the preparation of this
document.
Section VII – Initial Study Preparers: lists the names of individuals involved in the preparation of
this document.

Impact Sciences, Inc. 3 San Jose City College 2025 Facilities Master Plan
0461.003 August 2012
I. PROJECT INFORMATION
1. Project title:
San José City College 2025 Facilities Master Plan
2. Lead agency name and address:
San José/Evergreen Community College District Board of Trustees
4750 San Felipe Road
San José, California 95135
3. Contact person and phone number:
Mr. Douglas Smith
Vice Chancellor, Administrative Services
(408) 270-6428
4. Project location:
San José City College
2100 Moorpark Avenue
San José, California 95128
5. Project sponsor’s name and address:
San José/Evergreen Community College District
4750 San Felipe Road
San José, California 95135
6. Custodian of the administrative record for this project (if different from response to item 3 above.):
Same as above.

Impact Sciences, Inc. 4 San Jose City College 2025 Facilities Master Plan
0461.003 August 2012
II. PROJECT LOCATION AND DESCRIPTION
1. Description of project:
Location: San José City College is located at 2100 Moorpark Avenue in central San José in Santa
Clara County. The location of the campus within the City of San José is shown in Figure 1,
Regional and Site Location. The campus is immediately south of Interstate 280 (I-280) and is
bounded by Moorpark Avenue to the north, Rexford Way, Kingman Avenue and Fruitdale
Avenue to the south, Laswell Avenue and South Bascom Avenue to the west, and Leigh Avenue to
the east. Overall the campus encompasses about 54.5 acres.
Project Need: The 2025 FMP translates the program space needs established in the SJCC 2025
Educational Master Plan into physical facilities on campus. According to the 2025 Educational
Master Plan for the SJCC campus, total enrollment on campus is expected to reach approximately
14,500 students by 2025, which equates to 9,400 Full-Time Equivalent (FTE) students (FTES). Based
on these projections, future program needs on campus total approximately 353,500 square feet of
space. The amount of space required on campus takes into account of all facility needs of the
campus – academic space as well as space for support services. The 2025 FMP determined that
SJCC has more space than it needs to house the 2025 program of instruction and related support
services. However, SJCC does show modest space needs in a few categories. These will be best met
through the remodel or replacement of existing space on campus.
Project Characteristics: The 2025 FMP involves the reorganization of campus facilities and the
reconfiguration of campus access and circulation. The proposed 2025 FMP for the SJCC campus is
depicted in Figure 2, San Jose City College 2025 Facilities Master Plan.1 The recommendations
contained in the 2025 FMP address the current and projected needs of the campus through 2025.
Facility recommendations contained in the 2025 FMP include demolition/removal of existing
buildings on campus; construction of new buildings; and renovation of existing buildings on
campus to meet the future programs needs as outlined in 2025 Educational Master Plan.
A description of each of these elements is provided below.
Recommended Demolition/Removal
The 2025 FMP identifies several buildings for demolition/removal to eliminate non-functioning
space and replace outdated facilities with new facilities. Facilities identified for
demolition/removal include Drama/Theater, 100 Wing, 200 Wing, 300 Wing, Boiler Plant, Pool,
General Education Building (partial), Auxiliary Gym, Field House, Handball Courts, Portable
Restroom Building, and Locker Rooms. The location of each of these facilities is shown in Figure 3,
Recommended Demolition/Removal Plan.
New Construction Projects
Descriptions of the new construction projects planned on the SJCC campus are organized below
1 The Multidisciplinary Classrooms & Arts Complex is listed by the 2025 FMP as currently being under
construction. The project has under gone separate California Environmental Quality Act (CEQA) review, and is
not included under the CEQA review for the 2025 FMP.

Impact Sciences, Inc. 5 San Jose City College 2025 Facilities Master Plan
0461.003 August 2012
into groups based on campus location. The order of the projects does not reflect priority order or a
recommended sequence of development. Preliminary phasing plans will be developed following
the completion of the 2025 FMP and will be tied to availability of funding.
Physical Education Complex - The proposed Physical Education (PE) Complex would support a
number of athletic and physical education needs at SJCC, including disabled and adaptive PE
program needs. The PE Complex would include three primary elements – a main gymnasium, a
fitness center, and an aquatics facility. The complex replaces space that would be removed with the
demolition of the Locker Rooms, Auxiliary Gym, Field House, Handball Courts, and Swimming
Pool. Preliminary plans include locker rooms; team rooms; an athletic weight room; educational
spaces; faculty offices; cardio and weight rooms for fitness; concessions; and potentially a
25-meter, 10- to 12-lane swimming pool.
Vocational Technology Building - The proposed Vocational Technology Building and yard would
replace the existing 100, 200, and 300 Wing buildings, consolidate all the Vocational Technology
programs together, and provide instructional space. This building would include, but is not
limited to, the Applied Science and Technology Division, which includes the programs for Air
Conditioning/Refrigeration Technology, Electrician Apprenticeship, Facilities Maintenance, Laser
Technology, Machine Technology, Solar, and Transit.
Performing Arts Center – The proposed Performing Arts Center would replace the existing
Theatre, Drama, and Speech Buildings with a new facility in a central location on campus. The new
facility would provide state-of-the-art instructional space to support program needs. A new
theater would include the support spaces required to support a variety of performances and
community activities. The proposed location would be accessed from the proposed new drop-off
along Moorpark Avenue and tie into the newly developed main campus quad. This link to the
campus core would include a new Performing Arts Plaza that could be used for receptions before
and after events.
General Education Building – The proposed General Education Building would replace the
portions of the existing General Education Building that are recommended for removal as part of
the 2025 FMP. The new facility would provide instructional space to support the program needs.
The proposed location for this new building would create easy access to interdisciplinary
instructional spaces along the campus promenade and adjacent to other instructional buildings on
the west side of the campus. The proposed placement of the building would create an edge to the
newly developed Vo Tech Plaza and provide outdoor activity and gathering spaces for the campus
community.
Renovation Projects
The 2025 FMP recommends two types of renovations – change of use and renovation of existing
buildings. A description of renovation projects planned on the SJCC campus is provided below.
The order of the projects does not reflect priority order or a recommended sequence of
development. The 2025 FMP recommends that these renovations be addressed on an as-needed
basis and aligned with ongoing deferred maintenance projects.
Change of Use – The 2025 FMP recommends that the vacated floors of the existing High
Technology Center be repurposed to support the instructional program needs identified in the
2025 Educational Master Plan. In addition, Building K is recommended to be renovated to support

Impact Sciences, Inc. 6 San Jose City College 2025 Facilities Master Plan
0461.003 August 2012
the Maintenance and Operations function of the college.
Existing Buildings – SJCC has some buildings on campus that date back to the 1950s and 1960s.
Many of these are in need of extensive renovation in order to support the programs that are
housed there. The 2025 FMP identifies one of the buildings in the General Education Building
Complex and the Business Building as facilities in need of renovation. In addition, the Jaguar
Gymnasium (currently Main Gym) has been identified as an important building to preserve.
Site Improvements
In addition to the recommendations for facilities, a series of site improvement recommendations
are identified in the 2025 FMP consisting of a recommended vehicular circulation plan, a
recommended pedestrian circulation plan, and recommended landscape improvements. These are
shown in Figure 4, Recommended Vehicular Circulation Plan; Figure 5, Recommended
Pedestrian Circulation Plan; and Figure 6, Recommended Landscape Improvements.
2. Project objectives:
The primary objective of the 2025 FMP is to provide the necessary facilities to accommodate the
planned 2025 student population for the SJCC campus. Detailed objectives will be developed
in the Draft EIR.
3. Surrounding land uses and environmental setting:
The SJCC campus is in an urban setting and is surrounded by a variety of land uses. They include
commercial uses and Valley Medical Center to the west, single-family and multi-family residential
uses to the east and south, and I-280 to the north, with single-family residential uses across the
freeway. Homes to the north of the campus are in unincorporated Santa Clara County. Figure 7,
Surrounding Land Uses depicts the location of these land uses in relation to the SJCC campus.
4. Discretionary approval authority and other public agencies whose approval is required:
As the public entity principally responsible for approving or carrying out the proposed project, the
SJECCD is the Lead Agency under CEQA and is responsible for reviewing and certifying the
adequacy of the environmental document and approving the proposed project. The SJECCD Board
of Trustees would make the decision on project approval.
The project may also require approval by the following public agencies:
Division of the State Architect (DSA) for buildings, handicap accessibility, fire and life safety;
City of San Jose Public Works and Traffic;
City of San Jose Fire Department for site access and fire hydrants/water pressure;
Santa Clara County Water District;
San Jose Municipal Water District; and
California Department of Transportation for work in proximity to I-280.

Novato
SanRafael
MountainView
SanJose
Fremont
Hayward
SanRamon
WalnutCreek
Concord
Santa RosaNapa
Fairfield
Alameda
SanFrancisco
DalyCity
Berkeley
Vallejo
Vacaville
RedwoodCity
Woodside
SanMateo
Oakland
Richmond
Pa c i f i c
Oc e a
n
S an
Fr a
nc i s c o
Ba
y
US
101
US
101
80INTERSTATE
680INTERSTATE
580INTERSTATE
880INTERSTATE
280INTERSTATE
280INTERSTATE
ProjectSite
SanJose
280280
Regional and Site Location
FIGURE 1
0461-003•07/12
SOURCE: Impact Sciences, Inc. – May 2011
NOT TO SCALEn

San Jose City College 2025 Facilities Master Plan
FIGURE 2
461-03•07/12
SOURCE: SJCC 2025 Facilities Master Plan – November 2011

Recommended Demolition/Removal Plan
FIGURE 3
461-03•07/12
SOURCE: SJCC 2025 Facilities Master Plan – November 2011

Recommended Vehicular Circulation Plan
FIGURE 4
461-03•07/12
SOURCE: SJCC 2025 Facilities Master Plan – November 2011

Recommended Pedestrian Circulation Plan
FIGURE 5
461-03•07/12
SOURCE: SJCC 2025 Facilities Master Plan – November 2011

Recommended Landscape Improvements
FIGURE 6
461-03•07/12
SOURCE: SJCC 2025 Facilities Master Plan – November 2011

Valley Medical Center
Commercial
Single-Family Residential
Single-Family Residential
Single-Family Residential
Multi-Family Residential
Valley Medical Center
Commercial
Single-Family Residential
Single-Family Residential
Single-Family Residential
Multi-Family Residential
Surrounding Land Uses
FIGURE 7
461-03•07/12
SOURCE: Google Earth – August 2011
n

Impact Sciences, Inc. 14 San Jose City College 2025 Facilities Master Plan
0461.003 August 2012
III. ENVIRONMENTAL FACTORS POTENTIALLY AFFECTED
The environmental factors checked below could be potentially affected by the implementation of the
proposed 2025 FMP and/or by cumulative impacts resulting from implementation of the proposed 2025
FMP in conjunction with other expected developments through 2025. These factors will be evaluated in
the EIR.
▪ Aesthetics □ Agriculture and Forest Resources
▪ Air Quality □ Biological Resources
□ Cultural Resources □ Geology and Soils
▪ Greenhouse Gas Emissions □ Hazards and Hazardous Materials
□ Hydrology and Water Quality ▪ Land Use and Planning
□ Mineral Resources ▪ Noise
□ Population and Housing ▪ Public Services
□ Recreation ▪ Transportation and Circulation
▪ Utilities and Service Systems ▪ Mandatory Findings of Significance

Impact Sciences, Inc. 15 San Jose City College 2025 Facilities Master Plan
0461.003 August 2012
IV. DETERMINATION:
On the basis of the initial evaluation that follows:
□ I find that the proposed project WOULD NOT have a significant effect on the environment, and a
NEGATIVE DECLARATION will be prepared.
□
I find that although the proposed project could have a significant effect on the environment, there
will not be a significant effect in this case because revisions in the project have been made that will
avoid or reduce any potential significant effects to a less than significant level. A MITIGATED
NEGATIVE DECLARATION will be prepared.
▪I find that the proposed project MAY have a significant effect on the environment. An
ENVIRONMENTAL IMPACT REPORT will be prepared.
Signature Date
Douglas Smith For

Impact Sciences, Inc. 16 San Jose City College 2025 Facilities Master Plan
0461.003 August 2012
V. EVALUATION OF ENVIRONMENTAL IMPACTS
During the completion of the environmental evaluation, the SJECCD relied on the following categories of
impacts, noted as column headings in the IS checklist.
A) “Potentially Significant Impact” is appropriate if there is substantial evidence that the project’s
effect may be significant. If there are one or more “Potentially Significant Impacts” for which
effective mitigation may not be possible, an EIR will be prepared.
B) “Less Than Significant With Mitigation Incorporated” applies where the incorporation of
project-specific mitigation would reduce an effect from “Potentially Significant Impact” to a “Less
Than Significant Impact.”
C) “Less Than Significant Impact” applies where the project would not result in a significant effect
(i.e., the project impact would be less than significant without the need to incorporate mitigation).
D) “No Impact” applies where the project would not result in any impact in the category or the
category does not apply. This may be because the impact category does not apply to the proposed
project (for instance, the project site is not within a surface fault rupture hazard zone), or because
of other project-specific factors.

Impact Sciences, Inc. 17 San Jose City College 2025 Facilities Master Plan
0461.003 August 2012
Impact Questions and Responses
Issues
Potentially
Significant
Impact
Less than
Significant
with Project
Mitigation
Less Than
Significant
Impact
No
Impact
1. AESTHETICS – Would the project:
a) Have a substantial adverse effect on a scenic vista? □ □ □ ■
b) Substantially damage scenic resources, including, but
not limited to, trees, rock outcroppings, and historic
buildings within a state scenic highway?
□ □ □ ■
c) Substantially degrade the existing visual character or
quality of the site and its surroundings?■ □ □ □
d) Create a new source of substantial light or glare
which would adversely affect day or nighttime views in
the area?
■ □ □ □
Relevant Elements of the Project and its Setting
The proposed project consists of the demolition of existing campus buildings and construction of
replacement facilities identified in the 2025 FMP to meet future growth projections on campus. The
topography of the campus is relatively flat, and the campus is completely developed. Based on a review
of the San José 2020 General Plan, there are no scenic vistas that include the campus as a major part of the
view. I-280, which is located adjacent to Moorpark Avenue to the north of campus, is designated as a
Landscaped Throughway by the City of San José 2020 General Plan (San José 1994).
Discussion of Potential Project Impacts
a) A scenic vista is generally defined as an expansive view of highly valued landscape as observable from
a publicly accessible vantage point. There are no scenic vistas that include the campus as a major part of
the view. In addition, the campus and surrounding area are characterized by flat topography and do not
contain any ridgelines or other topographic forms that would be affected by development or that provide
views of the campus and its surroundings (SJECCD 2008). Ground-level views into the campus from
surrounding areas are limited by buildings and trees on campus, and views of the surrounding areas are
also limited by flat topography and extensive urban development. There are thus no scenic vistas in the
campus area. Based on these factors, the proposed project would have no impact with regard to this
criterion.
b) There are no state-designated scenic highways in the vicinity of the campus (CSHP 2011). I-280, which
is located adjacent to Moorpark Avenue to the north of the campus, is designated as a Landscaped
Throughway in the City’s General Plan. However, the I-280 roadway is up to 15 feet below the
surrounding ground level in the area of the campus, and the only parts of campus visible to drivers are
the top of the Theatre building (which is about 65 feet tall) and tops of some trees. Implementation of the
2025 FMP would result in the demolition of the Theatre building; however, the removal of the Theatre
building would not substantially affect views along this portion of I-280 as the area would still be highly
Impact Sciences, Inc. 18 San Jose City College 2025 Facilities Master Plan
0461.003 August 2012
urbanized. Therefore, changes in the site’s visual character as a result of the 2025 FMP would not affect
visual resources associated with any state-designated or local scenic highway. There would be no impact
with regard to this criterion.
c) Facilities identified in the 2025 FMP would be similar in type and scale to existing facilities on the
campus, and new facilities would be constructed entirely within the campus. However, there is still the
potential that implementation of the 2025 FMP could alter the existing visual character and quality of the
campus as viewed from the surrounding neighborhoods. In addition, the construction of facilities
identified in the 2025 FMP could result in the loss of mature trees, which would further alter the existing
visual character of the campus. This represents a potentially significant impact. The effects of the 2025
FMP on the existing visual character or quality of the campus and its surroundings will be analyzed in
the EIR.
d) Existing buildings on the campus are a source of light and glare, and cars on campus may also be a
source of glare. Other sources of existing light and glare on campus include sports facilities and lighting
in parking lots and along pathways. New buildings proposed under the 2025 FMP would shift some light
and glare sources within the campus, and could increase light and glare in parts of the campus. This
represents a potentially significant impact. The effects of light and glare associated with the 2025 FMP on
the campus and its surroundings will be analyzed in the EIR.
Discussion of Potential Cumulative Impacts
The proposed project combined with other current projects and probable future projects and projected
regional growth could result in significant cumulative impacts with regard to visual character. This issue
will be addressed in the EIR.

Impact Sciences, Inc. 19 San Jose City College 2025 Facilities Master Plan
0461.003 August 2012
Issues
Potentially
Significant
Impact
Less Than
Significant
with
Mitigation
Incorporated
Less Than
Significant
Impact
No
Impact
2. AGRICULTURE AND FORESTRY RESOURCES –
Would the project:
a) Convert Prime Farmland, Unique Farmland, or
Farmland of Statewide Importance (Farmland), as
shown on the maps prepared pursuant to the Farmland
Mapping and Monitoring Program of the California
Resources Agency, to non-agricultural use?
□ □ □ ■
b) Conflict with existing zoning for agricultural use, or a
Williamson Act contract?□ □ □ ■
c) Conflict with existing zoning for, or cause rezoning of,
forest land (as defined in Public Resources Code section
12220(g)), timberland (as defined in Public Resources
Code Section 4526), or Timberland zoned Timberland
Production (as defined by Government Code section
51104(g))?
□ □ □ ■
d) Result in the loss of forest land or conversion of forest
land to non-forest use?□ □ □ ■
e) Involve other changes in the existing environment,
which, due to their location or nature, could result in
conversion of Farmland, to non-agricultural use or
conversion of forest land to non-forest use?
□ □ □ ■
Relevant Elements of the Project and its Setting
The proposed project consists of the demolition of existing campus buildings and construction of
replacement facilities identified in the 2025 FMP to meet future growth projections on campus. The
campus is designated as Urban and Built-Up Land on maps prepared by the California State Department
of Conservation pursuant to the Farmland Mapping and Monitoring Program (FMMP) (FMMP 2011).
Discussion of Potential Project Impacts
a) The entire campus is developed and located in a densely developed area of the City of San José. The
campus is not used for agriculture, and is not designated as Farmland on maps prepared pursuant to the
FMMP. There would be no impact with regard to this criterion.
b-c) The campus is zoned for urban use by the City of San José. No portion of the campus is zoned for
agricultural use, forest land, or timberland. In addition, there is no Williamson Act contract applicable to
the campus. Therefore, future development on the campus would not conflict with existing zoning for
agricultural or forest land or timberland use or with a Williamson Act contract. There would be no
impact with regard to this criterion.

Impact Sciences, Inc. 20 San Jose City College 2025 Facilities Master Plan
0461.003 August 2012
d) The campus and surrounding area does not include any forest land or timberland. There would be no
impact with regard to this criterion.
e) No Farmland or other agricultural land is present in the vicinity of the campus. Therefore,
implementation of the 2025 FMP would not involve any changes that could indirectly cause conversion of
Farmland to non-agricultural use. There would be no impact with regard to this criterion.
Discussion of Potential Cumulative Impacts
The City of San José is urban in nature, and is not designated as Farmland on maps prepared pursuant to
the FMMP. As a result, anticipated future development in San José, including the future development on
the campus under the 2025 FMP, would not result in the loss of important farmland. In addition, land in
the City is zoned for urban uses. Therefore, anticipated future development in San José would not
displace land zoned for agricultural use or forest land or timberland, and would not conflict with land
under a Williamson Act contact. The impact of cumulative development on agricultural and forest
resources would be less than significant.

Impact Sciences, Inc. 21 San Jose City College 2025 Facilities Master Plan
0461.003 August 2012
Issues
Potentially
Significant
Impact
Less than
Significant
with Project
Mitigation
Less Than
Significant
Impact
No
Impact
3. AIR QUALITY – Where available, the significance
criteria established by the applicable air quality
management or air pollution control district may be
relied upon to make the following determinations.
Would the project:
a) Conflict with or obstruct implementation of the
applicable air quality plan?■ □ □ □
b) Violate any air quality standard or contribute
substantially to an existing or projected air quality
violation?
■ □ □ □
c) Result in a cumulatively considerable net increase of
any criteria pollutant for which the project region is non-
attainment under an applicable federal or state ambient
air quality standard (including releasing emissions
which exceed quantitative thresholds for ozone
precursors)?
■ □ □ □
d) Expose sensitive receptors to substantial pollutant
concentrations?■ □ □ □
e) Create objectionable odors affecting a substantial
number of people? □ □ ■ □
Relevant Elements of the Project and its Setting
The proposed project consists of the demolition of existing campus buildings and construction of
replacement facilities identified in the 2025 FMP to meet future growth projections on campus. The
nearest sensitive receptors to the campus include single-family and multifamily residential uses adjacent
to the east and south, and single-family residential uses to the north across I-280. Other sensitive
receptors in the vicinity of the campus include the Valley Medical Center to the west.
Discussion of Potential Project Impacts
a-c) The campus is located in the San Francisco Bay Area Air Basin, which is currently designated a non-
attainment area for PM10 (particulate matter less than 10 microns in diameter), PM2.5 (particulate matter
less than 2.5 microns in diameter), and ozone. Construction and operation of facilities identified in the
2025 FMP would be likely to add incrementally to regional ambient air pollutant emissions including
short- and long-term emissions of criteria air pollutants from mobile and stationary sources. This
represents a potentially significant impact. The EIR will estimate the total emissions from construction
and operation of future buildings identified in the 2025 FMP and evaluate whether the emissions would

Impact Sciences, Inc. 22 San Jose City College 2025 Facilities Master Plan
0461.003 August 2012
exceed the Bay Area Air Quality Management District (BAAQMD) recommended thresholds for
evaluating impacts from criteria pollutant emissions.
d) Construction of facilities identified in the 2025 FMP would result in on-site emissions of diesel
particulate matter, which the California Air Resources Board has identified as a toxic air contaminant. In
addition, operation of facilities identified in the 2025 FMP could impact nearby sensitive receptors by
creating the potential for localized carbon monoxide (CO) hotspots. This represents a potentially
significant impact. The EIR will evaluate concentrations of CO, toxic air contaminants, and other
pollutants associated with the 2025 FMP to determine whether they would result in a significant effect on
sensitive receptors.
e) Construction of facilities identified in the 2025 FMP would require the use of diesel-fueled equipment
and architectural coatings, both of which have an associated odor. However, these odors would be short-
term and temporary and would not be pervasive enough to affect a substantial number of people or to be
objectionable. Routine operation of facilities identified in the 2025 FMP would not involve activities that
typically produce odors such as wastewater treatment, manufacturing, agriculture, etc. Occasional use of
maintenance products on the campus could produce localized odors, but they would be temporary and
limited in area. Consequently, odors associated with short-term construction and long-term operation of
facilities under the 2025 FMP would not cause or be affected by odors, and the impact would be less than
significant.
Discussion of Potential Cumulative Impacts
The construction and operation of facilities identified in the 2025 FMP combined with other current
projects and probable future projects and projected regional growth could result in significant cumulative
impacts with regard to air quality. This issue will be addressed in the EIR.

Impact Sciences, Inc. 23 San Jose City College 2025 Facilities Master Plan
0461.003 August 2012
Issues
Potentially
Significant
Impact
Less than
Significant
with
Project
Mitigation
Less Than
Significant
Impact
No
Impact
4. BIOLOGICAL RESOURCES – Would the project:
a) Have a substantial adverse effect, either directly or
through habitat modifications, on any species identified
as a candidate, sensitive, or special status species in local
or regional plans, policies, or regulations, or by the
California Department of Fish and Game or U.S. Fish
and Wildlife Service?
□ ■ □ □
b) Have a substantial adverse effect on any riparian
habitat or other sensitive natural community identified
in local or regional plans, policies, regulations or by the
California Department of Fish and Game or US Fish and
Wildlife Service?
□ □ □ ■
c) Have a substantial adverse effect on federally
protected wetlands as defined by Section 404 of the
Clean Water Act (including, but not limited to, marsh,
vernal pool, coastal, etc.) through direct removal, filling,
hydrological interruption, or other means?
□ □ □ ■
d) Interfere substantially with the movement of any
native resident or migratory fish or wildlife species or
with established native resident or migratory wildlife
corridors, or impede the use of native wildlife nursery
sites?
□ ■ □ □
e) Conflict with any applicable policies protecting
biological resources, such as a tree preservation policy or
ordinance?
□ □ □ ■
f) Conflict with the provisions of an adopted Habitat
Conservation Plan, Natural Community Conservation
Plan, or other applicable local, regional, or state habitat
conservation plan?
□ □ □ ■

Impact Sciences, Inc. 24 San Jose City College 2025 Facilities Master Plan
0461.003 August 2012
Relevant Elements of the Project and its Setting
The proposed project consists of the demolition of existing campus buildings and construction of
replacement facilities identified in the 2025 FMP to meet future growth projections on campus. The entire
campus is developed and located in a densely developed area of the City of San José. There are no natural
habitats present on the campus, with the campus consisting entirely of buildings, paved parking lots and
walking areas, athletic fields, and landscaped areas.
Discussion of Potential Project Impacts
a) The most recent version of the California Natural Diversity Database (CNDDB) was reviewed for the
campus and surrounding area. No special-status species have been documented on the campus, but
several special-status wildlife species have been documented in nearby urban areas, including Cooper’s
hawk (Accipiter cooperii), American peregrine falcon (Falco peregrinus anatum), and hoary bat (Lasiurus
cinereus). American peregrine falcon is a state Fully Protected species and a federal Bird of Conservation
Concern. Cooper's hawk and hoary bat are included on the California Department of Fish and Game
(CDFG) Special Animals List, but do not have any formal state or federal protection status.2
According to the CNDDB, due to the presence of suitable habitat attributes, there is a potential for
Cooper's hawk to nest in the clusters of trees on the campus. American peregrine falcon is known to nest
nearby at San José City Hall. As this species nests on tall buildings in urbanized locations, it could nest on
the large buildings on the campus. While hoary bat has been documented in the area, the potential for
this or other bat species to roost on the campus is considered low. The campus is located in a heavily
developed area and there is no favorable foraging habitat on the campus. Therefore, this species is
presumed absent from the campus. Similarly, given the developed condition of the campus, suitable
habitat for other special-status wildlife species known from the project region (e.g., burrowing owl,
California tiger salamander), and for special-status plant species, is absent.
In the event that Cooper’s hawk and/or American peregrine falcon were to nest on the campus,
development under the 2025 FMP could result in the direct loss or noise-related disturbance of an active
nest of these species. This is considered a potentially significant impact. However, with implementation
of Mitigation Measure BIO-1, which requires a preconstruction survey and avoidance of active nests, the
impact would be reduced to a less than significant level. It should also be noted that numerous common
bird species could nest on the campus and that the active nests of all raptor species and most common
bird species are protected by the Migratory Bird Treaty Act and the California Fish and Game Code.
Mitigation Measure BIO-1: When outdoor construction activities within 100 feet of landscape
plantings would commence during the nesting/breeding season of native bird species potentially
nesting on the site (typically February through August in the project region), a pre-construction
survey for nesting birds shall be conducted by a qualified biologist not more than four weeks
before commencement of construction activities. The surveys shall continue on a weekly basis
with the last survey being conducted no more than three days before the start of
clearance/construction work.
If active nests are found in areas that could be directly affected or are within 100 feet (300 feet if
adjacent to natural vegetation) of construction and would be subject to prolonged construction-
related noise, no-disturbance buffer zones of 100 feet (300 feet adjacent to natural areas) shall be
2 “Special Animals” is a general term that refers to all of the taxa the CNDDB is interested in tracking, regardless
of their legal or protection status.

Impact Sciences, Inc. 25 San Jose City College 2025 Facilities Master Plan
0461.003 August 2012
created around active nests during the breeding season or until a qualified biologist determines
that all young have fledged. The size of the buffer zones and types of construction activities
restricted within them shall be determined through consultation with the CDFG, taking into
account factors such as the following:
Noise and human disturbance levels at the construction site at the time of the survey
and the noise and disturbance expected during the construction activity;
Distance and amount of vegetation or other screening between the construction site
and the nest; and
Sensitivity of individual nesting species and behaviors of the nesting birds.
b) The campus is completely developed, and no riparian habitat or other sensitive natural community is
present on the campus. Therefore, the project would not affect riparian habitat or other sensitive natural
communities. There would be no impact with regard to this criterion.
c) The campus is completely developed, and no wetlands, as defined by the federal Clean Water Act or
the California Fish and Game Code, are present on campus. There would be no impact with respect to
this criterion.
d) The entire campus is developed and located in a densely developed area. As the campus is bordered
on all sides by dense development, it does not provide habitat connectivity between undeveloped lands
and is not part of a regional wildlife movement corridor. Therefore, there would be no impact to wildlife
movement as a result of 2025 FMP implementation. As previously discussed, various bird species could
nest on the campus, but the implementation of Mitigation Measure BIO-1 (see above) would address
potential impacts to nesting birds and the campus' potential function as a "wildlife nursery site" for birds.
e) Construction of facilities identified in the 2025 FMP may require the removal of some trees, regardless
of health, to facilitate development or to mitigate potentially hazardous circumstances related to their
proximity to existing facilities. The City of San José has a tree ordinance that requires a permit for
removal of any trees on private property that have a trunk circumference of 56 inches or more, measured
2 feet above grade. As a state entity, the SJECCD is exempted by the state constitution from compliance
with local land use regulations and ordinances. There would be no impact with respect to this criterion.
f) No adopted habitat conservation plan or natural community conservation plan applies to the campus.
There would be no impact with respect to this criterion.
Discussion of Potential Cumulative Impacts
Anticipated future development in some portions of San José has the potential to adversely affect
biological resources in the City. However, with mitigation, future development under the 2025 FMP
would have no project-level impacts on biological resources. Therefore, implementation of the 2025 FMP
would not make a cumulatively considerable contribution to a cumulative impact on biological resources
that could result from other development in the City.

Impact Sciences, Inc. 26 San Jose City College 2025 Facilities Master Plan
0461.003 August 2012
Issues
Potentially
Significant
Impact
Less than
Significant
with Project
Mitigation
Less Than
Significant
Impact
No
Impact
5. CULTURAL RESOURCES – Would the project:
a) Cause a substantial adverse change in the
significance of a historical resource as defined in
Section 15064.5?
□ □ □ ■
b) Cause a substantial adverse change in the
significance of an archaeological resource pursuant
to Section 15064.5?
□ ■ □ □
c) Directly or indirectly destroy a unique
paleontological resource or site or unique geologic
feature?
□ ■ □ □
d) Disturb any human remains, including those
interred outside of formal cemeteries?□ ■ □ □
Relevant Elements of the Project and its Setting
The proposed project consists of the demolition of existing campus buildings and construction of
replacement facilities identified in the 2025 FMP to meet future growth projections on campus. The ages
of buildings on the campus range from the 1950s through the 1980s. According to the Northwest
Information Center (NWIC), while there is a moderately low potential for identifying unrecorded Native
American resources on or near the SJCC campus, there is a moderate potential for identifying unrecorded
historic-period archaeological resources on or near the SJCC campus (NWIC 2011). Construction of
individual buildings and facilities would include site grading and excavation, and thus could uncover
unknown resources.
Discussion of Potential Project Impacts
a) Under CEQA, “historic resources” means historic buildings or features or historic or prehistoric
archaeological deposits that qualify for inclusion on the California Register of Historic Resources based
on their historical or prehistoric significance. Several building on campus are identified in the 2025 FMP
for demolition. These include the Drama/Theater, 100 Wing, 200 Wing, 300 Wing, Boiler Plant, Pool,
General Education Building (partial), Auxiliary Gym, Field House, Handball Courts, Portable Restroom
Building, and Locker Rooms. The ages of these buildings range from the 1950s through the 1980s.
Historical surveys to determine eligibility for inclusion in the National Register of Historic Places, or the
California Register of Historic Resources were conducted for the 100 Wing, 200 Wing, 300 Wing, Boiler
Plant, Pool, Auxiliary Gym, Field House, Handball Courts, and Locker Rooms. The surveys indicated that
these structures do not qualify for listing on either of these registers (ARM, 2009a; ARM, 2009b). While
the Drama/Theater building was built in the 1950s, it does not appear to be eligible for inclusion in the
National Register of Historic Places, or the California Register of Historic Resources as it was built in a
mid-century utilitarian style and does not possess distinctive architectural features, In addition, no
historical events or persons associated with them are associated with the Drama/Theater building.
Finally, the General Education Building was built during the 1980s and Portable Restroom Building was

Impact Sciences, Inc. 27 San Jose City College 2025 Facilities Master Plan
0461.003 August 2012
built during the 2000s. As a result, these structures do not qualify for inclusion on any federal or state
register. Thus, the implementation of the 2025 FMP will have no impact on significant historic resources.
There would be no impact with regard to this criterion.
b) The NWIC was contacted to conduct an archaeological records search for the campus and surrounding
area. The NWIC indicated that while there is a moderately low potential of identifying unrecorded
Native American archaeological resources on or near the SJCC campus, there is a moderate potential of
identifying unrecorded historic-period archaeological resources on or near the SJCC campus given that a
review of older maps (1942 San José 15-minute topographic quadrangle and 1899 map) depict buildings
within the project site that were associated with a County hospital (NWIC 2011). Any inadvertent
damage to significant historic-period archaeological resources represents a potentially significant impact.
However, implementation of Mitigation Measures CUL-1 and CUL-2 would reduce the impact to a less
than significant level.
Mitigation Measure CUL-1: Prior to ground disturbance, the Campus shall conduct archival
research to determine the appropriate locations for archaeological monitoring during
removal of asphalt or concrete fill, vegetation, or structures. Following the exposure of the
original soils, a field inspection shall be conducted and a report containing “next step”
recommendations be provided. Field study may include, but is not limited to, pedestrian
survey, hand auger sampling, shovel test units, or geoarchaeological analyses as well as other
common methods used to identify the presence of archaeological resources.
Mitigation Measure CUL-2: If archaeological resources are encountered during construction,
work shall be temporarily halted in the vicinity of the discovered materials and workers shall
avoid altering the materials and their context until a qualified professional archaeologist has
evaluated the find and provided appropriate recommendations. Project personnel shall not
collect cultural resources. Native American resources include chert or obsidian flakes,
projectile points, mortars, and pestles; and dark friable soil containing shell and bone dietary
debris, heat-affected rock, or human burials. Historic-period resources include stone or adobe
foundations or walls; structures and remains with square nails; and refuse deposits or bottle
dumps, often located in old wells or privies.
c) The City of San José 2020 General Plan does not mention paleontological resources as an area of concern
for the City (San José 1994). The campus is developed and flat, and thus has no unique geologic features.
Subsurface soils are classified as Yolo series soils, which are well-drained medium and moderately fine
textured soils underlain by alluvium (SJECCD 2008). Such materials are considered to have a very low
likelihood of containing significant geologic or paleontological features. In addition, potential building
sites on the campus have likely been disturbed by past grading activities. Consequently, excavations on
campus are unlikely to disturb or damage fossil resources. This impact is considered less than significant.
d) See the responses to Items 5(a) and (b), above. As the campus is not located in an area with identified
archaeological resources, human remains are not expected to be present on the campus, but the potential
for their presence cannot be completely ruled out. Any disturbance of human remains would represent a
potentially significant impact. However, with implementation of Mitigation Measure CUL-3, which
outlines procedures to be followed in the event that previously unknown human remains are discovered,
any impacts would be reduced to a less than significant level.

Impact Sciences, Inc. 28 San Jose City College 2025 Facilities Master Plan
0461.003 August 2012
Mitigation Measure CUL-3: In the event of a discovery of human bone, potential human
bone, or a known or potential human burial, all ground-disturbing work in the vicinity of the
find will halt immediately and the area of the find will be protected until a qualified
archaeologist determines whether the bone is human. If the qualified archaeologist
determines the bone is human, the Campus will notify the County Coroner of the find.
Consistent with California Health and Safety Code Section 7050.5(b), which prohibits
disturbance of human remains uncovered by excavation until the Coroner has made a
finding relative to the requirements of Public Resources Code Section 5097, the Campus will
ensure that the remains and vicinity of the find are protected against further disturbance.
If it is determined that the find is of Native American origin, the Campus will comply with
the provisions of Public Resources Code Section 5097.98 regarding identification and
involvement of the Most Likely Descendant (MLD).
If the human remains cannot be protected in place following the Coroner’s determination, the
Campus shall ensure that the qualified archaeologist and the MLD are provided the
opportunity to confer on repatriation and/or archaeological treatment of human remains, and
that any appropriate studies, as identified through this consultation, are carried out prior to
reinterment. The Campus shall provide results of all such studies to the Native American
community, and shall provide an opportunity for Native American involvement in any
interpretative reporting. As stipulated by the provisions of the California Native American
Graves Protection and Repatriation Act, the Campus shall ensure that human remains and
associated artifacts recovered from campus projects on state lands are repatriated to the
appropriate local tribal group if requested.
Discussion of Potential Cumulative Impacts
Anticipated future development in some portions of San José has the potential to adversely affect cultural
resources in the City. However, with mitigation, future development on the campus under the 2025 FMP
would have no project-level impacts on cultural resources. Therefore, implementation of the 2025 FMP
would not make a cumulatively considerable contribution to a cumulative impact on cultural resources
that could result from other development in the City.

Impact Sciences, Inc. 29 San Jose City College 2025 Facilities Master Plan
0461.003 August 2012
Issues
Potentially
Significant
Impact
Less than
Significant
with Project
Mitigation
Less Than
Significant
Impact
No
Impact
6. GEOLOGY AND SOILS – Would the project:
a) Expose people or structures to potential
substantial adverse effects, including the risk of
loss, injury, or death involving:
i) Rupture of a known earthquake fault, as
delineated on the most recent Alquist-Priolo
Earthquake Fault Zoning Map issued by the
State Geologist for the area or based on other
substantial evidence of a known fault? Refer
to Division of Mines and Geology Special
Publication 42.
□ □ □ ■
ii) Strong seismic ground shaking? □ □ ■ □iii) Seismic-related ground failure, including
liquefaction? □ □ □ ■iv) Landslides? □ □ □ ■
b) Result in substantial soil erosion or the loss of
topsoil? □ □ ■ □
c) Be located on a geologic unit or soil that is
unstable, or that would become unstable as a
result of the project, and potentially result in on-
or off-site landslide, lateral spreading, subsidence,
liquefaction or collapse?
□ □ ■ □
d) Be located on expansive soil, as defined in the
City’s adopted building code, creating substantial
risks to life or property?
□ □ ■ □
e) Have soils incapable of adequately supporting
the use of septic tanks or alternative waste water
disposal systems where sewers are not available
for the disposal of waste water?
□ □ □ ■
Relevant Elements of the Project and its Setting
The proposed project consists of the demolition of existing campus buildings and construction of
replacement facilities identified in the 2025 FMP to meet future growth projections on campus. The
topography of the campus is relatively flat, and the campus is completely developed. Thus, no unique
geologic features are located on the campus.

Impact Sciences, Inc. 30 San Jose City College 2025 Facilities Master Plan
0461.003 August 2012
Discussion of Potential Project Impacts
a)(i) The campus is not located within an established Alquist-Priolo Earthquake Fault Zone for surface
fault rupture hazards (CGS 2011). The closest Alquist-Priolo Earthquake Fault Zone is located
approximately 7.5 miles to the east along the Hayward fault (ABAG 2001). Based on the available
geologic data, active or potentially active faults with the potential for surface fault rupture are not known
to be located directly beneath the campus. As a result, future development under the 2025 FMP would
not expose people or structures to potential substantial adverse effects associated with the rupture of a
known earthquake fault. There would be no impact with regard to this criterion.
a)(ii) The campus could be subject to strong ground shaking in the event of an earthquake originating
along one of the faults listed as active or potentially active in the Bay area. This hazard exists throughout
the Bay Area and could pose a risk to public safety and property by exposing people, property, or
infrastructure to potentially adverse effects including strong seismic ground shaking. However, any
future development on the campus under the 2025 FMP would be designed and constructed in
accordance with the current California Building Code (CBC), and thus would be consistent with the
current prevailing standard of care for structural and civil engineering and seismic safety. Impacts
associated with exposure to seismic groundshaking are thus expected to be less than significant.
a)(iii) The campus is not located in a liquefaction hazard zone designated by the State of California
pursuant to the Seismic Hazards Mapping Act of 1990 (CGS 2002). As a result, future development on the
campus would not expose structures and people to hazards associated with liquefaction, including the
potential for structural damage or failure and associated safety risks. There would be no impact with
regard to this criterion.
a)(iv) The campus and the surrounding area are characterized by flat topography and are located at a
substantial distance from the closest hilly or sloping areas that could generate landslides. The campus is
therefore not subject to hazards related to landslides or landslide runout; this includes seismically
induced and non-seismic landslides. No impact is anticipated with regard to this criterion.
b) Construction of facilities identified in the 2025 FMP would require activities such as vegetation
removal and grading that would expose soil to erosion. For projects that would disturb more than 1 acre,
coverage under the state’s National Pollutant Discharge Elimination System (NPDES) General Permit for
Discharges of Storm Water Associated with Construction Activity would be required prior to
construction and the construction contractor would be required to file a notice of intent (NOI) with the
State Water Resources Control Board and develop and implement a site-specific Storm Water Pollution
Prevention Plan (SWPPP). The SWPPP would include Best Management Practices (BMPs) to control on-
site erosion and off-site sedimentation, and to keep construction pollutants from coming into contact with
storm water. The campus would have oversight responsibility and would have the authority to shut
down construction in the event the SWPPP is improperly implemented. For projects that would disturb
less than 1 acre, the campus would develop an erosion control plan which would include sediment and
erosion controls to limit on-site erosion and off-site sedimentation, and to keep construction pollutants
from coming into contact with storm water. With these measures in place, impacts related to accelerated
erosion and sedimentation are expected to be less than significant.
c) Issues related to seismically induced and non-seismic landslide hazards are discussed in response to
Item (a)(iv), above. Issues related to liquefaction and related hazards are discussed in response to Item
(a)(iii), above. Issues related to soil properties are discussed in response to Item (d), below. Construction
of facilities identified in the 2025 FMP may require the creation of cut or fill slopes, which could be

Impact Sciences, Inc. 31 San Jose City College 2025 Facilities Master Plan
0461.003 August 2012
unstable if they are improperly designed or constructed. However, as identified above, development
would be designed and constructed in accordance with the current CBC, which includes provisions that
specifically address good grading practices and cut and fill slope stability. Impacts related to unstable cut
or fill slopes are therefore expected to be less than significant.
d) The potential for expansive soils exists on the campus (SJECCD 2008). The properties of any native
materials that may underlie individual development sites on the campus at depth are not known at this
time, but will be evaluated during the development of the site-specific geotechnical investigations that
the campus will prepare for the project design of each new facility identified by the 2025 FMP. As
discussed above, all facilities identified in the 2025 FMP will adhere to the current CBC, which includes
detailed provisions to ensure that the design of new facilities is appropriate to site soil conditions,
including requirements to address expansive and otherwise problematic soils. With adherence to the
CBC, impacts related to site soil conditions—including but not limited to expansive soils, if any are
present—would be less than significant.
e) Future development on the campus would not involve the installation of septic tanks or alternative
wastewater disposal systems. There would be no impact with regard to this criterion.
Discussion of Potential Cumulative Impacts
Most of the geologic impacts such as those related to risk from faults, liquefaction potential, slope
stability, landslide potential, expansive and compressible soils are site specific and do not cumulate.
Therefore, future development on the campus and other development in the vicinity of the campus
would not result in a significant cumulative impact related to geologic risks. The one area where the
impacts of concurrent construction projects have the potential to cumulate is related to soil erosion and
discharge of sediment into receiving waters during construction. This represents a significant cumulative
impact. However, all construction on campus would comply with NPDES requirements to minimize
erosion and sedimentation. Therefore, the contribution of future development on campus under the 2025
FMP to this impact would not be cumulatively considerable.

Impact Sciences, Inc. 32 San Jose City College 2025 Facilities Master Plan
0461.003 August 2012
IssuesPotentially
Significant
Impact
Less than
Significant
with Project
Mitigation
Less Than
Significant
Impact
No
Impact
7. GREENHOUSE GAS EMISSIONS – Would the
project:
a) Generate greenhouse gas emissions, either directly or
indirectly, that may have a significant impact on the
environment?
■ □ □ □
b) Conflict with any applicable plan, policy or
regulation of an agency adopted for the purpose of
reducing the emissions of greenhouse gases?
■ □ □ □
Relevant Elements of the Project and its Setting
The proposed project consists of the demolition of existing campus buildings and construction of
replacement facilities identified in the 2025 FMP to meet future growth projections on campus.
Discussion of Potential Project Impacts
a-b) Construction and operation of facilities identified in the 2025 FMP to meet future growth projections
on the campus would generate greenhouse gas (GHG) emissions. This represents a potentially significant
impact. The EIR will estimate the direct and indirect GHG emissions from the operation of facilities
identified in the 2025 FMP and discuss whether the emissions would exceed the BAAQMD’s
recommended threshold for GHGs emitted by land use development projects. The EIR will also estimate
and report GHG emissions that would be generated during construction of facilities identified in the 2025
FMP.
Discussion of Potential Cumulative Impacts
The contribution of the 2025 FMP to the global cumulative impact will be addressed in the EIR.

Impact Sciences, Inc. 33 San Jose City College 2025 Facilities Master Plan
0461.003 August 2012
Issues
Potentially
Significant
Impact
Less than
Significant
with Project
Mitigation
Less Than
Significant
Impact
No
Impact
8. HAZARDS AND HAZARDOUS MATERIALS
– Would the project:
a) Create a significant hazard to the public or the
environment through the routine transport, use, or
disposal of hazardous materials?
□ □ ■ □
b) Create a significant hazard to the public or the
environment through reasonably foreseeable
upset and accident conditions involving the
release of hazardous materials into the
environment?
□ □ ■ □
c) Emit hazardous emissions or handle hazardous
or acutely hazardous materials, substances, or
waste within one-quarter mile of an existing or
proposed school?
□ □ ■ □
d) Be located on a site which is included on a list
of hazardous materials sites compiled pursuant to
Government Code Section 65962.5 and, as a result,
would it create a significant hazard to the public
or the environment?
□ ■ □ □
e) For a project located within an airport land use
plan or, where such a plan has not been adopted,
within 2 miles of a public airport or public use
airport, would the project result in a safety hazard
for people residing or working in the project area?
□ □ □ ■
f) For a project within the vicinity of a private
airstrip, would the project result in a safety hazard
for people residing or working in the project area?
□ □ □ ■
g) Impair implementation of or physically
interfere with an adopted emergency response
plan or emergency evacuation plan?
□ □ □ ■
h) Expose people or structures to a significant risk
of loss, injury or death involving wildland fires,
including where wildlands are adjacent to
urbanized areas or where residences are
intermixed with wildlands?
□ □ □ ■

Impact Sciences, Inc. 34 San Jose City College 2025 Facilities Master Plan
0461.003 August 2012
Relevant Elements of the Project and its Setting
The proposed project consists of the demolition of existing campus buildings and construction of
replacement facilities identified in the 2025 FMP to meet future growth projections on campus. The
campus contains several older buildings that are identified for demolition in the 2005 FMP. The closest
school is the Neighborhood Christian Preschool, located approximately 300 feet east of the campus. The
nearest airport is San José International Airport, located approximately 2.5 miles north of the campus.
Discussion of Potential Project Impacts
a) Although the construction of facilities identified in the 2025 FMP would use small quantities of
hazardous materials on each construction site, compliance with local, state, and federal regulations would
minimize risks associated with the routine transport, use, or disposal of hazardous materials during
construction activities. Any hazardous materials used during the operation of facilities identified in the
2025 FMP would be limited to those typically used in academic support and standard maintenance
activities (e.g., laboratory chemicals, photo processing chemicals, solvents, paints, cleaning agents). The
use of all hazardous materials during operation would be required to comply with stringent local, state,
and federal regulations on hazardous materials use. Given the types and quantities of hazardous
materials that would be used as well as stringent regulations, the impacts related to the routine transport,
use, and disposal of hazardous materials would be less than significant.
b) See response to Item (a), above. Buildings to be demolished as part of the 2025 FMP could contain
asbestos, lead, and polychlorinated biphenyls (PCBs). State law requires that contractors and workers be
notified of the presence of asbestos in buildings constructed before 1979. The California Department of
Public Health requires certification of employees and supervisors performing lead-related construction
activities in residential and public buildings. Standard specifications included in all campus construction
contracts specify that contractors who disturb or potentially disturb asbestos or lead must comply with all
federal, state, and local rules and regulations regarding these materials. Contractors are also required to
stop work and inform the Campus if they encounter material believed to be asbestos, PCBs, lead, or other
hazardous materials. Compliance with federal, state, and local regulations would minimize possible
exposure to staff and students. Therefore, this impact would be less than significant.
c) The campus is located within 0.25 mile of a school. Risks associated with the use of hazardous
materials on the campus would be addressed through compliance with applicable regulations as
discussed in Item (a), above, and the campus does not and would not handle large quantities of such
materials that could create a substantial release affecting off-campus areas. Therefore, the impacts with
respect to this criterion are considered less than significant overall.
d) The SJCC campus is included on a list of hazardous materials sites subject to corrective action
compiled pursuant to Government Code Section 65962.5 (Cortese List). This listing stems from reported
cases of leaking underground storage tanks (LUST) on campus. The LUST contamination is related to fuel
tanks that have since been removed and have a “case closed” status. In addition, the campus is also
included on a number of federal, state, and local databases. These findings are based on an EDR report
that was prepared for the campus.
The generation of hazardous waste at the SJCC campus is related to academic uses and may include
inorganic and organic chemicals, chemical reagents and reaction products, solvents, mercury,
radioisotopes, biohazards, fuels, oils, paints, cleansers, and pesticides that are currently used in
laboratory research, building and grounds maintenance, vehicle maintenance, and fine arts. In addition,

Impact Sciences, Inc. 35 San Jose City College 2025 Facilities Master Plan
0461.003 August 2012
hazardous materials associated with electrical transmission are also located on campus. There is currently
no known contamination on the campus (Dias 2011).
The EDR report indicated that several other sites with known or potential contamination, hazardous
materials use, hazardous waste generation, or other hazardous-materials-related conditions are within 1
mile of the campus (EDR 2011). LUST (including one located at 840 Bascom Avenue, near the
southwestern corner of the campus) also appear to be the main source of local soil and groundwater
contamination. Because of the site status and orientation relative to groundwater flow direction for the
identified sites, it is unlikely that groundwater contamination from these sites may have migrated to the
campus (EDR 2011). However, given the uncertainty of contamination on the project site from sources off
site, this assessment conservatively assumes that contamination could be present and, if encountered
during construction, could result in the exposure of the public or construction workers to hazardous
materials. This is considered a potentially significant impact. However, with the implementation of
Mitigation Measure HAZ-1, which requires an assessment and cleanup of potential contamination that
may be encountered during construction, this impact would be reduced to a less than significant level.
Mitigation Measure HAZ-1: If evidence of contaminated soil and/or groundwater, such as
discolored soil, odors or oil sheen, is encountered during the removal of on-site debris or
during excavation and/or grading both on and off site, the construction contractors shall stop
work and immediately inform the Campus. An environmental hazardous materials
professional shall be contracted to conduct an on-site assessment. If the materials are
determined to pose a risk to the public or construction workers, the construction contractor
shall prepare and submit a remediation plan to the appropriate agency and comply with all
federal, state, and local laws. Soil remediation methods could include excavation and on-site
treatment, excavation and off-site treatment or disposal, and/or treatment without
excavation. Remediation alternatives for cleanup of contaminated groundwater could
include in-situ treatment, extraction and on-site treatment, or extraction and off-site
treatment and/or disposal. Construction plans shall be modified or postponed to ensure
construction will not inhibit remediation activities and will not expose the public or
construction workers to hazardous conditions.
e) The campus is not located within the immediate vicinity of the San José International Airport. Given
the distance of the campus from the airport, future development under the 2025 FMP would not place
persons within an airport hazard zone. There would be no impact with regard to this criterion.
f) The campus is not located in the vicinity of a private airstrip, and there would be no impact with regard
to this criterion.
g) The City of San Jose Emergency Operations Plan does not list Moorpark Avenue, Leigh Avenue,
Fruitdale Avenue, or South Bascom Avenue as emergency evacuation routes (City of San Jose 2004). In
addition, construction of facilities identified in the 2025 FMP would occur within the boundaries of the
campus, and thus would not impede traffic on roadways surrounding campus. There would be no
impact with regard to this criterion.
h) The project site is located in an urban area. It is not located in or adjacent to a wildland area, and there
would be no impact with regard to this criterion.

Impact Sciences, Inc. 36 San Jose City College 2025 Facilities Master Plan
0461.003 August 2012
Discussion of Potential Cumulative Impacts
Anticipated future development in San José has the potential to expose the public and the environment to
risks associated with hazards from on-site contamination and routine use of hazardous materials.
However, with mitigation, future development under the 2025 FMP would not expose the public or the
environment to potential on-site contamination during construction. In addition, while implementation of
the 2025 FMP would involve the continued routine use of hazardous materials during operation, the use
of these materials on campus would comply with all applicable local, state, and federal regulations.
Therefore, it would not contribute to a cumulative impact during operation.

Impact Sciences, Inc. 37 San Jose City College 2025 Facilities Master Plan
0461.003 August 2012
Issues
Potentially
Significant
Impact
Less than
Significant
with Project
Mitigation
Less Than
Significant
Impact
No
Impact
9. HYDROLOGY AND WATER QUALITY – Would the
project:
a) Violate any water quality standards or waste
discharge requirements?□ □ ■ □
b) Substantially deplete groundwater supplies or
interfere substantially with groundwater recharge such
that there would be a net deficit in aquifer volume or a
lowering of the local groundwater table level (e.g., the
production rate of pre-existing nearby wells would drop
to a level which would not support existing land uses or
planned uses for which permits have been granted)?
□ □ □ ■
c) Substantially alter the existing drainage pattern of the
site or area, including through the alteration of the
course of a stream or river, in a manner which would
result in substantial erosion or siltation on- or of-site?
□ □ □ ■
d) Substantially alter the existing drainage pattern of the
site or area, including through the alteration of the
course of a stream or river, or substantially increase the
rate or amount of surface runoff in a manner which
would result in flooding on- or off-site?
□ □ □ ■
e) Create or contribute runoff water which would exceed
the capacity of existing or planned stormwater drainage
systems or provide substantial additional sources of
polluted runoff?
□ □ □ ■
f) Otherwise substantially degrade water quality?□ □ □ ■
g) Place housing within a 100-year flood hazard area as
mapped on a federal Flood Hazard Boundary or Flood
Insurance Rate Map or other flood hazard delineation
map?
□ □ □ ■
h) Place within a 100-year flood hazard area structures
which would impede or redirect flood flows?□ □ □ ■

Impact Sciences, Inc. 38 San Jose City College 2025 Facilities Master Plan
0461.003 August 2012
Issues
Potentially
Significant
Impact
Less than
Significant
with Project
Mitigation
Less Than
Significant
Impact
No
Impact
i) Expose people or structures to a significant risk
of loss, injury or death involving flooding,
including flooding as a result of the failure of a
levee or dam?
□ □ ■ □
j) Inundation by seiche, tsunami, or mudflow? □ □ □ ■
Relevant Elements of the Project and its Setting
The proposed project consists of the demolition of existing campus buildings and construction of
replacement facilities identified in the 2025 FMP to meet future growth projections on campus.
Construction of individual buildings and facilities would include site grading and excavation. All runoff
from pavements, roofs, and other impervious surfaces that are developed on the campus would be
routed to the City of San José’s storm drain system. The campus is underlain by the Santa Clara
groundwater basin (DWR 2003). The campus is not located within a 100-year flood plain or a flood
inundation zone (FEMA 2009). The nearest body of water is the Vasona Reservoir, located 5 miles south
of the campus. The San Francisco Bay is located about 12 miles north of the campus.
Discussion of Potential Project Impacts
a) During construction of facilities identified in the 2025 FMP, there is a potential for increased erosion,
sedimentation, and discharge of polluted runoff from the site. However, as identified in Geology and
Soils Item 6(b), the construction contractor would be required to implement a SWPPP, including erosion
and pollution control measures, or an erosion control plan to control increases in off-site sediment
delivery. The impact to water quality from construction activities would be less than significant.
The development of facilities identified in the 2025 FMP would increase the amount of impervious
surfaces on the campus that would increase the amount of runoff generated on the campus. During
operation, all site drainage would be routed to the City’s storm drain system. This drainage is subject to
the conditions of the Municipal Regional Stormwater NPDES Permit No. CAS612008 for the San
Francisco Bay Region. This permit requires permittees to comply with the discharge prohibitions and
receiving water limitations through the timely implementation of control measures and other actions as
specified in the permit (San Francisco Bay RWQCB, 2009). Future development on the campus would be
required by law to comply with applicable NPDES requirements for stormwater quality. Therefore,
implementation of the 2025 FMP would not result in any direct or indirect discharges that would violate
water quality standards or waste discharge requirements. The impact to water quality would be less than
significant during operation.
b) The campus is underlain by the Santa Clara groundwater basin and a majority of the potable water on
campus is obtained from the basin through the local water retailer. Implementation of the 2025 FMP
would increase the amount of potable water used on campus. However, as the increase in potable water
on campus would be small, there would be no substantial impact to groundwater supplies. Natural
recharge in the basin occurs principally as infiltration from streambeds that flow from the upland areas
within the drainage basin and from direct percolation of precipitation that falls on the basin floor (DWR
2003). Implementation of the 2025 FMP would increase the amount of impervious surface on campus.
Impact Sciences, Inc. 39 San Jose City College 2025 Facilities Master Plan
0461.003 August 2012
However, as this increase in impervious surface would be small, there would be no substantial impact to
groundwater recharge. There would be no impact with regard to this criterion.
c) Storm water generated by future development under the 2025 FMP would be directed toward existing
storm drainage facilities serving the campus. As discussed in Item 6(b) above, each project on campus
would be required to control for soil erosion or siltation during construction through either the
preparation of a SWPPP if the project is large than 1 acre in size or the preparation of an erosion control
plan if the project is less than 1 acre in size. Implementation of the SWPPP would reduce the potential for
erosion on the construction sites and minimize the discharge of sediment into the storm drain system.
Once the new or replacement facilities are constructed, the project sites would be either under impervious
surfaces (buildings, pavement, etc.) or would be landscaped. This would minimize the potential for
erosion and sedimentation in the long term. In addition, while the implementation of the 2025 FMP
would increase the amount of impervious surface on campus, this increase in impervious surface would
be small. As a result, the amount of additional runoff entering the City’s storm drain system would not be
substantial enough to result in off-site erosion or siltation in downstream locations. Therefore, this impact
is considered less than significant.
d) As discussed in the previous response above, storm water generated by future development under the
2025 FMP would be directed toward existing storm drainage facilities serving the campus. There are no
existing flooding problems on campus, and each project built on campus would be designed to control
for on-site flooding. In addition, while the implementation of the 2025 FMP would increase the amount of
impervious surface on campus, this increase in impervious surface would be small. As a result, the
amount of additional runoff entering the City’s storm drain system would not be substantial enough to
result in off-site flooding in downstream locations. Therefore, this impact is considered less than
significant.
e) Implementation of the 2025 FMP would increase impervious surfaces on campus, which could increase
the volume of stormwater runoff in the City’s storm drain system. However, this increase in runoff
would be small and would not substantially exceed the capacity of existing or planned stormwater
drainage systems. See response to Item 9(a), above, with regard to water quality. Each project would be
required to implement a SWPPP, including erosion and pollution control measures, or an erosion control
plan to control increases in off-site sediment delivery during construction. During operation all runoff
generated on campus would be subject to the Municipal Regional Stormwater NPDES Permit. As a result,
implementation of the 2025 FMP would not provide substantial additional sources of polluted runoff.
Therefore, this impact is considered less than significant.
f) See responses to Items 9(a) through (d), above, and related discussions in the Hazards and Hazardous
Materials section of this checklist. No other potential project impacts to water quality were identified.
g-h) The campus is not located within a 100-year flood zone. The campus is located within Flood Zone D,
which is defined as an area with undetermined flooding, but where flooding is considered possible
(FEMA 2009). There are no existing residential uses on campus and no residential uses are included in the
2025 FMP. As a result, implementation of the 2005 FMP would not place housing or structures within an
area at risk of flood flows. There would be no impact with regard to this criterion.
i) The campus is located within the inundation area for the Lexington Dam, located in the foothills of the
Santa Cruz Mountains approximately 9 miles to the southwest (ABAG 1995). The dam is owned and
operated by the Santa Clara Valley Water District (SCVWD). The SCVWD routinely monitors the

Impact Sciences, Inc. 40 San Jose City College 2025 Facilities Master Plan
0461.003 August 2012
conditions of the dam to ensure its safety. Actions taken by the SCVWD include dam maintenance,
period studies, and annual inspections. For this reason, the risk of the campus being inundated due to a
failure of the Lexington Dam is low. Therefore, implementation of the 2025 FMP would not expose
people or structures to a significant risk of loss, injury or death involving flooding, including flooding as
a result of the failure of a levee or dam. This impact would be less than significant.
j) The campus is located well inland from the San Francisco Bay and no bodies of water are located in the
vicinity of the campus. As a result, the campus is not at risk of seiche or tsunami inundation. Because of
the location of the campus in flat topography at a substantial distance from the Santa Cruz Mountains
range front, there is no substantial risk of debris flow or mudflow. There would be no impact with regard
to this criterion.
Discussion of Potential Cumulative Impacts
Anticipated future development in San José could result in the violation of water quality or waste
discharge requirements during construction. However, construction projects in the City involving more
than 1 acre of land disturbance are required to prepare and implement a SWPPP that includes erosion
and pollution control measures and measures to control increases in off-site sediment delivery.
Furthermore, future development on the campus would be required to adhere to requirements in the
Regional NPDES permit. As a result, the cumulative impact with regard to water quality would be less
than significant.
Anticipated future development in San José would result in some alteration of drainage patterns on each
of the cumulative development project sites. However, all site drainage from these sites would be
designed and constructed in accordance with the current NPDES and applicable City requirements and
as discussed above and be routed to the City’s storm drain system. As a result, the cumulative impact
with regard to site drainage would be less than significant.
Anticipated future development in San José could place housing or structures within a 100-year flood
zone or within a dam inundation area. In addition, anticipated future development could place future
development within a tsunami inundation area. However, as the campus is not located within either a
100-year flood zone or within a tsunami inundation area, future development anticipated under the 2025
FMP would not contribute to this impact.

Impact Sciences, Inc. 41 San Jose City College 2025 Facilities Master Plan
0461.003 August 2012
Issues
Potentially
Significant
Impact
Less than
Significant
with Project
Mitigation
Less Than
Significant
Impact
No
Impact
10. LAND USE AND PLANNING – Would the project:
a) Physically divide an established community? □ □ □ ■
b) Conflict with any applicable land use plan, policy, or
regulation of an agency with jurisdiction over the project
(including, but not limited to the general plan, specific
plan, local coastal program, or zoning ordinance)
adopted for the purpose of avoiding or mitigating an
environmental effect?
■ □ □ □
c) Conflict with any applicable habitat conservation plan
or natural community conservation plan?□ □ □ ■
Relevant Elements of the Project and its Setting
The proposed project consists of the demolition of existing campus buildings and construction of
replacement facilities identified in the 2025 FMP to meet future growth projections on campus. Land use
plans applicable to the area surrounding the campus include the City of San José 2020 General Plan and
the County of Santa Clara General Plan.
Discussion of Potential Project Impacts
a) Implementation of the 2025 FMP would not physically divide an established community since the
campus already exists and future development on the campus would occur with campus boundaries.
There would be no impact with regard to this criterion.
b) The SJECCD is not subject to local plans, policies, or regulations. However, SJECCD is required by
Section 15125(d) of the State CEQA Guidelines to address inconsistencies between its proposed project and
applicable general plans, specific plans, and regional plans. It is generally the policy of the SJECCD to be
consistent with local and regional plans, policies, or regulations to the maximum extent possible. Any
conflict between the 2025 FMP and applicable local and regional plans could result in a potentially
significant impact As a result, the EIR will discuss the consistency of the 2025 FMP with applicable
regional plans such as the Bay Area 2010 Clean Air Plan, State Water Quality Control Board NPDES
Permit, Santa Clara Valley Urban Runoff Pollution Prevention Program, and Santa Clara County
Congestion Management Program.
c) There is no habitat conservation plan or natural community conservation plan applicable to the
campus. There would be no impact related to this criterion.
Discussion of Potential Cumulative Impacts
The proposed project combined with other current projects and probable future projects and projected
regional growth could result in significant cumulative impacts with regard to consistency with regional
plans. This issue will be addressed in the EIR.

Impact Sciences, Inc. 42 San Jose City College 2025 Facilities Master Plan
0461.003 August 2012
Issues
Potentially
Significant
Impact
Less Than
Significant with
Mitigation
Incorporated
Less Than
Significant
Impact
No
Impact
11. MINERAL RESOURCES – Would the
project:
a) Result in the loss of availability of a known
mineral resource that would be of value to the
region and the residents of the state?
□ □ □ ■
b) Result in the loss of availability of a locally
important mineral resource recovery site
delineated on a local general plan, specific plan
or other land use plan?
□ □ □ ■
Relevant Elements of the Project and its Setting
The proposed project consists of the demolition of existing campus buildings and construction of
replacement facilities identified in the 2025 FMP to meet future growth projections on campus. The City
of San José 2020 General Plan does not designate the campus as a mineral resource area (San José 1994).
Discussion of Potential Project Impacts
a, b) The campus is not designated as a mineral resource area, and no known or potential mineral
resources are located on the campus. In addition, existing zoning and land uses preclude the use of the
campus for mineral extraction (for example, sand, and gravel). Therefore, future development on the
campus would not impede extraction or result in the loss of availability of a known mineral resource.
There would be no impacts with regard to these criteria.
Discussion of Potential Cumulative Impacts
The City of San José is urban in nature, and minerals are not found to any appreciable extent in the
developed part of the City. As a result, anticipated future development in San José, including future
development under the 2025 FMP, would not result in the loss of availability of a known resource. The
cumulative impact would be less than significant.

Impact Sciences, Inc. 43 San Jose City College 2025 Facilities Master Plan
0461.003 August 2012
Issues
Potentially
Significant
Impact
Less than
Significant
with Project
Mitigation
Less Than
Significant
Impact
No
Impact
12. NOISE – Would the project result in:
a) Exposure of persons to or generation of noise
levels in excess of standards established in any
applicable plan or noise ordinance, or applicable
standards of other agencies?
■ □ □ □
b) Exposure of persons to or generation of
excessive groundborne vibration or groundborne
noise levels?
■ □ □ □
c) A substantial permanent increase in ambient
noise levels in the project vicinity above levels
existing without the project?
■ □ □ □
d) A substantial temporary or periodic increase in
ambient noise levels in the project vicinity above
levels existing without the project (including
construction)?
■ □ □ □
e) For a project located within an airport land use
plan or, where such a plan has not been adopted,
within 2 miles of a public airport or public use
airport, would the project expose people residing
or working in the project area to excessive noise
levels?
□ □ □ ■
f) For a project within the vicinity of a private
airstrip, would the project expose people residing
or working in the project area to excessive noise
levels?
□ □ □ ■
Relevant Elements of the Project and its Setting
The proposed project consists of the demolition of existing campus buildings and construction of
replacement facilities identified in the 2025 FMP to meet future growth projections on campus.
Construction of each individual facility would generate noise, and once construction is completed, the
operation of each individual facility would add to current sources of traffic noise by increasing,
redirecting, and rerouting vehicle trips on nearby roadways. The nearest sensitive receptors to the
campus include single-family and multifamily residential uses to the east and south of the campus, and
single-family residential uses to the north across I-280. Other sensitive receptors in the vicinity of the
campus include the Valley Medical Center to the west. The nearest airport is San José International
Airport, located approximately 2.5 miles north of the campus.

Impact Sciences, Inc. 44 San Jose City College 2025 Facilities Master Plan
0461.003 August 2012
Discussion of Potential Project Impacts
a) Implementation of the 2025 FMP could result in increases or changes in noise levels from sources such
as construction activities, stationary sources, and increased vehicular traffic, which could exceed
applicable noise standards. For example, construction activity or new stationary sources could exceed the
State’s exterior noise standard of 70 A-weighted decibels (dB(A)) community noise equivalent level
(CNEL) for schools. These impacts are considered potentially significant. The EIR will evaluate the
potential for facilities identified in the 2025 FMP to expose people to noise in excess of state standards.
b) Construction activities associated with the 2025 FMP could generate excessive groundborne vibration
and noise on and near the campus. This represents a potentially significant impact. The EIR will evaluate
the potential for increased groundborne vibration or noise levels associated with construction of facilities
identified in the 2025 FMP to affect nearby sensitive receptors.
c) Vehicle traffic associated with facilities identified in the 2025 FMP could result in substantial
permanent increases in ambient noise levels in the vicinity of the project site. These impacts are
considered potentially significant. The EIR will evaluate the potential for facilities identified in the 2025
FMP to permanently increase ambient noise levels.
d) Construction activities associated with the 2025 FMP could result in substantial temporary increases in
ambient noise levels on campus and in the vicinity of the project. These impacts are considered
potentially significant. The EIR will evaluate the potential for the construction of facilities identified in the
2025 FMP to temporarily increase ambient noise levels.
e) The campus is not located within the immediate vicinity of an airport. Other than aircraft overflights,
the project site would not be exposed to noise from public airports. There would be no impact with
respect to this criterion.
f) The proposed project is not located in the vicinity of a private airstrip, and there would be no impact
with regard to this criterion.
Discussion of Potential Cumulative Impacts
Future development under the 2025 FMP combined with other current projects and probable future
projects and projected regional growth could result in significant cumulative impacts with regard to
noise. This issue will be addressed in the EIR.

Impact Sciences, Inc. 45 San Jose City College 2025 Facilities Master Plan
0461.003 August 2012
Issues
Potentially
Significant
Impact
Less than
Significant
with Project
Mitigation
Less Than
Significant
Impact
No
Impact
13. POPULATION AND HOUSING – Would the
project:
a) Induce substantial population growth in an area,
either directly (for example, by proposing new homes
and businesses) or indirectly (for example, through
extension of roads or other infrastructure)?
□ □ ■ □
b) Displace substantial numbers of existing housing,
necessitating the construction of replacement housing
elsewhere?
□ □ □ ■
c) Displace substantial numbers of people, necessitating
the construction of replacement housing elsewhere?□ □ □ ■
Relevant Elements of the Project and its Setting
The proposed project consists of the demolition of existing campus buildings and construction of
replacement facilities identified in the 2025 FMP to meet future growth projections on campus.
Implementation of the 2025 FMP would accommodate an increase in enrollment on campus from
approximately 11,800 to 14,500 students by 2025. A corresponding increase in faculty and employees on
the campus is also anticipated.
Discussion of Potential Project Impacts
a) The SJCC campus generally serves the existing regional community. It does not provide housing and
students typically commute to campus from the surrounding communities. As enrollment grows, more
students would commute to campus from the surrounding communities; it is unlikely that students
would move into the San Jose area with the primary purpose of being closer to campus. New faculty and
staff required to serve the increase in students would likely be living in the Bay Area at the time of hire
and, although some may be new to the Bay Area, could live anywhere in the region and commute to
campus. Therefore, it is unlikely that additional students, faculty, and staff would substantially increase
population in the San Jose area. Therefore, this impact is considered less than significant.
b) The campus is currently developed with academic and related uses. No housing exists on the campus,
and there would be no impact with respect to this criterion.
c) See response to Item 13(b), above. There would be no impact with regard to this criterion.
Discussion of Potential Cumulative Impacts
Anticipated future development in San José would result in an increase in population throughout the
City, which could result in an overall population that exceeds population projections. As discussed
above, the increase in campus population associated with the 2025 FMP would not be substantial.
Therefore, the contribution of the 2025 FMP to this impact would not be cumulatively considerable.

Impact Sciences, Inc. 46 San Jose City College 2025 Facilities Master Plan
0461.003 August 2012
Issues
Potentially
Significant
Impact
Less than
Significant
with Project
Mitigation
Less Than
Significant
Impact
No
Impact
14. PUBLIC SERVICES – Would the project:
Would the project result in substantial adverse physical
impacts associated with the provision of new or
physically altered governmental facilities, need for new
or physically altered governmental facilities, the
construction of which could cause significant
environmental impacts, in order to maintain acceptable
service ratios, response times or other performance
objectives for any of the public services:
a) Fire protection? ■ □ □ □
b) Police protection? ■ □ □ □
c) Schools? □ □ ■ □
d) Parks? □ □ ■ □
e) Other public facilities? □ □ ■ □
Relevant Elements of the Project and its Setting
The proposed project consists of the demolition of existing campus buildings and construction of
replacement facilities identified in the 2025 FMP to meet future growth projections on campus. The City
of San José Fire Department provides fire protection services to the campus. The San José/Evergreen
Valley Community College District (SJECCD) Police Department provides law enforcement services to
the campus. Several neighborhood parks are located approximately 1 mile from the campus. The closest
off campus library, the Rose Garden Branch Library, is located approximately 1 mile from the campus.
Discussion of Potential Project Impacts
a-b) Implementation of the 2025 FMP would result in additional population on the campus. This increase
in population could place additional demand on the San José Fire Department for fire protection services
and the SJECCD Police Department for police protection services, and may result in the need for
construction or expansion of fire protection facilities. This impact is potentially significant, and will be
further analyzed in the EIR.
c) No residential uses are associated with the 2025 FMP. Therefore, future development on the campus
would not result in a direct impact on schools due to an increase in residential population. New students,
facility, and staff associated with the 2025 FMP would likely be living in the surrounding communities or
Bay Area at the time of enrollment or hire. To the extent that new students or employees move into Bay
Area communities to study or work at the college, their numbers would not be large and would not add a
substantial number of school age students to any one community. This impact is considered less than
significant.
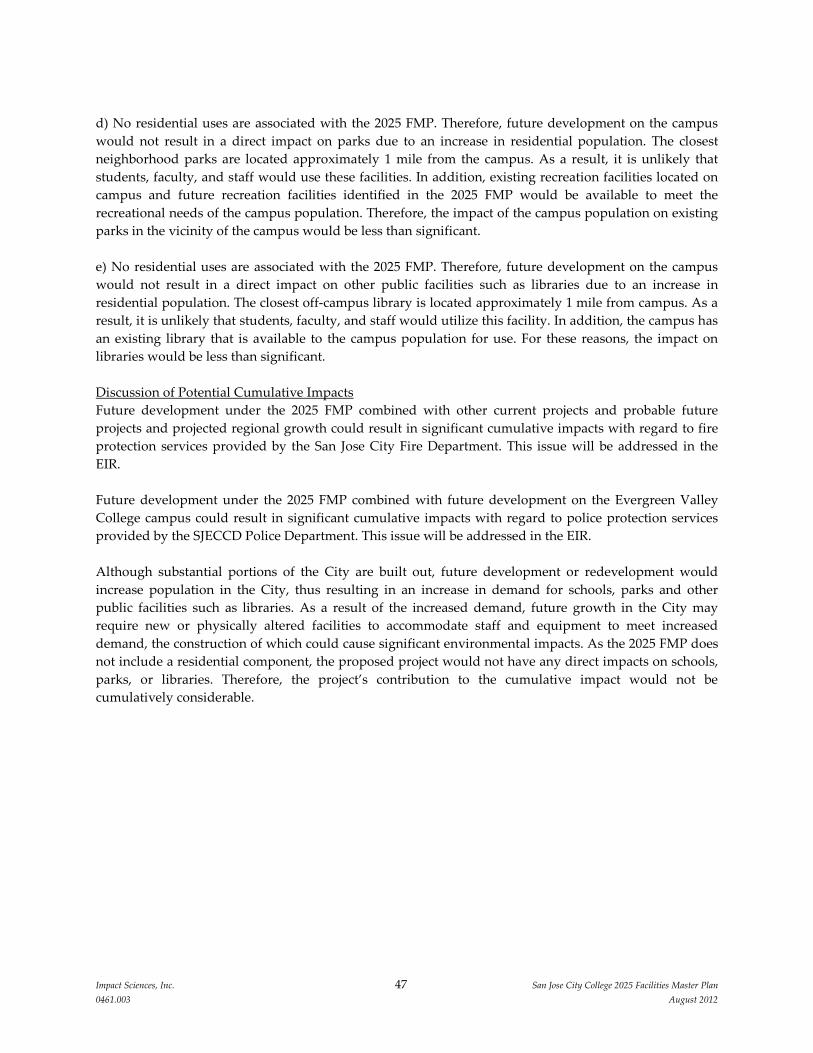
Impact Sciences, Inc. 47 San Jose City College 2025 Facilities Master Plan
0461.003 August 2012
d) No residential uses are associated with the 2025 FMP. Therefore, future development on the campus
would not result in a direct impact on parks due to an increase in residential population. The closest
neighborhood parks are located approximately 1 mile from the campus. As a result, it is unlikely that
students, faculty, and staff would use these facilities. In addition, existing recreation facilities located on
campus and future recreation facilities identified in the 2025 FMP would be available to meet the
recreational needs of the campus population. Therefore, the impact of the campus population on existing
parks in the vicinity of the campus would be less than significant.
e) No residential uses are associated with the 2025 FMP. Therefore, future development on the campus
would not result in a direct impact on other public facilities such as libraries due to an increase in
residential population. The closest off-campus library is located approximately 1 mile from campus. As a
result, it is unlikely that students, faculty, and staff would utilize this facility. In addition, the campus has
an existing library that is available to the campus population for use. For these reasons, the impact on
libraries would be less than significant.
Discussion of Potential Cumulative Impacts
Future development under the 2025 FMP combined with other current projects and probable future
projects and projected regional growth could result in significant cumulative impacts with regard to fire
protection services provided by the San Jose City Fire Department. This issue will be addressed in the
EIR.
Future development under the 2025 FMP combined with future development on the Evergreen Valley
College campus could result in significant cumulative impacts with regard to police protection services
provided by the SJECCD Police Department. This issue will be addressed in the EIR.
Although substantial portions of the City are built out, future development or redevelopment would
increase population in the City, thus resulting in an increase in demand for schools, parks and other
public facilities such as libraries. As a result of the increased demand, future growth in the City may
require new or physically altered facilities to accommodate staff and equipment to meet increased
demand, the construction of which could cause significant environmental impacts. As the 2025 FMP does
not include a residential component, the proposed project would not have any direct impacts on schools,
parks, or libraries. Therefore, the project’s contribution to the cumulative impact would not be
cumulatively considerable.

Impact Sciences, Inc. 48 San Jose City College 2025 Facilities Master Plan
0461.003 August 2012
Issues
Potentially
Significant
Impact
Less than
Significant
with Project
Mitigation
Less Than
Significant
Impact
No
Impact
15. RECREATION – Would the project:
a) Would the project increase the use of existing
neighborhood and regional parks or other recreational
facilities such that substantial physical deterioration of
the facility would occur or be accelerated?
□ □ ■ □
b) Does the project include recreational facilities or
require the construction or expansion of recreational
facilities, which might have an adverse physical effect on
the environment?
■ □ □ □
Relevant Elements of the Project and its Setting
The proposed project consists of the demolition of existing campus buildings and construction of
replacement facilities identified in the 2025 FMP to meet future growth projections on campus. Under the
2025 FMP several existing recreation facilities would be demolished, including the field house, handball
courts, locker rooms, auxiliary gym and pool, and several new recreation facilities would be constructed,
including a physical education complex consisting of a main gymnasium, a fitness center, and an aquatics
facility and the renovation of the main gym. Several neighborhood parks are located approximately
1 mile from campus.
Discussion of Potential Project Impacts
a) See the response to Item 14(d), above. Given the distance of neighborhood parks from the campus, the
presence of existing recreational facilities on the campus, and the construction of future facilities
identified in the 2025 FMP, the increase in campus population under the 2025 FMP would not result in an
increase in the use of existing neighborhood and regional parks or other recreational facilities that would
cause substantial physical deterioration of existing facilities to occur or be accelerated. Therefore, the
impact on recreation facilities would be less than significant.
b) No public parks or recreational facilities would be constructed as part of the 2025 FMP. The 2025 FMP
includes recreational facilities for use by the campus and community, the construction of which could
result in adverse physical effects on the environment. The EIR will analyze the air quality and noise
effects of constructing these recreational facilities. The effects to biological and cultural resources from
constructing these recreational facilities are addressed in Items 4 and 5, above, respectively.
Discussion of Potential Cumulative Impacts
Anticipated future development in San José would increase the extent of development in the City, thus
resulting in a cumulative increase in the use of recreational facilities. As a result, future growth in the City
may cause substantial physical deterioration of recreational facilities to occur or be accelerated, or may
require the construction or expansion of recreational facilities, the construction of which could cause
significant environmental impacts. As discussed above, no residential population is associated with 2025
FMP that would require parks or other City recreational facilities and existing park facilities are located
far enough away that no increase in use of park facilities by the students and employees on the campus

Impact Sciences, Inc. 49 San Jose City College 2025 Facilities Master Plan
0461.003 August 2012
would occur. Therefore, the project would make no contribution to the cumulative impact with regard to
the deterioration of recreational facilities. However, the 2025 FMP does include recreational facilities, the
construction of which could cause significant air quality and noise impacts, which could combine with
the construction phase impacts of other concurrent projects thus resulting in significant cumulative
environmental impacts. This issue will be addressed in the EIR.

Impact Sciences, Inc. 50 San Jose City College 2025 Facilities Master Plan
0461.003 August 2012
Issues
Potentially
Significant
Impact
Less than
Significant
with Project
Mitigation
Less Than
Significant
Impact
No
Impact
16. TRANSPORTATION AND TRAFFIC – Would the project:
a) Conflict with an applicable plan, ordinance or policy
establishing measures of effectiveness for the
performance of the circulation system, taking into
account all modes of transportation and relevant
components of the circulation system, including but not
limited to intersections, streets, highways, and freeways,
pedestrian and bicycle paths, and mass transit?
■ □ □ □
b) Conflict with an applicable congestion management
program, including, but not limited to level of service
standards and travel demand measures, or other
standards established by the county congestion
management agency for designated roads or highways?
■ □ □ □
c) Result in a change in air traffic patterns, including
either an increase in traffic levels or a change in location
that results in substantial safety risks?□ □ □ ■
d) Substantially increase hazards due to a design feature
(e.g., sharp curves or dangerous intersections) or
incompatible uses (e.g., farm equipment)? ■ □ □ □
e) Result in inadequate emergency access? ■ □ □ □f) Conflict with adopted policies, plans, or programs
regarding public transit, bicycle, or pedestrian facilities,
or otherwise decrease the performance or safety of such
facilities?
■ □ □ □
Relevant Elements of the Project and its Setting
The proposed project consists of the demolition of existing campus buildings and construction of
replacement facilities identified in the 2025 FMP to meet future growth projections on campus. The
campus is immediately south of I-280. Roadways that surround the campus include Moorpark Avenue to
the north; Rexford Way, Kingman Avenue and Fruitdale Avenue to the south; Laswell Avenue and South
Bascom Avenue to the west; and Leigh Avenue to the east. South Bascom Avenue is designated as a
pedestrian corridor by the City of San José 2020 General Plan (City of San José 1994).
Discussion of Potential Project Impacts
a-b) Implementation of the 2025 FMP could potentially cause an increase in traffic on surrounding
roadways or redirect traffic that is already in the area. These potential changes in traffic and circulation in
the vicinity of the campus could result in congestion. This represents a potentially significant impact.

Impact Sciences, Inc. 51 San Jose City College 2025 Facilities Master Plan
0461.003 August 2012
A detailed Traffic Impact Study will be prepared to evaluate the impacts of the 2025 FMP on local
roadway capacity and this issue will be addressed in the EIR.
c) The 2025 FMP does not include uses that would affect air traffic or result in changes to air patterns.
There would be no impact with regard to this criterion.
d) Traffic generated by facilities identified in the 2025 FMP would use the existing network of regional
arterial and local roadways located in the vicinity of the campus. The 2005 FMP includes recommended
vehicular and pedestrian circulation plans. The design of the pedestrian and vehicle circulation plans
could result in pedestrian and vehicle conflicts on the campus. This represents a potentially significant
impact. The effects of the recommended vehicular and pedestrian circulation plans on public safety will
be analyzed in the EIR.
e) Implementation of the 2025 FMP would result in land use changes and development of land that could
affect emergency access by causing roadway changes that could hinder emergency access. This represents
a potentially significant impact. The effects of the 2025 FMP on emergency access will be analyzed in the
EIR.
f) The EIR will describe the existing adopted policies, plans, and programs supporting alternative
transportation on the campus. Any conflicts between the 2025 FMP and alternative transportation
represent a potentially significant impact. The effects of the 2025 FMP on alternative transportation will
be analyzed in the EIR.
Discussion of Potential Cumulative Impacts
Implementation of the 2025 FMP combined with other current projects and probable future projects and
projected regional growth could result in significant cumulative impacts with regard to
transportation/traffic. This issue will be addressed in the EIR.

Impact Sciences, Inc. 52 San Jose City College 2025 Facilities Master Plan
0461.003 August 2012
Issues
Potentially
Significant
Impact
Less than
Significant
with Project
Mitigation
Less Than
Significant
Impact
No
Impact
17. UTILITIES AND SERVICE SYSTEMS – Would the project:
a) Exceed wastewater treatment requirements of the
applicable Regional Water Quality Control Board?■ □ □ □
b) Require or result in the construction of new water or
wastewater treatment facilities or expansion of existing
facilities, the construction of which could cause
significant environmental effects?
■ □ □ □
c) Require or result in the construction of new storm
water drainage facilities or expansion of existing
facilities, the construction of which could cause
significant environmental effects?
□ □ ■ □
d) Have sufficient water supplies available to serve the
project from existing entitlements and resources, or are
new or expanded entitlements needed?
■ □ □ □
e) Result in a determination by the wastewater treatment
provider which serves or may serve the project, that it
has inadequate capacity to serve the project’s projected
demand in addition to the provider’s existing
commitments?
■ □ □ □
f) Be served by a landfill with sufficient permitted
capacity to accommodate the project’s solid waste
disposal needs?
■ □ □ □
g) Comply with applicable federal, state, and local
statutes and regulations related to solid waste?■ □ □ □
Relevant Elements of the Project and its Setting
The proposed project consists of the demolition of existing campus buildings and construction of
replacement facilities identified in the 2025 FMP to meet future growth projections on campus.
Wastewater generated on campus is treated at the San José/Santa Clara Water Pollution Control Plant
(WPCP). Potable water is supplied to the campus by the San José Water Company (SJWC).
Discussion of Potential Project Impacts
a) The San Francisco Bay Regional Water Quality Control Board (RWQCB) regulates water quality and
quantity of effluent discharged from the Water Pollution Control Program (WPCP). Implementation of
the 2025 FMP may increase the volume of wastewater received at the WPCP for treatment. Any
exceedance of treatment requirements at the WPCP due to the increase in wastewater from the campus

Impact Sciences, Inc. 53 San Jose City College 2025 Facilities Master Plan
0461.003 August 2012
under the 2025 FMP would result in a potentially significant impact. The effects of the 2025 FMP on the
ability of the WPCP to meet wastewater treatment requirements set by the San Francisco Bay RWQCB
will be analyzed in the EIR.
b, e) Implementation of the 2025 FMP would result in an increase in water use and generation of
wastewater. This increase may result in the need for new water or wastewater treatment and conveyance
facilities or the expansion of existing facilities, the construction of which could cause significant
environmental effects. This represents a potentially significant impact. The effects of the 2025 FMP on
existing water and wastewater treatment facilities will be analyzed in the EIR.
c) Implementation of the 2025 FMP would increase impervious surfaces on the campus, which could
increase the volume of stormwater drainage conveyed to existing stormwater facilities. However, this
increase in runoff would be small and would not substantially exceed the capacity of existing or planned
stormwater drainage systems. Therefore, implementation of the 2025 FMP would not require or result in
the construction of new storm water drainage facilities or the expansion of existing facilities, the
construction of which could cause significant environmental effects. Therefore, this impact is considered
less than significant.
d) Implementation of the 2025 FMP would result in an increase in demand for water on campus and this
demand could exceed the amount of water available to the SJWC from existing entitlements and
resources. This represents a potentially significant impact. The effects of the 2025 FMP on existing water
entitlement and resources will be analyzed in the EIR.
f, g) Implementation of the 2025 FMP could result in an increase in solid waste generated on campus.
Various municipal suppliers collect and dispose of solid waste that is generated by the campus. The
amount of solid waste generated on campus requiring disposal could potentially exceed the capacity of
local landfills. In addition, implementation of the 2025 FMP could conflict with applicable federal, state,
and local statutes and regulations related to solid waste. This represents a potentially significant impact.
The effects of the 2025 FMP on landfill capacity and compliance with applicable regulations will be
analyzed in the EIR.
Discussion of Potential Cumulative Impacts
Implementation of the 2025 FMP combined with other current projects and probable future projects and
projected regional growth could result in significant cumulative impacts with regard to utilities. This
issue will be addressed in the EIR.
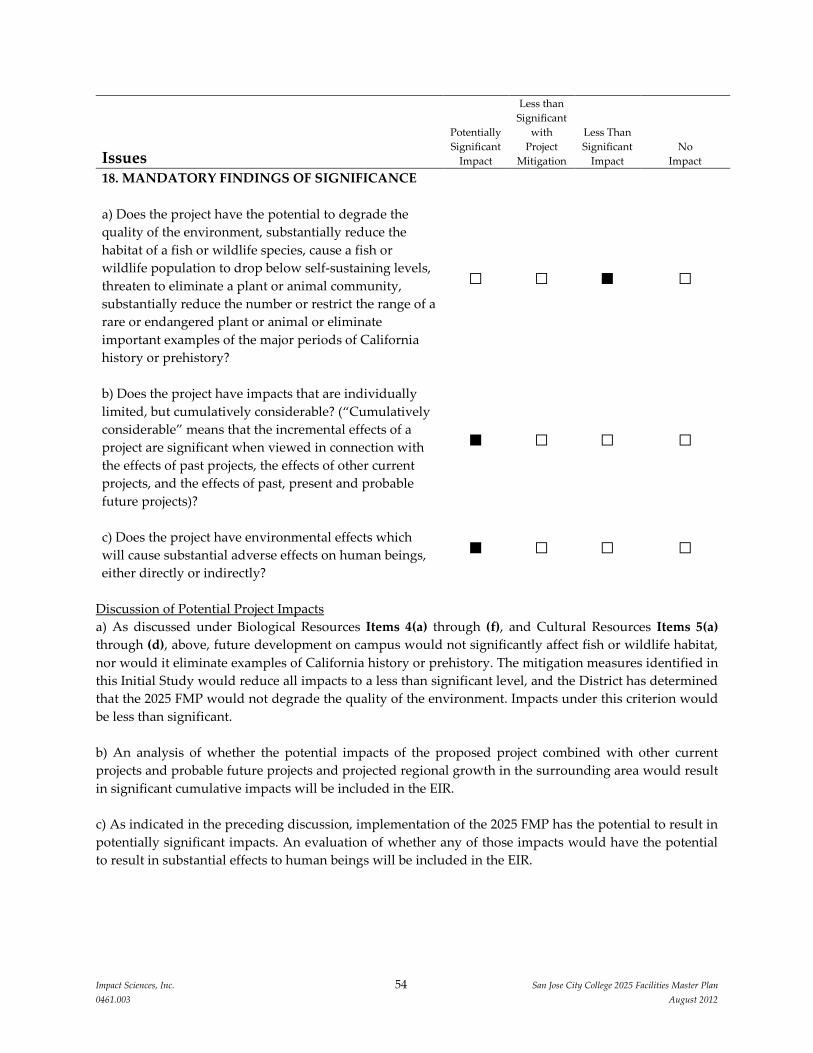
Impact Sciences, Inc. 54 San Jose City College 2025 Facilities Master Plan
0461.003 August 2012
Issues
Potentially
Significant
Impact
Less than
Significant
with
Project
Mitigation
Less Than
Significant
Impact
No
Impact
18. MANDATORY FINDINGS OF SIGNIFICANCE
a) Does the project have the potential to degrade the
quality of the environment, substantially reduce the
habitat of a fish or wildlife species, cause a fish or
wildlife population to drop below self-sustaining levels,
threaten to eliminate a plant or animal community,
substantially reduce the number or restrict the range of a
rare or endangered plant or animal or eliminate
important examples of the major periods of California
history or prehistory?
□ □ ■ □
b) Does the project have impacts that are individually
limited, but cumulatively considerable? (“Cumulatively
considerable” means that the incremental effects of a
project are significant when viewed in connection with
the effects of past projects, the effects of other current
projects, and the effects of past, present and probable
future projects)?
■ □ □ □
c) Does the project have environmental effects which
will cause substantial adverse effects on human beings,
either directly or indirectly?
■ □ □ □
Discussion of Potential Project Impacts
a) As discussed under Biological Resources Items 4(a) through (f), and Cultural Resources Items 5(a)
through (d), above, future development on campus would not significantly affect fish or wildlife habitat,
nor would it eliminate examples of California history or prehistory. The mitigation measures identified in
this Initial Study would reduce all impacts to a less than significant level, and the District has determined
that the 2025 FMP would not degrade the quality of the environment. Impacts under this criterion would
be less than significant.
b) An analysis of whether the potential impacts of the proposed project combined with other current
projects and probable future projects and projected regional growth in the surrounding area would result
in significant cumulative impacts will be included in the EIR.
c) As indicated in the preceding discussion, implementation of the 2025 FMP has the potential to result in
potentially significant impacts. An evaluation of whether any of those impacts would have the potential
to result in substantial effects to human beings will be included in the EIR.

Impact Sciences, Inc. 55 San Jose City College 2025 Facilities Master Plan
0461.003 August 2012
VI. SUPPORTING INFORMATION SOURCES
Association of Bay Area Governments. 2001. Alquist-Priolo Earthquake Fault Zone Maps. Available at
http://quake.abag.ca.gov/faults/ (ABAG 2001)
Association of Bay Area Governments. 1995. Dam Failure Inundation Hazard Map for San Jose. Available
at: http://www.abag.ca.gov/cgi-bin/pickdamx.pl. (ABAG 1995)
Archaeological Resource Management. 2009. Stage I: Historical Background & Photography of 12
Structures on the San José City College Campus in the City Of San José. October 23. (ARM 2009a)
Archaeological Resource Management. 2009. Stage II: Historical Evaluation of 12 Structures on the San
José City College Campus. October 23. (ARM 2009b)
California Department of Conservation, California Geological Survey, State of California Seismic Hazard
Zones, San Jose West Quadrangle, 2002. Available at:
http://gmw.consrv.ca.gov/shmp/download/pdf/ozn_sjosw.pdf. (CGS 2002)
California Department of Conservation, California Geological Survey. Alquist-Priolo Earthquake Fault
Zone Maps. Accessed May 17, 2011. http://www.quake.ca.gov/gmaps/ap/ap_maps.htm.
(GCS 2011)
California Department of Conservation, Division of Land Resource Protection, Farmland Mitigation and
Monitoring Program. 2011. Santa Clara County Important Farmland 2010. (FMMP 2011)
California Department of Transportation, California Scenic Highway Program. Accessed May 17, 2011.
http://www.dot.ca.gov/hq/LandArch/scenic/scpr.htm. (CSHP 2011)
California Department of Water Resources. 2003. California’s Groundwater - Bulletin 118, Update 2003.
(DWR 2003)
City of San Jose. 1994. City of San Jose 2020 General Plan, as amended 2008. (City of San Jose 1994)
City of San Jose. 2004. City of San Jose Emergency Operation Plan. (City of San Jose 2004)
Dias, Robert. 2011. Executive Director Facilities-Construction Management, San Jose/Evergreen
Community College District. Personal communication with Paul Stephenson, Project Manager,
Impact Sciences, Inc., June 1. (Dias 2011)
Environmental Data Resources, Inc. 2011. EDR Radius Map Report with Geotech, San José City College.
June 8. (EDR 2011)
Federal Emergency Management Agency. May 18, 2009. Flood Insurance Rate Map No. 06085C0233H for
Santa Clara County, California. (FEMA 2009)
Northwest Information Center. 2011. Records search results for the proposed San José City College 2025
Facilities Master Plan Project, San José, California. (NWIC 2011)
San Francisco Bay Regional Water Quality Control Board. 2009. California Regional Water Quality
Control Board San Francisco Bay Region Municipal Regional Stormwater NPDES Permit, Order
R2-2009-0074, NPDES Permit No. CAS612008. (San Francisco Bay RWQCB, 2009)
San José/Evergreen Community College District. 2008. Initial Study for San José City College Facilities
Master Plan Update 2021. (SJECCD 2008)

Impact Sciences, Inc. 56 San Jose City College 2025 Facilities Master Plan
0461.003 August 2012
VII. INITIAL STUDY PREPARERS
San José/Evergreen Community College District
Douglas Smith, Vice Chancellor of Administrative Services
Scott Jewell, Project Manager, Gilbane Companies
Impact Sciences, Inc.
Shabnam Barati, Ph.D., Managing Principal
Elizabeth Purl, Senior Project Manager
Paul Stephenson, Project Manager
Ian Hillway, B.S., Publications Manager

Scoping Comments


APPENDIX 4.2
Air Quality Worksheets

1/11/2013 12:23:53 PM
Page: 1
Urbemis 2007 Version 9.2.4
File Name:
Project Name: SJCC Construction
Project Location: Bay Area Air District
On-Road Vehicle Emissions Based on: Version : Emfac2007 V2.3 Nov 1 2006
Off-Road Vehicle Emissions Based on: OFFROAD2007
Summary Report for Summer Emissions (Pounds/Day)
CONSTRUCTION EMISSION ESTIMATES
2019 TOTALS (lbs/day mitigated) 10.38 17.17 17.00 0.01 3.89 0.90 4.66 0.81 0.83 1.52
2019 TOTALS (lbs/day unmitigated) 10.38 17.17 17.00 0.01 5.05 0.90 5.82 1.05 0.83 1.77
ROG NOx CO SO2 PM10 Dust PM10 Exhaust PM10 PM2.5 Dust PM2.5 Exhaust
PM2.5

1/11/2013 12:24:54 PM
Page: 1
Urbemis 2007 Version 9.2.4
File Name:
Project Name: SJCC Construction
Project Location: Bay Area Air District
On-Road Vehicle Emissions Based on: Version : Emfac2007 V2.3 Nov 1 2006
Off-Road Vehicle Emissions Based on: OFFROAD2007
Summary Report for Winter Emissions (Pounds/Day)
CONSTRUCTION EMISSION ESTIMATES
2019 TOTALS (lbs/day mitigated) 10.38 17.17 17.00 0.01 3.89 0.90 4.66 0.81 0.83 1.52
2019 TOTALS (lbs/day unmitigated) 10.38 17.17 17.00 0.01 5.05 0.90 5.82 1.05 0.83 1.77
ROG NOx CO SO2 PM10 Dust PM10 Exhaust PM10 PM2.5 Dust PM2.5 Exhaust
PM2.5

1/11/2013 12:24:38 PM
Page: 1
Urbemis 2007 Version 9.2.4
File Name:
Project Name: SJCC Construction
Project Location: Bay Area Air District
On-Road Vehicle Emissions Based on: Version : Emfac2007 V2.3 Nov 1 2006
Off-Road Vehicle Emissions Based on: OFFROAD2007
Summary Report for Annual Emissions (Tons/Year)
CONSTRUCTION EMISSION ESTIMATES
2019 TOTALS (tons/year mitigated) 0.30 1.33 1.36 0.00 0.36 0.06 0.43 0.08 0.06 0.13 304.82
Percent Reduction 0.00 0.00 0.00 0.00 4.41 0.00 3.78 4.41 0.00 2.55 0.00
2019 TOTALS (tons/year unmitigated) 0.30 1.33 1.36 0.00 0.38 0.06 0.44 0.08 0.06 0.14 304.82
ROG NOx CO SO2 PM10 Dust PM10 Exhaust PM10 PM2.5 Dust PM2.5 Exhaust
PM2.5 CO2

1/17/2012 2:20:03 PM
Page: 1
Urbemis 2007 Version 9.2.4
File Name: Z:\EBell\San Jose Colleges\Modeling\SJCC Existing.urb924
Project Name: SJCC Existing
Project Location: Santa Clara County
On-Road Vehicle Emissions Based on: Version : Emfac2007 V2.3 Nov 1 2006
Off-Road Vehicle Emissions Based on: OFFROAD2007
Summary Report for Summer Emissions (Pounds/Day)
TOTALS (lbs/day, unmitigated) 89.91 110.62 1,169.55 1.16 209.90 39.84
SUM OF AREA SOURCE AND OPERATIONAL EMISSION ESTIMATES
ROG NOx CO SO2 PM10 PM2.5
TOTALS (lbs/day, unmitigated) 86.99 106.47 1,164.53 1.16 209.88 39.82
OPERATIONAL (VEHICLE) EMISSION ESTIMATES
ROG NOx CO SO2 PM10 PM2.5
TOTALS (lbs/day, unmitigated) 2.92 4.15 5.02 0.00 0.02 0.02
AREA SOURCE EMISSION ESTIMATES
ROG NOx CO SO2 PM10 PM2.5

1/17/2012 2:20:13 PM
Page: 1
Urbemis 2007 Version 9.2.4
File Name: Z:\EBell\San Jose Colleges\Modeling\SJCC Existing.urb924
Project Name: SJCC Existing
Project Location: Santa Clara County
On-Road Vehicle Emissions Based on: Version : Emfac2007 V2.3 Nov 1 2006
Off-Road Vehicle Emissions Based on: OFFROAD2007
Summary Report for Winter Emissions (Pounds/Day)
TOTALS (lbs/day, unmitigated) 107.88 165.70 1,259.32 0.99 209.89 39.83
SUM OF AREA SOURCE AND OPERATIONAL EMISSION ESTIMATES
ROG NOx CO SO2 PM10 PM2.5
TOTALS (lbs/day, unmitigated) 105.08 161.57 1,255.85 0.99 209.88 39.82
OPERATIONAL (VEHICLE) EMISSION ESTIMATES
ROG NOx CO SO2 PM10 PM2.5
TOTALS (lbs/day, unmitigated) 2.80 4.13 3.47 0.00 0.01 0.01
AREA SOURCE EMISSION ESTIMATES
ROG NOx CO SO2 PM10 PM2.5

1/17/2012 2:22:40 PM
Page: 1
Urbemis 2007 Version 9.2.4
File Name: Z:\EBell\San Jose Colleges\Modeling\SJCC Proposed.urb924
Project Name: SJCC Proposed
Project Location: Santa Clara County
On-Road Vehicle Emissions Based on: Version : Emfac2007 V2.3 Nov 1 2006
Off-Road Vehicle Emissions Based on: OFFROAD2007
Summary Report for Summer Emissions (Pounds/Day)
TOTALS (lbs/day, unmitigated) 52.99 49.98 612.00 1.41 256.78 48.32
SUM OF AREA SOURCE AND OPERATIONAL EMISSION ESTIMATES
ROG NOx CO SO2 PM10 PM2.5
TOTALS (lbs/day, unmitigated) 50.55 46.54 607.58 1.41 256.76 48.30
OPERATIONAL (VEHICLE) EMISSION ESTIMATES
ROG NOx CO SO2 PM10 PM2.5
TOTALS (lbs/day, unmitigated) 2.44 3.44 4.42 0.00 0.02 0.02
AREA SOURCE EMISSION ESTIMATES
ROG NOx CO SO2 PM10 PM2.5

1/17/2012 2:22:51 PM
Page: 1
Urbemis 2007 Version 9.2.4
File Name: Z:\EBell\San Jose Colleges\Modeling\SJCC Proposed.urb924
Project Name: SJCC Proposed
Project Location: Santa Clara County
On-Road Vehicle Emissions Based on: Version : Emfac2007 V2.3 Nov 1 2006
Off-Road Vehicle Emissions Based on: OFFROAD2007
Summary Report for Winter Emissions (Pounds/Day)
TOTALS (lbs/day, unmitigated) 60.73 74.33 632.19 1.21 256.77 48.31
SUM OF AREA SOURCE AND OPERATIONAL EMISSION ESTIMATES
ROG NOx CO SO2 PM10 PM2.5
TOTALS (lbs/day, unmitigated) 58.41 70.91 629.32 1.21 256.76 48.30
OPERATIONAL (VEHICLE) EMISSION ESTIMATES
ROG NOx CO SO2 PM10 PM2.5
TOTALS (lbs/day, unmitigated) 2.32 3.42 2.87 0.00 0.01 0.01
AREA SOURCE EMISSION ESTIMATES
ROG NOx CO SO2 PM10 PM2.5

SJCCStationary Source Emissions
Natural Gas Boilers
Boiler DataNominal Rating per Boiler: 5.5 MMBtu/hrNumber of New Boilers: 4 Operational hours: 24 hr/day
8,760 hr/yrCapacity Factor: 75%Standard Temp 60 deg FMolar Volume 379.70 scf/moleHeat Content of Natural Gas 1,020 Btu/scf
Table STA-1Natural Gas Boiler Emissions
Units Criteria Pollutants Greenhouse GasesROG NOX CO SOX PM10 PM2.5 CO2 CH4 N2O CO2e
ppm @ 3% O2 30.00 lbs/MMBtu 0.0054 0.0360 0.0824 0.0006 0.0075 0.0075 116.98 0.0110 0.0002 117.28 lbs/hr 0.09 0.59 1.36 0.01 0.12 0.12 1,930.12 0.18 0.00 1,935.07 lbs/day 1.60 10.69 24.46 0.17 2.21 2.21 34,742.25 3.27 0.07 4,906.07 lbs/yr 584.54 3,902.58 8,927.47 63.77 807.72 807.72 12,680,920.80 1,194.96 23.90 12,713,423.73 tons/yr 0.29 1.95 4.46 0.03 0.40 0.40 6,340.46 0.60 0.01 6,356.71 metric tons/yr 5,751.97 0.54 0.01 5,766.71
Notes:1.
2.3.4.5. Emissions of CO2e assumes the following global warming potentials: CO2 = 1, CH4 = 21, N2O = 310.
Emission factors for ROG, CO, PM10, and SOX: U.S. Environmental Protection Agency, AP-42 Compilation of Air Pollutant Emission Factors, Chapter 1.4, Table 1.4-1 and 1.4-2.
Emission factor for PM2.5 assumes all PM is less than 1 micron in diameter.Emission factors for CO2, CH4, and N2O: California Climate Action Registry, General Reporting Protocol , Version 3.1, (2009) 101, 103.
Emission factor for NOX assumes compliance with 30 ppm standard.

SJCCStationary Source Emissions
Emergency Generator
Generator DataNominal Rating of Generator: 25 kWNumber of New Generators: 1 Engine size 34 hpOperational hours: 1 hr/day
50 hr/yrCapacity Factor: 100%MMBtu/yr 4
Table STA-2Emergency Generator Emissions
Units Criteria Pollutants Greenhouse GasesROG NOX CO SOX PM10 PM2.5 CO2 CH4 N2O CO2e
lbs/hp-hr 2.47E-03 3.10E-02 6.68E-03 1.21E-05 2.20E-03 2.20E-03lbs/hr 0.08 1.05 0.23 0.00 0.07 0.07 lbs/day 0.01 0.14 0.03 0.00 0.01 0.01 lbs/yr 4.20 52.70 11.36 0.02 3.74 3.74 tons/yr 0.00 0.03 0.01 0.00 0.00 0.00 kg/MMBtu 19.95 1.10E-02 6.00E-04 20.37 metric tons/yr 0.09 4.69E-05 2.56E-06 0.09
Notes:1.
2.
3.4.5. Emissions of CO2e assumes the following global warming potentials: CO 2 = 1, CH4 = 21, N2O = 310.
Emission factors for ROG, NOX, CO, PM10, and SOX: U.S. Environmental Protection Agency, AP-42 Compilation of Air Pollutant Emission Factors , Chapter 3.3, Table 3.3-1. Emission Factor for SOX is based on 15 ppm (0.0015%).
Emission factor for PM2.5 assumes all PM is less than 1 micron in diameter.Emission factors for CO2, CH4, and N2O: California Climate Action Registry, General Reporting Protocol , Version 3.1, (2009) 101, 103.
Emission factors for SOX: U.S. Environmental Protection Agency, AP-42 Compilation of Air Pollutant Emission Factors , Chapter 3.4, Table 3.4-1. Emission Factor for SOX is based on 15 ppm (0.0015%).

APPENDIX 4.3
Greenhouse Gas Emissions Worksheets

Summary Results
Project Name: SJCC ExistingProject and Baseline Years: 2012 N/A
ResultsTransportation: 18,690.05 18,690.05
Area Source: 0.23 0.23Electricity: 1,984.59 1,984.59
Natural Gas: 949.41 949.41Water & Wastewater: 29.96 29.96
Solid Waste: 358.09 358.09Agriculture: 0.00 0.00
Off‐Road Equipment: 0.00 0.00Refrigerants: 0.00 0.00
Sequestration: N/A 0.00Purchase of Offsets: N/A 0.00
Total: 22,012.34 22,012.34
Baseline is currently: OFFBaseline Project Name:
Go to Settings Tab to Turn On Baseline
Unmitigated Project‐Baseline CO2e (metric
tons/year)
Mitigated Project‐Baseline CO2e (metric
tons/year)
0.23
1,984.59
949.41
29.96
358.09
0.00
0.00
0.00
0.00
0.00
0.23
1,984.59
949.41
29.96
358.09
0.00
0.00
0.00
0.00
0.00
0.00 2,000.00 4,000.00 6,000.0
Transportation:
Area Source:
Electricity:
Natural Gas:
Water & Wastewater:
Solid Waste:
Agriculture:
Off‐Road Equipment:
Refrigerants:
Sequestration:
Purchase of Offsets:
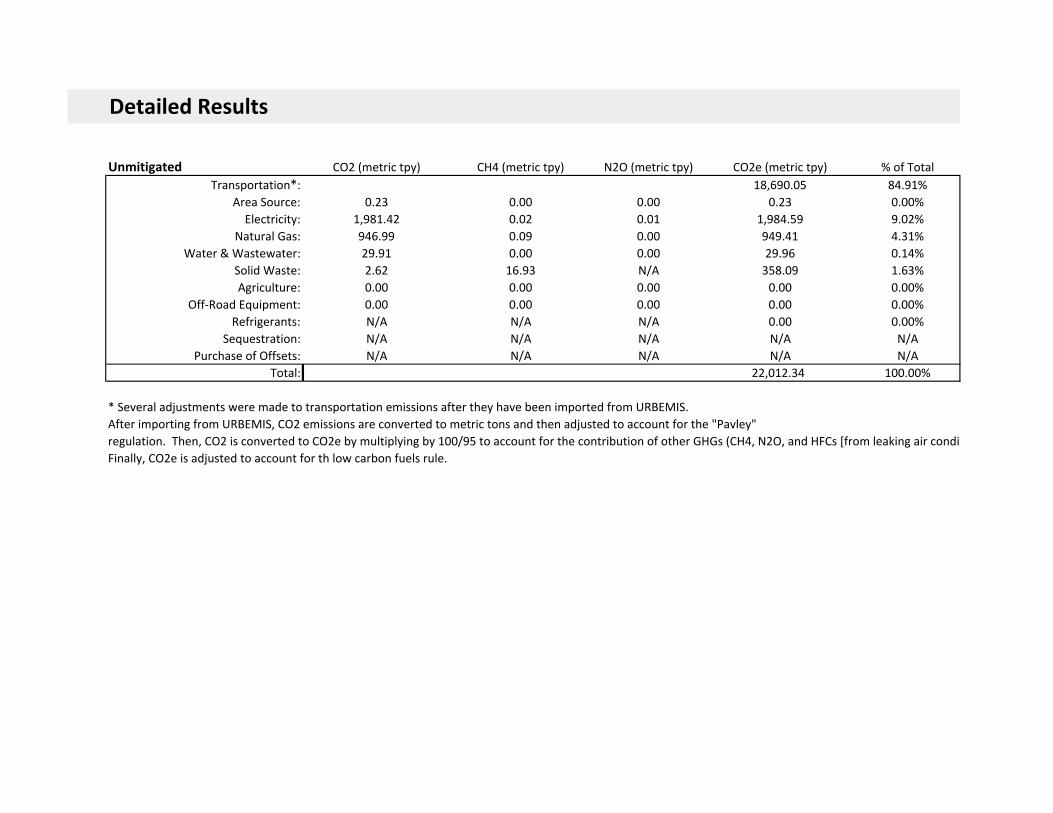
Unmitigated CO2 (metric tpy) CH4 (metric tpy) N2O (metric tpy) CO2e (metric tpy) % of TotalTransportation*: 18,690.05 84.91%
Area Source: 0.23 0.00 0.00 0.23 0.00%Electricity: 1,981.42 0.02 0.01 1,984.59 9.02%
Natural Gas: 946.99 0.09 0.00 949.41 4.31%Water & Wastewater: 29.91 0.00 0.00 29.96 0.14%
Solid Waste: 2.62 16.93 N/A 358.09 1.63%Agriculture: 0.00 0.00 0.00 0.00 0.00%
Off‐Road Equipment: 0.00 0.00 0.00 0.00 0.00%Refrigerants: N/A N/A N/A 0.00 0.00%
Sequestration: N/A N/A N/A N/A N/APurchase of Offsets: N/A N/A N/A N/A N/A
Total: 22,012.34 100.00%
* Several adjustments were made to transportation emissions after they have been imported from URBEMIS. After importing from URBEMIS, CO2 emissions are converted to metric tons and then adjusted to account for the "Pavley" regulation. Then, CO2 is converted to CO2e by multiplying by 100/95 to account for the contribution of other GHGs (CH4, N2O, and HFCs [from leaking air conditFinally, CO2e is adjusted to account for th low carbon fuels rule.
Detailed Results

Mitigated CO2 (metric tpy) CH4 (metric tpy) N2O (metric tpy) CO2e (metric tpy) % of TotalTransportation*: 18,690.05 84.91%
Area Source: 0.23 0.00 0.00 0.23 0.00%Electricity: 1,981.42 0.02 0.01 1,984.59 9.02%
Natural Gas: 946.99 0.09 0.00 949.41 4.31%Water & Wastewater: 29.91 0.00 0.00 29.96 0.14%
Solid Waste: 2.62 16.93 N/A 358.09 1.63%Agriculture: 0.00 0.00 0.00 0.00 0.00%
Off‐Road Equipment: 0.00 0.00 0.00 0.00 0.00%Refrigerants: N/A N/A N/A 0.00 0.00%
Sequestration: N/A N/A N/A 0.00 0.00%Purchase of Offsets: N/A N/A N/A 0.00 0.00%
Total: 22,012.34 100.00%

Mitigation Measures Selected:Transportation: Go to the following tab: Transp. Detail Mit for a list of the transportation mitigation measures selected (in URBE
Electricity: The following mitigation measure(s) have been selected to reduce electricity emissions.
Natural Gas: The following mitigation measure(s) have been selected to reduce natural gas emissions.
Water and Wastewater: The following mitigation measure(s) have been selected to reduce water and wastewater emissions.
Solid Waste: The following mitigation measure has been selected to reduce solid waste related GHG emissions.
Ag: No existing mitigation measures available.
Off‐Road Equipment: No existing mitigation measures available.
Refrigerants: The following mitigation measure has ben selected to reduce refrigerant emissions:
Carbon Sequestration: Project does not include carbon sequestration through tree planting.
Emission Offsets/Credits: Project does not include purchase of emission offsets/credits.

Project‐Baseline CO2e (metric tons/year)
18,690.0518,690.05
6,000.00 8,000.00 10,000.00 12,000.00 14,000.00 16,000.00 18,000.00 20,000.00
Unmitigated
Mitigated
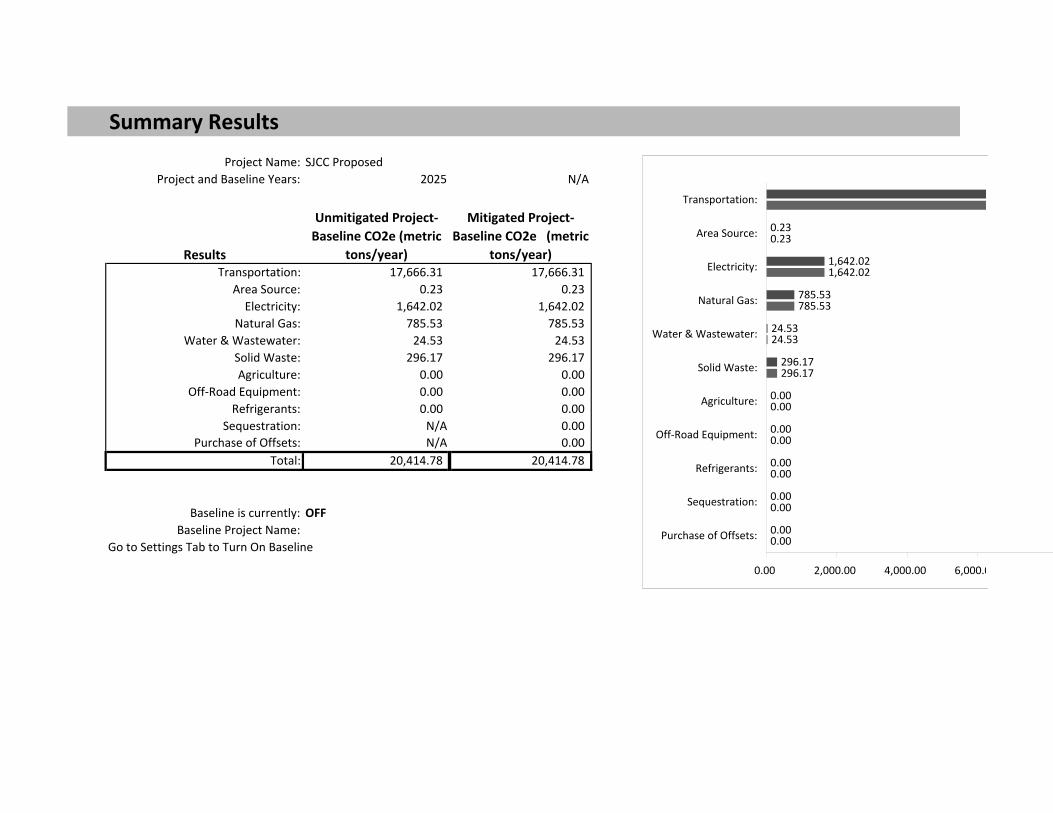
Summary Results
Project Name: SJCC ProposedProject and Baseline Years: 2025 N/A
ResultsTransportation: 17,666.31 17,666.31
Area Source: 0.23 0.23Electricity: 1,642.02 1,642.02
Natural Gas: 785.53 785.53Water & Wastewater: 24.53 24.53
Solid Waste: 296.17 296.17Agriculture: 0.00 0.00
Off‐Road Equipment: 0.00 0.00Refrigerants: 0.00 0.00
Sequestration: N/A 0.00Purchase of Offsets: N/A 0.00
Total: 20,414.78 20,414.78
Baseline is currently: OFFBaseline Project Name:
Go to Settings Tab to Turn On Baseline
Unmitigated Project‐Baseline CO2e (metric
tons/year)
Mitigated Project‐Baseline CO2e (metric
tons/year)
0.23
1,642.02
785.53
24.53
296.17
0.00
0.00
0.00
0.00
0.00
0.23
1,642.02
785.53
24.53
296.17
0.00
0.00
0.00
0.00
0.00
0.00 2,000.00 4,000.00 6,000.0
Transportation:
Area Source:
Electricity:
Natural Gas:
Water & Wastewater:
Solid Waste:
Agriculture:
Off‐Road Equipment:
Refrigerants:
Sequestration:
Purchase of Offsets:

Unmitigated CO2 (metric tpy) CH4 (metric tpy) N2O (metric tpy) CO2e (metric tpy) % of TotalTransportation*: 17,666.31 86.54%
Area Source: 0.23 0.00 0.00 0.23 0.00%Electricity: 1,639.40 0.01 0.01 1,642.02 8.04%
Natural Gas: 783.52 0.07 0.00 785.53 3.85%Water & Wastewater: 24.49 0.00 0.00 24.53 0.12%
Solid Waste: 2.06 14.01 N/A 296.17 1.45%Agriculture: 0.00 0.00 0.00 0.00 0.00%
Off‐Road Equipment: 0.00 0.00 0.00 0.00 0.00%Refrigerants: N/A N/A N/A 0.00 0.00%
Sequestration: N/A N/A N/A N/A N/APurchase of Offsets: N/A N/A N/A N/A N/A
Total: 20,414.78 100.00%
* Several adjustments were made to transportation emissions after they have been imported from URBEMIS. After importing from URBEMIS, CO2 emissions are converted to metric tons and then adjusted to account for the "Pavley" regulation. Then, CO2 is converted to CO2e by multiplying by 100/95 to account for the contribution of other GHGs (CH4, N2O, and HFCs [from leaking air conditFinally, CO2e is adjusted to account for th low carbon fuels rule.
Detailed Results

Mitigated CO2 (metric tpy) CH4 (metric tpy) N2O (metric tpy) CO2e (metric tpy) % of TotalTransportation*: 17,666.31 86.54%
Area Source: 0.23 0.00 0.00 0.23 0.00%Electricity: 1,639.40 0.01 0.01 1,642.02 8.04%
Natural Gas: 783.52 0.07 0.00 785.53 3.85%Water & Wastewater: 24.49 0.00 0.00 24.53 0.12%
Solid Waste: 2.06 14.01 N/A 296.17 1.45%Agriculture: 0.00 0.00 0.00 0.00 0.00%
Off‐Road Equipment: 0.00 0.00 0.00 0.00 0.00%Refrigerants: N/A N/A N/A 0.00 0.00%
Sequestration: N/A N/A N/A 0.00 0.00%Purchase of Offsets: N/A N/A N/A 0.00 0.00%
Total: 20,414.78 100.00%

Mitigation Measures Selected:Transportation: Go to the following tab: Transp. Detail Mit for a list of the transportation mitigation measures selected (in URBE
Electricity: The following mitigation measure(s) have been selected to reduce electricity emissions.
Natural Gas: The following mitigation measure(s) have been selected to reduce natural gas emissions.
Water and Wastewater: The following mitigation measure(s) have been selected to reduce water and wastewater emissions.
Solid Waste: The following mitigation measure has been selected to reduce solid waste related GHG emissions.
Ag: No existing mitigation measures available.
Off‐Road Equipment: No existing mitigation measures available.
Refrigerants: The following mitigation measure has ben selected to reduce refrigerant emissions:
Carbon Sequestration: Project does not include carbon sequestration through tree planting.
Emission Offsets/Credits: Project does not include purchase of emission offsets/credits.

Project‐Baseline CO2e (metric tons/year)
17,666.3117,666.31
6,000.00 8,000.00 10,000.00 12,000.00 14,000.00 16,000.00 18,000.00 20,000.00
Unmitigated
Mitigated

APPENDIX 4.5
Noise Modeling Output

Project Name
On-Site Noise Contours
Existing Conditions
Number
of Lanes Design Vehicle Mix Distance from Center of Roadway
ROADWAY NAME in Each Median ADT Speed Alpha Medium Heavy CNEL at DISTANCE TO CONTOUR
Segment Direction Width Volume (mph) Factor (1) Trucks Trucks 75 Feet 75 CNEL 70 CNEL 65 CNEL 60 CNEL
ROADWAY NAME
3 0 13,370 45 0 1.8% 0.7% 67.0 - - 118 366
3 0 21,650 45 0 1.8% 0.7% 69.1 - - 189 588
3 0 26,130 45 0 1.8% 0.7% 69.9 - - 228 707
3 0 24,780 45 0 1.8% 0.7% 69.7 - - 216 671
3 0 24,530 45 0 1.8% 0.7% 69.6 - - 214 665
3 0 24,690 45 0 1.8% 0.7% 69.6 - - 215 669
3 0 14,270 45 0 1.8% 0.7% 67.3 - - 125 390
1 0 1,760 25 0 1.8% 0.7% 52.4 - - - -
1 0 4,400 25 0 1.8% 0.7% 56.4 - - - -
1 0 380 25 0 1.8% 0.7% 45.7 - - - -
1 0 5,450 25 0 1.8% 0.7% 57.3 - - - -
1 0 6,580 25 0 1.8% 0.7% 58.1 - - - -
2 0 11,520 35 0 1.8% 0.7% 63.6 - - - 169
2 0 11,920 35 0 1.8% 0.7% 63.7 - - - 175
2 0 5,120 35 0 1.8% 0.7% 60.1 - - - 76
2 0 11,940 35 0 1.8% 0.7% 63.7 - - - 175
2 0 19,870 35 0 1.8% 0.7% 66.0 - - 93 290
2 0 10,940 35 0 1.8% 0.7% 63.4 - - - 161
1 0 2,270 25 0 1.8% 0.7% 53.5 - - - -
1 0 1,600 25 0 1.8% 0.7% 52.0 - - - -
1 0 1,800 25 0 1.8% 0.7% 52.5 - - - -
2 0 16,630 35 0 1.8% 0.7% 65.2 - - 78 243
2 0 15,050 35 0 1.8% 0.7% 64.8 - - - 220
2 0 9,240 35 0 1.8% 0.7% 62.6 - - - 136
3 0 16,550 45 0 1.8% 0.7% 67.9 - - 145 451
3 0 18,460 45 0 1.8% 0.7% 68.4 - - 162 502
3 0 15,660 45 0 1.8% 0.7% 67.7 - - 137 427
1 0 2,300 25 0 1.8% 0.7% 53.6 - - - -
1 0 2,710 25 0 1.8% 0.7% 54.3 - - - -
1 0 4,280 25 0 1.8% 0.7% 56.3 - - - -
2 0 14,420 35 0 1.8% 0.7% 64.6 - - - 211
2 0 15,300 35 0 1.8% 0.7% 64.8 - - - 224
2 0 10,540 35 0 1.8% 0.7% 63.2 - - - 155
2 0 5,350 35 0 1.8% 0.7% 60.3 - - - 80
Day Evening Night Total
77.70% 12.70% 9.60% 100.00%
87.43% 5.05% 7.52% 100.00%
89.10% 2.84% 8.06% 100.00%
Leigh, south of Fruitdale
San Carlos, West of Bascom
San Carlos, Between Bascom and Leigh
San Carlos, east of Leigh
Scott, west of Leigh
Leland, Between Parkmore and Moorpark
Sherman Oaks, North of Fruitdale
Leigh, Between San Carlos and Scott
Leigh, Between Scott and Parkmoor
Leigh, Parkmoor and Moorpark
Leigh, Moorpark and Fruitdale
Assumed 24-Hour Traffic Distribution:
"-" = contour is located within the roadway lanes or within 75 feet of the roadway centerline.
Noise levels and distances to contours do not assume any natural or constructed barriers that may attenuate noise.
Notes to Modeler: The 24-hour traffic distribution and vehicle mix percentages are defaults. For project-specific numbers, obtain the 24-hour traffic distribution, vehicle mix percentages, and traffic volumes from the traffic engineer. For state and
federal highways, obtain this information from the Caltrans website. Column G under Notes: should total 100%. Some jurisdictions have different distributions by roadway type, so check with that jurisdiction. An example is Riverside County.
Total ADT Volumes
Heavy-Duty Trucks
Medium-Duty Trucks
Renova, west of Bascom
SJCC Drivway, east of Bascom
Enborg, west of Bascom
Notes:
(1) Alpha Factor: Coefficient of absorption relating to the effects of the ground surface. An alpha factor of 0 indicates that the site is an acoustically "hard" site, such as aspalt. An alpha factor of 0.5 indicates that the site is an acoustically "soft" site such, as heavily vegetated
ground cover.
Fruitdale, between Bascom and Sherman Oaks
Fruitdale, between Sherman Oaks and Leigh
Fruitdale, between Leigh and SW Express
Fruitdale, east of SW Express
Bascom, North of San Carlos
Bascom, Between San Carlos and Parkmoor
Bascom, Between Parkmoor and Moorpark
Bascom, Between Moorpark and Renova
Bascom, between Renova and SJCC Driveway
Bascom, between SJCC Driveway and Fruitdale
Moorpark, between Bascom and Leland
Moorpark, between Leland and Leigh
Moorpark, east of Leigh
Parkmoor, west of Bascom
Parkmoor, between Bascom and Leland
Bascom, South of Fruitdale
Scott, east of Leigh
Parkmoor, between Leland and Leigh
Moorpark, west of Bascom
Leland, North of Parkmore
Impact Sciences, Inc.
Prepared by:
Date:
JN:
ISI Rev. 9/08

Project Name
On-Site Noise Contours
Existing Conditions
Number
of Lanes Design Vehicle Mix Distance from Center of Roadway
ROADWAY NAME in Each Median ADT Speed Alpha Medium Heavy CNEL at DISTANCE TO CONTOUR
Segment Direction Width Volume (mph) Factor (1) Trucks Trucks 75 Feet 75 CNEL 70 CNEL 65 CNEL 60 CNEL
ROADWAY NAME
3 0 13,400 45 0 1.8% 0.7% 67.0 - - 118 366
3 0 21,960 45 0 1.8% 0.7% 69.1 - - 192 596
3 0 26,840 45 0 1.8% 0.7% 70.0 - 75 234 726
3 0 25,030 45 0 1.8% 0.7% 69.7 - - 218 678
3 0 24,780 45 0 1.8% 0.7% 69.7 - - 216 671
3 0 25,180 45 0 1.8% 0.7% 69.7 - - 219 682
3 0 14,340 45 0 1.8% 0.7% 67.3 - - 126 392
1 0 1,770 25 0 1.8% 0.7% 52.4 - - - -
1 0 4,480 25 0 1.8% 0.7% 56.5 - - - -
1 0 380 25 0 1.8% 0.7% 45.7 - - - -
1 0 5,570 25 0 1.8% 0.7% 57.4 - - - -
1 0 6,670 25 0 1.8% 0.7% 58.2 - - - -
2 0 12,470 35 0 1.8% 0.7% 63.9 - - - 183
2 0 13,040 35 0 1.8% 0.7% 64.1 - - - 191
2 0 5,180 35 0 1.8% 0.7% 60.1 - - - 77
2 0 11,960 35 0 1.8% 0.7% 63.8 - - - 176
2 0 19,880 35 0 1.8% 0.7% 66.0 - - 93 290
2 0 11,010 35 0 1.8% 0.7% 63.4 - - - 162
1 0 2,270 25 0 1.8% 0.7% 53.5 - - - -
1 0 1,600 25 0 1.8% 0.7% 52.0 - - - -
1 0 1,800 25 0 1.8% 0.7% 52.5 - - - -
2 0 17,220 35 0 1.8% 0.7% 65.3 - - 81 252
2 0 15,700 35 0 1.8% 0.7% 64.9 - - - 230
2 0 9,260 35 0 1.8% 0.7% 62.6 - - - 137
3 0 17,260 45 0 1.8% 0.7% 68.1 - - 151 470
3 0 19,780 45 0 1.8% 0.7% 68.7 - - 173 538
3 0 16,190 45 0 1.8% 0.7% 67.8 - - 142 441
1 0 2,300 25 0 1.8% 0.7% 53.6 - - - -
1 0 3,060 25 0 1.8% 0.7% 54.8 - - - -
1 0 4,280 25 0 1.8% 0.7% 56.3 - - - -
2 0 14,690 35 0 1.8% 0.7% 64.6 - - - 215
2 0 15,570 35 0 1.8% 0.7% 64.9 - - - 228
2 0 10,760 35 0 1.8% 0.7% 63.3 - - - 158
2 0 5,410 35 0 1.8% 0.7% 60.3 - - - 80
Day Evening Night Total
77.70% 12.70% 9.60% 100.00%
87.43% 5.05% 7.52% 100.00%
89.10% 2.84% 8.06% 100.00%
Leigh, south of Fruitdale
San Carlos, West of Bascom
San Carlos, Between Bascom and Leigh
San Carlos, east of Leigh
Scott, west of Leigh
Leland, Between Parkmore and Moorpark
Sherman Oaks, North of Fruitdale
Leigh, Between San Carlos and Scott
Leigh, Between Scott and Parkmoor
Leigh, Parkmoor and Moorpark
Leigh, Moorpark and Fruitdale
Assumed 24-Hour Traffic Distribution:
"-" = contour is located within the roadway lanes or within 75 feet of the roadway centerline.
Noise levels and distances to contours do not assume any natural or constructed barriers that may attenuate noise.
Notes to Modeler: The 24-hour traffic distribution and vehicle mix percentages are defaults. For project-specific numbers, obtain the 24-hour traffic distribution, vehicle mix percentages, and traffic volumes from the traffic engineer. For state and
federal highways, obtain this information from the Caltrans website. Column G under Notes: should total 100%. Some jurisdictions have different distributions by roadway type, so check with that jurisdiction. An example is Riverside County.
Total ADT Volumes
Heavy-Duty Trucks
Medium-Duty Trucks
Renova, west of Bascom
SJCC Drivway, east of Bascom
Enborg, west of Bascom
Notes:
(1) Alpha Factor: Coefficient of absorption relating to the effects of the ground surface. An alpha factor of 0 indicates that the site is an acoustically "hard" site, such as aspalt. An alpha factor of 0.5 indicates that the site is an acoustically "soft" site such, as heavily vegetated
ground cover.
Fruitdale, between Bascom and Sherman Oaks
Fruitdale, between Sherman Oaks and Leigh
Fruitdale, between Leigh and SW Express
Fruitdale, east of SW Express
Bascom, North of San Carlos
Bascom, Between San Carlos and Parkmoor
Bascom, Between Parkmoor and Moorpark
Bascom, Between Moorpark and Renova
Bascom, between Renova and SJCC Driveway
Bascom, between SJCC Driveway and Fruitdale
Moorpark, between Bascom and Leland
Moorpark, between Leland and Leigh
Moorpark, east of Leigh
Parkmoor, west of Bascom
Parkmoor, between Bascom and Leland
Bascom, South of Fruitdale
Scott, east of Leigh
Parkmoor, between Leland and Leigh
Moorpark, west of Bascom
Leland, North of Parkmore
Impact Sciences, Inc.
Prepared by:
Date:
JN:
ISI Rev. 9/08

Project Name
On-Site Noise Contours
Existing Conditions
Number
of Lanes Design Vehicle Mix Distance from Center of Roadway
ROADWAY NAME in Each Median ADT Speed Alpha Medium Heavy CNEL at DISTANCE TO CONTOUR
Segment Direction Width Volume (mph) Factor (1) Trucks Trucks 75 Feet 75 CNEL 70 CNEL 65 CNEL 60 CNEL
ROADWAY NAME
3 0 14,460 45 0 1.8% 0.7% 67.3 - - 127 395
3 0 24,610 45 0 1.8% 0.7% 69.6 - - 215 667
3 0 29,880 45 0 1.8% 0.7% 70.5 - 84 260 807
3 0 28,720 45 0 1.8% 0.7% 70.3 - 80 250 776
3 0 26,430 45 0 1.8% 0.7% 69.9 - - 230 715
3 0 26,570 45 0 1.8% 0.7% 70.0 - - 231 719
3 0 15,650 45 0 1.8% 0.7% 67.7 - - 137 427
1 0 1,760 25 0 1.8% 0.7% 52.4 - - - -
1 0 5,270 25 0 1.8% 0.7% 57.2 - - - -
1 0 380 25 0 1.8% 0.7% 45.7 - - - -
1 0 6,220 25 0 1.8% 0.7% 57.9 - - - -
1 0 6,900 25 0 1.8% 0.7% 58.3 - - - -
2 0 12,030 35 0 1.8% 0.7% 63.8 - - - 177
2 0 12,390 35 0 1.8% 0.7% 63.9 - - - 182
2 0 5,310 35 0 1.8% 0.7% 60.2 - - - 79
2 0 13,510 35 0 1.8% 0.7% 64.3 - - - 198
2 0 23,340 35 0 1.8% 0.7% 66.7 - - 109 339
2 0 13,050 35 0 1.8% 0.7% 64.1 - - - 191
1 0 2,340 25 0 1.8% 0.7% 53.6 - - - -
1 0 1,680 25 0 1.8% 0.7% 52.2 - - - -
1 0 1,800 25 0 1.8% 0.7% 52.5 - - - -
2 0 19,130 35 0 1.8% 0.7% 65.8 - - 90 279
2 0 16,890 35 0 1.8% 0.7% 65.3 - - 79 247
2 0 10,970 35 0 1.8% 0.7% 63.4 - - - 161
3 0 18,960 45 0 1.8% 0.7% 68.5 - - 166 516
3 0 20,140 45 0 1.8% 0.7% 68.8 - - 176 547
3 0 17,570 45 0 1.8% 0.7% 68.2 - - 154 478
1 0 3,760 25 0 1.8% 0.7% 55.7 - - - -
1 0 2,710 25 0 1.8% 0.7% 54.3 - - - -
1 0 5,250 25 0 1.8% 0.7% 57.1 - - - -
2 0 14,820 35 0 1.8% 0.7% 64.7 - - - 217
2 0 15,740 35 0 1.8% 0.7% 64.9 - - - 230
2 0 10,900 35 0 1.8% 0.7% 63.4 - - - 160
2 0 8,070 35 0 1.8% 0.7% 62.0 - - - 119
Day Evening Night Total
77.70% 12.70% 9.60% 100.00%
87.43% 5.05% 7.52% 100.00%
89.10% 2.84% 8.06% 100.00%
Moorpark, between Bascom and Leland
Moorpark, between Leland and Leigh
Moorpark, east of Leigh
Parkmoor, west of Bascom
Parkmoor, between Bascom and Leland
Bascom, South of Fruitdale
Scott, east of Leigh
Parkmoor, between Leland and Leigh
Moorpark, west of Bascom
Leland, North of Parkmore
Bascom, North of San Carlos
Bascom, Between San Carlos and Parkmoor
Bascom, Between Parkmoor and Moorpark
Bascom, Between Moorpark and Renova
Bascom, between Renova and SJCC Driveway
Bascom, between SJCC Driveway and Fruitdale
Enborg, west of Bascom
Notes:
(1) Alpha Factor: Coefficient of absorption relating to the effects of the ground surface. An alpha factor of 0 indicates that the site is an acoustically "hard" site, such as aspalt. An alpha factor of 0.5 indicates that the site is an acoustically "soft" site such, as heavily vegetated
ground cover.
Fruitdale, between Bascom and Sherman Oaks
Fruitdale, between Sherman Oaks and Leigh
Fruitdale, between Leigh and SW Express
Fruitdale, east of SW Express
Leigh, Moorpark and Fruitdale
Assumed 24-Hour Traffic Distribution:
"-" = contour is located within the roadway lanes or within 75 feet of the roadway centerline.
Noise levels and distances to contours do not assume any natural or constructed barriers that may attenuate noise.
Notes to Modeler: The 24-hour traffic distribution and vehicle mix percentages are defaults. For project-specific numbers, obtain the 24-hour traffic distribution, vehicle mix percentages, and traffic volumes from the traffic engineer. For state and
federal highways, obtain this information from the Caltrans website. Column G under Notes: should total 100%. Some jurisdictions have different distributions by roadway type, so check with that jurisdiction. An example is Riverside County.
Total ADT Volumes
Heavy-Duty Trucks
Medium-Duty Trucks
Renova, west of Bascom
SJCC Drivway, east of Bascom
Leigh, south of Fruitdale
San Carlos, West of Bascom
San Carlos, Between Bascom and Leigh
San Carlos, east of Leigh
Scott, west of Leigh
Leland, Between Parkmore and Moorpark
Sherman Oaks, North of Fruitdale
Leigh, Between San Carlos and Scott
Leigh, Between Scott and Parkmoor
Leigh, Parkmoor and Moorpark
Impact Sciences, Inc.
Prepared by:
Date:
JN:
ISI Rev. 9/08

Project Name
On-Site Noise Contours
Existing Conditions
Number
of Lanes Design Vehicle Mix Distance from Center of Roadway
ROADWAY NAME in Each Median ADT Speed Alpha Medium Heavy CNEL at DISTANCE TO CONTOUR
Segment Direction Width Volume (mph) Factor (1) Trucks Trucks 75 Feet 75 CNEL 70 CNEL 65 CNEL 60 CNEL
ROADWAY NAME
3 0 14,490 45 0 1.8% 0.7% 67.3 - - 127 396
3 0 24,920 45 0 1.8% 0.7% 69.7 - - 217 675
3 0 30,590 45 0 1.8% 0.7% 70.6 - 86 266 826
3 0 28,970 45 0 1.8% 0.7% 70.3 - 81 252 783
3 0 26,680 45 0 1.8% 0.7% 70.0 - - 232 722
3 0 27,060 45 0 1.8% 0.7% 70.0 - 76 236 732
3 0 15,720 45 0 1.8% 0.7% 67.7 - - 138 429
1 0 1,770 25 0 1.8% 0.7% 52.4 - - - -
1 0 5,350 25 0 1.8% 0.7% 57.2 - - - -
1 0 380 25 0 1.8% 0.7% 45.7 - - - -
1 0 6,340 25 0 1.8% 0.7% 58.0 - - - -
1 0 6,990 25 0 1.8% 0.7% 58.4 - - - -
2 0 12,980 35 0 1.8% 0.7% 64.1 - - - 190
2 0 13,510 35 0 1.8% 0.7% 64.3 - - - 198
2 0 5,370 35 0 1.8% 0.7% 60.3 - - - 80
2 0 13,530 35 0 1.8% 0.7% 64.3 - - - 198
2 0 23,350 35 0 1.8% 0.7% 66.7 - - 109 340
2 0 13,120 35 0 1.8% 0.7% 64.2 - - - 192
1 0 2,340 25 0 1.8% 0.7% 53.6 - - - -
1 0 1,680 25 0 1.8% 0.7% 52.2 - - - -
1 0 1,800 25 0 1.8% 0.7% 52.5 - - - -
2 0 19,720 35 0 1.8% 0.7% 65.9 - - 93 287
2 0 17,540 35 0 1.8% 0.7% 65.4 - - 82 256
2 0 10,990 35 0 1.8% 0.7% 63.4 - - - 162
3 0 19,670 45 0 1.8% 0.7% 68.7 - - 172 535
3 0 21,460 45 0 1.8% 0.7% 69.0 - - 187 583
3 0 18,100 45 0 1.8% 0.7% 68.3 - - 159 493
1 0 3,760 25 0 1.8% 0.7% 55.7 - - - -
1 0 3,060 25 0 1.8% 0.7% 54.8 - - - -
1 0 5,250 25 0 1.8% 0.7% 57.1 - - - -
2 0 15,090 35 0 1.8% 0.7% 64.8 - - - 221
2 0 16,010 35 0 1.8% 0.7% 65.0 - - 75 234
2 0 11,120 35 0 1.8% 0.7% 63.4 - - - 164
2 0 8,130 35 0 1.8% 0.7% 62.1 - - - 120
Day Evening Night Total
77.70% 12.70% 9.60% 100.00%
87.43% 5.05% 7.52% 100.00%
89.10% 2.84% 8.06% 100.00%
Moorpark, between Bascom and Leland
Moorpark, between Leland and Leigh
Moorpark, east of Leigh
Parkmoor, west of Bascom
Parkmoor, between Bascom and Leland
Bascom, South of Fruitdale
Scott, east of Leigh
Parkmoor, between Leland and Leigh
Moorpark, west of Bascom
Leland, North of Parkmore
Bascom, North of San Carlos
Bascom, Between San Carlos and Parkmoor
Bascom, Between Parkmoor and Moorpark
Bascom, Between Moorpark and Renova
Bascom, between Renova and SJCC Driveway
Bascom, between SJCC Driveway and Fruitdale
Enborg, west of Bascom
Notes:
(1) Alpha Factor: Coefficient of absorption relating to the effects of the ground surface. An alpha factor of 0 indicates that the site is an acoustically "hard" site, such as aspalt. An alpha factor of 0.5 indicates that the site is an acoustically "soft" site such, as heavily vegetated
ground cover.
Fruitdale, between Bascom and Sherman Oaks
Fruitdale, between Sherman Oaks and Leigh
Fruitdale, between Leigh and SW Express
Fruitdale, east of SW Express
Leigh, Moorpark and Fruitdale
Assumed 24-Hour Traffic Distribution:
"-" = contour is located within the roadway lanes or within 75 feet of the roadway centerline.
Noise levels and distances to contours do not assume any natural or constructed barriers that may attenuate noise.
Notes to Modeler: The 24-hour traffic distribution and vehicle mix percentages are defaults. For project-specific numbers, obtain the 24-hour traffic distribution, vehicle mix percentages, and traffic volumes from the traffic engineer. For state and
federal highways, obtain this information from the Caltrans website. Column G under Notes: should total 100%. Some jurisdictions have different distributions by roadway type, so check with that jurisdiction. An example is Riverside County.
Total ADT Volumes
Heavy-Duty Trucks
Medium-Duty Trucks
Renova, west of Bascom
SJCC Drivway, east of Bascom
Leigh, south of Fruitdale
San Carlos, West of Bascom
San Carlos, Between Bascom and Leigh
San Carlos, east of Leigh
Scott, west of Leigh
Leland, Between Parkmore and Moorpark
Sherman Oaks, North of Fruitdale
Leigh, Between San Carlos and Scott
Leigh, Between Scott and Parkmoor
Leigh, Parkmoor and Moorpark
Impact Sciences, Inc.
Prepared by:
Date:
JN:
ISI Rev. 9/08

APPENDIX 4.7
Traffic Impact Analysis

San Jose City College Facilities Master Plan:
Draft Transportation Impact Analysis
160 W. Santa Clara St., Ste. 675San Jose, CA 95113
January 2012

San Jose City College Facilities Master Plan Transportation Impact Analysis
Prepared for:
San Jose/Evergreen Community College District
Prepared by:
Fehr & Peers
January, 2012
SJ11-1262

TABLE OF CONTENTS
EXECUTIVE SUMMARY ...................................................................................................................................... i Project Traffic Estimates ................................................................................................................................. i Intersection Impacts ....................................................................................................................................... i Freeway Segment Impacts ............................................................................................................................. i Pedestrian, Bicycle, and Transit Facility Impacts ........................................................................................... i Site Access, On-Site Circulation, and Parking .............................................................................................. ii
1. INTRODUCTION ........................................................................................................................................... 1 Project Study Area ......................................................................................................................................... 1 Intersection Analysis Scenarios ..................................................................................................................... 2 Traffic Analysis Methods ............................................................................................................................... 2 Intersection Impact Criteria ............................................................................................................................ 4 Freeway Impact Criteria ................................................................................................................................ 5 Report Organization ...................................................................................................................................... 5
2. EXISTING CONDITIONS .............................................................................................................................. 8 Existing Roadway Network ............................................................................................................................ 8 Existing Pedestrian and Bicycle Facilities ..................................................................................................... 9 Existing Transit Service ............................................................................................................................... 12 Existing Volumes and Lane Configurations ................................................................................................. 15 Existing Freeway Segment Levels of Service ............................................................................................. 18 Field Observations ....................................................................................................................................... 20
3. EXISTING PLUS PROJECT CONDITIONS ............................................................................................... 21 Project Traffic Estimates .............................................................................................................................. 21 Existing Plus Project Intersection Levels of Service .................................................................................... 26 Intersection Impacts and Mitigation Measures ............................................................................................ 27 Existing Plus Project Freeway Segment Levels of Service ......................................................................... 27 Freeway Impacts and Mitigation Measures ................................................................................................. 28 Pedestrian, Bicycle, and Transit Facility Impacts ........................................................................................ 29 Site Access and On-Site Circulation............................................................................................................ 30 Parking ......................................................................................................................................................... 30
4. CUMULATIVE CONDITIONS ..................................................................................................................... 31 Cumulative Traffic Estimates ....................................................................................................................... 31 Cumulative Roadway Improvements ........................................................................................................... 31 Cumulative Intersection Levels of Service .................................................................................................. 31 Cumulative Intersection Impacts and Mitigation Measures ......................................................................... 32
APPENDICES
Appendix A: Existing Traffic Counts
Appendix B: Intersection Level of Service Calculations
Appendix C: Approved & Pending Projects
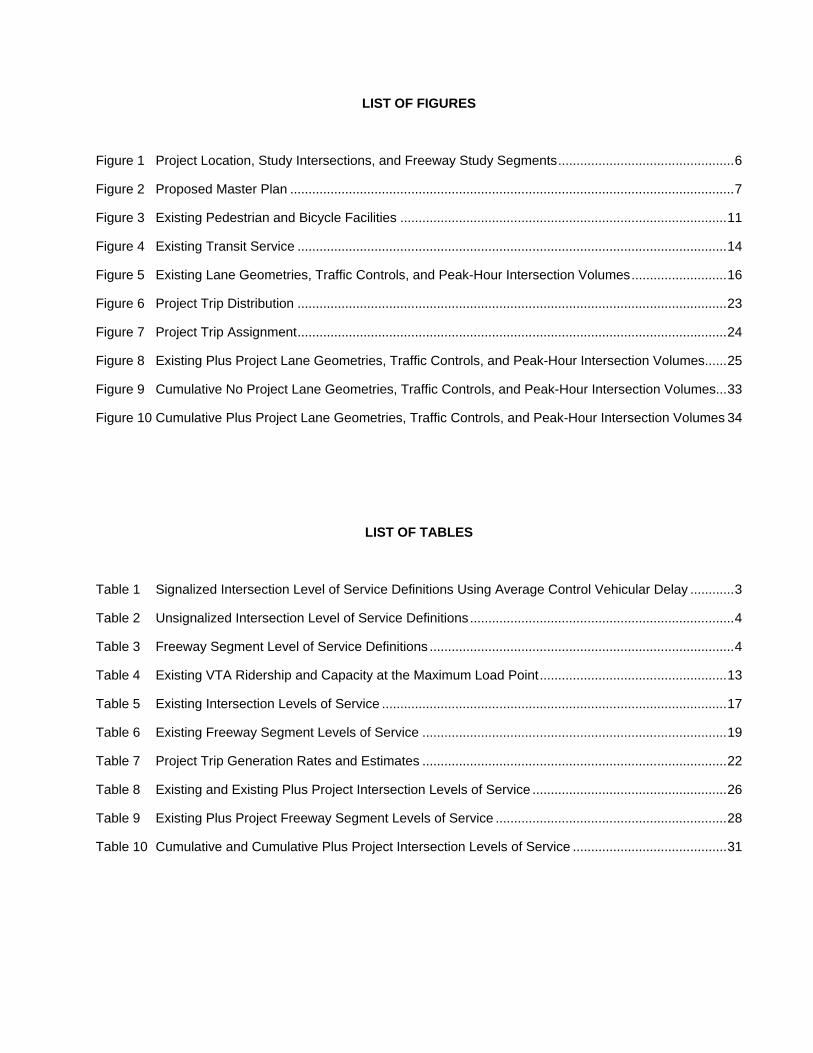
LIST OF FIGURES
Figure 1 Project Location, Study Intersections, and Freeway Study Segments ................................................ 6
Figure 2 Proposed Master Plan ......................................................................................................................... 7
Figure 3 Existing Pedestrian and Bicycle Facilities ......................................................................................... 11
Figure 4 Existing Transit Service ..................................................................................................................... 14
Figure 5 Existing Lane Geometries, Traffic Controls, and Peak-Hour Intersection Volumes .......................... 16
Figure 6 Project Trip Distribution ..................................................................................................................... 23
Figure 7 Project Trip Assignment ..................................................................................................................... 24
Figure 8 Existing Plus Project Lane Geometries, Traffic Controls, and Peak-Hour Intersection Volumes ...... 25
Figure 9 Cumulative No Project Lane Geometries, Traffic Controls, and Peak-Hour Intersection Volumes... 33
Figure 10 Cumulative Plus Project Lane Geometries, Traffic Controls, and Peak-Hour Intersection Volumes 34
LIST OF TABLES
Table 1 Signalized Intersection Level of Service Definitions Using Average Control Vehicular Delay ............ 3
Table 2 Unsignalized Intersection Level of Service Definitions ........................................................................ 4
Table 3 Freeway Segment Level of Service Definitions ................................................................................... 4
Table 4 Existing VTA Ridership and Capacity at the Maximum Load Point ................................................... 13
Table 5 Existing Intersection Levels of Service .............................................................................................. 17
Table 6 Existing Freeway Segment Levels of Service ................................................................................... 19
Table 7 Project Trip Generation Rates and Estimates ................................................................................... 22
Table 8 Existing and Existing Plus Project Intersection Levels of Service ..................................................... 26
Table 9 Existing Plus Project Freeway Segment Levels of Service ............................................................... 28
Table 10 Cumulative and Cumulative Plus Project Intersection Levels of Service .......................................... 31

San Jose City College Facilities Transportation Impact AnalysisJanuary 2012
i
EXECUTIVE SUMMARY
This report presents the results of the Transportation Impact Analysis (TIA) for the Facilities Master Plan (Project) of the San Jose City College (SJCC) located in the City of San Jose, California. SJCC is bounded by Moorpark Avenue to the north, Bascom Avenue to the west, Leigh Avenue to the east, and residential development to the south.
The Educational and Facilities Master Plan Update – 2025 (June 22, 2010) is a comprehensive plan highlighting the future educational and facility needs of the College. The plan projects an annual student population growth of 10 percent through 2025, resulting in an increase in the student population of approximately 2,670 students over the life of the plan.
To accommodate projected growth, the 2025 SJCC Facilities Master Plan was refined and approved (January 25, 2011), and includes demolition of existing facilities and construction of new facilities, increasing campus square footage by approximately 45,200 square-feet.
The analysis was conducted to identify potential transportation impacts of the proposed Project on the surrounding roadway system and to recommend appropriate improvements to mitigate any significant impacts. The roadway system was evaluated under Existing, Existing plus Project, Cumulative no Project andCumulative plus Project Conditions.
PROJECT TRAFFIC ESTIMATES
The amount of traffic generated by the proposed Project was estimated by applying rates based on data collected at the San Jose City College driveways. Community college trip generation rates per student were determined for the AM and PM peak hours. The proposed Project is estimated to generate 3,712 net new daily trips, 294 new AM peak-hour trips (234 inbound and 60 outbound) and 365 new PM peak-hour trips (232inbound and 123 outbound).
INTERSECTION IMPACTS
All study intersections operate at acceptable service levels in the Existing and Existing Plus Project condition. Therefore, the near-term intersection impact of the proposed Project is less-than-significant.
In the Cumulative scenario, the Bascom Avenue/San Carlos Street intersection operates unacceptably under no Project conditions. The addition of Project traffic would not increase the critical V/C and average vehicle delay by more than one percent or four seconds, the threshold of significance identified by the VTA. . The remaining study intersections are projected to operate acceptably with the addition of Project traffic in thecumulative condition. Therefore, the cumulative intersection impacts are considered less-than-significant.
FREEWAY SEGMENT IMPACTS
The proposed Project would have a significant impact on one study freeway segment. Implementation of a TDM program would incrementally reduce traffic volumes on all freeway segments; however, it would not reduce the identified impact to a less-than-significant level. The mitigation of freeway impacts is considered beyond the scope of an individual development project, thus, the addition of Project traffic to the freeway system results in a significant and unavoidable impact.
PEDESTRIAN, BICYCLE, AND TRANSIT FACILITY IMPACTS
The proposed Project would not significantly impact pedestrian, bicycle, or transit facilities in the study areabecause the proposed Project does not conflict with any existing or proposed pedestrian, bicycle, or transit

San Jose City College Facilities Transportation Impact AnalysisJanuary 2012
ii
facilities and the proposed Project does not create hazardous conditions for pedestrians, bicyclists, or transit riders.
SITE ACCESS, ON-SITE CIRCULATION, AND PARKING
The San Jose City College campus can be accessed from locations on Bascom Avenue, Moorpark Avenue, Leigh Avenue, and Kingman Avenue within the Sherman Oaks neighborhood. Site access is considered adequate for the volume of traffic projected for the site.
While there is no existing internal vehicular connection between the parking lots on the western side of campus with those on the eastern side, a connection is proposed in the Facilities Master Plan. Three new drop-off locations have been identified in the Master Plan to facilitate internal circulations.
A promenade has been recommended to serve as the primary pedestrian route through the campus. In addition, two secondary pedestrian roadways have been identified in the Plan.
The Facilities Master Plan has identified a target rate of 0.2 parking spaces per student. With a projected enrollment forecast of 14,500 students by 2025, approximately 2,900 spaces are needed to accommodate projected enrollment. Based on the existing parking supply, an additional 800 spaces are needed to accommodate increased enrollment levels. Although an exact increase in parking supply has not been identified and included as part of the Project, the campus is recommended to regularly monitor parking demand as enrollment increases to avoid parking deficiency.

San Jose City College Facilities Transportation Impact AnalysisJanuary 2012
1
1. INTRODUCTION
This report presents the results of the Transportation Impact Analysis (TIA) for the Facilities Master Plan (Project) of the San Jose City College (SJCC) located in Santa Clara County, California. SJCC is bounded by Moorpark Avenue to the north, Bascom Avenue to the west, Leigh Avenue to the east, and residential development to the south.
The Educational and Facilities Master Plan Update – 2025 (June 22, 2010) is a comprehensive plan highlighting the future educational and facility needs of the College. The plan projects an annual student population growth of 1.0 percent through 2025, resulting in an increase in the student population of approximately 2,670 students over the life of the plan.
To accommodate projected growth, the 2025 SJCC Facilities Master Plan was refined and approved (January 25, 2011), and includes demolition of existing facilities and construction of new facilities, increasing campus square footage by approximately 45,200 square-feet.
PROJECT STUDY AREA
The analysis was conducted to identify the potential transportation impacts of the proposed Project on the surrounding roadway system and to identify improvements to mitigate significant impacts. Figure 1 presentsthe project location, surrounding roadway system, study intersections, and freeway study segments. The proposed San Jose City College Facilities Master Plan is shown on Figure 2.
Study Intersections
Project impacts were estimated following the guidelines of the City of San Jose and the Santa Clara Valley Transportation Authority (VTA), which is the congestion management agency for Santa Clara County. The analysis evaluated the operations of the following key intersections, which were selected based on the amount of new traffic that could be added to the intersection by the proposed Project:
1. Bascom Avenue/San Carlos Street
2. Leigh Avenue/San Carlos Street
3. Leigh Avenue/Scott Street
4. Bascom Avenue/Parkmoor Avenue
5. Leland Avenue/Parkmoor Avenue
6. Leigh Avenue/Parkmoor Avenue
7. Bascom Avenue/Moorpark Avenue*
8. Leland Avenue/Moorpark Avenue
9. Leigh Avenue/Moorpark Avenue
10. Bascom Avenue/Renova Drive
11. Bascom Avenue/Kingman Avenue (San Jose City College driveway)
12. Bascom Avenue/Fruitdale Avenue*
13. Sherman Oaks Way/Fruitdale Avenue
14. Leigh Avenue/Fruitdale Avenue
15. Southwest Expressway/Fruitdale Avenue
* Designated CMP intersection.

San Jose City College Facilities Transportation Impact AnalysisJanuary 2012
2
Freeway Segments
The analysis also evaluated the operations of the following key freeway segments:
1. SR 17, between Hamilton Avenue and I-280
2. I-280, between Winchester Boulevard and I-880
3. I-280, between I-880 and Meridian Avenue
4. I-280, between Meridian Avenue and Bird Avenue
5. I-880, between I-280 and West San Carlos Street/Stevens Creek Boulevard
6. I-880, between West San Carlos Street/Stevens Creek Boulevard and Bascom Avenue
Freeway segments were evaluated under Existing and Existing plus Project Conditions following VTA and the California Department of Transportation (Caltrans) guidelines.
INTERSECTION ANALYSIS SCENARIOS
The operations of the key intersections were evaluated during the weekday morning (AM) and afternoon (PM) peak hours for the following four scenarios:
Scenario 1: Existing Conditions – Existing volumes obtained from counts.
Scenario 2: Existing Plus Project Conditions – Scenario 1 volumes plus traffic generated by the proposed Master Plan.
Scenario 3: Cumulative No Project Conditions – Existing volumes (Scenario 1) plus traffic from approved but not yet constructed and pending developments in the area.
Scenario 4: Cumulative Plus Project Conditions – Scenario 3 volumes plus traffic generated by the proposed Master Plan.
TRAFFIC ANALYSIS METHODS
The operations of roadway facilities are described with the term level of service (LOS). LOS is a qualitative description of traffic flow based on such factors as speed, travel time, delay, and freedom to maneuver. Six levels are defined from LOS A, with the best operating conditions, to LOS F, with the worst operating conditions. LOS E represents “at-capacity” operations. Operations are designated as LOS F when volumes exceed capacity, resulting in stop-and-go conditions.
The City of San Jose has established a minimum acceptable operating level of LOS D for all intersections including Congestion Management Program (CMP) designated intersections. The VTA accepts LOS E as the minimum acceptable level for CMP-monitored intersections.
Signalized Intersections
The level of service methodology approved by the City of San Jose and VTA analyzes a signalized intersection’s operation based on average control vehicular delay using the method described in Chapter 16 of the 2000 Highway Capacity Manual (HCM) by the Transportation Research Board, with adjusted saturation flow rates to reflect Santa Clara County conditions. Control delay includes initial deceleration delay, queuemove-up time, stopped delay, and final acceleration delay. The average control delay for signalized intersections is calculated using TRAFFIX 8.0 analysis software and correlated to a LOS designation as shown in Table 1.

San Jose City College Facilities Transportation Impact AnalysisJanuary 2012
3
TABLE 1SIGNALIZED INTERSECTION LEVEL OF SERVICE DEFINITIONS
USING AVERAGE CONTROL VEHICULAR DELAY
Level of Service Description
Average Control Delay Per Vehicle (Seconds)
A Operations with very low delay occurring with favorable progression and/or short cycle lengths. ≤ 10.0
B+ BB-
Operations with low delay occurring with good progression and/or short cycle lengths.
10.1 to 12.012.1 to 18.018.1 to 20.0
C+C C-
Operations with average delays resulting from fair progression and/or longer cycle lengths. Individual cycle failures begin to appear.
20.1 to 23.023.1 to 32.032.1 to 35.0
D+D D-
Operations with longer delays due to a combination of unfavorable progression, long cycle lengths, and high V/C ratios. Many vehicles
stop and individual cycle failures are noticeable.
35.1 to 39.039.1 to 51.051.1 to 55.0
E+ EE-
Operations with high delay values indicating poor progression, long cycle lengths, and high V/C ratios. Individual cycle failures are frequent
occurrences.
55.1 to 60.060.1 to 75.075.1 to 80.0
F Operations with delays unacceptable to most drivers occurring due to over-saturation, poor progression, or very long cycle lengths. > 80.0
Source: Traffic Level of Service Analysis Guidelines, VTA Congestion Management Program, June 2003; Highway Capacity Manual,Transportation Research Board, 2000.
Unsignalized Intersections
Operations of the unsignalized study intersections are evaluated using the method contained in Chapter 17 of the 2000 HCM and calculated using TRAFFIX 8.0 analysis software. LOS ratings for stop-sign controlled intersections are based on the average control delay expressed in seconds per vehicle. At two-way or side-street stop-controlled intersections, control delay is calculated for each movement, not for the intersection as a whole. For approaches composed of a single lane, control delay is computed as the average of all movements in that lane. For all-way stop-controlled locations, a weighted average delay for the entire intersection is presented. Table 2 summarizes the relationship between delay and LOS for unsignalized intersections.

San Jose City College Facilities Transportation Impact AnalysisJanuary 2012
4
TABLE 2UNSIGNALIZED INTERSECTION LEVEL OF SERVICE DEFINITIONS
Level of Service DescriptionAverage Control Delay Per
Vehicle (Seconds)
A Little or no delay. ≤ 10.0B Short traffic delays. 10.1 to 15.0 C Average traffic delays. 15.1 to 25.0D Long traffic delays. 25.1 to 35.0E Very long traffic delays. 35.1 to 50.0F Extreme traffic delays with intersection capacity exceeded. > 50.0
Source: Highway Capacity Manual, Transportation Research Board, 2000.
Freeway Segments
Freeway segments are evaluated using VTA’s analysis procedure, which is based on the density of the traffic flow using methods described in the 2000 HCM. Density is expressed in passenger cars per mile per lane. The Congestion Management Program range of densities for freeway segment level of service is shown in Table 3. The LOS standard for the freeway segments is LOS E.
TABLE 3FREEWAY SEGMENT LEVEL OF SERVICE DEFINITIONS
Level of Service Density (passenger cars per mile per lane)
A ≤ 11B 11.1 to 18.0C 18.1 to 26.0D 26.1 to 46.0E 46.1 to 58.0F > 58.0
Sources: Traffic Level of Service Analysis Guidelines, VTA Congestion Management Program, June 2003; Highway Capacity Manual,Transportation Research Board, 2000.
INTERSECTION IMPACT CRITERIA
The impacts of the project were evaluated by comparing the results of the level of service calculations under Existing plus Project Conditions to the results under Existing Conditions.
City of San Jose
Significant impacts at signalized San Jose intersections occur when project traffic causes one of the following:
• Operations degrade from an acceptable level (LOS D or better) under Existing Conditions to an unacceptable level (LOS E or F) under Existing plus Project Conditions.

San Jose City College Facilities Transportation Impact AnalysisJanuary 2012
5
• Unacceptable operations (LOS E or F) are exacerbated by increasing the critical delay by more than 4 seconds and increasing the volume-to-capacity (V/C) ratio by 0.01 or more.
• The V/C ratio increases by 0.01 or more at an intersection with unacceptable operations (LOS E or F) when the change in critical delay is negative (i.e., decreases). This can occur if the critical movements change.
Significant impacts at unsignalized intersections occur when project traffic causes one of the following:
• Operations degrade from an acceptable level (LOS D or better) under Existing Conditions to an unacceptable level (LOS E or F) under Existing plus Project Conditions, and the peak-hour signal warrant from the Manual on Uniform Traffic Control Devices (MUTCD) is met.
• Unacceptable operations (LOS E or F) are exacerbated by adding any traffic, and the MUTCD peak-hour signal warrant is met.
Valley Transportation Authority
Significant impacts at CMP intersections occur when project traffic causes one of the following:
• Operations degrade from an acceptable level (LOS E or better) under Existing Conditions to an unacceptable level (LOS F) under Existing plus Project Conditions.
• LOS F operations are exacerbated by increasing the critical delay by more than 4 seconds and increasing the volume-to-capacity (V/C) ratio by 0.01 or more.
• The V/C ratio increases by 0.01 or more at an intersection with LOS F operations when the change in critical delay is negative (i.e., decreases). This can occur if the critical movements change.
FREEWAY IMPACT CRITERIA
The impacts of the Project were evaluated by comparing the results of the level of service calculations under Existing plus Project Conditions to the results under Existing Conditions. Significant impacts to freeway segments occur when the addition of project traffic causes one of the following:
• A segment drops below its acceptable CMP operating standard (LOS E).
• Unacceptable operations (LOS F) are exacerbated by adding traffic equal to more than one percent of a segment’s capacity.
REPORT ORGANIZATION
The remainder of this report is divided into three chapters. The existing transportation system serving the site, including the operating conditions of study intersections and freeway segments are described in Chapter 2. Chapter 3 describes Existing plus Project Conditions, including the method used to estimate the amount of traffic added to the surrounding roadways by the proposed Projects and their impacts on the transportation system. A discussion of site access and on-site circulation is also contained in Chapter 3. Cumulative Conditions are described in Chapter 4.

PROJECTSITE
Stokes St.17
Forest Ave.
Stevens Creek Blvd.
Tisch Wy.
Downing Ave.Westfield Ave.
Fruitdale Ave.Enborg Ln.
Thor
nton
Wy.
San Carlos St.
Scott St.
Moorpark Ave.
Parkmoor Ave.Pfeffer Ln.
Mac
Arth
ur A
ve.
Bas
com
Ave
.
Mon
roe
St.
Lela
nd A
ve.
Leig
h A
ve.
Bel
lero
se
Dr.
Mer
idia
n Av
e.
Southw
est E
xpwy.
Hamilton Ave.
Bas
com
Ave
.
Leig
h A
ve.
880
280280
Mer
idia
n Av
e.
Renova Dr.
She
rman
O
aks
Dr.
SJCCDriveway
Kingman Ave.
1 2
3
4 5 67 8 9
12
10
11
14
16
1513
October 2011SJ11-1262
PROJECT LOCATION, STUDY INTERSECTIONS,AND FREEWAY STUDY SEGMENTS
FIGURE 1
San Jose City College Facilities Master Plan TIA
NNot to Scale
LEGEND= Study Intersections= Freeway Study Segment 1= Freeway Study Segment 2= Freeway Study Segment 3= Freeway Study Segment 4= Freeway Study Segment 5= Freeway Study Segment 6
1

MULTI DISCIPLINARYCR & ARTS COMPLEX
MAINTENANCE & OPS
VOCATIONALTECHNOLOGY
PHYSICAL EDUCATIONCOMPLEX
APPROVED FMP
January 2012SJ11-1262
San Jose City College Facilities Master Plan TIA
FIGURE 2
PROPOSED MASTER PLAN
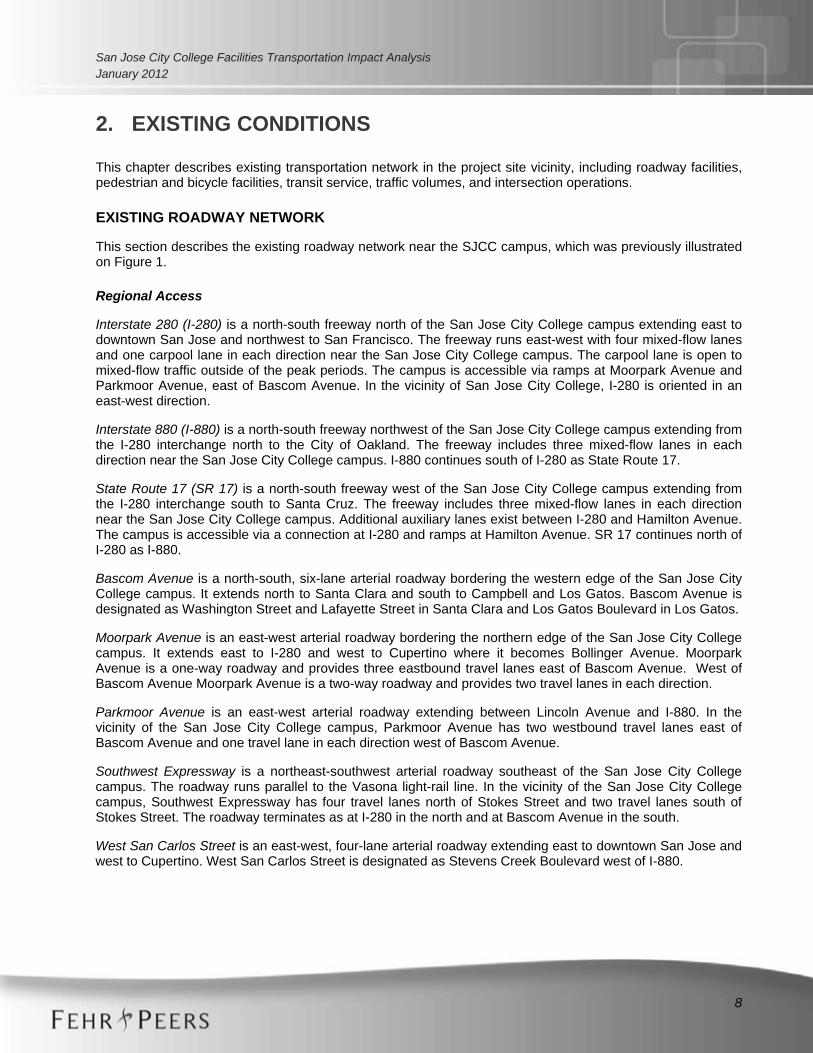
San Jose City College Facilities Transportation Impact AnalysisJanuary 2012
8
2. EXISTING CONDITIONS
This chapter describes existing transportation network in the project site vicinity, including roadway facilities, pedestrian and bicycle facilities, transit service, traffic volumes, and intersection operations.
EXISTING ROADWAY NETWORK
This section describes the existing roadway network near the SJCC campus, which was previously illustrated on Figure 1.
Regional Access
Interstate 280 (I-280) is a north-south freeway north of the San Jose City College campus extending east to downtown San Jose and northwest to San Francisco. The freeway runs east-west with four mixed-flow lanes and one carpool lane in each direction near the San Jose City College campus. The carpool lane is open to mixed-flow traffic outside of the peak periods. The campus is accessible via ramps at Moorpark Avenue and Parkmoor Avenue, east of Bascom Avenue. In the vicinity of San Jose City College, I-280 is oriented in an east-west direction.
Interstate 880 (I-880) is a north-south freeway northwest of the San Jose City College campus extending from the I-280 interchange north to the City of Oakland. The freeway includes three mixed-flow lanes in each direction near the San Jose City College campus. I-880 continues south of I-280 as State Route 17.
State Route 17 (SR 17) is a north-south freeway west of the San Jose City College campus extending from the I-280 interchange south to Santa Cruz. The freeway includes three mixed-flow lanes in each directionnear the San Jose City College campus. Additional auxiliary lanes exist between I-280 and Hamilton Avenue. The campus is accessible via a connection at I-280 and ramps at Hamilton Avenue. SR 17 continues north of I-280 as I-880.
Bascom Avenue is a north-south, six-lane arterial roadway bordering the western edge of the San Jose City College campus. It extends north to Santa Clara and south to Campbell and Los Gatos. Bascom Avenue is designated as Washington Street and Lafayette Street in Santa Clara and Los Gatos Boulevard in Los Gatos.
Moorpark Avenue is an east-west arterial roadway bordering the northern edge of the San Jose City College campus. It extends east to I-280 and west to Cupertino where it becomes Bollinger Avenue. Moorpark Avenue is a one-way roadway and provides three eastbound travel lanes east of Bascom Avenue. West of Bascom Avenue Moorpark Avenue is a two-way roadway and provides two travel lanes in each direction.
Parkmoor Avenue is an east-west arterial roadway extending between Lincoln Avenue and I-880. In the vicinity of the San Jose City College campus, Parkmoor Avenue has two westbound travel lanes east of Bascom Avenue and one travel lane in each direction west of Bascom Avenue.
Southwest Expressway is a northeast-southwest arterial roadway southeast of the San Jose City College campus. The roadway runs parallel to the Vasona light-rail line. In the vicinity of the San Jose City College campus, Southwest Expressway has four travel lanes north of Stokes Street and two travel lanes south of Stokes Street. The roadway terminates as at I-280 in the north and at Bascom Avenue in the south.
West San Carlos Street is an east-west, four-lane arterial roadway extending east to downtown San Jose and west to Cupertino. West San Carlos Street is designated as Stevens Creek Boulevard west of I-880.

San Jose City College Facilities Transportation Impact AnalysisJanuary 2012
9
Local Access
Fruitdale Avenue is an east-west, four-lane collector roadway extending from south of the San Jose City College campus east to San Jose’s Willow Glen neighborhood. The portion of Fruitdale Avenue located west of Bascom Avenue is called Enborg Lane and is a two-lane residential street.
Kingman Avenue is a discontinuous east-west, two-lane local roadway that is divided into two segments. The western segment terminates at Bascom Avenue in the west and serves as a driveway into the San Jose City College campus. The eastern segment terminates in the east into an apartment complex near Sherman Oaks Way and in the west at Mansfield Drive. The two segments both serve the western parking lots on campus.
Laswell Avenue is a north-south, two-lane local roadway that extends between Moorpark Avenue and the southern side of campus. The roadway serves as a driveway into the San Jose City College campus.
Leigh Avenue is a north-south, two- to four-lane arterial roadway bordering the eastern edge of the San Jose City College campus. Leigh Avenue provides four lanes south of Parkmoor Avenue and narrows to two lanes north of Parkmoor Avenue.
Leland Avenue is a north-south, two-lane local roadway that extends between Moorpark Avenue and San Carlos Street. At the signalized intersection of Leland Avenue and Moorpark Avenue, access to campus is provided only to vehicles on Moorpark Avenue as a right-in, right-out driveway. No through movements may be made to or from Leland Avenue from San Jose City College.
Internal circulation on the San Jose City College campus is facilitated by Kingman Avenue and Laswell Avenue and within campus parking lots. There are no roadways that extend from the west side of campus to the east side of campus.
EXISTING PEDESTRIAN AND BICYCLE FACILITIES
Pedestrian Facilities
Pedestrian facilities are comprised of sidewalks, crosswalks, pedestrian signals, and off-street paths. Sidewalks are consistent and continuous in the study area with the exception of Moorpark and Parkmoor Avenues. However, some sidewalks are provided near on-street parking spaces on the north side of Moorpark Avenue. Also, no sidewalks are provided on the south side of Parkmoor Avenue in the study area.
Crosswalks and pedestrian signals are located at all of the signalized intersections within the study area. A pedestrian bridge is located one-quarter mile east of the campus that spans the I-280 freeway connecting Moorpark Avenue and College Drive to Parkmoor Avenue. This bridge connects the neighborhood on the south side of the freeway with a shopping center and a post office on the north side of the freeway.
On-campus pedestrian facilities consist of paths connecting buildings to each other and to parking lots.Typically these campus paths provide for pedestrian connectivity and require bicyclists to walk their bicycles. A major pedestrian paseo arcs from the corner of Moorpark Avenue and Bascom Avenue through the Technology Center, across the center of campus, through the Student Center, and then to the corner of Moorpark Avenue and Leigh Avenue. This 20-foot wide pedestrian walkway serves as the central connection to most of the campus. However, the existing pedestrian paseo is discontinuous due to the gyms and pool. All other on-campus pedestrian circulation is provided by the use of pedestrian walkways/paths.
Bicycle Facilities
Bicycle facilities include the following:
• Bike paths (Class I) – Paved trails that are separated from roadways.

San Jose City College Facilities Transportation Impact AnalysisJanuary 2012
10
• Bike lanes (Class II) – Lanes on roadways designated for use by bicycles through striping, pavement legends, and signs.
• Bike routes (Class III) – Designated roadways for bicycle use by signs only; may or may not include additional pavement width for cyclists.
Figure 3 presents existing pedestrian and bicycle facilities in the study area.
A Class I bicycle path is located along Los Gatos Creek. Access to the trail is provided on the east side of Bascom Avenue and on both sides of Leigh Avenue. Class II bicycle lanes are located in both directions of Bascom Avenue south of Fruitdale Avenue, which is approximately 1,000 feet south of the Kingman Avenue entrance to campus. Bicycle lanes are also provided on Southwest Expressway south of Fruitdale Avenue.
The City of San Jose Bicycle Plan identifies future bike lanes on Moorpark Avenue from beyond Winchester Boulevard to College Drive at the pedestrian bridge. Other bike lanes are proposed on Bascom Avenue from the existing bike lanes south of Fruitdale Avenue northward to the City of Santa Clara, on Parkmoor Avenue from Meridian Avenue to Bascom Avenue, on Fruitdale Avenue from Bascom Avenue to beyond Meridian Avenue, and on Leigh Avenue from beyond Southwest Expressway to beyond San Carlos Street. Class III bike routes are also proposed for Kingman Avenue from Leigh Avenue to College Drive, Scott Street from Leigh Avenue to Willard Avenue, College Drive from Kingman Avenue to Moorpark Avenue, and Enborg Lane from Bascom Avenue to Thornton Way
No bicycle facilities such as bike paths or lanes exist on campus. Typical to other college and university campuses, bicycle use is prohibited in the center of campus where “bicycles… may not be ridden on campus sidewalks.”1 Bicycle parking is provided at a variety of locations on the San Jose City College campus via bike racks. Most of these locations are located near recently constructed high-use buildings such as the Technology Center and Student Center.
1 San Jose/Evergreen Community College District Parking and Traffic Regulations Section 3.00 (http://www.sjeccd.org/HTML/District/DistPolice/PoliceDownloads/Regulations.pdf )

Pedestrian Bridge
Pedestrian BridgePROJECTSITE
Stokes St.17
Forest Ave.
Stevens Creek Blvd.
Tisch Wy.
Downing Ave.Westfield Ave.
Fruitdale Ave.Enborg Ln.
Thor
nton
Wy.
San Carlos St.
Scott St.
Moorpark Ave.
Parkmoor Ave.Pfeffer Ln.
Mac
Arth
ur A
ve.
Bas
com
Ave
.
Mon
roe
St.
Lela
nd A
ve.
Leig
h A
ve.
Bel
lero
se
Dr.
Mer
idia
n Av
e.
Southw
est E
xpwy.
Hamilton Ave.
Bas
com
Ave
.
Leig
h A
ve.
880
280280
Mer
idia
n Av
e.
Renova Dr.
She
rman
O
aks
Dr.
SJCC Driveway
1 2
3
4 5 67 8 9
12
10
11
14 1513
EXISTING PEDESTRIAN AND BICYCLE FACILITIESFIGURE 3
San Jose City College Facilities Master Plan TIA
NNot to Scale
LEGEND= Study Intersections= Existing Bicycle Path= Existing Bicycle Lane= Existing Crosswalk
1
October 2011SJ11-1262

San Jose City College Facilities Transportation Impact AnalysisJanuary 2012
12
EXISTING TRANSIT SERVICE
Santa Clara Valley Transportation Authority (VTA) provides fixed-route bus service on 72 local routes in Santa Clara County, serving the City of San Jose. VTA also operates light rail service in Santa Clara County. Figure 4 shows the existing transit facilities in the study area.
VTA bus stops for routes 25, 61, 62, and 65 provide transit service adjacent to San Jose City College. The campus is easily accessible to transit at its northwest and northeast corners that are served by Routes 61, 62, and 65. While Route 25 does not serve the campus directly, stop locations on Fruitdale Avenue and Bascom Avenue south of the school are within 1,500 feet walking distance from the campus.
Route 25 provides service between east San Jose at the Alum Rock Transit Center and the city of Cupertino near De Anza College. Service is provided weekdays between 5:10 am and 12:35 am on 10 to 20-minute headways during the peak commute hours and 30 to 60-minute headways during other times of the day. Weekend service is provided on both Saturday and Sunday between 5:40 am and 12:00 am on 15 to 60-minute headways.
Routes 61 and 62 provide service between east San Jose near Piedmont Hills High School to south San Jose near Good Samaritan Hospital. Both routes use the same streets from the route terminus in east San Jose to the intersection of Bascom Avenue and Union Avenue in south San Jose. Route 61 continues to south San Jose near Good Samaritan Hospital via Bascom Avenue whereas Route 62 continues via Union Avenue. Service is provided weekdays between 5:50 am and 11:00 pm on 30 to 60-minute headways for both routes. Weekend service is provided on both Saturday and Sunday between 6:15 am and 10:15 pm on 60 to 90-minute headways for Route 61 and 30 to 60-minute headways for Route 62.
Route 65 is a community bus route and it provides service between south San Jose near Princeton Plaza and the northern edge of downtown San Jose. Service is provided weekdays between 6:25 am and 7:20 pm on 60-minute headways. There is no weekend service.
Other bus routes provide service within the study area but do not have stops adjacent to the campus, such as Express Routes 182 and the Highway 17 Express which operate along I-280. Route 103 also operates along Moorpark Avenue in the eastbound direction but does not have stops near San Jose City College. The nearest Route 103 stop to the campus is located at the Southwest Expressway/Fruitdale Avenue intersection, which is over a half-mile away from a campus entrance. The Fruitdale light rail transit station is also located at this intersection. Route 23 serves the San Carlos Street corridor. Ridership information for the two bus routes identified above are presented in Table 4.

San Jose City College Facilities Transportation Impact AnalysisJanuary 2012
13
TABLE 4EXISTING VTA RIDERSHIP AND CAPACITY AT THE MAXIMUM LOAD POINT
Route Direction Vehicle Type1 Maximum
Passenger Load2 Peak Hour Capacity3
Capacity Utilization
AM Peak Hour
25 Eastbound RBS 84 360 23%
25 Westbound RBS 140 360 39%
61 Northbound RBS 23 120 19%
61 Southbound RBS 46 120 39%
62 Northbound RBS 28 120 23%
62 Southbound RBS 56 120 47%
65 Northbound CBS 17 27 62%
65 Southbound CBS 14 27 51%
PM Peak Hour
25 Eastbound RBS 130 360 36%
25 Westbound RBS 86 360 24%
61 Northbound RBS 34 120 28%
61 Southbound RBS 18 120 15%
62 Northbound RBS 38 120 32%
62 Southbound RBS 38 120 32%
65 Northbound CBS 8 27 30%
65 Southbound CBS 10 27 37%
Notes: 1. RBS – Regular Bus Service; CBS – Community Bus Service 2. Ridership and number of buses during the peak hour 3. Total peak hour capacity in vehicles per hour Sources: VTA, 2011; Fehr & Peers, 2011

PROJECTSITE
Stokes St.17
Forest Ave.
Stevens Creek Blvd.
Tisch Wy.
Downing Ave.Westfield Ave.
Fruitdale Ave.Enborg Ln.
Thor
nton
Wy.
San Carlos St.
Scott St.
Moorpark Ave.
Parkmoor Ave.Pfeffer Ln.
Mac
Arth
ur A
ve.
Bas
com
Ave
.
Mon
roe
St.
Lela
nd A
ve.
Leig
h A
ve.
Bel
lero
se
Dr.
Mer
idia
n Av
e.
Southw
est E
xpwy.
Hamilton Ave.
Bas
com
Ave
.
Leig
h A
ve.
880
280280
Mer
idia
n Av
e.
Renova Dr.
She
rman
O
aks
Dr.
SJCC Driveway
1 2
3
4 5 67 8 9
12
10
11
14 1513
EXISTING TRANSIT SERVICEFIGURE 4
NNot to Scale
LEGEND= Study Intersections= Light Rail Line= Light Rail Station= Bus Route 61,62= Bus Route 25= Bus Route 65= Bus Route 23= Bus Route 82= Bus Route 63= Express Bus Route 103
1
VTA
San Jose City College Facilities Master Plan TIA
October 2011SJ11-1262
VTA
VTA
VTA
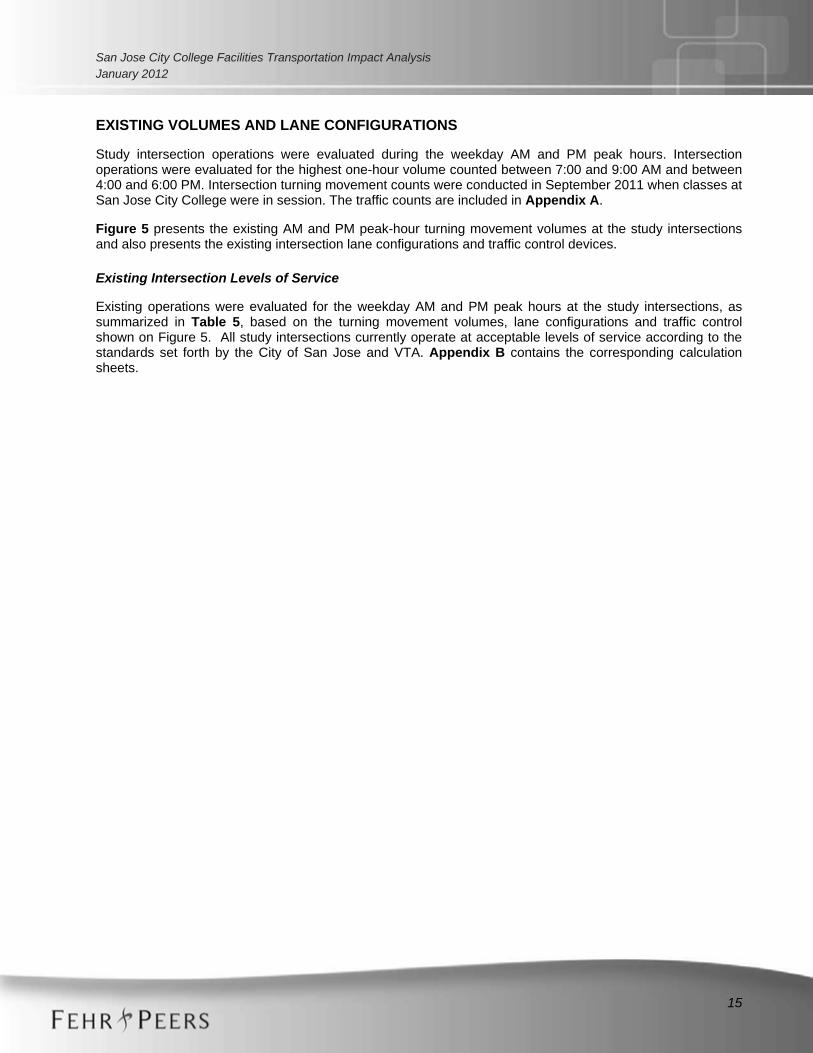
San Jose City College Facilities Transportation Impact AnalysisJanuary 2012
15
EXISTING VOLUMES AND LANE CONFIGURATIONS
Study intersection operations were evaluated during the weekday AM and PM peak hours. Intersection operations were evaluated for the highest one-hour volume counted between 7:00 and 9:00 AM and between 4:00 and 6:00 PM. Intersection turning movement counts were conducted in September 2011 when classes at San Jose City College were in session. The traffic counts are included in Appendix A.
Figure 5 presents the existing AM and PM peak-hour turning movement volumes at the study intersectionsand also presents the existing intersection lane configurations and traffic control devices.
Existing Intersection Levels of Service
Existing operations were evaluated for the weekday AM and PM peak hours at the study intersections, as summarized in Table 5, based on the turning movement volumes, lane configurations and traffic control shown on Figure 5. All study intersections currently operate at acceptable levels of service according to the standards set forth by the City of San Jose and VTA. Appendix B contains the corresponding calculation sheets.

FIGURE 5
EXISTING LANE GEOMETRIES, TRAFFIC CONTROLS, ANDPEAK-HOUR INTERSECTION VOLUMES
PROJECTSITE
Forest Ave.
Stevens Creek Blvd.
Tisch Wy.
Fruitdale Ave.Enborg Ln.
Wy.
San Carlos St.
Scott St.
Moorpark Ave.
Parkmoor Ave.Pfeffer Ln.
Mac
Arth
ur A
ve.
Bas
com
Ave
.
Mon
roe
St.
Lela
nd A
ve.
Leig
h A
ve.
Bel
lero
se
Dr.
Mer
idia
n Av
e.
880
280280
Renova Dr.
She
rman
Oak
s D
r.
SJCCDriveway
1 2
3
4 5 67 8 9
12
10
11
14 1513
STOP
2
KEY:XX (YY) = AM (PM) Peak
Hour TrafficVolume
= StudyIntersection
= SignalizedIntersection
= Stop Sign
1 2 3
TRUE
4
TRUETRUE TRUE TRUE TRUE
TRUETRUE
5 86 7
TRUE TRUETRUE TRUE TRUE TRUETRUE TRUE
9 10 1211
TRUE
TRUE TRUE TRUETRUE
13 14
15
San Jose City College Facilities Master Plan TIA
October 2011SJ11-1262
216 (117)47
(89)
432
(963
)
TRUE
175 (213)841 (480)
306
(190
)10
50 (4
72)
84 (2
23)
TRUE
Stevens Creek Boulevard
71 (69)251 (677)100 (189)
100
(248
)
Basc
om A
venu
eWest San Carlos Street
128
(114
)12
4 (7
7)36
(57)
20 (41)
TRUE
45 (71)
Leig
h A
venu
e
16 (9)
874 (698)59 (113)
West San Carlos Stree
46 (2
7)15
2 (1
20)
393 (979)
61 (5
8)
TRUE
TRUE
32 (6
0)
46 (52)
12 (19)33 (87)
55 (4
8)17
6 (2
18)
Leig
h A
venu
e
82 (34)157 (50)107 (55)
Scott Street
15 (2
6)21
3 (1
93)
9 (1
3)
TRUE
TRUE
3 (1
5)97
5 (6
34)
27 (9)
9 (2)
684 (582)
TRUE TRUEParkmoor Avenue
Basc
om A
venu
e
165 (118)268 (164)
12 (2
8)68
7 (1
373)
104
(69)
36 (54)
73 (5
9)
Lela
nd A
venu
e
141
(217
)65
(122
)
Parkmoor Avenue
1418 (1023)
TRUE TRUE
50 (42)
30
7 (1
67)
197
(214
)
Parkmoor Avenue
1088 (932)361 (419)
287
(245
)
TRUE
110
(60)
Leig
h Av
enue
95 (133)
TRUE
)672( 202
397
(249
)
Moorpark Avenue
867
(544
)27
7 (3
13)
TRUETRUE
715 (886)111 (105)
Basc
om A
venu
e
TRUE
527
(345
)61
5 (1
163)
256
(456
)
)84( 431
993 (1718)
206 (339)
34 (2
7)
TRUEMoorpark Avenue
Lela
nd A
venu
e
123
(101
)
TRUE
427
(226
)18
4 (1
16)
)154( 402 843 (1262)
77 (155)
TRUETRUE
227
(188
)
Moorpark Avenue
421
(476
)
Leig
h Av
enue
TRUE
Renova Drive
7 (1)
127
(51)
1439
(978
)17
(8)
27 (61)
TRUE
Basc
om A
venu
e
12 (26)3 (5)8 (18)
Driveway
20 (35)
26 (2
7)
TRUE
TRUE
100
(48)
704
(138
2)
11 (4
)
Kingman AvenueTRUE
Basc
om A
venu
e
36 (8
)56
7 (1
345)
5 (27)
TRUE
1570
(966
)18
0 (1
23)
23 (26)1 (0)91
(107
)
564 (338)
65 (2
8)35
9 (1
074)
TRUE
128 (226)243 (41)
120
(40)
1202
(703
)12
1 (1
47)
TRUE
Enborg Lane
34 (56)59 (123)43 (127)
183
(294
)
Basc
om A
venu
e
Fruitdale Avenue
TRUE
10 (5)
She
rman
Oak
s W
ay
28 (31)1066 (714)
Fruitdale Avenue
13 (1
7)
435 (491)
28 (2
2)
TRUE
TRUE
13 (1
6)
32 (71)
191 (105)242 (344)
150
(73)
262
(128
)
Leig
h A
venu
e
30 (32)
694 (400)15 (21)
Fruitdale Avenue
223
(288
)11
7 (4
20)
23 (8
6)
TRUE
TRUE
191 (277)
18 (1
0)93
2 (4
73)
113
(100
)
8 (8) 150 (160)
50 (70)
TRUE TRUEFruitdale Avenue
Sout
hwes
t Exp
ress
wa
317 (195)
60 (37)
441
(207
)38
8 (5
89)
117
(158
)
STOP
STO
P
STOP
STOP
STO
P
STOP

San Jose City College Facilities Transportation Impact AnalysisJanuary 2012
17
TABLE 5 EXISTING INTERSECTION LEVELS OF SERVICE
IntersectionTraffic Control Peak Hour Count Date Delay1 LOS2
1. Bascom Avenue/San Carlos Street SignalAMPM
9/20119/2011
42.050.7
D D
2. Leigh Avenue/San Carlos Street SignalAMPM
9/20119/2011
23.224.8
C C
3. Leigh Avenue/Scott Street 4-Way StopAMPM
9/20119/2011
13.511.8
BB
4. Bascom Avenue/Parkmoor Avenue SignalAMPM
9/20119/2011
33.631.1
C- C
5. Leland Avenue/Parkmoor Avenue SignalAMPM
9/20119/2011
19.421.1
B-C+
6. Leigh Avenue/Parkmoor Avenue SignalAMPM
9/20119/2011
31.121.9
C C+
7. Bascom Avenue/Moorpark Avenue* SignalAMPM
9/20119/2011
38.942.8
D+D
8. Leland Avenue/Moorpark Avenue SignalAMPM
9/20119/2011
8.65.0
AA
9. Leigh Avenue/Moorpark Avenue SignalAMPM
9/20119/2011
26.520.1
C C+
10. Bascom Avenue/Renova Drive SignalAMPM
9/20119/2011
11.312.6
B+ B
11. Bascom Avenue/Kingman Avenue Side-Street Stop
AMPM
9/20119/2011
20.020.3
C C
12. Bascom Avenue/Fruitdale Avenue* SignalAMPM
9/20119/2011
46.146.4
D D
13. Sherman Oaks Way/Fruitdale Avenue Side-Street Stop
AMPM
9/20119/2011
28.216.8
D C
14. Leigh Avenue/Fruitdale Avenue SignalAMPM
9/20119/2011
33.630.5
C- C
15. Southwest Expressway/Fruitdale Avenue Signal
AMPM
9/2011 9/2011
24.828.6
C C
Notes: 1 Whole intersection weighted average control delay expressed in seconds per vehicle calculated using methods described in the
2000 HCM, with adjusted saturation flow rates to reflect Santa Clara County Conditions. Total control delay for the worst movement is presented for side-street stop-controlled intersections. Delay for the worst approach is reported for Unsignalized intersections.
2 LOS = Level of service. LOS calculations conducted using the TRAFFIX level of service analysis software package. * CMP intersection. Source: Fehr & Peers, October 2011.
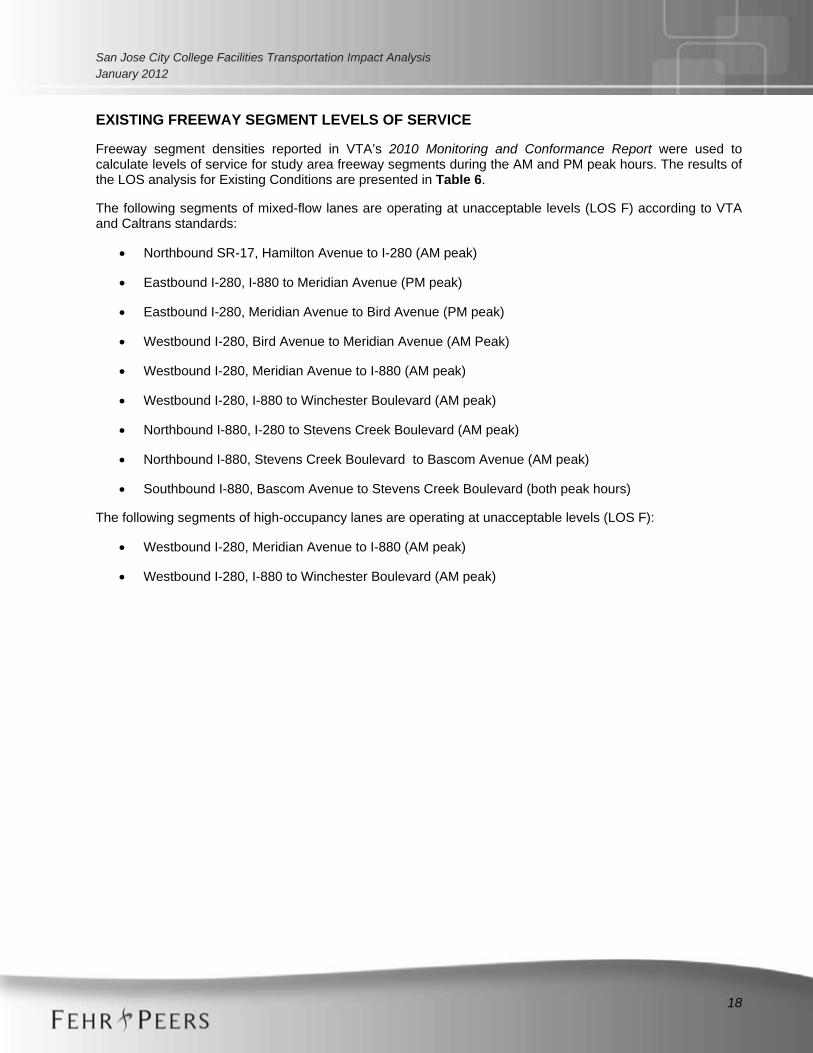
San Jose City College Facilities Transportation Impact AnalysisJanuary 2012
18
EXISTING FREEWAY SEGMENT LEVELS OF SERVICE
Freeway segment densities reported in VTA’s 2010 Monitoring and Conformance Report were used to calculate levels of service for study area freeway segments during the AM and PM peak hours. The results of the LOS analysis for Existing Conditions are presented in Table 6.
The following segments of mixed-flow lanes are operating at unacceptable levels (LOS F) according to VTA and Caltrans standards:
• Northbound SR-17, Hamilton Avenue to I-280 (AM peak)
• Eastbound I-280, I-880 to Meridian Avenue (PM peak)
• Eastbound I-280, Meridian Avenue to Bird Avenue (PM peak)
• Westbound I-280, Bird Avenue to Meridian Avenue (AM Peak)
• Westbound I-280, Meridian Avenue to I-880 (AM peak)
• Westbound I-280, I-880 to Winchester Boulevard (AM peak)
• Northbound I-880, I-280 to Stevens Creek Boulevard (AM peak)
• Northbound I-880, Stevens Creek Boulevard to Bascom Avenue (AM peak)
• Southbound I-880, Bascom Avenue to Stevens Creek Boulevard (both peak hours)
The following segments of high-occupancy lanes are operating at unacceptable levels (LOS F):
• Westbound I-280, Meridian Avenue to I-880 (AM peak)
• Westbound I-280, I-880 to Winchester Boulevard (AM peak)

San Jose City College Facilities Transportation Impact AnalysisJanuary 2012
19
TABLE 6 EXISTING FREEWAY SEGMENT LEVELS OF SERVICE
Freeway From To
Number of Lanes Peak Hour1
Density1 Level of Service
Mixed HOV Mixed HOV Mixed HOV
SR 17 Northbound Hamilton Avenue I-280 3 0
AMPM
6929
N/AN/A
F D
N/AN/A
SR 17 Southbound I-280 Hamilton Avenue 3 0
AMPM
27 35
N/AN/A
D D
N/AN/A
I-280Eastbound
Winchester Boulevard I-880 3 1
AMPM
2730
9 29
D D
AD
I-880 Meridian Avenue 4 1 AMPM
27 65
10 24
D F
AC
Meridian Avenue Bird Avenue 4 0 AMPM
4268
N/AN/A
D F
N/AN/A
I-280Westbound
Bird Avenue Meridian Avenue 4 0 AMPM
9542
N/AN/A
F D
N/AN/A
Meridian Avenue I-880 4 1 AMPM
12428
579
F D
EA
I-880 Winchester Boulevard 3 1
AMPM
10153
5812
F E
EB
I-880Northbound
I-280 Stevens Creek Boulevard 3 0
AMPM
92 17
N/AN/A
F B
N/AN/A
Stevens Creek Boulevard Bascom Avenue 3 0
AMPM
6027
N/AN/A
F D
N/AN/A
I-880Southbound
Bascom Avenue Stevens Creek Boulevard 3 0
AMPM
6963
N/AN/A
F F
N/AN/A
Stevens Creek Boulevard I-280 3 0
AMPM
24 28
N/AN/A
C D
N/AN/A
Note: 1 Measured in passenger cars per mile per lane. Source: 2010 Monitoring and Conformance Report, VTA, May 2011.

San Jose City College Facilities Transportation Impact AnalysisJanuary 2012
20
FIELD OBSERVATIONS
Field observations were conducted in September 2011 to verify the calculated operations of the study intersections. The study intersections appeared to operate at or near the calculated levels of service. However, heavy queuing was noted at these locations:
• Bascom Avenue at West San Carlos Street in all four directions (PM peak hour)
• Bascom Avenue, northbound at West San Carlos Street (AM peak hour)
• Bascom Avenue, northbound from Moorpark Avenue to Renova Drive (AM peak hour)
• Bascom Avenue, southbound left turn lane at Moorpark Avenue to Parkmoor Avenue (PM peak hour)
• Bascom Avenue, northbound from Fruitdale Avenue to Maywood Avenue (AM and PM peak hours)
• Bascom Avenue, southbound from Fruitdale Avenue (PM peak hour)
• Moorpark Avenue, eastbound from Bascom Avenue to Turner Drive (AM and PM peak hours)
• Moorpark Avenue, eastbound from Leland Avenue towards Bascom Avenue (PM peak hour)
• Moorpark Avenue, eastbound from Leigh Avenue to Leland Avenue (PM peak hour)
• Parkmoor Avenue, westbound from Bascom Avenue to Raymond Avenue (AM peak hour)
• Parkmoor Avenue, westbound from Leland Avenue to Leigh Avenue (PM peak hour)
• Parkmoor Avenue, westbound from Leigh Avenue to the I-280 off-ramp merge (AM peak hour)
• Fruitdale Avenue, westbound at Sherman Oaks Drive (AM and PM peak hour)
• Fruitdale Avenue, westbound from Leigh Avenue towards Southwest Expressway (AM and PM peak hour)
At the Bascom Avenue/Parkmoor Avenue intersection, the westbound queues did not regularly clear in one signal cycle during both peak hours. At the Bascom Avenue/San Carlos Avenue intersection, occasionally the northbound and southbound queues did not clear in one signal cycle during the PM Peak hour.
At the Southwest Expressway/Fruitdale Avenue intersection, heavy queuing was noted only during light rail vehicle preemption. During this preemption, both directions of Fruitdale experienced heavy queuing and the southbound right-turn lane also experienced heavy queuing during both peak hours. These queues regularly cleared within a few signal cycles after the preemption.

San Jose City College Facilities Transportation Impact AnalysisJanuary 2012
21
3. EXISTING PLUS PROJECT CONDITIONS
This chapter identifies the potential off-site impacts of the proposed Project on the surrounding roadway system. First, the method used to estimate the amount of traffic generated by the project is described. Then, the results of the level of service calculations for Existing plus Project Conditions are presented. Existing plus Project Conditions are defined as Existing Conditions plus traffic generated by the proposed Project. Existing plus Project impacts are then identified by comparing the level of service results under Existing plus ProjectConditions to those under Existing Conditions. Site access, on-site circulation, parking, and pedestrian, bicycle, and transit impacts are also addressed in this chapter.
PROJECT TRAFFIC ESTIMATES
The amount of traffic added to the roadway system by the proposed San Jose City College Master Plan is estimated using a three-step process:
1. Trip Generation – The amount of vehicle traffic entering and exiting the Project site was estimated, taking into consideration travel by walking, biking and busing to the campus.
2. Trip Distribution – The direction trips use to approach and depart the site was projected.
3. Trip Assignment – Trips were then assigned to specific roadway segments and intersection turning movements.
Results of the process for the proposed Project are described in the following sections.
Trip Generation
Additional Students
The amount of traffic generated by the additional students was estimated by applying rates derived from driveway counts of the existing campus conducted in September 2007. The rates were derived from the student enrollment at the time of the survey, which was approximately 12,000 students. Trip generation rates per student were calculated for the AM and PM peak hours, as shown in Table 7. The additional 2,670students (for an approximate total of 14,670 students) that were included in this analysis to obtain a “worst-case scenario is estimated to generate 3,710 net new daily trips, 294 new AM peak-hour trips (234 inbound and 60 outbound) and 355 new PM peak-hour trips (232 inbound and 123 outbound).
Comparison of Trip Generation Rates to ITE Rates
The Institute of Transportation Engineers Trip Generation, 8th Edition has trip generation rates of 0.12 trips per student for both the AM and PM peak hours. These are about 10 percent different than the rates observed in the surveys of the SJCC campus. However, the rates are based on a limited number of studies (5 trip generation surveys) and may not reflect a similar environment of the San Jose area. Two of the five studies identified transit centers within close proximity of the studied campuses. Transit use could affect the trip generation rates at those locations. The SJCC-specific trip generation rates were used in analyzing the traffic generation of the new students to reflect a locally validated trip generation rate.

San Jose City College Facilities Transportation Impact AnalysisJanuary 2012
22
TABLE 7 PROJECT TRIP GENERATION RATES AND ESTIMATES
Land Use Size Daily
AM PM
In Out Total In Out Total
Trip Rates1
San Jose City College StudentsPer student
1.39 80% 20% 0.11 65% 35% 0.13
Trip Estimates
San Jose City CollegeAdditional students
Additional 2,670
Students33,712 234 60 294 232 123 355
Total 3,712 234 60 294 232 123 355
Note: 1 Rates used based on data collected at San Jose City College driveways in 2007. Source: Fehr & Peers, October 2011.
Trip Distribution
The directions of approach and departure for Project traffic were estimated based on the existing travel patterns in the area and the relative locations of complementary land uses including residential and commercial uses. In addition, population density data from the 2000 Census Transportation Planning Packet (CTPP) was used. The major directions of approach and departure from the trip distribution pattern for the project, and are illustrated on Figure 6. The trip distribution is generally consistent with the analysis presented in the previous San Jose City College Facilities Master Plan EIR, May 2000.
Trip Assignment
Trips generated by the Project were assigned to the roadway system based on the directions of approach and departure discussed above. Figure 7 shows the AM and PM peak-hour project trips assigned to each turning movement at the study intersections. Project trips were added to Existing Conditions traffic volumes to establish intersection volumes for Existing plus Project Conditions, as shown on Figure 8.

PROJECTSITE
Stokes St.17
Forest Ave.
Stevens Creek Blvd.
Tisch Wy.
Downing Ave.Westfield Ave.
Fruitdale Ave.Enborg Ln.
Thor
nton
Wy.
San Carlos St.
Scott St.
Moorpark Ave.
Parkmoor Ave.Pfeffer Ln.
Mac
Arth
ur A
ve.
Bas
com
Ave
.
Mon
roe
St.
Lela
nd A
ve.
Leig
h A
ve.
Bel
lero
se
Dr.
Mer
idia
n Av
e.
Southw
est E
xpwy.
Hamilton Ave.
Bas
com
Ave
.
Leig
h A
ve.
880
280280
Mer
idia
n Av
e.
5% 5%
10%
2%
5%
5%
10%
3%
5%
45%
5%
PROJECT TRIP DISTRIBUTIONFIGURE 6
NNot to Scale
30%
30%
LEGEND
= Highway Distribution
= Surface Street Distribution
San Jose City College Facilities Master Plan TIA
October 2011SJ11-1262

STOP
STO
P
STOP
STOP
STO
P
PROJECTSITE
Forest Ave.
Stevens Creek Blvd.
Tisch Wy.
Fruitdale Ave.Enborg Ln.
Wy.
San Carlos St.
Scott St.
Moorpark Ave.
Parkmoor Ave.Pfeffer Ln.
Mac
Arth
ur A
ve.
Bas
com
Ave
.
Mon
roe
St.
Lela
nd A
ve.
Leig
h A
ve.
Bel
lero
se
Dr.
Mer
idia
n Av
e.
880
280280
Renova Dr.
She
rman
Oak
s D
r.
SJCCDriveway
1 2
3
4 5 67 8 9
12
10
11
14 1513
STOP
STOP
2
KEY:XX (YY) = AM (PM) Peak
Hour TrafficVolume
= StudyIntersection
= SignalizedIntersection
= Stop Sign
2 (4
)2
(6)
7 (7)
San Carlos St.Stevens Creek Blvd.
9 (1
0)
TRUETRUEB
asco
m A
ve.1
2
Leig
h A
ve.
4 (6)
San Carlos St.TRUE
2 (6
)
3
4 (6
)
Leig
h A
ve.
Scott St.TRUE
2 (6
)
TRUE
TRUE
4
16 (1
7)
Bas
com
Ave
.
2 (5)
33 (34)
Parkmoor Ave.
2 (4
)
TRUETRUE TRUE TRUE TRUE
TRUETRUE
5
TRUE
Lela
nd A
ve.
44 (67)4 (7)
Parkmoor Ave.
4 (6
)
Leig
h A
ve.
32 (32)
47 (60)
Parkmoor Ave. Moorpark Ave.
41 (4
3)
8
Bas
com
Ave
.
Lela
nd A
ve.
TRUE
2 (4
)7
(8)
TRUE TRUE TRUE TRUE
6
Moorpark Ave.TRUE TRUE
2 (6
)
7
1 (2
)7
(7)
4 (7
)
0 (1
)
12 (4
3)
1 (1
)
26 (7
8)1 (1)
27 (35))54(13)6(5
TRUE TRUETRUE TRUE TRUE TRUE
15 (42)
TRUE TRUE
9
52 (6
7)
10
Leig
h A
ve.
TRUE TRUE
7 (7
)
Bas
com
Ave
.
7 (7
)
12
Bas
com
Ave
.
3 (6)
5 (11)
17 (17)
Fruitdale Ave.
2 (4
)3
(7)
Bas
com
Ave
.
.evAllewsaL.rDavoneR.evAkraprooM
11
TRUE FALSE TRUE TRUE TRUE
9 (1
4)
Enborg Ln.
7 (8
)19
(19)
9 (1
0)
19 (53)28 (36)
TRUE
TRUE TRUE TRUETRUE
13 14
She
rman
Oak
s D
r.
17 (19)
TRUE TRUE1
(4)
1 (4
)
Leig
h A
ve.
2 (4)
11 (10)
TRUE
Sou
thw
est E
xpw
y.
9 (10)
.evAeladtiurF
.evAeladtiurF.evAeladtiurF
15
4 (4
)
7 (7
)2
(4)
TRUE
TRUE TRUE
1 (2)
1 (2)
)6(2
)4(2)7(3
PROJECT TRIP ASSIGNMENTFIGURE 7
TRUE TRUE
4 (7
) 0 (1)
0 (1
)
0 (2)
0
(2)
San Jose City College Facilities Master Plan TIA
October 2011SJ11-1262

FIGURE 8
EXISTING PLUS PROJECT LANE GEOMETRIES, TRAFFIC CONTROLS, ANDPEAK-HOUR INTERSECTION VOLUMES
PROJECTSITE
Forest Ave.
Stevens Creek Blvd.
Tisch Wy.
Fruitdale Ave.Enborg Ln.
Wy.
San Carlos St.
Scott St.
Moorpark Ave.
Parkmoor Ave.Pfeffer Ln.
Mac
Arth
ur A
ve.
Bas
com
Ave
.
Mon
roe
St.
Lela
nd A
ve.
Leig
h A
ve.
Bel
lero
se
Dr.
Mer
idia
n Av
e.
880
280280
Renova Dr.
She
rman
Oak
s D
r.
SJCCDriveway
1 2
3
4 5 67 8 9
12
10
11
14 1513
STOP
2
KEY:XX (YY) = AM (PM) Peak
Hour TrafficVolume
= StudyIntersection
= SignalizedIntersection
= Stop Sign
1 2 3
TRUE
4
TRUETRUE TRUE TRUE TRUE
TRUETRUE
5 86 7
TRUE TRUETRUE TRUE TRUE TRUETRUE TRUE
9 10 1211
TRUE
TRUE TRUE TRUETRUE
13 14
15
San Jose City College Facilities Master Plan TIA
October 2011SJ11-1262
EXISTING PLUS PROJECT LANE GEOMETRIES, TRAFFIC CONTROLS, AND
216 (118)47
(89)
444
(975
)
TRUE
175 (213)841 (481)
308
(194
)10
53 (4
78)
84 (2
23)
TRUE
Stevens Creek Boulevard
71 (69)251 (677)109 (198)
100
(248
)
Basc
om A
venu
eWest San Carlos Street
128
(115
)12
4 (7
7)39
(63)
20 (41)
TRUE
45 (71)
Leig
h A
venu
e
16 (9)
874 (698)65 (119)
West San Carlos Stree
46 (2
7)15
2 (1
20)
393 (980)
61 (5
8)
TRUE
TRUE
32 (6
0)
46 (52)
12 (19)33 (87)
55 (4
8)17
9 (2
24)
Leig
h A
venu
e
82 (34)157 (50)107 (55)
Scott Street
15 (2
6)21
9 (1
99)
9 (1
3)
TRUE
3 (1
5)97
8 (6
40)
27 (9)
9 (2)
728 (626)
TRUE TRUEParkmoor Avenue
Basc
om A
venu
e
165 (118)270 (168)
12 (2
8)70
8 (1
394)
TRUE
104
(69)
36 (54)
73 (5
9)
Lela
nd A
venu
e
141
(218
)66
(123
)
Parkmoor Avenue
1477 (1099)
TRUE TRUE
56 (48)
TRUE
32
9 (2
07)
200
(220
)
Parkmoor Avenue
1131 (974)424 (482)
293
(251
)
TRUE
110
(60)
Leig
h Av
enue
TRUE
95 (133)
TRUE
)672( 202
398
(251
)
Moorpark Avenue
870
(550
)28
6 (3
22)
TRUETRUE
722 (893)111 (105)
Basc
om A
venu
e
TRUE
528
(347
)62
4 (1
172)
311
(511
)
)48( 0711035 (1773)
207 (341)
69 (9
8)
TRUEMoorpark Avenue
Lela
nd A
venu
e
129
(107
)
TRUE
433
(232
)18
4 (1
16)
)984( 142 869 (1315)
97 (195)
TRUETRUE
227
(188
)
Moorpark Avenue
490
(544
)
Leig
h Av
enue
TRUE
Renova Drive
7 (1)
127
(51)
1451
(994
)17
(8)
27 (61)
TRUE
Basc
om A
venu
e
12 (26)3 (5)8 (18)
Driveway
20 (35)
26 (2
7)
TRUE
TRUE
100
(48)
713
(139
1)
11 (4
)
Kingman AvenueTRUE
Basc
om A
venu
e
36 (8
)56
7 (1
345)
12 (41)
TRUE
1579
(975
)20
6 (1
49)
27 (33)1 (0)10
0 (1
16)
TRUE
587 (361)
65 (2
8)36
2 (1
080)
TRUE
128 (227)243 (41)
120
(40)
1214
(715
)12
1 (1
47)
TRUE
Enborg Lane
34 (56)59 (123)43 (127)
187
(303
)
Basc
om A
venu
e
Fruitdale Avenue
TRUE
10 (5)
She
rman
Oak
s W
ay
28 (31)1089 (737)
Fruitdale Avenue
13 (1
7)
439 (500)
28 (2
2)
TRUE
TRUE
13 (1
6)
34 (74)
191 (105)245 (350)
159
(82)
265
(131
)
Leig
h A
venu
e
33 (35)
708 (414)15 (21)
Fruitdale Avenue
223
(289
)11
9 (4
23)
25 (8
9)
TRUE
TRUE
194 (283)
18 (1
0)93
2 (4
73)
113
(100
)
8 (8) 151 (163)
50 (70)
TRUE TRUEFruitdale Avenue
Sout
hwes
t Exp
ress
wa
329 (207)
60 (37)
446
(212
)38
8 (5
89)
117
(158
)
STOP
STO
P
STOP
STOP
STO
P
STOP

San Jose City College Facilities Transportation Impact AnalysisJanuary 2012
26
EXISTING PLUS PROJECT INTERSECTION LEVELS OF SERVICE
Level of service calculations were conducted to evaluate intersection operations under Existing plus Project Conditions. The results of the LOS analysis are summarized in Table 8. The changes in overall intersection delay due to the addition of project traffic are also shown in this table. In a few instances, slight improvements in delay are reported. This is due to the methodology the program uses to allocate green time to the various turning movements based on changes in the traffic volumes on individual approaches.
The results for Existing Conditions are included for comparison purposes, along with the projected increases in critical delay and critical volume-to-capacity (V/C) ratios. Critical delay represents the delay associated with the critical movements of the intersection, or the movements that require the most “green time” and have the greatest effect on overall intersection operations. The changes in critical delay and critical V/C ratio between Existing and Existing plus Project Conditions are used to identify significant impacts.
All intersections continue to operate acceptably in both peak periods under City of San Jose and VTAstandards.
TABLE 8 EXISTING AND EXISTING PLUS PROJECT INTERSECTION LEVELS OF SERVICE
IntersectionPeak Hour
Existing Existing Plus Project
Delay1 LOS2 Delay1 LOS2∆ in Crit.
V/C3∆ in Crit. Delay4
1. Bascom Avenue/San Carlos Street
AMPM
42.050.7
D D
42.150.8
D D
+0.001+0.007
+0.0 +0.3
2. Leigh Avenue/San Carlos Street
AMPM
23.224.8
C C
23.325.1
C C
+0.000+0.004
+0.0 0.4
3. Leigh Avenue/Scott Street(Unsignalized)
AMPM
13.511.8
BB
13.612.0
BB
N/AN/A
N/AN/A
4. Bascom Avenue/Parkmoor Avenue
AMPM
33.631.1
C- C
33.331.9
C- C
-0.0310 +0.018
+1.0+0.7
5. Leland Avenue/Parkmoor Avenue
AMPM
19.421.1
B-C+
19.420.8
B-C+
+0.019+0.025
-0.1-0.4
6. Leigh Avenue/Parkmoor Avenue
AMPM
31.121.9
C C+
33.323.6
C- C
+0.048+0.060
+2.5+2.1
7. Bascom Avenue/Moorpark Avenue*
AMPM
38.942.8
D+D
4043.6
D D
+0.003+0.041
+0.1+2.3
8. Leland Avenue/Moorpark Avenue
AMPM
8.65.0
AA
8.75.2
AA
+0.012+0.014
+0.2+0.2
9. Leigh Avenue/Moorpark Avenue
AMPM
26.520.1
C C+
26.219.9
C B-
+0.011+0.024
-0.2-0.5
10. Bascom Avenue/Renova DriveAMPM
11.312.6
B+ B
11.212.5
B+ B
+0.002+0.002
+0.0 +0.0
11. Bascom Avenue/Kingman Avenue (Unsignalized)
AMPM
20.020.3
C C
25.723.7
C C
N/AN/A
N/AN/A
12. Bascom Avenue/Fruitdale Avenue*
AMPM
46.146.4
D D
46.947
D D
+0.019+0.022
+1.2+0.8

San Jose City College Facilities Transportation Impact AnalysisJanuary 2012
27
TABLE 8 EXISTING AND EXISTING PLUS PROJECT INTERSECTION LEVELS OF SERVICE
13. Sherman Oaks Way/Fruitdale Avenue (Unsignalized)
AMPM
28.216.8
D C
29.217.3
D C
N/AN/A
N/AN/A
14. Leigh Avenue/Fruitdale Avenue
AMPM
33.630.5
C- C
33.830.8
C- C
+0.010 +0.011
+0.2+0.5
15. Southwest Expressway/Fruitdale Avenue
AMPM
24.828.6
C C
2528.8
C C
+0.004+0.006
+0.2+0.4
Notes: 1 Whole intersection weighted average control delay expressed in seconds per vehicle calculated using methods described in the
2000 HCM, with adjusted saturation flow rates to reflect Santa Clara County Conditions. Total control delay for the worst movement is presented for side-street stop-controlled intersections. Delay for the worst approach is reported for Unsignalized intersections.
2 LOS = Level of service. LOS calculations conducted using the TRAFFIX level of service analysis software package. 3 Change in the critical volume-to-capacity ratio (V/C) between Existing and Existing plus Project Conditions. 4 Change in critical movement delay between Existing and Existing plus Project Conditions. * CMP intersection. NA = not applicable Bold type indicates a project impact as defined by City standards. Source: Fehr & Peers, October 2011.
INTERSECTION IMPACTS AND MITIGATION MEASURES
All study intersections are operating at LOS D or better under Existing plus Project Conditions. Therefore, the proposed Project would have a less-than-significant impact at the study intersections.
EXISTING PLUS PROJECT FREEWAY SEGMENT LEVELS OF SERVICE
CMP guidelines require that freeway segments to which a proposed development is projected to add trips equal to or greater than one percent of the freeway segment’s capacity must be evaluated. Segments of SR 17, SR 280 and SR 880 were reviewed to determine if a significant amount of project traffic would be added to these freeway segments. Capacities of 2,300 vehicles per hour per lane (vphpl) for freeway segments with six or more lanes and 2,200 vphpl for freeway segments with four lanes were used in the freeway analysis. A capacity of 1,800 vphpl was used for high occupancy vehicle (HOV) lanes. For this analysis, it was assumed that the project trips using HOV lanes would be similar in proportion to existing use of HOV lanes. Table 9 presents the densities of each freeway segment and the estimated number of trips added to each segment by the proposed Project. The project would add more than one percent of capacity to one (1) study freeway segments.

San Jose City College Facilities Transportation Impact AnalysisJanuary 2012
28
TABLE 9 EXISTING PLUS PROJECT FREEWAY SEGMENT LEVELS OF SERVICE
Freeway From ToPeak Hour
Mixed Flow HOV
Trips Density1 LOS2%
Impact3 Trips Density1 LOS2%
Impact3
SR 17 Northbound
Hamilton Avenue I-280
AMPM
1212
6126
F C
0.15%0.15%
N/AN/A
N/AN/A
N/AN/A
N/AN/A
SR 17 Southbound I-280 Hamilton
AvenueAMPM
3 9
2735
D D
0.04%0.13%
N/AN/A
N/AN/A
N/AN/A
N/AN/A
I-280Eastbound
Winchester Boulevard I-880
AMPM
2120
2730
D D
0.30%0.28%
2 3
9 29
AD
0.14%0.21%
I-880 Meridian Avenue
AMPM
4845
2049
C E
0.52%0.49%
6 8
1024
AC
0.37%0.48%
Meridian Avenue Bird Avenue
AMPM
2755
4269
D F
0.29%0.60%
N/AN/A
N/AN/A
N/AN/A
N/AN/A
I-280Westbound
Bird Avenue
Meridian Avenue
AMPM
105104
9743
F D
1.14%1.13%
N/AN/A
N/AN/A
N/AN/A
N/AN/A
Meridian Avenue I-880
AMPM
8590
11726
F D
0.99% 1.06%
159
589
EA
0.91%0.55%
I-880 Winchester Boulevard
AMPM
8 11
10153
F E
0.11%0.15%
1 1
5812
F B
0.08%0.09%
I-880Northbound
I-280Stevens Creek
Boulevard
AMPM
5 10
9217
F B
0.07%0.14%
N/AN/A
N/AN/A
N/AN/A
N/AN/A
Stevens Creek
Boulevard
Bascom Avenue
AMPM
6 12
6027
F D
0.09%0.17%
N/AN/A
N/AN/A
N/AN/A
N/AN/A
I-880Southbound
Bascom Avenue
Stevens Creek
Boulevard
AMPM
2323
6963
F F
0.33%0.33%
N/AN/A
N/AN/A
N/AN/A
N/AN/A
Stevens Creek
BoulevardI-280
AMPM
1919
2428
C D
0.28%0.28%
N/AN/A
N/AN/A
N/AN/A
N/AN/A
Note:1 Measured in passenger cars per mile per lane. 2 LOS = level of service. 3 Percent impact determined by dividing the number of project trips by the freeway segment’s capacity. Bold type indicates a project impact. Source: 2010 Monitoring and Conformance Report, Fehr & Peers, October 2011
FREEWAY IMPACTS AND MITIGATION MEASURES
Based on the impact criteria listed above, the proposed Project would have a significant impact on westbound (northbound) Interstate 280 from Bird Avenue to Meridian Avenue during the AM peak period. The Project would have a less-than-significant impact on all other study freeway segments.

San Jose City College Facilities Transportation Impact AnalysisJanuary 2012
29
According to the Valley Transportation Plan 2035 (VTA, January 2009), improvements to the I-280/I-880/Stevens Creek Boulevard interchange (VTP ID H69) are planned and funded. However, those proposed improvements would not mitigate the project’s impacts to a less-than-significant level because they do not affect mainline capacity. No additional freeway improvements have been identified in the project area.
Implementation of a TDM program would incrementally reduce traffic volumes on all freeway segments; however, it would not reduce the identified impacts to a less-than-significant level. The mitigation of freeway impacts is considered beyond the scope of an individual project, due to the inability of any individual project or City to acquire right of way for freeway widening. Freeway improvements also would require approval by Caltrans, which neither the Evergreen Valley College District nor the City can guarantee. Therefore, the addition of project traffic results in a significant and unavoidable impact to the identified freeway segments.
PEDESTRIAN, BICYCLE, AND TRANSIT FACILITY IMPACTS
The Project would cause a significant impact to pedestrian, bicycle, and transit facilities and services if one of the following occurs:
• An element of the proposed Project conflicts with existing or planned pedestrian, bicycle, and transit facilities.
• The proposed Project creates hazardous conditions for pedestrians or bicyclists that currently do not exist.
The project may generate additional demand for pedestrian facilities. Existing sidewalks are provided adjacent to and in the vicinity of the site. Sidewalks and pedestrian bridges link the San Jose City College campus to adjacent neighborhoods. The existing pedestrian facilities are expected to accommodate the increased demand. The proposed Project does not conflict with any existing or proposed pedestrian facilitiesand the proposed Project does not create hazardous conditions for pedestrians. Therefore, a less-than-significant impact is expected for pedestrian facilities.
The project may generate additional demand for bicycle facilities. The proposed Project does not conflict with any existing or proposed facilities and the proposed Project does not create hazardous conditions for bicyclists. Therefore, a less-than-significant impact is expected for bicycle facilities.
The project may generate additional demand for transit service. The San Jose City College campus is served by four bus routes, and several stops are located adjacent to the campus. Approximately ten buses serve San Jose City College during each peak hour. The existing transit service is expected to accommodate the possible increased demand and the proposed Project does not conflict with any existing or proposed transit facilities. Therefore, a less-than-significant impact is anticipated for transit service.

San Jose City College Facilities Transportation Impact AnalysisJanuary 2012
30
SITE ACCESS AND ON-SITE CIRCULATION
Site Access
The San Jose City College campus can currently be accessed from locations along Bascom Avenue, Moorpark Avenue, Leigh Avenue, and Kingman Avenue within the Sherman Oaks neighborhood. Moorpark Avenue would be maintained as the primary access to the campus as well as all secondary access points. Based on the trip generation estimates, forecasted demand would be adequately served by these access points. Driveway spacing and sight distance at the new driveways would be adequate.
On-Site Circulation
On-site circulation is provided by internal roadways and driveways. These facilities connect various parking lots to each other. While there is no existing internal vehicular connection between the parking lots on the western side of campus with those on the eastern side, a connection is proposed in the Master Plan. This new connection would improve on-site circulation and allow greater flexibility in circulating through the campus. However, the new connection is not expected to change the overall travel patterns to the site. Three new drop-off locations have been identified in the Master Plan to facilitate internal circulations.
A promenade has been recommended to serve as the primary pedestrian route through the campus, the promenade is a continuation of the existing paseo arcs described under Existing Conditions. The promenade would connect with all secondary pedestrian facilities and assist in way-finding and student orientation throughout the campus. In addition to the promenade, two secondary pedestrian roadways have been identified in the Plan. These two north-south pedestrian facilities will be located at the western and eastern edge of the campus to form the core of the campus along with the promenade.
PARKING
Existing parking facilities on the San Jose City College campus consist of several paved surface lots and a four-story garage. These paid parking facilities are designated for specific uses (student, staff, etc.). Free, non-restrictive parking is available on the public roadways surrounding the campus.
Based on the parking surveys performed on the SJCC campus in a previous study completed by Fehr & Peers in October 2008, the parking demand rate is 0.18 spaces per student. Two notable parking peaks occur during a regular school day. The two peaks occur between 9:30 AM and 12:00 PM in the morning and between 6:00 PM and 7:00 PM in the evening. The morning peak is typically 10 – 20 percent higher than the evening peak.
The Master Plan has identified a targeted rate of 0.2 parking spaces per student, with a projected enrollment forecast of 14,500 students in the Year 2025, the number of parking spaces needed is 2,900. Based on the existing parking space inventory, an additional 800 spaces is needed to reach the desired goal.
Although an exact increase in parking supply has not been identified and included as part of the Project, the Master Plan has identified several existing surface parking lots as potential reconfiguration candidates to maximize efficiency and increase the total on-site parking supply. Additionally, strategies to manage the existing parking supply can be implemented as enrollment increases. The potential location of a second parking structure has been identified and could be constructed in the future to accommodate actual parking demands.
Based on the City of San Jose Ordinance Code 20.90.060 Table 20-190, A “Post Secondary” school (a Junior College/University) is required to provide 1 parking space per 3 students, plus 1 per staff. Thus, it is recommended that the parking demand be monitor regularly to ensure adequate parking as enrollment increases.

San Jose City College Facilities Transportation Impact AnalysisJanuary 2012
31
4. CUMULATIVE CONDITIONS
This chapter presents an analysis of Cumulative Conditions without and with the proposed Project. Cumulative No Project Conditions are defined as existing volumes plus traffic generated by approved but not yet constructed developments in the project study area, plus traffic generated by pending developments. Trips from the proposed Project are added to the Cumulative No Project Conditions to estimate Cumulative plus Project Conditions. This chapter describes the procedure used to determine the cumulative traffic volumes and the results of the level of service analysis for Cumulative Conditions. No freeway segments analysis was performed because VTA guidelines do not require an analysis of freeway operations under CumulativeConditions.
CUMULATIVE TRAFFIC ESTIMATES
Traffic volumes for Cumulative Conditions were estimated by adding traffic generated by approved and pending developments to existing traffic volumes. San Jose City staff provided an approved trip inventory (ATI) that accounts for projects that would potentially add traffic to the study intersections. The ATI is included in Appendix D. Traffic associated with pending projects, obtained from the City of San Jose, were also was included. Figure 9 illustrates the traffic volumes at the study intersections under Cumulative No Project Conditions. The trips generated by the proposed Project were added to the Cumulative No Project Condition volumes to establish Cumulative plus Project Conditions and are shown on Figure 10.
CUMULATIVE ROADWAY IMPROVEMENTS
No approved and funded transportation network improvements were assumed to be constructed prior to project completion; therefore, the existing roadway network was used for the cumulative analysis.
CUMULATIVE INTERSECTION LEVELS OF SERVICE
LOS calculations were conducted for the study intersections to evaluate their operations under Cumulative No Project and Cumulative plus Project Conditions. The results of the LOS analysis are presented in Table 10. Appendix B contains the corresponding calculation sheets. All study intersections will continue to operate at acceptable levels except the Bascom Avenue/San Carlos Avenue, which operates at LOS E during the PM peak hour.
TABLE 10CUMULATIVE AND CUMULATIVE PLUS PROJECT INTERSECTION LEVELS OF SERVICE
IntersectionPeak Hour
Cumulative No Project Cumulative Plus Project
Delay1 LOS2 Delay1 LOS2∆ in Crit.
V/C3∆ in Crit. Delay4
1. Bascom Avenue/San Carlos Street
AMPM
44.055.6
D E+
44.155.6
D E+
+0.001+0.014
+0.0+0.4
2. Leigh Avenue/San Carlos Street AMPM
22.324.8
C+C
22.425.2
C+C
+0.000 +0.008
+0.0+0.7
3. Leigh Avenue/Scott Street(Unsignalized)
AMPM
14.013.4
BB
14.213.6
BB
N/AN/A
N/AN/A
4. Bascom Avenue/Parkmoor Avenue
AMPM
34.732.6
C- C-
35.033.4
C- C-
+0.018+0.018
+0.3+0.7

San Jose City College Facilities Transportation Impact AnalysisJanuary 2012
32
TABLE 10CUMULATIVE AND CUMULATIVE PLUS PROJECT INTERSECTION LEVELS OF SERVICE
5. Leland Avenue/Parkmoor Avenue
AMPM
22.823.7
C+C
23.023.7
C+C
+0.019+0.025
+0.2-0.1
6. Leigh Avenue/Parkmoor Avenue AMPM
34.323.5
C- C
38.025.5
D+C
+0.048+0.060
+4.3+2.5
7. Bascom Avenue/Moorpark Avenue*
AMPM
39.346.4
D D
40.548.5
D D
+0.003+0.041
+0.2+5.2
8. Leland Avenue/Moorpark Avenue
AMPM
8.14.8
AA
8.25.0
AA
+0.012+0.014
+0.2+0.2
9. Leigh Avenue/Moorpark Avenue AMPM
26.520.3
C C+
26.220.3
C C+
+0.011+0.020
-0.2-0.3
10. Bascom Avenue/Renova Drive AMPM
13.118.5
BB-
13.018.4
BB-
+0.002+0.002
+0.0-0.1
11.Bascom Avenue/Kingman Avenue (Unsignalized)
AMPM
20.422,1
C C
26.726.4
D D
N/AN/A
N/AN/A
12.Bascom Avenue/Fruitdale Avenue*
AMPM
47.748.8
D D
48.749.5
D D
+0.019+0.022
+1.4+1.0
13.Sherman Oaks Way/Fruitdale Avenue (Unsignalized)
AMPM
30.318.0
D C
31.518.5
D C
N/AN/A
N/AN/A
14.Leigh Avenue/Fruitdale Avenue AMPM
33.830.9
C- C
33.931.2
C- C
+0.010+0.004
+0.3+0.0
15.Southwest Expressway/Fruitdale Avenue
AMPM
27.430.1
C C
27.530.3
C C
+0.001+0.004
+0.0+0.0
Notes: 1 Whole intersection weighted average control delay expressed in seconds per vehicle calculated using methods described in the
2000 HCM, with adjusted saturation flow rates to reflect Santa Clara County Conditions. Total control delay for the worst movement is presented for side-street stop-controlled intersections. Delay for the worst approach is reported for Unsignalized intersections.
2 LOS = Level of service. LOS calculations conducted using the TRAFFIX level of service analysis software package. 3 Change in the critical volume-to-capacity ratio (V/C) between Cumulative and Cumulative plus Project Conditions. 4 Change in critical movement delay between Cumulative and Cumulative plus Project Conditions. * CMP intersection. NA = not applicable Bold type indicates a project impact as defined by City standards. Source: Fehr & Peers, October 2011.
CUMULATIVE INTERSECTION IMPACTS AND MITIGATION MEASURES
Bascom Avenue/San Carlos Street
The Bascom Avenue/San Carlos Street intersection is projected to operate unacceptably under Cumulative no Project conditions. The addition of Project traffic would not increase the critical movement V/C ratio or delay by more than one percent or four seconds, respectively. Therefore, the impact to this intersection would be considered less-than-significant.

FIGURE 9
CUMULATIVE NO PROJECT LANE GEOMETRIES, TRAFFIC CONTROLS,AND PEAK-HOUR INTERSECTION VOLUMES
PROJECTSITE
Forest Ave.
Stevens Creek Blvd.
Tisch Wy.
Fruitdale Ave.Enborg Ln.
Wy.
San Carlos St.
Scott St.
Moorpark Ave.
Parkmoor Ave.Pfeffer Ln.
Mac
Arth
ur A
ve.
Bas
com
Ave
.
Mon
roe
St.
Lela
nd A
ve.
Leig
h A
ve.
Bel
lero
se
Dr.
Mer
idia
n Av
e.
880
280280
Renova Dr.
She
rman
Oak
s D
r.
SJCCDriveway
1 2
3
4 5 67 8 9
12
10
11
14 1513
STOP
2
KEY:XX (YY) = AM (PM) Peak
Hour TrafficVolume
= StudyIntersection
= SignalizedIntersection
= Stop Sign
1 2 3
TRUE
4
TRUETRUE TRUE TRUE TRUE
TRUETRUE
5 86 7
TRUE TRUETRUE TRUE TRUE TRUETRUE TRUE
9 10 1211
TRUE
TRUE TRUE TRUETRUE
13 14
15
San Jose City College Facilities Master Plan TIA
October 2011SJ11-1262
CUMULATIVE NO PROJECT LANE GEOMETRIES, TRAFFIC CONTROLS,
240 (121)49
(102
)48
0 (1
030)
TRUE
214 (248)960 (625)
342
(250
)11
32 (5
19)
120
(274
)
TRUE
Stevens Creek Boulevard
74 (94)321 (818)147 (241)
111
(281
)
Basc
om A
venu
eWest San Carlos Street
141
(123
)12
4 (7
9)45
(86)
20 (46)
TRUE
45 (72)
Leig
h A
venu
e
20 (10)
1018 (809)78 (129)
West San Carlos Stree
46 (2
9)15
2 (1
36)
462 (1155)
62 (6
4)
TRUE
TRUE
33 (6
5)
46 (57)
13 (24)33 (87)
56 (5
3)19
6 (2
49)
Leig
h A
venu
e
83 (38)157 (50)107 (62)
Scott Street
21 (3
0)22
3 (2
20)
13 (1
6)
TRUE
3 (1
5)10
93 (7
70)
27 (9)
9 (2)
908 (695)
TRUE TRUEParkmoor Avenue
Basc
om A
venu
e
165 (118)270 (170)
12 (2
8)81
2 (1
506)
104
(71)
36 (54)
73 (6
3)
Lela
nd A
venu
e
208
(300
)65
(122
)
Parkmoor Avenue
1601 (1127)
TRUE TRUE
50 (42)
32
5 (1
80)
219
(255
)
Parkmoor Avenue
1250 (1008)363 (436)
303
(275
)
TRUE
114
(68)
Leig
h Av
enue
95 (133)
TRUE
)692( 612
416
(276
)
Moorpark Avenue
960
(635
)30
7 (4
24)
TRUETRUE
748 (1006)119 (143)
Basc
om A
venu
e
681
(422
)80
8 (1
321)
258
(466
)
)84( 4311041 (1884)
273 (422)
34 (2
7)
TRUEMoorpark Avenue
Lela
nd A
venu
e
123
(103
)
TRUE
459
(262
)19
0 (1
29)
)554( 702 887 (1427)
78 (160)
TRUETRUE
231
(201
)
Moorpark Avenue
435
(505
)
Leig
h Av
enue
Renova Drive
7 (1)
134
(54)
1507
(106
7)17
(8)
41 (67)
TRUE
Basc
om A
venu
e
12 (26)3 (5)8 (18)
Driveway
57 (162)
26 (2
7)
TRUE
239
(114
)76
3 (1
474)
11 (4
)
Kingman AvenueTRUE
Basc
om A
venu
e
36 (8
)64
0 (1
443)
5 (27)
TRUE
1640
(105
8)18
0 (1
23)
28 (26)1 (0)91
(107
)
TRUE
569 (354)
89 (3
9)39
6 (1
140)
TRUE
131 (235)256 (52)
180
(73)
1263
(754
)12
5 (1
57)
TRUE
Enborg Lane
38 (79)62 (138)54 (190)
193
(312
)
Basc
om A
venu
e
Fruitdale Avenue
TRUE
10 (5)
She
rman
Oak
s W
ay
28 (31)1088 (756)
Fruitdale Avenue
14 (1
7)
453 (542)
31 (2
2)
TRUE
TRUE
14 (1
8)
34 (80)
193 (108)260 (385)
155
(79)
273
(135
)
Leig
h A
venu
e
31 (36)
710 (435)15 (22)
Fruitdale Avenue
225
(290
)12
3 (4
29)
24 (8
9)
TRUE
207 (317)
20 (1
0)10
82 (8
27)
150
(170
)
8 (10) 154 (162)
164 (132)
TRUE TRUEFruitdale Avenue
Sout
hwes
t Exp
ress
wa
329 (231)
206 (113)
443
(209
)69
9 (7
61)
240
(320
)
STOP
STO
P
STOP
STOP
STO
P
STOP

FIGURE 10
PROJECTSITE
Forest Ave.
Stevens Creek Blvd.
Tisch Wy.
Fruitdale Ave.Enborg Ln.
Wy.
San Carlos St.
Scott St.
Moorpark Ave.
Parkmoor Ave.Pfeffer Ln.
Mac
Arth
ur A
ve.
Bas
com
Ave
.
Mon
roe
St.
Lela
nd A
ve.
Leig
h A
ve.
Bel
lero
se
Dr.
Mer
idia
n Av
e.
880
280280
Renova Dr.
She
rman
Oak
s D
r.
SJCCDriveway
1 2
3
4 5 67 8 9
12
10
11
14 1513
STOP
2
KEY:XX (YY) = AM (PM) Peak
Hour TrafficVolume
= StudyIntersection
= SignalizedIntersection
= Stop Sign
1 2 3
TRUE
4
TRUETRUE TRUE TRUE TRUE
TRUETRUE
5 86 7
TRUE TRUETRUE TRUE TRUE TRUETRUE TRUE
9 10 1211
TRUE
TRUE TRUE TRUETRUE
13 14
15
San Jose City College Facilities Master Plan TIA
October 2011SJ11-1262
CUMULATIVE PLUS PROJECT LANE GEOMETRIES, TRAFFIC CONTROLS,AND PEAK-HOUR INTERSECTION VOLUMES
240 (122)49
(102
)49
2 (1
042)
TRUE
214 (248)960 (626)
344
(254
)11
35 (5
25)
120
(274
)
TRUE
Stevens Creek Boulevard
74 (94)321 (818)156 (250)
111
(281
)
Basc
om A
venu
eWest San Carlos Street
141
(124
)12
4 (7
9)48
(92)
20 (46)
TRUE
45 (72)
Leig
h A
venu
e
20 (10)
1018 (809)84 (135)
West San Carlos Stree
46 (2
9)15
2 (1
36)
462 (1156)
62 (6
4)
TRUE
TRUE
33 (6
5)
46 (57)
13 (24)33 (87)
56 (5
3)19
9 (2
55)
Leig
h A
venu
e
83 (38)157 (50)107 (62)
Scott Street
21 (3
0)22
9 (2
26)
13 (1
6)
TRUE
3 (1
5)10
96 (7
76)
27 (9)
9 (2)
952 (739)
TRUE TRUEParkmoor Avenue
Basc
om A
venu
e
165 (118)272 (174)
12 (2
8)83
3 (1
527)
104
(71)
36 (54)
73 (6
3)
Lela
nd A
venu
e
208
(301
)66
(123
)
Parkmoor Avenue
1660 (1203)
TRUE TRUE
56 (48)
34
7 (2
20)
222
(261
)
Parkmoor Avenue
1293 (1050)426 (499)
309
(281
)
TRUE
114
(68)
Leig
h Av
enue
95 (133)
TRUE
)692( 612
417
(278
)
Moorpark Avenue
963
(641
)31
6 (4
33)
TRUETRUE
755 (1013)119 (143)
Basc
om A
venu
e
682
(424
)81
7 (1
330)
313
(521
)
)48( 0711083 (1939)
274 (424)
69 (9
8)
TRUEMoorpark Avenue
Lela
nd A
venu
e
129
(109
)
TRUE
465
(268
)19
0 (1
29)
)394( 442 913 (1480)
98 (200)
TRUETRUE
231
(201
)
Moorpark Avenue
504
(573
)
Leig
h Av
enue
Renova Drive
7 (1)
134
(54)
1519
(108
3)17
(8)
41 (67)
TRUE
Basc
om A
venu
e
12 (26)3 (5)8 (18)
Driveway
57 (162)
26 (2
7)
TRUE
239
(114
)77
2 (1
483)
11
(4)
Kingman AvenueTRUE
Basc
om A
venu
e
36 (8
)64
0 (1
443)
12 (41)
TRUE
1649
(106
7)20
6 (1
49)
32 (33)1 (0)10
0 (1
16)
592 (377)
89 (3
9)39
9 (1
146)
TRUE
131 (236)256 (52)
180
(73)
1275
(766
)12
5 (1
57)
TRUE
Enborg Lane
38 (79)62 (138)54 (190)
197
(321
)
Basc
om A
venu
e
Fruitdale Avenue
TRUE
10 (5)
She
rman
Oak
s W
ay
28 (31)1111 (779)
Fruitdale Avenue
14 (1
7)
457 (551)
31 (2
2)
TRUE
TRUE
14 (1
8)
36 (83)
193 (108)263 (391)
164
(88)
276
(138
)
Leig
h A
venu
e
34 (39)
724 (449)15 (22)
Fruitdale Avenue
225
(291
)12
5 (4
32)
26 (9
2)TRUE
210 (323)
20 (1
0)10
82 (8
27)
150
(170
)
8 (10) 155 (165)
164 (132)
TRUE TRUEFruitdale Avenue
Sout
hwes
t Exp
ress
wa
341 (243)
206 (113)
448
(214
)69
9 (7
61)
240
(320
)
STOP
STO
P
STOP
STOP
STO
P
STOP

APPENDIX A: EXISTING TRAFFIC COUNTS

Traffic Data ServiceCampbell, CA(408) [email protected] File Name : 1AM FINAL RECOUNT
Site Code : 00000001Start Date : 9/15/2011Page No : 1
Groups Printed- VehiclesBASCOM AVE
SouthboundSAN CARLOS ST
WestboundBASCOM AVE
NorthboundSAN CARLOS ST
EastboundStart Time Right Thru Left Peds App. Total Right Thru Left Peds App. Total Right Thru Left Peds App. Total Right Thru Left Peds App. Total Int. Total
07:00 AM 5 44 6 2 57 15 81 11 2 109 17 106 33 0 156 4 24 7 0 35 35707:15 AM 3 59 18 2 82 32 165 28 6 231 7 138 49 0 194 20 35 11 3 69 57607:30 AM 21 74 16 2 113 42 205 26 7 280 18 175 47 0 240 32 45 15 3 95 72807:45 AM 13 133 28 1 175 46 221 52 1 320 17 266 102 0 385 29 70 20 0 119 999
Total 42 310 68 7 427 135 672 117 16 940 59 685 231 0 975 85 174 53 6 318 2660
08:00 AM 10 91 21 5 127 54 212 46 3 315 22 222 55 0 299 13 62 18 0 93 83408:15 AM 11 111 24 3 149 56 211 31 7 305 22 265 80 0 367 33 70 16 3 122 94308:30 AM 13 97 27 0 137 60 197 46 5 308 23 297 69 0 389 25 49 17 0 91 92508:45 AM 12 98 19 4 133 45 166 35 13 259 22 233 51 1 307 41 72 23 1 137 836
Total 46 397 91 12 546 215 786 158 28 1187 89 1017 255 1 1362 112 253 74 4 443 3538
Grand Total 88 707 159 19 973 350 1458 275 44 2127 148 1702 486 1 2337 197 427 127 10 761 6198Apprch % 9 72.7 16.3 2 16.5 68.5 12.9 2.1 6.3 72.8 20.8 0 25.9 56.1 16.7 1.3
Total % 1.4 11.4 2.6 0.3 15.7 5.6 23.5 4.4 0.7 34.3 2.4 27.5 7.8 0 37.7 3.2 6.9 2 0.2 12.3
BASCOM AVESouthbound
SAN CARLOS STWestbound
BASCOM AVENorthbound
SAN CARLOS STEastbound
Start Time Right Thru Left Peds App. Total Right Thru Left Peds App. Total Right Thru Left Peds App. Total Right Thru Left Peds App. Total Int. Total
Peak Hour Analysis From 07:00 AM to 08:45 AM - Peak 1 of 1Peak Hour for Entire Intersection Begins at 07:45 AM
07:45 AM 13 133 28 1 175 46 221 52 1 320 17 266 102 0 385 29 70 20 0 119 99908:00 AM 10 91 21 5 127 54 212 46 3 315 22 222 55 0 299 13 62 18 0 93 83408:15 AM 11 111 24 3 149 56 211 31 7 305 22 265 80 0 367 33 70 16 3 122 94308:30 AM 13 97 27 0 137 60 197 46 5 308 23 297 69 0 389 25 49 17 0 91 925
Total Volume 47 432 100 9 588 216 841 175 16 1248 84 1050 306 0 1440 100 251 71 3 425 3701% App. Total 8 73.5 17 1.5 17.3 67.4 14 1.3 5.8 72.9 21.2 0 23.5 59.1 16.7 0.7
PHF .904 .812 .893 .450 .840 .900 .951 .841 .571 .975 .913 .884 .750 .000 .925 .758 .896 .888 .250 .871 .926

Traffic Data ServiceCampbell, CA(408) [email protected] File Name : 1AM FINAL RECOUNT
Site Code : 00000001Start Date : 9/15/2011Page No : 2
BASCOM AVE S
AN
CA
RL
OS
ST
SA
N C
AR
LO
S S
T
BASCOM AVE
Right47
Thru432
Left100
Peds9
InOut Total1337 588 1925
Right216
Thru841
Left175
Peds 16
Out
Total
In435
1248 1683
Left306
Thru1050
Right84
Peds0
Out TotalIn707 1440 2147
Left71
T
hru
251
Rig
ht10
0 P
eds3
Tot
alO
utIn
1194
42
5 16
19
Peak Hour Begins at 07:45 AM
Vehicles
Peak Hour Data
North

Traffic Data ServiceCampbell, CA(408) [email protected] File Name : 1PM FINAL
Site Code : 00000001Start Date : 9/14/2011Page No : 1
Groups Printed- VehiclesBASCOM AVE
SouthboundSAN CARLOS ST
WestboundBASCOM AVE
NorthboundSAN CARLOS ST
EastboundStart Time Right Thru Left Peds App. Total Right Thru Left Peds App. Total Right Thru Left Peds App. Total Right Thru Left Peds App. Total Int. Total
04:00 PM 21 145 51 8 225 25 88 50 12 175 57 124 52 6 239 37 129 20 2 188 82704:15 PM 26 167 56 1 250 13 108 50 7 178 49 94 47 3 193 41 140 25 1 207 82804:30 PM 31 166 57 4 258 24 105 54 0 183 55 112 47 2 216 49 156 19 1 225 88204:45 PM 24 178 52 3 257 29 117 52 7 205 45 110 60 8 223 27 128 19 4 178 863
Total 102 656 216 16 990 91 418 206 26 741 206 440 206 19 871 154 553 83 8 798 3400
05:00 PM 24 226 71 2 323 35 126 45 6 212 50 116 42 1 209 41 161 22 3 227 97105:15 PM 21 253 62 7 343 22 119 59 8 208 79 130 52 6 267 32 190 17 1 240 105805:30 PM 26 235 72 6 339 30 107 51 4 192 54 114 49 8 225 51 165 15 7 238 99405:45 PM 18 249 43 4 314 30 128 58 7 223 40 112 47 6 205 65 161 15 4 245 987
Total 89 963 248 19 1319 117 480 213 25 835 223 472 190 21 906 189 677 69 15 950 4010
Grand Total 191 1619 464 35 2309 208 898 419 51 1576 429 912 396 40 1777 343 1230 152 23 1748 7410Apprch % 8.3 70.1 20.1 1.5 13.2 57 26.6 3.2 24.1 51.3 22.3 2.3 19.6 70.4 8.7 1.3
Total % 2.6 21.8 6.3 0.5 31.2 2.8 12.1 5.7 0.7 21.3 5.8 12.3 5.3 0.5 24 4.6 16.6 2.1 0.3 23.6
BASCOM AVESouthbound
SAN CARLOS STWestbound
BASCOM AVENorthbound
SAN CARLOS STEastbound
Start Time Right Thru Left Peds App. Total Right Thru Left Peds App. Total Right Thru Left Peds App. Total Right Thru Left Peds App. Total Int. Total
Peak Hour Analysis From 04:00 PM to 05:45 PM - Peak 1 of 1Peak Hour for Entire Intersection Begins at 05:00 PM
05:00 PM 24 226 71 2 323 35 126 45 6 212 50 116 42 1 209 41 161 22 3 227 97105:15 PM 21 253 62 7 343 22 119 59 8 208 79 130 52 6 267 32 190 17 1 240 105805:30 PM 26 235 72 6 339 30 107 51 4 192 54 114 49 8 225 51 165 15 7 238 99405:45 PM 18 249 43 4 314 30 128 58 7 223 40 112 47 6 205 65 161 15 4 245 987
Total Volume 89 963 248 19 1319 117 480 213 25 835 223 472 190 21 906 189 677 69 15 950 4010% App. Total 6.7 73 18.8 1.4 14 57.5 25.5 3 24.6 52.1 21 2.3 19.9 71.3 7.3 1.6
PHF .856 .952 .861 .679 .961 .836 .938 .903 .781 .936 .706 .908 .913 .656 .848 .727 .891 .784 .536 .969 .948

Traffic Data ServiceCampbell, CA(408) [email protected] File Name : 1PM FINAL
Site Code : 00000001Start Date : 9/14/2011Page No : 2
BASCOM AVE S
AN
CA
RL
OS
ST
SA
N C
AR
LO
S S
T
BASCOM AVE
Right89
Thru963
Left248
Peds19
InOut Total658 1319 1977
Right117
Thru480
Left213
Peds 25
Out
Total
In1148
835 1983
Left190
Thru472
Right223
Peds21
Out TotalIn1365 906 2271
Left69
T
hru
677
Rig
ht18
9 P
eds15
Tot
alO
utIn
759
950
1709
Peak Hour Begins at 05:00 PM
Vehicles
Peak Hour Data
North

Traffic Data ServiceCampbell, CA(408) [email protected] File Name : 2AM FINAL
Site Code : 00000002Start Date : 9/14/2011Page No : 1
Groups Printed- VehiclesLEIGH AVESouthbound
SAN CARLOS STWestbound
LEIGH AVENorthbound
SAN CARLOS STEastbound
Start Time Right Thru Left Peds App. Total Right Thru Left Peds App. Total Right Thru Left Peds App. Total Right Thru Left Peds App. Total Int. Total
07:00 AM 4 12 8 1 25 3 88 4 0 95 7 9 11 2 29 3 49 6 1 59 20807:15 AM 9 39 10 2 60 5 218 7 3 233 4 11 30 7 52 9 63 5 6 83 42807:30 AM 9 43 19 3 74 5 248 9 8 270 6 28 35 20 89 6 85 9 6 106 53907:45 AM 17 50 15 3 85 7 263 19 15 304 6 25 38 9 78 5 99 16 11 131 598
Total 39 144 52 9 244 20 817 39 26 902 23 73 114 38 248 23 296 36 24 379 1773
08:00 AM 9 29 12 4 54 3 220 16 3 242 13 32 22 9 76 5 100 8 5 118 49008:15 AM 11 30 15 4 60 1 143 15 1 160 11 39 33 2 85 4 109 12 1 126 43108:30 AM 11 36 9 1 57 0 163 15 0 178 14 21 29 0 64 8 126 11 3 148 44708:45 AM 7 23 8 10 48 2 218 26 2 248 7 20 34 2 63 10 107 14 3 134 493
Total 38 118 44 19 219 6 744 72 6 828 45 112 118 13 288 27 442 45 12 526 1861
Grand Total 77 262 96 28 463 26 1561 111 32 1730 68 185 232 51 536 50 738 81 36 905 3634Apprch % 16.6 56.6 20.7 6 1.5 90.2 6.4 1.8 12.7 34.5 43.3 9.5 5.5 81.5 9 4
Total % 2.1 7.2 2.6 0.8 12.7 0.7 43 3.1 0.9 47.6 1.9 5.1 6.4 1.4 14.7 1.4 20.3 2.2 1 24.9
LEIGH AVESouthbound
SAN CARLOS STWestbound
LEIGH AVENorthbound
SAN CARLOS STEastbound
Start Time Right Thru Left Peds App. Total Right Thru Left Peds App. Total Right Thru Left Peds App. Total Right Thru Left Peds App. Total Int. Total
Peak Hour Analysis From 07:00 AM to 08:45 AM - Peak 1 of 1Peak Hour for Entire Intersection Begins at 07:30 AM
07:30 AM 9 43 19 3 74 5 248 9 8 270 6 28 35 20 89 6 85 9 6 106 53907:45 AM 17 50 15 3 85 7 263 19 15 304 6 25 38 9 78 5 99 16 11 131 59808:00 AM 9 29 12 4 54 3 220 16 3 242 13 32 22 9 76 5 100 8 5 118 49008:15 AM 11 30 15 4 60 1 143 15 1 160 11 39 33 2 85 4 109 12 1 126 431
Total Volume 46 152 61 14 273 16 874 59 27 976 36 124 128 40 328 20 393 45 23 481 2058% App. Total 16.8 55.7 22.3 5.1 1.6 89.5 6 2.8 11 37.8 39 12.2 4.2 81.7 9.4 4.8
PHF .676 .760 .803 .875 .803 .571 .831 .776 .450 .803 .692 .795 .842 .500 .921 .833 .901 .703 .523 .918 .860

Traffic Data ServiceCampbell, CA(408) [email protected] File Name : 2AM FINAL
Site Code : 00000002Start Date : 9/14/2011Page No : 2
LEIGH AVE S
AN
CA
RL
OS
ST
SA
N C
AR
LO
S S
T
LEIGH AVE
Right46
Thru152
Left61
Peds14
InOut Total185 273 458
Right
16 T
hru874
Left 59 P
eds 27
Out
Total
In490
976 1466
Left128
Thru124
Right36
Peds40
Out TotalIn231 328 559
Left45
T
hru
393
Rig
ht20
Ped
s23
Tot
alO
utIn
1048
48
1 15
29
Peak Hour Begins at 07:30 AM
Vehicles
Peak Hour Data
North
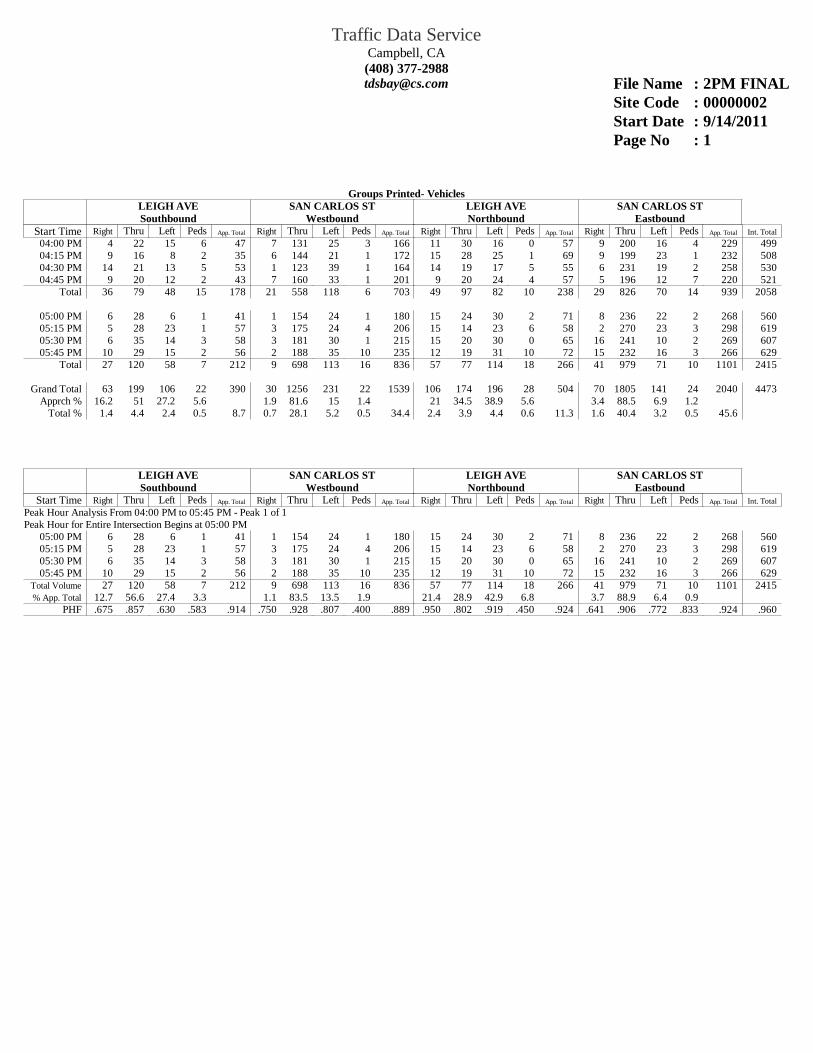
Traffic Data ServiceCampbell, CA(408) [email protected] File Name : 2PM FINAL
Site Code : 00000002Start Date : 9/14/2011Page No : 1
Groups Printed- VehiclesLEIGH AVESouthbound
SAN CARLOS STWestbound
LEIGH AVENorthbound
SAN CARLOS STEastbound
Start Time Right Thru Left Peds App. Total Right Thru Left Peds App. Total Right Thru Left Peds App. Total Right Thru Left Peds App. Total Int. Total
04:00 PM 4 22 15 6 47 7 131 25 3 166 11 30 16 0 57 9 200 16 4 229 49904:15 PM 9 16 8 2 35 6 144 21 1 172 15 28 25 1 69 9 199 23 1 232 50804:30 PM 14 21 13 5 53 1 123 39 1 164 14 19 17 5 55 6 231 19 2 258 53004:45 PM 9 20 12 2 43 7 160 33 1 201 9 20 24 4 57 5 196 12 7 220 521
Total 36 79 48 15 178 21 558 118 6 703 49 97 82 10 238 29 826 70 14 939 2058
05:00 PM 6 28 6 1 41 1 154 24 1 180 15 24 30 2 71 8 236 22 2 268 56005:15 PM 5 28 23 1 57 3 175 24 4 206 15 14 23 6 58 2 270 23 3 298 61905:30 PM 6 35 14 3 58 3 181 30 1 215 15 20 30 0 65 16 241 10 2 269 60705:45 PM 10 29 15 2 56 2 188 35 10 235 12 19 31 10 72 15 232 16 3 266 629
Total 27 120 58 7 212 9 698 113 16 836 57 77 114 18 266 41 979 71 10 1101 2415
Grand Total 63 199 106 22 390 30 1256 231 22 1539 106 174 196 28 504 70 1805 141 24 2040 4473Apprch % 16.2 51 27.2 5.6 1.9 81.6 15 1.4 21 34.5 38.9 5.6 3.4 88.5 6.9 1.2
Total % 1.4 4.4 2.4 0.5 8.7 0.7 28.1 5.2 0.5 34.4 2.4 3.9 4.4 0.6 11.3 1.6 40.4 3.2 0.5 45.6
LEIGH AVESouthbound
SAN CARLOS STWestbound
LEIGH AVENorthbound
SAN CARLOS STEastbound
Start Time Right Thru Left Peds App. Total Right Thru Left Peds App. Total Right Thru Left Peds App. Total Right Thru Left Peds App. Total Int. Total
Peak Hour Analysis From 04:00 PM to 05:45 PM - Peak 1 of 1Peak Hour for Entire Intersection Begins at 05:00 PM
05:00 PM 6 28 6 1 41 1 154 24 1 180 15 24 30 2 71 8 236 22 2 268 56005:15 PM 5 28 23 1 57 3 175 24 4 206 15 14 23 6 58 2 270 23 3 298 61905:30 PM 6 35 14 3 58 3 181 30 1 215 15 20 30 0 65 16 241 10 2 269 60705:45 PM 10 29 15 2 56 2 188 35 10 235 12 19 31 10 72 15 232 16 3 266 629
Total Volume 27 120 58 7 212 9 698 113 16 836 57 77 114 18 266 41 979 71 10 1101 2415% App. Total 12.7 56.6 27.4 3.3 1.1 83.5 13.5 1.9 21.4 28.9 42.9 6.8 3.7 88.9 6.4 0.9
PHF .675 .857 .630 .583 .914 .750 .928 .807 .400 .889 .950 .802 .919 .450 .924 .641 .906 .772 .833 .924 .960

Traffic Data ServiceCampbell, CA(408) [email protected] File Name : 2PM FINAL
Site Code : 00000002Start Date : 9/14/2011Page No : 2
LEIGH AVE S
AN
CA
RL
OS
ST
SA
N C
AR
LO
S S
T
LEIGH AVE
Right27
Thru120
Left58
Peds7
InOut Total157 212 369
Right 9
Thru698
Left113
Peds 16
Out
Total
In1094
836 1930
Left114
Thru77
Right57
Peds18
Out TotalIn274 266 540
Left71
T
hru
979
Rig
ht41
Ped
s10
Tot
alO
utIn
839
1101
19
40
Peak Hour Begins at 05:00 PM
Vehicles
Peak Hour Data
North

Traffic Data ServiceCampbell, CA(408) [email protected] File Name : 3AM FINAL
Site Code : 00000003Start Date : 9/14/2011Page No : 1
Groups Printed- VehiclesLEIGH AVESouthbound
SCOTT STWestbound
LEIGH AVENorthbound
SCOTT STEastbound
Start Time Right Thru Left Peds App. Total Right Thru Left Peds App. Total Right Thru Left Peds App. Total Right Thru Left Peds App. Total Int. Total
07:00 AM 1 19 3 0 23 5 11 13 1 30 6 26 6 2 40 4 5 0 0 9 10207:15 AM 1 51 1 0 53 8 15 23 0 46 10 41 13 4 68 6 4 0 0 10 17707:30 AM 0 57 0 1 58 15 25 32 2 74 6 48 11 1 66 17 7 6 1 31 22907:45 AM 9 70 4 1 84 16 47 38 1 102 9 47 26 1 83 10 5 2 0 17 286
Total 11 197 8 2 218 44 98 106 4 252 31 162 56 8 257 37 21 8 1 67 794
08:00 AM 4 43 2 1 50 18 40 15 0 73 9 39 10 0 58 12 17 1 0 30 21108:15 AM 2 43 3 0 48 33 45 22 1 101 8 42 8 0 58 7 4 3 4 18 22508:30 AM 3 50 4 8 65 16 24 18 2 60 7 47 10 2 66 9 6 0 0 15 20608:45 AM 1 41 4 2 48 14 37 15 1 67 4 48 11 0 63 7 7 3 1 18 196
Total 10 177 13 11 211 81 146 70 4 301 28 176 39 2 245 35 34 7 5 81 838
Grand Total 21 374 21 13 429 125 244 176 8 553 59 338 95 10 502 72 55 15 6 148 1632Apprch % 4.9 87.2 4.9 3 22.6 44.1 31.8 1.4 11.8 67.3 18.9 2 48.6 37.2 10.1 4.1
Total % 1.3 22.9 1.3 0.8 26.3 7.7 15 10.8 0.5 33.9 3.6 20.7 5.8 0.6 30.8 4.4 3.4 0.9 0.4 9.1
LEIGH AVESouthbound
SCOTT STWestbound
LEIGH AVENorthbound
SCOTT STEastbound
Start Time Right Thru Left Peds App. Total Right Thru Left Peds App. Total Right Thru Left Peds App. Total Right Thru Left Peds App. Total Int. Total
Peak Hour Analysis From 07:00 AM to 08:45 AM - Peak 1 of 1Peak Hour for Entire Intersection Begins at 07:30 AM
07:30 AM 0 57 0 1 58 15 25 32 2 74 6 48 11 1 66 17 7 6 1 31 22907:45 AM 9 70 4 1 84 16 47 38 1 102 9 47 26 1 83 10 5 2 0 17 28608:00 AM 4 43 2 1 50 18 40 15 0 73 9 39 10 0 58 12 17 1 0 30 21108:15 AM 2 43 3 0 48 33 45 22 1 101 8 42 8 0 58 7 4 3 4 18 225
Total Volume 15 213 9 3 240 82 157 107 4 350 32 176 55 2 265 46 33 12 5 96 951% App. Total 6.2 88.8 3.8 1.2 23.4 44.9 30.6 1.1 12.1 66.4 20.8 0.8 47.9 34.4 12.5 5.2
PHF .417 .761 .563 .750 .714 .621 .835 .704 .500 .858 .889 .917 .529 .500 .798 .676 .485 .500 .313 .774 .831

Traffic Data ServiceCampbell, CA(408) [email protected] File Name : 3AM FINAL
Site Code : 00000003Start Date : 9/14/2011Page No : 2
LEIGH AVE S
CO
TT
ST
SC
OT
T ST
LEIGH AVE
Right15
Thru213
Left9
Peds3
InOut Total270 240 510
Right
82 T
hru157
Left107
Peds 4
Out
Total
In74
350 42
4
Left55
Thru176
Right32
Peds2
Out TotalIn366 265 631
Left12
T
hru33
R
ight46
P
eds5
Tot
alO
utIn
227
96
323
Peak Hour Begins at 07:30 AM
Vehicles
Peak Hour Data
North
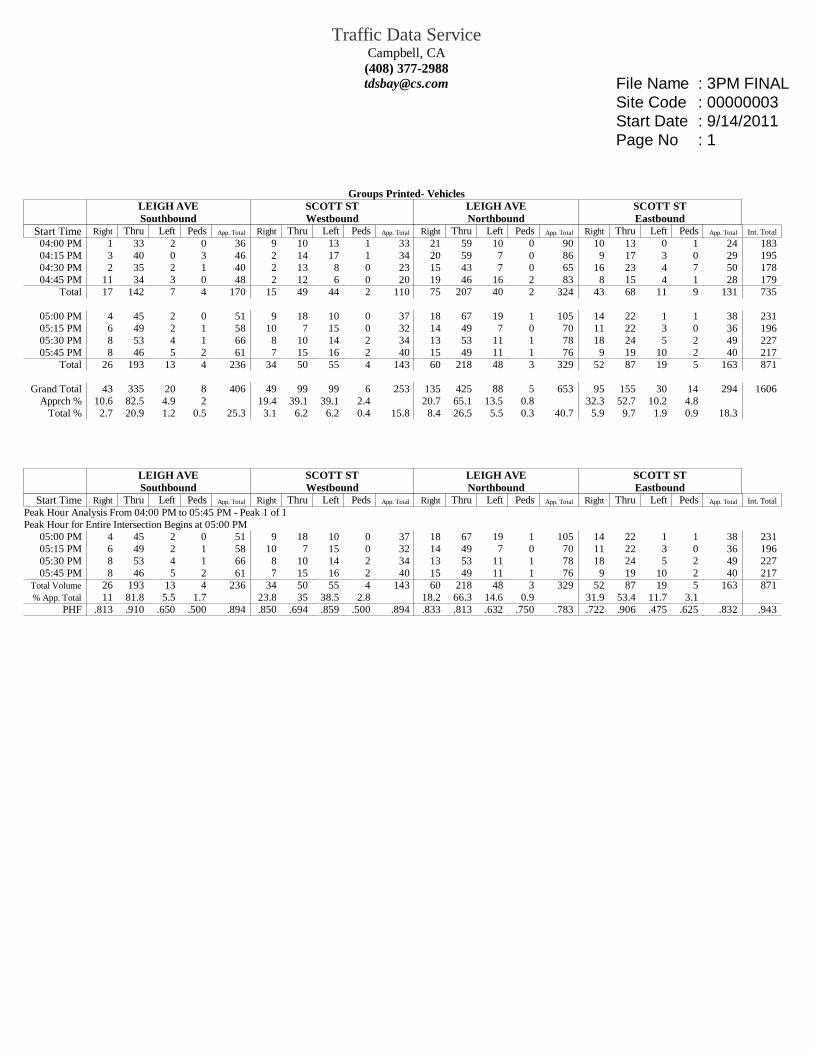
Traffic Data ServiceCampbell, CA(408) [email protected] File Name : 3PM FINAL
Site Code : 00000003Start Date : 9/14/2011Page No : 1
Groups Printed- VehiclesLEIGH AVESouthbound
SCOTT STWestbound
LEIGH AVENorthbound
SCOTT STEastbound
Start Time Right Thru Left Peds App. Total Right Thru Left Peds App. Total Right Thru Left Peds App. Total Right Thru Left Peds App. Total Int. Total
04:00 PM 1 33 2 0 36 9 10 13 1 33 21 59 10 0 90 10 13 0 1 24 18304:15 PM 3 40 0 3 46 2 14 17 1 34 20 59 7 0 86 9 17 3 0 29 19504:30 PM 2 35 2 1 40 2 13 8 0 23 15 43 7 0 65 16 23 4 7 50 17804:45 PM 11 34 3 0 48 2 12 6 0 20 19 46 16 2 83 8 15 4 1 28 179
Total 17 142 7 4 170 15 49 44 2 110 75 207 40 2 324 43 68 11 9 131 735
05:00 PM 4 45 2 0 51 9 18 10 0 37 18 67 19 1 105 14 22 1 1 38 23105:15 PM 6 49 2 1 58 10 7 15 0 32 14 49 7 0 70 11 22 3 0 36 19605:30 PM 8 53 4 1 66 8 10 14 2 34 13 53 11 1 78 18 24 5 2 49 22705:45 PM 8 46 5 2 61 7 15 16 2 40 15 49 11 1 76 9 19 10 2 40 217
Total 26 193 13 4 236 34 50 55 4 143 60 218 48 3 329 52 87 19 5 163 871
Grand Total 43 335 20 8 406 49 99 99 6 253 135 425 88 5 653 95 155 30 14 294 1606Apprch % 10.6 82.5 4.9 2 19.4 39.1 39.1 2.4 20.7 65.1 13.5 0.8 32.3 52.7 10.2 4.8
Total % 2.7 20.9 1.2 0.5 25.3 3.1 6.2 6.2 0.4 15.8 8.4 26.5 5.5 0.3 40.7 5.9 9.7 1.9 0.9 18.3
LEIGH AVESouthbound
SCOTT STWestbound
LEIGH AVENorthbound
SCOTT STEastbound
Start Time Right Thru Left Peds App. Total Right Thru Left Peds App. Total Right Thru Left Peds App. Total Right Thru Left Peds App. Total Int. Total
Peak Hour Analysis From 04:00 PM to 05:45 PM - Peak 1 of 1Peak Hour for Entire Intersection Begins at 05:00 PM
05:00 PM 4 45 2 0 51 9 18 10 0 37 18 67 19 1 105 14 22 1 1 38 23105:15 PM 6 49 2 1 58 10 7 15 0 32 14 49 7 0 70 11 22 3 0 36 19605:30 PM 8 53 4 1 66 8 10 14 2 34 13 53 11 1 78 18 24 5 2 49 22705:45 PM 8 46 5 2 61 7 15 16 2 40 15 49 11 1 76 9 19 10 2 40 217
Total Volume 26 193 13 4 236 34 50 55 4 143 60 218 48 3 329 52 87 19 5 163 871% App. Total 11 81.8 5.5 1.7 23.8 35 38.5 2.8 18.2 66.3 14.6 0.9 31.9 53.4 11.7 3.1
PHF .813 .910 .650 .500 .894 .850 .694 .859 .500 .894 .833 .813 .632 .750 .783 .722 .906 .475 .625 .832 .943

Traffic Data ServiceCampbell, CA(408) [email protected] File Name : 3PM FINAL
Site Code : 00000003Start Date : 9/14/2011Page No : 2
LEIGH AVE S
CO
TT
ST
SC
OT
T ST
LEIGH AVE
Right26
Thru193
Left13
Peds4
InOut Total271 236 507
Right
34 T
hru 50 Left 55
Peds 4
Out
Total
In160
143 30
3
Left48
Thru218
Right60
Peds3
Out TotalIn300 329 629
Left19
T
hru87
R
ight52
P
eds5
Tot
alO
utIn
124
163
287
Peak Hour Begins at 05:00 PM
Vehicles
Peak Hour Data
North

Traffic Data ServiceCampbell, CA(408) [email protected] File Name : 4AM FINAL
Site Code : 00000004Start Date : 9/15/2011Page No : 1
Groups Printed- VehiclesBASCOM AVE
SouthboundPARKMOOR AVE
WestboundBASCOM AVE
NorthboundPARKMOOR AVE
EastboundStart Time Right Thru Left Peds App. Total Right Thru Left Peds App. Total Right Thru Left Peds App. Total Right Thru Left Peds App. Total Int. Total
07:00 AM 2 98 0 0 100 45 29 120 0 194 0 101 1 1 103 2 0 1 0 3 40007:15 AM 2 130 0 0 132 46 30 124 4 204 0 122 1 0 123 2 0 0 0 2 46107:30 AM 3 173 0 0 176 44 33 143 3 223 0 201 0 0 201 3 0 2 0 5 60507:45 AM 5 184 0 0 189 62 61 171 3 297 0 250 1 0 251 5 0 4 0 9 746
Total 12 585 0 0 597 197 153 558 10 918 0 674 3 1 678 12 0 7 0 19 2212
08:00 AM 4 167 0 0 171 74 37 145 5 261 0 250 1 1 252 9 0 2 0 11 69508:15 AM 1 150 0 0 151 69 40 187 2 298 0 235 1 0 236 5 0 0 1 6 69108:30 AM 2 186 0 0 188 63 27 181 0 271 0 240 0 0 240 8 0 3 2 13 71208:45 AM 2 159 0 0 161 71 24 181 9 285 0 225 0 0 225 7 0 2 3 12 683
Total 9 662 0 0 671 277 128 694 16 1115 0 950 2 1 953 29 0 7 6 42 2781
Grand Total 21 1247 0 0 1268 474 281 1252 26 2033 0 1624 5 2 1631 41 0 14 6 61 4993Apprch % 1.7 98.3 0 0 23.3 13.8 61.6 1.3 0 99.6 0.3 0.1 67.2 0 23 9.8
Total % 0.4 25 0 0 25.4 9.5 5.6 25.1 0.5 40.7 0 32.5 0.1 0 32.7 0.8 0 0.3 0.1 1.2
BASCOM AVESouthbound
PARKMOOR AVEWestbound
BASCOM AVENorthbound
PARKMOOR AVEEastbound
Start Time Right Thru Left Peds App. Total Right Thru Left Peds App. Total Right Thru Left Peds App. Total Right Thru Left Peds App. Total Int. Total
Peak Hour Analysis From 07:00 AM to 08:45 AM - Peak 1 of 1Peak Hour for Entire Intersection Begins at 07:45 AM
07:45 AM 5 184 0 0 189 62 61 171 3 297 0 250 1 0 251 5 0 4 0 9 74608:00 AM 4 167 0 0 171 74 37 145 5 261 0 250 1 1 252 9 0 2 0 11 69508:15 AM 1 150 0 0 151 69 40 187 2 298 0 235 1 0 236 5 0 0 1 6 69108:30 AM 2 186 0 0 188 63 27 181 0 271 0 240 0 0 240 8 0 3 2 13 712
Total Volume 12 687 0 0 699 268 165 684 10 1127 0 975 3 1 979 27 0 9 3 39 2844% App. Total 1.7 98.3 0 0 23.8 14.6 60.7 0.9 0 99.6 0.3 0.1 69.2 0 23.1 7.7
PHF .600 .923 .000 .000 .925 .905 .676 .914 .500 .945 .000 .975 .750 .250 .971 .750 .000 .563 .375 .750 .953

Traffic Data ServiceCampbell, CA(408) [email protected] File Name : 4AM FINAL
Site Code : 00000004Start Date : 9/15/2011Page No : 2
BASCOM AVE P
AR
KM
OO
R A
VE
PA
RK
MO
OR
AV
E
BASCOM AVE
Right12
Thru687
Left0
Peds0
InOut Total1252 699 1951
Right268
Thru165
Left684
Peds 10
Out
Total
In0
1127 1127
Left3
Thru975
Right0
Peds1
Out TotalIn1398 979 2377
Left9
Thr
u0 R
ight27
P
eds3
Tot
alO
utIn
180
39
219
Peak Hour Begins at 07:45 AM
Vehicles
Peak Hour Data
North

Traffic Data ServiceCampbell, CA(408) [email protected] File Name : 4PM FINAL
Site Code : 00000004Start Date : 9/15/2011Page No : 1
Groups Printed- VehiclesBASCOM AVE
SouthboundPARKMOOR AVE
WestboundBASCOM AVE
NorthboundPARKMOOR AVE
EastboundStart Time Right Thru Left Peds App. Total Right Thru Left Peds App. Total Right Thru Left Peds App. Total Right Thru Left Peds App. Total Int. Total
04:00 PM 1 207 0 0 208 44 32 111 0 187 0 140 0 0 140 2 0 0 12 14 54904:15 PM 8 257 0 0 265 34 21 120 0 175 0 149 0 0 149 4 0 1 7 12 60104:30 PM 4 217 0 0 221 31 34 152 1 218 0 157 0 0 157 1 0 0 2 3 59904:45 PM 3 246 0 0 249 42 17 135 8 202 0 152 0 0 152 3 0 1 1 5 608
Total 16 927 0 0 943 151 104 518 9 782 0 598 0 0 598 10 0 2 22 34 2357
05:00 PM 6 307 0 0 313 52 23 117 5 197 0 191 1 0 192 0 0 0 1 1 70305:15 PM 8 345 0 3 356 44 22 121 3 190 0 165 1 0 166 3 0 0 0 3 71505:30 PM 10 362 0 0 372 33 30 162 3 228 0 142 7 0 149 0 0 0 1 1 75005:45 PM 4 359 0 3 366 35 43 182 6 266 0 136 6 0 142 6 0 2 1 9 783
Total 28 1373 0 6 1407 164 118 582 17 881 0 634 15 0 649 9 0 2 3 14 2951
Grand Total 44 2300 0 6 2350 315 222 1100 26 1663 0 1232 15 0 1247 19 0 4 25 48 5308Apprch % 1.9 97.9 0 0.3 18.9 13.3 66.1 1.6 0 98.8 1.2 0 39.6 0 8.3 52.1
Total % 0.8 43.3 0 0.1 44.3 5.9 4.2 20.7 0.5 31.3 0 23.2 0.3 0 23.5 0.4 0 0.1 0.5 0.9
BASCOM AVESouthbound
PARKMOOR AVEWestbound
BASCOM AVENorthbound
PARKMOOR AVEEastbound
Start Time Right Thru Left Peds App. Total Right Thru Left Peds App. Total Right Thru Left Peds App. Total Right Thru Left Peds App. Total Int. Total
Peak Hour Analysis From 04:00 PM to 05:45 PM - Peak 1 of 1Peak Hour for Entire Intersection Begins at 05:00 PM
05:00 PM 6 307 0 0 313 52 23 117 5 197 0 191 1 0 192 0 0 0 1 1 70305:15 PM 8 345 0 3 356 44 22 121 3 190 0 165 1 0 166 3 0 0 0 3 71505:30 PM 10 362 0 0 372 33 30 162 3 228 0 142 7 0 149 0 0 0 1 1 75005:45 PM 4 359 0 3 366 35 43 182 6 266 0 136 6 0 142 6 0 2 1 9 783
Total Volume 28 1373 0 6 1407 164 118 582 17 881 0 634 15 0 649 9 0 2 3 14 2951% App. Total 2 97.6 0 0.4 18.6 13.4 66.1 1.9 0 97.7 2.3 0 64.3 0 14.3 21.4
PHF .700 .948 .000 .500 .946 .788 .686 .799 .708 .828 .000 .830 .536 .000 .845 .375 .000 .250 .750 .389 .942

Traffic Data ServiceCampbell, CA(408) [email protected] File Name : 4PM FINAL
Site Code : 00000004Start Date : 9/15/2011Page No : 2
BASCOM AVE P
AR
KM
OO
R A
VE
PA
RK
MO
OR
AV
E
BASCOM AVE
Right28
Thru1373
Left0
Peds6
InOut Total800 1407 2207
Right164
Thru118
Left582
Peds 17
Out
Total
In0
881 88
1
Left15
Thru634
Right0
Peds0
Out TotalIn1964 649 2613
Left2
Thr
u0 R
ight9
Ped
s3
Tot
alO
utIn
161
14
175
Peak Hour Begins at 05:00 PM
Vehicles
Peak Hour Data
North
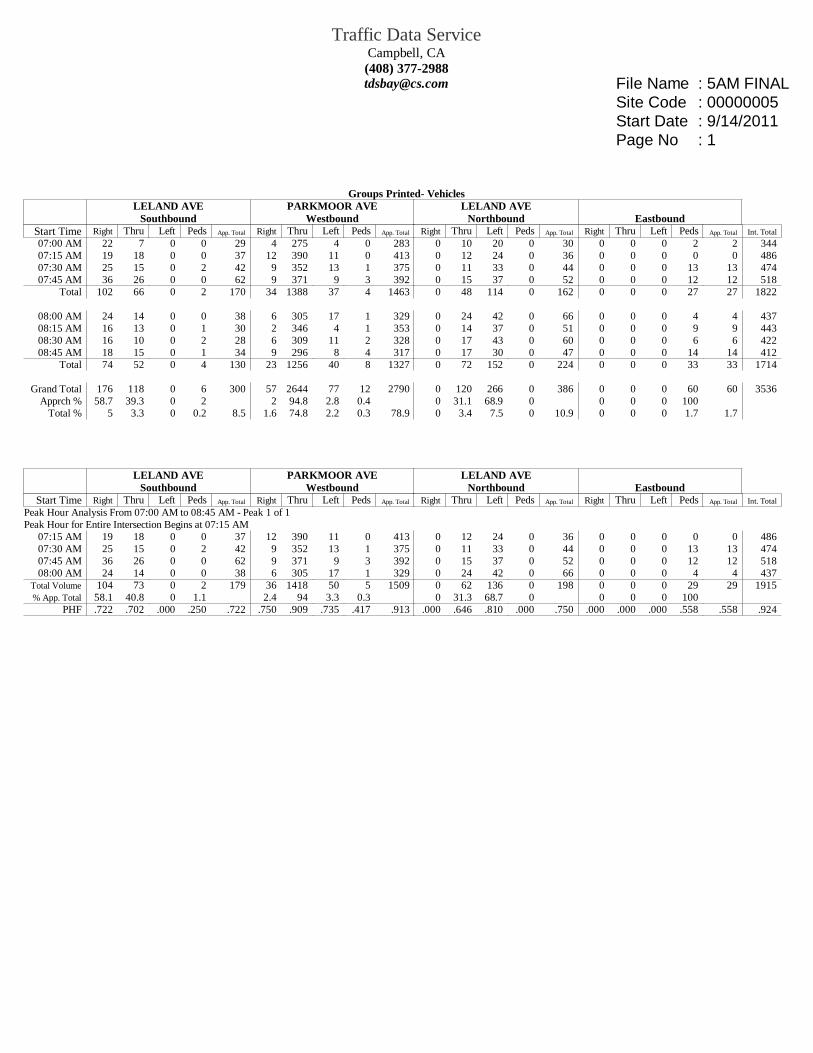
Traffic Data ServiceCampbell, CA(408) [email protected] File Name : 5AM FINAL
Site Code : 00000005Start Date : 9/14/2011Page No : 1
Groups Printed- VehiclesLELAND AVE
SouthboundPARKMOOR AVE
WestboundLELAND AVE
Northbound EastboundStart Time Right Thru Left Peds App. Total Right Thru Left Peds App. Total Right Thru Left Peds App. Total Right Thru Left Peds App. Total Int. Total
07:00 AM 22 7 0 0 29 4 275 4 0 283 0 10 20 0 30 0 0 0 2 2 34407:15 AM 19 18 0 0 37 12 390 11 0 413 0 12 24 0 36 0 0 0 0 0 48607:30 AM 25 15 0 2 42 9 352 13 1 375 0 11 33 0 44 0 0 0 13 13 47407:45 AM 36 26 0 0 62 9 371 9 3 392 0 15 37 0 52 0 0 0 12 12 518
Total 102 66 0 2 170 34 1388 37 4 1463 0 48 114 0 162 0 0 0 27 27 1822
08:00 AM 24 14 0 0 38 6 305 17 1 329 0 24 42 0 66 0 0 0 4 4 43708:15 AM 16 13 0 1 30 2 346 4 1 353 0 14 37 0 51 0 0 0 9 9 44308:30 AM 16 10 0 2 28 6 309 11 2 328 0 17 43 0 60 0 0 0 6 6 42208:45 AM 18 15 0 1 34 9 296 8 4 317 0 17 30 0 47 0 0 0 14 14 412
Total 74 52 0 4 130 23 1256 40 8 1327 0 72 152 0 224 0 0 0 33 33 1714
Grand Total 176 118 0 6 300 57 2644 77 12 2790 0 120 266 0 386 0 0 0 60 60 3536Apprch % 58.7 39.3 0 2 2 94.8 2.8 0.4 0 31.1 68.9 0 0 0 0 100
Total % 5 3.3 0 0.2 8.5 1.6 74.8 2.2 0.3 78.9 0 3.4 7.5 0 10.9 0 0 0 1.7 1.7
LELAND AVESouthbound
PARKMOOR AVEWestbound
LELAND AVENorthbound Eastbound
Start Time Right Thru Left Peds App. Total Right Thru Left Peds App. Total Right Thru Left Peds App. Total Right Thru Left Peds App. Total Int. Total
Peak Hour Analysis From 07:00 AM to 08:45 AM - Peak 1 of 1Peak Hour for Entire Intersection Begins at 07:15 AM
07:15 AM 19 18 0 0 37 12 390 11 0 413 0 12 24 0 36 0 0 0 0 0 48607:30 AM 25 15 0 2 42 9 352 13 1 375 0 11 33 0 44 0 0 0 13 13 47407:45 AM 36 26 0 0 62 9 371 9 3 392 0 15 37 0 52 0 0 0 12 12 51808:00 AM 24 14 0 0 38 6 305 17 1 329 0 24 42 0 66 0 0 0 4 4 437
Total Volume 104 73 0 2 179 36 1418 50 5 1509 0 62 136 0 198 0 0 0 29 29 1915% App. Total 58.1 40.8 0 1.1 2.4 94 3.3 0.3 0 31.3 68.7 0 0 0 0 100
PHF .722 .702 .000 .250 .722 .750 .909 .735 .417 .913 .000 .646 .810 .000 .750 .000 .000 .000 .558 .558 .924

Traffic Data ServiceCampbell, CA(408) [email protected] File Name : 5AM FINAL
Site Code : 00000005Start Date : 9/14/2011Page No : 2
LELAND AVE P
AR
KM
OO
R A
VE
LELAND AVE
Right104
Thru73
Left0
Peds2
InOut Total98 179 277
Right
36 T
hru1418
Left 50 P
eds 5
Out
Total
In0
1509 1509
Left136
Thru62
Right0
Peds0
Out TotalIn123 198 321
Left0
Thr
u0 R
ight0
Ped
s29
Tot
alO
utIn
1658
29
16
87
Peak Hour Begins at 07:15 AM
Vehicles
Peak Hour Data
North

Traffic Data ServiceCampbell, CA(408) [email protected] File Name : 5PM FINAL
Site Code : 00000005Start Date : 9/14/2011Page No : 1
Groups Printed- VehiclesLELAND AVE
SouthboundPARKMOOR AVE
WestboundLELAND AVE
Northbound EastboundStart Time Right Thru Left Peds App. Total Right Thru Left Peds App. Total Right Thru Left Peds App. Total Right Thru Left Peds App. Total Int. Total
04:00 PM 13 16 0 0 29 9 183 8 0 200 0 24 60 0 84 0 0 0 2 2 31504:15 PM 19 19 0 0 38 8 199 5 0 212 0 25 58 0 83 0 0 0 4 4 33704:30 PM 12 14 0 1 27 14 197 6 1 218 0 28 48 0 76 0 0 0 6 6 32704:45 PM 23 12 0 3 38 16 236 9 1 262 0 18 37 0 55 0 0 0 1 1 356
Total 67 61 0 4 132 47 815 28 2 892 0 95 203 0 298 0 0 0 13 13 1335
05:00 PM 22 17 0 0 39 11 220 11 2 244 0 27 70 1 98 0 0 0 4 4 38505:15 PM 15 11 0 1 27 16 223 7 2 248 0 25 48 0 73 0 0 0 7 7 35505:30 PM 17 19 0 0 36 15 284 8 0 307 0 42 51 0 93 0 0 0 3 3 43905:45 PM 15 12 0 2 29 12 296 16 2 326 0 28 48 0 76 0 0 0 6 6 437
Total 69 59 0 3 131 54 1023 42 6 1125 0 122 217 1 340 0 0 0 20 20 1616
Grand Total 136 120 0 7 263 101 1838 70 8 2017 0 217 420 1 638 0 0 0 33 33 2951Apprch % 51.7 45.6 0 2.7 5 91.1 3.5 0.4 0 34 65.8 0.2 0 0 0 100
Total % 4.6 4.1 0 0.2 8.9 3.4 62.3 2.4 0.3 68.3 0 7.4 14.2 0 21.6 0 0 0 1.1 1.1
LELAND AVESouthbound
PARKMOOR AVEWestbound
LELAND AVENorthbound Eastbound
Start Time Right Thru Left Peds App. Total Right Thru Left Peds App. Total Right Thru Left Peds App. Total Right Thru Left Peds App. Total Int. Total
Peak Hour Analysis From 04:00 PM to 05:45 PM - Peak 1 of 1Peak Hour for Entire Intersection Begins at 05:00 PM
05:00 PM 22 17 0 0 39 11 220 11 2 244 0 27 70 1 98 0 0 0 4 4 38505:15 PM 15 11 0 1 27 16 223 7 2 248 0 25 48 0 73 0 0 0 7 7 35505:30 PM 17 19 0 0 36 15 284 8 0 307 0 42 51 0 93 0 0 0 3 3 43905:45 PM 15 12 0 2 29 12 296 16 2 326 0 28 48 0 76 0 0 0 6 6 437
Total Volume 69 59 0 3 131 54 1023 42 6 1125 0 122 217 1 340 0 0 0 20 20 1616% App. Total 52.7 45 0 2.3 4.8 90.9 3.7 0.5 0 35.9 63.8 0.3 0 0 0 100
PHF .784 .776 .000 .375 .840 .844 .864 .656 .750 .863 .000 .726 .775 .250 .867 .000 .000 .000 .714 .714 .920

Traffic Data ServiceCampbell, CA(408) [email protected] File Name : 5PM FINAL
Site Code : 00000005Start Date : 9/14/2011Page No : 2
LELAND AVE P
AR
KM
OO
R A
VE
LELAND AVE
Right69
Thru59
Left0
Peds3
InOut Total176 131 307
Right
54 T
hru1023
Left 42 P
eds 6
Out
Total
In0
1125 1125
Left217
Thru122
Right0
Peds1
Out TotalIn101 340 441
Left0
Thr
u0 R
ight0
Ped
s20
Tot
alO
utIn
1309
20
13
29
Peak Hour Begins at 05:00 PM
Vehicles
Peak Hour Data
North

Traffic Data ServiceCampbell, CA(408) [email protected] File Name : 6AM FINAL
Site Code : 00000006Start Date : 9/15/2011Page No : 1
Groups Printed- VehiclesLEIGH AVESouthbound
PARKMOOR AVEWestbound
LEIGH AVENorthbound Eastbound
Start Time Right Thru Left Peds App. Total Right Thru Left Peds App. Total Right Thru Left Peds App. Total Right Thru Left Peds App. Total Int. Total
07:00 AM 16 24 0 1 41 18 195 35 3 251 0 14 47 0 61 0 0 0 2 2 35507:15 AM 26 58 0 3 87 38 292 65 1 396 0 34 75 1 110 0 0 0 0 0 59307:30 AM 35 83 0 1 119 19 265 91 2 377 0 48 82 0 130 0 0 0 6 6 63207:45 AM 31 77 0 1 109 20 268 98 1 387 0 61 92 0 153 0 0 0 2 2 651
Total 108 242 0 6 356 95 1020 289 7 1411 0 157 296 1 454 0 0 0 10 10 2231
08:00 AM 18 61 0 0 79 18 263 96 1 378 0 54 58 0 112 0 0 0 0 0 56908:15 AM 13 59 0 3 75 20 293 95 5 413 0 33 51 0 84 0 0 0 5 5 57708:30 AM 30 58 0 1 89 19 248 94 2 363 0 54 70 0 124 0 0 0 2 2 57808:45 AM 17 46 0 2 65 20 261 109 1 391 0 47 52 0 99 0 0 0 6 6 561
Total 78 224 0 6 308 77 1065 394 9 1545 0 188 231 0 419 0 0 0 13 13 2285
Grand Total 186 466 0 12 664 172 2085 683 16 2956 0 345 527 1 873 0 0 0 23 23 4516Apprch % 28 70.2 0 1.8 5.8 70.5 23.1 0.5 0 39.5 60.4 0.1 0 0 0 100
Total % 4.1 10.3 0 0.3 14.7 3.8 46.2 15.1 0.4 65.5 0 7.6 11.7 0 19.3 0 0 0 0.5 0.5
LEIGH AVESouthbound
PARKMOOR AVEWestbound
LEIGH AVENorthbound Eastbound
Start Time Right Thru Left Peds App. Total Right Thru Left Peds App. Total Right Thru Left Peds App. Total Right Thru Left Peds App. Total Int. Total
Peak Hour Analysis From 07:00 AM to 08:45 AM - Peak 1 of 1Peak Hour for Entire Intersection Begins at 07:15 AM
07:15 AM 26 58 0 3 87 38 292 65 1 396 0 34 75 1 110 0 0 0 0 0 59307:30 AM 35 83 0 1 119 19 265 91 2 377 0 48 82 0 130 0 0 0 6 6 63207:45 AM 31 77 0 1 109 20 268 98 1 387 0 61 92 0 153 0 0 0 2 2 65108:00 AM 18 61 0 0 79 18 263 96 1 378 0 54 58 0 112 0 0 0 0 0 569
Total Volume 110 279 0 5 394 95 1088 350 5 1538 0 197 307 1 505 0 0 0 8 8 2445% App. Total 27.9 70.8 0 1.3 6.2 70.7 22.8 0.3 0 39 60.8 0.2 0 0 0 100
PHF .786 .840 .000 .417 .828 .625 .932 .893 .625 .971 .000 .807 .834 .250 .825 .000 .000 .000 .333 .333 .939

Traffic Data ServiceCampbell, CA(408) [email protected] File Name : 6AM FINAL
Site Code : 00000006Start Date : 9/15/2011Page No : 2
LEIGH AVE P
AR
KM
OO
R A
VE
LEIGH AVE
Right110
Thru279
Left0
Peds5
InOut Total292 394 686
Right
95 T
hru1088
Left350
Peds 5
Out
Total
In0
1538 1538
Left307
Thru197
Right0
Peds1
Out TotalIn629 505 1134
Left0
Thr
u0 R
ight0
Ped
s8
Tot
alO
utIn
1505
8
1513
Peak Hour Begins at 07:15 AM
Vehicles
Peak Hour Data
North

Traffic Data ServiceCampbell, CA(408) [email protected] File Name : 6PM FINAL
Site Code : 00000006Start Date : 9/15/2011Page No : 1
Groups Printed- VehiclesLEIGH AVESouthbound
PARKMOOR AVEWestbound
LEIGH AVENorthbound Eastbound
Start Time Right Thru Left Peds App. Total Right Thru Left Peds App. Total Right Thru Left Peds App. Total Right Thru Left Peds App. Total Int. Total
04:00 PM 12 53 0 0 65 32 171 59 1 263 0 53 38 0 91 0 0 0 0 0 41904:15 PM 13 46 0 0 59 26 167 67 0 260 0 59 37 0 96 0 0 0 1 1 41604:30 PM 9 53 0 0 62 33 178 78 3 292 0 49 40 0 89 0 0 0 6 6 44904:45 PM 15 40 0 4 59 34 207 82 0 323 0 42 46 0 88 0 0 0 8 8 478
Total 49 192 0 4 245 125 723 286 4 1138 0 203 161 0 364 0 0 0 15 15 1762
05:00 PM 13 61 0 1 75 42 197 68 4 311 0 62 39 0 101 0 0 0 4 4 49105:15 PM 16 52 0 2 70 30 214 101 2 347 0 54 34 0 88 0 0 0 4 4 50905:30 PM 17 64 0 1 82 30 265 125 4 424 0 39 35 0 74 0 0 0 6 6 58605:45 PM 14 67 0 1 82 31 256 122 1 410 0 59 59 0 118 0 0 0 2 2 612
Total 60 244 0 5 309 133 932 416 11 1492 0 214 167 0 381 0 0 0 16 16 2198
Grand Total 109 436 0 9 554 258 1655 702 15 2630 0 417 328 0 745 0 0 0 31 31 3960Apprch % 19.7 78.7 0 1.6 9.8 62.9 26.7 0.6 0 56 44 0 0 0 0 100
Total % 2.8 11 0 0.2 14 6.5 41.8 17.7 0.4 66.4 0 10.5 8.3 0 18.8 0 0 0 0.8 0.8
LEIGH AVESouthbound
PARKMOOR AVEWestbound
LEIGH AVENorthbound Eastbound
Start Time Right Thru Left Peds App. Total Right Thru Left Peds App. Total Right Thru Left Peds App. Total Right Thru Left Peds App. Total Int. Total
Peak Hour Analysis From 04:00 PM to 05:45 PM - Peak 1 of 1Peak Hour for Entire Intersection Begins at 05:00 PM
05:00 PM 13 61 0 1 75 42 197 68 4 311 0 62 39 0 101 0 0 0 4 4 49105:15 PM 16 52 0 2 70 30 214 101 2 347 0 54 34 0 88 0 0 0 4 4 50905:30 PM 17 64 0 1 82 30 265 125 4 424 0 39 35 0 74 0 0 0 6 6 58605:45 PM 14 67 0 1 82 31 256 122 1 410 0 59 59 0 118 0 0 0 2 2 612
Total Volume 60 244 0 5 309 133 932 416 11 1492 0 214 167 0 381 0 0 0 16 16 2198% App. Total 19.4 79 0 1.6 8.9 62.5 27.9 0.7 0 56.2 43.8 0 0 0 0 100
PHF .882 .910 .000 .625 .942 .792 .879 .832 .688 .880 .000 .863 .708 .000 .807 .000 .000 .000 .667 .667 .898

Traffic Data ServiceCampbell, CA(408) [email protected] File Name : 6PM FINAL
Site Code : 00000006Start Date : 9/15/2011Page No : 2
LEIGH AVE P
AR
KM
OO
R A
VE
LEIGH AVE
Right60
Thru244
Left0
Peds5
InOut Total347 309 656
Right133
Thru932
Left416
Peds 11
Out
Total
In0
1492 1492
Left167
Thru214
Right0
Peds0
Out TotalIn660 381 1041
Left0
Thr
u0 R
ight0
Ped
s16
Tot
alO
utIn
1159
16
11
75
Peak Hour Begins at 05:00 PM
Vehicles
Peak Hour Data
North

Traffic Data ServiceCampbell, CA(408) [email protected] File Name : 7AM FINAL
Site Code : 00000007Start Date : 9/15/2011Page No : 1
Groups Printed- VehiclesBASCOM AVE
Southbound WestboundBASCOM AVE
NorthboundMOORPARK AVE
EastboundStart Time Right Thru Left Peds App. Total Right Thru Left Peds App. Total Right Thru Left Peds App. Total Right Thru Left Peds App. Total Int. Total
07:00 AM 94 81 37 1 213 0 0 0 1 1 30 94 34 1 159 16 84 7 4 111 48407:15 AM 93 104 48 2 247 0 0 0 5 5 48 102 65 2 217 26 85 13 5 129 59807:30 AM 124 132 63 0 319 0 0 0 8 8 88 182 97 3 370 54 183 24 3 264 96107:45 AM 137 188 69 0 394 0 0 0 4 4 63 208 123 1 395 41 192 30 7 270 1063
Total 448 505 217 3 1173 0 0 0 18 18 229 586 319 7 1141 137 544 74 19 774 3106
08:00 AM 128 129 51 3 311 0 0 0 6 6 72 220 102 4 398 56 185 24 9 274 98908:15 AM 119 144 64 3 330 0 0 0 2 2 54 190 75 4 323 51 155 24 16 246 90108:30 AM 115 161 69 4 349 0 0 0 0 0 65 200 69 1 335 42 138 35 9 224 90808:45 AM 107 169 93 3 372 0 0 0 12 12 58 183 70 4 315 38 135 30 27 230 929
Total 469 603 277 13 1362 0 0 0 20 20 249 793 316 13 1371 187 613 113 61 974 3727
Grand Total 917 1108 494 16 2535 0 0 0 38 38 478 1379 635 20 2512 324 1157 187 80 1748 6833Apprch % 36.2 43.7 19.5 0.6 0 0 0 100 19 54.9 25.3 0.8 18.5 66.2 10.7 4.6
Total % 13.4 16.2 7.2 0.2 37.1 0 0 0 0.6 0.6 7 20.2 9.3 0.3 36.8 4.7 16.9 2.7 1.2 25.6
BASCOM AVESouthbound Westbound
BASCOM AVENorthbound
MOORPARK AVEEastbound
Start Time Right Thru Left Peds App. Total Right Thru Left Peds App. Total Right Thru Left Peds App. Total Right Thru Left Peds App. Total Int. Total
Peak Hour Analysis From 07:00 AM to 08:45 AM - Peak 1 of 1Peak Hour for Entire Intersection Begins at 07:30 AM
07:30 AM 124 132 63 0 319 0 0 0 8 8 88 182 97 3 370 54 183 24 3 264 96107:45 AM 137 188 69 0 394 0 0 0 4 4 63 208 123 1 395 41 192 30 7 270 106308:00 AM 128 129 51 3 311 0 0 0 6 6 72 220 102 4 398 56 185 24 9 274 98908:15 AM 119 144 64 3 330 0 0 0 2 2 54 190 75 4 323 51 155 24 16 246 901
Total Volume 508 593 247 6 1354 0 0 0 20 20 277 800 397 12 1486 202 715 102 35 1054 3914% App. Total 37.5 43.8 18.2 0.4 0 0 0 100 18.6 53.8 26.7 0.8 19.2 67.8 9.7 3.3
PHF .927 .789 .895 .500 .859 .000 .000 .000 .625 .625 .787 .909 .807 .750 .933 .902 .931 .850 .547 .962 .921

Traffic Data ServiceCampbell, CA(408) [email protected] File Name : 7AM FINAL
Site Code : 00000007Start Date : 9/15/2011Page No : 2
BASCOM AVE M
OO
RP
AR
K A
VE
BASCOM AVE
Right508
Thru593
Left247
Peds6
InOut Total902 1354 2256
Right 0
Thru 0
Left 0 P
eds 20
Out
Total
In1239
20 1259
Left397
Thru800
Right277
Peds12
Out TotalIn795 1486 2281
Left
102
Thr
u71
5 R
ight
202
Ped
s35
Tot
alO
utIn
905
1054
19
59
Peak Hour Begins at 07:30 AM
Vehicles
Peak Hour Data
North

Traffic Data ServiceCampbell, CA(408) [email protected] File Name : 7PM FINAL
Site Code : 00000007Start Date : 9/15/2011Page No : 1
Groups Printed- VehiclesBASCOM AVE
Southbound WestboundBASCOM AVE
NorthboundMOORPARK AVE
EastboundStart Time Right Thru Left Peds App. Total Right Thru Left Peds App. Total Right Thru Left Peds App. Total Right Thru Left Peds App. Total Int. Total
04:00 PM 87 191 55 1 334 0 0 0 1 1 74 120 53 12 259 52 201 34 7 294 88804:15 PM 91 207 84 0 382 0 0 0 3 3 79 115 42 6 242 67 218 33 4 322 94904:30 PM 83 238 66 0 387 0 0 0 0 0 80 126 43 6 255 82 216 24 6 328 97004:45 PM 81 225 87 0 393 0 0 0 2 2 82 135 78 10 305 70 210 21 10 311 1011
Total 342 861 292 1 1496 0 0 0 6 6 315 496 216 34 1061 271 845 112 27 1255 3818
05:00 PM 71 254 107 2 434 0 0 0 2 2 93 145 61 5 304 52 225 35 8 320 106005:15 PM 88 263 101 0 452 0 0 0 0 0 71 137 54 4 266 75 224 28 7 334 105205:30 PM 99 303 123 1 526 0 0 0 5 5 82 118 56 2 258 73 208 23 6 310 109905:45 PM 82 325 118 0 525 0 0 0 2 2 67 118 78 6 269 76 229 14 6 325 1121
Total 340 1145 449 3 1937 0 0 0 9 9 313 518 249 17 1097 276 886 100 27 1289 4332
Grand Total 682 2006 741 4 3433 0 0 0 15 15 628 1014 465 51 2158 547 1731 212 54 2544 8150Apprch % 19.9 58.4 21.6 0.1 0 0 0 100 29.1 47 21.5 2.4 21.5 68 8.3 2.1
Total % 8.4 24.6 9.1 0 42.1 0 0 0 0.2 0.2 7.7 12.4 5.7 0.6 26.5 6.7 21.2 2.6 0.7 31.2
BASCOM AVESouthbound Westbound
BASCOM AVENorthbound
MOORPARK AVEEastbound
Start Time Right Thru Left Peds App. Total Right Thru Left Peds App. Total Right Thru Left Peds App. Total Right Thru Left Peds App. Total Int. Total
Peak Hour Analysis From 04:00 PM to 05:45 PM - Peak 1 of 1Peak Hour for Entire Intersection Begins at 05:00 PM
05:00 PM 71 254 107 2 434 0 0 0 2 2 93 145 61 5 304 52 225 35 8 320 106005:15 PM 88 263 101 0 452 0 0 0 0 0 71 137 54 4 266 75 224 28 7 334 105205:30 PM 99 303 123 1 526 0 0 0 5 5 82 118 56 2 258 73 208 23 6 310 109905:45 PM 82 325 118 0 525 0 0 0 2 2 67 118 78 6 269 76 229 14 6 325 1121
Total Volume 340 1145 449 3 1937 0 0 0 9 9 313 518 249 17 1097 276 886 100 27 1289 4332% App. Total 17.6 59.1 23.2 0.2 0 0 0 100 28.5 47.2 22.7 1.5 21.4 68.7 7.8 2.1
PHF .859 .881 .913 .375 .921 .000 .000 .000 .450 .450 .841 .893 .798 .708 .902 .908 .967 .714 .844 .965 .966

Traffic Data ServiceCampbell, CA(408) [email protected] File Name : 7PM FINAL
Site Code : 00000007Start Date : 9/15/2011Page No : 2
BASCOM AVE M
OO
RP
AR
K A
VE
BASCOM AVE
Right340
Thru1145
Left449
Peds3
InOut Total618 1937 2555
Right 0
Thru 0
Left 0 P
eds 9
Out
Total
In1648
9 1657
Left249
Thru518
Right313
Peds17
Out TotalIn1421 1097 2518
Left
100
Thr
u88
6 R
ight
276
Ped
s27
Tot
alO
utIn
589
1289
18
78
Peak Hour Begins at 05:00 PM
Vehicles
Peak Hour Data
North

Traffic Data ServiceCampbell, CA(408) [email protected] File Name : 8AM FINAL
Site Code : 00000008Start Date : 9/14/2011Page No : 1
Groups Printed- VehiclesLELAND AVE
Southbound WestboundLELAND AVE
NorthboundMOORPARK AVE
EastboundStart Time Right Thru Left Peds App. Total Right Thru Left Peds App. Total Right Thru Left Peds App. Total Right Thru Left Peds App. Total Int. Total
07:00 AM 0 0 12 0 12 0 0 0 0 0 2 0 0 1 3 6 110 25 3 144 15907:15 AM 0 0 21 0 21 0 0 0 0 0 7 0 0 5 12 16 164 34 0 214 24707:30 AM 0 0 31 3 34 0 0 0 0 0 15 0 0 3 18 23 213 40 8 284 33607:45 AM 0 0 28 1 29 0 0 0 0 0 6 0 0 6 12 19 285 53 20 377 418
Total 0 0 92 4 96 0 0 0 0 0 30 0 0 15 45 64 772 152 31 1019 1160
08:00 AM 0 0 36 3 39 0 0 0 0 0 5 0 0 4 9 58 190 51 23 322 37008:15 AM 0 0 16 0 16 0 0 0 0 0 13 0 0 4 17 32 238 53 5 328 36108:30 AM 0 0 20 0 20 0 0 0 0 0 10 0 0 1 11 25 280 49 4 358 38908:45 AM 0 0 26 5 31 0 0 0 0 0 12 0 0 0 12 24 264 54 19 361 404
Total 0 0 98 8 106 0 0 0 0 0 40 0 0 9 49 139 972 207 51 1369 1524
Grand Total 0 0 190 12 202 0 0 0 0 0 70 0 0 24 94 203 1744 359 82 2388 2684Apprch % 0 0 94.1 5.9 0 0 0 0 74.5 0 0 25.5 8.5 73 15 3.4
Total % 0 0 7.1 0.4 7.5 0 0 0 0 0 2.6 0 0 0.9 3.5 7.6 65 13.4 3.1 89
LELAND AVESouthbound Westbound
LELAND AVENorthbound
MOORPARK AVEEastbound
Start Time Right Thru Left Peds App. Total Right Thru Left Peds App. Total Right Thru Left Peds App. Total Right Thru Left Peds App. Total Int. Total
Peak Hour Analysis From 07:00 AM to 08:45 AM - Peak 1 of 1Peak Hour for Entire Intersection Begins at 07:45 AM
07:45 AM 0 0 28 1 29 0 0 0 0 0 6 0 0 6 12 19 285 53 20 377 41808:00 AM 0 0 36 3 39 0 0 0 0 0 5 0 0 4 9 58 190 51 23 322 37008:15 AM 0 0 16 0 16 0 0 0 0 0 13 0 0 4 17 32 238 53 5 328 36108:30 AM 0 0 20 0 20 0 0 0 0 0 10 0 0 1 11 25 280 49 4 358 389
Total Volume 0 0 100 4 104 0 0 0 0 0 34 0 0 15 49 134 993 206 52 1385 1538% App. Total 0 0 96.2 3.8 0 0 0 0 69.4 0 0 30.6 9.7 71.7 14.9 3.8
PHF .000 .000 .694 .333 .667 .000 .000 .000 .000 .000 .654 .000 .000 .625 .721 .578 .871 .972 .565 .918 .920

Traffic Data ServiceCampbell, CA(408) [email protected] File Name : 8AM FINAL
Site Code : 00000008Start Date : 9/14/2011Page No : 2
LELAND AVE M
OO
RP
AR
K A
VE
LELAND AVE
Right0
Thru0
Left100
Peds4
InOut Total206 104 310
Right 0
Thru 0
Left 0 P
eds 0
Out
Total
In1127
0 1127
Left0
Thru0
Right34
Peds15
Out TotalIn134 49 183
Left
206
Thr
u99
3 R
ight
134
Ped
s52
Tot
alO
utIn
0 13
85
1385
Peak Hour Begins at 07:45 AM
Vehicles
Peak Hour Data
North

Traffic Data ServiceCampbell, CA(408) [email protected] File Name : 8PM FINAL
Site Code : 00000008Start Date : 9/14/2011Page No : 1
Groups Printed- VehiclesLELAND AVE
Southbound WestboundLELAND AVE
NorthboundMOORPARK AVE
EastboundStart Time Right Thru Left Peds App. Total Right Thru Left Peds App. Total Right Thru Left Peds App. Total Right Thru Left Peds App. Total Int. Total
04:00 PM 0 0 29 1 30 0 0 0 0 0 15 0 0 2 17 5 333 86 5 429 47604:15 PM 0 0 25 1 26 0 0 0 0 0 21 0 0 1 22 16 383 81 6 486 53404:30 PM 0 0 19 2 21 0 0 0 0 0 10 0 0 0 10 28 439 81 10 558 58904:45 PM 0 0 18 0 18 0 0 0 0 0 10 0 0 5 15 11 399 72 6 488 521
Total 0 0 91 4 95 0 0 0 0 0 56 0 0 8 64 60 1554 320 27 1961 2120
05:00 PM 0 0 27 5 32 0 0 0 0 0 5 0 0 1 6 8 445 74 8 535 57305:15 PM 0 0 21 1 22 0 0 0 0 0 2 0 0 0 2 15 417 80 12 524 54805:30 PM 0 0 22 2 24 0 0 0 0 0 10 0 0 2 12 14 457 74 6 551 58705:45 PM 0 0 27 2 29 0 0 0 0 0 7 0 0 5 12 26 363 66 13 468 509
Total 0 0 97 10 107 0 0 0 0 0 24 0 0 8 32 63 1682 294 39 2078 2217
Grand Total 0 0 188 14 202 0 0 0 0 0 80 0 0 16 96 123 3236 614 66 4039 4337Apprch % 0 0 93.1 6.9 0 0 0 0 83.3 0 0 16.7 3 80.1 15.2 1.6
Total % 0 0 4.3 0.3 4.7 0 0 0 0 0 1.8 0 0 0.4 2.2 2.8 74.6 14.2 1.5 93.1
LELAND AVESouthbound Westbound
LELAND AVENorthbound
MOORPARK AVEEastbound
Start Time Right Thru Left Peds App. Total Right Thru Left Peds App. Total Right Thru Left Peds App. Total Right Thru Left Peds App. Total Int. Total
Peak Hour Analysis From 04:00 PM to 05:45 PM - Peak 1 of 1Peak Hour for Entire Intersection Begins at 04:30 PM
04:30 PM 0 0 19 2 21 0 0 0 0 0 10 0 0 0 10 28 439 81 10 558 58904:45 PM 0 0 18 0 18 0 0 0 0 0 10 0 0 5 15 11 399 72 6 488 52105:00 PM 0 0 27 5 32 0 0 0 0 0 5 0 0 1 6 8 445 74 8 535 57305:15 PM 0 0 21 1 22 0 0 0 0 0 2 0 0 0 2 15 417 80 12 524 548
Total Volume 0 0 85 8 93 0 0 0 0 0 27 0 0 6 33 62 1700 307 36 2105 2231% App. Total 0 0 91.4 8.6 0 0 0 0 81.8 0 0 18.2 2.9 80.8 14.6 1.7
PHF .000 .000 .787 .400 .727 .000 .000 .000 .000 .000 .675 .000 .000 .300 .550 .554 .955 .948 .750 .943 .947

Traffic Data ServiceCampbell, CA(408) [email protected] File Name : 8PM FINAL
Site Code : 00000008Start Date : 9/14/2011Page No : 2
LELAND AVE M
OO
RP
AR
K A
VE
LELAND AVE
Right0
Thru0
Left85
Peds8
InOut Total307 93 400
Right 0
Thru 0
Left 0 P
eds 0
Out
Total
In1812
0 1812
Left0
Thru0
Right27
Peds6
Out TotalIn62 33 95
Left
307
Thr
u17
00
Rig
ht62
Ped
s36
Tot
alO
utIn
0 21
05
2105
Peak Hour Begins at 04:30 PM
Vehicles
Peak Hour Data
North

Traffic Data ServiceCampbell, CA(408) [email protected] File Name : 9AM FINAL
Site Code : 00000009Start Date : 9/14/2011Page No : 1
Groups Printed- VehiclesLEIGH AVESouthbound Westbound
LEIGH AVENorthbound
MOORPARK AVEEastbound
Start Time Right Thru Left Peds App. Total Right Thru Left Peds App. Total Right Thru Left Peds App. Total Right Thru Left Peds App. Total Int. Total
07:00 AM 0 26 37 0 63 0 0 0 1 1 37 59 0 1 97 21 105 8 2 136 29707:15 AM 0 67 52 2 121 0 0 0 0 0 38 92 0 4 134 24 140 9 4 177 43207:30 AM 0 106 62 2 170 0 0 0 1 1 36 107 0 6 149 55 216 16 9 296 61607:45 AM 0 107 63 2 172 0 0 0 2 2 49 117 0 6 172 55 217 21 6 299 645
Total 0 306 214 6 526 0 0 0 4 4 160 375 0 17 552 155 678 54 21 908 1990
08:00 AM 0 104 43 1 148 0 0 0 1 1 60 91 0 4 155 48 192 19 4 263 56708:15 AM 0 104 59 1 164 0 0 0 5 5 39 79 0 11 129 46 218 15 6 285 58308:30 AM 0 116 48 0 164 0 0 0 0 0 35 100 0 8 143 52 222 15 3 292 59908:45 AM 0 125 42 2 169 0 0 0 3 3 47 82 0 8 137 44 248 33 10 335 644
Total 0 449 192 4 645 0 0 0 9 9 181 352 0 31 564 190 880 82 23 1175 2393
Grand Total 0 755 406 10 1171 0 0 0 13 13 341 727 0 48 1116 345 1558 136 44 2083 4383Apprch % 0 64.5 34.7 0.9 0 0 0 100 30.6 65.1 0 4.3 16.6 74.8 6.5 2.1
Total % 0 17.2 9.3 0.2 26.7 0 0 0 0.3 0.3 7.8 16.6 0 1.1 25.5 7.9 35.5 3.1 1 47.5
LEIGH AVESouthbound Westbound
LEIGH AVENorthbound
MOORPARK AVEEastbound
Start Time Right Thru Left Peds App. Total Right Thru Left Peds App. Total Right Thru Left Peds App. Total Right Thru Left Peds App. Total Int. Total
Peak Hour Analysis From 07:00 AM to 08:45 AM - Peak 1 of 1Peak Hour for Entire Intersection Begins at 07:30 AM
07:30 AM 0 106 62 2 170 0 0 0 1 1 36 107 0 6 149 55 216 16 9 296 61607:45 AM 0 107 63 2 172 0 0 0 2 2 49 117 0 6 172 55 217 21 6 299 64508:00 AM 0 104 43 1 148 0 0 0 1 1 60 91 0 4 155 48 192 19 4 263 56708:15 AM 0 104 59 1 164 0 0 0 5 5 39 79 0 11 129 46 218 15 6 285 583
Total Volume 0 421 227 6 654 0 0 0 9 9 184 394 0 27 605 204 843 71 25 1143 2411% App. Total 0 64.4 34.7 0.9 0 0 0 100 30.4 65.1 0 4.5 17.8 73.8 6.2 2.2
PHF .000 .984 .901 .750 .951 .000 .000 .000 .450 .450 .767 .842 .000 .614 .879 .927 .967 .845 .694 .956 .934

Traffic Data ServiceCampbell, CA(408) [email protected] File Name : 9AM FINAL
Site Code : 00000009Start Date : 9/14/2011Page No : 2
LEIGH AVE M
OO
RP
AR
K A
VE
LEIGH AVE
Right0
Thru421
Left227
Peds6
InOut Total465 654 1119
Right 0
Thru 0
Left 0 P
eds 9
Out
Total
In1254
9 1263
Left0
Thru394
Right184
Peds27
Out TotalIn625 605 1230
Left71
T
hru
843
Rig
ht20
4 P
eds25
Tot
alO
utIn
0 11
43
1143
Peak Hour Begins at 07:30 AM
Vehicles
Peak Hour Data
North

Traffic Data ServiceCampbell, CA(408) [email protected] File Name : 9PM FINAL
Site Code : 00000009Start Date : 9/14/2011Page No : 1
Groups Printed- VehiclesLEIGH AVESouthbound Westbound
LEIGH AVENorthbound
MOORPARK AVEEastbound
Start Time Right Thru Left Peds App. Total Right Thru Left Peds App. Total Right Thru Left Peds App. Total Right Thru Left Peds App. Total Int. Total
04:00 PM 0 60 49 0 109 0 0 0 2 2 20 43 0 4 67 68 275 44 3 390 56804:15 PM 0 67 47 0 114 0 0 0 1 1 22 54 0 0 76 92 279 48 1 420 61104:30 PM 0 78 54 0 132 0 0 0 4 4 29 58 0 2 89 94 337 36 9 476 70104:45 PM 0 81 40 0 121 0 0 0 2 2 22 52 0 5 79 97 300 35 9 441 643
Total 0 286 190 0 476 0 0 0 9 9 93 207 0 11 311 351 1191 163 22 1727 2523
05:00 PM 0 85 31 0 116 0 0 0 6 6 22 50 0 4 76 107 344 45 2 498 69605:15 PM 0 97 57 0 154 0 0 0 6 6 29 49 0 5 83 123 296 31 3 453 69605:30 PM 0 150 50 0 200 0 0 0 5 5 22 44 0 16 82 130 335 26 9 500 78705:45 PM 0 144 50 0 194 0 0 0 4 4 43 77 0 10 130 91 287 49 3 430 758
Total 0 476 188 0 664 0 0 0 21 21 116 220 0 35 371 451 1262 151 17 1881 2937
Grand Total 0 762 378 0 1140 0 0 0 30 30 209 427 0 46 682 802 2453 314 39 3608 5460Apprch % 0 66.8 33.2 0 0 0 0 100 30.6 62.6 0 6.7 22.2 68 8.7 1.1
Total % 0 14 6.9 0 20.9 0 0 0 0.5 0.5 3.8 7.8 0 0.8 12.5 14.7 44.9 5.8 0.7 66.1
LEIGH AVESouthbound Westbound
LEIGH AVENorthbound
MOORPARK AVEEastbound
Start Time Right Thru Left Peds App. Total Right Thru Left Peds App. Total Right Thru Left Peds App. Total Right Thru Left Peds App. Total Int. Total
Peak Hour Analysis From 04:00 PM to 05:45 PM - Peak 1 of 1Peak Hour for Entire Intersection Begins at 05:00 PM
05:00 PM 0 85 31 0 116 0 0 0 6 6 22 50 0 4 76 107 344 45 2 498 69605:15 PM 0 97 57 0 154 0 0 0 6 6 29 49 0 5 83 123 296 31 3 453 69605:30 PM 0 150 50 0 200 0 0 0 5 5 22 44 0 16 82 130 335 26 9 500 78705:45 PM 0 144 50 0 194 0 0 0 4 4 43 77 0 10 130 91 287 49 3 430 758
Total Volume 0 476 188 0 664 0 0 0 21 21 116 220 0 35 371 451 1262 151 17 1881 2937% App. Total 0 71.7 28.3 0 0 0 0 100 31.3 59.3 0 9.4 24 67.1 8 0.9
PHF .000 .793 .825 .000 .830 .000 .000 .000 .875 .875 .674 .714 .000 .547 .713 .867 .917 .770 .472 .941 .933

Traffic Data ServiceCampbell, CA(408) [email protected] File Name : 9PM FINAL
Site Code : 00000009Start Date : 9/14/2011Page No : 2
LEIGH AVE M
OO
RP
AR
K A
VE
LEIGH AVE
Right0
Thru476
Left188
Peds0
InOut Total371 664 1035
Right 0
Thru 0
Left 0 P
eds 21
Out
Total
In1566
21 1587
Left0
Thru220
Right116
Peds35
Out TotalIn927 371 1298
Left
151
Thr
u12
62
Rig
ht45
1 P
eds17
Tot
alO
utIn
0 18
81
1881
Peak Hour Begins at 05:00 PM
Vehicles
Peak Hour Data
North

Traffic Data ServiceCampbell, CA(408) [email protected] File Name : 10AM FINAL
Site Code : 00000010Start Date : 9/15/2011Page No : 1
Groups Printed- VehiclesBASCOM AVE
SouthboundRENOVA DR
WestboundBASCOM AVE
NorthboundRENOVA DR
EastboundStart Time Right Thru Left Peds App. Total Right Thru Left Peds App. Total Right Thru Left Peds App. Total Right Thru Left Peds App. Total Int. Total
07:00 AM 6 88 2 0 96 1 0 1 2 4 1 149 12 3 165 4 0 1 10 15 28007:15 AM 17 112 6 0 135 1 0 1 6 8 2 217 20 6 245 2 0 4 8 14 40207:30 AM 18 179 2 0 199 0 0 1 9 10 2 352 21 2 377 9 2 5 6 22 60807:45 AM 31 190 7 0 228 2 1 1 5 9 5 406 33 13 457 4 1 5 10 20 714
Total 72 569 17 0 658 4 1 4 22 31 10 1124 86 24 1244 19 3 15 34 71 2004
08:00 AM 18 160 9 0 187 5 0 5 6 16 4 370 39 10 423 8 3 6 8 25 65108:15 AM 33 175 8 1 217 5 2 1 8 16 6 311 34 10 361 6 1 4 7 18 61208:30 AM 20 148 15 0 183 2 1 1 7 11 7 341 24 8 380 5 3 4 8 20 59408:45 AM 28 181 21 1 231 5 1 1 5 12 10 314 25 15 364 6 0 7 14 27 634
Total 99 664 53 2 818 17 4 8 26 55 27 1336 122 43 1528 25 7 21 37 90 2491
Grand Total 171 1233 70 2 1476 21 5 12 48 86 37 2460 208 67 2772 44 10 36 71 161 4495Apprch % 11.6 83.5 4.7 0.1 24.4 5.8 14 55.8 1.3 88.7 7.5 2.4 27.3 6.2 22.4 44.1
Total % 3.8 27.4 1.6 0 32.8 0.5 0.1 0.3 1.1 1.9 0.8 54.7 4.6 1.5 61.7 1 0.2 0.8 1.6 3.6
BASCOM AVESouthbound
RENOVA DRWestbound
BASCOM AVENorthbound
RENOVA DREastbound
Start Time Right Thru Left Peds App. Total Right Thru Left Peds App. Total Right Thru Left Peds App. Total Right Thru Left Peds App. Total Int. Total
Peak Hour Analysis From 07:00 AM to 08:45 AM - Peak 1 of 1Peak Hour for Entire Intersection Begins at 07:30 AM
07:30 AM 18 179 2 0 199 0 0 1 9 10 2 352 21 2 377 9 2 5 6 22 60807:45 AM 31 190 7 0 228 2 1 1 5 9 5 406 33 13 457 4 1 5 10 20 71408:00 AM 18 160 9 0 187 5 0 5 6 16 4 370 39 10 423 8 3 6 8 25 65108:15 AM 33 175 8 1 217 5 2 1 8 16 6 311 34 10 361 6 1 4 7 18 612
Total Volume 100 704 26 1 831 12 3 8 28 51 17 1439 127 35 1618 27 7 20 31 85 2585% App. Total 12 84.7 3.1 0.1 23.5 5.9 15.7 54.9 1.1 88.9 7.8 2.2 31.8 8.2 23.5 36.5
PHF .758 .926 .722 .250 .911 .600 .375 .400 .778 .797 .708 .886 .814 .673 .885 .750 .583 .833 .775 .850 .905

Traffic Data ServiceCampbell, CA(408) [email protected] File Name : 10AM FINAL
Site Code : 00000010Start Date : 9/15/2011Page No : 2
BASCOM AVE R
EN
OV
A D
R R
EN
OV
A D
R
BASCOM AVE
Right100
Thru704
Left26
Peds1
InOut Total1471 831 2302
Right
12 T
hru 3 Left 8
Peds 28
Out
Total
In50
51 10
1
Left127
Thru1439
Right17
Peds35
Out TotalIn739 1618 2357
Left20
T
hru7
Rig
ht27
Ped
s31
Tot
alO
utIn
230
85
315
Peak Hour Begins at 07:30 AM
Vehicles
Peak Hour Data
North

Traffic Data ServiceCampbell, CA(408) [email protected] File Name : 10PM FINAL
Site Code : 00000010Start Date : 9/15/2011Page No : 1
Groups Printed- VehiclesBASCOM AVE
SouthboundRENOVA DR
WestboundBASCOM AVE
NorthboundRENOVA DR
EastboundStart Time Right Thru Left Peds App. Total Right Thru Left Peds App. Total Right Thru Left Peds App. Total Right Thru Left Peds App. Total Int. Total
04:00 PM 13 219 13 0 245 14 0 3 3 20 3 228 13 10 254 24 0 16 13 53 57204:15 PM 13 272 9 0 294 14 2 5 4 25 4 202 12 16 234 17 1 10 18 46 59904:30 PM 12 281 8 1 302 10 2 4 6 22 3 248 24 17 292 32 1 12 7 52 66804:45 PM 17 288 3 0 308 15 1 7 5 28 4 263 12 13 292 9 1 20 16 46 674
Total 55 1060 33 1 1149 53 5 19 18 95 14 941 61 56 1072 82 3 58 54 197 2513
05:00 PM 8 302 7 0 317 12 2 9 4 27 2 242 11 13 268 17 1 11 16 45 65705:15 PM 17 329 7 0 353 7 2 6 6 21 2 257 8 10 277 12 0 10 7 29 68005:30 PM 10 366 7 0 383 7 1 2 2 12 1 231 13 17 262 18 0 9 17 44 70105:45 PM 13 385 6 0 404 0 0 1 10 11 3 248 19 14 284 14 0 5 2 21 720
Total 48 1382 27 0 1457 26 5 18 22 71 8 978 51 54 1091 61 1 35 42 139 2758
Grand Total 103 2442 60 1 2606 79 10 37 40 166 22 1919 112 110 2163 143 4 93 96 336 5271Apprch % 4 93.7 2.3 0 47.6 6 22.3 24.1 1 88.7 5.2 5.1 42.6 1.2 27.7 28.6
Total % 2 46.3 1.1 0 49.4 1.5 0.2 0.7 0.8 3.1 0.4 36.4 2.1 2.1 41 2.7 0.1 1.8 1.8 6.4
BASCOM AVESouthbound
RENOVA DRWestbound
BASCOM AVENorthbound
RENOVA DREastbound
Start Time Right Thru Left Peds App. Total Right Thru Left Peds App. Total Right Thru Left Peds App. Total Right Thru Left Peds App. Total Int. Total
Peak Hour Analysis From 04:00 PM to 05:45 PM - Peak 1 of 1Peak Hour for Entire Intersection Begins at 05:00 PM
05:00 PM 8 302 7 0 317 12 2 9 4 27 2 242 11 13 268 17 1 11 16 45 65705:15 PM 17 329 7 0 353 7 2 6 6 21 2 257 8 10 277 12 0 10 7 29 68005:30 PM 10 366 7 0 383 7 1 2 2 12 1 231 13 17 262 18 0 9 17 44 70105:45 PM 13 385 6 0 404 0 0 1 10 11 3 248 19 14 284 14 0 5 2 21 720
Total Volume 48 1382 27 0 1457 26 5 18 22 71 8 978 51 54 1091 61 1 35 42 139 2758% App. Total 3.3 94.9 1.9 0 36.6 7 25.4 31 0.7 89.6 4.7 4.9 43.9 0.7 25.2 30.2
PHF .706 .897 .964 .000 .902 .542 .625 .500 .550 .657 .667 .951 .671 .794 .960 .847 .250 .795 .618 .772 .958

Traffic Data ServiceCampbell, CA(408) [email protected] File Name : 10PM FINAL
Site Code : 00000010Start Date : 9/15/2011Page No : 2
BASCOM AVE R
EN
OV
A D
R R
EN
OV
A D
R
BASCOM AVE
Right48
Thru1382
Left27
Peds0
InOut Total1039 1457 2496
Right
26 T
hru 5 Left 18
Peds 22
Out
Total
In36
71 10
7
Left51
Thru978
Right8
Peds54
Out TotalIn1461 1091 2552
Left35
T
hru1
Rig
ht61
Ped
s42
Tot
alO
utIn
104
139
243
Peak Hour Begins at 05:00 PM
Vehicles
Peak Hour Data
North

Traffic Data ServiceCampbell, CA(408) [email protected] File Name : 11AM FINAL
Site Code : 00000011Start Date : 9/15/2011Page No : 1
Groups Printed- VehiclesBASCOM AVE
SouthboundKINGMAN AVE
WestboundBASCOM AVE
NorthboundDRIVEWAYEastbound
Start Time Right Thru Left Peds App. Total Right Thru Left Peds App. Total Right Thru Left Peds App. Total Right Thru Left Peds App. Total Int. Total
07:00 AM 4 60 4 0 68 1 0 1 0 2 7 153 3 0 163 0 0 0 0 0 23307:15 AM 5 99 14 0 118 2 0 0 3 5 21 207 0 0 228 0 0 0 0 0 35107:30 AM 8 150 22 0 180 3 1 2 11 17 49 413 1 0 463 0 0 0 1 1 66107:45 AM 7 168 20 0 195 8 0 3 4 15 56 430 4 0 490 0 0 0 1 1 701
Total 24 477 60 0 561 14 1 6 18 39 133 1203 8 0 1344 0 0 0 2 2 1946
08:00 AM 4 128 25 1 158 5 0 0 3 8 41 372 3 1 417 0 0 0 2 2 58508:15 AM 17 121 24 1 163 7 0 0 10 17 34 355 3 0 392 0 0 0 3 3 57508:30 AM 9 122 24 2 157 6 0 3 10 19 48 389 1 0 438 0 0 0 1 1 61508:45 AM 4 147 39 1 191 11 0 3 10 24 57 322 4 0 383 0 0 0 4 4 602
Total 34 518 112 5 669 29 0 6 33 68 180 1438 11 1 1630 0 0 0 10 10 2377
Grand Total 58 995 172 5 1230 43 1 12 51 107 313 2641 19 1 2974 0 0 0 12 12 4323Apprch % 4.7 80.9 14 0.4 40.2 0.9 11.2 47.7 10.5 88.8 0.6 0 0 0 0 100
Total % 1.3 23 4 0.1 28.5 1 0 0.3 1.2 2.5 7.2 61.1 0.4 0 68.8 0 0 0 0.3 0.3
BASCOM AVESouthbound
KINGMAN AVEWestbound
BASCOM AVENorthbound
DRIVEWAYEastbound
Start Time Right Thru Left Peds App. Total Right Thru Left Peds App. Total Right Thru Left Peds App. Total Right Thru Left Peds App. Total Int. Total
Peak Hour Analysis From 07:00 AM to 08:45 AM - Peak 1 of 1Peak Hour for Entire Intersection Begins at 07:30 AM
07:30 AM 8 150 22 0 180 3 1 2 11 17 49 413 1 0 463 0 0 0 1 1 66107:45 AM 7 168 20 0 195 8 0 3 4 15 56 430 4 0 490 0 0 0 1 1 70108:00 AM 4 128 25 1 158 5 0 0 3 8 41 372 3 1 417 0 0 0 2 2 58508:15 AM 17 121 24 1 163 7 0 0 10 17 34 355 3 0 392 0 0 0 3 3 575
Total Volume 36 567 91 2 696 23 1 5 28 57 180 1570 11 1 1762 0 0 0 7 7 2522% App. Total 5.2 81.5 13.1 0.3 40.4 1.8 8.8 49.1 10.2 89.1 0.6 0.1 0 0 0 100
PHF .529 .844 .910 .500 .892 .719 .250 .417 .636 .838 .804 .913 .688 .250 .899 .000 .000 .000 .583 .583 .899

Traffic Data ServiceCampbell, CA(408) [email protected] File Name : 11AM FINAL
Site Code : 00000011Start Date : 9/15/2011Page No : 2
BASCOM AVE D
RIV
EW
AY
K
ING
MA
N A
VE
BASCOM AVE
Right36
Thru567
Left91
Peds2
InOut Total1593 696 2289
Right
23 T
hru 1 Left 5
Peds 28
Out
Total
In271
57 32
8
Left11
Thru1570
Right180
Peds1
Out TotalIn572 1762 2334
Left0
Thr
u0 R
ight0
Ped
s7
Tot
alO
utIn
48
7 55
Peak Hour Begins at 07:30 AM
Vehicles
Peak Hour Data
North

Traffic Data ServiceCampbell, CA(408) [email protected] File Name : 11PM FINAL
Site Code : 00000011Start Date : 9/15/2011Page No : 1
Groups Printed- VehiclesBASCOM AVE
SouthboundKINGMAN AVE
WestboundBASCOM AVE
NorthboundDRIVEWAYEastbound
Start Time Right Thru Left Peds App. Total Right Thru Left Peds App. Total Right Thru Left Peds App. Total Right Thru Left Peds App. Total Int. Total
04:00 PM 7 251 2 0 260 1 0 7 8 16 10 219 0 0 229 0 0 0 2 2 50704:15 PM 5 276 3 0 284 8 0 5 4 17 62 208 0 1 271 0 0 0 0 0 57204:30 PM 2 285 11 0 298 14 0 5 12 31 16 249 0 0 265 0 0 0 2 2 59604:45 PM 2 289 21 0 312 26 0 15 16 57 19 244 1 0 264 0 0 0 0 0 633
Total 16 1101 37 0 1154 49 0 32 40 121 107 920 1 1 1029 0 0 0 4 4 2308
05:00 PM 8 296 21 0 325 11 0 16 13 40 25 229 1 0 255 0 0 0 1 1 62105:15 PM 0 352 11 0 363 7 0 4 8 19 30 262 1 0 293 0 0 0 1 1 67605:30 PM 0 361 35 1 397 5 0 6 8 19 27 227 1 0 255 0 0 0 5 5 67605:45 PM 0 336 40 0 376 3 0 1 2 6 41 248 1 0 290 0 0 0 2 2 674
Total 8 1345 107 1 1461 26 0 27 31 84 123 966 4 0 1093 0 0 0 9 9 2647
Grand Total 24 2446 144 1 2615 75 0 59 71 205 230 1886 5 1 2122 0 0 0 13 13 4955Apprch % 0.9 93.5 5.5 0 36.6 0 28.8 34.6 10.8 88.9 0.2 0 0 0 0 100
Total % 0.5 49.4 2.9 0 52.8 1.5 0 1.2 1.4 4.1 4.6 38.1 0.1 0 42.8 0 0 0 0.3 0.3
BASCOM AVESouthbound
KINGMAN AVEWestbound
BASCOM AVENorthbound
DRIVEWAYEastbound
Start Time Right Thru Left Peds App. Total Right Thru Left Peds App. Total Right Thru Left Peds App. Total Right Thru Left Peds App. Total Int. Total
Peak Hour Analysis From 04:00 PM to 05:45 PM - Peak 1 of 1Peak Hour for Entire Intersection Begins at 05:00 PM
05:00 PM 8 296 21 0 325 11 0 16 13 40 25 229 1 0 255 0 0 0 1 1 62105:15 PM 0 352 11 0 363 7 0 4 8 19 30 262 1 0 293 0 0 0 1 1 67605:30 PM 0 361 35 1 397 5 0 6 8 19 27 227 1 0 255 0 0 0 5 5 67605:45 PM 0 336 40 0 376 3 0 1 2 6 41 248 1 0 290 0 0 0 2 2 674
Total Volume 8 1345 107 1 1461 26 0 27 31 84 123 966 4 0 1093 0 0 0 9 9 2647% App. Total 0.5 92.1 7.3 0.1 31 0 32.1 36.9 11.3 88.4 0.4 0 0 0 0 100
PHF .250 .931 .669 .250 .920 .591 .000 .422 .596 .525 .750 .922 1.000 .000 .933 .000 .000 .000 .450 .450 .979

Traffic Data ServiceCampbell, CA(408) [email protected] File Name : 11PM FINAL
Site Code : 00000011Start Date : 9/15/2011Page No : 2
BASCOM AVE D
RIV
EW
AY
K
ING
MA
N A
VE
BASCOM AVE
Right8
Thru1345
Left107
Peds1
InOut Total992 1461 2453
Right
26 T
hru 0 Left 27
Peds 31
Out
Total
In230
84 31
4
Left4
Thru966
Right123
Peds0
Out TotalIn1372 1093 2465
Left0
Thr
u0 R
ight0
Ped
s9
Tot
alO
utIn
12
9 21
Peak Hour Begins at 05:00 PM
Vehicles
Peak Hour Data
North

Traffic Data ServiceCampbell, CA(408) [email protected] File Name : 12AM FINAL
Site Code : 00000012Start Date : 9/15/2011Page No : 1
Groups Printed- VehiclesBASCOM AVE
SouthboundFRUITDALE AVE
WestboundBASCOM AVE
NorthboundENBORG LN
EastboundStart Time Right Thru Left Peds App. Total Right Thru Left Peds App. Total Right Thru Left Peds App. Total Right Thru Left Peds App. Total Int. Total
07:00 AM 10 30 28 4 72 52 33 19 1 105 13 109 24 0 146 2 7 8 1 18 34107:15 AM 19 56 26 10 111 91 54 13 9 167 25 151 29 1 206 12 12 8 1 33 51707:30 AM 11 92 48 12 163 142 56 29 18 245 23 283 19 0 325 15 20 9 0 44 77707:45 AM 23 109 54 8 194 163 84 37 12 296 34 353 37 0 424 17 11 5 2 35 949
Total 63 287 156 34 540 448 227 98 40 813 95 896 109 1 1101 46 50 30 4 130 2584
08:00 AM 16 73 40 11 140 148 58 39 5 250 26 275 33 0 334 4 16 12 2 34 75808:15 AM 15 85 41 9 150 111 45 23 10 189 38 291 31 0 360 7 12 8 4 31 73008:30 AM 21 88 33 10 152 139 53 26 8 226 15 274 41 0 330 8 10 13 2 33 74108:45 AM 21 92 30 7 150 126 44 30 8 208 29 271 30 0 330 7 6 14 3 30 718
Total 73 338 144 37 592 524 200 118 31 873 108 1111 135 0 1354 26 44 47 11 128 2947
Grand Total 136 625 300 71 1132 972 427 216 71 1686 203 2007 244 1 2455 72 94 77 15 258 5531Apprch % 12 55.2 26.5 6.3 57.7 25.3 12.8 4.2 8.3 81.8 9.9 0 27.9 36.4 29.8 5.8
Total % 2.5 11.3 5.4 1.3 20.5 17.6 7.7 3.9 1.3 30.5 3.7 36.3 4.4 0 44.4 1.3 1.7 1.4 0.3 4.7
BASCOM AVESouthbound
FRUITDALE AVEWestbound
BASCOM AVENorthbound
ENBORG LNEastbound
Start Time Right Thru Left Peds App. Total Right Thru Left Peds App. Total Right Thru Left Peds App. Total Right Thru Left Peds App. Total Int. Total
Peak Hour Analysis From 07:00 AM to 08:45 AM - Peak 1 of 1Peak Hour for Entire Intersection Begins at 07:30 AM
07:30 AM 11 92 48 12 163 142 56 29 18 245 23 283 19 0 325 15 20 9 0 44 77707:45 AM 23 109 54 8 194 163 84 37 12 296 34 353 37 0 424 17 11 5 2 35 94908:00 AM 16 73 40 11 140 148 58 39 5 250 26 275 33 0 334 4 16 12 2 34 75808:15 AM 15 85 41 9 150 111 45 23 10 189 38 291 31 0 360 7 12 8 4 31 730
Total Volume 65 359 183 40 647 564 243 128 45 980 121 1202 120 0 1443 43 59 34 8 144 3214% App. Total 10 55.5 28.3 6.2 57.6 24.8 13.1 4.6 8.4 83.3 8.3 0 29.9 41 23.6 5.6
PHF .707 .823 .847 .833 .834 .865 .723 .821 .625 .828 .796 .851 .811 .000 .851 .632 .738 .708 .500 .818 .847

Traffic Data ServiceCampbell, CA(408) [email protected] File Name : 12AM FINAL
Site Code : 00000012Start Date : 9/15/2011Page No : 2
BASCOM AVE E
NB
OR
G L
N
FR
UIT
DA
LE A
VE
BASCOM AVE
Right65
Thru359
Left183
Peds40
InOut Total1800 647 2447
Right564
Thru243
Left128
Peds 45
Out
Total
In363
980 1343
Left120
Thru1202
Right121
Peds0
Out TotalIn530 1443 1973
Left34
T
hru59
R
ight43
P
eds8
Tot
alO
utIn
428
144
572
Peak Hour Begins at 07:30 AM
Vehicles
Peak Hour Data
North

Traffic Data ServiceCampbell, CA(408) [email protected] File Name : 12PM FINAL
Site Code : 00000012Start Date : 9/15/2011Page No : 1
Groups Printed- VehiclesBASCOM AVE
SouthboundFRUITDALE AVE
WestboundBASCOM AVE
NorthboundENBORG LN
EastboundStart Time Right Thru Left Peds App. Total Right Thru Left Peds App. Total Right Thru Left Peds App. Total Right Thru Left Peds App. Total Int. Total
04:00 PM 4 190 75 11 280 62 17 34 25 138 40 164 10 1 215 42 48 18 2 110 74304:15 PM 10 218 67 5 300 72 11 28 10 121 30 164 18 0 212 22 21 17 1 61 69404:30 PM 11 230 58 7 306 63 15 39 11 128 25 171 19 0 215 37 37 31 5 110 75904:45 PM 11 226 74 3 314 74 11 59 8 152 30 178 16 0 224 23 21 21 0 65 755
Total 36 864 274 26 1200 271 54 160 54 539 125 677 63 1 866 124 127 87 8 346 2951
05:00 PM 6 256 62 6 330 73 11 60 9 153 29 165 7 1 202 45 46 17 1 109 79405:15 PM 5 257 82 5 349 85 8 61 5 159 33 177 11 0 221 33 28 17 1 79 80805:30 PM 10 280 87 9 386 81 13 57 12 163 44 171 11 0 226 28 29 12 2 71 84605:45 PM 7 281 63 4 355 99 9 48 1 157 41 190 11 0 242 21 20 10 0 51 805
Total 28 1074 294 24 1420 338 41 226 27 632 147 703 40 1 891 127 123 56 4 310 3253
Grand Total 64 1938 568 50 2620 609 95 386 81 1171 272 1380 103 2 1757 251 250 143 12 656 6204Apprch % 2.4 74 21.7 1.9 52 8.1 33 6.9 15.5 78.5 5.9 0.1 38.3 38.1 21.8 1.8
Total % 1 31.2 9.2 0.8 42.2 9.8 1.5 6.2 1.3 18.9 4.4 22.2 1.7 0 28.3 4 4 2.3 0.2 10.6
BASCOM AVESouthbound
FRUITDALE AVEWestbound
BASCOM AVENorthbound
ENBORG LNEastbound
Start Time Right Thru Left Peds App. Total Right Thru Left Peds App. Total Right Thru Left Peds App. Total Right Thru Left Peds App. Total Int. Total
Peak Hour Analysis From 04:00 PM to 05:45 PM - Peak 1 of 1Peak Hour for Entire Intersection Begins at 05:00 PM
05:00 PM 6 256 62 6 330 73 11 60 9 153 29 165 7 1 202 45 46 17 1 109 79405:15 PM 5 257 82 5 349 85 8 61 5 159 33 177 11 0 221 33 28 17 1 79 80805:30 PM 10 280 87 9 386 81 13 57 12 163 44 171 11 0 226 28 29 12 2 71 84605:45 PM 7 281 63 4 355 99 9 48 1 157 41 190 11 0 242 21 20 10 0 51 805
Total Volume 28 1074 294 24 1420 338 41 226 27 632 147 703 40 1 891 127 123 56 4 310 3253% App. Total 2 75.6 20.7 1.7 53.5 6.5 35.8 4.3 16.5 78.9 4.5 0.1 41 39.7 18.1 1.3
PHF .700 .956 .845 .667 .920 .854 .788 .926 .563 .969 .835 .925 .909 .250 .920 .706 .668 .824 .500 .711 .961
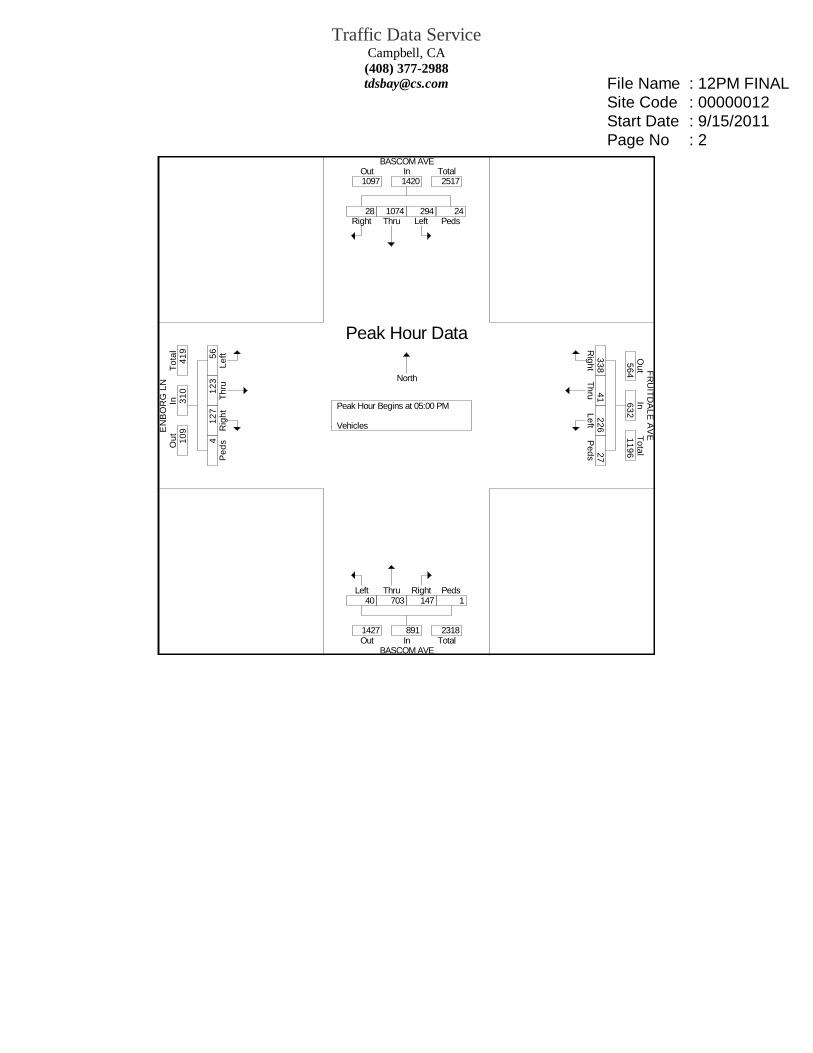
Traffic Data ServiceCampbell, CA(408) [email protected] File Name : 12PM FINAL
Site Code : 00000012Start Date : 9/15/2011Page No : 2
BASCOM AVE E
NB
OR
G L
N
FR
UIT
DA
LE A
VE
BASCOM AVE
Right28
Thru1074
Left294
Peds24
InOut Total1097 1420 2517
Right338
Thru 41
Left226
Peds 27
Out
Total
In564
632 1196
Left40
Thru703
Right147
Peds1
Out TotalIn1427 891 2318
Left56
T
hru
123
Rig
ht12
7 P
eds4
Tot
alO
utIn
109
310
419
Peak Hour Begins at 05:00 PM
Vehicles
Peak Hour Data
North

Traffic Data ServiceCampbell, CA(408) [email protected] File Name : 13AM FINAL
Site Code : 00000013Start Date : 9/14/2011Page No : 1
Groups Printed- VehiclesSHERMAN OAKS DR
SouthboundFRUITDALE AVE
Westbound NorthboundFRUITDALE AVE
EastboundStart Time Right Thru Left Peds App. Total Right Thru Left Peds App. Total Right Thru Left Peds App. Total Right Thru Left Peds App. Total Int. Total
07:00 AM 2 0 0 4 6 0 103 0 3 106 0 0 0 4 4 0 50 0 0 50 16607:15 AM 2 0 5 1 8 3 168 0 0 171 0 0 0 13 13 0 75 2 0 77 26907:30 AM 8 0 6 7 21 5 270 0 0 275 0 0 0 34 34 0 95 4 2 101 43107:45 AM 3 0 7 6 16 9 310 0 0 319 0 0 0 27 27 0 164 3 1 168 530
Total 15 0 18 18 51 17 851 0 3 871 0 0 0 78 78 0 384 9 3 396 1396
08:00 AM 1 0 9 6 16 8 270 0 0 278 0 0 0 17 17 0 95 1 0 96 40708:15 AM 1 0 6 2 9 6 216 0 0 222 0 0 0 10 10 0 81 2 0 83 32408:30 AM 4 0 7 0 11 16 184 0 0 200 0 0 0 1 1 0 63 2 0 65 27708:45 AM 1 0 5 1 7 12 198 0 0 210 0 0 0 4 4 0 63 3 2 68 289
Total 7 0 27 9 43 42 868 0 0 910 0 0 0 32 32 0 302 8 2 312 1297
Grand Total 22 0 45 27 94 59 1719 0 3 1781 0 0 0 110 110 0 686 17 5 708 2693Apprch % 23.4 0 47.9 28.7 3.3 96.5 0 0.2 0 0 0 100 0 96.9 2.4 0.7
Total % 0.8 0 1.7 1 3.5 2.2 63.8 0 0.1 66.1 0 0 0 4.1 4.1 0 25.5 0.6 0.2 26.3
SHERMAN OAKS DRSouthbound
FRUITDALE AVEWestbound Northbound
FRUITDALE AVEEastbound
Start Time Right Thru Left Peds App. Total Right Thru Left Peds App. Total Right Thru Left Peds App. Total Right Thru Left Peds App. Total Int. Total
Peak Hour Analysis From 07:00 AM to 08:45 AM - Peak 1 of 1Peak Hour for Entire Intersection Begins at 07:30 AM
07:30 AM 8 0 6 7 21 5 270 0 0 275 0 0 0 34 34 0 95 4 2 101 43107:45 AM 3 0 7 6 16 9 310 0 0 319 0 0 0 27 27 0 164 3 1 168 53008:00 AM 1 0 9 6 16 8 270 0 0 278 0 0 0 17 17 0 95 1 0 96 40708:15 AM 1 0 6 2 9 6 216 0 0 222 0 0 0 10 10 0 81 2 0 83 324
Total Volume 13 0 28 21 62 28 1066 0 0 1094 0 0 0 88 88 0 435 10 3 448 1692% App. Total 21 0 45.2 33.9 2.6 97.4 0 0 0 0 0 100 0 97.1 2.2 0.7
PHF .406 .000 .778 .750 .738 .778 .860 .000 .000 .857 .000 .000 .000 .647 .647 .000 .663 .625 .375 .667 .798

Traffic Data ServiceCampbell, CA(408) [email protected] File Name : 13AM FINAL
Site Code : 00000013Start Date : 9/14/2011Page No : 2
SHERMAN OAKS DR F
RU
ITD
ALE
AV
E F
RU
ITD
ALE
AV
E
Right13
Thru0
Left28
Peds21
InOut Total38 62 100
Right
28 T
hru1066
Left 0 P
eds 0
Out
Total
In463
1094 1557
Left0
Thru0
Right0
Peds88
Out TotalIn0 88 88
Left10
T
hru
435
Rig
ht0 P
eds3
Tot
alO
utIn
1079
44
8 15
27
Peak Hour Begins at 07:30 AM
Vehicles
Peak Hour Data
North

Traffic Data ServiceCampbell, CA(408) [email protected] File Name : 13PM FINAL
Site Code : 00000013Start Date : 9/14/2011Page No : 1
Groups Printed- VehiclesSHERMAN OAKS AVE
SouthboundFRUITDALE AVE
Westbound NorthboundFRUITDALE AVE
EastboundStart Time Right Thru Left Peds App. Total Right Thru Left Peds App. Total Right Thru Left Peds App. Total Right Thru Left Peds App. Total Int. Total
04:00 PM 2 0 2 1 5 7 122 0 0 129 0 0 0 0 0 0 114 2 0 116 25004:15 PM 0 0 5 3 8 4 115 0 0 119 0 0 0 0 0 0 105 2 0 107 23404:30 PM 1 0 4 6 11 5 143 0 0 148 0 0 0 0 0 0 117 2 0 119 27804:45 PM 2 0 4 2 8 2 134 0 0 136 0 0 0 0 0 0 127 3 0 130 274
Total 5 0 15 12 32 18 514 0 0 532 0 0 0 0 0 0 463 9 0 472 1036
05:00 PM 0 0 1 1 2 4 159 0 0 163 0 0 0 0 0 0 159 1 0 160 32505:15 PM 7 0 6 1 14 11 207 0 0 218 0 0 0 0 0 0 125 3 0 128 36005:30 PM 7 0 9 3 19 12 170 0 0 182 0 0 0 0 0 0 102 1 1 104 30505:45 PM 3 0 6 0 9 4 178 0 0 182 0 0 0 0 0 0 105 0 0 105 296
Total 17 0 22 5 44 31 714 0 0 745 0 0 0 0 0 0 491 5 1 497 1286
Grand Total 22 0 37 17 76 49 1228 0 0 1277 0 0 0 0 0 0 954 14 1 969 2322Apprch % 28.9 0 48.7 22.4 3.8 96.2 0 0 0 0 0 0 0 98.5 1.4 0.1
Total % 0.9 0 1.6 0.7 3.3 2.1 52.9 0 0 55 0 0 0 0 0 0 41.1 0.6 0 41.7
SHERMAN OAKS AVESouthbound
FRUITDALE AVEWestbound Northbound
FRUITDALE AVEEastbound
Start Time Right Thru Left Peds App. Total Right Thru Left Peds App. Total Right Thru Left Peds App. Total Right Thru Left Peds App. Total Int. Total
Peak Hour Analysis From 04:00 PM to 05:45 PM - Peak 1 of 1Peak Hour for Entire Intersection Begins at 05:00 PM
05:00 PM 0 0 1 1 2 4 159 0 0 163 0 0 0 0 0 0 159 1 0 160 32505:15 PM 7 0 6 1 14 11 207 0 0 218 0 0 0 0 0 0 125 3 0 128 36005:30 PM 7 0 9 3 19 12 170 0 0 182 0 0 0 0 0 0 102 1 1 104 30505:45 PM 3 0 6 0 9 4 178 0 0 182 0 0 0 0 0 0 105 0 0 105 296
Total Volume 17 0 22 5 44 31 714 0 0 745 0 0 0 0 0 0 491 5 1 497 1286% App. Total 38.6 0 50 11.4 4.2 95.8 0 0 0 0 0 0 0 98.8 1 0.2
PHF .607 .000 .611 .417 .579 .646 .862 .000 .000 .854 .000 .000 .000 .000 .000 .000 .772 .417 .250 .777 .893

Traffic Data ServiceCampbell, CA(408) [email protected] File Name : 13PM FINAL
Site Code : 00000013Start Date : 9/14/2011Page No : 2
SHERMAN OAKS AVE F
RU
ITD
ALE
AV
E F
RU
ITD
ALE
AV
E
Right17
Thru0
Left22
Peds5
InOut Total36 44 80
Right
31 T
hru714
Left 0 P
eds 0
Out
Total
In513
745 1258
Left0
Thru0
Right0
Peds0
Out TotalIn0 0 0
Left5
Thr
u49
1 R
ight0
Ped
s1
Tot
alO
utIn
731
497
1228
Peak Hour Begins at 05:00 PM
Vehicles
Peak Hour Data
North

Traffic Data ServiceCampbell, CA(408) [email protected] File Name : 14AM FINAL
Site Code : 00000014Start Date : 9/14/2011Page No : 1
Groups Printed- VehiclesLEIGH AVESouthbound
FRUITDALE AVEWestbound
LEIGH AVENorthbound
FRUITDALE AVEEastbound
Start Time Right Thru Left Peds App. Total Right Thru Left Peds App. Total Right Thru Left Peds App. Total Right Thru Left Peds App. Total Int. Total
07:00 AM 15 8 1 4 28 6 84 1 0 91 1 30 12 3 46 1 29 28 4 62 22707:15 AM 33 16 4 2 55 9 110 4 1 124 2 37 23 10 72 13 34 39 10 96 34707:30 AM 74 24 4 0 102 8 163 4 1 176 3 62 43 21 129 10 40 48 28 126 53307:45 AM 76 31 5 11 123 7 217 2 3 229 4 67 43 4 118 7 64 42 40 153 623
Total 198 79 14 17 308 30 574 11 5 620 10 196 121 38 365 31 167 157 82 437 1730
08:00 AM 31 31 11 0 73 9 177 4 1 191 5 71 34 4 114 7 92 68 24 191 56908:15 AM 42 31 3 0 76 6 137 5 3 151 1 62 30 3 96 8 46 33 2 89 41208:30 AM 47 17 6 0 70 4 117 5 1 127 3 74 28 2 107 6 65 53 3 127 43108:45 AM 47 27 6 2 82 19 136 2 3 160 4 59 30 0 93 4 35 30 4 73 408
Total 167 106 26 2 301 38 567 16 8 629 13 266 122 9 410 25 238 184 33 480 1820
Grand Total 365 185 40 19 609 68 1141 27 13 1249 23 462 243 47 775 56 405 341 115 917 3550Apprch % 59.9 30.4 6.6 3.1 5.4 91.4 2.2 1 3 59.6 31.4 6.1 6.1 44.2 37.2 12.5
Total % 10.3 5.2 1.1 0.5 17.2 1.9 32.1 0.8 0.4 35.2 0.6 13 6.8 1.3 21.8 1.6 11.4 9.6 3.2 25.8
LEIGH AVESouthbound
FRUITDALE AVEWestbound
LEIGH AVENorthbound
FRUITDALE AVEEastbound
Start Time Right Thru Left Peds App. Total Right Thru Left Peds App. Total Right Thru Left Peds App. Total Right Thru Left Peds App. Total Int. Total
Peak Hour Analysis From 07:00 AM to 08:45 AM - Peak 1 of 1Peak Hour for Entire Intersection Begins at 07:30 AM
07:30 AM 74 24 4 0 102 8 163 4 1 176 3 62 43 21 129 10 40 48 28 126 53307:45 AM 76 31 5 11 123 7 217 2 3 229 4 67 43 4 118 7 64 42 40 153 62308:00 AM 31 31 11 0 73 9 177 4 1 191 5 71 34 4 114 7 92 68 24 191 56908:15 AM 42 31 3 0 76 6 137 5 3 151 1 62 30 3 96 8 46 33 2 89 412
Total Volume 223 117 23 11 374 30 694 15 8 747 13 262 150 32 457 32 242 191 94 559 2137% App. Total 59.6 31.3 6.1 2.9 4 92.9 2 1.1 2.8 57.3 32.8 7 5.7 43.3 34.2 16.8
PHF .734 .944 .523 .250 .760 .833 .800 .750 .667 .816 .650 .923 .872 .381 .886 .800 .658 .702 .588 .732 .858
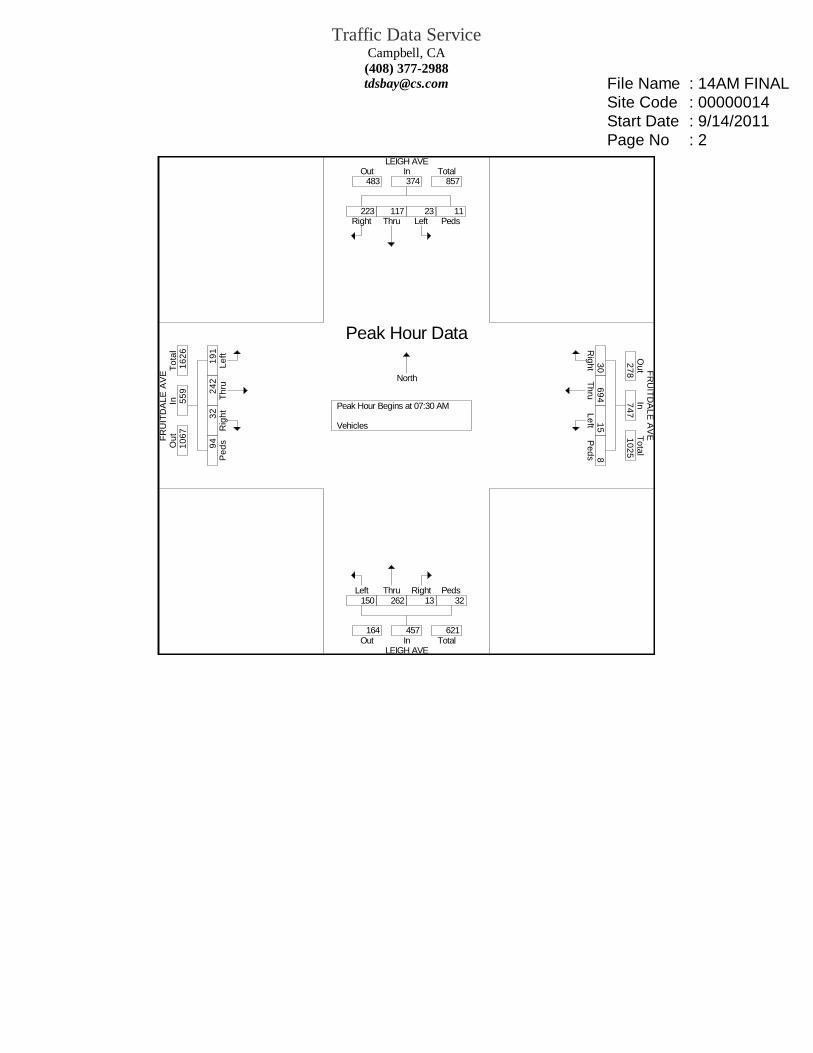
Traffic Data ServiceCampbell, CA(408) [email protected] File Name : 14AM FINAL
Site Code : 00000014Start Date : 9/14/2011Page No : 2
LEIGH AVE F
RU
ITD
ALE
AV
E F
RU
ITD
ALE
AV
E
LEIGH AVE
Right223
Thru117
Left23
Peds11
InOut Total483 374 857
Right
30 T
hru694
Left 15 P
eds 8
Out
Total
In278
747 1025
Left150
Thru262
Right13
Peds32
Out TotalIn164 457 621
Left
191
Thr
u24
2 R
ight32
P
eds94
Tot
alO
utIn
1067
55
9 16
26
Peak Hour Begins at 07:30 AM
Vehicles
Peak Hour Data
North

Traffic Data ServiceCampbell, CA(408) [email protected] File Name : 14PM FINAL
Site Code : 00000014Start Date : 9/14/2011Page No : 1
Groups Printed- VehiclesLEIGH AVESouthbound
FRUITDALE AVEWestbound
LEIGH AVENorthbound
FRUITDALE AVEEastbound
Start Time Right Thru Left Peds App. Total Right Thru Left Peds App. Total Right Thru Left Peds App. Total Right Thru Left Peds App. Total Int. Total
04:00 PM 57 57 8 1 123 6 68 2 2 78 1 20 14 3 38 13 107 25 4 149 38804:15 PM 56 61 16 0 133 6 68 4 0 78 5 29 13 1 48 9 67 17 5 98 35704:30 PM 66 84 15 0 165 6 82 5 1 94 3 30 11 2 46 11 79 33 0 123 42804:45 PM 64 80 14 1 159 9 67 7 1 84 1 32 21 6 60 24 85 34 6 149 452
Total 243 282 53 2 580 27 285 18 4 334 10 111 59 12 192 57 338 109 15 519 1625
05:00 PM 57 86 15 6 164 10 81 3 2 96 6 31 14 2 53 16 122 25 4 167 48005:15 PM 85 78 19 0 182 5 108 7 1 121 3 35 16 0 54 18 84 27 4 133 49005:30 PM 68 131 24 0 223 9 108 4 1 122 4 34 15 2 55 11 75 28 1 115 51505:45 PM 78 125 28 1 232 8 103 7 0 118 3 28 28 2 61 26 63 25 11 125 536
Total 288 420 86 7 801 32 400 21 4 457 16 128 73 6 223 71 344 105 20 540 2021
Grand Total 531 702 139 9 1381 59 685 39 8 791 26 239 132 18 415 128 682 214 35 1059 3646Apprch % 38.5 50.8 10.1 0.7 7.5 86.6 4.9 1 6.3 57.6 31.8 4.3 12.1 64.4 20.2 3.3
Total % 14.6 19.3 3.8 0.2 37.9 1.6 18.8 1.1 0.2 21.7 0.7 6.6 3.6 0.5 11.4 3.5 18.7 5.9 1 29
LEIGH AVESouthbound
FRUITDALE AVEWestbound
LEIGH AVENorthbound
FRUITDALE AVEEastbound
Start Time Right Thru Left Peds App. Total Right Thru Left Peds App. Total Right Thru Left Peds App. Total Right Thru Left Peds App. Total Int. Total
Peak Hour Analysis From 04:00 PM to 05:45 PM - Peak 1 of 1Peak Hour for Entire Intersection Begins at 05:00 PM
05:00 PM 57 86 15 6 164 10 81 3 2 96 6 31 14 2 53 16 122 25 4 167 48005:15 PM 85 78 19 0 182 5 108 7 1 121 3 35 16 0 54 18 84 27 4 133 49005:30 PM 68 131 24 0 223 9 108 4 1 122 4 34 15 2 55 11 75 28 1 115 51505:45 PM 78 125 28 1 232 8 103 7 0 118 3 28 28 2 61 26 63 25 11 125 536
Total Volume 288 420 86 7 801 32 400 21 4 457 16 128 73 6 223 71 344 105 20 540 2021% App. Total 36 52.4 10.7 0.9 7 87.5 4.6 0.9 7.2 57.4 32.7 2.7 13.1 63.7 19.4 3.7
PHF .847 .802 .768 .292 .863 .800 .926 .750 .500 .936 .667 .914 .652 .750 .914 .683 .705 .938 .455 .808 .943

Traffic Data ServiceCampbell, CA(408) [email protected] File Name : 14PM FINAL
Site Code : 00000014Start Date : 9/14/2011Page No : 2
LEIGH AVE F
RU
ITD
ALE
AV
E F
RU
ITD
ALE
AV
E
LEIGH AVE
Right288
Thru420
Left86
Peds7
InOut Total265 801 1066
Right
32 T
hru400
Left 21 P
eds 4
Out
Total
In446
457 90
3
Left73
Thru128
Right16
Peds6
Out TotalIn512 223 735
Left
105
Thr
u34
4 R
ight71
P
eds20
Tot
alO
utIn
761
540
1301
Peak Hour Begins at 05:00 PM
Vehicles
Peak Hour Data
North

Traffic Data ServiceCampbell, CA(408) [email protected] File Name : 15AM FINAL
Site Code : 00000015Start Date : 9/14/2011Page No : 1
Groups Printed- VehiclesSOUTHWEST EXPWY
SouthboundFRUITDALE AVE
WestboundSOUTHWEST EXPWY
NorthboundFRUITDALE AVE
EastboundStart Time Right Thru Left Peds App. Total Right Thru Left Peds App. Total Right Thru Left Peds App. Total Right Thru Left Peds App. Total Int. Total
07:00 AM 57 64 23 0 144 14 27 11 0 52 12 131 1 5 149 1 30 19 0 50 39507:15 AM 87 72 19 2 180 15 48 18 1 82 19 140 3 15 177 0 21 28 0 49 48807:30 AM 112 91 28 3 234 16 74 7 1 98 27 227 3 12 269 3 18 37 0 58 65907:45 AM 123 104 22 0 249 18 86 19 0 123 27 233 1 1 262 1 46 39 0 86 720
Total 379 331 92 5 807 63 235 55 2 355 85 731 8 33 857 5 115 123 0 243 2262
08:00 AM 116 109 32 2 259 18 74 10 1 103 29 242 8 5 284 3 67 40 0 110 75608:15 AM 90 84 35 0 209 8 83 14 1 106 30 230 6 6 272 1 60 34 1 96 68308:30 AM 74 101 29 1 205 17 74 11 0 102 30 225 1 5 261 1 31 39 2 73 64108:45 AM 78 93 20 1 192 5 87 8 1 101 12 179 4 9 204 2 32 26 1 61 558
Total 358 387 116 4 865 48 318 43 3 412 101 876 19 25 1021 7 190 139 4 340 2638
Grand Total 737 718 208 9 1672 111 553 98 5 767 186 1607 27 58 1878 12 305 262 4 583 4900Apprch % 44.1 42.9 12.4 0.5 14.5 72.1 12.8 0.7 9.9 85.6 1.4 3.1 2.1 52.3 44.9 0.7
Total % 15 14.7 4.2 0.2 34.1 2.3 11.3 2 0.1 15.7 3.8 32.8 0.6 1.2 38.3 0.2 6.2 5.3 0.1 11.9
SOUTHWEST EXPWYSouthbound
FRUITDALE AVEWestbound
SOUTHWEST EXPWYNorthbound
FRUITDALE AVEEastbound
Start Time Right Thru Left Peds App. Total Right Thru Left Peds App. Total Right Thru Left Peds App. Total Right Thru Left Peds App. Total Int. Total
Peak Hour Analysis From 07:00 AM to 08:45 AM - Peak 1 of 1Peak Hour for Entire Intersection Begins at 07:30 AM
07:30 AM 112 91 28 3 234 16 74 7 1 98 27 227 3 12 269 3 18 37 0 58 65907:45 AM 123 104 22 0 249 18 86 19 0 123 27 233 1 1 262 1 46 39 0 86 72008:00 AM 116 109 32 2 259 18 74 10 1 103 29 242 8 5 284 3 67 40 0 110 75608:15 AM 90 84 35 0 209 8 83 14 1 106 30 230 6 6 272 1 60 34 1 96 683
Total Volume 441 388 117 5 951 60 317 50 3 430 113 932 18 24 1087 8 191 150 1 350 2818% App. Total 46.4 40.8 12.3 0.5 14 73.7 11.6 0.7 10.4 85.7 1.7 2.2 2.3 54.6 42.9 0.3
PHF .896 .890 .836 .417 .918 .833 .922 .658 .750 .874 .942 .963 .563 .500 .957 .667 .713 .938 .250 .795 .932

Traffic Data ServiceCampbell, CA(408) [email protected] File Name : 15AM FINAL
Site Code : 00000015Start Date : 9/14/2011Page No : 2
SOUTHWEST EXPWY F
RU
ITD
ALE
AV
E F
RU
ITD
ALE
AV
E
SOUTHWEST EXPWY
Right441
Thru388
Left117
Peds5
InOut Total1142 951 2093
Right
60 T
hru317
Left 50 P
eds 3
Out
Total
In421
430 85
1
Left18
Thru932
Right113
Peds24
Out TotalIn446 1087 1533
Left
150
Thr
u19
1 R
ight8
Ped
s1
Tot
alO
utIn
776
350
1126
Peak Hour Begins at 07:30 AM
Vehicles
Peak Hour Data
North

Traffic Data ServiceCampbell, CA(408) [email protected] File Name : 15PM FINAL
Site Code : 00000015Start Date : 9/14/2011Page No : 1
Groups Printed- VehiclesSOUTHWEST EXPWY
SouthboundFRUITDALE AVE
WestboundSOUTHWEST EXPWY
NorthboundFRUITDALE AVE
EastboundStart Time Right Thru Left Peds App. Total Right Thru Left Peds App. Total Right Thru Left Peds App. Total Right Thru Left Peds App. Total Int. Total
04:00 PM 51 68 31 3 153 7 27 11 1 46 12 76 0 0 88 1 55 51 0 107 39404:15 PM 43 112 38 4 197 3 39 12 7 61 19 103 4 10 136 1 62 25 1 89 48304:30 PM 51 132 31 7 221 12 36 23 6 77 20 99 1 4 124 3 45 44 0 92 51404:45 PM 52 148 46 6 252 10 26 13 3 52 15 100 3 8 126 0 73 38 2 113 543
Total 197 460 146 20 823 32 128 59 17 236 66 378 8 22 474 5 235 158 3 401 1934
05:00 PM 51 202 35 5 293 7 34 15 5 61 22 134 6 7 169 3 58 55 2 118 64105:15 PM 60 112 43 7 222 6 59 10 2 77 22 105 2 5 134 0 82 38 2 122 55505:30 PM 39 126 37 1 203 11 55 25 0 91 32 106 1 6 145 4 72 41 1 118 55705:45 PM 57 149 43 4 253 13 47 20 6 86 24 128 1 3 156 1 65 26 0 92 587
Total 207 589 158 17 971 37 195 70 13 315 100 473 10 21 604 8 277 160 5 450 2340
Grand Total 404 1049 304 37 1794 69 323 129 30 551 166 851 18 43 1078 13 512 318 8 851 4274Apprch % 22.5 58.5 16.9 2.1 12.5 58.6 23.4 5.4 15.4 78.9 1.7 4 1.5 60.2 37.4 0.9
Total % 9.5 24.5 7.1 0.9 42 1.6 7.6 3 0.7 12.9 3.9 19.9 0.4 1 25.2 0.3 12 7.4 0.2 19.9
SOUTHWEST EXPWYSouthbound
FRUITDALE AVEWestbound
SOUTHWEST EXPWYNorthbound
FRUITDALE AVEEastbound
Start Time Right Thru Left Peds App. Total Right Thru Left Peds App. Total Right Thru Left Peds App. Total Right Thru Left Peds App. Total Int. Total
Peak Hour Analysis From 04:00 PM to 05:45 PM - Peak 1 of 1Peak Hour for Entire Intersection Begins at 05:00 PM
05:00 PM 51 202 35 5 293 7 34 15 5 61 22 134 6 7 169 3 58 55 2 118 64105:15 PM 60 112 43 7 222 6 59 10 2 77 22 105 2 5 134 0 82 38 2 122 55505:30 PM 39 126 37 1 203 11 55 25 0 91 32 106 1 6 145 4 72 41 1 118 55705:45 PM 57 149 43 4 253 13 47 20 6 86 24 128 1 3 156 1 65 26 0 92 587
Total Volume 207 589 158 17 971 37 195 70 13 315 100 473 10 21 604 8 277 160 5 450 2340% App. Total 21.3 60.7 16.3 1.8 11.7 61.9 22.2 4.1 16.6 78.3 1.7 3.5 1.8 61.6 35.6 1.1
PHF .863 .729 .919 .607 .828 .712 .826 .700 .542 .865 .781 .882 .417 .750 .893 .500 .845 .727 .625 .922 .913

Traffic Data ServiceCampbell, CA(408) [email protected] File Name : 15PM FINAL
Site Code : 00000015Start Date : 9/14/2011Page No : 2
SOUTHWEST EXPWY F
RU
ITD
ALE
AV
E F
RU
ITD
ALE
AV
E
SOUTHWEST EXPWY
Right207
Thru589
Left158
Peds17
InOut Total670 971 1641
Right
37 T
hru195
Left 70 P
eds 13
Out
Total
In535
315 85
0
Left10
Thru473
Right100
Peds21
Out TotalIn667 604 1271
Left
160
Thr
u27
7 R
ight8
Ped
s5
Tot
alO
utIn
412
450
862
Peak Hour Begins at 05:00 PM
Vehicles
Peak Hour Data
North

APPENDIX B: INTERSECTION LEVEL OF SERVICE CALCULATIONS

COMPARE Mon Sep 26 12:04:41 2011 Page 1-1
Traffix 8.0.0715 Copyright (c) 2008 Dowling Associates, Inc. Licensed to FEHR & PEERS WALNUT CRK
San Jose City College
SJ07-951 Summary Scenario Comparison Report (With Average Critical Delay)
Future Volume Alternative ??? Existing AM Balanced Ex + Proj AM ??? Avg Avg Avg Avg Avg Avg Crit Avg Crit Avg Crit Crit Crit Avg Crit Del Crit Del Del Crit Del Del Crit V/C Del Del Del Crit Del Intersection LOS (sec) V/C (sec) LOS (sec) V/C (sec) LOS (sec) V/C Change (sec) Change LOS (sec) V/C (sec) #1 Bascom/San Carlos ? xx.x x.xxx xx.x D 42.0 0.651 39.4 D 42.1 0.652 + 0.001 39.4 + 0.0 ? xx.x x.xxx xx.x #2 Leigh/San Carlos ? xx.x x.xxx xx.x C 23.2 0.395 19.3 C 23.3 0.395 + 0.000 19.3 + 0.0 ? xx.x x.xxx xx.x #3 Leigh/Scott [4-Way Stop] ? xx.x x.xxx xx.x B 12.1 0.531 12.1 B 12.2 0.535 + 0.004 12.2 + 0.1 ? xx.x x.xxx xx.x #4 Bascom/Parkmoor ? xx.x x.xxx xx.x C- 33.6 0.471 30.9 C- 33.3 0.440 - 0.031 31.9 + 1.0 ? xx.x x.xxx xx.x #5 Leland/Parkmoor ? xx.x x.xxx xx.x B- 19.4 0.627 19.3 B- 19.4 0.646 + 0.019 19.2 - 0.1 ? xx.x x.xxx xx.x #6 Leigh/Parkmoor ? xx.x x.xxx xx.x C 31.1 0.782 32.5 C- 33.3 0.831 + 0.048 34.9 + 2.5 ? xx.x x.xxx xx.x #7 Bascom/Moorpark ? xx.x x.xxx xx.x D+ 38.9 0.695 40.9 D 40.0 0.698 + 0.003 41.0 + 0.1 ? xx.x x.xxx xx.x #8 Leland/Moorpark ? xx.x x.xxx xx.x A 8.6 0.301 8.6 A 8.7 0.313 + 0.012 8.7 + 0.2 ? xx.x x.xxx xx.x #9 Leigh/Moorpark ? xx.x x.xxx xx.x C 26.5 0.443 29.4 C 26.2 0.453 + 0.011 29.2 - 0.2 ? xx.x x.xxx xx.x #10 Bascom/Renova ? xx.x x.xxx xx.x B+ 11.3 0.310 5.4 B+ 11.2 0.312 + 0.002 5.4 - 0.0 ? xx.x x.xxx xx.x #11 Bascom/Laswell [Unsignalized] ? xx.x x.xxx xx.x E 1.2 0.251 1.2 F 2.0 0.336 + 0.085 2.0 + 0.8 ? xx.x x.xxx xx.x #12 Bascom/Fruitdale ? xx.x x.xxx xx.x D 46.1 0.767 49.3 D 46.9 0.786 + 0.019 50.5 + 1.2 ? xx.x x.xxx xx.x #13 Sherman Oaks/Fruitdale [Unsignalized] ? xx.x x.xxx xx.x D 0.8 0.183 0.8 D 0.8 0.190 + 0.007 0.8 + 0.0 ? xx.x x.xxx xx.x #14 Leigh/Fruitdale ? xx.x x.xxx xx.x C- 33.6 0.570 35.1 C- 33.8 0.580 + 0.010 35.4 + 0.2 ? xx.x x.xxx xx.x #15 Southwest Expwy/Fruitdale ? xx.x x.xxx xx.x C 24.8 0.517 25.8 C 25.0 0.521 + 0.004 26.1 + 0.2 ? xx.x x.xxx xx.x

COMPARE Mon Sep 26 12:04:41 2011 Page 1-2
Traffix 8.0.0715 Copyright (c) 2008 Dowling Associates, Inc. Licensed to FEHR & PEERS WALNUT CRK

COMPARE Mon Sep 26 12:04:41 2011 Page 3-1
Traffix 8.0.0715 Copyright (c) 2008 Dowling Associates, Inc. Licensed to FEHR & PEERS WALNUT CRK
San Jose City College
SJ07-951 Level Of Service Computation Report
2000 HCM Operations (Future Volume Alternative) Existing AM Balanced
Intersection #1: Bascom/San Carlos Signal=Protect/Rights=Include Final Vol: 47 432 100*** Lanes: 1 0 3 0 1
Signal=Protect
Signal=Protect
Final Vol: Lanes: Rights=Include Vol Cnt Date: n/a Rights=Include Lanes: Final Vol:
71***
1 Cycle Time (sec): 140
1
216
0
Loss Time (sec): 12
0
251 1
Critical V/C: 0.651
2 841***
1
Avg Crit Del (sec/veh): 39.4
0
100 0
Avg Delay (sec/veh): 42.0
1 175
LOS: D
Lanes: 1 0 2 0 1 Final Vol: 306 1050*** 84 Signal=Protect/Rights=Include Street Name: Bascom San Carlos Approach: North Bound South Bound East Bound West Bound Movement: L - T - R L - T - R L - T - R L - T - R ------------|---------------||---------------||---------------||---------------| Min. Green: 7 10 10 7 10 10 7 10 10 7 10 10 Y+R: 4.0 4.0 4.0 4.0 4.0 4.0 4.0 4.0 4.0 4.0 4.0 4.0 ------------|---------------||---------------||---------------||---------------| Volume Module: Base Vol: 306 1050 84 100 432 47 71 251 100 175 841 216 Growth Adj: 1.00 1.00 1.00 1.00 1.00 1.00 1.00 1.00 1.00 1.00 1.00 1.00 Initial Bse: 306 1050 84 100 432 47 71 251 100 175 841 216 Added Vol: 0 0 0 0 0 0 0 0 0 0 0 0 PasserByVol: 0 0 0 0 0 0 0 0 0 0 0 0 Initial Fut: 306 1050 84 100 432 47 71 251 100 175 841 216 User Adj: 1.00 1.00 1.00 1.00 1.00 1.00 1.00 1.00 1.00 1.00 1.00 1.00 PHF Adj: 1.00 1.00 1.00 1.00 1.00 1.00 1.00 1.00 1.00 1.00 1.00 1.00 PHF Volume: 306 1050 84 100 432 47 71 251 100 175 841 216 Reduct Vol: 0 0 0 0 0 0 0 0 0 0 0 0 Reduced Vol: 306 1050 84 100 432 47 71 251 100 175 841 216 PCE Adj: 1.00 1.00 1.00 1.00 1.00 1.00 1.00 1.00 1.00 1.00 1.00 1.00 MLF Adj: 1.00 1.00 1.00 1.00 1.00 1.00 1.00 1.00 1.00 1.00 1.00 1.00 FinalVolume: 306 1050 84 100 432 47 71 251 100 175 841 216 ------------|---------------||---------------||---------------||---------------| Saturation Flow Module: Sat/Lane: 1900 1900 1900 1900 1900 1900 1900 1900 1900 1900 1900 1900 Adjustment: 0.92 1.00 0.92 0.92 1.00 0.92 0.92 0.98 0.95 0.92 1.00 0.92 Lanes: 1.00 2.00 1.00 1.00 3.00 1.00 1.00 1.41 0.59 1.00 2.00 1.00 Final Sat.: 1750 3800 1750 1750 5700 1750 1750 2645 1054 1750 3800 1750 ------------|---------------||---------------||---------------||---------------| Capacity Analysis Module: Vol/Sat: 0.17 0.28 0.05 0.06 0.08 0.03 0.04 0.09 0.09 0.10 0.22 0.12 Crit Moves: **** **** **** **** Green Time: 50.0 59.4 59.4 12.3 21.7 21.7 8.7 27.4 27.4 28.9 47.6 47.6 Volume/Cap: 0.49 0.65 0.11 0.65 0.49 0.17 0.65 0.48 0.48 0.48 0.65 0.36 Delay/Veh: 35.7 33.0 24.4 71.3 54.5 51.7 77.3 50.5 50.5 50.0 40.4 35.2 User DelAdj: 1.00 1.00 1.00 1.00 1.00 1.00 1.00 1.00 1.00 1.00 1.00 1.00 AdjDel/Veh: 35.7 33.0 24.4 71.3 54.5 51.7 77.3 50.5 50.5 50.0 40.4 35.2 LOS by Move: D+ C- C E D- D- E- D D D D D+ HCM2kAvgQ: 11 17 2 6 6 2 4 7 7 7 16 7 Note: Queue reported is the number of cars per lane.

COMPARE Mon Sep 26 12:04:41 2011 Page 3-2
Traffix 8.0.0715 Copyright (c) 2008 Dowling Associates, Inc. Licensed to FEHR & PEERS WALNUT CRK
San Jose City College
SJ07-951 Level Of Service Computation Report
2000 HCM Operations (Future Volume Alternative) Ex + Proj AM
Intersection #1: Bascom/San Carlos Signal=Protect/Rights=Include Final Vol: 47 444 100*** Lanes: 1 0 3 0 1
Signal=Protect
Signal=Protect
Final Vol: Lanes: Rights=Include Vol Cnt Date: n/a Rights=Include Lanes: Final Vol:
71***
1 Cycle Time (sec): 140
1
216
0
Loss Time (sec): 12
0
251 1
Critical V/C: 0.652
2 841***
1
Avg Crit Del (sec/veh): 39.4
0
109 0
Avg Delay (sec/veh): 42.1
1 175
LOS: D
Lanes: 1 0 2 0 1 Final Vol: 308 1053*** 84 Signal=Protect/Rights=Include Street Name: Bascom San Carlos Approach: North Bound South Bound East Bound West Bound Movement: L - T - R L - T - R L - T - R L - T - R ------------|---------------||---------------||---------------||---------------| Min. Green: 7 10 10 7 10 10 7 10 10 7 10 10 Y+R: 4.0 4.0 4.0 4.0 4.0 4.0 4.0 4.0 4.0 4.0 4.0 4.0 ------------|---------------||---------------||---------------||---------------| Volume Module: Base Vol: 306 1050 84 100 432 47 71 251 100 175 841 216 Growth Adj: 1.00 1.00 1.00 1.00 1.00 1.00 1.00 1.00 1.00 1.00 1.00 1.00 Initial Bse: 306 1050 84 100 432 47 71 251 100 175 841 216 Added Vol: 2 3 0 0 12 0 0 0 9 0 0 0 PasserByVol: 0 0 0 0 0 0 0 0 0 0 0 0 Initial Fut: 308 1053 84 100 444 47 71 251 109 175 841 216 User Adj: 1.00 1.00 1.00 1.00 1.00 1.00 1.00 1.00 1.00 1.00 1.00 1.00 PHF Adj: 1.00 1.00 1.00 1.00 1.00 1.00 1.00 1.00 1.00 1.00 1.00 1.00 PHF Volume: 308 1053 84 100 444 47 71 251 109 175 841 216 Reduct Vol: 0 0 0 0 0 0 0 0 0 0 0 0 Reduced Vol: 308 1053 84 100 444 47 71 251 109 175 841 216 PCE Adj: 1.00 1.00 1.00 1.00 1.00 1.00 1.00 1.00 1.00 1.00 1.00 1.00 MLF Adj: 1.00 1.00 1.00 1.00 1.00 1.00 1.00 1.00 1.00 1.00 1.00 1.00 FinalVolume: 308 1053 84 100 444 47 71 251 109 175 841 216 ------------|---------------||---------------||---------------||---------------| Saturation Flow Module: Sat/Lane: 1900 1900 1900 1900 1900 1900 1900 1900 1900 1900 1900 1900 Adjustment: 0.92 1.00 0.92 0.92 1.00 0.92 0.92 0.99 0.95 0.92 1.00 0.92 Lanes: 1.00 2.00 1.00 1.00 3.00 1.00 1.00 1.38 0.62 1.00 2.00 1.00 Final Sat.: 1750 3800 1750 1750 5700 1750 1750 2579 1120 1750 3800 1750 ------------|---------------||---------------||---------------||---------------| Capacity Analysis Module: Vol/Sat: 0.18 0.28 0.05 0.06 0.08 0.03 0.04 0.10 0.10 0.10 0.22 0.12 Crit Moves: **** **** **** **** Green Time: 49.7 59.5 59.5 12.3 22.0 22.0 8.7 27.7 27.7 28.5 47.5 47.5 Volume/Cap: 0.50 0.65 0.11 0.65 0.50 0.17 0.65 0.49 0.49 0.49 0.65 0.36 Delay/Veh: 35.9 33.0 24.4 71.4 54.3 51.4 77.4 50.4 50.4 50.4 40.4 35.2 User DelAdj: 1.00 1.00 1.00 1.00 1.00 1.00 1.00 1.00 1.00 1.00 1.00 1.00 AdjDel/Veh: 35.9 33.0 24.4 71.4 54.3 51.4 77.4 50.4 50.4 50.4 40.4 35.2 LOS by Move: D+ C- C E D- D- E- D D D D D+ HCM2kAvgQ: 11 17 2 6 6 2 4 7 7 7 16 7 Note: Queue reported is the number of cars per lane.

COMPARE Mon Sep 26 12:04:41 2011 Page 3-3
Traffix 8.0.0715 Copyright (c) 2008 Dowling Associates, Inc. Licensed to FEHR & PEERS WALNUT CRK
San Jose City College
SJ07-951 Level Of Service Computation Report
2000 HCM Operations (Future Volume Alternative) Existing AM Balanced
Intersection #2: Leigh/San Carlos Signal=Permit/Rights=Include Final Vol: 46 152*** 61 Lanes: 0 1 0 0 1
Signal=Protect
Signal=Protect
Final Vol: Lanes: Rights=Include Vol Cnt Date: n/a Rights=Include Lanes: Final Vol:
45***
1 Cycle Time (sec): 120
1
16
0
Loss Time (sec): 9
0
393 2
Critical V/C: 0.395
2 874***
0
Avg Crit Del (sec/veh): 19.3
0
20 1
Avg Delay (sec/veh): 23.2
1 59
LOS: C
Lanes: 1 0 0 1 0 Final Vol: 128 124 36 Signal=Permit/Rights=Include Street Name: Leigh San Carlos Approach: North Bound South Bound East Bound West Bound Movement: L - T - R L - T - R L - T - R L - T - R ------------|---------------||---------------||---------------||---------------| Min. Green: 10 10 10 10 10 10 7 10 10 7 10 10 Y+R: 4.0 4.0 4.0 4.0 4.0 4.0 4.0 4.0 4.0 4.0 4.0 4.0 ------------|---------------||---------------||---------------||---------------| Volume Module: Base Vol: 128 124 36 61 152 46 45 393 20 59 874 16 Growth Adj: 1.00 1.00 1.00 1.00 1.00 1.00 1.00 1.00 1.00 1.00 1.00 1.00 Initial Bse: 128 124 36 61 152 46 45 393 20 59 874 16 Added Vol: 0 0 0 0 0 0 0 0 0 0 0 0 PasserByVol: 0 0 0 0 0 0 0 0 0 0 0 0 Initial Fut: 128 124 36 61 152 46 45 393 20 59 874 16 User Adj: 1.00 1.00 1.00 1.00 1.00 1.00 1.00 1.00 1.00 1.00 1.00 1.00 PHF Adj: 1.00 1.00 1.00 1.00 1.00 1.00 1.00 1.00 1.00 1.00 1.00 1.00 PHF Volume: 128 124 36 61 152 46 45 393 20 59 874 16 Reduct Vol: 0 0 0 0 0 0 0 0 0 0 0 0 Reduced Vol: 128 124 36 61 152 46 45 393 20 59 874 16 PCE Adj: 1.00 1.00 1.00 1.00 1.00 1.00 1.00 1.00 1.00 1.00 1.00 1.00 MLF Adj: 1.00 1.00 1.00 1.00 1.00 1.00 1.00 1.00 1.00 1.00 1.00 1.00 FinalVolume: 128 124 36 61 152 46 45 393 20 59 874 16 ------------|---------------||---------------||---------------||---------------| Saturation Flow Module: Sat/Lane: 1900 1900 1900 1900 1900 1900 1900 1900 1900 1900 1900 1900 Adjustment: 0.92 0.95 0.95 0.92 0.95 0.95 0.92 1.00 0.92 0.92 1.00 0.92 Lanes: 1.00 0.78 0.22 1.00 0.77 0.23 1.00 2.00 1.00 1.00 2.00 1.00 Final Sat.: 1750 1395 405 1750 1382 418 1750 3800 1750 1750 3800 1750 ------------|---------------||---------------||---------------||---------------| Capacity Analysis Module: Vol/Sat: 0.07 0.09 0.09 0.03 0.11 0.11 0.03 0.10 0.01 0.03 0.23 0.01 Crit Moves: **** **** **** Green Time: 33.4 33.4 33.4 33.4 33.4 33.4 7.8 49.6 49.6 28.0 69.8 69.8 Volume/Cap: 0.26 0.32 0.32 0.13 0.40 0.40 0.40 0.25 0.03 0.14 0.40 0.02 Delay/Veh: 34.0 34.7 34.7 32.5 35.6 35.6 56.1 23.1 20.9 36.7 13.7 10.6 User DelAdj: 1.00 1.00 1.00 1.00 1.00 1.00 1.00 1.00 1.00 1.00 1.00 1.00 AdjDel/Veh: 34.0 34.7 34.7 32.5 35.6 35.6 56.1 23.1 20.9 36.7 13.7 10.6 LOS by Move: C- C- C- C- D+ D+ E+ C C+ D+ B B+ HCM2kAvgQ: 4 5 5 2 6 6 2 5 0 2 9 0 Note: Queue reported is the number of cars per lane.

COMPARE Mon Sep 26 12:04:41 2011 Page 3-4
Traffix 8.0.0715 Copyright (c) 2008 Dowling Associates, Inc. Licensed to FEHR & PEERS WALNUT CRK
San Jose City College
SJ07-951 Level Of Service Computation Report
2000 HCM Operations (Future Volume Alternative) Ex + Proj AM
Intersection #2: Leigh/San Carlos Signal=Permit/Rights=Include Final Vol: 46 152*** 61 Lanes: 0 1 0 0 1
Signal=Protect
Signal=Protect
Final Vol: Lanes: Rights=Include Vol Cnt Date: n/a Rights=Include Lanes: Final Vol:
45***
1 Cycle Time (sec): 120
1
16
0
Loss Time (sec): 9
0
393 2
Critical V/C: 0.395
2 874***
0
Avg Crit Del (sec/veh): 19.3
0
20 1
Avg Delay (sec/veh): 23.3
1 65
LOS: C
Lanes: 1 0 0 1 0 Final Vol: 128 124 39 Signal=Permit/Rights=Include Street Name: Leigh San Carlos Approach: North Bound South Bound East Bound West Bound Movement: L - T - R L - T - R L - T - R L - T - R ------------|---------------||---------------||---------------||---------------| Min. Green: 10 10 10 10 10 10 7 10 10 7 10 10 Y+R: 4.0 4.0 4.0 4.0 4.0 4.0 4.0 4.0 4.0 4.0 4.0 4.0 ------------|---------------||---------------||---------------||---------------| Volume Module: Base Vol: 128 124 36 61 152 46 45 393 20 59 874 16 Growth Adj: 1.00 1.00 1.00 1.00 1.00 1.00 1.00 1.00 1.00 1.00 1.00 1.00 Initial Bse: 128 124 36 61 152 46 45 393 20 59 874 16 Added Vol: 0 0 3 0 0 0 0 0 0 6 0 0 PasserByVol: 0 0 0 0 0 0 0 0 0 0 0 0 Initial Fut: 128 124 39 61 152 46 45 393 20 65 874 16 User Adj: 1.00 1.00 1.00 1.00 1.00 1.00 1.00 1.00 1.00 1.00 1.00 1.00 PHF Adj: 1.00 1.00 1.00 1.00 1.00 1.00 1.00 1.00 1.00 1.00 1.00 1.00 PHF Volume: 128 124 39 61 152 46 45 393 20 65 874 16 Reduct Vol: 0 0 0 0 0 0 0 0 0 0 0 0 Reduced Vol: 128 124 39 61 152 46 45 393 20 65 874 16 PCE Adj: 1.00 1.00 1.00 1.00 1.00 1.00 1.00 1.00 1.00 1.00 1.00 1.00 MLF Adj: 1.00 1.00 1.00 1.00 1.00 1.00 1.00 1.00 1.00 1.00 1.00 1.00 FinalVolume: 128 124 39 61 152 46 45 393 20 65 874 16 ------------|---------------||---------------||---------------||---------------| Saturation Flow Module: Sat/Lane: 1900 1900 1900 1900 1900 1900 1900 1900 1900 1900 1900 1900 Adjustment: 0.92 0.95 0.95 0.92 0.95 0.95 0.92 1.00 0.92 0.92 1.00 0.92 Lanes: 1.00 0.76 0.24 1.00 0.77 0.23 1.00 2.00 1.00 1.00 2.00 1.00 Final Sat.: 1750 1369 431 1750 1382 418 1750 3800 1750 1750 3800 1750 ------------|---------------||---------------||---------------||---------------| Capacity Analysis Module: Vol/Sat: 0.07 0.09 0.09 0.03 0.11 0.11 0.03 0.10 0.01 0.04 0.23 0.01 Crit Moves: **** **** **** Green Time: 33.4 33.4 33.4 33.4 33.4 33.4 7.8 49.6 49.6 28.0 69.8 69.8 Volume/Cap: 0.26 0.33 0.33 0.13 0.40 0.40 0.40 0.25 0.03 0.16 0.40 0.02 Delay/Veh: 34.0 34.8 34.8 32.5 35.6 35.6 56.1 23.1 20.9 36.8 13.7 10.6 User DelAdj: 1.00 1.00 1.00 1.00 1.00 1.00 1.00 1.00 1.00 1.00 1.00 1.00 AdjDel/Veh: 34.0 34.8 34.8 32.5 35.6 35.6 56.1 23.1 20.9 36.8 13.7 10.6 LOS by Move: C- C- C- C- D+ D+ E+ C C+ D+ B B+ HCM2kAvgQ: 4 5 5 2 6 6 2 5 0 2 9 0 Note: Queue reported is the number of cars per lane.

COMPARE Mon Sep 26 12:04:41 2011 Page 3-5
Traffix 8.0.0715 Copyright (c) 2008 Dowling Associates, Inc. Licensed to FEHR & PEERS WALNUT CRK
San Jose City College
SJ07-951 Level Of Service Computation Report
2000 HCM 4-Way Stop (Future Volume Alternative) Existing AM Balanced
Intersection #3: Leigh/Scott [4-Way Stop] Signal=Stop/Rights=Include Final Vol: 15 213*** 9 Lanes: 0 0 1! 0 0
Signal=Stop
Signal=Stop
Final Vol: Lanes: Rights=Include Vol Cnt Date: n/a Rights=Include Lanes: Final Vol:
12***
0 Cycle Time (sec): 100
0
82
0
Loss Time (sec): 0
0
33 1!
Critical V/C: 0.531
1! 157***
0
Avg Crit Del (sec/veh): 12.1
0
46 0
Avg Delay (sec/veh): 12.1
0 107
LOS: B
Lanes: 0 0 1! 0 0 Final Vol: 55 176*** 32 Signal=Stop/Rights=Include Street Name: Leigh Scott Approach: North Bound South Bound East Bound West Bound Movement: L - T - R L - T - R L - T - R L - T - R ------------|---------------||---------------||---------------||---------------| Min. Green: 7 10 10 7 10 10 7 10 10 7 10 10 ------------|---------------||---------------||---------------||---------------| Volume Module: Base Vol: 55 176 32 9 213 15 12 33 46 107 157 82 Growth Adj: 1.00 1.00 1.00 1.00 1.00 1.00 1.00 1.00 1.00 1.00 1.00 1.00 Initial Bse: 55 176 32 9 213 15 12 33 46 107 157 82 Added Vol: 0 0 0 0 0 0 0 0 0 0 0 0 PasserByVol: 0 0 0 0 0 0 0 0 0 0 0 0 Initial Fut: 55 176 32 9 213 15 12 33 46 107 157 82 User Adj: 1.00 1.00 1.00 1.00 1.00 1.00 1.00 1.00 1.00 1.00 1.00 1.00 PHF Adj: 1.00 1.00 1.00 1.00 1.00 1.00 1.00 1.00 1.00 1.00 1.00 1.00 PHF Volume: 55 176 32 9 213 15 12 33 46 107 157 82 Reduct Vol: 0 0 0 0 0 0 0 0 0 0 0 0 Reduced Vol: 55 176 32 9 213 15 12 33 46 107 157 82 PCE Adj: 1.00 1.00 1.00 1.00 1.00 1.00 1.00 1.00 1.00 1.00 1.00 1.00 MLF Adj: 1.00 1.00 1.00 1.00 1.00 1.00 1.00 1.00 1.00 1.00 1.00 1.00 FinalVolume: 55 176 32 9 213 15 12 33 46 107 157 82 ------------|---------------||---------------||---------------||---------------| Saturation Flow Module: Adjustment: 1.00 1.00 1.00 1.00 1.00 1.00 1.00 1.00 1.00 1.00 1.00 1.00 Lanes: 0.21 0.67 0.12 0.04 0.90 0.06 0.13 0.36 0.51 0.31 0.45 0.24 Final Sat.: 132 421 77 24 559 39 77 210 293 201 296 154 ------------|---------------||---------------||---------------||---------------| Capacity Analysis Module: Vol/Sat: 0.42 0.42 0.42 0.38 0.38 0.38 0.16 0.16 0.16 0.53 0.53 0.53 Crit Moves: **** **** **** **** Delay/Veh: 11.8 11.8 11.8 11.4 11.4 11.4 9.4 9.4 9.4 13.5 13.5 13.5 Delay Adj: 1.00 1.00 1.00 1.00 1.00 1.00 1.00 1.00 1.00 1.00 1.00 1.00 AdjDel/Veh: 11.8 11.8 11.8 11.4 11.4 11.4 9.4 9.4 9.4 13.5 13.5 13.5 LOS by Move: B B B B B B A A A B B B ApproachDel: 11.8 11.4 9.4 13.5 Delay Adj: 1.00 1.00 1.00 1.00 ApprAdjDel: 11.8 11.4 9.4 13.5 LOS by Appr: B B A B AllWayAvgQ: 0.6 0.6 0.6 0.5 0.5 0.5 0.1 0.1 0.1 1.0 1.0 1.0 Note: Queue reported is the number of cars per lane.

COMPARE Mon Sep 26 12:04:41 2011 Page 3-6
Traffix 8.0.0715 Copyright (c) 2008 Dowling Associates, Inc. Licensed to FEHR & PEERS WALNUT CRK
San Jose City College
SJ07-951 Level Of Service Computation Report
2000 HCM 4-Way Stop (Future Volume Alternative) Ex + Proj AM
Intersection #3: Leigh/Scott [4-Way Stop] Signal=Stop/Rights=Include Final Vol: 15*** 219 9 Lanes: 0 0 1! 0 0
Signal=Stop
Signal=Stop
Final Vol: Lanes: Rights=Include Vol Cnt Date: n/a Rights=Include Lanes: Final Vol:
12***
0 Cycle Time (sec): 100
0
82
0
Loss Time (sec): 0
0
33 1!
Critical V/C: 0.535
1! 157
0
Avg Crit Del (sec/veh): 12.2
0
46 0
Avg Delay (sec/veh): 12.2
0 107***
LOS: B
Lanes: 0 0 1! 0 0 Final Vol: 55 179 32*** Signal=Stop/Rights=Include Street Name: Leigh Scott Approach: North Bound South Bound East Bound West Bound Movement: L - T - R L - T - R L - T - R L - T - R ------------|---------------||---------------||---------------||---------------| Min. Green: 7 10 10 7 10 10 7 10 10 7 10 10 ------------|---------------||---------------||---------------||---------------| Volume Module: Base Vol: 55 176 32 9 213 15 12 33 46 107 157 82 Growth Adj: 1.00 1.00 1.00 1.00 1.00 1.00 1.00 1.00 1.00 1.00 1.00 1.00 Initial Bse: 55 176 32 9 213 15 12 33 46 107 157 82 Added Vol: 0 3 0 0 6 0 0 0 0 0 0 0 PasserByVol: 0 0 0 0 0 0 0 0 0 0 0 0 Initial Fut: 55 179 32 9 219 15 12 33 46 107 157 82 User Adj: 1.00 1.00 1.00 1.00 1.00 1.00 1.00 1.00 1.00 1.00 1.00 1.00 PHF Adj: 1.00 1.00 1.00 1.00 1.00 1.00 1.00 1.00 1.00 1.00 1.00 1.00 PHF Volume: 55 179 32 9 219 15 12 33 46 107 157 82 Reduct Vol: 0 0 0 0 0 0 0 0 0 0 0 0 Reduced Vol: 55 179 32 9 219 15 12 33 46 107 157 82 PCE Adj: 1.00 1.00 1.00 1.00 1.00 1.00 1.00 1.00 1.00 1.00 1.00 1.00 MLF Adj: 1.00 1.00 1.00 1.00 1.00 1.00 1.00 1.00 1.00 1.00 1.00 1.00 FinalVolume: 55 179 32 9 219 15 12 33 46 107 157 82 ------------|---------------||---------------||---------------||---------------| Saturation Flow Module: Adjustment: 1.00 1.00 1.00 1.00 1.00 1.00 1.00 1.00 1.00 1.00 1.00 1.00 Lanes: 0.21 0.67 0.12 0.04 0.90 0.06 0.13 0.36 0.51 0.31 0.45 0.24 Final Sat.: 130 422 76 23 559 38 76 209 291 200 294 153 ------------|---------------||---------------||---------------||---------------| Capacity Analysis Module: Vol/Sat: 0.42 0.42 0.42 0.39 0.39 0.39 0.16 0.16 0.16 0.53 0.53 0.53 Crit Moves: **** **** **** **** Delay/Veh: 11.9 11.9 11.9 11.5 11.5 11.5 9.4 9.4 9.4 13.6 13.6 13.6 Delay Adj: 1.00 1.00 1.00 1.00 1.00 1.00 1.00 1.00 1.00 1.00 1.00 1.00 AdjDel/Veh: 11.9 11.9 11.9 11.5 11.5 11.5 9.4 9.4 9.4 13.6 13.6 13.6 LOS by Move: B B B B B B A A A B B B ApproachDel: 11.9 11.5 9.4 13.6 Delay Adj: 1.00 1.00 1.00 1.00 ApprAdjDel: 11.9 11.5 9.4 13.6 LOS by Appr: B B A B AllWayAvgQ: 0.6 0.6 0.6 0.5 0.5 0.5 0.1 0.1 0.1 1.0 1.0 1.0 Note: Queue reported is the number of cars per lane.

COMPARE Mon Sep 26 12:04:41 2011 Page 3-7
Traffix 8.0.0715 Copyright (c) 2008 Dowling Associates, Inc. Licensed to FEHR & PEERS WALNUT CRK
San Jose City College
SJ07-951 Level Of Service Computation Report
2000 HCM Operations (Future Volume Alternative) Existing AM Balanced
Intersection #4: Bascom/Parkmoor Signal=Protect/Rights=Include Final Vol: 12 687 0*** Lanes: 0 1 2 0 0
Signal=Split
Signal=Split
Final Vol: Lanes: Rights=Include Vol Cnt Date: n/a Rights=Include Lanes: Final Vol:
9***
0 Cycle Time (sec): 140
1
268
0
Loss Time (sec): 12
0
0 1!
Critical V/C: 0.471
0 165***
0
Avg Crit Del (sec/veh): 30.9
1
27 0
Avg Delay (sec/veh): 33.6
1 684
LOS: C-
Lanes: 1 0 3 0 0 Final Vol: 3 975*** 0 Signal=Protect/Rights=Include Street Name: S Bascom Ave Parkmoor Ave Approach: North Bound South Bound East Bound West Bound Movement: L - T - R L - T - R L - T - R L - T - R ------------|---------------||---------------||---------------||---------------| Min. Green: 7 10 0 0 10 10 10 0 10 10 10 10 Y+R: 4.0 4.0 4.0 4.0 4.0 4.0 4.0 4.0 4.0 4.0 4.0 4.0 ------------|---------------||---------------||---------------||---------------| Volume Module: Base Vol: 3 975 0 0 687 12 9 0 27 684 165 268 Growth Adj: 1.00 1.00 1.00 1.00 1.00 1.00 1.00 1.00 1.00 1.00 1.00 1.00 Initial Bse: 3 975 0 0 687 12 9 0 27 684 165 268 Added Vol: 0 0 0 0 0 0 0 0 0 0 0 0 PasserByVol: 0 0 0 0 0 0 0 0 0 0 0 0 Initial Fut: 3 975 0 0 687 12 9 0 27 684 165 268 User Adj: 1.00 1.00 1.00 1.00 1.00 1.00 1.00 1.00 1.00 1.00 1.00 1.00 PHF Adj: 1.00 1.00 1.00 1.00 1.00 1.00 1.00 1.00 1.00 1.00 1.00 1.00 PHF Volume: 3 975 0 0 687 12 9 0 27 684 165 268 Reduct Vol: 0 0 0 0 0 0 0 0 0 0 0 0 Reduced Vol: 3 975 0 0 687 12 9 0 27 684 165 268 PCE Adj: 1.00 1.00 1.00 1.00 1.00 1.00 1.00 1.00 1.00 1.00 1.00 1.00 MLF Adj: 1.00 1.00 1.00 1.00 1.00 1.00 1.00 1.00 1.00 1.00 1.00 1.00 FinalVolume: 3 975 0 0 687 12 9 0 27 684 165 268 ------------|---------------||---------------||---------------||---------------| Saturation Flow Module: Sat/Lane: 1900 1900 1900 1900 1900 1900 1900 1900 1900 1900 1900 1900 Adjustment: 0.92 1.00 0.92 0.92 0.98 0.95 0.92 0.92 0.92 0.93 0.95 0.92 Lanes: 1.00 3.00 0.00 0.00 2.95 0.05 0.25 0.00 0.75 1.62 0.38 1.00 Final Sat.: 1750 5700 0 0 5504 96 438 0 1313 2860 690 1750 ------------|---------------||---------------||---------------||---------------| Capacity Analysis Module: Vol/Sat: 0.00 0.17 0.00 0.00 0.12 0.12 0.02 0.00 0.02 0.24 0.24 0.15 Crit Moves: **** **** **** **** Green Time: 14.1 49.2 0.0 0.0 35.1 35.1 10.0 0.0 10.0 68.8 68.8 68.8 Volume/Cap: 0.02 0.49 0.00 0.00 0.50 0.50 0.29 0.00 0.29 0.49 0.49 0.31 Delay/Veh: 56.8 35.7 0.0 0.0 45.2 45.2 62.9 0.0 62.9 24.0 24.0 21.6 User DelAdj: 1.00 1.00 1.00 1.00 1.00 1.00 1.00 1.00 1.00 1.00 1.00 1.00 AdjDel/Veh: 56.8 35.7 0.0 0.0 45.2 45.2 62.9 0.0 62.9 24.0 24.0 21.6 LOS by Move: E+ D+ A A D D E A E C C C+ HCM2kAvgQ: 0 10 0 0 8 8 2 0 2 13 13 7 Note: Queue reported is the number of cars per lane.

COMPARE Mon Sep 26 12:04:41 2011 Page 3-8
Traffix 8.0.0715 Copyright (c) 2008 Dowling Associates, Inc. Licensed to FEHR & PEERS WALNUT CRK
San Jose City College
SJ07-951 Level Of Service Computation Report
2000 HCM Operations (Future Volume Alternative) Ex + Proj AM
Intersection #4: Bascom/Parkmoor Signal=Protect/Rights=Include Final Vol: 12 708*** 0 Lanes: 0 1 2 0 0
Signal=Split
Signal=Split
Final Vol: Lanes: Rights=Include Vol Cnt Date: n/a Rights=Include Lanes: Final Vol:
9***
0 Cycle Time (sec): 140
1
270
0
Loss Time (sec): 12
0
0 1!
Critical V/C: 0.440
0 165***
0
Avg Crit Del (sec/veh): 31.9
1
27 0
Avg Delay (sec/veh): 33.3
1 728
LOS: C-
Lanes: 1 0 3 0 0 Final Vol: 3*** 978 0 Signal=Protect/Rights=Include Street Name: S Bascom Ave Parkmoor Ave Approach: North Bound South Bound East Bound West Bound Movement: L - T - R L - T - R L - T - R L - T - R ------------|---------------||---------------||---------------||---------------| Min. Green: 7 10 0 0 10 10 10 0 10 10 10 10 Y+R: 4.0 4.0 4.0 4.0 4.0 4.0 4.0 4.0 4.0 4.0 4.0 4.0 ------------|---------------||---------------||---------------||---------------| Volume Module: Base Vol: 3 975 0 0 687 12 9 0 27 684 165 268 Growth Adj: 1.00 1.00 1.00 1.00 1.00 1.00 1.00 1.00 1.00 1.00 1.00 1.00 Initial Bse: 3 975 0 0 687 12 9 0 27 684 165 268 Added Vol: 0 3 0 0 21 0 0 0 0 44 0 2 PasserByVol: 0 0 0 0 0 0 0 0 0 0 0 0 Initial Fut: 3 978 0 0 708 12 9 0 27 728 165 270 User Adj: 1.00 1.00 1.00 1.00 1.00 1.00 1.00 1.00 1.00 1.00 1.00 1.00 PHF Adj: 1.00 1.00 1.00 1.00 1.00 1.00 1.00 1.00 1.00 1.00 1.00 1.00 PHF Volume: 3 978 0 0 708 12 9 0 27 728 165 270 Reduct Vol: 0 0 0 0 0 0 0 0 0 0 0 0 Reduced Vol: 3 978 0 0 708 12 9 0 27 728 165 270 PCE Adj: 1.00 1.00 1.00 1.00 1.00 1.00 1.00 1.00 1.00 1.00 1.00 1.00 MLF Adj: 1.00 1.00 1.00 1.00 1.00 1.00 1.00 1.00 1.00 1.00 1.00 1.00 FinalVolume: 3 978 0 0 708 12 9 0 27 728 165 270 ------------|---------------||---------------||---------------||---------------| Saturation Flow Module: Sat/Lane: 1900 1900 1900 1900 1900 1900 1900 1900 1900 1900 1900 1900 Adjustment: 0.92 1.00 0.92 0.92 0.98 0.95 0.92 0.92 0.92 0.93 0.95 0.92 Lanes: 1.00 3.00 0.00 0.00 2.95 0.05 0.25 0.00 0.75 1.64 0.36 1.00 Final Sat.: 1750 5700 0 0 5507 93 438 0 1313 2894 656 1750 ------------|---------------||---------------||---------------||---------------| Capacity Analysis Module: Vol/Sat: 0.00 0.17 0.00 0.00 0.13 0.13 0.02 0.00 0.02 0.25 0.25 0.15 Crit Moves: **** **** **** **** Green Time: 7.0 44.5 0.0 0.0 37.5 37.5 10.0 0.0 10.0 73.5 73.5 73.5 Volume/Cap: 0.03 0.54 0.00 0.00 0.48 0.48 0.29 0.00 0.29 0.48 0.48 0.29 Delay/Veh: 63.4 39.6 0.0 0.0 43.3 43.3 62.9 0.0 62.9 21.3 21.3 18.9 User DelAdj: 1.00 1.00 1.00 1.00 1.00 1.00 1.00 1.00 1.00 1.00 1.00 1.00 AdjDel/Veh: 63.4 39.6 0.0 0.0 43.3 43.3 62.9 0.0 62.9 21.3 21.3 18.9 LOS by Move: E D A A D D E A E C+ C+ B- HCM2kAvgQ: 0 11 0 0 8 8 2 0 2 13 13 7 Note: Queue reported is the number of cars per lane.

COMPARE Mon Sep 26 12:04:41 2011 Page 3-9
Traffix 8.0.0715 Copyright (c) 2008 Dowling Associates, Inc. Licensed to FEHR & PEERS WALNUT CRK
San Jose City College
SJ07-951 Level Of Service Computation Report
2000 HCM Operations (Future Volume Alternative) Existing AM Balanced
Intersection #5: Leland/Parkmoor Signal=Protect/Rights=Include Final Vol: 104 73*** 0 Lanes: 0 1 0 0 0
Signal=Split
Signal=Split
Final Vol: Lanes: Rights=Include Vol Cnt Date: n/a Rights=Include Lanes: Final Vol:
0
0 Cycle Time (sec): 110
1
36
0
Loss Time (sec): 9
0
0 0
Critical V/C: 0.627
1 1418***
0
Avg Crit Del (sec/veh): 19.3
1
0 0
Avg Delay (sec/veh): 19.4
0 50
LOS: B-
Lanes: 1 0 1 0 0 Final Vol: 141*** 65 0 Signal=Protect/Rights=Include Street Name: Leland Ave Parkmoor Ave Approach: North Bound South Bound East Bound West Bound Movement: L - T - R L - T - R L - T - R L - T - R ------------|---------------||---------------||---------------||---------------| Min. Green: 7 10 0 0 10 10 0 0 0 10 10 10 Y+R: 4.0 4.0 4.0 4.0 4.0 4.0 4.0 4.0 4.0 4.0 4.0 4.0 ------------|---------------||---------------||---------------||---------------| Volume Module: Base Vol: 141 65 0 0 73 104 0 0 0 50 1418 36 Growth Adj: 1.00 1.00 1.00 1.00 1.00 1.00 1.00 1.00 1.00 1.00 1.00 1.00 Initial Bse: 141 65 0 0 73 104 0 0 0 50 1418 36 Added Vol: 0 0 0 0 0 0 0 0 0 0 0 0 PasserByVol: 0 0 0 0 0 0 0 0 0 0 0 0 Initial Fut: 141 65 0 0 73 104 0 0 0 50 1418 36 User Adj: 1.00 1.00 1.00 1.00 1.00 1.00 1.00 1.00 1.00 1.00 1.00 1.00 PHF Adj: 1.00 1.00 1.00 1.00 1.00 1.00 1.00 1.00 1.00 1.00 1.00 1.00 PHF Volume: 141 65 0 0 73 104 0 0 0 50 1418 36 Reduct Vol: 0 0 0 0 0 0 0 0 0 0 0 0 Reduced Vol: 141 65 0 0 73 104 0 0 0 50 1418 36 PCE Adj: 1.00 1.00 1.00 1.00 1.00 1.00 1.00 1.00 1.00 1.00 1.00 1.00 MLF Adj: 1.00 1.00 1.00 1.00 1.00 1.00 1.00 1.00 1.00 1.00 1.00 1.00 FinalVolume: 141 65 0 0 73 104 0 0 0 50 1418 36 ------------|---------------||---------------||---------------||---------------| Saturation Flow Module: Sat/Lane: 1900 1900 1900 1900 1900 1900 1900 1900 1900 1900 1900 1900 Adjustment: 0.92 1.00 0.92 0.92 0.95 0.95 0.92 1.00 0.92 0.95 0.97 0.92 Lanes: 1.00 1.00 0.00 0.00 0.41 0.59 0.00 0.00 0.00 0.07 1.93 1.00 Final Sat.: 1750 1900 0 0 742 1058 0 0 0 126 3574 1750 ------------|---------------||---------------||---------------||---------------| Capacity Analysis Module: Vol/Sat: 0.08 0.03 0.00 0.00 0.10 0.10 0.00 0.00 0.00 0.40 0.40 0.02 Crit Moves: **** **** **** Green Time: 14.1 31.4 0.0 0.0 17.3 17.3 0.0 0.0 0.0 69.6 69.6 69.6 Volume/Cap: 0.63 0.12 0.00 0.00 0.63 0.63 0.00 0.00 0.00 0.63 0.63 0.03 Delay/Veh: 50.9 29.2 0.0 0.0 47.8 47.8 0.0 0.0 0.0 12.8 12.8 7.6 User DelAdj: 1.00 1.00 1.00 1.00 1.00 1.00 1.00 1.00 1.00 1.00 1.00 1.00 AdjDel/Veh: 50.9 29.2 0.0 0.0 47.8 47.8 0.0 0.0 0.0 12.8 12.8 7.6 LOS by Move: D C A A D D A A A B B A HCM2kAvgQ: 5 2 0 0 7 7 0 0 0 15 15 0 Note: Queue reported is the number of cars per lane.

COMPARE Mon Sep 26 12:04:41 2011 Page 3-10
Traffix 8.0.0715 Copyright (c) 2008 Dowling Associates, Inc. Licensed to FEHR & PEERS WALNUT CRK
San Jose City College
SJ07-951 Level Of Service Computation Report
2000 HCM Operations (Future Volume Alternative) Ex + Proj AM
Intersection #5: Leland/Parkmoor Signal=Protect/Rights=Include Final Vol: 104 73*** 0 Lanes: 0 1 0 0 0
Signal=Split
Signal=Split
Final Vol: Lanes: Rights=Include Vol Cnt Date: n/a Rights=Include Lanes: Final Vol:
0
0 Cycle Time (sec): 110
1
36
0
Loss Time (sec): 9
0
0 0
Critical V/C: 0.646
1 1477
0
Avg Crit Del (sec/veh): 19.2
1
0 0
Avg Delay (sec/veh): 19.4
0 56***
LOS: B-
Lanes: 1 0 1 0 0 Final Vol: 141*** 66 0 Signal=Protect/Rights=Include Street Name: Leland Ave Parkmoor Ave Approach: North Bound South Bound East Bound West Bound Movement: L - T - R L - T - R L - T - R L - T - R ------------|---------------||---------------||---------------||---------------| Min. Green: 7 10 0 0 10 10 0 0 0 10 10 10 Y+R: 4.0 4.0 4.0 4.0 4.0 4.0 4.0 4.0 4.0 4.0 4.0 4.0 ------------|---------------||---------------||---------------||---------------| Volume Module: Base Vol: 141 65 0 0 73 104 0 0 0 50 1418 36 Growth Adj: 1.00 1.00 1.00 1.00 1.00 1.00 1.00 1.00 1.00 1.00 1.00 1.00 Initial Bse: 141 65 0 0 73 104 0 0 0 50 1418 36 Added Vol: 0 1 0 0 0 0 0 0 0 6 59 0 PasserByVol: 0 0 0 0 0 0 0 0 0 0 0 0 Initial Fut: 141 66 0 0 73 104 0 0 0 56 1477 36 User Adj: 1.00 1.00 1.00 1.00 1.00 1.00 1.00 1.00 1.00 1.00 1.00 1.00 PHF Adj: 1.00 1.00 1.00 1.00 1.00 1.00 1.00 1.00 1.00 1.00 1.00 1.00 PHF Volume: 141 66 0 0 73 104 0 0 0 56 1477 36 Reduct Vol: 0 0 0 0 0 0 0 0 0 0 0 0 Reduced Vol: 141 66 0 0 73 104 0 0 0 56 1477 36 PCE Adj: 1.00 1.00 1.00 1.00 1.00 1.00 1.00 1.00 1.00 1.00 1.00 1.00 MLF Adj: 1.00 1.00 1.00 1.00 1.00 1.00 1.00 1.00 1.00 1.00 1.00 1.00 FinalVolume: 141 66 0 0 73 104 0 0 0 56 1477 36 ------------|---------------||---------------||---------------||---------------| Saturation Flow Module: Sat/Lane: 1900 1900 1900 1900 1900 1900 1900 1900 1900 1900 1900 1900 Adjustment: 0.92 1.00 0.92 0.92 0.95 0.95 0.92 1.00 0.92 0.95 0.97 0.92 Lanes: 1.00 1.00 0.00 0.00 0.41 0.59 0.00 0.00 0.00 0.08 1.92 1.00 Final Sat.: 1750 1900 0 0 742 1058 0 0 0 135 3565 1750 ------------|---------------||---------------||---------------||---------------| Capacity Analysis Module: Vol/Sat: 0.08 0.03 0.00 0.00 0.10 0.10 0.00 0.00 0.00 0.41 0.41 0.02 Crit Moves: **** **** **** Green Time: 13.7 30.5 0.0 0.0 16.7 16.7 0.0 0.0 0.0 70.5 70.5 70.5 Volume/Cap: 0.65 0.13 0.00 0.00 0.65 0.65 0.00 0.00 0.00 0.65 0.65 0.03 Delay/Veh: 52.4 29.9 0.0 0.0 49.1 49.1 0.0 0.0 0.0 12.7 12.7 7.2 User DelAdj: 1.00 1.00 1.00 1.00 1.00 1.00 1.00 1.00 1.00 1.00 1.00 1.00 AdjDel/Veh: 52.4 29.9 0.0 0.0 49.1 49.1 0.0 0.0 0.0 12.7 12.7 7.2 LOS by Move: D- C A A D D A A A B B A HCM2kAvgQ: 5 2 0 0 7 7 0 0 0 15 15 0 Note: Queue reported is the number of cars per lane.

COMPARE Mon Sep 26 12:04:41 2011 Page 3-11
Traffix 8.0.0715 Copyright (c) 2008 Dowling Associates, Inc. Licensed to FEHR & PEERS WALNUT CRK
San Jose City College
SJ07-951 Level Of Service Computation Report
2000 HCM Operations (Future Volume Alternative) Existing AM Balanced
Intersection #6: Leigh/Parkmoor Signal=Protect/Rights=Include Final Vol: 110 287*** 0 Lanes: 1 0 1 0 0
Signal=Split
Signal=Split
Final Vol: Lanes: Rights=Include Vol Cnt Date: n/a Rights=Include Lanes: Final Vol:
0
0 Cycle Time (sec): 110
1
95
0
Loss Time (sec): 9
0
0 0
Critical V/C: 0.782
1 1088
0
Avg Crit Del (sec/veh): 32.5
1
0 0
Avg Delay (sec/veh): 31.1
0 361***
LOS: C
Lanes: 1 0 1 0 0 Final Vol: 307*** 197 0 Signal=Protect/Rights=Include Street Name: Leigh Parkmoor Approach: North Bound South Bound East Bound West Bound Movement: L - T - R L - T - R L - T - R L - T - R ------------|---------------||---------------||---------------||---------------| Min. Green: 7 10 0 0 10 10 0 0 0 10 10 10 Y+R: 4.0 4.0 4.0 4.0 4.0 4.0 4.0 4.0 4.0 4.0 4.0 4.0 ------------|---------------||---------------||---------------||---------------| Volume Module: Base Vol: 307 197 0 0 287 110 0 0 0 361 1088 95 Growth Adj: 1.00 1.00 1.00 1.00 1.00 1.00 1.00 1.00 1.00 1.00 1.00 1.00 Initial Bse: 307 197 0 0 287 110 0 0 0 361 1088 95 Added Vol: 0 0 0 0 0 0 0 0 0 0 0 0 PasserByVol: 0 0 0 0 0 0 0 0 0 0 0 0 Initial Fut: 307 197 0 0 287 110 0 0 0 361 1088 95 User Adj: 1.00 1.00 1.00 1.00 1.00 1.00 1.00 1.00 1.00 1.00 1.00 1.00 PHF Adj: 1.00 1.00 1.00 1.00 1.00 1.00 1.00 1.00 1.00 1.00 1.00 1.00 PHF Volume: 307 197 0 0 287 110 0 0 0 361 1088 95 Reduct Vol: 0 0 0 0 0 0 0 0 0 0 0 0 Reduced Vol: 307 197 0 0 287 110 0 0 0 361 1088 95 PCE Adj: 1.00 1.00 1.00 1.00 1.00 1.00 1.00 1.00 1.00 1.00 1.00 1.00 MLF Adj: 1.00 1.00 1.00 1.00 1.00 1.00 1.00 1.00 1.00 1.00 1.00 1.00 FinalVolume: 307 197 0 0 287 110 0 0 0 361 1088 95 ------------|---------------||---------------||---------------||---------------| Saturation Flow Module: Sat/Lane: 1900 1900 1900 1900 1900 1900 1900 1900 1900 1900 1900 1900 Adjustment: 0.92 1.00 0.92 0.92 1.00 0.92 0.92 1.00 0.92 0.95 0.98 0.92 Lanes: 1.00 1.00 0.00 0.00 1.00 1.00 0.00 0.00 0.00 0.51 1.49 1.00 Final Sat.: 1750 1900 0 0 1900 1750 0 0 0 922 2778 1750 ------------|---------------||---------------||---------------||---------------| Capacity Analysis Module: Vol/Sat: 0.18 0.10 0.00 0.00 0.15 0.06 0.00 0.00 0.00 0.39 0.39 0.05 Crit Moves: **** **** **** Green Time: 24.7 45.9 0.0 0.0 21.2 21.2 0.0 0.0 0.0 55.1 55.1 55.1 Volume/Cap: 0.78 0.25 0.00 0.00 0.78 0.33 0.00 0.00 0.00 0.78 0.78 0.11 Delay/Veh: 49.9 21.0 0.0 0.0 52.6 38.8 0.0 0.0 0.0 24.8 24.8 14.5 User DelAdj: 1.00 1.00 1.00 1.00 1.00 1.00 1.00 1.00 1.00 1.00 1.00 1.00 AdjDel/Veh: 49.9 21.0 0.0 0.0 52.6 38.8 0.0 0.0 0.0 24.8 24.8 14.5 LOS by Move: D C+ A A D- D+ A A A C C B HCM2kAvgQ: 11 4 0 0 11 4 0 0 0 22 22 2 Note: Queue reported is the number of cars per lane.

COMPARE Mon Sep 26 12:04:41 2011 Page 3-12
Traffix 8.0.0715 Copyright (c) 2008 Dowling Associates, Inc. Licensed to FEHR & PEERS WALNUT CRK
San Jose City College
SJ07-951 Level Of Service Computation Report
2000 HCM Operations (Future Volume Alternative) Ex + Proj AM
Intersection #6: Leigh/Parkmoor Signal=Protect/Rights=Include Final Vol: 110 293*** 0 Lanes: 1 0 1 0 0
Signal=Split
Signal=Split
Final Vol: Lanes: Rights=Include Vol Cnt Date: n/a Rights=Include Lanes: Final Vol:
0
0 Cycle Time (sec): 110
1
95
0
Loss Time (sec): 9
0
0 0
Critical V/C: 0.831
1 1131***
0
Avg Crit Del (sec/veh): 34.9
1
0 0
Avg Delay (sec/veh): 33.3
0 424
LOS: C-
Lanes: 1 0 1 0 0 Final Vol: 329*** 200 0 Signal=Protect/Rights=Include Street Name: Leigh Parkmoor Approach: North Bound South Bound East Bound West Bound Movement: L - T - R L - T - R L - T - R L - T - R ------------|---------------||---------------||---------------||---------------| Min. Green: 7 10 0 0 10 10 0 0 0 10 10 10 Y+R: 4.0 4.0 4.0 4.0 4.0 4.0 4.0 4.0 4.0 4.0 4.0 4.0 ------------|---------------||---------------||---------------||---------------| Volume Module: Base Vol: 307 197 0 0 287 110 0 0 0 361 1088 95 Growth Adj: 1.00 1.00 1.00 1.00 1.00 1.00 1.00 1.00 1.00 1.00 1.00 1.00 Initial Bse: 307 197 0 0 287 110 0 0 0 361 1088 95 Added Vol: 22 3 0 0 6 0 0 0 0 63 43 0 PasserByVol: 0 0 0 0 0 0 0 0 0 0 0 0 Initial Fut: 329 200 0 0 293 110 0 0 0 424 1131 95 User Adj: 1.00 1.00 1.00 1.00 1.00 1.00 1.00 1.00 1.00 1.00 1.00 1.00 PHF Adj: 1.00 1.00 1.00 1.00 1.00 1.00 1.00 1.00 1.00 1.00 1.00 1.00 PHF Volume: 329 200 0 0 293 110 0 0 0 424 1131 95 Reduct Vol: 0 0 0 0 0 0 0 0 0 0 0 0 Reduced Vol: 329 200 0 0 293 110 0 0 0 424 1131 95 PCE Adj: 1.00 1.00 1.00 1.00 1.00 1.00 1.00 1.00 1.00 1.00 1.00 1.00 MLF Adj: 1.00 1.00 1.00 1.00 1.00 1.00 1.00 1.00 1.00 1.00 1.00 1.00 FinalVolume: 329 200 0 0 293 110 0 0 0 424 1131 95 ------------|---------------||---------------||---------------||---------------| Saturation Flow Module: Sat/Lane: 1900 1900 1900 1900 1900 1900 1900 1900 1900 1900 1900 1900 Adjustment: 0.92 1.00 0.92 0.92 1.00 0.92 0.92 1.00 0.92 0.95 0.98 0.92 Lanes: 1.00 1.00 0.00 0.00 1.00 1.00 0.00 0.00 0.00 0.56 1.44 1.00 Final Sat.: 1750 1900 0 0 1900 1750 0 0 0 1009 2690 1750 ------------|---------------||---------------||---------------||---------------| Capacity Analysis Module: Vol/Sat: 0.19 0.11 0.00 0.00 0.15 0.06 0.00 0.00 0.00 0.42 0.42 0.05 Crit Moves: **** **** **** Green Time: 24.9 45.3 0.0 0.0 20.4 20.4 0.0 0.0 0.0 55.7 55.7 55.7 Volume/Cap: 0.83 0.26 0.00 0.00 0.83 0.34 0.00 0.00 0.00 0.83 0.83 0.11 Delay/Veh: 54.3 21.4 0.0 0.0 58.3 39.5 0.0 0.0 0.0 26.4 26.4 14.2 User DelAdj: 1.00 1.00 1.00 1.00 1.00 1.00 1.00 1.00 1.00 1.00 1.00 1.00 AdjDel/Veh: 54.3 21.4 0.0 0.0 58.3 39.5 0.0 0.0 0.0 26.4 26.4 14.2 LOS by Move: D- C+ A A E+ D A A A C C B HCM2kAvgQ: 12 4 0 0 12 4 0 0 0 25 25 2 Note: Queue reported is the number of cars per lane.

COMPARE Mon Sep 26 12:04:41 2011 Page 3-13
Traffix 8.0.0715 Copyright (c) 2008 Dowling Associates, Inc. Licensed to FEHR & PEERS WALNUT CRK
San Jose City College
SJ07-951 Level Of Service Computation Report
2000 HCM Operations (Future Volume Alternative) Existing AM Balanced
Intersection #7: Bascom/Moorpark Signal=Protect/Rights=Include Final Vol: 527*** 615 256 Lanes: 0 1 2 0 1
Signal=Split
Signal=Split
Final Vol: Lanes: Rights=Include Vol Cnt Date: n/a Rights=Include Lanes: Final Vol:
111
0 Cycle Time (sec): 140
0
0
1
Loss Time (sec): 9
0
715*** 1
Critical V/C: 0.695
0 0
0
Avg Crit Del (sec/veh): 40.9
0
202 1
Avg Delay (sec/veh): 38.9
0 0
LOS: D+
Lanes: 2 0 2 1 0 Final Vol: 397*** 867 277 Signal=Protect/Rights=Include Street Name: S Bascom Ave Moorpark Ave Approach: North Bound South Bound East Bound West Bound Movement: L - T - R L - T - R L - T - R L - T - R ------------|---------------||---------------||---------------||---------------| Min. Green: 7 10 10 7 10 10 10 10 10 0 0 0 Y+R: 4.0 4.0 4.0 4.0 4.0 4.0 4.0 4.0 4.0 4.0 4.0 4.0 ------------|---------------||---------------||---------------||---------------| Volume Module: Base Vol: 397 867 277 256 615 527 111 715 202 0 0 0 Growth Adj: 1.00 1.00 1.00 1.00 1.00 1.00 1.00 1.00 1.00 1.00 1.00 1.00 Initial Bse: 397 867 277 256 615 527 111 715 202 0 0 0 Added Vol: 0 0 0 0 0 0 0 0 0 0 0 0 PasserByVol: 0 0 0 0 0 0 0 0 0 0 0 0 Initial Fut: 397 867 277 256 615 527 111 715 202 0 0 0 User Adj: 1.00 1.00 1.00 1.00 1.00 1.00 1.00 1.00 1.00 1.00 1.00 1.00 PHF Adj: 1.00 1.00 1.00 1.00 1.00 1.00 1.00 1.00 1.00 1.00 1.00 1.00 PHF Volume: 397 867 277 256 615 527 111 715 202 0 0 0 Reduct Vol: 0 0 0 0 0 0 0 0 0 0 0 0 Reduced Vol: 397 867 277 256 615 527 111 715 202 0 0 0 PCE Adj: 1.00 1.00 1.00 1.00 1.00 1.00 1.00 1.00 1.00 1.00 1.00 1.00 MLF Adj: 1.00 1.00 1.00 1.00 1.00 1.00 1.00 1.00 1.00 1.00 1.00 1.00 FinalVolume: 397 867 277 256 615 527 111 715 202 0 0 0 ------------|---------------||---------------||---------------||---------------| Saturation Flow Module: Sat/Lane: 1900 1900 1900 1900 1900 1900 1900 1900 1900 1900 1900 1900 Adjustment: 0.83 0.99 0.95 0.92 1.00 0.92 0.95 0.98 0.92 0.92 1.00 0.92 Lanes: 2.00 2.25 0.75 1.00 2.00 1.00 0.28 1.72 1.00 0.00 0.00 0.00 Final Sat.: 3150 4242 1355 1750 3800 1750 497 3202 1750 0 0 0 ------------|---------------||---------------||---------------||---------------| Capacity Analysis Module: Vol/Sat: 0.13 0.20 0.20 0.15 0.16 0.30 0.22 0.22 0.12 0.00 0.00 0.00 Crit Moves: **** **** **** Green Time: 25.4 50.1 50.1 35.9 60.7 60.7 45.0 45.0 45.0 0.0 0.0 0.0 Volume/Cap: 0.70 0.57 0.57 0.57 0.37 0.70 0.70 0.70 0.36 0.00 0.00 0.00 Delay/Veh: 57.4 36.6 36.6 47.1 26.9 33.5 43.3 43.3 36.9 0.0 0.0 0.0 User DelAdj: 1.00 1.00 1.00 1.00 1.00 1.00 1.00 1.00 1.00 1.00 1.00 1.00 AdjDel/Veh: 57.4 36.6 36.6 47.1 26.9 33.5 43.3 43.3 36.9 0.0 0.0 0.0 LOS by Move: E+ D+ D+ D C C- D D D+ A A A HCM2kAvgQ: 10 13 13 10 8 20 17 17 7 0 0 0 Note: Queue reported is the number of cars per lane.

COMPARE Mon Sep 26 12:04:41 2011 Page 3-14
Traffix 8.0.0715 Copyright (c) 2008 Dowling Associates, Inc. Licensed to FEHR & PEERS WALNUT CRK
San Jose City College
SJ07-951 Level Of Service Computation Report
2000 HCM Operations (Future Volume Alternative) Ex + Proj AM
Intersection #7: Bascom/Moorpark Signal=Protect/Rights=Include Final Vol: 528*** 624 311 Lanes: 0 1 2 0 1
Signal=Split
Signal=Split
Final Vol: Lanes: Rights=Include Vol Cnt Date: n/a Rights=Include Lanes: Final Vol:
111***
0 Cycle Time (sec): 140
0
0
1
Loss Time (sec): 9
0
722 1
Critical V/C: 0.698
0 0
0
Avg Crit Del (sec/veh): 41.0
0
202 1
Avg Delay (sec/veh): 40.0
0 0
LOS: D
Lanes: 2 0 2 1 0 Final Vol: 398*** 870 286 Signal=Protect/Rights=Include Street Name: S Bascom Ave Moorpark Ave Approach: North Bound South Bound East Bound West Bound Movement: L - T - R L - T - R L - T - R L - T - R ------------|---------------||---------------||---------------||---------------| Min. Green: 7 10 10 7 10 10 10 10 10 0 0 0 Y+R: 4.0 4.0 4.0 4.0 4.0 4.0 4.0 4.0 4.0 4.0 4.0 4.0 ------------|---------------||---------------||---------------||---------------| Volume Module: Base Vol: 397 867 277 256 615 527 111 715 202 0 0 0 Growth Adj: 1.00 1.00 1.00 1.00 1.00 1.00 1.00 1.00 1.00 1.00 1.00 1.00 Initial Bse: 397 867 277 256 615 527 111 715 202 0 0 0 Added Vol: 1 3 9 55 9 1 0 7 0 0 0 0 PasserByVol: 0 0 0 0 0 0 0 0 0 0 0 0 Initial Fut: 398 870 286 311 624 528 111 722 202 0 0 0 User Adj: 1.00 1.00 1.00 1.00 1.00 1.00 1.00 1.00 1.00 1.00 1.00 1.00 PHF Adj: 1.00 1.00 1.00 1.00 1.00 1.00 1.00 1.00 1.00 1.00 1.00 1.00 PHF Volume: 398 870 286 311 624 528 111 722 202 0 0 0 Reduct Vol: 0 0 0 0 0 0 0 0 0 0 0 0 Reduced Vol: 398 870 286 311 624 528 111 722 202 0 0 0 PCE Adj: 1.00 1.00 1.00 1.00 1.00 1.00 1.00 1.00 1.00 1.00 1.00 1.00 MLF Adj: 1.00 1.00 1.00 1.00 1.00 1.00 1.00 1.00 1.00 1.00 1.00 1.00 FinalVolume: 398 870 286 311 624 528 111 722 202 0 0 0 ------------|---------------||---------------||---------------||---------------| Saturation Flow Module: Sat/Lane: 1900 1900 1900 1900 1900 1900 1900 1900 1900 1900 1900 1900 Adjustment: 0.83 0.99 0.95 0.92 1.00 0.92 0.95 0.98 0.92 0.92 1.00 0.92 Lanes: 2.00 2.23 0.77 1.00 2.00 1.00 0.27 1.73 1.00 0.00 0.00 0.00 Final Sat.: 3150 4213 1385 1750 3800 1750 493 3207 1750 0 0 0 ------------|---------------||---------------||---------------||---------------| Capacity Analysis Module: Vol/Sat: 0.13 0.21 0.21 0.18 0.16 0.30 0.23 0.23 0.12 0.00 0.00 0.00 Crit Moves: **** **** **** Green Time: 25.3 46.1 46.1 39.7 60.5 60.5 45.2 45.2 45.2 0.0 0.0 0.0 Volume/Cap: 0.70 0.63 0.63 0.63 0.38 0.70 0.70 0.70 0.36 0.00 0.00 0.00 Delay/Veh: 57.6 40.3 40.3 46.2 27.1 33.7 43.3 43.3 36.7 0.0 0.0 0.0 User DelAdj: 1.00 1.00 1.00 1.00 1.00 1.00 1.00 1.00 1.00 1.00 1.00 1.00 AdjDel/Veh: 57.6 40.3 40.3 46.2 27.1 33.7 43.3 43.3 36.7 0.0 0.0 0.0 LOS by Move: E+ D D D C C- D D D+ A A A HCM2kAvgQ: 10 14 14 12 9 20 17 17 7 0 0 0 Note: Queue reported is the number of cars per lane.

COMPARE Mon Sep 26 12:04:41 2011 Page 3-15
Traffix 8.0.0715 Copyright (c) 2008 Dowling Associates, Inc. Licensed to FEHR & PEERS WALNUT CRK
San Jose City College
SJ07-951 Level Of Service Computation Report
2000 HCM Operations (Future Volume Alternative) Existing AM Balanced
Intersection #8: Leland/Moorpark Signal=Split/Rights=Include Final Vol: 0 0 123*** Lanes: 0 0 0 0 1
Signal=Split
Signal=Split
Final Vol: Lanes: Rights=Ignore Vol Cnt Date: n/a Rights=Include Lanes: Final Vol:
206
0 Cycle Time (sec): 110
0
0
1
Loss Time (sec): 6
0
993*** 2
Critical V/C: 0.301
0 0
0
Avg Crit Del (sec/veh): 8.6
0
0 1
Avg Delay (sec/veh): 8.6
0 0
LOS: A
Lanes: 0 0 0 0 1 Final Vol: 0 0 0 Signal=Split/Rights=Ignore Street Name: Leland Ave Moorpark Ave Approach: North Bound South Bound East Bound West Bound Movement: L - T - R L - T - R L - T - R L - T - R ------------|---------------||---------------||---------------||---------------| Min. Green: 0 0 0 10 0 0 10 10 0 0 0 0 Y+R: 4.0 4.0 4.0 4.0 4.0 4.0 4.0 4.0 4.0 4.0 4.0 4.0 ------------|---------------||---------------||---------------||---------------| Volume Module: Base Vol: 0 0 34 123 0 0 206 993 134 0 0 0 Growth Adj: 1.00 1.00 1.00 1.00 1.00 1.00 1.00 1.00 1.00 1.00 1.00 1.00 Initial Bse: 0 0 34 123 0 0 206 993 134 0 0 0 Added Vol: 0 0 0 0 0 0 0 0 0 0 0 0 PasserByVol: 0 0 0 0 0 0 0 0 0 0 0 0 Initial Fut: 0 0 34 123 0 0 206 993 134 0 0 0 User Adj: 1.00 1.00 0.00 1.00 1.00 1.00 1.00 1.00 0.00 1.00 1.00 1.00 PHF Adj: 1.00 1.00 0.00 1.00 1.00 1.00 1.00 1.00 0.00 1.00 1.00 1.00 PHF Volume: 0 0 0 123 0 0 206 993 0 0 0 0 Reduct Vol: 0 0 0 0 0 0 0 0 0 0 0 0 Reduced Vol: 0 0 0 123 0 0 206 993 0 0 0 0 PCE Adj: 1.00 1.00 0.00 1.00 1.00 1.00 1.00 1.00 0.00 1.00 1.00 1.00 MLF Adj: 1.00 1.00 0.00 1.00 1.00 1.00 1.00 1.00 0.00 1.00 1.00 1.00 FinalVolume: 0 0 0 123 0 0 206 993 0 0 0 0 ------------|---------------||---------------||---------------||---------------| Saturation Flow Module: Sat/Lane: 1900 1900 1900 1900 1900 1900 1900 1900 1900 1900 1900 1900 Adjustment: 0.92 1.00 0.92 0.92 1.00 0.92 0.95 0.99 0.92 0.92 1.00 0.92 Lanes: 0.00 0.00 1.00 1.00 0.00 0.00 0.53 2.47 1.00 0.00 0.00 0.00 Final Sat.: 0 0 1750 1750 0 0 962 4637 1750 0 0 0 ------------|---------------||---------------||---------------||---------------| Capacity Analysis Module: Vol/Sat: 0.00 0.00 0.00 0.07 0.00 0.00 0.21 0.21 0.00 0.00 0.00 0.00 Crit Moves: **** **** Green Time: 0.0 0.0 0.0 25.7 0.0 0.0 78.3 78.3 0.0 0.0 0.0 0.0 Volume/Cap: 0.00 0.00 0.00 0.30 0.00 0.00 0.30 0.30 0.00 0.00 0.00 0.00 Delay/Veh: 0.0 0.0 0.0 35.2 0.0 0.0 5.9 5.9 0.0 0.0 0.0 0.0 User DelAdj: 1.00 1.00 1.00 1.00 1.00 1.00 1.00 1.00 1.00 1.00 1.00 1.00 AdjDel/Veh: 0.0 0.0 0.0 35.2 0.0 0.0 5.9 5.9 0.0 0.0 0.0 0.0 LOS by Move: A A A D+ A A A A A A A A HCM2kAvgQ: 0 0 0 4 0 0 5 5 0 0 0 0 Note: Queue reported is the number of cars per lane.

COMPARE Mon Sep 26 12:04:41 2011 Page 3-16
Traffix 8.0.0715 Copyright (c) 2008 Dowling Associates, Inc. Licensed to FEHR & PEERS WALNUT CRK
San Jose City College
SJ07-951 Level Of Service Computation Report
2000 HCM Operations (Future Volume Alternative) Ex + Proj AM
Intersection #8: Leland/Moorpark Signal=Split/Rights=Include Final Vol: 0 0 129*** Lanes: 0 0 0 0 1
Signal=Split
Signal=Split
Final Vol: Lanes: Rights=Ignore Vol Cnt Date: n/a Rights=Include Lanes: Final Vol:
207
0 Cycle Time (sec): 110
0
0
1
Loss Time (sec): 6
0
1035*** 2
Critical V/C: 0.313
0 0
0
Avg Crit Del (sec/veh): 8.7
0
0 1
Avg Delay (sec/veh): 8.7
0 0
LOS: A
Lanes: 0 0 0 0 1 Final Vol: 0 0 0 Signal=Split/Rights=Ignore Street Name: Leland Ave Moorpark Ave Approach: North Bound South Bound East Bound West Bound Movement: L - T - R L - T - R L - T - R L - T - R ------------|---------------||---------------||---------------||---------------| Min. Green: 0 0 0 10 0 0 10 10 0 0 0 0 Y+R: 4.0 4.0 4.0 4.0 4.0 4.0 4.0 4.0 4.0 4.0 4.0 4.0 ------------|---------------||---------------||---------------||---------------| Volume Module: Base Vol: 0 0 34 123 0 0 206 993 134 0 0 0 Growth Adj: 1.00 1.00 1.00 1.00 1.00 1.00 1.00 1.00 1.00 1.00 1.00 1.00 Initial Bse: 0 0 34 123 0 0 206 993 134 0 0 0 Added Vol: 0 0 35 6 0 0 1 42 36 0 0 0 PasserByVol: 0 0 0 0 0 0 0 0 0 0 0 0 Initial Fut: 0 0 69 129 0 0 207 1035 170 0 0 0 User Adj: 1.00 1.00 0.00 1.00 1.00 1.00 1.00 1.00 0.00 1.00 1.00 1.00 PHF Adj: 1.00 1.00 0.00 1.00 1.00 1.00 1.00 1.00 0.00 1.00 1.00 1.00 PHF Volume: 0 0 0 129 0 0 207 1035 0 0 0 0 Reduct Vol: 0 0 0 0 0 0 0 0 0 0 0 0 Reduced Vol: 0 0 0 129 0 0 207 1035 0 0 0 0 PCE Adj: 1.00 1.00 0.00 1.00 1.00 1.00 1.00 1.00 0.00 1.00 1.00 1.00 MLF Adj: 1.00 1.00 0.00 1.00 1.00 1.00 1.00 1.00 0.00 1.00 1.00 1.00 FinalVolume: 0 0 0 129 0 0 207 1035 0 0 0 0 ------------|---------------||---------------||---------------||---------------| Saturation Flow Module: Sat/Lane: 1900 1900 1900 1900 1900 1900 1900 1900 1900 1900 1900 1900 Adjustment: 0.92 1.00 0.92 0.92 1.00 0.92 0.95 0.99 0.92 0.92 1.00 0.92 Lanes: 0.00 0.00 1.00 1.00 0.00 0.00 0.52 2.48 1.00 0.00 0.00 0.00 Final Sat.: 0 0 1750 1750 0 0 933 4665 1750 0 0 0 ------------|---------------||---------------||---------------||---------------| Capacity Analysis Module: Vol/Sat: 0.00 0.00 0.00 0.07 0.00 0.00 0.22 0.22 0.00 0.00 0.00 0.00 Crit Moves: **** **** Green Time: 0.0 0.0 0.0 25.9 0.0 0.0 78.1 78.1 0.0 0.0 0.0 0.0 Volume/Cap: 0.00 0.00 0.00 0.31 0.00 0.00 0.31 0.31 0.00 0.00 0.00 0.00 Delay/Veh: 0.0 0.0 0.0 35.1 0.0 0.0 6.0 6.0 0.0 0.0 0.0 0.0 User DelAdj: 1.00 1.00 1.00 1.00 1.00 1.00 1.00 1.00 1.00 1.00 1.00 1.00 AdjDel/Veh: 0.0 0.0 0.0 35.1 0.0 0.0 6.0 6.0 0.0 0.0 0.0 0.0 LOS by Move: A A A D+ A A A A A A A A HCM2kAvgQ: 0 0 0 4 0 0 5 5 0 0 0 0 Note: Queue reported is the number of cars per lane.

COMPARE Mon Sep 26 12:04:41 2011 Page 3-17
Traffix 8.0.0715 Copyright (c) 2008 Dowling Associates, Inc. Licensed to FEHR & PEERS WALNUT CRK
San Jose City College
SJ07-951 Level Of Service Computation Report
2000 HCM Operations (Future Volume Alternative) Existing AM Balanced
Intersection #9: Leigh/Moorpark Signal=Protect/Rights=Include Final Vol: 0 421 227*** Lanes: 0 0 2 0 1
Signal=Split
Signal=Split
Final Vol: Lanes: Rights=Include Vol Cnt Date: n/a Rights=Include Lanes: Final Vol:
77
0 Cycle Time (sec): 110
0
0
1
Loss Time (sec): 9
0
843*** 2
Critical V/C: 0.443
0 0
0
Avg Crit Del (sec/veh): 29.4
0
204 1
Avg Delay (sec/veh): 26.5
0 0
LOS: C
Lanes: 0 0 2 0 1 Final Vol: 0 427*** 184 Signal=Protect/Rights=Include Street Name: Leigh Ave Moorpark Ave Approach: North Bound South Bound East Bound West Bound Movement: L - T - R L - T - R L - T - R L - T - R ------------|---------------||---------------||---------------||---------------| Min. Green: 0 10 10 7 10 0 10 10 10 0 0 0 Y+R: 4.0 4.0 4.0 4.0 4.0 4.0 4.0 4.0 4.0 4.0 4.0 4.0 ------------|---------------||---------------||---------------||---------------| Volume Module: Base Vol: 0 427 184 227 421 0 77 843 204 0 0 0 Growth Adj: 1.00 1.00 1.00 1.00 1.00 1.00 1.00 1.00 1.00 1.00 1.00 1.00 Initial Bse: 0 427 184 227 421 0 77 843 204 0 0 0 Added Vol: 0 0 0 0 0 0 0 0 0 0 0 0 PasserByVol: 0 0 0 0 0 0 0 0 0 0 0 0 Initial Fut: 0 427 184 227 421 0 77 843 204 0 0 0 User Adj: 1.00 1.00 1.00 1.00 1.00 1.00 1.00 1.00 1.00 1.00 1.00 1.00 PHF Adj: 1.00 1.00 1.00 1.00 1.00 1.00 1.00 1.00 1.00 1.00 1.00 1.00 PHF Volume: 0 427 184 227 421 0 77 843 204 0 0 0 Reduct Vol: 0 0 0 0 0 0 0 0 0 0 0 0 Reduced Vol: 0 427 184 227 421 0 77 843 204 0 0 0 PCE Adj: 1.00 1.00 1.00 1.00 1.00 1.00 1.00 1.00 1.00 1.00 1.00 1.00 MLF Adj: 1.00 1.00 1.00 1.00 1.00 1.00 1.00 1.00 1.00 1.00 1.00 1.00 FinalVolume: 0 427 184 227 421 0 77 843 204 0 0 0 ------------|---------------||---------------||---------------||---------------| Saturation Flow Module: Sat/Lane: 1900 1900 1900 1900 1900 1900 1900 1900 1900 1900 1900 1900 Adjustment: 0.92 1.00 0.92 0.92 1.00 0.92 0.95 0.99 0.92 0.92 1.00 0.92 Lanes: 0.00 2.00 1.00 1.00 2.00 0.00 0.26 2.74 1.00 0.00 0.00 0.00 Final Sat.: 0 3800 1750 1750 3800 0 469 5131 1750 0 0 0 ------------|---------------||---------------||---------------||---------------| Capacity Analysis Module: Vol/Sat: 0.00 0.11 0.11 0.13 0.11 0.00 0.16 0.16 0.12 0.00 0.00 0.00 Crit Moves: **** **** **** Green Time: 0.0 27.9 27.9 32.2 60.2 0.0 40.8 40.8 40.8 0.0 0.0 0.0 Volume/Cap: 0.00 0.44 0.41 0.44 0.20 0.00 0.44 0.44 0.31 0.00 0.00 0.00 Delay/Veh: 0.0 34.8 34.8 32.2 12.7 0.0 26.2 26.2 24.9 0.0 0.0 0.0 User DelAdj: 1.00 1.00 1.00 1.00 1.00 1.00 1.00 1.00 1.00 1.00 1.00 1.00 AdjDel/Veh: 0.0 34.8 34.8 32.2 12.7 0.0 26.2 26.2 24.9 0.0 0.0 0.0 LOS by Move: A C- C- C- B A C C C A A A HCM2kAvgQ: 0 6 5 6 3 0 8 8 5 0 0 0 Note: Queue reported is the number of cars per lane.

COMPARE Mon Sep 26 12:04:41 2011 Page 3-18
Traffix 8.0.0715 Copyright (c) 2008 Dowling Associates, Inc. Licensed to FEHR & PEERS WALNUT CRK
San Jose City College
SJ07-951 Level Of Service Computation Report
2000 HCM Operations (Future Volume Alternative) Ex + Proj AM
Intersection #9: Leigh/Moorpark Signal=Protect/Rights=Include Final Vol: 0 490 227*** Lanes: 0 0 2 0 1
Signal=Split
Signal=Split
Final Vol: Lanes: Rights=Include Vol Cnt Date: n/a Rights=Include Lanes: Final Vol:
97***
0 Cycle Time (sec): 110
0
0
1
Loss Time (sec): 9
0
869 2
Critical V/C: 0.453
0 0
0
Avg Crit Del (sec/veh): 29.2
0
241 1
Avg Delay (sec/veh): 26.2
0 0
LOS: C
Lanes: 0 0 2 0 1 Final Vol: 0 433*** 184 Signal=Protect/Rights=Include Street Name: Leigh Ave Moorpark Ave Approach: North Bound South Bound East Bound West Bound Movement: L - T - R L - T - R L - T - R L - T - R ------------|---------------||---------------||---------------||---------------| Min. Green: 0 10 10 7 10 0 10 10 10 0 0 0 Y+R: 4.0 4.0 4.0 4.0 4.0 4.0 4.0 4.0 4.0 4.0 4.0 4.0 ------------|---------------||---------------||---------------||---------------| Volume Module: Base Vol: 0 427 184 227 421 0 77 843 204 0 0 0 Growth Adj: 1.00 1.00 1.00 1.00 1.00 1.00 1.00 1.00 1.00 1.00 1.00 1.00 Initial Bse: 0 427 184 227 421 0 77 843 204 0 0 0 Added Vol: 0 6 0 0 69 0 20 26 37 0 0 0 PasserByVol: 0 0 0 0 0 0 0 0 0 0 0 0 Initial Fut: 0 433 184 227 490 0 97 869 241 0 0 0 User Adj: 1.00 1.00 1.00 1.00 1.00 1.00 1.00 1.00 1.00 1.00 1.00 1.00 PHF Adj: 1.00 1.00 1.00 1.00 1.00 1.00 1.00 1.00 1.00 1.00 1.00 1.00 PHF Volume: 0 433 184 227 490 0 97 869 241 0 0 0 Reduct Vol: 0 0 0 0 0 0 0 0 0 0 0 0 Reduced Vol: 0 433 184 227 490 0 97 869 241 0 0 0 PCE Adj: 1.00 1.00 1.00 1.00 1.00 1.00 1.00 1.00 1.00 1.00 1.00 1.00 MLF Adj: 1.00 1.00 1.00 1.00 1.00 1.00 1.00 1.00 1.00 1.00 1.00 1.00 FinalVolume: 0 433 184 227 490 0 97 869 241 0 0 0 ------------|---------------||---------------||---------------||---------------| Saturation Flow Module: Sat/Lane: 1900 1900 1900 1900 1900 1900 1900 1900 1900 1900 1900 1900 Adjustment: 0.92 1.00 0.92 0.92 1.00 0.92 0.95 0.99 0.92 0.92 1.00 0.92 Lanes: 0.00 2.00 1.00 1.00 2.00 0.00 0.31 2.69 1.00 0.00 0.00 0.00 Final Sat.: 0 3800 1750 1750 3800 0 562 5037 1750 0 0 0 ------------|---------------||---------------||---------------||---------------| Capacity Analysis Module: Vol/Sat: 0.00 0.11 0.11 0.13 0.13 0.00 0.17 0.17 0.14 0.00 0.00 0.00 Crit Moves: **** **** **** Green Time: 0.0 27.7 27.7 31.5 59.1 0.0 41.9 41.9 41.9 0.0 0.0 0.0 Volume/Cap: 0.00 0.45 0.42 0.45 0.24 0.00 0.45 0.45 0.36 0.00 0.00 0.00 Delay/Veh: 0.0 35.1 35.1 32.9 13.6 0.0 25.7 25.7 24.8 0.0 0.0 0.0 User DelAdj: 1.00 1.00 1.00 1.00 1.00 1.00 1.00 1.00 1.00 1.00 1.00 1.00 AdjDel/Veh: 0.0 35.1 35.1 32.9 13.6 0.0 25.7 25.7 24.8 0.0 0.0 0.0 LOS by Move: A D+ D+ C- B A C C C A A A HCM2kAvgQ: 0 6 5 6 4 0 8 8 6 0 0 0 Note: Queue reported is the number of cars per lane.

COMPARE Mon Sep 26 12:04:41 2011 Page 3-19
Traffix 8.0.0715 Copyright (c) 2008 Dowling Associates, Inc. Licensed to FEHR & PEERS WALNUT CRK
San Jose City College
SJ07-951 Level Of Service Computation Report
2000 HCM Operations (Future Volume Alternative) Existing AM Balanced
Intersection #10: Bascom/Renova Signal=Protect/Rights=Include Final Vol: 100 704 26*** Lanes: 0 1 2 0 1
Signal=Permit
Signal=Permit
Final Vol: Lanes: Rights=Include Vol Cnt Date: n/a Rights=Include Lanes: Final Vol:
20
0 Cycle Time (sec): 140
1
12
1
Loss Time (sec): 9
0
7*** 0
Critical V/C: 0.310
0 3
0
Avg Crit Del (sec/veh): 5.4
1
27 1
Avg Delay (sec/veh): 11.3
0 8
LOS: B+
Lanes: 1 0 2 1 0 Final Vol: 127 1439*** 17 Signal=Protect/Rights=Include Street Name: Bascom Ave Renova Dr Approach: North Bound South Bound East Bound West Bound Movement: L - T - R L - T - R L - T - R L - T - R ------------|---------------||---------------||---------------||---------------| Min. Green: 7 10 10 7 10 10 10 10 10 10 10 10 Y+R: 4.0 4.0 4.0 4.0 4.0 4.0 4.0 4.0 4.0 4.0 4.0 4.0 ------------|---------------||---------------||---------------||---------------| Volume Module: Base Vol: 127 1439 17 26 704 100 20 7 27 8 3 12 Growth Adj: 1.00 1.00 1.00 1.00 1.00 1.00 1.00 1.00 1.00 1.00 1.00 1.00 Initial Bse: 127 1439 17 26 704 100 20 7 27 8 3 12 Added Vol: 0 0 0 0 0 0 0 0 0 0 0 0 PasserByVol: 0 0 0 0 0 0 0 0 0 0 0 0 Initial Fut: 127 1439 17 26 704 100 20 7 27 8 3 12 User Adj: 1.00 1.00 1.00 1.00 1.00 1.00 1.00 1.00 1.00 1.00 1.00 1.00 PHF Adj: 1.00 1.00 1.00 1.00 1.00 1.00 1.00 1.00 1.00 1.00 1.00 1.00 PHF Volume: 127 1439 17 26 704 100 20 7 27 8 3 12 Reduct Vol: 0 0 0 0 0 0 0 0 0 0 0 0 Reduced Vol: 127 1439 17 26 704 100 20 7 27 8 3 12 PCE Adj: 1.00 1.00 1.00 1.00 1.00 1.00 1.00 1.00 1.00 1.00 1.00 1.00 MLF Adj: 1.00 1.00 1.00 1.00 1.00 1.00 1.00 1.00 1.00 1.00 1.00 1.00 FinalVolume: 127 1439 17 26 704 100 20 7 27 8 3 12 ------------|---------------||---------------||---------------||---------------| Saturation Flow Module: Sat/Lane: 1900 1900 1900 1900 1900 1900 1900 1900 1900 1900 1900 1900 Adjustment: 0.92 0.98 0.95 0.92 0.99 0.95 0.95 0.95 0.92 0.95 0.95 0.92 Lanes: 1.00 2.96 0.04 1.00 2.61 0.39 0.74 0.26 1.00 0.73 0.27 1.00 Final Sat.: 1750 5535 65 1750 4903 696 1333 467 1750 1309 491 1750 ------------|---------------||---------------||---------------||---------------| Capacity Analysis Module: Vol/Sat: 0.07 0.26 0.26 0.01 0.14 0.14 0.02 0.02 0.02 0.01 0.01 0.01 Crit Moves: **** **** **** Green Time: 40.6 114 114.0 7.0 80.4 80.4 10.0 10.0 10.0 10.0 10.0 10.0 Volume/Cap: 0.25 0.32 0.32 0.30 0.25 0.25 0.21 0.21 0.22 0.09 0.09 0.10 Delay/Veh: 38.3 3.3 3.3 66.0 14.9 14.9 62.1 62.1 62.2 61.0 61.0 61.1 User DelAdj: 1.00 1.00 1.00 1.00 1.00 1.00 1.00 1.00 1.00 1.00 1.00 1.00 AdjDel/Veh: 38.3 3.3 3.3 66.0 14.9 14.9 62.1 62.1 62.2 61.0 61.0 61.1 LOS by Move: D+ A A E B B E E E E E E HCM2kAvgQ: 4 5 5 1 6 6 1 1 1 1 1 1 Note: Queue reported is the number of cars per lane.

COMPARE Mon Sep 26 12:04:41 2011 Page 3-20
Traffix 8.0.0715 Copyright (c) 2008 Dowling Associates, Inc. Licensed to FEHR & PEERS WALNUT CRK
San Jose City College
SJ07-951 Level Of Service Computation Report
2000 HCM Operations (Future Volume Alternative) Ex + Proj AM
Intersection #10: Bascom/Renova Signal=Protect/Rights=Include Final Vol: 100 713 26*** Lanes: 0 1 2 0 1
Signal=Permit
Signal=Permit
Final Vol: Lanes: Rights=Include Vol Cnt Date: n/a Rights=Include Lanes: Final Vol:
20
0 Cycle Time (sec): 140
1
12
1
Loss Time (sec): 9
0
7*** 0
Critical V/C: 0.312
0 3
0
Avg Crit Del (sec/veh): 5.4
1
27 1
Avg Delay (sec/veh): 11.2
0 8
LOS: B+
Lanes: 1 0 2 1 0 Final Vol: 127 1451*** 17 Signal=Protect/Rights=Include Street Name: Bascom Ave Renova Dr Approach: North Bound South Bound East Bound West Bound Movement: L - T - R L - T - R L - T - R L - T - R ------------|---------------||---------------||---------------||---------------| Min. Green: 7 10 10 7 10 10 10 10 10 10 10 10 Y+R: 4.0 4.0 4.0 4.0 4.0 4.0 4.0 4.0 4.0 4.0 4.0 4.0 ------------|---------------||---------------||---------------||---------------| Volume Module: Base Vol: 127 1439 17 26 704 100 20 7 27 8 3 12 Growth Adj: 1.00 1.00 1.00 1.00 1.00 1.00 1.00 1.00 1.00 1.00 1.00 1.00 Initial Bse: 127 1439 17 26 704 100 20 7 27 8 3 12 Added Vol: 0 12 0 0 9 0 0 0 0 0 0 0 PasserByVol: 0 0 0 0 0 0 0 0 0 0 0 0 Initial Fut: 127 1451 17 26 713 100 20 7 27 8 3 12 User Adj: 1.00 1.00 1.00 1.00 1.00 1.00 1.00 1.00 1.00 1.00 1.00 1.00 PHF Adj: 1.00 1.00 1.00 1.00 1.00 1.00 1.00 1.00 1.00 1.00 1.00 1.00 PHF Volume: 127 1451 17 26 713 100 20 7 27 8 3 12 Reduct Vol: 0 0 0 0 0 0 0 0 0 0 0 0 Reduced Vol: 127 1451 17 26 713 100 20 7 27 8 3 12 PCE Adj: 1.00 1.00 1.00 1.00 1.00 1.00 1.00 1.00 1.00 1.00 1.00 1.00 MLF Adj: 1.00 1.00 1.00 1.00 1.00 1.00 1.00 1.00 1.00 1.00 1.00 1.00 FinalVolume: 127 1451 17 26 713 100 20 7 27 8 3 12 ------------|---------------||---------------||---------------||---------------| Saturation Flow Module: Sat/Lane: 1900 1900 1900 1900 1900 1900 1900 1900 1900 1900 1900 1900 Adjustment: 0.92 0.98 0.95 0.92 0.99 0.95 0.95 0.95 0.92 0.95 0.95 0.92 Lanes: 1.00 2.96 0.04 1.00 2.62 0.38 0.74 0.26 1.00 0.73 0.27 1.00 Final Sat.: 1750 5535 65 1750 4910 689 1333 467 1750 1309 491 1750 ------------|---------------||---------------||---------------||---------------| Capacity Analysis Module: Vol/Sat: 0.07 0.26 0.26 0.01 0.15 0.15 0.02 0.02 0.02 0.01 0.01 0.01 Crit Moves: **** **** **** Green Time: 40.3 114 114.0 7.0 80.7 80.7 10.0 10.0 10.0 10.0 10.0 10.0 Volume/Cap: 0.25 0.32 0.32 0.30 0.25 0.25 0.21 0.21 0.22 0.09 0.09 0.10 Delay/Veh: 38.5 3.3 3.3 66.0 14.7 14.7 62.1 62.1 62.2 61.0 61.0 61.1 User DelAdj: 1.00 1.00 1.00 1.00 1.00 1.00 1.00 1.00 1.00 1.00 1.00 1.00 AdjDel/Veh: 38.5 3.3 3.3 66.0 14.7 14.7 62.1 62.1 62.2 61.0 61.0 61.1 LOS by Move: D+ A A E B B E E E E E E HCM2kAvgQ: 4 5 5 1 6 6 1 1 1 1 1 1 Note: Queue reported is the number of cars per lane.

COMPARE Mon Sep 26 12:04:41 2011 Page 3-21
Traffix 8.0.0715 Copyright (c) 2008 Dowling Associates, Inc. Licensed to FEHR & PEERS WALNUT CRK
San Jose City College
SJ07-951 Level Of Service Computation Report
2000 HCM Unsignalized (Future Volume Alternative) Existing AM Balanced
Intersection #11: Bascom/Laswell [Unsignalized] Signal=Uncontrol/Rights=Include Final Vol: 36 567 91 Lanes: 0 0 3 0 1
Signal=Stop
Signal=Stop
Final Vol: Lanes: Rights=Include Vol Cnt Date: n/a Rights=Include Lanes: Final Vol:
0
0 Cycle Time (sec): 100
0
23
0
Loss Time (sec): 0
0
0 0
Critical V/C: 0.251
1! 1
0
Avg Crit Del (sec/veh): 1.2
0
0 0
Avg Delay (sec/veh): 1.2
0 5
LOS: E
Lanes: 0 0 2 1 0 Final Vol: 11 1570 180 Signal=Uncontrol/Rights=Include Street Name: S Bascom Ave Laswell Ave Approach: North Bound South Bound East Bound West Bound Movement: L - T - R L - T - R L - T - R L - T - R ------------|---------------||---------------||---------------||---------------| Volume Module: Base Vol: 11 1570 180 91 567 36 0 0 0 5 1 23 Growth Adj: 1.00 1.00 1.00 1.00 1.00 1.00 1.00 1.00 1.00 1.00 1.00 1.00 Initial Bse: 11 1570 180 91 567 36 0 0 0 5 1 23 Added Vol: 0 0 0 0 0 0 0 0 0 0 0 0 PasserByVol: 0 0 0 0 0 0 0 0 0 0 0 0 Initial Fut: 11 1570 180 91 567 36 0 0 0 5 1 23 User Adj: 1.00 1.00 1.00 1.00 1.00 1.00 1.00 1.00 1.00 1.00 1.00 1.00 PHF Adj: 1.00 1.00 1.00 1.00 1.00 1.00 1.00 1.00 1.00 1.00 1.00 1.00 PHF Volume: 11 1570 180 91 567 36 0 0 0 5 1 23 Reduct Vol: 0 0 0 0 0 0 0 0 0 0 0 0 FinalVolume: 11 1570 180 91 567 36 0 0 0 5 1 23 ------------|---------------||---------------||---------------||---------------| Critical Gap Module: Critical Gp: 4.1 xxxx xxxxx 4.1 xxxx xxxxx xxxxx xxxx xxxxx 6.8 6.5 6.9 FollowUpTim: 2.2 xxxx xxxxx 2.2 xxxx xxxxx xxxxx xxxx xxxxx 3.5 4.0 3.3 ------------|---------------||---------------||---------------||---------------| Capacity Module: Cnflict Vol: 603 xxxx xxxxx 1750 xxxx xxxxx xxxx xxxx xxxxx 2053 2467 613 Potent Cap.: 984 xxxx xxxxx 363 xxxx xxxxx xxxx xxxx xxxxx 49 31 440 Move Cap.: 984 xxxx xxxxx 363 xxxx xxxxx xxxx xxxx xxxxx 39 23 440 Volume/Cap: 0.01 xxxx xxxx 0.25 xxxx xxxx xxxx xxxx xxxx 0.13 0.04 0.05 ------------|---------------||---------------||---------------||---------------| Level Of Service Module: 2Way95thQ: 0.0 xxxx xxxxx 1.0 xxxx xxxxx xxxx xxxx xxxxx xxxx xxxx xxxxx Control Del: 8.7 xxxx xxxxx 18.2 xxxx xxxxx xxxxx xxxx xxxxx xxxxx xxxx xxxxx LOS by Move: A * * C * * * * * * * * Movement: LT - LTR - RT LT - LTR - RT LT - LTR - RT LT - LTR - RT Shared Cap.: xxxx xxxx xxxxx xxxx xxxx xxxxx xxxx xxxx xxxxx xxxx 130 xxxxx SharedQueue: 0.0 xxxx xxxxx xxxxx xxxx xxxxx xxxxx xxxx xxxxx xxxxx 0.8 xxxxx Shrd ConDel: 8.7 xxxx xxxxx xxxxx xxxx xxxxx xxxxx xxxx xxxxx xxxxx 40.6 xxxxx Shared LOS: A * * * * * * * * * E * ApproachDel: xxxxxx xxxxxx xxxxxx 40.6 ApproachLOS: * * * E Note: Queue reported is the number of cars per lane.

COMPARE Mon Sep 26 12:04:41 2011 Page 3-22
Traffix 8.0.0715 Copyright (c) 2008 Dowling Associates, Inc. Licensed to FEHR & PEERS WALNUT CRK
San Jose City College
SJ07-951 Level Of Service Computation Report
2000 HCM Unsignalized (Future Volume Alternative) Ex + Proj AM
Intersection #11: Bascom/Laswell [Unsignalized] Signal=Uncontrol/Rights=Include Final Vol: 36 567 100 Lanes: 0 0 3 0 1
Signal=Stop
Signal=Stop
Final Vol: Lanes: Rights=Include Vol Cnt Date: n/a Rights=Include Lanes: Final Vol:
0
0 Cycle Time (sec): 100
0
27
0
Loss Time (sec): 0
0
0 0
Critical V/C: 0.336
1! 1
0
Avg Crit Del (sec/veh): 2.0
0
0 0
Avg Delay (sec/veh): 2.0
0 12
LOS: F
Lanes: 0 0 2 1 0 Final Vol: 11 1579 206 Signal=Uncontrol/Rights=Include Street Name: S Bascom Ave Laswell Ave Approach: North Bound South Bound East Bound West Bound Movement: L - T - R L - T - R L - T - R L - T - R ------------|---------------||---------------||---------------||---------------| Volume Module: Base Vol: 11 1570 180 91 567 36 0 0 0 5 1 23 Growth Adj: 1.00 1.00 1.00 1.00 1.00 1.00 1.00 1.00 1.00 1.00 1.00 1.00 Initial Bse: 11 1570 180 91 567 36 0 0 0 5 1 23 Added Vol: 0 9 26 9 0 0 0 0 0 7 0 4 PasserByVol: 0 0 0 0 0 0 0 0 0 0 0 0 Initial Fut: 11 1579 206 100 567 36 0 0 0 12 1 27 User Adj: 1.00 1.00 1.00 1.00 1.00 1.00 1.00 1.00 1.00 1.00 1.00 1.00 PHF Adj: 1.00 1.00 1.00 1.00 1.00 1.00 1.00 1.00 1.00 1.00 1.00 1.00 PHF Volume: 11 1579 206 100 567 36 0 0 0 12 1 27 Reduct Vol: 0 0 0 0 0 0 0 0 0 0 0 0 FinalVolume: 11 1579 206 100 567 36 0 0 0 12 1 27 ------------|---------------||---------------||---------------||---------------| Critical Gap Module: Critical Gp: 4.1 xxxx xxxxx 4.1 xxxx xxxxx xxxxx xxxx xxxxx 6.8 6.5 6.9 FollowUpTim: 2.2 xxxx xxxxx 2.2 xxxx xxxxx xxxxx xxxx xxxxx 3.5 4.0 3.3 ------------|---------------||---------------||---------------||---------------| Capacity Module: Cnflict Vol: 603 xxxx xxxxx 1785 xxxx xxxxx xxxx xxxx xxxxx 2093 2507 629 Potent Cap.: 984 xxxx xxxxx 352 xxxx xxxxx xxxx xxxx xxxxx 46 29 430 Move Cap.: 984 xxxx xxxxx 352 xxxx xxxxx xxxx xxxx xxxxx 36 20 430 Volume/Cap: 0.01 xxxx xxxx 0.28 xxxx xxxx xxxx xxxx xxxx 0.34 0.05 0.06 ------------|---------------||---------------||---------------||---------------| Level Of Service Module: 2Way95thQ: 0.0 xxxx xxxxx 1.1 xxxx xxxxx xxxx xxxx xxxxx xxxx xxxx xxxxx Control Del: 8.7 xxxx xxxxx 19.2 xxxx xxxxx xxxxx xxxx xxxxx xxxxx xxxx xxxxx LOS by Move: A * * C * * * * * * * * Movement: LT - LTR - RT LT - LTR - RT LT - LTR - RT LT - LTR - RT Shared Cap.: xxxx xxxx xxxxx xxxx xxxx xxxxx xxxx xxxx xxxxx xxxx 89 xxxxx SharedQueue: 0.0 xxxx xxxxx xxxxx xxxx xxxxx xxxxx xxxx xxxxx xxxxx 1.9 xxxxx Shrd ConDel: 8.7 xxxx xxxxx xxxxx xxxx xxxxx xxxxx xxxx xxxxx xxxxx 74.5 xxxxx Shared LOS: A * * * * * * * * * F * ApproachDel: xxxxxx xxxxxx xxxxxx 74.5 ApproachLOS: * * * F Note: Queue reported is the number of cars per lane.

COMPARE Mon Sep 26 12:04:41 2011 Page 3-23
Traffix 8.0.0715 Copyright (c) 2008 Dowling Associates, Inc. Licensed to FEHR & PEERS WALNUT CRK
San Jose City College
SJ07-951 Level Of Service Computation Report
2000 HCM Operations (Future Volume Alternative) Existing AM Balanced
Intersection #12: Bascom/Fruitdale Signal=Protect/Rights=Include Final Vol: 65 359 183*** Lanes: 1 0 3 0 1
Signal=Split
Signal=Split
Final Vol: Lanes: Rights=Include Vol Cnt Date: n/a Rights=Include Lanes: Final Vol:
34
0 Cycle Time (sec): 140
1
564***
1
Loss Time (sec): 12
0
59*** 0
Critical V/C: 0.767
1 243
1
Avg Crit Del (sec/veh): 49.3
1
43 0
Avg Delay (sec/veh): 46.1
0 128
LOS: D
Lanes: 1 0 2 1 0 Final Vol: 120 1202*** 121 Signal=Protect/Rights=Include Street Name: Bascom Fruitdale Approach: North Bound South Bound East Bound West Bound Movement: L - T - R L - T - R L - T - R L - T - R ------------|---------------||---------------||---------------||---------------| Min. Green: 7 10 10 7 10 10 10 10 10 10 10 10 Y+R: 4.0 4.0 4.0 4.0 4.0 4.0 4.0 4.0 4.0 4.0 4.0 4.0 ------------|---------------||---------------||---------------||---------------| Volume Module: Base Vol: 120 1202 121 183 359 65 34 59 43 128 243 564 Growth Adj: 1.00 1.00 1.00 1.00 1.00 1.00 1.00 1.00 1.00 1.00 1.00 1.00 Initial Bse: 120 1202 121 183 359 65 34 59 43 128 243 564 Added Vol: 0 0 0 0 0 0 0 0 0 0 0 0 PasserByVol: 0 0 0 0 0 0 0 0 0 0 0 0 Initial Fut: 120 1202 121 183 359 65 34 59 43 128 243 564 User Adj: 1.00 1.00 1.00 1.00 1.00 1.00 1.00 1.00 1.00 1.00 1.00 1.00 PHF Adj: 1.00 1.00 1.00 1.00 1.00 1.00 1.00 1.00 1.00 1.00 1.00 1.00 PHF Volume: 120 1202 121 183 359 65 34 59 43 128 243 564 Reduct Vol: 0 0 0 0 0 0 0 0 0 0 0 0 Reduced Vol: 120 1202 121 183 359 65 34 59 43 128 243 564 PCE Adj: 1.00 1.00 1.00 1.00 1.00 1.00 1.00 1.00 1.00 1.00 1.00 1.00 MLF Adj: 1.00 1.00 1.00 1.00 1.00 1.00 1.00 1.00 1.00 1.00 1.00 1.00 FinalVolume: 120 1202 121 183 359 65 34 59 43 128 243 564 ------------|---------------||---------------||---------------||---------------| Saturation Flow Module: Sat/Lane: 1900 1900 1900 1900 1900 1900 1900 1900 1900 1900 1900 1900 Adjustment: 0.92 0.99 0.95 0.92 1.00 0.92 0.95 0.95 0.95 0.95 0.99 0.92 Lanes: 1.00 2.72 0.28 1.00 3.00 1.00 0.50 0.87 0.63 0.71 1.29 1.00 Final Sat.: 1750 5087 512 1750 5700 1750 900 1562 1138 1276 2423 1750 ------------|---------------||---------------||---------------||---------------| Capacity Analysis Module: Vol/Sat: 0.07 0.24 0.24 0.10 0.06 0.04 0.04 0.04 0.04 0.10 0.10 0.32 Crit Moves: **** **** **** **** Green Time: 29.7 42.0 42.0 18.6 30.9 30.9 10.0 10.0 10.0 57.3 57.3 57.3 Volume/Cap: 0.32 0.79 0.79 0.79 0.28 0.17 0.53 0.53 0.53 0.24 0.24 0.79 Delay/Veh: 47.2 47.4 47.4 74.9 45.5 44.3 64.8 64.8 64.8 27.2 27.2 41.8 User DelAdj: 1.00 1.00 1.00 1.00 1.00 1.00 1.00 1.00 1.00 1.00 1.00 1.00 AdjDel/Veh: 47.2 47.4 47.4 74.9 45.5 44.3 64.8 64.8 64.8 27.2 27.2 41.8 LOS by Move: D D D E D D E E E C C D HCM2kAvgQ: 5 19 19 9 4 2 4 4 4 5 5 23 Note: Queue reported is the number of cars per lane.

COMPARE Mon Sep 26 12:04:41 2011 Page 3-24
Traffix 8.0.0715 Copyright (c) 2008 Dowling Associates, Inc. Licensed to FEHR & PEERS WALNUT CRK
San Jose City College
SJ07-951 Level Of Service Computation Report
2000 HCM Operations (Future Volume Alternative) Ex + Proj AM
Intersection #12: Bascom/Fruitdale Signal=Protect/Rights=Include Final Vol: 65 362 187*** Lanes: 1 0 3 0 1
Signal=Split
Signal=Split
Final Vol: Lanes: Rights=Include Vol Cnt Date: n/a Rights=Include Lanes: Final Vol:
34
0 Cycle Time (sec): 140
1
587***
1
Loss Time (sec): 12
0
59*** 0
Critical V/C: 0.786
1 243
1
Avg Crit Del (sec/veh): 50.5
1
43 0
Avg Delay (sec/veh): 46.9
0 128
LOS: D
Lanes: 1 0 2 1 0 Final Vol: 120 1214*** 121 Signal=Protect/Rights=Include Street Name: Bascom Fruitdale Approach: North Bound South Bound East Bound West Bound Movement: L - T - R L - T - R L - T - R L - T - R ------------|---------------||---------------||---------------||---------------| Min. Green: 7 10 10 7 10 10 10 10 10 10 10 10 Y+R: 4.0 4.0 4.0 4.0 4.0 4.0 4.0 4.0 4.0 4.0 4.0 4.0 ------------|---------------||---------------||---------------||---------------| Volume Module: Base Vol: 120 1202 121 183 359 65 34 59 43 128 243 564 Growth Adj: 1.00 1.00 1.00 1.00 1.00 1.00 1.00 1.00 1.00 1.00 1.00 1.00 Initial Bse: 120 1202 121 183 359 65 34 59 43 128 243 564 Added Vol: 0 12 0 4 3 0 0 0 0 0 0 23 PasserByVol: 0 0 0 0 0 0 0 0 0 0 0 0 Initial Fut: 120 1214 121 187 362 65 34 59 43 128 243 587 User Adj: 1.00 1.00 1.00 1.00 1.00 1.00 1.00 1.00 1.00 1.00 1.00 1.00 PHF Adj: 1.00 1.00 1.00 1.00 1.00 1.00 1.00 1.00 1.00 1.00 1.00 1.00 PHF Volume: 120 1214 121 187 362 65 34 59 43 128 243 587 Reduct Vol: 0 0 0 0 0 0 0 0 0 0 0 0 Reduced Vol: 120 1214 121 187 362 65 34 59 43 128 243 587 PCE Adj: 1.00 1.00 1.00 1.00 1.00 1.00 1.00 1.00 1.00 1.00 1.00 1.00 MLF Adj: 1.00 1.00 1.00 1.00 1.00 1.00 1.00 1.00 1.00 1.00 1.00 1.00 FinalVolume: 120 1214 121 187 362 65 34 59 43 128 243 587 ------------|---------------||---------------||---------------||---------------| Saturation Flow Module: Sat/Lane: 1900 1900 1900 1900 1900 1900 1900 1900 1900 1900 1900 1900 Adjustment: 0.92 0.99 0.95 0.92 1.00 0.92 0.95 0.95 0.95 0.95 0.99 0.92 Lanes: 1.00 2.72 0.28 1.00 3.00 1.00 0.50 0.87 0.63 0.71 1.29 1.00 Final Sat.: 1750 5092 507 1750 5700 1750 900 1562 1138 1276 2423 1750 ------------|---------------||---------------||---------------||---------------| Capacity Analysis Module: Vol/Sat: 0.07 0.24 0.24 0.11 0.06 0.04 0.04 0.04 0.04 0.10 0.10 0.34 Crit Moves: **** **** **** **** Green Time: 29.3 41.3 41.3 18.5 30.5 30.5 10.0 10.0 10.0 58.1 58.1 58.1 Volume/Cap: 0.33 0.81 0.81 0.81 0.29 0.17 0.53 0.53 0.53 0.24 0.24 0.81 Delay/Veh: 47.5 48.7 48.7 77.6 45.8 44.7 64.8 64.8 64.8 26.7 26.7 42.7 User DelAdj: 1.00 1.00 1.00 1.00 1.00 1.00 1.00 1.00 1.00 1.00 1.00 1.00 AdjDel/Veh: 47.5 48.7 48.7 77.6 45.8 44.7 64.8 64.8 64.8 26.7 26.7 42.7 LOS by Move: D D D E- D D E E E C C D HCM2kAvgQ: 5 20 20 9 4 2 4 4 4 5 5 24 Note: Queue reported is the number of cars per lane.

COMPARE Mon Sep 26 12:04:41 2011 Page 3-25
Traffix 8.0.0715 Copyright (c) 2008 Dowling Associates, Inc. Licensed to FEHR & PEERS WALNUT CRK
San Jose City College
SJ07-951 Level Of Service Computation Report
2000 HCM Unsignalized (Future Volume Alternative) Existing AM Balanced
Intersection #13: Sherman Oaks/Fruitdale [Unsignalized] Signal=Stop/Rights=Include Final Vol: 13 0 28 Lanes: 0 0 1! 0 0
Signal=Uncontrol
Signal=Uncontrol
Final Vol: Lanes: Rights=Include Vol Cnt Date: n/a Rights=Include Lanes: Final Vol:
10
1 Cycle Time (sec): 100
1
28
0
Loss Time (sec): 0
0
435 2
Critical V/C: 0.183
2 1066
0
Avg Crit Del (sec/veh): 0.8
0
0 0
Avg Delay (sec/veh): 0.8
0 0
LOS: D
Lanes: 0 0 0 0 0 Final Vol: 0 0 0 Signal=Stop/Rights=Include Street Name: Sherman Oaks Fruitdale Approach: North Bound South Bound East Bound West Bound Movement: L - T - R L - T - R L - T - R L - T - R ------------|---------------||---------------||---------------||---------------| Volume Module: Base Vol: 0 0 0 28 0 13 10 435 0 0 1066 28 Growth Adj: 1.00 1.00 1.00 1.00 1.00 1.00 1.00 1.00 1.00 1.00 1.00 1.00 Initial Bse: 0 0 0 28 0 13 10 435 0 0 1066 28 Added Vol: 0 0 0 0 0 0 0 0 0 0 0 0 PasserByVol: 0 0 0 0 0 0 0 0 0 0 0 0 Initial Fut: 0 0 0 28 0 13 10 435 0 0 1066 28 User Adj: 1.00 1.00 1.00 1.00 1.00 1.00 1.00 1.00 1.00 1.00 1.00 1.00 PHF Adj: 1.00 1.00 1.00 1.00 1.00 1.00 1.00 1.00 1.00 1.00 1.00 1.00 PHF Volume: 0 0 0 28 0 13 10 435 0 0 1066 28 Reduct Vol: 0 0 0 0 0 0 0 0 0 0 0 0 FinalVolume: 0 0 0 28 0 13 10 435 0 0 1066 28 ------------|---------------||---------------||---------------||---------------| Critical Gap Module: Critical Gp:xxxxx xxxx xxxxx 6.8 6.5 6.9 4.1 xxxx xxxxx xxxxx xxxx xxxxx FollowUpTim:xxxxx xxxx xxxxx 3.5 4.0 3.3 2.2 xxxx xxxxx xxxxx xxxx xxxxx ------------|---------------||---------------||---------------||---------------| Capacity Module: Cnflict Vol: xxxx xxxx xxxxx 1304 1521 533 1094 xxxx xxxxx xxxx xxxx xxxxx Potent Cap.: xxxx xxxx xxxxx 155 120 496 645 xxxx xxxxx xxxx xxxx xxxxx Move Cap.: xxxx xxxx xxxxx 153 118 496 645 xxxx xxxxx xxxx xxxx xxxxx Volume/Cap: xxxx xxxx xxxx 0.18 0.00 0.03 0.02 xxxx xxxx xxxx xxxx xxxx ------------|---------------||---------------||---------------||---------------| Level Of Service Module: 2Way95thQ: xxxx xxxx xxxxx xxxx xxxx xxxxx 0.0 xxxx xxxxx xxxx xxxx xxxxx Control Del:xxxxx xxxx xxxxx xxxxx xxxx xxxxx 10.7 xxxx xxxxx xxxxx xxxx xxxxx LOS by Move: * * * * * * B * * * * * Movement: LT - LTR - RT LT - LTR - RT LT - LTR - RT LT - LTR - RT Shared Cap.: xxxx xxxx xxxxx xxxx 196 xxxxx xxxx xxxx xxxxx xxxx xxxx xxxxx SharedQueue:xxxxx xxxx xxxxx xxxxx 0.8 xxxxx xxxxx xxxx xxxxx xxxxx xxxx xxxxx Shrd ConDel:xxxxx xxxx xxxxx xxxxx 28.2 xxxxx xxxxx xxxx xxxxx xxxxx xxxx xxxxx Shared LOS: * * * * D * * * * * * * ApproachDel: xxxxxx 28.2 xxxxxx xxxxxx ApproachLOS: * D * * Note: Queue reported is the number of cars per lane.
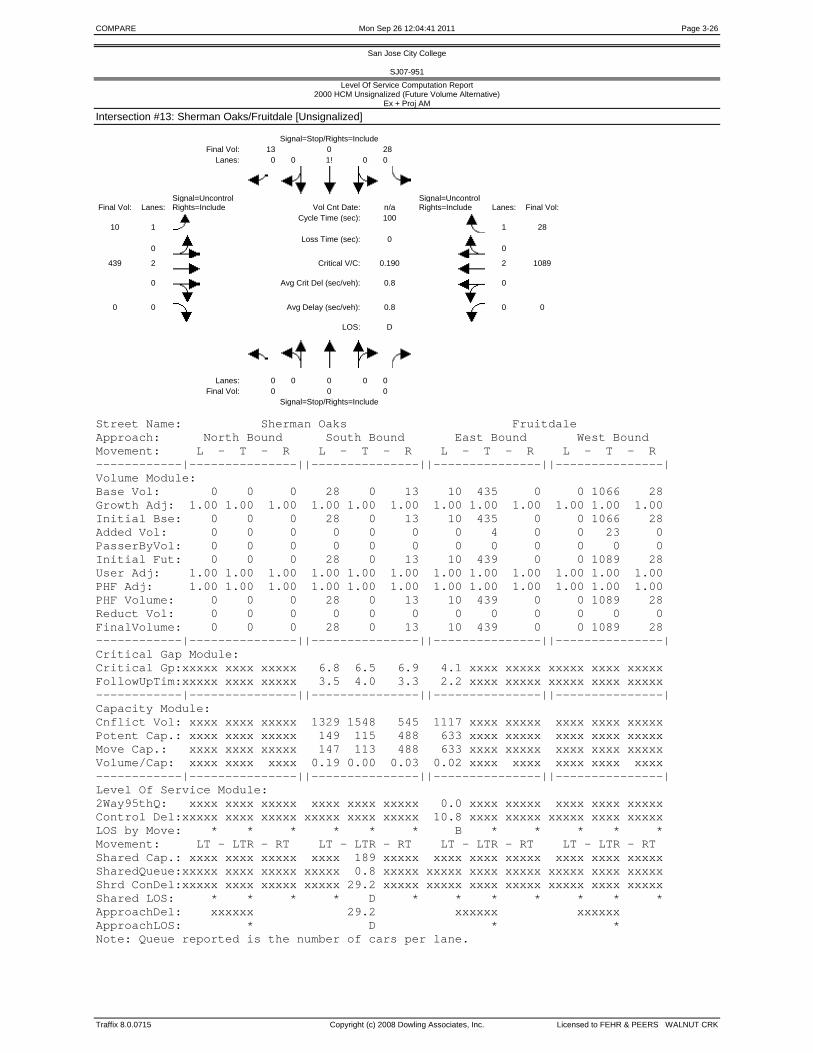
COMPARE Mon Sep 26 12:04:41 2011 Page 3-26
Traffix 8.0.0715 Copyright (c) 2008 Dowling Associates, Inc. Licensed to FEHR & PEERS WALNUT CRK
San Jose City College
SJ07-951 Level Of Service Computation Report
2000 HCM Unsignalized (Future Volume Alternative) Ex + Proj AM
Intersection #13: Sherman Oaks/Fruitdale [Unsignalized] Signal=Stop/Rights=Include Final Vol: 13 0 28 Lanes: 0 0 1! 0 0
Signal=Uncontrol
Signal=Uncontrol
Final Vol: Lanes: Rights=Include Vol Cnt Date: n/a Rights=Include Lanes: Final Vol:
10
1 Cycle Time (sec): 100
1
28
0
Loss Time (sec): 0
0
439 2
Critical V/C: 0.190
2 1089
0
Avg Crit Del (sec/veh): 0.8
0
0 0
Avg Delay (sec/veh): 0.8
0 0
LOS: D
Lanes: 0 0 0 0 0 Final Vol: 0 0 0 Signal=Stop/Rights=Include Street Name: Sherman Oaks Fruitdale Approach: North Bound South Bound East Bound West Bound Movement: L - T - R L - T - R L - T - R L - T - R ------------|---------------||---------------||---------------||---------------| Volume Module: Base Vol: 0 0 0 28 0 13 10 435 0 0 1066 28 Growth Adj: 1.00 1.00 1.00 1.00 1.00 1.00 1.00 1.00 1.00 1.00 1.00 1.00 Initial Bse: 0 0 0 28 0 13 10 435 0 0 1066 28 Added Vol: 0 0 0 0 0 0 0 4 0 0 23 0 PasserByVol: 0 0 0 0 0 0 0 0 0 0 0 0 Initial Fut: 0 0 0 28 0 13 10 439 0 0 1089 28 User Adj: 1.00 1.00 1.00 1.00 1.00 1.00 1.00 1.00 1.00 1.00 1.00 1.00 PHF Adj: 1.00 1.00 1.00 1.00 1.00 1.00 1.00 1.00 1.00 1.00 1.00 1.00 PHF Volume: 0 0 0 28 0 13 10 439 0 0 1089 28 Reduct Vol: 0 0 0 0 0 0 0 0 0 0 0 0 FinalVolume: 0 0 0 28 0 13 10 439 0 0 1089 28 ------------|---------------||---------------||---------------||---------------| Critical Gap Module: Critical Gp:xxxxx xxxx xxxxx 6.8 6.5 6.9 4.1 xxxx xxxxx xxxxx xxxx xxxxx FollowUpTim:xxxxx xxxx xxxxx 3.5 4.0 3.3 2.2 xxxx xxxxx xxxxx xxxx xxxxx ------------|---------------||---------------||---------------||---------------| Capacity Module: Cnflict Vol: xxxx xxxx xxxxx 1329 1548 545 1117 xxxx xxxxx xxxx xxxx xxxxx Potent Cap.: xxxx xxxx xxxxx 149 115 488 633 xxxx xxxxx xxxx xxxx xxxxx Move Cap.: xxxx xxxx xxxxx 147 113 488 633 xxxx xxxxx xxxx xxxx xxxxx Volume/Cap: xxxx xxxx xxxx 0.19 0.00 0.03 0.02 xxxx xxxx xxxx xxxx xxxx ------------|---------------||---------------||---------------||---------------| Level Of Service Module: 2Way95thQ: xxxx xxxx xxxxx xxxx xxxx xxxxx 0.0 xxxx xxxxx xxxx xxxx xxxxx Control Del:xxxxx xxxx xxxxx xxxxx xxxx xxxxx 10.8 xxxx xxxxx xxxxx xxxx xxxxx LOS by Move: * * * * * * B * * * * * Movement: LT - LTR - RT LT - LTR - RT LT - LTR - RT LT - LTR - RT Shared Cap.: xxxx xxxx xxxxx xxxx 189 xxxxx xxxx xxxx xxxxx xxxx xxxx xxxxx SharedQueue:xxxxx xxxx xxxxx xxxxx 0.8 xxxxx xxxxx xxxx xxxxx xxxxx xxxx xxxxx Shrd ConDel:xxxxx xxxx xxxxx xxxxx 29.2 xxxxx xxxxx xxxx xxxxx xxxxx xxxx xxxxx Shared LOS: * * * * D * * * * * * * ApproachDel: xxxxxx 29.2 xxxxxx xxxxxx ApproachLOS: * D * * Note: Queue reported is the number of cars per lane.

COMPARE Mon Sep 26 12:04:41 2011 Page 3-27
Traffix 8.0.0715 Copyright (c) 2008 Dowling Associates, Inc. Licensed to FEHR & PEERS WALNUT CRK
San Jose City College
SJ07-951 Level Of Service Computation Report
2000 HCM Operations (Future Volume Alternative) Existing AM Balanced
Intersection #14: Leigh/Fruitdale Signal=Protect/Rights=Include Final Vol: 223*** 117 23 Lanes: 0 1 1 0 1
Signal=Protect
Signal=Protect
Final Vol: Lanes: Rights=Include Vol Cnt Date: n/a Rights=Include Lanes: Final Vol:
191***
1 Cycle Time (sec): 105
1
30
0
Loss Time (sec): 12
0
242 2
Critical V/C: 0.570
2 694***
0
Avg Crit Del (sec/veh): 35.1
0
32 1
Avg Delay (sec/veh): 33.6
1 15
LOS: C-
Lanes: 1 0 1 1 0 Final Vol: 150*** 262 13 Signal=Protect/Rights=Include Street Name: Leigh Fruitdale Approach: North Bound South Bound East Bound West Bound Movement: L - T - R L - T - R L - T - R L - T - R ------------|---------------||---------------||---------------||---------------| Min. Green: 7 10 10 7 10 10 7 10 10 7 10 10 Y+R: 4.0 4.0 4.0 4.0 4.0 4.0 4.0 4.0 4.0 4.0 4.0 4.0 ------------|---------------||---------------||---------------||---------------| Volume Module: Base Vol: 150 262 13 23 117 223 191 242 32 15 694 30 Growth Adj: 1.00 1.00 1.00 1.00 1.00 1.00 1.00 1.00 1.00 1.00 1.00 1.00 Initial Bse: 150 262 13 23 117 223 191 242 32 15 694 30 Added Vol: 0 0 0 0 0 0 0 0 0 0 0 0 PasserByVol: 0 0 0 0 0 0 0 0 0 0 0 0 Initial Fut: 150 262 13 23 117 223 191 242 32 15 694 30 User Adj: 1.00 1.00 1.00 1.00 1.00 1.00 1.00 1.00 1.00 1.00 1.00 1.00 PHF Adj: 1.00 1.00 1.00 1.00 1.00 1.00 1.00 1.00 1.00 1.00 1.00 1.00 PHF Volume: 150 262 13 23 117 223 191 242 32 15 694 30 Reduct Vol: 0 0 0 0 0 0 0 0 0 0 0 0 Reduced Vol: 150 262 13 23 117 223 191 242 32 15 694 30 PCE Adj: 1.00 1.00 1.00 1.00 1.00 1.00 1.00 1.00 1.00 1.00 1.00 1.00 MLF Adj: 1.00 1.00 1.00 1.00 1.00 1.00 1.00 1.00 1.00 1.00 1.00 1.00 FinalVolume: 150 262 13 23 117 223 191 242 32 15 694 30 ------------|---------------||---------------||---------------||---------------| Saturation Flow Module: Sat/Lane: 1900 1900 1900 1900 1900 1900 1900 1900 1900 1900 1900 1900 Adjustment: 0.92 0.97 0.95 0.92 1.00 0.92 0.92 1.00 0.92 0.92 1.00 0.92 Lanes: 1.00 1.90 0.10 1.00 1.00 1.00 1.00 2.00 1.00 1.00 2.00 1.00 Final Sat.: 1750 3525 175 1750 1900 1750 1750 3800 1750 1750 3800 1750 ------------|---------------||---------------||---------------||---------------| Capacity Analysis Module: Vol/Sat: 0.09 0.07 0.07 0.01 0.06 0.13 0.11 0.06 0.02 0.01 0.18 0.02 Crit Moves: **** **** **** **** Green Time: 15.8 23.1 23.1 16.2 23.5 23.5 20.1 31.6 31.6 22.1 33.6 33.6 Volume/Cap: 0.57 0.34 0.34 0.09 0.28 0.57 0.57 0.21 0.06 0.04 0.57 0.05 Delay/Veh: 44.4 34.8 34.8 38.2 33.9 37.6 40.9 27.5 26.2 33.0 30.3 24.7 User DelAdj: 1.00 1.00 1.00 1.00 1.00 1.00 1.00 1.00 1.00 1.00 1.00 1.00 AdjDel/Veh: 44.4 34.8 34.8 38.2 33.9 37.6 40.9 27.5 26.2 33.0 30.3 24.7 LOS by Move: D C- C- D+ C- D+ D C C C- C C HCM2kAvgQ: 6 4 4 1 3 7 6 3 1 0 9 1 Note: Queue reported is the number of cars per lane.

COMPARE Mon Sep 26 12:04:41 2011 Page 3-28
Traffix 8.0.0715 Copyright (c) 2008 Dowling Associates, Inc. Licensed to FEHR & PEERS WALNUT CRK
San Jose City College
SJ07-951 Level Of Service Computation Report
2000 HCM Operations (Future Volume Alternative) Ex + Proj AM
Intersection #14: Leigh/Fruitdale Signal=Protect/Rights=Include Final Vol: 223*** 119 25 Lanes: 0 1 1 0 1
Signal=Protect
Signal=Protect
Final Vol: Lanes: Rights=Include Vol Cnt Date: n/a Rights=Include Lanes: Final Vol:
191***
1 Cycle Time (sec): 105
1
33
0
Loss Time (sec): 12
0
245 2
Critical V/C: 0.580
2 708***
0
Avg Crit Del (sec/veh): 35.4
0
34 1
Avg Delay (sec/veh): 33.8
1 15
LOS: C-
Lanes: 1 0 1 1 0 Final Vol: 159*** 265 13 Signal=Protect/Rights=Include Street Name: Leigh Fruitdale Approach: North Bound South Bound East Bound West Bound Movement: L - T - R L - T - R L - T - R L - T - R ------------|---------------||---------------||---------------||---------------| Min. Green: 7 10 10 7 10 10 7 10 10 7 10 10 Y+R: 4.0 4.0 4.0 4.0 4.0 4.0 4.0 4.0 4.0 4.0 4.0 4.0 ------------|---------------||---------------||---------------||---------------| Volume Module: Base Vol: 150 262 13 23 117 223 191 242 32 15 694 30 Growth Adj: 1.00 1.00 1.00 1.00 1.00 1.00 1.00 1.00 1.00 1.00 1.00 1.00 Initial Bse: 150 262 13 23 117 223 191 242 32 15 694 30 Added Vol: 9 3 0 2 2 0 0 3 2 0 14 3 PasserByVol: 0 0 0 0 0 0 0 0 0 0 0 0 Initial Fut: 159 265 13 25 119 223 191 245 34 15 708 33 User Adj: 1.00 1.00 1.00 1.00 1.00 1.00 1.00 1.00 1.00 1.00 1.00 1.00 PHF Adj: 1.00 1.00 1.00 1.00 1.00 1.00 1.00 1.00 1.00 1.00 1.00 1.00 PHF Volume: 159 265 13 25 119 223 191 245 34 15 708 33 Reduct Vol: 0 0 0 0 0 0 0 0 0 0 0 0 Reduced Vol: 159 265 13 25 119 223 191 245 34 15 708 33 PCE Adj: 1.00 1.00 1.00 1.00 1.00 1.00 1.00 1.00 1.00 1.00 1.00 1.00 MLF Adj: 1.00 1.00 1.00 1.00 1.00 1.00 1.00 1.00 1.00 1.00 1.00 1.00 FinalVolume: 159 265 13 25 119 223 191 245 34 15 708 33 ------------|---------------||---------------||---------------||---------------| Saturation Flow Module: Sat/Lane: 1900 1900 1900 1900 1900 1900 1900 1900 1900 1900 1900 1900 Adjustment: 0.92 0.97 0.95 0.92 1.00 0.92 0.92 1.00 0.92 0.92 1.00 0.92 Lanes: 1.00 1.90 0.10 1.00 1.00 1.00 1.00 2.00 1.00 1.00 2.00 1.00 Final Sat.: 1750 3527 173 1750 1900 1750 1750 3800 1750 1750 3800 1750 ------------|---------------||---------------||---------------||---------------| Capacity Analysis Module: Vol/Sat: 0.09 0.08 0.08 0.01 0.06 0.13 0.11 0.06 0.02 0.01 0.19 0.02 Crit Moves: **** **** **** **** Green Time: 16.4 23.2 23.2 16.3 23.1 23.1 19.8 31.5 31.5 22.0 33.7 33.7 Volume/Cap: 0.58 0.34 0.34 0.09 0.29 0.58 0.58 0.22 0.06 0.04 0.58 0.06 Delay/Veh: 44.2 34.7 34.7 38.2 34.2 38.1 41.4 27.6 26.3 33.1 30.4 24.7 User DelAdj: 1.00 1.00 1.00 1.00 1.00 1.00 1.00 1.00 1.00 1.00 1.00 1.00 AdjDel/Veh: 44.2 34.7 34.7 38.2 34.2 38.1 41.4 27.6 26.3 33.1 30.4 24.7 LOS by Move: D C- C- D+ C- D+ D C C C- C C HCM2kAvgQ: 6 4 4 1 3 7 6 3 1 0 9 1 Note: Queue reported is the number of cars per lane.

COMPARE Mon Sep 26 12:04:41 2011 Page 3-29
Traffix 8.0.0715 Copyright (c) 2008 Dowling Associates, Inc. Licensed to FEHR & PEERS WALNUT CRK
San Jose City College
SJ07-951 Level Of Service Computation Report
2000 HCM Operations (Future Volume Alternative) Existing AM Balanced
Intersection #15: Southwest Expwy/Fruitdale Signal=Protect/Rights=Include Final Vol: 441 388 117*** Lanes: 1 0 2 0 2
Signal=Split
Signal=Split
Final Vol: Lanes: Rights=Include Vol Cnt Date: n/a Rights=Include Lanes: Final Vol:
150***
1 Cycle Time (sec): 95
1
60
0
Loss Time (sec): 12
0
191 1
Critical V/C: 0.517
2 317***
1
Avg Crit Del (sec/veh): 25.8
0
8 0
Avg Delay (sec/veh): 24.8
1 50
LOS: C
Lanes: 1 0 2 0 1 Final Vol: 18 932*** 113 Signal=Protect/Rights=Include Street Name: Southwest Expwy Fruitdale Approach: North Bound South Bound East Bound West Bound Movement: L - T - R L - T - R L - T - R L - T - R ------------|---------------||---------------||---------------||---------------| Min. Green: 7 10 10 7 10 10 10 10 10 10 10 10 Y+R: 4.0 4.0 4.0 4.0 4.0 4.0 4.0 4.0 4.0 4.0 4.0 4.0 ------------|---------------||---------------||---------------||---------------| Volume Module: Base Vol: 18 932 113 117 388 441 150 191 8 50 317 60 Growth Adj: 1.00 1.00 1.00 1.00 1.00 1.00 1.00 1.00 1.00 1.00 1.00 1.00 Initial Bse: 18 932 113 117 388 441 150 191 8 50 317 60 Added Vol: 0 0 0 0 0 0 0 0 0 0 0 0 PasserByVol: 0 0 0 0 0 0 0 0 0 0 0 0 Initial Fut: 18 932 113 117 388 441 150 191 8 50 317 60 User Adj: 1.00 1.00 1.00 1.00 1.00 1.00 1.00 1.00 1.00 1.00 1.00 1.00 PHF Adj: 1.00 1.00 1.00 1.00 1.00 1.00 1.00 1.00 1.00 1.00 1.00 1.00 PHF Volume: 18 932 113 117 388 441 150 191 8 50 317 60 Reduct Vol: 0 0 0 0 0 0 0 0 0 0 0 0 Reduced Vol: 18 932 113 117 388 441 150 191 8 50 317 60 PCE Adj: 1.00 1.00 1.00 1.00 1.00 1.00 1.00 1.00 1.00 1.00 1.00 1.00 MLF Adj: 1.00 1.00 1.00 1.00 1.00 1.00 1.00 1.00 1.00 1.00 1.00 1.00 FinalVolume: 18 932 113 117 388 441 150 191 8 50 317 60 ------------|---------------||---------------||---------------||---------------| Saturation Flow Module: Sat/Lane: 1900 1900 1900 1900 1900 1900 1900 1900 1900 1900 1900 1900 Adjustment: 0.92 1.00 0.92 0.83 1.00 0.92 0.92 0.97 0.95 0.92 1.00 0.92 Lanes: 1.00 2.00 1.00 2.00 2.00 1.00 1.00 1.92 0.08 1.00 2.00 1.00 Final Sat.: 1750 3800 1750 3150 3800 1750 1750 3551 149 1750 3800 1750 ------------|---------------||---------------||---------------||---------------| Capacity Analysis Module: Vol/Sat: 0.01 0.25 0.06 0.04 0.10 0.25 0.09 0.05 0.05 0.03 0.08 0.03 Crit Moves: **** **** **** **** Green Time: 11.8 45.0 45.0 7.0 40.2 40.2 15.7 15.7 15.7 15.3 15.3 15.3 Volume/Cap: 0.08 0.52 0.14 0.50 0.24 0.60 0.52 0.33 0.33 0.18 0.52 0.21 Delay/Veh: 37.0 17.7 14.2 44.1 17.7 22.4 37.8 35.3 35.3 34.7 37.3 35.0 User DelAdj: 1.00 1.00 1.00 1.00 1.00 1.00 1.00 1.00 1.00 1.00 1.00 1.00 AdjDel/Veh: 37.0 17.7 14.2 44.1 17.7 22.4 37.8 35.3 35.3 34.7 37.3 35.0 LOS by Move: D+ B B D B C+ D+ D+ D+ C- D+ C- HCM2kAvgQ: 1 10 2 3 4 11 4 3 3 1 5 2 Note: Queue reported is the number of cars per lane.

COMPARE Mon Sep 26 12:04:41 2011 Page 3-30
Traffix 8.0.0715 Copyright (c) 2008 Dowling Associates, Inc. Licensed to FEHR & PEERS WALNUT CRK
San Jose City College
SJ07-951 Level Of Service Computation Report
2000 HCM Operations (Future Volume Alternative) Ex + Proj AM
Intersection #15: Southwest Expwy/Fruitdale Signal=Protect/Rights=Include Final Vol: 446 388 117*** Lanes: 1 0 2 0 2
Signal=Split
Signal=Split
Final Vol: Lanes: Rights=Include Vol Cnt Date: n/a Rights=Include Lanes: Final Vol:
151***
1 Cycle Time (sec): 95
1
60
0
Loss Time (sec): 12
0
194 1
Critical V/C: 0.521
2 329***
1
Avg Crit Del (sec/veh): 26.1
0
8 0
Avg Delay (sec/veh): 25.0
1 50
LOS: C
Lanes: 1 0 2 0 1 Final Vol: 18 932*** 113 Signal=Protect/Rights=Include Street Name: Southwest Expwy Fruitdale Approach: North Bound South Bound East Bound West Bound Movement: L - T - R L - T - R L - T - R L - T - R ------------|---------------||---------------||---------------||---------------| Min. Green: 7 10 10 7 10 10 10 10 10 10 10 10 Y+R: 4.0 4.0 4.0 4.0 4.0 4.0 4.0 4.0 4.0 4.0 4.0 4.0 ------------|---------------||---------------||---------------||---------------| Volume Module: Base Vol: 18 932 113 117 388 441 150 191 8 50 317 60 Growth Adj: 1.00 1.00 1.00 1.00 1.00 1.00 1.00 1.00 1.00 1.00 1.00 1.00 Initial Bse: 18 932 113 117 388 441 150 191 8 50 317 60 Added Vol: 0 0 0 0 0 5 1 3 0 0 12 0 PasserByVol: 0 0 0 0 0 0 0 0 0 0 0 0 Initial Fut: 18 932 113 117 388 446 151 194 8 50 329 60 User Adj: 1.00 1.00 1.00 1.00 1.00 1.00 1.00 1.00 1.00 1.00 1.00 1.00 PHF Adj: 1.00 1.00 1.00 1.00 1.00 1.00 1.00 1.00 1.00 1.00 1.00 1.00 PHF Volume: 18 932 113 117 388 446 151 194 8 50 329 60 Reduct Vol: 0 0 0 0 0 0 0 0 0 0 0 0 Reduced Vol: 18 932 113 117 388 446 151 194 8 50 329 60 PCE Adj: 1.00 1.00 1.00 1.00 1.00 1.00 1.00 1.00 1.00 1.00 1.00 1.00 MLF Adj: 1.00 1.00 1.00 1.00 1.00 1.00 1.00 1.00 1.00 1.00 1.00 1.00 FinalVolume: 18 932 113 117 388 446 151 194 8 50 329 60 ------------|---------------||---------------||---------------||---------------| Saturation Flow Module: Sat/Lane: 1900 1900 1900 1900 1900 1900 1900 1900 1900 1900 1900 1900 Adjustment: 0.92 1.00 0.92 0.83 1.00 0.92 0.92 0.97 0.95 0.92 1.00 0.92 Lanes: 1.00 2.00 1.00 2.00 2.00 1.00 1.00 1.92 0.08 1.00 2.00 1.00 Final Sat.: 1750 3800 1750 3150 3800 1750 1750 3553 147 1750 3800 1750 ------------|---------------||---------------||---------------||---------------| Capacity Analysis Module: Vol/Sat: 0.01 0.25 0.06 0.04 0.10 0.25 0.09 0.05 0.05 0.03 0.09 0.03 Crit Moves: **** **** **** **** Green Time: 11.6 44.6 44.6 7.0 40.0 40.0 15.7 15.7 15.7 15.7 15.7 15.7 Volume/Cap: 0.08 0.52 0.14 0.50 0.24 0.61 0.52 0.33 0.33 0.17 0.52 0.21 Delay/Veh: 37.2 18.0 14.4 44.1 17.8 22.8 38.0 35.3 35.3 34.3 37.0 34.6 User DelAdj: 1.00 1.00 1.00 1.00 1.00 1.00 1.00 1.00 1.00 1.00 1.00 1.00 AdjDel/Veh: 37.2 18.0 14.4 44.1 17.8 22.8 38.0 35.3 35.3 34.3 37.0 34.6 LOS by Move: D+ B- B D B C+ D+ D+ D+ C- D+ C- HCM2kAvgQ: 1 10 2 3 4 11 4 3 3 1 5 2 Note: Queue reported is the number of cars per lane.

COMPARE Wed Oct 05 10:41:56 2011 Page 1-1
Traffix 8.0.0715 Copyright (c) 2008 Dowling Associates, Inc. Licensed to FEHR & PEERS WALNUT CRK
San Jose City College
SJ07-951 Summary Scenario Comparison Report (With Average Critical Delay)
Future Volume Alternative ??? Existing PM Balanced EX + Proj PM ??? Avg Avg Avg Avg Avg Avg Crit Avg Crit Avg Crit Crit Crit Avg Crit Del Crit Del Del Crit Del Del Crit V/C Del Del Del Crit Del Intersection LOS (sec) V/C (sec) LOS (sec) V/C (sec) LOS (sec) V/C Change (sec) Change LOS (sec) V/C (sec) #1 Bascom/San Carlos ? xx.x x.xxx xx.x D 50.7 0.688 51.8 D 50.8 0.696 + 0.007 52.1 + 0.3 ? xx.x x.xxx xx.x #2 Leigh/San Carlos ? xx.x x.xxx xx.x C 24.8 0.432 23.3 C 25.1 0.436 + 0.004 23.7 + 0.4 ? xx.x x.xxx xx.x #3 Leigh/Scott [4-Way Stop] ? xx.x x.xxx xx.x B 10.8 0.464 10.8 B 10.9 0.474 + 0.010 10.9 + 0.1 ? xx.x x.xxx xx.x #4 Bascom/Parkmoor ? xx.x x.xxx xx.x C 31.1 0.502 33.8 C 31.9 0.520 + 0.018 34.5 + 0.7 ? xx.x x.xxx xx.x #5 Leland/Parkmoor ? xx.x x.xxx xx.x C+ 21.1 0.528 21.4 C+ 20.8 0.553 + 0.025 21.0 - 0.4 ? xx.x x.xxx xx.x #6 Leigh/Parkmoor ? xx.x x.xxx xx.x C+ 21.9 0.648 22.0 C 23.6 0.708 + 0.060 24.2 + 2.1 ? xx.x x.xxx xx.x #7 Bascom/Moorpark ? xx.x x.xxx xx.x D 42.8 0.752 49.8 D 43.6 0.793 + 0.041 52.1 + 2.3 ? xx.x x.xxx xx.x #8 Leland/Moorpark ? xx.x x.xxx xx.x A 5.0 0.450 5.0 A 5.2 0.464 + 0.014 5.2 + 0.2 ? xx.x x.xxx xx.x #9 Leigh/Moorpark ? xx.x x.xxx xx.x C+ 20.1 0.474 23.5 B- 19.9 0.498 + 0.024 23.0 - 0.5 ? xx.x x.xxx xx.x #10 Bascom/Renova ? xx.x x.xxx xx.x B 12.6 0.340 10.5 B 12.5 0.341 + 0.002 10.5 - 0.0 ? xx.x x.xxx xx.x #11 Bascom/Laswell [Unsignalized] ? xx.x x.xxx xx.x F 1.5 0.366 1.5 F 2.9 0.601 + 0.235 2.9 + 1.3 ? xx.x x.xxx xx.x #12 Bascom/Fruitdale ? xx.x x.xxx xx.x D 46.4 0.650 54.3 D 47.0 0.672 + 0.022 55.1 + 0.8 ? xx.x x.xxx xx.x #13 Sherman Oaks/Fruitdale [Unsignalized] ? xx.x x.xxx xx.x C 0.5 0.087 0.5 C 0.5 0.090 + 0.004 0.5 + 0.0 ? xx.x x.xxx xx.x #14 Leigh/Fruitdale ? xx.x x.xxx xx.x C 30.5 0.450 28.9 C 30.8 0.461 + 0.011 29.4 + 0.5 ? xx.x x.xxx xx.x #15 Southwest Expwy/Fruitdale ? xx.x x.xxx xx.x C 28.6 0.343 27.1 C 28.8 0.348 + 0.006 27.5 + 0.4 ? xx.x x.xxx xx.x

COMPARE Wed Oct 05 10:41:56 2011 Page 1-2
Traffix 8.0.0715 Copyright (c) 2008 Dowling Associates, Inc. Licensed to FEHR & PEERS WALNUT CRK

COMPARE Wed Oct 05 10:41:56 2011 Page 3-1
Traffix 8.0.0715 Copyright (c) 2008 Dowling Associates, Inc. Licensed to FEHR & PEERS WALNUT CRK
San Jose City College
SJ07-951 Level Of Service Computation Report
2000 HCM Operations (Future Volume Alternative) Existing PM Balanced
Intersection #1: Bascom/San Carlos Signal=Protect/Rights=Include Final Vol: 89 963*** 248 Lanes: 1 0 3 0 1
Signal=Protect
Signal=Protect
Final Vol: Lanes: Rights=Include Vol Cnt Date: n/a Rights=Include Lanes: Final Vol:
69
1 Cycle Time (sec): 150
1
117
0
Loss Time (sec): 12
0
677*** 1
Critical V/C: 0.688
2 480
1
Avg Crit Del (sec/veh): 51.8
0
189 0
Avg Delay (sec/veh): 50.7
1 213***
LOS: D
Lanes: 1 0 2 0 1 Final Vol: 190*** 472 223 Signal=Protect/Rights=Include Street Name: Bascom San Carlos Approach: North Bound South Bound East Bound West Bound Movement: L - T - R L - T - R L - T - R L - T - R ------------|---------------||---------------||---------------||---------------| Min. Green: 7 10 10 7 10 10 7 10 10 7 10 10 Y+R: 4.0 4.0 4.0 4.0 4.0 4.0 4.0 4.0 4.0 4.0 4.0 4.0 ------------|---------------||---------------||---------------||---------------| Volume Module: Base Vol: 190 472 223 248 963 89 69 677 189 213 480 117 Growth Adj: 1.00 1.00 1.00 1.00 1.00 1.00 1.00 1.00 1.00 1.00 1.00 1.00 Initial Bse: 190 472 223 248 963 89 69 677 189 213 480 117 Added Vol: 0 0 0 0 0 0 0 0 0 0 0 0 PasserByVol: 0 0 0 0 0 0 0 0 0 0 0 0 Initial Fut: 190 472 223 248 963 89 69 677 189 213 480 117 User Adj: 1.00 1.00 1.00 1.00 1.00 1.00 1.00 1.00 1.00 1.00 1.00 1.00 PHF Adj: 1.00 1.00 1.00 1.00 1.00 1.00 1.00 1.00 1.00 1.00 1.00 1.00 PHF Volume: 190 472 223 248 963 89 69 677 189 213 480 117 Reduct Vol: 0 0 0 0 0 0 0 0 0 0 0 0 Reduced Vol: 190 472 223 248 963 89 69 677 189 213 480 117 PCE Adj: 1.00 1.00 1.00 1.00 1.00 1.00 1.00 1.00 1.00 1.00 1.00 1.00 MLF Adj: 1.00 1.00 1.00 1.00 1.00 1.00 1.00 1.00 1.00 1.00 1.00 1.00 FinalVolume: 190 472 223 248 963 89 69 677 189 213 480 117 ------------|---------------||---------------||---------------||---------------| Saturation Flow Module: Sat/Lane: 1900 1900 1900 1900 1900 1900 1900 1900 1900 1900 1900 1900 Adjustment: 0.92 1.00 0.92 0.92 1.00 0.92 0.92 0.98 0.95 0.92 1.00 0.92 Lanes: 1.00 2.00 1.00 1.00 3.00 1.00 1.00 1.55 0.45 1.00 2.00 1.00 Final Sat.: 1750 3800 1750 1750 5700 1750 1750 2892 807 1750 3800 1750 ------------|---------------||---------------||---------------||---------------| Capacity Analysis Module: Vol/Sat: 0.11 0.12 0.13 0.14 0.17 0.05 0.04 0.23 0.23 0.12 0.13 0.07 Crit Moves: **** **** **** **** Green Time: 23.7 28.6 28.6 31.8 36.8 36.8 20.9 51.0 51.0 26.5 56.6 56.6 Volume/Cap: 0.69 0.65 0.67 0.67 0.69 0.21 0.28 0.69 0.69 0.69 0.33 0.18 Delay/Veh: 66.8 58.2 61.4 58.8 52.9 45.2 58.5 44.3 44.3 64.3 33.4 31.3 User DelAdj: 1.00 1.00 1.00 1.00 1.00 1.00 1.00 1.00 1.00 1.00 1.00 1.00 AdjDel/Veh: 66.8 58.2 61.4 58.8 52.9 45.2 58.5 44.3 44.3 64.3 33.4 31.3 LOS by Move: E E+ E E+ D- D E+ D D E C- C HCM2kAvgQ: 9 10 10 12 14 3 3 18 18 11 8 4 Note: Queue reported is the number of cars per lane.

COMPARE Wed Oct 05 10:41:56 2011 Page 3-2
Traffix 8.0.0715 Copyright (c) 2008 Dowling Associates, Inc. Licensed to FEHR & PEERS WALNUT CRK
San Jose City College
SJ07-951 Level Of Service Computation Report
2000 HCM Operations (Future Volume Alternative) EX + Proj PM
Intersection #1: Bascom/San Carlos Signal=Protect/Rights=Include Final Vol: 89 975*** 248 Lanes: 1 0 3 0 1
Signal=Protect
Signal=Protect
Final Vol: Lanes: Rights=Include Vol Cnt Date: n/a Rights=Include Lanes: Final Vol:
69
1 Cycle Time (sec): 150
1
118
0
Loss Time (sec): 12
0
677*** 1
Critical V/C: 0.696
2 481
1
Avg Crit Del (sec/veh): 52.1
0
198 0
Avg Delay (sec/veh): 50.8
1 213***
LOS: D
Lanes: 1 0 2 0 1 Final Vol: 194*** 478 223 Signal=Protect/Rights=Include Street Name: Bascom San Carlos Approach: North Bound South Bound East Bound West Bound Movement: L - T - R L - T - R L - T - R L - T - R ------------|---------------||---------------||---------------||---------------| Min. Green: 7 10 10 7 10 10 7 10 10 7 10 10 Y+R: 4.0 4.0 4.0 4.0 4.0 4.0 4.0 4.0 4.0 4.0 4.0 4.0 ------------|---------------||---------------||---------------||---------------| Volume Module: Base Vol: 190 472 223 248 963 89 69 677 189 213 480 117 Growth Adj: 1.00 1.00 1.00 1.00 1.00 1.00 1.00 1.00 1.00 1.00 1.00 1.00 Initial Bse: 190 472 223 248 963 89 69 677 189 213 480 117 Added Vol: 4 6 0 0 12 0 0 0 9 0 1 1 PasserByVol: 0 0 0 0 0 0 0 0 0 0 0 0 Initial Fut: 194 478 223 248 975 89 69 677 198 213 481 118 User Adj: 1.00 1.00 1.00 1.00 1.00 1.00 1.00 1.00 1.00 1.00 1.00 1.00 PHF Adj: 1.00 1.00 1.00 1.00 1.00 1.00 1.00 1.00 1.00 1.00 1.00 1.00 PHF Volume: 194 478 223 248 975 89 69 677 198 213 481 118 Reduct Vol: 0 0 0 0 0 0 0 0 0 0 0 0 Reduced Vol: 194 478 223 248 975 89 69 677 198 213 481 118 PCE Adj: 1.00 1.00 1.00 1.00 1.00 1.00 1.00 1.00 1.00 1.00 1.00 1.00 MLF Adj: 1.00 1.00 1.00 1.00 1.00 1.00 1.00 1.00 1.00 1.00 1.00 1.00 FinalVolume: 194 478 223 248 975 89 69 677 198 213 481 118 ------------|---------------||---------------||---------------||---------------| Saturation Flow Module: Sat/Lane: 1900 1900 1900 1900 1900 1900 1900 1900 1900 1900 1900 1900 Adjustment: 0.92 1.00 0.92 0.92 1.00 0.92 0.92 0.98 0.95 0.92 1.00 0.92 Lanes: 1.00 2.00 1.00 1.00 3.00 1.00 1.00 1.53 0.47 1.00 2.00 1.00 Final Sat.: 1750 3800 1750 1750 5700 1750 1750 2862 837 1750 3800 1750 ------------|---------------||---------------||---------------||---------------| Capacity Analysis Module: Vol/Sat: 0.11 0.13 0.13 0.14 0.17 0.05 0.04 0.24 0.24 0.12 0.13 0.07 Crit Moves: **** **** **** **** Green Time: 23.9 28.8 28.8 32.0 36.9 36.9 20.8 51.0 51.0 26.2 56.4 56.4 Volume/Cap: 0.70 0.66 0.66 0.66 0.70 0.21 0.28 0.70 0.70 0.70 0.34 0.18 Delay/Veh: 67.1 58.2 61.1 58.6 53.0 45.2 58.6 44.5 44.5 65.0 33.6 31.4 User DelAdj: 1.00 1.00 1.00 1.00 1.00 1.00 1.00 1.00 1.00 1.00 1.00 1.00 AdjDel/Veh: 67.1 58.2 61.1 58.6 53.0 45.2 58.6 44.5 44.5 65.0 33.6 31.4 LOS by Move: E E+ E E+ D- D E+ D D E C- C HCM2kAvgQ: 9 10 10 12 14 3 3 18 18 11 8 4 Note: Queue reported is the number of cars per lane.

COMPARE Wed Oct 05 10:41:56 2011 Page 3-3
Traffix 8.0.0715 Copyright (c) 2008 Dowling Associates, Inc. Licensed to FEHR & PEERS WALNUT CRK
San Jose City College
SJ07-951 Level Of Service Computation Report
2000 HCM Operations (Future Volume Alternative) Existing PM Balanced
Intersection #2: Leigh/San Carlos Signal=Permit/Rights=Include Final Vol: 27 120*** 58 Lanes: 0 1 0 0 1
Signal=Protect
Signal=Protect
Final Vol: Lanes: Rights=Include Vol Cnt Date: n/a Rights=Include Lanes: Final Vol:
71
1 Cycle Time (sec): 140
1
9
0
Loss Time (sec): 9
0
979*** 2
Critical V/C: 0.432
2 698
0
Avg Crit Del (sec/veh): 23.3
0
41 1
Avg Delay (sec/veh): 24.8
1 113***
LOS: C
Lanes: 1 0 0 1 0 Final Vol: 114 77 57 Signal=Permit/Rights=Include Street Name: Leigh San Carlos Approach: North Bound South Bound East Bound West Bound Movement: L - T - R L - T - R L - T - R L - T - R ------------|---------------||---------------||---------------||---------------| Min. Green: 10 10 10 10 10 10 7 10 10 7 10 10 Y+R: 4.0 4.0 4.0 4.0 4.0 4.0 4.0 4.0 4.0 4.0 4.0 4.0 ------------|---------------||---------------||---------------||---------------| Volume Module: Base Vol: 114 77 57 58 120 27 71 979 41 113 698 9 Growth Adj: 1.00 1.00 1.00 1.00 1.00 1.00 1.00 1.00 1.00 1.00 1.00 1.00 Initial Bse: 114 77 57 58 120 27 71 979 41 113 698 9 Added Vol: 0 0 0 0 0 0 0 0 0 0 0 0 PasserByVol: 0 0 0 0 0 0 0 0 0 0 0 0 Initial Fut: 114 77 57 58 120 27 71 979 41 113 698 9 User Adj: 1.00 1.00 1.00 1.00 1.00 1.00 1.00 1.00 1.00 1.00 1.00 1.00 PHF Adj: 1.00 1.00 1.00 1.00 1.00 1.00 1.00 1.00 1.00 1.00 1.00 1.00 PHF Volume: 114 77 57 58 120 27 71 979 41 113 698 9 Reduct Vol: 0 0 0 0 0 0 0 0 0 0 0 0 Reduced Vol: 114 77 57 58 120 27 71 979 41 113 698 9 PCE Adj: 1.00 1.00 1.00 1.00 1.00 1.00 1.00 1.00 1.00 1.00 1.00 1.00 MLF Adj: 1.00 1.00 1.00 1.00 1.00 1.00 1.00 1.00 1.00 1.00 1.00 1.00 FinalVolume: 114 77 57 58 120 27 71 979 41 113 698 9 ------------|---------------||---------------||---------------||---------------| Saturation Flow Module: Sat/Lane: 1900 1900 1900 1900 1900 1900 1900 1900 1900 1900 1900 1900 Adjustment: 0.92 0.95 0.95 0.92 0.95 0.95 0.92 1.00 0.92 0.92 1.00 0.92 Lanes: 1.00 0.57 0.43 1.00 0.82 0.18 1.00 2.00 1.00 1.00 2.00 1.00 Final Sat.: 1750 1034 766 1750 1469 331 1750 3800 1750 1750 3800 1750 ------------|---------------||---------------||---------------||---------------| Capacity Analysis Module: Vol/Sat: 0.07 0.07 0.07 0.03 0.08 0.08 0.04 0.26 0.02 0.06 0.18 0.01 Crit Moves: **** **** **** Green Time: 26.5 26.5 26.5 26.5 26.5 26.5 22.4 83.6 83.6 20.9 82.1 82.1 Volume/Cap: 0.34 0.39 0.39 0.18 0.43 0.43 0.25 0.43 0.04 0.43 0.31 0.01 Delay/Veh: 49.8 50.5 50.5 47.8 51.0 51.0 52.0 15.5 11.7 55.3 14.7 12.0 User DelAdj: 1.00 1.00 1.00 1.00 1.00 1.00 1.00 1.00 1.00 1.00 1.00 1.00 AdjDel/Veh: 49.8 50.5 50.5 47.8 51.0 51.0 52.0 15.5 11.7 55.3 14.7 12.0 LOS by Move: D D D D D D D- B B+ E+ B B HCM2kAvgQ: 5 5 5 2 6 6 3 11 1 5 7 0 Note: Queue reported is the number of cars per lane.

COMPARE Wed Oct 05 10:41:56 2011 Page 3-4
Traffix 8.0.0715 Copyright (c) 2008 Dowling Associates, Inc. Licensed to FEHR & PEERS WALNUT CRK
San Jose City College
SJ07-951 Level Of Service Computation Report
2000 HCM Operations (Future Volume Alternative) EX + Proj PM
Intersection #2: Leigh/San Carlos Signal=Permit/Rights=Include Final Vol: 27 120*** 58 Lanes: 0 1 0 0 1
Signal=Protect
Signal=Protect
Final Vol: Lanes: Rights=Include Vol Cnt Date: n/a Rights=Include Lanes: Final Vol:
71
1 Cycle Time (sec): 140
1
9
0
Loss Time (sec): 9
0
980*** 2
Critical V/C: 0.436
2 698
0
Avg Crit Del (sec/veh): 23.7
0
41 1
Avg Delay (sec/veh): 25.1
1 119***
LOS: C
Lanes: 1 0 0 1 0 Final Vol: 115 77 63 Signal=Permit/Rights=Include Street Name: Leigh San Carlos Approach: North Bound South Bound East Bound West Bound Movement: L - T - R L - T - R L - T - R L - T - R ------------|---------------||---------------||---------------||---------------| Min. Green: 10 10 10 10 10 10 7 10 10 7 10 10 Y+R: 4.0 4.0 4.0 4.0 4.0 4.0 4.0 4.0 4.0 4.0 4.0 4.0 ------------|---------------||---------------||---------------||---------------| Volume Module: Base Vol: 114 77 57 58 120 27 71 979 41 113 698 9 Growth Adj: 1.00 1.00 1.00 1.00 1.00 1.00 1.00 1.00 1.00 1.00 1.00 1.00 Initial Bse: 114 77 57 58 120 27 71 979 41 113 698 9 Added Vol: 1 0 6 0 0 0 0 1 0 6 0 0 PasserByVol: 0 0 0 0 0 0 0 0 0 0 0 0 Initial Fut: 115 77 63 58 120 27 71 980 41 119 698 9 User Adj: 1.00 1.00 1.00 1.00 1.00 1.00 1.00 1.00 1.00 1.00 1.00 1.00 PHF Adj: 1.00 1.00 1.00 1.00 1.00 1.00 1.00 1.00 1.00 1.00 1.00 1.00 PHF Volume: 115 77 63 58 120 27 71 980 41 119 698 9 Reduct Vol: 0 0 0 0 0 0 0 0 0 0 0 0 Reduced Vol: 115 77 63 58 120 27 71 980 41 119 698 9 PCE Adj: 1.00 1.00 1.00 1.00 1.00 1.00 1.00 1.00 1.00 1.00 1.00 1.00 MLF Adj: 1.00 1.00 1.00 1.00 1.00 1.00 1.00 1.00 1.00 1.00 1.00 1.00 FinalVolume: 115 77 63 58 120 27 71 980 41 119 698 9 ------------|---------------||---------------||---------------||---------------| Saturation Flow Module: Sat/Lane: 1900 1900 1900 1900 1900 1900 1900 1900 1900 1900 1900 1900 Adjustment: 0.92 0.95 0.95 0.92 0.95 0.95 0.92 1.00 0.92 0.92 1.00 0.92 Lanes: 1.00 0.55 0.45 1.00 0.82 0.18 1.00 2.00 1.00 1.00 2.00 1.00 Final Sat.: 1750 990 810 1750 1469 331 1750 3800 1750 1750 3800 1750 ------------|---------------||---------------||---------------||---------------| Capacity Analysis Module: Vol/Sat: 0.07 0.08 0.08 0.03 0.08 0.08 0.04 0.26 0.02 0.07 0.18 0.01 Crit Moves: **** **** **** Green Time: 26.2 26.2 26.2 26.2 26.2 26.2 22.4 82.9 82.9 21.9 82.3 82.3 Volume/Cap: 0.35 0.41 0.41 0.18 0.44 0.44 0.25 0.44 0.04 0.44 0.31 0.01 Delay/Veh: 50.1 50.9 50.9 48.1 51.2 51.2 51.9 15.8 11.9 54.6 14.6 11.9 User DelAdj: 1.00 1.00 1.00 1.00 1.00 1.00 1.00 1.00 1.00 1.00 1.00 1.00 AdjDel/Veh: 50.1 50.9 50.9 48.1 51.2 51.2 51.9 15.8 11.9 54.6 14.6 11.9 LOS by Move: D D D D D- D- D- B B+ D- B B+ HCM2kAvgQ: 5 6 6 2 6 6 3 11 1 5 7 0 Note: Queue reported is the number of cars per lane.

COMPARE Wed Oct 05 10:41:56 2011 Page 3-5
Traffix 8.0.0715 Copyright (c) 2008 Dowling Associates, Inc. Licensed to FEHR & PEERS WALNUT CRK
San Jose City College
SJ07-951 Level Of Service Computation Report
2000 HCM 4-Way Stop (Future Volume Alternative) Existing PM Balanced
Intersection #3: Leigh/Scott [4-Way Stop] Signal=Stop/Rights=Include Final Vol: 26 193*** 13 Lanes: 0 0 1! 0 0
Signal=Stop
Signal=Stop
Final Vol: Lanes: Rights=Include Vol Cnt Date: n/a Rights=Include Lanes: Final Vol:
19
0 Cycle Time (sec): 100
0
34
0
Loss Time (sec): 0
0
87*** 1!
Critical V/C: 0.464
1! 50***
0
Avg Crit Del (sec/veh): 10.8
0
52 0
Avg Delay (sec/veh): 10.8
0 55
LOS: B
Lanes: 0 0 1! 0 0 Final Vol: 48 218*** 60 Signal=Stop/Rights=Include Street Name: Leigh Scott Approach: North Bound South Bound East Bound West Bound Movement: L - T - R L - T - R L - T - R L - T - R ------------|---------------||---------------||---------------||---------------| Min. Green: 7 10 10 7 10 10 7 10 10 7 10 10 ------------|---------------||---------------||---------------||---------------| Volume Module: Base Vol: 48 218 60 13 193 26 19 87 52 55 50 34 Growth Adj: 1.00 1.00 1.00 1.00 1.00 1.00 1.00 1.00 1.00 1.00 1.00 1.00 Initial Bse: 48 218 60 13 193 26 19 87 52 55 50 34 Added Vol: 0 0 0 0 0 0 0 0 0 0 0 0 PasserByVol: 0 0 0 0 0 0 0 0 0 0 0 0 Initial Fut: 48 218 60 13 193 26 19 87 52 55 50 34 User Adj: 1.00 1.00 1.00 1.00 1.00 1.00 1.00 1.00 1.00 1.00 1.00 1.00 PHF Adj: 1.00 1.00 1.00 1.00 1.00 1.00 1.00 1.00 1.00 1.00 1.00 1.00 PHF Volume: 48 218 60 13 193 26 19 87 52 55 50 34 Reduct Vol: 0 0 0 0 0 0 0 0 0 0 0 0 Reduced Vol: 48 218 60 13 193 26 19 87 52 55 50 34 PCE Adj: 1.00 1.00 1.00 1.00 1.00 1.00 1.00 1.00 1.00 1.00 1.00 1.00 MLF Adj: 1.00 1.00 1.00 1.00 1.00 1.00 1.00 1.00 1.00 1.00 1.00 1.00 FinalVolume: 48 218 60 13 193 26 19 87 52 55 50 34 ------------|---------------||---------------||---------------||---------------| Saturation Flow Module: Adjustment: 1.00 1.00 1.00 1.00 1.00 1.00 1.00 1.00 1.00 1.00 1.00 1.00 Lanes: 0.15 0.67 0.18 0.06 0.83 0.11 0.12 0.55 0.33 0.40 0.36 0.24 Final Sat.: 103 470 129 38 560 75 75 342 204 239 217 148 ------------|---------------||---------------||---------------||---------------| Capacity Analysis Module: Vol/Sat: 0.46 0.46 0.46 0.34 0.34 0.34 0.25 0.25 0.25 0.23 0.23 0.23 Crit Moves: **** **** **** **** Delay/Veh: 11.8 11.8 11.8 10.5 10.5 10.5 9.9 9.9 9.9 9.8 9.8 9.8 Delay Adj: 1.00 1.00 1.00 1.00 1.00 1.00 1.00 1.00 1.00 1.00 1.00 1.00 AdjDel/Veh: 11.8 11.8 11.8 10.5 10.5 10.5 9.9 9.9 9.9 9.8 9.8 9.8 LOS by Move: B B B B B B A A A A A A ApproachDel: 11.8 10.5 9.9 9.8 Delay Adj: 1.00 1.00 1.00 1.00 ApprAdjDel: 11.8 10.5 9.9 9.8 LOS by Appr: B B A A AllWayAvgQ: 0.8 0.8 0.8 0.5 0.5 0.5 0.3 0.3 0.3 0.2 0.2 0.2 Note: Queue reported is the number of cars per lane.

COMPARE Wed Oct 05 10:41:56 2011 Page 3-6
Traffix 8.0.0715 Copyright (c) 2008 Dowling Associates, Inc. Licensed to FEHR & PEERS WALNUT CRK
San Jose City College
SJ07-951 Level Of Service Computation Report
2000 HCM 4-Way Stop (Future Volume Alternative) EX + Proj PM
Intersection #3: Leigh/Scott [4-Way Stop] Signal=Stop/Rights=Include Final Vol: 26 199 13*** Lanes: 0 0 1! 0 0
Signal=Stop
Signal=Stop
Final Vol: Lanes: Rights=Include Vol Cnt Date: n/a Rights=Include Lanes: Final Vol:
19***
0 Cycle Time (sec): 100
0
34
0
Loss Time (sec): 0
0
87 1!
Critical V/C: 0.474
1! 50***
0
Avg Crit Del (sec/veh): 10.9
0
52 0
Avg Delay (sec/veh): 10.9
0 55
LOS: B
Lanes: 0 0 1! 0 0 Final Vol: 48 224*** 60 Signal=Stop/Rights=Include Street Name: Leigh Scott Approach: North Bound South Bound East Bound West Bound Movement: L - T - R L - T - R L - T - R L - T - R ------------|---------------||---------------||---------------||---------------| Min. Green: 7 10 10 7 10 10 7 10 10 7 10 10 ------------|---------------||---------------||---------------||---------------| Volume Module: Base Vol: 48 218 60 13 193 26 19 87 52 55 50 34 Growth Adj: 1.00 1.00 1.00 1.00 1.00 1.00 1.00 1.00 1.00 1.00 1.00 1.00 Initial Bse: 48 218 60 13 193 26 19 87 52 55 50 34 Added Vol: 0 6 0 0 6 0 0 0 0 0 0 0 PasserByVol: 0 0 0 0 0 0 0 0 0 0 0 0 Initial Fut: 48 224 60 13 199 26 19 87 52 55 50 34 User Adj: 1.00 1.00 1.00 1.00 1.00 1.00 1.00 1.00 1.00 1.00 1.00 1.00 PHF Adj: 1.00 1.00 1.00 1.00 1.00 1.00 1.00 1.00 1.00 1.00 1.00 1.00 PHF Volume: 48 224 60 13 199 26 19 87 52 55 50 34 Reduct Vol: 0 0 0 0 0 0 0 0 0 0 0 0 Reduced Vol: 48 224 60 13 199 26 19 87 52 55 50 34 PCE Adj: 1.00 1.00 1.00 1.00 1.00 1.00 1.00 1.00 1.00 1.00 1.00 1.00 MLF Adj: 1.00 1.00 1.00 1.00 1.00 1.00 1.00 1.00 1.00 1.00 1.00 1.00 FinalVolume: 48 224 60 13 199 26 19 87 52 55 50 34 ------------|---------------||---------------||---------------||---------------| Saturation Flow Module: Adjustment: 1.00 1.00 1.00 1.00 1.00 1.00 1.00 1.00 1.00 1.00 1.00 1.00 Lanes: 0.14 0.68 0.18 0.05 0.84 0.11 0.12 0.55 0.33 0.40 0.36 0.24 Final Sat.: 101 472 127 37 561 73 74 339 203 237 215 146 ------------|---------------||---------------||---------------||---------------| Capacity Analysis Module: Vol/Sat: 0.47 0.47 0.47 0.35 0.35 0.35 0.26 0.26 0.26 0.23 0.23 0.23 Crit Moves: **** **** **** **** Delay/Veh: 12.0 12.0 12.0 10.6 10.6 10.6 9.9 9.9 9.9 9.9 9.9 9.9 Delay Adj: 1.00 1.00 1.00 1.00 1.00 1.00 1.00 1.00 1.00 1.00 1.00 1.00 AdjDel/Veh: 12.0 12.0 12.0 10.6 10.6 10.6 9.9 9.9 9.9 9.9 9.9 9.9 LOS by Move: B B B B B B A A A A A A ApproachDel: 12.0 10.6 9.9 9.9 Delay Adj: 1.00 1.00 1.00 1.00 ApprAdjDel: 12.0 10.6 9.9 9.9 LOS by Appr: B B A A AllWayAvgQ: 0.8 0.8 0.8 0.5 0.5 0.5 0.3 0.3 0.3 0.2 0.2 0.2 Note: Queue reported is the number of cars per lane.

COMPARE Wed Oct 05 10:41:56 2011 Page 3-7
Traffix 8.0.0715 Copyright (c) 2008 Dowling Associates, Inc. Licensed to FEHR & PEERS WALNUT CRK
San Jose City College
SJ07-951 Level Of Service Computation Report
2000 HCM Operations (Future Volume Alternative) Existing PM Balanced
Intersection #4: Bascom/Parkmoor Signal=Protect/Rights=Include Final Vol: 28 1373*** 0 Lanes: 0 1 2 0 0
Signal=Split
Signal=Split
Final Vol: Lanes: Rights=Include Vol Cnt Date: n/a Rights=Include Lanes: Final Vol:
2***
0 Cycle Time (sec): 150
1
164
0
Loss Time (sec): 12
0
0 1!
Critical V/C: 0.502
0 118***
0
Avg Crit Del (sec/veh): 33.8
1
9 0
Avg Delay (sec/veh): 31.1
1 582
LOS: C
Lanes: 1 0 3 0 0 Final Vol: 15*** 634 0 Signal=Protect/Rights=Include Street Name: S Bascom Ave Parkmoor Ave Approach: North Bound South Bound East Bound West Bound Movement: L - T - R L - T - R L - T - R L - T - R ------------|---------------||---------------||---------------||---------------| Min. Green: 7 10 0 0 10 10 10 0 10 10 10 10 Y+R: 4.0 4.0 4.0 4.0 4.0 4.0 4.0 4.0 4.0 4.0 4.0 4.0 ------------|---------------||---------------||---------------||---------------| Volume Module: Base Vol: 15 634 0 0 1373 28 2 0 9 582 118 164 Growth Adj: 1.00 1.00 1.00 1.00 1.00 1.00 1.00 1.00 1.00 1.00 1.00 1.00 Initial Bse: 15 634 0 0 1373 28 2 0 9 582 118 164 Added Vol: 0 0 0 0 0 0 0 0 0 0 0 0 PasserByVol: 0 0 0 0 0 0 0 0 0 0 0 0 Initial Fut: 15 634 0 0 1373 28 2 0 9 582 118 164 User Adj: 1.00 1.00 1.00 1.00 1.00 1.00 1.00 1.00 1.00 1.00 1.00 1.00 PHF Adj: 1.00 1.00 1.00 1.00 1.00 1.00 1.00 1.00 1.00 1.00 1.00 1.00 PHF Volume: 15 634 0 0 1373 28 2 0 9 582 118 164 Reduct Vol: 0 0 0 0 0 0 0 0 0 0 0 0 Reduced Vol: 15 634 0 0 1373 28 2 0 9 582 118 164 PCE Adj: 1.00 1.00 1.00 1.00 1.00 1.00 1.00 1.00 1.00 1.00 1.00 1.00 MLF Adj: 1.00 1.00 1.00 1.00 1.00 1.00 1.00 1.00 1.00 1.00 1.00 1.00 FinalVolume: 15 634 0 0 1373 28 2 0 9 582 118 164 ------------|---------------||---------------||---------------||---------------| Saturation Flow Module: Sat/Lane: 1900 1900 1900 1900 1900 1900 1900 1900 1900 1900 1900 1900 Adjustment: 0.92 1.00 0.92 0.92 0.98 0.95 0.92 0.92 0.92 0.93 0.95 0.92 Lanes: 1.00 3.00 0.00 0.00 2.94 0.06 0.18 0.00 0.82 1.67 0.33 1.00 Final Sat.: 1750 5700 0 0 5488 112 318 0 1432 2951 598 1750 ------------|---------------||---------------||---------------||---------------| Capacity Analysis Module: Vol/Sat: 0.01 0.11 0.00 0.00 0.25 0.25 0.01 0.00 0.01 0.20 0.20 0.09 Crit Moves: **** **** **** **** Green Time: 7.0 74.7 0.0 0.0 67.7 67.7 10.0 0.0 10.0 53.3 53.3 53.3 Volume/Cap: 0.18 0.22 0.00 0.00 0.55 0.55 0.09 0.00 0.09 0.55 0.55 0.26 Delay/Veh: 69.8 21.3 0.0 0.0 30.4 30.4 66.1 0.0 66.1 39.3 39.3 34.6 User DelAdj: 1.00 1.00 1.00 1.00 1.00 1.00 1.00 1.00 1.00 1.00 1.00 1.00 AdjDel/Veh: 69.8 21.3 0.0 0.0 30.4 30.4 66.1 0.0 66.1 39.3 39.3 34.6 LOS by Move: E C+ A A C C E A E D D C- HCM2kAvgQ: 1 5 0 0 15 15 1 0 1 14 14 6 Note: Queue reported is the number of cars per lane.

COMPARE Wed Oct 05 10:41:56 2011 Page 3-8
Traffix 8.0.0715 Copyright (c) 2008 Dowling Associates, Inc. Licensed to FEHR & PEERS WALNUT CRK
San Jose City College
SJ07-951 Level Of Service Computation Report
2000 HCM Operations (Future Volume Alternative) EX + Proj PM
Intersection #4: Bascom/Parkmoor Signal=Protect/Rights=Include Final Vol: 28 1394*** 0 Lanes: 0 1 2 0 0
Signal=Split
Signal=Split
Final Vol: Lanes: Rights=Include Vol Cnt Date: n/a Rights=Include Lanes: Final Vol:
2***
0 Cycle Time (sec): 150
1
168
0
Loss Time (sec): 12
0
0 1!
Critical V/C: 0.520
0 118***
0
Avg Crit Del (sec/veh): 34.5
1
9 0
Avg Delay (sec/veh): 31.9
1 626
LOS: C
Lanes: 1 0 3 0 0 Final Vol: 15*** 640 0 Signal=Protect/Rights=Include Street Name: S Bascom Ave Parkmoor Ave Approach: North Bound South Bound East Bound West Bound Movement: L - T - R L - T - R L - T - R L - T - R ------------|---------------||---------------||---------------||---------------| Min. Green: 7 10 0 0 10 10 10 0 10 10 10 10 Y+R: 4.0 4.0 4.0 4.0 4.0 4.0 4.0 4.0 4.0 4.0 4.0 4.0 ------------|---------------||---------------||---------------||---------------| Volume Module: Base Vol: 15 634 0 0 1373 28 2 0 9 582 118 164 Growth Adj: 1.00 1.00 1.00 1.00 1.00 1.00 1.00 1.00 1.00 1.00 1.00 1.00 Initial Bse: 15 634 0 0 1373 28 2 0 9 582 118 164 Added Vol: 0 6 0 0 21 0 0 0 0 44 0 4 PasserByVol: 0 0 0 0 0 0 0 0 0 0 0 0 Initial Fut: 15 640 0 0 1394 28 2 0 9 626 118 168 User Adj: 1.00 1.00 1.00 1.00 1.00 1.00 1.00 1.00 1.00 1.00 1.00 1.00 PHF Adj: 1.00 1.00 1.00 1.00 1.00 1.00 1.00 1.00 1.00 1.00 1.00 1.00 PHF Volume: 15 640 0 0 1394 28 2 0 9 626 118 168 Reduct Vol: 0 0 0 0 0 0 0 0 0 0 0 0 Reduced Vol: 15 640 0 0 1394 28 2 0 9 626 118 168 PCE Adj: 1.00 1.00 1.00 1.00 1.00 1.00 1.00 1.00 1.00 1.00 1.00 1.00 MLF Adj: 1.00 1.00 1.00 1.00 1.00 1.00 1.00 1.00 1.00 1.00 1.00 1.00 FinalVolume: 15 640 0 0 1394 28 2 0 9 626 118 168 ------------|---------------||---------------||---------------||---------------| Saturation Flow Module: Sat/Lane: 1900 1900 1900 1900 1900 1900 1900 1900 1900 1900 1900 1900 Adjustment: 0.92 1.00 0.92 0.92 0.98 0.95 0.92 0.92 0.92 0.93 0.95 0.92 Lanes: 1.00 3.00 0.00 0.00 2.94 0.06 0.18 0.00 0.82 1.69 0.31 1.00 Final Sat.: 1750 5700 0 0 5490 110 318 0 1432 2987 563 1750 ------------|---------------||---------------||---------------||---------------| Capacity Analysis Module: Vol/Sat: 0.01 0.11 0.00 0.00 0.25 0.25 0.01 0.00 0.01 0.21 0.21 0.10 Crit Moves: **** **** **** **** Green Time: 7.0 73.3 0.0 0.0 66.3 66.3 10.0 0.0 10.0 54.7 54.7 54.7 Volume/Cap: 0.18 0.23 0.00 0.00 0.57 0.57 0.09 0.00 0.09 0.57 0.57 0.26 Delay/Veh: 69.8 22.1 0.0 0.0 31.6 31.6 66.1 0.0 66.1 38.9 38.9 33.7 User DelAdj: 1.00 1.00 1.00 1.00 1.00 1.00 1.00 1.00 1.00 1.00 1.00 1.00 AdjDel/Veh: 69.8 22.1 0.0 0.0 31.6 31.6 66.1 0.0 66.1 38.9 38.9 33.7 LOS by Move: E C+ A A C C E A E D+ D+ C- HCM2kAvgQ: 1 5 0 0 16 16 1 0 1 15 15 6 Note: Queue reported is the number of cars per lane.

COMPARE Wed Oct 05 10:41:56 2011 Page 3-9
Traffix 8.0.0715 Copyright (c) 2008 Dowling Associates, Inc. Licensed to FEHR & PEERS WALNUT CRK
San Jose City College
SJ07-951 Level Of Service Computation Report
2000 HCM Operations (Future Volume Alternative) Existing PM Balanced
Intersection #5: Leland/Parkmoor Signal=Protect/Rights=Include Final Vol: 69 59*** 0 Lanes: 0 1 0 0 0
Signal=Split
Signal=Split
Final Vol: Lanes: Rights=Include Vol Cnt Date: n/a Rights=Include Lanes: Final Vol:
0
0 Cycle Time (sec): 105
1
54
0
Loss Time (sec): 9
0
0 0
Critical V/C: 0.528
1 1023***
0
Avg Crit Del (sec/veh): 21.4
1
0 0
Avg Delay (sec/veh): 21.1
0 42
LOS: C+
Lanes: 1 0 1 0 0 Final Vol: 217*** 122 0 Signal=Protect/Rights=Include Street Name: Leland Ave Parkmoor Ave Approach: North Bound South Bound East Bound West Bound Movement: L - T - R L - T - R L - T - R L - T - R ------------|---------------||---------------||---------------||---------------| Min. Green: 7 10 0 0 10 10 0 0 0 10 10 10 Y+R: 4.0 4.0 4.0 4.0 4.0 4.0 4.0 4.0 4.0 4.0 4.0 4.0 ------------|---------------||---------------||---------------||---------------| Volume Module: Base Vol: 217 122 0 0 59 69 0 0 0 42 1023 54 Growth Adj: 1.00 1.00 1.00 1.00 1.00 1.00 1.00 1.00 1.00 1.00 1.00 1.00 Initial Bse: 217 122 0 0 59 69 0 0 0 42 1023 54 Added Vol: 0 0 0 0 0 0 0 0 0 0 0 0 PasserByVol: 0 0 0 0 0 0 0 0 0 0 0 0 Initial Fut: 217 122 0 0 59 69 0 0 0 42 1023 54 User Adj: 1.00 1.00 1.00 1.00 1.00 1.00 1.00 1.00 1.00 1.00 1.00 1.00 PHF Adj: 1.00 1.00 1.00 1.00 1.00 1.00 1.00 1.00 1.00 1.00 1.00 1.00 PHF Volume: 217 122 0 0 59 69 0 0 0 42 1023 54 Reduct Vol: 0 0 0 0 0 0 0 0 0 0 0 0 Reduced Vol: 217 122 0 0 59 69 0 0 0 42 1023 54 PCE Adj: 1.00 1.00 1.00 1.00 1.00 1.00 1.00 1.00 1.00 1.00 1.00 1.00 MLF Adj: 1.00 1.00 1.00 1.00 1.00 1.00 1.00 1.00 1.00 1.00 1.00 1.00 FinalVolume: 217 122 0 0 59 69 0 0 0 42 1023 54 ------------|---------------||---------------||---------------||---------------| Saturation Flow Module: Sat/Lane: 1900 1900 1900 1900 1900 1900 1900 1900 1900 1900 1900 1900 Adjustment: 0.92 1.00 0.92 0.92 0.95 0.95 0.92 1.00 0.92 0.95 0.97 0.92 Lanes: 1.00 1.00 0.00 0.00 0.46 0.54 0.00 0.00 0.00 0.08 1.92 1.00 Final Sat.: 1750 1900 0 0 830 970 0 0 0 146 3554 1750 ------------|---------------||---------------||---------------||---------------| Capacity Analysis Module: Vol/Sat: 0.12 0.06 0.00 0.00 0.07 0.07 0.00 0.00 0.00 0.29 0.29 0.03 Crit Moves: **** **** **** Green Time: 24.6 38.8 0.0 0.0 14.1 14.1 0.0 0.0 0.0 57.2 57.2 57.2 Volume/Cap: 0.53 0.17 0.00 0.00 0.53 0.53 0.00 0.00 0.00 0.53 0.53 0.06 Delay/Veh: 36.4 22.4 0.0 0.0 44.5 44.5 0.0 0.0 0.0 15.5 15.5 11.2 User DelAdj: 1.00 1.00 1.00 1.00 1.00 1.00 1.00 1.00 1.00 1.00 1.00 1.00 AdjDel/Veh: 36.4 22.4 0.0 0.0 44.5 44.5 0.0 0.0 0.0 15.5 15.5 11.2 LOS by Move: D+ C+ A A D D A A A B B B+ HCM2kAvgQ: 7 3 0 0 5 5 0 0 0 11 11 1 Note: Queue reported is the number of cars per lane.

COMPARE Wed Oct 05 10:41:56 2011 Page 3-10
Traffix 8.0.0715 Copyright (c) 2008 Dowling Associates, Inc. Licensed to FEHR & PEERS WALNUT CRK
San Jose City College
SJ07-951 Level Of Service Computation Report
2000 HCM Operations (Future Volume Alternative) EX + Proj PM
Intersection #5: Leland/Parkmoor Signal=Protect/Rights=Include Final Vol: 69 59*** 0 Lanes: 0 1 0 0 0
Signal=Split
Signal=Split
Final Vol: Lanes: Rights=Include Vol Cnt Date: n/a Rights=Include Lanes: Final Vol:
0
0 Cycle Time (sec): 105
1
54
0
Loss Time (sec): 9
0
0 0
Critical V/C: 0.553
1 1099***
0
Avg Crit Del (sec/veh): 21.0
1
0 0
Avg Delay (sec/veh): 20.8
0 48
LOS: C+
Lanes: 1 0 1 0 0 Final Vol: 218*** 123 0 Signal=Protect/Rights=Include Street Name: Leland Ave Parkmoor Ave Approach: North Bound South Bound East Bound West Bound Movement: L - T - R L - T - R L - T - R L - T - R ------------|---------------||---------------||---------------||---------------| Min. Green: 7 10 0 0 10 10 0 0 0 10 10 10 Y+R: 4.0 4.0 4.0 4.0 4.0 4.0 4.0 4.0 4.0 4.0 4.0 4.0 ------------|---------------||---------------||---------------||---------------| Volume Module: Base Vol: 217 122 0 0 59 69 0 0 0 42 1023 54 Growth Adj: 1.00 1.00 1.00 1.00 1.00 1.00 1.00 1.00 1.00 1.00 1.00 1.00 Initial Bse: 217 122 0 0 59 69 0 0 0 42 1023 54 Added Vol: 1 1 0 0 0 0 0 0 0 6 76 0 PasserByVol: 0 0 0 0 0 0 0 0 0 0 0 0 Initial Fut: 218 123 0 0 59 69 0 0 0 48 1099 54 User Adj: 1.00 1.00 1.00 1.00 1.00 1.00 1.00 1.00 1.00 1.00 1.00 1.00 PHF Adj: 1.00 1.00 1.00 1.00 1.00 1.00 1.00 1.00 1.00 1.00 1.00 1.00 PHF Volume: 218 123 0 0 59 69 0 0 0 48 1099 54 Reduct Vol: 0 0 0 0 0 0 0 0 0 0 0 0 Reduced Vol: 218 123 0 0 59 69 0 0 0 48 1099 54 PCE Adj: 1.00 1.00 1.00 1.00 1.00 1.00 1.00 1.00 1.00 1.00 1.00 1.00 MLF Adj: 1.00 1.00 1.00 1.00 1.00 1.00 1.00 1.00 1.00 1.00 1.00 1.00 FinalVolume: 218 123 0 0 59 69 0 0 0 48 1099 54 ------------|---------------||---------------||---------------||---------------| Saturation Flow Module: Sat/Lane: 1900 1900 1900 1900 1900 1900 1900 1900 1900 1900 1900 1900 Adjustment: 0.92 1.00 0.92 0.92 0.95 0.95 0.92 1.00 0.92 0.95 0.97 0.92 Lanes: 1.00 1.00 0.00 0.00 0.46 0.54 0.00 0.00 0.00 0.09 1.91 1.00 Final Sat.: 1750 1900 0 0 830 970 0 0 0 155 3545 1750 ------------|---------------||---------------||---------------||---------------| Capacity Analysis Module: Vol/Sat: 0.12 0.06 0.00 0.00 0.07 0.07 0.00 0.00 0.00 0.31 0.31 0.03 Crit Moves: **** **** **** Green Time: 23.6 37.1 0.0 0.0 13.5 13.5 0.0 0.0 0.0 58.9 58.9 58.9 Volume/Cap: 0.55 0.18 0.00 0.00 0.55 0.55 0.00 0.00 0.00 0.55 0.55 0.06 Delay/Veh: 37.7 23.6 0.0 0.0 45.8 45.8 0.0 0.0 0.0 15.0 15.0 10.5 User DelAdj: 1.00 1.00 1.00 1.00 1.00 1.00 1.00 1.00 1.00 1.00 1.00 1.00 AdjDel/Veh: 37.7 23.6 0.0 0.0 45.8 45.8 0.0 0.0 0.0 15.0 15.0 10.5 LOS by Move: D+ C A A D D A A A B B B+ HCM2kAvgQ: 7 3 0 0 5 5 0 0 0 12 12 1 Note: Queue reported is the number of cars per lane.

COMPARE Wed Oct 05 10:41:56 2011 Page 3-11
Traffix 8.0.0715 Copyright (c) 2008 Dowling Associates, Inc. Licensed to FEHR & PEERS WALNUT CRK
San Jose City College
SJ07-951 Level Of Service Computation Report
2000 HCM Operations (Future Volume Alternative) Existing PM Balanced
Intersection #6: Leigh/Parkmoor Signal=Protect/Rights=Include Final Vol: 60 245*** 0 Lanes: 1 0 1 0 0
Signal=Split
Signal=Split
Final Vol: Lanes: Rights=Include Vol Cnt Date: n/a Rights=Include Lanes: Final Vol:
0
0 Cycle Time (sec): 100
1
133
0
Loss Time (sec): 9
0
0 0
Critical V/C: 0.648
1 932
0
Avg Crit Del (sec/veh): 22.0
1
0 0
Avg Delay (sec/veh): 21.9
0 419***
LOS: C+
Lanes: 1 0 1 0 0 Final Vol: 167*** 214 0 Signal=Protect/Rights=Include Street Name: Leigh Parkmoor Approach: North Bound South Bound East Bound West Bound Movement: L - T - R L - T - R L - T - R L - T - R ------------|---------------||---------------||---------------||---------------| Min. Green: 7 10 0 0 10 10 0 0 0 10 10 10 Y+R: 4.0 4.0 4.0 4.0 4.0 4.0 4.0 4.0 4.0 4.0 4.0 4.0 ------------|---------------||---------------||---------------||---------------| Volume Module: Base Vol: 167 214 0 0 245 60 0 0 0 419 932 133 Growth Adj: 1.00 1.00 1.00 1.00 1.00 1.00 1.00 1.00 1.00 1.00 1.00 1.00 Initial Bse: 167 214 0 0 245 60 0 0 0 419 932 133 Added Vol: 0 0 0 0 0 0 0 0 0 0 0 0 PasserByVol: 0 0 0 0 0 0 0 0 0 0 0 0 Initial Fut: 167 214 0 0 245 60 0 0 0 419 932 133 User Adj: 1.00 1.00 1.00 1.00 1.00 1.00 1.00 1.00 1.00 1.00 1.00 1.00 PHF Adj: 1.00 1.00 1.00 1.00 1.00 1.00 1.00 1.00 1.00 1.00 1.00 1.00 PHF Volume: 167 214 0 0 245 60 0 0 0 419 932 133 Reduct Vol: 0 0 0 0 0 0 0 0 0 0 0 0 Reduced Vol: 167 214 0 0 245 60 0 0 0 419 932 133 PCE Adj: 1.00 1.00 1.00 1.00 1.00 1.00 1.00 1.00 1.00 1.00 1.00 1.00 MLF Adj: 1.00 1.00 1.00 1.00 1.00 1.00 1.00 1.00 1.00 1.00 1.00 1.00 FinalVolume: 167 214 0 0 245 60 0 0 0 419 932 133 ------------|---------------||---------------||---------------||---------------| Saturation Flow Module: Sat/Lane: 1900 1900 1900 1900 1900 1900 1900 1900 1900 1900 1900 1900 Adjustment: 0.92 1.00 0.92 0.92 1.00 0.92 0.92 1.00 0.92 0.95 0.99 0.92 Lanes: 1.00 1.00 0.00 0.00 1.00 1.00 0.00 0.00 0.00 0.64 1.36 1.00 Final Sat.: 1750 1900 0 0 1900 1750 0 0 0 1147 2552 1750 ------------|---------------||---------------||---------------||---------------| Capacity Analysis Module: Vol/Sat: 0.10 0.11 0.00 0.00 0.13 0.03 0.00 0.00 0.00 0.37 0.37 0.08 Crit Moves: **** **** **** Green Time: 14.7 34.6 0.0 0.0 19.9 19.9 0.0 0.0 0.0 56.4 56.4 56.4 Volume/Cap: 0.65 0.33 0.00 0.00 0.65 0.17 0.00 0.00 0.00 0.65 0.65 0.13 Delay/Veh: 45.9 24.4 0.0 0.0 40.7 33.5 0.0 0.0 0.0 15.7 15.7 10.4 User DelAdj: 1.00 1.00 1.00 1.00 1.00 1.00 1.00 1.00 1.00 1.00 1.00 1.00 AdjDel/Veh: 45.9 24.4 0.0 0.0 40.7 33.5 0.0 0.0 0.0 15.7 15.7 10.4 LOS by Move: D C A A D C- A A A B B B+ HCM2kAvgQ: 5 5 0 0 8 2 0 0 0 15 15 2 Note: Queue reported is the number of cars per lane.

COMPARE Wed Oct 05 10:41:56 2011 Page 3-12
Traffix 8.0.0715 Copyright (c) 2008 Dowling Associates, Inc. Licensed to FEHR & PEERS WALNUT CRK
San Jose City College
SJ07-951 Level Of Service Computation Report
2000 HCM Operations (Future Volume Alternative) EX + Proj PM
Intersection #6: Leigh/Parkmoor Signal=Protect/Rights=Include Final Vol: 60 251*** 0 Lanes: 1 0 1 0 0
Signal=Split
Signal=Split
Final Vol: Lanes: Rights=Include Vol Cnt Date: n/a Rights=Include Lanes: Final Vol:
0
0 Cycle Time (sec): 100
1
133
0
Loss Time (sec): 9
0
0 0
Critical V/C: 0.708
1 974
0
Avg Crit Del (sec/veh): 24.2
1
0 0
Avg Delay (sec/veh): 23.6
0 482***
LOS: C
Lanes: 1 0 1 0 0 Final Vol: 207*** 220 0 Signal=Protect/Rights=Include Street Name: Leigh Parkmoor Approach: North Bound South Bound East Bound West Bound Movement: L - T - R L - T - R L - T - R L - T - R ------------|---------------||---------------||---------------||---------------| Min. Green: 7 10 0 0 10 10 0 0 0 10 10 10 Y+R: 4.0 4.0 4.0 4.0 4.0 4.0 4.0 4.0 4.0 4.0 4.0 4.0 ------------|---------------||---------------||---------------||---------------| Volume Module: Base Vol: 167 214 0 0 245 60 0 0 0 419 932 133 Growth Adj: 1.00 1.00 1.00 1.00 1.00 1.00 1.00 1.00 1.00 1.00 1.00 1.00 Initial Bse: 167 214 0 0 245 60 0 0 0 419 932 133 Added Vol: 40 6 0 0 6 0 0 0 0 63 42 0 PasserByVol: 0 0 0 0 0 0 0 0 0 0 0 0 Initial Fut: 207 220 0 0 251 60 0 0 0 482 974 133 User Adj: 1.00 1.00 1.00 1.00 1.00 1.00 1.00 1.00 1.00 1.00 1.00 1.00 PHF Adj: 1.00 1.00 1.00 1.00 1.00 1.00 1.00 1.00 1.00 1.00 1.00 1.00 PHF Volume: 207 220 0 0 251 60 0 0 0 482 974 133 Reduct Vol: 0 0 0 0 0 0 0 0 0 0 0 0 Reduced Vol: 207 220 0 0 251 60 0 0 0 482 974 133 PCE Adj: 1.00 1.00 1.00 1.00 1.00 1.00 1.00 1.00 1.00 1.00 1.00 1.00 MLF Adj: 1.00 1.00 1.00 1.00 1.00 1.00 1.00 1.00 1.00 1.00 1.00 1.00 FinalVolume: 207 220 0 0 251 60 0 0 0 482 974 133 ------------|---------------||---------------||---------------||---------------| Saturation Flow Module: Sat/Lane: 1900 1900 1900 1900 1900 1900 1900 1900 1900 1900 1900 1900 Adjustment: 0.92 1.00 0.92 0.92 1.00 0.92 0.92 1.00 0.92 0.95 0.99 0.92 Lanes: 1.00 1.00 0.00 0.00 1.00 1.00 0.00 0.00 0.00 0.68 1.32 1.00 Final Sat.: 1750 1900 0 0 1900 1750 0 0 0 1224 2474 1750 ------------|---------------||---------------||---------------||---------------| Capacity Analysis Module: Vol/Sat: 0.12 0.12 0.00 0.00 0.13 0.03 0.00 0.00 0.00 0.39 0.39 0.08 Crit Moves: **** **** **** Green Time: 16.7 35.4 0.0 0.0 18.7 18.7 0.0 0.0 0.0 55.6 55.6 55.6 Volume/Cap: 0.71 0.33 0.00 0.00 0.71 0.18 0.00 0.00 0.00 0.71 0.71 0.14 Delay/Veh: 47.1 23.9 0.0 0.0 44.6 34.5 0.0 0.0 0.0 17.4 17.4 10.7 User DelAdj: 1.00 1.00 1.00 1.00 1.00 1.00 1.00 1.00 1.00 1.00 1.00 1.00 AdjDel/Veh: 47.1 23.9 0.0 0.0 44.6 34.5 0.0 0.0 0.0 17.4 17.4 10.7 LOS by Move: D C A A D C- A A A B B B+ HCM2kAvgQ: 7 5 0 0 9 2 0 0 0 17 17 2 Note: Queue reported is the number of cars per lane.

COMPARE Wed Oct 05 10:41:56 2011 Page 3-13
Traffix 8.0.0715 Copyright (c) 2008 Dowling Associates, Inc. Licensed to FEHR & PEERS WALNUT CRK
San Jose City College
SJ07-951 Level Of Service Computation Report
2000 HCM Operations (Future Volume Alternative) Existing PM Balanced
Intersection #7: Bascom/Moorpark Signal=Protect/Rights=Include Final Vol: 345 1163 456*** Lanes: 0 1 2 0 1
Signal=Split
Signal=Split
Final Vol: Lanes: Rights=Include Vol Cnt Date: n/a Rights=Include Lanes: Final Vol:
105***
0 Cycle Time (sec): 150
0
0
1
Loss Time (sec): 9
0
886 1
Critical V/C: 0.752
0 0
0
Avg Crit Del (sec/veh): 49.8
0
276 1
Avg Delay (sec/veh): 42.8
0 0
LOS: D
Lanes: 2 0 2 1 0 Final Vol: 249 544 313*** Signal=Protect/Rights=Include Street Name: S Bascom Ave Moorpark Ave Approach: North Bound South Bound East Bound West Bound Movement: L - T - R L - T - R L - T - R L - T - R ------------|---------------||---------------||---------------||---------------| Min. Green: 7 10 10 7 10 10 10 10 10 0 0 0 Y+R: 4.0 4.0 4.0 4.0 4.0 4.0 4.0 4.0 4.0 4.0 4.0 4.0 ------------|---------------||---------------||---------------||---------------| Volume Module: Base Vol: 249 544 313 456 1163 345 105 886 276 0 0 0 Growth Adj: 1.00 1.00 1.00 1.00 1.00 1.00 1.00 1.00 1.00 1.00 1.00 1.00 Initial Bse: 249 544 313 456 1163 345 105 886 276 0 0 0 Added Vol: 0 0 0 0 0 0 0 0 0 0 0 0 PasserByVol: 0 0 0 0 0 0 0 0 0 0 0 0 Initial Fut: 249 544 313 456 1163 345 105 886 276 0 0 0 User Adj: 1.00 1.00 1.00 1.00 1.00 1.00 1.00 1.00 1.00 1.00 1.00 1.00 PHF Adj: 1.00 1.00 1.00 1.00 1.00 1.00 1.00 1.00 1.00 1.00 1.00 1.00 PHF Volume: 249 544 313 456 1163 345 105 886 276 0 0 0 Reduct Vol: 0 0 0 0 0 0 0 0 0 0 0 0 Reduced Vol: 249 544 313 456 1163 345 105 886 276 0 0 0 PCE Adj: 1.00 1.00 1.00 1.00 1.00 1.00 1.00 1.00 1.00 1.00 1.00 1.00 MLF Adj: 1.00 1.00 1.00 1.00 1.00 1.00 1.00 1.00 1.00 1.00 1.00 1.00 FinalVolume: 249 544 313 456 1163 345 105 886 276 0 0 0 ------------|---------------||---------------||---------------||---------------| Saturation Flow Module: Sat/Lane: 1900 1900 1900 1900 1900 1900 1900 1900 1900 1900 1900 1900 Adjustment: 0.83 1.00 0.92 0.92 0.99 0.95 0.95 0.98 0.92 0.92 1.00 0.92 Lanes: 2.00 2.00 1.00 1.00 2.29 0.71 0.22 1.78 1.00 0.00 0.00 0.00 Final Sat.: 3150 3800 1750 1750 4317 1281 392 3308 1750 0 0 0 ------------|---------------||---------------||---------------||---------------| Capacity Analysis Module: Vol/Sat: 0.08 0.14 0.18 0.26 0.27 0.27 0.27 0.27 0.16 0.00 0.00 0.00 Crit Moves: **** **** **** Green Time: 19.9 35.7 35.7 51.9 67.7 67.7 53.4 53.4 53.4 0.0 0.0 0.0 Volume/Cap: 0.60 0.60 0.75 0.75 0.60 0.60 0.75 0.75 0.44 0.00 0.00 0.00 Delay/Veh: 63.6 51.6 55.9 48.6 31.3 31.3 45.0 45.0 37.4 0.0 0.0 0.0 User DelAdj: 1.00 1.00 1.00 1.00 1.00 1.00 1.00 1.00 1.00 1.00 1.00 1.00 AdjDel/Veh: 63.6 51.6 55.9 48.6 31.3 31.3 45.0 45.0 37.4 0.0 0.0 0.0 LOS by Move: E D- E+ D C C D D D+ A A A HCM2kAvgQ: 6 11 15 20 17 17 21 21 10 0 0 0 Note: Queue reported is the number of cars per lane.

COMPARE Wed Oct 05 10:41:56 2011 Page 3-14
Traffix 8.0.0715 Copyright (c) 2008 Dowling Associates, Inc. Licensed to FEHR & PEERS WALNUT CRK
San Jose City College
SJ07-951 Level Of Service Computation Report
2000 HCM Operations (Future Volume Alternative) EX + Proj PM
Intersection #7: Bascom/Moorpark Signal=Protect/Rights=Include Final Vol: 347 1172 511*** Lanes: 0 1 2 0 1
Signal=Split
Signal=Split
Final Vol: Lanes: Rights=Include Vol Cnt Date: n/a Rights=Include Lanes: Final Vol:
105***
0 Cycle Time (sec): 150
0
0
1
Loss Time (sec): 9
0
893 1
Critical V/C: 0.793
0 0
0
Avg Crit Del (sec/veh): 52.1
0
276 1
Avg Delay (sec/veh): 43.6
0 0
LOS: D
Lanes: 2 0 2 1 0 Final Vol: 251 550 322*** Signal=Protect/Rights=Include Street Name: S Bascom Ave Moorpark Ave Approach: North Bound South Bound East Bound West Bound Movement: L - T - R L - T - R L - T - R L - T - R ------------|---------------||---------------||---------------||---------------| Min. Green: 7 10 10 7 10 10 10 10 10 0 0 0 Y+R: 4.0 4.0 4.0 4.0 4.0 4.0 4.0 4.0 4.0 4.0 4.0 4.0 ------------|---------------||---------------||---------------||---------------| Volume Module: Base Vol: 249 544 313 456 1163 345 105 886 276 0 0 0 Growth Adj: 1.00 1.00 1.00 1.00 1.00 1.00 1.00 1.00 1.00 1.00 1.00 1.00 Initial Bse: 249 544 313 456 1163 345 105 886 276 0 0 0 Added Vol: 2 6 9 55 9 2 0 7 0 0 0 0 PasserByVol: 0 0 0 0 0 0 0 0 0 0 0 0 Initial Fut: 251 550 322 511 1172 347 105 893 276 0 0 0 User Adj: 1.00 1.00 1.00 1.00 1.00 1.00 1.00 1.00 1.00 1.00 1.00 1.00 PHF Adj: 1.00 1.00 1.00 1.00 1.00 1.00 1.00 1.00 1.00 1.00 1.00 1.00 PHF Volume: 251 550 322 511 1172 347 105 893 276 0 0 0 Reduct Vol: 0 0 0 0 0 0 0 0 0 0 0 0 Reduced Vol: 251 550 322 511 1172 347 105 893 276 0 0 0 PCE Adj: 1.00 1.00 1.00 1.00 1.00 1.00 1.00 1.00 1.00 1.00 1.00 1.00 MLF Adj: 1.00 1.00 1.00 1.00 1.00 1.00 1.00 1.00 1.00 1.00 1.00 1.00 FinalVolume: 251 550 322 511 1172 347 105 893 276 0 0 0 ------------|---------------||---------------||---------------||---------------| Saturation Flow Module: Sat/Lane: 1900 1900 1900 1900 1900 1900 1900 1900 1900 1900 1900 1900 Adjustment: 0.83 1.00 0.92 0.92 0.99 0.95 0.95 0.98 0.92 0.92 1.00 0.92 Lanes: 2.00 2.00 1.00 1.00 2.29 0.71 0.22 1.78 1.00 0.00 0.00 0.00 Final Sat.: 3150 3800 1750 1750 4319 1279 389 3310 1750 0 0 0 ------------|---------------||---------------||---------------||---------------| Capacity Analysis Module: Vol/Sat: 0.08 0.14 0.18 0.29 0.27 0.27 0.27 0.27 0.16 0.00 0.00 0.00 Crit Moves: **** **** **** Green Time: 20.4 34.8 34.8 55.2 69.6 69.6 51.0 51.0 51.0 0.0 0.0 0.0 Volume/Cap: 0.59 0.62 0.79 0.79 0.59 0.59 0.79 0.79 0.46 0.00 0.00 0.00 Delay/Veh: 62.9 52.6 58.3 49.0 29.9 29.9 48.3 48.3 39.4 0.0 0.0 0.0 User DelAdj: 1.00 1.00 1.00 1.00 1.00 1.00 1.00 1.00 1.00 1.00 1.00 1.00 AdjDel/Veh: 62.9 52.6 58.3 49.0 29.9 29.9 48.3 48.3 39.4 0.0 0.0 0.0 LOS by Move: E D- E+ D C C D D D A A A HCM2kAvgQ: 6 11 16 23 17 17 23 23 11 0 0 0 Note: Queue reported is the number of cars per lane.

COMPARE Wed Oct 05 10:41:56 2011 Page 3-15
Traffix 8.0.0715 Copyright (c) 2008 Dowling Associates, Inc. Licensed to FEHR & PEERS WALNUT CRK
San Jose City College
SJ07-951 Level Of Service Computation Report
2000 HCM Operations (Future Volume Alternative) Existing PM Balanced
Intersection #8: Leland/Moorpark Signal=Split/Rights=Include Final Vol: 0 0 101*** Lanes: 0 0 0 0 1
Signal=Split
Signal=Split
Final Vol: Lanes: Rights=Ignore Vol Cnt Date: n/a Rights=Include Lanes: Final Vol:
339***
0 Cycle Time (sec): 110
0
0
1
Loss Time (sec): 6
0
1718 2
Critical V/C: 0.450
0 0
0
Avg Crit Del (sec/veh): 5.0
0
0 1
Avg Delay (sec/veh): 5.0
0 0
LOS: A
Lanes: 0 0 0 0 1 Final Vol: 0 0 0 Signal=Split/Rights=Ignore Street Name: Leland Ave Moorpark Ave Approach: North Bound South Bound East Bound West Bound Movement: L - T - R L - T - R L - T - R L - T - R ------------|---------------||---------------||---------------||---------------| Min. Green: 0 0 0 10 0 0 10 10 0 0 0 0 Y+R: 4.0 4.0 4.0 4.0 4.0 4.0 4.0 4.0 4.0 4.0 4.0 4.0 ------------|---------------||---------------||---------------||---------------| Volume Module: Base Vol: 0 0 27 101 0 0 339 1718 48 0 0 0 Growth Adj: 1.00 1.00 1.00 1.00 1.00 1.00 1.00 1.00 1.00 1.00 1.00 1.00 Initial Bse: 0 0 27 101 0 0 339 1718 48 0 0 0 Added Vol: 0 0 0 0 0 0 0 0 0 0 0 0 PasserByVol: 0 0 0 0 0 0 0 0 0 0 0 0 Initial Fut: 0 0 27 101 0 0 339 1718 48 0 0 0 User Adj: 1.00 1.00 0.00 1.00 1.00 1.00 1.00 1.00 0.00 1.00 1.00 1.00 PHF Adj: 1.00 1.00 0.00 1.00 1.00 1.00 1.00 1.00 0.00 1.00 1.00 1.00 PHF Volume: 0 0 0 101 0 0 339 1718 0 0 0 0 Reduct Vol: 0 0 0 0 0 0 0 0 0 0 0 0 Reduced Vol: 0 0 0 101 0 0 339 1718 0 0 0 0 PCE Adj: 1.00 1.00 0.00 1.00 1.00 1.00 1.00 1.00 0.00 1.00 1.00 1.00 MLF Adj: 1.00 1.00 0.00 1.00 1.00 1.00 1.00 1.00 0.00 1.00 1.00 1.00 FinalVolume: 0 0 0 101 0 0 339 1718 0 0 0 0 ------------|---------------||---------------||---------------||---------------| Saturation Flow Module: Sat/Lane: 1900 1900 1900 1900 1900 1900 1900 1900 1900 1900 1900 1900 Adjustment: 0.92 1.00 0.92 0.92 1.00 0.92 0.95 0.99 0.92 0.92 1.00 0.92 Lanes: 0.00 0.00 1.00 1.00 0.00 0.00 0.51 2.49 1.00 0.00 0.00 0.00 Final Sat.: 0 0 1750 1750 0 0 923 4676 1750 0 0 0 ------------|---------------||---------------||---------------||---------------| Capacity Analysis Module: Vol/Sat: 0.00 0.00 0.00 0.06 0.00 0.00 0.37 0.37 0.00 0.00 0.00 0.00 Crit Moves: **** **** Green Time: 0.0 0.0 0.0 14.1 0.0 0.0 89.9 89.9 0.0 0.0 0.0 0.0 Volume/Cap: 0.00 0.00 0.00 0.45 0.00 0.00 0.45 0.45 0.00 0.00 0.00 0.00 Delay/Veh: 0.0 0.0 0.0 45.8 0.0 0.0 3.0 3.0 0.0 0.0 0.0 0.0 User DelAdj: 1.00 1.00 1.00 1.00 1.00 1.00 1.00 1.00 1.00 1.00 1.00 1.00 AdjDel/Veh: 0.0 0.0 0.0 45.8 0.0 0.0 3.0 3.0 0.0 0.0 0.0 0.0 LOS by Move: A A A D A A A A A A A A HCM2kAvgQ: 0 0 0 3 0 0 7 7 0 0 0 0 Note: Queue reported is the number of cars per lane.

COMPARE Wed Oct 05 10:41:56 2011 Page 3-16
Traffix 8.0.0715 Copyright (c) 2008 Dowling Associates, Inc. Licensed to FEHR & PEERS WALNUT CRK
San Jose City College
SJ07-951 Level Of Service Computation Report
2000 HCM Operations (Future Volume Alternative) EX + Proj PM
Intersection #8: Leland/Moorpark Signal=Split/Rights=Include Final Vol: 0 0 107*** Lanes: 0 0 0 0 1
Signal=Split
Signal=Split
Final Vol: Lanes: Rights=Ignore Vol Cnt Date: n/a Rights=Include Lanes: Final Vol:
341***
0 Cycle Time (sec): 110
0
0
1
Loss Time (sec): 6
0
1773 2
Critical V/C: 0.464
0 0
0
Avg Crit Del (sec/veh): 5.2
0
0 1
Avg Delay (sec/veh): 5.2
0 0
LOS: A
Lanes: 0 0 0 0 1 Final Vol: 0 0 0 Signal=Split/Rights=Ignore Street Name: Leland Ave Moorpark Ave Approach: North Bound South Bound East Bound West Bound Movement: L - T - R L - T - R L - T - R L - T - R ------------|---------------||---------------||---------------||---------------| Min. Green: 0 0 0 10 0 0 10 10 0 0 0 0 Y+R: 4.0 4.0 4.0 4.0 4.0 4.0 4.0 4.0 4.0 4.0 4.0 4.0 ------------|---------------||---------------||---------------||---------------| Volume Module: Base Vol: 0 0 27 101 0 0 339 1718 48 0 0 0 Growth Adj: 1.00 1.00 1.00 1.00 1.00 1.00 1.00 1.00 1.00 1.00 1.00 1.00 Initial Bse: 0 0 27 101 0 0 339 1718 48 0 0 0 Added Vol: 0 0 71 6 0 0 2 55 36 0 0 0 PasserByVol: 0 0 0 0 0 0 0 0 0 0 0 0 Initial Fut: 0 0 98 107 0 0 341 1773 84 0 0 0 User Adj: 1.00 1.00 0.00 1.00 1.00 1.00 1.00 1.00 0.00 1.00 1.00 1.00 PHF Adj: 1.00 1.00 0.00 1.00 1.00 1.00 1.00 1.00 0.00 1.00 1.00 1.00 PHF Volume: 0 0 0 107 0 0 341 1773 0 0 0 0 Reduct Vol: 0 0 0 0 0 0 0 0 0 0 0 0 Reduced Vol: 0 0 0 107 0 0 341 1773 0 0 0 0 PCE Adj: 1.00 1.00 0.00 1.00 1.00 1.00 1.00 1.00 0.00 1.00 1.00 1.00 MLF Adj: 1.00 1.00 0.00 1.00 1.00 1.00 1.00 1.00 0.00 1.00 1.00 1.00 FinalVolume: 0 0 0 107 0 0 341 1773 0 0 0 0 ------------|---------------||---------------||---------------||---------------| Saturation Flow Module: Sat/Lane: 1900 1900 1900 1900 1900 1900 1900 1900 1900 1900 1900 1900 Adjustment: 0.92 1.00 0.92 0.92 1.00 0.92 0.95 0.99 0.92 0.92 1.00 0.92 Lanes: 0.00 0.00 1.00 1.00 0.00 0.00 0.50 2.50 1.00 0.00 0.00 0.00 Final Sat.: 0 0 1750 1750 0 0 903 4696 1750 0 0 0 ------------|---------------||---------------||---------------||---------------| Capacity Analysis Module: Vol/Sat: 0.00 0.00 0.00 0.06 0.00 0.00 0.38 0.38 0.00 0.00 0.00 0.00 Crit Moves: **** **** Green Time: 0.0 0.0 0.0 14.5 0.0 0.0 89.5 89.5 0.0 0.0 0.0 0.0 Volume/Cap: 0.00 0.00 0.00 0.46 0.00 0.00 0.46 0.46 0.00 0.00 0.00 0.00 Delay/Veh: 0.0 0.0 0.0 45.6 0.0 0.0 3.1 3.1 0.0 0.0 0.0 0.0 User DelAdj: 1.00 1.00 1.00 1.00 1.00 1.00 1.00 1.00 1.00 1.00 1.00 1.00 AdjDel/Veh: 0.0 0.0 0.0 45.6 0.0 0.0 3.1 3.1 0.0 0.0 0.0 0.0 LOS by Move: A A A D A A A A A A A A HCM2kAvgQ: 0 0 0 4 0 0 7 7 0 0 0 0 Note: Queue reported is the number of cars per lane.

COMPARE Wed Oct 05 10:41:56 2011 Page 3-17
Traffix 8.0.0715 Copyright (c) 2008 Dowling Associates, Inc. Licensed to FEHR & PEERS WALNUT CRK
San Jose City College
SJ07-951 Level Of Service Computation Report
2000 HCM Operations (Future Volume Alternative) Existing PM Balanced
Intersection #9: Leigh/Moorpark Signal=Protect/Rights=Include Final Vol: 0 476 188*** Lanes: 0 0 2 0 1
Signal=Split
Signal=Split
Final Vol: Lanes: Rights=Include Vol Cnt Date: n/a Rights=Include Lanes: Final Vol:
155
0 Cycle Time (sec): 100
0
0
1
Loss Time (sec): 9
0
1262 2
Critical V/C: 0.474
0 0
0
Avg Crit Del (sec/veh): 23.5
0
451*** 1
Avg Delay (sec/veh): 20.1
0 0
LOS: C+
Lanes: 0 0 2 0 1 Final Vol: 0 226 116*** Signal=Protect/Rights=Include Street Name: Leigh Ave Moorpark Ave Approach: North Bound South Bound East Bound West Bound Movement: L - T - R L - T - R L - T - R L - T - R ------------|---------------||---------------||---------------||---------------| Min. Green: 0 10 10 7 10 0 10 10 10 0 0 0 Y+R: 4.0 4.0 4.0 4.0 4.0 4.0 4.0 4.0 4.0 4.0 4.0 4.0 ------------|---------------||---------------||---------------||---------------| Volume Module: Base Vol: 0 226 116 188 476 0 155 1262 451 0 0 0 Growth Adj: 1.00 1.00 1.00 1.00 1.00 1.00 1.00 1.00 1.00 1.00 1.00 1.00 Initial Bse: 0 226 116 188 476 0 155 1262 451 0 0 0 Added Vol: 0 0 0 0 0 0 0 0 0 0 0 0 PasserByVol: 0 0 0 0 0 0 0 0 0 0 0 0 Initial Fut: 0 226 116 188 476 0 155 1262 451 0 0 0 User Adj: 1.00 1.00 1.00 1.00 1.00 1.00 1.00 1.00 1.00 1.00 1.00 1.00 PHF Adj: 1.00 1.00 1.00 1.00 1.00 1.00 1.00 1.00 1.00 1.00 1.00 1.00 PHF Volume: 0 226 116 188 476 0 155 1262 451 0 0 0 Reduct Vol: 0 0 0 0 0 0 0 0 0 0 0 0 Reduced Vol: 0 226 116 188 476 0 155 1262 451 0 0 0 PCE Adj: 1.00 1.00 1.00 1.00 1.00 1.00 1.00 1.00 1.00 1.00 1.00 1.00 MLF Adj: 1.00 1.00 1.00 1.00 1.00 1.00 1.00 1.00 1.00 1.00 1.00 1.00 FinalVolume: 0 226 116 188 476 0 155 1262 451 0 0 0 ------------|---------------||---------------||---------------||---------------| Saturation Flow Module: Sat/Lane: 1900 1900 1900 1900 1900 1900 1900 1900 1900 1900 1900 1900 Adjustment: 0.92 1.00 0.92 0.92 1.00 0.92 0.95 0.99 0.92 0.92 1.00 0.92 Lanes: 0.00 2.00 1.00 1.00 2.00 0.00 0.34 2.66 1.00 0.00 0.00 0.00 Final Sat.: 0 3800 1750 1750 3800 0 612 4987 1750 0 0 0 ------------|---------------||---------------||---------------||---------------| Capacity Analysis Module: Vol/Sat: 0.00 0.06 0.07 0.11 0.13 0.00 0.25 0.25 0.26 0.00 0.00 0.00 Crit Moves: **** **** **** Green Time: 0.0 14.0 14.0 22.7 36.6 0.0 54.4 54.4 54.4 0.0 0.0 0.0 Volume/Cap: 0.00 0.43 0.47 0.47 0.34 0.00 0.47 0.47 0.47 0.00 0.00 0.00 Delay/Veh: 0.0 39.9 41.1 34.4 23.1 0.0 14.1 14.1 14.4 0.0 0.0 0.0 User DelAdj: 1.00 1.00 1.00 1.00 1.00 1.00 1.00 1.00 1.00 1.00 1.00 1.00 AdjDel/Veh: 0.0 39.9 41.1 34.4 23.1 0.0 14.1 14.1 14.4 0.0 0.0 0.0 LOS by Move: A D D C- C A B B B A A A HCM2kAvgQ: 0 3 4 5 5 0 9 9 9 0 0 0 Note: Queue reported is the number of cars per lane.

COMPARE Wed Oct 05 10:41:56 2011 Page 3-18
Traffix 8.0.0715 Copyright (c) 2008 Dowling Associates, Inc. Licensed to FEHR & PEERS WALNUT CRK
San Jose City College
SJ07-951 Level Of Service Computation Report
2000 HCM Operations (Future Volume Alternative) EX + Proj PM
Intersection #9: Leigh/Moorpark Signal=Protect/Rights=Include Final Vol: 0 544 188*** Lanes: 0 0 2 0 1
Signal=Split
Signal=Split
Final Vol: Lanes: Rights=Include Vol Cnt Date: n/a Rights=Include Lanes: Final Vol:
195
0 Cycle Time (sec): 100
0
0
1
Loss Time (sec): 9
0
1315 2
Critical V/C: 0.498
0 0
0
Avg Crit Del (sec/veh): 23.0
0
489*** 1
Avg Delay (sec/veh): 19.9
0 0
LOS: B-
Lanes: 0 0 2 0 1 Final Vol: 0 232 116*** Signal=Protect/Rights=Include Street Name: Leigh Ave Moorpark Ave Approach: North Bound South Bound East Bound West Bound Movement: L - T - R L - T - R L - T - R L - T - R ------------|---------------||---------------||---------------||---------------| Min. Green: 0 10 10 7 10 0 10 10 10 0 0 0 Y+R: 4.0 4.0 4.0 4.0 4.0 4.0 4.0 4.0 4.0 4.0 4.0 4.0 ------------|---------------||---------------||---------------||---------------| Volume Module: Base Vol: 0 226 116 188 476 0 155 1262 451 0 0 0 Growth Adj: 1.00 1.00 1.00 1.00 1.00 1.00 1.00 1.00 1.00 1.00 1.00 1.00 Initial Bse: 0 226 116 188 476 0 155 1262 451 0 0 0 Added Vol: 0 6 0 0 68 0 40 53 38 0 0 0 PasserByVol: 0 0 0 0 0 0 0 0 0 0 0 0 Initial Fut: 0 232 116 188 544 0 195 1315 489 0 0 0 User Adj: 1.00 1.00 1.00 1.00 1.00 1.00 1.00 1.00 1.00 1.00 1.00 1.00 PHF Adj: 1.00 1.00 1.00 1.00 1.00 1.00 1.00 1.00 1.00 1.00 1.00 1.00 PHF Volume: 0 232 116 188 544 0 195 1315 489 0 0 0 Reduct Vol: 0 0 0 0 0 0 0 0 0 0 0 0 Reduced Vol: 0 232 116 188 544 0 195 1315 489 0 0 0 PCE Adj: 1.00 1.00 1.00 1.00 1.00 1.00 1.00 1.00 1.00 1.00 1.00 1.00 MLF Adj: 1.00 1.00 1.00 1.00 1.00 1.00 1.00 1.00 1.00 1.00 1.00 1.00 FinalVolume: 0 232 116 188 544 0 195 1315 489 0 0 0 ------------|---------------||---------------||---------------||---------------| Saturation Flow Module: Sat/Lane: 1900 1900 1900 1900 1900 1900 1900 1900 1900 1900 1900 1900 Adjustment: 0.92 1.00 0.92 0.92 1.00 0.92 0.95 0.99 0.92 0.92 1.00 0.92 Lanes: 0.00 2.00 1.00 1.00 2.00 0.00 0.40 2.60 1.00 0.00 0.00 0.00 Final Sat.: 0 3800 1750 1750 3800 0 723 4876 1750 0 0 0 ------------|---------------||---------------||---------------||---------------| Capacity Analysis Module: Vol/Sat: 0.00 0.06 0.07 0.11 0.14 0.00 0.27 0.27 0.28 0.00 0.00 0.00 Crit Moves: **** **** **** Green Time: 0.0 13.3 13.3 21.6 34.9 0.0 56.1 56.1 56.1 0.0 0.0 0.0 Volume/Cap: 0.00 0.46 0.50 0.50 0.41 0.00 0.48 0.48 0.50 0.00 0.00 0.00 Delay/Veh: 0.0 40.7 41.9 35.5 24.9 0.0 13.3 13.3 13.8 0.0 0.0 0.0 User DelAdj: 1.00 1.00 1.00 1.00 1.00 1.00 1.00 1.00 1.00 1.00 1.00 1.00 AdjDel/Veh: 0.0 40.7 41.9 35.5 24.9 0.0 13.3 13.3 13.8 0.0 0.0 0.0 LOS by Move: A D D D+ C A B B B A A A HCM2kAvgQ: 0 3 4 5 6 0 9 9 10 0 0 0 Note: Queue reported is the number of cars per lane.

COMPARE Wed Oct 05 10:41:56 2011 Page 3-19
Traffix 8.0.0715 Copyright (c) 2008 Dowling Associates, Inc. Licensed to FEHR & PEERS WALNUT CRK
San Jose City College
SJ07-951 Level Of Service Computation Report
2000 HCM Operations (Future Volume Alternative) Existing PM Balanced
Intersection #10: Bascom/Renova Signal=Protect/Rights=Include Final Vol: 48 1382*** 27 Lanes: 0 1 2 0 1
Signal=Permit
Signal=Permit
Final Vol: Lanes: Rights=Include Vol Cnt Date: n/a Rights=Include Lanes: Final Vol:
35
0 Cycle Time (sec): 150
1
26
1
Loss Time (sec): 9
0
1 0
Critical V/C: 0.340
0 5
0
Avg Crit Del (sec/veh): 10.5
1
61*** 1
Avg Delay (sec/veh): 12.6
0 18
LOS: B
Lanes: 1 0 2 1 0 Final Vol: 51*** 978 8 Signal=Protect/Rights=Include Street Name: Bascom Ave Renova Dr Approach: North Bound South Bound East Bound West Bound Movement: L - T - R L - T - R L - T - R L - T - R ------------|---------------||---------------||---------------||---------------| Min. Green: 7 10 10 7 10 10 10 10 10 10 10 10 Y+R: 4.0 4.0 4.0 4.0 4.0 4.0 4.0 4.0 4.0 4.0 4.0 4.0 ------------|---------------||---------------||---------------||---------------| Volume Module: Base Vol: 51 978 8 27 1382 48 35 1 61 18 5 26 Growth Adj: 1.00 1.00 1.00 1.00 1.00 1.00 1.00 1.00 1.00 1.00 1.00 1.00 Initial Bse: 51 978 8 27 1382 48 35 1 61 18 5 26 Added Vol: 0 0 0 0 0 0 0 0 0 0 0 0 PasserByVol: 0 0 0 0 0 0 0 0 0 0 0 0 Initial Fut: 51 978 8 27 1382 48 35 1 61 18 5 26 User Adj: 1.00 1.00 1.00 1.00 1.00 1.00 1.00 1.00 1.00 1.00 1.00 1.00 PHF Adj: 1.00 1.00 1.00 1.00 1.00 1.00 1.00 1.00 1.00 1.00 1.00 1.00 PHF Volume: 51 978 8 27 1382 48 35 1 61 18 5 26 Reduct Vol: 0 0 0 0 0 0 0 0 0 0 0 0 Reduced Vol: 51 978 8 27 1382 48 35 1 61 18 5 26 PCE Adj: 1.00 1.00 1.00 1.00 1.00 1.00 1.00 1.00 1.00 1.00 1.00 1.00 MLF Adj: 1.00 1.00 1.00 1.00 1.00 1.00 1.00 1.00 1.00 1.00 1.00 1.00 FinalVolume: 51 978 8 27 1382 48 35 1 61 18 5 26 ------------|---------------||---------------||---------------||---------------| Saturation Flow Module: Sat/Lane: 1900 1900 1900 1900 1900 1900 1900 1900 1900 1900 1900 1900 Adjustment: 0.92 0.98 0.95 0.92 0.98 0.95 0.95 0.95 0.92 0.95 0.95 0.92 Lanes: 1.00 2.97 0.03 1.00 2.90 0.10 0.97 0.03 1.00 0.78 0.22 1.00 Final Sat.: 1750 5555 45 1750 5412 188 1750 50 1750 1409 391 1750 ------------|---------------||---------------||---------------||---------------| Capacity Analysis Module: Vol/Sat: 0.03 0.18 0.18 0.02 0.26 0.26 0.02 0.02 0.03 0.01 0.01 0.01 Crit Moves: **** **** **** Green Time: 12.9 99.3 99.3 26.3 113 112.7 15.4 15.4 15.4 15.4 15.4 15.4 Volume/Cap: 0.34 0.27 0.27 0.09 0.34 0.34 0.19 0.19 0.34 0.12 0.12 0.14 Delay/Veh: 65.9 10.4 10.4 51.9 6.3 6.3 62.2 62.2 63.7 61.5 61.5 61.7 User DelAdj: 1.00 1.00 1.00 1.00 1.00 1.00 1.00 1.00 1.00 1.00 1.00 1.00 AdjDel/Veh: 65.9 10.4 10.4 51.9 6.3 6.3 62.2 62.2 63.7 61.5 61.5 61.7 LOS by Move: E B+ B+ D- A A E E E E E E HCM2kAvgQ: 2 6 6 1 7 7 2 2 3 1 1 1 Note: Queue reported is the number of cars per lane.

COMPARE Wed Oct 05 10:41:56 2011 Page 3-20
Traffix 8.0.0715 Copyright (c) 2008 Dowling Associates, Inc. Licensed to FEHR & PEERS WALNUT CRK
San Jose City College
SJ07-951 Level Of Service Computation Report
2000 HCM Operations (Future Volume Alternative) EX + Proj PM
Intersection #10: Bascom/Renova Signal=Protect/Rights=Include Final Vol: 48 1391*** 27 Lanes: 0 1 2 0 1
Signal=Permit
Signal=Permit
Final Vol: Lanes: Rights=Include Vol Cnt Date: n/a Rights=Include Lanes: Final Vol:
35
0 Cycle Time (sec): 150
1
26
1
Loss Time (sec): 9
0
1 0
Critical V/C: 0.341
0 5
0
Avg Crit Del (sec/veh): 10.5
1
61*** 1
Avg Delay (sec/veh): 12.5
0 18
LOS: B
Lanes: 1 0 2 1 0 Final Vol: 51*** 994 8 Signal=Protect/Rights=Include Street Name: Bascom Ave Renova Dr Approach: North Bound South Bound East Bound West Bound Movement: L - T - R L - T - R L - T - R L - T - R ------------|---------------||---------------||---------------||---------------| Min. Green: 7 10 10 7 10 10 10 10 10 10 10 10 Y+R: 4.0 4.0 4.0 4.0 4.0 4.0 4.0 4.0 4.0 4.0 4.0 4.0 ------------|---------------||---------------||---------------||---------------| Volume Module: Base Vol: 51 978 8 27 1382 48 35 1 61 18 5 26 Growth Adj: 1.00 1.00 1.00 1.00 1.00 1.00 1.00 1.00 1.00 1.00 1.00 1.00 Initial Bse: 51 978 8 27 1382 48 35 1 61 18 5 26 Added Vol: 0 16 0 0 9 0 0 0 0 0 0 0 PasserByVol: 0 0 0 0 0 0 0 0 0 0 0 0 Initial Fut: 51 994 8 27 1391 48 35 1 61 18 5 26 User Adj: 1.00 1.00 1.00 1.00 1.00 1.00 1.00 1.00 1.00 1.00 1.00 1.00 PHF Adj: 1.00 1.00 1.00 1.00 1.00 1.00 1.00 1.00 1.00 1.00 1.00 1.00 PHF Volume: 51 994 8 27 1391 48 35 1 61 18 5 26 Reduct Vol: 0 0 0 0 0 0 0 0 0 0 0 0 Reduced Vol: 51 994 8 27 1391 48 35 1 61 18 5 26 PCE Adj: 1.00 1.00 1.00 1.00 1.00 1.00 1.00 1.00 1.00 1.00 1.00 1.00 MLF Adj: 1.00 1.00 1.00 1.00 1.00 1.00 1.00 1.00 1.00 1.00 1.00 1.00 FinalVolume: 51 994 8 27 1391 48 35 1 61 18 5 26 ------------|---------------||---------------||---------------||---------------| Saturation Flow Module: Sat/Lane: 1900 1900 1900 1900 1900 1900 1900 1900 1900 1900 1900 1900 Adjustment: 0.92 0.98 0.95 0.92 0.98 0.95 0.95 0.95 0.92 0.95 0.95 0.92 Lanes: 1.00 2.98 0.02 1.00 2.90 0.10 0.97 0.03 1.00 0.78 0.22 1.00 Final Sat.: 1750 5555 45 1750 5413 187 1750 50 1750 1409 391 1750 ------------|---------------||---------------||---------------||---------------| Capacity Analysis Module: Vol/Sat: 0.03 0.18 0.18 0.02 0.26 0.26 0.02 0.02 0.03 0.01 0.01 0.01 Crit Moves: **** **** **** Green Time: 12.8 99.7 99.7 26.0 113 112.9 15.3 15.3 15.3 15.3 15.3 15.3 Volume/Cap: 0.34 0.27 0.27 0.09 0.34 0.34 0.20 0.20 0.34 0.13 0.13 0.15 Delay/Veh: 66.0 10.3 10.3 52.2 6.2 6.2 62.2 62.2 63.8 61.6 61.6 61.8 User DelAdj: 1.00 1.00 1.00 1.00 1.00 1.00 1.00 1.00 1.00 1.00 1.00 1.00 AdjDel/Veh: 66.0 10.3 10.3 52.2 6.2 6.2 62.2 62.2 63.8 61.6 61.6 61.8 LOS by Move: E B+ B+ D- A A E E E E E E HCM2kAvgQ: 2 6 6 1 7 7 2 2 3 1 1 1 Note: Queue reported is the number of cars per lane.

COMPARE Wed Oct 05 10:41:56 2011 Page 3-21
Traffix 8.0.0715 Copyright (c) 2008 Dowling Associates, Inc. Licensed to FEHR & PEERS WALNUT CRK
San Jose City College
SJ07-951 Level Of Service Computation Report
2000 HCM Unsignalized (Future Volume Alternative) Existing PM Balanced
Intersection #11: Bascom/Laswell [Unsignalized] Signal=Uncontrol/Rights=Include Final Vol: 8 1345 107 Lanes: 0 0 3 0 1
Signal=Stop
Signal=Stop
Final Vol: Lanes: Rights=Include Vol Cnt Date: n/a Rights=Include Lanes: Final Vol:
0
0 Cycle Time (sec): 100
0
26
0
Loss Time (sec): 0
0
0 0
Critical V/C: 0.366
1! 0
0
Avg Crit Del (sec/veh): 1.5
0
0 0
Avg Delay (sec/veh): 1.5
0 27
LOS: F
Lanes: 0 0 2 1 0 Final Vol: 4 966 123 Signal=Uncontrol/Rights=Include Street Name: S Bascom Ave Laswell Ave Approach: North Bound South Bound East Bound West Bound Movement: L - T - R L - T - R L - T - R L - T - R ------------|---------------||---------------||---------------||---------------| Volume Module: Base Vol: 4 966 123 107 1345 8 0 0 0 27 0 26 Growth Adj: 1.00 1.00 1.00 1.00 1.00 1.00 1.00 1.00 1.00 1.00 1.00 1.00 Initial Bse: 4 966 123 107 1345 8 0 0 0 27 0 26 Added Vol: 0 0 0 0 0 0 0 0 0 0 0 0 PasserByVol: 0 0 0 0 0 0 0 0 0 0 0 0 Initial Fut: 4 966 123 107 1345 8 0 0 0 27 0 26 User Adj: 1.00 1.00 1.00 1.00 1.00 1.00 1.00 1.00 1.00 1.00 1.00 1.00 PHF Adj: 1.00 1.00 1.00 1.00 1.00 1.00 1.00 1.00 1.00 1.00 1.00 1.00 PHF Volume: 4 966 123 107 1345 8 0 0 0 27 0 26 Reduct Vol: 0 0 0 0 0 0 0 0 0 0 0 0 FinalVolume: 4 966 123 107 1345 8 0 0 0 27 0 26 ------------|---------------||---------------||---------------||---------------| Critical Gap Module: Critical Gp: 4.1 xxxx xxxxx 4.1 xxxx xxxxx xxxxx xxxx xxxxx 6.8 6.5 6.9 FollowUpTim: 2.2 xxxx xxxxx 2.2 xxxx xxxxx xxxxx xxxx xxxxx 3.5 4.0 3.3 ------------|---------------||---------------||---------------||---------------| Capacity Module: Cnflict Vol: 1353 xxxx xxxxx 1089 xxxx xxxxx xxxx xxxx xxxxx 1698 2603 384 Potent Cap.: 515 xxxx xxxxx 648 xxxx xxxxx xxxx xxxx xxxxx 85 25 620 Move Cap.: 515 xxxx xxxxx 648 xxxx xxxxx xxxx xxxx xxxxx 74 21 620 Volume/Cap: 0.01 xxxx xxxx 0.17 xxxx xxxx xxxx xxxx xxxx 0.37 0.00 0.04 ------------|---------------||---------------||---------------||---------------| Level Of Service Module: 2Way95thQ: 0.0 xxxx xxxxx 0.6 xxxx xxxxx xxxx xxxx xxxxx xxxx xxxx xxxxx Control Del: 12.0 xxxx xxxxx 11.6 xxxx xxxxx xxxxx xxxx xxxxx xxxxx xxxx xxxxx LOS by Move: B * * B * * * * * * * * Movement: LT - LTR - RT LT - LTR - RT LT - LTR - RT LT - LTR - RT Shared Cap.: xxxx xxxx xxxxx xxxx xxxx xxxxx xxxx xxxx xxxxx xxxx 130 xxxxx SharedQueue: 0.0 xxxx xxxxx xxxxx xxxx xxxxx xxxxx xxxx xxxxx xxxxx 1.7 xxxxx Shrd ConDel: 12.0 xxxx xxxxx xxxxx xxxx xxxxx xxxxx xxxx xxxxx xxxxx 50.6 xxxxx Shared LOS: B * * * * * * * * * F * ApproachDel: xxxxxx xxxxxx xxxxxx 50.6 ApproachLOS: * * * F Note: Queue reported is the number of cars per lane.

COMPARE Wed Oct 05 10:41:56 2011 Page 3-22
Traffix 8.0.0715 Copyright (c) 2008 Dowling Associates, Inc. Licensed to FEHR & PEERS WALNUT CRK
San Jose City College
SJ07-951 Level Of Service Computation Report
2000 HCM Unsignalized (Future Volume Alternative) EX + Proj PM
Intersection #11: Bascom/Laswell [Unsignalized] Signal=Uncontrol/Rights=Include Final Vol: 8 1345 116 Lanes: 0 0 3 0 1
Signal=Stop
Signal=Stop
Final Vol: Lanes: Rights=Include Vol Cnt Date: n/a Rights=Include Lanes: Final Vol:
0
0 Cycle Time (sec): 100
0
33
0
Loss Time (sec): 0
0
0 0
Critical V/C: 0.601
1! 0
0
Avg Crit Del (sec/veh): 2.9
0
0 0
Avg Delay (sec/veh): 2.9
0 41
LOS: F
Lanes: 0 0 2 1 0 Final Vol: 4 975 149 Signal=Uncontrol/Rights=Include Street Name: S Bascom Ave Laswell Ave Approach: North Bound South Bound East Bound West Bound Movement: L - T - R L - T - R L - T - R L - T - R ------------|---------------||---------------||---------------||---------------| Volume Module: Base Vol: 4 966 123 107 1345 8 0 0 0 27 0 26 Growth Adj: 1.00 1.00 1.00 1.00 1.00 1.00 1.00 1.00 1.00 1.00 1.00 1.00 Initial Bse: 4 966 123 107 1345 8 0 0 0 27 0 26 Added Vol: 0 9 26 9 0 0 0 0 0 14 0 7 PasserByVol: 0 0 0 0 0 0 0 0 0 0 0 0 Initial Fut: 4 975 149 116 1345 8 0 0 0 41 0 33 User Adj: 1.00 1.00 1.00 1.00 1.00 1.00 1.00 1.00 1.00 1.00 1.00 1.00 PHF Adj: 1.00 1.00 1.00 1.00 1.00 1.00 1.00 1.00 1.00 1.00 1.00 1.00 PHF Volume: 4 975 149 116 1345 8 0 0 0 41 0 33 Reduct Vol: 0 0 0 0 0 0 0 0 0 0 0 0 FinalVolume: 4 975 149 116 1345 8 0 0 0 41 0 33 ------------|---------------||---------------||---------------||---------------| Critical Gap Module: Critical Gp: 4.1 xxxx xxxxx 4.1 xxxx xxxxx xxxxx xxxx xxxxx 6.8 6.5 6.9 FollowUpTim: 2.2 xxxx xxxxx 2.2 xxxx xxxxx xxxxx xxxx xxxxx 3.5 4.0 3.3 ------------|---------------||---------------||---------------||---------------| Capacity Module: Cnflict Vol: 1353 xxxx xxxxx 1124 xxxx xxxxx xxxx xxxx xxxxx 1738 2643 400 Potent Cap.: 515 xxxx xxxxx 629 xxxx xxxxx xxxx xxxx xxxxx 80 24 606 Move Cap.: 515 xxxx xxxxx 629 xxxx xxxxx xxxx xxxx xxxxx 68 19 606 Volume/Cap: 0.01 xxxx xxxx 0.18 xxxx xxxx xxxx xxxx xxxx 0.60 0.00 0.05 ------------|---------------||---------------||---------------||---------------| Level Of Service Module: 2Way95thQ: 0.0 xxxx xxxxx 0.7 xxxx xxxxx xxxx xxxx xxxxx xxxx xxxx xxxxx Control Del: 12.0 xxxx xxxxx 12.0 xxxx xxxxx xxxxx xxxx xxxxx xxxxx xxxx xxxxx LOS by Move: B * * B * * * * * * * * Movement: LT - LTR - RT LT - LTR - RT LT - LTR - RT LT - LTR - RT Shared Cap.: xxxx xxxx xxxxx xxxx xxxx xxxxx xxxx xxxx xxxxx xxxx 113 xxxxx SharedQueue: 0.0 xxxx xxxxx xxxxx xxxx xxxxx xxxxx xxxx xxxxx xxxxx 3.4 xxxxx Shrd ConDel: 12.0 xxxx xxxxx xxxxx xxxx xxxxx xxxxx xxxx xxxxx xxxxx 83.5 xxxxx Shared LOS: B * * * * * * * * * F * ApproachDel: xxxxxx xxxxxx xxxxxx 83.5 ApproachLOS: * * * F Note: Queue reported is the number of cars per lane.

COMPARE Wed Oct 05 10:41:56 2011 Page 3-23
Traffix 8.0.0715 Copyright (c) 2008 Dowling Associates, Inc. Licensed to FEHR & PEERS WALNUT CRK
San Jose City College
SJ07-951 Level Of Service Computation Report
2000 HCM Operations (Future Volume Alternative) Existing PM Balanced
Intersection #12: Bascom/Fruitdale Signal=Protect/Rights=Include Final Vol: 28 1074 294*** Lanes: 1 0 3 0 1
Signal=Split
Signal=Split
Final Vol: Lanes: Rights=Include Vol Cnt Date: n/a Rights=Include Lanes: Final Vol:
56
0 Cycle Time (sec): 150
1
338***
1
Loss Time (sec): 12
0
123 0
Critical V/C: 0.650
1 41
1
Avg Crit Del (sec/veh): 54.3
1
127*** 0
Avg Delay (sec/veh): 46.4
0 226
LOS: D
Lanes: 1 0 2 1 0 Final Vol: 40 703*** 147 Signal=Protect/Rights=Include Street Name: Bascom Fruitdale Approach: North Bound South Bound East Bound West Bound Movement: L - T - R L - T - R L - T - R L - T - R ------------|---------------||---------------||---------------||---------------| Min. Green: 7 10 10 7 10 10 10 10 10 10 10 10 Y+R: 4.0 4.0 4.0 4.0 4.0 4.0 4.0 4.0 4.0 4.0 4.0 4.0 ------------|---------------||---------------||---------------||---------------| Volume Module: Base Vol: 40 703 147 294 1074 28 56 123 127 226 41 338 Growth Adj: 1.00 1.00 1.00 1.00 1.00 1.00 1.00 1.00 1.00 1.00 1.00 1.00 Initial Bse: 40 703 147 294 1074 28 56 123 127 226 41 338 Added Vol: 0 0 0 0 0 0 0 0 0 0 0 0 PasserByVol: 0 0 0 0 0 0 0 0 0 0 0 0 Initial Fut: 40 703 147 294 1074 28 56 123 127 226 41 338 User Adj: 1.00 1.00 1.00 1.00 1.00 1.00 1.00 1.00 1.00 1.00 1.00 1.00 PHF Adj: 1.00 1.00 1.00 1.00 1.00 1.00 1.00 1.00 1.00 1.00 1.00 1.00 PHF Volume: 40 703 147 294 1074 28 56 123 127 226 41 338 Reduct Vol: 0 0 0 0 0 0 0 0 0 0 0 0 Reduced Vol: 40 703 147 294 1074 28 56 123 127 226 41 338 PCE Adj: 1.00 1.00 1.00 1.00 1.00 1.00 1.00 1.00 1.00 1.00 1.00 1.00 MLF Adj: 1.00 1.00 1.00 1.00 1.00 1.00 1.00 1.00 1.00 1.00 1.00 1.00 FinalVolume: 40 703 147 294 1074 28 56 123 127 226 41 338 ------------|---------------||---------------||---------------||---------------| Saturation Flow Module: Sat/Lane: 1900 1900 1900 1900 1900 1900 1900 1900 1900 1900 1900 1900 Adjustment: 0.92 0.99 0.95 0.92 1.00 0.92 0.95 0.95 0.95 0.92 1.00 0.92 Lanes: 1.00 2.46 0.54 1.00 3.00 1.00 0.37 0.80 0.83 1.00 1.00 1.00 Final Sat.: 1750 4630 968 1750 5700 1750 659 1447 1494 1750 1900 1750 ------------|---------------||---------------||---------------||---------------| Capacity Analysis Module: Vol/Sat: 0.02 0.15 0.15 0.17 0.19 0.02 0.09 0.09 0.09 0.13 0.02 0.19 Crit Moves: **** **** **** **** Green Time: 14.7 35.0 35.0 38.8 59.2 59.2 19.6 19.6 19.6 44.6 44.6 44.6 Volume/Cap: 0.23 0.65 0.65 0.65 0.48 0.04 0.65 0.65 0.65 0.43 0.07 0.65 Delay/Veh: 63.2 53.1 53.1 52.9 34.1 28.0 65.1 65.1 65.1 43.0 37.9 48.8 User DelAdj: 1.00 1.00 1.00 1.00 1.00 1.00 1.00 1.00 1.00 1.00 1.00 1.00 AdjDel/Veh: 63.2 53.1 53.1 52.9 34.1 28.0 65.1 65.1 65.1 43.0 37.9 48.8 LOS by Move: E D- D- D- C- C E E E D D+ D HCM2kAvgQ: 2 13 13 13 12 1 8 8 8 9 1 14 Note: Queue reported is the number of cars per lane.

COMPARE Wed Oct 05 10:41:56 2011 Page 3-24
Traffix 8.0.0715 Copyright (c) 2008 Dowling Associates, Inc. Licensed to FEHR & PEERS WALNUT CRK
San Jose City College
SJ07-951 Level Of Service Computation Report
2000 HCM Operations (Future Volume Alternative) EX + Proj PM
Intersection #12: Bascom/Fruitdale Signal=Protect/Rights=Include Final Vol: 28 1080 303*** Lanes: 1 0 3 0 1
Signal=Split
Signal=Split
Final Vol: Lanes: Rights=Include Vol Cnt Date: n/a Rights=Include Lanes: Final Vol:
56
0 Cycle Time (sec): 150
1
361***
1
Loss Time (sec): 12
0
123 0
Critical V/C: 0.672
1 41
1
Avg Crit Del (sec/veh): 55.1
1
127*** 0
Avg Delay (sec/veh): 47.0
0 227
LOS: D
Lanes: 1 0 2 1 0 Final Vol: 40 715*** 147 Signal=Protect/Rights=Include Street Name: Bascom Fruitdale Approach: North Bound South Bound East Bound West Bound Movement: L - T - R L - T - R L - T - R L - T - R ------------|---------------||---------------||---------------||---------------| Min. Green: 7 10 10 7 10 10 10 10 10 10 10 10 Y+R: 4.0 4.0 4.0 4.0 4.0 4.0 4.0 4.0 4.0 4.0 4.0 4.0 ------------|---------------||---------------||---------------||---------------| Volume Module: Base Vol: 40 703 147 294 1074 28 56 123 127 226 41 338 Growth Adj: 1.00 1.00 1.00 1.00 1.00 1.00 1.00 1.00 1.00 1.00 1.00 1.00 Initial Bse: 40 703 147 294 1074 28 56 123 127 226 41 338 Added Vol: 0 12 0 9 6 0 0 0 0 1 0 23 PasserByVol: 0 0 0 0 0 0 0 0 0 0 0 0 Initial Fut: 40 715 147 303 1080 28 56 123 127 227 41 361 User Adj: 1.00 1.00 1.00 1.00 1.00 1.00 1.00 1.00 1.00 1.00 1.00 1.00 PHF Adj: 1.00 1.00 1.00 1.00 1.00 1.00 1.00 1.00 1.00 1.00 1.00 1.00 PHF Volume: 40 715 147 303 1080 28 56 123 127 227 41 361 Reduct Vol: 0 0 0 0 0 0 0 0 0 0 0 0 Reduced Vol: 40 715 147 303 1080 28 56 123 127 227 41 361 PCE Adj: 1.00 1.00 1.00 1.00 1.00 1.00 1.00 1.00 1.00 1.00 1.00 1.00 MLF Adj: 1.00 1.00 1.00 1.00 1.00 1.00 1.00 1.00 1.00 1.00 1.00 1.00 FinalVolume: 40 715 147 303 1080 28 56 123 127 227 41 361 ------------|---------------||---------------||---------------||---------------| Saturation Flow Module: Sat/Lane: 1900 1900 1900 1900 1900 1900 1900 1900 1900 1900 1900 1900 Adjustment: 0.92 0.99 0.95 0.92 1.00 0.92 0.95 0.95 0.95 0.92 1.00 0.92 Lanes: 1.00 2.47 0.53 1.00 3.00 1.00 0.37 0.80 0.83 1.00 1.00 1.00 Final Sat.: 1750 4644 955 1750 5700 1750 659 1447 1494 1750 1900 1750 ------------|---------------||---------------||---------------||---------------| Capacity Analysis Module: Vol/Sat: 0.02 0.15 0.15 0.17 0.19 0.02 0.09 0.09 0.09 0.13 0.02 0.21 Crit Moves: **** **** **** **** Green Time: 14.4 34.4 34.4 38.6 58.6 58.6 19.0 19.0 19.0 46.0 46.0 46.0 Volume/Cap: 0.24 0.67 0.67 0.67 0.49 0.04 0.67 0.67 0.67 0.42 0.07 0.67 Delay/Veh: 63.4 54.1 54.1 53.9 34.5 28.3 66.5 66.5 66.5 41.9 36.8 48.7 User DelAdj: 1.00 1.00 1.00 1.00 1.00 1.00 1.00 1.00 1.00 1.00 1.00 1.00 AdjDel/Veh: 63.4 54.1 54.1 53.9 34.5 28.3 66.5 66.5 66.5 41.9 36.8 48.7 LOS by Move: E D- D- D- C- C E E E D D+ D HCM2kAvgQ: 2 13 13 13 12 1 8 8 8 9 1 15 Note: Queue reported is the number of cars per lane.

COMPARE Wed Oct 05 10:41:56 2011 Page 3-25
Traffix 8.0.0715 Copyright (c) 2008 Dowling Associates, Inc. Licensed to FEHR & PEERS WALNUT CRK
San Jose City College
SJ07-951 Level Of Service Computation Report
2000 HCM Unsignalized (Future Volume Alternative) Existing PM Balanced
Intersection #13: Sherman Oaks/Fruitdale [Unsignalized] Signal=Stop/Rights=Include Final Vol: 17 0 22 Lanes: 0 0 1! 0 0
Signal=Uncontrol
Signal=Uncontrol
Final Vol: Lanes: Rights=Include Vol Cnt Date: n/a Rights=Include Lanes: Final Vol:
5
1 Cycle Time (sec): 100
1
31
0
Loss Time (sec): 0
0
491 2
Critical V/C: 0.087
2 714
0
Avg Crit Del (sec/veh): 0.5
0
0 0
Avg Delay (sec/veh): 0.5
0 0
LOS: C
Lanes: 0 0 0 0 0 Final Vol: 0 0 0 Signal=Stop/Rights=Include Street Name: Sherman Oaks Fruitdale Approach: North Bound South Bound East Bound West Bound Movement: L - T - R L - T - R L - T - R L - T - R ------------|---------------||---------------||---------------||---------------| Volume Module: Base Vol: 0 0 0 22 0 17 5 491 0 0 714 31 Growth Adj: 1.00 1.00 1.00 1.00 1.00 1.00 1.00 1.00 1.00 1.00 1.00 1.00 Initial Bse: 0 0 0 22 0 17 5 491 0 0 714 31 Added Vol: 0 0 0 0 0 0 0 0 0 0 0 0 PasserByVol: 0 0 0 0 0 0 0 0 0 0 0 0 Initial Fut: 0 0 0 22 0 17 5 491 0 0 714 31 User Adj: 1.00 1.00 1.00 1.00 1.00 1.00 1.00 1.00 1.00 1.00 1.00 1.00 PHF Adj: 1.00 1.00 1.00 1.00 1.00 1.00 1.00 1.00 1.00 1.00 1.00 1.00 PHF Volume: 0 0 0 22 0 17 5 491 0 0 714 31 Reduct Vol: 0 0 0 0 0 0 0 0 0 0 0 0 FinalVolume: 0 0 0 22 0 17 5 491 0 0 714 31 ------------|---------------||---------------||---------------||---------------| Critical Gap Module: Critical Gp:xxxxx xxxx xxxxx 6.8 6.5 6.9 4.1 xxxx xxxxx xxxxx xxxx xxxxx FollowUpTim:xxxxx xxxx xxxxx 3.5 4.0 3.3 2.2 xxxx xxxxx xxxxx xxxx xxxxx ------------|---------------||---------------||---------------||---------------| Capacity Module: Cnflict Vol: xxxx xxxx xxxxx 970 1215 357 745 xxxx xxxxx xxxx xxxx xxxxx Potent Cap.: xxxx xxxx xxxxx 254 183 645 872 xxxx xxxxx xxxx xxxx xxxxx Move Cap.: xxxx xxxx xxxxx 253 182 645 872 xxxx xxxxx xxxx xxxx xxxxx Volume/Cap: xxxx xxxx xxxx 0.09 0.00 0.03 0.01 xxxx xxxx xxxx xxxx xxxx ------------|---------------||---------------||---------------||---------------| Level Of Service Module: 2Way95thQ: xxxx xxxx xxxxx xxxx xxxx xxxxx 0.0 xxxx xxxxx xxxx xxxx xxxxx Control Del:xxxxx xxxx xxxxx xxxxx xxxx xxxxx 9.2 xxxx xxxxx xxxxx xxxx xxxxx LOS by Move: * * * * * * A * * * * * Movement: LT - LTR - RT LT - LTR - RT LT - LTR - RT LT - LTR - RT Shared Cap.: xxxx xxxx xxxxx xxxx 345 xxxxx xxxx xxxx xxxxx xxxx xxxx xxxxx SharedQueue:xxxxx xxxx xxxxx xxxxx 0.4 xxxxx xxxxx xxxx xxxxx xxxxx xxxx xxxxx Shrd ConDel:xxxxx xxxx xxxxx xxxxx 16.8 xxxxx xxxxx xxxx xxxxx xxxxx xxxx xxxxx Shared LOS: * * * * C * * * * * * * ApproachDel: xxxxxx 16.8 xxxxxx xxxxxx ApproachLOS: * C * * Note: Queue reported is the number of cars per lane.
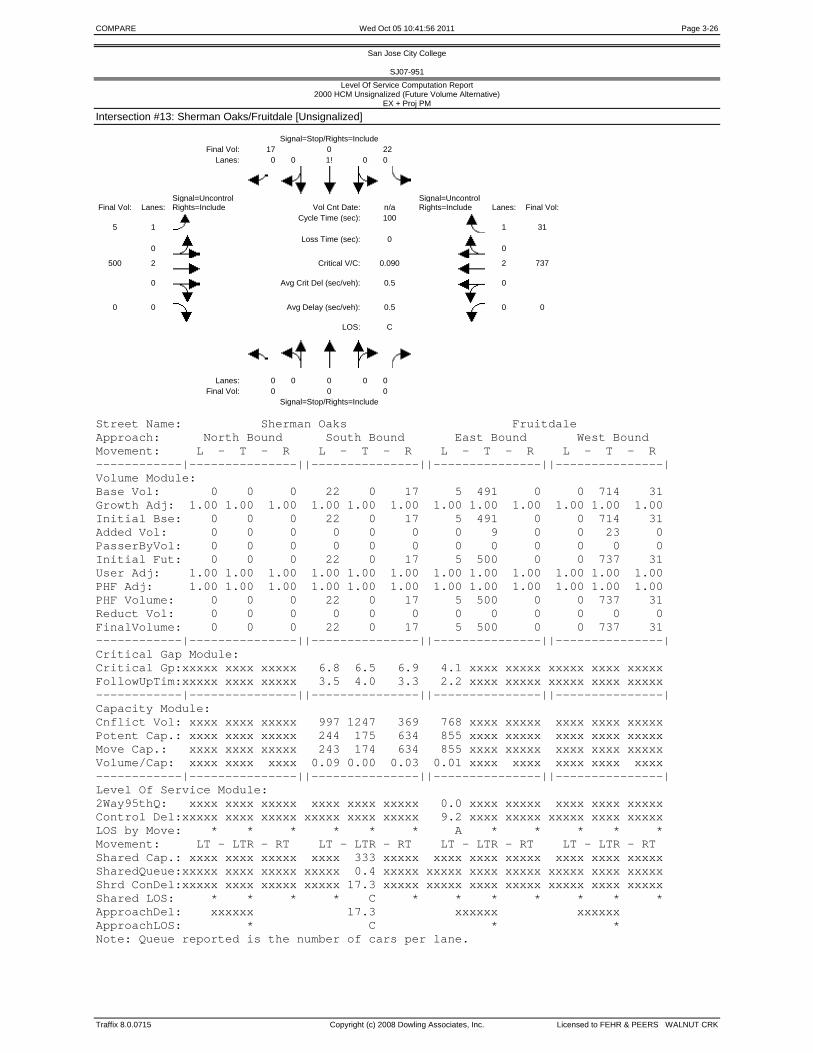
COMPARE Wed Oct 05 10:41:56 2011 Page 3-26
Traffix 8.0.0715 Copyright (c) 2008 Dowling Associates, Inc. Licensed to FEHR & PEERS WALNUT CRK
San Jose City College
SJ07-951 Level Of Service Computation Report
2000 HCM Unsignalized (Future Volume Alternative) EX + Proj PM
Intersection #13: Sherman Oaks/Fruitdale [Unsignalized] Signal=Stop/Rights=Include Final Vol: 17 0 22 Lanes: 0 0 1! 0 0
Signal=Uncontrol
Signal=Uncontrol
Final Vol: Lanes: Rights=Include Vol Cnt Date: n/a Rights=Include Lanes: Final Vol:
5
1 Cycle Time (sec): 100
1
31
0
Loss Time (sec): 0
0
500 2
Critical V/C: 0.090
2 737
0
Avg Crit Del (sec/veh): 0.5
0
0 0
Avg Delay (sec/veh): 0.5
0 0
LOS: C
Lanes: 0 0 0 0 0 Final Vol: 0 0 0 Signal=Stop/Rights=Include Street Name: Sherman Oaks Fruitdale Approach: North Bound South Bound East Bound West Bound Movement: L - T - R L - T - R L - T - R L - T - R ------------|---------------||---------------||---------------||---------------| Volume Module: Base Vol: 0 0 0 22 0 17 5 491 0 0 714 31 Growth Adj: 1.00 1.00 1.00 1.00 1.00 1.00 1.00 1.00 1.00 1.00 1.00 1.00 Initial Bse: 0 0 0 22 0 17 5 491 0 0 714 31 Added Vol: 0 0 0 0 0 0 0 9 0 0 23 0 PasserByVol: 0 0 0 0 0 0 0 0 0 0 0 0 Initial Fut: 0 0 0 22 0 17 5 500 0 0 737 31 User Adj: 1.00 1.00 1.00 1.00 1.00 1.00 1.00 1.00 1.00 1.00 1.00 1.00 PHF Adj: 1.00 1.00 1.00 1.00 1.00 1.00 1.00 1.00 1.00 1.00 1.00 1.00 PHF Volume: 0 0 0 22 0 17 5 500 0 0 737 31 Reduct Vol: 0 0 0 0 0 0 0 0 0 0 0 0 FinalVolume: 0 0 0 22 0 17 5 500 0 0 737 31 ------------|---------------||---------------||---------------||---------------| Critical Gap Module: Critical Gp:xxxxx xxxx xxxxx 6.8 6.5 6.9 4.1 xxxx xxxxx xxxxx xxxx xxxxx FollowUpTim:xxxxx xxxx xxxxx 3.5 4.0 3.3 2.2 xxxx xxxxx xxxxx xxxx xxxxx ------------|---------------||---------------||---------------||---------------| Capacity Module: Cnflict Vol: xxxx xxxx xxxxx 997 1247 369 768 xxxx xxxxx xxxx xxxx xxxxx Potent Cap.: xxxx xxxx xxxxx 244 175 634 855 xxxx xxxxx xxxx xxxx xxxxx Move Cap.: xxxx xxxx xxxxx 243 174 634 855 xxxx xxxxx xxxx xxxx xxxxx Volume/Cap: xxxx xxxx xxxx 0.09 0.00 0.03 0.01 xxxx xxxx xxxx xxxx xxxx ------------|---------------||---------------||---------------||---------------| Level Of Service Module: 2Way95thQ: xxxx xxxx xxxxx xxxx xxxx xxxxx 0.0 xxxx xxxxx xxxx xxxx xxxxx Control Del:xxxxx xxxx xxxxx xxxxx xxxx xxxxx 9.2 xxxx xxxxx xxxxx xxxx xxxxx LOS by Move: * * * * * * A * * * * * Movement: LT - LTR - RT LT - LTR - RT LT - LTR - RT LT - LTR - RT Shared Cap.: xxxx xxxx xxxxx xxxx 333 xxxxx xxxx xxxx xxxxx xxxx xxxx xxxxx SharedQueue:xxxxx xxxx xxxxx xxxxx 0.4 xxxxx xxxxx xxxx xxxxx xxxxx xxxx xxxxx Shrd ConDel:xxxxx xxxx xxxxx xxxxx 17.3 xxxxx xxxxx xxxx xxxxx xxxxx xxxx xxxxx Shared LOS: * * * * C * * * * * * * ApproachDel: xxxxxx 17.3 xxxxxx xxxxxx ApproachLOS: * C * * Note: Queue reported is the number of cars per lane.

COMPARE Wed Oct 05 10:41:56 2011 Page 3-27
Traffix 8.0.0715 Copyright (c) 2008 Dowling Associates, Inc. Licensed to FEHR & PEERS WALNUT CRK
San Jose City College
SJ07-951 Level Of Service Computation Report
2000 HCM Operations (Future Volume Alternative) Existing PM Balanced
Intersection #14: Leigh/Fruitdale Signal=Protect/Rights=Include Final Vol: 288 420*** 86 Lanes: 0 1 1 0 1
Signal=Protect
Signal=Protect
Final Vol: Lanes: Rights=Include Vol Cnt Date: n/a Rights=Include Lanes: Final Vol:
105***
1 Cycle Time (sec): 105
1
32
0
Loss Time (sec): 12
0
344 2
Critical V/C: 0.450
2 400***
0
Avg Crit Del (sec/veh): 28.9
0
71 1
Avg Delay (sec/veh): 30.5
1 21
LOS: C
Lanes: 1 0 1 1 0 Final Vol: 73*** 128 16 Signal=Protect/Rights=Include Street Name: Leigh Fruitdale Approach: North Bound South Bound East Bound West Bound Movement: L - T - R L - T - R L - T - R L - T - R ------------|---------------||---------------||---------------||---------------| Min. Green: 7 10 10 7 10 10 7 10 10 7 10 10 Y+R: 4.0 4.0 4.0 4.0 4.0 4.0 4.0 4.0 4.0 4.0 4.0 4.0 ------------|---------------||---------------||---------------||---------------| Volume Module: Base Vol: 73 128 16 86 420 288 105 344 71 21 400 32 Growth Adj: 1.00 1.00 1.00 1.00 1.00 1.00 1.00 1.00 1.00 1.00 1.00 1.00 Initial Bse: 73 128 16 86 420 288 105 344 71 21 400 32 Added Vol: 0 0 0 0 0 0 0 0 0 0 0 0 PasserByVol: 0 0 0 0 0 0 0 0 0 0 0 0 Initial Fut: 73 128 16 86 420 288 105 344 71 21 400 32 User Adj: 1.00 1.00 1.00 1.00 1.00 1.00 1.00 1.00 1.00 1.00 1.00 1.00 PHF Adj: 1.00 1.00 1.00 1.00 1.00 1.00 1.00 1.00 1.00 1.00 1.00 1.00 PHF Volume: 73 128 16 86 420 288 105 344 71 21 400 32 Reduct Vol: 0 0 0 0 0 0 0 0 0 0 0 0 Reduced Vol: 73 128 16 86 420 288 105 344 71 21 400 32 PCE Adj: 1.00 1.00 1.00 1.00 1.00 1.00 1.00 1.00 1.00 1.00 1.00 1.00 MLF Adj: 1.00 1.00 1.00 1.00 1.00 1.00 1.00 1.00 1.00 1.00 1.00 1.00 FinalVolume: 73 128 16 86 420 288 105 344 71 21 400 32 ------------|---------------||---------------||---------------||---------------| Saturation Flow Module: Sat/Lane: 1900 1900 1900 1900 1900 1900 1900 1900 1900 1900 1900 1900 Adjustment: 0.92 0.98 0.95 0.92 0.99 0.95 0.92 1.00 0.92 0.92 1.00 0.92 Lanes: 1.00 1.77 0.23 1.00 1.16 0.84 1.00 2.00 1.00 1.00 2.00 1.00 Final Sat.: 1750 3289 411 1750 2194 1504 1750 3800 1750 1750 3800 1750 ------------|---------------||---------------||---------------||---------------| Capacity Analysis Module: Vol/Sat: 0.04 0.04 0.04 0.05 0.19 0.19 0.06 0.09 0.04 0.01 0.11 0.02 Crit Moves: **** **** **** **** Green Time: 9.7 32.0 32.0 22.4 44.7 44.7 14.0 22.7 22.7 15.9 24.6 24.6 Volume/Cap: 0.45 0.13 0.13 0.23 0.45 0.45 0.45 0.42 0.19 0.08 0.45 0.08 Delay/Veh: 47.1 26.4 26.4 34.5 21.6 21.6 43.3 35.8 33.9 38.4 34.8 31.5 User DelAdj: 1.00 1.00 1.00 1.00 1.00 1.00 1.00 1.00 1.00 1.00 1.00 1.00 AdjDel/Veh: 47.1 26.4 26.4 34.5 21.6 21.6 43.3 35.8 33.9 38.4 34.8 31.5 LOS by Move: D C C C- C+ C+ D D+ C- D+ C- C HCM2kAvgQ: 3 2 2 2 8 8 3 5 2 1 5 1 Note: Queue reported is the number of cars per lane.

COMPARE Wed Oct 05 10:41:56 2011 Page 3-28
Traffix 8.0.0715 Copyright (c) 2008 Dowling Associates, Inc. Licensed to FEHR & PEERS WALNUT CRK
San Jose City College
SJ07-951 Level Of Service Computation Report
2000 HCM Operations (Future Volume Alternative) EX + Proj PM
Intersection #14: Leigh/Fruitdale Signal=Protect/Rights=Include Final Vol: 289 423*** 89 Lanes: 0 1 1 0 1
Signal=Protect
Signal=Protect
Final Vol: Lanes: Rights=Include Vol Cnt Date: n/a Rights=Include Lanes: Final Vol:
105***
1 Cycle Time (sec): 105
1
35
0
Loss Time (sec): 12
0
350 2
Critical V/C: 0.461
2 414***
0
Avg Crit Del (sec/veh): 29.4
0
74 1
Avg Delay (sec/veh): 30.8
1 21
LOS: C
Lanes: 1 0 1 1 0 Final Vol: 82*** 131 16 Signal=Protect/Rights=Include Street Name: Leigh Fruitdale Approach: North Bound South Bound East Bound West Bound Movement: L - T - R L - T - R L - T - R L - T - R ------------|---------------||---------------||---------------||---------------| Min. Green: 7 10 10 7 10 10 7 10 10 7 10 10 Y+R: 4.0 4.0 4.0 4.0 4.0 4.0 4.0 4.0 4.0 4.0 4.0 4.0 ------------|---------------||---------------||---------------||---------------| Volume Module: Base Vol: 73 128 16 86 420 288 105 344 71 21 400 32 Growth Adj: 1.00 1.00 1.00 1.00 1.00 1.00 1.00 1.00 1.00 1.00 1.00 1.00 Initial Bse: 73 128 16 86 420 288 105 344 71 21 400 32 Added Vol: 9 3 0 3 3 1 0 6 3 0 14 3 PasserByVol: 0 0 0 0 0 0 0 0 0 0 0 0 Initial Fut: 82 131 16 89 423 289 105 350 74 21 414 35 User Adj: 1.00 1.00 1.00 1.00 1.00 1.00 1.00 1.00 1.00 1.00 1.00 1.00 PHF Adj: 1.00 1.00 1.00 1.00 1.00 1.00 1.00 1.00 1.00 1.00 1.00 1.00 PHF Volume: 82 131 16 89 423 289 105 350 74 21 414 35 Reduct Vol: 0 0 0 0 0 0 0 0 0 0 0 0 Reduced Vol: 82 131 16 89 423 289 105 350 74 21 414 35 PCE Adj: 1.00 1.00 1.00 1.00 1.00 1.00 1.00 1.00 1.00 1.00 1.00 1.00 MLF Adj: 1.00 1.00 1.00 1.00 1.00 1.00 1.00 1.00 1.00 1.00 1.00 1.00 FinalVolume: 82 131 16 89 423 289 105 350 74 21 414 35 ------------|---------------||---------------||---------------||---------------| Saturation Flow Module: Sat/Lane: 1900 1900 1900 1900 1900 1900 1900 1900 1900 1900 1900 1900 Adjustment: 0.92 0.98 0.95 0.92 0.99 0.95 0.92 1.00 0.92 0.92 1.00 0.92 Lanes: 1.00 1.78 0.22 1.00 1.17 0.83 1.00 2.00 1.00 1.00 2.00 1.00 Final Sat.: 1750 3297 403 1750 2197 1501 1750 3800 1750 1750 3800 1750 ------------|---------------||---------------||---------------||---------------| Capacity Analysis Module: Vol/Sat: 0.05 0.04 0.04 0.05 0.19 0.19 0.06 0.09 0.04 0.01 0.11 0.02 Crit Moves: **** **** **** **** Green Time: 10.7 32.1 32.1 22.5 43.8 43.8 13.7 22.6 22.6 15.8 24.8 24.8 Volume/Cap: 0.46 0.13 0.13 0.24 0.46 0.46 0.46 0.43 0.20 0.08 0.46 0.08 Delay/Veh: 46.3 26.4 26.4 34.5 22.3 22.3 43.7 35.9 34.0 38.4 34.7 31.3 User DelAdj: 1.00 1.00 1.00 1.00 1.00 1.00 1.00 1.00 1.00 1.00 1.00 1.00 AdjDel/Veh: 46.3 26.4 26.4 34.5 22.3 22.3 43.7 35.9 34.0 38.4 34.7 31.3 LOS by Move: D C C C- C+ C+ D D+ C- D+ C- C HCM2kAvgQ: 3 2 2 2 8 8 3 5 2 1 6 1 Note: Queue reported is the number of cars per lane.

COMPARE Wed Oct 05 10:41:56 2011 Page 3-29
Traffix 8.0.0715 Copyright (c) 2008 Dowling Associates, Inc. Licensed to FEHR & PEERS WALNUT CRK
San Jose City College
SJ07-951 Level Of Service Computation Report
2000 HCM Operations (Future Volume Alternative) Existing PM Balanced
Intersection #15: Southwest Expwy/Fruitdale Signal=Protect/Rights=Include Final Vol: 207 589*** 158 Lanes: 1 0 2 0 2
Signal=Split
Signal=Split
Final Vol: Lanes: Rights=Include Vol Cnt Date: n/a Rights=Include Lanes: Final Vol:
160***
1 Cycle Time (sec): 105
1
37
0
Loss Time (sec): 12
0
277 1
Critical V/C: 0.343
2 195***
1
Avg Crit Del (sec/veh): 27.1
0
8 0
Avg Delay (sec/veh): 28.6
1 70
LOS: C
Lanes: 1 0 2 0 1 Final Vol: 10*** 473 100 Signal=Protect/Rights=Include Street Name: Southwest Expwy Fruitdale Approach: North Bound South Bound East Bound West Bound Movement: L - T - R L - T - R L - T - R L - T - R ------------|---------------||---------------||---------------||---------------| Min. Green: 7 10 10 7 10 10 10 10 10 10 10 10 Y+R: 4.0 4.0 4.0 4.0 4.0 4.0 4.0 4.0 4.0 4.0 4.0 4.0 ------------|---------------||---------------||---------------||---------------| Volume Module: Base Vol: 10 473 100 158 589 207 160 277 8 70 195 37 Growth Adj: 1.00 1.00 1.00 1.00 1.00 1.00 1.00 1.00 1.00 1.00 1.00 1.00 Initial Bse: 10 473 100 158 589 207 160 277 8 70 195 37 Added Vol: 0 0 0 0 0 0 0 0 0 0 0 0 PasserByVol: 0 0 0 0 0 0 0 0 0 0 0 0 Initial Fut: 10 473 100 158 589 207 160 277 8 70 195 37 User Adj: 1.00 1.00 1.00 1.00 1.00 1.00 1.00 1.00 1.00 1.00 1.00 1.00 PHF Adj: 1.00 1.00 1.00 1.00 1.00 1.00 1.00 1.00 1.00 1.00 1.00 1.00 PHF Volume: 10 473 100 158 589 207 160 277 8 70 195 37 Reduct Vol: 0 0 0 0 0 0 0 0 0 0 0 0 Reduced Vol: 10 473 100 158 589 207 160 277 8 70 195 37 PCE Adj: 1.00 1.00 1.00 1.00 1.00 1.00 1.00 1.00 1.00 1.00 1.00 1.00 MLF Adj: 1.00 1.00 1.00 1.00 1.00 1.00 1.00 1.00 1.00 1.00 1.00 1.00 FinalVolume: 10 473 100 158 589 207 160 277 8 70 195 37 ------------|---------------||---------------||---------------||---------------| Saturation Flow Module: Sat/Lane: 1900 1900 1900 1900 1900 1900 1900 1900 1900 1900 1900 1900 Adjustment: 0.92 1.00 0.92 0.83 1.00 0.92 0.92 0.97 0.95 0.92 1.00 0.92 Lanes: 1.00 2.00 1.00 2.00 2.00 1.00 1.00 1.94 0.06 1.00 2.00 1.00 Final Sat.: 1750 3800 1750 3150 3800 1750 1750 3596 104 1750 3800 1750 ------------|---------------||---------------||---------------||---------------| Capacity Analysis Module: Vol/Sat: 0.01 0.12 0.06 0.05 0.16 0.12 0.09 0.08 0.08 0.04 0.05 0.02 Crit Moves: **** **** **** **** Green Time: 7.0 33.7 33.7 18.1 44.8 44.8 26.4 26.4 26.4 14.8 14.8 14.8 Volume/Cap: 0.09 0.39 0.18 0.29 0.36 0.28 0.36 0.31 0.31 0.28 0.36 0.15 Delay/Veh: 46.3 27.8 25.8 38.2 20.6 19.8 32.9 32.1 32.1 41.0 41.2 39.8 User DelAdj: 1.00 1.00 1.00 1.00 1.00 1.00 1.00 1.00 1.00 1.00 1.00 1.00 AdjDel/Veh: 46.3 27.8 25.8 38.2 20.6 19.8 32.9 32.1 32.1 41.0 41.2 39.8 LOS by Move: D C C D+ C+ B- C- C- C- D D D HCM2kAvgQ: 0 6 2 3 6 5 4 4 4 2 3 1 Note: Queue reported is the number of cars per lane.

COMPARE Wed Oct 05 10:41:56 2011 Page 3-30
Traffix 8.0.0715 Copyright (c) 2008 Dowling Associates, Inc. Licensed to FEHR & PEERS WALNUT CRK
San Jose City College
SJ07-951 Level Of Service Computation Report
2000 HCM Operations (Future Volume Alternative) EX + Proj PM
Intersection #15: Southwest Expwy/Fruitdale Signal=Protect/Rights=Include Final Vol: 212 589*** 158 Lanes: 1 0 2 0 2
Signal=Split
Signal=Split
Final Vol: Lanes: Rights=Include Vol Cnt Date: n/a Rights=Include Lanes: Final Vol:
163***
1 Cycle Time (sec): 105
1
37
0
Loss Time (sec): 12
0
283 1
Critical V/C: 0.348
2 207***
1
Avg Crit Del (sec/veh): 27.5
0
8 0
Avg Delay (sec/veh): 28.8
1 70
LOS: C
Lanes: 1 0 2 0 1 Final Vol: 10*** 473 100 Signal=Protect/Rights=Include Street Name: Southwest Expwy Fruitdale Approach: North Bound South Bound East Bound West Bound Movement: L - T - R L - T - R L - T - R L - T - R ------------|---------------||---------------||---------------||---------------| Min. Green: 7 10 10 7 10 10 10 10 10 10 10 10 Y+R: 4.0 4.0 4.0 4.0 4.0 4.0 4.0 4.0 4.0 4.0 4.0 4.0 ------------|---------------||---------------||---------------||---------------| Volume Module: Base Vol: 10 473 100 158 589 207 160 277 8 70 195 37 Growth Adj: 1.00 1.00 1.00 1.00 1.00 1.00 1.00 1.00 1.00 1.00 1.00 1.00 Initial Bse: 10 473 100 158 589 207 160 277 8 70 195 37 Added Vol: 0 0 0 0 0 5 3 6 0 0 12 0 PasserByVol: 0 0 0 0 0 0 0 0 0 0 0 0 Initial Fut: 10 473 100 158 589 212 163 283 8 70 207 37 User Adj: 1.00 1.00 1.00 1.00 1.00 1.00 1.00 1.00 1.00 1.00 1.00 1.00 PHF Adj: 1.00 1.00 1.00 1.00 1.00 1.00 1.00 1.00 1.00 1.00 1.00 1.00 PHF Volume: 10 473 100 158 589 212 163 283 8 70 207 37 Reduct Vol: 0 0 0 0 0 0 0 0 0 0 0 0 Reduced Vol: 10 473 100 158 589 212 163 283 8 70 207 37 PCE Adj: 1.00 1.00 1.00 1.00 1.00 1.00 1.00 1.00 1.00 1.00 1.00 1.00 MLF Adj: 1.00 1.00 1.00 1.00 1.00 1.00 1.00 1.00 1.00 1.00 1.00 1.00 FinalVolume: 10 473 100 158 589 212 163 283 8 70 207 37 ------------|---------------||---------------||---------------||---------------| Saturation Flow Module: Sat/Lane: 1900 1900 1900 1900 1900 1900 1900 1900 1900 1900 1900 1900 Adjustment: 0.92 1.00 0.92 0.83 1.00 0.92 0.92 0.97 0.95 0.92 1.00 0.92 Lanes: 1.00 2.00 1.00 2.00 2.00 1.00 1.00 1.94 0.06 1.00 2.00 1.00 Final Sat.: 1750 3800 1750 3150 3800 1750 1750 3598 102 1750 3800 1750 ------------|---------------||---------------||---------------||---------------| Capacity Analysis Module: Vol/Sat: 0.01 0.12 0.06 0.05 0.16 0.12 0.09 0.08 0.08 0.04 0.05 0.02 Crit Moves: **** **** **** **** Green Time: 7.0 33.2 33.2 17.8 44.0 44.0 26.5 26.5 26.5 15.5 15.5 15.5 Volume/Cap: 0.09 0.39 0.18 0.30 0.37 0.29 0.37 0.31 0.31 0.27 0.37 0.14 Delay/Veh: 46.3 28.2 26.2 38.4 21.1 20.3 32.9 32.1 32.1 40.3 40.8 39.2 User DelAdj: 1.00 1.00 1.00 1.00 1.00 1.00 1.00 1.00 1.00 1.00 1.00 1.00 AdjDel/Veh: 46.3 28.2 26.2 38.4 21.1 20.3 32.9 32.1 32.1 40.3 40.8 39.2 LOS by Move: D C C D+ C+ C+ C- C- C- D D D HCM2kAvgQ: 0 6 3 3 6 5 5 4 4 2 3 1 Note: Queue reported is the number of cars per lane.

COMPARE Wed Oct 05 10:43:39 2011 Page 1-1
Traffix 8.0.0715 Copyright (c) 2008 Dowling Associates, Inc. Licensed to FEHR & PEERS WALNUT CRK
San Jose City College
SJ07-951 Summary Scenario Comparison Report (With Average Critical Delay)
Future Volume Alternative ??? Cuml No Proj AM Cumulative AM ??? Avg Avg Avg Avg Avg Avg Crit Avg Crit Avg Crit Crit Crit Avg Crit Del Crit Del Del Crit Del Del Crit V/C Del Del Del Crit Del Intersection LOS (sec) V/C (sec) LOS (sec) V/C (sec) LOS (sec) V/C Change (sec) Change LOS (sec) V/C (sec) #1 Bascom/San Carlos ? xx.x x.xxx xx.x D 44.0 0.718 41.7 D 44.1 0.719 + 0.001 41.7 + 0.0 ? xx.x x.xxx xx.x #2 Leigh/San Carlos ? xx.x x.xxx xx.x C+ 22.3 0.436 18.0 C+ 22.4 0.436 + 0.000 18.0 + 0.0 ? xx.x x.xxx xx.x #3 Leigh/Scott [4-Way Stop] ? xx.x x.xxx xx.x B 12.6 0.547 12.6 B 12.8 0.550 + 0.003 12.8 + 0.1 ? xx.x x.xxx xx.x #4 Bascom/Parkmoor ? xx.x x.xxx xx.x C- 34.7 0.516 33.0 C- 35.0 0.534 + 0.018 33.3 + 0.3 ? xx.x x.xxx xx.x #5 Leland/Parkmoor ? xx.x x.xxx xx.x C+ 22.8 0.723 22.9 C+ 23.0 0.742 + 0.019 23.1 + 0.2 ? xx.x x.xxx xx.x #6 Leigh/Parkmoor ? xx.x x.xxx xx.x C- 34.3 0.851 36.1 D+ 38.0 0.899 + 0.048 40.3 + 4.3 ? xx.x x.xxx xx.x #7 Bascom/Moorpark ? xx.x x.xxx xx.x D 39.3 0.807 43.7 D 40.5 0.810 + 0.003 43.8 + 0.2 ? xx.x x.xxx xx.x #8 Leland/Moorpark ? xx.x x.xxx xx.x A 8.1 0.323 8.1 A 8.2 0.334 + 0.012 8.2 + 0.2 ? xx.x x.xxx xx.x #9 Leigh/Moorpark ? xx.x x.xxx xx.x C 26.5 0.463 29.6 C 26.2 0.474 + 0.011 29.4 - 0.2 ? xx.x x.xxx xx.x #10 Bascom/Renova ? xx.x x.xxx xx.x B 13.1 0.345 7.7 B 13.0 0.347 + 0.002 7.7 - 0.0 ? xx.x x.xxx xx.x #11 Bascom/Laswell [Unsignalized] ? xx.x x.xxx xx.x E 1.3 0.267 1.3 F 2.3 0.397 + 0.130 2.3 + 1.0 ? xx.x x.xxx xx.x #12 Bascom/Fruitdale ? xx.x x.xxx xx.x D 47.7 0.794 50.7 D 48.7 0.813 + 0.019 52.1 + 1.4 ? xx.x x.xxx xx.x #13 Sherman Oaks/Fruitdale [Unsignalized] ? xx.x x.xxx xx.x D 0.9 0.213 0.9 D 0.9 0.221 + 0.008 0.9 + 0.0 ? xx.x x.xxx xx.x #14 Leigh/Fruitdale ? xx.x x.xxx xx.x C- 33.8 0.581 35.3 C- 33.9 0.591 + 0.010 35.6 + 0.3 ? xx.x x.xxx xx.x #15 Southwest Expwy/Fruitdale ? xx.x x.xxx xx.x C 27.4 0.649 29.4 C 27.5 0.649 + 0.001 29.5 + 0.0 ? xx.x x.xxx xx.x

COMPARE Wed Oct 05 10:43:39 2011 Page 1-2
Traffix 8.0.0715 Copyright (c) 2008 Dowling Associates, Inc. Licensed to FEHR & PEERS WALNUT CRK

COMPARE Wed Oct 05 10:43:39 2011 Page 3-1
Traffix 8.0.0715 Copyright (c) 2008 Dowling Associates, Inc. Licensed to FEHR & PEERS WALNUT CRK
San Jose City College
SJ07-951 Level Of Service Computation Report
2000 HCM Operations (Future Volume Alternative) Cuml No Proj AM
Intersection #1: Bascom/San Carlos Signal=Protect/Rights=Include Final Vol: 49 480 111*** Lanes: 1 0 3 0 1
Signal=Protect
Signal=Protect
Final Vol: Lanes: Rights=Include Vol Cnt Date: n/a Rights=Include Lanes: Final Vol:
74***
1 Cycle Time (sec): 140
1
240
0
Loss Time (sec): 12
0
321 1
Critical V/C: 0.718
2 960***
1
Avg Crit Del (sec/veh): 41.7
0
147 0
Avg Delay (sec/veh): 44.0
1 214
LOS: D
Lanes: 1 0 2 0 1 Final Vol: 342 1132*** 120 Signal=Protect/Rights=Include Street Name: Bascom San Carlos Approach: North Bound South Bound East Bound West Bound Movement: L - T - R L - T - R L - T - R L - T - R ------------|---------------||---------------||---------------||---------------| Min. Green: 7 10 10 7 10 10 7 10 10 7 10 10 Y+R: 4.0 4.0 4.0 4.0 4.0 4.0 4.0 4.0 4.0 4.0 4.0 4.0 ------------|---------------||---------------||---------------||---------------| Volume Module: Base Vol: 306 1050 84 100 432 47 71 251 100 175 841 216 Growth Adj: 1.00 1.00 1.00 1.00 1.00 1.00 1.00 1.00 1.00 1.00 1.00 1.00 Initial Bse: 306 1050 84 100 432 47 71 251 100 175 841 216 Added Vol: 0 0 0 0 0 0 0 0 0 0 0 0 Cuml: 36 82 36 11 48 2 3 70 47 39 119 24 Initial Fut: 342 1132 120 111 480 49 74 321 147 214 960 240 User Adj: 1.00 1.00 1.00 1.00 1.00 1.00 1.00 1.00 1.00 1.00 1.00 1.00 PHF Adj: 1.00 1.00 1.00 1.00 1.00 1.00 1.00 1.00 1.00 1.00 1.00 1.00 PHF Volume: 342 1132 120 111 480 49 74 321 147 214 960 240 Reduct Vol: 0 0 0 0 0 0 0 0 0 0 0 0 Reduced Vol: 342 1132 120 111 480 49 74 321 147 214 960 240 PCE Adj: 1.00 1.00 1.00 1.00 1.00 1.00 1.00 1.00 1.00 1.00 1.00 1.00 MLF Adj: 1.00 1.00 1.00 1.00 1.00 1.00 1.00 1.00 1.00 1.00 1.00 1.00 FinalVolume: 342 1132 120 111 480 49 74 321 147 214 960 240 ------------|---------------||---------------||---------------||---------------| Saturation Flow Module: Sat/Lane: 1900 1900 1900 1900 1900 1900 1900 1900 1900 1900 1900 1900 Adjustment: 0.92 1.00 0.92 0.92 1.00 0.92 0.92 0.99 0.95 0.92 1.00 0.92 Lanes: 1.00 2.00 1.00 1.00 3.00 1.00 1.00 1.35 0.65 1.00 2.00 1.00 Final Sat.: 1750 3800 1750 1750 5700 1750 1750 2536 1163 1750 3800 1750 ------------|---------------||---------------||---------------||---------------| Capacity Analysis Module: Vol/Sat: 0.20 0.30 0.07 0.06 0.08 0.03 0.04 0.13 0.13 0.12 0.25 0.14 Crit Moves: **** **** **** **** Green Time: 49.2 58.1 58.1 12.4 21.2 21.2 8.2 29.2 29.2 28.3 49.3 49.3 Volume/Cap: 0.56 0.72 0.17 0.72 0.56 0.18 0.72 0.61 0.61 0.61 0.72 0.39 Delay/Veh: 37.7 35.7 25.8 77.1 55.8 52.2 86.2 51.5 51.5 53.8 41.2 34.5 User DelAdj: 1.00 1.00 1.00 1.00 1.00 1.00 1.00 1.00 1.00 1.00 1.00 1.00 AdjDel/Veh: 37.7 35.7 25.8 77.1 55.8 52.2 86.2 51.5 51.5 53.8 41.2 34.5 LOS by Move: D+ D+ C E- E+ D- F D- D- D- D C- HCM2kAvgQ: 12 20 3 6 7 2 5 10 10 10 19 8 Note: Queue reported is the number of cars per lane.

COMPARE Wed Oct 05 10:43:39 2011 Page 3-2
Traffix 8.0.0715 Copyright (c) 2008 Dowling Associates, Inc. Licensed to FEHR & PEERS WALNUT CRK
San Jose City College
SJ07-951 Level Of Service Computation Report
2000 HCM Operations (Future Volume Alternative) Cumulative AM
Intersection #1: Bascom/San Carlos Signal=Protect/Rights=Include Final Vol: 49 492 111*** Lanes: 1 0 3 0 1
Signal=Protect
Signal=Protect
Final Vol: Lanes: Rights=Include Vol Cnt Date: n/a Rights=Include Lanes: Final Vol:
74***
1 Cycle Time (sec): 140
1
240
0
Loss Time (sec): 12
0
321 1
Critical V/C: 0.719
2 960***
1
Avg Crit Del (sec/veh): 41.7
0
156 0
Avg Delay (sec/veh): 44.1
1 214
LOS: D
Lanes: 1 0 2 0 1 Final Vol: 344 1135*** 120 Signal=Protect/Rights=Include Street Name: Bascom San Carlos Approach: North Bound South Bound East Bound West Bound Movement: L - T - R L - T - R L - T - R L - T - R ------------|---------------||---------------||---------------||---------------| Min. Green: 7 10 10 7 10 10 7 10 10 7 10 10 Y+R: 4.0 4.0 4.0 4.0 4.0 4.0 4.0 4.0 4.0 4.0 4.0 4.0 ------------|---------------||---------------||---------------||---------------| Volume Module: Base Vol: 306 1050 84 100 432 47 71 251 100 175 841 216 Growth Adj: 1.00 1.00 1.00 1.00 1.00 1.00 1.00 1.00 1.00 1.00 1.00 1.00 Initial Bse: 306 1050 84 100 432 47 71 251 100 175 841 216 Added Vol: 2 3 0 0 12 0 0 0 9 0 0 0 Cuml: 36 82 36 11 48 2 3 70 47 39 119 24 Initial Fut: 344 1135 120 111 492 49 74 321 156 214 960 240 User Adj: 1.00 1.00 1.00 1.00 1.00 1.00 1.00 1.00 1.00 1.00 1.00 1.00 PHF Adj: 1.00 1.00 1.00 1.00 1.00 1.00 1.00 1.00 1.00 1.00 1.00 1.00 PHF Volume: 344 1135 120 111 492 49 74 321 156 214 960 240 Reduct Vol: 0 0 0 0 0 0 0 0 0 0 0 0 Reduced Vol: 344 1135 120 111 492 49 74 321 156 214 960 240 PCE Adj: 1.00 1.00 1.00 1.00 1.00 1.00 1.00 1.00 1.00 1.00 1.00 1.00 MLF Adj: 1.00 1.00 1.00 1.00 1.00 1.00 1.00 1.00 1.00 1.00 1.00 1.00 FinalVolume: 344 1135 120 111 492 49 74 321 156 214 960 240 ------------|---------------||---------------||---------------||---------------| Saturation Flow Module: Sat/Lane: 1900 1900 1900 1900 1900 1900 1900 1900 1900 1900 1900 1900 Adjustment: 0.92 1.00 0.92 0.92 1.00 0.92 0.92 0.99 0.95 0.92 1.00 0.92 Lanes: 1.00 2.00 1.00 1.00 3.00 1.00 1.00 1.33 0.67 1.00 2.00 1.00 Final Sat.: 1750 3800 1750 1750 5700 1750 1750 2488 1211 1750 3800 1750 ------------|---------------||---------------||---------------||---------------| Capacity Analysis Module: Vol/Sat: 0.20 0.30 0.07 0.06 0.09 0.03 0.04 0.13 0.13 0.12 0.25 0.14 Crit Moves: **** **** **** **** Green Time: 49.0 58.2 58.2 12.4 21.5 21.5 8.2 29.5 29.5 28.0 49.2 49.2 Volume/Cap: 0.56 0.72 0.17 0.72 0.56 0.18 0.72 0.61 0.61 0.61 0.72 0.39 Delay/Veh: 38.0 35.7 25.8 77.2 55.7 51.9 86.4 51.5 51.5 54.2 41.3 34.5 User DelAdj: 1.00 1.00 1.00 1.00 1.00 1.00 1.00 1.00 1.00 1.00 1.00 1.00 AdjDel/Veh: 38.0 35.7 25.8 77.2 55.7 51.9 86.4 51.5 51.5 54.2 41.3 34.5 LOS by Move: D+ D+ C E- E+ D- F D- D- D- D C- HCM2kAvgQ: 12 20 3 6 7 2 5 10 10 10 19 8 Note: Queue reported is the number of cars per lane.

COMPARE Wed Oct 05 10:43:39 2011 Page 3-3
Traffix 8.0.0715 Copyright (c) 2008 Dowling Associates, Inc. Licensed to FEHR & PEERS WALNUT CRK
San Jose City College
SJ07-951 Level Of Service Computation Report
2000 HCM Operations (Future Volume Alternative) Cuml No Proj AM
Intersection #2: Leigh/San Carlos Signal=Permit/Rights=Include Final Vol: 46 152*** 62 Lanes: 0 1 0 0 1
Signal=Protect
Signal=Protect
Final Vol: Lanes: Rights=Include Vol Cnt Date: n/a Rights=Include Lanes: Final Vol:
45***
1 Cycle Time (sec): 120
1
20
0
Loss Time (sec): 9
0
462 2
Critical V/C: 0.436
2 1018***
0
Avg Crit Del (sec/veh): 18.0
0
20 1
Avg Delay (sec/veh): 22.3
1 78
LOS: C+
Lanes: 1 0 0 1 0 Final Vol: 141 124 45 Signal=Permit/Rights=Include Street Name: Leigh San Carlos Approach: North Bound South Bound East Bound West Bound Movement: L - T - R L - T - R L - T - R L - T - R ------------|---------------||---------------||---------------||---------------| Min. Green: 10 10 10 10 10 10 7 10 10 7 10 10 Y+R: 4.0 4.0 4.0 4.0 4.0 4.0 4.0 4.0 4.0 4.0 4.0 4.0 ------------|---------------||---------------||---------------||---------------| Volume Module: Base Vol: 128 124 36 61 152 46 45 393 20 59 874 16 Growth Adj: 1.00 1.00 1.00 1.00 1.00 1.00 1.00 1.00 1.00 1.00 1.00 1.00 Initial Bse: 128 124 36 61 152 46 45 393 20 59 874 16 Added Vol: 0 0 0 0 0 0 0 0 0 0 0 0 Cuml: 13 0 9 1 0 0 0 69 0 19 144 4 Initial Fut: 141 124 45 62 152 46 45 462 20 78 1018 20 User Adj: 1.00 1.00 1.00 1.00 1.00 1.00 1.00 1.00 1.00 1.00 1.00 1.00 PHF Adj: 1.00 1.00 1.00 1.00 1.00 1.00 1.00 1.00 1.00 1.00 1.00 1.00 PHF Volume: 141 124 45 62 152 46 45 462 20 78 1018 20 Reduct Vol: 0 0 0 0 0 0 0 0 0 0 0 0 Reduced Vol: 141 124 45 62 152 46 45 462 20 78 1018 20 PCE Adj: 1.00 1.00 1.00 1.00 1.00 1.00 1.00 1.00 1.00 1.00 1.00 1.00 MLF Adj: 1.00 1.00 1.00 1.00 1.00 1.00 1.00 1.00 1.00 1.00 1.00 1.00 FinalVolume: 141 124 45 62 152 46 45 462 20 78 1018 20 ------------|---------------||---------------||---------------||---------------| Saturation Flow Module: Sat/Lane: 1900 1900 1900 1900 1900 1900 1900 1900 1900 1900 1900 1900 Adjustment: 0.92 0.95 0.95 0.92 0.95 0.95 0.92 1.00 0.92 0.92 1.00 0.92 Lanes: 1.00 0.73 0.27 1.00 0.77 0.23 1.00 2.00 1.00 1.00 2.00 1.00 Final Sat.: 1750 1318 482 1750 1382 418 1750 3800 1750 1750 3800 1750 ------------|---------------||---------------||---------------||---------------| Capacity Analysis Module: Vol/Sat: 0.08 0.09 0.09 0.04 0.11 0.11 0.03 0.12 0.01 0.04 0.27 0.01 Crit Moves: **** **** **** Green Time: 30.2 30.2 30.2 30.2 30.2 30.2 7.1 54.6 54.6 26.2 73.7 73.7 Volume/Cap: 0.32 0.37 0.37 0.14 0.44 0.44 0.44 0.27 0.03 0.20 0.44 0.02 Delay/Veh: 36.9 37.6 37.6 34.9 38.4 38.4 57.5 20.4 18.1 38.6 12.3 9.0 User DelAdj: 1.00 1.00 1.00 1.00 1.00 1.00 1.00 1.00 1.00 1.00 1.00 1.00 AdjDel/Veh: 36.9 37.6 37.6 34.9 38.4 38.4 57.5 20.4 18.1 38.6 12.3 9.0 LOS by Move: D+ D+ D+ C- D+ D+ E+ C+ B- D+ B A HCM2kAvgQ: 5 6 6 2 7 7 2 5 0 3 10 0 Note: Queue reported is the number of cars per lane.

COMPARE Wed Oct 05 10:43:39 2011 Page 3-4
Traffix 8.0.0715 Copyright (c) 2008 Dowling Associates, Inc. Licensed to FEHR & PEERS WALNUT CRK
San Jose City College
SJ07-951 Level Of Service Computation Report
2000 HCM Operations (Future Volume Alternative) Cumulative AM
Intersection #2: Leigh/San Carlos Signal=Permit/Rights=Include Final Vol: 46 152*** 62 Lanes: 0 1 0 0 1
Signal=Protect
Signal=Protect
Final Vol: Lanes: Rights=Include Vol Cnt Date: n/a Rights=Include Lanes: Final Vol:
45***
1 Cycle Time (sec): 120
1
20
0
Loss Time (sec): 9
0
462 2
Critical V/C: 0.436
2 1018***
0
Avg Crit Del (sec/veh): 18.0
0
20 1
Avg Delay (sec/veh): 22.4
1 84
LOS: C+
Lanes: 1 0 0 1 0 Final Vol: 141 124 48 Signal=Permit/Rights=Include Street Name: Leigh San Carlos Approach: North Bound South Bound East Bound West Bound Movement: L - T - R L - T - R L - T - R L - T - R ------------|---------------||---------------||---------------||---------------| Min. Green: 10 10 10 10 10 10 7 10 10 7 10 10 Y+R: 4.0 4.0 4.0 4.0 4.0 4.0 4.0 4.0 4.0 4.0 4.0 4.0 ------------|---------------||---------------||---------------||---------------| Volume Module: Base Vol: 128 124 36 61 152 46 45 393 20 59 874 16 Growth Adj: 1.00 1.00 1.00 1.00 1.00 1.00 1.00 1.00 1.00 1.00 1.00 1.00 Initial Bse: 128 124 36 61 152 46 45 393 20 59 874 16 Added Vol: 0 0 3 0 0 0 0 0 0 6 0 0 Cuml: 13 0 9 1 0 0 0 69 0 19 144 4 Initial Fut: 141 124 48 62 152 46 45 462 20 84 1018 20 User Adj: 1.00 1.00 1.00 1.00 1.00 1.00 1.00 1.00 1.00 1.00 1.00 1.00 PHF Adj: 1.00 1.00 1.00 1.00 1.00 1.00 1.00 1.00 1.00 1.00 1.00 1.00 PHF Volume: 141 124 48 62 152 46 45 462 20 84 1018 20 Reduct Vol: 0 0 0 0 0 0 0 0 0 0 0 0 Reduced Vol: 141 124 48 62 152 46 45 462 20 84 1018 20 PCE Adj: 1.00 1.00 1.00 1.00 1.00 1.00 1.00 1.00 1.00 1.00 1.00 1.00 MLF Adj: 1.00 1.00 1.00 1.00 1.00 1.00 1.00 1.00 1.00 1.00 1.00 1.00 FinalVolume: 141 124 48 62 152 46 45 462 20 84 1018 20 ------------|---------------||---------------||---------------||---------------| Saturation Flow Module: Sat/Lane: 1900 1900 1900 1900 1900 1900 1900 1900 1900 1900 1900 1900 Adjustment: 0.92 0.95 0.95 0.92 0.95 0.95 0.92 1.00 0.92 0.92 1.00 0.92 Lanes: 1.00 0.72 0.28 1.00 0.77 0.23 1.00 2.00 1.00 1.00 2.00 1.00 Final Sat.: 1750 1295 505 1750 1382 418 1750 3800 1750 1750 3800 1750 ------------|---------------||---------------||---------------||---------------| Capacity Analysis Module: Vol/Sat: 0.08 0.10 0.10 0.04 0.11 0.11 0.03 0.12 0.01 0.05 0.27 0.01 Crit Moves: **** **** **** Green Time: 30.2 30.2 30.2 30.2 30.2 30.2 7.1 54.6 54.6 26.2 73.7 73.7 Volume/Cap: 0.32 0.38 0.38 0.14 0.44 0.44 0.44 0.27 0.03 0.22 0.44 0.02 Delay/Veh: 36.9 37.7 37.7 34.9 38.4 38.4 57.5 20.4 18.1 38.8 12.3 9.0 User DelAdj: 1.00 1.00 1.00 1.00 1.00 1.00 1.00 1.00 1.00 1.00 1.00 1.00 AdjDel/Veh: 36.9 37.7 37.7 34.9 38.4 38.4 57.5 20.4 18.1 38.8 12.3 9.0 LOS by Move: D+ D+ D+ C- D+ D+ E+ C+ B- D+ B A HCM2kAvgQ: 5 6 6 2 7 7 2 5 0 3 10 0 Note: Queue reported is the number of cars per lane.
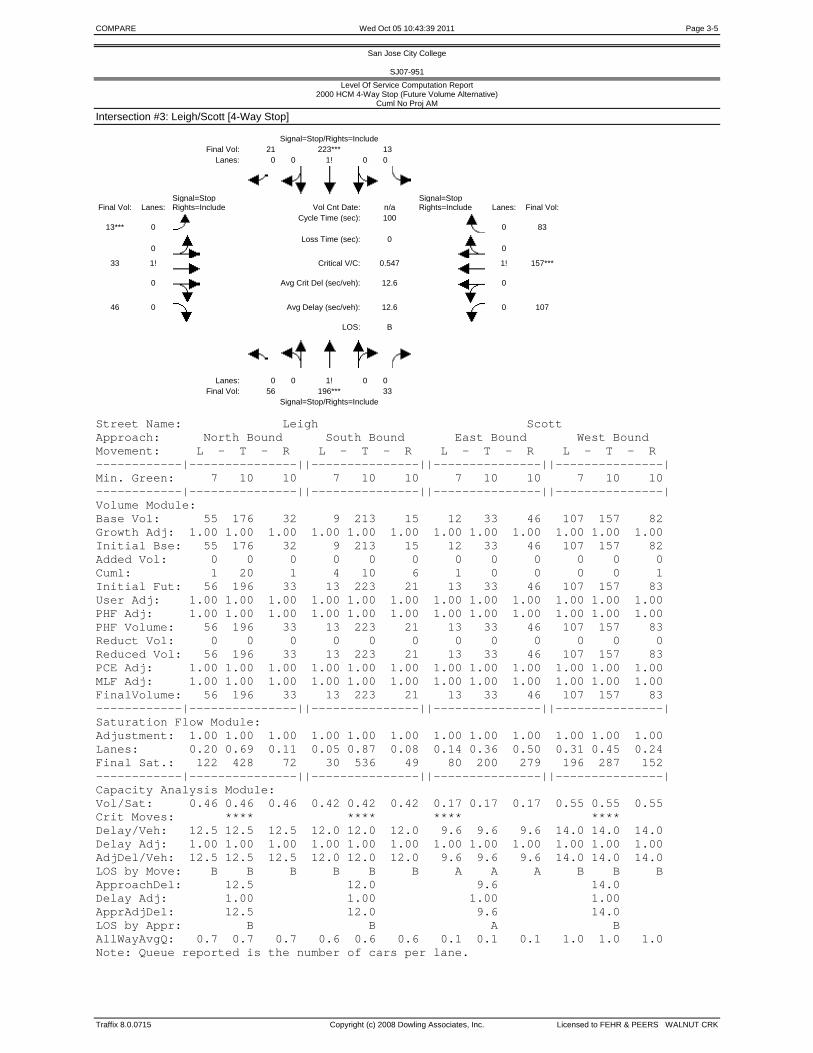
COMPARE Wed Oct 05 10:43:39 2011 Page 3-5
Traffix 8.0.0715 Copyright (c) 2008 Dowling Associates, Inc. Licensed to FEHR & PEERS WALNUT CRK
San Jose City College
SJ07-951 Level Of Service Computation Report
2000 HCM 4-Way Stop (Future Volume Alternative) Cuml No Proj AM
Intersection #3: Leigh/Scott [4-Way Stop] Signal=Stop/Rights=Include Final Vol: 21 223*** 13 Lanes: 0 0 1! 0 0
Signal=Stop
Signal=Stop
Final Vol: Lanes: Rights=Include Vol Cnt Date: n/a Rights=Include Lanes: Final Vol:
13***
0 Cycle Time (sec): 100
0
83
0
Loss Time (sec): 0
0
33 1!
Critical V/C: 0.547
1! 157***
0
Avg Crit Del (sec/veh): 12.6
0
46 0
Avg Delay (sec/veh): 12.6
0 107
LOS: B
Lanes: 0 0 1! 0 0 Final Vol: 56 196*** 33 Signal=Stop/Rights=Include Street Name: Leigh Scott Approach: North Bound South Bound East Bound West Bound Movement: L - T - R L - T - R L - T - R L - T - R ------------|---------------||---------------||---------------||---------------| Min. Green: 7 10 10 7 10 10 7 10 10 7 10 10 ------------|---------------||---------------||---------------||---------------| Volume Module: Base Vol: 55 176 32 9 213 15 12 33 46 107 157 82 Growth Adj: 1.00 1.00 1.00 1.00 1.00 1.00 1.00 1.00 1.00 1.00 1.00 1.00 Initial Bse: 55 176 32 9 213 15 12 33 46 107 157 82 Added Vol: 0 0 0 0 0 0 0 0 0 0 0 0 Cuml: 1 20 1 4 10 6 1 0 0 0 0 1 Initial Fut: 56 196 33 13 223 21 13 33 46 107 157 83 User Adj: 1.00 1.00 1.00 1.00 1.00 1.00 1.00 1.00 1.00 1.00 1.00 1.00 PHF Adj: 1.00 1.00 1.00 1.00 1.00 1.00 1.00 1.00 1.00 1.00 1.00 1.00 PHF Volume: 56 196 33 13 223 21 13 33 46 107 157 83 Reduct Vol: 0 0 0 0 0 0 0 0 0 0 0 0 Reduced Vol: 56 196 33 13 223 21 13 33 46 107 157 83 PCE Adj: 1.00 1.00 1.00 1.00 1.00 1.00 1.00 1.00 1.00 1.00 1.00 1.00 MLF Adj: 1.00 1.00 1.00 1.00 1.00 1.00 1.00 1.00 1.00 1.00 1.00 1.00 FinalVolume: 56 196 33 13 223 21 13 33 46 107 157 83 ------------|---------------||---------------||---------------||---------------| Saturation Flow Module: Adjustment: 1.00 1.00 1.00 1.00 1.00 1.00 1.00 1.00 1.00 1.00 1.00 1.00 Lanes: 0.20 0.69 0.11 0.05 0.87 0.08 0.14 0.36 0.50 0.31 0.45 0.24 Final Sat.: 122 428 72 30 536 49 80 200 279 196 287 152 ------------|---------------||---------------||---------------||---------------| Capacity Analysis Module: Vol/Sat: 0.46 0.46 0.46 0.42 0.42 0.42 0.17 0.17 0.17 0.55 0.55 0.55 Crit Moves: **** **** **** **** Delay/Veh: 12.5 12.5 12.5 12.0 12.0 12.0 9.6 9.6 9.6 14.0 14.0 14.0 Delay Adj: 1.00 1.00 1.00 1.00 1.00 1.00 1.00 1.00 1.00 1.00 1.00 1.00 AdjDel/Veh: 12.5 12.5 12.5 12.0 12.0 12.0 9.6 9.6 9.6 14.0 14.0 14.0 LOS by Move: B B B B B B A A A B B B ApproachDel: 12.5 12.0 9.6 14.0 Delay Adj: 1.00 1.00 1.00 1.00 ApprAdjDel: 12.5 12.0 9.6 14.0 LOS by Appr: B B A B AllWayAvgQ: 0.7 0.7 0.7 0.6 0.6 0.6 0.1 0.1 0.1 1.0 1.0 1.0 Note: Queue reported is the number of cars per lane.

COMPARE Wed Oct 05 10:43:39 2011 Page 3-6
Traffix 8.0.0715 Copyright (c) 2008 Dowling Associates, Inc. Licensed to FEHR & PEERS WALNUT CRK
San Jose City College
SJ07-951 Level Of Service Computation Report
2000 HCM 4-Way Stop (Future Volume Alternative) Cumulative AM
Intersection #3: Leigh/Scott [4-Way Stop] Signal=Stop/Rights=Include Final Vol: 21 229*** 13 Lanes: 0 0 1! 0 0
Signal=Stop
Signal=Stop
Final Vol: Lanes: Rights=Include Vol Cnt Date: n/a Rights=Include Lanes: Final Vol:
13***
0 Cycle Time (sec): 100
0
83
0
Loss Time (sec): 0
0
33 1!
Critical V/C: 0.550
1! 157***
0
Avg Crit Del (sec/veh): 12.8
0
46 0
Avg Delay (sec/veh): 12.8
0 107
LOS: B
Lanes: 0 0 1! 0 0 Final Vol: 56 199 33*** Signal=Stop/Rights=Include Street Name: Leigh Scott Approach: North Bound South Bound East Bound West Bound Movement: L - T - R L - T - R L - T - R L - T - R ------------|---------------||---------------||---------------||---------------| Min. Green: 7 10 10 7 10 10 7 10 10 7 10 10 ------------|---------------||---------------||---------------||---------------| Volume Module: Base Vol: 55 176 32 9 213 15 12 33 46 107 157 82 Growth Adj: 1.00 1.00 1.00 1.00 1.00 1.00 1.00 1.00 1.00 1.00 1.00 1.00 Initial Bse: 55 176 32 9 213 15 12 33 46 107 157 82 Added Vol: 0 3 0 0 6 0 0 0 0 0 0 0 Cuml: 1 20 1 4 10 6 1 0 0 0 0 1 Initial Fut: 56 199 33 13 229 21 13 33 46 107 157 83 User Adj: 1.00 1.00 1.00 1.00 1.00 1.00 1.00 1.00 1.00 1.00 1.00 1.00 PHF Adj: 1.00 1.00 1.00 1.00 1.00 1.00 1.00 1.00 1.00 1.00 1.00 1.00 PHF Volume: 56 199 33 13 229 21 13 33 46 107 157 83 Reduct Vol: 0 0 0 0 0 0 0 0 0 0 0 0 Reduced Vol: 56 199 33 13 229 21 13 33 46 107 157 83 PCE Adj: 1.00 1.00 1.00 1.00 1.00 1.00 1.00 1.00 1.00 1.00 1.00 1.00 MLF Adj: 1.00 1.00 1.00 1.00 1.00 1.00 1.00 1.00 1.00 1.00 1.00 1.00 FinalVolume: 56 199 33 13 229 21 13 33 46 107 157 83 ------------|---------------||---------------||---------------||---------------| Saturation Flow Module: Adjustment: 1.00 1.00 1.00 1.00 1.00 1.00 1.00 1.00 1.00 1.00 1.00 1.00 Lanes: 0.19 0.70 0.11 0.05 0.87 0.08 0.14 0.36 0.50 0.31 0.45 0.24 Final Sat.: 121 429 71 29 536 48 79 198 276 195 286 151 ------------|---------------||---------------||---------------||---------------| Capacity Analysis Module: Vol/Sat: 0.46 0.46 0.46 0.43 0.43 0.43 0.17 0.17 0.17 0.55 0.55 0.55 Crit Moves: **** **** **** **** Delay/Veh: 12.7 12.7 12.7 12.1 12.1 12.1 9.6 9.6 9.6 14.2 14.2 14.2 Delay Adj: 1.00 1.00 1.00 1.00 1.00 1.00 1.00 1.00 1.00 1.00 1.00 1.00 AdjDel/Veh: 12.7 12.7 12.7 12.1 12.1 12.1 9.6 9.6 9.6 14.2 14.2 14.2 LOS by Move: B B B B B B A A A B B B ApproachDel: 12.7 12.1 9.6 14.2 Delay Adj: 1.00 1.00 1.00 1.00 ApprAdjDel: 12.7 12.1 9.6 14.2 LOS by Appr: B B A B AllWayAvgQ: 0.7 0.7 0.7 0.6 0.6 0.6 0.1 0.1 0.1 1.0 1.0 1.0 Note: Queue reported is the number of cars per lane.

COMPARE Wed Oct 05 10:43:39 2011 Page 3-7
Traffix 8.0.0715 Copyright (c) 2008 Dowling Associates, Inc. Licensed to FEHR & PEERS WALNUT CRK
San Jose City College
SJ07-951 Level Of Service Computation Report
2000 HCM Operations (Future Volume Alternative) Cuml No Proj AM
Intersection #4: Bascom/Parkmoor Signal=Protect/Rights=Include Final Vol: 12 812*** 0 Lanes: 0 1 2 0 0
Signal=Split
Signal=Split
Final Vol: Lanes: Rights=Include Vol Cnt Date: n/a Rights=Include Lanes: Final Vol:
9***
0 Cycle Time (sec): 140
1
270
0
Loss Time (sec): 12
0
0 1!
Critical V/C: 0.516
0 165
0
Avg Crit Del (sec/veh): 33.0
1
27 0
Avg Delay (sec/veh): 34.7
1 908***
LOS: C-
Lanes: 1 0 3 0 0 Final Vol: 3*** 1093 0 Signal=Protect/Rights=Include Street Name: S Bascom Ave Parkmoor Ave Approach: North Bound South Bound East Bound West Bound Movement: L - T - R L - T - R L - T - R L - T - R ------------|---------------||---------------||---------------||---------------| Min. Green: 7 10 0 0 10 10 10 0 10 10 10 10 Y+R: 4.0 4.0 4.0 4.0 4.0 4.0 4.0 4.0 4.0 4.0 4.0 4.0 ------------|---------------||---------------||---------------||---------------| Volume Module: Base Vol: 3 975 0 0 687 12 9 0 27 684 165 268 Growth Adj: 1.00 1.00 1.00 1.00 1.00 1.00 1.00 1.00 1.00 1.00 1.00 1.00 Initial Bse: 3 975 0 0 687 12 9 0 27 684 165 268 Added Vol: 0 0 0 0 0 0 0 0 0 0 0 0 Cuml: 0 118 0 0 125 0 0 0 0 224 0 2 Initial Fut: 3 1093 0 0 812 12 9 0 27 908 165 270 User Adj: 1.00 1.00 1.00 1.00 1.00 1.00 1.00 1.00 1.00 1.00 1.00 1.00 PHF Adj: 1.00 1.00 1.00 1.00 1.00 1.00 1.00 1.00 1.00 1.00 1.00 1.00 PHF Volume: 3 1093 0 0 812 12 9 0 27 908 165 270 Reduct Vol: 0 0 0 0 0 0 0 0 0 0 0 0 Reduced Vol: 3 1093 0 0 812 12 9 0 27 908 165 270 PCE Adj: 1.00 1.00 1.00 1.00 1.00 1.00 1.00 1.00 1.00 1.00 1.00 1.00 MLF Adj: 1.00 1.00 1.00 1.00 1.00 1.00 1.00 1.00 1.00 1.00 1.00 1.00 FinalVolume: 3 1093 0 0 812 12 9 0 27 908 165 270 ------------|---------------||---------------||---------------||---------------| Saturation Flow Module: Sat/Lane: 1900 1900 1900 1900 1900 1900 1900 1900 1900 1900 1900 1900 Adjustment: 0.92 1.00 0.92 0.92 0.98 0.95 0.92 0.92 0.92 0.93 0.95 0.92 Lanes: 1.00 3.00 0.00 0.00 2.95 0.05 0.25 0.00 0.75 1.70 0.30 1.00 Final Sat.: 1750 5700 0 0 5518 82 438 0 1313 3004 546 1750 ------------|---------------||---------------||---------------||---------------| Capacity Analysis Module: Vol/Sat: 0.00 0.19 0.00 0.00 0.15 0.15 0.02 0.00 0.02 0.30 0.30 0.15 Crit Moves: **** **** **** **** Green Time: 7.0 43.3 0.0 0.0 36.3 36.3 10.0 0.0 10.0 74.7 74.7 74.7 Volume/Cap: 0.03 0.62 0.00 0.00 0.57 0.57 0.29 0.00 0.29 0.57 0.57 0.29 Delay/Veh: 63.4 42.0 0.0 0.0 45.5 45.5 62.9 0.0 62.9 22.3 22.3 18.2 User DelAdj: 1.00 1.00 1.00 1.00 1.00 1.00 1.00 1.00 1.00 1.00 1.00 1.00 AdjDel/Veh: 63.4 42.0 0.0 0.0 45.5 45.5 62.9 0.0 62.9 22.3 22.3 18.2 LOS by Move: E D A A D D E A E C+ C+ B- HCM2kAvgQ: 0 13 0 0 10 10 2 0 2 16 16 7 Note: Queue reported is the number of cars per lane.

COMPARE Wed Oct 05 10:43:39 2011 Page 3-8
Traffix 8.0.0715 Copyright (c) 2008 Dowling Associates, Inc. Licensed to FEHR & PEERS WALNUT CRK
San Jose City College
SJ07-951 Level Of Service Computation Report
2000 HCM Operations (Future Volume Alternative) Cumulative AM
Intersection #4: Bascom/Parkmoor Signal=Protect/Rights=Include Final Vol: 12 833*** 0 Lanes: 0 1 2 0 0
Signal=Split
Signal=Split
Final Vol: Lanes: Rights=Include Vol Cnt Date: n/a Rights=Include Lanes: Final Vol:
9***
0 Cycle Time (sec): 140
1
272
0
Loss Time (sec): 12
0
0 1!
Critical V/C: 0.534
0 165
0
Avg Crit Del (sec/veh): 33.3
1
27 0
Avg Delay (sec/veh): 35.0
1 952***
LOS: C-
Lanes: 1 0 3 0 0 Final Vol: 3*** 1096 0 Signal=Protect/Rights=Include Street Name: S Bascom Ave Parkmoor Ave Approach: North Bound South Bound East Bound West Bound Movement: L - T - R L - T - R L - T - R L - T - R ------------|---------------||---------------||---------------||---------------| Min. Green: 7 10 0 0 10 10 10 0 10 10 10 10 Y+R: 4.0 4.0 4.0 4.0 4.0 4.0 4.0 4.0 4.0 4.0 4.0 4.0 ------------|---------------||---------------||---------------||---------------| Volume Module: Base Vol: 3 975 0 0 687 12 9 0 27 684 165 268 Growth Adj: 1.00 1.00 1.00 1.00 1.00 1.00 1.00 1.00 1.00 1.00 1.00 1.00 Initial Bse: 3 975 0 0 687 12 9 0 27 684 165 268 Added Vol: 0 3 0 0 21 0 0 0 0 44 0 2 Cuml: 0 118 0 0 125 0 0 0 0 224 0 2 Initial Fut: 3 1096 0 0 833 12 9 0 27 952 165 272 User Adj: 1.00 1.00 1.00 1.00 1.00 1.00 1.00 1.00 1.00 1.00 1.00 1.00 PHF Adj: 1.00 1.00 1.00 1.00 1.00 1.00 1.00 1.00 1.00 1.00 1.00 1.00 PHF Volume: 3 1096 0 0 833 12 9 0 27 952 165 272 Reduct Vol: 0 0 0 0 0 0 0 0 0 0 0 0 Reduced Vol: 3 1096 0 0 833 12 9 0 27 952 165 272 PCE Adj: 1.00 1.00 1.00 1.00 1.00 1.00 1.00 1.00 1.00 1.00 1.00 1.00 MLF Adj: 1.00 1.00 1.00 1.00 1.00 1.00 1.00 1.00 1.00 1.00 1.00 1.00 FinalVolume: 3 1096 0 0 833 12 9 0 27 952 165 272 ------------|---------------||---------------||---------------||---------------| Saturation Flow Module: Sat/Lane: 1900 1900 1900 1900 1900 1900 1900 1900 1900 1900 1900 1900 Adjustment: 0.92 1.00 0.92 0.92 0.98 0.95 0.92 0.92 0.92 0.93 0.95 0.92 Lanes: 1.00 3.00 0.00 0.00 2.96 0.04 0.25 0.00 0.75 1.71 0.29 1.00 Final Sat.: 1750 5700 0 0 5520 80 438 0 1313 3026 524 1750 ------------|---------------||---------------||---------------||---------------| Capacity Analysis Module: Vol/Sat: 0.00 0.19 0.00 0.00 0.15 0.15 0.02 0.00 0.02 0.31 0.31 0.16 Crit Moves: **** **** **** **** Green Time: 7.0 43.0 0.0 0.0 36.0 36.0 10.0 0.0 10.0 75.0 75.0 75.0 Volume/Cap: 0.03 0.63 0.00 0.00 0.59 0.59 0.29 0.00 0.29 0.59 0.59 0.29 Delay/Veh: 63.4 42.3 0.0 0.0 46.2 46.2 62.9 0.0 62.9 22.5 22.5 18.0 User DelAdj: 1.00 1.00 1.00 1.00 1.00 1.00 1.00 1.00 1.00 1.00 1.00 1.00 AdjDel/Veh: 63.4 42.3 0.0 0.0 46.2 46.2 62.9 0.0 62.9 22.5 22.5 18.0 LOS by Move: E D A A D D E A E C+ C+ B- HCM2kAvgQ: 0 13 0 0 10 10 2 0 2 17 17 7 Note: Queue reported is the number of cars per lane.

COMPARE Wed Oct 05 10:43:39 2011 Page 3-9
Traffix 8.0.0715 Copyright (c) 2008 Dowling Associates, Inc. Licensed to FEHR & PEERS WALNUT CRK
San Jose City College
SJ07-951 Level Of Service Computation Report
2000 HCM Operations (Future Volume Alternative) Cuml No Proj AM
Intersection #5: Leland/Parkmoor Signal=Protect/Rights=Include Final Vol: 104 73*** 0 Lanes: 0 1 0 0 0
Signal=Split
Signal=Split
Final Vol: Lanes: Rights=Include Vol Cnt Date: n/a Rights=Include Lanes: Final Vol:
0
0 Cycle Time (sec): 110
1
36
0
Loss Time (sec): 9
0
0 0
Critical V/C: 0.723
1 1601
0
Avg Crit Del (sec/veh): 22.9
1
0 0
Avg Delay (sec/veh): 22.8
0 50***
LOS: C+
Lanes: 1 0 1 0 0 Final Vol: 208*** 65 0 Signal=Protect/Rights=Include Street Name: Leland Ave Parkmoor Ave Approach: North Bound South Bound East Bound West Bound Movement: L - T - R L - T - R L - T - R L - T - R ------------|---------------||---------------||---------------||---------------| Min. Green: 7 10 0 0 10 10 0 0 0 10 10 10 Y+R: 4.0 4.0 4.0 4.0 4.0 4.0 4.0 4.0 4.0 4.0 4.0 4.0 ------------|---------------||---------------||---------------||---------------| Volume Module: Base Vol: 141 65 0 0 73 104 0 0 0 50 1418 36 Growth Adj: 1.00 1.00 1.00 1.00 1.00 1.00 1.00 1.00 1.00 1.00 1.00 1.00 Initial Bse: 141 65 0 0 73 104 0 0 0 50 1418 36 Added Vol: 0 0 0 0 0 0 0 0 0 0 0 0 Cuml: 67 0 0 0 0 0 0 0 0 0 183 0 Initial Fut: 208 65 0 0 73 104 0 0 0 50 1601 36 User Adj: 1.00 1.00 1.00 1.00 1.00 1.00 1.00 1.00 1.00 1.00 1.00 1.00 PHF Adj: 1.00 1.00 1.00 1.00 1.00 1.00 1.00 1.00 1.00 1.00 1.00 1.00 PHF Volume: 208 65 0 0 73 104 0 0 0 50 1601 36 Reduct Vol: 0 0 0 0 0 0 0 0 0 0 0 0 Reduced Vol: 208 65 0 0 73 104 0 0 0 50 1601 36 PCE Adj: 1.00 1.00 1.00 1.00 1.00 1.00 1.00 1.00 1.00 1.00 1.00 1.00 MLF Adj: 1.00 1.00 1.00 1.00 1.00 1.00 1.00 1.00 1.00 1.00 1.00 1.00 FinalVolume: 208 65 0 0 73 104 0 0 0 50 1601 36 ------------|---------------||---------------||---------------||---------------| Saturation Flow Module: Sat/Lane: 1900 1900 1900 1900 1900 1900 1900 1900 1900 1900 1900 1900 Adjustment: 0.92 1.00 0.92 0.92 0.95 0.95 0.92 1.00 0.92 0.95 0.97 0.92 Lanes: 1.00 1.00 0.00 0.00 0.41 0.59 0.00 0.00 0.00 0.06 1.94 1.00 Final Sat.: 1750 1900 0 0 742 1058 0 0 0 112 3588 1750 ------------|---------------||---------------||---------------||---------------| Capacity Analysis Module: Vol/Sat: 0.12 0.03 0.00 0.00 0.10 0.10 0.00 0.00 0.00 0.45 0.45 0.02 Crit Moves: **** **** **** Green Time: 18.1 33.1 0.0 0.0 15.0 15.0 0.0 0.0 0.0 67.9 67.9 67.9 Volume/Cap: 0.72 0.11 0.00 0.00 0.72 0.72 0.00 0.00 0.00 0.72 0.72 0.03 Delay/Veh: 52.3 27.9 0.0 0.0 55.6 55.6 0.0 0.0 0.0 15.7 15.7 8.2 User DelAdj: 1.00 1.00 1.00 1.00 1.00 1.00 1.00 1.00 1.00 1.00 1.00 1.00 AdjDel/Veh: 52.3 27.9 0.0 0.0 55.6 55.6 0.0 0.0 0.0 15.7 15.7 8.2 LOS by Move: D- C A A E+ E+ A A A B B A HCM2kAvgQ: 7 2 0 0 8 8 0 0 0 19 19 0 Note: Queue reported is the number of cars per lane.

COMPARE Wed Oct 05 10:43:39 2011 Page 3-10
Traffix 8.0.0715 Copyright (c) 2008 Dowling Associates, Inc. Licensed to FEHR & PEERS WALNUT CRK
San Jose City College
SJ07-951 Level Of Service Computation Report
2000 HCM Operations (Future Volume Alternative) Cumulative AM
Intersection #5: Leland/Parkmoor Signal=Protect/Rights=Include Final Vol: 104 73*** 0 Lanes: 0 1 0 0 0
Signal=Split
Signal=Split
Final Vol: Lanes: Rights=Include Vol Cnt Date: n/a Rights=Include Lanes: Final Vol:
0
0 Cycle Time (sec): 110
1
36
0
Loss Time (sec): 9
0
0 0
Critical V/C: 0.742
1 1660***
0
Avg Crit Del (sec/veh): 23.1
1
0 0
Avg Delay (sec/veh): 23.0
0 56
LOS: C+
Lanes: 1 0 1 0 0 Final Vol: 208*** 66 0 Signal=Protect/Rights=Include Street Name: Leland Ave Parkmoor Ave Approach: North Bound South Bound East Bound West Bound Movement: L - T - R L - T - R L - T - R L - T - R ------------|---------------||---------------||---------------||---------------| Min. Green: 7 10 0 0 10 10 0 0 0 10 10 10 Y+R: 4.0 4.0 4.0 4.0 4.0 4.0 4.0 4.0 4.0 4.0 4.0 4.0 ------------|---------------||---------------||---------------||---------------| Volume Module: Base Vol: 141 65 0 0 73 104 0 0 0 50 1418 36 Growth Adj: 1.00 1.00 1.00 1.00 1.00 1.00 1.00 1.00 1.00 1.00 1.00 1.00 Initial Bse: 141 65 0 0 73 104 0 0 0 50 1418 36 Added Vol: 0 1 0 0 0 0 0 0 0 6 59 0 Cuml: 67 0 0 0 0 0 0 0 0 0 183 0 Initial Fut: 208 66 0 0 73 104 0 0 0 56 1660 36 User Adj: 1.00 1.00 1.00 1.00 1.00 1.00 1.00 1.00 1.00 1.00 1.00 1.00 PHF Adj: 1.00 1.00 1.00 1.00 1.00 1.00 1.00 1.00 1.00 1.00 1.00 1.00 PHF Volume: 208 66 0 0 73 104 0 0 0 56 1660 36 Reduct Vol: 0 0 0 0 0 0 0 0 0 0 0 0 Reduced Vol: 208 66 0 0 73 104 0 0 0 56 1660 36 PCE Adj: 1.00 1.00 1.00 1.00 1.00 1.00 1.00 1.00 1.00 1.00 1.00 1.00 MLF Adj: 1.00 1.00 1.00 1.00 1.00 1.00 1.00 1.00 1.00 1.00 1.00 1.00 FinalVolume: 208 66 0 0 73 104 0 0 0 56 1660 36 ------------|---------------||---------------||---------------||---------------| Saturation Flow Module: Sat/Lane: 1900 1900 1900 1900 1900 1900 1900 1900 1900 1900 1900 1900 Adjustment: 0.92 1.00 0.92 0.92 0.95 0.95 0.92 1.00 0.92 0.95 0.97 0.92 Lanes: 1.00 1.00 0.00 0.00 0.41 0.59 0.00 0.00 0.00 0.07 1.93 1.00 Final Sat.: 1750 1900 0 0 742 1058 0 0 0 121 3579 1750 ------------|---------------||---------------||---------------||---------------| Capacity Analysis Module: Vol/Sat: 0.12 0.03 0.00 0.00 0.10 0.10 0.00 0.00 0.00 0.46 0.46 0.02 Crit Moves: **** **** **** Green Time: 17.6 32.2 0.0 0.0 14.6 14.6 0.0 0.0 0.0 68.8 68.8 68.8 Volume/Cap: 0.74 0.12 0.00 0.00 0.74 0.74 0.00 0.00 0.00 0.74 0.74 0.03 Delay/Veh: 54.2 28.6 0.0 0.0 57.7 57.7 0.0 0.0 0.0 15.7 15.7 7.9 User DelAdj: 1.00 1.00 1.00 1.00 1.00 1.00 1.00 1.00 1.00 1.00 1.00 1.00 AdjDel/Veh: 54.2 28.6 0.0 0.0 57.7 57.7 0.0 0.0 0.0 15.7 15.7 7.9 LOS by Move: D- C A A E+ E+ A A A B B A HCM2kAvgQ: 8 2 0 0 8 8 0 0 0 20 20 0 Note: Queue reported is the number of cars per lane.

COMPARE Wed Oct 05 10:43:39 2011 Page 3-11
Traffix 8.0.0715 Copyright (c) 2008 Dowling Associates, Inc. Licensed to FEHR & PEERS WALNUT CRK
San Jose City College
SJ07-951 Level Of Service Computation Report
2000 HCM Operations (Future Volume Alternative) Cuml No Proj AM
Intersection #6: Leigh/Parkmoor Signal=Protect/Rights=Include Final Vol: 114 303*** 0 Lanes: 1 0 1 0 0
Signal=Split
Signal=Split
Final Vol: Lanes: Rights=Include Vol Cnt Date: n/a Rights=Include Lanes: Final Vol:
0
0 Cycle Time (sec): 110
1
95
0
Loss Time (sec): 9
0
0 0
Critical V/C: 0.851
1 1250
0
Avg Crit Del (sec/veh): 36.1
1
0 0
Avg Delay (sec/veh): 34.3
0 363***
LOS: C-
Lanes: 1 0 1 0 0 Final Vol: 325*** 219 0 Signal=Protect/Rights=Include Street Name: Leigh Parkmoor Approach: North Bound South Bound East Bound West Bound Movement: L - T - R L - T - R L - T - R L - T - R ------------|---------------||---------------||---------------||---------------| Min. Green: 7 10 0 0 10 10 0 0 0 10 10 10 Y+R: 4.0 4.0 4.0 4.0 4.0 4.0 4.0 4.0 4.0 4.0 4.0 4.0 ------------|---------------||---------------||---------------||---------------| Volume Module: Base Vol: 307 197 0 0 287 110 0 0 0 361 1088 95 Growth Adj: 1.00 1.00 1.00 1.00 1.00 1.00 1.00 1.00 1.00 1.00 1.00 1.00 Initial Bse: 307 197 0 0 287 110 0 0 0 361 1088 95 Added Vol: 0 0 0 0 0 0 0 0 0 0 0 0 Cuml: 18 22 0 0 16 4 0 0 0 2 162 0 Initial Fut: 325 219 0 0 303 114 0 0 0 363 1250 95 User Adj: 1.00 1.00 1.00 1.00 1.00 1.00 1.00 1.00 1.00 1.00 1.00 1.00 PHF Adj: 1.00 1.00 1.00 1.00 1.00 1.00 1.00 1.00 1.00 1.00 1.00 1.00 PHF Volume: 325 219 0 0 303 114 0 0 0 363 1250 95 Reduct Vol: 0 0 0 0 0 0 0 0 0 0 0 0 Reduced Vol: 325 219 0 0 303 114 0 0 0 363 1250 95 PCE Adj: 1.00 1.00 1.00 1.00 1.00 1.00 1.00 1.00 1.00 1.00 1.00 1.00 MLF Adj: 1.00 1.00 1.00 1.00 1.00 1.00 1.00 1.00 1.00 1.00 1.00 1.00 FinalVolume: 325 219 0 0 303 114 0 0 0 363 1250 95 ------------|---------------||---------------||---------------||---------------| Saturation Flow Module: Sat/Lane: 1900 1900 1900 1900 1900 1900 1900 1900 1900 1900 1900 1900 Adjustment: 0.92 1.00 0.92 0.92 1.00 0.92 0.92 1.00 0.92 0.95 0.98 0.92 Lanes: 1.00 1.00 0.00 0.00 1.00 1.00 0.00 0.00 0.00 0.46 1.54 1.00 Final Sat.: 1750 1900 0 0 1900 1750 0 0 0 832 2867 1750 ------------|---------------||---------------||---------------||---------------| Capacity Analysis Module: Vol/Sat: 0.19 0.12 0.00 0.00 0.16 0.07 0.00 0.00 0.00 0.44 0.44 0.05 Crit Moves: **** **** **** Green Time: 24.0 44.6 0.0 0.0 20.6 20.6 0.0 0.0 0.0 56.4 56.4 56.4 Volume/Cap: 0.85 0.28 0.00 0.00 0.85 0.35 0.00 0.00 0.00 0.85 0.85 0.11 Delay/Veh: 57.7 22.2 0.0 0.0 60.6 39.5 0.0 0.0 0.0 27.1 27.1 13.9 User DelAdj: 1.00 1.00 1.00 1.00 1.00 1.00 1.00 1.00 1.00 1.00 1.00 1.00 AdjDel/Veh: 57.7 22.2 0.0 0.0 60.6 39.5 0.0 0.0 0.0 27.1 27.1 13.9 LOS by Move: E+ C+ A A E D A A A C C B HCM2kAvgQ: 12 5 0 0 13 4 0 0 0 26 26 2 Note: Queue reported is the number of cars per lane.

COMPARE Wed Oct 05 10:43:39 2011 Page 3-12
Traffix 8.0.0715 Copyright (c) 2008 Dowling Associates, Inc. Licensed to FEHR & PEERS WALNUT CRK
San Jose City College
SJ07-951 Level Of Service Computation Report
2000 HCM Operations (Future Volume Alternative) Cumulative AM
Intersection #6: Leigh/Parkmoor Signal=Protect/Rights=Include Final Vol: 114 309*** 0 Lanes: 1 0 1 0 0
Signal=Split
Signal=Split
Final Vol: Lanes: Rights=Include Vol Cnt Date: n/a Rights=Include Lanes: Final Vol:
0
0 Cycle Time (sec): 110
1
95
0
Loss Time (sec): 9
0
0 0
Critical V/C: 0.899
1 1293
0
Avg Crit Del (sec/veh): 40.3
1
0 0
Avg Delay (sec/veh): 38.0
0 426***
LOS: D+
Lanes: 1 0 1 0 0 Final Vol: 347*** 222 0 Signal=Protect/Rights=Include Street Name: Leigh Parkmoor Approach: North Bound South Bound East Bound West Bound Movement: L - T - R L - T - R L - T - R L - T - R ------------|---------------||---------------||---------------||---------------| Min. Green: 7 10 0 0 10 10 0 0 0 10 10 10 Y+R: 4.0 4.0 4.0 4.0 4.0 4.0 4.0 4.0 4.0 4.0 4.0 4.0 ------------|---------------||---------------||---------------||---------------| Volume Module: Base Vol: 307 197 0 0 287 110 0 0 0 361 1088 95 Growth Adj: 1.00 1.00 1.00 1.00 1.00 1.00 1.00 1.00 1.00 1.00 1.00 1.00 Initial Bse: 307 197 0 0 287 110 0 0 0 361 1088 95 Added Vol: 22 3 0 0 6 0 0 0 0 63 43 0 Cuml: 18 22 0 0 16 4 0 0 0 2 162 0 Initial Fut: 347 222 0 0 309 114 0 0 0 426 1293 95 User Adj: 1.00 1.00 1.00 1.00 1.00 1.00 1.00 1.00 1.00 1.00 1.00 1.00 PHF Adj: 1.00 1.00 1.00 1.00 1.00 1.00 1.00 1.00 1.00 1.00 1.00 1.00 PHF Volume: 347 222 0 0 309 114 0 0 0 426 1293 95 Reduct Vol: 0 0 0 0 0 0 0 0 0 0 0 0 Reduced Vol: 347 222 0 0 309 114 0 0 0 426 1293 95 PCE Adj: 1.00 1.00 1.00 1.00 1.00 1.00 1.00 1.00 1.00 1.00 1.00 1.00 MLF Adj: 1.00 1.00 1.00 1.00 1.00 1.00 1.00 1.00 1.00 1.00 1.00 1.00 FinalVolume: 347 222 0 0 309 114 0 0 0 426 1293 95 ------------|---------------||---------------||---------------||---------------| Saturation Flow Module: Sat/Lane: 1900 1900 1900 1900 1900 1900 1900 1900 1900 1900 1900 1900 Adjustment: 0.92 1.00 0.92 0.92 1.00 0.92 0.92 1.00 0.92 0.95 0.98 0.92 Lanes: 1.00 1.00 0.00 0.00 1.00 1.00 0.00 0.00 0.00 0.51 1.49 1.00 Final Sat.: 1750 1900 0 0 1900 1750 0 0 0 917 2782 1750 ------------|---------------||---------------||---------------||---------------| Capacity Analysis Module: Vol/Sat: 0.20 0.12 0.00 0.00 0.16 0.07 0.00 0.00 0.00 0.46 0.46 0.05 Crit Moves: **** **** **** Green Time: 24.3 44.2 0.0 0.0 19.9 19.9 0.0 0.0 0.0 56.8 56.8 56.8 Volume/Cap: 0.90 0.29 0.00 0.00 0.90 0.36 0.00 0.00 0.00 0.90 0.90 0.11 Delay/Veh: 64.8 22.5 0.0 0.0 69.3 40.2 0.0 0.0 0.0 30.2 30.2 13.6 User DelAdj: 1.00 1.00 1.00 1.00 1.00 1.00 1.00 1.00 1.00 1.00 1.00 1.00 AdjDel/Veh: 64.8 22.5 0.0 0.0 69.3 40.2 0.0 0.0 0.0 30.2 30.2 13.6 LOS by Move: E C+ A A E D A A A C C B HCM2kAvgQ: 14 5 0 0 14 4 0 0 0 30 30 2 Note: Queue reported is the number of cars per lane.

COMPARE Wed Oct 05 10:43:39 2011 Page 3-13
Traffix 8.0.0715 Copyright (c) 2008 Dowling Associates, Inc. Licensed to FEHR & PEERS WALNUT CRK
San Jose City College
SJ07-951 Level Of Service Computation Report
2000 HCM Operations (Future Volume Alternative) Cuml No Proj AM
Intersection #7: Bascom/Moorpark Signal=Protect/Rights=Include Final Vol: 681*** 808 258 Lanes: 0 1 2 0 1
Signal=Split
Signal=Split
Final Vol: Lanes: Rights=Include Vol Cnt Date: n/a Rights=Include Lanes: Final Vol:
119
0 Cycle Time (sec): 140
0
0
1
Loss Time (sec): 9
0
748*** 1
Critical V/C: 0.807
0 0
0
Avg Crit Del (sec/veh): 43.7
0
216 1
Avg Delay (sec/veh): 39.3
0 0
LOS: D
Lanes: 2 0 2 1 0 Final Vol: 416*** 960 307 Signal=Protect/Rights=Include Street Name: S Bascom Ave Moorpark Ave Approach: North Bound South Bound East Bound West Bound Movement: L - T - R L - T - R L - T - R L - T - R ------------|---------------||---------------||---------------||---------------| Min. Green: 7 10 10 7 10 10 10 10 10 0 0 0 Y+R: 4.0 4.0 4.0 4.0 4.0 4.0 4.0 4.0 4.0 4.0 4.0 4.0 ------------|---------------||---------------||---------------||---------------| Volume Module: Base Vol: 397 867 277 256 615 527 111 715 202 0 0 0 Growth Adj: 1.00 1.00 1.00 1.00 1.00 1.00 1.00 1.00 1.00 1.00 1.00 1.00 Initial Bse: 397 867 277 256 615 527 111 715 202 0 0 0 Added Vol: 0 0 0 0 0 0 0 0 0 0 0 0 Cuml: 19 93 30 2 193 154 8 33 14 0 0 0 Initial Fut: 416 960 307 258 808 681 119 748 216 0 0 0 User Adj: 1.00 1.00 1.00 1.00 1.00 1.00 1.00 1.00 1.00 1.00 1.00 1.00 PHF Adj: 1.00 1.00 1.00 1.00 1.00 1.00 1.00 1.00 1.00 1.00 1.00 1.00 PHF Volume: 416 960 307 258 808 681 119 748 216 0 0 0 Reduct Vol: 0 0 0 0 0 0 0 0 0 0 0 0 Reduced Vol: 416 960 307 258 808 681 119 748 216 0 0 0 PCE Adj: 1.00 1.00 1.00 1.00 1.00 1.00 1.00 1.00 1.00 1.00 1.00 1.00 MLF Adj: 1.00 1.00 1.00 1.00 1.00 1.00 1.00 1.00 1.00 1.00 1.00 1.00 FinalVolume: 416 960 307 258 808 681 119 748 216 0 0 0 ------------|---------------||---------------||---------------||---------------| Saturation Flow Module: Sat/Lane: 1900 1900 1900 1900 1900 1900 1900 1900 1900 1900 1900 1900 Adjustment: 0.83 0.99 0.95 0.92 1.00 0.92 0.95 0.98 0.92 0.92 1.00 0.92 Lanes: 2.00 2.25 0.75 1.00 2.00 1.00 0.28 1.72 1.00 0.00 0.00 0.00 Final Sat.: 3150 4241 1356 1750 3800 1750 508 3192 1750 0 0 0 ------------|---------------||---------------||---------------||---------------| Capacity Analysis Module: Vol/Sat: 0.13 0.23 0.23 0.15 0.21 0.39 0.23 0.23 0.12 0.00 0.00 0.00 Crit Moves: **** **** **** Green Time: 22.9 54.7 54.7 35.6 67.5 67.5 40.6 40.6 40.6 0.0 0.0 0.0 Volume/Cap: 0.81 0.58 0.58 0.58 0.44 0.81 0.81 0.81 0.42 0.00 0.00 0.00 Delay/Veh: 65.6 34.0 34.0 47.5 24.0 33.5 50.7 50.7 40.8 0.0 0.0 0.0 User DelAdj: 1.00 1.00 1.00 1.00 1.00 1.00 1.00 1.00 1.00 1.00 1.00 1.00 AdjDel/Veh: 65.6 34.0 34.0 47.5 24.0 33.5 50.7 50.7 40.8 0.0 0.0 0.0 LOS by Move: E C- C- D C C- D D D A A A HCM2kAvgQ: 11 14 14 10 11 27 19 19 8 0 0 0 Note: Queue reported is the number of cars per lane.

COMPARE Wed Oct 05 10:43:39 2011 Page 3-14
Traffix 8.0.0715 Copyright (c) 2008 Dowling Associates, Inc. Licensed to FEHR & PEERS WALNUT CRK
San Jose City College
SJ07-951 Level Of Service Computation Report
2000 HCM Operations (Future Volume Alternative) Cumulative AM
Intersection #7: Bascom/Moorpark Signal=Protect/Rights=Include Final Vol: 682*** 817 313 Lanes: 0 1 2 0 1
Signal=Split
Signal=Split
Final Vol: Lanes: Rights=Include Vol Cnt Date: n/a Rights=Include Lanes: Final Vol:
119***
0 Cycle Time (sec): 140
0
0
1
Loss Time (sec): 9
0
755 1
Critical V/C: 0.810
0 0
0
Avg Crit Del (sec/veh): 43.8
0
216 1
Avg Delay (sec/veh): 40.5
0 0
LOS: D
Lanes: 2 0 2 1 0 Final Vol: 417*** 963 316 Signal=Protect/Rights=Include Street Name: S Bascom Ave Moorpark Ave Approach: North Bound South Bound East Bound West Bound Movement: L - T - R L - T - R L - T - R L - T - R ------------|---------------||---------------||---------------||---------------| Min. Green: 7 10 10 7 10 10 10 10 10 0 0 0 Y+R: 4.0 4.0 4.0 4.0 4.0 4.0 4.0 4.0 4.0 4.0 4.0 4.0 ------------|---------------||---------------||---------------||---------------| Volume Module: Base Vol: 397 867 277 256 615 527 111 715 202 0 0 0 Growth Adj: 1.00 1.00 1.00 1.00 1.00 1.00 1.00 1.00 1.00 1.00 1.00 1.00 Initial Bse: 397 867 277 256 615 527 111 715 202 0 0 0 Added Vol: 1 3 9 55 9 1 0 7 0 0 0 0 Cuml: 19 93 30 2 193 154 8 33 14 0 0 0 Initial Fut: 417 963 316 313 817 682 119 755 216 0 0 0 User Adj: 1.00 1.00 1.00 1.00 1.00 1.00 1.00 1.00 1.00 1.00 1.00 1.00 PHF Adj: 1.00 1.00 1.00 1.00 1.00 1.00 1.00 1.00 1.00 1.00 1.00 1.00 PHF Volume: 417 963 316 313 817 682 119 755 216 0 0 0 Reduct Vol: 0 0 0 0 0 0 0 0 0 0 0 0 Reduced Vol: 417 963 316 313 817 682 119 755 216 0 0 0 PCE Adj: 1.00 1.00 1.00 1.00 1.00 1.00 1.00 1.00 1.00 1.00 1.00 1.00 MLF Adj: 1.00 1.00 1.00 1.00 1.00 1.00 1.00 1.00 1.00 1.00 1.00 1.00 FinalVolume: 417 963 316 313 817 682 119 755 216 0 0 0 ------------|---------------||---------------||---------------||---------------| Saturation Flow Module: Sat/Lane: 1900 1900 1900 1900 1900 1900 1900 1900 1900 1900 1900 1900 Adjustment: 0.83 0.99 0.95 0.92 1.00 0.92 0.95 0.98 0.92 0.92 1.00 0.92 Lanes: 2.00 2.23 0.77 1.00 2.00 1.00 0.28 1.72 1.00 0.00 0.00 0.00 Final Sat.: 3150 4215 1383 1750 3800 1750 504 3196 1750 0 0 0 ------------|---------------||---------------||---------------||---------------| Capacity Analysis Module: Vol/Sat: 0.13 0.23 0.23 0.18 0.22 0.39 0.24 0.24 0.12 0.00 0.00 0.00 Crit Moves: **** **** **** Green Time: 22.9 50.6 50.6 39.6 67.3 67.3 40.8 40.8 40.8 0.0 0.0 0.0 Volume/Cap: 0.81 0.63 0.63 0.63 0.45 0.81 0.81 0.81 0.42 0.00 0.00 0.00 Delay/Veh: 65.9 37.7 37.7 46.5 24.1 33.7 50.7 50.7 40.6 0.0 0.0 0.0 User DelAdj: 1.00 1.00 1.00 1.00 1.00 1.00 1.00 1.00 1.00 1.00 1.00 1.00 AdjDel/Veh: 65.9 37.7 37.7 46.5 24.1 33.7 50.7 50.7 40.6 0.0 0.0 0.0 LOS by Move: E D+ D+ D C C- D D D A A A HCM2kAvgQ: 11 15 15 12 11 27 20 20 8 0 0 0 Note: Queue reported is the number of cars per lane.

COMPARE Wed Oct 05 10:43:39 2011 Page 3-15
Traffix 8.0.0715 Copyright (c) 2008 Dowling Associates, Inc. Licensed to FEHR & PEERS WALNUT CRK
San Jose City College
SJ07-951 Level Of Service Computation Report
2000 HCM Operations (Future Volume Alternative) Cuml No Proj AM
Intersection #8: Leland/Moorpark Signal=Split/Rights=Include Final Vol: 0 0 123*** Lanes: 0 0 0 0 1
Signal=Split
Signal=Split
Final Vol: Lanes: Rights=Ignore Vol Cnt Date: n/a Rights=Include Lanes: Final Vol:
273***
0 Cycle Time (sec): 110
0
0
1
Loss Time (sec): 6
0
1041 2
Critical V/C: 0.323
0 0
0
Avg Crit Del (sec/veh): 8.1
0
0 1
Avg Delay (sec/veh): 8.1
0 0
LOS: A
Lanes: 0 0 0 0 1 Final Vol: 0 0 0 Signal=Split/Rights=Ignore Street Name: Leland Ave Moorpark Ave Approach: North Bound South Bound East Bound West Bound Movement: L - T - R L - T - R L - T - R L - T - R ------------|---------------||---------------||---------------||---------------| Min. Green: 0 0 0 10 0 0 10 10 0 0 0 0 Y+R: 4.0 4.0 4.0 4.0 4.0 4.0 4.0 4.0 4.0 4.0 4.0 4.0 ------------|---------------||---------------||---------------||---------------| Volume Module: Base Vol: 0 0 34 123 0 0 206 993 134 0 0 0 Growth Adj: 1.00 1.00 1.00 1.00 1.00 1.00 1.00 1.00 1.00 1.00 1.00 1.00 Initial Bse: 0 0 34 123 0 0 206 993 134 0 0 0 Added Vol: 0 0 0 0 0 0 0 0 0 0 0 0 Cuml: 0 0 0 0 0 0 67 48 0 0 0 0 Initial Fut: 0 0 34 123 0 0 273 1041 134 0 0 0 User Adj: 1.00 1.00 0.00 1.00 1.00 1.00 1.00 1.00 0.00 1.00 1.00 1.00 PHF Adj: 1.00 1.00 0.00 1.00 1.00 1.00 1.00 1.00 0.00 1.00 1.00 1.00 PHF Volume: 0 0 0 123 0 0 273 1041 0 0 0 0 Reduct Vol: 0 0 0 0 0 0 0 0 0 0 0 0 Reduced Vol: 0 0 0 123 0 0 273 1041 0 0 0 0 PCE Adj: 1.00 1.00 0.00 1.00 1.00 1.00 1.00 1.00 0.00 1.00 1.00 1.00 MLF Adj: 1.00 1.00 0.00 1.00 1.00 1.00 1.00 1.00 0.00 1.00 1.00 1.00 FinalVolume: 0 0 0 123 0 0 273 1041 0 0 0 0 ------------|---------------||---------------||---------------||---------------| Saturation Flow Module: Sat/Lane: 1900 1900 1900 1900 1900 1900 1900 1900 1900 1900 1900 1900 Adjustment: 0.92 1.00 0.92 0.92 1.00 0.92 0.95 0.99 0.92 0.92 1.00 0.92 Lanes: 0.00 0.00 1.00 1.00 0.00 0.00 0.65 2.35 1.00 0.00 0.00 0.00 Final Sat.: 0 0 1750 1750 0 0 1163 4435 1750 0 0 0 ------------|---------------||---------------||---------------||---------------| Capacity Analysis Module: Vol/Sat: 0.00 0.00 0.00 0.07 0.00 0.00 0.23 0.23 0.00 0.00 0.00 0.00 Crit Moves: **** **** Green Time: 0.0 0.0 0.0 24.0 0.0 0.0 80.0 80.0 0.0 0.0 0.0 0.0 Volume/Cap: 0.00 0.00 0.00 0.32 0.00 0.00 0.32 0.32 0.00 0.00 0.00 0.00 Delay/Veh: 0.0 0.0 0.0 36.7 0.0 0.0 5.4 5.4 0.0 0.0 0.0 0.0 User DelAdj: 1.00 1.00 1.00 1.00 1.00 1.00 1.00 1.00 1.00 1.00 1.00 1.00 AdjDel/Veh: 0.0 0.0 0.0 36.7 0.0 0.0 5.4 5.4 0.0 0.0 0.0 0.0 LOS by Move: A A A D+ A A A A A A A A HCM2kAvgQ: 0 0 0 4 0 0 5 5 0 0 0 0 Note: Queue reported is the number of cars per lane.

COMPARE Wed Oct 05 10:43:39 2011 Page 3-16
Traffix 8.0.0715 Copyright (c) 2008 Dowling Associates, Inc. Licensed to FEHR & PEERS WALNUT CRK
San Jose City College
SJ07-951 Level Of Service Computation Report
2000 HCM Operations (Future Volume Alternative) Cumulative AM
Intersection #8: Leland/Moorpark Signal=Split/Rights=Include Final Vol: 0 0 129*** Lanes: 0 0 0 0 1
Signal=Split
Signal=Split
Final Vol: Lanes: Rights=Ignore Vol Cnt Date: n/a Rights=Include Lanes: Final Vol:
274
0 Cycle Time (sec): 110
0
0
1
Loss Time (sec): 6
0
1083*** 2
Critical V/C: 0.334
0 0
0
Avg Crit Del (sec/veh): 8.2
0
0 1
Avg Delay (sec/veh): 8.2
0 0
LOS: A
Lanes: 0 0 0 0 1 Final Vol: 0 0 0 Signal=Split/Rights=Ignore Street Name: Leland Ave Moorpark Ave Approach: North Bound South Bound East Bound West Bound Movement: L - T - R L - T - R L - T - R L - T - R ------------|---------------||---------------||---------------||---------------| Min. Green: 0 0 0 10 0 0 10 10 0 0 0 0 Y+R: 4.0 4.0 4.0 4.0 4.0 4.0 4.0 4.0 4.0 4.0 4.0 4.0 ------------|---------------||---------------||---------------||---------------| Volume Module: Base Vol: 0 0 34 123 0 0 206 993 134 0 0 0 Growth Adj: 1.00 1.00 1.00 1.00 1.00 1.00 1.00 1.00 1.00 1.00 1.00 1.00 Initial Bse: 0 0 34 123 0 0 206 993 134 0 0 0 Added Vol: 0 0 35 6 0 0 1 42 36 0 0 0 Cuml: 0 0 0 0 0 0 67 48 0 0 0 0 Initial Fut: 0 0 69 129 0 0 274 1083 170 0 0 0 User Adj: 1.00 1.00 0.00 1.00 1.00 1.00 1.00 1.00 0.00 1.00 1.00 1.00 PHF Adj: 1.00 1.00 0.00 1.00 1.00 1.00 1.00 1.00 0.00 1.00 1.00 1.00 PHF Volume: 0 0 0 129 0 0 274 1083 0 0 0 0 Reduct Vol: 0 0 0 0 0 0 0 0 0 0 0 0 Reduced Vol: 0 0 0 129 0 0 274 1083 0 0 0 0 PCE Adj: 1.00 1.00 0.00 1.00 1.00 1.00 1.00 1.00 0.00 1.00 1.00 1.00 MLF Adj: 1.00 1.00 0.00 1.00 1.00 1.00 1.00 1.00 0.00 1.00 1.00 1.00 FinalVolume: 0 0 0 129 0 0 274 1083 0 0 0 0 ------------|---------------||---------------||---------------||---------------| Saturation Flow Module: Sat/Lane: 1900 1900 1900 1900 1900 1900 1900 1900 1900 1900 1900 1900 Adjustment: 0.92 1.00 0.92 0.92 1.00 0.92 0.95 0.99 0.92 0.92 1.00 0.92 Lanes: 0.00 0.00 1.00 1.00 0.00 0.00 0.63 2.37 1.00 0.00 0.00 0.00 Final Sat.: 0 0 1750 1750 0 0 1130 4468 1750 0 0 0 ------------|---------------||---------------||---------------||---------------| Capacity Analysis Module: Vol/Sat: 0.00 0.00 0.00 0.07 0.00 0.00 0.24 0.24 0.00 0.00 0.00 0.00 Crit Moves: **** **** Green Time: 0.0 0.0 0.0 24.3 0.0 0.0 79.7 79.7 0.0 0.0 0.0 0.0 Volume/Cap: 0.00 0.00 0.00 0.33 0.00 0.00 0.33 0.33 0.00 0.00 0.00 0.00 Delay/Veh: 0.0 0.0 0.0 36.6 0.0 0.0 5.5 5.5 0.0 0.0 0.0 0.0 User DelAdj: 1.00 1.00 1.00 1.00 1.00 1.00 1.00 1.00 1.00 1.00 1.00 1.00 AdjDel/Veh: 0.0 0.0 0.0 36.6 0.0 0.0 5.5 5.5 0.0 0.0 0.0 0.0 LOS by Move: A A A D+ A A A A A A A A HCM2kAvgQ: 0 0 0 4 0 0 6 6 0 0 0 0 Note: Queue reported is the number of cars per lane.

COMPARE Wed Oct 05 10:43:39 2011 Page 3-17
Traffix 8.0.0715 Copyright (c) 2008 Dowling Associates, Inc. Licensed to FEHR & PEERS WALNUT CRK
San Jose City College
SJ07-951 Level Of Service Computation Report
2000 HCM Operations (Future Volume Alternative) Cuml No Proj AM
Intersection #9: Leigh/Moorpark Signal=Protect/Rights=Include Final Vol: 0 435 231*** Lanes: 0 0 2 0 1
Signal=Split
Signal=Split
Final Vol: Lanes: Rights=Include Vol Cnt Date: n/a Rights=Include Lanes: Final Vol:
78***
0 Cycle Time (sec): 110
0
6
1
Loss Time (sec): 9
0
887 2
Critical V/C: 0.463
0 0
0
Avg Crit Del (sec/veh): 29.6
0
207 1
Avg Delay (sec/veh): 26.5
0 0
LOS: C
Lanes: 0 0 2 0 1 Final Vol: 0 459*** 184 Signal=Protect/Rights=Include Street Name: Leigh Ave Moorpark Ave Approach: North Bound South Bound East Bound West Bound Movement: L - T - R L - T - R L - T - R L - T - R ------------|---------------||---------------||---------------||---------------| Min. Green: 0 10 10 7 10 0 10 10 10 0 0 0 Y+R: 4.0 4.0 4.0 4.0 4.0 4.0 4.0 4.0 4.0 4.0 4.0 4.0 ------------|---------------||---------------||---------------||---------------| Volume Module: Base Vol: 0 427 184 227 421 0 77 843 204 0 0 0 Growth Adj: 1.00 1.00 1.00 1.00 1.00 1.00 1.00 1.00 1.00 1.00 1.00 1.00 Initial Bse: 0 427 184 227 421 0 77 843 204 0 0 0 Added Vol: 0 0 0 0 0 0 0 0 0 0 0 0 Cuml: 0 32 0 4 14 0 1 44 3 0 0 6 Initial Fut: 0 459 184 231 435 0 78 887 207 0 0 6 User Adj: 1.00 1.00 1.00 1.00 1.00 1.00 1.00 1.00 1.00 1.00 1.00 1.00 PHF Adj: 1.00 1.00 1.00 1.00 1.00 1.00 1.00 1.00 1.00 1.00 1.00 1.00 PHF Volume: 0 459 184 231 435 0 78 887 207 0 0 6 Reduct Vol: 0 0 0 0 0 0 0 0 0 0 0 0 Reduced Vol: 0 459 184 231 435 0 78 887 207 0 0 6 PCE Adj: 1.00 1.00 1.00 1.00 1.00 1.00 1.00 1.00 1.00 1.00 1.00 1.00 MLF Adj: 1.00 1.00 1.00 1.00 1.00 1.00 1.00 1.00 1.00 1.00 1.00 1.00 FinalVolume: 0 459 184 231 435 0 78 887 207 0 0 6 ------------|---------------||---------------||---------------||---------------| Saturation Flow Module: Sat/Lane: 1900 1900 1900 1900 1900 1900 1900 1900 1900 1900 1900 1900 Adjustment: 0.92 1.00 0.92 0.92 1.00 0.92 0.95 0.99 0.92 0.92 1.00 0.92 Lanes: 0.00 2.00 1.00 1.00 2.00 0.00 0.25 2.75 1.00 0.00 0.00 0.00 Final Sat.: 0 3800 1750 1750 3800 0 453 5147 1750 0 0 0 ------------|---------------||---------------||---------------||---------------| Capacity Analysis Module: Vol/Sat: 0.00 0.12 0.11 0.13 0.11 0.00 0.17 0.17 0.12 0.00 0.00 xxxx Crit Moves: **** **** **** Green Time: 0.0 28.7 28.7 31.4 60.1 0.0 40.9 40.9 40.9 0.0 0.0 0.0 Volume/Cap: 0.00 0.46 0.40 0.46 0.21 0.00 0.46 0.46 0.32 0.00 0.00 xxxx Delay/Veh: 0.0 34.5 34.2 33.1 12.9 0.0 26.4 26.4 24.9 0.0 0.0 0.0 User DelAdj: 1.00 1.00 1.00 1.00 1.00 1.00 1.00 1.00 1.00 1.00 1.00 1.00 AdjDel/Veh: 0.0 34.5 34.2 33.1 12.9 0.0 26.4 26.4 24.9 0.0 0.0 0.0 LOS by Move: A C- C- C- B A C C C A A A HCM2kAvgQ: 0 6 5 7 3 0 8 8 5 0 0 0 Note: Queue reported is the number of cars per lane.

COMPARE Wed Oct 05 10:43:39 2011 Page 3-18
Traffix 8.0.0715 Copyright (c) 2008 Dowling Associates, Inc. Licensed to FEHR & PEERS WALNUT CRK
San Jose City College
SJ07-951 Level Of Service Computation Report
2000 HCM Operations (Future Volume Alternative) Cumulative AM
Intersection #9: Leigh/Moorpark Signal=Protect/Rights=Include Final Vol: 0 504 231*** Lanes: 0 0 2 0 1
Signal=Split
Signal=Split
Final Vol: Lanes: Rights=Include Vol Cnt Date: n/a Rights=Include Lanes: Final Vol:
98
0 Cycle Time (sec): 110
0
6
1
Loss Time (sec): 9
0
913*** 2
Critical V/C: 0.474
0 0
0
Avg Crit Del (sec/veh): 29.4
0
244 1
Avg Delay (sec/veh): 26.2
0 0
LOS: C
Lanes: 0 0 2 0 1 Final Vol: 0 465*** 184 Signal=Protect/Rights=Include Street Name: Leigh Ave Moorpark Ave Approach: North Bound South Bound East Bound West Bound Movement: L - T - R L - T - R L - T - R L - T - R ------------|---------------||---------------||---------------||---------------| Min. Green: 0 10 10 7 10 0 10 10 10 0 0 0 Y+R: 4.0 4.0 4.0 4.0 4.0 4.0 4.0 4.0 4.0 4.0 4.0 4.0 ------------|---------------||---------------||---------------||---------------| Volume Module: Base Vol: 0 427 184 227 421 0 77 843 204 0 0 0 Growth Adj: 1.00 1.00 1.00 1.00 1.00 1.00 1.00 1.00 1.00 1.00 1.00 1.00 Initial Bse: 0 427 184 227 421 0 77 843 204 0 0 0 Added Vol: 0 6 0 0 69 0 20 26 37 0 0 0 Cuml: 0 32 0 4 14 0 1 44 3 0 0 6 Initial Fut: 0 465 184 231 504 0 98 913 244 0 0 6 User Adj: 1.00 1.00 1.00 1.00 1.00 1.00 1.00 1.00 1.00 1.00 1.00 1.00 PHF Adj: 1.00 1.00 1.00 1.00 1.00 1.00 1.00 1.00 1.00 1.00 1.00 1.00 PHF Volume: 0 465 184 231 504 0 98 913 244 0 0 6 Reduct Vol: 0 0 0 0 0 0 0 0 0 0 0 0 Reduced Vol: 0 465 184 231 504 0 98 913 244 0 0 6 PCE Adj: 1.00 1.00 1.00 1.00 1.00 1.00 1.00 1.00 1.00 1.00 1.00 1.00 MLF Adj: 1.00 1.00 1.00 1.00 1.00 1.00 1.00 1.00 1.00 1.00 1.00 1.00 FinalVolume: 0 465 184 231 504 0 98 913 244 0 0 6 ------------|---------------||---------------||---------------||---------------| Saturation Flow Module: Sat/Lane: 1900 1900 1900 1900 1900 1900 1900 1900 1900 1900 1900 1900 Adjustment: 0.92 1.00 0.92 0.92 1.00 0.92 0.95 0.99 0.92 0.92 1.00 0.92 Lanes: 0.00 2.00 1.00 1.00 2.00 0.00 0.30 2.70 1.00 0.00 0.00 0.00 Final Sat.: 0 3800 1750 1750 3800 0 543 5056 1750 0 0 0 ------------|---------------||---------------||---------------||---------------| Capacity Analysis Module: Vol/Sat: 0.00 0.12 0.11 0.13 0.13 0.00 0.18 0.18 0.14 0.00 0.00 xxxx Crit Moves: **** **** **** Green Time: 0.0 28.4 28.4 30.7 59.1 0.0 41.9 41.9 41.9 0.0 0.0 0.0 Volume/Cap: 0.00 0.47 0.41 0.47 0.25 0.00 0.47 0.47 0.37 0.00 0.00 xxxx Delay/Veh: 0.0 34.8 34.4 33.7 13.7 0.0 25.9 25.9 24.8 0.0 0.0 0.0 User DelAdj: 1.00 1.00 1.00 1.00 1.00 1.00 1.00 1.00 1.00 1.00 1.00 1.00 AdjDel/Veh: 0.0 34.8 34.4 33.7 13.7 0.0 25.9 25.9 24.8 0.0 0.0 0.0 LOS by Move: A C- C- C- B A C C C A A A HCM2kAvgQ: 0 6 5 7 4 0 8 8 6 0 0 0 Note: Queue reported is the number of cars per lane.

COMPARE Wed Oct 05 10:43:39 2011 Page 3-19
Traffix 8.0.0715 Copyright (c) 2008 Dowling Associates, Inc. Licensed to FEHR & PEERS WALNUT CRK
San Jose City College
SJ07-951 Level Of Service Computation Report
2000 HCM Operations (Future Volume Alternative) Cuml No Proj AM
Intersection #10: Bascom/Renova Signal=Protect/Rights=Include Final Vol: 239 763 26*** Lanes: 0 1 2 0 1
Signal=Permit
Signal=Permit
Final Vol: Lanes: Rights=Include Vol Cnt Date: n/a Rights=Include Lanes: Final Vol:
57
0 Cycle Time (sec): 140
1
12
1
Loss Time (sec): 9
0
7*** 0
Critical V/C: 0.345
0 3
0
Avg Crit Del (sec/veh): 7.7
1
41 1
Avg Delay (sec/veh): 13.1
0 8
LOS: B
Lanes: 1 0 2 1 0 Final Vol: 134 1507*** 17 Signal=Protect/Rights=Include Street Name: Bascom Ave Renova Dr Approach: North Bound South Bound East Bound West Bound Movement: L - T - R L - T - R L - T - R L - T - R ------------|---------------||---------------||---------------||---------------| Min. Green: 7 10 10 7 10 10 10 10 10 10 10 10 Y+R: 4.0 4.0 4.0 4.0 4.0 4.0 4.0 4.0 4.0 4.0 4.0 4.0 ------------|---------------||---------------||---------------||---------------| Volume Module: Base Vol: 127 1439 17 26 704 100 20 7 27 8 3 12 Growth Adj: 1.00 1.00 1.00 1.00 1.00 1.00 1.00 1.00 1.00 1.00 1.00 1.00 Initial Bse: 127 1439 17 26 704 100 20 7 27 8 3 12 Added Vol: 0 0 0 0 0 0 0 0 0 0 0 0 Cuml: 7 68 0 0 59 139 37 0 14 0 0 0 Initial Fut: 134 1507 17 26 763 239 57 7 41 8 3 12 User Adj: 1.00 1.00 1.00 1.00 1.00 1.00 1.00 1.00 1.00 1.00 1.00 1.00 PHF Adj: 1.00 1.00 1.00 1.00 1.00 1.00 1.00 1.00 1.00 1.00 1.00 1.00 PHF Volume: 134 1507 17 26 763 239 57 7 41 8 3 12 Reduct Vol: 0 0 0 0 0 0 0 0 0 0 0 0 Reduced Vol: 134 1507 17 26 763 239 57 7 41 8 3 12 PCE Adj: 1.00 1.00 1.00 1.00 1.00 1.00 1.00 1.00 1.00 1.00 1.00 1.00 MLF Adj: 1.00 1.00 1.00 1.00 1.00 1.00 1.00 1.00 1.00 1.00 1.00 1.00 FinalVolume: 134 1507 17 26 763 239 57 7 41 8 3 12 ------------|---------------||---------------||---------------||---------------| Saturation Flow Module: Sat/Lane: 1900 1900 1900 1900 1900 1900 1900 1900 1900 1900 1900 1900 Adjustment: 0.92 0.98 0.95 0.92 0.99 0.95 0.95 0.95 0.92 0.95 0.95 0.92 Lanes: 1.00 2.97 0.03 1.00 2.26 0.74 0.89 0.11 1.00 0.73 0.27 1.00 Final Sat.: 1750 5537 62 1750 4263 1335 1603 197 1750 1309 491 1750 ------------|---------------||---------------||---------------||---------------| Capacity Analysis Module: Vol/Sat: 0.08 0.27 0.27 0.01 0.18 0.18 0.04 0.04 0.02 0.01 0.01 0.01 Crit Moves: **** **** **** Green Time: 35.0 110 109.7 7.0 81.7 81.7 14.3 14.3 14.3 14.3 14.3 14.3 Volume/Cap: 0.31 0.35 0.35 0.30 0.31 0.31 0.35 0.35 0.23 0.06 0.06 0.07 Delay/Veh: 43.1 4.6 4.6 66.0 14.8 14.8 59.6 59.6 58.4 56.9 56.9 57.0 User DelAdj: 1.00 1.00 1.00 1.00 1.00 1.00 1.00 1.00 1.00 1.00 1.00 1.00 AdjDel/Veh: 43.1 4.6 4.6 66.0 14.8 14.8 59.6 59.6 58.4 56.9 56.9 57.0 LOS by Move: D A A E B B E+ E+ E+ E+ E+ E+ HCM2kAvgQ: 5 6 6 1 7 7 3 3 2 0 0 1 Note: Queue reported is the number of cars per lane.

COMPARE Wed Oct 05 10:43:39 2011 Page 3-20
Traffix 8.0.0715 Copyright (c) 2008 Dowling Associates, Inc. Licensed to FEHR & PEERS WALNUT CRK
San Jose City College
SJ07-951 Level Of Service Computation Report
2000 HCM Operations (Future Volume Alternative) Cumulative AM
Intersection #10: Bascom/Renova Signal=Protect/Rights=Include Final Vol: 239 772 26*** Lanes: 0 1 2 0 1
Signal=Permit
Signal=Permit
Final Vol: Lanes: Rights=Include Vol Cnt Date: n/a Rights=Include Lanes: Final Vol:
57
0 Cycle Time (sec): 140
1
12
1
Loss Time (sec): 9
0
7*** 0
Critical V/C: 0.347
0 3
0
Avg Crit Del (sec/veh): 7.7
1
41 1
Avg Delay (sec/veh): 13.0
0 8
LOS: B
Lanes: 1 0 2 1 0 Final Vol: 134 1519*** 17 Signal=Protect/Rights=Include Street Name: Bascom Ave Renova Dr Approach: North Bound South Bound East Bound West Bound Movement: L - T - R L - T - R L - T - R L - T - R ------------|---------------||---------------||---------------||---------------| Min. Green: 7 10 10 7 10 10 10 10 10 10 10 10 Y+R: 4.0 4.0 4.0 4.0 4.0 4.0 4.0 4.0 4.0 4.0 4.0 4.0 ------------|---------------||---------------||---------------||---------------| Volume Module: Base Vol: 127 1439 17 26 704 100 20 7 27 8 3 12 Growth Adj: 1.00 1.00 1.00 1.00 1.00 1.00 1.00 1.00 1.00 1.00 1.00 1.00 Initial Bse: 127 1439 17 26 704 100 20 7 27 8 3 12 Added Vol: 0 12 0 0 9 0 0 0 0 0 0 0 Cuml: 7 68 0 0 59 139 37 0 14 0 0 0 Initial Fut: 134 1519 17 26 772 239 57 7 41 8 3 12 User Adj: 1.00 1.00 1.00 1.00 1.00 1.00 1.00 1.00 1.00 1.00 1.00 1.00 PHF Adj: 1.00 1.00 1.00 1.00 1.00 1.00 1.00 1.00 1.00 1.00 1.00 1.00 PHF Volume: 134 1519 17 26 772 239 57 7 41 8 3 12 Reduct Vol: 0 0 0 0 0 0 0 0 0 0 0 0 Reduced Vol: 134 1519 17 26 772 239 57 7 41 8 3 12 PCE Adj: 1.00 1.00 1.00 1.00 1.00 1.00 1.00 1.00 1.00 1.00 1.00 1.00 MLF Adj: 1.00 1.00 1.00 1.00 1.00 1.00 1.00 1.00 1.00 1.00 1.00 1.00 FinalVolume: 134 1519 17 26 772 239 57 7 41 8 3 12 ------------|---------------||---------------||---------------||---------------| Saturation Flow Module: Sat/Lane: 1900 1900 1900 1900 1900 1900 1900 1900 1900 1900 1900 1900 Adjustment: 0.92 0.98 0.95 0.92 0.99 0.95 0.95 0.95 0.92 0.95 0.95 0.92 Lanes: 1.00 2.97 0.03 1.00 2.26 0.74 0.89 0.11 1.00 0.73 0.27 1.00 Final Sat.: 1750 5538 62 1750 4274 1323 1603 197 1750 1309 491 1750 ------------|---------------||---------------||---------------||---------------| Capacity Analysis Module: Vol/Sat: 0.08 0.27 0.27 0.01 0.18 0.18 0.04 0.04 0.02 0.01 0.01 0.01 Crit Moves: **** **** **** Green Time: 34.8 110 109.8 7.0 82.0 82.0 14.2 14.2 14.2 14.2 14.2 14.2 Volume/Cap: 0.31 0.35 0.35 0.30 0.31 0.31 0.35 0.35 0.23 0.06 0.06 0.07 Delay/Veh: 43.2 4.5 4.5 66.0 14.7 14.7 59.7 59.7 58.5 57.0 57.0 57.0 User DelAdj: 1.00 1.00 1.00 1.00 1.00 1.00 1.00 1.00 1.00 1.00 1.00 1.00 AdjDel/Veh: 43.2 4.5 4.5 66.0 14.7 14.7 59.7 59.7 58.5 57.0 57.0 57.0 LOS by Move: D A A E B B E+ E+ E+ E+ E+ E+ HCM2kAvgQ: 5 6 6 1 7 7 3 3 2 0 0 1 Note: Queue reported is the number of cars per lane.

COMPARE Wed Oct 05 10:43:39 2011 Page 3-21
Traffix 8.0.0715 Copyright (c) 2008 Dowling Associates, Inc. Licensed to FEHR & PEERS WALNUT CRK
San Jose City College
SJ07-951 Level Of Service Computation Report
2000 HCM Unsignalized (Future Volume Alternative) Cuml No Proj AM
Intersection #11: Bascom/Laswell [Unsignalized] Signal=Uncontrol/Rights=Include Final Vol: 36 640 91 Lanes: 0 0 3 0 1
Signal=Stop
Signal=Stop
Final Vol: Lanes: Rights=Include Vol Cnt Date: n/a Rights=Include Lanes: Final Vol:
0
0 Cycle Time (sec): 100
0
28
0
Loss Time (sec): 0
0
0 0
Critical V/C: 0.267
1! 1
0
Avg Crit Del (sec/veh): 1.3
0
0 0
Avg Delay (sec/veh): 1.3
0 5
LOS: E
Lanes: 0 0 2 1 0 Final Vol: 11 1640 180 Signal=Uncontrol/Rights=Include Street Name: S Bascom Ave Laswell Ave Approach: North Bound South Bound East Bound West Bound Movement: L - T - R L - T - R L - T - R L - T - R ------------|---------------||---------------||---------------||---------------| Volume Module: Base Vol: 11 1570 180 91 567 36 0 0 0 5 1 23 Growth Adj: 1.00 1.00 1.00 1.00 1.00 1.00 1.00 1.00 1.00 1.00 1.00 1.00 Initial Bse: 11 1570 180 91 567 36 0 0 0 5 1 23 Added Vol: 0 0 0 0 0 0 0 0 0 0 0 0 Cuml: 0 70 0 0 73 0 0 0 0 0 0 5 Initial Fut: 11 1640 180 91 640 36 0 0 0 5 1 28 User Adj: 1.00 1.00 1.00 1.00 1.00 1.00 1.00 1.00 1.00 1.00 1.00 1.00 PHF Adj: 1.00 1.00 1.00 1.00 1.00 1.00 1.00 1.00 1.00 1.00 1.00 1.00 PHF Volume: 11 1640 180 91 640 36 0 0 0 5 1 28 Reduct Vol: 0 0 0 0 0 0 0 0 0 0 0 0 FinalVolume: 11 1640 180 91 640 36 0 0 0 5 1 28 ------------|---------------||---------------||---------------||---------------| Critical Gap Module: Critical Gp: 4.1 xxxx xxxxx 4.1 xxxx xxxxx xxxxx xxxx xxxxx 6.8 6.5 6.9 FollowUpTim: 2.2 xxxx xxxxx 2.2 xxxx xxxxx xxxxx xxxx xxxxx 3.5 4.0 3.3 ------------|---------------||---------------||---------------||---------------| Capacity Module: Cnflict Vol: 676 xxxx xxxxx 1820 xxxx xxxxx xxxx xxxx xxxxx 2147 2610 637 Potent Cap.: 925 xxxx xxxxx 341 xxxx xxxxx xxxx xxxx xxxxx 42 25 425 Move Cap.: 925 xxxx xxxxx 341 xxxx xxxxx xxxx xxxx xxxxx 33 18 425 Volume/Cap: 0.01 xxxx xxxx 0.27 xxxx xxxx xxxx xxxx xxxx 0.15 0.06 0.07 ------------|---------------||---------------||---------------||---------------| Level Of Service Module: 2Way95thQ: 0.0 xxxx xxxxx 1.1 xxxx xxxxx xxxx xxxx xxxxx xxxx xxxx xxxxx Control Del: 8.9 xxxx xxxxx 19.3 xxxx xxxxx xxxxx xxxx xxxxx xxxxx xxxx xxxxx LOS by Move: A * * C * * * * * * * * Movement: LT - LTR - RT LT - LTR - RT LT - LTR - RT LT - LTR - RT Shared Cap.: xxxx xxxx xxxxx xxxx xxxx xxxxx xxxx xxxx xxxxx xxxx 125 xxxxx SharedQueue: 0.0 xxxx xxxxx xxxxx xxxx xxxxx xxxxx xxxx xxxxx xxxxx 1.0 xxxxx Shrd ConDel: 8.9 xxxx xxxxx xxxxx xxxx xxxxx xxxxx xxxx xxxxx xxxxx 44.1 xxxxx Shared LOS: A * * * * * * * * * E * ApproachDel: xxxxxx xxxxxx xxxxxx 44.1 ApproachLOS: * * * E Note: Queue reported is the number of cars per lane.

COMPARE Wed Oct 05 10:43:39 2011 Page 3-22
Traffix 8.0.0715 Copyright (c) 2008 Dowling Associates, Inc. Licensed to FEHR & PEERS WALNUT CRK
San Jose City College
SJ07-951 Level Of Service Computation Report
2000 HCM Unsignalized (Future Volume Alternative) Cumulative AM
Intersection #11: Bascom/Laswell [Unsignalized] Signal=Uncontrol/Rights=Include Final Vol: 36 640 100 Lanes: 0 0 3 0 1
Signal=Stop
Signal=Stop
Final Vol: Lanes: Rights=Include Vol Cnt Date: n/a Rights=Include Lanes: Final Vol:
0
0 Cycle Time (sec): 100
0
32
0
Loss Time (sec): 0
0
0 0
Critical V/C: 0.397
1! 1
0
Avg Crit Del (sec/veh): 2.3
0
0 0
Avg Delay (sec/veh): 2.3
0 12
LOS: F
Lanes: 0 0 2 1 0 Final Vol: 11 1649 206 Signal=Uncontrol/Rights=Include Street Name: S Bascom Ave Laswell Ave Approach: North Bound South Bound East Bound West Bound Movement: L - T - R L - T - R L - T - R L - T - R ------------|---------------||---------------||---------------||---------------| Volume Module: Base Vol: 11 1570 180 91 567 36 0 0 0 5 1 23 Growth Adj: 1.00 1.00 1.00 1.00 1.00 1.00 1.00 1.00 1.00 1.00 1.00 1.00 Initial Bse: 11 1570 180 91 567 36 0 0 0 5 1 23 Added Vol: 0 9 26 9 0 0 0 0 0 7 0 4 Cuml: 0 70 0 0 73 0 0 0 0 0 0 5 Initial Fut: 11 1649 206 100 640 36 0 0 0 12 1 32 User Adj: 1.00 1.00 1.00 1.00 1.00 1.00 1.00 1.00 1.00 1.00 1.00 1.00 PHF Adj: 1.00 1.00 1.00 1.00 1.00 1.00 1.00 1.00 1.00 1.00 1.00 1.00 PHF Volume: 11 1649 206 100 640 36 0 0 0 12 1 32 Reduct Vol: 0 0 0 0 0 0 0 0 0 0 0 0 FinalVolume: 11 1649 206 100 640 36 0 0 0 12 1 32 ------------|---------------||---------------||---------------||---------------| Critical Gap Module: Critical Gp: 4.1 xxxx xxxxx 4.1 xxxx xxxxx xxxxx xxxx xxxxx 6.8 6.5 6.9 FollowUpTim: 2.2 xxxx xxxxx 2.2 xxxx xxxxx xxxxx xxxx xxxxx 3.5 4.0 3.3 ------------|---------------||---------------||---------------||---------------| Capacity Module: Cnflict Vol: 676 xxxx xxxxx 1855 xxxx xxxxx xxxx xxxx xxxxx 2187 2650 653 Potent Cap.: 925 xxxx xxxxx 331 xxxx xxxxx xxxx xxxx xxxxx 40 23 415 Move Cap.: 925 xxxx xxxxx 331 xxxx xxxxx xxxx xxxx xxxxx 30 16 415 Volume/Cap: 0.01 xxxx xxxx 0.30 xxxx xxxx xxxx xxxx xxxx 0.40 0.06 0.08 ------------|---------------||---------------||---------------||---------------| Level Of Service Module: 2Way95thQ: 0.0 xxxx xxxxx 1.2 xxxx xxxxx xxxx xxxx xxxxx xxxx xxxx xxxxx Control Del: 8.9 xxxx xxxxx 20.5 xxxx xxxxx xxxxx xxxx xxxxx xxxxx xxxx xxxxx LOS by Move: A * * C * * * * * * * * Movement: LT - LTR - RT LT - LTR - RT LT - LTR - RT LT - LTR - RT Shared Cap.: xxxx xxxx xxxxx xxxx xxxx xxxxx xxxx xxxx xxxxx xxxx 84 xxxxx SharedQueue: 0.0 xxxx xxxxx xxxxx xxxx xxxxx xxxxx xxxx xxxxx xxxxx 2.3 xxxxx Shrd ConDel: 8.9 xxxx xxxxx xxxxx xxxx xxxxx xxxxx xxxx xxxxx xxxxx 89.2 xxxxx Shared LOS: A * * * * * * * * * F * ApproachDel: xxxxxx xxxxxx xxxxxx 89.2 ApproachLOS: * * * F Note: Queue reported is the number of cars per lane.

COMPARE Wed Oct 05 10:43:39 2011 Page 3-23
Traffix 8.0.0715 Copyright (c) 2008 Dowling Associates, Inc. Licensed to FEHR & PEERS WALNUT CRK
San Jose City College
SJ07-951 Level Of Service Computation Report
2000 HCM Operations (Future Volume Alternative) Cuml No Proj AM
Intersection #12: Bascom/Fruitdale Signal=Protect/Rights=Include Final Vol: 89 396 193*** Lanes: 1 0 3 0 1
Signal=Split
Signal=Split
Final Vol: Lanes: Rights=Include Vol Cnt Date: n/a Rights=Include Lanes: Final Vol:
38***
0 Cycle Time (sec): 140
1
569***
1
Loss Time (sec): 12
0
62 0
Critical V/C: 0.794
1 256
1
Avg Crit Del (sec/veh): 50.7
1
54 0
Avg Delay (sec/veh): 47.7
0 131
LOS: D
Lanes: 1 0 2 1 0 Final Vol: 180 1263*** 125 Signal=Protect/Rights=Include Street Name: Bascom Fruitdale Approach: North Bound South Bound East Bound West Bound Movement: L - T - R L - T - R L - T - R L - T - R ------------|---------------||---------------||---------------||---------------| Min. Green: 7 10 10 7 10 10 10 10 10 10 10 10 Y+R: 4.0 4.0 4.0 4.0 4.0 4.0 4.0 4.0 4.0 4.0 4.0 4.0 ------------|---------------||---------------||---------------||---------------| Volume Module: Base Vol: 120 1202 121 183 359 65 34 59 43 128 243 564 Growth Adj: 1.00 1.00 1.00 1.00 1.00 1.00 1.00 1.00 1.00 1.00 1.00 1.00 Initial Bse: 120 1202 121 183 359 65 34 59 43 128 243 564 Added Vol: 0 0 0 0 0 0 0 0 0 0 0 0 Cuml: 60 61 4 10 37 24 4 3 11 3 13 5 Initial Fut: 180 1263 125 193 396 89 38 62 54 131 256 569 User Adj: 1.00 1.00 1.00 1.00 1.00 1.00 1.00 1.00 1.00 1.00 1.00 1.00 PHF Adj: 1.00 1.00 1.00 1.00 1.00 1.00 1.00 1.00 1.00 1.00 1.00 1.00 PHF Volume: 180 1263 125 193 396 89 38 62 54 131 256 569 Reduct Vol: 0 0 0 0 0 0 0 0 0 0 0 0 Reduced Vol: 180 1263 125 193 396 89 38 62 54 131 256 569 PCE Adj: 1.00 1.00 1.00 1.00 1.00 1.00 1.00 1.00 1.00 1.00 1.00 1.00 MLF Adj: 1.00 1.00 1.00 1.00 1.00 1.00 1.00 1.00 1.00 1.00 1.00 1.00 FinalVolume: 180 1263 125 193 396 89 38 62 54 131 256 569 ------------|---------------||---------------||---------------||---------------| Saturation Flow Module: Sat/Lane: 1900 1900 1900 1900 1900 1900 1900 1900 1900 1900 1900 1900 Adjustment: 0.92 0.99 0.95 0.92 1.00 0.92 0.95 0.95 0.95 0.95 0.99 0.92 Lanes: 1.00 2.72 0.28 1.00 3.00 1.00 0.49 0.81 0.70 0.70 1.30 1.00 Final Sat.: 1750 5095 504 1750 5700 1750 888 1449 1262 1252 2447 1750 ------------|---------------||---------------||---------------||---------------| Capacity Analysis Module: Vol/Sat: 0.10 0.25 0.25 0.11 0.07 0.05 0.04 0.04 0.04 0.10 0.10 0.33 Crit Moves: **** **** **** **** Green Time: 36.5 42.8 42.8 19.0 25.3 25.3 10.0 10.0 10.0 56.1 56.1 56.1 Volume/Cap: 0.39 0.81 0.81 0.81 0.38 0.28 0.60 0.60 0.60 0.26 0.26 0.81 Delay/Veh: 43.2 47.9 47.9 77.3 50.7 49.9 66.9 66.9 66.9 28.1 28.1 44.3 User DelAdj: 1.00 1.00 1.00 1.00 1.00 1.00 1.00 1.00 1.00 1.00 1.00 1.00 AdjDel/Veh: 43.2 47.9 47.9 77.3 50.7 49.9 66.9 66.9 66.9 28.1 28.1 44.3 LOS by Move: D D D E- D D E E E C C D HCM2kAvgQ: 7 20 20 9 5 3 4 4 4 5 5 24 Note: Queue reported is the number of cars per lane.

COMPARE Wed Oct 05 10:43:39 2011 Page 3-24
Traffix 8.0.0715 Copyright (c) 2008 Dowling Associates, Inc. Licensed to FEHR & PEERS WALNUT CRK
San Jose City College
SJ07-951 Level Of Service Computation Report
2000 HCM Operations (Future Volume Alternative) Cumulative AM
Intersection #12: Bascom/Fruitdale Signal=Protect/Rights=Include Final Vol: 89 399 197*** Lanes: 1 0 3 0 1
Signal=Split
Signal=Split
Final Vol: Lanes: Rights=Include Vol Cnt Date: n/a Rights=Include Lanes: Final Vol:
38***
0 Cycle Time (sec): 140
1
592***
1
Loss Time (sec): 12
0
62 0
Critical V/C: 0.813
1 256
1
Avg Crit Del (sec/veh): 52.1
1
54 0
Avg Delay (sec/veh): 48.7
0 131
LOS: D
Lanes: 1 0 2 1 0 Final Vol: 180 1275*** 125 Signal=Protect/Rights=Include Street Name: Bascom Fruitdale Approach: North Bound South Bound East Bound West Bound Movement: L - T - R L - T - R L - T - R L - T - R ------------|---------------||---------------||---------------||---------------| Min. Green: 7 10 10 7 10 10 10 10 10 10 10 10 Y+R: 4.0 4.0 4.0 4.0 4.0 4.0 4.0 4.0 4.0 4.0 4.0 4.0 ------------|---------------||---------------||---------------||---------------| Volume Module: Base Vol: 120 1202 121 183 359 65 34 59 43 128 243 564 Growth Adj: 1.00 1.00 1.00 1.00 1.00 1.00 1.00 1.00 1.00 1.00 1.00 1.00 Initial Bse: 120 1202 121 183 359 65 34 59 43 128 243 564 Added Vol: 0 12 0 4 3 0 0 0 0 0 0 23 Cuml: 60 61 4 10 37 24 4 3 11 3 13 5 Initial Fut: 180 1275 125 197 399 89 38 62 54 131 256 592 User Adj: 1.00 1.00 1.00 1.00 1.00 1.00 1.00 1.00 1.00 1.00 1.00 1.00 PHF Adj: 1.00 1.00 1.00 1.00 1.00 1.00 1.00 1.00 1.00 1.00 1.00 1.00 PHF Volume: 180 1275 125 197 399 89 38 62 54 131 256 592 Reduct Vol: 0 0 0 0 0 0 0 0 0 0 0 0 Reduced Vol: 180 1275 125 197 399 89 38 62 54 131 256 592 PCE Adj: 1.00 1.00 1.00 1.00 1.00 1.00 1.00 1.00 1.00 1.00 1.00 1.00 MLF Adj: 1.00 1.00 1.00 1.00 1.00 1.00 1.00 1.00 1.00 1.00 1.00 1.00 FinalVolume: 180 1275 125 197 399 89 38 62 54 131 256 592 ------------|---------------||---------------||---------------||---------------| Saturation Flow Module: Sat/Lane: 1900 1900 1900 1900 1900 1900 1900 1900 1900 1900 1900 1900 Adjustment: 0.92 0.99 0.95 0.92 1.00 0.92 0.95 0.95 0.95 0.95 0.99 0.92 Lanes: 1.00 2.72 0.28 1.00 3.00 1.00 0.49 0.81 0.70 0.70 1.30 1.00 Final Sat.: 1750 5099 500 1750 5700 1750 888 1449 1262 1252 2447 1750 ------------|---------------||---------------||---------------||---------------| Capacity Analysis Module: Vol/Sat: 0.10 0.25 0.25 0.11 0.07 0.05 0.04 0.04 0.04 0.10 0.10 0.34 Crit Moves: **** **** **** **** Green Time: 36.0 42.1 42.1 19.0 25.0 25.0 10.0 10.0 10.0 57.0 57.0 57.0 Volume/Cap: 0.40 0.83 0.83 0.83 0.39 0.28 0.60 0.60 0.60 0.26 0.26 0.83 Delay/Veh: 43.6 49.3 49.3 80.3 51.0 50.2 66.9 66.9 66.9 27.6 27.6 45.4 User DelAdj: 1.00 1.00 1.00 1.00 1.00 1.00 1.00 1.00 1.00 1.00 1.00 1.00 AdjDel/Veh: 43.6 49.3 49.3 80.3 51.0 50.2 66.9 66.9 66.9 27.6 27.6 45.4 LOS by Move: D D D F D- D E E E C C D HCM2kAvgQ: 7 21 21 10 5 3 4 4 4 5 5 25 Note: Queue reported is the number of cars per lane.

COMPARE Wed Oct 05 10:43:39 2011 Page 3-25
Traffix 8.0.0715 Copyright (c) 2008 Dowling Associates, Inc. Licensed to FEHR & PEERS WALNUT CRK
San Jose City College
SJ07-951 Level Of Service Computation Report
2000 HCM Unsignalized (Future Volume Alternative) Cuml No Proj AM
Intersection #13: Sherman Oaks/Fruitdale [Unsignalized] Signal=Stop/Rights=Include Final Vol: 14 0 31 Lanes: 0 0 1! 0 0
Signal=Uncontrol
Signal=Uncontrol
Final Vol: Lanes: Rights=Include Vol Cnt Date: n/a Rights=Include Lanes: Final Vol:
10
1 Cycle Time (sec): 100
1
28
0
Loss Time (sec): 0
0
453 2
Critical V/C: 0.213
2 1088
0
Avg Crit Del (sec/veh): 0.9
0
0 0
Avg Delay (sec/veh): 0.9
0 0
LOS: D
Lanes: 0 0 0 0 0 Final Vol: 0 0 0 Signal=Stop/Rights=Include Street Name: Sherman Oaks Fruitdale Approach: North Bound South Bound East Bound West Bound Movement: L - T - R L - T - R L - T - R L - T - R ------------|---------------||---------------||---------------||---------------| Volume Module: Base Vol: 0 0 0 28 0 13 10 435 0 0 1066 28 Growth Adj: 1.00 1.00 1.00 1.00 1.00 1.00 1.00 1.00 1.00 1.00 1.00 1.00 Initial Bse: 0 0 0 28 0 13 10 435 0 0 1066 28 Added Vol: 0 0 0 0 0 0 0 0 0 0 0 0 Cuml: 0 0 0 3 0 1 0 18 0 0 22 0 Initial Fut: 0 0 0 31 0 14 10 453 0 0 1088 28 User Adj: 1.00 1.00 1.00 1.00 1.00 1.00 1.00 1.00 1.00 1.00 1.00 1.00 PHF Adj: 1.00 1.00 1.00 1.00 1.00 1.00 1.00 1.00 1.00 1.00 1.00 1.00 PHF Volume: 0 0 0 31 0 14 10 453 0 0 1088 28 Reduct Vol: 0 0 0 0 0 0 0 0 0 0 0 0 FinalVolume: 0 0 0 31 0 14 10 453 0 0 1088 28 ------------|---------------||---------------||---------------||---------------| Critical Gap Module: Critical Gp:xxxxx xxxx xxxxx 6.8 6.5 6.9 4.1 xxxx xxxxx xxxxx xxxx xxxxx FollowUpTim:xxxxx xxxx xxxxx 3.5 4.0 3.3 2.2 xxxx xxxxx xxxxx xxxx xxxxx ------------|---------------||---------------||---------------||---------------| Capacity Module: Cnflict Vol: xxxx xxxx xxxxx 1335 1561 544 1116 xxxx xxxxx xxxx xxxx xxxxx Potent Cap.: xxxx xxxx xxxxx 148 113 488 633 xxxx xxxxx xxxx xxxx xxxxx Move Cap.: xxxx xxxx xxxxx 146 111 488 633 xxxx xxxxx xxxx xxxx xxxxx Volume/Cap: xxxx xxxx xxxx 0.21 0.00 0.03 0.02 xxxx xxxx xxxx xxxx xxxx ------------|---------------||---------------||---------------||---------------| Level Of Service Module: 2Way95thQ: xxxx xxxx xxxxx xxxx xxxx xxxxx 0.0 xxxx xxxxx xxxx xxxx xxxxx Control Del:xxxxx xxxx xxxxx xxxxx xxxx xxxxx 10.8 xxxx xxxxx xxxxx xxxx xxxxx LOS by Move: * * * * * * B * * * * * Movement: LT - LTR - RT LT - LTR - RT LT - LTR - RT LT - LTR - RT Shared Cap.: xxxx xxxx xxxxx xxxx 187 xxxxx xxxx xxxx xxxxx xxxx xxxx xxxxx SharedQueue:xxxxx xxxx xxxxx xxxxx 0.9 xxxxx xxxxx xxxx xxxxx xxxxx xxxx xxxxx Shrd ConDel:xxxxx xxxx xxxxx xxxxx 30.3 xxxxx xxxxx xxxx xxxxx xxxxx xxxx xxxxx Shared LOS: * * * * D * * * * * * * ApproachDel: xxxxxx 30.3 xxxxxx xxxxxx ApproachLOS: * D * * Note: Queue reported is the number of cars per lane.

COMPARE Wed Oct 05 10:43:39 2011 Page 3-26
Traffix 8.0.0715 Copyright (c) 2008 Dowling Associates, Inc. Licensed to FEHR & PEERS WALNUT CRK
San Jose City College
SJ07-951 Level Of Service Computation Report
2000 HCM Unsignalized (Future Volume Alternative) Cumulative AM
Intersection #13: Sherman Oaks/Fruitdale [Unsignalized] Signal=Stop/Rights=Include Final Vol: 14 0 31 Lanes: 0 0 1! 0 0
Signal=Uncontrol
Signal=Uncontrol
Final Vol: Lanes: Rights=Include Vol Cnt Date: n/a Rights=Include Lanes: Final Vol:
10
1 Cycle Time (sec): 100
1
28
0
Loss Time (sec): 0
0
457 2
Critical V/C: 0.221
2 1111
0
Avg Crit Del (sec/veh): 0.9
0
0 0
Avg Delay (sec/veh): 0.9
0 0
LOS: D
Lanes: 0 0 0 0 0 Final Vol: 0 0 0 Signal=Stop/Rights=Include Street Name: Sherman Oaks Fruitdale Approach: North Bound South Bound East Bound West Bound Movement: L - T - R L - T - R L - T - R L - T - R ------------|---------------||---------------||---------------||---------------| Volume Module: Base Vol: 0 0 0 28 0 13 10 435 0 0 1066 28 Growth Adj: 1.00 1.00 1.00 1.00 1.00 1.00 1.00 1.00 1.00 1.00 1.00 1.00 Initial Bse: 0 0 0 28 0 13 10 435 0 0 1066 28 Added Vol: 0 0 0 0 0 0 0 4 0 0 23 0 Cuml: 0 0 0 3 0 1 0 18 0 0 22 0 Initial Fut: 0 0 0 31 0 14 10 457 0 0 1111 28 User Adj: 1.00 1.00 1.00 1.00 1.00 1.00 1.00 1.00 1.00 1.00 1.00 1.00 PHF Adj: 1.00 1.00 1.00 1.00 1.00 1.00 1.00 1.00 1.00 1.00 1.00 1.00 PHF Volume: 0 0 0 31 0 14 10 457 0 0 1111 28 Reduct Vol: 0 0 0 0 0 0 0 0 0 0 0 0 FinalVolume: 0 0 0 31 0 14 10 457 0 0 1111 28 ------------|---------------||---------------||---------------||---------------| Critical Gap Module: Critical Gp:xxxxx xxxx xxxxx 6.8 6.5 6.9 4.1 xxxx xxxxx xxxxx xxxx xxxxx FollowUpTim:xxxxx xxxx xxxxx 3.5 4.0 3.3 2.2 xxxx xxxxx xxxxx xxxx xxxxx ------------|---------------||---------------||---------------||---------------| Capacity Module: Cnflict Vol: xxxx xxxx xxxxx 1360 1588 556 1139 xxxx xxxxx xxxx xxxx xxxxx Potent Cap.: xxxx xxxx xxxxx 142 109 480 621 xxxx xxxxx xxxx xxxx xxxxx Move Cap.: xxxx xxxx xxxxx 140 107 480 621 xxxx xxxxx xxxx xxxx xxxxx Volume/Cap: xxxx xxxx xxxx 0.22 0.00 0.03 0.02 xxxx xxxx xxxx xxxx xxxx ------------|---------------||---------------||---------------||---------------| Level Of Service Module: 2Way95thQ: xxxx xxxx xxxxx xxxx xxxx xxxxx 0.0 xxxx xxxxx xxxx xxxx xxxxx Control Del:xxxxx xxxx xxxxx xxxxx xxxx xxxxx 10.9 xxxx xxxxx xxxxx xxxx xxxxx LOS by Move: * * * * * * B * * * * * Movement: LT - LTR - RT LT - LTR - RT LT - LTR - RT LT - LTR - RT Shared Cap.: xxxx xxxx xxxxx xxxx 180 xxxxx xxxx xxxx xxxxx xxxx xxxx xxxxx SharedQueue:xxxxx xxxx xxxxx xxxxx 0.9 xxxxx xxxxx xxxx xxxxx xxxxx xxxx xxxxx Shrd ConDel:xxxxx xxxx xxxxx xxxxx 31.5 xxxxx xxxxx xxxx xxxxx xxxxx xxxx xxxxx Shared LOS: * * * * D * * * * * * * ApproachDel: xxxxxx 31.5 xxxxxx xxxxxx ApproachLOS: * D * * Note: Queue reported is the number of cars per lane.

COMPARE Wed Oct 05 10:43:39 2011 Page 3-27
Traffix 8.0.0715 Copyright (c) 2008 Dowling Associates, Inc. Licensed to FEHR & PEERS WALNUT CRK
San Jose City College
SJ07-951 Level Of Service Computation Report
2000 HCM Operations (Future Volume Alternative) Cuml No Proj AM
Intersection #14: Leigh/Fruitdale Signal=Protect/Rights=Include Final Vol: 225*** 123 24 Lanes: 0 1 1 0 1
Signal=Protect
Signal=Protect
Final Vol: Lanes: Rights=Include Vol Cnt Date: n/a Rights=Include Lanes: Final Vol:
193***
1 Cycle Time (sec): 105
1
31
0
Loss Time (sec): 12
0
260 2
Critical V/C: 0.581
2 710***
0
Avg Crit Del (sec/veh): 35.3
0
34 1
Avg Delay (sec/veh): 33.8
1 15
LOS: C-
Lanes: 1 0 1 1 0 Final Vol: 155*** 273 14 Signal=Protect/Rights=Include Street Name: Leigh Fruitdale Approach: North Bound South Bound East Bound West Bound Movement: L - T - R L - T - R L - T - R L - T - R ------------|---------------||---------------||---------------||---------------| Min. Green: 7 10 10 7 10 10 7 10 10 7 10 10 Y+R: 4.0 4.0 4.0 4.0 4.0 4.0 4.0 4.0 4.0 4.0 4.0 4.0 ------------|---------------||---------------||---------------||---------------| Volume Module: Base Vol: 150 262 13 23 117 223 191 242 32 15 694 30 Growth Adj: 1.00 1.00 1.00 1.00 1.00 1.00 1.00 1.00 1.00 1.00 1.00 1.00 Initial Bse: 150 262 13 23 117 223 191 242 32 15 694 30 Added Vol: 0 0 0 0 0 0 0 0 0 0 0 0 Cuml: 5 11 1 1 6 2 2 18 2 0 16 1 Initial Fut: 155 273 14 24 123 225 193 260 34 15 710 31 User Adj: 1.00 1.00 1.00 1.00 1.00 1.00 1.00 1.00 1.00 1.00 1.00 1.00 PHF Adj: 1.00 1.00 1.00 1.00 1.00 1.00 1.00 1.00 1.00 1.00 1.00 1.00 PHF Volume: 155 273 14 24 123 225 193 260 34 15 710 31 Reduct Vol: 0 0 0 0 0 0 0 0 0 0 0 0 Reduced Vol: 155 273 14 24 123 225 193 260 34 15 710 31 PCE Adj: 1.00 1.00 1.00 1.00 1.00 1.00 1.00 1.00 1.00 1.00 1.00 1.00 MLF Adj: 1.00 1.00 1.00 1.00 1.00 1.00 1.00 1.00 1.00 1.00 1.00 1.00 FinalVolume: 155 273 14 24 123 225 193 260 34 15 710 31 ------------|---------------||---------------||---------------||---------------| Saturation Flow Module: Sat/Lane: 1900 1900 1900 1900 1900 1900 1900 1900 1900 1900 1900 1900 Adjustment: 0.92 0.98 0.95 0.92 1.00 0.92 0.92 1.00 0.92 0.92 1.00 0.92 Lanes: 1.00 1.90 0.10 1.00 1.00 1.00 1.00 2.00 1.00 1.00 2.00 1.00 Final Sat.: 1750 3519 180 1750 1900 1750 1750 3800 1750 1750 3800 1750 ------------|---------------||---------------||---------------||---------------| Capacity Analysis Module: Vol/Sat: 0.09 0.08 0.08 0.01 0.06 0.13 0.11 0.07 0.02 0.01 0.19 0.02 Crit Moves: **** **** **** **** Green Time: 16.0 23.1 23.1 16.2 23.3 23.3 19.9 31.6 31.6 22.1 33.8 33.8 Volume/Cap: 0.58 0.35 0.35 0.09 0.29 0.58 0.58 0.23 0.06 0.04 0.58 0.06 Delay/Veh: 44.6 34.9 34.9 38.2 34.2 38.0 41.3 27.6 26.2 33.0 30.4 24.6 User DelAdj: 1.00 1.00 1.00 1.00 1.00 1.00 1.00 1.00 1.00 1.00 1.00 1.00 AdjDel/Veh: 44.6 34.9 34.9 38.2 34.2 38.0 41.3 27.6 26.2 33.0 30.4 24.6 LOS by Move: D C- C- D+ C- D+ D C C C- C C HCM2kAvgQ: 6 4 4 1 3 7 6 3 1 0 9 1 Note: Queue reported is the number of cars per lane.

COMPARE Wed Oct 05 10:43:39 2011 Page 3-28
Traffix 8.0.0715 Copyright (c) 2008 Dowling Associates, Inc. Licensed to FEHR & PEERS WALNUT CRK
San Jose City College
SJ07-951 Level Of Service Computation Report
2000 HCM Operations (Future Volume Alternative) Cumulative AM
Intersection #14: Leigh/Fruitdale Signal=Protect/Rights=Include Final Vol: 225*** 125 26 Lanes: 0 1 1 0 1
Signal=Protect
Signal=Protect
Final Vol: Lanes: Rights=Include Vol Cnt Date: n/a Rights=Include Lanes: Final Vol:
193***
1 Cycle Time (sec): 105
1
34
0
Loss Time (sec): 12
0
263 2
Critical V/C: 0.591
2 724***
0
Avg Crit Del (sec/veh): 35.6
0
36 1
Avg Delay (sec/veh): 33.9
1 15
LOS: C-
Lanes: 1 0 1 1 0 Final Vol: 164*** 276 14 Signal=Protect/Rights=Include Street Name: Leigh Fruitdale Approach: North Bound South Bound East Bound West Bound Movement: L - T - R L - T - R L - T - R L - T - R ------------|---------------||---------------||---------------||---------------| Min. Green: 7 10 10 7 10 10 7 10 10 7 10 10 Y+R: 4.0 4.0 4.0 4.0 4.0 4.0 4.0 4.0 4.0 4.0 4.0 4.0 ------------|---------------||---------------||---------------||---------------| Volume Module: Base Vol: 150 262 13 23 117 223 191 242 32 15 694 30 Growth Adj: 1.00 1.00 1.00 1.00 1.00 1.00 1.00 1.00 1.00 1.00 1.00 1.00 Initial Bse: 150 262 13 23 117 223 191 242 32 15 694 30 Added Vol: 9 3 0 2 2 0 0 3 2 0 14 3 Cuml: 5 11 1 1 6 2 2 18 2 0 16 1 Initial Fut: 164 276 14 26 125 225 193 263 36 15 724 34 User Adj: 1.00 1.00 1.00 1.00 1.00 1.00 1.00 1.00 1.00 1.00 1.00 1.00 PHF Adj: 1.00 1.00 1.00 1.00 1.00 1.00 1.00 1.00 1.00 1.00 1.00 1.00 PHF Volume: 164 276 14 26 125 225 193 263 36 15 724 34 Reduct Vol: 0 0 0 0 0 0 0 0 0 0 0 0 Reduced Vol: 164 276 14 26 125 225 193 263 36 15 724 34 PCE Adj: 1.00 1.00 1.00 1.00 1.00 1.00 1.00 1.00 1.00 1.00 1.00 1.00 MLF Adj: 1.00 1.00 1.00 1.00 1.00 1.00 1.00 1.00 1.00 1.00 1.00 1.00 FinalVolume: 164 276 14 26 125 225 193 263 36 15 724 34 ------------|---------------||---------------||---------------||---------------| Saturation Flow Module: Sat/Lane: 1900 1900 1900 1900 1900 1900 1900 1900 1900 1900 1900 1900 Adjustment: 0.92 0.98 0.95 0.92 1.00 0.92 0.92 1.00 0.92 0.92 1.00 0.92 Lanes: 1.00 1.90 0.10 1.00 1.00 1.00 1.00 2.00 1.00 1.00 2.00 1.00 Final Sat.: 1750 3521 179 1750 1900 1750 1750 3800 1750 1750 3800 1750 ------------|---------------||---------------||---------------||---------------| Capacity Analysis Module: Vol/Sat: 0.09 0.08 0.08 0.01 0.07 0.13 0.11 0.07 0.02 0.01 0.19 0.02 Crit Moves: **** **** **** **** Green Time: 16.7 23.2 23.2 16.3 22.9 22.9 19.6 31.5 31.5 22.0 33.9 33.9 Volume/Cap: 0.59 0.35 0.35 0.10 0.30 0.59 0.59 0.23 0.07 0.04 0.59 0.06 Delay/Veh: 44.4 34.8 34.8 38.2 34.5 38.5 41.9 27.8 26.4 33.1 30.5 24.6 User DelAdj: 1.00 1.00 1.00 1.00 1.00 1.00 1.00 1.00 1.00 1.00 1.00 1.00 AdjDel/Veh: 44.4 34.8 34.8 38.2 34.5 38.5 41.9 27.8 26.4 33.1 30.5 24.6 LOS by Move: D C- C- D+ C- D+ D C C C- C C HCM2kAvgQ: 6 4 4 1 3 7 6 3 1 0 10 1 Note: Queue reported is the number of cars per lane.

COMPARE Wed Oct 05 10:43:39 2011 Page 3-29
Traffix 8.0.0715 Copyright (c) 2008 Dowling Associates, Inc. Licensed to FEHR & PEERS WALNUT CRK
San Jose City College
SJ07-951 Level Of Service Computation Report
2000 HCM Operations (Future Volume Alternative) Cuml No Proj AM
Intersection #15: Southwest Expwy/Fruitdale Signal=Protect/Rights=Include Final Vol: 443 699 240*** Lanes: 1 0 2 0 2
Signal=Split
Signal=Split
Final Vol: Lanes: Rights=Include Vol Cnt Date: n/a Rights=Include Lanes: Final Vol:
154***
1 Cycle Time (sec): 95
1
206***
0
Loss Time (sec): 12
0
207 1
Critical V/C: 0.649
2 329
1
Avg Crit Del (sec/veh): 29.4
0
8 0
Avg Delay (sec/veh): 27.4
1 164
LOS: C
Lanes: 1 0 2 0 1 Final Vol: 20 1082*** 150 Signal=Protect/Rights=Include Street Name: Southwest Expwy Fruitdale Approach: North Bound South Bound East Bound West Bound Movement: L - T - R L - T - R L - T - R L - T - R ------------|---------------||---------------||---------------||---------------| Min. Green: 7 10 10 7 10 10 10 10 10 10 10 10 Y+R: 4.0 4.0 4.0 4.0 4.0 4.0 4.0 4.0 4.0 4.0 4.0 4.0 ------------|---------------||---------------||---------------||---------------| Volume Module: Base Vol: 18 932 113 117 388 441 150 191 8 50 317 60 Growth Adj: 1.00 1.00 1.00 1.00 1.00 1.00 1.00 1.00 1.00 1.00 1.00 1.00 Initial Bse: 18 932 113 117 388 441 150 191 8 50 317 60 Added Vol: 0 0 0 0 0 0 0 0 0 0 0 0 Cuml: 2 150 37 123 311 2 4 16 0 114 12 146 Initial Fut: 20 1082 150 240 699 443 154 207 8 164 329 206 User Adj: 1.00 1.00 1.00 1.00 1.00 1.00 1.00 1.00 1.00 1.00 1.00 1.00 PHF Adj: 1.00 1.00 1.00 1.00 1.00 1.00 1.00 1.00 1.00 1.00 1.00 1.00 PHF Volume: 20 1082 150 240 699 443 154 207 8 164 329 206 Reduct Vol: 0 0 0 0 0 0 0 0 0 0 0 0 Reduced Vol: 20 1082 150 240 699 443 154 207 8 164 329 206 PCE Adj: 1.00 1.00 1.00 1.00 1.00 1.00 1.00 1.00 1.00 1.00 1.00 1.00 MLF Adj: 1.00 1.00 1.00 1.00 1.00 1.00 1.00 1.00 1.00 1.00 1.00 1.00 FinalVolume: 20 1082 150 240 699 443 154 207 8 164 329 206 ------------|---------------||---------------||---------------||---------------| Saturation Flow Module: Sat/Lane: 1900 1900 1900 1900 1900 1900 1900 1900 1900 1900 1900 1900 Adjustment: 0.92 1.00 0.92 0.83 1.00 0.92 0.92 0.97 0.95 0.92 1.00 0.92 Lanes: 1.00 2.00 1.00 2.00 2.00 1.00 1.00 1.92 0.08 1.00 2.00 1.00 Final Sat.: 1750 3800 1750 3150 3800 1750 1750 3562 138 1750 3800 1750 ------------|---------------||---------------||---------------||---------------| Capacity Analysis Module: Vol/Sat: 0.01 0.28 0.09 0.08 0.18 0.25 0.09 0.06 0.06 0.09 0.09 0.12 Crit Moves: **** **** **** **** Green Time: 11.9 41.7 41.7 11.2 40.9 40.9 12.9 12.9 12.9 17.2 17.2 17.2 Volume/Cap: 0.09 0.65 0.20 0.65 0.43 0.59 0.65 0.43 0.43 0.52 0.48 0.65 Delay/Veh: 36.9 21.8 16.5 44.1 19.0 21.8 45.1 38.3 38.3 36.6 35.4 40.7 User DelAdj: 1.00 1.00 1.00 1.00 1.00 1.00 1.00 1.00 1.00 1.00 1.00 1.00 AdjDel/Veh: 36.9 21.8 16.5 44.1 19.0 21.8 45.1 38.3 38.3 36.6 35.4 40.7 LOS by Move: D+ C+ B D B- C+ D D+ D+ D+ D+ D HCM2kAvgQ: 1 13 3 5 7 11 5 3 3 5 5 7 Note: Queue reported is the number of cars per lane.
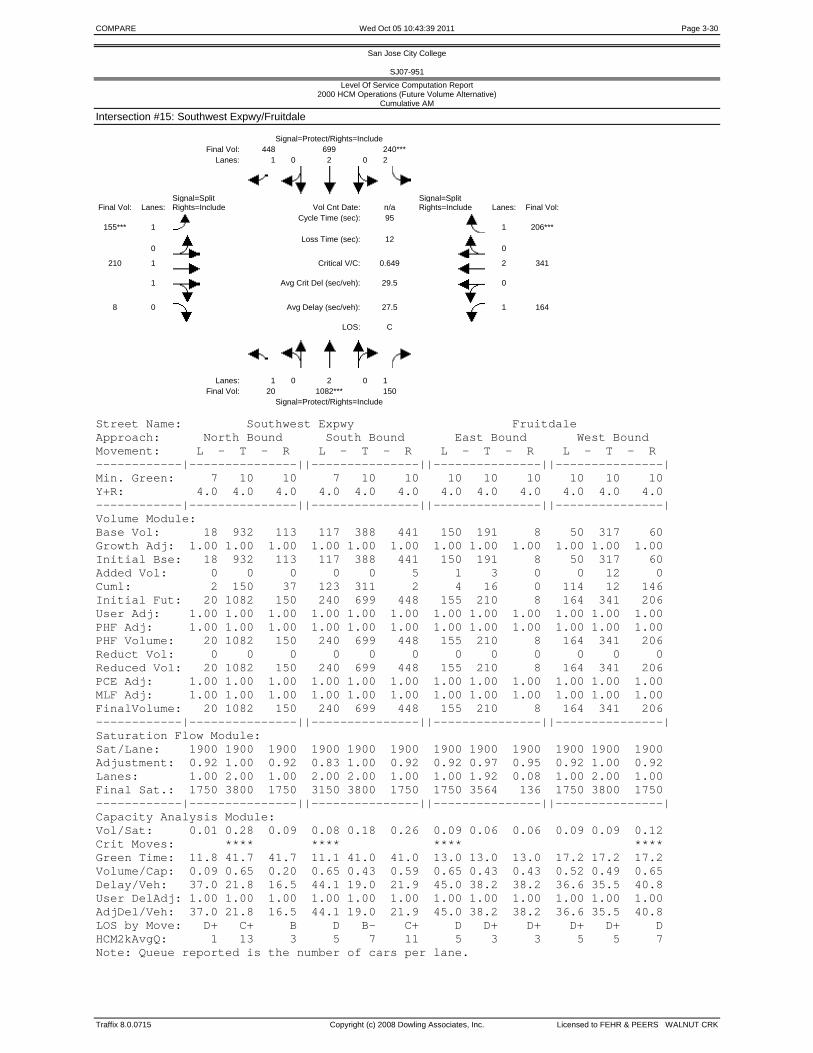
COMPARE Wed Oct 05 10:43:39 2011 Page 3-30
Traffix 8.0.0715 Copyright (c) 2008 Dowling Associates, Inc. Licensed to FEHR & PEERS WALNUT CRK
San Jose City College
SJ07-951 Level Of Service Computation Report
2000 HCM Operations (Future Volume Alternative) Cumulative AM
Intersection #15: Southwest Expwy/Fruitdale Signal=Protect/Rights=Include Final Vol: 448 699 240*** Lanes: 1 0 2 0 2
Signal=Split
Signal=Split
Final Vol: Lanes: Rights=Include Vol Cnt Date: n/a Rights=Include Lanes: Final Vol:
155***
1 Cycle Time (sec): 95
1
206***
0
Loss Time (sec): 12
0
210 1
Critical V/C: 0.649
2 341
1
Avg Crit Del (sec/veh): 29.5
0
8 0
Avg Delay (sec/veh): 27.5
1 164
LOS: C
Lanes: 1 0 2 0 1 Final Vol: 20 1082*** 150 Signal=Protect/Rights=Include Street Name: Southwest Expwy Fruitdale Approach: North Bound South Bound East Bound West Bound Movement: L - T - R L - T - R L - T - R L - T - R ------------|---------------||---------------||---------------||---------------| Min. Green: 7 10 10 7 10 10 10 10 10 10 10 10 Y+R: 4.0 4.0 4.0 4.0 4.0 4.0 4.0 4.0 4.0 4.0 4.0 4.0 ------------|---------------||---------------||---------------||---------------| Volume Module: Base Vol: 18 932 113 117 388 441 150 191 8 50 317 60 Growth Adj: 1.00 1.00 1.00 1.00 1.00 1.00 1.00 1.00 1.00 1.00 1.00 1.00 Initial Bse: 18 932 113 117 388 441 150 191 8 50 317 60 Added Vol: 0 0 0 0 0 5 1 3 0 0 12 0 Cuml: 2 150 37 123 311 2 4 16 0 114 12 146 Initial Fut: 20 1082 150 240 699 448 155 210 8 164 341 206 User Adj: 1.00 1.00 1.00 1.00 1.00 1.00 1.00 1.00 1.00 1.00 1.00 1.00 PHF Adj: 1.00 1.00 1.00 1.00 1.00 1.00 1.00 1.00 1.00 1.00 1.00 1.00 PHF Volume: 20 1082 150 240 699 448 155 210 8 164 341 206 Reduct Vol: 0 0 0 0 0 0 0 0 0 0 0 0 Reduced Vol: 20 1082 150 240 699 448 155 210 8 164 341 206 PCE Adj: 1.00 1.00 1.00 1.00 1.00 1.00 1.00 1.00 1.00 1.00 1.00 1.00 MLF Adj: 1.00 1.00 1.00 1.00 1.00 1.00 1.00 1.00 1.00 1.00 1.00 1.00 FinalVolume: 20 1082 150 240 699 448 155 210 8 164 341 206 ------------|---------------||---------------||---------------||---------------| Saturation Flow Module: Sat/Lane: 1900 1900 1900 1900 1900 1900 1900 1900 1900 1900 1900 1900 Adjustment: 0.92 1.00 0.92 0.83 1.00 0.92 0.92 0.97 0.95 0.92 1.00 0.92 Lanes: 1.00 2.00 1.00 2.00 2.00 1.00 1.00 1.92 0.08 1.00 2.00 1.00 Final Sat.: 1750 3800 1750 3150 3800 1750 1750 3564 136 1750 3800 1750 ------------|---------------||---------------||---------------||---------------| Capacity Analysis Module: Vol/Sat: 0.01 0.28 0.09 0.08 0.18 0.26 0.09 0.06 0.06 0.09 0.09 0.12 Crit Moves: **** **** **** **** Green Time: 11.8 41.7 41.7 11.1 41.0 41.0 13.0 13.0 13.0 17.2 17.2 17.2 Volume/Cap: 0.09 0.65 0.20 0.65 0.43 0.59 0.65 0.43 0.43 0.52 0.49 0.65 Delay/Veh: 37.0 21.8 16.5 44.1 19.0 21.9 45.0 38.2 38.2 36.6 35.5 40.8 User DelAdj: 1.00 1.00 1.00 1.00 1.00 1.00 1.00 1.00 1.00 1.00 1.00 1.00 AdjDel/Veh: 37.0 21.8 16.5 44.1 19.0 21.9 45.0 38.2 38.2 36.6 35.5 40.8 LOS by Move: D+ C+ B D B- C+ D D+ D+ D+ D+ D HCM2kAvgQ: 1 13 3 5 7 11 5 3 3 5 5 7 Note: Queue reported is the number of cars per lane.

COMPARE Wed Oct 05 10:42:49 2011 Page 1-1
Traffix 8.0.0715 Copyright (c) 2008 Dowling Associates, Inc. Licensed to FEHR & PEERS WALNUT CRK
San Jose City College
SJ07-951 Summary Scenario Comparison Report (With Average Critical Delay)
Future Volume Alternative ??? Cuml No Proj PM Cumulative PM ??? Avg Avg Avg Avg Avg Avg Crit Avg Crit Avg Crit Crit Crit Avg Crit Del Crit Del Del Crit Del Del Crit V/C Del Del Del Crit Del Intersection LOS (sec) V/C (sec) LOS (sec) V/C (sec) LOS (sec) V/C Change (sec) Change LOS (sec) V/C (sec) #1 Bascom/San Carlos ? xx.x x.xxx xx.x E+ 55.6 0.810 58.3 E+ 55.6 0.824 + 0.014 58.6 + 0.4 ? xx.x x.xxx xx.x #2 Leigh/San Carlos ? xx.x x.xxx xx.x C 24.8 0.501 23.6 C 25.2 0.509 + 0.008 24.4 + 0.7 ? xx.x x.xxx xx.x #3 Leigh/Scott [4-Way Stop] ? xx.x x.xxx xx.x B 11.9 0.539 11.9 B 12.0 0.549 + 0.010 12.0 + 0.2 ? xx.x x.xxx xx.x #4 Bascom/Parkmoor ? xx.x x.xxx xx.x C- 32.6 0.563 35.7 C- 33.4 0.580 + 0.018 36.5 + 0.7 ? xx.x x.xxx xx.x #5 Leland/Parkmoor ? xx.x x.xxx xx.x C 23.7 0.614 24.3 C 23.7 0.639 + 0.025 24.2 - 0.1 ? xx.x x.xxx xx.x #6 Leigh/Parkmoor ? xx.x x.xxx xx.x C 23.5 0.701 23.9 C 25.5 0.761 + 0.060 26.4 + 2.5 ? xx.x x.xxx xx.x #7 Bascom/Moorpark ? xx.x x.xxx xx.x D 46.4 0.871 56.6 D 48.5 0.912 + 0.041 61.7 + 5.2 ? xx.x x.xxx xx.x #8 Leland/Moorpark ? xx.x x.xxx xx.x A 4.8 0.498 4.8 A 5.0 0.512 + 0.014 5.0 + 0.2 ? xx.x x.xxx xx.x #9 Leigh/Moorpark ? xx.x x.xxx xx.x C+ 20.3 0.513 19.7 C+ 20.3 0.533 + 0.020 19.4 - 0.3 ? xx.x x.xxx xx.x #10 Bascom/Renova ? xx.x x.xxx xx.x B- 18.5 0.431 17.6 B- 18.4 0.433 + 0.002 17.6 - 0.1 ? xx.x x.xxx xx.x #11 Bascom/Laswell [Unsignalized] ? xx.x x.xxx xx.x F 1.8 0.449 1.8 F 3.7 0.739 + 0.290 3.7 + 2.0 ? xx.x x.xxx xx.x #12 Bascom/Fruitdale ? xx.x x.xxx xx.x D 48.8 0.713 57.0 D 49.5 0.736 + 0.022 58.0 + 1.0 ? xx.x x.xxx xx.x #13 Sherman Oaks/Fruitdale [Unsignalized] ? xx.x x.xxx xx.x C 0.5 0.096 0.5 C 0.5 0.100 + 0.004 0.5 + 0.0 ? xx.x x.xxx xx.x #14 Leigh/Fruitdale ? xx.x x.xxx xx.x C 30.9 0.469 29.5 C 31.2 0.481 + 0.011 30.0 + 0.4 ? xx.x x.xxx xx.x #15 Southwest Expwy/Fruitdale ? xx.x x.xxx xx.x C 30.1 0.550 32.1 C 30.3 0.552 + 0.002 32.2 + 0.1 ? xx.x x.xxx xx.x

COMPARE Wed Oct 05 10:42:49 2011 Page 1-2
Traffix 8.0.0715 Copyright (c) 2008 Dowling Associates, Inc. Licensed to FEHR & PEERS WALNUT CRK

COMPARE Wed Oct 05 10:42:49 2011 Page 3-1
Traffix 8.0.0715 Copyright (c) 2008 Dowling Associates, Inc. Licensed to FEHR & PEERS WALNUT CRK
San Jose City College
SJ07-951 Level Of Service Computation Report
2000 HCM Operations (Future Volume Alternative) Cuml No Proj PM
Intersection #1: Bascom/San Carlos Signal=Protect/Rights=Include Final Vol: 102 1030 281*** Lanes: 1 0 3 0 1
Signal=Protect
Signal=Protect
Final Vol: Lanes: Rights=Include Vol Cnt Date: n/a Rights=Include Lanes: Final Vol:
94
1 Cycle Time (sec): 150
1
121
0
Loss Time (sec): 12
0
818*** 1
Critical V/C: 0.810
2 625
1
Avg Crit Del (sec/veh): 58.3
0
241 0
Avg Delay (sec/veh): 55.6
1 248***
LOS: E+
Lanes: 1 0 2 0 1 Final Vol: 250 519 274*** Signal=Protect/Rights=Include Street Name: Bascom San Carlos Approach: North Bound South Bound East Bound West Bound Movement: L - T - R L - T - R L - T - R L - T - R ------------|---------------||---------------||---------------||---------------| Min. Green: 7 10 10 7 10 10 7 10 10 7 10 10 Y+R: 4.0 4.0 4.0 4.0 4.0 4.0 4.0 4.0 4.0 4.0 4.0 4.0 ------------|---------------||---------------||---------------||---------------| Volume Module: Base Vol: 190 472 223 248 963 89 69 677 189 213 480 117 Growth Adj: 1.00 1.00 1.00 1.00 1.00 1.00 1.00 1.00 1.00 1.00 1.00 1.00 Initial Bse: 190 472 223 248 963 89 69 677 189 213 480 117 Added Vol: 0 0 0 0 0 0 0 0 0 0 0 0 Cuml: 60 47 51 33 67 13 25 141 52 35 145 4 Initial Fut: 250 519 274 281 1030 102 94 818 241 248 625 121 User Adj: 1.00 1.00 1.00 1.00 1.00 1.00 1.00 1.00 1.00 1.00 1.00 1.00 PHF Adj: 1.00 1.00 1.00 1.00 1.00 1.00 1.00 1.00 1.00 1.00 1.00 1.00 PHF Volume: 250 519 274 281 1030 102 94 818 241 248 625 121 Reduct Vol: 0 0 0 0 0 0 0 0 0 0 0 0 Reduced Vol: 250 519 274 281 1030 102 94 818 241 248 625 121 PCE Adj: 1.00 1.00 1.00 1.00 1.00 1.00 1.00 1.00 1.00 1.00 1.00 1.00 MLF Adj: 1.00 1.00 1.00 1.00 1.00 1.00 1.00 1.00 1.00 1.00 1.00 1.00 FinalVolume: 250 519 274 281 1030 102 94 818 241 248 625 121 ------------|---------------||---------------||---------------||---------------| Saturation Flow Module: Sat/Lane: 1900 1900 1900 1900 1900 1900 1900 1900 1900 1900 1900 1900 Adjustment: 0.92 1.00 0.92 0.92 1.00 0.92 0.92 0.98 0.95 0.92 1.00 0.92 Lanes: 1.00 2.00 1.00 1.00 3.00 1.00 1.00 1.53 0.47 1.00 2.00 1.00 Final Sat.: 1750 3800 1750 1750 5700 1750 1750 2857 842 1750 3800 1750 ------------|---------------||---------------||---------------||---------------| Capacity Analysis Module: Vol/Sat: 0.14 0.14 0.16 0.16 0.18 0.06 0.05 0.29 0.29 0.14 0.16 0.07 Crit Moves: **** **** **** **** Green Time: 25.9 29.0 29.0 29.7 32.8 32.8 19.5 53.0 53.0 26.2 59.7 59.7 Volume/Cap: 0.83 0.71 0.81 0.81 0.83 0.27 0.41 0.81 0.81 0.81 0.41 0.17 Delay/Veh: 76.7 59.7 71.5 70.7 60.6 49.0 61.2 47.8 47.8 74.3 32.7 29.3 User DelAdj: 1.00 1.00 1.00 1.00 1.00 1.00 1.00 1.00 1.00 1.00 1.00 1.00 AdjDel/Veh: 76.7 59.7 71.5 70.7 60.6 49.0 61.2 47.8 47.8 74.3 32.7 29.3 LOS by Move: E- E+ E E E D E D D E C- C HCM2kAvgQ: 13 11 14 15 17 4 5 24 24 14 10 4 Note: Queue reported is the number of cars per lane.

COMPARE Wed Oct 05 10:42:49 2011 Page 3-2
Traffix 8.0.0715 Copyright (c) 2008 Dowling Associates, Inc. Licensed to FEHR & PEERS WALNUT CRK
San Jose City College
SJ07-951 Level Of Service Computation Report
2000 HCM Operations (Future Volume Alternative) Cumulative PM
Intersection #1: Bascom/San Carlos Signal=Protect/Rights=Include Final Vol: 102 1042*** 281 Lanes: 1 0 3 0 1
Signal=Protect
Signal=Protect
Final Vol: Lanes: Rights=Include Vol Cnt Date: n/a Rights=Include Lanes: Final Vol:
94
1 Cycle Time (sec): 150
1
122
0
Loss Time (sec): 12
0
818*** 1
Critical V/C: 0.824
2 626
1
Avg Crit Del (sec/veh): 58.6
0
250 0
Avg Delay (sec/veh): 55.6
1 248***
LOS: E+
Lanes: 1 0 2 0 1 Final Vol: 254*** 525 274 Signal=Protect/Rights=Include Street Name: Bascom San Carlos Approach: North Bound South Bound East Bound West Bound Movement: L - T - R L - T - R L - T - R L - T - R ------------|---------------||---------------||---------------||---------------| Min. Green: 7 10 10 7 10 10 7 10 10 7 10 10 Y+R: 4.0 4.0 4.0 4.0 4.0 4.0 4.0 4.0 4.0 4.0 4.0 4.0 ------------|---------------||---------------||---------------||---------------| Volume Module: Base Vol: 190 472 223 248 963 89 69 677 189 213 480 117 Growth Adj: 1.00 1.00 1.00 1.00 1.00 1.00 1.00 1.00 1.00 1.00 1.00 1.00 Initial Bse: 190 472 223 248 963 89 69 677 189 213 480 117 Added Vol: 4 6 0 0 12 0 0 0 9 0 1 1 Cuml: 60 47 51 33 67 13 25 141 52 35 145 4 Initial Fut: 254 525 274 281 1042 102 94 818 250 248 626 122 User Adj: 1.00 1.00 1.00 1.00 1.00 1.00 1.00 1.00 1.00 1.00 1.00 1.00 PHF Adj: 1.00 1.00 1.00 1.00 1.00 1.00 1.00 1.00 1.00 1.00 1.00 1.00 PHF Volume: 254 525 274 281 1042 102 94 818 250 248 626 122 Reduct Vol: 0 0 0 0 0 0 0 0 0 0 0 0 Reduced Vol: 254 525 274 281 1042 102 94 818 250 248 626 122 PCE Adj: 1.00 1.00 1.00 1.00 1.00 1.00 1.00 1.00 1.00 1.00 1.00 1.00 MLF Adj: 1.00 1.00 1.00 1.00 1.00 1.00 1.00 1.00 1.00 1.00 1.00 1.00 FinalVolume: 254 525 274 281 1042 102 94 818 250 248 626 122 ------------|---------------||---------------||---------------||---------------| Saturation Flow Module: Sat/Lane: 1900 1900 1900 1900 1900 1900 1900 1900 1900 1900 1900 1900 Adjustment: 0.92 1.00 0.92 0.92 1.00 0.92 0.92 0.98 0.95 0.92 1.00 0.92 Lanes: 1.00 2.00 1.00 1.00 3.00 1.00 1.00 1.52 0.48 1.00 2.00 1.00 Final Sat.: 1750 3800 1750 1750 5700 1750 1750 2833 866 1750 3800 1750 ------------|---------------||---------------||---------------||---------------| Capacity Analysis Module: Vol/Sat: 0.15 0.14 0.16 0.16 0.18 0.06 0.05 0.29 0.29 0.14 0.16 0.07 Crit Moves: **** **** **** **** Green Time: 26.4 29.5 29.5 30.2 33.3 33.3 19.3 52.5 52.5 25.8 59.1 59.1 Volume/Cap: 0.82 0.70 0.80 0.80 0.82 0.26 0.42 0.82 0.82 0.82 0.42 0.18 Delay/Veh: 75.9 59.2 69.7 69.0 60.1 48.6 61.5 49.0 49.0 76.6 33.2 29.8 User DelAdj: 1.00 1.00 1.00 1.00 1.00 1.00 1.00 1.00 1.00 1.00 1.00 1.00 AdjDel/Veh: 75.9 59.2 69.7 69.0 60.1 48.6 61.5 49.0 49.0 76.6 33.2 29.8 LOS by Move: E- E+ E E E D E D D E- C- C HCM2kAvgQ: 13 11 13 15 17 4 5 25 25 14 10 4 Note: Queue reported is the number of cars per lane.

COMPARE Wed Oct 05 10:42:49 2011 Page 3-3
Traffix 8.0.0715 Copyright (c) 2008 Dowling Associates, Inc. Licensed to FEHR & PEERS WALNUT CRK
San Jose City College
SJ07-951 Level Of Service Computation Report
2000 HCM Operations (Future Volume Alternative) Cuml No Proj PM
Intersection #2: Leigh/San Carlos Signal=Permit/Rights=Include Final Vol: 29 136 64 Lanes: 0 1 0 0 1
Signal=Protect
Signal=Protect
Final Vol: Lanes: Rights=Include Vol Cnt Date: n/a Rights=Include Lanes: Final Vol:
72
1 Cycle Time (sec): 140
1
10
0
Loss Time (sec): 9
0
1155*** 2
Critical V/C: 0.501
2 809
0
Avg Crit Del (sec/veh): 23.6
0
46 1
Avg Delay (sec/veh): 24.8
1 129***
LOS: C
Lanes: 1 0 0 1 0 Final Vol: 123 79*** 86 Signal=Permit/Rights=Include Street Name: Leigh San Carlos Approach: North Bound South Bound East Bound West Bound Movement: L - T - R L - T - R L - T - R L - T - R ------------|---------------||---------------||---------------||---------------| Min. Green: 10 10 10 10 10 10 7 10 10 7 10 10 Y+R: 4.0 4.0 4.0 4.0 4.0 4.0 4.0 4.0 4.0 4.0 4.0 4.0 ------------|---------------||---------------||---------------||---------------| Volume Module: Base Vol: 114 77 57 58 120 27 71 979 41 113 698 9 Growth Adj: 1.00 1.00 1.00 1.00 1.00 1.00 1.00 1.00 1.00 1.00 1.00 1.00 Initial Bse: 114 77 57 58 120 27 71 979 41 113 698 9 Added Vol: 0 0 0 0 0 0 0 0 0 0 0 0 Cuml: 9 2 29 6 16 2 1 176 5 16 111 1 Initial Fut: 123 79 86 64 136 29 72 1155 46 129 809 10 User Adj: 1.00 1.00 1.00 1.00 1.00 1.00 1.00 1.00 1.00 1.00 1.00 1.00 PHF Adj: 1.00 1.00 1.00 1.00 1.00 1.00 1.00 1.00 1.00 1.00 1.00 1.00 PHF Volume: 123 79 86 64 136 29 72 1155 46 129 809 10 Reduct Vol: 0 0 0 0 0 0 0 0 0 0 0 0 Reduced Vol: 123 79 86 64 136 29 72 1155 46 129 809 10 PCE Adj: 1.00 1.00 1.00 1.00 1.00 1.00 1.00 1.00 1.00 1.00 1.00 1.00 MLF Adj: 1.00 1.00 1.00 1.00 1.00 1.00 1.00 1.00 1.00 1.00 1.00 1.00 FinalVolume: 123 79 86 64 136 29 72 1155 46 129 809 10 ------------|---------------||---------------||---------------||---------------| Saturation Flow Module: Sat/Lane: 1900 1900 1900 1900 1900 1900 1900 1900 1900 1900 1900 1900 Adjustment: 0.92 0.95 0.95 0.92 0.95 0.95 0.92 1.00 0.92 0.92 1.00 0.92 Lanes: 1.00 0.48 0.52 1.00 0.82 0.18 1.00 2.00 1.00 1.00 2.00 1.00 Final Sat.: 1750 860 940 1750 1484 316 1750 3800 1750 1750 3800 1750 ------------|---------------||---------------||---------------||---------------| Capacity Analysis Module: Vol/Sat: 0.07 0.09 0.09 0.04 0.09 0.09 0.04 0.30 0.03 0.07 0.21 0.01 Crit Moves: **** **** **** Green Time: 25.7 25.7 25.7 25.7 25.7 25.7 20.0 84.8 84.8 20.5 85.3 85.3 Volume/Cap: 0.38 0.50 0.50 0.20 0.50 0.50 0.29 0.50 0.04 0.50 0.35 0.01 Delay/Veh: 51.0 52.6 52.6 48.8 52.6 52.6 54.2 15.8 11.2 56.6 13.7 10.8 User DelAdj: 1.00 1.00 1.00 1.00 1.00 1.00 1.00 1.00 1.00 1.00 1.00 1.00 AdjDel/Veh: 51.0 52.6 52.6 48.8 52.6 52.6 54.2 15.8 11.2 56.6 13.7 10.8 LOS by Move: D D- D- D D- D- D- B B+ E+ B B+ HCM2kAvgQ: 5 7 7 3 7 7 3 14 1 6 8 0 Note: Queue reported is the number of cars per lane.

COMPARE Wed Oct 05 10:42:49 2011 Page 3-4
Traffix 8.0.0715 Copyright (c) 2008 Dowling Associates, Inc. Licensed to FEHR & PEERS WALNUT CRK
San Jose City College
SJ07-951 Level Of Service Computation Report
2000 HCM Operations (Future Volume Alternative) Cumulative PM
Intersection #2: Leigh/San Carlos Signal=Permit/Rights=Include Final Vol: 29 136 64 Lanes: 0 1 0 0 1
Signal=Protect
Signal=Protect
Final Vol: Lanes: Rights=Include Vol Cnt Date: n/a Rights=Include Lanes: Final Vol:
72
1 Cycle Time (sec): 140
1
10
0
Loss Time (sec): 9
0
1156*** 2
Critical V/C: 0.509
2 809
0
Avg Crit Del (sec/veh): 24.4
0
46 1
Avg Delay (sec/veh): 25.2
1 135***
LOS: C
Lanes: 1 0 0 1 0 Final Vol: 124 79*** 92 Signal=Permit/Rights=Include Street Name: Leigh San Carlos Approach: North Bound South Bound East Bound West Bound Movement: L - T - R L - T - R L - T - R L - T - R ------------|---------------||---------------||---------------||---------------| Min. Green: 10 10 10 10 10 10 7 10 10 7 10 10 Y+R: 4.0 4.0 4.0 4.0 4.0 4.0 4.0 4.0 4.0 4.0 4.0 4.0 ------------|---------------||---------------||---------------||---------------| Volume Module: Base Vol: 114 77 57 58 120 27 71 979 41 113 698 9 Growth Adj: 1.00 1.00 1.00 1.00 1.00 1.00 1.00 1.00 1.00 1.00 1.00 1.00 Initial Bse: 114 77 57 58 120 27 71 979 41 113 698 9 Added Vol: 1 0 6 0 0 0 0 1 0 6 0 0 Cuml: 9 2 29 6 16 2 1 176 5 16 111 1 Initial Fut: 124 79 92 64 136 29 72 1156 46 135 809 10 User Adj: 1.00 1.00 1.00 1.00 1.00 1.00 1.00 1.00 1.00 1.00 1.00 1.00 PHF Adj: 1.00 1.00 1.00 1.00 1.00 1.00 1.00 1.00 1.00 1.00 1.00 1.00 PHF Volume: 124 79 92 64 136 29 72 1156 46 135 809 10 Reduct Vol: 0 0 0 0 0 0 0 0 0 0 0 0 Reduced Vol: 124 79 92 64 136 29 72 1156 46 135 809 10 PCE Adj: 1.00 1.00 1.00 1.00 1.00 1.00 1.00 1.00 1.00 1.00 1.00 1.00 MLF Adj: 1.00 1.00 1.00 1.00 1.00 1.00 1.00 1.00 1.00 1.00 1.00 1.00 FinalVolume: 124 79 92 64 136 29 72 1156 46 135 809 10 ------------|---------------||---------------||---------------||---------------| Saturation Flow Module: Sat/Lane: 1900 1900 1900 1900 1900 1900 1900 1900 1900 1900 1900 1900 Adjustment: 0.92 0.95 0.95 0.92 0.95 0.95 0.92 1.00 0.92 0.92 1.00 0.92 Lanes: 1.00 0.46 0.54 1.00 0.82 0.18 1.00 2.00 1.00 1.00 2.00 1.00 Final Sat.: 1750 829 971 1750 1484 316 1750 3800 1750 1750 3800 1750 ------------|---------------||---------------||---------------||---------------| Capacity Analysis Module: Vol/Sat: 0.07 0.10 0.10 0.04 0.09 0.09 0.04 0.30 0.03 0.08 0.21 0.01 Crit Moves: **** **** **** Green Time: 26.2 26.2 26.2 26.2 26.2 26.2 19.9 83.7 83.7 21.1 84.9 84.9 Volume/Cap: 0.38 0.51 0.51 0.20 0.49 0.49 0.29 0.51 0.04 0.51 0.35 0.01 Delay/Veh: 50.5 52.4 52.4 48.3 52.0 52.0 54.3 16.5 11.7 56.3 13.9 10.9 User DelAdj: 1.00 1.00 1.00 1.00 1.00 1.00 1.00 1.00 1.00 1.00 1.00 1.00 AdjDel/Veh: 50.5 52.4 52.4 48.3 52.0 52.0 54.3 16.5 11.7 56.3 13.9 10.9 LOS by Move: D D- D- D D- D- D- B B+ E+ B B+ HCM2kAvgQ: 5 7 7 3 7 7 3 14 1 6 8 0 Note: Queue reported is the number of cars per lane.

COMPARE Wed Oct 05 10:42:49 2011 Page 3-5
Traffix 8.0.0715 Copyright (c) 2008 Dowling Associates, Inc. Licensed to FEHR & PEERS WALNUT CRK
San Jose City College
SJ07-951 Level Of Service Computation Report
2000 HCM 4-Way Stop (Future Volume Alternative) Cuml No Proj PM
Intersection #3: Leigh/Scott [4-Way Stop] Signal=Stop/Rights=Include Final Vol: 30 220*** 16 Lanes: 0 0 1! 0 0
Signal=Stop
Signal=Stop
Final Vol: Lanes: Rights=Include Vol Cnt Date: n/a Rights=Include Lanes: Final Vol:
24***
0 Cycle Time (sec): 100
0
38
0
Loss Time (sec): 0
0
87 1!
Critical V/C: 0.539
1! 50***
0
Avg Crit Del (sec/veh): 11.9
0
57 0
Avg Delay (sec/veh): 11.9
0 62
LOS: B
Lanes: 0 0 1! 0 0 Final Vol: 53 249*** 65 Signal=Stop/Rights=Include Street Name: Leigh Scott Approach: North Bound South Bound East Bound West Bound Movement: L - T - R L - T - R L - T - R L - T - R ------------|---------------||---------------||---------------||---------------| Min. Green: 7 10 10 7 10 10 7 10 10 7 10 10 ------------|---------------||---------------||---------------||---------------| Volume Module: Base Vol: 48 218 60 13 193 26 19 87 52 55 50 34 Growth Adj: 1.00 1.00 1.00 1.00 1.00 1.00 1.00 1.00 1.00 1.00 1.00 1.00 Initial Bse: 48 218 60 13 193 26 19 87 52 55 50 34 Added Vol: 0 0 0 0 0 0 0 0 0 0 0 0 Cuml: 5 31 5 3 27 4 5 0 5 7 0 4 Initial Fut: 53 249 65 16 220 30 24 87 57 62 50 38 User Adj: 1.00 1.00 1.00 1.00 1.00 1.00 1.00 1.00 1.00 1.00 1.00 1.00 PHF Adj: 1.00 1.00 1.00 1.00 1.00 1.00 1.00 1.00 1.00 1.00 1.00 1.00 PHF Volume: 53 249 65 16 220 30 24 87 57 62 50 38 Reduct Vol: 0 0 0 0 0 0 0 0 0 0 0 0 Reduced Vol: 53 249 65 16 220 30 24 87 57 62 50 38 PCE Adj: 1.00 1.00 1.00 1.00 1.00 1.00 1.00 1.00 1.00 1.00 1.00 1.00 MLF Adj: 1.00 1.00 1.00 1.00 1.00 1.00 1.00 1.00 1.00 1.00 1.00 1.00 FinalVolume: 53 249 65 16 220 30 24 87 57 62 50 38 ------------|---------------||---------------||---------------||---------------| Saturation Flow Module: Adjustment: 1.00 1.00 1.00 1.00 1.00 1.00 1.00 1.00 1.00 1.00 1.00 1.00 Lanes: 0.14 0.68 0.18 0.06 0.83 0.11 0.14 0.52 0.34 0.42 0.33 0.25 Final Sat.: 98 462 121 39 539 73 84 303 199 235 190 145 ------------|---------------||---------------||---------------||---------------| Capacity Analysis Module: Vol/Sat: 0.54 0.54 0.54 0.41 0.41 0.41 0.29 0.29 0.29 0.26 0.26 0.26 Crit Moves: **** **** **** **** Delay/Veh: 13.4 13.4 13.4 11.5 11.5 11.5 10.5 10.5 10.5 10.4 10.4 10.4 Delay Adj: 1.00 1.00 1.00 1.00 1.00 1.00 1.00 1.00 1.00 1.00 1.00 1.00 AdjDel/Veh: 13.4 13.4 13.4 11.5 11.5 11.5 10.5 10.5 10.5 10.4 10.4 10.4 LOS by Move: B B B B B B B B B B B B ApproachDel: 13.4 11.5 10.5 10.4 Delay Adj: 1.00 1.00 1.00 1.00 ApprAdjDel: 13.4 11.5 10.5 10.4 LOS by Appr: B B B B AllWayAvgQ: 1.0 1.0 1.0 0.6 0.6 0.6 0.3 0.3 0.3 0.3 0.3 0.3 Note: Queue reported is the number of cars per lane.

COMPARE Wed Oct 05 10:42:49 2011 Page 3-6
Traffix 8.0.0715 Copyright (c) 2008 Dowling Associates, Inc. Licensed to FEHR & PEERS WALNUT CRK
San Jose City College
SJ07-951 Level Of Service Computation Report
2000 HCM 4-Way Stop (Future Volume Alternative) Cumulative PM
Intersection #3: Leigh/Scott [4-Way Stop] Signal=Stop/Rights=Include Final Vol: 30*** 226 16 Lanes: 0 0 1! 0 0
Signal=Stop
Signal=Stop
Final Vol: Lanes: Rights=Include Vol Cnt Date: n/a Rights=Include Lanes: Final Vol:
24***
0 Cycle Time (sec): 100
0
38
0
Loss Time (sec): 0
0
87 1!
Critical V/C: 0.549
1! 50
0
Avg Crit Del (sec/veh): 12.0
0
57 0
Avg Delay (sec/veh): 12.0
0 62***
LOS: B
Lanes: 0 0 1! 0 0 Final Vol: 53 255*** 65 Signal=Stop/Rights=Include Street Name: Leigh Scott Approach: North Bound South Bound East Bound West Bound Movement: L - T - R L - T - R L - T - R L - T - R ------------|---------------||---------------||---------------||---------------| Min. Green: 7 10 10 7 10 10 7 10 10 7 10 10 ------------|---------------||---------------||---------------||---------------| Volume Module: Base Vol: 48 218 60 13 193 26 19 87 52 55 50 34 Growth Adj: 1.00 1.00 1.00 1.00 1.00 1.00 1.00 1.00 1.00 1.00 1.00 1.00 Initial Bse: 48 218 60 13 193 26 19 87 52 55 50 34 Added Vol: 0 6 0 0 6 0 0 0 0 0 0 0 Cuml: 5 31 5 3 27 4 5 0 5 7 0 4 Initial Fut: 53 255 65 16 226 30 24 87 57 62 50 38 User Adj: 1.00 1.00 1.00 1.00 1.00 1.00 1.00 1.00 1.00 1.00 1.00 1.00 PHF Adj: 1.00 1.00 1.00 1.00 1.00 1.00 1.00 1.00 1.00 1.00 1.00 1.00 PHF Volume: 53 255 65 16 226 30 24 87 57 62 50 38 Reduct Vol: 0 0 0 0 0 0 0 0 0 0 0 0 Reduced Vol: 53 255 65 16 226 30 24 87 57 62 50 38 PCE Adj: 1.00 1.00 1.00 1.00 1.00 1.00 1.00 1.00 1.00 1.00 1.00 1.00 MLF Adj: 1.00 1.00 1.00 1.00 1.00 1.00 1.00 1.00 1.00 1.00 1.00 1.00 FinalVolume: 53 255 65 16 226 30 24 87 57 62 50 38 ------------|---------------||---------------||---------------||---------------| Saturation Flow Module: Adjustment: 1.00 1.00 1.00 1.00 1.00 1.00 1.00 1.00 1.00 1.00 1.00 1.00 Lanes: 0.14 0.69 0.17 0.06 0.83 0.11 0.14 0.52 0.34 0.42 0.33 0.25 Final Sat.: 97 464 118 38 540 71 84 301 197 234 188 144 ------------|---------------||---------------||---------------||---------------| Capacity Analysis Module: Vol/Sat: 0.55 0.55 0.55 0.42 0.42 0.42 0.29 0.29 0.29 0.27 0.27 0.27 Crit Moves: **** **** **** **** Delay/Veh: 13.6 13.6 13.6 11.6 11.6 11.6 10.5 10.5 10.5 10.5 10.5 10.5 Delay Adj: 1.00 1.00 1.00 1.00 1.00 1.00 1.00 1.00 1.00 1.00 1.00 1.00 AdjDel/Veh: 13.6 13.6 13.6 11.6 11.6 11.6 10.5 10.5 10.5 10.5 10.5 10.5 LOS by Move: B B B B B B B B B B B B ApproachDel: 13.6 11.6 10.5 10.5 Delay Adj: 1.00 1.00 1.00 1.00 ApprAdjDel: 13.6 11.6 10.5 10.5 LOS by Appr: B B B B AllWayAvgQ: 1.0 1.0 1.0 0.6 0.6 0.6 0.3 0.3 0.3 0.3 0.3 0.3 Note: Queue reported is the number of cars per lane.

COMPARE Wed Oct 05 10:42:49 2011 Page 3-7
Traffix 8.0.0715 Copyright (c) 2008 Dowling Associates, Inc. Licensed to FEHR & PEERS WALNUT CRK
San Jose City College
SJ07-951 Level Of Service Computation Report
2000 HCM Operations (Future Volume Alternative) Cuml No Proj PM
Intersection #4: Bascom/Parkmoor Signal=Protect/Rights=Include Final Vol: 28 1506*** 0 Lanes: 0 1 2 0 0
Signal=Split
Signal=Split
Final Vol: Lanes: Rights=Include Vol Cnt Date: n/a Rights=Include Lanes: Final Vol:
2***
0 Cycle Time (sec): 150
1
170
0
Loss Time (sec): 12
0
0 1!
Critical V/C: 0.563
0 118
0
Avg Crit Del (sec/veh): 35.7
1
9 0
Avg Delay (sec/veh): 32.6
1 695***
LOS: C-
Lanes: 1 0 3 0 0 Final Vol: 15*** 770 0 Signal=Protect/Rights=Include Street Name: S Bascom Ave Parkmoor Ave Approach: North Bound South Bound East Bound West Bound Movement: L - T - R L - T - R L - T - R L - T - R ------------|---------------||---------------||---------------||---------------| Min. Green: 7 10 0 0 10 10 10 0 10 10 10 10 Y+R: 4.0 4.0 4.0 4.0 4.0 4.0 4.0 4.0 4.0 4.0 4.0 4.0 ------------|---------------||---------------||---------------||---------------| Volume Module: Base Vol: 15 634 0 0 1373 28 2 0 9 582 118 164 Growth Adj: 1.00 1.00 1.00 1.00 1.00 1.00 1.00 1.00 1.00 1.00 1.00 1.00 Initial Bse: 15 634 0 0 1373 28 2 0 9 582 118 164 Added Vol: 0 0 0 0 0 0 0 0 0 0 0 0 Cuml: 0 136 0 0 133 0 0 0 0 113 0 6 Initial Fut: 15 770 0 0 1506 28 2 0 9 695 118 170 User Adj: 1.00 1.00 1.00 1.00 1.00 1.00 1.00 1.00 1.00 1.00 1.00 1.00 PHF Adj: 1.00 1.00 1.00 1.00 1.00 1.00 1.00 1.00 1.00 1.00 1.00 1.00 PHF Volume: 15 770 0 0 1506 28 2 0 9 695 118 170 Reduct Vol: 0 0 0 0 0 0 0 0 0 0 0 0 Reduced Vol: 15 770 0 0 1506 28 2 0 9 695 118 170 PCE Adj: 1.00 1.00 1.00 1.00 1.00 1.00 1.00 1.00 1.00 1.00 1.00 1.00 MLF Adj: 1.00 1.00 1.00 1.00 1.00 1.00 1.00 1.00 1.00 1.00 1.00 1.00 FinalVolume: 15 770 0 0 1506 28 2 0 9 695 118 170 ------------|---------------||---------------||---------------||---------------| Saturation Flow Module: Sat/Lane: 1900 1900 1900 1900 1900 1900 1900 1900 1900 1900 1900 1900 Adjustment: 0.92 1.00 0.92 0.92 0.98 0.95 0.92 0.92 0.92 0.93 0.95 0.92 Lanes: 1.00 3.00 0.00 0.00 2.94 0.06 0.18 0.00 0.82 1.71 0.29 1.00 Final Sat.: 1750 5700 0 0 5498 102 318 0 1432 3035 515 1750 ------------|---------------||---------------||---------------||---------------| Capacity Analysis Module: Vol/Sat: 0.01 0.14 0.00 0.00 0.27 0.27 0.01 0.00 0.01 0.23 0.23 0.10 Crit Moves: **** **** **** **** Green Time: 7.0 72.9 0.0 0.0 65.9 65.9 10.0 0.0 10.0 55.1 55.1 55.1 Volume/Cap: 0.18 0.28 0.00 0.00 0.62 0.62 0.09 0.00 0.09 0.62 0.62 0.26 Delay/Veh: 69.8 23.0 0.0 0.0 33.0 33.0 66.1 0.0 66.1 39.9 39.9 33.5 User DelAdj: 1.00 1.00 1.00 1.00 1.00 1.00 1.00 1.00 1.00 1.00 1.00 1.00 AdjDel/Veh: 69.8 23.0 0.0 0.0 33.0 33.0 66.1 0.0 66.1 39.9 39.9 33.5 LOS by Move: E C+ A A C- C- E A E D D C- HCM2kAvgQ: 1 7 0 0 17 17 1 0 1 16 16 6 Note: Queue reported is the number of cars per lane.

COMPARE Wed Oct 05 10:42:49 2011 Page 3-8
Traffix 8.0.0715 Copyright (c) 2008 Dowling Associates, Inc. Licensed to FEHR & PEERS WALNUT CRK
San Jose City College
SJ07-951 Level Of Service Computation Report
2000 HCM Operations (Future Volume Alternative) Cumulative PM
Intersection #4: Bascom/Parkmoor Signal=Protect/Rights=Include Final Vol: 28 1527*** 0 Lanes: 0 1 2 0 0
Signal=Split
Signal=Split
Final Vol: Lanes: Rights=Include Vol Cnt Date: n/a Rights=Include Lanes: Final Vol:
2***
0 Cycle Time (sec): 150
1
174
0
Loss Time (sec): 12
0
0 1!
Critical V/C: 0.580
0 118
0
Avg Crit Del (sec/veh): 36.5
1
9 0
Avg Delay (sec/veh): 33.4
1 739***
LOS: C-
Lanes: 1 0 3 0 0 Final Vol: 15*** 776 0 Signal=Protect/Rights=Include Street Name: S Bascom Ave Parkmoor Ave Approach: North Bound South Bound East Bound West Bound Movement: L - T - R L - T - R L - T - R L - T - R ------------|---------------||---------------||---------------||---------------| Min. Green: 7 10 0 0 10 10 10 0 10 10 10 10 Y+R: 4.0 4.0 4.0 4.0 4.0 4.0 4.0 4.0 4.0 4.0 4.0 4.0 ------------|---------------||---------------||---------------||---------------| Volume Module: Base Vol: 15 634 0 0 1373 28 2 0 9 582 118 164 Growth Adj: 1.00 1.00 1.00 1.00 1.00 1.00 1.00 1.00 1.00 1.00 1.00 1.00 Initial Bse: 15 634 0 0 1373 28 2 0 9 582 118 164 Added Vol: 0 6 0 0 21 0 0 0 0 44 0 4 Cuml: 0 136 0 0 133 0 0 0 0 113 0 6 Initial Fut: 15 776 0 0 1527 28 2 0 9 739 118 174 User Adj: 1.00 1.00 1.00 1.00 1.00 1.00 1.00 1.00 1.00 1.00 1.00 1.00 PHF Adj: 1.00 1.00 1.00 1.00 1.00 1.00 1.00 1.00 1.00 1.00 1.00 1.00 PHF Volume: 15 776 0 0 1527 28 2 0 9 739 118 174 Reduct Vol: 0 0 0 0 0 0 0 0 0 0 0 0 Reduced Vol: 15 776 0 0 1527 28 2 0 9 739 118 174 PCE Adj: 1.00 1.00 1.00 1.00 1.00 1.00 1.00 1.00 1.00 1.00 1.00 1.00 MLF Adj: 1.00 1.00 1.00 1.00 1.00 1.00 1.00 1.00 1.00 1.00 1.00 1.00 FinalVolume: 15 776 0 0 1527 28 2 0 9 739 118 174 ------------|---------------||---------------||---------------||---------------| Saturation Flow Module: Sat/Lane: 1900 1900 1900 1900 1900 1900 1900 1900 1900 1900 1900 1900 Adjustment: 0.92 1.00 0.92 0.92 0.98 0.95 0.92 0.92 0.92 0.93 0.95 0.92 Lanes: 1.00 3.00 0.00 0.00 2.94 0.06 0.18 0.00 0.82 1.73 0.27 1.00 Final Sat.: 1750 5700 0 0 5499 101 318 0 1432 3061 489 1750 ------------|---------------||---------------||---------------||---------------| Capacity Analysis Module: Vol/Sat: 0.01 0.14 0.00 0.00 0.28 0.28 0.01 0.00 0.01 0.24 0.24 0.10 Crit Moves: **** **** **** **** Green Time: 7.0 71.7 0.0 0.0 64.7 64.7 10.0 0.0 10.0 56.3 56.3 56.3 Volume/Cap: 0.18 0.28 0.00 0.00 0.64 0.64 0.09 0.00 0.09 0.64 0.64 0.27 Delay/Veh: 69.8 23.7 0.0 0.0 34.2 34.2 66.1 0.0 66.1 39.7 39.7 32.7 User DelAdj: 1.00 1.00 1.00 1.00 1.00 1.00 1.00 1.00 1.00 1.00 1.00 1.00 AdjDel/Veh: 69.8 23.7 0.0 0.0 34.2 34.2 66.1 0.0 66.1 39.7 39.7 32.7 LOS by Move: E C A A C- C- E A E D D C- HCM2kAvgQ: 1 7 0 0 18 18 1 0 1 17 17 6 Note: Queue reported is the number of cars per lane.

COMPARE Wed Oct 05 10:42:49 2011 Page 3-9
Traffix 8.0.0715 Copyright (c) 2008 Dowling Associates, Inc. Licensed to FEHR & PEERS WALNUT CRK
San Jose City College
SJ07-951 Level Of Service Computation Report
2000 HCM Operations (Future Volume Alternative) Cuml No Proj PM
Intersection #5: Leland/Parkmoor Signal=Protect/Rights=Include Final Vol: 71 63*** 0 Lanes: 0 1 0 0 0
Signal=Split
Signal=Split
Final Vol: Lanes: Rights=Include Vol Cnt Date: n/a Rights=Include Lanes: Final Vol:
0
0 Cycle Time (sec): 105
1
54
0
Loss Time (sec): 9
0
0 0
Critical V/C: 0.614
1 1127***
0
Avg Crit Del (sec/veh): 24.3
1
0 0
Avg Delay (sec/veh): 23.7
0 42
LOS: C
Lanes: 1 0 1 0 0 Final Vol: 300*** 122 0 Signal=Protect/Rights=Include Street Name: Leland Ave Parkmoor Ave Approach: North Bound South Bound East Bound West Bound Movement: L - T - R L - T - R L - T - R L - T - R ------------|---------------||---------------||---------------||---------------| Min. Green: 7 10 0 0 10 10 0 0 0 10 10 10 Y+R: 4.0 4.0 4.0 4.0 4.0 4.0 4.0 4.0 4.0 4.0 4.0 4.0 ------------|---------------||---------------||---------------||---------------| Volume Module: Base Vol: 217 122 0 0 59 69 0 0 0 42 1023 54 Growth Adj: 1.00 1.00 1.00 1.00 1.00 1.00 1.00 1.00 1.00 1.00 1.00 1.00 Initial Bse: 217 122 0 0 59 69 0 0 0 42 1023 54 Added Vol: 0 0 0 0 0 0 0 0 0 0 0 0 Cuml: 83 0 0 0 4 2 0 0 0 0 104 0 Initial Fut: 300 122 0 0 63 71 0 0 0 42 1127 54 User Adj: 1.00 1.00 1.00 1.00 1.00 1.00 1.00 1.00 1.00 1.00 1.00 1.00 PHF Adj: 1.00 1.00 1.00 1.00 1.00 1.00 1.00 1.00 1.00 1.00 1.00 1.00 PHF Volume: 300 122 0 0 63 71 0 0 0 42 1127 54 Reduct Vol: 0 0 0 0 0 0 0 0 0 0 0 0 Reduced Vol: 300 122 0 0 63 71 0 0 0 42 1127 54 PCE Adj: 1.00 1.00 1.00 1.00 1.00 1.00 1.00 1.00 1.00 1.00 1.00 1.00 MLF Adj: 1.00 1.00 1.00 1.00 1.00 1.00 1.00 1.00 1.00 1.00 1.00 1.00 FinalVolume: 300 122 0 0 63 71 0 0 0 42 1127 54 ------------|---------------||---------------||---------------||---------------| Saturation Flow Module: Sat/Lane: 1900 1900 1900 1900 1900 1900 1900 1900 1900 1900 1900 1900 Adjustment: 0.92 1.00 0.92 0.92 0.95 0.95 0.92 1.00 0.92 0.95 0.97 0.92 Lanes: 1.00 1.00 0.00 0.00 0.47 0.53 0.00 0.00 0.00 0.07 1.93 1.00 Final Sat.: 1750 1900 0 0 846 954 0 0 0 133 3567 1750 ------------|---------------||---------------||---------------||---------------| Capacity Analysis Module: Vol/Sat: 0.17 0.06 0.00 0.00 0.07 0.07 0.00 0.00 0.00 0.32 0.32 0.03 Crit Moves: **** **** **** Green Time: 29.3 42.0 0.0 0.0 12.7 12.7 0.0 0.0 0.0 54.0 54.0 54.0 Volume/Cap: 0.61 0.16 0.00 0.00 0.61 0.61 0.00 0.00 0.00 0.61 0.61 0.06 Delay/Veh: 35.3 20.3 0.0 0.0 49.0 49.0 0.0 0.0 0.0 18.7 18.7 12.8 User DelAdj: 1.00 1.00 1.00 1.00 1.00 1.00 1.00 1.00 1.00 1.00 1.00 1.00 AdjDel/Veh: 35.3 20.3 0.0 0.0 49.0 49.0 0.0 0.0 0.0 18.7 18.7 12.8 LOS by Move: D+ C+ A A D D A A A B- B- B HCM2kAvgQ: 9 2 0 0 5 5 0 0 0 13 13 1 Note: Queue reported is the number of cars per lane.

COMPARE Wed Oct 05 10:42:49 2011 Page 3-10
Traffix 8.0.0715 Copyright (c) 2008 Dowling Associates, Inc. Licensed to FEHR & PEERS WALNUT CRK
San Jose City College
SJ07-951 Level Of Service Computation Report
2000 HCM Operations (Future Volume Alternative) Cumulative PM
Intersection #5: Leland/Parkmoor Signal=Protect/Rights=Include Final Vol: 71 63*** 0 Lanes: 0 1 0 0 0
Signal=Split
Signal=Split
Final Vol: Lanes: Rights=Include Vol Cnt Date: n/a Rights=Include Lanes: Final Vol:
0
0 Cycle Time (sec): 105
1
54
0
Loss Time (sec): 9
0
0 0
Critical V/C: 0.639
1 1203***
0
Avg Crit Del (sec/veh): 24.2
1
0 0
Avg Delay (sec/veh): 23.7
0 48
LOS: C
Lanes: 1 0 1 0 0 Final Vol: 301*** 123 0 Signal=Protect/Rights=Include Street Name: Leland Ave Parkmoor Ave Approach: North Bound South Bound East Bound West Bound Movement: L - T - R L - T - R L - T - R L - T - R ------------|---------------||---------------||---------------||---------------| Min. Green: 7 10 0 0 10 10 0 0 0 10 10 10 Y+R: 4.0 4.0 4.0 4.0 4.0 4.0 4.0 4.0 4.0 4.0 4.0 4.0 ------------|---------------||---------------||---------------||---------------| Volume Module: Base Vol: 217 122 0 0 59 69 0 0 0 42 1023 54 Growth Adj: 1.00 1.00 1.00 1.00 1.00 1.00 1.00 1.00 1.00 1.00 1.00 1.00 Initial Bse: 217 122 0 0 59 69 0 0 0 42 1023 54 Added Vol: 1 1 0 0 0 0 0 0 0 6 76 0 Cuml: 83 0 0 0 4 2 0 0 0 0 104 0 Initial Fut: 301 123 0 0 63 71 0 0 0 48 1203 54 User Adj: 1.00 1.00 1.00 1.00 1.00 1.00 1.00 1.00 1.00 1.00 1.00 1.00 PHF Adj: 1.00 1.00 1.00 1.00 1.00 1.00 1.00 1.00 1.00 1.00 1.00 1.00 PHF Volume: 301 123 0 0 63 71 0 0 0 48 1203 54 Reduct Vol: 0 0 0 0 0 0 0 0 0 0 0 0 Reduced Vol: 301 123 0 0 63 71 0 0 0 48 1203 54 PCE Adj: 1.00 1.00 1.00 1.00 1.00 1.00 1.00 1.00 1.00 1.00 1.00 1.00 MLF Adj: 1.00 1.00 1.00 1.00 1.00 1.00 1.00 1.00 1.00 1.00 1.00 1.00 FinalVolume: 301 123 0 0 63 71 0 0 0 48 1203 54 ------------|---------------||---------------||---------------||---------------| Saturation Flow Module: Sat/Lane: 1900 1900 1900 1900 1900 1900 1900 1900 1900 1900 1900 1900 Adjustment: 0.92 1.00 0.92 0.92 0.95 0.95 0.92 1.00 0.92 0.95 0.97 0.92 Lanes: 1.00 1.00 0.00 0.00 0.47 0.53 0.00 0.00 0.00 0.08 1.92 1.00 Final Sat.: 1750 1900 0 0 846 954 0 0 0 142 3558 1750 ------------|---------------||---------------||---------------||---------------| Capacity Analysis Module: Vol/Sat: 0.17 0.06 0.00 0.00 0.07 0.07 0.00 0.00 0.00 0.34 0.34 0.03 Crit Moves: **** **** **** Green Time: 28.2 40.5 0.0 0.0 12.2 12.2 0.0 0.0 0.0 55.5 55.5 55.5 Volume/Cap: 0.64 0.17 0.00 0.00 0.64 0.64 0.00 0.00 0.00 0.64 0.64 0.06 Delay/Veh: 36.8 21.3 0.0 0.0 50.8 50.8 0.0 0.0 0.0 18.3 18.3 12.1 User DelAdj: 1.00 1.00 1.00 1.00 1.00 1.00 1.00 1.00 1.00 1.00 1.00 1.00 AdjDel/Veh: 36.8 21.3 0.0 0.0 50.8 50.8 0.0 0.0 0.0 18.3 18.3 12.1 LOS by Move: D+ C+ A A D D A A A B- B- B HCM2kAvgQ: 9 2 0 0 5 5 0 0 0 14 14 1 Note: Queue reported is the number of cars per lane.

COMPARE Wed Oct 05 10:42:49 2011 Page 3-11
Traffix 8.0.0715 Copyright (c) 2008 Dowling Associates, Inc. Licensed to FEHR & PEERS WALNUT CRK
San Jose City College
SJ07-951 Level Of Service Computation Report
2000 HCM Operations (Future Volume Alternative) Cuml No Proj PM
Intersection #6: Leigh/Parkmoor Signal=Protect/Rights=Include Final Vol: 68 275*** 0 Lanes: 1 0 1 0 0
Signal=Split
Signal=Split
Final Vol: Lanes: Rights=Include Vol Cnt Date: n/a Rights=Include Lanes: Final Vol:
0
0 Cycle Time (sec): 100
1
133
0
Loss Time (sec): 9
0
0 0
Critical V/C: 0.701
1 1008***
0
Avg Crit Del (sec/veh): 23.9
1
0 0
Avg Delay (sec/veh): 23.5
0 436
LOS: C
Lanes: 1 0 1 0 0 Final Vol: 180*** 255 0 Signal=Protect/Rights=Include Street Name: Leigh Parkmoor Approach: North Bound South Bound East Bound West Bound Movement: L - T - R L - T - R L - T - R L - T - R ------------|---------------||---------------||---------------||---------------| Min. Green: 7 10 0 0 10 10 0 0 0 10 10 10 Y+R: 4.0 4.0 4.0 4.0 4.0 4.0 4.0 4.0 4.0 4.0 4.0 4.0 ------------|---------------||---------------||---------------||---------------| Volume Module: Base Vol: 167 214 0 0 245 60 0 0 0 419 932 133 Growth Adj: 1.00 1.00 1.00 1.00 1.00 1.00 1.00 1.00 1.00 1.00 1.00 1.00 Initial Bse: 167 214 0 0 245 60 0 0 0 419 932 133 Added Vol: 0 0 0 0 0 0 0 0 0 0 0 0 Cuml: 13 41 0 0 30 8 0 0 0 17 76 0 Initial Fut: 180 255 0 0 275 68 0 0 0 436 1008 133 User Adj: 1.00 1.00 1.00 1.00 1.00 1.00 1.00 1.00 1.00 1.00 1.00 1.00 PHF Adj: 1.00 1.00 1.00 1.00 1.00 1.00 1.00 1.00 1.00 1.00 1.00 1.00 PHF Volume: 180 255 0 0 275 68 0 0 0 436 1008 133 Reduct Vol: 0 0 0 0 0 0 0 0 0 0 0 0 Reduced Vol: 180 255 0 0 275 68 0 0 0 436 1008 133 PCE Adj: 1.00 1.00 1.00 1.00 1.00 1.00 1.00 1.00 1.00 1.00 1.00 1.00 MLF Adj: 1.00 1.00 1.00 1.00 1.00 1.00 1.00 1.00 1.00 1.00 1.00 1.00 FinalVolume: 180 255 0 0 275 68 0 0 0 436 1008 133 ------------|---------------||---------------||---------------||---------------| Saturation Flow Module: Sat/Lane: 1900 1900 1900 1900 1900 1900 1900 1900 1900 1900 1900 1900 Adjustment: 0.92 1.00 0.92 0.92 1.00 0.92 0.92 1.00 0.92 0.95 0.99 0.92 Lanes: 1.00 1.00 0.00 0.00 1.00 1.00 0.00 0.00 0.00 0.62 1.38 1.00 Final Sat.: 1750 1900 0 0 1900 1750 0 0 0 1117 2582 1750 ------------|---------------||---------------||---------------||---------------| Capacity Analysis Module: Vol/Sat: 0.10 0.13 0.00 0.00 0.14 0.04 0.00 0.00 0.00 0.39 0.39 0.08 Crit Moves: **** **** **** Green Time: 14.7 35.3 0.0 0.0 20.6 20.6 0.0 0.0 0.0 55.7 55.7 55.7 Volume/Cap: 0.70 0.38 0.00 0.00 0.70 0.19 0.00 0.00 0.00 0.70 0.70 0.14 Delay/Veh: 49.0 24.5 0.0 0.0 42.4 33.0 0.0 0.0 0.0 17.2 17.2 10.7 User DelAdj: 1.00 1.00 1.00 1.00 1.00 1.00 1.00 1.00 1.00 1.00 1.00 1.00 AdjDel/Veh: 49.0 24.5 0.0 0.0 42.4 33.0 0.0 0.0 0.0 17.2 17.2 10.7 LOS by Move: D C A A D C- A A A B B B+ HCM2kAvgQ: 6 6 0 0 9 2 0 0 0 17 17 2 Note: Queue reported is the number of cars per lane.

COMPARE Wed Oct 05 10:42:49 2011 Page 3-12
Traffix 8.0.0715 Copyright (c) 2008 Dowling Associates, Inc. Licensed to FEHR & PEERS WALNUT CRK
San Jose City College
SJ07-951 Level Of Service Computation Report
2000 HCM Operations (Future Volume Alternative) Cumulative PM
Intersection #6: Leigh/Parkmoor Signal=Protect/Rights=Include Final Vol: 68 281*** 0 Lanes: 1 0 1 0 0
Signal=Split
Signal=Split
Final Vol: Lanes: Rights=Include Vol Cnt Date: n/a Rights=Include Lanes: Final Vol:
0
0 Cycle Time (sec): 100
1
133
0
Loss Time (sec): 9
0
0 0
Critical V/C: 0.761
1 1050***
0
Avg Crit Del (sec/veh): 26.4
1
0 0
Avg Delay (sec/veh): 25.5
0 499
LOS: C
Lanes: 1 0 1 0 0 Final Vol: 220*** 261 0 Signal=Protect/Rights=Include Street Name: Leigh Parkmoor Approach: North Bound South Bound East Bound West Bound Movement: L - T - R L - T - R L - T - R L - T - R ------------|---------------||---------------||---------------||---------------| Min. Green: 7 10 0 0 10 10 0 0 0 10 10 10 Y+R: 4.0 4.0 4.0 4.0 4.0 4.0 4.0 4.0 4.0 4.0 4.0 4.0 ------------|---------------||---------------||---------------||---------------| Volume Module: Base Vol: 167 214 0 0 245 60 0 0 0 419 932 133 Growth Adj: 1.00 1.00 1.00 1.00 1.00 1.00 1.00 1.00 1.00 1.00 1.00 1.00 Initial Bse: 167 214 0 0 245 60 0 0 0 419 932 133 Added Vol: 40 6 0 0 6 0 0 0 0 63 42 0 Cuml: 13 41 0 0 30 8 0 0 0 17 76 0 Initial Fut: 220 261 0 0 281 68 0 0 0 499 1050 133 User Adj: 1.00 1.00 1.00 1.00 1.00 1.00 1.00 1.00 1.00 1.00 1.00 1.00 PHF Adj: 1.00 1.00 1.00 1.00 1.00 1.00 1.00 1.00 1.00 1.00 1.00 1.00 PHF Volume: 220 261 0 0 281 68 0 0 0 499 1050 133 Reduct Vol: 0 0 0 0 0 0 0 0 0 0 0 0 Reduced Vol: 220 261 0 0 281 68 0 0 0 499 1050 133 PCE Adj: 1.00 1.00 1.00 1.00 1.00 1.00 1.00 1.00 1.00 1.00 1.00 1.00 MLF Adj: 1.00 1.00 1.00 1.00 1.00 1.00 1.00 1.00 1.00 1.00 1.00 1.00 FinalVolume: 220 261 0 0 281 68 0 0 0 499 1050 133 ------------|---------------||---------------||---------------||---------------| Saturation Flow Module: Sat/Lane: 1900 1900 1900 1900 1900 1900 1900 1900 1900 1900 1900 1900 Adjustment: 0.92 1.00 0.92 0.92 1.00 0.92 0.92 1.00 0.92 0.95 0.99 0.92 Lanes: 1.00 1.00 0.00 0.00 1.00 1.00 0.00 0.00 0.00 0.66 1.34 1.00 Final Sat.: 1750 1900 0 0 1900 1750 0 0 0 1192 2507 1750 ------------|---------------||---------------||---------------||---------------| Capacity Analysis Module: Vol/Sat: 0.13 0.14 0.00 0.00 0.15 0.04 0.00 0.00 0.00 0.42 0.42 0.08 Crit Moves: **** **** **** Green Time: 16.5 36.0 0.0 0.0 19.4 19.4 0.0 0.0 0.0 55.0 55.0 55.0 Volume/Cap: 0.76 0.38 0.00 0.00 0.76 0.20 0.00 0.00 0.00 0.76 0.76 0.14 Delay/Veh: 51.1 24.1 0.0 0.0 47.0 34.1 0.0 0.0 0.0 19.1 19.1 11.0 User DelAdj: 1.00 1.00 1.00 1.00 1.00 1.00 1.00 1.00 1.00 1.00 1.00 1.00 AdjDel/Veh: 51.1 24.1 0.0 0.0 47.0 34.1 0.0 0.0 0.0 19.1 19.1 11.0 LOS by Move: D- C A A D C- A A A B- B- B+ HCM2kAvgQ: 7 6 0 0 10 2 0 0 0 20 20 2 Note: Queue reported is the number of cars per lane.

COMPARE Wed Oct 05 10:42:49 2011 Page 3-13
Traffix 8.0.0715 Copyright (c) 2008 Dowling Associates, Inc. Licensed to FEHR & PEERS WALNUT CRK
San Jose City College
SJ07-951 Level Of Service Computation Report
2000 HCM Operations (Future Volume Alternative) Cuml No Proj PM
Intersection #7: Bascom/Moorpark Signal=Protect/Rights=Include Final Vol: 422 1321 466*** Lanes: 0 1 2 0 1
Signal=Split
Signal=Split
Final Vol: Lanes: Rights=Include Vol Cnt Date: n/a Rights=Include Lanes: Final Vol:
143
0 Cycle Time (sec): 150
0
0
1
Loss Time (sec): 9
0
1006*** 1
Critical V/C: 0.871
0 0
0
Avg Crit Del (sec/veh): 56.6
0
296 1
Avg Delay (sec/veh): 46.4
0 0
LOS: D
Lanes: 2 0 2 1 0 Final Vol: 276 635 424*** Signal=Protect/Rights=Include Street Name: S Bascom Ave Moorpark Ave Approach: North Bound South Bound East Bound West Bound Movement: L - T - R L - T - R L - T - R L - T - R ------------|---------------||---------------||---------------||---------------| Min. Green: 7 10 10 7 10 10 10 10 10 0 0 0 Y+R: 4.0 4.0 4.0 4.0 4.0 4.0 4.0 4.0 4.0 4.0 4.0 4.0 ------------|---------------||---------------||---------------||---------------| Volume Module: Base Vol: 249 544 313 456 1163 345 105 886 276 0 0 0 Growth Adj: 1.00 1.00 1.00 1.00 1.00 1.00 1.00 1.00 1.00 1.00 1.00 1.00 Initial Bse: 249 544 313 456 1163 345 105 886 276 0 0 0 Added Vol: 0 0 0 0 0 0 0 0 0 0 0 0 Cuml: 27 91 111 10 158 77 38 120 20 0 0 0 Initial Fut: 276 635 424 466 1321 422 143 1006 296 0 0 0 User Adj: 1.00 1.00 1.00 1.00 1.00 1.00 1.00 1.00 1.00 1.00 1.00 1.00 PHF Adj: 1.00 1.00 1.00 1.00 1.00 1.00 1.00 1.00 1.00 1.00 1.00 1.00 PHF Volume: 276 635 424 466 1321 422 143 1006 296 0 0 0 Reduct Vol: 0 0 0 0 0 0 0 0 0 0 0 0 Reduced Vol: 276 635 424 466 1321 422 143 1006 296 0 0 0 PCE Adj: 1.00 1.00 1.00 1.00 1.00 1.00 1.00 1.00 1.00 1.00 1.00 1.00 MLF Adj: 1.00 1.00 1.00 1.00 1.00 1.00 1.00 1.00 1.00 1.00 1.00 1.00 FinalVolume: 276 635 424 466 1321 422 143 1006 296 0 0 0 ------------|---------------||---------------||---------------||---------------| Saturation Flow Module: Sat/Lane: 1900 1900 1900 1900 1900 1900 1900 1900 1900 1900 1900 1900 Adjustment: 0.83 1.00 0.92 0.92 0.99 0.95 0.95 0.98 0.92 0.92 1.00 0.92 Lanes: 2.00 2.00 1.00 1.00 2.25 0.75 0.26 1.74 1.00 0.00 0.00 0.00 Final Sat.: 3150 3800 1750 1750 4242 1355 460 3240 1750 0 0 0 ------------|---------------||---------------||---------------||---------------| Capacity Analysis Module: Vol/Sat: 0.09 0.17 0.24 0.27 0.31 0.31 0.31 0.31 0.17 0.00 0.00 0.00 Crit Moves: **** **** **** Green Time: 19.2 41.7 41.7 45.8 68.3 68.3 53.5 53.5 53.5 0.0 0.0 0.0 Volume/Cap: 0.68 0.60 0.87 0.87 0.68 0.68 0.87 0.87 0.47 0.00 0.00 0.00 Delay/Veh: 67.3 47.5 58.7 63.8 33.1 33.1 51.7 51.7 38.0 0.0 0.0 0.0 User DelAdj: 1.00 1.00 1.00 1.00 1.00 1.00 1.00 1.00 1.00 1.00 1.00 1.00 AdjDel/Veh: 67.3 47.5 58.7 63.8 33.1 33.1 51.7 51.7 38.0 0.0 0.0 0.0 LOS by Move: E D E+ E C- C- D- D- D+ A A A HCM2kAvgQ: 7 12 21 23 21 21 28 28 11 0 0 0 Note: Queue reported is the number of cars per lane.

COMPARE Wed Oct 05 10:42:49 2011 Page 3-14
Traffix 8.0.0715 Copyright (c) 2008 Dowling Associates, Inc. Licensed to FEHR & PEERS WALNUT CRK
San Jose City College
SJ07-951 Level Of Service Computation Report
2000 HCM Operations (Future Volume Alternative) Cumulative PM
Intersection #7: Bascom/Moorpark Signal=Protect/Rights=Include Final Vol: 424 1330 521*** Lanes: 0 1 2 0 1
Signal=Split
Signal=Split
Final Vol: Lanes: Rights=Include Vol Cnt Date: n/a Rights=Include Lanes: Final Vol:
143
0 Cycle Time (sec): 150
0
0
1
Loss Time (sec): 9
0
1013*** 1
Critical V/C: 0.912
0 0
0
Avg Crit Del (sec/veh): 61.7
0
296 1
Avg Delay (sec/veh): 48.5
0 0
LOS: D
Lanes: 2 0 2 1 0 Final Vol: 278 641 433*** Signal=Protect/Rights=Include Street Name: S Bascom Ave Moorpark Ave Approach: North Bound South Bound East Bound West Bound Movement: L - T - R L - T - R L - T - R L - T - R ------------|---------------||---------------||---------------||---------------| Min. Green: 7 10 10 7 10 10 10 10 10 0 0 0 Y+R: 4.0 4.0 4.0 4.0 4.0 4.0 4.0 4.0 4.0 4.0 4.0 4.0 ------------|---------------||---------------||---------------||---------------| Volume Module: Base Vol: 249 544 313 456 1163 345 105 886 276 0 0 0 Growth Adj: 1.00 1.00 1.00 1.00 1.00 1.00 1.00 1.00 1.00 1.00 1.00 1.00 Initial Bse: 249 544 313 456 1163 345 105 886 276 0 0 0 Added Vol: 2 6 9 55 9 2 0 7 0 0 0 0 Cuml: 27 91 111 10 158 77 38 120 20 0 0 0 Initial Fut: 278 641 433 521 1330 424 143 1013 296 0 0 0 User Adj: 1.00 1.00 1.00 1.00 1.00 1.00 1.00 1.00 1.00 1.00 1.00 1.00 PHF Adj: 1.00 1.00 1.00 1.00 1.00 1.00 1.00 1.00 1.00 1.00 1.00 1.00 PHF Volume: 278 641 433 521 1330 424 143 1013 296 0 0 0 Reduct Vol: 0 0 0 0 0 0 0 0 0 0 0 0 Reduced Vol: 278 641 433 521 1330 424 143 1013 296 0 0 0 PCE Adj: 1.00 1.00 1.00 1.00 1.00 1.00 1.00 1.00 1.00 1.00 1.00 1.00 MLF Adj: 1.00 1.00 1.00 1.00 1.00 1.00 1.00 1.00 1.00 1.00 1.00 1.00 FinalVolume: 278 641 433 521 1330 424 143 1013 296 0 0 0 ------------|---------------||---------------||---------------||---------------| Saturation Flow Module: Sat/Lane: 1900 1900 1900 1900 1900 1900 1900 1900 1900 1900 1900 1900 Adjustment: 0.83 1.00 0.92 0.92 0.99 0.95 0.95 0.98 0.92 0.92 1.00 0.92 Lanes: 2.00 2.00 1.00 1.00 2.25 0.75 0.25 1.75 1.00 0.00 0.00 0.00 Final Sat.: 3150 3800 1750 1750 4245 1353 457 3242 1750 0 0 0 ------------|---------------||---------------||---------------||---------------| Capacity Analysis Module: Vol/Sat: 0.09 0.17 0.25 0.30 0.31 0.31 0.31 0.31 0.17 0.00 0.00 0.00 Crit Moves: **** **** **** Green Time: 19.7 40.7 40.7 48.9 69.9 69.9 51.4 51.4 51.4 0.0 0.0 0.0 Volume/Cap: 0.67 0.62 0.91 0.91 0.67 0.67 0.91 0.91 0.49 0.00 0.00 0.00 Delay/Veh: 66.4 48.6 63.7 67.5 31.8 31.8 57.3 57.3 39.7 0.0 0.0 0.0 User DelAdj: 1.00 1.00 1.00 1.00 1.00 1.00 1.00 1.00 1.00 1.00 1.00 1.00 AdjDel/Veh: 66.4 48.6 63.7 67.5 31.8 31.8 57.3 57.3 39.7 0.0 0.0 0.0 LOS by Move: E D E E C C E+ E+ D A A A HCM2kAvgQ: 7 13 23 26 21 21 29 29 12 0 0 0 Note: Queue reported is the number of cars per lane.

COMPARE Wed Oct 05 10:42:49 2011 Page 3-15
Traffix 8.0.0715 Copyright (c) 2008 Dowling Associates, Inc. Licensed to FEHR & PEERS WALNUT CRK
San Jose City College
SJ07-951 Level Of Service Computation Report
2000 HCM Operations (Future Volume Alternative) Cuml No Proj PM
Intersection #8: Leland/Moorpark Signal=Split/Rights=Include Final Vol: 0 0 103*** Lanes: 0 0 0 0 1
Signal=Split
Signal=Split
Final Vol: Lanes: Rights=Ignore Vol Cnt Date: n/a Rights=Include Lanes: Final Vol:
422
0 Cycle Time (sec): 110
0
0
1
Loss Time (sec): 6
0
1884*** 2
Critical V/C: 0.498
0 0
0
Avg Crit Del (sec/veh): 4.8
0
0 1
Avg Delay (sec/veh): 4.8
0 0
LOS: A
Lanes: 0 0 0 0 1 Final Vol: 0 0 0 Signal=Split/Rights=Ignore Street Name: Leland Ave Moorpark Ave Approach: North Bound South Bound East Bound West Bound Movement: L - T - R L - T - R L - T - R L - T - R ------------|---------------||---------------||---------------||---------------| Min. Green: 0 0 0 10 0 0 10 10 0 0 0 0 Y+R: 4.0 4.0 4.0 4.0 4.0 4.0 4.0 4.0 4.0 4.0 4.0 4.0 ------------|---------------||---------------||---------------||---------------| Volume Module: Base Vol: 0 0 27 101 0 0 339 1718 48 0 0 0 Growth Adj: 1.00 1.00 1.00 1.00 1.00 1.00 1.00 1.00 1.00 1.00 1.00 1.00 Initial Bse: 0 0 27 101 0 0 339 1718 48 0 0 0 Added Vol: 0 0 0 0 0 0 0 0 0 0 0 0 Cuml: 0 0 0 2 0 0 83 166 0 0 0 0 Initial Fut: 0 0 27 103 0 0 422 1884 48 0 0 0 User Adj: 1.00 1.00 0.00 1.00 1.00 1.00 1.00 1.00 0.00 1.00 1.00 1.00 PHF Adj: 1.00 1.00 0.00 1.00 1.00 1.00 1.00 1.00 0.00 1.00 1.00 1.00 PHF Volume: 0 0 0 103 0 0 422 1884 0 0 0 0 Reduct Vol: 0 0 0 0 0 0 0 0 0 0 0 0 Reduced Vol: 0 0 0 103 0 0 422 1884 0 0 0 0 PCE Adj: 1.00 1.00 0.00 1.00 1.00 1.00 1.00 1.00 0.00 1.00 1.00 1.00 MLF Adj: 1.00 1.00 0.00 1.00 1.00 1.00 1.00 1.00 0.00 1.00 1.00 1.00 FinalVolume: 0 0 0 103 0 0 422 1884 0 0 0 0 ------------|---------------||---------------||---------------||---------------| Saturation Flow Module: Sat/Lane: 1900 1900 1900 1900 1900 1900 1900 1900 1900 1900 1900 1900 Adjustment: 0.92 1.00 0.92 0.92 1.00 0.92 0.95 0.99 0.92 0.92 1.00 0.92 Lanes: 0.00 0.00 1.00 1.00 0.00 0.00 0.57 2.43 1.00 0.00 0.00 0.00 Final Sat.: 0 0 1750 1750 0 0 1025 4574 1750 0 0 0 ------------|---------------||---------------||---------------||---------------| Capacity Analysis Module: Vol/Sat: 0.00 0.00 0.00 0.06 0.00 0.00 0.41 0.41 0.00 0.00 0.00 0.00 Crit Moves: **** **** Green Time: 0.0 0.0 0.0 13.0 0.0 0.0 91.0 91.0 0.0 0.0 0.0 0.0 Volume/Cap: 0.00 0.00 0.00 0.50 0.00 0.00 0.50 0.50 0.00 0.00 0.00 0.00 Delay/Veh: 0.0 0.0 0.0 47.3 0.0 0.0 2.9 2.9 0.0 0.0 0.0 0.0 User DelAdj: 1.00 1.00 1.00 1.00 1.00 1.00 1.00 1.00 1.00 1.00 1.00 1.00 AdjDel/Veh: 0.0 0.0 0.0 47.3 0.0 0.0 2.9 2.9 0.0 0.0 0.0 0.0 LOS by Move: A A A D A A A A A A A A HCM2kAvgQ: 0 0 0 3 0 0 8 8 0 0 0 0 Note: Queue reported is the number of cars per lane.

COMPARE Wed Oct 05 10:42:49 2011 Page 3-16
Traffix 8.0.0715 Copyright (c) 2008 Dowling Associates, Inc. Licensed to FEHR & PEERS WALNUT CRK
San Jose City College
SJ07-951 Level Of Service Computation Report
2000 HCM Operations (Future Volume Alternative) Cumulative PM
Intersection #8: Leland/Moorpark Signal=Split/Rights=Include Final Vol: 0 0 109*** Lanes: 0 0 0 0 1
Signal=Split
Signal=Split
Final Vol: Lanes: Rights=Ignore Vol Cnt Date: n/a Rights=Include Lanes: Final Vol:
424***
0 Cycle Time (sec): 110
0
0
1
Loss Time (sec): 6
0
1939 2
Critical V/C: 0.512
0 0
0
Avg Crit Del (sec/veh): 5.0
0
0 1
Avg Delay (sec/veh): 5.0
0 0
LOS: A
Lanes: 0 0 0 0 1 Final Vol: 0 0 0 Signal=Split/Rights=Ignore Street Name: Leland Ave Moorpark Ave Approach: North Bound South Bound East Bound West Bound Movement: L - T - R L - T - R L - T - R L - T - R ------------|---------------||---------------||---------------||---------------| Min. Green: 0 0 0 10 0 0 10 10 0 0 0 0 Y+R: 4.0 4.0 4.0 4.0 4.0 4.0 4.0 4.0 4.0 4.0 4.0 4.0 ------------|---------------||---------------||---------------||---------------| Volume Module: Base Vol: 0 0 27 101 0 0 339 1718 48 0 0 0 Growth Adj: 1.00 1.00 1.00 1.00 1.00 1.00 1.00 1.00 1.00 1.00 1.00 1.00 Initial Bse: 0 0 27 101 0 0 339 1718 48 0 0 0 Added Vol: 0 0 71 6 0 0 2 55 36 0 0 0 Cuml: 0 0 0 2 0 0 83 166 0 0 0 0 Initial Fut: 0 0 98 109 0 0 424 1939 84 0 0 0 User Adj: 1.00 1.00 0.00 1.00 1.00 1.00 1.00 1.00 0.00 1.00 1.00 1.00 PHF Adj: 1.00 1.00 0.00 1.00 1.00 1.00 1.00 1.00 0.00 1.00 1.00 1.00 PHF Volume: 0 0 0 109 0 0 424 1939 0 0 0 0 Reduct Vol: 0 0 0 0 0 0 0 0 0 0 0 0 Reduced Vol: 0 0 0 109 0 0 424 1939 0 0 0 0 PCE Adj: 1.00 1.00 0.00 1.00 1.00 1.00 1.00 1.00 0.00 1.00 1.00 1.00 MLF Adj: 1.00 1.00 0.00 1.00 1.00 1.00 1.00 1.00 0.00 1.00 1.00 1.00 FinalVolume: 0 0 0 109 0 0 424 1939 0 0 0 0 ------------|---------------||---------------||---------------||---------------| Saturation Flow Module: Sat/Lane: 1900 1900 1900 1900 1900 1900 1900 1900 1900 1900 1900 1900 Adjustment: 0.92 1.00 0.92 0.92 1.00 0.92 0.95 0.99 0.92 0.92 1.00 0.92 Lanes: 0.00 0.00 1.00 1.00 0.00 0.00 0.56 2.44 1.00 0.00 0.00 0.00 Final Sat.: 0 0 1750 1750 0 0 1005 4594 1750 0 0 0 ------------|---------------||---------------||---------------||---------------| Capacity Analysis Module: Vol/Sat: 0.00 0.00 0.00 0.06 0.00 0.00 0.42 0.42 0.00 0.00 0.00 0.00 Crit Moves: **** **** Green Time: 0.0 0.0 0.0 13.4 0.0 0.0 90.6 90.6 0.0 0.0 0.0 0.0 Volume/Cap: 0.00 0.00 0.00 0.51 0.00 0.00 0.51 0.51 0.00 0.00 0.00 0.00 Delay/Veh: 0.0 0.0 0.0 47.4 0.0 0.0 3.1 3.1 0.0 0.0 0.0 0.0 User DelAdj: 1.00 1.00 1.00 1.00 1.00 1.00 1.00 1.00 1.00 1.00 1.00 1.00 AdjDel/Veh: 0.0 0.0 0.0 47.4 0.0 0.0 3.1 3.1 0.0 0.0 0.0 0.0 LOS by Move: A A A D A A A A A A A A HCM2kAvgQ: 0 0 0 4 0 0 9 9 0 0 0 0 Note: Queue reported is the number of cars per lane.

COMPARE Wed Oct 05 10:42:49 2011 Page 3-17
Traffix 8.0.0715 Copyright (c) 2008 Dowling Associates, Inc. Licensed to FEHR & PEERS WALNUT CRK
San Jose City College
SJ07-951 Level Of Service Computation Report
2000 HCM Operations (Future Volume Alternative) Cuml No Proj PM
Intersection #9: Leigh/Moorpark Signal=Protect/Rights=Include Final Vol: 0 505 201*** Lanes: 0 0 2 0 1
Signal=Split
Signal=Split
Final Vol: Lanes: Rights=Include Vol Cnt Date: n/a Rights=Include Lanes: Final Vol:
160***
0 Cycle Time (sec): 100
0
13
1
Loss Time (sec): 9
0
1427 2
Critical V/C: 0.513
0 0
0
Avg Crit Del (sec/veh): 19.7
0
455 1
Avg Delay (sec/veh): 20.3
0 0
LOS: C+
Lanes: 0 0 2 0 1 Final Vol: 0 262*** 116 Signal=Protect/Rights=Include Street Name: Leigh Ave Moorpark Ave Approach: North Bound South Bound East Bound West Bound Movement: L - T - R L - T - R L - T - R L - T - R ------------|---------------||---------------||---------------||---------------| Min. Green: 0 10 10 7 10 0 10 10 10 0 0 0 Y+R: 4.0 4.0 4.0 4.0 4.0 4.0 4.0 4.0 4.0 4.0 4.0 4.0 ------------|---------------||---------------||---------------||---------------| Volume Module: Base Vol: 0 226 116 188 476 0 155 1262 451 0 0 0 Growth Adj: 1.00 1.00 1.00 1.00 1.00 1.00 1.00 1.00 1.00 1.00 1.00 1.00 Initial Bse: 0 226 116 188 476 0 155 1262 451 0 0 0 Added Vol: 0 0 0 0 0 0 0 0 0 0 0 0 Cuml: 0 36 0 13 29 0 5 165 4 0 0 13 Initial Fut: 0 262 116 201 505 0 160 1427 455 0 0 13 User Adj: 1.00 1.00 1.00 1.00 1.00 1.00 1.00 1.00 1.00 1.00 1.00 1.00 PHF Adj: 1.00 1.00 1.00 1.00 1.00 1.00 1.00 1.00 1.00 1.00 1.00 1.00 PHF Volume: 0 262 116 201 505 0 160 1427 455 0 0 13 Reduct Vol: 0 0 0 0 0 0 0 0 0 0 0 0 Reduced Vol: 0 262 116 201 505 0 160 1427 455 0 0 13 PCE Adj: 1.00 1.00 1.00 1.00 1.00 1.00 1.00 1.00 1.00 1.00 1.00 1.00 MLF Adj: 1.00 1.00 1.00 1.00 1.00 1.00 1.00 1.00 1.00 1.00 1.00 1.00 FinalVolume: 0 262 116 201 505 0 160 1427 455 0 0 13 ------------|---------------||---------------||---------------||---------------| Saturation Flow Module: Sat/Lane: 1900 1900 1900 1900 1900 1900 1900 1900 1900 1900 1900 1900 Adjustment: 0.92 1.00 0.92 0.92 1.00 0.92 0.95 0.99 0.92 0.92 1.00 0.92 Lanes: 0.00 2.00 1.00 1.00 2.00 0.00 0.31 2.69 1.00 0.00 0.00 0.00 Final Sat.: 0 3800 1750 1750 3800 0 565 5035 1750 0 0 0 ------------|---------------||---------------||---------------||---------------| Capacity Analysis Module: Vol/Sat: 0.00 0.07 0.07 0.11 0.13 0.00 0.28 0.28 0.26 0.00 0.00 xxxx Crit Moves: **** **** **** Green Time: 0.0 13.4 13.4 22.4 35.8 0.0 55.2 55.2 55.2 0.0 0.0 0.0 Volume/Cap: 0.00 0.51 0.49 0.51 0.37 0.00 0.51 0.51 0.47 0.00 0.00 xxxx Delay/Veh: 0.0 41.1 41.8 35.2 23.9 0.0 14.2 14.2 13.9 0.0 0.0 0.0 User DelAdj: 1.00 1.00 1.00 1.00 1.00 1.00 1.00 1.00 1.00 1.00 1.00 1.00 AdjDel/Veh: 0.0 41.1 41.8 35.2 23.9 0.0 14.2 14.2 13.9 0.0 0.0 0.0 LOS by Move: A D D D+ C A B B B A A A HCM2kAvgQ: 0 4 4 6 5 0 10 10 9 0 0 0 Note: Queue reported is the number of cars per lane.

COMPARE Wed Oct 05 10:42:49 2011 Page 3-18
Traffix 8.0.0715 Copyright (c) 2008 Dowling Associates, Inc. Licensed to FEHR & PEERS WALNUT CRK
San Jose City College
SJ07-951 Level Of Service Computation Report
2000 HCM Operations (Future Volume Alternative) Cumulative PM
Intersection #9: Leigh/Moorpark Signal=Protect/Rights=Include Final Vol: 0 573 201*** Lanes: 0 0 2 0 1
Signal=Split
Signal=Split
Final Vol: Lanes: Rights=Include Vol Cnt Date: n/a Rights=Include Lanes: Final Vol:
200
0 Cycle Time (sec): 100
0
13
1
Loss Time (sec): 9
0
1480*** 2
Critical V/C: 0.533
0 0
0
Avg Crit Del (sec/veh): 19.4
0
493 1
Avg Delay (sec/veh): 20.3
0 0
LOS: C+
Lanes: 0 0 2 0 1 Final Vol: 0 268*** 116 Signal=Protect/Rights=Include Street Name: Leigh Ave Moorpark Ave Approach: North Bound South Bound East Bound West Bound Movement: L - T - R L - T - R L - T - R L - T - R ------------|---------------||---------------||---------------||---------------| Min. Green: 0 10 10 7 10 0 10 10 10 0 0 0 Y+R: 4.0 4.0 4.0 4.0 4.0 4.0 4.0 4.0 4.0 4.0 4.0 4.0 ------------|---------------||---------------||---------------||---------------| Volume Module: Base Vol: 0 226 116 188 476 0 155 1262 451 0 0 0 Growth Adj: 1.00 1.00 1.00 1.00 1.00 1.00 1.00 1.00 1.00 1.00 1.00 1.00 Initial Bse: 0 226 116 188 476 0 155 1262 451 0 0 0 Added Vol: 0 6 0 0 68 0 40 53 38 0 0 0 Cuml: 0 36 0 13 29 0 5 165 4 0 0 13 Initial Fut: 0 268 116 201 573 0 200 1480 493 0 0 13 User Adj: 1.00 1.00 1.00 1.00 1.00 1.00 1.00 1.00 1.00 1.00 1.00 1.00 PHF Adj: 1.00 1.00 1.00 1.00 1.00 1.00 1.00 1.00 1.00 1.00 1.00 1.00 PHF Volume: 0 268 116 201 573 0 200 1480 493 0 0 13 Reduct Vol: 0 0 0 0 0 0 0 0 0 0 0 0 Reduced Vol: 0 268 116 201 573 0 200 1480 493 0 0 13 PCE Adj: 1.00 1.00 1.00 1.00 1.00 1.00 1.00 1.00 1.00 1.00 1.00 1.00 MLF Adj: 1.00 1.00 1.00 1.00 1.00 1.00 1.00 1.00 1.00 1.00 1.00 1.00 FinalVolume: 0 268 116 201 573 0 200 1480 493 0 0 13 ------------|---------------||---------------||---------------||---------------| Saturation Flow Module: Sat/Lane: 1900 1900 1900 1900 1900 1900 1900 1900 1900 1900 1900 1900 Adjustment: 0.92 1.00 0.92 0.92 1.00 0.92 0.95 0.99 0.92 0.92 1.00 0.92 Lanes: 0.00 2.00 1.00 1.00 2.00 0.00 0.37 2.63 1.00 0.00 0.00 0.00 Final Sat.: 0 3800 1750 1750 3800 0 667 4932 1750 0 0 0 ------------|---------------||---------------||---------------||---------------| Capacity Analysis Module: Vol/Sat: 0.00 0.07 0.07 0.11 0.15 0.00 0.30 0.30 0.28 0.00 0.00 xxxx Crit Moves: **** **** **** Green Time: 0.0 13.2 13.2 21.5 34.8 0.0 56.2 56.2 56.2 0.0 0.0 0.0 Volume/Cap: 0.00 0.53 0.50 0.53 0.43 0.00 0.53 0.53 0.50 0.00 0.00 xxxx Delay/Veh: 0.0 41.6 42.1 36.3 25.3 0.0 13.9 13.9 13.7 0.0 0.0 0.0 User DelAdj: 1.00 1.00 1.00 1.00 1.00 1.00 1.00 1.00 1.00 1.00 1.00 1.00 AdjDel/Veh: 0.0 41.6 42.1 36.3 25.3 0.0 13.9 13.9 13.7 0.0 0.0 0.0 LOS by Move: A D D D+ C A B B B A A A HCM2kAvgQ: 0 4 4 6 6 0 11 11 10 0 0 0 Note: Queue reported is the number of cars per lane.

COMPARE Wed Oct 05 10:42:49 2011 Page 3-19
Traffix 8.0.0715 Copyright (c) 2008 Dowling Associates, Inc. Licensed to FEHR & PEERS WALNUT CRK
San Jose City College
SJ07-951 Level Of Service Computation Report
2000 HCM Operations (Future Volume Alternative) Cuml No Proj PM
Intersection #10: Bascom/Renova Signal=Protect/Rights=Include Final Vol: 114 1474*** 27 Lanes: 0 1 2 0 1
Signal=Permit
Signal=Permit
Final Vol: Lanes: Rights=Include Vol Cnt Date: n/a Rights=Include Lanes: Final Vol:
162
0 Cycle Time (sec): 150
1
26
1
Loss Time (sec): 9
0
1*** 0
Critical V/C: 0.431
0 5
0
Avg Crit Del (sec/veh): 17.6
1
67 1
Avg Delay (sec/veh): 18.5
0 18
LOS: B-
Lanes: 1 0 2 1 0 Final Vol: 54*** 1067 8 Signal=Protect/Rights=Include Street Name: Bascom Ave Renova Dr Approach: North Bound South Bound East Bound West Bound Movement: L - T - R L - T - R L - T - R L - T - R ------------|---------------||---------------||---------------||---------------| Min. Green: 7 10 10 7 10 10 10 10 10 10 10 10 Y+R: 4.0 4.0 4.0 4.0 4.0 4.0 4.0 4.0 4.0 4.0 4.0 4.0 ------------|---------------||---------------||---------------||---------------| Volume Module: Base Vol: 51 978 8 27 1382 48 35 1 61 18 5 26 Growth Adj: 1.00 1.00 1.00 1.00 1.00 1.00 1.00 1.00 1.00 1.00 1.00 1.00 Initial Bse: 51 978 8 27 1382 48 35 1 61 18 5 26 Added Vol: 0 0 0 0 0 0 0 0 0 0 0 0 Cuml: 3 89 0 0 92 66 127 0 6 0 0 0 Initial Fut: 54 1067 8 27 1474 114 162 1 67 18 5 26 User Adj: 1.00 1.00 1.00 1.00 1.00 1.00 1.00 1.00 1.00 1.00 1.00 1.00 PHF Adj: 1.00 1.00 1.00 1.00 1.00 1.00 1.00 1.00 1.00 1.00 1.00 1.00 PHF Volume: 54 1067 8 27 1474 114 162 1 67 18 5 26 Reduct Vol: 0 0 0 0 0 0 0 0 0 0 0 0 Reduced Vol: 54 1067 8 27 1474 114 162 1 67 18 5 26 PCE Adj: 1.00 1.00 1.00 1.00 1.00 1.00 1.00 1.00 1.00 1.00 1.00 1.00 MLF Adj: 1.00 1.00 1.00 1.00 1.00 1.00 1.00 1.00 1.00 1.00 1.00 1.00 FinalVolume: 54 1067 8 27 1474 114 162 1 67 18 5 26 ------------|---------------||---------------||---------------||---------------| Saturation Flow Module: Sat/Lane: 1900 1900 1900 1900 1900 1900 1900 1900 1900 1900 1900 1900 Adjustment: 0.92 0.98 0.95 0.92 0.99 0.95 0.95 0.95 0.92 0.95 0.95 0.92 Lanes: 1.00 2.98 0.02 1.00 2.78 0.22 0.99 0.01 1.00 0.78 0.22 1.00 Final Sat.: 1750 5558 42 1750 5197 402 1789 11 1750 1409 391 1750 ------------|---------------||---------------||---------------||---------------| Capacity Analysis Module: Vol/Sat: 0.03 0.19 0.19 0.02 0.28 0.28 0.09 0.09 0.04 0.01 0.01 0.01 Crit Moves: **** **** **** Green Time: 10.7 88.1 88.1 21.4 98.7 98.7 31.5 31.5 31.5 31.5 31.5 31.5 Volume/Cap: 0.43 0.33 0.33 0.11 0.43 0.43 0.43 0.43 0.18 0.06 0.06 0.07 Delay/Veh: 69.1 15.9 15.9 56.2 12.3 12.3 52.2 52.2 48.9 47.5 47.5 47.6 User DelAdj: 1.00 1.00 1.00 1.00 1.00 1.00 1.00 1.00 1.00 1.00 1.00 1.00 AdjDel/Veh: 69.1 15.9 15.9 56.2 12.3 12.3 52.2 52.2 48.9 47.5 47.5 47.6 LOS by Move: E B B E+ B B D- D- D D D D HCM2kAvgQ: 2 8 8 1 11 11 7 7 3 1 1 1 Note: Queue reported is the number of cars per lane.

COMPARE Wed Oct 05 10:42:49 2011 Page 3-20
Traffix 8.0.0715 Copyright (c) 2008 Dowling Associates, Inc. Licensed to FEHR & PEERS WALNUT CRK
San Jose City College
SJ07-951 Level Of Service Computation Report
2000 HCM Operations (Future Volume Alternative) Cumulative PM
Intersection #10: Bascom/Renova Signal=Protect/Rights=Include Final Vol: 114 1483*** 27 Lanes: 0 1 2 0 1
Signal=Permit
Signal=Permit
Final Vol: Lanes: Rights=Include Vol Cnt Date: n/a Rights=Include Lanes: Final Vol:
162
0 Cycle Time (sec): 150
1
26
1
Loss Time (sec): 9
0
1*** 0
Critical V/C: 0.433
0 5
0
Avg Crit Del (sec/veh): 17.6
1
67 1
Avg Delay (sec/veh): 18.4
0 18
LOS: B-
Lanes: 1 0 2 1 0 Final Vol: 54*** 1083 8 Signal=Protect/Rights=Include Street Name: Bascom Ave Renova Dr Approach: North Bound South Bound East Bound West Bound Movement: L - T - R L - T - R L - T - R L - T - R ------------|---------------||---------------||---------------||---------------| Min. Green: 7 10 10 7 10 10 10 10 10 10 10 10 Y+R: 4.0 4.0 4.0 4.0 4.0 4.0 4.0 4.0 4.0 4.0 4.0 4.0 ------------|---------------||---------------||---------------||---------------| Volume Module: Base Vol: 51 978 8 27 1382 48 35 1 61 18 5 26 Growth Adj: 1.00 1.00 1.00 1.00 1.00 1.00 1.00 1.00 1.00 1.00 1.00 1.00 Initial Bse: 51 978 8 27 1382 48 35 1 61 18 5 26 Added Vol: 0 16 0 0 9 0 0 0 0 0 0 0 Cuml: 3 89 0 0 92 66 127 0 6 0 0 0 Initial Fut: 54 1083 8 27 1483 114 162 1 67 18 5 26 User Adj: 1.00 1.00 1.00 1.00 1.00 1.00 1.00 1.00 1.00 1.00 1.00 1.00 PHF Adj: 1.00 1.00 1.00 1.00 1.00 1.00 1.00 1.00 1.00 1.00 1.00 1.00 PHF Volume: 54 1083 8 27 1483 114 162 1 67 18 5 26 Reduct Vol: 0 0 0 0 0 0 0 0 0 0 0 0 Reduced Vol: 54 1083 8 27 1483 114 162 1 67 18 5 26 PCE Adj: 1.00 1.00 1.00 1.00 1.00 1.00 1.00 1.00 1.00 1.00 1.00 1.00 MLF Adj: 1.00 1.00 1.00 1.00 1.00 1.00 1.00 1.00 1.00 1.00 1.00 1.00 FinalVolume: 54 1083 8 27 1483 114 162 1 67 18 5 26 ------------|---------------||---------------||---------------||---------------| Saturation Flow Module: Sat/Lane: 1900 1900 1900 1900 1900 1900 1900 1900 1900 1900 1900 1900 Adjustment: 0.92 0.98 0.95 0.92 0.99 0.95 0.95 0.95 0.92 0.95 0.95 0.92 Lanes: 1.00 2.98 0.02 1.00 2.78 0.22 0.99 0.01 1.00 0.78 0.22 1.00 Final Sat.: 1750 5559 41 1750 5200 400 1789 11 1750 1409 391 1750 ------------|---------------||---------------||---------------||---------------| Capacity Analysis Module: Vol/Sat: 0.03 0.19 0.19 0.02 0.29 0.29 0.09 0.09 0.04 0.01 0.01 0.01 Crit Moves: **** **** **** Green Time: 10.7 88.4 88.4 21.2 98.9 98.9 31.4 31.4 31.4 31.4 31.4 31.4 Volume/Cap: 0.43 0.33 0.33 0.11 0.43 0.43 0.43 0.43 0.18 0.06 0.06 0.07 Delay/Veh: 69.1 15.8 15.8 56.4 12.3 12.3 52.4 52.4 49.0 47.6 47.6 47.7 User DelAdj: 1.00 1.00 1.00 1.00 1.00 1.00 1.00 1.00 1.00 1.00 1.00 1.00 AdjDel/Veh: 69.1 15.8 15.8 56.4 12.3 12.3 52.4 52.4 49.0 47.6 47.6 47.7 LOS by Move: E B B E+ B B D- D- D D D D HCM2kAvgQ: 2 8 8 1 11 11 7 7 3 1 1 1 Note: Queue reported is the number of cars per lane.

COMPARE Wed Oct 05 10:42:49 2011 Page 3-21
Traffix 8.0.0715 Copyright (c) 2008 Dowling Associates, Inc. Licensed to FEHR & PEERS WALNUT CRK
San Jose City College
SJ07-951 Level Of Service Computation Report
2000 HCM Unsignalized (Future Volume Alternative) Cuml No Proj PM
Intersection #11: Bascom/Laswell [Unsignalized] Signal=Uncontrol/Rights=Include Final Vol: 8 1443 107 Lanes: 0 0 3 0 1
Signal=Stop
Signal=Stop
Final Vol: Lanes: Rights=Include Vol Cnt Date: n/a Rights=Include Lanes: Final Vol:
0
0 Cycle Time (sec): 100
0
26
0
Loss Time (sec): 0
0
0 0
Critical V/C: 0.449
1! 0
0
Avg Crit Del (sec/veh): 1.8
0
0 0
Avg Delay (sec/veh): 1.8
0 27
LOS: F
Lanes: 0 0 2 1 0 Final Vol: 4 1058 123 Signal=Uncontrol/Rights=Include Street Name: S Bascom Ave Laswell Ave Approach: North Bound South Bound East Bound West Bound Movement: L - T - R L - T - R L - T - R L - T - R ------------|---------------||---------------||---------------||---------------| Volume Module: Base Vol: 4 966 123 107 1345 8 0 0 0 27 0 26 Growth Adj: 1.00 1.00 1.00 1.00 1.00 1.00 1.00 1.00 1.00 1.00 1.00 1.00 Initial Bse: 4 966 123 107 1345 8 0 0 0 27 0 26 Added Vol: 0 0 0 0 0 0 0 0 0 0 0 0 Cuml: 0 92 0 0 98 0 0 0 0 0 0 0 Initial Fut: 4 1058 123 107 1443 8 0 0 0 27 0 26 User Adj: 1.00 1.00 1.00 1.00 1.00 1.00 1.00 1.00 1.00 1.00 1.00 1.00 PHF Adj: 1.00 1.00 1.00 1.00 1.00 1.00 1.00 1.00 1.00 1.00 1.00 1.00 PHF Volume: 4 1058 123 107 1443 8 0 0 0 27 0 26 Reduct Vol: 0 0 0 0 0 0 0 0 0 0 0 0 FinalVolume: 4 1058 123 107 1443 8 0 0 0 27 0 26 ------------|---------------||---------------||---------------||---------------| Critical Gap Module: Critical Gp: 4.1 xxxx xxxxx 4.1 xxxx xxxxx xxxxx xxxx xxxxx 6.8 6.5 6.9 FollowUpTim: 2.2 xxxx xxxxx 2.2 xxxx xxxxx xxxxx xxxx xxxxx 3.5 4.0 3.3 ------------|---------------||---------------||---------------||---------------| Capacity Module: Cnflict Vol: 1451 xxxx xxxxx 1181 xxxx xxxxx xxxx xxxx xxxxx 1823 2793 414 Potent Cap.: 473 xxxx xxxxx 599 xxxx xxxxx xxxx xxxx xxxxx 70 19 593 Move Cap.: 473 xxxx xxxxx 599 xxxx xxxxx xxxx xxxx xxxxx 60 15 593 Volume/Cap: 0.01 xxxx xxxx 0.18 xxxx xxxx xxxx xxxx xxxx 0.45 0.00 0.04 ------------|---------------||---------------||---------------||---------------| Level Of Service Module: 2Way95thQ: 0.0 xxxx xxxxx 0.6 xxxx xxxxx xxxx xxxx xxxxx xxxx xxxx xxxxx Control Del: 12.7 xxxx xxxxx 12.3 xxxx xxxxx xxxxx xxxx xxxxx xxxxx xxxx xxxxx LOS by Move: B * * B * * * * * * * * Movement: LT - LTR - RT LT - LTR - RT LT - LTR - RT LT - LTR - RT Shared Cap.: xxxx xxxx xxxxx xxxx xxxx xxxxx xxxx xxxx xxxxx xxxx 108 xxxxx SharedQueue: 0.0 xxxx xxxxx xxxxx xxxx xxxxx xxxxx xxxx xxxxx xxxxx 2.2 xxxxx Shrd ConDel: 12.7 xxxx xxxxx xxxxx xxxx xxxxx xxxxx xxxx xxxxx xxxxx 67.3 xxxxx Shared LOS: B * * * * * * * * * F * ApproachDel: xxxxxx xxxxxx xxxxxx 67.3 ApproachLOS: * * * F Note: Queue reported is the number of cars per lane.

COMPARE Wed Oct 05 10:42:49 2011 Page 3-22
Traffix 8.0.0715 Copyright (c) 2008 Dowling Associates, Inc. Licensed to FEHR & PEERS WALNUT CRK
San Jose City College
SJ07-951 Level Of Service Computation Report
2000 HCM Unsignalized (Future Volume Alternative) Cumulative PM
Intersection #11: Bascom/Laswell [Unsignalized] Signal=Uncontrol/Rights=Include Final Vol: 8 1443 116 Lanes: 0 0 3 0 1
Signal=Stop
Signal=Stop
Final Vol: Lanes: Rights=Include Vol Cnt Date: n/a Rights=Include Lanes: Final Vol:
0
0 Cycle Time (sec): 100
0
33
0
Loss Time (sec): 0
0
0 0
Critical V/C: 0.739
1! 0
0
Avg Crit Del (sec/veh): 3.7
0
0 0
Avg Delay (sec/veh): 3.7
0 41
LOS: F
Lanes: 0 0 2 1 0 Final Vol: 4 1067 149 Signal=Uncontrol/Rights=Include Street Name: S Bascom Ave Laswell Ave Approach: North Bound South Bound East Bound West Bound Movement: L - T - R L - T - R L - T - R L - T - R ------------|---------------||---------------||---------------||---------------| Volume Module: Base Vol: 4 966 123 107 1345 8 0 0 0 27 0 26 Growth Adj: 1.00 1.00 1.00 1.00 1.00 1.00 1.00 1.00 1.00 1.00 1.00 1.00 Initial Bse: 4 966 123 107 1345 8 0 0 0 27 0 26 Added Vol: 0 9 26 9 0 0 0 0 0 14 0 7 Cuml: 0 92 0 0 98 0 0 0 0 0 0 0 Initial Fut: 4 1067 149 116 1443 8 0 0 0 41 0 33 User Adj: 1.00 1.00 1.00 1.00 1.00 1.00 1.00 1.00 1.00 1.00 1.00 1.00 PHF Adj: 1.00 1.00 1.00 1.00 1.00 1.00 1.00 1.00 1.00 1.00 1.00 1.00 PHF Volume: 4 1067 149 116 1443 8 0 0 0 41 0 33 Reduct Vol: 0 0 0 0 0 0 0 0 0 0 0 0 FinalVolume: 4 1067 149 116 1443 8 0 0 0 41 0 33 ------------|---------------||---------------||---------------||---------------| Critical Gap Module: Critical Gp: 4.1 xxxx xxxxx 4.1 xxxx xxxxx xxxxx xxxx xxxxx 6.8 6.5 6.9 FollowUpTim: 2.2 xxxx xxxxx 2.2 xxxx xxxxx xxxxx xxxx xxxxx 3.5 4.0 3.3 ------------|---------------||---------------||---------------||---------------| Capacity Module: Cnflict Vol: 1451 xxxx xxxxx 1216 xxxx xxxxx xxxx xxxx xxxxx 1863 2833 430 Potent Cap.: 473 xxxx xxxxx 581 xxxx xxxxx xxxx xxxx xxxxx 66 18 579 Move Cap.: 473 xxxx xxxxx 581 xxxx xxxxx xxxx xxxx xxxxx 56 14 579 Volume/Cap: 0.01 xxxx xxxx 0.20 xxxx xxxx xxxx xxxx xxxx 0.74 0.00 0.06 ------------|---------------||---------------||---------------||---------------| Level Of Service Module: 2Way95thQ: 0.0 xxxx xxxxx 0.7 xxxx xxxxx xxxx xxxx xxxxx xxxx xxxx xxxxx Control Del: 12.7 xxxx xxxxx 12.7 xxxx xxxxx xxxxx xxxx xxxxx xxxxx xxxx xxxxx LOS by Move: B * * B * * * * * * * * Movement: LT - LTR - RT LT - LTR - RT LT - LTR - RT LT - LTR - RT Shared Cap.: xxxx xxxx xxxxx xxxx xxxx xxxxx xxxx xxxx xxxxx xxxx 93 xxxxx SharedQueue: 0.0 xxxx xxxxx xxxxx xxxx xxxxx xxxxx xxxx xxxxx xxxxx 4.2 xxxxx Shrd ConDel: 12.7 xxxx xxxxx xxxxx xxxx xxxxx xxxxx xxxx xxxxx xxxxx 124 xxxxx Shared LOS: B * * * * * * * * * F * ApproachDel: xxxxxx xxxxxx xxxxxx 124.1 ApproachLOS: * * * F Note: Queue reported is the number of cars per lane.

COMPARE Wed Oct 05 10:42:49 2011 Page 3-23
Traffix 8.0.0715 Copyright (c) 2008 Dowling Associates, Inc. Licensed to FEHR & PEERS WALNUT CRK
San Jose City College
SJ07-951 Level Of Service Computation Report
2000 HCM Operations (Future Volume Alternative) Cuml No Proj PM
Intersection #12: Bascom/Fruitdale Signal=Protect/Rights=Include Final Vol: 39 1140 312*** Lanes: 1 0 3 0 1
Signal=Split
Signal=Split
Final Vol: Lanes: Rights=Include Vol Cnt Date: n/a Rights=Include Lanes: Final Vol:
79
0 Cycle Time (sec): 150
1
354***
1
Loss Time (sec): 12
0
138 0
Critical V/C: 0.713
1 52
1
Avg Crit Del (sec/veh): 57.0
1
190*** 0
Avg Delay (sec/veh): 48.8
0 235
LOS: D
Lanes: 1 0 2 1 0 Final Vol: 73 754*** 157 Signal=Protect/Rights=Include Street Name: Bascom Fruitdale Approach: North Bound South Bound East Bound West Bound Movement: L - T - R L - T - R L - T - R L - T - R ------------|---------------||---------------||---------------||---------------| Min. Green: 7 10 10 7 10 10 10 10 10 10 10 10 Y+R: 4.0 4.0 4.0 4.0 4.0 4.0 4.0 4.0 4.0 4.0 4.0 4.0 ------------|---------------||---------------||---------------||---------------| Volume Module: Base Vol: 40 703 147 294 1074 28 56 123 127 226 41 338 Growth Adj: 1.00 1.00 1.00 1.00 1.00 1.00 1.00 1.00 1.00 1.00 1.00 1.00 Initial Bse: 40 703 147 294 1074 28 56 123 127 226 41 338 Added Vol: 0 0 0 0 0 0 0 0 0 0 0 0 Cuml: 33 51 10 18 66 11 23 15 63 9 11 16 Initial Fut: 73 754 157 312 1140 39 79 138 190 235 52 354 User Adj: 1.00 1.00 1.00 1.00 1.00 1.00 1.00 1.00 1.00 1.00 1.00 1.00 PHF Adj: 1.00 1.00 1.00 1.00 1.00 1.00 1.00 1.00 1.00 1.00 1.00 1.00 PHF Volume: 73 754 157 312 1140 39 79 138 190 235 52 354 Reduct Vol: 0 0 0 0 0 0 0 0 0 0 0 0 Reduced Vol: 73 754 157 312 1140 39 79 138 190 235 52 354 PCE Adj: 1.00 1.00 1.00 1.00 1.00 1.00 1.00 1.00 1.00 1.00 1.00 1.00 MLF Adj: 1.00 1.00 1.00 1.00 1.00 1.00 1.00 1.00 1.00 1.00 1.00 1.00 FinalVolume: 73 754 157 312 1140 39 79 138 190 235 52 354 ------------|---------------||---------------||---------------||---------------| Saturation Flow Module: Sat/Lane: 1900 1900 1900 1900 1900 1900 1900 1900 1900 1900 1900 1900 Adjustment: 0.92 0.99 0.95 0.92 1.00 0.92 0.95 0.95 0.95 0.92 1.00 0.92 Lanes: 1.00 2.46 0.54 1.00 3.00 1.00 0.39 0.68 0.93 1.00 1.00 1.00 Final Sat.: 1750 4634 965 1750 5700 1750 699 1221 1681 1750 1900 1750 ------------|---------------||---------------||---------------||---------------| Capacity Analysis Module: Vol/Sat: 0.04 0.16 0.16 0.18 0.20 0.02 0.11 0.11 0.11 0.13 0.03 0.20 Crit Moves: **** **** **** **** Green Time: 13.6 34.2 34.2 37.5 58.1 58.1 23.8 23.8 23.8 42.5 42.5 42.5 Volume/Cap: 0.46 0.71 0.71 0.71 0.52 0.06 0.71 0.71 0.71 0.47 0.10 0.71 Delay/Veh: 66.9 55.3 55.3 56.8 35.4 28.8 64.1 64.1 64.1 45.1 39.6 53.1 User DelAdj: 1.00 1.00 1.00 1.00 1.00 1.00 1.00 1.00 1.00 1.00 1.00 1.00 AdjDel/Veh: 66.9 55.3 55.3 56.8 35.4 28.8 64.1 64.1 64.1 45.1 39.6 53.1 LOS by Move: E E+ E+ E+ D+ C E E E D D D- HCM2kAvgQ: 4 14 14 14 13 1 11 11 11 9 2 16 Note: Queue reported is the number of cars per lane.

COMPARE Wed Oct 05 10:42:49 2011 Page 3-24
Traffix 8.0.0715 Copyright (c) 2008 Dowling Associates, Inc. Licensed to FEHR & PEERS WALNUT CRK
San Jose City College
SJ07-951 Level Of Service Computation Report
2000 HCM Operations (Future Volume Alternative) Cumulative PM
Intersection #12: Bascom/Fruitdale Signal=Protect/Rights=Include Final Vol: 39 1146 321*** Lanes: 1 0 3 0 1
Signal=Split
Signal=Split
Final Vol: Lanes: Rights=Include Vol Cnt Date: n/a Rights=Include Lanes: Final Vol:
79
0 Cycle Time (sec): 150
1
377***
1
Loss Time (sec): 12
0
138 0
Critical V/C: 0.736
1 52
1
Avg Crit Del (sec/veh): 58.0
1
190*** 0
Avg Delay (sec/veh): 49.5
0 236
LOS: D
Lanes: 1 0 2 1 0 Final Vol: 73 766*** 157 Signal=Protect/Rights=Include Street Name: Bascom Fruitdale Approach: North Bound South Bound East Bound West Bound Movement: L - T - R L - T - R L - T - R L - T - R ------------|---------------||---------------||---------------||---------------| Min. Green: 7 10 10 7 10 10 10 10 10 10 10 10 Y+R: 4.0 4.0 4.0 4.0 4.0 4.0 4.0 4.0 4.0 4.0 4.0 4.0 ------------|---------------||---------------||---------------||---------------| Volume Module: Base Vol: 40 703 147 294 1074 28 56 123 127 226 41 338 Growth Adj: 1.00 1.00 1.00 1.00 1.00 1.00 1.00 1.00 1.00 1.00 1.00 1.00 Initial Bse: 40 703 147 294 1074 28 56 123 127 226 41 338 Added Vol: 0 12 0 9 6 0 0 0 0 1 0 23 Cuml: 33 51 10 18 66 11 23 15 63 9 11 16 Initial Fut: 73 766 157 321 1146 39 79 138 190 236 52 377 User Adj: 1.00 1.00 1.00 1.00 1.00 1.00 1.00 1.00 1.00 1.00 1.00 1.00 PHF Adj: 1.00 1.00 1.00 1.00 1.00 1.00 1.00 1.00 1.00 1.00 1.00 1.00 PHF Volume: 73 766 157 321 1146 39 79 138 190 236 52 377 Reduct Vol: 0 0 0 0 0 0 0 0 0 0 0 0 Reduced Vol: 73 766 157 321 1146 39 79 138 190 236 52 377 PCE Adj: 1.00 1.00 1.00 1.00 1.00 1.00 1.00 1.00 1.00 1.00 1.00 1.00 MLF Adj: 1.00 1.00 1.00 1.00 1.00 1.00 1.00 1.00 1.00 1.00 1.00 1.00 FinalVolume: 73 766 157 321 1146 39 79 138 190 236 52 377 ------------|---------------||---------------||---------------||---------------| Saturation Flow Module: Sat/Lane: 1900 1900 1900 1900 1900 1900 1900 1900 1900 1900 1900 1900 Adjustment: 0.92 0.99 0.95 0.92 1.00 0.92 0.95 0.95 0.95 0.92 1.00 0.92 Lanes: 1.00 2.47 0.53 1.00 3.00 1.00 0.39 0.68 0.93 1.00 1.00 1.00 Final Sat.: 1750 4646 952 1750 5700 1750 699 1221 1681 1750 1900 1750 ------------|---------------||---------------||---------------||---------------| Capacity Analysis Module: Vol/Sat: 0.04 0.16 0.16 0.18 0.20 0.02 0.11 0.11 0.11 0.13 0.03 0.22 Crit Moves: **** **** **** **** Green Time: 13.4 33.6 33.6 37.4 57.6 57.6 23.1 23.1 23.1 43.9 43.9 43.9 Volume/Cap: 0.47 0.74 0.74 0.74 0.52 0.06 0.74 0.74 0.74 0.46 0.09 0.74 Delay/Veh: 67.1 56.4 56.4 58.2 35.8 29.1 65.7 65.7 65.7 43.9 38.6 53.3 User DelAdj: 1.00 1.00 1.00 1.00 1.00 1.00 1.00 1.00 1.00 1.00 1.00 1.00 AdjDel/Veh: 67.1 56.4 56.4 58.2 35.8 29.1 65.7 65.7 65.7 43.9 38.6 53.3 LOS by Move: E E+ E+ E+ D+ C E E E D D+ D- HCM2kAvgQ: 4 15 15 15 13 1 11 11 11 9 2 17 Note: Queue reported is the number of cars per lane.

COMPARE Wed Oct 05 10:42:49 2011 Page 3-25
Traffix 8.0.0715 Copyright (c) 2008 Dowling Associates, Inc. Licensed to FEHR & PEERS WALNUT CRK
San Jose City College
SJ07-951 Level Of Service Computation Report
2000 HCM Unsignalized (Future Volume Alternative) Cuml No Proj PM
Intersection #13: Sherman Oaks/Fruitdale [Unsignalized] Signal=Stop/Rights=Include Final Vol: 17 0 22 Lanes: 0 0 1! 0 0
Signal=Uncontrol
Signal=Uncontrol
Final Vol: Lanes: Rights=Include Vol Cnt Date: n/a Rights=Include Lanes: Final Vol:
5
1 Cycle Time (sec): 100
1
31
0
Loss Time (sec): 0
0
542 2
Critical V/C: 0.096
2 756
0
Avg Crit Del (sec/veh): 0.5
0
0 0
Avg Delay (sec/veh): 0.5
0 0
LOS: C
Lanes: 0 0 0 0 0 Final Vol: 0 0 0 Signal=Stop/Rights=Include Street Name: Sherman Oaks Fruitdale Approach: North Bound South Bound East Bound West Bound Movement: L - T - R L - T - R L - T - R L - T - R ------------|---------------||---------------||---------------||---------------| Volume Module: Base Vol: 0 0 0 22 0 17 5 491 0 0 714 31 Growth Adj: 1.00 1.00 1.00 1.00 1.00 1.00 1.00 1.00 1.00 1.00 1.00 1.00 Initial Bse: 0 0 0 22 0 17 5 491 0 0 714 31 Added Vol: 0 0 0 0 0 0 0 0 0 0 0 0 Cuml: 0 0 0 0 0 0 0 51 0 0 42 0 Initial Fut: 0 0 0 22 0 17 5 542 0 0 756 31 User Adj: 1.00 1.00 1.00 1.00 1.00 1.00 1.00 1.00 1.00 1.00 1.00 1.00 PHF Adj: 1.00 1.00 1.00 1.00 1.00 1.00 1.00 1.00 1.00 1.00 1.00 1.00 PHF Volume: 0 0 0 22 0 17 5 542 0 0 756 31 Reduct Vol: 0 0 0 0 0 0 0 0 0 0 0 0 FinalVolume: 0 0 0 22 0 17 5 542 0 0 756 31 ------------|---------------||---------------||---------------||---------------| Critical Gap Module: Critical Gp:xxxxx xxxx xxxxx 6.8 6.5 6.9 4.1 xxxx xxxxx xxxxx xxxx xxxxx FollowUpTim:xxxxx xxxx xxxxx 3.5 4.0 3.3 2.2 xxxx xxxxx xxxxx xxxx xxxxx ------------|---------------||---------------||---------------||---------------| Capacity Module: Cnflict Vol: xxxx xxxx xxxxx 1037 1308 378 787 xxxx xxxxx xxxx xxxx xxxxx Potent Cap.: xxxx xxxx xxxxx 230 161 625 841 xxxx xxxxx xxxx xxxx xxxxx Move Cap.: xxxx xxxx xxxxx 229 160 625 841 xxxx xxxxx xxxx xxxx xxxxx Volume/Cap: xxxx xxxx xxxx 0.10 0.00 0.03 0.01 xxxx xxxx xxxx xxxx xxxx ------------|---------------||---------------||---------------||---------------| Level Of Service Module: 2Way95thQ: xxxx xxxx xxxxx xxxx xxxx xxxxx 0.0 xxxx xxxxx xxxx xxxx xxxxx Control Del:xxxxx xxxx xxxxx xxxxx xxxx xxxxx 9.3 xxxx xxxxx xxxxx xxxx xxxxx LOS by Move: * * * * * * A * * * * * Movement: LT - LTR - RT LT - LTR - RT LT - LTR - RT LT - LTR - RT Shared Cap.: xxxx xxxx xxxxx xxxx 317 xxxxx xxxx xxxx xxxxx xxxx xxxx xxxxx SharedQueue:xxxxx xxxx xxxxx xxxxx 0.4 xxxxx xxxxx xxxx xxxxx xxxxx xxxx xxxxx Shrd ConDel:xxxxx xxxx xxxxx xxxxx 18.0 xxxxx xxxxx xxxx xxxxx xxxxx xxxx xxxxx Shared LOS: * * * * C * * * * * * * ApproachDel: xxxxxx 18.0 xxxxxx xxxxxx ApproachLOS: * C * * Note: Queue reported is the number of cars per lane.

COMPARE Wed Oct 05 10:42:49 2011 Page 3-26
Traffix 8.0.0715 Copyright (c) 2008 Dowling Associates, Inc. Licensed to FEHR & PEERS WALNUT CRK
San Jose City College
SJ07-951 Level Of Service Computation Report
2000 HCM Unsignalized (Future Volume Alternative) Cumulative PM
Intersection #13: Sherman Oaks/Fruitdale [Unsignalized] Signal=Stop/Rights=Include Final Vol: 17 0 22 Lanes: 0 0 1! 0 0
Signal=Uncontrol
Signal=Uncontrol
Final Vol: Lanes: Rights=Include Vol Cnt Date: n/a Rights=Include Lanes: Final Vol:
5
1 Cycle Time (sec): 100
1
31
0
Loss Time (sec): 0
0
551 2
Critical V/C: 0.100
2 779
0
Avg Crit Del (sec/veh): 0.5
0
0 0
Avg Delay (sec/veh): 0.5
0 0
LOS: C
Lanes: 0 0 0 0 0 Final Vol: 0 0 0 Signal=Stop/Rights=Include Street Name: Sherman Oaks Fruitdale Approach: North Bound South Bound East Bound West Bound Movement: L - T - R L - T - R L - T - R L - T - R ------------|---------------||---------------||---------------||---------------| Volume Module: Base Vol: 0 0 0 22 0 17 5 491 0 0 714 31 Growth Adj: 1.00 1.00 1.00 1.00 1.00 1.00 1.00 1.00 1.00 1.00 1.00 1.00 Initial Bse: 0 0 0 22 0 17 5 491 0 0 714 31 Added Vol: 0 0 0 0 0 0 0 9 0 0 23 0 Cuml: 0 0 0 0 0 0 0 51 0 0 42 0 Initial Fut: 0 0 0 22 0 17 5 551 0 0 779 31 User Adj: 1.00 1.00 1.00 1.00 1.00 1.00 1.00 1.00 1.00 1.00 1.00 1.00 PHF Adj: 1.00 1.00 1.00 1.00 1.00 1.00 1.00 1.00 1.00 1.00 1.00 1.00 PHF Volume: 0 0 0 22 0 17 5 551 0 0 779 31 Reduct Vol: 0 0 0 0 0 0 0 0 0 0 0 0 FinalVolume: 0 0 0 22 0 17 5 551 0 0 779 31 ------------|---------------||---------------||---------------||---------------| Critical Gap Module: Critical Gp:xxxxx xxxx xxxxx 6.8 6.5 6.9 4.1 xxxx xxxxx xxxxx xxxx xxxxx FollowUpTim:xxxxx xxxx xxxxx 3.5 4.0 3.3 2.2 xxxx xxxxx xxxxx xxxx xxxxx ------------|---------------||---------------||---------------||---------------| Capacity Module: Cnflict Vol: xxxx xxxx xxxxx 1065 1340 390 810 xxxx xxxxx xxxx xxxx xxxxx Potent Cap.: xxxx xxxx xxxxx 221 154 615 825 xxxx xxxxx xxxx xxxx xxxxx Move Cap.: xxxx xxxx xxxxx 220 153 615 825 xxxx xxxxx xxxx xxxx xxxxx Volume/Cap: xxxx xxxx xxxx 0.10 0.00 0.03 0.01 xxxx xxxx xxxx xxxx xxxx ------------|---------------||---------------||---------------||---------------| Level Of Service Module: 2Way95thQ: xxxx xxxx xxxxx xxxx xxxx xxxxx 0.0 xxxx xxxxx xxxx xxxx xxxxx Control Del:xxxxx xxxx xxxxx xxxxx xxxx xxxxx 9.4 xxxx xxxxx xxxxx xxxx xxxxx LOS by Move: * * * * * * A * * * * * Movement: LT - LTR - RT LT - LTR - RT LT - LTR - RT LT - LTR - RT Shared Cap.: xxxx xxxx xxxxx xxxx 306 xxxxx xxxx xxxx xxxxx xxxx xxxx xxxxx SharedQueue:xxxxx xxxx xxxxx xxxxx 0.4 xxxxx xxxxx xxxx xxxxx xxxxx xxxx xxxxx Shrd ConDel:xxxxx xxxx xxxxx xxxxx 18.5 xxxxx xxxxx xxxx xxxxx xxxxx xxxx xxxxx Shared LOS: * * * * C * * * * * * * ApproachDel: xxxxxx 18.5 xxxxxx xxxxxx ApproachLOS: * C * * Note: Queue reported is the number of cars per lane.

COMPARE Wed Oct 05 10:42:49 2011 Page 3-27
Traffix 8.0.0715 Copyright (c) 2008 Dowling Associates, Inc. Licensed to FEHR & PEERS WALNUT CRK
San Jose City College
SJ07-951 Level Of Service Computation Report
2000 HCM Operations (Future Volume Alternative) Cuml No Proj PM
Intersection #14: Leigh/Fruitdale Signal=Protect/Rights=Include Final Vol: 290 429*** 89 Lanes: 0 1 1 0 1
Signal=Protect
Signal=Protect
Final Vol: Lanes: Rights=Include Vol Cnt Date: n/a Rights=Include Lanes: Final Vol:
108***
1 Cycle Time (sec): 105
1
36
0
Loss Time (sec): 12
0
385 2
Critical V/C: 0.469
2 435***
0
Avg Crit Del (sec/veh): 29.5
0
80 1
Avg Delay (sec/veh): 30.9
1 22
LOS: C
Lanes: 1 0 1 1 0 Final Vol: 79*** 135 18 Signal=Protect/Rights=Include Street Name: Leigh Fruitdale Approach: North Bound South Bound East Bound West Bound Movement: L - T - R L - T - R L - T - R L - T - R ------------|---------------||---------------||---------------||---------------| Min. Green: 7 10 10 7 10 10 7 10 10 7 10 10 Y+R: 4.0 4.0 4.0 4.0 4.0 4.0 4.0 4.0 4.0 4.0 4.0 4.0 ------------|---------------||---------------||---------------||---------------| Volume Module: Base Vol: 73 128 16 86 420 288 105 344 71 21 400 32 Growth Adj: 1.00 1.00 1.00 1.00 1.00 1.00 1.00 1.00 1.00 1.00 1.00 1.00 Initial Bse: 73 128 16 86 420 288 105 344 71 21 400 32 Added Vol: 0 0 0 0 0 0 0 0 0 0 0 0 Cuml: 6 7 2 3 9 2 3 41 9 1 35 4 Initial Fut: 79 135 18 89 429 290 108 385 80 22 435 36 User Adj: 1.00 1.00 1.00 1.00 1.00 1.00 1.00 1.00 1.00 1.00 1.00 1.00 PHF Adj: 1.00 1.00 1.00 1.00 1.00 1.00 1.00 1.00 1.00 1.00 1.00 1.00 PHF Volume: 79 135 18 89 429 290 108 385 80 22 435 36 Reduct Vol: 0 0 0 0 0 0 0 0 0 0 0 0 Reduced Vol: 79 135 18 89 429 290 108 385 80 22 435 36 PCE Adj: 1.00 1.00 1.00 1.00 1.00 1.00 1.00 1.00 1.00 1.00 1.00 1.00 MLF Adj: 1.00 1.00 1.00 1.00 1.00 1.00 1.00 1.00 1.00 1.00 1.00 1.00 FinalVolume: 79 135 18 89 429 290 108 385 80 22 435 36 ------------|---------------||---------------||---------------||---------------| Saturation Flow Module: Sat/Lane: 1900 1900 1900 1900 1900 1900 1900 1900 1900 1900 1900 1900 Adjustment: 0.92 0.98 0.95 0.92 0.99 0.95 0.92 1.00 0.92 0.92 1.00 0.92 Lanes: 1.00 1.76 0.24 1.00 1.17 0.83 1.00 2.00 1.00 1.00 2.00 1.00 Final Sat.: 1750 3264 435 1750 2207 1492 1750 3800 1750 1750 3800 1750 ------------|---------------||---------------||---------------||---------------| Capacity Analysis Module: Vol/Sat: 0.05 0.04 0.04 0.05 0.19 0.19 0.06 0.10 0.05 0.01 0.11 0.02 Crit Moves: **** **** **** **** Green Time: 10.1 31.5 31.5 22.1 43.5 43.5 13.8 23.8 23.8 15.6 25.6 25.6 Volume/Cap: 0.47 0.14 0.14 0.24 0.47 0.47 0.47 0.45 0.20 0.08 0.47 0.08 Delay/Veh: 47.0 26.9 26.9 34.9 22.6 22.6 43.7 35.3 33.2 38.6 34.3 30.7 User DelAdj: 1.00 1.00 1.00 1.00 1.00 1.00 1.00 1.00 1.00 1.00 1.00 1.00 AdjDel/Veh: 47.0 26.9 26.9 34.9 22.6 22.6 43.7 35.3 33.2 38.6 34.3 30.7 LOS by Move: D C C C- C+ C+ D D+ C- D+ C- C HCM2kAvgQ: 3 2 2 2 8 8 3 5 2 1 6 1 Note: Queue reported is the number of cars per lane.

COMPARE Wed Oct 05 10:42:49 2011 Page 3-28
Traffix 8.0.0715 Copyright (c) 2008 Dowling Associates, Inc. Licensed to FEHR & PEERS WALNUT CRK
San Jose City College
SJ07-951 Level Of Service Computation Report
2000 HCM Operations (Future Volume Alternative) Cumulative PM
Intersection #14: Leigh/Fruitdale Signal=Protect/Rights=Include Final Vol: 291 432*** 92 Lanes: 0 1 1 0 1
Signal=Protect
Signal=Protect
Final Vol: Lanes: Rights=Include Vol Cnt Date: n/a Rights=Include Lanes: Final Vol:
108***
1 Cycle Time (sec): 105
1
39
0
Loss Time (sec): 12
0
391 2
Critical V/C: 0.481
2 449***
0
Avg Crit Del (sec/veh): 30.0
0
83 1
Avg Delay (sec/veh): 31.2
1 22
LOS: C
Lanes: 1 0 1 1 0 Final Vol: 88*** 138 18 Signal=Protect/Rights=Include Street Name: Leigh Fruitdale Approach: North Bound South Bound East Bound West Bound Movement: L - T - R L - T - R L - T - R L - T - R ------------|---------------||---------------||---------------||---------------| Min. Green: 7 10 10 7 10 10 7 10 10 7 10 10 Y+R: 4.0 4.0 4.0 4.0 4.0 4.0 4.0 4.0 4.0 4.0 4.0 4.0 ------------|---------------||---------------||---------------||---------------| Volume Module: Base Vol: 73 128 16 86 420 288 105 344 71 21 400 32 Growth Adj: 1.00 1.00 1.00 1.00 1.00 1.00 1.00 1.00 1.00 1.00 1.00 1.00 Initial Bse: 73 128 16 86 420 288 105 344 71 21 400 32 Added Vol: 9 3 0 3 3 1 0 6 3 0 14 3 Cuml: 6 7 2 3 9 2 3 41 9 1 35 4 Initial Fut: 88 138 18 92 432 291 108 391 83 22 449 39 User Adj: 1.00 1.00 1.00 1.00 1.00 1.00 1.00 1.00 1.00 1.00 1.00 1.00 PHF Adj: 1.00 1.00 1.00 1.00 1.00 1.00 1.00 1.00 1.00 1.00 1.00 1.00 PHF Volume: 88 138 18 92 432 291 108 391 83 22 449 39 Reduct Vol: 0 0 0 0 0 0 0 0 0 0 0 0 Reduced Vol: 88 138 18 92 432 291 108 391 83 22 449 39 PCE Adj: 1.00 1.00 1.00 1.00 1.00 1.00 1.00 1.00 1.00 1.00 1.00 1.00 MLF Adj: 1.00 1.00 1.00 1.00 1.00 1.00 1.00 1.00 1.00 1.00 1.00 1.00 FinalVolume: 88 138 18 92 432 291 108 391 83 22 449 39 ------------|---------------||---------------||---------------||---------------| Saturation Flow Module: Sat/Lane: 1900 1900 1900 1900 1900 1900 1900 1900 1900 1900 1900 1900 Adjustment: 0.92 0.98 0.95 0.92 0.99 0.95 0.92 1.00 0.92 0.92 1.00 0.92 Lanes: 1.00 1.76 0.24 1.00 1.17 0.83 1.00 2.00 1.00 1.00 2.00 1.00 Final Sat.: 1750 3273 427 1750 2210 1488 1750 3800 1750 1750 3800 1750 ------------|---------------||---------------||---------------||---------------| Capacity Analysis Module: Vol/Sat: 0.05 0.04 0.04 0.05 0.20 0.20 0.06 0.10 0.05 0.01 0.12 0.02 Crit Moves: **** **** **** **** Green Time: 11.0 31.6 31.6 22.1 42.7 42.7 13.5 23.8 23.8 15.5 25.8 25.8 Volume/Cap: 0.48 0.14 0.14 0.25 0.48 0.48 0.48 0.45 0.21 0.09 0.48 0.09 Delay/Veh: 46.3 26.9 26.9 34.9 23.2 23.2 44.1 35.3 33.2 38.8 34.3 30.6 User DelAdj: 1.00 1.00 1.00 1.00 1.00 1.00 1.00 1.00 1.00 1.00 1.00 1.00 AdjDel/Veh: 46.3 26.9 26.9 34.9 23.2 23.2 44.1 35.3 33.2 38.8 34.3 30.6 LOS by Move: D C C C- C C D D+ C- D+ C- C HCM2kAvgQ: 3 2 2 3 9 9 3 5 2 1 6 1 Note: Queue reported is the number of cars per lane.

COMPARE Wed Oct 05 10:42:49 2011 Page 3-29
Traffix 8.0.0715 Copyright (c) 2008 Dowling Associates, Inc. Licensed to FEHR & PEERS WALNUT CRK
San Jose City College
SJ07-951 Level Of Service Computation Report
2000 HCM Operations (Future Volume Alternative) Cuml No Proj PM
Intersection #15: Southwest Expwy/Fruitdale Signal=Protect/Rights=Include Final Vol: 209 761 320*** Lanes: 1 0 2 0 2
Signal=Split
Signal=Split
Final Vol: Lanes: Rights=Include Vol Cnt Date: n/a Rights=Include Lanes: Final Vol:
162***
1 Cycle Time (sec): 105
1
113
0
Loss Time (sec): 12
0
317 1
Critical V/C: 0.550
2 231
1
Avg Crit Del (sec/veh): 32.1
0
10 0
Avg Delay (sec/veh): 30.1
1 132***
LOS: C
Lanes: 1 0 2 0 1 Final Vol: 10 827*** 170 Signal=Protect/Rights=Include Street Name: Southwest Expwy Fruitdale Approach: North Bound South Bound East Bound West Bound Movement: L - T - R L - T - R L - T - R L - T - R ------------|---------------||---------------||---------------||---------------| Min. Green: 7 10 10 7 10 10 10 10 10 10 10 10 Y+R: 4.0 4.0 4.0 4.0 4.0 4.0 4.0 4.0 4.0 4.0 4.0 4.0 ------------|---------------||---------------||---------------||---------------| Volume Module: Base Vol: 10 473 100 158 589 207 160 277 8 70 195 37 Growth Adj: 1.00 1.00 1.00 1.00 1.00 1.00 1.00 1.00 1.00 1.00 1.00 1.00 Initial Bse: 10 473 100 158 589 207 160 277 8 70 195 37 Added Vol: 0 0 0 0 0 0 0 0 0 0 0 0 Cuml: 0 354 70 162 172 2 2 40 2 62 36 76 Initial Fut: 10 827 170 320 761 209 162 317 10 132 231 113 User Adj: 1.00 1.00 1.00 1.00 1.00 1.00 1.00 1.00 1.00 1.00 1.00 1.00 PHF Adj: 1.00 1.00 1.00 1.00 1.00 1.00 1.00 1.00 1.00 1.00 1.00 1.00 PHF Volume: 10 827 170 320 761 209 162 317 10 132 231 113 Reduct Vol: 0 0 0 0 0 0 0 0 0 0 0 0 Reduced Vol: 10 827 170 320 761 209 162 317 10 132 231 113 PCE Adj: 1.00 1.00 1.00 1.00 1.00 1.00 1.00 1.00 1.00 1.00 1.00 1.00 MLF Adj: 1.00 1.00 1.00 1.00 1.00 1.00 1.00 1.00 1.00 1.00 1.00 1.00 FinalVolume: 10 827 170 320 761 209 162 317 10 132 231 113 ------------|---------------||---------------||---------------||---------------| Saturation Flow Module: Sat/Lane: 1900 1900 1900 1900 1900 1900 1900 1900 1900 1900 1900 1900 Adjustment: 0.92 1.00 0.92 0.83 1.00 0.92 0.92 0.97 0.95 0.92 1.00 0.92 Lanes: 1.00 2.00 1.00 2.00 2.00 1.00 1.00 1.94 0.06 1.00 2.00 1.00 Final Sat.: 1750 3800 1750 3150 3800 1750 1750 3587 113 1750 3800 1750 ------------|---------------||---------------||---------------||---------------| Capacity Analysis Module: Vol/Sat: 0.01 0.22 0.10 0.10 0.20 0.12 0.09 0.09 0.09 0.08 0.06 0.06 Crit Moves: **** **** **** **** Green Time: 15.2 41.5 41.5 19.4 45.7 45.7 17.7 17.7 17.7 14.4 14.4 14.4 Volume/Cap: 0.04 0.55 0.25 0.55 0.46 0.27 0.55 0.53 0.53 0.55 0.44 0.47 Delay/Veh: 38.7 24.9 21.4 40.0 21.1 19.2 42.2 40.7 40.7 45.0 42.2 43.2 User DelAdj: 1.00 1.00 1.00 1.00 1.00 1.00 1.00 1.00 1.00 1.00 1.00 1.00 AdjDel/Veh: 38.7 24.9 21.4 40.0 21.1 19.2 42.2 40.7 40.7 45.0 42.2 43.2 LOS by Move: D+ C C+ D C+ B- D D D D D D HCM2kAvgQ: 0 11 4 6 9 5 5 5 5 5 4 4 Note: Queue reported is the number of cars per lane.

COMPARE Wed Oct 05 10:42:49 2011 Page 3-30
Traffix 8.0.0715 Copyright (c) 2008 Dowling Associates, Inc. Licensed to FEHR & PEERS WALNUT CRK
San Jose City College
SJ07-951 Level Of Service Computation Report
2000 HCM Operations (Future Volume Alternative) Cumulative PM
Intersection #15: Southwest Expwy/Fruitdale Signal=Protect/Rights=Include Final Vol: 214 761 320*** Lanes: 1 0 2 0 2
Signal=Split
Signal=Split
Final Vol: Lanes: Rights=Include Vol Cnt Date: n/a Rights=Include Lanes: Final Vol:
165***
1 Cycle Time (sec): 105
1
113
0
Loss Time (sec): 12
0
323 1
Critical V/C: 0.552
2 243
1
Avg Crit Del (sec/veh): 32.2
0
10 0
Avg Delay (sec/veh): 30.3
1 132***
LOS: C
Lanes: 1 0 2 0 1 Final Vol: 10 827*** 170 Signal=Protect/Rights=Include Street Name: Southwest Expwy Fruitdale Approach: North Bound South Bound East Bound West Bound Movement: L - T - R L - T - R L - T - R L - T - R ------------|---------------||---------------||---------------||---------------| Min. Green: 7 10 10 7 10 10 10 10 10 10 10 10 Y+R: 4.0 4.0 4.0 4.0 4.0 4.0 4.0 4.0 4.0 4.0 4.0 4.0 ------------|---------------||---------------||---------------||---------------| Volume Module: Base Vol: 10 473 100 158 589 207 160 277 8 70 195 37 Growth Adj: 1.00 1.00 1.00 1.00 1.00 1.00 1.00 1.00 1.00 1.00 1.00 1.00 Initial Bse: 10 473 100 158 589 207 160 277 8 70 195 37 Added Vol: 0 0 0 0 0 5 3 6 0 0 12 0 Cuml: 0 354 70 162 172 2 2 40 2 62 36 76 Initial Fut: 10 827 170 320 761 214 165 323 10 132 243 113 User Adj: 1.00 1.00 1.00 1.00 1.00 1.00 1.00 1.00 1.00 1.00 1.00 1.00 PHF Adj: 1.00 1.00 1.00 1.00 1.00 1.00 1.00 1.00 1.00 1.00 1.00 1.00 PHF Volume: 10 827 170 320 761 214 165 323 10 132 243 113 Reduct Vol: 0 0 0 0 0 0 0 0 0 0 0 0 Reduced Vol: 10 827 170 320 761 214 165 323 10 132 243 113 PCE Adj: 1.00 1.00 1.00 1.00 1.00 1.00 1.00 1.00 1.00 1.00 1.00 1.00 MLF Adj: 1.00 1.00 1.00 1.00 1.00 1.00 1.00 1.00 1.00 1.00 1.00 1.00 FinalVolume: 10 827 170 320 761 214 165 323 10 132 243 113 ------------|---------------||---------------||---------------||---------------| Saturation Flow Module: Sat/Lane: 1900 1900 1900 1900 1900 1900 1900 1900 1900 1900 1900 1900 Adjustment: 0.92 1.00 0.92 0.83 1.00 0.92 0.92 0.97 0.95 0.92 1.00 0.92 Lanes: 1.00 2.00 1.00 2.00 2.00 1.00 1.00 1.94 0.06 1.00 2.00 1.00 Final Sat.: 1750 3800 1750 3150 3800 1750 1750 3589 111 1750 3800 1750 ------------|---------------||---------------||---------------||---------------| Capacity Analysis Module: Vol/Sat: 0.01 0.22 0.10 0.10 0.20 0.12 0.09 0.09 0.09 0.08 0.06 0.06 Crit Moves: **** **** **** **** Green Time: 15.2 41.4 41.4 19.3 45.6 45.6 17.9 17.9 17.9 14.3 14.3 14.3 Volume/Cap: 0.04 0.55 0.25 0.55 0.46 0.28 0.55 0.53 0.53 0.55 0.47 0.47 Delay/Veh: 38.7 25.1 21.5 40.1 21.2 19.4 42.1 40.5 40.5 45.1 42.5 43.3 User DelAdj: 1.00 1.00 1.00 1.00 1.00 1.00 1.00 1.00 1.00 1.00 1.00 1.00 AdjDel/Veh: 38.7 25.1 21.5 40.1 21.2 19.4 42.1 40.5 40.5 45.1 42.5 43.3 LOS by Move: D+ C C+ D C+ B- D D D D D D HCM2kAvgQ: 0 11 4 6 9 5 5 5 5 5 4 4 Note: Queue reported is the number of cars per lane.

APPENDIX C: APPROVED & PENDING PROJECTS

Total TotalApproved
1 H06-027 N/S OF STEVENS CREEK BLVD BETW WINCHESTER BLVD AND MONROE ST 490000 Commercial Commercial 392 17642 NSJ NORTH SAN JOSE PHASE 1 - 12.5M SF R&D, 6000 RES UNITS R/D / Residential 0 03 PDC00-08-068 FRUITDALE AVE & SOUTHWEST EXPWY (SE/C) 500 SFA, 40KSF RETAIL, 250KSF OFFICE Retail / Office 960 10784 PDC02-046 DELMAS & SAN FERNANDO 325 Residential / 1.04M SF Mixed Use 1323 13955 PDC02-102 SAN CARLOS ST AND BUENA VISTA AV (NE/C) 100 SENIOR / 32 SFA / 4,000 SF RETAIL Retail / Residential 86 1206 PDC89-09-121 LABARBERA & SOUTHWEST EXP (SE/C) 95 SFA Residential 0 07 PDC97-06-036 STEVENS CREEK & WINCHESTER (SE/C) 1600 units / 695 ksf commercial Commercial / Residential 723 1346
Pending1 PDC07-017 n/w corner San Carlos & Lincoln 47 SF attached Res. Residential Condo / Townhouse 21 242 PDC07-043 north end of S. Baywood Ave 104 SF attached Res. Residential Condo / Townhouse 46 543 PDC07-083 s/e corner Southwest & Leigh 64 MF Res. Apartment 33 404 PDC07-096 s/w corner San Carlos & Meridian 218 SF attached Res. Residential Condo / Townhouse 96 1135 PDC08-061 s/w corner San Carlos & Sunol 825 MF Res. Apartment 421 512
50 ksf Commercial Shopping Center 52 1886 PT06-078 n/w corner San Carlos & Meridian 84 SF attached Res. Residential Condo / Townhouse 37 447 PT07-036 n/e corner Park & Sunol 122 mixed-use Condos Residential Condo / Townhouse 54 63
S Monroe and Tisch 104 townhomes Residential Condo / Townhouse 46 5490 ksf office Office 140 134825 multi-family res Apartment 421 51250 ksf Commercial Shopping Center 52 188
DescriptionAM
Land Use
SW Corner of W San Carlos and Sunol
Approved and Cumulative ProjectsTrip Generation Estimates
PM ProjectNo. Location


![[Updated Constantly] - ITExamAnswers.net](https://static.fdokumen.com/doc/165x107/631602506ebca169bd0b61e0/updated-constantly-itexamanswersnet.jpg)