samoa_efa_mda_report.pdf - Planipolis
155
-
Upload
khangminh22 -
Category
Documents
-
view
1 -
download
0
Transcript of samoa_efa_mda_report.pdf - Planipolis


1
Table of Contents
Message – Minister for Education, Sports and Culture 3
Foreword – CEO for the Ministry of Education, Sports and Culture 4
Abbreviations 5 List of Indicators 7 List of Figures 12 Parts
Part 1: Introduction 16 1.1: Background 16 1.2: Objective 18 1.3: Methodology 18 1.4: Acknowledgements 18
Part 2: Executive Summary 19 Part 3: Country Profile 22
3.1: Location and Environment 22 3.2: Population 22 3.3: Historical 23 3.4: Political System 23 3.5: Religion and Culture 24 3.6: General Overview of Level of Development 24 3.7: The Role of Education in the Context of National
Development 29
3.8: Disadvantaged Groups in Samoa 30
Part 4: Educational Development 31 4.1: Trends in Educational Development 31 4.2: Educational Policy, Laws, and Legislation 40
Part 5: Analysis of Six EFA Goals 43 5.1: Early Childhood Care and Education 43 5.2: Achieving Universal Primary Education 53 5.3: Life Skills and Lifelong Learning 64 5.4: Literacy 92 5.5: Gender Parity and Equality 98 5.6: Quality Education 109

- 2 -
Part 6: Managing International Support and Coordination of EFA Partners
142
6.1: Indirect 142 6.2: Direct 142
Part 7: Conclusion and Policy Recommendations 144
References 149 EFA Task Force Members 153

- 3 -
Message from the Minister of Education, Sports and Culture
In 2001, the Government of Samoa (GoS) endorsed its Education for All (EFA) Action Plan. This was a direct result of Samoa’s commitment to the ‘Dakar Framework for Action’, sanctioned in the World Education Forum at Dakar, Senegal in 2000. The Framework was developed as a collective commitment to action, urging Governments to establish broad-based partnerships with the civil society, to give EFA the utmost political support. Prior to this, the GoS had already been implementing its reform program by advocating education improvement via its Statements of Economic Strategy (currently known as the Strategy for the Development of Samoa (SDS)) which started in 1996. Education was then and still is a significant priority for development in this document. This is evident in the current SDS 2005 – 2007 with the theme “enhancing people’s choices”. The six focal areas on educational development that incorporates EFA targets for these three years are:
• Strengthening community support in education; • Improving teacher quality; • Improving curriculum and assessment practices; • Improving teaching materials; • Improving school facilities and equipment; and, • Strengthening the Ministry of Education.
In the context of the EFA initiative, the Ministers of Education in the Pacific developed their Forum Basic Education Action Plan (FBEAP) in 2001. In September 2006, the Ministers agreed that their national FBEAP review be undertaken simultaneously with the EFA Mid-Decade Assessment. The preparation of this report involved a wide consultation with all stakeholders who share an interest in the development of education in Samoa. Therefore, I hereby present this report to you on the progress of Samoa’s achievement towards the six World EFA goals, as well as where we are with the FBEAP objectives since 2001. It is highly anticipated that the support and cooperation from all citizens will steer Samoa to fulfill its educational needs by 2015. Hon. To’omata Alapati Po’ese To’omata MINISTER OF EDUCATION, SPORTS and CULTURE

- 4 -
Foreword Samoa’s National Action Plan on Education for All (EFA) was developed through an intensive consultation process spearheaded by the selected National Forum for EFA. The Forum consists of 13 members representing Government ministries, non-government organisations, mission and private institutions, early childhood, special needs, tertiary, technical and vocational institutions and the media. The Action Plan was based on achievements and shortfalls in the provision of education since the World Declaration on EFA in Jomtien, Thailand in 1990. The pledge in 1990 aimed to work towards providing “education for every child and a massive reduction in adult illiteracy”. In addition the framework “to meet basic learning needs” was also approved which detailed targets and strategies to achieve this goal by 2000. Samoa participated and practiced various programs, namely the Pacific’s initiative called the Basic Education for Life Skills (BELS). The BELS program started in 1993 and completed in 2000. The same year, Samoa reviewed its progress and reported in its ‘EFA Assessment Country Report’. The report highlighted achievements and pin-pointed problem areas and unreached groups. More imperatively, it served as a model for future action. As a result, EFA 2000 Assessment Country Reports became the basis for the re-affirmation of the World Declaration on EFA at the World Education Forum (WEF) at Dakar, Senegal in 2000. Its perception:
• education being a fundamental human right; and, • that the basic learning needs of all, can, and must be met.
The WEF reviewed its plan on EFA and formulated six World Goals from the country assessments to be achieved by 2015. The WEF also agreed that all member countries produce National Plans to address the six goals.
We have incorporated the EFA goals and our national activities into the Ministry of Education, Sports and Culture Strategic Policies and Plan (SPP) for 2006 – 2015, and Corporate Plan for 2006 – 2009. The Ministry’s former SPP (Education Policies and Strategies 1995 – 2005) was a ten-year plan, however the current SPP was intentionally changed to nine years not only to suit the three-year Corporate Plan cycle, but more importantly to fall in line with the EFA deadline. This report depicts Samoa’s progress on EFA and FBEAP. Therefore, we strongly believe that this report will be the basis of future planning and decision making for the provision of educational development, in faith that EFA and FBEAP Goals are met by 2015. Tautāpilimai Levaopolo Tupae Esera CHIEF EXECUTIVE OFFICER MINISTRY OF EDUCATION, SPORTS AND CULTURE

- 5 -
Abbreviations
Denotes EFA and/or FBEAP indicator
ADB Asian Development Bank AIGA Augmenting Institution for General Attainment AusAID Australian Agency for International Development BELS Basic Education Life Skills CCCS Congregational Christian Church of Samoa CEDAW Convention for the Elimination of Discrimination Against Women CMAD Curriculum Materials and Assessment Division CRC Convention for the Rights of the Child DESD Decade of Education for Sustainable Development DoE Department of Education DPT3 Diphtheria, pertussis, tetanus ECE Early Childhood Education EFA Education for All ESD Education for Sustainable Development ESP Education Sector Project EU European Union FBEAP Forum Basic Education Action Plan FoE Faculty of Education FY Financial year GDI Gender Development Index GDP Gross Domestic Product GER Gross Enrolment Ratio GoS Government of Samoa GPI Gender Parity Index HDI Human Development Index HIV/AIDS Human Immune Virus / Acquired Immunity Deficiency Syndrome IA Internal Assessment ICT Information and Communications Technology IE Inclusive Education IOT Institute of Technology ISP Institutional Strengthening Project JICA Japanese International Cooperation Agency MDG Millennium Development Goal MESC Ministry of Education, Sports and Culture METI Matuaileo’o Environmental Trust Incorporated MOF Ministry of Finance MOH Ministry of Health MWCSD Ministry of Women, Community and Social Development NCECES National Council for Early Childhood Education in Samoa, Inc. NCPF National Curriculum Policy Framework NFE Non-Formal Education NGO Non-Government Organisation NTDF National Teachers Development Framework NUS National University of Samoa NZAID New Zealand Agency for International Development PEMP Primary Education Materials Project

- 6 -
PPRD Policy, Planning and Research Division PRIDE Pacific Region Initiative for the Delivery of Basic Education PSC Public Service Commission PSET Post School Education and Training PSSC Pacific Senior School Certificate PTA Parents and Teachers Association SAT Samoan Tala SATVETI Samoa Association of Technical and Vocational Education and Training
Institutions SBEC Small Business Enterprise Centre SDS Strategy for the Development of Samoa SNE Special Needs Education SNEAC Special Needs Education Advisory Committee SPBEA South Pacific Board for Educational Assessment SPELL Samoa Primary Education Literacy Level SPP Strategic Policies and Plan SQA Samoa Qualifications Authority SRO School Review Officer SSECRP Samoa Secondary Education Curriculum and Resource Project STI Sexually Transmitted Infection TALAVOU Towards a Legacy of Achievement, Versatility and Opportunity through
Unity TVET Technical and Vocational Education and Training UNDP United Nations Development Programme UNESCO United Nations Educational, Scientific and Cultural Organisation UNICEF United Nations Children’s Fund USP University of the South Pacific WHO World Health Organisation

- 7 -
List of Indicators ( )
5.1: Early Childhood Care and Education
Existence of ECE policy
46
Gross Enrolment Ratio (GER) for ECE
48
Under five mortality
49
Proportion of 1-year old children immunised against DPT3, Polio, Measles, Hepatitis, and other vaccines
49
Quality of ECE
50
5.2: Achieving Universal Primary Education
Gross Intake Rate (GIR) in primary education
55
Net Intake Rate (NIR) in primary education
55
Percentage of late and early starters
56
Percentage of unadmitted children of official admission age
56
Gross Enrolment Rate (GER) of primary education
56
Net Enrolment Rate (NER) in primary education
56
Repetition rates in primary education
57
Promotion rate in primary education
58
Survival rate to Year 8
58
Graduation rate from primary education
59
Transition rate to secondary education
59
Inclusive education policy
61
Inclusive education in practice
61
Compulsory and free education for children with disabilities
63
Regional training and curriculum development
63
Percentage of trained teachers
63
Teacher training and qualifications
63
Physical facilities and equipment 64

- 8 -
Teacher and learning materials
64
5.3: Life Skills and Lifelong Learning
Benchmark for literacy and numeracy at Year 6
65
Role of civil societies in the provision and delivery of basic education
66
Psycho-social skills – Curriculum
67
Psycho-social skills – Benchmarks at Year 8
68
Psycho-social skills – Life skills programmes
68
Incidence of reported violence in schools
68
Existence of school committees
69
Existence of parent and teacher associations
70
Provision of school counseling services
70
Youth unemployment rate
70
Availability of TVET in the formal school system of country
72
TVET addressed in national strategic plan and education policies
73
Existence of nationally certified TVET institutions
73
TVET enrolments
73
TVET graduates
74
Types of TVET programmes
74
Enrolments in tertiary studies
76
Graduates from tertiary studies
76
NFE is an important strategy for development
77
Children’s understanding of traditional national culture and identities
79
National events and celebrations
80
Existence of a national ICT policy on education
81
Percentage of total Government expenditure on ICT in education
81
Percentage of total Government expenditure on teacher training programmes in ICT
81

- 9 -
Access to ICT
82
Computer access
83
Internet access
83
Quality of ICT in education
83
HIV/AIDS and STI rates
84
Existence of awareness programmes for children and young peoples on HIV/AIDS
85
Incidence of substance abuse among young people
86
Percentage of smokers under 18 years
86
Incidence of diabetes
86
Inclusion of health related issues in the curriculum
87
Health promoting schools
88
Existence of extra-curricular activities
89
Curriculum includes aspects of human rights, good governance, enhancement of Pacific Heritages, participation in the global community, and safety and well-being
89
Education for governance through NFE
90
Representation of formal and non-formal providers of basic education on national curriculum advisory bodies
90
Integration of ESD in national education strategic plan
91
Curriculum incorporates ESD and indigenous culture
91
5.4: Literacy
Youth literacy rates (age 15 to 24)
93
Adult literacy rate (age 15 and above)
93
Ratio of literate female to males (age 15 to 24)
93
5.5: Gender Parity and Equality
Country Gender Development Index (GDI)
99
Literacy Gender Parity Index (GPI)
100
GPI for GIR in primary education 100

- 10 -
GPI for NIR in primary education
100
Ratio of girls to boys in primary education
101
GPI for GER in primary education
101
GPI for NER in primary education
102
Ratio of girls to boys in secondary
102
GPI for GER in secondary education
103
GPI for NER in secondary education
103
Ratio of girls to boys in tertiary
104
GPI for repetition rates
105
GPI for survival rate to Year 8
105
GPI for transition rates
106
Percent of female/male teachers
106
Gender qualitative indicators
107
5.6: Quality Education
Percentage of total Government national budget for education sector
110
Public current expenditure on education sector as a percentage of GDP
110
Public current expenditure on ECE, primary, secondary and SNE as percentage of total public expenditure on education
114
Public current expenditure on ECE, primary and secondary per pupil as percentage of GDP per capita
114
Percentage of education budget devoted to non-salary expenses, FY2001/02 – 2006/07
115
Public expenditure on TVET
115
Ratio of private sector investments to formal institutions share in overall Government budget for TVET programmes
116
Donor funding
117
Compulsory and free education
117
Survival rate to Year 8
118
Drop out rate in secondary education
118

- 11 -
Pupil-teacher ratio
118
Pupil-class ratio
120
Learning achievement tests
121
Percentage of Year 5 + who have mastered nationally defined basic learning competencies
121
Teaching and learning resources in primary and secondary schooling
124
National assessment framework in line with national curriculum framework
127
Instructional hours
127
Existence of a national language policy
130
Use of indigenous language as the language of instruction in the early years of education
131
Percentage of primary school teachers having the required qualifications
133
Percentage of secondary school teachers having the required qualifications
133
Existence of national policy/protocol for teacher recruitment
135
Teacher development (professional development)
135
Availability of primary school level teacher training
137
Quality of life skills programmes
138
Capacity of national systems to develop coherent national educational plans
139
Existence of funding frameworks and guidelines for purposes of annual budgeting and education sector planning
139
Existence of sound policy and planning frameworks which assist with data and information collection and retrieval systems to provide accurate, timely and relevant data for informed policy decisions
140
National planning for universal and equitable education participation
141
Existence of a national qualifications framework
141
Regional qualifications framework
141

- 12 -
List of Figures
Figure 1 Population of Samoa by region, 2001 and 2006
24
Figure 2 Human Development Index, 1985 – 2004
26
Figure 3 Status of key development indicators
26
Figure 4 Samoa poverty incidence, 2002
28
Figure 5 The school system of Samoa, 1926
34
Figure 6 The school system of Samoa, 1945
34
Figure 7 Overview of primary education, 2007
36
Figure 8 Overview of secondary education, 2007
37
Figure 9 Distribution of ECE Centres among community groups by region, 2007
45
Figure 10 Number of ECE Centres registered with NCECES, 2003 – 2007
45
Figure 11 Number of children enrolled in ECE, 2003 – 2007
46
Figure 12 Distribution of children enrolled in ECE among community groups, 2007
46
Figure 13 GER for ECE (National), 2003 – 2007
48
Figure 14 GPI for GER in ECE (National), 2003 – 2007
49
Figure 15 Immunisation rates for children under 2 years old, Samoa, 2003 – 2006
50
Figure 16 Overview of Primary Education, 2007
55
Figure 17 Progress on GIR, NIR, late and early starters and percentage of unadmitted children of admission age (National), 2000 – 2006
56
Figure 18 Progress on GER and NER for primary education (National), 2000 – 2006
57
Figure 19 Number of repeaters in all primary schools by level (National), 1999 – 2007
57
Figure 20 Promotion rate by year level (National), 2000 – 2006
58
Figure 21 Survival rate to Year 8 by region, 2001 – 2006
59
Figure 22 Graduation rate for Year 8 National Examination (National), 2000 – 2006
59
Figure 23 Transition rate from primary to secondary education by region, 2000 – 2006
60
Figure 24 Employment indicators, 1991 – 2001
71

- 13 -
Figure 25 Age group as a percentage of unemployed persons, 2001
72
Figure 26 Total students enrolled in selected TVET institutions, 2000 – 2007
74
Figure 27 Total students graduated from selected TVET institutions, 2000 – 2007
74
Figure 28 IOT programmes, 2007
75
Figure 29 Students commencing first year of tertiary studies at NUS, 2002 – 2007
76
Figure 30 Graduates from the NUS in main programmes, 2000 – 2004
76
Figure 31 Number of computers and telephones in primary and secondary schools, 2002 – 2007
83
Figure 32 Reported number of STI cases in Samoa, 1999 – 2004
84
Figure 33 Tobacco use for youth in Years 8 to 11, 2007
86
Figure 34 Diabetes prevalence in Samoa, 1978, 1991, 2002
87
Figure 35 Diabetes prevalence in age groups, 2002
87
Figure 36 Primary students identified as at risk, Year 4 (All schools) – Results from SPELL 1 Test, 2000 – 2006
94
Figure 37 Primary students identified as at risk, Year 6 (Government schools) - Results from SPELL 2 Test, 2000 – 2006
95
Figure 38 GPI for GIR for primary education (National), 2000 – 2006
100
Figure 39 GPI for NIR for primary education (National), 2000 – 2006
101
Figure 40 Ratio of girls to boys enrolment in primary education (National), 2000 – 2006
101
Figure 41 GPI for GER for primary level (National), 2000 – 2006
102
Figure 42 GPI for NER for primary level (National), 2000 – 2006
102
Figure 43 Ratio of girls to boys enrolment in secondary education (National), 2000 – 2006
103
Figure 44 GPI for GER for secondary level (National), 2000 – 2006
103
Figure 45 GPI for NER for secondary level (National), 2000 – 2006
104
Figure 46 Ratio of girls to boys enrolment at NUS, 2002 – 2005
104
Figure 47 GPI for repetition rate by Year 5 (National), 2000 – 2005
105
Figure 48 GPI for repetition rate by Year 8 (National), 2000 – 2005
105
Figure 49 GPI for survival rate to Year 8 (National), 2001 – 2006
106
Figure 50 GPI for transition rate from primary to secondary education (National), 106

- 14 -
2000 – 2006
Figure 51 Percent of males and female teachers in primary education (National), 2000 – 2007
107
Figure 52 Percent of males and female teachers in secondary education (National), 2000 – 2007
107
Figure 53 Correlation between public expenditure on education as percentage of total Government expenditure and as percentage of GDP, FY2000/01 – 2006/07
111
Figure 54 Public expenditure on ECE, FY2000/01 – 2006/07 (SAT)
112
Figure 55 Public expenditure on primary education, FY2000/01 – 2006/07 (SAT)
112
Figure 56 Public expenditure on secondary education, FY2000/01 – 2006/07 (SAT)
112
Figure 57 Government expenditure on SNE, FY 2000/01 – 2006/07 (SAT)
113
Figure 58 Overview of the education expenditure spent on the different levels of education, FY2000/01 – 2006/07
113
Figure 59 Public current expenditure on ECE, primary, secondary and SNE as percentage of total public expenditure on education, FY2000/01 – 2006/07
114
Figure 60 Public current expenditure on ECE, primary and secondary per pupil as percentage of GDP per capita, FY2000/01 – 2006/07
115
Figure 61 Percentage of the education budget devoted to non-salary expenses, FY2001/02 – 2006/07
115
Figure 62 Government grants to TVET institutions, FY2004/05 – 2006/07 (SAT)
115
Figure 63 Statement of Revenue for IOT, FY1999/00 – 2004/05 (SAT)
116
Figure 64 Example of breakdown of annual revenue source for Don Bosco Technical Centre
116
Figure 65 Government expenditure on sponsoring students to FoE at NUS, FY2000/01 – 2006/07
117
Figure 66 Major Donors to Education (Grants Only), FY2000/01- 2004/05
117
Figure 67 Drop out rate by year level in secondary education (National), 1995 – 2007
118
Figure 68 Pupil-teacher ratio in primary education by region, 2000 – 2006
119
Figure 69 Pupil-teacher ratio in secondary education by region, 2000 – 2006
120
Figure 70 Pupil-class ratio in primary education by region, 2000 – 2006
120
Figure 71 Pupil-class ratio in secondary education by region, 2000 – 2006 121

- 15 -
Figure 72 Primary students identified as at risk, Year 6 (Government Schools) –
Results from SPELL Two Test, 2000 – 2006
122
Figure 73 Average raw score for core subjects at National Year 8 Examinations (All schools), 2000 – 2006
122
Figure 74 Percentage of Year 8 students that sat the Year 8 National Examination (All students), 2000 – 2006
123
Figure 75 Number of students sitting National Year 12 Examination (All schools), 2004 – 2006
123
Figure 76 Average raw score for core subjects at National Year 12 Examination (All schools), 2000 – 2006
123
Figure 77 Language of instruction from ECE to Year 8
131
Figure 78 Number of teachers in all schools, 2007
132
Figure 79 Number of primary and secondary teachers in all schools, 2001 – 2007
132
Figure 80 Percentage of primary teachers certified to teach according to national standards (National), 2001 – 2007
133
Figure 81 Percentage of secondary teachers certified to teach according to national standards (National), 2001 – 2007
134
Figure 82 Percentage of secondary teachers having the required academic qualification (National), 2001 – 2007
134
Figure 83 Number of graduates from the FoE, NUS, 2000 – 2007
136
Figure 84 Levels of planning and annual budgeting within MESC
140

- 16 -
Part 1: Introduction
1.1 Background 1.1.1 Education For All (EFA) Article 26 of The Universal Declaration of Human Rights was adopted in 1948 by the General Assembly of the United Nations. Article 26 recognises EFA as a basic human right. In 1990 at the World Conference for EFA in Jomtien, Thailand, this notion of education as a fundamental human right was affirmed and the international community, including Samoa, pledged to work towards primary education for every child and a massive reduction in adult literacy by the year 2000. The Jomtien Framework for Action to Meet the Basic Learning Needs set out targets and strategies for attaining EFA by the year 2000. Countries were expected to undertake a regular review of their progress towards these goals, including a major ten-year appraisal. A decade later, with many countries having made little progress, the international community met again in Dakar, Senegal to assess the achievements, lessons and failures since the Jomtien Declaration. Here, the Dakar Framework for Action was adopted, which identified six education goals to be met by the year 2015.
The EFA Goals
Goal 1: Ensuring and improving comprehensive early childhood care and education especially for the most vulnerable and disadvantaged children
Goal 2: Ensuring that by 2015 all children have access to and complete, free and compulsory
primary education of good quality
Goal 3: Ensuring that the learning needs of all young people and adults are met through equitable access to appropriate learning and life skills programmes
Goal 4: Achieving a 50 percent improvement in levels of adult literacy by 2015
Goal 5: Eliminating gender disparities in primary and secondary education by 2005, and
achieving gender equity in education by 2015
Goal 6: Improving all aspects of the quality and excellence of education with measurable learning outcomes
1.1.2 Forum Basic Education Action Plan (FBEAP) At the regional level, the Pacific Forum Ministers of Education met in Auckland, New Zealand in May 2001 and adopted the FBEAP. The Forum Ministers recognised that development of basic education takes place in the context of commitments to the world community and meeting the demands of the global economy, which should be balanced with the enhancement of their own distinctive Pacific values, morals, social, political, economic and cultural heritages, and reflect the Pacific’s unique geographical context.1
1 Pacific Forum Secretariat, Forum Basic Education Action Plan - 2001, Auckland, 15 May 2001, p. 2.

- 17 -
The Ministers agreed on the following vision and goals:2 “Vision Basic education as the fundamental building block for society should engender the broader life skills that lead to social cohesion and provide the foundations for vocational callings, higher education and life long learning. These when combined with enhanced employment opportunities create a higher level of personal and societal security and development.
Goal To achieve universal and equitable educational participation and achievement. To ensure access and equity and improve quality and outcomes.”
The main components outlined in the FBEAP include: • National and regional development context (policy and planning frameworks) • Delivery and resourcing of basic education • Improving quality in basic education • Technical and vocational education and training • Financing education • Developing partnerships • Gender and equity issues • Teaching of governance and civics.
The Forum Ministers further reaffirmed their commitment to the Dakar EFA Framework for Action goals and embedded the EFA goals within the FBEAP. The Pacific Regional Initiatives for the Development of Basic Education (PRIDE) was developed in 2004 to support the implementation of the FBEAP. Funded by the European Union (EU) and the New Zealand Agency for International Development (NZAID), this regional initiative assists countries to develop strategic plans for education as well as to implement, monitor and evaluate their plans, providing capacity building activities for educators at national, sub-regional and regional levels.3 The combination of the FBEAP and PRIDE initiatives are indicative of a strong political commitment in the Pacific region to implement policies and strategies to achieve EFA. 1.1.3 Samoa’s EFA National Action Plan At a country level, Samoa’s National EFA Forum was established in 2001, encouraging broad-based partnerships between MESC and civil society in the development of Samoa’s EFA National Action Plan. The Forum members agreed to make all six EFA goals of equal importance and integrate the protection of human rights and basic health education into the plan. The goals, objectives and activities pertaining to EFA have since been incorporated into the Strategic Policies and Plan (SPP) of the Ministry of Education, Sports and Culture (MESC), as well as Samoa’s National Strategy for the Development of Samoa (SDS).
2 ibid., pp. 1-2. 3 E Lameta, Pacific Regional Overview of Progress Towards EFA Since Dakar, April 2005, p. 31. The 15 countries covered by PRIDE are Cook Islands, Federated States of Micronesia, Fiji, Kiribati, Marshall Islands, Nauru, Niue, Palau, Papua New Guinea, Samoa, Soloman Islands, Tokelau, Tonga, Tuvalu, and Vanuatu.

- 18 -
1.2 Objective
This report is a compilation of findings on the status of the EFA Action Plan and the FBEAP in Samoa since 2000. It highlights the achievements and identifies gaps that will need to be addressed to meet the overall goals for EFA and FBEAP by 2015. The inclusion of the FBEAP was due to a request by its writers, the Pacific Ministers of Education that its national review is done simultaneously with that of EFA. It is anticipated that this report will provide the MESC, and other sister educational institutions and organisations a clear direction for future planning and decision making in the provision of effective and efficient educational developments and services. More imperatively, provide the GoS sound measures to continuously support educational enhancement.
1.3 Methodology
In the planning stages of developing this document, Samoa firstly established a special Task Force in August 2006. The Task Force was selected from within the MESC by the Core Executive. It consists of 14 people, with the EFA Coordinator as the Chairperson and the MESC’s Core Executive as the managing body. EFA and FBEAP indicators were allocated to the Task Force members, who would in turn report back their findings to the Task Force in their fortnightly meetings which later became weekly meetings. Information for the preparation of this report was obtained from data and documents provided by MESC, other Government agencies, institutions and organisations, and from interviews. Consultations have been held with staff of MESC and relevant stakeholders to ensure the accuracy and relevancy of this report.
1.4 Acknowledgements
Acknowledgement is extended to all Government agencies, institutions and organisations, civil society and individuals for their contribution to this report. Their contributions, more decisively made our task much easier than it seemed at first. Special recognition is due to the MESC’s Core Executive for their encouragement and patience whilst developing this report. Special thanks to the GoS for their endless support in education, and UNESCO for their guidance and assistance in putting this report together. Last but not least all education development partners who have contributed to the development of education in Samoa, with honours extended to New Zealand and the EU via PRIDE for funding the collation and compilation of this report.
- 19 -
Part 2: Executive Summary
The preparation of this report started in August 2006 with the establishment of the Task Force responsible for Samoa’s EFA Mid-Decade Assessment. The Task Force consists of 14 members all of whom are from within the Ministry of Education, Sports and Culture. Although there was no involvement of other Government ministries and civil society in the Task Force, frequent meetings and deliberations with pertinent organisations and individuals were conducted to obtain the most updated and relevant information for this report. Stakeholder consultations were held to present the findings of the Task Force. Important feedback was obtained during these consultations, which have been incorporated into this report. This report comprises of seven parts:
Part 1- Introduction Part 2- Executive Summary Part 3- Country Profile Part 4- Educational Development Part 5- Analysis of Six EFA Goals
Part 6- Managing of International Support and Coordination of EFA Partners Part 7- Conclusion and Policy Recommendations. The purpose of this report is positioned in Part 5. In the re-affirmation of the Declaration on EFA in Dakar, Senegal in 2001, the adopted framework for action consisted of six World Goals to be achieved by all participating nations by 2015. Thus, Part 5 assesses the current situation Samoa is with EFA and FBEAP against the six World Goals. The following are the six EFA goals in the same order presented in Part 5, highlighting some of the content:
2.1 Early Childhood Care and Education
Early Childhood Education (ECE) in Samoa is provided mainly by church groups community based organisations and private individuals. The Government’s role in ECE was established under the AIGA Project which commenced in 1998. The Government has since supported ECE through the provision of an annual grant and some stationery items. The participation rate in ECE remains low. The standards for ECE Centres were set by the National Council of Early Childhood Education of Samoa, which monitors the quality of ECE Centres to ensure the educational, social and physical welfare of children. As ECE Centre’s operate with limited funds they face challenges in keeping certified teachers and providing good facilities, equipment and learning materials.

- 20 -
2.2 Achieving Universal Primary Education Although primary education from Years 1 to 8 is compulsory, there are still children in the community not attending school. In particular, many children with special needs are not enrolled in school. Primary schools are located in all parts of Samoa, rural and urban. Of concern, national intake and enrolment rates have fallen in recent years. Also, rates for survival to Year 8 and transition from primary to secondary education in the rural areas are worse than in urban areas. These issues need to be addressed. The Government pays teacher salaries and provides stationery and text books free to schools. Parents contribute to the cost of education by assisting with school maintenance costs, and providing uniforms, transport and food for their children.
2.3 Life Skills and Lifelong Learning Life skills can be broken down into basic skills, psycho-social skills and practical/contextual skills. In addition to formal schooling, civil societies play an important role in the delivery of basic education. For example pastor schools supplement regular education and NGO’s and church groups provide second chance educational programs for pre-mature school leavers. MESC is trying to incorporate psycho-social skills development in learning activities, such as communication, problem solving and social skills. An area which has been highlighted for improvement is the provision of counseling services which can improve mental health and behaviour in schools. The incorporation of practical subjects in schools and provision of TVET programmes has become important in meeting the learning needs of all students and also the economy. In Samoa, the promotion of living a healthy life has become more relevant as obesity and diabetes remains a problem and the population is at risk of HIV/AIDS and STIs. Ministries and NGOs have been using creative methods to educate children and youth about HIV/AIDS and STIs, and MESC has been placing more emphasis on health and physical education in school curriculum.
2.4 Literacy The reported figures for Samoa’s literacy rate are high, but concerns have been expressed over literacy test results at the primary level. To address this issue a Literacy Task Force was established in 2004 and MESC is working on expanding their Library services. Second chance education providers and pastor schools also assist with the provision with the aim of improving literacy for all.

- 21 -
2.5 Gender Parity and Equality
National and international policies and frameworks which focus on improving the situation of women and girls do not reflect the current need in Samoa. Gender parity exists at the primary level, but at the secondary and tertiary levels, females dominate enrolment. Also of concern is that boys are more likely to repeat and less likely to survive to Year 8, which reflects concern about the learning achievement of boys.
2.6 Quality Education
Improving the quality of education is highlighted in the SDS. This priority is reflected by the increase in Government expenditure to the education sector. The quality of education depends on a number of factors. School facilities, equipment, and teaching and learning materials have improved over the years with the assistance of Government and donors. Teacher shortage remains a challenge. The cause of low learning achievement levels needs to be addressed.

- 22 -
Part 3: Country Profile
3.1 Location and Environment Samoa consists of two large and eight small islands which lie south of the Equator and about half way between Hawaii and New Zealand. The vast majority of the population lives on the two larger islands of Upolu and Savai’i which account for approximately 96 percent of the country’s total land area of 2,934 square kilometres. 19.4 percent of the land is arable and forest accounts for less than 37 percent of the land area. The major crops are coconut/copra, taro, bananas, and nonu fruit. Much of the land is volcanic and difficult to cultivate. The climate is equatorial with an average temperature of 26.5 degrees Celsius and an annual rainfall of around 2880 mm on average. The rainy season extends from November to April. The country is vulnerable to cyclones and active volcanoes pose a threat.4 Transport and telecommunication infrastructure between the main islands is efficient and well developed. Public utilities are easily accessible except in remote parts of Savai’i and the smaller islands.5
3.2 Population The Preliminary Population Count from the 2006 Census estimates the population of Samoa to be 179,186, with 92,961 males and 86,225 females. Compared to the last Census conducted in 2001, Samoa’s population grew by 1.4 percent.6 4 PRIDE, Samoa Education Sector Evaluation Study Final Report, Apia, December 2005, p. 13. 5 ibid. 6 MOF (Samoa Statistics Department), Preliminary Report of the Census of Population and Housing 2006, <http://www.spc.int/prism/country/ws/stats/>.

- 23 -
At the time of writing this report, the complete results of the 2006 Census were not available. Based on the 2001 Census the ethnic make-up of Samoa is approximately 92.6 percent Samoan, seven percent Euronesian (mixture of European and Polynesian), and 0.4 percent European. Approximately 75.8 percent of the population total is based on the island of Upolu with 22 percent concentrated in the city of Apia (approximately 36,000).7 Samoa has a very young population, with over 50 percent of the population between the ages of 12 and 30 years. The median age in Samoa is 19.7 years old.8 Population growth in Samoa is very low due to the high rates of migration (about 3,500 persons per year). There are 330 villages and towns in Samoa. The average household in Samoa consists of eight persons.9 Figure 1: Population of Samoa by region, 2001 and 2006
2006 2001Total Population
Male Female Total Male Female Total
Apia Urban Area
18,869 18,368 37,237 19,837 18,999 38,836
North West Upolu
28,929 26,894 55,823 27,443 25,133 52,576
Rest of Upolu
22,725 20,298 43,023 22,384 20,090 42,474
Savai'i 22,438 20,665 43,103 22,386 20,438 42,824 Samoa 92,961 86,225 179,186 92,050 84,660 176,710 Source: MOF (Samoa Statistics Department), Preliminary Report of the Census of Population and Housing 2006
Samoan is the national language, but English is used in commerce and Government business.
3.3 Historical In 1899, Samoa became a German colony. This followed the arrival of missionaries who settled on to the island in the 1830s. Following the outbreak of the World War I, New Zealand assumed control of Samoa as the islands became a mandated territory of New Zealand pursuant to the League of Nations. After World War II, New Zealand administered Samoa as a United Nations trust territory. Samoa became independent in 1962, being the first Pacific Island country to gain independence. With effect from 4 July 1997, a constitutional amendment changed the name of the country from Western Samoa to Samoa.
3.4 Political System Samoa is a stable parliamentary democracy with certain concessions to local cultural practices. There is a constitutional Head of State elected by the fono (Legislative Assembly) for a five-year term. The current Head of State, His Highness Tuiatua Tupua
7 PRIDE, loc. cit. 8 SBEC, TALAVOU Programme: Desk Review Report, Apia, March 2007, p. 7. 9 ADB TA 4256-SAM, Samoa Education Sector Project II – Education Sector Review, Apia, November 2004, p. 1.

- 24 -
Tamasese Efi, was appointed in June 2007. The late Head of State, His Highness Malietoa Tanumafili II was elected as co-Head of State in 1962 with a life term. Executive power lies with a Cabinet headed by a Prime Minister supported by the majority of the 49 members of the fono, with a five-year term. Ministers are selected by the Prime Minister from the fono. Forty-seven members of the fono are elected from amongst the matai, with the other two are non-matai candidates as representatives of Euronesian and European descendents. Cabinet decisions are subject to review by the Executive Council, which is made up of the Head of State and Cabinet itself.10 The governing Human Rights Protection Party, which came into office in 1988, is the dominant party in Samoan politics. Tuilaepa Lupesoliai Sailele Malielegaoi was appointed Prime Minister in November 1998. Samoa has an independent judiciary, including a Land and Titles Court which resolves disputes over land and traditional titles.
3.5 Religion and Culture Religion plays an integral part in Samoan culture. The population is predominantly Christian (99.7 percent), the main denominations being Congregational Christian Church (34.8 percent), Roman Catholic (19.6 percent), Methodist (15 percent), Latter Day Saints (12.7 percent), Assembly of God (6.6 percent) and Seventh Day Adventists (3.5 percent). The other denominations account for 7.8 percent of the population.11 The faaSamoa, which denotes the Samoan way of life, is dominant in managing all aspects of village life, particularly in the rural areas. Each village (nu’u) comprises of a group of extended families (aiga) with communal ownership being central to each group. The matai or chief represents the family at the village council (fono). The matai is an elected position and can be male or female, but candidates for positions often have inherited titles. The matai is responsible for law enforcement and punishment of infractions occurring in the village. There exists other regulatory positions in each village such as the pulenu’u (mayor/chief) elected every three years and one or more tulafale (orators) who liaise and perform ceremonial duties.12
3.6 General Overview of Level of Development 3.6.1 Human Development Index The UNDP Human Development Index (HDI) provides a composite measure of three dimensions of human development: longevity, as measured by life expectancy at birth; education attainment, as measured by the combination of adult literacy and combined primary, secondary and tertiary enrolment ratios; and standard of living, as measured by the real GDP per capita. The HDI allows for a broader view of a country’s development than does income alone. In 2004, the HDI for Samoa was 0.778, which ranked Samoa
10 PRIDE, op. cit., p. 16. 11 PRIDE, op. cit., p. 13. 12 ibid., p. 16.

- 25 -
75th out of 177 countries.13 Ranked in the middle third of the countries listed in the UNDP Human Development Report, Samoa is on par with countries like Thailand, Saudi Arabia and Ukraine. The increase in Samoa’s HDI reflects a strong Government commitment and a large national investment in education and health services. In the 2000 to 2004 financial years, consistently, over one third of public expenditure went on social services. Large amounts of foreign aid have also been injected into health and education.14
Figure 2: Human Development Index, 1985 – 2004
1985 1990 1995 2000 2004National 0.705 0.700 0.742 0.765 0.778
Source: UNDP, Human Development Report 2006
Figure 3: Status of Key Development Indicators Key Development Indicators Value Years
Population size 179,186 (a) 2006 Population growth rate 1.4% since 2001 (b) 2006 Life expectancy at birth (females) 73.8 (c) 2001 Life expectancy at birth (males) 71.8 (d) 2001 GDP per capita (constant) SAT 5,573 (e) FY2006/07 External debt as a percentage of GDP 35.8% (f) 2006 Poverty ratio (population below poverty line – US $1 per day) 5.5% (g) 2002 Unemployment rate of 15-24 year olds 12.22% of labour force
(h) 2001
Infant mortality rate (per 1,000 live births) – Hospital only 13.7 (i) FY2005/06 Age 5-14 years enrolled in primary schools – National participation rate primary
95 % (j) 2006
Enrolment ratio for girls in primary school – GER and NER primary (5-12 years)
GER: 103% NER: 96% (k)
2006
Enrolment ratio for boys in primary school – GER and NER primary (5-12 years)
GER: 105% NER: 98% (l)
2006
Enrolment ratio for girls in secondary school – GER and NER secondary (13-17 years)
GER: 73% NER: 64% (m)
2006
Enrolment ratio for boys in secondary school – GER and NER secondary (13-17 years)
GER: 62% NER: 54% (n)
2006
Literacy rate for 15-24 year olds 97.4 % females 98.4% males(o)
1991
Population use of traditional wood fuel <50% and dropping (p) 2000 People without access to safe water 10% (q) 1999 Prevalence of HIV/AIDS (known cases) 12 cases since 1990 (r) 2004 Prevalence of non-communicable diseases Increasing (s) 2004 Sources:
(a) MOF (Samoa Statistics Department), Preliminary Report of the Census of Population and Housing 2006 (b) MOF (Samoa Statistics Department), Preliminary Report of the Census of Population and Housing 2006 (c) MOF (Samoa Statistics Department) (d) MOF (Samoa Statistics Department) (e) MOF (f) MOF, Economic Statement to Support the 2007/2008 Budget (g) ADB, Millennium Development Goals Statistical Tables, <http://www.adb.org/Statistics> (h) MOF (Samoa Statistics Department). Note: Labour force includes paid and unpaid workers (i) MOH, Annual Report 2005 – 2006 (j) MESC (k) MESC (l) MESC (m) MESC
13 UNDP, Human Development Report 2006, <http://hdr.undp.org/hdr2006>. 14 SF Muagututi’a, ‘The Human Development Indices’ in A So’o, UF Va’a, T Lafotanoa, J Boon (eds), Samoa National Human Development Report 2006, The Centre for Samoan Studies (National University of Samoa), Apia, 2006, p. 56.

- 26 -
(n) Samoa EFA 2000 Assessment (o) MOF (Samoa Statistics Department), Census of Population and Housing 1991 (p) Samoa National Human Development Report 2006 (q) Samoa National Human Development Report 2006 (r) Samoa Aids Foundation (s) Samoa National Human Development Report 2006
3.6.2 The Economy Samoa’s economy is small and agriculturally based. It is one of the better performing economies in the Pacific region. Economic growth since the mid-1990s has been driven by fisheries, agriculture, tourism and the Government’s efforts to promote economic stability.15 The real average growth in GDP of 3.2 percent over the past five years has rested on the Government’s commitment to a number of large capital works projects together with private sector investment in the hotel and restaurant industry and church construction, and also from significant capital investment in the telecommunications sector.16 However, the growth rate has reduced significantly from 5.2 percent in 2005 to 2.6 percent in 2006, reflecting the easing off from construction activities and a decline in fishing, agriculture and Yazaki production.17 The tourism industry has been performing strongly with a 9.1 percent increase in tourism earnings and a 12 percent rise in tourist arrivals in 2006.18 The availability of land for commercial development purposes remains low due to the communal ownership of land. Customary land covers roughly 80 percent of Samoa and its sale is prohibited.19 In 2006, Samoa was carrying an external debt of SAT448.38 million being 35.8 percent of GDP.20 Its economy is assisted by large remittances from Samoans living abroad, primarily in the United States, Australia and New Zealand. For the period 2006 to 2007, remittances made a contribution of SAT225 million, being Samoa’s largest source of foreign exchange.21 These remittances remain an important source of income to many families, especially to low-income rural families. Subsistence agriculture remains the primary economic activity, although its share of GDP is declining. Total export earnings have been falling since 2001 with total export earnings in 2006 at SAT28.75 million. Samoa’s largest export is fish, followed by nonu juice, beer and coconut cream.22 The 2001 Census indicated that about 50 percent of the population aged 15 years and over were engaged in some form of economic activity. Of those in paid employment, agriculture (33 percent), manufacturing (10 percent) and public administration (6 percent) were the major employers. Five percent of the economically active population was unemployed. The 2001 Census reported that 24.2 percent of the population was receiving wages and salaries in the Apia urban area, followed by 16.6 percent in North- 15 Australian Government Department of Foreign Affairs and Trade, Samoa Country Brief – August 2007, <http://www.dfat.gov.au/geo/samoa/samoa_brief.html>. 16 New Zealand Ministry of Foreign Affairs and Trade, Samoa, <http://www.mfat.govt.nz/Countries/Pacific/Samoa.php>. 17 MOF, National Accounts Report 2006, < http://www.mof.gov.ws/uploads/gdp_rep_2006_with_gdb_estimates.pdf>. 18 MOF, Economic Statement to Support the 2007/2008 Budget, <http://www.mof.gov.ws/uploads/economic_statement__english_version_.pdf>. 19 ADB, Samoa Country Information, <http://www.adb.org/samoa/country-info.asp>. 20 MOF, loc. cit. 21 New Zealand Ministry of Foreign Affairs and Trade, loc. cit. 22 MOF, loc. cit.

- 27 -
West Upolu. In contrast, only 6.9 percent in Savai’i and 8.1 percent of the population in rural Upolu were wage or salary earners. Workers in Savai’i and rural Upolu were also generally more lowly paid.23 3.6.3 Poverty in Samoa There is no officially accepted definition of poverty in Samoa. In 2002, the Government of Samoa with the Asian Development Bank (ADB) conducted a qualitative study24 on what is poverty or hardship in Samoa. Due to faaSamoa and the abundance of land, extreme poverty or hunger does not fit the Samoan context. Poverty is seen more in terms of hardship, lack of access to essential services or poor education.25 The national poverty lines are calculated for Food Poverty (FPL) and Basic Needs Poverty (BNPL). FPL gives an indication of the poorest of the poor in society, whilst the BNPL measures the incidence of basic needs hardship. The national FPL for Samoa in 2002 has been estimated at SAT24.68 per capita per week, being the amount that an individual is estimated to need each week to acquire a basic minimum diet. The BNPL has been estimated at SAT37.49 per capita per week and represents the bare minimum additional income required to meet essential non-food expenditure (eg basic costs for essential housing, transport, utilities, school fees, clothing, church donations and cultural obligations (fa’alavelave)). From these poverty line estimates, 20.3 percent of all households had per capita expenditure below the BNPL level. Extreme hardship, as measured by the FPL level, was experienced by an average of one-in-thirteen families (7.6 percent). The highest degree of financial hardship in meeting basic food needs was experienced most in North-West Upolu (12.3 percent) and the least by families in Apia and the Rest of Upolu.26
Figure 4: Samoa Poverty Incidence, 2002
Recorded ExpenditurePercent of Households Below Food Poverty Line Basic Needs Poverty LineNational 7.6 20.3 Apia 5.6 23.3 North-West Upolu 12.3 24.8 Rest of Upolu 5.6 13.0 Savai’i 9.8 15.9 Source: Samoa Education Sector Project II – Education Sector Review
It appears that cultural and church obligation costs have contributed substantially to hardship. Church contribution and donations strained some household budgets, particularly as these contributions have become competitive. The costs of weddings, funerals and title bestowals were becoming more expensive as material expectations were rising. The 2002 Household Income Expenditure Survey recorded that on an average, about SAT1 million a week had been spent on both cultural and church obligations, about SAT52 million a year.27 23 ADB TA 4256-SAM, op. cit., pp. 3-4. 24 Participatory Assessment on Hardship under TA 3623: SSTA Household Income and Expenditure Survey for Socio-economic Equity Assessment, ADB, 2002. 25 ADB TA 4256-SAM, op. cit., pp. 4-5. 26 ibid., pp. 5-6. 27 Muagututi’a, op. cit., p. 62
- 28 -
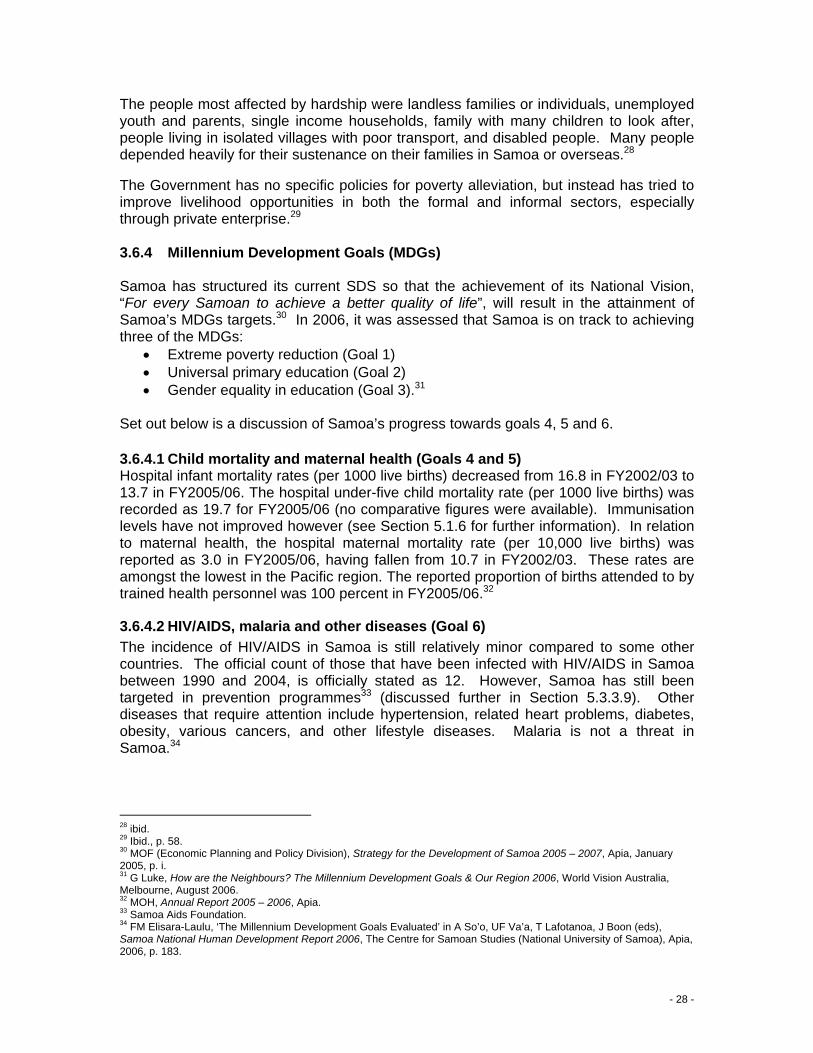
The people most affected by hardship were landless families or individuals, unemployed youth and parents, single income households, family with many children to look after, people living in isolated villages with poor transport, and disabled people. Many people depended heavily for their sustenance on their families in Samoa or overseas.28 The Government has no specific policies for poverty alleviation, but instead has tried to improve livelihood opportunities in both the formal and informal sectors, especially through private enterprise.29 3.6.4 Millennium Development Goals (MDGs) Samoa has structured its current SDS so that the achievement of its National Vision, “For every Samoan to achieve a better quality of life”, will result in the attainment of Samoa’s MDGs targets.30 In 2006, it was assessed that Samoa is on track to achieving three of the MDGs:
• Extreme poverty reduction (Goal 1) • Universal primary education (Goal 2) • Gender equality in education (Goal 3).31
Set out below is a discussion of Samoa’s progress towards goals 4, 5 and 6. 3.6.4.1 Child mortality and maternal health (Goals 4 and 5) Hospital infant mortality rates (per 1000 live births) decreased from 16.8 in FY2002/03 to 13.7 in FY2005/06. The hospital under-five child mortality rate (per 1000 live births) was recorded as 19.7 for FY2005/06 (no comparative figures were available). Immunisation levels have not improved however (see Section 5.1.6 for further information). In relation to maternal health, the hospital maternal mortality rate (per 10,000 live births) was reported as 3.0 in FY2005/06, having fallen from 10.7 in FY2002/03. These rates are amongst the lowest in the Pacific region. The reported proportion of births attended to by trained health personnel was 100 percent in FY2005/06.32
3.6.4.2 HIV/AIDS, malaria and other diseases (Goal 6) The incidence of HIV/AIDS in Samoa is still relatively minor compared to some other countries. The official count of those that have been infected with HIV/AIDS in Samoa between 1990 and 2004, is officially stated as 12. However, Samoa has still been targeted in prevention programmes33 (discussed further in Section 5.3.3.9). Other diseases that require attention include hypertension, related heart problems, diabetes, obesity, various cancers, and other lifestyle diseases. Malaria is not a threat in Samoa.34
28 ibid. 29 Ibid., p. 58. 30 MOF (Economic Planning and Policy Division), Strategy for the Development of Samoa 2005 – 2007, Apia, January 2005, p. i. 31 G Luke, How are the Neighbours? The Millennium Development Goals & Our Region 2006, World Vision Australia, Melbourne, August 2006. 32 MOH, Annual Report 2005 – 2006, Apia. 33 Samoa Aids Foundation. 34 FM Elisara-Laulu, ‘The Millennium Development Goals Evaluated’ in A So’o, UF Va’a, T Lafotanoa, J Boon (eds), Samoa National Human Development Report 2006, The Centre for Samoan Studies (National University of Samoa), Apia, 2006, p. 183.

- 29 -
3.6.4.3 Environmental sustainability (Goal 7) From 1991 to 2001, significant improvements were made in the availability of safe water. In 2001, 83 percent of households had access to an exclusive piped supply and a further eight percent of households with shared access, compared to 1991 with 56 percent or households with exclusive piped supply and a further third of all households sharing. Nationally, 86 percent of households used piped water as their main source of drinking water. Seventeen percent of Savai’i households however, had to rely on rainwater. Consultations showed that many people were not satisfied with the quality of water supplies. Access to sanitation has also improved. Population pressures, climate change and changing consumption patterns have placed pressure on land and marine resources. Deforestation is a major concern. Samoa also faces problems with waste disposal with a significant amount of waste dumped into the sea and bush.35 In March 2006, the United Nations reviewed Samoa’s Least Developed Country (LDC) status and recommended graduation to the Developing Country status. Samoa has sought a review of this decision. In the meantime, it will retain LDC status for the two years that it will take for the review to be finalised.
3.7 The Role of Education in the Context of National Development
Under the current SDS, education is defined as one of the six priority areas for Samoa’s development during the period 2005 to 2007.36 The goal for education is “improved student learning outcomes with specific emphasis on raising numeracy and literacy levels”. The strategies outlined in the SDS for attaining this goal are:
• Strengthening community support in education • Improving teacher quality • Improving curriculum and assessment practices • Improving teaching materials • Improving school facilities and equipment • Strengthening MESC • Developing Sports.
The Government’s focus on education is reflected in the level of spending on the sector. Since FY 2000/01, public expenditure on education as a percentage of total Government spending has been around 22 to 25 percent. The education sector has consistently received the largest proportion of Government expenditure, followed by the health sector.
35 ADB, Millennium Development Goals in the Pacific – Relevance and Progress, Manila, March 2003, p. 39 36 The other five priority areas are private sector development, agricultural development, tourism, community and health.

- 30 -
3.8 Disadvantaged Groups in Samoa The objective of the EFA Mid-Decade Assessment is to focus on reaching the unreached. The three main disadvantaged groups in Samoa that we have identified are premature school leavers, males and children with special needs. 3.8.1 Premature School Leavers In an ideal world, when schooling is made available from early childhood to early adulthood, all people would take advantage of this provision and acquire all the requisite skills to enable one to live comfortably in society. However, in Samoa, children and students do leave school prematurely for various reasons.37 These reasons include: inability by parents to afford school fees; lack of parental support and low priority placed on education; loss of interest in school; peer pressure to drop out of school; chronic health problems; and misbehaviour by the child in school.38 Problems caused by not being in school included increasing theft, drug abuse, fighting in the community and sexual misbehaviour.39 3.8.2 Males Statistics show that male achievement levels are lower than that of females in primary and secondary schooling. Further to this, as reflected by gender disparity in secondary education enrolments, males are more likely to drop out of school. 3.8.3 Children with Special Needs There are children with special needs not at school. Common causes preventing children with special needs to be in schools include: fears of parents regarding safety; care; teasing; poor facilities; and lack of trained teachers in the child’s locality. A survey conducted in 2002 found that 87 percent of children with special needs were in the community and not in school.40
37 GT Afamasaga, FS Moli and E Kruse-Vaai, Reinforcing/Incorporating Skills Development in the Samoa National EFA Plan – National Study, Apia, March 2005, p. 14. 38 ibid., pp. 16-17. 39 ibid., p. 18. 40 R McCullough, Samoa National Surveys of Disabled People, 2002 cited in ibid., pp. 18-19.

- 31 -
Part 4: Educational Development
4.1 Trends in Educational Development
4.1.1 Historical Origins Education in Samoa existed prior to any contact with Europeans. It began with traditional and cultural learning through informal and non-formal settings of story telling and learning through examples, role playing or modeling.41 From 1830 to 1900 mission activities led the establishment of Pastor Schools in the villages, established mainly by the London Missionary Society and Wesleyan Missionaries. Marist schools were created in Apia specifically for children of mixed marriage. The aim of education was to “enable the Samoans to read, write and reckon in their own language”.42 This was achieved as dignitaries from London recorded their amazement at finding a population who were almost one hundred percent literate in their own language.43 Introduction of the modern institutional school had a profound impact of the way people understood education. While the traditional forms of education continued the school came to be seen as the normal delivery mechanism for education that had value and as a result conditioned subsequent developments. Even though the traditional forms of education continued their status was reduced. Yet individuals continued to participate in both forms of education.44 4.1.2 Education Structure45 Samoa has come a long way in educational development. Education today is the product of four successive influences namely “Samoan culture, the nineteenth century Christian Mission efforts, the twentieth century colonialism first under Germany then New Zealand, and commitment and convictions of Samoan educational leaders”46 who have directed schooling since Samoa gained independence in 1962.
4.1.2.1 Missionary period The missionary period between 1830 and 1900 saw the introduction of a western style formal education system characterised by specialised learning institutions with established curricula and formalised methods. The objective of the missionaries was to spread the “Word of God’ and create a good Christian society. Consequently, the establishment of formalised schooling was seen by the missionaries as necessary to achieve this objective. 4.1.2.2 Establishing the Government school system - German administration Between 1900 and 1914, Germany had colonial control over Samoa. During this period several developments in education occurred that had significance impact. Three schools were established, all located in Apia, which were not church schools. The first in 1905 was located at Leifiifi and was for expatriate and ‘local European’ children. The second,
41 MESC, Samoa National EFA Action Plan, Apia, 2001, p. 13. 42 DoE, Special Report on Development of Education in Western Samoa, Apia, 1980. 43 ibid. 44 E Lameta, Non-Formal Education in Samoa: Report of the Research Study, Apia, September 2005, p. 20. 45 Sections 4.1.2.1 to 4.1.2.4 is reproduced in part from: Lameta, op.cit., pp. 21-29. 46 MESC, loc. cit., p. 13.

- 32 -
in response to Samoan requests to establish an opportunity for Samoan students to gain education was established in 1908 and located at Malifa. It was built by the local villagers on a site provided by the Government and with materials provided by the Government. The Government also supplied the teachers. The third was a boarding school for boys, established at Malifa in response to a request from the matai that some of their older sons should gain training that would allow them to work as Government officials. The Government resourced the post-primary boarding school at Malifa with buildings teachers and equipment.
The developments of these schools for Samoans were significant because they established the nucleus of the present day ‘Government schools’ system as being separate from the church schools. It was the initial step to draw Government resources, interests, and policy into education in Samoa. With the establishment of a path within the education system that was not church based but was resourced by Government the scope, purpose, structure and access to that system would inevitably become matters of public concern and Government policy. There was no parallel interest by Government in the informal community-based education. Policies related to the expansion and improvements in education were only focused on the formal, institutional system.
4.1.2.3 Formalising the structure of the national schooling system – New Zealand mandate When New Zealand occupied Samoa in August 1914 the formal schooling system was made up of the mission sector including the Pastors schools, various denominational primary and secondary schools, and denominational theological colleges, and the emerging Government sector. The New Zealand Government was inclined to promote the concept that education is a state responsibility, secular system of schooling modeled on the New Zealand system. However, developing such a system was difficult because there was no coordination within the education system, the Government sector acting as separate entities. The new administration adopted the policy of attempting to develop a satisfactory national system that encompassed the various sub-sectors. In an Education Conference in 1923 it was agreed that the system should have the following general characteristics -
• 3 grades of schools: a) Grade I – Village school taught by pastors. Teaching was in Samoan. The school was not Government but was able to be entered by Government inspectors. It was under the control of the mission. b) Grade II – Sub-district schools. Teaching was by Samoan teachers. English was taught as a language. Second grade schools were subsidised by Government although run by missions. Government would prescribe syllabus and hours of instruction. Attendance was compulsory for four hours a day, four days per week c) Grade III – District schools. It was visualised that there would be four district schools on Upolu and two in Savai’i, headed by palagi teachers with Samoan assistants. English was to be the language of instruction. School was to be controlled and conducted by the Government. Pupils of Grade II

- 33 -
could qualify for entry by sitting an examination at the end of Grade II. The syllabus included elementary technical subjects. Boarding schools and attendance was not compulsory. Age of admission was to be between 14 and 16 years.
• A number of scholarships to provide graduates for the district schools with
opportunity for further education in New Zealand. • Government education was to be secular and the religious teaching and training
of pastors was to be left entirely to the missions concerned.
Figure 5 summarises the number of schools and post school provision by 1927. Figure 5: The School System of Samoa, 1926 Level Government Mission LMS Methodist Mormon Roman
Catholic Post-school 1 1 1 Grade III 2 2 2 2 Grade II 2 18 6 1 Grade I Pastor
Schools Pastor
Schools Pastor
Schools Pastor
Schools
There was constant pressure by Samoans for the Government authorities to expand the schooling system and to establish more schools in the districts to provide access to the type of education available within the schooling system. Expansion of the system was made difficult due to lack of adequate resourcing. The New Zealand Government was reluctant to commit itself to the needed level of resourcing. It was decided that the only course was for the education system to be funded through a mixed base including the Government, the churches, and the villages. Nevertheless, the system began to expand (see Figure 6). Village primary schools were built with materials provided by the Government at cost and construction and maintenance through the village. The Government provided the teachers who taught a state defined standardised curriculum. Entry to these schools was open to the children from the village that the school was in, and from villages within walking distance. In 1945 the system was still organised in the same way as in 1923. However, the number of schools in the system had increased and a post-school sector had emerged with the establishment of a Teacher Training facility.
Figure 6: The School System of Samoa, 1945
Level Government Mission LMS Methodist Mormon Roman
Catholic Post-school Teachers Training
School and one Post primary
1 1 1
Grade III 3 2 2 2 Grade II 10747 18 6 2 Grade I Pastor
Schools Pastor
Schools Pastor
Schools Pastor
Schools
47 After an increase of 105 schools between 1923- 1945 there was an increase of 59 schools between 1945-2005 to give a total of 166.
- 34 -
However, as a result of the combination of a strong community desire for schooling combined with a lack of resourcing to meet the demand and a collective inability and unwillingness to envision alternatives to the school system, rationing of entrance to higher levels of education became necessary and became accepted as the norm.
4.1.2.4 Preparation for independence – Expanding post-secondary education With the end of World War II, decolonisation became a high priority internationally. Attention turned to developing an education system capable of supporting nation building. The education system needed to be able to provide sufficient numbers of individuals capable of meeting the needs of the new Government bureaucracy of the emerging state. This lead to the expansion of the Government schooling system with Samoa College being formally established in October 1953 when Samoa was under the New Zealand administration. It is co-educational and was set up as the premier tertiary education provider to prepare the would-be leaders of Samoa for the impending task of nationhood in 1962. 4.1.2.5 Education in Samoa today
Early childhood education (ECE) ECE in Samoa was previously mainly the responsibility of NGOs. The Education Policies and Strategies of 1995 – 2005 made a commitment for the first time by the Government in this area – teacher education courses coordinated and administered by the National Council for Early Childhood Education in Samoa (NCECES) and an annual per capita grant from the Government to registered ECE Centres. Most of the ECE Centres are owned and run by the pastors’ wives while a few are run by school boards of the local community, affiliated to NGOs. As of July 2007, there were 111 registered pre-schools with an average size of 30 to 35 children in an ECE Centre.48 A typical ECE Centre has the minimum number of children at 15.49 ECE catered for approximately 4629 children in 2007.50
Primary and secondary education Currently, primary and secondary education in Samoa is provided through three stakeholders, namely the Government in partnership with village based school committee, mission schools and private schools. An important partner in this process is the donor community who provide various forms of assistance – from buildings to curriculum. Improved education standards is one of the Government’s key strategic areas and the community, particularly at the primary level, contributes substantially with the provision of land, school buildings and other assets, management and ongoing fund-raising for school equipment and other needs. Primary education is from Years 1 to 8 and is compulsory for children between the ages of five and 14 years old. The islands of Upolu and Savai’i are divided
48 MESC, ECE Database. 49 NCECES, ECE Standards for Pre-Schools, Apia, 2001. 50 MESC, ECE Database.

- 35 -
into three regions and 22 education districts. The three regions are Apia Urban, Rest of Upolu, and Savai’i.51 Students sit a national exit examination at the end of Year 8 to determine entry into secondary schools. In 2007, there are 39,578 students enrolled in primary education. There are 141 Government primary schools, 13 mission primary schools and six private primary schools. In addition there are seven schools that are classified as primary-secondary schools. The number of primary schools is currently 160 (see Figure 7). A total of 1,273 teachers are teaching in primary schools in 2007.52 Figure 7: Overview of Primary Education*, 2007
Government Mission Private TotalSchools 141 13 6 160 Students Males Females
33,010 17,232 15,778
4,970 2,449 2,521
1,598 808 790
39,578 20,489 19,089
Teachers 1,039 158 76 1,273 S/T Ratio 32 27 20 * Excludes combined schools Source: MESC, Education Statistical Digest 2007 The primary school curriculum consists of 26 themes in Years 1 to 3 and consists of five core subjects in Years 4 to 8. The core subjects are English, Samoan, Mathematics, Social Studies and Basic Science. The secondary programme covers five years from Years 9 to 13 with only certain senior secondary colleges both in the private and public sectors offering full programs up to Year 13. Secondary education begins at age 13 or 14 and lasts for five years. From 2005, all secondary school students are to receive five years of secondary education, offered in the senior secondary schools for Year 9 to Year 12, with Colleges or Year 9 to Year 13 offering the full Year 13 curriculum because of the shortage in teacher numbers.53 This means there are only 15 Government schools offering Year 13 programs. Five of the senior secondary colleges, one in Savai’i and four in Upolu, are fully funded by the Government. Figure 8 shows that in 2007, there are 42 secondary schools. The total enrolment in 2007 is 15,165. A total of 792 teachers are teaching in secondary schools in 2007.54
51 These education districts are different from the districts used by the MOF in the Census for Population and Housing. This impacts upon the ability to disaggregate by region and district. 52 MESC, Educational Statistical Digest 2007, Apia. 53 PRIDE, op. cit., p. 34. 54 MESC, op. cit., Part 1, p. 4.
- 36 -
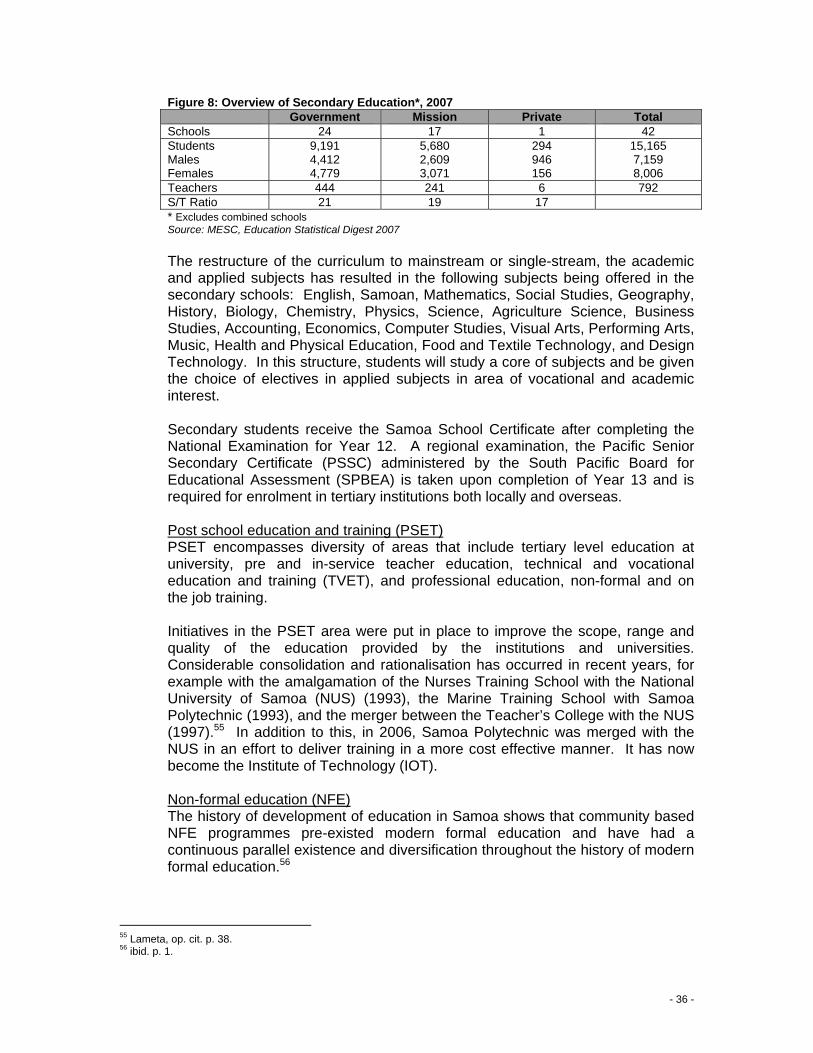
Figure 8: Overview of Secondary Education*, 2007 Government Mission Private TotalSchools 24 17 1 42 Students Males Females
9,191 4,412 4,779
5,680 2,609 3,071
294 946 156
15,165 7,159 8,006
Teachers 444 241 6 792 S/T Ratio 21 19 17 * Excludes combined schools Source: MESC, Education Statistical Digest 2007 The restructure of the curriculum to mainstream or single-stream, the academic and applied subjects has resulted in the following subjects being offered in the secondary schools: English, Samoan, Mathematics, Social Studies, Geography, History, Biology, Chemistry, Physics, Science, Agriculture Science, Business Studies, Accounting, Economics, Computer Studies, Visual Arts, Performing Arts, Music, Health and Physical Education, Food and Textile Technology, and Design Technology. In this structure, students will study a core of subjects and be given the choice of electives in applied subjects in area of vocational and academic interest. Secondary students receive the Samoa School Certificate after completing the National Examination for Year 12. A regional examination, the Pacific Senior Secondary Certificate (PSSC) administered by the South Pacific Board for Educational Assessment (SPBEA) is taken upon completion of Year 13 and is required for enrolment in tertiary institutions both locally and overseas. Post school education and training (PSET) PSET encompasses diversity of areas that include tertiary level education at university, pre and in-service teacher education, technical and vocational education and training (TVET), and professional education, non-formal and on the job training. Initiatives in the PSET area were put in place to improve the scope, range and quality of the education provided by the institutions and universities. Considerable consolidation and rationalisation has occurred in recent years, for example with the amalgamation of the Nurses Training School with the National University of Samoa (NUS) (1993), the Marine Training School with Samoa Polytechnic (1993), and the merger between the Teacher’s College with the NUS (1997).55 In addition to this, in 2006, Samoa Polytechnic was merged with the NUS in an effort to deliver training in a more cost effective manner. It has now become the Institute of Technology (IOT). Non-formal education (NFE) The history of development of education in Samoa shows that community based NFE programmes pre-existed modern formal education and have had a continuous parallel existence and diversification throughout the history of modern formal education.56
55 Lameta, op. cit. p. 38. 56 ibid. p. 1.

- 37 -
NFE is carried out in a variety of settings and by a diverse range of providers. The type of programmes offered are also varied, covering second chance education, education for social justice, personal development activities, professional training, community enhancement and cultural continuity, and supplementary education.57
4.1.3 Expansion of Government Financed Education to Various Categories of Learners Commitment to improving both the quality and effectiveness of education is a key element in the GoS’s economic strategy. As discussed earlier, in support of this policy, the education sector consistently receives the largest portion of the National Budget, accounting for between 22 and 25 percent of total Government spending. Since 1999, the GoS through the MESC has allocated SAT3 million for distribution to Early Childhood Education, Special Needs Schools, Technical and Vocational Education and Training institutions, Mission Education and private schools. This annual grant increased to SAT4 million in FY2006/07. 4.1.4 Development in Education Since Jomtien (1990), Dakar (2000), and Auckland (2001) Discussed below are the major achievements in the education sector of the recent past.
4.1.4.1 Augmenting Institution for General Attainment project (AIGA)58 The AIGA Project was a collaboration between the MESC and the UNDP on a national programme framework which aimed at strengthening education at all levels and facilitating linkages between levels. It commenced in 1998 and was completed in December 2003. The three broad components of this project were Early Childhood Education, Special Needs Education, and Language and Literacy. Set out below is an outline of the achievements of this project:
Early childhood education (ECE) o Curriculum guidelines were put in place o A Curriculum Committee was set up o An ECE Coordinator was recruited for MESC in April 2002.
Special needs education (SNE)
o The Special Needs Education Advisory Committee (SNEAC) consisting of representatives from private and public sector was set up and continues to play its role in the development of SNE
o Six SNE units were established in selected schools on Upolu (4) and Savai’i (2)
o A SNE coordinator was recruited for MESC o Peace Corps Volunteers attached to MESC specialising in the areas of
speech therapy and language therapy were recruited o A database specific for SNE was established.
57 ibid. pp. 130-131. 58 DoE, Annual Report – 1 July 2000 – 30 June 2001, Apia, pp. 8-9.

- 38 -
Language and literacy This sub-component of the AIGA Project supported the Language Policy. A research study on the use of Samoan Language as a medium of instruction at the primary level was carried out and as a result, developments have taken place in promoting the Samoan language. A database of translated words and a list of Samoan AutoCorrect were some of these developments. It is planned that a Samoan Language Commission will be set up to support language and literacy in Samoan
An overview framework for proficiency in languages and assessing literacy was developed. New SPELL tests for Years 4 and 6 were trialed at 15 schools. Descriptors for Samoan, English and Numeracy at different levels were made.
4.1.4.2 Primary Education Materials Production project (PEMP 1 and PEMP 2)59 PEMP 1 and PEMP 2 was a bi-lateral project by the GoS and AusAID which took place from 1997 to 2003. By developing additional learning materials for primary schools, the aim was to assist teachers to improve the quality of learning by promoting learning and teaching strategies that encourage greater student participation.
4.1.4.3 Institutional Strengthening Program (ISP) The ISP was a five-year bi-lateral program between the GoS and Australia, which started in May 1999 and completed in November 2004. The overall purpose of the programme was to strengthen the services and provisions of the MESC. These functions were then embedded into the appropriate divisions of the Ministry to ensure effective and efficient implementation and delivery. 4.1.4.4 Samoa Secondary Education Curriculum and Resource Development Project (SSECRP)60 The goal of the SSECRP was to enhance the quality and delivery of secondary education. NZAID and the GoS provided NZ $6 million for the SSECRP programme (1998 to 2004) to modernise secondary education curriculum, produce learning materials and teacher training. This included the preparation of curriculum and materials for expansion of secondary education to Years 12 and 13. 4.1.4.5 Associated Schools Project (ASP)61 Seventy schools were registered in this UNESCO programme to promote its objectives which were World Concerns and United Nations, Education for Peace and Human Rights, Inter-cultural Learning and Understanding and Natural Environment Conservation. These schools ranged from the ECE Centres to colleges. 4.1.4.6 Health Promoting Schools (HPS) project62 The HPS Project is a “place where all members of the school community work together to provide students with integrated and positive experiences and structures which promote and protect their health”. The HPS project was funded by the World health Organisation (WHO) as part of its “Health for All” campaign in which all schools in Samoa were involved. 59 DoE, Annual Report – 1 July 2002 – 30 June 2003, pp. 14-15. 60 DoE, Annual Report – 1 July 2003 – 30 June 2004, p. 16. 61 DoE, Annual Report –1 July 2002 – 30 June 2003, p. 19. 62 ibid., p. 18.

- 39 -
4.1.4.7 Education Sector Project I (ESP I)63 ESP I, which started in October 2002 and completed in 2006, was funded by a loan from the Asian Development Bank (ADB). The overall goal of the project was consistent with the GoS’s economic strategy “to increase the availability of human resources with adequate professional and technical skills to meet the labour requirement of a broad-based market-oriented economy.” In achieving this, the Project aimed to expand equitable access and improve the quality of primary and secondary education in Samoa. 16 primary and secondary schools were identified as sub-project schools. Of this number, seven primary and 12 secondary schools were upgraded. All 12 secondary schools upgraded were colleges.
4.1.4.8 Construction of new primary schools and refurbishment of other schools from donor assistance MESC extends its acknowledgement to other donor agencies that have assisted greatly with various Government schools around the country with their development activities through their micro-project and grassroots scheme. In particular JICA, EU, ADB, AusAID, NZAid, and UNDP have assisted with the refurbishment and development of schools in collaboration with the GoS.
4.1.3.9 Focusing Resources on Effective School Health (FRESH)64 Towards the end of 2005, six schools entered into an agreement with UNESCO to implement the FRESH project. The four components of this project are: (i) Policies to make school safer by eliminating sexual harassment, violence and bullying; (ii) Safe water and sanitation to prevent the spread of infectious disease; (iii) Skills-based health education to help pupils adopt attitudes and values for healthy lifestyles and to prevent HIV/AIDS and other sexually-transmitted infections, early pregnancy, drug abuse; and (iv) Simple health and nutritional services such as food supplements and deworming provided at schools.
4.1.3.10 Supporting Teacher Education Pacific Schools (STEPS)65 Funded by UNESCO and the Government of New Zealand, STEPS is an on-going program designed to provide teachers with school-based in-service training. The focus of the program is on the development of instructional skills that promote student-centred learning. Hence, through professional development of teachers, student-learning outcomes should improve.
The project was conducted on a teamwork basis where objectives are: all staff to be included in training where possible; emphasis on student learning outcomes; encourage innovative ways of teaching; encourage innovative use of local resources and assist teachers to learn by observation and by practice.
4.1.3.11 Coastal Sustainable Improvement Samoa Project (CSI) – Education for Sustainable Living66 The CSI project is a worldwide program. Funded by UNESCO and GoS, it started in Samoa in June 2000 and completed in 2004. Its main interest was the protection of natural heritage through the conservation and sustainable use of bio-diversity, while at
63 DoE, Annual Report – 1 July 2003 – 30 June 2004, p. 15. 64 ibid., p. 22. 65 MESC, Annual Report – 1 July 2004 – 30 June 2005, pp. 17-18. 66 DOE, Annual Report – 1 July 2003 – 30 June 2004, p. 17.

- 40 -
the same time strengthening cultural identity through the recognition and innovative application of indigenous ecological knowledge and practice. Spearheading this project was the project team comprised of personnel from the Ministry of Natural Resources, Environment and Meteorology, NUS and MESC. 4.1.3.12 School Based Assessment67 This programme was co-funded by the South Pacific Board for Education Assessment (SPBEA) and the GoS through the MESC. It replaced the Year 11 National Examinations, which was phased out in 2001. Planning started in June 2001 and five schools implemented the project in 2002. The objective of the programme was to introduce Internal Assessment (IA) at Years 9 and 10, so that when students reach Year 12 they are familiar with IA. Teachers for Year 9 were trained for this work.
4.1.3.13 Samoa Qualifications Authority (SQA)68 The SQA was established by an Act of Parliament in 2006. The role of SQA in relation to PSET is as follows:
• Provide policy advice to Government on strategies and priorities for PSET • Monitor and report to Government and the post-school education sector, on the
activities, resourcing, and overall performance of the post-school education sector in relation to national strategic goals for economic, social and cultural development
• Provide advice to Government and the post-school education sector on findings and implications arising from research, monitoring or evaluation conducted by the Authority or other agencies, bodies or persons
• Coordinate and strengthen all PSET, so as to better focus the post-school education sector on national development goals and to promote and develop articulation among programmes.
4.2 Educational Policy and Laws
4.2.1 National Constitution The Constitution of Samoa was adopted in 1961 and enacted in 1962. The Constitution does not guarantee the right to education. However, it implies that education should follow bilingualism. 4.2.2 National Policies and Laws These are the policies and laws that guide education in Samoa:
• Education Ordinance 1959 • Compulsory Education Act 1992/1992 • National Curriculum Policy Framework • Special Needs Policy Framework • Strategy for the Development of Samoa 2005 – 2007 • Education Strategies 1995 – 2005
67 DoE, Annual Report – 1 July 2002 – 30 June 2003, p. 17. 68 S Mualia and E Manila-Silipa, A report on initial data collection from Post School Education and Training providers, Apia, February 2007, pp. 4-5.

- 41 -
• Education Policies 1995 – 2005 • MESC Strategic Policies and Plan July 2006 – June 2015 • National Youth Policy
There is also a MESC Bill and an Education Bill in draft form yet to go before Parliament. These will amend the Education Ordinance 1959. Equity, access, efficiency and quality are the key concepts to current educational policy and strategies.
4.2.3 National EFA Programme/Action Plan After actively participating in the global EFA conferences, Samoa completed its EFA Action Plan in 2002. In line with the World Declaration at the EFA Conference in Dakar, Senegal in April of 2000, Samoa has undertaken to achieve Education for All goals by the year 2015. Samoa’s EFA Action Plan recognises the right to education for all children, including those with disabilities, as a basic human right. Although Samoa has complied with the requirements for developing a separate stand-alone EFA Action Plan, remaining activities required for achieving the EFA Goals have been included in MESC’s SPP 2006 – 2015.
4.2.4 International Frameworks The notion of lifelong learning and the need for a holistic and integrated education system is stressed in a number of international frameworks that Samoa has committed to. These are the Pacific Plan (2005), Education for All (EFA 2000), Pacific Forum Basic Education Plan (FBEAP 2001), Millennium Development Goals (MDGs 2001), and the Decade of Education for Sustainable Development (DESD 2005). Samoa is also a signatory to the Convention for the Rights of the Child and the Convention for the Elimination of all forms of Discriminations Against Women. EFA focuses on ways of providing basic education to everyone; the MDGs emphasise the challenges of poverty and provide a set of tangible and measurable development goals within which education is a significant input and indicator; the FBEAP stresses the role of basic education in achieving a higher level of personal and society security and development; and DESD promotes a set of underlying values, relational processes and behavioural outcomes which should characterise learning in all circumstances.
“All of them aim to achieve comparable impacts: an improvement in the quality of life, particularly for the most deprived and marginalised, fulfilment of human rights including gender equality, poverty reduction, democracy and active citizenship. There is also a common consensus around the central importance of basic education and the need to extend it and enhance its quality.”
Samoa’s development vision of “improved quality of life for all” is embedded within these frameworks.69
69 Lameta, op. cit., p. 55.

- 42 -
The primary context of the implementation of all these initiatives is the national level. To ensure maximum impact is attained, there needs to be closer monitoring and coordination between the national level strategies to meet these initiatives. All sectors are integral to the achievement of these international frameworks. Through its commitments to international frameworks, the GoS has also recognised the following national goals in relation to education:
4.2.4.1 Convention for the Rights of the Child (CRC) Samoa ratified the CRC on the 29th of November 1994 thereby making a commitment to the child’s right to education. Article 28 of CRC establishes that right. Education is recognised to be essential for all children. The article stresses the ‘right must be achieved on the basis of equal opportunity’. Thus it includes:
• Making primary education compulsory and available to all • Promoting the different forms of secondary education and vocational
education • Making higher education accessible to all • Making educational and vocational information readily available • Taking measures to encourage regular attendance at schools and reducing
dropout rates.
4.2.4.2 Convention for the Elimination of all forms of Discriminations Against Women (CEDAW) Samoa acceded to the CEDAW on the 24th of September 1992. Article 10 of the CEDAW convention was stipulated to help women receive all forms of education, health and family planning, to stop stereotyping in school books, encourage the education of boys and girls together and to get women and girls’ full participation in sports. By ratifying the convention, the Government acknowledges the strategic objectives contained within CEDAW relating to the elimination of gender discrimination against girls and women. These include:
• Ensuring equal access to education • Eradicating illiteracy among women • Improving women’s access to vocational training, science and technology
and continuing education • Developing non-discriminatory education and training • Allocating sufficient resources to monitor the implementation of educational
reforms.
- 43 -
Part 5: Analysis of Six EFA Goals
5.1 Early Childhood Care and Education Measuring progress towards EFA Goal 1: Expanding and improving comprehensiveness of early childhood care and education especially
for the most vulnerable and disadvantaged children
The GoS’s vision for Early Childhood Education (ECE) is for “quality early childhood education for all children between the ages of three to five in Samoa”.70 Samoa’s ECE strategy recognises that learning begins at birth. For all children, the home provides the basis for pre-school learning, but ECE Centres are important in complementing the role of the family and the local community.71 The goal of expanding and improving ECE has been integrated into MESC’s SPP for July 2006 – June 2015. During this period, the aims of the education sector in relation to ECE are72:
• Equity: ECE opportunities are available and attendance at pre-school is encouraged
• Quality: ECE Centres meet the approved minimum standards for safety of children; the availability of hygienic bathrooms and clean water; and teacher-student ratios
• Relevance: Appropriate resources and experiences which reflect the child’s home environment are provided. The involvement of parents in each child’s education and PTAs assist ECE Centres
• Efficiency: Providers should ensure that resources are used effectively and efficiently. Community support should be encouraged
• Sustainability: The Government will continue to support the development of ECE. Parents, community and development partners are encouraged to continue their current role in the development of ECE.
5.1.1 The Development of ECE in Samoa The majority of the children enrolled in ECE Centres are between the ages of three to five years. However, ECE Centres can take children up to the age of eight years. ECE in Samoa was previously the responsibility of non-governmental organisations (NGOs).73 The Government first made a commitment to ECE under the Education Policies and Strategies of 1995 – 2005. (Refer to section 5.1.3 for further discussion.) The operation of the ECE programme is administered under the umbrella of the National Council for Early Childhood Education in Samoa, Inc (NCECES). The NCECES was established in 1998 to provide minimum standards and guidelines, as well as set new directions for future operations in the development of ECE in Samoa.74 These standards are outlined in the Standards for Samoa Pre-Schools handbook to be adhered to by all
70 MESC, Strategic Polices and Plan July 2006 – June 2015 (SPP), Apia, June 2006, p.18. 71 ibid. 72 ibid., pp. 12-17. 73 Afamasaga, ‘The Challenge in Education’ in A So’o, UF Va’a, T Lafotanoa, J Boon (eds), Samoa National Human Development Report 2006, The Centre for Samoan Studies (National University of Samoa), Apia, 2006, p. 82. 74 PRIDE, op. cit., p. 31.

- 44 -
ECE Centres. An important project which supported the development of ECE in Samoa was the UNDP’s Augmenting Institutions for General Attainment (AIGA) project which commenced in 1998. Under the AIGA project, curriculum guidelines (Ta’iala Mo Aoga Amata i Samoa) were established and an ECE Coordinator recruited in 2002 to work closely with the NCECES as an officer of CMAD in the MESC. Another major step forward in the development of ECE was the NCECES merging with the Sogi pre-school establishment in 2004. Following this merger, the pre-school was converted into a model school and an ECE and Special Needs Education teaching training was commenced, providing certificate level teacher training.75
5.1.2 Status of ECE in 2007 Today (2007), there are 111 ECE Centres in operation and registered with the NCECES.76 Approximately 4,629 children are enrolled.77 On average, one ECE Centre accommodates 41 children, but they range from 15 to 139.78 The minimum size, as dictated by the NCECES standards, is 15 students.79 The geographic location of ECE Centres is widespread with 19 in the urban area, 57 in the rural area of Upolu, and 35 in Savai’i.80 Figure 9 shows the distribution of ECE Centres by community groups. A range of private, community-based and church groups operate their own Centres. Some of these ECE Centres have their own buildings, but others operate in church halls, women’s committee fales81, and private homes. There are approximately 336 teachers engaged in ECE in these 111 Centres.82
Figure 9: Distribution of ECE Centres among community groups by region, 2007 Group Number in Urban Area Number in Rural Area Number in Savai’i Methodist 3 11 16 Catholic 3 7 3 Komiti Tumama 0 15 4 CCCS – Faaea 0 6 3 Private 13 18 9 Source: MESC, ECE Database
The number of ECE Centres registered with NCECES has declined over the years (refer to Figure 10). This is because many ECE Centres have been closed for failure to comply with national standards. The Government has also been pushing for one ECE Centre per village. Some villages have more than one ECE Centre.
Figure 10: Number of ECE Centres registered with NCECES, 2003 – 2007 2003 2004 2005 2006 2007 Number of registered ECE Centres
127 122 121 114 111
Source: MESC, ECE Database
75 ibid., p. 32. 76 MESC, ECE Database. 77 ibid. 78 ibid. 79 NCECES, op. cit., p. 10. 80 MESC, ECE Database. “Urban area” covers the villages on Upolu from Vailele – Vaoala – Aleisa – Faleula – Apia. “Rural area” includes all villages outside of the “Urban area” on Upolu, and the islands Manono and Apolima. 81 A “fale” is a Samoan open house with no walls. 82 MESC, ECE Database.

- 45 -
The enrolment levels of children in ECE Centres have gradually decreased from 4,855 in 2003 to 4,629 in 2007 (refer to Figure 11). There is a high percentage of enrolments in private ECE Centres. Figure 12 shows that 42.8 percent of children enrolled in ECE attend private ECE Centres.
Figure 11: Number of children enrolled in ECE, 2003 – 2007 2003 2004 2005 2006 2007 Number of children enrolled in ECE
4,855 4,558 5,007 4,963 4,629
Source: MESC, ECE Database
Figure 12: Distribution of children enrolled in ECE among community groups, 2007 Group Number enrolled Community group’s percentage
share of enrolments Methodist 969 20.9% Catholic 601 13.0% Komiti Tumama 735 15.9% CCCS – Faaea 343 7.4% Private 1981 42.8% TOTAL 4,629 Source: MESC, ECE Database
5.1.3 ECE Policies and Legislation
Existence of ECE policy
Education Policies 1995 – 2005 The GoS first recognised the importance of ECE in the Education Policies 1995 –2005. This policy devised that an ECE working party be formed to consider issues to formulate appropriate aims and polices, and more specifically, make decisions regarding regulatory mechanisms, staffing issues such as teacher qualifications and training options, and the development of curriculum guidelines.83 The Standards for Samoan Preschools and Ta’iala Mo A’oga ‘Amata i Samoa, which currently guide the operation of ECE Centres, were developed in line with this policy. Standards for Samoan Pre-schools Registration must be considered and approved by NCECES. The Standards for Samoa Pre-schools should be strictly observed and complied by all ECE Centres. Registration entitles ECE Centres to receive financial assistance from the GoS’s annual grant. The standards have been an important step in regulating ECE Centres to ensure the educational, social and physical welfare of pre-school children. The standards have been designed to ensure the health, safety and welfare of children as well as the provision of a stimulating and challenging learning environment. More explicitly, the guidelines specify facility requirements, furniture and equipment needs, hygiene and safety features, play area requirements, staffing and staff qualifications, enrolment and class sizes, child and staff health, support and treatment of children, programs of activities, responsibilities of management, and record keeping.
83 DoE, Western Samoa Education Policies 1995 – 2005, Apia, July 1995, p. 15.

- 46 -
The NCECES standards state that entry into ECE Centres must be non-discriminatory with regard to religion, gender, social status and location of family. By allowing the enrolment of children up to the age of eight years into ECE Centres, it is intended that this will improve accessibility for children with special needs. Ta’iala Mo A’oga ‘Amata i Samoa The Ta’iala Mo A’oga ‘Amata i Samoa (Guide to Pre-schools in Samoa) sets the curriculum which must be followed by ECE Centres. It was developed by the NCECES in collaboration with MESC. It emphasises the importance of ECE practices in the home, from birth to the age of three years. Trainees undertaking the one-year ECE certificate with the NCECES are trained in line with this curriculum Strategic Policies and Plan July 2006 – June 2015 The goal of expanding and improving ECE in this policy is an indication of total commitment by MESC to this area. The current policy statements relating to ECE are as follows84:
o The establishment of one ECE Centre in a village will be encouraged o Parents will be encouraged to enroll children between the ages of three to
five years old at an ECE Centre o MESC will explore ways to fund ECE teachers’ salaries o Teachers in ECE Centres will be encouraged to enroll in ECE
programmes offered by the NCECES, USP and the NUS o All ECE programmes should be guided by the approved national
curriculum o MESC will conduct in-service training for ECE in collaboration with
NCECES o MESC and NCECES will collaborate in monitoring the quality of ECE
Centres. Legislation The existing education legislation coverage excludes ECE. The Education Bill was drafted in 2004 and intends to amend the Education Ordinance 1959 to empower MESC to include ECE within its mandate. The Education Bill sets into the legal framework:
o Requirements relating to behaviour management, discipline and intoxication
o Makes it an offence for a person to willfully disturb an ECE Centre or insult or abuse any child or person employed in an ECE Centre in the presence or hearing of children
o Prohibits the operation of unregistered ECE Centres, with registration acceptance to be determined by assessment against listed criteria
o Empowers School Review Officers (SROs) to monitor compliance of ECE Centres with standards.
84 MESC, SPP, p. 19.
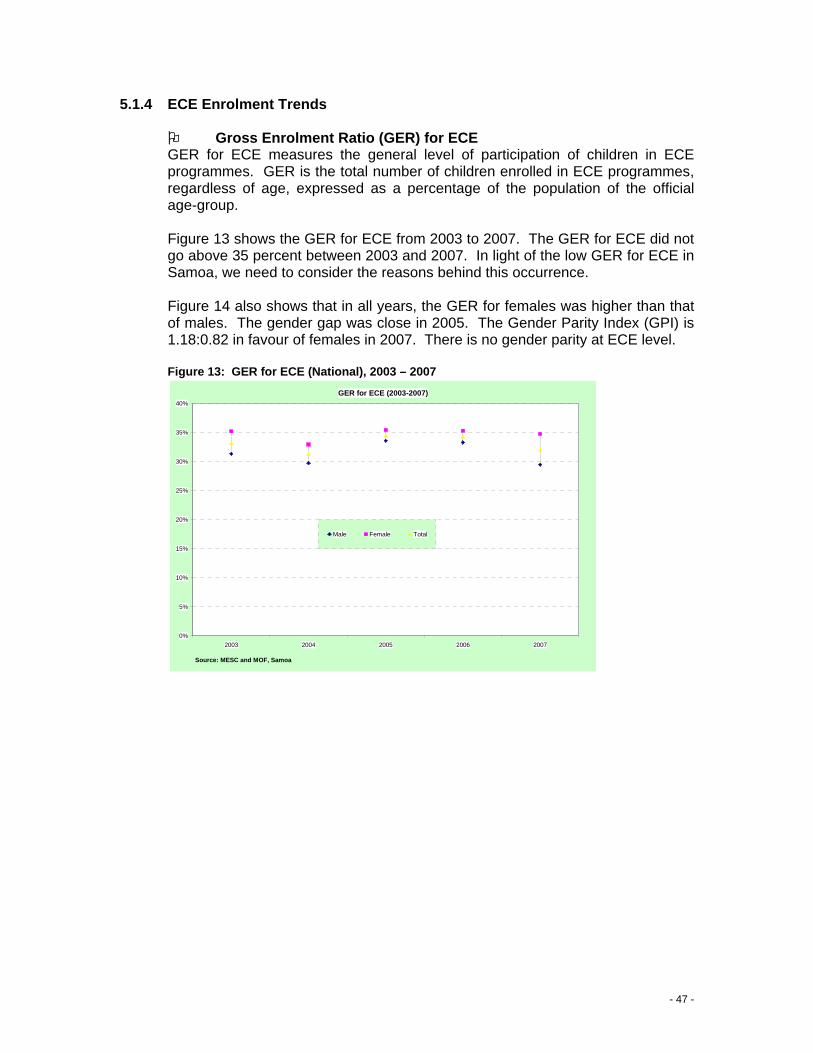
- 47 -
5.1.4 ECE Enrolment Trends
Gross Enrolment Ratio (GER) for ECE GER for ECE measures the general level of participation of children in ECE programmes. GER is the total number of children enrolled in ECE programmes, regardless of age, expressed as a percentage of the population of the official age-group. Figure 13 shows the GER for ECE from 2003 to 2007. The GER for ECE did not go above 35 percent between 2003 and 2007. In light of the low GER for ECE in Samoa, we need to consider the reasons behind this occurrence. Figure 14 also shows that in all years, the GER for females was higher than that of males. The gender gap was close in 2005. The Gender Parity Index (GPI) is 1.18:0.82 in favour of females in 2007. There is no gender parity at ECE level.
Figure 13: GER for ECE (National), 2003 – 2007
GER for ECE (2003-2007)
0%
5%
10%
15%
20%
25%
30%
35%
40%
2003 2004 2005 2006 2007
Male Female Total
Source: MESC and MOF, Samoa

- 48 -
Figure 14: GPI for GER in ECE (National), 2003 – 2007
5.1.5 Financing ECE Please refer to Section 5.6.1.1 for information regarding financing ECE. 5.1.6 Child Health
Under five mortality
A holistic approach to ECE integrates education, health and nutrition to ensure the psycho-social and physical development of young children. The under five mortality rate is the probability (expressed as a rate of 1,000 live births) of a child born in a specified year dying before reaching the age of five. The hospital under five mortality rate for FY2005/06 was 19.7.85 Unfortunately, comparative figures from other years were not available. High rates of under five mortality would imply that significant proportions of children are not receiving adequate care or living in appropriate environments. Child mortality rates in Samoa are amongst the lowest in the Pacific region.
Proportion of 1-year old children immunised against DPT3, Polio,
Measles, Hepatitis, and other vaccines Immunisation protects children from vaccine-preventable diseases and is considered a priority preventative health service. 1981 saw the inception of an immunisation programme in Samoa.86 Inadequate protection against these diseases means that children face life-threatening illnesses and have their capacity to participate in school or learn to their full potential negatively impacted upon.87
85 MOH, Annual Report 2005 – 2006. 86 F P Aiavao, ‘The Health Sector’ in A So’o, UF Va’a, T Lafotanoa, J Boon (eds), Samoa National Human Development Report 2006, The Centre for Samoan Studies (National University of Samoa), Apia, 2006, p. 71. 87 UNICEF, Guidelines for the Asia and Pacific Education For All: Mid-Decade Assessment: Identifying and Reaching the Unreached, Bangkok, p. 40.
GPI for GER in ECE (2003-2007)
1.12
1.11
1.06
1.06
1.18
0.88
0.89
0.94
0.94
0.82
0.00 0.20 0.40 0.60 0.80 1.00 1.20 1.40 1.60 1.80 2.00
2003 2004 2005 2006 2007
female male
Source: MESC and MOF, Samoa
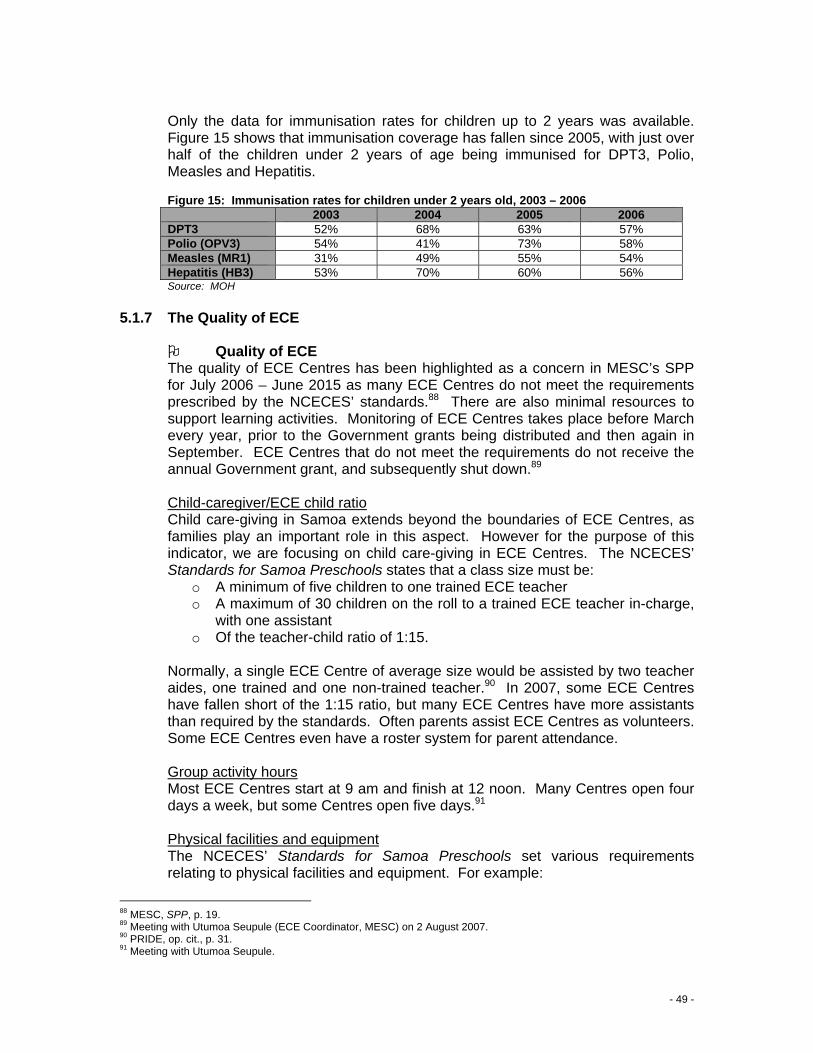
- 49 -
Only the data for immunisation rates for children up to 2 years was available. Figure 15 shows that immunisation coverage has fallen since 2005, with just over half of the children under 2 years of age being immunised for DPT3, Polio, Measles and Hepatitis. Figure 15: Immunisation rates for children under 2 years old, 2003 – 2006 2003 2004 2005 2006 DPT3 52% 68% 63% 57% Polio (OPV3) 54% 41% 73% 58% Measles (MR1) 31% 49% 55% 54% Hepatitis (HB3) 53% 70% 60% 56% Source: MOH
5.1.7 The Quality of ECE
Quality of ECE The quality of ECE Centres has been highlighted as a concern in MESC’s SPP for July 2006 – June 2015 as many ECE Centres do not meet the requirements prescribed by the NCECES’ standards.88 There are also minimal resources to support learning activities. Monitoring of ECE Centres takes place before March every year, prior to the Government grants being distributed and then again in September. ECE Centres that do not meet the requirements do not receive the annual Government grant, and subsequently shut down.89 Child-caregiver/ECE child ratio Child care-giving in Samoa extends beyond the boundaries of ECE Centres, as families play an important role in this aspect. However for the purpose of this indicator, we are focusing on child care-giving in ECE Centres. The NCECES’ Standards for Samoa Preschools states that a class size must be:
o A minimum of five children to one trained ECE teacher o A maximum of 30 children on the roll to a trained ECE teacher in-charge,
with one assistant o Of the teacher-child ratio of 1:15.
Normally, a single ECE Centre of average size would be assisted by two teacher aides, one trained and one non-trained teacher.90 In 2007, some ECE Centres have fallen short of the 1:15 ratio, but many ECE Centres have more assistants than required by the standards. Often parents assist ECE Centres as volunteers. Some ECE Centres even have a roster system for parent attendance. Group activity hours Most ECE Centres start at 9 am and finish at 12 noon. Many Centres open four days a week, but some Centres open five days.91
Physical facilities and equipment The NCECES’ Standards for Samoa Preschools set various requirements relating to physical facilities and equipment. For example:
88 MESC, SPP, p. 19. 89 Meeting with Utumoa Seupule (ECE Coordinator, MESC) on 2 August 2007. 90 PRIDE, op. cit., p. 31. 91 Meeting with Utumoa Seupule.

- 50 -
o Buildings are to be structurally sound in accordance with Public Works standards and well ventilated with adequate windows or suitable openings for sufficient air and light
o There must be a sick bay o Children must have access to a supply of safe drinking water o There must be a first-aid cabinet, fully equipped and in good condition for
immediate use o Outdoor play areas must be fenced off from the road, water hazards, and
other hazards o Ramps for wheelchairs must be installed o Chairs and tables must be in good repair at all times.
Sample building plans are presented in the guidelines. Concern has been raised over the Sogi Model Pre-school, which is also the NCECES headquarters and training centre. The ECE Centre is housed in a very old building which was built in 1978 and is not up to the prescribed standards. The training is undertaken in a renovated adjacent building.92
Teaching and learning materials The NCECES’ Standards for Samoa Preschools states that the programme must follow the recommended curriculum from NCECES which is in line with the MESC policies:
o All activities to cover the different aspects of the curriculum for the full development of the child
o Sports and other play-work sessions are included o Individual and group activities, both indoor and outdoor are included o Field trips are included wherever relevant o Activities are integrated to develop appreciation of and respect for the
environment o Intellectual and cultural sessions are included.
The Ta’iala Mo A’oga ‘Amata i Samoa sets out the specific skills that a teacher should have for effective and successful ECE. The document also runs through the topics that teachers should introduce to the children, such as the person, Easter, health and safety, animals, independence, sea and air, sports, Samoa, and culture and traditions. Learning outcomes of the children, methods of teaching the topics and suggested activities are addressed. It also provides examples of work plans, timetables, and progress sheets for each child.
In relation to the equipment, the standards require that the equipment should:
o Provide the opportunity to explore, experiment, manipulate, discover and problem-solve. Equipment should be challenging, stimulating, interesting and within easy reach of children
o Be changed regularly and repaired so that children’s interest is maintained and learning and development will not be limited
o Kept safe, clean and secure o Include such things as play dough, blocks, plastic/wooden animals and
toys, buckets and shovels, egg cartons, string, wool, costumes, natural materials such as coconut leaves.
92 ADB TA 4256-SAM, op. cit., p. 9.
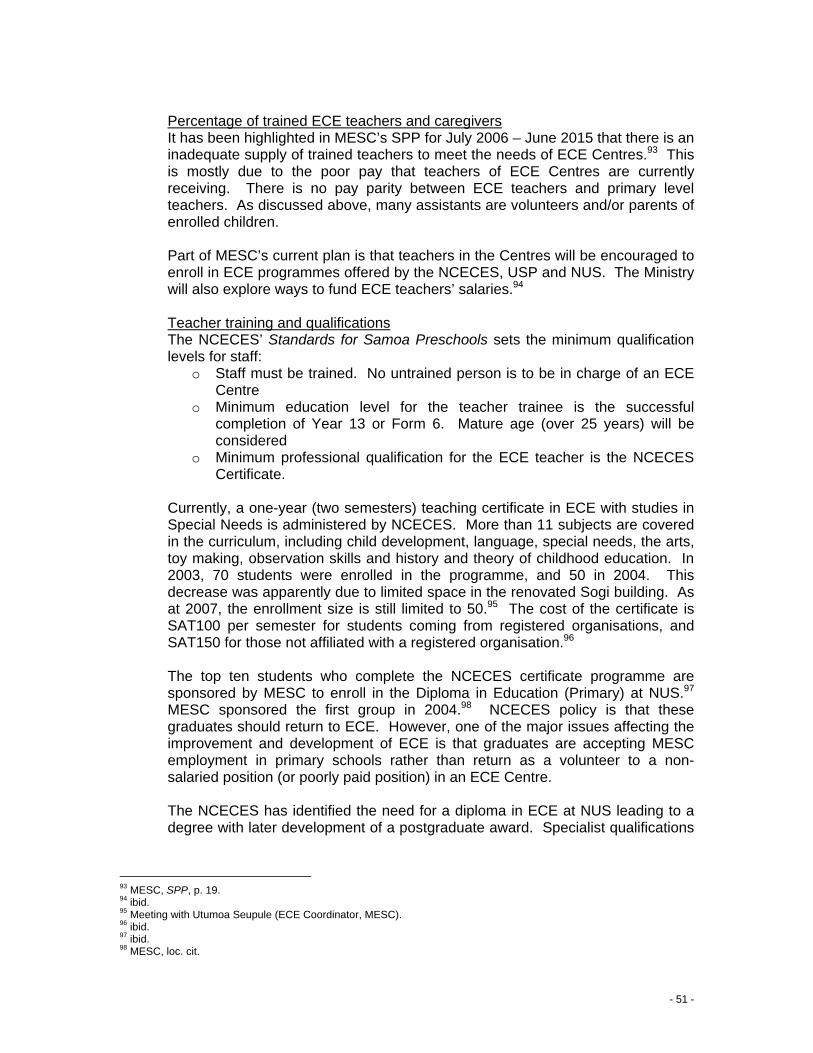
- 51 -
Percentage of trained ECE teachers and caregivers It has been highlighted in MESC’s SPP for July 2006 – June 2015 that there is an inadequate supply of trained teachers to meet the needs of ECE Centres.93 This is mostly due to the poor pay that teachers of ECE Centres are currently receiving. There is no pay parity between ECE teachers and primary level teachers. As discussed above, many assistants are volunteers and/or parents of enrolled children. Part of MESC’s current plan is that teachers in the Centres will be encouraged to enroll in ECE programmes offered by the NCECES, USP and NUS. The Ministry will also explore ways to fund ECE teachers’ salaries.94
Teacher training and qualifications The NCECES’ Standards for Samoa Preschools sets the minimum qualification levels for staff:
o Staff must be trained. No untrained person is to be in charge of an ECE Centre
o Minimum education level for the teacher trainee is the successful completion of Year 13 or Form 6. Mature age (over 25 years) will be considered
o Minimum professional qualification for the ECE teacher is the NCECES Certificate.
Currently, a one-year (two semesters) teaching certificate in ECE with studies in Special Needs is administered by NCECES. More than 11 subjects are covered in the curriculum, including child development, language, special needs, the arts, toy making, observation skills and history and theory of childhood education. In 2003, 70 students were enrolled in the programme, and 50 in 2004. This decrease was apparently due to limited space in the renovated Sogi building. As at 2007, the enrollment size is still limited to 50.95 The cost of the certificate is SAT100 per semester for students coming from registered organisations, and SAT150 for those not affiliated with a registered organisation.96
The top ten students who complete the NCECES certificate programme are sponsored by MESC to enroll in the Diploma in Education (Primary) at NUS.97 MESC sponsored the first group in 2004.98 NCECES policy is that these graduates should return to ECE. However, one of the major issues affecting the improvement and development of ECE is that graduates are accepting MESC employment in primary schools rather than return as a volunteer to a non-salaried position (or poorly paid position) in an ECE Centre.
The NCECES has identified the need for a diploma in ECE at NUS leading to a degree with later development of a postgraduate award. Specialist qualifications
93 MESC, SPP, p. 19. 94 ibid. 95 Meeting with Utumoa Seupule (ECE Coordinator, MESC). 96 ibid. 97 ibid. 98 MESC, loc. cit.

- 52 -
in ECE are available by distance learning at USP through their certificate or diploma programme.99
This year, MESC together with NCECES has started to assess teacher performance. The teacher’s performance is assessed based on the following: performance of duties; knowledge of work; quality of work; preparation and records; attitude; potential for responsible position; administration; relationship; and attendance/punctuality. The ECE Coordinator is available to assist with the training of teachers in areas that require improvement.100 It should be noted that the standards do not set requirements for in-service training. ECE for children with special needs There are no special resources, facilities or equipment for children with disabilities in Samoan ECE Centres due to high costs involved. Apparently there are children with disabilities enrolled in pre-schools in Samoa, which is why the entry age is extended to eight years old. In 2007, only 15 ECE Centres have children with disabilities.101 A Special Needs Education component is taken by students undertaking the one-year certificate in ECE with NCECES.
99 ADB TA 4256-SAM, op. cit., p. 10. 100 Meeting with Utumoa Seupule (ECE Coordinator, MESC). 101 MESC, ECE Database.

- 53 -
5.2 Achieving Universal Primary Education
Measuring progress towards EFA Goal 2: Ensuring that by 2015 all children have access to and complete, free and compulsory primary
education of good quality One of the goals of education in Samoa is the achievement of universal primary education. “Universal primary education aims not only to expand access to primary education for all children, but also the improvement of the education system’s internal efficiency so that all pupils actually complete the primary cycle”.102 The aim is to improve primary net enrolment rates by the year 2015, in line with the EFA initiatives, MDGs and FBEAP. To achieve these increased levels, the education sector is looking to improve access to primary schooling through the following measures103:
• Universal provision and access to primary education with a broad and enriching curriculum to enable all students to realise their full potential
• Monitor and enforce compulsory education • Provide and ensure an accommodating learning environment for all students • Provision of an adequate supply of teachers • Assess and examine areas that prohibit access of all to primary education.
5.2.1 Compulsory Primary Education Primary education covers an eight-year cycle from Years 1 to 8. Students sit a national examination at the end of Year 8 to determine entry into secondary schools. The Compulsory Education Act has been in place since 1991/1992, but has lacked enforcement. Legislation requires that “every child is hereby required to have his name enrolled on the register of some Government or registered school from the time he attains the age of five years until either he attains the age of 14 years or sooner completes the work of Year 8”.104 Although penalties are set out in the legislation, none has been imposed due to several factors like limited human resources and coordination of resources. Although not yet passed by Parliament, the Education Bill seeks to give “attendance officers” the power to detain and question children of compulsory school-age who are not at school during school hours. The enforcement of compulsory education legislation is also included as part of MESC’s SPP for July 2006 – June 2015. 5.2.2 Parent Contributions to Education Education in Samoa is not completely free. While some schools do not charge school fees, parents and communities contribute to maintaining school buildings and pay for other school costs such as for transport, uniforms and food. All in all, there are indirect costs if not directly affecting students and parents. 102 UNICEF, op. cit., p. 49. 103 MESC, SPP, p. 12. 104 Education Ordinance 1959 (Western Samoa), section 16(1).
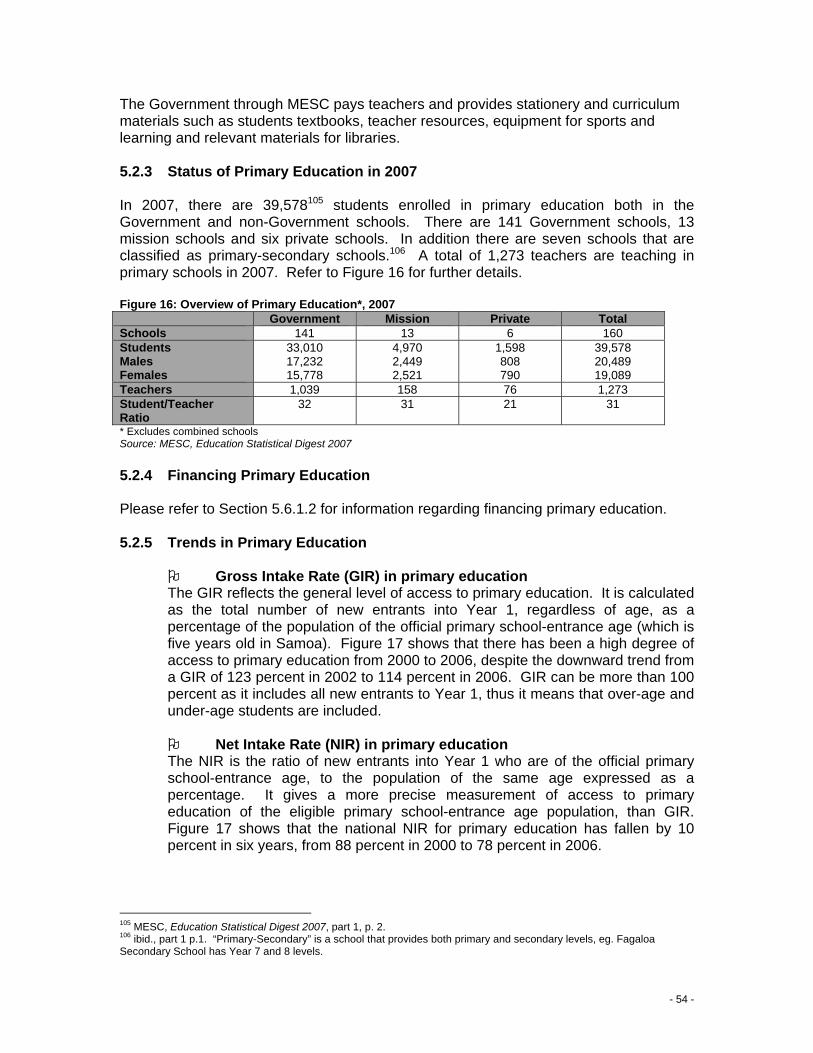
- 54 -
The Government through MESC pays teachers and provides stationery and curriculum materials such as students textbooks, teacher resources, equipment for sports and learning and relevant materials for libraries. 5.2.3 Status of Primary Education in 2007 In 2007, there are 39,578105 students enrolled in primary education both in the Government and non-Government schools. There are 141 Government schools, 13 mission schools and six private schools. In addition there are seven schools that are classified as primary-secondary schools.106 A total of 1,273 teachers are teaching in primary schools in 2007. Refer to Figure 16 for further details. Figure 16: Overview of Primary Education*, 2007
Government Mission Private Total Schools 141 13 6 160 Students Males Females
33,010 17,232 15,778
4,970 2,449 2,521
1,598 808 790
39,578 20,489 19,089
Teachers 1,039 158 76 1,273 Student/Teacher Ratio
32 31 21 31
* Excludes combined schools Source: MESC, Education Statistical Digest 2007 5.2.4 Financing Primary Education Please refer to Section 5.6.1.2 for information regarding financing primary education. 5.2.5 Trends in Primary Education
Gross Intake Rate (GIR) in primary education
The GIR reflects the general level of access to primary education. It is calculated as the total number of new entrants into Year 1, regardless of age, as a percentage of the population of the official primary school-entrance age (which is five years old in Samoa). Figure 17 shows that there has been a high degree of access to primary education from 2000 to 2006, despite the downward trend from a GIR of 123 percent in 2002 to 114 percent in 2006. GIR can be more than 100 percent as it includes all new entrants to Year 1, thus it means that over-age and under-age students are included.
Net Intake Rate (NIR) in primary education
The NIR is the ratio of new entrants into Year 1 who are of the official primary school-entrance age, to the population of the same age expressed as a percentage. It gives a more precise measurement of access to primary education of the eligible primary school-entrance age population, than GIR. Figure 17 shows that the national NIR for primary education has fallen by 10 percent in six years, from 88 percent in 2000 to 78 percent in 2006.
105 MESC, Education Statistical Digest 2007, part 1, p. 2. 106 ibid., part 1 p.1. “Primary-Secondary” is a school that provides both primary and secondary levels, eg. Fagaloa Secondary School has Year 7 and 8 levels.

- 55 -
Percentage of late and early starters The percentage of late and early starters is calculated as the difference between GIR and NIR. Figure 17 shows that the percentage of late and early starters has fallen from the high levels of 2002, where 46 percent of males and 40 percent of females enrolled in primary education, were outside of the official admission age. This indicates that the internal efficiency of the system has improved.
Percentage of unadmitted children of official admission age
This indicator is calculated as the difference between 100 percent and the NIR. It indicates the percentage of children who are not enrolled in Year 1 as a percentage of the population of the official admission age (five years old in Samoa). Figure 17 shows that the proportion of children of official admission age not enrolled in Year 1 has increased from 12 percent in 2000 to 22 percent in 2006.
Figure 17: Progress on GIR, NIR, late and early starters and percentage of unadmitted children of admission age (National), 2000 – 2006
Progress on GIR, NIR, Late and Early Starters and percent of Unadmitted Children of Official Admission Age
111%
119%123% 121%
118%113% 114%
88%
82% 80%85% 85%
79% 78%
23%
37%43%
36%33% 34% 35%
12%
18% 20%15% 15%
21% 22%
0%
20%
40%
60%
80%
100%
120%
140%
2000 2001 2002 2003 2004 2005 2006
girnirlate and early starters% of unadmitted children of official admission age
Gross Enrolment Rate (GER) in primary education The GER for primary education measures the total enrolment in primary level, regardless of age, expressed as a percentage of the eligible official school-age population for primary level, in a given school year. It shows the general level of participation in primary education. As the cycle for primary education is eight years, to calculate GER and NER, we have taken the official school-age population to be between five and 12 years. Figure 18 details the progress of GER in primary education from 2000 to 2006. Over this period, the trend has moved positively since 2000, and been above 100 percent levels since 2001. This indicates a high degree of participation in primary education.
Net Enrolment Rate (NER) in primary education
The NER gives a more precise measurement of the extent of participation in primary education of children belonging to the official primary school age. The NER is calculated as the enrolment of children of the official primary school age

- 56 -
as a percentage of the corresponding population. Figure 18 shows that from 2000 to 2006, the NER for primary education increased from 92 percent in 2000 to 97 percent in 2006, reflecting improved participation levels in primary education over this period. However, there has been a negative drift since the high levels of 99 percent in 2004, where universal primary education was almost achieved. Figure 18: Progress on GER and NER for primary education (National), 2000 – 2006
Progress on national GER and NER for primary education (2000-2006)
97.8%
100.6%
103.2%
104.4%105.3%
104.8%103.8%
92.5%
94.8%
96.7%
98.8%99.3%
98.3%97.3%
85%
90%
95%
100%
105%
110%
2000 2001 2002 2003 2004 2005 2006
ger ner
Source: MESC and MOF, Samoa
Repetition rates in primary education The repetition rate is the proportion of pupils that repeat a year level. Figure 19 shows that the percentage of repeaters for all primary levels, from 1999 to 2007. The repetition rates for Years 2 to 7 are consistently low, between 0.4 and 1.7 percent or equivalent to 20 to 88 students respectively. More pupils repeat Years 1 and 8 than any other year level, suggesting that some children are enrolled into Year 1 too early and that is why some students are not prepared for entry into secondary school. We noted that the high repetition rates evident in 2002 have improved in all year levels in 2007.
Figure 19: Number of repeaters in all primary schools by level (National), 1999 – 2007
Number of repeaters by level in primary education (1999-2007)
150 125 142
306345
234 223 206
47 36
8870
6951 51
35 20
69 58
5134 46
22 29
83 66
55
41 44
20 26
6640
63
36 31
33 12
4762
43
24 25
3734
5345
33
41 28192
122
188155
148
105 130
201
39
35
22
20
55
24
19
21
30
16
41
17
68
188
0
100
200
300
400
500
600
700
800
900
1000
1999 2000 2001 2002 2003 2004 2005 2006 2007
yr1 yr2 yr3 yr4 yr5 yr6 yr7 yr8
Source: MESC, Samoa

- 57 -
Promotion rate in primary education Promotion rate is the proportion of students who have successfully completed a grade and proceeded to the next grade the following year. In Samoa, automatic progression is not practiced. Figure 20 details the promotion rate in primary by year level, from 2000 to 2006. In all year levels besides Year 1 to 2, the promotion rate is in the high ninety percentile, indicating a sound internal efficiency of the education system at these year levels. The lower promotion rate from Year 1 to 2 across all years suggests that some parents are enrolling their children into Year 1 too early, which leads to repetition of Year 1 in the following year.
Figure 20: Promotion rate by year level (National), 2000 - 2006
Promotion rate by year level in primary education (2000-2006)
80%
85%
90%
95%
100%
105%
110%
2000 2001 2002 2003 2004 2005 2006
yr1-yr2 yr2-yr3 yr3-yr4 yr4-yr5
yr5-yr6 yr6-yr7 yr7-yr8
Source: MESC, Samoa
Survival rate to Year 8 Survival rate to Year 8 is a proportion of the cohort of pupils who reached Year 8 expressed as a percentage of the pupils enrolled in Year 1 of a given cycle. This indicator is used to show the extent to which a school system can retain pupils, with or without repetition, and also indicates the drop out rate. Figure 21 presents the survival rate to Year 8, by region and national. During the period from 2001 to 2006, pupils from the Apia Urban area were consistently more likely to survive until Year 8, than pupils in Savai’i and the Rest of Upolu (ROU). However, the survival rate for ROU has improved over this period, whilst that of Savai’i has dropped from 91 percent in 2001 to 82 percent in 2006 indicating a rise in the drop out incidence in Savai’i.

- 58 -
Figure 21: Survival rate to Year 8 by region, 2001 – 2006 Survival rate to year 8 by region (2001-2006)
96% 95% 95%93%
88%
93%
73% 73% 75%78%
82%79%
91%89% 87%
79%
85%82%
85% 84% 85% 83% 84% 84%
0%
20%
40%
60%
80%
100%
120%
2001 2002 2003 2004 2005 2006
Apia Urban ROU
Savaii National
Source: MESC, Samoa
Graduation rate from primary education We have assumed for the purposes of this indicator, that all students that sit the Year 8 National examination, graduate and complete primary education. Figure 22 illustrates the percent of Year 8 students that sit the five examinable subjects. In all years, the graduation rate has remained in the low ninety percentile and the rest of the 100 percentile either drop out from the system or repeat the same level.
Figure 22: Graduation rate for Year 8 National Examination (National), 2000 – 2006
Graduation rate for primary education (1999-2006)
86%
87%
88%
89%
90%
91%
92%
93%
94%
95%
96%
1999 2000 2001 2002 2003 2004 2005 2006
English Samoa Mathematics
Science Social Science National
Source: MESC, Samoa
Transition rate to secondary education Transition rate to secondary education is expressed as the proportion of students that progress from Year 8 to Year 9, expressed as a percentage of those enrolled in Year 8 in the proceeding school year. Figure 23 shows that there was a much higher degree of transition or access in Apia Urban, in all years from 2000 to 2006, than in Savai’i and ROU. This may be most of the secondary schools are concentrated in the Apia Urban area. Despite this, the situation in Savai’i has improved greatly over this period, with
- 59 -
the transition rate to secondary education increasing from 63 percent in 2000 to 82 percent in 2006. This increase was inline with the positive outlook of the national trend with a five percent growth through out the series 2006. The 2001 National Population and Housing Census reported that the internal migration level was 9.51 percent into Apia Urban area from the rest of Samoa.107 This trend might explain why transition rates in the Apia Urban area are higher than 100 percent. Figure 23: Transition rate from primary to secondary education by region, 2000 – 2006
Transition rate from primary to secondary level (2000-2006)
113% 112%
104%107%
104%107% 109%
74%
81% 80%83%
80%75% 76%
63% 64%
72% 70%
76%
82% 82%
89%84% 86% 86%
89%88%88%
0%
20%
40%
60%
80%
100%
120%
2000 2001 2002 2003 2004 2005 2006
Apia Urban Rest of Upolu
Savaii National
Source: MESC, Samoa 5.2.6 Special Needs Education (SNE) From the 1960s to 2000, the main providers of education to children with special needs were primarily NGOs. All these NGOs were based in Apia.108 The AIGA Programme in 2000 paved the way for Government involvement in SNE. MESC began to provide grants to the NGOs, and started the establishment of Special Needs Units in selected primary schools.109 Currently, the NGOs still play the most important role in educating children with special needs. The NGOs that provide SNE are Loto Taumafai, Fiamalamalama, Senese Junior Preparatory School and the Special Education Unit Savai’i (SEUS). These NGOs are education centres for children with disability that operate as ‘special schools’, in that they are segregated in both setting and most programmes. Private and mission schools are also providers of education to some children with disability. The establishment by Loto Taumafai of an early intervention programme was an important development that is now in its sixth year (2007) of operation, supporting families with children with disabilities and follows a community based approach.
107 MOF (Department of Statistics), Samoa Census of Population and Housing 2001, Apia, 2002, p. 60. 108 F Mulitalo, M Pesamino and D Lene, Inclusive Education Workshop, 1-5 October 2007, Status Report on Inclusive Education, Samoa, October 2007, p. 4. 109 R McCollough, Case Study and Manual on Guidelines for Action to include Children and Youth with Disabilities in School Systems and the EFA Monitoring Process, Christchurch, 2005, p. 9.

- 60 -
Notably, Samoa is also a signatory to and has responded to the following plans/frameworks which relate to SNE110:
• The Asian and Pacific Decade of Disabled Persons with Disabilities • The Salamanca Statement and Framework for Action • The Biwako Millennium Framework • The FBEAP • EFA.
Inclusive education policy
In 2005, MESC drafted the Samoa – Special Needs Policy with the commitment to provide appropriate programmes for students with special needs or at risk because of economic circumstances. The Special Needs Policy which addresses an approach to inclusive education states that: “where possible, all students’ needs should be met in normal schools”. MESC’s SPP for 2006 – 2015 has a dedicated component to the development of inclusive education. The vision for Inclusive Education is “a national education system supporting sustainable quality inclusive education and sports for all persons with special needs”.111 The key policy statements are as follows112:
o Facilitate the enrolment and participation of children with disabilities. Special attention will be given to girls and women with disabilities.
o Develop sound knowledge and best practice for inclusive education o Work in collaboration with NGOs and the MOH to ensure the future
sustainability of early intervention for children with disabilities o Capacity building for SNEAC will be encouraged o Ongoing support for SNE teachers o MESC will support public awareness programmes on inclusive education
and people with disabilities o In collaboration with the Ministry of Works, Transport and Infrastructure
national guidelines for appropriate accessible educational and public facilities will be enforced
o Document, record and adopt appropriate models of good practice for educational and sporting provision.
Inclusive Education in practice
“Students with special needs are whose health, abilities, performance or behaviour is significantly different from their peers. This will include students who are talented and gifted as well as those with high learning needs.”113
In the past, the activities of SNE NGOs led to awareness campaigns and advocacy about the rights of the children with special needs. These awareness campaigns together with teacher training workshops were conducted by overseas donors and volunteers in the form of forums which brought in new ideas about the integration, mainstreaming and inclusion children with special needs.114 The combination of influences from the local family community and the
110 ibid., p. 4. 111 MESC, SPP, p. 29. 112 ibid., p. 30. 113 MESC, Special Needs Education Policy, Apia, January 2006, p. 3. 114 McCollough, op. cit., p.3.
- 61 -
global community continue to develop a stronger and more inclusive understanding of the right to education for ALL children. The current system within the primary level was developed as a result of MESC’s Education Policies and Strategies 1995 – 2005. It was formulated concurrently with the training of teachers in the areas of SNE 115 at the FoE at NUS. The SNEAC (with representation from NGOs and Government sectors) was established in 1998 and provides advice to the Chief Executive Officer of MESC in relation to Special Needs and Inclusive Education and the needs of students and their families. To facilitate the development of SNE, the SNE Coordinator position was established within the MESC organisational structure in 2001 to provide support and advice in the development of a national system to increase the access and quality of education for children with disabilities. This has involved in-service teacher training, provision of regular support for SROs, principals, SNE teachers and students in schools, coordination of public awareness for parents and communities concerning the rights and needs of children with disabilities and contributing to the formulation of MESC policies to ensure they are inclusive. Currently, there are no regular inclusive schools. The six Special Needs Units, four in Upolu (Falefitu, Saleimoa, Lalomanu, Magiagi) and two in Savai’i (Tutaga, Sataua) were established in 2001 by MESC based on identified needs from the survey. Since 2002, these units have suffered from a general teacher shortage which has resulted in some special needs teachers reallocated to regular class duties. Currently, these SNE Units are functioning. In the spirit of inclusive education there are other primary schools who have accepted children with special needs.
In 2006, the PRIDE Sub-Project on Inclusive Education commenced to help support the development of systems to facilitate inclusive education. This included meetings to discuss concepts and strategies, teacher training on how to support children with specific disabilities, media campaign to help get accurate information about disability to the general public, and accessible guidelines for the design of schools.116 MESC supports and encourages sports development programs for people with special needs. One of the major achievements was the completion of the “Samoa Sports Ability Workshop” for people with special needs, conducted by Officials from the Australian South Pacific Sports Programme in collaboration with the Sports Division. The workshop resulted in the establishment of the Samoa Sports Ability Advisory Committee, consisting of members from all special needs schools and organisations to advise the Sports Division on programs and activities for people with special needs.117
115 ibid., p. 17. 116 Mulitalo, op. cit., p. 5. 117 MESC, SPP, p. 29.

- 62 -
Compulsory and free education for children with disabilities As discussed earlier, the Compulsory Education Act requires all children to attend school between the ages of 5 to 14 years. All children including those with special needs are within this age group. However, as the legislation lacks enforcement, there are children with special needs not enrolled in schools. As all parents contribute to the costs of education, free education does not exist in Samoa. MESC does not require parents of children with disabilities to contribute additional costs to their child’s education in its Special Needs Units. Please refer to Section 5.6.1.4 for information regarding Government financing for SNE.
Regional training and curriculum development; Percentage of
trained teachers; Teacher training and qualifications There is no special curriculum development for special needs education. Special needs students follow the same curriculum as regular students in the classroom. The focus is on teaching method rather than curriculum development. With the assistant of Volunteer Service Abroad volunteers, the FoE began developing curriculum for SNE to support the MESC policies. The initial six SNE courses and the skill sharing capacity of the volunteer culminated in the appointment of a Principal Lecturer to do the SNE work. Since 2000, students enrolled at the FoE at NUS could opt to take the SNE component which gave them a ‘specialty’ area in SNE. In 2000 the first group of six student teachers with SNE training graduated. In 2005, out of the 80 teacher trainees, 14 of them have elected to take up SNE courses.118 Currently, the total number of student teachers that have graduated from the FoE with SNE training is approximately 40. In 2005, a new course was developed called ‘Inclusive Education’ and this is now a compulsory course for all teacher trainees. The other SNE courses are:
o Introduction and Understanding Education for Special Needs o The Individual Education Programme o Assessment Techniques and Teaching Strategies o Special Education: Barriers to Learning o People with Special Needs in Samoa.
SNE teachers attend course work at NUS and have practicum experiences and placements with the SNE NGOs, organised and monitored by the Principal Lecturer. NUS embarked on a professional staff development program and two NUS lecturers are pursuing studies in special needs education at the postgraduate level. Both have completed Masters in Special Needs Education with one pursuing studies in PhD level in New Zealand.
118 McCollough, op. cit., p. 49.

- 63 -
At present all in-service training is the responsibility of MESC, with the FoE asked from time to time to conduct training which they are more than happy to do. The FoE also conduct monthly forums on specific topics including SNE to which all teachers and interested people are invited to attend. The training of teachers to teach special needs children requires specialist skills and certain types of personalities and aptitudes that are quite scarce and recruiting such people is difficult.119
Physical facilities and equipment The provision of physical facilities and equipment for SNE in primary schools has been limited. Many village schools which have had to raise their own funds for facilities and equipment do not include accessibility in their plans due to the extra costs involved.120 However, schools built with ADB funding include accessible toilets and ramps.
Teacher and learning materials Two special needs educational (Samoan Sign Language Dictionary and the Inclusive Alphabet) resources have been developed in Samoa to be used by both teachers and students. MESC has also implemented a Tool Kit to promote Inclusive Education with the introduction of six booklets, three of which have been translated and distributed to schools.
119 Afamasaga, ‘The Challenge in Education’, p. 83. 120 McCollough, op. cit., p. 7.

- 64 -
5.3 Life Skills and Lifelong Learning
Measuring progress toward EFA Goal 3: Ensuring that the learning needs of all young people and adults are met through equitable access to
appropriate learning and life skills programmes The 1990 Jomtien Declaration defined life skills as “essential learning tools and basic learning content required by human beings to be able to survive, to develop their full capacities… to improve the quality of their lives…” A decade later, the 2000 Dakar Framework for Action revised this definition, expanding it to include the acquisition of knowledge, values, attitudes and skills through the Four Pillars of Learning: learning to know, learning to do, learning to live together and with others, and learning to be.121 For assessment purposes, life skills can be broken down into:
• Basic skills: for example, literacy and numeracy • Psycho-social skills: for example, problem solving, critical thinking, decision-
making, inter-personal, communicating, and team work • Practical/contextual skills: for example, income generation,
technical/vocational, health, gender, family, environment, and civic education/governance.
These three aspects of life skills are discussed in turn below. One of the goals of education in Samoa is to “improve adult literacy and access to life skills and continuing education for adults and youth”122. Further to this, the aims of the education sector include related objectives as123:
• At primary level – promoting individual development such as encouraging independent and creative thinking; achieving an understanding of the need to protect and sustain the natural and cultural environment
• At secondary level – developing cultural understanding such as knowledge and understanding of customs and values relating to people and property in faa Samoa; encouraging community development such as preparing for proper and effective participation as a member of the local and national community
• At PSET level – enhancing provision for livelihood opportunities, self employment and income generation in PSET.
5.3.1 Basic Skills
Benchmark for literacy and numeracy at Year 6
At the primary level, the aims of the education sector in relation to basic skills are124:
o Achievement of the appropriate levels of literacy in Samoan and English o The systematic development of numerical concepts and mathematical
computation skills.
121 UNICEF, op. cit., p. 81. 122 MESC, SPP, p. 12. 123 ibid., pp. 11-14. 124 ibid., p. 13.

- 65 -
MESC believes that it is important to build these basic skills in the early years during primary schooling. The Samoa Primary Education Literacy Levels (SPELL) Tests are conducted at Year 4 and Year 6 to test student ability in English, Samoan and Numeracy in an effort to establish common benchmarks across schools. The tests are taken in all Government schools, and most non-Government schools also participate but it is not compulsory. At risk are those scoring at levels 4 and 5 on the test. MESC sets the tests and analyses the test results. The intention is that test results are provided to principals and teachers so that they can devise intervention strategies to assist at risk students. The results of the SPELL Tests, although improved since 2003, remain a concern. See Section 5.4.1.2 for further discussion of the SPELL Tests. There is a move in the Pacific region towards setting benchmarks for literacy and numeracy, to be assessed at Years 2, 4, 6 and 8. This will allow member countries to measure and monitor the quality of basic education in their countries, rather than against other countries in the Pacific. These benchmarks will also introduce to the Pacific region definitions for literacy, numeracy and life skills. See Section 5.4.2.3 for further discussion.
Role of civil societies in the provision and delivery of basic
education The SDS for 2005 – 2007 emphasises the importance of strengthening community support in education for improving student learning outcomes.125 Church groups, NGOs and private organisations all assist in the provision and delivery of basic education in Samoa.
Mission and private schools At the primary and secondary level, non-Government schooling is provided by mission and private schools. Mission schools are run by churches. With the exception of religious instruction at mission schools, subjects and extracurricular activities are the same as Government schools. In 2007, there are 30 mission schools and eight private schools.126 Hence, 18.6 percent of primary and secondary schools are run by non-government institutions. Pastors’ schools and study centres Aoga a Faifeau (pastors’ schools) supplement regular education through teaching basic numeracy and literacy alongside biblical knowledge. The church/village based study centre also exists to supplement primary and secondary education through supporting students to understand and complete their school tasks and assessment requirements. For example, the Vaiala Study Centre’s mission statement is:
“to provide an enabling environment for extra study through the provision of a suitable study centre, peaceful surroundings and on the spot academic counseling and other professional help in all subjects taught at school, including the current issues and syllabus of the Ministry of Education”.127
125 MOF, Strategy for the Development of Samoa, p. 20. 126 MESC, Education Statistical Digest 2007, part 1, p. 1. 127 Lameta, op. cit., p. 112.

- 66 -
Second-chance education For those that cannot benefit from the formal school system, second-chance education provides a substitute for regular full-time schooling. Don Bosco Technical Centre (Catholic) and Ulimasao Marist Centre for Special Learning (Marist-Catholic) offer second-chance education programmes in school settings. These programmes provide early-school leavers the opportunity to develop basic literacy and numeracy skills, and to develop skills for life and for work. The process for programme planning and implementation includes community consultation to identify target groups, developing an outcomes based curriculum tailor-made to suit each student’s basic education and employment need, establishing linkages with work places for work experience and placements, and establishing linkages with mainstream education for future education.128 Laumua o Puna’oa (Methodist) also has similar programmes. Don Bosco and Puna ‘oa are located in Upolu. Ulimasao Marist Centre for Special Learning is located in Savai’i. Matuaileo’o Environmental Trust Incorporated (METI) is a NGO working with MESC on a second-chance education development programme. Funded by the Commonwealth Secretariat under its “Commonwealth Service Abroad Programme”, METI and MESC conducted the 1st Life Skills Training Course for Premature School Leavers in early 2006. Manono village was the first pilot centre. Currently the programme in collaboration with the TALAVOU Project and MESC is working on developing Curriculum Module materials for all subjects (including literacy and numeracy), targeting second chance for all mature, premature and drop out students.129 The intention is that the module will be accredited by SQA for continuous learning purposes. Private organisatons Private tutoring organisations also exist. For example, Kip McGrath, which is an international company, offers individual tuition on literacy and numeracy in Samoa. Other tutoring support is provided by pastor schools, study centres, and family members.
5.3.2 Psycho-Social Skills
Curriculum
The impact of having psycho-social skills included in education standards includes increased academic achievement, improved behaviour in schools and better mental health.130 The National Curriculum Policy Framework (NCPF) states that some learning outcomes occur across the different learning areas. These are described as “essential skills”, being the broader skills that are developed throughout years of schooling and the result of the quality of experiences provided in all classroom and school activities. Essential skills include131:
128 Lameta, op. cit., p. 97. 129 MESC, Annual Report – 1 July 2005 – 30 June 2006, p. 21. 130 UNICEF, op. cit., p. 92. 131 MESC, National Curriculum Policy Framework (NCPF), Apia, 2006, pp.11-12.
- 67 -
o Communicating effectively (reading, writing, speaking and listening, visual and graphic representation, non-verbal communication and use of number and data to convey meaning)
o Solving problems (use of inquiry and reasoning, gathering data and processing information, posing creative solutions and evaluating outcomes)
o Developing social and cultural skills and attributes (capacity to operate socially, teamwork, understanding of context, cultural norms and expectations, and negotiation)
o Managing oneself and developing work and study skills (time management, conflict resolution, personal responsibility for choices and actions).
The development of these essential skills depends very much on the methodology used by teachers in their learning areas. Pedagogies are meant to be active, interactive and creative. For example, such essential skills can be developed through undertaking group work, debating, presentations and projects. MESC’s current SPP highlights the issue that the current education system privileges the learning of facts and a teacher dominated pedagogy.132
Benchmarks at Year 8
Students sit a national examination at the end of Year 8 to determine entry into secondary schools. The students are examined in five core subjects only: English, Samoan, mathematics, basic science and social science. It is acknowledged that the testing of psycho-social skill is limited in Year 8 due to the nature of the ‘pen and paper’ examination. Teachers are also more likely to teach students in accordance with what is likely to be examinable. MESC is working on trying to include more psycho-social skills in testing.
Life skills programmes
There are no specific programmes within schools focusing on developing psycho-social skills. As part of the development of benchmarks for literacy and numeracy in the Pacific region, it is also proposed that life skills benchmarks be developed also, to be assessed at Years 4 and 8. The components to be assessed are communication and interpersonal skills, decision-making and critical thinking skills, coping and self-management skills, practical/livelihood skills, and contextual/issues based skills. Please refer to Section 5.4.2.3 for further information.
Incidence of reported violence in schools
Violence in schools, including bullying by peers impacts upon mental health, academic achievement and overall socialisation of children and young people. In affecting young people’s perceptions of safety, school violence works against the establishment of child friendly or health promoting schools.133 We are unable to provide numbers of the acts of violence in schools. MESC has a process to investigate claims of violence when they are filed with the Ministry. However, not all complaints come to the Ministry. In some cases, families take
132 MESC, SPP, p. 41. 133 UNICEF, op. cit., p. 92.

- 68 -
their complaints directly to the Police and end up in court. At other times, complaints are settled at the school level and not reported to MESC. MESC has made it clear to its staff, principals and teachers, that corporal punishment will not be tolerated. Some schools have well-established rules for behaviour, but it is evident that some teachers are still using physical force to discipline students. This ranges from ear-pinching134 to much more serious acts of violence.
Existence of school committees
The existence of school committees is part of a set of policies and guidelines to assist school communities and responsible people to carry out the task of school improvement and school management. This partnership between school committees and the Government has long existed, but was strengthened during the MESC’s ISP programme which ran from 1999 to 2004. MESC appoints and pays the salaries of principals and teachers, and distributes stationery and curriculum materials to schools. The local communities (village/district) provide the school buildings, furniture and equipment, and are also responsible for the maintenance of the school and its environment. All 141 Government primary schools in Samoa have a school committee. Of the 25 Government secondary/colleges, 21 have school committees (the exception being Samoa College, Vaipouli College, Avele College and Leifiifi College because they are administered and controlled by MESC).135 The school committee acting on behalf of the village council has the controlling authority of the school, with the principal as the secretary. They perform their responsibilities on behalf of the local community and the Government through MESC. The school committee is responsible for136:
o Preparing an annual budget indicating sources of income and allocation of expenditure
o Ensuring that the determination, collection and disbursement of school funds raised is in accordance with the annual budget and MESC policies
o Enforcing compulsory education, curriculum requirements, and determining and providing optional curriculum requirements
o The proper accounting of Government provided resources o Preparing and managing a School Management Plan o Maintaining an up to date asset register o Ensuring the efficient and effective management of the school o Ensuring that the behaviour of the students at each school is in
accordance with Government requirements and the expectations of the parents of the school and the local community.
In the PRIDE, Samoa Education Sector Evaluation Study conducted in 2005, discussions took place with school committees in Apia, rural Upolu, and Savai’i. The school committees consulted thought that school committees:
“greatly enhanced school management at local level by giving effect to an active and efficient body to support school operations. The main elements that have contributed to this include well-defined [terms of reference] for committees, clear
134 MESC, Values in Education Study, Apia, 2007. 135 Interview with Malama Taaloga Faasalaina (Principal School Improvements Officer, MESC). 136 MESC, School Operations Handbook, Apia, July 2004.

- 69 -
duties and responsibilities, and a contract that essentially binds the committee to accountability and transparency… Ultimately, the parents and community have gained a much better insight into the work of the school and have adopted a sense of ownership, whereas previously they felt alienated”.137
Existence of parent and teacher associations (PTAs)
Some schools do have PTAs that exist alongside school committees. PTAs can assist with fundraising activities and general maintenance of grounds, school buildings and facilities.
Provision of school counseling services
Supporting the personal and social development of young people through professional counseling services can lead to greater academic achievement and increased health and well being. In Samoa, schools do not have registered counseling services provided within schools. It is expected that this role falls to the teachers, parents and pastor. MESC has highlighted the need for careers counseling to be strengthened.138 Currently, there are no careers counselors stationed within the education sector. However, ministries, NGOs, and private companies do visit schools to give advice on the subjects and courses students need to take to assist with employment. For example, since 2003 MESC has run an annual careers day for students. Since 2004, Avanoa Tutusa has conducted careers days for Years 12 and 13 students on Savai’i and Upolu.
5.3.3 Practical/Contextual Skills
Youth unemployment rate
Unemployment is on the rise, especially for young people. Measuring unemployment in Samoa is challenging because a lot of excess labour is absorbed by the subsistence sector. A high proportion of young people work as unpaid family workers, which can be a semi-disguised form of unemployment.139
In the 2001 Census, the following definitions applied140:
o Economic active population: consisted of all persons who were Employed and Unemployed for seven days prior to the 2001 Census date.
o Employed: comprised of all persons who had a paid job, persons working to earn money, and, all persons working in activities such as farming, planting, fishing and handicrafts for family consumption or for sale during the reference period.
o Unemployed: included all persons who were actively looking for a job either for the first time or otherwise.
o Economically inactive population: consisted of all persons attending school or mostly taking school courses during the reference period, persons mainly involved in housework and caring, and, all those persons not doing any work.
137 PRIDE, op. cit., p. 53. 138 MESC, SPP, p. 22. 139 Muagututi’a, op. cit., p. 51. 140 MOF (Department of Statistics), Samoa Census of Population and Housing 2001.

- 70 -
Figure 24: Employment indicators, 1991 to 2001 1991 2001 ECONOMICALLY ACTIVE POPULATION Male 38,839 36,739 Female 18,303 16,206 Employed Male 38,240 35,118 Female 17,727 15,207 Unemployed Male 599 1,621 Female 576 999 INACTIVE Male 11,431 17,673 Female 27,356 34,106 Unemployed 15-24 male 490 879 Unemployed 15-24 female 467 638 Source: MOF, Statistical Services Division
The 2001 Census indicated that about 51 percent of the population, 15 years and over was economically active. About 32 percent of the economically active population was female, whilst 68 percent was male. About 60 percent of males were employed in Agriculture/Fisheries and Crafting. The creation of jobs within the formal economy, public sector and private, does not meet the number of new job seekers.141 Each year, a new group of school-leavers attempt to join the labour force, many of them prepared for white-collared jobs that do not exist. Five percent of all the economically active persons 15 years and over were reported as unemployed (seeking paid employment). Unemployed youth between the ages of 15 and 24 years accounted for 58 percent of the unemployed population. The 25 to 34 age group increased this figure to a further 30 percent, so that 88 percent of the unemployment was experienced by youth between the ages of 15 to 34. Male youth were more likely to be unemployed than female youth with youth unemployment sex distribution as 58 percent male and 42 percent female. Further to this, the largest number of unemployed youth resided in the urban area. 142
141 Lameta, op. cit., p. 16. 142 SBEC, op. cit., p. 30.

- 71 -
Figure 25: Age group as a percentage of unemployed persons, 2001
15-2458%
25-3430%
35-448%
45-543%
55+1%
Source: SBEC, TALAVOU Programme: Desk Review Report
5.3.3.1 Post School Education and Training (PSET) PSET in Samoa encompasses diversity of areas that include tertiary level education at university, pre and in-service teacher education, technical and vocational education, and professional education, non-formal and on the job training. The vision under MESC’s current SPP is for “a post school education and training subsector that is well coordinated with adequate provision to meet the needs of society and all the people of Samoa”.143 5.3.3.2 Technical and Vocational Education and Training (TVET)
Availability of TVET in the formal school system of country
TVET in Samoa comprises a range of programs with courses offered at different levels. Training is offered at tertiary technical and vocational institutes, the main one being the Institute of Technology of the NUS (IOT), previously known as Samoa Polytechnic. TVET is also offered in secondary schools and colleges as practical subjects including agriculture, food and textiles technology, arts and crafts and design technology. Don Bosco Technical Centre (a vocational centre owned and operated by the Catholic Church), Laumua o Puna’oa Technical Centre and Uesiliana College (owned and run by the Methodist Church), and the Leulumoega School of Fine Arts, are examples of main non-government owned institutions.144 An important milestone for the development of TVET in Samoa has been the establishment of the Samoa Association of Technical and Vocational Education Training Institutions (SATVETI) which is a national association firmly committed to the development of effective TVET for Samoa.145
143 MESC, SPP, p. 22. 144 ibid., pp. 26-27. 145 ibid., p. 27.

- 72 -
TVET addressed in national strategic plan and education policies
TVET is addressed in MESC’s SPP for July 2006 – June 2015. The vision is for “quality technical, vocational and applied educational programmes to enable people to be gainfully employed in order to meet the skills requirements of industry and commerce in Samoa”.146 Please refer to Section 5.6.1.6 for information regarding the financing of TVET.
Existence of nationally certified TVET institutions
Besides the IOT, the private institutions listed below offer a range of technical and vocational training for out of school youth and adults. SQA intends to accredit all PSET providers, including TVET institutions. During 2007, each institution will be encouraged to undergo the accreditation and registration process by SQA so that their courses will meet the required quality standards and are within the national qualification framework.
TVET Providers147
o Beautiful Expression of Nature Fine Arts Academy o Church College of Western Samoa, Pesega o Don Bosco Technical Centre o June Ryan Music School o Laumua o Puna’oa Technical Centre o Leulumoega Fou School of Fine Art o Loto Taumafai Education Centre for the Disabled o Pacific International Uni-Tech o Samoa School of Music o Tesese Institute of Administrative Studies o Tiapapata Art Centre o Uesiliana Vocational Training Centre o Ulimasao Marist Centre for Special Learning
TVET enrolments
Many TVET institutions are facing challenges with collecting data. Figure 26 shows enrolment numbers at some TVET institutions. Enrolments in all four institutions have increased since 2000. The percentage of females to males enrolled at IOT has not improved greatly, from 35.7 percent in 2000 to 38.6 percent in 2007. Laumua o Puna’oa has fared much better improving from 13.3 percent in 2000 to 33.3 percent in 2006. Uesiliana has a similar proportion of females to males, sitting at 32.4 percent in 2007. We note that Don Bosco only offers programmes to males.
146 MESC, SPP, p. 27. 147 SATVETI records.

- 73 -
Figure 26: Total students enrolled in selected TVET institutions, 2000 – 2007 2000 2001 2002 2003 2004 2005 2006 2007
IOT Male 287 325 351 322 397 352 355 351 Female 159 159 141 145 157 201 183 221 Total 446 484 492 467 554 553 538 572 Punaoa Male 52 61 63 62 68 70 80 n/a Female 8 11 12 22 21 26 40 n/a Total 60 72 75 84 89 96 120 n/a Don Bosco
Male 265 250 230 205 235 215 260 280 Total 265 250 230 205 235 215 260 280 Uesiliana Male 7 13 3 23 25 23 31 23 Female 0 1 18 5 5 10 11 11 Total 7 14 21 28 30 33 42 34 Source: NUS, Laumua o Puna’oa Technical Centre, Don Bosco Technical Centre, Uesiliana Technical Centre
TVET graduates
Many TVET Institutions do not keep comprehensive records to enable the determination of the destinations of students, and the outcomes and usefulness of the training.148 Figure 27 shows the total number of students that graduated from IOT, Laumua o Puna’oa and Uesiliana Technical Centre from 2000 to 2006. IOT is currently offering diplomas and certificates which take between one and two years to complete. The certificate of completion awarded at Laumua o Puna’oa and Uesiliana takes two years to finish. As you can see, when compared to the enrolment rates, the number of graduates from these institutions is quite low indicating a high programme drop-out rate.
Figure 27: Total students graduated from selected TVET institutions, 2000 – 2007
2000 2001 2002 2003 2004 2005 2006IOT 230 265 261 259 249 276 251 Puna’oa 10 15 22 25 30 44 49 Uesiliana 3 6 9 10 9 11 Source: NUS, Laumua o Puna’oa Technical Centre, Uesiliana Technical Centre
Don Bosco Technical Centre reports that 75 percent of students who graduated from Don Bosco between 2004 and 2006 obtained permanent employment in either the private sector or with the GoS. About 25 percent gained employment in American Samoa, New Zealand, Hawaii and Alaska.149
Types of TVET programmes
The IOT are currently (2007) offering a range of one year and two year programmes, as set out in Figure 28.
148 SATVETI. 149 Letter from Don Bosco Technical Centre dated 18 July 2007.

- 74 -
Figure 28: IOT programmes, 2007 Programme One year Two years• Certificate in Computer Operating Certificate of Tourism and Hospitality • Certificate in Tropical Horticulture • Certificate of Achievement in Journalism • Certificate of Achievement in Maritime Training – Rating 2
• Diploma in Office Management • Diploma in Business • Diploma in Tourism • Diploma in Journalism • Diploma of Radio and Electronics • Intermediate Certificate in Automotive Engineering • Intermediate Certificate in Electrical Engineering • Intermediate Certificate in Fitting and Machining • Intermediate Certificate in Refrigeration and Airconditioning • Intermediate Certificate in Welding and Fabrication • Intermediate Certificate in Plumbing and Sheetmetal • Intermediate Certificate in Construction and Joinery
Source: NUS Short-term refresher/upskilling courses are also offered at the IOT (for example, computer and hospitality). At Laumua o Puna’oa Technical Centre, during the two year programme students study communication, Samoan and Christian Education as compulsory subjects, and select their own trade of interest. The trades offered are welding, electrical, textile, plumbing, automotive, fine arts, carpentry and joinery, cooking, and computer. Don Bosco Technical Centre students can undertake the Basic Life Skills Programme which runs for two years full-time, and then a further Specialised Two Year Programme. The first and second year requires students to take practical trade subjects such as motor mechanics and carpentry and joinery. Theory subjects in technical drawing, trade maths, English, religion and Samoan are also included. The third and fourth year requires students to take a specialised course in motor mechanics, metal fabrication, carpentry and joinery or plumbing/building maintenance. The theory subjects are business studies, trade maths, English and religion. We note that the Ulimasao Marist Centre for Special Learning provides second chance learning and skills training for disadvantaged youth, including students with disabilities.
5.3.3.3 Tertiary education Tertiary education is offered in Samoa at the NUS, Le Amosa o Savavau Institute and the University of the South Pacific (USP) – Alafua campus or through the Extension Centre. The Samoa Oceania University of Medicine based at the MOH, runs programmes that are delivered mainly through on-line and internet modalities.150 Malua, Piula and Moamoa Theological Colleges also offer tertiary education. Many Samoans also study via distance education at overseas universities.
150 Afamasaga, ‘The Challenge in Education’, p. 90.

- 75 -
The USP offers degree and post graduate studies in arts, science, law and commerce by distance and flexible learning as well as agriculture and continuing education in the face to face mode.151 The NUS has five faculties – Arts, Business Entrepreneurship, Education, Nursing and Science, under the Institute of Higher Education. It offers certificates, diplomas and degrees.
Enrolments in tertiary studies Figure 29 below details the number of students commencing first year of tertiary studies at NUS, from 2002 to 2007.
Figure 29: Students commencing first year of tertiary studies at NUS, 2002 – 2007
2002 2003 2004 2005 2006 2007Number of students commencing 1st year
studies at NUS
490 370 411 444 557 529
Source: MESC, Education Statistical Digest 2007
Graduates from tertiary studies Figure 30 shows the graduates from NUS in the main programmes from 2000 to 2004. Figure 30: Graduates from the NUS in main programmes, 2000 – 2004 Programmes 2000 2001 2002 2003 2004Dip. Arts 15 17 10 12 14 B. Arts 18 19 19 14 24 Cert. Commerce 51 82 29 45 38 Dip. Commerce 24 44 36 36 22 B. Commerce 19 29 42 53 38 Cert. Science 17 10 5 9 6 Cert. Computing 12 9 17 10 10 Dip. Computing 5 10 5 6 13 Cert. Maths 1 - 2 3 - Dip. Maths 3 - - - - B. Sc 1 4 2 3 5 Dip. Ed 71 59 63 56 57 B. Ed - - - 6 6 Dip. Nursing 5 7 9 29 18 B. Nursing - 5 5 28 20 Source: Samoa National Human Development Report 2006; NUS
NUS receive an annual grant from Government and levies fees for tuition. It has an annual budget of around SAT9 million. The Government grant has been capped at SAT5 million in the past five years.152
5.3.3.4 Opportunities for youth with special needs in TVET and tertiary education Opportunities in TVET and tertiary education are limited for people with special needs in Samoa. Most who wish to go on to tertiary studies go overseas. According to a study
151 MESC, SPP, p. 24. 152 Afamasaga, ‘The Challenge in Education’, p. 91.

- 76 -
that was conducted in 2005 on people with disabilities in Samoa, three young women with disability completed university degrees and returned to Samoa to work.153 There is no inclusive education policy in place at NUS. Currently, NUS has one special needs student at IOT, in the Journalism programme. A major development in this area was the establishment in 2003 of the Ulimasao Marist Centre for Special Learning, based in Savai’i. The centre provides second-chance learning opportunities. In 2004, there were 109 full-time and 30 part-time students, many of whom were students with special needs.154 5.3.3.5 Non-formal education (NFE)
NFE is an important strategy for development
NFE is provided by various non-government agencies and ministries. For example, the MOH, Youth Division of MWCSD, Women in Business, and Faataua le Ola, all run programmes specific to their concerns and related areas. In 2005, MESC commissioned a study of NFE in Samoa.155 Through MESC’s SPP for July 2006 – June 2015, a commitment has been made to strengthen the NFE system so that “it is recognised as a legitimate form of education providing integrated and coordinated programmes, aimed at improving the quality of life, and enabling individuals and communities to achieve a sustainable future”. MESC’s current SPP sets out strategies in relation to NFE156:
o MESC and SQA to encourage and support the development of coordinated quality provision of NFE
o MESC to work with NFE stakeholders to work out functional relationships between the non-formal and formal sectors
o SQA to establish standards and mechanisms to ensure quality of providers, trainers, programmes, planning, resources and delivery
o Information system to be developed at both provider and national level to enable analysis, planning and evaluation. This system will provide linkages between providers and coordinating agencies
o MESC to develop a funding policy for NFE that is criterion based, fair and transparent.
In line with the MESC 2007 Annual Management Plan, a national policy on NFE is in progress.
5.3.3.6 Income generation and entrepreneurial skills The development of income generation and entrepreneurial skills is addressed in school curriculum and also forms part of the work of certain NGOs and Government agencies. School Curriculum Students from Year 9 can undertake subjects in Agricultural Science, Food Textiles and Technology, and Design and Technology. Each of these subjects includes an internal 153 McCollough, op. cit., p. 22. 154 ibid., p. 11. 155 E Lameta, Non-Formal Education in Samoa: Report of the Research Study, Apia, September 2005. 156 MESC, SPP, pp. 28-29.

- 77 -
assessment component aimed to develop entrepreneurial and income generation skills. Students are required to produce products, use costing and budgeting skills, and market and sell the products. MESC is also currently planning to introduce similar projects into Accounting, Business Studies, and Economics, integrating entrepreneurial and financial education into the curriculum (to be piloted in 2008). MESC The Culture Division in MESC has been conducting two-week vocational workshops in villages with a focus on carving, weaving and textile printing since 1997. The workshops aimed to equip unemployed youths with the necessary skills and knowledge to assist them in seeking employment or to become self-entrepreneurs. TALAVOU Programme The Samoa National Joint Young People’s Programme, TALAVOU, was launched in April 2006, with the Youth Division of the MWCSD as the implementing agency. TALAVOU means “Towards a legacy of achievement, versatility and opportunity through unity”. The programme targets youth with limited education. Its overall objective is to improve the potential social and economic development of Samoa and reduce poverty through a more socially and economically productive youth population. To achieve this goal, the following four programme components and related objectives must be met:
• Self-worth improvement: to improve the self-worth of Samoan young people through education and building the long-term physical and psychological capacity of young people
• Skills and human development: to foster flexible and inclusive learning environments conducive to school retention, skills formation and careers choices for young people in formal and non-formal education by 2008
• Income generation/livelihood opportunities: to increase employment and income generation opportunities for urban and rural young people in formal and non-formal sectors by 2008
• Programme management and coordination.157 Pursuant to the TALAVOU Programme, the Youth Division has implemented a number of activities since the programme’s inception. For example, they have held a retail skills workshop for young entrepreneurs (in collaboration with UNDP and SBEC), and have disseminated information to young people about existing micro-finance institutions and schemes to encourage and support enterprise. In progress also is the development of a life skills programme within the community and the provision of ICT training for rural youth to launch sustainable e-commerce activities. The programme is also working with METI and MESC in developing curriculum for second chance education programmes. The Youth Division has also conducted sewing training in areas of Upolu and Savai’i. Women in Business Women in Business is a NGO which focuses on women, youth and people with disabilities in skills training on beekeeping, fine mat weaving, and coconut oil production. The vision of Women in Business is:
157 TALAVOU Programme, Project Implementation Document, Apia, April 2006, p. 3.

- 78 -
“that women, youth, people with disabilities and their families in Samoa are able to contribute to the development of themselves, their families and their country through income generation, job creation and participation in the village community”.158
More specifically, its goals include:
• To help women, youth and people with disabilities achieve this vision, by providing them with skills, opportunities, access to finance, and access to markets
• To provide long-term training, access to finance and counseling support to women, youth and people with disabilities who wish to generate income through business or employment
• To identify and gain access to markets for products made by women, youth and people with disabilities.159
Other programmes Other programes offered by NGOs and Government agencies to develop income generation and entrepreneurial skills:
• METI provides second chance education options and works with cooperatives on production based projects such as the production of coconut oil and coconut soap.160
• SBEC provides training for those interested in starting a business. A one-week course is provided which takes a trainee through developing business plans and accessing finance. 161
• The Ministry of Agriculture is working on a project targeting young farmers in Samoa.162
• MWCSD conducts a skills building and livelihoods skills programme aimed to enhance the traditional skills of women in communities, such as weaving, handicrafts, sowing and making traditional foods.
5.3.3.7 Traditional knowledge and skills
Children’s understanding of traditional national culture and
identities Formal schooling Samoan culture and identities is introduced from ECE level. The National Guide to Preschools in Samoa requires teachers to teach topics that introduce children at an early age to Samoan culture, traditions and national events and celebrations.
At the primary and secondary level, student understanding of Samoan tradition and culture is developed through curriculum in Samoan, Social Science and Performing and Visual arts (as set out in the NCPF):
o Samoan: It is acknowledged that the Samoan language plays a central role in maintaining, preserving and further developing Samoan culture. It defines the Samoan way of life and carries within in the customs and stories unique to the Samoan character. In developing a high skill in
158 Lameta, op. cit., p. 109. 159 ibid. 160 SBEC, op. cit., p. 44. 161 ibid. 162 ibid.

- 79 -
Samoan, the focus is on using Samoan to develop the thinking skills of students as well as their own sense of identity and an understanding of their culture. This includes being able to communicate in ways appropriate for different purposes, understand the importance of Samoan language for governance and mediation and for the learning of traditional skills.
o Social Science: Learning about Samoan history and geography form part of social science studies. For primary students, the study of social sciences involves stories, drama and begin with an understanding of themselves, their families and local community.
o Performing and Visual Arts: Students learn about appropriate techniques of traditional and modern performance associated with music making, dance and visual arts. The curriculum recognizes the central role that music, drama and dance play within Samoan culture.
Schools also stage Culture Days, which include siva performances and traditional food preparation contests. Due to Government reforms, the Culture Division merged with the Education Department to form the MESC in 2003. Since then, the Culture Division has been revising its functions to include schools. In FY2006/07, three workshops were conducted in schools. The figures for museum visits by schools are as follows: 12 school visits in FY2003/04; 10 school visits in FY2004/05; five school visits in FY 2005/06; and eight school visits in FY2006/07.163
Other Outside of formal schooling, traditional culture education takes place inside the home setting through family instruction, within the village structure, and in Apia through commercial providers. In the villages, traditional culture education is primarily organised through traditional structures such as the aumaga (untitled men’s group), the aualuma (village women’s group), the village fono or the titled people’s group. Traditional culture education includes developing knowledge and competence in cultural protocols and in creative arts in the skills of building, tattooing and fishing. In Apia, groups such as Siva Afi and Siva i Moana focus on developing the skills of their participants who have not learned these from village life, and who for heritage reasons are now keen to do so.164
National events and celebrations
Many national events are celebrated in Samoa. Children and youth often get involved in these celebrations as part of their school, church, and/or local community.
o White Sunday: White Sunday is a special day for all children of Samoa. The children of different religions perform plays enacted from the Bible to replace the normal sermon given by the church minister.
o Independence Celebration: Samoan Independence is celebrated on the 1st of June each year. The occasion is marked with an early morning
163 MESC. 164 Lameta, op. cit., pp. 109-111.

- 80 -
march and service in the capital, Apia, and a number of other activities including fautasi (longboat) races.
o Teuila Festival: The Teuila Festival has been a national event for 16 years whereby many cultural displays including weaving, carving, and traditional dance are showcased. Kirikiti (Samoan cricket) tournaments and canoe and fautasi races are also included. Floral parade is also an exciting opportunity to see contestants vying for the Miss Samoa title.
o Palolo Rising: Another National Event is the Palolo Rising which occurs around October/November each year. Palolo (egg sperm) is known as a Samoan delicacy and rises out of the sea only twice a year.
o Mothers’ Day: Families celebrate Mothers’ Day on the first Sunday of May, which is followed by a public holiday.
o Fathers’ Day: Fathers’ Day is celebrated by families on the second Sunday of August, which is followed by a public holiday.
o National Youth Week: Youth programmes related to development of social and economic skills are held annually during the second week of December.
5.3.3.8 Information and Communication Technology in Education (ICT) The integration of computer and communications technology into education is still in its initial stages and implemented through a variety of projects such as SchoolNet.
Existence of a national ICT policy on education Samoa has a number of policies guiding ICT in education:
o Samoa National Strategic Plan for Information and Communication Technology 2004 – 2009
o MESC ICT Master Plan 2004 – 2007 o MESC SPP July 2006 – June 2015.
MESC’s vision is for “educational planning and management, teaching and learning that is enhanced through the use of cost effective ICT”.165
Percentage of total Government expenditure on ICT in education
At the moment, there is limited funding in the MESC’s budget to support ICT in the schools. School equipment is funded by the school committees, and such technology will have to be funded by the contributions from school committee or donors.166
Percentage of total Government expenditure on teacher training
programmes in ICT In the area of teacher training, new technologies have introduced new ways of teaching. Training must provide teachers with the knowledge of the basics of computer use. However, it must be emphasised that new teaching approaches and methodologies in ICT go beyond computers, and need to incorporate new communication technologies and multimedia for learning.167
165 MESC, SPP, p. 42. 166 Interview with Rosemarie Esera (Principal Information Technology Officer, MESC).
167 MESC, SPP, p. 43.

- 81 -
Teacher training in ICT through MESC is a new initiative and still in its development stage. Professional development for teachers in ICT has been recently introduced due to the development of curriculum development in this area. Currently, Computer Studies is available at the secondary level for Years 12 and 13 (we note that some schools start computer classes from Year 9). The national Computer Studies curriculum for Years 12 and 13 was implemented in 2005 by some secondary schools that had the resources available. Computer Studies is now examined as part of the Year 12 Samoa School Certificate and regional PSSC examination for Year 13. MESC’s SPP has raised the problem that curriculum development has not been accompanied by a systematic teacher training programme and provision of equipment and other support facilities in schools.168 This has resulted in a lack of teachers with ICT skills. The existence of current teachers with computer skills was developed through their own initiative and with the support from their school leaders. Therefore, only the more experienced teachers are able to design learning activities to achieve curriculum objectives. Basic computer training is currently provided for new entrants into the FoE. There has also been a series of short-term courses for teachers in the areas of computer literacy and curriculum development at IOT. At the post secondary level, the NUS offers formal courses in computing and technical training through its CISCO Academy. Other vocational training centres also offer computer courses.
Access to ICT
While ICT development in Samoa has increased in the last five years, such developments concentrate around the main business centres such as Apia and Salelologa. In 2004, it was reported that in some of the rural villages, ICT access especially those of the modern ICTs such as the use of email and the internet had started with the hope of improvement. Radio was the most common medium of ICT in most villages followed by the television. In terms of the telephone, about 55 percent of the country had basic telephone access. Some rural villages had only one telephone for the whole village, which was often situated at the women’s committee house and managed by the women’s committees. Only a few rural villages situated at the most remote parts of Samoa had no access to a telephone; they have to travel to nearby villages to use the telephone.169 This situation has improved in recent years. The use of tele-centres in rural villages has been introduced and piloted. Recent ICT developments for connectivity include SchoolNet, Distance learning, Health Net, Agrinet are yet to be improved.170
168 ibid. 169 GoS, Samoa National Strategic Plan for Information and Communication Technology 2004 – 2009, Apia, pp. 5-6. 170 ibid., p. 6.

- 82 -
Computer access Computers and accessories are still very costly in Samoa. Institutions struggle to provide ICT teaching facilities. Private ownership of a computer is limited to those who can afford it. The number of computers and telephones in the primary and secondary schools are shown in Figure 31. Since 2002, computer and telephone resources have increased due to donor assisted projects like ESP I and donations. The Government, Latter-Day Saints and Catholic schools have the greatest number of computer and telephone resources.
Figure 31: Number of computers and telephones in primary and secondary schools, 2002 to 2007 2002 2003 2004 2005 2006 2007Secondary Computer 291 337 390 487 515 591 Telephone 52 57 54 72 73 76 Primary Computer 61 68 123 145 163 207 Telephone 52 56 68 87 114 107 Source: MESC, Education Statistical Digest
The Samoa SchoolNet and Community Access project is an initiative of the GoS and is funded by the ADB. The initiative is now in its early stages in piloting an appropriate model for introducing ICT into schools and communities. A fully equipped Learning Centre with computers, photocopier, camera, DVD, printer, internet facility, fax facility, multimedia projector will be located in schools for the use of students and teachers during school hours, and for the respective school community as a business venture to cater for their community members after hours. Vaitele uta Primary School was the first school in Samoa to be connected to the network, then Vaimauga College and Lepa/Lotofaga. The team then connected Amoa and Mataaevave on Savai’i. The facilities already connected have been tested and they are up and running well.
Internet access
Besides the schools that have been given access to internet under the SchoolNet Project, no other schools provide internet access to students. There are a few internet cafes located in Apia, Salelologa in Savai’i, and tourist centres. They generally charge about 10 tala per hour, which puts access out of reach for most students. Most homes and businesses are connected to the internet, usually via dial-up. Broadband is rare and expensive.
Quality of ICT in education
As discussed earlier, ICT in education is still in its early stages of development. At present, computers in most schools are used for administrative purposes, though there are a few experienced ICT teachers. In 2006, only four secondary Government schools offered computer studies at Years 9, 10, 11, 12 and 13, with one offering the subject only to Year 9, 10 and 13.

- 83 -
The SchoolNet and Community Access project has provided excellent ICT resources to the participating schools.
5.3.3.9 Health
HIV/AIDS and STI rates
Sexually transmitted diseases are on the rise at present, however the incidence of HIV/AIDS is relatively low compared to other developing countries.171 The official count of those that have been infected with HIV/AIDS in Samoa between 1990 and 2004 is stated officially at twelve (eight males and four females), eight having since died of AIDS related illnesses. The remaining four people are alive and being treated. Eight of the cases resulted from heterosexual transmission. Two cases were from mother to child, and the remaining two cases from homosexual transmission. These figures may not show a complete picture of the HIV/AIDS situation in Samoa as Samoa does not have testing facilities.172 Figure 32 shows that the number of STI cases in Samoa between 1999 and 2004.
Figure 32: Reported number of STI cases in Samoa, 1999 – 2004 1999 2000 2001 2002 2003 2004 Syphilis 84 - - - - 140 Gonorrhoea - - 139 140 - - Other 39 - 68 40 - 127 Source: WHO, Second Generation Surveillance Surveys of HIV, other STIs and Risk Behaviours in 6 Pacific Island Countries (2004 – 2005)
The majority of STIs are in the 20 to 29 age group.173 A WHO Study, Second Generation Surveillance Surveys of HIV, other STIs and Risk Behaviours in 6 Pacific Island Countries (2004-2005), found that Chlamydia is endemic among pregnant women, particularly young women and unmarried women. 40.7 percent of young Samoan pregnant women presented with Chlamydia, the highest in the Pacific Region.174
HIV knowledge, belief and attitudes This WHO Study also included a behavioural survey of sexual behaviours related to HIV and or STI infection in 300 Samoan youth aged 15 to 24 years, conducted between October 2004 and March 2005. The survey found that condom use is extremely low and that the population remains highly vulnerable to HIV infection with biologic, behavioral and sexual indicators of risk. For example, youth surveyed reported a low level of condom use and a low level of knowledge of HIV/AIDS, especially among females175:
o Only 14 percent of 15 to 24 year olds used a condom at last high risk sex
171 Aiavao, op. cit., p. 75. 172 Samoa Aids Foundation. 173 ibid. 174 WHO, Second Generation Surveillance Surveys of HIV, other STIs and Risk Behaviours in 6 Pacific Island Countries (2004 – 2005), 2006, p. 77. 175 ibid.

- 84 -
o Only 14.3 percent of 15 to 24 year olds had a comprehensive and correct knowledge of HIV/AIDS.
Existence of awareness programmes for children and young
peoples on HIV/AIDS Prevention and control is the main component of Samoa’s response to HIV/AIDS. Current programmes include media and health talks, condom distribution, workshops, clergy and youth programmes and initiatives organised by NGOs such as the Red Cross176 and Samoa Aids Foundation.
Primary and Secondary Beginning from Years 7 and 8, sex education is integrated into the formal curriculum. Reproductive health education, although not a subject in itself, is integrated into science subjects, and health and physical education. Secondary teachers undertook training in HIV/AIDS and STIs in November 2003 and June 2004.177 Samoa Aids Foundation (SAF) SAF runs numerous programmes that focus on HIV/AIDS awareness:
o The Poula Theatre Group is a performance group which performs a play composing of traditional dance, song, drama and comedy to promote safe messages about HIV/AIDS and other STIs in schools across Samoa. To date, the group has visited eight schools and two universities, in addition to performing for other youth events. Young people compose the group, with the objective of acting as role models for students themselves.
o SAF sponsors sporting programmes for youth in which sports people are used to promote safe messages about HIV and other STIs. In 2007, they conducted the ‘Run Out HIV’ cricket day with Samoa English Cricket Association during which five schools competed in a round robin HIV awareness and cricket skills day. Similar events are run by SAF every three months or so.
o SAF also coordinated the Safe Games Campaign, another HIV awareness campaign which took place during the South Pacific Games in Samoa (2007). The Youth Division of MWCSD assisted with the peer education component for the campaign, including conducting radio talk-back shows with MOH. The campaign included handing out to athletes backpacks containing HIV/AIDS information kits and condoms.
Other The MWCSD runs a Mothers and Daughter programme, designed for mothers and their teenage daughters, it addresses a number of issues including reproductive health. This programme is complemented by the Women and Husbands programme which targets young couples and addresses issues such as marriage, infidelity and sex within the Samoan cultural context. The MOH and the Youth Division of MWCSD coordinate the Adolescent Health Development Programme.
176 ibid., p. 63. 177 DoE, Annual Report – 1 July 2003 – 30 June 2004, p. 10.

- 85 -
Incidence of substance abuse among young people The leading cause of disease or ill health among the young is injuries and poisoning associated with risk taking behaviour like cigarette smoking and alcohol consumption.178 A behavioural prevalence survey of sexual and risk behaviours related to HIV and or STI infection in 300 youth in Samoa aged between 15 to 24 years was conducted between October 2004 and March 2005. The findings regarding substance behaviour are as follows179:
o About one third of participants consumed alcohol at least once in the last four weeks.
o Among all 300 participants, 120 reported they had used drugs in their lifetime, the most popular drug was tobacco, followed by kava, marijuana, and mushroom.
o None of the participants reported injecting drug use in the previous 12 months.
Percentage of smokers under 18 years
The Samoa Global Youth Tobacco Survey was a school-based survey of students in Years 8 to 11, conducted in 2007. A total of 1,297 students participated in the survey. Figure 33 sets out some of the findings from the survey, which shows that more males have smoked and/or currently smoke. Interestingly, 46.1 percent of students had been taught in class, during the past year, about the dangers of smoking.
Figure 33: Tobacco use in Samoa for youth in Years 8 to 11, 2007
Both sexes Males FemalesPercentage who have ever smoked cigarettes
21.9 27.6 16.3
Percentage who currently use any tobacco product
24.2 29.7 18.4
Percentage who currently smoke cigarettes
13.5 17.3 9.1
Percentage who currently use other tobacco products
17.9 24.2 13.2
Percentage of never smokers likely to initiate smoking next year
27.4
Source: Samoa Global Youth Tobacco Survey Fact Sheet, 2007
Incidence of diabetes Non-communicable diseases, such as diabetes, are lifestyle diseases associated with diet, lack of exercise and excessive use of tobacco and alcohol. More Samoans suffer from non-communicable diseases such as obesity, diabetes, hypertension and cancer now than from infectious diseases.180 Separate studies in 1978, 1991 and 2002 looked at the prevalence of diabetes. It showed significant increases in the number of patients affected by diabetes in both the rural and urban areas. Figure 34 shows an almost four-fold increase in the number of diabetic patients from 1978 to 2002. It is higher in the urban areas than in the rural areas, and higher among females than males. Figure 35 illustrates that diabetes prevalence increases with age.181
178 SBEC, op. cit., p. 28. 179 WHO, op. cit., p. 44. 180 Aiavao, op. cit., p. 74. 181 ibid.

- 86 -
Figure 34: Diabetes prevalence in Samoa, 1978, 1991, 2002
6.4
11.5
23.1
0
5
10
15
20
25
1978 1991 2002
Year
Prev
alen
ce (%
)
Source: Samoa National Human Development Report 2006
Figure 35: Diabetes prevalence in age groups, 2002
12.722.9
32.342.2
0102030405060708090
100
25-34 35-44 45-54 55-64
Age group
Prev
alen
ce (%
)
Source: Samoa National Human Development Report 2006
Inclusion of health related issues in the curriculum
Health and Physical Education is part of school curriculum. The subject’s learning areas focus on the increasing need to equip students with the knowledge, skills, and attitudes to make informed decisions about their own health and the health of the community, and the importance of developing life-long patterns of physical activity.182 The importance of a nutritious diet and hygiene are addressed in Food and Textile Technology (offered from Years 9 to 13 as an optional subject). Health and Physical Education is part of the curriculum at all primary levels for two and a half to three hours per week.183 At the secondary level, Health and Physical Education remains part of the curriculum from Years 9 to 11, but the suggested time allocated is only one hour. In Years 12 and 13, this subject is optional. The MESC SPP for July 2006 – June 2015 plan has highlighted the
182 MESC, NCPF, p. 10. 183 ibid., pp. 14-15.

- 87 -
lack of emphasis placed on physical education and health. The SPP includes the following strategies184:
o Physical education and health to be compulsory for two hours a week from Years 1 to 8
o Physical education and health at secondary school to be compulsory for one hour a week for Years 9 to13, and made an examinable subject in Years 12 to 13.
MESC has just recently employed two curriculum officers specialising in Health and Physical Education for primary and secondary levels. Police also make visits to schools, informing students about the hazards of taking drugs.
Health promoting schools
Health Promoting Schools Project (HPS) HPS was a project funded by the WHO that started in 2002. The Project aimed for all members of the school community to work together to provide students with integrated and positive experiences and structures which promote and protect their health. All schools were involved. Schools implemented the six components which were: health policies, physical environment, social environment, community relationship, personal health and health services. The MOH and MESC worked collaboratively in promoting this project to schools and the community at large.185 School Nutrition Standards MESC is in the process of drafting School Nutrition Standards186 with the intention that all schools put into practice what is being taught through the curriculum on Food and Nutrition and healthy diets. The schools aim to:
o Encourage healthy eating habits that we believe the children will carry through life
o Promote and make healthy eating an easy and affordable choice for the whole school community
o Help reduce health risk factors by encouraging the development of healthy eating habits consistent with the Dietary Guidelines for Samoa
o Raise awareness and improve knowledge in providing healthy foods and drinks for the schools and the wider community.
The standards:
o Provide a guide to foods that schools, canteen caterers and food vendors should be promoting
o Address healthy hygiene practices o Require school staff to monitor foods sold by canteen caterers and food
vendors daily, and MESC to monitor monthly o Require prices to be set at an affordable level
184 MESC, SPP, p. 32. 185 MESC, Annual Reports – 1 July 2002 – 30 June 2003 and 1 July 2003 – 30 June 2004. 186 MESC, Draft School Nutrition Standards, Apia, July 2007.

- 88 -
o Ban advertisements promoting unhealthy foods in schools and encourage the placement of nutrition and health promotion posters
o Set out a suggested weekly menu for school lunch.
Existence of extra-curricular activities We classify extra-curricular activities as sporting and social activities that take place after the normal school hours. Extra-curricular activities may include rugby games between senior secondary schools, netball competitions between senior schools, soccer for primary school students, musical concerts, school visits, cultural activities or even hiking for exercise after school. These activities involve students but their participation is not compulsory. School calendars are filled with extra-curricular activities. These activities are planned by the Samoa Secondary Principals Association, and run by the teachers nominated as members into the various committees to organise and run such programmes. For secondary schools, the usual features are the smoke free rugby sevens tournament, the inter-school rugby competition for boys, the inter-school netball for girls, and the inter-school athletics. In primary schools, weekly sports days take place on Friday after recess. In the more competitive arena, soccer dominates the sporting calendar.
5.3.3.10 Civic education and governance
Curriculum includes aspects of human rights, good governance,
enhancement of Pacific Heritages, participation in the global community, and safety and well-being One of the goals of curriculum under the NCPF is “to equip students to take an active role in the development of a just and prosperous society that builds on a rich cultural heritage and maximizes future local and international opportunities”187. For example, the focus of Social Sciences is on people as social beings. It is concerned with how people relate to each other and with their environment in local, national and international settings. Students are expected to gain an understanding of the place of individuals in society, their rights, responsibilities and privileges.188 Pacific heritages are promoted through the subject Performing and Visual Arts (from Year 1), where students are taught Samoan traditional arts such as carving, weaving, music, and dancing. Unfortunately this subject is not offered in all schools due to the lack of teachers in these areas. As discussed above, Health and Physical Education learning areas focus on the increasing need to equip students with the knowledge, skills, and attitudes to make informed decisions about their own health and the health of the community, and the importance of developing life-long patterns of physical activity.189 In
187 MESC, NCPF, p. 5. 188 ibid., p. 8. 189 ibid., p. 10.

- 89 -
regards to safety, police make visits to schools educating students about the hazards of taking drugs and to raise issues about bullying in schools.
Education for governance through NFE
Education for social justice programmes exist in the community, in Apia, workplaces and school settings. According to Lameta’s study on NFE in Samoa, while all age groups participate, almost half of the programmes involve the 16 to 29 age group. Generally, these programmes advocate for inclusion, participation and access. Three of the key focused groups in NFE programmes for social justice are women, people living with disability and youth with limited education. The organisations aim to change the structure of existing social relations through programmes that help participants to reassert their contribution and place in society. For example, the goals of the Inailau Women Leaderships Network are to:
“empower Samoan women and girls’ to full participation in decision-making processes – within the home, community, workplace and nation”. Their mission is to “facilitate a process to influence family, local community, work-place and national development agendas toward a gender balance in policy, planning, programmes and governance systems that are sensitive to the needs of everyone, including the vulnerable and people with disabilities”.190
One of these processes is voter education, which aims to increase understanding of the political process, decision making, legislative and policy making, electoral processes to assist women in Samoa to have greater political participation and participation in decision making.191 The Division of Youth in MWCSD also coordinates Youth Parliament which takes place during National Youth Week. The Youth Parliament initiative looks to develop leadership skills, decision making and policy making and involves young representatives from every electoral constituency.
Representation of formal and non-formal providers of basic
education on national curriculum advisory bodies MESC has in place a national curriculum advisory process and system for formal and non-formal basic education. The NCPF together with the MESC SPP are two important documents for guiding educators and stakeholders in curriculum and assessment development. The NCPF outlines in detail the curriculum development, evaluation and review process. The National Curriculum Committee and the National Assessment Committee meet four times a year and advise MESC on relevant issues. At the subject level, national subject committees for both primary and secondary meet regularly to discuss curriculum/assessment development issues. These committees are made up of MESC officers, principals, teachers, other education institutions and industry representatives. Other institutions in the education sector have established similar curriculum/assessment advisory bodies. An example is the Samoa Association for Technical and Vocational Education and Training Institutions (SATVETI). The
190 Lameta, op. cit., p. 99. 191 ibid.

- 90 -
National Council for Second Chance Education (NCSCE) is also an advisory body focusing on the development of curriculum and assessment modules to suit and cater for the learning needs of those who would like a second chance at learning. Both the SATVETI and the NCSCE comprise of members from the MESC, SQA, Government and NGOs, TVET and tertiary institutions.
5.3.3.11 Education for sustainable development (ESD)
Integration of ESD in national education strategic plan
The goals of education, as outlined in MESC’s SPP July 2006 – June 2015, state that they are in line with global goals, including the Decade of Education for Sustainable Development. More specifically, goals five and six look to:
o Eliminate gender disparities in schools and achieve gender equity o Poverty reduction, development of good governance, elimination of
disease, and achievement of environmental sustainability.192
Curriculum incorporates ESD and indigenous culture ESD and indigenous culture is incorporated into the NCPF. In relation to ESD, one of the principles of curriculum in Samoa is a sustainable future. The Samoan curriculum emphasises the need to develop environmentally and socially sustainable practices, not only to the physical environment but also in the way society structures itself socially, culturally and economically.193 For example, Social Sciences address aspects of good governance, rights and responsibilities, human interaction between themselves and with their environment, and learning from the past. Science curriculum includes looking at developing attitudes of responsibility towards the environment and national resources, and developing skills in maintaining a sustainable agricultural system through proper management of Samoa’s limited resources.194 Health promotion, as discussed already, is the main objective of the Health and Physical Education curriculum. Samoan and Performing and Visual Arts curriculum address indigenous culture. Through Samoan, students learn about customs and stories unique to Samoa, and gain skills in Samoan language for cultural protocol purposes. An appreciation of and an understanding of Samoan heritage comes with participating in music, drama and dance within the Performing and Visual Arts curriculum.
Coastal Sustainable Improvement Samoa Project The Coastal Sustainable Improvement Samoa Project also incorporated elements of ESD into the school curriculum. This worldwide programme was funded by UNESCO and the GoS at the country-level. It began in Samoa in June 2000 and was completed around 2005, the main site being the Saanapu-Sataoa Mangrove Conservation area. Its main interest was the protection of natural heritage through the conservation and sustainable use of bio-diversity, while at the same time strengthen cultural identity through the recognition and
192 MESC, SPP, p. 12. 193 MESC, NCPF, p. 5. 194 ibid., pp. 9-10.

- 91 -
innovative application of indigenous ecological knowledge and practice. The project team comprised of personnel from the Ministry of Natural Resources, Environment and Meteorology, NUS and MESC. The project aimed to provide an opportunity for primary and secondary school students to develop an understanding, appreciation, and in-depth knowledge of the importance of mangrove eco-systems through organised field studies. The project also aimed to strengthen the value of healthy mangrove systems as sources of food, as well as places of economic, environmental and cultural significance.195
195 MESC, Annual Report – 1 July 2003 – 30 June 2004 and 1 July 2004 – 30 June 2005.

- 92 -
5.4 Literacy
Measuring progress towards EFA Goal 4: Achieving a 50 percent improvement in levels of adult literacy by 2015, especially for women, and
equitable access to basic and continuing education for all adults
“Literacy is the foundation of learning. It constitutes a critical life skill, a requisite for successful participation in society and fundamental for economic, social and political participation and development in the knowledge society. Literacy is key to enhancing capabilities, with wide-ranging benefits including critical thinking, improved health and family planning, HIV/AIDS prevention, children’s education, poverty reduction and active citizenship. Literacy is key for the achievement of the other EFA goals.”196
The GoS through its SDS for 2005 – 2007 made a commitment to improving the quality of education, at all levels, to achieve higher rates of literacy and numeracy. Through a review of its previous three-year strategy, the Government learnt that educational outputs must include more functionally literate and numerate persons.197 One of the goals of education, under MESC’s SPP for July 2006 – June 2015, is to “improve adult literacy and access to life skills and continuing education for adults and youth”.198 5.4.1 Measuring Literacy 5.4.1.1 Measuring youth and adult literacy
Youth literacy rates (age 15 to 24); Adult literacy rate (age 15 and
above); Ratio of literate female to males (age 15 to 24) International standards define adult literacy rate as the percentage of the population aged 15 years and over who can both read and write with understanding a short simple statement related to everyday life. Youth literacy is defined in the same way, but as a percentage of the population aged from 15 to 24 years. The reported figures for Samoa’s literacy rate varies depending on the publication, but is usually recorded in the high 90 percentile. The official reported literacy level of Samoans is very high, but literacy tests at the primary level (SPELL Tests 1 and 2) indicate significant problems with standards being attained in these early years. At the national level, the collection of data relating to literacy forms part of the Census of Population and Housing. The 1991 Census reported that 97.4 percent of females and 98.4 percent of males for those 15 years of age and above were literate199 (GPI of 0.990 in favour of males). For the age group 15 to 24 years, data showed that 98.9 percent of females and 99.1 percent of males were literate200 (GPI of 0.998 in favour of males). A more in depth UNESCO sample survey in 1991 testing the numeracy and reading ability of respondents in Samoan gave much lower rates,
196 A Benavot in UNESCO, EFA Mid-Decade Assessment Meeting Report, Bangkok, 2006, p. 46. 197 MOF, Strategy for the Development of Samoa 2005 – 2007, p. 43. 198 MESC, SPP, p. 12. 199 DoE, Education For All Year 2000 Assessment: Samoa, Apia, 2000, p. 35. 200 ibid.

- 93 -
with females showing consistently higher rates than men.201 There is a possibility that literacy skills were not assessed during the Census, but measured crudely through such means as through individual self-declaration or by asking the head of the household. The most recent Census took place in 2006. Unfortunately the Census report had not been finalised yet at the time of writing this report for comparative analysis. We understand that the literacy component addressed literacy in both Samoan and English.
5.4.1.2 Measuring literacy at the primary level
“The attainment of the mastery of level of reading, writing and calculating at the stage of formal primary education is critical for achieving literacy for all.”202
MESC places an emphasis on assessing literacy at the primary level so that intervention strategies can be implemented early in life. By increasing the literacy rates at primary level, the adult illiteracy rate can be reduced over the years. The Samoa Primary Education Literacy Levels (SPELL) Tests are conducted at Year 4 and Year 6. The areas covered are Samoan, English and Numeracy. The initial intention behind the SPELL Tests was to use the test as a measurement and diagnostic tool to allow literacy standards to be monitored and identify students whose performance in the test placed them at some risk in achieving educational outcomes.203 The results of SPELL 1 and 2 are presented in Figures 36 and 37. The results for SPELL 1 cover all schools, Government and non-Government. The SPELL 2 results are presented only for Government schools. The results from SPELL 1 show that in all subjects, the percentage of students at risk has dropped from the high levels recorded in 2002 and 2003. However, the results for English have deteriorated from 13 percent at risk in 2005 to 19 percent at risk in 2006. In all subjects, girls have been performing much better than boys. Figure 36: Primary students identified as at risk, Year 4 (All schools) Results from SPELL 1 Test Subject Gender 2000 2001 2002 2003 2004 2005 2006English Boys 29% 18% 55% 61% 19% 19% 25%
Girls 17% 11% 41% 41% 8% 7% 12% Total 23% 15% 48% 51% 13% 13% 19%
Samoan Boys 40% 26% 40% 39% 39% 33% 30% Girls 26% 15% 23% 20% 19% 13% 16% Total 33% 21% 32% 29% 28% 23% 23%
Numeracy Boys 30% 29% 33% 40% 40% 37% 32% Girls 24% 19% 24% 25% 25% 22% 19% Total 27% 24% 28% 32% 32% 30% 26%
Source: MESC, Education Statistical Digest 2007 The results from SPELL 2 show the at risk percentage for English have increased from 46 percent in 2000 to 53 percent in 2006. Samoan results have improved slightly over the years to 13 percent at risk in 2006. The results for numeracy have improved from 71 201 GoS, Report on the Status of Women in Samoa 2001, Apia, pp. 56-57. 202 UNESCO, The Plurailty of Literacy and its Implications for Polices and Programmes, France, 2004, p. 19. 203 ADB TA 4256-SAM, op. cit., p. 43.

- 94 -
percent at risk in 2003 to 58 percent at risk in 2006. Once again, girls have performed consistently better over the past seven years, in all subjects. Figure 37: Primary students identified as at risk, Year 6 (Government schools) Results from SPELL 2 Test Subject Gender 2000 2001 2002 2003 2004 2005 2006English Boys 51% 60% 63% 68% 69% 69% 60%
Girls 35% 36% 38% 42% 44% 45% 45% Total 46% 48% 50% 55% 56% 57% 53%
Samoan Boys 24% 23% 27% 24% 17% 18% 18% Girls 11% 10% 11% 7% 12% 7% 7% Total 17% 16% 19% 16% 12% 12% 13%
Numeracy Boys 66% 61% 68% 77% 76% 75% 63% Girls 51% 50% 56% 64% 58% 59% 52% Total 58% 56% 62% 71% 67% 67% 58%
Source: MESC, Education Statistical Digest 2007 Examination results in the SPELL tests are concerning. The quality of teaching, inadequate teaching resources and minimal support for teachers, may be causal factors. Other factors affecting scores may be the quality of assessment in terms of validity and reliability.204 It was previously recognised that the potential of the test results to be used by schools to assist ‘at risk’ students were not utilized. Results from each school were presented in the form of the percentage of students from that school determined to be at risk. Other problems are that there are no strong links between SPELL and the present primary curriculum205, there is a tendency by some teachers to try to access test papers to prep their students, and some principals hold onto the test results without passing on to the teachers.206 The results of SPELL 2 are also much worse than in SPELL 1, which should not be the case. Bilingualism in Samoa has been suggested as a reason why the overall language learning in Samoa is of low quality. From the Education Policies of 1995 – 2005, it was recognised that “a prime objective of the Samoan education system should be bilingualism, the development of bilingual individuals, fully literate in Samoan and English”. Some of the practical effects of this have been:
• Learners were put in a position to learn in a language in which they had not acquired proficiency while their first language was removed, which could be used to learn the second language
• The opportunities for using Samoan to develop cognition became limited • Language expansion became limited in both languages as teachers devoted
more time to the acquisition of the English language rather than development of thinking in both languages.207
There is a need for continuing discussion and research on the required competence threshold that students must achieve in English. The intention of the policy was that Samoan literacy would be established first in Years 1-3, with English being introduced in Year 4 as a subject. The medium of instruction was Samoan up to Year 6. At Year 7, the medium of instruction switched to English with 204 Afamasaga, ‘The Challenge in Education’, p. 83. 205 ADB TA 4256-SAM, op. cit., p. 44. 206 Interview with Ainslie So’o (Language Specialist, MESC) on 22 August 2007. 207 MESC, SPP, p. 34.

- 95 -
Samoan as a subject only for two years before a national examination was sat in Year 8 in English. English is the sole medium of instruction throughout secondary level.208 The results from the National Examinations in Year 8 are also concerning, with the average raw score in 2006 for English at 43, Samoan at 52 and Mathematics at 33.209 5.4.2 Addressing Literacy in Schools 5.4.2.1 Establishment of a Literacy Taskforce After the SPELL tests conducted from years 2000 to 2003, an increasing number of at risk children was noted. As a result, a Literacy Taskforce was established to address the concerns within the MESC, under the guidance of the Assistant Chief Executive Officer of CMAD. Members of the taskforce are Curriculum Officers, SROs, and employees of MESC. The Literacy Taskforce was established to support teachers in raising the achievement levels of students in literacy and numeracy. The Literary Taskforce monitors schools with high levels of ‘at risk’ students and assists teachers develop intervention strategies. More specifically, the terms of reference of the taskforce include:
• Provide an action plan for each school calendar year • Provide assistance on how literacy programmes are implemented • Provide advice on how intervention strategies are carried out • Provide advice on how progress and literacy levels are measured • Provide training (where necessary) on different ways to survey and observe
literacy • Consider additional support materials to improve literacy • Identify and provide information to the Ministry on ways to improve literacy on a
national level • Conduct monitoring visits to schools and report on the progress and standard of
literacy. Since this development, SPELL results have improved. Following each SPELL Test, the results are analysed by the taskforce, with schools exhibiting a high number of at risk students marked as high priority for visitation. The taskforce visits the high priority schools and undergoes their own assessment with the students, sometimes individually. Teachers are also provided with a list of students at risk so that they can provide more targeted assistance. Intervention strategies that are provided to teachers by the taskforce are not fully carried out by some teachers.210 MESC has acknowledged that more quality readers are required to support the teaching of literacy. Over the last three years, the Ministry has increased its spending on procuring books produced by local writers to promote and support the teaching of literacy.211
208 ibid. 209 MESC, Education Statistical Digest 2007, part 2, p. 1. 210 Interview with Ainslie So’o (Language Specialist, MESC). 211 MESC, SPP, p. 40.

- 96 -
5.4.2.2 Improving library services MESC’s SPP for 2006 – 2015 acknowledges the importance of creating a literate environment. The Ministry has a vision of “library services responsive to the needs of schools to enhance information literacy and learning for all”. Limited student access to libraries does not encourage a reading culture in Samoa.212 In August 2007, school library services received a major boost with the completion of a new training programme for School Library Assistances. USP Alafua Campus Continuing and Community Education programme and MESC collaborated to develop this programme with involved lecturers from USP, NUS and MESC. Twenty trainees graduated and were awarded with certificates after an intensive 16 week training programme. 5.4.2.3 Setting regional benchmarks for literacy and numeracy There has never been a real measure of literacy, numeracy or life-skills in the Pacific region. In July 2006, a representative from MESC attended a workshop hosted by Vanuatu to draft regional benchmarks for literacy, numeracy and life-skills. The four agencies involved are UNESCO, UNICEF, PRIDE and SPBEA. The benchmarks are guided by EFA and MDGs goals and the wishes of the Pacific Ministers as reflected in FBEAP. The recommendations that came out of the workshop included213:
• That the Ministers adopt the concept of regional benchmarks in literacy, numeracy and life-skills
• That the regional benchmarks be used as the basis for monitoring the quality of education at the country level
• That the ministers endorse household surveys of their countries to ascertain literacy levels for people aged 15 and above.
A draft of the benchmarks has been circulated for comment. It is proposed that monitoring of basic skills in these areas take place in Years 2, 4, 6 and 8. The project also proposes a Pacific definition of literacy and numeracy214:
• ‘Literacy’: A person is considered to be functionally literate if he/she has acquired the necessary knowledge and skills to be able to communicate effectively through any form of language of their society, with respect to everyday life
• ‘Numeracy’: A person will be considered to be functionally numerate if they have acquired the necessary knowledge and skills to be able to use numbers effectively in mathematical processes, as well as the language of mathematics, for a variety of purposes in everyday life not only within the society he/she lives but beyond.
5.4.3 Literacy Programmes Within the Community Non-formal education programmes must address the needs of those unreached through formal basic education.
212 ibid., p. 36. 213 Setting regional benchmarks for literacy, numeracy and life-skills to monitor the quality of basic education in the Pacific region, pp. 1-2. 214 ibid., pp. 3-4.

- 97 -
5.4.3.1 Second-chance education Literacy programmes are conducted within many institutions that offer second-chance education to early-school leavers and drop-outs. For example, Don Bosco Technical Centre (Catholic) and Ulimasao Marist Centre for Special Learning (Marist-Catholic) offer second-chance education programmes which develop basic literacy and numeracy skills, and develop skills for life and for work. Laumua o Puna’oa (Methodist) also has similar programmes. Don Bosco and Puna ‘oa are located in Upolu. Ulimasao Marist is located in Savai’i. METI is a NGO working with MESC on a second-chance education development programme. Currently the programme in collaboration with the TALAVOU Project and MESC is working on developing Curriculum Module materials for all subjects, targeting second chance for all mature, premature and drop out students.215 Some of these modules to be developed are for literacy, in Samoan and English. 5.4.3.2 A’oga Faifeau and study centres A’oga Faifeau (pastors’ schools) supplement regular education through teaching basic numeracy and literacy alongside biblical knowledge. Church/village based study centres also provide support by helping students to understand and complete their school tasks and assessment requirements. 5.4.3.3 Community learning centres MESC is also coordinating the development of community learning centres as an on-going long-term development programme. The project stemmed from the EFA Action Plan programmes and is funded by UNESCO. The project was incepted in November 2003, and is being piloted at the village of Moata’a, Upolu ESPII will fund the next community Learning centre in Fagaloa, Upolu The action plan focuses on five objectives, one of which is to promote a reading culture among people of all ages.
215 MESC, Annual Report – 1 July 2005 – 30 June 2006, p. 21.

- 98 -
5.5 Gender Parity and Equality Measuring progress towards EFA Goal 5: Eliminating gender disparities in primary and secondary education by 2005, and achieving gender equity in
education by 2015
“Gender refers to the roles and responsibilities of men and women that are created in our families, our societies and our cultures. The concept of gender also includes the expectations held about the characteristics, aptitudes and likely behaviours of both women and men… Gender equality means that women and men have equal conditions for realizing their full human rights and for contributing to, and benefiting from, economic, social, cultural and political development.”216
Gender policies in Samoa are found in MESC’s SPP for 2006 – 2015, MWCSD’s policies, NCPF and also national curriculum statements requiring gender-inclusiveness, non-sexism, and equity in terms of fairness in access, treatment and outcome. Strategies to promote gender equality are outlined in Government ministries’ corporate plans and in NGO’s strategic plans. All these contribute to the overall Strategy for the Development of Samoa. Other strategies are included in Samoa’s response to global frameworks such as the UN Convention on the Elimination of All Forms of Discrimination against Women (CEDAW), EFA, MDGs and the Commonwealth Plan of Action on Gender Equity 2005 – 2015.217 Samoa’s gender policies and strategies during the last decade focused on the well-being, participation and advancement of women and girls, a concern that it echoed in the CEDAW, EFA, MDGs and the Commonwealth Plan of Action on Gender Equality. There is an emerging awareness and concern over the underachievement of boys and recognition of the need for a gender inclusive response in national initiatives that provides more choices and opportunities for not only women, but also men, youth and children. One of the goals of education in MESC’s current SPP is to address this situation because it impacts on the make up of the work force and all other aspects of society. 5.5.1 Gender Parity
Country Gender Development Index (GDI)
The GDI is a composite index measuring average achievement in the three basic dimensions captured in the Human Development Index (HDI) – a long and healthy life, knowledge and a decent standard of living – adjusted to account for inequalities between men and women. The greater the gender disparity in basic human development, the lower is the country’s GDI relative to its HDI. Samoa’s GDI ranking is 63rd out of 136 countries in the Year 2004. Samoa has a GDI value of 0.770 and a HDI of 0.778. Its GDI value is 99 percent of its HDI value, which indicates that Samoa has no gender disparity in basic human development.
216 UNICEF, op. cit., p. 131. 217 Adapted from – E Lameta and Q Reid-Enari, Boys and Achievement, Apia, 2005.

- 99 -
Literacy Gender Parity Index As discussed in Goal 4, the 1991 Census reported that 97.4 percent of females and 98.4 percent of males for those 15 years of age and above were literate218, giving a GPI of 0.990 in favour of males. For the age group 15 to 24 years, the data showed that 98.9 percent of females and 99.1 percent of males were literate219, giving a GPI of 0.998 in favour of males. These figures suggest that there is gender parity in literacy.
GPI for GIR in primary education
The GPI for GIR at primary level is used to assess gender differences in intakes between boys and girls. Figure 38 below shows that in all years, except for 2001, gross intakes favoured males. Gender disparity for GIR was most pronounced in 2000, 2003 and 2005. However, in all other years, the GPI was within acceptable benchmark for equity (0.97 to 1.03).
Figure 38: GPI for GIR for primary education (National), 2000 – 2006
GPI for GIR in primary education (2000-2006)
0.94 1.01 0.98 0.94 0.97 0.95 0.97
1.06 0.99 1.02 1.06 1.03 1.05 1.03
0.00
0.20
0.40
0.60
0.80
1.00
1.20
1.40
1.60
1.80
2.00
2000 2001 2002 2003 2004 2005 2006
female male
Source: MESC and MOF, Samoa
GPI for NIR in primary education
The GPI for NIR at primary level is used to assess gender differences by the appropriate age of intake ie, age 5. Figure 39 shows that even though the net intake favoured females in most years, there was gender parity for NIR at the primary level in all years excluding 2001.
218 DoE, Education For All Year 2000 Assessment: Samoa, p. 35. 219 ibid.

- 100 -
Figure 39: GPI for NIR for primary education (National), 2000 – 2006 GPI for net intake rate in primary education (2000-2006)
0.971.06 1.03 1.03 1.08 1.02 1.01
1.030.94 0.97 0.97 0.92 0.98 0.99
0.00
0.20
0.40
0.60
0.80
1.00
1.20
1.40
1.60
1.80
2.00
2000 2001 2002 2003 2004 2005 2006
female male
Source: MESC and MOF, Samoa
Ratio of girls to boys in primary education Figure 40 shows that male enrolments at primary education level was in all years from 2000 to 2006 approximately four percent higher than that of females. Interestingly, as discussed under Goal 1, the GPI for GER at ECE level was heavily in favour of females in all years. Figure 40: Ratio of girls to boys enrolment in primary education (National), 2000 – 2006
Ratio of girls to boys enrolment in primary education (2000-2006)
48.3% 48.2% 48.1% 48.0% 48.0% 48.1% 48.1%
51.7% 51.8% 51.9% 52.0% 52.0% 51.9% 51.9%
45.00%
46.00%
47.00%
48.00%
49.00%
50.00%
51.00%
52.00%
53.00%
2000 2001 2002 2003 2004 2005 2006
% of female enrolment in primary education
% of male enrolment in primary education
Source: MESC, Samoa
GPI for GER in primary education The GPI for Primary GER assesses gender differences in gross enrolment at primary level. As the cycle for primary education is eight years, GER and NER for primary education are calculated using the population of five to 12 years. Figure 41 shows that from 2000 to 2006, there was gender parity in GER at the primary level.

- 101 -
Figure 41: GPI for GER for primary level (National), 2000-2006 GPI for GER in primary education (2000-2006)
0.99 0.98 0.98 0.97 0.97 0.98 0.98
1.01 1.02 1.02 1.03 1.03 1.02 1.02
0.00
0.20
0.40
0.60
0.80
1.00
1.20
1.40
1.60
1.80
2.00
2000 2001 2002 2003 2004 2005 2006
female male
Source: MESC and MOF, Samoa
GPI for NER in primary education The GPI for primary NER is used to assess gender differences in primary net enrolment. Figure 42 suggests that the gender gap for in primary net enrolment has widened over the years from a perfect gender parity level in 2000. However, the disparity is still within acceptable levels. Figure 42: GPI for NER for primary level (National), 2000-2006
GPI for NER in primary education (2000-2006)
1.00 0.99 0.99 0.98 0.99 0.99 0.98
1.00 1.01 1.01 1.02 1.01 1.01 1.02
0.00
0.20
0.40
0.60
0.80
1.00
1.20
1.40
1.60
1.80
2.00
2000 2001 2002 2003 2004 2005 2006
female male
Source: MESC and MOF, Samoa
Ratio of girls to boys in secondary Looking at the ratio of girls to boys enrolment at secondary level (refer to Figure 43), the trend is reversed with enrolment dominated by females. Female enrolment levels were approximately two to six percent higher in all years from 2000 to 2006. 2006 exhibited the greatest gender gap in this time series analysis. This posts a concern over males and raises the need to refocus our policies and strategies to address the issues of boys rather than girls.

- 102 -
Figure 43: Ratio of girls to boys enrolment in secondary education (National), 2000 – 2006 Ratio of girls to boys enrolment in secondary (2000-2006)
51% 51% 51%
52%52%
52%
53%
49% 49% 49%
48%48%
48%
47%
44%
45%
46%
47%
48%
49%
50%
51%
52%
53%
54%
2000 2001 2002 2003 2004 2005 2006
% female enrolment in secondary education
% male enrolment in secondary education
Source: MESC, Samoa
GPI for GER in secondary education The GPI for secondary GER is used to assess gender differences in secondary enrolment. GER and NER for secondary education is calculated using the population of 13 to 17 year olds. Figure 44 indicates that although gender disparities at the primary level were minimal and within acceptable levels, the gender gap at the secondary level widened dramatically beyond the equity benchmark with gross enrolments favouring females in all years.
Figure 44: GPI for GER for secondary level (National), 2000-2006
GPI for GER in secondary education (2000-2006)
1.17 1.16 1.15 1.19 1.17 1.14 1.18
0.83 0.84 0.85 0.81 0.83 0.86 0.82
0.00
0.20
0.40
0.60
0.80
1.00
1.20
1.40
1.60
1.80
2.00
2000 2001 2002 2003 2004 2005 2006
female male
Source: MESC and MOF, Samoa
GPI for NER in secondary education The GPI for secondary NER is used to assess gender differences at post primary. Figure 45 shows that the high level of gender disparity has lessened since 2001. The GPI in favour of females was 1.18 to 0.82 in 2006.

- 103 -
Figure 45: GPI for NER for secondary level (National), 2000-2006 GPI for NER in secondary education (2000-2006)
1.16 1.21 1.17 1.20 1.20 1.16 1.18
0.84 0.79 0.83 0.80 0.80 0.84 0.82
0.00
0.20
0.40
0.60
0.80
1.00
1.20
1.40
1.60
1.80
2.00
2000 2001 2002 2003 2004 2005 2006
female male
Source: MESC and MOF, Samoa
Ratio of girls to boys in tertiary In line with the trend at secondary level, females dominate enrolments at the tertiary level. Figure 46 presents the ratio of girls to boys enrolment at NUS from 2002 to 2005. In all years except 2003, there were a higher number of female students with female enrolments accounting around 61 percent of all enrolments.
Figure 46: Ratio of girls to boys enrolment at NUS, 2002 – 2005
Ratio of girls to boys at NUS (2002-2005)
61.5%61.1%62.7%
46.8%
38.5%38.9%
53.2%
37.3%
0%
10%
20%
30%
40%
50%
60%
70%
80%
90%
100%
2002 2003 2004 2005
Females Males
Source: NUS
In the early 1990s, a quota of 50 percent was set for tertiary awards tenable outside Samoa to be for women. Although equal numbers of men and women received scholarship awards over the period 1996 to 2001, women received on average slightly higher numbers than men. The selection for scholarships is still based on merit.220 In order to address the gender imbalance in vocational training at the IOT, a number of scholarships were offered to attract females into the trades usually taken up by males. A gender equity policy had also been put in place.221
220 GoS, Report on the Status of Women in Samoa 2001, p. 44. 221 ibid.

- 104 -
GPI for repetition rates
Figure 47 shows the repetition rate at Year 5. Girls are less likely to repeat Year 5 than boys. We recognised this issue in the GIR and NIR where boys dominate the GIR (which includes under and over age students) and girls dominate NIR (which measure the access to primary at the official school-entrance age of five).
Figure 47: GPI for repetition rate by Year 5 (National), 2000-2005
GPI for repetition rate by year 5 in primary (2000-2005)
0.32
0.57
0.84
0.56
0.98
0.36
1.68
1.43
1.16
1.44
1.02
1.64
0.00 0.20 0.40 0.60 0.80 1.00 1.20 1.40 1.60 1.80 2.00
2000
2001
2002
2003
2004
2005
Female Male
Source: MESC, Samoa At the Year 8 level, the repetition rate was dominated by males in all years except 2000 and 2004 which was dominated by females. However, the gender disparity was much less pronounced here than at the Year 5 level, with gender parity achieved in 2005. (Refer to Figure 48).
Figure 48: GPI for repetition rate by Year 8 (National), 2000 – 2005
GPI for repetition rate by year 8 (2000-2005)
0.92
1.11
0.80
0.78
1.34
0.99
1.08
0.89
1.20
1.22
0.66
1.01
0.00 0.20 0.40 0.60 0.80 1.00 1.20 1.40 1.60 1.80 2.00
2000
2001
2002
2003
2004
2005
Female Male
Source: MESC, Samoa
GPI for survival rate to Year 8 The GPI for survival rate to Year 8 is used to assess gender differences in primary completion. Figure 49 shows that in all years from 2001 to 2006, females were more likely to survive to Year 8 than males. From 2005 to 2006, the GPI was stable at 0.95 to 1.05.

- 105 -
Figure 49: GPI for survival rate to Year 8 (National), 2001 – 2006 GPI for survival rate to year 8 (2001-2006)
1.04 1.01 1.04 1.03 1.05 1.05
0.96 0.99 0.96 0.97 0.95 0.95
0.00
0.20
0.40
0.60
0.80
1.00
1.20
1.40
1.60
1.80
2.00
2001 2002 2003 2004 2005 2006
female male
Source: MESC, Samoa
GPI for transition rates The transition rate from primary to secondary level increased nationally, since 2000. The GPI for secondary transition rates measures the progress towards achieving gender parity in completing primary and entering secondary school. Figure 50 shows that there was gender disparity in the most recent years.
Figure 50: GPI for transition rate from primary to secondary education (National), 2000 – 2006
GPI for transition rate from primary to secondary (2000-2006)
0.96 1.010.91 0.98 0.95 0.91 0.95
1.04 0.991.09 1.02 1.05 1.09 1.05
0.00
0.20
0.40
0.60
0.80
1.00
1.20
1.40
1.60
1.80
2.00
2000 2001 2002 2003 2004 2005 2006
female male
Source: MESC, Samoa
Percent of female/male teachers Figures 51 and 52 displays the percentage of female and male teachers at the primary and secondary level, from 2000 to 2007. At the primary level, there are a large number of female teachers compared to male teachers. Female teachers account for over 70 percent of teachers at the primary level, while males account for less than 30 percent of the teaching force. At the secondary level, there is more gender parity, with males accounting for 47 percent to 50 percent of the secondary teaching profession.

- 106 -
Figure 51: Percent of males and female teachers in primary education (National), 2000 – 2007
Percent of male and female teachers in Primary level (2000-2007)
73%
76%
72%
70%
74%
75%
76%
77%
27%
24%
28%
30%
26%
25%
24%
23%
0% 10% 20% 30% 40% 50% 60% 70% 80% 90% 100%
2000
2001
2002
2003
2004
2005
2006
2007
Female teachers Male teachers
Source: MESC, Samoa
Figure 52: Percent of males and female teachers in secondary education (National), 2000 – 2007
Percent of male and female teachers in secondary level (2000-2007)
52%
53%
50%
52%
52%
53%
52%
53%
48%
47%
50%
48%
47%
48%
47%
48%
0% 10% 20% 30% 40% 50% 60% 70% 80% 90% 100%
2000
2001
2002
2003
2004
2005
2006
2007
Female teachers Male teachers
Source: MESC, Samoa
Gender qualitative indicators Curriculum and textbooks Gender stereotyping in education has diminished as a result of curriculum review, gender sensitization workshops, affirmative action and the development of gender equity polices in institutions like the IOT. Curriculum development is an area which is usually supported by bilateral aid programmes. This being so, gender issues supported by gender sensitization workshops for staff involved are built into programmes. There is careful monitoring to ensure there is no gender stereotyping in teachers guides and other learning materials.222 A good example of this is the ESPII project, jointly funded by GoS, ADB, AusAID and NZAID, under which gender sensitive curriculum and learning materials will be developed for primary schools. Teaching: teacher attitude and expectations Staff in primary, secondary and tertiary institutions undergo gender sensitization workshops.
222 ibid., p.61.

- 107 -
Parent/societal values, attitudes and expectations Samoan women have experienced significant changes in their economic, social and political lives over the last half century. There has been an increased participation of women in paid employment, increased interest and participation at the national political level, and more women holding senior management positions in the Government.223 Other developments have been decreased fertility rates and related reduction in family size. The steady success rate of females in sciences and commerce has also helped remove the image that females are meant to be teachers, secretaries and nurses only. In the non-formal sector, there has been a general shift away from home economics activities to ‘income generating activities’.224 In the late 1990s Polytechnic’s (now, the IOT) Gender Equity Project saw an increase in young girls attaining certificates in carpentry, refrigeration, electrical fitting and machining, and maritime studies.225 Gender responsiveness of education policies Equity is one of the five key concepts under MESC’s SPP July 2006 – June 2015. Equity calls for the system to treat all individuals fairly and justly in the provision of services and opportunities. Policies, strategies and practices, will be identified and articulated appropriately to avoid treatment that may disadvantage any social group.
5.5.2 Discussion of ‘Boys and Achievement’ Research Study226 MESC undertook a study into ‘Boys and Achievement’ in 2005. The reason behind the research study was the emerging awareness and concern about the underachievement of boys, and a recognition of the need for a gender inclusive response in national initiatives that provides more opportunities for all. Gender based data in achievement is limited. Gender equity in education is most commonly reported in terms of enrolment patterns and achievement in primary levels in Years 4 and Year 6 for English, Samoan and Numeracy. Achievement in the senior secondary school levels based in the Samoa School Certificate Examination, the regional Pacific Senior Secondary Certificate is not disaggregated by gender. EFA plans and MDGs’ focus on girls does not fit Samoa’s identified needs in relation to the underachievement of boys. It is fair to say that the achievement of boys in Samoa does not have documented profile to any extensive level. The gender difference in educational access, participation and achievement has been shown to favour girls over boys. Given the youthful nature of Samoa’s population with 19.5 being the median age, the limitations of our economic base, and keeping in mind the traditional philosophies stressing the importance of the collective and notions of servitude, there is an urgent need to address the conditions within which boys find themselves both in education and in society. In education their underachievement at the basic levels in Years 4 and 6 means they have a very weak base to work from. Their 223 ibid., p. 43. 224 ibid., p. 47 225 ibid., p. 58 226 Adapted from – E Lameta and Q Reid-Enari, Boys and Achievement.

- 108 -
diminishing participation in secondary and post-secondary opportunities would have to be a feature of a weakened primary base. All of which contribute to diminished capacity to fulfill traditional expectations of provider, server, and leader, and diminished power to take control of lifestyles and living conditions. Samoa’s youthful population around half of whom are males require specific policies and strategies aimed at changing the conditions resulting in their marginalisation from a very early age, for their school age years and post school experiences. The social and economic costs to society of not recognising the marginalisation of boys in specific actions now would be unthinkable in the next five to ten years. Actions could begin by redefining the focus of the MDGs and EFA to fit Samoa’s issues associated with boys rather than girls.
- 109 -
5.6 Quality Education
Measuring progress towards EFA Goal 6: Improving all aspects of the quality and excellence of education with measurable learning outcomes
The GoS through its SDS is fully committed to the achievement of quality goals which include the improvement of literacy and numeracy, teacher quality, curriculum materials and assessment policy, management of education, infrastructure, financing, community participation and support, and monitoring and evaluation. The academic achievement of students in the primary level will be:
“achieved through appropriate levels of literacy in Samoan and English; the systematic development of numerical concepts and mathematical computational skills; creating sound philosophy about health and hygiene; introduction to scientific and technological concepts, skills and knowledge about global warming; an understanding of the need to protect and sustain the natural and cultural environment; introduction to the processes and methods of social science through the study of social and ethnic groups in Samoa and elsewhere; stimulation of imagination and creativity through the expressive arts; qualified trained teachers”.227
In the secondary level, excellence in achievement will be:
“achieved through maintenance of a strong academic curriculum with focus on the development of general education in languages, mathematics, science, social science and arts as the foundation for intellectual development; flexibility to choose from pathways of courses based on interest with a view to employment; a critical approach to all subjects; inclusion in academic course structures of applied subjects as the foundation for further education and training; development of competencies in analysis and problem solving; skills in decision making; the enjoyment of ideas, drama and literature; knowledge and experience of music, art and aesthetics providing for the creative use of imagination and individual expression; appreciation of group values; knowledge of cultural values in a changing society; introduction to research and simple project design; an increasing engagement in more complex intellectual skills; effective curriculum and support material; appropriate assessment mechanisms; enhance the capacity of schools to provide good quality education; qualified trained teachers”. 228
5.6.1 Financing Education
Percentage of total Government national budget for education
sector; Public current expenditure on education sector as a percentage of GDP Figure 53 shows the correlation between public expenditure on education as a percentage of total Government expenditure and also as a percentage of GDP. Public expenditure on education as a percentage of total Government spending was around 22 to 25 percent during the period FY2000/01 to FY2004/05. Although the percentage dropped to 19.6 percent in FY2005/06, actual expenditure to the education sector increased by 5.5 percent from FY2004/05.
227 MESC, SPP, p. 13. 228 ibid., p. 14.

- 110 -
The spiked increase in FY2006/07 reflected the Government’s extra funding allocated to MESC to fund upgrades and renovations for the facilities for the SPG. Spending was above the sustainable regional benchmark of 20 percent, except in FY2005/06. Public expenditure on education as a percentage of GDP remained constant over the years (until FY2006/07) at around four to five percent. These figures were below the sustainable regional benchmark of at least 6 percent of GDP, except in the FY2006/07. Figure 53: Correlation between public expenditure on education as percentage of total Government expenditure and as percentage of GDP, FY2000/01 – 2006/07
Correlation between public expenditure as % of total government expenditure and % of GDP, 2000/01 - 2006/07
22.8% 22.6% 22.4%
24.9%
22.1%
19.6%
29.9%
4.5% 4.8% 4.9% 5.2% 4.9% 4.6%
8.7%
0%
5%
10%
15%
20%
25%
30%
35%
2000/01 2001/02 2002/03 2003/04 2004/05 2005/06 2006/07
Public expenditure on education as % of total government expenditure
Public expenditure on education as % of GDP
Source: MESC and MOF, Samoa 5.6.1.1 Financing ECE Since 1999, the GoS, through MESC, has been providing an annual per capita grant to pre-schools registered with the NCECES. The current allocation (2007) is approximately SAT60 per child. The provision of most of the materials and teacher salaries remain the responsibility of the provider of ECE.229 Salaries are often fundraised by PTAs and communities. MESC provides stationery items such as paper, crayons, educational posters and musical instruments.230 Figure 54 demonstrates that the total financial commitment by the GoS to ECE has increased from SAT150,000 in FY2000/01 to SAT425,676 in FY2006/07. During this period, the annual Government grant to ECE doubled such that in FY2006/07, the Government grant was equivalent to 7.5 percent of the entire annual Government grant (SAT4,000,000). The entire annual grant is distributed between mission and private schools, special schools and ECE centres. Also, the Government’s allocation towards development of ECE curriculum increased to SAT125,676 in FY2006/07.
229 Afamasaga, ‘The Challenge in Education’, p. 82. 230 ADB TA 4256-SAM , op. cit., p. 8.

- 111 -
Figure 54: Public expenditure on ECE, FY2000/01 – 2006/07 (SAT) Financial Year
2000/01 2001/02 2002/03 2003/04 2004/5 2005/06 2006/07
Annual Grant
150,000 225,000 225,000 225,000 225,000 300,000 300,000
Curriculum Services
- 86,956 103,744 102,769 80,930 101,666 125,676
Total 150,000 311,956 328,744 327,769 305,930 401,666 425,676 Source: MESC Parents are required to pay fees to ECE centres. Depending on the provider, fees range from SAT5 per term to SAT200 per term in 2007, with private ECE centres generally charging more. 5.6.1.2 Financing primary education The GoS highlighted its commitment to primary education by increasing its budget allocation by 46.2 percent from FY2000/01 (SAT12,701,862) to FY2006/07 (SAT18,564,472) (refer to Figure 55). More than 90 percent of this fund has gone towards the teaching services, with the remainder funding curriculum services, teacher training services, level and counterpart costs.231 Figure 55: Public expenditure on primary education, FY2000/01 – 2006/07 (SAT) Financial Year
2000/01 2001/02 2002/03 2003/04 2004/05 2005/06 2006/07
Curriculum Services
52,696 288,287 343,948 340,713 268,309 337,057 416,656
Teaching Services
12,164,666 12,306,421 12,839,141 12,512,166 14,300,192 16,409,546 17,893,532
Teacher Training Services
238,450 286,376 266,125 280,261 386,294 223,513 229,283
Levels 246,050 - 147,570 - 674,869 - - Counterpart Costs
- - - - 246,109 50,000 25,000
Total 12,701,862 12,881,084 13,596,784 13,133,140 15,875,772 17,020,117 18,564,472 Source: MESC 5.6.1.3 Financing secondary education Public expenditure on secondary education also increased (refer to Figure 56) by 37.6 percent (SAT6.9 million in FY2000/01 to SAT9.5 million in FY2006/07). The main contributor to this growth was teaching services. Figure 56: Public expenditure on secondary education, FY2000/01 – 2006/07 (SAT) Financial Year
2000/01 2001/02 2002/03 2003/04 2004/05 2005/06 2006/07
Curriculum Services
568,193 323,823 386,344 382,711 301,382 378,605 468,016
Teaching Services
5,213,428 5,274,180 5,502,489 5,362,357 6,128,654 7,032,663 7,668,657
Teacher Training Services
238,450 286,376 266,125 280,286 386,294 223,513 229,283
Levels 902,025 1,146,871 2,096,775 2,091,825 1,720,538 1,352,301 1,131,731 Counterpart Costs
- - - - 221,109 35,000 25,000
Total 6,922,096 7,031,250 8,251,733 8,117,154 8,752,976 9,022,082 9,522,686 Source: MESC
231 ‘Level costs’ are maintenance costs to schools. There has been no expenditure by the GoS on level costs since FY2004/05. ‘Counterpart costs’ are the monetary contributions from the GoS to projects jointly funded by donors.

- 112 -
5.6.1.4 Financing SNE Figure 57 below indicates that the commitment of the GoS to SNE in Samoa has increased. Government expenditure increased from SAT150,000 in FY2000/01 to SAT409,459 in FY2006/07. This is an increase of 173 percent. In addition to the annual grant to SNE providers, the Government under the MESC’s budget also allocates appropriations towards the development of ECE curriculum. This allocation increased to SAT209,459 in FY2006/07 from SAT144,926 in FY2001/02. Figure 57: Government expenditure on SNE, FY 2000/01 – 2006/07 (SAT) Financial Year
2000/01 2001/02 2002/03 2003/04 2004/5 2005/06 2006/07
Annual Grant
150,000 225,000 225,000 225,000 225,000 200,000 200,000
Curriculum Services
- 144,926 172,907 171,282 134,883 169,444 209,459
Total 150,000 369,926 397,907 396,282 359,883 369,444 409,459 Source: MESC 5.6.1.5 Overview of the education expenditure on different levels of education in Samoa Figure 58 below shows the overview of Government commitment in financing ECE, primary, secondary and SNE in Samoa. There was an increase in Government financing at all levels over the seven year period from FY2000/01. Primary education received the most funding, followed by secondary education. Expenditure on primary education grew by 46.2 percent over the seven year period whilst expenditure on secondary education grew by 37.6 percent. SNE and ECE saw 173 percent and 184 percent growth in expenditure, respectively. This reflects the commitment of the Government in the current SDS 2005-2007, where development of education is a priority focus. Figure 58: Overview of the education expenditure spent on the different levels of education, FY2000/01 – 2006/07
Overview of the education expenditure spent on the different levels of education in millions (2000/01-2006/07)
12,881,084 13,596,784 13,133,14015,875,772
17,020,117
7,031,2508,251,733 8,117,154
8,752,9769,022,082
409,459369,444359,883396,282397,907369,926150,000
425,676401,666305,930327,769328,744311,956150,000
18,564,472
12,701,862
9,522,686
6,922,096
0
2,000,000
4,000,000
6,000,000
8,000,000
10,000,000
12,000,000
14,000,000
16,000,000
18,000,000
20,000,000
22,000,000
24,000,000
26,000,000
28,000,000
30,000,000
2000/01 2001/02 2002/03 2003/04 2004/05 2005/06 2006/07
sne ece primary seconadry
Source: MESC and MOF, Samoa

- 113 -
Public current expenditure on ECE, primary, secondary and SNE as percentage of total public expenditure on education Whilst the actual expenditure on different levels of education has increased since FY2000/01 (refer to Figure 58 above), the amounts as a percentage of the total public expenditure on education has decreased over time, particularly for FY2006/07 (refer to Figure 59). Contributing factors to that effect was the increase of funds to MESC to prepare for the South Pacific Games in FY2006/07 where SAT37 million was allocated under the MESC budget.
Figure 59: Public current expenditure on ECE, primary, secondary and SNE as percentage of total public expenditure on education, FY2000/01 – 2006/07
Public current expenditure on education on sne, ece, primary and secondary education as percent of total public expenditure on education
0.4% 0.9% 0.9% 0.8% 0.7%
34.1%
31.0%30.1%
25.8%
30.3% 30.8%
19.1%18.6%16.9%
18.3%
15.9% 16.7% 16.3%
9.8%
0.4%0.7%0.4% 0.8% 0.7% 0.6% 0.6% 0.4%0.7%0.0%
5.0%
10.0%
15.0%
20.0%
25.0%
30.0%
35.0%
40.0%
2000/01 2001/02 2002/03 2003/04 2004/05 2005/06 2006/07
% of education expenditure on sne % of education expenditure on ece
% of education expenditure on primary % of education expenditure on secondary
Source, MESC and MOF, Samoa
Public current expenditure on ECE, primary and secondary per pupil as percentage of GDP per capita This indicator measures the share of per capita income that has been spent on each pupil or student. It helps in assessing a country’s level of investment in human capital development in different levels of education. Figure 60 below clearly shows that the secondary level receives a higher share of per capita income with around 10 percent being spent on each student. Expenditure on ECE progressed very slowly with a growth rate of 0.9 percent, from 0.6 percent in FY2000/01 to 1.5 percent in FY2006/07. Overall, the Government invested quite a lot in relation to average per capita income in primary and secondary, except ECE where the Government needs to increase their share in the near future.

- 114 -
Figure 60: Public current expenditure on ECE, primary and secondary per pupil as percentage of GDP per capita, FY200/01 – 2006/07
Public expenditure on different levels of education as % of GDP per capita (2000/01-2006/07)
7.2%6.8% 6.7%
6.1%
6.7% 6.6%
7.9%
10.9%
10.2%10.8%
10.2% 10.0%
9.3%
10.5%
0.6%
1.3% 1.3% 1.3%1.0% 1.3%
1.5%
0%
2%
4%
6%
8%
10%
12%
2000/01 2001/02 2002/03 2003/04 2004/05 2005/06 2006/07
Public expenditure per pupil as % of GDP per capita for primary level
Public expenditure per pupil as % of GDP per capita for secondary level
Public expenditure per pupil as % of GDP per capita for ece level
Source: MESC and MOF, Samoa
Percentage of education budget devoted to non-salary expenses
(benchmark 10 percent) Figure 61 shows the percentage of the education budget that has been allocated to non-salary expenses from FY2001/02 to FY2006/07. The percentage has decreased over this period, coming close to the 10 percent benchmark in FY2006/07. Figure 61: Percentage of the education budget devoted to non-salary expenses, FY2001/02 – 2006/07
Financial Year
2001/02 2002/03 2003/04 2004/05 2005/06 2006/07
Percent 28 41 32 17 14 13 Source: MESC
5.6.1.6 Financing TVET
Public expenditure on TVET The Government, as part of its annual grant, distributes funds to certain TVET institutions out of the amount allocated to mission and private schools. In FY2006/2007, 87.5 percent out of a total of SAT4,000,000 was given to mission and private schools. Figure 62 below details the annual grants distributed to certain TVET institutions from FY2004/05 to FY2005/06.
Figure 62: Government grants to TVET institutions, FY2004/05 – 2006/07 (SAT) Financial Year
TVET Institutions Beautiful
Expression of Nature
Don Bosco
June Ryan
Loto Taumafai
Marist Centre
Samoa Music School
Tesese Secretarial
School
Tiapapata Art Centre
2004/05 29,000 70,000 30,000 70,000 25,000 30,000 75,000 29,000 2005/06 30,000 81,600 68,000 140,000 68,000 68,000 102,000 30,000 2006/07 10,000 90,450 15,000 82,000 33,500 15,000 20,000 10,000 Source: MESC

- 115 -
In addition to the above, Laumua o Puna’oa Technical Centre and Uesiliana Vocational Training Centre receive part of the Government grant distributed to the Methodist Board, and Leulumoega Fou School of Fine Art from the Government grant distributed to the EFKS mission.
The Government also gives a grant to the IOT. The Statement of Revenue for IOT in Figure 63 shows that the majority of costs are covered by the annual grant to IOT, but student fees are charged to assist with expenditure. Generally, PSET providers (and therefore TVET providers also) structure their fees to consider factors such as resources necessary for delivering the courses, maintenance of the facilities, staff salaries and the market value of the qualification gained.232
Figure 63: Statement of revenue for IOT, FY1999/00 – 2004/05 (SAT) Financial Year
1999/00 2000/01 2001/02 2002/03 2003/04 2004/05
Government Grant
2,600,000 2,550,000 2,550,000 2,650,000 3,073,399 2,800,000
Fees & others
423,081 472,425 467,508 718,617 579,199 472,686
Total 3,023,081 3,022,425 3,017,508 3,368,617 3,652,598 3,272,686 Source: SATVETI
Of all the TVET institutions, the IOT receives the most donor funding. For example, from 2001 to 2006, Japan funded the Samoa Polytechnic Campus Upgrading Project for SAT40,000,000. Donor funding mainly assists in developing physical and academic facilities.233
Ratio of private sector investments to formal institutions share in
overall Government budget for TVET programmes Private sector investment in TVET is very limited and is mainly through the provision of scholarships awards to students and donations. As an example, Figure 64 presents the Don Bosco Technical Centre’s breakdown of revenue sources for its annual budget.
Figure 64: Example of breakdown of annual revenue source for Don Bosco Technical Centre Revenue source PercentageSchool fees 10% Government grant 20% Fundraising 20% Donations 10% Salesians of Don Bosco 25% Donor projects 15% Source: SATVETI
5.6.1.7 Financing tertiary education The NUS receives an annual grant from Government and levies fees for tuition. It has an annual budget of around SAT9 million. The Government grant has been capped at SAT5 million in the past five years.234 The Government also sponsors students to tertiary institutions, such as NUS and overseas universities. As an example, Figure 65
232 Mualia and Manila-Silipa, op. cit., p. 15. 233 SATVETI. 234 Afamasaga, ‘The Challenge in Education’, p. 91.

- 116 -
details the Government expenditure on sponsoring students to the FoE at NUS, which has increased dramatically since FY2003/04. Figure 65: Government expenditure on sponsoring students to FoE at NUS, FY2000/01 – 2006/07 Financial Year 2000/01 2001/02 2002/03 2003/04 2004/05 2005/06 2006/07Expenditure on FoE (NUS) Sponsored Students
- - - 275,868 375,000 845,388 850,000
Source: MESC 5.6.1.8 Donor contributions to education
Donor funding
Donor funding has played a major role in the development of education in various ways. Figure 66 below details the actual monetary contributions from different partners during the period FY2000/01 to FY2004/05 to fund schools.
Figure 66: Major Donors to Education (Grants Only), FY 2000/01- 2004/05 (US$000) Financial Year
ADB
AusAID
Canada Fund
EU
JICA
LDS NZAID
UNDP
WHO
Total
2000/01 820 3,430 25 159 93 3,485 607 8,619 2001/02 3,431 125 204 748 300 4,808 2002/03 63 73 138 1,309 121 165 1,869 2003/04 14 1,031 85 920 2,050 2004/05 350 1,415 10,000 884 551 13,200 Total 1,170 8,353 223 1,532 12,235 121 5,454 1,458 30,546 Ongoing yearly
1,532 1,111 283 412 3,338
Source: Samoa Education Sector Project II – Education Sector Review
5.6.1.9 Parent contributions to education
Compulsory and free education
As discussed under Goal 2, primary education is compulsory between the ages of 5 years and 14 years (or completion of Year 8). However, the Compulsory Education Act is not enforced. Although penalties are set out in the legislation, none has been imposed due to several factors like limited human resources and coordination of resources. The provision of primary education is a partnership between the Government and communities. MESC appoints and pays the salaries of principals and teachers, and distributes stationery and curriculum materials to schools. In the budget for FY2005/06 and FY2006/07, the Government made provision for the purchase of consumables in secondary schools to improve the quality of practical subjects. The local communities (village and district) provide the school buildings, furniture and equipment, and are also responsible for the maintenance of the school and its environment. These maintenance costs are passed on to parents who pay maintenance fees, which can vary from SAT5 to SAT50 in the urban area. Parents also contribute in other ways in funding their child’s education. For example, funding school uniform costs, transport, lunches and other school requirements.

- 117 -
5.6.2 The Quality of Primary and Secondary Education 5.6.2.1 Trends in education
Survival rate to Year 8
Refer to Section 5.2.5 for discussion on this indicator.
Drop out rate in secondary education Figure 67 illustrates the drop out rate for year level in secondary education. It shows that drop out is most likely to occur during Year 13. The rate of drop out has decreased since 1995 at all year levels, excluding Year 11 which has increased.
Figure 67: Drop out rate by year level in secondary education (National), 1995 – 2007
Drop out rate by year level in secondary education (1995-2007)
0
10
20
30
40
50
60
1995 1996 1997 1998 1999 2000 2001 2002 2003 2004 2005 2006 2007
yr9 yr10 yr11
yr12 yr13
Source: MESC
Pupil-teacher ratio Primary level The national standard for pupil-teacher ratio for primary education is 30:1. Figure 68 shows the pupil-teacher ratio at primary level, by region for 2000 to 2006. At a national level, the ratio has increased over the years, to 31.1 in 2006. This increase can be attributed to the increase of the pupil-teacher ratio during this period across all regions. In all years, the Apia Urban area exceeded the national standard whereas primary schools in Savai’i fell below the standard. The pupil-teacher ratio gap between Savai’i and Apia Urban gradually narrowed as we moved from 2000 to 2006. In 2007, 57 percent of Government primary schools met the national standard, with 61 primary schools above the national standard.235 The problems of overcrowding at the Malifa compound in the capital, Apia, have been relieved through assistance from the ADB ESP I. A major objective of the project was to redistribute primary students in the overly large Malifa compound schools in Apia
235 MESC, Education Statistical Digest 2007, part 2, p. 6.

- 118 -
to smaller schools in the surrounding area under the authority of local school committees.236 Private and mission schools generally have a lower pupil-teacher ratio at the primary level, than Government schools.
Figure 68: Pupil-teacher ratio in primary education by region, 2000 – 2006
Pupil/teacher ratio in primary education, by region (2000-2006)
0.0
5.0
10.0
15.0
20.0
25.0
30.0
35.0
40.0
2000 2001 2002 2003 2004 2005 2006
Pupi
l/tea
cher
ratio
s
National level
Apia Urban
Rest of Upolu
Savaii
Source: MESC, Samoa
Secondary level The national standard for pupil-teacher ratio in secondary education is 20:1. Figure 69 shows that at a national level, the ratio has exceeded this standard since 2002. In all years, schools in the Apia Urban area experienced the greatest shortage in teachers. The gap in the secondary level between Savai’i and Apia Urban gradually narrowed as we moved from 2000 to 2006. The data for pupil-teacher ratio in secondary schools does not reveal the shortage of teachers in certain subject areas such as Science and Mathematics. In 2007, 52 percent of secondary schools met the national standard ratios, with 12 secondary schools exceeding the ratio.237 Private and mission schools generally have a lower pupil-teacher ratio at the secondary level, than Government schools.
236 ADB TA 4256-SAM, op. cit., p. 11. 237 MESC, Education Statistical Digest 2007, part 2, p. 6.

- 119 -
Figure 69: Pupil-teacher ratio in secondary education by region, 2000 – 2006 Pupil/teacher ratio in secondary education, by region (2000-2006)
0.0
5.0
10.0
15.0
20.0
25.0
2000 2001 2002 2003 2004 2005 2006
Pupi
l tea
cher
ratio
s
National level
Apia Urban
Rest of Upolu
Savaii
Source: MESC, Samoa
Pupil-class ratio
Primary level MESC’s School Staffing Manual requires that schools with eight year levels have at least three teachers. Schools with less than eight year levels will have at least two teachers.238 The overall increase in the pupil-class ratio at the national level demonstrates the shortage of teachers (refer to Figure 70). The pupil-class ratio gap in the primary level in Savai’i and the Apia Urban area remained fairly constant as we moved from 2000 to 2006. This indicates that more teachers are required.
Figure 70: Pupil-class ratio in primary education by region, 2000 – 2006
Pupil/class ratio in primary education, by region (2000-2006)
0
5
10
15
20
25
30
35
40
2001 2002 2003 2004 2005 2006
Pupi
l cla
ss ra
tios
National level Apia Urban
Rest of Upolu Savaii
Source: MESC, Samoa 238 MESC, School Staffing Manual, Apia, 2002, p. 11.

- 120 -
Secondary level MESC’s School Staffing Manual applies a Size Adjustment Factor to all schools below 200 enrolment.239 The pupil-class ratio in secondary education (refer to Figure 71) at a national level has remained steady since 2003, at around 30:1. The pupil-class ratio is highest in the Apia Urban area.
Figure 71: Pupil-class ratio in secondary education by region, 2000 – 2006
Pupil/class ratio in secondary education, by region (2000-2006)
0
5
10
15
20
25
30
35
2001 2002 2003 2004 2005 2006
Pupi
l cla
ss ra
tios
National level Apia Urban
Rest of Upolu Savaii
5.6.2.2 Learning achievement
Learning achievement tests
Learning achievement is measured by four examinations. At the national level there are the SPELL Tests for Years 4 and 6, the Year 8 National Examination, and the Samoa School Certificate at Year 12 which is administered by MESC. SPELL Tests 1 and 2 are used as a measurement and diagnostic tool to allow literacy standards to be monitored and identify students who are at risk in achieving educational outcomes. At the regional level, learning achievement is tested by the PSSC at Year 13, which is administered by South Pacific Board for Educational Assessment (SPBEA). Refer to Section 5.6.2.3 for further explanation of these tests.
Percentage of Year 5 + who have mastered nationally defined basic
learning competencies The testing of student competencies at a national level after Year 5 occurs at Year 6, Year 8 and Year 12. All Year 6 students at Government schools undertake the SPELL Two Test. Figure 72 shows the percentage of students identified as at risk. In 2006, the percent of students identified as at risk at a national level was 53 percent for English, 13 percent for Samoan, and 58 percent for Numeracy. The overall
239 ibid.

- 121 -
results over the defined period show that girls have been performing better than boys.
Figure 72: Primary students identified as at risk, Year 6 (Government Schools) - Results from SPELL Two Test, 2000 – 2006
Source: MESC
Figures 73 and 74 show the percentage of Year 8 students that sat the Year 8 National Examination (a measure of the Year 8 completion rate) and the average raw score for core subjects. Since 2000, around 90 percent of enrolled students have sat the Year 8 National Examination annually. The results are concerning. In 2006, the average raw scores were 43 for English, 52 for Samoan, 33 for Mathematics, 33 for Basic Science, and 41 for Social Science. The trend has not improved since 2000.
Figure 73: Average raw score for core subjects at National Year 8 Examinations (All schools), 2000 – 2006
Source: MESC
Y e a r 8 N a t io n a l E x a m in a t io n S u b je c t R a w M e a n S c o r e s
0
1 0
2 0
3 0
4 0
5 0
6 0
E n g lis h S a m o a n M a t h e m a t ic s B a s ic S c ie n c e S o c ia l S c ie n c e
2 0 0 0 2 0 0 1 2 0 0 2 2 0 0 3 2 0 0 4 2 0 0 5 2 0 0 6
S t u d e n t s Id e n t i f ie d a s a t R is k ( % ) , Y e a r 6
0 %
1 0 %
2 0 %
3 0 %
4 0 %
5 0 %
6 0 %
7 0 %
8 0 %
9 0 %
B o y sE n g l i s h :
G i r l sE n g l i s h :
T o t a lE n g l i s h :
B o y sS a m o a n :
G i r l sS a m o a n :
T o t a lS a m o a n :
B o y sN u m e r a c y :
G i r l sN u m e r a c y :
T o t a lN u m e r a c y :
G e n d e r
2 0 0 0 2 0 0 1 2 0 0 2 2 0 0 3 2 0 0 4 2 0 0 5 2 0 0 6

- 122 -
Figure 74: Percentage of Year 8 students240 that sat the Year 8 National Examination (All students), 2000 – 2006
Source: MESC
In relation to the Year 12 National Exam, the percentage of Year 12 students that sat it has decreased since 2004, dropping from 89 percent in 2004 to 82 percent in 2006 (refer to Figure 75). Figure 76 shows the average raw score for core subjects. Average raw scores for all subjects (excluding Mathematics, Geography and Computer Studies) have fallen in 2006 from the 2005 scores.
Figure 75: Number of students241 sitting National Year 12 Examination (All schools), 2004 – 2006
Source: MESC
Figure 76: Average raw score for core subjects at National Year 12 Examination (All schools), 2000 – 2006
Source: MESC
240 The percentage of Year 8 students sitting Year 8 exams is a measure of Year 8 completion rate. 241 Total number of students who sat any one of the Year 12 exams. Note that no subjects are compulsory at Year 12, but most students take English, Samoan and Mathematics. However, individual schools may have a policy of some subjects being compulsory.
P e r c e n t a g e o f Y e a r 8 S t u d e n t s t h a t s a t t h e Y e a r 8 E x a m
8 2 %
8 4 %
8 6 %
8 8 %
9 0 %
9 2 %
9 4 %
9 6 %
9 8 %
1 0 0 %
E n g lis h S a m o a n M a t h e m a t ic s S c ie n c e S o c ia l S c ie n c e
2 0 0 0 2 0 0 1 2 0 0 2 2 0 0 3 2 0 0 4 2 0 0 5 2 0 0 6
S a m o a S c h o o l C e r t i f ic a t e S u b je c t R a w M e a n s
0
1 0
2 03 0
4 0
5 0
6 0
7 08 0
9 0
1 0 0
Engl
ish
Sam
oan
Mat
hem
atic
s
Geo
grap
hy
His
tory
Biol
ogy
Che
mis
try
Phys
ics
Scie
nce
Agric
ultu
ral S
cien
ce
Acco
untin
g
Econ
omic
s
Typi
ng
Com
pute
r Stu
dies
Food
& N
utrit
ion
Woo
d Te
chno
logy
2 0 0 0 2 0 0 1 2 0 0 2 2 0 0 3 2 0 0 4 2 0 0 5 2 0 0 6

- 123 -
5.6.2.3 Quality of teaching, learning resources, and assessment
Teaching and learning resources in primary and secondary schooling Physical facilities and equipment Schools in many regions are often damaged in natural disasters. Lack of regular maintenance has also seen many school facilities in need of rehabilitation, or in some cases, replacement. The EU, JICA and other donors have provided assistance for upgrading primary school facilities, but much more work needs to be done. Six primary schools were upgraded under ESPI project.242 In regards to secondary schools, ESPI upgraded 12 Government school buildings. Some secondary schools were partly upgraded through funding from donors.243 Under ESPII, the aim of component 3 is to increase access and equity in education, primarily through targeting the remaining Government secondary schools. The project will include repairing and rebuilding these remaining secondary schools, so that they include library blocks, science laboratories, design and textiles workshops and toilet blocks. There will also be provision for full access facilities for special needs students.244 Many school committees require financial assistance to procure consumables for practical subjects in secondary schools.245 In the budget for FY2005/06 and 2006/07, the Government made provision to purchase consumables for practical subjects in secondary schools. Further to this, the quantities of textbooks distributed by MESC are insufficient. The learning materials that were originally provided under projects are now MESC’s responsibility. It is not unusual for students to share books between themselves, and even with nearby schools. They are generally not available to students for homework and personal study purposes.246 Quality and relevance of teaching materials MESC through the CMAD provides the curriculum and relevant support materials for all schools. At the primary level, these materials include schemes for each of the subject areas, teachers’ manuals, student books, in-service training modules, science kits, resource kits containing readers, CDs and hands on activities for students, as well as radios and CD players. Curriculum for secondary schools include curriculum statements for all subject areas, student books, teacher guides, learner guides, off the shelf texts and in-service training modules.247 Primary The primary curriculum is over 25 years old and not integrated with the new secondary curriculum. From 1997 to 2003, AusAID funded the Primary Education Materials Project I and II (PEMP I and PEMP II) to develop additional
242 ADB TA 4256-SAM, op. cit., p. 12. 243 MESC, SPP, p.21. 244 GoS, ESPII Project Administration and Implementation Manual, Apia, December 2006, section 3, pp. 18-19. 245 MESC, SPP, p. 40. 246 ADB TA 4256-SAM, op. cit., p. 77. 247 MESC, SPP, p. 39.

- 124 -
learning materials for primary schools to assist teachers to improve the quality of learning by promoting learning and teaching strategies that encourage greater student participation in learning. The printed curriculum materials in each subject area were of high quality and designed locally. In addition to this, learning support materials were provided, such as science equipment, a Samoan dictionary, cassette radios, radio broadcasts and graded readers for Years 4 to 8. For Years 1 to 3, textbooks, teachers manuals, student workbooks, a kit of hands-on learning materials (including puppets and puzzles), and a set of CDs with CD player were distributed.248 Under ESPII, component 1 will look at developing new primary curriculum and related instructional materials to emphasize more active, child-centred learning activities in the classroom, and assessment techniques essential for high-quality learning. The new curriculum will also be consistent with the bilingual education policy, the NCPF, and National Special Needs Policy.249 The plan is to implement the new primary curriculum by 2010.250 Secondary NZAID and the GoS provided NZ $6 million for the Secondary Education Curriculum Resource Project (SSECRP) programme (1998 to 2004) to modernise secondary education curriculum, produce learning materials and teacher training. This included the preparation of curriculum and materials for expansion of secondary education to Years 12 and 13.251 Many schools need to take better care of materials and equipment to extend the life-span of resources. The MESC SPP July 2006 – June 2015 states that in the medium term, schools will need to develop and implement a policy on the use, safe and secure storage, and maintenance of materials and equipment.252 Teaching methods and styles The quality of teaching services is the product of a combination of a number of different factors, including the quality of intake into teacher-training institutions, teaching training programs, resources available, work environment, working conditions and entitlements, teacher support systems and personal qualities.253 Development projects such as PEMP I and II, SSECRP and ESP I provided funding and extensive training for teachers in new curriculum initiatives, and quality teaching methods. In addition, MESC has also assisted teachers with writing work plans and setting examinations. Teachers need to develop and use more creative teaching approaches. Assessment procedures which are valid and reliable MESC is responsible for all national examinations and for progressively reviewing and recommending improvements in assessment practices to ensure that these practices are in line with national policies and objectives. The
248 ADB TA 4256-SAM, op. cit., p. 40. 249 GoS, op. cit., section 3, p. 4. 250 ibid., section 3, p. 9. 251 ADB TA 4256-SAM, op. cit., p. 12. 252 MESC, SPP, p.40. 253 ibid., p. 44.

- 125 -
Assessment Unit administers SPELL 1 and 2 Tests, the Year 8 National Examination and the Year 12 Samoan School Certificate. The SPBEA, based in Fiji, administers the PSSC for Year 13. The examination papers are set by SPBEA and examiners and markers contracted from throughout the Pacific, including Samoan educators. It has been acknowledged that the current assessment system privileges the learning of facts and a teacher dominated pedagogy. Over the past few years, the introduction of internal assessment has meant that there is less ‘pen and paper’ assessment. Teachers are being asked to assess students’ ability to cooperate in group work, communicate ideas through dance, drama and visual arts, learn from manipulating materials and apply skills in various ways. This has required a diversity of assessment strategies, such as observation or watching a play.254 The capacity of teachers to provide fair and accurate assessments of student achievement is central to effective classroom practice and in the reporting of the achievement of students. The current results from examinations is an indicator that teaching quality is either not good or the assessment procedures are not valid. SPELL 1 and 2 Tests It has been raised that there is a lack of explicit links between SPELL and the present primary curriculum.255 Concerns have been expressed about teachers obtaining copies of SPELL Tests prior to examinations, and drilling answers to students to ensure top performances.256 Year 8 National Examination The Year 8 National Examination covers Samoan, Mathematics, Science, Social Science and English. This examination is for selecting students into secondary schools and colleges. The Year 8 examination is prepared by MESC curriculum officers and NUS. All examiners and moderators undergo training conducted by senior staff in the Assessment Unit of MESC. One of the criticisms of the Year 8 examination is the pressure upon teachers to teach to the examination, thereby encouraging memorization and working less to develop higher order thinking skills. Further to this, the examination is seen as a barrier to the goal of equity in the Samoan education system as the medium for the examination is English. This means that students sitting the examination have approximately only two years of English medium of instruction which is about the amount of time a person needs to be able to use a second language for social purposes. Six years of instruction is required before use in an academic context. So the examination discriminates in favour of the students who have had more exposure to English. Under the
254 ADB TA 4256-SAM, op. cit., p. 47. 255 ADB TA 4256-SAM, op. cit., p. 44. 256 Interview with Ainslie So’o (Language Specialist, MESC).

- 126 -
MESC’s current SPP, the purpose and continuing use of Year 8 national exams will be reviewed. National Year 12 Examination The Year 12 examination serves two purposes. One is to certify students who leave at this level for other institutions or work and to select students for Year 13. All Samoan School Certificate examinations subjects now have Internal Assessment Components as a result of the recent reform of the secondary curriculum.257 Year 13 PSSC Examination The performance of students in the Year 13 PSSC has generally been lower than the results achieved by students in other participating Pacific countries. Students normally sit four or five examinations and receive a scaled mark to 100 that may comprise of an examination mark, an IA mark, and a Common Assessment Task mark that is administered by the class teacher and marked by SPBEA appointed examiner and monitors. Since 2003, SPBEA have expanded their offered subjects.
National assessment framework in line with national curriculum
framework Cabinet approved in 2003, the establishment of a National Assessment Council as an advisory body to MESC to ensure that the assessment policies are consistent with developments in national curriculum, regional assessment initiatives, tertiary and vocational education as well as employment.258 A National Assessment Framework is being developed under ESPII project. The need for changes to the examination system is due to the introduction of new primary curriculum and the expected changes to the way students move to further education and employment. As mentioned above, the assessment and examination policies will be reviewed, including the purpose and continuing use of the Year 8 examination. The framework will include assessment modes that reflect current curriculum reforms, including bilingual education, the recent assessment reforms as a result of SSECRP and allow monitoring of progress of student learning over time. The framework will also take into account the proposed changes to the PSSC administration, introduction of a regional Form 7 examination, links to post-school recognition and the work of SQA.259
Instructional hours260
Guidelines for subject provision take account of the teaching practice that best meets the principles and goals of the system as well as allowing best classroom practice to be achieved. Classroom practice will vary depending on the developmental level of students. For younger students, subjects will be more integrated than for older students.
257 MESC, SPP, p. 41. 258 MESC, SPP, p. 41. 259 GoS, op. cit., section 3, p. 8. 260 MESC, NCPF, pp. 13-16.

- 127 -
In order to plan teaching approaches schooling is considered at various stages of development. For all stages and year levels the times are provided as a guide. In order to plan a curriculum that meets the individual needs of schools, schools have the flexibility to create their own curriculum program within the guidelines.
ECE ECE instructional hours are from 9 a.m. – 12 p.m. daily. Some centres have a four day programme while others have a five day programme. Early Primary – Year 1 to Year 3 The minimum hours of instruction for primary students in Years 1 to 3 is 25 hours a week.
Year 1 Samoan (including poems, speech training and printing) 7.5 hours English (initially oral English) 1 hour Social Science (incorporating story and drama) 3 hours Mathematics 5 hours Science 2.5 hours Health and Physical Education 3 hours Visual and Performing Arts (including art and music) 3 hours Other (assemblies/recess) 2.5 hours TOTAL: 25 hours of instruction
Year 2 Samoan (including poems and writing) 7 hours English (initially oral English) 1.5 hours Social Science (incorporating story and drama) 3 hours Mathematics 5 hours Science 2.5 hours Health and Physical Education 3 hours Visual and Performing Arts (including art and music) 3 hours Other (assemblies/recess) 2.5 hours TOTAL: 25 hours of instruction Year 3 Samoan (including writing, reading, listening & speaking) 6 hours English (including writing, reading, listening & speaking) 4 hours Social Science 3 hours Mathematics 5 hours Science 2.5 hours Health and Physical Education 2.5 hours Visual and Performing Arts (includes art and music) 2 hours Other (assemblies/recess) 2.5 hours TOTAL: 25 hours of instruction
An example of how the timetable might operate on a daily basis at Year 3 Time Allocated Learning Areas addressed8.00 – 10.00 Language activities (both for Samoan and English) 10.00 – 10.30 Recess 10.30 – 11.00 Mathematics including some integrated activities 11.00 – 11.30 Health and Physical Education 11.30 – 1.30 Integrated activities involving Social Science,
Science, Visual and Performing Arts and language development

- 128 -
Primary Years – Year 4 to Year 8 The minimum hours of instruction for primary students in Years 4 to 8 is 25 hours per week.
Samoan 5 hours English 5 hours Social Science 3 hours Mathematics 5 hours Science 2.5 hours Health and Physical Education 2.5 hours Visual and Performing Arts (includes art and music) 2 hours Other (assemblies/recess) 2.5 hours TOTAL: 25 hours of instruction
Secondary Years – Year 9 to Year 11 The minimum hours for instruction for secondary students in Years 9 to 11 are 25 hours per week.
The suggested allocation of hours per week for compulsory subjects is: Samoan 3 hours English 4 hours Social Science 3 hours Mathematics 3 hours Science 3 hours Health and Physical Education 1 hours Visual and Performing Arts (includes art and music) 1 hours SUB TOTAL: 18 hours Optional subjects may be undertaken in:
• Food and Textile Technology • Design Technology • Information and Communication Technology • Agricultural Science • Business Studies
The total time for optional subjects is 7 hours with at least two hours provided for each option studied. TOTAL: 25 hours of instruction
Senior Secondary Years – Year 12 and Year 13 In the senior secondary years, students must undertake the study of English and then choose four subjects from the following options. Both English and optional subjects shall be allocate a minimum time of five hours per week.
The Year 12 and Year 13 subjects are: English (compulsory) Samoan History Biology Chemistry Physics Science (Year 12 only) Mathematics Accounting Economics Development Studies (Year 13 only) Agricultural Science Computer Studies Geography Food and Textile Technology (Year 12 only)
- 129 -
Design Technology (Year 12 only) Design and Technology (Year 13 only) Physical Education and Health The Arts
Homework Policy Homework is an important part of learning that takes place after school where parents and the community can provide direct support to students. The following is the daily recommended times that should be allocated for homework has been approved.
Year Maximum time for Homework1 to 3 30 minutes 4 to 6 45 minutes 7 and 8 1 hour 9 to 11 1 hour and 30 minutes
Year Maximum time for Homework12 and 13 Students should spend at lest 2 hours per day in
self directed study
In February 2007, the starting time for schools changed to 8.30 a.m. to 2 p.m. 5.6.3 Language
Existence of a national language policy
The vernacular language of the people of Samoa is Samoan while English is their second language. However, with the establishment of formal education, the English language has become the language of access to educational opportunities and subsequent economic choices. This has affected the role of Samoan language in learning and limited the opportunities for it to expand its vocabulary, structures and textual features needed to be fully functioning for school learning. Yet the Samoan language is essential to the cultural identity and well being of Samoans. From the Education Policies of 1995 – 2005 it was recognised that “a prime objective of the Samoan education system should be bilingualism, the development of bilingual individuals, fully literate in Samoan and English”. The intent of the previous policy was clearly that of additive bilingualism – the development and maintenance of both Samoan and English languages. However in the language policy implementation tasks of the past ten years, the practice was that of transitional bilingualism in which Samoan language was used to support the development of English before English became the sole medium of instruction. Bilingualism has also been identified as a priority in the current MESC SPP. Currently, there is no specific section on the use of language in education under the Samoa Constitution. However, there are sections that relate to Samoan language and its use not only in education but other proceedings, and it implies that education follows this bilingualism process.

- 130 -
Section 9 – Rights to a Fair Trial 4) Every person charged with an offence has the following minimum rights: (a) To be informed promptly, in a language which he understands and in detail, of the nature and cause of the accusation against him; (e) To have the free assistance of an interpreter, if any doubt exists as to whether he can understand or speak the language used in court. Section 54 – Languages (1) All debates and discussions in the Legislative Assembly shall be conducted in the Samoan language and the English language. (2) The Minutes and the debates of the Legislative Assembly, every bill introduced therein, every paper presented thereto and all minutes of proceedings, minutes of evidence, and reports of committees of the Assembly shall be in the Samoan language and the English language.
Section 112 – Authoritative texts The Samoan and English texts of this Constitution are equally authoritative but, in case of difference, the English text shall prevail.
The Education Bill has provisions about language:
Schedule 2 Ministry’s Responsibilities (3) Cultural Affairs (i) To promote and preserve the Samoan Language
Cabinet has approved the establishment of the Samoan Language Commission to develop appropriate guidelines for Samoan language with a budget of SAT50,000. This will strengthen, promote and reduce issues with language use.
Use of indigenous language as the language of instruction in the
early years of education MESC through the NCPF has directed the split between English and Samoan in the early years of education (see Figure 77). English is gradually introduced into lessons, with more emphasis placed on English instruction after Year 6. Figure 77: Language of instruction from ECE to Year 8 Year Samoan EnglishECE and early Year 1 Medium of instruction Introduced through songs, stories,
rhymes, simple greetings and social changes in day to day activities
Remainder of Year 1 90% of units prepared, taught and assessed
10%of units prepared, taught and assessed
Year 2 80% of units prepared, taught and assessed
20% of units prepared, taught and assessed
Year 3 70% of units prepared, taught and assessed
30% of units prepared, taught and assessed
Years 4 and 5 60% of units prepared, taught and assessed
40% of units prepared, taught and assessed
Year 6 50% of units prepared, taught and assessed
50% of units prepared, taught and assessed
Years 7 and 8 40% of units prepared, taught and assessed
60% of units prepared, taught and assessed
Year 8 examination Samoan language examination Remaining subjects examined in English

- 131 -
5.6.4 Quality of Teaching Services
Critical to the achievement of quality of education is the existence of an adequate number of teachers and quality teachers. Factors that impact upon teacher quality include salaries, conditions of work, teacher performance, opportunities for professional development. Routine programmes undertaken by MESC to improve the quality of teaching service include: managing training to upgrade content knowledge; block course training in pedagogy; training by subject clusters; school-based training; school-based monitoring of the quality of teaching and learning; and teacher performance appraisal.261 5.6.4.1 The teaching profession There are (2007) a total of 2,096 teachers. 70.8 percent of these teachers are working in Government schools (refer to Figure 78). Figure 78: Number of teachers in all schools, 2007 Government Mission Private TotalPrimary 1,039 158 76 1,273 Primary-Secondary262 and Secondary
446 353 24 823
Total 2,096 Source: MESC, Educational Statistical Digest 2007 Figure 79: Number of primary and secondary teachers in all schools, 2001 to 2007
Number of primary and secondary teachers, all schools
0
200
400
600
800
1000
1200
1400
1600
2001 2002 2003 2004 2005 2006 2007
Primary Secondary
Source: MESC, Samoa
Figure 79 shows the total number of primary and secondary teachers in all schools, from 2001 to 2007. The number of secondary school teachers has increased slightly since 2001, from 798 to 823 teachers in 2007. However, the number of teachers at primary level has dropped from 1432 to 1273 teachers over this same period. These trends are
261 MESC, SPP, p. 45. 262 Primary-Secondary is a school that provides both primary and secondary levels, eg. Fagaloa Secondary School has Year 7 and 8 levels.

- 132 -
concerning as enrolments have increased over this period at both primary and secondary levels. Please refer to Section 5.6.2.1 of this report for further discussion about pupil-teacher ratios. An analysis of teachers from January 2001 to July 2004 found that there was a deficit of 26 teachers every year. Considering all the reasons for leaving the service (long service/personal leave, secondment/study leave, maternity leave), a total of 52 full time equivalent teachers also left the service during the period. This resulted in a total shortfall in supply of approximately 78 teachers during the three and a half year period.263 5.6.4.2 Teacher qualifications MESC defines a qualified teacher as one who has a formal qualification from a recognised teacher training institution and a Trained Teacher’s Certificate.
Percentage of primary school teachers having the required qualifications Figure 80 shows that the percentage of teachers certified to teach according to national standards has increased from 92 percent in 2001 to 96 percent nationally in 2007. These numbers represent the percentage of primary teachers with a Trained Teacher’s Certificate and a formal qualification from a teacher training institution, such as the FoE at NUS.
Figure 80: Percentage of primary teachers certified to teach according to national standards (National), 2001 – 2007
Percentage of primary teachers certified to teach according to national standards (2001-2007)
0.9
0.91
0.92
0.93
0.94
0.95
0.96
0.97
2001 2002 2003 2004 2005 2006 2007
Male Female Total
Source: MESC
Percentage of secondary school teachers having the required
qualifications Figure 81 shows that the percentage of secondary school teachers certified to teach according to the national standards has increased by around five percent from 77 percent in 2001 to 82 percent in 2007.
263 Afamasaga, ‘The Challenge in Education’, p. 95.

- 133 -
The percentage of secondary school teachers having the required academic qualifications is illustrated in Figure 82. This is defined as a teacher who hold a Trained Teacher’s Certificate and also a tertiary qualification (other than a qualification from a teacher training institution). This graph shows that there has been an increase in the number of secondary teachers holding the required academic qualification from around 85 percent in 2001 to 90 percent in 2007.
Figure 81: Percentage of secondary teachers certified to teach according to national standards (National), 2001 – 2007
Percentage of secondary teachers certified to teach according to national stardards (2001-2007)
77%
83%
80%
77%
81%
85%
82%
77%
84%
80%
77%
81%
85%
82%
77%
83%
80%
77%
81%
85%
82%
0.72 0.74 0.76 0.78 0.8 0.82 0.84 0.86
2001
2002
2003
2004
2005
2006
2007
Male Female Total
Source: MESC Figure 82: Percentage of secondary teachers having the required academic qualification (National), 2001 – 2007
Percent of secondary teachers having the required academic qualification (2001-2007)
85%
90%
88%
85%
88%
93%
90%
85%
90%
88%
84%
89%
93%
90%
0.78 0.8 0.82 0.84 0.86 0.88 0.9 0.92 0.94 0.96
2001
2002
2003
2004
2005
2006
2007
Male Female
Source: MESC

- 134 -
Existence of national policy/protocol for teacher recruitment Teacher entry into the primary and secondary is determined by entry criteria set out by NUS. MESC actively seeks teacher trainees and funds their training. Graduates from other universities without a teaching qualification are also employed by MESC. They are encouraged to undertake the one-year post-graduate education diploma from NUS. To re-employ teachers, a teacher certificate needs to be sighted. For teachers coming from outside the Government service, one needs to also provide referees. For appointments to Positions of Responsibility264 level in schools the recruitment selection process of the Public Service Commission are followed. What is currently in progress is the formulation and finalisation of the National Teacher Development Framework (NTDF). The NTDF is looking at the whole issue of teacher recruitment and the teaching profession.
Teacher development (professional development)
Pre-service training In the belief that teacher training could be better carried out by a tertiary institution, the transfer of teacher training from MESC to NUS was one of the targets of the 1995 – 2005 policies and strategies. This was achieved in 1996. The NUS now provides training for primary, secondary, ECE, and SNE teachers. Programmes include a Foundation Certificate in Education which is preparatory to entering a two-year concurrent academic and professional Diploma of Education programme. A further two years enables a student to obtain a Bachelor of Education. There is also a one year Graduate Diploma of Education programme to provide teacher training for graduates.265 Figure 83 presents the number of graduates from the FoE between 2000 and 2006. The number of graduates of the Foundation Certificate and Diploma of Education has risen over this period. However, specialisation in Secondary level education has fallen over this period. The drop out rates of students from these programmes is significant. For example, in 2004, 224 students were enrolled in the Diploma in Education programme. However, only 80 of these students completed and graduated in 2006. Further to this there is a low enrolment in Science and Mathematics subjects at FoE contributing to the shortage of teachers in these areas.
264 These are management positions in the schools. They include; Principals, Deputy Principals (Secondary and Colleges), First Assistants (Primary), Infant Supervisors (Primary). 265 Afamasaga, ‘The Challenge in Education’, p. 95.

- 135 -
Figure 83: Number of graduates from the FoE, NUS, 2000 – 2007 2000 2001 2002 2003 2004 2005 2006
Foundation Certificate in Education
46 71 80
Diploma in Education (Primary)
30 28 30 23 39 34 46
Diploma in Education (Secondary)
41 31 33 33 18 22 34
Bachelor of Education
6 6 11 5
Source: NUS
Through the USP office in Savai’i, it is possible for students to complete a Bachelor of Education degree. Three teachers have completed the Bachelor of Education at USP, where part of their course was completed by distance mode. They were provided with scholarships from the Government. The fees at USP are almost double those at the NUS, making this option for teacher development very expensive.
In-service training MESC is responsible for teacher development for the public education sector, whilst also assisting the private sector. The responsible divisions within MESC are the School Operations division and CMAD. The expectations in the SPP for 2006 – 2015 for teacher development includes266:
o Teachers will be supported through regular in-service programmes o All teachers in the public sector will hold a professional qualification in
teaching o Professional development courses for teachers will be offered via open
and distance learning o Monitoring and evaluation of all teacher development activities will be
reviewed and strengthened.
Most in-service training has been mainly project driven and therefore lacked cohesiveness and continuity in many subject areas. Development projects such as PEMP I & II, SSECRP and ESPI provided funding and extensive training for teachers in new curriculum initiatives and quality teaching methods (such as more active, learner- centred teaching methods). Under ESPI, system wide training in quality teaching methods was implemented for all primary teachers, and subject-based approach for secondary teachers. This training under ESPI adopted a ‘Train-the-Trainer’ model.267 With teacher shortages, multi-grade teaching has increased. A focus of training in recent times has been multi-grade teaching. MESC also responds to requests from schools on a needs basis. Staff visit schools and carry out school based training, depending on the availability of funds.
266 MESC, SPP, pp. 46-47. 267 ADB TA 4256-SAM, op. cit., p. 62.

- 136 -
However, the MESC current plan recognises that teachers in the rural areas do not have the same opportunities for professional development as teachers in the urban area.268 Approximately 10 percent of the MESC budget is spent on teacher development.269
Availability of primary school level teacher training
Primary school level teacher training is available. Please refer to the discussion above for information regarding this indicator.
5.6.4.3 Issues affecting the quality of teaching services
• The entry criteria to pre-service teacher training are generous and allow a much wider pool of students into the FoE than other faculties at NUS. The high demand for teachers has meant that greater numbers of teacher trainees are recruited at a cost to quality. The FoE is not adequately funded and teacher trainees do not have the access to necessary resources and equipment. Classroom based training is limited.270 Further to this, many students enroll in the FoE as a stepping stone to other professional programmes.
• Teacher salaries in Government schools are perceived to be low compared to other civil servants.
• Some schools have inadequate equipment, facilities and teaching resources. • There is a high attrition rate. • MESC cannot provide relief teachers when regular teachers go on maternity
leave, study leave or long service leave, or when teachers are transferred. • Due to the shortage of teachers in certain subject areas, some schools have
teachers teaching outside their specialised fields. • Teachers who have had to move away from home are generally not provided
with accommodation and/or a travel allowance.271 5.6.4.4 Strategies to improve the quality of teaching services Some of the strategies proposed by MESC in its SPP for July 2006 – June 2015 to address the quality of teaching services include272:
• All teachers sponsored by MESC will be bonded for a period of time equivalent to the length of time spent on training.
• Teachers will be required to remain in a school for a minimum of three years before they seek a transfer to another school.
• Teachers will progress in the approved Public Service Commission Teaching Careers and Salary Structure based on continuous excellent performance over a three-year period.
• Standards for pre-service qualifications for teachers will be consistently reviewed over the next nine years.
• Teachers’ outstanding performance will be recognised through special merit awards and further training opportunities. As a first step, the Samoa Education Awards was launched by MESC in 2007 to acknowledge outstanding
268 MESC, SPP, p. 46. 269 TA. No. 4738-SAM, Samoa National Teacher Development Framework Project – Technical Assistance Interim Report, Apia, 2007, p.20. 270 ibid., p. 25. 271 ibid., p. 27. 272 MESC, SPP, p. 46.

- 137 -
contributions made by teachers. MESC intends to expand these awards to include recognition of principals, school committees, SROs and beginning teachers.
Further to the above strategies, the ESPII Project will also address the development of effective teachers. To combat teacher shortages the project will support the development and implementation of an intensive three month programme to train 100 new primary teachers over four years and provide 10 fast-track teacher fellowships in agricultural science, food and textiles, visual arts, and design and technology. The ESPII project will also support a combination of training programmes and courses to improve general teaching skills, provide subject cluster content training, and ensure school-based support for improved teaching as a follow up to the training. Every teacher will be exposed to in-service training for an average of 10 days per year.273 The NTDF will guide teacher development policy and monitor the implementation of quality programmes. 5.6.5 Life Skills Programmes
Quality of life skills programmes
Due to the diverse range of life skills providers and programmes offered in Samoa and the lack of a centralised body in this area, it is difficult to assess the quality of life skills programmes on offer. However, Lameta’s research study in 2005 on NFE in Samoa does shed some light in this area. It found that providers of NFE range from Government ministries to church and village-based organisations and private small businesses. Out of the 61 organisations who responded to this survey, 182 programmes were identified, covering second chance education, education for social justice, personal development activities, professional training, community enhancement and cultural continuity, and supplementary education.
The study found that:
o Existing relationships among providers and programmes are informal and adhoc, risking fragmentation and duplication in activities
o The information base on programmes at a provider and central level is weak. Data is sparse on participants, trainers, and outcomes/impacts of programmes
o Less than half of the providers surveyed included as part of their planning processes participant evaluation, programme impact assessment, review of linkages with other organisations, and needs analysis to gauge demand
o Programme design decisions are mostly top-down and external to participants
o About half of the programme facilitators have had training in adult teaching and learning
o Most programmes are primarily self-funded. o Many providers have had problems with resourcing, such as inadequate
facilities and curriculum, inadequate quantity and quality of material and human resources, and uncertainty of funding.
273 GoS, op. cit., pp. 11-15.

- 138 -
A number of recommendations were made as a result of these findings, which were adopted in MESC’s SPP July 2006 – June 2015. In relation to quality, the plan highlights the need to develop and implement quality assurance arrangements, including quality of provider, quality of trainers, quality of programme planning, resources and delivery of training. Pursuant to this, SQA will establish standards and mechanisms to ensure quality. A funding policy for providers will also be developed to ensure sustainability of programmes.274
5.6.6 Education Planning
Capacity of national systems to develop coherent national
educational plans The SDS defines within any specific three-year period the broad strategic objectives of Government. It highlights the goals for each sector for that given period. Specific strategies against the goals are mentioned to guide the sectors in further planning to achieve the goals. Sector planning is a process that operates as a long-term strategy for each major sector. Input is provided by various ministries/organisations that share common goals. The development of the Education Sector Plan is initiated by the MESC who is referred to as the central agency for education. The production of the plan involves participation from the other educational institutions such as ECE, SNE, TVET and tertiary. The recent Education Policies and Strategies 1995 – 2005 was for a ten-year period. The current SPP July 2006 – June 2015 is for nine years. This change in years was purposely done not only to fall in line with the MESC three-year Corporate Plan cycle, but to also complete simultaneously with EFA and MDGs. The Statements of Economic Strategy (currently known as the SDS) 1998 – 1999, specifically emphasised that all Government ministries/institutions develop Corporate Plans to produce strategies to address gaps that hindered with achievement of goals in the SDS and their Sector Plans. The Ministry produced its first Corporate Plan July 2000 – June 2003 in 1999. The Ministry’s current Corporate Plan is from July 2006- June 2009. In addition, MESC has a Capability Plan which is submitted on 1 March each year to the Public Service Commission. The Capability Plan is a tool for managers to identify critical impediments to achieving corporate objectives. It also provides MESC and the Public Service Commission with information to negotiate funding for training and development needs (including overseas funding).
Existence of funding frameworks and guidelines for purposes of annual budgeting and education sector planning It is from the Ministry’s three-year Corporate Plan that the Annual Management Plan (AMP) is developed. The AMP depicts activities prioritised from goals and targets of the Corporate Plan to be implemented in a mentioned year. Each division develops their AMP from the Corporate Plan. Costings are then put against these activities which propose the annual budget for the Ministry.
274 MESC, SPP, p. 28.

- 139 -
The relationship between the different levels of planning and annual budgeting within MESC is defined by Figure 84. Figure 84: Levels of planning and annual budgeting within MESC
Existence of sound policy and planning frameworks which assist
with data and information collection and retrieval systems to provide accurate, timely and relevant data for informed policy decisions The Policy, Planning and Research unit (PPRD) within MESC is responsible for conducting research, coordinating policy development and the implementation of plans, coordinating projects, and gathering and analysing information. The unit has one Research and Policy Officer, one Planning Officer, one Information Analysis Officer and one Projects Coordination Officer, all working under the supervision of the PPRD Assistant-CEO. The Strategic Policy, Research and Development Projects Framework sets out the processes to be followed when undertaking these responsibilities. Coordination is undertaken by using and maintaining the policy register, developmental projects monitoring and coordination system, and research register. The services of PPRD were strengthened during the ISP (1999 – 2004) for MESC. However, the MESC SPP July 2006 – June 2015 has identified that there needs to be further capacity building in policy development, research and information analysis, and that the data collection methodology needs to be reviewed. Part of ESPII will be focusing on these areas, with plans designed to:
o Strengthen the national capacity for research and evaluation, which will provide a stronger basis for evidence-based policy development
o Strengthen the capacity of staff to analyse education data, identify priority issues for action, plan remedial interventions and policy reforms, and monitor implementation.
Sector Plans IMPACTS
IMPACT MEASURES
Corporate Plans RESULTS
PERFORMANCE MEASURES
Annual Management Plans OUTPUTS
ACHIEVEMENTS TASKS INPUTS
SECTOR PLANNING 9 YEAR CYCLE
CORPORATE PLANNING 3 YEAR CYCLE
ANNUAL MANAGEMENT PLANNING 1 YEAR CYCLE
BUDGET
NATION-WIDE PLANNING 3 YEAR CYCLE

- 140 -
National planning for universal and equitable education participation
MESC in its current SPP has as its vision: “A quality holistic education system that recognises and realises the spiritual, cultural, intellectual and physical potential of all participants, enabling them to make fulfilling life choices.”
The overall goal of the education sector is for the:
“… inclusive development of education, sports and culture that satisfies basic human needs. Meaning nurturing cultural and spiritual values and attitudes, and developing knowledge, skills and sporting potential that will prepare capable citizens who contribute to national development and a healthy nation.”
5.6.7 Education Qualification at a Regional Level
Existence of a national qualifications framework; Regional
qualifications framework Secondary education As discussed earlier, at the secondary level, Samoan students sit the PSSC examinations in Year 13. This examination is offered to Year 13 students around the Pacific region. Students who pass this examination can further their studies by enrolling in tertiary institutions for foundation level courses in tertiary institutions in the Pacific. PSET For PSET, SQA has developed the Samoa Qualifications Framework (SQF) to provide a coherent structure to recognise the value and characteristics of qualifications awarded in Samoa, by both national and international providers. The SQF:
o Provides a structure for establishing equivalence and comparability of all qualifications offered in Samoa
o Facilitates international comparability of qualifications awarded in Samoa o Facilitates the understanding of the skills, processes and competences
graduates have achieved through clear level descriptors o Facilitates the matching of skills demanded by industry and the supply of
skilled workers o Provides opportunities for career development and clear and flexible
pathways o Facilitates the recognition of prior learning, previously acquired skills and
current competencies o Provides opportunities to facilitate the pursuit of lifelong learning o Where necessary, distinguishes between institutional and national
qualifications.
The SQA has also finalised the SQA Quality Standards to ensure the quality of PSET providers and their programmes. The document states that ‘SQA will conduct regular quality audits of PSET providers to examine compliance and effectiveness against the elements of the Standard’.275 Policies and criteria for
275 SQA, draft SQA Quality document, pp. 8-9.

- 141 -
provider registration, programme accreditation, recognition of non-formal education and training, and quality audit, have also been drafted by SQA. Samoa has also participated in the first round of consultations, coordinated by the SPBEA, for the development of a Pacific regional qualifications framework for PSET.

- 142 -
Part 6: Managing International Support and Coordination of EFA Partners
6.1 Indirect
The standard process practiced in Samoa when managing and coordinating international support (funding in particular) involves the MOF who eventually becomes the Executing Agency. They play the medium role between the donor and the Implementing Agency/Ministry who carry out the work. Thus, exercising Government’s primary principles of accountability, transparency and efficiency. The donor may also deal directly with communities for educational development in terms of facilities and equipment. The contributors in this form are namely the EU, JICA, AusAID, NZAID, and the Canada Fund. The support by these partners have many been direct grants/bilateral aid, however Samoa has also moved to loaning funds from the ADB for educational development in infrastructure as coordinated under the ESP I. Other projects and programs have also contributed to achieving EFA with a clear and comprehensive donor management and coordination role. A current example is the ESP II, which has incorporated activities from Samoa’s action plan into its overall objective to improve education in the country. This project will run from 2006 to 2012 with commitment coming from NZAID, AusAID, ADB and the GoS. The significance of donors/organisations working in partnership as in ESP II is the effective and efficient use of the assistance provided. Addressing gaps will be shared, and support will be given to areas of need that best suits the donor/organisation. Thus, this harmonization will avoid duplication and enable the provision of resources (financial/ materials & equipment) and services (technical) to operate and smoothly flow to achieve basic education in Samoa.
6.2 Direct
In developing the EFA Action Plans in 2001, countries were advised to prioritise activities identified to bridge gaps that hindered the achievement of the six World goals. More importantly, put costing against each of these activities. Upon completing the development of plans and endorsement by their Governments, individual country plans were distributed (via UNESCO) to the donor community/organisations for screening so see whether the activities mentioned fell under their planned areas for international support according to their priorities and budget. A year later, a regional synthesis summarising the links/similarities of the needs and activities amongst countries was produced. It was generically put together to highlight and justify areas needing assistance for the donor community/organisations, and how some of these needs overlap between countries in the region and its distinction from other countries around the world.

- 143 -
In the implementation of activities pertaining to EFA Action Plans, countries have worked closely with organisations classified as EFA Partners. In the Pacific region, the partners are driven by UNESCO and include all UN and some education advocating Pacific Organisations such as the Pacific Islands Forum Secretariat, South Pacific Board Education Assessment and the Pacific Regional Initiatives for the Development of basic Education (PRIDE). This regional cooperation has brought benefits to member countries not only through sharing ideas in addressing EFA gaps, but also in terms of technical and financial assistance. PRIDE who is supported by EU and NZAID, is the major financial contributor in the production of this report. Activities for the provision of Second Chance Education (SCE) have been outsourced. With assistance from the Commonwealth Secretariat under their Commonwealth Service Abroad Program, operations have been passed on to Matuaileo’o Environmental Trust Inc. (METI) to serve as the local counterpart. METI is a strong advocate for EFA with its Director being their representative in Samoa’s EFA Forum. In light of their role as local counterpart, they are responsible to report back to the Forum and the MESC on all progress towards SCE. The UNDP in collaboration with the TALAVOU Project based in the Youth Division of the MWCSD, have provided support in funding a UN Volunteer to work closely with METI on the provision of SCE in Samoa. The UN Volunteer is responsible to report occasionally on progress to the National Coordinating Committee for SCE. UNESCO has also provided assistance pertaining to EFA activities for Samoa on short term projects.
- 144 -
Part 7: Conclusions and Policy Recommendations
By incorporating the goals, objectives and activities pertaining to EFA into national policies and strategies, the GoS has made much progress towards achieving education for all. Equity, access, efficiency and quality, which are underlying concepts in all six EFA goals, form the basis of current educational policy and strategies. This report gives an overview of the situation of education in Samoa and identifies some critical issues that impact upon Samoa’s progress towards achieving education for all. Education is a very important aspect in achieving Samoa’s development vision of an “Improved quality of life for all”.
Goal 1: Early Childhood Education and Care Issue 1: The participation levels of children in ECE are low, with GER not exceeding 35 percent.
Strategy 1: Encourage parents and communities to enroll children at an ECE Centre through running public awareness campaigns.
Issue 2: Knowledge about the impact of ECE on children graduates is limited.
Strategy 2: MESC to conduct research into the impact of ECE on the new intake and achievements of primary school children, for effective policy and planning in this area
Issue 3: The supply of qualified ECE teachers to meet the needs of ECE centres is inadequate.
Strategy 3: MESC to explore ways to fund ECE teacher salaries to ensure there is pay parity with primary school teacher salaries.
Issue 4: There is a failure of some ECE centres in meeting the national standards due to limited resourcing for facilities, equipment, and learning materials
Strategy 4(a): Government to explore ways to increase investment into ECE. Strategy 4(b): Communities and churches will also be encouraged to give support to ECE Centres and to assist providers with improving and maintaining facilities and equipment.

- 145 -
Goal 2: Achieving Universal Primary Education Issue 1: Enforcement of compulsory education is limited. There are children within communities not completing a full cycle of primary education.
Strategy 1(a): Parliament to pass the Education Bill so that compulsory education enforcement measures can take place. Strategy 1(b): Partnerships between village councils and MESC to be strengthened to encourage school attendance.
Issue 2: There is a high rate of repeaters in Year 1.
Strategy 2: Schools to enforce official school admission age. Issue 3: The survival rate to Year 8 and transition rate to secondary education is higher in the urban area.
Strategy 3: Decentralise Government activities from urban to rural areas.
Issue 4: There is low participation of children with special needs in primary education.
Strategy 4: MESC will support public awareness programmes on inclusive education and people with special needs.
Goal 3: Life skills and Life long learning Issue 1: Information collection and record keeping by TVET institutions is poor.
Strategy 1: Assist TVET institutions by setting up proper databases and strengthen their record management systems. Encourage institutions to trace achievements of students after graduation.
Issue 2: The drop out rates of students from PSET is high.
Strategy 2: MESC to conduct research to identify the causes of early drop-outs. Issue 3: PSET opportunities are limited for youth with special needs.
Strategy 3: Encourage PSET institutions to develop inclusive education policies for all students.
Issue 4: Corporal punishment is still practised in some schools.
Strategy 4: MESC to strengthen policies and sanctions in corporal punishment, with emphasis placed on the monitoring process.

- 146 -
Issue 5: Professional counseling services do not exist in schools.
Strategy 5(a): Government to establish drop-in counseling centres around the country. Strategy 5(b): MESC to explore the possibility of create counseling positions in this field to service schools.
Issue 6: Resoucing of ICT to schools (equipment and qualified and trained personnel) needs to be improved.
Strategy 6: SchoolNet is to be expanded under ESP II Project, which will improve resourcing and access to ICT in schools. MESC to encourage teacher trainees to undertake ICT programmes.
Issue 7: Population is at high risk of HIV and STIs.
Strategy 7: Market sexual health as ‘reproductive health’ to encourage community acceptance of sexual health education within schools and the community.
Goal 4: Literacy
Issue 1: Limited definition as to what is a literate and numerate person in Samoa.
Strategy 1: MESC to set benchmarks regarding literacy and numeracy to assist with assessment.
Issue 2: Lack in coordination between agencies in conducting literacy surveys.
Strategy 2: MESC to coordinate with partners in conducting national literacy surveys.
Issue 3: SPELL Tests show that there is poor literacy and numeracy achievement in the early years.
Strategy 3(a): MESC to investigate the validity of SPELL Tests and look into other methods of testing literacy and numeracy. Strategy 3(b): MESC to also encourage teachers to provide more assistance to students identified as at risk.

- 147 -
Goal 5: Gender Parity and Equality Issue 1: There is gender disparity at the secondary level, with more females enrolled in secondary schools than males. This gender disparity is carried through to tertiary level.
Strategy 1(a): National and international policies and frameworks focus on improving the situation of women and girls, which does not reflect the situation in Samoa. The Government needs to redefine focus of national policies and plans on issues associated with boys. Strategy 1(b): MESC to undertake research as to why there is low access/attendance and achievement by boys.
Issue 2: There is gender disparity in repetition rates for Years 5 and 8 and the survival rate from Year 1 to 8, with females doing better.
Strategy 2(a): Teachers to identify strengths in students and encourage students to pursue and participate in programmes which develop these strengths further, for example, in arts, sports, agricultural science, and music. Strategy 2(b): Parents, communities and the church to provide care qualities for boys. MESC to conduct awareness campaigns and programmes for parents to encourage equality of treatment between girls and boys
Goal 6: Quality Education Issue 1: Exam results at both primary and secondary levels are poor.
Strategy 1: MESC to undertake research to identify the cause(s) of low levels of achievement.
Issue 2: Teacher shortages at primary level and for specific subjects at secondary level.
Strategy 2(a): This issue is being addressed under ESPII Project, via a fast-tracking programme to train teachers. Strategy 2(b): MESC to explore incentives to attract teachers and maintain their commitment to the teaching profession (eg. expand career path opportunities for teachers, teacher exchange programme).
Issue 3: There is an insufficient supply of learning materials to primary and secondary levels.
Strategy 3(a): Encourage teachers to utilise the resources provided more effectively.

- 148 -
Strategy 3(b): Schools to develop policies on the proper maintenance of materials and equipment life span.
Issue 4: The current policy of bilingualism is affecting students’ ability to learn both Samoan and English to an adequate level.
Strategy 4: Undertake research into bilingualism to determine the appropriate balance between Samoan and English.
Issue 5: The career path structure for teachers is limited.
Strategy 5: This issue is being addressed under ESPII Project as part of the National Teacher Development Framework

- 149 -
References
GT Afamasaga, ‘The Challenge in Education’ in A So’o, UF Va’a, T Lafotanoa, J Boon (eds), Samoa National Human Development Report 2006, The Centre for Samoan Studies (National University of Samoa), Apia, 2006 GT Afamasaga, FS Moli and E Kruse-Vaai, Reinforcing/Incorporating Skills Development in the Samoa National EFA Plan – National Study, Apia, March 2005 F P Aiavao, ‘The Health Sector’ in A So’o, UF Va’a, T Lafotanoa, J Boon (eds), Samoa National Human Development Report 2006, The Centre for Samoan Studies (National University of Samoa), Apia, 2006 Asian Development Bank TA. No. 4256-SAM, Samoa Education Sector Project II – Education Sector Review, Apia, November 2004 Asian Development Bank TA. No. 4738-SAM, Samoa National Teacher Development Framework Project – Technical Assistance Interim Report, Apia, 2007 Asian Development Bank, Millennium Development Goals in the Pacific – Relevance and Progress, Manila, March 2003 Australian Government Department of Foreign Affairs and Trade, Samoa Country Brief – August 2007, <http://www.dfat.gov.au/geo/samoa/samoa_brief.html> Department of Education, Annual Report – 1 July 2000 – 30 June 2001, Apia Department of Education, Annual Report – 1 July 2001 – 30 June 2002, Apia Department of Education, Annual Report – 1 July 2002 – 30 June 2003, Apia Department of Education, Annual Report – 1 July 2003 – 30 June 2004, Apia Department of Education, Education For All Year 2000 Assessment: Samoa, Apia, 2000 Department of Education, Education Policies 1995 – 2005, Apia, July 1995 Department of Education, Education Strategies 1995 – 2005, Apia, July 1995 Department of Education, Special Report on Development of Education in Western Samoa, Apia, 1980 The Education Ordinance 1959 (Western Samoa), reprinted as on 1 January 1997 FM Elisara-Laulu, ‘The Millennium Development Goals Evaluated’ in A So’o, UF Va’a, T Lafotanoa, J Boon (eds), Samoa National Human Development Report 2006, The Centre for Samoan Studies (National University of Samoa), Apia, 2006 Government of Samoa, ESPII Project Administration and Implementation Manual, Apia, December 2006 Government of Samoa, Samoa National Strategic Plan for Information and Communication Technology 2004 – 2009, Apia

- 150 -
Government of Samoa, Report on the Status of Women in Samoa 2001, Apia Japan International Cooperation Agency, Samoa Education Sector Study, Apia, March 2004 E Lameta, Non-Formal Education in Samoa: Report of the Research Study, Apia, September 2005 E Lameta, Pacific Regional Overview of Progress Towards EFA Since Dakar, April 2005 E Lameta and Q Reid-Enari, Boys and Achievement, Apia, 2005 G Luke, How are the Neighbours? The Millennium Development Goals & Our Region 2006, World Vision Australia, Melbourne, August 2006 R McCollough, Case Study and Manual on Guidelines for Action to include Children and Youth with Disabilities in School Systems and the EFA Monitoring Process, Christchurch, 2005 Ministry of Education, Sports and Culture, Annual Report – 1 July 2004 – 30 June 2005, Apia Ministry of Education, Sports and Culture, Annual Report – 1 July 2005 – 30 June 2006, Apia Ministry of Education, Sports and Culture, ICT Master Plan 2004 – 2007, Apia Ministry of Education, Sports and Culture, Manumea Database Ministry of Education, Sports and Culture, National Curriculum Policy Framework, Apia, 2006 Ministry of Education, Sports and Culture, Samoa National EFA Action Plan, Apia, 2001 Ministry of Education, Sports and Culture, School Nutrition Standards (draft), Apia, July 2007 Ministry of Education, Sports and Culture, School Operations Handbook, Apia, July 2004 Ministry of Education, Sports and Culture, School Staffing Manual, Apia, 2002 Ministry of Education, Sports and Culture, Special Needs Education Policy, Apia, 2006 Ministry of Education, Sports and Culture, Strategic Polices and Plan July 2006 – June 2015, Apia, June 2006 Ministry of Education, Sports and Culture, Strategic Policy, Research & Developmental Projects Framework, Apia Ministry of Education, Sports and Culture, Values in Education Study (draft), Apia, 2007 Ministry of Finance, Economic Statement to Support the 2007/2008 Budget, <http://www.mof.gov.ws/uploads/economic_statement__english_version_.pdf> Ministry of Finance, National Accounts Report 2006, <http://www.mof.gov.ws/uploads/gdp_rep_2006_with_gdb_estimates.pdf> Ministry of Finance (Economic Planning and Policy Division), Strategy for the Development of Samoa 2005 – 2007, Apia, January 2005 Ministry of Finance (Samoa Statistics Department), Samoa Census of Population and Housing 2001, Apia, 2002

- 151 -
Ministry of Finance (Samoa Statistics Department), Preliminary Report of the Census of Population and Housing 2006, <http://www.spc.int/prism/country/ws/stats/> Ministry of Youth, Sports and Cultural Affairs, Samoa National Youth Policy 2001 – 2010, Apia, 2001 SF Muagututi’a, ‘The Human Development Indices’ in A So’o, UF Va’a, T Lafotanoa, J Boon (eds), Samoa National Human Development Report 2006, The Centre for Samoan Studies (National University of Samoa), Apia, 2006 S Mualia and E Manila-Silipa, A Report on Initial Data Collection from Post School Education and Training Providers, Apia, February 2007 F Mulitalo, M Pesamino and D Lene, Inclusive Education Workshop, 1-5 October 2007, Status Report on Inclusive Education, Samoa, Apia, October 2007 National Council of Early Childhood Education of Samoa Inc., Standards for Samoa Pre-Schools, Apia, 2001 National Council of Early Childhood Education of Samoa Inc., Ta’iala Mo A’oga ‘Amata i Samoa, Apia New Zealand Ministry of Foreign Affairs and Trade, Samoa, <http://www.mfat.govt.nz/Countries/Pacific/Samoa.php> Pacific Forum Secretariat, Forum Basic Education Action Plan - 2001, New Zealand, 15 May 2001 PRIDE, Samoa Education Sector Evaluation Study Final Report, Apia, December 2005 Samoa Business Enterprise Centre, TALAVOU Programme: Desk Review Report, Apia, March 2007 Samoa Global Youth Tobacco Survey Fact Sheet, 2007 Setting regional benchmarks for literacy, numeracy and life-skills to monitor the quality of basic education in the Pacific region SQA, draft SQA Quality document TALAVOU Programme, Project Implementation Document, Apia, April 2006 K Tomasevski, Free and Compulsory Education For All Children: The gap between promise and performance, Gothenburg, 2001 UNDP, Human Development Report 2006, <http://hdr.undp.org/hdr2006> UNESCO, EFA Mid-Decade Assessment Meeting Report, Bangkok, 2006 UNESCO, The Plurailty of Literacy and its Implications for Polices and Programmes, France, 2004 UNICEF, Guidelines for the Asia and Pacific Education For All: Mid-Decade Assessment: Identifying and Reaching the Unreached, Bangkok

- 152 -
World Health Organisation, Second Generation Surveillance Surveys of HIV, other STIs and Risk Behaviours in 6 Pacific Island Countries (2004 – 2005), 2006

- 153 -
EFA Task Force Members
Tautāpilimai Levaopolo Tupae Esera Chief Executive Officer – MESC Marie Bentin-Toalepaialii EFA Mid-Decade Assessment Project Manager & Assistant Chief Executive Officer (Policy, Planning & Research Division) – MESC Doreen Roebeck-Tuala Assistant Chief Executive Officer (Curriculum Materials and Assessment Division) – MESC Lenata’i Victor Tamapua EFA Mid-Decade Assessment Coordinator & Principal Officer (Corporate Planning) – MESC So’oalo Mene Siaosi Principal Officer (Information Analysis) – MESC Quandolita Reid-Enari Principal Officer (Research & Policy Analysis) – MESC Malama Ta’aloga Fa’asalaina Principal Officer (Teacher Development) – MESC Fa’amatuainu Sa Vasa Principal Officer (Communications) – MESC Sina Ah Poe Principal Officer (Museum) – MESC Melaia Reed Principal Accountant – MESC Candice Apelu Principal Officer (Sports) – MESC Ainslie So’o Language Specialist – MESC Gauna Wong Principal Officer (Secondary Curriculum) – MESC Debbie Wong Policy Development Officer (Australian Youth Ambassador for Development) – MESC

- 154 -