SALT long-slit spectroscopy of LBQS 2113-4538: variability of the Mg II and Fe II component
10
arXiv:1308.3980v2 [astro-ph.CO] 2 Jan 2014 Astronomy & Astrophysics manuscript no. LBQS˙v17d c ESO 2014 January 3, 2014 SALT long-slit spectroscopy of LBQS 2113-4538: variability of the Mg II and Fe II component ⋆,⋆⋆ . K. Hryniewicz 1 , B. Czerny 1 , W. Pych 1 , Udalski 2 , M. Krupa 3 , A. ´ Swie ¸to´ n 3 , and J. Kaluzny 1 1 Nicolaus Copernicus Astronomical Center, Bartycka 18, 00-716 Warsaw, Poland 2 Warsaw University Observatory, Al. Ujazdowskie 4, 00-478 Warszawa, Poland 3 Astronomical Observatory of the Jagiellonian University, Orla 171, 30-244 Cracow, Poland Received ............; accepted .............. ABSTRACT Context. The Mg II line is of extreme importance in intermediate redshift quasars since it allows us to measure the black hole mass in these sources and to use these sources as probes of the distribution of dark energy in the Universe, as a complementary tool to SN Ia. Aims. Reliable use of Mg II requires a good understanding of all the systematic effects involved in the measurement of the line properties, including the contamination by Fe II UV emission. Methods. We performed three spectroscopic observations of a quasar LBQS 2113-4538 (z = 0.956) with the SALT telescope separated in time by several months and we analyze in detail the mean spectrum and the variability in the spectral shape. Results. We show that even in our good-quality spectra the Mg II doublet is well fit by a single Lorentzian shape. We tested several models of the Fe II pseudo-continuum and showed that one of them well represents all the data. The amplitudes of both components vary in time, but the shapes do not change significantly. The measured line width of LBQS 2113-4538 identifies this object as a class A quasar. The upper limit of 3% for the contribution of the Narrow Line Region (NLR) to Mg II may suggest that the separation of the Broad Line Region (BLR) and NLR disappears in this class of objects. Key words. accretion, accretion disks – black hole physics 1. Introduction Broad emission lines in active galactic nuclei (AGN) allow us to study the central parts of the nuclei that cannot be spatially resolved with current instruments. The lines probe the geome- try, the inflow/outflow of the gas, and offer a way to measure the black hole mass relatively accurately. It was recently proposed that they can even be used to measure the expansion rate of the Universe since they obey a relation between the size of the emit- ting region and the absolute monochromatic luminosity (Watson et al. 2011, Czerny & Hryniewicz 2011). The most important emission lines are Hβ for nearby sources, Mg II for intermedi- ate redshift objects, and CIV for high redshift quasars. Detailed studies of these lines are thus essential. Extensive monitoring of over 50 nearby quasars and Seyfert galaxies showed that Hβ line intensity follows closely the vari- ation of the continuum emission with very little scatter, and the line width is mostly determined by the Keplerian motion without significant inflow/outflow pattern (e.g., Peterson 1993, Kaspi et al. 2000, Peterson et al. 2004, Wandel et al. 1999, Bentz et al. 2013). This line is now broadly used for black hole mass deter- mination. However, for sources at higher redshifts the Hβ line moves out of the optical band to the IR and thus has to be re- placed with another line. In the intermediate redshift quasars the Mg II 2800 Å line is an attractive option. The Mg II line, like Hβ, belongs to the ⋆ based on observations made with the Southern African Large Telescope (SALT) under program 2012-1-POL-008 (PI: B. Czerny) ⋆⋆ new Fe II template shown in Fig. 8 is only available in elec- tronic form at the CDS via anonymous ftp to cdsarc.u-strasbg.fr (130.79.128.5) or via http://cdsweb.u-strasbg.fr/cgi-bin/qcat?J/A+A/ low ionization line (LIL) class. These lines are thought to be emitted close to the accretion disk surface while high ionization lines (HIL), like CIV, come instead from outflowing wind and are strongly affected by varying conditions (Collin-Souffrin et al. 1988). There have been only only a few examples of Mg II monitoring in nearby objects (Clavel et al. 1991 for NGC 5548; Reichert et al. 1994 for NGC 3783; Peterson et al. 2004 for Fairall 9; Metzroth et al. 2006 for NGC 4151) . The line was used instead of Hβ to determine the black hole mass from a sin- gle epoch spectra in quasar samples by Kong et al. (2006) and Vestergaard & Osmer (2009). Shen et al. (2008) analysis showed that Mg II is indeed a good proxy for the Hβ line. On the other hand, Wang et al. (2009) on the basis of the study of SDSS in- termediate redshift quasars concluded that the velocity width of Mg II tends to be smaller than that of Hβ. In their fits, the au- thors were using the multiple component fit to Mg II and the Fe II pseudo-continuum template from Tsuzuki et al. (2006). In this paper we present high-quality medium resolution spectra of the quasar LBQS 2113-4538 (z = 0.946 ± 0.005; Hewet et al. 1995) obtained with the Southern African Large Telescope. The source was first identified in the objective-prism plates from the UK Schmidt Telescope (Morris et al. 1991) and included in the Large Bright Quasar Sample (LBQS; Hewett et al. 1995) as well as in the Veron-Cetty & Veron (2001) catalog. The previous measurements of the line equivalent width (EW) and the full width at half maximum (FWHM) indicated typical values of the Mg II line width and shape, and a simple line profile (EW = 27 +14 −11 Å, FWHM = 4500 ± 1100 km s −1 in Forster et al. 2001, and 4500 ± 550 km s −1 in Vestergaard & Osmer 2009 for this source, and in the whole LBQS sample the median values were EW = 33.8 Å, FWHM = 4440 km s −1 respectively, Forster 1
-
Upload
independent -
Category
Documents
-
view
2 -
download
0
Transcript of SALT long-slit spectroscopy of LBQS 2113-4538: variability of the Mg II and Fe II component
arX
iv:1
308.
3980
v2 [
astr
o-ph
.CO
] 2
Jan
2014
Astronomy & Astrophysicsmanuscript no. LBQS˙v17d c© ESO 2014January 3, 2014
SALT long-slit spectroscopy of LBQS 2113-4538: variability of theMg II and Fe II component⋆,⋆⋆.
K. Hryniewicz1, B. Czerny1, W. Pych1, Udalski2, M. Krupa3, A. Swieton3, and J. Kaluzny1
1 Nicolaus Copernicus Astronomical Center, Bartycka 18, 00-716 Warsaw, Poland2 Warsaw University Observatory, Al. Ujazdowskie 4, 00-478 Warszawa, Poland3 Astronomical Observatory of the Jagiellonian University,Orla 171, 30-244 Cracow, Poland
Received ............; accepted ..............
ABSTRACT
Context. The Mg II line is of extreme importance in intermediate redshift quasars since it allows us to measure the black hole mass inthese sources and to use these sources as probes of the distribution of dark energy in the Universe, as a complementary tool to SN Ia.Aims. Reliable use of Mg II requires a good understanding of all thesystematic effects involved in the measurement of the lineproperties, including the contamination by Fe II UV emission.Methods. We performed three spectroscopic observations of a quasar LBQS 2113-4538 (z= 0.956) with the SALT telescope separatedin time by several months and we analyze in detail the mean spectrum and the variability in the spectral shape.Results. We show that even in our good-quality spectra the Mg II doublet is well fit by a single Lorentzian shape. We tested severalmodels of the Fe II pseudo-continuum and showed that one of them well represents all the data. The amplitudes of both componentsvary in time, but the shapes do not change significantly. The measured line width of LBQS 2113-4538 identifies this object as a classA quasar. The upper limit of 3% for the contribution of the Narrow Line Region (NLR) to Mg II may suggest that the separationofthe Broad Line Region (BLR) and NLR disappears in this class of objects.
Key words. accretion, accretion disks – black hole physics
1. Introduction
Broad emission lines in active galactic nuclei (AGN) allow usto study the central parts of the nuclei that cannot be spatiallyresolved with current instruments. The lines probe the geome-try, the inflow/outflow of the gas, and offer a way to measure theblack hole mass relatively accurately. It was recently proposedthat they can even be used to measure the expansion rate of theUniverse since they obey a relation between the size of the emit-ting region and the absolute monochromatic luminosity (Watsonet al. 2011, Czerny & Hryniewicz 2011). The most importantemission lines are Hβ for nearby sources, Mg II for intermedi-ate redshift objects, and CIV for high redshift quasars. Detailedstudies of these lines are thus essential.
Extensive monitoring of over 50 nearby quasars and Seyfertgalaxies showed that Hβ line intensity follows closely the vari-ation of the continuum emission with very little scatter, and theline width is mostly determined by the Keplerian motion withoutsignificant inflow/outflow pattern (e.g., Peterson 1993, Kaspi etal. 2000, Peterson et al. 2004, Wandel et al. 1999, Bentz et al.2013). This line is now broadly used for black hole mass deter-mination. However, for sources at higher redshifts the Hβ linemoves out of the optical band to the IR and thus has to be re-placed with another line.
In the intermediate redshift quasars the Mg II 2800 Å lineis an attractive option. The Mg II line, like Hβ, belongs to the
⋆ based on observations made with the Southern African LargeTelescope (SALT) under program 2012-1-POL-008 (PI: B. Czerny)⋆⋆ new Fe II template shown in Fig. 8 is only available in elec-tronic form at the CDS via anonymous ftp to cdsarc.u-strasbg.fr(130.79.128.5) or via http://cdsweb.u-strasbg.fr/cgi-bin/qcat?J/A+A/
low ionization line (LIL) class. These lines are thought to beemitted close to the accretion disk surface while high ionizationlines (HIL), like CIV, come instead from outflowing wind andare strongly affected by varying conditions (Collin-Souffrin etal. 1988). There have been only only a few examples of Mg IImonitoring in nearby objects (Clavel et al. 1991 for NGC 5548;Reichert et al. 1994 for NGC 3783; Peterson et al. 2004 forFairall 9; Metzroth et al. 2006 for NGC 4151) . The line wasused instead of Hβ to determine the black hole mass from a sin-gle epoch spectra in quasar samples by Kong et al. (2006) andVestergaard & Osmer (2009). Shen et al. (2008) analysis showedthat Mg II is indeed a good proxy for the Hβ line. On the otherhand, Wang et al. (2009) on the basis of the study of SDSS in-termediate redshift quasars concluded that the velocity width ofMg II tends to be smaller than that of Hβ. In their fits, the au-thors were using the multiple component fit to Mg II and the FeII pseudo-continuum template from Tsuzuki et al. (2006).
In this paper we present high-quality medium resolutionspectra of the quasar LBQS 2113-4538 (z = 0.946± 0.005;Hewet et al. 1995) obtained with the Southern African LargeTelescope. The source was first identified in the objective-prismplates from the UK Schmidt Telescope (Morris et al. 1991) andincluded in the Large Bright Quasar Sample (LBQS; Hewett etal. 1995) as well as in the Veron-Cetty & Veron (2001) catalog.The previous measurements of the line equivalent width (EW)and the full width at half maximum (FWHM) indicated typicalvalues of the Mg II line width and shape, and a simple line profile(EW = 27+14
−11 Å, FWHM = 4500± 1100 km s−1 in Forster et al.2001, and 4500± 550 km s−1 in Vestergaard & Osmer 2009 forthis source, and in the whole LBQS sample the median valueswere EW= 33.8 Å, FWHM= 4440 km s−1 respectively, Forster
1
Hryniewicz et al.: SALT Long-slit Spectroscopy of LBQS 2113-4538
et al. 2001). We analyze in detail the shape and the variability ofthe Mg II line and the underlying Fe II emission in this source.
2. Observations
We performed three observations of the quasar LBQS 2113-4538 using the Robert Stobie Spectrograph (RSS; Burgh et al.2003, Kobulnicky et al. 2003; Smith et al. 2006) on the SouthernAfrican Large Telescope (SALT) in the service mode. The datawas collected in three blocks, on the nights of May 15/16, July30/31, and November 18/19, 2012 (UT) thus covering a pe-riod of 6 months. Each block consisted of a pair of 978 sec-ond exposures of the target spectrum in a long slit mode, withthe slit width of 2”, followed by an exposure of the spectrumof the Argon calibration lamp, and a set of flat-field images.We used RSS PG1300 grating, with the spectral resolution ofR = 1047 at 5500 Å, and the PC04600 filter. The observa-tions were performed in a dark moon, bright moon, and greymoon conditions. The nights were not photometric, in particularthe third (grey moon) observation was performed in the pres-ence of thin clouds. Initial data reduction steps (gain correc-tion, cross-talk correction, overscan bias subtraction, and am-plifier mosaicking) were performed by the SALT Observatorystaff using a semi-automated pipeline from the SALT PyRAFpackage1 (see Crawford et al. 2010). Flat-field correction andfurther reduction steps were performed using procedures withinthe IRAF package. The pairs of adjacent spectrum images ofLBQS 2113-4538 were combined into a single image. This en-abled us to efficiently reject cosmic rays and raise the signal-to-noise ratio. Identification of the lines in the calibration lampspectrum, wavelength calibration, image rectification, and ex-traction of one dimensional spectra were done using functionsfrom the noao.twodspec package within IRAF2.
The spectroscopic observations were supplemented with theseven photometric observations in V band by the OGLE team(Fig. 1). Broadband optical observations of LBQS 2113-4538were carried out as a subproject of the OGLE survey. The 1.3-mWarsaw telescope located at Las Campanas Observatory, Chile,equipped with the 32 CCD detector mosaic camera was used.The source LBQS 2113-4538 was observed approximately ev-ery two weeks through the V-band filter with the exposure timeof 240 seconds. Collected images were reduced with the stan-dard OGLE pipeline based on the image difference technique(Udalski 2003). Accuracy of each single measurement of LBQS2113-4538 was about 0.01 mag. Additionally, the stability of thephotometry was checked by comparison of three nearby brighterstars (V: 14.5-16.5 mag). All these stars were constant at the 5mmag level. The source was weakly but significantly variable,as measured with respect to the three comparison stars.
Here we analyze in detail the limited spectral band betweenthe 2700 Å and 2900 Å (measured in the rest frame) with theaim of reproducing the behavior of the Mg II and Fe II emission.
To perform flux calibrations we used the star TYC 8422-788-1 from the Hipparcos catalog located in the slit and separated by3.5 arc min from the quasar. The star, according to Piquard etal. (2001), is a variable star3 of the δ Cephei type, with a V-
1 http://pysalt.salt.ac.za2 IRAF is distributed by the National Optical Astronomy
Observatories, which are operated by the Association of Universitiesfor Research in Astronomy, Inc., under cooperative agreement with theNSF.
3 http://cdsarc.u-strasbg.fr/cgi-bin/nph-Cat/html/max=107?II/233/tableb-v.dat
band luminosity of 11 mag and a period of 8.740332 days. Thetemperature of these stars typically varies between 5000 K and6000 K, and the surface gravity is on order of 1.5 - 2.3. We ex-tracted the spectra of the star with the same procedure as forthe quasar. Next we used the Castelli & Kurucz (2004) modelassuming an effective temperature 5500 K, surface gravity 1.5,and solar metalicity. We divided the observed spectrum of thestar by the atmosphere model. The ratio was fitted with the thirdorder polynomial thus creating the response function. The wave-length range above 5000 K was in the Wien tail and the modelsgave the same spectral shape, independent of assumptions ofthestar temperature and gravity.
This response function was then applied to each of the quasarspectra in the 5100 - 5700 Å range in the observed frame. In theactual data fitting, only the narrower region (2700 - 2900 Å inthe rest frame; 5280 - 5672 Å in the observed frame) was used,wide enough to cover the Mg II well but smaller than the wholeregion in order to minimize the systematic errors connectedwiththe flux calibration.
We estimated the instrumental broadening close to the MgII using the 5200 Å sky line to be 135± 7 km s−1 for the low-est quality observation 3. This value is much narrower than theexpected line width so in the data fitting we neglect this effect.We checked in one example that introducing the instrumentalbroadening leads to marginally narrower lines by∼ 100 km s−1.
Finally, the spectra were dereddened to account for theGalactic extinction assumingAλ = 0.150, 0.113,and 0.090 in theB,V and R bands for this source (Schlafly & Finkbeiner 2011)after NED4, with quadratic extrapolation between these valuesfor other wavelengths.
Next, we obtained the mean spectrum by adding the threespectra together. We then analyzed both the mean spectrum andthe individual spectra in search of the variability in the spectralshape.
We neglected the intrinsic absorption as there is no clear sig-nature of such an extinction in the spectra. We also neglected apossible host galaxy contribution as it is not likely to be impor-tant at such short wavelengths.
3. Model
We modeled the spectrum assuming the following components:power-law continuum, Fe II pseudo-continuum, and Mg II line.The line was modeled either as a single line at 2800 Å or asa doublet (2796.35, 2803.53; Morton 1991). The doublet ratiowas found to be 1.2:1 in I Zw I FOS/HST data implying an op-tically thick case, and in our considerations we fixed this ratio at1:1. The redshift of the object is treated as an arbitrary param-eter since the determination by Forster et al. (2001) is not ac-curate from the point of view of our high-quality spectroscopy.The 2700 - 2900 Å region is also contaminated by the Balmercontinuum (see, e.g., Dietrich et al. 2001) but this component isshallow in the limited wavelength range so this component can-not be distinguished from the underlying power law. This effectslightly influences the fitted power-law slope but does not affecteither the normalization of the Fe II component or the Mg IIshape.
A single Mg II component is modeled either as a Gaussian,or a Lorentzian. We also tried a two-component Guassianfit, as well as a rotationally broadened Lorentzian, followingKollatschny & Zetzl (2013).
4 NASA/IPAC Extragalactic Database (NED) is operated by the JetPropulsion Laboratory, California Institute of Technology
2
Hryniewicz et al.: SALT Long-slit Spectroscopy of LBQS 2113-4538
LBQS 2113- 4538
3rd spectr. obs.
6200 6220 6240 626017.58
17.56
17.54
17.52
17.5
comparison star
6200 6220 6240 626016.58
16.56
16.54
16.52
16.5
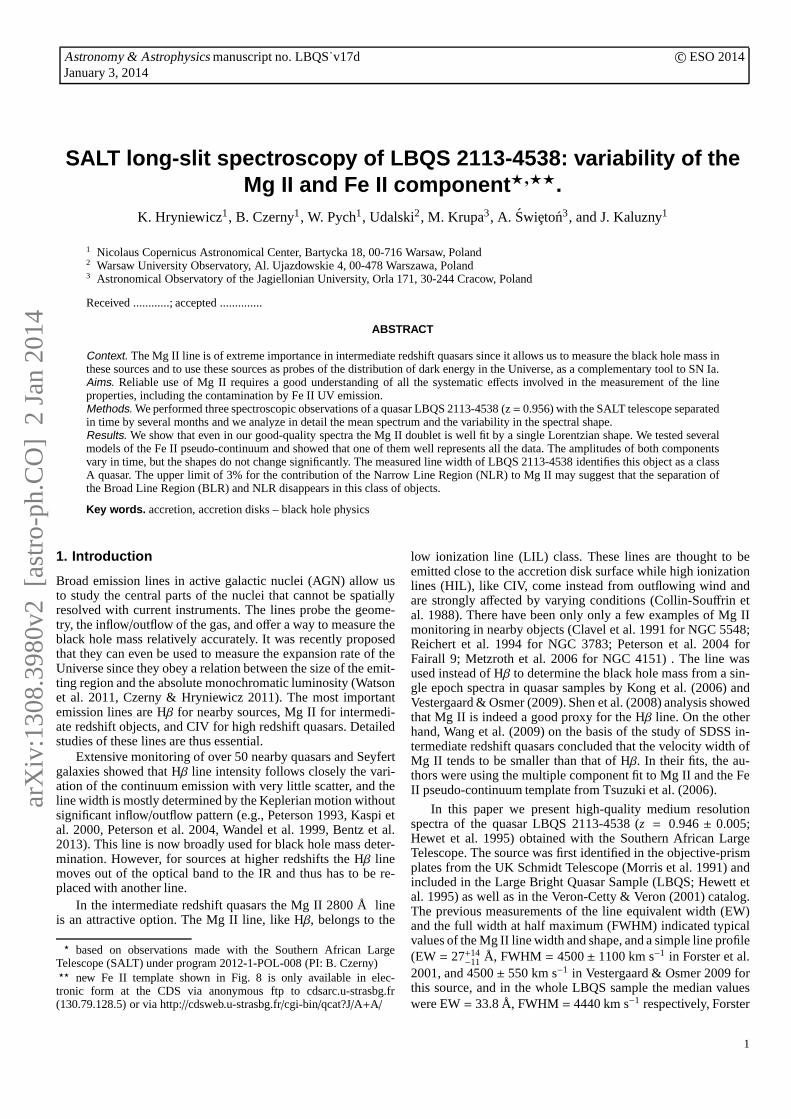
Fig. 1. The V-band light curve of LBQS 2113-4538 (lower panel)and one of the comparison stars (upper panel); the last spectro-scopic observation was performed during this photometric cam-paign.
The Fe II UV emission is modeled with the use of severaltemplates, both theoretical and observational. We start with theVestergaard & Wilkes (2001) template, based on I Zw 1 withzero contribution underlying the Mg II core, and the templateof Tsuzuki et al. (2006) also based on I Zw 1 but with some FeII emission underlying Mg II obtained by subtraction of the twoGaussians modeling the Mg II doublet. Next we experiment withpurely theoretical templates of Bruhweiler and Verner (2008),calculated for different values of the density, turbulent velocity,and ionization parameterΦ. We allow for Fe II broadening aswell as for the shift with respect to Mg II since Fe II was sug-gested to come from infalling material (Ferland et al. 2009).
4. Analysis of the spectra
We model the three high-quality RSS SALT spectra of LBQS2113-4538 in the 2700 - 2900 Å rest frame as consisting of thepower-law continuum, the Fe II pseudo-continuum, and the MgII line. The observation span covers six months. The photomet-ric observations, covering three months, show clear although notvery strong variations, with an amplitude of∼ 0.03 mag. Thelight curve and one of the three comparison stars are shown inFig. 1.
4.1. Mean spectrum
Since the variability is not very strong, we started with thecom-posite of the three spectra. The fits are summarized in Table 1.Line and pseudo-continuum EW was calculated in the 2700 -2900 Å band where the fit was performed, and both were cal-culated with respect to the power law continuum. The statisticalerrors for the best-fit parameters are typically on the orderof 0.3Å for EW(Mg II), 2.0 Å for EW(Fe II), and 50 - 100 km s−1 forMg II kinematic width. The Fe II smearing velocity was mostlyfixed, but we tested a few possible values, and the implied ac-curacy of the values given in the table is about 100 - 200 kms−1.
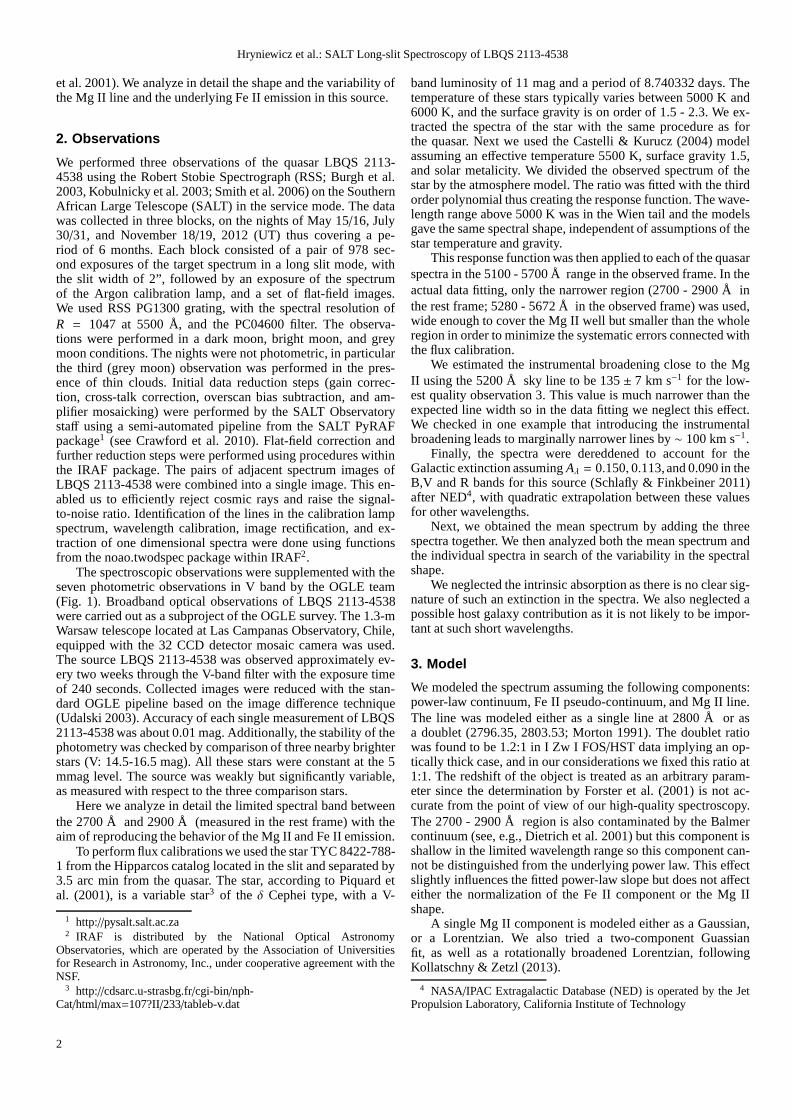
Fig. 2. The best fit and the fit components for model C. Upperpanel: Total model (black solid line), continuum (green dashedline), continuum with Fe II pseudo-continuum (blue dotted line),Mg II component with continuum (red dotted line). Lower panel:residuals. See Table 1 for the model parameters.
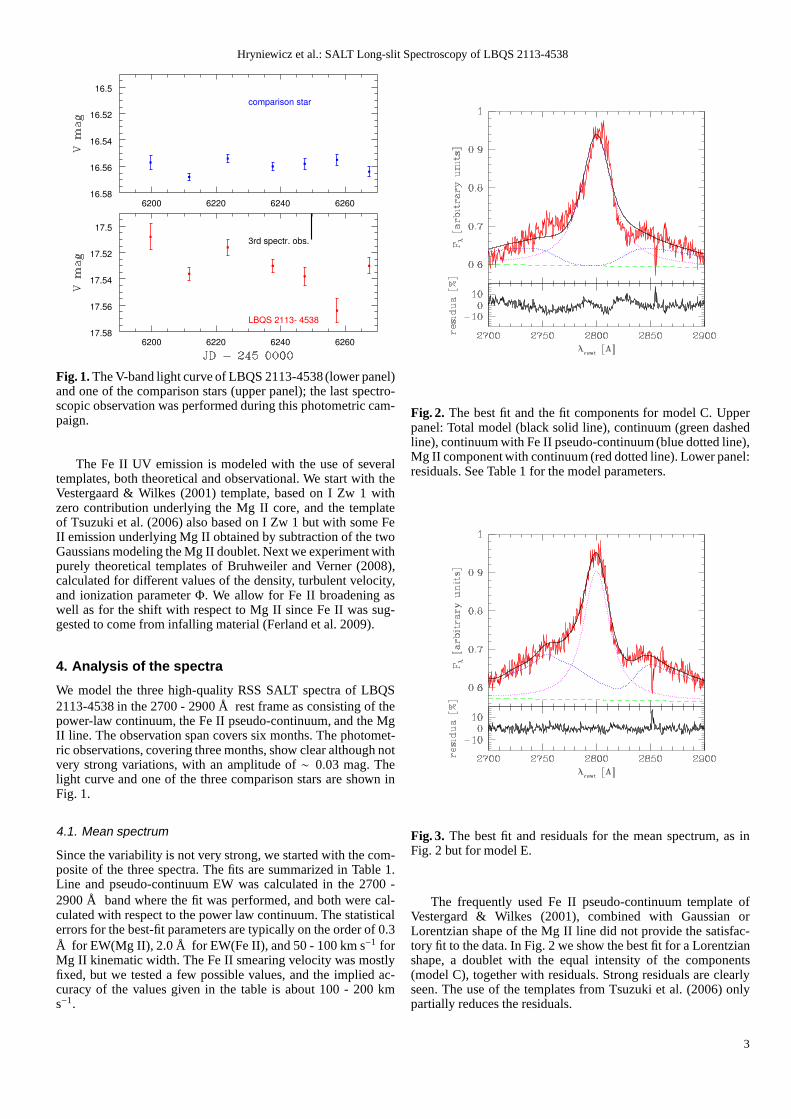
Fig. 3. The best fit and residuals for the mean spectrum, as inFig. 2 but for model E.
The frequently used Fe II pseudo-continuum template ofVestergard & Wilkes (2001), combined with Gaussian orLorentzian shape of the Mg II line did not provide the satisfac-tory fit to the data. In Fig. 2 we show the best fit for a Lorentzianshape, a doublet with the equal intensity of the components(model C), together with residuals. Strong residuals are clearlyseen. The use of the templates from Tsuzuki et al. (2006) onlypartially reduces the residuals.
3
Hryniewicz et al.: SALT Long-slit Spectroscopy of LBQS 2113-4538
However, we obtained very interesting results for the theo-retical templates of Fe II from Bruhweiler and Verner (2008),which were recently applied to a large sample of SDSS quasars(Marziani et al. 2013). These templates give systematic residualsat 2950 Å due to the absence of Fe I emission in the model (seeMarziani et al. for the discussion), but our fits did not extend tosuch wavelengths. The best fit for model E was fully satisfac-tory, no significant patterns are seen (see Fig 3), and theχ2/do fdropped by almost a factor of three. It has been frequently arguedthat the Lorentzian shape provides a very good description andour high-quality spectra support this conclusion. All the com-plexities of the nearby wavelength range are satisfactorily ex-plained by the complexity of the Fe II component. In particular,the strong pattern at∼ 2750 Å and the somewhat weaker featureat ∼ 2850 Å in the total spectrum are then nicely reproduced.The exact parameters of the best theoretical template (model E)are: model with 735 atomic levels, number densitynH = 1011
cm−3, turbulent velocityvturb = 20 km s−1, andΦ = 1020.5
cm−2 s−1. Interestingly, Bruhweiler and Verner (2008) came tothe same conclusion when analysing the I Zw I spectrum.
The fits for several other theoretical templates fromBruhweiler and Verner (2008) were not as good, but were stillreasonable (models F and L). The worst fit was for models J andK which suggests thatvturb > 10 km s−1. The comparison ofmodel L and P strongly favors densities lower than 1012 cm−3.
We tested whether allowing for a velocity shift of the Fe IIpseudo-continuum and the Mg II line improves the fit. However,we have not found any evidence of such a difference, we onlyobtained the upper limit of 300 km s−1 for the relative velocity.
We also checked whether the rotationally broadenedLorentzian shape, justified theoretically (see, e.g., Kollatschny& Zetzl 2013) provides a better fit than a single Lorentzian.However, when we considered the intrinsic width of theLorentzian to be much narrower than the rotational broadening,the fit quality dropped. Better fits than for a single Lorentzianwere obtained when the rotational broadening was smaller thanthe intrinsic width, but the change was not actually significant(the drop inχ2 below 2.0). This does not mean that there is norotational component in the line; it only shows that this rotationalbroadening is not well reproduced by the orbital motion of thespherically distributed clouds.
4.2. Separate spectra
We next analyze the three spectra separately because the obser-vational conditions were significantly different in all three ob-servations, and the source did vary, as shown by the photometricmeasurements.
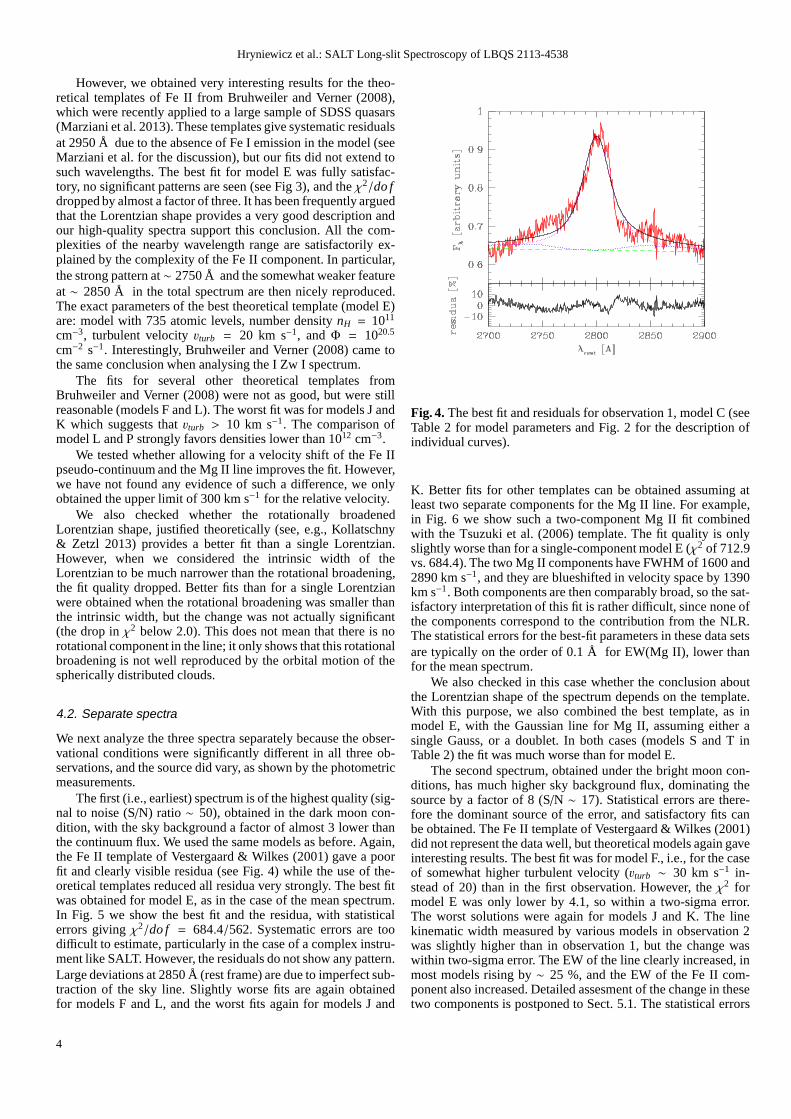
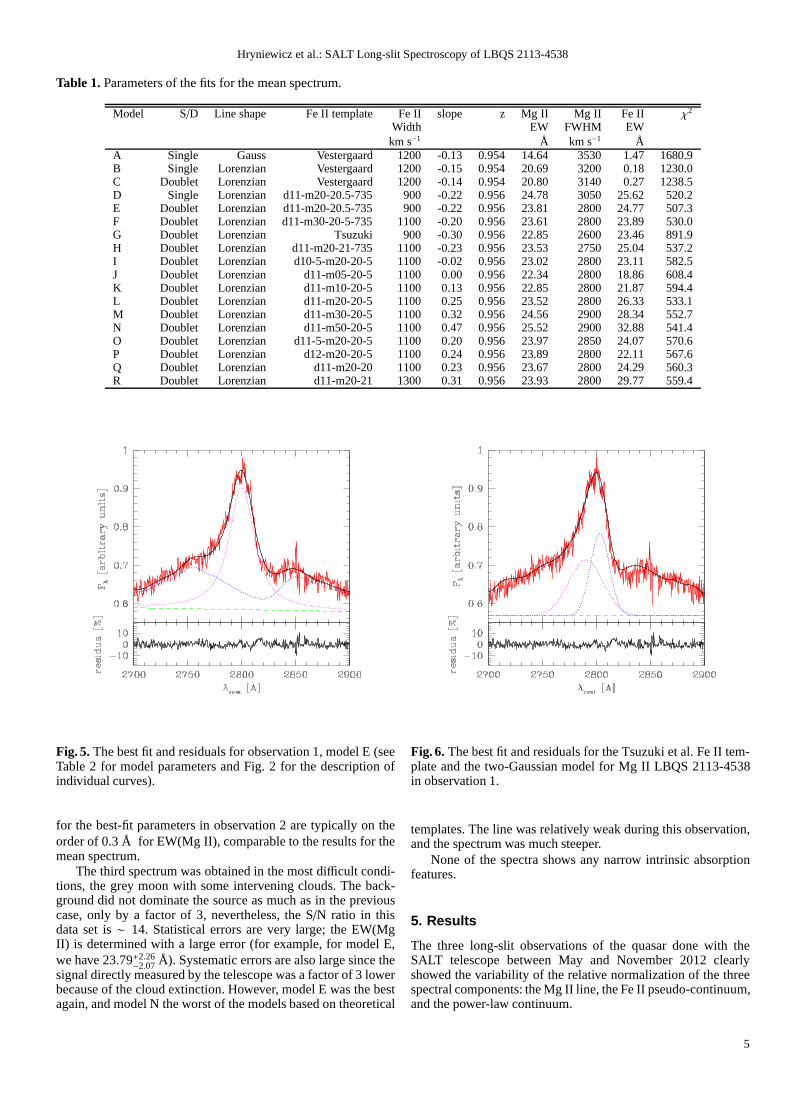
The first (i.e., earliest) spectrum is of the highest quality(sig-nal to noise (S/N) ratio ∼ 50), obtained in the dark moon con-dition, with the sky background a factor of almost 3 lower thanthe continuum flux. We used the same models as before. Again,the Fe II template of Vestergaard & Wilkes (2001) gave a poorfit and clearly visible residua (see Fig. 4) while the use of the-oretical templates reduced all residua very strongly. The best fitwas obtained for model E, as in the case of the mean spectrum.In Fig. 5 we show the best fit and the residua, with statisticalerrors givingχ2/do f = 684.4/562. Systematic errors are toodifficult to estimate, particularly in the case of a complex instru-ment like SALT. However, the residuals do not show any pattern.Large deviations at 2850 Å (rest frame) are due to imperfect sub-traction of the sky line. Slightly worse fits are again obtainedfor models F and L, and the worst fits again for models J and
Fig. 4. The best fit and residuals for observation 1, model C (seeTable 2 for model parameters and Fig. 2 for the description ofindividual curves).
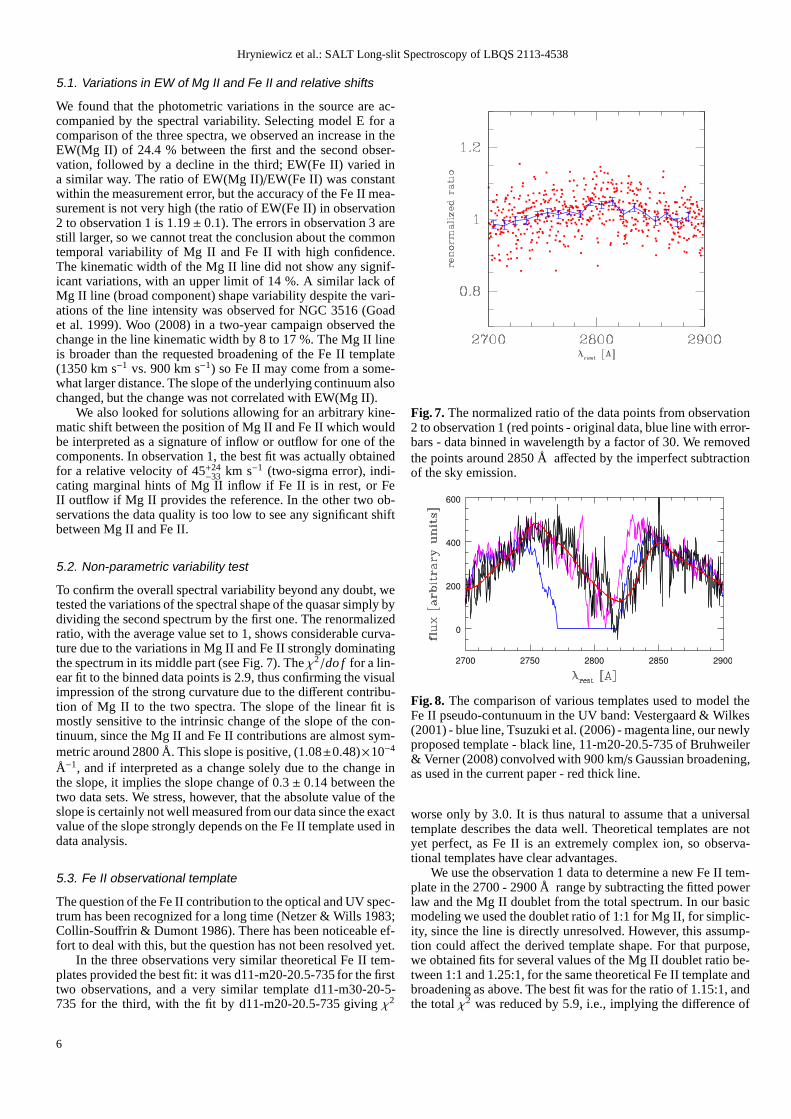
K. Better fits for other templates can be obtained assuming atleast two separate components for the Mg II line. For example,in Fig. 6 we show such a two-component Mg II fit combinedwith the Tsuzuki et al. (2006) template. The fit quality is onlyslightly worse than for a single-component model E (χ2 of 712.9vs. 684.4). The two Mg II components have FWHM of 1600 and2890 km s−1, and they are blueshifted in velocity space by 1390km s−1. Both components are then comparably broad, so the sat-isfactory interpretation of this fit is rather difficult, since none ofthe components correspond to the contribution from the NLR.The statistical errors for the best-fit parameters in these data setsare typically on the order of 0.1 Å for EW(Mg II), lower thanfor the mean spectrum.
We also checked in this case whether the conclusion aboutthe Lorentzian shape of the spectrum depends on the template.With this purpose, we also combined the best template, as inmodel E, with the Gaussian line for Mg II, assuming either asingle Gauss, or a doublet. In both cases (models S and T inTable 2) the fit was much worse than for model E.
The second spectrum, obtained under the bright moon con-ditions, has much higher sky background flux, dominating thesource by a factor of 8 (S/N ∼ 17). Statistical errors are there-fore the dominant source of the error, and satisfactory fits canbe obtained. The Fe II template of Vestergaard & Wilkes (2001)did not represent the data well, but theoretical models again gaveinteresting results. The best fit was for model F., i.e., for the caseof somewhat higher turbulent velocity (vturb ∼ 30 km s−1 in-stead of 20) than in the first observation. However, theχ2 formodel E was only lower by 4.1, so within a two-sigma error.The worst solutions were again for models J and K. The linekinematic width measured by various models in observation 2was slightly higher than in observation 1, but the change waswithin two-sigma error. The EW of the line clearly increased, inmost models rising by∼ 25 %, and the EW of the Fe II com-ponent also increased. Detailed assesment of the change in thesetwo components is postponed to Sect. 5.1. The statistical errors
4
Hryniewicz et al.: SALT Long-slit Spectroscopy of LBQS 2113-4538
Table 1. Parameters of the fits for the mean spectrum.
Model S/D Line shape Fe II template Fe II slope z Mg II Mg II Fe II χ2
Width EW FWHM EWkm s−1 Å km s−1 Å
A Single Gauss Vestergaard 1200 -0.13 0.954 14.64 3530 1.47 1680.9B Single Lorenzian Vestergaard 1200 -0.15 0.954 20.69 3200 0.18 1230.0C Doublet Lorenzian Vestergaard 1200 -0.14 0.954 20.80 31400.27 1238.5D Single Lorenzian d11-m20-20.5-735 900 -0.22 0.956 24.78 3050 25.62 520.2E Doublet Lorenzian d11-m20-20.5-735 900 -0.22 0.956 23.81 2800 24.77 507.3F Doublet Lorenzian d11-m30-20-5-735 1100 -0.20 0.956 23.61 2800 23.89 530.0G Doublet Lorenzian Tsuzuki 900 -0.30 0.956 22.85 2600 23.46891.9H Doublet Lorenzian d11-m20-21-735 1100 -0.23 0.956 23.53 2750 25.04 537.2I Doublet Lorenzian d10-5-m20-20-5 1100 -0.02 0.956 23.02 2800 23.11 582.5J Doublet Lorenzian d11-m05-20-5 1100 0.00 0.956 22.34 280018.86 608.4K Doublet Lorenzian d11-m10-20-5 1100 0.13 0.956 22.85 280021.87 594.4L Doublet Lorenzian d11-m20-20-5 1100 0.25 0.956 23.52 280026.33 533.1M Doublet Lorenzian d11-m30-20-5 1100 0.32 0.956 24.56 290028.34 552.7N Doublet Lorenzian d11-m50-20-5 1100 0.47 0.956 25.52 290032.88 541.4O Doublet Lorenzian d11-5-m20-20-5 1100 0.20 0.956 23.97 2850 24.07 570.6P Doublet Lorenzian d12-m20-20-5 1100 0.24 0.956 23.89 280022.11 567.6Q Doublet Lorenzian d11-m20-20 1100 0.23 0.956 23.67 2800 24.29 560.3R Doublet Lorenzian d11-m20-21 1300 0.31 0.956 23.93 2800 29.77 559.4
Fig. 5. The best fit and residuals for observation 1, model E (seeTable 2 for model parameters and Fig. 2 for the description ofindividual curves).
for the best-fit parameters in observation 2 are typically ontheorder of 0.3 Å for EW(Mg II), comparable to the results for themean spectrum.
The third spectrum was obtained in the most difficult condi-tions, the grey moon with some intervening clouds. The back-ground did not dominate the source as much as in the previouscase, only by a factor of 3, nevertheless, the S/N ratio in thisdata set is∼ 14. Statistical errors are very large; the EW(MgII) is determined with a large error (for example, for model E,we have 23.79+2.26
−2.07 Å). Systematic errors are also large since thesignal directly measured by the telescope was a factor of 3 lowerbecause of the cloud extinction. However, model E was the bestagain, and model N the worst of the models based on theoretical
Fig. 6. The best fit and residuals for the Tsuzuki et al. Fe II tem-plate and the two-Gaussian model for Mg II LBQS 2113-4538in observation 1.
templates. The line was relatively weak during this observation,and the spectrum was much steeper.
None of the spectra shows any narrow intrinsic absorptionfeatures.
5. Results
The three long-slit observations of the quasar done with theSALT telescope between May and November 2012 clearlyshowed the variability of the relative normalization of thethreespectral components: the Mg II line, the Fe II pseudo-continuum,and the power-law continuum.
5
Hryniewicz et al.: SALT Long-slit Spectroscopy of LBQS 2113-4538
5.1. Variations in EW of Mg II and Fe II and relative shifts
We found that the photometric variations in the source are ac-companied by the spectral variability. Selecting model E for acomparison of the three spectra, we observed an increase in theEW(Mg II) of 24.4 % between the first and the second obser-vation, followed by a decline in the third; EW(Fe II) varied ina similar way. The ratio of EW(Mg II)/EW(Fe II) was constantwithin the measurement error, but the accuracy of the Fe II mea-surement is not very high (the ratio of EW(Fe II) in observation2 to observation 1 is 1.19± 0.1). The errors in observation 3 arestill larger, so we cannot treat the conclusion about the commontemporal variability of Mg II and Fe II with high confidence.The kinematic width of the Mg II line did not show any signif-icant variations, with an upper limit of 14 %. A similar lack ofMg II line (broad component) shape variability despite the vari-ations of the line intensity was observed for NGC 3516 (Goadet al. 1999). Woo (2008) in a two-year campaign observed thechange in the line kinematic width by 8 to 17 %. The Mg II lineis broader than the requested broadening of the Fe II template(1350 km s−1 vs. 900 km s−1) so Fe II may come from a some-what larger distance. The slope of the underlying continuumalsochanged, but the change was not correlated with EW(Mg II).
We also looked for solutions allowing for an arbitrary kine-matic shift between the position of Mg II and Fe II which wouldbe interpreted as a signature of inflow or outflow for one of thecomponents. In observation 1, the best fit was actually obtainedfor a relative velocity of 45+24
−33 km s−1 (two-sigma error), indi-cating marginal hints of Mg II inflow if Fe II is in rest, or FeII outflow if Mg II provides the reference. In the other two ob-servations the data quality is too low to see any significant shiftbetween Mg II and Fe II.
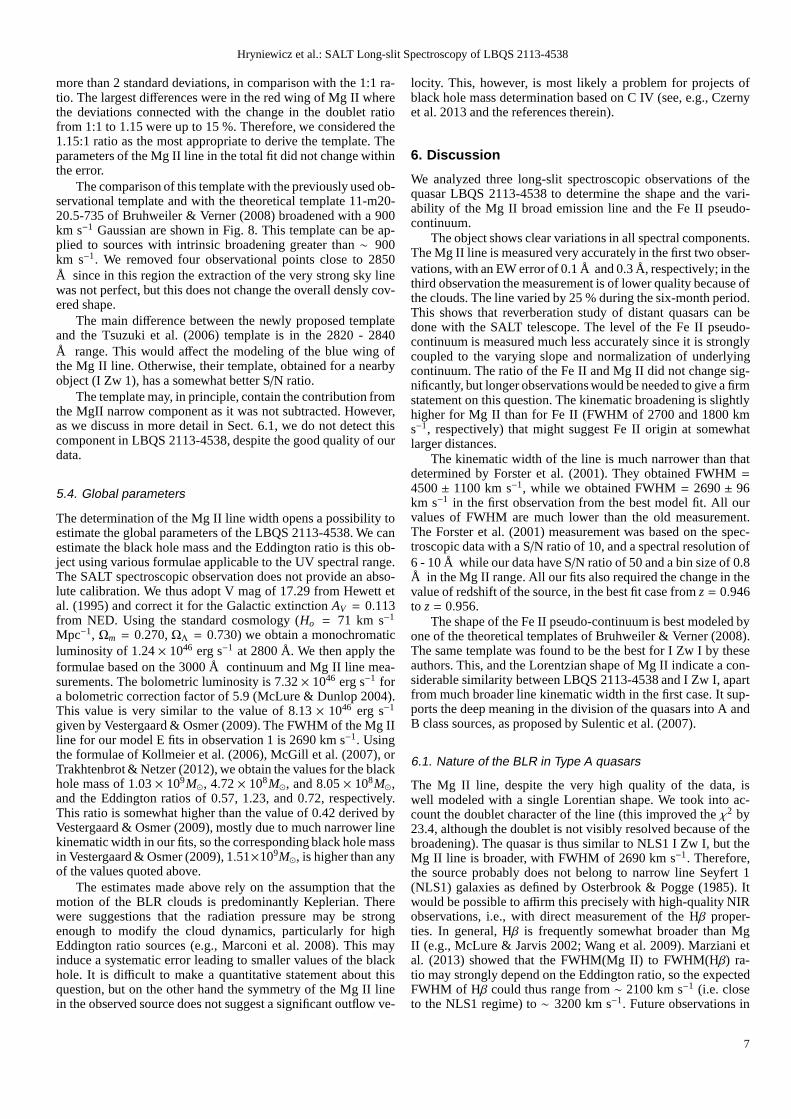
5.2. Non-parametric variability test
To confirm the overall spectral variability beyond any doubt, wetested the variations of the spectral shape of the quasar simply bydividing the second spectrum by the first one. The renormalizedratio, with the average value set to 1, shows considerable curva-ture due to the variations in Mg II and Fe II strongly dominatingthe spectrum in its middle part (see Fig. 7). Theχ2/do f for a lin-ear fit to the binned data points is 2.9, thus confirming the visualimpression of the strong curvature due to the different contribu-tion of Mg II to the two spectra. The slope of the linear fit ismostly sensitive to the intrinsic change of the slope of the con-tinuum, since the Mg II and Fe II contributions are almost sym-metric around 2800 Å. This slope is positive, (1.08±0.48)×10−4
Å−1, and if interpreted as a change solely due to the change inthe slope, it implies the slope change of 0.3± 0.14 between thetwo data sets. We stress, however, that the absolute value oftheslope is certainly not well measured from our data since the exactvalue of the slope strongly depends on the Fe II template usedindata analysis.
5.3. Fe II observational template
The question of the Fe II contribution to the optical and UV spec-trum has been recognized for a long time (Netzer & Wills 1983;Collin-Souffrin & Dumont 1986). There has been noticeable ef-fort to deal with this, but the question has not been resolvedyet.
In the three observations very similar theoretical Fe II tem-plates provided the best fit: it was d11-m20-20.5-735 for thefirsttwo observations, and a very similar template d11-m30-20-5-735 for the third, with the fit by d11-m20-20.5-735 givingχ2
Fig. 7. The normalized ratio of the data points from observation2 to observation 1 (red points - original data, blue line witherror-bars - data binned in wavelength by a factor of 30. We removedthe points around 2850 Å affected by the imperfect subtractionof the sky emission.
2700 2750 2800 2850 2900
0
200
400
600
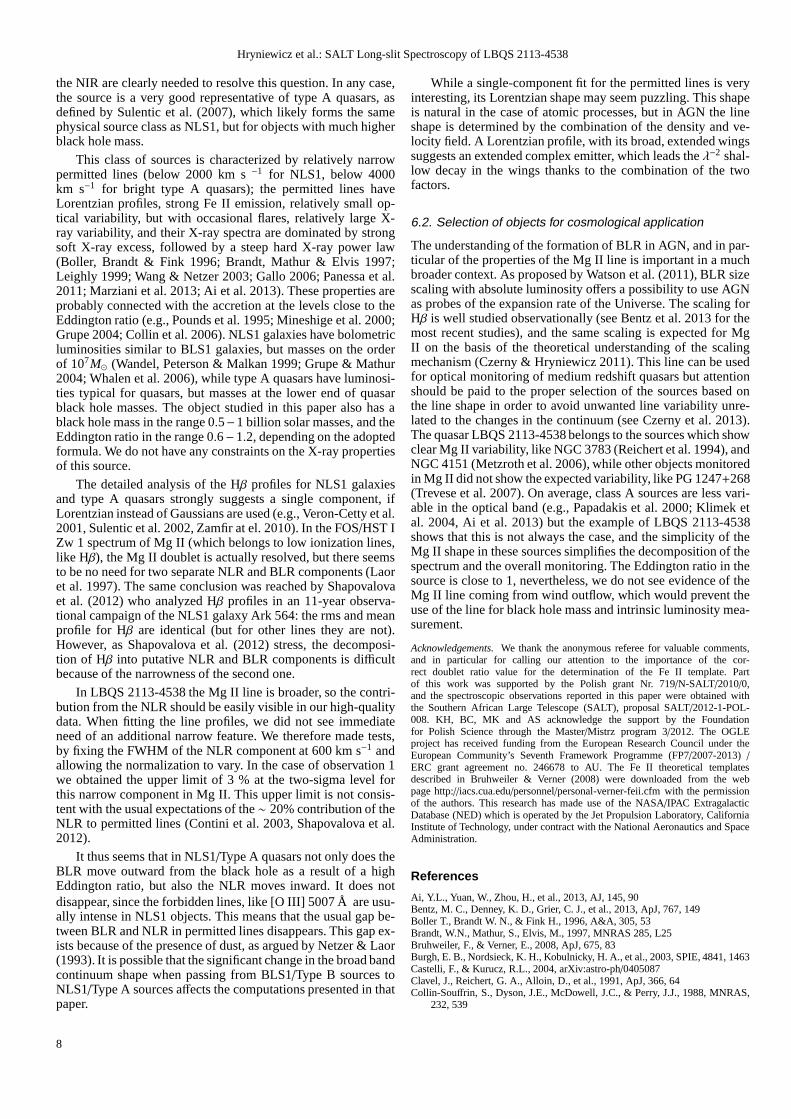
Fig. 8. The comparison of various templates used to model theFe II pseudo-contunuum in the UV band: Vestergaard & Wilkes(2001) - blue line, Tsuzuki et al. (2006) - magenta line, our newlyproposed template - black line, 11-m20-20.5-735 of Bruhweiler& Verner (2008) convolved with 900 km/s Gaussian broadening,as used in the current paper - red thick line.
worse only by 3.0. It is thus natural to assume that a universaltemplate describes the data well. Theoretical templates are notyet perfect, as Fe II is an extremely complex ion, so observa-tional templates have clear advantages.
We use the observation 1 data to determine a new Fe II tem-plate in the 2700 - 2900 Å range by subtracting the fitted powerlaw and the Mg II doublet from the total spectrum. In our basicmodeling we used the doublet ratio of 1:1 for Mg II, for simplic-ity, since the line is directly unresolved. However, this assump-tion could affect the derived template shape. For that purpose,we obtained fits for several values of the Mg II doublet ratio be-tween 1:1 and 1.25:1, for the same theoretical Fe II templateandbroadening as above. The best fit was for the ratio of 1.15:1, andthe totalχ2 was reduced by 5.9, i.e., implying the difference of
6
Hryniewicz et al.: SALT Long-slit Spectroscopy of LBQS 2113-4538
more than 2 standard deviations, in comparison with the 1:1 ra-tio. The largest differences were in the red wing of Mg II wherethe deviations connected with the change in the doublet ratiofrom 1:1 to 1.15 were up to 15 %. Therefore, we considered the1.15:1 ratio as the most appropriate to derive the template.Theparameters of the Mg II line in the total fit did not change withinthe error.
The comparison of this template with the previously used ob-servational template and with the theoretical template 11-m20-20.5-735 of Bruhweiler & Verner (2008) broadened with a 900km s−1 Gaussian are shown in Fig. 8. This template can be ap-plied to sources with intrinsic broadening greater than∼ 900km s−1. We removed four observational points close to 2850Å since in this region the extraction of the very strong sky linewas not perfect, but this does not change the overall densly cov-ered shape.
The main difference between the newly proposed templateand the Tsuzuki et al. (2006) template is in the 2820 - 2840Å range. This would affect the modeling of the blue wing ofthe Mg II line. Otherwise, their template, obtained for a nearbyobject (I Zw 1), has a somewhat better S/N ratio.
The template may, in principle, contain the contribution fromthe MgII narrow component as it was not subtracted. However,as we discuss in more detail in Sect. 6.1, we do not detect thiscomponent in LBQS 2113-4538, despite the good quality of ourdata.
5.4. Global parameters
The determination of the Mg II line width opens a possibilitytoestimate the global parameters of the LBQS 2113-4538. We canestimate the black hole mass and the Eddington ratio is this ob-ject using various formulae applicable to the UV spectral range.The SALT spectroscopic observation does not provide an abso-lute calibration. We thus adopt V mag of 17.29 from Hewett etal. (1995) and correct it for the Galactic extinctionAV = 0.113from NED. Using the standard cosmology (Ho = 71 km s−1
Mpc−1, Ωm = 0.270,ΩΛ = 0.730) we obtain a monochromaticluminosity of 1.24× 1046 erg s−1 at 2800 Å. We then apply theformulae based on the 3000 Å continuum and Mg II line mea-surements. The bolometric luminosity is 7.32× 1046 erg s−1 fora bolometric correction factor of 5.9 (McLure & Dunlop 2004).This value is very similar to the value of 8.13 × 1046 erg s−1
given by Vestergaard & Osmer (2009). The FWHM of the Mg IIline for our model E fits in observation 1 is 2690 km s−1. Usingthe formulae of Kollmeier et al. (2006), McGill et al. (2007), orTrakhtenbrot & Netzer (2012), we obtain the values for the blackhole mass of 1.03× 10⁹M⊙, 4.72× 10⁸M⊙, and 8.05× 10⁸M⊙,and the Eddington ratios of 0.57, 1.23, and 0.72, respectively.This ratio is somewhat higher than the value of 0.42 derived byVestergaard & Osmer (2009), mostly due to much narrower linekinematic width in our fits, so the corresponding black hole massin Vestergaard & Osmer (2009), 1.51×10⁹M⊙, is higher than anyof the values quoted above.
The estimates made above rely on the assumption that themotion of the BLR clouds is predominantly Keplerian. Therewere suggestions that the radiation pressure may be strongenough to modify the cloud dynamics, particularly for highEddington ratio sources (e.g., Marconi et al. 2008). This mayinduce a systematic error leading to smaller values of the blackhole. It is difficult to make a quantitative statement about thisquestion, but on the other hand the symmetry of the Mg II linein the observed source does not suggest a significant outflow ve-
locity. This, however, is most likely a problem for projectsofblack hole mass determination based on C IV (see, e.g., Czernyet al. 2013 and the references therein).
6. Discussion
We analyzed three long-slit spectroscopic observations ofthequasar LBQS 2113-4538 to determine the shape and the vari-ability of the Mg II broad emission line and the Fe II pseudo-continuum.
The object shows clear variations in all spectral components.The Mg II line is measured very accurately in the first two obser-vations, with an EW error of 0.1 Å and 0.3 Å, respectively; in thethird observation the measurement is of lower quality because ofthe clouds. The line varied by 25 % during the six-month period.This shows that reverberation study of distant quasars can bedone with the SALT telescope. The level of the Fe II pseudo-continuum is measured much less accurately since it is stronglycoupled to the varying slope and normalization of underlyingcontinuum. The ratio of the Fe II and Mg II did not change sig-nificantly, but longer observations would be needed to give afirmstatement on this question. The kinematic broadening is slightlyhigher for Mg II than for Fe II (FWHM of 2700 and 1800 kms−1, respectively) that might suggest Fe II origin at somewhatlarger distances.
The kinematic width of the line is much narrower than thatdetermined by Forster et al. (2001). They obtained FWHM=4500± 1100 km s−1, while we obtained FWHM= 2690± 96km s−1 in the first observation from the best model fit. All ourvalues of FWHM are much lower than the old measurement.The Forster et al. (2001) measurement was based on the spec-troscopic data with a S/N ratio of 10, and a spectral resolution of6 - 10 Å while our data have S/N ratio of 50 and a bin size of 0.8Å in the Mg II range. All our fits also required the change in thevalue of redshift of the source, in the best fit case fromz = 0.946to z = 0.956.
The shape of the Fe II pseudo-continuum is best modeled byone of the theoretical templates of Bruhweiler & Verner (2008).The same template was found to be the best for I Zw I by theseauthors. This, and the Lorentzian shape of Mg II indicate a con-siderable similarity between LBQS 2113-4538 and I Zw I, apartfrom much broader line kinematic width in the first case. It sup-ports the deep meaning in the division of the quasars into A andB class sources, as proposed by Sulentic et al. (2007).
6.1. Nature of the BLR in Type A quasars
The Mg II line, despite the very high quality of the data, iswell modeled with a single Lorentian shape. We took into ac-count the doublet character of the line (this improved theχ2 by23.4, although the doublet is not visibly resolved because of thebroadening). The quasar is thus similar to NLS1 I Zw I, but theMg II line is broader, with FWHM of 2690 km s−1. Therefore,the source probably does not belong to narrow line Seyfert 1(NLS1) galaxies as defined by Osterbrook & Pogge (1985). Itwould be possible to affirm this precisely with high-quality NIRobservations, i.e., with direct measurement of the Hβ proper-ties. In general, Hβ is frequently somewhat broader than MgII (e.g., McLure & Jarvis 2002; Wang et al. 2009). Marziani etal. (2013) showed that the FWHM(Mg II) to FWHM(Hβ) ra-tio may strongly depend on the Eddington ratio, so the expectedFWHM of Hβ could thus range from∼ 2100 km s−1 (i.e. closeto the NLS1 regime) to∼ 3200 km s−1. Future observations in
7
Hryniewicz et al.: SALT Long-slit Spectroscopy of LBQS 2113-4538
the NIR are clearly needed to resolve this question. In any case,the source is a very good representative of type A quasars, asdefined by Sulentic et al. (2007), which likely forms the samephysical source class as NLS1, but for objects with much higherblack hole mass.
This class of sources is characterized by relatively narrowpermitted lines (below 2000 km s−1 for NLS1, below 4000km s−1 for bright type A quasars); the permitted lines haveLorentzian profiles, strong Fe II emission, relatively small op-tical variability, but with occasional flares, relatively large X-ray variability, and their X-ray spectra are dominated by strongsoft X-ray excess, followed by a steep hard X-ray power law(Boller, Brandt & Fink 1996; Brandt, Mathur & Elvis 1997;Leighly 1999; Wang & Netzer 2003; Gallo 2006; Panessa et al.2011; Marziani et al. 2013; Ai et al. 2013). These propertiesareprobably connected with the accretion at the levels close totheEddington ratio (e.g., Pounds et al. 1995; Mineshige et al. 2000;Grupe 2004; Collin et al. 2006). NLS1 galaxies have bolometricluminosities similar to BLS1 galaxies, but masses on the orderof 107M⊙ (Wandel, Peterson & Malkan 1999; Grupe & Mathur2004; Whalen et al. 2006), while type A quasars have luminosi-ties typical for quasars, but masses at the lower end of quasarblack hole masses. The object studied in this paper also has ablack hole mass in the range 0.5−1 billion solar masses, and theEddington ratio in the range 0.6−1.2, depending on the adoptedformula. We do not have any constraints on the X-ray propertiesof this source.
The detailed analysis of the Hβ profiles for NLS1 galaxiesand type A quasars strongly suggests a single component, ifLorentzian instead of Gaussians are used (e.g., Veron-Cetty et al.2001, Sulentic et al. 2002, Zamfir at el. 2010). In the FOS/HST IZw 1 spectrum of Mg II (which belongs to low ionization lines,like Hβ), the Mg II doublet is actually resolved, but there seemsto be no need for two separate NLR and BLR components (Laoret al. 1997). The same conclusion was reached by Shapovalovaet al. (2012) who analyzed Hβ profiles in an 11-year observa-tional campaign of the NLS1 galaxy Ark 564: the rms and meanprofile for Hβ are identical (but for other lines they are not).However, as Shapovalova et al. (2012) stress, the decomposi-tion of Hβ into putative NLR and BLR components is difficultbecause of the narrowness of the second one.
In LBQS 2113-4538 the Mg II line is broader, so the contri-bution from the NLR should be easily visible in our high-qualitydata. When fitting the line profiles, we did not see immediateneed of an additional narrow feature. We therefore made tests,by fixing the FWHM of the NLR component at 600 km s−1 andallowing the normalization to vary. In the case of observation 1we obtained the upper limit of 3 % at the two-sigma level forthis narrow component in Mg II. This upper limit is not consis-tent with the usual expectations of the∼ 20% contribution of theNLR to permitted lines (Contini et al. 2003, Shapovalova et al.2012).
It thus seems that in NLS1/Type A quasars not only does theBLR move outward from the black hole as a result of a highEddington ratio, but also the NLR moves inward. It does notdisappear, since the forbidden lines, like [O III] 5007 Å areusu-ally intense in NLS1 objects. This means that the usual gap be-tween BLR and NLR in permitted lines disappears. This gap ex-ists because of the presence of dust, as argued by Netzer & Laor(1993). It is possible that the significant change in the broad bandcontinuum shape when passing from BLS1/Type B sources toNLS1/Type A sources affects the computations presented in thatpaper.
While a single-component fit for the permitted lines is veryinteresting, its Lorentzian shape may seem puzzling. This shapeis natural in the case of atomic processes, but in AGN the lineshape is determined by the combination of the density and ve-locity field. A Lorentzian profile, with its broad, extended wingssuggests an extended complex emitter, which leads theλ−2 shal-low decay in the wings thanks to the combination of the twofactors.
6.2. Selection of objects for cosmological application
The understanding of the formation of BLR in AGN, and in par-ticular of the properties of the Mg II line is important in a muchbroader context. As proposed by Watson et al. (2011), BLR sizescaling with absolute luminosity offers a possibility to use AGNas probes of the expansion rate of the Universe. The scaling forHβ is well studied observationally (see Bentz et al. 2013 for themost recent studies), and the same scaling is expected for MgII on the basis of the theoretical understanding of the scalingmechanism (Czerny & Hryniewicz 2011). This line can be usedfor optical monitoring of medium redshift quasars but attentionshould be paid to the proper selection of the sources based onthe line shape in order to avoid unwanted line variability unre-lated to the changes in the continuum (see Czerny et al. 2013).The quasar LBQS 2113-4538 belongs to the sources which showclear Mg II variability, like NGC 3783 (Reichert et al. 1994), andNGC 4151 (Metzroth et al. 2006), while other objects monitoredin Mg II did not show the expected variability, like PG 1247+268(Trevese et al. 2007). On average, class A sources are less vari-able in the optical band (e.g., Papadakis et al. 2000; Klimeketal. 2004, Ai et al. 2013) but the example of LBQS 2113-4538shows that this is not always the case, and the simplicity of theMg II shape in these sources simplifies the decomposition of thespectrum and the overall monitoring. The Eddington ratio inthesource is close to 1, nevertheless, we do not see evidence of theMg II line coming from wind outflow, which would prevent theuse of the line for black hole mass and intrinsic luminosity mea-surement.
Acknowledgements. We thank the anonymous referee for valuable comments,and in particular for calling our attention to the importance of the cor-rect doublet ratio value for the determination of the Fe II template. Partof this work was supported by the Polish grant Nr. 719/N-SALT/2010/0,and the spectroscopic observations reported in this paper were obtained withthe Southern African Large Telescope (SALT), proposal SALT/2012-1-POL-008. KH, BC, MK and AS acknowledge the support by the Foundationfor Polish Science through the Master/Mistrz program 3/2012. The OGLEproject has received funding from the European Research Council under theEuropean Community’s Seventh Framework Programme (FP7/2007-2013) /ERC grant agreement no. 246678 to AU. The Fe II theoretical templatesdescribed in Bruhweiler & Verner (2008) were downloaded from the webpage http://iacs.cua.edu/personnel/personal-verner-feii.cfm with the permissionof the authors. This research has made use of the NASA/IPAC ExtragalacticDatabase (NED) which is operated by the Jet Propulsion Laboratory, CaliforniaInstitute of Technology, under contract with the National Aeronautics and SpaceAdministration.
References
Ai, Y.L., Yuan, W., Zhou, H., et al., 2013, AJ, 145, 90Bentz, M. C., Denney, K. D., Grier, C. J., et al., 2013, ApJ, 767, 149Boller T., Brandt W. N., & Fink H., 1996, A&A, 305, 53Brandt, W.N., Mathur, S., Elvis, M., 1997, MNRAS 285, L25Bruhweiler, F., & Verner, E., 2008, ApJ, 675, 83Burgh, E. B., Nordsieck, K. H., Kobulnicky, H. A., et al., 2003, SPIE, 4841, 1463Castelli, F., & Kurucz, R.L., 2004, arXiv:astro-ph/0405087Clavel, J., Reichert, G. A., Alloin, D., et al., 1991, ApJ, 366, 64Collin-Souffrin, S., Dyson, J.E., McDowell, J.C., & Perry, J.J., 1988, MNRAS,
232, 539
8
Hryniewicz et al.: SALT Long-slit Spectroscopy of LBQS 2113-4538
Collin-Souffrin, S., & Dumont, S., 1986, A&A, 166, 13Collin, S., Kawaguchi, T., Peterson, B.M., & Vestergaard, M., 2006, A&A, 456,
75Contini, M., Rodriguez-Ardila, A., & Viegas, S., 2003, A&A,408, 101Crawford, S. M., Still, M., Schellart, P., et al., 2010, PySALT: the SALT Science
Pipeline. SPIE Astronomical Instrumentation, 7737-82.Czerny, B., & Hryniewicz, K., 2011, A&A, 525, L8Czerny, B., Hryniewicz, K., Maity, I., et al., 2013, A&A, 556, A97Ferland, G., Hu, C., Wang, J-M., et al., 2009, ApJ, 707, L82Forster, K., Green, P. J., Aldcroft, T. L., et al., 2001, ApJS, 134, 35Gallo, L. C., 2006, MNRAS, 368, 479Goad, M. R., Koratkar, A. P., Kim-Quijano, J., et al., 1999, ApJ, 512, L95Grupe, D., 2004, AJ, 127, 1799Grupe, D. & Mathur, S., 2004, ApJ, 606, L41Hewett, P.C., Foltz, C.B., & Chaffee, F.H., 1995, AJ, 109, 1498Kaspi, S., Smith, P. S., Netzer, H., et al., 2000, ApJ, 533, 631Klimek, E. S., Gaskell, C. M., & Hedrick, C. H., 2004, ApJ, 609, 69Kobulnicky, H. A., Willmer, C. N. A., Phillips, A. C., et al.,2003, ApJ, 599, 1006Kollatschny, W., & Zetzl, M., 2013, A&A, 549, A100Kollmeier, J. A., Szczygiel, D. M., Burns, C. R., et al., 2006, ApJ, 648, 128Kong M.-Z., Wu X.-B., Wang R., & Han J.-L., 2006, Chin. J. Astron. Astrophys.,
6, 396Laor, A., Jannuzi, B.T., Green, R.F., & Boroson, T.A., 1997,ApJ, 489, 656Leighly K. M., 1999, ApJS, 125, 317Marconi A., Axon, D. J., Maiolino, R., et al., 2008, ApJ, 678,693Marziani, P., Sulentic, J. W., Plauchu-Frayn, I., & del Olmo, A., 2013, A&A 555,
A89Mineshige, S., Kawaguchi, T., Takeuchi, M., & Hayashida, K., 2000, PASJ, 52,
499McGill, K. L., Woo, J., Treu, T., & Malkan, M. A., 2008, ApJ, 673, 703McLure, R. J., & Dunlop, J.S., 2004, MNRAS, 352, 1390McLure, R. J. & Jarvis, M.J., 2002, MNRAS, 337, 109Morton, D. C., 1991, ApJS, 77, 119Netzer, H., & Laor, A., 1993, ApJ, 404, L51Osterbrock, D. E., & Pogge, R. W., 1985, ApJ, 297, 166Panessa, F., de Rosa, A., Bassani, L., et al., 2011, MNRAS, 417, 2426Papadakis, I. E., Brinkmann, W., Negoro, H., Detsis, E., Papamastorakis, I., &
Gliozzi, M., 2000, arXiv:astro-ph/0012317Peterson, B. M., 1993, PASP, 105, 247Peterson, B. M., Ferrarese, L., Gilbert, K. M., et al., 2004,ApJ, 613, 682Piquard, S., Halbwachs, J.-L., Fabricius, C., et al., 2001,A&A, 373, 576Pounds, K.A., Done, C., & Osborne, J.P., 1995, MNRAS, 277, L5Reichert, G. A., Rodriguez-Pascual, P. M., Alloin, D., et al., 1994, ApJ, 425, 582Schlafly, E.F., & Finkbeiner, D.P., 2011, ApJ, 737, 103Shapovalova, A. I., Popovic, L. C., Burenkov, A. N., et al., 2012, ApJS, 202, 10Shen, Y., Greene, J. E., Strauss, M. A., Richards, G. T., & Schneider, D. P., 2008,
ApJ, 680, 169Smith, M. P., Nordsieck, K. H., Burgh, E. B., et al., 2006, in Society of Photo-
Optical Instrumentation Engineers (SPIE) Conference Series, Vol. 6269,Society of Photo-Optical Instrumentation Engineers (SPIE) ConferenceSeries
Sulentic, J. W., Bachev, R., Marziani, P., Negrete, C. A., & Doltzin, D., 2007,ApJ, 666, 757
Sulentic, J. W., Marziani, P., Zamanov, R., Bachev, R., Calvani, M., & Dultzin-Hacyan, D., 2002, ApJ, 566, L71
Trakhtenbrot, B., & Netzer, H., 2012, MNRAS, 427, 3081Trevese, D., Paris, D., Stirpe, G. M., Vagnetti, F., & Zitelli, V., 2007, A&A, 470,
491Tsuzuki, Y., Kawara, K., Yoshi, Y., Oyabu, Sh., Tanabe, T., &Matsuoka, Y.,
2006, ApJ, 650, 5-Veron-Cetty, M.-P., Vron, P., 2001, A&A, 374, 92Veron-Cetty M.-P., Veron P., Goncalves A. C., 2001, A&A, 372, 730Vestergaard, M., & Wilkes, B., 2001, 134, 1Vestergaard, M., & Osmer, P. S., 2009, ApJ, 699, 800Udalski, A., 2003, Acta Astron. 53, 291Wandel, A., Peterson, B. M., & Malkan, M.A., 1999, 526, 419Wang, J.-M., & Netzer H., 2003, A&A, 398, 927Wang, J.-G., Dong, X.-B., Wang, T.-G., et al., 2009, ApJ, 707, 1334Watson, D., Denney, K. D., Vestergaard, M., & Davis, T. M., 2011, ApJ, 740,
L49Whalen, D. J., Laurent-Muehleisen, S. A., Moran, E. C., & Becker, R. H., 2006,
AJ, 131, 1948Woo, J.-H., 2008, AJ, 135, 1849Zamfir, S., Sulentic, J.W., Marziani, P., & Dulcin, D., 2010,MNRAS, 403, 1759-
1786
9

Hryniewicz et al.: SALT Long-slit Spectroscopy of LBQS 2113-4538
Table 2. Parameters of the fits for the three individual spectra obtained with SALT between May and November 2012.
Model S/D Line shape Fe II template Fe smear slope z Mg II Mg II EW Fe II χ2
EW FWHM EWÅ km s−1 Å
Obs. 1A Single Gauss Vestergaard 1200 -0.11 0.954 14.23 3530 2.86 2167.4B Single Lorenzian Vestergaard 1200 -0.18 0.954 20.83 3350 2.32 1556.1C Doublet Lorenzian Vestergaard 1200 -0.18 0.954 20.54 3150 2.60 1569.9D Single Lorenzian d11-m20-20.5-735 900 -0.24 0.956 21.78 2950 22.04 707.8E Doublet Lorenzian d11-m20-20.5-735 900 -0.24 0.956 21.33 2690 22.48 684.4F Doublet Lorenzian d11-m30-20-5-735 1100 -0.16 0.956 22.43 2750 26.88 712.9G Doublet Lorenzian Tsuzuki 900 -0.26 0.956 21.69 2500 26.741274.2H Doublet Lorenzian d11-m20-21-735 1100 -0.23 0.956 21.46 2680 23.66 741.2I Doublet Lorenzian d10-5-m20-20-5 1100 0.28 0.956 22.31 2800 26.09 778.9J Doublet Lorenzian d11-m05-20-5 1100 0.06 0.956 19.36 2650 15.39 863.4K Doublet Lorenzian d11-m10-20-5 1100 0.18 0.956 21.29 2750 22.20 832.1L Doublet Lorenzian d11-m20-20-5 1100 0.25 0.956 21.71 2750 26.70 728.5M Doublet Lorenzian d11-m30-20-5 1100 0.25 0.956 22.15 2800 26.28 758.1N Doublet Lorenzian d11-m50-20-5 1100 0.40 0.956 23.33 2900 30.22 741.4O Doublet Lorenzian d11-5-m20-20-5 1100 0.16 0.956 21.79 2800 21.94 786.7P Doublet Lorenzian d12-m20-20-5 1100 0.22 0.956 22.36 2800 21.70 778.1Q Doublet Lorenzian d11-m20-20 1100 0.20 0.956 21.70 2750 23.28 756.3R Doublet Lorenzian d11-m20-21 1300 0.30 0.956 21.72 2700 28.72 778.2S Doublet Gauss d11-m20-20.5-735 900 -0.19 0.956 14.43 2700 23.72 915.4T Single Gauss d11-m20-20.5-735 900 -0.19 0.956 14.40 2820 23.71 916.4Obs. 2A Single Gauss Vestergaard 1200 0.08 0.954 20.26 3940 9.55 777.5B Single Lorenzian Vestergaard 1200 0.08 0.954 29.20 3750 7.61 649.5C Doublet Lorenzian Vestergaard 1200 0.08 0.954 28.65 3500 8.11 653.8D Single Lorenzian d11-m20-20.5-735 900 -0.05 0.956 25.22 3050 21.03 484.2E Doublet Lorenzian d11-m20-20.5-735 900 0.00 0.956 26.54 2870 26.65 476.3F Doublet Lorenzian d11-m30-20-5-735 1100 0.05 0.956 26.05 2850 26.42 478.2G Doublet Lorenzian Tsuzuki 900 0.03 0.956 28.16 2650 38.21 550.6H Doublet Lorenzian d11-m20-21-735 1100 0.00 0.956 26.05 2850 26.34 478.8I Doublet Lorenzian d10-5-m20-20-5 1100 0.50 0.956 26.01 2900 26.42 484.1J Doublet Lorenzian d11-m05-20-5 1100 0.30 0.956 23.10 2750 17.05 497.2K Doublet Lorenzian d11-m10-20-5 1100 0.44 0.956 25.29 2900 24.17 489.3L Doublet Lorenzian d11-m20-20-5 1100 0.61 0.956 27.15 2900 31.92 478.7M Doublet Lorenzian d11-m30-20-5 1100 0.61 0.956 27.72 3000 31.36 481.8N Doublet Lorenzian d11-m50-20-5 1100 0.83 0.956 29.16 3050 37.15 480.5O Doublet Lorenzian d11-5-m20-20-5 1100 0.38 0.956 25.88 2900 23.36 480.5P Doublet Lorenzian d12-m20-20-5 1100 0.46 0.956 26.34 2900 22.78 485.1Q Doublet Lorenzian d11-m20-20 1100 0.48 0.956 26.42 2920 25.99 484.7R Doublet Lorenzian d11-m20-21 1300 0.61 0.956 27.08 2900 33.48 480.9Obs. 3A Single Gauss Vestergaard 1200 -1.03 0.954 20.91 3825 14.00373.0B Single Lorenzian Vestergaard 1200 -1.11 0.954 31.74 3700 14.20 323.1C Doublet Lorenzian Vestergaard 1200 -1.10 0.954 31.84 3600 14.05 325.0D Single Lorenzian d11-m20-20.5-735 900 -1.12 0.956 24.69 2950 21.49 237.7E Doublet Lorenzian d11-m20-20.5-735 900 -1.09 0.956 23.79 2650 22.43 237.3F Doublet Lorenzian d11-m30-20-5-735 1100 -1.09 0.956 24.22 2720 21.99 240.3G Doublet Lorenzian Tsuzuki 900 -1.13 0.956 24.550 2450 29.054 262.8H Doublet Lorenzian d11-m20-21-735 1100 -1.07 0.956 28.48 2700 42.39 292.0I Doublet Lorenzian d10-5-m20-20-5 1100 -0.68 0.956 23.52 2650 22.74 242.9J Doublet Lorenzian d11-m05-20-5 1100 -0.80 0.956 21.63 2625 13.78 247.2K Doublet Lorenzian d11-m10-20-5 1100 -0.70 0.956 23.52 2650 22.40 248.7L Doublet Lorenzian d11-m20-20-5 1100 -0.45 0.956 24.74 2600 33.85 250.3M Doublet Lorenzian d11-m30-20-5 1100 -0.53 0.956 26.79 2900 31.53 248.5N Doublet Lorenzian d11-m50-20-5 1100 0.35 0.956 36.12 3100 66.83 312.6O Doublet Lorenzian d11-5-m20-20-5 1100 -0.35 0.956 30.50 3000 40.41 295.9P Doublet Lorenzian d12-m20-20-5 1100 -0.45 0.956 27.33 2800 30.23 266.1Q Doublet Lorenzian d11-m20-20 1100 -0.70 0.956 24.30 2775 21.83 243.8R Doublet Lorenzian d11-m20-21 1300 -0.70 0.956 23.48 2700 23.03 243.2
10