Salem, Units 1 & 2 and Hope Creek, Unit 1 - Response to NRC ...
455
Remedial Investigation Report PSEG Nuclear, LLC Salem Generating Station Hancock's Bridge, New Jersey March 2004 PREPARED FOR PSEG Services Corporation 80 Park Plaza Newark, NJ 07102
-
Upload
khangminh22 -
Category
Documents
-
view
3 -
download
0
Transcript of Salem, Units 1 & 2 and Hope Creek, Unit 1 - Response to NRC ...

Remedial Investigation Report
PSEG Nuclear, LLCSalem Generating StationHancock's Bridge, New Jersey
March 2004
PREPARED FORPSEG Services Corporation80 Park PlazaNewark, NJ 07102
ARCADIS
Remedial InvestigationReport
PSEG Nuclear LLCSalem Generating StationHancock's Bridge, New Jersey
Staff Scientist
Prepared for.PSEG Services Corporation80 Park PlazaNewark, NJ 07102
Prepared by:ARCADIS G&M, Inc.6 Terry Drive, Suite 300Newtown, Pennsylvania 18940Tel 267.685.1800Fax 267.685.1801
Our Ref.
NP000571.0003
Date:
March 2004
This document is intended only for the useof the individual or entity for which it was
prepared and may contain information that
is privileged, confidential, and exempt fromdisclosure under applicable law. Any
dissemination, distribution, or copying of
this document is strictly prohibited.

Table of Contents
Executive Summary 1
1 Introduction 1
1.1 Project Background .1
1.2 Investigation Objectives 3
1.3 Report Organization 4.
2 History of Station Operations 6
2.1 Operating History 6
2.1.1 Area of Concern 6
.2.1.2 Historical Spills and Releases 7
2.1.3 Constituents of Concern 7
2.2 Regulatory Review 8
3 Station Setting 10
3.1 Land Use 10
3.2 Estuarine Location• 10
3.3 Topography and Station Drainage 10
3.4 Climate and Precipitation• 11
3.5 Regional Geology and Hydrogeology 11
3.5.1 Hydraulic Fill. 12
3.5.2 Riverbed Deposits 12
3.5.3 Kirkwood Formation 12
3.5.4 Vincentown Formation 13
3.5.5 Hornerstown-Navesink Aquitard 13
3.5.6 Mt. Laurel-Wenonah Aquifer 13
3.5.7 Matawan Aquitard 14
3.5.8 Magothy Aquifer 14
3.5.9 Raritan Confining Unit 14
3.5.10 Raritan Formation 15
* 3.5.11 Potomac Group 15

Table of Contents
3.5.12 Wissahickon Formation 15
4 Facility Construction and Local Geology 16
4.1 Pre-Facility Construction 16
4.2 Facility Construction 16
4.2:1 Construction of the Cofferdam 17
4.2.1.1 Construction Within the Cofferdam 18
4.2.1.1.1 Lean Concrete 18
4.2.1.1.2 Structural Concrete 19
4.2.1.1.3 Structural Fill 20
4.2.2 Construction of the Service Water Intake Structure 20
4.2.3 Construction of the Service Water Pipes 21
4.2.4 Construction of the Circulating Water Intake Structure 21
4.2.5 Construction of the Circulating Water Pipes 21
4.2.6 Sheet Pile - Circulating Water Intake Structure to the ServiceWater Intake Structure 22
4.3 Local Geology 22
5 Initial Station Investigation Activities 24
5.1 Phase 1 25
5.2 Phase II 26
5.3 Phase III 27
6 Remedial Investigation - March 2003 through February 2004 29
6.1 New Monitoring Well Installation - May through June 2003 29
6.1.1 Objectives 29
6.1.2 Field Implementation 30
6.2 Supplemental Remedial Investigation - July through September 2003 31
6.2.1 Objectives 31
6.2.2 Field Implementation 32
6.2.3 Results 33
6.3 Monitoring Well Installation Activities - September through October 2003 34
ii

Table of Contents
6.3.1 Objectives 34
6.3.2 Field Implementation 35
6. 4 Monitoring Well Installation Activities - January through February 2004 36
6.4.1 Objectives 36
6.4.2 Field Implementation 38
6.5 Monitoring Well Sampling and Analysis 39
6.6 Hydrogeologic Investigation Activities 41
6.6.1 Evaluation of Tidal Influence 41
6.6.2 Evaluation of Groundwater Elevations 42
.6.6.2.1 Shallow, Water-Bearing Unit 42
6.6.2.2 Vincentown Formation 42
6.6.2.3 Evaluation of Vertical Groundwater Gradients 42
6.6.3 Evaluation of the Kirkwood Formation 43
6.6.4 Aquifer Characterization 43
6.6.4.1 Slug Tests 43
6.6.4.2 Pumping Tests 44
6.6.4.2.1 Well AB 44
6.6.4.2.2 Well AC 45
6.6.4.2.3 Well AD .45
6.6.4.2.4 Well Al 45
6.6.4.2.5 Well AJ 45
6.6.4.2.6 Well AM 46
6.6.4.2.7 Well S 46
7 Hydrogeologic Evaluation 47
7.1 Local Hydrogeology - Pre-Facility Construction 47
7.2 Local Hydrogeology - Current 47
7.2.1 Groundwater Flow -Shallow, Water-Bearing Unit 47
7,2.2 Groundwater Flow -Vincentown Formation 48
7,2.3 Vertical Gradients 49
7.3 Tidal Evaluation Results 49
iii

Table of Contents
7.4 Evaluation of the Kirkwood Formation 49
7.5 Aquifer Characteristics 49
7.5.1 Slug Test Results 49
7.5.2 Pumping Test Results 50
7.5.2.1 Well AB 50
7.5.2.2 Well AC 50
7.5.2.3 Well AD 51
7.5.2.4 Well Al 51
7.5.2.5 Well AJ 51
7.5.2.6 Well AM 51
7.5.2.7 Well S 52
8 Analytical Results 53
8.1 Soil Samples 54
8.2 Groundwater Samples 55
8.2.1 Summary of Analytical Data for Wells Screened in theVincentown Formation (Wells L, K, P, Q, and V) 55
8.2.2 Summary of Analytical Data for Wells Screened in the Shallow,Water Bearing Unit Within the Limits of the Cofferdam (Wells M,N, 0, R, AC, and AE) 57
8.2.3 Summary of Analytical Data for Wells Screened in the Shallow,Water-Bearing Unit Outside of the Cofferdam (Wells S, T, U, V,W, Y, Z, AA, AB, AD, and AF) 59
8.3 Delaware River Tritium Concentrations 62
9 Fate and Transport Analysis 64
9.1 Constituent Pathways - Advective Water Movement 64
9.2 Water Balance Estimate of Groundwater Velocities 65
9.3 Sorptive Processes 67
94 Degradation 68
9.5 Dispersion 68
9.6 Tritium Age Dating and Groundwater Travel Time 69
10 Health and Environmental Risk Assessment 71
iv
Table of Contents•
10.1 On-Site Environmental Data for Tritium 71
10.2 Off-Site Environmental Data for Tritium 71,
10.3 Methodology for Health and Environmental Risk Assessment 72
10.3.1 Identification of Exposure Pathways 72
10.3.2 Identification and Characterization of Potentially ExposedIndividuals and Biota . .73
10.3.3 Approach to Calculation of Doses to Humans and Comparisonswith Applicable Standards 73
10.3.4 *Approach to Calculation of Doses to Biota and Comparisonswith Applicable Guidance 74
10.3.5 Approach to Calculation of Health Risks to Humans 75
10.4 Assessment of Potential Off-Site Exposures of Humans and Biota 76
11 Conclusions and Recommendations 77
11.1 Conclusions 77
11.2 Recommendations 78
12 References 79
v

Table of Contents
Tables
1 Physical and Chemical Properties of Constituents of Concern
2 Phase I Investigation Results
3 Phase II Investigation Results
4 Well Details
5 Supplemental Investigation Details
6 Supplemental Investigation Results
7 Field Parameters
8 Groundwater Elevation Measurements
9 Pumping Test Field Observations
10 Slug Test Results - Estimates of Hydraulic Conductivity
11 Pumping Test Results - Aquifer Parameters
12 Groundwater Analytical Results
Figures
1 Station Location
2 Station Layout
3 Regional Cross Sections
4 Surface Elevation of the Kirkwood Formation
5 Station Cross Section A - A'
6 Station Cross Section B - B'
7 Station Cross Section C - C'
8 Station Cross Section D - D'
9 Station Cross Section E - E'
10 Phase I and I1 Sample Locations
11 Monitoring Well Network
12 Supplemental Investigation Sample Locations
13 Supplemental Investigation Results
14 Groundwater Elevation Contours - Shallow, Water-Bearing Unit (February20, 2004)
15 Groundwater Elevation Contours - Vincentown Formation (High - HighTide)
Vi

Table of Contents
16 Groundwater Elevation Contours -Vincentown Formation (Low- HighTide)
17 Groundwater Elevation Contours - Vincentown Formation (Low - LowTide)
18 Hydraulic Conductivities and Travel Time Calculations
19 Relationship Between Dispersivity and Travel Distance
Appendices
A. Investigations of Salem Unit 1 Fuel Pool Leakage - Final Report Summary
B. Section C - ISRA Non-Applicability Application (Station Operational History).
C. Well Details (Boring Logs, Well Completion Details, Well CompletionRecords, and Survey Form Bs)
D. Tidal Evaluation Results
E. Evaluation of Water Levels in the Vincentown Formation
F. Slug Test Results
G. Pumping Test Results
H. Dissolved Gas, Technetium-99 and Groundwater Age DeterminationResults for the PSEG Nuclear, LLC Salem Generating Station
I. Tritium Trend Plots for the Station Monitoring Wells
J. A Perspective on Radiation Doses and Health Risks from Ingestion ofTritium in Drinking Water and Potential Impacts on Aquatic and TerrestrialBiota
vii

Remedial Investigation ReportPSEG Nuclear, LLCSalem Generating StationHancock's Bridge, New Jersey
Executive Summary
ARCADIS, Inc. (ARCADIS), on behalf of PSEG Services Corporation ("PSEG SC"), hasprepared this Remedial Investigation Report to document the findings of a remedialinvestigation conducted at the PSEG Nuclear, LLC Salem Generating Station (the"Station") located on Artificial Island in Lower Alloways Creek Township, Salem County,New Jersey. The groundwater investigation was conducted in accordance with the scope ofwork defined in the Remedial Investigation Work Plan ("June 2003 RIWP") and the InitialGroundwater Investigation Report and Remedial Investigation Work Plan Addendum("RIWP Addendum") that were submitted to the New Jersey Department of EnvironmentalProtection ("NJDEP") in June 2003 and January 2004, respectively. The scope of workoutlined in these documents was designed to investigate the discovery of tritium in theshallow, water-bearing unit adjacent to Unit I of the Salem Generating Station.
The remedial investigation was initiated in September 2002 following the detection of low-level radioactive contaminants on the shoes of Station technicians. Initial investigationsindicated that the source of the low-level radioactive contaminants was water seepingthrough small cracks in the 78-foot Mechanical Penetration Room of the Unit I AuxiliaryBuilding. Further investigation revealed a second leak at the 92-foot elevation of the Unit ISpent Fuel Pool cooling line, adjacent to the pipe penetration through the concrete wall.Analytical results of water samples collected from the leaks indicated that the water hadcharacteristics of Spent Fuel Pool water and that a leak from the Spent Fuel Pool systemhad likely occurred.
The Salem Generating Station Unit I Spent Fuel Pool is lined with stainless steel. Behindthe stainless steel liner are liner drains (commonly referred to as "telltale drains") that areused as a combined leak monitoring, collection, and drainage mechanism. On January 31,2003, a fiber optic examination of two of the telltale drains indicated that mineral depositshad formed a blockage in them. The blockage obstructed the flow of water in these drainsresulting in the accumulation of Spent Fuel Pool water, which likely migrated along thepaths of least resistance (e.g., a pipe conduit, construction joints, or cracks in the concrete)and ultimately manifested at the crack in the wall in the 78-foot elevation MechanicalPenetration Room and through the gap/penetration where the Spent Fuel Pool coolingreturn lines intersects the wall at the 92-foot elevation. The mineral deposits havesubsequently been removed to restore flow in the telltale drains.
Further investigations conducted within the Station indicated that water from the Spent FuelPool had migrated to the Styrofoam-filled seismic gap located between the Unit I FuelHandling Building and the Auxiliary Building. Along the narrow western and southernends of the Seismic Gap, a flow path exists between the Styrofoam and foundation soils.As such, the potential exists for water in the seismic gap to migrate beyond the limits of the
ES-1

Remedial Investigation ReportPSEG Nuclear, LLCSalem Generating StationHancock's Bridge, New Jersey
engineered structures of the Station. Remedial investigation activities were initiated todetermine if the Spent Fuel Pool water that had accumulated in the seismic gap hadmigrated beyond the limits of the engineered features of the building and into theenvironment (i.e., soil and groundwater. in contact with the seismic gap).
Initially, eight groundwater monitoring wells.(Wells K through R) were installed in Januaryand February 2003 at locations adjacent to and around the perimeter-of the Salem Unit IFuel Handling Building. Analytical results of groundwater samples collected from thesemonitoring wells indicated that a potential release of water from the Spent Fuel Pool orother plant source to the environment had likely occurred. At this time, the subjectremedial investigation was initiated..
The scope of work proposed inthe June 2003 RIWP and the RIWP Addendum wasdesigned to determine if the tritium detected in groundwater samples collected frommonitoring wells installed adjacent to Salem Unit 1 is a result of a release to theenvironment from the Unit 1 Spent Fuel Pool, a non-authorized release from other onsiteoperating or maintenance activities, or elevated background levels of tritium fromauthorized releases and other operating practices. The proposed scope of work was also
O designed to assess the potential for: 1) tritium to migrate beyond the property boundaries;2) human health 'and environmental risks associated with the -tritium detected ingroundwater; and, 3) the need for any further action.
The scope of work presented in the June 2003 RJWP and the RIWP Addendum consistedof the following: 1) the installation of an additional 21 monitoring wells and tworeplacement monitoring wells; 2). the collection and analysis of groundwater samples fromthe monitoring well network, including a one time event for groundwater age determinationand for technetium-99 to definitively identify the Spent Fuel Pool as the source of thetritium; 3) an evaluation of the local and regional geology and hydrogeology including areview of published information and the performance of water level gauging events, slugtests and pumping tests; 4) an evaluation of tidal influences on select water-bearing units.beneath the Station; 5) an evaluation of possible sources of the tritium detected ingroundwater; 6) an evaluation of facility construction details and the preparation of detailedcross sections to identify potential migration pathways from the seismic gap and tohighlight the principal components of the conceptual site model; 7) fate and transportanalysis including the refinement of the conceptual site model, the delineation ofgroundwater flow pathways, and fate and transport calculations to estimate the' age of thetritium release and groundwater flow velocity; and, 8) to assess potential health risks tohumans and potential impacts to aquatic and terrestrial biota. The following sectionsprovide a summary of the details and results of the remedial investigation activities.
ES-2

Remedial Investigation Report
PSEG Nuclear, LLCSalem Generating StationHancock's Bridge, New Jersey
Well Installation, Groundwater Sampling and the Supplemental Investigation
The initial investigation included the installation and sampling of eight monitoring wells ordirect-push points (Well K through Well R; M and R being direct-push points). Analyticalresults of groundwater samples collected from the monitoring wells indicated that tritiumwas detected at concentrations above 3,000 picocuries per liter (pCi/L), the interim furtherinvestigation criterion proposed in the June 2003 RIWP, in groundwater samples collectedfrom Monitoring Wells M, N, 0 and R. Tritium was also detected in the groundwatersample collected from Well N on January 30, 2003 at a concentration above the New JerseyGroundwater Quality Criterion (GWQC) for tritium in groundwater of Class h1A aquifers(20,000 pCi/L).
Monitoring Wells S through W were installed between May 5 and June 18, 2003 andexisting Monitoring Wells M and R were replaced with properly constructed and developedmonitoring wells. Figure ES-1 shows the monitoring well network installed during theremedial investigation. Following installation and development of the new monitoringwells, groundwater samples were collected from the wells and analyzed by Maplewood fortritium, sodium, boron, and gamma-emitting isotopes. All samples were non-detect for.gamma-emitting isotopes. In July 2003, all tritium concentrations, with the exception ofMonitoring Wells M and S, were below the GWQC of 20,000 pCi/L. The replacement.well for Monitoring Well M, within the cofferdam, indicated a tritium concentration ofapproximately 62,000 pCi/L and Well S, screened in the shallow, water-bearing unitoutside of the cofferdam, indicated a tritium concentration of 3,500,000 pCi/L.
A "supplemental" groundwater investigation was initiated in July 2003 in response to thedetections of tritium in groundwater samples collected from Well S. The objectives of thesupplemental investigation were as follows: 1) determine if the tritium measured ingroundwater samples collected from Well S was migrating towards the property boundary;2) delineate the vertical and horizontal extent of the. tritium in groundwater in the vicinity ofWell S; and 3) evaluate the potential sources of tritium in Well S. The supplementalinvestigation consisted of collecting grab groundwater samples from direct-push boreholesand temporary well points screened at various depths and locations along the site boundary,as well as surrounding Well S. Groundwater samples were submitted for analysis fortritium, boron, and gamma-emitting isotopes.
Figure ES-2 shows the 37 proposed boring locations; samples were collected at as many asthree depths at each location. Borings 1 through 8 were proposed to evaluate-concentrations along the site perimeter to assess the potential for off-site migration.Borings 9 through 18 and Borings 31 through 37 were proposed near Station infrastructureto identify possible sources of tritium. These potential sources include the liquidradioactive waste ("rad waste") line, the Unit 1 Spent Fuel Pool, the Unit I refueling water
ES-3

Remedial Investigation Report
PSEG Nuclear, LLCSalem Generating StationHancock's Bridge, New Jersey
storage tank, and the Unit 1 primary water storage tank. Borings 19 through 30 wereproposed in the vicinity and downgradient of Well S to determine the extent of tritium ingroundwater.
The findings from the supplemental investigation are summarized as follows: (1) the limitof groundwater concentrations above the GWQC for tritium (20,000 pCi/L) was defined asshown on Figure ES-2; (2) an expanded area in the vicinity of WellS with tritium levelsabove 500,000 pCi/L was quantified as shown on Figure ES-2; (3) a completed pathwaybetween a potential source and groundwater was not identified, but tritium concentrationsand groundwater flow direction indicate that the southern end of the seismic gap is thelikely source of tritium in groundwater; and (4) extensive on-site monitoring of shallowgroundwater indicates no tritium above permissible levels has migrated to the Stationboundary.
Following completion of the supplemental investigation, the RiWP Addendum wasprepared and submitted to the NJDEP-BNE presenting the details and results of remedialinvestigation activities completed to date. The RIWP Addendum proposed additionalremedial investigation activities designed to complete the delineation of groundwaterimpacts, and the hydrogeologic characterization of the shallow, water-bearing unit. Theproposed remedial investigation activities included the installation of 16 additionalgroundwater monitoring wells.
Between September 2003 and February 2004, the 16 additional groundwater monitoringwells proposed in the RIWP Addendum were installed at the Station. Initially, MonitoringWell Y, Well Z, and Wells AA through AF'were installed. Following the collection andanalysis of groundwater samples from these wells, and a re-evaluation of groundwater flowdynamics within the shallow, water-bearing unit, Monitoring Well AG (Shallow and Deep),Well AH (Shallow and Deep), Well Al, Well AJ, Well' AL, and Well AM were installed tofill data gaps identified. The locations of the wells are shown of Figure ES-1.
Groundwater monitoring activities have been ongoing since the installation of Wells Kthrough R during initial Station investigation activities. Initially, groundwater sampleswere collected on a weekly basis. As the additional monitoring wells were installed, and asa database of groundwater analytical results for the monitoring wells was generated, themonitoring well sampling program was modifiedL The sampling program is beingadaptively managed to provide the investigational data required to meet the currentinvestigation objectives and evaluate changes in tritium concentrations. The adaptivesampling management program is designed to ensure representative data are collected thatmeet the objectives of the. investigation and provide the information necessary to evaluateplume dynamics and migration. The current monitoring plan specifies.either biweekly,monthly, or quarterly sampling based upon the analytical history of each well.
ES-4

Remedial Investigation ReportPSEG Nuclear, LLCSalem Generating StationHancock's Bridge, New Jersey
Groundwater samples are analyzed for tritium, major cations and anions, and gammaemitting isotopes. Analysis of groundwater samples collected from most of the StationMonitoring Wells has also included a single event analysis for groundwater agedetermination (by tritium - helium-3 age dating). As proposed in-the RIWP Addendum,Tc-99.was also analyzed as a single-event analysis for select monitoring wells to assist inthe determination of the source of the tritium.
Groundwater Flow
Groundwater elevations in monitoring wells screened in the shallow, water-bearing unitwithin the limits of the cofferdam are generally higher than groundwater elevations inmonitoring wells screened in the shallow, water-bearing unit outside the limits of thecofferdam. Groundwater flow in the shallow, water-bearing formation is generally fromthe center of the island (northeast of the Salem Generating Station) towards the DelawareRiver. Due to permeability differences between the structural fill and the hydraulic fill,groundwater is mounded within the area of the cofferdam. Groundwater flows radiallyoutward from the cofferdam, and the observed mounding effect dissipates quickly.
Water levels in the Vincentown Formation, because it is a confined-unit, are tidallyinfluenced. Water levels can vary as much as four feet per tide cycle depending on theproximity of the well to the Delaware River. To more accurately assess groundwater flowconditions in the Vincentown Formation, water level and tide data were evaluated tocharacterize groundwater flow conditions during various stages of the tide cycle of theDelaware River. Groundwater flow direction in the Vincentown Formation oscillates withthe tides. During the high tide stage of the tide cycle groundwater flow in the VincentownFormation is perpendicular from the shoreline of the Delaware River in the west and southtowards the center of Artificial Island. During the low tide stage of the tide cyclegroundwater flow in the Vincentown Formation is from the center of Artificial Islandtowards the Delaware River. During an intermediate stage of the tide cycle, an observedgroundwater saddle is present between the Station and the Delaware River. Groundwaterflow to the north and east of the saddle is to the south and east. Groundwater flow to thesouth and west of the saddle is to the north and east.
Aquifer Testing
Eight pumping tests were performed on seven wells (Wells AB, AC, AD, Al, AJ, AM, andS) to quantify the hydrogeologic characteristics (e.g., hydraulic conductivity) of theshallow, water-bearing unit within the limits of and just south of the cofferdam. Thepumping test results indicate a range of transmissivity of 0.337 ft2/day to 27.7 ft2/day andhydraulic conductivities of 0.03 ftlday to 2.77 ft/day.
ES-5
Remedial Investigation Report
PSEG Nuclear, LLCSalemGenerating StationHancock's Bridge, New Jersey
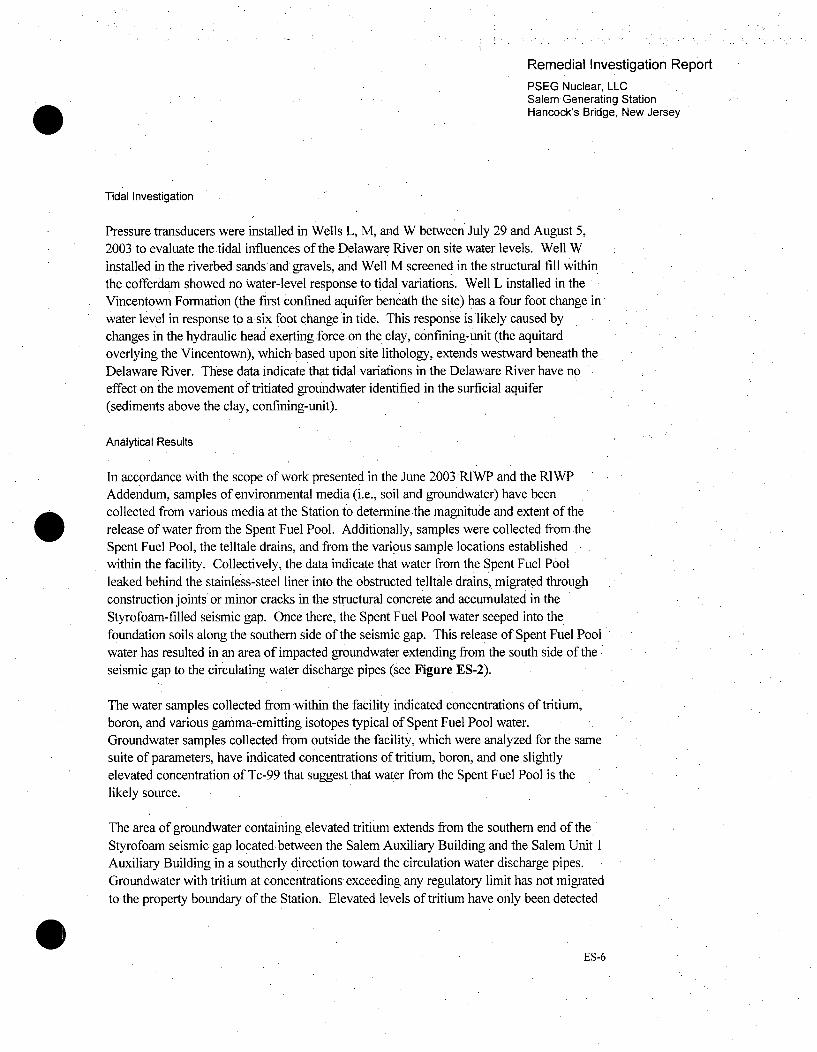
Tidal Investigation
Pressure transducers were installed in Wells L, M, and W between July 29 and August 5,2003 to evaluate the tidal influences of the Delaware River on site water levels. Well Winstalled in the riverbed sandsand gravels, and Well M screened in the structural fill withinthe cofferdam showed no water-level response to tidal variations. Well L installed in theVincentown Formation (the first confined aquifer beneath the site) has a four foot change inwater level in response to a six foot change in tide. This response is likely caused bychanges in the hydraulic head exerting force on the clay, confining-unit (the aquitardoverlying the Vincentown), which based upon site lithology, extends westward beneath theDelaware River. These data indicate that tidal variations in the Delaware River have noeffect on the movement of tritiated groundwater identified in the surficial aquifer(sediments above the clay, confining-unit).
Analytical Results
In accordance with the scope of work presented in the June 2003 RIWP and the RIWPAddendum, samples of environmental media (i.e., soil and groundwater) have beencollected from various media at the Station to determine the magnitude and extent of the
* release of water from the Spent Fuel Pool. Additionally, samples were collected from theSpent Fuel Pool, the telltale drains, and from the various sample locations establishedwithin the facility. Collectively, the data indicate that water from the Spent Fuel Poolleaked behind the stainless-steel liner into the obstructed telltale drains, migrated throughconstruction joints or minor cracks in the structural concrete and accumulated in theStyrofoam-filled seismic gap. Once there, the Spent Fuel Pool water seeped into thefoundation soils along the southern side of the seismic gap. This release of Spent Fuel Poolwater has resulted in an area of impacted groundwater extending from the. south side of theseismic gap to the circulating water discharge pipes (see Figure ES-2).
The water samples collected from within the facility indicated concentrations of tritium,
boron, and various gamma-emitting isotopes typical of Spent Fuel Pool water.
Groundwater samples collected from outside the facility, which were analyzed for the samesuite of parameters, have indicated concentrations of tritium, boron, and one slightlyelevated concentration of Tc-99 that suggest that water from the Spent Fuel Pool is thelikely source.
The area of groundwater containing elevated tritium extends from the southern end of theStyrofoam seismic gap located between the Salem Auxiliary Building and the Salem Unit 1Auxiliary Building in a southerly direction toward the circulation water discharge pipes.Groundwater with tritium at concentrations exceeding any regulatory limit has not migratedto the property boundary of the Station. Elevated levels of tritium have only been detected
0ES-6

Remedial Investigation ReportPSEG Nuclear, LLCSalem Generating StationHancock's Bridge, New Jersey
in groundwater samples collected from the shallow, water-bearing unit. There is noevidence that suggests that water from the .Spent Fuel Pool has migrated to an underlyingaquifer as confirmed by groundwater samples collected from monitoring wells screened inthe Vincentown Formation.
Fate and Transport Analysis
Shallow groundwater in the vicinity of the Station has been impacted by a release of waterfrom the Spent Fuel Pool. The pathway from the building to the environment cannot bedocumented with absolute certainty; however, site evidence indicates the seismic gapbetween the Salem Unit I Fuel Handling Building and Auxiliary Building is the primaryrelease point. The groundwater travel time between the primary release point and the500,000 pCi/L contour was computed using observed water levels, aquifer properties,facility operations data, groundwater recharge, and helium to tritium ratios. Collectively,these data indicate that the groundwater plume is between 5 and 10 years old.
Health and. Environmental Risk Assessment
The principal radionuclide of concern for this remedial investigation is tritium in shallowgroundwater adjacent to Salem Generating Station Unit 1. To date, a completed exposurepathway to humans from tritium in shallow groundwater has not been established, nor isthere any evidence that significant exposures of biota have occurred.
Conclusions
The results of remedial investigation activities conducted at the PSEG Nuclear, LLC SalemGenerating Station, which were conducted in response to the detection of tritium ingroundwater, indicate that the source of tritium detected in groundwater was the Spent FuelPool, the tritium release to the. environment has been stopped, and that tritium has notmigrated to the property boundary above any regulatory limit. The following bulletsprovide a more detailed description of the investigation findings:
There was a release of water from the Spent Fuel Pool system resulting fromblockage of the telltale drains by mineral precipitates. The telltale drains are aleak monitoring, collection, and drainage mechanism specifically designed tocollect leakage that may accumulate behind the stainless steel liner of the SpentFuel Pool and Refueling Canal. The blockage of the telltale drains resulted in theaccumulation of water from the Spent Fuel Pool system (between the liner and theconcrete wall) that created hydrostatic head and facilitated migration to theStyrofoam-filled seismic gap located between the Salem Unit I Fuel HandlingBuilding and Auxiliary Building. The mineral precipitates have been physically
ES-7

Remedial Investigation Report
PSEG Nuclear, LLCSalem Generating StationHancock's Bridge, New Jersey
removed to ensure the proper operation of the telltale drains. The process ofmonitoring the telltale drains is routinely performed to ensure that blockage doesnot reoccur. Permanent seismic gap drains are beinginstalled on Salem Units 1and 2, to permit identification, sampling, and drainage of any accumulated waterin the seismic gap, and to create. an ingradient to the gap;
The release of water from the Spent Fuel Pool system was investigated throughthe sampling of monitoring wells installed in the area of Salem Unit 1. Thegroundwater analytical data collected from the monitoring well network were usedto delineate an area of groundwater in the shallow, water-bearing unit thatcontains elevated tritium. Gamma-emitting isotopes were also monitored in thegroundwater samples collected from the monitoring wells because the suspectedsource. of the tritium was the Spent Fuel Pool. No plant related gamma-emittingisotopes have been detected in groundwater samples collected from themonitoring wells;
The area of groundwater containing elevated tritium extends from the southernend of the Styrofoam seismic gap located between the Salem Unit I FuelHandling'Building and the Auxiliary Building in a southerly direction toward thecirculation water discharge pipes. Groundwater with tritium at concentrationsexceeding any regulatory limit has not migrated to the property boundary of theStation;
Elevated levels of tritium have only been detected in groundwater samplescollected from the shallow, water-bearing unit. There is no evidence that suggeststhat water from the Spent Fuel Pool has migrated to an underlying aquifer asconfirmed by groundwater samples collected from monitoring wells screened inthe Vincentown Formation; and,
A completed exposure pathway to humans from tritium in shallow groundwaterhas not been established, nor is there any evidence that significant exposures ofbiota have occurred.
ES-8

C--C------in
-7, ~~1- - - .fr~
) X(iia ii
N
'O 1
770
Q%
DRAWN DATE OJCT MANAGER DEPARTMENT MANAGERu. WA9EwSC 9/16/03 P. MuOUS D. FUtTON
SLEAD DESIGN PROF. CHECKED0 250 MONrlURIN RU. IL RWqM S. POTTER fB PIERCE
E SCALE: 1"=250' AHlC A DiS w t pE G R U LEMALH C PRO JECT NUJMBER RAWING NIUMBER
L IiU Ir P nSALEM AGENERATIN NSTATION 1P000571.000 ES-iI _ _ _ _ _ _ _ _ _ _ _ _ _ _ _ _ _ _HANCOCK'S BRIDGE, NEW £RSEY
0

0 S
-----------------------------------
~yN
o~Z~I .
-J1¸
ý2 2
+23
LEGEND-
SEISMIC CAP
AREA OFSUPPLEMENTALINVESTIGATION
_1____________-___DRAWN I DATE PROJECT MANAGER DEPARTMENT MANAGERi. WASLEWSKI 19/15/03 P. MUJoNMS 0. FULTON
100 LEAD DESIGN PROF. ICHECKED
EKA•OF I . IR UM LEVELS S. POTTER B.lPERCEIl SCLE:, o 1I0' ABOVE 500.000 pc/L IPRo.EC-1 NUMBER DRAING NUMBER"- .I PSEG NUCLEAR, LLC•
I____________"___________________•_________'___________ _ .SALEM GENERATING STATION l -llo"A I A/7 1 .0 0 0 3 E S - 2ARýTiICRIAL ISLAND
oHANCOCKS BRIDE , NEW JERSEY'U'

Remedial Investigation ReportPSEG Nuclear, LLCSalem Generating StationHancock's Bridge, New Jersey
1 Introduction
ARCADIS, Inc. ("ARCADIS"), on behalf of PSEG Services Corporation ("PSEG SC"),has prepared this Remedial Investigation Report ("RIR") to document the findings of aremedial investigation conducted at the PSEG Nuclear, LLC Salem Generating Station (the"Station") located on Artificial Island in Lower Alloways Creek Township, Salem County,New Jersey. The Station location and layout are shown on Figures 1 and 2, respectively.The remedial investigation was conducted in accordance with the Remedial InvestigationWork Plan ("June 2003 RIWP") that was submitted to the New Jersey Department ofEnvironmental Protection Bureau of Nuclear Engineering ("NJDEP-BNE") in June 2003.The scope of work outlined in the June 2003 RIWP was designed to investigate thediscovery of tritium in the shallow, water-bearing unit at the Station.
A document entitled, "Initial Groundwater Investigation Report and Remedial InvestigationWork Plan Addendum" ("RIWP Addendum") was submitted to the NJDEP in January2004. The RIWP Addendum contained the initial results of the remedial investigation and,based on these results, proposed certain modifications to the June 2003 RIWP.
This RIR contains the results of remedial investigations as described in both the June 2003RIWP and the RIWP Addendum. The remedial investigation produced a comprehensivebody of knowledge regarding the tritium discharge, its fate in the environment, and thephysical environment at and in the vicinity of the Station. The findings presented in thisRIR will be used as the basis for the development of a remedial action strategy and workplan that will be submitted to the NJDEP-BNE under separate cover.
1.1 Project Background
On September 18, 2002, the Station Radiation Protection staff reported measuring low-level radioactivity on the shoes of technicians inside the radiologically controlled AuxiliaryBuilding. An initial facility investigation led to the discovery of a radioactive "chalk-like"substance adhering to the west wall in the 78-foot Mechanical Penetration Room of theUnit I Auxiliary Building. The buildup of the "chalk-like" deposits was removed and anactive seep of water into the 78-foot Mechanical Penetration Room was observed. Furtherinvestigation revealed a second leak at the 92-foot elevation of the Unit I Spent Fuel Poolcooling line, adjacent to the pipe penetration through the concrete wall.
As presented in Section 5, sample points were established for the collection and analysis ofwater samples from the observed leaks. Samples collected from the sample points wereanalyzed for tritium, major cations and anions, and gamma-emitting isotopes to determinethe concentrations of constituents of concern in the water samples, to evaluate the potentialage of the leak, and to evaluate a potential source of the water. Analytical results of thesamples indicated that the water from both leaks had characteristics of Spent Fuel Poolwater and that a leak from the Spent Fuel Pool system had likely occurred.
I

Remedial Investigation ReportPSEG Nuclear, LLCSalem Generating StationHancock's Bridge, New Jersey
The Salem Generating Station Unit 1 Spent Fuel Pool is lined with stainless steel. Behindthe stainless steel liner are liner drains (commonly. referred to as "telltale drains") that areused as a combined leak monitoring, collection, and drainage mechanism. The telltaledrains are specifically designed to collect leakage that may accumulate behind the stainlesssteel liner of the Spent Fuel Pool and Refueling Canal. There are ten telltale drainsassociated with the Salem Generating Station Unit I Spent Fuel Pool that are identified asDrain Nos. 1 through 10. There are seven telltale drains associated with the Salem
Generating Station Unit 1 Refueling Canal that are identified as Drain Nos. 11 through 17.Drains No. 11 through 17 are designed to monitor, collect, and drain leakage from theRefueling Canal that is associated with the Spent Fuel Pool.
A series of water samples was collectedfrom the telltale drains to characterize the waterthat had accumulated. Analytical results of the water samples, discussed in further detail inSection 5, indicated that the likely source of water in the Spent Fuel Pool telltale drains wasSpent Fuel Pool water, while the source of water in the Refueling Canal telltale drainsindicated a possible mixing of water from the Spent Fuel Pool 'system with sodium, whichis uncharacteristic of water from the Spent Fuel Pool system. A lack of chloride detected inwater samples collected from the Refueling Canal telltale drains suggests that the sodium
* concentrations are likely from the interaction of the Spent Fuel :Pool water with thestructural concrete.
On January 31, 2003, a fiber opticexamination of the telltale drains indicated a blockage bymineral deposits of the No. 4 and No. 5 drains beneath the welds in the stainiess-steel linerof the Spent Fuel Pool, which obstructed the flow of water that leaked behind the stainless-steel liner. While obstructed, the flow of water from leak(s) in the Spent Fuel Pool linerwas likely forced between the liner plates and the structural concrete base and walls of theFuel Handling Building to establish hydraulic equilibrium with the water level in the SpentFuel Pool. The Spent Fuel Pool water likely migrated along the paths of least resistance
(e.g., a pipe conduit, construction joints, or cracks in the concrete) and ultimatelymanifested at the crack in the wall in the 78-foot elevation Mechanical Penetration.Room
and-through the gap/penetration where the Spent Fuel Pool cooling return lines intersectsthe wall at the 92-foot'elevation.'
The mineral deposits were physically removed from the telltale drains to restore flow,which was measured to be approximately .100 gallons per day (gpd), which is within -thedesign parameters of the leak detection, collection and monitoring system and is processedthrough the routine waste treatment processes. The process of monitoring and removingthe mineral deposits, as needed, has been and will continue to be conducted to ensure thatthe telltale drains do not become obstructed in the future.
Analytical results of water samples collected from the observed leaks (78-foot elevationMechanical Penetration Room and through the gap where the Spent Fuel Pool cooling
2
Remedial Investigation ReportPSEG Nuclear, LLCSalem Generating StationHancock's Bridge, New Jersey
return lines intersects the wall at the 92-foot elevation) and subsequent investigations of the
Unit 1 telltale drains indicated that further investigation was necessary to: 1) characterizethe observed leaks and determine their source; 2) determine the extent of the leaks withinthe Salem Generating Station Auxiliary and Spent Fuel Pool Buildings; and, 3) determinethe extent of the impact from the leak, if any, into the environment (soil and groundwater incontact with the engineered features of the Station).
Further investigations indicated that water from the Spent Fuel Pool had migrated to theStyrofoam-filled seismic gap located between the Unit I Fuel Handling Building and theAuxiliary Building. The details and results of sampling activities that were conductedwithin the facility to identify the source of the water observed in the 78-foot elevationMechanical Penetration Room and through the gap where the Spent Fuel Pool coolingreturn lines intersects the wall at .the 92-foot elevation are summarized in Section 5 and arepresented in detail in the Investigations, of Salem Unit 1 Fuel Pool Leakage - Final ReportSummary provided in Appendix A.
The Styrofoam-filled seismic gap is approximately six-inches wide and extends verticallyfrom grade (100 feet Plant Datum [PD]) to the top of the concrete foundation of the FuelHandling Building. A discussion of the lean concrete foundation is presented in Section4.2.1. The Styrofoam was originally used as a concrete form for the surrounding concretepour. The Styrofoam was left in place to serve as a seismic gap. Along the narrow westernand'southern ends of the Seismic Gap, a flowpath exists between the Styrofoam andfoundation soils. As such, the potential exists for water in the seismic gap to migratebeyond the limits of the engineered structures of the Station and into the environment.
Following the discovery of water characteristic of the Spent Fuel Pool in the Styrofoam-filled seismic gap, remedial investigation activities were initiated to determine if Spent FuelPool water that had accumulated in the seismic gap had migrated beyond the limits of theengineered features of the building and into the environment (i.e., soil and groundwater incontact with the seismic gap). Initially, eight groundwater monitoring wells (Wells Kthrough R) were installed in January and February 2003 adjacent to and around theperimeter of the Fuel Handling Building. Analytical results of groundwater samplescollected from these monitoring wells (discussed in more detail in Section 4.2) indicatedthat a potential release of water from the Spent Fuel Pool or other plant source to theenvironment had likely occurred. At this time, the subject remedial investigation wasinitiated.
1.2 Investigation Objectives
As presented in Section 5.3, analytical results of groundwater samples collected frommonitoring wells installed adjacent to and around the perimeter of the Unit 1 Fuel HandlingBuilding indicated concentrations of tritium above the New Jersey Groundwater Quality
3

Remedial Investigation Report
PSEG Nuclear, LLCSalem Generating StationHancock's Bridge, New Jersey
Criteria ("GWQC") of 20,000 picocuries per liter ("pCi/L"). Other radionuclides were notdetected in the groundwater samples at concentrations above background levels.
The scope of work proposed in the June 2003 RIWP and the RIWP Addendum wasdesigned to determine if the tritium detected in groundwater samples collected frommonitoring wells installed adjacent to Salem Unit I is a result of a release to theenvironment from the Unit I Spent Fuel Pool, a non-authorized release from other onsiteoperating or maintenance activities, or elevated background levels of tritium fromauthorized releases and other operating practices. The proposed scope of work was alsodesigned to assess the potential for: 1) tritium to migrate beyond the property boundaries;2) human health and environmental risks associated with the tritium detected ingroundwater; and, 3) the need for any further action.
1.3 Report Organization
This report provides relevant background information, the details and results of remedialinvestigation activities conducted to date, and proposed activities in the following sections:
* Section 2 - History of Station Operations;
* Section 3 - Station Setting;
* Section 4 - Facility Construction and Local Geology;
* Section 5 - Initial Station Investigation Activities;
* Section 5 - Remedial Investigation Activities;
* Section 7 - Hydrogeologic Evaluation;
* Section 8 - Analytical Results
. Section 9 - Fate and Transport Results
* Section 10 - Health and Environmental Risk Assessment;
* Section 11 - Conclusions and Recommendations; and,
* Section 12 - References
The History of Station Operations section (Section 2) presents information on the.Stationioperating history, historical releases, the area and constituents of concern, as well asregulatory information about the Station.
The Station Setting section (Section 3) presents a description of the setting of the SalemGenerating Station, including land use, the estuarine location, topography and-stationdrainage, climate and precipitation, and regional geology and hydrogeology. -
4

Remedial Investigation Report
PSEG Nuclear, LLCSalem Generating StationHancock's Bridge, New Jersey
The Facility Construction and Local Geolo•y section (Section 4) presents conditions atArtificial Island prior to the construction of the Station and details how the facilityconstruction has altered the local geology.
The Initial Station Investigation Activities section (Section 5) presents the details andresults of the initial investigation activities conducted to identify a source of theradioactivity, to characterize the extent of the release within the facility, and to determine ifthe release of water from the Spent Fuel Pool' system has migrated beyond the seismic gap.
The Remedial Investigation Activities section (Section 6) presents a detailed summary ofthe remedial investigation activities that have been conducted following the submittal of theJune 2003 RIWP and the subsequent RIWP Addendum. This section includes the details forthe initial station investigation activities, including sampling conducted.
The Hydrogeologic Evaluation section (Section 7) provides the results of hydrogeologicinvestigation activities, including slug tests and pumping tests, designed to characterizegroundwater movement at the Station.
The Analytical Results section (Section 8) provides a sumiary of analytical results forsamples collected to date. The analytical results section includes a discussion regarding thedistribution of tritium in groundwater and the results of ýiýtiu..n a&e-dating analysis andtechnetium-99 (Tc-99) analysis.
The Fate and Transpoft Results section (Section 9) discuýses. potential flow pathways fromthe facility and the rate of migration of tritium in ground4 ater.
The Health and Environmental Risk Assessment section (Section 10) presents a discussion* regardifig potential exposure pathways and the methodology used for evaluating the risk
associated with the exposure pathways.
The Conclusions and Recommendations section (Section 11) presents a summary of thefindings of the remedial investigation and recommendations for further actions based on thefindings.
A list of References is presented in Section 12.
5

Remedial Investigation Report
PSEG Nuclear, LLCSalem Generating StationHancock's Bridge, New Jersey
2 History of Station Operations
The following sections present information on the operating history of the Station, the areaand constituents of concern, historical spills and releases, as well as regulatory informationabout the Station.
2.1 Operating History
PSEG Nuclear, LLC operates and is part owner of the Salem Generating Station located onArtificial Island in Lower Alloways Creek Township, Salem County, New Jersey. PSEGNuclear, LLC (57.41%) and Exelon (42.59%) jointly own the Station. The SalemGenerating Station is adjacent to the Hope Creek Generating Station, also located onArtificial Island. Both the Salem and Hope Creek Generating Stations (the Stations) arelocated on the eastern bank of the Delaware River. The Salem Generating Stationencompasses an approximate 26-acre portion of the approximately 740-acre ArtificialIsland site.
The Salem Generating Station is composed of two nuclear generating units (Units I and 2)and one distillate oil fueled combustion turbine unit (Unit 3). Commercial operations ofUnits 1 and 2 commenced in 1976 and 1981, respectively. The combustion turbine unitcommenced operations in 1972. The nuclear generating units operate as base load unitsand the combustion turbine unit operates as a peaking unit. The Salem Generating Stationhas a combined generating capacity of over 2,300 MW. Over its operational life, the SalemGenerating Station has experienced no significant changes in its operation.
A detailed description of Salem Generating Station's operations and operational history,was prepared for Exhibit C of the September 1999 Industrial Site Recovery Act (ISRA)Non-Applicability Application, as is included in this RIR as Appendix B.
2.1.1 Area of Concern
The remedial investigation proposed in the June 2003 RJWP focused on tritium detected ingroundwater adjacent to the Salem Generating Station Unit I Fuel Handling Building. Asstated in Section 1.2, the primary objective of the remedial investigation was to determine ifthe tritium detected in groundwater samples collected from monitoring wells installedadjacent to Salem Unit I is a result of a release to the environment from the Unit I SpentFuel Pool, a non-authorized release from other onsite operating or maintenance activities,or elevated background levels of tritium from authorized releases and other operatingpractices. Although the suspected source of the tritium in groundwater was the Spent FuelPool water that had accumulated in the seismic gap, other potential sources of tritium wereevaluated to determine if they were the primary source, or likely contributors to theelevated levels of tritium. These potential sources included the radioactive liquid waste
6
Remedial Investigation Report
PSEG Nuclear, LLCSalem Generating StationHancock's Bridge, New Jersey
discharge line, the Salem Unit 1 Fuel Transfer Canal, and the steam generator blowdownlines, each of which is shown on Figure 1.
To evaluate the radioactive liquid waste discharge line and the Unit I Fuel Transfer Canal,PSEG Nuclear, LLC, performed local leak rate.tests. Additionally, a pressure test wasperformed on the radioactive liquid waste discharge line. According to PSEG Nuclear,LLC, the results of both the local leak rate tests and the pressure test indicated that theradioactive liquid waste discharge line and the Unit I Fuel Transfer Canal are functioningproperly and are not considered sources of tritium (PSEG, verbal communication 2004).The steam generator blowdown lines, which typically contain tritium at concentrations ofapproximately 6,000 pCi/L, are not considered a significant source of tritium. As such, thesteam generator blowdown lines were not tested for integrity.
In addition to the potential point-source contributors of tritium, potential non-point sourcessuch as historical spills and releases were also considered. A summary of historical spillsand releases reported within the area of investigation are presented in Section 2.1.2.
2.1.2 Historical Spills and Releases
To evaluate potential sources of the tritium detected in groundwater adjacent to the SalemGenerating Station Unit 1 Spent Fuel Pool, PSEG Nuclear, LLC conducted a review ofh•storical data and interviewed Station personnel regarding any historical. spills or releases
in the area of investigation. According to PSEG Nuclear, LLC, the results of the evaluation
indicated that reported events~in the area of investigation generally occurred during the
early years of the Station's construction and operation (PSEG, verbal communicaiiofni2004). Historical spills or releases were reported to the appropriate agencies to the extentthat they met the reporting thresholds in affect at the time and resulted in leaks that weremanaged through the Station's radioactive liquid waste system without entering theenvironment or to the soil that was removed and properly disposed off-site. These eventsdid not likely result in the elevated levels of tritium detected in groundwater samplescollected from Station monitoring wells. This is evidenced by the difference between therecent groundwater analytical results and the quantity and concentration of tritium reportedduring these events and the corrective actions taken at the time of the events.
2.1.3 Constituents of Concern
The remedial investigation was initiated when water samples collected from the Styrofoam-filled seismic gap indicated the presence of tritium, boron, and various gamma-emittingradioisotopes typical of water from the Spent Fuel Pool. The physical and chemicalproperties of the constituents detected in the water samples from the seismic gap, aresummarized in Table 1. These constituents are routinely monitored in groundwater samplescollected from the Station monitoring wells. Other than tritium and boron, the physical
7
Remedial Investigation Report
PSEG Nuclear, LLCSalem Generating StationHancock's Bridge, New Jersey
properties of the constituents identified in the seismic gap will limit their potential migrationin the environment. For example, the gamma-emitting cations (e.g., strontium-90, cesium-137, and cobalt-60) in water will tend to bind strongly to soil particles causing them tomigrate at least 100 times slower than groundwater. Tc-99, another constituent of spent fuelpool water, has "intermediate" mobility in groundwater (10 to 20 percent of the rate ofgroundwater). Tritium and boron do not adsorb strongly to soils and migrate withgroundwater. No plant related gamma-emitting isotopes have been detected to date ingroundwater samples collected from monitoring wells installed at the Station; however,PSEG SC continues to analyze groundwater samples collected from the monitoring wellsfor gamma-emitting isotopes because the suspected source of the tritium is the Spent FuelPool.
The primary constituent of concern for this investigation istritium in groundwater. Tritiumis a radioactive isotope of the element hydrogen. Molecular hydrogen can exist in over 40forms, most commonly hydrogen, deuterium, and tritium. Tritium is a hydrogen atom thathas two additional neutrons in its nucleus. Tritium occurs naturally in the upperatmosphere when high-energy cosmic radiation bombard atmospheric nitrogen and oxygenand splits off a tritium nucleus (spallation); however, the predominant sources of tritium inthe post-nuclear era (i.e., anthropogenic tritium) are the explosions of nuclear weapons, thebyproduct of nuclear reactors, and commercial production for use in various self-luminescent devices. Although tritium can occur as hydrogen gas, it is most commonlyfound as a liquid. Tritium, like non-radioactive hydrogen, reacts with oxygen to formtritiated water. Tritiated water is colorless and odorless, has a half-life of 12.3 years, andemits low-energy beta particles that can be measured by liquid scintillation. Standardscintillation methods can routinely detect tritium concentrations of 200 pCi/L and greater.
As proposed in the June 2003 RIWP, two action levels were defined for tritium ingroundwater to assist in the evaluation of data generated through the investigation. Theseaction levels are the Interim Further Investigation Criterion and the Further ActionCriterion. The Interim Further Investigation Criterion for this investigation is 3,000 pCi/L.The Further Action Criterion for tritium in groundwater is 20,000 pCi!L, which is the NewJersey Groundwater Quality Criteria for tritium in Class II A' aquifers. These criterion wereused to evaluate the need for further delineation and characterization for tritium detected ingroundwater, and the need for any further action (i.e., remediation).
2.2 Regulatory Review
Regulatory oversight for the Salem Generating Station, and other nuclear generatingstations, is provided by both federal and state agencies. These agencies ensure that thestations are designed, constructed, licensed and operate in a manner that maximizes the safecontainment and management of radioactive materials. These agencies also ensure that
8
Remedial Investigation ReportPSEG Nuclear, LLCSalem Generating StationHancock's Bridge, New Jersey
sufficient funding mechanisms have been established, are adequately funded, and will beavailable to decommission the nuclear generating stations at the end of their life cycle.
On the federal and state levels, the United States Nuclear Regulatory Commission(USNRC) and NJDEP-BNE conduct licensing and oversight of nuclear generatingfacilities. Oversight by the NJDEP-BNE and USNRC includes inspections of nuclearpower plants and conducting environmental radiological monitoring.
9

Remedial Investigation Report
PSEG Nuclear, LLCSalem Generating StationHancock's Bridge, New Jersey
3 Station Setting
The following sections provide information regarding the setting of the Salem GeneratingStation, including land use, the estuarine location, topography and station drainage, climateand precipitation, and regional geology and hydrogeology. A more detailed description ofthe setting of the Station is included in Section C of the ISRA Non-ApplicabilityApplication, which is provided in Appendix B to this report.
3.1 Land Use
PSEG Nuclear LLC owns and/or controls an approximately 740-acre area of ArtificialIsland that is situated adjacent to and surrounds the Salem and Hope Creek GeneratingStations. This area contains administrative and support facilities used by the Stations, theHope Creek Switch Yard, the Salem Switch Yard, and undeveloped vacant land. With theexception of the Salem Generating Stations (Units I through 3) and the Salem Switchyard,the remaining acreage is considered to be the Hope Creek Generating Station.
The zoning classification for the Salem Generating Station is industrial. The land adjacentto the Salem Generating Station is zoned for industrial and residential or agricultural use.
3.2 Estuarine Location
The Salem Generating Station is located on a portion of Artificial Island that borders theDelaware Estuary. The Estuary, in the location of the Salem Generating Station, is a tidal,brackish river, located in an area designated as Zone 5 by the Delaware River BasinCommission (DRBC).
The United States Army Corps of Engineers, beginning in the early twentieth century,created Artificial Island by depositing dredge spoils within a diked area established arounda natural sand bar that projected into the Delaware River. Prior to construction of theSalem Generating Station, the property was vacant, undeveloped, low-lying land.
3.3 Topography and Station Drainage
The topography at the Salem Generating Station is relatively flat with limited local relief.Topographic contours for the Station are included on Figure 2.
Stormwater is managed in accordance with the Salem Generating Station New JerseyPollution Discharge Elimination System (NJPDES) permit and Stormwater PollutionPrevention Plan. Stormwater is collected in storm drains and routed to the Delaware Riverfor discharge. The locations of the storm drains are included on Figure 2. Stormwater
10

Remedial Investigation Report
PSEG Nuclear, LLCSalem Generating StationHancock's Bridge, New Jersey
from the principle petroleum storage and handling areas is routed to the oil/water separatorprior to discharge.
3.4 Climate and Precipitation
Salem County is located in southwestern New Jersey. The county's climate is consideredto be humid and temperate, as the climate in this county is readily influenced by itsproximity to the Delaware Bay. Coastal storms are not uncommon in this region and canproduce high winds and heavy rainfall, which can cause wind damage and flooding in low-lying areas (USDA, 1969).
Wind direction in this region is dependent upon the season; during the summer, winds aretypically from the southwest while during the winter, winds are commonly from thenorthwest. Temperatures vary by season and the maximum expected high temperature fora given year is 96 degrees Fahrenheit, while the minimum expected yearly low temperatureis minus 2 degrees Fahrenheit. The average annual precipitation total is 39.9 inches.
3.5 RegionalGeology and Hydrogeology
The Salem Generating Station is located on the east edge of the Delaware River, sevenmiles north of the Delaware Bay, eight miles southeast of the City of Salem and about 40miles south of Philadelphia, Pennsylvania. The Station is located in the Atlantic CoastalPlain Physiographic Province, approximately 19 miles southeast of the contact between thecoastal plain sediments and the Appalachian Highlands. This area is characterized byrelatively flat to gently undulating terrain, underlain by unconsolidated sediments thatincrease in thickness to the southeast.
The coastal plain sediments were deposited in marine and non-marine environments. Thesediments are between 1,500 and 2,000 feet thick in the vicinity of the Station, andunconformably overlie bedrock. These sediments range in age from Holocene toCretaceous (0 to 146 million years old), and are comprised of clay, silt, sand, and gravel.Published geologic mapping indicates that the basement rock beneath these sediments (inthe area of the Station) is metamorphic schist of the Wissahickon Formation, which is Pre-Cambrian in age (570 to 900 million years old) (USGS 1999).
The shallow, water-bearing unit at the Station consists of approximately 25 to 35 feet ofdredge spoils (hydraulic fill), structural fill material, tidal marsh deposits and riverbeddeposits. The structural fill replaced the dredge spoils and natural deposits in selectlocations at the facility during construction of the Station. Additional informationregarding the construction of the facility and the composition and nature of the structuralfill are provided in Section 4.2.
11
Remedial Investigation Report
PSEG Nuclear, LLCSalem Generating StationHancock's Bridge, New Jersey
The geologic formations beneath the shallow, water-bearing unit, in order of increasingdepth, are as follows: the Kirkwood Formation; the Vincentown Formation; theHomerstown-Navesink Aquitard; the Mount Laurel-Wenonah Formations; the MatawanFormation; the Magothy Formation; the Raritan Confining Unit and Aquifer; the PotomacGroup; and, the Wissahickon Formation. Regional cross sections trending northeast tosouthwest (A-A') parallel to the Delaware River, and northwest to southeast (B-B')perpendicular to the river are provided on Figure 3 (USGS 1999).
The following sections describe in more detail the units of the coastal plain sediments thatare encountered in the vicinity of the Station.
3.5.1 Hydraulic Fill
Artificial Island is composed largely of hydraulically placed dredge spoils fromconstruction and maintenance of nearby navigational channels by the United States ArmyCorps of Engineers. The hydraulic fill is not considered a source of drinking water.
3.5.2 Riverbed Deposits
A relatively thin layer of riverbed deposits underlies the more recent native andanthropogenic deposits composing Artificial Island. The layer consists of an approximatefive- to ten-foot layer of discontinuous Quaternary Age deposits consisting primarily ofsand with some gravel, silt and clay. The unit appears as a discrete deposit in some borings(Wells U and V). The results of aquifer tests conducted previously have shown theriverbed deposits to have a hydraulic conductivity on the order of 0.01 to I ft/day (Dames& Moore 1988, 1974).
3.5.3 Kirkwood Formation
The Kirkwood Formation, which consists of an upper clay-unit and a basal sand unit,separates the Vincentown Formation from the hydraulic fill and riverbed deposits of theshallow, water-bearing unit. The Kirkwood Formation consists of gray clay with trace siltand gravel, and is laterally extensive in the area of the investigation (see Figure 4).Conflicting geologic reports suggest that the geologic unit previously interpreted as theKirkwood Formation may in fact be the Pleistocene Van Sciver Lake Bed deposits (USGS1979 and 1999). To determine the relative age of this underlying unit, samples of the clayobtained during the drilling of Well V (see Section 6.5) were analyzed to determine therelative age of the unit, which is interpreted to be the Kirkwood Formation based on the agedata.
The Kirkwood Formation occurs at or near the surface and is considered unconfined inSalem and Gloucester Counties (USGS 1999). The Kirkwood Formation is composed of
12

Remedial Investigation ReportPSEG Nuclear, LLCSalem Generating StationHancock's Bridge, New Jersey
micaceous sands and diatomaceous clay, trends from the northeast to the southwest, anddips to the east-southeast. The sand content increases to the east-northeast where theKirkwood includes the Atlantic City 800-foot sand. In the vicinity of Artificial Island, theunit is primarily composed of hard clays with trace fine micaceous sand and a basal sandunit directly overlying the Vincentown Formation. The basal unit of the KirkwoodFormation is a fine to medium micaceous sand with varying silt content that coarsens withdepth (Dames & Moore July 1976). The upper clay in the Kirkwood Formation isconsidered an aquitard for the Vincentown Formation and the overlying basal sand unit.
3.5.4 Vincentown Formation
The Vincentown Formation is an aquifer of minor importance in some areas. In thevicinity of the Station, the Vincentown Formation has chloride concentrations of 1,800 to4,300 mg/L preventing the aquifer from being used as a potable water source (Dames &Moore 1988). The Vincentown Formation outcrops over a small area of central SalemCounty, and trends northeast to southwest and dips to the east-southeast. The VincentownFormation is composed of sands to silty sand characterized by a glauconitic quality.Confined by the overlying Kirkwood Formation, the Vincentown Formation extendssoutheast from Keasby Creek to Stow Creek with the greatest thickness (approximately 60feet) coinciding with Alloways Creek (USGS 1999). The Vincentown thins and narrows tothe northeast reaching a minimum thickness between Glassboro and Berlin before againincreasing in thickness and lateral extent. The results of aquifer and laboratory tests haveshown the Vincentown Formation to have a hydraulic conductivity on the order of I to 10ft/day (USGS 1999; Dames & Moore 1988). The Hornerstown-Navesink Aquitardunderlies the Vincentown Formation.
3.5.5 Hornerstown-Navesink Aquitard
The Homerstown-Navesink Aquitard is considered to be part of a composite confining unitthat includes the less permeable portions of the Vincentown and Piney Point Formations.The aquitard is composed of clayey to silty glauconitic green and black sands with arelatively low permeability (USGS 1999). The results of aquifer tests indicate that theHormerstown-Navesink Aquitard has a vertical hydraulic conductivity on the order of 0.01ft/day in Salem County (USGS 1999). Qualitative evidence indicates that leakage occursfrom the Vincentown through the Homerstown-Navesink Aquitard to the underlying Mt.Laurel-Wenonah Aquifer (Dames & Moore 1988).
3.5.6 Mt. Laurel-Wenonah Aquifer
The Mt. Laurel-Wenonah Aquifer is considered to be a major aquifer for the region and iscomposed of slightly glauconitic sand and increasing silt with depth. The Mt. Laurel-Wenonah aquifer is also identified as existing in Delaware by the Delaware Geological
13

Remedial Investigation ReportPSEG Nuclear, LLCSalem Generating StationHancock's Bridge, New Jersey
Survey (DGS). The depth to the top of the Mt. Laurel-Wenonah Aquifer is approximately173 feet in the vicinity of the Station, with the outcrop area extending from slightly west ofSalem and extending approximately halfway to Pennsville (Dames & Moore Decemberl6,1968; USGS 1999). The aquifer has a strike of northeast-southwest and dips to the east-southeast. The maximum thickness of the aquifer is approximately parallel to strike and is
coincident with Williamstown and Stow Creek. The results of aquifer tests have shown theMt. Laurel-Wenonah Aquifer to have a hydraulic conductivity on the order of 0.01 to 10ft/day and a storativity on the order of x10-5 to 1x0"4 (USGS 1999). The MatawanAquitard underlies the Mt. Laurel-Wenonah Aquifer.
3.5.7 Matawan Aquitard
The Matawan Aquitard is a composite unit including the Woodbury Clay andMerchantville Formations. The aquitard is predominantly composed of micaceous andglauconitic clay with some sand present. This unit is a major aquitard, conforming toregional strike and dip that may contain a thin water bearing sand in some areas. The NewJersey Geologic Survey (1995) defined the leakance of the aquitard as being on the order oflx 10-1 to Ix]0V feet/day/foot (day-1) in Salem and Gloucester Counties with the greatervalues in the western portions of the counties. The Matawan Aquitard is the confining unitfor the Magothy Aquifer.
3.5.8 Magothy Aquifer
The Magothy Aquifer is composed of fine to coarse-grained sand with local beds of darkgray lignitic clay, and is located at a depth of 445 feet with a thickness of 50 to 100 feet inthe vicinity of the Station (Dames & Moore Decemberl 6, 1968; USGS 1999). The
Magothy outcrops just west of Pennsville with the outcrop area following the regionalstrike of the coastal plain sediments. The Magothy Aquifer dips and thickens to thesoutheast (USGS 1999), and has been documented by the DGS as existing in Delaware.The results of aquifer tests have shown the Magothy to have a hydraulic conductivity on theorder of 100 ft/day and a storativity on the order of Ix0-3 (USGS 1999; NJGS 1995). TheMagothy Formation is separated from theRaritan Formation by an unnamed confining unit.
3.5.9 Raritan Confining Unit
The confining unit separating the Magothy and Raritan aquifers is composed primarily ofdense clay at an approximate depth of 490 feet with a thickness of 190 feet including a 22-foot thick sand unit (Dames & Moore Decemberl6, 1968; 1988). A leakance on the orderof 10-1 day-', increasing up dip, has been used by the NJGS (1995) to characterize themovement of water through the confining unit to the underlying Raritan Aquifer.
14

Remedial Investigation Report
PSEG Nuclear, LLCSalem Generating StationHancock's Bridge, New Jersey
3.5.10 Raritan Formation
The Raritan Formation is composed of sand with traces of silt and with occasional lenses ofclay appear with increasing frequency down dip. The Raritan is a major aquifer for theregion conforming to the regional strike and dip (USGS 1999). The Raritan Aquiferconsists of two sandy zones beneath the Station. The first is the 22-foot thick sandmentioned above at a depth of 688 feet often identified with the Raritan Confining Unit.The second includes a 35- and a 24-foot sand located at depths of 766 and 811 feet belowground surface (bgs), respectively (Dames & Moore December 16, 1968). The totalthickness of the Raritan Aquifer has not been well quantified in eastern New Jersey (USGS1999); however, it tends to thicken down dip, has an approximate thickness of 100 feetbeneath the Station, and its maximum identified thickness occurs between Pennsville andSalem. The results of aquifer tests have shown the hydraulic conductivity of the RaritanFormation to be on the order of I to 1,000 ft/ day and storativity to be on the order of lxl03
to lxI0 (USGS 1999; Dames & Moore 1988). The Raritan Formation is separated fromthe Potomac Group by a discontinuous confining unit (USGS 1999).
3.5.11 Potomac Group
The Potomac Group is an undifferentiated series of gravel, sand, silt and clay layersseparated from the Raritan in some areas by a confining unit. Down dip, the Raritan andPotomac are undifferentiated (USGS 1983). The Potomac Formation is thought to be morethan 250 feet thick and is located at a depth of approximately 836 feet beneath the Stationwith the uppermost sand occurring at 860 feet bgs (Dames & Moore Decemberl6, 1968;USGS 1999). The results of aquifer tests in Gloucester County have shown the group tohave a hydraulic conductivity on the order of 100 ft/day and a storativity on the order oflxlO-to 1xl04 (Barksdale et al. 1958). The Potomac Group is underlain by Pre-Cretaceous bedrock of the Wissahickon Formation (USGS 1999)
3.5.12 Wissahickon Formation
Located at a depth of approximately 1,400 feet, the Wissahickon Formation is primarilycomposed of metamorphic gneiss and schist (Hardt and Hilton 1969). The bedrock is notconsidered a significant source of groundwater.
15

Remedial Investigation ReportPSEG Nuclear, LLCSalem Generating StationHancock's Bridge, New Jersey
4 Facility Construction and Local Geology
The construction of the Salem Generating Station has caused significant changes to thelocal geology and hydrogeology. Within the footprint of the cofferdam surrounding UnitsI and 2, the majority of original Artificial Island materials were removed to a depth of 70feet bgs. Beyond the limits of the cofferdam, sheet piling was driven into the KirkwoodFormation and left in place, portions of the riverbed deposits were excavated and replacedwith structural fill, other portions of the riverbed deposits were chemically grouted therebychanging their physical properties, and the foundations of structures, utilities, as well asvarious buried piping systems, extend below the water table affecting groundwater flow.These issues and their potential influence on groundwater flow and transport are discussedin further detail in Section 8. The following sections describe the conditions at ArtificialIsland prior to the construction of the Station, and detail how the construction of the Stationhas altered the local geology.
4.1 Pre-Facility Construction
The Station is located on the southern tip of what was once a natural sand bar projectinginto the Delaware River. The area between the sand bar and the mainland had been used asa dredge spoil deposit area. In 1899, a timber sheetpile wall was installed around theperimeter of the sand bar. Over the next 50 or so years the area was used as a spoil depositarea for material collected during the dredging of the Delaware River. Riprap was added tothe perimeter when the timbers began to degrade (Dames & Moore February 1974, June1977). The area landward of Artificial' Island has remained a tidal marsh.
4.2 Facility Construction
The construction of the Station has resulted in significant changes to the local geology. Itwas necessary to remove andrework much of the soil in the area of the presentinvestigation in order to facilitate construction of the Station. This construction processwas guided in part by the recommendations of the geotechnical investigation of ArtificialIsland (Dames and Moore August 28, 1968). This study recommended that thecontainment, fuel handling and auxiliary buildings be constructed upon a foundation matplaced at a depth of 50 to 70 feet bgs in the Vincentown Formation and recommended thatthe turbine, service and administration buildings be placed on pilings driven into theVincentown Formation. This section describes the construction of the Station, which hashad a significant impact on local hydrogeology in the area of the investigation. Facilityconstruction details are highlighted on cross section diagrams through various Stationfeatures (Figures 5 through 9)
16

Remedial Investigation ReportPSEG Nuclear, LLCSalem Generating StationHancock's Bridge, New Jersey
4.2.1 Construction of the Cofferdam
The recommendations for the containment, fuel handling, and auxiliary buildings (primaryor Class I structures) were implemented by first constructing a cellular cofferdam of weldedinterlocking sheet piling. The extent of the cofferdam is shown on Figure 2 and in profileon Figures 5 and 6. The cellular cofferdam, which encircled the excavation for all theClass I structures, was constructed at an approximate depth of 23 feet below existinggrade (approximately 77 feet plant datum [PD] or -12.92 feet above mean sea level [amslNAVD 1988]). The cofferdam consists of 24 circular cells, approximately 60.5 feet indiameter with connecting arcs, that were advanced approximately 10 feet into theVincentown Formation to an elevation of 17 feet PD (-72.92 feet amsl). The cofferdamsections are of two different heights, 50 feet and 60 feet. The elevation of the top of thecofferdam is 77 feet PD (-12.92 feet armsl) on the north, south and west sides. Theelevation of the eastern side is 67 feet PD (-22.92 feet amsl) providing access and afoundation for the return circulating water pipes and associated thrust block.
The inside area of the cofferdam sections were excavated to elevation 27 feet PD (-62.92feet amsl). A vertical steel wall was added inside each individual cofferdam section todivide the sections approximately in half. The inner half of the individual cofferdamsections, or the section facing the building foundations, was then filled to the top withlean concrete. The area contained by the entire cofferdam structure was then excavatedto the Vincentown Formation for placement of the lean concrete mat that served as thefoundation for the construction of the structures within the cofferdam. During this stageof the excavation, qualified personnel visually inspected the bottom of the excavation toverify that the excavation had reached the top of Vincentown Formation prior to placingany lean concrete.
Prior to the completion of the excavation, at approximately elevation 45 feet PD (-44.92feet amsl), 15 exploratory borings were drilled through the remaining KirkwoodFormation and into the underlying Vincentown to verify the depth to the formation.These additional borings showed no measurable differences from the study borings.After the Vincentown Formation had been exposed, an additional six test borings wereadvanced in the excavated area into the underlying Vincentown Formation to verify andensure that the Vincentown Formation directly supported the foundation mat. Four ofthese borings were drilled under the Unit 2 Reactor Containment and two borings weredrilled under the Unit I Reactor Containment. All of the borings penetrated a minimumof 20 feet into the underlying Vincentown Formation. Based on a review of availabledocuments, the top of the Vincentown Formation in-the area of the cofferdam rangesbetween 27 and 30 feet PD (-62.92 to -65.92 feet amsl).
When the surface of the Vincentown Formation was reached, the area was cleared of loosesoil and lean concrete was poured directly onto the exposed Vincentown Formation.
017
Remedial Investigation ReportPSEG Nuclear, LLCSalem Generating StationHancock's Bridge, New Jersey
Because the latter stages of the excavation were performed in freezingtemperatures, a layerof material was left in place to insulate the Vincentown Formation until the concrete wasready to pour. In cases where the top of the Vincentown Formation did freeze prior topouring of the concrete, the frozen soils were excavated or thawed prior to starting the pour.The station construction drawings indicate that the base of the first lean concrete pourwas at 30 feet PD (-59.92).
4.2.1.1 Construction Within the Cofferdam
The cofferdam serves as a basin in which the Class I structures were constructed. Prior toconstruction of the primary structures, a lean concrete mat was placed on top of theVincentown Formation for support of the structures. Following placement of the leanconcrete, the Auxiliary Building, Fuel Handling Buildings and Reactor ContainmentBuildings were constructed. The remainder of the excavation within the cofferdam wasthen backfilled with structural fill meeting the design specifications of the Station. Thefollowing sections provide the details of these construction activities.
4.2.1.1.1 Lean Concrete
The lean concrete Was placed in multiple pours. The initial lean concrete pour had auniform thickness of 5.75 feet within the entire cofferdam area and went from elevation30 feet to 35.75 feet PD (-59.92 to -54.17 feet amsl). As noted previously, the top of theVincentown Formation in the area of the Station varies between 27 and 30 feet PD (-62.92 to -65.92 feet arnsl). Review of available documentation indicates that the base forthe first lean concrete pour was essentially uniform at 30 feet PD (-62.92 feet amsl) andthat a soil blanket up to 3 feet thick in some areas was placed on top of the VincentownFormation.
The second lean concrete pour went from elevation 35.75 feet PD (-54.17 feet amsl) to45.75 feet PD (-44.17 feet amsl) for an overall thickness of 10 feet. The second pourcovered the entire area within the cofferdam with the exception of the Reactor Pit withinthe Containment Building and the RHR pump pit within the Auxiliary Building. Theseareas did not receive additional lean concrete beyond the first pour.
The third lean concrete pour went from elevation 45.75 feet PD (-44.17 feet amsl) to59.75 feet PD (-30.17 feet amsl) for an overall thickness of 14 feet. The third pourcovered the entire area within the cofferdam except for the Reactor Pit within theContainment Building, and the residual heat removal (RHR) pump pit within theAuxiliary Building. In the area of the Auxiliary Building along the station centerline, thethird pour only reached an elevation of 53.75 feet PD (- 36.17 feet amsl). There is also asloped area running southeast-from the RHR pump pit within the Auxiliary Building upto the cofferdam area that did not reach an elevation 53.75 feet PD (- 36.17 feet amsl).
18
Remedial Investigation ReportPSEG Nuclear, LLCSalem Generating StationHancock's Bridge, New Jersey
The fourth and fifth lean concrete pours were limited to the area under the Fuel HandlingBuildings and a portion of the Auxiliary Buildings. The fourth pour went from elevation59.75 feet PD (-29.17 feet amsl) to an elevation of 69.75 feet PD (-19.17 feet amsl). Thefifth pour brought the elevation of the lean concrete to 77.75 feet PD (-12.17 feet amsl).The overall thickness of the fourth and fifth pours combined was 18.25 feet 3 inches.The primary purpose of these pours was to provide the base for the Fuel HandlingBuilding.
After the lean concrete pour was completed, the subgrade exterior walls and foundationswere waterproofed. A rubber waterproof membrane was installed under all foundationsand was extended vertically up to 6 inches below yard grade. The horizontalwaterproofing membrane was constructed of 1/16-inch thick Ethylene Propylene DieneMonomers (EPDM rubber). A 1/8-inch thick hard board was installed over themembrane and then a concrete protection course approximately 3 inches thick wasinstalled over the hard board. After construction, the waterproofing membrane wasextended vertically up the foundation walls with 3/64-inch thick nylon reinforced rubberthat was protected with 1/8-inch thick hardboard.
The individual foundations for the Reactor Containments, Auxiliary, and Fuel HandlingBuildings were placed on top of the completed lean concrete. These buildings weredesigned to be separate structures sitting on the same base mat of lean concrete. Toaccomplish this design, the base mat structural concrete for these buildings was kept asseparate structures with seismic clearance between the base mats.
4.2.1.1.2 Structural Concrete
Auxiliary Building
The base mat structural concrete under the Auxiliary Building in the area of the RHRpump pit starts at elevation 36 feet PD (-53.92 feet amsl) and extends up to approximateelevation 45 feet PD (-44.92 feet amsl). In the area of the Containment Building sumpsthis base mat extends from elevation 36 feet PD (-53.92 feet amsl) to an elevation of 60feet PD (-29.92 feet amsl) where it completes the foundation structure for theContainment Building base mat. The base mat structural concrete under the center sectionof the Auxiliary Building starts at elevation 54 feet PD (-35.92 feet amsl) and extends upto elevation 64 feet PD (-25.92 feet amsl). The remainder of the Auxiliary Building wallsand levels are continued up from these base mats to complete the structure.
Reactor Containment
The structural concrete base mat for the Containment Building that completed the reactorpit area to an approximate elevation of 52 feet PD (-37.92 feet amsl) and the remainder of
19

Remedial Investigation Report
PSEG Nuclear, LLCSalem Generating StationHancock's Bridge, New Jersey
the containment base mat to an elevation of 75.5 feet PD (-14.42 feet amsl). This surfacewas then covered with a stainless steel liner plate and topped with concrete. The totalthickness of the stainless steel liner and concrete is 0.5 feet. Once the reactor pit areabase mat was completed to an elevation of 59.75 feet PD (-30.17 feet amsl), the reactorcontainment base mats for Salem Units I and 2 were poured in 6 and 8 circular segments,respectively. Vertical construction joints were constructed with expanded wire mesh. Nohorizontal joints were permitted. This flat concrete base mat is approximately 16-feetthick with a liner plate located on top of this mat. Once the base mat and liner plate wascompleted, the finished concrete floor of the containment was poured and thecontainment structure completed.
The underground portion of the containment structure is waterproofed in order to avoidseepage of groundwater through cracks in the concrete. The waterproofing consists of animpervious membrane that is. placed under the mat and on the outside of the walls. TheEPDM membrane is designed to resist tearing during handling and when backfill isplaced against it.
Fuel Handling Building
The Fuel Handling Building base mat structural concrete was poured from the top of thelean concrete at approximate elevation 77.75 feet PD (-12.17-feet amsl). The Spent FuelPool and the Fuel Transfer Pool were included in the first two structural concrete pourswith approximate base elevations of 89.5 feet PD (-0.42 feet amsl) and 86 feet PD (-3.92feet amsl), respectively.
4.2.1.1.3 Structural Fill
The soils removed from within the cofferdam were not used to backfill the completedstructure because the hydraulically placed fill underlying Artificial Island did not meet thebuilding design specifications for the Station. Therefore, it was necessary to importconstruction or structural fill to build the facility. The structural fill was placed betweenand around the Auxiliary Building, Fuel Handling Buildings, Units I and 2, portions of thecofferdam, above the return circulating water pipes, and from the top of the KirkwoodFormation to the land surface in the portions of the area between the cofferdam and thecirculating water discharge pipes. This material was used extensively in the area of Unit Iand the circulation water pipes.
4.2.2 Construction of the Service Water Intake Structure
The service water intake structure, shown on Figure 2, was constructed by driving sheetpiles into the Vincentown Formation, and dewatering and excavating the enclosed soils(Dames & Moore August 28, 1968). The foundation of the structure lies upon a lean
20

Remedial Investigation Report
PSEG Nuclear, LLCSalem Generating StationHancock's Bridge, New Jersey
concrete pour placed upon the top of the Vincentown Formation. The base of the leanconcrete is at elevation 45 to 50 feet PD (44.92 to -39.92 feet amsl) (Dames & Moore June3, 1970). This structure extends from the top of the Kirkwood Formation to the landsurface preventing groundwater flow from this area to the Delaware River.
4.2.3 Construction of the Service Water Pipes
The original material in the locations of the service water pipes was excavated to the top ofthe riverbed deposits that overly the Kirkwood Formation. Structural backfill was placedabove the riverbed deposits. The structural fill was compacted to 98 percent of optimumand used as the foundation for the service water lines (Dames & Moore August 28, 1968).Compaction is the process of increasing soil unit weight by forcing soil solids into atighter state and reducing soil voids. This process strengthens soils and reduces hydraulicconductivity. Optimum compaction is the maximum soil weight that can be achieved at agiven moisture content. The service water lines are two-foot diameter and are located atvarying depths below ground surface throughout the area of investigation. The location ofthe lines is shown on Figure 2.
4.2.4 Construction of the Circulating Water Intake Structure
The circulating water intake structure is shown on Figure 2. The area of the intakes for thecirculating water pipes was dredged to elevation 56 feet PD (-33.92 feet amsl). Thesurrounding structure was constructed on piles cut off at elevation 56 feet PD (-33.92 feetamsl). The top of the Vincentown Formation in this area is between elevation 40 and 53feet PD (-49.92 and -36.92 feet amsl) (Dames & Moore June 3, 1970). This structureextends from the top of the Kirkwood Formation to the land surface preventinggroundwater flow from this area to theDelaware River.
4.2.5 Construction of the Circulating Water Pipes
Water in the circulating water system is drawn from near shore, through 12, 7-foot diameterwater intake lines. Water passes through the turbine building and returns to the DelawareRiver through 6, 10-foot diameter pipes extending approximately 500-feet off shore anddischarging at an elevation of 53 feet PD (-36.92 feet amsl). The location of the lines isshown on Figure 2. The return circulating water lines are an important subsurface featureaffecting groundwater flow in the area of investigation. They were constructed by sheetpiling and excavation dewatering of the overlying sediments to the top of the KirkwoodFormation. Concrete footers were constructed perpendicular to the pipes from the turbinebuilding to the shoreline. Between the concrete footers, crushed compacted concrete wasplaced. The surface of this foundation is sloped uniformly from an elevation ofapproximately 65 feet PD (-24.92 feet amsl) near the shore to about 75 feet PD (-14.92 feetamsl) near the turbine building. Following construction, lean concrete was poured between
21

Remedial Investigation Report
PSEG Nuclear, LLCSalem• Generating StationHancock's Bridge, New Jersey
the pipes. These pipes and underlying foundations are a buried flow barrier, extendingvertically 15 to 20 feet from the top of the Kirkwood Formation limiting southwardgroundwater movement. Construction of the return circulating water pipes were completedby placement and compaction of structural fill from near the top of the pipes to the presentland surface.
4.2.6 Sheet Pile - Circulating Water Intake Structure to the Service Water Intake Structure
Groundwater movement toward the Delaware River is also restricted between theCirculating Water and the Service Water Intake Structures by interlocking sheet pile.The sheet piling is considered tobe good barrier to flow as cathodic protection is used tocontrol corrosion. The sheet piling was driven through the surficial aquifer into the firstaquitard beneath Artificial Island (the Kirkwood Formation) during construction of theSalem Generating Station. The sheet piling is located asshown on Figure 9. Where thesheet piling is indicated using a dark black line, the elevation of the top is above thecurrent water table; the sheet piling acts as a dam limiting the horizontal movement ofwater. Where the sheet piling is indicated using a gray line, the elevation of the top isbelow the current water table; groundwater is moving across the top of the sheet pilingtoward the Delaware River.
4.3 Local Geology
Certain information made available through the design and construction of the Station wereused in conjunction with data obtained during the remedial investigation to define thegeology as it currently exists. The Station geology is tied into the regional geology via the
Vincentown Formation. During construction many areas were excavated down to the topof the Vincentown Formation, as such, it is a logical reference point. In the vicinity of theStation, the Vincentown Formation is overlain by the Kirkwood Formation, including the
Kirkwood basal sand unit and the Kirkwood Aquitard, the riverbed deposits, hydraulicallyplaced dredge spoils, and in some locations structural backfill. In most cases, the propertiesof these formations have been described in the above sections.
The upper surface of the Vincentown Formation in the area of the Station ranges between27 and 30 feet PD (-62.92 to -65.92 feet amsi). The.Vincentown is composed ofglauconitic sands to silty sands with varying degrees of calcite cementation. The Kirkwoodbasal sand overlies the Vincentown Formation in the vicinity of the Station.
The Kirkwood basal sand is a reddish brown fine to medium sand coarsening with depth.*The sand is variable in thickness at the Station and has been misidentified as the deeperaquifer in previous investigations (Dames & Moore May 23, 1974). Pumping testsconducted in the Kirkwood basal sand and Vincentown Formation have shown the units to
22

Remedial Investigation Report
PSEG Nuclear, LLCSalem Generating StationHancock's Bridge, New Jersey
have a hydraulic conductivity on the order of lxi0"V cm/s and a storativity with a magnitudeon the order of 1x10⁴ to 1x10³ (Dames & Moore May 23, 1974).
The Kirkwood Aquitard extends from the top of the Kirkwood basal sand to approximately60 feet PD (-30.53 feet amsl). The Kirkwood Aquitard is composed of hard tan to grayclay with some sand and silt ten to twenty feet in thickness. The Kirkwood Aquitard isoverlain by the riverbed deposits of the shallow, water-bearing unit.
The riverbed deposits are a dense, dark gray to tan, fine to medium sand with varyinggravel content. With an upper elevation of approximately 65 feet PD (-25.53 feet amsl), theriverbed sand and gravel ranges in thickness from approximately I to 9 feet at the facility.The riverbed sand and gravel is overlain by hydraulic fill in some areas and structural fill inothers, and is considered a leaky confined aquifer (Dames & Moore February 27, 1981 andDecember 23, 1992).
The hydraulic fill is a dark gray estuarial silt and clay with a hydraulic conductivity 1,000to 10,000 times less than the underlying riverbed sand and gravel unit (Dames & MooreDecember 23, 1992). The hydraulic fill extends approximately from an elevation of 35 feetPD (-55.53 feet amnsl) to surface grade in areas that remained undisturbed during theconstruction of the generating station. In other areas, the hydraulic fill has been entirelyremoved and replaced with structural fill.
The structural fill used at the station was obtained from a number of sources in New Jerseyand Delaware. One fill source used in the area of this investigation was the Hinchner Pit.While the location of the borrow source was not identified, the material was described asyellowish-brown fine to medium sand with a trace of silt and clay (Dames & Moore June20, 1972).
23
Remedial Investigation Report
PSEG Nuclear, LLCSalem Generating StationHancock's Bridge, New Jersey
5 Initial Station Investigation Activities
Samples of leaking water were collected from three locations in an effort to characterize thenature of the leak detected from the west wall of the 78-foot Mechanical Penetration Roomof the Unit I Auxiliary Building and from the penetration of the Unit 1 Spent Fuel Pool.cooling line at the 92-foot elevation. The three sample locations were as follows:
" A drip bag was installed at the crack in the wall of the 78-foot MechanicalPenetration Room;
" A catch tray with a sample tube was placed under the Spent Fuel Pool cooling lineat the interface between the Auxiliary Building and the Fuel Handling Building;*and,
" A sample tube was established in the water stop located at the penetration betweenthe Auxiliary Building and the Fuel Handling Building.
Samples collected from these locations were analyzed for tritium, major cations and anions,and gamma-emitting isotopes to determine the concentrations of constituents of concern inthe water samples and to evaluate a potential source of the water. Analytical results of thesamples were compared with analytical results of water samples collected from the SpentFuel Pool and the telltale drains. The analytical results of the initial samples from theselocations indicated that the water from the leaks had characteristics of Spent Fuel Poolwater and that a leak from the Spent Fuel Pool system had occurred.
A series of samples from these initially established locations, as well as other locationssubsequently established within the Station were collected and analyzed to characterize theleak from the Spent Fuel Pool system within the limits of the facility structures. The resultsof these sampling activities are presented in the Investigations of Salem Unit 1 Fuel PoolLeakage - Final Report Summary, which is provided in Appendix A.
An investigation of environmental media (i.e., groundwater and soil) in response to the leakfrom the Spent Fuel Pool was initiated in October 2002. These activities were conducted inthree distinct phases (herein identified as Phase I, II, and 1I1) each designed to determine thenature and extent of the release of water from the Spent Fuel Pool. Phases I and. II of theinvestigation consisted of the collection and analysis of samples from within the facility.structures, from the shallow, groundwater unit beneath the Station, and from selectproduction and monitoring wells located adjacent to the Station. Sections 5.1 and 5.2present the details of Phases I and 1I, respectively. Details of Phase III investigationactivities, which included the installation and sampling of eight groundwater monitoringwells (Wells K through R), are presented in Section 5.3.
024
Remedial Investigation Report
PSEG Nuclear, LLCSalem Generating StationHancock's Bridge, New Jersey
5.1 Phase I
The objectives of Phase I of the investigation were to further characterize the leak in the 78-foot elevation Mechanical Penetration Room, and to assess the likelihood that the leak hadmigrated to other locations within the Station, or beyond the limits of the Station structuresand into the environment. The sampling program that comprised Phase I of theinvestigation included the following:
" Two groundwater samples were collected from inside the area through the "Doorto Nowhere" in the 100-foot elevation Auxiliary Building. The sample locationsconsisted of the following:.
o Above the fuel transfer canal in the space between the ContainmentBuilding and the Fuel Handling Building (Sample Al). This required theremoval of sandbags to a depth that groundwater was encountered.
o Immediately inside the door to the right and next to the Fuel HandlingBuilding (Sample A2).
" A groundwater sample was collected from inside the security gate at the northeastcomer of the Fuel Handling Building yard area (Sample B).
" Water samples were collected from catch basins numbers 26 (Sample C26) and 33(Sample C33).
" A water sample was collected from the drain line located in the 78-foot elevationMechanical Penetration Room (Sample D).
" An additional water sample was collected from the active drip located in the area ofthe crack observed in the 78-foot elevation Penetration Room (Sample E).
The Phase I sample locations are shown on Figure 10. The groundwater samples (SamplesAl, A2, and B) were discrete samples collected from a depth of four to five feet bgs (plantdatum, [PD], 96 to 95 feet) in the area surrounding the Mechanical Penetration Room. Thewater samples collected from the catch basins (Samples C26 and C33), the drain linelocated in the 78-foot elevation Mechanical Penetration Room (Sample D), and the activedrip from the crack in the wall of the 78-foot elevation Mechanical Penetration Room weregrab samples. The samples (both water and groundwater) were analyzed onsite for gammaemitting isotopes. The analysis of Sample E included boron.
Analytical results of the water samples collected during Phase I are summarized in Table 2.Analytical results of water samples collected in the shallow subsurface (five feet bgs) did
25

Remedial Investigation Report
PSEG Nuclear, LLCSalem Generating StationHancock's Bridge, New Jersey
not indicate concentrations of target analytes that would indicate a release of water from theSpent Fuel Pool.
Analytical results of Sample E, collected from the active drip in the crack observed in the78-foot elevation penetration room, indicated a boron concentration of 2,600 milligrams-.per liter (mg/L), a cesium-134 (Cs-134) concentration of 118,000 pCiiL, and a cesium-137(Cs-137) concentration of 320,000 pCi/L. These concentrations are characteristic of waterfrom the Spent Fuel Pool..
5.2 Phase II
The objective of Phase II of the investigation was to evaluate the extent of contamination ingroundwater and the Styrofoam-filled seismic gap between the Salem Auxiliary Buildingand the Salem Unit I Fuel Handling Building. The sampling program that comprisedPhase II of the investigation is described in more detail below:
On December 12 and 13, 2002, the PSEG Salem Generating Station ChemistryDivision (PSEG Chemistry) collected groundwater samples from select productionand monitoring wells installed within the vicinity of the Station. The samples were
collected to assess whether the leak detected within the facility had migratedbeyond the engineered structures of the Station. The groundwater samples weresubmitted to the PSEG SC Maplewood Laboratory and Testing Services(Maplewood) for analysis for tritium and gamma-emitting isotopes. The watersample collected from Well G was also analyzed for sodium, chloride, and boron.Analytical results of the groundwater samples, summarized in Table 3, did notindicate concentrations of constituents of concern above expected backgroundconcentrations. Although the radium detected in the Hope Creek and Salemproduction wells is naturally occurring, the concentrations indicated bygroundwater samples collected from the wells were above the New JerseyDrinking Water Standard. Since the production wells may be used for drinkingwater, the NJDEP requested that PSEG Nuclear, LLC collect water samples fromthe facility water distribution network and submit those samples for gross alphaanalysis. Analytical results of the water samples did not indicate gross alpha*activity above 5 pCi/L. As such, further radium analysis of the wells is notrequired.
On December 19 and 20, 2002, two direct-push discrete water samplers (DP-1 andDP-2) were advanced into the Styrofoam-filled Seismic Gap between the SalemAuxiliary Building and the Salem Unit I Fuel Handling Building. The watersamplers consisted of one and one quarter-inch steel rods with a two-foot millslotted sample screen. Water samples were obtained using quarterrinchpolyethylene tubing and a peristaltic pump. The locations of DP-l and DP-2 are
26

Remedial Investigation Report
PSEG Nuclear, LLCSalem Generating StationHancock's Bridge, New Jersey
shown on Figure 10. DP- 1 was installed vertically along the northeast exteriorwall of the Fuel Handling Building. DP-2 was installed on a 45-degree angle fromthe area of the "door to nowhere" into the Styrofoam to a depth that correspondedwith the leak observed at the 78-foot elevation in the Mechanical PenetrationRoom. Analytical results of water samples collected from DP-I and DP-2,summarized in Table 3, indicated concentrations of constituents of concern(primarily boron and tritium) that are consistent with Spent Fuel Pool water.
Results of the Phase II investigation indicated that water in the Styrofoam-filled SeismicGap and the water observed leaking into the 78-foot elevation of the MechanicalPenetration Room had characteristics of Spent Fuel Pool water and likely had accumulatedwhen the Spent Fuel Pool telltale drains had become obstructed.
5.3 Phase Ill
Phase III of the investigation was initiated following the discovery of water containingboron and various radioisotopes characteristic of water from the Spent Fuel Pool in theStyrofoam-filled Seismic Gap and was designed to determine if water leaking from theSpent Fuel Pool had migrated into the environment (i.e., soil and groundwater underlyingthe facility) adjacent to the Fuel Handling Building. This phase of the investigationinvolved the installation and collection of groundwater samples from eight monitoringwells adjacent to and around the perimeter of the Fuel Handling Building.
The installation of the eight monitoring wells was completed in two sub-phases (III. (a) andIII (b)). The locations of the Sub-Phase III (a) and Sub-Phase III (b) Monitoring Wells areshown on Figure 11. Monitoring Wells M, N, 0, and R installed during Phase III (a), wereinstalled at locations between the Phase II direct push discrete water samplers (DP-1 andDP-2) and the cofferdam, which bounds the perimeter of the Salem Generating Stationfoundation. The Sub-Phase III (a) wells were installed to a total depth of 20 feet bgs. The.depths of the wells considered the elevation of the lean concrete foundation within thecofferdam. As discussed in Section 4.2.2, the elevation of the lean concrete foundation isapproximately 78 feet PD. Each monitoring well was constructed with a ten-foot screenedinterval (10 to 20-feet bgs). Monitoring Wells M and R are constructed of 11¼-inch steeland were installed using direct push (i.e., Geoprobe®) technology due to accessrestrictions. Monitoring Wells N and 0 are constructed of two-inch PVC and wereinstalled using hollow-stem auger drilling equipment.
Monitoring Wells K, L, P, and Q installed during Phase III (b), were installed outside thelimits of the cofferdam. The Sub-Phase III (b) wells were installed into the VincentownFornation using hollow-stem auger drilling equipment to a total depth of 80 feet bgs (20feet PD), which corresponds with an elevation often feet below the Salem GeneratingStation foundation. The Sub-Phase III (b) monitoring wells, designed to monitor
27

Remedial Investigation ReportPSEG Nuclear, LLCSalem Generating StationHancock's Bridge, New Jersey
groundwater quality outside of the cofferdam, were constructed with a ten-foot screenedinterval (70 to 80-feet bgs) and are constructed of two-inch diameter PVC well materials.A summary of the well construction details for the Station monitoring wells is presented inTable 4, and well construction logs and boring logs are included-in Appendix C.
Following installation and development of the monitoring wells, groundwater samples werecollected on a periodic basis to assess groundwater quality. Details of the groundwatersampling activities are presented in-Secti6n 6.5. Analytical Results of the groundwatersampling activities, which are discussed in detail in Section 8, indicate that tritium wasdetected above the Interim Further Investigation Criterion for tritium (3,000 pCi/L) ingroundwater samples collected from Monitoring Wells M, N, 0, and R. In addition, tritiumwas detected above the laboratory detection limit in the groundwater samples collectedfrom Monitoring Well K. Tritium was detected in the groundwater sample collected fromMonitoring Well N on January 30, 2003 at a concentration above the New JerseyGroundwater Quality Criterion for tritium in Class IiA aquifers (20,000 pCi/L). Analyticalresults of groundwater samples collected from the Phase III monitoring wells indicated.that
the release of water from the Salem Generating Station Unit I Spent Fuel Pool hadpotentially migrated beyond the Styrofoam-filled Seismic Gap and into the environment.Additional investigation activities were then initiated to determine the source of the tritiumdetected in groundwater.
28

Remedial Investigation ReportPSEG Nuclear, LLCSalem Generating StationHancock's Bridge, New Jersey
6 Remedial Investigation - March 2003 through February 2004
The remedial investigation of the release of water from the Spent Fuel Pool system wasconducted between March 2003 and February 2004 in accordance with the June 2003RiWP and the RIWP Addendum. The remedial investigation proposed in the June 2003RPWP and the RIWP Addendum was based on the results of the three-phased initialinvestigation that was described in Section 5 of this report. The remedial investigation wasdesigned to determine: 1) the source of the tritium in groundwater; 2) the extent of tritiumin groundwater; 3) the fate and transport of tritium in groundwater; 4) the potential fortritium to migrate beyond the property boundaries; 5) human health and environmentalrisks associated with the tritium detected ingroundwater; and, 6) the need for any furtheraction.
The following sections provide the details of the remedial investigation. The results ofremedial investigation activities are presented in subsequent sections of this report.
6.1 New Monitoring Well Installation - May through June 2003
Five locations were identified for the installation of additional monitoring wells. Detailsregarding these wells and their installation are provided in the following sections.
6.1.1 Objectives
Five additional groundwater monitoring wells (Wells S through W) and two replacementgroundwater monitoring wells (Wells M and R) were installed at pre-determined locationssurrounding Salem Unit I to evaluate the extent.of tritium in groundwater, and to evaluategroundwater flow dynamics in the shallow, water-bearing unit. The locations of themonitoring wells are shown on Figure 11. The specific purposes for each of themonitoring wells are as follows:
" Monitoring Wells S and W were installed south and southwest of the cofferdam tocharacterize groundwater quality and flow conditions in an area downgradient ofthe Salem Generating Station Unit I Spent Fuel Pool between the cofferdam andthe Delaware River;
" Monitoring Wells T, U, and V were installed north of the cofferdam to characterizegroundwater quality and flow conditions upgradient of the cofferdam both in theshallow water-bearing unit and the Vincentown Formation; and,
" Replacements for the existing Monitoring Wells M and R were installed to allowfor the collection of groundwater samples in the area of these wells from properlyconstructed and developed monitoring wells.
29

Remedial Investigation Report
PSEG Nuclear, LLCSalem Generating StationHancock's Bridge, New Jersey
6.1.2 Field Implementation
Between May 5 and June 18, 2003, Monitoring Wells S through W were installed. Inmaddition, existing Monitoring Wells M and R, which were originally installed as temporarywells constructed of mill-slotted Geoprobe® sample rods, were replaced with properlyconstructed and developed monitoring wells. The monitoring wells were installed byCT&E Environmental Services, Inc. of West Creek, New Jersey using a combination ofdirect-push, hollow-stem auger, and mud rotary drilling equipment. ARCADIS personnelsupervised monitoring well installation activities. A summary of the well constructiondetails for the Station monitoring wells is presented in Table 4. Appendix C presents theboring logs, well completion details, NJDEP Bureau of Water Allocation Monitoring WellRecords, and Monitoring Well Certification Forms (Form B) for the wells.
Monitoring Wells S through W were constructed, with two-inch diameter Schedule 40 PVCcasing and well screen (0.0 10 slot). Well V, which is screened in the VincentownFormation, is constructed with a six-inch diameter Schedule 40 PVC outer casing. Thereplacement monitoring wells for Well M and Well R were constructed of one-inchdiameter Schedule 40 PVC casing and well screen (0.010 slot). A gravel pack consisting ofMorie.No. 1 sand was installed to a minimum of one foot above the top of the well screen.The. remainder of the borehole was grouted with neat cement containing approximately fivepercent bentonite. The grout was installed in the annular space around the casing using agrout pump and a tremie-pipe.
Monitoring Wells S, T, U, and W were installed at various locations outside of thecofferdam. The wells were constructed with screened intervals in the hydraulic fill andriverbed deposits encountered above the Kirkwood Formation. The screened intervals forthese Wells range from 22 to 37 feet bgs. Monitoring Well V, installed north of thecofferdam, is constructed with a screened interval from 70 to 80 feet bgs in the deeperVincentown Formation.
*The monitoring wells were developed using a combination of surging and pumpingtechniques. Development of the monitoring wells was considered complete:when thedischarge appeared to be sediment free.' Following installation, Stires 'Associates, P.A., alicensed New Jersey surveyor, surveyed the monitoring wells. Top of casing elevations,reported in elevations relative-to plant datum, are included in Table 4. Monitoring WellCertification Form Bs for the wells are included in Appendix C. In August 2003, PSEGNuclear, LLC conducted a separate survey to .determine the relationship between plantdatum and mean sea level (NAVD. 1988). The results of the Survey'indicate that theconversion factor from plant datum to NAVD 1988 is -89.92 (i.e., to convert from plantdatum to NAVD 1988 subtract 89.92 feet).
Investigation-derived waste (IDW) (i.e., drill cuttings, purge water, and decontaminationmaterials) generated during the installation of the monitoring wells was containerized in 55-
30

Remedial Investigation Report
PSEG Nuclear, LLCSalem Generating StationHancock's Bridge, New Jersey
gallon steel drums and labeled for identification. Characterization and disposal of the IDWwas in accordance with Station radiological controls and waste management programs.During monitoring well installation activities, Station personnel from radiation protectionmonitored radioactivity in the work area to ensure the safety of project personnel and as apreliminary screening measure for IDW.
6.2 Supplemental Remedial Investigation - July through September 2003
Following installation of Monitoring Wells S through W and replacement monitoring wellsfor Wells M and R, an initial round of groundwater samples was collected during the weeksof June 30 and July 7, 2003. Analytical results of these groundwater samples, which arediscussed in detail in Section 8, indicated that tritium was detected in the groundwatersample collected from Monitoring Well S at a concentration of 3,530,000 pCi/L. Based onthe results of the groundwater sample collected from Monitoring Well S, a supplementalremedial investigation was implemented to assess the extent of tritium as indicated by thiswell. The details and results of the supplemental remedial investigation are presented in thefollowing sections.
6.2.1 Objectives
In an effort to characterize groundwater in the vicinity of Monitoring Well S and toinvestigate the source of tritium detected in groundwater samples collected from the well, asupplemental remedial investigation was initiated. The objectives of the supplementalremedial investigation were to: 1) determine if the tritium indicated by the groundwatersample collected from Monitoring Well S had migrated to the river; 2) delineate the verticaland horizontal extent of the tritium in groundwater in the vicinity of Monitoring Well S;and 3) evaluate the potential sources of tritium in Monitoring Well S.
To achieve the objectives of the supplemental investigation, the groundwater samplingprogram was expanded significantly. The expanded groundwater sampling programconsisted of the collection of grab groundwater samples from various depths at locationsalong the Delaware River, and surrounding Well S. The samples were then submitted foranalysis for tritium, boron, and gamma-emitting isotopes. The groundwater samplingprogram designed to achieve the objectives of the investigation consisted of the collectionof three proposed groundwater samples from discrete intervals in 37 proposed borings. Thelocations of the borings are shown on Figure 12. The specific purposes of the proposedborings were as follows:
Borings 1 through 8 were advanced along the Station boundary with theDelaware River. The purpose of the borings was to evaluate concentrations oftritium and other analytes in groundwater as it approached the Delaware River.
31

Remedial Investigation Report
PSEG Nuclear, LLCSalem Generating StationHancock's Bridge, New Jersey
Borings 9 through 18 and Borings 31 through 37 were advanced within thevicinity of Station infrastructure identified as possible sources of tritium in
groundwater. These potential sources include the "rad-waste" line, the Unit 1Spent Fuel Pool, the Unit I refueling water storage tank; and the Unit Iprimary water storage tank.
Borings 19 through 30 were advanced in the vicinity and downgradient of Well
S to evaluate the extent of tritium indicated by groundwater samples collectedfrom the well.
The following. sections provide the details of the field implementation and analytical resultsobtained through the implementation of the supplemental remedial investigation.
6.2.2 Field Implementation
The supplemental remedial investigation was initiated in July 2003 following the detection
of elevated concentrations of tritium in Monitoring Well S. As stated previously, theobjectives of the supplemental investigation were to determine the extent of migration ofthe tritium, as indicated by Well S, and to assess the lateral and vertical extent and potentialsources of the tritium in groundwater.
Borings were advanced at the locations shown on Figure 12 using truck mountedHurricane® direct-push drilling equipmenti to the sample target depths. The Hurricane® rigwas operated by ADT Diamond Drilling, Inc. of Neptune, New Jersey. Prior to advancingthe borings, Underground Services, Inc. of West Chester, Pennsylvania cleared the borings
to a depth often feet bgs using SoftDig® technology (a vacuum excavation system).Subsurface structures, which prohibited the advancement of borings, were encountered inthe locations of Borings 5, 6, 11, 16, 17, 21, and 29 through the use of SoftDig®. In thesecircumstances, attempts to advance the borings were abandoned.
Once cleared, groundwater samples were collected from the borings through the use of aGeoprobe® SP- 15 screened point sampler advance to select target depths. Typically, thetarget depths for the collection of groundwater samples were as follows: 1) 11 to 15 feet
bgs; 2) 21 to 25 feet bgs; and, .3) 31 to 35 feet bgs. These target intervals were chosen toevaluate groundwater at or near the water table surface, in the riverbed deposits or othersediments encountered just above the Kirkwood Formation, and some intermediate sampleinterval. The target sample intervals were modified in the field based on field conditions
and observations, as necessary.
In several locations, the shallower target intervals (11 to 15 feet and 21 to 25 feet) yieldedtoo little groundwater to collect a sufficient volume of water for analysis. In theselocations, one-inch diameter Schedule 40 PVC temporary wells were installed to facilitate
32

Remedial Investigation Report
PSEG Nuclear, LLCSalem Generating StationHancock's Bridge, New Jersey
the collection of groundwater. The temporary wells were installed using two and a quarterinch diameter Geoprobe® well installation rods with an expendable point. Drillingequipment and sampling devices (e.g., the SP- 15 sampler) were decontaminated betweensample locations.
Maplewood Testing Services personnel (Maplewood) collected the groundwater samplesusing peristaltic pumps. New sample tubing was used at each sample location to preventcross contamination between sample locations. A sufficient volume of water was collectedfrom each sample location to analyze for tritium. Groundwater samples were collectedfrom select borings to be analyzed for major cations and anions and gamma emittingisotopes.
The groundwater samples were submitted to the Salem Generating Station ChemistryDepartment (Chemistry) for initial screening for tritium and gamma-emitting isotopes. Ifgroundwater samples did not indicate a concentration of tritium above the StationChemistry lower level of detection (LLD), the sample was sent to the Maplewoodlaboratory for analysis using more sensitive equipment.
The advancement and subsequent sampling of 30 out of the 37 proposed borings wascompleted successfully. Table 5 presents a summary of the details of the supplementalremedial investigation. The results of the investigation are presented in the followingsection.
6.2.3 Results
The laboratory analytical results for the supplemental remedial investigation aresummarized in Table 6 and are included on Figure 13 along with the analytical results ofgroundwater samples collected from the Station monitoring wells. Groundwater analyticalresults for samples collected from the borings advanced beyond the limits of the definedplume demonstrate that there has not been a release of tritium or gamma-emitting isotopesto the river above any regulatory limits. In addition, the groundwater analytical results forsamples collected from borings located at the southern and eastern limits of thesupplemental investigation generally define the extent of groundwater containing tritium;however, the results of the supplemental investigation have identified an expanded area inthe vicinity of Monitoring Well S with elevated levels of tritium in groundwater. This areaof groundwater has been identified on Figure 13 as an area with tritium levels above500,000 pCi/L. Gamma-emitting isotopes were not detected at concentrations aboveexpected background concentrations in groundwater samples collected during thesupplemental investigation.
The results of the supplemental investigation were not able to complete a pathway betweena potential source of primary water and Well S. Based on the distribution of tritium, and
33

Remedial Investigation ReportPSEG Nuclear, LLCSalem Generating StationHancock's Bridge, New Jersey
water levels observed in Monitoring Wells R and N (i.e., the hydraulic gradient in theseismic gap is from the northern to. southern end), the likely source of tritium in theshallow, water-bearing unit is the southern end of the Seismic-Gap, which is in directcontact with foundation soils. In order to further characterize groundwater flow within the
shallow, water-bearing unit, and to establish permanent groundwater monitoring points,additional monitoring wells were required. Following completion of the supplementalinvestigation, the RIWP Addendum was prepared and submitted to the NJDEP-BNEpresenting the details and results of remedial investigation activities completed to date. TheRIWP Addendum proposed additional remedial investigation activities designed tocomplete the delineation of groundwater impacts, and the hydrogeologic characterization ofthe shallow, water-bearing unit. The proposed remedial investigation activities. includedthe installation of 16 additional groundwater monitoring wells.
Between September 2003 and February 2004, the 16 additional groundwater monitoringwells proposed in the RIWP Addendum were installed at the Station. Initially, MonitoringWell Y, Well Z, and Wells AA through AF were installed. Following the collection andanalysis of groundwater samples from these wells, and a re-evaluation of groundwater flowdynamics within the shallow, water-bearing unit, Monitoring Well AG (Shallow and Deep),. Well AH (Shallow and Deep), Well Al, Well AJ, Well AL, and Well AM were installed tofill data gaps identified. Sections 6.3 and 6.4 provide the details of these monitoring wellinstallation activities.
6.3 Monitoring Well Installation Activities - September through October 2003
Between September 22 and October 8, 2003, eight additional groundwater monitoring.wells (Wells Y, Z and AA through AF) were installed at various locations adjacent toSalem Unit I to establish permanent groundwater monitoring locations between the Stationand the Delaware River, to further characterize the extent of tritium in groundwater withconcentrations above the New Jersey Groundwater Quality Criterion of 20,000 pCi/L, andto evaluate groundwater flow dynamics in the shallow, water-bearing unit. The followingsections present the details of the well installation activities.
6.3.1 Objectives
The specific purposes for each of the Monitoring Wells areasfollows:
Monitoring Wells Y and Z were installed in the locations of supplementalinvestigation Borings I and 3, respectively. These wells were installed tocharacterize groundwater quality and flow conditions in an area downgradient ofthe Salem Generating Station Unit I Spent Fuel Pool between the cofferdam and
the Delaware River;
034

Remedial Investigation Report
PSEG Nuclear, LLCSalem Generating StationHancock's Bridge, New Jersey
.Monitoring Wells AA and AB were installed in the locations of supplementalinvestigation Borings 13 and 20, respectively. These wells were installed tocharacterize groundwater quality and flow conditions in an area south andsoutheast of Monitoring Well S, respectively;
U Monitoring Well AC was installed near the location of supplemental investigationBoring 35, as close to the Styrofoam-filled seismic gap as practical. This well wasinstalled to characterize groundwater quality and flow conditions directly south ofthe Styrofoam-filled seismic gap and to the east of the Unit 1 equipment hatch;
M Monitoring Well AD was installed-at a location outside of the cofferdam andwithin the area of groundwater containing tritium to further characterizegroundwater quality and flow conditions. This well was also used for performing apumping test to evaluate aquifer parameters;
* Monitoring Well AE was installed in the location of supplemental investigationBoring 37. This well was installed in a location east of the Salem GeneratingStation Unit I to characterize groundwater quality and flow conditions in this area;and,
* Monitoring Well AF was installed in the location of supplemental investigationBoring 18. This well was installed to characterize groundwater quality and flowconditions in an area south of the circulating water discharge pipes.
6.3.2 Field Implementation
Monitoring Wells Y, Z and AA through AF were installed by A.C. Schultes, Inc. ofWoodbury Heights, New Jersey using hollow-stem auger drilling equipment. ARCADISpersonnel supervised monitoring well installation activities. The locations of themonitoring wells are shown on Figure 11. A summary of the well construction details forthe Station monitoring wells is presented in Table 4. Appendix C presents the boring logs,well completion details, NJDEP Bureau of Water Allocation Monitoring Well Records, andMonitoring Well Certification Forms (Form B) for the wells.
Other than Well AD, the monitoring wells were constructed with two-inch diameterSchedule 40 PVC casing and well screen (0.010 slot). Well AD was constructed with six-inch diameter Schedule 40 PVC casing and well screen (0.010 slot). A gravel packconsisting of Morie No. I sand was installed to a minimum of one foot above the top of thewell screen. The remainder of the borehole was grouted with neat cement containingapproximately five percent bentonite. The grout was installed in the annular space aroundthe casing using a grout pump and a tremie-pipe.
35

Remedial Investigation ReportPSEG Nuclear, LLCSalem Generating StationHancock's Bridge, New Jersey
Other than Well AC and Well AE, which were installed within the limits of the cofferdam,the boreholes for the wells were advanced to the depth that the Kirkwood Formation wasencountered. The Kirkwood Formation was confirmed at each of-the monitoring welllocations through the collection of split-spoon samples. The wells were then constructedwith ten-foot screened intervals exposed to the hydraulic fill and riverbed deposits directlyabove the Kirkwood Formation. The screened intervals for these wells ranges from a,minimum top of casing depth of 26 feet bgs to a maximum bottom of screen depth of 42feet bgs. This screened interval was chosen to monitor groundwater directly above the.Kirkwood Formation in the zone of the shallow, water-bearing unit that had the potentialfor exhibiting the highest hydraulic conductivity (i.e., the riverbed deposits).
Well AC and Well AE, installed within the limits of the cofferdam, were advanced to thelean concrete foundation. The lean concrete was encountered at depths of 25 and 27.5 feetbgs in Well AC and Well AE, respectively. The wells were constructed with ten-footscreened intervals directly above the lean concrete. This screened interval was chosen tomonitor groundwater directly above the lean concrete.
The monitoring wells were deveioped using a combination of surging and pumping:
techniques. Well AD, which was originally being considered for use during a long-termpumping test, was also developed using a chemical development agent (BMR®).Development of the monitoring wells was considered complete when the dischargeappeared to be sediment free. Following installation, Stires Associates, P.A., a licensedNew Jersey surveyor, surveyed the monitoring wells. IDW was handled in a mannersimilar to the description provided in Section 6.1.
6.4 Monitoring Well Installation Activities - January through February 2004
Following installation and development of the additional monitoring wells in Septemberand October 2003 (Wells Y, Z and AA through AF), groundwater monitoring activitieswere initiated to determine the extent' of delineation, and to identify data gaps that may bepresent in the existing monitoring well network. Groundwater monitoring activitiesconsisted of the collection and analysis of groundwater samples from the recently installedwells and the collection and evaluation of two rounds of synoptic water levels from all ofthe Station monitoring wells. Based on the results of the groundwater monitoring activities,several data gaps were identified within the existing monitoring well network. As a result,eight additional monitoring wells (Wells AG-Shallow, AG-Deep, AH-Shallow, AH-Deep,Al, AJ, AL, and AM) were installed at the Salem Generating Station.
6.4.1 Objectives
The purposes for the additional monitoring wells are as follows:
36

Remedial Investigation Report
PSEG Nuclear, LLCSalem Generating StationHancock's Bridge, New Jersey
" The well cluster consisting of Monitoring Wells AG-Shallow and AG-Deep wasinstalled at the location of supplemental investigation Boring 7. The well clusterwas installed to characterize groundwater quality and flow conditions in an areadowngradient of the Salem Generating Station Unit I Spent Fuel Pool andimmediately north of the circulation water discharge pipes;
" The well cluster consisting of Monitoring Wells AH-Shallow and AH-Deep wasinstalled at the location of supplemental investigation Boring 8. The well clusterwas installed to characterize groundwater quality and flow conditions in an areadowngradient of the Salem Generating Station Unit 1 Spent Fuel Pool andimmediately south of the circulation water discharge pipes;
" Monitoring Well Al was installed in the location of supplemental investigationBoring 9. This well was installed to further characterize groundwater quality andflow conditions within the cofferdam. Following installation, a pump test wasperformed on this well to evaluate aquifer parameters and potential remedialalternatives for the tritium in groundwater (e.g., capture of the tritiated waterthrough pumping and permitted discharge);
" Monitoring Well AJ was installed outside of the cofferdam within the area ofgroundwater indicating relatively high concentrations of tritium. This well wasused for performing a pumping test to evaluate aquifer parameters, and potentiallymay be incorporated into a remedial action designed to capture the groundwatercontaining tritium;
E Monitoring Well AL was installed in the location of supplemental investigationBoring 30. This well was installed to characterize groundwater quality and flowconditions south of the Salem Generating Station Unit I Spent Fuel Pool and thecirculation water discharge pipes; and,
" Monitoring Well AM was installed near the location of supplemental investigationBoring 34, as close to the Styrofoam-filled seismic gap as practical. This well wasinstalled to characterize groundwater quality and flow conditions directly south ofthe Styrofoam-filled seismic gap and to the west of the Unit I equipment hatch.
An additional monitoring well (Well AK) was proposed for the location of supplementalinvestigation Boring 28; however, due to plans for an additional structure to be erected atthe proposed well location, the well was not installed. Other locations for the well wereconsidered, but attempts to install the well were abandoned due to the existence ofsignificant subsurface infrastructure in this location and the proximity of the proposed wellto existing wells.
37

Remedial Investigation ReportPSEG Nuclear, LLCSalem Generating StationHancock's Bridge, New Jersey
6.4.2 Field Implementation
Between January 14 and February 18, 2004, Monitoring Wells AG-Shallow, AG-Deep,AH-Shallow, AH-Deep, Al, AJ, AL, and AM were installed. Talon Drilling of WestTrenton, New Jersey' installed the monitoring wells using hollow-stem auger drillingequipment. ARCADIS personnel supervised monitoring well installation activities. Thelocations of the monitoring wells are shown on Figure 11. A summary of thewell,construction details for the Station monitoring wells is presented in Table 4. Appendix Cpresents the boring logs, well completion details, NJDEP Bureau of Water AllocationMonitoring Well Records, and Monitoring Well Certification Forms (Form B) for thewells.
Well clusters were installed at the locations of Well AG (Shallow and Deep) and Well AH(Shallow and Deep). The well clusters, completed within the same borehole, wereconstructed with screened intervals from 15 to 25 feet bgs and 30 to 40 feet bgs. Thescreened intervals, which were designed to provide a vertical profile of tritium immediatelydowngradient of the sheetpiling through which thecirculation water discharge pipespenetrate, are separated by approximately four-feet of grout.. The wells within each clusterare constructed of one-inch diameter Schedule 40 PVC casing and well screen (0.010 slot).A gravel pack consisting of Morie No. 1 sand, which grades to Morie No. 00 sand over thelast foot, was installed to approximately one foot above the top of the well screen. Theremainder of each borehole was grouted with neat cement containing approximately fivepercent bentonite. The gout was installed in the annular space around the casing using agrout pump and a tremie-pipe. Details regarding the installation of the remaining wells areas follows:
Well Al and AM were installed within the limits of the cofferdam. The boreholesfor these wells were advanced to the depth that lean concrete was encountered.The wells were then constructed with ten-foot screened intervals immediatelyabove the lean concrete. These wells were constructed with four-inch diameterSchedule 40 PVC casing and well screen (0.010 slot).
Well AJ was installed outside of the limits of the cofferdam within the areaexhibiting elevated (greater than 500,000 pCi/L) levels of tritium. The borehole forwell AJ was advanced to the depth that the Kirkwood Formation was encountered,which was confirmed through the, collection of split-spoon samples. Well AJ wasconstructed with four-inch diameter Schedule 40 PVC casing and well screen(0.010 slot). The well was constructed with a 25-foot screened interval installedimmediately above the Kirkwood Formation.
Well AL, installed beyond the limits of the cofferdam and directly south of thecirculation water discharge pipes, was installed to a depth of 25 feet bgs. Well ALwas completed with a ten-foot screened interval designed to monitor groundwater
, 38

Remedial Investigation ReportPSEG Nuclear, LLC
Salem Generating StationHancock's Bridge, New Jersey
above and downgradient of the circulation water discharge pipes. The well wasconstructed with two-inch diameter Schedule 40 PVC casing and well screen(0.010 slot).
A gravel pack consisting of Morie No. I sand was installed to a minimum of one footabove the top of the well screens. The remainder of each borehole was grouted with neatcement containing approximately five percent bentonite. The grout was installed in theannular space around the casing using a grout pump and a tremie-pipe. The monitoringwells were developed using a combination of surging and pumping techniques.Development of the monitoring wells was considered complete when the dischargeappeared to be sediment free. Following installation, Stires Associates, P.A., a licensedNew Jersey surveyor, surveyed the monitoring wells. IDW was handled in a mannersimilar to the description provided in Section 6.1.
6.5 Monitoring Well Sampling and Analysis
Groundwater monitoring activities have been ongoing since the installation of Wells Kthrough R during Phase III of the initial Station investigation activities. Initially,groundwater samples were collected on a weekly basis. As additional monitoring wellswere installed, and as a database of groundwater analytical results for the monitoring wellswas generated, the monitoring well sampling program was modified. Groundwatersamples are analyzed for tritium, major cations and anions, and gamma emitting isotopes.The sampling program is being adaptively managed to provide the investigational datarequired to meet the current investigation objectives and evaluate changes in tritiumconcentrations. Currently, the sampling program design for the Station monitoring wellsconsists of the following:
* Due to the relatively low levels of tritium (typically less than 1,000 pCi/L) historicallydetected in groundwater samples collected from Wells L, P, Q, T, U, and V, and the"natural" (or ambient) levels of tritium detected using low-level tritium in-growthtechniques (detection limit approximately 1.5 pCi/L), these wells are currently sampledon a quarterly basis and the frequency may be reduced to semi-annual in the nearfuture;
* Wells K, R, W, and AF are currently sampled on a monthly basis but are beingevaluated for a reduced frequency based on consistent analytical results below the levelof detection;
" Wells such as M, N, 0, AA, AB, AC, AD, and AE, which indicate concentrations oftritium above 20,000 pCi/L, are currently sampled on a monthly basis. These wells aremonitored to evaluate current plume dynamics and migration; and,
39

Remedial Investigation ReportPSEG Nuclear, LLCSalem Generating StationHancock's Bridge, New Jersey
Recently installed monitoring wells, such as Wells AG through AM, are currentlysampled on a bi-weekly basis to establish an analytical history for these wells.Following development of the analytical history, the sample frequency will bemodified based on similar factors as explained above.
The adaptive sampling management program is designed to ensure representative data arecollected .that meet the objectives of the investigationand provide the informationnecessary to evaluate plume dynamics and migration.
Analysis of groundwater samples collected from most of the Station Monitoring Wells hasalso included a single event analysis for groundwater age determination (by tritium -helium-3 age dating). As proposed in the RIWP Addendum, Tc-99 was also analyzed as asingle-event analysis. The Tc-99 analysis, which was performed in lieu of iodine- 129, wasperformed to assist in the determination of the source of the tritium. The iodine-129analysis could not be performed due to unavailability of analysis equipment at Purdue
University. Analytical results of groundwater samples collected through December 2003are discussed in Section 8 of this report.
To minimize the influence of turbidity, groundwater samples are collected in accordanceO with the low-flow sampling 'procedure outlined in the Quality Assurance Project Plan
(QAPP), which was included as an appendix to the June 2003 RIWP. The use of low-flowpurging and sampling procedures results in the collection of groundwater samples frommonitoring wells that are representative of groundwater conditions in the geologicformation. This is accomplished by minimizing stress on the geologic formation andminimizing disturbance of sediment that has collected in the well (Groundwater SamplingProcedure, Low Stress (Low Flow) Purging and Sampling, United States Environmental
Protection Agency Region I, March 1998).
As outlined in the low-flow sampling standard operating procedure (SOP) provided in theQAPP, low-flow purging and sampling involves lowering a QED® Micropurge %-inchdiameter bladder pump (model SP-%-P) to the midpoint of the screened interval of themonitoring wells. The wells are then purged at a constant rate maintained at or below 200milliliters per minute. The water level in the well being sampled is monitored during
purging, and the pumping rate is adjusted to minimize drawdown. A properly calibratedMicropurge Basics Flow Cell Model MP20DT is used to collect field parametermeasurements every five minutes from the recovered groundwater. The parameters includedissolved oxygen (DO), oxidation-reduction potential (ORP), specific conductivity, pH,and temperature.
Once the field parameters stabilize (no more than 10 percent fluctuation over threemeasurements), a sample is collected. The sample is collected directly from the pump
discharge line, which is disconnected from the influent line of the flow-through cell toO facilitate sample collection. A summary of stabilized field parameters (final readings) for
40
Remedial Investigation ReportPSEG Nuclear, LLCSalem Generating StationHancock's Bridge, New Jersey
groundwater samples collected from the monitoring wells is provided in Table 7. The fieldparameter measurements collected during sample collection activities indicated thefollowing:
" Temperature ranged from 12.50 to 32.69 degrees Centigrade (°C).
" Specific conductivity ranged from 15.10 to 0'19 millisiemens per centimeter (mS/cm).
" pH ranged from 4.96 to 8.32 standard units (su).
" ORP ranged from -219 to +484 millivolts (mV).
" DO concentrations ranged from 0.04 to 8.02 milligrams per liter (mg/L).
The relatively wide range of temperatures is likely due to the influence of the facilityinfrastructure. The wells indicating higher temperatures are screened in the shallow, water-table aquifer in areas adjacent to subsurface structures that cause an increase in subsurfacetemperature (e.g., steam blow down lines).
Before sampling and between each well, all non-dedicated field equipment (e.g.,submersible pumps and water-level indicators) is decontaminated following the proceduresoutlined in the QAPP. Purge water generated during sampling is containerized pendingdisposal in accordance with Station radiological controls and waste management programs.
6.6 Hydrogeologic Investigation Activities
The following sections provide the details of the site-specific hydrogeologic investigationactivities detailed in the June 2003 RIWP and RIWP Addendum. These activities includethe collection of groundwater elevation data from Station monitoring wells to evaluategroundwater flow conditions in the shallow, water-bearing unit; the monitoring ofgroundwater elevations in the Vincentown Formation to evaluate groundwater flowconditions during various points in the tide cycle; the performance of slug tests andpumping tests on various monitoring wells; the evaluation of tidal influences on the varioushydrogeologic units encountered beneath the Station; and, the evaluation of a clay samplefrom the Kirkwood Formation to accurately characterize this unit. The results of the site-specific hydrogeologic investigation activities are presented in Section 6.
6.6.1 Evaluation of Tidal Influence
Between July 29 and August 5, 2003, data logging miniTROLL pressure transducers wereinstalled in Monitoring Wells L, M, and W to evaluate the tidal influences of the DelawareRiver on water levels in the Vincentown Formation (Well L), the hydraulic fill and riverbed deposits (Well W), and the structural fill within the cofferdam (Well M). TheminiTROLLs were programmed to record data on 15-minute intervals throughout theperiod of record. In addition to the water-level information from the wells, actual tidal data
41

Remedial Investigation ReportPSEG Nuclear, LLCSalem Generating StationHancock's Bridge, New Jersey
from the Reedy Point, Delaware tidal station (USGS Station No. 8551910), andprecipitation data from the weather station located approximately 0.9 miles east of theSalem Generating Station were obtained.
Following completion of the tests, the data were downloaded from the miniTROLLs andevaluated using Win-Situ software. The tidal data from Reedy Point and precipitation dataobtained from the Station were also evaluated. An analysis of the tidal evaluation data andresults are presented in Section 7.3.
6.6.2 Evaluation of Groundwater Elevations
As presented in Section 7.3, water levels in the Vincentown Formation are influenced bytidal fluctuations in the Delaware River, while water levels in the shallow, water-bearingunit are not tidally influenced. As such, the approach to evaluating groundwater elevationsin these units varied. The following sections provide the details for the evaluation ofgroundwater elevations in these units.
6.6.2.1 Shallow, Water-Bearing Unit
To characterize groundwater flow conditions in the shallow, water-bearing unit, water levelmeasurements were collected from the monitoring wells during six synoptic eventsconducted on June 26, July 28, August 15, October 14, and November 6, 2003 andFebruary 20, 2004. A summary of the water level measurements is presented in Table 8.The results of the water level measurement events are discussed in Section 7.2. 1.,
6.6.2.2 Vincentown Formation
To characterize groundwater flow conditions in the Vincentown Formation, continuousdata logging pressure transducers were installed in Well K, Well L, Well P, Well Q, andWell V from January 12 through 19, 2004. Tide data for the same time period wereobtained from the tide station located at the Hope Creek Generating Station. The dataobtained from these wells and the tide station were evaluated to characterize groundwaterflow conditions in the Vincentown Formation during various stages of the tide in theDelaware River. The results of the groundwater elevation data for the VincentownFormation are presented in Section 7.2.2.
6.6.2.3 Evaluation of Vertical Groundwater Gradients
To evaluate the vertical, gradient between the shallow, water-bearing unit, relativegroundwater elevations for the units, calculated from water level measurements obtained onJune 26, July 28, August 15, October 14; and November 6, 20034 were compared. Theresults of this evaluation are presented in Section 7.2.3.
42
Remedial Investigation ReportPSEG Nuclear, LLCSalem Generating StationHancock's Bridge, New Jersey
6.6.3 Evaluation of the Kirkwood Formation
Conflicting geologic reports suggest that the clay, confining unit that separates the riverbeddeposits and hydraulic fill of the shallow, water-bearing unit from the VincentownFormation is either the Miocene Kirkwood Formation or the Pleistocene Van Sciver LakeBed deposits (USGS 1979 and 1999). In order to determine the relative age of the clay,confining-unit, samples of the clay obtained during the drilling of Well V were submitted toLehigh University for pollen analysis. Results of the age determination analysis arepresented in Section 7.4.
6.6.4 Aquifer Characterization
To evaluate aquifer parameters (e.g., hydraulic conductivity) for the shallow, water-bearingunit and the Vincentown Formation, slug tests and pumping tests were performed onvarious monitoring wells. The details of these tests are presented in the following sections.
.6.6.4.1 Slug Tests
ARCADIS collected slug test data from Monitoring Wells N, 0, and U in August 2003.The purpose of the slug tests was to obtain preliminary estimates of hydraulic conductivityfor the structural fill encountered within the cofferdam and the hydraulic fill and riverbeddeposits. Pumping tests were performed to obtain a more refined estimate of the hydraulicconductivity and other aquifer parameters for the various components of the shallow,water-bearing unit. Details regarding the proposed pumping tests are included in Section7.4.1.
The slug tests were performed by first programming and installing an In-Situ®miniTROLL-30 PSIA pressure transducer and data logger (miniTROLL) in the test well.Programming the miniTROLLs consisted of entering the test start time (projected to beapproximately 15 minutes following installation of the miniTROLLs into the test well) anddata collection interval (minimum of 1.5 seconds). Following installation of theminiTROLL into the test well, the water level in the well was allowed to stabilize. (If thewater level had stabilized by the time the miniTROLL was scheduled to start recordingdata, the slug was introduced to the well. If the water level had not stabilized, the waterlevel was allowed to stabilize before introducing the slug.) The slug that was used for thetests is a three-foot long, one and a half (1.5) inch diameter, solid Schedule 80 PVC rod. Ina two-inch diameter well, the slug will displace the water table approximately 1.7 feet (i.e.,0.27 gallons).
Upon introducing the slug to the test well to start the falling head test, the time and depth towater were recorded. During the test, the depth to water was periodically recorded tocompare the water-level readings recorded by the miniTROLL. Once the water table had
43

Remedial Investigation Report
PSEG Nuclear, LLCSalem Generating StationHancock's Bridge, New Jersey
recovered to within 90 percent of static, the slug was removed to start the rising head test.
Again, depth to water measurements and the time were recorded initially after removing theslug and periodically during the test. The testwas considered complete once the watertable had recovered to within 90 percent of static. The same process was repeated for eachtest well. An analysis of the slug test data and results are presented in Section 7.4.1.
6.6.4.2 Pumping Tests
Between January 30 and February 4, 2004, eight aquifer pumping tests were conducted on
seven monitoring wells (Wells AB, AC, AD, Al, AJ, AM, and S) screened in the shallow,
water-bearing unit. The tests, which consisted of both a pumping phase and a recoveryphase, were performed to quantify the hydrogeologic characteristics (e.g., hydraulicconductivity) of this unit within the limits of and just south of the cofferdam.
The pumping tests were performed by first installing a variable rate two-inch submersible
Grundfos® pump in the test well. A miniTROLL data logging pressure transducer was
then programmed and installed in the test well. Programming the miniTROLLs consistedof entering the test start time (projected to be approximately 15 minutes followinginstallation of the miniTROLLs into the test well) and data collection interval (logarithmic).Following installation of the miniTROLL into the test well, the water level in the well wasmeasured and manually recorded. The pumping test was then initiated.
The wells were tested at pumping rates ranging from 0.25 to 2.0 gallons per minute (gpm).Pumping rates maintained during the pumping portion of the test Were confirmed through
the use of a digital flow meter and through manual flow rate calculations using a calibratedreceptacle and a stopwatch. Recovery data were monitored until the water level in the wellhad recovered to a minimum of 85% of the static water level measured at the start of thetest. The water generated during the tests was pumped directly into 55-gallon steel drums.Following completion of the tests, water in the drums was transferred to a storage tankpending characterization and disposal, which was coordinated by PSEG Nuclear, LLCpersonnel Details regarding the pumping tests performed on the individual wells areprovided in the following sections. Field observations made during the tests are
summarized in Table 9. Results of the pumping tests are presented in Section 7.4.2.
6.6.4.2.1 Well AB
The pumping test conducted on Well AB consisted of a 304-minute step-drawdown test.The steps of the test were performed at the following pumping rates: 0.25 gpm; 0.5 gpm;1.0 gpm; and, 2.0 gpm. Drawdown stabilized in the well during each pumping rate. Thetotal volume of water recovered during the pumping test was approximately 280 gallons.'
The maximum drawdown observed in the well was approximately 16 feet from the staticwater level.
44

Remedial Investigation Report
PSEG Nuclear, LLCSalem Generating StationHancock's Bridge, New Jersey
6.6.4.2.2 Well AC
The pumping test conducted on Well AC consisted of a 283-minute step-drawdown test,which was conducted concurrently with a pumping test on Well AM. The steps of the testwere performed at the following pumping rates: 0.25 gpm; 0.5 gpm; and, 0.75 gpm.Drawdown stabilized in the well during the 0.25 gpm and 0.5 gpm pumping rates but thewell was not able to maintain a pumping rate of 0.75 gpm. The total volume of waterrecovered during the pumping test was approximately 116 gallons. The maximumdrawdown observed in the well was approximately 10.3 feet from the static water level.
6.6.4.2.3 Well AD
The pumping test conducted on Well AD consisted of a 331 -minute step-drawdown test,which was conducted concurrently with the development of Well AJ. A noticeable effectof the development of Well AJ was observed in the water levels measured in Well AD.The steps of the test were performed at the following pumping rates: 0.25 gpm and 0.5gpm. Drawdown stabilized in the well during the 0.25 gpm pumping rate but the well wasnot able to maintain a pumping rate of 0.5 gpm. The total volume of water recoveredduring the pumping test was approximately 85 gallons. The maximum drawdown observedin the well was approximately 17 feet from the static water level.
6.6.4.2.4 Well Al
The pumping test conducted on Well Al consisted of a 315-minute step-drawdown test.The steps of the test were performed at the following pumping rates: 0.25 gpm; 0.5 gpm;and, 0.75 gpm. Drawdown stabilized in the well during the 0.25 gpm and the 0.5 gpmpumping rates but the well was not able to maintain a pumping rate of 0.75 gpm. The totalvolume of water recovered during the pumping test was approximately 145 gallons. Themaximum drawdown observed in the well was approximately 11.6 feet from the staticwater level.
6.6.4.2.5 Well AJ
The pumping test conducted on Well AJ consisted of a 275-minute step-drawdown test,which was conducted concurrently with the pumping test on Well S. The steps of the testwere performed at the following pumping rates: 0.25 gpm and 0.5 gpm. Drawdownstabilized in the well during the 0.25 gpm pumping rate but the well was not able tomaintain a pumping rate of 0.5 gpm. The total volume of water recovered during thepumping test was approximately 75 gallons. The maximum drawdown observed in thewell was approximately 23.2 feet from the static water level.
45

Remedial Investigation Report
PSEG Nuclear, LLCSalem Generating StationHancock's Bridge, New Jersey
6.6.4.2.6 Well AM
The pumping test performed on Well AM consisted of a 202-minute test that waseffectively separated into two separate time frames (i.e., an initial portion and a subsequentportion). The test on Well AM was also performed.concurrently with the pumping testperformed on Well AC.
The initial portion of the test was performed at the following pumping rates: 0,25 gpm and0.5 gpm. Drawdown' stabilized in the well during the 0.25 gpm pumping rate but the wellwas not able to maintain a pumping rate of 0.5 gpm. The total volume of water recoveredduring the initial portion of the test was approximately 40 gallons. The maximumdrawdown observed in the well during this portion was. approximately 12.3 feet from thestatic water level.
Prior to initiating the subsequent portion of the test, the water level in the well was allowedto recover to within 90-percent of the static water level. This required approximately 90minutes. The subsequent portion of the test on Well AM was conducted at a pumping rateof 0.33 gpm. Drawdown in the well had not stabilized at the time the subsequent portion ofthe test was terminated, and approximately 18 gallons of water were recovered during thisportion of the test.
6.6.4.2.7 Well S
The pumping test conducted on Well S consisted of a 305-minute test, which wasconducted concurrently with the pumping test on Well. AJ. The pumping test wasconducted at a pumping rate of 0.25 gpm. Drawdown in the well began to stabilize at thispumping rate near the end of the pumping phase of the test. The total volume of waterrecovered during the pumping test was approximately 77 gallons. The maximumdrawdown observed in the well was approximately 20 feet from the static water level.
0 46

Remedial Investigation ReportPSEG Nuclear, LLCSalem Generating StationHancock's Bridge, New Jersey
7 Hydrogeologic Evaluation
The following sections provide the results of the site-specific hydrogeologic investigationactivities detailed in the June 2003 RIWP and RIWP Addendum, as well as a hypothesisregarding groundwater flow at the facility prior to construction of the cofferdam and otherfacility structures, which have had a significant impact on groundwater flow. As presentedin Section 5, the site-specific hydrogeologic investigation activities included the collectionof groundwater elevation data from Station monitoring wells to evaluate groundwater flowconditions in the shallow, water-bearing unit; the monitoring of groundwater elevations inthe Vincentown Formation to evaluate groundwater flow conditions during various pointsin the tide cycle; the performance of slug tests and pumping tests on various monitoringwells; the evaluation of tidal influences on the various hydrogeologic units encounteredbeneath the Station; and, the evaluation of a clay sample from the Kirkwood Formation toaccurately characterize this unit.
7.1 Local Hydrogeology - Pre-Facility Construction
The Station is located on the southern tip of what was once a natural bar projecting into theDelaware River. The groundwater flow conditions .present in the natural bar would havebeen typical of those present on any island composed of unconsolidated materials. Waterwould move away from the axis of the bar in either direction with semi-radial flowoccurring at the ends of the bar.
The area between the bar and the mainland had been formerly used as a dredge spoil area.In 1899, a timber sheetpile wall was installed around the perimeter of the bar. Over thenext 50 or so years the area was used as a spoil deposit area for material obtained during thedredging of the Delaware River by the United States Army Corps of Engineers. Riprapwas added to the perimeter when the timbers began to degrade (Dames & Moore February1974, June 1977). The area landward of Artificial Island has remained a tidal marsh.
7.2 Local Hydrogeology - Current
The following sections provide the results of the site-specific hydrogeologic investigationactivities. Detailed water level measurements have been collected from site monitoringwells as well as the site tidal station to determine groundwater flow directions and surfacewater/groundwater interactions. The results of these activities are summarized below.
7.2.1 Groundwater Flow - Shallow, Water-Bearing Unit
ARCADIS personnel performed site-wide monitoring well gauging events on June 26, July28, August 15, October 14, and November 6, 2003 and February 20, 2004. The depth-to-water in each well was measured relative to the top of the well casing using an electronic
47

Remedial Investigation ReportPSEG Nuclear, LLCSalem Generating StationHancock's Bridge, New Jersey
water-level indicator. Using the gauging measurements and the surveyed top of casingelevations, groundwater elevations were calculated for each well. Table 8 provides asummary of the groundwater elevation data.
As summarized in Table 8, groundwater elevations in monitoring wells screened intheshallow, water-bearing unit within the limits of the cofferdam are generally higher thangroundwater elevations in monitoring wells screened in the shallow, water-bearing unitoutside the limits of the cofferdam. Water-table elevations have generally decreased acrossthe site since June 2003. A groundwater elevation contour map for the shallow, water-bearing unit based on the February 20, 2004 data is presented on Figure 14. Groundwaterflow. is generally from the center of the island (northeast of the Salem Generating Station)towards the Delaware River. Due to permeability differences between the structural fill andthe hydraulic fill, groundwater is mounded within the area of the cofferdam. Groundwaterflows radially outward from the cofferdam, and the observed mounding effect dissipates.quickly.
7.2.2 Groundwater Flow - Vincentown Formation
As presented in Section 7.3, water levels in the Vincentown Formation, because it is a
confined-unit, are tidally influenced. Water levels can vary as much as four feet per tidecycle depending on the proximity of the well to the Delaware River. To more accuratelyassess groundwater flow conditions in the Vincentown Formation, data logging pressuretransducers were installed in Well K, Well L, Well P, Well Q, and Well V from January 12through 19, 2004. Tide data for the same time period were obtained from the tide stationlocated at the Hope Creek Generating Station. The water level and tide data were evaluatedto characterize groundwater flow conditions during various stages of the tide cycle of theDelaware River.
Graphs of water levels for the individual wells and .the tide data are presented as Figures E-I through E-6 in Appendix D. The tide data was evaluated to determine the highest tide(high-high tide), the lowest tide (low-low-tide), and an intermediate high tide (low-high
tide) observed during the monitoring period. Corresponding water levels in the monitoringwells were noted for these stages of the tide cycle, and groundwater elevations werecalculated. Groundwater elevation contours for the high-high tide, the low-high tide, andthe low-low tide are presented on Figures 15, 16, and 17, respectively.
Groundwater. flow direction in the Vincentown Formation oscillates with the tides. Duringthe high-high tide stage of the tide cycle (Figure 15), groundwater flow in the VincentownFormation is perpendicular to the shoreline of the Delaware River in the west and southtowards the center of Artificial Island. During the low-high tide stage of the tide cycle(Figure 16), an observed groundwater saddle is present between the Station and theDelaware River. Groundwater flow to .the north and east of the saddle is to the south and
48

Remedial Investigation ReportPSEG Nuclear, LLCSalem Generating StationHancock's Bridge, New Jersey
east. Groundwater flow to the south and west of the saddle is to the north and east. Duringthe low-low tide stage of the tide cycle (Figure 17), groundwater flow in the VincentownFormation is from the center of Artificial Island towards the Delaware River.
7.2.3 Vertical Gradients
As summarized in Table 8, groundwater elevations in the Vincentown Formation aregenerally two to four feet lower than the hydraulic head in the shallow, water-bearing unit.This indicates that the potential for downward vertical migration of groundwater exists.
7.3 Tidal Evaluation Results
The results of the tidal investigation were consistent with previous tidal studies (Dames &Moore January 4, 1968). Approximately four feet of tidal response was observed in Well L(screened within the Vincentown Formation). Well W, screened within the shallow, water-bearing unit, showed a negligible tidal response. Similarly, Well M, located within thecofferdam on the west end of the Salem Unit 1 Fuel Handling Building exhibited nodiscemable tidal response. These tidal data indicate that the Kirkwood Aquitard effectivelyisolates the riverbed deposits from tidal fluctuations in the Vincentown Formation and thereare no tidal influences in the aquifer where tritium has been detected. Plots depicting thetidal evaluation analyses are provided in Appendix E.
7.4 Evaluation of the Kirkwood Formation
Conflicting geologic reports suggest that the clay, confining unit that separates the riverbeddeposits and hydraulic fill of the shallow, water-bearing unit from the VincentownFormation is either the Miocene Kirkwood Formation or the Pleistocene Van Sciver LakeBed deposits (USGS 1979 and 1999). In order to determine the relative age of the clay,confining-unit, samples of the clay obtained during the drilling of Well V were submitted toLehigh University for pollen analysis. Results of the age determination analysis indicatethat the clay, confining-unit is late Miocene or Pliocene in age (Yu 2003). As such, theclay, confining-unit is interpreted as the Kirkwood Formation.
7.5 Aquifer Characteristics
The following sections provide the results of the slug tests and pumping tests performed onthe various monitoring wells at the Station.
7;5.1 Slug Test Results
Slug tests were performed on Monitoring Wells N, 0, and U to quantify hydraulicproperties in the unconfined aquifer. The field procedure followed for these tests are
49
Remedial Investigation ReportPSEG Nuclear, LLCSalem Generating Station
* .Hancock's Bridge, New Jersey
discussed in Section 6.6.4.1. The slug test data generated from these wells were evaluatedusing the Bouwer and Rice (1976) method. The primary assumptions of this analysis are:1) the flow field is steady and laminar near the well; 2) the aquifer is homogenous andisotropic within the zone of influence; and 3) the well screen is clean.
Table 10 provides a summary of the hydraulic conductivity values estimated from the slugtests. Plots of the slug test analyses are provided in Appendix F. Monitoring Wells N and
0 are screened in the structural fill. The estimated hydraulic conductivity at Well N isbetween 0.09 and 0.14 ft/day. The estimated hydraulic conductivity at Well 0 is between3.6 and 4.3 ft/day. The variation in hydraulic conductivity between wells reflects not onlydifferences between soils and well construction, but also slug test procedures in general.Slug tests displace only a small volume of water in the vicinity of the well, therebystressing only a small portion of the aquifer. The discrepancy between sampling points isnot atypical. The estimated hydraulic conductivity value for Monitoring Well U screenedin the riverbed deposits was 2.95 ft/day.
7.5.2 Pumping Test Results
As presented in Section 6.6.4.2, eight pumping tests were performed on seven wells (Wells.AB, AC, AD, Al, AJ, AM, and S) to quantify the hydrogeologic characteristics (e.g.,hydraulic conductivity) of the shallow, water-bearing unit within the limits of and just southof the cofferdam. The data collected during the pumping and recovery phases of thepumping tests were analyzed using AQTESLOV for Windows (HydroSOLVE, !1996). Theresults of the individual pumping tests, which are discussed in the following sections, aresummarized in Table 11. The pumping test results indicate a range of transmissivity of0.337 ft2/day to 27.7 ft2/day and hydraulic conductivities of 0.03 ft/day to 2.77 ft/day.
7.5.2.1 Well AB
Details of the analysis of the pumping and recovery phases of the step-drawdown testperformed on Well AB are presented, on Figures H-I and H-2 in Appendix G, respectively.The average transmissivity and hydraulic conductivity calculated from the pumping data
for the various steps are 27.7 ft2/day and 2.77 ft/day, respectively. The transmissivity andhydraulic conductivity calculated from the recovery data are 22.7 fl2/day and 2.27 ft/day,respectively.
7.5.2.2 Well AC
Details of the analysis of the pumping and recovery phases of the step-drawdown testperformed on Well AC are presented on Figures H-3 and H-4 in Appendix G, respectively.The average transmissivity and hydraulic conductivity calculated from the pumping datafor the various steps are 12.6 ft2/day and 1.26 ft/day, respectively. The transmissivity and
0 50

Remedial Investigation Report
PSEG Nuclear, LLCSalem Generating StationHancock's Bridge, New Jersey
hydraulic conductivity calculated from the recovery data are 1.67 ft2/day and 0.17 ft/day,respectively.
7.5.2.3 Well AD
Details of the analysis of the pumping and recovery phases of the step-drawdown testperformed on Well AD are presented on Figures H-5 and H-6 in Appendix G, respectively.The average transmissivity and hydraulic conductivity calculated from the pumping datafor the various steps are 0.942 ft2/day and 0.09 ft/day, respectively. The transmissivity andhydraulic conductivity calculated from the recovery data are 0.937 ft2/day and 0.09 ft/day,respectively.
7.5.2.4 Well Al
Details of the analysis of the pumping and recovery phases of the step-drawdown testperformed on Well Al are presented on Figures H-7 and H-8 in Appendix G, respectively.The average transmissivity and hydraulic conductivity calculated from the pumping datafor the various steps are 7.97 ft2/day and 0.80 ft/day, respectively. The transmissivity andhydraulic conductivity calculated from the recovery data are 2.10 ft2/day and 0.21 ft/day,respectively.
7.5.2.5 Well AJ
Details of the analysis dfthe pumping and recovery phases of the step-drawdown testperformed on Well AJ are presented on Figures H-9 and H- 10 in Appendix G,respectively. The average transmissivity and hydraulic conductivity calculated from thepumping data for the various steps are 1.73 ft2/day and 0.09 ft/day, respectively. Thetransmissivity and hydraulic conductivity calculated from the recovery data are 0.56 ft2/dayand 0.03 ft/day, respectively.
7.5.2.6 Well AM
Details of the analysis of the first portion of the pumping and recovery phases of the step-drawdown test performed on Well AM are presented on Figures H-1l and H-12 inAppendix G, respectively. The average transmissivity and hydraulic conductivitycalculated from the pumping data for the various steps are 1.40 ft2/day and 0.14 ft/day,respectively. The transmissivity and hydraulic conductivity calculated from the recoverydata are 0.572 ft2/day and 0.06 ft/day, respectively.
Details of the analysis of the second portion of the pumping and recovery phases of thestep-drawdown test performed on Well AM are presented on Figures H-13 and H-14 inAppendix G, respectively. The transmissivity and hydraulic conductivity calculated from
51
Remedial Investigation Report
PSEG Nuclear, LLCSalem Generating StationHancock's Bridge, New Jersey
the pumping data are 1.08 ft2/day and 0.11 ft/day, respectively. The transmissivity and
hydraulic conductivity calculated from the recovery data are 0.338 ft2/day and 0.03 ft/day,respectively.
7.5.2.7 Well S
Details of the analysis of the pumping and recovery phases of the constant-rate test
performed on Well S are presented on Figures H- 15 and H- 16 in Appendix G,respectively. The transmissivity and hydraulic conductivity calculated from the pumping
data are 1.70 ft2 /day and 0.17 ft/day, respectively. The transmissivity and hydraulicconductivity calculated from the recovery data are 1.10 ft2/day and 0.11 ft/day,respectively.
0 52

Remedial Investigation Report
PSEG Nuclear, LLCSalem Generating StationHancock's Bridge, New Jersey
8 Analytical Results
in accordance with the scope of work presented in the June 2003 RIWP and the RIWPAddendum, samples have been collected from various media at the Station to determine themagnitude and extent of the release of water from the Spent Fuel Pool. Soils samples wereobtained during the installation of the monitoring wells, grab groundwater samples werecollected at various depths using direct push methods, and groundwater samples werecollected using low flow sampling methods from the Station monitoring wells. Throughoutthe investigation, samples were also collected from the Spent Fuel Pool, the telltale drains,and from the various sample locations established within the facility (see Appendix A).Collectively, the data indicate that water from the Spent Fuel Pool leaked behind thestainless-steel liner into the obstructed telltale drains, migrated through curing cracks in thestructural concrete and accumulated in the Styrofoam-filled seismic gap. Once there, theSpent Fuel Pool water, for which there is a flowpath to foundation soils, seeped into thefoundation soils along the southern side of the seismic gap. This release of Spent Fuel Poolwater has resulted in an area of impacted groundwater extending from the south side of theseismic gap to the circulating water discharge pipes.
The water samples collected from within the facility indicated concentrations of tritium,boron, and various gamma-emitting isotopes typical of Spent Fuel Pool water.Groundwater samples collected from outside the facility, which were analyzed for the same.suite of parameters, have indicated concentrations of tritium, boron, and one slightlyelevated concentration of Tc-99 that suggest that water from the Spent Fuel Pool is theprobable source. The data generated during the remedial investigation, both from withinthe facility and groundwater samples collected from the Station monitoring wells, indicatethat the removal of the mineral deposits from the telltale drains has resulted in the proper*operation of the leak detection, collection and monitoring system. Analytical results ofwater samples collected from the drill points established within the seismic gap (DP- I andDP-2), which initially indicated that the water in the gap was mostly Spent Fuel Pool water,have indicated decreasing concentration trends of Spent Fuel Pool constituents. Aspresented in Appendix B, the most recent water samples collected from the seismic gapindicate that the water is approximately three-percent Spent Fuel Pool water.
Additional evidence that suggests that the hydraulic head created by the blockage in thetelltale drains has been removed and that Spent Fuel Pool water is no longer migrating tothe seismic gap is the concentration trend of tritium in groundwater samples collected fromWell AC. This well, which is installed near the contact of the southern end of the seismicgap with foundation soils, has indicated the highest concentrations of tritium and boron ingroundwater and is therefore considered the source area monitoring well. Groundwatersamples collected from Well AC have indicated stable concentrations of tritium indicatingthat the source of the tritium has been removed. Future groundwater samples collectedfrom Well AC should indicate a decreasing trend for tritium and boron concentrations.
53

Remedial Investigation ReportPSEG Nuclear, LLCSalem Generating StationHancock's Bridge, New Jersey
As stated in Section 1. 1, the telltale drains are routinely monitored to ensure that mineraldeposits do not accumulate and result in an additional discharge of tritium and otherconstituents to the seismic gap. To further ensure that the seismic gap does not provide apathway for the migration of constituents of concern to the environment, gap drains arecurrently being designed and will be installed to permit detection, sampling, and draining ofwater (both groundwater and water from other sources) that accumulates in the seismicgaps of both Salem Units 1 and 2. The water that accumulates in the seismic gaps will becharacterized by Salem Chemistry and will be handled in accordance with Stationprocedures. Characterization samples collected from the seismic gap drains will provide anadditional line of evidence to suggest that the corrective actions taken by PSEG Nuclear,LLC have resulted in the proper functioning of the telltale drains. The drain will alsoprovide control for residual contamination within the Unit 1 seismic gap resulting from theaccumulation of Spent Fuel Pool water by permitting controlled draining of the residualcontamination.
The analytical results of soil and groundwater samples collected following the initiation of.the remedial investigation are presented in the following sections. Radiation protectionpersonnel screened soil samples obtained during the installation of the Station monitoringwells for gamma-emitting isotopes. Groundwater samples collected from the monitoringwells following installation were submitted toSalem Chemistry, Maplewood and theUniversity of Rochester for various analyses. Collectively, the data generated during theinvestigation was evaluated to determine that the investigation objectives were meet. Asdiscussed previously, the investigation objectives were to determine the source, the extent,and the risk associated with the tritium in groundwater.
8.1 Soil Samples
Salem Chemistry analyzed soil samples collected from the borehole cuttings of the Stationmonitoring wells for gamma-emitting isotopes to determine the appropriate disposaltechnique based on Station procedures. The soil samples were composite samples (onesample per drum) of cuttings obtained during the monitoring well installation and vacuumexcavation activities. According to PSEG, soil samples were non-detect for plant relatedgamma-emitting isotopes, with the exception of one of the nine soil samples collected fromthe cuttings of Well T (PSEG, verbal communication 2004). Well T is located to the northof the Salem Generating Station. The plant related gamma-emitting isotope identified inthe Well T cuttings is not related to the tritium investigation based on the distance andorientation from the area of concern. Gamma-emitting isotopes were not detected in theother well installation soil samples.
54
Remedial Investigation Report
PSEG Nuclear, LLCSalem Generating StationHancock's Bridge, New Jersey
8.2 Groundwater Samples
A total of 29 monitoring wells have been installed at various locations surrounding theStation'to delineate the extent of groundwater impacts from the release of water from theSpent Fuel Pool. Numerous water quality samples have been collected from the Stationmonitoring wells. The groundwater samples have been analyzed to assess naturalgeochemistry, as well as facility-related constituents. As presented in Section 6.5,groundwater samples were initially collected on a weekly basis; however, as the number ofmonitoring wells increased and the analytical history of the individual monitoring wellswas established, the sampling program was modified. The current monitoring planspecifies either biweekly, monthly, or quarterly sampling basedupon the analytical history.of each well.
Groundwater samples were submitted to Maplewood and!or Salem Chemistry for analysisfor tritium, major cations and anions (sodium and boron), and gamma-emitting isotopes. Asummary of the analytical results obtained from Maplewood and Salem Chemistry ispresented in Table 12, and the analytical results for tritium are shown on Figure 13. Aspresented in Section 5.2.5, a separate set of groundwater samples was collected to performa one-time analysis for groundwater age determination (by tritium - helium-3 ratio),dissolved gases, and Tc-99. The research analytical laboratory at the University ofRochester performed these analyses. Analytical results obtained from the University ofRochester are provided in Appendix H.
Analytical results for the groundwater samples, which are discussed in the followingsections, were evaluated based on the water-bearing zone in which the monitoring wells arescreened. The three primary water-bearing units being investigated beneath the Station are:1) the Vincentown Formation; 2) the shallow, water-bearing unit within the limits of thecofferdam; and, 3) the shallow, water-bearing unit outside of the limits of the cofferdam.
8.2.1 Summary of Analytical Data for Wells Screened in the Vincentown Formation (Wells L, K, P,
Q, and V)
With the exception of Wells K and V, analytical results of groundwater samples collectedfrom monitoring wells screened in the Vincentown Formation do not indicateconcentrations of tritium above regional background concentrations. Analytical results ofgroundwater samples collected from Wells K and V indicate tritium concentrationsbetween 185 pCi/L and 1,200 pCi/L, which may be a result of tritiated water from Stationactivities 20 years ago that recharged to the aquifer. Analytical results of the groundwatersamples obtained from the Vincentown Formation indicate concentrations of Tc-99 (0.8pCi/L) consistent with the ambient abundance of this constituent in precipitation in the1970s. Plant-related gamma-emitting isotopes have not been detected in groundwatersamples collected from the monitoring wells screened in the Vincentown Formation. Based
55

Remedial Investigation Report
PSEG Nuclear, LLCSalem Generating StationHancock's Bridge, New Jersey
on groundwater flow directions and dissolved methaneconcentrations detected in thegroundwater samples, recharge to the Vincentown Formation is likely to occur from areasnorth and east of the plant. The following bullets provide an evaluation of the analyticalresults for the individual monitoring wells screened in the Vincentown Formation.
• Well K - Tritium has not been detected in groundwater samples collected fromWell K at concentrations above the further investigation criterion (3,000 pCi/L). Atrend graph of tritium concentrations is presented on Figure I-, in Appendix I.Analytical results of groundwater samples collected from Well K consistentlyindicate tritium concentrations between 500 and 1,200 pCi/L. The groundwaterage investigation (Appendix H) of Well K indicates that tritiated water rechargedat about 3,000 to 5,000 pCi/L approximately 19 years ago and has traveled to theupper part of the Vincentown Formation. The most likely source for this rechargeis east of Well K. The level of Tc-99 is 0.8 pCi/L, consistent with post-nuclearbackground for the eastern United States 25 years ago.
Well L - Tritium has not been detected in groundwater samples collected fromWell L at concentrations above .the further investigation criterion.(3,000 pCi/L).Analytical results from Maplewood for groundwater samples collected from WellL are below the laboratory detection limit. Results from the University ofRochester indicate a tritium concentration of 45 pCi/L. The groundwater ageanalysis indicates that the water at Well L recharged about 21 years ago consistentwith local precipitation 20 to 25 years ago. Groundwater at Well L isapproximately the same age as groundwater at Well K, consistent with rechargethat occurred 20 years ago. The absence of tritium above the laboratory detectionlimit suggests that there is no major pathway for tritiated water into theVincentown Formation.
> Well P - Tritium has not been detected in groundwater samples collected fromWell P at concentrations above the further investigation criterion (3,000 pCi/L).Analytical results from Maplewood for groundwater samples collected from WellP indicate tritium concentrations between 465 pCi/L and the laboratory detectionlimit. Results from the University of Rochester measured 58 pCi/L with agroundwater age of about 13 years. Well P is located downgradient, south ofSalem Unit 1.
> Well Q - Tritium has not been detected in groundwater samples collected fromWell Q at concentrations above the further investigation criteria (3,000 pCi/L).Analytical results from Maplewood for groundwater samples collected from WellQ are all below the laboratory detection limit. Low-level tritium analysisperformed at the University of Rochester indicates a tritium concentration of 1.5pCi/L, which is typical of precipitation that recharges prior to the onset of the
56
Remedial Investigation Report
PSEG Nuclear, LLCSalem Generating StationHancock's Bridge, New Jersey
nuclear era (ca. 1950). Elevated levels of dissolved methane in Well Q at 38 cc/kg(1.7mmol/kg) and less than solubility levels for argon and nitrogen indicate thepoint of recharge to be within the marshes that border the plant to the east.
Well V - Tritium has not been detected in groundwater samples collected fromWell V at concentrations above the further investigation criterion (3,000 pCi/L). Atrend graph of tritium concentrations is presented on Figure 1-8, in Appendix I.Analytical results from Maplewood for groundwater samples collected from WellV indicate tritium concentrations between 185 pCi/L and 549 pCi/L. Laboratoryanalyses from the University of Rochester were 549 pCi/L. Groundwater agedating indicates the local groundwater in Well V is 15.4 years old. Groundwatersamples collected from this well indicated a dissolved methane concentration of15.4 cc/kg methane and dissolved neon and argon concentrations belowatmospheric solubility, indicating recharge from the marshes to the east.
8.2.2 Summary of Analytical Data for Wells Screened in the Shallow, Water Bearing Unit Within
the Limits of the Cofferdam (Wells M, N, 0, R, AC, and AE)
Analytical results of the groundwater samples indicate that tritium has been detected above3,000 pCi!L (the Interim Further Investigation Criterion for Tritium) in groundwatersamples collected from Monitoring Wells M, N, 0, AC, AE and R installed within thelimits of the cofferdam. Analytical results of groundwater samples collected from Well M,N, and AC have indicated concentrations of tritium above the further action criteria of20,000 pCi!L. While they indicate elevated concentrations of tritium, they do not indicateelevated levels of plant related gamma-emitting isotopes or Tc-99. Tritium concentrationshave been steady throughout the period of investigation, consistent with the hypothesis thatdraining of the seismic gap and the unplugging of the telltale drains has stopped the furthermigration of Spent Fuel Pool water out of the seismic gap. Tc-99 has been detectedbetween 0.2 to 0.7 pCi/L, consistent with background concentrations.
1; Well M - Prior to the replacement of Well M in May 2003, tritium concentrationsdetected in groundwater samples collected from Well M indicated a steadydecrease in concentrations from 18,700 pCi/L on February 12, 2003 to 8,800 pCi/Lon April 30, 2003. This well was replaced to conform to New Jersey wellconstruction requirements with the new screen interval a few feet deeper than theoriginal; the well was drilled to refusal. The analytical results of groundwatersamples collected from the replacement well were initially 126,000 pCi/L, andhave steadily declined to 11,400 pCi/L. Current concentrations are consistent withconcentrations measured before the well was replaced. A trend graph of tritiumconcentrations is presented on Figure 1-2, in Appendix I. The groundwater agedating indicates the water became isolated from the atmosphere less than 0.1 yearsago. Boron concentrations in Well M are between 0.222 mg/L and 0.320 mg/L,
57

Remedial Investigation Report
PSEG Nuclear, LLCSalem Generating StationHancock's Bridge, New Jersey
consistent with background for. Artificial Island. The Tc799 concentration for thiswell is 0.5 pCi/L, also consistent with backgroun&
> Well N - Initial groundwater samples collected from Well N indicatedconcentrations of tritium above the further action criteria for tritium (20,000pCi/L). A groundwater sample collected from Well N on January 30, 2003indicated a concentration of tritium of 69,000 pCi/L. Concentrations detected ingroundwater samples collected from Well N have declined steadily in subsequentmonitoring to 6,460 pCi/L. A trend graph of tritium concentrations is presented onFigure 1-3, in Appendix I. Boron concentrations are between 0.197 and 0.409mg/L consistent with background levels for Artificial Island. Groundwater agedating suggests an age of about 1 year. The Tc-99 concentration in this well is 0.4pCi/L, near the background value of 0.5 pCi/liter.
> Well 0 - Analytical results of groundwater samples collected from Well 0 haveconsistently indicated concentrations of tritium above the further investigationcriterion (3,000 pCi/L) during 2003. Analytical results of groundwater samples.collected from Well 0 by Maplewood indicate tritium concentrations between1,220 and 13,400 pCi/L. A trend graph~of tritium concentrations is presented on
Figure 1-4, in Appendix I. Concentration fluctuations have stabilized and areapproximately 7,000 pCi/L. Boron concentrations have ranged from 0.071 and0.305 mg/L consistent with background levels for Artificial Island. Groundwater
age dating indicates the water is 0.22 years old. The Tc-99 concentration in this
well is 0.2 pCi/L, near the background value of 0.5 pCi/liter.
> Well R - Analytical results of groundwater samples collected from Well R havedetected concentrations of tritium at or above the further investigation criterion(3,000 pCi/L). Tritium concentrations have steadily decreased from 13,900 PCiLon February 26, 2003 to 2,550 pCi/L on December 12, 2003. A trend graph oftritium concentrations is presented on Figure 1-5, in Appendix I. Groundwater agedating results suggest an age of about 1.2 years. Boron concentrations have ranged
from 0.229 and 0.511 mg/L consistent with background levels for Artificial Island.The Tc-99 concentration in this well is 0.4 pCi/L, near the background value of 0.5
pCi/liter.
> Well AC - Analytical results of groundwater samples collected from Well AChave indicated the highest concentrations of tritium in Site monitoring wells(15,000,000 pCi/L): Tritium concentrations have.ranged from 10,700,000 pCi/L
and 15,000,000 pCi/L. A trend graph of tritium concentrations is presented onFigure 1-13, in Appendix I. Groundwater age dating and Tc-99 analysis have notbeen completed in this wellbecause of the high levels of tritium. The boronconcentration was measured between 253 mg/L and 332 mg/L. Comparison of
0 58

Remedial Investigation Report
PSEG Nuclear, LLCSalem Generating StationHancock's Bridge, New Jersey
tritium concentrations in Well AC to the Spent Fuel Pool indicates localgroundwater is 5.5 to 7.5 percent Spent Fuel Pool. Comparison of the boronconcentrations in Well AC to Spent Fuel Pool indicates that local groundwater isbetween 11 and 15 percent Spent Fuel Pool water. The difference in thepercentages of Spent Fuel Pool water indicates either a 50% degradation in tritium(the water is about 12 years old) or that the plume is stratified across the wellscreen. Given the close proximity of Well AC to the seismic, gap, the most likelyinterpretation is that the plume is stratified.
Well AE - Analytical results of groundwater samples collected from Well AEhave detected concentrations of tritium at or above the further investigationcriterion (3,000 pCi/L). Tritium concentrations have ranged from 5,990 pCi!L to16,100 pCi/L. A trend graph of tritium concentrations is presented on Figure 1-15,in Appendix I. Groundwater age dating results suggest an age of about 0.33 years.The boron concentration was measured at 0.234 mg/L consistent with backgroundlevels for Artificial Island. The Tc-99 concentration in this well is 0.7 pCi/L, nearthe background value of 0.5 pCi/liter.
8.2.3 Summary of Analytical Data for Wells Screened in the Shallow, Water-Bearing Unit Outsideof the Cofferdam (Wells S, T, U, V, W, Y, Z, AA, AB, AD, and AF)
The wells installed in the shallow, water-bearing:unit outside of the limits of the cofferdamare screened either just above the Kirkwood Formation, or in the interval indicating thehighest tritium concentrations during the Supplemental Investigation. The samples indicatethat tritium has been detected above 3,000 pCi!L (the Interim Further InvestigationCriterion for Tritium) in Wells S, W, AB, and AD. Wells S, AB, and AD also haveindicated concentrations of tritium above the further action criteria of 20,000 pCi/L.Groundwater samples collected from these monitoring wells did not indicate concentrationsof plant-related gamma-emitting isotopes. Groundwater samples collected from Well Windicated a concentration of Tc-99 above background for Artificial Island. When analyzed,there are elevated levels of boron where tritium is greater than 20,000 pCi/L. Consistentwith conditions inside the cofferdam, tritium concentrations have been steady throughoutthe period of investigation. Tc-99 has been detected between 0.2 and 4.1 pCi/L, consistentwith background concentrations or slightly higher in the groundwater sample from Well W.
Well S - Groundwater samples collected from Well S detected concentrations oftritium above the further action criteria for tritium (20,000 pCi/L). Concentrationsof tritium in Well S have ranged from 1,420,000 to 3,530,000 pCi/L with adeclining trend over the period of investigation. A trend graph of tritiumconcentrations is presented on Figure 1-6, in Appendix I. Boron concentration hasbeen sampled once at 57.4 mg/L, indicating Spent Fuel Pool water. Comparingtritium concentrations in local groundwater to SFP indicate 0.7% to 1.7% Spent
59

Remedial Investigation ReportPSEG Nuclear, LLCSalem Generating StationHancock's Bridge, New Jersey
Fuel Pool water. The boron sample indicates a composition of about 2.5% SpentFuel Pool water. This reduced tritium concentration indicates an age ofapproximately 6.9 years. Groundwater'age dating comparing helium to tritiumratios suggests an age of about 0.7 years. No plant related gamma-emittingisotopes have been detected in Well S. The Tc-99 concentration in this well is 0.5pCi!L, equal to the background value. Groundwater samples collected from Well Swere also analyzed for strontium-89 and strontium-90. Analytical results of thesegroundwater samples did not indicate concentrations of these constituents above.the laboratory detection limit.
> Well T - Groundwater samples collected from Well T have been below the furtherinvestigation criteria for tritium (3,000 pCi/L). All samples sent to Maplewoodwere non-detect for tritium while the one sample sent to the University ofRochester detected 257 pCi/L. Boron concentrations ranged from 0.601 mg/L to0.680 mg/L consistent with background levels for Artificial Island. Groundwaterage dating suggests an age of about 1.6 years. No plant related gamma-emittingisotopes have been detected in Well T. The Tc-99 concentration in this well is 0.7pCi!L, slightly above the background value of 0.5 pCi/L.
> Well U - Groundwater samples collected from Well U been below the furtherinvestigation criterion for tritium (3,000 pCi/L). Tritium results from samples sentto Maplewood ranged from non-detect to 203 pCi/L while the one sample sent to
the University of Rochester detected 78 pCi/L. A trend graph of tritiumconcentrations is presented on Figure 1-7, in Appendix I. Boron concentrationsranged from 0.341 mg/L to 0.421 mg/L consistent with background for ArtificialIsland. Groundwater age dating suggests an age of about 4.1 years. No plantrelated gamma-emitting isotopes have been detected in Well U. The Tc-99concentrationin this well is 0.5 pCi/L, equal to the background value.
Well W - Groundwater samples collected from Well W have been above thefurther investigation criterion for' tritium (3,000 pCiiL). Tritium results fromsamples ranged from 6,010 pCi/L to 15,500 pCiIL. The one sample sent to theUniversity of Rochester detected 13,062 pCi/L. A trend graph of tritiumconcentrations is presented on Figure 1-9, in Appendix I. Boron concentrations-range from 0.464 mg/L to 0.591 mg/L consistent with background levels forArtificial Island. The groundwater age determination for a groundwater samplecollected in July 2003 had a significant uncertainty likely related to the monitoringwell installation. The groundwater age determination for a groundwater samplecollected in November 2003 indicated an age of'4.1 years. No plant relatedgamma-emitting isotopes have been detected in Well U. The Tc-99 concentrationin this well is 4.1 pCi/L, slightly above the expected background value.
0 60
Remedial Investigation Report
PSEG Nuclear, LLCSalem Generating StationHancock's Bridge, New Jersey
Well Y - Groundwater samples collected from Well Y have been below the furtherinvestigation criterion for tritium (3,000 pCi/L). Tritium results from samples sentto Maplewood have been non-detect. The boron concentration was measured at0.822 mg/L, consistent with background levels for Artificial Island. The well wasnot sampled for groundwater age dating or Tc-99. No plant related gamma-emitting isotopes have been detected in Well Y.
Well Z - Groundwater samples collected from Well Z have been below the furtherinvestigation criterion for tritium (3,000 pCi/L). Tritium results from samples sentto Maplewood ranged from non-detect to 729 pCi/L while the one sample sent tothe University of Rochester detected 729 pCi/L. A trend graph of tritiumconcentrations is presented on Figure 1-10, in Appendix I. The boronconcentration was 0.498 mg/L, which is consistent with the background level forArtificial Island. Groundwater age dating suggests an age of about 3.2 years. Noplant related gamma-emitting isotopes have been detected in Well U. The Tc-99concentration of the groundwater sample collected from this well is 0.4 pCi/L,slightly below the background value of 0.5 pCi/L.
Well AA - Tritium concentrations in groundwater samples collected fromMonitoring Well AA have been below the further investigation criterion for tritium(3,000 pCi/L). Tritium results from samples sent to Maplewood ranged from 613pCi/L to 785 pCi/L while the one sample sent to the University of Rochesterdetected 734 pCi/L. A trend graph of tritium concentrations is presented on Figure1-11, in Appendix I. The boron concentration was 0.247 mg/L, which is consistentwith the background level for Artificial Island. Groundwater age dating suggestsan age of about 2.1 years. No plant related gamma-emitting isotopes have beendetected in Well AA. The Tc-99 concentration of the groundwater samplecollected from this well is 0.5 pCi/L, equal to the background value.
Well AB - Groundwater samples collected from Well AB detected concentrationsof tritium above the further action criterion for tritium (20,000 pCiiL).Concentrations of tritium defected in groundwater samples collected from Well ABhave ranged from 280,000 to 409,000 pCi/L. A trend graph of tritiumconcentrations is presented on Figure 1-12, in Appendix I. Boron analysis has notbeen performed on groundwater samples collected from this well due to elevatedtritium results. Comparing tritium concentrations in local groundwater to SpentFuel Pool indicate that the groundwater is 0.14% to 0.20% Spent Fuel Pool water.Groundwater age dating suggests an age of about 1.38 years. No plant relatedgamma-emitting isotopes have been detected in Well AB. The Tc-99concentration in the groundwater sample collected from this well is 0.4 pCi/L,slightly below the background value of 0.5 pCi/L.
61

Remedial Investigation ReportPSEG Nuclear, LLCSalem Generating StationHancock's Bridge, New Jersey
Well AD - Groundwater samples collected from Well AD detected concentrationsof tritium above the further action criterion for tritium (20,000 pCi/L).Concentrations of tritium detected in groundwater samples collected from Well ADhave ranged from 220,000 to 487,000 pCi/L. A trend graph of tritiumconcentrations is presented on Figure 1-1, in Appendix I. Boronanalysis has notbeen performed on groundwater samples collected from this well due to elevatedtritium results. Comparing tritium concentrations in local groundwater to SpentFuel Pool indicates that 0.11% to 0.24% of the ground-water is Spent Fuel Poolwater. Water samples from this well were not analyzed for age dating or Tc-99.No plant related gamma-emitting isotopes have been detected in Well AD.
Well AF - Groundwater samples collected from Well AF did not detect tritium.concentrations above the further investigation criterion for tritium (3,000 pCi/L).Concentrations in Well AF have ranged from non-detect to 330 pCi/L. The
* analytical results of the low-level tritium analysis performed at the University ofRochester indicated a tritium concentration of 245 pCi/L. The groundwater agedetermination for the sample collected from Well AF indicates an age ofapproximately 10 years. A trend graph of tritium concentrations is presented onFigure 1-14, in Appendix I. Boron has been detected at concentrations between0.380 mg/L and 0.429 mg/L consistent with background levels for Artificial Island.The Tc-99 concentration detected in the groundwater sample collected in this wellis consistent with regional background concentrations. No plant related gamma-emitting isotopes have been detected in Well AF.
8.3 Delaware River Tritium Concentrations
Based on the analytical results of groundwater samples collected from the monitoring wellsplaced near the Station boundary with the Delaware River, the tritium detected in theshallow, water-bearing unit is not releasing to the Delaware River at concentrations thatcould violate any exiting standard.
A groundwater model is being developed that will provide a quantitative assurance that thetritium in the shallow, water-bearing unit will continue to meet all off-site regulatorystandards for tritium. Sampling and analysis of the Delaware River in the vicinity of Salemis routinely conducted and reported under the Radiological Environmental MonitoringProgram ("REMP"). A surface water sampling program was evaluated and determined tobe impracticable. The tritium contamination in the shallow, water-bearing unit would notbe expected to be discernable in the Delaware River even if a release occurred because:
Based on the location and extent of the plume as determined by sitesampling, tritium concentrations from the shallow, water-bearing unitwould not be detected in the Delaware River;
62
Remedial Investigation Report
PSEG Nuclear, LLCSalem Generating StationHancock's Bridge, New Jersey
2. The ambient tritium levels fluctuate in the environment as shown in thehistorical Radiological Environmental Monitoring Reports (RERRs)submitted annually. There is no viable method of distinguishing low levelambient tritium in the Delaware River from any shallow, water-bearingunit discharge;
3. The volume, velocity, and bi-directional tidal flow of the Delaware Riverprevent making generalizations regarding the transport of tritium in theriver and distinguishing between potential sources including routinepermitted discharges; and,
4. Analyses conducted on shallow, water-bearing unit show the only facilityrelated parameter to be tritium; no plant related gamma emitters have beendetected. Therefore, there are no "tracer" parameters that can be used todefine the source of any tritium detected; and,
5. Delaware River sediment sampling would not provide any useful dataregarding a potential release of tritium from the shallow, water-bearingunit as tritium is water and will not adsorb to soil or sediment.
Based on these evaluations, no sampling of the Delaware River water or sediment fortritium has been. conducted for this remedial investigation. A mathematical model of thepotential concentrations in the Delaware River will be developed to provide the informationfor adapting the remedial action plan to ensure there is no release to the Delaware Riverabove a regulatory standard as well as validating that there is no significant impact to theenvironment. The model will serve as the basis for evaluating tritium mass flux to theDelaware River and to assess remedialsystem performance.
The groundwater flow model will be constructed using the computer programMODFLOW, a publicly available groundwater flow simulation program developed by theUSGS. MODFLOW is thoroughly documented, widely used by consultants, governmentagencies and researchers, and is consistently accepted in regulatory proceedings. Thehydrogeologic studies conducted and samples collected for the tritium investigation will beused to define model parameters.
A solute transport model will be used to simulate the movement of tritium considering theprocesses advection, dispersion, and radioactive decay. The solute transport modeling willbe performed using MT3D, a three-dimensional solute transport program developed by theUS Environmental Protection Agency. MT3D is used in conjunction with MODFLOW,thereby providing a seamless transition from the groundwater flow model to the solutetransport modeling. Similar to MODFLOW, MT3D is thoroughly documented androutinely used in regulatory proceeding.
63

Remedial Investigation, Report
PSEG Nuclear, LLCSalem Generating StationHancock's Bridge, New Jersey
9 Fate and Transport Analysis
Shallow groundwater in the vicinity of the Station has been impacted by a release of waterfrom the Spent Fuel Pool. The pathway from the building to the environment cannot bedocumented with absolute certainty; however, site evidence, indicates the seismic gapbetween the Salem Unit I Fuel Handling Building and Auxiliary Building is the primaryrelease point. The origin of the water in the seismic gap is the Spent Fuel Pool and thepathway from the Spent Fuel Pool is discussed in Section 5. This release has resulted in aplume of boron and tritium extending south-southwest from this point-of-origin as shownon Figure 13; no other contaminates of significance have been detected in the affected area.The fate and transport of this plume is assessed in this section to determine flow pathwaysand the rate of migration.
Quantification of solute migration requires specification of various transport parametersand processes that control the rate, movement, mixing, sorption, and degradation of acontaminant in the subsurface. Advection defines the process of contaminant migrationdue to the movement of groundwater. Dispersion accounts for the spreading and mixing ofthe constituent due to heterogeneities and non-ideal flow paths in the soil that cause.variations in the groundwater velocity as well as Fickian diffusion driven by concentrationgradients. Sorption refers to the partitioning of a contaminant between the liquid and solidphases of the aquifer. Degradation is the mass decay of a contaminant as a result ofphysical, chemical, and biological activity within the aquifer. Each of these processes andtheir effect on the movement of site related constituents along flow pathways aresummarized in the following sections.
9.1 Constituent Pathways -Advective Water Movement
Water-level measurements taken in monitoring wells distributed spatially across the siteand distributed within several depth intervals provide the necessary information to describethe direction of groundwater movement. These water-level measurements are combined.with effective porosity and hydraulic conductivity measurements .to determine the rate orspeed of groundwater movement. In general, water-level measurements are used to definethe slope of the water table (gradient) and direction of movement; groundwater movesdown the slope or gradient from high water table elevations to lower water table, elevations.Water level elevations, hydraulic gradients, and groundwater flow directions for theshallow, water-bearing unit are presented on Figure 14. Based upon both water levels andconstituent concentrations, the primary flow pathways are away from the seismic gaptoward the south-southwest. Along individual flow paths there is a decrease in both water-level elevations and concentrations of isotopes of interest.
The movement of a solute with the groundwater, or advective transport, can be computedusing Darcy's Law. Darcy's Law is written as follows:
64

Remedial Investigation ReportPSEG Nuclear, LLCSalem Generating StationHancock's Bridge, New Jersey
q=Ki (1)
where, q is the Darcian flux (ft3/day/ft2 or ft/day), K is the hydraulic conductivity (ft/day),and i is the hydraulic gradient (ft/ft). Aquifer testing at the Site (Section 7.5) hasdetermined that the mean hydraulic conductivity of the soils affected by tritium to beapproximately 0.4 ft/day. The average hydraulic gradients are approximately 0.008 ft/ftand 0.004 ft/ft inside and outside the cofferdam, respectively. Therefore, the specificdischarge of groundwater inside and outside the cofferdam is 0.0032 ft/day and 0.0016ft/day, respectively. Since water can only move through the pore spaces, these values arenot the velocities at which groundwater is moving. The average linear velocity ofgroundwater is higher as water moves only through the voids or pore spaces of the soil:
= (2)YO
where v is thevelocity (ft/day) and 0, is the effective porosity (ft3/ft3). The effectiveporosity for the unconsolidated sediments at the site was assumed to be 0.20. This value isconsistent with estimates developed by the USEPA (1989) that indicate most medium tocoarse-grained soils (Unified Soil Classification System textural groups GW, GP, GM, GC,SW, SP, SM, and SC) have an effective porosity of approximately 0.2. The groundwatervelocity inside and outside the cofferdam computed from the average flow rates and aneffective porosity of 0.2, are 5.8 ft/yr (0.0032/0.2*365) and 2.9 ft/yr (0.0016/0.2*365),respectively. Applying the higher of these velocities over the groundwater pathwaybetween the seismic gap and the 500,000 pCi/L contour, indicates the plume is 31 yearsold. This travel time or age of the tritium plume is inconsistent with facility data, otherobserved, modeled, and calculated data, and it is longer than the facility has been inoperation. These slow travel velocities indicate that the hydraulic conductivity value fromthe pumping tests are biased low; the use of drawdown data in the pumping well as the onlyobservation point for each test precludes assessment of well efficiency which increasedrawdown in the pumping well. The pumping test data and analysis did provide accurateinformation concerning sustained yield for the design of a groundwater containmentsystem.
9.2 Water Balance Estimate of Groundwater Velocities
To assess this discrepancy and develop'a better estimate of groundwater velocities andtravel times, an alternative method based upon continuity and a water balance approach,was used to estimate the hydraulic conductivity and groundwater velocities. The plumeand the impacted groundwater are located in a hydrologically isolated portion of the.facility; the source for all of the groundwater within the plume, originates from within theplume. Therefore, if we know how much water is moving along a flow path (the rechargerate), the length of the flow path (seismic gap to the 500,000 pCi/L isopleth), the saturatedthickness of the aquifer (about 15 feet within the cofferdam and 35 feet outside the
65

Remedial Investigation Report
PSEG Nuclear, LLCSalem Generating StationHancock's Bridge, New Jersey
cofferdam), and hydraulic gradient (the water table slope is .0.008 inside the cofferdam and0.004 outside the cofferdam), an effective or mean hydraulic conductivity can be computed.
Figure 18 illustrates the idealized flow path from the seismic gap to the 500,000 pCi/Lisopleth. The total flow per unit width at a point along this pathline is:
q =Kib (3)
where b is the saturated aquifer thickness. Equation (3) is also equal to thecumulativerecharge upgradient from a point where (3) is applied:
q =LN (4)
where N isthe recharge and L is the upgradient flow path length. Recharge or percolationis the flux to the water table; a portion of precipitation impacts the land surface, a portionruns off, the remainder infiltrates •into the groundwater, and the fraction that infiltrateswhich does not become evapotranspiration is recharge. The total length of a flow path fromthe seismic gap to the 500,000 pCi/L isopleth is approximately 186 feet, 102 feet from theseismic gap to the limit of the cofferdam (section 1), with an additional 84 feet from thelimit of the cofferdam to the 500,000 pCi/L contour (section 2). If we equate equations (3)and. (4), assume a recharge rate of 8 in/year, and apply them to section 1 of the flowpath onFigure 18, we can write the following:,
K, i1 b, L, N
K X0.008- /tx 15 ft= 102ft x 0.67 fyr
102 0x.67 = 5 7 0 f 'orl'K,-57 t r100.008 x 15 ly day
In summaray, if the percolation rate is approximately 8 iniyr, the effective hydraulicconductivity of the saturated soils above the cofferdam is about 1.6 ft/day. Similarly, if therecharge rate were 16 in/yr, the effective hydraulic conductivity of the saturated soils abovethe cofferdam would be double or about 3.2 ft/day.
Repeating these calculations for Section 2 of the flowpath on Figure 18, and noting that thetotal amount of water through this section also includes the flow through section 1, we can,write the following:
K2 i2 b 2 LIN+L 2 N = N(LI +L2)
66

Remedial Investigation Report
PSEG Nuclear, LLCSalem Generating StationHancock's Bridge, New Jersey
K2 x 0.00.4 -ftlx 3 5 ft 0. 6 7 ftl y(102 ft + 84 ft)
186x0.67 - 8 9 0 ft or2.4f
0.004 x 35 yT day
In summary, if the percolation rate is approximately 8 in/yr, the effective hydraulicconductivity of the saturated soils outside the cofferdam is about 2.4 ftday. Similarly, ifthe recharge rate were 16 in/yr, the effective hydraulic conductivity of the saturated soilsoutside the cofferdam would be double or 4.8 ft/day.
Consistent with Section 9.1 above, groundwater velocities were computed using thesealternative hydraulic conductivity values developed using equations (3) and (4). Thegroundwater velocity inside and outside the cofferdam computed from the averagehydraulic gradients, an effective porosity of 0.2, and a recharge rate of 8 in/yr are 23.4 ft/yr(1.6*0.008/0.2*365) and 17.5 ftyr (2.4*0.004/0.2*365), respectively. Similarly, if therecharge rate were 16 in/yr, then the groundwater velocity inside and outside the cofferdamwould be 46.7 ft/yr (3.2*0.008/0.2*365) and 35.0 ft/yr (4.8*0.004/0.2*365), respectively.Applying these velocities over the groundwater pathway between the seismic gap and the500,000 pCi/L contour, the plume is between 4.6 and 9.2 years old. This estimated age ofthe tritium plume is consistent with general hydrogeologic conditions and available facilityoperation records, and groundwater age results.
9.3 Sorptive Processes
The term sorption refers to the removal of a solute from solution through association with asolid surface. This attraction between a soil surface and a solute can result from a numberof forces. The effects of these forces or processes are commonly described by sorptionisotherms. These isotherms assume that when a solution contacts a solid, the solute willtend to transfer from liquid to solid until the concentration of solute in solution is inequilibrium with the soil concentration. These processes, especially for inorganiccompounds, tend to be pH dependent, not always completely irreversible, and site specific.With respect to the constituents found in groundwater at the Salem site, this process has noeffect on the movement of tritiated water and only a minor effect on the movement ofboron; however, this process is important to understanding why the other dissolvedconstituents identified in the seismic gap have not been found in Site monitoring wells.
Table 1 summarizes the complete list of constituents found in the Spent Fuel Pool andpotentially in the seismic gap and adjacent groundwater as well as their sorptivecharacteristics to soil. Columns 4 and 5 summarize the range in literature reporteddistribution coefficients. The distribution coefficient (Kd) is defined as follows:
67

Remedial Investigation ReportPSEG Nuclear, LLCSalem Generating StationHancock's Bridge, New Jersey
Kd = Soil Concentration (5)
Dissolved Concentration
Therefore, the higher the distribution coefficient, the more strongly a constituent will stick(i.e., adsorb and absorb) to soils. The range in values reported in Table 1 is most stronglycorrelated to pH and amount of clay or fines in site soils. Solutes dissolved in low pHwater in soils without fine materials will tend to adsorb to soils and have Kd in the lowerreported range. Solutes dissolved in neutral pH water (consistent with site conditions) Witha quantifiable fraction of fine sediments (the site soils have a minimum of 5% silt and clay)will tend not to adsorb to soils and have Kd in the lower reported range. This process ofexchange and interaction between solute and soil will also cause solutes to move slowerthan the groundwater. This ratio of the groundwater velocity to the solute velocity iscaused the retardation factor. The retardation factor can be computed from the distributioncoefficient using the following equation:
Rf +PbKd~0--
where Pb is the bulk density. Gamma emitting isotopes are absent from site monitoringwells because they have adsorbed to soils near the seismic gap- and are moving at only afraction of the speed of the tritium and boron.
9.4 Degradation
With the exception of boron, all site related constituents degrade. Table 1 summarizes thehalf-lives for each constituent.
9.5 Dispersion
Dispersion is the process whereby contaminants spread over a greater region than wouldbe predicted solely from the average linear groundwater velocity. Dispersion occurs atmultiple scales. The primary cause of dispersion is variations in groundwater velocity, ona microscale by variations in pore size and on a macroscale by variations in hydraulicconductivity. The hydrodynamic dispersion tensor is complex. For isotropic media, thedispersion coefficient written to incorporate molecular diffusion (described byFick's
Law), is calculated as follows:
D= ad v + D (7)
68

Remedial Investigation ReportPSEG Nuclear, LLCSalem Generating StationHancock's Bridge, New Jersey
where D, is the dispersion coefficient [L2/T], Otd is the dispersivity [L], v is thegroundwater velocity [L/T], and D the molecular diffusion coefficient [L2/T].
While the general process of dispersion is understood, the dispersivity of a formation isnot easily measured or quantified at the field scale. Therefore, as dispersion is related toporewater velocities, plume travel distance is the single most important factor that-can becorrelated to dispersivity. This general relationship is best illustrated in a figure developedby Gelhar et al. (1992). If we consider Figure 19, the scale of the plume is about 180 ft (60in), which corresponds to a longitudinal dispersivity of approximately 3.3 m. Thegroundwater velocity is about 9 mryr, and molecular diffusion for most common ions is onthe order of 2xl 09 m2/s (or 0.0631 m2/yr). Substituting these values into equation (7),yields:
D4 =3.3mx9m r +0.0631mXyryr y
22De=29.7m +0.0631m •/7
Comparison of the above two terms, indicates that movement of the primary constituents atthe site (tritium and boron) is primarily an advectively driven process as the first term isapproximately 500 times larger than the second. The site data also reflects this, withslightly elevated levels of tritium extending approximately 75 feet downgradient of theleading edge of the center of mass of the plume.
9.6 Tritium Age Dating and Groundwater Travel Time
The most effective use of groundwater age dating in transport analyses is in thedetermination of the vertical component of groundwater velocity and the recharge rate tothe aquifer. The shallow wells inside of the cofferdam (Wells N, 0, M, and AE) haveeffectively "zero tritium- 3He ages" because of the shallow depth of the wells below thewater table, the screened interval's exposure to air (i.e., interval above the water table) andthe introduction of atmospheric gases during monitoring well installation activities. Thewells outside of the cofferdams (Wells S, AA, and AB) that are directly downgradient fromthe seismic gap have ages from which one can estimate recharge. For Well S, thecalculation of age determination has tritium moving over the top of the cofferdam (at -13feet and zero tritium-3He age) to the mid-point of the screened interval at S (-18 feet) or 5vertical feet in 0.7 years (7 +/- 2 feet/yr). This change in vertical elevation for the tritiumplume is equivalent to a recharge of 16 in/yr (assumes a porosity of 0.2). A similarcalculation for Well AB, as the plume moves from -13 feet at the cofferdam to -23 feet atthe well, yields a recharge rate of 17 in/yr (vertical movement of 10 feet in 1.4 years). Asimilar calculation can be made for Well AA. Because AA is not tritium contaminated, theflow line did not originate at the lean concrete at the top of the cofferdam but rather at the
69

Remedial Investigation Report
PSEG Nuclear, LLCSalem Generating StationHancock's Bridge, New Jersey
seasonally low water table in the vicinity of well S. The "clock" for this age system is notset until approximately 3 feet below the water table. Thus, we have the flow from -3 feetto -18 feet (mid-point of screen) in 2.1 years or 7 feet/yr, equal to 16 in/yr of recharge. Theagreement in recharge estimates for the three wells is somewhat fortuitous but it canreasonably be characterized as 16 +/- 4 in/yr or about 40% of annual precipitation. Thisestimate of 40% is consistent with other flow systems that have limited evapotransporation(i.e., no grass or trees). Other wells that are screened at the 35-foot level (Wells Z, U, T,
and W) have ages of about 3 to 4 years for 20-25 feet of vertical travel, equal to a verticalvelocity of 6 to 8 feet/yr. The recharge estimate can then be used in the water balancecalculation (Section 9.2) to estimate horizontal transport. The calculations based ongroundwater ages agree with the estimates based on the physical properties of the structuralfill (e.g., aquifer pumping tests) and water balance calculations.
0
70

Remedial Investigation ReportPSEG Nuclear, LLCSalem Generating StationHancock's Bridge, New Jersey
10 Health and Environmental Risk Assessment
The principal radionuclide of concern for this remedial investigation is tritium in shallowgroundwater adjacent to Salem Generating Station Unit 1. To date, a completed exposurepathway to humans from tritium in shallow groundwater has not been established, nor isthere any evidence that significant exposures of biota have occurred. However, since theremedial investigation is continuing, there is a still a possibility that findings might indicatethat significant amounts of tritium have migrated to off-site locations, or could be expectedto do so, under certain conditions. Therefore, there should be a conceptual approach thatoutlines the methodology that will be followed in assessing potential impacts on humanhealth and the environment from any such occurrence. This conceptual approach ispresented in Section 6.3, following brief discussions of on-site and off-site environmentaldata for tritium.
10.1 On-Site Environmental Data for Tritium
Concentrations of tritium in groundwater samples taken over time from monitoring wellson the Salem Site provide the most important data set for characterizing the inventory oftritium that could potentially migrate to off-site locations. If transport from shallowgroundwater to off-site locations were observed or assumed to occur, data from monitoringwells would be used as input to an analysis of environmental transport to locations wherehumans or biota could be exposed. Data on concentrations over time at various on-sitelocations could be used to calibrate a dynamic environmental transport model to projectfuture releases. Knowledge of the age of tritiumn in on-site environmental samples isneeded to determine if releases occurred many years ago or are recent and, perhaps,continuing at the present time.
10.2 Off-Site Environmental Data for Tritium
The program of off-site environmental monitoring at the Salem Station has not detectedtritium in environmental media or biota at concentrations above the lower limit of detectionin routine sampling procedures. Routine off-site environmental monitoring data willcontinue to be examined for indications that tritium in shallow groundwater at the SalemStation has migrated beyond the Station boundary.
In evaluating environmental monitoring data, it is important toxrecognize that allenvironmental media and living organisms contain low levels of tritium from two sourcesthat are unrelated to operations at the Salem Station: (1) naturally occurring tritium that iscontinually produced by interactions of cosmic radiation with constituents of the earth'satmosphere, and (2) tritium that was injected into the atmosphere during the period ofabove-ground testing of nuclear weapons that ended in the early 1960s. Tritium from thosesources occurs as tritiated water, which is transported in the environment and incorporated
71

Remedial Investigation Report
PSEG Nuclear, LLC.Salem Generating StationHancock's Bridge, New Jersey
into tissues of all organisms by the natural movement of water. This remedial investigationis concerned only with uncontrolled or unexpected releases of tritium to off-site locations,but not with levels due to natural production in the atmosphere and residual contaminationfrom nuclear-weapons testing.
10.3 Methodology for Health and Environmental Risk Assessment
The following sections discuss the steps to be taken to perform a health and environmentalrisk assessment if tritium were released, or assumed to be released, to locations beyond thesite boundary under uncontrolledor unpermitted conditions.
10.3.1 Identification of Exposure Pathways
Since tritium in the environment normally is in the form of tritiated water, exposures ofhumans and biota occur as a result of intakes of contaminated water by various pathways.When tritium is found in groundwater or surface water, the most important pathway ofexposure of humans often is direct consumption of tritium in drinking water obtained from.a contaminated source. Consumption of contaminated plant and animal products, includingfish, also can be important exposure pathways for humans. A third potential exposurepathway for humans is inhalation and skin absorption of tritiated water vapor. Thispathway can be important if an on-site release of tritiated water vapor occurs and airbornetritium is transported to off-site receptor locations. External exposure to tritium is not aconcern, because tritium emits only very low-energy electrons (beta particles) that cannotpenetrate the outer dead layer of.skin.
Doses and risks to humans occur only when there is a completed exposure pathway. If noexposure pathways are known to exist, an assumption that humans are being exposed toknown sources of tritium in the environment (either on-site or off-site) can be made for thepurpose of obtaining bounding estimates of potential doses and risks. For example, directconsumption of tritium in shallow groundwater at the Salem site can be assumed, eventhough that pathway is precluded by institutional controls that are maintained at the site.Such bounding analyses are hypothetical, but they are useful in evaluating the potentialimportance of assumed levels of environmental contamination. However, it is important toemphasize that calculated doses are credible only if there is a completed exposure pathway.
Doses to aquatic and terrestrial biota due to tritium in the environment normally can beestimated on the basis of an assumption that organisms reside in a contaminated medium(e.g., surface water) and that concentrations of tritium in tissues of organisms are the sameas concentrations of tritium in water in the medium. Since tritium in the environmentbehaves in the same way as water, tritium is not concentrated in tissues of organismscompared with levels in contaminated environmental media.
72

Remedial Investigation Report
PSEG Nuclear, LLCSalem Generating StationHancock's Bridge, New Jersey
10.3.2 Identification and Characterization of Potentially Exposed Individuals and Biota
A realistic assessment of doses and risks to humans requires knowledge of the locations andliving habits of potentially exposed individuals. However, for purposes of a boundinganalysis, it is often assumed that humans are exposed at locations of highest concentrationsin the environment beyond the site boundary, even though there may be no receptors atthose locations at the present time. Assumptions about locations and exposures of potentialreceptors can be basedon readily available demographic information on the localpopulation, augmented by standard assumptions about living habits of typical members ofthe general public. The level of detail in characterizing potential receptors should becommensurate with expected levels of environmental contamination and associated dosesand risks.
A detailed characterization of local flora and fauna is not required in evaluating impacts oftritium (and other radionuclides) on biota, because current guidance on protection of biotais based on assumptions about the effects of ionizing radiation on the most sensitive speciesof aquatic animals and terrestrial plants and animals. Thus, an assessment of potentialimpacts on biota can be based on an assumption that all organisms are located where thehighest concentrations of tritium in environmental media occur.
10.3.3 Approach to Calculation of Doses to Humans and Comparisons with Applicable Standards
On the basis of estimated concentrations of tritium in environmental media, including theirdependence on time, and assumptions about exposure pathways, it is a straightforwardprocedure to estimate radiation doses to humans. In general, dose is calculated as theproduct of an activity concentration of tritium in a material (air, water, or foodstuff) used byhumans, an assumed intake of that material by ingestion, inhalation, or skin absorption, andestimated doses per unit activity intake of tritium by each route.
Using the drinking water pathway as an example, the dose to an exposed individual iscalculated as the product of (1) the concentration of tritium in the source of water beingconsumed, (2) the quantity of water consumed over the period of concern, and (3) the doseper unit activity intake of tritium by ingestion. The first factor is based on environmentalmeasurements or projections of future contamination; the second factor is an appropriateassumption for the exposure pathway of concern, such as a consumption rate of 2 liters (L)per day of drinking water; and the third factor is a standard value calculated by theInternational Commission on Radiological Protection (ICRP), with an appropriatemodification that takes into account the biological effectiveness of beta particles emitted intritium decay. An example dose calculation for tritium in drinking water is given inAppendix I (Kocher 2003).
73

Remedial Investigation ReportPSEG Nuclear, LLC
Salem Generating StationHancock's Bridge, New Jersey
A number of regulatory standards are applicable to control of exposures to tritium at theSalem Station. In regard to releases of tritium beyond the Station boundary, the applicablestandards include (1) the NRC's radiation protection standards for the public in 10 CFRPart 20, which specify limits on concentrations of tritium (and other radionuclides)in air orwater at the boundary and also specify that annual doses to individual members of thepublic from airborne releases shall comply with standards established by the EPA under theClean Air Act in 40 CFR Part 61, and (2) the EPA's uranium fuel-cycle standards in 40CFR Part 190, which specify limits on annual doses to individual members of the publicfrom all release and exposure pathways combined. The two EPA standards differ from theNRC standards in IQ CFR Part 20 in that they apply at locations where members of thepublic are exposed, rather than at the Station boundary. The standard for airborne releasesof tritium in EPA's Clean Air Act standards is a limit on annual effective dose equivalent of10 mrem, and the limit for all release pathways in EPA's fuel-cycle standards is an annual
dose equivalent to the whole body of 25 mrem. The effective dose equivalent and doseequivalent to the whole body are assumed to be the same for tritium.
* The NRC's 10 CFR Part 20 also includes requirements for protection of workers within theStation boundary in the form of limits on annual effective dose equivalent and limits onconcentrations of radionuclides in air and water. In addition, the EPA's drinking waterstandards in 40 CFR Part 141, which specify concentration limits for individualradionuclides in drinking water, are applied as groundwater protection requirements by theState of New Jersey. The drinking water standard for tritium is a concentration limit of20,000 pCi/L. A comprehensive assessment of potential impacts of releases on humansshould include comparisons of measured or calculated concentrations or doses withrelevant regulatory requirements.
10.3.4 Approach to Calculation~of Doses to Biota and Comparisons with Applicable Guidance
Measured or calculated concentrations of tritium in environmental media, especiallysurface water, also are used to estimate doses to aquatic and terrestrial biota. Becausetritium in the environment behaves the same as water, doses to biota are calculated on the
basis of an assumption that the activity per unit mass of water in tissues of organisms is thesame as the activity per unit mass of water in the environmental medium to which anorganism is exposed. Bounding estimates of dose to biota can be based on the highestmeasured or projected concentrations in water.
The NRC and EPA have not established standards to limit radiation exposures of biota.However, guidance on dose limits for biota, which are intended to ensure adequateprotection of populations of the most sensitive species, has been developed by expert
groups and adopted by the U.S. Department of Energy; this guidance is summarized inAppendix I. The consensus dose limits for biota, which are 0.1 or I rad/day depending on
0 74

Remedial Investigation Report
PSEG Nuclear, LLCSalem Generating StationHancock's Bridge, New Jersey
the type of organism, are much higher than applicable dose limits for individual workers ormembers of the public.
10.3.5 Approach to Calculation of Health Risks to Humans
Once doses to humans are estimated, the associated risks to human health, specifically therisks of cancer incidence associated with an exposure, can be estimated on the basis of anassumption about the cancer risk per unit dose. Estimates of cancer risk assume that anyadditional dose entails some risk and that risk is proportional to the dose from exposure tothe source of concern. For purposes of assessing cancer risks in general terms, exposureover a lifetime often is assumed, and the assumed risk per unit dose is an average valueover an individual's normal life span of about 70 years. An example calculation of thelifetime risk of cancer incidence from consumption of tritium in drinking water is given inAppendix I.
Estimates of health risks from exposure to tritium, or any other environmental contaminant,can be used to provide a perspective on the significance of estimated exposures. Bycomparing calculated cancer risks with other risks experienced in everyday life, includingunavoidable risks from exposure to natural background radiation, a frame of reference thatwould allow affected individuals to judge the significance of potential exposures isprovided.
For example, a useful frame of reference for evaluating the significance of doses due toreleases of tritium would be to compare estimated doses with doses from exposure tonaturally occurring tritium produced in the atmosphere and tritium produced byatmospheric testing of nuclear weapons. Doses from these sources are unavoidable and areexperienced by all members of the public. The National Council on Radiation Protectionand Measurements (NCRP) has estimated that the annual dose from exposure to naturallyoccurring tritium produced in the atmosphere is about 0.001 millirem (mrem), and theannual dose from exposure to tritium produced by atmospheric testing of nuclear weaponscurrently is about 0.003 mrem (NCRP 1979). In comparison, the total annual dose from allsources of natural background radiation is about 100 mrem, excluding indoor radon, andabout 300 mrem if indoor radon is included.
Estimates of health risks as described above are not relevant for biota, because cancer is nota biological effect of concern and current guidance on dose limits is based on anassumption that all species will be adequately protected if doses are maintained belowspecified limits, even though individual members of species may be harmed. Potentialimpacts on species can be indicated in a general way by comparing estimated doses withdose limits in the guidance. The lower the estimated doses relative to the limits, the greaterthe margin of safety in protecting species of aquatic and terrestrial biota.
75
Remedial Investigation ReportPSEG Nuclear, LLCSalem Generating Station.Hancock's Bridge, New Jersey
10.4 Assessment of Potential Off-Site Exposures of Humans and Biota
There is no evidence to date to indicate that a significant quantity of tritium in groundwaterhas migrated or is presently migrating beyond the boundary of the Salem site. Elevatedlevels of tritium have been found only in the water table aquifer on the site, and there is noevidence that tritium in shallow groundwater has migrated directly to the Delaware River orto an underlying aquifer that provides a source of drinking water for the local population.
Thus, on the basis of present knowledge, an exposure pathway to humans beyond the siteboundary or to biota has not been completed; and there is no basis for performing anassessment of potential off-site exposures of humans and biota.
76
Remedial Investigation Report
PSEG Nuclear, LLCSalem Generating StationHancock's Bridge, New Jersey
11 Conclusions and Recommendations
The following sections provide conclusions and recommendations based on the results ofremedial investigation activities conducted to date.
11.1 Conclusions
The following detailed conclusions are presented that support the evidence that the sourceof tritium detected in groundwater was the Spent Fuel Pool, the tritium released to theenvironment has been stopped, and that tritium has not migrated to the property boundaryabove any regulatory limit:
1. There was a release of water from the Spent Fuel Pool system resulting fromblockage of the telltale drains by mineral precipitates. The telltale drains are a leakmonitoring, collection, and drainage mechanism specifically designed to collectleakage that may accumulate behind the stainless steel liner of the Spent Fuel Pooland Refueling Canal. The blockage of the telltale drains resulted in theaccumulation of water from the Spent Fuel Pool system (between the liner and theconcrete wall) that created hydrostatic head and facilitated migration to theStyrofoam-filled seismic gap located between the Salem Unit I Fuel HandlingBuilding and Auxiliary Building. The mineral precipitates have been physicallyremoved to ensure the proper operation of the telltale drains. The process ofmonitoring the telltale drains is routinely performed to ensure that blockage doesnot reoccur. Permanent seismic gap drains are being installed to facilitate controlof the accumulation of water in the seismic gap, and to create an ingradient to thegap;
2. The release of water from the Spent Fuel Pool system was investigated through thesampling of monitoring wells installed in the area of Salem Unit 1. Thegroundwater analytical data collected from the monitoring well network were usedto delineate an area of groundwater in the shallow, water-bearing unit that containselevated concentrations of tritium. Gamma-emitting isotopes were also monitoredin the groundwater samples collected from the monitoring wells because thesuspected source of the tritium was the Spent Fuel Pool. No plant related gamma-emitting isotopes have been detected in groundwater samples collected from themonitoring wells;
3. The area of groundwater containing elevated tritium extends from the southern endof the Styrofoam seismic gap located between the Salem Auxiliary Building andthe Salem Unit I Reactor Containment Building in a southerly direction toward thecirculation water discharge pipes. Groundwater with tritium at concentrations
77
Remedial Investigation ReportPSEG Nuclear, LLCSalem.Generating StationHancock's Bridge, New Jersey
exceeding any regulatory limit has not migrated to the property boundary of theStation;
4. Elevated levels of tritium have only been detected in groundwater samplescollected from the shallow, water-bearing unit. There is no evidence that suggeststhat water from the Spent Fuel Pool has migrated to an underlying aquifer asconfirmed by groundwatersamples collected from monitoring wells screened inthe Vincentown Formation;.
5. A completed exposure pathway to humans from .tritium in shallow groundwater.has not been established, nor is there any evidence that significant exposures ofbiota have occurred.
11.2 Recommendations
Based on the conclusions of the remedial investigation, the following recommendations arepresented:
1. Continued groundwater monitoring should be conducted on a periodic basis. Thisgroundwater monitoring should include the collection of groundwater samplesfrom monitoring wells screened in the shallow, water-bearing unit on a monthly orquarterly basis, to be determined based on quantitative parameters. During thesesampling events, depth to water-level measurements should be collected from sitemonitoring wells. Groundwater samples should also be collected from monitoringwells screened in the Vincentown Formation on a semi-annual basis.
2. A pilot test should be conducted to evaluate the feasibility of groundwaterextraction, to provide engineering data to support the extraction system design, andto initially contain the furthermigration of tritium in groundwater near Salem Unit
3. A Remedial Action Workplan (RAW) should be prepared in accordance with the
Technical Requirements for Site Remediation (N.J.A.C. 7:26E). The RAW will be
submitted within 90 days of approval of the Remedial Investigation Report.
78

Remedial Investigation ReportPSEG Nuclear, LLCSalem Generating StationHancock's Bridge, New Jersey
12 References
ARCADIS, June 2003; Remedial Investigation Work Plan, PSEG Nuclear LLC, SalemGenerating Station, Hancock's Bridge, New Jersey.
ARCADIS, January 2004; Initial Groundwater Investigation Report and RemedialInvestigation Work Plan Addendum, PSEG Nuclear LLC,. Salem Generating Station,Hancock's Bridge, New Jersey.
Dames & Moore, August 28, 1968, Report, Foundation Studies, Proposed Salem
Generating Station.
Dames & Moore, December] 6, 1968, Report, Groundwater Supply Investigation, SalemGenerating Station.
Dames & Moore, April 9, 1969, Supplemental Report, Control of Excavation, SalemGenerating Station.
Dames & Moore, June 3, 1970, Report, Supplementary Studies, Proposed SalemGenerating Station.
Dames & Moore, June 20, 1972, Report, Consultation, Proposed Heavy Equipment HaulRoad, Salem Generating Station.
Dames & Moore, February 7, 1974, Design, High Water Levels, Proposed Hope CreekGenerating Station.
Dames & Moore, May 23, 1974, Report, Foundation Studies, Proposed Hope CreekGenerating Station.
Dames & Moore, July 6,1976, Report Auxiliary Boring Program Along Service WaterSupply Lines, Hope Creek Generating Station.
Dames & Moore, June 1977, Evaluation of Shoreline Stability, Hope Creek GeneratingStation.
Dames & Moore, February 27, 1981, Final Report, Seismic Ground Motion and SiteStability Evaluation at the Controlled Facilities Building, Salem Generating Station.
Dames & Moore, 1988, Final Report, Study of Long-Term Groundwater Withdrawals andWater-Supply Alternatives, Salem and Hope Creek Generating Stations.
79

Remedial Investigation ReportPSEG Nuclear, LLCSalem Generating StationHancock's Bridge, New Jersey
Dames & Moore, December 23, 1992; Report, Geotechnical Investigation and Evaluation,Proposed Oil-Water Separator Basin, Salem Generating Stations.
NJGS, 1995, Geologic Survey Report GSR 38, Ground-Water Flow Conditions in thePotomac-Raritan-Magothy aquifer System, Camden Area, New Jersey.
United States Department of Agriculture (USDA) Natural Resources Conservation ServiceNational Water & Climate Center. 1988. Field Office Guide to Climatic Data, lastrevised 18 November 1998.
'USGS, 1979, Geological Survey Professional Paper 1067-D, Upper Cenozoic Sediments ofthe LowerDelaware Valley and the Northern Delmarva Peninsula, New Jersey,Pennsylvania, Delaware, and Maryland.
USGS, 1999, Water-Resources investigations report. 98-4136, Hydroge01ogy of, Water
Withdrawal from, and Water levels and Chloride Concentrations in the MajorCoastal plain Aquifers of Gloucester and Salem Counties, New Jersey. West TrentonNew. Jersey.0
80

Table 01. Physical and Chemical Properties of Constituents of Concern, PSEG Nuclear, LLC, Salem Generating Station, Hancock's Bridge, New Jersey.
Kd (mL/g) Retardation Factor1
Molecular Specific Half-LifeConstituent of Concern Weight (gl/mol) Gravity
2 Minumum Maximum Recommended3
Minimum Maximum Recommended' Half-Life UnitsAntimony-125 124.905 6.68 0 10,000 3,981 1 68,901 27,431 2.758 years
Barium-133 132.906 3.62 NR NR - - - - 10.53 years
Barium-140/Lanthanum-140 139.911/139.909 3.62 NR NR - - - 12.75/1.678 days
Berium-7 7.0169 NR NR -- - - - 53.28 days
Boron 10.811 2.34 0 3,990 0 1.00 27,492 1 NR
Cerium-141 140.908 6.77 10 10,000. 1,000 69.9 68,901 6,891 32.5 days
Cerium-144 143.914 6.77 10 10,000 1,000 69.9 68,901 6,891 284.6 days
Cesium-133 132.906 1.93 1 100,000 501 7.89 689,001 3,454 NR
Cesium-134 133.907 1.93 1 100,000 501 7.89 689,001 3,454 2.065 years
Cesium-137 136.907 1.93 1 100,000 501 7.89 689,001 3,454 30.2 years
Chromium-51 50.945 7.15 1 1,000 40 7.89 6,891 275 27.7 days
Cobalt-58 57.936 8.86 0.1 1,000 10 1.689 6,891 70 70.88 days
Cobalt-60 59.934 8.86 0.1 1,000 10 1.689 6,891 70 5.271. years
Iodine-129 128.904 4.93 0.001 1 0.20 1.00689 9 2 1.70E+07 years
Iodine-131 130.906 4.93 0.001 2 . 0.20 1.00689 15 2 8.04 days
Iron-59 58.935 7.87 NR NR .- - - - 44.51 days
Manganese-54 53.94 7.3 NR NR "- -.. 312.1 . . days
Molybdenum-99 98.908 10.2 0 100 - 1 690 - 2.748 . days
Potassium-40 39.964 0.89 NR NR - - - 1.26E+09 years
Radium-Natural (Ra-226) 226.0254 5 5 1,000,000 100 35.45 6,890,001 690 1599 years
Ruthenium-103 102.906 12.1 100 1,000 158 690 6,891 1,093 39.27 days
Ruthenium-106 105.907 12.1 100 1,000 158 690 6,891 1,093 1.02 years
Silver-11iM 109.906 10.5 10 1,000 100 69.9 6,891 690 249.8 days
Sodium-22 21.994 0.97 NR NR - - - - 2.605 years
Technetium-99 98.906 11 0 100 0.001 1 690 1 2.13E+05 years
Tellurium-129M 128.906 6.24 NR NR - - - - 33.6 days
Tellurium-132 131.909 6.24 NR NR - - - - 3.26 days
Thorium-232 232.038 11.7 10 100,000 100 69.9 689,001 690 1.40E+10 years
Thorium-234 234.044 11.7 10 100,000 100 69.9 .689,001 690 24.1 days
Tritium 3.016 0.2693 0.001 0 0.001 1.00689 1 1 12.33 years
Uranium-235 235.044 19.1 0.1 1,000,000 40 1.689 6,890,001 275 7.04E+08 years
Zinc-65 64.929 7.14 0.1 10,000 16 1.689 68,901 110 243.8 days
Zirconiurm-95/Niobium-95 94.908 6.52 260 500 - 1792.4 3,446 - 64.02 days
NOTES:Assumes an effective porosity of 0.25 and a bulk density of 1.7225
NR Not Reported2 Value for the stable isotope
Based on Looney et al., 1988
Boron Kd values The table presents the entire range reported in the literature, mostly derived from soil systems. It is likely that Kd is negligible in low day, sandy aquifer sediments.
Looney, B.B., Grant, M.W., King, C.M., 1987, Estimation of Geochemical Parameters for Assessing Subsurface Transport at the Svannah River Plant: DPST-85-904.
Spitz K. and Moreno, J., 1996, A Practical Guide to Groundwater and Solute Transport Modeling: John Wiley and Sons, New York.
Montgomery J.H., 2000, Groundwater Chemicals Desk Reference: Lewis Publishers, Boca Raton.
Lide, D.R., 2003, CRC Handbook of Chemistry and Physics, 83rd Edition: CRC Press, Boca Raton.
References:

1 of I
Table 02. Groundwater Analytical Results, Phase I Investigation, October through November 2002,
PSEG Salem Generating Station, Hancock's Bridge, New Jersey.
Sample. Identification' and Collection Date
A2 B C26 C33 Al E A2 A2
Constituent of Concern 10/02/02 10/03/02 10/04/02 10/04/02 10/04/02 10/05/02 11/22/02 11/22/02
Major Cations and Anions (mg/L)
Boron NA NA NA NA NA 2,600 NA NA
Gamma Emmitting Isotopes (pCi/L)
Potassium-40 1,490 3,780 5,960 6,450 NA NA 1,760 1,970
Cesium-134 NA NA NA NA NA .118,000 NA NA
Cesium-137 NA NA NA NA NA 320,000 NA NA
Notes:mg/L-
pCi/LNA
Milligrams per literPicocuries per literConstituent not analyzedBold values exceed the laboratory detection limit.
Corresponds with sample locations shown on Figure 10.

of I
Table 03. Groundwater Analytical Results, Phase 1I Investigation, December 2002, PSEG Salem Generating Station, Hancock's Bridge, New Jersey.
Sample Sample Sodium Chlorine Boron Tritium Gamma Emmitting Isotopes (pCi/L)
Identification Date (mg/L) (mg/L) (mg/L) (pCi/L) Potassium-40 Chromium-51 Manga...e.54 Cobalt-58 Cobalt6 Antiony-125 Iodine-13 Cesium-134 Cesium-t37 Radium-Nat M aThorium-234 C Uraniuim-de35
Production Wells and Observation Wells
HC-I 12/12/2002 NA NA NA <160 53.3 <6.64 <01881 <0892 <125 <2.87 <0.863 <0.614 <118 V1.6 NA NA
HC-2 . 12/12/2002 NA NA NA <166 75.0 <6.80 <0:822 <1.11 <0.985 <1.99 <0.992 <0.895 <1.86 51.9 NA NA
PW-2 12/12/2002 NA NA NA <167 66.3 <6.81 <0.649 <0.747 <1.02 <2.33 <0.936 <0.841 <1.11 58.0 NA NA
PW1-5 12/12/2002 NA NA NA <162 43.7 <4.01 <1 20 <0.793 <0.681 <1.37 <0.457 <0.803 <1.31 17.0 NA NA
PW-6 . 12/12/2002 NA NA NA <156 42.4 <6.45 <0.902 <0,630 <0.813 <1.45 <0.601 <0.541 <0.850 18.0 NA NA
Obs G 12/13/2002 NA NA NA <169 . 64.2 <6.62 <1.28 <0.988 <1.26 <3.75 <0.842 . <1.19 <1.66 221 42.10 3.90
ObsJ 12/13/2002 NA NA NA <161 31.0 <5.72 <0,424 <0.562 <0,788 <1.95 <0.685 <0.832 <0.780 19.2 53.10 1.79
Direct-Push Discrete Water Samples
DP-I 12/19/02 14:37 14.0 5.5 1,705 137,000,000 NA NA NA NA 6,779 24,870 NA 75,790 254,100 NA NA NA
DP- 1 12/20/02 9:30 10.4 0.33 1,968 120,000,000 NA NA 1,057 1,025 2,107 1,776 2,591 . 40,570 132,600 NA NA NA
DP-2 12/20/02 13:00 98.0 0.39 684 69,800,000 NA NA 234 NA NA NA 794 23,760 72,710 NA . NA NA
DP-2 12/20/02 13:25 40.6 0.43 1,293 121,000,000 NA NA 201 NA 316 NA 1,595 19,650 64,930 NA NA NA
DP-2 12/20/02 14:00 22.6 0.50 1,725 182,000,000 NA NA 697 NA 784 NA 2,134 32,290 102,800 NA NA NA
DP-2 . 12/20/02 14:40 23.3 . 0.56 1,771 179,000,000 NA NA 972 638 3,877 3,635 . 2,362 40,240 133,900 NA NA NA
Notes:mgfLpCi/L14.0<6.64NDNA
Milligrams per literPicocuries per literResult was detected above laboratory method detection limit.Laboratory method detection limit.Analyte was not detected; laboratory detection limit is not known.
Constituent not analyzed.
Corresponds with sample locations shown on Figure 10.

of I
Table 04. Well Construction Details, PSEG Nuclear, LLC, Salem Generating Station, Hancock's Bridge, New Jersey. ,
Installation Construction Diameter Total Depth Monitoring Monitored MP MP Northing EastingWell ID Date Purpose Details (inches) (feet bgs) Interval Hydrogeologic Elevation Elevation (NAD 83) (NAD 83)
(feet bgs) Unit (feet RPD) (feet amsl)
Well K Feb-03 Monitoring Sch-40 PVC 2 80.0 70.0-80.0 Vincentown1
102.00 12.08 231,435 199,697
Well L Jan-03 Monitoring Sch-40 PVC 2 80.0 70.0-80.0 Vincentown1
101.46 11.54 230,933 199,263
Well M May-03 Monitoring Sch-40 PVC 1 20.0 10.0-20.0 Cofferdam2
102.17 12.25 230,843 199,546
Well N Jan-03 Monitoring Sch-40 PVC 2 20.0 10.0-20.0 Cofferdam2 101.65 11.73 230,777 199,661
Well 0 Jan-03 Monitoring Sch-40 PVC 2 20.0 10.0-20.0 Cofferdam2
101.33 11.41 230,804 199,839
Well P Mar-03 Monitoring Sch-40 PVC 2 80.0 70.0-80.0 Vincentown'
101.13 11.21 230,336 200,000
Well Q Mar-03 Monitoring Sch-40 PVC 2 80.0 70.0-80.0 Vincentown' 106.59 16.67 230,645 201,196
Well R Jun-03 Monitoring Sch-40 PVC 1 19.0 9.0- 19.0 Cofferdam2 102.35 12.43 230,906 199,640
Well S4 May-03 Monitoring Sch-40 PVC 2 34.7 24.7-34.7 Shallow3 99.04 9.12 230,711 199,613
Well T Jun-03 Monitoring Sch-40 PVC 2 31.2 21.2 - 31.2 Shallow3 104.13 14.21 231,575 199,575
Well U4
May-03 Monitoring Sch-40 PVC 2 32.2 27.2-32.2 Shallow3 98.57 8.65 231,370 199,618
Well V4 Jun-03 Monitoring Sch-40 PVC 2 79.5 69.5-79.5 Vincentown' 98.74 8.82 231,355 199,548
Well W4
Jun-03 Monitoring Sch-40 PVC 2 35.0 25.0- 35.0 Shallow3
98.69 8.77 230,777 199,450
Well Y Sep-03 Monitoring Sch-40 PVC 2 37.0 27.0-35.0 Shallow3 101.81 11.89 230,771 199,343.
Well Z Sep-03 Monitoring Sch-40 PVC 2 37.5 27.5-37.5 Shallow3 101.86 1.1.94 230,681 199,399
Well AA4 Sep-03 Monitoring Sch-40 PVC 2 36.0 26.0-36.0 Shallow' 99.07 9.15 230,603 199,541
Well AB4
Oct-03 Monitoring Sch-40 PVC , 2 42.0 32.0- 42.0 Shallow3 98.93 9.01 230,623 199,677
Well AC4
Sep-03 Monitoring Sch-40 PVC 2 24.0 14:0 - 24.0 Cofferdam2 98.77 8.85 230,724 199,725
Well AD4 Oct-03 Monitoring Sch-40 PVC 6 43.0 33.0'- 43.0 Shallow
3 98.99 9.07 230,684 199,607
Well AE Oct-03 Monitoring Sch-40 PVC 2 37.5 27.5-37.5 Cofferdam2 101.54 11.62 230,829 .199,845
Well AF Oct-03 Monitoring Sch-40 PVC 2 45.0 35.0- 45.0 Shallow3
101.61 11.69 230,491 199,702
Well AG-Shallow Feb-04 Monitoring Sch-40 PVC 1 24.2 - 14.2 -24.2 Shallow3
99.29 9.37 230,496 199,508
WellAG-Deep Feb-04 Monitoring Sch-40 PVC 1 40.0 30.0-40.0 Shallow3 99.20 9.28 230,496 199,508
Well AH-Shallow Feb-04 Monitoring Sch-40 PVC 1 24.5 14.5-24.5 Shallow3 102.58 12.66 . 230,450 199,596
Well AH-Deep Feb-04 Monitoring Sch-40 PVC 1 40.0 30.0-40.0 Shallow3 102.70 12.78 230,450 199,596
Well Al Jan-04 Monitoring Sch-40 PVC 4 22.0 12.0-22.0 Cofferdam2
98.79 8.87 230,798 19§,521
Well AJ Jan-04 Monitoring Sch-40 PVC 4 35.3 15.3- 35!3 Shallow3 98.85 8.93 . 230,670 199,665
Well AL Jan-04 Monitoring Sch-40 PVC 2 25.3 15.3-25.3 Shallow3 99.13 9.21 230,594 199,806
Well AM Jan-04 Monitoring Sch-40 PVC 4 20.9 - 10.9-20.9 Cofferdam2 98.55 8.63 230,762 199,680
Notes:MPbgs
RPDamsl
2
3
4
Measuring PointBelow ground surfaceRelative to plant datumRelative to mean sea level (NAVD 1988).
Monitoring well is screened in the Vincentown Formation.Monitoring well is screened in the shallow, water-bearing unit at a location within the limits of the cofferdam.
Monitoring well is screened in the shallow, water-bearing unit at a location outside the limits of the cofferdam.
The surface completions of Monitoring Wells S,-U, V, W, AA, AB, AC, and AD were converted from above-grade to flush-grade in February 2004.

Page 1 of 3
Table 05. Supplemental Groundwater Investigation Details. PSEG Nuclear, LLC, Salem Generating Station,Hancock's Bridge, New Jersey.
Groundwater Sample Interval (ft bgs) Groundwater Sample Analysis
Boring Comments/Details Gamma-Identification Cm nDei 15' 21 to 25 15 to 252 31 to ' Tritium - Tritium - Boron Gamma-
11 to1 2 2 15 Sae3 Maplewood4 EmittingSIsotopes 5
1X X -- X X X X X
2 4-... X X X X X X
4 -- ... X X X X X X
5 Unable to advance boring due to obstruction.-- .. . ..........
6 Unable to advance boring due to obstruction. -- -- ............
7 x X -- x x x x x
8 .... x x x ......
9 Equipment refusal encountered at 22 ft bgs. -- X(18-22) .... X --......
10 Equipment refusal encountered at 21.5 ft bgs. -- X(17.5-21.5) -- " -- X .....
I1 Unable to advance boring due to obstruction. -- -- -............
12 X(8-9) -- X -- X X -- X
Notes:ft bgs - Feet below ground surface.
Groundwater samples collected from the II to 15, 21 to 25 and 31 to 35 foot below ground surface intervals were collected using the Geoprobeg four-foot SP-15Screened Point Groundwater Sampler.
2 Groundwater samples collected from the interval. of 15 to 25 foot below ground surface were collected from a temporary one-inch diameter PVC well. The temporary wells were
installed to facilitate the collection of groundwater samples in areas/intervals that did not yield sufficient groundwater.Refers to the PSEG Nuclear, LLC Station Chemistry. Initial analysis of groundwater samples was conducted at the on-site laboratory for screening purposes.If tritium concentrations indicated by the groundwater sample were below the detection limits of Station chemistry, the sample was submitted to
Maplewood Testing Services for analysis.4 Maplewood Testing Services.5 The list of gamma-emitting isotopes included: Potassium-40; Actinium-228; Lead-221; Bismuth-212; Thallium-208; Thorium-234; Lead-214; Bismuth-214; Cesium-137; and, Uranium-235.-- Indicates that either a sample was attempted and was unsuccessful, the collection of water from the interval was not attempted, and/or the analysis was not performed.X - Indicates that a groundwater sample was collected from the listed sample. interval, unless otherwise indcated (e.g., "18-22), and was subsequently analyzed for the indicated parameters.
Table 05 - Supplem nvestigation Details

Page 2 of 3
Table 05. Supplemental Groundwater Investigation Details, PSEG Nuclear, LLC, Salem Generating Station,Hancock's Bridge, New Jersey.
Groundwater Sample Interval (ft bgs) Groundwater Sample Analysis
Boring . Gamma-Identification Comments/Details toooTritium Tritium -
II to Is' 21 to 25. 15t5 3Maplewood4
t Boron EmittingSalemsotopes5
13 ... - -- X .X " . .
14 X X. X X.
15 . X X X X
16 Unable to advance boring due to obstruction.- -.... - .........
17 Unable to advance boring due to obstruction. 7- . ..... -
18 X X X ......
19 x X(14-18) X
20 XX .. ...
21 Unable to advance boring due to obstruction. - .............
22 Equipment refusal encountered at 33 ft bgs. X X -- X(29-33) X X -- X
23. X X X X -- X
24 X X X-- X
Notes:ft bgs - Feet below ground surface.
Groundwater samples collected from the I I to 15, 21 to 25 and 31 to 35 foot below ground surface intervals were collected using the Geoprobe® four-foot SP-15Screened Point Groundwater Sampler.
2 Groundwater samples collected from the interval of 15 to 25 foot below ground surface were collected from a temporary one-inch diameter PVC well. The temporary wells were
installed to facilitate the collection ofgroundwater samples in areas/intervals that did not yield sufficient groundwater.3 Refers to the PSEG Nuclear, LLC Station Chemistry. Initial analysis of groundwater samples was.conducted at the on-site laboratory for screening purposes.
If tritium concentrations indicated by the groundwater sample were below the detection limits of Station chemistry, the sample was submitted to. .Maplewood Testing Services for analysis.
4 Maplewood Testing Services.5 The list of gamma-emitting isotopes included: Potassium-40; Actinium-228; Lead-221; Bismuth-212; Thallium-208; Thorium-234; Lead-214; Bismuth-214; Cesium-137; and, Uranium-235.
Indicates that either a sample was attempted and was unsuccessful, the collection of water from the interval was not attempted, and/or the analysis was not performed.X - Indicates that a groundwater sample was collected from the listed sample interval, unless otherwise indcated (e.g., "18-22), and was subsequently analyzed fror the indicated parameters.
Table 05 - Supplemental Investigation Details
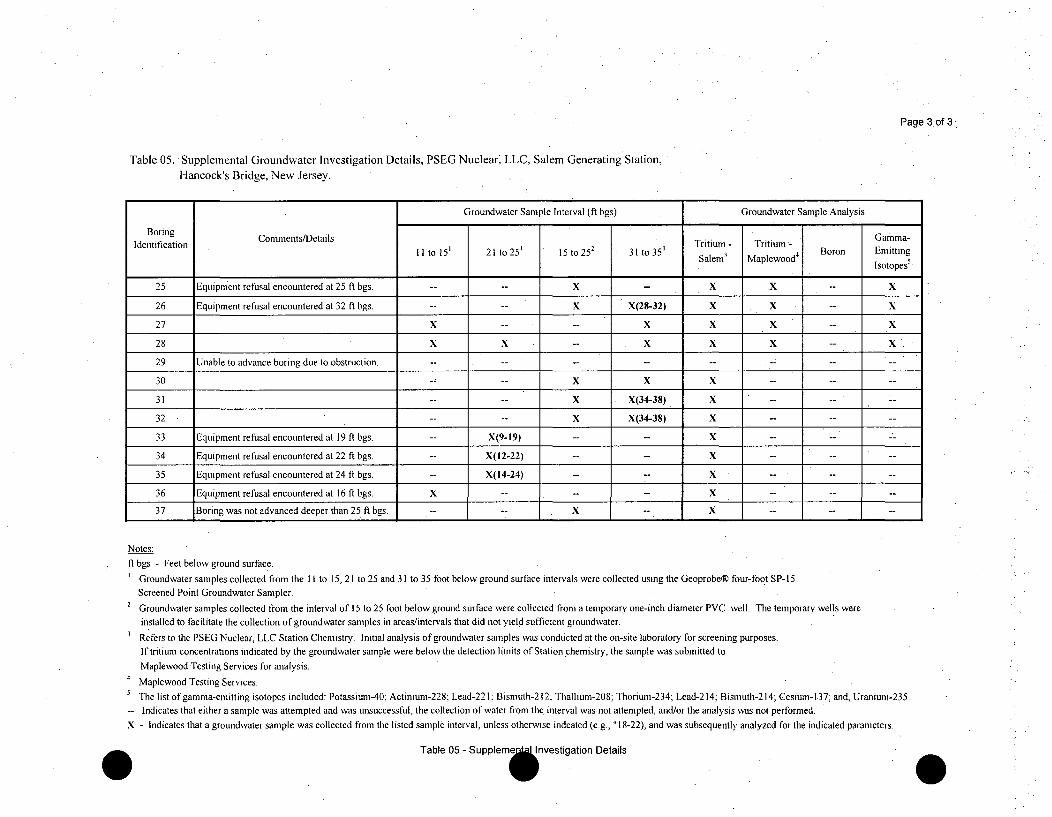
Page 3. of 3
Table 05. Supplemental Groundwater Investigation Details, PSEG Nuclear, LLC, Salem Generating Station,Hancock's Bridge, New Jersey.
Groundwater Sample Interval (ft bgs) Groundwater Sample Analysis
Boring Comments/Details Gamma-Identification CI to 15' 21 to 25' 15 to 252 31 to 35' Salem Maplewood 4 Boron Emitting
Isotopes5
25 Equipment refusal encountered at 25 ft bgs. -- -- X -- X X -- x
26 Equipment refusal encountered at 32 ft bgs. -- -- X X(28-32) X X -- X
27 X .... X X X -- X
28 X X -- X X X -- X
29 Unable to advance boring due to obstruction. - .......... - ....
30 ..... X X X ......
31 .... X X(34-38) X
32 -- -- X X(34-38) X .......
33 Equipm ent refusal encountered at 19 ft bgs. -- X (9-19) .... X .... "
34 Equipment refusal encountered at 22 ft bgs. -- X(12-22) .... X ......
35 Equipm ent refusal encountered at 24 ft bgs. -- X (14-24) .... X ......
36 Equipment refusal encountered at 16 ft bgs. X ...... X ......
37 Boring was not advanced deeper than 25 ft bgs. . .... X -- X ......
Notes:
ft bgs - Feet below ground surface.
Groundwater samples collected from the II to 15, 21 to 25 and 31 to 35 foot below ground surface intervals were collected using the Geoprobe® four-foot SP-15Screened Point Groundwater Sampler.
2 Groundwater samples collected from the interval of 15 to 25 foot below ground surface were collected from a temporary one-inch diameter PVC well. The temporary wells were
installed to facilitate the collection of groundwater samples in areas/intervals that did not yield sufficient groundwater.3 Refers to the PSEG Nuclear, LLC Station Chemistry. Initial analysis of groundwater samples was conducted at the on-site laboratory for screening purposes.
Iftritium concentrations indicated by the groundwater sample were below the detection limits of Station chemistry, the sample was submitted to
Maplewood Testing Services for analysis.4 Maplewood Testing Services.
The list of gamma-emitting isotopes included: Potassium-40; Actinium-228; Lead-221 Bismuth-212: Thallium-208; Thorium-234; Lead-214, Bismuth-214; Cesium-137; and, Uranium-235.
-- Indicates that either a sample was attempted and was unsuccessful, the collection of water from the. interval was not attempted, and/or the analysis was not performed.
X - Indicates that a groundwater sample was collected from the listed sample interval, unless otherwise indcated (e.g., "18-22), and was subsequently analyzed for the indicated parameters.
Table 05 - Supple n vestigation Details
W
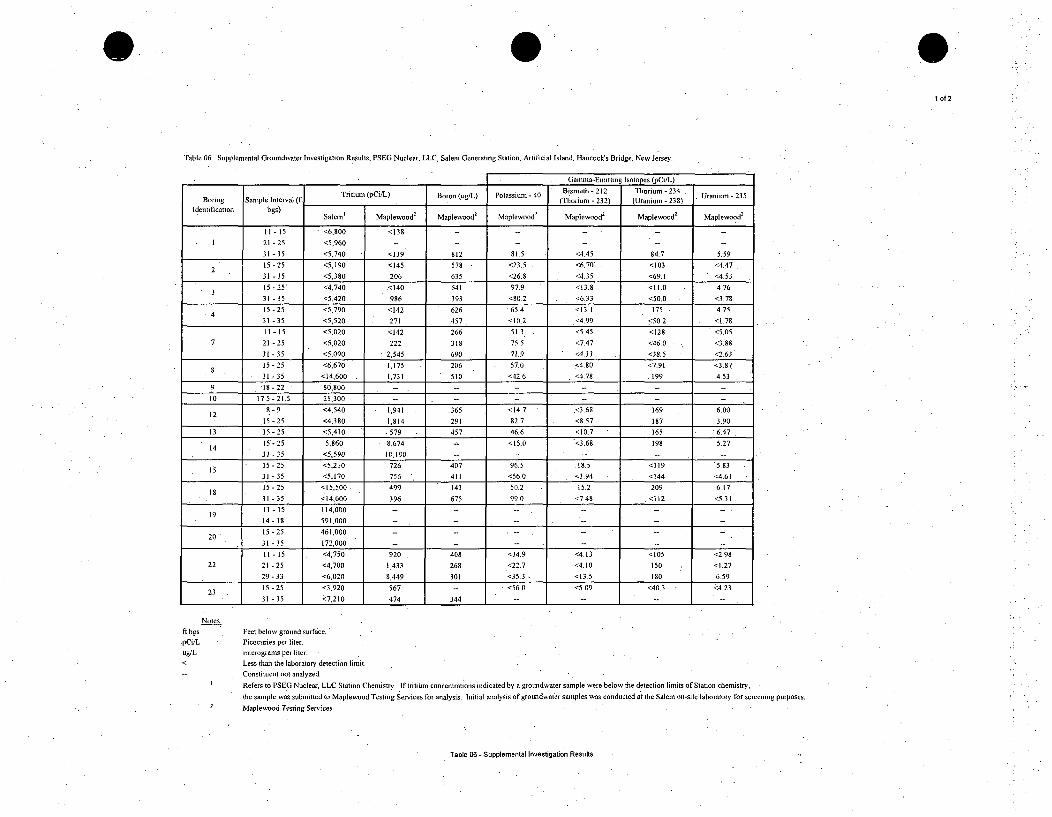
01 of 2
Table 06. Supplemental Groundwater Investigation Results, PSEG Nuclear, LLC, Salem Generating Station, Artificial Island, Hancock's Bridge, New Jersey.
Gamma-Enitting Isotopes (pCi/L)
Bismuth - 212 Thorium -234 Urnm-23Boring SanpleInterval (ft Tritium (pCiIL) Boron (ug/L) Potassium - 40 (Thoriumu -232) lUranih . U - 235Identification bgs)22 Salem' Maplewood' Maplewood' Maplewood
5 Maplewood
t Maplewood
t Maplewood
t
Il - 15 " <6,800 <138 - -
1 21 -25 <5,960 -...
31 -35 <5,740 <139 812 81.5 <4.45 84.7 5.592 15 -25 <5,190 <145 578 <23.5 • <6.70' <103 <4.47
31- 35 <5,380 206 635 <26.8 <4.35 <69.1 <4,5315 -25 <4,740 .<140 641 97.9 <13.8 <11.0 47631 - 35 <5,420 986 393 <80.2 <6.33 <50.0 <3.78
4 15 -25 <5,790 <•142 626 65.4 <13.1 175 . 4.7531 - 35 <5,520 271 457 . <10.2 <4.99 <50.2 <1.78
11 - 15 <5,020 <142 266 513 <545 <128 <5.057 21-25 <5,020 222 318, 75.5 <7.47 <46.0 . <3.88
31 - 35 <5,090 2,545 690 71.9 <4.33 <38.5 <2.63
15 -25 <6,670 1,175 206 57.0 <4.80 <7.91 . <3.8731 - 35 <14,600 1,731 510 <42.6 <4.78 .199 4,53
9 18-22 80,800 ..
10 17.5 -21.5 21,300 -...... _
28-9 <4,540 1,941 365 <14.7 .<3,68 169 6.001215 -25 <4,380 1,814 291 82.7 <8.57 187 3.90
13 15-25 <5,410 -579 457 46.6 <10.7 165 6,4715-25 5.860 8,674 - <15.0 <3.68 198 5.2731 -35 <5,590 10,190 ........
15 15-25 <5,210 726 407 96.5 .18.5 <119 5.83
31 -35 <5,170 756 411 <56.0 <3.94 <144 <4.61
I8 15-25 <15,500 499 143 50.2 15.2 209 6.17.31 -35 514,600 396 675 99.0 <7.48 <112 <5.31
19 11 - 15 114,000 ........ i
14- 18 591,000 -- . .
20 15 -25 461,000 .... ....31- 35 172,000 -.....II - 15 <4,750 920 408 <34.9 <4.13 <105 <2.98
22 21 -25 <4,700 1,433 268 <22.7 <4.10 150 <1.27
29-33 <6,020 8,449 301 <35.3 . <13.5 180 6.59
23 15 - 25 <3,920 567 -- • <56.0 <5.09 <40.3 <4.2331 -35 <7,210 474 344 --
Notes:ft bgspCi/Lug/L
Feet below ground surface.Picocuries per liter.micrograms per liter.Less than the laboratory detection limit.Constituent not analyzed.Refers to PSEG3 Nuclear, LLC Station Chemistry. If tritium concentrations indicated by a groundwater sample were below the detection limits of Station chemistry,
the sample was submitted to Maplewood Testing Services for analysis. Initial analysis of groundwater sarmples was conducted at the Salem on-site laboratory for screening purposes.Maplewood Testing Services.
Table 06 - Supplemental Investigation Results
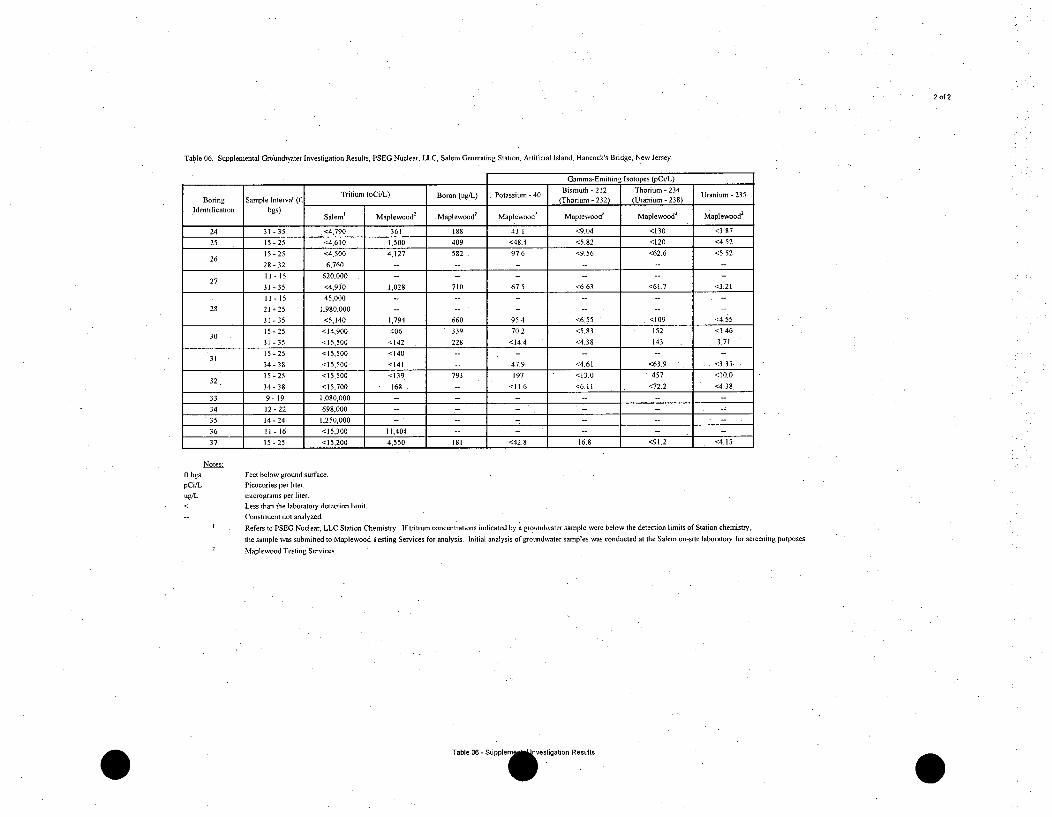
2 of 2
Table 06. Supplemental Groundwater Investigation Results, PSEG Nuclear, LLC, Salem Generating Station. Artificial Island, Hancock's Bridge. New Jersey.
I_ _ Gaammsa-Entitting Isotopes (pCi/L)
Tnti (p~/L) Boro (u/L) otasium-40 Bismuth - 212 Thorium - 234 Urnu-23Boring Sample Interval (f Tritium (pCi/L) Boron (TgoL) . Potassium- 40 Bisium - 232) TUranium - 238)
Identification bgs) Salem' Maplewood2 .Maplesood' Maplewood' Maplewood2 Maplewood' Maplewoodt
24 31-35 <4,790 361 188 43.1 <9.04 <130 <3.87
25 15-25 <4,610 1,500 409 <48.4 <5.82 <120 <4.52
15-25 <4.500 4,127 582 . 97.6 <9.56 <62.6 <5.522628-32 6,760 --......
I 1 - 15 620,090 . - ....2731 - 35 <4,930 1,028 710 67.5 <6.63 <61.7 <3.2111 - 15 45,000 -- -- --
28 21 -25 1,980,000 -- -- --
31-35 <5,140 1,794 660 95.4 <6.55 <109 <4.55
15 - 25 <14,900 406 339 70.2 <5.83 152 <1.463031-35 <15,500 <142 228 <14.4 <4.38 143 . 3.71
15-25 <15,500 <140 -- -- -- -- --3134-38 <15,500 <141 - 479 - <4.61 <63.9 . . <3.35
32 15 -25 < g15,500 <139 793 197 <13.0 457 <10.034-38 <15,700 168 - <11.6 <6.11 <72.2 <4.38
33 9- 19 1,080,000 .- --
34 12-22 698,000 .... -
35 14-24 1,250,000 -
36 11 - 16 <15,300 11,404 --..
37 15-25 <15,200 4,550 181 <42.8 16.8 <91.2 <4.15
Notes;fit bgspCi/Lag/L
Feet below ground surface.Picocuries per liter.micrograms per liter.Less than the laboratory detection limit.Constituent not analyzed.
Refers to PSEG Nuclear, LLC Station Chemistry. If tritium concentrations indicated by a groundwater sample were below the detection limits of Station chemistry,
the sample was submitted to Maplewood Testing Services for analysis. Initial analysis of grotmdwvater samples was conducted at the Salem on-site laboratory for screening purposes.Maplewood Testing Services.
Table 06 - Spplem esftigabonn Results
0
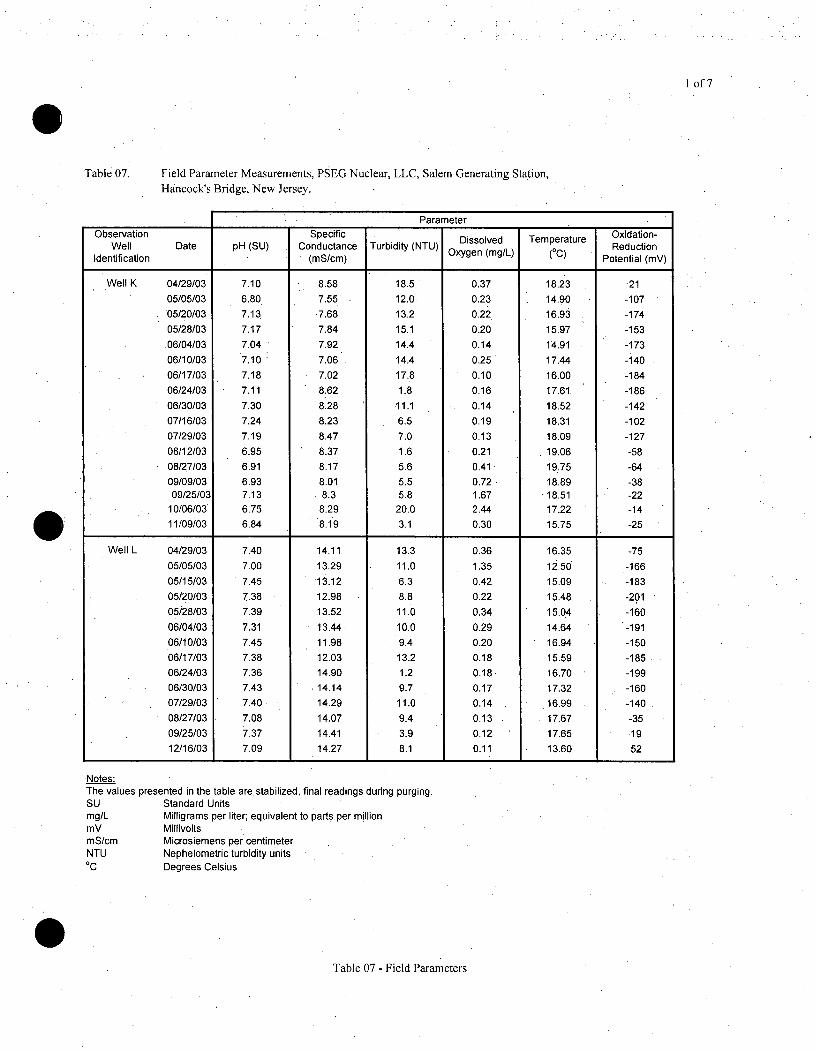
I of 7
Table 07. Field Parameter Measurements, PSEG Nuclear, LLC, Salem Generating Station,Hancock's Bridge, New Jersey.
ParameterObservation Specific Dissolved Temperature Oxidation-
Well Date pH (SU) Conductance Turbidity (NTU) Oxygen (mg/L) ReductionIdentification (mS/cm) (00) Potential (my)
Well K 04/29/03 7.10 8.58 18.5 0.37 18.23 21
05/05/03 6.80 7.55 12.0 0.23 14.90 -10705/20/03 7.13 ,7.68 13.2 0.22 16.93 -174
05/28/03 7.17 7.84 15.1 0.20 15.97 -153
06/04/03 7.04 7.92 14.4 0.14 14.91 -173
06/10/03 7.10 7.06 14.4 0.25 17.44 -140
06/17/03 7.18 7.02 17.8 0.10 16.00 -184
06/24/03 7.11 8.62 1.8 0.16 17.61. -186
06/30/03 7.30 8.28 11.1 0.14 18.52 -142
07/16/03 7.24 8.23 6.5 0.19 18.31 -10207/29/03 7.19 *8.47 7.0 0.13 18.09 -127
08/12/03 6.95 8.37 1.6 0.21 19.06 -5808/27/03 6.91 8.17 5.6 0.41 19.75 -6409/09/03 6.93 8.01 5.5 0.72 18.89 -3809/25/03 7.13 8.3 5.8 1.67 .18.51 -22
10/06/03 6.75 8.29 20.0 2.44 17.22 -1411/09/03 6.84 8.19 3.1 0.30 15.75 -25
Well L 04/29/03 7.40 14.11 13.3 0.36 16.35 -75
05/05/03 7.00 13.29 11.0 1.35 12.50 -166
05/15/03 7.45 13.12 6.3 0.42 15.09 -183
05/20/03 7.38 12.98 8.8 0.22 15.48 -201
05/28/03 7.39 13.52 11.0 0.34 15.04 -160
06/04/03 7.31 13.44 10.0 0.29 14.64 -191
06/10/03 7.45 11.98 9.4 0.20 16.94 -150
06/17/03 7.38 12.03 13.2 0.18 15.59 -18506/24/03 7.36 14.90 1.2 0.18 16.70 -199
06/30/03 7.43 ,14.14 9.7 0.17 17.32 -160
07/29/03 7.40 14.29 11.0 0.14 - 16.99 -140
08/27/03 7.08 14.07 9.4 0.13 17.67 -35
09/25/03 7.37 14.41 3.9 0.12 17.65 .19
12/16/03 7.09 14.27 8.1 0.11 13.60 52
Notes:The values presented in the table are stabilized, final readings during purging.SU Standard Unitsmg/L Milligrams per liter; equivalent to parts per millionmV MillivoltsmS/cm Microsiemens per centimeterNTU Nephelometric turbidity units°C Degrees Celsius
0Table 07 - Field Parameters

2 of 7
Table 07. Field Parameter Measurements, PSEG Nuclear, LLC, Salem Generating Station,Hancock's Bridge, New Jersey.
Parame~~r Oiain
Observation Specific Dissolved Temperature Oxidation-Well Date pH (SU) Conductance Turbidity (NTU) Oxygen (mg/L) (.C) Reduction
Identification (mS/cm) Potential (mV)
Well M 04/30/03 7.17 0.42 16.6 7.64 21.34 35
07/09/03 6.84 0.43 125.0 0.14 . 28.42 -27
07/23/03 6.81 0.43 59.0 0.11 28.89 -39
08/06/03 6.75 0.44 120.0 0.13 30.08 -19
08/20/03 6.70 0.43 100.0 0.15 30.53 85
09/04/03 6.72 0.42 .134 0.10 30.71 16309/16/03 6.72 0.42 71.5 0.25 32.69. 197
10/03/03 6.77 0.43 150.0 0.13 28.53 24
10/20/03 6.71 0.44 30.5 0.12 27.55 2712/04/03 6.85 0.39 22.3 0.11 19.48 95
Well N 04/30/03 5.70 0.37 3.8 2.18 20.14 484
05/06/03 5.65 0.31 7.9 3.40 19.60 23905/21/03 5.90 0.38 6.7 3.25 19.75 194
05/27/03 5.80 0.35 38.8 3.29 20.23 283
06/04/03 5.80 0.31 11.1 2.18 20.11 -58
06/11/03 5.66 0.28 8.1 1.70 21.83 151
06/19/03 5.63 0.29 25.1 1.24 22:21 19406/25/03 5.61 0.30 1.6 1.24 23.06 165
07/10/03 5.66 0.29 24.8 1.31 24.88 294
07/25/03 5.70 0.31 2.0 1.63 26.83 120
08/20/03 5.53 0.31 10.0 1.65 27.89 18809/04/03 5.77 3.65 2.0 2.03 27.45 263
09/17/03 5.81 0.37 3.2 2.88 28.52 33010/03/03 5.95 0.405 .13.5 3.19 27.42 19011/03/03 6.02 0.39 76.1 1.98 25.61 299
12/12/03 5.92 0.42 6.1 0.79 22.23 86
Notes:The values presented in the table are stabilized, final readings during purging.SU Standard Unitsmg/L Milligrams per liter; equivalent to parts per millionmV MillivoltsmS/cm Microsiemens per centimeterNTU Nephelometric turbidity units°C Degrees Celsius
Table 07 - Field Parameters

3.of 7
Table 07. Field-Parameter Measurements, PSEG Nuclear, LLC, Salem Generating Station,Hancock's Bridge, New Jersey.
Parameter
Observation p (U Specific Dissolved Temperature Oxidation-Well Date pH (SU) Conductance Turbidity(NTU) Oxygen (rag/L) (C) Reduction
Identification (mS/cm) Potential (mV)
Well 0 04/29/03 7.25 0.21 3.5 0.30 16.39 - NA
05/06/03 6.99 0.19 1.8 0.50 16.00 -144
05/23/03 7.28 0.20 4.9 0.32 18.87 -119
05/28/03. 7.40 0.23 6.5 0.39 17.92 -134
06/03/03 7.01 0.24 6.1 0.55 18.95 -82.
06/10/03 7.10* 0.21 10.6 0.54 20.30 -123
06/17/03 7.08 0.21 10.2 0.66 20.33 -91
06/24/03 6.84 0.27 0.0 .0.76 22.49 -88
07/09/03 7.05 0.27 0.0 0.41 23.81 -46
07/25/03 6.79 0.25 0.0 0.82 25.27 -1108/20/03 6.66 0.30 4.6 0.40 27.68 80
09/03/03 6.96 0.26 0.0 0.74 27.94 42
09/15/03 7.11 0.26 0.0 0.59 28.50 31
10/03/03 6.74 0.45 4.9 0.26 26.24 129
10/20/03 6.58 0.71 0.0 . 0.28 25.07 -35
11/17/03 6.68 0.42 3.8 0.21 .22.25 -43
12/18/03 6.20 2.49 2.1 .1.40 14.48 290
Well P 04/29/03 6.74 10.39 29.5 0.94 15.16 -40
05/05/03 6.50 9.94 13.4 0.48 12.90 -175
05/15/03 6.80 10.50 17.6 0.19 14.68 -166
05/20/03 6.83 10.38 15.8 0.33 16.22 -178
05/31/03 6.69 12.30 20.6 0.18 17.00 -137
06/04/03 6.75 10.84 24.3 0.10 14.25 -181
06/10/03 6.75 9.78 33.0 0.50 17.43 -165
06/17/03 6.79 9.98 40.2 0.17. 15.72 -176
06/24/03 6.86. 12.29 20.0 0.21 17.44 -181
07/16/03 6.88 1 i.91 46.7 0.18 18.44 -120
08/13/03 6.39 12.29 56.0 - 0.13 18.38 -105
09/08/03 6.52 11.78 9.9 0.10 18.29 -76
10/06/03 6.41 12.38 14.0 0.09 17.22 -96
Notes:The values presented in the table are stabilized, final readings during purging.SU Standard Unitsmg/L Milligrams per liter; equivalent to parts per millionmV MillivoltsmS/cm Microsiemens per centimeterNTU Nephelometric turbidity units0C Degrees Celsius
Table 07 - Field Parameters

4 of 7
Table 07. Field Parameter Measurements, PSEG Nuclear, LLC, Salem Generating Station,Hancock's Bridge, New Jersey.
Parameter
Observation Specific Dissolved Temperature Oxidation-Well Date pH (SU) Conductance Turbidity (NTU) Reduction
Identification (mS/cm) O e g(Potential (mV)
Well Q 04/30/03 6.46 13.69 20.0 0.20 14.55 -48
05/06/03 6.34 12.01 99.6 0.16 15.30 -123
05/12/03 6.28 12.43 38.9 0.36 16.56 -76
05/19/03 6.42 12.61 159 0.12 16.19 -170
05/30/03 6.35 14.80 173.0 0.22 16.88 -113
06/05/03 6.43 11.80 15.4 0.17 15.31 -157
06/11/03 6.35 11.74 12.6 0.14 17.64 -145
06/16/03 6.48 12.00 16.5 0.16 16.64 -152
06/23/03 6.24 15.10 8.3 0.18 16.99 -99
07/17/03 6.39 13.87 11.0 0.31 17.10 -86
08/13/03 6.25 14.11 14.2 0.14 18.98 -85
09/10/03 6.14 13.75 11.4 0.09 16.58 13
10/07/03 6.01 14.44 0.0 0.16 16.61 169
11/09/03 5.98 14.06 4.2 0.17 13.86 102
Well R 04/30/03 6.74 0.54 15.8 8.02 18.72 33
07/09/03 8.20 0.60 85 0.12 24.33 -189
07/25/03 7.30 0.57 21.6 0.12 25.52 -99
08/06/03 8.11 0.60 145 0.10 26.17 -99
08/20/03 6.76 0.58 280 0.19 27.13 84
09/17/03 8.32 0.63 27.3 0.16 26.03 -
10/03/03 6.66 0.64 19.8 0.12 24.48 178
10/21/03 6.58 0.65 24.9 0.12 22.86 197
12/05/03 6.31 0.64 24.8 0.13 15.87 279
Well S 07/09/03 6.89 0.72 5.9 0.12 19.20 -128
07/21/03 7.05 0.69 9.6 0.13 20.80 -10708/07/03 6.58 6.70 32.4 0.08 19.85 -73
08/21/03 6.92 0.62 -65.0 0.15 21.77 0
09/15/03 6.58 0.62 23.7 0.10 21.63 -23
10/04/03 6.29 0.63 40.8 0.13 20.75 61
10/13/03 6.43 0.67 15.0 0.10 21.11 0
10/20/03 5.98 0.70 39.0 0.10 19.54 145
11/09/03 6.42 0.63 13.6 0.11 18.40 -42
11/26/03 6.57 0.62 64.4 0.28 17.67 278
0
Notes:The values presented in the table are stabilized, final readings during purging.SU Standard Unitsmg/L Milligrams per liter; equivalent to parts per millionmV MillivoltsmS/cm Microsiemens per centimeterNTU Nephelometric turbidity units0C Degrees Celsius
Table 07 - Field Parameters

5 of 7
Table 07. Field Parameter Measurements. PSEG Nuclear, LLC, Salem Generating Station,Hancock's Bridge, New Jersey.
Parameter
Observation Specific.... Dissolved Temperature Oxidation-Well Date pH (SU) Conductance Turbidity (NTU) Reduction
Identification (mS/cm) Oxygen (mg/L) (0C) Potential (mV)
Well T 07/02/03 NA NA NA NA NA NA
07/10/03 6.86 6.35 3.0 0.10 17.80 -149
07/15/03 6.81 6.34 4.2 0.18 19.07 -101
07/30/03 6.88' 6.43 4.9 0.19 18.52 -92
08/12/03 6.83 6.41 .05 0.10 19.99 -100
08/28/03 6.61 6.27 59.1 0.13 18.85 12
09/09/03 6.71 6.18 38.9 0.07 19.23 -5509/25/03 7.07 6.33 50.0 0.09 19.53 -84
10/06/03 6.51 6.08 14.6 0.16 18.31 90
12/12/03 6.51 6.41 69.9 0.06 15.85 -21
Well U 07/02/03 NA. NA. NA NA NA NA
07/10/03. 6.91 1.57 6.7 0.13 16.45 -136
07/16/03 6.85 1.53 5.6 0.09 17.91 . -140
07/29/03 6.96 1.52 20.8 0.09 17.88 -128
08/12/03 6.81 1.59 0.4 0.10 18.72 -117
08/27/03 6.75 1.49 21.0 0.09 .19.05 -94
09/08/03 6.54 1.48 14.1 0.09 17.74 -46
09/25/03 7.07 1.43 24.9 0.12 18.98 -63
10/06/03 6.45 1.52 23.1 0.06 17.29 -65
12/12/03 6.38 1.52 11.0 0.06 14.36 0
Well V 07/02/03 NA NA NA NA NA NA
07/21/03 7.14 3.91 14.9 0.16 19.64 -29
07/29/03 7.06 3.90 7.2 0.11 18.61 -95
08/12/03 6.80 3.85 0.0 0.11- 18.82 -24
08/22/03 6.81 3.83 3.5 0.15 19.66 -10
09/09/03 6.72' 3.89 0.0 0.08 . 18.80 -41
09/25/03 7.30 4.05 0.6 0.20 18.99 12
10/06/03 6.65 3.69 0.0 0.07 17.94 -85
12/12/03 6.51 3.68 1.7 0.09 14.07 14
Notes:The values presented in the table are stabilized, final readings during purging.SU Standard Unitsmg/L Milligrams per liter; equivalent to parts per millionmV MillivoltsmS/cm Microsiemens per centimeterNTU Nephelometric turbidity units0C Degrees Celsius
0Table 07 - Field Parameters

6 of 7
Table 07. Field Parameter Measurements, PSEG Nuclear, LLC, Salem Generating Station,Hancock's Bridge, New Jersey.
ParameterObservation Specific Dissolved Temperature Oxidation-
Well Date pH (SU) Conductance Turbidity (NTU) Oxygen (mg/L) (00) ReductionIdentification (mS/cm) Potential (mV)
Well W 07/07/03 6.80 2.29 1.0 0.48 19.78 -108
07/21/03 6.80 2.36 2.0 0.14 20.74 -104
08/07/03 5.62 0.35 17.0 1.68 26.89 308
08/19/03 6.73 2.39 8.0 0.12 20.34 -74
09/03/03 6.63 2.33 3.3 0.10 19.25 -3509/15/03 6.72 2.34 0.5 0.13 20.37 -24
10/03/03 6.53 2.35 2.3 0.11 19.39 45
10/20/03 6.24 2.67 0.0 0.13 17.81 125
11/17/03 6.43 2.46 2.6 0.23 17.72 -24
12/16/03 6.49 2.16 6.0 0.09 15.11 8
Well Y 10/27/03 6.92 7.42 34ý2 0.32 16.29 10811/09/03 6.55 7.52 3.7 0.67 15.44 25911/24/03 6.92 7.49 5.6. 0.11 15.73 25512/12/03 6.43. 7.46 5.8 0.11 13.53 14112/22/03 6.33 7.5 11.5 0.09 14.25 186
Well Z 10/27/03 7.1.0 3.90 42.0 0.08 17.25 -3711/09/03 6.71 3.99 28.2 0.58 16.18 20611/24/03 7.06 4.00 19.5 0.07 16.21 12012/12/03 6.62 3.98 20.6 0.07 14.41 5512/22/03 6.51 3.92 9.9 0.09 15.13 76
Well AA 10/27/03 5.74 2.21 53.0 0.08 18.17 1011/10/03 5.73 2.24 49.2 0.15 17.79 8011/24/03 6.03 2.21 14.7 0.11 17.72 5712/10/03 5.02 2.19 18.3 0.16 18.70 23612/22/03 4:96 1.96 10.0 0.26 15.54 76
Well AB 10/28/03 6.41 1.79 58.7 0.12 22.95 2911/02/03 6.32 1.82 31.9 0.05 23.28 20511/17/03 6.13 1.90 16.2 0.14 22.12 1712/04/03 6.45 1.85 24.6 0.11 20.04 8712/16/03 6.31 1.89 5.1 0.07 19.22 :27
Well AC 10/28/03 6.68 0.45 50.3 0.24 24.61 -1611/03/03 6.65 0.43 25.0 0.30 24.38 0.42911/18/03 6.39 0.48 12.9 0.17 23.41 -21912/05/03 6.52 0.44 38.0 0.27 21.88 30412/18/03 6.49 0.44 14.4 0.05 20.25 101
Notes:The values presented in the table are stabilized, final readings during purging.SU Standard Unitsmg/L Milligrams per liter; equivalent to parts per millionmV MillivoltsmS/cm Microsiemens per centimeterNTU Nephelometric turbidity units0C Degrees Celsius
Table 07 - Field Parameters

7.of 7
Table 07. Field Parameter Measurements, PSEG Nuclear, LLC, Salem Generating Station,Hancock's Bridge, New Jersey.
Parameter "
Observation Specific Dissolved Temperature Oxidation-Well Date pH (SU) Conductance Turbidity (NTU) Oxygen (rag/L) (°C) Reduction
Identification (mS/cm) Potential (mV)
Well AD 10/27/03 7.12 1.90 24.0 0.07 20.28 -7211/02/03 6.67 1.98 16.3 0.06 21.36 6411/17/03 6.52 2.18 21.8 0.22 18.72 1512/04/03 6.76 1.60 4.6 0.08 17.69 8112/16/03 6.08 1.45 11.1 0.13 17.36 -12ý
Well AE 10/27/03 6ý64 0.27 11.4 0.10 24.98 -6011/02/03 6.19 0.25 13.6 0.44 25.18 -6011/17/03 6.15 0.25 2.9 0.16 23.64 -25
12/04/03 6.32 0.23 2.3 0.23 . • 19.83 83
12/18/03 5.60 0.22 1.6 0.36 17.09 288
Well AF 10/27/03 7.11 4.10 101.0 0.04 20.43 -99
11/10/03 6.73 3.00 55.4 0.09 19.68 2011/24/03 7.01 3.65 9.5 0.07 20.51 -3012/13/03 6.39 3.36 21.7 .0.11 18.50 23812/22/03 6.41 3.36 2.9 0.06 18.19 3
Maximum Measurement 8.32 15.10 280.0 8.02 32.69 . 484
Minimum Measurement 4.96 0.19 -65.0 0.04 12.50 -219
Average Measurement 6.65 4.73 23.1 0.48 19.584
Notes:The values presented in the table are stabilized, final readings during purging.SU Standard Unitsmg/L Milligrams per liter; equivalent to parts per millionmV MillivoltsmS/cm Microsiemens per centimeterNTU Nephelometric turbidity units0C Degrees Celsius
0Table 07 - Field Parameters
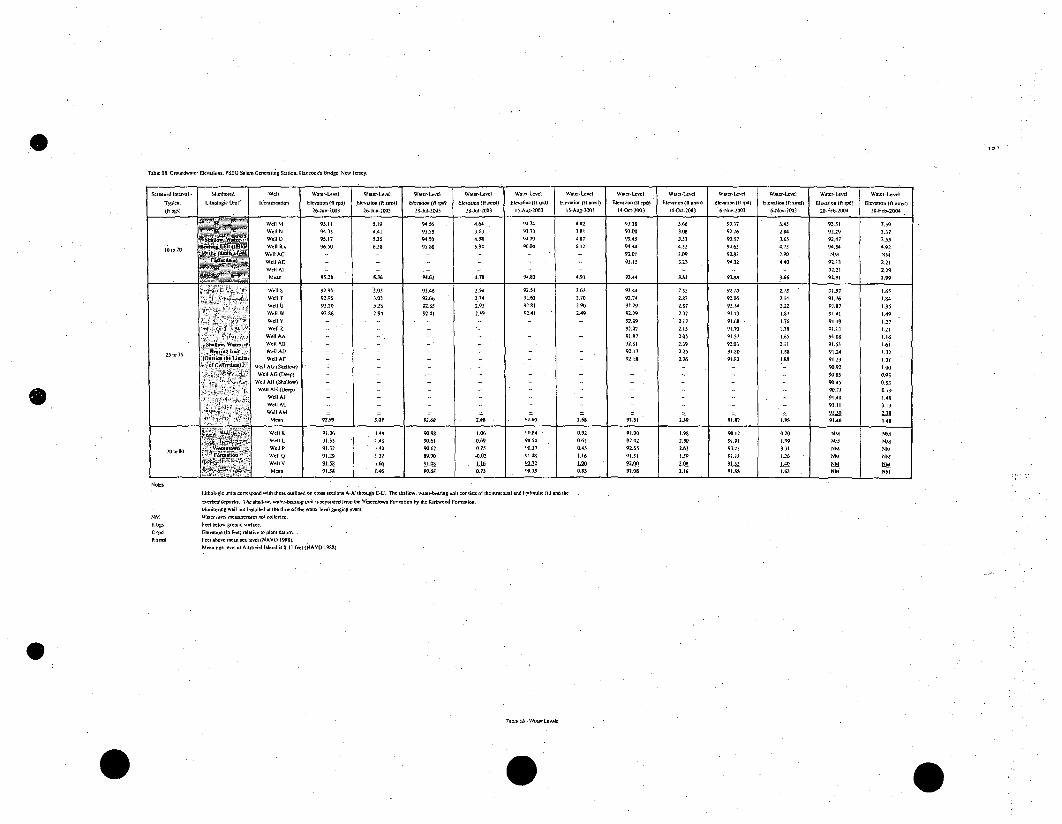
, ft
Table 08. Gm -w ale, Elations PSEG Salem Gmteeing Sttioe H -anOe s Br1idge. New Jetey.
Se need Ie-tedI Monletord Wel1 Water-Leee! Warn-4e-e1 Weer.-Le-Ie Water-Iee1 W.e-Le-el Wate-LeeI Witee-Leel Watet-Lerel Water-e eeL Water-Leeni Weterel Water-Le- lT7 il 0I L.1eilegte Un(t! (de nrifeeeiR- Elevetle (9 e wft Erpd) F9-wioeetioe(t Elceetle n (ft -ee) EJ-.tw. IIId) Eleeteen -9 S l) Elesin (t ,id) Eletlie (A -eer) Eleestir (0i Mill Eleelee (i ae=l) Eleeetiee (I( p! Eleation (9 atete!)(Ii b9s) 26-Jlr-233 26-Je-203 2-u1.1-2003 29-J.l-2003
15-A.-2093 l3-Aug-20X2 1-Oet.2003 I4-Oet-2003 6-Ne-Z20Q3 6-Noe-2003 20.Feb-2M84 20-Fee-20G4Well M 95.11 5.19 9456 3464 - 74 4.82 93.39 566 93.37 3.45 93.51 3.59____ - WelIIN 94k33 4.41 9155 3,63 9335 3. 93100 3.98 92.76 2.4 9229 2.37-•anIe.¶~re. WOlO1 95.!? 9.2 94.30 453 8.7 4.47 9.45 3.3 35 .39.723[01o20 • at.-8)e (84 Wel} R, 96.5(0 6.58$ 95.86 5.94 0694 6.12 94.4 4.32 9465 4.73 94.84 4.92lWlel ACj - - .93.01 3.39 9292 2.99 NM NM1 Well AE - 93.15 3.23 94.32 4.40 92.13 2.21Wel A] .- .......
- 92.21 2.29.M1- 99.28 546 W8.62 4.70 %4.83 4.9. 93.84 3.S2 93- . 3.6i 992.91 299
Well, 92.93 3.03 92.946 2.3 92.5 W.29.4 2.52 97.10 2.18 - 9.716Well T 92.95 3.03 92.66 .2.4 9262 2.70 92.74 2.92 92.94 2.14 91.76 1.84Well Ii 93.20 338 94.95 2.93 92.92 2.96 92.79 .. 37 92.14 2.22 91,87 1.95Will1W 92.94 2.94 32.4! 2.9491 92.4 2.49 92.29 2.93 91.91.8 91,41 1.49WelS . . . . - 93.3 2.27l 91.8 -. 76 9:9137WellE - - - - - 92.07 2.15 91.70 1.79 91913 1.21Wel! AI ."A 91.97 2.05 91.97 1.65 91.08 l..6
-Nh~ee. aae- Wel 4 - -- -. 923!2.39 92.903 2.11 91,53 1625,,,e3
5 e ia Ver - WeI AD 1 92.17 2.25 91.80 I.88 91.24 1.3225 ee3 d ldei Ueee0 Well AF - 92.19 2.26 91.90 0:8 912" Z.3
WelIAll Sllow- - 390.43 0.53
-e1 Allit ep) W-.---- .3.7! 0 79WeIIAI -- -- 91,40WeIIIAL - -----93.!! 3.1WeIll AM .... ...
L - a 29Mer 92.99 3.43 92.66 2.684 . . . " 2.68 99.31 2.39 91.117 L"3 91.40 1.48Wl.939 .4 39.98 1.06 1 392 9." 1.9 .2 0.20 NM NMWell 1 91.35 1.42 39.6! 7.69 1154 . 0.62 92A2 2.30 91.91 I.-9 NM9 NM72 e ra •v• WellP 9!032 1.4 9.67 0.75 :0.37 A.45 92.55 2.63 93.43 3.31 NM NM
Lieale .- wel 91.29 1 .33 9939..02 11 1.16 91.31 L"3 P.1 136 NM NMwel:: L6_k 9109 .i JJ! 992 19 99 )-j240 3(99 NMMern 9138 1.49 W9.65 0.33 M 7.18.83 929L.6 19G.3 . NM NN1
NM36bp354P}a~le
Li94louie uit,, ,,ep".d eilh fth, efllned I. ee iet• A-A lroh gh E-.'U. aha1e. eat-6eaing eel eeee~e• ef lie e 1a a-d rdeimlge ,,1 atd thedeeelred depeite. Tee9hllewe eatet-beatIeg eel! i eqeatetd f-ee 1b, Vineentetn Fee byatloi t9 IhIMe ...eire FoiPm.Monitringteell ee installed at the fi b e , he w-ele eli gauging ee.Waeetleelte eeetteeteeeeeloeleeted.
Feel leleow geeted sreface.
Eleeeliere lie Peet)telalle 2 pIae! dAreFeet aees etan area Ieee (6A90 19991.
Mere tide leerl at Aeilpeial Ilanad is Ol.11lfel 19690 19981.
TO M - I-WO teel
0

o1 oflI
Table09. Summary of Field Observations Aquifer Pumping Tests, PSEG Nuclear, LLC, Salem Generating Station, Hancock's Bridge, New Jersey.
Total Dpth toDurationDuainoRdusVlm
Depth to Appo t Maximum Volume ofDate Total Static of Approximate Duration of Displacment at Water
Well ID Test TestNo. Depth of Water Pumping Discharge Discharge Specified Rate of well of WellWell (ft) 2 Phase of Rates (gpm) Rate (min) (in) (gal) (gal)
Level (ft) 2 Test (min) 0 80
AM' 2/4/2004 1 20.9 6.74 140 0.65 60 5.3 0.17 48.5 40•0.5 60 12.3
AM' 2/4/2004 2 20.9 7.5 62 0.33 62 9.1 0.17 45.9 18S 2/2/2004 1 37.2 11.83 305 0.25 305 19.9 0.08 74.6 77
0.25 78 2.3AC 2/4/2004 1 27 9.64 283 0.5 174 6.4 .0.08 51.0 116
0.75 31 10.3AJ1 2/2/2004 1 35.3 8.16 275 0.25 148 7.3 0.17 93.0 75
0.5 127 23.20.25 80 3.3
Al' 2/3/2004 1. 22 10.63 315 05 175 6.6 0.17 38.9 1450.75 60 11.60.25 205 8.6
AD 1/30/2004 1 45.5 10.44 331 0.5 26 1.0 0.25 148.1 850.5 126 17.0
0.25 60 1.50.5 70 3.3
AB 1/29/2004 1 44.5 11.1 304 0 6.2 0.08 98.2 2802I 94 6.22 80 16.0
Notes:
I Well not completed, top of well approximately at land surface.2 From measuring point, approximately 2.5 feet above land surface.3 included volume of gravel pack
ft feetgal = gallons
Table 09 - Pumping Test - Field Observations

1 of 1
Table 10. Slug Test Results, PSEG Nuclear, LLC, Salem Generating Station, Hancock's Bridge, New Jersey.
Hydraulic HydraulicWell Monitored Test Type Conductivity Conductivity
Identification Lithologic Unit' Results Results
(ft/day) (cm/s)
Well N Engineered Fill Falling Head 0.144 5.07 x 10⁵
(10 to 20 ft bgs) Rising.Head 0.0928 3.28 x 10⁻⁵
Well 0 Engineered Fill Falling Head 3.62 -1.28 x.10-3
(10 to 20 ft bgs) Rising Head. 4.26 1.50 x 10.
Well U Vincentown formation Falling Head 2.95 1.04 x 10.3
(70 to 80 ft bgs) Rising Head NA NA
NotesI
ft/daycm/sft bgsNA
Lithologic Units correspond with those outlined on cross sections A-A' through E-E'.Feet per day.Centimeters per second.Feet below ground surface.Data not available. Test not performed
Table 10 - S Test Results
0

1 of I
Table 11. Summary of Aquifer Pumping Test Results, PSEG Nuclear, LLC, Salem Generating Station,Hancock's Bridge, New Jersey.
Puminiz, Recoverv
Transmissivity Coducic Transmissivity HydraulicWell ID Date of Test Conductivity Conductivity
(ft'lday) (ft/day) (ft2/day) (ft/day)
AM 2/4/2004 1.403 0.14 0.572 0.06
AM2 2/4/2004 1.079 0.11 . 0.338 0.03
S 2/2/2004 1.701 0.17 1.096 0.11
AC 2/4/2004 12.63 1.26 1.672 0.17
AJ 2/2/2004 1.73 0.09 0.56 0.03
Al 2/3/2004 7.97 0.80 2.101 0.21
AD 1/30/2004 0.942 0.09 0.937 0.09
AB 1/29/2004 27.67 2.77 22.69. .2.27
Notes:Results of the step drawdown test.
2 Results of the constant rate test.
ft2/day = square feet per day.ft/day - feet per day.
0Table 11 - Pumping Test - Results
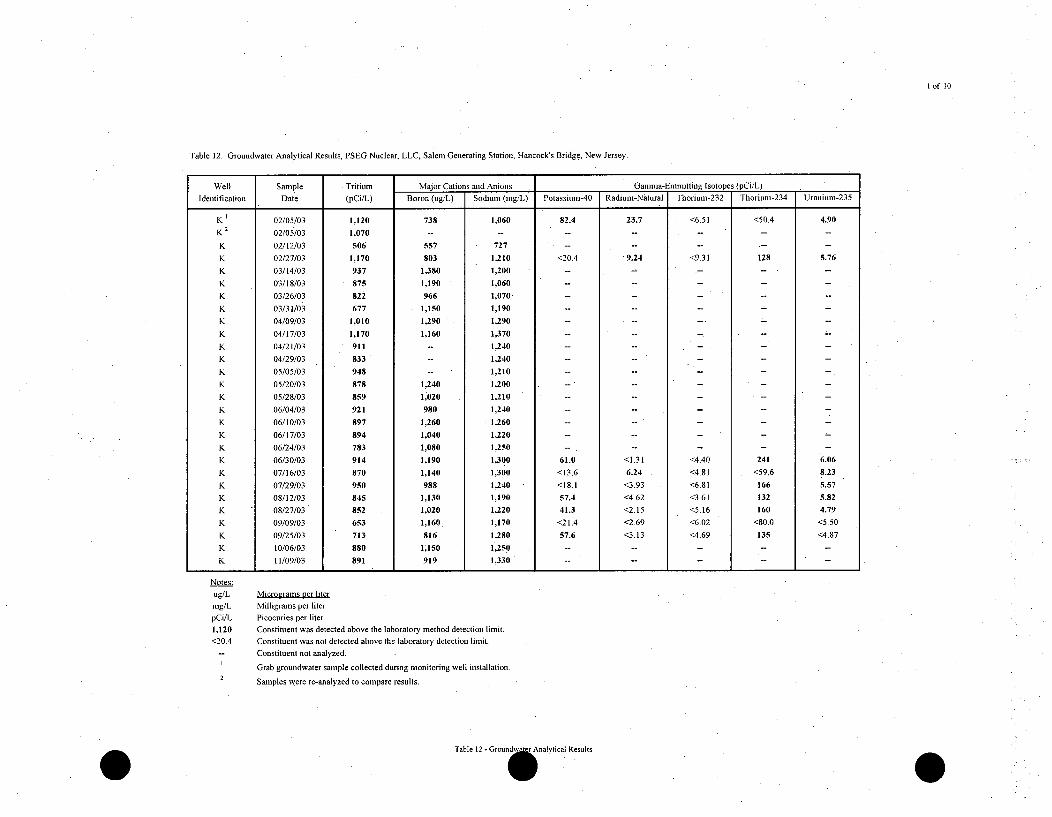
I of 10
Table 12. Groundwater Analytical Results, PSEG Nuclear, LLC, Salem Generating Station, Hancock's Bridge, New Jersey.
Well Sample Tritium Major Cations and Anions Gamma-Emmitting Isotopes (pCi/L)
Identification Date (pCi/L) Boron (ug/L) Sodium (mg/L) Potassiun-40 Radium-Natural Thorium-232 Thorium-234 Uranium-235
K 1 02/05/03 1,120 738 1,060 82.4 23.7 <651 <50.4 4.90
K 2 02/05/03 1,070 -- -- -- -- --
K 02/12/03 506 557 727 -- ......
K 02/27/03 1,170 803 1,210 <20.4 "9.24 <9.31 128 5.76
K 03/14/03 937 1,380. 1,200 - - - - -
K 03/18/03 875 1,190 1,060 .... -
K 03/26/03 822 966 1,070 - .......
K 03/31/03 677 - 1,150 1,190 .... - ....
K 04/09/03 1,010 1,290 1,290 ...... - --
K 04/17/03 1,170 1,160 1,370 ....... -
K 04/21/03 911 -- 1,240 ...... -
K 04/29/03 833 -- 1,240 ..........
K 05/05/03 948 -- 1,210 ...... " ..
K 05/20/03 878 1,240 1,200 -- ........
K. 05/28/03 859 1,020 1,210 ..... ..
K 06/04/03 921 980 1,240 ........
K 06/10/03 897 1,260 1,260 ......
K 06/17/03 894 1,040 1,220 ......
K 06/24/03 783 1,080 1,250 - . .....
K 06/30/03 914 1,190 1,300 61.0 <1.31 <4.40 241 6.06
K 07/16/03 870 1,140 1,300 <13.6 6.24 <4.81 <59.6 8.23
K 07/29/03 950 988 1,240 <18.1 <3.93 <6.81 166 5.57
K 08/12/03 845 1,130 1,190 57.4 <4.62 <3.61 132 5.82
K 08/27/03 852 1,020 1,220 41.3 <2.15 <5.16 160 4.79
K 09/09/03 653 1,160. 14170 <21.4 <2.69 <6.02 <80.0 <5.50
K 09/25/03 713 816 1,280 57.6 <3.13 <4.69 135 <4.87
K 10/06/03 880 1,150 1,250 .........
K 11/09/03 891 919 1,330 ..........
Notes:
ug/L Micrograms per liter
mg/L Milligrams per liter
pCi/L Picocuries per liter
1,120 Constituent was detected above the laboratory method detection limit.
<20.4 Constituent was not detected above the laboratory detection limit.
- Constituent not analyzed.I Grab groundwater sample collected during monitoring well installation.
Samples were re-analyzed to compare results.
Table 12 - Ground Analytical Results

2 of 1O
p
Table 12ý Groundwater Analytical Results, PSEG Nuclear, LLC, Saleln Generating Station, Hancock's Bridge, New Jersey.
Well Sample Tritium Major Cations and Anions Gamma-Emmitting Isotopes (pCi/L)
Identification Date (pCi/L) Boron (ug/L) Sodium (rag/L) Potassiumn-40 Radium-Natural Thorium-232 Thorium'234 Uranium-235
L 01/27/03 <151 533 1,900 ......
L 03/14/03 <143 .. . ........
L 03/18/03 < 143 --
L 03/26/03 < 141 - .........
L 0 4 /0 2 /0 3 < 1 5 3 2 ,1 7 0 2 ,2 6 0 - . - .......
L 04/08/03 <142.-- ...........
L 04/15/03 <141 ....... ' -- ....
• L 04/24/03 <i39- ....- ....
L 04/29/03 <141 .. ........
L 05/05/03 <134 -- . - -- . - -- --
L. ' 05/15/03 <144 = ........- " -
L 05/20/03 <144 . ....... " --
L. 05/28/03 <.5141 -- --.. .. ....
L 06/04/03 <140 " 7" "
L. 06/10/03 <137 - - - - - ..
L 06/17/03 <141 . . .. " - - -
L 06/24/03 <141 ............
L 06/30/03 <140 2,080 2,490 <95.3 <5.55 <19.1. 447 12.3
L 07/29/03 .<141 1,860 . 2,360 <9.99 6.47 <5.08 264 9.55
L " 08/27/03 <142 1,950 2,330 - -..
L 09/25/03 <140 1,620 2,490 - - - - -
L 12/16/03 <146 - - - ....
M 02/12/03 18,700 252 23.0 146 12.9 <13.3 <43.2 7.10
M 02/28/03 14,400 168 27.7 64.7 <2.84 <6.48 123 <1.22
M 03/03/03 9,420 164 26.6. 62.7 <2.44 <4.54 <42.8 <2.90
M 03/10/03 15,000 234 23.6 - ..-..
M 03/17/03 10,600 207 22.2 - .....
M 03/24/03 10,100 171 26.3 .........
M 03/31/03 11,000 161 23.1 ......
M 04/07/03. 9,260 177 24.3 - - - . -
M 04/14/03 9,600 186 23.9 -.....-- -
Notes:
ug/L. Micrograms per liter
mg/L -Milligrams per liter
pCi/L Picocuries per liter
18,700 Constituent was detected above the laboratory method detection limit.
<141. Constituent was not detected above the laboratory detection limit.-- Constituemt not analyzed.
Grab groundwater sample collected during monitoring well installation.
Table 12 -Groundwater Analytical Results

3 of 10
Table 12. Groundwater Analytical Results, PSEG Nuclear, LLC, Salem Generating Station, Hancock's Bridge, New Jersey.
Well Sample Tritium Major Cations and Anions Gamra-Emmitting Isotopes (pCi/L)
Identification Date (pCi/L) . Boron (ug/L) Sodium (nig/L) Potassiuni-40 Radiuni-Natural Thorium-232 Thoriunr-234 Uraniurn-235.
M3 04/21/03 8,880 . 22.5 - - -
M3
04/30/03 8,800 - 23.7 .......
M3 07/09/03 126,000 > /' 307 20.8 <23.7 43.9 <3.70 <83.2 <4.13
M 07/23/03 113,001 ' 234 . 22.0 78.1 <2.97 <7.30 <82.4 <4.52
M 08/06/03 73,20o9 242 21.9 53.1 16.1 <4.38 <38.9 <2.88
M 08/20/03 62,000) 274 22.5 48.1 <2.17 <4.08 169 <4.31
M 09/04/03 3,3 0 11 222 22.8 63.2 12.7 <4.48 178 <337
M 09/16/03 28,400 320 24.5 47.7 7.26 <3.97 <148 <412
M 10/03/03 25,4001 266 25.0 49.0 11.8 <4.46 116 <479
M 10/20/03 16,380 ....-
M 12/04/03 9,010 - -- . ....
M 01/06/04 11,400 " -.. -
N 01/30/03 69,000 339 14.3 <41.2 32 <5.25 <38.4 <3.37
N 2 01/30/03 5 _8400 370 14.4 - -..
N 02/10/03 15,600 276 10.6 - -.....
N 03/04/03 2,770 197 34.3 62.5 43.9 <7.23 <47.0 4.99N 03/14/03 2,670 408 24.0 .- -.. ..
N 03/17/03 3,830 362 20.5 .....
N 03/25/03 3,480 238 18.1 -- - - . ...
N 04/04/03 3,560 210 19.6 .....
N 04/11/03 3,730 249 19.3 ..... - -
N 04/16/03 3,910 228 " 22.2 ......
N 04/25/03 4,600 - 16.2 - - ....
N 04/30/03 9,370 - 15.8 .... -- --
N 05/06/03 9,830 - 19.8 - - - -- -
N 05/21/03 7,480 299 19.2 ......
N 05/27/03 7,130 225 17.6 .....
N 06/04/03 5,480 233 20.0 ........
N 06/11/03 4,990 304 19.8 - .....
Notes:
ug/L Micrograms Per liter
mg/L Milligrams per liter
pCi/L Picocuries per liter
18,700 Constituent was detected above the laboratory method detection limit.
<141 Constituent was not detected above the laboratory detection limit.
-- Constituent not analyzed.I Grab groundwater sample collected during monitoring well installation.2 Samples were re-analyzed to compare results.
3 Well M was replaced in May 2003 with a properly constructed Monitoring Well. Prior to this, Well M was installed as a temporary Well constructed with nmill-slotled steel
Table 12 - Groud Analytical Results
0

04of 1O
Table 12. Groundwater Analytical Results, PSEG Nuclear, LLC, Salem Generating Station, Hancock's Bridge, New Jersey.
Well Sample Tritium Major Cations and Anions Gamma-Emmitting Isotopes (pCi/L)
Identification Date (pCi/L) Boron (ug/L) Sodium (ing/L) Potassiunu-40 Radium-Natural Thorium-232 Thoriuln-234 Uranium-235
N 06/19/03 5,680 217 18.4 -- - - - -
N 06/25/03 5,060 268 17.1 ......
N 07/10/03 5,020 268 17.5 <21.1 5.37 <4.48 <64.5 8.10
N .07/25/03 5,220 217 19.6 <13.0 <2.38 <4.19 153 <4.52
N 08/07/03 5,110 210 23.5 <15.4 14.7 <4.70 <93.5 11.0
N 08/20/03 5,850 247 20.4 <9.32 <2.41 <4.00 <160 <4.06
N 09/04/03 5,660 334 22.8 <16.1 <1.75 <4.54 <52.9 3.96
N 09/17/03 6,160 267 22.4 67.9 <2.51 <5.90 <57.1 <4.81
N 10/03/03 5,740 240 24.0 <31.7 6.37 <3.87 166 <125
N 11/03/03 5,560 .- -- - -- -
N 12/12/03 6,010 ......
N 01/20/04 6,460 - -- - - - -
0 01/29/03 . 1,220 156 40.5 930 62.9 88.5 177 16.5
0 2 01/29/03 1,400 172 .40.4 - .- -- - -
0 02/10/03 10,300 97 13.2 -- .....
0 02/21/03 .7,370 89 15.4 .- -- --
0 02/28/03 11,700 . 89 17.0 <14.8 9.12 <6.97 120 4.04.
0 03/04/03 8,800 71 r 20.8 -.... " -
0 03/13/03 12,300 108 15.5 .......
0 03/17/03 11,000 83 11.9 .......
0 03/25/03 8,660 98 11.7 .....
0 03/31/03 8,010 64 13.91 -- - -
0 04/07/03 7,290 77 8.8 -- -- --
0 04/15/03 12,400 85 10.0 - - - - -
0 04/21/03 11,800 1- 1.5 - - - -
0 04/29/03 10,500 - 12.3 - - " - "
0 05/06/03 10,200 -- ' 11.2 .....
0 05/21/03 11,100 108 10.3 ---- -- --
0 05/28/03 12,700 183 11.9 --"....
Notes:
ug/L Micrograms per liter
mg/L Milligrams per liter
pCi/L Picocuries per liter
12,400
<16.1
2
Constituent was detected above the laboratory method detection limit.
Constituent was not detected above the laboratory detection limit.
Constituent hot analyzed.
Grab groundwater sample collected during monitoring well installation.
Samples were re-analyzed to compare results.
Table 12 - Groundwater Analytical Results

5of 10
Table 12. Grouadwater Analytical Results, PSEG Nuclear, LLC, Salem Generating Station, Hancock's Bridge, New Jersey.
Well Sample Tritium Major Cations and Anions Gamma-Emmitting Isotopes (pCi/L)
Identification Date (pCi/L) Boron (ug/L) Sodium (mg/L) Potassiunm-40 Radium-Natoral Thoriunm-232 Thoriln-234 Uranium-235
0 . 0 6 /0 8 /0 3 12 ,2 0 0 14 0 13 .5 ......
0 06/10/03 12,800 183 14.3 . .....
O 06/17/03 10,300 204 14.9 .........
O 06/24/03 13,400 252 14.7 .........
O 07/09/03 9,100 272 14.6 <21.2 <2.66 <6.62 <123 <3.43
O 07/25/03 7,710 234 13.5 <37.8 6.34 <4.13 <199 3.95
O 08/06/03 8,300 240 14.4 39.2 10.8 <4.26 <148 <4.13
O 08/20/03 7,440 305 13.9 <16.4 <2.58 <3.82 164 <4.31
O 09/03/03 6,400 282 13.5 46.2 <2.58 <3.82 164 <4.31
o 09/15/03 5,110 270 12.9 <2.62 6.13 <6.96 58.2 <3.52
O 10/03/03 6,980 233 23.2 4.30 10.7 <3.55 <92.9 <3.45
O 10/20/03 6,700 201 47.0 - - ....
0 12/18/03 7,060 ..-- - -
p 02/06/03 <153 -.........
P 02/21/03 <148 -- --..... . -
p 03/13/03 303 417 1,080 ........
P 03/18/03 465 199 699 .........
P 03/26/03 <143 336 698 ...... •- --
P 04/03/03 <154 241 1,110 ........
p 04/24/03 <139 -- .......- --
P 04/29/03 <144 . " .... - --
P 05/05/03 <134 ........ -
P 05/20/03 <145 ........
P 05/30/03 <142 ..........
P 06/04/03 <141 ...... -
p 06/10/03 <138 ........
P 06/17/03 <141 ............
P 06/24/03 <141 .............
p 07/16/03 <141 485 1,580 60.7 <3.56 <5.04 127 3.46
P 08/13/03 <140 480 1,570 47.5 3.21 <4.54 <1.98 <4.34
P .09/09/03 <147 645 1,560 63.8 11.8 6.19 54.8 <5.02
p 10/06/03 <143 481 1,610 -- - - -- --
Notes:
ug/L
mg/L
pCi/L
303
<3.56
Microatrams per liter
Milligrams per liter
Picocuries per liter
Constituent was detected above the laboratory method detection limit.
Constituent was not detected above the laboratory detection limit.
Constituent not aiialyzed.
Grab groundwater sample collected during monitoring well installation.
0Table 12 - GrounodAnalytical Results

6 of 10
Table 12. Groundwater Analytical Results, PSEG Nuclear, LLC, Salem Generating Station, Hancock's Bridge, New Jersey.
Well Sample Tritium Major Cations and Anions Gamma-Emmitting Isotopes (pCi/L)
Identification Date (pCi/L) Boron (ug/L) . Sodium (rag/L) Potassiun-40 Radium-Natural Thorium-232 Thoriun-234 Uranium-235
Q 03/14/03 <143 ----.... ...
Q 03/19/03 <143 - - ....
Q 03/24/03 <143 .......
Q 04/23/03 <139 " - -- - -" "
Q . 04/30/03 <142 -- . .......-
Q 05/06/03 <135 -- -- -- - ..
Q 05/12/03 <144 - .-- -...
Q 05/19/03 <144 -- - - - - -
Q 05/30/03 <140 - - - - - - -
Q 06/05/03 <139 . ...... . - -
Q 06/11/03 <138 . ..... - ......
Q 06/16/03 <141 .. • ....
Q 06/23/03 <143 - - .... - -
Q 07/17/03 <141 340 2,100 151 <5.78 <13.9 <88.4 8.99
Q 08/13/03 <142 315 1,830 85.7 5.63 <4.09 <7.45 <3.06
Q 09/10/03 <148 247 1,790 86.8 30.2 <5.42 98.1 5.53
Q 10/07/03> <144 331 1,920 .- -- .......
Q 111/09/03 < 142 317 1,930 --- .......
R .•2 02/26/03 13,900 288 42.6 258 15.0 <8.58 122 7.49
R2 03/03/03 . 7,490 229 37.3 80.5 7.37 <8.73 144 5.75
R2 03/10/03 6,170 270 28.7
R2
03/17/03 7,270 269 33.4 - : . - " ..
R' 03/25/03 6,810 248 32.4 - - - - -
R2 04/01/03 6,740 216 34.8 - .....
R 2 04/08/03 5,940 251 33.3 .... - --
R2 04/14/03 5,890 255 33.4 .... ..
R2 04/22/03 5,800 - 32.6 --....... -
R2 04/30/03 5,260 - " 31.8 ......
R 07/09/03 1 3,270 511 57.4 58.2 33.4 <4.73 <36.6 <3. 18
Notes:
ug/L Micrograms per liter.
mg/L Milligrams per liter
pCi/L Picocuries per liter
6,740 Constituent was detected above the laboratory method detection limit.
<4.73 Constituent was not detected above the laboratory detection limit.
-- Constituent not analyzed.
Grab groundwater sample collected during monitoring well installation.
Well R was replaced in May 2003 with a properly constructed Monitoring Well. Prior to this, Well R was installed as a temporary well construicted with mill-slotted steel
Table 12 - Groundwater Analytical Results
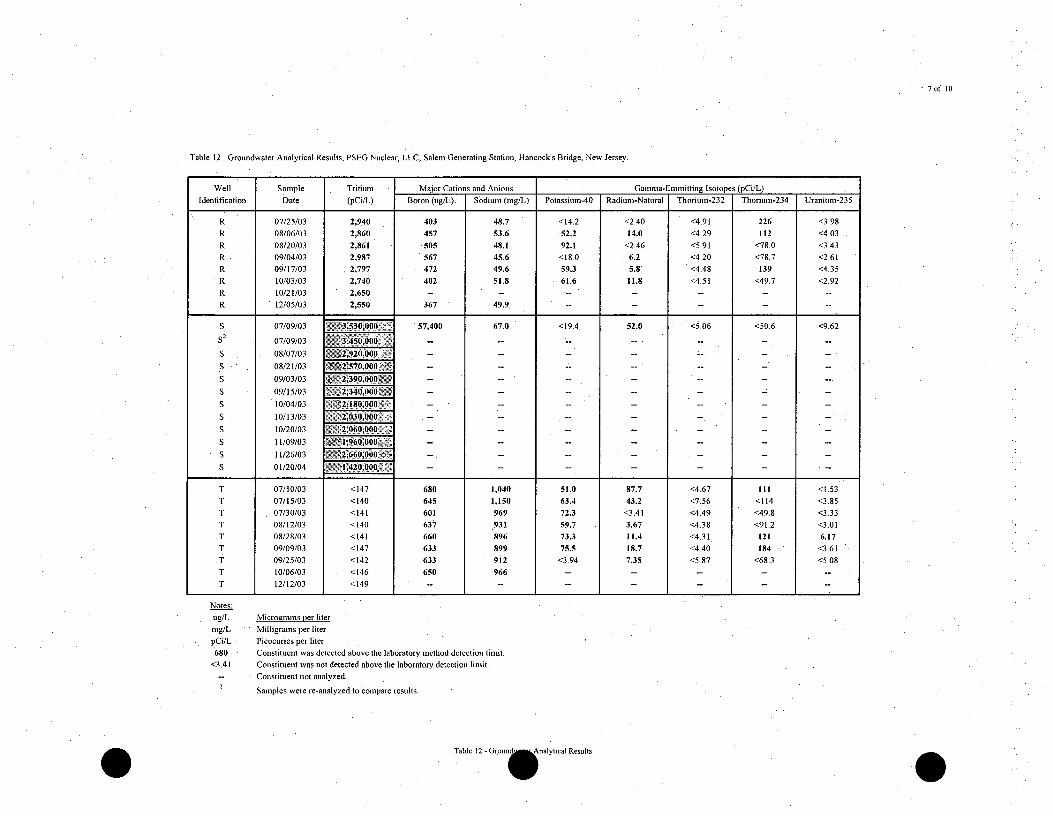
7of 1O
Table 12. Groundwater Analytical Results. PSEG Nuclear, LLC, Salem Generating Station, Hancock's Bridge, New Jersey.
Well Sample Tritium Major Cations and Anions Gamma-Emmitting Isotopes (pCi/L)
Identification Date (pCi/L) Boron (ug/L). Sodium (mg/L) Potassiutn-40 Radium-Natural Thorium-232 Thorium-234 Uranium-235
R 07/25/03 2,940 403 48.7 <14.2 <2.40 <4.91 226 <3.98
R 08/06/03 2,860 457 53.6 52.2 14.0 <4.29 112 <4.03
R 08/20/03 2,861 .505 48.1 92.1 <2.46 <5.91 <78.0 <3.43
R 09/04/03 2,987 567 45.6 <18.0 6.2 <4.20 <78.7 <2.61
R 09/17/03 2,797 472 49.6 59.3 5.8 <4.48 139 <4.35
R 10/03/03 2,740 402 51.8 61.6 11.8 <4.51 <49.7 <2.92
R 10/21/03 2,650 - - -- - - . ...
R 12/05/03 2,550 367 49.9. -......
S 07/09/03 ;,530,130O0 57,400 67.0 <19.4. 52.0 <5.06 <50.6 <9.62S 07/09/03 3,450,000: - -- - . -- - --
S 08/07/03 Z920,000.. ...... .
S 09/03/03 232190,000..S 09/15/03 •2,340,0003 .........
S 10/04/03 ',2•i80,000, .
S 10/13/03 .i,.2,30,0001 - -......
S 10/20/03 •2,060,00O -- -.....--
S 11/09/03 i "9610•0.
S 11/26/03 . 2,660.•000
S 0 1 / 2 0 / 0 4 _ 1 ,4 2 0 ,0 0 0 ', :. - -- --... .. ..
T 07/10/03 <147 680 1,040 51.0 87.7 <4.67 111 <1.53
T 07/15/03 <140 645 1,150 63.4 43.2 <7.56 <114 <3.85
T 07/30/03 <141 601 969 72.3 <3.41 <4.49 <49.8 <3.33
T 08/12/03 < 140 637 931 59.7 3.67 <4.38 <91.2 <3.01
T 08/28/03 < 141 660 896 73.3 11.4 <4.31 121 6.17T 09/09/03 <147 633 899 75.5 18.7 <4.40 184 <3.61
T 09/25/03 <142 633 9i2 <3.94 7.35 <5.87 <68.3 <5.08
T 10/06/03 <146 650 966 -- - - - -
T 12/12/03 <149 - -.....
Notes:
ug/L Micrograms per liter
mg/L Milligrams per liter
pCi/L Picocuries per liter
680 - Constituent was detected above the laboratory method detection limit.
<3.41 Constituent was not detected above the laboratory detection limit.
-- •Constituent not analyzed.2 Samtples were re-analyzed to comnpare results.
Table 12.Grou rAnalytical Results
0

8of tO
Table 12. Groundwater Analytical Results, PSEG Nuclear, LLC; Salem Generating Station, Hancock's Bridge, New Jersey.
Well Sample Tritium Major Cations and Anions Gamma-Emmitting Isotopes (pCi/L)
Identification Date (pCi/L) Boron (ug/L) Sodium (tng/L) Potassium-40 Radium-Natural Thorium-232 Thorium-234 Uraniuni-235
U 07/10/03 <136 389 178 88.4 13.6 <7.18 <48.6 <4.55
U 07/16/03 '146 380 175 77.4 14.5 <4.56 <35.2 <4.01
U 07/29/03 <141 421 146 53.2 <3.09 <4.05 153 <3.90
U 08/12/03 <139 341 " 139 64.6 <2.13 <4.65 201 <1.16
U 08/27/03 <143 347 144 <43.3 4.20 <4.55 <136 <3.62
U. 09/09/03 .148 376 .. 139 . <36.8 <3.97 <4.60 107 5.30
U 09/25/03 <139 335 155 <23.3 <1.79 <4.58 <46.9 <3.59
U 10/06/03 203 354 140 -- - -- -
U 12/12/03 <148 - - .......
V 07/21/03 334 489 609 43.0 <1.86 <4.01 <5.68 <2.78
V 07/29/03 285 431 592 47.4 <3.26 . <4.71 164 <4.63
V 08/12/03 278 495 568 39.0 <1.60 <3.95 < 143 <2.47
V 08/27/03 338 607 584 <16.8 <1.81 <3.97 <53.3 "<3.21
V 09/09/03 337 571 582 <15.7 <4.35 <4.06 116 5.23
V 09/25/03 261 472 670 <43.5 <1.79 <4.30 171 4.65
V 10/06/03 185 463 543 . ......
V .11/19/03 549 -- ..--. ...
V 12/12/03 207 ...... .- - -.
W 07/07/03 10,500 490 220 <15.9 9.51 <3.36 98.2 <4.56
W 07/21/03 11,100 491 227 67.7 <1.73 <3.11 <59.0 <2.65
W 08/06/03 11,500 464 211 74.2 <2.78 <7.46 <94.1 <4.62
W 08/07/03 6,010 - - -... ..
W 08/19/03 7,660 . 591 215 60.1 <2.43 <5.86 <135 <5.29
W 09/03/03 8,110 533 222 <45.1 <1.76 <3.82 111 5.80
W 09/15/03 8,710 566 237 55.2 <2.43 <4.33 158 <1.23
W 10/03/03 li1 00 455 240 <68.1 <3.82 <6.46 <51.9 <5.91
W 10/21/03 8,260 - - -- - - - --
W 1i/17/03 12,200- - - .. . -- ..
W 11/19/03 13,200 -- -- -- .
W 12/16/03 15,500 ... -• -
W 01/14/04 11,400 - • - - -- -
Notes:
mg/L
pCi/L
Milligrams per liter
Picocuries per liter
10,500 Constituent was detected above the laboratory method detection limit.
<148 . Constituent was not detected above the laboratory detection limit.
-- Constituent not analyzed..
Table 12 - Groundwater Analytical Results

9of 10
Table 12. Groundwater Analytical Results, PSEG Nuclear, LLC, Salem Generating Station, Hancock's Bridge, New Jersey.
Well Sample Tritium Major Cations and Anions Gannma-Emmitting Isotopes (pCi/L)
Identification Date (pCi/L) Boron (ug/L) Sodium (rig/L) Potassium.-40 Radiunm-Natural Thorium-232 Thorium-234 Uranint-235
Y 10/27/03 < 142 -- -- -.. -
Y 11/09/03 <143 ..........
Y 11/19/03 <3,750 -- --.......
Y 11/25/03 < 141 822 1,070 ........
Y 12/12/03 <148 --...........
Y 12/22/03 <147 -- - -.............
Z 10/27/03 573 ............
Z 11/09/03 <140 ..... - -- - - -
Z 11/19/03 729 --.........
Z 11/24/03 583 498 519 ..... - -
Z 12/12/03 621 - -- ......
Z 12/22/03 659 -- ... - --
AA 10/27/03 613 . .......
AA 11/10/03 645 ..........
AA 11/19/03 734 -- --........
AA 11/24/03 639 247 253 ..........
AA 12/10/03 785 ..............
AA 12/22/03 682 ..............
AA 01/06/04 713 .... . .....
AB 10/28/03 .292.00..
AB 11/02/03 '< >•28o;0,011 0 ..........
AB 11/19/03 / )•321,.0o) - .......
AB 12/04/03 ...409,0.
AB 12/16/03 • :396,00 V• - .........
AB 01/14/03 -[. 281,000 .---
Notes:
mg/L
pCi/L
613
<140
Milligrams per liter
Picocuries per liter
Constituent was detected above the laboratory method detection limit.
Constituent was not detected above the laboratory detection limit.
Constituent not analyzed.
Table 12 - Gro Analytical Results

10 of 10
Table 12. Groundwater Analytical Results, PSEG Nuclear, LLC, Salem Generating Station, Hancock's Bridge, New Jersey.,
Well Sample Tritium Major Cations and Anions Gamma-Emmitting Isotopes (pCi/L)
Identification Date (pCi/L) Boron (og/L) Sodium (mg/L) Potassiom-40 Radium-Natural Thoriumn-232 Thoriumt-234 Uranitnn-235
AC 10/28/03 " i0O96 ,000 253,000 30.8 ....
AC 1 1/03/03 14 ,2.00,000 332,000 30.4 -- - --
AC 11/18/03 14,200,•@ .-....
AC i 2/18/03 s0o15,00(t,000 ....
AC -01/20/04 0,700,0o00 - -- -- - - - -
AD 10/27/03 : 244,00. -0.. -.....
AD 11/02/03 2" .42... -•00"0- -:
AD 11/17/03 225,000 -- - ......
AD 12/04/03 392,000. • ..... .
AD 12/16/03 , 4.7.. - - - - -
AD. 01/14/04 ",220,000 ...... - - -
AE 10/27/03 5,990 . -- .....- " -
AE 11/02/03 5,710 ............
AE 11/19/03 6,910 234 14.2 ... , -- • ....
AE 12/04/03. 6,310 ......
AE 12/18/03 16,100 - - - . ....
AE 01/14/04 12,600 - -. - - - -
AF 10/07/03 < 142 380 227 .......
AF 10/27/03 242 - -
AF 11/10/03 330 -- -- - - -- --
AF 11/19/03 256 ..--... -- --
AF 11/24/03 245 429 545 ....- " -- -
AF 12/10/03 343 - -- '
AF 12/22/03 302 - - ....
Notes:
mg/L Milligrams per liter
pCi/L Picocuries per liter
242 Constittent was detected above the laboratory method detection linst.
<142 . Constituent was not detected above the laboratory detection limit.
- Constituent not analyzed.
Table 12 - Groundwater Analytical Results

6
'~ '~
K;.:
AL LOW1- Vi•
SITE LOCAT-I ON;(-
1-
~- 01
~Iy TRE E
~< $~A~K..
St&wP~n~
S
N L/
QUADRANGLE LOCATION
SCALE 1:24000
10 1 MILE
1000 • 0 1000 2000 3000 4000 5000 6000 7000 FEET
10 \'.5 0 1 KILOMETER 187 MILS 0`21'
6 MIL
CONTOUR INTERVAL 10 FEETNATIONAL GEODETIC VERTICAL DATUM OF 1929
UTM GRID AND 1981
TOPOGRAPHICAL OUADRANGLE TAYLORS BRIDGE. DEL-N.J. 1948 PHOTOREVISED 1981. MAGNETIC NORTHSOURPCE> UISIS 7.P. MINT1SOURCE, HSrS 7 5 MIN
Y ~ .... ~
00> ARCADIS
UDAWN GUAIL I PIROJLCI MANAGERV. WASILEWSOI 2/27/04 P. MIUONIS
DEPARTMENT MANAGER0. FULTON
+SITE LOCAlnON
PSEG NUCLEAR, LLCSALEM GENERATING STATION
ARTIFICIAL ISLANDHANCOCK'S BRIDGE. NEW JERSEY
LLAS JtSIUN POTI .S. POTTER CHECKEDB PIERCE Ia-J.
PROJECT NUMBER
NP000571.0003DRAWING NUMBER
1
-- mw
'Al 0 OJC P- PM7*mo m6N \ aem\ , 1.0003 - Remedial investigation \codd \FIG- 1 STATION LOCATION.DWG 2/27/2004 - 2:30:44 PM Layout: 8.501 H

NV?
I-
.. ..2 I
~I1
. ... - PROPE R
-- Om.. LOW O N
-- .LGUID RAW" WASTE LINE
L . SEISMIC CAP (STYROFOAM)
SERVICE WATER PIPING
SCIRCULATING WATER OUTLET PIPING
< • CIRCULATING WATER INLET PIPING
S-. TOPOGRAPHIC CONTOUR
(ONE FOOT CONTOUR INTERVAL)
I - -- - - STORM SEWER PIPING
CATCH BASIN
e MANHOLE (STORM SEWER)
SHEET PILE - EXTENDS FROMABOVE THE WATER TABLE THROUGHTHE KIRKWOOD FORMATION
SHEET PILE - DOES NOT EXTENDTO AN ELEVATION ABOVE THE WATERTABLE
SLOCATION OF THRUST BLOCK(DASHED WHERE INFERRED)
m
AFST AUXILIARY FEEDWATER STORAGE TANKPWST PRIMARY WATER STORAGE TANK
RNST REFUEUNG WATER STORAGE TANK
NOTE:
LOCATION OF THE THRUST BLOCK ISAPPROXIMATE. CONSTRUCTION DETAILS OF THETHRUST BLOCK WERE OBTAINED FROMENGINEERING DRAWINGS AND PHOTOGRAPHSTAKEN DURING FACILITY CONSTRUCTION.
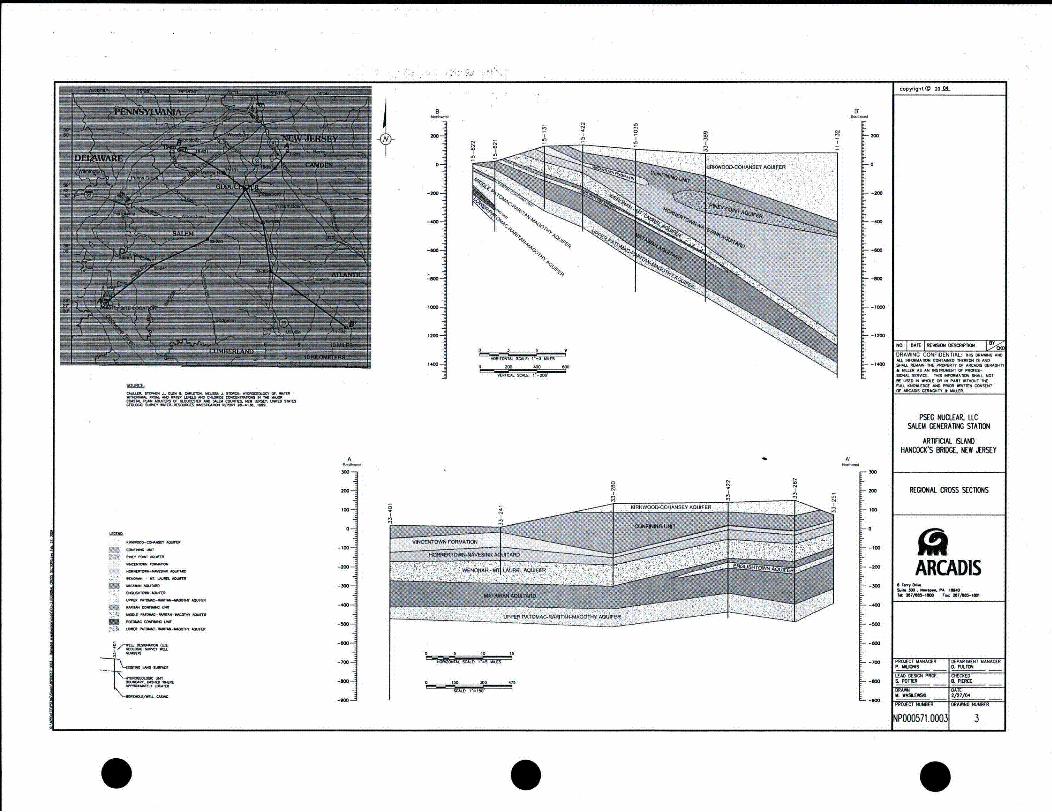
B
- Io 1
a.
-- I--na
- -a--
'TIFi~
A
33 Ia33 3333 3333 33
A
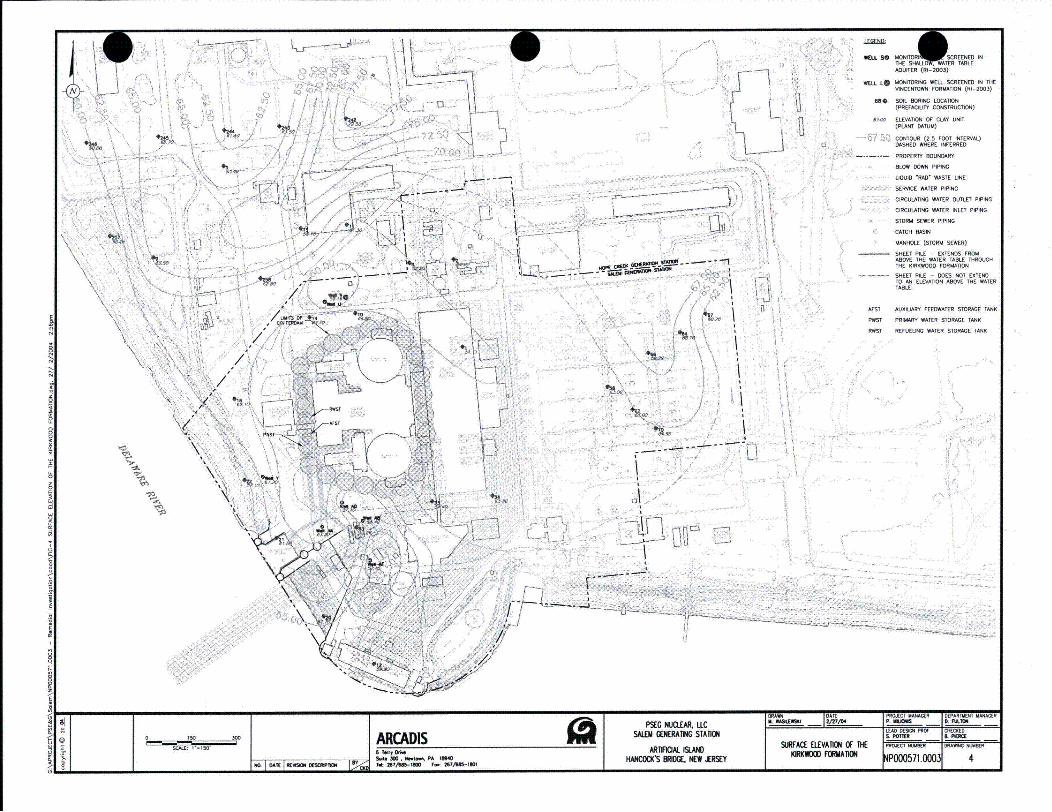
I EGNO
NEILL So
• " •: L
AQUIFER (RI-2003)
WEL. LO MONITORING WELL SCREENED IN THEVTNCENTOWN FORMATION (RI-2OO3)
-A
7
2~~~~~'F
IF--
7/ LI~
~
A.-~
IIt
r
I~ j
R41 SOIL BORING LOCATION(PREFACILITY CONSTRUCTION)
HA UT ELEVATION OF CLAY UNIT(PLANT DATUM)
CONTOUR (2.5 FOOT INTERVAL)
LDASHED WHERE INFERRED
-" -- -..... PROPERTY BOUNDARYBLOW DOWN PIPING
LIQUID =RADO WASTE LINE
SE RACE WATER PIPING
CIRCULATING WATER OUTLET PIPING
CIRCULATING WATER INLET PIPING
STORM SEWER PIPING
CATCH BASIN
MANHOLE (STORM SEWER)
- SHEET PILE - EXTENDS FROMHABGE THE WATER TABLE THROUGHTHE KIRKWOOO FORMATION
- .SHEET PILE - DOES NOT EXTENDTO AN ELEVATION ABOVE TUE WATERTABLE.ii
AFST AUXILIARY FEEDWATER STORAGE TANK
PWIST PRIMARY WATER STORAGE TANK
RWST REFUELING WATER STORAGE TANK
lza"
~-1
1/
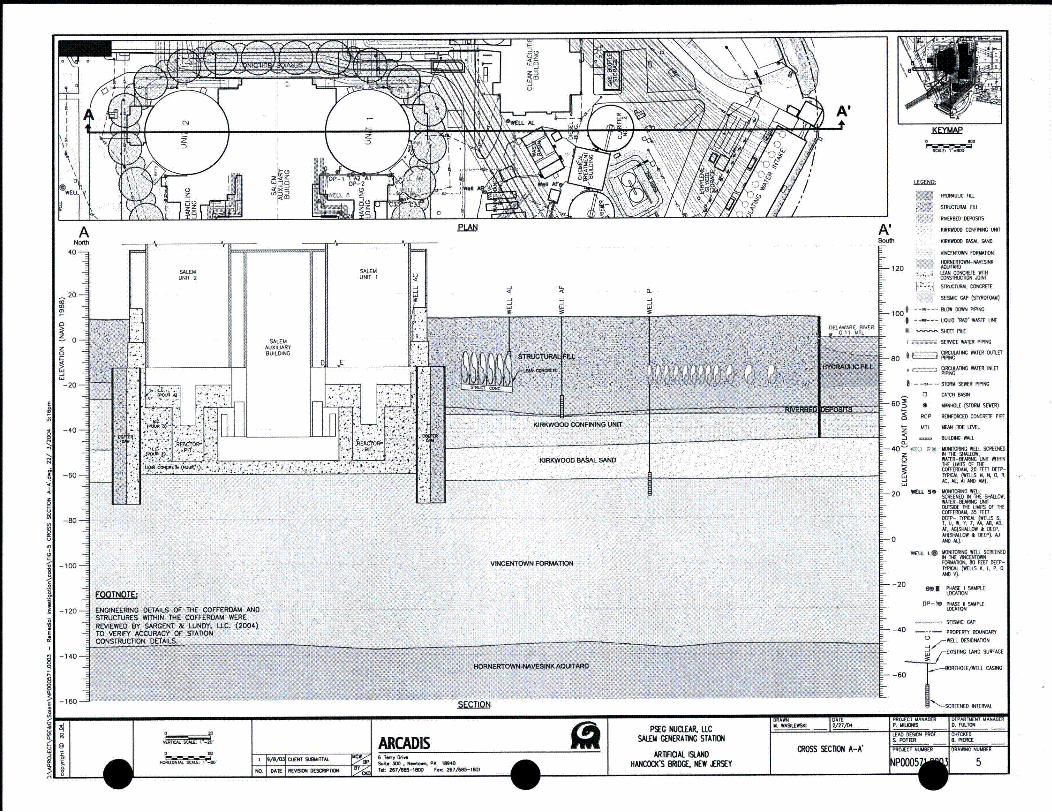
J~XU~E
Q-
J
LEGENG, _
L
STRUTURAL FLLCTL
. T KIRKWMOO CONFITNG UN1ISouth KIRKWOOD BASAL SAND
HWICEHTTTONORA THIER
20 N-NJVESOINTLEHAN COTNCRETE WTTHCBMTWTlLEEEDW ~STUTURAL COSEISIC GAP (SMRO)
_100 -- - - - - SLOW DOWN MN
* - ---- WDO WR WASTE IME
Ti "'"--SHEETPFGE
SERACE WATER PB'I
C0RClUL AIR WATER OUTLET
XL ' CICTRTH•A• WATER IWLET
S -~-- -STORMG SLY" PIPING
0 CATH BASNI
S 60, WHRLE (STORM SEWER)
RCP RENFORCED COTEETE PPE
t ML RME THERE LEVEL
SBILDIDG WALL
40 W aLI. r MONTTTJNG WELL SCREEEDz N THE SHAILO,0 MATER-MBEHNG UNAf WIT N
THE HU•MSOF THECOFFERDAM, 20 FEET DEEP-
"TPICAL WELlS N. 0D, R.
AC. AE. AT AMI H).
20 I 50 M ¶FR NG WELL
WATER-REARMIG UNITOUTSIDE TE LPITS OG TIECOFERDEAM. 35 FEETDEEP- TYPCAL (WELLS S.T. U. W. Y. Z, HAAR. WAD.AF. AE(SMALLTW & [EEP,
0 (SI•IUM• DEEP), A
Wi a LO MOTRT WELL SCREENALN INE vtx DowfmECR1AR10 90 FEET DEEP-
* TYPICAL (WELLS H, L P. UANDR).
-20 uM PSE ISAMPLELOCATION
DP-T PHS u SAMPLEI LOCATIONW
KIRIK FACT
KIRKWOOD BASAL SAN
U
VICENTOWN FORMATION
FOOTNOTE
-140 -
SEISME CAP'-- 40 PROPERTY BOUNDARY
-0
,0-MWELL OESrIN.TION
-- EXXRtTTG LEAT SURFACE
--_60t ER.EOLE/ILL CASE
-160-

STRUCTURAL FILL
BB RrVERBEO DEPOSITS UI
West E"" KIRKWOOD CONFINING UNIT
40 KIRKWOOD BASAL SAND
FUEL MVINCENTOWN FORMATIONHANDLING SALEM -120
BUILDING UNIT 1 RORNERTOWN-NAVESINK AQUITARD
LEAN CONCRETE WITH0 m C LCONSTRUCTION JOINTSTRUCTURAL CONCRETE WITH
t CONSTRUCTION JOINT
A, 10 • SEISMIC GAP (STYROFOAM)
- ------ BLOW DOWN PIPING
DELAWAR RIVER- UOUID "RAD" WASTE LINE
0 T- 11 - SHEET PILE
HYT)IkALIC OL U 'U SERVICE RATER PIPINGS*-0O• CIRCULAINGO RATEsR OUTLET PIPING
LEA(X)............ . . . . . . . . .. CC.. - CIRCULATING WATER INLET PIPING
-20 STORM SEWER PIPING
z MANHOLE (STORM SEWER)
a- RCP REINFORCED CONCRETE PIPE
0zRAM~r %ý l.(OR3. Mr. MEAN TIDE LEVEL0- BUILDING WALL
BA KIRKOOO ASALSAND.>.B4 MONIT•0RIGR WELL SCREENED IN TAE SHALLOW.
... . . . . . . .... WATR-WEANG UNIT WIHIN- THE N UITS OF THEIORKOOD ASALSANDCOFTERDAM, 20 FEET DEEP- TYISCAL (WELLS M,
N. 0. It AC. AL .N M SM).
WEAL BR IJONVISRA SCEL ERNED IN ATHE SHANLLO.
z WAVRNR-BEARWNG UNIT OUTSIDE MHE LMITS OF TH
0 AR20 . . ROP 35 FEET DEEP- YTUN AY (ELLS V.1. LL W. Y. Z. AA AB. AN D, NV. AG(SWLLOW A
SEEP. A-CSEA.LO A DEEP). M AND RAN.
0 EU LO MONITORING WELL CREEBED IN THETuNCEOTO-N FORATION. W• FEET DEEP-TTH*N. (WELLS A. L, P,.S AND ).
Sol L~oiONSPL
OPO HS ISAMPLE
(100ATENC-EST M FORVMATION LmSSEISMIC GAP
2 -PROPERTY BOUNDARY
F N 140,-ECTOWELL DESIGNATITN
-120 ENGNEERNG ETALS O TH COFERDM AD _ ERISFING LABS SUR1FACE
STRUTURS WTHINTHECOFERDA WEE BRWESOLE/WELL CASING
TO VRIFYACCRACYOF TATIN _ WATER-LEVEL ELEVATION
-140 ~20 FEBRUARY 2003 )NAVD TBRR)-140 SIETIQSCREENED INTERVAL
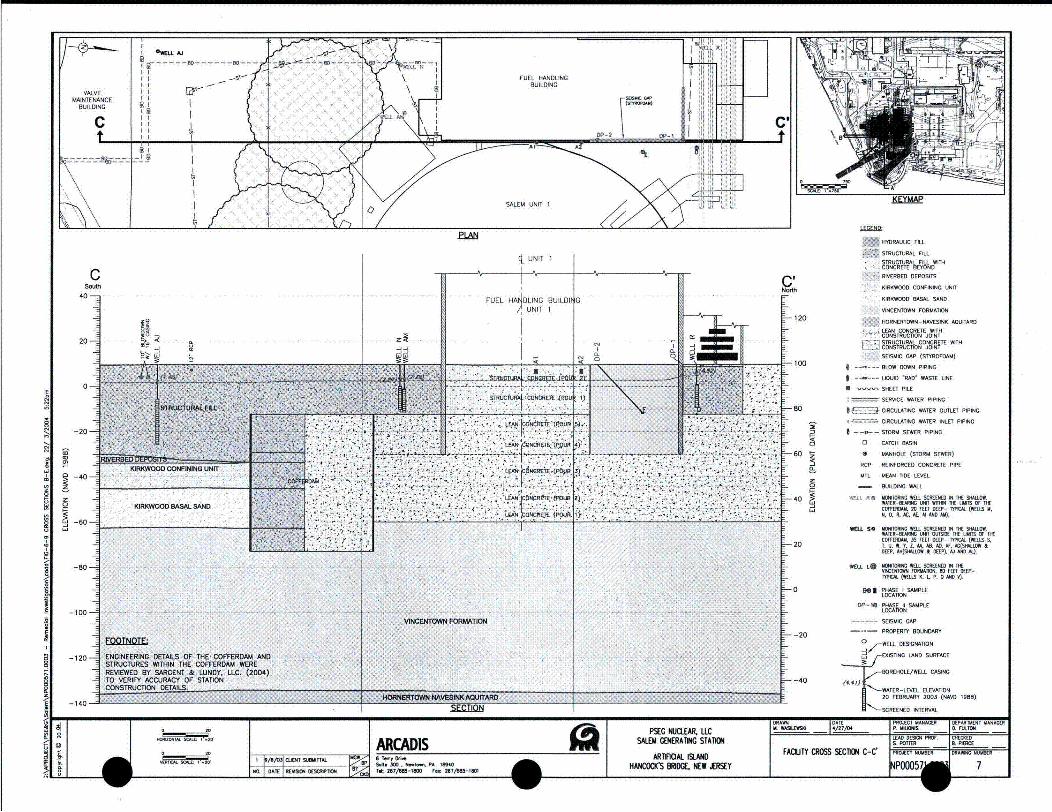
FUEL HANDLINGBUILDING
v
UNIT 1
CSouth
40]
201
0-
FUEL HAiODLING BUILDII
UNIT I
DTRUCrARA4 :CDONEVE (PoU
LJPUR
L"N .. CON C :P0UA,
-20-
-- - -- - -- -
IG
-80
-60
-400
HYDRAULIC FILLSTRUCTURAL FILL
* STRUCTURAL FILL WITHCONCRETE BEYONDRIVERBED DEPOSITS
KIRKWOOD CONFINING UNIT
K KIRKWOOD BASAL SAND
VINCENTOWN FORMATION
HORNERTOWN-NAVESINK ADUITARDA LEAN CONCRETE WITH
CONSTRUCTION JOINTS UCTURAL CONCRETE AMTNK-.' CONSTRUCTION JOINT
SEISMIC GAP (STYROFOAM)
-- RI-- BLOW DOWN PIPING
* ----- ' LIQUID "RAD* WASTE UNE
IN SHEET PILE
1 SERVICE WATER PIPING
.. CIRCULATING WATER OUTLET PIPING
, CIRCULATING WATER INLET PIPING
-- -RI- STORM SEWER PIPING
E CATCH BASIN
M AINHOLE (STORM SEWER)
RCP REINFORCED CONCRETE PIPE
MTL MEAN TIDE LEVEL
- BUILDING WALL
"VtI.I. Re• NIORBIG BELL SCREENED IN THE %TALLOW.WATER-BEARBG UNIT WiTIB RH TIRIS OF THCODTFERDMM 20 FEET DEEP- TTFk (WELLS M.N. 0. A. AC. AL N AD AM).
z
-40 H
_60-
-120-
-20
:-0
-20
- -40
W SL 50 MRIOR BELL SCREENED IN TS 51IAIUDW,WATER-BE•ARI UNIT D 1TSE tR TAMT OF TECEEU.RWM., 35 FEET DEEP- TP.A (WEUS S.T, U. W. 0,. L AA. l AD, AF. AE(SIWLLGW ItDEEP, AN(S1WLUD It DEEP). AJ AND AQ)
VINCENTOWN FORMATION
FOOTNOTE
WEL LeO MONITORIN WL SCREENED B THEVBICEBNORN FORMATION. BT FEET DEEP-TYPECAL (WELLS K. L P. 0 WAR A).
B0§ PHASE I SAMPLELOCATION
DP-Ml PHASE II SAMPLELOCATION
. SEISMIC GAP
PROPERTY BOUNDARY
S--WELL DESIGNATION
_ EXISTING LAND SURFACE
BOREHOLE/WELL CASING
( " '-BWATER-LEVEL ELEVATION
20 FEBRUARY 2003 (NATO 19RR)
SCREENED INTERVAL
:ENGINEERING DETAILS OF THE COFFERDAM ANDSTRUCTURES WITHIN THE COFFERDAM WEREREVIEWED. BY SARGENT & LUNDY., UC. (2004)TO VERIFY ?ACCURACY OF STATIONCONSTRuC'nON DETAILS.r
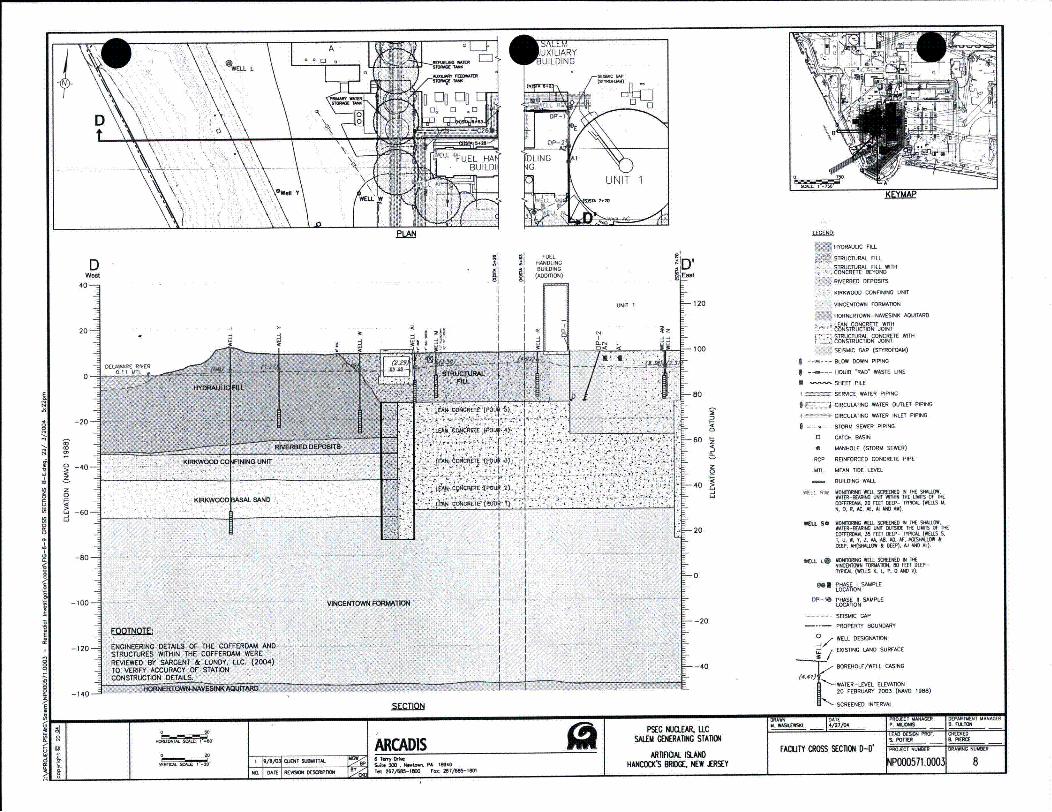
-ITORAULIC FILL
DSTRUCTURAL FILL
D i BUILDINGD'SRCUAFILW7Wast (ADDITION) CONCRETE BEYOND
40 RIVERBED DEPOSITS
KIRKWOOD CONFINING UNIT
UNIT 1- 120 VINCENTOWN FORMATION4OH•NERTOWN-NAVESINK AOUITARD
LEAN CONCRETE WITH" CONSTRUCTION JOINT
C, -,sTRCUA CONCRETE WITHCONSTRUCTION JOINT
100 SEISMIC GAP (STYROFO.AM)
----BLOB DOWN PIPING
0ý I I MLIQUIUD RAD' BASTE LINE
H SHEET PILE
___0_ SERVICE WATER PIPING
.- S .; .' ... I- CIRCULATING WATER OUTLET PIPING
....... CIRCULATING RATER INLET PIPING
L A. .DA) BTE .I - OUI 4- - STORM SEWER PIPING
0 - CATCH BASIN
5 MANHOLE (STORM SEWER)
KRN tA : RCP REINFORCED CONCRETE PIPE
o . MTL MEAN TIDE LEVEL
-40*.. T BUILDING WALL TEMSFR
0RI N MOWOINCE BELL SCREEFED IN TIM. SNAMGOW,BAT2R-BE UNIM T RIFHN THE LIMITS Of ITE
ýDCOFFERDAM. 35 FEET DEEP.- TYPIL (BELLS M,
_60T• N. U. R. A .AE, . A D AN AH).
WEILL LO MOWTOFORB WELL SEFRUFO 01 TH NIM. .--COFF OMK 35 E ET DEEP- TEP- 4 (RES S.TP (. W. Y. L. P. A•. H.• . ,). X ,
DEEP PAR(SEII11 &SAMPLE AJAMW
.INLOCATION
--T ... . ... ... W-E NT - - I I ". .. -AM PHASE II SAMPLE20 LOCATION
SEISMIC CAP
-120 COFFER0A~ AN, "I-PROPERTY BOUNDARY
-120 ENINEERING DETAILS OF THE COFFRDAM AND, WELL DESIGNATION
STRUCTURES WITHIN THE COFFERDAM WERE , EXISTING LAND SURFACE
REVI EWEO By SARGENT & LUNDY, LLC, (2004) ".TO VERIFY ACCURACY OF STATION "40 BOREHOLE/WELL CASING
CONSTRUCTION DE'TALS. (4..7)
-140 * <k,,NAESjIKAO r\AR-WATER-LEVEL ELEVATION
-140 1D' 20 FEBRUARY 2003 (NAVD 1988)
SECTION SCREENED INTERVAL

AULAJIZ.lL
11
5550 00-1 A
KEY
PLAN
ENoFr#Iwd
40
SALEM
20 UNIT I C
~ 1-I
I3* -L
o
J,
E
DELAWARE RIVER •
AC.-
0
0-
-20-
-40)--
-60
-80-
-100-"
-120•
LE.ENQTYO. AUlJC FILL
STRUCTIINAL FILL
RIVERBED DEPOSITS
KIRKWOOD CONFINING UNIT
IKIRKWOOD BASAL SAND
; VINCENTOWN FORMAATION
NORNERTOWN-NAVESINK ACUITARDLEAN CONCRETE WITH
120 CONSTRUCTION JOINTSTRUCTURAL CONCRETE WITH
• CONSTRUCTION JOINT
SEISMIC GAP (STYROFOAM)
BLOW DOWN PIPING
-100 --- LIQUID 'RAO' WASTE UNE
HE - SHEET PILE
T ItElýL SERVICE WATER PIPING
z CIRCULATING WATER OUTLET PIPING
-o0 CIRCULATING WATER INLET PIPING
--. '- - STORM SEWER PIPING
0 CATCH BASIN
F 8 MANHOLE (STORM SEWER)
RCP REINFORCED CONCRETE PIPE60 MTL MEAN TIDE LEVEL
- BUILDING WALL
Z WýI. p" MNOmrTR WELL SCREENED IN THI SHALLOWO WRTER-BEARNG UNIT Bn TBt UNITS Or THE
COFFERDAM. 20 TEET DEET- TYPIAL (WRELS u.
-40 N. 0. R, AC. AER MlIAD U4)
I(KWOOO CONFINING1 UNIT III iREACTORPIT
KUIRIEVD BASAL SAND II II WATER-BERKI LANE OUTIRDE THE RNITS OF TICCDFFE•M. 35 FEETDE- .T7CAL (WELLS S.I. U. NE V. Z. A., . DW. R. NC(SLANLW &DEEP. N(SHALL0W & DEEP). i ANID AL)
VINCENTOWN FORMATION
ý20
20
-40
FOOTNOTE~
ENGINEERING DETAILS OF THE COFFERDAM ANDSTRUCTURES WITHIN THE. COFFERDAM WEREREVIEWED BY SARGENT. & LUNDY. LLC. (2004)TO VERIFY ACCURACY OF STATIONCONSTRUCTION DETAILS.
T ~ j
WELL LIS WDONTIOR WELL SCREENED IN TEWVIENTW FORMATIOrN, RD FEET DEEP-TrPCN. (WELLS K. L P. 0 MND VH.
BDI PHASE I SAMPLELOCATION
D 1P-1 PHASE It SAMPLELOCATION
.. SEISMIC GAP
PROPERTY BOUNDARY
SDESIGNATIN
0 TEMORARYWELL DESIGNATION
u.a EXISTING LAND SURFACE
BOREHOLE/WELL CASING
A-WATER-LEVIEL ELEVATION20FEBRUARY DOUR (NAVO TORN)
SCREENED INTERVAL
A-ANALYTICAL TRITIUM RESULTS FROMSUPPLEMENTAL GROUNDWATERINVESTIGATION (AUGUST 20ft3 - f
-140-IC -, .. I...--------.. . . .. aTLL•ILLLLN. 4 <UJCOMWIflNNLAM.mnflhr t. UTANIN, -
SE~TIO
0
N.

LEGEND*
A2 0
DPN
PHASE I SAMPLE LOCATIONPHASE II SAMPLE LOCATION
PROPERTY BOUNDARY
BLOW DOWN PIPING
UQUID "RAD" WASTE UNE
SEISMIC GAP (STYROFOAM)
SERVICE WATER PIPING
CIRCULATING WATER OUTLET PIPING
CIRCULATING WATER INLET PIPING
STORM SEWER PIPING
CATCH BASIN
MANHOLE (STORM SEWER)
SHEET PILE
AUXILIARY FEEDWATER STORAGE TANK
PRIMARY WATER STORAGE TANK
REFUEUNG WATER STORAGE TANK
AFST
PWST
RWST
<

NI L ..1
>k ~'
4.
HTLLL Ml MONITORING NELL SCREENED INTHE SHALLOW, WATER-BEARINGUNIT WITHIN THE UMITS OF FMECOFFERDAM. 20 FEET DEEP-TYPICAL (WELLS M. N. 0. R. AC.AE. Al AND AM).
WELL SO MONITORING WELL SCREENED INTHE SHALLOW. WATER-BEARINGUNRIT OUTSIDE THE UMITS OF THECOFFERDAM. 35 FEET DEEP-TYPICAL (WELLS S. T. U. W. Y, Z.AA AR. AD, AF. AG(SHALLOW &DEEP. AH(SHALLOW & DEEP). A.)AND AL).
WELU LO MOMTORING WELL SCREENED INTHE VINGENTOWN FORMATION. RoFEET DEEP- TYPICAL (WELLS K, L,P. 0 AND V).
13
"rn i"PROPERTY BOUNDARY
BLOW DOWN PIPING
UOUIO "RAD' WASTE LINE
SEISMIC GAP (STYROFOAM)
SERVICE WATER PIPING
CIRCULATING WATER OUTLET PIPING
CIRCULATING WATER INLET PIPING
STORM SEWER PIPING
CATCH BASIN
MANHOLE (STORM SEWER)
-- _ SHEET PILE - EXTENDS FROMAROVE THE WATER TABLE THROUGHTHE KIRKWOOD FORMATION
SHEET PILE - DOES NOT EXTENDTO AN ELEVATION ABOVE THE WATERTABLE.
f]
AFST AUXILIARY FEEDWATER STORAGE TANK
PWST PRIMARY WATER STORAGE TANK
RWST REFUEUNG WATER STORAGE TANK
ElI
U//
//
/4
THE MEAN TIDAL LEVEL OF THE DELAWARERIER AT ARTIFICIAL ISLAND IS 0.11 FT(NAVD 195a)
l0_
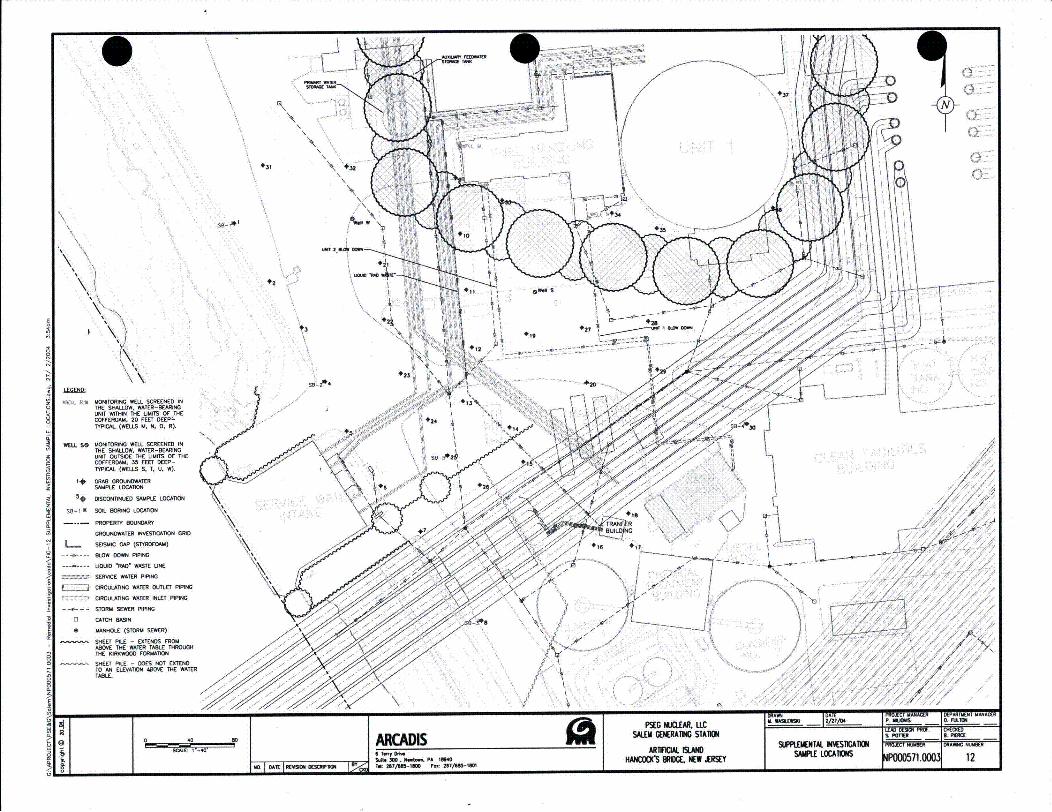
A
U
\\\\
LEGEND*
O R MONITORING WELL SCREENED INTHE SHALLOW. WATER-BEARMNGUNIT WITHIN THE UMITS OF THECOFFERDAM, 20 F DEEPT -
TYPICAL (WELLS M. N. 0, R).
WEILL SO MONITORING WELL SCREENED INTHE SHALLOW. WATER-SEARING
UNIT OUTSIDE THE UMITS OF THECOFFERDAM, 35 FEET DEEP-TYIPICAL. (WELLS S. T. U. W).
I+ GRAB GROUNDWATER
SAMPLE LOCATION
5, DISCONTINUED SAMPLE LOCATION
SS-i W SOIL BORING LOCATION
PROPERTY BOUNDARY
GROUNDWATER INVESTiGATION GRID
L... GEST GAP (STYROFOAM)
------- . .SLOW DOWN PIPING
-----.... UGIJO HPAD WASTE UNE
SERVICE WATER PIPING
E7 CIRCULATING WATER OUTLET PIPING
CIRCULATING WATER INLET PIPING
- STORM SEWER PIPING
o CATCH BASIN
* MANHOLE (STORM SEWER)
- SHEET PILE - EXTENOS FROMABORE THE WATER TABLE THROUGHTHE KIRKWOOO FORMATION
SHEET PILE - DOES ROT EXTENDTO AN ELEVATION ADMO THE WATERTABLE.
3i3
*33
V, # j! .. /....../$ .....~ . . .... .......
i a ~PSE6 wJIXLAR LLC DAIIW /TEG fU ~ D~O
________ ARCADIS SIPLMETA WKSMA 11O LA (31DR OIIESCLE "-Q PAq &k. ARWIM AM SAPL LE)N
Zwccc 300. .i .oý PMA IBM01 PACDSMNWJRE000571.0003 12MO. DATE W*M u iu TAN myjR-Io FIm- nDWD/sD-IW

T712 1002 . U. w. 0. AC00.22M ill0
00100707000 00710000100 '
U.1 000*01 040 F 7
070101 (01075 5 10 . 6.7 0 .2372, 0. 0. 01 OC(00J.0104
* - M 10Ro 107
L.. 5010010(700000
~~~~~~~~M 0101R0 071 207100 <Ž4KBUno= 050000112
o 007R Boo
* E0000(000000
510017 100 000 000000100 '
A7
SWýE/
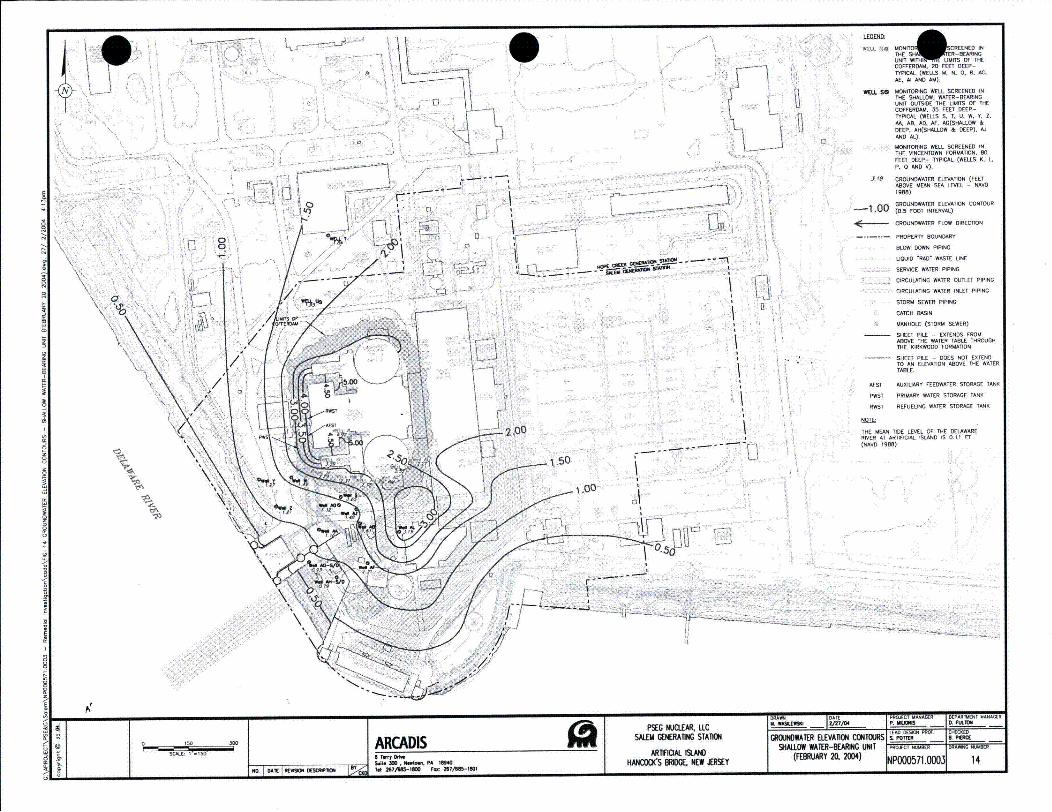
N Li
Kr WE. fig THETTI TSCREENED IN_ESITR BEARING
UNIT WITHRT IMITurS OF THECOFFERDAM, 20 FEET DEEP-TYPIICAL (WELLS M. N. 0. R. AC,AE. Al AND AM).
WU~L SQ MONITORING WELL SCREENED INTHE SHALLOW. WATER-BEARINGUNIT OUTSIDE THE UNITS OF THECOFFERDAM, 35 FEET DEEP-TYPICAL (WELLS S. 1. U. W. Y. Z.AA, AB, AD, AE. AG(SHAULOW &DEEP. AI-(SIIALLDW Al DEEP). A.JAND AL).
MONITORING WELL SCREENED INTHE IIINCENTOWN FORMATION. RDFEET SEEP- TYPICAL (WELLS K. L.P. 0 AND V),
J. 19 GROUNDWATER ELEVATION (FEETABOVE MEAN SEA LEVEL - NAVD1988)
GRO0(''UNDWATER ELEVATION CONTOUR-1 .0 (.5 FOOT INTERVAL)
IE GROUNDWATER FLOW DIRECTION
211
00~ i-i'Took .... PROPERTY BOUNDA~RYBLOW DOWN PIPING
LUQUID 'PAD" WASTE UNE
SERVICE WATER PIPING
CIRCULATING WATER OUTLET PIPING
CIRCULATING WATER INLET PIPING
STORM SEWER PIPING
CATCH BASIN
MANHOLE (STORM SEWER)
SHEET PILE - EXTENDS FROMABOVE THE WATER TABLE THROUGHTHE KIRKWOOD FORMATION
SHEET PILE - DOES NOT EXTENDTO AN ELEVATION ABOVE THE WATERTABLE.
.
'iL
AFST AUXILIARY F•EEWATER STORAGE TANKPWST PRIMARY WATER STORAGE TANK
RWST REFUELING WATER STORAGE TANK
THE MEAN TIDE LEVEL OF THE DELAWARERIVER AT ARTIFICIAL ISLAND IS 0.11 FT(NAVO 1•88)
'IP.50
~*o0riT~*
9

N \ .
2.••: •i-•LErGEND
0
MONITORING WELL SCREENED INTHE SHALLOW. WATER-BEA'INGUNIT WITHIN THE LIMITS OF THECOFFERDAM. 20 FEET DEEP-TYPICAL (WELLS M. N. 0. R. AC.AE, AM AND AM).
MONITORING WELL SCREENED INTHE SHALLOW. WATER-SEARINGUNIT OUTSIDE THE LIMITS OF THECOFFERDAM. 35 FEET DEEP-TYPICAL (WELLS S, T. U. W. Y. Z,AA, AN. AU, HF. AGFSHALLOW &DEEP. AH(SHALLOW & DEEP). AJAND AL).
WELL L@ MONITORING WELL SCREENED INTHE VINCENTOWN FORMATION. NDFEET DEEP- TYPICAL (WELLS K. LP. 0 AND V).
L
Hz~i-'jI1/ 77-77 -
I1
~ ~ ENANLIP
\
J•/
I0T GROUNDWATER ELEVATION (FEETABOVE MEAN SEA LEVEL - NAVD1988)
-1 .00 GROUNDWATER ELEVATION CONTOUR(1.0 FOOT INTERVAL) DASHEDWHERE INFERRED
VT .114 /I.I
-,.1'
*1~ /
l - GROUNDWATER FLOW DIRECTION
U'
- -- ---- PROPERTY BOUNDARY
BLOW DOWN PIPING
UGUID 'RAD' WASTE LINE
SERVICE WATER PIPING
CIRCULATING WATER OUTLET PIPING
CIRCULATING WATER INLET PIPING
STORM SEWER PIPING
CATCH BASIN
MANHOLE (STORM SEWER)
SHEET PILE - EXTENDS FROMABOVE THE WATER TABLE THROUGHTHE KIRKWOOD FORMATION
SHEET PILE - DOES NOT EXTENDTO AN ELEVATION ABOVE THE WATERTABLE.
AFST AUXILIARY FEEDWATER STORAGE TANK
PMST PRIMARY WATER STORAGE TANK
RWST REFUELING WATER STORAGE TANK
THE MEAN TIDE LEVEL OF THE DELAWARERIVER AT ARTI FCIAL ISLAND I 0.11 FT(NAVO 1988)~RS
V
'C2 i~
-.....(2.03•)

>IICT
(J.- -~
2
A
'12.MON TORIýCRECNED IN
COFFERDAM, 20 FEET DEEP
TYPICAL (WELLS U. N. 0. R, AC.AE. A AND AM).
MONITORING WELL SCREENED INTHUE SHALLOW. RATER-REARINGUNIT OUTSIDE THE LIMITS OF THlE
COFFERDAM. 35 FEET DEEP-
TYPICAL (WELLS S. T, U. W. Y. Z.AA. AB. AD. AP, AG(SIXRLLOW &DEEP. AII(SHAALLOW & DEEP). AMAND AL),
WELL. Le MONITORING WELL SCREENED INTHlE VINCENTOWN FORMATION. RI0FEET DEEP- TYPICAL (WELLS K. L.P. 0 AND V).
-02Z6 GROUNDWATER ELEVATION (FEETABOVE MEAN SEA LEVEL - NAVO1988)
.0 GROUNDWATER ELEVATION CONTOUR-1 .0 (0. 5 FOOT INTERVAL) DASHED
WHERE INFERRED
,4 . GROUNDWATER FLOW DIRECTION4 GROUNDWATER SADDLE
- -- ---- PROPERTY BOUNDARY
BLOW DOWN PIPING
UQUID "RAD' WASTE LINE
SERVICE WATER PIPING
CIRCULATING WATER OUTLET PIPING
CIRCULATING WATER INLET PIPING
STORM SEWER PIPING
CATCH BASIN
MANHOLE (STORM SEWER)
- SHEET PILE - EXTENDS FROMABOVE THE WATER TABLE THROUGHTHE KIRKWOOD FORMATION
- SHEET PILE - DOES NOT EXTENDTO AN ELEVATION ABOVE THE WATERTABLE.
AFS7 AUXILIARY FEEDWATER STORAGE TANK
PIWST PRIMARY WATER STORAGE TANK
RWST REFUELING WATER STORAGE TANK
THE MEAN TIDE LEVEL OF THE DELAWARERIVER AT ARTIFICIAL ISLAND IS 0.11 FT
(NAVD 1988)
iR.N~ XIV

/ N
~4
~.
K?
2~
MONITORING WELL SCREENED INTHE SHALLOW. WATER-SEARINGUNIT WITHIN THE UMITS OF THECOFFERDAM. 20 FEET DEEP-TYPICAL (WELLS M, N. 0. R. AC.AE. AJ AND AM).
MONITORING WELL SCREENED INTHE SHALLOW. WATER-BEARINGUNIT OCJTSIDE THE LIMITS OF THECOFFERDAM. 35 FEET DEEP-TYPICAL (WELLS S. T. U. W. Y. Z.AA. AB, AD. A. AU(SHALLOW &DEEP. AH(SHAILOW & DEEP). MJAND AL).
WELL * MONITORING WELL SCREENED INTHE VINCENTOWN FORMAITON. 0FEET DEEP- TYPICAL (WELLS K. L.P. 0 AND V).
0 7 0PU)
'.76 GROUNDWATER ELEVATION (FEETABOVE MEAN EA LEVEL - NAVD1988)
_1.00 GROUNDWATER ELEVATION CONTOUR(1.0 FOOT INTERVAL) DASHEDWHERE INFERRED
E- GROUNDWATER FLOW DIRECTION
4U,
PROPERTY BOUNDARY
BLOW DOWN PIPING
L00UID "RAD WASTE LINE
SERVICE WATER PIPING
CIRCULATING WATER OUTLET PIPING
CIRCULATING WATER INLET PIPING
STORM SEWER PIPING
CATCH BASIN
MANHOLE (STORM SEWER)
SERVICE WATER PIPING
CIRCULATING WATER OUTLET PIPING
CIRCULATING WATER INLET PIPING
AFST AUXIUAR'Y FEEDWATER STORAGE TANI
PWST PRIMARY WATER STORAGE TANW
RWST REFUELUIN WATER STORAGE TANK
EEL
w
EEL
THE MEAN TIDE LEVEL OF THE DELAWARERIVER AT ARTIFICIAL. ISLAND IS 0.11 FT(NAVD 198)
-201.00-2;00

90
80-7
0
70--
60-
5E*
2 40•
aL
I UNIT I
(4 -92)9
dt~ X~ X
-___10
q',K~i
20LIN q~2= L2N
2'(LO 84'(L,)
10
4 0
U
I2
I P 20~
-50
-70
Recharge(N) = 8/yr-80
Hydraulic Conductivity Groundwater GroundwatWrEstimate Velocty
K~b1 =LIN V. =KI/O 2 1110 -
K~x0.008x15ft = 102 ftxf2 fttyr V . = 1.6(0.008)10.20 t" = 1=0
K,= =570ft/yr or 1.6 It/day " " - 23.4 fyr t,=4.36yr. .. ... . .." . .. . . .. 10 0
K2 = LIN + L2N = N(L+ LW V2= KelI1e t
KIxO.004 x35ft = f lVyr (102ft + 84 ft) V= 2.4 (0.004) 10.20 t, =
Ki=W%=866Wyr or 2.4ft/day t.=17,5ftyr t1=4.80yr -110
Total Travel Time =4.361+4.80 = 9.2 yrs
ICM.tA SMII MXUA. L
26/1-u-0 2. 100HCDSM ,W M P000571.0003 1

r
Lu
0
Relationship Between Dispersivity and FIGURE
ARCADIS Travel Distance 19PSEG Nuclear, LLC Salem Generating Station
Hancock's Bridge, New Jersey

Appendix A
Investigations of Salem Unit 1 Fuel
Pool Leakage - Final Report
Summary
0

INVESTIGATIONS OF SALEM UNIT 1 FUELPOOL LEAKAGE
FINAL REPORT SUMMARY
FEBRUARY 23, 2004
PSEG NUCLEAR LLCRADIATION PROTECTION/CHEMISTRY
SUPPORTP.O. BOX 236
HANCOCKS BRIDGE, NEW JERSEY 08038

ABSTRACT
On September 18, 2002 radioactive contamination in the 78-Foot Mechanical Penetration Roomin the Unit 1 Auxiliary Building had characteristics of Spent Fuel Pool (SFP) water. Preliminaryconclusions from sample results during the initial Phase I investigations prompted an extensiveinvestigation to characterize the source of activity and leakage paths. This evaluation documentsthe pathway for leakage from the SFP to the liner surrounding the SFP; blockage in the telltaledrains; seepage through constructionjoints in the liner into the Styrofoam Seismic Gap betweenthe Auxiliary Building and the Fuel Handling Building. The seepage is confirmed by monitoringthe 78-Foot Mechanical Penetration Room wall, the Spent Fuel Pool cooling line' at the interfacebetween the Auxiliary and Fuel Handling Building, the water stop (boot) at the penetrationbetween the Auxiliary Building and the Fuel Handling Building, and two drill points in theStyrofoam. The testing results indicate that build-up of SFP water behind the liner has beenongoing for at least five years on the basis of cesium activity ratios, and that water from thesampling points is consistent with boron and tritium levels in the Unit 1 Spent Fuel Pool.The telltale drains were snaked on January 29, 2003 and following days. Water then freelydrained from the telltales, thereby reducing both the amount of water and the time that SFP waterstayed in the leakage collection system (i.e. the space between the liner and the concreteenclosure). Water from the telltales (after snaking) drained at about 100 gpd and hadcharacteristics that more closely resembled SFP water with less indication of interactions with theconcrete enclosure. By February 7 th, "cleared" telltales had reduced the hydraulic pressure andeffectively stopped the seepage around the Auxillary and Fuel Handling Building. In February2003, 45 gallons of water were pumped from Drill Pont No. 1, thereby significantly reducing theamount of water in the Styrofoam Seismic Gap. Further investigation during 2003 indicated thatthe composition of the water that migrated back into the gap was most likely a mixture of SFPwater (3%) that had migrated beyond the gap and groundwater (97%). Again, boron and tritiumconfirm the link to the SFP, whereas cesium and cobalt activity are at very low or non-detectablelevels because of interactions with concrete and soil surfaces. Water from the SFP continues todrain through the telltales at the rate of about 130 gpd (as of January 2 9 th 2004). Most of thewater drips through Telltale No. 2 with tritium levels that reflect the changes in the SFP tritium(50% increase during 2003). Cesium activity ratios in the telltales do not change in response tointroduction of SFP demineralizers, again reflecting the strong role that concrete surfaces play incontrolling cesium levels.

Background for Investigation
The Spent Fuel Pool (hereafter referred to as SFP) liner drains (telltale drains) are a leakagedetection system designed to collect water from the SFP that migrates through the stainless steelliner into the concrete enclosure surrounding the SFP. Work orders, interim reports anddiscussions with Salem personnel have indicated that the Unit 1 telltale drains have performed thisfunction since early in the operation of the plant. At some unknown point in the past, chemicaldeposits (originally assumed to be boric acid- now shown to be a mix of boric acid and othercrystals such as calcium carbonate) began to interfere with the drainage system. The spacebetween the stainless steel liner and concrete enclosure of the SFP began to collect water withcharacteristics of the SFP. On September 18, 2002, Radiation Protection reported the detectionof low-level radioactivity on several technicians' shoes. Investigations indicated a "calcium-like"substance adhering to the west wall in the 78-Foot Mechanical Penetration Room had measurableradionuclide contamination (Notification No. 20114071). These deposits were removed and anactive flow of water into the room was then noted. Phase I investigations indicted that the leakhad characteristics of Spent Fuel Pool water (see Table 1) and more samples were collected tocharacterize the source of activity and possible leakage paths. Another leak was subsequentlydiscovered around the Unit I Spent Fuel Pool cooling line return on the 92-Foot Elevation(relative to a plant surface elevation of 100 :feet). This leak was separated into the return line atthe interface between the Auxiliary Building and Fuel Handling Building and the water stop (boot)at the penetration between the Auxiliary Building and the Fuel Handling Building. The followingsample points were routinely monitored for radioactivity and compared with activity in the SFPand the telltale drains:
* A drip bag was constructed on the 78-Foot Mechanical Penetration Room wall to collectwater. This is the "Drip Bag" sample.
* A catch tray with a sample tube was placed under the Spent Fuel Pool cooling line at theinterface between the Auxiliary and Fuel Handling Building on December 17, 2002. Thissample was designated as the "Short" sample because of the length of the sample line.
* A sample tube was inserted in the water stop (boot) located at the penetration between theAuxiliary Building and the Fuel Handling Building. This sample was designated as the"Long" sample because of the length of the sample line.
* Two drill points (Drill Point No. 1 and Drill Point No. 2) were inserted into the Styrofoambetween the Auxiliary Building and the Fuel Handling Building (often referred to as theSeismic Gap).
* Water that accumulated between the Unit 1 Containment and the Auxiliary Building(1BD41).
Because of low flow from the leakage collection system of about 6 gallons/day (as well asother factors), the telltale drains were snaked on January 29 and following days. Water thenfreely drained from the telltales, thereby reducing both the amount of water and the time that SFPwater stayed in the leakage collection system. Water from the telltales (after snaking) drained atabout 100 gpd and had characteristics that more closely resembled SFP water with less indicationof interactions with the concrete enclosure. Fiber optic examinations of the telltale drains onJanuary 3 1st showed blockage in No. 4 and 5 drains beneath the welds, creating a dam effect. Theprobe inserted beyond this point indicated chemical deposits (originally assumed to be boric acid

Wcrystals) had formed. Flow from leakage of the SS liner was forced between the liner plate andconcrete providing water to other channels. Rather than draining out, the blockage diverted thewater along the space between the SS liner and the concrete, eventually seeping out at the 78-Foot Elevation in the Mechanical Penetration Room. Water also seeped out of the gap where theSpent Fuel Pool cooling return line intersects the wall at the 92-Foot Elevation. Over time, thewater apparently migrated and reached the void space between the Auxiliary Building andContainment. Figure 4 shows these locations.
By February 7, 2003, "cleared" telltales had reduced the hydraulic pressure in the leakagecollection system and samples from the Drip Bag, "Short," and "Long" sample points could notbe obtained because the flow had stopped,(or nearly so). Minoramounts of water could beobtained from the sampling points at infrequent intervals in 2003. In February 2003, 45 gallons ofwater were pumped from Drill Point No. 1, thereby significantly reducing the amount of water in,the Styrofoam Seismic Gap. Some water migrated back into the gap and samples Were collectedwhen sufficient water was present or about every two months). All radionuclide characteristicsfrom the sampling program waters supported the scenario described above.
Summary of Evaluation Methodology
Characteristics of SFP Water
Radioactive water from the SFP of a PWR (Pressurized Water Reactor) will containapproximately constant levels of boron, tritium, cesium, and cobalt activities (subject toradioactive decay). To detect and quantify leakage from the Spent Fuel Pool, the results areinterpreted using the assumptions that the Spent Fuel Pool water typically contains a distinctiveradionuclide fingerprint and that interaction with solid surfaces (e.g. concrete) can alter theactivity levels dramatically:
* Boron at approximately 2300 ppm and tritium at 0.2 [tCi/mL (increasing during 2003 to 0.3pCi/mL - see Figure 1, Tables I and 5). These two tracers are relatively inert and typicallymigrate with minimal reactivity to concrete or soil (termed "conservative" behavior in theliterature).
* Cesium-134 (134Cs has a 2.062 year half-life) and "3'Cs (30.17 year half-life) activity in theSFP results from refueling operations and leaching from rods stored in the pool. The activitylevels and ratio can change during the course of a fuel cycle. Demineralizers effectivelyremove cesium from the SFP and change the activity by more than a factor often (see Figure1). Because of difference in half-lives but similar chemical behavior the ratio of cesiumactivity can provide some qualitative measure of the approximate timing of any release andmigration of SFP water. However, cesium interacts strongly with both concrete and soil toretard the migration away from the SFP (i.e. most of the cesium remains sorbed on theconcrete enclosure of the SEP. This strong interaction with soil and concrete surfaces alsocomplicates the straightforward use of cesium activity ratios.
Cobalt Activity: 58Co (70.80 day half-life) and 6"Co (5.271 year half-life) will have aAcharacteristic activity ratio after refueling operations that will drop rapidly as the 58Co decays.

Cobalt also interacts strongly with soil and concrete with typically a lower mobility thancesium.
The presence of short-lived radionuclides such as 131} (a nuclide that does not adsorb tosolid surfaces) would be indicative of rapid transport of SFP water from pool to samplepoint. Only during an October 21,2002 fuel movement (Mode 6) were any shorter-livedradionuclides (i.e., 131I) detected.
Although assumed to have a constant radionuclide inventory, activity levels in the SFP dochange in response to the use of a mixed-bed resin demineralizer (to reduce radioactive cationsand anions in the SFP water) and to operational events such as refueling . After an interval oftime, the levels return to an approximately "steady state" condition (where production.andremoval rates are equivalent and levels remain constant). However, water analyzed many yearsafter migration from the SFP (or other source) may be difficult to trace to a particular eventbecause of non-unique activity ratios and chemical interactions with concrete and soil. Bothcesium and cobalt activity levels (relative to tritium or boron) from SFP leakage will be differentthan activity in the Spent Fuel Pool because of these chemical and physical interactions (plusdecay of short-lived cesium and cobalt). Activity ratios of a given element (i.e., cesium or cobalt)may provide an indication of the age of the leak and/or the extent of the interaction with solidsurfaces because of the very different half-lives of the two isotopes. As seen in Tables 1 and 2,the cesium and cobalt activity ratios are much lower for the sampling points vs. the SFP andstrongly point to both age of the leak and chemical/physical interactions with the surroundingconcrete and soil. Because demineralizers reduce all reactive cations (and anions) in the SFPwater, any measurable cation concentration (such as sodium) could indicate introduction ofgroundwater and/or leaching of sodium from the concrete. Boron and tritium levels showed a"qualitative" inverse relationship with sodium (higher sodium in some samples- e.g. 1BD41- thathave lower tritium) that may indicate mixing with groundwater, although the correlation is farfrom exact.
Conclusions from Radionuclide Evaluation
The results from the radionuclide investigations produce the following conclusions about theleakage collection system (telltale drains). This system was designed to collect and drain the waterthat migrated through the stainless steel liner of the SFP. All available reports and data indicatedthat the Unit 1 telltale drains had performed this function since early in the operation of the plant.At some unknown point in the past, the precipitation of chemical deposits (originally assumed tobe boric acid; calcium carbonate has also been detected) began to interfere with the drainagesystem. The space between the stainless steel liner and concrete enclosure of the SFP began tocollect SFP water. In October 2002, a number. of seepage points appeared in the AuxiliaryBuilding and were collected for radionuclide analysis. They indicated that water from the leakagecollection system had seeped/migrated to several sampling sites (see Figure 4 for locations andbackground investigation for description). Table I summarized the average results for samplescollected for the Phase I1 investigation (prior to snaking of the telltales drains) (Figures 5 through10 graph the time series of the data and discussion of the individual sampling points follows thissection). The following major conclusions result from the Phase II samples in January 2003 (priorto snaking):

The samples from the Spent Fuel Pool telltale drains, the 78-Foot Elevation Drip Bag, andthe water in the Styrofoambetween the Fuel Handling Building and the Auxiliary Buildinghad common isotopic characteristics. Boron and tritium levels are equivalent to SFP water(90 to 100% of SFP level). Sodium was between 2 and 15 ppm indicating minimalgroundwater input and/or leaching of structural material. Cesium and cobalt absoluteactivities were more than a factor of five lower than the SFP (8 to 20% of SFP) and theactivity ratios were indicative of extensive interaction with the concrete and structuralmaterials.
The samples from the canal telltale drains and the water stop (boot) located at thepenetrationbetween the Auxiliary Building and the Fuel Handling Building ("Long" sample) had commoncharacteristics. Boron and tritium were at 60% to 70% of SFP water; elevated sodiumsuggested that groundwater mixed with these two sources (although the potential pathwayfor groundwater ingress was unclear). The canal telltales and "Long" sample also had verylow 60Co activity, suggesting a strong interaction with structural materials or soil.
Water in the space between the Unit 1 Containment and the Auxiliary Building (1BD41sample) had characteristics of Spent Fuel Pool water that left the pool more than five-yearsago and was subject to extensive interaction with structural materials. Cesium-137 activity isnearly 70 times lower than SFP and cobalt activity is at or near ND (non-detectable) levels.Higher sodium with some chlorideindicated a groundwater component and/or interactionwith solid surfaces. Most likely, SFP water had migrated from the leakage collection systemover time through a six-inch gap between buildings and mixed with groundwater (70% SFP-30% groundwater) (although the pathway is not clear).
The whole question surrounding the seepage of groundwater into the various sampling pointsis problematic. The pathways are not defined but average water table elevations are about 5feet bgs (95 feet plant datum) vs. sampling points between 78 and 92 feet (plant datum).Thus for most of the past twenty years there has been a hydrostatic head driving waterthrough cracks and construction joints into the Auxiliary and Fuel Handling Building. In theabsence of any radionuclide contamination, this small amount of water that seeps into thebuilding would not be noticed (most or all would evaporate rather than pool). The presenceof sodium in a sample does not automatically "fingerprint" groundwater as the source of thesodium. If sodium and chloride are not "balanced" and the levels of tritium and boron arenear or at SFP values (e.g. Drip Bag samples), then most likely the sodium has been releasedfrom leaching of the concrete/structural materials. On the other hand if tritium and boron areat some % of SFP values (e.g. Canal Telltales and 78' Long -Table 1) and sodium iselevated, then the sodium may come from seepage of groundwater into the facility or mixingwith periodic precipitation and structural concrete. A complete structural analysis ofpotential seepage paths is not required for analysis of the source of the SFP water.
* Iodine-I131 in selected samples was related to Mode 6 operation (part of iRI 5 refueling)during October 2002. 131} leached from rods stored in the fuel racks during the refuelingoperations. This water, containing 131J, leaked and mixed with existing water (1311-free) in thespace between the SS liner and the concrete enclosure of the SFP. Cesium activity ratios for

the sampling points reflect water that has interacted with the concrete as opposed to "zero-age" SFP water. The 1311 activity suggests a relatively rapid migration of small amounts ofSFP water to the sampling points. Iodine- 131 activity has not been detected in samples afterJanuary 2003, supporting the link to the refueling operation and not some other leakage path.
TABLE 1: AVERAGE COMPOSITION AND ACTIVITY LEVELS DURING STABLEPERIODS FOR PHASE II SAMPLE POINTS (January 2003)
AVERAGE RESULT DURING STABLE PERIODSConstituent I SFP Pool Canal 78 "Short" Drip Bag 78 "Long" Drill Points 1 BD41
Telltales* Telltales* _ .Na, ppm 6.2 122 2.8 14.7 26.8 6.02 59.7CI, ppm 0.0012 0.09 0.52 10.6 0.41 12.1
Iron, ppm 0.03 0.10 0.47 5.15 0.04
Boron, ppm 2316 2257 1465 2292 2605 1365 2119 1208H-3 1.93E-01 1.78E-01 1.31E-01 1:91E-01 1.81 E-01 1.18E-01 1.88E-01 1.19E-01
H-3: Ratio to SFP 92% 68% 99% 94% 61% 97% 62%1311, Mode 6** 5.96E-04 4.25E-04 ND 4.24E-04 4.05E-04 3.12E-04 3.84E-04 1.28E-04
134cs 2.18E-03 5.34E-05 5.11E-05 3.01E-04 5.84E-05 8.62E-05 4.01E-05 6.22E-061370s 2.17E-03 1.67E-04 1.87E-04 4.52E-04 1.73E-04 2.02E-04 1.31 E-04 3.06E-05
137Cs 7.7% 8.6% 20.8% 8.0% 9.3% 6.0% 1.4%Ratio to SFP
54Mn 4.1OE-05 2.38E-06 ND 9.07E-06 1.39E-06 1.87E-06 1.22E-06 ND58Co, Mode 6** 8.02E-03 2.46E-05 2.72E-05 9.OOE-04 ND 1.05E-04 8.43E-07 ND
60co 9.82E-04 5.88E-05 8.06E-06 2.12E-04 3.56E-07 2.86E-05 1.02E-06 9.99E-08125Sb 1.07E-05 2.59E-05 2.12E-06 9.40E-06 ND 3.62E-06 1.82E-06 ND
13 4Cs/13 7Cs 1.02 0.33 0.22 0.67 0.34 0.42 0.31 0.20
58Co/0 °Co 8.27 0.83 2.74 4.211 0.0 3.59 0.531ND = Not detected in samples analyzed.
Units for concentrations of radionuclides are presented in microcuries per milliliter (?Ci/mL)
*Before snaking telltale drains.
**Shorter-lived activities were decay-corrected to October 21, 2002 22:42 when Mode 6 (fuel movement) was established.
"Snaking " of the Telltale Drains
Because of low flow from the leakage collection system (as well as other factors), the telltaledrains were snaked on January 29 and followingdays. Fiber optic inspection confirmed that thedrains had been generally cleared. Water then freely drained from the telltailes, thereby reducingboth the amount of water and the time that SFP water stayed in the leakage collection system.Water from the telltales (after snaking) drained at about 100 gpd and this rate has continued tothe present, as measured by the building sump pump (February, 2004). Most of the water (about500 ml/min) drained through Telltale No.2. By February 7, 2003, "cleared" telltales had reducedthe hydraulic pressure and samples from the Drip Bag, "Short," and "Long". sample points couldnot be obtained at regular intervals because the flow had stopped (or nearly so). The resultsobtained during 2003 (after snaking) are summarized in Table 2:
* After the "snaking" operation, .the telltale (TT) samples.closely resembled the SFP water (seetime series in Figures 1 and 2). In boron and tritium, the match is almost exact, reflecting thefact that neither constituent reacts with the concrete materials in the SFP. Cesium-137activity was 75% of SFP. at No. 1 TT and 16% at No. 8 TT; the cesium activity ratios (0.89 -0.64) and the 60Co activity (64% to 2%) also decrease in a similar fashion reflecting anincrease in flow path and time for chemical interactions from No..1 TT to No. 8 TT..
Water from the SFP continues to drain through the telltales at the rate of about 130 gpd (asof January 2 9 th 2004). Most of the water drips through No. 2 TT and has tritium levels thatreflect the changes in the SFP during 2003 (from 0.2 [tCi/ml to 0.3 ktCi/ml): Cesium ratios inthe telltales did not change dramatically in response to introduction of SFP demineralizers inOctober 2003, again reflecting the strong role that concrete surfaces play in controllingcesium levels. Figure 2 does show a consistent drop in Cesium- 137 activity, for Telltale No.2during 2003 as the cesium on the surface of the concrete exchanges with low cesium in thedemineralized SFP water to "buffer" the activity level.
After "snaking of the telltales", sampling points outside the concrete 'enclosure had a loweroverall yield as well as a lower contribution of water from the leakage collection system.Tritium dropped to 14% (of SFP) at BD41 to 31% at the Drip Bag (Table 2). The tritiumlevel in the Styrofoam Seismic Gap dropped to 3% of SFP levels from about 70% prior to"snaking" the drains. The low tritium level at Drill Point No. 1 resulted from inflow ofgroundwater or precipitation into the Seismic Gap, driven by the change in hydrostatic headwhen water was pumped from the Seismic Gap. Cesium-activity levels were 2 to 8% of SFP(with the exception of a single Drip Bag sample that was not replicated). Cesium activityratios were comparable to pre-snaking ratios and reflect long-term interaction with theconcrete enclosure of the SFP. Cobalt activity is at or near non-detectable (ND) and <1% ofSFP because of strong adsorption to structural material.
The interpretation and results from the individual sampling locations during 2002 and 2003are presented in the sections that follow and are used to support the above conclusions. Thetime series is typically divided into "pre and post - snaking", pre and post refueling operation.

Table 2. Activity in Selected Samples (Averages after Snaking) Ratios to Unit 1 SpentFuel Pool.
Boron, Na, 3H 37CS, ý134CS/137CS 60Oo, 58CO/60Oo
Sample Date/Time ppm ppm jgCi/mL gCi/mL Ratio ICi/mL Ratio
1 SFP 12-Jun-03 2395 -0 2.36E-01 3.08E-03 0.75 2.42E-03 0.3610-Jul-03 2354 -0 2.67E-01 3.48E-03 0.71 2.46E-03 0.2817-Jul-03 - 0 3.65E-03 0.71 2.40E-03 0.2924-Jul-03 2359 -0 3.73E-03 0.69. 2.60E-03 0.247-Aug-03 2349 -0 4.32E-03 0.67 2.86E-03 0.21
1SFP Average 2364 2.52E-01 3.65E-03 0.71 2.55E-03 0.28Drill Pt 12-Jun-03 234** 38 7.71E-03 1.34E-04 0.28 2.40E-07 -
No. 1 30-Jul-03 - 6.77E-03 1.25E-04 0.26 2.14E-07 -
Ratio to-SFP 0.10 0.029 0.035 0.38 0.0000891 BD 41 24-Sep-03 - 5.49E-05 0.20 ND
23-Oct-03 317* 178 3.45E-02 6.99E-05 0.19 NDRatio to-SFP 0.13 0.14 0.019 0.27
"Long" 1-Jul-03 332 60 5.19E&023-Jul-03 3.34E-04 0.36 1.72E-05
Ratio to-SFP 0.14 0.21 0.091 0.51 0.00778 Drip Bag 1-Jul-03 2.45. 7.87E-02
3-Jul-03 5.86E-03 0.30Ratio to-SFP 0.31 1.61 0.43
No. 1 TT 27-Aug-03 2393 1.50 2.90E-01 2.84E-03 0.65 1.42E-03. 0.1924-Sep-03 2371 5.60 * 2.64E-03 0.63 1.65E-03 0.1422-Oct-03 2364 0:94 2.61E-01 2.78E-03 0.60 1.79E-03 0.11
Ratio to-SFP 1.01 1.10 0.75 0.89 0.64 0.53
Boron, Na, 3H, 137Cs, 134Cs/137Cs
6 0CO,
58CO/
60CO
Sample Date/Time ppm ppm. GCi/mL jiCimL Ratio gCi/mL Ratio
No. 2 TT 27-Aug-03 2264 4.52 3.06E-01 1.64E-03 0.62 6.99E-04 0.1824-Sep-03 2278 14.7 * 9.59E-04 0.64 3.35E-04 0.1522-Oct-03 2310 2.70 3.26E-01 1.33E-03 0.61 6.54E-04 0.09
Ratio to-SFP 0.97 1.26 0.36 0.88 0.22 0.51No. 3 TT 2-Jul-03 2140 1.00 *** 3.78E-04 0.61 8.72E-05
26-Sep-03 2282 * 5.62E-04 0.53 3.48E-0523-Oct-03 2294 2.40 2.67E-01 1.01tE-03 0.53 3.89E-05
Ratio to-SFP 0.95 1.06 0.18 0.79 0.021
No. 5 TT 27-Aug-03 2296 4.01 2.93E-01 8.52E-04 0.56 6.55E-0526-Sep-03 2260 24.5 * 5.95E-04 0.52 7.92E-0523-Oct-03 2054** 6.40 2.25E-01 5.26E-04 0.48 8.78E-05 -
Ratio to-SFP 0.93 - 1.03 0.18 0.74 0.030No. 8 TT 27-Aug-03 2279 5.56 2.89E-01 6.63E-04 0.509 1.OOE-04
26-Sep-03 2263 - 2.97E-01 5.20E-04 0.46 1.51E-04 0.0923-Oct-03 2159* 4.90 2.68EI01 5.19E-04 0.51 2.12E-04 0.10
Ratio to-SFP 0.94 1.13 0.16 0.68 0.061 0.34* Suspect Value
**Re-analysis
***Insufficient sample

FIGURE la. SAIEM UNIT 1 SPENT FUEL POOI./JLETALENO. 1 BORON, CESIUIM AND IODINE ACTIVITY
2600 1.001E-02
2400
j~eltals~ydolye.1.00E-04
1600 1.0E-0 6
-4-- SF1'Boron, ppm ,-4- Boron, IT No.1,ppm" . TrSnaked
o...@ SFPCs-134,uC/mL - 4- -CS-134,Tr No. 1, uCi/mnL--.A-o. SFPC~s-137,u~i/mL
--- Cs-137, TiT No. 1, uGl/mL -4 SF1' 1-131, uCi/mL
FIGUREIlb SALEMUNIT1 SPENT FUEL PIOO/TELLTALE NO. 1 BORON AND COBALT ACWITFY
Denimt Res
2400
22
200
1800
.1600)
1.OOE-02
1.00]E-04'5
am41.OOE-05
FIGURE 1c SALEM UN1T1 SPENT FUEL PIOI/TELLTALE NO. 1 BORON, TRITIUMK AND SODIUM
2600 .V vs 1.00E+01
2400 Y
LDmHEl1.00E+00 •
I80- - 0~ Tdll As A ,R i;J1600 1.00E-01
--- SFP Boron, ppm -...- Bororw'IT No.1, ppm " -TSnakedU SFPIDenmin - O- -H-3, ITNo.u1, u/nL A SFPH-3,uCG/mL.
- -U-- - Na,1T No. 1, ppm
---- SFPBoron, ppm -0.- Boron, TrNo.1ppm is T Soaked
a- SFP --U- SFP Co-58, uCi/mL --.-- Co-58, TT No. 1, uCi/mL
-- SFPCo.60, uQ/mL --- Co-0, Tr No.1, u,/mL
FIGUREld SALEM UNIt1 TELLTALE NO. 1METALS AND COBALTAAcnvITY
10000 - --- -` 1.OOE-02- Las-t Sufficien
1000 - elae Hdoye aml 12)1Cw
-- g m - bS• -: ?. -1.OOE-03 2
100 -s ~ 0 10OOF/ -
HJ 1.00E-04.i
E1• Na, 1T rb. 1, ppm . .•.-Ca Tr No. 1, ppm .:..•.-Fe, Tf No. 1, ppb
-- 0--. 7n, TT No. 1, ppb T]Tr Snae -m Co-58, Tr No. 1, uGi/L- -0- -Co0TrNo.-1,ui/mL
10

FIGURE2a. SALEM UN1T1 SPENT RJELPOOITELLTAIENQ 2 BORON, CESIUM,.AND IODINE ACVWITY
2400-2600Hoyd1.00E-03S2200 -t40 u .0-3..
I•2d I4 1.00E-04
nemiapwue (Telitale N.. 1 ... peMte),8.8 Day Half-Life* . : = mif..... 1.00E-051800 [ .::, ::. :: .. ;,:,:: * : :Flow #50 lmn
* Floodupl . in TeRtale No.2 Sa-pIes.- ,i i 1 97 , 4/ -
1600 M . rv 15dei6;it:.i :i<Kr ..r 1.1 'ii ii I 1.OOE-06
----- SFPBoror ppm .- BoronT No.2. ppm * TelltalesSnaked0 SFPCs-134, ui/nmL - -- - Cs-134, TF No. Z uCi/mL -- -tz - SFP Cs-137, uG/ mL
-- Cs-137, Tr No.2, uCi/rnL -- SFP 1-131, uCi/mL
HGURE 21x SAILEM UNIt 1 SPENT FIEL P0(1/TEILTALE NO. 2 BORON AND COBALT ACTnTVHY
2600Dtmus Res
2400
2S2200
200
1800
1600
1.UOE-02
1.00E-03.4
1.00E-05~
1.00E-06
IIH95 iaQý f9i Egg 855o--- F PBornppm -'-.Bor'nTrM.,ppm ITS'ed
%]•P 1Denul. .... .... P Co-9ý,uG/trd5 C--58, Tr No. Z uGi/mL---o- SFP o-60, uC!/ni- - 9- - Co-60,Tr No.2,ui/mrL
L
SFIGURE2c: SALEMUNH'1 SPENTFUELIOOI/TLLTA[LENO.2BORON,TRMIIUM AND SODIUM
2600
2400
2200
S2000
1800
1600
1.00E+02
1.00E+01
1.00E+00;
2
1.OOE-01 El
1.00E-02
-*- SrFBro ppmU SFP ermt
*-ao Na,'T No. 2;ppin
-o-- BorumT lNo. Z ppmn.- 0 H-3jfTNo.Zt11/mL.
MTrSnak,-dA SFPH-3,uG/rnL
m g? ý?Ell 811 j,2- 1 6ý Ge 19
1ý1-- Na, TT No. Z ppni 0 CaTTNo.2,ppm FeTrNo.Zppb
------ ZiiTTNo.Zppb El 'rTSrwWd -jD--Cb58,TTNo.2,uG/ni,---e- -Co-60,TTNo.ZuG/mL I
11
0 0

FIGURE 3A: SALEM UNIT 1 SPENT FUELBORON, CESIUM, AND IODINE
2600 1.OOE-02Demin.
2400 lOEOC
Bor AmL5-on,2200 m L.i r: Q ; :: :
on, 220 0 1 "UA 88 Day Half-Life 10E0~pp ! : i . 1.00E-0-1ict-!i0 0i: Lo i: i: Deminii
m 2000-- i 'iiiii=,;!? i• ii!i ivit
Out
Mode 6, 1.OOE-051800
8Floodu
1600 4" '''"" '''' 1.OOE-069/1/ 9/11 9/21 10/110/1 10/2 10/3 11/1 11/2 11/3 121 12/2 12/3 1/9/ 1/19 1/29 2/8/ 2/1802 (02 (02 (02 1/02 1/02 1/02 0/02 0/02 0/02 0/02 0/02 0/02 03 /03 (03 03 .103
---- Boron, ppm 0 Cs-134, uCi/mL -A CS-137, uCi/mL--o- 1-131, uCi/m]
0
0
FIGURE 3B: SALEM UNIT 1 SPENT FUEL
2600 - BORON AND" COBALT 1.00E-02
2400Ci!
Bor 1.OOE-03CLon, 2200 m
pp,%m 2000 ivit
Demin.Q 1.00E-04y
1800 *Mode 6, Low
- *Floodu
1600 1.OOE-059/1/ 9/11 9/21 10/1 10/1 10/2 10/3 11/1 11/2 11/3 12/1 12/2 12/3 1/9/ 1/19 1/29 2/8/ 2/1802 /02 /02 (02 1/02 1/02 1/02 0/02 0/02 0/02 0/02 0/02 0/02 03 (03 (03 03 /03
S--•-- Boron, ppm j Co-58, uCi/mL -- Co-60, uCi/mL
12

Time Series of Individual Sampling Locations
SALEM UNIT 1 SPENT FUEL POOL -(Recent History)
Salem performs weekly boron and gamma isotopic analyses and monthly impurity (e.g.,chloride, fluoride, and sulfate)analyses of the Spent Fuel Pool water. The normal sample point isthe Spent Fuel Pump discharge pressure tap and is representative of water re-circulated in theSpent Fuel Pool through the unit's heat exchanger (note. that water beneath the fuel racks couldbe relatively stagnant and only mix with the rest of the SFP by thermal convection). Figures 3Aand 3B show historic boron levels in the Salem Spent Fuel Pools based on routine analyses. SalemUnit 1 prepared for a scheduled refueling outage in October 2002. Salem Chemistry personnelhave noticed a faint "bathtub" ring of white crystals at the wall interface of the pool surface thatsuggests decreasing water level and deposition of trace levels of boric acid. Boron levels in theUnit I Spent Fuel Pool decreased prior to the refueling outage ; the result of a combination of.evaporation, leakage of SFP water through the SS liner and makeup with de-mineralized (boron-free) water. Mass balance calculations are not sufficiently sensitive to estimate leakage ratesbecause the evaporation term is a number of times greater than the leakage rate through the SSliner (which by October 2002 had slowed considerably (< I Ogpd) as the water level in theconcrete enclosure reached the level of the SFP, thereby eliminating the hydrostatic driving force).
Salem Unit 1 entered Mode 3 for IRI5 (refueling operation) on October 10, 2002. Thecavity was flooded on October 15"' and Mode 6 was established on October 21 St. Duringrefueling, the water in the canal is connected to the Spent Fuel Pool when the gate is open, but re-circulation between the Spent Fuel Pool and the canal is limited. The significance of flooding wasthat reactor coolant was mixed with refueling water and activity, levels in the Spent Fuel Poolincreased.
Iodine-131 and 58Co activity reported after October 21 ' was decayed-corrected toOctober 21' when Mode 6 was established to enable comparisons of isotopes with different half-lives. Iodine- 131 was not detected in the bulk Spent Fuel Pool water after November 29th (Figure3A); sample size and the counting interval were not optimized to detect 311 prior to the recentinvestigation. The average decay-corrected level of 1311 was 5.96 x 1 0 -4 [Ci/mL. Several samples(see Table 3) detected 131I activity after October 21, suggesting a relatively short pathway fromthe SFP to sampling points such as the Styrofoam Seismic Gap.
The Spent Fuel Pool de-mineralizer wasplaced in service January 1, 2003. Activity levelsdecreased by approximately a factor of ten as the resin effectively reduced radioactive cesium andcobalt (Figures 3A and 3B). Antimony-125 could now be detected because spectral interferenceswere reduced. Cobalt and cesium activities had begun to increase because of low flow in thedemineralizer and continued to increase after removal of the demineralizer on February 6th2 Priorto placing the demineralizer in service, the average 1
34Cs/"37Cs activity ratio was 1.02, whereas theaverage decay-corrected (to Mode. 6 on October 21, 2002). 5 Co/ 6°Co activity ratio was 8.27.After the demineralizer was placed in service, the cesium activity ratio decreased from 1.02 to0.80 and the cobalt activity ratio decreased, from a decay-corrected value of approximately 8.27 to
13

2.9. This is explained by isotopic equilibration with accumulated cesium on the demineralizerrkesin and differences in removal efficiency for 58Co relative to 60Co with the purification mediaused inthe demineralizer vessel.
On January 30, 2003 special sampling techniques were used to safely sample waterunderneath the fuel racks in the Unit 1 Spent Fuel Pool and water at the bottom of the canal. Forcomparison a separate samplewas collected near the surface of the Spent Fuel Pool. Thesesample results are summarized in Table 3 and provide important conclusions:
. Water in the Unit 1 Spent Fuel Pool at the normal sampling point, near the pool surface, andbeneath the fuel racks was homogeneous with little temperature gradient.
* The special sample analysis results do not indicate that a difference exists in the waterchemistry beneath the fuel racks and the circulating water; after the demineralizer was placedin service January 1, 2003, the pool water was homogeneous by January 3 0 th.
* The special sampling did not establish that 131I levels were higher in the bottom of the poolprior to placing the demineralizer in service. With an 8.04 day half-life, insufficient 13"
activity remained by January 3 0 th to, provide confirmation.* The demineralizers were taken out of service in late January 2003: Cesium and cobalt activity
levels gradually increased throughout 2003 (Figure 1)' Tritium also showed a slight increasethroughout 2003. Cesium and cobalt activity dropped again when the de-mineralizers wereplaced into service in late October 2003.
In conclusion, activity in the Unit 1 Spent Fuel Pool increased during refueling operations asexpected and decreased when the demineralizer was placed in service on January 1, 2003. Theexpectation is that samples from leakage paths from the Spent Fuel Pool would eventually showdecreasing activity levels and changing activity ratios, providing a means to estimate the migrationtime (however, the strong interaction of cesium and cobalt with concrete surfaces obscured anysimple correlation). Temperature, boron, tritium, cesium and cobalt activity indicate homogeneity.in the SFP. Activity levels from the bottom of the pool, where assemblies with defective rods arestored, were equivalent to surface SFP water. at 29 days after the demineralizer was placed inservice. During 2003, nuclear operations continued in a normal mode and activity levels in theSFP stabilized over the course of the year (slight increase in activity from February to October).In October, the demineralizer was returned to service and cesium and cobalt activity levelsdropped dramatically in the SFP. Because of the strong interaction of cesium and cobalt with theconcrete surfaces, the telltale drain samples did not show a dramatic change because the largeamount of cesium present on the surfaces of structural material "buffered" the cesium activity.
SPENT FUEL POOL LINER DRAINS
The Salem Unit I Spent Fuel Pool liner drains (e.g., telltale drains) are a leakdetection/collection system designed to collect leakage beneath the stainless steel liner. Telltaledrains No. 1 through 10 receive the leakage from the Spent Fuel Pool, whereas drains No. 11through 17 receive the leakage from the refueling canal, which is deeper than the Spent Fuel Pool(Tables3 and 4). Three sets of samples were collected from the telltale drains (prior tothe"snaking" operation. The first set was taken December 11 - 12, 2002 and the second set was
14

taken December 14,. 2002 by collecting water dripping from each drain. The average leakage wasequivalent to approximately 5.8 gpd. Drains No. 1, 2, 4, and 6 of the Spent Fuel Pool and No. 14of the'canal had the highest leakage; no leakage was noted for No. 7, 10, 11 ,and 12. Caps wereplaced on the drains and removed January 17, 2003 for the third set of samples.
Tables 2-4 summarize boron, impurities, tritium, and gamma activity from the samplescollected. Time series are graphed in Figures. 1 and 2. Boron and tritium levels in the telltale drainsamples provided a direct correlation with the Spent Fuel Pool, whereas cesium and cobaltactivities (and ratios) were expected to provide a possible indication of sample age and extent ofinteraction with structural material. Sodium levels may provide an indication of groundwaterintrusion and/or leaching from structural materials. Chloride should balance sodium ifgroundwater is present. pH changes may indicate interactions of the boric acid with structuralmaterials. On January 29, 2003 the telltale drains were individually snaked; the water collected,analyzed, and reported in Tables 2-4. Collectively, the telltale drain data indicate the following:
Boron and tritium data from the Unit 1 Spent Fuel Pool telltale drains indicate that the poolwater was the source (Figures 1 and 2), whereas the canal telltale drains indicate possiblemixing with groundwater (10 to 20%). Sodium levels for the SFP drains were reasonablyconsistent at <lppm. In Telltale No. 14 and No. 16 (from the canal liner), sodium was 69.7ppm and 329 ppm, respectively. Boron and tritium in the canal telltale drains were lowerthan typical levels in the pool drains, and sodium was also much higher, suggesting dilutionby groundwater (although the sodium was not balanced by chloride ion) and/or release ofsodium from the interactions with structural materials.Iodine-131 (8.04 day half-life), when detected, was present in selected samples from telltalesamples from the Spent Fuel Pool but not present in the telltale samples from the canal area.When decay-corrected to Mode 6 (the time of fuel movement), the average.level was 71% ofthe average SFP. decay-corrected activity of "'I. This comparison strongly suggests that theSpent Fuel Pool was the source of the 1311 activity. The lack of detected "3'I activity in thetelltale drain samples after December 14, 2002 also points to the refueling operation as thesource of the activity which became too low to measure after two months of decay.Cobalt-5 8 was not, detected in all samples in which 1311 was detected, suggesting interactionsof cobalt with structural materials (e.g., concrete) that does not adsorb iodine. The 1311-to-137Cs activity ratio corrected to Mode 6 for drains No. 3, 4, 5, and 6 was 5.2, compared to0.36 for the Spent Fuel Pool. Substantial uptake of cesium by structural materials hadoccurred, to reduce cesium activity by about 90%. Cesium and cobalt activity levels in thetelltale drain samples were small fractions of levels in .the Spent Fuel Pool water analyzed,most likely as a result of interactions with structural materials. The 134Cs-to- 137Cs activityratio (0.19 - 0.85) and 58Co-to- 6°Co activity ratio (0.20 - 2.01) in the telltale drain sampleswere also lower than average ratios for the Spent Fuel Pool (1.02 and 8.27, respectively).The cesium and cobalt in telltale drain water had exchanged (to isotopic equilibration) with"old" cesium and cobalt (low 58Co and 134Cs activity), adsorbed to the structural concrete.Thus, even if the path is short (from SFP to telltale) the cesium and cobalt exchange rapidlywith the large amount of cesium and cobalt on the concrete and will reflect the activity ratioof the adsorbed fraction (i.e. "old") rather than the activity ratio of the SFP (i.e., "young").
15
Because. 131I only weakly adsorbs to concrete and migrates at the rate of water flow, levels of1311 activity are present soon after the refueling operation was completed.
Antimony-125 was detected in only one telltale drain sample from the canal and in several ofthe pool telltale drain samples. Antimony-125 (2.77 year half-life) is a decay product of, 25 Sn.(9.64 day half-life), an activation product of 124Sn (5.79% in nature), which is in thezirconium alloy cladding., Leakage from water in the pool in contact with fuel rods wouldexplain the 125Sb in the samples.The average pH of pool drains No. 1, 3, 4, 5, and 6 sampled January 1 7 'h was-7.10 comparedto an expected pH for approximately 2,257 ppm boron of 4.56. The average pH of canaldrains No. 13 and 14 was 7.79 compared to an expected pH of approximately 4.80 for 1465ppm boron. The neutral to basic pH indicates interactions with structural materials and/ormixing with groundwater. The calcium carbonate in concrete would neutralize the hydrogenions in boric acid to increase the pH to neutral without changing the borate contentof the
"water. Cation exchange of hydrogen ion for sodium and potassium -in the concrete wouldcause both an increase in the pH and in the sodium and potassium concentration.
After snaking on January 2 9th significant tan or brown debris,, characteristic of rust deposits,flushed from drains No. 2, No. 3, No. 6, and No.14. The debris was not magnetic. The waterinitially flowed from drain No. 2 at approximately I gpm after snaking, decreasing to about I literper minute. Telltale No. 2 continued to drain at about 0.5 liters/min through 2003. The otherdrains had at least a factor often lower flow. The data in Table 3 suggest that the operationallowed accumulated water to drain, and resulted in an increase in both the 58Co level and 58Co-to-60Co activity ratio [1.5 to approximately 3.2 (decay-corrected to Mode 6)] . Fiber opticinspections on January 31, 2003 indicated deposits (originally thought. to be boric acid) behind thetelltale drains. The restriction of flow forced leaking water to the build up in the leakagecollection system. The formation of deposits suggests that the leakage had occurred over manyyears, which helps to explain the age characteristics of cesium and cobalt activity in the telltaledrain samples. The drip rate from telltale drains was approximately 5.8 gpd prior to snaking.After snaking, initially water freely flowed from the telltale drains, diminishing to steady drips;however, the rate was not accurately measured for an extended period. Snaking was repeatedFebruary 21, 2003 and the flow was measured at 22 litersper hour (139 gpd) from the sumppump. This rate continued throughout 2003.
'Deposits on the wall area above the pitchdown trench, which receives the drips from thetelltale drains, hadan average 134Cs-to-137 Cs- activity ratio of 0.13. Decay of an initial sourcewith an activity ratio of 1.02 (SFP water) would require 6.5 years to 'decrease to an activity ratioof 0.13; an upper limit age of the activity on the wall. The calculated "age" was about three yearsif one used an activity ratio typical of the telltale drains (0.3 to 0.4). Cobalt activity was not
'detected in the white deposits, confirming the slow migration rate of cobalt in contact withconcrete.
In summary, water beneath the fuel racks is postulated to be leaking into the telltale drainsbeneath the Unit 1 Spent Fuel Pool, and' water beneath the canal is postulated to be leaking intothe telltale drains beneath the canal area. Groundwater may be mixing with the water in the drainsbeneath the canal based on lower tritium and higher sodium levels (although the pathway is not
16
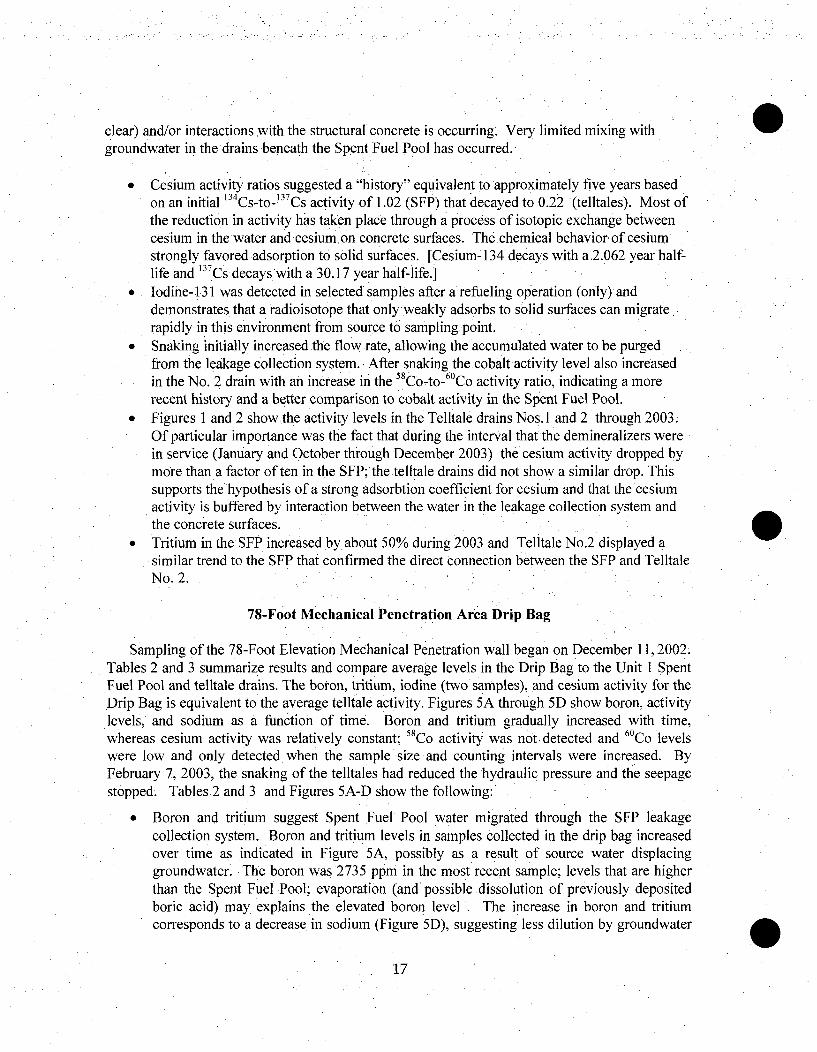
clear) and/or interactions with the structural concrete is occurring. Very limited mixing withgroundwater in the drains beneath the Spent Fuel Pool has occurred.
* Cesium activity ratios suggested a "history" equivalent to approximately five years basedon an initial 134Cs-to-' 3 7Cs activity of 1.02 (SFP) that decayed to 0.22 (telltales). Most ofthe reduction in activity has taken place through a process of isotopic exchange betweencesium in the water and cesium on concrete surfaces. The chemical behavior of cesiumstrongly favored adsorption to solid surfaces. [Cesium-134 decays with a.2.062 year half-life and '37Cs decays with a 30.17 year half-life.]
* Iodine-131 was detected in selected samples after a refueling operation (only) anddemonstrates that a radioisotope that only weakly adsorbs .to solid surfaces can migrate..rapidly in this environment from source to sampling, point.
* Snaking initially increased, the flow rate, allowing the accumulated water to be purgedfrom the- leakage collection system. After snaking the cobalt activity level also increasedin the No. 2 drain with an increase in the 58Co-to- 60Co activity ratio, indicating a morerecent history and a better comparison to cobalt activity in the Spent Fuel Pool.
* Figures 1 and 2 show the activity levels in the Telltale drains Nos.1 and 2 through 2003.Of particular importance was the fact that during the interval that the demineralizers werein service (January and October through December 2003) the cesium activity dropped bymore than a factor often in the SFP; the telltale drainsdid not show a similar drop. Thissupports the hypothesis of a strong adsorbtion coefficient for cesium and that the cesiumactivity is buffered by interaction between the water in the leakage collection system andthe concrete surfaces.
* Tritium in the SFP increased by about 50% during 2003 and Telltale No.2 displayed asimilar trend to the SFP that confirmed the direct connection between the SFP and TelltaleNo. 2.
78-Foot Mechanical Penetration Area Drip Bag
Sampling of the 78-Foot Elevation Mechanical Penetration wall began on December 11,2002.Tables 2 and 3 summarize results and compare average levels in the Drip Bag to the Unit 1 SpentFuel Pool and telltale drains. The boron, tritium, iodine (two samples), and cesium activity for theDrip Bag is equivalent to the average telltale activity. Figures 5A through 5D show boron, activitylevels, and sodium as a function of time. Boron and tritium gradually increased with time,whereas cesium activity was relatively constant; 58Co activity was not detected and 60Co levelswere low and only detected, when the sample size and counting intervals were increased. ByFebruary 7, 2003, the snaking of the telltales had reduced the hydraulic pressure and the seepagestopped. Tables 2 and 3 and Figures 5A-D show the following:
Boron and tritium suggest Spent Fuel Pool water migrated through the SFP leakagecollection system. Boron and tritium levels in samples collected in the drip bag increasedover time as indicated in Figure 5A, possibly as a result of source water displacinggroundwater. The boron was 2735 ppm in the most recent sample; levels that are higherthan the Spent Fuel Pool; evaporation (and' possible dissolution of previously depositedboric acid) may explains the elevated boron level . The increase in boron and tritiumcorresponds to a decrease in sodium (Figure 5D), suggesting less dilution by groundwater
17

and/or less chemical interaction with structural material over time (chloride was less than 1ppm, a level that would support the latter conclusion).
* The extremely low cesium and cobalt activity levels -compared to the Unit 1 Spent FuelPool levels (but similar to telltale drain samples) may be explained by interactions withstructural materials; the cesium activity ratio also linked the Drip Bag samples to thetelltale drain. Low sodium and chloride levels also indicate a low level of groundwaterdilution (chloride was less. than 1 ppm). Relatively constant cesium levels indicateequilibrium with construction materials/concrete.
* The relatively low 13 4Cs-to-"3 7Cs activity ratio in the Drip Bag samples (0.34 average)indicates "old" cesium that has adsorbed to the walls of the leakage collection system andmatches the cesium ratio in the telltale drain samples (0.33 average prior to snaking). Thisconclusion is supported by non-detectable 58Co (70.80 day half-life) and detectable 60Co(5.27 year half-life) only in counting large samples.
* Iodine-131 (8.04 day half-life) was detected in two samples after the drip bag wasestablished. When decay-corrected to the time Mode 6 was established for 1R15, theactivity levels match levels in the Unit 1 Spent Fuel Pool. This fact and the lack ofdetected 131. activity in later: samples point to the refueling operation as the source of 1311.
Iodine does not adsorb strongly to surfaces, as cesium and cobalt do, and may explain whythe iodine signal reflects "young" water while the cesium activity reflects "old" water.
. Iron was measured in selected samples and present at 0.09 to 0.48 ppm. The source ofiron is uncertain and two, scenarios are most plausible. The concern is boric acid corrosionof rebar in the concrete. If iron rebar corrodes under reducing conditions (Fe metal wouldoxidize to Fe(II)aqueous; although the rate is certainly much, lower than under oxidizingconditions - i.e. when oxygen is present), soluble Fe(II) is formed. Groundwater alsocontains high levels of mobile Fe(II). Groundwater Fe(II) occurs when bacteria reduceFeO(OH) in soils to soluble Fe(II). The Fe acts as an electron acceptor bacterial oxidationof organic matter. Soluble Fe in groundwater can be as high as 5ppm in organic richsediments of coastal marshes. In either scenario, when soluble Fe(II) is exposed to air(oxygen),- insoluble Fe(III) hydroxides form, leading to the familiar yellow to orange tored staining patterns from Fe(OH)3, FeOOH, and Fe203 . An extensive structural review isunderway by plant personnel to understand the source of the iron.
• .The pH of the Drip Bag sample collected January 28, 2003 was 7.16 rather than anexpected pH of 4.45 for 2735 ppm boron as boric acid. The concrete can neutralize thehydrogen ions via exchange of sodium and potassium in the concrete for hydrogen ion.
In conclusion, the 78-Foot Mechanical Penetration Area Drip Bag samples match reasonably wellwith the Unit 1 Spent Fuel Pool telltale drains. The water in the SFP leakage collection system hasbeen modified from the original SFP activity ratios via interaction with structural material.Possible minor dilution with groundwater may occur for the Drip*Bag sample (although chloridewas less than I ppm). The cesium activity ratio and levels match, but cobalt activity levels in thedrip bag are lower as explained by additional uptake (interaction) with structural materials.Cesium and cobalt activity levels through January 28, 2003 did not decrease when the Unit 1Spent Fuel Pool demineralizer was placed in service January 1st, suggesting that the cesium and
18

cobalt activity in the leakage collection system are controlled by surface interactions between theconcrete and the water.
19

FIGURE 4: LOCATION OF SAMPLES TO CHARACTERIZE SALEM UNIT 1 SPENT FUEL POOL LEAKAGE
(Not to Scale)
110' -
100'
90'
80'.
70'.
60' _
43' .
Aux Building
"Long" (Boot) and
"Short" (Cooling LineReturn) Samples
78-Foot ElevationMech Penetration---Drip Bag Samples
FB
uel Handlinguilding
Fuel Pool Cooling Lin(
Ground Level (100')
Groundwater (96')
Telltale Drains on 84 Elevation at
-approximately 86 FeetWeeping Wall 78'-A
-78' Elevation
Proposed Sample, ---<D epth (80')
ýofferdamns'67'&79.')`
Concrete - Styrofoam
20

FIGURE 5A. 78 DRIP BAG BORON AND TRITIUM2800 Z0OE-01
2600 1.80E-01
- ~Telltale Drains
5 SnakedP. 2400 1.60E-01
2000- 1.20E-01
1800 1.00E-01
-0-- Boron, ppm A No Flow ... 0 TrititunhiuCi/AL
FIGURE 5B: 78 DRIP BAG BORON,
2800
2600
2400
2200
2000
1.00E-03
1.00E-04
1.00E-05
1.00E-06 .
1.00E-0721n m .Om0eEen m eRN Mc : 'R
--- Boron, ppm A No Flow-0- Cs-134, uCi/mL ---- 1-131, uCi/mL
-. -A- - - Cs-137, uCi/mL I
21

0U
FIGURE 5D: 78 DRIP BAG
BORON AND SODIUM2800
2600
2400
2200
2000
1800
Telltale Drains Snaked
:.i:i'",,I i I I i,?: I I '•• I I i'~ [:" '' II I I < •ti,':,• {,<.j': i
40
35,
30
25
20
15;0
10 ci:1
5
0S~0
F--- Boron, ppm A No Flow ... - Sodium, ppm]022
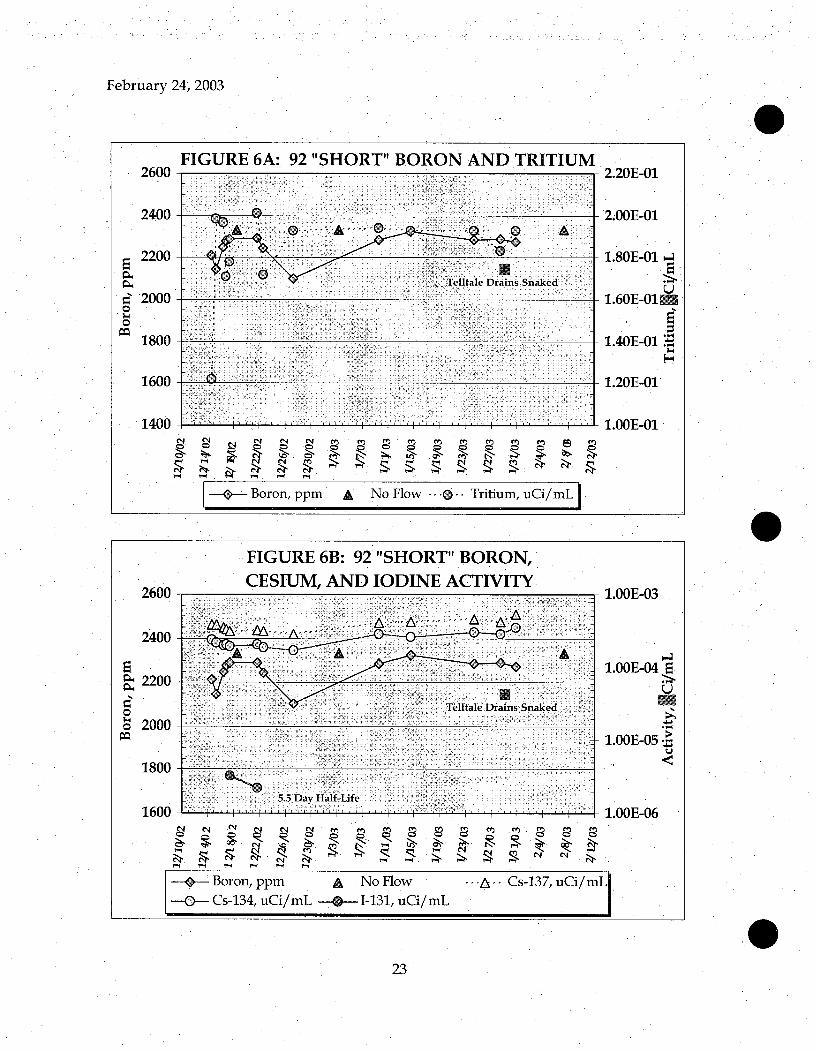
February 24, 2003
FIGURE 6A: 92 "SHORT" BORON AND TRITIUM2600
2 4 0 0 - ................220~~0 ....... ... A, 0,:; 0... A]:i
200o b Telltale Drains Snaked,
="2000
.1 6 0 0 - - :;;
F* Boron, ppm, A No Flow ...,ED- Tritium, uCi/ mL
2.20E-01 -
1.80E-01 -4
1.20E-01
1.0OE-01
FIGURE 6B: 92 "SHORT" BORON,CESIUM, AND IODINE ACTIVITY
2600
2400
2200
08 2000
1800
1600
Telltale Drains Snaked
5.5 Day Half-LifeI I I:, ,I,
1.00E-03
1.OOE-04 E
1.OOE-05 "
1.00E-06
0
- Boron, ppm A No Flow
-- 0- Cs-134, uCi/mL ---&- 1-131, uCi/mLCs-137, uCi/mL
23
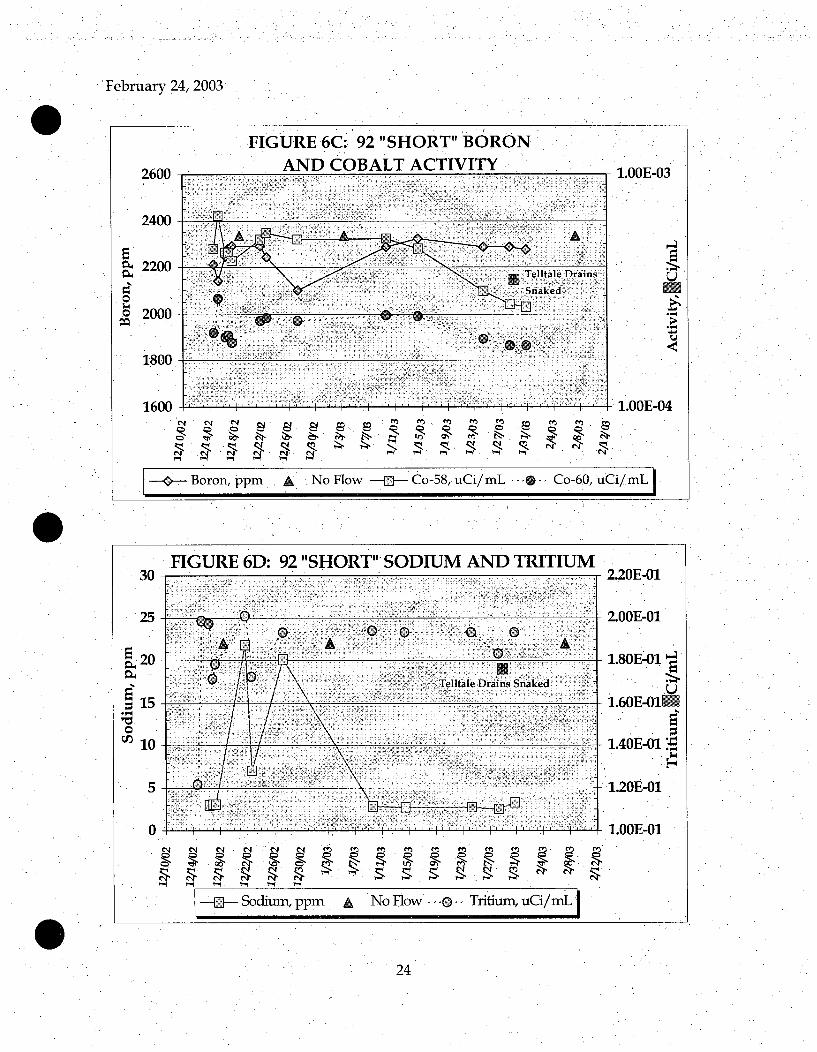
February 24, 2003
FIGURE 6C: 92 "SHORT" BORON
2600 AND-COBALT ACTIVITY 1.OOE-03
2400.
Aý I
2200 TelltaleDU
Snaked~2000 , 8
1800
1600 -, , 1.00E-04
--* Boron, ppm A No Flow --- Co-58, uCi/mL --.- - Co-60, uCi/mL
FIGURE 6D: 92 "SHORT" SODIUM AND TRITIUM30 2.20E-01
... .. .. .. .. .0:-- .......... a 0T•? • ; '< ' 1 '"
~ ~ A -1.OOE-01
0.20 Tltl 1.80E-01~6 TeltaleDrains Snaked
~15-16E00
10 --- 1 --- - -1.40E-01 :,-E74
5 1.20t-01
0 1.IE0
-0-Sodiumppm A No Flow .. O-- Tritiun-, uCi/mLIppm,
24

February 24, 2003
Spent Fuel Pool Cooling Line Return at the Auxiliary and Fuel Handling BuildingInterface ("Short" Sample)
Water was dripping from the annular space around the Spent Fuel Pool cooling return line atthe interface between the Auxiliary Building and Fuel Handling Building. A catch tray with asample tube was installed on December 17, 2002 to divert and collect the water, which ranged'from 0 to 0.039 gpm (14.5 gpd average) between December 22, 2002 and January 7, 2003.Because of the length of the sample tube, the sample point was designated as the "Short" sample.Tables 2 and 3 summarize analysis results from this sample and Figures 6A through 6D showtrends over time. The analysis results indicate the following:
* The "Short" sample was not water currently re-circulating in the Unit 1 Spent Fuel Pool (i.e.,a leak in the cooling return line is not indicated).
* Once the sample source was separated, the boron and tritium levels were relatively constantand indicate Spent Fuel Pool water modified by interaction with structural material (e.g.concrete). Most likely this water originated in the leakage collection system of the SFP.
* Sodium levels initially were erratic, but became stable and relatively low. Sodium levels weremuch higher than levels expected in the Spent Fuel Pool but comparable to water in~theleakage collection system.. This suggested that interactions with structural materials releasedsodium to water in the leakage collection system (also explains the increase in pH) and thiswater migrated to the "Short" sample. Chloride levels were less than 0.1 ppm and suggestminimal involvement of groundwater.
* Cesium and cobalt activity levels were relatively stable and intermediate between levels in theUnit 1 Spent Fuel Pool and the telltale drains. The 34Cs-to-' 37Cs activity ratio averaged 0.67(compared to 1.02 for the Spent Fuel Pool and 0.33 for the average telltale), and the decay-corrected 58Co-to-6 °Co activity averaged 4.21 compared to 8.27 for the Spent Fuel Pool.This suggests a more recent history and/or less interaction with structural concrete than theDrip Bag or telltale samples. The higher activity ratios suggest a shorter and quicker pathwayfor migration from the SFP to the "Short" sampler. Because both cesium and cobalt activitylevels were lower than corresponding levels in the Spent Fuel Pool, both dilution andinteraction with structural materials was indicated,
* Iodine- 131 (8.04 day half-life) was detected in two samples. When decay-corrected to thetime Mode 6 was established for iR15, the activity levels match levels in the Unit I SpentFuel Pool .(and the telltale drains for the pool and 78-foot elevation Drip Bag) reasonablywell. This linked the iodine activity to the refueling operation and a postulated leak fromareas in the Spent Fuel Pool that contained defective rods from 1R15.
* Iron levels were low, indicating relatively little contact with corroding ferrous materials oriron in groundwater.
* The pH of the "Short" sample collected January 28, 2003 was 6.47 rather than an expectedpH of 4.55 for 2290 ppm boron as boric acid. It is not as basic as the Drip Bag sampleperhaps indicative of a shorter travel time or direct mixing of SFP water with water from theleakage collection system.
After the telltale drains were snaked on January 29, 2003, the flow from the "Short" sampledecreased. When the caps were placed on the drainsthe flow resumed. Radiation Protection
25

February 24, 2003
personnel noted this correlation on three occasions. By February 7, 2003, flow was insufficient toobtain a sample. This behavior supported a hypothesis that water from leakage from the poolliner was restricted and being forced, into the region between the concrete and the liner, eventuallyissuing through the opening where the cooling line return pipe intersects the wall.In conclusion,,the "Short" sample indicated a morerecent history and less interaction with thestructural material than other samples (such as the Drip Bag or telltale drains) as compared withwater in the Unit I Spent Fuel Pool after 1R15. Interactions with structural materials and dilutionwith an "older" source (e.g. water from the leakage collection system) can explain cesium andcobalt activity levels being lower than corresponding levels in the Spent Fuel Pool. Cesium andcobalt activity levels in the "Short" sample were higher than corresponding levels in the telltaledrain samples or the 78-Foot Elevation Drip Bag sample, suggesting less opportunity forinteractions with structural materials. Cesium and cobalt activity levels in the "Short" samplewere higher than corresponding levels in other samples, but below levels in the Spent Fuel Pool.After snaking, the telltale drains showed more common characteristics with the "Short" sample(before it dried up).
Water Stop (Boot) Around the Fuel Handling Building Concrete Plug at 92-FootElevation ("Long" Sample)
A rupture in the boot occurred on' December 14, 2002 and the flow eventually stabilized.. Along tube was inserted to divert the water, hence the designation of"Long" sample. The flowrate ranged from 0 to I gpm, averaging approximately 51.4 gpd between December 21, 2002 andJanuary 7, 2003. The flow appeared to be affected by rainfall (as noted by Radiation Protectionpersonnel) because leakage from the roof between the Auxiliary Building and the Fuel HandlingBuilding near the service water .pit, resulted in rainwater in the penetrations area in the 12 ServiceWater Valve Room; repairs were completed, January 10, 2003. Precipitation data showed a directcorrelation between the daily rainfall and increasing the "Long" sample flow rate, which was notindicated for the "Short" sample. Results for the "Long" sample are summarized in Tables 2 and3 and plotted in Figures 7A through 7D. Boron, tritium, gamma activity, and sodium levels weremore variable than for other sample points, suggesting mixing with other sources (such asrainfall). Boron generally followed tritium, suggesting a common source. The followingconclusions result from evaluating Table 3 data and Figures 7A through 7D:
* After the "long" tube was inserted into the "boot" on December 14 1h boron, tritium, andsodium increased for about three weeks. This suggests that the initial samples containedhigher levels of groundwater .In early January 2003, chloride concentrations increased andtritium and boron decreased, suggesting a quick response of this sampling point to changingenvironmental variables.
* Cesium activity levels were relatively stable (137Cs <10% of SFP water) until January 6, 2003,after which time levels increased as tritium and boron decreased. The average '3 4Cs-to-' 37 Csactivity ratio prior to January 6, 2003 was 0.36, similar to "old" cesium activity present in theleakage collection system....
* Cobalt activity was more variable and' was not detected in several samples. The average58Co-to-60Co activity ratio based on 58Co activity (decay-corrected to Mode 6) was 3.59,suggesting that a small fraction of the water came from the previous refueling operation.
26

February 24, 2003
* Iodine-131 was detected in four sample and related (in time) to the Mode 6 refuelingoperation, contributing "recent" radioisotopes to the SFP inventory.
On the average, the "Long" sample showed similar characteristics to the water in the telltaledrains. A mixture of groundwater and/or rainfall reduced activity of tritium to about 70 to 90%of the level in the leakage collection system. 131I and 5"Co activity in some samples, linked in timeto Mode 6 refueling, suggested that at least a small fraction of recent SFP or canal water couldmigrate (through the SS liner of the SFP- most likely) to the "Long" sample at 92-foot elevation.After January 2 4th the sample point dried up because of limited groundwater ingress with lack ofprecipitation and eventually from the "snaking", of the telltales that drained the water from theleakage collection system of the SFP.
27

February 24, 2003
FIGURE 7A. 92 ."LONG" BORON AND TRITIUM2000
1800
c1600
1400
1200
1 fnn
2.OOE-01
1.80E-01
1.60E-01
1..4-0
1.20E-01
•vv•
2 21 OOE-01
Boron, ppm A No Flow ... @ D - Tritium, uCi/mL
FIGURE 7B: 92 "LONG" BORON,CESIUM, AND IODINE ACTIVITY
2000
1800
S1600
0.0 1400
1200
1000
!,i•i;iii•:}:i ::i •:! :i{i
A
A
AA
eLnaired by 3110O/03.
1.OOE-03
-1.OOE-04
-1.OOE-05
*1.OOE-06
Roi::io tb
eliminating rainwater inleakae.::;:TT:-7,TZr777 7Z•ZJ •7771.7,;'-t.9t::
i i i
9 • e N e N. m "- Boron, ppm A No Flow .-- A... Cs-137, uCi/mL I
Cs-134, uCi/mL --- 1-131, uCi/mL I
28

February 24, 2003
STYROFOAM SEISMIC GAP- AUXILARY BUILDING AND THE FUEL HANDLING BUILDING
Two drill points were installed in the Styrofoam between the Salem Auxiliary Building andthe Fuel Handling Building on December 19 and 20, 2002. The drill points consisted of a 1-'/4-inch direct push sampler with a 2-foot mill-slotted well point. The samples were obtained using1/4•-inch tubing and a pump. Drill Point No. 1 was installed vertically along the northeast exteriorwall-of the Fuel Handling Building as shown in Figure 8. Drill Point No. 2 was installed on a 45-degree angle into the Styrofoam from the "Door to Nowhere" (100-Foot Elevation of AuxiliaryBuilding, opening to the outside of the Fuel Handling Building on theright and Containment onthe left) near the area for the 78 Drip Bag sample in the Auxiliary Building. Tables 2 and 3summarize results through February 21, 2003. Figures 9A through 9D showed Drill Point No. Itrends and Figures 1 A through 1 OD showed Drill Point No. 2 trends. The Table 3 data and plotsshowed the following:
* The initial samples indicated groundwater mixed with water containing activity levels similarto the leakage collection system. Once purged of the groundwater component, boron,tritium, and cesium activity levels were stable and identical to water from the SFP telltales (orthe 78-Foot Drip Bag sample). After stable conditions were attained, Drill Point No. 1 andDrill Point No. 2 were essentially equivalent.The average 134Cs-to-137Cs activity ratio of 0.31 and the average decay-corrected 58Co-to-60Co activity ratio of 0.90 suggested"old"' activity that resulted from isotopic equilibrationwith the concrete enclosure of the SFP.Iodine-131 was detected in selected samples up to January 9, 2003. Decay-corrected 131I
activity supports the link between 1311 and the Mode 6 refueling operation.Activity levels through January 28, 2003 were reasonably stable, with no effect from use ofthe demineralizer after January 1, 2003. The water in the Styrofoam Seismic Gap was notdirectly related to the water in the Spent Fuel Pool (based on cesium and cobalt activity) butrather-had flowed through the SS liner of the SFP and into the leakage collection system.Interaction with the walls of the concrete enclosure reduced the cesium and cobalt activity.
Water in the seismic gap was a cause of concern because of its elevated tritium activity andits ability to migrate away from the Containment building and to contaminate groundwater. OnFebruary 6 through 13, 2003 , 45 gallons of water were extracted from the Styrofoam at DrillPoint No. 1. As shown in Figures 9A and I OA, boron and tritium decreased and sodiumincreased as shown in Figures 9D and 1OD. Cesium activity remained constant and 60Codecreased (58Co had not been detected since January 16th). Cesium adsorbs strongly onto surfacesand the cesium activity reflects an isotopic exchange between the water and structural materialnear the Seismic Gap. The snaking the telltale drains eliminated the source of SFP water to theSeismic Gap and removal of the water in the Seismic Gap allowed ambient groundwater to flowinto the region. Boron and tritium levels dramatically dropped from SFP levels to less than 50%of SFP activity in one week.. The important conclusion was that the chemical and radionuclidecharacteristics for bothdrill points were identifiable to the Spent Fuel Pool telltale drains, and thecombined effects of snaking telltale drains and pumping the water out of the Styrofoam waseffective in dramatically reducing boron, tritium, and cobalt activity. Samples collected during the
29

February 24, 2003
summer of 2003 (Table 2) at Drill Point No. I had decreased levels of tritium (3% of SFP),consistent with.the stoppage of the leak to the Styrofoam Seismic Gap and the subsequent inflowof groundwater to the Styrofoam. Cesium and cobalt activity are also very low, near ND levels.
30

February 24, 2003
FIGURE 8: LOCATION OF DRILL POINTS DECEMBER 19 - 20,2002
AUx Buil
Salem 'Unit #1Reactor
Containment
Area of Seepage Crack inýWall at 78 84 Foot
Line leVation.F.
ill Point No . 450• • "[ A -~.
/Point N(rDrill
31
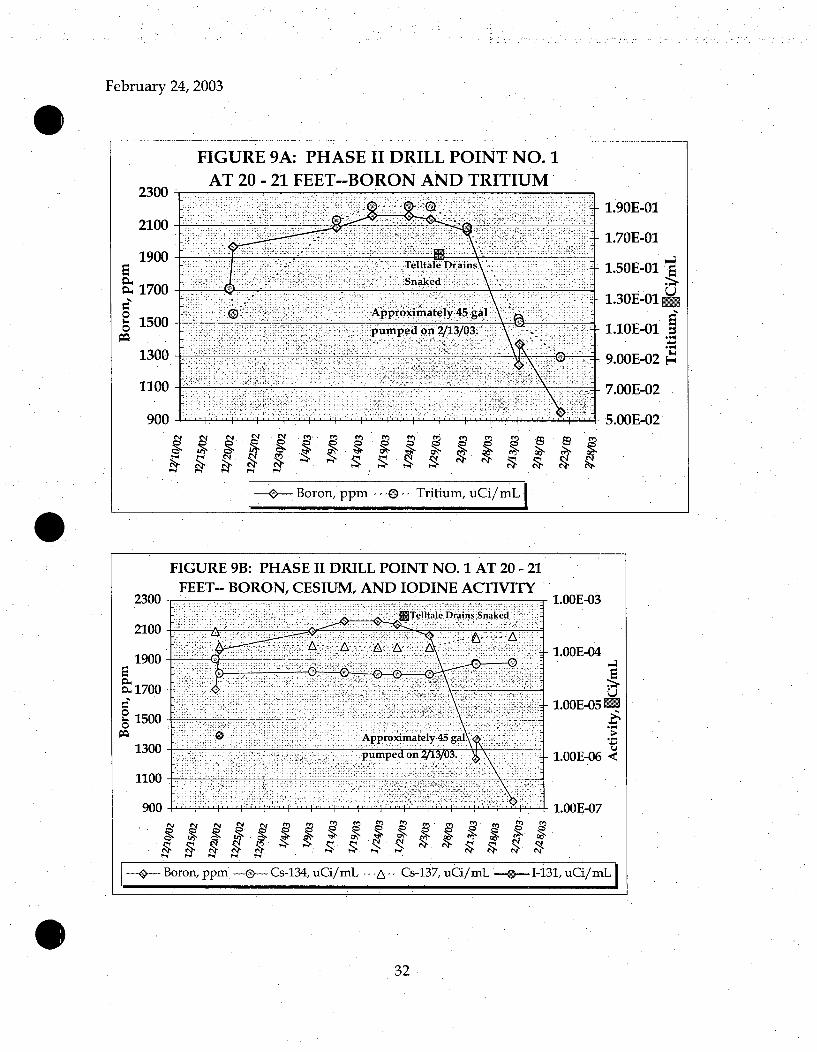
February 24, 2003
0FIGURE 9A: PHASE II DRILL POINT NO. 1
AT 20 - 21 FEET--BORON AND TRITIUM•2300
2100
1900
1700
1500
1300
1100
r%~.
Snaked
Approximately:45 gal
- 1.90E-01
1.70E-01
1.50E-01
1.30E-O1MU
1.10E-01
9.OOE-02 °,
7.00E-02
r. nnu-n,)
pumped on 2/13/03.
1100 7.OOE-02
QAA ~ nnr~v~J.aa.a..IUU
--- Boron, ppm -.-.. Tritium, uCi/mL
• UUI• U•
0FIGURE 9B: PHASE II DRILL POINT NO. 1 AT 20 - 21
FEET- BORON, CESIUM, AND IODINE ACTIVITY2300 1.OOE-03
Ejeitale Drains Snaked2100
1900 A A ~1.OOE-041900 --
o17001.OOE-05
~1500__* Approximately 45 gal
1300 pumped on 2/13/03. 1.OOE-06 <
1100
900... .. 1.00E-07
F-- Boron, ppm --- Cs-134, uCi/mL - - Cs-137, uCi/mL I--i-31, uCi/mLi
32

February 24, 2003
FIGURE 9C: PHASE II DRILL POINT NO. 1 AT 20 - 21FEET--BORON AND COBALT ACTIVITY
2300. . . . . .. 1.00E-05
2100-
1900Snk
1700-1.OOE-06
1500.
1300Approximately 45 gl
1100 pumped on
900 I I": I I , I I 1.00E-07
-0- Boron, ppm - -- - Co-58, uCi/rnL -- M- Co-60, uCi/mL
FIGURE 9D: PHASE II DRILL POINT NO. 1AT 20 - 21 FEET--BORON AND SODIUM
2100. 30
Telltale Drains 21900 2Snaked 25
c 1700 20~0 A~pproximnately 45 ga
0ý4 1500 15~Epumped on2/1/0.
1300 10l
1100 5-0n El '• E 7u5
900~00
--.-- Boron, ppm .. [- E-- Sodium, ppm
33

February 24, 2003
FIGURE 1OA: PHASE II DRILL POINT NO. 2AT 27 FEET--BORON AND TRITIUM
2300 1.90E-0i
2100-1.70E-01
1900 - ---Telltale Drains Snaked-0
S1500 p m yg1.15E-0i
from Drill Point No. Ion 2/13/03 9.OE.'.02-•1300 9.00E-02
1100- 7.OOE-02
900 ii I 5.00E-02
-. 0_ Boron, ppm ..-o. Tritium, uCi/mLI
FIGURE 1OC: PHASE II DRILL POINT NO. 2 AT 27
FEET--. BORON AND COBALT ACTIVITY2300 1.00E-05
PqTellltale'Drains Sniaked
1 9 0 0 , : :::,:••: : , , :::•
PL 1700 U1.OOE-061500.
1300-Approximately 45 galI pumped
1100from Drill Point No. 1 on 2/13/03.
900 .. ....~' i'' 1.00&-07
---- Boron, ppm .... - ,, Co-58, uCi/mL -- M Co-60, uCi/mL
34

February 24, 2003
FIGURE 10D: PHASE II DRILL POINT NO. 220AT 27 FEET--BORON AND SODIUM2300 . . . . . . . . . ....- . .. 35
Telltale Drains Snaked
2100 30
1900 . .... 25
1700 .: .Approximately 45 gal pumped ,20
21500 from Drill Point No. 1 on 2/13/03. 11500 ,. . . .15
00
1300 10 ~1100 ... 11-FI 5
900 1 .... . 0
-~-Boron, ppm -E .Sodium, ppm
35

February 24, 2003
W OTHER SAMPLE LOCATIONS
Table 4 summarizes analysis results for miscellaneous samples withdrawn at various Salem Unit Iand Unit 2 locations. Evaluation of these data indicate the following:
* The Unit 1 RWST after IR15 was not the source of contamination on the basis of tritiumlevel (1.26 E-1 jiCi/mL versus 1.91 E-1 tCi/nL average in the "Short" sample) and average58Co-to- 6°Co activity ratio (1.51 versus 4.21 average in the "Short" sample, decay correctedto Mode 6).
* Although the. 12 RHR floor drain indicated cesium and cobalt contamination, boron was notdetected in deposits collected in the area.
* The stalactites in the RAP tank area (this the RWST, AFST, and PWST) did not contain'boron; leakage from the RWST to this area was eliminated on this basis.
* Three samples of seepage water between the Unit 1 Containment and Auxiliary Building(1BD41) suggest a link to the leakage collection system on the basis of boron (1208 ppmaverage) and tritium (1.19E-1 aCi/mL average). Water from the leakage collection systemcould possibly migrate in the void between buildings and accumulate over time. The 134Cs-to-'37Cs activity ratio of 0.20 indicates "old" activity, consistent with the telltale samples. Alow 60Co level was detected, but interactions with structural materials will reduce cobalt inliquid samples. The 59.7-ppm sodium (average) and 12.1-ppm chloride level indicates somegroundwater, and/or leaching from structural materials. The source of 1311, seen in many ofthe telltale, drill point and seepage samples most likely related to the refueling in October2002.
036
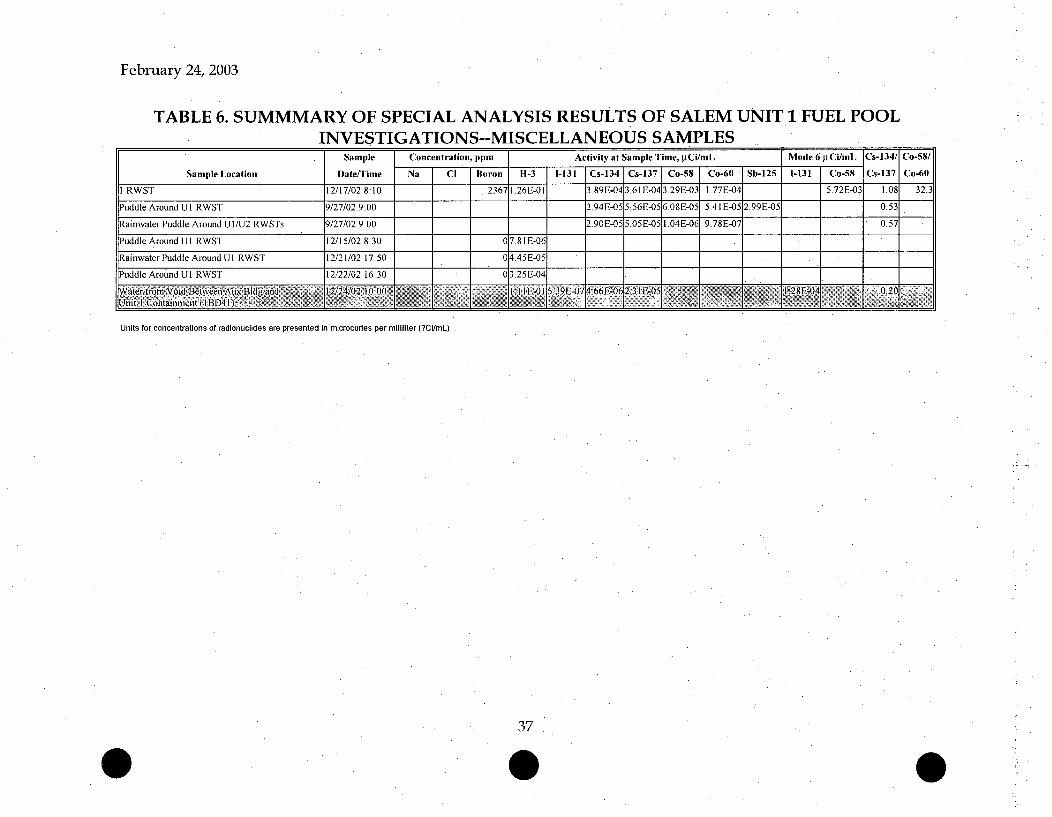
February 24, 2003
TABLE 6. SUMMMARY OF SPECIAL ANALYSIS RESULTS OF SALEM UNIT 1 FUEL POOLINVESTIGATIONS--MISCELLANEOUS SAMPLES
Sample Concentration, ppm Activity at Sample Time, ltCi/mL Mode 6 4Ci/mL Cs-134/ Co-58/
Sample Location Date/Time Na Cl Boron 11-3 1-131 Cs-134 Cs-137 Co-58 Co-60I Sb-125 1-131 Co-58 Cs-137 Co-60
I RWST 12/17/02 8:10 2367 1.26E-01 3.89E-043.61E-043.29E-03 1.77E-04 5.72E-03 1.08 32.3
Puddle Around U 1 RWST 9/27/02 9:00 2.94E-05 5:56E-056.08E-05 5.41E-05 2.99E-05 0.53
Rainwater Puddle Around UI/U2 RWSTs 9/27/02 9:00 2.90E-05 5.05E-05 1.04E-06 9.78E-07 0.57
Puddle Around U I RWST 12/15/02 8:30 0 7.81E-06
Rainwater Puddle Around UI RWST 12/21/02 17:50 0 4.45E-051
Puddle Around U I RWST 12/22/02 16:30 0 3.25 E-041
Units for concentrations of radionuclides are presented in microcudes per milliliter (?Ci/mL)
37

February 24, 2003
TABLE 6 (continued). SUMMMARY OF SPECIAL ANALYSIS RESULTS OF SALEM UNIT 1 FUELPOOL INVESTIGATIONS--MISCELLANEOUS SAMPLES
Sample Concentration,. ppm Activity at Sample Time, ICi/mL Mode 6 iCi/mL Cs-134/ Co-58/
Sample Location. Date/Time Na Cl Boron H1-3 1-131 Cs-134 Cs-137 Co-58 Co-60 Sb-125 1-131 Co-58 Cs-137 Co-60
Water from Void Between Aux da1/'17/03 85o <3!723 1 '24E-051 7 4-03 /--I 719 0 2Unit I Containment (2BD41)WUiter fr2 C iab d TnBfes AU ut RLi ,and /9/03id50 1 4705 12561 H-I 6.47E-0638 2E-0 1- -07 0,29Unit I Contiri~nmit ID4I K ) P
Water from Void Betwveen Aux Bldg and 1/17/03 8:35') <3.3 2. 1E-0 5Unit 2 Containment (2BD4 1)Unit 2Cable Tunnels Under South RAP Tank 1/9/03 10:50 0 5.49E-08 1.92E-07 I 68E-07 0.29
U1 12 RHR-Wall Across from Ladder 1/2/03 10:00 0
UI 12 RHR-Floor Drain 1/2/03 10:02 0 1.42E-04 2.81E-03
UI 12 RHR-12SJ147 1/2/03 10:05 0 7T83E-05 8.18E-05 1.59E-04 1.94
Pipe Trench North RAP Tanks Overhead Stalactites 1/15/03 13:12 - 0
Units for concentrations of radionuclides are presented in microcuries per milliliter (?Ci/mL)
38-

Summary
The Salem Unit I Spent Fuel Pool has experienced leakage through the SS liner into the leakagecollection system that surrounded the SFP. Over time chemical deposits in the telltale drains restrictedflow and caused a buildup of water in the concrete enclosure surrounding the SFP. This water hasseeped through the enclosure and migrated to several unexpected locations: the area behind the 78-FootMechanical Penetration Room wall in the Auxiliary Building, the Spent Fuel Pool cooling line at theinterface between the Auxiliary and Fuel Handling Building, the water stop (boot) located at thepenetration between the Auxiliary Building and the Fuel Handling Building, and Styrofoam Seismic Gapbetween the Fuel Handling Building and the Auxiliary Building. The water .in question had manycharacteristics of Spent Fuel Pool water (e.g., boron and tritium levels), but low cesium and cobaltactivity levels and activity ratios suggested extensive interactions with structural materials (e.g.concrete). Iodine-13 1 in selected samples when decay corrected to Mode 6 during. IR15 refueling,were comparable to levels in the Spent Fuel Pool. This finding for 131I, which does not interact withconcrete, suggests relatively rapid migration of SFP water through the SS liner and ultimately seepingthrough construction joints and/or cracks in the concrete enclosure of the SFP. Iodine-131 activity wasnot detected at other times, suggesting that the refueling operations were the source. None of thesamples points showed the effects of placing the Spent Fuel Pool demineralizer in service January 1,2003 because cesium and cobalt activity levels and ratios are controlled by exchange with solid surfaces(e.g. concrete). Flow rates at seepage points dropped dramatically (or stopped) after the telltale drainswere snaked and normal flow in the leakage collection system resumed (at about 100 gpd). Because ofmore rapid throughput of water to the telltales after snaking, the activity levels in the telltales moreclosely resembled SFP water (e.g. Telltale No.2 tritium level increased by about 50% through 2003 inresponse to a similar increase in the SFP). In October 2003, the use of demineralizers reduced SFPcesium and cobalt by more than a factor of ten; a similar decrease was not observed in the Telltale No. 2because of the buffering effect of the cesium that strongly sorbed to the surfaces of the SFP concreteenclosure. Removal of the water in the Styrofoam Seismic Gap on February 13,2003 reduced activitylevels of tritium to 3% of SFP levels in the Gap via groundwater inflow. Less than 5 gallons of watercould be withdrawn from the gap on two occasions and the activity levels were at about 3% of SFP fortritium and <<1% for cobalt and cesium activity.
39

f U
CC 6'.-'~ 4
aNj~a4 ~
'.Oa ~
0 N
0.0
0
rJ4
U
U(-I
H
H.-1
zo
z
0
04
0
U
'C
*C -
0
U
U
0)
(0
K~1
'C
0U
IN
U
0
N000
ira
'.0,0
(J~Ca
~
Ca
0
2' Lea
0
a-?'>
N
N
0
N
(U4
'<4
0
aO
-4
N
en LQ L
00
eý n Ia'e
0q 0 0
N zv~-
N ', 'en
en '
0 O 70'
Lý n,c afoo
N0
N `0N 00
90
N 00
~00
00
r4
en Nf -4 ýN 0
~0
0
0
0)
0~ai
C:)
caJ
0
(U0
0)
('a
Z I, -
>> 0~>S.< <4 L
r7
F-.
0
'(000
000~
.00N
'0
'(0
"4', 4444,
tfa '~ "(C
"'(000O'4~(0
000 ~cfl ~7E-
LI~ 0
00 <~ 0(CN
.9 ~*~ >"<: (0~
I

February 24, 2003
TABLE 3 (continued). SUMMMARY OF SPECIAL ANALYSIS RESULTS OF SALEM UNIT 1 SPENTFUEL POOL LINER DRAINS PRIOR TO SNAKING (TELLTALE DRAINS)
Concentration, ppm l Activity at Sampl Tine, pCi/il Mode 6 p CifmL Cs-134/ Co-58/
Sample Location Fe Na Cl Boron H-3 1-131 Cs-134 Cs-137 Co-58 Co-60 Sb-125 1-131 Co-58 Cs-137 Co-60
Ratio to No. 2 Telltales 1.05 1.03 0.99 3.86 2.84 3.59 0.82 4.61 1.37 1.31
Ratio to 78 Drip Bag >0.33 0.19 0.18 0.88 1.05 5.15 . 2.62 595 1.05 .1.97
Ratio to 1 SFP 0.99 0.99 0.14 0.21 0.22 1.00 0.71 0.11 0.66 0.51
ANERAGE "LONG•,' • f& 04 26.8 .10.6 . 1365i 8E-iL'84E-06 "•62Ef05 ,2 02E-04 4,69E-05 2.86E-i5 '362E06 3:2E-04 ,O5E•0, 0.42• 3:5,
Ratio to "Short" 14.4 9.9 113.2 0.60 0.62 0.29 0.45 0.13 0.39 0.74 0.12 0.63 0.8E
Ratio to Canal 0.22 0.93 0.90 1.69 1.08 3.54 1.71 3.85 1.93 1.31
Ratio to 1 SFP 0.59 0.61 0.04 0.093 0.029 0.38 0.52 0.013 0.41 0.42
Ave.W1No. 1 (21 ~5.15 6.02 0.41 2119 1.8§E-01i 1.86E-06 4.01 F-05~ -131 E-04 4.9-71.02E-06 1.82E-0& 3.S4E-.04 4A3E-07 ~0.3'1 cFt), No. 2(27 Ft) K .. . I ,{
Ratio to 78 Drip Bag 51.2 0.41 0.79 0.81 1.04 0.69 .076 2.87 0.95 0.91
Ratio to "Short" 156 2.13 4.36 0.92 0.98 0.13 0.29 0.0048 0.19 0.91 0.00094 0.46 0.1ý
Ratio to "Long" 10.9 0.22 0.039 1.55 • . 1.60 0.47 0.65 0.036 0.50 1.23 0.008 0.74 0.1E
Ratio to Pool Telltales 0.97 0.94 1.06 0.75 0.78 0.017 0.07 0.90 0.034 0.93 0.64
Ratio to 1 SFP 0.91 0.97 0.018 0.06 0.001 0.64 0.000105 0.30 0.064
Units for concentrations of radionuclides are presented in microcuries per milliliter (?Ci/mL)
41

February 24, 2003
TABLE 3 (continued). SUMMMARY OF SPECIAL ANALYSIS RESULTS OF SALEM UNIT 1 SPENTFUEL POOL LINER DRAINS PRIOR TO SNAKING (TELLTALE DRAINS)
Sample A Co)'3tncentraton ,ppm. . Actvtt atSampleTirme,pCi/nile M.•. lde 6.Ci/•m Cs-134/ Co-58/
Sample Location Date/Time Fe Na CI Boron 14-3 1-131 Cs-134 Cs-137 Co-58 Co-60 Sb-125 1-131 Co-58 Cs-137 Co-60
rench Below Drains 9/30/02 10:35 2.34E-04 7.23E-04 1.00E-03 2.51E-04 0.32
Telltale No. 1 (Pool) 12/11/02 16:30 2232 7.01E-05 1.72E-04 2.14E-05 S.90E-05 -3.52E-05 0.41 0.60
Telltale No. 1 (Pool) 12/14/02 6:00 1.86E-01 1.08E-04 2.07E-04 2.11E-05 4.65E-05 3.56E-05 0.52 0.77
Telltale No. I (Pool) 1/17/03 13:05 -4.76 2355 1.95E-01 6.01E-05 1.40E-04 2.63E-05 5.66E-05 9.32E-06 6.21E-05 0.43 1.10
Telltale No. 2 (Pool) 12/11/02 16:45 2229 2.27E-04 2.68E-04 1.92E-05 1.57E-05 3.16E-05 0.85 2.01
Telltale No. 2 (Pool) 12/14/02 6:00 1.85E-01 5.71E-05 1.24E-04 9.71E-06 1.56E-05 1.83E-05 1.64E-05 0.46 1.05
Telltale No. 2 (Pool) 1/17/03 13:07 - 4.74 . 2301 3.69E-05 9.59E-05 1.33E-05.2.23E-05 1.78E-05 3.13E-05 0.38 1.40
Telltale No. 3 (Pool) 12/12/02 17:30 2263 4.83E-06 1.27E-05 4.82E-05 . 2.81E-05 4.20E-04 0.26
Telltale No. 3 (Pool) 12/14/02 11:45 1.64E-01 2.35E-06 1.17E-05 5.12E-05 :2.42E-05 2.37E-04 0.23
Telltale No. 3 (Pool) 1/17/03 13:09 3.44 2259 1.94E-01 1.02E-05 4.32E-05 3.22E-05 0.24
elltale No. 4 (Pool) 12/11/02 16:45 2230 7.43E-06 2.93E-05 8.52E-05 4.32E-06 2.41E-05 2.33E-05 5.91E-04 7.10E-06 0.34 0.29
Telltale No. 4 (Pool) 12/14/02 6:00 1.65EM01 3.20E-06 5.04E-05 1.12E-04 5.79E-06 1.93E-05 2.54E-05 3.17E-04 9.76E-06 0.45 0.51
Units for concentrations of radionuclides are presented in microcuries per milliliter (?Ci/mL)
42

February 24, 2003
TABLE 3 (continued). SUMMMARY OF SPECIAL ANALYSIS RESULTS OF SALEM UNIT 1 SPENTFUEL POOL LINER DRAINS PRIOR TO SNAKING (TELLTALE DRAINS)
Sample [ _ cniit__ati_ I yc t-iv at Sample Tim p iW/roL•'> i 4> •jl e 6 - Cs-134/ Co-58/
SampleLocation Date/Time [Fe Na I I ] Boron I- 3 1-131 Cs-134 Cs-137 Co-58 Co-60 Sb-125 1-131 Co-58 Cs-1371 Co-60
Telltale No. 4 (Pool) 1/17/03 13:12 4.56 2301 1.85E-01 2.93E-05 8.09E-05 5.OOE-06 3;19E-05 1.50E-05 1.18E-05 0.36 0.37
Telltale No. 5 (Pool) 12/12/02 17:30 2357 2.93E-06 2.25E-05 7.38E-05 3.78E-05 2.54E-04 0.30
Telltale No.5 (Pool) 12/14/02 11:45 1.34E-01 2.92E-06 2.40E-05 8.25E-05 4.15E-05 2.95E-04 0.29
Telltale No. 5 (Pool) 1/17/03 13:15 3.34 2232 1.90E-01 2.09E-05 6.43E-05 4.59E-05 0.33
Telltale No. 6 (Pool) 12/11/02 16:45 2221 8.80E-06 2.86E-05 1.07E-04 2.54E-05 1.48E-05 7.OOE-04 0.27
Telltale No. 6 (Pool) 12/14/02 6:00 1.35E-01 4.98E-05 1.39E-04 3.29E-06 2.80E-05 1.50E-05 5.54E-06 0.36 0.20
Telltale No. 6 (Pool) 1/17/03 13:19 7.84 2402 1.91 E-01 2.62E-05 1.05E-04 1.76E-04 4.73E-05 0.25
Telltale No. 8 (Pool) 12/12/02 1730 2290 5.27E-06 8.05E-05 3.88E-04 2.87E-05 1.25E-•5 4.58E-04 0.21
Telltale No. 8 (Pool) 12/14/02 11:45 1.71E-01 5.48E-06 7.OOE-•5 3.38E-04 2.61 E-05 5.54E-04 0.21
Telltale No. 8 (Pool) 1/17/03 13:21 12.1 2304 7.07E-05 3.48E-04 4. 52E-04 1.05E-04 0.20
Telltale No. 9 (Pool) 12/12/02 17:30 2271 6.95E-05 3.31E-04 3.22E-05 0.21
Telltale No. 9 (Pool) 12/14/02 11:45 i.72E-01 4.24E-06 6.49E-05 3.49E-04 3.14E-05 4.29E-04 0.19
Telltale No. 9 (Pool) 1/17/03 13:23 9.16 1861 5.12E-05 2.55E-04 1.12E-04 6.62E-06 0.20
AVERAGE POOL DRAMS: ,' ;. :6.24 2257 1.74E-01 14.74E-06 5.34E-05 1.67E-04 1.29E-051 .88E-05 2.59E05 •425E;-04 2.46E-6;5 o033 •O.83
Units for concentrations of radionuclides are presented in microcuries per milliliter (?Ci/mL)
43

February 24, 2003
TABLE 3 (continued). SUMMMARY OF SPECIAL ANALYSIS RESULTS OF SALEM UNIT 1 SPENTFUEL POOL LINER DRAINS PRIOR TO SNAKING (TELLTALE DRAINS)
Sample Concentratlion, ppm, Acthivty at Sample Time, [iCi/mL Mode 26,ICi/mL Cs-134/ Co-58/
Sample Location Date/Time Fe Na Cl *Boron H-3 1-131 Cs-134 Cs-137 Co-58 Co-60 Sb-125 1-131 Co-58 Cs-137 Co-60
Telltale No. II (Canal) 1/17/03 13:26 3.03E-06 1.76E-05 1.66E-06 3.48E-06 3.91E-06 0.17. 1.12
Telltale No. 13 (Canal) 12/12/02 17:30 2085 8.54E-05 4.10E-04 0.21
Telltale No. 13 (Canal) 12/14/02 11:45 1.49E-01 8.63E-05 3.68E-04 0.23
Telltale No. 13 (Canal) 1/17/03 13:28 48.4 1.92E-01 5.77E-05 2.66E-04 9.90E-07 2.12E-06 0.22
Telltale No. 14 (Canal) 12/11/02 16:50 1703 5.18E-05 2.12E-04 1.IIE-05 1.82E-05 0.24
Telltale No. 14 (Canal) 12/14/02 6:00 1.12E-01 7.11E-05 2.12E-04 9.92E-06 4.05E-06 1.67E-05 0.34 4.13
Telltale No. 14 (Canal) 1/17/03 13:30 09.7 1665 1.59E-01 5.02E-05 1.82E-04 2.97E-05 2.37E-05' 7.01 E-05 •0.28 2.95
Telltale No. 15 (Canal) 1/17/03 13:30 40.7 7.34E-06 0.00
Telltale No. 16 (Canal) 1/17/03 13:34 329 408 4.40E-02 3.31E-06 1.29E-05 0.26
Ratio Pool Drains:l SFP 0.97 0.92 0.025 .0.077 0.060 2.74 0.71 0.0031 0.33 0.10
Ratio Canal Drains:l SFP " 0.63 0.68 0.023 0.086 0.008 0.22 0.00 0.0034 0.21 0.33
Note: Bolded values were used in averages. Mode 6 for 1R15 was established 10/21/02 22:42.Units for concentrations of radionuclides are presented in microcuries per milliliter (?Ci/mL)
44

TABLE 3B: SUMMMARY OF SPECIAL ANALYSIS RESULTS OF SALEM UNIT 1 SPENT FUELPOOL LINER DRAINS AFTER SNAKING (TELLTALE DRAINS)
Sample Concentration, ppm Br Activity at Sample Time, ýtCi/mL Mode 6 pCi/mL I Cs-134/ Co-58/
F saple Location Date/Time Fe Na I C Boron [ 11-3 1 1-131 Cs-134 1 Cs-137 I Co-58 Co-60 I Sb-125 1 1-131 Co-58 Cs-137 Co-60
Telltale No. 1
Ave Before Snaking 4.76 2294 1.91E-01 7.95E-05 1.73E-04 2.30E-05 5.40E-05 9.32E-06 4.43E-05 0.45 0.82
After Snaking 1/29/03 10:30 3.04 2242 7.65E-05 1.70E-04 2.91E-05 6.90E-05 2.63E-05 7.71E-05 0.45 1.12
Telltale No. 2
Ave Before Snaking 4.74 2265 1.89E-01 1.07E-04 1.63E-04 1.41EE-05 1.79E-05 1.80E-05 2.64E-05 0.56 1.49
After Snaking 1/29/03 10:25 2.84 2229 1.97E-01 7 04E-05 1.50E-04 1E0 F 5 1.26E-05 1.46E-04 0.47 )/3]01
1/29/03 10:50 2.84 2230 1.76E-01 7.23E-05 1.49E-04 9124E•0.7.3lE05 1.27E-05 2.450-04 0.48. 3
1/29/03 14:00 2.42 2237 2.01E-01 ' 7.60E-05 1.50E-04• • 3-5•9jE405 1.24E-05 1.95E-04 0.51 3,27
2/3/03 14:30 3.10 2241 2.OOE-01 9.33E-05 1.87E-04 403EI;. 8.27E-06 1.12E-04 0.50 2•05
Telltale No 3
Ave Before Snaking 3.44 2261 1.79E-01 3.59E-06 1.15E-05 4.75E-05 2.82E-05 3.29E-04 0.24
After Snaking 1/29/03 9:45 5.42 2217 3.36E-05 9,70E-05 8.44E-06 6.12E-05 1.46E-05 2.23E-05 0.35 0.36Telltale No 5
Ave Before Snaking 3.3 2295 1.62E-01 2.92E-06 2.25E-05 7.35E-05 4.17E-05 2.75E-04 0.31
After Snaking 1/29/03 10:15 8.081 2349 4.26E-05 1.48E-04 1.00E-04 0.29
Units for concentrations of radionuclides are presented in microcuries per milliliter (?Ci/mL)
06

TABLE 3B (continued): SUMMMARY OF SPECIAL ANALYSIS RESULTS OF SALEM UNIT 1 SPENT FUEL POOLLINER DRAINS AFTER SNAKING (TELLTALE DRAINS),
Sample Concentration, ppm Activity at Sample Time, pCi/mL Mode 6 piCi/mLJ Cs-134/1 Co-58/
Sample Location Date/Time Fe Na J Cl [ Boron I H-3 1-131 [ Cs-134 ] Cs-137 1 Co-58 Co-60 JSb-125 1-131 ] Co.58 Cs-,371 Co-60
Telltale No 6
Ave Before Snaking 7.84 2312 1.63E-01 3.48E-05 1.17E-04 3.29E-06 7.65E-05 2.57E-05 7.OOE-04 5.54E-06 0.29 0.20
After Snaking 1/29/03 12:00 5.40 2206 3.98E-05 272E-04 8,48E-07 7.43E-05 7.23E-06 2.25E-06 0.15 0.03
Telltale No 8
Ave Before Snaking 12.1 2297 1.71E-01 5.37E-06 7.37E-05 3.58E-04 1.69E-04 5.89E-05 5.06E-04 0.21
AfterSnaking 1/29/03 10:25 12.4 2123 6.28E-05 2.91E-04 3.25E-05 774E-06 0.221
Telltale No 9
Ave Before Snaking 9.16 2066 1.92E-01 4.24E-06 6.19E-05 3.11E-04 5.86E-05 6.62E-06 4.29E-04 0.20
AfterSnaking 1/29/03 10:35 2145 5.53E-05 3.23E-04 1.01E-041. 0.17
Telltale No 13
Ave Before Snaking 48.4 2085 1.71E-0I 7.65E-05 3.48E-04 9.90E-O7 2.12E-06 . 0.22
After Snaking . 1/29/03 13:35 1806 1.93E-01 5.19E-05 2.44E-04 2 22E-06 4.30E-06 0l21
Telltale No 14
Ave Before Snaking 69.7 1684 1.35E-01 5.77E-05 2.02E-04 1.69E-05 1.39E-05 3.50E-05 0.29 3.54
After Snaking 1/29/03 9:08 .66.0 1637 .1.79E-01 3.78E-05 1.74E-04 2.18E-05 9.02E-05 2.52E-05 5.76E-05 0.22 0.64
Units for concentrations of radionuclides are presented in microcuries per milliliter (?Ci/mL)
46

TABLE 4: UNIT 1 TELLTALE ANALYSIS SUMMARY (August 2003 to January 2004)
Telltale
No.
LR,mL/min
Na,
ppm
K, Ca,
ppm ppm
Mg,ppm
Zn, Cr,
ppb pp)b
Ni,
ppb
Fe, Boron,
ppb ppm
Activity: jlCi/mL137cS 60coDate/Time pH 1, Cs 7CS I HCo ""Co
No. 1 8/27/03 8:30 6.18 1.50 15.4 32.3 0.689 288 <8.06 98.9 <7.15 2393 2.90E-01 1.86E-03 2.84E-03 2.68E-04 1.42E-03 0.65 0.19
9/24/03 9:19 5.60 4.06 28.2 0.574 312 <8.06 113 84.7 2371 1.67E-03 2.64E-03 2.24E-04 1.65E-03 0.63 0.14
10/22/03 2:20 6.19 0.94 1.55 220 0.548 316 12.2 139 395 2364 2.61E-01 1.67E-03 2.78E-03 1.88E-04 1.79E-03 0.60 0.11
11/20/03 10:30 6.06 0.65 .1.34 205 0.510. 414 106 36.7 657 2367 3.27E-01 7.51E-04 1.26E-03 3.67E-05 3.70E-04 0.59 0.10
12/22/03 9:00 No sample
1/14/04 8:45 <1 No sample
No. 2 8/27/03 8:30 6.84 4.52 9.35 62.1 1.70 -266 9.66 45,5 21.5 2264 3.06E-01 1.02E-03 1.64E-03 1.23E-04 6.99E-04 0.62 0.18
9/24/03 9:19 14.7 8.38 48.8 1.81 536 <8.06. 26.0 94.3 2278 6.17E-04 9.59E-04 5.12E-05 3.35E-04 0.64 0.1510/22/03 2:20 6.74 2.70 8.25 53.6 1.50 71.0 11.8 53.7 2155 2310 3.26E-01 8.19E-04 1.33E-03 5.60E-05 6.54E-04 0.61 0.09
11/20/03 10:30 6.19 0.79 7.34 21.3 0.60 626 13.5 33.7 2668 2347 3.20E-01 6.72E-04 1.12E-03 ND 4.OOE-04 0.60
12/17/039:00 6.77 2.08 2274 3.21 E-01 3.46E-04 6.16E-04 ND 1.62E-04 0.56
1/6/04 12:20 6.67 1.60 2268. 4.36 E-01 ND ND ND ND ND -1/6/04 13:00 500
1/14/04 8:00 500 6.66 1.70 2319 2.45E-04 4.60E-04 5.50E-06 1.29E-04 0.53 0.04
No. 3 8/27/03 8:45 No sample
9/26/03 10:40 59.6 57.2 1.95 6196 <8.06 10.8 <7.15 2282 3.00E-04 5.62E-04 ND 3.48E-05 0.53
10/23/03 0:50, 6.94 2.40 102 55.0 1.82 11,900 10.1 <10.0 53.5 2294 2.67E-01 5.33E-04 1.01E-03 ND 3.89E-05 0.53
11/20/03 10:30 6.78 3.39 18.3 70.5 2.08 534 11.4 <10.0 1132 2463 2.93E-01I 5.37E-04 8.86E-04 ND 8.68E-05 0.61
12/17/03 9:00 7.14 5.33 2210 2.38E-04 4.67E-04 ND 8.93E-05 0.51 -
1/14/04 8:05 0.14
No. 4 8/13/03 13:00 Insufficient sample
9/26/03 10:40 250 61.9 2.30 113 <8.06 <10.0. 90.3 2279 4.05E-04 6.69E-04 ND 6.17E-05 0.61
10/23/03 0:50 7.05 4.30 15.0 83.8 2.91 954 9.91 <10.0 271 2378 2.80E-01 6.09E-04 1.03E-03 ND 9.27E-05 0.59
11/20/03 10:30 7.16 6.20 21.0 115 4.00 861 11.3 <10.0 13.5 2254 13.12E-01 2.5713-04 5.32E-04 ND 4.41E-05 0.48 -
12/17/03 9:00 7.33 5.73 1 2224 3.21E-01 2.15E-04 4.62E-04 ND 5.85E-05 0.46 -
1/14/04 8:10. 0.23
Units for concentrations of radionuclides are presented in microcuries per milliliter (?Ci/mL)
0

2February 24, 2003
TABLE 4: UNIT 1 TELLTALE ANALYSIS SUMMARY, Continued
Telltale LR, Na, . K, . Ca, Mg, Zn, Cr, Ni, . Fe, Boron, Activity: .Ci/mL "4Cs/
58Co/
No. Date/Time mL/min pH1 ppm ppm ppm ppm ppb ppb ppb ppb ppm H 1. Cs 13 7
CS 58Co Co 17Ca
6 0Co
No. 5 8/27/03 8:30 6.90 4.01 11.7 67.5 2.36 52.8 8.71 <10.0 26.7 2296 2.93E-01 4 74E-04 8.52E-04 ND 6.55E-05 0.56 -
9/26/0310:40. 24.5 15ý7 108 3.35 573 <8.06 <10.0 <7.15 2260 3,07E-04 5.95E-04 ND 7.92E-05 0.52
10/23/03 0:50 7.16 6.40 17.4 119 4.02 1253 10.1 <10.0 24.6 2054 2.25E-01 2,52E-04. 5.26E-04 ND 8.78E-05 .0.48
11/20/03 10:30 7.17 6.00 13.3 119 3.92 1514 9.62 12.2 16.4 2246 3.16E-01 2,18E-04 4.88E-04 ND 6.44E-05 0.45 -
12/17/039:00 7.64 6.70 .... 2203 3.18E-01
1/14/04 8:15 0.18
No. 6 8/27/03 8:30'. 7.16 7.03 153 99.0 3.72 <11.3 <8.06 16.7 19.3 2231 2.87E-01 2.83E-04 6.17E-04 2.14E-05 1.15E-04 0.46 0.19
9/26/03 10:40 30.8 223 220 3.82 31.6 <8.06 -<10.0 <7.15 2236 .2.05E-04 5.23E-04 . ND 6.02E-05 0.39 -
10/23/03 0:50 7.21 6.40 19.6 130 3.73 59.4 11.8 10.1 19.8 2124 2.17E-01 1.69E-04 4.18E-04 ND 6.30E-05 0.40 -
11/20/03 10:30 7.24 7.21 21.0 130 3.81 55.2 11.3 <10.0 22.0 2250 3.05E-01 2.13E-04 5.46E-04 ND 7.49E-05 0.39 -
12/17/039:00 7.59 6.68 ' 2190 3.21E-01 1.86E-04 4.20E-04 -ND 5.80E-05 0.44
1/14/04 8:20 027
No. 8 8/27/03 8:30 5.56 13.6 108 3.27 534 8.28 15.5 170 2279 2.89E-01 3,33E-04 6.63E-04 ND 1.OOE-04 0.50 -
9/26/03 10:35 • 8.05 135 2.99 453 <8.06 <10.0 16.6 2263 2.97E-01 2A41E-04 5.20E-04 1.43E-05 1.J51E-04 0.46 0.09
10/23/03 0:50 7.16 4.90 9.47 108 3.06 330 11.4 21.3 2114 2159 2.68E-01 2.66E-04 5.19E-04 2.22E-05 2.12E-04 0.51 0.10.
11/20/0310:30 7.18 5.98 21.2 118 3.64 309 11.6 19.0 2561 2264 3.17E-01 2.96E-04 6.49E-04 ND 1.52E-04 0.46 -
12/17/03 9:00 7.40 5.30 " 2110 3.37E-01 2.65E-04 5.54E-04 ND • 1.62E-04 0.48
1/14/04 8:25 0.68 -
No. 9 8/27/03 8:30 15.2 185 3.70 13,390 9.97 109 <7.15 1. 19E-01 7.58E-05 2.95E-04 ND 2.18E-04 0.26 -
9/26/03,10:35 15.6 145 4.02 16,400 <8.06 91.9 19.2 2445
10/23/03 0:50 No sample.
11/20/03 10.30 No sample . .....
12/17/03 9:00 No sample
1/14/04 8:45 <1 No sample
No. 10 1/14/04 8:45 <1 No sample
No. 11 1/14/04 8:45 <1 No sample
No. 12 1/14/04 8:45 <1 No sample
No.13 1/14/04 8:30 <1 No sample
No. 14 1/14/03 8:35 <1 No sample
No. 15 1/14/04 8:45 <1 osample
No. 16 1/14/04 8:45 <1 No sample
No. 17 1/14/04 8:45 <1 o0 sample.
48

February 24, 2003TABLE'5: SALEM UNIT 1 SPENT FUEL POOL ANALYSIS SUMMARY
1.,. ~l.
Boron,'ppm
ActiVitv, jtCi/mL1 3
4CS/S13.7Cs
58Co/6 0
CoDate/Time6 0
Co58Co 6 0
Co
08/07/03 14:40 2349 2.90E-03 4.32E-03. 6.12E-04 2.86E-03 0.67 0.2108/13/03 13:13 2.88E-03 4.40E-03 6.08E-04 2.85E-03 0.66 0.21
08/14/03 9:15 235308/20/03 8:00 2364 3.10E-03 4.80E-03 5.71E-04 2.86E-03 0.6.5 0.2008/28/03 9:20 2374 3.28E-03 5.07E-03 5.36E-04 3.19E-03 0.65 0.17
09/04/03 8:00 2359 2.73E-01 3.07E-03 4.91E-03 4.75E-04 3.05E-03 0.63 0.1609/18/03 8:45 2370 3.39E-03 5.29E-03 4.68E-04 3.28E-03 0.64 0.14
09/25/03 10:30 2350 3.08E-03 4.75E-03 4.04E-04 2.89E-03 0.65 0.14
10/02/03 9:55 2351 2.23E-01 3.12E-03 4.92E-03 4.26E-04 2.92E-03 0.64 0.1510/09/03 0:55 2358 3.11E-03 4.83E-03 3.41E-04 2.92E-03 0.64 0.1210/16/03 8:55 2366 3.53E-03 5.45E-03 3.48E-04 3.08E&03 0.65 0.11
10/22/03 22:15 2345
10/23/03 0:05 3.39E-03 5.45E-03 3.22E-04 3.10E-03 0.62 0.10
10/30/03 0:30 2348 3.20E-01 6.05E-04 1.06E-03 5.83E-05 5.69E-04 0.57 0.1011/06/03 5:35 2357, 1.69E-04 3.06E-04 1.52E-05 1.79E-04 0.55 0.085
11/12/03 23:00 2375
11/20/03 8:15 2383 6.94E-05 1.26E-04 6.94E-06 1.09E-04 0.55 0.06311/26/03 12:50 2370 3.02E-0112/04/03 8:45 2339 6.01E-05 1.01E-04, ND. 1.11E-04 0.60 -
12/11/03 9:15 2329 3.83E-05 7.53E-05 3.83E-06 6.94E-05 0.51 0.05512/18/03 8:50 2325 , 3.50E-05 6.49E-05 ND 5.81E-05 0.54 -
12/23/03 8:10 2336 3.74E-05 6.33E-05 ND 7.37E-05 0.59
01/01/04 8:30 2307 3.87E-05 7.34E-05 ND 7.44E-05 0.53 -
01/08/04 8:05 2327 3.32E-01 2.97E-05 4.49E-05 ND 4.06E-05 0.6601/15/04 8:05 2333 3.28E-05 4.74E-05 ND 7.89E-05 0.6901/21/04 13:15 2298
01/21/04 17:10 229901/22/04 8:15 3.25E-01 2.76E-05 6.13E-05 ND 7.68E-05 0.4501/29/04 8:10 2313 2.82E-05 6.36E-05 ND 9.14E-05 0.44
49

Appendix B
Section C - ISRA Non-Applicability
Application (Station Operational
History)

Exhibit CSalem and Hope Creek Generating Station Assessments
0

Salem Generating Station Assessment
0
0

Table of Contents
1. Introduction ............................................. 1
2. Salem Generating Station Characteristics................................................. 22.1. Station Description and Setting .............................................................. 22.2. Station Processes and Operations .............................................................. 2
2.2.1.Nuclear Electric Generating Process .................. ............................. 22.2.2. Support Processes and Operations .................................................. 13
2.3. Environm ental Setting ............................................................................. 172.3.1. Surrounding Land Use and Surface Waters .................................... 172.3.2. Topography and Surface Drainage ................................................. 182.3,3.G eology ...................................... ........................ ..................... 182.3.4. H ydrogeology ................................................................................ 19
2.4. Environmental Characterization and Remedial Activities ......................... 20
3. Liability Screening, Characterization, and Valuation ................................. 213.1. Candidate Liability Screening and Identification ..................................... 213.2. Liability Characterization I ..................... ; ................................ 223.3. Liability V aluation .................................................................................. 22
3.3.1.D ecision Tree .............. . .................................. 223.3.2. Remedy Probability Assignments and Remedy Cost Calculations ....... 223.3.3. Liability Expected Value Computation .......................... ........... 23
B ibliography ......................................................... ............................................... 24
FiguresFigure 2-1: Map Showing the Salem and Hope Creek Generating Station .............. 28Figure 2-2: Major Operational Features Associated with the Salem GeneratingStation ................................................ ........................... . . .......................................... 29Figure 2-3: Pressurized Water Reactor ................................................................... 30Figure 2-4: Salem Generating Station Operations ...... I ........................................... 31
TablesTable 2-1: Hazardous Wastes On Site .................................... 32Table 2-2: Current Hazardous Substances and Related Pollution Prevention Systems..34Table 2-3: Historic Operations and Related Pollution Prevention Systems .............. 37Table 2-4: Pollution Prevention Plans .................................................................. 39Table 2-5: Summary of Discharge Investigations and Remediation Cases .............. 41Table 3-1: ,Liability Screening-Salem Generating Station ... .......... ...... 42Table 3-2: Liability Characterization-Salem Generating Station ......................... 44Table 3-3: Liability Decision Tree-Salem Generating Station ................ 49Table 3-4: Liability Valuation-Salem Generating Station..................................... 51
.Appendix to Exhibit C
Salem.09123/99 i

Salem Generating Station
1. Introduction
Public Service Electric and Gas Company ("PSE&G") is making an application to theNew Jersey Department of Environmental Protection ("NJDEP") for a determination ofthe applicability of the requirements of the industrial Site Recovery Act ("ISRA")' withrespect to PSE&G's transfer of generation-related assets to an affiliate. This applicationcontains detailed information on PSE&G's generation-related assets, identifiespotential environmental liabilities related to these assets, calculates the expected valueof these liabilities, and presents relevant financial information concerning the affiliate.
PSE&G's generation-related assets include steam electric generating units andcombustion turbine electric generating units. The steam electric generating units useboth fossil and nuclear fuels. The Salem Generating Station ("Salem") consists of twonuclear-fueled steam electric generating units and one combustion turbine unit fueledby distillate oil. Nuclear-fueled steam electric generating units preseni a potential forradioactivity to impact the environment. Because of this and other potential impacts,the United States Nuclear Regulatory Commission ("USNRC") has been empowered tostrictly regulate all aspects of Salem related to radiological controls. The Appendix tothis Exhibit describes this strict regulatory program and how it applies to the design,construction, licensing, operation, monitoring, and decommissioning of Salem so as toensure that potential radiological impacts are minimized and addressed in the unlikelyevent that this becomes necessary. This Exhibit describes all major aspects of Salem'selectric generating processes, including those associated with radioactivity. ThisExhibit presents the expected value of potential environmental liabilities associatedwith the non-radiological aspects of Salem's electric generating process. However, theexpected value of any potential environmental liabilities associated with radioactivity isnot calculated for the reasons discussed in the Appendix to this Exhibit.
Although unique features exist, steam electric generating stations that use nuclear fuelemploy the same basic processes as are' employed by steam electric generating stationsthat use fossil fuels. Since many of the processes conducted at Salem are the same asthose 'conducted at PSE&G's other steam electric generating stations, the informationset forth in Exhibit B to the Memorandum in Support of Applicability Determinationprovides a useful reference for understanding certain processes present at Salem. Basedon the, station-specific information as supplemented by Exhibit B, Exhibit C to theMemorandum in Support of Applicability Determination identifies potentialenvironmental liabilities for the processes not.associated with releases of radioactivityand calculates their expected value using the methodology and approach described inExhibit A to the Memorandum in Support of Applicability Determination.
0Salem.09123/99 I
Salem Generating Station
2. Salem Generating Station Characteristics
2.1. Station Description and Setting
PSE&G operates and is a part owner of Salem which is located on Artificial Island inLower Alloways Creek Township, Salem County, New Jersey (see Figure 2-1). Salemis jointly owned as follows: PSE&G (42.59 percent), Philadelphia Electric Company("PECO") (42.59 percent), Atlantic Electric Company (7.41 percent), andDELMARVA Power and .Light Company (7.41 percent). Salem is situated adjacent tothe Hope Creek Generating Station ("Hope Creek" and together with Salem, the"Stations"),. which is also located on Artificial Island. The Stations are located on theeastern bank of the Delaware River. Salem is approximately 26 acres in size. At anyone time during the operational history of Salem, the electric generation and ancillaryfacilities occupied only a portion of the property.
PSE&G owns and controls an approximately .600-acre area of Artificial Island that issituated adjacent to and surrounds Salem and Hope Creek. This area contains certainadministrative and support facilities that are used by both Salem and Hope Creek, theHope Creek Switchyard, the Salem Switchyard, and certain undeveloped vacant land.With the exception of the Salem Switchyard, this area is evaluated as part of the HopeCreek Generating Station.
The zoning classification for the Salem property is industrial. The land adjacent toSalem is zoned for industrial and residential or agricultural use, but falls under statutesthat restrict development.
2.2. Station Processes and Operations
Salem is composed of two nuclear generating units and one combustion turbine unitfueled by distillate oil. Commercial operations of Unit 1 commenced in 1976 andcommercial operations of Unit 2 commenced in 1981. The combustion turbine unitcommenced operations in 1972. The nuclear generating units operate as base load unitsand the combustion turbine unit is a peaking unit. Salem has a combined generatingcapacity of approximately 2,250 MW. Over its operational life Salem has experiencedno significant changes in its operation. Figure 2-2 is a site plan showing the majoroperational features associated with Salem.
Section .2.2.1 describes the nuclear electric generating process, while Section 2.2.2describes the support processes and operations, including those associated with electricgeneration and those that support electric generation.
2.2.1. Nuclear Electric Generating ProcessThe primary difference between nuclear fuel electric generation and fossil-fueledelectric generation is that a nuclear reactor replaces the boiler to generate heat for theproduction of steam to drive the turbine generator. Salem's reactors are Pressurized
Salem.09123/99
Salem Generating Station
Water Reactors ("PWR"), with a generating capacity of 1,106 MW each (seeFigure 2-3)..
Water used as reactor coolant in the production of electricity is obtained from on-sitewells and demineralized using resins to remove impurities prior to introduction to thesystem. Reactor coolant is pumped at high pressure through the reactor core in a closedloop system called the Reactor Coolant System ("RCS"), described in further detailbelow. The reactor coolant is heated by the reactor core and is then pumped under highpressure from the reactor core to the steam generators, where it heats the water in thesteam generator to produce steam in a second closed loop system, referred to as thesecondary cooling system. The reactor coolant recirculates from the steam generatorsback to the reactor core to continue the cycle. Once the steam is produced in the steamgenerators, the nuclear generating unit processes are essentially the same as the fossil-fueled steam electric generating processesl The steam produced in the steam generatorsis- transferred to the turbine generator to generate electricity. Exhaust steam from theturbine passes into the condensers where it is cooled and condensed using DelawareRiver water as non-contact cooling water in the Circulating Water System ("CWS").The condensate is returned to the steam generators as feed to continue the cycle. Afterpassing once through the condenser, the non-contact cooling water is returned totheRiver.
Gases are removed from the condenser to improve steam cycle efficiency. There arestationary radiological monitors at the condenser, which continuously monitor theremoved gases for radioactivity. This monitoring is described in the Appendix to thisExhibit.
Reactor coolant becomes radioactive during this process as a result of fission productsfrom fuel rods, activation of corrosion products, and radiolytic decomposition of thereactor coolant. Salem is designed to control this radioactivity and to provide for itsappropriate management. A portion of the reactor coolant is continuously let down andtreated in demineralizers to remove both radioactivity and impurities in order tomaintain reactor coolant quality. Most of this reactor coolant is returned to the system,but the letdown process does generate certain liquid, solid, and gaseous radioactivewastes. Radioactive and other gases accumulate in the reactor coolant and are removedby degassing during the letdown process. These gases are managed as gaseousradioactive wastes. Small amounts of the reactor coolant are also periodically removedfrom the system to maintain equilibrium and are managed as a liquid radioactive waste.The management of these and other solid, liquid, and gaseous radioactive wastes isdiscussed below.
Nuclear generating stations are designed and constructed to incorporate a series ofoverlapping physical barriers and boundaries to contain radioactivity to protect publicsafety and the environment. This overlapping system of barriers and boundariesembodies the "defense in depth" principle that constitutes the foundation for theUSNRC licensing requirements for nuclear generating stations. Barriers are physicalcontainments. These physical containments include various components of the Nuclear
Salem.09/23/99 3

Salem Generating Station
Steam Supply System ("NSSS"), including but not limited to the fuel rods and theRCS; the reactor containment; and the Radiologically Controlled Area ("RCA"). Theboundaries, which are defined areas within which specified radiological controls arerequired, are the Protected Area and the Owner Controlled Area ("OCA").These barriers and boundaries are discussed below.
2.2.1.1. Nuclear Steam Supply SystemThe NSSS is the system by which steam is generated at Salem to produce electricity. Itconsists of the fuel rods and the RCS, and is designed to function as a barrier to containradioactivity, and thereby prevent any unplanned releases. The function of the fuel rodsand the RCS and associated systems as barriers is described below.
2.2. 1. 1.1. Fuel RodsThe PWR uses uranium dioxide as fuel. Pellets of uranium dioxide in a ceramic matrixare sealed inside 12-foot-long zirconium-alloy tubes called fuel rods, which arearranged in bundles called fuel assemblies. The fuel assemblies are inserted verticallyinto the reactor vessel (which is a large carbon steel tank approximately seven inchesthick with a stainless steel liner, filled with water) in a precise grid pattern known as thereactor core.
The ceramic matrix provides voids that allow for thermal and gaseous expansion withinthe fuel rods during the fission process without deforming the fuel rods. The zirconiumalloy is used for the fuel rods due to its strength and corrosion resistance. The fuel rodsare designed to contain fission gasses generated during the fission process and,therefore, most of the radioactivity. The fuel rods prevent the contact of the reactorcoolant water with the fuel and limit the release of fission products to the reactorcoolant water. The small amounts of radioactivity released to the reactor coolant aremanaged as described below in connection with the letdown process for maintainingreactor coolant quality and RCS equilibrium. Thus, the fuel rods provide the firstbarrier for the control of radioactivity.
2.2.1.1.2. Reactor Coolant SystemThe RCS includes: the reactor vessel; four coolant loops connected in parallel to thereactor vessel, each of which contains a circulating pump and a steam generator; and apressurizer. The pressurizer includes relief valves and a relief tank and appurtenantpiping. These elements compose the closed loop system, in which heat is transferredfrom the reactor to the reactor coolant for the steam generation process. Thus, thissystem contains or transports all fluids coming from, or going to, the reactor core. Allcomponents of this system. are constructed of or lined with corrosion-resistant stainlesssteel and are designed to contain the pressure of the system. The RCS is designed toaccommodate water volume, temperature, and pressure changes. Protection fromoverpressure of the RCS is provided. by the pressurizer relief system. The pressurizerrelief system releases steam from the top of the pressurizer, which is quenched anddirected to the pressurizer relief tank. The resultant liquid in the pressurizer relief tankis managed in the radioactive liquid waste system.
Salem.09/23/99 4

Salem Generating Station
The RCS is a closed.loop system, 'located entirely within the Reactor ContainmentBuilding, and constitutes the Reactor Coolant Pressure Boundary ("RCPB"), the: secondbarrier for the control of radioactivity.
2.2.1.2. Reactor Containment BuildingThe Reactor Containment Building contains the NSSS, which as .indicated aboveincludes the fuel rods and the RCS. It is a domed, reinforced concrete structure andextends about 190 feet above grade. The Reactor Containment Building has a 16-foot-thick concrete base, which is constructed atop a 30-foot-thick concrete foundation. Thecontainment building is constructed of reinforced concrete; the walls are 4.5 feet thickand the hemispherical dome is 3.5 feet thick. A steel liner, ranging from 0.25 to 0.75inches thick, is attached to the interior wall of the containment building for impactprotection. The underground portion of the containment building is waterproofed withan impervious membrane to prevent seepage of groundwater.
The Reactor Containment Building, its access openings and penetrations, and relatedsafety systems are virtually air-tight. The Reactor Containment Building is designed,consistent with applicable USNRC regulatory requirements, to contain the energyreleased and the, resultant pressure build-up following a loss-of-coolant accident("LOCA") as wellas to contain the atmosphere of the' building under normal operatingconditions. Under operating conditions, it'is isolated from the ambient atmosphere, andthere are no gaseous releases from the Reactor Containment Building. Periodic grabsamples of the air within the Reactor Containment Building are collected and analyzed.The Reactor Containment Building contains systems to filter the air, if necessary, andthen to purge the air through the Plant Vent. Releases from the Plant Vent arecontinuously monitored by Salem's Radiation Monitoring System, and periodic grabsamples are collected and analyzed pursuant to Salem's radiological effluent releaseprogram, as described in the Appendix to this Exhibit.
The Reactor Containment Building is specially controlled and monitored to ensure theintegrity of the equipment, processes, and structures it contains, to control exposure toradioactivity, and to prevent unplanned releases of radioactivity. It has secured ingress.and egress points to.help achieve these objectives. Prior to leaving, personnel andequipment are monitored for radioactive contamination. This monitoring is conductedusing portable survey meters. In the event of an elevated reading; the source of thecontamination would be identified and the individual or equipment would bedecontaminated prior to leaving the Reactor Containment Building.
The Reactor Containment Building constitutes the third barrier for the control ofradioactivity.
2.2.1.3. Radiologically Controlled AreaThe Radiologically Controlled Area ("RCA") is an area at Salem that is speciallydesigned, controlled, and monitored to ensure the integrity of the equipment, processes,and structures it contains; to control exposure to radioactivity; and to prevent transfer ofradioactivity beyond the RCA. While all areas of the RCA are subject to control, most
Salem.09/23/99 5

Salem Generating Station
areas within the RCA do not have elevated levels of radioactivity. Those areas withinthe RCA that have elevated levels of radioactivity are subject to special controls relatedto access, as discussed below. Radiation monitoring conducted in the RCA is discussedin the Appendix to this Exhibit.
Salem.09/23/99 6
Salem Generating Station
All of the equipment, processes, and structures discussed above in Sections in 2.2.1.1and 2.2.1.2 are located within the RCA. The RCA also contains other equipment,processes, and structures. In addition.to the Reactor Containment Building, thestructures within the RCA include the auxiliary buildings and the fuel handlingbuildings. These buildings are constructed of reinforced concrete. The auxiliarybuildings house radioactive waste handling and management systems and certain safetysystems, which are discussed, below. The RCA also houses other auxiliary systems suchas fire protection systems, component cooling systems, and ventilation systems. Theauxiliary and fuel handling buildings' ventilation systems are designed to maintain aslight negative pressure within these buildings to ensure that no unmonitored releasesof airborne radioactivity will occur.
All areas within the auxiliary and fuel handling buildings that potentially haveradioactivity.have ventilation systems that route ambient air to the.Plant Vent (locatedat the top of the containment building) for controlled and monitored release to theenvironment. There are stationary radiological monitors at the Plant Vent thatcontinuously monitor for radioactivity. Periodic grab samples are also collected from
• the Plant Vent and analyzed for radioactivity. These monitoring programs are describedin the Appendix to this Exhibit.
The fuel handling buildings contain the new fuel storage areas and the spent fuel pools.New fuel is stored in strategically located, separate dry concrete storage vaults inspecially designed fuel storage racks. The concrete storage vaults protect the fuel fromany design basis accidents. The storage racks are configured to prevent a fission chainreaction of the stored fuel. As stored, the new fuel has very low levels of naturalradioactivity.
Similar to new fuel, spent fuel is stored in the strategically located pool with concretewalls that protect the spent fuel from any design basis accidents. The spent fuel isstored in a pool of borated water in specially designed storage racks configured toprevent a fission chain reaction of the stored fuel. Boron is added to the water as anadditional means to absorb neutrons, further reducing the potential for fission to occurin the spent fuel pool The borated water is recirculated to cool the spent fuel. Thewater from the spent fuel pool is routed to demineralizers and heat exchangers and thenreturned to the pool. Fuel is placed in and removed from the reactor in accordance withthe operating license Technical Specifications and Station operating procedures.
Approximately every 18 months, 30 to 50 percent of fuel rods are removed from eachreactor vessel and transported within enclosed structures within the RCA for storage inthe spent fuel pool. Following safe shutdown of the reactors, the removal processinvolves the following steps: (1) the reactor vessel head is removed and stored inside*the Reactor Containment Building using a specially designed, in-situ crane; (2) thereactor vessel cavity is filled with borated water; (3) the spent fuel rods are removedfrom the reactor vessel using the in-situ crane and placed in borated water in a speciallydesigned canal, which is equipped with rails; (4) the spent fuel rods are directed via railthrough the canal to the spent fuel pool in the fuel handling building; and (5) the spent
Salem.09/23/99 7

Salem Generating Station
fuel rods are removed from the canal in the fuel handling building using a speciallydesigned in-situ crane, which places them in the spent fuel pool. A similar process isused to move new fuel from the new fuel storage area to the reactor vessel.
Once the refueling process is complete, excess water from the reactor vessel cavity andthe water from the canal are drained and stored for reuse in the fuel handling process.Enhanced radiological controls, including enhanced radiation monitoring, areimplemented throughout the refueling process pursuant to USNRC requirements.
The RCA has a single, monitored ingress and egress point (the control point) to controlnormal access to the RCA and to prevent the transfer of radioactivity beyond the RCA.Controls on the ingress are discussed below. Prior to leaving, personnel and equipmentare monitored for radioactive contamination. This monitoring is conducted by bothradiation protection personnel and stationary electronic monitoring devices. In theevent of an elevated reading, the source of the contaminationwould be identified andthe individual or equipment would be decontaminated prior to leaving the RCA. Thismonitoring is discussed in the Appendix to this Exhibit.
The RCA constitutes an additional barrier for the control of radioactivity from Salem.
2.2.1.4. Protected AreaThe Protected Area is an area, common to both Salem and Hope Creek, inside theestablished security fence line. It encompasses the entire RCAs for both Salem andHope Creek, as well as a designated area surrounding the RCAs. The security fence lineconsists of two separate fences: an inner fence and an outer fence. Each fence isconstructed of seven-foot-high steel chain link fencing topped with one foot of barbedwire. The two fences are separated by a 25-foot area known as the "Isolation Zone." Nopersonnel or equipment is permitted in the Isolation Zone. There are motion sensitivedetectors located in the Isolation Zone to provide a continuous alarm function.
The entire Protected Area, including the Isolation Zone, is monitored by roving securitypatrols and a continuously operating closed-circuit television system, which provideinformation on movements of individuals and vehicles to the security force, which is onduty 24 hours a day. Stationary radiation monitoring devices are located throughout theProtected Area. These are discussed in the Appendix to this Exhibit.
The Protected Area has a single, secured ingress point, the primary purpose of which isto prevent unauthorized access to the Stations. This single ingress point also serves asthe sole egress point to prevent the transfer of radioactivity beyond the Protected Area.Controls on ingress are discussed below. Prior to leaving, personnel and equipment aremonitored for radioactive contamination. This monitoring is conducted by stationaryelectronic monitoring devices. In the unlikely event of an elevated reading, the sourceof the contamination would be identified, appropriate corrective action taken, and theincident reported to the USNRC.
Salem.09/23/99 8

Salem Generating Station
02.2.1.4.1. Protected Area AccessAs indicated above, the Protected Area is the area inside an established•securityfenceline, which encompasses the entire RCAs for both Salem and Hope Creek, as wellas a designated area surrounding the RCAs, and which has a single, secured ingress and.egress point: Personnel and vehicle access for the Stations is provided through acommon point, the Security Center. Access is limited and strictly controlled inaccordance with USNRC requirements. Personnel granted access to the Protected Areamust be specially trained and have a security clearance or must be escorted by.personnel with the required training and clearance. Escorts must remain with visitors atall times. All personnel entering the Protected Area must pass through a metal detector,an explosives detector, and sensitive radiation monitors. These devices ensure that nounauthorized materials are brought into the Protected Area..Drivers of vehicles seekingaccess to the Protected Area must pass through the same security systems as visitors onfoot after which their vehicles are appropriately processed for entry and escorted totheir destination by security personnel. As indicated above, movements of individualsand vehicles within the Protected Area are monitored by security cameras and rovingpatrols.
As also discussed above, ingress to the RCA is through a single point of entry (the
"Control Point"). Individuals seeking access to the RCA must have first passed throughthe controls associated with entry to the Protected Area, •discussed above. RadiationProtection Personnel are stationed at the entrance to the RCA and ensure that onlyauthorized individuals gain access.
Individuals seeking access to the RCA must have been issued a Radiation Work Permitby Salem's Radiation Protection Department. Radiation Work Permits are issued onlyfor specific tasks and activities and limit access to specified areas, all of which areindicated on the Permit.
Each individual entering the RCA must be equipped with a personal radiationmonitoring device, the sophistication of which is dependent upon the work beingperformed and the areas being accessed. These monitors measure, record, and indicatea total radiation dose to which an individual is exposed while in the RCA. Certain ofthese monitors are equipped with an alarm function that activates when predetermineddose limits are approached.
2.2.1.5. Owner Controlled AreaThe area owned and controlled by the Company outside the Protected Area is known asthe Owner Controlled Area ("OCA"). The OCA contains a number of supportoperations, including the Stations' administrative support building, employee andvisitor parking areas, contractor trailer facilities, and a network of roads. The area ofthe OCA immediately outside of and adjacent to the outer security fence is maintainedas an "exclusion zone" by security personnel and is continuously monitored by securitycameras. The OCA is also monitored by roving security patrols. This area provides anadditional buffer between the Stations and the public at large.
Salem.09/23/99 9

Salem Generating Station
2.2,1.6. Station Safety SystemsSalem has several systems that are designed to safely shut down the reactor, maintainadequate reactor cooling after shutdown, and contain radioactivity primarily for thepurpose of ensuring the protection of the public and the environment in the event of adesign basis accident. Salem has never experienced a design basis accident. Certain ofthese systems may be used to support safe, normal, shutdown operations.
2.2,1.7. Radioactive Waste Management SystemsGaseous, liquid, and solid wastes are generated within the RCA. These wastes aremanaged as radioactive unless and until measurements demonstrate otherwise. Salem'sradioactive waste management systems, typically referred to as "radwaste systems,"provide for the collection, processing, monitoring, and release or disposal of radioactivematerial in liquid, gaseous, and solid form from Salem. Salem's Operating Licenserequires that the radwaste systems be operated and maintained to ensure that the releaseof radioactivity is kept as low as reasonably achievable,("ALARA"). Salem'sOperating License imposes limitations on all radiological effluents, compliance withwhich will ensure that the ALARA standard is met. Salem's effluents are managed,monitored, released, and documented in accordance with Salem's operating proceduresand the USNRC's requirements, as discussed in the Appendix to this Exhibit. A reportof the monitoring results is filed with the USNRC and the BNE semi-annually. Theradiological waste management system, in concert with Salem's radiation monitoringprograms, ensures that any release of radioactivity is protective of public safety and theenvironment.
2.2.1.7.1. Gaseous WasteGases accumulate in the reactor coolant, are removed in the letdown process, asdiscussed above, and are then managed as a gaseous radioactive waste via theradioactive gaseous waste system. This system consists primarily of piping, waste gascompressors, and waste gas decay. tanks. The gases removed in the letdown process arecompressed and directed to the decay tanks, where they are stored for a discrete periodof time to allow for decay of radionuclides. The gases in the decay tanks are sampledand analyzed pursuant to the radiological effluent release program to determine whenappropriate radioactive decay has occurred. Once appropriate decay has occurred andrequisite Station approvals have been received, the gases are released to the Plant Vent.Gaseous releases from the tank are monitored continuously, and an automatic shutoffvalve will activate to terminate the release if predetermined setpoints are reached. Allgaseous releases are also continuously monitored at the Plant Vent for grossradioactivity pursuant to Salem's Radiation Monitoring System. Salem's radiologicaleffluent monitoring program and Radiation Monitoring System are described in theAppendix to this Exhibit.
As previously discussed, the Reactor Containment Building purge system, and theauxiliary building and the fuel handling building ventilation systems, route and manageexhaust air (which may contain radioactivity) for release through the Plant Vent. Thesepurge and ventilation systems include HEPA (high-efficiency particulate air) and
Salem.09/23/99 10
Salem Generating Station
charcoal filtration, as necessary, to remove airborne particulates and certain gases priorto release of any gaseous effluent to the atmosphere. The management of the exhaust.
0
Salem.09/23/99 11

Salem Generating Station
air through the Reactor Containment Building purge system and the auxiliary buildingand fuel handling building ventilation systems includes radiation monitoring which isdescribed in the Appendix to this Exhibit.
2.2.1.7.2. Liquid WasteSalem generates liquid radioactive wastes in the course of ordinary operations. Thesewastes are generated by leakage from equipment, system water sampling, intentionalsystem bleeds, drainage, and dewatering of solid radioactive wastes. All liquid wastesgenerated within the RCA are handled as radioactive and managed through theRadioactive.Liquid Waste System ("RLWS"). This system collects liquid wastesthrough a network of drains and pipes which direct the wastes to stainless steel holdingtanks for management prior to reuse or discharge.
The liquid wastes in these RLWS tanks are sampled and analyzed for levels ofradioactivity. If appropriate, the liquid wastes are treated to reduce radioactivity, usingprimarily filtration and/or demineralization. When treatment is complete, the wastes aretransferred to stainless steel monitor tanks. The monitor tanks are isolated (to preventthe addition of more wastes), recirculated to mix the contents, and sampled to measurefor radioactivity. The radioactivity level is evaluated against the radioactive effluentlimitations contained in the Technical Specifications. If the radioactive effluent•limitations are met and requisite Station approvals are received, the radioactive liquidwaste may be manually released in a controlled manner from the monitor tanks toSalem's cooling water for discharge to the Delaware River. If the effluent limitationsare not met, the wastes are subjected to further treatment. The RLWS discharge pipingcontains radiation monitors that will activate automatic isolation valves to terminate thedischarge if predetermined setpoints are reached. As discussed in the Appendix to thisExhibit, the results of this liquid effluent sampling are reported to the USNRC and theBNE semi-annually.
2.2.1.7.3. Solid WasteSolid radioactive wastes are generated from either dry or wet processes. Dry, solidradioactive wastes include materials such as removed components, anti-contaminationclothing, ventilation filters, rags, and debris. These materials are collected throughoutthe RCA and accumulated in the radioactive waste handling area in the auxiliarybuilding, These materials are then placed in USDOT-specification shipping containers(e.g., 55-gallon drums) that have been approved by the USNRC. Solid radioactivewastes generated from wet processes (e.g., demineralizer resins, water filters) aredewatered and placed in special USNRC and USDOT-specification shipping containers(e.g., casks). The area in. which solid radiological waste is packaged and stored on sitecontains stationary instrumentation installed as part of the Radiation MonitoringSystem area-wide monitors that continuously measure ambient radioactivity levels, Theresults of this monitoring are displayed, recorded, and alarmed in Salem's ControlRoom. Documentation of these results is made available for USNRC inspection.
The outside of the solid radioactive waste shipping containers is surveyed forradioactive materials and radiation levels before transfer to a licensed radioactive
Salem.09/23/99 12

Salem Generating Station
material transporter for delivery to the USNRC-licensed disposal site (e.g., Barnwell,S.C.). As discussed in the Appendix to this Exhibit, the volume of, and the quantity ofradioactivity in, the. radioactive solid waste sent off site for disposal are reported to theUSNRC and the BNE semi-annually. .
2.2.2. Support Processes and OperationsThere are a number of processes and operations that support the nuclear electricgenerating process in addition to those described above. These additional processes andoperations, for the most part, are located outside the RCA. Salem is designed, andoperated so that these, additional processes and operations are, not exposed toradioactive materials.
Support processes and operations began at Salem circa 1970 in connection, withconstruction activities. The function of these operations shifted from constructionsupport to operations support when the nuclear unitsbegan commercial operation.Other support processes and operations that were, not required for construction supportbecame operational in 1976. There have been relatively few modifications to theseprocesses and operations since 1976.
Sections 2.2.2.1 through 2.2.2.7 of this Exhibit describe the various auxiliary andsupport processes and operations employed at Salem. Exhibit B to the Memorandum inSupport of Applicability Determination contains a more detailed review of certainaspects of these processes and operations.
Representative inventories of hazardous waste generated at Salem and Hope Creek are
presented in Table 2-1 (PSE&G jointly manages hazardous wastes from both Stations).The current inventory of hazardous substances at Salem is presented in Table 2-2.Table 2-3 describes relevant information regarding Station facilities and their historicoperations for each relevant potential candidate liability issue identified in Exhibit A tothe Memorandum in Support of Applicability Determination. Table 2-4 providesinformation regarding the various pollution prevention plans developed andimplemented at Salem. Figure 2-4 summarizes major operating components of Salemrelative to fossil fuel use and wastewater effluents. Radioactive wastes are managedseparately, as discussed above and in the Appendix to this Exhibit.
2.2.2.1. Auxiliary Boilers (1972-Present)Salem has two auxiliary boilers that commenced operations circa 1972. Distillate oilhas been the only fuel source for the boilers for the life of Salem. The auxiliary boilersare located in the house heating boiler building north of the turbine building. Theboilers have been used as a general steam source and for building heating.
2.2.2.2. Emergency Generators (1976-Present)Salem has six emergency generators that were made available for operations in 1976.Distillate oil has been the only fuel used in the generators. The generators are located in0 the auxiliary building. Generally, the electricity needed for normal operations of Salem
Salem.09/23/99 13

Salem Generating Station
is generated by the Station itself. When Salem is not generating electricity, it obtainspower from off-site sources. In the unlikely event that off-site power were not available
Salem,09/23199 14

Salem Generating Station
when Salem was not generating electricity, the emergency generators Would provideelectricity to Salem to maintain safe shutdown conditions. These unitshave not beenoperated other than for periodic testing to ensure operability.
2.2.2.3. Combustion Turbine Unit (1972-Present)There is one combustion turbine unit at Salem .to provide peaking capabilities duringperiods of high demand.. The unit was installed in a metal housing on a concretefoundation. Distillate oil is the only fuel source for the combustion turbine unit. Thefuel is stored in the 840,000-gallon above ground, diked storage tank that was installedin 1970, as discussed below.,
The .combustion turbine unit has a purge oil collection system to collect unburned fuelthat remains in' the engine each time a unit is shut down. The system typically collectedless than five gallons of fuel each time the unit shut down. As originally constructed,the purge oil tanks for this unit were underground. The system consisted of two 55-gallon tanks and associated valves and piping. In the early 1990s, these purge oil tankswere -replaced with sumps that are routed to the high-volume oil/water separatorsystem. Separated oil is managed in accordance with applicable regulations.
2.2.2.4. Distillate Oil Storage and HandlingThe primary fossil fuel used at Salem has been distillate oil. This fuel is used togenerate electricity at the Unit 3 combustion turbine, to power the emergency dieselgenerators, and in the auxiliary boilers. The distillate oil is stored in an 840,000-gallonabove ground, diked storage tank, which was constructed in 1970 and remains in use.This tank was constructed consistent with the design criteria for distillate oil tanksdescribed in Exhibit B to the Memorandum in Support of Applicability Determination.
Distillate oil was initially delivered to Salem by barge. Since circa 1972, distillate oilhas been delivered by tank truck. Distillate oil is unloaded from tank trucks at adesignated area and is pumped via underground pipeline to the storage tank. Thedesignated tank truck unloading area is currently curbed and has secondarycontainment. Piping from the storage tanks to the emergency generators, the boilers,and the combustion turbine unit is also underground.
2.2.2.5. Electric Transmission and Distribution EquipmentSalem uses a switchyard that is located on property immediately adjacent to Salemproperty. It became operational in 1976 when Salem began commercial operation. Theswitchyard occupies approximately eight acres, as shown in Figure 2-1. These facilitiescontain mineral oil-filled transformers and other miscellaneous mineral oil-filledequipment. The switchyard has been expanded and upgraded overthe life of Salem;specifically, eight of its 16 transformers were added in 1992. There arealso a numberof mineral oil-filled transformers located outside the switchyard, some of which arelocated adjacent to Salem's electric generating units. The design andoperation of theelectrical equipment is consistent with that discussed in Exhibit B to the Memorandumin Support of Applicability Determination.
Salem.09/23!99 15

Salem Generating Station
There are approximately 70 pieces of mineral oil-filled electrical equipment (e.g.,transformers) at Salem. PSE&G implemented a survey of certain mineral oil-filledequipment at Salem inthe late 1980s. This survey indicated that some of the mineraloil-filled equipment was PCB-contaminated. Based upon the results of this survey, in1990, Salem initiated a comprehensive program to retrofill any mineral oil-filledelectrical equipment that contained mineral oil with PCB concentrations in excess of50 ppm, and to label the mineral oil-filledequipment pursuant to applicable regulatoryrequirements. This program was completed circa 1993, and currently there is nomineral oil-filled electrical equipment at Salem containing mineral oil with measuredPCB concentrations in excess of 50 ppm.
Mineral oil in the electrical equipment is maintained using mobile filtering equipment,as described in Exhibit B to the Memorandum in Support of ApplicabilityDetermination.
2.2.2.6. Wastewater EffluentsLiquid radiological waste management is discussed above and in the Appendix to thisExhibit. Management of liquid radiological effluent releases including monitoring isdiscussed in the Appendix to the Exhibit.
The primary wastewater effluent generated at Salem has been and remains non-contactcooling water. Non-contact cooling wateris discharged to the Delaware River inaccordance with Salem's National or New Jersey Pollutant. Discharge EliminationSystem ("NJPDES") permit. Other wastewater effluents at Salem include non-radioactive liquid waste, discharges from the high-volume oil/water separator system,and stormwater. The volumes of these other effluents are significantly lower than thoseof the non-contact cooling water flow. All wastewater discharges from Salem havebeen authorized by Salem's NJPDES permit since 1975, before Salem begancommercial operation.
Wastewater treatment systems for the effluents discussed in this section wereconstructed at different times during the life of Salem to enable Salem to comply withthe effluent limitations contained in applicable NJPDES permits. Non-radioactiveliquid wastewaters include those from dernineralizers, condensate polishers, the non-radioactive wastewater treatment system laboratory, building sumps, and roof drains.Non-radioactive liquid wastewaters have always been -treated in a wastewater treatmentplant prior to discharge to the river in accordance with Salem's NJPDES permit. Priorto 1988, the non-radioactive liquid waste was routed to an equalization basin where thepH was increased with caustic to facilitate precipitation. Decant water from this basinwas discharged with the non-contact cooling water to the river in compliance withSalem's NJPDES permit. In 1988, the non-radioactive wastewater treatment plant wasupgraded and expanded. The wastewater is collected in an equalization basin wheresodium hypochlorite may be added to reduce total organic carbon. The effluent fromthe equalization basin is routed to clarifiers for settling. If necessary, caustic may beadded to promote settling. The final effluent is discharged with the non-contact cooling
Salem 09/23/99 16

Salem Generating Station
water to the river in compliance with Salem's NJPDES permit. The wastewatertreatment plant is operated by a licensed operator.
Prior to 1994, process water with the potential to contain oil was treated in three skimtanks. In 1994, the oil/water separator was installed. Treated water from the skim tanksand, subsequently, from the oil/water separator has been discharged to the river inaccordance withSalem's NJPDES permit.
Stormwater is managed in accordance with Salem's NJPDES permit and StormwaterPollution Prevention Plan. Stormwater is collected in storm drains and routed to theriver for discharge in accordance with Salem's NJPDES permit. Stormwater-from themajor petroleum storage and handling areas is routed to the oil/water separator prior todischarge.
Prior to 1990, Salem sanitary wastewater was treated in a 10,500-gallon extendedaeration tank and a 20,000-gallon rotating biological contactor. In 1990, a sewagetreatment plant was constructed at Hope Creek, which began receiving Salem's sanitarywastewater. All solids were removed from the sanitary treatment system and disposedin accordance with applicable regulations. The treatment system structures wereremoved, soil samples were collected and analyzed, and the area was graded. Closuredocumentation was submitted to the NJDEP in accordance with applicable regulations.
2.2.2.7. Auxiliary and Maintenance ProcessesThe auxiliary and maintenance processes associated with Station operations andconducted outside the RCA are generally the same as those processes described inExhibit B to the Memorandum in Support of Applicability Determination for steamgenerating units. For the nuclear electric generating unit, these processes include waterconditioning, non-contact cooling, equipment cleanings, and equipment lubrication.For the combustion turbine unit, these processes include engine cleanings, purge oilcollection, and equipment lubrication.
2.3. Environmental Setting
2.3.1., Surrounding Land Use and Surface WatersSalem is located on the Delaware Estuary. The Estuary, in the location of Salem, is atidal, brackish river, located in an area designated as Zone 5 bythe Delaware RiverBasin Commission.
Artificial Island was created by the U.S. Army Corps of Engineers, beginning early inthe twentieth century. Hydraulic dredging spoils were deposited within a diked areaestablished around a natural bar that projected into the river. Prior to construction ofSalem, the property, was vacant, undeveloped,. low-lying land.
The zoning classification of the property is industrial. The land adjacent to the propertyon which' Salem is located is zoned for industrial and residential or agricultural use, but
Salem.09/23/99 17

Salem Generating Station
falls under statutes that restrict development. The nearest resident in New Jersey isthree miles away.
2.3.2. Topography and Surface DrainageThe topography at Salem is nearly flat. Stormwater management is as described above.There are no permanent bodies of surface water on the property.
2.3.3. GeologySalem and Hope Creek are underlain by approximately 25 feet of engineered fillcomposed mainly of dredge spoils (PSE&G, 1987; PSE&G, 1999). The engineered fillconsists of silt, silty clay, sand, and gravel (Dames & Moore, 1974). Due to thecomposition of the engineered fill, the hydraulic conductivity of this material is verylow, severely limiting the extent and rate of vertical movement of liquids through themedium. Below the engineered fill there is five feet of tidal marsh deposits, consistingof silty peat and organic silt and meadow mat (Thor, 1982; Warren George, 1970). Thetidal marsh deposits are semi-confining. Beneath the tidal marsh deposits areapproximately ten feet of discontinuous Quaternary Age riverbed deposits of sand andgravel (Davisson, 1979; Thor, 1982). The discontinuous riverbed deposits occur from30 to 40 feet below ground surface ("bgs"). Below the ten-foot-thick discontinuousriverbed deposits is the Miocene Kirkwood Formation. The Kirkwood Formation isdark gray clay with some silt and layers of fine-grained micaceous quartz sand. TheKirkwood Formation is approximately 15 feet thick at the property and occurs fromapproximately 40 to 55 feet bgs (Dames & Moore, 1970; Rosenau and others, 1969;PSE&G 1987).
Below the Kirkwood Formation, the Paleocene-Eocene Vincentown Formation isencountered at 55 feet bgs to a depth of approximately 135 feet bgs (Dames & Moore,1970; Dames & Moore, 1974). The Vincentown Formation is a competent, greenish-gray, fine to medium sand with some silt and shell fragments and some feldspar andglauconite (Dames & Moore, 1970; PSE&G, 1987). Beneath the VincentownFormation lies the Paleocene Hornerstown Formation. The Hornerstown Formation isprimarily a glauconitic sand and occurs from 135 feet bgs to approximately 145 feetbgs (Davisson, 1979).
Beneath the Hornerstown Formation lies the Upper Cretaceous Navesink Formation,which consists of glauconitic sand. The Navesink Formation is encountered fromapproximately 145 to 170 feet bgs. Beneath the Navesink Formation lies the UpperCretaceous Mount Laurel-Wenonah Formation, which is clayey medium sand with.some gravel, feldspar, and glauconite (PSE&G, 1987). At the property and regionally,the Mount Laurel-Wenonah Formation is approximately 100 feet thick and occurs fromapproximately 170 to 270 feet bgs (Rosenau, 1969; Dames & Moore, 1974).
Regionally, over 1,000 feet of Upper Cretaceous sediments lie beneath the MountLaurel-Wenonah Formation. These formations collectively overlie crystalline bedrockand include in descending order: the Marshalltown Formation (gray fine sand), theEnglishtown Formation (yellow-brown fine sand), the Woodbury Clay (dark gray, stiff,
Salem.09/23/99 18

Salem Generating Station0silty clay), the Merchantville Formation (dark green clay), the Magothy Formation(coarse to fine silt with little, fine sand), and the Raritan and Potomac Formations(interbedded sand, gravelly sand, and clay) (Dames & Moore, 1974; Rosenau, 1969).
Bedrock at the.property is the Late Precambrian Wissahickon Schist, which underliesthe entire Upper Cretaceous sedimentary package in the region. The WissahickonSchist is encountered at depths up to 1,500 feet bgs at the property (Rosenau, 1969).
2.3.4. HydrogeologyThere are four aquifers directly beneath the property: a shallow aquifer and .three deepaquifers. The shallow aquifer occurs from 10 to 40 feet bgs. The shallow aquifer iswithin the engineered fill, tidal marsh sediments, and discontinuous Quaternaryriverbed deposits (Dames & Moore, 1974). In general, the engineered fill and tidalmarsh deposits have low permeabilities (Dames & Moore, 1974;, PSE&G, 1987).Occasional lenses of sand within the engineered fill may contain perched water within afew feet of the ground surface (Dames & Moore, 1974). The groundwater in theshallow aquifer is generally brackish, with flow to the southeast and a gradient ofapproximately 0.007ft/ft (Rosenau, 1969; Dames & Moore, 1974). The KirkwoodFormation, which is composed of Miocene clays, occurs from 40 to 55 feet bgs and isconsidered a confining layer which separates the shallow aquifer above from the firstdeep aquifer (PSE&G, 1984).
The first ofthedeep aquifers beneath the property occurs from 55 to 135 feet bgs and isthe Paleocene-Eocene Vincentown Formation. The Vincentown Formation is a semi-confined to confined aquifer under artesian conditions (Dames & Moore, 1974) and isunderlain by the leaky confining units in the Hornerstown and Navesink Formations.The confining units of the Hornerstown and Navesink Formations occur from 135 to170 feet bgs (Dames & Moore, 1974). Groundwater in the Vincentown aquifergenerally flows from north to south with a gradient of approximately 0.003 ft/ft(Dames & Moore, 1974). Regionally, the Vincentown aquifer is a water-producingaquifer, which supplies some of the domestic Wells within Salem County (PSE&G,1984; Rosenau, 1969). Groundwater in this aquifer is moderately hard with a high ironcontent (Rosenau, 1969; Dames & Moore, 1974). However, salt-water intrusions occurwithin this aquifer near the Delaware River, where water quality is brackish and non-potable (Rosenau, 1969).
The second deep aquifer is confined and occurs in the Upper Cretaceous Mount Laurel-Wenonah Formations at depths from 170 to 270 ft bgs. The Mount Laurel-Wenonahaquifer is bounded above by the confining units of the Hornerstown and NavesinkFormations. Two potable and fire-water supply wells at the property can produce fromthis aquifer, although these wells are not typically used. Below the Mount Laurel-Wenonah aquifer lies the Marshaltown Formation (Rosenau, 1969).
The third deep aquifer is confined and is the Cretaceous Potomac-Raritan-Magothy(PRM) Aquifer System, which is the primary water-producing aquifer in the State ofNew Jersey. In Salem County, the PRM Aquifer System occurs at. depths in excess of
Salem.09/23/99 19
Salem Generating Station
500 feet bgs. At the property, four potable and fire-water supply wells produce fromthis aquifer system at depths ranging from 800 to 1,100 feet bgs. This aquifer system isbounded above by the Merchantville Formation and below by the crystalline basementof the Wissahickon Schist.
The crystalline basement rock of the Wissahickon Schist is not considered a productiveaquifer and only locally transmits water along fractures and faults (Rosenau, 1969).Salem County has no known wells that produce water from this formation (Rosenau,1969).
2.4. Environmental Characterization and Remedial Activities
Table 2-5 summarizes the nature of and results from environmental characterizationand remedial activities conducted at the property.
Salem.09/23/99 20

Salem Generating Station
3. Liability Screening, Characterization, and Valuation
The liability estimation process applied at each generation-related asset followed astep-wise procedure, as shown schematically below. This process is discussed in detailin Exhibit A to the Memorandum in Support of Applicability Determination.
Liability Liability ~ Liability.Screening Characterization Valuation~
and Identification
The liability estimation process produces a quantitative estimate of the expected valuefor Salem's potential remediation liabilities. This section presents the results of theliability screening, characterization, and valuation for this Station.
3.1. Candidate Liability Screening and Identification
Candidate Liability Issues and associated Liability Elements that are potentiallyapplicable to all generation-related assets, were developed as discussed in Exhibit A tothe Memorandum in Support of Applicability Determination. Each Candidate LiabilityIssue and Liability Element was evaluated based on the asset-specific data collectedpursuant to the data collection protocol described in Exhibit A to the Memorandum inSupport of Applicability Determination to determine:
1. Whether the activity or source existed at this generation-related asset;2. Whether an environmental investigation has been conducted or chemical data were
collected that demonstrate that contamination is not present at this generation-relatedasset with respect to a particular activity or source; or
3. Whether structural or engineering systems, such as full secondary containment, couldhave prevented a liability from arising at this generation-related asset.
Liabilities were screened out for this generation-related asset if: (1) an activity neverexisted at the property; (2) there is convincing documentation that issues never existedor have been eliminated through remediation or other corrective action; or (3) therehave been structural or engineering systems that would have prevented a liability issuefrom. arising. If any of a Candidate Liability Issue's Liability Elements was determinedto be applicable to this generation-related asset, it was retained for characterization andvaluation.
Table 3-1 provides the results of the liability screening for this generation-related assetand the rationale for the screening decisions.
Salem.09/23199 21

Salem Generating Station
3.2. Liability Characterization
For each retained Liability Issue and Liability Element,. pertinent information collectedusing the data collection protocol was used to determine the number of Liability Units("Liability Enumeration"), the aggressiveness of remedial effort (i.e., high, medium, orlow intensity) ("Remedy Intensity"), and the physical extent of remedial effort("Remedy Scale"). These were each determined employing the standard decision rulesset forth in Exhibit A to the Memorandum in Support of Applicability Determination.
The results of the liability characterization are presented in Table 3-2.
3.3. Liability Valuation
As described in Exhibit A to the Memorandum in Support of ApplicabilityDetermination, the Liability Valuation step consists of three activities: decision treeconfiguration, liability evaluation, and expected value computation. This step produceda quantitative estimate of this generation-related asset's potential remediation liabilities.
3.3.1. Decision TreeTable 3-3 is the remediation decision tree for this generation-related asset. Thisdecision tree incorporates all Candidate Liability Issues retained for this generation-related asset as well as the investigation and monitoring activities. The decision tree iscomposed of a series of columns, each of which represents a Candidate Liability Issue.Remedy scenarios available to address each Issue are arrayed vertically in each column.
Remedy scenarios consist of a number of remedial technologies. The remedy scenariosincluded in the decision tree for each Liability Issue are those that we determined,based on our professional judgment, to best reflect the feasible choices available toremedy that particular Liability Issue. Remedial scenarios were considered for eachLiability Issue retained to address all media of concern through either institutionalcontrols, engineering controls, or active treatment. The selection of remedy scenariosand remediation technologies is detailed in Exhibit A to the Memorandum in Supportof Applicability Determination.
3.3.2. Remedy Probability Assignments and Remedy Cost CalculationsFor each retained Liability Issue, a probability was assigned.to each remedy scenariothat represents the probability that, following a site investigation, the remedy scenariowould be selected and approved by the NJDEP. These probabilities were determinedemploying the standard decision rules set forth in Exhibit A to the Memorandum inSupport of Applicability Determination. The decision rules identify the probabilityallocation for each Liability Issue first by reference to investigation effort, remedialalternative, or monitoring effort, as appropriate, and then by reference to RemedyIntensity. The remedy probability allocations for this generation-related asset arepresented in the decision tree, Table 3-3.
Salem.09/23/99 22

Salem Generating Station
The capital and operating costs of each remedy scenario in the decision tree weredetermined following the procedures outlined in Exhibit A to the Memorandum inSupport of Applicability Determination. The remedy scenario costs were calculatedusing the scale inputs set forth in Table 3-2 and Arthur D. Little's in-house remediationcost database, which is based on standard remediation engineering cost assumptions.The present value of each remedy was calculated using accepted financial analysisprinciples and incorporating assumptions about the timing of remedial actions as wellas discount and inflation rates. Key assumptions incorporated into the cost calculationsare set forth in Exhibit A to the Memorandum in Support of ApplicabilityDetermination.
3.3.3. Liability Expected Value ComputationThe liability valuation expected value computation was performed using a Microsoft®Excel spreadsheet-based cost-estimating model for the decision tree shown inTable 3-3. The model calculated the expected value for this generation-related asset bymultiplying the probability assigned to each remedy alternative by the cost of thatalternative and adding the calculated probability-weighted cost of all the remedyalternatives for that Liability Issueý The total expected value for this generation-relatedasset is the sum of the expected values for each Liability Issue.
The summary spreadsheet tabulating the remedy scenarios in the decision tree, presentvalue costs, probabilities, and expected values is shown in Table 3-4. The totalexpected value cost estimate for this generation-related asset is $1,901,055.
0Salem.09/23/99 23

Salem Generating Station
Bibliography
Audits
1. Internal PSE&G Corporate Audit Report, October 1989.
2. Internal PSE&G Corporate Audit Report, July/August 1993.
3. Internal PSE&G Corporate Audit Report, July/August 1998.
Environmental Permits and Related Documents
1. Dredge and Fill Permit, U.S. Army Corps of Engineers, No. NAPOR-R-970,June 23, 1975.
2. Dredge and Fill Permit, New Jersey Department of Environmental Protection,No. 85-0938-1.
3. Water Discharge Permit, National Pollutant Discharge Elimination System(NPDES), No. NJ0005622, March 31, 1975.
4. Water Discharge Permit, New Jersey Pollutant Discharge Elimination System(NJPDES), No. NJ0005622, March 6, 1981.
5. Water Discharge Permit, New Jersey Pollutant Discharge Elimination System(NJPDES), No. NJ0005622, December 1, 1985.
6. Water Discharge Permit, New Jersey Pollutant Discharge Elimination System(NJPDES), No. NJ0005622, September 1, 1994.
7. Waterfront Development Permit, New Jersey Department of EnvironmentalProtection, 1704-90-0001.8, Exp. February 22, 2000.
8. Riparian License, New Jersey Department of Environmental Protection, 69-80.
9. Maintenance Dredging and Desilting Operations, U.S. Army Corps of Engineers,CENAP-OP-R-199501755-45, April 15, 1996
Agency Enforcements
1. Citation from NJDEPE for water discharge violations, August 1988.
2. Citation from NJDEPE for water discharge violations, November 1988.
Salem.09/23/99 24

Salem Generating Station
3. Citation from USCG for spill discharge violations, November 1988.
4* Citation from NJDEPE for water discharge violations, March 1989.
5. Citation from USEPA for water discharge violations, June 1989.
6. Citation from USEPA for water discharge violations, July 1989.
7. Citation from USEPA for water discharge violations, September 1989.
8. Citation from USEPA for water discharge violations, February 1990.
9. Citation from USEPA forwater discharge violations, April 1990.
10. Citation from USEPA for spill violations, February 1991.
11. Citation from USEPA for water discharge violations,.January 1991.
12. Citation from USEPA for water discharge violations, March 1991.
13. Citation from NJDEPE for water discharge violations, August 1992.
14. Citation from USCG for spill violations, December 1992.
15. Citation from NJDEPE and USCG for spill violations, February 1993.
16. Citation from NJDEPE and USCG for spill violations, May 13, 1993.
17. Three citations from USCG for spill violations, September 1993.
18. Citation from USCG for spill violations, May 24, 1995.
19. Citation from USCG for spill violations, October 1, 1995.
20. Citation from USCG for spill violations, April 1997.
21. Citation from USCG for spill violations, June 13, 1997.
Pollution'Prevention Plans
1. Discharge Prevention, Containment, and Countermeasures Plan; Discharge Cleanupand Removal Plan; Spill Prevention, Containment, and Countermeasures Plan(DPCC/DCR/SPCC), 1978; last updated July 1999.
Salem.09/23/99 25

Salem Generating Station
2. Best Management Practices (BMP) Plan, 1985.
3. Stormwater Pollution Prevention Plan, 1998.
4. Facility Response Plan, February 1993.
5. RCRA Contingency Plan, February 1998.
6. Wastewater Treatment Plant Operations and Maintenance Manuals, 1996.
7. Regulatory Reporting Guide, January 1997.
Spills and Discharges
1. Spill Incident Reports: 1973 to 1985 reported to U.S. Coast Guard.
2. Spill Incident Reports: 1988 to Present reported to NJDEP.
Maps and Photos
1. Aerial Viewpoint. Photograph, March 11, 1940. (1":1667').
2. Aerial Viewpoint. Photograph, February 18, 1951. (1":1667').
3. Aerial Viewpoint. Photograph, March 1, 1962. (1":1500').
4. Aerial Viewpoint. Photograph, March 14, 1974. (1":1500').
5. Aerial Viewpoint. Photograph, March 6, 1987. (Scale not available.)
6. Aerial Viewpoint. Photograph, March 13, 1996. (1":1000').
7. Aerial Viewpoint. Photograph, March 16, 1996. (1": 1000').
Geology and Hydrogeology
1. Dames & Moore, 1970. Circulating Water Intake Structure, Service Water IntakeStructure, And Circulating Water Discharge Piping for Salem Nuclear GeneratingStation Units No. I and No. 2., Detail Specification No. 70-7272. 67 borings.
2. Dames & Moore, 1974. Report: Foundation Studies for Proposed Hope CreekGenerating Station, Lower Alloways Creek Township, NJ. For PSE&G. 43 pp.Figures.
Salem.09/23/99 26
Salem Generating Station
3. Davisson, M. T. and Rempe, D. M., 1979.Report on Pile Load Test Program andRecommendations for Installation of Piling at Miscellaneous Structures Hope CreekGenerating Station for-PSE&G, Champaign, IL., July. 16 pp. Figures.
4. Thor Engineers, P.A., 1982. Report on Soils Investigation Hope Creek GeneratingStation Access Road Widening, Salem, New Jersey. Project No. 03682. 8 pp.Figures.
5. PSE&G, 1984. Hope Creek Generating Station Final Environmental Statement.
6. PSE&G, 1987. Salem Generating Station Updated Final Safety Analysis ReportControlled Document, December 4 (last update) to Nuclear Regulatory Agency.
7. PSE&G, 1999. Groundwater Conservation Plan and Drought Emergency WaterSupply Plan.
8. Richards, H. G., Olmsted, F. H., and Ruhle, J. L., 1962. Generalized StructureContour Maps of the New Jersey Coastal Plain, NJ, Department of Conservationand Economic Development, Geological Report SeriesNo. 4.
* 9. Rosenau, J. C., Lang, S. M., Hilton, G. S., Ronnie, J. G., 1969. Geology andGroundwater Resources of Salem County, New Jersey, U.S.G.S., Special ReportNo. 33, 142.
10. Warren George, Inc., 1970. Test Borings for Salem to New Freedom SouthTransmission Line. Test Boring Logs for PSE&G.
Other
1. PSE&G database. of underground storage tanks and related files of registrationsand/or removal.
0Salem.09/23/99 27

Salem Generating Station
Figure 2-1: Map Showing the Salem and Hope Creek Generating Station
Salem.09/23/99 28

Salem Generating Station
Figure 2-2: Major Operational Features Associated with theSalem Generating Station
0
Salem.09/23/99 29

Salem Generating Station
Figure 2-3: Pressurized Water Reactor
Salem.09/23/99 30

CSalem Generating Station
Figure 2-4: Salem Generating Station Operations
Auxiliary Boilers and
Combustion Turbine Units
Point Sources
Oil/Water Separator
Skim Tanks
Sanitary Waste TreatmentSystem
Salem and Hope CreekNon-Rad WasteTreatment
1910I I I I I I I I " 1 5 19 I I I I I1910 1915 1920 1925 1930 1935 1940" lg45 1950 1955 1960 "1965 1970 1975 1980 1985 1990 1995 2000
Salem.09/23/99 31

Salem Generating Station
Table 2-1: Representative Hazardous Wastes for Salem and Hope Creek Generating Stations
~Amount(1997)
Contaminated solids and debris (toxic) containing benzene (D018) 413 lbs.
Contaminated solids and debris (toxic) containing chromium (D007) 1,614 Ibs.
Contaminated water (toxic), containing chromium (D007) 5,572 lbs.
Oil and other liquid hydrocarbon waste (toxic), containing 1,1,1-trichloroethane (FO01) 434 lbs.
Oil and other liquid hydrocarbon waste (toxic), containing oil, benzene, and tetrachloroethylene (D018, D029, D039, D040, F001) 20,627 lbs.
Paint-related waste (ignitable) containing petroleum hydrocarbons (DO01) 739 lbs.
Paint-related waste (ignitable) debris, containing petroleum hydrocarbons (DO01) 11,169 lbs.
Paint-related waste (ignitable) labpack, containing petroleum hydrocarbons (DO01) 1,485 lbs.
Paint-related waste (ignitable, toxic), containing mineral spirits and methyl ethyl ketone (DO01, D035) 9,025 lbs.
Photography development (reactive) waste, containing reactive sulfides (D003) 3,869 lbs.
Process chemicals (corrosive) in labpacks containing acid and amine solutions (D002) 208 lbs.
Process chemicals (corrosive) in-labpacks containing hydroxides or various acids and bases (D002) 304 lbs.
Process chemicals (corrosive, ignitable) containing methanol and potassium hydroxide (D001, D002, F003) 125 lbs.
Process chemicals (corrosive, ignitable) in labpacks containing, amine solutions or petroleum acids and acid (DO01, D002) 134 lbs.
Process chemicals (corrosive, ignitable, toxic) containing acetic acid and formic acid (DO01, D002, U123) 125 Ibs.
Process chemicals (corrosive, ignitable, toxic) containing sulfuric acid, nitric acid, and silver (DO01, D002, D011) 175 lbs.
Process chemicals (corrosive, ignitable, toxic) in labpacks containing sodium dichromate and sulfuric acid (DO01, D002, D007) 40 lbs.
Process chemicals (corrosive, toxic) containing mercuric nitrate and sodium hydroxide (D002, D009) 8 lbs.
Process chemicals (corrosive, toxic) containing organic acids, inorganic acids, and chromium (D002, D007) 58 lbs.
Process chemicals (ignitable) containing ammonium persulfate (DO01) 2 lbs.
Process chemicals (ignitable) containing benzyl peroxide (DO01) 18 lbs.
Process chemicals (ignitable) containing iron and copper (DO01) 25 lbs.
Salem.09/23/99 32

Salem Generating Station
Table 2-1: Representative Hazardous Wastes for Salem and Hope Creek Generating Stations (continued)
Process chemicals (ignitable) containing permanganates (UUU1) I IbS.
Process chemicals (ignitable) containing peroxides (D001) 15 lbs.
Process chemicals (ignitable) containing petroleum distillates (D001) 1,237 lbs.
Process chemicals (ignitable) containing sodium nitrite (D001) 20 lbs.Process chemicals (ignitable, toxic) containing acetone and benzene (D001, D018, F003) 70 lbs.
Process chemicals (ignitable, toxic) containing mercuric nitrate (DO01, D009) 7 lbs.
Process chemicals (ignitable, toxic) containing sodium hypochlorite and silver (D001) 8 lbs.
Process chemicals (toxic) containing arsenic (D004) 125 lbs.
Process chemicals (toxic) containing barium, chromium, and silver (D005, D007, D011) 41 lbs.
Process chemicals (toxic) containing mercuric acetate (D009) 5 lbs.
Process chemicals (toxic) containing mercury (D009) 16 lbs.
Process chemicals (toxic)in labpacks containing silver (D011) 5 lbs.
Solvent waste (ignitable) from cleaning and degreasing, containing mineral spirits (D001) 2,758 lbs.
Solvent waste (ignitable) from laboratory samples; containing isopropanol (D001) 826 lbs.
Solvent waste (toxic) from cleaning and degreasing in labpacks containing 1,1,1-trichloroethane (F002) 8 lbs.
Note: Hazardous wastes reported in this table are the total types and quantities of hazardous waste generated on Artificial Island. Data wereobtained from the annual hazardous.waste report submitted in February 1998 to the NJDEP for Calendar year 1997.
.Salem.09123/99 33

Salem Generating Station
Table 2-2: Current Hazardous Substances and Related Pollution Prevention Systems
Hydrocarbon Sources
Main fuel oil storage tank Steel tank Distillate oil 840,000 gallons Gravel dike withand truck unloading area, impermeable membrane
liner
70 pieces of (active) Steel housing . Mineral oil 172,647 gallons total Housekeeping; concreteoutside mineral oil-filled pad and curbed withelectrical equipment crushed rock bottom;
diversion to oil/waterseparator
4 storage tanks Steel tank Distillate oil 120,000 gallons total Concrete room encloseseach tank
13 lube oil storage tanks Steel tank Petroleum lube oil 101,800 gallons total Housekeeping; concreteand associated truck floor; diversion to oil/waterunloading areas separator
2 oil/water separators Steel tank Oil/water mix 80,000 gallons total Concrete containment
3 tanks Concrete tank Oil/water mixtures 30,000 gallons Housekeeping
2 pieces of (inactive) spare Steel housing Mineral oil 22,500 gallons total Housekeeping; concretemineral oil-filled padtransformers
Sludge storage tank and Steel tank Oily. sludge 5,000 gallons Concrete containmenttransfer area
2 storage tanks and Steel tank Waste oil 4,000 gallons total Integral steel insideassociated transfer area concrete
6 smaller day tanks Steel tank Distillate oil 3,300 gallons total Concrete curb/floor
Salem.09/23/99 34
0

Salem Generating Station
Table 2-2: Current Hazardous Substances and Related Pollution Prevention Systems (continued)
ource Container Type Hazardous Product Quantity Containment Type_____ _____ _____ __ __ _____ _____ _____Substance _ _ _ _ _ _ _ _ _ _
5 smaller storage tanks Steel tank Distillate oil 1,600 gallons total Concrete curbing; padlocated in the boiler diversion to oil/waterbuilding and the pump skimmerhouse
Chemical Sources
Clarifier No. 1 and 2 Coated carbon steel tank Process wastewater 880,000 gallons Housekeeping; concretefloor
Waste equalization basin Fiberglass-lined concrete Process wastewater 240,000 gallons Housekeeping; concretetank -•floor
4 waste tanks (low and Coated concrete tank Process wastewater 195,000 gallons total Housekeeping; concretehigh conductivity) floor; diversion to chemical
• • waste tank
2 storage tanks (Unit Durakane fiberglass-lined' Sodium hypochlorite 176,000 gallons Earth dike (sand, gravel,Nos. 1 and 2) and truck steel tank (15%) solution • and clay); asphalt sprayed;unloading areas concrete/asphalt floor
5 caustic storage tanks Durakane fiberglass-lined Sodium hydroxide (50%) 17,500 gallons Caustic-resistant concreteand associated truck steel tank, epoxy enamel- solution dike/floor; diversion tounloading areas coated steel tank chemical waste tank
4 storage tanks and truck Lined or resin-coated steel Sulfuric acid (98%) . 12,500 gallons total Acid-resistant dike/unloading areas . tank flooring; diversion to
chemical waste tank
4 smaller tanks Fiberglass tank, coated Process wastewater 12,250 gallons total Housekeeping; concreteconcrete tank, lined steel . flooring divertedto largertank process waste tanks
2 spray additive tanks and Steel tank Sodium hydroxide 8,000 gallons total Housekeeping; concretetruck unloading areas building and floor
Salem.09/23/99 35

Salem Generating Station
Table 2-2: Current Hazardous Substances and Related Pollution Prevention Systems (continued)
Source , • Container Type . Hazardous . Product Quantity)Substance1 ethylene glycol storage Steel tank Ethylene glycol 5,200 gallonstank (antifreeze)
Containment Type
Steel
3 storage tanks at Unit Steel tank. Ammonia hydroxide 4,000 gallons total Concrete curbing;No. 1 turbine, and truck (<28%) solution diversion to chemicalunloading areas waste tank
2 component coolant Steel tank Potassium chromate. 4,000 gallons total Housekeeping; concretesystem surge/mix tanks floor(Unit Nos. 1 and 2)
4 storage tanks for the Steel tank Hydrazine (5-35%) 850 gallons total Housekeeping; concreteUnit No. 1 turbine solution floor; diversion to chemical
waste tank
Salem.09/23/99 36

Salem Generating Station
Table 2-3: Historic Operations and Related Pollution Prevention Systems
Hydrocarbon Sources
USTs One removed fiberglass distillate oil 2,000 gallons Unknown- None N/Astorage tank, located at the TSC 1989
ASTs Salem Main Fuel Tank: Distillate Oil 840,000 gallons 1970- Concrete dike on Impermeable liner on gravelPresent Delaware River dike added in 1990..
side ofcontainment,gravel dike;periodic integritytesting
Transfer All fuel oil piping from distillate oil N/A 1971- None NonePipelines tank to day tanks, generators, and Present
combustion turbine unit isunderground, single-walled and hasno leak detection.
Combustion Unit No. 3 combustion turbine has 55 gallons 1971- Two underground Tanks replaced in 1991 withTurbine Units underground purge oil collection Present 55-gallon steel* sump directed to high-volume
tank that. collects unburned oil when tanks oil/water separator.engines are shut down.
Salem.09123/99 37

Salem Generating Station
Table 2-3: Historic Operations and Related Pollution Prevention Systems (continued)
Oil-ContainingElectric T&DEquipment
One 500kv switchyard at eachgenerating station; mineral oil-filledcontainers that require regularmineral oil changeouts via mobilefiltering equipment.
7.5-8 acres 1976-Present
Traprock;inspection/housekeeping;generallyconcretecontainment,drain to treatmentsystem
None
Salem.09/23/99 38

Salem Generating Station
Table 2-4: Pollution Prevention Plans
Discharge Prevention, Containment,and Countermeasures PlanDischarge Cleanup and RemovalPlan (DPCC/SPCC/DCR)
Spill Prevention Control andCountermeasures Plan
Management of petroleum and other hazardous substances.The plans include provisions for spill prevention, spill response,inspection of storage and containment areas, training ofpersonnel, etc.
1978 July 1999
Approximately1978
Best Management Practices (BMP) Management of hazardous substances to prevent unauthorized 1985 1999Plan discharges to ground and surface waters.
Stormwater Pollution Prevention Plan Management of stormwater runoff to prevent contamination. September 1998
Facility Response Plan Management of major sources of oil storage and transfer on February 1993 February 1998navigable waters.
Underground Storage Tank Release Management of response to releases from underground storage. No undergroundResponse Plan . tanks. storage tanks on
site
RCRA Contingency Plan.. Management of releases of hazardous waste. This information . February 1998is shared with Local Emergency Planning Committees.
Non-Radioactive Waste Operations Procedures for operations and maintenance of the treatment 1985 July 1996and Maintenance Manual facility under routine and emergency conditions.
Low-Volume Oily Waste Operations Procedures for operations and maintenance of the treatment 1985 July 1996and Maintenance Manual facility under routine and emergency conditions.
Cooling Tower Manual Operations Procedures for operations and maintenance of the treatment 1985 July 1996and Maintenance Manual facility under routine and emergency conditions..
Sewage Treatment Plant Operations Procedures for operations and maintenance of the treatment 1985 March 1999and Maintenance Manual facility under routine and emergency conditions.
Emergency Response Guide Substance-specific procedures for responding to releases and November 1992ND.FP-EO.ZZ-0002(Z) spills of hazardous substances.
Salem.09/23/99 39

Salem Generating Station
Table 2-4: Pollution Prevention Plans (continued)
Date Status/1Last Update
January 1997Regulatory Reporting GuideECG Aft. 16
Reference guidelines for reporting and documentingenvironmental incidents.
Operations Manual for Fuel Transfer Management of fuel transfer operations from barges. N/AOperations By Barge
Salem.09/23/99 40
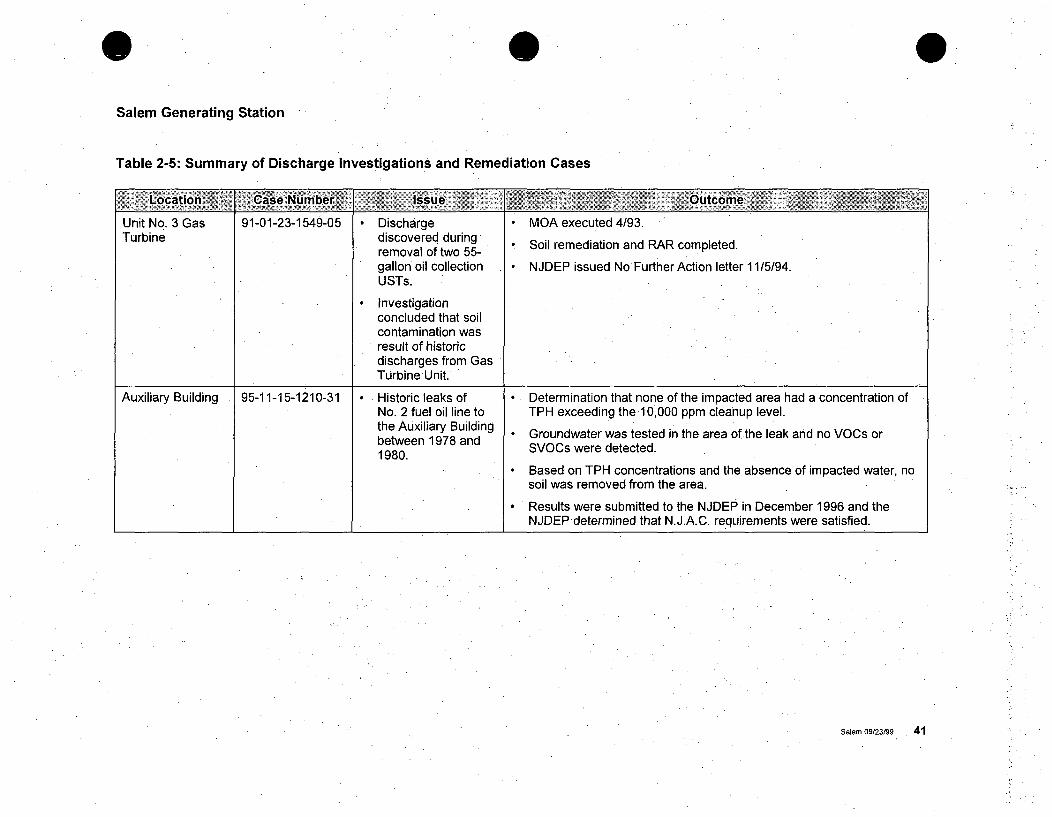
0 0Salem Generating Station
Table 2-5: Summary of Discharge Investigations and Remediation Cases
L.ocationi .. Case Nu.mber Issue • " > Outcome
Unit No. 3 Gas 91-01-23-1549-05 * Discharge MOA executed 4/93.Turbine discovered duringrembinediscoval of tSoil remediation and RAR completed.removal of two 55.
gallon oil collection * NJDEP issued No Further Action letter 11/5/94.USTs.
Investigationconcluded that soilcontamination wasresult of historicdischarges from GasTurbine Unit.
Auxiliary Building 95-11-15-1210-31 * Historic leaks of Determination that none of the impacted area had a concentration ofNo. 2 fuel oil line to TPH exceeding the 10,000 ppm cleanup level..the Auxiliary Buildingbetween 1978 and B Groundwater was tested in the area of the leak and no VOCs or1980. 1SVOCs were detected.1980.
Based on TPH concentrations and the absence of impacted water, nosoil was removed from the area.Results were submitted to the NJDEP in December 1996 and the
NJDEP determined that N.J.A.C. requirements were satisfied.
Salem.09/23199 41

Salem Generating. Station
Table 3-1: Liability Screening-Salem Generating Station
investigation Yes i Investigation is retained as an issue at all sites wnere any candidateliability issue is retained.
Ash Ponds No X Issue does not exist at Salem.
Coal Pile No X Issue does not exist at Salem.
Hydrocarbon Sources Yes , One or more elements were retained.USTs Yes V One UST was removed from Salem in 1989. There are insufficient data to
warrant exclusion as an element,
ASTs-distillate oil Yes / Salem has one distillate oil AST. There are no site-specific data to warrantexclusion as an element.
ASTs-heavy oil No X Element does not exist at Salem.
Transmission pipelines No X Element does not exist at Salem.
Transfer pipelines Yes V Underground transfer pipelines exist at Salem. There are no site-specificdata to warrant exclusion as an element.
Combustion turbine units No X One combustion turbine unit exists at Salem. Two former undergroundpurge oil collection tanks were removed in 1990. Soil remediation related topurge oil tanks occurred in the area of the former tanks. In November 1994,the NJDEP issued an NFA letter for soil and groundwater at the combustionturbine unit. The existing purge oil collection tanks are contained inside aconcrete vault. Therefore, the element is not retained.
Oil-containing electric T&D equipment Yes V Element exists at Salem. There are no site-specific data to warrantexclusion as an element.
Miscellaneous spills Yes V Spill records date back to 1986. There are no records of spills prior to 1986to warrant exclusion as an element.
Salem.09/23199 42

Salem Generating Station
Table 3-1: Liability Screening-Salem Generating Station (continued)
~Candidate Liability Issue I~ ssue, ~Element* Retained Retained~
Chemical Sources
Boiler operations and maintenanceprocesses
Bulk storage and handling areas
Yes
No
Yes
Yes
Yes
V One or more elements were retained.,
X The auxiliary boiler building foundation is poured concrete that providescontainment for operations and maintenance processes.
V Element exists at Salem. There are no site-specific data to warrantexclusion as an element.
V There are no site-specific data to warrant exclusion as an element.
V Spill records date back to 1986. There are no records of spills prior to 1986to warrant exclusion as an element..
Waste disposal
Miscellaneous spills
PCB Sources Yes V One or more elements were retained.
Oil-containing electric T&D equipment Yes V Salem has oil-filled equipment that was in service when PCBs were in use.There are insufficient site-specific data to warrant exclusion as an element.
Gas condensate blowdown No X Element does not exist at Salem.
On-Site Fill No X No elements were retained.,
Historic fill No X The property was made by deposition of hydraulic fill from USACOEdredging at depth of the Delaware River channel. The majority of the fillingoccurred prior to 1940. Therefore, it is not retained as an element.
Ash fill No X Element does not exist at Salem.
Dredge spoils No X Element does not exist at Salem.
On-Site Surface Water, Drainages, Yes V Element exists at Salem and there are potential upgradient sourcesand Wetlands associated with Station operations.
Monitoring Yes V Monitoring is retained as an issue at all sites where any candidateliability issue is retained.
Salem.09/23/99 43

Salem Generating Station
Table 3-2: Liability Characterization-Salem Generating Station
Investigation N/A I N/A N/A M(16liabilityunits)
N/A NIA .1N/A
Ash Ponds N/A N/A N/A NIA N/A N/A N/A
Coal Pile N/A N/A N/A N/A N/A N/A N/A
Hydrocarbon'Sources
USTs 1 Potential UST removed in 1989 in M Default scale 200 600pathway to accordance with of 200 cy/tank.groundwater applicable regulations. Assume depthand Delaware of 9 feet andRiver and Total: 1 surface areawetlands of 600 sf/tank.
ASTs-- 1 Potential The AST has had an M Default scale 400 3,600distillate oil pathway to earthen dike or other of 400 cy/unit.
groundwater containment throughout Assume depthand Delaware its history, has been of 3 feet, andRiver and Upgraded to meet API surface areawetlands requirements, and an of 3,600 sf/
impermeable liner has unit.been installed.
Total: 1
ASTs-heavy N/A N/A N/A N/A N/A N/A N/Aoil
Transmission N/A N/A N/A N/A N/A N/A N/APipelines
Salem.09/23/99 44
0
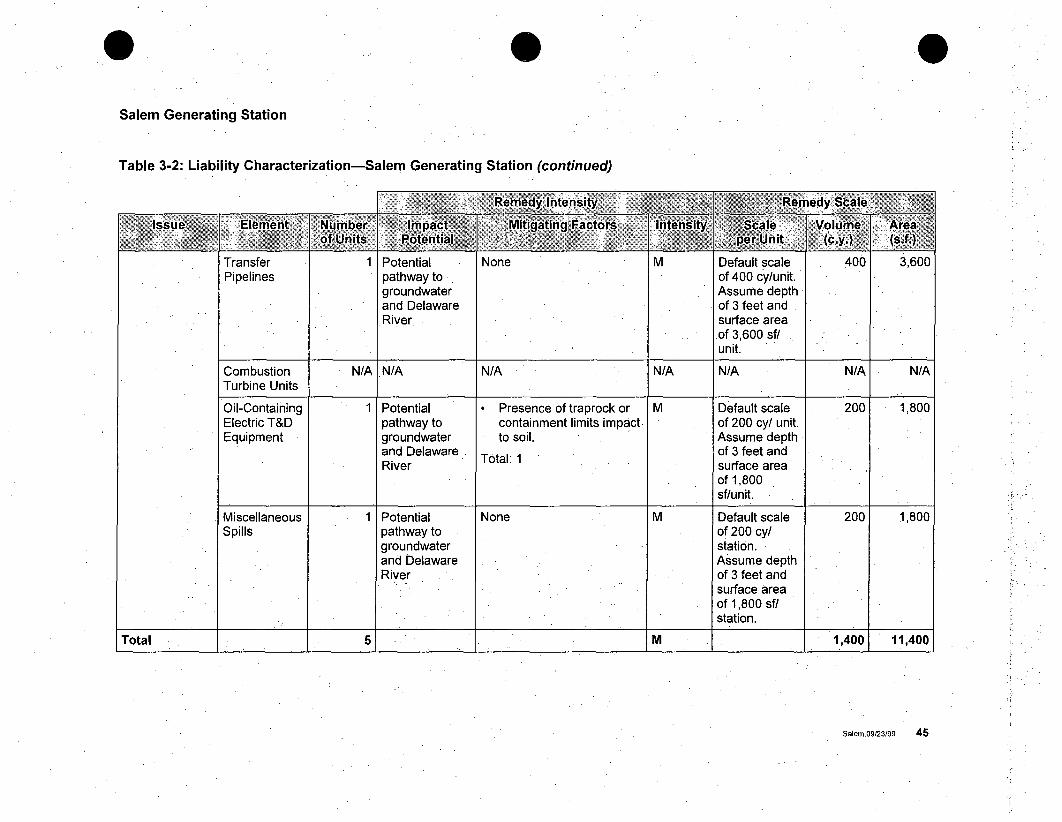
0 0Salem Generating Station
Table 3-2: Liability Characterization-Salem Generating Station (continued)
TransferPipelines
1 Potentialpathway togroundwaterand DelawareRiver
None M Default scaleof 400 cy/unit.Assume depthof 3 feet andsurface areaof 3,600 sf/unit.
4oo 3,60UU
Combustion N/A N/A N/A N/A N/A N/A N/ATurbine Units
Oil-Containing 1 Potential • Presence of traprock or M Default scale 200 1,800Electric T&D pathway to containment limits impact of 200 cy/ unit.Equipment groundwater to soil. Assume depth
and Delaware Total: 1 of 3 feet andRiver surface area
of 1,800sf/unit.
MiscellaneousSpills
1 Potentialpathway togroundwaterand DelawareRiver I
None M Default scaleof 200 cy/station.Assume depthof 3 feet andsurface areaof 1,800 sf/station.
200 1,800
Total [-__ . [ M I __.1,4001 11,400
Salern.09/23/99 45

Salem Generating Station
Table 3-2: Liability Characterization-Salem Generating Station (continued)
Chemical Sources
BoilerOperationsandMaintenanceProcesses
N/A I N/A N/A N/A N/A N/A N/A
Bulk Storage 1 Potential * Areas have been M Default scale 100 900and Handling pathway to contained since circa of 100 cy/Areas groundwater 1990. station.
and Delaware Total- 1 Assume depthRiver of 3 feet and
surface areaof 900 sf/station.
WasteDisposal.
1 Potentialpathway togroundwaterand DelawareRiver
None M Default scaleof 100.cy/station.Assume depthof 3 feet andsurface areaof 900 sf/station.
100 9001
Salem.09/23/99 46

Salem Generating Station
Table 3-2: Liability Characterization.-Salem Generating Station (continued)
MiscellaneousSpills
1 Potentialpathway togroundwaterand DelawareRiver
None M Default scaleof 100 cy/station.Assume depthof 3 feet andsurface areaof 900 sf/station.
100 900
Total [ _31 1 M 1 300[ 2,700
PCB Sources
Oil-Containing 7 Potential Presence of traprock or M Default scale 420 3,780Electric T&D pathway to containment limits impact of 60 cy/Equipment groundwater to soil. station.
and Delaware T 1 Assume depthRiver and to of 3 feet andStation surface areapersonnel of 540 sf/
station.
Gas N/A N/A N/A N/A N/A N/A NIACondensateBlowdown
Total 7 M 420 3,780
Salem.09/23/99 47
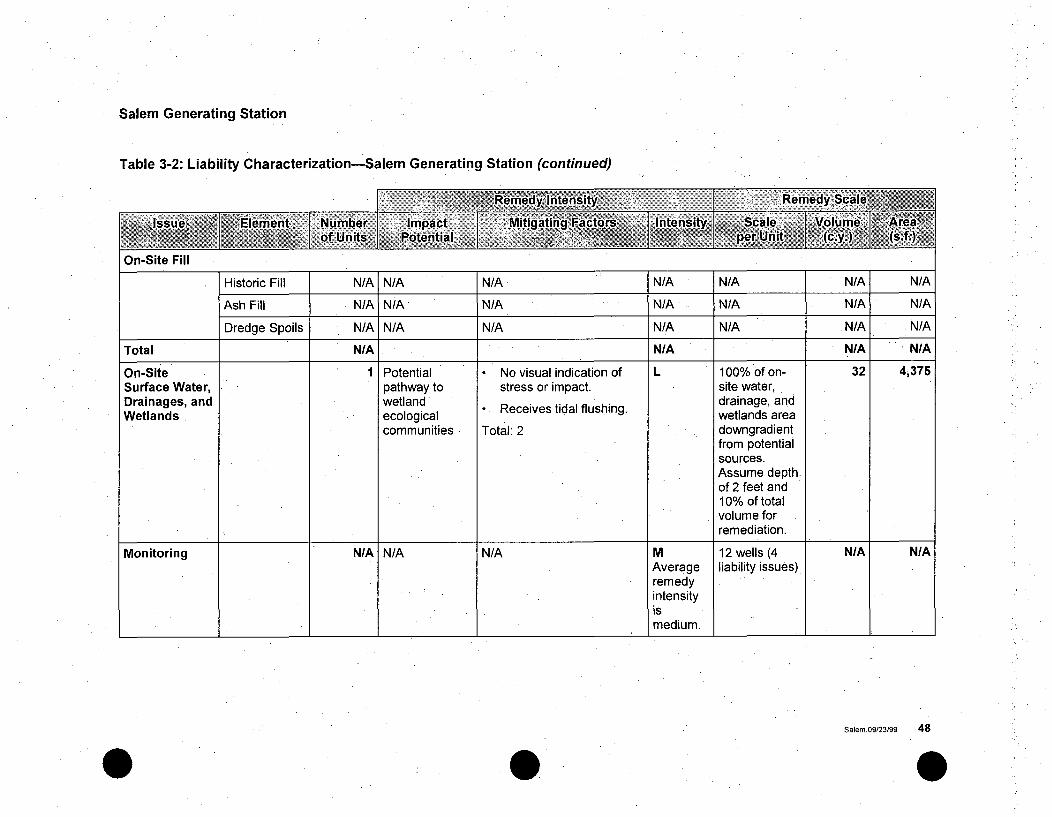
Salem Generating Station
Table 3-2: Liability Characterization-Salem Generating Station (continued)
On-Site Fill
Historic Fill N/A N/A N/A N/A N/A N/A N/A
Ash Fill N/A N/A N/A N/A N/A N/A N/A
Dredge Spoils N/A N/A N/A N/A N/A N/A N/A
Total N/A N/A N/A N/A
On-Site 1 Potential * No visual indication of L 100% of on- 32 4,375Surface Water, pathway to stress or impact. site water,Drainages, and wetland• drainage, andWetlands ecological wetlands area
communities Total: 2 downgradientfrom potentialsources.Assume depth.of 2 feet and10% of totalvolume forremediation.
Monitoring N/A N/A N/A M 12 wells (4 N/A N/AAverage liability issues)remedyintensityismedium.
Salem.09/23/99 48

Salem Generating Station
Table 3-3: Liability Decision Tree-Salem Generating Station
1 2 3Investigation Hydrocarbon Sources Chemical Sources
(PA/SI/RI/RAWP)
4PCB Sources
*Institutional controls are also assumed as a component of all engineering controls and active treatment remedies.
Salem.09/23/99 49

Salem Generating Station
Table 3-3: Liability Decision Tree-Salem Generating Station (continued)
5 6On-Site Surface Water, Monitoring
Drainages, and Wetlands
*Institutional controls are also assumed as a component of all engineering controls and active treatment remedies.
Salem.09/23/99 50

0Salem Generating Station
Table 3-4: Liability Valuation-Salem Generating Station
Item I - Investligatin tern 4. Hydrocarbon Sources
Scenario CoSt Prob. Expected Scenario Cost Prob. Expected
Value Value
U.S.$ M U.S.$ S,$ M U.S.$
Low Effort $ 23M318 0.30 $ 71.495 Inltuional Controls $ 11.396 0.20 $ 2,279
Soil Rerovl/Off-SgeDisposal or On-See
Mediu, Effort $ 476S636 0.40 $ 190.654 Treatment $ 214.070 0.40 $ 85,628
Soil Removal and NAPI
High Effort $ 1,429.907 0.30 $ 42B,972 Recouery $ 270.362 0.30 $ 81,109
Soil R-1oval. NAPLnecovery. and
Groundoelr Efracfion_reanent e Carlbon) 1 $ 1.556.661 0.10 $ 155666
r If S, 691,121 1100 3
Item 5 - Chemical Sources hem 6 - PCB Sources
Scenario C-t Prob. Expected Scenario Cost Prob. Expected
Value Value
oU.S.f$ M U.SS.$ U.S.$ M U.S.S
instnrtiolControls $ 1' .3 0.40 $ 4,558 Insbtutional Controls $ 11t396 0.10 $ rIS40Sog Remowvl/Off-SiReDisposal or On-Sd•e"ret.ent. $ . 173,16, 0.30 $ 51.949 FeninrfCapir S 410f25 0.20 $ 8,205
Grounduste, Exffacon t Soil R--emoff-Sten
and Treatment $ 1.276,75.5 . 0.20 $ 255.351 Disposal $ 11.278 0.60 $ 69,167
Soil Renovi end ; Capping andSroundtenr -. -rcundoter
E.trecion/Treratent 1$ 1,450,085 0.10 0 EractioinTreatment $ 1,317,781 0.05 $ 65.A89
Excavaion/Off-SdeDisposal andGrounddwr,
0.05is 1.392.198 $ 69.610
I I_1.W Is 456,867 214 0v
hem s -On-Site Surface Water, Drainages, and Wetlands Item 9 - Monitoring TotaloExpected>- ~Value
Scenario Cost Prob. Expected Scenario Cost Pros. Expected-Value Value
U.0..$ L U0.. . U.S.$ M U0.S.$
nsrutio•nlControfs $ 7517 0.40 $ 3007 M ounrorin.- 5 sm $ 97,500 030 $ 29,274
Access Contols/ RunoffControls $ 127.006 0.30 S 38.102 Monitorino- 10 learns $ 147.096 0.40 $ 5883Lrimnid SedinentR,,ova -Off-Sit. Diopolecr OnS Soil Treatment $ 67w006 0,30 $ 20.126 Monitodnn -20 years $ 216.759 0.30 $ 65,028
Assesrnent. Iredling. anoOff-Sin Sediment Dispoco $ 341 780 50. _
1.E0 61,235 10O $ 163,140 $ 1,901,055
Discount RateInflation Rate
Start Year of Remediation
7%21/6
4
Salem.09123199 ' 51

Appendix C
Well Details (Boring Logs, Well
Completion Details, Well
Completion Details, Well
Completion Records, and Survey
Form Bs)

0Sample/ARCADISSample/Core Log
Boring/Well Well M P.
Site
Location Artificial Island, Hancock's Bridge, New Jersey
roject/No. PSEG Nuclear, LLC Salem Generrating Station/NP000571.0002 Page 1 of 1
Drilling Drilling
Started 5/3/2003 Completed .5/3/2003
Type of Sample/inches Coring Device NATotal Depth Drilled
Length and Diameter
of Coring Device
Land-Surface Elev.
Drilling Fluid Used
DrillingContractor
PreparedBy
20.0 Feet Hole Diameter 5.25
5.25 inches by 5.0 feet hollow-stem augers
99.26 feet
None
Sampling Interval NA feet
D Estimated Datum Plant DatumM-' Surveyed
Drilling Method Hollow Stem Auger
CT&E Environmental Services, Inc.
Jon Rutledge
Driller Nick Helper Larry
Hammer HammerWeight NA Drop NA inches
Sample/Core Depth
(feet below land surface) Core Blow
Recovery Counts
From To (feet)
PID
Reading
(ppm) Sample/Core Description
0.0 10.0 " Borehole advanced to 10.0 feet below ground surface using vacuum excavation.
11.5 20.0 -- SAND, medium, brown, some Silt, wet, slight hydrocarbon odor.
Description from cuttings.
20.0 End of boring. Boring completed as Monitoring Well M.
Soil Boring Logs - Wells M and R through W.xls3/9/2005

ARCADISSample/Core Log
Boring/Well Well R P1
SiteLocation Artificial Island, Hancock's Bridge, New Jersey
roject/No. PSEG Nuclear, LLC Salem Generrating Station/ NP000571.0002 Page 1 of 1
Total Depth Drilled
Length and Diameterof Coring Device
Land-Surface Elev.
Drilling Fluid Used
DrillingContractor
PreparedBy
19.0 Feet .Hole Diameter 3.25
Drilling Drilling
Started 6/3/2003 Completed 6/3/2003
Type of Sample/inches Coring Device NA
Sampling Interval NA feet
IEstimated Datum Plant Datum
3.25 inches by 4.0 feet
99.82 feet
None
'xSurveyed F11-1
Drilling Method Direct Push
CT&E Environmental Services, Inc. Driller Jeff Helper Steve
Hammer HammerWeight NA Drop NA inchesJon Rutledge
Sample/Core Depth
(feet below land surface) CoreRecovery
From To (feet)
Blow
Counts
PID
Reading
(ppm) Sample/Core Description
0.0 3.0 ..... Description from cuttings: SAND, reddish to yellowish orange, some silt, clay and
gravel.
3.0 12.0 .... " - Description from cuttings: CLAY, yellowish orange, some sand (fine to medium).
Borehole advanced-to 12.0 feet below ground surface using vacuum excavation.
12.0 19.0 Boring advanced from 12.0 feet to 19.0 feet using direct push process.
A sample/core desription was unable to be observed between 12.0 and
19.0' due to the nature of the direct push process.
19.0 End of boring. Boring completed as Monitoring Well R.
F + F
i i + + i
+ F S ± F
-4- F + + F
± -F 4 4- F
4- F 4 4- F
- .4- F + + F
+ F S F ±
Soil Boring Logs - Wells M and R through W.xls3/9/2005

ARCADIS
Sample/Core Log
Boring/Well Well S Project/No. PSEG Nuclear, LLC Salem Generrating Station/NP000571.0002 Page 1 of 1
Site
Location Artificial Island, Hancock's Bridge, New JerseyDrilling DrillingStarted 5/29/2003 Completed 5/29/2003
Type of Sample/
inches Coring Device Split-SpoonTotal Depth Drilled
Length and Diameter
of Coring Device
Land-Surface Elev.
Drilling Fluid Used
DrillingContractor
PreparedBy
36.0 Feet Hole Diameter 2
2 feet by 2 inches
None
Sampling Interval
U-Estimated Datum Plant Datum
5 feet
feet s urveyed
Drilling Method Hollow Stem Auger
CT&E Environmental Services, Inc.
Jon Rutledge
Driller Marc Helper Steve
Hammer HammerWeight 140 pounds Drop 36 inches
Sample/Core Depth
(feet below land surface) Core Blow
Recovery CountsFrom To (feetf
PID
Readingfoomt Samole/Core Descriot ion
00.0 - 9.5' Vacuum excavation to identify subsurface utilities
9.5 11.5 2.0 7-9-11-15 0.0 9.5 - 14.0' orange, silty medium SAND with gravel
14.0 16.0 1.9 12-15-16-17 0.0 14.0 - 19.0' tan, clayey medium SAND with gravel
19.0 .21.0 2.0 8-9-13-15 0.0 19.0 -20.7' light brown, medium SAND with gravel
"_ 20.7 - 24.0' gray, medium SAND with gravel
24.0 26.0 2.0 140 lbs/0.9'-2-3 0.0 24.0 - 25.7'r gray, CLAY with trace fine sand and mica
25.7 - 26.0' gray, fine sandy CLAY with trace mica
29.0 31.0 2.0 140 lbs/0.5'-2-1-2 1.0 26.0 - 34.4' gray, CLAY with trace fine sand and mica
34.0 36.0 2.0 2-2-8-14 0.0 34.4 - 36.0' gray, medium SAND with gravel and trace mica
36.0' End of Boring
+ 4 4 + 4
Soil Boring Logs - Wells M and R through W.xls3/9/2005

C ARCADISSample/Core Log
Boring/Well Well T Project/
Site
Location Artificial Island, Hancock's Bridge, New Jersey
Total Depth Drilled 35.5 Feet
Length and Diameter
of Coring Device 2 feet by 2 inches
Land-Surface Elev. 100.97 feet
Drilling Fluid Used None
DrillingContractor CT&E Environmental Services, Inc.
PreparedBy Jon Rutledge
No. PSEG Nuclear, LLC Salem Generrating Station/NP000571.0002 Page .1 of 1
Drilling Drilling
Started 6/5/2003 Completed 6/5/2003
Type of Sample/inches Coring Device Split-SpoonHole Diameter 2
Sampling Interval
Datum Plant Datum
5 feet
[]Surveyed DEstimated
Drilling Method Hollow Stem Auger
Driller Marc Helper Steve
Hammer HammerWeight 140 pounds Drop 36 inches
Sample/Core Depth
(feet below land surface) Core Blow
Recovery Counts
From To (feet)
PID
Reading
(ppm) Sample/Core Description
0.0 - 9.5' Vacuum excavation to identify subsurface utilities
9.5 11.5 2.0 2-2-2-2 0.0 9.5 - 14.9' gray, CLAY with trace fine sand and mica
14.5 16.5 2.0 5-4-3-3 0.0 14.9- 15.4' gray, medium SAND with trace clay andmica
19.5 21.5 2.0 1-2-2-3 0.0 15.4 - 26.0' gray, CLAY with trace fine sand.and mica
24.5 26.5 2.0 1-2-2-4 0.0 26.0.- 26.5' gray, fine sandy CLAY with trace mica
29.5 31.5 2.0 3-3-21-50 0.0
31.5 33.5 2.0 25-30-20-15 0.0 26.5 - 33.2' gray, medium SAND with gravel and trace mica
33.5 35.5 0.0 140 lbs/2.0' NA 33.2- 33.5' gray, CLAY with trace mica
35.5' End of Boring
F + +
F + +
F I ± I +
F I + I +
F I + I +
F + +
Soil Boring Logs - Wells M and R through W.xls3/9/2005
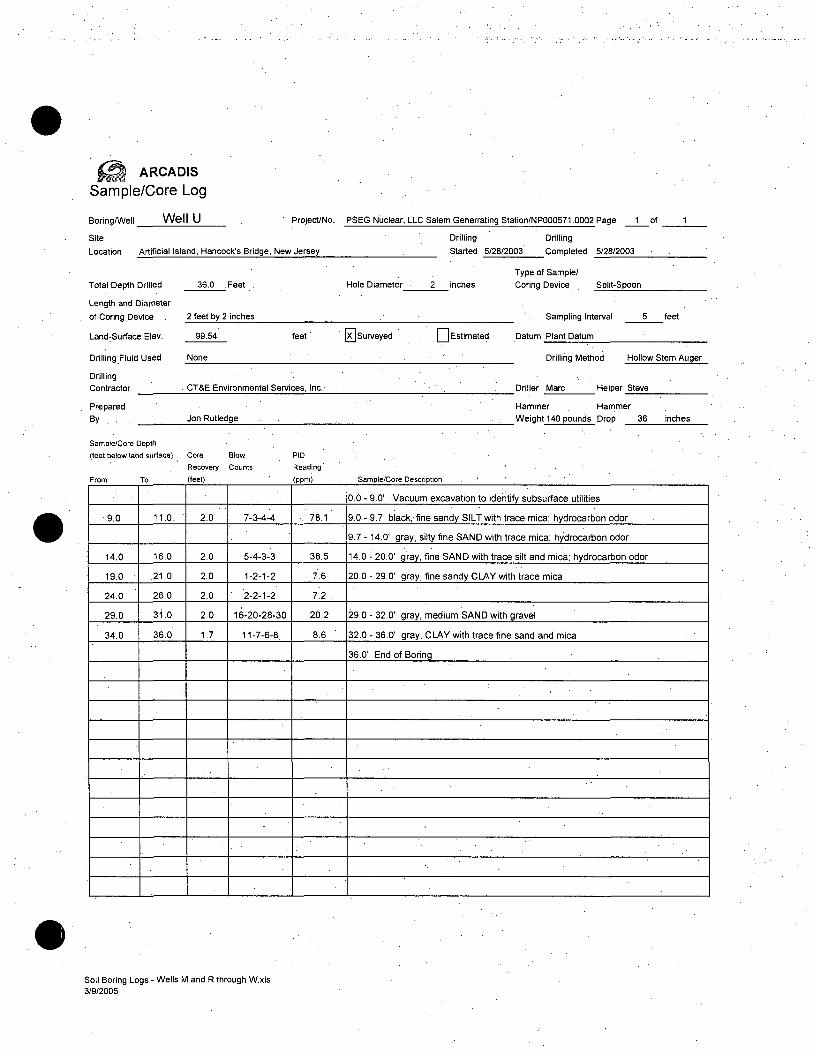
ARCADISSample/Core Log
Boring/Well Well U Project/i
Site
Location Artificial Island, Hancock's Bridge, New Jersey
No. PSEG Nuclear, LLC Salem Generrating Station/NP000571.0002 Page 1 of 1
Drilling Drilling
Started 5/28/2003 Completed 5/28/2003
Type of Sample/inches Coring Device Split-SpoonTotalDepth Drilled
Length and Diameter
of Coring Device
Land-Surface Elev.
Drilling Fluid Used,
DrillingContractor
PreparedBy . .
36.0 . Feet
2 feet by 2 inches
Hole Diameter 2
99.54
None
Sampling Interval
Datum Plant Datum
5 feet
feet ' I] Surveyed D Estimated
Drilling Method Hollow Stem Auger
CT&E Environmental Services, Inc.
Jon Rutledge
Driller Marc Helper Steve
Hammer HammerWeight 140 pounds Drop 36 inches
Sample/Core Depth
(feet below land surface) Core Blow
Recovery Counts
From To (feet)
PlO
Reading
(Domi Samole/Core Description
0• " _0.0 - 9.0' Vacuum excavation to identify subsurface utilities
9.0 11.0 2.0 7-3-4-4 78.1 9.0- 9.7 black,tfine sandy SILT with trace mica; hydrocarbon odor
9.7 - 14.0' gray, silty fine SAND with trace mica; hydrocarbon odor
14.0 16.0 2.0 5-4-3-3 38.5 14.0 - 20.0' gray, fine SAND with trace silt and mica; hydrocarbon odor
19.0 .21.0 2.0 1-2-1-2 7.6 20.0 - 29.0' gray, fine sandy CLAY with trace mica
24.0 26.0 2.0 2-2-1-2 7.2
29.0 3i.0 2.0 16-20-28-30 20.2 29.0 - 32.0' gray, medium SAND with gravel
34.0 36.0 1.7 11-7-6-8. 8.6 32.0 - 36.0' gray, CLAY with trace fine sand and mica
36.0' End of Boring
Soil Boring Logs - Wells M and R through W.xls3/9/2005

ARCADIS
Sample/Core Log
Boring/Well Well V Project/No. PSEG Nuclear, LLC Salem Generrating Station/NP000571.0002 Page 1 of 2
Site
Location Artificial Island, Hancock's Bridge, New Jersey
Total Depth Drilled
Length and Diameter
of Coring Device
Land-Surface Elev.
Drilling Fluid Used
DrillingContractor
PreparedBy
80.0 Feet Hole Diameter 2
Drilling Drilling
Started 6/6/2003 Completed 6/12/2003
Type of Sample/inches Coring Device Split-Spoon
Sampling Interval Continous
D Estimated Datum Plant Datum
2 feet by 2 inches
99.16
None
feet -]Surveyed
Drilling Method Mud Rotary
CT&E Environmental Services, Inc. Driller Marc Helper Steve
Hammer HammerWeight 140 pounds Drop 36 inchesJon Rutledqe
Sample/Core Depth
(feet below land surface) Core
Recovery
Prom To /feetl
Blow PID
Counts Reading
(ppm) Sample/Core Description
0.0- 10.0' Vacuum excavation to identify subsurface utilities
10.0 12.0 2.0 1-1-3-2 0.0 10.0 - 12.0' gray, fine sandy CLAY with trace mica
12.0 14.0 2.0 3-1-1-2 0.0 12.0- 14.0' gray, fine sandy CLAY with trace mica
14.0 16.0 2.0 3-3-1/1.0' 0.0 14.0 - 16.0' gray, CLAY with trace medium sand and mica
16.0 18.0 2.0 3-1-1-3 0.0 16.0 - 18.0' gray, CLAY with trace fine sand and mica
18.0 20.0 2.0 140 lbs./1.0'-2-1 0.0 18.0 - 20.0' gray, CLAY with trace fine sand and mica
20.0 22.0 2.0 1-2-2-2 0.0 20.0 - 22.0' gray, CLAY with trace fine sand and mica
22.0 24.0 2.0 140 Ibs./1.0'-3-3 0.0 22.0 - 24.0' gray, CLAY with trace fine sand and mica
24.0 26.0 2.0 3-2-3-2 0.0 24.0 - 26.0' gray, CLAY with trace fine sand and mica
26.0 28.0 2.0 140 Ibs./1.0'-3-3 0.0 26.0 - 28.0'. gray, fine sandy CLAY with trace mica
28.0 30.0 2.0 3-2-2-3 0.0 28.0 - 30.0' gray, fine sandy CLAY with trace mica
30.0 32.0 2.0 8-9-11-15 0.0 30.0 - 31.3' gray, fine sandy CLAY with organic material
31.3 - 32.0' gray, medium SAND
32:0 34.0 2.0 15-20-25-23 0.0 32.0 - 33.5' gray, silty medium SAND
33.5 - 33.6' purple, fine SAND with gravel
33.6 - 34.0' brown, medium to coarse SAND with gravel
34.0 36.0 1.0 20-18-15-9 0.0 34.0 - 36.0' gray, medium to coarse SAND with gravel
36.0 38.0 2.0 6-6-8-15 0.0 36.0 - 36.8' gray, medium to coarse SAND with gravel
36.8 - 38.0' gray, CLAY
38.0 40.0 0.5 7-8-8-10 0.0 38.0 - 40.0' gray, GRAVEL with trace clay
Soil Boring Logs - Wells M and R through W.xls3/9/2005

ARCADIS GERAGHTY & MILLER
Sample/Core Log (Cont.d)
BoringtWell Well V Page 2 of 2
Prepared by Jon Rutledge
Sample/Core Depth
(feet below land surface) Core
Recovery
From To (feet)
PID
Reading
(ppm) Sample/Core Description
40.0 2.0 40.0 - 42.0' arav. CLAY with trace silt and qravel42.0 7-7-8-12 0.0
0
42.0 44.0 2.0 5-7-9-12 0.0 42.0- 44.0' gray, CLAY with trace silt
44.0 46.0 2.0 7-9-12-12 0.0 44.0-44.6' gray, GRAVEL (cave-in)
44.6-46.0' gray, CLAY with trace silt
46.0 48.0 2.0 9-9-10-13 0.0 46.0 - 46.2' gray, GRAVEL (cave-in)
46.2 -48.0' gray, CLAY with trace silt
48.0 50.0 2.0 16-8-9-10 0.0 48.0 - 50.0' gray, CLAY with trace silt
•50.0 52.0 2.0 5-5-6-10 0.0 50.0 - 52.0' gray, CLAY withtrace silt
52.0 54.0 2.0 10-11-12-13 0.0 52.0- 53.6' gray, CLAY
" 53.6 - 54.0' dark purple, silty sandy CLAY with trace mica
54.0 56.0 2.0 . 10-13-17-17. 0.0 54.0 - 56.0' red, clayey fine SAND with trace mica
56.0 .58.0 2.0 8-11-25-22 0.0 56.0 - 57.5' reddish gray, clayey fine SAND with trace mica
57.5 7 58.0'. reddish gray, fine SAND with trace mica
5 0 60.0 2.0 12-12-9-9 0.0 58.0 - 60.0' gray, fine.SAND with trace mica
60,0 62.0 1.7 8-11-20-21 0.0 60.0 - 62.0' gray, fine SAND with trace mica
62.0 64.0 2.0 .8-10-15-25 0.0 62.0 - 64.0' gray, fine SAND with trace silt and mica
64.0 66.0 0.9 24-24-18-10 0.0 64.0 - 66.0' gray, medium to coarse SAND with gravel
666.0 68.0 1.4 4-4-6-12 . 0.0 66.0 - 67.2' gray, medium to coarse SAND with gravel
67.2 - 68.0' green, fine SAND with trace silt
68.0 70.0 1.5 15-15-13-23 0.0 68.0 - 70.0' grayish green, fine SAND with trace silt
70.0 72.0 .2.0 16-16-20-22 0.0 70.0 - 72.0' green, fine SAND with trace silt and gravel
72.0 74.0 2.0 20-20-31-20 0.0 72.0 - 74.0' greenish black, fine to medium SAND with fragments of seashells
74.0 76.0 1.5 48-50/0.3' 0.0 74.0 - 76.0' dark green, fine SAND with trace fragments of seashells*"
76.0 78.0 2.0 30-18-23-30 0.0 76.0•- 78.0' olive green, fine SAND with trace silt
78.0 80.0 1.0 30-70-50/0.2' 0.0 78.0 - 80.0' olive green, fine SAND with trace silt
80.0' End of Boring
Soil Boring Logs - Wells M and R through W.xls3/9/2005

0P ARCADIS
Sample/Core Log
Boring/Well Well W Pro
Site
Location Artificial Island, Hancock's Bridge, New Jersey
ject/No. PSEG Nuclear, LLC Salem Generrating Station/NP000571.0002 Page 1 of 1
Drilling Drilling
Started 6/2/2003 Completed 6/3/2003
Type of Sample/inches Coring Device Split-SpoonTotal Depth Drilled
Length and Diameter
of Coring Device
Land-Surface Elev.
Drilling Fluid Used
DrillingContractor
PreparedBy
36.0 Feet Hole Diameter 2
2 feet by 2 inches
99.36
None
feet 'Surveyed
Sampling Interval
DEstimated Datum Plant Datum
5 feet
Drilling Method Hollow.Stem Auger
CT&E Environmental Services, Inc. Driller Marc Helper Steve
Hammer HammerWeight 140 pounds Drop 36 inchesJon Rutledge
Sample/Core Depth
(feet below land surface) Core
Recovery
From To (feet)
Blow
Counts
PID
Reading
(ppm) Sample/Core Description
0.0 - 9.5' Vacuum excavation to identifysubsurface utilities
9.5 11.5 1.6 15-20-22-22 0.0 9.5 - 16.2' brown, medium to coarse SAND with gravel
14.5 16.5 0.3 1/0.9'-2-2 0.0 16.2 - 18.0' gray, medum sandy CLAY
18.0 20.0 2.0 1/1.5'-2 0.0
24.0 26.0 2.0 140 lbs/0.5-1-1-2 0.0
29.0 31.0 1.9 140 lbs/2.0' 0.0 18.0 - 34.3' gray, CLAY with trace fine sand and mica
34.0 36.0 2.0 6-8-3-4 0.0 34.3 - 36.0' gray, clayey fine SAND
36.0' End of Boring
Soil Boring Logs - Wells M and R through W.xls3/9/2005

ARCADISSample/Core Log
Boring/Well Well Y P
SiteLocation Artificial Island, Hancock's Bridge. New Jersey
roject/No. PSEG Nuclear, LLC Salem Generating Station / NP000571.0002 Page- 1 of 1
Drilling Drilling
Started 9/27/2003 Completed 9/27/2003
Type of Sample/inches Coring Device Split-spoon (2-inches by 2-feet)Total Depth Drilled
Length and Diameter
of Coring Device
Land-Surface Elev.
Drilling Fluid Used
DrillingContractor
PreparedBy
40,0 Feet Hole Diameter 9.0
9.0-inch by 5.0-feet hollow-stem augers.
99.20 feet
None
FX-Surveyed
Sampling Interval 5.0 feet
D Estimated Datum NAVD 1988
Drilling Method Hollow-Stem Auger
A:C. Schultes, Inc. Driller C. Warren Helper W. Powers
Hammer HammerWeight 140 lbs Drop 30 inchesChristopher Sharpe
Sample/Core Depth
(feet below land surface) Core Blow
Recovery Counts
From To (feetl
PID
Reading
(ppm) Sample/Core Description
0.0 10.0 ...... Borehole advanced to 10 feet below ground surface using vacuum excavation.
14.0 16.0 2.0 110/1/0 -- SILT, dark gray, trace sand, fining with depth, wet.
19.0 21.0 2.0 ,0/0/111 -- SILT, dark gray, trace sand, stiffening with depth, wet.
24.0. 26.0 1.5 1/3/4/5 -- SILT, dark gray, trace sand.
29.0. 31.0 2.0 112/1/2 -- First 1.0 feet: SILT, dark gray; Next 1.0 feet: SILT, with clay and some sand,
- -- -.. .... -- sand increasing with depth.
34.0 36.0 2.0 2/3/5/6 -- • First 1.0 feet: SILT, dark gray; Next 1.0 feet: CLAY, gray, stiff.
37.0 39.0 1.5 3/1/0/1 • -- First 1.0 feet: SILT, dark gray; Next 0.5 feet: CLAY, gray and tan, stiff.
40.0 .. .. -- -- End of boring. Boring completed as Monitoring Well Y.:
0Soil Boring Logs - Wells Y through AF.xls3/9/2005

ARCADIS
Sample/Core Log
Boring/Well Well Z
Site
Project/No. PSEG Nuclear, LLC Salem Generating Station / NP000571.0002 Page 1 of I
Drilling Drilling
Location Artificial Island, Hancock's Bridge, New Jersey Started 9/30/2003 Completed 9/30/2003
Type of Sample/Coring DeviceTotal Depth Drilled 38 Feet
Length and Diameter
of Coring Device 9.0-inch by 5.0-f
Land-Surface Elev. 99.3 feet
Drilling Fluid Used None
Hole Diameter 9.0 inches Split-spoon (2-inches by 2-feet)
feet hollow-stem augers. Sampling Interval 5.0 feet
Datum NAVD 1988[X-Surveyed D Estimated
Drilling Method Hollow-Stem Auger
DrillingContractor
PreparedBy
A.C. Schultes, Inc.
Christopher Sharpe
Driller C. Warren Helper W. Powers
Hammer HammerWeight 140 lbs Drop 30 inches
Sample/Core Depth
(feet below land surface) Core Blow
Recovery Counts
From To (feet)
PID
Reading
(ppm) Sample/Core Description
0 10 .... Borehole advanced to 10 feet below ground surface using vacuum excavation.
15 17 2 2/11111 -- SILT, dark gray with trace fine sand (diesel odor).
20 22 2 0/1/0/1 -- SILT, dark gray with trace fine sand.
25 27 2 0/0/2/1 -- CLAY, dark gray with some silt and trace fine sand.
27 29 2 1/2/2 -- SILT, dark gray with some clay and fine to medium sand,
... .. ... • -- coarsening with depth.
29 31 2 2/1/1/1 -- SILT, dark gray with some clay and trace sand.
.. .. .... . .. (Distict 0.05 to 0.1 foot organic horizon @ 1.2 ft)
31 33 2 15/20/44/33 -- First 1.5 feet: SILT, dark gray with some clay and trace sand.
.. .. ......- Next 0.25 foot: SAND with gravel.
-- - ..... -. Next 0.25 foot: SAND, brown, medium-fine.
33 35 2 10/11/29144 -- First 0.25 foot: SAND, cemented gray
S-- -. ......- Next 1.75 feet: SAND, dark gray with gravel.
35 37 2 2/9/15/25 -- First 1.2 feet: SAND, dark gray silty.
.. .. ......- Next 0.8 foot: SAND, brown with gravel.
37 .. ...... End of boring. Boring completed as Monitoring Well Z.
Soil Boring Logs - Wells Y through AF.xls3/9/2005
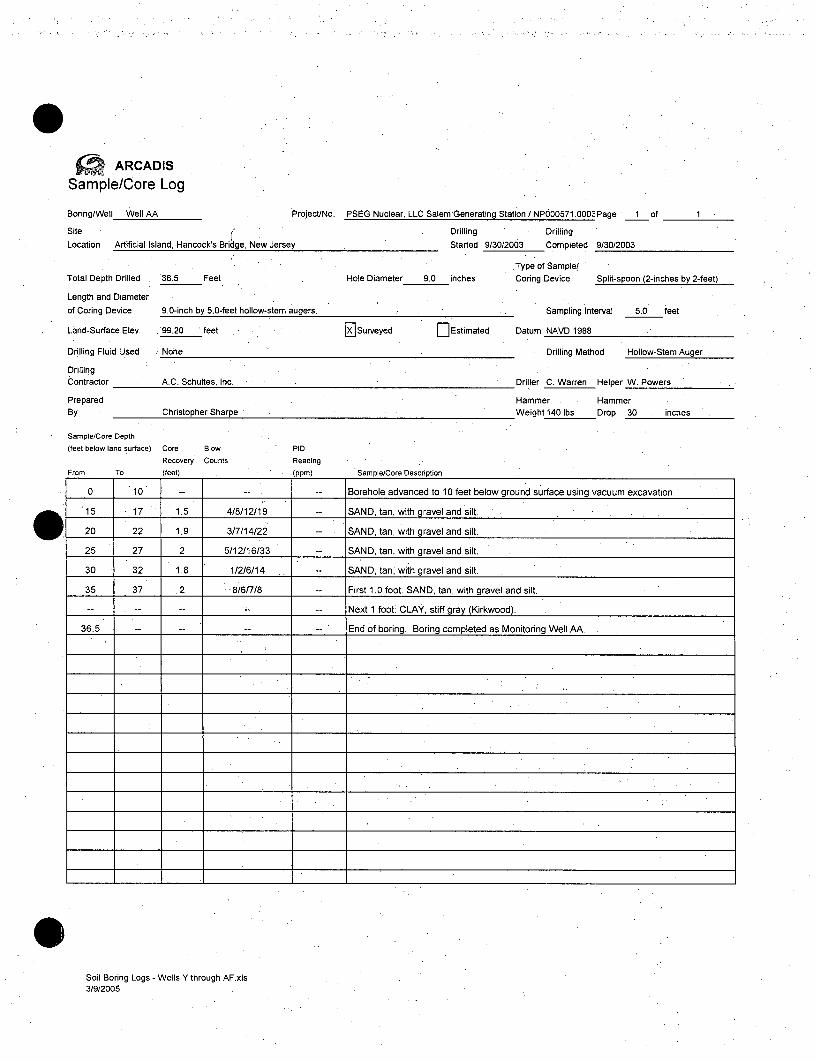
P ARCADISSample/Core Log
Boring/Well Well AA P
Site (Location Artificial Island, Hancock's Bridge, New Jersey
roject/No. PSEG Nuclear, LLC Salem Generating Station / NP000571.0002 Page 1 of 1
Drilling DrillingStarted 9/30/2003 Completed 9/30/2003
Type of Sample/inches Coring Device Split-spoon (2-inches by 2-feet)Total Depth Drilled 36.5 Feet
Length and Diameter
of Coring Device 9.0-inch by 5.0-f
Land-Surface Elev. . 99.20 feet
Drilling Fluid Used None
DrillingContractor A.C. Schultes, It
PreparedBy Christopher Sha
Hole Diameter 9.0
eet hollow-stem augers.
[ Surveyed
Sampling. Interval 5.0 feet
D Estimated Datum NAVD 1988
Drilling Method Hollow-Stem Auger
nc. Driller C. Warren Helper W. Powers
Hammer HammerWeight 140 lbs Drop 30 inchesirpe
Sample/Core Depth
(feet below land surface) Core
Recovery
From To (feet)
Blow
Counts
PID
Reading
(ppm) Sample/Core Description
0 10 -- -- Borehole advanced to 10 feet below ground surface using vacuum excavation.
15 17 1.5 4/8/12/19 SAND, tan, with gravel and silt.
W 20 22 1.9 3/7/14122 SAND. tan. with aravel and silt.
25 27 2 5/12/16/33 -- SAND, tan, with gravel and silt.
30 32 1.8 1/2/6/14 -- SAND, tan, with gravel and silt.
35 37 .2 8/6/7/8 -- First 1.0 foot: SAND, tan, with gravel and silt.
.. .. ..- -- -- Next 1 foot: CLAY, stiff gray (Kirkwood).
36.5 .. .... End of boring. Boring completed as Monitoring Well AA.
Soil Boring Logs - Wells Y through AF.xls3/9/2005

ARCADISSample/Core Log
Boring/Well Well AB PI
Site
Location Artificial Island, Hancock's Bridge, New Jersey
roject/No. PSEG Nuclear, LLC Salem Generating Station / NP000571 .000Z Page 1 of 1
Total Depth Drilled 43 Feet
Length and Diameter
of Coring Device 90-inch by 5.0-f
Land-Surface Elev. 99. 10 feet
Drilling Fluid Used None
Drilling*Contractor A.C. Schultes, Ir
PreparedBy Christopher Sha
Hole Diameter 9.0
Drilling Drilling.
Started 10/2/2003 Completed 10/2/2003
Type of Sample/inches Coring Device Split-spoon (2-inches by 2-feet)
Sampling Interval 5.0 feet
-Estimated Datum NAVD 1988
eet hollow-stem augers.
'Surveyed /qF--.1 ... . .
nrpe
Drilling Method Hollow-Stem Auger
Driller C. Warren Helper W. Powers
Hammer HammerWeight 140 lbs Drop 30 inchesirpe
Sample/Core Depth
(feet below lannd surface) Core
Recovery
Blow
Counts
PID
ReadingInm',•r•m £=mnl•/•nr• R•rintinn
0 10 ...... Borehole advanced to 10 feet below ground surface using vacuum excavation.
15 17 1.2 314/4/5 -- SAND, tan, with gravel and silt.
20 22 2 7/7/12/24 -- SAND, tan, with gravel and silt.
25 27 2 4/12/5/7 -- SAND, tan, with gravel and silt.
30 32 1.2 5/4/5/3 -- SAND, tan, with gravel and silt.
35 37 2 5/7/7/13 -- First 1.8 feeet: SAND, tan, with gravel and silt.
.. .. ...... Next 0.4 foot: SAND, dark gray, medium (petroleum odor).
37 39 2 13/27/13/15 -- First 1.6 feet: SAND, tan, with gravel and silt.
.. .. ......- Next 0.4 foot: SAND, dark gray, clayey.
39 41 2 8/8/8/11 -- First 0.3 foot: SAND, gray.
... .. ..... .- Next 1.4 feet: SAND, tan, with gravel and silt.
. . . ... .. .. .-- N e x t 0 .3 f o o t : S A N D , g r a y .
41 43 2 7/5/3/5 First 1 foot: SLOUGH.
.. .. ......- Next 0.6 foot: SAND, gray, medium.
.. .......- Next 0.3 foot: CLAY, gray, stiff.
43.0 .. ...... End of boring. Boring completed as Monitoring Well AB.
Soil Boring Logs - Wells Y through AF.xls3/9/2005
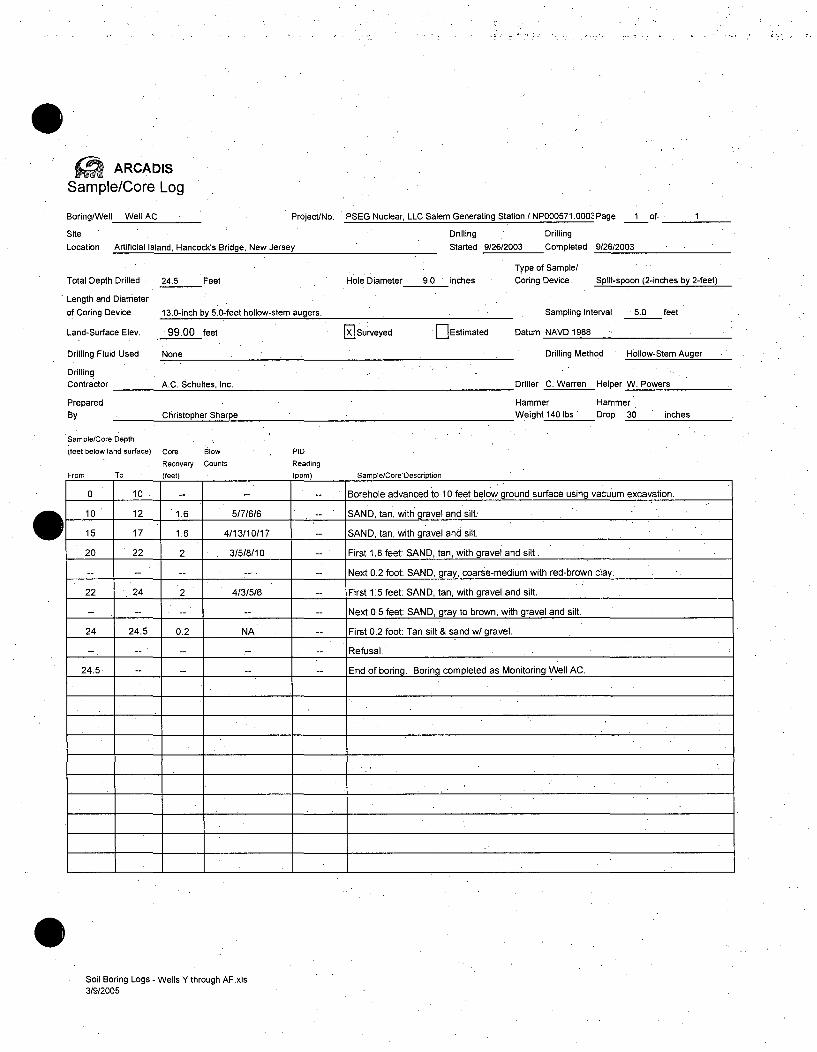
ARCADIS
Sample/Core Log
Boring/Well Well AC Pi
Site
Location Artificial Island, Hancock's Bridge, New Jersey
rojectiNo. PSEG Nuclear, LLC Salem Generating Station / NP000571.0002 Page 1 of 1
Drilling Drilling
Started 9/26/2003 Completed 9/26/2003
Type of Sample/
inches Coring Device Split-spoon (2-inches by 2-feet)Hole Diameter 9.0Total Depth Drilled 24.5 Feet
Length and Diameter
of Coring Device 13.0-inch by 5.0
Land-Surface Elev. 99.00 feet
Drilling Fluid Used None
DrillingContractor A.C. Schultes, Ir
PreparedBy Christopher Sha
-feet hollow-stem augers. Sampling Interval 5.0 feet
FlEstimated Datum NAVD 1988" Surveyed
Drilling Method Hollow-Stem Auger
lc.
.rpe
Driller C. Warren Helper W. Powers
Hammer HammerWeight 140 lbs Drop 30 inches
Sample/Core Depth
(feet below land surface) Core
RecoveryFrom To (feet)
Blow
Counts
PID
Reading
(ppm) Sample/Core Description
0 10 . Borehole advanced to 10 feet below ground surface using vacuum excavation.
10 12 1.6 5/7/6/6 SAND, tan, with qravel and silt.
15 17 1.6 4/13/10/17 SAND, tan, with gravel and silt.
20 22 2 3/5/8/10 -- First 1.8 feet: SAND, tan, with gravel and silt.
.. .. .......- Next 0.2 foot: SAND, gray, coarse-medium with red-brown clay.
22 24 2 4/3/5/6 -- First 1.5 feet: SAND, tan, with gravel and silt.
-- .. .. -.... Next 0.5 feet: SAND, gray to brown, with gravel and silt.
24 24.5 0.2 NA -- First 0.2 foot: Tan silt & sand w/ gravel.
-- -- " -- -- -- Refusal.
24.5 . .. ..... End of boring. Boring completed as Monitoring W ell AC.
0Soil Boring Logs - Wells Y through AF.xls3/9/2005

ARCADISSample/Core Log
Boring/Well Well AD P
Site
Location Artificial Island, Hancock's Bridge, New Jersey
roject/No. PSEG Nuclear, LLC Salem Generating Station / NP000571.0002 Page 1 of 1
Drilling DrillingStarted 10/3/2003 Completed 10/3/2003
Type of Sample/
inches Coring Device Split-spoon (2-inches by 2-feet)Total Depth Drilled 44 Feet
Length and Diameter
of Coring Device 9.0-inch by 5.0-f
Land-Surface Elev. 99.10 feet
.Drilling Fluid Used None
DrillingContractor A.C. Schultes, I
PreparedBy Christopher Sha
Hole Diameter 9.0
feet hollow-stem augers.
FSurveyed
Sampling Interval 5.0 feet
LlEstimated Datum NAVD 1988
Drilling Method Hollow-Stem Auger
nc. Driller C. Warren Helper W. Powers
Hammer . HammerWeight 140 lbs Drop 30 inchesarpe
Sample/Core Depth
(feet below land surface) Core
RecoveryFrom To (feet)
Blow
Counts
PID
Reading
(DOm) Samole/Core Description
0 10 ...... Borehole advanced to 10 feet below ground surface using vacuum excavation.
15 17 2 1/0/0/1 -- CLAY, dark gray with silt and organic material.
20 . 22 2 0/0/0/0 -- CLAY, dark gray with silt and organic material.
25 27 2 1/0/1/1 -- First 1 foot: CLAY, dark gray with silt and organic material.
.. .. ..- -. ... . Next 1 foot: SAND, dark gray with silt.
30 32 2 0/1/2/1 -- CLAY, dark gray with silt and organic material (phragmites).
-- .. ......- First 1 foot: SILT, dark gray with sand.
.. .. ......- Next 1 foot: SAND, dark gray, with silt.
37 39 2 3/7/8/5 -- First 1 foot: CLAY, dark gray, sandy.
.. .. .. ...- Next 1 foot: SAND, gray to brown with gravel.
39 41 - 2 9/12/6/5 -- First 0.5 foot: SLOUGH.
.. .. ....- -- " Next 0.5 foot: SAND, gray, interbedded with dark gray organic material
.. .. .... .. ..- (rhythm ites).
.. .. -...... Next 0.5 foot: CLAY, dark gray.
.. .. -- ..... Next 0.5 foot: SAND, tan, medium.
41 43 2 3/5/5/5 -- First 1 foot: SAND, gray to brown with gravel.
.. .. -...... Next 1 foot: CLAY, dark gray, stiff.
44.0 .. ...... End of boring. Boring completed as Monitoring Well AD.
Soil Boring Logs -Wells Y through AF.xls3/9/2005

SampleARCADISSample/Core Log
Boring/Well Well AE Pt
Site
Location Artificial Island, Hancock's Bridge, New Jersey
roject/No. PSEG Nuclear, LLC Salem Generating Station / NP000571.000Z Page 1 of 1
Drilling Drilling
Started 10/2/2003 Completed 10/2/2003
Type of Sample/inches Coring Device Split-spoon (2-inches by 2-feet)Total Depth Drilled 28 Feet
Length and Diameter
of Coring Device 9.0-inch by 5.0-f
Land-Surface Elev. 99.30 feet
Drilling Fluid Used None
DrillingContractor A.C. Schultes, Ir
PreparedBy Christopher Sha
Sample/Core Depth
Hole Diameter 9.0
eat hollow-stem augers.
X Surveyed
Sampling Interval 5.0 feet
DEstimated Datum NAVD 1988
Drilling Method Hollow-Stem Auger
nc.
rpe
Driller C. Warren Helper W. Powers
Hammer HammerWeight 140 lbs Drop 30 inches
feet below land surface) Core
Recovery
From To (feet)
Blow
Counts
PID
Reading
(ppm) Sample/Core Description
0 10 -- ' " -- lBorehole advanced to 10 feet below ground surface using vacuum excavation.
15 •17. -28/9/18/20 SAND, tan, with qr6vel and silt.
20 22 2 14/14/25/32 SAND, tan, with gravel and silt..
22 24 2 10/7/13/18 -- SAND, tan, with gravel and silt.
24 26 2 6/13/21/20 -- SAND, tan, with gravel and silt.
26 28 1.5 15/16/34/30 -- First 1:6 feet: SAND, tan, with gravei and silt.
- -- -- -..... Next 0.1 foot: CONCRETE chips, w gravel.
28.0 -- End of boring. Boring completed as Monitoring Well AE:
, . ' ,q
0Soil Boring Logs -Wells Y through AF.xls3/9/2005

ARCADISSample/Core Log
Boring/Well Well AF P
Site
Location Artificial Island, Hancock's Bridge, New Jersey
roject/No. PSEG Nuclear, LLC Salem Generating Station / NP000571.0002 Page 1 of . 1
Drilling Drilling
Started 10/1/2003 Completed 10/1/2003
Type of Sample/inches Coring Device Split-spoon (2-inches by 2-feet)Total Depth Drilled
Length and Diameter
of Coring Device
Land-Surface Elev.
Drilling Fluid Used
DrillingContractor
PreparedBy
49.0 Feet Hole Diameter 9.0
9.0-inch by 5.0-feet hollow-stem augers.
99.20 feet
None
lx-Surveyed
Sampling Interval 5.0 feet
r-Estimated Datum NAVD 1988
Drilling Method Hollow-Stem Auger
A.C. Schuftes, Inc. Driller C. Warren Helper W. Powers
Hammer HammerWeight 140 Ibs Drop 30 inchesChristopher Sharpe
Sample/Core Depth
(feet below land surface) Core BlowRecovery Counts
From To (feet)
PID
Reading
(olm) Samole/Core Descriotion
0 10 ...... Borehole advanced to 10 feet below ground surface using vacuum excavation.
15 17 1.4 0/4/4/2 -- SAND, tan, with gravel and silt.
20 22 1.5 4/3/8/14 -- SAND, tan, with gravel and silt.
25 27 2 3/6/10/9 -- First 0.6 foot: SAND, tan, with gravel and silt.
.. .. ......- Next 0.6 foot: SAND, gray, with gravel and clay.
.. .. ......- Next 0.6 foot: SAND, tan, with gravel and silt.
30 32 2 2/1/2/2 -- First 0.33 foot: Tan silt & sand w/ gravel. Next1 foot gray clay,
. Next 0.66 foot gray silty sand.
32 34 2 4/9/13/13 -- First 0.66 foot: CLAY, gray with sand.
.. .. ......- Next 0.6 foot: SAND, dark gray, clayey.
.. .. ......- Next 0.6 foot: SAND, gray.
34 36 2 5/6/5/37 -- SAND, gray with red gravel at the tip.
36 38 2 16/16/13/22 -- SAND, gray, medium.
38 40 2 7/6/9/20 -- SAND, gray with greenish sand at tip.
40 42 2 10/13/24/24 -- SAND, gray with greenish sand at tip.
43 45 2 8/8/8/6 -- SAND, dark gray with gravel.
45 47 2 3/5/5/7 -- First 1.5 feet: SAND, silty with some gravel.
.. .. ......- Next 0.25 foot: SAND, greenish.
.. ..- - --... Next 0.25 foot: CLAY, gray.
47 49 2 5/4/5/6 -- First 1 foot: SLOUGH (loose sand, silt & clay). Next 1 foot: CLAY dark gray.
49.0 End of boring. Boring completed as Monitoring Well AF.
Soil Boring Logs - Wells Y through AF.xls3/9/2005

ARCADIS
Sample/Core Log
Boring/well Well AG-Shallow and Deep Project/No.
Site
Location Artificial Island, Hancock's Bridle, New Jersey
PSEG Nuclear, Salem Generating Station/NP000571.0003 Page 1 of 1
Drilling Drilling
Started 2/912004 Completed 02/09/04
Type of Sample/inches Coring Device Split-SpoonTotal Depth Drilled
Length and Diameter
of Coring Device
Land-Surface Elev.
Drilling Fluid Used
DrillingContractor
PreparedBy
40.0 Feet
2 feet by 2 inches
Hole Diameter 7
"_ -Sampling Interval
FEstimated Datum NAD 83
5 feet
feet . -Surveyed
None Drilling Method Hollow Stem Auger
Talon Drilling Company Driller' Joe A. Helper Bill B.
Hammer HammerWeight 140 pounds Drop 36 inchesJon Rutledge
Sample/Core Depth
(feet below land surface)
From To
Core Blow
Recovery Counts
(feet)
PID
Reading
(ppm) Sample/Core Description
0.0 - 10.0' Vacuum excavation to identify subsurface utilities
10.0 12.0 NR 4-2-3-3 NA 10.0 - 18.0' Tan, fine to medium SAND, well sorted, wet
13.0 15.0 . 1.2 4-3-3-3 0.0
18.0 20.0 1.0 7-5-4-3 0.0 18.0 - 24.7' Tan, fine to medium SAND, well sorted,trace silt, wet
23.0 25.0 0.8 3-2-1-2 0.0 24.7 - 28.0' Black, silty fine SAND, well sorted, wet
28.0 30.0 2.0 1-2-1-2 0.0 28.0 - 29.1' Grey, fine SAND, well sortedl, trace silt, wet
29.1 - 33.0' Black to grey, fine sandy, well sorted, SILT with gravel, wet,
organic odor
33.0 35.0 NR 5-5-6-5 NA 33.0 - 38.0' Black, fine SAND and SILT with GRAVEL, wet
38.0 40.0 1.5 6-6-5-5 0.0 38.0 - 39.2' Dark grey, fine SAND, well sorted, tracesilt, wet
• 39.2 - 39.6' Grey, silty fine to coarse SAND, poorly sorted, with gravel, wet
39.6 - 40.0' Grey, silty fine sandy CLAY with gravel, wet
40.0' End of boring
0Soil Boring Logs - Wells AG through AM.xls3/9/2005

& ARCADISSample/Core Log
Boring/Well Well AH-Shallow and Deep Project/No.
Site
Location Artificial Island, Hancock's Bridge, New Jersey
PSEG Nuclear, Salem Generating Station/NP000571.0003
Drilling Drilling
Started 2/4/2004 Completed
Type of Sample/inches Coring Device
Page 1 of 1
02/04/04
Split-Spoon
terval 5 feet
Total Depth Drilled
Length and Diameter
of Coring Device
Land-Surface Elev.
Drilling Fluid Used
DrillingContractor
PreparedBy
40.0 Feet
2 feet by 2 inches
Hole Diameter 7
feet n Surveyed
Sampling In
-- Estimated Datum NAD 83
None Drilling Method Hollow Stem Auger
Talon Drilling Company Driller Joe A. Helper Bill B.
Hammer HammerWeight 140 pounds Drop 36 inchesJon Rutledge
Sample/Core Depth
(feet below land surface) Core
Recovery
From To (feet)
Blow
Counts
PID
Reading
(ppm) Sample/Core Description
0.0 - 10.0' Vacuum excavation to identify subsurface utilities
10.0 12.0 0.9 2-2-2-2 0.0 10.0 - 15.0' Tan, medium SAND, well sorted, trace silt, wet
15.0 17.0 1.5 3-2-1-2 0.0 15.0- 25.0' Tan, medium SAND, well sorted, wet
20.0 22.0 0.8 2-2-2-140 lbs./O.5' 0.0 25.0 - 30.0' Light grey to tan, fine to medium SAND, well sorted, trace gravel,
25.0 27.0 0.7 3-2-140 lbs./1.0' 0.0 wet
30.0 32.0 2.0 Rods/0.5'-8-11-20 0.0 30.0 - 32.7' Grey, fine to medium SAND, well sorted, trace silt, wet
32.7 - 33.0' Black, GRAVEL, trace fine sand and silt, wet
33.0 35.0 0.2 4-1-2-1 0.0 33.0 - 39.5' Black, fine sandy SILT with gravel, wet
35.0 37.0 NR Rods/2.0' 0.0
38.0 40.0 1.5 3-5-6-6 0.0 39.5 - 40.0' Grey to black, medium to coarse SAND, poorly sorted, with gravel,
trace silt, wet
40.0' End of boring
-I- + +
i 4 + +
Soil Boring Logs - Wells AG through AM.xls3/9/2005

ARCADISSample/Core Log
Boring/Well Well Al Pr
Site
Location Artificial Island, Hancock's Bridge, New Jersey
oject/No. PSEG Nuclear, Salem Generating Station/NP000571.0003 Page 1 of 1
Drilling Drilling
Started 1/20/2004 Completed 1/20/2004
Type of Sample/inches Coring Device Split-SpoonTotal Depth Drilled
Length and Diameter
of Coring Device
Land-Surface Elev.
Drilling Fluid Used
DrillingContractor
PreparedBy
22.0 Feet Hole Diameter 10
2 feet by 2 inches- Sampling Interval
DEstimated Datum NAD 83
5 *feet
feet iXISurveyed
None Drilling Method Hollow'Stem Auger
Talon Drilling Company
Jon Rutledge
Driller Joe A. Helper Joe K.
Hammer HammerWeight 140 pounds Drop 30 inches
Sample/Core
(feet below lar
Depth
nd surface) Core
Recovery
To (feet)
Blow
Counts
PID
Reading
(ppm)From Sample/Core Description
I T [0.0 - 10.0' Vacuum excavation to identify subsurface utilities
0 10.0 12.0 1.2 9-16-19-18 0.0 10.0 - 15.0' Brown, fine to medium SAND, poorly sorted, with gravel and
trace silt, wet
15.0 17.0 1.0 4-9-12-12 ,88.2 15.0 -20.0' Brown, silty fine to medium SAND, poorly sorted, wet,
20.0 22.0 1.3 7-8-9-15 5.1 diesel fuel odor, sheen from 16.5 - 17.0'
20.0 - 22.0' Brown, fine to medium SAND, poorly sorted, with trace silt, wet
diesel fuel odor, sheen from 20.9 - 21.1'
22.0' Auger refusal on lean concrete
0Soil Boring Logs - Wells AG through AM.xls3/9/2005

0ARCADISSample/Core Log
Boring/Well Well AJ P
SiteLocation Artificial Island, Hancock's Bridoe, New Jersey
roject/No. PSEG Nuclear, Salem Generating Station/NP000571.0003
Drilling DrillingStarted 1/22/2004 Completed
Type of Sample/inches Coring Device
Page 1 of. 1
1/22/2004
Split-Spoon
terval 5 feet
Total Depth Drilled
Length and Diameter
of Coring Device
Land-Surface Elev.
Drilling Fluid Used
DrillingContractor
PreparedBy
38.0 Feet
2 feet by 2 inches
Hole Diameter 10
feet nXSurveyed
Sampling In
D Estimated Datum NAD 83
None Drilling Method Hollow Stem Auger
Talon Drilling Company Driller Joe A. Helper Not Applicable
Hammer HammerWeight 140 pounds Drop 30 inchesJon Rutledge
Sample/Core Depth
(feet below land surface) Core
Recovery
From To (feet)
Blow
Counts
PID
Reading
(ppm) Sample/Core Description
0.0 - 10.0' Vacuum excavation to identify subsurface utilities
10.0 12.0 1.1 6-9-12-12 0.0 10.0 - 15.8' Orange to tan, fine to medium SAND, poorly sorted, with gravel
and trace silt, wet
15.0 17.0 1.5 2-2-2-3 0.0 15.8 - 25.0' Black to grey, clayey fine sandy SILT with trace mica,
20.0 22.0 1.0 5-5-7-4 0.0 organic odor, wet
25.0 27.0 2.0 1-1-2-2 0:0 25.0 - 28.0' Black to grey, fine sandy clayey SILT with trace mica,
27.0 29.0 2.0 3-4-4-5 0.0 organic odor, wet
28.0 30.0 2.0 1-1-2-2 0.0 28.0 - 28.4' Brown, silty fine to medium SAND, poorly sorted, with gravel, wet
30.0 32.0 2.0 6-6-7-6 0.0 28.4 - 32.0' Grey, fine sandy silty CLAY with trace mica, wet
32.0 34.0 1.1 5-5-3-3 0.0 32.0 - 34.0' Grey, fine sandy silty CLAY with trace mica and gravel, wet
34.0 36.0 2.0 6-7-8-7 0.0 34.0 - 34.9' Grey, fine sandy silty CLAY, wet
36.0 38.0 2.0 7-7-8-10 0.0 34.9 - 35.2' Grey, silty Clayey fine to medium SAND, poorly sorted, with gravel,
_Wet
35.2 - 38.0' Grey to brown, very stiff CLAY with trace mica,
(Kirkwood Formation), wet
38.0' End of boring
+ 4 + +
Soil Boring Logs - Wells AG through AM.xls3/9/2005

ARCADIS
Sample/Core Log
Boring/Well Well AL P
Site
Location Artificial Island, Hancock's Bridge, New Jersey
'roject/No. PSEG Nuclear, Salem Generating Station/NP000571.0003 Page 1 of 1
Drilling Drilling
Started 1/21/2004 Completed 1/21/2004
Type of Sample/inches Coring Device Split-SpoonTotal Depth Drilled
Length and Diameter
of Coring Device
Land-Surface Elev.
Drilling Fluid Used
DrillingContractor
PreparedBy
26.0 Feet
2 feet by 2 inches
Hole Diameter 7
Sampling Interval
D Estimated Datum NAD 83
.5 feet
feet [] Surveyed
None Drilling Method Hollow Stem Auger
Talon Drilling Company Driller Joe A. Helper. Not Applicable
Hammer HammerWeight 140 pounds Drop 30 inchesJon Rutledge
Sample/Core Depth
(feet below land surface) Core
Recovery
From To (feet)
Blow
Counts
PID
Reading
(ppm) Sample/Core Description
0.0 - 10.0' Vacuum excavation to identify subsurface utilities
9.0 11.0 0.5 2-2-4-5 0.0 11.0 - 21.0' Orange to brown, fine to medium SAND, poorly sorted, with gravel
15.0 17.0 1.2 9-7-6-5 0.0 and trace silt, wet
17.0 19:0 0.4 . 5-5-4-3 0.0
19.0 21.0 0.8 7-8-9-11 0.0
24.0 26.0 1.4 9-13-23-24 0.0 21.0 -'26.0' Orange totbrown, silty fine to medium SAND, poorly sorted, with
__gravel, wet
26.0' End of boring
______ t ______*1 _____ I ____________ _______ I _____________________________________________________
+ ____ . . t I
Soil Boring Logs - Wells AG through AM.xls3/9/2005

ARCADIS
Sample/Core Log
Boring/Well Well AM P
Site
Location Artificial Island, Hancock's Bridge, New Jersey
roject/No. PSEG Nuclear, Salem Generating Station/NP000571.0003 Page 1 of 1
Drilling Drilling
Started 1/152004 Completed 1/15/2004
Type of Sample/inches Coring Device Split-SpoonTotal Depth Drilled
Length and Diameter
of Coring Device
Land-Surface Elev.
Drilling Fluid Used
DrillingContractor
PreparedBy
20.9 Feet
2 feet by 2 inches
Hole Diameter 10
Sampling Interval
Datum NAD 83
5 feet
feet ESurveyed. D Estimated
None Drilling Method Hollow Stem Auger
Talon Drilling Company Driller Joe A. Helper Joe K.
Hammer HammerWeight 140 pounds Drop 30 inchesJon Rutledge
Sample/Core Depth
(feet below land surface) Core BlowRecovery Counts
From To (feet)
PID
Reading
(ppm) Sample/Core Description
0.0 - 10.0' Vacuum excavation to identify subsurface utilities
10.0 12.0 112 " 9-13-12-8 0.0 10.0 - 16.5' Tan to orange, medium to coarse SAND, poorly sorted, with
15.0 17.0 1.1 4-16-17-34 0.0 gravel, wet
20.0 • 20.8 0.5 " 9-50/0.3' 0.0 16.5 - 20.0' Tan fine to medium sandy, poorly sorted, SILT, wet
20.0 - 20.9' Grey, silty medium to coarse SAND, poorly sorted, wet
20.9' Auger refusal on lean concrete
_____ t _____ I ____ ] * *I. .1 ____________________________________________
4 4 -I- 4 4
4 4 + 4 1
4 4 4- 4 4
+ 4 + 4 . I
__ __ _ I ___ __ _______________
Soil Boring Logs - Wells AG through AM.xls3/9/2005

r ARCADIS
Well Construction Log(Unconsolidated)
Outer Protective Steel Well Casing
Well Identification Well M
Project/No. PSEG Nuclear, LLC - Salem Generating Station/NP000571.0002
Site Location Salem Generating Station -Artificial Island
Town/City Hancock's Bridge
County Salem State New Jersey
Permit No. 3400006990
Land-Surface Elevation 99.26 feet W Surveyed
Top-of-Casing Elevation 102.17 feet Estimated
Datum New Jersey State Plane Coordinates NAD 83
Installation Date(s) May 5, 2003
Drilling Method Hollow Stem Auger
Drilling Contractor CT&E Environmental Services, Inc
Dnlling Fluid Not Applicable (NA),
-,Development Technique(s) and Date(s): Peristaltic pump on May 5, 2003.Development was considered complete when turbidity in discharge
was reduced/eliminated.
Fluid Loss During Drilling: 0 gallons
Water Removed During Development: 10 gallons
Static Depth to Water: 'NA feet below M.P.-
Pumping Depth to Water: NA feet below M.P.ý*
Pumping Duration: 0.75 hours
Yield NA gpm Date: NA
Specific Capacity: NA gpm/ft
Well Purpose Well installed to monitor groundwater quality.
Remarks Vacuum excavation was performed to a depth of 10 feetbelow ground surface at the location of the monitoring well to help identifypotential utilities.
Prepared by: Jon Rutledae
M.P. Measuring Point. Top of 2-inch PVC well casing unless otherwise noted.Depth Below Land Surface

. ARCADIS
Well Construction Log(Unconsolidated)
Outer Protective Steel Well Casing
Well Identification Well R
Lockable Expanding Well
6 inch diametervacuum excavation hole
Project/No. PSEG Nuclear, LLC - Salem Generating Station/NP000571 .0002
Site Location Salem Generating Station - Artificial Island
Town/City Hancock's Bridge
County Salem State New Jersey
Permit No. 3400006991
Land-Surface Elevation 99.82 feet [ Surveyed
Top-of-Casing Elevation 102.35 feet Estimated
Datum New Jersey State Plane Coordinates NAD 83
Installation Date(s) June 6, 2003
Drilling Method Hollow Stem Auger
Drilling Contractor CT&E Environmental Services, Inc
Drilling Fluid Not Applicable (NA)
Development Technique(s) and Date(s): Perstaltic pump on June 6, 2003.Development was considered complete when turbidity in discharge
was reduced/eliminated.
Well Casing1 inch diameter
Schedule 40 PVC
- 5% Bentonite Grout
7 ft* Bottom of 5% Bentonite Grout
XX ft*t I--- Top of Pre-packed Well Screen
16.0 ft- Bottom of Vacuum Excavation
Pre-packed Well Screen1 inch diameter, 0.01 Slot
Schedule 40 PVC
3.25 inch diameterdrilled hole
Fluid Loss During Drilling: 0 gallons
Water Removed During Development: 10 gallons
Static Depth to Water: 6.91 feet below M.P.-
Pumping Depth to Water. NA feet below M.P.-
Pumping Duration: 0.5 hours
Yield: NA gpm Date: NA
Specific Capacity: NA gpm/ft
Well Purpose Well installed to monitor groundwater quality.
Remarks Vacuum excavation was performed to a depth of 10 feetbelow ground surface at the location of the monitoring well to help identifypotential utilities.
LEGEND
Overburden
== No. 1 Mone Sand
= = 5% Bentonite Grout
SCALE
Prepared by: . Jon RutledgeNot to Scale.
19 ft* Bottom of Well M.P. Measuring Point. Top of 2-inch PVC well casing unless otherwise noted.Depth Below Land Surface
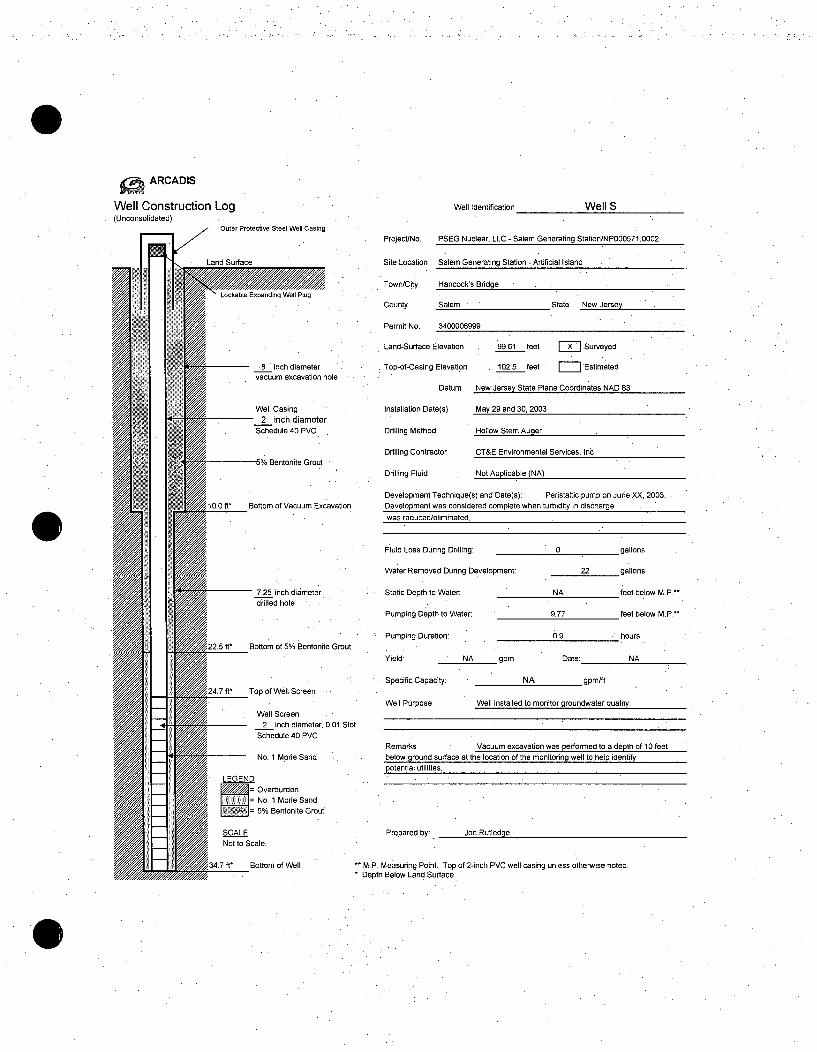
ARCADIS
Well Construction Log(Unconsolidated)
Outer Protective Steel Well Casing
Land Surface
Well Identification Well S
Project/No. PSEG Nuclear, LLC - Salem Generating Station/NP000571.0002
Site Location Salem Generating Station - Artificial Island
Town/City Hancock's Bridge
County Salem . State New Jersey
Permit No. 3400006999
Land-Surface Elevation 99,61 feet 7 Surveyed
Top-of-Casing Elevation 102.5 feet " Estimated
Datum New Jersey State Plane Coordinates NAD 83
Installation Date(s) May 29 and 30, 2003
Drilling Method Hollow Stem Auger
Drilling Contractor CT&E Environmental Services, Inc
Drilling Fluid Not Applicable (NA)
Development Technique(s) and Date(s): Pedstaltic pump on June XX, 2003.Development was considered complete when turbidity in discharge
was reduced/eliminated.
Fluid Loss During Drilling: 0 gallons
Water Removed During Development: 22 gallons
Static Depth to Water: NA feet below M.P.
Pumping Depth to Water: 9.77 feet below M.P.
Pumping Duration: 0.9 hours
Yield: NA gpm Date: NA
Specific Capacity: NA gpm/ft
Well Purpose Well installed to monitor groundwater quality.
Remarks Vacuum excavation was performed to a depth of 10 feetbelow ground surface at the location of the monitoring well to help identify
potential utilities.
Prepared by: dull rXULI~U~~
M.P. Measuring Point. Top of 2-inch PVC well casing unless otherwise noted.Depth Below Land Surface
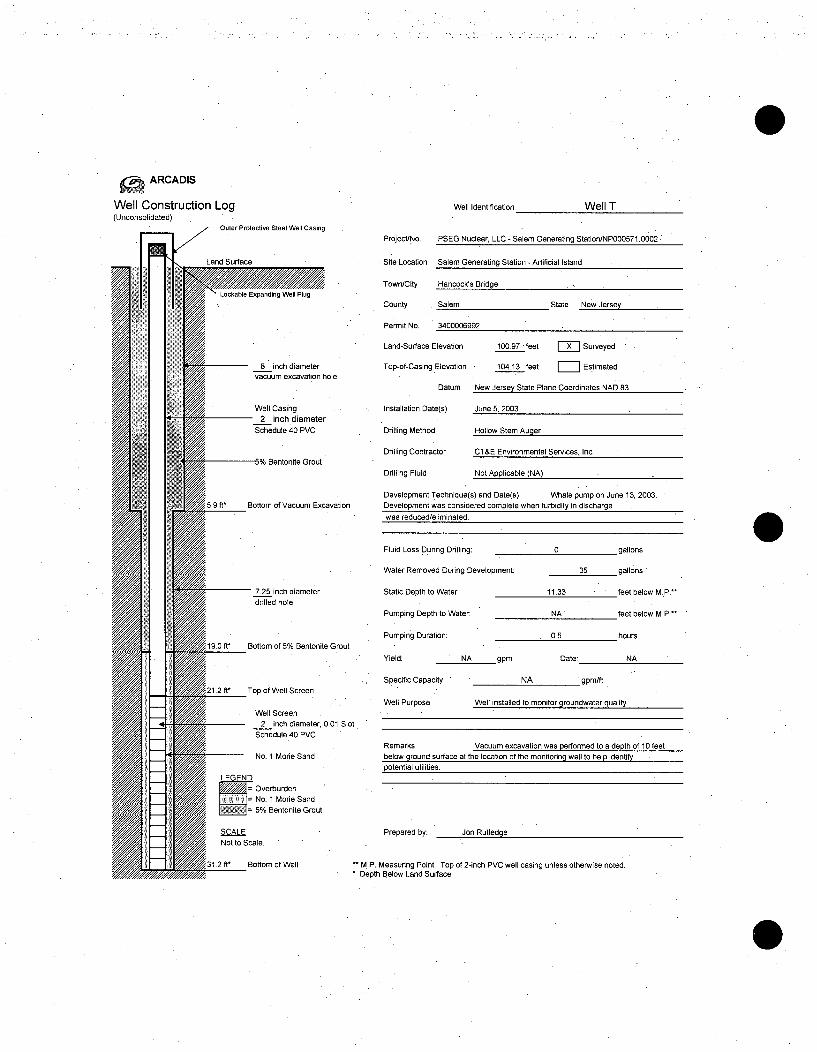
ARCADIS
Well Construction Log(Unconsolidated)
r• • Outer Protective Steel Well Casing
Well Identification Well T
Project/No. PSEG Nuclear, LLC - Salem Generating Station/NP000571.0002
Site Location Salem Generating Station -Artificial Island
Town/City Hancock's Bridge
County Salem State New Jersey
Permit No. 3400006992
Land-Surface Elevation 100.97. feet [X Surveyed -
Top-of-Casing Elevation 104.13 feet = Estimated
Datum New Jersey State Plane Coordinates NAD 83
Installation Date(s) June 5, 2003
Drilling Method Hollow Stem Auger
Drilling Contractor CT&E Environmental Services, Inc
Drilling Fluid Not Applicable (NA)
Development Technique(s) and Date(s): Whale pump on June 13, 2003.Development was considered complete when turbidity in discharge
was reduced/eliminated.
Fluid Loss During Drilling: 0 gallons
Water Removed During Development: 35 gallons'
Static Depth to Water: 11.33 feet below M.P.-
Pumping Depth to Water: NA feet below M.P.-
Pumping Duration: 0.5 hours
Yield: NA gpm Date: NA
Specific Capacity: NA gpm/ft
Well Purpose . Well installed to monitor groundwater quality.
Remarks Vacuum excavation was performed to a depth of 10 feetbelow ground surface at the location of the monitoring well to help identifypotential utilities,
Prepared by: Jon Rutledge
**M.P. Measuring Point. Top of 2-inch PVC well casing unless otherwise noted.Depth Below Land Surface

ARCADIS
Well Construction Log(Unconsolidated)
Outer Protective Steel Well Casing
Well Identification Well U
-U'.-alt -xp-H."y W.- -Yg
8 inch diametervacuum excavation hole
Project/No. PSEG Nuclear, LLC - Salem Generating Station/NP000571.0002
Site Location Salem Generating Station - Artificial Island
Town/City Hancock's Bridge
County Salem State New Jersey
Permit No. 3400006994
Land-Surface Elevation 99.54 feet X Surveyed
Top-ot-Casing Elevation 101.54 feet Estimated
Datum New Jersey State Plane Coordinates NAD 83
Installation Date(s) May 28 and 29, 2003
Drilling Method Hollow Stem Auger.
Drilling Contractor CT&E Environmental Services, Inc
Drilling Pluid Not Applicable (NA)
Development Technique(s) and Date(s): Whale pump on June 10, 2003.
Development was considered complete when turbidity in discharge
was reduced/eliminated.
Well Casing2 inch diameter
Schedule 40 PVC
"- 5% Bentonite Grout
0I10.0 ft* Bottom of Vacuum Excavation
7.25 inch diameterdrilled hole
Fluid Loss During Drilling: 0 gallons
Water Removed During Development: 55 gallons
Static Depth to Water: 8.53 feet below M.P.*
Pumping Depth to Water: NA feet below M.P.-
Pumping Duration: 1 hours
Yield: NA gpm Date: NA
Specific Capacity: NA. gpm/ft
Well Purpose Wel installed to monitor groundwater quality.
7/
25.2 ft Bottom of 5% Bentonite Grout
7.2 ft* Top of Well Screen
Well Screen2 inch diameter, 0.01 Slot
Schedule 40 PVC
No. 1 Mode SandRemarks Vacuum excavation was performed to a depth of 10 feet
below ground surface at the location of the monitoring well to help identity
potential utilities.
LEGEND
OverburdenNo. I Mode Sand
5% Bentonite Grout
SCALENot to Scale.
!.2 ft* Bottom of WellM - End of Boring
Prepared by: . Jon Rutledge
MP. Measuring Point. Top of 2-inch PVC well casing unless other/wise noted.Depth Below Land Surface
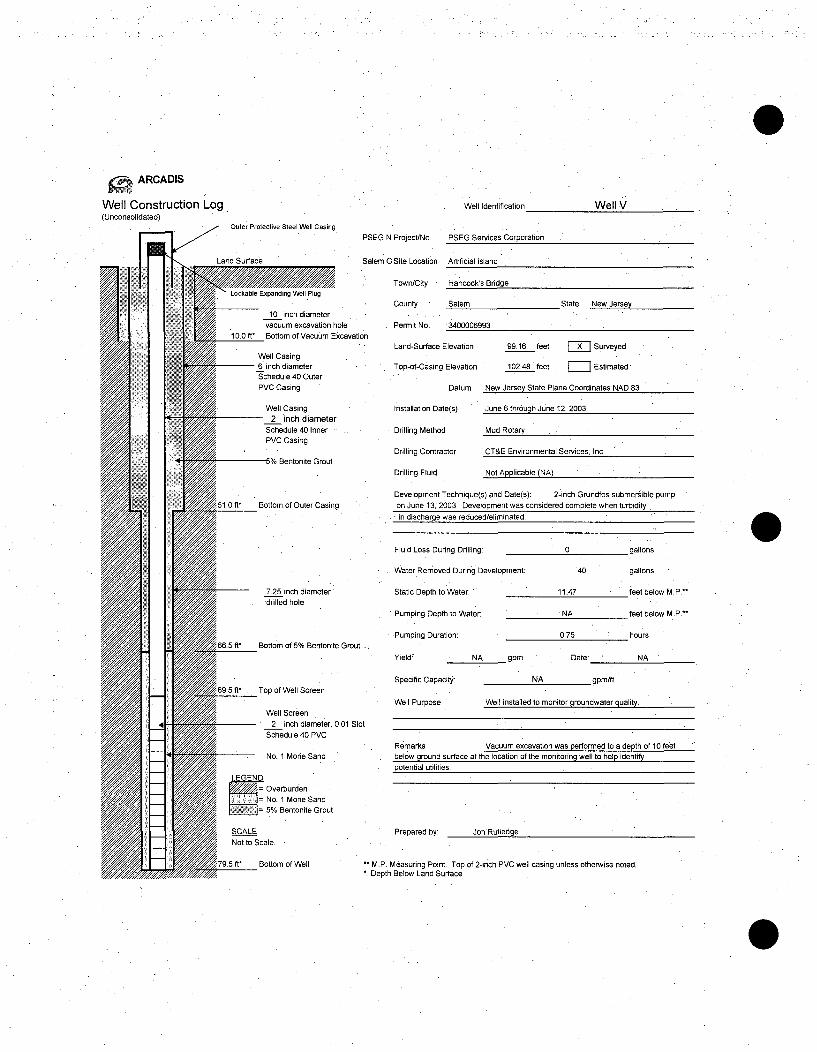
ARCADIS
Well Construction Log(Unconsolidated)
Outer Protective Steel Well Casing
Well Identification Well V
PSEG N Project/No. PSEG Services Corporation
Salem G Site Location Artificial Island
Town/City Hancock's Bridge
County Salem State New Jersey
Permit No 3400006993on
Land-Surface Elevation 99.16 feet Surveyed
Top-of-Casing Elevation 102.48 feet Estimated
Datum New Jersey State Plane Coordinates NAD 83
Installation Date(s) June 6 through June 12, 2003
Drilling Method Mud Rotary
Drilling Contractor CT&E Environmental Services, Inc
Drilling Fluid Not Applicable (NA)
Development Technique(s) and Date(s): 2-inch Grundfos submersible pumpon June 13, 2003 Development was considered complete when turbidity
in discharge was reduced/eliminated.
Fluid Loss During Drilling: 0 gallons
Water Removed During Development: 40 gallons
Static Depth to Water. 11.47 feet below M.P.-
Pumping Depth to Water: NA feet below M.P.-
Pumping Duration: 0.75 hours
Yield: NA gpm Date: NA
Specific Capacity: NA gpm/ft
Well Purpose Well installed to monitor groundwater quality.
Remarks Vacuum excavation was performed to a depth of 10 feetbelow ground surface at the location of the monitoring well to help identifypotential utilities.
Prepared by: Jon Rutledge
M.P. Measuring Point. Top of 2-inch PVC well casing unless otherwise noted.Depth Below Land Surface

* ARCADIS
Well Construction Log(Unconsolidated)
Outer Protective Steel Well Casing
Well Identification Well W
Project/No. PSEG Nuclear, LLC - Salem Generating Station/NP000571.0002
Site Location Salem Generating Station - Artificial Island
Town/City Hancock's Bridge
County Salem State New Jersey
Permit No. 3400006995
Land-Surface Elevation 99.36 feet i7 Surveyed
Top-of-Casing Elevation 101.67 feet, - Estimated
Datum New Jersey State Plane CoordinatesNAD 83
Installation Date(s) June 2 and 3, 2003
Drilling Method Hollow Stem Auger
Drilling Contractor CT&E Environmental Services, Inc
Drilling Fluid Not Applicable (NA)
Development Technique(s) and Date(s): Whale pump on June 11 2003.Development was considered complete when turbidity in discharge
was reduced/eliminated.0Fluid Loss During Drilling: 0 gallons
Water Removed During Development: 15 gallons
Static Depth to Water: 9.03 feet below M.P.-
Pumping Depth to Water: NA feet below M.P.-
Pumping Duration: 0.2 hours
Yield: NA gpm Date: NA
Specific Capacity: NA gpm/ft
Well Purpose Well installed to monitor groundwater quality.
Remarks Vacuum excavation was performed to a depth of 10 feetbelow ground surface at the location of the monitoring well to help identify
ootential utilities.
Prepared by: - I -- Uyý
M.P. Measuring Point. Top of 2-inch PVC well casing unless otherwise noted.Depth Below Land Surface

; ARCADIS
Well Construction Log(Unconsolidated)
-Ouer Protective Steel Well Casing
I F ff -, 3... .....
Well Identification Well Y
- LcKable Lxpadaing vv
I
8 inch diametervacuum excavation hole
Project/No. PSEG Nuclear, LLC - Salem Generating Station / NP000571.0003
Site Location Artificial Island, Hancock's Brdge, New Jersey
Town/City Hancock's Bridge
County Salem State New Jersey
Permit No. 340007078
Land-Surface Elevation 99.20 feet X Surveyed
Top-of-Casing Elevation 101.81 feet Estimated
Datum NAVD 1988
Installation Date(s) September 27, 2003
Drilling Method Hollow-Stem Auger
Drilling Contractor A.C. Schultes, Inc.
Drilling Fluid Not Applicable (NA)
Development Technique(s) and Date(s): Submersible pump onOctober 7, 2003. Development was considered complete when
turbidity in discharge was reduced/eliminated.
Well Casing2 inch diameter
Schedule 40 PVC
- - 5% Bentonite Grout
10.0 ft* Bottom of Vacuum Excavation
6.25 inch diameter
drilled hole
25.0 ft* Bottom of 5% Bentonite Grout
Fluid Loss During Drilling: 0 gallons
Water Removed During Development: 50 gallons
Static Depth to Water: 10 feet below M.P.-
Pumping Depth to Water. 27 feet below M.P.-
Pumping Duration: 2.9 hours
Yield: 1 gpm Date: October 7, 2003
Specific Capacity: 0.06 gpm/ft
Well Purpose Well installed to monitor groundwater quality.
Remarks Vacuum excavation was performed to a depth of 10 feetbelow ground surface at the location of the monitoring well to help identifypotential utilities.
27.0 ft* .Top of Well Screen
Well Screen
2 inch diameter, 0.01 SlotSchedule 40 PVC
No. 1 Mode Sand
LEGEND
OverburdenNo. 1 Mode Sand
5% Bentonite Grout
SCALENot to Scale.
37.0 ft* Bottom of Well
40.0 ft* End of Boring
Prepared by: Christopher Sharpe
M.P. Measuring Point. Top of 2-inch PVC well casing unless otherwise noted.
Depth Below Land Surface

ARCADIS
Well ConstructionLog(Unconsolidated)
S Outer Protective Steel Well CasingI 3 Feet
Well Identification Well Z
Project/No. PSEG Nuclear, LLC - Salem Generating Station I NP000571.0003
Site Location Artificial Island, Hancock's Bridge, New Jersey
Town/City Hancock's Bridge
County Salem State New Jersey
Permit No. 340007079
Land-Surface Elevation 99.30 feet X Surveyed
Top-of-Casing Elevation 101.86 feet Estimated
Datum NAVD 1988
Installation Date(s) September 30, 2003
Drilling Method Hollow-Stem Auger
Drilling Contractor A.C. Schultes, Inc.
Drilling Fluid - Not Applicable (NA)
Development Technique(s) and Date(s): Submersible pump on
October 7, 2003. Development was considered complete whenturbidity in discharge was reduced/eliminated.
Fluid Loss During Drilling: 0 gallons
Water Removed During Development: 50 gallons
Static Depth to Water: 10.5 feet below M.P.-
Pumping Depth to Water: 24.5 feet below M.P.-
Pumping Duration: 1 hours
Yield: 2 gpm Date: October 7, 2003
Specific Capacity: 0.14 gpm!ft
Well Purpose Well installed to monitor groundwater quality.
Remarks Vacuum excavation was performed to a depth of 10 feetbelow ground surface at the location of the monitoring well to help identifypotential utilities.
Prepared by: Christopher Sharpe
M.P. Measuring Point. Top of 2-inch PVC well casing unless otherwise noted.
Depth Below Land Surface
0

ARCADIS
Well Construction Log(Unconsolidated)
Outer Protective Steel Well Casing3 Feet
Well Identification Well AA
Project/No. PSEG Nuclear, LLC - Salem Generating Station / NP000571.0003
Site Location Artificial Island, Hancock's Bridge, New Jersey
Town/City Hancock's Bridge
County Salem State New Jersey
Permit No. 340007080
Land-Surface Elevation 99.20 feet Surveyed
Top-of-Casing Elevation 101.56 feet Estimated
Datum NAVD 1988
Installation Date(s) September 30, 2003
Drilling Method Hollow-Stem Auger
Drilling Contractor A.C. Schultes, Inc.
Drilling Fluid Not Applicable (NA)
Development Technique(s) and Date(s): Submersible pump onOctober 7, 2003. Development was considered complete when
turbidity in discharge was reduced/eliminated.
Fluid Loss During Drilling: 0 gallons
Water Removed During Development: 50 gallons
Static Depth to Water: 10 feet below M.P.-
Pumping Depth to Water: 21.5 feet below M.P.-
Pumping Duration: 1 hours
Yield: 1.8 gpm Date: October 7, 2003
Specific Capacity: 0.16 gpm/ft
Well Purpose Well installed to monitor groundwater quality.
Remarks Vacuum excavation was performed to a depth of 10 feetbelow ground surface at the location of the monitoring well to help identifypotential utilities.
Prepared by: Christopher Sharpe
M.P. Measuring Point. Top of 2-inch PVC well casing unless otherwise noted.
* Depth Below Land Surface

ARCADIS
Well Construction Log(Unconsolidated)
Outer Protective Steel Well Casing3' Feet
Well Identification Well AB
Lockable Expanding Well Plug
8 inch diametervacuum excavation hole
Well Casing2 inch diameter
Schedule 40 PVC
- -5% Bentonite Grout
10.0 ft* Bottom of Vacuum Excavation
6.25 inch diameterdrilled hole
Project/No. PSEG Nuclear, LLC - Salem Generating Station I NP000571.0003
Site Location Artificial Island, Hancock's Bridge, New Jersey
Town/City Hancock's Bridge
County Salem State• New Jersey
Permit No. 340007081
Land-Surface Elevation 99.10 feet • Surveyed
Top-of-Casing Elevation 101.83 feet Estimated
Datum NAVD 1988
Installation Date(s) October 2, 2003
Drilling Method Hollow-Stem Auger
Drilling Contractor A.C. Schultes, Inc.
Drilling Fluid Not Applicable (NA)
Development Technique(s) and Date(s): Submersible pump on
October 7, 2003. Development was considered complete when
turbidity in discharge was reduced/eliminated..
Fluid Loss During Drilling: 0 gallons
Water Removed During Development: 50 gallons
Static Depth to Water: 9.5 feet below M.P.-
Pumping Depth to Water: 19.7 feet below M.P.-
Pumping Duration: 1.3 hours
Yield: 1.25 gpm Date: October 7, 2003
Specific Capacity: .0.12 gpm/ft
Well Purpose Well installed to monitor groundwater quality.
4
30.0 ft* Bottom of 5% Bentonite Grout
32.0 ft Top of Well Screen
Well Screen
- .__ 2 inch diameter, 0.01 Slot
Schedule 40 PVC
No. 1 Mode SandRemarks Vacuum excavation was performed to a depth of 10 feetbelow ground surface at the location of the monitoring well to help identify
potential utilities.
LEGEND"Oerburden
•=No. 1 Mode Sand
ý=.5% Bentonite Grout
SCALENot to Scale.
42.0 ft* Bottom of Well
43.0 ft* End of Boring
Prepared by: Christopher Sharpe
M.P. Measuring Point. Top of 2-inch PVC well casing unless otherwise noted.
Depth Below Land Surface
0
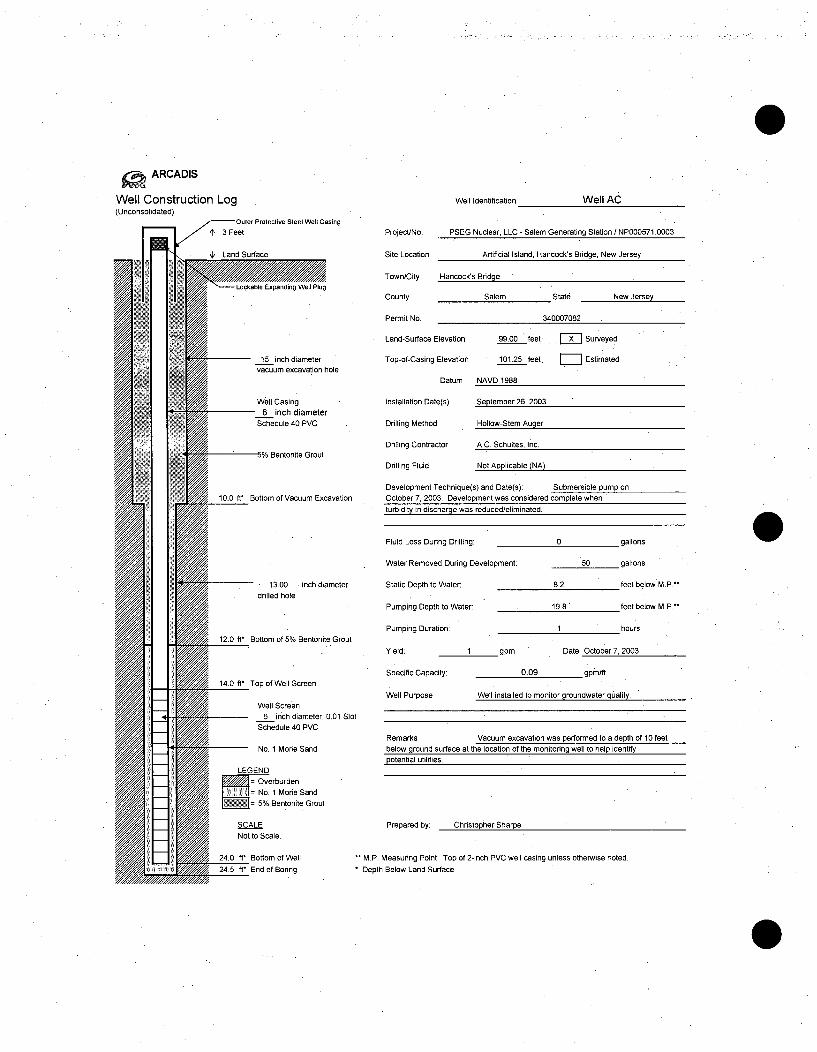
ARCADIS
Well Construction Log(Unconsolidated)
iuOuter Protective Steel Well Casing
3 Feet
Well Identification Well AC
-- cOxKa..'e tpanoeng
15 inch diametervacuum excavation hole
Project/No. PSEG Nuclear, LLC - Salem Generating Station / NP000571.0003
Site Location Artificial Island, Hancock's Bridge, New Jersey
Town/City Hancock's Bridge
County Salem State New Jersey
Permit No. 340007082
Land-Surface Elevation 99.00 'feet FT] Surveyed
Top-of-Casing Elevation 101.25 feet, [ Estimated
Datum NAVD 1988
Installation Date(s) September 26, 2003
Drilling Method Hollow-Stem Auger
Drilling Contractor A.C. Schultes, Inc.
Drilling Fluid Not Applicable (NA)
Development Technique(s) and Date(s): Submersible pump onOctober 7, 2003. Development was considered complete when
turbidity in discharge was reduced/eliminated.
Well Casing6 inch diameter
Schedule 40 PVC
-- -- 5% Bentonite Grout
10.0 ft* Bottom of Vacuum Excavation
13.00 inch diameter
drilled hole
Fluid Loss During Drilling: 0 gallons
Water Removed During Development: 50 gallons
Static Depth to Water: 8.2 feet below M.P.-
Pumping Depth to Water: 19.8' feet below M.P.-*
Pumping Duration: 1 hours
Yield: 1 gpm Date: October 7, 2003
Specific Capacity: 0.09 gprn/ft
Well Purpose Well installed to monitor groundwater quality.
4
12.0 ft* Bottom of 5% Bentonite Grout
14.0 ft* Top of Well Screen
Well Screen6 inrch diameter, 0.01 Slot
Schedule 40 PVC
No. 1 Mode SandRemarks Vacuum excavation was performed to a depth of 10 feetbelow ground surface at the location of the monitoring well to help identifypotential utilities.
LEGEND
OverburdenNo. I Mode Sand
o5%Y Bentonite Grout
SCALENot to Scale.
24.0 ft* Bottom of Well
24.5 ft* End of Boring
Prepared by: Christopher Sharpe
M.P. Measuring Point. Top of 2-inch PVC well casing unless otherwise noted.
Depth Below Land Surface
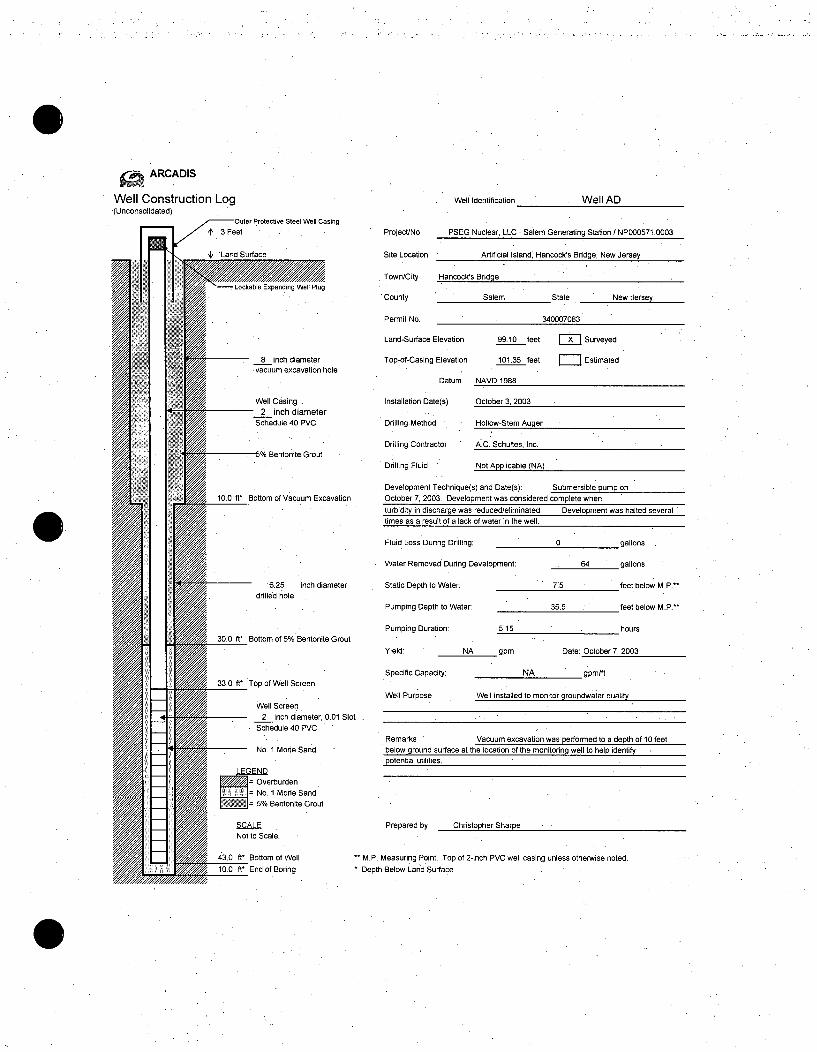
0 ARCADISWell Construction Log(Unconsolidated)
( lOuter Protective Steel Well Casing
t 3 Feet
Well Identification Well AD
8 inch diameter• vacuum excavation hole
Well Casing
2 inch diameterSchedule 40 PVC
"-- % Bentonite Grout
10.0 ft* Bottom of Vacuum Excavation
6.25 inch diameterdrilled hole
Project/No. PSEG Nuclear, LLC - Salem Generating Station t NP000571.0003
Site Location Artificial Island, Hancock's Bridge, New Jersey
Town/City Hancock's Bridge
County Salem State New Jersey
Permit No. 340007083
Land-Surface Elevation 99.10 feet X Surveyed
Top-of-Casing Elevation 101.35 feet Estimated
Datum NAVD 1988
Installation Date(s) October 3, 2003
Drilling Method Hollow-Stem Auger
Drilling Contractor A:.C. Schultes, Inc.
Drilling Fluid Not Applicable (NA)
Development Technique(s) and Date(s): Submersible pump onOctober 7, 2003. Development was considered complete when
turbidity in discharge was reduced/eliminated. Development was halted severaltimes as a result of a lack of water in the well.
Fluid Loss During Drilling: 0 gallons
Water Removed Durng Development: 64 gallons
Static Depth to Water: 7.5 feetbelow M.P.-
Pumping Depth to Water: 35.5 feet below M.P.-
Pumping Duration: 5.15 hours
Yield: NA gpm Date: October 7, 2003
Specific Capacity: NA gpm/ff
Well Purpose Well installed to monitor groundwater quality.730.0 ft* Bottom of 5% Bentonite Grout
33.0 ft* Top of Well Screen
Well Screen
2 inch dia meter, 0.01 SlotSchedule 40 PVC
No. 1 Mode Sand
LEGEND
OverburdenNo. 1 Morie Sand5% Bentonite Grout
SCALENot to Scale.
43.0 f6* Bottom of Well
10.0 F End of Boring
Remarks Vacuum excavation was performed to a depth of 10 feetbelow ground surface at the location of the monitoring well to help identifypotential utilities.
Prepared by: Christopher Sharpe
M.P. Measuring Point. Top of 2-inch PVC well casing unless otherwise noted.
Depth Below Land Surface
0
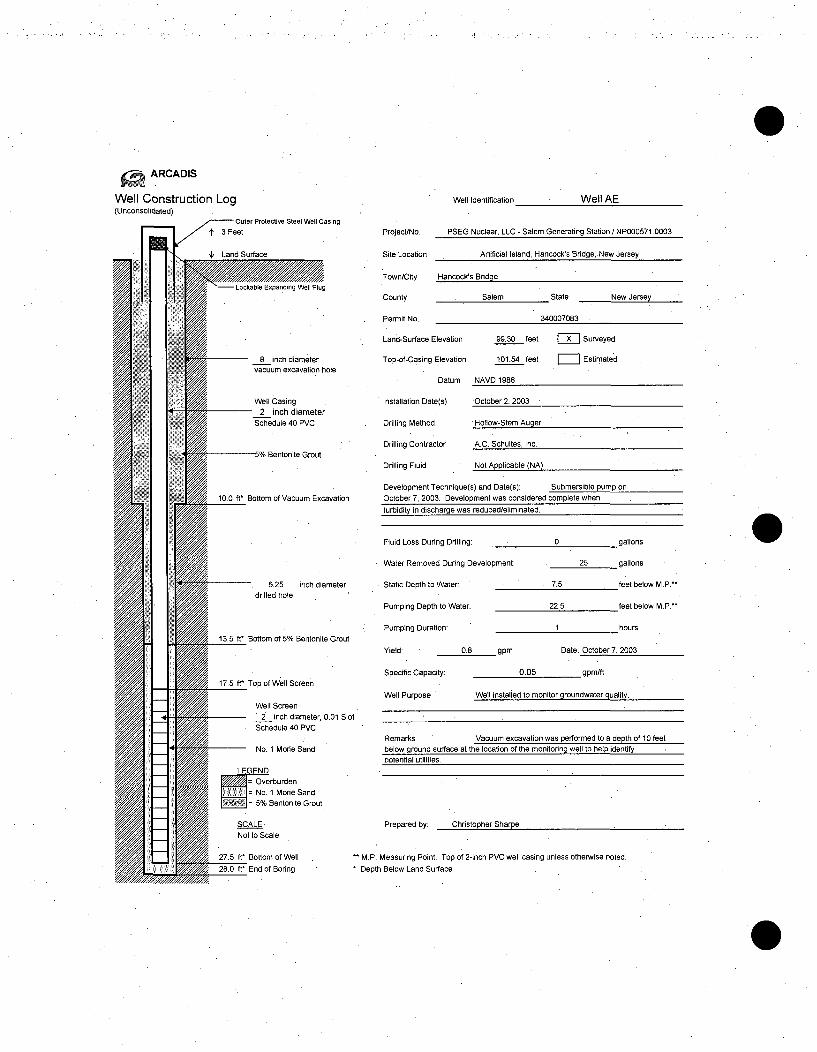
ARCADIS
Well Construction Log(Unconsolidated)
Outer Protective Steel Well Casing
t 3 Feet
IFP1 .~
Well Identification .Well AE
Project/No. PSEG Nuclear, LLC - Salem Generating Station / NP000571.0003
Site Location Artificial Island, Hancock's Bridge,New Jersey
Town/City Hancock's Bridge
County Salem . State New Jersey
Permit No. 340007083
Land-Surface Elevation 99.30 feet X Surveyed
Top-of-Casing Elevation 101.54 feet Estimated
Datum NAVD 1988
Installation Date(s) October 2, 2003
Drilling Method Hollow-Stem Auger
Drilling Contractor A.C. Schultes, Inc.
Drilling Fluid Not Applicable (NA)
Development Technique(s) and Date(s): Submersible pump on
October 7, 2003. Development was considered complete when
turbidity in discharoe was reduced/eliminated.
Fluid Loss During Drilling: 0 gallons
Water Removed During Development: 25 gallons
Static Depth to Water: 7.5 feet below M.P.-
Pumping Depth to Water: 22.5 feet below M.P.-
Pumping Duration: 1 hours
Yield: 0.8 gpm Date: October 7, 2003
Specific Capacity: 0.05 gpm/ft
Well Purpose Well installed to monitor groundwater quality.
Remarks Vacuum excavation was performed to a depth of 10 feet.
below ground surface at the location of the monitoring well to help identify
potential utilities.
Prepared by: Christopher Sharpe
M.P. Measuring Point. Top of 2-inch PVC well casing unless otherwise noted.
Depth Below Land Surface

ARCADIS
Well Construction Log Well Ide'ntification Well AF(Unconsolidated)
Outer Protective Steel Well Casing3 Feet Project/No. PSEG Nuclear, LLC - Salem Generating Station / NP000571.0003
4' Land Surface Site Location Artificial Island, Hancock's Bridge, New Jersey
Town/City Hancock's BridgeLockable Expanding Well Plug
County Salem State New Jersey
Permit No. 340007085
Land-Surface Elevation 99.20 feet * Surveyed
8 inch diameter Top-of-Casing Elevation 101.61 feet Estimated-vacuum excavation hole
Datum NAVD 1988
Well Casing Installation Date(s) October 1, 20032 inch diameter
Schedule 40 PVC Drilling Method . Hollow-Stem Auger
Drilling Contractor A.C. Schultes, Inc.
ol Drilling Fluid Not Applicable (NA)
Development Technique(s) and Date(s)> Submersible pump on10.0 ft* Bottom of Vacuum Excavation October 7, 2003. Development was considered complete when
Al turbidity in discharge was reduced/eliminated.
Fluid Loss During Drilling: . 0 gallons
Water Removed During Development:. 50 gallons
6.25 inch diameter. Static Depth to Water: 10 feet below M.P.-drilled hole
Pumping Depth to Water. 1315 feet below M.P.-
Pumping Duration: 0.75 hours30.0 ft* Bottom of 5% Bentonite Grout
Yield: 2.5 . gpm Date: October 7, 2003
Specific Capacity: 0.71 . gpm/ft35.0 ft Top of Well Screen
Well Purpose Well installed to monitor groundwater quality.Well Screen
2 inch diameter, 0.01 SlotSchedule 40 PVC
Remarks Vacuum excavation was performed to a depth of 10 feet
No. 1 Mode Sand below ground surface at the location of the monitoring well to help identifypotential utilities.
• ~LEG'END,Oerburden ,
•-- No. 1 Mode Sand
_77 5% Bentonite Grout
SCALE Prepared by: Christopher SharpeNot to Scale.
45.0 ft* Bottom of Well M.P. Measuring Point. Top of 2-inch PVC well casing unless otherwise noted.
48.0 ft* End of Boring . Depth Below Land Surface
0

ARCADIS
Well Construction Log Well Identification Well AG Shallow and Deep(Unconsolidated)
8-inch Diameter Standard Flushgrade Well Vault Project/No. PSEG Nuclear, LLC - Salem Generating Station/NP000571.0003
Land Surface Site Location Salem Generating Station - Artificial Island
Town/City Hancock's Bridge
County Salem State New Jersey
Lockable Expanding Well Plug Permit No. 3400007135 (Shallow) and 3400007153 (Deep)
Land-Surface Elevation feet F'JSurveyed
10 inchdiameter Top-of-Casing Elevation feet Estimatedvacuum excavation hole
Datum New Jersey State Plane Coordinates NAD 83
Well Casing Installation Date(s) February 9 and 10, 20041 inch diameter
Schedule 40 PVC Drilling Method Hollow Stem Auger
Drilling Contractor Talon Drilling Company
%Bti o Drilling Fluid Not Applicable (NA)10 ft* Bottom of Vacuum Excavation
12.5 ft* Bottom of 5% Bentonite Grout Development Technique(s) and Date(s): February 11, 20041 13 Bottom of No. 00 More Sand Surging with 0.75-inch surge block and pumping with peristaltic pump.
14.2 ft* Top of Well Screen Development was considered complete when turbidity in discharge wasreduced/eliminated.-- No. 1 Mode Sand
-- Well Screen Fluid Loss During Drilling: Not Applicable gallons1 inch diameter, 0.01 Slot
Schedule 40 PVC Water Removed During Development: 16 gallons
7 inch diameter Static Depth to Water: 9.52 (shallow) and 9.71 (deep) feet below M.P.-
drilled holePumping Depth to Water: Not Applicable feet below M.P.-
24.2 ft* Bottom of Well/Top of 5% Pumping Duration: 0.75 hours
Bentonite GroutYield: Not Applicable gpm Date: February 10, 2004
Specific Capacity: • Not Applicable gpm/ft
28.4 ft* Bottom of 5% Bentonite Grout
29 ft* Bottom of of No. 00 More Sand Well Purpose Well installed to monitor groundwater quality.30 ft* Top of Well Screen
-- Well Screen
1 inch diameter, 0.01 SlotSchedule 40 PVC Remarks Vacuum excavation was performed to a depth of 10 feetNo. 1 Mode Sand below ground surface at the location of the monitoring well to help identify
potential utilities.LEGEND
Overburden
-5% Bentonite Grout
No. 00 Modie Sand
No. 1 Mode Sand
Prepared by: Jon Rutledge
M.P. Measuring Point. Top of 1-inch PVC well casing unless otherwise noted.Depth Below Land Surface

ARCADIS
Well Construction Log Well Identification Well AH Shallow and Deep(Unconsolidated
Outer Protective Steel Wall rasing
Project/No. PSEG Nuclear, LLC - Salem Generating Station/NP000571.0003
Land Surface Site Location Salem Generating Station - Artificial Island
Town/City Hancock's Bridge
County Salem State New Jersey
Lockable Expanding Well Plug Permit No. 3400007136 (Shallow) and 3400007154 (Deep)
Land-Surface Elevation feet EX Surveyed
10 inch diameter Top-of-Casing Elevation feet Estimatedvacuum excavation hole
Datum New Jersey State Plane Coordinates NAD 83
Well Casing Installation Date(s) February 4 and 5, 20041 inch diameter
S Schedule 40 PVC Drilling Method Hollow Stem Auger
Drilling Contractor Talon Drilling Company5% Bentonite Grout
Drilling Fluid Not Applicable (NA)
10 Wt Bottom of Vacuum Excavation
f13 t Bottom of 5% Bentonite Grout Development Technique(s) and Date(s): February 11,2004
'13.5 ft* Bottom of No. 00 Mode Sand Surging with 0.75-inch surge block and pumping with peristaltic pump.
14.5 ft' Top of Well Screen Development was considered complete when turbidity in discharge wasreduced/eliminated.
No. 1 Mode Sand
Well Screen Fluid Loss During Drilling: Not Applicable gallons
1 inch diameter, 0.01 SlotSchedule 40 PVC Water Removed During Development: 20 gallons
7 inch diameter Static Depth to Water . 13.58 (shallow) and 12.92 (deep) feet below M.P.-
drilled hole.Pumping Depth to Water: Not Applicable feet below M.P.
24.5 ft* Bottom of Well. Pumping Duration: 1 hours25.2 ft* Top of Bentonite Grout
Yield: Not Applicable gpm Date: February 10, 2004
5% Bentonite GroutSpecific Capacity: Not Applicable gpm/ft
28.5 ft* Bottom of 5% Bentonite Grout
Bottom of of No. 00 Mode Sand Well Purpose Well installed to monitor groundwater quality.
30 ft* Top of Well Screen
Well inch diameter, 0.01 SlotS " 1
Schedule 40 PVC Remarks Vacuum excavation was performed to a depth of 10 feetNo. 1 Mode Sand below ground surface at the location of the monitoring well to help identify
potential utilities.
LEGENDverburden
= 5% Bentonite Grout• = No. 00 Mode Sand
No. i.Mone SandPrepared by: Jon Rutledge
SCAL.. E . ...
Not to Scale.40 ft* Bottom of Well M.P. Measuring Point. Top of 1-inch PVC well casing unless otherwise noted.
Depth Below Land Surface
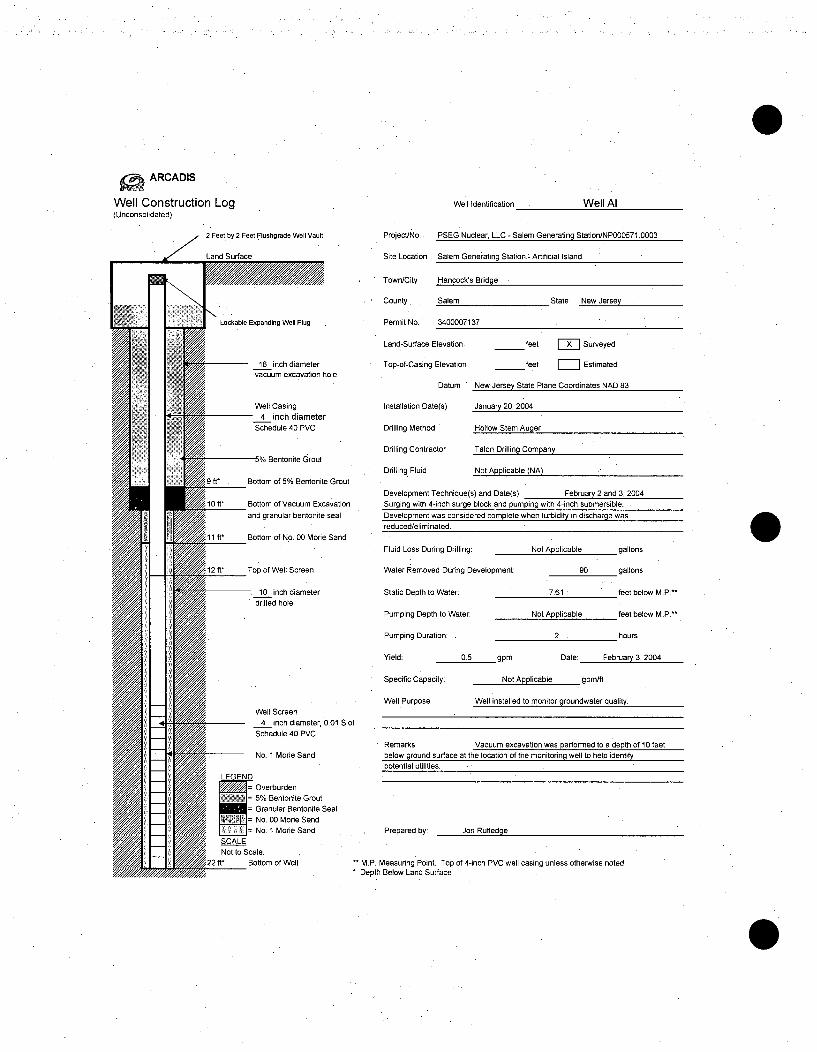
0 ARCADIS
Well Construction Log(Unconsolidated)
Well Identification Well Al
2 Feet by 2 Feet Flushgrade Well Vault
,,••,Land Surface
Lockable Expanding Well Plug
16 inch diametervacuum excavation hole
Well Casing4 inch diameter
Schedule 40 PVC
% Bentonite Grout
9 ft* . Bottom of 5% Bentonite Grout
10 ft* Bottom of Vacuum Excavationand granular bentonite seal
11 ft* Bottom of No. 00 Morie Sand
12 ft* Top of Well Screen
10 inch diameter
drilled hole
Well Screen4 inch diameter, 0.01 Slot
Schedule 40 PVC
No. 1 Mode Sand
Project/No. PSEG Nuclear, LLC - Salem Generating Station/NP000571.0003
Site Location Salem Generating Station - Artificial Island
Town/City Hancock's Bridge
County . Salem State New Jersey
Permit No. 3400007137
Land-Surface Elevation feet X Surveyed
Top-of-Casing Elevation feet Estimated
Datum New.Jersey State Plane Coordinates NAD 83
Installation Date(s) January 20, 2004
Drilling Method Hollow Stem Auger
Drilling Contractor Talon Drilling Company
Drilling Fluid Not Applicable (NA)
Development Technique(s) and Date(s): February 2 and3, 2004Surging with 4-inch surge block and pumping with 4-inch submersible.
Development was considered complete when turbidity in discharge wasreduced/eliminated.
Fluid Loss During Drilling: Not Applicable gallons
Water Removed During Development: 90 gallons
Static Depth to Water 7.61 feet below M.P.-
Pumping Depth to Water: Not Applicable feet below M.P.-
Pumping Duration: 2 hours
Yield: 0.5 gpm Date: February 3, 2004
Specific Capacity: Not Applicable gpm/ft
Well Purpose Well installed to monitor groundwater quality.
Remarks Vacuum excavation was performed to a depth of 10 feetbelow ground surface at the location of the monitoring well to help identifypotential utilities. -
LEGENDOverburden
=5%Y Bentonite Grout
Granular Bentonite Seal=No. 00 Mode SandNo. I Mode Sand
SCALENot to Scale.
2 ft* Bottom of Well
Prepared by: Jon Rutledge
M.P. Measuring Point. Top of 4-inch PVC well casing unless otherwise noted.* Depth Below Land Surface

ARCADIS
Well Construction Log(Unconsolidated)
Well Identification Well AJ
2 Feet by 2 Feet Flushgrade Well Vault
Land Surface
Lockable Expanding Well Plug
16 inch diametervacuum excavation hole
Well Casing4 inch diameter
• Schedule 40 PVC
-- 5% Bentonite Grout
10.0 ft* Bottom of Vacuum Excavation
10 inch diameter
drilled hole
12 ft* Bottom of 5% Bentonite Grout
13 ft* Bottom of Granular Bentonite Seal
:14 ft* Bottom of No. 00 Mode Sand
15.3 ft Top of Wel! Screen
Well Screen4 inch diameter, 0.01 Slot
Schedule 40 PVC
No. 1 Mode Sand
LEGEND= Overburden= 5% Bentonite Grout= Granular Bentonite Seal= No. 00 Mode Sand
= No. 1 Mode Sand
SCALENot to Scale.
,35.3 ft* Bottom of Well M
Project/No. PSEG Nuclear, LLC - Salem Generating Station/NP000571.0003
Site Location Salem Generating Station -Artificial Island
Town/City Hancock's Bridge
County Salem State New Jersey
Permit No. 3400007138
Land-Surface Elevation " feet = Surveyed
Top-of-Casing Elevation feet = Estimated
Datum New Jersey State Plane Coordinates NAD 83
Installation Date(s) January 23, 2004
Drilling Method Hollow Stem Auger
Drilling Contractor Talon Drilling Company
Drilling Fluid Not Applicable (NA)
Development Technique(s) and Date(s): January 29 and 30, 2004Surging with 4-inch surge block and pumping with 4-inch submersible.
Development was considered complete when turbidity in discharge wasreduced/eliminated.
Fluid Loss During Drilling: Not Applicable gallons
Water Removed During Development: 130 gallons
Static Depth to Water. 8.14 feet below M.P.-
Pumping Depth to Water. Not Applicable feet below M.P.-
Pumping Duration: 3.5 hours
Yield: 0.25 gpm Date: Janauary 30, 2004
Specific Capacity: Not Applicable gpm/ft
Well Purpose Well installed to monitor groundwater quality.
Remarks Vacuum excavation was performed to a depth of 10 feetbelow ground surface at the location of the monitoring well to help identifypotential utilities.
Prepared by: Jon Rutledoe
.P. Measuring Point. Top of 4-inch PVC well casing unless otherwise noted.epth Below Land SurfaceUI

K ARCADIS
Well Construction Log Well Identification Well AL(Unconsolidated)
z 8-inch Diameter Standard Flushgrade Well Vault Project/No. PSEG Nuclear, LLC - Salem Generating Station/NP000571.0003
Land Surface Site Location Salem Generating Station - Artificial Island
ATown/City Hancock's Bridge
County Salem State New Jersey
Lockable Expanding Well Plug Permit No. 3400007140
Land-Surface Elevation feet Eý Surveyed
10 inch diameter Top-of-Casing Elevation - feet Estimatedvacuum excavation hole
Datum New Jersey State Plane Coordinates NAD 83
Well Casing Installation Date(s) January 21, 20042 inch diameter
Schedule 40 PVC Drilling Method Hollow Stem Auger
Drilling Contractor Talon Drilling Company
Drilling Fluid Not Applicable (NA)
Development Technique(s) and Date(s): February 3 and 4, 200410.0 ft* Bottom of Vacuum Excavation Surging with 2-inch surge block and pumping with 2-inch submersible.
Development was considered complete when turbidity in discharge wasreduced/eliminated.
Fluid Loss During Drilling: Not Applicable gallons
Water Removed During Development: 80 gallons
7 inch diameter Static Depth to Water: 7.09 feet below M.P.*-drilled hole
Pumping Depth to Water: Not Applicable feet below M.P.-12 ft* Bottom of 5% Bentonite Grout
13 ft* Bottom of Granular Bentonite Seal Pumping Duration: 1.5 hours
13.5 ft* Bottom of No. 00 Mode Sand
Yield: 1 gpm Date: February 3, 2004
Specific Capacity: Not Applicable gpm/ft15.3 ft* "Top of Well Screen
Well Purpose Well installed to monitor groundwater quality.Well Screen
2 inch diameter, 0.01 SlotSýchedule 40 PVC
Remarks Vacuum excavation was performed to a depth of 10 feetNo. 1-Mode Sand below ground surface at the location of the monitoring well to help identify
potential utilities.LEGEND
•=Overburden
= 5% Bentonite Grout
Granular Bentonite SealNo. 00 Mode Sand
:= No. 1 Mode Sand Prepared by: Jon Rutledge
M.P. Measuring Point. Top of 2-inch PVC well casing unless otherwise noted.Depth Below Land Surface

01 ARCADISWell Construction Log(Unconsolidated)
Well Identification Well AM
2 Feet by 2 Feet Flushgrade Well Vault
Land Surface
7 - Lockable Expanding Well Plug
. 16 inch diameter-vacuum excavation hole
Well Casing-- 4 inch diameter
• •chedule 40 PVC
"•---5% Bentonite Grout
8.5 ft* Bottom of 5%Y Bentonite Grout
9.5 ft* Bottom of No. 00 More Sand
10.0 ft* .. Bottom of V/acuum Excavation
10.9 ft* -Top of Well Screen
10 inch diameter
dr~illed hole
Well Screen
4.4 inch diameter, 0.01 Slot
Schedule 40 PVC
No. 1 Mode Sand
Project/No. •PSEG Nuclear, LLC.- Salem Generating Station/NP000571.0003
Site Location Salem Generating Station. Artificial Island
Town/City Hancock's Brddge
County Salem State New Jersey•
Permit No. 3400007141 •".
Land-Surface Elevation feet F_ Surveyed
.Top-of-Casing Elevation feet = Estimated
Datum New Jersey State Plane Coordinates NAD 83
Installation Date(s) January 15, 2004
Drillinlg Method Hollow Stem Auger
Drilling Contractor Talon Drilling Company.
Drilling Fluid " Not Applicable (NA) "•
Development Technique(s) and Date(s): February 2 and 3, 2004
Surging with 4-inch surge block and pumping with 4-inch submersible.
Development was considered complete when turbidity in discharge was
reduced/eliminated.
SFluid Loss During Drilling: Not Applicable gallons
Water Removed During Development: 60 gallons
Static Depth to Water. 6.91 feet below M.P.**
Pumping Depth to Water: Not Applicable feet below M.P.~*
Pumping Duration: 2 hours
Yield: 0.25 gpm Date: February 4, 2004
Specific Capacity: Not Applicable -gpm/ft
Well Purpose Well installed to monitor groundwater quality.
Remarks Vacuum excavation was performed to a depth of 10 feetbelow ground surface at the location of the monitoring well to help identify
potential utilities.
LEGEND
Overburden5% Bentonite GroutNo. 00 Morie SandNo. 1 Monae Sand
SCALE .Not to Scale.
1.9 ft* Bottom of Well
Prepared by: Jon Rutledae
**M.P. Measuring Point. Top of 4-inch PVC well casing unless otherwise noted.*Depth Below Land Surface
0

MONITORING WELL CERTIFICATION FORM BLOCATION CERTIFICATION
I Name of Owner
Name of Facility
Location
PSE&G Salem Generating Facility
PSE&G Salem Generatiniz Facility0
T mxjpr A1Im~i~ovv C'rpplt ~olpm flAndvLocation T ýý- A now. rreAv Salem Colinty
UST Number: SRP CLAND SURVEYOR'S CERTIFICATIONWell Permit Number:This number must be permanently affixed to the well casing.
ase No.:
Owners Well Number (As shown on application or plans) -Geographic Coordinates NAD 83 (to the nearest 1/10 of second)
Well K
Longitude: West .750 32' 08.95"New Jersey State Plane Coordinates NAD 83 to nearest 10 feet:
North 231,435Elevation of Top of Inner Casing (Cap off) atReference mark (to nearest 0.01' in relation to permanenton-site datum)
Latitude: North 390 27' 51.08"
East 199,697
Rim 102.36 PVC 102.00 ground 99.71
Source of elevation datum (benchmark, number/description and elevation/datum. If an on-site datum is used,. identify here,assume datum of 100', and give approximate actual elevation. Please note that, if information from the well is to besubmitted electronically, the EDSA manual specifies the well elevation to be reported according to NAVD 1988 to anaccuracy of 0.2'.)
Site Monument N 5+0, E 2+0 Elevation 102.78 scaled actual elevation
Significant observations and notes: 0AUTHENTICATION
I certify under penalty of law that I have personally examined and am familiar with the information submitted in thisdocument and all attachments and that, based on my inquiry of those individuals immediately responsible for obtaining theinformation, I believe the submitted information is true, accurate and complete. I am aware that there are significantpenalties for submitting false, inaccurate, and incomplete information and'that I am committing a crime in the fourth degreeif I rnake a false statement that I d o not believe t o b e true. I am a Iso a ware that if I knowingly direct or authorize theviolation of any statute, I am personally liable for the penalties.
4 /_____________________________ 6/16/2003PROFESSIONAL LAND SURVEYOR'S SIGNATURE DATE
RICHARD C. MATHEWS GS29353PROFESSIONAL LAND SURVEYOR'S NAME AND LICENSE NUMBER
43 WEST HIGH STREET. SOMERVILLE, NEW JERSEY 908 725 0230PROFESSIONAL LAND SURVEYOR'S ADDRESS AND PHONE NUMBER
S

MONITORING WELL CERTIFICATION FORM BLOCATION CERTIFICATION
I Name of Owner
Name of Facility
PSE&G Salem Generating Facility
PSE&GSalem Generatin Facility
Location Lower Alloways Creek. Salem County
UST Number: SRP CLAND SURVEYOR'S CERTIFICATIONWell Permit Number:This number must be permanently affixed to the well casing.
ase No.:
Owners Well Number (As shown on application or plans) -Geographic Coordinates NAD 83 (to the nearest 1/10 of second)
Well L
Longitude: West 750 32' 14.41"New Jersey State Plane Coordinates NAD 83 to nearest 10 feet:
North 230,933Elevation of Top of Inner Casing (Cap off) atReference mark (to nearest 0.01' in relation to permanenton-site datum)
Latitude: North 39* 27' 46.07"
E-ft i 00 14111oo~,'~
Rim 101.74 PVC 101.46 vround 9134
aSource of elevation datum (benchmark, number/description and elevation/datum. If an on-site datum is used, identify here,assume datum of 100', and give approximate actual elevation. Please note that, if information from the Well is to besubmitted electronically, the EDSA manual specifies the well elevation to be reported according to NAVD 1988 to anaccuracy of 0.2'.)
Site Monument N 5+0, E 2+0 Elevation 102.78 scaled actual elevation 10
Significant observations and notes:
AUTHENTICATION
I certify under penalty of law that I have personally examined and am familiar with the information submitted in thisdocument and all attachments and that, based o n my inquiry of those, individuals immediately responsible for obtaining theinformation, I believe the submitted information is true, accurate and complete. I am aware that there are significantpenalties for submitting false, inaccurate, and incomplete information and that I am committing a crime in the fourth degreeif I make a false statement that I do not believe to be true. I am also aware that if I knowingly direct or authorize theviolation of any statute, I am personally liable for the penalties.
PROFESSIONAL LAND SURVEYOR'S SIGNATURE
RICHARD C. MATHEWS GS29353.PROFESSIONAL LAND SURVEYOR'S NAME AND LICENSE NUMBER
43 WEST HIGH.STREET, SOMERVILLE, NEW JERSEY 908 725 0230PROFESSIONAL LAND SURVEYOR'S ADDRESS AND PHONE NUMBER
6/16/2003DATE ,
I

MONITORING WELL CERTIFICATION FORM BLOCATION CERTIFICATION
Name of Owner PSE&G Salem Generating FaciliV
Name of Facility PSE&G Salem Generating Facility
Location Lower Alloways Creek, Salem Co
UST Number. SRP C.LAND SURVEYOR'S CERTIFICATIONWell Permit Number:This number must be permanently affixed to the well casing.
untv
ase No.:
Owners Well Number (As shown on application or plans) -Geographic Coordinates NAD 83 (to the nearest 1/10 of second)
MW-M
Longitude: West 750 32' 10.79"New Jersey State Plane Coordinates NAD 83 to nearest 10 feet:
North 230,843Elevation of Top of Inner Casing (Cap off) atReference mark (to nearest 0.01' in relation to permanenton~site datum)
Latitude: North 390 27' 45.20"
East 199.546
Rim 102.37 PVC 102.17 ground 99.26
Source of elevation datum (benchmark, number/description and elevation/datum. If an on-site datum is used, identify here,assume datum of 100', and give approximate actual elevation. Please note that, if information from the well is to besubmitted electronically, the EDSA manual specifies the well elevation to be reported according to NAVD 1988 to anaccuracy of 0.2'.)
Site Monument N 5+0, E 2+0 Elevation 102.78 scaled actual elevation 10I Significant observations and notes:
AUTHENTICATION
I certify under penalty of law that I have personally examined and am familiar with the information submitted in thisdocument and all attachments and that, based on my inquiry of those individuals immediately responsible for obtaining theinformation, I believe the submitted information is true, accurate and complete. I am aware that there are significantpenalties for submitting false, inaccurate, and incomplete information and that I am committing a crime in the fourth degreeif I make a false statement that I do notbelieve to be true. I am also aware that if I knowingly direct or authorize theviolation of any statute, I am personally liable for the penalties.
PROFESSIONAL LAND SURVEYOR'S SIGNATURE7/0/2003DATE
RICHARD C. MATHEWS GS29353PROFESSIONAL LAND SURVEYOR'S NAME AND LICENSE NUMBER
43 WEST HIGH STREET, SOMERVILLE, NEW JERSEY 908 725 0230PROFESSIONAL LAND SURVEYOR'S ADDRESS AND PHONE NUMBER
0

I Name of Owner
Name of Facility
MONITORING WELL CERTIFICATION FORM BLOCATION CERTIFICATION
PSE&G Salem Generating Facility
PSE&G Salem Generating Facility
Locatirin T __rp A1nru (rrp.le ', 1pnlF r~nintLocation
UST Number: SRP CLAND SURVEYOR'S CERTIFICATIONWell Permit Number:This number must be permanently affixed to the well casing.
ase No
Owners Well Number (As shown on application or plans)Geographic Coordinates NAD 83 (to the nearest 1/10 of second)
Well N
Longitude: West 750 32' 09.31"New Jersey State PlaneCoordinates NAD 83 to nearest 10 feet:
North 2303777Elevation of Top of Inner Casing (Cap off) atReference mark (to nearest 0.01' in relation to permanenton-site datum)
Latitude: North 390 27' 44.57"
East 199661
Rim 102.00 PVC 101.65 .ground 99.41
Source of elevation datum (benchmark, number/description and elevation/datum. If an on-site datum is used, identify here,assume datum of 100', and give approximate actual elevation. Please note that, if information from the well is to besubmitted electronically, the EDSA manual specifies the well elevation to be reported according to NAVD 1988 to anaccuracy of 0.2'.)
Site MonumentN 5+0, E 2+0 Elevation 102.78 scaled actual elevation 10SISignificant observations and notes:
AUTHENTICATION
I certify under penalty of law that I have personally examined and am familiar with the information submitted in thisdocument and all attachments and that, based on my inquiry of those individuals immediately responsible for obtaining theinformation, I believe the submitted information is true, accurate and complete. I am aware that there are significantpenalties for submitting false, inaccurate, and incomplete information and that I am committing a crime in the fourth degreeif I make a false statement that I do not believe to be true. I am also aware that if I knowingly direct or authorize theviolation of any statute, I am personally liable for the penalties.
PROFESSIONAL-LANDSURVEYOR'S SIGNA E 6/16/2003PROFESSIONAL LAN) SURVEYOR'S SIGNATURE DATE
RICHARD C. MATHEWS GS29353PROFESSIONAL LAND SURVEYOR'S NAME AND LICENSE NUMBER
43 WEST HIGH STREET, SOMERVILLE, NEW JERSEY 908 725 0230PROFESSIONAL LAND SURVEYOR'S ADDRESS AND PHONE NUMBER

MONITORING WELL CERTIFICATION FORM BLOCATION CERTIFICATION
Name of Owner
Name of Facility
Location
PSE&G Salem Generatin Facility
PSE&G Salem Generating Facility
I cnxpr A11nw2v~ Cr~~k ~,lv'~m flnmitvLocation T nufýr All Creel- Salem Cni-tv
UST Number: SRP CLAND SURVEYOR'S CERTIFICATIONWell Permit Number:This number must be permanently affixed to the well casing.
ase No.:
Owners Well Number (As shown on application or plans) -Geographic Coordinates NA] 83 (to the nearest 1/10 of second)
Well 0
Longitude: West 750 32' 07.05"New Jersey State Plane Coordinates NAD 83 to nearest 10 feet:
North 230,804Elevation of Top of Inner Casing (Cap off), atReference mark (to nearest 0.01' in relation to permanenton-site datum)
Latitude: North 390 27' 44.85"
East 199-R3;9
Rim 101.76 PVC 1.01.33 ground 99.20
Source of elevation datum (benchmark, number/description and elevation/datum. If an on-site datum is used, identify here,assume datum of 100', and give approximate actual elevation. Please note that, if information from the well is to besubmitted electronically, the EDSA manual specifies the well elevation to be reported according to NAVD 1988 to anaccuracy of 0.2'.)
Site Monument N 5+0, E 2+0 Elevation 102.78 scaled actual elevation 10
Significant observations and notes:
AUTHENTICATION
I certify under penalty of law that I have personally examined and am familiar with the information submitted in thisdocument and all attachments and that, based on my inquiry of those individuals immediately responsible for obtaining theinformation, I believe the submitted information is true, accurate and complete. I am aware that there are significantpenalties for submitting false, inaccurate, and incomplete information and that I am committing a crime in the fourth degreeif I make a false statement that I don ot believe t o b e true. I am also a ware t hat if I knowingly direct or authorize theviolation of any statute, I am personally liable for the penalties.
PROFESSIONAL LAND SURVEYOR'S SIGNATURE
RICHARD C. MATHEWS GS29353PROFESSIONAL LAND SURVEYOR'S NAME AND LICENSE NUMBER
43 WEST HIGH STREET, SOMERVILLE, NEW JERSEY 908 725 0230PROFESSIONAL LAND SURVEYOR'S ADDRESS AND PHONE NUMBER
6/16/2003DATE
I

MONITORING WELL CERTIFICATION FORM BLOCATION CERTIFICATION
PSE&G Salem Generating Facility
PSE&G Salem Generating Facilit
Name of Owner
Name of Facility
Location T nwer Allnwavs Creek- Salem County
UST Number: SRPLAND SURVEYOR'S CERTIFICATIONWell Permit Number:This number must be permanently affixed to the well casinI
(',,e NnCase No:
Owners Well Number (As shown on application or plans) .Geographic Coordinates NAD 83 (to the nearest 1/10 of second)
Longitude: West 750 32' 04.93"New Jersey State Plane Coordinates NAD 83 to nearest 10 feet:
North 230,336Elevation of Top of Inner Casing (Cap off) atReference mark (to nearest 0.01' in relation to permanenton-site datum)
Well P
Latitude: North 39* 27' 40.25"
T.a~t 9AA Ann
Rim 101.56 PVC 101.13 ground 99.00
Source of elevation datum (benchmark, number/description and elevation/daturm. If an on-site datum is used, identify here,assume datum of 100', and give approximate actual elevation. Please note that, if information from the well is to besubmitted electronically, the EDSA manual specifies the well elevation to be reported according to NAVD 1988 to anaccuracy of 0.2'.)
Site Monument N 5+0, E 2+0 Elevation 102.78 scaledactual elevation 10a Significant observations and notes:
AUTHENTICATION
I certify under penalty of law that I have personally examined and am familiar with the information submitted in thisdocument and all attachments and that, based on my inquiry of those individuals immediately responsible for obtaining theinformation, I believe the submitted information is true, accurate and complete. I am aware that there are significantpenalties for submitting false, inaccurate, and incomplete information and that I am committing a crime in the fourth degreeifI make a false statement that I do not believe tobe true. I am also aware that ff I knowingly direct or authorize theviolation of any statute, I am personally liable for the penalties.
PROFESSIONAL LAND SURVEYOR'S SIGNATURE
RICHARD C. MATHEWS GS29353PROFESSIONAL LAND SURVEYOR'S NAME AND LICENSE NUMBER
43 WEST HIGH STREET, SOMERVILLE, NEW JERSEY 908 725 0230PROFESSIONAL LAND SURVEYOR'S ADDRESS AND PHONE NUMBER-
6/16/2003DATE

MONITORING WELL CERTIFICATION FORM BLOCATION CERTIFICATION
Name of Owner
Name of Facility
Location
PSE&G Salem Generating Facilit
PSE&G Salem Generating Facility
Lower Allowavs Creek, Salem Count
UST Number: SRP Case No.:LAND SURVEYOR'S CERTIFICATIONWell Permit Number:This number must be permanently affixed to the well casing.
Owners Well Number (As shown on application or plans)Geographic Coordinates NA) 83 (to the nearest 1/10 of second)
Longitude: West 750 31' 49.72"New Jersey State Plane Coordinates NAD 83 to nearest 10 feet:
North 230,645Elevation of Top of Inner Casing (Cap off) atReference mark (to nearest 0.01' in relation to permanenton-site datum)
WellO
Latitude: North 390 27' 43.45"
East -- .- 2--1 62019
• Rim-107,03 PVC 106.59 ,round 104.45
Source of elevation datum (benchmark, number/description and elevation/datum. If an on-site datum is used, identify here,assume datum of 100', and give approximate actual elevation. Please note that, if information from the well is to besubmitted electronically, the EDSA manual specifies the well elevation to be reported according to NAVD 1988 to anaccuracy of 0.2'.)
Site Monument N 5+0, E 2+0 Elevation 102.78 scaled actual elevation 10I Significant observations and notes:
AUTHENTICATION
I certify under penalty of law that I have personally examined and am familiar with the information submitted in thisdocument and all attachments and that, based on my inquiry of those individuals immediately responsible for obtaining theinformation, I believe the submitted information is true, accurate and complete. I am aware that there are significantpenalties for submitting false, inaccurate, and incomplete information and that I am committing a crime in the fourth degreeif I make a false statement that I do not believe t o b e t rue. I a m also a ware that if I knowingly direct or authorize theviolation of any statute, I am personally liable for the penalties.
PROFESSIONAL LAND SURVEYOR'S SIGNATURE7/1/2003DATE
RICHARD C. MATHEWS GS29353PROFESSIONAL LAN'D SURVEYOR'S NAME AND LICENSE NUMBER
43 WEST HIGH STREET, SOMERVILLE, NEW JERSEY 908 725 0230PROFESSIONAL LAND SURVEYOR'S ADDRESS AND PHONE NUMBER
I

MONITORING WELL CERTIFICATION FORM BLOCATION CERTIFICATION
Name of OwnerI
Name of Facility
Location
PSE&G Salem Generating Facility
PSE&G Salem Generating Facility
Lower Allowavs Creek. Salem County
UST Number: SRP CiLAND SURVEYOR'S CERTIFICATIONWell Permit Number:This number must be permanently affixed to the well casing.
ase No :
Owners Well Number (As shown on application or plans)Geographic Coordinates NAD 83 (to the nearest 1/10 of second)
Longitude: West 750 32' 09.60"New Jersey State Plane Coordinates NAD 83 to nearest 10 feet:.
North 230,906Elevation of Top of Inner Casing (Cap off) atReference mark (to nearest 0.01' in relation to permanenton-site datum)
MW-R
Latitude: North 390 27' 45.84"
East 199,640
Rim 102.42 PVC 102.35 Lround 99.82
Source of elevation datum (benchmark, number/description and elevation/datum. If an on-site datum is used, identify here,assume datum of 100', and give approximate actual elevation. Please note that, if information from the well is to besubmitted electronically, the EDSA manual specifies the well elevation to be reported according to NAVD 1988 to anaccuracy of 0.2'.)
.Site Monument N 5+0, E 2+0 Elevation 102.78 scaled actual elevation 10S Significant observations and notes:
AUTHENTICATION
I certify under penalty of law that I have personally examined and am familiar with the information submitted in thisdocument and all attachments and that, based on my inquiry of those individuals immediately responsible for obtaining theinformation, I believe the submitted information is true, accurate and complete. I am aware that there are significantpenalties for submitting false, inaccurate, and incomplete information and that I am committing a crime in the fourth degreeif I make a false statement thattI do notbelieve to be true. I am also aware that if I knowingly direct or authorize theviolation.of any statute, I am personally liable for the penalties.
PROFESSIONAL LAND SURVEYOR'S SIGNATURE
RICHARD C. MATHEWS GS29353PROFESSIONAL LAND SURVEYOR'S NAME AND LICENSE NUMBER
43 WEST HIGH STREET, SOMERVILLE, NEW JERSEY 908 725 0230PROFESSIONAL LAND SURVEYOR'S ADDRESS AND PHONE NUMBER
7/GB/2003DATE

'I
MONITORING WELL CERTIFICATION FORM BLOCATION CERTIFICATION
PSE&G Salem Generating Facility
PSE&G Salem Generating Facility
Name of Owner
Name of Facility
Location Lower Alloways Creek, Salem County
UST Number: SRP CLAND SURVEYOR'S CERTIFICATIONWell Permit Number:This number must be permanently affixed to the well casing.
ase No.:
Owners Well Number (As shown on application or plans) -Geographic Coordinates NAD 83 (to the nearest 1/10 of second)
MW S
Longitude: West. 750 32' 09.92"New Jersey State Plane Coordinates NAD 83 to nearest 10 feet:
North 230,711Elevation of Top of Inner Casing (Cap off) atReference mark (to nearest 0.01' in relation to permanenton-site datum)
Latitude: North 390 27' 43.92"
P.n~t 199 t61-East 199613
PVC 99.04
Source of elevation datum (benchmark, number/description and elevation/datum. If an on-site datum is used, identify here,assume datum of 100', and give approximate actual elevation. Please note that, if information from the well is to besubmitted electronically, the EDSA manual specifies the well elevation to be reported according to NAVD 1988 to anaccuracy of 0.2'.)
Site Monument N 5+0, E 2+0 Elevation 102.78 scaled actual elevation 10I 0Significant observations and notes:
AUTHENTICATION
I certify under penalty of law that I have personally examined and am familiar with the information submitted in thisdocument and all attachments and that, based on my inquiry of those 'individuals immediately responsible for obtaining theinformation,' I believe the submitted information is true, accurate and complete. I am aware that there are significantpenalties for submitting false, inaccurate, and incomplete information and that I am committing a crime in the fourth degreeif I make a false statement that I do not believe to be true. I am also a ware that if I knowingly direct or authorize theviolation of any statute, I am personally liable for the penalties.
PROFESSIONAL LAND SURVEYOR'S SIGNATURE
RICHARD C. MATHEWS GS29353PROFESSIONAL LAND SURVEYOR'S NAME AND LICENSE NUMBER
43 WEST HIGH STREET. SOMERVILLE. NEW JERSEY 908 725 0230PROFESSIONAL LAND SURVEYOR'S ADDRESS AND PHONE NUMBER
2/23/04DATE'
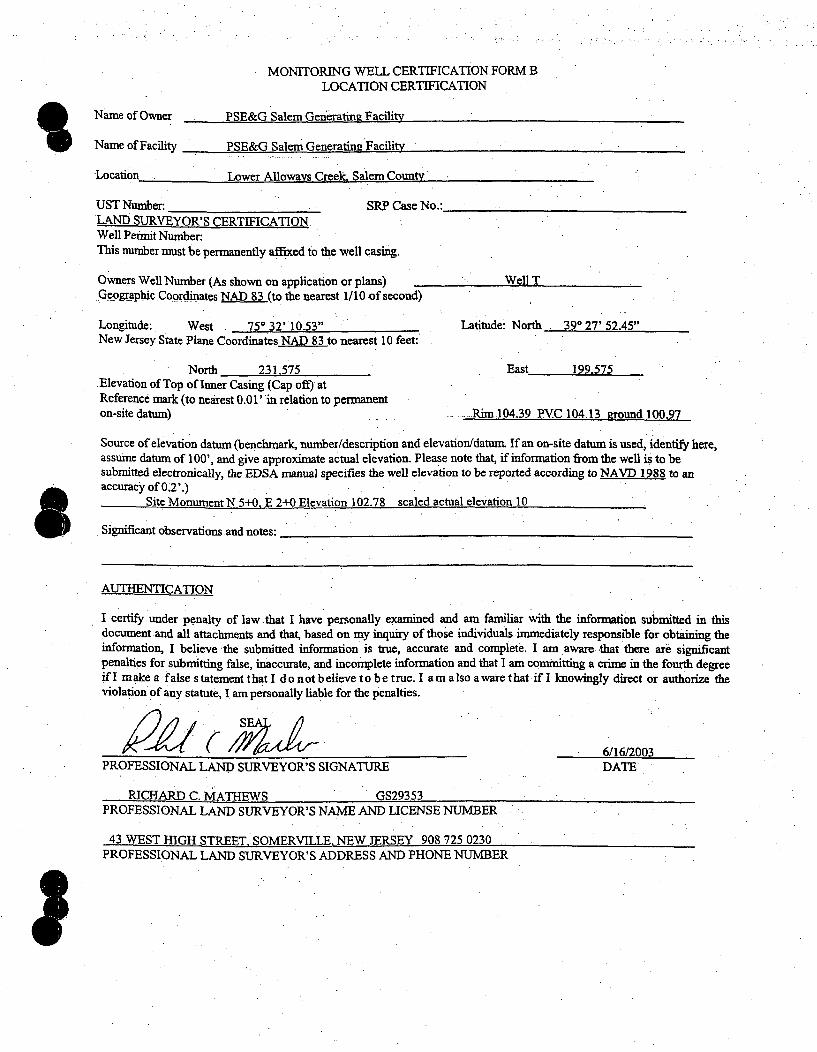
MONITORING WELL CERTIFICATION FORM BLOCATION CERTIFICATION
I Name of Owner
Name of Facility
PSE&G Salem Generating Facfiiy
PSE&G Salem Generatine Facility
Location Lower Alloways Creek. Salem CopntY
UST Number: SRP C•LAND SURVEYOR'S CERTIFICATION.Well Permit Number:This number must be permanently affixed to the well casing.
ase No.:
Owners Well Number (As shown on application or plans).Geographic Coordinates NAD 83 (to the nearest 1/10 of second)
Longitude: West 750 32' 10.53"New Jersey State Plane Coordinates NAD 83 to nearest 10 feet:
North 231,575Elevation of Top of Inmer Casing (Cap off) atReference mark (to nearest 0.01' in relation to permanenton-site datum)
Well T
Latitude: North 390 27' 52.45"
East 199,575
Rim 104.39 PVC 104.13 ground 100.97
Source of elevation datum (benchmark, number/description and elevation/datur. If an on-site datum is used, identify here,assume datum of 100', and give approximate actual elevation. Please note that, if information from the well is to besubmitted electronically, the EDSA manual specifies the well elevation to be reported according to NAVD 1988 to anaccuracy of 0.2'.)
Site Monument N 5+0, E 2+0 Elevation 102.78 scaled actual elevation 108 • Significant observations and notes:
AUTHENTICATION
I certify under penalty of law .that I have personally examined and am familiar with the information submitted in thisdocument and all attachments and that, based on my inquiry of those individuals immediately responsible for obtaining theinformation, I believe the submitted information is true, accurate and complete. I am aware -that there are significantpenalties for submitting false, inaccurate, and incomplete information and that I am committing a crime in the fourth degreeifI make a false statement that I do not believe to be true. I am also aware that if I knowingly direct or authorize theviolation of any statute, I am personally liable for the penalties.
PROFESSIONAL LAND SURVEYOR'S SIGNATURE
RICHARD C. MATHEWS GS29353PROFESSIONAL LAND SURVEYOR'S NAME AND LICENSE NUMBER
43 WEST HIGH STREET, SOMERVILLE, NEW JERSEY 908 725 0230PROFESSIONAL LAND SURVEYOR'S ADDRESS AND PHONE NUMBER
6/16/2003DATE

IMONITORING WELL CERTIFICATION FORM B
LOCATION CERTIFICATION
PSE&G Salem Generating Facility
PSE&G Salem Generating Facility
Name of Owner
Name of Facility
Location Lower Allowavs Creek. Salem Count-y
UST Number: SRP CLAND SURVEYOR'S CERTIFICATIONWell Permit Number:This number must be permanently affixed to the well casing.
ase No.:.
Owners Well Number (As shown on application or plans)Geographic Coordinates NAD 83 (to the nearest 1/10 of second)
MW U
Longitude: West 750 32' 09.95"New Jersey State Plane Coordinates NAD 83 to nearest 10 feet:
North 231,370Elevation of Top of Inner Casing (Cap off) atReference mark (to nearest 0.01' in relation to permanenton-site datum)
Latitude: North 390 27' 50.43"
F=.m•t 199 61REast
RIM 99.19 PVC 98.57
Source of elevation datum (benchmark, number/description and elevation/datun. If an on-site datum is used, identify here,assume datum of 100', and give approximate actual elevation. Please note that, if information from the well is to besubmitted electronically, the EDSA manual specifies the well elevation to be reported according to NAVD 1988 to anaccuracy of 0.2'.)
Site Monument N 5+_0, E 2+0 Elevation 102.7 8 scaled actual elevation 10
Significant observations and notes:
AUTHENTICATION
I certify under penalty of law that I have personally examined and am familiar with the information submitted in thisdocument and all attachments and that, based on my inquiry of those individuals immediately responsible for obtaining theinformation, I believe the submitted information is true, accurate and complete. I am aware that there are significantpenalties for submitting false, inaccurate, and incomplete information and that I am committing a crime in the fourth degreeif I make a false s tatement that I d o not believe t o b e t rue. I a m also a ware t hat if I knowingly direct or authorize theviolation of any statute, I am personally liable for the penalties.
SEAL.,'
PROFESSIONAL LAND SURVEYOR'S SIGNATURE
RICHARD C. MATHEWS GS29353PROFESSIONAL LAND SURVEYOR'S NAME AND LICENSE NUMBER
43 WEST HIGH STREET, SOMERVILLE. NEW JERSEY 908 725 0230PROFESSIONAL LAND SURVEYOR'S ADDRESS AND PHONE NUMBER
2/23/04DATE
I

MONITORING WELL CERTIFICATION FORM BLOCATION CERTIFICATION
Name of Owner
Name of Facility
Location
PSE&G Salem Generating Facility
PSE&G Salem Generating Facility
Tonwpr Alinwayv Creek_ Salem County
UST Number: _. SRP C:LAND SURVEYOR'S CERTIFICATION.Well Permit Number:This number must be permanently affixed to the well casing.
a No:
Owners Well Number (As shown on application or plans) -Geographic Coordinates NAD 83 (to the nearest 1 / 10 of second)
MW V
Longitude: West 750 32' 10.83"New Jersey State Plane Coordinates NAD 83 to nearest 10 feet:
North 231,355Elevation of Top of Inner Casing (Cap off) atReference mark (to nearest 0.01' in relation to permanenton-site datum)
Latitude: North 390 27' 50.27"
East 199,548
RIM 99.03 PVC 98.74
Source of elevation datum (benchmark, number/description and elevation/datum. If an on-site datum is used, identify here,assume datum of 100', and give approximate actual elevation. Please note that, if information from the well is to besubmitted electronically, the EDSA manual specifies the well elevation to be reported according to NAVD 1988 to anaccuracy of 0.2'.)
Site Monument N 5+0, E 2+0 Elevation 102.78 scaled actual elevation 10
Significant observations and notes:
AUTHENTICATION
I certify under penalty of law that I have personally examined and am familiar with the information submitted in thisdocument and all attachments and that, based on my inquiry of those individuals immediately responsible for obtaining theinformation, I believe the submitted information is true, accurate and complete. I am aware that there are significantpenalties for submitting false, inaccurate, and incomplete information and that I am committing a crime in the fourth degreeif I make a false statement that I d o not believe to be t rue. I a m a Iso a ware t hat if I knowingly direct or authorize theviolation of any statute, I am personally liable for the penalties.
PA L SE AL/S
PROFESSIONAL LAND SURVEYOR'S SIGNATURE2/23/04DATE
RICHARD C. MATHEWS GS29353:PROFESSIONAL LAND SURVEYOR'S NAME AND LICENSE NUMBER
43 WEST HIGH STREET, SOMERVILLE. NEW JERSEY 908 725 0230PROFESSIONAL LAND SURVEYOR'S ADDRESS AND PHONE NUMBER

'I
MONITORING WELL CERTIFICATION FORM BLOCATION CERTIFICATION
Name of Owner
Name of Facility
PSE&G Salem Generating Facility-
PSE&G Salem Generating Facility
Location Lower Alloways Creek, Salem County
UST Number: SRP CLAND SURVEYOR'S CERTIFICATIONWell Permit Number:This number must be permanently affixed to the well casing.
ase No.:
Owners Well Number (As shown on application or plans)Geographic Coordinates NAD 83 (to the nearest 1/10 of second).
Longitude: West 750 32' 12.01"New Jersey State Plane Coordinates NAD 83 to nearest .10 feet:
North 230,777Elevation of Top of Inner Casing (Cap off) atReference mark (to nearest 0.01' in relation to permanenton-site datum)
MW W
Latitude: North 390 27' 44.55"
East 199.450
RIM 98.99 PVC 98.69
Source of elevation datum (benchmark, number/description and elevation/datum. If an on-site datum is used, identify here,assume datum of 100', and give approximate actual elevation. Please note that, if information from the well is to besubmitted electronically, the' EDSA manual specifies the well elevation to be reported according to NAVD 1988 to anaccuracy of 0.2'.)
Site Monument N 5+0. E 2+0 Elevation 102.78 scaled actual elevation 10I Significant observations and notes:
AUTHENTICATION
I certify under penalty of law that I have personally examined and am familiar with the information submitted in thisdocument and all attachments and that, based on my inquiry of those individuals immediately responsible for obtaining theinformation, I believe the submitted information is true, accurate and complete. I am aware that there are significantpenalties for submitting false, inaccurate, and incomplete information and that I am committing a crime in the fourth degreeif I make a false statement that I d o n ot b elieve t o b e t rue. I am also a ware t hat if I knowingly direct or authorize theviolation of any statute, I am personally liable for the penalties.
) 4 / SEAL/
PROFESSIONAL LAND SURVEYOR'S SIGNATURE
RICHARD C. MATHEWS GS29353PROFESSIONAL LAND SURVEYOR'S NAME AND LICENSE NUMBER
43 WEST HIGH STREET, SOMERVILLE, NEW JERSEY 908 725 0230PROFESSIONAL LAND SURVEYOR'S ADDRESS AND PHONE NUMBER
2/23/04DATE
I

MONITORING WELL CERTIFICATION FORM BLOCATION CERTIFICATION
I Name of Owner
Name of Facility
PSE&G Salem Generatinp, Facility
PSE&G Salem Generating Facility
Location I AWPT A11nwov~ C~rpe~k ~hmi flountvLower Allowa- CreAr Sale County
UST Number: SRP CLAND SURVEYOR'S CERTIFICATIONWell Permit Number:This number must be permanently affixed to the well casing.
ase No.:
Owners Well Number (As shown on application or plans)Geographic Coordinates NAD 83 (to the nearest1/10 of seconr
MW-Y
Longitude: West 750 32' 13.36"New Jersey State Plane Coordinates NAD 83 to nearest 10 feet:
North 230,771Elevation of Top of Inner Casing (Cap off) atReference mark (to nearest 0.01' in relation to permanenton-site datum)
Latitude: North 39* 27' 44.47"
East 199-34';East 199343
" Casing 102.31 PVC 101.81 Ground 99.2
Source of elevation datum (benchmark, number/description and elevation/datum. If an on-site datum is used, identify here,assume datum of 100', and give approximate actual elevation. Please note that, if information from the well is to besubmitted electronically, the EDSA manual specifies the well elevation to be reported according to NAVD 1988 to anaccuracy of 0.2'.)
Site Monument N 5 + 0, E 2 + 0 Elevation 102.78 scaled actual elevation 10N Significant observations and notes:
AUTHENTICATION
I certify under penalty of law that I have personally examined and am familiar with the information submitted in thisdocument and all attachments and that, based on my inquiry of those individuals immediately responsible for obtaining theinformation, I believe the. submitted information is true, accurate and complete. I am aware that there are significantpenalties for submitting false, inaccurate, and incomplete information and that I am committing a crime in the fourth degreeif I make a false statement that I do not believe to be true. I am also aware that if I knowingly direct or authorize theviolation of any statute, I am personally liable for the penalties.
PROFESSIONAL LAND SURVEYOR'S SIGNATURE10/22/03DATE
RICHARD C. MATHEWS GS29353PROFESSIONAL LAND SURVEYOR'S NAME AND LICENSE NUMBER
43 WEST HIGH STREET, SOMERVILLE, NEW JERSEY 908 725 0230PROFESSIONAL LAND SURVEYOR'S ADDRESS AND PHONE NUMBER

MONITORING WELL CERTIFICATION FORM BLOCATION CERTIFICATION
Name of Owner
Name of Facility
PSE&G Salem Generating Facility
PSE&G Salem Generating Facility
PSE&G~~~ ~ Sae enrtn FcltLAý 0UU LoweIjfdUoways Cie S4I e '.uIEUy
UST Number: SRP CLAND SURVEYOR'S CERTIFICATIONWell Permit Number:This number must be permanently affixed to the well casing.
ase No.:
Owners Well Number (As shown on application or plans)Geographic Coordinates NAD 83 (to the nearest 1/10 of second)
MW-Z
Longitude: West 750 32' 12.64"New Jersey State Plane Coordinates NAD 83 to nearest 10 feet:
North 230,681Elevation of Top of Inner Casing (Cap off) atReference mark (to nearest 0.01' in relation to permanenton-site datum)
Latitude: North 39* 27' 44.59"
East 199.399
Casing 102.39 PVC 101.86 Ground 99.3
Source of elevation datum (benchmark, number/description and elevation/datum. If an on-site datum is used, identify here,assume datum of 100', and give approximate actual elevation. Please note that, if information from the well is to besubmitted electronically, the EDSA manual specifies the well elevation to be reported according to NAVD 1988 to anaccuracy of 0.2'.)
Site Monument N 5 + 0, E 2 + 0 Elevation 102.78 scaled actual elevation 10I Significant observations and notes:
AUTHENTICATION
I certify under penalty of law that I have personally examined and am familiar with the information submitted in thisdocument and all attachments and that, based on my inquiry of those individuals immediately responsible for obtaining theinformation, I believe the submitted information is true, accurate and complete. I am aware that there are significantpenalties for submitting false, inaccurate, and incox rplete information and that I am committing a crime in the fourth degreeif I make a false statement that I do not believe to be true. I am also aware that if I knowingly direct or authorize theviolation of any statute, I am personally liable for the penalties.
PROFESSIONAL LAND SURVEYOR'S SIGNATURE
RICHARD C. MATHEWS GS29353PROFESSIONAL LAND SURVEYOR'S NAME AND LICENSE NUMBER
43 WEST HIGH STREET, SOMERVILLE, NEW JERSEY 908 725 0230PROFESSIONAL LAND SURVEYOR'S ADDRESS AND PHONE NUMBER
10/22/03DATE
I

MONITORING WELL CERTIFICATION FORM BLOCATION CERTIFICATION
Name of Owner
Name of Facility
PSE&G Salem Generating Facility
PSE&G Salem Generating Facili!Y
Location Lower Allowavs Creek. Salem Count-vLocation Lower Allowavs Creek Salem Countv ý
UST Number: ._. SRP Case 1LAND SURVEYOR'S CERTIFICATIONWell Permit Number:This number must be permanently affixed to the well casing.
Owners Well Number (As shown on application or plans)Geographic Coordinates NAD 83 (to the nearest 1/10 of second)
Longitude: West 750 32' 10.81"New Jersey State Plane Coordinates NAD 83 to nearest 10 feet:
North 230,603Elevation of Top of Inner Casing (Cap off) atReference mark (to nearest 0.01' in relation to permanenton-site datum)
MW AA
Latitude: North 390 27' 42.83"
East 199,541
RIM 99.30 PVC 99.07
ISource of elevation datum (benchmark, number/description and elevation/datum. If an on-site datum is used, identify here,assume datum of 100', andgive approximate actual elevation. Please note that, if information from the well is to besubmitted electronically, the EDSA manual specifies the well elevation to be reported according to NAVD 1988 to anaccuracy of 0.2'.)
Site Monument N 5+0, E 2+0 Elevation 102.78 scaled actual elevation 10
Significant observations and notes:
AUTHENTICATION
I certify under penalty of law that I have personally examined and am familiar with the information submitted in thisdocument and all attachments and that, based on my inquiry of those individuals immediately responsible for obtaining theinformation, I believe the submitted information is true, accurate and complete. I am aware that there are significant:penalties for submitting false, inaccurate, and incomplete information and that I am committing a crime in the fourth degreeif I make a false statement that I do not believe to be true. I am also awarethat if I knowingly direct or authorize theviolation of any statute, I am personally liable for the penalties.
SEAL
PROFESSIONAL LAND SURVEYOR'S SIGNATURE2/23/04DATE
RICHARD C. MATHEWS GS29353PROFESSIONAL LAND SURVEYOR'S NAME AND LICENSE NUMBER
43 WEST HIGH STREET, SOMERVILLE. NEW JERSEY 908 725 0230PROFESSIONAL LAND SURVEYOR'S ADDRESS AND PHONE NUMBER

MONITORING WELL CERTIFICATION FORM BLOCATION CERTIFICATION
Name of Owner
Name of Facility
Location
PSE&G Salem Generating Facility
PSE&G Salem Generatine Facility
I.ower Allowavs Creek. Salem County
UST Number: SRP CLAND SURVEYOR'S CERTIFICATIONWell Permit Number:This number must be permanently affixed to the well casing.
ase No.:
Owners Well Number (As shown on application or plans)Geographic Coordinates NAD 83 (to the nearest 1/10 of second)
MW AB
Longitude: West 750 32' 09.08"New Jersey State Plane Coordinates NAD 83 to nearest 10 feet:
North 230,623Elevation of Top of Inner Casing (Cap off) atReference mark (to nearest 0.01' in relation to permanenton-site datum)
Latitude: North 390 27' 43.05"
East 199,677
PVC 98.93
Source of elevation datum (benchmark, number/description and elevation/datum. If an on-site datum is used, identify here,assume datum of 100', and give approximate actual elevation. Please note that, if information from the well is to besubmitted electronically, the EDSA manual specifies the well elevation to be reported according to NAVD 1988 to anaccuracy of 0.2'.)
Site Monument N 5+0, E 2+0 Elevation 102.78 scaled actual elevation 10
Significant observations and notes:
AUTHENTICATION
I certify under penalty of law that I have personally examined, and am familiar with the information submitted in thisdocument and all attachments and that, based on my inquiry of those individuals immediately responsible for obtaining theinformation, I believe the submitted information is true, accurate and complete. I am aware that there are significantpenalties for submitting false, inaccurate, and incomplete information and that lam committing a crime in the fourth degreeif I mn ake a false statement that I do not believe, to be true. I am also a ware that if I knowingly direct or authorize theviolation of any statute, I am personally liable for the penalties.
SEAL.PROFESSIONAL LAND SURVEYOR'S SIGNATURE
RICHARD C. MATHEWS GS29353PROFESSIONAL LAND SURVEYOR'S NAME AND LICENSE NUMBER
43 WEST HIGH STREET, SOMERVILLE. NEW JERSEY 908 725 0230PROFESSIONAL LAND SURVEYOR'S ADDRESS AND PHONE NUMBER
2/23/04DATE

MONITORING WELL CERTIFICATION FORM BLOCATION CERTIFICATION
Name of Owner
Name of Facility
Location
PSE&G Salem Generatingt Facility
PSE&G Salem Generating Facility
I.nwer Allnwavs Creek. Salem County
UST Number: __SRP C;LAND SURVEYOR'S CERTIFICATIONWell Permit Number:This number must be permanently affixed to the well casing.
ase No.:
Owners Well Number (As shown on application or plans) -Geographic Coordinates NAD 83 (to the nearest 1/10 of second)
MW AC
Longitude: West 750 32' 08.49"New Jersey State Plane Coordinates NAD 83 to nearest 10 feet:
North 230.724Elevation of Top of Inner Casing (Cap off) atReference mark (to nearest 0.01' in relation to permanenton-site datum)
Latitude: North 390 27' 44.05"
F.At lqq 79•1 9q725
PVC 98.77
a
Source of elevation datum (benchmark, number/description and elevation/datum. If an on-site datum is used, identify here,assume datum of 100', and give approximate actual elevation. Please note that, if information from the well is to besubmitted electronically, the EDSA manual specifies the well elevation to be reported according to NAVD 1988 to anaccuracy of 0.2'.)
Site Monument N 5+0, E 2+0 Elevation 102.78 scaled actual elevation 10
Significant observations and notes:
AUTHENTICATION
I certify under penalty of law that I have personally examined and am familiar with the information submitted in thisdocument and all attachments and that, based on my inquiry of those individuals immediately responsible for obtaining theinformation, I believe the submitted information is true, accurate and complete. I am aware that there are significantpenalties for submitting false, inaccurate, and incomplete information and that I am committing a crime in the fourth degreeif I make a f alse.s tatement t hat I d o n ot believe t o b e t rue. I a m also a ware t hat if I knowingly direct or authorize theviolation of any statute, I am personally liable for the penalties.
SE ;,PROFESSIONAL LAND SURVEYOR'S SIGNATURE
RICHARD C. MATHEWS GS29353PROFESSIONAL LAND SURVEYOR'S NAME AND LICENSE NUMBER
43 WEST HIGH STREET, SOMERVILLE, NEW JERSEY 908 725 0230PROFESSIONAL LAND SURVEYOR'S ADDRESS'AND PHONE NUMBER
2/23/04DATE

MONITORiNG WELL CERTIFICATION FORM BLOCATION CERTIFICATIONn.
Name of Owner
Name of Facility
Location
PSE&G Salem Generatinp Facility
PSE&G Salem Generating Facility
I nuer A l1nu~v~ C'rpplc 1Pm r~iinf-vT -Wer A 11-wa s Creek Sale Count-
UST Number: SRP CLAND SURVEYOR'S CERTIFICATIONWell Permit Number: .This number must be permanently affixed to the well casing.
ase No:
Owners Well Number (As shown on application or plans)Geographic Coordinates NAD 83 (to the nearest 1/10 of second)
MW AD
Longitude: West 750 32' 09.99"New Jersey State Plane Coordinates NAD 83 to nearest 10 feet:
North 230,684Elevation of Top of Inner Casing (Cap off) atReference mark (to nearest 0.01' in relation to permanenton-site datum)
Latitude: North 390 27' 43.64"
East 199,607
PVC 98.99
Source of elevation datum (benchmark, number/description and elevation/datum. If an on-site datum is used, identify here,assume datum of 100', and give approximate actual elevation. Please note that, if information from the well is to besubmitted electronically, the EDSA manualspecifies the well elevation to be reported according to NAVD 1988 to anaccuracy of 0.2'.)
Site Monument N 5+0, E 2+0 Elevation 102.78 scaled actual elevation 10
Significant observations and notes:
AUTHENTICATION
I certify under penalty of law that I have personally examined and am familiar with the information submitted in thisdocument and all attachments and that, based on my inquiry of those individuals immediately responsible for obtaining theinformation, I believe the submitted information is true, accurate and complete. I am aware that there are significantpenalties for submitting false, inaccurate, and incomplete information and that I am committing a crime in the fourth degreeif I make a false statement that I do not believe t o b e true. I am a lso a ware that if I knowingly direct or authorize theviolation of any statute, I am personally liable for the penalties.
SEAL
PROFESSIONAL LAND SURVEYOR'S SIGNATURE
RICHARD C. MATHEWS GS29353PROFESSIONAL LAND SURVEYOR'S NAME AND LICENSE NUMBER
43 WEST HIGH STREET, SOMERVILLE, NEW JERSEY 908 725 0230PROFESSIONAL LAND SURVEYOR'S ADDRESS AND PHONE NUMBER
2/23/04DATE
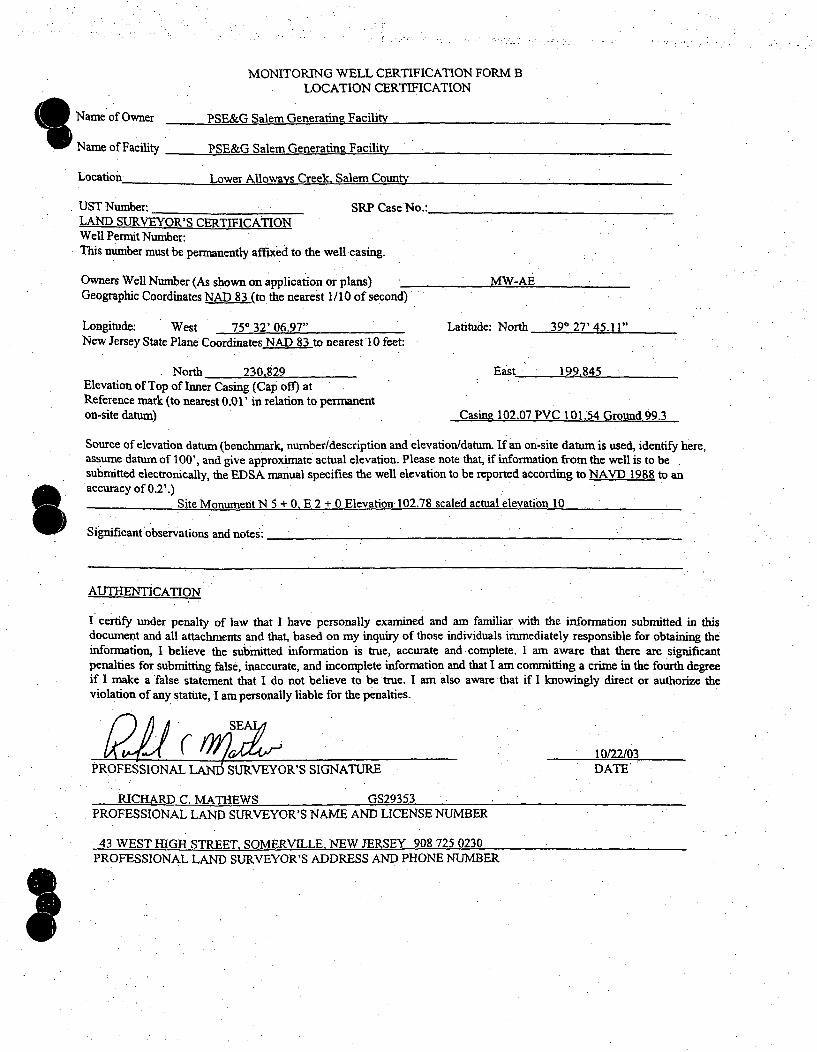
' Name of OwnerName of Facility
Location
MONITORING WELL CERTIFICATION FORM B
LOCATION CERTIFICATION
PSE&G Salem Generating Facility
PSE&G Salem Generating Facility
I rnxpr A1lnwav~ C~r~pk ~ah~yn flnunNLower Allow-s Cret-1c Salem Cnuntv
UST Number: .... SRP C:LAND SURVEYOR'S CERTIFICATIONWell Permit Number:This number must be permanently affixed to the well casing.
ase No.:
Owners Well Number (As shown on application or plans)Geographic Coordinates NAD 83 (to the nearest 1/10 of second)
MW-AE
Longitude: West 750 32' 06.97"New Jersey State Plane Coordinates NAD 83 to nearest 10 feet:
North 230,829Elevation of Top of Inner Casing (Cap off) atReference mark (to nearest 0.01' in relation to permanenton-site datum)
Latitude: North 39' 27' 45.11"
Eas t 10 QA4 •t-'r.
100 ~
Casing 102.07 PVC 101.54 Ground 99.3
Source of elevation datum (benchmark, number/description and elevation/datum. If an on-site datum is used, identify here,assume datum of 100', and give approximate actual elevation. Please note that, if information from the well is to besubmitted electronically, the EDSA manual specifies the well elevation to be reported according to NAVD 1988 to anaccuracy of 0.2'.)
Site Monument N 5 + 0, E 2 + 0 Elevation 102.78 scaled actual elevation 10
Significant observations and notes:
AUTHENTICATION
I certify under penalty of law that I have personally examined and am familiar with the information submitted in thisdocument and all attachments and that, based on my inquiry of those individuals immediately responsible for obtaining theinformation, I believe the submitted information is true, accurate and complete. I am aware that there are significantpenalties for submitting false, inaccurate, and incomplete information and that I am committing a crime in the fourth degreeif I make a false statement that I do not believe to be true. I am also aware that if I knowingly direct or authorize theviolation of any statute, I am personally liable for the penalties.
PROFESSIONAL LA 'SURVEYOR'S SIGNATURE10/22/03DATE'
RICHARD C. MATHEWS GS29353PROFESSIONAL LAND SURVEYOR'S NAME AND LICENSE NUMBER
43 WEST HIGH STREET, SOMERVILLE, NEW JERSEY 908 725 0230PROFESSIONAL LAND SURVEYOR'S ADDRESS AND PHONE NUMBER

MONITORING WELL CERTIFICATION FORM BLOCATION CERTIFICATION
Name of Owner
Name of Facility
Location
PSE&G Salem Generatinp, Facility
PSE&G Salem Generating Facility
Lower Allowavs Creek. Salem County
UST Number: SRP Case No.:.LAND SURVEYOR'S CERTIFICATIONWell Permit Number:This number must be permanently affixed to the well casing.
Owners Well Number (As shown on application or plans)Geographic Coordinates NAD 83 (to the nearest 1/10 of second)
MW-AF
Longitude: West 750 32' 08.75"New Jersey State Plane Coordinates NAD 83 to nearest 10 feet:
North 230,491Elevation of Top of Inner Casing (Cap off) atReference mark (to nearest 0.01' in relation to permanenton-site datum)
Latitude: North * 390 27' 41.74"
East 199.702
Casing 102.00 PVC 101.61 Ground 99.2
Source of elevation datum (benchmark, number/description and elevation/datum. If an on-site datum is used, identify here,assume datum of 100', and give approximate actual elevation. Please note that, if information from the well is to besubmitted electronically, the EDSA manual specifies the well elevation to be reported according to NAVD 1988 to anaccuracy of 0.2'.)
Site Monument N 5 + 0, E 2 + 0 Elevation 102.78 scaled actual elevation 10
Significant observations and notes: 0AUTHENTICATION
I certify under penalty of law that I have personally examined and am familiar with the information submitted in thisdocument and all attachments and that, based on my inquiry of those individuals immediately responsible for obtaining theinformation, I believe the submitted information is true, accurate and complete. I am aware that there are significantpenalties for submitting false, inaccurate, and incomplete information and that I am committing a crime in the fourth degreeif I make a false statement that I do not believe to be true. I am also aware that if I knowingly direct or authorize theviolation of any statute, I am personally liable for the penalties.
PROFESSIONAL LAND SURVEYOR'S SIGNATURE10/22/03DATE
RICHARD C. MATHEWS GS29353PROFESSIONAL LAND SURVEYOR'S NAME AND LICENSE NUMBER
43 WEST HIGH STREET, SOMERVILLE, NEW JERSEY 908 725 0230PROFESSIONAL LAND SURVEYOR'S ADDRESS AND PHONE NUMBER

I Name of Owner
Name of Facility
MONITORING WELL CERTIFICATION FORM BLOCATION CERTIFICATION
PSE&G Salem Generating Facility
PSE&G Salem Generating Facility
Location T All r' 1, Q I - i, -LA -L.A - .Ifl Y. -... A.E. 3L..l , t flA !6
UST Number:LAND SURVEYOR'S CERTIFICATIONWell Permit Number:This number must be permanently affixed to the well
Owners Well Number (As shown on application or p]Geographic Coordinates NAD 83 (to the nearest 1/IC
Longitude: West 750 32' 11.23"New Jersey State Plane Coordinates NAD 83 to near.
SRP Case No.:
casing.
lans) MW AG-S
Latitude: North 390 27' 41.77"
North 230,496 'Elevation of Top of Inner Casing (Cap off) atReference mark (to nearest 0.01' in relation to permanenton-site datum)
East1 VC99.29199.508
.PVC 99.29
Source of elevation datum (benchmark, number/description and elevation/datum. If an on-site datum is used, identify here,assume datum of 100', and give approximate actual elevation. Please note that, if information from the well is to besubmitted electronically, the EDSA manual specifies the well elevation to be reported according to NAVD 1988 to anaccuracy of 0.2'.)
Site Monument N 5+0, E 2+0 Elevation 102.78 scaled actual elevation 10
Significant observations and notes:
AUTHENTICATION
I certify under penalty of law that I have personally examined and am familiar with the information submitted in thisdocument and all attachments and that, based on my inquiry of those individuals immediately responsible for obtaining theinformation, I believe the submitted information is true, accurate and complete. I am aware that there are significantpenalties for submitting false, inaccurate, and incomplete information and that I am committing a crime in the fourth degreeif I make a false statement that I do not believe to be true. I am also aware that if 1.knowingly direct or authorize theviolation of any statute, I am personally liable for the penalties.
/( SEAL.
PROFESSIONAL LAND SURVEYOR'S SIGNATURE
RICHARD C. MATHEWS GS29353PROFESSIONAL LAND SURVEYOR'S NAME AND LICENSE NUMBER
43 WEST HIGH STREET, SOMERVILLE. NEW JERSEY 908 725 0230PROFESSIONAL LAND SURVEYOR'S ADDRESS AND PHONE NUMBER
2/23/04DATE

MONITORING WELL CERTIFICATION FORM BLOCATION CERTIFICATION
Name of Owner
Name of Facility
Location
PSE&G Salem Generating Facility
PSE&G Salem Generating Facility
Lower Allowavs Creek. Salem CountyLocation
UST Number: SRP CLAND SURVEYOR'S CERTIFICATIONWell Permit Number:This number must be permanently affixed to the well casing.
3ase No.:
Owners Well Number (As shown on application or plans)Geographic Coordinates NAD 83 (to the nearest 1/10 of secont
MW AG-D
Longitude: West 750 32' 11.23"New Jersey State Plane Coordinates NAD 83 to nearest 10 feet:
North 230,496Elevation of Top of Inner Casing (Cap off) atReference mark (to nearest 0.01' in relation to permanenton-site datum)
Latitude: North 390 27' 41.77"
East 199,508
PVC 99.20
Source of elevation datum (benchmark, number/description and elevation/datum. If an on-site datum is used, identify here,assume datum of 100', and give approximate actual elevation. Please note that, if information from the well is to besubmitted electronically, the EDSA manual specifies the well elevation to be reported according to NAVD 1988 to anaccuracy of 0.2'.)
Site Monument N 5+0, E 2+0 Elevation 102.78 scaled actual elevation 10
Significant observations and notes:
AUTHENTICATION
I certify under penalty of law that I have -personally examined and am familiar with the information submitted in thisdocument and all attachments and that, based on my inquiry of those individuals immediately responsible for obtaining theinformation, I believe the submitted information is true, accurate and complete. I am aware that there are significantpenalties for submitting false, inaccurate, and incomplete information and that I am committing a crime in the fourth degreeif I make a false statement t hat I d o not believe t o b e t rue. I a m a lso a ware t hat if I knowingly direct or authorize theviolation of any statute, I am personally liable for the penalties.
{ • AL
PROFESSIONAL LAND SURVEYOR'S SIGNATURE
RICHARD C. MATHEWS GS29353PROFESSIONAL LAND SURVEYOR'S NAME AND LICENSE NUMBER
43 WEST HIGH STREET, SOMERVILLE, NEW JERSEY 908 725 0230PROFESSIONAL LAND SURVEYOR'S ADDRESS AND PHONE NUMBER
2/23/04DATE
I

MONITORING WELL CERTIFICATION FORM BLOCATION CERTIFICATION
Name of Owner
Name of Facility
Location
PSE&G Salem Generating Facility
PSE&G Salem Generatinie Facility
Lower Alloways Creek, Salem.County
UST Number: SRP CLAND SURVEYOR'S CERTIFICATIONWell Permit Number:This number must be permanently affixed to the well casing.
;ase No.:
Owners Well Number (As shown on application or plans)Geographic Coordinates NAD 83 (to the nearest 1/10 of secon
MW AH-S
Longitude: West 750 32' 10.10"New Jersey State Plane Coordinates NAD 83 to nearest 0. feet:
North 230,450Elevation of Top of Inner Casing (Cap off) atReference mark (to nearest 0.01' in relation to permanenton-site datum)
Latitude: North 390 27' 41.33"
East 199,596
PVC 102.58
Source of elevation datum (benchmark, number/description and elevation/datum. If an on-site datum is used, identify here,assume datum of 100', and give approximate actual elevation. Please note that, if information from~tbe well is to besubmitted electronically, the EDSA-manual specifies the well elevation to be reported according to NAVD 1988 to anaccuracy of 0.2'.)
Site Monument N 5+0. E 2+0 Elevation 102.78 scaled actual elevation 10
Significant observations and notes:
AUTHENTICATION
I certify under penalty of law that I have personally examined and am familiar with the information submitted in thisdocument and all attachments and that, based on my inquiry of.those individuals immediately responsible for obtaining theinformation, I believe the submitted information is true, accurate and complete. I am aware that there are significantpenalties for submitting false, inaccurate, and incomplete information and that I am. committing a crime in the fourth degreeif I make a false statement that I do not believe to be true. I arm also aware that if I knowingly direct or authorize theviolation of any statute, I am personally liable for the penalties.
/ > SEAL,
PROFESSIONAL LAND SURVEYOR'S SIGNATURE
RICHARD C. MATHEWS GS29353PROFESSIONAL LAND SURVEYOR'S NAME AND LICENSE NUMBER
43 WEST HIGH STREET, SOMERVILLE, NEW JERSEY 908 725 0230PROFESSIONAL LAND SURVEYOR'S ADDRESS AND PHONE NUMBER
2/23/04DATE

MONITORING WELL CERTIFICATION FORM BLOCATION CERTIFICATION:
*0Name of Owner
Name of Facility
PSE&G Salem Generating Facility
PSE&G Salem Generating Facility
Location Lower Alloways Creek. Salem Count
UST Number: SRP C•LAND SURVEYOR'S CERTIFICATIONWell Permit Number:This number must be permanently affixed to the well casing.
ase No.:
Owners Well Number (As shown on application or plans) -Geographic Coordinates NAD 83 (to the nearest 1/10 of second)
MW AH-D
Longitude: , West 750 32' 10.10"New Jersey State Plane Coordinates NAD 83 to nearest 10 feet:
E North 230,450Elevation of Top of Inner Casing (Cap off) atReference mark (to nearest 0.01' in relation to permanenton-site datum)
Latitude: North 390 27' 41.33"
East 199,596
PVC 102.70
Source of elevation datum (benchmark, number/description and elevation/datum. If an on-site datum is used, identify here,assume datum of 100', and give approximate actual elevation. Please note that, if information from the well is to besubmitted electronically, the EDSA manual specifies the well elevation to be reported according to NAVD 1988 to anaccuracy of 0.2'.)
Site Monument N 5+0. E 2+0 Elevation 102.78 scaled actual elevation 10
Significant observations and notes:
AUTHENTICATION
I certify under penalty of law that I have personally examined and am familiar with the information submitted in thisdocument and all attachments and that, based on my inquiry of those individuals immediately responsible for obtaining theinformation, I believe the submitted information is true, accurate and complete. I am aware that there are significantpenalties for submitting false, inaccurate, and incomplete information and that I am committing a crime in the fourth degreeifI make a false statement thatI do not believe to be true. I am also aware that if I knowingly direct or authorize theviolation of any statute, I am personally liable for the penalties.
SEAL
PROFESSIONAL LAND SURVEYOR'S SIGNATURE
RICHARD C. MATHEWS GS29353PROFESSIONAL LAND SURVEYOR'S NAME AND LICENSE NUMBER
43 WEST HIGH STREET, SOMERVILLE, NEW JERSEY 908 725 0230PROFESSIONAL LAND SURVEYOR'S ADDRESS AND PHONE NUMBER
2/23/04DATE

MONITORING WELL CERTIFICATION FORM BLOCATION CERTIFICATION
Name of Owner
Name of Facility
Location
PSE&G Salem Generatinpifacility
-PSE&G Salem Generating Facility
Lower Allnwavs Creek. Salem County
UST Number: SRP C•LAND SURVEYOR'S CERTIFICATIONWell Permit Number:This number must be permanently affixed to the well casing.
se No:
Owners Well Number (As shown on application or plans)Geographic Coordinates NAD 83 (to the nearest 1/10 of second)
Longitude: West 750 32' 11.11"New Jersey State Plane Coordinates NAD 83 to nearest 10 feet:
North 230,798Elevation of Top of Inner Casing (Cap off) atReference mark (to nearest 0.01' in relation to permanenton-site datum)
MW Al
Latitude: North 390 27' 44.76"
East 199,521
PVC 98.79
Source of elevation datum (benchmark, number/description and elevation/datum. If an on-site datum is used, identify here,assume datum of 100', and give approximate actual elevation. Please note that, if information from the well is to besubmitted electronically, the EDSA manual specifies the well elevation to be reported according to NAVD 1988 to an.accuracy of 0.2'.)
Site Monument N 5+0, E 2+0 Elevation 102.78 scaled actual elevation 10
Significant observations and notes:
AUTHENTICATION
I certify under penalty of law that I have personally examined and am familiar with the information submitted in thisdocument and all attachments and that, based on my inquiry of those individuals immediately responsible for obtaining theinformation, I believe the submitted information is true, accurate and complete. I am aware that there are significantpenalties for submitting false, inaccurate, and incomplete information and that I am committing a crime in the fourth degreeifI make a false statement that I do not believe to be true. I am also aware that if I knowingly direct or authorize theviolation of any statute, I am personally liable for the penalties.
SEAL
PROFESSIONAL LAND SURVEYOR'S SIGNATURE
RICHARD C. MATHEWS GS29353PROFESSIONAL LAND SURVEYOR'S NAME AND LICENSE NUMBER
43 WEST HIGH STREET, SOMERVILLE. NEW JERSEY 908 725 0230PROFESSIONAL LAND SURVEYOR'S ADDRESS AND PHONE NUMBER
2/23/04DATE

MONITORING WELL CERTIFICATION FORM BLOCATION CERTIFICATION
Name of Owner
Name of Facility
Location
PSE&G Salem Generating Facility
PSE&G Salem Generating Facility
l.ower Allowavs Creek. Salem County
UST Number: ._SRP CLAND SURVEYOR'S CERTIFICATIONWell Permit Number:This number must be permanently affixed to the well casing.
ase No.:
Owners Well Number (As shown on application or plans) -Geographic Coordinates NAD 83 (to the nearest 1/10 of second)
MW AJ
Longitude: West 750 32' 09.24"New Jersey State Plane Coordinates NAD 83 to nearest 10 feet:
North 230,670Elevation of Top of Inner Casing (Cap off) atReference mark (to nearest 0.01' in relation to permanenton-site datum).
Latitude: North 390 27' 43.51"
EastPVC98.65I 99.665
PVC 98.85
Source of elevation datum (benchmark, number/description and elevation/datum. If an on-site datum is used, identify here,assume datum of 100', and give approximate actual elevation. Please note that, if information from the well is to besubmitted electronically, the EDSA manual specifies the well elevation to be reported according to NAVD 1988 to anaccuracy of 0:2'.)
Site Monument N 5+0. E 2+0 Elevation 102.78 scaled actual elevation 10
Significant observations and notes;
AUTHENTICATION
I certify under penalty of law that I have personally examined and am familiar with the information submitted in thisdocument and all attachments and that, based on my inquiry of those individuals immediately responsible for obtaining theinformation, I believe the submitted information is true, accurate and complete. I am aware that there are significantpenalties for submitting false, inaccurate, and incomplete information and that I am committing a crime in the fourth-degreeif I make a false statement that I d o not b elieve to b e true. I a m also a ware that if I knowingly direct or authorize theviolation of any statute, I am personally liable for the penalties.
SEAL,
PROFESSIONAL LAND SURVEYOR'S SIGNATURE2/23/04DATE
RICHARD C. MATHEWS GS29353PROFESSIONAL LAND SURVEYOR'S NAME AND L1CENSE NUMBER
43 WEST HIGH STREET, SOMERVILLE, NEW JERSEY 908 725 0230PROFESSIONAL LAND SURVEYOR'S ADDRESS AND PHONE NUMBER
Il0

MONITORING WELL CERTIFICATION FORM BLOCATION CERTIFICATION
Name of Owner
Name of Facility
Location
PSE&G Salem Generating Facility
PSE&G Salem Generating Facility
Loe A~lnljwv' C'reek Sale Coun-rt
UST Number: SRP C;LAND SURVEYOR'S CERTIFICATIONWell Permit Number:This number must be permanently affixed to the well casing.
ase No:No.:
-Owners Well Number (As shown on application or plans)Geographic Coordinates NAD 83 (to the nearest 1/10 of second)
Longitude: West 750 32' 07.44"New Jersey State Plane Coordinates NAD 83 to nearest 10 feet:
North 230,594Elevation of Top of Inner Casing (Cap off) atReference mark (to nearest 0.01' in relation to permanenton-site datum)
MW AL
Latitude: North 390 27' 42.78"
East 199,806
RIM 99.42 PVC 99.13
S1Source of elevation datum (benchmark, number/description and elevation/datum. If an on-site datum is used, identify here,assume datum of 100', and give approximate actual elevation. Please note that, if information from the well is to besubmitted electronically, the EDSA manual specifies the well elevation to be reported according to NAVD 1988 to anaccuracy of 0.2'.)
Site Monument N 5+0, E 2+0 Elevation 102.78 scaled actual elevation 10
Significant observations and notes:
AUTHENTICATION
I certify under penalty of law that I have personally examined and am familiar with the information submitted in thisdocument and all. attachments and that, based on my inquiry of those 'individuals immediately responsible for obtaining theinformation, I believe the submitted information is true, accurate and complete. I am aware that there are significantpenalties for submitting false, inaccurate, and incomplete information and that I am committing a crime in the fourth degreeif I make a false statement that I do not believe to be true. I am also a ware that if I knowingly direct or authorize theviolation of any statute, I am personally liable for the, penalties.
A SE
PROFESSIONAL LAND SURVEYOR'S SIGNATURE,
RICHARD C. MATHEWS GS29353PROFESSIONAL LAND SURVEYOR'S NAME AND LICENSE NUMBER
43 WEST HIGH STREET, SOMERVILLE. NEW JERSEY 908 725 0230PROFESSIONAL LAND SURVEYOR'S ADDRESS AND PHONE NUMBER
D2/23/04DATE'
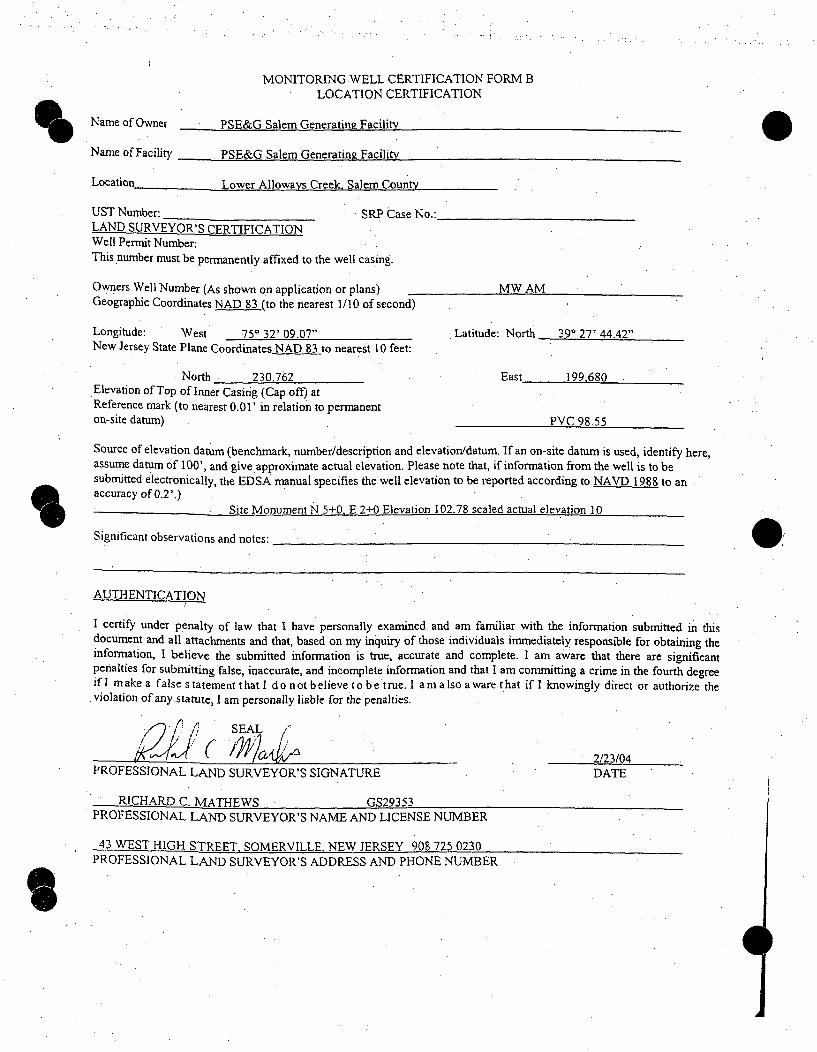
MONITORING WELL CERTIFICATION FORM B". LOCATION CERTIFICATION
Name of Owner
Name of Facility
Location
PSE&G Salem Generating Facility
PSE&G Salem Generating Facility
Lower Allowavs Creek. Salem County
UST Number: SRP CaseLAND SURVEYOR'S CERTIFICATIONWell Permit Number:This number must be permanently affixed to the well casing.
Owners Well Number (As shown on application or plans)Geographic Coordinates NAD 83 (to the nearest 1/10 of second)
Longitude: West 750 32' 09.07"New Jersey State Plane Coordinates NAD 83 to nearest 10 feet:
MO.:
MW AM
North . 230,762Elevation of Top of Inner Casing (Cap off) atReference mark (to nearest 0.01' in relation to permanenton-site datum)
Latitude: North 390 27' 44.42"
East 199,680
PVC 98.55
Source of elevation datum (benchmark, number/description and elevation/datum. If an on-site datum is used, identify here,assume datum of 100', and give approximate actual elevation. Please note that, if information from the well is to besubmitted electronically, the EDSA manual specifies the well elevation to be reported according to NAVD 1988 to anaccuracy of 0.2'.)
Site Monument N 5+0, E 2+0 Elevation 102.78 scaled actual elevation 10
Significant observations and notes:
AUTHENTICATION
I certify under penalty of law that I have personally examined and am familiar with the information submitted in thisdocument and all attachments and that, based on my inquiry of those'individuals immediately responsible for obtaining theinformation, I believe the submitted information is true, accurate and complete. I am aware that there are significantpenalties for submitting false, inaccurate, and incomplete information and that I am committing a crime in the fourth degreeif I make a false statement that I do not believe to betrue. I am also aware that if I knowingly direct or authorize theviolation of any statute, I am personally liable for the penalties.
SEAL
PROFESSIONAL LAND SURVEYOR'S SIGNATURE
RICHARD C. MATHEWS GS29353PROFESSIONAL LAND SURVEYOR'S NAME AND LICENSE NUMBER
43 WEST HIGH STREET, SOMERVILLE, NEW JERSEY 908 725 0230PROFESSIONAL LAND SURVEYOR'S ADDRESS AND PHONE NUMBER
2/23/04DATE
EIj
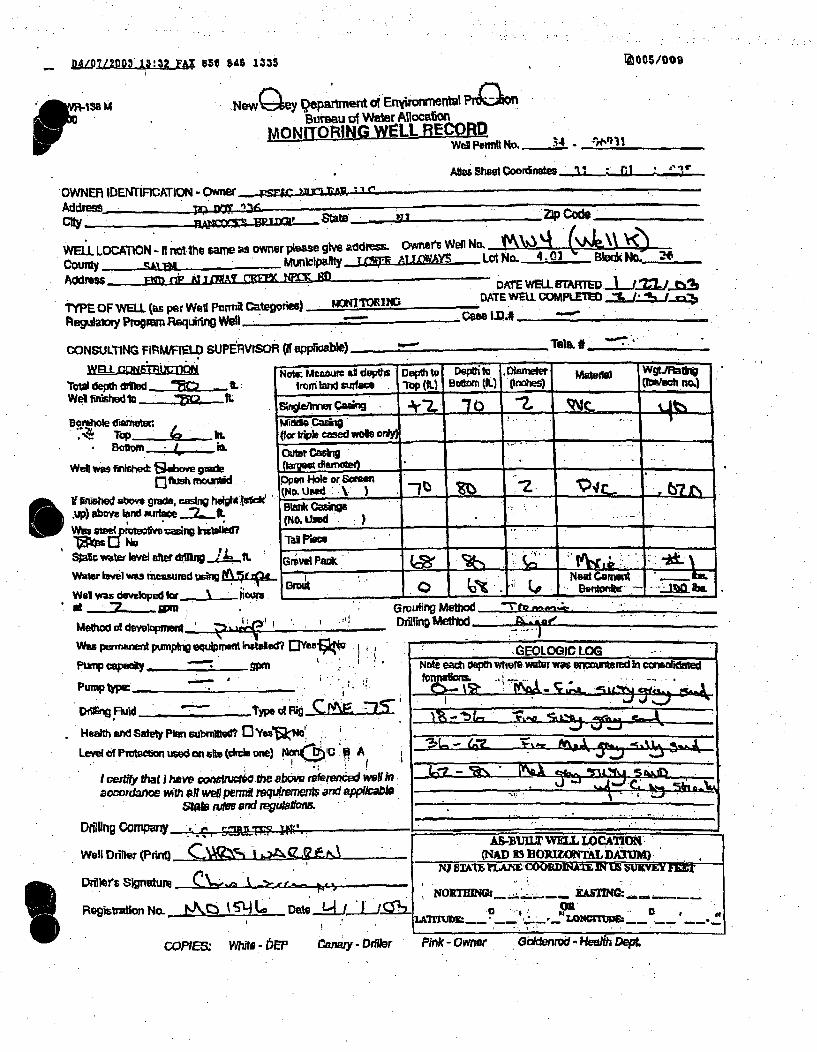
- i4L97/2DO~ 15:52 F4~ 351 345 1535 ZOOs/OO9
r 38 M
NewQe~y lgepallnent of EnvjrongrmOfltU Prj~BUrsau of Water Alocati
MONITORING WELLBXECCRD-WO eriPWItINo. 34 1h,41
.OWNER IDENTIRiCATION - OWWeAddres pm
WELL. LOCATIN - i ro~t the sami as Owner please WGt address. Owns~r3 WePlNG. , h~4 (p~L\rcounty slmMruncipaity IJA LLWYS Lt 4-02 lc N .L
Address i n ip~l& rdF NR¶iRDATE WELL. STARTEM
TYPE OF WW.L (as per Wedl Puman~ Ctegorif) ~vmiDATE Wal. COMPLE1M !1
VAeg~atoy "mm PanIFfqLdflf Well -OML~
CONSULlI-NG FIRWlELD SUPERVISOR (9~ a~pr*&oble) -
'row Oplesd ~Wei f~nshed~ 10 ALJI
Borehole mmmeft
Wel w as fmtsheck toove uiwle
r oIfished abee graft, cmkqi hugh ,.c*'Wu) aboe land muftm se _f
StaIc wateklvel adffter- ft.Ik!
Notumecasur aI depth Deht - e to D Olaele MKknk I IW Wgtj~tadrimmn lard suifac lbp (f.) Elotom (IL) 'Orohes) ~ 35n.
meat Co0i
&W~s lwel was measuredvf 11ln -.9Lh~AWei was dmlopied far how
Method I dewiopm sr_____________Wa emanent Pumptr equiment intoted? Omeu1,:kN yI
DiiVn !1W .tp d Ri4
Heafth and Safety Plan cumilimS0 Yes'UýM''
Ir c hegifyat i hove c efruct~O.Me abmv rvf~enca1 wvN inlamoodnw~o IWlh 0l wedl Perift wqulWmmeM nls d *PfkltSD
5tats nsev anid reqL~alkzns
firling )AetIw -
GEOLOGIC LOGNote each 0"p where Water was m =a Wemd In cor"Ictoed
MCI S kko
Dnllrig Oonipun ;P
Well Dn~lW (P"n~C i~i~onhIers Signature -.- ' 1
Ftog'ivnton No- U~~ DAI La D .ate.Q'
i -
AS-BILT WELL WOCAION(NAD 13 H0Rwr0NTkLDA7UM)
NJ bITAh 1'LAZ{E-CXK)eD"INF IN US SURVEY FM
LATIT~M*.-- 014CM
COPIE& Wme - 6EP calsw - I)rftr COPES I~i. Caay Dr~r Pink - Owner .Oddenrod - NeaWfDept.

04/07/2003 14:32 FAX 8s9 $4S 1338 Q00e/009
DVF-138 M New(:D~ey Department o? EnvironmafltWl PrQ~nBureau of Water Allocalimn
MOITORING WELL iRE:-CORDWel1 Permi No. .. -OI92
OWNER IDENTIFICATION! OWne ..
Addrms fZrn 3,16cliv r. -M~~a
All~hes trCoaffnates ld -.2... 1 it,
I' Iyn!I State. ____________________Zip Cdods______
WELL LOCATION - If, not fi ~fi can e owner pleaws gýve addreu Owner's Well No.cc"urtly S ~ l j- Mun~cpamy t~ P 'M : - Lek Na. 4.01 SIodCN oAddrem VMa ne At fmui cr rmI ? IM, tfi ...... _ -.... ..........
DATE WELL STARTED f. J..2Lj tGDATE WELL. COMPLErED I LJaa..j. 4MTYPE OF WEL.L-(as per wcAi Prmit Categot~es)
Resulatory Prog=w Req~rfr Won U LUWlill
CONSUMING flRWFIMELD SLIPCRVISOR (if applbiqal)
Wal tmldd to !50 A
Borehole claneW.Tap- A nBonTfj,. ii
WARl UMs trshod Raw"~v 9asd[Ifllmh montod
It finlzhdabod v~e grd., casng heotl lscolkup) aove lrd sudee~
-Sinhc WOWe level aft erk 111
Wfatr level vm n Msammd luV"~q
Wgwas developed for . .. ,. hamrcM .. 93
Nele: Measure oil depths tpthto DepItit Driametar Moe WtalaingbonI"i sujilso -Top (kL) BO~OMN Oct")~a) (ls/ w o
F(tar bil* cased wells oni___________
outer coaftQw~gestd Motoi -- -
Open Hole rat w -S crem -
Blin ca~s-ig(No. Used
Telvv Pla*
Neat CQmGM -f.
_________ ____ ur~tgl Got.
I *
( ~rodnifg Method.Method of d~onn ýwas perrnarwmu pumping eqimeud Inswi~ed? Oyes~ft
Drffkin FluiM - Tp of Rig M . $LH~amt and Saely plan siriite?
Level of Protedntmwj sd ~ mi (grcle oft) N,%nCDC -8 A
I wtbI, that Ihavce Wnshxewfme abovo ffikmma wed inaccordonce wilh oil well pen* ,equilMemr 8)7d HPP~kS*~
S"a~ roWD and feguisU - j
W61IF YIFTUWU -ý 1
rEbLOGIC LO
Note oaoh deplh where waterwwas erw*Mr9 In cegwokdeM
U0 so -!% I~A tb -%
Aý&KONT& DS UATUM'NJ SIATh IA COORDMUT IN U3 S(JRVEYMIr
Dr~iikg Compeny
Well Driller(P"in - -C ,-
Registratin No. '"'-~ Date 4 .S
COPIES. Whft - DEP COPIE: Wh~e DEP canary - VrW -e Puik - Owner olfvc-eatDp00MMW - Heab DepE
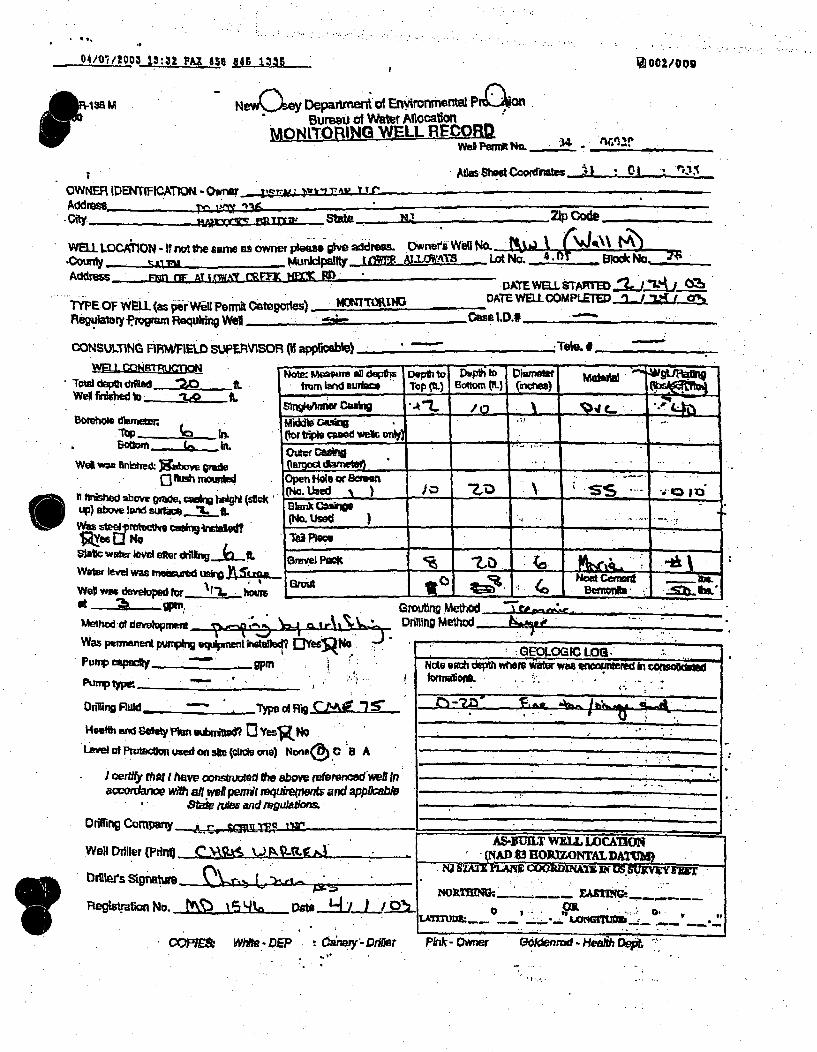
04/07/200z M3:32 PAlZ 856 1i 1/ 'A Gel/cog
' 138 M
New~sy Depaft Imernt ofetronmnenta P oBureau of Water Alocation "
MONITORIN Wa LL RECORD3Web Pemit NIL ~ __ _ _ _ _
OWNER IDENTIFICATION.OwnI pr_=rm. .avv TUPAddmsa s- i.,g , 'mr ,, ,,
RI~T~~U Stake Zip Code_ _____
WELL LOCATION - It not fte sarne as owner pkAaes U) ve addtra. Ownersa Well NO.-Oourdy S433 Wr~l~dpf~ty LW- ~OA8 LotwN. 4.U17 WocNAddrs PFm1 CF AT iJaY CgFFX t=E FPD
PACTE WELL S I AM11 _u1 ±WDATE WELL OOMPLEED3.13 (9ý5TYPE OF WELL (as OrvwPermit ategories)
Aeyp .rygmr Roqu• wVi .WllM=)RIND
-- " .. .. .. iiI , i
0"Se ID.# 1iii • m
CONSULTING RRWFIELD SUP.V1SOR VI aioble) •Telle. #_ "- _
TroW dpth ddled2 nIo L
WWN finihed Ic
Borethe dlmnaetur
* Boaom _ in.
WOO -.a aff-hei )flm&b warfd
m.•~ ~ C .. ,,. m,, r r,." d-V? finWW abrw gade, cor'k hoelghl (ckup) abo__ lad s_ Il IL&Wus *tel imrtedhjv mfngtded?
izabc wanter low after dI11II-g.-LWAWe levt was tnebpged wkg * Sz .WeOd oe de'elomdfor I f,.,,at
tram lard aur,,, TOP (k.) . o , ) (o.ld")"-
Siwhrercmpn .. 'OL ,a. 4 -'0 w• , u . ' ' ... .. ... ..(for tripl cavned vmUl oi4 -
Oiutc Oeaf03re idntisi -Open Hole cm Se".(o. U ,sed .o ) S S , .._____________ - -~p'No. Usw• },,... -
__ - - -_ ,'tU P, , ..
Grui4 Ll~md~ c~enm~t l
(.,,G.. rm eMod~~ ~ Drilng Me~hrd.
~eD -~.,
Was .mmswt p.rN;V ' ~Snstallak¶? wPUNP eft"~y gpm
DriliV Flui - Type a! KS~ 2~.Health and WSeVty~ subartVmit 0 Yes$(NoL Avelofpw~tw~ft used ns (dies one) Nons(2) C U A
I Jertffy fth hav oonmroulaje ft abom mJfermwdwmtw Inaomdanoe tdM ant wapmir maq,*,ne, and aPPLkaMl
Sh*i ndw and iwg~a~aton
v
GEOLIOGICL--INoteeflh, de . wher . . ..a4w qf~edi m o ue
F.~. 4 ~ -~m~
Drilling ComPnr SOP=$ 1W
Well Driller (Pdrito !C)W$4 V FJ-~ '. AS-,ILT WL LOCA1ION_ .A 6,•3 HOIONTALDATU,,M• _ ---
Druller 81grnwn. ( ~rt~
pagitkatio No. ,~5I L41 zJJ..~L
INJ SWXU ILA1M3 kVV.LM.DINA~ Wi W*USKSjri~lI4OU.--------- L4__D(.__
LA "TOm .- -
COMM~~ Wh.oDE aim-D*cOPJ& W~le- ZEP O~wa- DR~r Pink - Oiwwe ftkIden1- Heftih DedL

Water Supply Element - Bureau of Water Allocation
WELL ABANDONMENT REPORTAl T Bureau of Water Allocation WELL PERMIT s 34-06028
P C B ox 426 .of w ell sealedPO Box 426Trenton, NJ 08625-0426 DATE WELL SEALED 5/6103
PROPERTY OWNER PSE&G Serices Corp
ADDRESS 80 Park Place Newark, NJ 07102
WELL LOCATION Artificial Island Lower Alloway Twp., NI Salem-
Street & No., Township, County
Well M 4.01 26
Well No. Lot No.. Block No.
USE OF WELL PRIOR TO ABANDONMENT: Monitoring
REASON FOR ABANDONMENT: Deconmnission
WAS A NEW WELL DRILLED? BYES O NO PERMIT # OF NEW WELL 3400006990-Cross-section Draw a sketch showing distance and relations of well site toTOTAL DEPTH OF WELL 20 ot sealed well nearest roads, buildings, etc.
DIAMETERCASING LENGTH 10-SCREEN LENGTH 10'
.-
NUMBER-OF CASINGS 1 101 K3idI tAP MATERIAL USED TO DECOMMISSION WELL:5-'KNA Gallons of Water 1p,
Lbs. of Cement (HA Lbs. of Bentonite
Lbs. of Sand/Gravel •.1 I-lrods 4- r-,,t so+ Scr-n ovedr;11.4(none Ri well is, contaminated) ~ ~+ tpL.l'poei,4+~ W~tDJOX 10
FORMATION: Unconsolidated .4 4 N
TO permit adequate grouting, the casing should remain in place, but ungrouted liner pipes or any other obstructions mustbe removed. Pressure grouting is the only accepted method.
WAS CASING LEFT IN PLACE? D YES 0 NO CASING MATERIAL:
WERE OTHER OBSTRUCTIONS LEFT IN WELL? []YES 0 NO WHAT WERE THE OBSTRUCTIONS:
IF "YES", AUTHORIZATION GRANTED BY_ _ _ _ _ _ _ _ _ ON(NJDEP Official) (Date)
Was an alternative decommissioning method used? 0 YES ONO
IF 'YES", authorization granted by ON(NJDEP Official) (Date)
I certify that this well was sealed in accordance with N.J.A.C. 7:9-9.1 et seq.Nicholas A. Fallucca PO Box 423 West Creek, NJ 6/26/03
Performing Work (Print oWr Type) d Mailin DateName of NJ Certified Well Sealer L _a7AJ1527
Signature of NJ Certified Well SealerPerforming Work
Yellow - Owner Pink - Health Dept.
Registration #
Goldenrod - Driller 4COPIES: White - Water Allocation

Bureau oi water Puocauon
MONITORING WELL RECORD3400006990
AtlasgSheet Coordinates
3401635.OWNER IDENTIFICATION PSE&G Services CorpI ss 80 Park PlaceNewark State New Jersey
WELL LOCATION - If not the same as owner please give addressCounty Salem -Municipality Lower Alloway Twp.
Zip Code 07102
Owner's Well..No., Well M
Lot No. 4.01 Block No. 26Address Artificial Island
WELL USE Monitoring DATE WELL STARTED 5/6/03DATE WELL COMPLETED 5/6103
eph to _Depth to ]Diameter Material [ Wop (ft.) Bottom (ft.) (inches) (I (Ibs/sch no.)
WELL CONSTRUCTION
Total-Depth Drilled__20 , ft,
Finished Well Depth 20 ft.
Borehole Diameter:
Top 6 m.
Bottom 6 M.
Well was finished: above grade
"-'-[]flush mountedIf finished above grade, casing height(stick up) above land surface 3
Steel protective casing installed?
Yes [:]No
tic Water Level after drilling 6 ft.
Note: Measure all depthsfrom land surface T
I Singlellnner Casing 1[+3 10 PVC Fsch40oMiddle Casing
(for tinple cased wells only) 1 l _______ _____ I__________IOuter Casing l
(agsdimeter) f ____ ______ _____ _________ ______
(N0Used .010 10 F20 1 * PVC/s.s. ch40Blak~aing _____ _______[ ___ I ________ _____I
[ jj T il Pie e _ II !I ..... 1Gravel Pack **"'7.5' 20 6 # 1 well g200 lbs
0 I I I lcmntbnntip' bGrout 1 7.5 6 lbs
-Water Level was Measured Using Tape
Well was developed for 1 hours
at 3/4 gpm
Method of development Peristoltic Pump
Pump Capacity gpmPump Type
Drilling Fluid __ Type of Rig Geoprobe 66DTHealth and Safety Plan Submitted? 0Yes "[No
Level of Protection used on site'(circle one) None . C B A
I certify that I have constructed the above referenced well inaccordance with all wellpermit requirements and applicable Staterules and regulations.
Drilling Company C T & E ENVIROVNMEN.TAL SERVICES
Well Driller (Print) NichWlas Fallucca
Driller's Signature
Legistration No. J1526 Date 16.3
3550
ORIGINAL: DEP COPIES'. DRILLER
e
Grouting Method
Drilling MethodTreOOie
HSA
GEOLOGIC LOG1Note each depth where water was encountered in consolidated tons
0-20' fine to reed orange sand, trace gravel
0-20' fine to med orange sand, trace gravel
* 1" PVC w/staindess steel mesh wrap (2.5" OD sand pack)
**install sand pack around pre-packed screen
0 WNER HEALTH DEPARTMENT

04/07/2003 13m~ PAX 651 645 1336 O003/009
I IwR-ma M Nm~eryDepartment ot Ervvironrnental Pro-onBureau of Water Aloat~ion
MpbIflORIt4Q WIELL RlECORDWell Permit Mo. nce __________
OWNER IDENTIFICATION - Owner,Acdd~~
Allas Shieet Coartfia-eW
fU __:_ -, *10%6wl-ý 'P'ý i
SEM1
WELL LOCAllON - Inot fte sarne as owner -please glve address. OVA-Art Well No. rMQ7 01- \V-JCoiMV *-_=ELL Municpliyawe iyj my Lot No. 4 n C e. look Na.-
Addren END MT MIpWAY -PM N FrM21• _ ---- ,,, o
TYPE- OF WELL (as per well permit 08Weg0062FPeVIgatmw Program Rert~lng won____ - CBS
DATE WELL S1ARTH I UT 3DATh WRLLCOMPLETE I I4 k
CONSULTiNG FFIR~~ELD SUPERVISOR~ (If appkiaab)e I Telia. #
"row 00At dried !7tL-1WdM Iffthot to. -rA L
Well wet fir****. Mabou grade
Vf ftrshed abaft cirkde5 endris ho~t (ftckup) at~va m~d wriew .-2- ILWa* u 'reda WigistIvrw No
Sttcwatr Wgvsl ghwe thflin I
Water was e meaaured wzing~uWet Was daekigpd to r MI iure14- !1 .gMMMOUV4 oldeyb orM
- ~ -~ r -- *~ _____________________________ ______________________
Kota: M.%sure all dePths Depth to -Depthi to j~iamuwejWLR~nfrom lam Unme ITop (fL) BOaMM VL)I[.Ch.%)
I
Matarl Wq%./R*"obshch R0.1
9
S Wtid n e C.9 m g C
(lat"rtiC1,ed Wells Oy)
0UW
(No. UsedTall Psece
Gravel PacKG~mftNeed C80nK
eft __e - B.
Groulng Methd 7 ,,Dr•ling Method_ _________________
WaS permnsmr pwryzvg equoya~t Installml? EDYes 'ptl
PURF COP&*y
Punt,1 ro
Wrina kW - Tpe ut ig CN- IE~
fivlt Wi 60d ftV~ Plan~ submMadi 03 Y'wivio
Levelof t Nvwjn Ludnd sue 5 (cilcla owi) Ncm<()C. B A
I er*r~ that I have Constructed the abOve referened 06l inlaocofdwioe wfth a# we v.iperrt requfiremenft " nd applieablo
Stat Mides and Mplti
GEOLOGIC LOGNft n ch dph where wate w mnmurituwd In consolidaed
I I
0- U_
D04ln Cornpany, w p w • • •lvV .........- Mo fffr
WellDrifer (PdrfrilW 11 A,~A JP.APJ
Offi1ert %~gnature Q~.~ .
TflegitrMtin 141. 11\F~ 0"L,_ Da% e1 J.JJ2i
ASJUIL %=L LOCATIN(NAD 33 H0RIZNTAL DAT(W~
rC MM~F flAMl WORkDDMAltIN4 $UM UvYTMT-
-0x
OOPIE& Wbbt - DEP Canary - Driler we ~k~ndHai pPh* - owner 60klenrod - HWA Dog
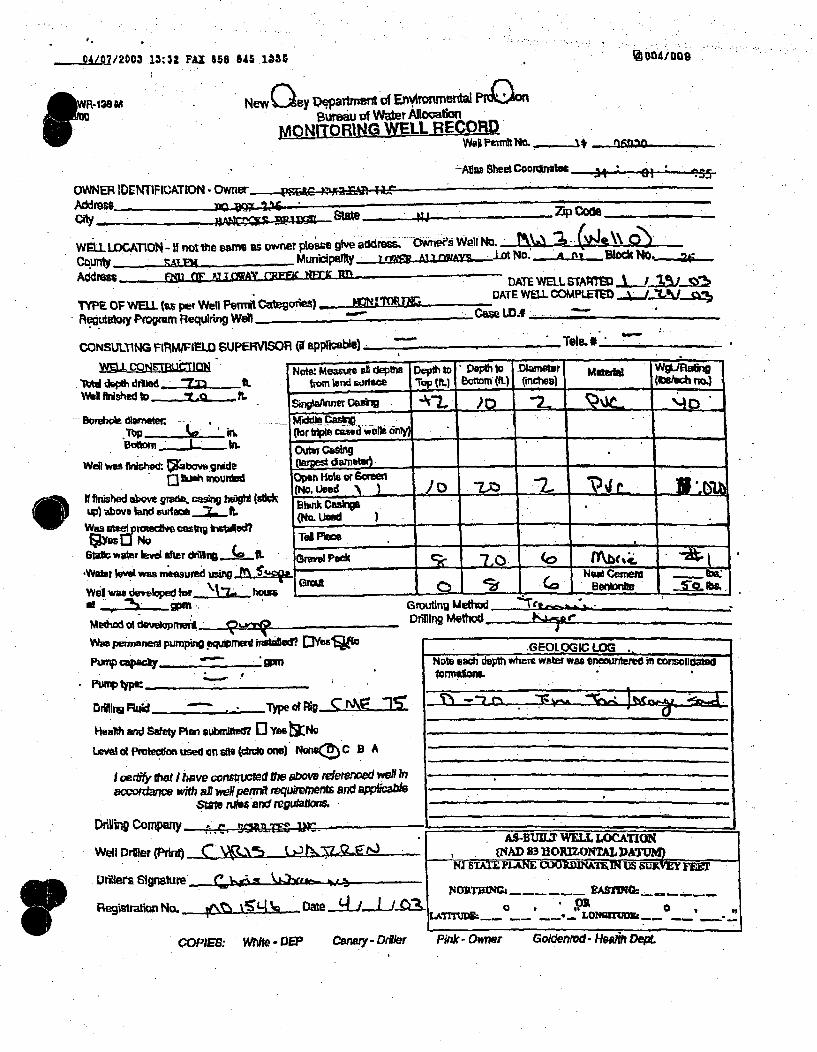
•o•inos04/07/2003 13:32 PAX 858 845 1335
Wr Isom
Ne y Q8 I)patet ol Er~onmental PrmOon
MOIOIG LLLEO_
OWNERl IDENTIFICATION -Owner t'v~ ~L~UAddress ~ ~ v~______
COtY ~ ttvzip code_______
WMIL wC~~roH omt the "e arns owner Pless give ad4.mm.ree, OwiievW W ell No. 2(J\ %
Address fM tr Pa I OM -CF tw " OhWELL vTAmfTm i hJ gn
TYPE OF WELL (as pet Well Perrut CatqvTes)DAEW4 OPIDFieguLdlory Program tiequiring Well .C-. -- -- -- -- -- ,
CONSULTING FIRAMFIRIL SUPEHVISR (Vif pprwewab) - -...--.--- '_______
1MW depth drillod - fW.ftl rished tD !2 - t
~Dewdiarneter.
Wenl VMS &fthocl Vabove grade. hwsh 1nounrde
I fitniuhod abaft grstik casinq hsagl 4t dup,) above Wind pzifv* -3.fL.
'Winier leve .a I~~ftlUTvd usingSL-
We$ was dwvvloped fr..ŽL~.hiofgi
Note,' Measurelli dePVf Dpt to Do*~ to DianGO, Wa~ WJl~igfrom land wiltace reP tom) Bomtm (fI)tNcts) ~s no.
go ort caue-whM - _6_
OWe Hole or screew(No. Uved~) j j .Slunk Casing(Nm Umd
Gravel POd( '7 0 (40 bfitL~bI ~-~- ~ I - I -~---~---- I -~6=1* C3 WOW %AM=~
Grouting MethodlDrIlIng Meftho - b I*.
Modiod dl developMerWee p~m"Tem pumpirv eqawmuirikale hutudDLef
Punp capacky........ 5W?. I, , v
ftump typ
DUrifting .. Type 0169 M
Health and Safety Plan aubmied? 0 YAKbN
Level at Pratcdn u sed an sille (cmii 0ng) NoneCZ C 0 A
I vertf thau I have consm~letd Nw abov rdeteieoa mOe )VIaczvrdtnv with 81 *VePpemot eqjjft~fltS and OX&Ial*
S"i nLe4 ancf roodiaffons.
Nole enoti deAt whem water was Sfleourtere ill corsoflloal
Demrui Conipaty 'r U~-~.- U_______________________________________
Well Dtiner{Prmno) CV x A-CZ c'-)
Lrillers Signature fA u 4Kim-
AS-BLW. WELL LOCATION(MAD 83 13 ORIZNTAL ])ATM) I
NJ STAUi P!ANI CiOR RIMIX!N US SURVEYrn=
Pinkr - Owner GOWdelld - Hsafit DeptCOWIES: Whte . DEP Cnq-DirConm- ZDa~r

S4/07/2003 13:D -AX 651 8. 1335
DW1R138Mr= Ne(ey O~eyaflmeot of Erwironmental Pr0Bureau of Water AIocation
M0NITfGRING LL RECORDWell Parm* Vic. . .. ",- n,,)
-34 *- 01 .ý--
OWNER IDENTMATION - Owner
Ag ors - .T..• 326'l'• :, ;- ,- V VIrb i Af5vto ,cy %,Qm : _ .w•
WELL LOCATION - i w not the sam a. owner p""M• give address. Owner's Well No.County AI Municipalfty_ ir i 0= t fAr3y Lot No. 4.-m1 BkK:ok 'o,2Address _ F, F ,t ' . - .. ... . I ..9x m
DAI
-TYPE OF WELL-(as per Wall Permit Vegodm) ... V•,• Regulsiory Pogm RequiWng e OCase IDA
WELL OMPLE7E J3 1 Id .J4
CONSULTING FIRMIFIELp SUPMWSOR Of Opp"lcl) *1ela.E____________
BoBto Kmidein
fI-e ~IIo', -. md•
If fifhed above 0 du, aing heigN (id*up) awov larx Wacerz -Z--&
W*9 steei Proltw~e cWg ftftwd13* LlNoSoftWair W,* lb ftw dI&-tILJ
Meau4e e•iepm C to Depth to Oaimetr . WgtJ'Ft',g1rom l u~andsi mte Tp I Bottem (21) (indies) _ _ _ _ _ l.Ifo)° -" • t~ein -' ,i qc
Middla cwk.,(fortipde ~aed wells w
Out Ga-n•- •-, , --
Open hql or Soue• .(Ni.Uai \ I,. f "I Z •.:.•zBlank Ouia(No- ), .
.,VL mad oj!,Grlvw eaR1* __-Wate -ee wa. meaejted usw M "e
Wei was developed for h tom:2 IGrotmqg MgmmO '_riR t•s.L
Driling Method "
Was pa•ralwnt pumping "-Amewi h' .d? L"YS .
-- n -.- - .,
DTnfng Khid ~ .type ol riS1 '75
Heanh anid Safat PlanmisbatDV:[] UYes"R4No
Level of Protegaion used an uft (dide onme) N&e(3)C' .B: A!I
AlcerM fltlWt I twv cns tnixecl the above ,n99m=9d'Wm~eV In&Gcmkrtlnc wiMt ONt wvg pem*l reqgupehMei an ppgcabfe
- . ,a . .• ,an d w. g a c , : . .
hlvinn fhv
J
t.
I I IIl/J m L , ,T ! I.GEOLO(iC;rL
Now 0a81 depUh wnare *t tr wim encounufed In consmlida=dfIa'm~~x• . .
0. Aj .1..
a--,_I flu,.,• Z" '•u•L- ,Z,-',VE o:
=.n •,n. I• v**n • '.g.r•. *31 -XC t . j 2"1. 4' &;;-" 1 , --m ; - . "
Well Dnflar (PrnnQ C)\2- t;_VRPAS-•..•'T WE. WCATIO"
.NAD 83 BORNTAL1Wr._
llll I
Drileft Signatur -,C , _ _ k ~
Registration No. to DY1"o Ie_ I
?Q rUM2PL&NE COOUDINAIE M US 9UAVE!jW
NOuRTRMIG,- ------------ EAMRGO
LArXM _ __ __ " 0 ,711¶DU~ W LTIU-._--~6
COP*-&- WWile .DE o•,.•Cy- Pnr m - Or,•- GG.WenMd- H"Iftl 0@0.,
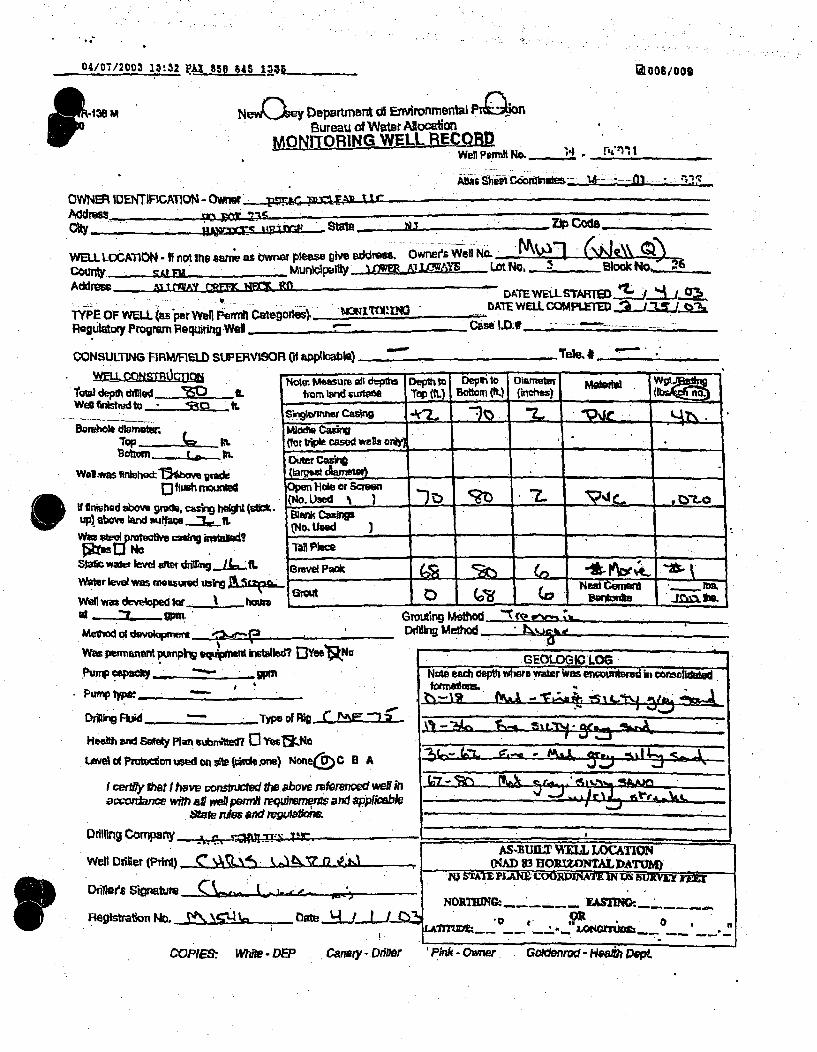
04/07/2003 10 32 FAX 855• *4 143. Is8/OO9
• 138 M Ne v Department ol Ermronmentau Pro,=Bureau of Water Ao01tion1
MONIQTRINQGELL RECOR_Wet PeJmhNo. .. ± , F_'__ ..... . .
OWNER IDENTIFIGA11ON - Owner 4mu' r a r
city S tm~ ~ ZIP cods
WELL LOCATION - If not the swn e as iDww p*ese give eaddram,. Owner's Well No. L _. - _
CounOty F _ - MunIpa~Ity • 3 A11,AT Lot No, 5 Blook No._ _z_
Add,~e MI ~UY ~ ~DATE WFLL STAIMrTYPE OF WELL tas pewelPmiCaeoe4L4ODATE WELL COMPLETED J- 2
Ragultor Progtrn Requiring Wel ______C__i__ _______
CONSULTNG FIRM/RELD SUPERVISOR ('d &poiatbl) avow.Je, __ ___""___
* W1M dtpl, u Depth to Dep to Drimtu) , ,lowl~ed dq* ~ g tts ILMI Iw~ swtom TOP Mft) Bottom (ft (hicte)I MOW"___
WA~l frishiid tosivtnnner c""n 2~J. ~i..BoruhO*e di•amter,; MNlo Cafng
TOP . . L.Il (for tVipl cased wels aid _____•Bottorn._ _L,. • -.- . -.-
W.1.wd. flnichgd 1w vm* (tar,2 mw T..
0 flmbh mwnrefd Opon Hole or Sceen ,
up I]had abov, gruc graft, a.. h. **. (No. Used -
wa x l P ro w s ,, (N Ue d Ct _g.
PXM El No TaA di 3
Dm S -aal•lnbr - -
Si• ae ee l er dntt JA •J rp,•• •- -: _
ater level was wexurd. Next Cement....We. was developed Wa I hems _______DLe J m
Meftod of devuevpmrnt !*A=4 D~t Mei
w.GEOLIC LOS_____up"___ N06 eac Oeph wtwe waftr Was ewmturud i coldid
nDv 'Dngaid Type of Rig C rIEZ1n-
HOOMl said Safey Plan~ pAstied 0ina~
Lwe~cPaVtoonusadnx*(wad.9mn) Nofie(q>C B A L to K- M 5I.J&
f cer1ffy fthtIIhave vorsmxIred ft-a bove iafrenoe weff in f~ %L .~.~~&acnitance WIt all wag prM~ mpquWrM7)m and applk.sbI j ~
swte nAuis *Ad wqL&4m~ow
Drilling Comrpany ~ v ~ __________________
Well Dfiller (Plint) C'~ ~AS-IUILZ WflLL OCATINrCqAD 33 HORfZONTALIDAT7M)
Dnwi~er'aionsturs
Regstration Nlo cleftG- PRI
COPlE6- Whde - DEP Canary - D4ller Pik* - Owner. Goxionroa - Health DepL
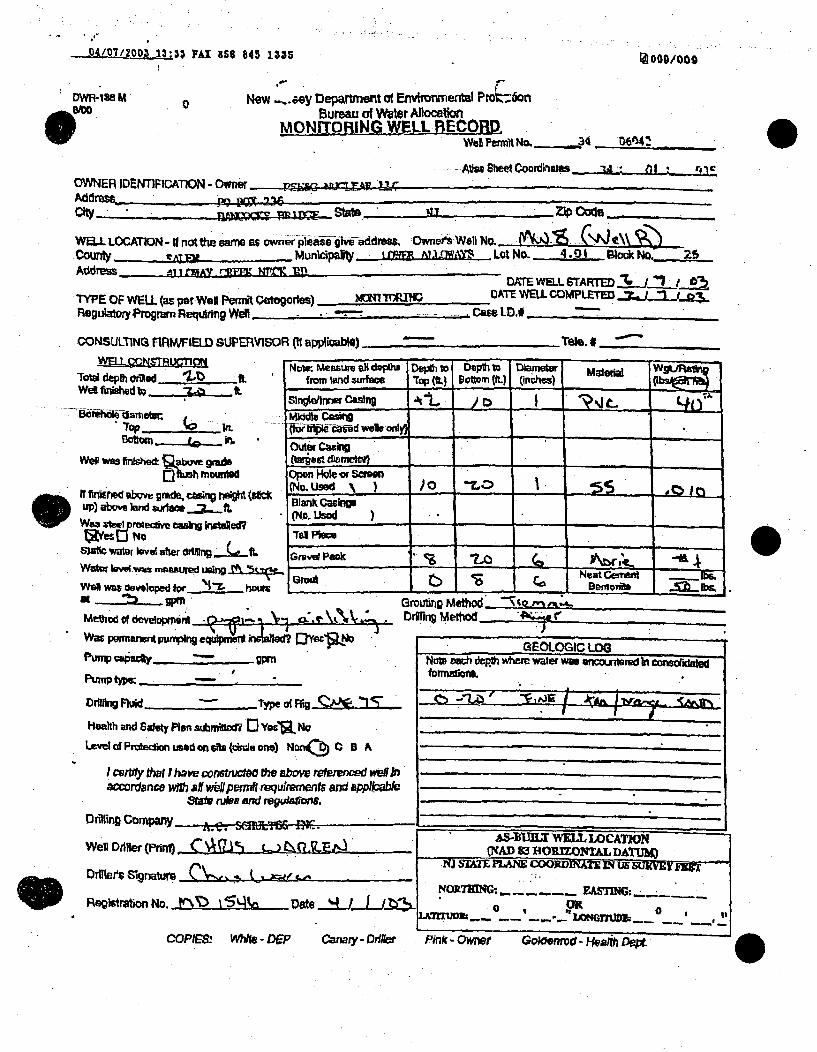
- -DAI7/!004 13:3; Pkl 46S 845 133509/0 19009/009
DWH-i-fs MWoo
0 New -,.ey Department df E uiromeritul Prok-6oiiBureau of Water AilOcati
MONITORING WELL RECORD2Wei Permit No. ~ 4 06(942
OMNER IDENTIFICATION - OwnerAddrs
Ma MtCoordiriata I.: t rt
T1fNyO lm= -P~ ftt zip Code_______
WELL LOCATION -l rIfot the samn as owner pleas-egmiveAddree Owneri'WellfN.t-' '4~~ ~count IrAlTm- -- municipavly if1~m A1~1-'JAYS LatNo.. -4,91- Mwockt o.24
,dores AIl 'DAT L=P1 W-rk, tUDA7TE WELL STARTED.J .7 J 1• _
DATE WELL COMPLETED-.J.l-.I..3TYPE OF WELL (as per-Weil Penrit CQtegories)Rleguatory Progmrn Requiring Well - Case LD.0 -
CONSULliNG FIRMIIEWD SUPERVISOR (11 appjlicabt) Tele. #._____
-TOW depthdr~Ied Z .
Wet fainuahed Wo 3,Q A
WOP was flnis~id: l~abve*
It llriniged abu7vt grade, C-Wsir hAiW1 (s$ctU~P) abu land A&Mee.2~f
Ws olt¶ rwaercwe uoftVerG
WattW "w. was nfasuie~d usingM t(rWell w" developed tbr ''-Z ha.,nat- na M ,
NoW. iessura il depth& Dqr~~to, Depti o DaJwpwdw aeta W9LJiEatlg-from land 3urfac 7ro (ft.) 601tom #QL (Inches) _ _ _ _ __ I
outer Casing
Open Hole or Screen(No. Uaed \
BakCuslnp(No. Used__ _ _ _ _ _
Tel PWWc
Grawal Pack % 7 ~ ~-~~~ ~Neat Gemel n cjt;
- Be~telaC-
method of devopmerv 4Idk~W36 pormarwnt pwiming equorieiW wt d o'lcpNo
Purwnp Mg6 -C
Groubng MethodDOIInng Medlod..
DOrftn Fhd Type o(Fri I
Health and Saety Plan subrtftad? 0 Yas'R NoLaevel CA PrOtdion Used an $ftu (Oisi. one) NonCi) C B A
I cvfly dn1l I have constud00 ft abmv wtsfrenced *W Inacciardance wtMz aff wdUpernift rvquftnwmenfs and &PPI/bae
&stH flies and raputcriof6.Oniling Company jk.e. - r ncWeflDrt~erQ(Pnfn-(- CQb5
R~egirsbrton No. 15%lSLn Date J~~
NOWe eah depth whome water W&W encvxruieed In conoruxaedf~maslom.
A54BUIIZ WRMLL WCTOqCNAD 83 140MWZNTAL DATUB)
NJ SLU-F. PLANE CoORDNAEaf- IqUs SUORVY ixFMNOR7m4G~ --S-T - -
0 OR$ 0
COPM WMe - AEP co~i~s ~V~e- DEP Canary -D04e0 Pink -OWnef G~ew elh0GoOeftrod - 1-ks)ih Dept

New Jersey Department of Env'ronmentai, rutretiui i•i8.-7 Water Supply Element - Bureau of Water Allocation
WELL ABANDONMENT REPORTI "T Bureau of Water Allocation oL weMI 3ea6 ed
PO Box 426 .of well sealed
Trenton, NJ 08625-0426 DATE WELL SEALED 613/03
PROPERTY OWNER PSE&G Services Corp
ADDRESS 80 Park Place Newark, NJ 07102
WELL LOCATION Artificial Island Lower Alloway Twp., NJ Salem
Street & No., Township, County
.. WeI . .4.01 26
.WeII No. .. Lot No.- - Block.No.
USE OF WELL PRIOR TO ABANDONMENT: Monitoring
REASON FOR ABANDONMENT: Decomumission
WAS A NEW WELL DRILLED? E&YES 0 NO PERMIT # OF NEW WELL 3400006991Cross-section Draw a sketch showing distance and relations of well site to
TOTAL DEPTH OF WELL 20' of sealed well nearest roads, buildings, etc.DIAMETER VCASING LENGTH 10 •SCREEN LENGTH 10'NUMBER OF CASINGS "1
O MATERIAL USED TO DECOMMISSION WELL: ,'1. "
-NA Gallons of WaterLbs. of CementLbs. of Bentonite ' )o. l 'Lbs. ol Sand/Gravel kO16,(none if well is contaminated) . w,- - q, w H - at•.f. IJlpo-4- v rlo.
FORIMATION: Consolidated Cr-iWdII_Unconsolidated +N
To permit adequate grouting, the casing should remain in place, but ungrouted liner pipes or any other obstructions mustbe removed. Pressure grouting is the only accepted method.
WAS CASING LEFT IN PLACE? 0 YES N NO CASING MATERIAL:_.._ _ _ _
WERE OTHER OBSTRUCTIONS LEFT IN WELL? DYES O NO WHAT WERE THE OBSTRUCTIONS:____
IF "YES", AUTHORIZATION GRANTED BY_ __ON(NJDEP Official) (Date)
Was an alternative decommissioning method used? [3 YES DNO
IF 'YES", authorization granted by ON
(NJDEP Official) (Date)I certify that this well was sealed in accordance with N.J.A.C. 7:9-9.1 et seq.
NihlsA.Fluc PO Box 423 West Creek, NJ 6/26/03Performing Work (Print or Type)5 Mailing DatName of NJ Certified Well Sealer . _ • _ _1526-
Signature of NJ Certified Well Sealer Registration #Performing Work
COPIES. White. Water Allocation Yellow - Owner Pink - Health Dept. Goldenrod- Driller

Bureau of Water Allocation
MONITORING WELL RECORD3400006991
Atlas Sheet Coordinates
OWNER IDENTIFICATION PSE&G Services Corp 3401635
A-"-Ss SOParkPlaceNewark State New JerseY Zip Code 07102
WELL LOCATION - If not the same as owner please give address Owner's Well No. Well R
County Salem Municipality Lower Alloway Twp. Lot No. 4.01 Block No. 26
Address Artificial Island
WELL USE Monitoring WELL..SE.M.n.....g.... DATE WELL STARTED - 6/3/03'....
DATE WELL COMPLETED_ 63/03
WELL CONSTRUCTION
Total-Depth Drilled 20 ft.
Finished Well Depth 20, ft.
Borehole Diameter:
Top 6 M.
Bottom 6 M.
Well was finished: .0.above grade
[]flush mountedIf finished above grade, casing height(stick up) above land surface 3 ft.
Steel protective casing installed?I Yes []Noic Water Level after drilling 6 ft.
Note: Measure all depths ]j Depth to I Depthto Diameter 1W I t./Ratinfron land surface dsu Top (ft.) Bottom (ft.) - (inches) II Material ttII I'I 3rfc (lbgslsch no.l)
Singlnner Casing IJ PVC ji
Middle Casing(for triple cased wells only))..
Outer Casing(largest diameter) __,_ _
Open Hole or Screen(No Ued 7 T-1 _____J- 0 PVC/s's. sc4
Blank Casings
Pie1 ! II P e II*Gravel Pack 1t*7.5' 206 I # I well grave 1**200 lbsI
ia iec 1• /I ..Gr t200 lbs
0... o.5 L nteo tI l
Water Level was Measured Using Tape
Well was developed for I hours
at 3/4 gpm
Method of development Peristoltic Pump.
Pump Capacity gprn
Pump Type
Drilling Fluid Type of Rig Geoprobe 66DTHealth and Safety Plan Submitted? 0Yes QNo
Level of Protection used on site (circle one) None @ C B A
Grouting Method Trer
Drilling Method HSA
nie
GEOLOGIC LOG
Note each depth where water was encountered in consolidated tormatiow
0-20' fine to med orange sand, trace gravel
* 1" PVC w/stainless steel meshwrap (2.5" OD sand pack)k
** install sand pack around pre-packed screen
1 certify that I have constructed the above referenced well inaccordance with all wellpermit requirements and applicable Staterules and regulations.
Drilling Company C T & E ENVIRONMENTAL SERVICES.
Well Driller (Print) Nicholas A. Fallucca
DilrsSignatureQ
• gistration No. 11526 Date
3550
ORIGINAL: DEP COPIES: DRILLE'R 0 WArER HEALTH DEPARTMENT

Bureau of Water Allocation
M ONITORING WELL RECORD3400006995
IDENTIFICATION PSE&G Services Corp 3401635
s 90 Park PlaceNewark State New Jersey Zip Code 07102
WELL LOCATION - If not the same as owner please give address Owner's Well No. GM-1 (Well S)County Salem Municipality Lower Alloway Twp. Lot No. 4.01 Block No. 26
Address Artificial Island
WELL USE Monitoring DATE WELL STARTED 5/29/03
DATE WELL COMPLETED 530/03.
WELL CONSTRUCTION
Total Depth Drilled 35 ft.
Finished Well Depth 35 ft.
Borehole Diameter:
Top 8 in m.
Bottom 8 in M.
Well was finished: 0 above grade
Ljflush mountedIf finished above grade, casing height(stick up) above land surface. 2.5 ft.
,MIWl protective casing installed?
t er []tNo
"K cWater Level after drilling 9 ft.
Note: Meassr all depths iF Depth to Deptlh to ~Diameter WgU atnfrnrný(lt lnsufc ITPd."Bottom f. i.1nhs Material ~ ~ ainfrml'deudaiI T f)1 ice llet h. Ir
Singlellnner Casing +2~.5~ 25 2 IL Pvc-I sch 40Middle Casing -
(for triplecased wells only) _ _ _ _ _ i_'•Outer Ciasing
(largest dianieter) ____ ______ _____
Open Role or Screen, I(No. Used .010 ) I 25 " 35 2 Jl PVC ___sh40
Blank Casings I(No. Used______ ____ ______ _______ ____
Tal Piece . • ____.. II _Gravel Pack II 35 sand 1 s1
Grout ii ____ 40U lbsS0rout 23 f 8 Cement/bentornte 10 l..I bs
Water Level was Measured Using Tape
Well was developed for 1/2 hours
at 2 gpm
Method of development . Pump
Pump Capacity .5 gpm
Pump Type Submersible
Drilling Fluid - Type of Rig Mobile B-61
Health and Safety Plan Submitted? MYes f"No
Level ofProtection used oil site (circle one) None 0 C B A
I certify that I have constructed theLabove referenced ivell inaccordance with all wellpermit requirements and applicable Staterules and regulations.
Drilling Company C T & E ENVIRONMENTAL SERVICES
Well Driller (Print)_ Marc Hauge
hrlleies Signature 12373_
istration No. J23173 Date
Grouting Method Tremie
Drilling Metlhod HSA
GEOLOGIC LOG
Note each depth where water was encountered in consolidated foraliorm
0-10' fill
10-34' black silt& sand
34-35' grey med sand
OWNER HEALTH DEPARTMENT
3550
ORIGINAL: DEP COPIES: DRILLER

MONITORI]NG WELL RECORD
3WMM:R E .MJFCAjfON PSE&O Sevice, Corp
Wdren 0 Paik PtIat
City Newazk Staft New jczevsl
•L .CATION - It not the same as owner ple4S give. address
It~nty Salem Municipality .Lower Allow3y Twp.
Address Artici Island
WELL SW mroitoin1
A SM S t C~ordiaf-3401633 -I I II I I Im I
I Zip Code 07102
O tnoes We.lNo. S2±L We1S)Lot No. 4.01 )lco. 26
~ ~
DATE WELL STAR1 5jZ3
DATE WELL COMfL.,TED 51/3Q$
WE OONSIUCTRtON Nott: Measure dl~deptktiFTOtal Deh Drilled 35 ft fromland s O
Fiznihcd Well DePth 3 .5 ft. Singlefinuar Cusing.Borehole DimnmtV . MiddleCCiugin
S(for triple tased Vdllis only) :-Top gj " i - o,.,i" ITOP 8 in MOter Casing E
Bottom. S ia _". (larget ditt) 3LWell was finisbtd- [Nabove trade 0pe Cg or Screen.
[noti d ,(No.• s"eU .010 ) I
(Sx*UP a-Vlade~ lsefehwL (No. Used"
sted protucve icasing installed? 2d -
Static WaterLevel afttr dritling 9 t Ou
I develope f hor1c 3oaveopma
deve lo pument PuiPUmp CapacitY __________pmP=uP Type 5rxubm~beDrilling Fuid _Type otRig Mobile B-61Hcal& eand Safetty Plan Snboilutd? Oye QNoLevd of PrOUmeonutd on site (cimk om) None § C B A
I cerri* Lwc I hwey construcetd the ab&ove rqferenced well inOrdance with dl wellperd remruirenqtr ad applicuib State
rules and regdatiau
D •.ling CoMy CT& E gENIVONNNTAL SERVICES
Well Irmler (Prin) 1vdse Hauge
Drifla•eStr .tegisftrtioft No. 123173. Date IL &
Q(I) [Bcwon(kL) (inches) (lbs/Sck no.)tt i i•m I_______"
L5 35 PV w 4
_Wn__I23 = I "6h
GO,.ting Tw~nrkis tx ESRA
0-10o9010-34 black sat& said
34-39" RLE med said
3550
SGIjVZAL" DEP COP=-S, DMrLLE "7.HFULTH DEPA J?7UFAr

Bureau of Water Allocation3400006992
MONITORING WELL RECORD Atlas Sheet Coordinates
'R IDENTIFICATION PSE&G Sen,ices Corp 3401635
80 Park Place__
_ _ _ __Newark State New Jersey Zip Code 07102
WELL LOCATION- If not the same as owner please give address Owner's Well No. GM-3 (Well T)
County Salem Municipality Lower Alloway Twp. Lot No. 4.01 Block No. 26
Address Artificial Island
WELL USE Monitoring . DATE WELL STARTED 6/5/03
DATE WELL COMPLETED 6/5/03
WELL CONSTRUCTION
Total Depth Drilled 35 ft.
Finished Well Depth 35 ft.
Borehole Diameter:
Top 8 in m.Bottom 8 in M.
- Well was finished:- above grade[]flush mounted
If finished above grade, casing height(stick up) above land surface 2.5 ft.
eel protective casing installed?
*Yes ONOtic Water Level after drill ing .9 ft.
ONt:Ws ets ett iameter Maera Wt /Ratoinfrom land surface Top (ft) Bottom (ft.) h a(il bs/sch nEo.) i
single/inner casing 1+ 2.5 25 C
M~iddle Casing.i[(for triple cased wells only) ._._.:_..
Outer Casing(largest~diamteter) ____ _____
Open.-Hole..or Screen(No. Used .010 ) . 25 . 35 2 PVC sch40
Blank Casings(No. Used -_ _ II " _ _ ... ... II ]1 "
~ __________ 31 ______________ ______ _________ II ____d 1i __b_
Gravel Pack JE23 -#I sand
Grout \ 0 ] 278. ICement/bentonitell 10lts I
Water Level was Measured Using Tape
Well was developed for 1/2 hours
at 2 gpm
Method of development Pump
Pump Capacity .5 gpm
Pump Type Submersible
Drilling Fluid Type of Rig Mobile B-61
Health and Safety Plan Submitted? 0•yes No
Level of Protection used on site (circle one) None @ C B A
Grouting Method TICflhic
Drilling Method HSA
GEOLOGIC LOG
Note each depth Where water was encountered in consolidated formations
0-10 fill
10-33' black silt & sand
3 3-35' grey med sand
k
I certify that I have constructed the above referenced well inaccordance with all wellpermit requirements and applicable Staterules and regulations.
Drilling Company C T & E ENVIRONMENTAL SERVICES
Well Driller (Print) Marc Hauge
Driller's Signature No. _J23173 _Date___ _ 1
haistration No. J23173 Dat I6 10/31
3550
ORIGINAL: DEP COPIES: DRILLER OWNER HF-A L TH DEPA R TMEN 7

Bureau of Water Allocation
MONITORING WELL RECORD3400006994
Atlas Sheet Coordinates
OWNER IDENTIFICATION PSE&G Services Corp i'IU1Oi*
*ss 80 Park Place
Newark State New Jersey Zip Code 07102
WELL LOCATION - If not tlesarne as o,.vn ei" 1lese- give- address Owner's Well No. GM2 (WellU)
County Salem Municipality Lower Alloway Twp. Lot No. 4.01 Block No. 26
Address Artificial Island
WELL USE Monitoring
WELL CONSTRUCTION Note: Measure all depths D
Total Depth Drilled 32 ft. :from land surface T
Finished Well Depth 32 ft. Si g CasingBorehole Diameter: Middle Casing
(for tri le cased wells only) ITop 8 in m. Oiuter CasingBottom 8 in M. (largest diameter)
.:Well-i-iafinished-__ above grade Open Hole.or.Screen
jLflush mounted (No. Used .010
If finished above grade, casing height Blank Casings
(stick up) above land surface 2.5 ft. No. Used2. t Tail Piece
Steel protective casing installedT __ Gavil Piece ,
9 a WYes QeNo isallen? 8Gravel Pack 8 t
4 1tcWtrLv1after dril .ling 8 ft.Gru
DATE WELL STARTED -- 5/28/03
DATE WELL COMPLETED 5/29/03
epth to Depthto Diameter Material Wgt./Ratingop (ft.) IBottom (ft.) I (inches) .lbs/sch no.)
+2.5I 27 2 PVC 1,, ~
__27- 32 L---I--PVC -sh4 125 * II ..... j #1sand j I25 :I.- 32 8, ...... nd .... 0-lb-
II I '1Il
0 Il 25 8 IlCement/bentoniteI 10 lbs,
Water Level was Measured Using Tape
Well was developed for 1/2 hours
at 2 gpm
Method of development Pump
Pump Capacity 5 gpmn
Pump Type Submersible
Drilling Fluid Type of Rig Mobile B-61
Health and Safety Plan Submitted? 0Yes ONo
Level of Protection used on site (circle one) None @ C B
Grouting Method-
Drilling Method -
Tremie v
GELOICLO
I GEOLOGIC LOGNote each depth where water was encountered in consolidated formation,
0-10' fill
10-28' black silt & sand
28-32' grey med sand
I certify that I have constructed the above referenced well inaccordance with all wellpertnit requirements and applicable Staterules and regulations.
Drilling Company C T & E ENVIRONMENTAL SERVICES
Well Driller (Print) Marc Hauge
Driller's Signature 7 IC,,,<t &(ff:A
* gistration No. J23173 Date / L.S
3550
ORIGINAL: DEP COPIES: DRILLER
OWERHALHDEATMN0OWNER HEALTH DEPARTMENf-
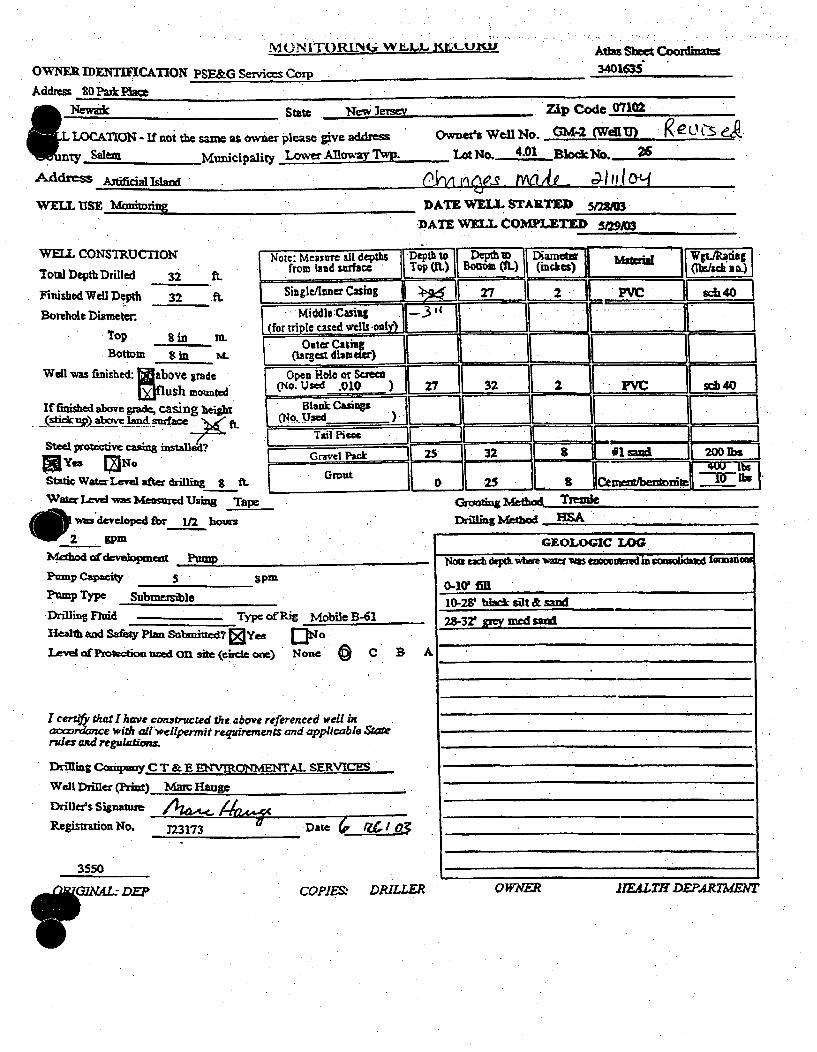
M(JN1TORIIN(i,- Wr-" AWLUMU Atls Sb Cooxdies3401635OWNER 1DENTM~CATION PSE&G Seivices -Corp,
Address 0 Paik PlaceI Newmc state Ncvw Jersew Zip C~de 07101LOCAM01N - If not tbhe saMe ar. owner please ZiVe address Owxteies Well No. GC(-2 (Weliti 9'e 0 C3 es
flnty We Municipality Lower Alloway LRX. Lot No. 4.01 Bljok&W 26
Address .A~itific slan nnvi''e-s~ A- LA~~ I M0
WVELT. USE lfntorting DATE WELL $TARTSD 5/shoo3
MATE. VWEL COMPLETED sW103
WELL CONSTRUCTION Note: Measure all dh• p Dl
Total Depth Drilled 32 ft. from land s[ofac
Fluinibd Well Depth 32 -ft Single/Inner Casing
Borehole Diaratern Middle CasixgTop, & i M. for tripIt cased wells .oaly)
STop S in 1. Outer Casing
Bottom S in zN (largest diamstfr)
Well Nwa finished: fffabove grade Opf oe rSreojflush mounte d
If finished ahove grade, casing beight Blank Casings
(sti&pObVr la~n4 ,d srfc+ t
St~e4 ptetve eas;=innu Tail Pit=
YeGravel Pk
StatiC -W~ Lr 4aftra &Min g r tr
,wa= Lx%,d Wa NMeasd 'Usg Tape
gwas developed for 112 hours
'W 2 gpinMethod of dev le w puaat pPuMp Capacity 5 gpm
PMp Type Subnmsible
Drilling Fluid Typc of Rig Mobile B-61
Health and Safety Plan SabmiDUcd? 0ys ONO
Level of( PVOsM Wed OXI site (onkel oam) None C S
I cerrjfy that I hcrve constructed the. above referenced well inac=cxtnce with all'wellpermit requirements and applicable S ettrules and regulatioia
Drilling ComayC EýIO'MNTLSRIE
Well Driller (Pain) Marc H.Aug
Driller's Signaturo 2.a '-Registaton No. 323173 Date r
Qvninice MTrmlDrillig Nthod HSA
GEOLOGIC LOG,
1NcE tead~ wbom -= e s Me A~ i~d n conpubda~d iamtaLONf
0-1w fil10-29' bl aslt &sand
-7.-3r miyned sand
3550
",010IL- DEP COPIES- DRILLER 0 WNER 1ELHDPRMNHEALTH DEPARTMMff

Bureau of Water Allocation
MONITORING WELL RECORD3400006993
Atlas Sheet Coordinates
OWNER IDENTIFICATION PSE&G Services Corp 3401635S ress 80 Park Plaza
Newark State New Jersey Zip Code 07102
WELL LOCATION - If not the same as owner please give address Owner's Well No. GM-2D (Well V)
County Salem Mu nicipality Lower Alloway Twp Lot No. 4.01 Block No. 26
Address Artificial Island
WELL USE Monitoring DT ELSATD650DATE WELL STARTED 6/5/03DATE WELL COMPLETED 6/12/03
WELL CONSTRUCTION Note: Measure all depths j Dep
Total Depth Drilled 90 ft. I irorn land surface
Finished Well Depth . 80 ft. Single/Inner Casing
Borehole Diameter: Middle CasingTfor triple cased wells only)
Top 10 in m. Outer CasingBottom 6 in M.. (largest diameter) C
Well was finished: Iabove grade Open Hole or Screen-flush mounted (No. Used .010.
Iffinished above grade, casing height BlNo. Casie g(stick up) above land surface 2.5 ft. (No. Used_)TFail Piece
Steel protective casing installed? ck
Yes flNo GaeIPc
@ atic Water Level after drilling 16 ft. Grout • .Water Level was Measured Using Mscope
Well was developed for 1/2 hours
at 3 gpm
Method of development Pump
Pump Capacity 5 gpmPump Type Submersible Pump
Drilling Fluid Quick Gel Type of Rig Mobile B-61
Health and Safety Plan Submitted? 0Yes [No
Level of Protection used on site (circle one) No'e @ C B
ffiI Depth to Diameter Material(ft.)_IL Botom (.- es)- (bsch no.
70 II 2PC I
11. PVC, ____,o
70 80 2 -PVC--,o
67 II _ _ II _ _ _ _ Ii _
67 80 6 1 #1 sand j 350 lbs
0/ ~ 36 j 06 met/entoWmte 149lbo.x TremiU-.3 Trernie%.Rout 2 e
DrilliGg Method Mud RotaIy
GEOLOGIC LOGNote each depth where water was encountered in consolidated torinaiio
0-10' Fill
10-33' Black silt & sand
33-36' Grey med sand
36-54' Grey clay
54-80' Green & black sand
I certify that I have constructed the above referenced well inaccordance with all *wellpermit requirements and applicable Staterules and regulations.
Drillhig Company-C T & E ENVIRONMENTAL SERVICES
Well Driller (Print) Marc Hauge
Drile'si NSignature
OitainNo. J23173 Date /x io1)
3550
ORIGINAL: DEP COPIES: DRILLER 0 WNER HF-4LTHDEPARTMEJVT

MONITORING WFLL RECORD Atlas Sbed Coodiae3401635OW"M MENTLwATIoN PMF&G Servicies Corp
Ad&=e -SOParkPlmz
New Jerovm1
( LOC AION - If not the sam as owner please zive addressrty UMMunicipality Lower Alowxy'Twp
Address AnifiCj Jjd
Zip Code 07102
owneeSWell No. C -M (Wenv) 4.SeALotNo. 4.01 BlockNo, 26
WELL USE )&ndtng DATE WE.LL STARTED &MSR03DATE WVELL COMLETEI 6n=~3
WELL CONSTRUCTION Note: Measure all dept DepTotal Depth Drilled so f. from land sirfacc Top
Finished Well Det f Singleflnser CWag
Borehole Diameter. Middleit Coiag
Top 10 in m. for | icl1 cased Well only)outer Casilgi~ttom . 6 in i.. (laretst diameter)
Well 'W* finish&dZ Mabove grade Open Hole or Sersen
U USh,•n*Mjtd (No. Used 01o
If finisind absove grad,-, casing beiga lnkCsig( $. U * ix,) b , t l a d • a w c -2 ; & ( o .U s i, . .
staci Prtb ai s~d Tail Pitee
I "yes IxNo Ii PackStatic Water Level a drilling 16 &f. GroutWatcr Level W= Mmared Using r Ž! p,wats d~veloped for 112 bourng
SpinMedkod Gf&dVeloC tPump Capacity. 5 gpm
Pump Type Sbfmersible PmpDrilling Rauid _ uckC Type of Rig Mobile B_61Heailth azn5 Safety Pla Submitted? 0Yes Q,Lev4o, P",00to mUd On site (oir+c one) Note C B A
I cetz tizaL I haVe• i"•itrUC ted the above referenced well InCkrd= with lfrwlpennlpt requiremnts 'and applicable kSae
nRest and reguladoi..
Drilling Com~panyCT&F &lO MTLS R 1
Wenl Driller (print) pMai HMO~Dzille~s Signztaare /~ ~PRsiraulonNo- J23173 Date /x 103e
If t DepdtxI Diwtmfe )atI(ft.) Botin (ft-) (iches) iLA-in
1- ir iX!! 70 2Sch 40
53 16 __ 4
67 so 6 1snd 30f
OJ53/677 10__7Va
x&wue1ft. q A, 1 14 *lss
Driling M*IdW MWpx
k
GEOLOPGIC LOGNme euh &pch d wbet W hn w1i cousolliat IuýMt
10-33' Black salt & sand
36-54' Gre day54WGre. & bhe* send
3550
COPIES., DRILLER O WMER HEA~LTH DE-PARTMEATC

Bureau of Water Allocation
IM ONITORING WELL RECORD3400006999
Atlas Sheet Coordinates
3401635)WNER IDENTIFICATION PSE&G Services Corp
o 80 Paik Place
JWP Newark State New Jersey Zip Code 07102
N1ELL LOCATION - If not the same as owner please give address Owner's Well No. GM4 (Well W)
County Salem Municipality Lower Alloway Twp. Lot No. 4.01 Block No. 26
Address Artificial Island
WELL USE Monitoring DATE WELL STARTED rmiwz
DATE WELL COMPLETED 6/3/03
WELL CONSTRUCTION Note: Measure all depths
Total Depth Drilled 35 ft. from land surface
Finished Well Depth 35 SingleInner Casing
Borehole Diameter: Middle Casing(for triple cased wells onlTfop gin M.
Outer CasingBottom gin M. (largest diameler)Well was finished: IMabove grade Open Hole or Screen
fflush mounted (No, Used .010
If finished above grade, casing height Blano Casings(stick up) above land surface 2.5 ft. (No. Used
Tail -Piece.. ~eel protective casing installed?.
M ELs -[No Gravel Pack
"!tic Water Level after drilling 8 ft. Grout
Water Level was Measured Using Tape
Well was developed for 1/2 hours
at 2 gpm
Method of development Pump
Pump Capacity 5 gpiIPump Type Submersible Pump
Drilling Fluid Type of Rig Mobile B-61Health and Safety Plan Submitted? 11Yes fNo
Level of Protection used On site (circle one) None © C
•t ,1•1 v...
DATE WELLCOMPLETED 6/3/03 .
Depth Dep Depth to DiameterTop (ft.) Bottom (ft.) (inches) II material "1 Wgt-/Rating
(lbs/sch no.)
ff25 PVC __ sc
]1 23 II 35 8 #iwelgravel '45Olbs
II -, ii olbs0 O-IF23 -I 78 ICement/bentoitle 10O lbs,
Grouting Method Tremie
Drilling Method HSA
GEOLOGIC LOG
Note each depth where water was encountered in consolidated formatlos
0-10' Fill
10-33' Black silt and sand
33-35' Grey sand
A
I certify that I have constructed the above referenced well inaccordance with all wellpermit requirements and applicable Staterules and regulations.
Drilling Company C T & E ENVIRONMENTAL SERVICES
Well Driller (Print) Marc Hauge
% Driller's Signature ___________________
istration No. J23 173 0 Date I z-4-1 0 3
3550
ORIGINAL: DEP CO'IES. DRILL)
0 'ERHALHDEATMNFR 0 PVAIER HEALTH DEPARTMENT

IViJrJI I A 'JKL ku'NY Wi IIiIyA.K Alias Shee Cord
3401635ODWNE ThF.NTMFCATION PSE&G Seivi=e CorpAddress 80 Paik 1'ha
Qk Neva& taf
I m I I IIIII I
Nmemyeae
F L OCAMON - if not the sa= as ow=e please give addrmSW nty Salem Municipality Lower AlloWy TWP.
-Address Axfc am
WXLLIUSE, Mrloring
zip C4od. 710
owznoes wai io. Gh&44(WeU) Y(Cuwsed(Lo o 4.01 Balo& No. 26
I.DATE WELL STAXTZ3D 6&W10SAITZ NWLL COMPL22TE 6/3j3
Wm-L. CONSTRUCniON Note: Mwzure 4l depth& i cTOWa Decpth Driled 35 ft.rm a mac
Fiihd W el)l Depth.- 35 ft. SinglelnanerCasig
~ok~iaiet--mid4idle -cuing.
Top gn m- for iii Ia cased welkoly)cTo pt o Sa i .. tef C asdag *I
Well was firnisbcd: bovt grade ps .,eo Sre
If6ibe aov gad, asng height Blank Casinps i(strkizP) above lad sufm (No. Used
St Prutv -tisisald Tail PiaecBredproecfve asin intaledGravel Pack
Sac WaterLcydafterdrining S ; Grout
Va~ Lezd Was Masuared Usin Tapwsdeveloped for In~ hams
rmip CSeit pinP=uP TYP6 Submrmble POUPDuilling Pluid _________1 f R1ig Mobile B-41HEfth med Saf&W Plan Santiited? Jaye$ a*1Lcvel Q(rFo&tkcn Umsd Ca 2ke (cir* ame) None @ C 8 A
WC 25 21 W1_4
L5 35 2 1 FVC sII sd40
35 a wen 450 log .
0 23 a deilS
IMA
GEOXXOGIC LOG
1;Aft each dc;6 ubwe wsw VMS emmimed m conmo[Mmud TRUtMan
0_1WFm
10-33* BlsK* sW and =nd
33-35' Grey md
I cetz4 that I have CMnzfruvwld the above refere Inced well finaC~Zaiyue -with anl -WeIpermit regquirmqts amd appli cable Sm~erunII and redailoai
DA~ing Cakav T&EH O ~ T L SaRV1CEwell Drlla (Prna) U=ar HauagDailer's Signatmie___________________
Regi'stmtiou No. 3231-73 Dst d, /U/o t
35SO
0 GINAL COP]ES- DRILLER 0 WNER IEA.LTH DEPAR73aENT

New Jersey Department of Environmental ProtectionBureau of Water Allocation
MONITORING WELL RECORD
Well Permit Number
3400007078
Atlas Sheet Coordinates
3401635WNER IDENTIFICATION PSE&G SERVICES CORP
ss 80 PARK PLACE
City Newark State 4ew Jersey
WELL LOCATION - If not the same as owner please give address
County Salem Municipality Lower Alloways Creek
Address ARTIFICIAL ISLAND SALEM GENERATING STATION.
WELL USE Monitoring
_ Zip Code 07102
Owner's Well No.
Lot No. 4.01 Block No. 26
DATE WELL STARTED
DATE WELL COMPLET ED j$"i,
WELL CONSTRUCTION Note: Measure all depths [Dept
Total Depth Drilled o ft.m land surface Top
Finished Well Depth Mid lft. iSigl Casing ]±
Borehole Diameter: (for triple cased wells only)Top " l. in, Outer Casing
Bott~ - C~ in. (largest diaetr
Well was finished: Babove grade Open Hole or Screen["1 flush mounted (No. Used ( )flu h ounedBlank Casings 1
If finished above grade, casing height (No. Used )(stick up) above land surface ý ft. I
Tail Piece 1..W el protective casing installed? Gravel Pack 11
Ys No GroutIStatic Water Level after drillingji. ft. •Water Level was Measured Using . ,
Well was developed for j, hours
at gpm ,
Method of development JL ', , t
Pump Capacity , gpm
Pump Type /I -/ A./- / -j) .Drilling Fluid ._,.______TypeofRig (./E- 2
Health and Safety Plan Submitted? .EaYes []NOLevel of Protection used on site (circle one) None (D) C B A
Grouting Method -- f:-e / ,1.,
Drilling Method p S 1-41
GEOLOGIC LOG
Note each depth where water was encountered in consolidatedformations
q L~7 71te AV-• -.. ,-3,-';4 /- ,71' - C(, Ae v" •lv'
Lt/ -9ig - Z ,.q5,,I certify that I have constructed the above referenced well inaccordance with all well permit requirements and applicable Staterules and regulations.
Drilling Company A C SCHULTES INC
Well Driller (Print) (3 f-- IZ'• •, A ,( ý ' Al/
b iller's Signature __
Registration No. ,) 71-, (-, Date _ ___/.- _/
, ~~~Ciq-c'-,-
)-
ORIGINAL: DEP COPIES: DRILLER OWNER HEALTH DEPARTMENT

New Jersey Department of Environmental ProtectionBureau of Water Allocation
MONITORING WELL RECORD
R IDENTIFICATION PSE&G SERVICES CORP
80 PARK PLACE
Well Permit Number
3400007079
Atlas Sheet Coordinates
3401635
City Newark State New Jersey
WELL LOCATION - If not the same as owner please give address OW
County Salem Municipality Lower Alloways Creek
Address ARTIFICIAL ISLAND SALEM GENERATING STATION
Zip Code 07102
'ner's Well No. ZLot No.. 4.01. Block No. 26
WELL USE Monitoring DATE WELL STARTED V ,/ 1 1 zDATE WELL. COMPLETED/-';/_•
WELL CONSTRUCTION Note: M teaure all depths IDe
Total Depth Drilled -. 2 f. from land surface o
Finished Well Depth -7, ' . [ SnlefiiCasing
Borehole Diameter: Middle Casing iBorehole Din.eter] (for triple eased wells only)
Top in. Outer Casingin LOrasig VBottom G in. ii rgest diameter) 41
Well was finished: M"above grade Open Hole or Screen
0 flush mounted (No. Used
If finished above grade, casing height Blank Casings,(stick up) above land surface TPft.aP e I
protective casing installed? G Tail Piece _
Yes " No' Grou
Static Water Level after drilling i(, ft.Water Level was Measured Using L ,v
Well was developed for / hours
at "- gpm
Method of development ,? t, IY] P,'V&-
Pump Capacity . . gpmPumpType , . jOgya5
Drilling Fluid /" 1 Type of Rig ( 7Health and Safety Plan Submitted? 13yes []No
Level of Protection used on site (circle one) None & C B
Be,,onite o ,.
Grouting Method - m, ,-v .
Drilling Method i-/ S
s,
GEOLOGIC LOGNote each depth where water was encountered in consolidatedformations
i0"-> ,- rr -e,. sA ,-.- V
SAA,'O w S'Lr L,'i "e,j,t-I certify that I have constructed the above referenced well inaccordance with all well permit requirements and applicable Staterules and regulations.
Drilling Company A C SCHULTES INC
ell Driller (Print) CA Ii " l A 8 e• /V"
t iller's Signature ,5Registration No. /1.,'/ - j7 Date /A- 3!,-/jj.'jC: i- q :•Daek•/./~
ORIGINAL. DEP COPIES: DRILLER OWNER HEA L TH DEPA R THENT

New Jersey Department of Environmental ProtectionBureau of Water Allocation
MONITORING WELL RECORD
W ER IDENTIFICATION PSE&G SERVICES CORP
s80 PARK PLACE
City Newark State New Jersey
WELL LOCATION - If not the same as owner please give address Owner's Well N
County Salem Municipality Lower Alloways Creek Lot No. 4
-Address ARTIFICIAL ISLAND SALEM GENERATING STATION
Well Permit Number
3400007080
Atlas Sheet Coordinates
3401635
.•Zip Code 07102
. o. A1.01 Block No. 26,
WELL USE Monitoring DATE WELL STARTED i C'- " 0 3DATE WELL COMPLETED .'Q-
--WELL CONSTRUCTION Note: Measure-all depths Deptl
Total Depth Drilled 3. z. ft from land surface j ITop
Finished Well Depth -3• ft. [IS in CinIi TMiddle Casing i
Borehole Diameter: (for triple cased wells only)Top _____in. Outer Casing iBottom C in. (largest diameter)
Well was finished: t~above grade Ope HoIo cen I.Q-flush mounted (No. Used / )L-
If finished above grade, casing height olank Casings
(stick up) above land surface - T!.l Pftie" "- I Tail Piece.]O el protective casing installed? Gravel Pack
Yes ]No GProutStatic Water Level after drilling__LLL ft. Io.Water Level was Measured Using . §, cS L
Well was developed for ! hours
at -,. gpm
Method of development .'Y 12 -",1-
Pump Capacity C gpm
Pump Type C-6t1;MPj tt' ,'
Drilling Fluid .' A Type of Rig C r: --. ,L
Health and Safety Plan Submitted? faYes "No
Level of Protection used on site (circle one) None C B A
• tol Depth to Diameter(ft.) Bottom (ft.) (inches)
Grouting Method .!7 .•--e rt,-t. , <f
Drilling Method #. ,
GEOLOGIC LOGNote each depth where water was encountered in consolidatedformations
7m - t--" 4/ $ A- g
X/L.Z7'-, SoL-
(.. -, _2 S. ,t7 " Ys.11,,, ix /s t_ 7- 1•-/- ,I certfy that I have constructed the above referenced well inaccordance with all well permnit requirements and applicable Staterules and regulations.
Drilling Company A C SCHULTES INC
Well Driller (Print) A r, - RP-'tA//
iller's Signature j T,..JRegistration No. /7kI) - G . Date Id 13 I
F. flc~ (1
2
p0
ORIGINAL: DEP COPIES: DRILLER OWNER HEALTH DEPARTMENT
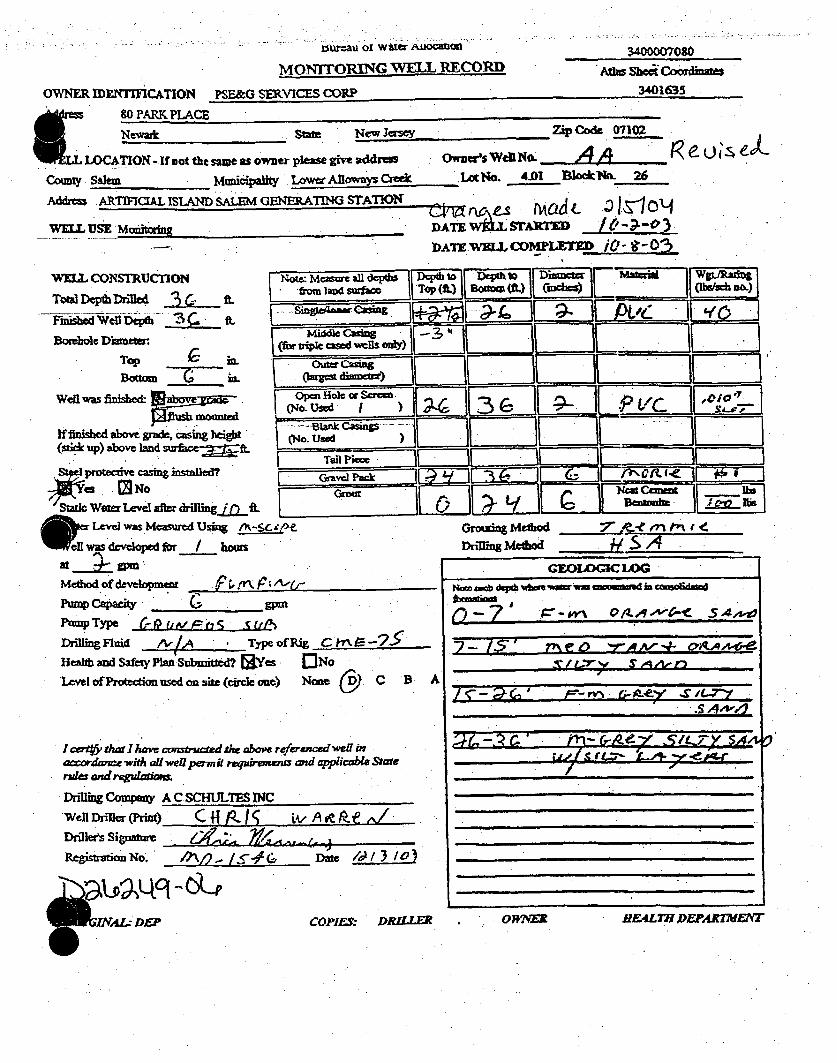
ilurzau 01 water A1i0m1Von
MONIlTORING WVELL RECORDOWNER II)NMUCATION PSE&G SERVICES CORP
8"re 0 PARK PIACE3401635
Newaik
WLL LOCATION - If not the same as ownerCounty Salem, Mumicipality
Addis ARTIC[MtAL ISLAND SALEM G
WELL USE Monitorlng
tae New jersey Zip Code 07102
please give awlrew QwneeJs wen N&A- fLo~ flwascreek LctNo. 4-01 Bko& No 26
ýTM1N STA-Ioa
STDA.Lt--)DATE.WEILLCOMPLETED 10'-t-0
WEL3L CONSTRUC17ION
TOWa Deptb Drile ILk ~Finished Well Dep& 3! ILBotebole DM.eter.
TOP in.
Well was flnishc&
it finise "Mv gae casing heigh(sbc& uip) above land smnceýýft
Stpe prtecivecasinkg lasmtaled_M le .- I No
Static Water Level after &iflingjfLD
Note Men=e aldpts FDcpth to Dqpch 10 Diumucla. &= land saurface31 TOP MI) 11 soga MI) 11(indxs) 11 Material
(for triple Cased Well onl)
open Hole or screen.~ I- I
(No. U04 __ __
Beanit Cae
c-LevrA was Measurcd Using ~clulwas dvveloped fr / omr
Method o'f development ' Y
Pumap Caowei __ _ __ MuPUMP TYe 6- Ujjve,4 P_ 6Driling Fluid /-V Typc oflkig CI' 2
e~alth and Safety Plan Submited? raes O3NoLavel of Protection used on site (circle ane) None (OD C 'B A
Grouezig MediodDdrmtm Method
o -- , ffJ,•,.- " - ... .
N= *a 6cp vde n vow wna omind in awschdmaed
S4f CPA,4S 4A4PP
4rp-- - 5L7X AtI cc~tyf that I have conrtrudted tize above referenced well inaccordance with all weil perm it requiremnr and applicable Statendes and ragulaution
Drllir~g COMPOW~ A C SCHULThS INCWell Dniller (Print) C PL z 'ePDrille's siatnu LA.L t 4R4gi=vtion No. J J5 (, Dat6 Id /31
~~qq = cbDEJP SCOPIES: DR£iLLER ., ORV'R4A BF-4MIDEPAKTMENT

New Jersey Departmentof Environmental ProtectionBureau of Water Allocation
MONITORING WELL RECORD
Well Permit Number
3400007081
Atlas Sheet Coordinates
3401635"ER IDENTIFICATION PSE&G SERVICES CORP
*s 80 PARK PLACE
City Newark State New Jersey
WELL LOCATION - If not the same as owner please give address Ow
County Salem Municipality Lower Alloways Creek
Address ARTIFICIAL ISLAND SALEM GENERATING STATION
Zip Code 07102
ner's Well No. A ,1
Lot No.- 4.01 BlockNo. 26
WELL USE Monitoring DATE WELL STARTED /Q -.-
DATE WELL COMPLETED/ -I t)
WELL CONSTRUCTION Note: Measure alldepths Dep,
Total Depth Drilled .. ft. f land surface Top
Finished Well Depth ft. S[n.le Sin,
Borehole Diameter: Middle Casing(for triple cased wells only)
Top C- in.. . Outer Casing IfBottom in. (largest diameter).
Well was fmished: f~above grade(Open Hole or Screen :"0] flush mounted(. ed E,Blank Casings
If finished above grade, casing height (No. Used )(stick up) above land surface - ft. Tail Piece# 1 protective casing installed? Gravel Pack
Yes Q'No Grout
Static Water Level after drilling ft.
Water Level was Measured Using
Well was developed for , hours
at _ gpm
Method of development . •.. ýY : /,-
Pump Capacity ( gpm
PumpType - tC,./ su't
Drilling Fluid /^/ . Type of Rig C P'hx r= - 7 .,Health and Safety Plan Submitted? BYes []No
Level of Protection used on site (circle one) None (D) C B A
Grouting Method "7, -tL "
Drilling Method /W . .z
k
GEOLOGIC LOG
Note each depth where water was encountered in consolidated.formations
/4-17' 1- 74'1V r
S A40
, -1.-C 7 -j.-v
7-4Z' -rr
I certify that I have constructed the above referenced well inaccordance with all well permit requirements and applicable Staterules and regulations.
Drilling Company A C SCHULTES INC
jl ell Driller (Print) 6 1-4 -( 5 \ - '4. r N'
iller's Signature (-ij • I ) -
Registration No. /;'.r9 -. -(" Date e } / 3 1 6:
OR LiGAL: C- DEPORIGINAL: DEP COPIES: DRILLER OWNER HEALTHDEPARTMENT
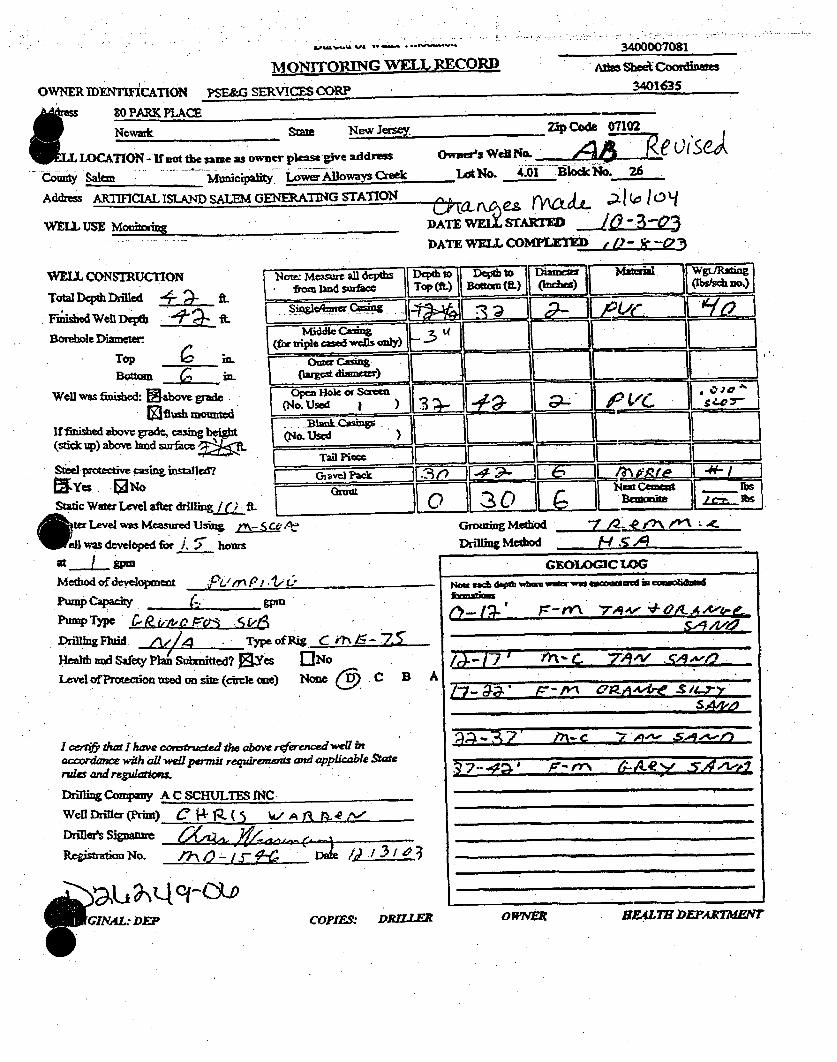
*~ - ... w&3.400007091
MONITORING WELL RECORD Sboa C,0o:iOWNER M)r-MiCAT'ON PSE&G SERVICES COP 341635
PAK0 PAR PLACE
N_ _ _ _ _ S= New Jersey, Zip Coe 07102
LOCATION -If not the sae as owner plese g&e ad•eds s " " A.iI • uCowmay Sa1 Mu nicip aly Lower• •loways Creek Lot ao. 4k.0x1§ Bl/dc. 26Address ARTIFICLAL ISLAND SALEM G;ENERAI-NG STATION nad
WELL USE Mouhoring]DT 1URDDATE WELL C OMPLE"M_. 3
WFII CONSTRUCTON Nocm Mcasurt Il de VSiepc
Tol Depth Dr d "
Methohd Weld .epomtb itCm . "L L i"
Middlec Caing
Bo..oel Diarmeteo tra onsr €l ne) None a ..s Cel B ,y)
TOP__ in. Oi~Csn
Well was finished: lhaove grade o p " (0wrawthll b Irmontend (No. Used _
(up) abend nfac (No. UsedStel protective asiAg installed? C
,9Yes. , RNoStatic Waro L-vel after driI.ingj•/L
Lervel was Measurcd UzibM Ms x-1 ,1was defeloped 1ix I hours
Mediod of dcryclo1,mcai 4~/,rr /.n 'LPump C~ack (71, winu
Drillig Fluid ~ 4 Typ. offRi C eh, C- -7.Health mid Safety Plan Suhnitted? IRYes .[]NoLevel of Protection used on site (coircl one) Non. ~ C B A
I cerri5 dud I have conn red Me above refere wcdi hiaccordm=c with all Wel pm7nmi requiravzanls and appllaable Sat-t
Drilling Company A C SCHULTES INCWe~llDriller (Pri) A11 sY E
Drilling Metodod H.GEOLOGICLOG
Nom nc 6@p& mm -rced ima onwmd
L- -V. -. Z
SA4-0
-- ' rofn-v
i 0ýu 9,ýq'c'GINAZ-' PEP COPfFS: DRILLER OWNErRE OFALTHIM-MATMOff
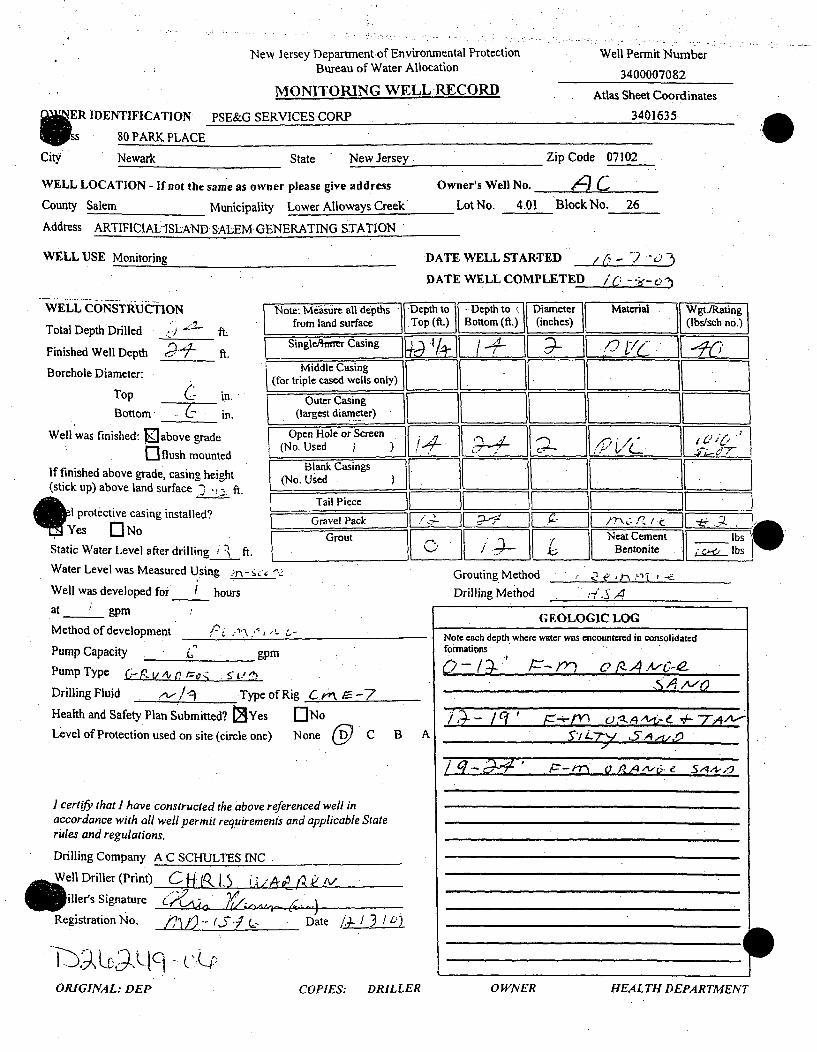
New Jersey Department of Environmental Protection
Bureau of Water Allocation
MONITORING WELL RECORD
Well Permit Number
3400007082
ER IDENTIFICATION PSE&G SERVICES CORP
Wss 80 PARK PLACE
Atlas Sheet Coordinates
.3401635
City Newark State New Jersey. Zip Code 07102
WELL LOCATION - If not the same as owner please give address Owner's Well No.
County Salem Municipality Lower Alloways Creek Lot No. 4.01 Block No. 26
Address ARTIFICIAL ISLAND SALEM GENERATING STATION
WELL USE Monitoring
WELL CONSTRUCTION
DATE WELL STAR-TED / 7 -"
DATE WELL COMPLETED /6 -
Note: Me•aure all depths 'F-Depth to II :Depth to°j Diameter Material if Wgt'Ratingfrom land surface rTop(ft.) Bottom(fi. (inches)]l 11 (Ibs/seh no.)Total Depth Drilled . &; . ft.
Finished Well Depth ___'__- ft.
Borehole Diameter:
Top C in.
Bottom --__-__-in.
Well was finished: El above grade
0-flush mounted
If finished above grade, casing height(stick up) above land surface " I-. ft.'I protective casing installed?
Yes ONo
Static Water Level after drilling i ft.
Middle Casing if i f(for triple cased wells only) ..
Outer Casing(largest diameter) i ______U_________ _______ 1____________ ________
Open Hole or Screen -"
(No. Used. f i I iBlank Casings
Tail Piece II _ t_ ii if _
GravelPack I " II -: ;Wts i !l f. l I - .- 1-Grout Neat Cement oie l bs
(* /.;l~II ] Bentonte c-i lbs
Water Level was Measured Using .-r\-..
Well was developed for I hours
at _ gpm
Method of development . " .', ." -
Pump Capacity 9 gpm
Pump Type Cj-y c,"., r_-o0 .
Drilling Fluid ,-!'- Type of Rig C M,65 -7Health and Safety Plan Submitted? MYes []No
Level of Protection used on site (circle one) None (9 C B A
I certify that I have constructed the above referenced well inaccordance with all well permit requirements and applicable Staterules and regulations.
Drilling Company A C SCHULTES INC
Well Driller (Print) C t- f -i .b i I/ A a ' iV
iller's Signature ,/ A /, .
Registration No. ,/, "j- t,'5-7 -. Date /Q- I . 1 0)
Grouting Method . ,y .e. : t-
Drilling Method . . i-4'.S 4
GEOLOGIC LOG
Note each depth where water was encountered in consolidatedformations
0 r .A,,vC-
/ q'.- • ".. -,i 4.ý 15A,,. "V-0 ,.,
ska
OR1G11VAL: DEP
I
W
COPIES: DRILLER 0 WNER HEALTH DEPARTMENT

MONrTORING WELL RECORD3400007082
AaS vcCooxdbnatsOWNE I)ENTMC•TION PSE&G .SERVICES CORP
AA~ipm 80 PARK PLACE3401635
NewarkNewilrk St New Jersey
'WWI LOCATION - It not the same as ownier please &ce addrencoCoAiY Salem Mimiipeihy Lower Alloways CreekAddnes AXTTYICIAL ISLAND SALEM GTNERATING STATION
Wf.L US Moiilwiing
ZipCode 07102
Owmers Wdl No. LIecLo. NoN 4.01 BbOx*N. 26
DATE WELL. MLARTED "-4DATE WELL CONW LEXQTIS
WELL CONSTRUCTIOP4
ToWa Depd& Duifed -4 A.
Borehole Diamieter.
Top n U.dBottom ___ i'
wenl was finished ~above gradeEfhush mounmted
-ftihed aboe g• de, casbiag eig(suck up) above land suorfce
St4 provoctve casing Lsthlned?Yes tNo
Noe:MSI u kt ctb to ,Dpht .Ds ia ~ ~ f
rom bud O) 1i . •JaftiJE
Middk Cain
(No.L U.•t an---=1L _.• 3
W Level was Measgued USinghý& c'-,w" devloped for I howr$
atMethod of deveippment PL /'1f A, I,
Pum~p Cad 'ity CwPType rP-P..rt,=o,o S', Vtl,'Puwp•<p F• ,vi .•+<•• •,-flrI1Th Fluid ~ Type of Rig* rl~-Health and Safety Pla Submiltd? 03Yeas []NoLev1l offtecdon used on she (ircle e) None 9-C B A
Mcc,-danc. with al well permit reqfsnuwcm =d qT&.abl atendes andregdahv=
Dr6ing Compmy A C SCHUL7BS INC
]DnImt'sSintrRtttiosNo ) - f..5 D.= LLI e2, tDOJ44 _ -o
Grouti.g Method
Drilling Medsode YN y I e-&
GEOLOCIC OAGNoft cocb deph 4wbm ,woug conwia easeU
0 4-.-- .,4 ,9,t ' S-,-0-
_q • ~ t-e I _L_,,'
17 a| j8A
'--DEP COPIE&S: DRiR OWNERH RFAUHI DFEPAR77'MiENTI

New Jersey Department of Environmental ProtectionBureau of Water Allocation
MONITORING WELL RECORD
Well Permit Number
3400007083
Atlas Sheet Coordinates'3401635AWER IDENTIFICATION PSE&G SERVICES CORP
Vss 80 PARK PLACECity Newark State
3401635
4ew Jersey
WELL LOCATION - If not the same as owner please give address OwCounty Salem Municipality Lower Alloways Creek
Address ARTIFICIAL ISLAND SALEM GENERATING STATION
Zip Code 07102
ner's Well No. A bLotNo. 4.01 BlockNo. 26
WELL USE Monitoring DATE WELL STARTED /(; i''c-
DATE WELL COMPLETED 'C' 1
WELL CONSTRUCTION Note: Measure all-depths I1 Delurac Tor:
Total Depth Drilled from land surface l
Finished Well Depth "2L ft. [ gle/C 4
Borehole Diameter: Middle Casing -(for triple cased wells only)
Top [ in. Outer Casing I '
Bottom i in. (largest diameter)
Well was finished: 0 above grade Open Hole or Screen
'rflush mounted (No. Used j )Blank Casings
If finished above grade, casing height (No. Used )(stick up) above land surface ft.
Tail Pieceq protective casing installed? Gravel PackYes ONo Grout
Static Water Level after drilling 'ý ft. iWater Level was Measured Using 1jf,-A .
Well was developed for . hours
at gpm
Method of development J-"'f./ P/ .i L-v
Pump Capacity C gpmPump Type & - vty/ , .'i.
Drilling Fluid Type of Rig P..,_-2 -
Health and Safety Plan Submitted?,J.Yes []No
Level of Protection used on site (circle one) None C B A
II -~Neat Cement
11 ..: C I i nI BentoniteI
Grouting Method ,, r7 2 .,.rt ! veDrilling Method ; /.'.
GEOLOGIC LOG
Note each depth where water was encountered in consolidatedformations
A,.:A -rV+
I certify that I have constructed the above referenced well inaccordance with all well permit requirements and applicable Staterules and regulations.
Drilling Company A C SCHULTES INC
Well Driller (Print) (H (, (5 iA/I .I iller's Signature • C , ..
RegistrationNo. j1. i -( '/- ( Date i 0- 5 to7
ORIGINAL: DEP COPIES: DRILLER OWNER HEALTH DEPARTMENT

nuz-lr'Au YVA TV OUQ& rý ý
MON1TO1MNG WVELL RECORD3400=0803
*Aths SbcC49rainues
3401635OWNER IDE.NTIFICATION PSE&G SERLVICES CORP
Wtw Sotai New 3eMc
ILOCATION - if not the same as owner please give addren
Couty~ Salem Mmnieipa1ly Lower A~oways.Creek
Addr= AknMCIAL ISLAND SALEM GENERATING STATION /V
WELL USE Monittorlng DAMi
WELLCONSihVCTIom oe =t Hdp
Total Depth Drilledfrmln zt
Fbinisd Will Det& t
Borehle Dlmeta(for triple cased 'wcU only)Top Oue inBottom j3QW (rcStdn)
Well wa finished: j~above Vade Ope Hol orSreeJflusb mounted (N.Ue -)
If fmishd above Wrade, m-ig Blaflk (No. Use
Taud Piece -IF.Steel Prowdcive casin insmlkd? __vl~x
WYes 14 NO "StatiC Water Level 41We drili~ngt ft.________
*Zip Code 07102
ihIs WeillNo. Ui L i's e 0loa No. 4.01 Bkwk Wo 26
SWEKLLCOblimfZK cV4?bq~l to i3ýWZJRaihig
som=b~ Mno.)es
IIG
CJz lb~s11.- r I1 1 D"am Core
W Level was Measured Using M 1,iwa devetoped for :5) hows
at gPiu
Meddof developmecnt ý& , r/,4
Y26PnnpCaaiy _ _ _ _
Dril luinied TypeofRig CfA-'5HeaAt aud safety Plan Subm&KV Ye []NoLevel of Protection used an shte (circle one) None (9 C B A
Grouting Method t,.,t p~E 4'
Drillig Melbod Ns d~
ga-Il -75 ~ j #/n 7
-P-ft1 C -i .*4.$ As*
I Cert*5 that rIhow comtruaeddth above refrei=ad well inaco,-doxe with aUwll ~permit rgfrements and appicable Staterrdes and regdadoms
Diifliug Coenpeny A C SCHULTES INCWell Driller (Priit) uf(i lagtAie.&Driuces signature 4L~c, 4 1 -Rqgisuzd= No. /'1/Y(1;131
O-PUVAL. DEP rN4L~ DEP COPIEY2 DRILLE" OTERNHAZ~DPRTLVHEALTH.D"AMWENT

New Jersey Department of Environmental Protection
Bureau of Water Allocation
MONITORING WELL RECORD
Well Permit Number
3400007084
Atlas Sheet Coordinates
3403535,9 R IDENTIFICATION PSE&G CORP.ss" 80 PARK PLACE
Zity. Newark tate New Jersey
WELL LOCATION - If not the same as owner please give address Ow
County Salem Municipality Lower Alloways Creek
Address ARTIFICAL ISLAND SALEM GENERATING STATION
Zip Code 07102
Lners Well No. i 2 )LotNo. 4.01i Block No. 26
WELL USE Monitoring DATE WELL STARTED
DATE WELL COMPLETED / &//.,. /
WELL CONSTRUCTION Note: Measure all depths Fu1" pfrom land surfaceITotal Depth Drilled 9 , S ft.
Finished Well Depth 97.5,5 ft. __nglrj-r Casing
Borehole Diameter: (for triple cased s only)
Top G. in. outer Casing, EBottom C( in. (largest diameter)
Well was finished: Qabove grade pen o rCree[Qflush mounted. =-E
If finished above grade, casing height ! :Ifank-Casmgs• ick up) above land surface } 1 Usft.d)
protective casing installed? TilPieceZ i) -F raelPack ~
* es No Grout
Static Water Level after drilling ft.
Water Level was Measured Using M
Well was developed for ., hours
at / gpm"
Method of development __"____",.' ___._.___/__________-
Pump Capacity _ ,_ _gpm
Pump Type C_ r,.,-t .3. •c.(-/',t
Drilling Fluid . / Type of Rig C'r.-*f
Health and Safety Plan 4ubmitted? QYes NINo
Level of Protection used on site (circle one) None 0 C B A
Grouting Method "'\ 4 -
Drilling Method .
GEOLOGIC LOG
s,
formations
q 17' P~.A/ & e '
I certify that I have constructed the above referenced well inaccordance with all well permit requirements and applicable Staterules and regulations.
Drilling Company A
Well Driller (Print)
Willer's Signature
C SCHULTES INC
Registration No. /1\ i j .
I -... 4.4,
Ka (-I 3
V
nRfrlNAL:- DEP COPIES: DRILLER OWNER HEALTH DEPARTMENT

New Jersey Department of Environmental ProtectionBureau of Water Allocation
S R IDENTIFICATION PSE&G CO]ss 80PARK PLACE
MONITORING WELL RECORD3400007085
Atlas Sheet Coordinates
3403535
City Newark State New Jersey
WELL LOCATION - If not the same as owner please give address Owi
County Salem Municipality Lower Alloways Creek ,
Address ARTIFICAL ISLAND SALEM GENERATING STATION
Zip Code 07102
ner's Well No. A LJ/Lot No. 4.01 Block No. 26
WELL USE Monitoring
WELL- CONSTRUCTION -Note:-Measure all deptlio
Total Depth Drlle& ft. f lsurfc To;
Finished Well Depth 9 t [Lsi~~"Miaiddle •i 'i -"Borehole Diameter: (for triple cased wells only)
Top C .~J _Top /"b:-" in''Outer C.asing -
Bottom in. (largest diameter)
Well was finished. Babove grade -~pfi~eo cen i[]flush mounted Bno. ;-se 7
If finished above grade, casing height (No. Used ns(stick up) above land surface - ft T
*lel protective casing installed?Yes INo 7Uraout
Static Water Level after drilling ((ift.*Water Level was Measured Using 9>~*Well was developed for • hoursat gpm
Method of development _ e vi , c.'Pump Capacity .__ ,.... __ gprn
Pump Type. -5 L"-,'Drilling Fluid ___________TypeofRig C rj -- 2"
Health and Safety Plan ; ubmitted? []Yes I]NoLevel of Protection used on site (circle one) None (_,D: C B A
DATE WELL STARTED L
DATE WELL COMPLETED :
________ U ________________ .11 ______________ It ________________________ U _________________
iF ii
Grouting Method
Drilling Method
k
GEOLOGIC LOG
Note each depth where water was encountered in consolidatedl'forations
O- (¢, /=- • 7-,, A- -Xd
,9 1 -. 3 - 7 7 '
3q t '!'m VLL,,, -r
114 3q' j/::
I certify that I have constructed the above referenced well inaccordance with all well perm it requirements and applicable Staterules and regulations.
Drilling Company A C SCHULTES INC
Well Driller (Print) " /C, N f 12
ler's Signature
Registration No. r)) , 7 , 7 -
A P-' L , ?,
(/4.-V~iA '"I-. A m
Date J, _1C1
ORIGINAL: DEP COPIES: DRILLER OWNER HEALTH DEPARTMENT

P4GW JCLiVy MIAUp LI1.IiA4LI U1 L.AlyllVil 1-1-f!~*4 &1 -- Vi!
Bureau of Water Allocation
MONITORING WELL RECORD
)WNER IDENTIFICATION PSE&G SERVICES CORP
tjfts 80 PARK PLACE
AtUa rC[heet CoUodinaes
3400007135
Atlas Sheet Coordinates
3401634
Newark State New Jersey Zip Code 07102
WELL LOCATION - If not the same as owner please give-address Owner's Well No. -f- " . LO C C (0xounty Salem Municipality Lower Alloways Creek Lot No.. 4.01 BlockNo. 26kddress ALLOWAY CREEK NECK RD SALEM GENERATING STATION At
WELL USE Monitoring DATE WELL STARTED .- I" iC-DATE WELL COMPLETED - "
WELL CONSTRUCTION
rotal Depth Drilled _.- ft.
Finished Well Depth f.__ t*
Note: Measure all depths Depth to Depth to .' Diaceer Mateial Wgt./Rating- from land-surface ... . Top (ft.) inh (lbs/sch no.)
Single/Inner i-- j1 P .c I[ F,• i 'ýoBorehole Diameter: Middle Casing • . i.
To p in. (for triple cased wells only) " " *I" _
Outer Casing 0Bottom _ . _ in. (largest diameter) 0- ,'. ,
Well was finished: r above grade Open Hole or Screen " )•(No. Used tOi()., )' ___.• ___,__I I'...
['flush mounted Blank Casings I [If finished above grade, casing height (No. Used ings . " ___._____
:stick up) above land surface Tai Pe ....-" TailPiece ._ l i . i . .'.-."...--....... ii_ __'teyrotective casing installed?
* Grael Pack II =11DE lb.. . ~ONo ------ I etCement iWater Level after drilling .1 -A._f_.__ " _ -. _B nI b-, • "-__ I _ _...__ _• .. / . . .... . . ... .. .._.,-
Water Level was Measured Using -- (,Well was developed for . hours
tt •gpm
'4ethod of development __'___.________.
lump Capacity - gpm
?ump Type
)rilling Fluid ______ Type of Rig 'At .(AX.
-iealth and Safety Plan Submitted? es []No
.evel of Protection used on site (circle one) None C B
Grouting MethodDrilling Method
-rh~rn~ c~. ____
A
GEOLOGIC LOG
Nole each depth whcrc wimcr was encountcred in consolidatedformations
AS-BUILT WELL LOCATION
(NAD 83 HORIZONTAL DATUM)
NJ STATE PLANE COORDINATE IN US SURVEY FEET
NORTIIING: EASTING:
OR
LATITUDE: LONGITUDE:0 . 0 *
certify that I have constructed the above referenced well iniccordance with all well permit requirements and applicable Statevies and regulations.
)rilling Company TALON DRILLING CO
Well Driller (Print)___
)rillers Signature .., tion No. ~Date /I
IRIGINAL:- DEP COPIES: DRILLER . OWNER HF-4LTHDEPARTAfENT

New Jersey Department of Environmental Protection
Bureau of Water Allocation
MONITORING WELL RECORD
Well Permit Number
34000IJ7153
Atlas Sheet Coordinates
3401634L IDENTIFICATION PSE&G SERVICES CORP.
80 PARK PLACE
Newark State New Jersey
IELL LOCATION -If not the same as owner please give address
ounty Salem Municipality Lower Alloways Creek
.ddress ALLOWAY CREEK NECK RD SALEM GENERATING STATIO
r
Zip Code 07102
Owner's Well No. 4.01n BlckN. 6Lot No. 4.01 Block 14n 26 r
VELL USE Monitoring. DATE WELL STARTED . qj IDATE WELL COMPLETED a /q/0
'YELL CONSTRUCTION Note: Measure all depths Dept
7otal Depth Drilled t . . from land surface Top' ~ ~~Single/lnnerCsng("'inished Well Depth C f... .--'
lorehole Diameter: ~ ideCsnloreole iameer:(for triple cased wells only) II:Top i_ in. Outer CasingBottom in. (largest diameter)
Well was finished: aIlbove grade o•e ole or scen '0"flush mounted (No. Used 0/C) ) LF Blank Casings'
f finished above grade, casing height l(No. Used nstick up) above land surface _I_ . R.
• Tail Piece*•rotective casing installed? _ _ONo r .. reac Ii
W atr L e after drilling -j --ft-
,Water Level was Measured Using
Well was developed .for { :hours
it . gpm
.4ethod of development .____.___
'ump Capacity * gpm
'ump Type "__
)rilling Fluid T type of Rig cup"ealth and Safety Plan Submitted? [Q•es []No
.evel of Protection used on site (circle one) None C B A
certify that I have constructed the above referenced well inrccordance with all well permit requirements and applicable Stateules and regulations.
)rilling Company TALON DRILLING CO
Vell Driller (Print) J -,"_k ia's Signature
I ation No. /Y5 mLILJN . f O'I
ToII Depthto o .F Di~et7r M aterial wg./R-ating(1) .1 Bottom (ft.)I(inches) L(Ibs/sch no.)
3oi 50LAp _CiKschoi
DII 111• Iit____ IL CLJiSjiq6
I ______ fflýrrET,Neat Ceement7f E s:Bentonite - _='s
Grouting Method .The.4)"l t.
Drilling Method 10113 ý4&m
GEOLOGIC LOGNote each depth where water was encountered in consolidatedfornations
0-t0 rJ 1 f
ao- o' en6orW-C• rid, v,
AS-BUILT WELL LOCATION(NAD 83 HORIZONTAL DATUM)
NJ STATE PLANE COORDINATE IN US SURVEY FEET
NORTHING: EASTING:
OR
LATITUDE- LONGITUDE:
* 0 0 I
ORIGINAL: DEP COPIES: DRILLER OWNER HF-4LTH DEPARTMENT

i-cw icrscy Lepartment ot znvirunmnt•1 l rrotecuonBureau of Water Allocation
MONITORING WELL RECORD
Well permit Number
3400007136
Atlas Sheet Coordinates3401634IWNER IDENTIFICATION PSE&G SERVICES CORP
80 PARK PLACE
o Newark State New Jersey
VELL LOCATION - If not the same as owner please give address Own'0unty Salem Municipality Lower Alloways Creek L
Wddress ALLOWAY CREEK NECK RD SALEM GENERATING STATION Al
3401634
Zip Code 07102
er's Well No.
ot No. 4.01 BlockNo. 26
VELL USE Monitoring DATE WELL STARTED a I sl/oqDATE WELL COMPLETED o• LI,•1o4
WELL CONSTRUCTION Note: Measure all depths Derotal Depth Drilled " ft. from land surface Toi
Finished Well Depth _ ft Single/Inner Casing [4-Borehole Diameter.( Middle Casing
oro r triple cased wells only)•Top "_ in. Outer CasingBottom * in. (largest diameter) I
Well was finished: [gaove grade Open Hole or S~crecen if" flush mounted No. Used i - )
Tf finished above grade, casing height Blank Cas )stick up) above land surface ft. .. Use
Iprotective casing installed? GrTail Piece ,• -'No [ Gravel Fack 7771
W at-r Leel ater rillng-q ft.GroutEWater Level was Measured Using
Well was developed for I hours
tt t gpm
dethod of development •... ( 4bump Capacity gpm
'ump Type
)rilling Fluid _Type of Rig
lealth and Safety Plan Submitted? E[ s .[]No
,evel of Protection used on site (circle one) None E) C B A
p-thto] Depth !to [D-ia-met~er M~aterial jfWgt.Ra-tin~gp (ft.) ottom (inches) (Ibs/sch no.)
-2, I L-J1 P c- 11--•/•ii i i ______ I t _____ III _ ________ _____ II________ _____ II 1I
_ _ _ _______II _ _ _ _ _II __ _ _ _ __ _ _ _ IIA
0 II jI Neat Cement !5 13...-.. lbs -Bentonite c lbs W
Grouting Method "c r"Drilling Method
GEOLOGIC LOGNote each depth where water was encountered in consolidatedformations
k
to -., -4-ýT .Cd k klel rlf-
AS-BUILT WELL LOCATION(NAD 83 HORIZONTAL DATUM)
certify that I have constructed the above referenced well inccordance with all well permit requirements and applicable Statetdes and regulations.
wrilling Company TALON DRILLING CO
/ell Driller (Print) . •,£3 2 ."
'riller's Signature
tion No. 42 Date 3 /t '
NJ STATE PLANE COORDINATE IN US SURVEY FEET
NORTHING: EASTING:
ORL-ONGII'UIE:LATITUDE:
0 t 0 .
RIGINAL: DEP COPIES: DRILLER OWNER HEAL T7- DEPARTMENT
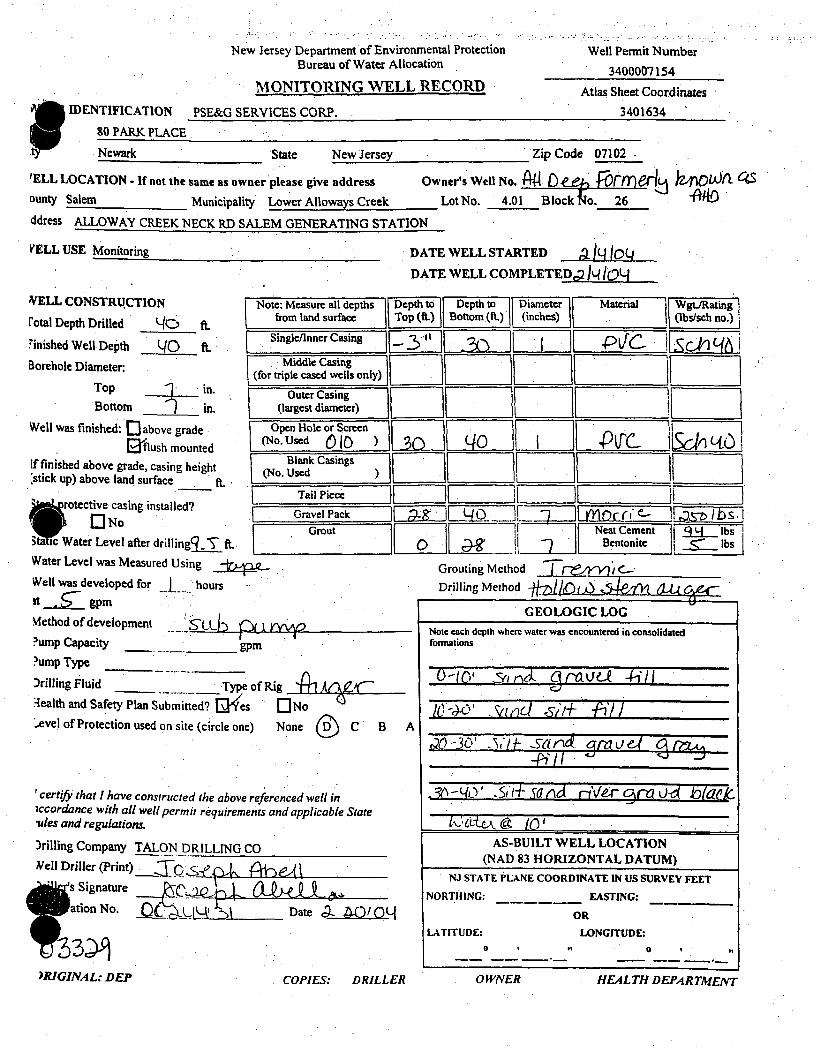
New Jersey Department of Environmental Protection
Bureau of Water Allocation
MONITORING WELL RECORD
Well Permit Number
3400007154
Atlas Sheet Coordinates
3401634#• IDENTIFICATION PSE&G SERVICES CORP.80 PARK PLACE
Newark State New Jersey
ILL LOCATION - If not the same as owner please give addressounty Salem Municipality Lower Alloways Creek
ddress ALLOWAY CREEK NECK RD SALEM GENERATING STATIO
Zip Code 07102
Owner's Well No. @N [ r_ j k )n4OWn CsLot No. 4.01 Block 1ko. 26 , "40
VELL USE Monitoring DATE WELL STARTED aL 1 (OLADATE, WELL COMPLETEDp• Iq IL')L
NELL CONSTRUCTION Note: Measure all depths 1 Derotal Depth Drilled " , L.• .from land surface Top
'inished Well Depth & Single/InnerCasing I{ "
Borehole Diameter: (for"Middle Casing .t(for ýiple cased wells only) ftToP " • in". Outer Casing I
Bottom in. (largest diameter)
Well was finished: 0 above grade Open Hole or Scrn9lush mounted (No.Used
If finished above grade, casing height ( Bln k Used )
:stick up) above land surface BLln Cai
• rotective casing installed? Tail- Piie
r No d g f Gravel Pack
;3#taic Water Level after dr[illingi ifL.GWater Level was Measured Using ,
Well was developed for _ ... hours
It gpm
V4ethod of development .. LL prlI?ump Capacity gpm
?ump Type
Xrilling Fluid Type ofRig 9" 1A(•" j 3.ilealth and Safety Plan Submitted? Q 'es []No2evel of Protection used onsite (circle one) None 9 C B A
ibt(Deth to iameter Material 1[ WgtdRating!(ft.) Bottom(ft.L) (inches) IP( bs/sch no.)
- I _______ ______ __________ II __________II -_ I _I 1
1111 ________1 ______ 11 ________
i . ]IJLVC l(4A•WTLCO__._L ~ kOx~VIC 1 &Jo-n c tos
Neat Cement 0 3L. lbs
Bentonite l ,bs
Grouting Method "T- • IC.-Drilling Method 6,1. 4 G.(
k
certify that I have constructed the above referenced well in
iccordance with all well permit requirements and applicable Stateules and regulations.
)rilling Company TALON DRILLING CO
Wiell Driller (Print) C- c %4 •i-eI
mjIM s Signature
~ation No. 0 kDt
GEOLOGIC LOGNoit each depth where water was encountered in consolidatedformations
- . . '-0-1c" .V' nck, LiP
_•./l . &i
AS-BUILT WELL LOCATION(NAD 83 HORIZONTAL DATUM)
NJ STATE PLANE COORDINATE IN US SURVEY FEET
NORTH ING: EASTING:
ORLATITUDE: LONGITUDE:
0 * 0 ,
I
rF33Dý)RIGINAL: DEP COPIES: DRILLER OWNER HEALTH DEPARTMENT

N~ew JrSey sVCPd1UnetA~Ui r.IIViI UjU1iQ1ILa1 r I VQuuuL
Bureau of Water Allocation
MONITORING WELL RECORD
,WNER IDENTIFICATION PSE&G SERVICES CORP
g 80 PARK PLACE
weu rerMILL i•utnour
3400067137
Atlas Sheet Coordinates
3401634
Newark State New Jersey
VELL LOCATION - If not the same as owner please give address Own
'ounty Salem Municipality Lower Alloways Creek L
Wddress ALLOW" CREEK NECK RD SALEM GENERATING STATION AT
Zip Code 07102
er's Well No.
ot No. 4.01 BlockNo. 26
NtELL USE Monitoring DATE WELL STARTED II j.- O 10
DATE WELL COMPLETED [j,(O1QtO
WELL CONSTRUCTION Note: Measure all depths Del
total Depth Drilled /1,,• . f. from land surface Top
minished Well Depth & - f SingledInner Casing
3orehole Diameter: . Middle Casing i(for triple cased wells only) IL
Outer CasingBottom I in. (largest diameter)
Well was finished: 0 above grade Open Hole or Screen Ilrflush mounted (No. Used 010 ) Ii
f finished above grade, casing height Blank Casing s*stick up) above land surface ft. I Use
TailPiece7Et i rotective casing installed? Gavl Pack
ONo Grout ac
Water Level after drilling Cj ft.
W'ater Level was Measured Using
W'ell was developed for .. hours
tt gpm
dethod of development .()LLr14 .lump Capacity gpm
lump Type
)rilling Fluid . _ _ Type of Rig
'Iealth and Safety Plan Submitted?) F Yes []No
,evel of Protection used on site (circle one) None CD C B A
certify that I have constructed the above referenced well in!ccordance with all well permit requirements and applicable Stateules and regulations.
)rilling Company TALON DRILLING CO
Veil Driller (Print),• 1t 1 .
llr~ Signature '~r 4.f /-tion No. _ ________ Date /.0/ 0
,(L) Bottom (ft.) -/(inches) (I hno.)
I~~~~~~ wo '4i wr fc~~
NeatCemnt Z'4lbsý0 ~ IC Bentnit .~LJ. lbs
Grouting Method "Ire_4/ C...Drilling Method ,-I-W Akfli 17 1 -
GEOLOGIC LOG
Note each depth where water was encountered in consolidatedformations
(0 4 ,;
AS-BUILT WELL LOCATION(NAD 83 HORIZONTAL DATUM)
NJ STATE PLANE COORDINATE IN US SURVEY FEET
NORTHING: EASTING:_
ORLATITUDE: LONGITUDE:
0 t** 0 t
'RIGINAL: DEP COPIES: DRILLER OWNER HEALTH DEPARTMENT

New Jersey Department of Environmental Protection
Bureau of Water Allocation
MONITORING WELL RECORD
Well Permit Number
3400007140
Atlas Sheet Coordinates
3401634IDENTIFICATION PSE&G SERVICES CORP
80 PARK PLACE
Newark State Ilew Jersey Zip Code 07102
VELL LOCATION - If not the same as owner please give address Owner's Well No. _ _ _ _ _
a.0unty salem Municipality Lower Alloways Creek Lot No. 4.01 Block No. 26
,ddress ALLOWAY CREEK NECK RD SALEM GENERATING STATION A..
VELL USE Monitoring DATE WELL STARTED I L."
DATE WELL COMPLETED I k.-1 1. L.
.ELL CONSTRUCTION Note-:Measure Ua-depths ]IDep
rotal Depth Drilled ft. from land surface Top
'inished Well Depth f 1" Singledlnner Casingg l.-
3orehole Diameter: Middle Casing(for triple cased wells only)
TOP P in. OuterCasing EiBottom I in. (largest diameter)
Well was finished: [I above grade Open Hole or Screen
Q ush mounted Used C) I) ) LLIf finished above grade, casing height B(No k Used i*stick up) above landsurface ft. I Tail~iece 1 -
3tQ rotective casing installed? Grail Pice
3-foaterLev after driling ft Gve Pack
Wtater Level was Measured Using,
Well was developed for " -. hours
it _ gptn
vAethod of development _: _iz-',
'ump Capacity .. gpmlump Type
)rilling Fluid . Type of Rig
•Iealth and Safety Plan Submitted? Q•'es "[]No
.evel of Protection used on site (circle one) None C B A
S(f1) Bottom (ft.) (inches) (lbs/sch no.)
IiL~tIP ~vrc ___
Grouting Method iem, i e-Drilling Method "H7)1W__A , 1
GEOLOGIC LOG
Note each depth whcrec water was encountered in consolidated.formations
/1)-a7E' ý atyf nd ' •/#6 'a (5k
I certify that I have constructed the above referenced well iniccordance with all well permit requirements and applicable Slateiles and regulations.
*)rilling Company TALON DRILLING CO
WCell Driller (Print) ja.ob 8.A'-\ IA• et
, Signature _o_,_______Dae _____
ation No. ~L L(3IDate kL P
i,0 cct.Q.- @.-
AS-BUILT WELL LOCATION(NAD 83 HORIZONTAL DATUM)
NJ STATE PLANE COORDINATE IN US SURVEY FEET
NORTHING: EASTING:
OR
LATITUDE:0 'I
LONGITUDE:0 * .0 0
)RIGINAL: DEP COPIES: DRILLER OWNER HEALTH DEPARTMENT

New Jersey Department of Environmental ProtectionBureau of Water Allocation
MONITORING WELL RECORD
Well Permit Number
3400007141
Atlas Sheet Coordinates
3401634VNER IDENTIFICATION PSE&G SERVICES CORP
P 80 PARK PLACE
Newark State 110
qew Jersey Zip Code 07102
ELL LOCATION - If not the same as owner please give address Ownirunty Salem Municipality Lower Alloways Creek Lddress ALLOWAY CREEK NECK RD SALEM GENERATING STATION AF
er's Well No. Pr Mot No. 4.01 Block No. 26
/ELL USE Monitoring DATE WELL STARTED - IT j 10ADATE WELL COMPLETED I!1 in 4
YELL CONSTRUCTION Note: Measure all depths iDeptotal Depth Drilled o I from land surface Top
:inished Well Depth jj ft. IingeInner Casingi jf -
3orehole Diameter: (frMiddle Casing(for triple cased wells only) -
Top _... in. [ Outer Casing
Bottom IJCD in. (largest diameter)
Well was finished: [ above grade O pen Hole or Screen9ilush mounted (No. Used 0 ) 0
If finished above grade, casing height (No. Used)(stick up) above land surface BnC g
, rotctive casing installed? Z Tail Piece[ ONo IIGravel Pack
Static Water Level after drillingj ft.u
Water Level was Measured Using
Well was developed for 3 hoursit •j gpmMethod of development - .• pPump Capacity. gpmPump Type
Drilling Fluid " Type of Rig P'c.• c-"Health and Safety Plan Submitted? "Kes []No 0Level of Protection used on site (circle one) None D C B A
IfaDepthroMateDiaeter WgtRating(t) Bottomii(fto I (inches) j(b/c no.)
__ __ __K __ __ _ __ __ _
11 1u~eie~1 ~.lbs~jI ~s J to Bentonite j[=jjW
Grouting Method -Ffl&'-l V,Drilling Method 4ED I I OW fkw n& au~~~
'I
GEOLOGIC LOGNote.each depth where water was encountered in consolidatedformations
q- ra e-j , Is_ -7 /I
AS-BUILT WELL LOCATION(NAD 83 HORIZONTAL DATUM)
NJ STATE PLANE COORDINATE IN US SURVEY FEET
NORTHING: EASTING:
OR
certify that I have constructed the above referenced well inXcordance with all well permit requirements and applicable State"ules and regulations.
)rilling Company TALON DRILLING CO
Well Driller (Print) 0•_.4_ _- _ _ _ _ _
a tignMo S Dature 'a-9 w t'ion No. LDt ý0
0 3 331)RIGINAL: DEP
LATITUDE:
0 *'
LONGITUDE:
0
COPIES: DRILLER OWNER HEALTH DEPARTMENT

Appendix D
Tidal Evaluation.Results0
0

4-
G)-J
a)4-
4
3
2
0
-1-
-2
-3
-4
-5
I I I II I I I I I I I I I I * I I * I I* II I I I I LI I
-6 -4I I''
12-Jan 13-Jan 14-Jan 15-Jan 16-Jan 17-Jan 18-Jan 19-Jan 20-Jan
Date/Time
ZD
0
FIGUREWater Level In Well K
ARCA 15 Tidal Assessment - 1/12 to 1/20 D-1PSEG NUCLEAR, LLC SALEM GENERATING STATION
HANCOCK'S BRIDGE, NEW JERSEY

F
Lu
H
0
CL
Lii0LM:
4 I I I 1 1. 1 1 1 1 1 1 1 1 1 1 1 1 1 1 1 1 I11 . 1 .1 1 1
4.'4-
-JI...
.4-'Cu
3
2
1-
0
-1-
-2
-3-
-4
-5
*0
z
z
-6 tji~.
12-Jan 13-Jan 14-Jan 15-Jan 16-Jan 17-Jan 18-Jan 19-Jan 20-Jan
Date/Time
.u
H3
0
Water Level In Well L FIGURE
ARCAD1S; Tidal Assessment - 1/12 to 1/20 D-2PSEG NUCLEAR, [[C SALEM GENERATING STATION
HANCOCK'S BRIDGE, NEW JERSEY

'I-.
0)-Ja...0)'U
4
3
2
0
-1-
-2
-3
-4
-5
' ' I I I ; ; I ; ; ; I i ; ; I ; ; ; I
I................................I
-6I I I I I I I I I I I I I I I I I I I I I I II I
12-Jan 13-Jan 14-Jan 15-Jan 16-Jan 17-Jan 18-Jan
Date/Time
19-Jan 20-Jan
w
I-
(S
a
FIGURE
Water Level In Well P
ARCAD1S; Tidal Assessment - 1/12 to 1/20 D-3PSEG NUCLEAR, LLC SALEM GENERATING STATION
HANCOCK'S BRIDGE, NEW JERSEY
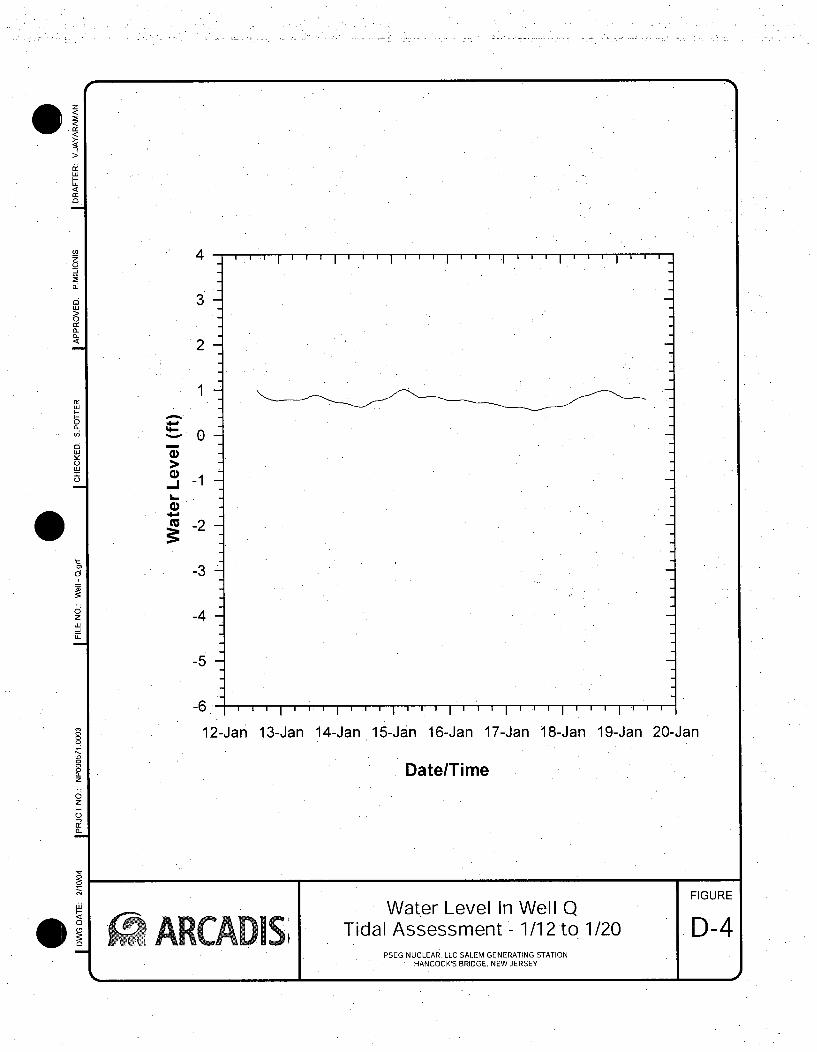
V)z
Lu
0
0:(L
Lu
L)'Lia:C-,
4
3
2
L .1 I I I I I I I I *1 ~ ~ I I -
1
'p
0-JI-0
0
-1
-2-0r
z
0~z
(L
-3
-4
-5-
_P:C., I I I I " I ' "1 ' I ' I I ' ' I ' " I ' ' I I I ' I
12-Jan 13-Jan 14-Jan 15-Jan 16-Jan 17-Jan 18-Jan 19-Jan 20-Jan
Date/Time
LuI-0
FIGUREWater Level In Well QARCAD1S •Tidal Assessment - 1/12 to 1/20 D-4
PSEG NUCLEAR, LLC SALEM GENERATING STATIONHANCOCK'S BRIDGE, NEW JERSEY
_________________________________________ - C

0
CL
b
uJ0
w-
I-0
a)-J1..a)
4
3
2
1-
0
-2
-3
-4
-5
..............
0z
-6I I II I I I I I I I. I I I I I I I I I I I I I I I I I I I I
0~z
I-
0_
a-
12-Jan 13-Jan 14-Jan 15-Jan 16-Jan 17-Jan 18-Jan 19-Jan 20-Jan
Date/Time
LI)
I-000
Water Level In Well V FIGURE
, ARCAD STidal Assessment - 1/12 to 1/20 D-5PSEG NUCLEAR, LLC SALEM GENERATING STATION
HANCOCK'S BRIDGE, NEW JERSEY

@1Lu
i-
0
z
00~
C-
LI-0a-
0w
z
12-Jan 13-Jan 14-Jan 15-Jan 16-Jan 17-Jan 18-Jan 19-Jan 20-Jan4 I ; . 1 ; ; I - I
'4-
a,-J1..a,
1-
0
-1-
-2
-3
-4
-5
-6I I I I I I I I I I I I I I I I I I I I I I I I I I I
12-Jan 13-Jan 14-Jan 15-Jan 16-Jan 17-Jan 18-Jan 19-Jan 20-Jan
Date/Time
ujI-0CS00
FIGURETide Water Level
ARCADIS Tidal Assessment - 1/12 to 1/20 D-6PSEG NUCLEAR, LLC SALEM GENERATING STATION
HANCOCK'S BRIDGE, NEW JERSEY

Appendix E
Evaluation of Water Levels in theVincentown Formation

tz0
Tidal EvaluationReedy Point
< Well Lw
Well M~0
01 0 ' ' I' ' ' I- . . . I ' ' I' ' I ' ' ' I . . . '
9
8
U.) 9
S u.- 4 I
It t
00
C; -2
• . -3.o 28-J u129-J ulg0-J u131 -Jul 1 -Aug 2-Aug 3-Aug 4-Aug 5-Aug
-" .) "9 9 9 9 ~ 9 99
DDate
LU)
'"' Tidal EvaluationoCM IS;
2i
6-Aug 7-Aug 8-Aug
PSEG NUCLEAR, LLC SALEM GENERATING STATIONHANCOCK'S BRIDGE, NEW JERSEY

Appendix F
Slug Test Results

I
10. Obs. Wells ,o Well 0 (F)
Aquifer Model
Confined
Solution
Bouwer-Rice
Parameters
K = 3.624 ft/dayyO = 1.36 ft
I ;
ca)
0
0zLU
zLU
0.1
0.010. 2. 4. 6. 8. 10.
Time (min)
0
0
0
z
6i
Slug Test Analysis Well 0 FIGURE
Falling Test F-iPSEG NUCLEAR, LLC SALEM GENERATING STATION
HANCOCK'S BRIDGE, NEW JERSEY

10.
1.
Obs. Wells
o Well 0 (R)
Aquifer Model
Confined
Solution
Bouwer-Rice
Parameters
K = 4.257ft/dayyO = 1.375 ftEF
0-
C')
0.1
0.01
0.0010. 2. 4. 6. 8.
Time (min)
10.
5z
C-,
a
Slug Test Analysis Well 0 FIGURE
Rising Test F-2PSEG NUCLEAR, LLC SALEM GENERATING STATION
HANCOCK'S BRIDGE, NEW JERSEY

0
C-,
w
w
C-,
10.Obs. Wells.o Well N (f)
Aquifer Model
Confined
Solution
Bouwer-Rice
Parameters
K = 0.1439ft/dayyO = 0.834 ftE
C)
1.
.0z
z
I
0.10. 6. 12. 18. 24. 30.
Time (min)
0
SzC.,
a
wI-
0
0
* di
0
Slug Test Analysis Well N FIGURE
Falling Test F-3PSEG NUCLEAR, LLC SALEM GENERATING STATION
HANCOCK'S BRIDGE, NEW JERSEY
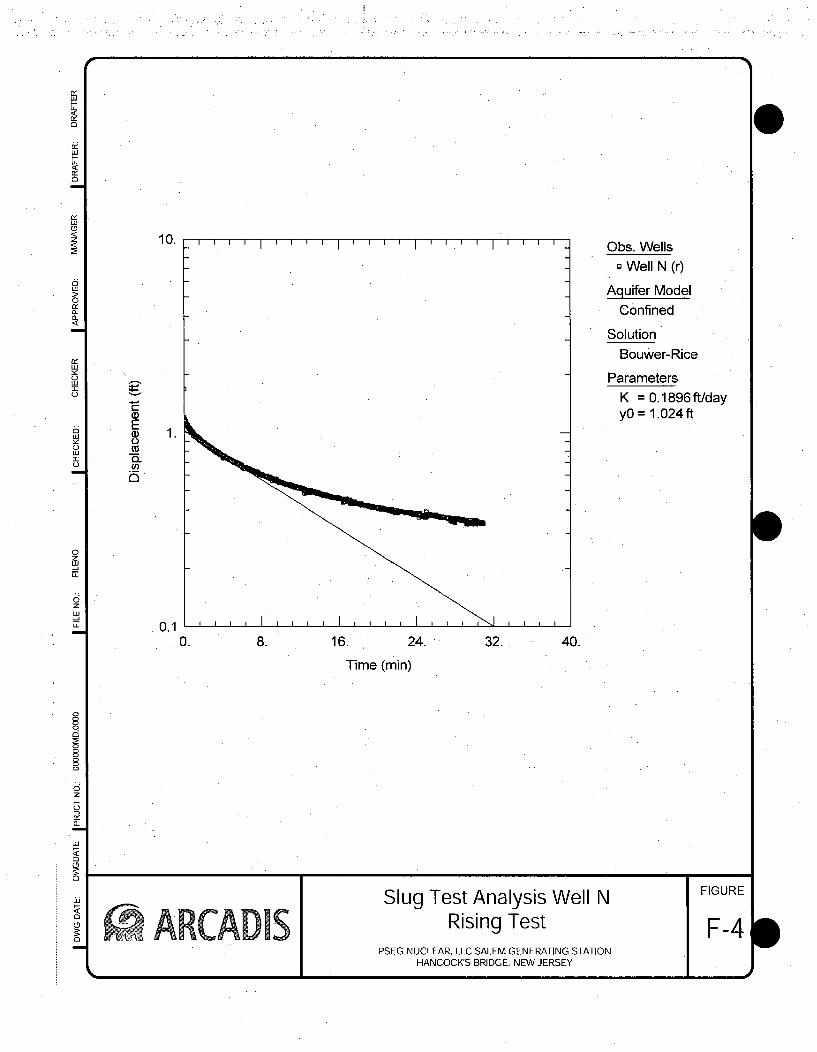
10.Obs. Wells
1 Well N (r)
Aquifer Model
Confined
Solution
Bouwer-Rice
Parameters
K = 0.1896ft/dayy0 = 1.024 ft
E
C.TCU
1.
0
0.10. 8. 16. 24. 32.
Time (min)
40.
0
z
LU
6H
Slug Test Analysis Well NLA ý , 3&Rising Test
PSEG NUCLEAR, LLC SALEM GENERATING STATIONHANCOCK'S BRIDGE, NEW JERSEY

P,
LU
0
LU
0
0U
0U
0
Lii
0
L4
*10.
1.
Obs. Wells
n Well U (F)
Aquifer Model
Confined
Solution
Bouwer-Rice
Parameters
K = 2.947 ft/dayyO = 0.881 ftU)
2U)UU)
U,
0.1
0.010. 4. 8. 12. 16. 20.
Time (min)
0
0
z
6C
I-
L0
H-
,'
CD0
Slug Test Analysis Well U FIGURE
ARCADIS Falling Test F-5PSEG NUCLEAR, LLC SALEM GENERATING STATION
HANCOCK'S BRIDGE, NEW JERSEY

Appendix G
Pumping Test Results

wU
LU
0Z
0
100. Obs. Wellso Well AB
Aquifer ModelConfined
Solution. Theis
00ýC')
Parameters
T = 27.67ft2/dayS = 0.0001249KzKr = 0.1b = lO.ft
10.
0LU
LUIjM-,
a,E
1.
s
5zLU
0.11. 10. 100. 1000. 1.OE+4 1.OE+5
Time (sec)co0
8n0
z
o
LUI-
0CD
0 I ARCADISAquifer Pumping Te
Well ABst Analysis
PSEG NUCLEAR, LLC SALEM GENERATING STATIONHANCOCK'S BRIDGE, NEW JERSEY
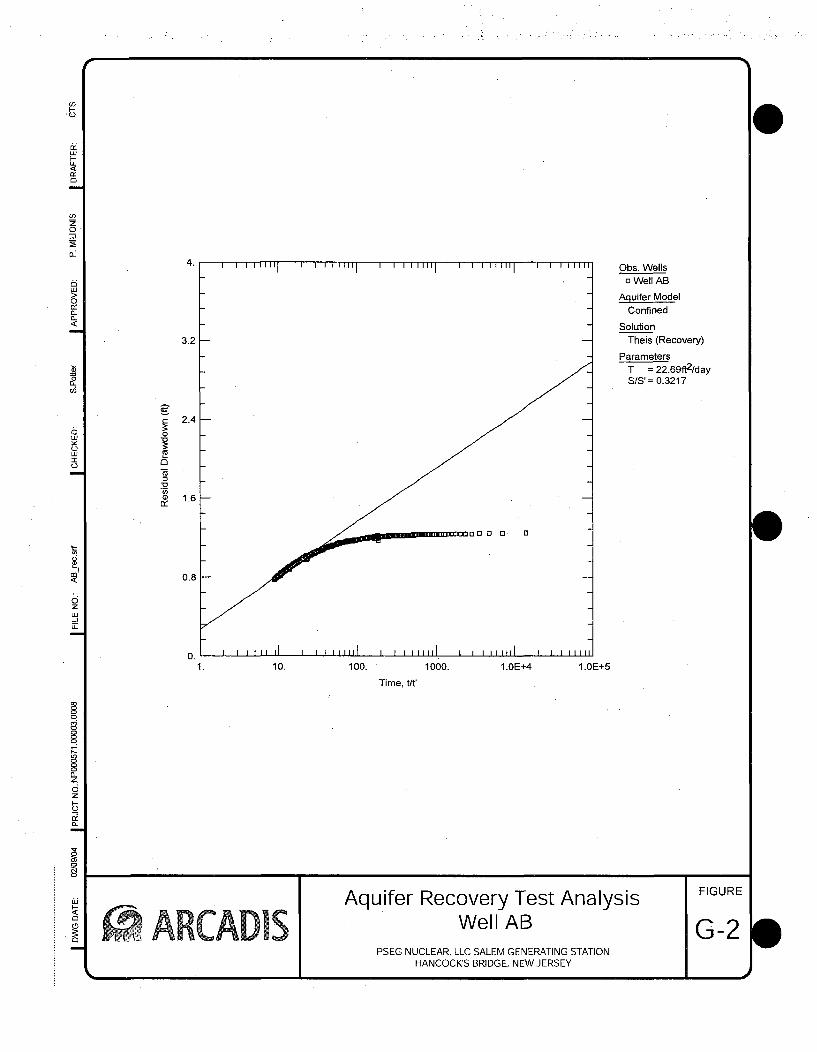
0
4.
3.2
2.40
1.6
0.8
0.
Obs. Wellso Well AB
Aquifer Model
Confined
Solution
Theis (Recovery)
Parameters
T = 22.69ft2/dayS/S' = 0.3217
1. 10. 100. 1000. 1.OE+4
Time, t/t'
1.OE+5
co
0
z
Aquifer Recovery Test Analysis FIGURE
ADiS Well AB G-2PSEG NUCLEAR, LLC SALEM GENERATING STATION
HANCOCK'S BRIDGE, NEW JERSEY
S

p-wm
o
0
w0Of(L
Obs. Wellso Well AC
Aquifer ModelConfined
SolutionTheis
ParametersT = 12.63ft2 /dayS = 0.0004371Kz/Kr = 0.1b =10.ftc,.
LwyC-,
E
0,
d
0zuJ
1. 10. 100. 1000. 1.0E+4 1.OE+5
Time (sec)
o
8
0-
0z
9
wF-0CD
0 ARCADI!,5`4Aquifer Pumping Test Analysis
Well ACPSEG NUCLEAR, LLC SALEM GENERATING STATION
HANCOCKS BRIDGE, NEW JERSEY

U)
U
20.
16.
Obs. Wellso Well AC
Aquifer Model
Confined
Solution
Theis (Recovery)
Parameters
T = 1.672 ft 2/dayS/S' = 14.27
C
0
Cu
0
(120
12.
8.
4.
0.1. 10. 100. 1000.
Time, t/t'
1.OE+4 1.OE+5
0~
z
Aquifer Recovery Test Analysis FIGURE
Well ACARCADISG-4PSEG NUCLEAR, LLC SALEM GENERATING STATION
HANCOCK'S BRIDGE, NEW JERSEY
S

ij~
0
0w
0~
xCL
C-)
uLJ
0
zH
0~
100.
10.
Obs. Wells13 Well AD
Aquifer Model
Confined
Solution
Theis
Parameters
T = 0.942ft2 /dayS = 0.3757Kz/Kr = 0.1b = 10.ft
Ea)coa0,
1.
0.1
0.011. 10. 100. 1000. 1.OE+4
Time (sec)
1.0E+5
* EARLY DRAWDOWN WAS EXCESSIVE DUE TO EFFECTS FROMDEVELOPMENT OF WELL AJ DURING AQUIFER PUMPING TEST.
'T
0U',,
03
0L
Aquifer Pumping Test Analysis FIGURE
Well AD G-5PSEG NUCLEAR, LLC SALEM GENERATING STATION
HANCOCK'S BRIDGE, NEW JERSEY
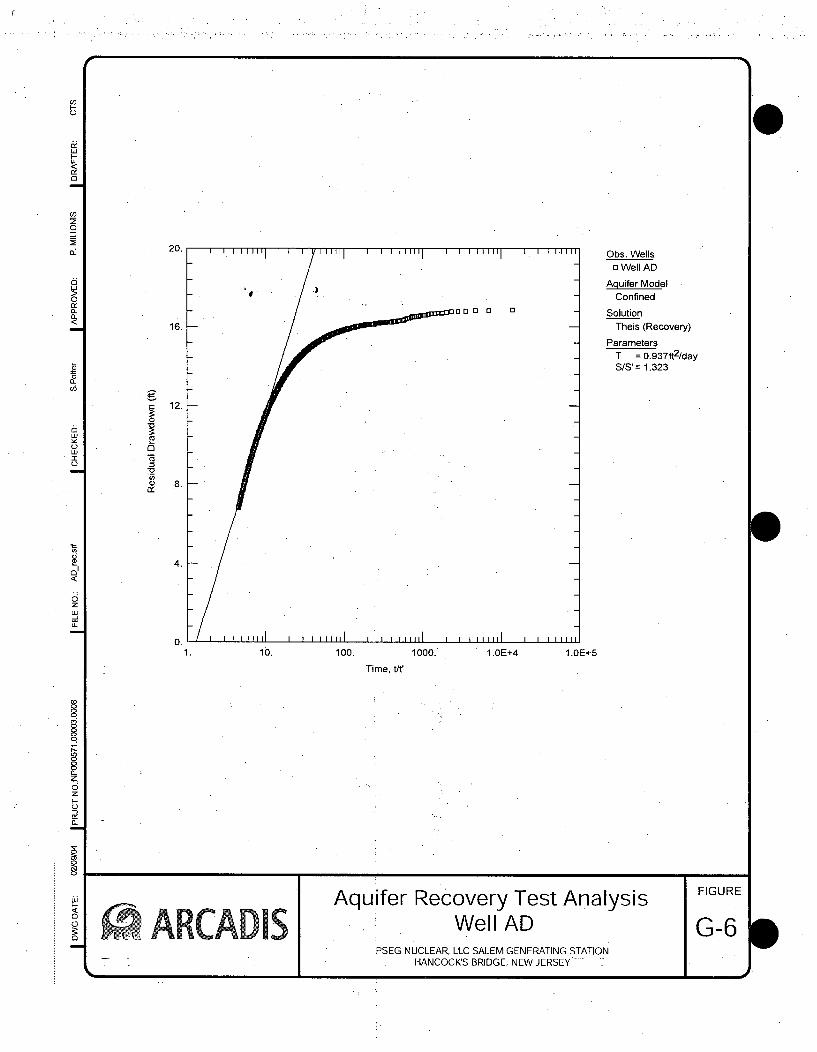
C,0I-0
20.
16.
12.
0
Z8
Obs. Wells.0 Well AD
Aquifer Model
Confined
Solution
Theis (Recovery)
Parameters
T = 0.937ft2/day
SIS'= 1.323
i04.
0.1. 10. 100. 1000. 1.OE+4
Time, t/t'
1.0E+5
co
0~
zC-)
6i
Aquifer Recovery Test AnalysisWell AD
PSEG NUCLEAR, LLC SALEM GENERATING STATIONHANCOCK'S BRIDGE, NEW JERSEY

LUH-
0
LU0O~
100. Obs. Wellsa Well Al
Aquifer Model
Confined
•0 10. SolutionTheis
-1-LU E
C-,
ParametersT = 7.97 ft2/dayS = 0.01104Kz/Kr = 0.1b = 10.ft
1.
0.1f
0.011. 10. 100: 1000. 1.0E+4 1.OE+5
- Time (sec)
8
0
z
CC
CC
0
0wH
0
00 ARCADIS
Aquifer Pumping Test AnalysisWell Al
PSEG NUCLEAR, LLC SALEM GENERATING STATIONHANCOCKS BRIDGE, NEW JERSEY

20.
16.
12.
0
a 8.
4.
Obs. Wells0 Well Al
Aquifer Model
Confined
Solution
Theis (Recovery)
Parameters
T = 2.101ft2/day
SIS' = 5.308
0.1.- 10. 100: 1000. 1.OE+4
Time, t/t'
1.0E+5
0
z
0~
6j
Aquifer Recovery Test Analysis FIGURE
A ADC 1 Well Al G-8PSEG NUCLEAR, LLC SALEM GENERATING STATION
HANCOCK'S BRIDGE, NEW JERSEY

E
0
0~
C,
wC-)uJ
Obs. Wells0 Well AJ
Aquifer Model
Confined
SolutionTheis
ParametersT = 1.73ft2/dayS = 0.2521KzIKr = 0.1b = 20. ft
a)E
0.
8)
2
0z
U-.,"L
0.011.. 10. 100. 1000. 1.OE+4
Time (sec)
1.OE+5
0co
a.
0z
I-
0
0
wJ
I-
Aquifer Pumping Test Analysis FIGURE
Well AJ G-9PSEG NUCLEAR, LLC SALEM GENERATING STATION
HANCOCK'S BRIDGE, NEW JERSEY I" A

r
30.
24.
Obs. Wellso Well AJ
Aquifer Model
Confined
Solution
Theis (Recovery)
Parameters
T = 0.5596ftI2/daySIS'= 1.519
18.
0
0
12.
6.
0.
S
1 . 10. 100. 1000. 1.OE+4
Time, t/t'
1.OE+5
.9;31
0
Aquifer Recovery Test Analysis FIGURE
7 Well AJ G-10OPSEG NUCLEAR, LLC SALEM GENERATING STATION
HANCOCK'S BRIDGE, NEW JERSEY
S

0
LU
6i
100. Obs. Wellsa Well AM
Aquifer Model
Confined
Solution
Theis
Parameters
T = 1.403ft2/day
S =0.515KzIKr = 0.1b = 10.ft
9
a)E
00
z
U-
CLL
00
0zo-z.
r.
0.0110. 100. 1000. 1.OE+4
Time (sec)
1.0E+5
C
C
6I-CCCD
C
Aquifer Pumping Test Analysis FIGURE
SARCADiS Well AM - Step Drawdown Test G-1 1PSEG NUCLEAR, LLC SALEM GENERATING STATION
,HANCOCKS BRIDGE, NEW JERSEY

20.
16.
12.
0
8o8 .
Obs. Wellso Well AM
Aquifer Model
Confined
Solution
Theis (Recovery)
Parameters
T = 0.5716ft2/day
SIS' = 2.005
St
z
4.
0O1. 10. 100. 1000.
Time, t/t'
1.0E+4
C0
0~
6zI-C,0•0~
C
C
C"I-
0
CD
0
Aquifer Recovery Test Analysis FIGURE
ARCADIS Well AM - Step Drawdown Test G-1 2PSEG NUCLEAR, LLC SALEM GENERATING STATION
HANCOCK'S BRIDGE. NEW JERSEY
a

w
CL
0
w
00z
L4
Obs. Wellsa Well AM
Aquifer Model
Confined
Solution
Theis
Parameters
T = 1 .079ft2/dayS = 0.029Kz/Kr= 0.1b , =10.ft
E.
E
'0
0.11. 10. 100. 1000.
Time (sec)
1.OE+4
8
Cco
0~
z
0
a
tC
i
* EARLY DRAWDOWN WAS GREATER THAN EXPECTED BECAUSETHE WELL HAD NOT RECOVERED COMPLETELY AT THE START OFTHIS TEST.
Aquifer Pumping Test Analysis FIGURE
Well AM - Constant Rate Test G-1 3PSEG NUCLEAR, LLC SALEM GENERATING STATION
HANCOCK'S BRIDGE, NEW JERSEY

r -I
Co
0
IL:
LU
0
0~0ý
fin
.0
zuJ
S
Obs. Wells,o Well AM
Aquifer Model
Confined
Solution
Theis (Recovery)
Parameters
T = 0.3375ft2 /dayS/S' = 1.806
9:6.
0
6.4
0.10. 100. 1000.
Time, t/t'
1.OE+4
CC
C
6z0
0~
C0)C
C
I-
0cri
C
Aquifer Recovery Test AnalysisA cA iS Well AM .- Constant Rate TestPSEG NUCLEAR, LLC SALEM GENERATING STATION
HANCOCK'S BRIDGE, NEW JERSEY

U,EZ
w
0~
Obs. Wellso Well S
Aquifer Model
Confined
SolutionTheis
ParametersT = 1.701 ft
2/day
S = 0.06051Kz/Kr = 0.1b = 10.ft
C0~C,)
C
E
L
'C
0zw
10. 100. 1000. 1.0E+4 1.0E+5
Time (sec)
0•
wI-CCDC
Aquifer
ARCADUSPumping
WellTestS
Analysis
PSEG NUCLEAR, LLC SALEM GENERATING STATIONHANCOCK'S BRIDGE, NEW JERSEY

U,HC.,
&
u-
C3
U)2
w0
20.Obs. Wells
0 Well S
Aquifer ModelConfined
Solution
Theis (Recovery)
Parameters
T = 1.096ft9/daySIS' = 4.723
'I
LLU
LU"l-
I0
CCoa
0C,,I
zwU
1. 10. 100. 1000. 1.OE+4 1.0E+5
Time, t/'
00
0~
z
di
0, (ARCADISAquifer Recovery Test Analysis
Well S.PSEG NUCLEAR, LLC SALEM GENERATING STATION
HANCOCK'S BRIDGE, NEW JERSEY

Appendix H
Dissolved Gas, Technetium-99 andGroundwater Age DeterminationResults for the PSEG Nuclear, LLCSalem Generating Station
0

Dissolved Gas, Technetium-99 and Groundwater Age DeterminationResults for the PSEG Nuclear, LLC Salem Generating Station
Prepared by Dr. Robert Poreda, University of Rochester
This report details the results of the dissolved gas, technetium-99 (Tc-99), andgroundwater age determination performed on groundwater samples collected throughNovember 2003 from the monitoring well network at the PSEG Nuclear, LLC SalemGenerating Station (the "Station"). The analyses were performed in accordance with theattached procedures (Attachment 1 - Groundwater Age Determination and Attachment 2- Tc-99). Analytical results for the groundwater samples, which are summarized in theattached table, are evaluated based on the water-bearing zone where the monitoring wellsare screened. The three primary water-bearing zones investigated beneath the Station are:1) the Vincentown Formation; 2) the shallow, water-bearing unit within the limits of thecofferdam; and, 3) the shallow, water-bearing unit outside the limits of the cofferdam.Hydrogeologic and geochemical data indicate that the zones of the shallow, water-bearingunit within and outside the limits of the cofferdam are hydraulically connected, but thezones are evaluated as separate units because of their relative proximity to the facilitystructures.
1. Summary of the Vincentown Formation
> Well K -The groundwater age analysis of samples from Well K indicates thattritiated water containing between 3,000 picocuries per liter (pCi/L) to 5,000pCi/L of tritium recharged approximately 19 years ago and has, traveled to theupper part of the Vincentown Formation (70 to 80 feet below ground surface).The upper limit of 5,000 pCi/L is estimated by assuming dispersion of a slug oftritiated water over 20 years and is based on measured dispersion for non-nuclearwaters from the 1963 bomb pulse at other sites (Solomon et al 1993). The mostlikely location for the recharge is east of Well K based on groundwater flow. Tc-99 was detected in the groundwater sample collected from this well at aconcentration of 0.8 pCi/L, which is consistent with post-nuclear precipitation(i.e., background) for the eastern United States 25 years ago.
> Well L -The groundwater age analysis of Well L indicates that groundwateradjacent to this well recharged approximately 21 years ago with tritiumconcentrations (measured at 45 pCi/L) equivalent to local precipitation 20 to 25years ago (based on the Szabo et al measurements at Gloucester). Thebackground tritium concentrations indicated by Well L demonstrate that therelease of tritium 20 years ago as indicated by Well K was relatively minor and didnot extend over a wide area in the Vincentown Formation. Well L is located to thewest and downgradient of the Station near the brackish/fresh water interface. Thebackground concentrations of tritium detected in groundwater samples collectedfrom Well L indicate that theclay confining-unit of the Kirkwood Formation has

Weffectively segregated the Vincentown Formation from the overlying shallow,water-bearing unit.
Well P -The groundwater age, analysis of Well P indicates that precipitation withbackground concentrations of tritium (60 pCi/L - equivalent to local precipitation20 to 25 years ago, based on the Szabo et al measurements: at Gloucester)recharged approximately 13 years ago.. The methane concentration indicated bygroundwater samples collected from Well P (1 cubic centimeter per kilogram[cc/kg]) suggests that the recharge area for Well P is likely in or near the marshesto the east of the Station or that a small amount of methane has been generatedwithin the Vincentown Formation. As with Well L, the background concentrationsof tritium detected in groundwater samples collected from Well P indicate that theclay confining-unit of the Kirkwood Formation has effectively segregated theVincentown Formation from the overlying shallow, water-bearing unit.
Well Q -The low-level analysis for tritium in the groundwater sample from Well Qindicates a tritium concentration close to the method detection limit (1.5 pCi/L).This low concentration of tritium suggests that groundwater in the vicinity of thiswell recharged close to the onset of the nuclear era (circa 1950). Dissolvedmethane concentrations' in groundwater samples collected from WellQ (38 :cc/kgor 1.7 millimoles/kg [mm0l/kg]) and levels of argon and nitrogen below solubilitylimits indicate that the likely point of recharge is the marshes that border the
* Station tothe east.
Well V -The results of the groundwater age analysis of Well V are consistent withthe results of Well K. Groundwater samplescollected from Well V. indicate aslightly elevated tritium concentration (549 pCi/L) relative to background (localprecipitation). The initial tritium level in the recharge water is estimated to beapproximately 3,000 pCi/L. The results of the groundwater age analysis for WellV indicate a slightly younger age relative to Well L and Well K, but the age iswithin the range observed for these wells (13 to 22 years). The relatively highconcentration of dissolved methane detected in the groundwater sample collectedfrom Well V indicates that the groundwater either recharged in the marshes to' theeast of the Station, or is from in situ biological production.
Analytical results of groundwater samples collected from monitoring wells screened in theVincentown Formation (Wells K, L,P, Q, and V) do not indicate that tritium from theStation has migrated beyond the shallow, water-bearing unit above theKirkwoodFormation and into the deeper Vincentown Formation. Tc-99 concentrations indicated bygroundwater samples collected from Well K and Well V (0.5 pCi/L and 0.8 pCi/L,respectively) are consistent with the suspected ambient concentration in precipitationrecharged during the 1970s. The Tc-99 concentrations indicated by Well K and Well Vare approximately 10 parts per million (100,000 times below) of Spent Fuel Pool water(based on data from Ginna station). 'At this concentration, Tc:99 is not an effective
0

indicator of Spent Fuel Pool water due to the combined effects of ambient Tc-99 and aconcentration of Tc-99 near the method detection limit.
2.0 Summary for the Shallow, Water-Bearing Formation Within the Limits ofthe Cofferdam.
> Well M - The groundwater age analysis of Well M indicates a relatively youngage for this groundwater since it became isolated from the atmosphere (less than0.1 years). The young age suggests that preferential pathways for fluid flow mayexist in the subsurface near the plant and/or that elevated dissolved atmospherichelium concentrations have resulted in skewed age determination results. Elevateddissolved atmospheric helium concentrations could be the result of increased gasexchange between the atmosphere and the structural fill within, the cofferdam orfrom the introduction of atmospheric gases during the monitoring well installationactivities. The Tc-99 concentration indicated by the groundwater sample collectedfrom this well is at or near the regional background concentration of 0.5 pCi/L.The ratio of tritium/Tc-99 at Well M (280,000) is more than 100 times theestimated ratio of 2000 for the Salem Spent Fuel Pool (based on data from Ginnastation). The absence of Tc-99 in groundwater from Well M indicates that thetritium detected in this well may have a source other than the Spent Fuel Pool, orthat tritium migrated to Well M by aqueous diffusion. The diffusion coefficient oftritium is approximately 0.04 square meters per year (m2/yr) (mean diffusion lengthis about 0.1 m/yr), relative to an approximate Tc-99 diffusion coefficient that maybe as much as an order of magnitude lower than tritium (accurate Tc-99 diffusiondata does not exist). Diffusion of tritium would be several times more rapid thanTc-99 because of the smaller size of the molecule and the lack of interaction withsoil (i.e., sorption).
) Well N -The groundwater age determination of the sample from Well N suggestsa recharge age of approximately one year. The young age suggests thatpreferential pathways for fluid flow may exist in the subsurface near the plantand/or that elevated dissolved atmospheric helium concentrations have resulted inskewed age determination results. Elevated dissolved atmospheric heliumconcentrations could be the result of increased gas exchange between theatmosphere and the structural fill within the cofferdam or from the introduction ofatmospheric gases during the monitoring well installation activities. The Tc-99concentration for this well is at or near the regional background concentration of0.5 pCi/L of less than 10 ppm of Spent Fuel Pool levels. The absence of Tc-99 ingroundwater from Well N indicates that the tritium detected in this well may havea source other than the Spent Fuel Pool, or that tritium migrated to Well N byaqueous diffusion similar to Well M.
Well 0 -The groundwater age determination of the sample from Well 0 indicatesa relatively young age of approximately 0.22 years. The young age suggests thatpreferential pathways for fluid flow may exist in the subsurface near the plant

Wand/or that elevated dissolved atmospheric helium concentrations have resulted inskewed age determination results. The Tc-99 concentration for this well is at ornear the regional background concentration of 0.5 pCi/L.
Well R - Groundwater age results from Well R suggest an age of approximately1.2 years. This age. is consistent with the location of Well R at the maximum inhydraulic head Wherethe flow path is almost vertical; the age is a lower limitbecause of loss of He-3 by diffusion and possible exchange with the atmosphere.The Tc-99 concentration for this well is at or near the regional backgroundconcentration of 0.5 pCi/L (see discussion for Wells M and N).
Well AC- Groundwater samples from Well AC were not submitted for analysisfor dissolved gases, Tc-99, or groundwater age determination at the University ofRochester because of the elevated concentration of tritium detected in this sampleby Salem Chemistry. Station protocols prohibited the transport of this sample offsite.
Well AE -The analytical result of the groundwater sample collected fromMonitoring Well AE indicate a tritium concentration of 8,500 pCi/L. Thegroundwater age determination of the sample from Well R indicates a relativelyyoung age of approximately 0.33 years. The recent groundwater age againsuggests that preferential pathways for fluid flow may exist in the subsurface nearthe plant and/or that elevated dissolved atmospheric helium concentrations haveresulted in skewed age determination results. The Tc-99 concentration for thesample from Well AE is at or near the regional backgroundconcentration of 0.5pCi/L.
Analytical results of groundwater samples collected from monitoring wells screened in theshallow, water-bearing unit within the limits of the cofferdam (Wells M, N, 0, R, AC, andAE) indicate groundwater ages of less than 0.1 years to approximately 1.2 years. Therecent groundwater age again suggests that preferential pathways for fluid flow may existin the subsurface near the plant and/or that elevated dissolved atmospheric heliumconcentrations have resulted in skewed age determination results. Tc-99 concentrationsindicated by groundwater samples collected from wells screened in this unit are consistentwith the regional background concentration for this constituent. The absence of Tc-99indicates that the tritium detected in these wells may have a source other than the SpentFuel Pool, or that tritium migrated to the wells by aqueous diffusion
0

3.0 Summary for the Shallow, Water-Bearing Formation Outside of the Limits ofthe Cofferdam.
Well S - The groundwater age determination of the sample from Well S indicatesa relatively young age (less than one year). The recent age of this water isconsistent with other shallow wells close to the plant and inside of the cofferdam.The Tc-99 concentration for this well is at or near the regional backgroundconcentration of 0.5 pCi/L.
Well T - Analytical results of the low-level tritium analysis of the sample fromWell T indicate a tritium concentration of 257 pCi/L. The groundwater ageanalysis for this sample indicates an age of approximately 1.6 years, which isconsistent with the ages of other samples collected from this zone. The analyticalresults of thegroundwater sample collected from Well T indicate a methaneconcentration and low concentrations of dissolved atmospheric gases (15% ofsolubility) consistent with recharge in the marshes to the east of the Station(similar to Wells Q and U). The Tc-99 concentration for the sample from Well Tis at regional background concentration.
Well U - Analytical results of the low-level tritium analysis of the sample fromWell U indicate a tritium concentration of 78 pCi/L. The groundwater age analysisfor this sample indicates an age of approximately 4.1 years, which is consistentwith the ages of other groundwater samples collected from monitoring wellsscreened in this zone. The analytical results of the groundwater sample collectedfrom Well U indicate a methane concentration and low concentrations of dissolvedatmospheric gases (15% of solubility) consistent with recharge in the marshes tothe east of the Station (similar to Well T). The Tc-99 concentration for the samplefrom Well T is at regional background concentration.
Well W -Analytical results of the groundwater sample collected from MonitoringWell W indicate a tritium concentration of 11,300 pCi/L, and the groundwater agedetermination for this well indicates an age of four years. The analytical results forthe groundwater sample from Well W also indicate an elevated concentration ofdissolved methane, which suggests that groundwater at Well W is a mixture ofgroundwater with characteristics similar to groundwater from Well T (or Well Z)with tritiated water from plant activity. Well W is located at or near the boundarybetween methane-rich water flowing from east to the south and west, and tritiated,methane free water that recharges to the south of Salem Unit #1. The Tc-99concentration for the sample from Well W is approximately 4 pCi/L, which isabove the regional background concentration (0.5 pCi/L). The ratio of tritium toTc-99 (2700) is very close to the ratio in the Spent Fuel Pool (Tc-99 data fromGinna which has similar tritium and Spent Fuel Pool characteristics to Salem).Although Well W is located X feet from the center of the plume, it is only a fewmeters outside of the cofferdam.

W WELL Z - Analytical results of the groundwater sample collected from Well Zindicate a tritium concentration of 730 pCi/L. Although the tritium concentrationindicated by the groundwater sample collected from Well Z is slightly elevatedrelative to regional precipitation (i.e., background), there is no indication that therelease of water from the Spent Fuel Pool has migrated to Well Z. The relativelyhigh concentration of dissolved methane (24 cc/kg or 1.1 mmoles/kg) detected inthe groundwater sample from Well Z indicates that the groundwater recharged inthe marshes to the east of the Station. Results of the groundwater agedetermination indicate an age of 3.2 years, which is consistent with the other wellsscreened in this zone (e.g., Wells U, T, and W). The relatively low concentrationsof dissolved methane indicated by monitoring wells installed near the facility andthe elevated tritium concentrations indicated by groundwater samples collectedfrom Wells S and AB contrast with the methane-rich, low tritium water indicatedby Well Z.
WELL AA - Analytical results of the groundwater sample collected from Well AAindicate a tritium concentration of 734 pCi/L, which is similar to Well Z. Adissolved methane concentration of 0.22 cc/kg indicates that the site of rechargefor groundwater at. Well AA is likely in the vicinity of the cofferdam on thesouthwest side of the facility rather than the marshes to the east. Although WellAA is directly downgradient from Well S, it is apparent that groundwater with thecharacteristics of Spent Fuel Pool water has not migrated this far south (Well AAis located about 50 meters southwest of the cofferdam). The groundwater ageanalysis of the sample collected from Well AA indicates an age of 2.1 years.
WELL AB - Analytical results of the groundwater sample collected from Well ABindicate a tritium concentration of 321,000 pCi/L. The groundwater age result forthis well is 1.4 years.
WELL AF - Analytical results of the groundwater sample collected from Well AFindicate a tritium concentration of 256 pCi!L. Groundwater age estimates for thiswell are about 10 years, indicating a relatively long/slow flow path (perhapsstagnant conditions) and little or no connection to contaminated waters seen closeto the plant (e.g., S or AB). The groundwater at AF is methane-rich, suggesting arecharge location in the marshes to the east of the plant and similar to Wells U, T,and Z.
0

Corrected For Excess Air
Sample #Tc-99 4He Ne N2 Ar
pCi/liter [tcc/kg ptcc/kg cc/kg cc/kgR Methane 4He 4
Herad He-3* pCi/L H-3 pCi/L Age (yr)
Ra cc/kg pcc/kg p cc/kg
Salem L-80
Salem K-80b
Salem Q-80
Salem P-80
Salem 0-20
43.11 190.4
0.8 51.90 204.3
29.69 90.7
48.10 197.4
59.83 228.6
13.8 0.351 2.253 0.19 43.11
15.2 0.333 22.475 0.46 46.08
6.6 0.169 0.745 37.91 47.55
-1.39 99
2.18 1792.
6.53
45
955
1.6
21.03
19.23
13.6 0.316 1.718
14.4 0.361 1.321
14.9 0.329 22.19
12.4 0.359 0.175
16.5 0.501 0.062
1.03 43.30 -0.26 57 58 12.46
49.29 3.84 30 6000 0.09
Salem K-80
Salem Well 3
PSEG Well 6
42.55 146.0
337.42 281.3
1920.21 294.6
0.33 43.3
5.01 309.5 264.9
0.05 1898.0 1849.9
1662 955 18.35<0.5 >100
<0.5 >100
Salem Well TSalem Well USalem Well NSalem Well WSalem Well M
Salem Well 0Salem Well S
Salem Well RSalem Well V
0.70.50.4
*.***4.1
0.50.20.5
0.40.8
4.187.57
55.48307.50
53.6959.0645.00
59.37
14.926.7
239.81354.7215.3216.5210.0
25.92
1.71.5
13.2
26.615.014.414.0
14.5
0.0410.0410.3290.390
0.3680.3100.340
0.320
1.273 31.92 23 257 1.59
1.226 8.16 20 78 4.10
0.02 37.778 -5.525 24.2 5194 0.08
4.225 17.26 263.9 13062 0.36
2.344 0.39 46.788 2.197 132.1 142696 0.02
2.010 0.01 48.627 4.320 109.6 12963 0.15
1564 0.01 126900 3480000 0.65
3.103 37.38 -6.67 227.6 3447 1.16549
Salem Well Z 0.4Salem Well AA 0.5
Salem Well AB 0.4
Salem Well AE 0.7
Salem Well AF 0.2
Salem Well V 0.5
Salem Well W 2.5Salem Well Y LOST
19.1886.6058.20
62.13
25.60
24.75
20.12
95.65393.81
236.08
253.56
97.1490.60
80.97
6.1821.23
19.6115.64
7.177.57
7.98
0.1330.424
0.377
0.310
0.1690.166
0.166
5.08 24.06
1.55 0.22240.79 2.65
2.36 0.02
4.83 20.9817.25 15.36
80.36 28.02
142 729 3.24
88 734 2.06
25261 321000 1.38
155 8558 0.33
178 256 9.61
729 549 15.37
2891 11305 4.14
0

Appendix H
Attachment I
Research Laboratory ProceduresRemedial Investigation ReportPSEG Nuclear, LLC, Salem Generating,Station, Salem, New Jersey
Item Title
1 Hydrology of the Salem Generating Station, Proposal, 26 February 2003
2 Standard Operating Procedure, Tritium-Helium Dating of Groundwater
In the event of a conflict between the Standard Operating Procedure and the Hydrology of the Salem Generating Stationproposal, the Hydrology of the Salem Generating Station proposal will be followed.
0g:\aprogeetpae&g~sa~em - tnftiunttnal reports'april 2004- ri0appendices~.appendix h - rochester resuhsaftachmrent 1-age0 datiegknhttement I - cover.doc

Hydrology of the Salem Generating Station
Proposal prepared for
PSEG
by Robert J. Poreda
Professor of Environmental Sciences
University of Rochester
February 26, 2003

The proposed investigation will examine the potential for radionuclide migration in
groundwater at the PSEG Salem Power Station. Specifically, the investigation addressed the
source of the contamination, the magnitude of the release to the environment and the best
methods to address long term monitoring at Salem. Standard monitoring by PSEG scientists had
detected tritium at levels above environmental concentrations at several sites surrounding Salem
#1 .Of particular concern is the possibility that water from the spent fuel pool has leaked or is
leaking into the groundwater that surrounds the containment building.
1. Sites that contained elevated tritium levels would also be analyzed for 1291 (a long-lived
radionuclide produced by uranium fission). The AcceleratorMass Spectrometry method
has a detection limit of 106 atoms of 129I/liter of water. 1291 measurements have several
distinct characteristics that make it a suitable tracer for identifying sources of radionuclide
release: a). 1291 displays "conservative" behavior in groundwater (as F) so that it migrates
with the flowing water rather than adsorbing on particles .(as is the case for 137Cs). b)
Because 129I is a long-lived radio-isotope, it can be used to detect anypast as well as
present leakage of 1291-bearing waters into the environment (the other iodine radio-
isotopes decay to background levels in less than one month and hence are only useful in
assessing very recent leaks): c) Elevated levels of 1291 should be characteristic of water
leaking from the spent fuel pool because of the proximity to the large amount of.
fissionable uranium, Water that leaks from other sources (e.g. the turbine drains or steam
releases) should have low 1291 because the water that is used to generate the steam has
extremely low concentration of dissolved ions.
2. Determine the residence time of groundwater in the vicinity of thecontainment building
and the rate of possible shallow groundwater flow to thesouthwest (i.e. toward the river).
Evaluate flow in the upper Vincetown Formation (50 to 80') to determine: 1. flow
direction and recharge estimates; 2. Evidence for or against tritium migration from the
surface fill into the Vincetown Formation; 3. the "age" of any tritium release. To
accomplish this task, we used the 3He/3H groundwater age dating method. The validity of
this method has been established in a series of papers by Poreda, Solomon, and Schlosser
(with co-authors) (see references and appended papers). The technique makes use of the

fact that groundwater, once it has been isolated from the atmosphere begins to accumulate3He from the decay of tritium.. Because tritium levels in this region are elevated relative to
environmental levels, the technique is extremely sensitive in establishing rates of
groundwater flow. We applied this method to the "down gradient" environmental
monitoring wells and to the wells that (based on hydraulic heads) flow back to a basement
sumps for processing. The goal will be to establish if the rates of groundwater flow away
from and toward the facility from the age dating and simple mass balance calculation
(residence time = volume of water/flux) .
3. From this preliminary investigation and a review of the initial site survey, we will propose
to PSEG an environmental well monitoring program that will provide for rapid and
effective detection of the migration of any radionuclides off-site.
Tritium - Helium-3 Age Dating
We can estimate the transit time of the tritium in the subsurface by measuring the amount (%)of
the tritium that has decayed to 3He [see the analytical methods section and the attached reference
articles for complete procedures]. The tritium levels near the plant are typically 10 to 100 times
average rainfall (1.0 vs. 0.1 pCi/g) and the likely source of the tritium is from activities at Salem
(a major component is thought to have come from "events" (such as steam release into the
system), To calculate a transit time for the tritium, we assume that once the water is isolated
from the atmosphere (vadose zone) it begins to accumulate 3He. Thus the ratio of 3He*/3H can
be used to assess the subsurface transit time by the following equation:
time = (1/k) In [(3He*/ 3H) + 1]
where k = 0.0555yr-1
Because a certain percentage of the 3He is from atmospheric solubility, we use the ratio of3He/Ne in "air-saturated" water to subtract the atmospheric 3He from the total. The tritium
values from the University of Rochester Lab will be compared with the estimates made by
PSEG's direct counting techniques.

Iodine-129 and the Iodine - Tritium Correlation
To investigate the potential sources of contamination at Salem, we extend the use of
radioactive tracers to include the long-lived radioactive isotope of iodine, 1291 (15.7 million year
half life), a product of U fission. The ratios of1291 / 3H will help us to identify the release paths for
the radionuclides. Todineand tritium behave as "conservative" (non-reactive) tracers in
groundwater. Different sources (secondary water, air-fall, spent fuel pool, natural groundwater)
will have distinct ratios of 129j / 3H. The 129 Imeasurement by Accelerator Mass Spectrometry can
detect 1291 at levels of 106 atoms and a 1291/I ratio of 10714. Thus, this represents an extremely
sensitive and long-lived tracer for radionuclide release.
Steam is thought to have extremely low 1291 concentrations (1000 atoms/g), presumably
because of the procedures used to remove ions from solution to ensure the integrity of the steam
generation process. Any leakage of water between the primaiy and secondary systems leaks
mainly tritium (1000 pCi/g) and is not a major release mechanism for other radionuclides. The
Turbine Drain sample wilI serve as an analogue for the water that could.leak during any steam
release. Only the Spent Fuel Pool contains significant levels of 1291 ( approximately equivalent to
the natural creeks that drain the West Valley, NY facility) although there is no evidence that
significant amounts of water have leaked from the pool into the environment. There is a factor of
10000 difference between the ambient 1291 concentration in precipitation (1000 atoms/g) and
Spent Fuel Pool water (10,000,000 atoms/g). A similar factor of about a million exists for tritium
in precipitation (0.05pCi/g) and spent fuel water(50,000 pCi/g). From this simple comparison,
one can estimate the percentage of Spent Fuel Pool water finds its way into any of the
groundwater monitoring wells. Other sources of significant 129I, may come from the combined
effects of "wash down" from the containment building and seepage into the Moat This
washdown should be collected by the drainage system that surrounds the plant but must be
evaluated as a potential source. A simple model would propose three potential "end-member"
compositions for water at Salem the Spent.Fuel Pool water (high in tritium and high in 1291),
Turbine Drain Water (relatively high in tritium but very low in 1291.) and local precipitation (very
low in tritium and "291 .0
ANAL YTICAL PROCED URES for IODINE
Water samples were prepared for 1291 /1 ratio measurement by an adaptation of the method
described in Fehn et al., 1992. Approximately 100 mL of water was used as starting material for
sample preparation except for the two samples with the highest expected ratios where 1 mL and
0.1 mL were used. Since samples were expected to have high 1291 /1 ratios and. low iodine
concentrations, carrier iodine with low 129I content was added to each sample prior to extraction.
Addition of carrier serves the dual purpose of increasing sample bulk to facilitate measurement, as
well as preventing cross-contamination in the source from "hot" samples, i.e., samples high in 1291,
during Accelerator Mass Spectrometry (AMS) measurements. To achieve isotopic equilibrium
between the sample and carrier KI which is added, samples and carrier were converted to 104
Iodine in the samples was then extracted into CCh, and back-extracted into the aqueous phase,
followed by precipitation as AgI powder, following standard procedures. The silver iodide was
pressed into stainless steel sample holders and loaded on a
sample wheel for AMS measurement.1291 -to-stable iodine ratios (1291 /1) were determined by AMS at the PRIME lab facility at
Purdue University. AMS uses a tandem accelerator in conjunction with an ion source, several
magnets and suitable detectors to sensitively measure atoms of choice with detection limits of one
atom in 1015 stable atoms, with associated removal of interfering atoms (see Elmore et al. (1984a
and 1984b), Kubik et al. (1987) for a detailed description of AMS techniques). (This facility is
the only one currently in operation in the U.S that can perform the analysis at the required
levels of precision). The 12 9 I/1 ratios were normalized to a known standard during AMS
measurement. AMS has a theoretical detection limit of 1291/ ratio = lIx .10-5 although practical
detection limits areabout 50 x 10-15, due to the lack of natural materials with lower 1291 /1 ratios.
Chemical blanks and carrier iodine had 1291 /1 ratios of 80 x 10-15 during that AMS run. I-
content in the carrier solution was measured by ion chromatography. with errors of +/- 5%.

Analytical Methods for Tritium and Helium
Shallow wells will be sampled using a dedicated "micro-purge" bladder pump to lift the
water.. Care will be taken to place the purge tube near the top of the standing water column to
ensure that the well was flushed completely and that the well screen is not exposed to air.
* Dissolved gas samples were collected in 3/8" o.d. Cu tubing sealed with refrigeration clamps in
accordance with standard procedures. Water is collected in 500ml glass bottles fitted with ploy-
seal caps.
Gases are extracted from -25 g of water on a high vacuum line constructed of stainless
steel and Corning-1724 glass to minimize helium diffusion. The non-condensable gases (He,
Ne, Ar, N2 , CH 4) plus water vapor are transferred into a 1724 glass ampoule for subsequent
analysis. The amount of non-condensable gas was measured using a calibrated gas volume fitted
with a capacitance manometer. Gas ratios (N2 , Ar, CH 4 ) were analyzed on a Dycor Quadropole
mass spectrometer fitted with a variable leak valve. The results are combined with the
capacitance manometer measurement to obtain gas concentrations (cc STP/Kg of water (+
2%). Prior to helium isotope analyses, N2 and 02 are removed by reaction with Zr-Al alloy
(SAES-ST707), Ar and Ne are adsorbed on activatedcharcoal at 770 K and at 400 K,
respectively. SAES-ST-10 1 Getters (one in the inlet line and 2 in the mass spectrometer)reduce
the HD+ background to -100 ions/sec.
Helium isotope ratios and concentrations were analyzed on a VG 5400 Rare Gas Mass
Spectrometer fitted with a Faraday cup (resolution of 200) and a Johnston electron multiplier
(resolution of 600) for sequential analyses of the 4He (F-cup) and 3He (multiplier)
beams. On the axial collector (resolution of 600) 3He+ is completely. separated from
HiD+ with a baseline separation of < 2% of the HD+ peak. The contribution of iD+ to
the 3He peak if< 0.1 ion/sec at 1,000 ions/sec of 1ID+. For 2.0 ucc of He with an air ratio
(sensitivity of 2 x 1074 Amps/torr), the 3He signal averaged 2,000 ions/sec with a background
signal of-15 cps, due to either. scattered 4 He ions or the formation of 4 He ions at lower
voltage potentials within the source of the mass spectrometer. All 3 He/4 He ratios are
reported relative to the atmospheric ratio (RA), using air helium as the absolute standard. Errors
* *in the 3He/ 4He ratios result from the precision of the sample measurement (0.2%) and
variation in the ratio measurement in air (0.2%) and give a total error of 0.3% at 2a for the Wreported helium isotope value. Helium concentrations (cc STP/Kg of water) are derived from
comparison of a known split of the total sample to a standard of known size. The value, as
measured by peak height comparison, is accurate to 2% (2a).
Tritium values are analyzed using the 3He "in-growth" technique. 150 g of water are
degassed of all He on a high vacuum line and sealed in a 3" O.D. 1724 glass ampoule for a
period of 30 to 50 days (because of the high tritium levels , with respect to typical
precipitation). Glass ampoules had been baked at 2500 C in a helium-free nitrogen gas to
minimize the solubility of helium in the glass. After sealing, the ampoules are stored at -20' C
to limit diffusion of helium into the bulb during sample storage. During this interval, 3He
produced from the decay of tritium accumulates in the flask. Typical sample blanks are -10" 9 cc
of 4 He and 10- 15cc of 3He. Blank corrections to 3He are made using the 4 He content and
assuming that the blank has the air 3 He/4 He ratio. The 3He content of the storage ampoule is
measured on the VG 5400 using the above procedures and compared to the 3He content of air
standard. Typical 3He signals for a sample, containing 10 T.U. and stored for 90 days are 0-8x10 5 atoms (± 2%) and a blank of 3 lxl 04 atoms of 3He. Errors in the reported tritium
value are dependent on the amount of tritium and are 2% (2c) at 10 T.U. Higher precision
can be achieved with larger samples and longer storage times.

Sampling Strategy
1. Determine the age and rate of groundwater flow in the 4 existing shallow (20 foot) near-
field wells O,M,N,R. and 2 to 4 proposed shallow wells. It is hypothesized that this water
should drain toward the containment building (based on hydraulic head distribution).
Tritium (by PSEG) / Helium-3 (by U of Rochester) can determine this flow to +1- 20%.
The flow will be compared to the tritium inventory estimates for the building sumps (pump.
rate x tritium level) to evaluate the flow of tritiated water back toward the containment
building (cost $1500 - 2000 @$300 per sample)) (analysis time 1 month)
2. Measure tritium and 3He in 4 existing far field wells that penetrate into the Vincetown
Formation Aquifer: K (80), L (80), P (,80), Q(80) (both measurements to be made at.
Rochester). The goals are to estimate the travel times for natural groundwater in the
Vincetown Fromation, determine if any significant tritium release has migrated away from
containment and to determine the groundwater age of any discovered tritium release.
Possible enhanced pathways for migration may exist along piping or "footings" pounded
to depth. The method does not require knowledge of the tritium input function because
the ratio of tritium to helium-3 establishes the age. (cost ($2400 @ 4 X$300 for tritium and
4 x $300 for.3He) (analysis time 3 months)
3. Measure trtium and dissolved gases in three to five existing deep wells (300 to 800 feet)
that tap two drinking water aquifers (Mt Laurel-Wenonah at - 300 feet and the Upper
Raritan at 800 feet). The water at depth is most likely pre-nuclear with tritium at
background levels (0.3 pCi/liter). Any potential leakage of surface water can be evaluated
at the lppm level based on the significant tritium levels found in Turbine steam
(1,000,000 pCi/liter) and Spent fuel pool water (100,000,000 pCi/liter) (cost $2000 -3000
at $600/sample) (analysis time 3 months)
4. Measure 1-129 in two background samples (precipitation and far field groundwater) and
six to eight wells that contain elevated tritium (4-5 shallow (20') and 2-3 wells from 80
feet). The ratio of 1291 to 3 He will be used to evaluate whether the source is steam (low
"9I) or spent fuel pool water (high 1291). (cost $7000 @ $700 per sample) (analysis time
6 months)

References
Andrews, J. N., I. S. Giles, R. L. F. Kay, and D. J. Lee, Radioelements, radiogenic helium, andage relationships for groundwaters from the granites at Stripa, Sweden, Geochim.Cosmochim. Acta, 46, 1533-1543, 1982.
Elmore, D, PW Kubik, N Conard and J. Fabrika -Martin, Computer controlled isotope ratio.measurements and data analysis. Nuclear Instruments and Methods. 83, 233-237, 1984.
Fehn, U, and GR Holdren, Determination of natural and anthropogenic 1291 in marine sediments,Geophysical Research Letters 13, 137-139, 1986.
Kubik, PW, D. Elmore, T.K. Hemick, H.E. Gove, U. Fehn, R.T.D. Teng, S. Jiang and S. TullaiAccelerator Mass spectrometry at the University of Rochester, Nuclear Instruments and
. Methods B29, 138-142, 1987.Marine, 1. W., The use of naturally occurring helium to estimate groundwater velocities for
studies of geologic storage of radioactive waste, Water Resources Res., 15, 1130-1136,1979.
Mazor, E., and A. Bosch, Helium as a semi-quantitative tool for groundwater dating in the rangeof 104-108 years, Consultants meeting on isotopes of noble gases as tracers inenvironmental studies, Vienna, May 29-June 2, Panel Proceedings Series InternationalAtomic Energy Agency, p. 163-178, 1989.
Mazor, E. and A. Bosch, Dynamics of groundwater in deep basins 4He dating, hydraulicdiscontinuities, and rates of drainage, Proceedings of the International conference ongroundwater in large sedimentary basins, Australian Water Resources Council ConferenceSeries, 20, 380-389, 1990.
Poreda, R. J., T..E. Cerling, and D. K. Solomon, Use of tritium and helium isotopes ashydrologic tracers in a shallow unconfined aquifer. J Hydrology, 103: 1-9, 1988.
Poreda, R.J., and K. A. Farley, Rare gases in Samoan Xenoliths, Earth Planet. Sci. Lett., 113,129-144, 1992.
Saunders, M, R. J., Cross, H. A. Jimenez-Vasquez, and R. J. Poreda, Stable compounds of heliumand neon: He:@C60 and Ne@C60, Science, 259, 1428-1429, 1993.
Schlosser, P., M. Stute, H. Db5rr, I. Levin, and K. 0. Mannich, Tritium/ 3He dating of shallowgroundwater. EPSL, 89: 353-362, 1988.
Solomon, D. K., R. J. Poreda, S. L. Schiff, and J. A. Cherry, Tritium and helium-3 asgroundwater age tracers in the Borden aquifer. Water Res. Res. 28: 741-755, 1992.
Solomon, D. K., S. L. Schiff, R. J. Poreda, and W. B. Clarke, A validation of the 3H/3He methodfor determining groundwater recharge, Water Resour. Res., 29 (9), 2951-2962, 1993.
Solomon, D. K., R. J. Poreda, P. G. Cook, and A. Hunt, Site characterization using 3H/3Heground water ages, Cape Cod MA, Ground Water, 33, 988-996, 1995.
Stute, M, C. Sonntag, J. Dedk, and P. Schlosser, Helium in deep circulating groundwater in theGreat Hungarian Plain: Flow dynamics and crustal and mantle helium fluxes, Geochimicaet Cosmochimica Acta, 56, 2051-2067, 1992.

W Standard Operating ProcedureTritium-Helium Dating of Groundwater
Samples of groundwater from the Site will be provided to the noble gas laboratory at the.University of Rochester. The helium samples (about 30 grams of water) will be collected incopper tubing according to standard methods (see attached instructions). Tritium samples willbe collected in 0.5 liter glass bottles that are sealed with polyethylene caps. The helium andtritium samples will be analyzed at the University of Rochester according to standard methods*(see Solomon et al., 1992 and references therein). All contracted work will be performed atUniversity of Rochester facilities. Analytical precision for the measurements are as follows:.
1) Tritium: detection limit of0.t TU with a maximum uncertainty of +/- 0.1 TU.
2) Helium-4 concentration: Detection limit of I cc/kg with a maximum uncertainty of +-1cc/kg.
3) 3He/4He ratios (relative to. an air helium standard) with a precision of 0.3% for samplescontaining 40 grams of water. (Smaller volume samples will have lower precision).
4) Dissolved nitrogen concentrations (detection limit of 1cc/kg) with a maximumuncertainty of +I- 1 cc/kg.
Air standards are used to calibrate the mass spectrometer with the standard procedure ofone standard repeated every two samples. High vacuum blanks will be analyzed at a rate of oneblank per five samples.
The results of the analyses will be synthesized and provided in tabular format. Inaddition, groundwater ages based on the tritium and 3He contents of the samples will be
calculated and a written report will provide the details of such calculations.
Analytical Methods for Tritium and Helium
Wells are sampled using a Waterra "lift" pump or a "downhole sampler"(a length of Cutubing fitted with a check valve) to minimize formation of bubbles in the water stream. Eachwell had been recently purged by extracting more than three well volumes from the.standingwater in the well prior to sampling. Care was taken to place the purge tube near the top of thestanding water column to ensure that the well was flushed completely. During sampling, theWaterra pump was lowered to within 30cm of the bottom of the well. Samples were collected in3/8" o.d. Cu tubing sealed with refrigeration clamps in accordance with standard oceanographicprocedures.
Gases are extracted from -25 g of water on a high vacuum line constructed of stainlesssteel and Coming-1724 glass to minimize helium diffusion. The non-condensable gases (He, Ne,
O Ar, N2, CH 4 ). are transferred to a 1724-glass ampoule, filled with activated charcoal, by the use
of a "water vapor pump" .Water vapor streams off the sample from the actions of ultrasonicagitation and condenses in the ampoule which is held at -1 95TC. A 2mm constriction in thesample ampoule limits the "back-streaming" of gases. After removal of H2 0 vapor and CO2 at.-
900 C and -1950 C respectively, the non-condensable gas was measured using a calibrated gas
splitter fitted with a capacitance manometer. Gas ratios (N2 , Ar, CH4 ) were analyzed on a
Dycor Quadropole mass spectrometer fitted with a variable leak valve. The results are combinedwith the capacitance manometer measurement to obtain gas concentrations (cc STP/Kg ofwater (+ 2%). Prior to helium isotope analyses, N2 and 02 are removed by reaction with Zr-Al
alloy (SAES-ST707), Ar and Ne are adsorbed on activated charcoal at 770 K and at 400 K,respectively. SAES-ST-101 Getters (one inthe inlet line and 2 in the mass spectrometer) reduce
the HD+ background to -1,000 ions/sec.
Helium isotope ratios and concentrations were analyzed on a VG 5400 Rare Gas MassSpectrometer fitted with a Faraday cup (resolution of 200) and a Johnston electron multiplier
(resolution of 600) for sequential analyses of -the 4 He (F-cup) and 3He (multiplier)
beams. On the axial collector (resolution of 600) 3He+ is completely separated from
HD+ with a baseline separation of < 2% of the HD+ peak. The contribution of iD+ to
the 3He peak if< 0.1 ion/sec at 1,000 ions/sec of HiD+. For 2.0 ucc of He with an air ratio
(sensitivity of 2 x 10⁻⁴ Amps/torr), the 3He signal averaged 2,500 ions/sec with a background
signal of -15 cps, due to either scattered 4 He ions or the formation of 4He ions at lower
voltage potentials within the source of the mass spectrometer. All 3 He/4 He ratios arereported relative to the atmospheric ratio (RA), using air helium as the absolute standard. Errors
in the 3 He/4 He ratios result from the precision of the sample measurement (0.2%) andvariation in the ratio measurement in air (0.2%) and give a total error of 0.3% at 2CT for thereported helium isotope value. Helium concentrations (cc STP/Kg of water) are derived fromcomparison of a known split of the total sample to a standard of known size. The value, asmeasured by peak height comparison, is accurate to 2% (2a).
Tritium values are analyzed using the 3He "in-growth" technique. 150 g of water are.degassed of all He on a high vacuum line and sealed in a 3" O.D. 1724 glass ampoule for a
period of 60 to 90 days. Glass ampoules had been baked at 2500 C in a helium-free nitrogengas to minimize the solubility of helium in the glass. After sealing, the ampoules are stored at-20° C to limit diffusion of helium into the bulb during sample storage. During this
interval, 3He produced from the decay of tritium accumulates in the flask. Typical sample blanks
are -10- 9cc of 4 He and 10- 15cc of 3 He. Blank corrections to 3He are made using the 4He
content and assuming that the blank has the air 3He/ 4He ratio. The 3He content of the storage
ampoule is measured on the VG 5400 using the above procedures and compared to the 3He
content of air standard. Typical 3He signals for a sample containing 10 T.U. and stored for 90
days are -8xl0 5 atoms (± 2%) and a blanklof 3 ± 1xl0 4 atoms of 3He.* Errors in the reportedtritium value are dependent on the amount of tritium and are 2% (2a) at 10 T.U. Higherprecision can be achieved with larger samples and longer storage times.
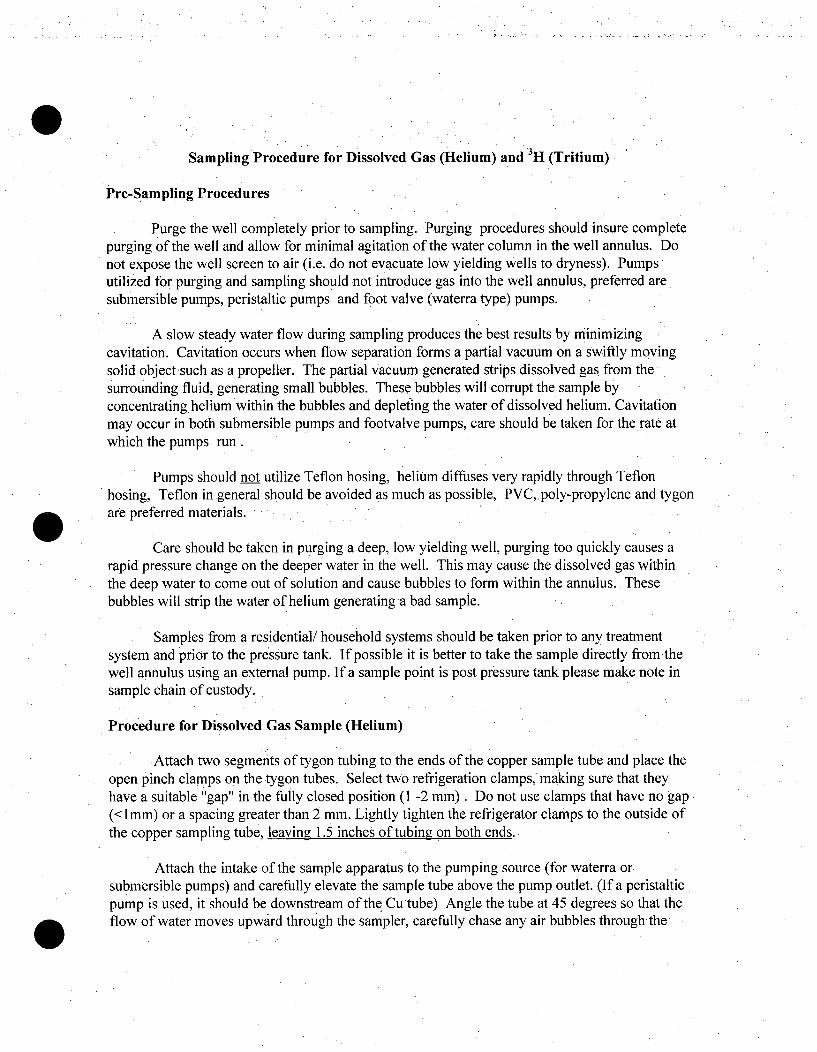
Sampling Procedure for Dissolved Gas (Helium) and 3H (Tritium)
Pre-Sampling Procedures
Purge the well completely prior to sampling. Purging procedures should insure completepurging of the well and allow for minimal agitation of the water column in the well annulus. Donot expose the well screen to air (i.e. do not evacuate low yielding wells to dryness). Pumpsutilized for purging and sampling should not introduce gas into the well annulus, preferred aresubmersible pumps, peristaltic pumps and foot valve (waterra type) pumps.
A slow steady water flow during sampling produces the best results by minimizingcavitation. Cavitation occurs when flow separation forms a partial vacuum on a swiftly movingsolid objectsuch as a propeller. The partial vacuum generated strips dissolved gas from thesurrounding fluid, generating small bubbles. These bubbles will corrupt the sample byconcentrating helium within the bubbles and depleting the water of dissolved helium. Cavitationmay occur in both submersible pumps and footvalve pumps, care should be taken for the rate atwhich the pumps run.
Pumps should not utilize Teflon hosing, helium diffuses very rapidly through Teflonhosing, Teflon in general should be avoided as much as possible, PVC, poly-propylene and tygonare preferred, materials.
Care should be taken in purging a deep, low yielding well, purging too quickly causes arapid pressure change on the deeper water in the well. This may cause the dissolved gas withinthe deep water to come out of solution and cause bubbles to form within the annulus. Thesebubbles will strip the water of helium generating a bad sample.
Samples from a residential/ household systems should be taken prior to any treatmentsystem and prior to the pressure tank. If possible it is better to take the sample directly fromthe.well annulus using an external pump. If a sample point is post pressure tank please make note insample chain of custody.
Procedure for Dissolved Gas Sample (Helium)
Attach two segments of tygon tubing to the ends of the copper sample tube and place theopen pinch clamps on the tygon tubes. Select two refrigeration clamps,. making sure that theyhave a suitable "gap" in the fully closed position (1 -2 mm). Do not use clamps that have no gap(<1mm) or a spacing greater than 2 mm. Lightly tighten the refrigerator clamps to the outside ofthe copper sampling tube, leaving 1.5 inches of tubing on both ends.
Attach the intake of the sample apparatus to the pumping source (for waterra orsubmersible pumps) and carefully elevate the sample tube above the pump outlet. (If a peristalticpump is used, it should be downstream of the Cu tube) Angle the tube at 45 degrees so that theflow of water moves upward through the sampler, carefully chase any air bubbles throughthe

sampler so that no air bubbles are noted within the pump/sampler assembly. Continue pumping,keeping a close eye on the downstream tygon tubing for bubbles, gently tap the copper sampletube, held in the "angled" position, with a metal wrench in order to release any bubbles that maybe stuck to the side of the sampler. Continue pumping until several tube volumes have flushedthrough the copper tube and NO bubbles of gas are noted in the tygon lines and sample tube. Aslow steady stream of water works best ( about 100 - 400 cc/min)
Note: This step can sometimes be very difficult, be patient, if it doesn't work afternumerous attempts just do the best you can and make note of the problem
Continue pumping and slowly close off the upstream pinch clamp on the tygon tubing,then quickly close off the downstream pinch clamp after the upstream is closed. Start to tightenthe refrigerator clamps on the copper sample tube by holding the clamp with one hand andtightening the clamp nuts with the other. Tighten the clamp evenly to avoid "scissoring " of thecopper tube. The clamp should be tightened to the point where the maximum force is applied tothe head of the wrench while holding the clamp tight. Over tightening will breach the sample tubewhile under tightening will allow the sample to leak. Sometimes there will be a small gap (1-2mm) in the clamp when it is closed, clamp gaps will vary.
Carefully remove both tygon hoses and check to see if the crimped ends are either wiggly(over tightened) or leak (under tightened), re-sample if necessary. Check that the clamps aresecure by giving them a final tightening (torque of about 30 ft.lbs - force applied with a 4 to 6inch lever ann- e.g. a box end wrench). If theends are sealed properly, fill the ends of the coppersample tube with water and cap, keep as little headspace in the ends as possible. If possible it is a 0good idea to take a duplicate sample, just in case. Label the sample tube with the date, time ofsampling, and sample number on a sample tag as well as directly on the copper tube with amarking pen.
Procedures For 3H Sample
After taking the dissolved gas sample, simply fill a 500 ml glass sample bottle from thepump discharge and cap with a poly-propylene cap, leaving no headspace within the bottle.Label the bottle with date, time, and sample number. Make sure the sample cap is tight, you cantape the cap to the bottle to prevent loosening with simple electrical tape.
Shipping the Samples Back to the Lab
Store the copper sampling tubes in a horizontal position packed in either foam rubber ontheir own or encased within piece of aluminum channel stock, packed in foam rubber, pay carefulattention to the sample ends, they must be protected from bumps and jars. Either package forshipping very securely or hand carry, bent tubes, mangled ends, and breached tubes are oftenunextractable back in the lab. As for the tritium sample bottles, pack very tight so that the glassof one bottle cannot contact the glass of another bottle. They should not be able to move or shiftwithin the packing container, usually double boxed sample bottles fair better than single boxedsamples. Again some samples have ended up on the floor of UPS due to poor packing, OverPacking Works

Ship samples back with sample identification and sampling dates and times on a separatesheet of paper. Ship to:
Dr. R. J. PoredaDept. of Earthand Environmental SciencesHutchinson Hall Rm. 227University of RochesterRochester, NY 14627.Phone 716-275-8691 (lab)
Appendix H
Attachment 2
Research Laboratory ProceduresRemedial Investigation ReportPSEG Nuclear, LLC, Salem GeneratingStation, Salem, New Jersey
Item Title
I Technetium-99 Analysis
9 ~aprojecftpse~ggsalem - tr~tur~fina I reports~ap; 12004 -rAappendices~append,, h rochester resultstatachment 2- tc-ggtaftachment2 2-cover~doc

Appendix H
Technetium-99 Analysis
Prepared for
PSEG
by Robert J. Poreda
Professor of Environmental Sciences
University of Rochester
September 15, 2003

Appendix H
This project will use state-of-the-art methods to determine the abundance and distributionof Technetium-99 in the Salem I plant environment. Technetium-99 (99Tc) is aradioactive by-product of nuclear power generation (in addition to other mostly "nuclear"sources). Recent analytical advances in inductively-coupled plasma mass spectrometry(ICP-MS) make it possible to detect sub-picogram (less than 1010 atoms) quantities of99Tc. We will apply these methods to understanding the migration of 99Tc in theenvironment. 99Tc levels have not been accurately monitored in low-level radioactivesettings because of difficulties in detection nor have the pathways of migration in theenvironment been determined.
One major focus of the research plan is to understand the migration of radionuclides(especially 99Tc and "291) through the groundwater/soil environment. At Rochester,Professor Udo Fehn and his students have developed and tested the state of the artmethods for the determination of 1291. These analyses were successfully used at Ginna toestablish the integrity of the containment system that minimized the radionuclidemigration from the site. The behavior of Tc in groundwater and its interaction with soilssuggests that the mobility of Tc-99 is nearly equivalent to 1-129 and tritium. Thegeochemistry of Tc is such that it exists as an oxyanion, TcO 4 , and has limitedadsorption onto soils. Thus Tc-99 could be readily adopted as a fingerprint for spent fuelpool water with the added benefit of lower analytical costs and more rapid samplethroughput than 1-129 (only the Purdue accelerator can achieve the LLDs necessary forthis investigation).
Technetium (Tc) was detected in 1937 by C. Perrier and E. Segre in a deuteron-irradiatedmolybdenum sample in the cyclotron of E.O. Lawrence in California. Minute quantitiesof 99Tc (half life = 2.14 x 10⁵yr.) are found to occur naturally as a result of spontaneousfission of uranium in uranium ore bodies. However, the largest source of the weaklyradioactive isotope, 99Tc, is from the fission of uranium in nuclear reactors. Technetiumfrom nuclear power generating stations makes up about 6 percent of uranium fissionproducts (Peacock, 1973), and together with 129, represents the major long-lived radio-isotopes generated in the nuclear industry. Federal regulations (IOCFR61 ...) specify the99Tc and 1291 activity levels for disposal in low-level radioactive burial sites, althoughmost waste shipments over-estimate the activity (by as much as 100x) and simply reportthe 99Tc and 1291 levels as "upper limit values".
Technetium differs from most of the radionuclides associated with the nuclear industry(90Sr, 1
37Cs,
6 0Co,
63Ni) that have half lives of 30 years or less and decay to less than 0.01percent of their original activity in 300 years (the monitoring/evaluation interval).Because of the long half life, 99Tc in environmental samples is not easily measured byconventional low level counting techniques. Typical detection limit for 99Tc, obtained by
I
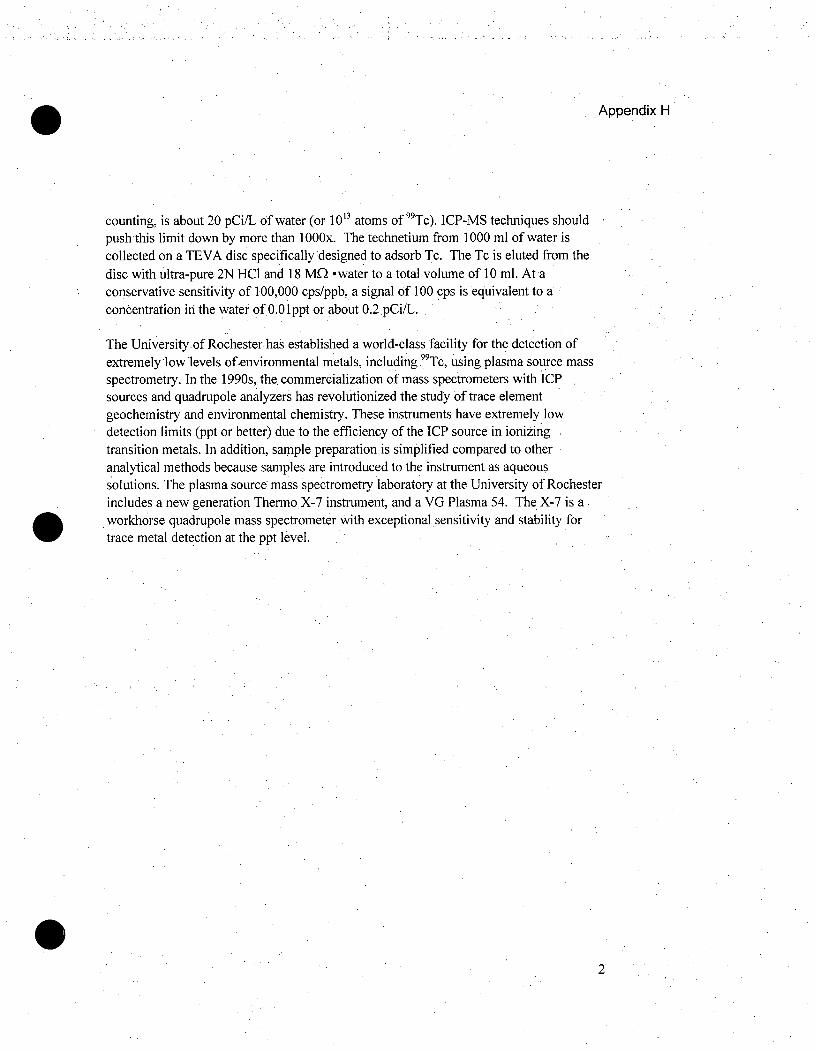
.Appendix H
counting, is about 20 pCi/L of water (or 1013 atoms of 99Tc). ICP-MS techniques shouldpush this limit down by more than I 000x. The technetium from 1000 ml of water iscollected on a TEVA disc specifically designed to adsorb Tc. The Tc is eluted from thedisc with ultra-pure 2N HCI and 18 MQ -water to a total volume of 10 ml. At aconservative sensitivity of 100,000 cps/ppb, a signal of 100 cps is equivalent to aconcentration in the water of.0.01ppt or about 0.2 pCi/L.
The University.of Rochester has established a world-class facility for the detection ofextremely low levels of.environmental metals, including. 99Tc, using plasma source massspectrometry. In the 1990s, the, commercialization of mass spectrometers with ICPsources and quadrupole analyzers has revolutionized the study of trace elementgeochemistry and environmental chemistry. These instruments have extremely lowdetection limits (ppt or better) due to the efficiency of the ICP source in ionizingtransition metals. In addition, sample preparation is simplified compared to otheranalytical methods because samples are introduced to the instrument as aqueoussolutions. The plasma source mass spectrometry laboratory at the University of Rochesterincludes a new generation Thermo X-7 instrument, and a VG Plasma 54. The X-7 is a.
.workhorse quadrupole mass spectrometer with exceptional sensitivity and stability fortrace metal detection at the ppt level.
2

Appendix I
Tritium Trend Plots for the StationMonitoring Wells.

100,000,000 F~
10,000,000 -
1,000,000 -
100,000
I I I I I I
C)
0.
I-
C.0
E
NJ GW Quality Criterion
10,000
1,000, -
Further Investigation Criterion--------------------- --------------------
100
10 3 7 I3/17/03
I I I I I I I I I I I
1/1/03 5/31/03 8/14/03 10/28/03 1/11/04
C-
0
z
Date
Well Summary_:
Installation Date Feb-2003Monitored Unit VincentownTop of Screen 70.0 ft bgsBottom of Screen: 80.0 ft bgs
FIGURE
ARCAD1 , Tritium Concentration in Well KPSEG NUCLEAR, LLC SALEM GENERATING STATI1N
HANOX'S BRIDGE, NEO JERSEY

0.
.E
100,000,000 :
10,000,000
1,000,000
100,000
10,000
1,000o
' ' I ' ', I ' ' I ' ' I
NJ GWf Quality Criterion
Further Investigation Criterion
100,
10
1/1/03 3/17/03 5/31/03 8/14/03 10/28/03 1/11/04
z
c5z
6H
Date
Well Surmmry
Installation Date May-2003Monitored Unit CofferdamTop of Screen 10.OftbgsBottom of Screen: 20.0 ft bgs
FIGURE
ARCADIS, Tritium Concentration in Well M I-2PSEG NUCLEAR LIC SALEM GENERA1ING STA11CN
HPANCCK'S BRIDGE, NEW JERSEY

r
*1
0
C0
b0U
U)
0U
L)
w
0w
z
0~
F-L)
100,000,000
10,000,000
[NJ G\QualityCriterion -
0~
Cu
E
1,000,000
100,000
10,000
1,000
100
10
1
--------------
Further Investigation Criterion
/1 I 3/7I 5/1/03 3/17/03 5/31/03
' I ' ' .
8/14/03 10/28/0 1"
Date
1/11/04
Well Summary:
Installation Date Jan-2003Monitored Unit CofferdamTop of Screen : 10.OftbgsBottom of Screen: 20.0 ft bgs
Lii
I-
0
(S00
FIGURE
ARCA S, Tritium Concentration in Well N 1-3PSEG NUCLEAR LLC SALEM GENERATN STAIICN
ICOC('S BRIDGE NEW JERSEY
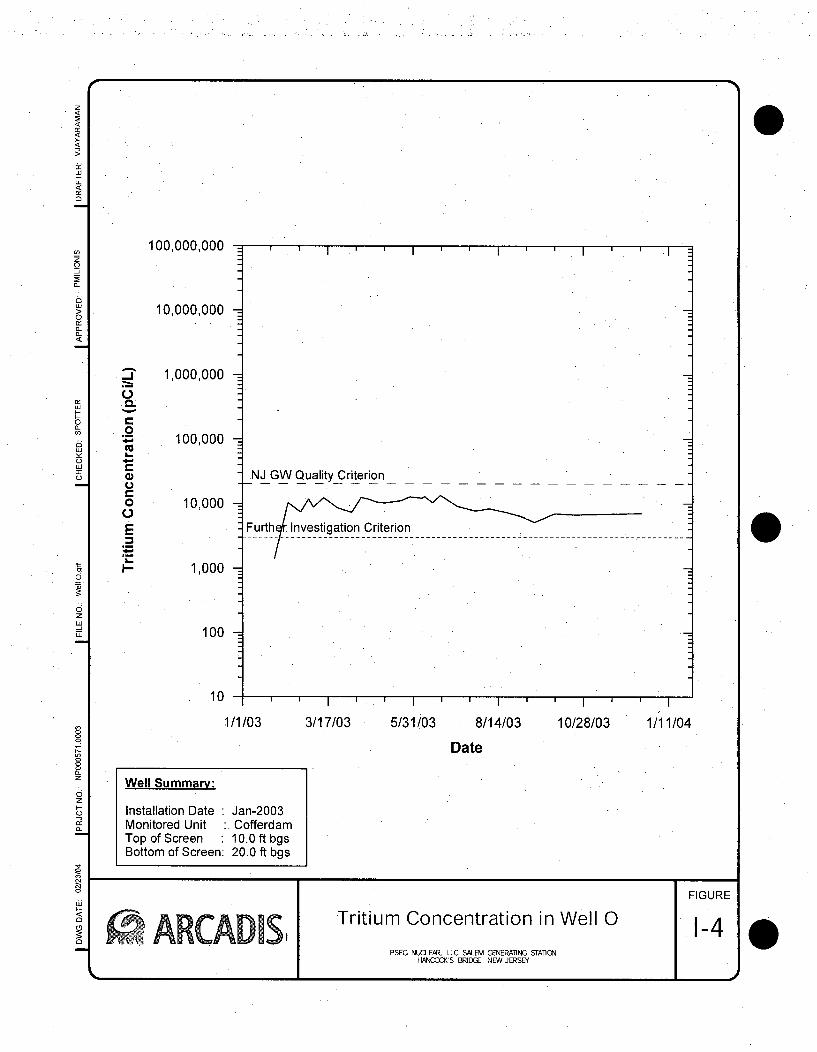
C.)
0.0Eu
100,000,000
10,000,000
1,000,000
100,000
10,000
1,000
100
10
II .
NJ GW Quality Criterion
Furth Investigation Criterion
. . . . . . . . . .3/17/031/1/03 5/31/03
(L5z
0z
w
8/14/03 10/28/03 1/11/04
Date
Well Summary:
Installation Date Jan-2003Monitored Unit CofferdamTop of Screen 10.0ftbgsBottom of Screen: 20.0 ft bgs
FIGURE
ARCAD 5'1 Tritium Concentration in Well 0 1-4PSEG NUCLEAR LLC SALED CENERATING STAIlCN
HNCOCK'S BRIDCE, NEW JERSEY
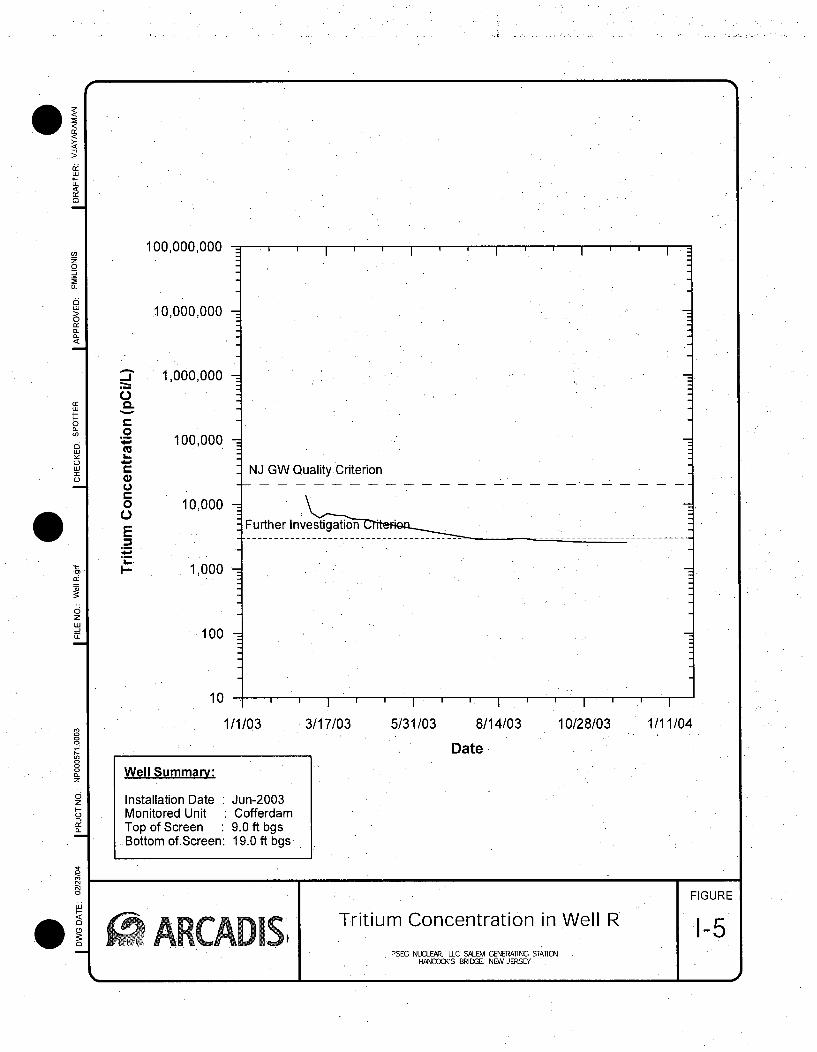
IF
C.,
0.
0
L.)
Ea.2
100,000,000
.10,000,000
1,000,000 -
100,000
10,000
1,000
.100
10
NJ GW Quality CriterionFrh -nvestigation -.-
Further Investigation""
I., I.' I I
1/1/03 3/17/03 5/31/03
C-
z
LzdI-
C-,
"C
0
8/14/03 10/28/03
Date
1/11/04
Well Summary:
Installation Date Jun-2003Monitored Unit CofferdamTop of Screen 9.0 ft bgs
-Bottom of.Screen: 19.0 ft bgs
FIGURE
ARC D S Tritium Concentration in Well R 1-5PSEG NUCLEAR LLC SALEM GENERAliNG STATCON
HANCOCK'S BRIDGI, NEW JERSEY

0
100,000,000
10,000,000 -
0.
0
E
1,000,000
100,000
10,000
1,000
. .. . I ' ' I j
NJ GW Quality Criterion
Further Investigation Criterion
05z
100 -
10 -4- . . I . I I . I I I I
1/1/03 3/17/03 5/31/03
ILz
0z
C-)
8/14/03 10/28/03 1/11/04
Date
Well Summary;
Installation Date May-2003Monitored Unit Shallow, outside CofferdamTop of Screen 24.7 ft bgsBottom of Screen: 34.7 ft bgs
6iFIGURE
SARCAD1S' Tritium Concentration in Well S 1-6PSEG NUCLEAR, LLC SALEM GENERAllNG STAllON
HANCOCK'S BRIDEl, NEW JERSEY
00

i-
0
0
0
w
C-)LuI
0z
6z
z
zC-)
100,000,000
10,000,000
2D0
.2E-
1,000,000
100,000
'I I I ' I I ̧ I ' I"
NJ GWQuality Criterion
Further Investigation Criterion
10,000
1,000
1001
1/1/03 3/17/03 5/31/03
I I I ' ' I
8/14/03 10/28/03 1/11/04
Date
Well Summary:
Installation Date May-2003Monitored Unit Shallow, outside CofferdamTop of Screen 27.2 ft bgsBottom of Screen: 32.2 ft bgs
uJ
H-° FIGURE
~ ARCAD1S, Tritium Concentration in Well U
PSEG NUCLEAR, LLC SALEM GENERAliNG STAnCNHANOR'OXS BRIDGE, NEW JERSEY

.-)
[..
CL0
00E
I-
100,000,000 :
10,000,000
1,000,000
100,000
10,000
1,000
100
10
' 1 ' . . ' ' I '
NJ GW Quality Criterion
Further Investigation Criterion
0zw
1/1/03 .3/17/03 5/31/03 8/14/03 10/28/03 1/11/04
z
0zI-C-
Date
Well Summa:
Installation Date Jun-2003Monitored Unit VincentownTop of Screen 69.5 ft bgsBottom of Screen: 79.5 ft bgs
wJ
I-
0
FIGURE
ARCAD1S, Tritium Concentration in Well V 1-8PSEG NUCLEAR LLC SALEM CENERA1lNG STA1CEN
HANOXX'S BRIE, NEW JERSEY

C-,
.4-
100,000,000
.10,000,000
1,000,000
100,000
10,000
I ' 'II
NJ GW Quality Criterion
Further Investigation Criterion
1,000
100
10 I I ' ' I ' ' I I
1/1/03 3/17/03 5/31/03
ELz
zF-
8/14/03
Date .10/28/03 1/11/04
Well Summary:
Installation Date Jun-2003Monitored Unit : Shallow, outside CofferdamTop of Screen 25.0 ft bgsBottom of Screen: 35.0ft bgs
6-
0FIGURE
As; Tritium Concentration in Well W 1-9PSEG NJCLEA. LLC SALEM GENERAllNG STA]IEN
HN'a"'S BRIDGE. NEW JERSEY
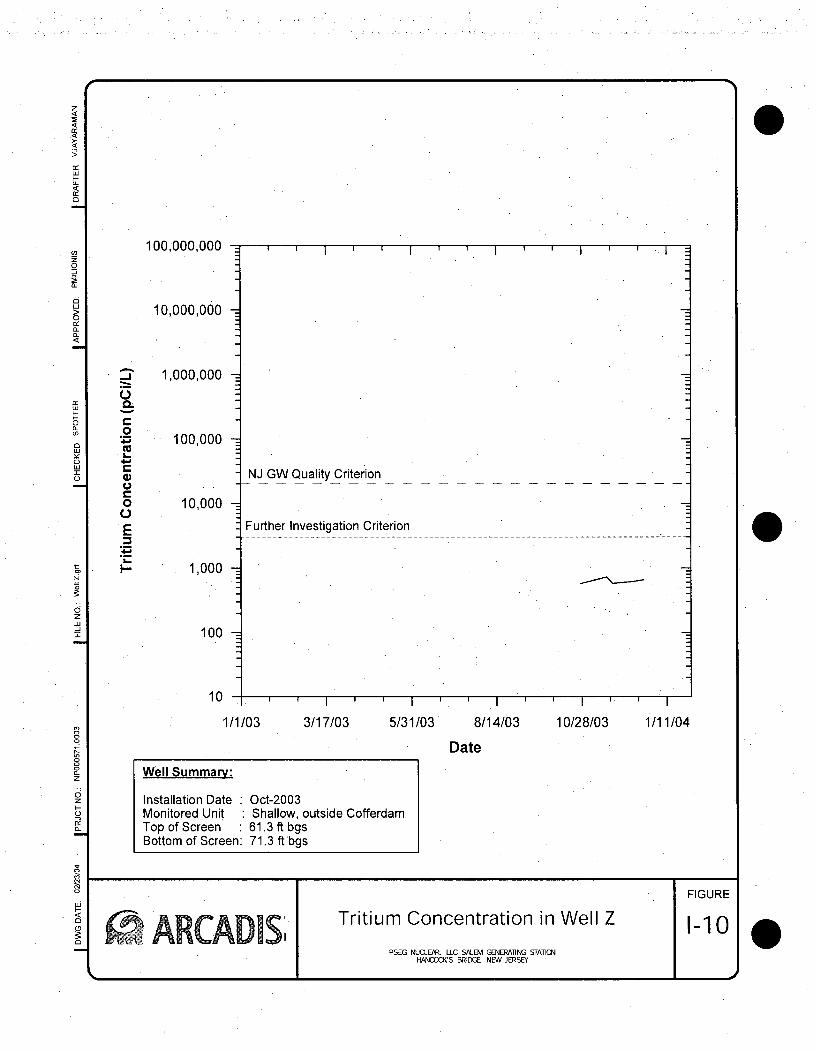
r
100,000,000
10,000,000
C.,
Cu
0
0
E...
1,000,000
100,000
10,000
1,000
100
101/
: ' I ' ' I ' ' I '*'
NJ GW Quality Criterion
Further Investigation Criterion
1/03I ' I
3/17/03 5/31/03 8/14/03 10/28/03 1/11/04
C.
z
zI-
Date
Well Summary:
Installation Date Oct-2003Monitored Unit Shallow, outside CofferdamTop of Screen 61.3 ft bgsBottom of Screen: 71.3 ft bgs
w•
I-
FIGURE
A A m Tritium Concentration in Well Z 1-10PSEG NUCLEAR, LLC SALEM GENERATING STAn]CN
I-COCX'S BRIDGE, NEW JERSEY

0!
Cnw
0o
0
a
L)
0
(.Lw
0
C,
W
y-
C,)
0U
wCL9
100,000,000
10,000,000
CL
0
0
E
11-
1,000,000
100,000
10,000
1,000
NJ GW Quality Criterion
Further Investigation Criterion.--------------------------------- -------------- -
100
10 I
1/1/03 3/17/03 5/31/03 8/14/03 10/28/03 1/11/04
a
z
0z
L-
Date
Installation Date Oct-2003Monitored Unit Shallow, outside CofferdamTop of Screen : 63.2 ft bgs
Bottom of Screen: 73.2 ft bgs
FIGURE
ARCAD1S; Tritium Concentration in Well AA
PSEG NUCLFEAR LLC SALEM GENERATING STA1n0NHAECCK'S BRIDGE, NEW JERSEY

or
100,000,000
10,000,000
C.)
0.
.16-
0
E.2~
1,000,000
NJ GW Quality Criterion
Further Investigation Criterion
100,000
1,000
100
10 +' I . , I I I I ' ' I
1/1/03 3/17/03 5/31/03
z
0z
6j)
8/14/03
Date
10/28/03 1/11/04
Well Summary:
Installation Date Oct-2003Monitored Unit Shallow, outside CofferdamTop of Screen : 57.1 ft bgsBottom of Screen: 67.1 ft bqs
FIGURE
~ ARCADiS; Tritium Concentration in Well AB I-i2PSEG NUCLEAR UC SALEM GENERATING STATMON
HAN(X'S BRIDGE, NEW JERSEY

z.0
iL
EL
(0
LU
Lii
LUJm:C-)
0
0.0.
.E
100,000,000
10,000,000
1,000,000
100,000
10,000
1,000
100
10
NJ GW Quality Criterion
Further Investigation Criterion00
zL9
I *' i *' i
1/1/03 3/17/03 5/31/030
z
L
LU
8/14/03
Date
10/28/03 1/11/04
Well Summary:
Installation Date Oct-2003Monitored Unit CofferdamTop of Screen 74.0 ft bgsBottom of Screen: 84.0 ft bgs
FIGURE
ARCAD1S, Tritium Concentration in Well AC I-13PSEG NUCLEAR, LLC SALEM GENERATING STATICN
HAAM.K'S BRIDGE, NEW JERSEY

C.,
0.
16.
4)
0C.)E
100,000,000
10,000,000
1,000,000
100,000
10,000
1,000
100
10
NJ GW Quality Criterion
Further Investigation Criterion
3/17/03 5/31/03
I I I I I I I I I
1/1/03 8/14/03 10/28/03 1/11/04
z
0z
C-,
6i
Date
Well Summary:
Installation Date Oct-2003Monitored Unit Shallow, outside CofferdamTop of Screen 57.1 ft bgsBottom of Screen: 67.1 ft bgs
FIGURE
ARCADiS; Tritium Concentration in Well AD I' 4PSEG NUCLEAR, LLC SALEM GENERATING STAT1CN
I-PROCC'S BRIDGE, NEW JERSEY
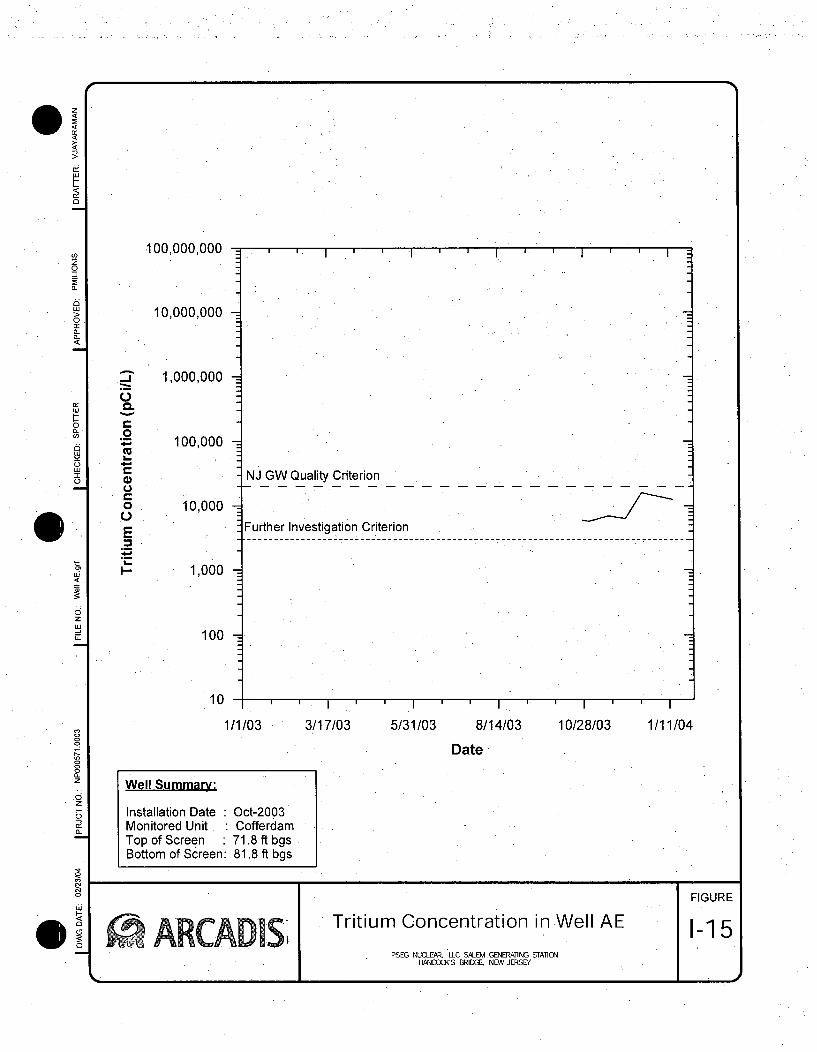
r
U)0
0
w0
w
0
L)
LU0-
Q
0.
0.0E4-
100,000,000
10,000,000
1,000,000
100,000
10,000
1,000
NJ GW Quality Criterion
Further Investigation Criterion
0zLu
100
10 .
1/1/03 3/17/03 5/31/03 8/14/03 10/28/03 1/11/04
(Lz
.0z
(L
Date
Well Summary:
Installation Date Oct-2003Monitored Unit • CofferdamTop of Screen 71.8 ft bgsBottom of Screen: 81.8 ft bgs
FIGURE
ARC ADI Tritium Concentration in Well AE 1-15PSEG NUCLEAR. LLC SALEM GENERATING STAT1N
. .ANOCK'S BRIDGE, NEW JERSEY

CL
C)
0
E.2
100,000,000
10,000,000
1,000,000
100,000
10,000.
1,000
100
10.
" ' I ' " I . .I ' I
NJ GW Quality Criterion
Further Investigation Criterion
0zw9
*1-I '/' I ' I
8/14/03 10/28/03 1/11/041/1/03 3/17/03 5/31/03
0~
z
ci
Date
Well Summary:
Installation Date Oct-2003Monitored Unit Shallow, outside CofferdamTop of Screen 54.2 ft bgsBottom of Screen: 64.2 ftbgs
I-0c,
0•
FIGURE
Tritium Concentration in Well AF 1-16PSEG NUCLEAR, UC SALEM GENERAlING STATICN
HANCOCK'S BRIDGE, NEW JERSEY

uLJ
W.0
LL
0~
0
(n
0U
LU
C.
.0
E
100,000,000 =
10,000,000
1,000,000
100,000
10,000
1,000
100
10
1/1/03
0
zLU
0z
z
3/17/03 5/31/03 8/14/03 10/28/03 1/11/04
Date
Wells in Vincentown Formation
Wells inside the cofferdam-- Wells outside the cofferdam
Monitoring Wells L, P, Q and T are not shown as tritium concentrations are non detect
H•
0
C,0Comparison of Tritium Concentration FIGURE
in All Site Monitoring Wells 1-17PSEG NUCLEAR, LLC SALEM GENERA1nNG STA1TC:N
HPlCCK S BRIDGE, NEW JERSEY

0
Appendix J
A Perspective on Radiation Doses *and Health Risks from Ingestion ofTritium in Drinking Water andPotential Impacts on Aquatic andTerrestrial Biota

A PERSPECTIVE ON RADIATION DOSES AND HEALTH RISKSFROM INGESTION OF TRITIUM IN DRINKING WATER AND
POTENTIAL IMPACTS ON AQUATIC AND TERRESTRIAL BIOTA
David C. KocherSENES Oak Ridge, Inc.
102 Donner Drive, Oak Ridge, TN 37830
The main purpose of this discussion is to consider radiation doses and health risks to thepublic resulting from ingestion .of tritium in drinking water. We begin by comparing the doseresulting from ingestion of a unit activity of tritium with the dose per unit activity of otherradionuclides ingested to provide an indication of the radiotoxicity of tritium. We then present asimple method of estimating doses and cancer risks from ingestion of drinking water containinga known concentration of tritium. This method is illustrated by estimating the dose and riskassociated with the current drinking water standard for tritium. This discussion also considerscurrent guidance on radiation dose limits for aquatic and terrestrial biota and levels of tritium inwater that would be required to potentially impact populations of species.
Dose Per Unit Activity Intake of Tritium and Other Radionuclides
Of all the radionuclides of potential concern in radiation dose and risk assessments forworkers and the public, tritium is among the least radiotoxic, meaning that the dose per unitactivity intake by ingestion (or inhalation) is among the lowest of all man-made or naturallyoccurring radionuclides. This conclusion is illustrated by current estimates of doses to adults perunit activity intake of radionuclides by ingestion given in Table 1.1 Doses are given in millirem(mrem), or one-thousandth of a rem, and the assumed unit activity is I picocurie (pCi), whichcorresponds to 0.037 disintegrations per second, or approximately 130 per hour.2
Doses to adults per unit activity intake of radionuclides by ingestion given in Table I arevalues currently recommended for use in radiation protection of the public by the InternationalCommission on Radiological Protection (ICRP).' In addition to tritium, radionuclides listed inTable 1 include several fission and activation products of importance at nuclear reactors, isotopes
'.A few radionuclides not listed in Table 1 have estimated doses per unit activity intake byingestion slightly lower than the value for tritium. However, these radionuclides are rarely, if ever,encountered in significant quantities in the workplace or the environment.
2Doses per unit activity intake by an adult in Table I represent an effective dose to the wholebody over a period of 50 years following an intake. They are based on considerations of doses todifferent organs and the period of time after an intake over which radionuclides are retained in the bodyand continue to deliver a dose even with no further intakes; this time is many decades in some cases.
3The ICRP has been the leading international authority on radiation protection since the late1920's, and ICRP recommendations have formed the basis for radiation protection standards andprograms throughout the world. However, many current ICRP recommendations, including doses perunit activity intake of radionuclides by ingestion or inhalation, have not yet been formally adopted byregulatory authorities in the U.S., although these authorities may accept their use in many cases.
I

*of uranium found in nuclear fuel, the most important isotopes of plutonium and americiumproduced in reactors, and naturally occurring isotopes of potassium, radium, and thorium.
The dose per unitactivity of a radionuclide ingested depends on several factors includingthe half-life of the radionuclide, the types and energies of radiations emitted by the radionuclide,the extent of absorption from the GI tract, the organs of the body in which the radionuclide isdeposited and the extent of deposition in those organs, and the rate of elimination from the bodyby. biological processes. The low dose per unit activity intake of tritium, compared with valuesfor other radionuclides, is due to two factors. First, most tritium taken into the body in the formof water behaves as normal body water and is rapidly eliminated from the body with a biologicalhalf-time of about 10 days in adults, and this biological half-time is much less than values for theother radionuclides listed in Table 1. Second, the beta radiations (electrons) emitted in tritiumdecay have very low energies and, thus, the energy deposited in tissue, which determines thedose from decay of tritium in the body, is much lower than the energy deposited by radiationsemitted by other radionuclides.
Conversely, doses per unit activity intake of isotopes of radium, thorium, uranium,plutonium, and americium listed in Table 1 are relatively high because, first,. these radionuclideshave relatively long retention half-times in the body, taking into account radioactive decay andbiological elimination, and, second, they (or their radioactive decay products) decay by emissionof alpha particles, which deposit relatively large amounts of energy per unit mass of tissue. Inaddition, alpha particles are biologically more effective than gamma rays and beta particles inproducing health effects (cancers). That is, for the same amount of energy deposited per unitmass of tissue (absorbed dose), the probability of a health effect is much higher for alphaparticles than for other radiations.' The increased biological effectiveness of alpha particles istaken into account in radiation protection by multiplying absorbed dose in rads by a factor of 20to calculate dose equivalent in rem.
There is an additional consideration for tritium that is not taken into account in the doseper unit activity intake of 6.7 x 10⁻⁸ mrem per pCi currently recommended by the ICRP andgiven in Table 1. This value assumes that the biological effectiveness of low-energy betaparticles in tritium decay is the same as that of gamma rays and higher-energy beta particles,such as those emitted in decay of Sr-90 and its decay product Y-90. However, many studies in avariety of organisms have indicated that tritium beta particles are biologically more effectivethan gamma rays and higher-energy beta particles. A representative factor to describe this effectthat we have developed for use in human health risk assessments is about 2.4;. this modification
4The biological effectiveness of ionizing radiations is believed to depend on the density ofionization in tissue (i.e., the amount of energy deposited per unit path length in passing through matter),and alpha particles have a much higher density of ionization than gamma rays and beta particles, due totheir high energies and very short ranges in matter.
5The increased biological effectiveness of tritium beta particles has been incorporated, forexample, in the methodology developed by SENES Oak Ridge for the National Institute of OccupationalSafety and Health (NIOSH) for use in estimating probability of causation of cancers for the purpose ofevaluating claims for compensation by workers at U.S. Department of Energy facilities who developradiogenic cancers.
2

Wof absorbed dose from exposure to tritium is analogous to the factor of 20 for alpha particlesused in radiation protection, as described above.6'. Taking into account the. increased biologicaleffectiveness of tritium beta particles, the dose to an adult per unit activity intake by ingestionwould be 1.6 x 10⁻⁷ mrem per pCi; this is the second value listed in Table 1.
*Doses per unit activity intake given in Table 1 apply to adults. However, the generalpopulation consists of younger age groups aswell as adults. Doses per unit activity intake ofradionuclides by younger age groups generally are higher than values for adults, due primarily tothe smaller masses of body organs and, in many cases (but not for tritium), the higher absorptionof ingested radionuclides in the GI tract at younger ages. For ingestion of tritium in the form ofwater, doses per unit activity intake at different ages currently recommended by the ICRP aregiven in Table 2.' At age 1 year or less, for example, we see that doses per unit activity intake oftritium are about a factor of 3 to 4 higher than the value .for adults. However, in assessing dosesto the public resulting from ingestion oftritium in water, the increased dose per unit activityintake at younger ages is compensated to some extent by the generally lower intake rates of.water at those ages. Therefore, the dose per unit intake is not, by itself, indicative of doses toyounger age groups from intakes of water containing a known concentration of tritium comparedwith the dose to adults.
Even though the dose per unit activity intake of tritium (and other radionuclides) is higherat younger ages than in adults, it is nonetheless reasonable to focus on assessing exposures ofadults if the objective of the assessment is to gain a general understanding of doses and risks tothe public from exposure to known concentrations of radionuclides in the environment. Thisapproach can be justified based on the consideration that if intakes over a normal lifetime ofabout 70 years are assumed, as is often the case in dose assessments for routine exposures of thepublic, the total dose and associated lifetime cancer risk usually will be dominated by the doseand risk resulting from intakes during adult years. More refined calculations that take intoaccount the age-dependence of intakes and dose per unit activity intake do not change estimatesof lifetime dose and risk by a large amount, as is illustrated by calculations of the risk fromingestion of tritium in drinking water over a lifetime in a later section. Many dose assessmentsfor the public performed by the U.S. Nuclear Regulatory Commission (NRC) and EnvironmentalProtection Agency (EPA) assume exposure of adults only.
Estimation of Dose from Ingestion of Tritium in Drinking Water
Estimation of dose from ingestion of drinking water containing a known activityconcentration of tritium (or any other radionuclide) is a straightforward procedure. The dosefrequently calculated in an assessment of radiological impacts on workers or the public is the
6In early ICRP recommendations issued in 1960, a modifying factor of 1.7 was used to calculatedose equivalent from exposure to tritium, to account for the increased biological effectiveness of tritiumbeta particles, but this factor has not been retained in recommendations since 1977.
7Doses per unit activity intake in Table 2 represent an effective dose to the whole body over aperiod from the age at intake to age 70; intakes by adults are assumed to occur at age 20.
3

dose resulting from one year's intakes of a radionuclide.8 The annual dose from a knownconcentration of a radionuclide in drinking water is given by
Dose (mrem per year) = Concentration (pCi per liter) x Intake rate (liters per day)x Exposure frequency (days per year) x Dose per unit intake (mrem per pCi).
As an example, consider the annual dose to an adult corresponding to.the EPA's currentdrinking water standard for tritium; this standard is a concentration limit of 20,000 pCi per liter.'For purposes of estimating dose and risk corresponding to drinking water standards, an intakerate of 2 liters (L) per day often is assumed; this intake rate is a reasonable value for an adultwho consumes above-average amounts of drinking water. The annual dose to an adultcorresponding to 20,000 pCi/L of tritium in water then is given by
Dose = (20,000 pCi/L)(2 L/day)(365 days/year)(1.6 x 10-7 mrem/pCi) = 2.3 mrem/year.
This calculation assumes the higher dose per unit activity intake of tritium in Table 1, whichincorporates an assumption of a higher biological effectiveness of tritium beta particles. If thisassumption were not included, as is presently the case in dose assessments performed by theEPA and NRC, the annual dose would be a factor of 2.4 lower, or about I mrem per year.
To put the annual dose associated with the drinking water standard for tritium intoperspective, we note that the average dose to a member of the public from exposure to naturalbackground radiation, excluding the dose from indoor radon, is about 100 mrem per year, andthat the average dose from indoor radon is about 200 mrem per year. Thus, the drinking waterstandard for tritium corresponds to a dose that is about 1% of the total dose from naturalbackground. This comparison is not intended to trivialize potential exposures to tritium ingroundwater, or to convince the public that they should not be concerned about such exposures.Rather, the purpose is to illustrate that limits on acceptable exposures of the public to man-madesources of radiation often are set at a small fraction of unavoidable exposures to naturalbackground radiation.
The procedure given above also can be used to estimate annual doses to other age groupsusing doses per unit activity intake given in Table 2, increased by a factor of 2.4 to account for.the greater biological effectiveness of tritium beta particles. However, especially at the youngestages, a substantially lower intake rate of water should be assumed. For example, during the first
'Calculation of an annual dose is particularly appropriate when the purpose of the assessment is todemonstrate compliance with a limit on dose in any year. Many radiation standards for workers and thepublic, in the U.S. are expressed in terms of limits on annual dose.
9The EPA's drinking water standards strictly apply at the tap (i.e., after treatment by a municipalwater supply), rather than the source. However, the EPA often applies these standards to protection ofgroundwater resources, regardless of whether groundwater is being used to supply drinking water; see, forexample, the report on Protecting the Nation's GroundWater:.EPA's Strategy for the 1990s (1991),Office of Solid Waste and Emergency Response (OSWER) Directive 9200.4-18 (1997), which applied tocleanup of radioactively contaminated sites under CERCLA (Superfund), standards for hazardous wastedisposal facilities regulated under Subtitle C of RCRA (40 CFR Part 264), and standards for disposal ofspent fuel, high-level radioactive waste, and transuranic waste (40 CFR Parts 191 and 197).
4

Wyear of life, a reasonable maximum intake rate of water is about 1 L/day. Based on doses perunit activity intake by a 3-month-old and 1-year-old in Table 2, the dose during the first year oflife would be between 11 and 15 mrem.
Estimation of Lifetime Cancer Risk from Ingestion of Tritium in Drinking Water
Once the annual dose from ingestion of tritium in drinking water is estimated, it is astraightforward procedure .to obtain an estimate of the risk of cancer incidence that would result
'from exposure over a lifetime. The lifetime cancer risk is given by
Risk = Annual dose (mrerm per year) x Exposure duration (years) x Risk per unit dose.
As an example, radiation risk assessments for hypothetical and prospective exposures ofthe public often assume that exposure occurs over a 70-year lifetime. Then, using a standardassumption developed by the EPA that the risk of cancer incidence per unit dose in the generalpopulation is 7.6 x 10⁻⁷ per mrem,1I the lifetime risk of cancer incidence corresponding to thedrinking water standard of 20,000 pCi/L for tritium is
Risk (2.3 mrem/y)(70 years)(7.6 x 10⁻⁷ per mrem) =1.2 x 10⁴.
That is, there would be slightly more than one chance in 10,000 of a radiation-induced cancerfrom a lifetime's exposure to tritium in water at the drinking water standard.
The calculated lifetime risk given above is highly simplistic in that it assumes that theconcentration of tritium in drinking water remains constant over 70 years. More realistically, ifthere were no further releases of tritium to the source of drinking water, the concentration woulddecrease substantially over time as a result of radioactive decay and dilution by inflow fromuncontaminated sources, such as rainwater. For example, taking only radioactive decay intoaccount, the average concentration of tritium over 70 years would be about 25% of the initialconcentration, and the same reduction in lifetime risk resulting from exposure over 70 yearswould occur. On the other hand, the concentration could remain fairly constant or even increaseover time if there were continuing releases of tritium.
The calculated lifetime risk of slightly above I in 10,000 corresponding to the drinkingwater standard for tritium is at the upper end of the range of acceptable risks of 1 in 10,000 (10-4)to I in 1,000,000 (106) used by the EPA to establish preliminary remediation goals (PRGs) atcontaminated sites subject to cleanup under CERCLA (Superfund)." A limit on acceptable riskof about I in 10,000 also is incorporated in other EPA regulations that apply to releases of
l"The risk of cancer incidence per unit dose estimated by the EPA is an average value in apopulation of all ages, and it takes into account that the risk per. unit dose depends on age at time ofexposure and is generally highest at the youngest ages.
"Risks corresponding to drinking water standards for radionuclides generally fall in theacceptable risk range under CERCLA when an exposure time of 70 years is assumed and risks of cancerincidence to the public per unit activity of radionuclides in drinking water are estimated in accordancewith current federal guidance.05

radionuclides to the environment or radioactive waste disposal.' 2 We also note that riskassessments at Superfund sites often assume a shorter exposure duration of 30 years. Thisassumption would reduce estimates of lifetime cancer risk from ingestion of radionuclides indrinking water, assuming also that the concentration remains constant, by a factor of 0.43. Toput risks .corresponding to the drinking water standard for tritium in perspective, we note that thelifetime risk of cancer incidence from exposure to natural background radiation at an averagedose of about 300 mrem per year, including the dose from indoor radon, is nearly 2 in 100.
The calculation of lifetime cancer risk described above ignores the age-dependence ofintake rates of drinking water and doses per unit activity intake of tritium. More refinedcalculations that incorporate the age-dependence of intakes and dose are given in the EPA'sFederal Guidance Report No. 13, Cancer Risk Coefficients for Environmental Exposure toRadionuclides. For ingestion of tritium in drinking water, the EPA has estimated a lifetime riskof cancer incidence per unit activity intake in the whole population of 5.1 x 10⁻¹⁴ per pCi. Thiscalculation does not incorporate an enhanced biological effectiveness of tritium beta particles bya factor of about 2.4; if this factor were included as in the dose calculations given above, the riskper unit activity intake would increase to 1.2 x 10⁻¹³ per pCi. For example, if the tritiumconcentration in water is at the drinking water standard of 20,000 pCi/L, the activity, intake overa 70-year lifetime, assuming a water intake of 2 L/day, would be 1.0 x 10⁹ pCi, and the resultinglifetime risk of cancer incidence would be 1.2 x 10 4, or slightly above I in 10,000. Thus, fortritium, the refined calculation of risk that accounts for age-dependent effects gives essentiallythe same answer as our calculation based on an assumption of intakes by adults only. 3
Finally, we note that the calculations of dose and risk described above involve substantialuncertainty. The uncertainty in the dose per unit activity intake of tritium recommended by the.ICRP is believed to be about a factor of 2, meaning that the true value could be as much as afactor of 2 above or below the recommended values in Table I and 2, the uncertainty in thebiological effectiveness of tritium beta particles (the factor of 2.4) used in our dose calculationsis also about a factor of 2, and the uncertainty in the risk per unit dose is believed to.be about afactor of 3. In addition, .the uncertainty in the intake rate of drinking water by an individual isabout a factor of 2 to 3, depending on age. These uncertainties generally are not taken intoaccount in radiation protection or in dose assessments for hypothetical and prospective exposuresituations. However, they are important when the purpose of an assessment is to estimate, doses,cancer risks, or probability of causation of cancers in identifiable individuals.
Effects of Tritium on Aquatic and Terrestrial Biota
In addition to potential effects on human health arising from the presence of tritium (andother radionuclides) in groundwater, potential impacts on aquatic and terrestrial biota are of
12See, for example, standards for airborne emissions of radionuclides developed under the CleanAir Act (40 CFR Part 61) and the standards for radioactive waste disposal identified in footnote 9.
13For many radionuclides, there are differences in the two approaches to calculating risk fromingestion, although the differences usually are not large and do not exceed a factor of about 5 in the worstcase. When there are differences, the refined calculations that account for the age-dependence of intakesand doses per unit activity intake generally give lower risks.
6
concern. Approaches to radiation protection of biota differ from approaches to radiationprotection of humans in two important ways.
First, a basic premise of radiation protection of humans is that all individuals should beafforded adequate protection. This objective is reflected in requirements that are intended tolimit doses and health risks to individuals who could receive the highest doses. In contrast,standards for protection of biota normally focus on protection of populations of species,including species that are the most sensitive to radiation.'.4 The basic premise is that the abilityof all species to reproduce and maintain viable populations, which allows them to serve theirfunctions in an ecosystem, should not, be impaired, although it is .recognized that individualmembers of a species may be harmed.
Second, the fundamental concern in radiation protection of humans is to limit the risk ofcancer in exposed individuals and populations, and the approach to limiting cancer risks is basedon an assumption that there is some probability of aradiation-induced cancer at any dose."5 Incontrast, based on studies of radiation effects in many organisms, the critical biological effectson populations of species, that involve impairment of reproductive capability (i.e., the effects thatoccur at the lowest doses) are found to occur only at doses and dose rates above a threshold. 16
Therefore, biota are considered to be protected as long as the dose and dose rate is maintainedbelow the threshold for impairment of reproductive capability in the most sensitive species.Other effects on populations of species, such as a significant increase in mortality, occur only atsubstantially higher doses.
Although there is no formal system of radiation protection of biota similar to the systemof radiation protection for humans, the International Atomic Energy Agency (IAEA) andNational Council on Radiation Protection and Measurements (NCRP) have developedrecommendations on dose limits for aquatic and terrestrial biota, and the U.S. Department ofEnergy is applying these limits at its facilities. Specifically, it is generally considered thatpopulations of the most sensitive species of terrestrial animals will be protected if the absorbeddose is limited to less than 0.1 rad/day, and that the absorbed dose to aquatic animals andterrestrial plants should be limited .to less than 1 radlday.17 The recommended dose limits for
"4Exceptions can occur when potential exposures of individual members of threatened orendangered species are of concern.
"'Radiation protection of humans also is concerned with limiting the risk of severe hereditary
(genetic) effects in an exposed individual's offspring, and these effects also are assumed to occur withsome probability at any dose. However, the risk of radiation-induced hereditary effects in humans isbelieved to be much less than the risk of cancer.
16The threshold doses and dose rates for impairment of reproductive'capability can vary greatly(e.g., by a factor of 100 to 1,000) depending on the particular species of concern.' Although there areexceptions, threshold doses and dose rates tend to be lowest in mammals and birds, intermediate in higherplants, fishes, amphibians, reptiles, and crustaceans, and highest in insects, primitive plants, mollusks, andsimple life forms (bacteria, protozoans, and viruses).
"TImplicit in these daily dose limits is an assumption that exposures are occurring over a lobg timeperiod (on the order of months or more), rather than over short periods of time. If exposures occur onlyover short time periods, species generally can tolerate higher dose rates without significant impairment ofreproductive capability.
7

biota are much higher than the current dose limit for members of the public from all controlledsources combined, which is 0.1 rem per year.8
It should be noted that dose limits for biota are expressed in terms of absorbed dose,rather than dose equivalent as-in standards for humans. The question of the biologicaleffectiveness of such radiations as alpha particles and low-energy tritium beta particles ininducing threshold effects that impair reproductive capabilities of biota is controversial andunresolved at the present time. One view to which we subscribe is that if there is an increasedbiological effectiveness of tritium beta particles in inducing threshold effects in biota, it shouldbe less than the value that applies to induction of cancers in humans.19 Thus, the biologicaleffectiveness of tritium beta particles in biota should be less than a factor; of two and probablycan be ignored.
Levels of tritium in water that could result in impacts on aquatic or terrestrial biota can beestimated in the followingway. Since more than half of the mass of many organisms is water, itis reasonable to assume that the concentration of tritium in an organism is the same as theconcentration in water to which the organism is exposed; the average concentration in all tissuesof an organism generally would be lower. Then, based on the known average energy of tritiumbeta particles, the absorbed dose rate per unit activity concentration of tritium can be calculated;the result is 2.9 x 10⁻⁷ rad/day per pCi/gram. Since the density of water is 1,000 grams (g) perliter, the concentration of tritium in water corresponding to the dose limit for terrestrial animalsof 0.1 rad/day is
Concentration= [(0. lrad/day)/(2.9 x 107 rad/day per pCi/g)] × (103 g/L) - 3.4 x 10⁸ pCi/L.
The concentration of tritium in water corresponding to the dose limit for aquatic animals andterrestrial plants of 1 rad/day is a factor of 10 higher, or 3.4 x 10i pCi/L. Based on this simpleanalysis, it is evident that concentrations of tritium in water would need to be more than a factorof 10,000 higher than the drinking water standard of 20,000 pCi/L for there to be any potentialfor deleterious effects on populations of terrestrial biota, and that the difference would need to bemore than a factor of 100,000 to potentially affect populations of aquatic biota.
18The public dose limit of 0.1 rem per year is included in the NRC's radiation protectionstandards in 10 CFR Part 20. Although the public dose limit is intended to be applied to the total dosefrom all controlled sources combined, the NRC applies this dose limit to individual licensees, withoutregard for doses due to other controlled sources. However, other EPA regulations that apply to the Salemfacility, including standards for operations of nuclear fuel-cycle facilities (40 CFR Part 190) andstandards for airborne releases of radionuclides (40 CFR Part 61), limit doses to the public due to releasesfrom the facility to a small fraction of the dose limit of 0.1 rem per year. The NRC also requires thatreleases of radionuclides -to the environment be maintained as low as reasonably achievable (ALARA),and application of the ALARA requirement generally reduces doses to the public from operations atnuclear power plants to a very small fraction of the dose limit.
"9This view is based on the notion that.radiation effects on biota occur only at high doses wherethe density of ionization is high for any radiation type (including gamma rays) and, therefore, that thereshould be less difference in the biological effectiveness of different radiations at high doses than at themuch lower doses of concern in assessing cancer risks in humans.
8

Summary
These discussions have sought to establish the following points.
° Tritium has a substantially lower dose per unit activity intake than otherradionuclides, either man-made or naturally occurring, to which workers andmembers of the public normally could be exposed.
Based on many studies, of the effects of tritium in various organisms, we believethat calculations of radiation doses to humans from ingestion (or inhalation) oftritium, should take into account an increased biological effectiveness of betaparticles emitted in tritium decay of a factor of about 2.4, even though this effectis not yet incorporated in estimates of dose per unit activity intake recommendedby the ICRP or used by the EPA and NRC.
'The dose per unit activity intake of tritium is higher in younger age groups than inadults, with the increase being the highest in infants. However, when the lowerintake rates of water by younger age groups are taken into account, the dose perunit activity concentration of tritium in water is less than a factor of 2 higher forinfants than adults, and the total dose and cancer risk resulting from intakes ofwater over a lifetime are dominated by the dose from intakes during adult years.
Doses and health risks to the public that would result from consumption of,drinking water that contains tritium at concentrations equal tosthe EPA's drinkingwater standard of 20,000 pCi/L are low and are only a small fraction of the..unavoidable doses and risks from exposure to natural background radiation.
The lowest concentrations of tritium in water that could be of concern in regard toensuring protection of populations of the most sensitive species of aquatic andterrestrial biota are more than a factor of 10,000 higher than the drinking water.standard of 20,000 pCi/L.
9

Table 1. Doses to adults per unit activity intake of radionuclides by ingestiona
Radionuclide Radioactive half-life Dose per activity intake(mrem per pCi)
H-3 (tritium) 12.33 years 6.7 x 10⁻⁸ (1.6 x 10⁻⁷)b
K-40 1.277 x 10⁹ years 2.3 x 10-'
Mn-54 312.11 days 2.6 x 10⁻⁶
Co-58 70.86 days 2.7x 10⁻⁶
Co-60 5.27 years 1.3 x 10-'
Sr-90 28.79 years 1.0 x 10⁻⁴
Sb-125 2.75856 years 4.1 x 1076
1-129 1.57 x 10⁷ years 4.1 x 10⁻⁴
1-131 8.0207 days 8.1 x 1075
Cs-134 2.07 years 7.0 x 10-'
Cs-137 30.07 years 4.8 x 10⁻⁵
Ra-226 1600 years 1.0 x 10⁻³
*Ra-228 5.75 years 2.6 x 10³
Th-228 1.9116 years 2.7 x 10⁴Th-232 1.405 x 10¹⁰ years 8.5 4x 10
1.8 x 10⁴U-234 2.455 x 10⁵ years 1.8 x 10'
U-235 7.038 x 10⁸ years 1.7 x 10⁻⁴
U-238 4.468 x 10⁹ years 1.7 x 10⁻⁴
Pu-239 24,110 years 9.3 x 10⁻⁴
Am-241 432.2 years 7.4 x 10'4
aExcept as noted, values are current recommendations of the International Commission onRadiololical Protection (ICRP) for exposure of adults in the general population (see footnote 2 in text).
Value in parentheses takes into account an assumption of an increased biological effectivenessof low-energy beta particles emitted in tritium decay by a factor of 2.4 (see text).
10

Table 2. Doses to individuals of various ages per unit activityintake of tritium by ingestion'
Age at time of intakeDose per activity intake
(mrem per pCi)
3 months 2.4 x 10⁻⁷
1 year 1.8 x l0-7
5 years 1.1 x 10⁻⁷
10 years 8.5 x 101
15 years 6.7 x 10⁻⁸
Adult 6.7 x 10⁻⁸
aValues are current recommendations of the InternationalCommission on Radiological Protection (ICRP) for exposures ofmembers ofthe general population (see footnotes 2 and 7 in text). If anincreased biological effectiveness of tritium beta particles is assumed,values should be increased by a factor of about 2.4 (see text).
11