Saharan dust particle properties over the central Mediterranean
27
Saharan dust particle properties over the central Mediterranean A.M. Tafuro a , F. Barnaba b,1 , F. De Tomasi a , M.R. Perrone a, * , G.P. Gobbi b a Dipartimento di Fisica, Universita ` di Lecce, Lecce, Italy b Istituto di Scienze dell’Atmosfera e del Clima (ISAC-CNR), Roma, Italy Received 23 May 2005; received in revised form 10 November 2005; accepted 10 November 2005 Abstract AERONET sun photometer measurements performed at five different sites of the Central Mediterranean during strong Saharan dust outbreaks are used to characterize optical and physical properties of dust particles. Sun photometer retrievals are combined at two of the five sites with lidar observations. It is shown that at low aerosol optical depths (AODs) the dust particle properties are quite dependent on dust load and monitoring site location. Differences on retrieved particle properties reduce with increasing dust load. AERONET retrievals at AOD (440 nm) z 0.6 are then used in this paper to characterize dust particles over the central Mediterranean basin leading to columnar averaged values of the real refractive index b nN = 1.5 F 0.1, the imaginary refractive index b k N = 0.004 F 0.002, the single scattering albedo b SSAN = 0.89 F 0.03, and the Angstrom exponent b A ˚ N = 0.2 F 0.1. It is shown that A ˚ represents the best marker to trace the temporal evolution of dust events. Volume size distributions show a dominant coarse mode peaking at 1.7–3 Am. In particular, the average coarse mode that is centred at i2.2 Am at Lampedusa, which is ~200 km away from the northwest Africa coast, gets peaked at i1.7 Am at Lecce, which is ~800 km away. Lidar retrievals are used to characterize the vertical distribution of dust particles by the vertical profiles of the backscatter and extinction coefficients, the lidar ratio, and the depolarization ratio. Lidar retrievals show that over the Mediterranean basin, dust layers generally extend from 1 up to 6 km and that their vertical distribution can significantly change within a few hours. It is also shown that at high values of the AODs dust particles are characterized by lidar ratios spanning the 50–70 sr range and depolarization ratios larger than 30%. D 2005 Elsevier B.V. All rights reserved. Keywords: Sun-photometer; Saharan dust; Aerosol optical and microphysical properties; Lidar 0169-8095/$ - see front matter D 2005 Elsevier B.V. All rights reserved. doi:10.1016/j.atmosres.2005.11.008 * Corresponding author. E-mail address: [email protected] (M.R. Perrone). 1 Now at Ente Nazionale Nuove Tecnologie Energia ed Ambiente (ENEA), Frascati, Roma, Italy. Atmospheric Research 81 (2006) 67 – 93 www.elsevier.com/locate/atmos
-
Upload
nationalacademies -
Category
Documents
-
view
1 -
download
0
Transcript of Saharan dust particle properties over the central Mediterranean
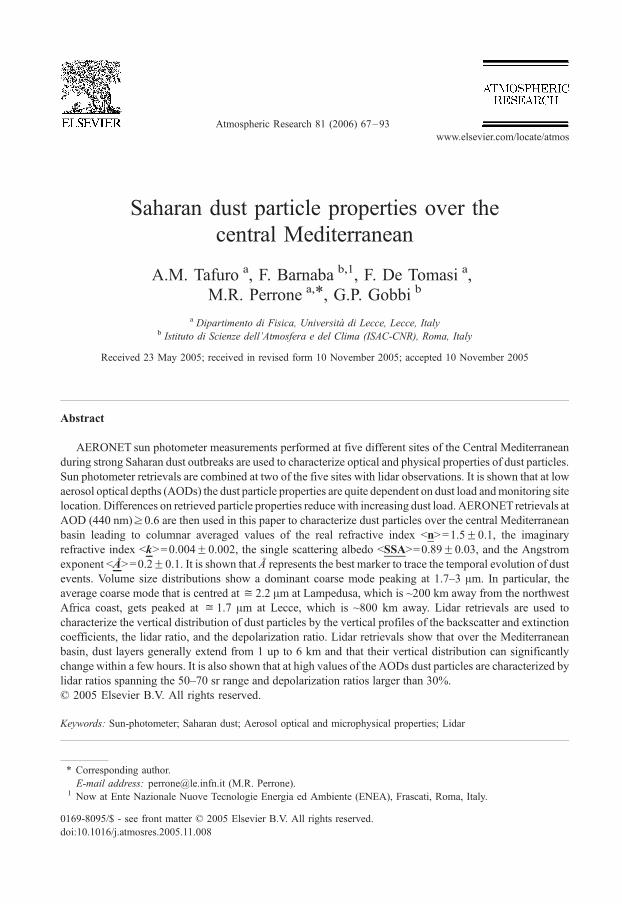
Atmospheric Research 81 (2006) 67–93
www.elsevier.com/locate/atmos
Saharan dust particle properties over the
central Mediterranean
A.M. Tafuro a, F. Barnaba b,1, F. De Tomasi a,
M.R. Perrone a,*, G.P. Gobbi b
a Dipartimento di Fisica, Universita di Lecce, Lecce, Italyb Istituto di Scienze dell’Atmosfera e del Clima (ISAC-CNR), Roma, Italy
Received 23 May 2005; received in revised form 10 November 2005; accepted 10 November 2005
Abstract
AERONET sun photometer measurements performed at five different sites of the Central Mediterranean
during strong Saharan dust outbreaks are used to characterize optical and physical properties of dust particles.
Sun photometer retrievals are combined at two of the five sites with lidar observations. It is shown that at low
aerosol optical depths (AODs) the dust particle properties are quite dependent on dust load andmonitoring site
location. Differences on retrieved particle properties reducewith increasing dust load. AERONETretrievals at
AOD (440 nm)z0.6 are then used in this paper to characterize dust particles over the central Mediterranean
basin leading to columnar averaged values of the real refractive index bnN=1.5F0.1, the imaginary
refractive index bkN=0.004F0.002, the single scattering albedo bSSAN=0.89F0.03, and the Angstrom
exponent bAN=0.2F0.1. It is shown that A represents the best marker to trace the temporal evolution of dust
events. Volume size distributions show a dominant coarse mode peaking at 1.7–3 Am. In particular, the
average coarse mode that is centred ati2.2 Am at Lampedusa, which is ~200 km away from the northwest
Africa coast, gets peaked at i1.7 Am at Lecce, which is ~800 km away. Lidar retrievals are used to
characterize the vertical distribution of dust particles by the vertical profiles of the backscatter and extinction
coefficients, the lidar ratio, and the depolarization ratio. Lidar retrievals show that over the Mediterranean
basin, dust layers generally extend from 1 up to 6 km and that their vertical distribution can significantly
change within a few hours. It is also shown that at high values of the AODs dust particles are characterized by
lidar ratios spanning the 50–70 sr range and depolarization ratios larger than 30%.
D 2005 Elsevier B.V. All rights reserved.
Keywords: Sun-photometer; Saharan dust; Aerosol optical and microphysical properties; Lidar
0169-8095/$ -
doi:10.1016/j.a
* Correspond
E-mail add1 Now at En
see front matter D 2005 Elsevier B.V. All rights reserved.
tmosres.2005.11.008
ing author.
ress: [email protected] (M.R. Perrone).
te Nazionale Nuove Tecnologie Energia ed Ambiente (ENEA), Frascati, Roma, Italy.
A.M. Tafuro et al. / Atmospheric Research 81 (2006) 67–9368
1. Introduction
Mineral dust lifted from arid regions of the Earth exerts a large influence over radiative
transfer processes: directly through scattering and absorbing processes and indirectly by
affecting microphysical properties and lifetime of clouds (e.g., Andreae, 2001). Model studies
suggest that the direct radiative forcing of dust on regional as well as on a global scale may be
comparable to or even exceed the forcing by anthropogenic aerosols (Tegen and Fung, 1995;
Li et al., 1998; Sokolik and Toon, 1996). Nevertheless, net radiative forcing and climate
impact of dust particles are still largely uncertain (IPCC, 2001). This indetermination arises
because of a still limited knowledge of production sources, transport patterns, particle
properties and evolution and changes during the particles’ lifetime. To infer microphysical
properties of dust particles from different sources, it is then important to monitor them at
various locations as well as to highlight changes occurring during the particles’ lifetime. On a
global scale, the dominant sources of mineral dust are all located in the Northern Hemisphere,
mainly in North Africa, the Middle East, Central Asia, and the Indian subcontinent (Prospero
et al., 2002). North-west Africa is the most important source of mineral aerosols over the
Mediterranean basin (e.g. Moulin et al., 1997; De Tomasi et al., 2003; Perrone et al., 2004).
Large-scale atmospheric circulation spreads Saharan dust particles both across the Mediter-
ranean, reaching up to Northern Europe (Ansmann et al., 2003) and across the Atlantic,
reaching the Caribbean and the Amazon basin (Husar et al., 1997). Several dedicated
campaigns employing correlated ground, airborne, and space-based observations have been set
up to reduce uncertainties in modelling and forecasting mineral aerosol effects on climate. The
European Mediterranean Dust Experiment—MEDUSE (e.g. Soderman and Dulac, 1998;
Hamonou et al., 1999), the second Aerosol Characterization Experiment—ACE 2 (e.g. Raes et
al., 2000), the Saharan Dust Experiment—SHADE (e.g. Tanre et al., 2003) are just a few
examples.
The establishment of the Aerosol Robotic Network (AERONET), which is a federated
international network funded in 1993 and coordinated by the NASA Goddard Space Flight
Center that maintains more than 200 automatic sun/sky radiometers worldwide (Holben et al.,
1998, 2001), has significantly contributed in the last years to obtain a global coverage and good
sampling of aerosol properties (http://aeronet.gsfc.nasa.gov/). The goal of AERONET is to
assess aerosol optical properties and validate satellite retrievals of aerosol optical parameters
worldwide. To this end, the network imposes standardization of instruments, calibration, and
data processing.
In this study, AERONET sun photometer measurements performed at five sites of the
central Mediterranean are used to characterize dust particles advected from north-west Africa
and to investigate the effects of the dust event intensity and monitoring site location on
retrieved properties. In particular, the main goal of the paper is to define average values of
the main optical and physical parameters that characterize dust particles over the central
Mediterranean. We believe that these average parameters can allow a better representation of
dust particle properties in global circulation and/or chemical transport models. Since model
spatial resolutions are generally larger than 300�300 km (e.g. Kinne et al., 2003), average
parameters characterizing aerosols over a broader area can be of larger interest than aerosol
data referring to a single location. To this aim, we have considered AERONET retrievals of
two strong Saharan dust outbreaks occurring in the second half of July 2003, which have
spread large tongues of dust particles all over the central Mediterranean. In particular,
AERONET sun photometer measurements performed at Lecce, Lampedusa, Oristano, Rome
A.M. Tafuro et al. / Atmospheric Research 81 (2006) 67–93 69
and Etna have been used to spatially and temporally investigate the aerosol optical properties
during the 15–18 and 22–25 July dust events. For both the Etna and the Lecce AERONET
sites, lidar measurements of aerosols were also available in the period addressed in this
study. Lidars are important remote sensing tools that, besides providing a clear view of the
temporal evolution of dust outbreaks, allow characterizing the vertical distribution of dust
particles by the vertical profiles of the backscatter and extinction coefficient, the lidar ratio,
and the depolarization ratio, thus adding information complementary to that provided by
sunphotometers. Satellite images have also been used to infer the geographical extent of
dust-plumes.
A short overview of the AERONET sun photometers and monitoring sites is given in Section
2. An overview of the dust events as observed in satellite images and lidar profiles is given in
Section 3. Results and discussion are presented in Sections 4 and 5, respectively.
2. Instruments and experimental sites
The Cimel sun/sky radiometers used within AERONET are automatic, robotically operated
instruments. Two detectors are used for the measurements of direct sun and sky radiance.
Spectral observations of sun radiance are generally made at seven spectral channels: 340,
380, 440, 500, 675, 870, and 1020 nm, while measurements of sky radiance are made at
440, 675, 870, and 1020 nm. Holben et al. (1998, 2001) give detailed descriptions of the
instrument and data acquisition procedures. A flexible inversion algorithm, developed by
Dubovik and King (2000) is used to retrieve columnar aerosol volume size distributions, real
and imaginary refractive indices (n and k), and SSAs from direct-sun and diffuse-sky
radiance measurements. A brief discussion on the accuracy of individual retrievals is reported
in Dubovik et al. (2002a). Cloud-screened retrievals (level 1.5) are used in this study
(Smirnov et al., 2000).
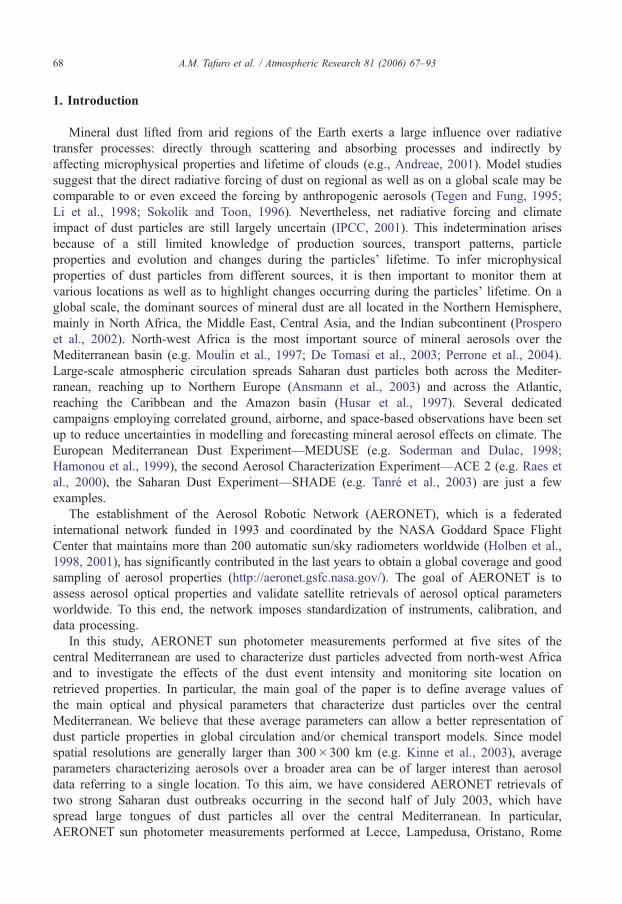
Fig. 1 shows the geographical location of the Mediterranean AERONET sites selected for
this study. Lampedusa is a small Italian island located in the middle of the Sicilian Channel,
about 130 km east of the coasts of Tunisia. The sun photometer is located in the area of the
Military Base LORAM (35.528N, 12.638E, 45 m asl). Thanks to its proximity to the African
continent, the instrument is particularly appropriate to detect the frequent dust outbreaks
from the Sahara desert. A minor impact of anthropogenic pollution is expected at this site.
The Oristano site is situated on the west coast of Sardinia, at about 400 km north from the
African coasts. In Oristano, the sunphotometer is located on the roof of the International
Marine Center (IMC, 39.918N, 8.58E, 10 m asl). The AERONET site on the Etna Volcano
is located in Nicolosi (37.618N, 15.028E, 736 m asl), a small village on the Southern flank
of Mt. Etna, and 400 km far from the African coasts. The sunphotometer is situated on the
roof of the building of the Italian Institute of Geophysics and Volcanology (INGV). The
Cimel radiometer in Rome–Tor Vergata is placed on the roof of the ISAC-CNR building
(41.848N, 12.658E, 130 m asl). The Rome–Tor Vergata site, in the southern suburbs of
Rome, is at about 15 km from the city centre, 30 km from the Tyrrhenian Sea, and 600 km
from the northern African coasts. Both anthropogenic particles (of local origin or
transported) and desert dust from the Sahara dominate the aerosol load over this site
(e.g. Gobbi et al., 2004a). The sun photometer in Lecce is located on the roof of the
Physics Department of Lecce University (40.338N, 18.108E, 27 m asl). The site is in a rural
area, 6 km away from the city centre, 16 km from the Adriatic Sea, 23 km from the Ionian
Sea, and about 800 km from the North African coasts. Thanks to its location, far from
45
40
35
30
25
Lat
itu
de,
deg
rees
302520151050
Longitude, degrees
Rome
LecceOristano
Etna
Lampedusa
Fig. 1. Selected sunphotometer sites.
A.M. Tafuro et al. / Atmospheric Research 81 (2006) 67–9370
anthropogenic pollution, the Lecce instrument is appropriate to detect the frequent dust
outbreaks from the Sahara desert.
As mentioned, lidar measurements of aerosols are also available at the locations of Etna and
Lecce. An elastic-Raman lidar employing a XeF excimer laser is routinely used at the Physics
Department of Lecce’s University for the aerosol vertical monitoring. The XeF laser emits light
pulses of 30 ns duration at 351 nm, with a maximum energy and repetition rate of 250 mJ and 100
Hz, respectively. The XeF-based Raman lidar has been designed to derive vertical profiles of
aerosol extinction and backscatter coefficients (aaer and baer) and hence of lidar ratios (aaer /baer)
during night time operations, and to get backscatter coefficient profiles during day time
measurements. Each profile is obtained by averaging signals from about 2�105 laser shots.
Details on experimental apparatus and data analysis are reported in De Tomasi and Perrone
(2003). The vehicle-mounted lidar system (VELIS, Gobbi et al., 2000) was operating at Mount
Etna in July 2003. The VELIS system, specifically designed to be easily employed in field
campaigns, was deployed at Milo (37.738N, 15.128E, 815 m asl), approximately 11 km east of
the Mt. Etna summit and 15 km northeast of the AERONET sunphotometer. VELIS is an
elastic, polarization-sensitive lidar that employs a Nd:YAG laser generating 15 Hz, 100 mJ
pulses at 532 nm. VELIS provides tropospheric aerosol depolarization and backscatter
coefficient profiles (at 532 nm) in both daylight and night time conditions. Each profile is
obtained by averaging signals from about 6000 laser shots. As mentioned, the system is
polarization-sensitive, i.e., it emits linearly polarized light and collects the signal backscattered
on both the parallel and cross-polarized planes. Since only non-spherical particles can produce
a change in the polarization plane of the backscattered light, this set-up is particularly efficient
in revealing presence of non-spherical particles as desert dust, volcanic ash, cirrus clouds (e.g.,
Gobbi et al., 2004a).
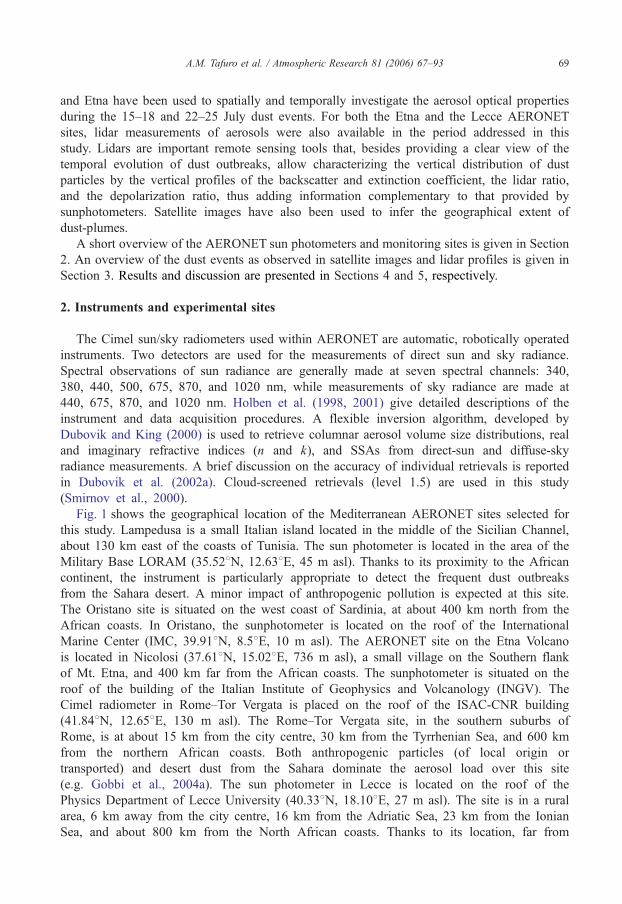
Fig. 2. SeaWiFS true-colour images of (a) 15 (11 :57 UTC), (b) 16 (12 :39 UTC), (c) 17 (11 :40), (d) 18 (12 :21 UTC), (e)
19 (11 :23 UTC), (f) 20 (12 :04 UTC), (g) 21 (11 :07 UTC), (h) 22 (11 :48 UTC), (i) 23 (12 :29 UTC), (l) 24 (11 :31
UTC), (m) 25 (12 :11 UTC), and (n) 26 (11 :14 UTC), July 2003.
A.M. Tafuro et al. / Atmospheric Research 81 (2006) 67–93 71
A.M. Tafuro et al. / Atmospheric Research 81 (2006) 67–9372
3. Dust events overview by satellite images and lidar profiles
In order to provide an overview of the July 2003 Saharan dust outbreaks to the Mediterranean
region, some indication of both the horizontal (i.e., geographical) and the vertical displacement
of the dust plumes based on satellite images and lidar data is given first. In Section 4, we shall
use the picture emerging from such satellite and lidar data as a support to the interpretation of the
photometric observations.
Fig. 2 shows the true-colour images obtained between July 15 and July 26, 2003, from the
Sea Wide Field-of-view Sensor (SeaWiFS, http://seawifs.gsfc.nasa.gov) on board the NASA
SeaStar spacecraft. One picture per day is shown for the whole Mediterranean region, as a
composite of the data collected between 11 and 13 UTC along the spacecraft polar orbit (data
1
2
3
4
5
6
7
8
9
10
Alt
itu
de
(km
)
1.5
2.5
3.5
5.5
7.0
15 16 17 18 19 20 21 22 23 24 25 26 27 28
15 16 17 18 19 20 21 22 23 24 25 26 27 28B
acks
catt
er R
atio
, R
15 16 17 18 19 20 21 22 23 24 25 26 27 28
1
2
3
4
5
6
7
8
9
10
Alt
itu
de
(km
)
5%
15%
25%
35%
50%
Dep
ola
riza
tio
n R
atio
, D (
%)
Day of July, 2003 (UTC)
(a)
(b)
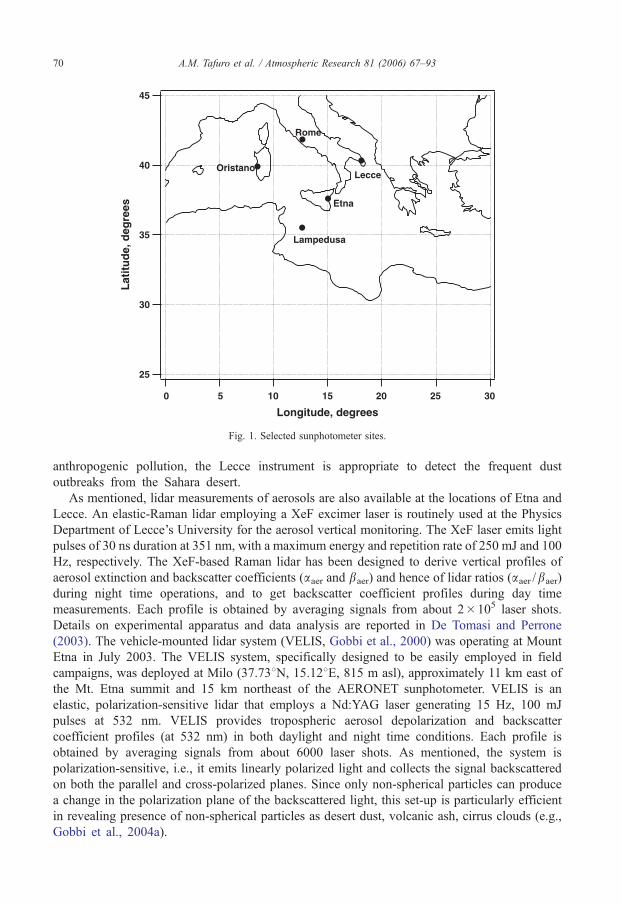
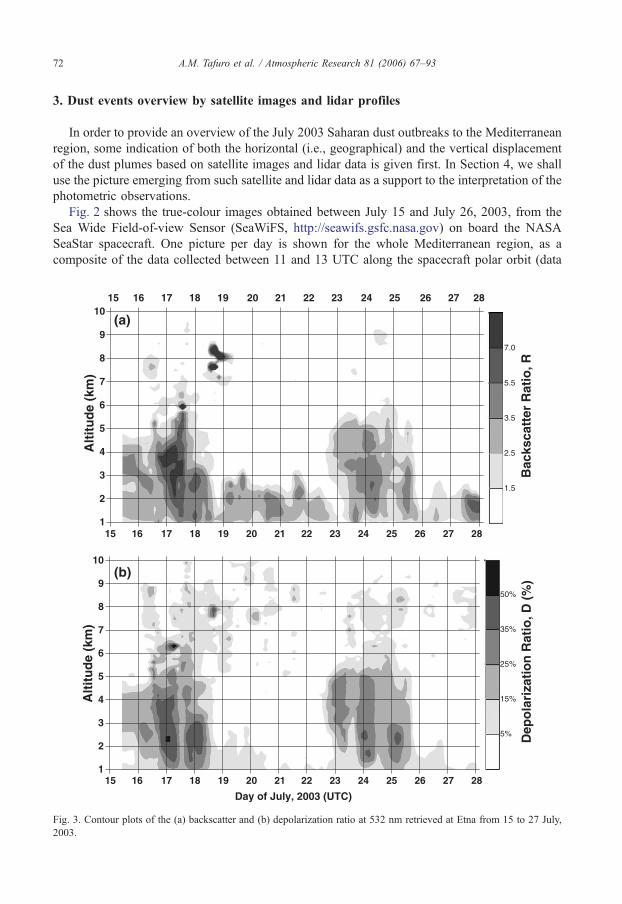
Fig. 3. Contour plots of the (a) backscatter and (b) depolarization ratio at 532 nm retrieved at Etna from 15 to 27 July,
2003.
A.M. Tafuro et al. / Atmospheric Research 81 (2006) 67–93 73
acquisition and processing by the Satellite Observation Group, GOS, of CNR ISAC—Rome,
http://www.gos.ifa.rm.cnr.it). The overview of the vertically-resolved evolution of the aerosol
layers (and dust plumes) over the Etna site is given in Fig. 3, in which both backscatter (Fig.
3a) and depolarization ratios (Fig. 3b) are reported. The backscatter ratio, defined as
R =(baer+bmol) /bmol, where baer (bmol) represents the atmospheric aerosol (molecules)
backscatter coefficients, provides the information on the aerosol load: in a pure molecular
atmosphere R =1, while R increases for increasing aerosol contribution. Conversely, the
depolarization ratio (D =cross-polarized /parallel-polarized signals) provides the information on
the aerosol morphology: spherical particles produce a low depolarization whilst non-spherical
particles are associated to D values larger than 10–15%. Note in Fig. 3 the typical fingerprints
of dust conditions revealed by the high D values (up to 50%) associated with aerosol layers
reaching up to the free troposphere. We believe that the rather high depolarization ratios
retrieved during the first dust event are mainly due either to the fact that Mt. Etna is rather
close to the North Africa coast and to the high intensity of the 15–18 July dust event (e.g.
Gobbi et al., 2003; Gobbi et al., 2004b). On average, lower depolarization ratios have been
retrieved during the 23–25 dust event that is also characterized by lower backscatter ratios
(Fig. 3a). It is worth mentioning that the depolarization ratios of Sahara dust retrieved by
VELIS in several locations of the Mediterranean region and in the Canary Islands, range from
10% to 50% and higher depolarization ratios have on average been retrieved at sites closer to
the dust source. Aged dust layers, as a consequence of internal/external mixings with
hygroscopic aerosols, are expected to lead to lower depolarization ratios (e.g. Gobbi et al.,
2003). It is also worth mentioning that laboratory measurements performed with different
0.0080.0040.000 0.0080.0040.000
6
5
4
3
2
1
0
Alt
itu
de
(km
)
40200
16/07/2003 Lecce 14:40 - 15:40 UTC Etna 15:30 - 15:40 UTC
40200
16/07/2003 Lecce 18:00 - 19:00 UTC Etna 18:10 - 18:20 UTC
Backscatter Coefficient (km*sr)-1
Depolarization Ratio (%)
(a) (b)
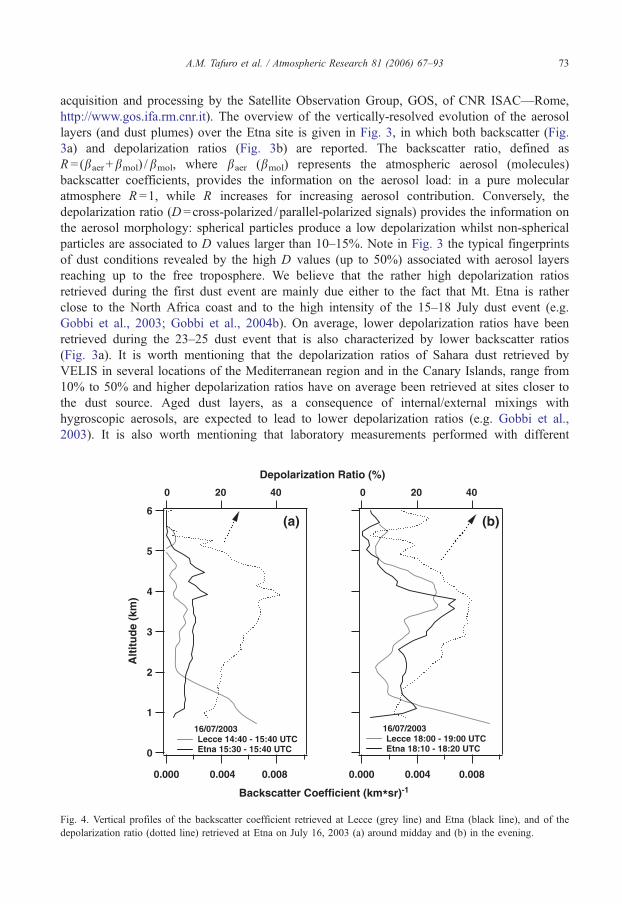
Fig. 4. Vertical profiles of the backscatter coefficient retrieved at Lecce (grey line) and Etna (black line), and of the
depolarization ratio (dotted line) retrieved at Etna on July 16, 2003 (a) around midday and (b) in the evening.
A.M. Tafuro et al. / Atmospheric Research 81 (2006) 67–9374
types of pure mineral aerosol samples report depolarization ratios in the range 46–62% for
Sahara dust and depolarization ratios in the range 24–41% for feldspar, loess, red clay and
quartz particles (Volten et al., 2001).
The first satellite image in Fig. 2 referring to July 15 at 11:57 UTC (Fig. 2a) shows a
dust plume in the western Mediterranean reaching both Sardinia and Sicily. This plume is
therefore likely to affect both the Oristano and Lampedusa sites. Over the Etna site, lidar
measurements confirm the presence of the dust layer between 2.7 and 4.3 km (Fig. 3). On
the following day (July 16), a well-defined and intense dust plume is visible in Fig. 2b over
most of the Mediterranean basin and completely covering the Italian peninsula. A
comparison of the aerosol backscatter-coefficient profiles collected at Lecce (solid grey
line) and Etna (solid black line) on July 16 at different day hours is shown in Fig. 4a and b.
Error bars have not been added on backscatter coefficient profiles to make the figure clearer.
Relative uncertainties are lower than 10% at Lecce for baerz1.5�10�3 km�1 sr�1. In the
Etna backscatter profiles, relative uncertainties below 5 km are less than 10% (7% at night)
and up to 30% (12% at night) in the altitude range 5–8 km. Conversely, relative
uncertainties on D profiles are lower than 10% (5% at night) and up to 50% (15% at night)
in the range 5–8 km.
It is worth observing that the backscatter coefficient profiles are rather similar at the two sites.
In particular, a well-defined 3 km-thick dust layer also revealed at Etna by the high
depolarization ratios D N20% (Fig. 4, dotted line), is visible between 2 and 5 km altitude,
with increasing intensity from 14:40–15:40 UTC (Fig. 4a) to 18–19 UTC (Fig. 4b). Given that
the two-lidar sites are 400 km apart, we can therefore suggest that a rather uniform dust layer
0.60.40.20.0
Ext. Coeff. (km)-1
6
5
4
3
2
1
0
Alt
itu
de
(km
)
100806040200
Lidar Ratio (sr)
Lecce 16/07/200318:00 - 19:00 UTC
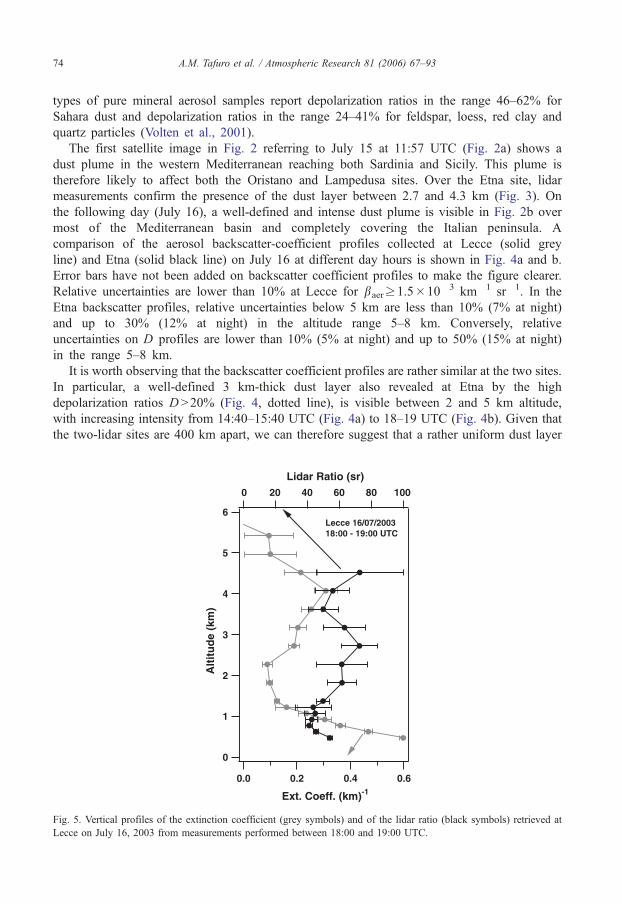
Fig. 5. Vertical profiles of the extinction coefficient (grey symbols) and of the lidar ratio (black symbols) retrieved at
Lecce on July 16, 2003 from measurements performed between 18:00 and 19:00 UTC.
A.M. Tafuro et al. / Atmospheric Research 81 (2006) 67–93 75
was present in the central Mediterranean atmosphere on the afternoon of July 16. The full
evolution of the dust layer over the Etna site on July 16 can be found in Fig. 3. This also reveals
some mixing of dust with the local, boundary-layer aerosols occurring below 2 km (high D
values with respect to no-dust days).
Fig. 5 shows the vertical profiles at 351 nm of the extinction coefficient (grey dots) and of
the extinction to backscatter coefficient ratio (lidar ratio, black dots) obtained from nighttime
(18:00–19:00 UTC) lidar measurements at Lecce. Lidar ratio values allow inferring the
vertical distribution of predominant aerosol types (Ackermann, 1998). Fig. 5 shows that lidar
ratios span the range 50–70 sr between 2 and 5 km. In accordance with literature data, these
values are representative of non-spherical dust particles (e.g. Barnaba et al., 2004; Perrone et
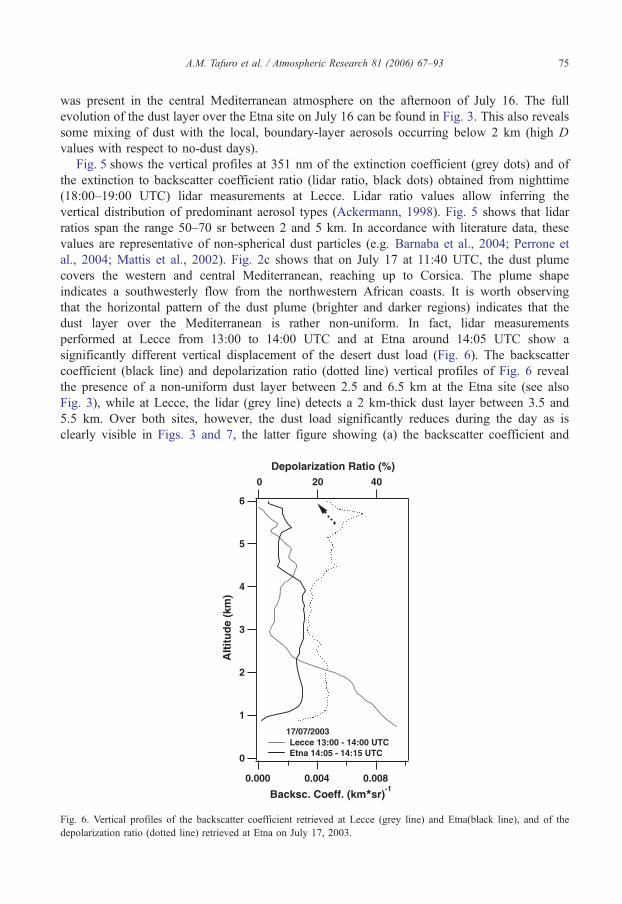
al., 2004; Mattis et al., 2002). Fig. 2c shows that on July 17 at 11:40 UTC, the dust plume
covers the western and central Mediterranean, reaching up to Corsica. The plume shape
indicates a southwesterly flow from the northwestern African coasts. It is worth observing
that the horizontal pattern of the dust plume (brighter and darker regions) indicates that the
dust layer over the Mediterranean is rather non-uniform. In fact, lidar measurements
performed at Lecce from 13:00 to 14:00 UTC and at Etna around 14:05 UTC show a
significantly different vertical displacement of the desert dust load (Fig. 6). The backscatter
coefficient (black line) and depolarization ratio (dotted line) vertical profiles of Fig. 6 reveal
the presence of a non-uniform dust layer between 2.5 and 6.5 km at the Etna site (see also
Fig. 3), while at Lecce, the lidar (grey line) detects a 2 km-thick dust layer between 3.5 and
5.5 km. Over both sites, however, the dust load significantly reduces during the day as is
clearly visible in Figs. 3 and 7, the latter figure showing (a) the backscatter coefficient and
0.0080.0040.000
Backsc. Coeff. (km*sr)-1
6
5
4
3
2
1
0
Alt
itu
de
(km
)
40200
Depolarization Ratio (%)
17/07/2003 Lecce 13:00 - 14:00 UTC Etna 14:05 - 14:15 UTC
Fig. 6. Vertical profiles of the backscatter coefficient retrieved at Lecce (grey line) and Etna(black line), and of the
depolarization ratio (dotted line) retrieved at Etna on July 17, 2003.
0.60.40.20.0
Ext. Coeff. (km)-1
100806040200
Lidar Ratio (sr)
0.0080.0040.000
Backsc. Coeff. (km*sr)-1
6
5
4
3
2
1
0
Alt
itu
de
(km
)
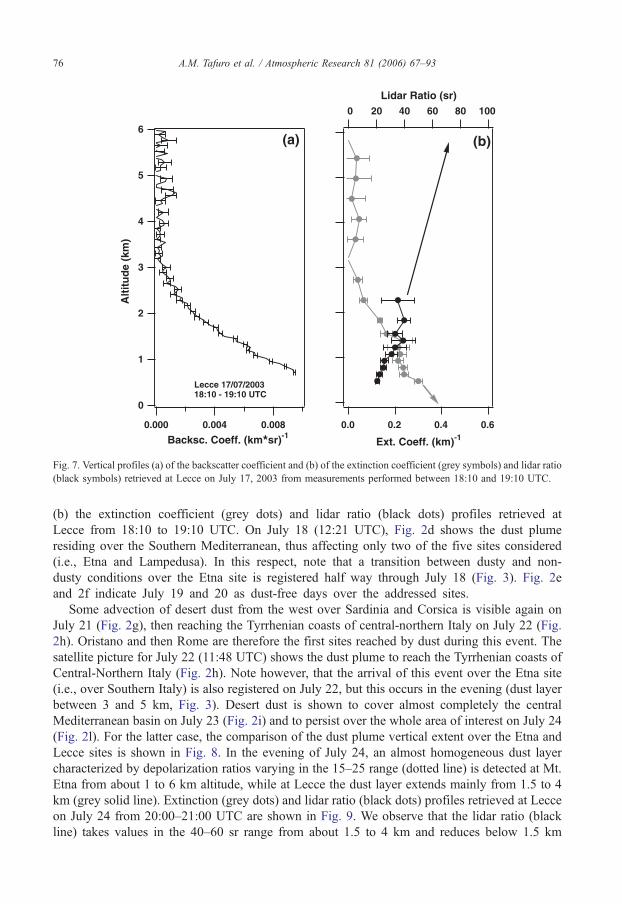
Lecce 17/07/2003 18:10 - 19:10 UTC
(a) (b)
Fig. 7. Vertical profiles (a) of the backscatter coefficient and (b) of the extinction coefficient (grey symbols) and lidar ratio
(black symbols) retrieved at Lecce on July 17, 2003 from measurements performed between 18:10 and 19:10 UTC.
A.M. Tafuro et al. / Atmospheric Research 81 (2006) 67–9376
(b) the extinction coefficient (grey dots) and lidar ratio (black dots) profiles retrieved at
Lecce from 18:10 to 19:10 UTC. On July 18 (12:21 UTC), Fig. 2d shows the dust plume
residing over the Southern Mediterranean, thus affecting only two of the five sites considered
(i.e., Etna and Lampedusa). In this respect, note that a transition between dusty and non-
dusty conditions over the Etna site is registered half way through July 18 (Fig. 3). Fig. 2e
and 2f indicate July 19 and 20 as dust-free days over the addressed sites.
Some advection of desert dust from the west over Sardinia and Corsica is visible again on
July 21 (Fig. 2g), then reaching the Tyrrhenian coasts of central-northern Italy on July 22 (Fig.
2h). Oristano and then Rome are therefore the first sites reached by dust during this event. The
satellite picture for July 22 (11:48 UTC) shows the dust plume to reach the Tyrrhenian coasts of
Central-Northern Italy (Fig. 2h). Note however, that the arrival of this event over the Etna site
(i.e., over Southern Italy) is also registered on July 22, but this occurs in the evening (dust layer
between 3 and 5 km, Fig. 3). Desert dust is shown to cover almost completely the central
Mediterranean basin on July 23 (Fig. 2i) and to persist over the whole area of interest on July 24
(Fig. 2l). For the latter case, the comparison of the dust plume vertical extent over the Etna and
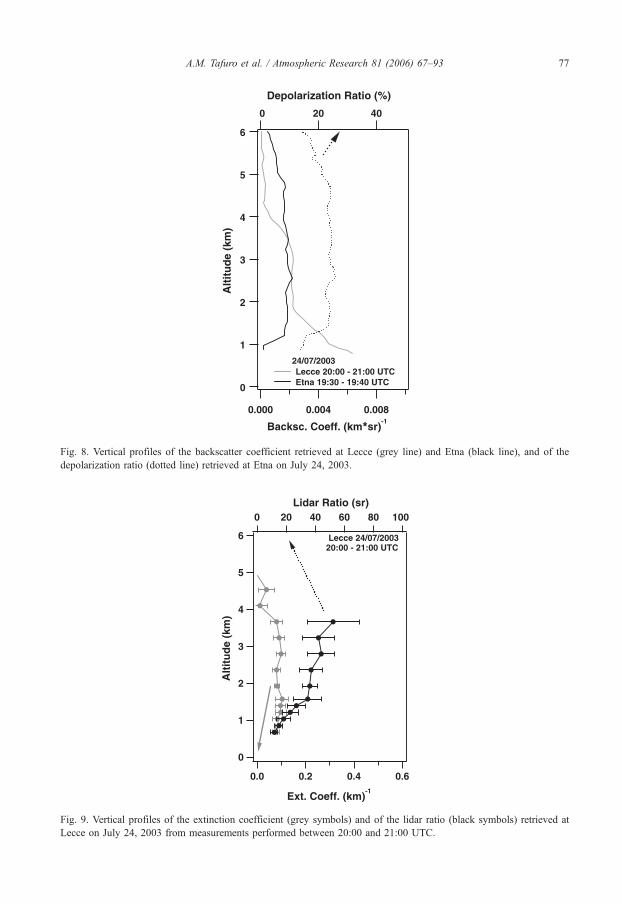
Lecce sites is shown in Fig. 8. In the evening of July 24, an almost homogeneous dust layer
characterized by depolarization ratios varying in the 15–25 range (dotted line) is detected at Mt.
Etna from about 1 to 6 km altitude, while at Lecce the dust layer extends mainly from 1.5 to 4
km (grey solid line). Extinction (grey dots) and lidar ratio (black dots) profiles retrieved at Lecce
on July 24 from 20:00–21:00 UTC are shown in Fig. 9. We observe that the lidar ratio (black
line) takes values in the 40–60 sr range from about 1.5 to 4 km and reduces below 1.5 km
0.0080.0040.000
Backsc. Coeff. (km*sr)-1
6
5
4
3
2
1
0
Alt
itu
de
(km
)
40200
Depolarization Ratio (%)
24/07/2003 Lecce 20:00 - 21:00 UTC Etna 19:30 - 19:40 UTC
Fig. 8. Vertical profiles of the backscatter coefficient retrieved at Lecce (grey line) and Etna (black line), and of the
depolarization ratio (dotted line) retrieved at Etna on July 24, 2003.
0.60.40.20.0
Ext. Coeff. (km)-1
6
5
4
3
2
1
0
Alt
itu
de
(km
)
100806040200Lidar Ratio (sr)
Lecce 24/07/200320:00 - 21:00 UTC
Fig. 9. Vertical profiles of the extinction coefficient (grey symbols) and of the lidar ratio (black symbols) retrieved a
Lecce on July 24, 2003 from measurements performed between 20:00 and 21:00 UTC.
A.M. Tafuro et al. / Atmospheric Research 81 (2006) 67–93 77
t
A.M. Tafuro et al. / Atmospheric Research 81 (2006) 67–9378
revealing some mixing of dust with local, boundary-layer aerosols. In fact, the lidar ratio
decreases to about 15 sr below 1 km: these values are typical of marine aerosol (Ackermann,
1998; Barnaba et al., 2004). At the Etna location, lidar depolarization shows this dust event to
terminate on the afternoon of July 25 (Fig. 3). This timing is in good agreement with the satellite
records of Fig. 2m and n.
4. AERONET data and discussion
AERONET sunphotometer retrievals at the five selected monitoring sites (level 1.5) from July
13 to July 25, 2003 are considered in this study to characterize typical optical and physical
parameters of the dust particles advected from north-west Africa over the Mediterranean. Results
are presented in terms of the temporal evolution of the aerosol optical depth (AOD), Angstrom
exponent (A), imaginary (k) and real (n) refractive index, and single scattering albedo (SSA).
Volume size distributions and coarse-to-fine volume ratios Cc /Cf are also discussed.
4.1. Aerosol optical depth and Angstrom exponent results
The aerosol optical thickness represents one of the most commonly used parameters in
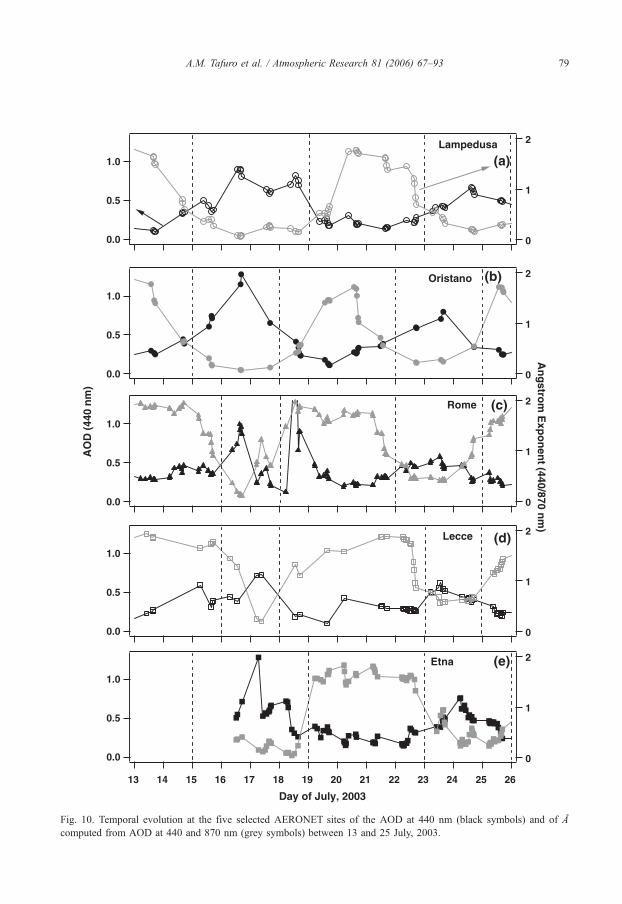
aerosol studies. Fig. 10 (black symbols) shows the AOD (at 440 nm) temporal evolution as
recorded by the 5 selected AERONET photometers. The AOD accuracy is DAOD=F0.01
(Dubovik et al., 2002a). Vertical dotted lines in Fig. 10 indicate the (approximate) duration of the
investigated dust events. Besides SeaWiFS images, analytical backtrajectories have also been
used to classify dusty and dust-free days at the different monitoring sites. 5-day analytical
backtrajectories are provided by NASA GSFC (http://www.croc.gsfc.nasa.gov/aeronet/
index.html). The trajectories are based on a kinetic trajectory analysis using NASA GMAO
assimilated gridded data. Data are provided for two arrival times (00:00 UTC and 12:00 UTC)
and for four distinct arrival height levels (950, 850, 700, and 500 hPa). Analytical
backtrajectories show that north-west Africa was the source region of the dust events addressed
in this study.
As can be seen from the overview of Section 3, Lampedusa is affected by desert dust from 15
to 18 and from 23 to 25 July (Fig. 10a). Dust overpasses Oristano from 15 to 17 July and from
22 to 24 July (Fig. 10b). Rome is affected by desert dust on 16 and 17 July and from 22 to 24
July (Fig. 10c), as in Lecce except for July 22 (Fig. 10d). Desert dust is observed at the Etna
station from 15 to 18 July and from 23 to 25 July (Fig. 10e).
Fig. 10 shows that, with respect to dust-free days, AODs tend to be larger during dust events
at all sites. Oristano’s AODs span the 0.6–1.3 and 0.3–0.6 range during the first and second July
dust event, respectively, while, AODs lower than 0.4 are detected during dust-free days. We
believe that the quite high AOD monitored at Rome on July 18 (dust-free day) is due to local
anthropogenic emissions. We also observe from Fig. 10 that the 15–18 July dust-event is more
intense than that of the 22–25 July. In fact, AODs larger than 0.9 are detected in Lampedusa,
Oristano, Rome, and Etna during the first dust event, whereas during the second dust event
AODs up to 0.9 are only detected at Etna in the early morning of July 24. Lidar measurements
support this last conclusion. Dust layers leading to backscatter coefficients up to about
5.5�10�3 (Fig. 4b, grey line) and 3�10�3 km�1 sr�1 (Fig. 8, grey line) have been retrieved at
Lecce during the first and second dust event, respectively. The lower intensity of the second dust
event is clearly revealed at Etna by the contour plots of the backscatter and depolarization ratio
of Fig. 3.
2
1
0
Oristano
1.0
0.5
0.0
1.0
0.5
0.0
1.0
0.5
0.0
1.0
0.5
0.0
1.0
0.5
0.0
2
1
0
Lampedusa
2
1
0
Lecce
2
1
0
Rome
13 14 15 16 17 18 19 20 21 22 23 24 25 26
2
1
0
Etna
AO
D (
440
nm
) A
ng
strom
Exp
on
ent (440/870 n
m)
Day of July, 2003
(a)
(c)
(b)
(d)
(e)
Fig. 10. Temporal evolution at the five selected AERONET sites of the AOD at 440 nm (black symbols) and of A
computed from AOD at 440 and 870 nm (grey symbols) between 13 and 25 July, 2003.
A.M. Tafuro et al. / Atmospheric Research 81 (2006) 67–93 79
A.M. Tafuro et al. / Atmospheric Research 81 (2006) 67–9380
The Angstrom exponent A is defined by the spectral dependence of the aerosol optical depth
AOD(k)~k�A. It mainly depends on the aerosol size distribution: typical values range from
A N2.0 for fresh smoke particles, which are dominated by accumulation mode aerosols, to nearly
zero for large dust particles (Dubovik et al., 2000). The temporal evolution of the Angstrom
exponent (computed from AOD values at 440 and 870 nm) is also reported in Fig. 10 (grey
symbols). We clearly observe that AODs and Angstrom exponents are anti-correlated at all sites.
In particular, A appears as a good marker to trace the temporal evolution of dust outbreaks due to
its evident and quite rapid variation. At Lampedusa, A that is ~1.5 on July 13, and spans the 0.3–
0.4 range on July 15, reduces to 0.07 on July 16 when the AOD is 0.9. Then, we observe from
Fig. 10 that A increases fast as the dust event ends (A =1.8 on July 20), and again reduces to 0.2
during the second dust event characterized by AODs in the 0.4–0.7 range. Similar results are
found for the other sites with dust-free days characterized by A N1 (typical continental aerosols
with modal radii 60.1 Am show A61–1.5) and A b1 during dusty days. As mentioned in
Section 3, a large tongue of dust from north-western Africa is first advected to the west coasts of
Sardinia and to the south of Sicily on July 15 (Fig. 2a) while, on July 17 dust particles spread all
over the Italian peninsula (Fig. 2c). Accordingly, Fig. 10a and b reveal that Oristano and
Lampedusa are the first sites affected by this dust event. A different path characterizes the
second dust event (see Section 3 and Fig. 2), so that the presence of dust is first detected over
Oristano and Rome on July 22. The whole central Mediterranean is loaded with dust on July 23
and A values lower than 0.5 are retrieved at the five sites (Fig. 10). In agreement with the
satellite view (Fig. 2) the Rome site shows a transition from dusty to non-dusty conditions on
July 24.
The discussion above has clearly highlighted the A usefulness to trace the temporal evolution
of dust outbreaks. Nonetheless, it is worth observing from Fig. 10 that A values are quite
dependent on the dust load intensity: on average lower A values have been retrieved at all sites
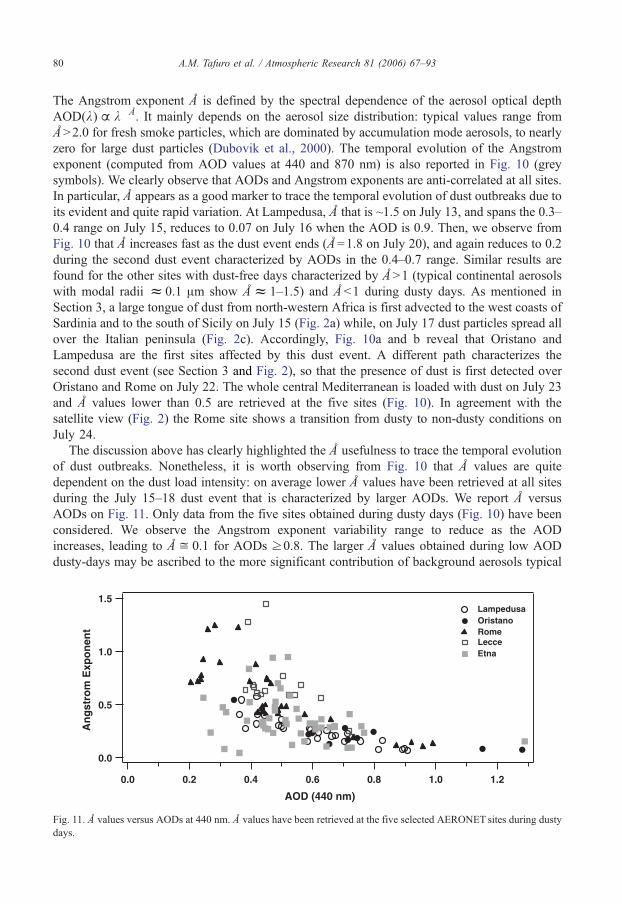
during the July 15–18 dust event that is characterized by larger AODs. We report A versus
AODs on Fig. 11. Only data from the five sites obtained during dusty days (Fig. 10) have been
considered. We observe the Angstrom exponent variability range to reduce as the AOD
increases, leading to Ai0.1 for AODs z0.8. The larger A values obtained during low AOD
dusty-days may be ascribed to the more significant contribution of background aerosols typical
1.5
1.0
0.5
0.0
An
gst
rom
Exp
on
ent
1.21.00.80.60.40.20.0
AOD (440 nm)
Lampedusa Oristano Rome Lecce Etna
Fig. 11. A values versus AODs at 440 nm. A values have been retrieved at the five selected AERONET sites during dusty
days.
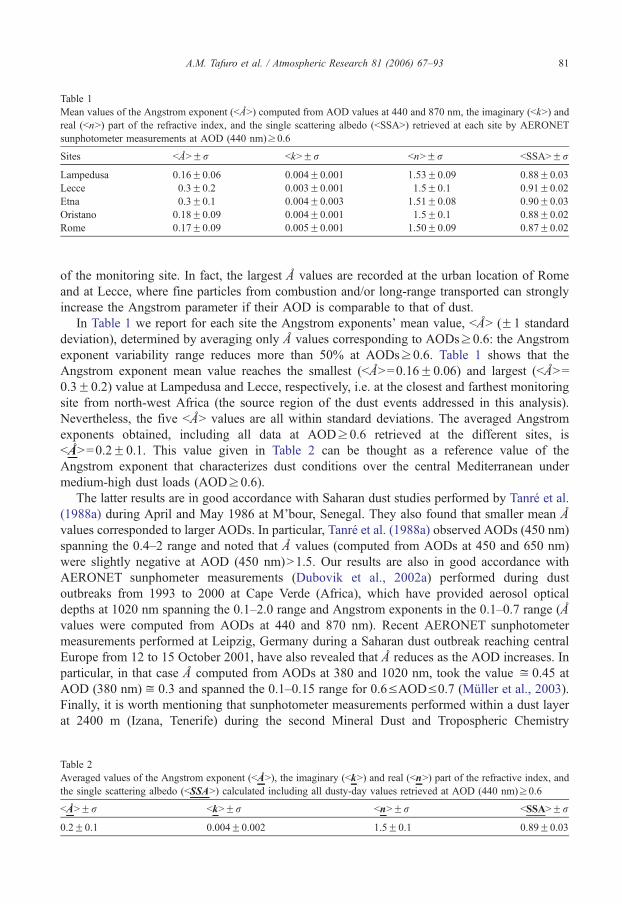
Table 1
Mean values of the Angstrom exponent (bAN) computed from AOD values at 440 and 870 nm, the imaginary (bkN) and
real (bnN) part of the refractive index, and the single scattering albedo (bSSAN) retrieved at each site by AERONET
sunphotometer measurements at AOD (440 nm)z0.6
Sites bANFr bkNFr bnNFr bSSANFr
Lampedusa 0.16F0.06 0.004F0.001 1.53F0.09 0.88F0.03
Lecce 0.3F0.2 0.003F0.001 1.5F0.1 0.91F0.02
Etna 0.3F0.1 0.004F0.003 1.51F0.08 0.90F0.03
Oristano 0.18F0.09 0.004F0.001 1.5F0.1 0.88F0.02
Rome 0.17F0.09 0.005F0.001 1.50F0.09 0.87F0.02
A.M. Tafuro et al. / Atmospheric Research 81 (2006) 67–93 81
of the monitoring site. In fact, the largest A values are recorded at the urban location of Rome
and at Lecce, where fine particles from combustion and/or long-range transported can strongly
increase the Angstrom parameter if their AOD is comparable to that of dust.
In Table 1 we report for each site the Angstrom exponents’ mean value, bAN (F1 standard
deviation), determined by averaging only A values corresponding to AODsz0.6: the Angstrom
exponent variability range reduces more than 50% at AODsz0.6. Table 1 shows that the
Angstrom exponent mean value reaches the smallest (bAN=0.16F0.06) and largest (bAN=
0.3F0.2) value at Lampedusa and Lecce, respectively, i.e. at the closest and farthest monitoring
site from north-west Africa (the source region of the dust events addressed in this analysis).
Nevertheless, the five bAN values are all within standard deviations. The averaged Angstrom
exponents obtained, including all data at AODz0.6 retrieved at the different sites, is
bAN=0.2F0.1. This value given in Table 2 can be thought as a reference value of the
Angstrom exponent that characterizes dust conditions over the central Mediterranean under
medium-high dust loads (AODz0.6).
The latter results are in good accordance with Saharan dust studies performed by Tanre et al.
(1988a) during April and May 1986 at M’bour, Senegal. They also found that smaller mean A
values corresponded to larger AODs. In particular, Tanre et al. (1988a) observed AODs (450 nm)
spanning the 0.4–2 range and noted that A values (computed from AODs at 450 and 650 nm)
were slightly negative at AOD (450 nm)N1.5. Our results are also in good accordance with
AERONET sunphometer measurements (Dubovik et al., 2002a) performed during dust
outbreaks from 1993 to 2000 at Cape Verde (Africa), which have provided aerosol optical
depths at 1020 nm spanning the 0.1–2.0 range and Angstrom exponents in the 0.1–0.7 range (A
values were computed from AODs at 440 and 870 nm). Recent AERONET sunphotometer
measurements performed at Leipzig, Germany during a Saharan dust outbreak reaching central
Europe from 12 to 15 October 2001, have also revealed that A reduces as the AOD increases. In
particular, in that case A computed from AODs at 380 and 1020 nm, took the value i0.45 at
AOD (380 nm)i0.3 and spanned the 0.1–0.15 range for 0.6VAODV0.7 (Muller et al., 2003).
Finally, it is worth mentioning that sunphotometer measurements performed within a dust layer
at 2400 m (Izana, Tenerife) during the second Mineral Dust and Tropospheric Chemistry
Table 2
Averaged values of the Angstrom exponent (bAN), the imaginary (bkN) and real (bnN) part of the refractive index, and
the single scattering albedo (bSSAN) calculated including all dusty-day values retrieved at AOD (440 nm)z0.6
bANFr bkNFr bnNFr bSSANFr
0.2F0.1 0.004F0.002 1.5F0.1 0.89F0.03
A.M. Tafuro et al. / Atmospheric Research 81 (2006) 67–9382
(MINATROC) campaign (July 15–August 15, 2002) have provided Ai0.20 for AODs (500
nm) in the 0.3–0.9 range (A values computed from AODs at 500 and 1020 nm). Due to the
altitude of the site, no contamination by other types of aerosols in the atmospheric column was
expected in that case (Gobbi et al., 2004b).
4.2. Particle size distributions and volume concentrations
In accordance with the above reported discussion, the driving of the optical properties by
large particles is the principal feature of desert dust aerosols. Nonetheless, the non-sphericity of
dust particles also deserves some attention. Such non-sphericity is responsible for the high
depolarization ratios measured at Etna during dusty days (Fig. 3). Numerous studies have
indicated the need to account for particle non-sphericity in modelling the optical properties of
dustlike aerosols. In fact, there is sufficient experimental evidence (Volten et al., 2001; Gobbi et
al., 2002) that the non-sphericity of desert dust particles can lead to scattering properties
significantly different from those predicted by the standard Mie theory (Mishchenko et al.,
2000). A model that considers dustlike aerosol particles as polydisperse, randomly oriented
spheroids has been implemented in the AERONET retrieval by Dubovik et al. (2002b) to
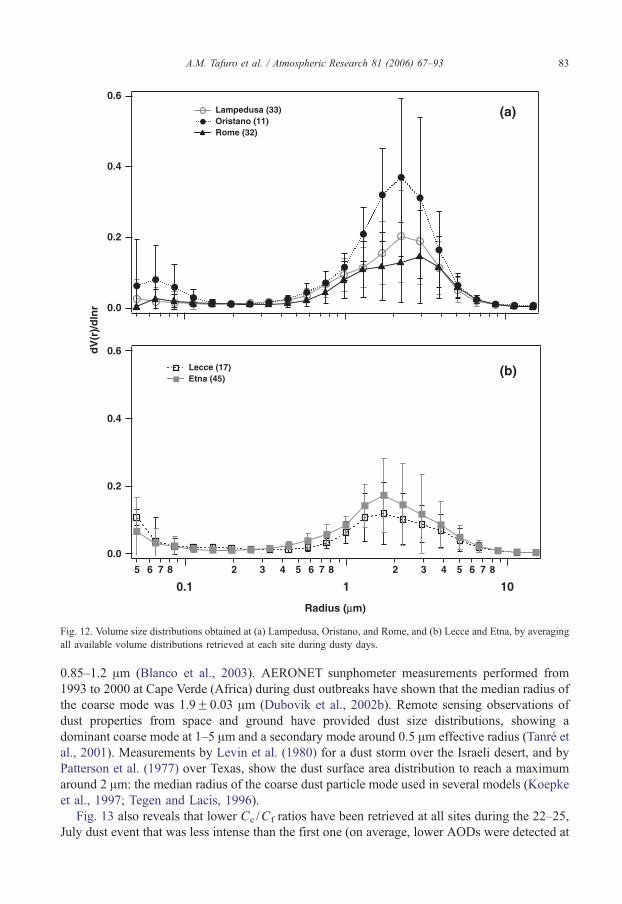
improve the quality of dust particle properties derived from photometric measurements. Fig. 12a
shows the mean volume size distributions obtained at Lampedusa (open grey dots), Oristano
(full black dots), and Rome (full triangles) by averaging, respectively, 33, 11, and 32 different
volume distribution profiles retrieved during dusty days. Vertical error bars represent F1
standard deviation from the average value and indicate the size distribution variability. Fig. 12b
shows the mean volume size distributions obtained at Lecce (open black boxes) and Etna (full
grey boxes) by averaging 17 and 45 different volume distribution profiles, respectively. Several
studies by Dubovik et al. (2002a,b) have shown that for AOD(440 nm)z0.05 and particle size
range 0.1b r b7 Am, the retrieval errors do not exceed 10% in the maxima of the size
distribution. The domination of coarse-mode particles (rN0.6 Am) in desert aerosols is clearly
pointed-out by Fig. 12: particle radius peak values span the 1.7–3 Am range. In particular, the
average coarse mode distribution peaking at i2.2 Am at Lampedusa (Fig. 12a), which is ~200
km away from the African coast, shifts toi1.7 Am at Lecce (Fig. 12b), which is ~800 km away
from the African coast. We believe that latter results are mainly due to sedimentation effects of
large size particles as dust clouds move away from source regions and less to retrieval errors. To
this end, it is worth noting that 64% of the 33 volume distributions that have been averaged to
get the Lampedusa’s profile of Fig. 12a, have the coarse mode distribution peaking at i2.2 Amand 21% have the coarse mode distribution peaking at i2.9 Am. On the contrary, 50% and 31%
of the 17 volume distributions that have been averaged to get the Lecce’s profile of Fig. 12b,
have the coarse mode distribution peaking at i1.7 Am and at i1.3 Am, respectively. The
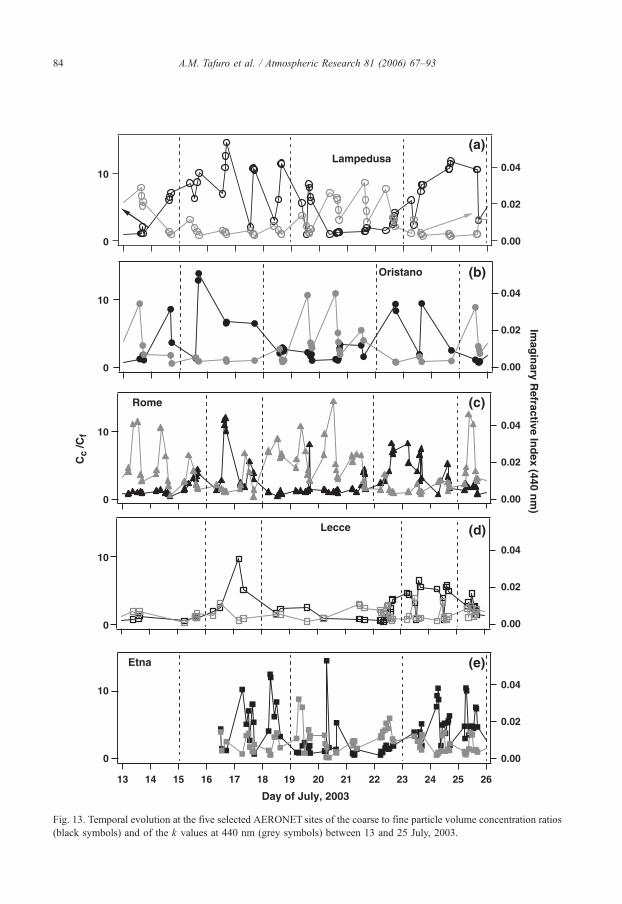
temporal evolution of the Cc /Cf ratio at Lampedusa, Oristano, Rome, Lecce, and Etna,
respectively (Fig. 13a–d, black symbols), also appears to decrease as dust clouds move away
from source regions. Cc and Cf denote the coarse and fine particle volume concentrations
respectively and accordingly to Dubovik et al. (2002a), all particles with radius smaller than 0.6
Am are considered as belonging to the fine mode and all particles with radius larger than 0.6 Amas belonging to the coarse mode. Cc /Cf ratios up to about 15 are retrieved at Lampedusa (Fig.
13a) and Oristano (Fig. 13b) during the mid-July dust event. Conversely, Cc /Cf V10 are
detected at Lecce (Fig. 13d). It is worth mentioning that scanning electron microscopy analyses
of several dust samples from rainfall residues collected at Lecce during dust storms occurring
from April to June 2002, have provided size distributions with median-radius values between
0.6
0.4
0.2
0.0
5 6 7 8
0.1
2 3 4 5 6 7 8
1
2 3 4 5 6 7 8
10
Radius (µm)
Lecce (17) Etna (45)
0.6
0.4
0.2
0.0
Lampedusa (33) Oristano (11) Rome (32)
(a)
(b)
dV
(r)/
dln
r
Fig. 12. Volume size distributions obtained at (a) Lampedusa, Oristano, and Rome, and (b) Lecce and Etna, by averaging
all available volume distributions retrieved at each site during dusty days.
A.M. Tafuro et al. / Atmospheric Research 81 (2006) 67–93 83
0.85–1.2 Am (Blanco et al., 2003). AERONET sunphometer measurements performed from
1993 to 2000 at Cape Verde (Africa) during dust outbreaks have shown that the median radius of
the coarse mode was 1.9F0.03 Am (Dubovik et al., 2002b). Remote sensing observations of
dust properties from space and ground have provided dust size distributions, showing a
dominant coarse mode at 1–5 Am and a secondary mode around 0.5 Am effective radius (Tanre et
al., 2001). Measurements by Levin et al. (1980) for a dust storm over the Israeli desert, and by
Patterson et al. (1977) over Texas, show the dust surface area distribution to reach a maximum
around 2 Am: the median radius of the coarse dust particle mode used in several models (Koepke
et al., 1997; Tegen and Lacis, 1996).
Fig. 13 also reveals that lower Cc /Cf ratios have been retrieved at all sites during the 22–25,
July dust event that was less intense than the first one (on average, lower AODs were detected at
10
0
13 14 15 16 17 18 19 20 21 22 23 24 25 26
Day of July, 2003
Etna
10
0
Lecce
10
0
Oristano
10
0
0.04
0.02
0.00
0.04
0.02
0.00
0.04
0.02
0.00
0.04
0.02
0.00
0.04
0.02
0.00
Lampedusa
Cc
/Cf
(a)
(d)
(e)
(c)
(b)
10
0
Rome
Imag
inary R
efractive Ind
ex (440 nm
)
Fig. 13. Temporal evolution at the five selected AERONET sites of the coarse to fine particle volume concentration ratios
(black symbols) and of the k values at 440 nm (grey symbols) between 13 and 25 July, 2003.
A.M. Tafuro et al. / Atmospheric Research 81 (2006) 67–9384
A.M. Tafuro et al. / Atmospheric Research 81 (2006) 67–93 85
all sites). The decreasing relative contribution of the coarse mode to the total aerosol mass for
decreasing dust loads may be responsible for the latter results. The rather low Cc /Cf values that
at all sites characterize dust-free days support this last conclusion. It is worth mentioning that
Cc /Cf ~50 have been observed at Cape Verde, Africa by Dubovik et al. (2002a) at high dust
loads (AODi2 at 1020 nm): besides the differences in dust load, sedimentation effects that
reduce the relative contribution of large particles may also be responsible of the difference
between the Cc /Cf ratios of Cape Verde and those observed over the central Mediterranean.
4.3. Imaginary and real parts of the refractive index
Besides scattering that depends on particle shape, size, and composition, the absorption of
solar radiation by mineral dust also affects the sign of the radiative forcing generated by this
aerosol. Fig. 13 (grey symbols) shows the temporal plots of the refractive index imaginary part k
retrieved at 440 nm at the 5 selected AERONET sites. Analyses by Dubovik et al. (2000 and
2002b) have shown that k values are retrieved with errors on the order of 30–50% for AOD (440
nm)z0.5. While, for AOD (440 nm)V0.2 the accuracy levels drop down to 80–100% for the
imaginary part of the refractive index. It is worth observing from Fig. 13 that on average
significantly larger imaginary refractive indices are retrieved during dust-free-days at
Lampedusa (Fig. 13a), Oristano (Fig. 13b), and Rome (Fig. 13c), while k values at Lecce
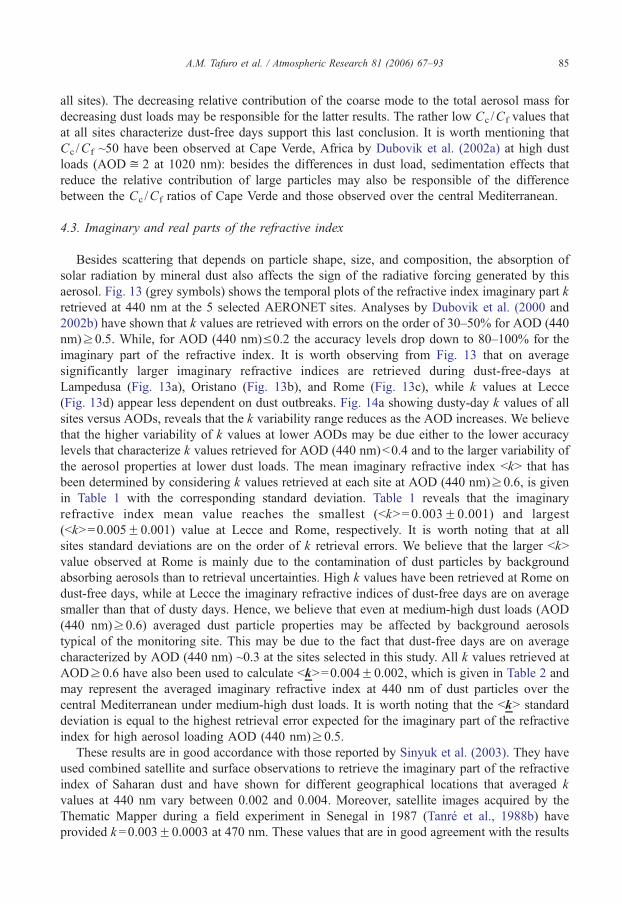
(Fig. 13d) appear less dependent on dust outbreaks. Fig. 14a showing dusty-day k values of all
sites versus AODs, reveals that the k variability range reduces as the AOD increases. We believe
that the higher variability of k values at lower AODs may be due either to the lower accuracy
levels that characterize k values retrieved for AOD (440 nm)b0.4 and to the larger variability of
the aerosol properties at lower dust loads. The mean imaginary refractive index bkN that has
been determined by considering k values retrieved at each site at AOD (440 nm)z0.6, is given
in Table 1 with the corresponding standard deviation. Table 1 reveals that the imaginary
refractive index mean value reaches the smallest (bkN=0.003F0.001) and largest
(bkN=0.005F0.001) value at Lecce and Rome, respectively. It is worth noting that at all
sites standard deviations are on the order of k retrieval errors. We believe that the larger bkN
value observed at Rome is mainly due to the contamination of dust particles by background
absorbing aerosols than to retrieval uncertainties. High k values have been retrieved at Rome on
dust-free days, while at Lecce the imaginary refractive indices of dust-free days are on average
smaller than that of dusty days. Hence, we believe that even at medium-high dust loads (AOD
(440 nm)z0.6) averaged dust particle properties may be affected by background aerosols
typical of the monitoring site. This may be due to the fact that dust-free days are on average
characterized by AOD (440 nm) ~0.3 at the sites selected in this study. All k values retrieved at
AODz0.6 have also been used to calculate bkN=0.004F0.002, which is given in Table 2 and
may represent the averaged imaginary refractive index at 440 nm of dust particles over the
central Mediterranean under medium-high dust loads. It is worth noting that the bkN standard
deviation is equal to the highest retrieval error expected for the imaginary part of the refractive
index for high aerosol loading AOD (440 nm)z0.5.
These results are in good accordance with those reported by Sinyuk et al. (2003). They have
used combined satellite and surface observations to retrieve the imaginary part of the refractive
index of Saharan dust and have shown for different geographical locations that averaged k
values at 440 nm vary between 0.002 and 0.004. Moreover, satellite images acquired by the
Thematic Mapper during a field experiment in Senegal in 1987 (Tanre et al., 1988b) have
provided k =0.003F0.0003 at 470 nm. These values that are in good agreement with the results
0.03
0.02
0.01
0.00
k (4
40 n
m)
Lampedusa Oristano Rome Lecce Etna
(a)
(b)
1.0
0.9
0.8
0.7
SS
A (
440
nm
)
1.21.00.80.60.40.20.0
AOD (440 nm)
1.6
1.5
1.4
1.3
n (
440
nm
)
(c)
Fig. 14. Plot of the (a) imaginary and (b) real refractive indices, and (c) of the single scattering albedo versus AODs at
440 nm. k, n and SSA values at 440 nm have been retrieved at the five selected AERONET sites during dusty days.
A.M. Tafuro et al. / Atmospheric Research 81 (2006) 67–9386
A.M. Tafuro et al. / Atmospheric Research 81 (2006) 67–93 87
of several recent investigations (Colarco et al., 2002; Dubovik et al., 2002a; Perrone et al.,
2004), and are significantly lower than previously reported values (Patterson et al., 1977; World
Climate Program, 1986). It is also worth mentioning, that spectroscopic characterizations of
water-insoluble components of Saharan dust samples from rainfall residuals collected at Lecce,
have revealed that dust particles with a high content of illite are mainly advected over the
Mediterranean basin during dust storms from north-west of Sahara (Blanco et al., 2003).
According to Sokolik and Toon (1999), illite is characterized by k ~0.001 at 440 nm.
The AERONET inversion model that considers dustlike particles as polydisperse, randomly
oriented spheroids (Dubovik et al., 2002b), has been used to retrieve the refractive index real part
n at 440 nm during dusty days. Numerical tests have shown that the presence of non-spherical
particles may cause an unrealistically strong decrease of the real part of the refractive index with
decreasing wavelength when the model based on the standard Mie theory is used. Dusty-day n
values versus AODs retrieved at Lampedusa, Oristano, Rome, Etna, and Lecce are shown in Fig.
14b. Dubovik et al. (2002b) have shown that n values are retrieved with accuracy to the level of
0.04 for AOD (440 nm)z0.5. While, for AOD (440 nm)V0.2 the accuracy level drops down to
0.05 for the real part of the refractive index. We observe that n values vary at all sites within the
variability range (1.33–1.6) set by the inversion algorithm developed by Dubovik and King
(2000) and do not reveal any significant dependence on AOD. The mean real part of the
refractive index bnN determined at each site by considering the n values retrieved at AODz0.6
is given in Table 1 with the corresponding standard deviation. Table 1 shows that the averaged
real refractive indices retrieved at the different sites are in accordance within one standard
deviation. All n values retrieved at AODz0.6 have then been used to calculate bnN=1.5F0.1,
which is given in Table 2 and may represent the averaged real refractive index at 440 nm of dust
particles over the central Mediterranean basin. It is worth noting that the bnN standard deviation
is significantly larger than the retrieval error (0.04) for the real part of the refractive index for
high aerosol loading AOD (440 nm)z0.5. Several models suggest that the real part of the
refractive index of dust is 1.53 for the visible spectral region (Shettle and Fenn, 1979; Koepke et
al., 1997).
4.4. Single scattering albedos
The single scattering albedo, SSA depends on scattering and absorption properties of
atmospheric particles and represents an important parameter to evaluate the aerosol radiative
impact. The presence in the atmosphere of desert dust layers can lead to either a cooling or a
warming effect, depending on properties such as single-scattering albedo and altitude of the layer
(e.g. Sokolik and Toon, 1999; Tegen and Fung, 1995; Liao and Seinfeld, 1998). In particular,
Hansen et al. (1997) showed that when cloud effects are included in the radiative forcing
analysis, aerosol SSAs smaller than 0.91 lead to warming and higher values to a cooling of the
climate system.
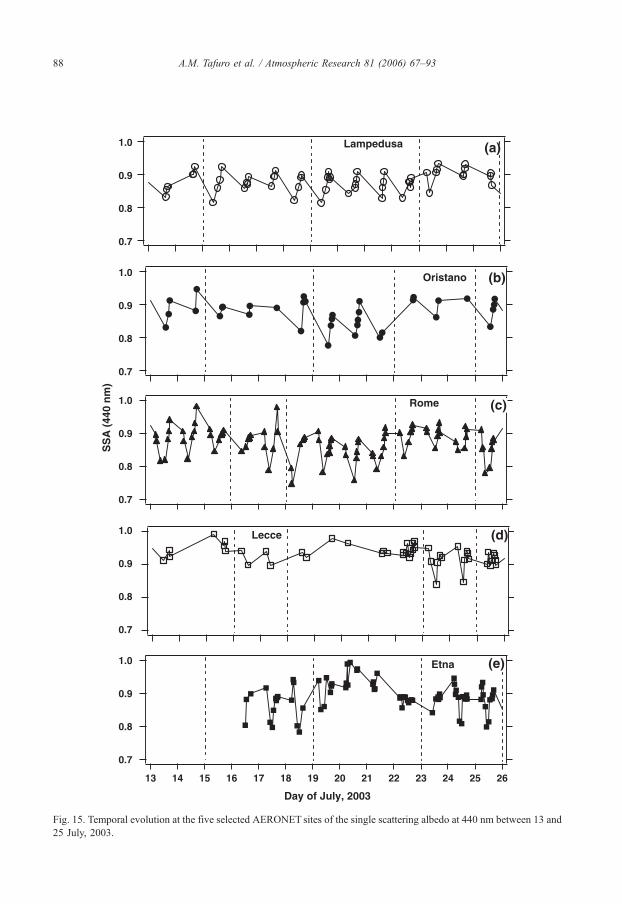
Fig. 15 shows the 440 nm-SSA temporal plots retrieved at the 5 selected AERONET sites
from 13 to 25 July. Dubovik et al. (2002b) have shown that SSA values are retrieved with
accuracy to the level of 0.03 for AOD (440 nm)z0.5. While, for AOD (440 nm)V0.2 the SSA
accuracy level drops down to 0.05–0.07. Fig. 15 reveals that on average SSA values are quite
affected by dust events. In addition, SSA values and variability ranges are also quite dependent
on monitoring site location. Lecce is the site characterized by larger SSA values that span the
0.91–0.99 and 0.84–0.92 range during dust-free- and dusty-days, respectively (Fig. 15d).
Oristano and Rome are the sites on average characterized by smaller SSA values. At Oristano
13 14 15 16 17 18 19 20 21 22 23 24 25 26
Day of July, 2003
Etna
Lecce
Rome
Oristano
1.0
0.9
0.8
0.7
1.0
0.9
0.8
0.7
1.0
0.9
0.8
0.7
1.0
0.9
0.8
0.7
1.0
0.9
0.8
0.7
Lampedusa
SS
A (
440
nm
)
(a)
(e)
(d)
(c)
(b)
Fig. 15. Temporal evolution at the five selected AERONET sites of the single scattering albedo at 440 nm between 13 and
25 July, 2003.
A.M. Tafuro et al. / Atmospheric Research 81 (2006) 67–9388
A.M. Tafuro et al. / Atmospheric Research 81 (2006) 67–93 89
(Fig. 15b) SSAs span the 0.82–0.92 and 0.78–0.91 range during dusty and dust-free-days,
respectively, while at Rome SSAs vary from 0.79 to 0.98 on dusty-days and from 0.75 to 0.98 on
dust-free-days (Fig. 15c). We believe that the lower SSAs retrieved both at Oristano and Rome
are mainly due to the larger contamination of measurements by background absorbing aerosols
and less to retrieval errors. In fact, dust-free-day aerosols are on average characterized by larger k
values (Fig. 13, grey symbols) at both sites. Fig. 14c shows the SSA values retrieved at all sites
during dusty-days versus the corresponding AODs and reveals that the SSA variability range
reduces as the AOD increases. We believe that the higher variability of SSA values retrieved at
lower AODs is due to the lower accuracy of SSA values retrieved at lower AODs and to the
higher variability of the aerosol properties: the contribution of background aerosols is expected
to be more significant at low dust AODs. The average single-scattering-albedo bSSAN that has
been determined at each site by considering the SSA values retrieved at AODz0.6, is given in
Table 1 with the corresponding standard deviation that is of the order of SSA retrieval errors. We
observe that the largest and smallest bSSAN values are obtained at Lecce and Rome,
respectively. Nevertheless, bSSAN values retrieved at the different sites are in good accord
within one standard deviation. It is worth observing from Table 1 that standard deviations are
rather close to the accuracy level of 0.03 typical of SSAs retrieved for AOD (440 nm)z0.5. All
SSAs retrieved at AODz0.6 have also been used to calculate bSSAN=0.89F0.03, which is
given in Table 2 and may represent the average SSA of dust particles over the central
Mediterranean basin.
Our results confirm the values recently derived by Kaufman et al. (2001), i.e., 0.90F0.02 in
the blue. It is also worth noting that Dubovik et al. (2002a) have obtained at Cape Verde an
averaged SSA value of 0.93F0.01 at 440 nm, while sunphotometer measurements made during
SHADE have provided a mean value of 0.96 at 440 nm (Haywood et al., 2003). The results from
SHADE concern unpolluted dust aerosols (Tanre et al., 2003). The lower averaged SSA values
obtained in this study (bSSAN=0.89F0.03) with respect to those retrieved over North Africa by
Dubovik et al. (2002a) and Haywood et al. (2003), may be due to both changes and/or
contamination occurring during the dust particle transport and to the optical effects of local
aerosols. According to Hansen et al. (1997), small differences in aerosol SSA about the value
~0.90 can be quite significant since they may change the warming to a cooling of the climate
system. In any case, our SSA values further indicate that Saharan dust has significantly less
absorption than that reported in the past by several authors (e.g. d’Almeida et al., 1991). This
difference is possibly due to discrepancy between dust absorption inferred from discrete in situ
measurements and absorption directly inferred from the radiation field in the atmosphere (Tanre
et al., 2001).
5. Summary and conclusion
Two dust outbreaks occurring on the second half of July 2003 over the central Mediterranean
basin have been studied at 5 different AERONET sites to retrieve averaged columnar values of
the main optical and physical parameters that characterize Saharan dust particles. At two sites
(Etna and Lecce), sunphotometer measurements have been combined with lidar observations to
infer the vertical distribution of dust layers and to characterize dust layer properties by the
vertical profiles of the backscatter and extinction coefficient, and of the depolarization and lidar
ratio. The selected sites are differently affected by anthropogenic pollution. Sunphotometer
retrievals have clearly revealed that at low dust loads, dust-particle physical and optical
parameters are characterized by a larger variability range and depend more on monitoring site
A.M. Tafuro et al. / Atmospheric Research 81 (2006) 67–9390
location. Latter results are maybe due to larger retrieval errors and to the larger variability of
aerosol parameters retrieved at lower dust loads. The plot of the Angstrom exponent (that mainly
depends on particle’s size) versus AOD reveals that the A variability range reduces more than
50% at AOD (440 nm)z0.6, and that A values i0.1 are retrieved at all sites at AODz0.8.
Accordingly, the Cc /Cf plots reveal the larger contribution of coarse particles under higher dust
loads. The coarse- to fine-particle volume concentration ratios reach larger values at all sites
during the 15–18 July dust event that is characterized by higher AODs. The larger intensity
(higher AODs) of the first dust event revealed by sunphotometer measurements is supported at
both Lecce and Etna by lidar measurements. Dust particle vertical profiles on average
characterized by larger backscatter coefficients have been retrieved at Lecce and Etna during the
15–18, July dust event.
It is also shown that k and SSA values are quite dependent on AODs: at all sites the
variability range of k and SSA reduces as AODs increase. Besides the higher retrieval errors
that characterize k and SSA values retrieved for AOD (440 nm)b0.6, the contamination by
anthropogenic and/or natural background aerosols typical of the monitoring site that gets
more significant at lower AODs is likely responsible of these results. To this end, it is
worth noting that A, Cc /Cf, k, and SSA temporal plots reveal that on average, dust-free-day
values are quite different from dusty-day values. Hence, to reduce the effects either of
retrieval errors or of background aerosols, AERONET data at AODsz0.6 have been used at
all sites to get averaged values of relevant parameters characterizing at 440 nm the optical
and physical properties of dust particles over the central Mediterranean. These are:
bnN=1.5F0.1, bkN=0.004F0.002, bSSAN=0.89F0.03, and bAN=0.2F0.1. Volume size
distributions have shown a dominant coarse mode peaked at 1.7–3 Am. In particular, the
averaged coarse mode that is peaked at i2.2 Am at Lampedusa, which is ~200 km away
from the northwest Africa coast, gets peaked at i1.7 Am at Lecce, which is ~800 km
away.
Lidar retrievals have allowed characterizing dust layer vertical distributions and have
provided a clear view of dust outbreak temporal evolutions mainly at the Etna site where lidar
measurements have been more frequent. Lidar backscatter coefficients have revealed that over
the Mediterranean basin, dust layers are generally located from 1 up to 6 km and that their
vertical distribution can significantly change within a few hours. At Lecce it has also been
shown that dust particles are characterized by lidar ratios spanning the 50–70 sr range under
high dust loads and that lidar ratios reduce with dust load possibly because of the more
significant contamination by spherical background aerosols. Depolarization ratio measurements
performed at Etna and reaching values as high as 50% under high dust loads, support the last
comment.
Besides revealing a satisfactory accordance, the comparison of the results of this paper to
those of recent studies mainly performed over North Africa has furthermore indicated that
Saharan dust is significantly less absorbing than has been reported in the past by several authors.
It has also been suggested that the small differences in averaged parameters characterizing dust
particles at different sites, are mainly due to changes and/or contamination occurring during the
dust particle transport at the monitoring site and less to retrieval errors. To this end it is worth
noting that the sites selected in this study were characterized by AOD (440 nm) ~0.3 during
dust-free days and that averaged dust particle parameters have been retrieved during dusty days
with AODsz0.6.
In any case, we believe that the retrieved average values of the main parameters that
characterize dust particles over the central-east Mediterranean basin under medium-high dust
A.M. Tafuro et al. / Atmospheric Research 81 (2006) 67–93 91
loads, and the indication of the dust-layer vertical distribution, can be usefully employed in
global circulation models and/or chemical transport models, to represent dust outbreaks over the
central Mediterranean.
Acknowledgements
This work has been supported by Ministero dell’Istruzione dell’Universita e della Ricerca of
Italy (Programma di Ricerca 2004. Prot. 20004023854). Results presented in this paper have been
obtained using data from the Aerosol Robotic Network, AERONET. The authors kindly thank the
Principal Investigators of Oristano, Lampedusa, and Etna sites. Lidar measurements performed at
the Etna site were supported by the Italian Space Agency (ASI), under the contract I/R/157/02.
References
Ackermann, J., 1998. The extinction-to-backscatter ratio of tropospheric aerosol: a numerical study. J. Atmos. Ocean.
Technol. 15, 1044–1050.
Andreae, M.O., 2001. The dark side of aerosols. Nature 409, 671–672.
Ansmann, A., Bosenberg, J., Chaikovsky, A., Comeron, A., Eckhardt, S., Eixmann, R., Freudenthaler, V., Ginoux, P.,
Komguem, L., Linne, H., Marquez, M.A.L., Matthias, V., Mattis, I., Mitev, V., Muller, D., Music, S., Nickovic, S.,
Pelon, J., Sauvage, L., Sobolewsky, P., Srivastava, M.K., Stohl, A., Torres, O., Vaughan, G., Wandinger, U., Wiegner,
M., 2003. Long-range transport of Saharan dust to northern Europe: the 11–16 October 2001 outbreak observed with
EARLINET. J. Geophys. Res. 108, 4783.
Barnaba, F., De Tomasi, F., Gobbi, G.P., Perrone, M.R., Tafuro, A., 2004. Extinction versus backscatter relationships for
lidar applications at 351 nm: maritime and desert aerosol simulations and comparison with observations. Atmos. Res.
70, 229–259.
Blanco, A., De Tomasi, F., Filippo, E., Manno, D., Perrone, M.R., Serra, A., Tafuro, A.M., Tepore, A., 2003.
Characterization of African dust over southern Italy. Atmos. Chem. Phys. 3, 1–13.
Colarco, P.R., Toon, O.B., Torres, O., Rasch, P.J., 2002. Determining the UV imaginary index of refraction of Saharan
dust particles from TOMS data using a three dimensional model of dust transport. J. Geophys. Res. 107 (D16).
doi:10.1029/2001JD000903.
d’Almeida, G.A., Koepke, P., Shettle, E.P., 1991. In: Deepack, A., Hampton, V. (Eds.), Atmospheric Aerosol — Global
Climatology and Radiative Characteristics, 561 pp.
De Tomasi, F., Perrone, M.R., 2003. Lidar measurements of tropospheric water vapor and aerosol profiles over
southeastern Italy. J. Geophys. Res. 108, 4286–4297.
De Tomasi, F., Blanco, A., Perrone, M.R., 2003. Raman lidar monitoring of extinction and backscattering of Africa dust
layers and dust characterization. Appl. Opt. 42, 1699–1709.
Dubovik, O., King, M.D., 2000. A flexible inversion algorithm for retrieval of aerosol optical properties from Sun and
sky radiance measurements. J. Geophys. Res. 105, 20673–20696.
Dubovik, O., Smirnov, A., Holben, B.N., King, M.D., Kaufman, Y.J., Eck, T.F., Slutsker, I., 2000. Accuracy assessments
of aerosol optical properties retrieved from Aerosol Robotic Network (AERONET) Sun and sky radiance
measurements. J. Geophys. Res. 105 (D8), 9791–9806.
Dubovik, O., Holben, B.N., Eck, T.F., Smirnov, A., Kaufman, Y.J., King, M.D., Tanre, D., Slutsker, I., 2002a.
Variability of absorption and optical properties of key aerosol types observed in worldwide locations. J. Atmos. Sci.
59, 590–608.
Dubovik, O., Holben, B.N., Lapyonok, T., Sinyuk, A., Mishchenko, M.I., Yang, P., Slutsker, I., 2002b. Non-spherical
aerosol retrieval method employing light scattering by spheroids. Geophys. Res. Lett. 29 (10), 54(1)–54(4).
Gobbi, G.P., Barnaba, F., Giorgi, R., Santacasa, A., 2000. Altitude-resolved properties of a Saharan-Dust event over the
Mediterranean. Atmos. Environ. 34, 5119–5127.
Gobbi, G.P., Barnaba, F., Blumthaler, M., Labow, G., Herman, J., 2002. Observed effects of particles non-sphericity on
the retrieval of marine and desert-dust aerosol optical depth by lidar. Atmos. Res. 61, 1–14.
Gobbi, G.P., Barnaba, F., Van Dingenen, R., Putaud, J.P., Mircea, M., Facchini, M.C., 2003. Lidar and in situ
observations of continental and Saharan aerosol: closure analysis of particles optical and physical properties. Atmos.
Chem. Phys. 3, 2161–2172.
A.M. Tafuro et al. / Atmospheric Research 81 (2006) 67–9392
Gobbi, G.P., Barnaba, F., Ammannato, L., 2004a. The vertical distribution of aerosols, Saharan dust and cirrus clouds in
Rome (Italy) in the year 2001. Atmos. Chem. Phys. 4, 351–359.
Gobbi, G.P., Barnaba, F., Ammannato, L., 2004b. Lidar and photometric measurements of Saharan dust outbreaks at
Izana (Tenerife) during the Minatroc 2002 field campaign. In: Pappalardo, Amodeo (Eds.), Reviewed and Revised
Proceedings of the International Laser Radar Conference (ILRC22), Matera 2004. European Space Agency, SP-561,
pp. 369–372.
Hamonou, E.P., Chazette, P., Balis, D., Dulac, F., Schneider, X., Galani, E., Ancellet, G., Papayannis, A., 1999.
Characterization of the vertical structure of Saharan dust export to the Mediterranean basin. J. Geophys. Res. 104,
22257–22270.
Hansen, J., Sato, M., Ruedy, R., 1997. Radiative forcing and climate response. J. Geophys. Res. 102, 9397–9407.
Haywood, J., Francis, P., Osborne, S., Glew, M., Loeb, N., Highwood, E., Tanre, D., Myhre, G., Formenti, P., Hirst, E.,
2003. Radiative properties and direct radiative effect of Saharan dust measured by the C-130 aircraft during SHADE:
1. Solar Spectrum. J. Geophys. Res. 108 (D18), 8577.
Holben, B.N., Eck, T.F., Slutsker, I., Tanre, D., Buis, J.P., Setzer, A., Vermote, E., Reagan, J.A., Kaufman, Y.J.,
Nakajima, T., Lavenu, F., Jankowiak, I., Smirnov, A., 1998. AERONET — a federate instrument network and data
archive for aerosol characterization. Remote Sens. Environ. 66, 1–16.
Holben, B.N., Tanre, D., Smirnov, A., Eck, T.F., Slutsker, I., Abuhassan, N., Newcomb, W.W., Shafer, J., Chatenet, B.,
Lavenue, F., Kaufman, Y.J., Vande Castel, J., Setzer, A., Markham, B., Clark, D., Frouin, R., Halthore, R., Karnieli,
A., O’Neill, N.T., Pietras, C., Pinker, R.T., Voss, K., Zibordi, G., 2001. An emerging ground-based aerosol
climatology: aerosol optical depth from AERONET. J. Geophys. Res. 106, 12067–12097.
Husar, R.B., Prospero, J.M., Stowe, L.L., 1997. Characterization of tropospheric aerosols over the oceans with the
NOOA advanced very high resolution radiometer optical thickness operational product. J. Geophys. Res. 102,
16889–16909.
IPCC (Intergovernmental Panel on Climate Change), Climate Change, 2001. In: Houghton, J.T., Ding, Y., Nogua,
M., Griggs, D., Vander Linden, P., Maskell, K. (Eds.), The Scientific Basis. Cambridge Univ. Press, Cambridge,
U.K.
Kaufman, Y.J., Tanre, D., Dubovik, O., Karnieli, A., Remer, L.A., 2001. Absorption of sunlight by dust as inferred from
satellite and ground-based remote sensing. Geophys. Res Lett. 28 (8), 1479–1482.
Kinne, S., Lohmann, U., Feichter, J., Schulz, M., Timmreck, C., Ghan, S., Easter, R., Chin, Ginoux, P., Takemura, T.,
Tegen, I., Koch, D., Herzog, M., Penner, J., Pitari, G., Holben, B., Eck, T., Smirnov, A., Dubovik, O., Dlutsker, I.,
Tanre, D., Torres, O., Mishchenko, M., Geogdzhayev, I., Chu, D.A., Kaufman, Y., 2003. Monthly averages of aerosol
properties: a global comparison among models, satellite data, and AERONET ground data. J. Geophys. Res. 108
(D20), 4634. doi:10.1029/2001JD001253.
Koepke, P., Hess, M., Schult, I., Shettle, P., 1997. Global aerosol data set. MPI Meteorologie Hamburg Rep., vol. 243,
44 pp.
Levin, Z., Joseph, J.H., Mekler, Y., 1980. Properties of Sharav (Khamsin) Dust — comparison of optical and direct
sampling data. J. Atmos. Sci. 37, 882–891.
Li, X., Maring, H.B., Prospero, J.M., 1998. Effects of relative humidity on light scattering by mineral dust as measured in
the marine boundary layer over the tropical Atlantic Ocean. J. Geophys. Res. 103, 31113–31121.
Liao, H., Seinfeld, J.H., 1998. Radiative forcing by mineral dust aerosols: sensitivity to key variables. J. Geophys. Res.
103, 31637–31645.
Mattis, I., Ansmann, A., Muller, D., Wandinger, U., Althausen, D., 2002. Dual-wavelength Raman lidar observations of
the extinction-to-backscatter ratio of Saharan dust. Geophys. Res. Lett. 29 (9), 20.1–20.4.
Mishchenko, M.I., Hovenir, J.W., Travis, L.D., 2000. Light Scattering by Nonspherical Particles. Academic Press, San
Diego. 690 pp.
Moulin, C., Guillard, F., Dulac, F., Lambert, C.E., 1997. Long-Term daily monitoring of Saharan dust load over ocean
using Meteosat ISCCP-B2 data: 1. Methodology and preliminary results for 1983–1994 in the Mediterranean.
J. Geophys. Res. 102 (D14), 16947–16958.
Muller, D., Mattis, I., Wandinger, U., Ansmann, A., Althausen, D., Dubovik, O., Eckhardt, S., Stohl, A., 2003. Saharan
dust over a central European EARLINET–AERONET site: combined observations with Raman lidar and sun-
photometer. J. Geophys. Res. 108 (D12), 4345. doi:10.1029/2002JD002918.
Patterson, E.M., Gillette, D.A., Stockton, B.H., 1977. Complex index of refraction between 300 and 700 nm for Saharan
aerosol. J. Geophys. Res. 82, 3153–3160.
Perrone, M.R., Barnaba, F., De Tomasi, F., Gobbi, G.P., Tafuro, A.M., 2004. Imaginary refractive-index effects on desert-
aerosol extinction versus backscatter relationships at 351 nm: numerical computations and comparison with Raman
lidar measurements. Appl. Opt. 29, 5531–5541.
A.M. Tafuro et al. / Atmospheric Research 81 (2006) 67–93 93
Prospero, J.M., Ginoux, P., Torres, O., Nicholson, S.E., Gill, T.E., 2002. Environmental characterization of global sources
of atmospheric soil dust identified with Nimbus 7 total ozone mapping spectrometer (TOMS) absorbing aerosol
product. Rev. Geophys. 40, 2(1)–2(31).
Raes, F., Bates, T., McGovern, F., Van Liedekerke, M., 2000. The 2nd Aerosol Characterization Experiment (ACE-2):
general review and main results. Tellus 52B, 111–125.
Shettle, E.P., Fenn. R.W., 1979. Models of aerosols of lower troposphere and the effect of humidity variations on their
optical properties. AFCRLTech. Rep. 79 0214, Air Force Cambridge Research Laboratory, Hanscom Air Force base,
MA., 100 pp.
Sinyuk, A., Torres, O., Dubovik, O., 2003. Imaginary refractive index of desert dust using satellite and surface
observations. Geophy. Res. Lett. 30 (2), 1081. doi:10.1029/2002GL016189.
Smirnov, A., Holben, B.N., Eck, T.F., Dubovik, O., Slutsker, I., 2000. Cloud screening and quality control algorithms for
aerosol data base. Remote Sens. Environ. 73, 337–349.
Sokolik, I.N., Toon, O.B., 1996. Direct radiative forcing by anthropogenic airborne mineral aerosols. Nature 381,
681–683.
Sokolik, I.N., Toon, O.B., 1999. Incorporation of mineralogical composition into models of the radiative properties of
mineral aerosol from UV to IR wavelength. J. Geophys. Res. 104, 9423–9444.
Soderman, D., Dulac, F., 1998. Monitoring and prediction of the atmospheric transport and deposition of desert dust in
the Mediterranean region. In: World Meteorol. Organ. (Ed.), First LAS/WMO International Symposium on Sand and
Dust Storm Damascu, Syrian Arab Republic, 2 – 7 November 1997, WMO/TD, vol. 864, Geneva. 325 pp.
Tanre, D., Devaux, C., Herman, M., Santer, R., Gac, J.Y., 1988a. Radiative properties of desert aerosols by optical
ground-based measurements at solar wavelengths. J. Geophys. Res. 83, 14223–14231.
Tanre, D., Deschamps, P.Y., Devaux, C., Herman, M., 1998b. Estimation of Saharan aerosol optical thickness from
blurring effects in thematic mapper data. J. Geophys. Res. 93, 15955–15964.
Tanre, D., Kaufman, Y.J., Holben, B.N., Chatenet, B., Karnieli, A., Lavenu, F., Blarel, L., Dubovik, O., Remer, L.A.,
Smirnov, A., 2001. Climatology of dust aerosol size distribution and optical properties derived from remotely sensed
data in the solar spectrum. J. Geophys. Res. 106, 18205–18218.
Tanre, D., Haywood, J., Pelon, J., Leon, J.F., Chatenet, B., Formenti, P., Francis, P., Goloub, P., Highwood, E.J., Myhre,
G., 2003. Measurement and modeling of the Saharan dust radiative impact: overview of the Saharan Dust Experiment
(SHADE). J. Geophys. Res. 108 (D18). doi:10.1029/2002JD003273.
Tegen, I., Fung, I., 1995. Contribution to the atmospheric mineral aerosol load from land surface modification.
J. Geophys. Res. 100, 18707–18726.
Tegen, I., Lacis, A.A., 1996. Modeling of particle influence on the radiative properties of mineral dust aerosol.
J. Geophys. Res. 101, 19237–19244.
Volten, H., Minoz, O., Rol, E., de Haan, J., Vassen, W., Hovenier, J., 2001. Laboratory measurements of scattering
matrices of irregular mineral particles. J. Geophys. Res. 106, 17375–17401.
World Climate Program (WCP), 1986. A Preliminary Cloudless Standard Atmosphere for Radiation Computation. World
Meteorol. Org., Geneva.