Safe Journey - National Indian Justice Center
154
FUNDED BY CALIFORNIA DEPARTMENT OF TRANSPORTATION CONDUCTED BY NATIONAL INDIAN JUSTICE CENTER Safe Journey
-
Upload
khangminh22 -
Category
Documents
-
view
2 -
download
0
Transcript of Safe Journey - National Indian Justice Center
FUNDED BY CALIFORNIA DEPARTMENT OF TRANSPORTATION
CONDUCTED BY
NATIONAL INDIAN JUSTICE CENTER
Safe Journey

This workshop is made possible by funding from the California Department of Transportation, Contract No. 74A0175.
Safe Journey Workshop
AGENDA
Safety Issues
• Driver, Passenger, Pedestrian & Vehicle
Equipment – CHP Officer
• Roadways – CALTRANS
• Current Transportation Safety Statistics/ Data
Collection
• Policies – Tribal & State Officials
• Public Education and Outreach

Safe Journey
Table of ContentsPage
Public Law 280Termination . . . . . . . . . . . . . . . . . . . . . . . . . . . . . . . . . . . . . . . . . . . . . . . . . . . . . . . . . . 1P.L. 280 - Civil Provisions . . . . . . . . . . . . . . . . . . . . . . . . . . . . . . . . . . . . . . . . . . . . . . . 2P.L. 280 - Criminal Provisions . . . . . . . . . . . . . . . . . . . . . . . . . . . . . . . . . . . . . . . . . . . . 3General Crimes Act . . . . . . . . . . . . . . . . . . . . . . . . . . . . . . . . . . . . . . . . . . . . . . . . . . . . 4Major Crimes Act . . . . . . . . . . . . . . . . . . . . . . . . . . . . . . . . . . . . . . . . . . . . . . . . . . . . . . 5
Indian Civil Rights Act . . . . . . . . . . . . . . . . . . . . . . . . . . . . . . . . . . . . . . . . . . . . . . . . . . . . . . . . 6U.S. Bill of Rights (Amendments 1-10) . . . . . . . . . . . . . . . . . . . . . . . . . . . . . . . . . . . . . . . . . . . 7What is Transportation Safety Education? . . . . . . . . . . . . . . . . . . . . . . . . . . . . . . . . . . . . . . . . 9Foundation Stage (Ages 3 - 5) . . . . . . . . . . . . . . . . . . . . . . . . . . . . . . . . . . . . . . . . . . . . . . . . 11SIWTRS - 2003 Annual Report (Excerpts) . . . . . . . . . . . . . . . . . . . . . . . . . . . . . . . . . . . . . . . 17NHTSA Traffic Safety Sheet 2004 Data Overview . . . . . . . . . . . . . . . . . . . . . . . . . . . . . . . . . 182003 California Quick Collision Facts . . . . . . . . . . . . . . . . . . . . . . . . . . . . . . . . . . . . . . . . . . . 30NHTSA - California Data . . . . . . . . . . . . . . . . . . . . . . . . . . . . . . . . . . . . . . . . . . . . . . . . . . . . . 31California Office of Traffic Safety . . . . . . . . . . . . . . . . . . . . . . . . . . . . . . . . . . . . . . . . . . . . . . 35
Del Norte County Rankings . . . . . . . . . . . . . . . . . . . . . . . . . . . . . . . . . . . . . . . . . . . . . 37Humboldt County Rankings . . . . . . . . . . . . . . . . . . . . . . . . . . . . . . . . . . . . . . . . . . . . . 38Modoc County Rankings . . . . . . . . . . . . . . . . . . . . . . . . . . . . . . . . . . . . . . . . . . . . . . . 39San Diego County Rankings . . . . . . . . . . . . . . . . . . . . . . . . . . . . . . . . . . . . . . . . . . . . 40Trinity County Rankings . . . . . . . . . . . . . . . . . . . . . . . . . . . . . . . . . . . . . . . . . . . . . . . 41
California Department of Transportation, Deputy Directive . . . . . . . . . . . . . . . . . . . . . . . . . . . 42Getting a License to Drive in California . . . . . . . . . . . . . . . . . . . . . . . . . . . . . . . . . . . . . . . . . . 67Can you Afford to Drink and Drive? . . . . . . . . . . . . . . . . . . . . . . . . . . . . . . . . . . . . . . . . . . . . . 71Sample - Flow Chart of DWI in New Mexico . . . . . . . . . . . . . . . . . . . . . . . . . . . . . . . . . . . . . 73California Vehicle Restraint Laws . . . . . . . . . . . . . . . . . . . . . . . . . . . . . . . . . . . . . . . . . . . . . . 744 Steps for Kids . . . . . . . . . . . . . . . . . . . . . . . . . . . . . . . . . . . . . . . . . . . . . . . . . . . . . . . . . . . 75Keeping it Clicking in California: A Case Study of Sustained Success with a High Seat Belt Use Rate . . . . . . . . . . . . . . . . . . . . . . . . . . . . . . . . . . . . . . . . . . . . . . . . . . . . . . . . . . . . . 76CHP - Most Common Equipment Violations . . . . . . . . . . . . . . . . . . . . . . . . . . . . . . . . . . . . . . 82CHP - Bicycle Riding . . . . . . . . . . . . . . . . . . . . . . . . . . . . . . . . . . . . . . . . . . . . . . . . . . . . . . . . 83CHP - Skateboards, Rollerblades and Scooters . . . . . . . . . . . . . . . . . . . . . . . . . . . . . . . . . . . 88AAA Foundation for Traffic Safety Brochures
Wake Up . . . . . . . . . . . . . . . . . . . . . . . . . . . . . . . . . . . . . . . . . . . . . . . . . . . . . . . . . . . 91Pay Attention . . . . . . . . . . . . . . . . . . . . . . . . . . . . . . . . . . . . . . . . . . . . . . . . . . . . . . . . 97Road Rage . . . . . . . . . . . . . . . . . . . . . . . . . . . . . . . . . . . . . . . . . . . . . . . . . . . . . . . . 105Blinded by the Light . . . . . . . . . . . . . . . . . . . . . . . . . . . . . . . . . . . . . . . . . . . . . . . . . . 109The Older and Wiser Driver . . . . . . . . . . . . . . . . . . . . . . . . . . . . . . . . . . . . . . . . . . . . 117
Ford’s Driving Skills for Life . . . . . . . . . . . . . . . . . . . . . . . . . . . . . . . . . . . . . . . . . . . . . . . . . . 123The Impact of Media (excerpt of UK brochure) . . . . . . . . . . . . . . . . . . . . . . . . . . . . . . . . . . . 127Additional Resources targeting Parents and Teens . . . . . . . . . . . . . . . . . . . . . . . . . . . . . . . 131CA DMV’s Sample Written Test and Answers . . . . . . . . . . . . . . . . . . . . . . . . . . . . . . . . . . . . 133Parent/Teen Driving Agreement . . . . . . . . . . . . . . . . . . . . . . . . . . . . . . . . . . . . . . . . . . . . . . 137
MATERIALS ON CALIFORNIA TRIBES AS GOVERNMENTS

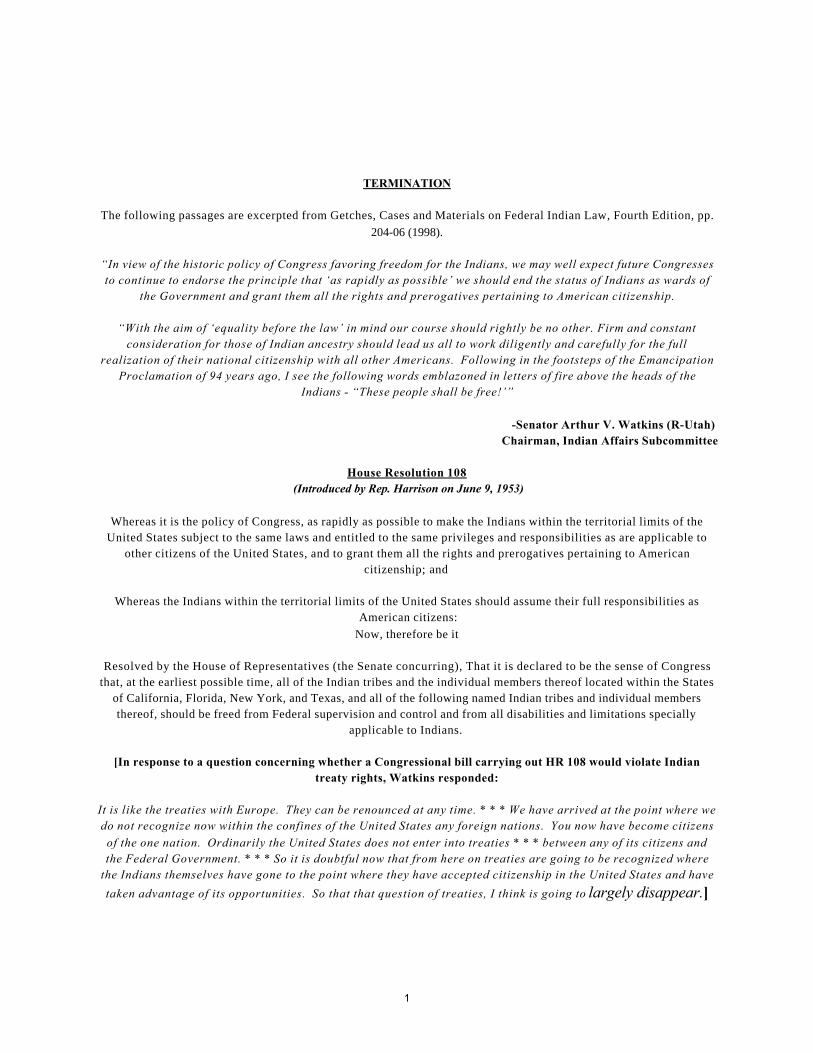
TERMINATION
The following passages are excerpted from Getches, Cases and Materials on Federal Indian Law, Fourth Edition, pp.204-06 (1998).
“In view of the historic policy of Congress favoring freedom for the Indians, we may well expect future Congressesto continue to endorse the principle that ‘as rapidly as possible’ we should end the status of Indians as wards of
the Government and grant them all the rights and prerogatives pertaining to American citizenship.
“With the aim of ‘equality before the law’ in mind our course should rightly be no other. Firm and constantconsideration for those of Indian ancestry should lead us all to work diligently and carefully for the full
realization of their national citizenship with all other Americans. Following in the footsteps of the EmancipationProclamation of 94 years ago, I see the following words emblazoned in letters of fire above the heads of the
Indians - “These people shall be free!’”
-Senator Arthur V. Watkins (R-Utah) Chairman, Indian Affairs Subcommittee
House Resolution 108 (Introduced by Rep. Harrison on June 9, 1953)
Whereas it is the policy of Congress, as rapidly as possible to make the Indians within the territorial limits of theUnited States subject to the same laws and entitled to the same privileges and responsibilities as are applicable to
other citizens of the United States, and to grant them all the rights and prerogatives pertaining to Americancitizenship; and
Whereas the Indians within the territorial limits of the United States should assume their full responsibilities asAmerican citizens:
Now, therefore be it
Resolved by the House of Representatives (the Senate concurring), That it is declared to be the sense of Congressthat, at the earliest possible time, all of the Indian tribes and the individual members thereof located within the States
of California, Florida, New York, and Texas, and all of the following named Indian tribes and individual membersthereof, should be freed from Federal supervision and control and from all disabilities and limitations specially
applicable to Indians.
[In response to a question concerning whether a Congressional bill carrying out HR 108 would violate Indiantreaty rights, Watkins responded:
It is like the treaties with Europe. They can be renounced at any time. * * * We have arrived at the point where wedo not recognize now within the confines of the United States any foreign nations. You now have become citizensof the one nation. Ordinarily the United States does not enter into treaties * * * between any of its citizens andthe Federal Government. * * * So it is doubtful now that from here on treaties are going to be recognized where
the Indians themselves have gone to the point where they have accepted citizenship in the United States and have
taken advantage of its opportunities. So that that question of treaties, I think is going to largely disappear.]
1
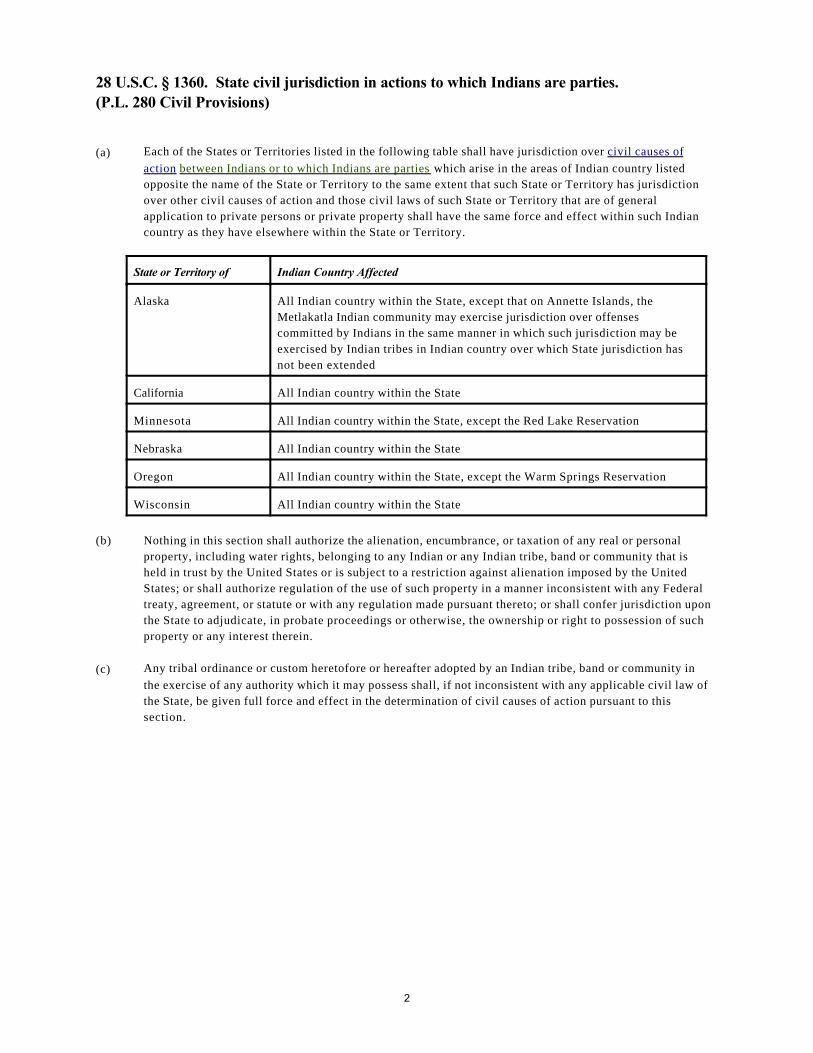
28 U.S.C. § 1360. State civil jurisdiction in actions to which Indians are parties. (P.L. 280 Civil Provisions)
(a) Each of the States or Territories listed in the following table shall have jurisdiction over civil causes ofaction between Indians or to which Indians are parties which arise in the areas of Indian country listedopposite the name of the State or Territory to the same extent that such State or Territory has jurisdictionover other civil causes of action and those civil laws of such State or Territory that are of generalapplication to private persons or private property shall have the same force and effect within such Indiancountry as they have elsewhere within the State or Territory.
State or Territory of Indian Country Affected
Alaska All Indian country within the State, except that on Annette Islands, theMetlakatla Indian community may exercise jurisdiction over offensescommitted by Indians in the same manner in which such jurisdiction may beexercised by Indian tribes in Indian country over which State jurisdiction hasnot been extended
California All Indian country within the State
Minnesota All Indian country within the State, except the Red Lake Reservation
Nebraska All Indian country within the State
Oregon All Indian country within the State, except the Warm Springs Reservation
Wisconsin All Indian country within the State
(b) Nothing in this section shall authorize the alienation, encumbrance, or taxation of any real or personalproperty, including water rights, belonging to any Indian or any Indian tribe, band or community that isheld in trust by the United States or is subject to a restriction against alienation imposed by the UnitedStates; or shall authorize regulation of the use of such property in a manner inconsistent with any Federaltreaty, agreement, or statute or with any regulation made pursuant thereto; or shall confer jurisdiction uponthe State to adjudicate, in probate proceedings or otherwise, the ownership or right to possession of suchproperty or any interest therein.
(c) Any tribal ordinance or custom heretofore or hereafter adopted by an Indian tribe, band or community inthe exercise of any authority which it may possess shall, if not inconsistent with any applicable civil law ofthe State, be given full force and effect in the determination of civil causes of action pursuant to thissection.
2
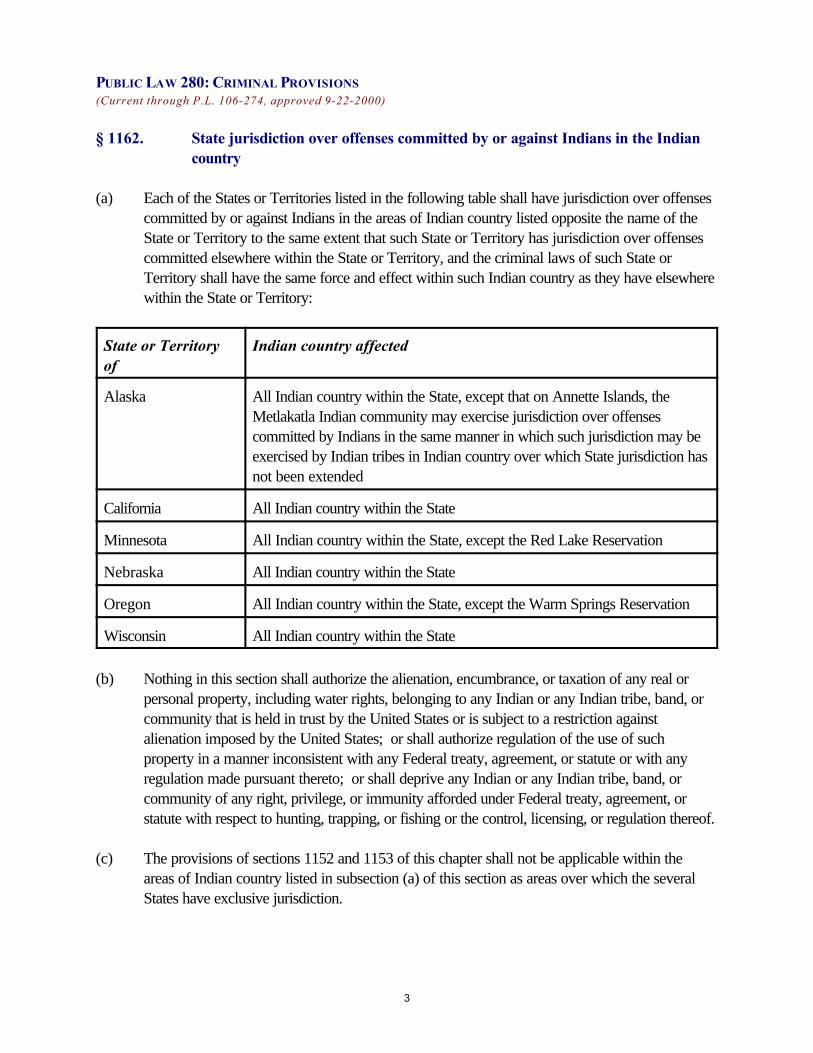
PUBLIC LAW 280: CRIMINAL PROVISIONS(Current through P.L. 106-274, approved 9-22-2000)
§ 1162. State jurisdiction over offenses committed by or against Indians in the Indiancountry
(a) Each of the States or Territories listed in the following table shall have jurisdiction over offensescommitted by or against Indians in the areas of Indian country listed opposite the name of theState or Territory to the same extent that such State or Territory has jurisdiction over offensescommitted elsewhere within the State or Territory, and the criminal laws of such State orTerritory shall have the same force and effect within such Indian country as they have elsewherewithin the State or Territory:
State or Territoryof
Indian country affected
Alaska All Indian country within the State, except that on Annette Islands, theMetlakatla Indian community may exercise jurisdiction over offensescommitted by Indians in the same manner in which such jurisdiction may beexercised by Indian tribes in Indian country over which State jurisdiction hasnot been extended
California All Indian country within the State
Minnesota All Indian country within the State, except the Red Lake Reservation
Nebraska All Indian country within the State
Oregon All Indian country within the State, except the Warm Springs Reservation
Wisconsin All Indian country within the State
(b) Nothing in this section shall authorize the alienation, encumbrance, or taxation of any real orpersonal property, including water rights, belonging to any Indian or any Indian tribe, band, orcommunity that is held in trust by the United States or is subject to a restriction againstalienation imposed by the United States; or shall authorize regulation of the use of suchproperty in a manner inconsistent with any Federal treaty, agreement, or statute or with anyregulation made pursuant thereto; or shall deprive any Indian or any Indian tribe, band, orcommunity of any right, privilege, or immunity afforded under Federal treaty, agreement, orstatute with respect to hunting, trapping, or fishing or the control, licensing, or regulation thereof.
(c) The provisions of sections 1152 and 1153 of this chapter shall not be applicable within theareas of Indian country listed in subsection (a) of this section as areas over which the severalStates have exclusive jurisdiction.
3
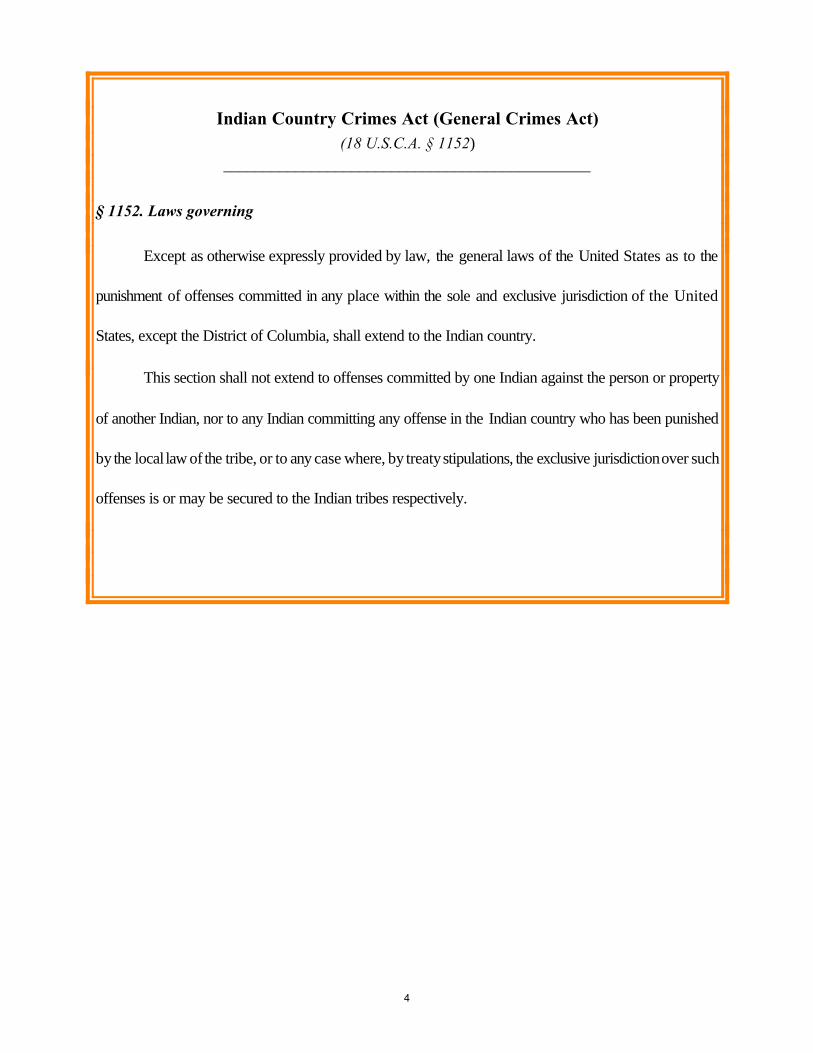
Indian Country Crimes Act (General Crimes Act)(18 U.S.C.A. § 1152)
______________________________________________
§ 1152. Laws governing
Except as otherwise expressly provided by law, the general laws of the United States as to the
punishment of offenses committed in any place within the sole and exclusive jurisdiction of the United
States, except the District of Columbia, shall extend to the Indian country.
This section shall not extend to offenses committed by one Indian against the person or property
of another Indian, nor to any Indian committing any offense in the Indian country who has been punished
by the local law of the tribe, or to any case where, by treaty stipulations, the exclusive jurisdiction over such
offenses is or may be secured to the Indian tribes respectively.
4
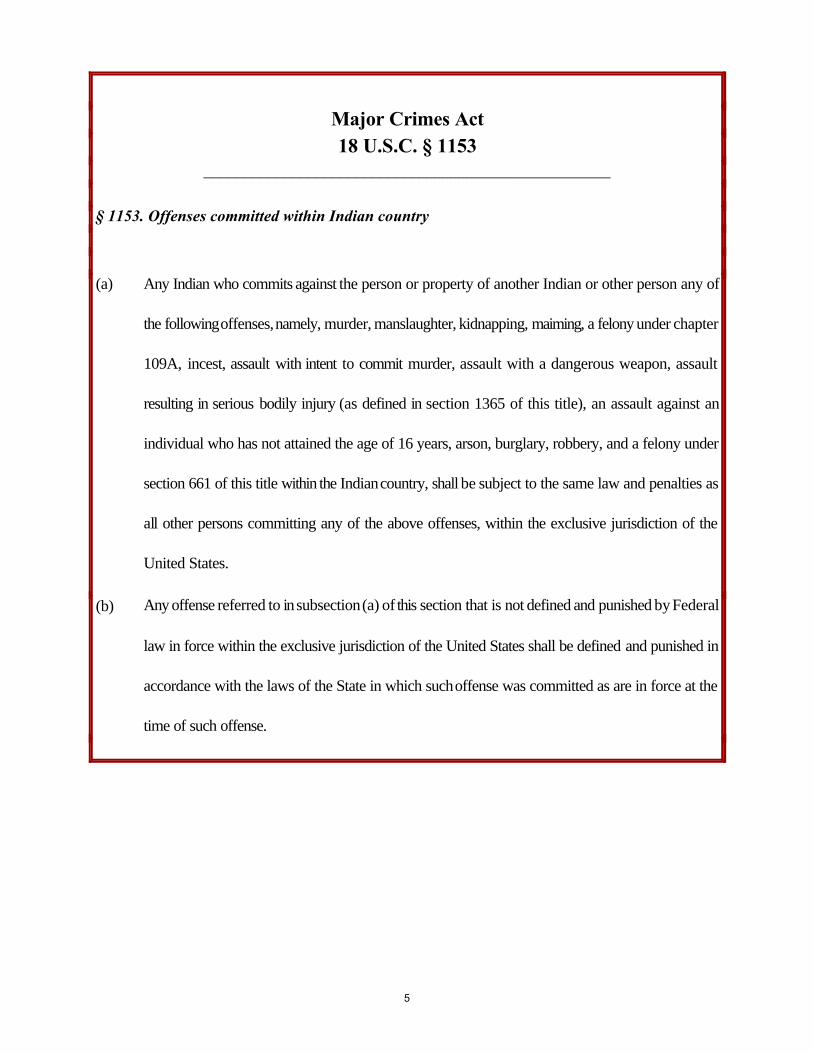
Major Crimes Act18 U.S.C. § 1153
___________________________________________________
§ 1153. Offenses committed within Indian country
(a) Any Indian who commits against the person or property of another Indian or other person any of
the following offenses, namely, murder, manslaughter, kidnapping, maiming, a felony under chapter
109A, incest, assault with intent to commit murder, assault with a dangerous weapon, assault
resulting in serious bodily injury (as defined in section 1365 of this title), an assault against an
individual who has not attained the age of 16 years, arson, burglary, robbery, and a felony under
section 661 of this title within the Indian country, shall be subject to the same law and penalties as
all other persons committing any of the above offenses, within the exclusive jurisdiction of the
United States.
(b) Any offense referred to in subsection (a) of this section that is not defined and punished by Federal
law in force within the exclusive jurisdiction of the United States shall be defined and punished in
accordance with the laws of the State in which such offense was committed as are in force at the
time of such offense.
5
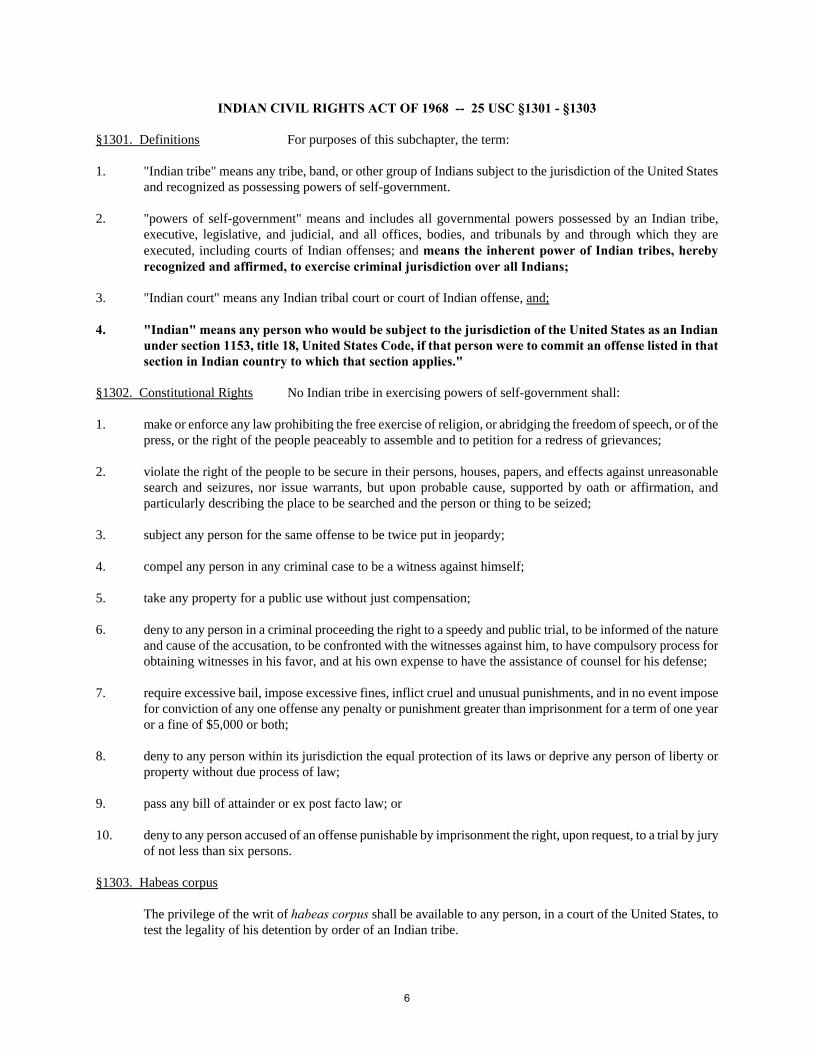
INDIAN CIVIL RIGHTS ACT OF 1968 -- 25 USC §1301 - §1303
§1301. Definitions For purposes of this subchapter, the term:
1. "Indian tribe" means any tribe, band, or other group of Indians subject to the jurisdiction of the United Statesand recognized as possessing powers of self-government.
2. "powers of self-government" means and includes all governmental powers possessed by an Indian tribe,executive, legislative, and judicial, and all offices, bodies, and tribunals by and through which they areexecuted, including courts of Indian offenses; and means the inherent power of Indian tribes, herebyrecognized and affirmed, to exercise criminal jurisdiction over all Indians;
3. "Indian court" means any Indian tribal court or court of Indian offense, and;
4. "Indian" means any person who would be subject to the jurisdiction of the United States as an Indianunder section 1153, title 18, United States Code, if that person were to commit an offense listed in thatsection in Indian country to which that section applies."
§1302. Constitutional Rights No Indian tribe in exercising powers of self-government shall:
1. make or enforce any law prohibiting the free exercise of religion, or abridging the freedom of speech, or of thepress, or the right of the people peaceably to assemble and to petition for a redress of grievances;
2. violate the right of the people to be secure in their persons, houses, papers, and effects against unreasonablesearch and seizures, nor issue warrants, but upon probable cause, supported by oath or affirmation, andparticularly describing the place to be searched and the person or thing to be seized;
3. subject any person for the same offense to be twice put in jeopardy;
4. compel any person in any criminal case to be a witness against himself;
5. take any property for a public use without just compensation;
6. deny to any person in a criminal proceeding the right to a speedy and public trial, to be informed of the natureand cause of the accusation, to be confronted with the witnesses against him, to have compulsory process forobtaining witnesses in his favor, and at his own expense to have the assistance of counsel for his defense;
7. require excessive bail, impose excessive fines, inflict cruel and unusual punishments, and in no event imposefor conviction of any one offense any penalty or punishment greater than imprisonment for a term of one yearor a fine of $5,000 or both;
8. deny to any person within its jurisdiction the equal protection of its laws or deprive any person of liberty orproperty without due process of law;
9. pass any bill of attainder or ex post facto law; or
10. deny to any person accused of an offense punishable by imprisonment the right, upon request, to a trial by juryof not less than six persons.
§1303. Habeas corpus
The privilege of the writ of habeas corpus shall be available to any person, in a court of the United States, totest the legality of his detention by order of an Indian tribe.
6
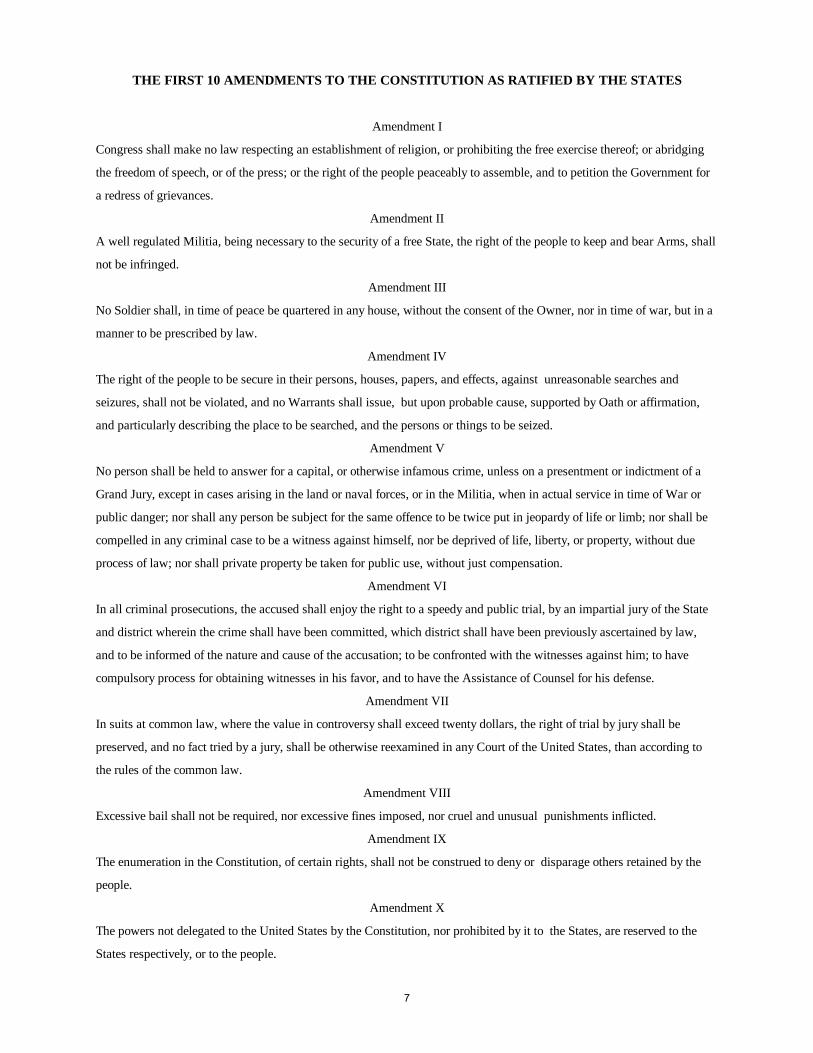
THE FIRST 10 AMENDMENTS TO THE CONSTITUTION AS RATIFIED BY THE STATES
Amendment I
Congress shall make no law respecting an establishment of religion, or prohibiting the free exercise thereof; or abridging
the freedom of speech, or of the press; or the right of the people peaceably to assemble, and to petition the Government for
a redress of grievances.
Amendment II
A well regulated Militia, being necessary to the security of a free State, the right of the people to keep and bear Arms, shall
not be infringed.
Amendment III
No Soldier shall, in time of peace be quartered in any house, without the consent of the Owner, nor in time of war, but in a
manner to be prescribed by law.
Amendment IV
The right of the people to be secure in their persons, houses, papers, and effects, against unreasonable searches and
seizures, shall not be violated, and no Warrants shall issue, but upon probable cause, supported by Oath or affirmation,
and particularly describing the place to be searched, and the persons or things to be seized.
Amendment V
No person shall be held to answer for a capital, or otherwise infamous crime, unless on a presentment or indictment of a
Grand Jury, except in cases arising in the land or naval forces, or in the Militia, when in actual service in time of War or
public danger; nor shall any person be subject for the same offence to be twice put in jeopardy of life or limb; nor shall be
compelled in any criminal case to be a witness against himself, nor be deprived of life, liberty, or property, without due
process of law; nor shall private property be taken for public use, without just compensation.
Amendment VI
In all criminal prosecutions, the accused shall enjoy the right to a speedy and public trial, by an impartial jury of the State
and district wherein the crime shall have been committed, which district shall have been previously ascertained by law,
and to be informed of the nature and cause of the accusation; to be confronted with the witnesses against him; to have
compulsory process for obtaining witnesses in his favor, and to have the Assistance of Counsel for his defense.
Amendment VII
In suits at common law, where the value in controversy shall exceed twenty dollars, the right of trial by jury shall be
preserved, and no fact tried by a jury, shall be otherwise reexamined in any Court of the United States, than according to
the rules of the common law.
Amendment VIII
Excessive bail shall not be required, nor excessive fines imposed, nor cruel and unusual punishments inflicted.
Amendment IX
The enumeration in the Constitution, of certain rights, shall not be construed to deny or disparage others retained by the
people.
Amendment X
The powers not delegated to the United States by the Constitution, nor prohibited by it to the States, are reserved to the
States respectively, or to the people.
7

8
SAFETY EDUCATION

What is Transportation Safety Education? Transportation safety education is not necessarily about isolating children, young people and adults from all potential hazards but is about equipping them to deal with situations safely. To do so, we need to educate tribal community members consistently on transportation safety topics. We must also provide supervised opportunities for practical application of skills. Risk assessment skills The capacity of tribal members to assess risk or hazardous conditions while driving, riding or walking on roads is essential to increasing safe outcomes.
• Hazards, risk and risk control • Recognize hazards, assess consequent risks and take steps to control the risks to
themselves and others • to use information to assess the immediate and cumulative risks • to manage their environment to ensure the health and safety of themselves and
others • to explain the steps they take to control risks
Personal and social skills Children, young people and adults need skills to deal with pressures and stereotypes that can encourage risk taking while in a motor vehicle. Peer pressure to play "chicken" on busy roads or media stereotypes about fast driving are good examples. Personal and social skills like assertiveness are useful in situations where a person must ask for help or ask someone to stop doing something dangerous. Health skills such as emergency assistance also need to be taught and practiced. The following examples of personal and social skills should be used in practical exercises with children between 5 and 16 years of age:
• to learn and practice driver, passenger and pedestrian safety skills • to take responsibility for their actions • to be able to ask for help in a pressured situation • to develop the confidence to give advice concerning dangerous behavior • to deal with unhelpful stereotypes and pressures • to recognize risk and make safer choices
Playing a part in tribal communities safer places Safety education should involve all community members taking responsibility for transportation issues (i.e., community representatives participating in safety audits). Discussing safety issues to do with their routes to school or gymnasium, for example, can lead to agreeing to new safety rules or designing safer roads and walking paths. Presenting their suggestions to tribal council or other policy makers will encourage proactive discussion and planning within the membership.
9
To assist the membership to meet this responsibility, tribal transportation offices should provide education and outreach on the following topics:
• to understand the need for tribal transportation planning, construction and maintenance rules
• to take part in making and changing rules • to research and discuss local and topical issues (i.e., data collection) • to consider social and moral dilemmas (i.e., impacts on community resources) • to participate in decision making • Understanding the work of transportation safety professionals
Discussing the roles of safety professionals can help community members to understand the importance of safety issues. Identifying the responsibilities and skills of the school crossing patrol, firefighters or CHP officers, for example, can be the basis for thinking about their own safety skills and knowledge.
• to meet and talk with people with a range of work roles and skills • to identify their own skills and achievements • to think about ways to develop these skills further
10
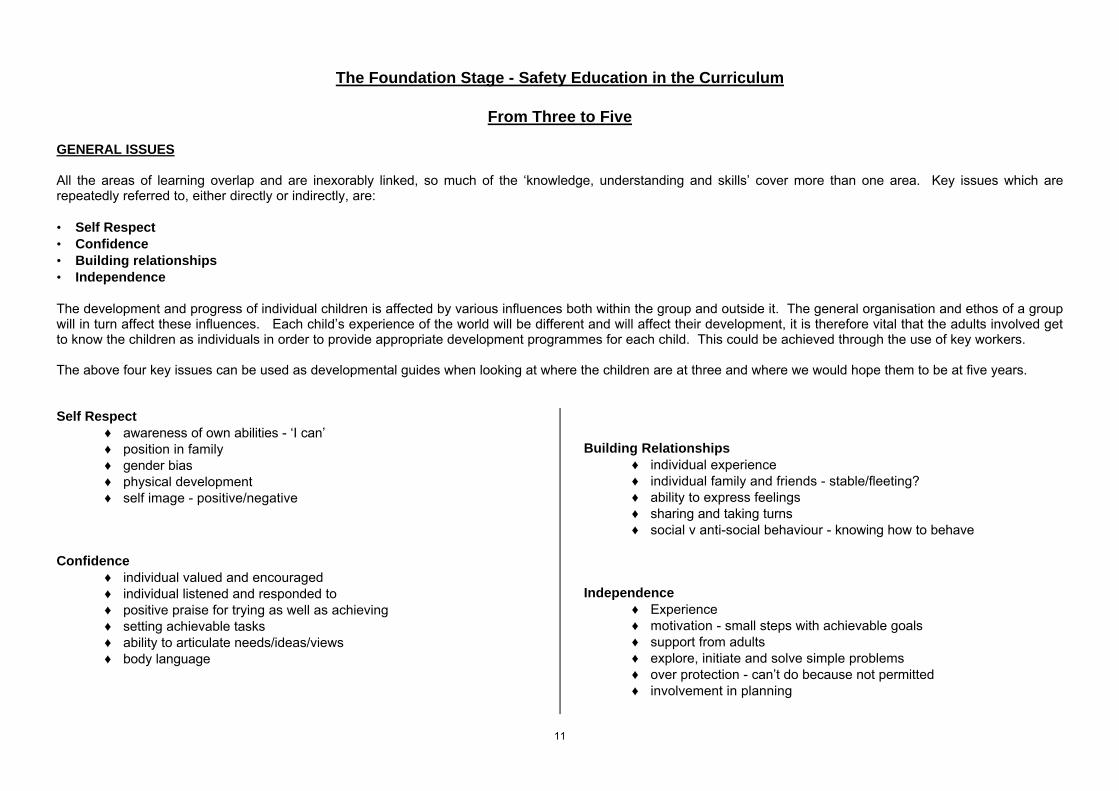
The Foundation Stage - Safety Education in the Curriculum
From Three to Five GENERAL ISSUES All the areas of learning overlap and are inexorably linked, so much of the ‘knowledge, understanding and skills’ cover more than one area. Key issues which are repeatedly referred to, either directly or indirectly, are: • Self Respect • Confidence • Building relationships • Independence The development and progress of individual children is affected by various influences both within the group and outside it. The general organisation and ethos of a group will in turn affect these influences. Each child’s experience of the world will be different and will affect their development, it is therefore vital that the adults involved get to know the children as individuals in order to provide appropriate development programmes for each child. This could be achieved through the use of key workers. The above four key issues can be used as developmental guides when looking at where the children are at three and where we would hope them to be at five years. Self Respect
♦ awareness of own abilities - ‘I can’ ♦ position in family ♦ gender bias ♦ physical development ♦ self image - positive/negative
Confidence
♦ individual valued and encouraged ♦ individual listened and responded to ♦ positive praise for trying as well as achieving ♦ setting achievable tasks ♦ ability to articulate needs/ideas/views ♦ body language
Building Relationships
♦ individual experience ♦ individual family and friends - stable/fleeting? ♦ ability to express feelings ♦ sharing and taking turns ♦ social v anti-social behaviour - knowing how to behave
Independence
♦ Experience ♦ motivation - small steps with achievable goals ♦ support from adults ♦ explore, initiate and solve simple problems ♦ over protection - can’t do because not permitted ♦ involvement in planning
11
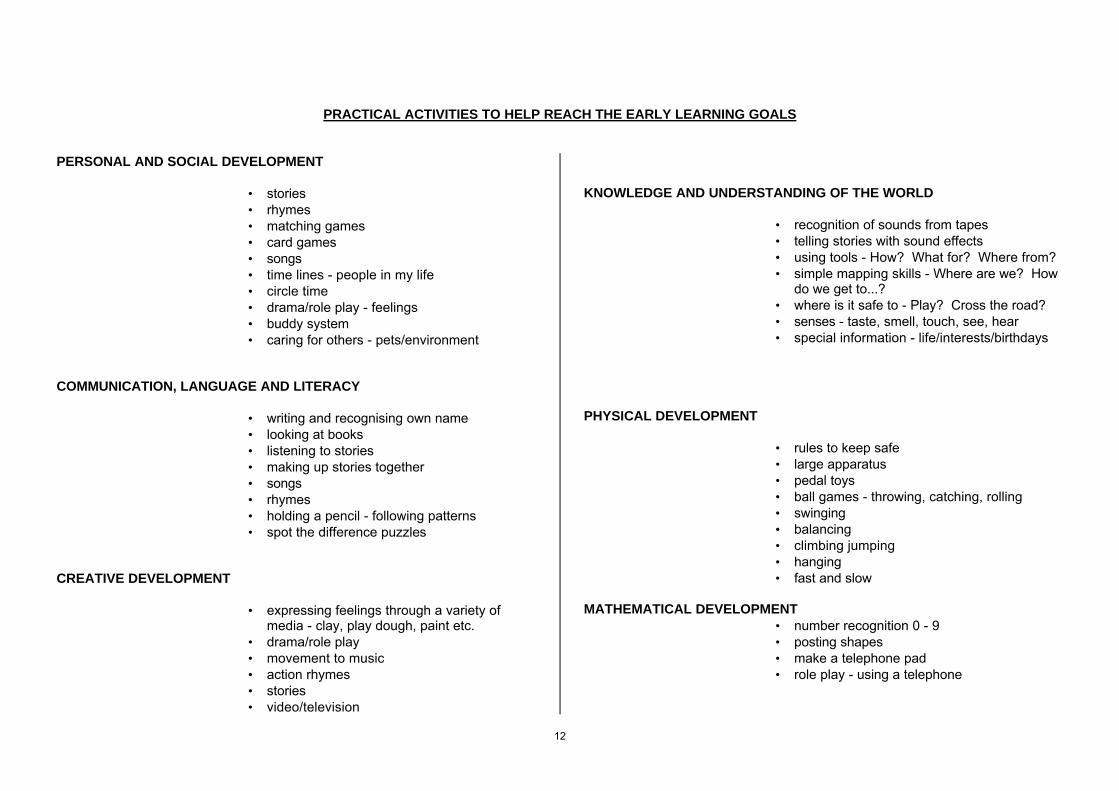
PRACTICAL ACTIVITIES TO HELP REACH THE EARLY LEARNING GOALS PERSONAL AND SOCIAL DEVELOPMENT
• stories • rhymes • matching games • card games • songs • time lines - people in my life • circle time • drama/role play - feelings • buddy system • caring for others - pets/environment
COMMUNICATION, LANGUAGE AND LITERACY
• writing and recognising own name • looking at books • listening to stories • making up stories together • songs • rhymes • holding a pencil - following patterns • spot the difference puzzles
CREATIVE DEVELOPMENT
• expressing feelings through a variety of media - clay, play dough, paint etc.
• drama/role play • movement to music • action rhymes • stories • video/television
KNOWLEDGE AND UNDERSTANDING OF THE WORLD
• recognition of sounds from tapes • telling stories with sound effects • using tools - How? What for? Where from? • simple mapping skills - Where are we? How
do we get to...? • where is it safe to - Play? Cross the road? • senses - taste, smell, touch, see, hear • special information - life/interests/birthdays
PHYSICAL DEVELOPMENT
• rules to keep safe • large apparatus • pedal toys • ball games - throwing, catching, rolling • swinging • balancing • climbing jumping • hanging • fast and slow
MATHEMATICAL DEVELOPMENT
• number recognition 0 - 9 • posting shapes • make a telephone pad • role play - using a telephone
12
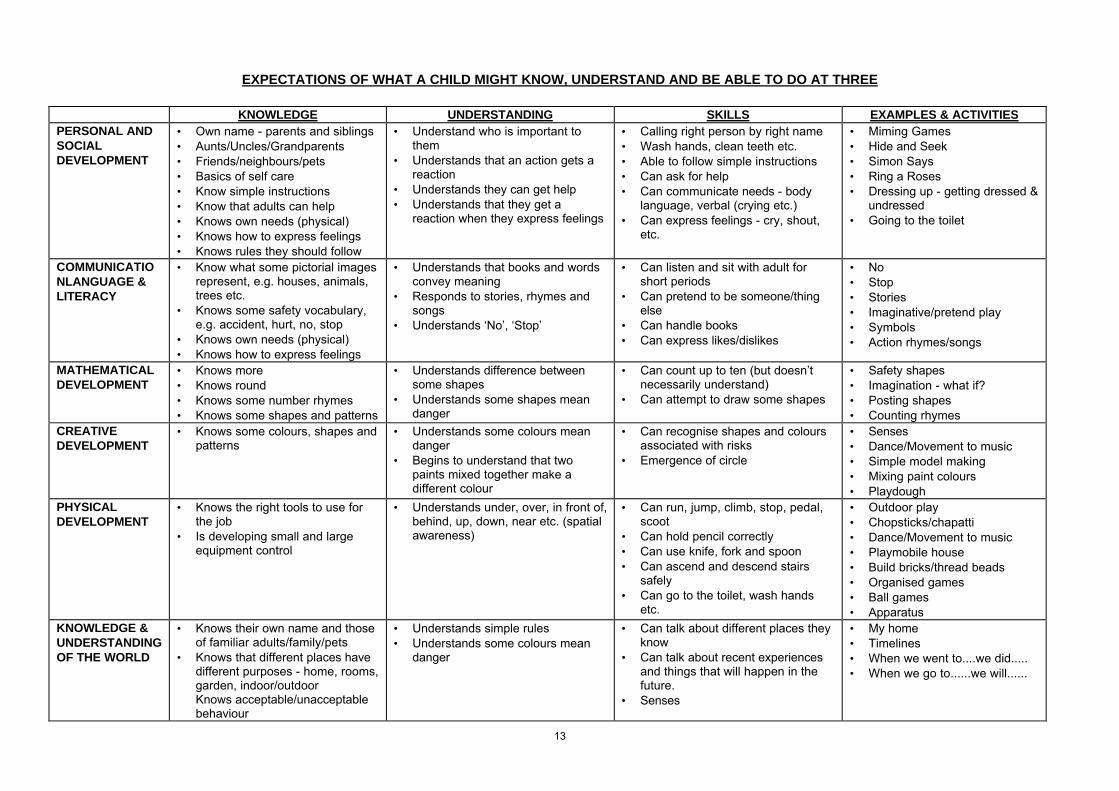
EXPECTATIONS OF WHAT A CHILD MIGHT KNOW, UNDERSTAND AND BE ABLE TO DO AT THREE
KNOWLEDGE UNDERSTANDING SKILLS EXAMPLES & ACTIVITIES PERSONAL AND SOCIAL DEVELOPMENT
• Own name - parents and siblings • Aunts/Uncles/Grandparents • Friends/neighbours/pets • Basics of self care • Know simple instructions • Know that adults can help • Knows own needs (physical) • Knows how to express feelings • Knows rules they should follow
• Understand who is important to them
• Understands that an action gets a reaction
• Understands they can get help • Understands that they get a
reaction when they express feelings
• Calling right person by right name • Wash hands, clean teeth etc. • Able to follow simple instructions • Can ask for help • Can communicate needs - body
language, verbal (crying etc.) • Can express feelings - cry, shout,
etc.
• Miming Games • Hide and Seek • Simon Says • Ring a Roses • Dressing up - getting dressed &
undressed • Going to the toilet
COMMUNICATIONLANGUAGE & LITERACY
• Know what some pictorial images represent, e.g. houses, animals, trees etc.
• Knows some safety vocabulary, e.g. accident, hurt, no, stop
• Knows own needs (physical) • Knows how to express feelings
• Understands that books and words convey meaning
• Responds to stories, rhymes and songs
• Understands ‘No’, ‘Stop’
• Can listen and sit with adult for short periods
• Can pretend to be someone/thing else
• Can handle books • Can express likes/dislikes
• No • Stop • Stories • Imaginative/pretend play • Symbols • Action rhymes/songs
MATHEMATICAL DEVELOPMENT
• Knows more • Knows round • Knows some number rhymes • Knows some shapes and patterns
• Understands difference between some shapes
• Understands some shapes mean danger
• Can count up to ten (but doesn’t necessarily understand)
• Can attempt to draw some shapes
• Safety shapes • Imagination - what if? • Posting shapes • Counting rhymes
CREATIVE DEVELOPMENT
• Knows some colours, shapes and patterns
• Understands some colours mean danger
• Begins to understand that two paints mixed together make a different colour
• Can recognise shapes and colours associated with risks
• Emergence of circle
• Senses • Dance/Movement to music • Simple model making • Mixing paint colours • Playdough
PHYSICAL DEVELOPMENT
• Knows the right tools to use for the job
• Is developing small and large equipment control
• Understands under, over, in front of, behind, up, down, near etc. (spatial awareness)
• Can run, jump, climb, stop, pedal, scoot
• Can hold pencil correctly • Can use knife, fork and spoon • Can ascend and descend stairs
safely • Can go to the toilet, wash hands
etc.
• Outdoor play • Chopsticks/chapatti • Dance/Movement to music • Playmobile house • Build bricks/thread beads • Organised games • Ball games • Apparatus
KNOWLEDGE & UNDERSTANDING OF THE WORLD
• Knows their own name and those of familiar adults/family/pets
• Knows that different places have different purposes - home, rooms, garden, indoor/outdoor
Knows acceptable/unacceptable behaviour
• Understands simple rules • Understands some colours mean
danger
• Can talk about different places they know
• Can talk about recent experiences and things that will happen in the future.
• Senses
• My home • Timelines • When we went to....we did..... • When we go to......we will......
13
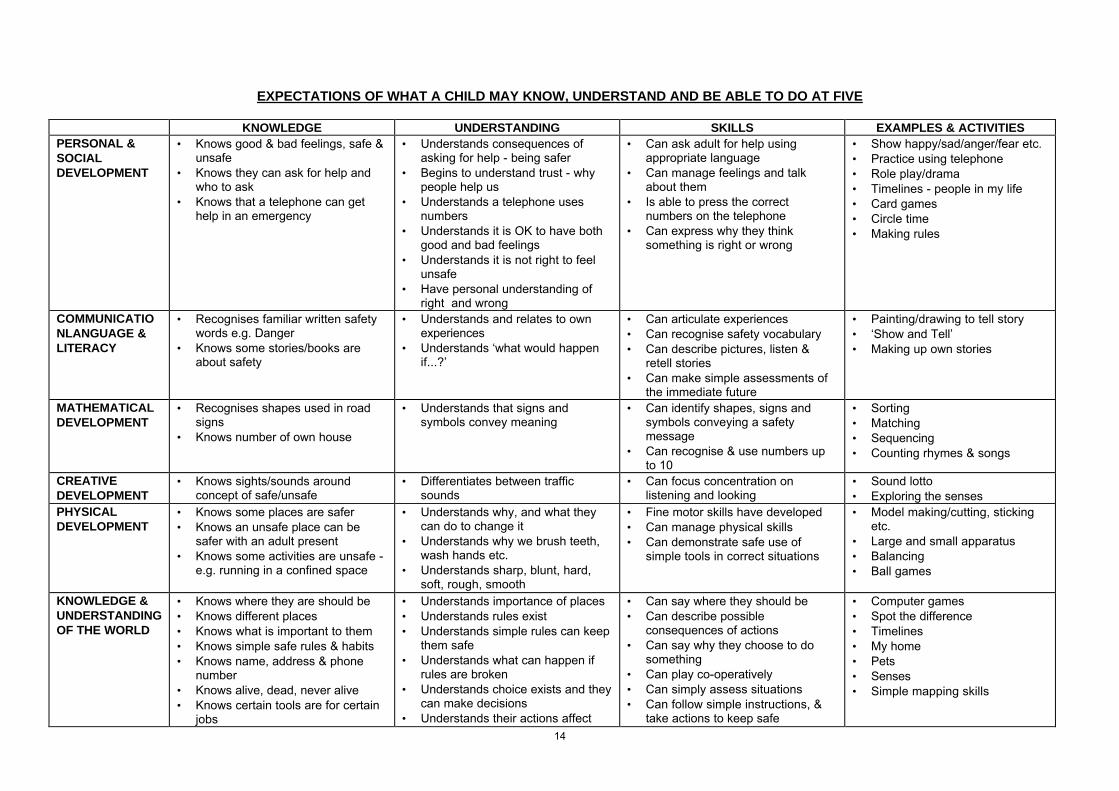
EXPECTATIONS OF WHAT A CHILD MAY KNOW, UNDERSTAND AND BE ABLE TO DO AT FIVE
KNOWLEDGE UNDERSTANDING SKILLS EXAMPLES & ACTIVITIES PERSONAL & SOCIAL DEVELOPMENT
• Knows good & bad feelings, safe & unsafe
• Knows they can ask for help and who to ask
• Knows that a telephone can get help in an emergency
• Understands consequences of asking for help - being safer
• Begins to understand trust - why people help us
• Understands a telephone uses numbers
• Understands it is OK to have both good and bad feelings
• Understands it is not right to feel unsafe
• Have personal understanding of right and wrong
• Can ask adult for help using appropriate language
• Can manage feelings and talk about them
• Is able to press the correct numbers on the telephone
• Can express why they think something is right or wrong
• Show happy/sad/anger/fear etc. • Practice using telephone • Role play/drama • Timelines - people in my life • Card games • Circle time • Making rules
COMMUNICATIONLANGUAGE & LITERACY
• Recognises familiar written safety words e.g. Danger
• Knows some stories/books are about safety
• Understands and relates to own experiences
• Understands ‘what would happen if...?’
• Can articulate experiences • Can recognise safety vocabulary • Can describe pictures, listen &
retell stories • Can make simple assessments of
the immediate future
• Painting/drawing to tell story • ‘Show and Tell’ • Making up own stories
MATHEMATICAL DEVELOPMENT
• Recognises shapes used in road signs
• Knows number of own house
• Understands that signs and symbols convey meaning
• Can identify shapes, signs and symbols conveying a safety message
• Can recognise & use numbers up to 10
• Sorting • Matching • Sequencing • Counting rhymes & songs
CREATIVE DEVELOPMENT
• Knows sights/sounds around concept of safe/unsafe
• Differentiates between traffic sounds
• Can focus concentration on listening and looking
• Sound lotto • Exploring the senses
PHYSICAL DEVELOPMENT
• Knows some places are safer • Knows an unsafe place can be
safer with an adult present • Knows some activities are unsafe -
e.g. running in a confined space
• Understands why, and what they can do to change it
• Understands why we brush teeth, wash hands etc.
• Understands sharp, blunt, hard, soft, rough, smooth
• Fine motor skills have developed • Can manage physical skills • Can demonstrate safe use of
simple tools in correct situations
• Model making/cutting, sticking etc.
• Large and small apparatus • Balancing • Ball games
KNOWLEDGE & UNDERSTANDING OF THE WORLD
• Knows where they are should be • Knows different places • Knows what is important to them • Knows simple safe rules & habits • Knows name, address & phone
number • Knows alive, dead, never alive • Knows certain tools are for certain
jobs
• Understands importance of places • Understands rules exist • Understands simple rules can keep
them safe • Understands what can happen if
rules are broken • Understands choice exists and they
can make decisions • Understands their actions affect
• Can say where they should be • Can describe possible
consequences of actions • Can say why they choose to do
something • Can play co-operatively • Can simply assess situations • Can follow simple instructions, &
take actions to keep safe
• Computer games • Spot the difference • Timelines • My home • Pets • Senses • Simple mapping skills
14
• Knows that some tools are not for them to use
and influence others • Can care for people, pets and belongings
15

16
TRAFFIC SAFETY FACTS

PREFACE
The Business, Transportation and Housing Agency is the lead agency for traffic safety in the State of California. It oversees the activities of the Office of Traffic Safety and Departments of California Highway Patrol, Transportation and Motor Vehicles. The California Highway Patrol has prepared the 2003 Annual Report of Fatal and Injury Motor Vehicle Traffic Collisions. This Report was completed as a result of motor vehicle traffic collision reports received from local police and sheriff jurisdictions and from California Highway Patrol field offices. The Statewide Integrated Traffic Records System (SWITRS) processes all reported fatal and injury collisions which occurred on California’s state highways and all other roadways, excluding private property. SWITRS, a 30 year old system, was re-engineered beginning with 2002 data. Due to changes in the program and the processing of traffic collision reports, 2003 data may contain some anomalies and may not be comparable to years prior to 2002. Property Damage Only (PDO) collisions are found in Sections 1 and 8 of this publication. PDOs are indicators of the volume of traffic collisions and are not exact statistics. This is due to some agencies reporting only partial numbers of their PDO collisions or none at all. This report is prepared in accordance with Section 2408 of the California Vehicle Code. The cooperation of all traffic law enforcement agencies is greatly appreciated. This report can also be viewed at the California Highway Patrol Internet Home Page at http://www.chp.ca.gov under “Publications.”
17
NHTSA’s National Center for Statistics and Analysis 400 Seventh St., SW., Washington, DC 20590
DOT HS 809 911
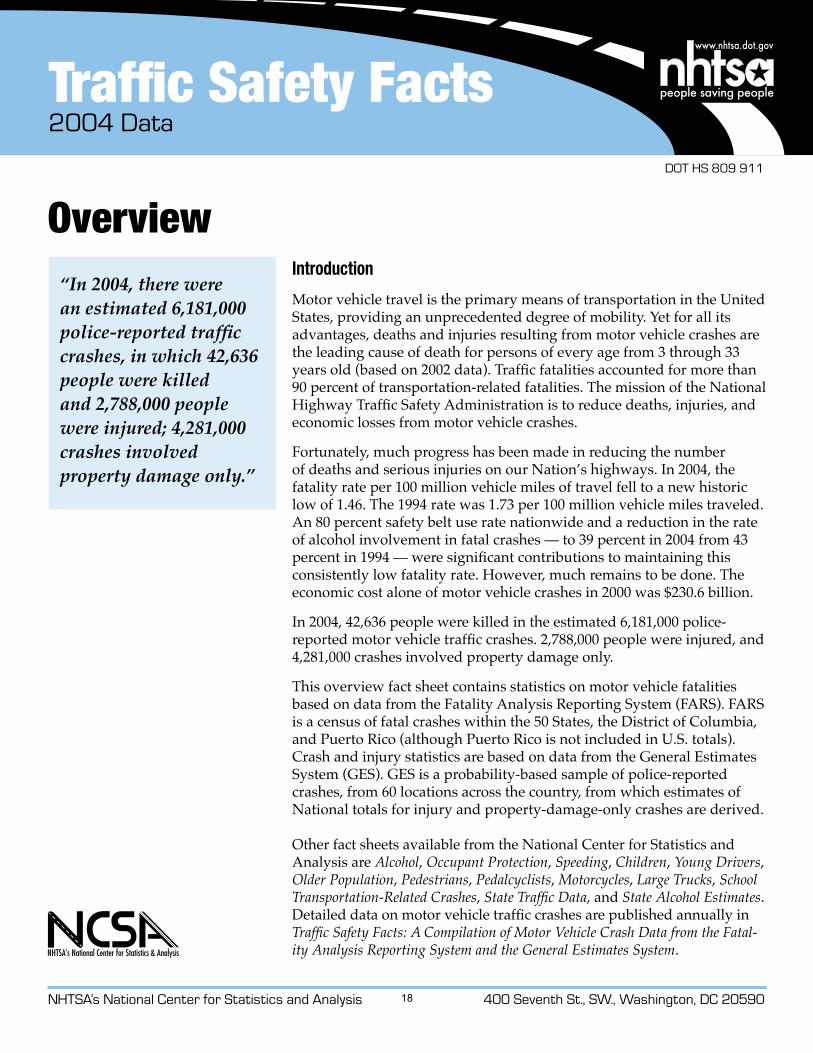
Overview“In 2004, there were an estimated 6,181,000 police-reported traffic crashes, in which 42,636 people were killed and 2,788,000 people were injured; 4,281,000 crashes involved property damage only.”
Traffic Safety Facts2004 Data
Introduction
Motor vehicle travel is the primary means of transportation in the United States, providing an unprecedented degree of mobility. Yet for all its advantages, deaths and injuries resulting from motor vehicle crashes are the leading cause of death for persons of every age from 3 through 33 years old (based on 2002 data). Traffic fatalities accounted for more than 90 percent of transportation-related fatalities. The mission of the National Highway Traffic Safety Administration is to reduce deaths, injuries, and economic losses from motor vehicle crashes.
Fortunately, much progress has been made in reducing the number of deaths and serious injuries on our Nation’s highways. In 2004, the fatality rate per 100 million vehicle miles of travel fell to a new historic low of 1.46. The 1994 rate was 1.73 per 100 million vehicle miles traveled. An 80 percent safety belt use rate nationwide and a reduction in the rate of alcohol involvement in fatal crashes — to 39 percent in 2004 from 43 percent in 1994 — were significant contributions to maintaining this consistently low fatality rate. However, much remains to be done. The economic cost alone of motor vehicle crashes in 2000 was $230.6 billion.
In 2004, 42,636 people were killed in the estimated 6,181,000 police-reported motor vehicle traffic crashes. 2,788,000 people were injured, and 4,281,000 crashes involved property damage only.
This overview fact sheet contains statistics on motor vehicle fatalities based on data from the Fatality Analysis Reporting System (FARS). FARS is a census of fatal crashes within the 50 States, the District of Columbia, and Puerto Rico (although Puerto Rico is not included in U.S. totals). Crash and injury statistics are based on data from the General Estimates System (GES). GES is a probability-based sample of police-reported crashes, from 60 locations across the country, from which estimates of National totals for injury and property-damage-only crashes are derived.
Other fact sheets available from the National Center for Statistics and Analysis are Alcohol, Occupant Protection, Speeding, Children, Young Drivers, Older Population, Pedestrians, Pedalcyclists, Motorcycles, Large Trucks, School Transportation-Related Crashes, State Traffic Data, and State Alcohol Estimates. Detailed data on motor vehicle traffic crashes are published annually in Traffic Safety Facts: A Compilation of Motor Vehicle Crash Data from the Fatal-ity Analysis Reporting System and the General Estimates System.
18
NHTSA’s National Center for Statistics and Analysis 400 Seventh St., SW., Washington, DC 20590
�
“An average of 117 people died each day in motor vehicle crashes in 2004 — one every 12 minutes.”
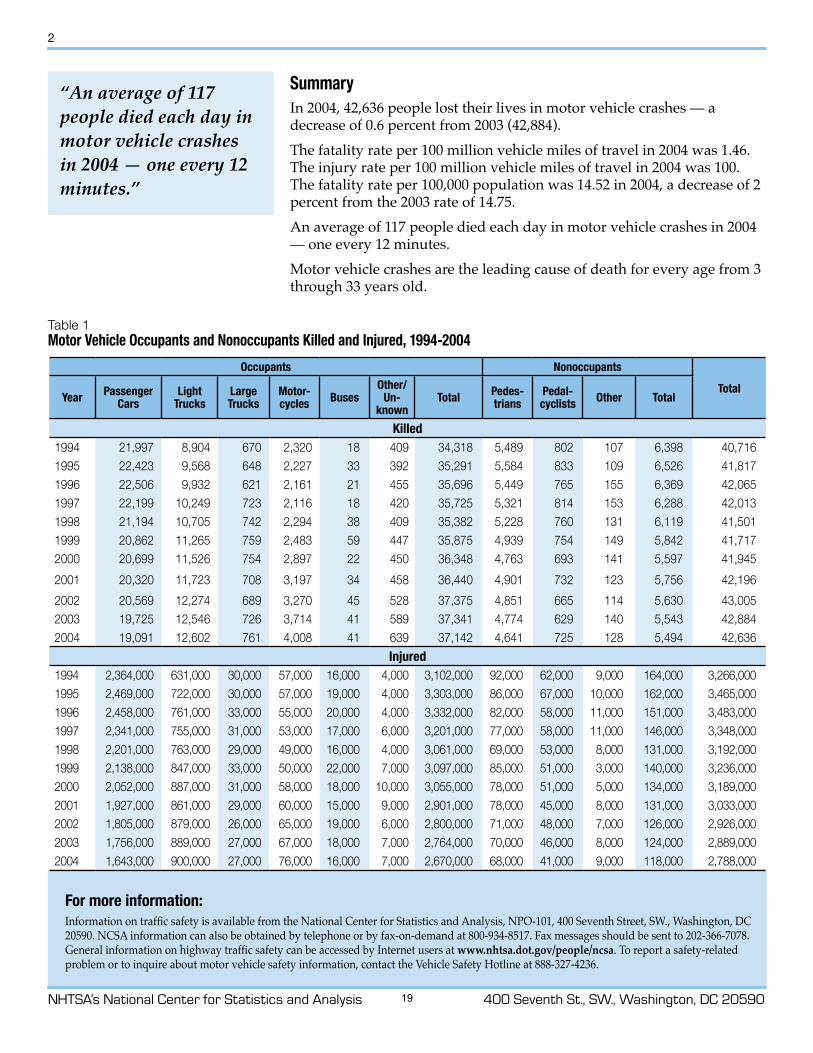
SummaryIn 2004, 42,636 people lost their lives in motor vehicle crashes — a decrease of 0.6 percent from 2003 (42,884).The fatality rate per 100 million vehicle miles of travel in 2004 was 1.46. The injury rate per 100 million vehicle miles of travel in 2004 was 100. The fatality rate per 100,000 population was 14.52 in 2004, a decrease of 2 percent from the 2003 rate of 14.75.An average of 117 people died each day in motor vehicle crashes in 2004 — one every 12 minutes.Motor vehicle crashes are the leading cause of death for every age from 3 through 33 years old.
Occupants Nonoccupants
TotalYear Passenger
CarsLight
Trucks Large Trucks
Motor-cycles Buses
Other/ Un-
known Total Pedes-
trians Pedal-cyclists Other Total
Killed1994 21,997 8,904 670 2,320 18 409 34,318 5,489 802 107 6,398 40,7161995 22,423 9,568 648 2,227 33 392 35,291 5,584 833 109 6,526 41,8171996 22,506 9,932 621 2,161 21 455 35,696 5,449 765 155 6,369 42,0651997 22,199 10,249 723 2,116 18 420 35,725 5,321 814 153 6,288 42,0131998 21,194 10,705 742 2,294 38 409 35,382 5,228 760 131 6,119 41,5011999 20,862 11,265 759 2,483 59 447 35,875 4,939 754 149 5,842 41,7172000 20,699 11,526 754 2,897 22 450 36,348 4,763 693 141 5,597 41,945
2001 20,320 11,723 708 3,197 34 458 36,440 4,901 732 123 5,756 42,196
2002 20,569 12,274 689 3,270 45 528 37,375 4,851 665 114 5,630 43,0052003 19,725 12,546 726 3,714 41 589 37,341 4,774 629 140 5,543 42,8842004 19,091 12,602 761 4,008 41 639 37,142 4,641 725 128 5,494 42,636
Injured1994 2,364,000 631,000 30,000 57,000 16,000 4,000 3,102,000 92,000 62,000 9,000 164,000 3,266,0001995 2,469,000 722,000 30,000 57,000 19,000 4,000 3,303,000 86,000 67,000 10,000 162,000 3,465,0001996 2,458,000 761,000 33,000 55,000 20,000 4,000 3,332,000 82,000 58,000 11,000 151,000 3,483,0001997 2,341,000 755,000 31,000 53,000 17,000 6,000 3,201,000 77,000 58,000 11,000 146,000 3,348,0001998 2,201,000 763,000 29,000 49,000 16,000 4,000 3,061,000 69,000 53,000 8,000 131,000 3,192,0001999 2,138,000 847,000 33,000 50,000 22,000 7,000 3,097,000 85,000 51,000 3,000 140,000 3,236,0002000 2,052,000 887,000 31,000 58,000 18,000 10,000 3,055,000 78,000 51,000 5,000 134,000 3,189,0002001 1,927,000 861,000 29,000 60,000 15,000 9,000 2,901,000 78,000 45,000 8,000 131,000 3,033,0002002 1,805,000 879,000 26,000 65,000 19,000 6,000 2,800,000 71,000 48,000 7,000 126,000 2,926,0002003 1,756,000 889,000 27,000 67,000 18,000 7,000 2,764,000 70,000 46,000 8,000 124,000 2,889,0002004 1,643,000 900,000 27,000 76,000 16,000 7,000 2,670,000 68,000 41,000 9,000 118,000 2,788,000
For more information:Information on traffic safety is available from the National Center for Statistics and Analysis, NPO-101, 400 Seventh Street, SW., Washington, DC 20590. NCSA information can also be obtained by telephone or by fax-on-demand at 800-934-8517. Fax messages should be sent to 202-366-7078. General information on highway traffic safety can be accessed by Internet users at www.nhtsa.dot.gov/people/ncsa. To report a safety-related problem or to inquire about motor vehicle safety information, contact the Vehicle Safety Hotline at 888-327-4236.
Table 1 Motor Vehicle Occupants and Nonoccupants Killed and Injured, 1994-2004
19
NHTSA’s National Center for Statistics and Analysis 400 Seventh St., SW., Washington, DC 20590
�
“NHTSA estimates that 15,434 lives were saved in 2004 by the use of safety belts.”
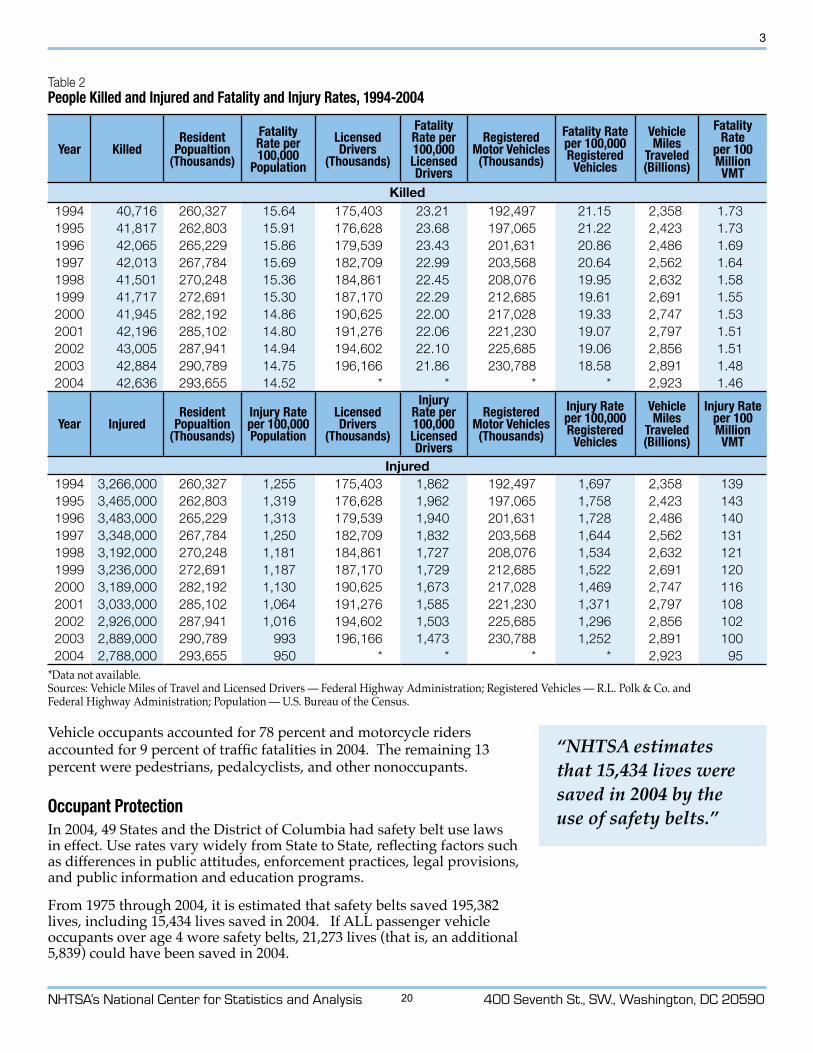
Vehicle occupants accounted for 78 percent and motorcycle riders accounted for 9 percent of traffic fatalities in 2004. The remaining 13 percent were pedestrians, pedalcyclists, and other nonoccupants.
Occupant ProtectionIn 2004, 49 States and the District of Columbia had safety belt use laws in effect. Use rates vary widely from State to State, reflecting factors such as differences in public attitudes, enforcement practices, legal provisions, and public information and education programs.
From 1975 through 2004, it is estimated that safety belts saved 195,382 lives, including 15,434 lives saved in 2004. If ALL passenger vehicle occupants over age 4 wore safety belts, 21,273 lives (that is, an additional 5,839) could have been saved in 2004.
Table 2 People Killed and Injured and Fatality and Injury Rates, 1994-2004
Year KilledResident
Popualtion (Thousands)
Fatality Rate per 100,000
Population
Licensed Drivers
(Thousands)
Fatality Rate per 100,000 Licensed Drivers
Registered Motor Vehicles (Thousands)
Fatality Rate per 100,000 Registered
Vehicles
Vehicle Miles
Traveled (Billions)
Fatality Rate
per 100 Million VMT
Killed1994 40,716 260,327 15.64 175,403 23.21 192,497 21.15 2,358 1.731995 41,817 262,803 15.91 176,628 23.68 197,065 21.22 2,423 1.731996 42,065 265,229 15.86 179,539 23.43 201,631 20.86 2,486 1.691997 42,013 267,784 15.69 182,709 22.99 203,568 20.64 2,562 1.641998 41,501 270,248 15.36 184,861 22.45 208,076 19.95 2,632 1.581999 41,717 272,691 15.30 187,170 22.29 212,685 19.61 2,691 1.552000 41,945 282,192 14.86 190,625 22.00 217,028 19.33 2,747 1.532001 42,196 285,102 14.80 191,276 22.06 221,230 19.07 2,797 1.512002 43,005 287,941 14.94 194,602 22.10 225,685 19.06 2,856 1.512003 42,884 290,789 14.75 196,166 21.86 230,788 18.58 2,891 1.482004 42,636 293,655 14.52 * * * * 2,923 1.46
Year InjuredResident
Popualtion (Thousands)
Injury Rate per 100,000 Population
Licensed Drivers
(Thousands)
Injury Rate per 100,000 Licensed Drivers
Registered Motor Vehicles (Thousands)
Injury Rate per 100,000 Registered
Vehicles
Vehicle Miles
Traveled (Billions)
Injury Rate per 100 Million VMT
Injured1994 3,266,000 260,327 1,255 175,403 1,862 192,497 1,697 2,358 1391995 3,465,000 262,803 1,319 176,628 1,962 197,065 1,758 2,423 1431996 3,483,000 265,229 1,313 179,539 1,940 201,631 1,728 2,486 1401997 3,348,000 267,784 1,250 182,709 1,832 203,568 1,644 2,562 1311998 3,192,000 270,248 1,181 184,861 1,727 208,076 1,534 2,632 1211999 3,236,000 272,691 1,187 187,170 1,729 212,685 1,522 2,691 1202000 3,189,000 282,192 1,130 190,625 1,673 217,028 1,469 2,747 1162001 3,033,000 285,102 1,064 191,276 1,585 221,230 1,371 2,797 1082002 2,926,000 287,941 1,016 194,602 1,503 225,685 1,296 2,856 1022003 2,889,000 290,789 993 196,166 1,473 230,788 1,252 2,891 1002004 2,788,000 293,655 950 * * * * 2,923 95
*Data not available. Sources: Vehicle Miles of Travel and Licensed Drivers — Federal Highway Administration; Registered Vehicles — R.L. Polk & Co. and Federal Highway Administration; Population — U.S. Bureau of the Census.
20
NHTSA’s National Center for Statistics and Analysis 400 Seventh St., SW., Washington, DC 20590
�
“Alcohol-related traffic fatalities fell to 16,694 in 2004 —39 percent of all traffic fatalities for the year.”
In 2004, an estimated 451 children under the age of 5 were saved as a result of child restraint use. An estimated 7,472 lives were saved by child restraints from 1975 through 2004.
Children in rear-facing child safety seats should not be placed in the front seat of vehicles equipped with passenger-side air bags. The impact of a deploying air bag striking a rear-facing child safety seat could result in injury to the child. NHTSA also recommends that children 12 and younger sit in the rear seat away from the force of a deploying air bag.
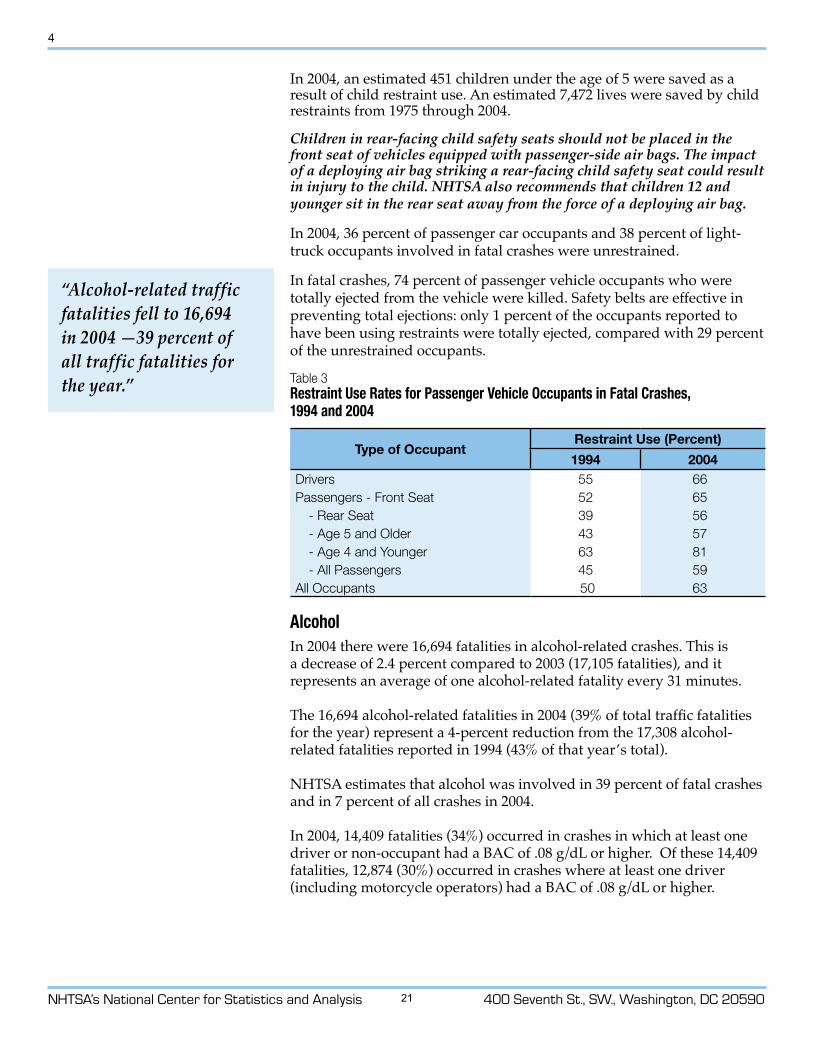
In 2004, 36 percent of passenger car occupants and 38 percent of light-truck occupants involved in fatal crashes were unrestrained.
In fatal crashes, 74 percent of passenger vehicle occupants who were totally ejected from the vehicle were killed. Safety belts are effective in preventing total ejections: only 1 percent of the occupants reported to have been using restraints were totally ejected, compared with 29 percent of the unrestrained occupants.
AlcoholIn 2004 there were 16,694 fatalities in alcohol-related crashes. This is a decrease of 2.4 percent compared to 2003 (17,105 fatalities), and it represents an average of one alcohol-related fatality every 31 minutes.
The 16,694 alcohol-related fatalities in 2004 (39% of total traffic fatalities for the year) represent a 4-percent reduction from the 17,308 alcohol-related fatalities reported in 1994 (43% of that year’s total).
NHTSA estimates that alcohol was involved in 39 percent of fatal crashes and in 7 percent of all crashes in 2004.
In 2004, 14,409 fatalities (34%) occurred in crashes in which at least one driver or non-occupant had a BAC of .08 g/dL or higher. Of these 14,409 fatalities, 12,874 (30%) occurred in crashes where at least one driver (including motorcycle operators) had a BAC of .08 g/dL or higher.
Table 3 Restraint Use Rates for Passenger Vehicle Occupants in Fatal Crashes, 1994 and 2004
Type of OccupantRestraint Use (Percent)
1994 2004Drivers 55 66Passengers - Front Seat 52 65 - Rear Seat 39 56 - Age 5 and Older 43 57 - Age 4 and Younger 63 81 - All Passengers 45 59All Occupants 50 63
21
NHTSA’s National Center for Statistics and Analysis 400 Seventh St., SW., Washington, DC 20590
�
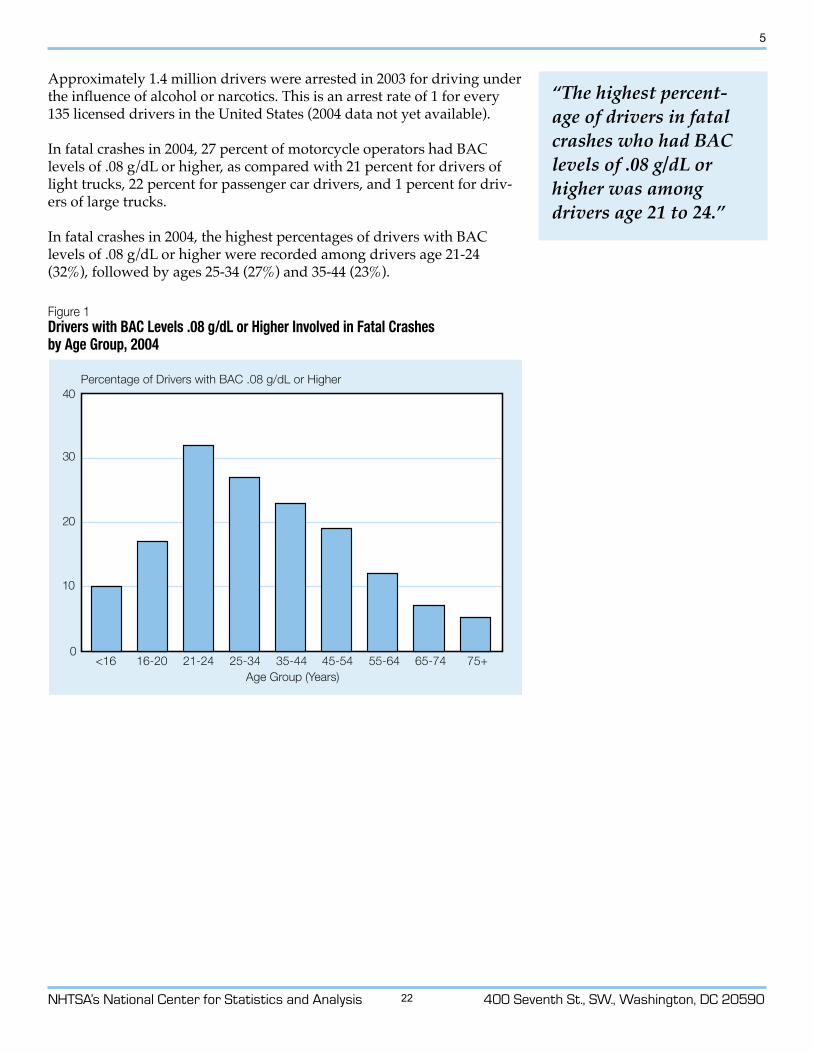
“The highest percent-age of drivers in fatal crashes who had BAC levels of .08 g/dL or higher was among drivers age 21 to 24.”
40
30
20
10
016-20
Percentage of Drivers with BAC .08 g/dL or Higher
<16 21-24 25-34 35-44Age Group (Years)
45-54 55-64 65-74 75+
Approximately 1.4 million drivers were arrested in 2003 for driving under the influence of alcohol or narcotics. This is an arrest rate of 1 for every 135 licensed drivers in the United States (2004 data not yet available).
In fatal crashes in 2004, 27 percent of motorcycle operators had BAC levels of .08 g/dL or higher, as compared with 21 percent for drivers of light trucks, 22 percent for passenger car drivers, and 1 percent for driv-ers of large trucks.
In fatal crashes in 2004, the highest percentages of drivers with BAC levels of .08 g/dL or higher were recorded among drivers age 21-24 (32%), followed by ages 25-34 (27%) and 35-44 (23%).
Figure 1 Drivers with BAC Levels .08 g/dL or Higher Involved in Fatal Crashes by Age Group, 2004
22
NHTSA’s National Center for Statistics and Analysis 400 Seventh St., SW., Washington, DC 20590
�
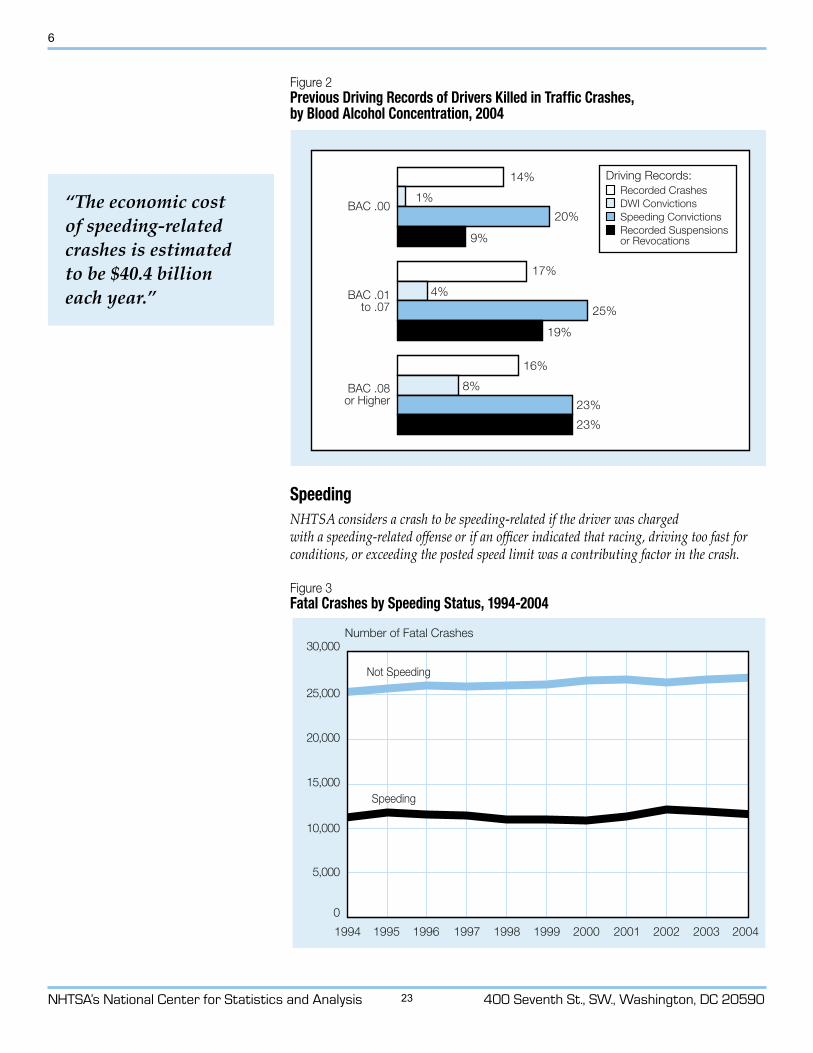
Figure 2 Previous Driving Records of Drivers Killed in Traffic Crashes, by Blood Alcohol Concentration, 2004
“The economic cost of speeding-related crashes is estimated to be $40.4 billion each year.”
20041995 1996 1997 1998 1999 2000 2001 2002 20031994
30,000Number of Fatal Crashes
15,000
10,000
5,000
0
Not Speeding
Speeding
25,000
20,000
BAC .01to .07
BAC .08or Higher
BAC .00
23%
8%
4%
17%
25%
16%
9%
20%
1%
14%Recorded CrashesDWI ConvictionsSpeeding ConvictionsRecorded Suspensionsor Revocations
Driving Records:
23%
19%
SpeedingNHTSA considers a crash to be speeding-related if the driver was charged with a speeding-related offense or if an officer indicated that racing, driving too fast for conditions, or exceeding the posted speed limit was a contributing factor in the crash.
Figure 3 Fatal Crashes by Speeding Status, 1994-2004
23
NHTSA’s National Center for Statistics and Analysis 400 Seventh St., SW., Washington, DC 20590
�
“In 2004, 38 percent of male drivers age 15 to 20 who were involved in fatal crashes were speeding.”
“Per vehicle mile traveled, motorcyclists were 32 times more likely than passenger car occupants to die in a traffic crash.”
25
30
35
40
20
15
10
021-24
Percent Speeding
15-20 25-34 35-44 45-54 55-64 65-74 75+Age Group (Years)
Females Males
5
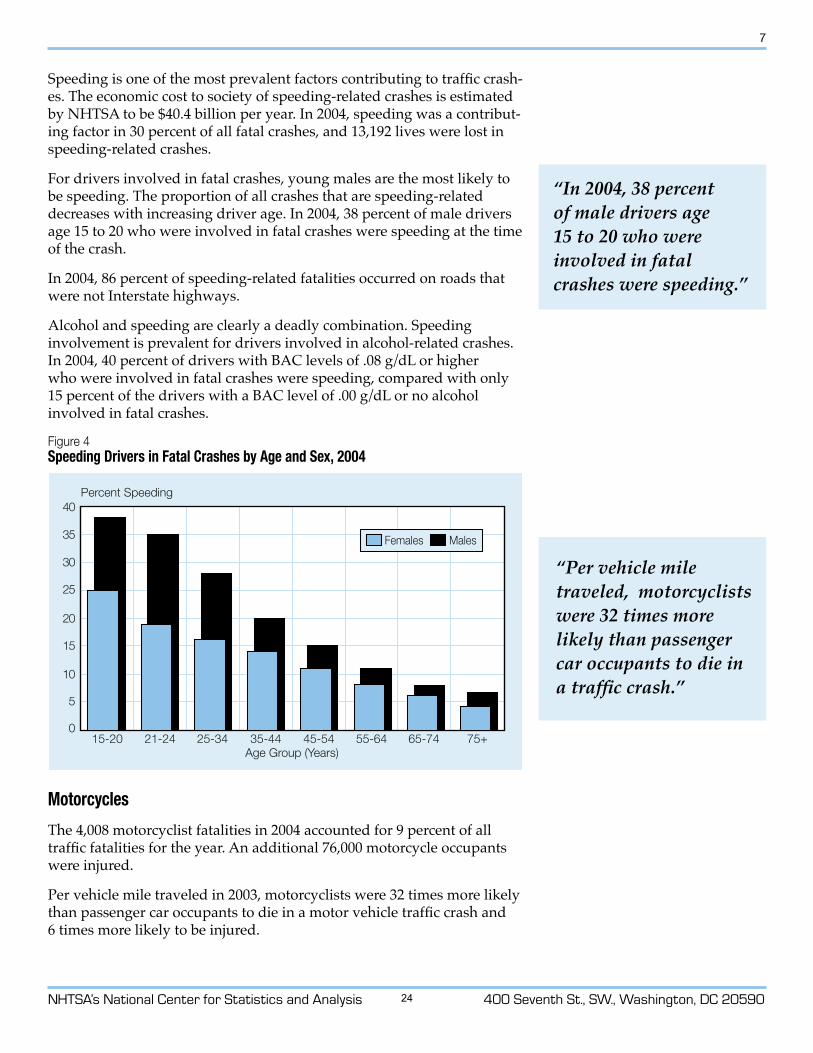
Speeding is one of the most prevalent factors contributing to traffic crash-es. The economic cost to society of speeding-related crashes is estimated by NHTSA to be $40.4 billion per year. In 2004, speeding was a contribut-ing factor in 30 percent of all fatal crashes, and 13,192 lives were lost in speeding-related crashes.
For drivers involved in fatal crashes, young males are the most likely to be speeding. The proportion of all crashes that are speeding-related decreases with increasing driver age. In 2004, 38 percent of male drivers age 15 to 20 who were involved in fatal crashes were speeding at the time of the crash.
In 2004, 86 percent of speeding-related fatalities occurred on roads that were not Interstate highways.
Alcohol and speeding are clearly a deadly combination. Speeding involvement is prevalent for drivers involved in alcohol-related crashes. In 2004, 40 percent of drivers with BAC levels of .08 g/dL or higher who were involved in fatal crashes were speeding, compared with only 15 percent of the drivers with a BAC level of .00 g/dL or no alcohol involved in fatal crashes.
Figure 4 Speeding Drivers in Fatal Crashes by Age and Sex, 2004
Motorcycles
The 4,008 motorcyclist fatalities in 2004 accounted for 9 percent of all traffic fatalities for the year. An additional 76,000 motorcycle occupants were injured.
Per vehicle mile traveled in 2003, motorcyclists were 32 times more likely than passenger car occupants to die in a motor vehicle traffic crash and 6 times more likely to be injured.
24
NHTSA’s National Center for Statistics and Analysis 400 Seventh St., SW., Washington, DC 20590
�
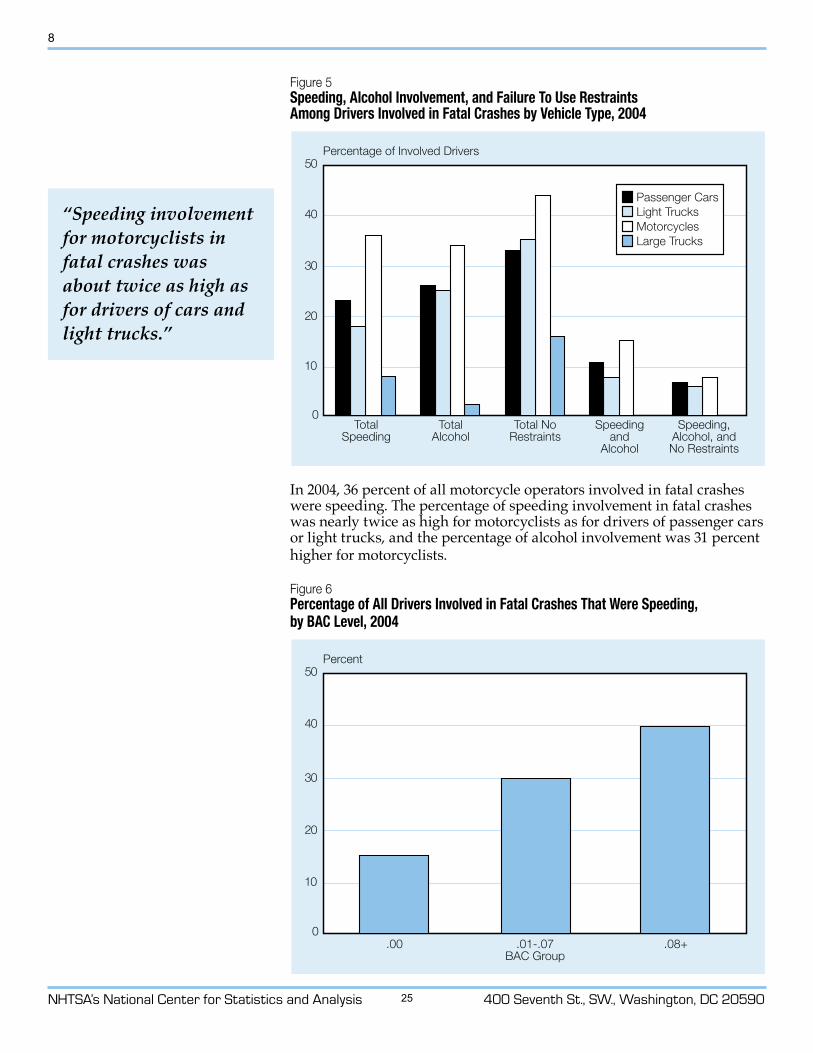
Figure 5 Speeding, Alcohol Involvement, and Failure To Use Restraints Among Drivers Involved in Fatal Crashes by Vehicle Type, 2004
In 2004, 36 percent of all motorcycle operators involved in fatal crashes were speeding. The percentage of speeding involvement in fatal crashes was nearly twice as high for motorcyclists as for drivers of passenger cars or light trucks, and the percentage of alcohol involvement was 31 percent higher for motorcyclists.
Figure 6 Percentage of All Drivers Involved in Fatal Crashes That Were Speeding, by BAC Level, 2004
“Speeding involvement for motorcyclists in fatal crashes was about twice as high as for drivers of cars and light trucks.”
40
30
20
10
0
Percentage of Involved Drivers
TotalSpeeding
TotalAlcohol
Total NoRestraints
Speedingand
Alcohol
Speeding,Alcohol, andNo Restraints
50
Passenger CarsLight TrucksMotorcyclesLarge Trucks
40
30
20
10
0
Percent
.00 .01-.07BAC Group
.08+
50
25
NHTSA’s National Center for Statistics and Analysis 400 Seventh St., SW., Washington, DC 20590
�
“One out of eight traffic fatalities in 2004 resulted from a collision involving a large truck.”
In 2004, 44 percent of fatally injured motorcycle operators and 53 percent of fatally injured passengers were not wearing helmets at the time of the crash.
Nearly one out of four motorcycle operators (24 percent) involved in fatal crashes in 2004 was operating the vehicle with an invalid license at the time of the collision.
The percentage of motorcycle operators involved in fatal crashes in 2004 who had BAC levels of .08 g/dL or higher — 27 percent — was higher than for any other type of motor vehicle driver.
NHTSA estimates that helmets saved the lives of 1,173 motorcyclists in 2004. If all motorcyclists had worn helmets, an additional 671 lives could have been saved.
Large Trucks
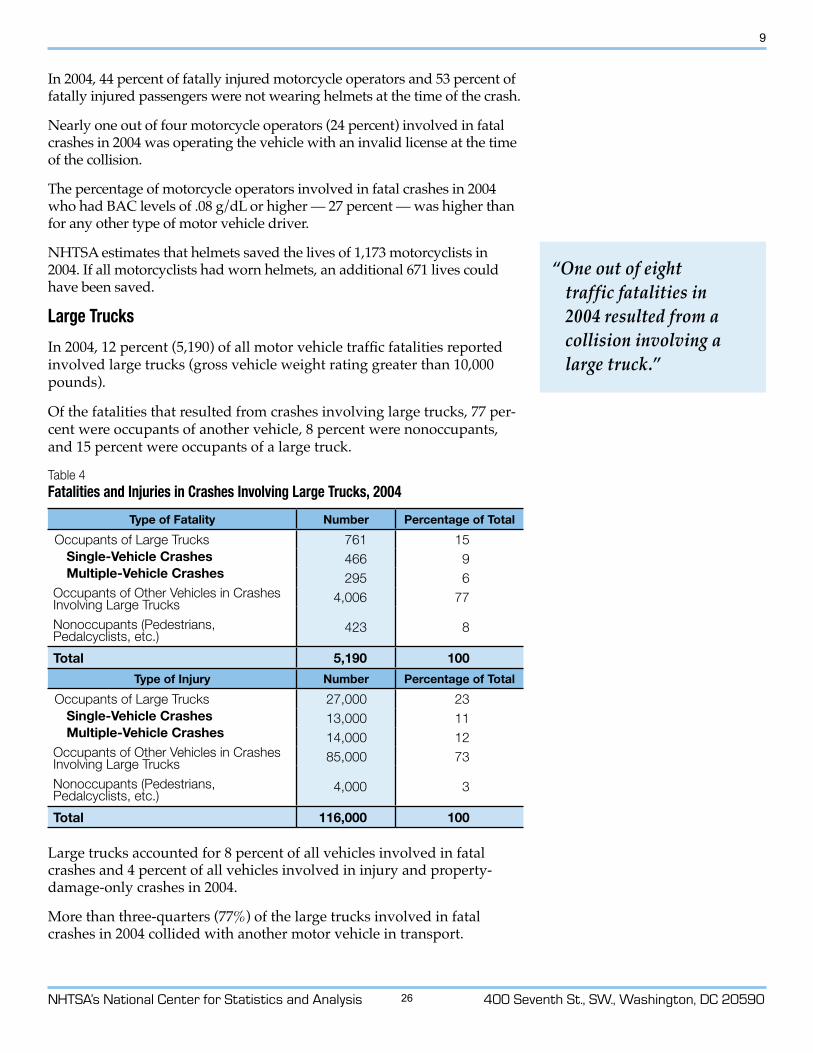
In 2004, 12 percent (5,190) of all motor vehicle traffic fatalities reported involved large trucks (gross vehicle weight rating greater than 10,000 pounds).
Of the fatalities that resulted from crashes involving large trucks, 77 per-cent were occupants of another vehicle, 8 percent were nonoccupants, and 15 percent were occupants of a large truck.
Table 4 Fatalities and Injuries in Crashes Involving Large Trucks, 2004
Type of Fatality Number Percentage of Total
Occupants of Large TrucksSingle-Vehicle CrashesMultiple-Vehicle Crashes
Occupants of Other Vehicles in Crashes Involving Large Trucks
Nonoccupants (Pedestrians, Pedalcyclists, etc.)
761 15466 9295 6
4,006 77
423 8
Total 5,190 100
Type of Injury Number Percentage of Total
Occupants of Large TrucksSingle-Vehicle Crashes Multiple-Vehicle Crashes
Occupants of Other Vehicles in Crashes Involving Large Trucks
Nonoccupants (Pedestrians, Pedalcyclists, etc.)
27,000 2313,000 1114,000 1285,000 73
4,000 3
Total 116,000 100
Large trucks accounted for 8 percent of all vehicles involved in fatal crashes and 4 percent of all vehicles involved in injury and property-damage-only crashes in 2004.
More than three-quarters (77%) of the large trucks involved in fatal crashes in 2004 collided with another motor vehicle in transport.
26
NHTSA’s National Center for Statistics and Analysis 400 Seventh St., SW., Washington, DC 20590
10
“Ejection from a vehicle accounted for 27 percent of all passenger vehicle occupant fatalities.”
“More than half of passenger vehicle occupants killed in traffic crashes in 2004 were unrestrained.”
Nonrollover
Rollover
Head-on
Angle
Other/Unknown
Sideswipe
Rear-end
Pedalcyclists
Pedestrians
Other Nonoccupants
4,6415,489
725802
128107
9,0537,741
9,2358,256
9,3478,607
5,2237,013
2,3031,954
9180
1,063747
19942004
12,00010,0008,0006,0004,0002,0000
Only 1 percent of the drivers of large trucks involved in fatal crashes in 2004 had BAC levels .08 g/dL or higher, compared with 22 percent for pas-senger cars, 21 percent for light trucks, and 27 percent for motorcycles.
Cars, Light Trucks, and VansIn 2004, 31,693 occupants of passenger vehicles were killed in traffic crashes and an additional 2,543,000 were injured, accounting for 85 percent of all occupant fatalities (51% in passsenger cars and 34% in light trucks and vans) and 95 percent of all occupants injured (62% in passenger cars and 34% in light trucks and vans).
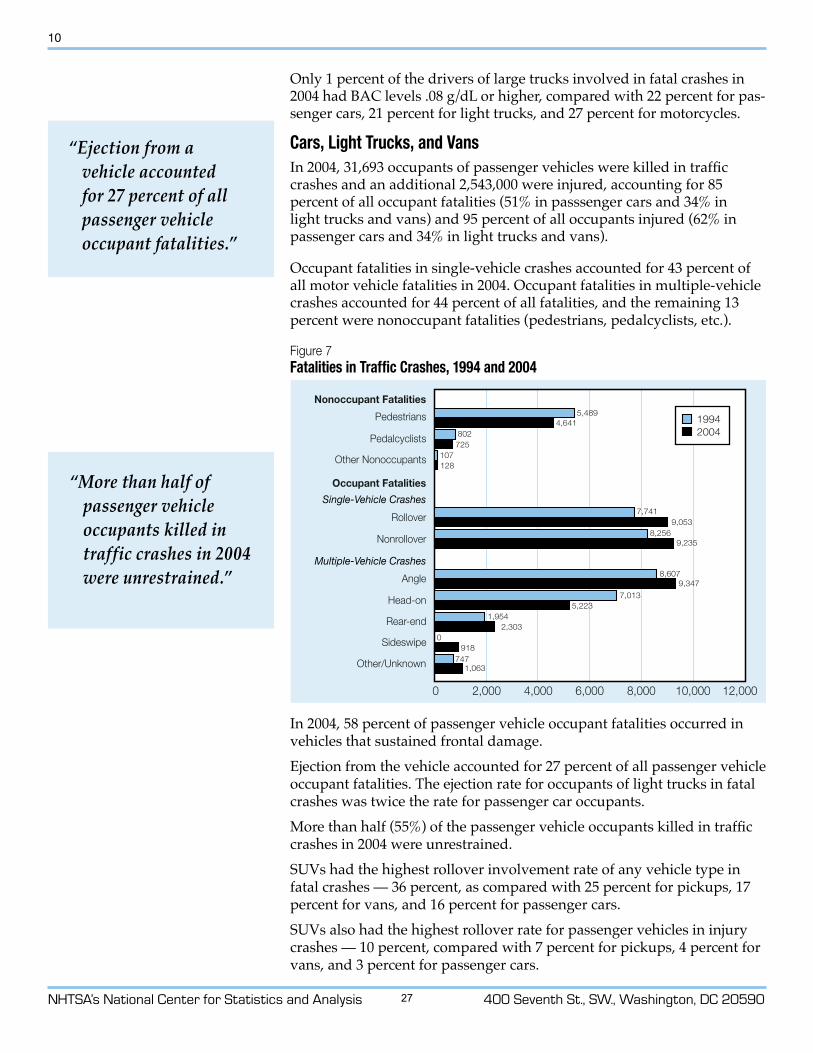
Occupant fatalities in single-vehicle crashes accounted for 43 percent of all motor vehicle fatalities in 2004. Occupant fatalities in multiple-vehicle crashes accounted for 44 percent of all fatalities, and the remaining 13 percent were nonoccupant fatalities (pedestrians, pedalcyclists, etc.).
Figure 7 Fatalities in Traffic Crashes, 1994 and 2004
In 2004, 58 percent of passenger vehicle occupant fatalities occurred in vehicles that sustained frontal damage.Ejection from the vehicle accounted for 27 percent of all passenger vehicle occupant fatalities. The ejection rate for occupants of light trucks in fatal crashes was twice the rate for passenger car occupants.More than half (55%) of the passenger vehicle occupants killed in traffic crashes in 2004 were unrestrained.SUVs had the highest rollover involvement rate of any vehicle type in fatal crashes — 36 percent, as compared with 25 percent for pickups, 17 percent for vans, and 16 percent for passenger cars.SUVs also had the highest rollover rate for passenger vehicles in injury crashes — 10 percent, compared with 7 percent for pickups, 4 percent for vans, and 3 percent for passenger cars.
27
NHTSA’s National Center for Statistics and Analysis 400 Seventh St., SW., Washington, DC 20590
11
“In 2004, older people accounted for 12 percent of all traffic fatalities and 16 percent of all pedestrian fatalities.”
“Males accounted for 69 percent of all traffic fatalities, 69 percent of all pedestrian fatalities, and 87 percent of all pedalcyclist fatalities in 2004.”
Driver AgeThere are over 26 million people age 70 and older in the United States. In 2004, this age group made up 9 percent of the total U.S. resident popula-tion, compared with 8.9 percent in 1994. From 1994 to 2004, the growth rate for this older segment of the population was 4 percent higher than the growth rate of the total population.
In 2004, 141,000 older individuals were injured in traffic crashes, account-ing for 5 percent of all the people injured in traffic crashes during the year. These older individuals made up 12 percent of all traffic fatalities, 11 percent of all vehicle occupant fatalities, and 16 percent of all pedes-trian fatalities.
The percentage of older drivers involved in fatal crashes in 2004 who had BAC levels of .08 g/dL or higher (5%) was lower than for any other group of adult drivers.
In two-vehicle fatal crashes involving an older driver and a younger driver, the vehicle driven by the older person was twice as likely to be the one that was struck (64% and 29%, respectively). In 44 percent of these crashes, both vehicles were proceeding straight at the time of the collision. In 27 percent, the older driver was turning left — 7 times more often than the younger driver.
YouthIn 2004, 16- to 24-year-olds represented 24 percent of all traffic fatalities, compared with 6 percent for age 15 and younger, 45 percent for ages 25 to 54, and 24 percent for ages 55 and older.
On a per population basis, drivers under the age of 25 had the highest rate of involvement in fatal crashes of any age group.
In 2004, 17 percent of 16- to 20-year-old drivers involved in fatal crashes had BAC levels of .08 g/dL or higher. The highest percentages were for drivers ages 21 to 24 and 25 to 34 (32% and 27%, respectively).
Nearly one-fifth (19%) of all children between the ages of 5 and 9 who were killed in motor vehicle traffic crashes were pedestrians. Children age 15 and younger accounted for 15 percent of the pedestrian fatalities in 2004.
Passenger vehicle occupants age 10 to 24 involved in fatal crashes had the lowest restraint use rate (55%), and those over age 65 had the highest rate (75%).
Male/Female Fatal Crash InvolvementIn 2004, the fatal crash involvement rate per 100,000 population was almost 3 times higher for male drivers than for females.
Males accounted for 69 percent of all traffic fatalities, 69 percent of all pedestrian fatalities, and 87 percent of all pedalcyclist fatalities in 2004.
28
NHTSA’s National Center for Statistics and Analysis 400 Seventh St., SW., Washington, DC 20590
1�
“Pedestrian fatalities in 2004 were 15 percent lower than in 1994”
“Nearly one-fifth of the pedalcyclists killed in traffic crashes in 2004 were between the ages of 5 and 15.”
Among male drivers involved in fatal crashes in 2004, 23 percent had BAC levels of .08 g/dL or higher, compared with 12 percent of the female drivers involved in fatal crashes.
Among female drivers of passenger vehicles involved in fatal crashes in 2004, 25 percent were unrestrained at the time of the collision, compared with 39 percent of male drivers in fatal crashes.
PedestriansIn 2004, 68,000 pedestrians were injured and 4,641 were killed in traffic crashes in the United States, representing 2 percent of all the people injured in traffic crashes and 11 percent of all traffic fatalities.
On average, a pedestrian is killed in a motor vehicle crash every 113 minutes, and one is injured every 8 minutes.
Alcohol involvement — either for the driver or the pedestrian — was reported in 47 percent of the traffic crashes that resulted in pedestrian fatalities. Of the pedestrians involved, 34 percent had BAC levels of .08 g/dL or higher. Of the drivers involved in fatal crashes, only 13 percent had BAC levels of .08 g/dL or higher. In 6 percent of the crashes, both the driver and the pedestrian had BAC levels of .08 g/dL or higher.
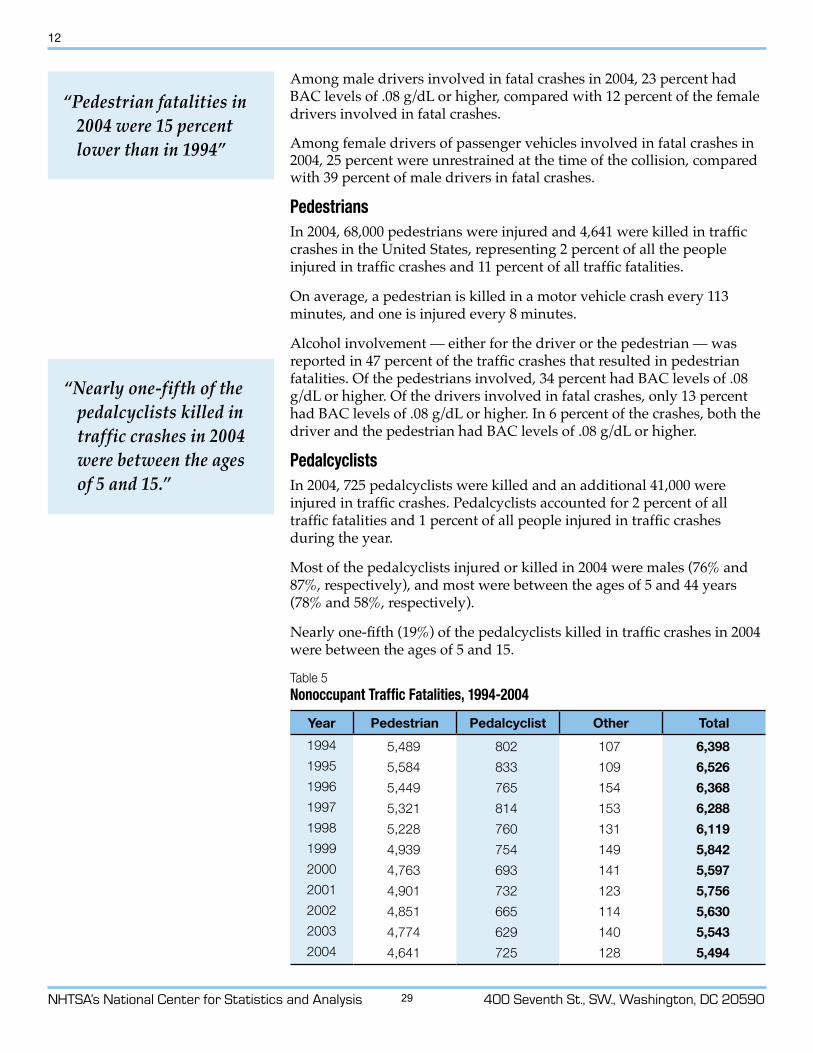
PedalcyclistsIn 2004, 725 pedalcyclists were killed and an additional 41,000 were injured in traffic crashes. Pedalcyclists accounted for 2 percent of all traffic fatalities and 1 percent of all people injured in traffic crashes during the year.
Most of the pedalcyclists injured or killed in 2004 were males (76% and 87%, respectively), and most were between the ages of 5 and 44 years (78% and 58%, respectively).
Nearly one-fifth (19%) of the pedalcyclists killed in traffic crashes in 2004 were between the ages of 5 and 15.
Table 5 Nonoccupant Traffic Fatalities, 1994-2004
Year Pedestrian Pedalcyclist Other Total
1994 5,489 802 107 6,3981995 5,584 833 109 6,5261996 5,449 765 154 6,3681997 5,321 814 153 6,2881998 5,228 760 131 6,1191999 4,939 754 149 5,8422000 4,763 693 141 5,5972001 4,901 732 123 5,7562002 4,851 665 114 5,6302003 4,774 629 140 5,5432004 4,641 725 128 5,494
29
2003 California Quick Collision Facts
During 2003, California had a total of 538,955 traffic collisions: 3,726 fatal, 204,174 injury and 331,055 property damage only. A traffic collision was reported every 59 seconds. One person was killed every 2 hours and 4 minutes as a result of a traffic collision. One person was injured every minute and 43 seconds as a result of a traffic collision. Children under the age of 15 accounted for 24.7% of pedestrian victims and 25.1% of bicycle victims (victims killed and injured). For each person killed there were 73 persons injured. Speed was indicated as the Primary Collision Factor in 28.3% of the fatal and injury collisions. Beginning in 1999, motorcyclist victims began to increase over the all time low experienced in 1998. Motorcyclists killed in 2003 increased 84.0% from 1998 and those injured increased 52.9% over that same year. Alcohol involved fatal collisions have increased 23.8% and alcohol involved persons killed have also increased 23.5% within the last five years. Of the licensed drivers in California, 22.1% were under 30 years of age: however, drivers under 30 years of age comprise 35.3% of all drivers in fatal and injury collisions. One out of every 8,505 persons living in California was killed in a traffic collision; one out of every 117 persons was injured; and one out of every 59 licensed drivers was involved in a fatal or injury traffic collision. As a result of the 3,726 fatal collisions, 4,225 persons were killed for an average of 1.1 deaths per fatal collision. There were 1.30 persons killed and 94.83 persons injured for every 100 million vehicle miles of travel. (These are more commonly known as the mileage death and mileage injury rates.) Hit-and-run was indicated in 10.0% of the fatal and injury collisions. California has not had a day without a traffic fatality since September 12, 2000.
30
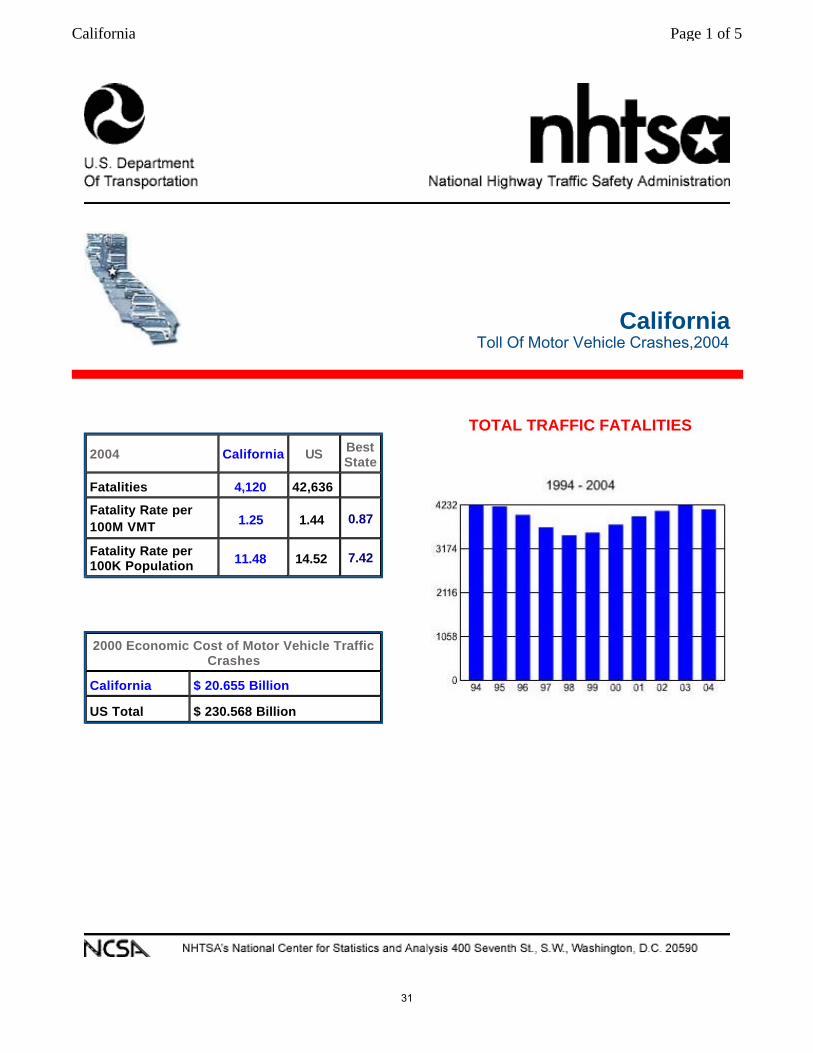
California
Toll Of Motor Vehicle Crashes,2004
2004 California US Best State
Fatalities 4,120 42,636 Fatality Rate per 100M VMT 1.25 1.44 0.87
Fatality Rate per 100K Population 11.48 14.52 7.42
TOTAL TRAFFIC FATALITIES
2000 Economic Cost of Motor Vehicle Traffic Crashes
California $ 20.655 Billion
US Total $ 230.568 Billion
Page 1 of 5California
31
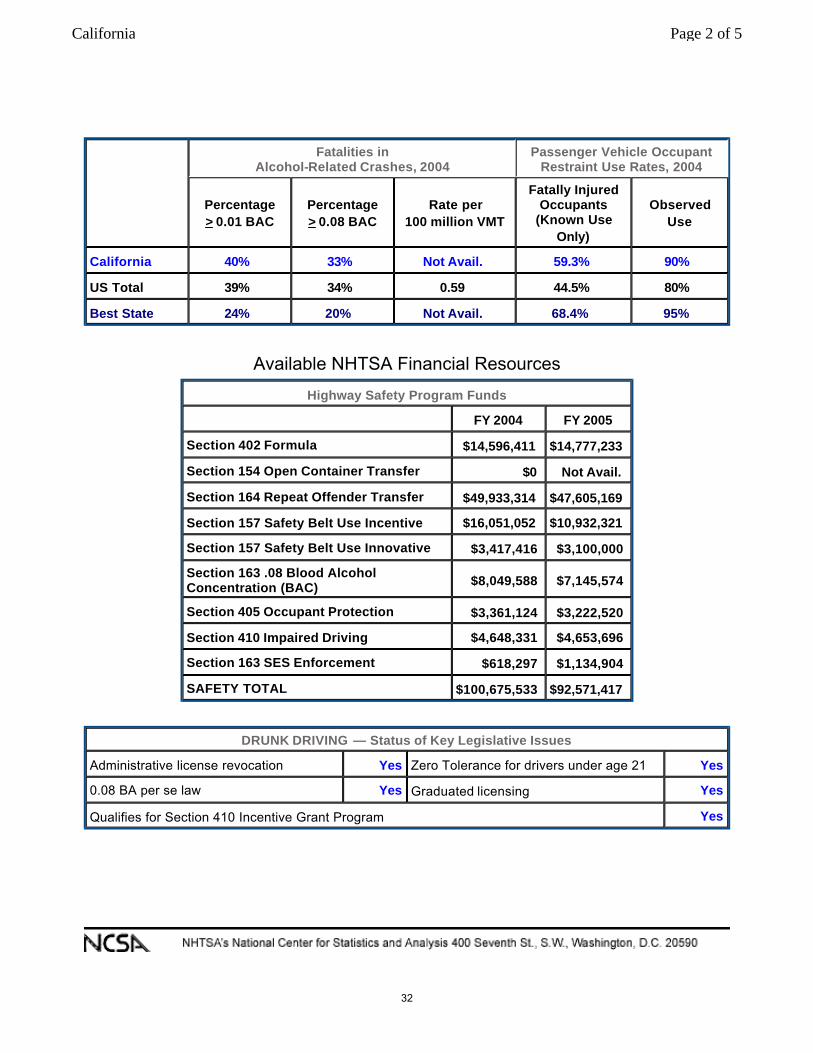
Fatalities in Alcohol-Related Crashes, 2004
Passenger Vehicle Occupant Restraint Use Rates, 2004
Percentage > 0.01 BAC
Percentage > 0.08 BAC
Rate per 100 million VMT
Fatally Injured Occupants
(Known Use Only)
Observed Use
California 40% 33% Not Avail. 59.3% 90%
US Total 39% 34% 0.59 44.5% 80%
Best State 24% 20% Not Avail. 68.4% 95%
Available NHTSA Financial Resources
Highway Safety Program Funds FY 2004 FY 2005
Section 402 Formula $14,596,411 $14,777,233 Section 154 Open Container Transfer $0 Not Avail. Section 164 Repeat Offender Transfer $49,933,314 $47,605,169
Section 157 Safety Belt Use Incentive $16,051,052 $10,932,321 Section 157 Safety Belt Use Innovative $3,417,416 $3,100,000 Section 163 .08 Blood Alcohol Concentration (BAC) $8,049,588 $7,145,574
Section 405 Occupant Protection $3,361,124 $3,222,520
Section 410 Impaired Driving $4,648,331 $4,653,696 Section 163 SES Enforcement $618,297 $1,134,904 SAFETY TOTAL $100,675,533 $92,571,417
DRUNK DRIVING — Status of Key Legislative Issues Administrative license revocation Yes Zero Tolerance for drivers under age 21 Yes
0.08 BA per se law Yes Graduated licensing Yes
Qualifies for Section 410 Incentive Grant Program Yes
Page 2 of 5California
32
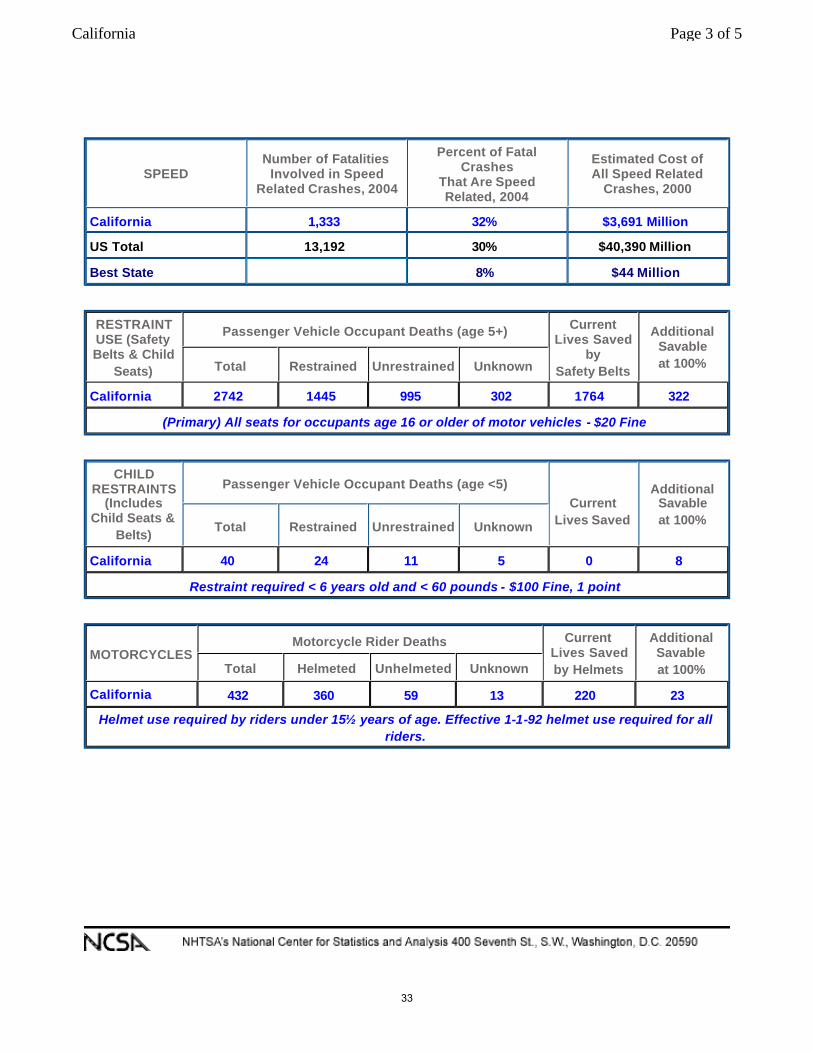
SPEED Number of Fatalities
Involved in Speed Related Crashes, 2004
Percent of Fatal Crashes
That Are Speed Related, 2004
Estimated Cost of All Speed Related
Crashes, 2000
California 1,333 32% $3,691 Million US Total 13,192 30% $40,390 Million
Best State 8% $44 Million
RESTRAINT USE (Safety Belts & Child
Seats)
Passenger Vehicle Occupant Deaths (age 5+) Current Lives Saved
by Safety Belts
Additional Savable at 100% Total Restrained Unrestrained Unknown
California 2742 1445 995 302 1764 322
(Primary) All seats for occupants age 16 or older of motor vehicles - $20 Fine
CHILD RESTRAINTS
(Includes Child Seats &
Belts)
Passenger Vehicle Occupant Deaths (age <5) Current
Lives Saved
Additional Savable at 100% Total Restrained Unrestrained Unknown
California 40 24 11 5 0 8
Restraint required < 6 years old and < 60 pounds - $100 Fine, 1 point
MOTORCYCLES Motorcycle Rider Deaths Current
Lives Saved by Helmets
Additional Savable at 100% Total Helmeted Unhelmeted Unknown
California 432 360 59 13 220 23 Helmet use required by riders under 15½ years of age. Effective 1-1-92 helmet use required for all
riders.
Page 3 of 5California
33
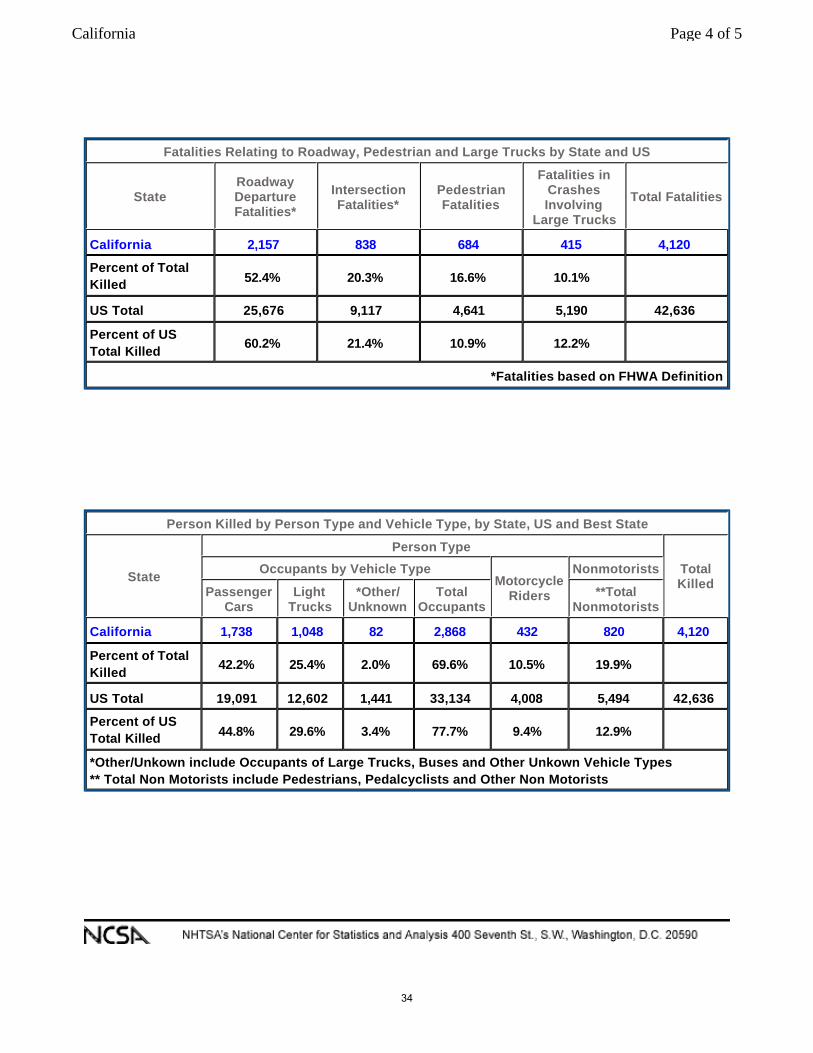
Fatalities Relating to Roadway, Pedestrian and Large Trucks by State and US
State Roadway Departure Fatalities*
Intersection Fatalities*
Pedestrian Fatalities
Fatalities in Crashes Involving
Large Trucks
Total Fatalities
California 2,157 838 684 415 4,120 Percent of Total Killed 52.4% 20.3% 16.6% 10.1%
US Total 25,676 9,117 4,641 5,190 42,636 Percent of US Total Killed 60.2% 21.4% 10.9% 12.2%
*Fatalities based on FHWA Definition
Person Killed by Person Type and Vehicle Type, by State, US and Best State
State
Person Type
Total Killed
Occupants by Vehicle Type Motorcycle
Riders
Nonmotorists
Passenger Cars
Light Trucks
*Other/ Unknown
Total Occupants
**Total Nonmotorists
California 1,738 1,048 82 2,868 432 820 4,120 Percent of Total Killed 42.2% 25.4% 2.0% 69.6% 10.5% 19.9%
US Total 19,091 12,602 1,441 33,134 4,008 5,494 42,636 Percent of US Total Killed 44.8% 29.6% 3.4% 77.7% 9.4% 12.9%
*Other/Unkown include Occupants of Large Trucks, Buses and Other Unkown Vehicle Types ** Total Non Motorists include Pedestrians, Pedalcyclists and Other Non Motorists
Page 4 of 5California
34
California Home Friday, June 02, 2006
Home
OTS Profile
Grants & Programs
Public Relations
Calendar of Events
Publications and Reports
Statistics
Hot Links
In the News
Click It or Ticket Campaign on tap
“Buckle Up Coachella Valley” enforcement campaign continues
Police targeting seat belt scofflaws
Police on patrol for drivers not wearing seat belts
Motor Carrier Services
Office of Traffic Safety search
My CA OTS' Web Sitenmlkj nmlkji
Rankings
OTS Rankings Explanation
The Office of Traffic Safety (OTS) rankings facilitate funding decisions and identify emerging traffic safety problem areas. The rankings allow cities to compare themselves to other cities with similar-sized populations and help them identify their potential disproportionate traffic safety problem(s). They also allow counties to compare themselves with all the other counties in the state. Please note that OTS rankings are only indicators of potential problems; there are many factors that may either understate or overstate a city/county ranking.
Victim and collision data for the rankings is taken from the latest published California Highway Patrol (CHP) Statewide Integrated Traffic Records System (SWITRS) report. OTS provides two types of rankings: victim and collision rankings and DUI arrest rankings.
Victim and collision rankings are based on rates of victims killed and injured or fatal and injury collisions per “1,000 daily-vehicle-miles-of-travel" (2004 CALTRANS) and per “1,000 average population" (2004-2005 Department of Finance) figures. Pedestrian and bicyclist victim rankings do not take into account the size or demographics of a city or county's pedestrian/bicyclist population.
DUI Arrest rankings are calculated for cities only and are based on rates of non-CHP DUI arrests (2004 Department of Justice) per estimated average number of licensed drivers.
Counties are assigned statewide rankings, while cities are assigned population group rankings. Population groups using 2004 SWITRS data are as follows:
For victim and collision rankings, a Population Group Ranking of "1/97" would be assigned to the city with the highest number of victims/collisions per 1,000 residents in population group C, while a ranking of "97/97" would be assigned to the city with the lowest number of victims/collisions per 1,000 residents in population group C.
For DUI arrest rankings, a population group rank of 1/49 would be assigned to the city with the lowest DUI arrest rate in population group B, while a population group rank of 49/49 would be assigned to the city with the highest DUI arrest rate in population group B.
Example: Anytown Population 75,000 (Group C) Victims Killed and Injured in Alcohol Involved Collisions Population group ranking 9/97 The city of Anytown ranked 9 of 97 cities for victims killed and injured in alcohol involved collisions within their population group (50,001 to 100,000). This means Anytown has the 9th highest rate of victims killed and injured in alcohol involved collisions in population category "C".
NOTES: Cities reporting 0 victims and/or collisions for a category or 0 DUI arrests are ranked using the variable upon which the ranking is based. For example, if 10 of 99 cities in population group D reported 0 hit-and-run fatal and injury collisions when ranking by per “1,000 average population,” the city with the highest population of these 10 cities would be ranked 99/99, and the city with the lowest population of these 10 cities would be ranked 90/99. The same
Population Group Rankings
Collisions and Victims Rankings
DUI Arrest Rankings
A = over 250,000 13 cities ranked 13 cities ranked B = 100,001 to 250,000 50 cities ranked 49 cities ranked C = 50,001 to 100,000 97 cities ranked 95 cities ranked D = 25,001 to 50,000 99 cities ranked 99 cities ranked
Page 1 of 2Office of Traffic Safety: Sample Concept Papers
6/2/2006http://www.ots.ca.gov/grants/rankingsEx.asp
35

methodology has been applied when ranking per “1,000 daily-vehicle-miles-of-travel” and per “estimated average number of licensed drivers.”
The percentage displayed next to the DUI arrest ranking is the percentage of estimated licensed drivers in each city arrested for DUI. In 2003, 0.8% of all licensed drivers statewide were arrested for DUI. This percentage is used as a measure of DUI enforcement activity in each area; the higher the percentage, the higher the DUI enforcement activity in the area.
OTS recommends that cities use this measure to determine how to adjust their DUI enforcement activity. When DUI enforcement is combined with education and public information campaigns, it leads to a reduction of the incidence of DUI. Cities should therefore increase their DUI enforcement/education/public information activities to meet or exceed the statewide percentage in an effort to decrease the incidence of DUI in their area. .
Select Rankings
Back to Top of Page
The content found herein may not necessarily represent the views and opinions of the Schwarzenegger Administration. Conditions of Use | Privacy Policy | Contact Us
Page 2 of 2Office of Traffic Safety: Sample Concept Papers
6/2/2006http://www.ots.ca.gov/grants/rankingsEx.asp
36
California Home
Home
OTS Profile
Grants & Programs
Public Relations
Calendar of Events
Publications and Reports
Statistics
Hot Links
In the News
Click It or Ticket Campaign on tap
“Buckle Up Coachella Valley” enforcement campaign continues
Police targeting seat belt scofflaws
Police on patrol for drivers not wearing seat belts
Motor Carrier Services
Office of Traffic Safety search
My CA OTS' Web Sitenmlkj nmlkji
Rankings
OTS Rankings Explanation
Select a City or County from one of the dropdown lists and click on the Show City or Show County button
OTS Rankings are only indicators. Please read this explanation.
CITY:
— SELECT ONE —
SHOW CITY
COUNTY:
— SELECT ONE —
SHOW COUNTY
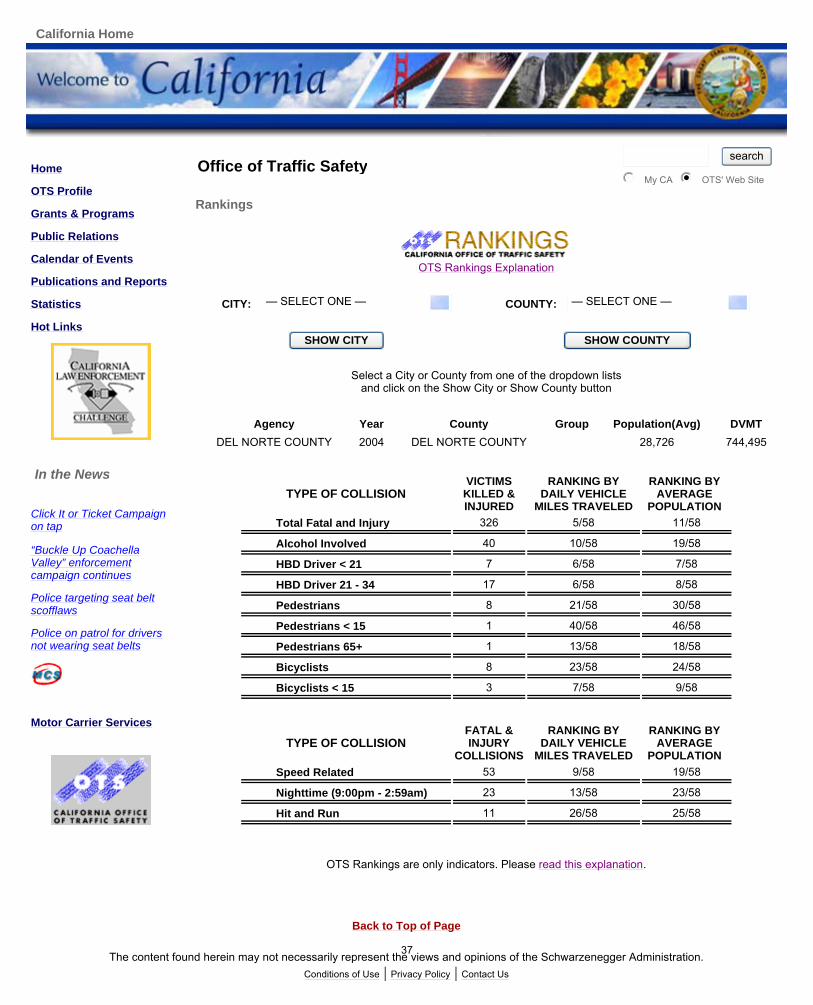
Agency Year County Group Population(Avg) DVMTDEL NORTE COUNTY 2004 DEL NORTE COUNTY 28,726 744,495
TYPE OF COLLISIONVICTIMS KILLED & INJURED
RANKING BY DAILY VEHICLE
MILES TRAVELED
RANKING BY AVERAGE
POPULATIONTotal Fatal and Injury 326 5/58 11/58
Alcohol Involved 40 10/58 19/58
HBD Driver < 21 7 6/58 7/58
HBD Driver 21 - 34 17 6/58 8/58
Pedestrians 8 21/58 30/58
Pedestrians < 15 1 40/58 46/58
Pedestrians 65+ 1 13/58 18/58
Bicyclists 8 23/58 24/58
Bicyclists < 15 3 7/58 9/58
TYPE OF COLLISION FATAL & INJURY
COLLISIONS
RANKING BY DAILY VEHICLE
MILES TRAVELED
RANKING BY AVERAGE
POPULATIONSpeed Related 53 9/58 19/58
Nighttime (9:00pm - 2:59am) 23 13/58 23/58
Hit and Run 11 26/58 25/58
Back to Top of Page
The content found herein may not necessarily represent the views and opinions of the Schwarzenegger Administration. Conditions of Use | Privacy Policy | Contact Us
Page 1 of 2Welcome to California - Office of Traffic Safety
6/2/2006http://www.ots.ca.gov/cgi-bin/rankings.pl
37

California Home
Home
OTS Profile
Grants & Programs
Public Relations
Calendar of Events
Publications and Reports
Statistics
Hot Links
In the News
Click It or Ticket Campaign on tap
“Buckle Up Coachella Valley” enforcement campaign continues
Police targeting seat belt scofflaws
Police on patrol for drivers not wearing seat belts
Motor Carrier Services
Office of Traffic Safety search
My CA OTS' Web Sitenmlkj nmlkji
Rankings
OTS Rankings Explanation
Select a City or County from one of the dropdown lists and click on the Show City or Show County button
OTS Rankings are only indicators. Please read this explanation.
CITY:
— SELECT ONE —
SHOW CITY
COUNTY:
— SELECT ONE —
SHOW COUNTY
Agency Year County Group Population(Avg) DVMTHUMBOLDT COUNTY 2004 HUMBOLDT COUNTY 130,863 3,546,749
TYPE OF COLLISIONVICTIMS KILLED & INJURED
RANKING BY DAILY VEHICLE
MILES TRAVELED
RANKING BY AVERAGE
POPULATIONTotal Fatal and Injury 1,237 17/58 21/58
Alcohol Involved 164 18/58 26/58
HBD Driver < 21 24 12/58 15/58
HBD Driver 21 - 34 60 18/58 21/58
Pedestrians 56 5/58 6/58
Pedestrians < 15 10 25/58 19/58
Pedestrians 65+ 6 8/58 12/58
Bicyclists 50 14/58 10/58
Bicyclists < 15 8 36/58 37/58
TYPE OF COLLISION FATAL & INJURY
COLLISIONS
RANKING BY DAILY VEHICLE
MILES TRAVELED
RANKING BY AVERAGE
POPULATIONSpeed Related 206 29/58 33/58
Nighttime (9:00pm - 2:59am) 114 12/58 16/58
Hit and Run 40 36/58 39/58
Back to Top of Page
The content found herein may not necessarily represent the views and opinions of the Schwarzenegger Administration. Conditions of Use | Privacy Policy | Contact Us
Page 1 of 2Welcome to California - Office of Traffic Safety
6/2/2006http://www.ots.ca.gov/cgi-bin/rankings.pl
38

California Home
Home
OTS Profile
Grants & Programs
Public Relations
Calendar of Events
Publications and Reports
Statistics
Hot Links
In the News
Click It or Ticket Campaign on tap
“Buckle Up Coachella Valley” enforcement campaign continues
Police targeting seat belt scofflaws
Police on patrol for drivers not wearing seat belts
Motor Carrier Services
Office of Traffic Safety search
My CA OTS' Web Sitenmlkj nmlkji
Rankings
OTS Rankings Explanation
Select a City or County from one of the dropdown lists and click on the Show City or Show County button
OTS Rankings are only indicators. Please read this explanation.
CITY:
— SELECT ONE —
SHOW CITY
COUNTY:
— SELECT ONE —
SHOW COUNTY
Agency Year County Group Population(Avg) DVMTMODOC COUNTY 2004 MODOC COUNTY 9,671 558,720
TYPE OF COLLISIONVICTIMS KILLED & INJURED
RANKING BY DAILY VEHICLE
MILES TRAVELED
RANKING BY AVERAGE
POPULATIONTotal Fatal and Injury 85 57/58 28/58
Alcohol Involved 18 42/58 9/58
HBD Driver < 21 0 56/58 56/58
HBD Driver 21 - 34 5 48/58 16/58
Pedestrians 0 58/58 58/58
Pedestrians < 15 0 55/58 55/58
Pedestrians 65+ 0 49/58 48/58
Bicyclists 0 58/58 58/58
Bicyclists < 15 0 55/58 54/58
TYPE OF COLLISION FATAL & INJURY
COLLISIONS
RANKING BY DAILY VEHICLE
MILES TRAVELED
RANKING BY AVERAGE
POPULATIONSpeed Related 15 53/58 34/58
Nighttime (9:00pm - 2:59am) 6 57/58 48/58
Hit and Run 1 54/58 55/58
Back to Top of Page
The content found herein may not necessarily represent the views and opinions of the Schwarzenegger Administration. Conditions of Use | Privacy Policy | Contact Us
Page 1 of 2Welcome to California - Office of Traffic Safety
6/2/2006http://www.ots.ca.gov/cgi-bin/rankings.pl
39
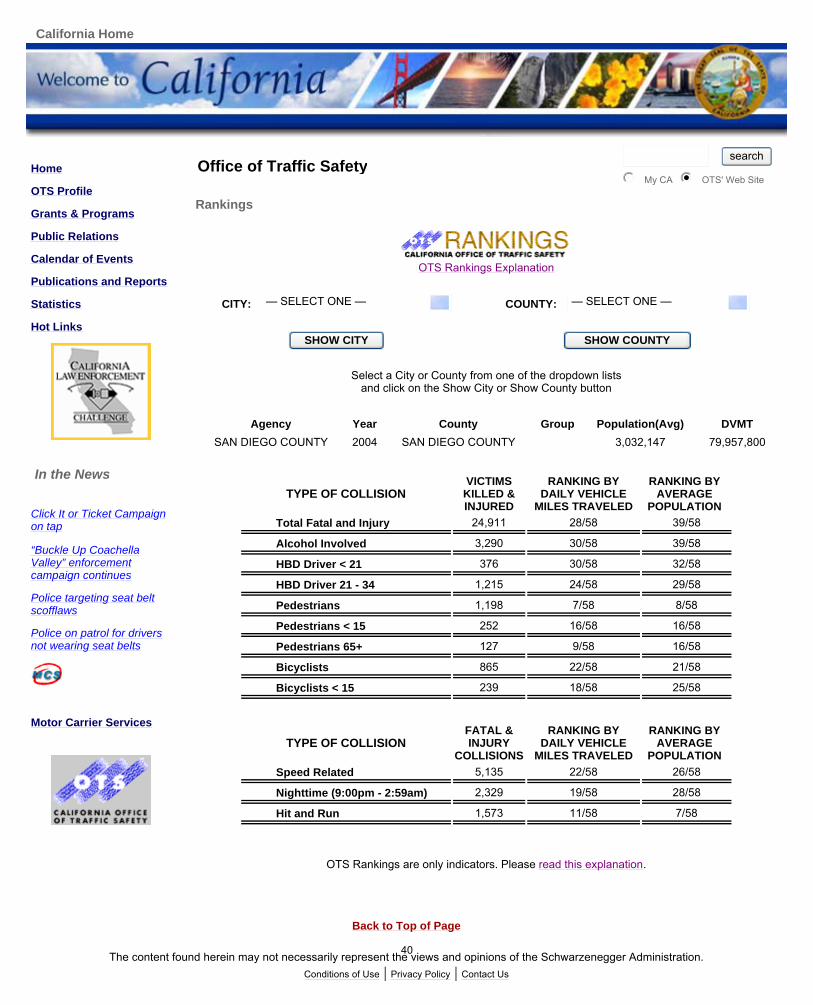
California Home
Home
OTS Profile
Grants & Programs
Public Relations
Calendar of Events
Publications and Reports
Statistics
Hot Links
In the News
Click It or Ticket Campaign on tap
“Buckle Up Coachella Valley” enforcement campaign continues
Police targeting seat belt scofflaws
Police on patrol for drivers not wearing seat belts
Motor Carrier Services
Office of Traffic Safety search
My CA OTS' Web Sitenmlkj nmlkji
Rankings
OTS Rankings Explanation
Select a City or County from one of the dropdown lists and click on the Show City or Show County button
OTS Rankings are only indicators. Please read this explanation.
CITY:
— SELECT ONE —
SHOW CITY
COUNTY:
— SELECT ONE —
SHOW COUNTY
Agency Year County Group Population(Avg) DVMTSAN DIEGO COUNTY 2004 SAN DIEGO COUNTY 3,032,147 79,957,800
TYPE OF COLLISIONVICTIMS KILLED & INJURED
RANKING BY DAILY VEHICLE
MILES TRAVELED
RANKING BY AVERAGE
POPULATIONTotal Fatal and Injury 24,911 28/58 39/58
Alcohol Involved 3,290 30/58 39/58
HBD Driver < 21 376 30/58 32/58
HBD Driver 21 - 34 1,215 24/58 29/58
Pedestrians 1,198 7/58 8/58
Pedestrians < 15 252 16/58 16/58
Pedestrians 65+ 127 9/58 16/58
Bicyclists 865 22/58 21/58
Bicyclists < 15 239 18/58 25/58
TYPE OF COLLISION FATAL & INJURY
COLLISIONS
RANKING BY DAILY VEHICLE
MILES TRAVELED
RANKING BY AVERAGE
POPULATIONSpeed Related 5,135 22/58 26/58
Nighttime (9:00pm - 2:59am) 2,329 19/58 28/58
Hit and Run 1,573 11/58 7/58
Back to Top of Page
The content found herein may not necessarily represent the views and opinions of the Schwarzenegger Administration. Conditions of Use | Privacy Policy | Contact Us
Page 1 of 2Welcome to California - Office of Traffic Safety
6/2/2006http://www.ots.ca.gov/cgi-bin/rankings.pl
40

California Home
Home
OTS Profile
Grants & Programs
Public Relations
Calendar of Events
Publications and Reports
Statistics
Hot Links
In the News
Click It or Ticket Campaign on tap
“Buckle Up Coachella Valley” enforcement campaign continues
Police targeting seat belt scofflaws
Police on patrol for drivers not wearing seat belts
Motor Carrier Services
Office of Traffic Safety search
My CA OTS' Web Sitenmlkj nmlkji
Rankings
OTS Rankings Explanation
Select a City or County from one of the dropdown lists and click on the Show City or Show County button
OTS Rankings are only indicators. Please read this explanation.
CITY:
— SELECT ONE —
SHOW CITY
COUNTY:
— SELECT ONE —
SHOW COUNTY
Agency Year County Group Population(Avg) DVMTTRINITY COUNTY 2004 TRINITY COUNTY 13,674 489,741
TYPE OF COLLISIONVICTIMS KILLED & INJURED
RANKING BY DAILY VEHICLE
MILES TRAVELED
RANKING BY AVERAGE
POPULATIONTotal Fatal and Injury 163 21/58 6/58
Alcohol Involved 47 1/58 2/58
HBD Driver < 21 7 1/58 1/58
HBD Driver 21 - 34 17 2/58 2/58
Pedestrians 2 50/58 50/58
Pedestrians < 15 1 31/58 23/58
Pedestrians 65+ 0 48/58 50/58
Bicyclists 3 41/58 33/58
Bicyclists < 15 0 54/58 56/58
TYPE OF COLLISION FATAL & INJURY
COLLISIONS
RANKING BY DAILY VEHICLE
MILES TRAVELED
RANKING BY AVERAGE
POPULATIONSpeed Related 25 36/58 21/58
Nighttime (9:00pm - 2:59am) 18 6/58 4/58
Hit and Run 3 47/58 47/58
Back to Top of Page
The content found herein may not necessarily represent the views and opinions of the Schwarzenegger Administration. Conditions of Use | Privacy Policy | Contact Us
Page 1 of 2Welcome to California - Office of Traffic Safety
6/2/2006http://www.ots.ca.gov/cgi-bin/rankings.pl
41
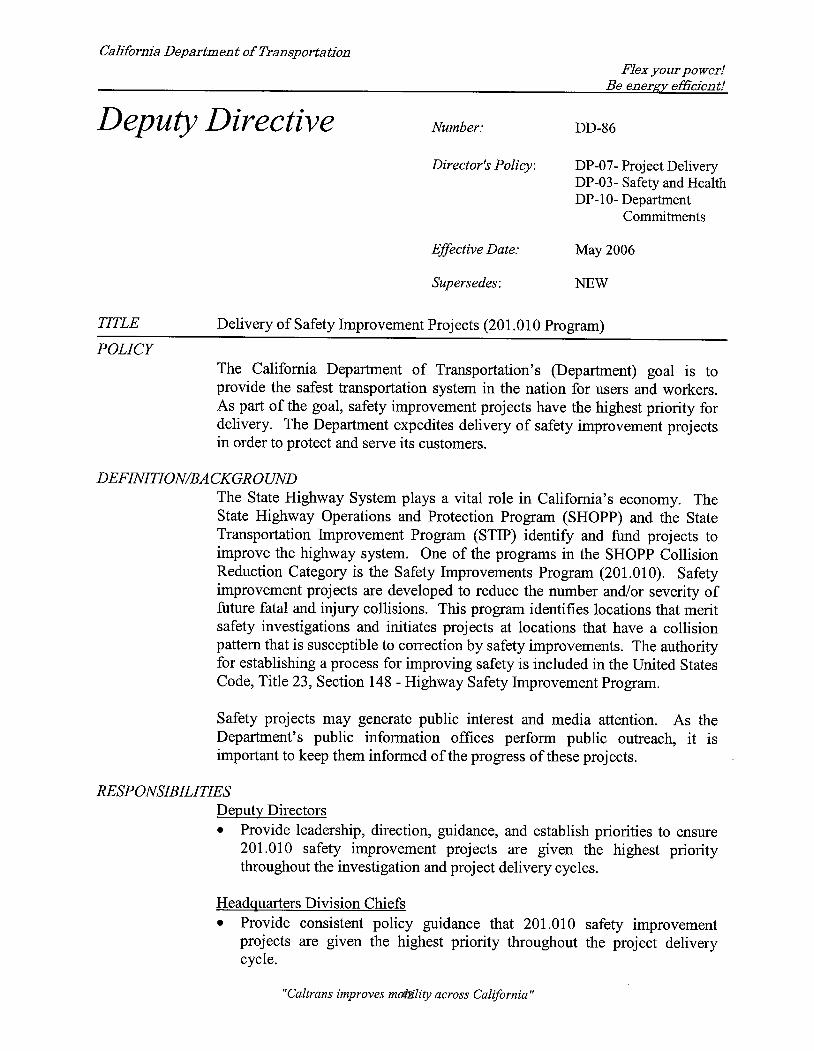
42
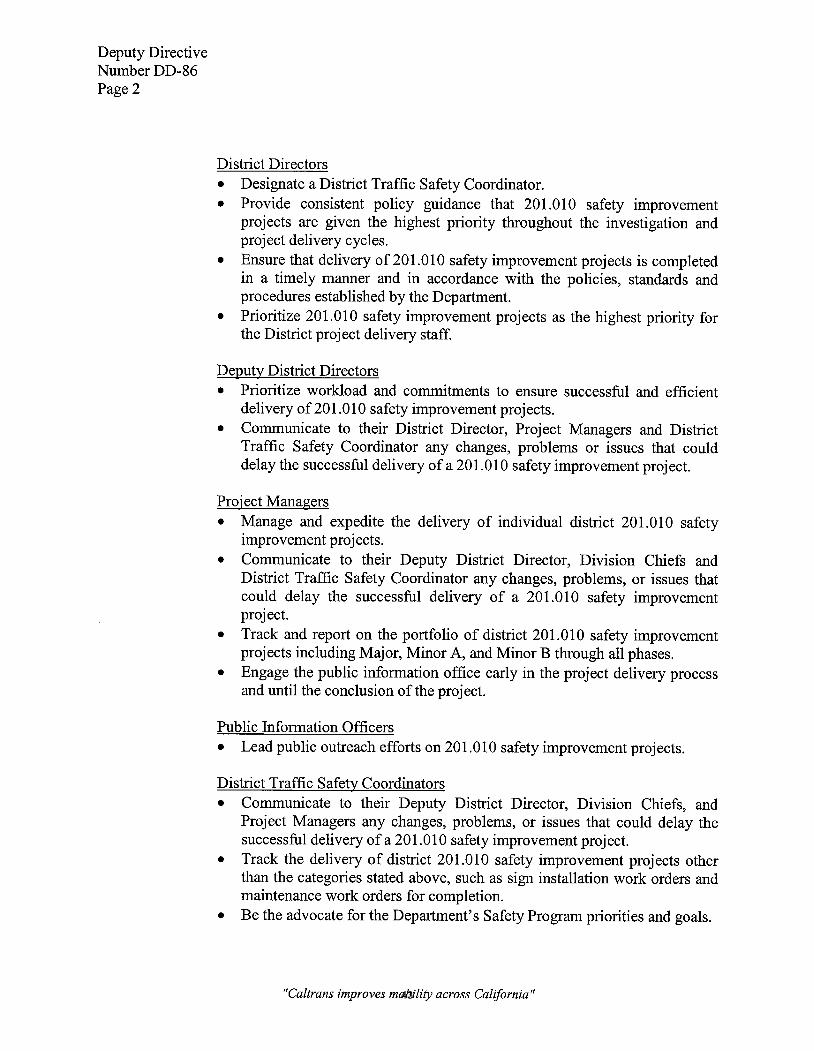
43
44
GLOSSARY
Alcohol Involved Collision Any motor vehicle traffic collision where a driver, pedestrian or bicyclist had been drinking.
At Fault
The involved party in a motor vehicle traffic collision considered by the officer to be most at fault.
Bicycle Involved A traffic collision involving at least one bicycle in a solo collision, as well as those involved with a parked vehicle or moving motor vehicle, pedestrian or with another bicycle.
Bicyclist
In this report, the term bicyclist will be used to denote bicyclist victims or bicyclist parties. Bicyclist victims include the driver (rider) and/or passenger of any device propelled exclusively by human power through a belt, chain or gears, and having two or more wheels. A bicyclist party is comprised of only a driver of the vehicle described above.
Collision
For the purposes of this report, the terms “collision” and “motor vehicle traffic collision” have the same definition. See “motor vehicle traffic collision.”
Complaint of Pain
Injuries claimed but not evident (includes limping claimed to have been caused by the collision).
County Roadways Any roadway in the unincorporated area of a county that is not an Interstate, U. S. or State Route.
Driver For the purpose of this report, the terms “driver” and “motor vehicle driver” have the same definition. See “motor vehicle driver.”
DUI/PCF
Driving Under the Influence of alcohol and/or drugs (DUI) which in the officer’s opinion best describes the Primary Collision Factor (PCF) or main cause of the collision.
Prior to 2002, when the Sobriety-Drug/Physical field on the traffic collision report indicated B-HBD-Under Influence or E-Under Drug Influence for the party at fault and the officer indicated a PCF violation other than DUI, the SWITRS program would change the PCF to DUI. Effective with 2002 re-engineering of SWITRS, the PCF violation is no longer changed from the PCF violation indicated by the officer.
Fatal Collision A motor vehicle traffic collision resulting in the death of one or more persons within thirty days of the collision.
Fetus The death of a fetus of a pregnant female involved in a traffic collision is a fatal injury if the coroner attributes the death to the collision.
45
Fetus (Cont’d) Prior to 2002, fetus was included in the 60 and over age group, 65 and over age group or 85 and over age group.
Had Been Drinking The description of the condition of a driver, pedestrian or bicyclist involved in a collision with regard to alcohol. The party can be described as “Had Been Drinking-under influence, Had Been Drinking-not under influence, or Had Been Drinking-impairment unknown.” In 1992, California Legislation made it unlawful for an operator of a commercial vehicle to drive when his/her blood alcohol level is .04 or greater. In 1995, California Legislation made it unlawful for motor vehicle drivers under the age of 21 to drive with a blood alcohol level of .05 or greater.
HBD-Impairment Unknown Had Been Drinking (HBD) but it is impossible to determine the extent of impairment. For example, the involved party was unconscious when removed from the collision scene, or was fatally injured in the collision.
HBD-Not Under Influence The investigating officer has determined that the involved party Had Been Drinking (HBD) and was not under the influence.
HBD-Under Influence The investigating officer has determined that the involved party Had Been Drinking (HBD) and was under the influence. NOTE: In California, presumptive evidence indicates that a party is under the influence when his/her blood alcohol level is .08 or greater. However, someone with a blood alcohol level less than .08 can also be determined under the influence by the reporting officer. Prior to 1990, the alcohol level necessary for presumed under the influence was .10 or greater.
Hit-and-Run
The investigating officer has determined that the facts and evidence indicate either a felony or misdemeanor hit-and-run was committed. Hit-and-run is the failure of a driver involved in a collision to stop and provide identification to the other involved parties or property owner or to law enforcement officials. When an injury or death to another party is involved, the hit-and-run becomes a felony.
Incorporated A community which has obtained a charter and established itself as a corporation. Usually referred to as a city and has its own police, fire, and other governmental agencies.
Injured A person sustaining injuries as the result of a motor vehicle traffic collision. This would include victims with the extent of injury classified as severe wound, other visible injuries or complaint of pain. Victims killed are not included as injured.
Injury Collision A motor vehicle traffic collision resulting in injury to one or more persons. Injury would include severe wound, other visible injuries or complaint of pain. A fatal collision is not included in injury collision.
46
Killed
A person who dies, as a result of a motor vehicle collision, within 30 days of the collision.
Licensed Motorcycle Drivers Any person holding a valid California driver license with a class 4 or M endorsement, or any person holding a valid class 4 or M only driver license. Class 4 or M includes any two-wheeled motorcycle or any two-wheel motor-driven cycle. Mopeds do not require class 4 or M driver license.
Moped A moped or motorized bicycle is any two-wheeled or three-wheeled device having fully operative pedals for propulsion by human power, or having no pedals if powered solely by electrical energy, and an automatic transmission and a motor which produces less than two gross brake horsepower and is capable of propelling the device at a maximum speed of not more than 30 miles per hour on level ground.
Motor Vehicle A mechanically or electrically powered device not operated on rails, upon which or by which any person or property may be transported or drawn upon a roadway is a motor vehicle. This would include motorized bicycles (mopeds).
Motor Vehicle Driver A person who drives or is in actual control of a motor vehicle. This would include the rider of a moped or motorcycle.
Motor Vehicle Registration Number of automobiles, trucks, and motorcycles registered with the California Department of Motor Vehicles (DMV). The figured used is DMV fee paid motorized vehicles and does not include exempt vehicles or trailers.
Motor Vehicle Traffic Collision An unintended event that causes death, injury, or property damage involving a motor vehicle in transport (in motion or in readiness for motion) on a roadway (a way or place) any part of which is open to the use of the public for purposes of vehicular travel.
Motorcycle Involved A motor vehicle traffic collision involving at least one motorcycle (includes collisions involving mopeds).
Motorcycle Registration The number of two-wheeled motorcycles and two-wheeled motor-driven cycles registered with the California Department of Motor Vehicles. To view specification requirements for these registered vehicles, please see definitions (Mopeds, Motorcyclists) for clarification.
47
Motorcyclist In this report, the term motorcyclist will be used to denote motorcyclist victims or motorcyclist parties. Motorcyclist victims include the driver (rider) and/or passenger of any motor vehicle, other than a tractor, having a seat or saddle for the use of the rider, and designed to travel on not more than three wheels in contact with the ground and weighing less than 1,500 pounds. Four wheels may be in contact with the ground when two of the wheels are a functional part of a sidecar. Motorcyclist victims also include the rider or passenger of a moped. A motorcyclist party is comprised of only the driver of the vehicle described above.
Other Visible Injuries
Injury other than fatal or severe which is evident to any person at the collision scene.
Party A participant in a motor vehicle traffic collision. A party involved in a collision may be categorized as a driver, pedestrian, parked vehicle, bicyclist or other.
Passenger
A passenger is any occupant of a vehicle other than its driver. Includes passengers on bicycles, mopeds and motorcycles.
Pedestrian Any person not in or upon a vehicle, bicycle or animal. Includes a person in or operating a pedestrian conveyance, such as a baby carriage, coaster wagon, skateboard, roller skates, skis, sled, non-motorized and motorized wheelchair, and a person in or upon a device moved by pedaling, except a bicycle. Excludes a person boarding or alighting from a conveyance, except a pedestrian conveyance, and a person jumping or falling from a motor vehicle.
Pedestrian Involved A motor vehicle traffic collision involving a motor vehicle and at least one pedestrian.
Primary Collision Factor The one element or driving action which, in the officer’s opinion, best describes the primary or main cause of the collision. Prior to 2002, the SWITRS program changed the Primary Collision Factor (PCF) to “Driving Under the Influence of Alcohol and/or Drugs” or “Pedestrian Under the Influence of Alcohol and/or Drugs” if these PCFs were supported by the Sobriety-Drug/Physical field on the traffic collision report as marked by the officer. With the 2002 re-engineering of SWITRS, the PCF is not changed from what the officer has stated; therefore, many categories of PCF are not comparable to prior years, i.e. “Speed.”
Property Damage Only Collision A non-injury motor vehicle traffic collision which results in property damage.
Roadway A way or place of whatever nature, publicly maintained and open to the use of the public for purposes of vehicular travel.
Safety Equipment Includes lap belt, shoulder harness, lap/shoulder harness, passive restraint and air bag for vehicle occupants and helmet for motorcyclists and bicyclists.
48
Severe Wound Injury which prevents the injured party from walking, driving, or performing activities he/she was normally capable of before the collision.
Truck A truck with two or more axles, or truck tractor, operated singly or with one or more trailers or semi-trailers (excludes pickups, panel trucks or vans).
Type of Collision The category which best describes the general type of collision which was the first event. Head-on, sideswipe, rear end and broadside are used only if two or more motor vehicles are involved in the first event.
Unincorporated That portion of a county that is not incorporated; outside city limits.
Unincorporated Roadways Those roadways outside city limits (excludes all incorporated city roadways; includes county roadways and unincorporated state highways).
Unincorporated State Highways Those Interstates, U. S. or State Routes located outside incorporated city limits.
Vehicle For the purpose of this report the terms “vehicle” and “motor vehicle” have the same definition. See “motor vehicle.”
Vehicle Occupant Includes a driver or a passenger in the following vehicle types: passenger car; station wagon; jeep; pickup or panel truck with or without trailer(s); and truck or truck tractor with or without trailer(s).
Victim Any person killed or injured as the result of a motor vehicle traffic collision.
49
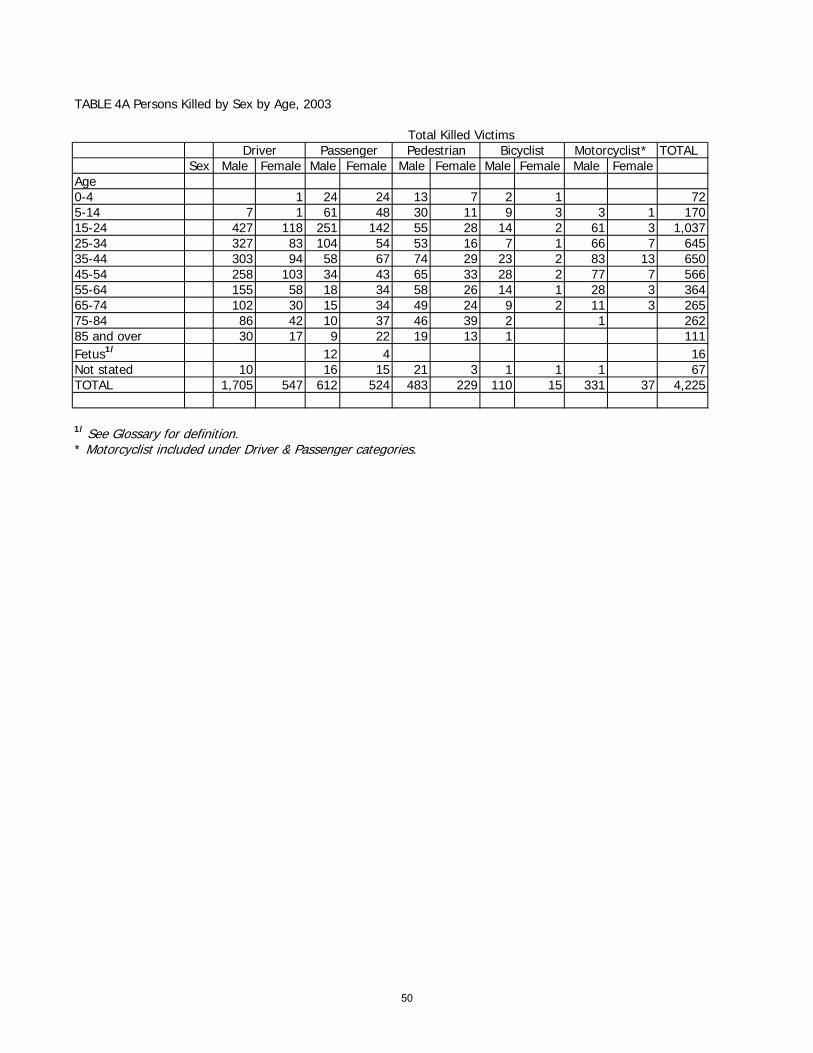
TABLE 4A Persons Killed by Sex by Age, 2003
Total Killed VictimsDriver Passenger Pedestrian Bicyclist Motorcyclist* TOTAL
Sex Male Female Male Female Male Female Male Female Male FemaleAge 0-4 1 24 24 13 7 2 1 725-14 7 1 61 48 30 11 9 3 3 1 17015-24 427 118 251 142 55 28 14 2 61 3 1,03725-34 327 83 104 54 53 16 7 1 66 7 64535-44 303 94 58 67 74 29 23 2 83 13 65045-54 258 103 34 43 65 33 28 2 77 7 56655-64 155 58 18 34 58 26 14 1 28 3 36465-74 102 30 15 34 49 24 9 2 11 3 26575-84 86 42 10 37 46 39 2 1 26285 and over 30 17 9 22 19 13 1 111Fetus1/ 12 4 16Not stated 10 16 15 21 3 1 1 1 67TOTAL 1,705 547 612 524 483 229 110 15 331 37 4,225
1/ See Glossary for definition.* Motorcyclist included under Driver & Passenger categories.
50
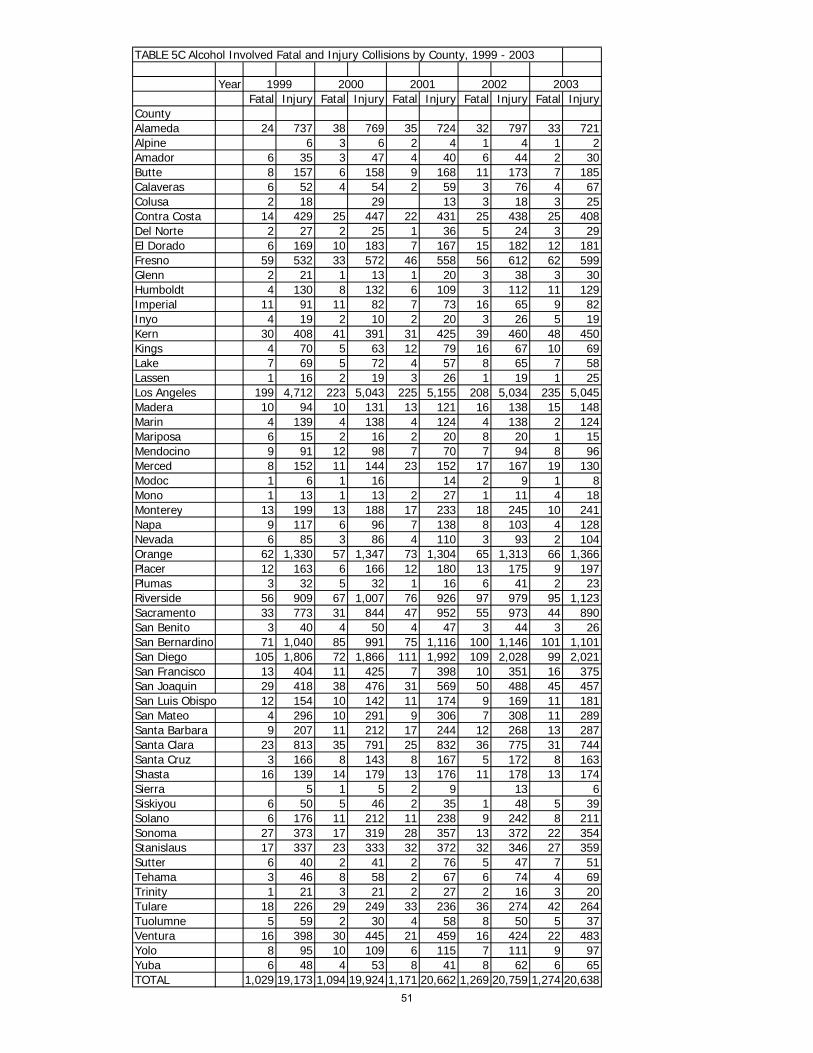
TABLE 5C Alcohol Involved Fatal and Injury Collisions by County, 1999 - 2003
Year 1999 2000 2001 2002 2003Fatal Injury Fatal Injury Fatal Injury Fatal Injury Fatal Injury
County Alameda 24 737 38 769 35 724 32 797 33 721Alpine 6 3 6 2 4 1 4 1 2Amador 6 35 3 47 4 40 6 44 2 30Butte 8 157 6 158 9 168 11 173 7 185Calaveras 6 52 4 54 2 59 3 76 4 67Colusa 2 18 29 13 3 18 3 25Contra Costa 14 429 25 447 22 431 25 438 25 408Del Norte 2 27 2 25 1 36 5 24 3 29El Dorado 6 169 10 183 7 167 15 182 12 181Fresno 59 532 33 572 46 558 56 612 62 599Glenn 2 21 1 13 1 20 3 38 3 30Humboldt 4 130 8 132 6 109 3 112 11 129Imperial 11 91 11 82 7 73 16 65 9 82Inyo 4 19 2 10 2 20 3 26 5 19Kern 30 408 41 391 31 425 39 460 48 450Kings 4 70 5 63 12 79 16 67 10 69Lake 7 69 5 72 4 57 8 65 7 58Lassen 1 16 2 19 3 26 1 19 1 25Los Angeles 199 4,712 223 5,043 225 5,155 208 5,034 235 5,045Madera 10 94 10 131 13 121 16 138 15 148Marin 4 139 4 138 4 124 4 138 2 124Mariposa 6 15 2 16 2 20 8 20 1 15Mendocino 9 91 12 98 7 70 7 94 8 96Merced 8 152 11 144 23 152 17 167 19 130Modoc 1 6 1 16 14 2 9 1 8Mono 1 13 1 13 2 27 1 11 4 18Monterey 13 199 13 188 17 233 18 245 10 241Napa 9 117 6 96 7 138 8 103 4 128Nevada 6 85 3 86 4 110 3 93 2 104Orange 62 1,330 57 1,347 73 1,304 65 1,313 66 1,366Placer 12 163 6 166 12 180 13 175 9 197Plumas 3 32 5 32 1 16 6 41 2 23Riverside 56 909 67 1,007 76 926 97 979 95 1,123Sacramento 33 773 31 844 47 952 55 973 44 890San Benito 3 40 4 50 4 47 3 44 3 26San Bernardino 71 1,040 85 991 75 1,116 100 1,146 101 1,101San Diego 105 1,806 72 1,866 111 1,992 109 2,028 99 2,021San Francisco 13 404 11 425 7 398 10 351 16 375San Joaquin 29 418 38 476 31 569 50 488 45 457San Luis Obispo 12 154 10 142 11 174 9 169 11 181San Mateo 4 296 10 291 9 306 7 308 11 289Santa Barbara 9 207 11 212 17 244 12 268 13 287Santa Clara 23 813 35 791 25 832 36 775 31 744Santa Cruz 3 166 8 143 8 167 5 172 8 163Shasta 16 139 14 179 13 176 11 178 13 174Sierra 5 1 5 2 9 13 6Siskiyou 6 50 5 46 2 35 1 48 5 39Solano 6 176 11 212 11 238 9 242 8 211Sonoma 27 373 17 319 28 357 13 372 22 354Stanislaus 17 337 23 333 32 372 32 346 27 359Sutter 6 40 2 41 2 76 5 47 7 51Tehama 3 46 8 58 2 67 6 74 4 69Trinity 1 21 3 21 2 27 2 16 3 20Tulare 18 226 29 249 33 236 36 274 42 264Tuolumne 5 59 2 30 4 58 8 50 5 37Ventura 16 398 30 445 21 459 16 424 22 483Yolo 8 95 10 109 6 115 7 111 9 97Yuba 6 48 4 53 8 41 8 62 6 65TOTAL 1,029 19,173 1,094 19,924 1,171 20,662 1,269 20,759 1,274 20,638
51

2002 1/ 2003 2/
Victim Severity Cost Per Total Cost Cost Per Total CostKilled $2,998,000 $12,259,000,000 $3,052,000 $12,895,000,000Injured
Severe Injury $208,000 $2,796,000,000 $211,000 $2,752,000,000Other Visible $42,000 $3,667,000,000 $42,000 $3,632,000,000
Complaint of Pain $22,000 $4,618,000,000 $22,000 $4,568,000,000Property Damage Only Collisions $2,000 $672,000,000 $2,000 $662,000,000Total $24,012,000,000 $24,509,000,000
/Source of cost estimates: U. S. Department of Transportation, Federal Highway Administration, October 31, 1994, "Technical Advisory on Motor Vehicle
Accident Costs." Costs have been updated to 2002 dollars using the Gross Domestic Product (GDP). Due to changes in the GDP, cost estimates are subject to
change in future publications.2/
Source of cost estimate: 1994 Study as indicated in footnote number one (1/). Costs have been updated to 2003 dollars using the Gross Domestic
Product (GDP) figure provided by the U. S. Department of Commerce-Bureau of Economic Analysis.
TABLE 7C Estimated Cost Per Person and Per Collision by Victim Severity and Property Damage Only Collisions, 2002 - 2003
52
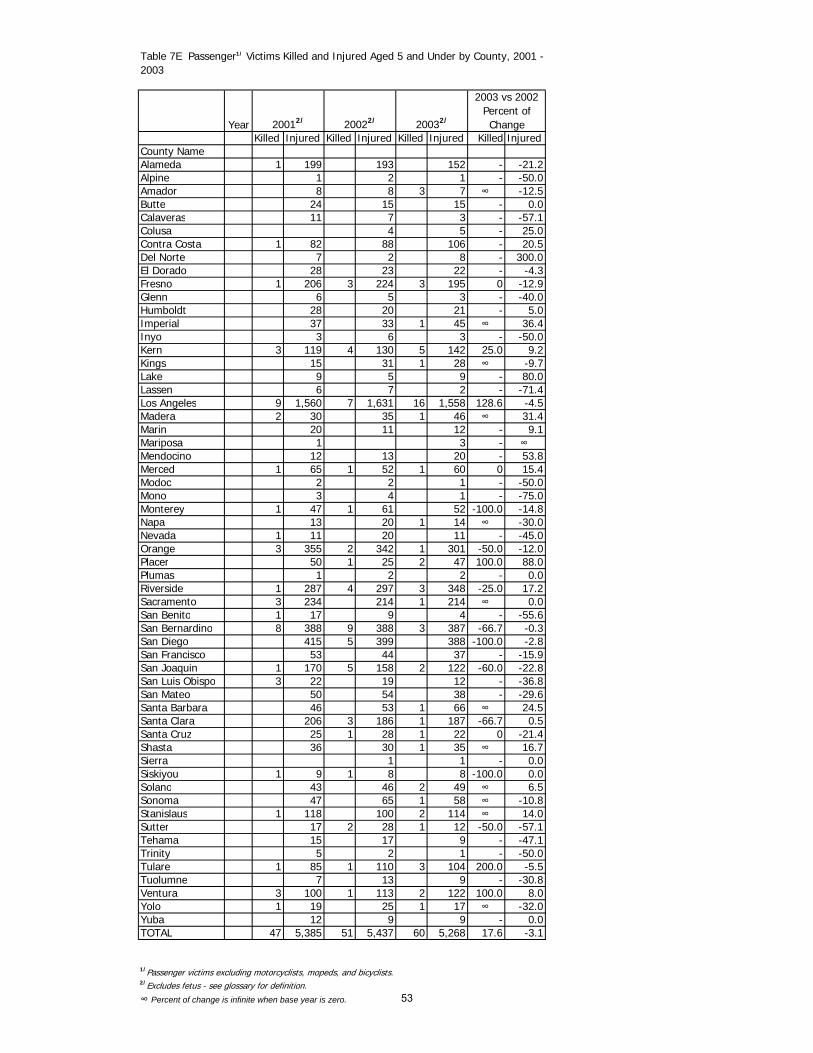
Year 20012/ 20022/ 20032/
Killed Injured Killed Injured Killed Injured Killed InjuredCounty NameAlameda 1 199 193 152 - -21.2Alpine 1 2 1 - -50.0Amador 8 8 3 7 ∞ -12.5Butte 24 15 15 - 0.0Calaveras 11 7 3 - -57.1Colusa 4 5 - 25.0Contra Costa 1 82 88 106 - 20.5Del Norte 7 2 8 - 300.0El Dorado 28 23 22 - -4.3Fresno 1 206 3 224 3 195 0 -12.9Glenn 6 5 3 - -40.0Humboldt 28 20 21 - 5.0Imperial 37 33 1 45 ∞ 36.4Inyo 3 6 3 - -50.0Kern 3 119 4 130 5 142 25.0 9.2Kings 15 31 1 28 ∞ -9.7Lake 9 5 9 - 80.0Lassen 6 7 2 - -71.4Los Angeles 9 1,560 7 1,631 16 1,558 128.6 -4.5Madera 2 30 35 1 46 ∞ 31.4Marin 20 11 12 - 9.1Mariposa 1 3 - ∞ Mendocino 12 13 20 - 53.8Merced 1 65 1 52 1 60 0 15.4Modoc 2 2 1 - -50.0Mono 3 4 1 - -75.0Monterey 1 47 1 61 52 -100.0 -14.8Napa 13 20 1 14 ∞ -30.0Nevada 1 11 20 11 - -45.0Orange 3 355 2 342 1 301 -50.0 -12.0Placer 50 1 25 2 47 100.0 88.0Plumas 1 2 2 - 0.0Riverside 1 287 4 297 3 348 -25.0 17.2Sacramento 3 234 214 1 214 ∞ 0.0San Benito 1 17 9 4 - -55.6San Bernardino 8 388 9 388 3 387 -66.7 -0.3San Diego 415 5 399 388 -100.0 -2.8San Francisco 53 44 37 - -15.9San Joaquin 1 170 5 158 2 122 -60.0 -22.8San Luis Obispo 3 22 19 12 - -36.8San Mateo 50 54 38 - -29.6Santa Barbara 46 53 1 66 ∞ 24.5Santa Clara 206 3 186 1 187 -66.7 0.5Santa Cruz 25 1 28 1 22 0 -21.4Shasta 36 30 1 35 ∞ 16.7Sierra 1 1 - 0.0Siskiyou 1 9 1 8 8 -100.0 0.0Solano 43 46 2 49 ∞ 6.5Sonoma 47 65 1 58 ∞ -10.8Stanislaus 1 118 100 2 114 ∞ 14.0Sutter 17 2 28 1 12 -50.0 -57.1Tehama 15 17 9 - -47.1Trinity 5 2 1 - -50.0Tulare 1 85 1 110 3 104 200.0 -5.5Tuolumne 7 13 9 - -30.8Ventura 3 100 1 113 2 122 100.0 8.0Yolo 1 19 25 1 17 ∞ -32.0Yuba 12 9 9 - 0.0TOTAL 47 5,385 51 5,437 60 5,268 17.6 -3.1
1/Passenger victims excluding motorcyclists, mopeds, and bicyclists.2/Excludes fetus - see glossary for definition.
∞ Percent of change is infinite when base year is zero.
2003 vs 2002 Percent of Change
Table 7E Passenger1/ Victims Killed and Injured Aged 5 and Under by County, 2001 - 2003
53
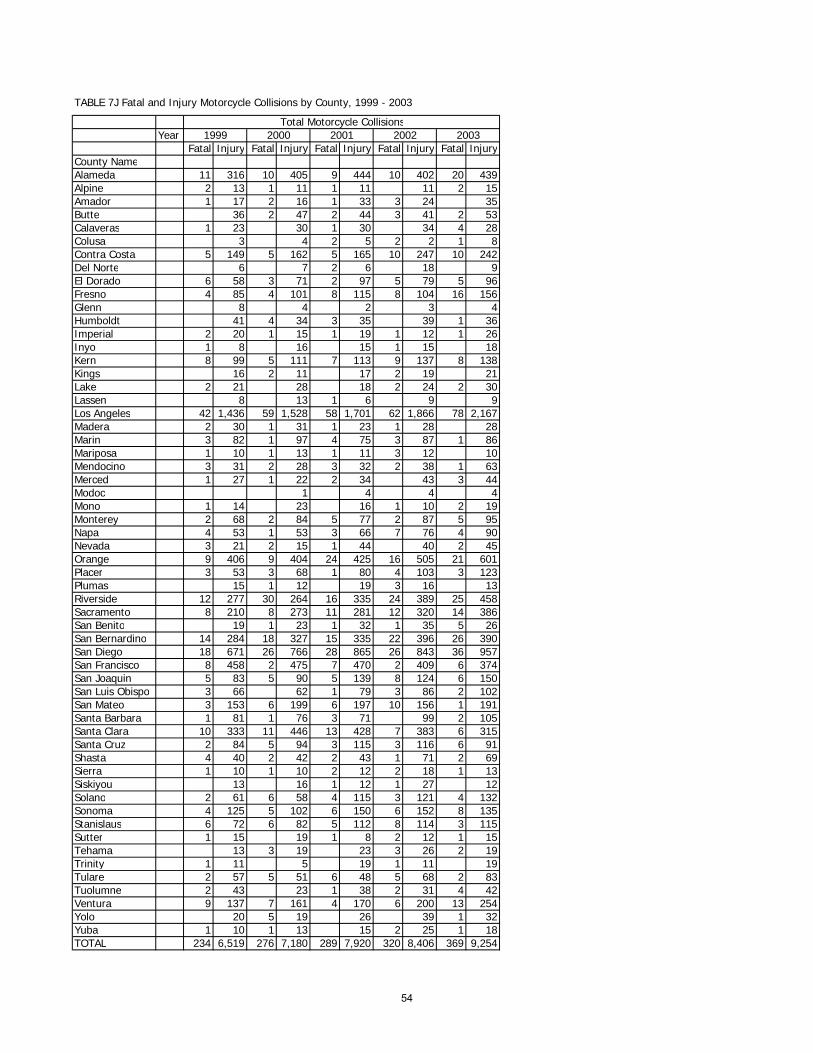
TABLE 7J Fatal and Injury Motorcycle Collisions by County, 1999 - 2003
Total Motorcycle CollisionsYear 1999 2000 2001 2002 2003
Fatal Injury Fatal Injury Fatal Injury Fatal Injury Fatal InjuryCounty NameAlameda 11 316 10 405 9 444 10 402 20 439Alpine 2 13 1 11 1 11 11 2 15Amador 1 17 2 16 1 33 3 24 35Butte 36 2 47 2 44 3 41 2 53Calaveras 1 23 30 1 30 34 4 28Colusa 3 4 2 5 2 2 1 8Contra Costa 5 149 5 162 5 165 10 247 10 242Del Norte 6 7 2 6 18 9El Dorado 6 58 3 71 2 97 5 79 5 96Fresno 4 85 4 101 8 115 8 104 16 156Glenn 8 4 2 3 4Humboldt 41 4 34 3 35 39 1 36Imperial 2 20 1 15 1 19 1 12 1 26Inyo 1 8 16 15 1 15 18Kern 8 99 5 111 7 113 9 137 8 138Kings 16 2 11 17 2 19 21Lake 2 21 28 18 2 24 2 30Lassen 8 13 1 6 9 9Los Angeles 42 1,436 59 1,528 58 1,701 62 1,866 78 2,167Madera 2 30 1 31 1 23 1 28 28Marin 3 82 1 97 4 75 3 87 1 86Mariposa 1 10 1 13 1 11 3 12 10Mendocino 3 31 2 28 3 32 2 38 1 63Merced 1 27 1 22 2 34 43 3 44Modoc 1 4 4 4Mono 1 14 23 16 1 10 2 19Monterey 2 68 2 84 5 77 2 87 5 95Napa 4 53 1 53 3 66 7 76 4 90Nevada 3 21 2 15 1 44 40 2 45Orange 9 406 9 404 24 425 16 505 21 601Placer 3 53 3 68 1 80 4 103 3 123Plumas 15 1 12 19 3 16 13Riverside 12 277 30 264 16 335 24 389 25 458Sacramento 8 210 8 273 11 281 12 320 14 386San Benito 19 1 23 1 32 1 35 5 26San Bernardino 14 284 18 327 15 335 22 396 26 390San Diego 18 671 26 766 28 865 26 843 36 957San Francisco 8 458 2 475 7 470 2 409 6 374San Joaquin 5 83 5 90 5 139 8 124 6 150San Luis Obispo 3 66 62 1 79 3 86 2 102San Mateo 3 153 6 199 6 197 10 156 1 191Santa Barbara 1 81 1 76 3 71 99 2 105Santa Clara 10 333 11 446 13 428 7 383 6 315Santa Cruz 2 84 5 94 3 115 3 116 6 91Shasta 4 40 2 42 2 43 1 71 2 69Sierra 1 10 1 10 2 12 2 18 1 13Siskiyou 13 16 1 12 1 27 12Solano 2 61 6 58 4 115 3 121 4 132Sonoma 4 125 5 102 6 150 6 152 8 135Stanislaus 6 72 6 82 5 112 8 114 3 115Sutter 1 15 19 1 8 2 12 1 15Tehama 13 3 19 23 3 26 2 19Trinity 1 11 5 19 1 11 19Tulare 2 57 5 51 6 48 5 68 2 83Tuolumne 2 43 23 1 38 2 31 4 42Ventura 9 137 7 161 4 170 6 200 13 254Yolo 20 5 19 26 39 1 32Yuba 1 10 1 13 15 2 25 1 18TOTAL 234 6,519 276 7,180 289 7,920 320 8,406 369 9,254
54
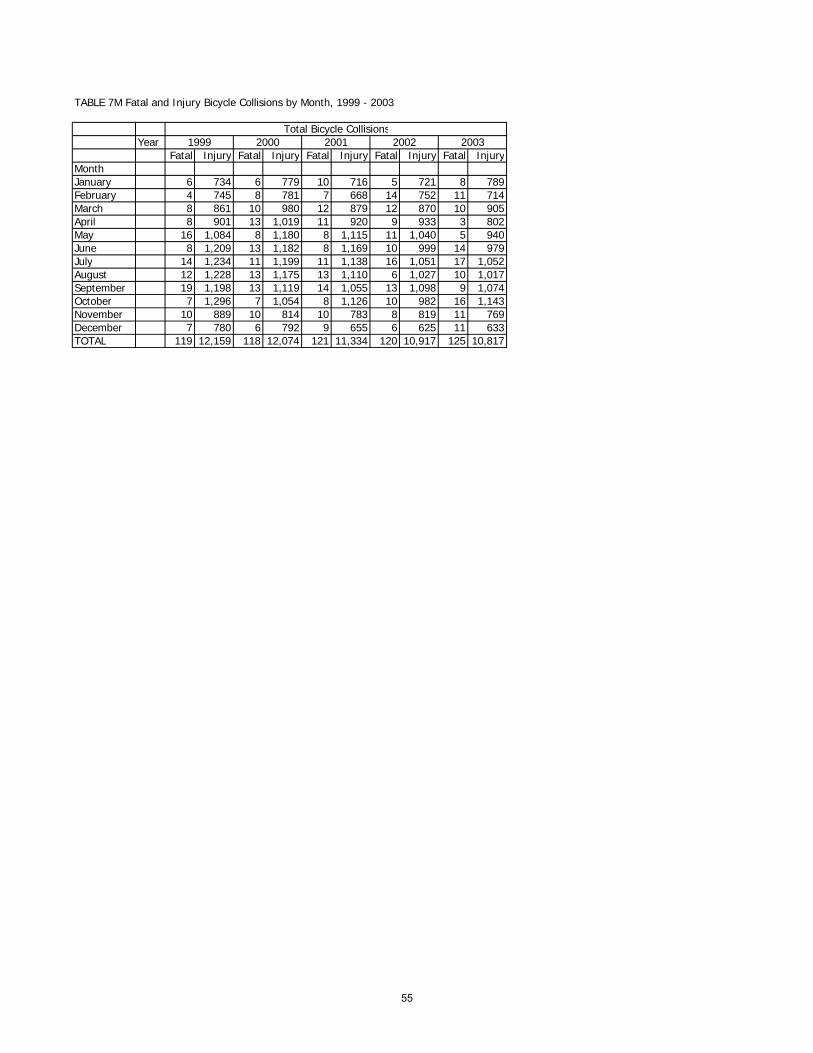
TABLE 7M Fatal and Injury Bicycle Collisions by Month, 1999 - 2003
Total Bicycle CollisionsYear 1999 2000 2001 2002 2003
Fatal Injury Fatal Injury Fatal Injury Fatal Injury Fatal InjuryMonthJanuary 6 734 6 779 10 716 5 721 8 789February 4 745 8 781 7 668 14 752 11 714March 8 861 10 980 12 879 12 870 10 905April 8 901 13 1,019 11 920 9 933 3 802May 16 1,084 8 1,180 8 1,115 11 1,040 5 940June 8 1,209 13 1,182 8 1,169 10 999 14 979July 14 1,234 11 1,199 11 1,138 16 1,051 17 1,052August 12 1,228 13 1,175 13 1,110 6 1,027 10 1,017September 19 1,198 13 1,119 14 1,055 13 1,098 9 1,074October 7 1,296 7 1,054 8 1,126 10 982 16 1,143November 10 889 10 814 10 783 8 819 11 769December 7 780 6 792 9 655 6 625 11 633TOTAL 119 12,159 118 12,074 121 11,334 120 10,917 125 10,817
55
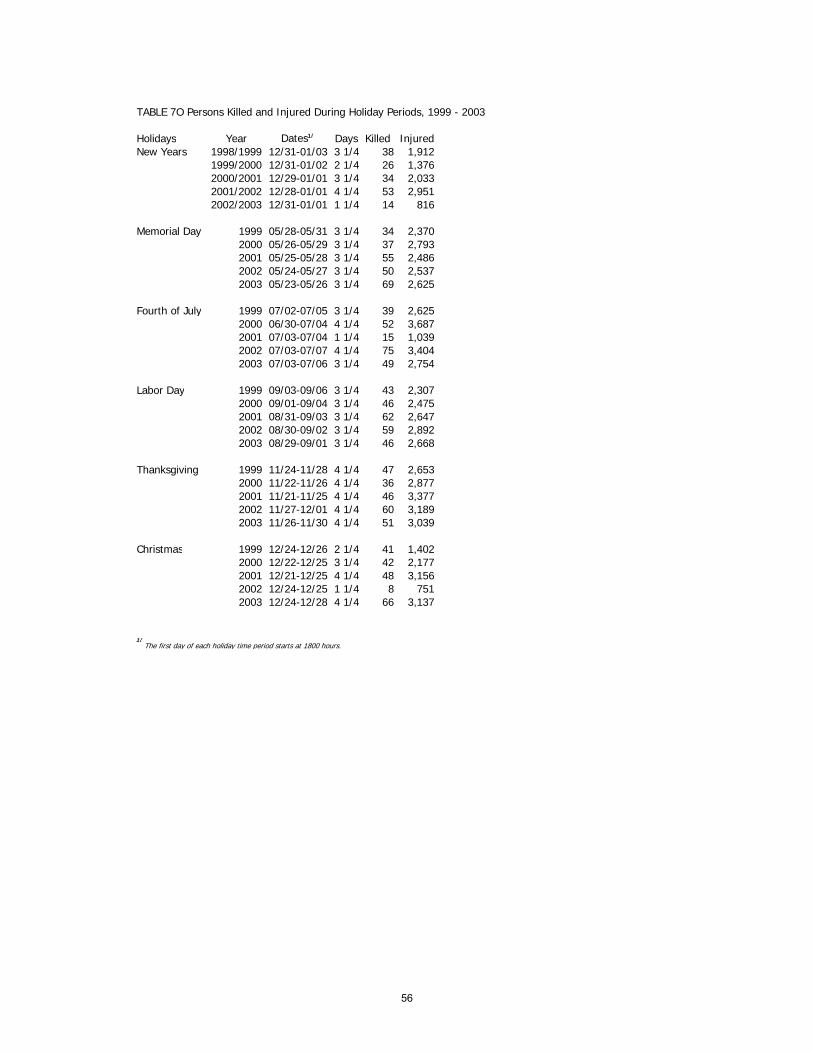
TABLE 7O Persons Killed and Injured During Holiday Periods, 1999 - 2003
Holidays Year Dates1/ Days Killed InjuredNew Years 1998/1999 12/31-01/03 3 1/4 38 1,912
1999/2000 12/31-01/02 2 1/4 26 1,3762000/2001 12/29-01/01 3 1/4 34 2,0332001/2002 12/28-01/01 4 1/4 53 2,9512002/2003 12/31-01/01 1 1/4 14 816
Memorial Day 1999 05/28-05/31 3 1/4 34 2,3702000 05/26-05/29 3 1/4 37 2,7932001 05/25-05/28 3 1/4 55 2,4862002 05/24-05/27 3 1/4 50 2,5372003 05/23-05/26 3 1/4 69 2,625
Fourth of July 1999 07/02-07/05 3 1/4 39 2,6252000 06/30-07/04 4 1/4 52 3,6872001 07/03-07/04 1 1/4 15 1,0392002 07/03-07/07 4 1/4 75 3,4042003 07/03-07/06 3 1/4 49 2,754
Labor Day 1999 09/03-09/06 3 1/4 43 2,3072000 09/01-09/04 3 1/4 46 2,4752001 08/31-09/03 3 1/4 62 2,6472002 08/30-09/02 3 1/4 59 2,8922003 08/29-09/01 3 1/4 46 2,668
Thanksgiving 1999 11/24-11/28 4 1/4 47 2,6532000 11/22-11/26 4 1/4 36 2,8772001 11/21-11/25 4 1/4 46 3,3772002 11/27-12/01 4 1/4 60 3,1892003 11/26-11/30 4 1/4 51 3,039
Christmas 1999 12/24-12/26 2 1/4 41 1,4022000 12/22-12/25 3 1/4 42 2,1772001 12/21-12/25 4 1/4 48 3,1562002 12/24-12/25 1 1/4 8 7512003 12/24-12/28 4 1/4 66 3,137
1/The first day of each holiday time period starts at 1800 hours.
56
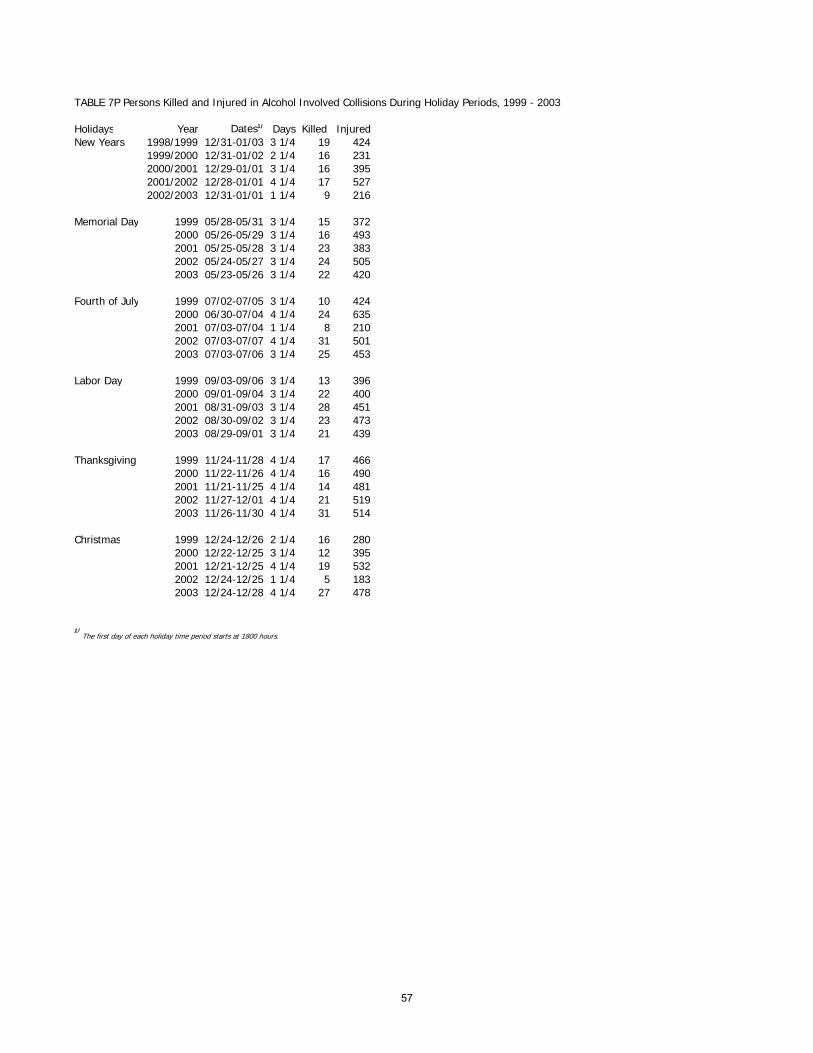
TABLE 7P Persons Killed and Injured in Alcohol Involved Collisions During Holiday Periods, 1999 - 2003
Holidays Year Dates1/ Days Killed InjuredNew Years 1998/1999 12/31-01/03 3 1/4 19 424
1999/2000 12/31-01/02 2 1/4 16 2312000/2001 12/29-01/01 3 1/4 16 3952001/2002 12/28-01/01 4 1/4 17 5272002/2003 12/31-01/01 1 1/4 9 216
Memorial Day 1999 05/28-05/31 3 1/4 15 3722000 05/26-05/29 3 1/4 16 4932001 05/25-05/28 3 1/4 23 3832002 05/24-05/27 3 1/4 24 5052003 05/23-05/26 3 1/4 22 420
Fourth of July 1999 07/02-07/05 3 1/4 10 4242000 06/30-07/04 4 1/4 24 6352001 07/03-07/04 1 1/4 8 2102002 07/03-07/07 4 1/4 31 5012003 07/03-07/06 3 1/4 25 453
Labor Day 1999 09/03-09/06 3 1/4 13 3962000 09/01-09/04 3 1/4 22 4002001 08/31-09/03 3 1/4 28 4512002 08/30-09/02 3 1/4 23 4732003 08/29-09/01 3 1/4 21 439
Thanksgiving 1999 11/24-11/28 4 1/4 17 4662000 11/22-11/26 4 1/4 16 4902001 11/21-11/25 4 1/4 14 4812002 11/27-12/01 4 1/4 21 5192003 11/26-11/30 4 1/4 31 514
Christmas 1999 12/24-12/26 2 1/4 16 2802000 12/22-12/25 3 1/4 12 3952001 12/21-12/25 4 1/4 19 5322002 12/24-12/25 1 1/4 5 1832003 12/24-12/28 4 1/4 27 478
1/The first day of each holiday time period starts at 1800 hours.
57
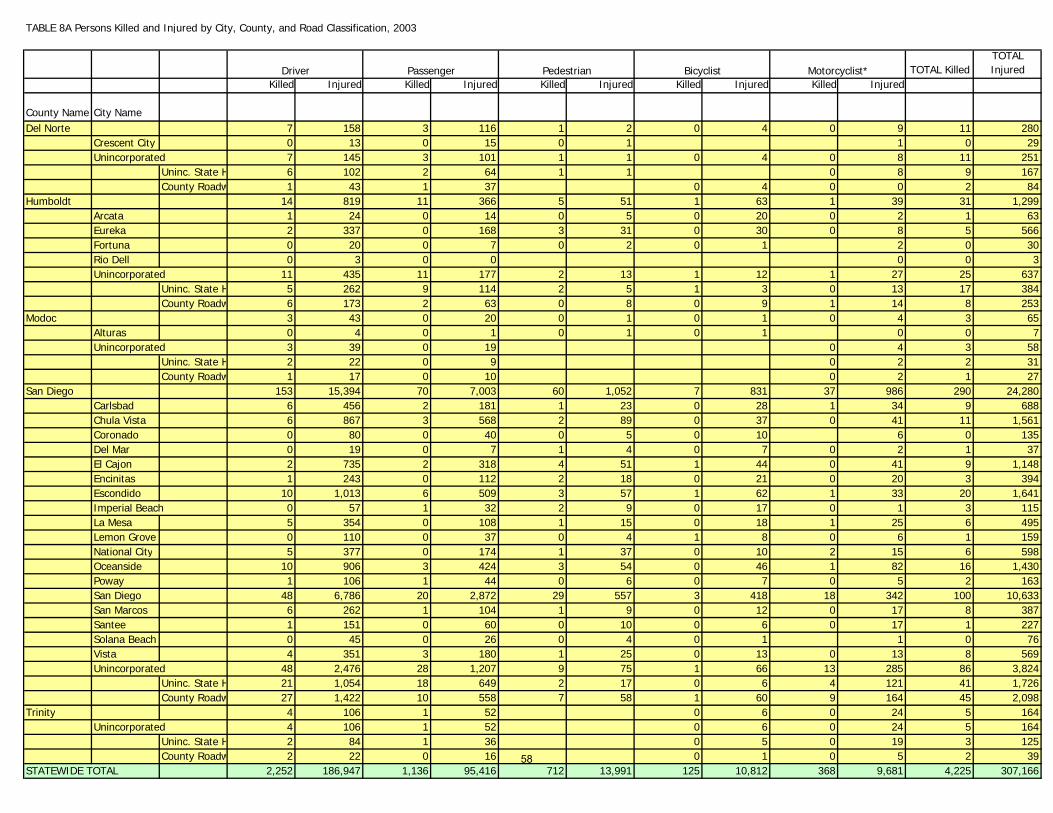
TABLE 8A Persons Killed and Injured by City, County, and Road Classification, 2003
Driver Passenger Pedestrian Bicyclist Motorcyclist* TOTAL KilledTOTAL Injured
Killed Injured Killed Injured Killed Injured Killed Injured Killed Injured
County Name City Name Del Norte 7 158 3 116 1 2 0 4 0 9 11 280
Crescent City 0 13 0 15 0 1 1 0 29Unincorporated 7 145 3 101 1 1 0 4 0 8 11 251
Uninc. State H 6 102 2 64 1 1 0 8 9 167County Roadw 1 43 1 37 0 4 0 0 2 84
Humboldt 14 819 11 366 5 51 1 63 1 39 31 1,299Arcata 1 24 0 14 0 5 0 20 0 2 1 63Eureka 2 337 0 168 3 31 0 30 0 8 5 566Fortuna 0 20 0 7 0 2 0 1 2 0 30Rio Dell 0 3 0 0 0 0 3Unincorporated 11 435 11 177 2 13 1 12 1 27 25 637
Uninc. State H 5 262 9 114 2 5 1 3 0 13 17 384County Roadw 6 173 2 63 0 8 0 9 1 14 8 253
Modoc 3 43 0 20 0 1 0 1 0 4 3 65Alturas 0 4 0 1 0 1 0 1 0 0 7Unincorporated 3 39 0 19 0 4 3 58
Uninc. State H 2 22 0 9 0 2 2 31County Roadw 1 17 0 10 0 2 1 27
San Diego 153 15,394 70 7,003 60 1,052 7 831 37 986 290 24,280Carlsbad 6 456 2 181 1 23 0 28 1 34 9 688Chula Vista 6 867 3 568 2 89 0 37 0 41 11 1,561Coronado 0 80 0 40 0 5 0 10 6 0 135Del Mar 0 19 0 7 1 4 0 7 0 2 1 37El Cajon 2 735 2 318 4 51 1 44 0 41 9 1,148Encinitas 1 243 0 112 2 18 0 21 0 20 3 394Escondido 10 1,013 6 509 3 57 1 62 1 33 20 1,641Imperial Beach 0 57 1 32 2 9 0 17 0 1 3 115La Mesa 5 354 0 108 1 15 0 18 1 25 6 495Lemon Grove 0 110 0 37 0 4 1 8 0 6 1 159National City 5 377 0 174 1 37 0 10 2 15 6 598Oceanside 10 906 3 424 3 54 0 46 1 82 16 1,430Poway 1 106 1 44 0 6 0 7 0 5 2 163San Diego 48 6,786 20 2,872 29 557 3 418 18 342 100 10,633San Marcos 6 262 1 104 1 9 0 12 0 17 8 387Santee 1 151 0 60 0 10 0 6 0 17 1 227Solana Beach 0 45 0 26 0 4 0 1 1 0 76Vista 4 351 3 180 1 25 0 13 0 13 8 569Unincorporated 48 2,476 28 1,207 9 75 1 66 13 285 86 3,824
Uninc. State H 21 1,054 18 649 2 17 0 6 4 121 41 1,726County Roadw 27 1,422 10 558 7 58 1 60 9 164 45 2,098
Trinity 4 106 1 52 0 6 0 24 5 164Unincorporated 4 106 1 52 0 6 0 24 5 164
Uninc. State H 2 84 1 36 0 5 0 19 3 125County Roadw 2 22 0 16 0 1 0 5 2 39
STATEWIDE TOTAL 2,252 186,947 1,136 95,416 712 13,991 125 10,812 368 9,681 4,225 307,16658

TABLE 8A Persons Killed and Injured by City, County, and Road Classification, 2003
Driver Passenger Pedestrian Bicyclist Motorcyclist* TOTAL KilledTOTAL Injured
Killed Injured Killed Injured Killed Injured Killed Injured Killed Injured
County Name City Name Del Norte 7 158 3 116 1 2 0 4 0 9 11 280
Crescent City 0 13 0 15 0 1 1 0 29Unincorporated 7 145 3 101 1 1 0 4 0 8 11 251
Uninc. State H 6 102 2 64 1 1 0 8 9 167County Roadw 1 43 1 37 0 4 0 0 2 84
Humboldt 14 819 11 366 5 51 1 63 1 39 31 1,299Arcata 1 24 0 14 0 5 0 20 0 2 1 63Eureka 2 337 0 168 3 31 0 30 0 8 5 566Fortuna 0 20 0 7 0 2 0 1 2 0 30Rio Dell 0 3 0 0 0 0 3Unincorporated 11 435 11 177 2 13 1 12 1 27 25 637
Uninc. State H 5 262 9 114 2 5 1 3 0 13 17 384County Roadw 6 173 2 63 0 8 0 9 1 14 8 253
Modoc 3 43 0 20 0 1 0 1 0 4 3 65Alturas 0 4 0 1 0 1 0 1 0 0 7Unincorporated 3 39 0 19 0 4 3 58
Uninc. State H 2 22 0 9 0 2 2 31County Roadw 1 17 0 10 0 2 1 27
San Diego 153 15,394 70 7,003 60 1,052 7 831 37 986 290 24,280Carlsbad 6 456 2 181 1 23 0 28 1 34 9 688Chula Vista 6 867 3 568 2 89 0 37 0 41 11 1,561Coronado 0 80 0 40 0 5 0 10 6 0 135Del Mar 0 19 0 7 1 4 0 7 0 2 1 37El Cajon 2 735 2 318 4 51 1 44 0 41 9 1,148Encinitas 1 243 0 112 2 18 0 21 0 20 3 394Escondido 10 1,013 6 509 3 57 1 62 1 33 20 1,641Imperial Beach 0 57 1 32 2 9 0 17 0 1 3 115La Mesa 5 354 0 108 1 15 0 18 1 25 6 495Lemon Grove 0 110 0 37 0 4 1 8 0 6 1 159National City 5 377 0 174 1 37 0 10 2 15 6 598Oceanside 10 906 3 424 3 54 0 46 1 82 16 1,430Poway 1 106 1 44 0 6 0 7 0 5 2 163San Diego 48 6,786 20 2,872 29 557 3 418 18 342 100 10,633San Marcos 6 262 1 104 1 9 0 12 0 17 8 387Santee 1 151 0 60 0 10 0 6 0 17 1 227Solana Beach 0 45 0 26 0 4 0 1 1 0 76Vista 4 351 3 180 1 25 0 13 0 13 8 569Unincorporated 48 2,476 28 1,207 9 75 1 66 13 285 86 3,824
Uninc. State H 21 1,054 18 649 2 17 0 6 4 121 41 1,726County Roadw 27 1,422 10 558 7 58 1 60 9 164 45 2,098
Trinity 4 106 1 52 0 6 0 24 5 164Unincorporated 4 106 1 52 0 6 0 24 5 164
Uninc. State H 2 84 1 36 0 5 0 19 3 125County Roadw 2 22 0 16 0 1 0 5 2 39
STATEWIDE TOTAL 2,252 186,947 1,136 95,416 712 13,991 125 10,812 368 9,681 4,225 307,16659
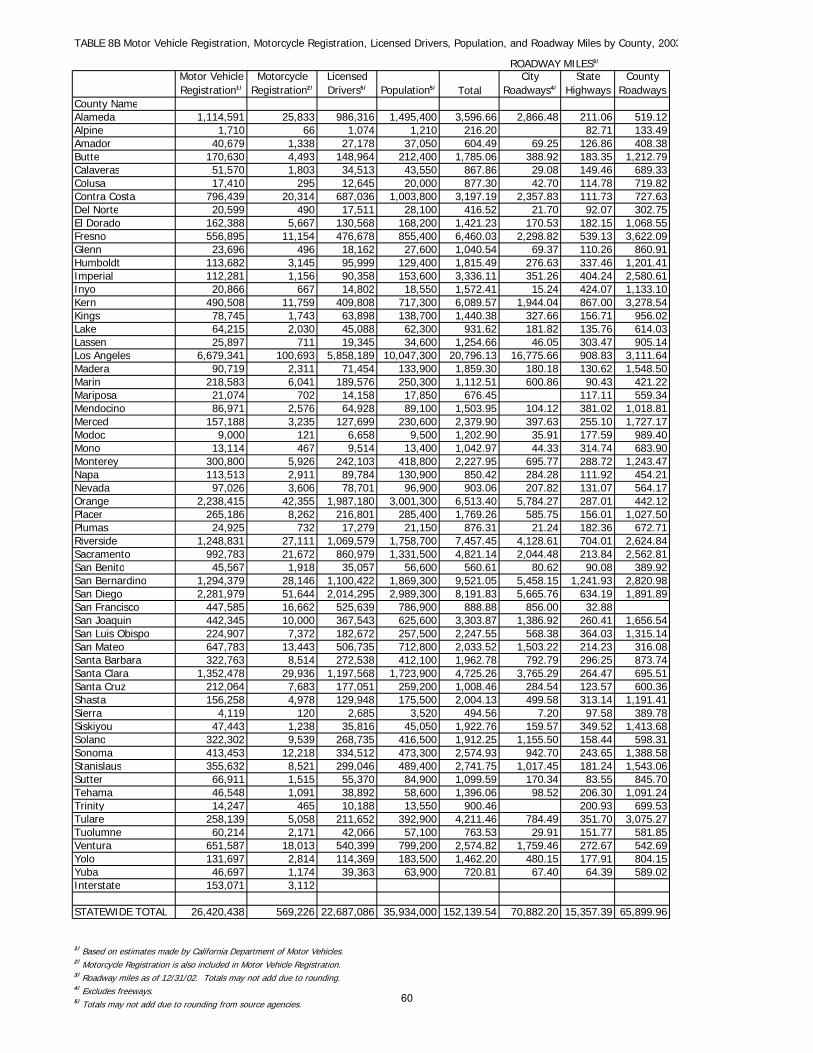
TABLE 8B Motor Vehicle Registration, Motorcycle Registration, Licensed Drivers, Population, and Roadway Miles by County, 2003
ROADWAY MILES3/
Motor Vehicle Registration1/
Motorcycle Registration2/
Licensed Drivers5/ Population5/ Total
City Roadways4/
State Highways
County Roadways
County NameAlameda 1,114,591 25,833 986,316 1,495,400 3,596.66 2,866.48 211.06 519.12Alpine 1,710 66 1,074 1,210 216.20 82.71 133.49Amador 40,679 1,338 27,178 37,050 604.49 69.25 126.86 408.38Butte 170,630 4,493 148,964 212,400 1,785.06 388.92 183.35 1,212.79Calaveras 51,570 1,803 34,513 43,550 867.86 29.08 149.46 689.33Colusa 17,410 295 12,645 20,000 877.30 42.70 114.78 719.82Contra Costa 796,439 20,314 687,036 1,003,800 3,197.19 2,357.83 111.73 727.63Del Norte 20,599 490 17,511 28,100 416.52 21.70 92.07 302.75El Dorado 162,388 5,667 130,568 168,200 1,421.23 170.53 182.15 1,068.55Fresno 556,895 11,154 476,678 855,400 6,460.03 2,298.82 539.13 3,622.09Glenn 23,696 496 18,162 27,600 1,040.54 69.37 110.26 860.91Humboldt 113,682 3,145 95,999 129,400 1,815.49 276.63 337.46 1,201.41Imperial 112,281 1,156 90,358 153,600 3,336.11 351.26 404.24 2,580.61Inyo 20,866 667 14,802 18,550 1,572.41 15.24 424.07 1,133.10Kern 490,508 11,759 409,808 717,300 6,089.57 1,944.04 867.00 3,278.54Kings 78,745 1,743 63,898 138,700 1,440.38 327.66 156.71 956.02Lake 64,215 2,030 45,088 62,300 931.62 181.82 135.76 614.03Lassen 25,897 711 19,345 34,600 1,254.66 46.05 303.47 905.14Los Angeles 6,679,341 100,693 5,858,189 10,047,300 20,796.13 16,775.66 908.83 3,111.64Madera 90,719 2,311 71,454 133,900 1,859.30 180.18 130.62 1,548.50Marin 218,583 6,041 189,576 250,300 1,112.51 600.86 90.43 421.22Mariposa 21,074 702 14,158 17,850 676.45 117.11 559.34Mendocino 86,971 2,576 64,928 89,100 1,503.95 104.12 381.02 1,018.81Merced 157,188 3,235 127,699 230,600 2,379.90 397.63 255.10 1,727.17Modoc 9,000 121 6,658 9,500 1,202.90 35.91 177.59 989.40Mono 13,114 467 9,514 13,400 1,042.97 44.33 314.74 683.90Monterey 300,800 5,926 242,103 418,800 2,227.95 695.77 288.72 1,243.47Napa 113,513 2,911 89,784 130,900 850.42 284.28 111.92 454.21Nevada 97,026 3,606 78,701 96,900 903.06 207.82 131.07 564.17Orange 2,238,415 42,355 1,987,180 3,001,300 6,513.40 5,784.27 287.01 442.12Placer 265,186 8,262 216,801 285,400 1,769.26 585.75 156.01 1,027.50Plumas 24,925 732 17,279 21,150 876.31 21.24 182.36 672.71Riverside 1,248,831 27,111 1,069,579 1,758,700 7,457.45 4,128.61 704.01 2,624.84Sacramento 992,783 21,672 860,979 1,331,500 4,821.14 2,044.48 213.84 2,562.81San Benito 45,567 1,918 35,057 56,600 560.61 80.62 90.08 389.92San Bernardino 1,294,379 28,146 1,100,422 1,869,300 9,521.05 5,458.15 1,241.93 2,820.98San Diego 2,281,979 51,644 2,014,295 2,989,300 8,191.83 5,665.76 634.19 1,891.89San Francisco 447,585 16,662 525,639 786,900 888.88 856.00 32.88San Joaquin 442,345 10,000 367,543 625,600 3,303.87 1,386.92 260.41 1,656.54San Luis Obispo 224,907 7,372 182,672 257,500 2,247.55 568.38 364.03 1,315.14San Mateo 647,783 13,443 506,735 712,800 2,033.52 1,503.22 214.23 316.08Santa Barbara 322,763 8,514 272,538 412,100 1,962.78 792.79 296.25 873.74Santa Clara 1,352,478 29,936 1,197,568 1,723,900 4,725.26 3,765.29 264.47 695.51Santa Cruz 212,064 7,683 177,051 259,200 1,008.46 284.54 123.57 600.36Shasta 156,258 4,978 129,948 175,500 2,004.13 499.58 313.14 1,191.41Sierra 4,119 120 2,685 3,520 494.56 7.20 97.58 389.78Siskiyou 47,443 1,238 35,816 45,050 1,922.76 159.57 349.52 1,413.68Solano 322,302 9,539 268,735 416,500 1,912.25 1,155.50 158.44 598.31Sonoma 413,453 12,218 334,512 473,300 2,574.93 942.70 243.65 1,388.58Stanislaus 355,632 8,521 299,046 489,400 2,741.75 1,017.45 181.24 1,543.06Sutter 66,911 1,515 55,370 84,900 1,099.59 170.34 83.55 845.70Tehama 46,548 1,091 38,892 58,600 1,396.06 98.52 206.30 1,091.24Trinity 14,247 465 10,188 13,550 900.46 200.93 699.53Tulare 258,139 5,058 211,652 392,900 4,211.46 784.49 351.70 3,075.27Tuolumne 60,214 2,171 42,066 57,100 763.53 29.91 151.77 581.85Ventura 651,587 18,013 540,399 799,200 2,574.82 1,759.46 272.67 542.69Yolo 131,697 2,814 114,369 183,500 1,462.20 480.15 177.91 804.15Yuba 46,697 1,174 39,363 63,900 720.81 67.40 64.39 589.02Interstate 153,071 3,112
STATEWIDE TOTAL 26,420,438 569,226 22,687,086 35,934,000 152,139.54 70,882.20 15,357.39 65,899.96
1/ Based on estimates made by California Department of Motor Vehicles.2/ Motorcycle Registration is also included in Motor Vehicle Registration.3/ Roadway miles as of 12/31/02. Totals may not add due to rounding.4/ Excludes freeways.5/ Totals may not add due to rounding from source agencies.
60
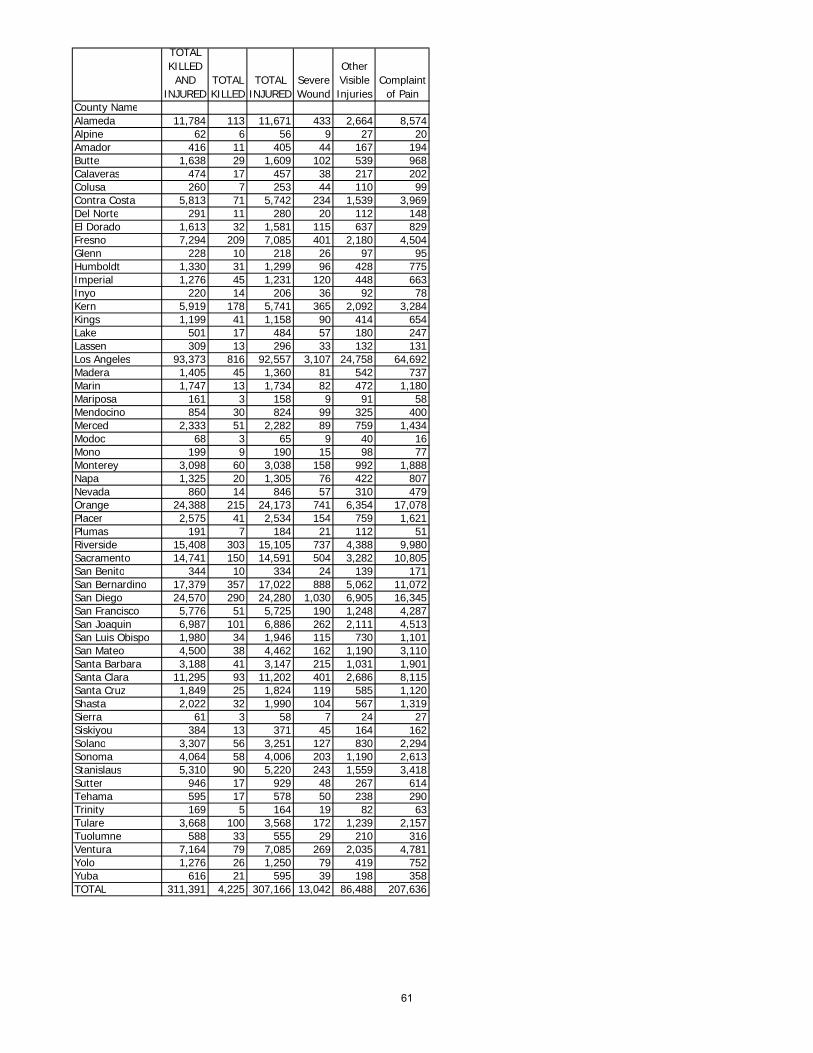
TOTAL KILLED
AND INJURED
TOTAL KILLED
TOTAL INJURED
Severe Wound
Other Visible Injuries
Complaint of Pain
County NameAlameda 11,784 113 11,671 433 2,664 8,574Alpine 62 6 56 9 27 20Amador 416 11 405 44 167 194Butte 1,638 29 1,609 102 539 968Calaveras 474 17 457 38 217 202Colusa 260 7 253 44 110 99Contra Costa 5,813 71 5,742 234 1,539 3,969Del Norte 291 11 280 20 112 148El Dorado 1,613 32 1,581 115 637 829Fresno 7,294 209 7,085 401 2,180 4,504Glenn 228 10 218 26 97 95Humboldt 1,330 31 1,299 96 428 775Imperial 1,276 45 1,231 120 448 663Inyo 220 14 206 36 92 78Kern 5,919 178 5,741 365 2,092 3,284Kings 1,199 41 1,158 90 414 654Lake 501 17 484 57 180 247Lassen 309 13 296 33 132 131Los Angeles 93,373 816 92,557 3,107 24,758 64,692Madera 1,405 45 1,360 81 542 737Marin 1,747 13 1,734 82 472 1,180Mariposa 161 3 158 9 91 58Mendocino 854 30 824 99 325 400Merced 2,333 51 2,282 89 759 1,434Modoc 68 3 65 9 40 16Mono 199 9 190 15 98 77Monterey 3,098 60 3,038 158 992 1,888Napa 1,325 20 1,305 76 422 807Nevada 860 14 846 57 310 479Orange 24,388 215 24,173 741 6,354 17,078Placer 2,575 41 2,534 154 759 1,621Plumas 191 7 184 21 112 51Riverside 15,408 303 15,105 737 4,388 9,980Sacramento 14,741 150 14,591 504 3,282 10,805San Benito 344 10 334 24 139 171San Bernardino 17,379 357 17,022 888 5,062 11,072San Diego 24,570 290 24,280 1,030 6,905 16,345San Francisco 5,776 51 5,725 190 1,248 4,287San Joaquin 6,987 101 6,886 262 2,111 4,513San Luis Obispo 1,980 34 1,946 115 730 1,101San Mateo 4,500 38 4,462 162 1,190 3,110Santa Barbara 3,188 41 3,147 215 1,031 1,901Santa Clara 11,295 93 11,202 401 2,686 8,115Santa Cruz 1,849 25 1,824 119 585 1,120Shasta 2,022 32 1,990 104 567 1,319Sierra 61 3 58 7 24 27Siskiyou 384 13 371 45 164 162Solano 3,307 56 3,251 127 830 2,294Sonoma 4,064 58 4,006 203 1,190 2,613Stanislaus 5,310 90 5,220 243 1,559 3,418Sutter 946 17 929 48 267 614Tehama 595 17 578 50 238 290Trinity 169 5 164 19 82 63Tulare 3,668 100 3,568 172 1,239 2,157Tuolumne 588 33 555 29 210 316Ventura 7,164 79 7,085 269 2,035 4,781Yolo 1,276 26 1,250 79 419 752Yuba 616 21 595 39 198 358TOTAL 311,391 4,225 307,166 13,042 86,488 207,636
61
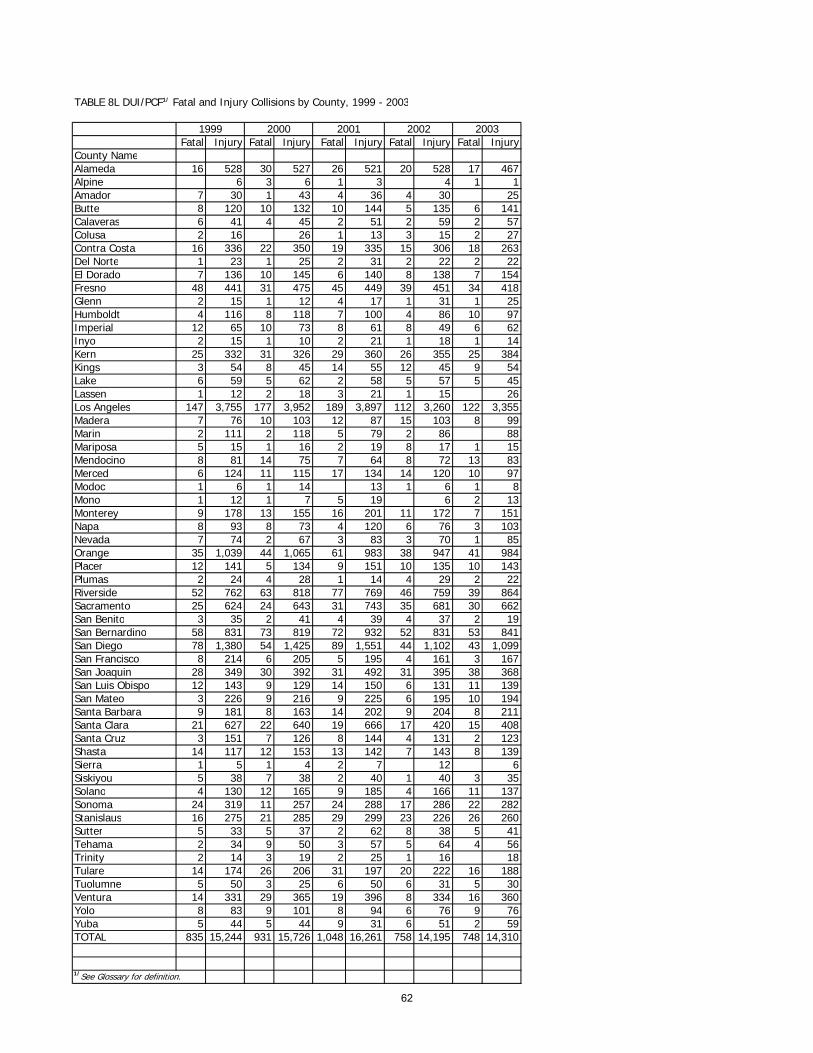
TABLE 8L DUI/PCF1/ Fatal and Injury Collisions by County, 1999 - 2003
1999 2000 2001 2002 2003Fatal Injury Fatal Injury Fatal Injury Fatal Injury Fatal Injury
County NameAlameda 16 528 30 527 26 521 20 528 17 467Alpine 6 3 6 1 3 4 1 1Amador 7 30 1 43 4 36 4 30 25Butte 8 120 10 132 10 144 5 135 6 141Calaveras 6 41 4 45 2 51 2 59 2 57Colusa 2 16 26 1 13 3 15 2 27Contra Costa 16 336 22 350 19 335 15 306 18 263Del Norte 1 23 1 25 2 31 2 22 2 22El Dorado 7 136 10 145 6 140 8 138 7 154Fresno 48 441 31 475 45 449 39 451 34 418Glenn 2 15 1 12 4 17 1 31 1 25Humboldt 4 116 8 118 7 100 4 86 10 97Imperial 12 65 10 73 8 61 8 49 6 62Inyo 2 15 1 10 2 21 1 18 1 14Kern 25 332 31 326 29 360 26 355 25 384Kings 3 54 8 45 14 55 12 45 9 54Lake 6 59 5 62 2 58 5 57 5 45Lassen 1 12 2 18 3 21 1 15 26Los Angeles 147 3,755 177 3,952 189 3,897 112 3,260 122 3,355Madera 7 76 10 103 12 87 15 103 8 99Marin 2 111 2 118 5 79 2 86 88Mariposa 5 15 1 16 2 19 8 17 1 15Mendocino 8 81 14 75 7 64 8 72 13 83Merced 6 124 11 115 17 134 14 120 10 97Modoc 1 6 1 14 13 1 6 1 8Mono 1 12 1 7 5 19 6 2 13Monterey 9 178 13 155 16 201 11 172 7 151Napa 8 93 8 73 4 120 6 76 3 103Nevada 7 74 2 67 3 83 3 70 1 85Orange 35 1,039 44 1,065 61 983 38 947 41 984Placer 12 141 5 134 9 151 10 135 10 143Plumas 2 24 4 28 1 14 4 29 2 22Riverside 52 762 63 818 77 769 46 759 39 864Sacramento 25 624 24 643 31 743 35 681 30 662San Benito 3 35 2 41 4 39 4 37 2 19San Bernardino 58 831 73 819 72 932 52 831 53 841San Diego 78 1,380 54 1,425 89 1,551 44 1,102 43 1,099San Francisco 8 214 6 205 5 195 4 161 3 167San Joaquin 28 349 30 392 31 492 31 395 38 368San Luis Obispo 12 143 9 129 14 150 6 131 11 139San Mateo 3 226 9 216 9 225 6 195 10 194Santa Barbara 9 181 8 163 14 202 9 204 8 211Santa Clara 21 627 22 640 19 666 17 420 15 408Santa Cruz 3 151 7 126 8 144 4 131 2 123Shasta 14 117 12 153 13 142 7 143 8 139Sierra 1 5 1 4 2 7 12 6Siskiyou 5 38 7 38 2 40 1 40 3 35Solano 4 130 12 165 9 185 4 166 11 137Sonoma 24 319 11 257 24 288 17 286 22 282Stanislaus 16 275 21 285 29 299 23 226 26 260Sutter 5 33 5 37 2 62 8 38 5 41Tehama 2 34 9 50 3 57 5 64 4 56Trinity 2 14 3 19 2 25 1 16 18Tulare 14 174 26 206 31 197 20 222 16 188Tuolumne 5 50 3 25 6 50 6 31 5 30Ventura 14 331 29 365 19 396 8 334 16 360Yolo 8 83 9 101 8 94 6 76 9 76Yuba 5 44 5 44 9 31 6 51 2 59TOTAL 835 15,244 931 15,726 1,048 16,261 758 14,195 748 14,310
1/See Glossary for definition.
62

TABLE 8N Persons Injured Indicating Seat Belt, Helmet, or Other Safety Equipment Usage by City, County, and Road Classification, 2003
Vehicle Occupant Total1/
Safety Equipment
Used
Safety Equipment Not Used*
Bicyclist Total
Safety Equipment
Used
Safety Equipment Not Used*
Motorcyclist Total
Safety Equipment
Used
Safety Equipment Not Used*
County Name
City Name
Del Norte 260 203 57 4 1 3 9 9 0Crescent City 27 13 14 0 0 0 1 1 0Unincorporated 233 190 43 4 1 3 8 8 0
Uninc. State Highways 155 133 22 0 0 0 8 8 0County Roadways 78 57 21 4 1 3 0 0 0
Humboldt 1,039 900 139 63 12 51 39 30 9Arcata 33 27 6 20 5 15 2 2 0Eureka 419 387 32 30 4 26 8 5 3Fortuna 23 18 5 1 0 1 2 1 1Rio Dell 2 0 2 0 0 0 0 0 0Unincorporated 562 468 94 12 3 9 27 22 5
Uninc. State Highways 355 300 55 3 1 2 13 13 0County Roadways 207 168 39 9 2 7 14 9 5
Modoc 54 41 13 1 1 0 4 4 0Alturas 5 3 2 1 1 0 0 0 0Unincorporated 49 38 11 0 0 0 4 4 0
Uninc. State Highways 25 20 5 0 0 0 2 2 0County Roadways 24 18 6 0 0 0 2 2 0
San Diego 20,580 18,407 2,173 831 210 621 986 859 127Carlsbad 548 508 40 28 15 13 34 30 4Chula Vista 1,286 1,171 115 37 5 32 41 36 5Coronado 103 81 22 10 7 3 6 6 0Del Mar 24 21 3 7 5 2 2 1 1El Cajon 967 866 101 44 11 33 41 37 4Encinitas 322 286 36 21 8 13 20 17 3Escondido 1,427 1,312 115 62 12 50 33 31 2Imperial Beach 86 70 16 17 3 14 1 1 0La Mesa 426 393 33 18 5 13 25 23 2Lemon Grove 139 133 6 8 3 5 6 5 1National City 517 470 47 10 3 7 15 13 2Oceanside 1,222 1,110 112 46 12 34 82 70 12Poway 139 114 25 7 3 4 5 3 2San Diego 8,970 8,020 950 418 84 334 342 289 53San Marcos 338 309 29 12 5 7 17 15 2Santee 190 164 26 6 4 2 17 12 5Solana Beach 69 60 9 1 0 1 1 1 0Vista 499 390 109 13 4 9 13 12 1Unincorporated 3,308 2,929 379 66 21 45 285 257 28
Uninc. State Highways 1,546 1,360 186 6 1 5 121 111 10County Roadways 1,762 1,569 193 60 20 40 164 146 18
Trinity 131 101 30 6 1 5 24 19 5Unincorporated 131 101 30 6 1 5 24 19 5
Uninc. State Highways 98 81 17 5 0 5 19 15 4County Roadways 33 20 13 1 1 0 5 4 1
TOTAL (for all counties) 256,321 229,750 26,571 10,812 2,225 8,587 9,681 8,145 1,536Subtotal (for selected countie 22,064 19,652 2,412 905 225 680 1,062 921 141
63

TABLE 8N Persons Killed Indicating Seat Belt, Helmet, or Other Safety Equipment Usage by City, County, and Road Classification, 2003
Vehicle Occupant Total1/
Safety Equipment
Used
Safety Equipment Not Used*
Bicyclist Total
Safety Equipment
Used
Safety Equipment Not Used*
Motorcyclist Total
Safety Equipment
Used
Safety Equipment Not Used*
County Name
City Name
Del Norte 10 8 2 0 0 0 0 0 0Unincorporated 10 8 2 0 0 0 0 0 0
Uninc. State Highways 8 7 1 0 0 0 0 0 0County Roadways 2 1 1 0 0 0 0 0 0
Humboldt 23 11 12 1 1 0 1 1 0Arcata 1 0 1 0 0 0 0 0 0Eureka 1 0 1 0 0 0 0 0 0
Unincorporated 21 11 10 1 1 0 1 1 0Uninc. State Highways 14 7 7 1 1 0 0 0 0County Roadways 7 4 3 0 0 0 1 1 0
Modoc 3 2 1 0 0 0 0 0 0Unincorporated 3 2 1 0 0 0 0 0 0
Uninc. State Highways 2 2 0 0 0 0 0 0 0County Roadways 1 0 1 0 0 0 0 0 0
San Diego 179 101 78 7 1 6 37 31 6Carlsbad 6 5 1 0 0 0 1 1 0Chula Vista 7 4 3 0 0 0 0 0 0Del Mar 0 0 0 0 0 0 0 0 0El Cajon 4 1 3 1 0 1 0 0 0Encinitas 1 1 0 0 0 0 0 0 0Escondido 15 12 3 1 0 1 1 0 1Imperial Beach 0 0 0 0 0 0 0 0 0La Mesa 4 2 2 0 0 0 1 1 0Lemon Grove 0 0 0 1 0 1 0 0 0National City 3 1 2 0 0 0 2 2 0Oceanside 12 7 5 0 0 0 1 1 0Poway 2 1 1 0 0 0 0 0 0San Diego 48 25 23 3 1 2 18 15 3San Marcos 7 1 6 0 0 0 0 0 0Santee 1 0 1 0 0 0 0 0 0Vista 7 4 3 0 0 0 0 0 0Unincorporated 62 37 25 1 0 1 13 11 2
Uninc. State Highways 34 17 17 0 0 0 4 3 1County Roadways 28 20 8 1 0 1 9 8 1
Trinity 5 0 5 0 0 0 0 0 0Unincorporated 5 0 5 0 0 0 0 0 0
Uninc. State Highways 3 0 3 0 0 0 0 0 0County Roadways 2 0 2 0 0 0 0 0 0
TOTAL - all counties 2,905 1,637 1,268 125 26 99 368 321 47(Subtotal - selected counties) 220 122 98 8 2 6 38 32 6
1/ See Glossary for definition.*Safety equipment "not stated" is included.
64
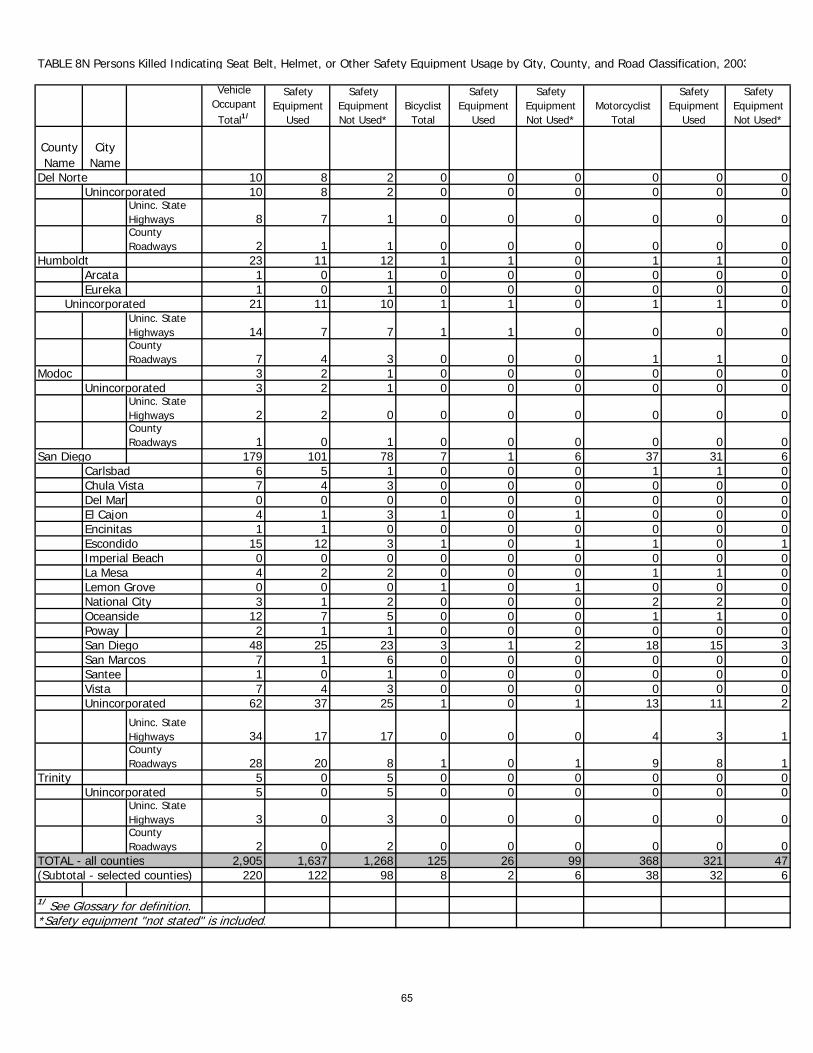
TABLE 8N Persons Killed Indicating Seat Belt, Helmet, or Other Safety Equipment Usage by City, County, and Road Classification, 2003
Vehicle Occupant Total1/
Safety Equipment
Used
Safety Equipment Not Used*
Bicyclist Total
Safety Equipment
Used
Safety Equipment Not Used*
Motorcyclist Total
Safety Equipment
Used
Safety Equipment Not Used*
County Name
City Name
Del Norte 10 8 2 0 0 0 0 0 0Unincorporated 10 8 2 0 0 0 0 0 0
Uninc. State Highways 8 7 1 0 0 0 0 0 0County Roadways 2 1 1 0 0 0 0 0 0
Humboldt 23 11 12 1 1 0 1 1 0Arcata 1 0 1 0 0 0 0 0 0Eureka 1 0 1 0 0 0 0 0 0
Unincorporated 21 11 10 1 1 0 1 1 0Uninc. State Highways 14 7 7 1 1 0 0 0 0County Roadways 7 4 3 0 0 0 1 1 0
Modoc 3 2 1 0 0 0 0 0 0Unincorporated 3 2 1 0 0 0 0 0 0
Uninc. State Highways 2 2 0 0 0 0 0 0 0County Roadways 1 0 1 0 0 0 0 0 0
San Diego 179 101 78 7 1 6 37 31 6Carlsbad 6 5 1 0 0 0 1 1 0Chula Vista 7 4 3 0 0 0 0 0 0Del Mar 0 0 0 0 0 0 0 0 0El Cajon 4 1 3 1 0 1 0 0 0Encinitas 1 1 0 0 0 0 0 0 0Escondido 15 12 3 1 0 1 1 0 1Imperial Beach 0 0 0 0 0 0 0 0 0La Mesa 4 2 2 0 0 0 1 1 0Lemon Grove 0 0 0 1 0 1 0 0 0National City 3 1 2 0 0 0 2 2 0Oceanside 12 7 5 0 0 0 1 1 0Poway 2 1 1 0 0 0 0 0 0San Diego 48 25 23 3 1 2 18 15 3San Marcos 7 1 6 0 0 0 0 0 0Santee 1 0 1 0 0 0 0 0 0Vista 7 4 3 0 0 0 0 0 0Unincorporated 62 37 25 1 0 1 13 11 2
Uninc. State Highways 34 17 17 0 0 0 4 3 1County Roadways 28 20 8 1 0 1 9 8 1
Trinity 5 0 5 0 0 0 0 0 0Unincorporated 5 0 5 0 0 0 0 0 0
Uninc. State Highways 3 0 3 0 0 0 0 0 0County Roadways 2 0 2 0 0 0 0 0 0
TOTAL - all counties 2,905 1,637 1,268 125 26 99 368 321 47(Subtotal - selected counties) 220 122 98 8 2 6 38 32 6
1/ See Glossary for definition.*Safety equipment "not stated" is included.
65

66

HIGHWAY SAFETY REQUIREMENTS

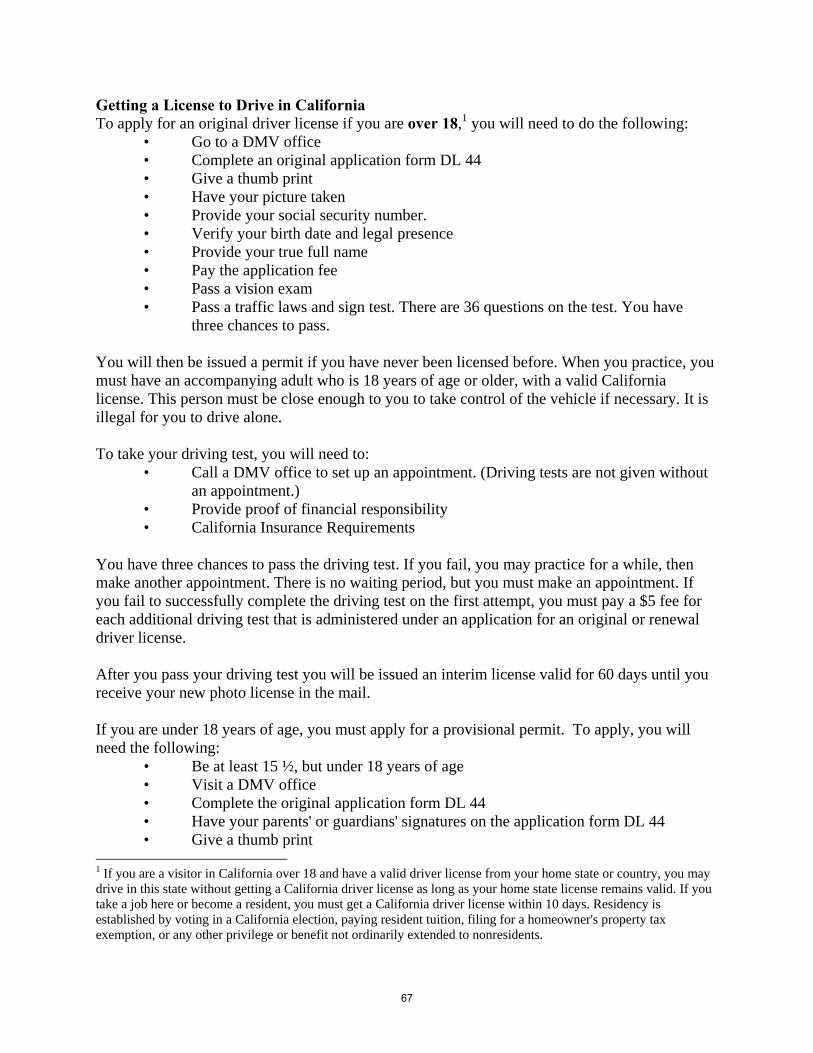
Getting a License to Drive in California To apply for an original driver license if you are over 18,1 you will need to do the following:
• Go to a DMV office • Complete an original application form DL 44 • Give a thumb print • Have your picture taken • Provide your social security number. • Verify your birth date and legal presence • Provide your true full name • Pay the application fee • Pass a vision exam • Pass a traffic laws and sign test. There are 36 questions on the test. You have
three chances to pass.
You will then be issued a permit if you have never been licensed before. When you practice, you must have an accompanying adult who is 18 years of age or older, with a valid California license. This person must be close enough to you to take control of the vehicle if necessary. It is illegal for you to drive alone. To take your driving test, you will need to:
• Call a DMV office to set up an appointment. (Driving tests are not given without an appointment.)
• Provide proof of financial responsibility • California Insurance Requirements
You have three chances to pass the driving test. If you fail, you may practice for a while, then make another appointment. There is no waiting period, but you must make an appointment. If you fail to successfully complete the driving test on the first attempt, you must pay a $5 fee for each additional driving test that is administered under an application for an original or renewal driver license. After you pass your driving test you will be issued an interim license valid for 60 days until you receive your new photo license in the mail. If you are under 18 years of age, you must apply for a provisional permit. To apply, you will need the following:
• Be at least 15 ½, but under 18 years of age • Visit a DMV office • Complete the original application form DL 44 • Have your parents' or guardians' signatures on the application form DL 44 • Give a thumb print
1 If you are a visitor in California over 18 and have a valid driver license from your home state or country, you may drive in this state without getting a California driver license as long as your home state license remains valid. If you take a job here or become a resident, you must get a California driver license within 10 days. Residency is established by voting in a California election, paying resident tuition, filing for a homeowner's property tax exemption, or any other privilege or benefit not ordinarily extended to nonresidents.
67
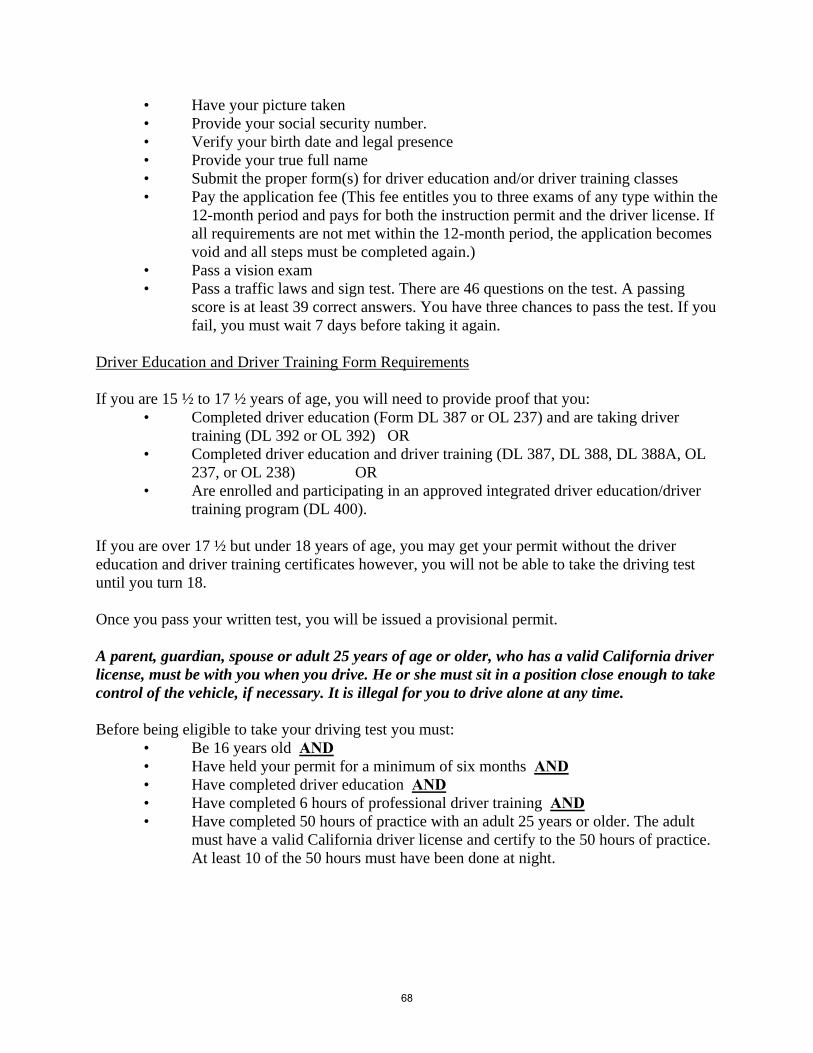
• Have your picture taken • Provide your social security number. • Verify your birth date and legal presence • Provide your true full name • Submit the proper form(s) for driver education and/or driver training classes • Pay the application fee (This fee entitles you to three exams of any type within the
12-month period and pays for both the instruction permit and the driver license. If all requirements are not met within the 12-month period, the application becomes void and all steps must be completed again.)
• Pass a vision exam • Pass a traffic laws and sign test. There are 46 questions on the test. A passing
score is at least 39 correct answers. You have three chances to pass the test. If you fail, you must wait 7 days before taking it again.
Driver Education and Driver Training Form Requirements If you are 15 ½ to 17 ½ years of age, you will need to provide proof that you:
• Completed driver education (Form DL 387 or OL 237) and are taking driver training (DL 392 or OL 392) OR
• Completed driver education and driver training (DL 387, DL 388, DL 388A, OL 237, or OL 238) OR
• Are enrolled and participating in an approved integrated driver education/driver training program (DL 400).
If you are over 17 ½ but under 18 years of age, you may get your permit without the driver education and driver training certificates however, you will not be able to take the driving test until you turn 18. Once you pass your written test, you will be issued a provisional permit. A parent, guardian, spouse or adult 25 years of age or older, who has a valid California driver license, must be with you when you drive. He or she must sit in a position close enough to take control of the vehicle, if necessary. It is illegal for you to drive alone at any time. Before being eligible to take your driving test you must:
• Be 16 years old AND • Have held your permit for a minimum of six months AND • Have completed driver education AND • Have completed 6 hours of professional driver training AND • Have completed 50 hours of practice with an adult 25 years or older. The adult
must have a valid California driver license and certify to the 50 hours of practice. At least 10 of the 50 hours must have been done at night.
68
To take your driving test, you will need to: • Call a DMV office to set up an appointment. (Driving tests are not given without
an appointment.) • Provide proof of financial responsibility
After you pass your driving test you will be issued an interim license valid for 60 days until you receive your new photo license in the mail. If you fail your driving test, you must wait two weeks before you can take the test again. You have three chances to pass. Parents' or guardians' signatures - accepting liability for a minor When parents or guardians sign for a minor to get a driver license, they are stating that they will accept financial responsibility for that minor. Financial responsibility in California requires that drivers and vehicle owners carry the following minimum monetary limits:
• $15,000 for injury or death of 1 person per accident • $30,000 for injury or death of 2 or more persons per accident • $5,000 for any property damage per accident
Evidence of financial responsibility must be carried at all times in the vehicle. Driver Education and Driver Training Information You may take driver education (classroom training) or driver training (behind-the-wheel) in a public or private high school, or in a state licensed, professional driving school. Driver Education and Driver Training courses must be conducted as prescribed by the Department of Education. Driver Education must consist of at least 30 hours or 2 1/2 semester periods of professional classroom instruction. Driver training must consist of at least six hours of behind-the-wheel professional instruction. Professional schools and instructors in California are licensed by the DMV. Schools must carry liability insurance, be bonded, and maintain complete records for DMV inspection. Their teaching cars are subject to inspection every 6 months. Instructors must pass qualifying examinations every three years, or show proof of continuing education in traffic safety. Provisional driver license restrictions during the first year On January 1, 2006, a new law went into effect that increased driving restrictions for persons under the age of 18 who:
• Are issued a provisional driver license (DL) on or after January 1, 2006, or • Already hold a provisional DL issued on or after January 1, 2005.
69
Provisional Driving Restrictions—You must be accompanied and supervised by a licensed parent, guardian or other licensed driver 25 years of age or older or a licensed or certified driving instructor when you:
• Transport passengers under 20 years of age at any time, for the first twelve months.
• Drive between 11 pm and 5 am for the first twelve months. Persons under 18 may not be employed to drive a motor vehicle. When you turn 18 years of age, the provisional part of your license ends. You may continue to drive as an adult using your photo license, which will expire on your 5th birthday after the date you applied. Exceptions to Restrictions When reasonable transportation is not available and it is necessary for you to drive, the law grants the following exceptions for minors to drive between 11 pm and 5 am or to transport an immediate family member unaccompanied and unsupervised. The law requires that you must carry a note explaining why you must drive and when the necessity will end. • Medical Necessity: The note must be signed by your physician and contain a diagnosis
and probable date when recovery will end your need to drive. • School or School–Authorized Activities: The note must be signed by your school
principal, dean, or his or her designee and include a reason for the school or school–authorized activity and the date when the activity will end.
• Employment Necessity: The note must be signed by your employer and verify employment and the date your employment will end.
• Immediate Need of Family Member: The note must be signed by your parent or legal guardian and include the reason and date the necessity will end.
• Emancipated Minor: No documentation is needed for this exemption, however you must have already declared yourself emancipated by completing a DMV form and by providing Proof of Financial Responsibility (SR 1P) in lieu of your guarantors’ signatures when you applied for your instruction permit.
70
Can You Afford to Drink and Drive?
Suspension and Revocation of Your License: Once you are arrested for Driving Under theInfluence (DUI), the officer is required by law to immediately forward a copy of the completednotice of suspension or revocation form and any driver license taken into possession, with asworn report to the Department of Motor Vehicles (DMV). At the time of the arrest, the officerissues an Order of Suspension and Temporary License. You may drive for 30 days from the datethe order of suspension or revocation was issued, provided you have been issued a Californiadriver license and your driver license is not expired, or your driving privilege is not suspended orrevoked for some other reason.
The DMV automatically conducts an administrative review that includes an examination of theofficer's report, the suspension or revocation order, and any test results. If the suspension orrevocation is upheld during the administrative review, you may request a hearing to contest thesuspension or revocation.
DMV Administrative Hearing: You have the right to request a hearing from the DMV within10 days of receipt of the suspension or revocation order. A hearing is your opportunity to showthat the suspension or revocation is not justified. If the review shows there is no basis for thesuspension or revocation, the action will be set aside. You will be notified by the DMV inwriting only if the suspension or revocation is set aside following the administrative review. (Arequest for a restricted license cannot be considered at the DMV hearing. You may apply for arestricted license to drive to and from work at any DMV field office.)
The DMV suspension or revocation is an administrative action taken against your drivingprivilege only. A DMV hearing is not required. You must still comply with the state courtprocess. The suspension or revocation following a conviction in state court is a mandatoryaction for which jail, fine, or other criminal penalty can be imposed.
The DMV hearing is an administrative proceeding regarding your driving privilege and thecircumstances surrounding the arrest, not whether you are innocent or guilty of a criminal act.Only the following issues will be discussed:
If you took a blood or breath or (if applicable) a urine test: • Did the peace officer have reasonable cause to believe you were driving a motor
vehicle in violation of Vehicle Code Section 23140 , 23152 , or 23153 ? • Were you placed under lawful arrest? • Were you driving a motor vehicle when you had 0.08% or more by weight of
alcohol in your blood?
If you refused or failed to complete a blood, breath test, or (if applicable) a urine test: • Did the peace officer have reasonable cause to believe you were driving a motor
vehicle in violation of Vehicle Code Section 23140 , 23152 , or, 23153 ? • Were you placed under lawful arrest? • Were you told that if you refused to submit to or failed to complete a test of your
blood, breath, or (when applicable) urine, your driving privilege would be
71
suspended for one year or revoked for two or three years? • Did you refuse to submit to or failed to complete a blood or breath test, or (if
applicable) a urine test after being requested to do so by a peace officer?
Reissue License Fee: At the time of the arrest, the officer confiscates your driver license. Yourdriver license will be returned to you at the end of the suspension or revocation, provided youpay a $125 reissue fee to the DMV and you file proof of financial responsibility. The reissue feeremains at $100 if you were under age 21 and were suspended under the Zero Tolerance Lawpursuant to Vehicle Code §§23136, 13353.1, 13388, 13392. If it is determined that there is not abasis for the suspension or revocation, your driver license will be issued or returned to you.
Blood Alcohol Content (BAC)/Blood Drug Content: You are required by law to submit to achemical test to determine the alcohol and/or drug content of your blood. If you are 21 yearsof age or older, took a blood or breath test, or (if applicable) a urine test, and the results showed0.08% BAC or more:
• A first offense will result in a 4-month suspension of your license. • A second or subsequent offense within 7 years will result in a 1-year suspension. • If you are under 21 year of age, took a preliminary alcohol screening (PAS) test
or other chemical test and results showed 0.01% BAC or more, your drivingprivilege will be suspended for 1 year.
As of January 1999, a urine test is no longer available unless: • The officer suspects you were driving under the influence of drugs or a
combination of drugs and alcohol, or • Both the blood or breath tests are not available, or • You are a hemophiliac, or • You are taking anticoagulant medication in conjunction with a heart condition.
If you were 21 years or older at the time of arrest and you refused or failed to complete a bloodor breath test, or (if applicable) a urine test:
• A first offense will result in a 1-year suspension. • A second offense within 7 years will result in a 2-year revocation. • A third or subsequent offense within 7 years will result in a 3-year revocation.
If you were under 21 years of age at the time of being detained or arrested and you refused orfailed to complete a PAS test or other chemical test:
• A first offense will result in a 1-year suspension. • A second offense within 7 years will result in a 2-year revocation. • A third or subsequent offense within 7 years will result in a 3-year revocation.
72
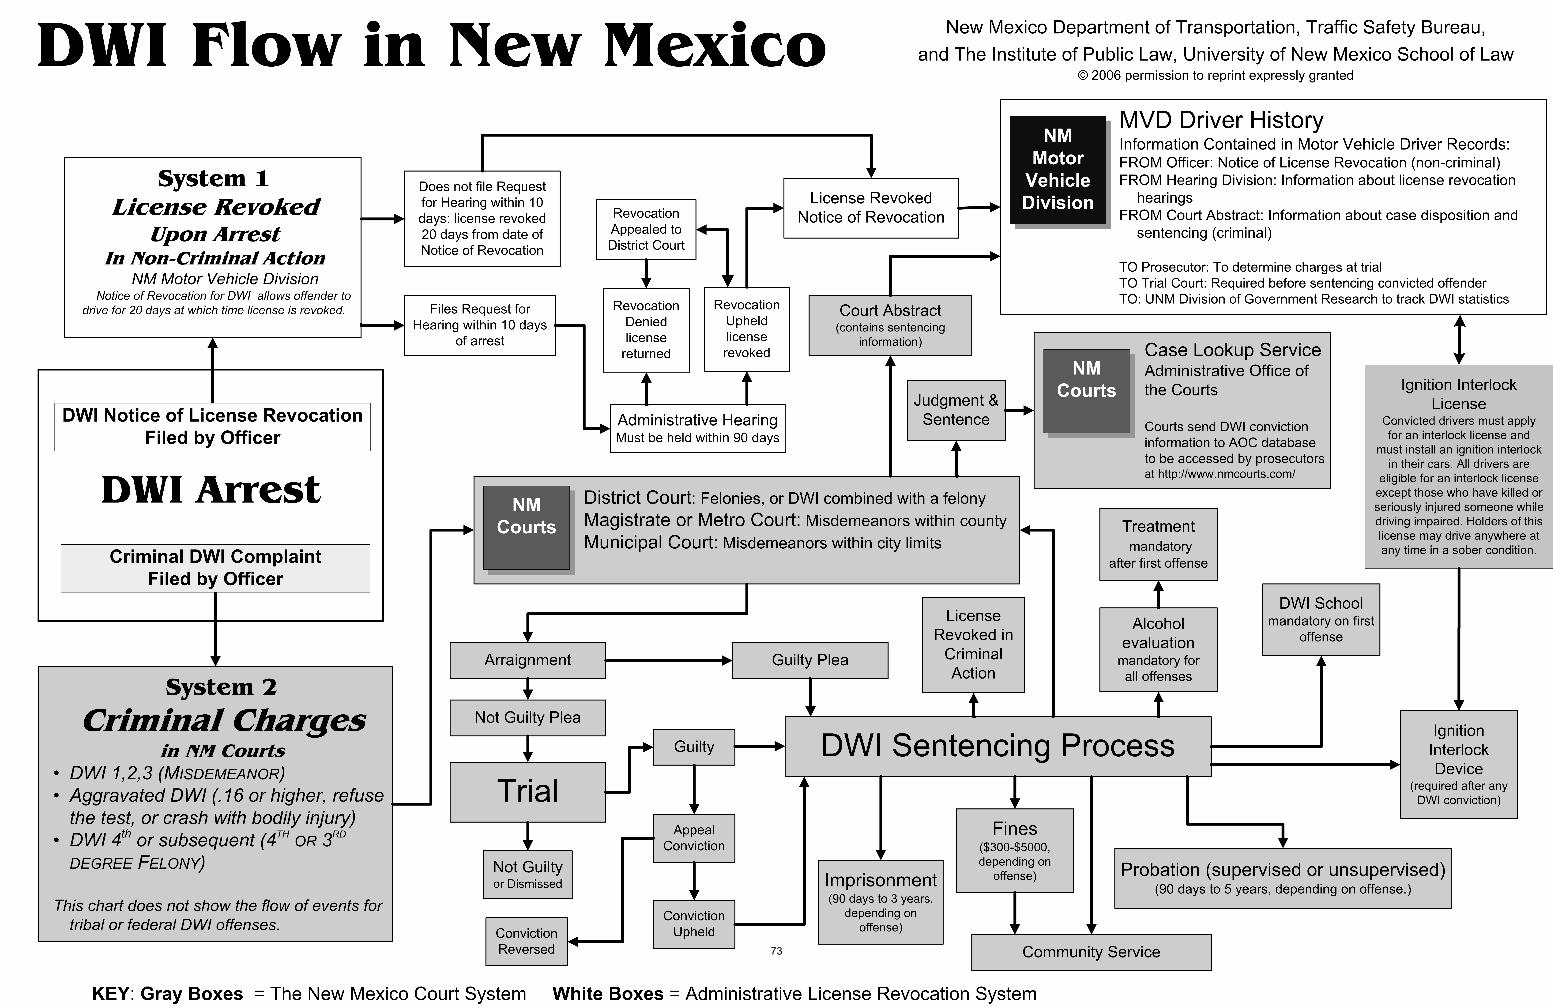
73
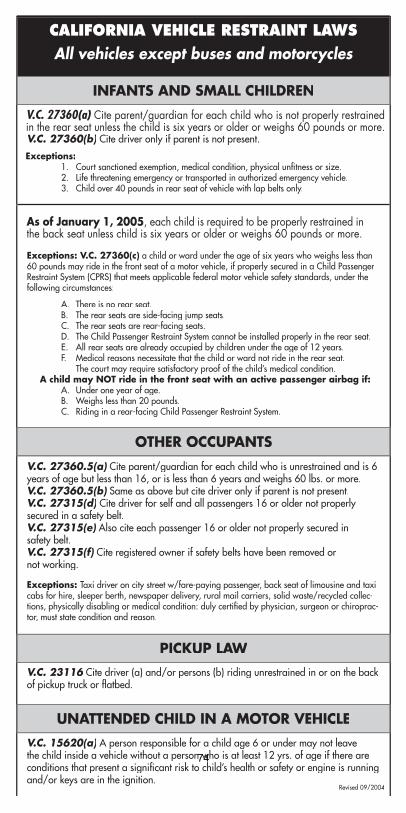
��������������������������������������������������������������������������
��������������������������������������������������������������������������������������������������������������������������������������������������������������������������������������������������������������������������������������������������������������������������������������������������������������������������������������������������������������������������������������������������������
����������������������������������������������������������������������������������������������������������
�������������������������������������������������������������������������������������������������������������������������������������������������������������������������������������������������������������������������������������������������������������������������������������������������������������������
�������������������������������������������������������������������������������������������������������������������������������������������������������������������������������������������������������������������������������������������������������������������������������������������������������������������������������������������������������������������������������������������������������������������������������������������������������������������������������������������������������������������������������������������������������������������������������������������������������������������������������������������������������������������������������������������������������������������������������������������������������������������������������������������������������������������������������������������������������������������������������������������������������������������������������������������������������������������������������������������������������������������
��������������������������������������������������������������������������������������������������������������������������������������������������������������������������������������������������������������������������������������������������������������������������������������������������������������������������������������������
�����������������������������������������������������������������������������������������������������������������������������������������������������������������������������������������������������������������������
� � ��� ����������������������� � ��� ������������������������������������������� � ��� �������������������������������������� � ��� ������������������������������������������������������������������������������������ � ��� ��������������������������������������������������������������������������� � ��� ������������������������������������������������������������������������������ � ����������������������������������������������������������������������������������������������������������������������������������������������������
� � ��� ������������������������ � ��� ���������������������������� � ��� ���������������������������������������������������������
����������������������������������������������������������������������������������������������������������������������������������������������������������������������������������������������������������������������������������������������������������������������������������������������������������������������������������������������������������������������������������������������������������������������������
������������ � ��� ��������������������������������������������������������������������������� � ��� ��������������������������������������������������������������������������� � ��� �����������������������������������������������������������������
���������������
V.C. 27360(a) Cite parent/guardian for each child who is not properly restrained in the rear seat unless the child is six years or older or weighs 60 pounds or more.
As of January 1, 2005, each child is required to be properly restrained in the back seat unless child is six years or older or weighs 60 pounds or more.
74
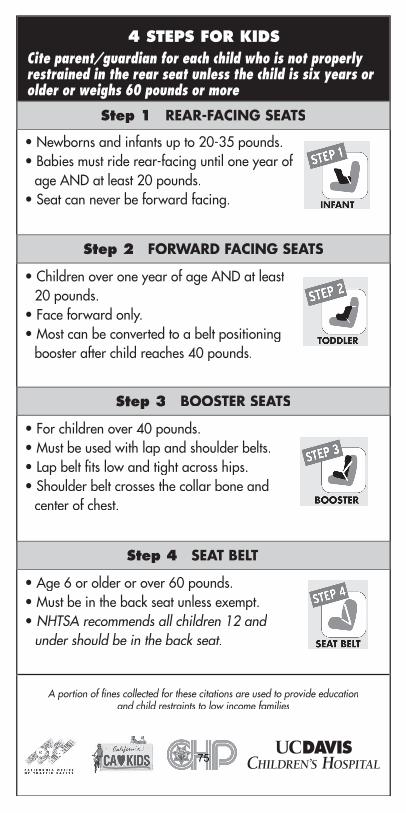
�������������������������������������������������������
����������������������
��������������������������
���������������������������������������������������������������������������������������������������������������������������������������������������������
�����������������������������
���������������������������������������������������������������������������������������������������������������������������������������������������������������
����������������������
��������������������������������������������������������������������������������������������������������������hips�������������������������������������������������������������
������������������
����������������������������������������������������������������������������������������������������������������������������������������������������
��������������������������������������������������������������������������������������������������������������������������
Cite parent/guardian for each child who is not properly restrained in the rear seat unless the child is six years or older or weighs 60 pounds or more
75
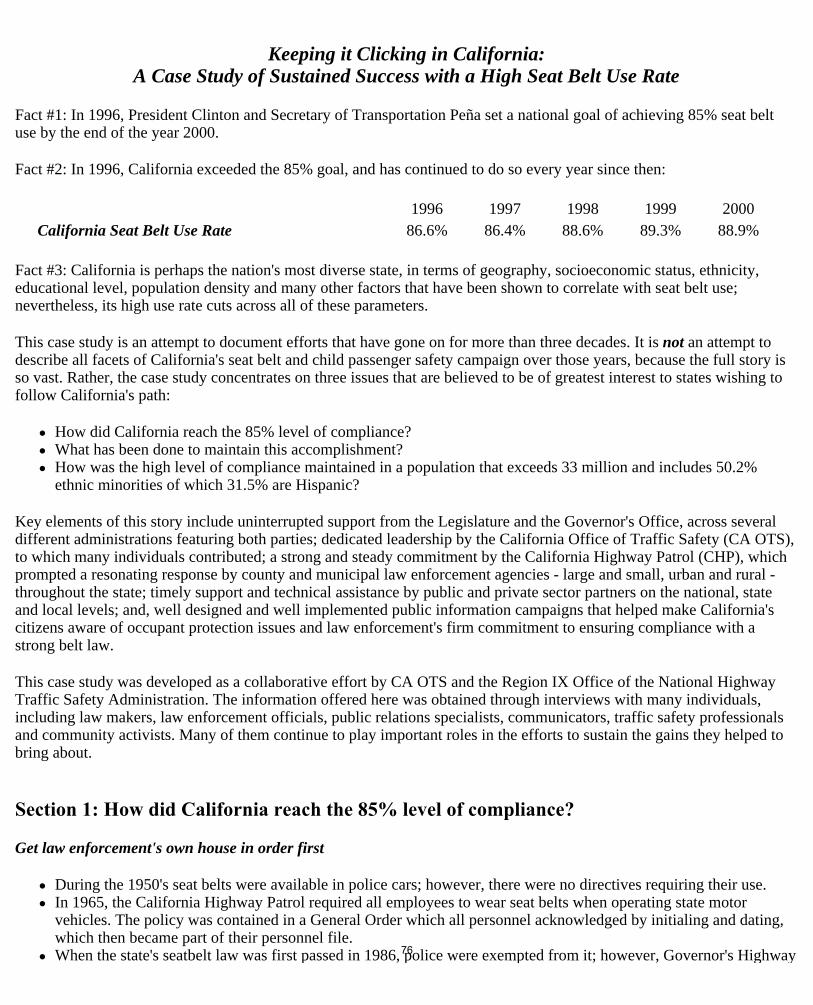
Keeping it Clicking in California:
A Case Study of Sustained Success with a High Seat Belt Use Rate
Fact #1: In 1996, President Clinton and Secretary of Transportation Peña set a national goal of achieving 85% seat belt use by the end of the year 2000.
Fact #2: In 1996, California exceeded the 85% goal, and has continued to do so every year since then:
Fact #3: California is perhaps the nation's most diverse state, in terms of geography, socioeconomic status, ethnicity, educational level, population density and many other factors that have been shown to correlate with seat belt use; nevertheless, its high use rate cuts across all of these parameters.
This case study is an attempt to document efforts that have gone on for more than three decades. It is not an attempt to describe all facets of California's seat belt and child passenger safety campaign over those years, because the full story is so vast. Rather, the case study concentrates on three issues that are believed to be of greatest interest to states wishing to follow California's path:
How did California reach the 85% level of compliance? What has been done to maintain this accomplishment? How was the high level of compliance maintained in a population that exceeds 33 million and includes 50.2% ethnic minorities of which 31.5% are Hispanic?
Key elements of this story include uninterrupted support from the Legislature and the Governor's Office, across several different administrations featuring both parties; dedicated leadership by the California Office of Traffic Safety (CA OTS), to which many individuals contributed; a strong and steady commitment by the California Highway Patrol (CHP), which prompted a resonating response by county and municipal law enforcement agencies - large and small, urban and rural - throughout the state; timely support and technical assistance by public and private sector partners on the national, state and local levels; and, well designed and well implemented public information campaigns that helped make California's citizens aware of occupant protection issues and law enforcement's firm commitment to ensuring compliance with a strong belt law.
This case study was developed as a collaborative effort by CA OTS and the Region IX Office of the National Highway Traffic Safety Administration. The information offered here was obtained through interviews with many individuals, including law makers, law enforcement officials, public relations specialists, communicators, traffic safety professionals and community activists. Many of them continue to play important roles in the efforts to sustain the gains they helped to bring about.
Section 1: How did California reach the 85% level of compliance?
Get law enforcement's own house in order first
During the 1950's seat belts were available in police cars; however, there were no directives requiring their use. In 1965, the California Highway Patrol required all employees to wear seat belts when operating state motor vehicles. The policy was contained in a General Order which all personnel acknowledged by initialing and dating, which then became part of their personnel file. When the state's seatbelt law was first passed in 1986, police were exempted from it; however, Governor's Highway
1996 1997 1998 1999 2000California Seat Belt Use Rate 86.6% 86.4% 88.6% 89.3% 88.9%
Page 1 of 7Keeping it Clicking in California:A Case Study of Sustained Success with a High Seat Belt Use Rate
6/3/2006http://www.nhtsa.dot.gov/people/injury/airbags/buckleplan/bua_website/Archive-04/Cases/California.html
76
Safety Representative Peter O'Rourke required police agencies to have a written policy requiring three-point (lap and shoulder) seat belt use by officers in order to receive grants from CA OTS. CHP Captain Steve Ellis began a series of presentations to California Police Chiefs and Sheriffs to establish a seat belt policy for their departments as well as law enforcement employee groups to gain their support for increased seat belt use. Once the law enforcement community was convinced of the benefits of occupant protection, then the second phase of Capt. Ellis's program became operational, i.e., the encouragement of officers in the enforcement of the seat belt law. Safety belt laws were incorporated in police cadet vehicle code training at law enforcement academies, and NHTSA' s Occupant Protection Use and Enforcement (OPUE) course was approved by the Commission on Peace Officers Standardized Training (P.O.S.T.).
Focus on saving kids to build a base of public support
In 1972, the CHP began a campaign to encourage the use of seat belts in the Los Angeles Area. "Buckle Your Body Down" was a 12 month program which included a series of radio public information messages and the distribution of iron-on patches for children featuring Captain Safe Ride and his pet turtle Cecil. In 1979, a Child Passenger Safety (CPS) Workshops in Berkeley was attended by a large group of pediatricians, obstetricians, public health practitioners, and activists. Discussion topics included the new child restraint law in Tennessee, and loaner programs that were supporting compliance with the law. In early 1980, at a follow-up CPS conference in Sacramento, a group was organized to push for education and loaner programs throughout state, and lead the charge for a State CPS law. A bill sponsored by Senator Nicholas Petris, with the support of American Academy of Pediatrics, California Medical Association, American College of Obstetrics and Gynecology, Children's Lobby, and NHTSA became the CPS law in 1982. The Third California CPS Conference was held in Los Angeles. More police were invited than for the previous conferences and discussed the new CPS law and the training officers, deputies and troopers would need to enforce it fully. OTS awarded a grant for a training program, and developed and disseminated a video for local police on why and how to enforce the CPS law. The climate of strict enforcement, at the state, county and local levels, that was established in the context of the CPS law subsequently spilled over into adult seat belt enforcement, once that law was passed.
Get a law, enforce it, and improve it
Under legislation authored by the California Speaker of the House, Willie L. Brown, Jr,. a mandatory secondary enforcement seat belt law was enacted in 1986 with a 10 year sunset clause. The seat belt use rate rose from 18% in 1986 to 71% by 1992. Law enforcement officers at the state, county and local levels were encouraged to write tickets for seat belt violations. The California Highway Patrol conducted the Safety Belt Awareness Campaign to increase seat belt use from October 1988 to December 1992. A major component of the Safety Belt Awareness Campaign was the safety Belt Task force established by CHP Commissioner Maury Hannigan. The California Seat Belt Task Force (CSBTF) was charged with determining and implementing the methodology for increasing awareness of and compliance with the safety belt law. In addition to CA OTS NHTSA and the CHP, task force members included representatives of local law enforcement, education, media, medical community, automobile club, insurance companies and traffic safety organizations. Speaker Brown authored the bill that on January 1, 1993 changed the seat belt law from secondary to primary, with the 1996 sunset clause remaining. Under an CA OTS grant, the California Safety Belt Task Force (CSBTF) convened from February 1993 to January 1996 to further two goals and objectives: cultivate public support for the primary seat belt law and eliminate the sunset clause; and, reach a statewide compliance rate of 85% by 1996. Both goals were accomplished.
Section 2: What has been done to maintain this accomplishment?
Page 2 of 7Keeping it Clicking in California:A Case Study of Sustained Success with a High Seat Belt Use Rate
6/3/2006http://www.nhtsa.dot.gov/people/injury/airbags/buckleplan/bua_website/Archive-04/Cases/California.html
77
Never relax the enforcement effort: in California, mobilization is constant
Beginning in Fiscal Year 1994, all law enforcement agencies seeking Police Traffic Safety grants from CA OTS were required to include an occupant protection element. During 1997, the CHP conducted the Speed Compliance and Occupant Restraint Enforcement IV (SCORE IV) project at 30 sites statewide (25 were occupant restraint and speed sites and 5 were exclusively speed sites). The program provided 17,724 officer, 1,718 sergeant, 466 communications operator and 336 clerical overtime hours. One of the goals was to increase compliance with mandatory safety belt and child safety seat laws on targeted roadways by 5% from pre-enforcement surveys. By 1999, there were very few municipal agencies in California that did not consider the education and enforcement of occupant protection laws as very significant to their mission in reducing injuries and deaths associated with traffic collisions.
City Police Departments report that they spend a significant percentage of their organization's total available time (average of 25%)on traffic Law Enforcement. California Sheriff's Departments report that they commit an average of 12% of their total resources to traffic law enforcement. An overwhelming majority of municipal law enforcement agencies credit CA OTS with their success in undertaking traffic safety programs.
Participation by California law enforcement agencies in the Buckle Up America Mobilizations has steadily increased:
Use law enforcement officials to spread the word to their peers
An inquiry of 110 randomly selected municipal and 12 county law enforcement agencies resulted in the following comments when asked about the importance of seat belt and child safety seat enforcement as part of their overall traffic law enforcement effort:
"Twenty-five percent of our entire department's traffic enforcement effort is devoted to occupant protection violations, and among our traffic enforcement personnel that constitutes 90% of their effort. We believe that a primary seat belt law, seat belt checkpoints, the Safe Streets Act of 1995 (Vehicle Impound Program) and lowering the BAC to .08% have all contributed to our success in traffic law enforcement." Stockton Police Department. "Extremely. Although California's sheriffs do not have traffic law enforcement responsibilities in the unincorporated areas of our counties, we have contracts to provide traffic enforcement in a number of our cities. We operate Drunk Driving Checkpoints, Child Safety Seat Inspection Programs, seat belt education, and bicycle safety education programs. Traffic Safety Grants have been very important to us." Contra Costa County Sheriff's Office. "Seat belt and Child Safety Seat enforcement is a major concern as this is action which decreases injuries in collisions. We practice aggressive enforcement of all occupant safety laws, participate in each operation ABC Mobilization as part of a national effort, checkpoints, and informational handouts to the public." Porterville Police Department.
The commitment to this aggressive and continuing effort is evidenced by the responses provided by both executive, supervisory, and line personnel, all of whom have a clear understanding of the injury and life saving value of seat belt and child safety restraint enforcement.
Chief Ron Scott, of the Livermore Police Department states it well when he says that seat belt and child safety seat enforcement are critical to his department' s overall traffic law enforcement effort. "Highly visible and advertised enforcement, child safety seat checkpoints and training, and a variety of other traffic safety efforts have contributed to the success of our program", he says. Lieutenant Stan Muller of the Berkeley Police Department reports that seat belt and child safety seat enforcement is the most important tool his department has in dealing with traffic law enforcement. "Once you
May 1998 - 42 agencies November 1998 - 128 agenciesMay 1999 - 357 agencies November 1999 - 379 agenciesMay 2000 - 348 agencies
Page 3 of 7Keeping it Clicking in California:A Case Study of Sustained Success with a High Seat Belt Use Rate
6/3/2006http://www.nhtsa.dot.gov/people/injury/airbags/buckleplan/bua_website/Archive-04/Cases/California.html
78
realize the true cost of traffic related incidents you will clearly see the need to increase enforcement, and provide education and enlightenment through Child Safety Seat checkpoints." Captain Michael Kemmitt of the San Francisco Police Department says that seat belt and child safety seat enforcement is very important to his department. He credits seat belt and child car seat safety checkpoints, car seat giveaways and targeted enforcement with their success in maintaining a high seat belt use. He also suggests that agencies are wise to partner with other agencies public and private in educating the public about this issue.
Virtually all local agencies in California have working agreements with their local media which provide for the timely release of information involving traffic collisions. As part of the process, local law enforcement agencies have learned to use each of these events as a means of "getting the message" to the public about the difference that appropriate occupant protection measures can make. It is commonplace to see media releases from local law enforcement agencies reporting whether the occupants in vehicles involved in collisions were belted or not, reinforcing the safety benefits, while providing the media with the more sensational details of the event.
Never stop expanding the network of partners: there is always room for more
"Buckle Up San Diego" was formed by a cooperative agreement between the City of San Diego and the National Safety Council Chapter to promote seat belt use. Letters and materials were mailed to corporations inviting them to participate in the campaign to have companies establish a seat belt policy. Senator Nicholas Petris sponsored two additional CPS laws. One in 1991which required hospitals to inform parents about the CPS law, and the other in 1995 which amended the 1991 law to require all pediatric health care facilities and birthing centers to have a written policy on disseminating CPS information. In 1993 - 94, the Safe Communities concept was developed to partner with non-traditional traffic related injury prevention groups with an emphasis on education about the importance of compliance with occupant protection laws. A priority concern of the coalitions was safety belt use and child passenger safety. There are now 43 Safe Communities coalitions in California, most coordinated by the Department of Health Services under an CA OTS grant. In 1996, under a CA OTS grant, a corporate strategy was developed through the Network of Employers for Traffic Safety (NETS). Quarterly informational updates are mailed to 1,600 companies and organizations about available materials such as costs of crashes to employers, logos, and camera ready articles and cartoons. CA OTS occupant protection grants were provided to Community Based Organizations (generally defined as non-government agencies organized to work together on a community based issue). In 1999, the California Department of Health Services established a Child Passenger Safety coordinator in 61 county health departments, children's hospitals and day care providers to nurture consistency and quality for all CPS programs.
Going for 90%: what California's leading law enforcement officials recommend
Train Officers in occupant protection at the recruit level and keep them current with roll call and in-service refresher courses. Establish and enforce a safety belt policy for departmental employees. Integrate safety belt and child passenger safety seat enforcement into all traffic enforcement activities. Consider safety belt and child passenger citations on the same level as other hazardous citations when rating an officer's performance. Make available a "ready-reference" card with section numbers and a brief description of occupant protect laws that officers can carry in their citation books. Preprint occupant protection violation section numbers on citations; make it as easy as possible for police officers write seatbelt tickets. Pass out public information cards containing local or state statistical information on use/non-use in crashes and the positive effects of habitual safety belt use. Include safety belt and child passenger safety use on collision reports. Conduct surveys to measure the effectiveness of enforcement and public information efforts.
Page 4 of 7Keeping it Clicking in California:A Case Study of Sustained Success with a High Seat Belt Use Rate
6/3/2006http://www.nhtsa.dot.gov/people/injury/airbags/buckleplan/bua_website/Archive-04/Cases/California.html
79
Section 3: How was the high level of compliance maintained in a population that exceeds 33 million and includes 50% ethnic minorities of which 32% are Hispanic?
California's diverse population is made up of 31.5% Hispanic, 12% Asian and Pacific Islander and 7.5% African-American. A large segment of the Hispanic community are long time residents who are descendants of the families that settled the area before statehood, as compared to the recent arrivals from Mexico and South America. It is the new immigrants who present the greatest challenge to increasing safety belt use.
Pitch a big tent, and invite everyone in
In the 1970's law enforcement agencies in California began special efforts to recruit and hire members of diverse groups to establish better communication and relationships with ethnic minority populations. In 1988, CHP started the "El Protector" Program as a pro-active traffic safety outreach project directed at the Hispanic community. From 1995 - 1997, the program strongly emphasized proper installation and use of child passenger safety seats (which included an element on children with special needs) and safety belts use. Beginning in 1994, the CHP Academy required all cadets to pass a Spanish language proficiency test. From 1994 to 1997, Glendale Police Department, under an CA OTS grant, developed a multi-cultural CPS project "Lifesaving In Any Language". Brochures and training materials were developed to reach Los Angeles County's largest diverse groups in their native language about proper installation and use of child passenger safety seats. The theme was "A Tradition of Protecting Our Children" focusing on a common trait of all societies to nurture and protect their children. The diverse groups were identified as African-Americans, Armenians, Cambodians, Chinese-Americans, Filipinos, Hispanic, Koreans, Native-Americans, Russians and Vietnamese. From 1993 to1994, the Department of Motor Vehicles conducted a survey of 3,493 motorists renewing their driver's license. Ninety percent knew they could be stopped for a belt violation alone and seventy-five percent felt the law was being strictly enforced. More than half stated they wore their belts more often.
Keep focusing on the community level
Twenty-six Community Occupant Protection Programs are currently focused on child passenger safety and safety belt use. An overview of some of the programs shows:
San Bernardino County's "Comprehensive Child Passenger Safety Program" trained community volunteers to assist with child safety seat check ups and distributed 2,127 child safety seats and booster seats. Tuolumne County's "Child Safety seat Education Program" conducted 25 educational programs impacting 1,475 people, and distributed 212 safety seats which resulted in a local increase in safety seat use from 43% to 68%. Contra Costa County's "Operation Replace Me" established a statewide 1-800 number hotline for callers inquiring about crash involved safety belts and car seats, training for first responders and produced "Replace Me" stickers for crash involved restraints. Contra Costa County's "Nurses & Cops Caring for Contra Costa Children" conducted over 20 car seat check ups per year from 1998 to 2000 and distributed 350 car seats. The local car seat misuse rate has decreased from 97% to 87%. Los Angeles County's "Child Passenger Safety Training Program" conducted 6 NHTSA CPS Technician Training classes, responded to 15,119 calls from parents and guardians on their toll free hotline, developed an officer recognition program, and encouraged judges to strictly enforce occupant restraint laws. CHP's "On Right? Right On" program distributes multi-cultural educational materials and a toll free number for a "Spotter" program to report CPS violations observed by the public.
The Los Angeles County Safe Communities Program works through five Community Based Organizations in different geographical areas of the county. All staff are bilingual and materials are printed in English and Spanish. They also work with a Spanish language media consultant and a Hispanic marketing group to get the safety belt use and CPS message to the community. One of the challenges is developing information for two main groups of the Hispanic population; people from Mexico and those from other Latin American countries with significant cultural and dialect differences from their Mexican-American neighbors. In Riverside County, the Safe Communities programs focus on Head-start preschools and Daycare, in home with
Page 5 of 7Keeping it Clicking in California:A Case Study of Sustained Success with a High Seat Belt Use Rate
6/3/2006http://www.nhtsa.dot.gov/people/injury/airbags/buckleplan/bua_website/Archive-04/Cases/California.html
80

families, because the parents of a the large number of the Hispanic children are recent arrivals in this country. Low cost CPS seats are available through this program as well as through their VIP court diversion program. All materials are bilingual and Spanish speaking staff members are always available to answer questions by telephone or through public contacts such as community health fairs.
CONCLUSION
California's increasing population and its vibrant economy make traffic safety more important today than at any time in the state's history. The safe movement of goods and people on its roadways is vital to California's continuing economic prosperity. Yet, with over 23 million registered vehicles in California, ensuring the safety of motorists is a challenging task.
The highway safety partners in California have shown a never ending commitment to increasing seat belt use. The California strategy employing education and enforcement, combined with a community-based approach to occupant safety issues and traffic safety problem solving has proven to be a winning combination. The tireless effort of the CA OTS and its grantees, CHP and local law enforcement, and traffic safety professionals and advocates throughout the state are to be commended for making this a successful strategy. Because of these partnership efforts, California continues to lead the nation in seat belt use.
Seat belt use has become a way of life for most California drivers. Belt use and awareness have been in the forefront of California traffic safety for more than three decades. The need to use seat belts has been instilled in children early on in school focused programs and these children have continued their belt use as adults. The continuing emphasis by California on child safety through the use of safety seats has had a spillover effect on the millions of parents who know the importance of buckling themselves along with their children. New residents to California are bombarded with public safety messages and media events, in languages they understand, extolling the need to buckle up for safety in California.
Enforcement of the seat belt and child passenger safety laws has become an integral part of the law enforcement culture in California. In California maintaining the high level of seat belt use has indeed been a team effort!
BIBLIOGRAPHY
A Blueprint for Occupant Protection Programs, California Office of Traffic Safety, August 1999 A Blueprint for Police Traffic Services Programs, California Office of Traffic Safety, March 2000 Annual Progress Report, 1999, California Office of Traffic Safety, January 2000 Buckle Up California! The Case for Priority Occupant Protection Enforcement, CHP/CA OTS Booklet, April 1998 Buckle Your Body Down, Seat Belt Campaign in the Los Angeles Area, CHP Report May 1973 California's New Primary Safety Belt Law Reaps Impressive Gains In Belt Use, NHTSA Technology Transfer Series Number 84, January 1995 California Safety Belt Task Force, Final Report, CHP/CA OTS, January, 1997 Child Occupant Restraint Campaign, Final Report, Kent R. Milton & Charles S. Kohler, May, 1983 Comprehensive Child Passenger Safety Seat Program, CHP Report 1998 Evaluation of California's Safety Belt Law Change to Primary Enforcement, DOT HS 808 205 From Secondary To Primary, California's Seat Belt Law, CHP Report, 1998 Glendale Police Department's Countywide Child Passenger Safety Project Final Report, December 30, 1996 How to Implement an El Protector Traffic Safety Program, DOT HS 808 110, 1994 Ideas And Examples On Reaching A Seat Belt Compliance Rate Of 90%, CHP Report, 1992 7 Reasons Why Police Agencies Should Have A 3-Point Safety Belt Policy, CHP/CA OTS 1991 1980 Motor Vehicle Occupant Restraint Systems Study, CHP Report 1980 Safety Belt Awareness Campaign, Final Repot, CHP March 1993 Speed Compliance and Occupant Restraint Enforcement (SCORE IV) Final Report,
Page 6 of 7Keeping it Clicking in California:A Case Study of Sustained Success with a High Seat Belt Use Rate
6/3/2006http://www.nhtsa.dot.gov/people/injury/airbags/buckleplan/bua_website/Archive-04/Cases/California.html
81
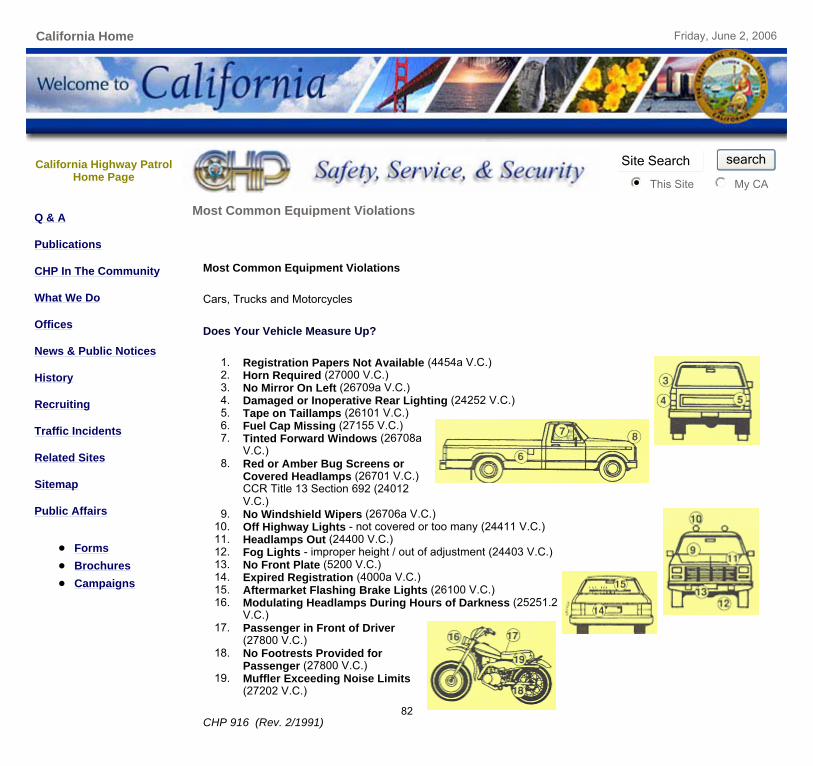
California Home Friday, June 2, 2006
California Highway Patrol Home Page
This Site My CA
Site Search search
nmlkji nmlkj
Q & A
Publications
CHP In The Community
What We Do
Offices
News & Public Notices
History
Recruiting
Traffic Incidents
Related Sites
Sitemap
Public Affairs
Forms Brochures Campaigns
Most Common Equipment Violations
Most Common Equipment Violations
Cars, Trucks and Motorcycles
Does Your Vehicle Measure Up?
1. Registration Papers Not Available (4454a V.C.) 2. Horn Required (27000 V.C.) 3. No Mirror On Left (26709a V.C.) 4. Damaged or Inoperative Rear Lighting (24252 V.C.) 5. Tape on Taillamps (26101 V.C.) 6. Fuel Cap Missing (27155 V.C.) 7. Tinted Forward Windows (26708a
V.C.) 8. Red or Amber Bug Screens or
Covered Headlamps (26701 V.C.) CCR Title 13 Section 692 (24012 V.C.)
9. No Windshield Wipers (26706a V.C.) 10. Off Highway Lights - not covered or too many (24411 V.C.) 11. Headlamps Out (24400 V.C.) 12. Fog Lights - improper height / out of adjustment (24403 V.C.) 13. No Front Plate (5200 V.C.) 14. Expired Registration (4000a V.C.) 15. Aftermarket Flashing Brake Lights (26100 V.C.) 16. Modulating Headlamps During Hours of Darkness (25251.2
V.C.) 17. Passenger in Front of Driver
(27800 V.C.) 18. No Footrests Provided for
Passenger (27800 V.C.) 19. Muffler Exceeding Noise Limits
(27202 V.C.)
CHP 916 (Rev. 2/1991)
Back to Top of Page
© 1997 - 2006 California Highway Patrol. Conditions of Use | Privacy Policy | E-mail the CHP Webmaster
Page 1 of 1CHP -- Most Common Equipment Violations
6/2/2006http://www.chp.ca.gov/html/equipviolations.html
82

California Home Saturday, June 3, 2006
California Highway Patrol Home Page
This Site My CA
Site Search search
nmlkji nmlkj
Q & A
Publications
CHP In The Community
What We Do
Offices
News & Public Notices
History
Recruiting
Traffic Incidents
Related Sites
Sitemap
Public Affairs
Forms Brochures Campaigns Perspectives 2002 24 Hours With The CHP Public Contact SWITRS 2003 Report SWITRS 2002 Report SWITRS 2001 Report SWITRS 2000 Report SWITRS 1999 Report SWITRS 1998 Report SWITRS 1997 Report Fatalities 0 - 4 Years
Bicycle Riding
Bicycle rider using the wrong side of road Auto driver making unsafe left or right turn Bicyclist riding from driveway or sidewalk into path of car Auto driver opening door as bicycle passes Bicycle rider weaving, leaving edge of road or bike lane Bicyclist making unsafe left turn Bicycle without headlight or reflectors
Bicycle riders and automobile drivers follow the same rules and have the same rights. Example: Cars must stop at a stop sign, and bicycles must stop at a stop sign. Always ride
with traffic. Bicyclists must travel in the same direction as cars.
1. When moving slower than the normal traffic speed, stay near the right edge of the road, except:
a. When passing another bicycle or vehicle. b. When getting ready to turn left. c. When passing a parked car or to avoid other objects. d. When on a one-way road, two lanes or wider. Then
?
Page 1 of 5CHP -- Bicycle Riding
6/3/2006http://www.chp.ca.gov/html/bicycleriding.html
83
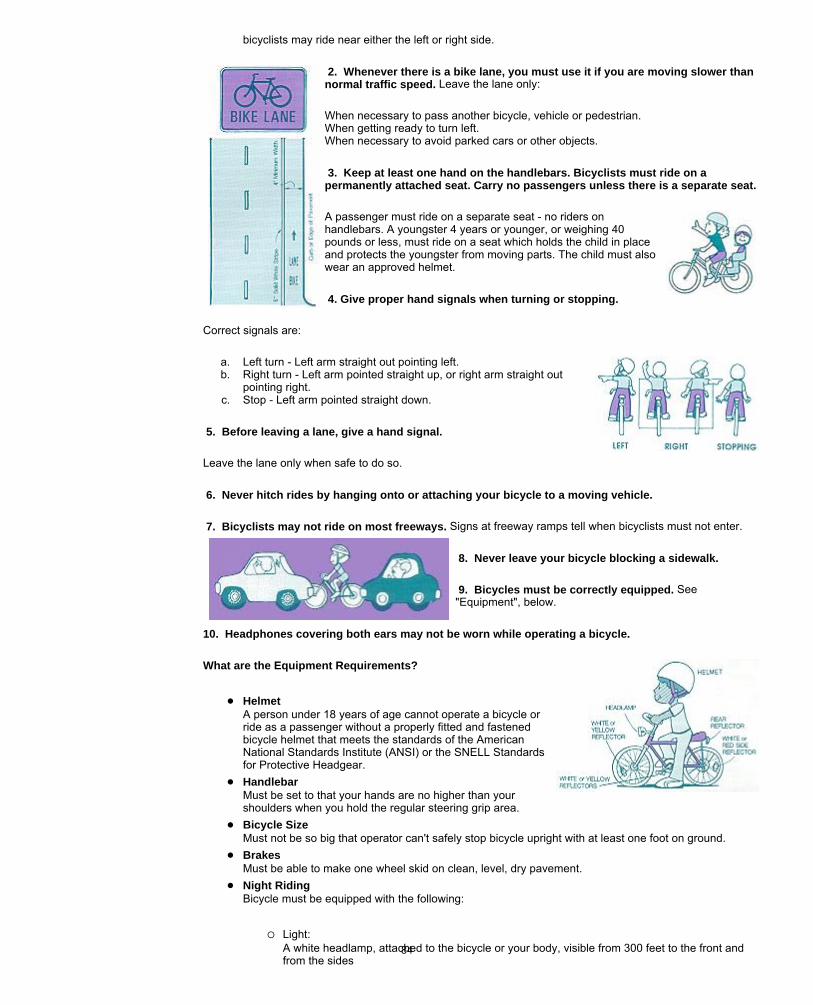
bicyclists may ride near either the left or right side.
2. Whenever there is a bike lane, you must use it if you are moving slower than normal traffic speed. Leave the lane only:
a. When necessary to pass another bicycle, vehicle or pedestrian. b. When getting ready to turn left. c. When necessary to avoid parked cars or other objects.
3. Keep at least one hand on the handlebars. Bicyclists must ride on a permanently attached seat. Carry no passengers unless there is a separate seat.
A passenger must ride on a separate seat - no riders on handlebars. A youngster 4 years or younger, or weighing 40 pounds or less, must ride on a seat which holds the child in place and protects the youngster from moving parts. The child must also wear an approved helmet.
4. Give proper hand signals when turning or stopping.
Correct signals are:
a. Left turn - Left arm straight out pointing left. b. Right turn - Left arm pointed straight up, or right arm straight out
pointing right. c. Stop - Left arm pointed straight down.
5. Before leaving a lane, give a hand signal.
Leave the lane only when safe to do so.
6. Never hitch rides by hanging onto or attaching your bicycle to a moving vehicle.
7. Bicyclists may not ride on most freeways. Signs at freeway ramps tell when bicyclists must not enter.
8. Never leave your bicycle blocking a sidewalk.
9. Bicycles must be correctly equipped. See "Equipment", below.
10. Headphones covering both ears may not be worn while operating a bicycle.
What are the Equipment Requirements?
Helmet A person under 18 years of age cannot operate a bicycle or ride as a passenger without a properly fitted and fastened bicycle helmet that meets the standards of the American National Standards Institute (ANSI) or the SNELL Standards for Protective Headgear. Handlebar Must be set to that your hands are no higher than your shoulders when you hold the regular steering grip area. Bicycle Size Must not be so big that operator can't safely stop bicycle upright with at least one foot on ground. Brakes Must be able to make one wheel skid on clean, level, dry pavement. Night Riding Bicycle must be equipped with the following:
Light: A white headlamp, attached to the bicycle or your body, visible from 300 feet to the front and from the sides
Page 2 of 5CHP -- Bicycle Riding
6/3/2006http://www.chp.ca.gov/html/bicycleriding.html
84

Reflectors a. Red rear reflector b. White or yellow reflectors on front and back of each pedal c. White or yellow reflectors on each side forward of center of bike, and red or
white reflectors on each side rear of center - usually mounted on wheel spokes (If you have reflectorized tires in front and rear, you do not need side reflectors.)
Cross sewer gratings and railroad tracks at an angle. Stay in single file when riding with others. Cross busy intersections by walking your bicycle. Wear shoes - avoid getting toes caught in moving parts. Avoid long skirts and flare pants. Clasp pants to legs with clips or leg bands. Clip or band hair to keep it from blocking vision. Avoid scarves which can flap over eyes. Wear proper safety equipment at all times, i.e. bright clothing, approved
bicycle helmet, safety goggles, etc.
Theft Precautions
Always lock your bike when leaving it. Use a strong chain and padlock. Secure the frame of the bike to something solid (bike rack, tree, etc.). Jot down the license number, the frame serial number, and the type and model of the bike. Keep the note in a safe place. If the bike is stolen, you will need to identify it. Park your bike where it can be easily seen.
Do I have to register my bicycle?
You must register your bicycle if your community requires it. Many cities and counties do. Usually, you can register at the local fire or police station. Call your city hall or county office to be sure.
Maintenance
Bicycles require routine maintenance to assure proper operation.
Things you can check while riding:
Listen for sounds of rubbing, squeaks and rattles and immediately investigate their sources. Slipping (free wheeling) or difficulty changing gears may mean that the gear cable tension is too loose or too tight (multi-speed bikes). Loose tension on the drive chain. Brake effectiveness.
Things you can do yourself:
Use a tire gauge to check tires every few days. Proper pressure is indicated on the tire sidewall or in your bicycle manual. Check for cracks, cuts, bulges. Remove imbedded stones, nails, glass, etc. Adjust seat and handlebars to fit. Lightly oil and clean moving parts. Keep oil off rubber. Wipe off excess oil. Tighten and/or adjust loose parts. Make sure handle grips are glued or tightly secured to handlebars. Where possible, store your bike indoors; moisture will cause rust. Keep your bicycle clean by wiping dust away with a soft cloth. Wipe it dry when it gets wet.
Page 3 of 5CHP -- Bicycle Riding
6/3/2006http://www.chp.ca.gov/html/bicycleriding.html
85
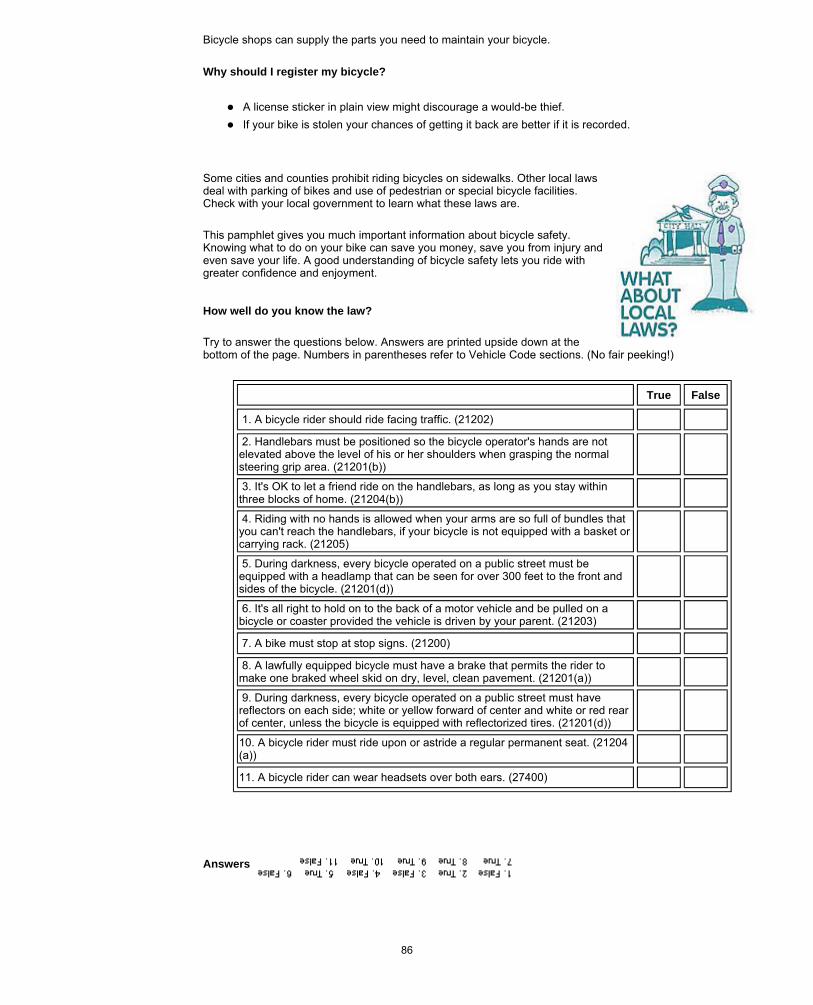
Bicycle shops can supply the parts you need to maintain your bicycle.
Why should I register my bicycle?
A license sticker in plain view might discourage a would-be thief. If your bike is stolen your chances of getting it back are better if it is recorded.
Some cities and counties prohibit riding bicycles on sidewalks. Other local laws deal with parking of bikes and use of pedestrian or special bicycle facilities. Check with your local government to learn what these laws are.
This pamphlet gives you much important information about bicycle safety. Knowing what to do on your bike can save you money, save you from injury and even save your life. A good understanding of bicycle safety lets you ride with greater confidence and enjoyment.
How well do you know the law?
Try to answer the questions below. Answers are printed upside down at the bottom of the page. Numbers in parentheses refer to Vehicle Code sections. (No fair peeking!)
Answers
True False
1. A bicycle rider should ride facing traffic. (21202) 2. Handlebars must be positioned so the bicycle operator's hands are not elevated above the level of his or her shoulders when grasping the normal steering grip area. (21201(b))
3. It's OK to let a friend ride on the handlebars, as long as you stay within three blocks of home. (21204(b)) 4. Riding with no hands is allowed when your arms are so full of bundles that you can't reach the handlebars, if your bicycle is not equipped with a basket or carrying rack. (21205)
5. During darkness, every bicycle operated on a public street must be equipped with a headlamp that can be seen for over 300 feet to the front and sides of the bicycle. (21201(d))
6. It's all right to hold on to the back of a motor vehicle and be pulled on a bicycle or coaster provided the vehicle is driven by your parent. (21203)
7. A bike must stop at stop signs. (21200) 8. A lawfully equipped bicycle must have a brake that permits the rider to make one braked wheel skid on dry, level, clean pavement. (21201(a)) 9. During darkness, every bicycle operated on a public street must have reflectors on each side; white or yellow forward of center and white or red rear of center, unless the bicycle is equipped with reflectorized tires. (21201(d))
10. A bicycle rider must ride upon or astride a regular permanent seat. (21204(a))
11. A bicycle rider can wear headsets over both ears. (27400)
Page 4 of 5CHP -- Bicycle Riding
6/3/2006http://www.chp.ca.gov/html/bicycleriding.html
86
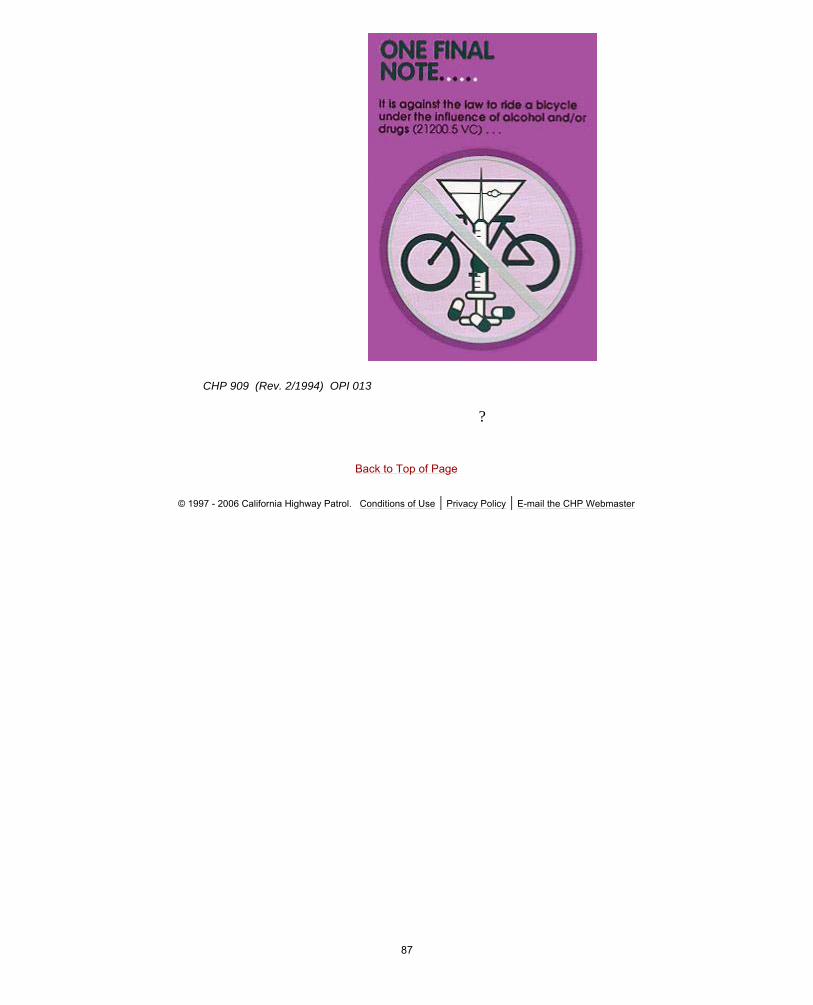
CHP 909 (Rev. 2/1994) OPI 013
?
Back to Top of Page
© 1997 - 2006 California Highway Patrol. Conditions of Use | Privacy Policy | E-mail the CHP Webmaster
Page 5 of 5CHP -- Bicycle Riding
6/3/2006http://www.chp.ca.gov/html/bicycleriding.html
87
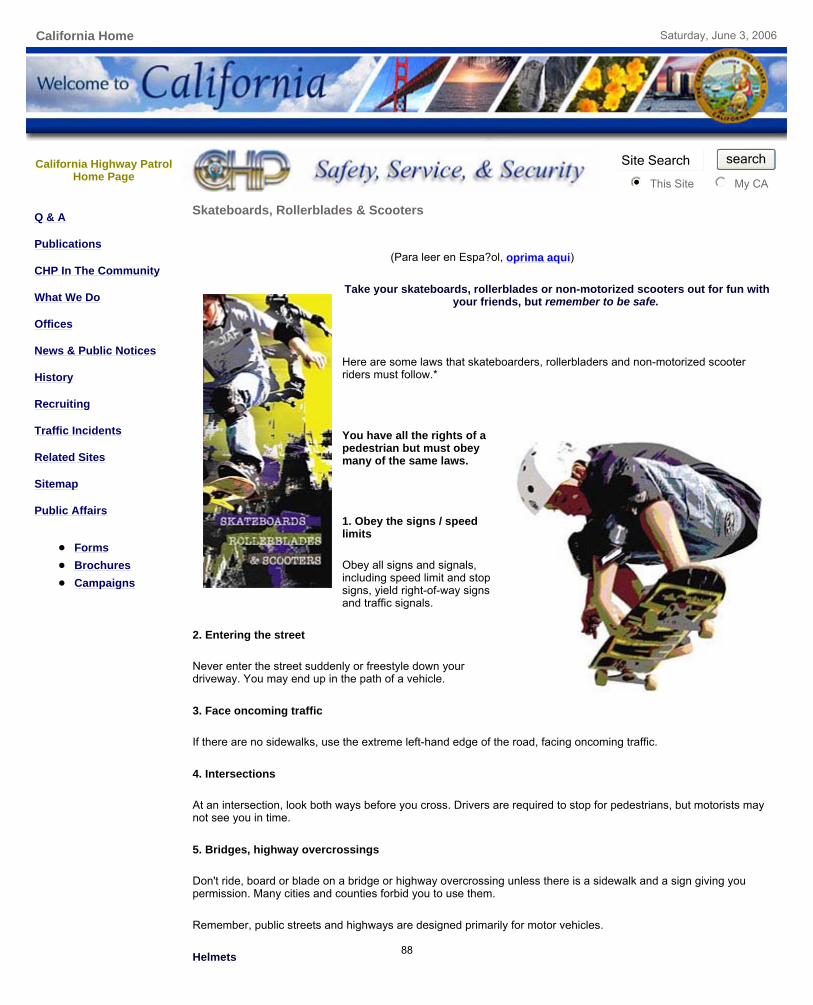
California Home Saturday, June 3, 2006
California Highway Patrol Home Page
This Site My CA
Site Search search
nmlkji nmlkj
Q & A
Publications
CHP In The Community
What We Do
Offices
News & Public Notices
History
Recruiting
Traffic Incidents
Related Sites
Sitemap
Public Affairs
Forms Brochures Campaigns
Skateboards, Rollerblades & Scooters
(Para leer en Espa?ol, oprima aqui)
Take your skateboards, rollerblades or non-motorized scooters out for fun with your friends, but remember to be safe.
Here are some laws that skateboarders, rollerbladers and non-motorized scooter riders must follow.*
You have all the rights of a pedestrian but must obey many of the same laws.
1. Obey the signs / speed limits
Obey all signs and signals, including speed limit and stop signs, yield right-of-way signs and traffic signals.
2. Entering the street
Never enter the street suddenly or freestyle down your driveway. You may end up in the path of a vehicle.
3. Face oncoming traffic
If there are no sidewalks, use the extreme left-hand edge of the road, facing oncoming traffic.
4. Intersections
At an intersection, look both ways before you cross. Drivers are required to stop for pedestrians, but motorists may not see you in time.
5. Bridges, highway overcrossings
Don't ride, board or blade on a bridge or highway overcrossing unless there is a sidewalk and a sign giving you permission. Many cities and counties forbid you to use them.
Remember, public streets and highways are designed primarily for motor vehicles.
Helmets
Page 1 of 2CHP -- Skateboards, Rollerblades & Scooters
6/3/2006http://www.chp.ca.gov/html/skateboard.html
88

6. The law requires
Anyone under 18 who uses a skateboard, non-motorized scooter, rollerblades or roller skates is required to wear a helmet. It could save your life.
Motorized Skateboards
Motorized Skateboards are legal on private property only.
They are illegal on highways, sidewalks, bikeways and hiking or recreational trails.
Riding and Blading Tips
Make eye contact with a vehicle driver to remind him or her of your presence.
Be very careful around cars and trucks. Drivers often don't realize how fast you're going.
In addition to your helmet, wear gloves, knee pads and other protective gear.
* Counties and cities may have additional local ordinances.
CHP 926 ? (Rev. 7/03) ? OPI 013
Back to Top of Page
© 1997 - 2006 California Highway Patrol. Conditions of Use | Privacy Policy | E-mail the CHP Webmaster
Page 2 of 2CHP -- Skateboards, Rollerblades & Scooters
6/3/2006http://www.chp.ca.gov/html/skateboard.html
89

90
IMPORTANT SAFETY TIPS

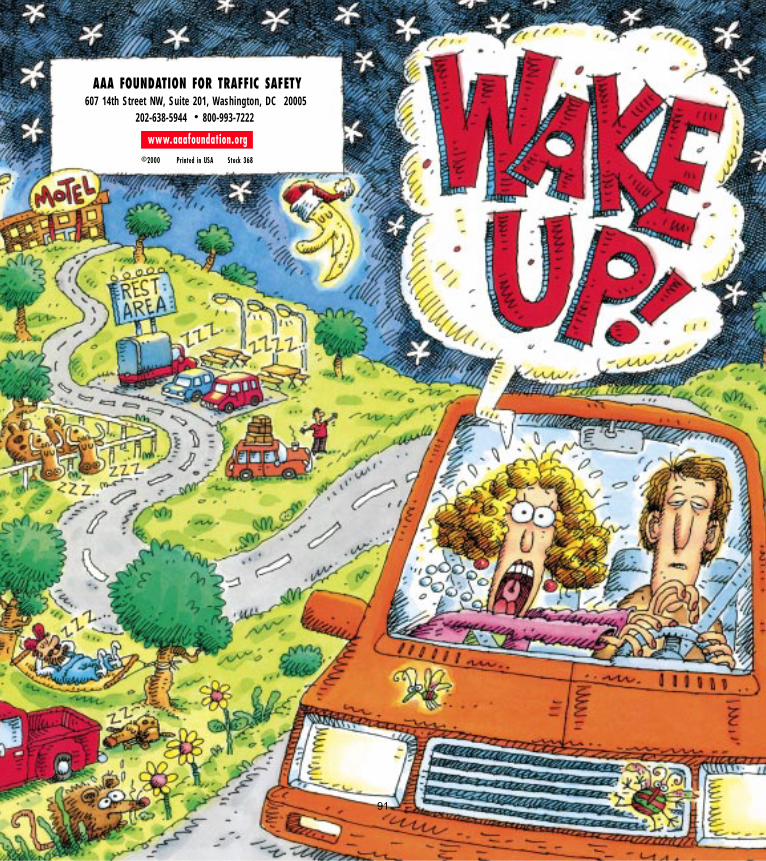
AAA FOUNDATION FOR TRAFFIC SAFETY607 14th Street NW, Suite 201, Washington, DC 20005
202-638-5944 • 800-993-7222
www.aaafoundation.org©2000 Printed in USA Stock 368
91
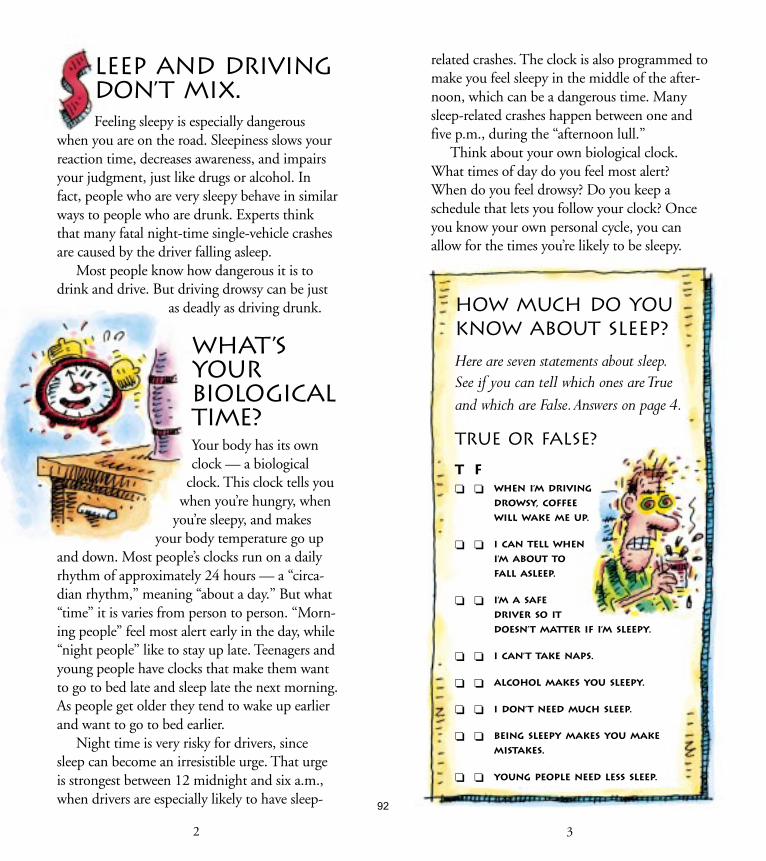
3
How MUCH DO YOUKNOW ABOUT SLEEP?
Here are seven statements about sleep.See if you can tell which ones are Trueand which are False. Answers on page 4.
True or False?
T F❏ ❏ WHEN I’M DRIVING
DROWSY, COFFEE
WILL WAKE ME UP.
❏ ❏ I can tell when
I’m ABOUT to
FALL Asleep.
❏ ❏ I’m a safe
driver so it
doesn’t matter if I’m sleepy.
❏ ❏ I can’t take naps.
❏ ❏ ALCOHOL MAKES YOU SLEEPY.
❏ ❏ I DON’T NEED MUCH sleep.
❏ ❏ Being sleepy makes you MAKE
MISTAKES.
❏ ❏ Young people need less sleep.
related crashes. The clock is also programmed tomake you feel sleepy in the middle of the after-noon, which can be a dangerous time. Manysleep-related crashes happen between one andfive p.m., during the “afternoon lull.”
Think about your own biological clock.What times of day do you feel most alert?When do you feel drowsy? Do you keep aschedule that lets you follow your clock? Onceyou know your own personal cycle, you canallow for the times you’re likely to be sleepy.
2
leep and drivingdon’t mix.Feeling sleepy is especially dangerous
when you are on the road. Sleepiness slows yourreaction time, decreases awareness, and impairsyour judgment, just like drugs or alcohol. Infact, people who are very sleepy behave in similarways to people who are drunk. Experts thinkthat many fatal night-time single-vehicle crashesare caused by the driver falling asleep.
Most people know how dangerous it is todrink and drive. But driving drowsy can be just
as deadly as driving drunk.
WHAT’syourbiologicaltime?Your body has its ownclock — a biological
clock. This clock tells youwhen you’re hungry, when
you’re sleepy, and makesyour body temperature go up
and down. Most people’s clocks run on a dailyrhythm of approximately 24 hours — a “circa-dian rhythm,” meaning “about a day.” But what“time” it is varies from person to person. “Morn-ing people” feel most alert early in the day, while“night people” like to stay up late. Teenagers andyoung people have clocks that make them wantto go to bed late and sleep late the next morning.As people get older they tend to wake up earlierand want to go to bed earlier.
Night time is very risky for drivers, sincesleep can become an irresistible urge. That urgeis strongest between 12 midnight and six a.m.,when drivers are especially likely to have sleep- 92
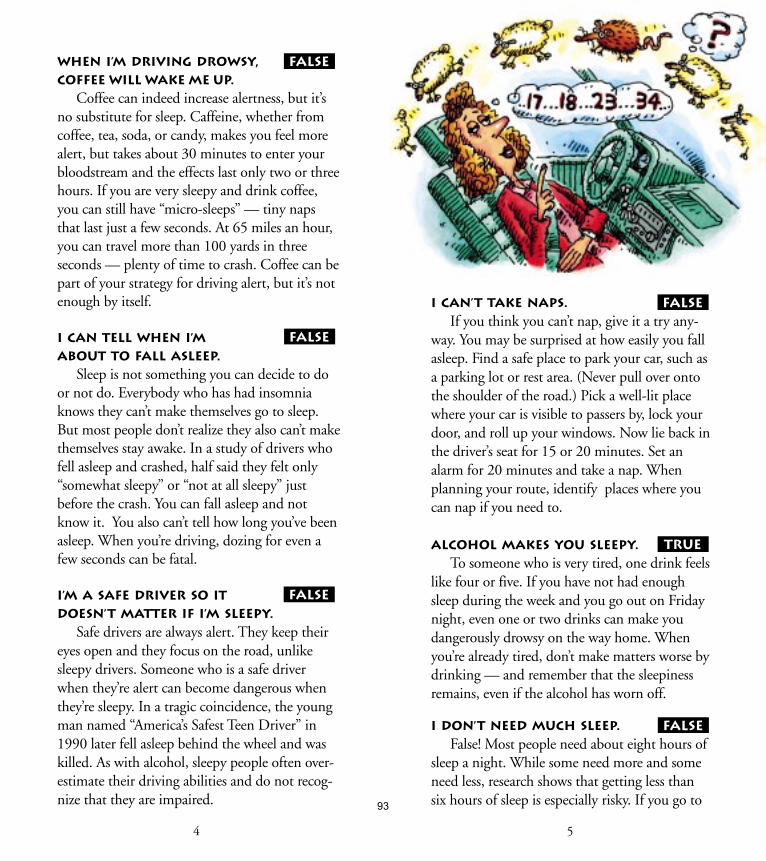
I can’t take naps.If you think you can’t nap, give it a try any-
way. You may be surprised at how easily you fallasleep. Find a safe place to park your car, such asa parking lot or rest area. (Never pull over ontothe shoulder of the road.) Pick a well-lit placewhere your car is visible to passers by, lock yourdoor, and roll up your windows. Now lie back inthe driver’s seat for 15 or 20 minutes. Set analarm for 20 minutes and take a nap. Whenplanning your route, identify places where youcan nap if you need to.
Alcohol makes you sleepy.To someone who is very tired, one drink feels
like four or five. If you have not had enoughsleep during the week and you go out on Fridaynight, even one or two drinks can make youdangerously drowsy on the way home. Whenyou’re already tired, don’t make matters worse bydrinking — and remember that the sleepinessremains, even if the alcohol has worn off.
I don’t need much sleep.False! Most people need about eight hours of
sleep a night. While some need more and someneed less, research shows that getting less thansix hours of sleep is especially risky. If you go to
5
TRUE
False
False
WHEN I’m driving drowsy,coffee will wake me up.
Coffee can indeed increase alertness, but it’sno substitute for sleep. Caffeine, whether fromcoffee, tea, soda, or candy, makes you feel morealert, but takes about 30 minutes to enter yourbloodstream and the effects last only two or threehours. If you are very sleepy and drink coffee,you can still have “micro-sleeps” — tiny napsthat last just a few seconds. At 65 miles an hour,you can travel more than 100 yards in threeseconds — plenty of time to crash. Coffee can bepart of your strategy for driving alert, but it’s notenough by itself.
I can tell when I’mABOUT TO FALL Asleep.
Sleep is not something you can decide to door not do. Everybody who has had insomniaknows they can’t make themselves go to sleep.But most people don’t realize they also can’t makethemselves stay awake. In a study of drivers whofell asleep and crashed, half said they felt only“somewhat sleepy” or “not at all sleepy” justbefore the crash. You can fall asleep and notknow it. You also can’t tell how long you’ve beenasleep. When you’re driving, dozing for even afew seconds can be fatal.
I’m a safe driver so itdoesn’t matter if I’m sleepy.
Safe drivers are always alert. They keep theireyes open and they focus on the road, unlikesleepy drivers. Someone who is a safe driverwhen they’re alert can become dangerous whenthey’re sleepy. In a tragic coincidence, the youngman named “America’s Safest Teen Driver” in1990 later fell asleep behind the wheel and waskilled. As with alcohol, sleepy people often over-estimate their driving abilities and do not recog-nize that they are impaired.
4
False
False
False
93
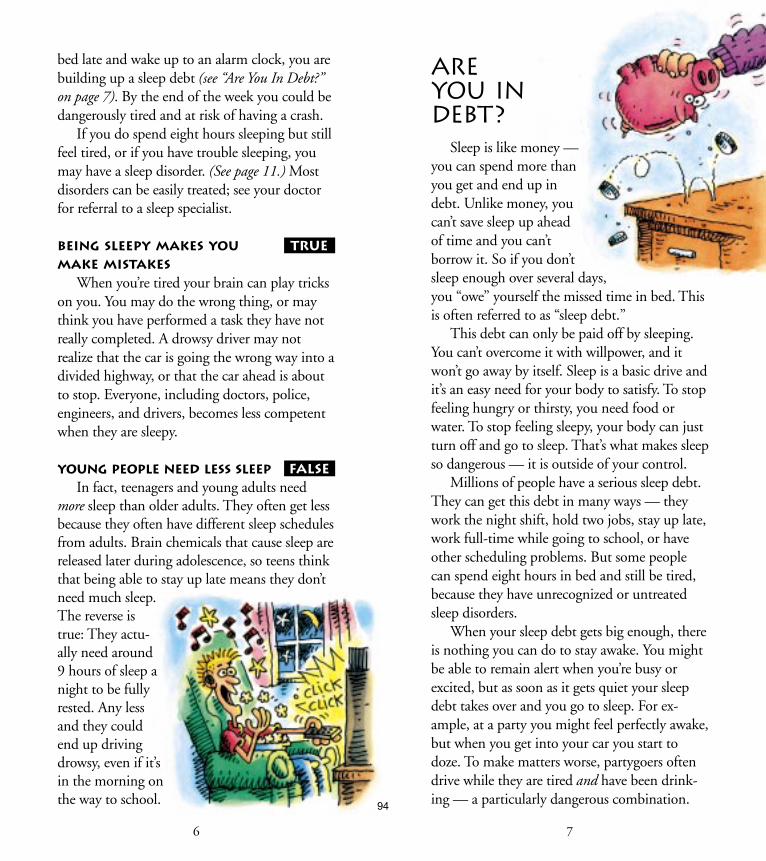
6 7
bed late and wake up to an alarm clock, you arebuilding up a sleep debt (see “Are You In Debt?”on page 7). By the end of the week you could bedangerously tired and at risk of having a crash.
If you do spend eight hours sleeping but stillfeel tired, or if you have trouble sleeping, youmay have a sleep disorder. (See page 11.) Mostdisorders can be easily treated; see your doctorfor referral to a sleep specialist.
Being sleepy makes youmake mistakes
When you’re tired your brain can play trickson you. You may do the wrong thing, or maythink you have performed a task they have notreally completed. A drowsy driver may notrealize that the car is going the wrong way into adivided highway, or that the car ahead is aboutto stop. Everyone, including doctors, police,engineers, and drivers, becomes less competentwhen they are sleepy.
Young people need less sleepIn fact, teenagers and young adults need
more sleep than older adults. They often get lessbecause they often have different sleep schedulesfrom adults. Brain chemicals that cause sleep arereleased later during adolescence, so teens thinkthat being able to stay up late means they don’tneed much sleep.The reverse istrue: They actu-ally need around9 hours of sleep anight to be fullyrested. Any lessand they couldend up drivingdrowsy, even if it’sin the morning onthe way to school.
areyou indebt?
Sleep is like money —you can spend more thanyou get and end up indebt. Unlike money, youcan’t save sleep up aheadof time and you can’tborrow it. So if you don’tsleep enough over several days,you “owe” yourself the missed time in bed. Thisis often referred to as “sleep debt.”
This debt can only be paid off by sleeping.You can’t overcome it with willpower, and itwon’t go away by itself. Sleep is a basic drive andit’s an easy need for your body to satisfy. To stopfeeling hungry or thirsty, you need food orwater. To stop feeling sleepy, your body can justturn off and go to sleep. That’s what makes sleepso dangerous — it is outside of your control.
Millions of people have a serious sleep debt.They can get this debt in many ways — theywork the night shift, hold two jobs, stay up late,work full-time while going to school, or haveother scheduling problems. But some peoplecan spend eight hours in bed and still be tired,because they have unrecognized or untreatedsleep disorders.
When your sleep debt gets big enough, thereis nothing you can do to stay awake. You mightbe able to remain alert when you’re busy orexcited, but as soon as it gets quiet your sleepdebt takes over and you go to sleep. For ex-ample, at a party you might feel perfectly awake,but when you get into your car you start todoze. To make matters worse, partygoers oftendrive while they are tired and have been drink-ing — a particularly dangerous combination.
TRUe
False
94
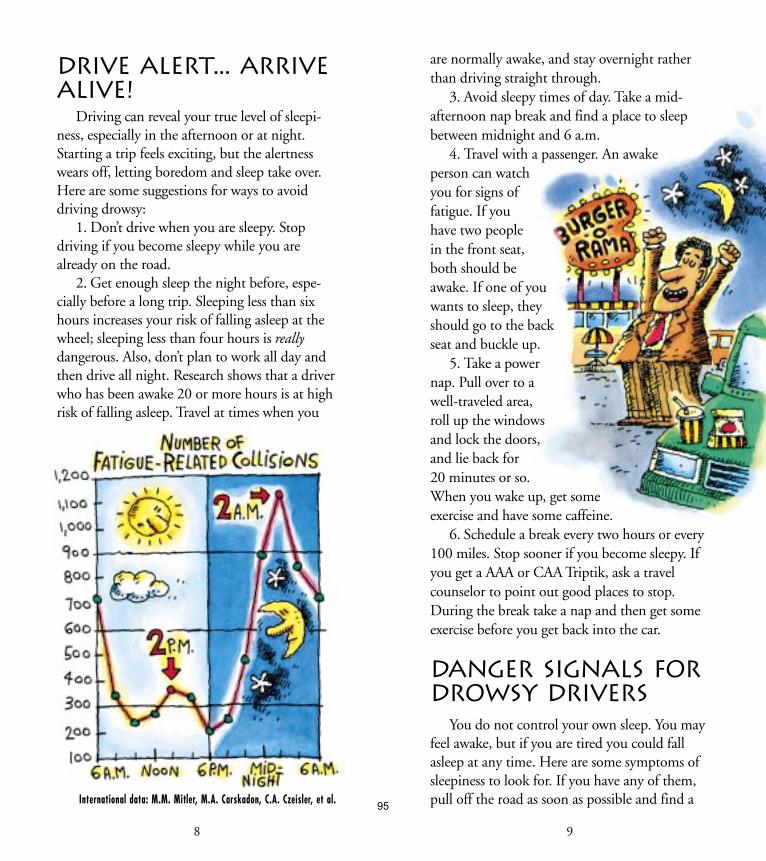
9
are normally awake, and stay overnight ratherthan driving straight through.
3. Avoid sleepy times of day. Take a mid-afternoon nap break and find a place to sleepbetween midnight and 6 a.m.
4. Travel with a passenger. An awakeperson can watchyou for signs offatigue. If youhave two peoplein the front seat,both should beawake. If one of youwants to sleep, theyshould go to the backseat and buckle up.
5. Take a powernap. Pull over to awell-traveled area,roll up the windowsand lock the doors,and lie back for20 minutes or so.When you wake up, get someexercise and have some caffeine.
6. Schedule a break every two hours or every100 miles. Stop sooner if you become sleepy. Ifyou get a AAA or CAA Triptik, ask a travelcounselor to point out good places to stop.During the break take a nap and then get someexercise before you get back into the car.
Danger Signals forDrowsy Drivers
You do not control your own sleep. You mayfeel awake, but if you are tired you could fallasleep at any time. Here are some symptoms ofsleepiness to look for. If you have any of them,pull off the road as soon as possible and find aInternational data: M.M. Mitler, M.A. Carskadon, C.A. Czeisler, et al.
Drive Alert... ARRIVEALIVE!~
Driving can reveal your true level of sleepi-ness, especially in the afternoon or at night.Starting a trip feels exciting, but the alertnesswears off, letting boredom and sleep take over.Here are some suggestions for ways to avoiddriving drowsy:
1. Don’t drive when you are sleepy. Stopdriving if you become sleepy while you arealready on the road.
2. Get enough sleep the night before, espe-cially before a long trip. Sleeping less than sixhours increases your risk of falling asleep at thewheel; sleeping less than four hours is reallydangerous. Also, don’t plan to work all day andthen drive all night. Research shows that a driverwho has been awake 20 or more hours is at highrisk of falling asleep. Travel at times when you
8
95
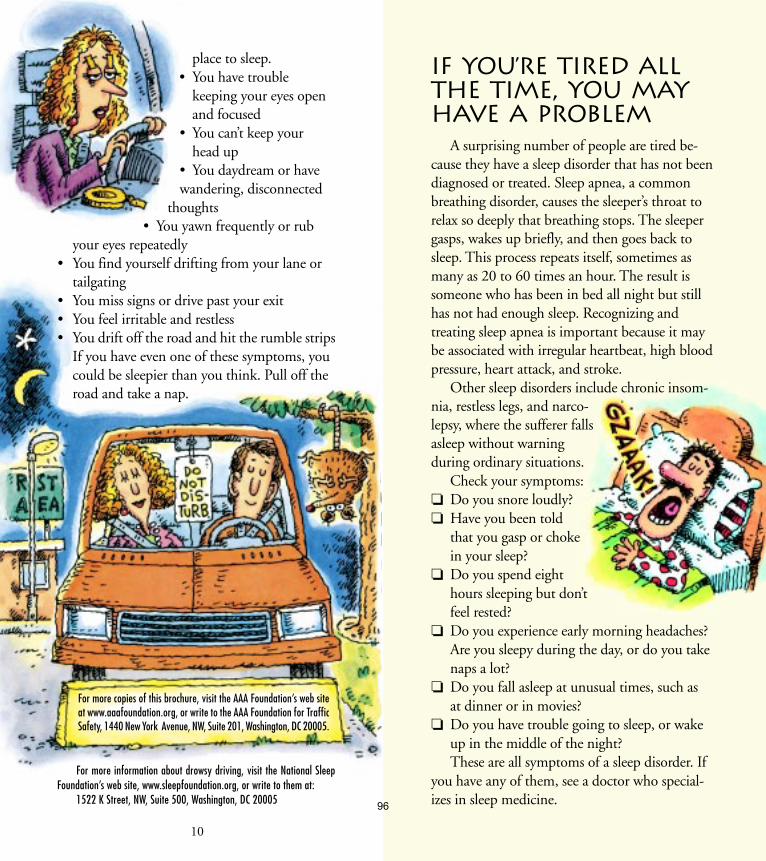
11
place to sleep.• You have trouble
keeping your eyes openand focused
• You can’t keep yourhead up
• You daydream or havewandering, disconnected
thoughts• You yawn frequently or rub
your eyes repeatedly• You find yourself drifting from your lane or
tailgating• You miss signs or drive past your exit• You feel irritable and restless• You drift off the road and hit the rumble strips
If you have even one of these symptoms, youcould be sleepier than you think. Pull off theroad and take a nap.
For more copies of this brochure, visit the AAA Foundation’s web siteat www.aaafoundation.org, or write to the AAA Foundation for TrafficSafety, 1440 New York Avenue, NW, Suite 201, Washington, DC 20005.
For more information about drowsy driving, visit the National SleepFoundation’s web site, www.sleepfoundation.org, or write to them at:
1522 K Street, NW, Suite 500, Washington, DC 20005
10
If You’re Tired AllThe Time, You MayHave a Problem
A surprising number of people are tired be-cause they have a sleep disorder that has not beendiagnosed or treated. Sleep apnea, a commonbreathing disorder, causes the sleeper’s throat torelax so deeply that breathing stops. The sleepergasps, wakes up briefly, and then goes back tosleep. This process repeats itself, sometimes asmany as 20 to 60 times an hour. The result issomeone who has been in bed all night but stillhas not had enough sleep. Recognizing andtreating sleep apnea is important because it maybe associated with irregular heartbeat, high bloodpressure, heart attack, and stroke.
Other sleep disorders include chronic insom-nia, restless legs, and narco-lepsy, where the sufferer fallsasleep without warningduring ordinary situations.
Check your symptoms:❏ Do you snore loudly?❏ Have you been told
that you gasp or chokein your sleep?
❏ Do you spend eighthours sleeping but don’tfeel rested?
❏ Do you experience early morning headaches?Are you sleepy during the day, or do you takenaps a lot?
❏ Do you fall asleep at unusual times, such asat dinner or in movies?
❏ Do you have trouble going to sleep, or wakeup in the middle of the night?These are all symptoms of a sleep disorder. If
you have any of them, see a doctor who special-izes in sleep medicine.96
F u n d e d t h r o u g h t h e g e n e r o s i t y o f
a n d t h e i r
m e m b e r s
AAA FOUNDATION FOR TRAFFIC SAFETY
607 14th Street, NW, Suite 201, Washington, DC 20005202-638-5944 • 800-993-7222 • www.aaafoundation.org Printed in USA
IllustrationsbyJared Lee
STOCK 962
©2004Reprinted2006
97
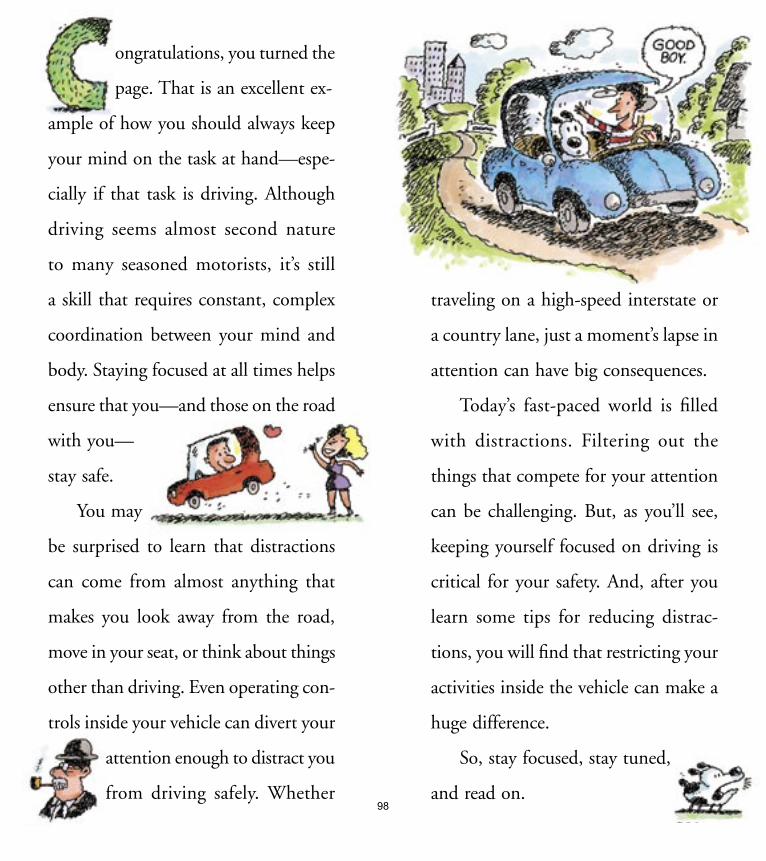
ongratulations, you turned the
page. That is an excellent ex-
ample of how you should always keep
your mind on the task at hand—espe-
cially if that task is driving. Although
driving seems almost second nature
to many seasoned motorists, it’s still
a skill that requires constant, complex
coordination between your mind and
body. Staying focused at all times helps
ensure that you—and those on the road
with you—
stay safe.
You may
be surprised to learn that distractions
can come from almost anything that
makes you look away from the road,
move in your seat, or think about things
other than driving. Even operating con-
trols inside your vehicle can divert your
attention enough to distract you
from driving safely. Whether
traveling on a high-speed interstate or
a country lane, just a moment’s lapse in
attention can have big consequences.
Today’s fast-paced world is filled
with distractions. Filtering out the
things that compete for your attention
can be challenging. But, as you’ll see,
keeping yourself focused on driving is
critical for your safety. And, after you
learn some tips for reducing distrac-
tions, you will find that restricting your
activities inside the vehicle can make a
huge difference.
So, stay focused, stay tuned,
and read on.98
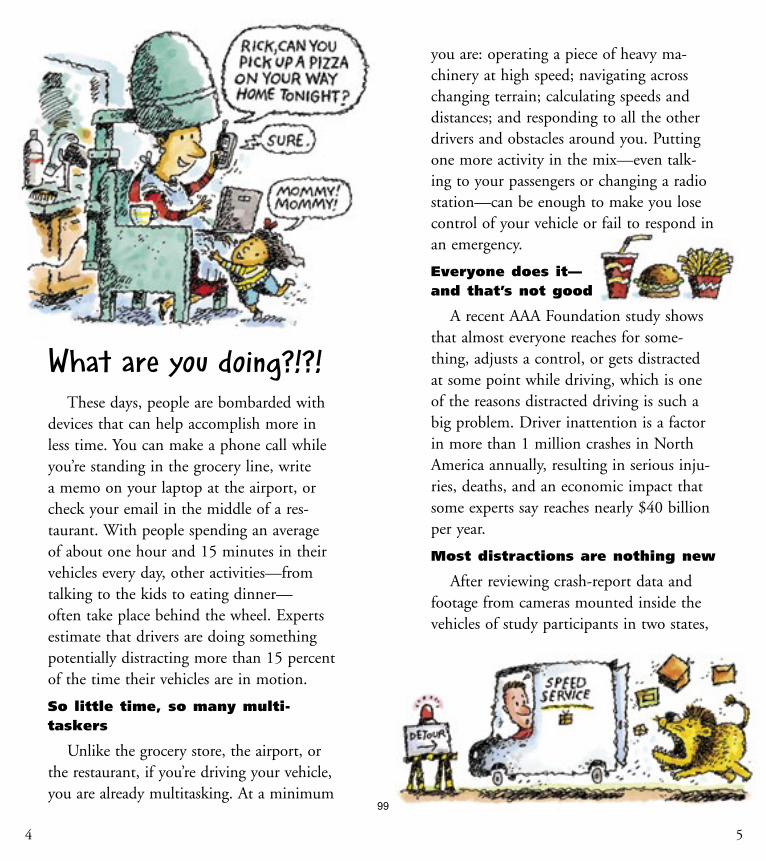
54
What are you doing?!?!These days, people are bombarded with
devices that can help accomplish more in less time. You can make a phone call while you’re standing in the grocery line, write a memo on your laptop at the airport, or check your email in the middle of a res-taurant. With people spending an average of about one hour and 15 minutes in their vehicles every day, other activities—from talking to the kids to eating dinner—often take place behind the wheel. Experts estimate that drivers are doing something potentially distracting more than 15 percent of the time their vehicles are in motion.
So little time, so many multi- taskers
Unlike the grocery store, the airport, or the restaurant, if you’re driving your vehicle, you are already multitasking. At a minimum
you are: operating a piece of heavy ma-chinery at high speed; navigating across changing terrain; calculating speeds and distances; and responding to all the other drivers and obstacles around you. Putting one more activity in the mix—even talk-ing to your passengers or changing a radio station—can be enough to make you lose control of your vehicle or fail to respond in an emergency.
Everyone does it— and that’s not good
A recent AAA Foundation study shows that almost everyone reaches for some-thing, adjusts a control, or gets distracted at some point while driving, which is one of the reasons distracted driving is such a big problem. Driver inattention is a factor in more than 1 million crashes in North America annually, resulting in serious inju-ries, deaths, and an economic impact that some experts say reaches nearly $40 billion per year.
Most distractions are nothing new
After reviewing crash-report data and footage from cameras mounted inside the vehicles of study participants in two states,
99
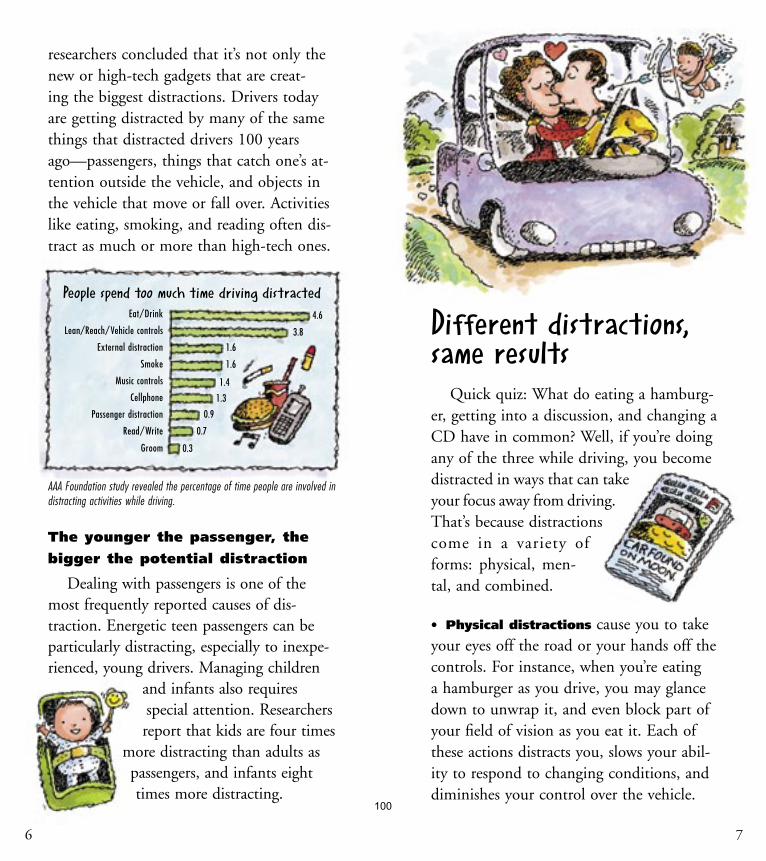
76
People spend too much time driving distractedEat/Drink
Lean/Reach/ Vehicle controls
External distraction
Smoke
Music controls
Cellphone
Passenger distraction
Read/ Write
Groom
1.6
1.6
1.4
1.3
0.9
0.7
0.3
4.6
3.8
AAA Foundation study revealed the percentage of time people are involved indistracting activities while driving.
researchers concluded that it’s not only the new or high-tech gadgets that are creat-ing the biggest distractions. Drivers today are getting distracted by many of the same things that distracted drivers 100 years ago—passengers, things that catch one’s at-tention outside the vehicle, and objects in the vehicle that move or fall over. Activities like eating, smoking, and reading often dis-tract as much or more than high-tech ones.
The younger the passenger, the
bigger the potential distraction
Dealing with passengers is one of the most frequently reported causes of dis-traction. Energetic teen passengers can be particularly distracting, especially to inexpe-rienced, young drivers. Managing children
and infants also requires special attention. Researchers report that kids are four times
more distracting than adults as passengers, and infants eight times more distracting.
Different distractions,same results
Quick quiz: What do eating a hamburg-er, getting into a discussion, and changing a CD have in common? Well, if you’re doing any of the three while driving, you becomedistracted in ways that can take your focus away from driving. That’s because distractions come in a variety of forms: physical, men-tal, and combined.
• Physical distractions cause you to take your eyes off the road or your hands off the controls. For instance, when you’re eating a hamburger as you drive, you may glance down to unwrap it, and even block part of your field of vision as you eat it. Each of these actions distracts you, slows your abil-ity to respond to changing conditions, and diminishes your control over the vehicle.
100
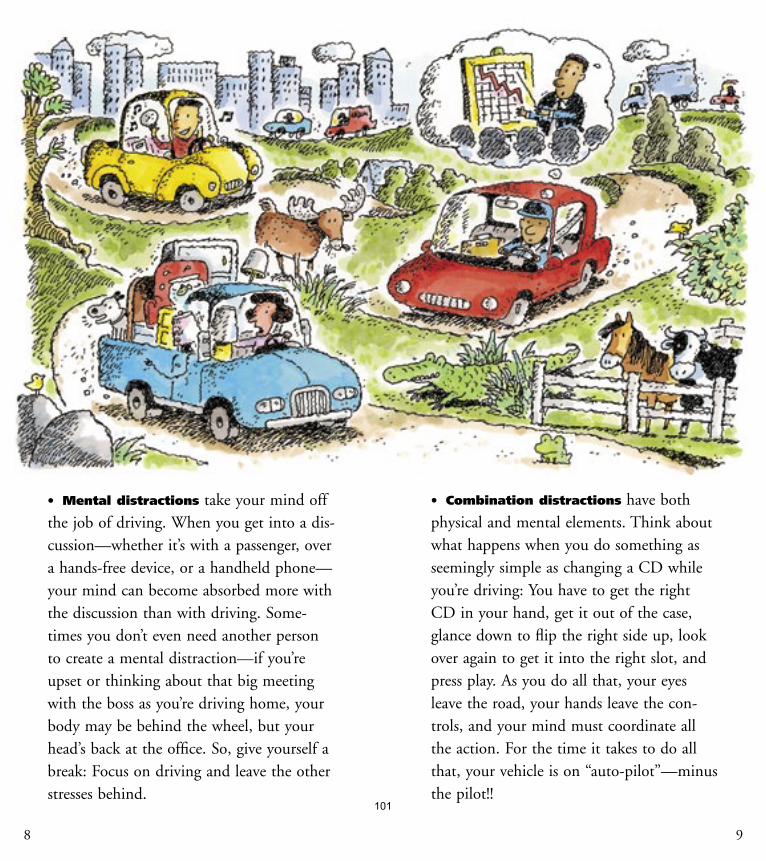
• Mental distractions take your mind off the job of driving. When you get into a dis-cussion—whether it’s with a passenger, over a hands-free device, or a handheld phone—your mind can become absorbed more with the discussion than with driving. Some-times you don’t even need another person to create a mental distraction—if you’re upset or thinking about that big meeting with the boss as you’re driving home, your body may be behind the wheel, but your head’s back at the office. So, give yourself a break: Focus on driving and leave the other stresses behind.
• Combination distractions have both physical and mental elements. Think about what happens when you do something as seemingly simple as changing a CD while you’re driving: You have to get the right CD in your hand, get it out of the case, glance down to flip the right side up, look over again to get it into the right slot, and press play. As you do all that, your eyes leave the road, your hands leave the con-trols, and your mind must coordinate all the action. For the time it takes to do all that, your vehicle is on “auto-pilot”—minus the pilot!!
98
101

11
WHAT ABOUT CELL PHONES? We’ve all experienced it: The guy next to you is yelling into his cell phone, irritat-ing everyone around him. It’s so annoying, many people think it must be distracting, too—and they’re right. Studies show cell phones are a distraction, but past research hasn’t definitely determined just how much they divert a driver’s attention or how many crashes are cell-phone-related. Police reports list cell phones as a crash-causing distraction less often than tuning the radio, talking to passengers, adjusting the vehicle’s controls, or eating while driving. This may be due to the underreporting of cell phone involvement in crashes because of the stigma and fear of repercussions, and the reality that most police reports do not have a specific check box for cell-phone use. What we do know is this: If you are involved in a conversation, whether on a handheld phone or hands-free device, you’re risking a mental distraction that can take your attention away from driving.
Honest, it’s not that hard. You’ll always have passengers, controls, and things that suddenly capture your attention—but you can reduce the distractions around you.
Be aware that distraction is a problem that affects YOU.
Of the distractions often cited in crash reports—adjusting controls, passengers, cell phone, eating/drinking, objects in car— think about the things that distract you. Raising your awareness of potential distrac-tions and their impact on your driving can help you reduce your risk.
Don’t touch that dial.
Adjust seat positions, climate controls, sound systems, and other devices before you leave or while the vehicle is stopped. Know how your controls work, so if you must adjust something on the fly, you’ll be less distracted. Use presets for radio and climate control, or have your passenger assist you.
You want me to paymore attention to being less distracted?
102
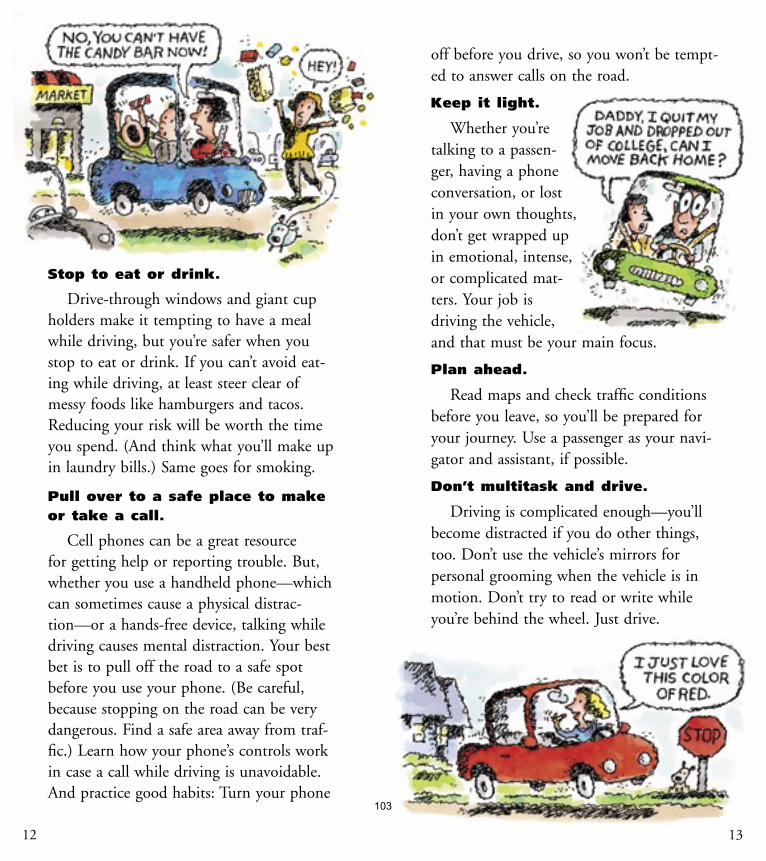
12
Stop to eat or drink.
Drive-through windows and giant cup holders make it tempting to have a meal while driving, but you’re safer when you stop to eat or drink. If you can’t avoid eat-ing while driving, at least steer clear of messy foods like hamburgers and tacos. Reducing your risk will be worth the time you spend. (And think what you’ll make up in laundry bills.) Same goes for smoking.
Pull over to a safe place to make or take a call.
Cell phones can be a great resource for getting help or reporting trouble. But, whether you use a handheld phone—which can sometimes cause a physical distrac-tion—or a hands-free device, talking while driving causes mental distraction. Your best bet is to pull off the road to a safe spot before you use your phone. (Be careful, because stopping on the road can be very dangerous. Find a safe area away from traf-fic.) Learn how your phone’s controls work in case a call while driving is unavoidable. And practice good habits: Turn your phone
13
off before you drive, so you won’t be tempt-ed to answer calls on the road.
Keep it light.
Whether you’retalking to a passen-ger, having a phoneconversation, or lost in your own thoughts,don’t get wrapped upin emotional, intense,or complicated mat-ters. Your job isdriving the vehicle,and that must be your main focus.
Plan ahead.
Read maps and check traffic conditions before you leave, so you’ll be prepared for your journey. Use a passenger as your navi-gator and assistant, if possible.
Don’t multitask and drive.
Driving is complicated enough—you’ll become distracted if you do other things, too. Don’t use the vehicle’s mirrors for personal grooming when the vehicle is in motion. Don’t try to read or write while you’re behind the wheel. Just drive.
103
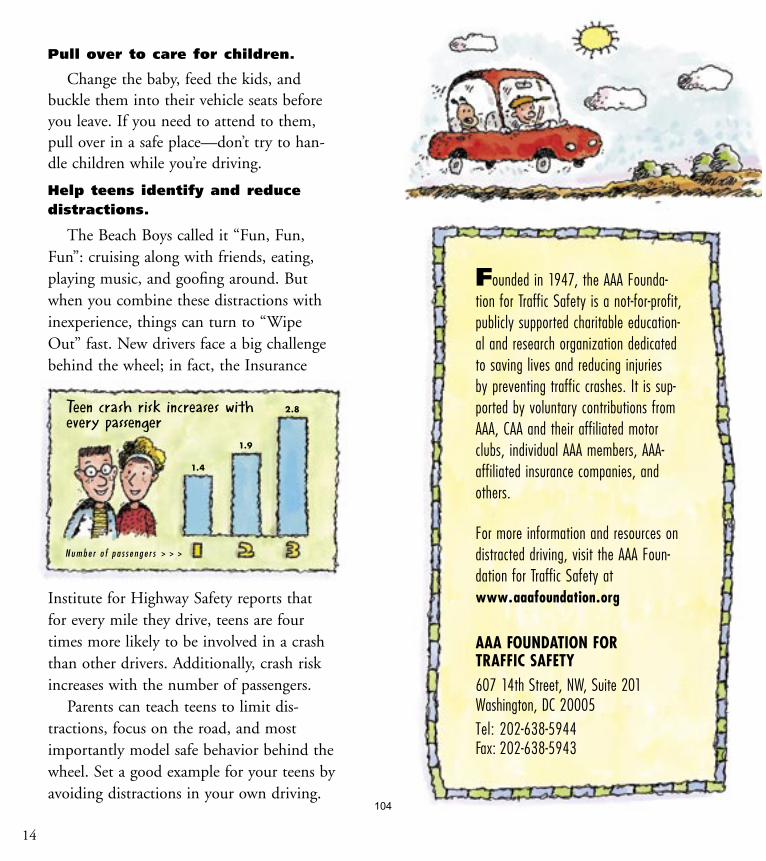
14
Pull over to care for children.
Change the baby, feed the kids, and buckle them into their vehicle seats before you leave. If you need to attend to them, pull over in a safe place—don’t try to han-dle children while you’re driving.
Help teens identify and reduce distractions.
The Beach Boys called it “Fun, Fun, Fun”: cruising along with friends, eating, playing music, and goofing around. But when you combine these distractions with inexperience, things can turn to “Wipe Out” fast. New drivers face a big challenge behind the wheel; in fact, the Insurance
Founded in 1947, the AAA Founda-tion for Traffic Safety is a not-for-profit, publicly supported charitable education-al and research organization dedicated to saving lives and reducing injuries by preventing traffic crashes. It is sup-ported by voluntary contributions from AAA, CAA and their affiliated motor clubs, individual AAA members, AAA-affiliated insurance companies, and others.
For more information and resources on distracted driving, visit the AAA Foun-dation for Traffic Safety at www.aaafoundation.org
AAA FOUNDATION FOR TRAFFIC SAFETY607 14th Street, NW, Suite 201Washington, DC 20005Tel: 202-638-5944 Fax: 202-638-5943
Institute for Highway Safety reports that for every mile they drive, teens are four times more likely to be involved in a crash than other drivers. Additionally, crash risk increases with the number of passengers.
Parents can teach teens to limit dis-tractions, focus on the road, and most importantly model safe behavior behind the wheel. Set a good example for your teens by avoiding distractions in your own driving.
N u m b e r o f p a s s e n g e r s > > >
1.4
1.9
2.8Teen crash risk increases with every passenger
104
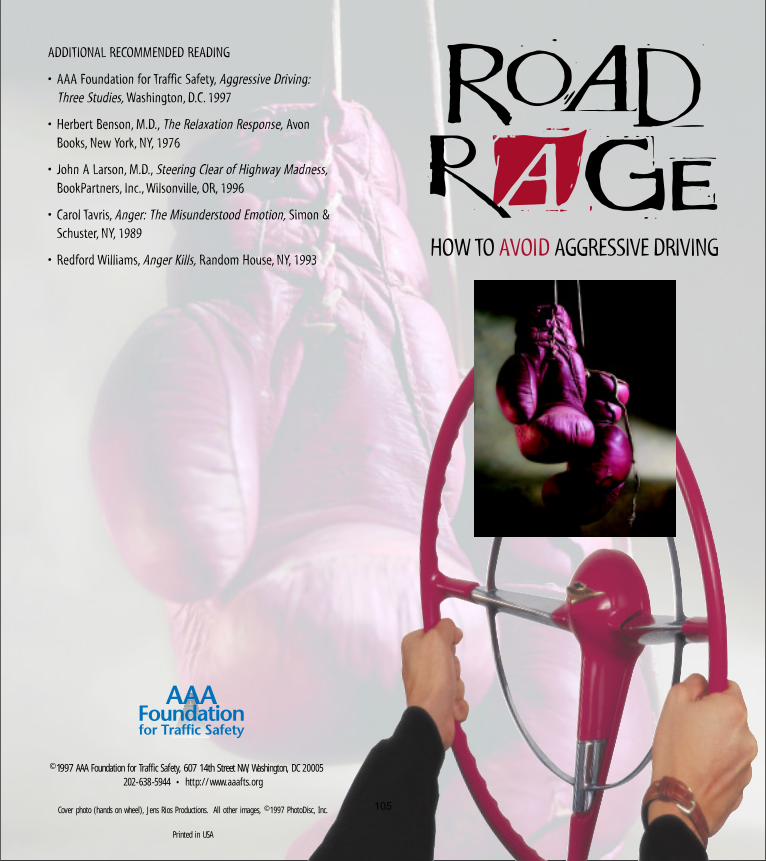
rOAd ageHOW TO AVOID AGGRESSIVE DRIVING
ADDITIONAL RECOMMENDED READING
• AAA Foundation for Traffic Safety, Aggressive Driving:Three Studies, Washington, D.C. 1997
• Herbert Benson, M.D., The Relaxation Response, AvonBooks, New York, NY, 1976
• John A Larson, M.D., Steering Clear of Highway Madness,BookPartners, Inc., Wilsonville, OR, 1996
• Carol Tavris, Anger: The Misunderstood Emotion, Simon &Schuster, NY, 1989
• Redford Williams, Anger Kills, Random House, NY, 1993
©1997 AAA Foundation for Traffic Safety, 607 14th Street NW, Washington, DC 20005202-638-5944 • htt p://www.aaafts.org
Cover photo (hands on wheel), Jens Rios Productions. All other images, ©1997 PhotoDisc, Inc.
Printed in USA
R
105
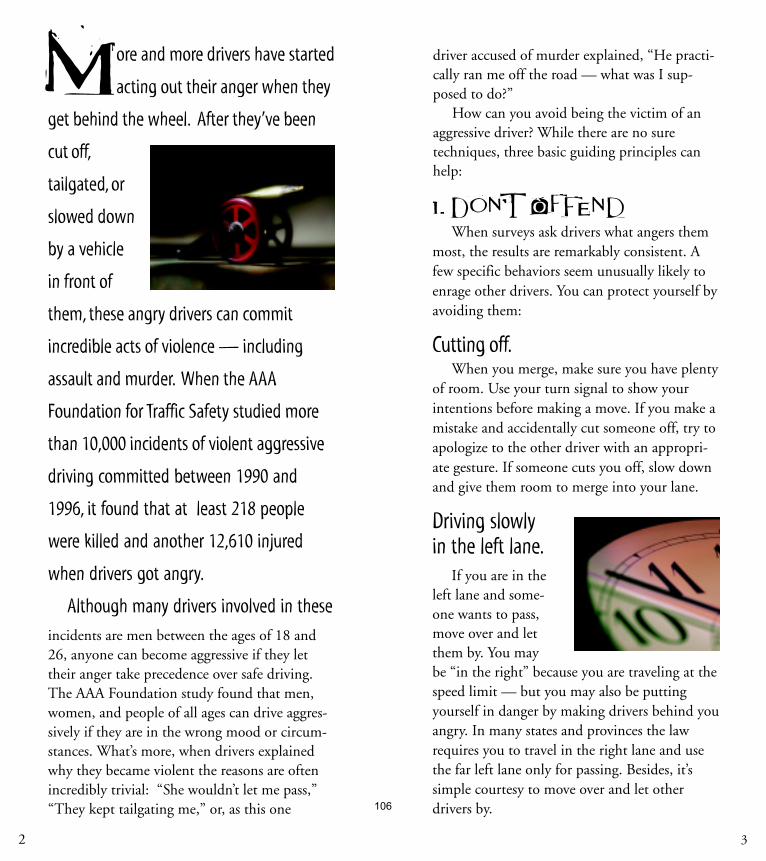
ore and more drivers have started
acting out their anger when they
get behind the wheel. After they’ve been
cut off,
tailgated, or
slowed down
by a vehicle
in front of
them, these angry drivers can commit
incredible acts of violence — including
assault and murder. When the AAA
Foundation for Traffic Safety studied more
than 10,000 incidents of violent aggressive
driving committed between 1990 and
1996, it found that at least 218 people
were killed and another 12,610 injured
when drivers got angry.
Although many drivers involved in theseincidents are men between the ages of 18 and26, anyone can become aggressive if they lettheir anger take precedence over safe driving.The AAA Foundation study found that men,women, and people of all ages can drive aggres-sively if they are in the wrong mood or circum-stances. What’s more, when drivers explainedwhy they became violent the reasons are oftenincredibly trivial: “She wouldn’t let me pass,”“They kept tailgating me,” or, as this one
M
2 3
driver accused of murder explained, “He practi-cally ran me off the road — what was I sup-posed to do?”
How can you avoid being the victim of anaggressive driver? While there are no suretechniques, three basic guiding principles canhelp:
1. DOn't offendWhen surveys ask drivers what angers them
most, the results are remarkably consistent. Afew specific behaviors seem unusually likely toenrage other drivers. You can protect yourself byavoiding them:
Cutting off.When you merge, make sure you have plenty
of room. Use your turn signal to show yourintentions before making a move. If you make amistake and accidentally cut someone off, try toapologize to the other driver with an appropri-ate gesture. If someone cuts you off, slow downand give them room to merge into your lane.
Driving slowlyin the left lane.
If you are in theleft lane and some-one wants to pass,move over and letthem by. You maybe “in the right” because you are traveling at thespeed limit — but you may also be puttingyourself in danger by making drivers behind youangry. In many states and provinces the lawrequires you to travel in the right lane and usethe far left lane only for passing. Besides, it’ssimple courtesy to move over and let otherdrivers by.106
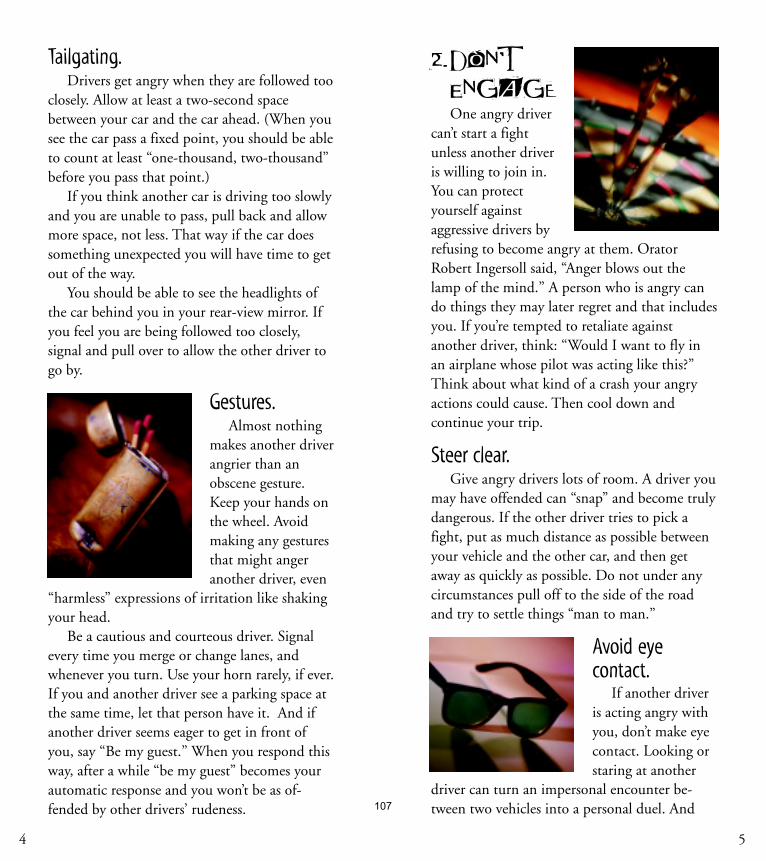
2.Don't
engagEOne angry driver
can’t start a fightunless another driveris willing to join in.You can protectyourself againstaggressive drivers byrefusing to become angry at them. OratorRobert Ingersoll said, “Anger blows out thelamp of the mind.” A person who is angry cando things they may later regret and that includesyou. If you’re tempted to retaliate againstanother driver, think: “Would I want to fly inan airplane whose pilot was acting like this?”Think about what kind of a crash your angryactions could cause. Then cool down andcontinue your trip.
Steer clear.Give angry drivers lots of room. A driver you
may have offended can “snap” and become trulydangerous. If the other driver tries to pick afight, put as much distance as possible betweenyour vehicle and the other car, and then getaway as quickly as possible. Do not under anycircumstances pull off to the side of the roadand try to settle things “man to man.”
Avoid eyecontact.
If another driveris acting angry withyou, don’t make eyecontact. Looking orstaring at another
driver can turn an impersonal encounter be-tween two vehicles into a personal duel. And
4 5
Tailgating.Drivers get angry when they are followed too
closely. Allow at least a two-second spacebetween your car and the car ahead. (When yousee the car pass a fixed point, you should be ableto count at least “one-thousand, two-thousand”before you pass that point.)
If you think another car is driving too slowlyand you are unable to pass, pull back and allowmore space, not less. That way if the car doessomething unexpected you will have time to getout of the way.
You should be able to see the headlights ofthe car behind you in your rear-view mirror. Ifyou feel you are being followed too closely,signal and pull over to allow the other driver togo by.
Gestures.Almost nothing
makes another driverangrier than anobscene gesture.Keep your hands onthe wheel. Avoidmaking any gesturesthat might angeranother driver, even
“harmless” expressions of irritation like shakingyour head.
Be a cautious and courteous driver. Signalevery time you merge or change lanes, andwhenever you turn. Use your horn rarely, if ever.If you and another driver see a parking space atthe same time, let that person have it. And ifanother driver seems eager to get in front ofyou, say “Be my guest.” When you respond thisway, after a while “be my guest” becomes yourautomatic response and you won’t be as of-fended by other drivers’ rudeness. 107
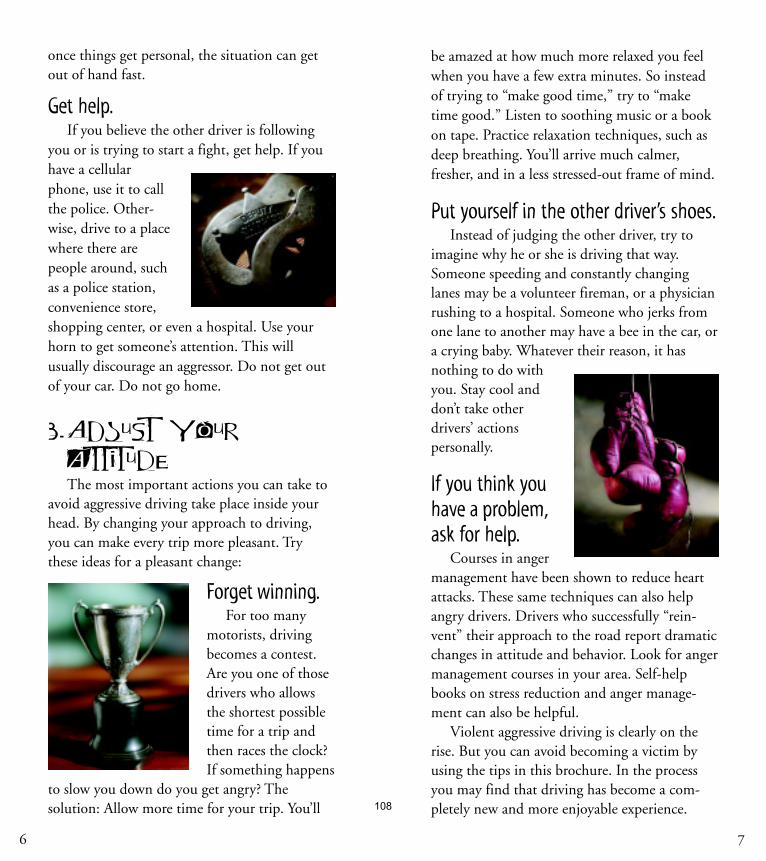
once things get personal, the situation can getout of hand fast.
Get help.If you believe the other driver is following
you or is trying to start a fight, get help. If youhave a cellularphone, use it to callthe police. Other-wise, drive to a placewhere there arepeople around, suchas a police station,convenience store,shopping center, or even a hospital. Use yourhorn to get someone’s attention. This willusually discourage an aggressor. Do not get outof your car. Do not go home.
3.ADjust your
attItudeThe most important actions you can take to
avoid aggressive driving take place inside yourhead. By changing your approach to driving,you can make every trip more pleasant. Trythese ideas for a pleasant change:
Forget winning.For too many
motorists, drivingbecomes a contest.Are you one of thosedrivers who allowsthe shortest possibletime for a trip andthen races the clock?If something happens
to slow you down do you get angry? Thesolution: Allow more time for your trip. You’ll
6 7
be amazed at how much more relaxed you feelwhen you have a few extra minutes. So insteadof trying to “make good time,” try to “maketime good.” Listen to soothing music or a bookon tape. Practice relaxation techniques, such asdeep breathing. You’ll arrive much calmer,fresher, and in a less stressed-out frame of mind.
Put yourself in the other driver’s shoes.Instead of judging the other driver, try to
imagine why he or she is driving that way.Someone speeding and constantly changinglanes may be a volunteer fireman, or a physicianrushing to a hospital. Someone who jerks fromone lane to another may have a bee in the car, ora crying baby. Whatever their reason, it hasnothing to do withyou. Stay cool anddon’t take otherdrivers’ actionspersonally.
If you think youhave a problem,ask for help.
Courses in angermanagement have been shown to reduce heartattacks. These same techniques can also helpangry drivers. Drivers who successfully “rein-vent” their approach to the road report dramaticchanges in attitude and behavior. Look for angermanagement courses in your area. Self-helpbooks on stress reduction and anger manage-ment can also be helpful.
Violent aggressive driving is clearly on therise. But you can avoid becoming a victim byusing the tips in this brochure. In the processyou may find that driving has become a com-pletely new and more enjoyable experience.108
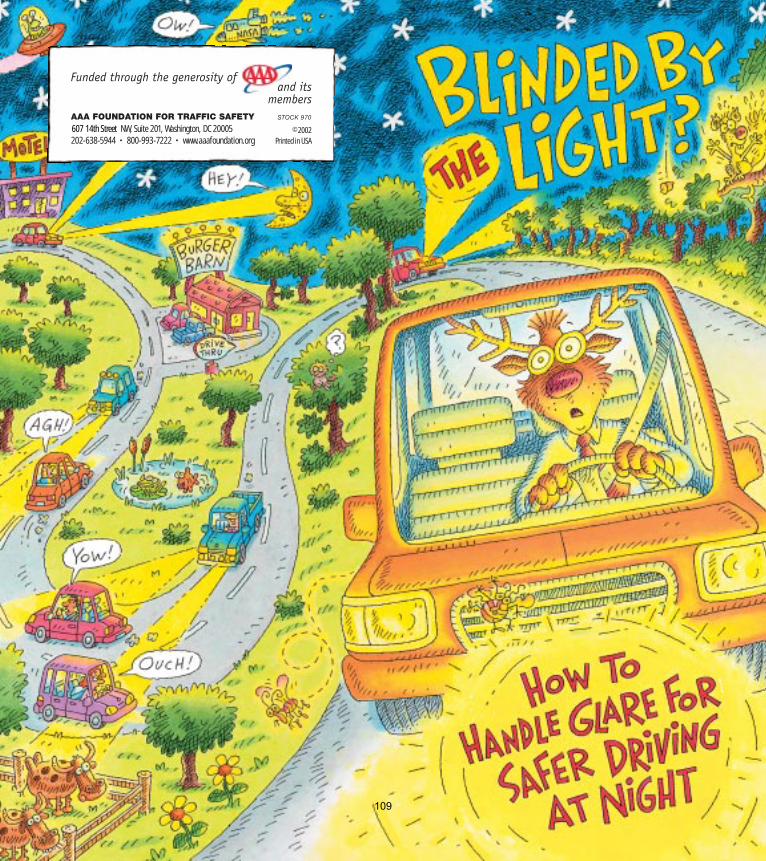
AAA FOUNDATION FOR TRAFFIC SAFETY607 14th Street NW, Suite 201, Washington, DC 20005202-638-5944 • 800-993-7222 • www.aaafoundation.org
STOCK 970
©2002Printed in USA
109
f bright lights have been both-
ering you more lately when you drive
at night, you’re not alone. The com-
ment above, like hundreds of other
complaints received recently by the
government and AAA clubs across the
country, indicates that glare from
headlights has flared into a bigger
problem than ever.
But you don’t need to continue to
suffer. With the right strategies, the
right driving techniques, and the right
equipment, you can fight back at
nighttime glare.
“I feel like I just stared at an arc welder.”
New Lights, Old ProblemsDrivers have been complaining about
glare ever since electric headlights beganreplacing oil lamps on automobiles morethan 85 years ago. So what’s the big dealnow? Why does glare seem to have grownworse? The answer involves technology,automotive design, and demographics.
Extra lights.
Many vehicles now sport fog lamps orother auxiliary lights in front. Ideally, foglamps cast a low, broad beam to reduce“back-scatter” from the vehicle’s headlightswhen water droplets hang in the air.They’re intended to improve a driver’s abil-ity to see in foggy, misty, or hazyconditions. However, when they’re aimedimproperly or used on clear nights, theycan annoy other drivers.
3110
High-tech lights.
Introduced in Europe in 1996, high-intensity discharge (HID) lights areshowing up on more cars in the UnitedStates, especially upscale models. Unlikeconventional bulbs, HID headlights don’thave filaments. Instead, they use a high-voltage electrical arc to ionize xenon gasand make it glow. HIDs emit twice thelight of halogen headlamps, but also pro-duce a blue-white light. Other headlightslook yellow by comparison.
Whether you love HIDs or hate themdepends on which side of the light you’reon. Drivers with HIDs swear by them,while other drivers swear at them. Manymotorists who are faced with HID lightsfind the amount of light and its blue-whitequality blinding.
Higher lights.
After years of steady growth, sales ofSUVs and light trucks have surpassed salesof passenger cars. Many of these larger ve-hicles—especially the four-wheel-drivevariety—ride higher than cars. As a resulttheir headlights ride higher, too. Althoughno headlights can exceed the 54-inchheight limit set by federal safety standards,the lights on SUVs typically measure about33 inches—almost 9 inches higher thanheadlights on passenger cars. It’s no won-der car drivers often complain that thelights on big 4X4s shine directly in theireyes.
54
Off-kilter lights.
Headlights pointed aslittle as one degree too high can makea huge difference to oncoming drivers.Misaimed beams also don’t cast asmuch light on the road, where itcounts. Unfortunately, studies showthat almost half the vehicles in statesthat require regular inspections hadat least one improperly aimed head-light. Vehicles more than five yearsold are twice as likely to have off-kilter headlights as newer ones.
Your eyes.
Like beauty, glare is often in the eye ofthe beholder. Middle-aged and older driv-ers are more sensitive to glare than youngerdrivers because their eyes take longer toadjust to changing light levels. As thepopulation ages, the number of older driv-ers will continue to rise—and complaintsabout glare will rise, too. Lighter-coloredeyes are more sensitive, which means thelighter your eyes are the more glare willbother you. Certain other conditions, suchas having had vision-correction surgerythat affects the corneas, may also increaseyour sensitivity to glare.
111
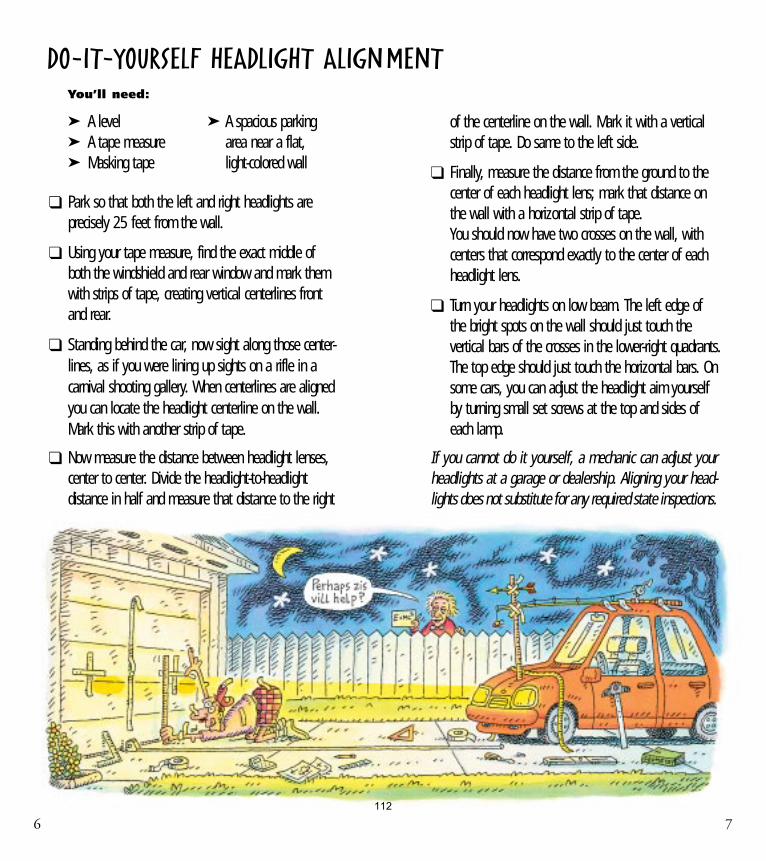
76
of the centerline on the wall. Mark it with a verticalstrip of tape. Do same to the left side.
❑ Finally, measure the distance from the ground to thecenter of each headlight lens; mark that distance onthe wall with a horizontal strip of tape.You should now have two crosses on the wall, withcenters that correspond exactly to the center of eachheadlight lens.
❑ Turn your headlights on low beam. The left edge ofthe bright spots on the wall should just touch thevertical bars of the crosses in the lower-right quadrants.The top edge should just touch the horizontal bars. Onsome cars, you can adjust the headlight aim yourselfby turning small set screws at the top and sides ofeach lamp.
If you cannot do it yourself, a mechanic can adjust yourheadlights at a garage or dealership. Aligning your head-lights does not substitute for any required state inspections.
DO-IT-YOURSELF HEADLIGHT ALIGNMENTYou’ll need:
➤ A level ➤ A spacious parking➤ A tape measure area near a flat,➤ Masking tape light-colored wall
❑ Park so that both the left and right headlights areprecisely 25 feet from the wall.
❑ Using your tape measure, find the exact middle ofboth the windshield and rear window and mark themwith strips of tape, creating vertical centerlines frontand rear.
❑ Standing behind the car, now sight along those center-lines, as if you were lining up sights on a rifle in acarnival shooting gallery. When centerlines are alignedyou can locate the headlight centerline on the wall.Mark this with another strip of tape.
❑ Now measure the distance between headlight lenses,center to center. Divide the headlight-to-headlightdistance in half and measure that distance to the right
112
Prepare to Fight GlareEven before you hit the road, prepare
yourself and your vehicle for combatingthe bright lights ahead.
Clean your headlights.
When you squeegee your windshield atthe gas station, be sure to clean your head-lights, too. Even a thin layer of road grimeon the lenses can block up to 90 percent ofthe light and severely restrict your abilityto see at night.
Clean lenses are even more important ifyou have HID headlights. Dirt diffuses thelight from HIDs and causes glare that cantemporarily blind other drivers, so head-light-cleaning systems are standardequipment on many cars with HIDs. Us-ing the headlight cleaners regularlybecomes a matter of “enlightened” self-interest for you; when you reduce glare foroncoming drivers you improve your ownsafety as well. After all, everybody sharesthe same road.
Keep all glass clear—really clear.
Streaks, smudges, and road grime onyour windows catch and refract light. Thisincludes the inside of your windshield.Chemicals from the plastic in your car’sinterior slowly build up on the glass, untilpretty soon you’re looking at the wind-shield, not through it. Scratched eyeglassesor contact lenses also make glare worse.
For maximum glare prevention, keep everysurface between your eyes and the road asclear as possible—including both sides ofyour windshield and your eyeglasses. Cleanthe windows (inside and out!) at least oncea month to get rid of haze—more often ifyou smoke in the car.
While you’re at it, clean your wiperblades with a paper towel dipped in wind-shield washer fluid. This removes grimeand oxidized rubber from the edge of theblade and helps prevent streaking. Ifstreaks persist, you need new blade refills.(These are available at any auto parts storeor discount chain.)
Have chips or cracks in the windshieldrepaired, pronto. Often a trained glass re-pair technician can fill small damaged areaswith special resin—a fast, inexpensive pro-cess that not only improves visibility butalso prevents the crack or chip from grow-ing and requiring a windshield replacement.
98113
Aim your headlights correctly.
If you live in a state that requires regularsafety inspections, ask the technician tocheck and correct the aim of your head-lights. If your state doesn’t require such aninspection, take your vehicle to a dealer orother properly equipped repair shop atleast once a year for a headlight checkup.Your properly aligned headlights will helpyou see the road better, and will help otherdrivers avoid glare.See p. 6-7 on how to align your own head-lights.
Adjust both outside mirrors.
Properly aligned mirrors not only re-duce blind spots, they also reduce glarefrom vehicles behind you.
AAA recommends the followingmethod: While sitting in the driver’s seat,lean to the left and tilt your head until itrests against the window. From that posi-tion, adjust the driver’s side mirror so youcan just see the left rear fender. Next, whilesitting in the driver’s seat, lean to the rightand tilt your head until it’s in the center ofthe vehicle. From that position, adjust thepassenger-side mirror so that the right rearfender is just visible.
Now when cars pass you, you’ll noticethat your mirrors don’t direct the brightestpart of the headlights into your eyes. You’llalso notice that the arrangement reducesblind spots and makes it easier to spot ve-hicles to the side and rear.
Have your vision checked regularly.
The American Optometric Associationrecommends that everyone under age 40have a thorough eye exam at least everythree years; drivers 41 to 60, every twoyears; and drivers over age 60, every year.Age makes eyes more sensitive to glare, butcertain medical conditions, such as en-croaching cataracts, will increase the
problem. If the problem is detected early,your eye care professional can recommendeffective treatment.
Behind-the-Wheel Tips
A few simple but surprisingly effectivetechniques will help you fight glare:
Avert your eyes.
When oncoming vehicles shine lightdirectly into your eyes, look down and to
1110114
12
the right. Turn your gaze to the white lineon the right side of the road, or to wherepavement meets the shoulder, until thevehicle goes by. You can still see the vehi-cles around you with your peripheralvision, but the glare won’t bother you asmuch because you are not using the mostlight-sensitive part of your eyes.
Use the mirror’s “night” setting.
All cars have “day/night” interior mir-rors to reduce reflected glare from vehiclesdirectly behind you. You can change themirror to its “night” setting by flipping thesmall lever at the bottom of the mirror.
This changes the angle of the reflective sur-face and appears to dim the mirror. Lightswill still show up in the glass, but they’remuch less bright and not so bothersome.
Use your lights courteously.
If your car has fog lamps, don’t usethem if there is no fog. In fog, use onlyyour low-beam headlights; high beams re-
duce your own ability to see and may tem-porarily blind other drivers. Avoid usingyour high beams when you see oncomingvehicles or when you drive in urban areas.
Take frequent breaks.
If you’re driving at night for a longtime, stop often to reduce fatigue and giveyour eyes a chance to recover. Take a shortnap, or at least a brisk walk and some caf-feine to help you stay alert.
Extra Glare ProtectionOK, you prepped your car completely
for night driving. You’ve had your eyeschecked by a professional. And you’ve triedthe behind-the-wheel techniques above.But glare still bothers you. Don’t give up!Try these strategies:
Anti-reflective eyeglass coating.
Many eye care professionals stronglyrecommend glasses with an anti-reflective(AR) coating. This ultra-thin film, madefrom zircon and silicon, reduces internalreflections in the lenses. Unlike sunglassesor self-darkening lenses, which block somelight, AR-coated glasses actually transmitmore light—about 8 percent more. Thisimproves vision at night and helps distin-guish fine details during the day. Highwaypatrol troopers have reported better nightand day vision and reduced nighttime glarewith AR-coated lenses. These lenses mayhelp you, too.
13115
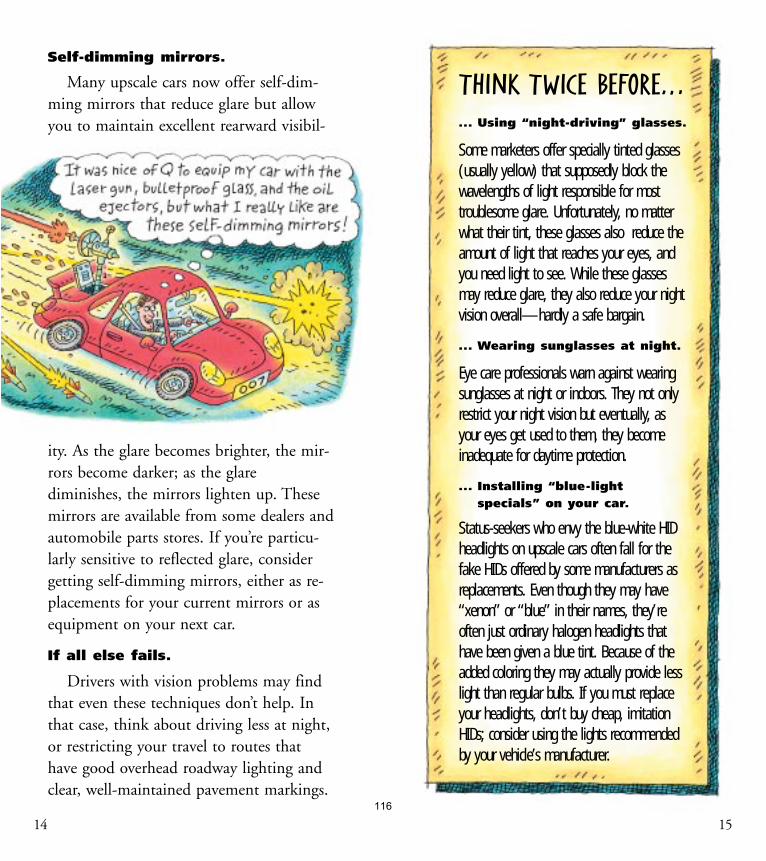
14
Self-dimming mirrors.
Many upscale cars now offer self-dim-ming mirrors that reduce glare but allowyou to maintain excellent rearward visibil-
ity. As the glare becomes brighter, the mir-rors become darker; as the glarediminishes, the mirrors lighten up. Thesemirrors are available from some dealers andautomobile parts stores. If you’re particu-larly sensitive to reflected glare, considergetting self-dimming mirrors, either as re-placements for your current mirrors or asequipment on your next car.
If all else fails.
Drivers with vision problems may findthat even these techniques don’t help. Inthat case, think about driving less at night,or restricting your travel to routes thathave good overhead roadway lighting andclear, well-maintained pavement markings.
THINK TWICE BEFORE…
... Using “night-driving” glasses.
Some marketers offer specially tinted glasses(usually yellow) that supposedly block thewavelengths of light responsible for mosttroublesome glare. Unfortunately, no matterwhat their tint, these glasses also reduce theamount of light that reaches your eyes, andyou need light to see. While these glassesmay reduce glare, they also reduce your nightvision overall—hardly a safe bargain.
... Wearing sunglasses at night.
Eye care professionals warn against wearingsunglasses at night or indoors. They not onlyrestrict your night vision but eventually, asyour eyes get used to them, they becomeinadequate for daytime protection.
... Installing “blue-lightspecials” on your car.
Status- seekers who envy the blue-white HIDheadlights on upscale cars often fall for thefake HIDs offered by some manufacturers asreplacements. Even though they may have“xenon” or “blue” in their names, they’reoften just ordinary halogen headlights thathave been given a blue tint. Because of theadded coloring they may actually provide lesslight than regular bulbs. If you must replaceyour headlights, don’t buy cheap, imitationHIDs; consider using the lights recommendedby your vehicle’s manufacturer.
15116
©1997 AAA FOUNDATION FOR TRAFFIC SAFETY • Printed in USA • STOCK 860
117
GING IS INEVITABLE — IT
HAPPENS TO EVERYBODY.
BUT GROWING OLDER DOESN’T have
to mean giving up an active life. While
aging does impose physical limitations,
many people achieved their greatest
success when they were over 60. For
example, businessman Henry M.
Leland founded the Cadillac
Automobile Company when he was
59. A few years later he left that
company and started the Lincoln
Motor Company at the age of 74.
Traffic safety is vital for drivers of all
ages, but older drivers experience
physical changes that can affect driving
ability — changes in vision, reaction
time, and flexibility. Yet while older
drivers as a group do have more
crashes than people in their 40s, their
individual safety records differ as much
as those of any other group.
Here are some suggestions about
how to become an older and wiser
driver.
118
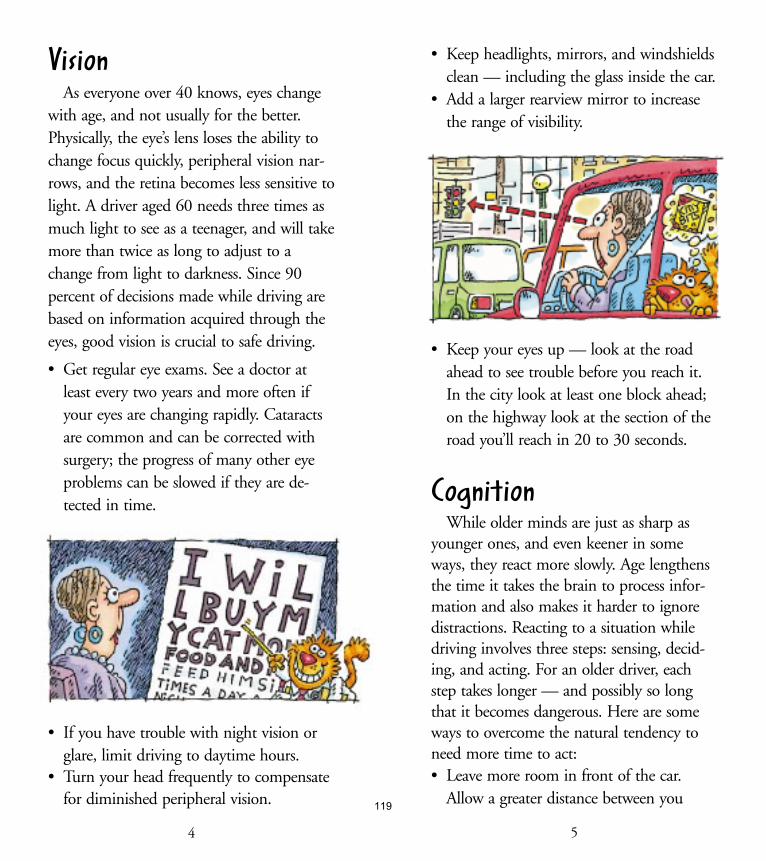
VisionAs everyone over 40 knows, eyes change
with age, and not usually for the better.Physically, the eye’s lens loses the ability tochange focus quickly, peripheral vision nar-rows, and the retina becomes less sensitive tolight. A driver aged 60 needs three times asmuch light to see as a teenager, and will takemore than twice as long to adjust to achange from light to darkness. Since 90percent of decisions made while driving arebased on information acquired through theeyes, good vision is crucial to safe driving.
• Get regular eye exams. See a doctor atleast every two years and more often ifyour eyes are changing rapidly. Cataractsare common and can be corrected withsurgery; the progress of many other eyeproblems can be slowed if they are de-tected in time.
• If you have trouble with night vision orglare, limit driving to daytime hours.
• Turn your head frequently to compensatefor diminished peripheral vision.
4
• Keep headlights, mirrors, and windshieldsclean — including the glass inside the car.
• Add a larger rearview mirror to increasethe range of visibility.
• Keep your eyes up — look at the roadahead to see trouble before you reach it.In the city look at least one block ahead;on the highway look at the section of theroad you’ll reach in 20 to 30 seconds.
CognitionWhile older minds are just as sharp as
younger ones, and even keener in someways, they react more slowly. Age lengthensthe time it takes the brain to process infor-mation and also makes it harder to ignoredistractions. Reacting to a situation whiledriving involves three steps: sensing, decid-ing, and acting. For an older driver, eachstep takes longer — and possibly so longthat it becomes dangerous. Here are someways to overcome the natural tendency toneed more time to act:• Leave more room in front of the car.
Allow a greater distance between you
5
119
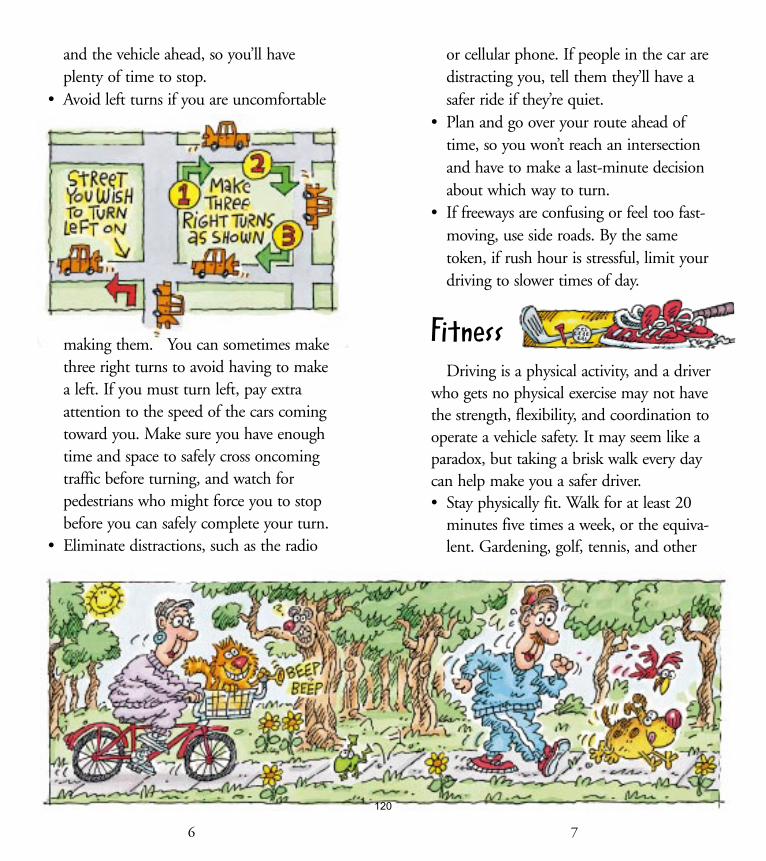
76
or cellular phone. If people in the car aredistracting you, tell them they’ll have asafer ride if they’re quiet.
• Plan and go over your route ahead oftime, so you won’t reach an intersectionand have to make a last-minute decisionabout which way to turn.
• If freeways are confusing or feel too fast-moving, use side roads. By the sametoken, if rush hour is stressful, limit yourdriving to slower times of day.
FitnessDriving is a physical activity, and a driver
who gets no physical exercise may not havethe strength, flexibility, and coordination tooperate a vehicle safety. It may seem like aparadox, but taking a brisk walk every daycan help make you a safer driver.• Stay physically fit. Walk for at least 20
minutes five times a week, or the equiva-lent. Gardening, golf, tennis, and other
and the vehicle ahead, so you’ll haveplenty of time to stop.
• Avoid left turns if you are uncomfortable
making them. You can sometimes makethree right turns to avoid having to makea left. If you must turn left, pay extraattention to the speed of the cars comingtoward you. Make sure you have enoughtime and space to safely cross oncomingtraffic before turning, and watch forpedestrians who might force you to stopbefore you can safely complete your turn.
• Eliminate distractions, such as the radio
120
8
sports can also help keep you in goodphysical shape.
• Stay mentally active. Using your problem-solving skills in non-driving ways can helpmental flexibility — including activitieslike jigsaw puzzles or crosswords. Learninga new skill or hobby is fun at any age,and helps keep your mind flexible.
MedicationMedications can interfere with driving by
making the driver drowsy or distracted. Thisincludes many over-the-counter medications,such as decongestants or cold remedies.Some of the worst offenders includetranquilizers, pain pills, sleep medicines,antidepressants, cough medicines, antihista-mines, and decongestants.• Read the fine print. If a medication
you’re taking is labeled “Do not use whileoperating heavy machinery,” let someoneelse drive.
• Inform your doctor about what nonpre-scription medication you are taking. Thisincludes alcohol, which can interact with
9
some drugs to cause serious side effects.• Discuss your medication and its effects
with your doctor or pharmacist.• Always check with your doctor before
stopping any medication.• Avoid driving when you first start taking
a new medication. Side effects such asdrowsiness are often worse for the firstfew days, but lessen as the body adjuststo the drug.
• If any medication makes you feel sleepyor disoriented, don’t drive.
When to StopA driver’s chronological age is not a good
predictor of driving ability. What counts onthe road is performance. Here are a few ofthe signs of diminished capacity for drivingsafely:• Having a series of minor accidents or
near misses.• Having wandering thoughts or being
unable to concentrate.
121
10
GETTING ADDITIONAL HELP
Many motor clubs affiliated with
the American Automobile Associa-
tion and the Canadian Automobile
Association offer refresher courses
for older drivers. So do some chap-
ters of the National Safety Council
and the American Association of
Retired Persons. These courses can
update you on changes in traffic
laws, signs, signals, and markings,
and offer safe driving tips. Some
also offer actual behind-the-wheel
assessments, which can be especially
helpful in sharpening your driving
skills. Behind-the-wheel assessments
are also offered by some physical
rehabilitation specialists; these can
be very important when one’s driv-
ing abilities have been affected by a
stroke or other serious ailment.
• Being unable to read ordinary road signs.• Getting lost on familiar roads.• Having other drivers honk at you
frequently.• Being spoken to about your driving by
police, family, and friends.
AND REMEMBER —
ALWAYS WEAR YOUR SAFETY BELT!
Know Your LimitsBeing a safe driver means more than
avoiding crashes. It also means paying atten-tion to road conditions and being aware ofyour own changing abilities. Just a fewsimple adjustments, such as limiting yourdriving to certain times or adding an extra-wide mirror — can help protect you andthose around you from deadly crashes.
Follow the simple guidelines in thisbooklet and you, too, can remainan older and wiser driver!
122
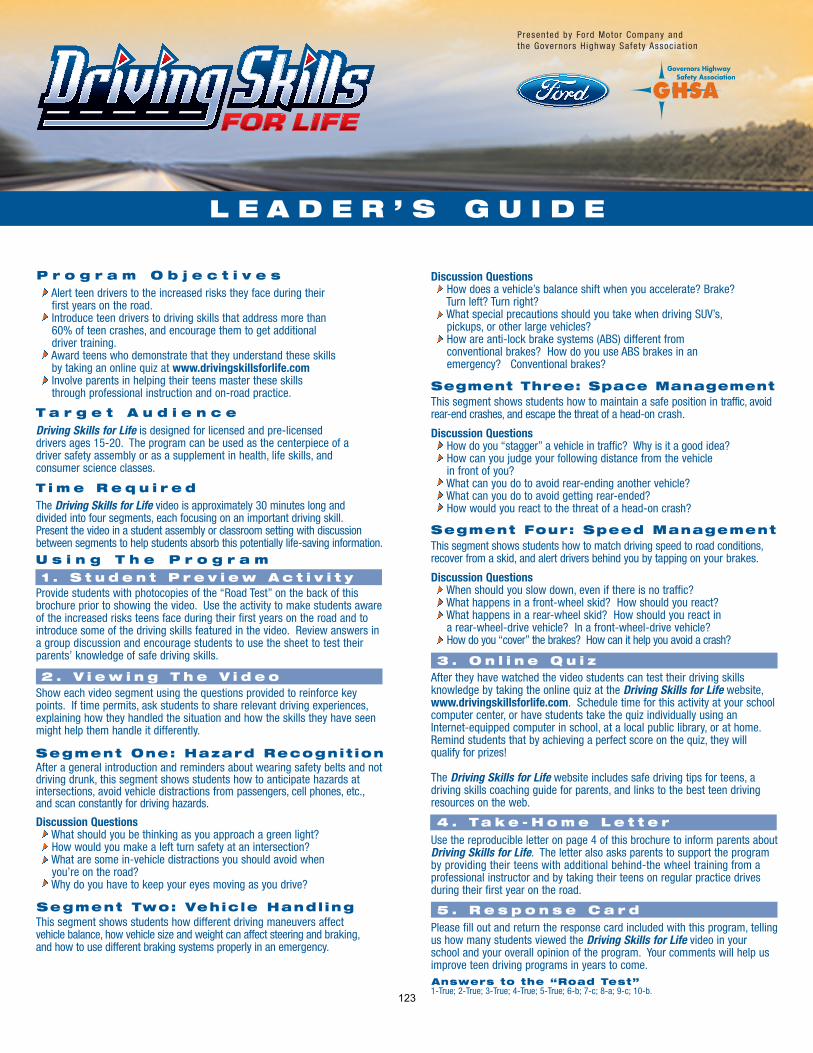
Alert teen drivers to the increased risks they face during their first years on the road.Introduce teen drivers to driving skills that address more than 60% of teen crashes, and encourage them to get additional driver training.Award teens who demonstrate that they understand these skills by taking an online quiz at www.drivingskillsforlife.comInvolve parents in helping their teens master these skills through professional instruction and on-road practice.
Driving Skills for Life is designed for licensed and pre-licensed drivers ages 15-20. The program can be used as the centerpiece of a driver safety assembly or as a supplement in health, life skills, and consumer science classes.
The Driving Skills for Life video is approximately 30 minutes long and divided into four segments, each focusing on an important driving skill.Present the video in a student assembly or classroom setting with discussionbetween segments to help students absorb this potentially life-saving information.
Provide students with photocopies of the “Road Test” on the back of thisbrochure prior to showing the video. Use the activity to make students awareof the increased risks teens face during their first years on the road and tointroduce some of the driving skills featured in the video. Review answers ina group discussion and encourage students to use the sheet to test theirparents’ knowledge of safe driving skills.
Show each video segment using the questions provided to reinforce keypoints. If time permits, ask students to share relevant driving experiences,explaining how they handled the situation and how the skills they have seenmight help them handle it differently.
After a general introduction and reminders about wearing safety belts and notdriving drunk, this segment shows students how to anticipate hazards atintersections, avoid vehicle distractions from passengers, cell phones, etc.,and scan constantly for driving hazards.
Discussion QuestionsWhat should you be thinking as you approach a green light?How would you make a left turn safety at an intersection?What are some in-vehicle distractions you should avoid when you’re on the road?Why do you have to keep your eyes moving as you drive?
This segment shows students how different driving maneuvers affect vehicle balance, how vehicle size and weight can affect steering and braking,and how to use different braking systems properly in an emergency.
Discussion QuestionsHow does a vehicle’s balance shift when you accelerate? Brake? Turn left? Turn right?What special precautions should you take when driving SUV’s,pickups, or other large vehicles?How are anti-lock brake systems (ABS) different from conventional brakes? How do you use ABS brakes in an emergency? Conventional brakes?
This segment shows students how to maintain a safe position in traffic, avoidrear-end crashes, and escape the threat of a head-on crash.
Discussion QuestionsHow do you “stagger” a vehicle in traffic? Why is it a good idea?How can you judge your following distance from the vehicle in front of you?What can you do to avoid rear-ending another vehicle?What can you do to avoid getting rear-ended?How would you react to the threat of a head-on crash?
This segment shows students how to match driving speed to road conditions,recover from a skid, and alert drivers behind you by tapping on your brakes.
Discussion QuestionsWhen should you slow down, even if there is no traffic?What happens in a front-wheel skid? How should you react?What happens in a rear-wheel skid? How should you react in a rear-wheel-drive vehicle? In a front-wheel-drive vehicle?How do you “cover” the brakes? How can it help you avoid a crash?
After they have watched the video students can test their driving skillsknowledge by taking the online quiz at the Driving Skills for Life website,www.drivingskillsforlife.com. Schedule time for this activity at your schoolcomputer center, or have students take the quiz individually using anInternet-equipped computer in school, at a local public library, or at home.Remind students that by achieving a perfect score on the quiz, they will qualify for prizes!
The Driving Skills for Life website includes safe driving tips for teens, a driving skills coaching guide for parents, and links to the best teen drivingresources on the web.
Use the reproducible letter on page 4 of this brochure to inform parents aboutDriving Skills for Life. The letter also asks parents to support the programby providing their teens with additional behind-the wheel training from aprofessional instructor and by taking their teens on regular practice drivesduring their first year on the road.
Please fill out and return the response card included with this program, tellingus how many students viewed the Driving Skills for Life video in yourschool and your overall opinion of the program. Your comments will help usimprove teen driving programs in years to come.
1-True; 2-True; 3-True; 4-True; 5-True; 6-b; 7-c; 8-a; 9-c; 10-b.
T a r g e t A u d i e n c e
T i m e R e q u i r e d
U s i n g T h e P r o g r a m1 . S t u d e n t P r e v i e w A c t i v i t y
2 . V i e w i n g T h e V i d e o
Segment One: Hazard Recogni t ion
Segment Two: Vehic le Handl ing
Segment Three: Space Management
Segment Four: Speed Management
3 . O n l i n e Q u i z
4 . Ta k e - H o m e L e t t e r
5 . R e s p o n s e C a r d
Answers to the “Road Test”
P r o g r a m O b j e c t i v e s
L E A D E R ’ S G U I D E
Presented by Ford Motor Company andthe Governors H ighway Safety Assoc ia t ion
123
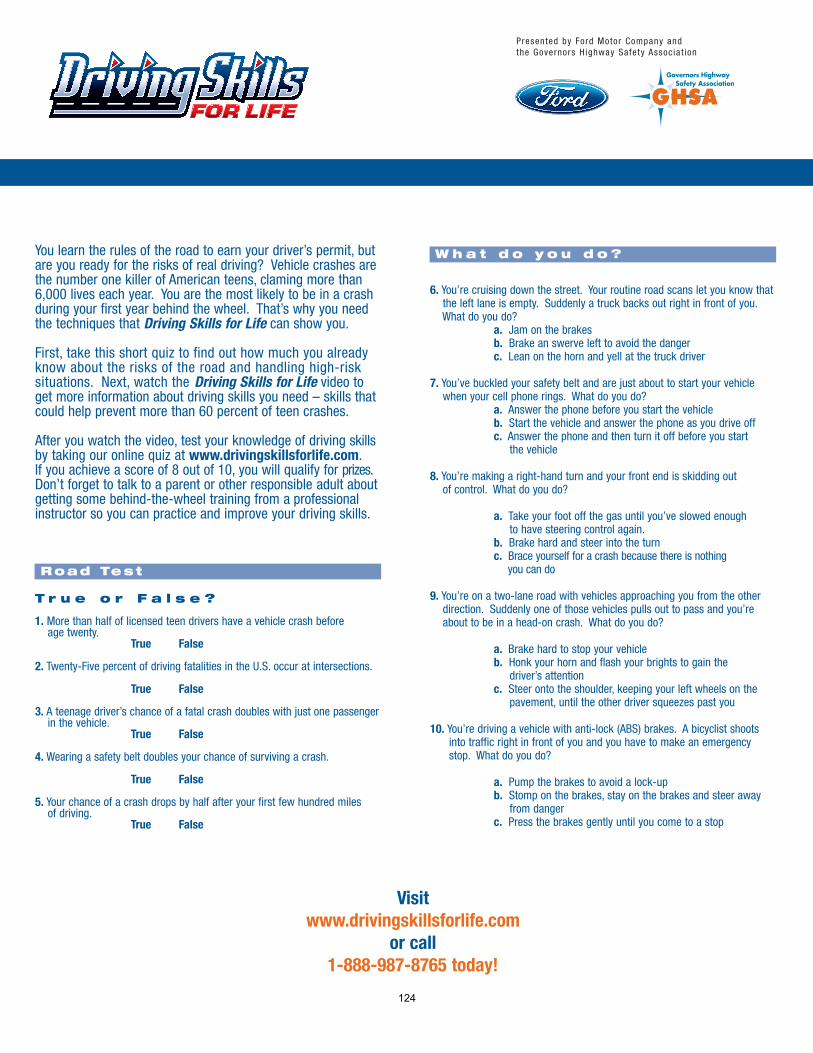
Visit www.drivingskillsforlife.com
or call 1-888-987-8765 today!
You learn the rules of the road to earn your driver’s permit, butare you ready for the risks of real driving? Vehicle crashes arethe number one killer of American teens, claming more than6,000 lives each year. You are the most likely to be in a crashduring your first year behind the wheel. That’s why you needthe techniques that Driving Skills for Life can show you.
First, take this short quiz to find out how much you alreadyknow about the risks of the road and handling high-risksituations. Next, watch the Driving Skills for Life video toget more information about driving skills you need – skills thatcould help prevent more than 60 percent of teen crashes.
After you watch the video, test your knowledge of driving skillsby taking our online quiz at www.drivingskillsforlife.com.If you achieve a score of 8 out of 10, you will qualify for prizes.Don’t forget to talk to a parent or other responsible adult aboutgetting some behind-the-wheel training from a professionalinstructor so you can practice and improve your driving skills.
1. More than half of licensed teen drivers have a vehicle crash before age twenty.
True False
2. Twenty-Five percent of driving fatalities in the U.S. occur at intersections.
True False
3. A teenage driver’s chance of a fatal crash doubles with just one passengerin the vehicle.
True False
4. Wearing a safety belt doubles your chance of surviving a crash.
True False
5. Your chance of a crash drops by half after your first few hundred miles of driving.
True False
6. You’re cruising down the street. Your routine road scans let you know thatthe left lane is empty. Suddenly a truck backs out right in front of you.What do you do?
a. Jam on the brakesb. Brake an swerve left to avoid the dangerc. Lean on the horn and yell at the truck driver
7. You’ve buckled your safety belt and are just about to start your vehiclewhen your cell phone rings. What do you do?
a. Answer the phone before you start the vehicleb. Start the vehicle and answer the phone as you drive offc. Answer the phone and then turn it off before you start
the vehicle
8. You’re making a right-hand turn and your front end is skidding outof control. What do you do?
a. Take your foot off the gas until you’ve slowed enough to have steering control again.
b. Brake hard and steer into the turnc. Brace yourself for a crash because there is nothing
you can do
9. You’re on a two-lane road with vehicles approaching you from the otherdirection. Suddenly one of those vehicles pulls out to pass and you’reabout to be in a head-on crash. What do you do?
a. Brake hard to stop your vehicleb. Honk your horn and flash your brights to gain the
driver’s attentionc. Steer onto the shoulder, keeping your left wheels on the
pavement, until the other driver squeezes past you
10. You’re driving a vehicle with anti-lock (ABS) brakes. A bicyclist shootsinto traffic right in front of you and you have to make an emergency stop. What do you do?
a. Pump the brakes to avoid a lock-upb. Stomp on the brakes, stay on the brakes and steer away
from dangerc. Press the brakes gently until you come to a stop
T r u e o r F a l s e ?
Road Test
W h a t d o y o u d o ?
Presented by Ford Motor Company andthe Governors H ighway Safety Assoc ia t ion
124
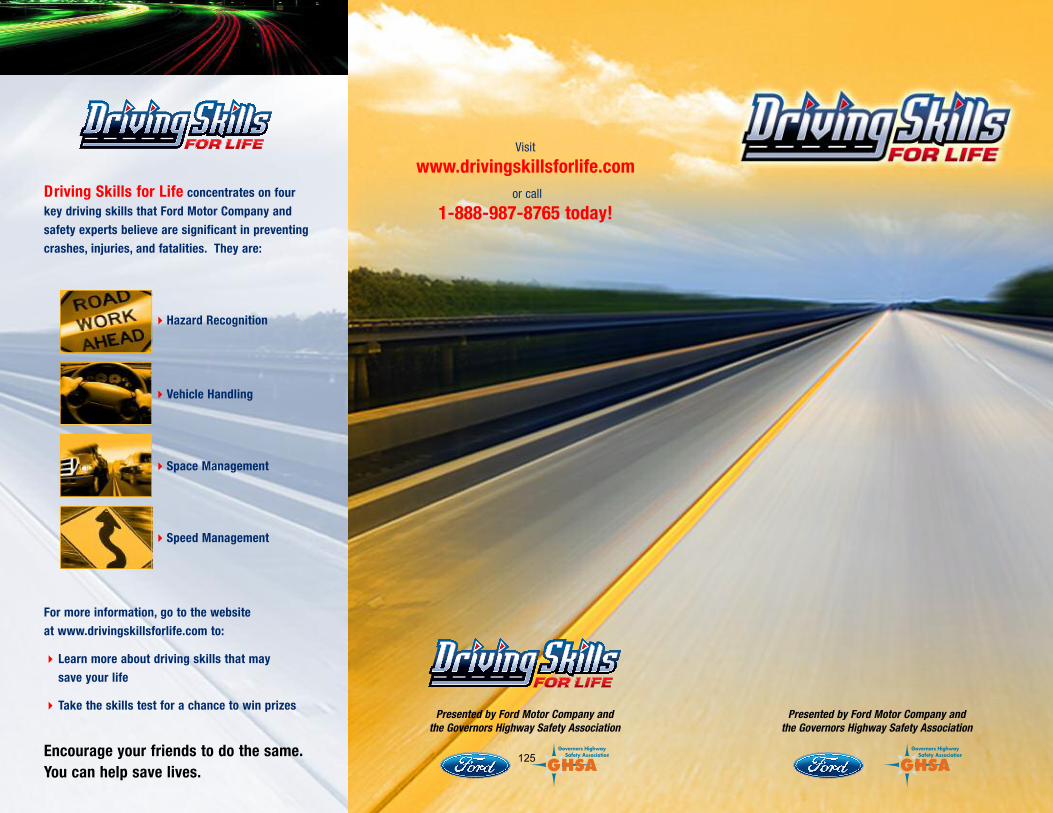
Presented by Ford Motor Company and the Governors Highway Safety Association
Presented by Ford Motor Company and the Governors Highway Safety Association
Visit
www.drivingskillsforlife.comor call
1-888-987-8765 today!Driving Skills for Life concentrates on four key driving skills that Ford Motor Company andsafety experts believe are significant in preventingcrashes, injuries, and fatalities. They are:
4Hazard Recognition
4Vehicle Handling
4Space Management
4Speed Management
For more information, go to the website at www.drivingskillsforlife.com to:
4Learn more about driving skills that may save your life
4Take the skills test for a chance to win prizes
Encourage your friends to do the same.You can help save lives.
125
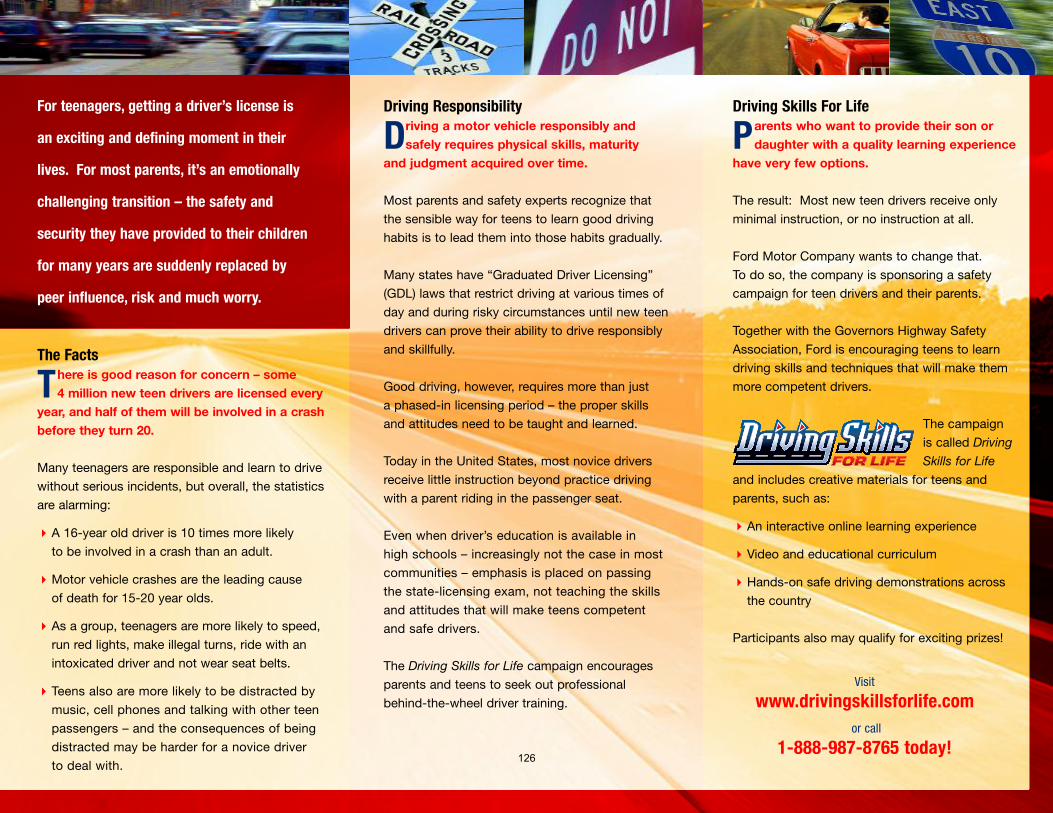
For teenagers, getting a driver’s license is
an exciting and defining moment in their
lives. For most parents, it’s an emotionally
challenging transition – the safety and
security they have provided to their children
for many years are suddenly replaced by
peer influence, risk and much worry.
The Facts
There is good reason for concern – some 4 million new teen drivers are licensed every
year, and half of them will be involved in a crashbefore they turn 20.
Many teenagers are responsible and learn to drive
without serious incidents, but overall, the statistics
are alarming:
4A 16-year old driver is 10 times more likely
to be involved in a crash than an adult.
4Motor vehicle crashes are the leading cause
of death for 15-20 year olds.
4As a group, teenagers are more likely to speed,
run red lights, make illegal turns, ride with an
intoxicated driver and not wear seat belts.
4Teens also are more likely to be distracted by
music, cell phones and talking with other teen
passengers – and the consequences of being
distracted may be harder for a novice driver
to deal with.
Driving Responsibility
Driving a motor vehicle responsibly and safely requires physical skills, maturity
and judgment acquired over time.
Most parents and safety experts recognize that
the sensible way for teens to learn good driving
habits is to lead them into those habits gradually.
Many states have “Graduated Driver Licensing”
(GDL) laws that restrict driving at various times of
day and during risky circumstances until new teen
drivers can prove their ability to drive responsibly
and skillfully.
Good driving, however, requires more than just
a phased-in licensing period – the proper skills
and attitudes need to be taught and learned.
Today in the United States, most novice drivers
receive little instruction beyond practice driving
with a parent riding in the passenger seat.
Even when driver’s education is available in
high schools – increasingly not the case in most
communities – emphasis is placed on passing
the state-licensing exam, not teaching the skills
and attitudes that will make teens competent
and safe drivers.
The Driving Skills for Life campaign encourages
parents and teens to seek out professional
behind-the-wheel driver training.
Driving Skills For Life
Parents who want to provide their son or daughter with a quality learning experience
have very few options.
The result: Most new teen drivers receive only
minimal instruction, or no instruction at all.
Ford Motor Company wants to change that.
To do so, the company is sponsoring a safety
campaign for teen drivers and their parents.
Together with the Governors Highway Safety
Association, Ford is encouraging teens to learn
driving skills and techniques that will make them
more competent drivers.
The campaign
is called Driving
Skills for Life
and includes creative materials for teens and
parents, such as:
4An interactive online learning experience
4Video and educational curriculum
4Hands-on safe driving demonstrations across
the country
Participants also may qualify for exciting prizes!
Visit
www.drivingskillsforlife.comor call
1-888-987-8765 today!126
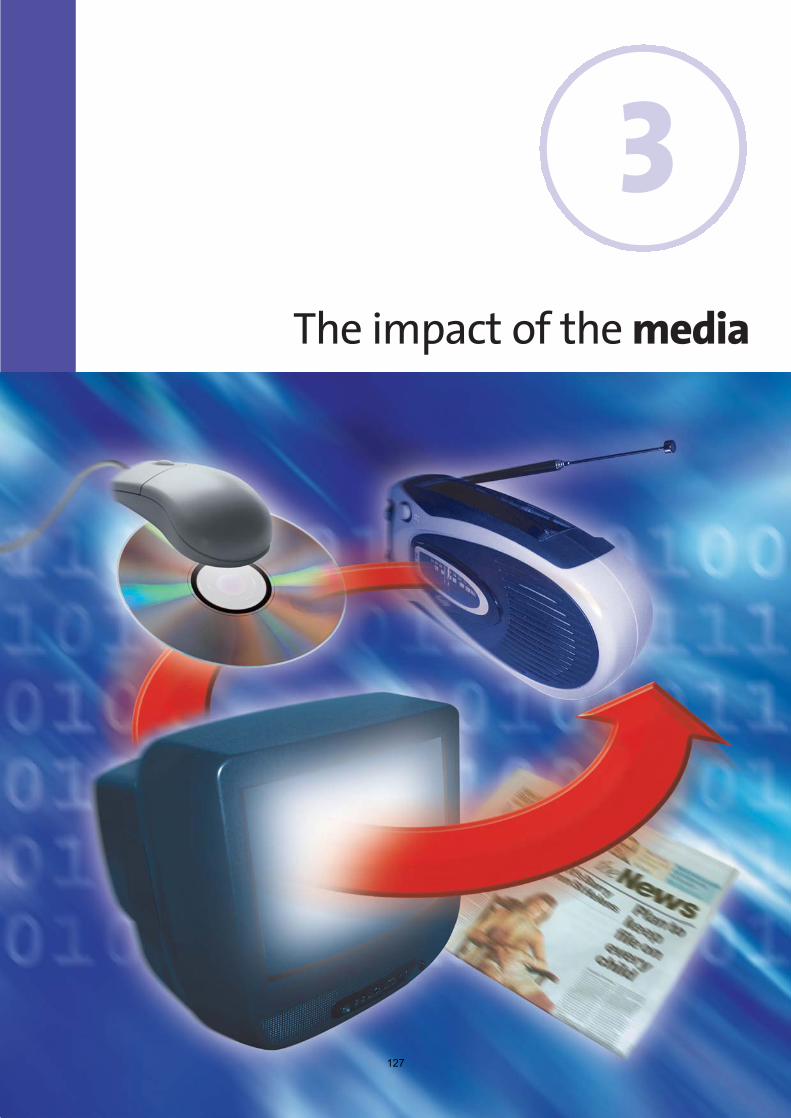
The impact of the media
3
127
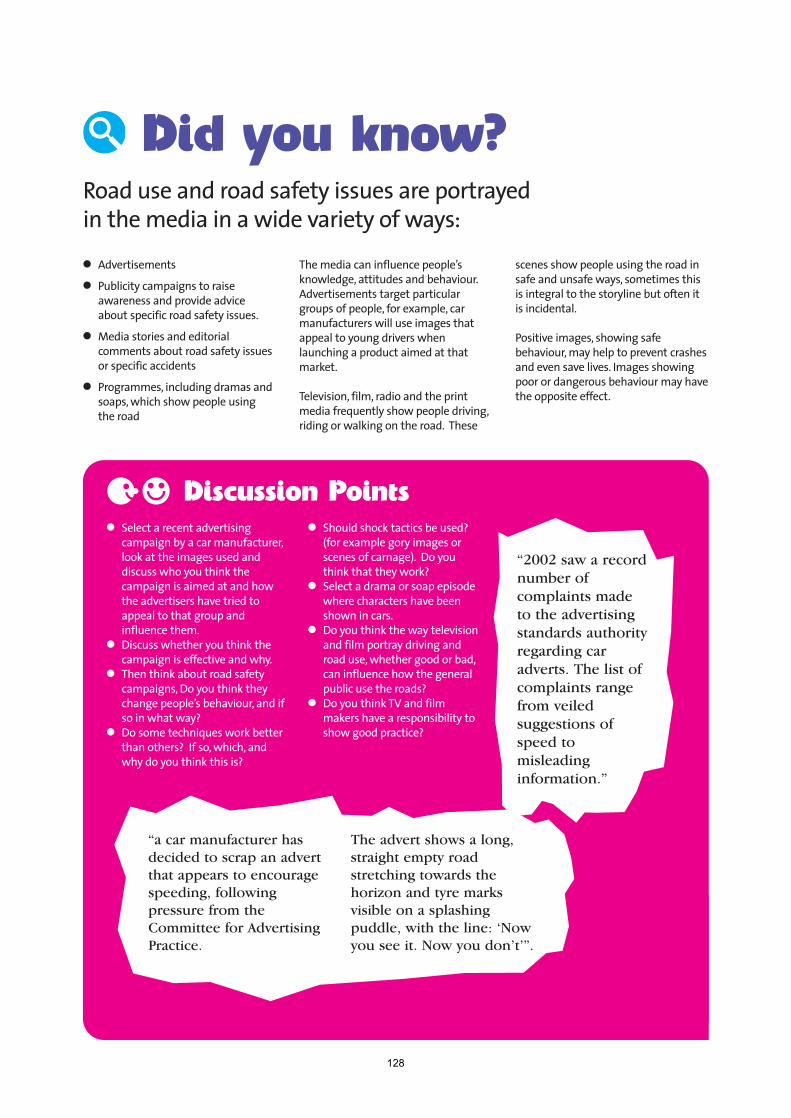
Road use and road safety issues are portrayedin the media in a wide variety of ways:● Advertisements● Publicity campaigns to raise
awareness and provide adviceabout specific road safety issues.
● Media stories and editorialcomments about road safety issuesor specific accidents
● Programmes, including dramas andsoaps, which show people usingthe road
The media can influence people’sknowledge, attitudes and behaviour.Advertisements target particulargroups of people, for example, carmanufacturers will use images thatappeal to young drivers whenlaunching a product aimed at thatmarket.
Television, film, radio and the printmedia frequently show people driving,riding or walking on the road. These
scenes show people using the road insafe and unsafe ways, sometimes thisis integral to the storyline but often itis incidental.
Positive images, showing safebehaviour, may help to prevent crashesand even save lives. Images showingpoor or dangerous behaviour may havethe opposite effect.
Did you know?
● Select a recent advertisingcampaign by a car manufacturer,look at the images used anddiscuss who you think thecampaign is aimed at and howthe advertisers have tried toappeal to that group andinfluence them.
● Discuss whether you think thecampaign is effective and why.
● Then think about road safetycampaigns, Do you think theychange people’s behaviour, and ifso in what way?
● Do some techniques work betterthan others? If so, which, andwhy do you think this is?
● Should shock tactics be used?(for example gory images orscenes of carnage). Do youthink that they work?
● Select a drama or soap episodewhere characters have beenshown in cars.
● Do you think the way televisionand film portray driving androad use, whether good or bad,can influence how the generalpublic use the roads?
● Do you think TV and filmmakers have a responsibility toshow good practice?
“2002 saw a record
number of
complaints made
to the advertising
standards authority
regarding car
adverts. The list of
complaints range
from veiled
suggestions of
speed to
misleading
information.”
“a car manufacturer has
decided to scrap an advert
that appears to encourage
speeding, following
pressure from the
Committee for Advertising
Practice.
The advert shows a long,
straight empty road
stretching towards the
horizon and tyre marks
visible on a splashing
puddle, with the line: ‘Now
you see it. Now you don’t’”.
41 Discussion Points
128
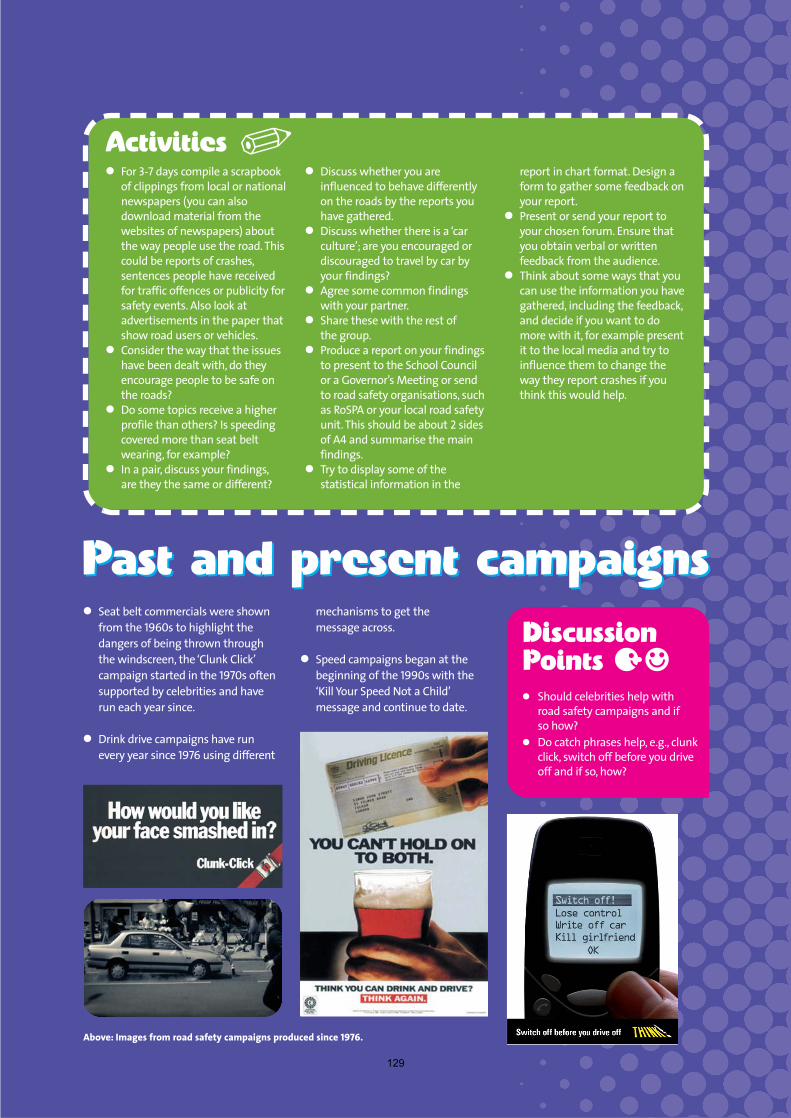
Past and present campaignsPast and present campaigns● Seat belt commercials were shown
from the 1960s to highlight thedangers of being thrown throughthe windscreen, the ‘Clunk Click’campaign started in the 1970s oftensupported by celebrities and haverun each year since.
● Drink drive campaigns have runevery year since 1976 using different
mechanisms to get themessage across.
● Speed campaigns began at thebeginning of the 1990s with the‘Kill Your Speed Not a Child’message and continue to date.
● Should celebrities help withroad safety campaigns and ifso how?
● Do catch phrases help, e.g., clunkclick, switch off before you driveoff and if so, how?
DiscussionPoints
● For 3-7 days compile a scrapbookof clippings from local or nationalnewspapers (you can alsodownload material from thewebsites of newspapers) aboutthe way people use the road. Thiscould be reports of crashes,sentences people have receivedfor traffic offences or publicity forsafety events. Also look atadvertisements in the paper thatshow road users or vehicles.
● Consider the way that the issueshave been dealt with, do theyencourage people to be safe onthe roads?
● Do some topics receive a higherprofile than others? Is speedingcovered more than seat beltwearing, for example?
● In a pair, discuss your findings,are they the same or different?
● Discuss whether you areinfluenced to behave differentlyon the roads by the reports youhave gathered.
● Discuss whether there is a ‘carculture’; are you encouraged ordiscouraged to travel by car byyour findings?
● Agree some common findingswith your partner.
● Share these with the rest ofthe group.
● Produce a report on your findingsto present to the School Councilor a Governor’s Meeting or sendto road safety organisations, suchas RoSPA or your local road safetyunit. This should be about 2 sidesof A4 and summarise the mainfindings.
● Try to display some of thestatistical information in the
report in chart format. Design aform to gather some feedback onyour report.
● Present or send your report toyour chosen forum. Ensure thatyou obtain verbal or writtenfeedback from the audience.
● Think about some ways that youcan use the information you havegathered, including the feedback,and decide if you want to domore with it, for example presentit to the local media and try toinfluence them to change theway they report crashes if youthink this would help.
41
Activities �
Above: Images from road safety campaigns produced since 1976.
129

The Royal Society for the Prevention of AccidentsEdgbaston Park, 353 Bristol Road, Birmingham B5 7STTelephone: 0870 777 2171/0121 248 2000Fax: 0870 777 2199/0121 248 2001
Registered Charity No. 207823VAT Registration No. 655 1316 49 www.rospa.com
● Choose a storyline from a TV soap opera whichinvolves a road safety issue.
● Discuss how the storyline addresses the safetyissues, if at all.
● Produce your own plot for a soap that includes aroad safety topic, possibly involving a roadsafety crash.
● Discuss how you would portray the road safetyissue to show safe behaviour or the consequencesof unsafe behaviour.
Activities● Find out whether your parents
and other adults rememberthese older campaigns. Do theythink these campaigns made adifference to them personally,did it affect the way theybehaved? Do they think thesecampaigns made a difference tothe public in general?
● Find out whether these adultsfeel that the current THINK!campaigns on drink/drive,seatbelt wearing and speedingare more or less effective thanthe older campaigns and discussthe reasons for their viewswith them.
● Produce a timeline to show thecampaigns and plot totalcasualty numbers against it. Dothis for the 1970s, 1980s, 1990sand since 2000 then put themall together.
Information on current and previouscampaigns can be found atwww.thinkroadsafety.gov.uk andat www.rospa.com/roadsafety/info/campaigns.pdf. Data on roadcasualty numbers is available in theTransport Statistics section ofwww.dft.gov.uk.
● In a pair, take 2 road safetycampaigns and see if there areany common messages,or major differences.
● Which one is more effective toyou and why?
● Plan a road safety campaign.
Consider:● Which issue do you want to
focus on, for example, seat beltwearing, drink/drug driving,driver fatigue or distraction, for
example using a mobile phonewhilst driving.
● Is this a local or nationalcampaign?
● Who would be your targetaudience?
● Which medium do you want touse? TV, radio, newspapers?
● What format do you want touse? Celebrity presenter,character, shock tactics?
● Run your campaign either inschool or in your localcommunity, make sure that youestablish a way to evaluate thesuccess of the campaign. Set atime limit for the campaign, thiscould be a couple of days or aweek or more. You will need todraw up a plan of action toensure the smooth running ofthe campaign and resource allthe materials that you need toset it up.
�
www.highwaycode.gov.ukwww.rospa.comwww.thinkroadsafety.gov.uk(The Government’s road safetycampaign)www.asa.org.uk (AdvertisingStandards Agency)
www.ofcom.org.uk(Communications IndustryRegulator)www.dft.gov.uk(Department for Transport, whichincludes a section on statistics)
www.larsoa.org.uk(Local Authorities Road SafetyOfficers Association)www.rospa.com/roadsafety/info/roadmedia.pdf
l Useful links
e Take it further...
MS186
130
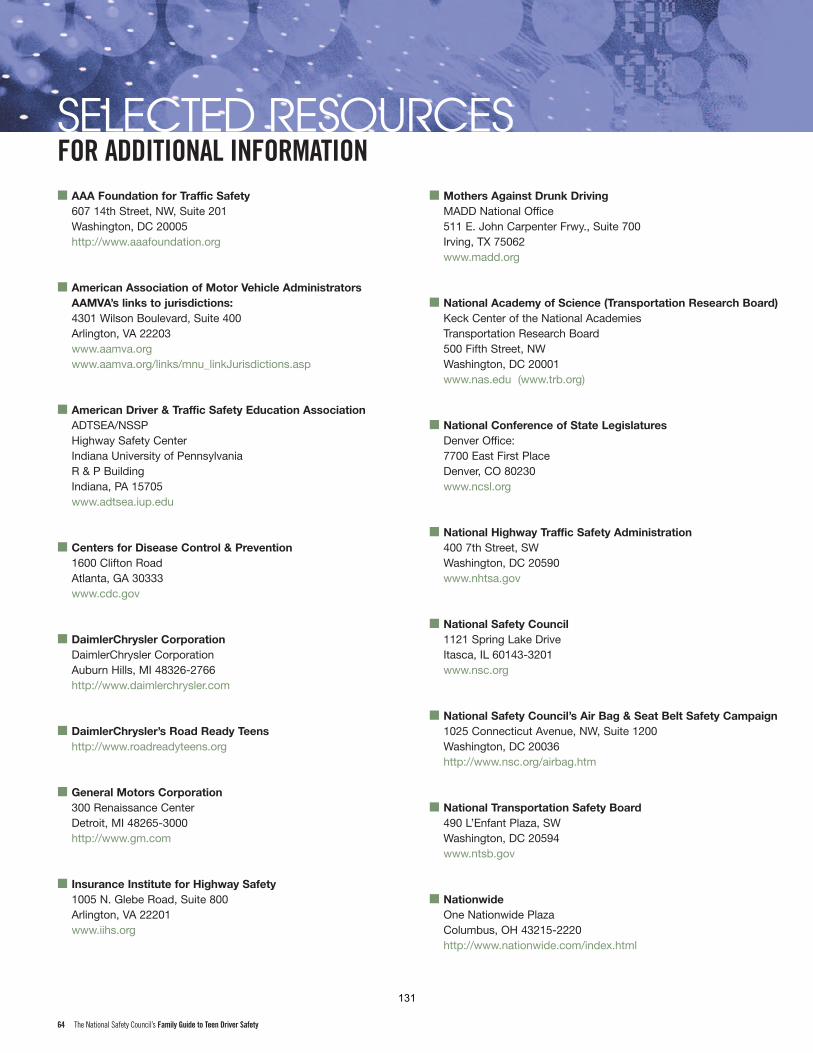
■ AAA Foundation for Traffic Safety607 14th Street, NW, Suite 201Washington, DC 20005http://www.aaafoundation.org
■ American Association of Motor Vehicle AdministratorsAAMVA’s links to jurisdictions:4301 Wilson Boulevard, Suite 400Arlington, VA 22203www.aamva.orgwww.aamva.org/links/mnu_linkJurisdictions.asp
■ American Driver & Traffic Safety Education AssociationADTSEA/NSSPHighway Safety CenterIndiana University of PennsylvaniaR & P BuildingIndiana, PA 15705www.adtsea.iup.edu
■ Centers for Disease Control & Prevention1600 Clifton Road Atlanta, GA 30333www.cdc.gov
■ DaimlerChrysler CorporationDaimlerChrysler CorporationAuburn Hills, MI 48326-2766http://www.daimlerchrysler.com
■ DaimlerChrysler’s Road Ready Teenshttp://www.roadreadyteens.org
■ General Motors Corporation300 Renaissance CenterDetroit, MI 48265-3000http://www.gm.com
■ Insurance Institute for Highway Safety1005 N. Glebe Road, Suite 800Arlington, VA 22201www.iihs.org
■ Mothers Against Drunk DrivingMADD National Office511 E. John Carpenter Frwy., Suite 700Irving, TX 75062www.madd.org
■ National Academy of Science (Transportation Research Board)Keck Center of the National AcademiesTransportation Research Board500 Fifth Street, NWWashington, DC 20001www.nas.edu (www.trb.org)
■ National Conference of State LegislaturesDenver Office:7700 East First PlaceDenver, CO 80230www.ncsl.org
■ National Highway Traffic Safety Administration400 7th Street, SW Washington, DC 20590www.nhtsa.gov
■ National Safety Council1121 Spring Lake DriveItasca, IL 60143-3201www.nsc.org
■ National Safety Council’s Air Bag & Seat Belt Safety Campaign1025 Connecticut Avenue, NW, Suite 1200Washington, DC 20036http://www.nsc.org/airbag.htm
■ National Transportation Safety Board490 L’Enfant Plaza, SW Washington, DC 20594www.ntsb.gov
■ NationwideOne Nationwide PlazaColumbus, OH 43215-2220http://www.nationwide.com/index.html
64 The National Safety Council’s Family Guide to Teen Driver Safety
SELECTED RESOURCESFOR ADDITIONAL INFORMATION
131
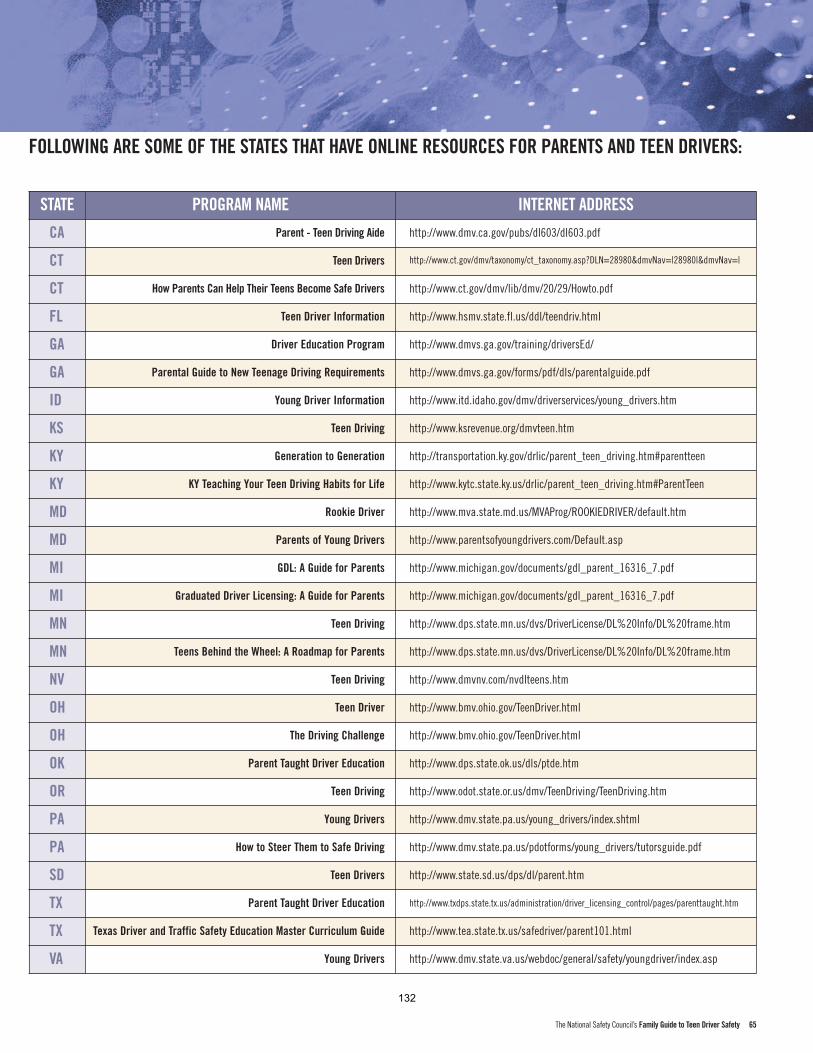
The National Safety Council’s Family Guide to Teen Driver Safety 65
FOLLOWING ARE SOME OF THE STATES THAT HAVE ONLINE RESOURCES FOR PARENTS AND TEEN DRIVERS:
STATE PROGRAM NAME INTERNET ADDRESS
CA Parent - Teen Driving Aide http://www.dmv.ca.gov/pubs/dl603/dl603.pdf
CT Teen Drivers http://www.ct.gov/dmv/taxonomy/ct_taxonomy.asp?DLN=28980&dmvNav=|28980|&dmvNav=|
CT How Parents Can Help Their Teens Become Safe Drivers http://www.ct.gov/dmv/lib/dmv/20/29/Howto.pdf
FL Teen Driver Information http://www.hsmv.state.fl.us/ddl/teendriv.html
GA Driver Education Program http://www.dmvs.ga.gov/training/driversEd/
GA Parental Guide to New Teenage Driving Requirements http://www.dmvs.ga.gov/forms/pdf/dls/parentalguide.pdf
ID Young Driver Information http://www.itd.idaho.gov/dmv/driverservices/young_drivers.htm
KS Teen Driving http://www.ksrevenue.org/dmvteen.htm
KY Generation to Generation http://transportation.ky.gov/drlic/parent_teen_driving.htm#parentteen
KY KY Teaching Your Teen Driving Habits for Life http://www.kytc.state.ky.us/drlic/parent_teen_driving.htm#ParentTeen
MD Rookie Driver http://www.mva.state.md.us/MVAProg/ROOKIEDRIVER/default.htm
MD Parents of Young Drivers http://www.parentsofyoungdrivers.com/Default.asp
MI GDL: A Guide for Parents http://www.michigan.gov/documents/gdl_parent_16316_7.pdf
MI Graduated Driver Licensing: A Guide for Parents http://www.michigan.gov/documents/gdl_parent_16316_7.pdf
MN Teen Driving http://www.dps.state.mn.us/dvs/DriverLicense/DL%20Info/DL%20frame.htm
MN Teens Behind the Wheel: A Roadmap for Parents http://www.dps.state.mn.us/dvs/DriverLicense/DL%20Info/DL%20frame.htm
NV Teen Driving http://www.dmvnv.com/nvdlteens.htm
OH Teen Driver http://www.bmv.ohio.gov/TeenDriver.html
OH The Driving Challenge http://www.bmv.ohio.gov/TeenDriver.html
OK Parent Taught Driver Education http://www.dps.state.ok.us/dls/ptde.htm
OR Teen Driving http://www.odot.state.or.us/dmv/TeenDriving/TeenDriving.htm
PA Young Drivers http://www.dmv.state.pa.us/young_drivers/index.shtml
PA How to Steer Them to Safe Driving http://www.dmv.state.pa.us/pdotforms/young_drivers/tutorsguide.pdf
SD Teen Drivers http://www.state.sd.us/dps/dl/parent.htm
TX Parent Taught Driver Education http://www.txdps.state.tx.us/administration/driver_licensing_control/pages/parenttaught.htm
TX Texas Driver and Traffic Safety Education Master Curriculum Guide http://www.tea.state.tx.us/safedriver/parent101.html
VA Young Drivers http://www.dmv.state.va.us/webdoc/general/safety/youngdriver/index.asp
132
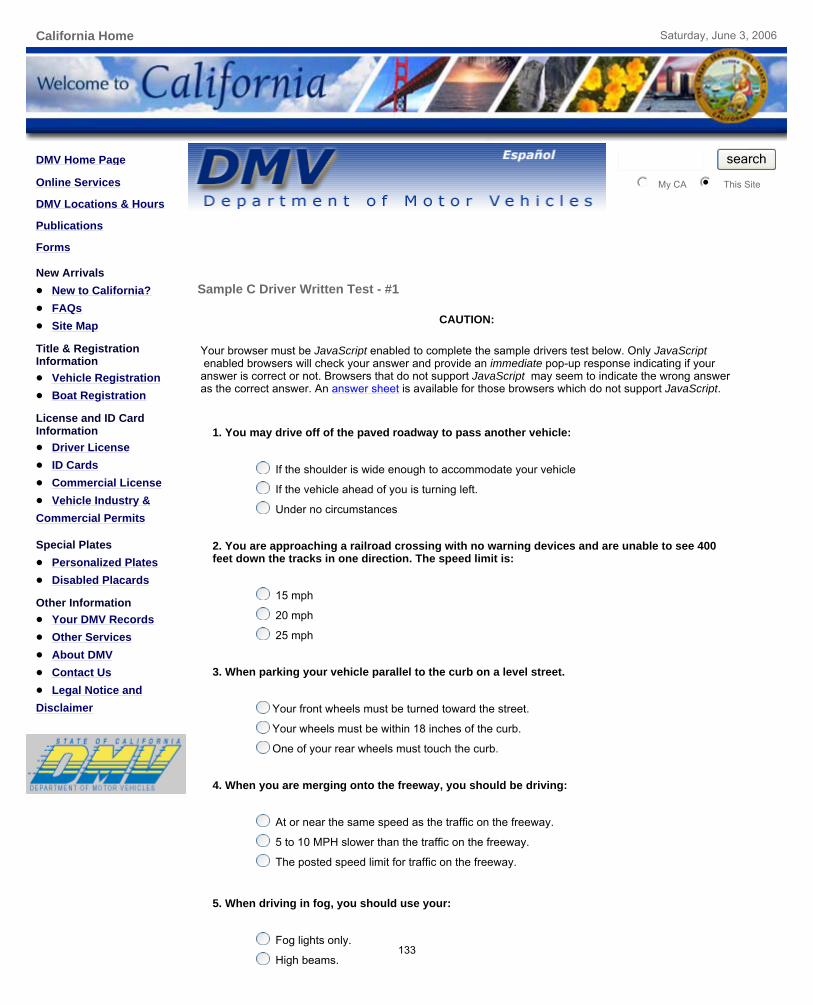
California Home Saturday, June 3, 2006
DMV Home Page
Online Services
DMV Locations & Hours
Publications
Forms
New Arrivals New to California? FAQs Site Map
Title & Registration Information
Vehicle Registration Boat Registration
License and ID Card Information
Driver License ID Cards Commercial License Vehicle Industry &
Commercial Permits
Special Plates Personalized Plates Disabled Placards
Other Information Your DMV Records Other Services About DMV Contact Us Legal Notice and
Disclaimer
My CA This Site
search
nmlkj nmlkji
Sample C Driver Written Test - #1
CAUTION:
Your browser must be JavaScript enabled to complete the sample drivers test below. Only JavaScript enabled browsers will check your answer and provide an immediate pop-up response indicating if your answer is correct or not. Browsers that do not support JavaScript may seem to indicate the wrong answer as the correct answer. An answer sheet is available for those browsers which do not support JavaScript.
1. You may drive off of the paved roadway to pass another vehicle:
If the shoulder is wide enough to accommodate your vehicle
If the vehicle ahead of you is turning left.
Under no circumstances
2. You are approaching a railroad crossing with no warning devices and are unable to see 400 feet down the tracks in one direction. The speed limit is:
15 mph
20 mph
25 mph
3. When parking your vehicle parallel to the curb on a level street.
Your front wheels must be turned toward the street.
Your wheels must be within 18 inches of the curb.
One of your rear wheels must touch the curb.
4. When you are merging onto the freeway, you should be driving:
At or near the same speed as the traffic on the freeway.
5 to 10 MPH slower than the traffic on the freeway.
The posted speed limit for traffic on the freeway.
5. When driving in fog, you should use your:
Fog lights only.
High beams.
Page 1 of 2Sample C Driver Written Test - #1
6/3/2006http://www.dmv.ca.gov/pubs/interactive/tdrive/clc2written.htm
133
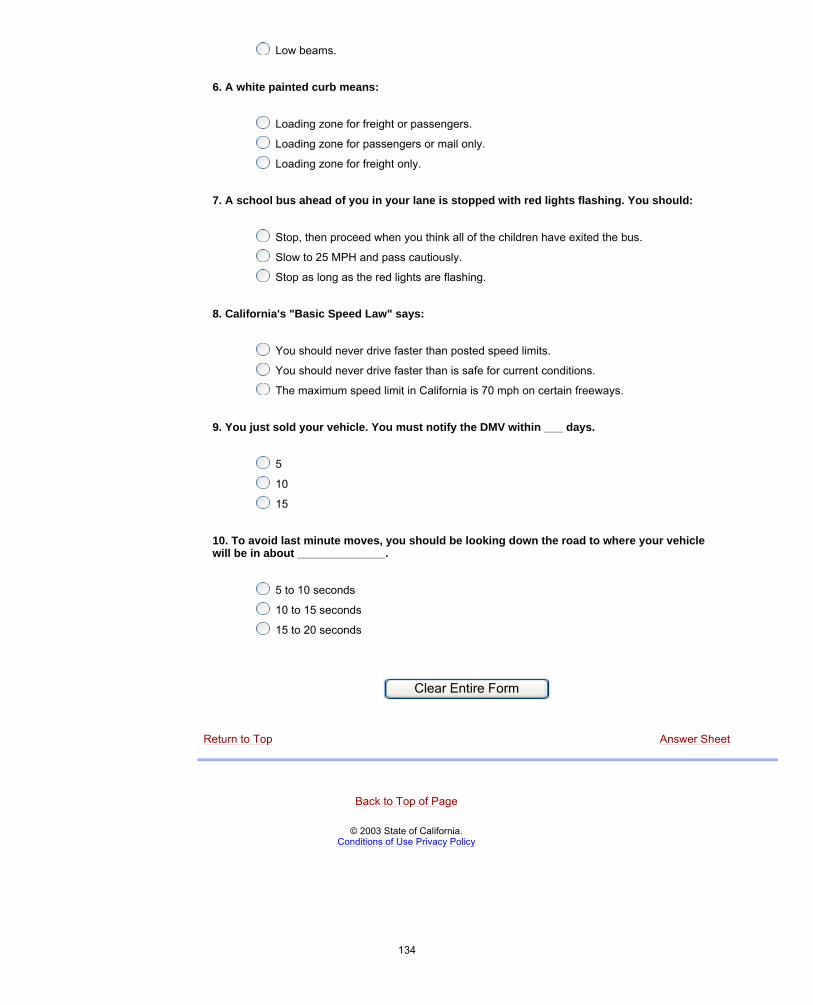
Low beams.
6. A white painted curb means:
Loading zone for freight or passengers.
Loading zone for passengers or mail only.
Loading zone for freight only.
7. A school bus ahead of you in your lane is stopped with red lights flashing. You should:
Stop, then proceed when you think all of the children have exited the bus.
Slow to 25 MPH and pass cautiously.
Stop as long as the red lights are flashing.
8. California's "Basic Speed Law" says:
You should never drive faster than posted speed limits.
You should never drive faster than is safe for current conditions.
The maximum speed limit in California is 70 mph on certain freeways.
9. You just sold your vehicle. You must notify the DMV within ___ days.
5
10
15
10. To avoid last minute moves, you should be looking down the road to where your vehicle will be in about ______________.
5 to 10 seconds
10 to 15 seconds
15 to 20 seconds
Clear Entire Form
Return to Top Answer Sheet
Back to Top of Page
© 2003 State of California.
Conditions of Use Privacy Policy
Page 2 of 2Sample C Driver Written Test - #1
6/3/2006http://www.dmv.ca.gov/pubs/interactive/tdrive/clc2written.htm
134
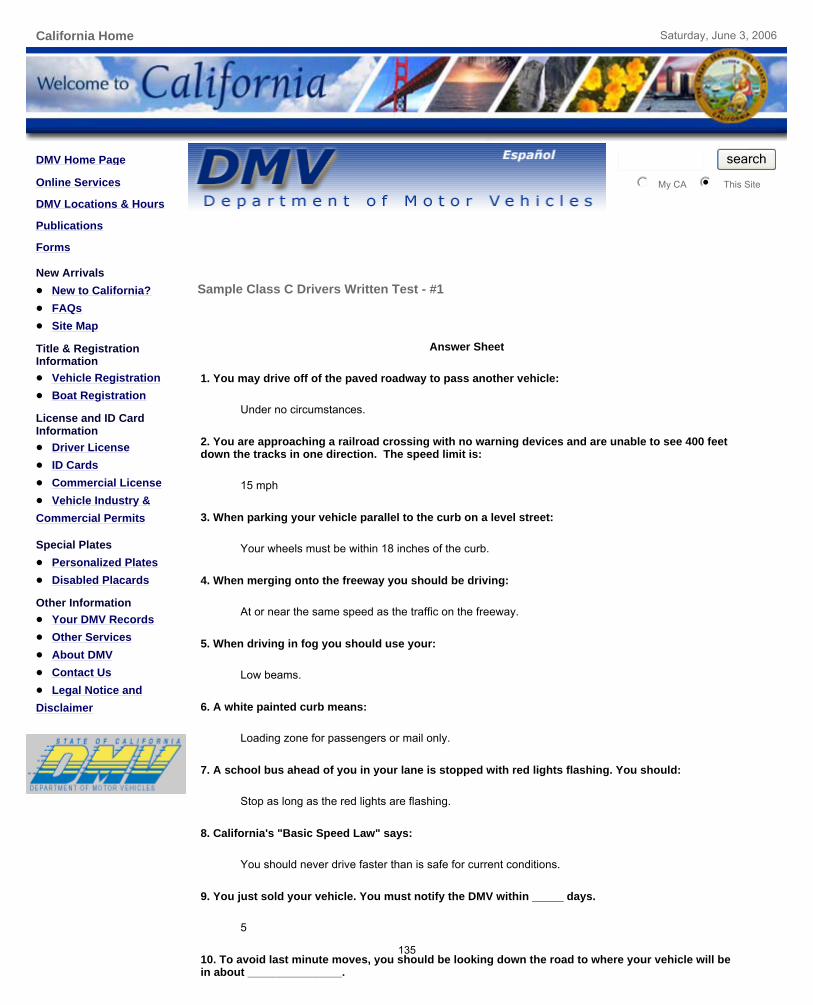
California Home Saturday, June 3, 2006
DMV Home Page
Online Services
DMV Locations & Hours
Publications
Forms
New Arrivals New to California? FAQs Site Map
Title & Registration Information
Vehicle Registration Boat Registration
License and ID Card Information
Driver License ID Cards Commercial License Vehicle Industry &
Commercial Permits
Special Plates Personalized Plates Disabled Placards
Other Information Your DMV Records Other Services About DMV Contact Us Legal Notice and
Disclaimer
My CA This Site
search
nmlkj nmlkji
Sample Class C Drivers Written Test - #1
Answer Sheet
1. You may drive off of the paved roadway to pass another vehicle:
Under no circumstances.
2. You are approaching a railroad crossing with no warning devices and are unable to see 400 feet down the tracks in one direction. The speed limit is:
15 mph
3. When parking your vehicle parallel to the curb on a level street:
Your wheels must be within 18 inches of the curb.
4. When merging onto the freeway you should be driving:
At or near the same speed as the traffic on the freeway.
5. When driving in fog you should use your:
Low beams.
6. A white painted curb means:
Loading zone for passengers or mail only.
7. A school bus ahead of you in your lane is stopped with red lights flashing. You should:
Stop as long as the red lights are flashing.
8. California's "Basic Speed Law" says:
You should never drive faster than is safe for current conditions.
9. You just sold your vehicle. You must notify the DMV within _____ days.
5
10. To avoid last minute moves, you should be looking down the road to where your vehicle will be in about _______________.
Page 1 of 2Sample Class C Drivers Written Test - #1
6/3/2006http://www.dmv.ca.gov/pubs/interactive/tdrive/clc2answer.htm
135

10 to 15 seconds
Back to Top of Page
© 2003 State of California.
Conditions of Use Privacy Policy
Page 2 of 2Sample Class C Drivers Written Test - #1
6/3/2006http://www.dmv.ca.gov/pubs/interactive/tdrive/clc2answer.htm
136
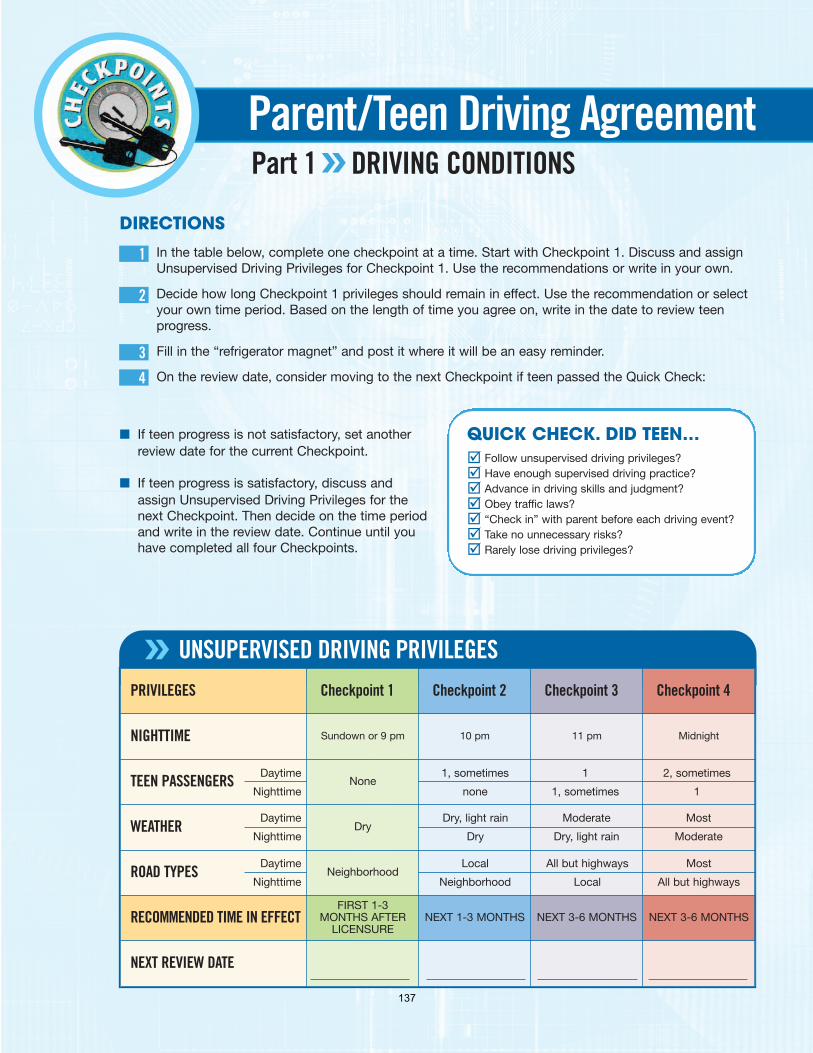
DIRECTIONSIn the table below, complete one checkpoint at a time. Start with Checkpoint 1. Discuss and assignUnsupervised Driving Privileges for Checkpoint 1. Use the recommendations or write in your own.
Decide how long Checkpoint 1 privileges should remain in effect. Use the recommendation or selectyour own time period. Based on the length of time you agree on, write in the date to review teenprogress.
Fill in the “refrigerator magnet” and post it where it will be an easy reminder.
On the review date, consider moving to the next Checkpoint if teen passed the Quick Check:
■ If teen progress is not satisfactory, set anotherreview date for the current Checkpoint.
■ If teen progress is satisfactory, discuss andassign Unsupervised Driving Privileges for thenext Checkpoint. Then decide on the time periodand write in the review date. Continue until youhave completed all four Checkpoints.
Parent/Teen Driving AgreementPart 1 DRIVING CONDITIONS»
QUICK CHECK. DID TEEN…Follow unsupervised driving privileges?Have enough supervised driving practice?Advance in driving skills and judgment?Obey traffic laws?“Check in” with parent before each driving event?Take no unnecessary risks?Rarely lose driving privileges?
1
2
3
4
UNSUPERVISED DRIVING PRIVILEGES»PRIVILEGES Checkpoint 1 Checkpoint 2 Checkpoint 3 Checkpoint 4
NIGHTTIME Sundown or 9 pm 10 pm 11 pm Midnight
TEEN PASSENGERS None
WEATHER Dry
ROAD TYPES Neighborhood
RECOMMENDED TIME IN EFFECTFIRST 1-3
MONTHS AFTERLICENSURE
NEXT 1-3 MONTHS NEXT 3-6 MONTHS NEXT 3-6 MONTHS
NEXT REVIEW DATE
Daytime
Nighttime
Daytime
Nighttime
Daytime
Nighttime
1, sometimes
none
Dry, light rain
Dry
Local
Neighborhood
1
1, sometimes
Moderate
Dry, light rain
All but highways
Local
2, sometimes
1
Most
Moderate
Most
All but highways
137
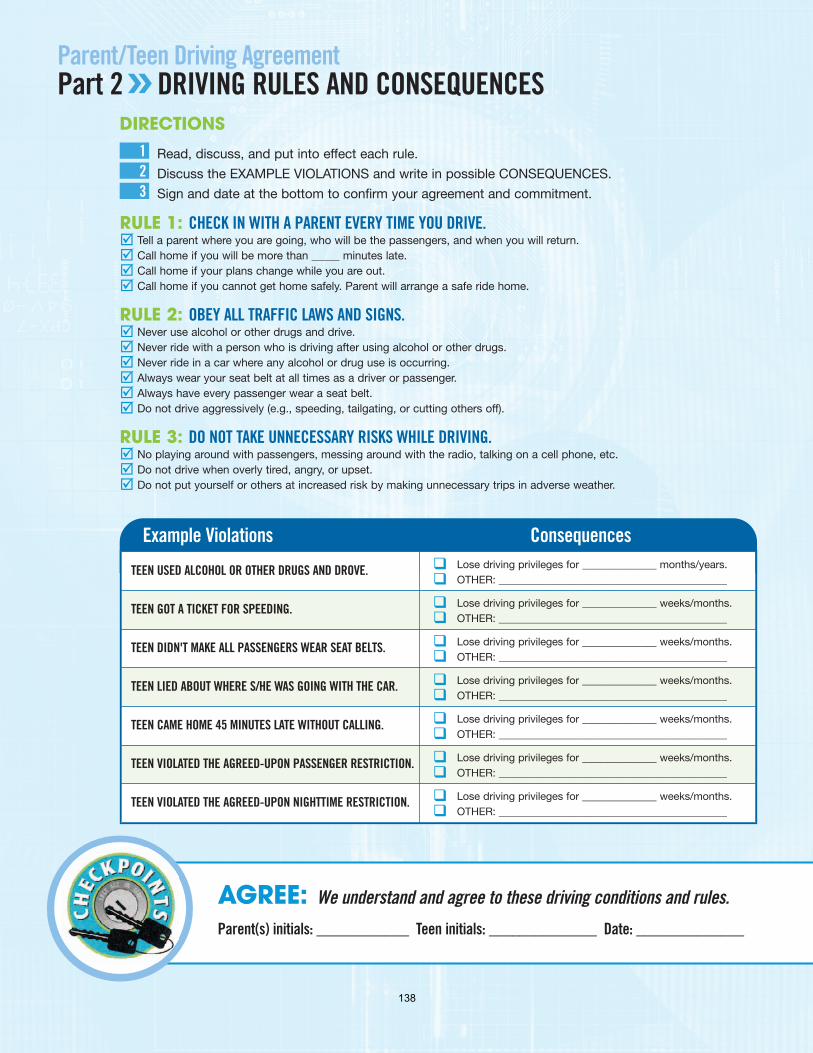
Example Violations Consequences
Parent/Teen Driving AgreementPart 2 DRIVING RULES AND CONSEQUENCES»
DIRECTIONS
Read, discuss, and put into effect each rule.
Discuss the EXAMPLE VIOLATIONS and write in possible CONSEQUENCES.
Sign and date at the bottom to confirm your agreement and commitment.
RULE 1: CHECK IN WITH A PARENT EVERY TIME YOU DRIVE.Tell a parent where you are going, who will be the passengers, and when you will return.Call home if you will be more than _____ minutes late.Call home if your plans change while you are out.Call home if you cannot get home safely. Parent will arrange a safe ride home.
RULE 2: OBEY ALL TRAFFIC LAWS AND SIGNS.Never use alcohol or other drugs and drive.Never ride with a person who is driving after using alcohol or other drugs.Never ride in a car where any alcohol or drug use is occurring.Always wear your seat belt at all times as a driver or passenger.Always have every passenger wear a seat belt.Do not drive aggressively (e.g., speeding, tailgating, or cutting others off).
RULE 3: DO NOT TAKE UNNECESSARY RISKS WHILE DRIVING.No playing around with passengers, messing around with the radio, talking on a cell phone, etc.Do not drive when overly tired, angry, or upset.Do not put yourself or others at increased risk by making unnecessary trips in adverse weather.
123
AGREE: We understand and agree to these driving conditions and rules.
Parent(s) initials: ____________ Teen initials: ______________ Date: ______________
TEEN USED ALCOHOL OR OTHER DRUGS AND DROVE. Lose driving privileges for ______________ months/years.OTHER: ___________________________________________
TEEN GOT A TICKET FOR SPEEDING. Lose driving privileges for ______________ weeks/months.OTHER: ___________________________________________
TEEN DIDN'T MAKE ALL PASSENGERS WEAR SEAT BELTS. Lose driving privileges for ______________ weeks/months.OTHER: ___________________________________________
TEEN LIED ABOUT WHERE S/HE WAS GOING WITH THE CAR. Lose driving privileges for ______________ weeks/months.OTHER: ___________________________________________
TEEN CAME HOME 45 MINUTES LATE WITHOUT CALLING. Lose driving privileges for ______________ weeks/months.OTHER: ___________________________________________
TEEN VIOLATED THE AGREED-UPON PASSENGER RESTRICTION. Lose driving privileges for ______________ weeks/months.OTHER: ___________________________________________
TEEN VIOLATED THE AGREED-UPON NIGHTTIME RESTRICTION. Lose driving privileges for ______________ weeks/months.OTHER: ___________________________________________
138