s41467-018-05090-y.pdf - Nature
16
ARTICLE Anterior cingulate cortex and its input to the basolateral amygdala control innate fear response Jinho Jhang 1 , Hyoeun Lee 2 , Min Soo Kang 1 , Han-Sol Lee 1 , Hyungju Park 2 & Jin-Hee Han 1 Prefrontal brain areas are implicated in the control of fear behavior. However, how prefrontal circuits control fear response to innate threat is poorly understood. Here, we show that the anterior cingulate cortex (ACC) and its input to the basolateral nucleus of amygdala (BLA) contribute to innate fear response to a predator odor in mice. Optogenetic inactivation of the ACC enhances freezing response to fox urine without affecting conditioned freezing. Con- versely, ACC stimulation robustly inhibits both innate and conditioned freezing. Circuit tra- cing and slice patch recordings demonstrate a monosynaptic glutamatergic connectivity of ACC-BLA but no or very sparse ACC input to the central amygdala. Finally, our optogenetic manipulations of the ACC-BLA projection suggest its inhibitory control of innate freezing response to predator odors. Together, our results reveal the role of the ACC and its pro- jection to BLA in innate fear response to olfactory threat stimulus. DOI: 10.1038/s41467-018-05090-y OPEN 1 Department of Biological Sciences, KAIST Institute for the BioCentury (KIB), Korea Advanced Institute of Science and Technology (KAIST), 291 Daehak-ro, Yuseong-gu, Daejeon 34141, Korea. 2 Department of Structure & Function of Neural Network, Korea Brain Research Institute (KBRI), 61 Cheomdan-ro, Dong-gu, Daegu 41068, Korea. Correspondence and requests for materials should be addressed to H.P. (email: [email protected]) or to J.-H.H. (email: [email protected]) NATURE COMMUNICATIONS | (2018)9:2744 | DOI: 10.1038/s41467-018-05090-y | www.nature.com/naturecommunications 1 1234567890():,;
-
Upload
khangminh22 -
Category
Documents
-
view
1 -
download
0
Transcript of s41467-018-05090-y.pdf - Nature

ARTICLE
Anterior cingulate cortex and its input to thebasolateral amygdala control innate fear responseJinho Jhang1, Hyoeun Lee2, Min Soo Kang1, Han-Sol Lee1, Hyungju Park2 & Jin-Hee Han1
Prefrontal brain areas are implicated in the control of fear behavior. However, how prefrontal
circuits control fear response to innate threat is poorly understood. Here, we show that the
anterior cingulate cortex (ACC) and its input to the basolateral nucleus of amygdala (BLA)
contribute to innate fear response to a predator odor in mice. Optogenetic inactivation of the
ACC enhances freezing response to fox urine without affecting conditioned freezing. Con-
versely, ACC stimulation robustly inhibits both innate and conditioned freezing. Circuit tra-
cing and slice patch recordings demonstrate a monosynaptic glutamatergic connectivity of
ACC-BLA but no or very sparse ACC input to the central amygdala. Finally, our optogenetic
manipulations of the ACC-BLA projection suggest its inhibitory control of innate freezing
response to predator odors. Together, our results reveal the role of the ACC and its pro-
jection to BLA in innate fear response to olfactory threat stimulus.
DOI: 10.1038/s41467-018-05090-y OPEN
1 Department of Biological Sciences, KAIST Institute for the BioCentury (KIB), Korea Advanced Institute of Science and Technology (KAIST), 291 Daehak-ro,Yuseong-gu, Daejeon 34141, Korea. 2 Department of Structure & Function of Neural Network, Korea Brain Research Institute (KBRI), 61 Cheomdan-ro,Dong-gu, Daegu 41068, Korea. Correspondence and requests for materials should be addressed to H.P. (email: [email protected]) or to J.-H.H.(email: [email protected])
NATURE COMMUNICATIONS | (2018) 9:2744 | DOI: 10.1038/s41467-018-05090-y | www.nature.com/naturecommunications 1
1234
5678
90():,;

Fear behaviors, such as freezing in a threatening situation, areessential for survival and adaptation in humans and animals.The emotional processing system in the brain controls such
fear-related behaviors in animals, and abnormalities in emotionalprocessing contribute to fear- and anxiety-related mental dis-orders in humans. Multiple subdivisions in frontal lobe areas,including the medial prefrontal cortex (mPFC) and anteriorcingulate cortex (ACC), play a critical role in regulating fearresponses1,2. The prelimbic (PL) and infralimbic (IL) regions ofthe mPFC in rodent brains are homologous to the ventral-medial
prefrontal cortex (vmPFC) and ventral anterior cingulate cortex(vACC) in humans1,3. Previous studies in rodents extensivelyinvestigated the role of these two brain regions and their pro-jections in the regulation of fear response to learned threat. TheIL has been found to be a critical regulator of freezing responsesafter extinction4–6. Specifically, the activity of IL projections tothe amygdala inhibits the freezing response to a conditionedthreat stimulus after extinction7. Conversely, the PL is thought tostimulate the expression of learned fear4. A recent study in miceshowed that inactivation of PL somata decreases the conditioned
CaMKIIα eNpHR3.0 eYFP WPRE pA
CaMKIIα eGFP WPRE pA
eNpHR3.0-eYFP
Coronal (Bregma A/P +1.0 mm)
PL
IL
+0.8 mm A/P from bregma
Auditory fearcond.
Retention test
1 d 2 d
Laser OFF OFF ON
3min
1min
1min
3×
Laser OFF OFF ON
Pre-CS Pre-CS
1 2 3
OFF ON OFF ON OFF ON
60
40
20
0
% F
reez
ing
to to
ne
eNpHR3.0
Pre-CS
OFF ON OFF ON OFF ON
60
40
20
0
% F
reez
ing
to to
ne
1 2 3
eGFP
eNpHR3.0 eGFP
60
40
20
0
–60
–40
–20
Δ F
reez
ing
(ON
–OF
F)
Emptycage Water
Fox urine
Fox urine
******
***
0–1 1–2 2–3 3–4
Time after entry (min)
60
40
20
0
% F
reez
ing
**
Emptycage
Water Foxurine
60
40
20
0
% F
reez
ing
(3–4
min
)
Empty cage
Water
Fox urine
3min
1min
1min
3x
1 2 3
OFF ON OFF ON OFF ON
60
40
20
0
% F
reez
ing
eNpHR3.0
****
OFF ON OFF ON OFF ON
60
40
20
0
% F
reez
ing
1 2 3
eGFP60
40
20
0
–60
–40
–20
Δ F
reez
ing
(ON
–OF
F)
eNpHR3.0 eGFP
**
Laser OFF OFF ON
3min
1min
1min
3×
Water
OFF ON OFF ON OFF ON
60
40
20
0
% F
reez
ing
1 2 3
Water, eNpHR3.0
a b
c d e f
g h
i j k l
m n
ACC
ARTICLE NATURE COMMUNICATIONS | DOI: 10.1038/s41467-018-05090-y
2 NATURE COMMUNICATIONS | (2018) 9:2744 | DOI: 10.1038/s41467-018-05090-y | www.nature.com/naturecommunications

freezing response from 80 to 40% 6 h and 7 d after conditioning8.Despite the accumulating evidence, however, the prefrontal cir-cuit that controls fear response to innate threat is unknown
Research in humans and monkeys suggests that the ACCcontrols fear behavior in threat situations9. In monkeys, activa-tion of the anterior midcingulate cortex (aMCC) is associatedwith changes in behavioral patterns in response to increasedthreat imminence10. Consistently, in humans, the aMCC is acti-vated at moments of escape from virtual predators in a dynamiccomputer-based task11. Moreover, the ACC contributes to emo-tional regulation during fear extinction and controls emotionalconflict via top-down modulation of limbic and endocrinesystems1,12,13. In rodents, the ACC is comprised of the caudal-dorsal division of the mPFC14–16, which is homologous tothe dorsal ACC (including the aMCC) in humans17. Consistentwith a possible role of the ACC in regulating fearbehavior, anatomical analyses of rodent brains using neuralcircuit tracing techniques, such as injection of anterograde orretrograde tracers (e.g., fluorescent tracer dyes, horseradishperoxidase-wheat germ agglutinin (WGA), and Phaseolus vulgarisleucoagglutinin)16,18–20, show that the ACC sends a strong pro-jection to the BLA, which is involved in the regulation of fearresponses to threats21,22. However, another line of evidencesuggests an idea that the ACC is not involved in conditioned fearresponses. Specifically, no significant changes in ACC activity areobserved during the freezing response to a CS 1 day after con-textual fear conditioning23. Also, conditioned freezing23,24 isnormally expressed when neuronal activity in the ACC is silenced(by lidocaine23 and optogenetics24) during the retrieval of 1-day-old fear memory. Furthermore, the expression of place aversion isshown to be normal in animals with ACC lesions25. Despite theseresults suggesting that the ACC may not play a critical role in theexpression of learned fear in rodents, the role of the ACC and itsprojection to the BLA in regulating fear responses to innate threatis unknown.
Here, we explored whether the ACC and its input to the BLAcontrol fear responses to an innate threat in mice by employingoptogenetic manipulation, bidirectional circuit tracing, andex vivo patch-clamp recording approaches. We report that theACC input to the BLA contributes to determine innate fearresponse.
ResultsACC photoinhibition increases an innate fear response. As thefirst step for exploring a role of the caudal-dorsal area of themPFC (covering the caudal ACC and a portion of the precentral
cortex, hereafter referred to as the ACC) in regulating fearbehavioral responses, we used an optogenetic silencing approachto investigate the effect of ACC inhibition on the behavioralexpression of conditioned or innate fear. For ACC photoinhibi-tion, adeno-associated viral (AAV) vectors encodinghalorhodopsin-3.0 fused with enhanced yellow fluorescenceprotein (eNpHR3.0-eYFP; AAV-eNpHR3.0) or green fluores-cence protein (eGFP; AAV-eGFP) as a control under control ofthe CaMKIIα promoter were injected into the bilateral ACC. A561-nm laser light was delivered to the ACC through surgicallyimplanted dual-fiber optic elements (Fig. 1a). Specific viralexpression in the caudal ACC with no expression in the rostralACC, PL, and IL was confirmed for each mouse after behavioraltesting by microscopic observation (Fig. 1b, SupplementaryFig. 1).
Mice injected with AAV-eNpHR3.0 or AAV-eGFP weretrained for auditory fear conditioning in which an auditory toneas a CS was paired with a foot shock as an unconditionedstimulus (US), and 24 h later mice were re-exposed to the tone CSin a different context (Fig. 1c). During testing, mice received threelight off/on cycles in the presence of the tone CS after a pre-CSperiod. Mice in both groups exhibited freezing responses to thetone CS that were not significantly changed by light stimulation(Fig. 1d–f), suggesting that inhibition of ACC activity does notaffect the expression of conditioned fear behavior to an auditorystimulus. This result is consistent with previous reports showingthat inhibition of ACC activity does not affect the freezingresponse to the CS after fear conditioning23,24.
Fear behavior is provoked in response to not only learnedthreats but also innate threats such as a predator-related sensorystimulus or a live predator in prey animals26. Thus, we examinedwhether ACC inhibition affects the freezing response to an innatethreat. Because exposure to natural fox urine or its ingredientselicits fear behavior and a physiological stress response inrodents27–29, we used fox urine as an innate threat stimulus.We first confirmed that mice exhibited freezing in the presence offox urine (Fig. 1g, h). Consistent with fear response to the foxurine, we also found that the fox urine exposure induced theactivation of the dorsal periaqueductal gray, a brain structurecritical for innate fear responses21,28,30–32 (Supplementary Fig. 2).In optogenetic behavior experiment, mice were placed in a cagewith fox urine and received three light off/on cycles (Fig. 1i).Unlike auditory fear conditioning, we here observed significantlyincreased freezing in eNpHR3.0-expressing mice during light-onperiods compared with light-off periods in a reversible manner(Fig. 1j), whereas eGFP-expressing mice exhibited no significant
Fig. 1 Photoinhibition of CaMKIIα-positive neurons in the ACC increases the freezing response to an innate threat but not to a learned threat. a Illustrationof eNpHR3.0-based silencing of CaMKIIα-positive neurons in the ACC. b Left, representative confocal image of eNpHR3.0-eYFP expression in the ACC.Scale bar, 500 µm. Right, illustration of viral injection into the ACC. c Experimental procedure for auditory fear conditioning test with photoinhibition ofACC neurons. d, e Time spent freezing during the retention test was not affected by photoinhibition in the eNpHR3.0 (n= 7) (d) or eGFP (n= 7)(e) groups. Paired t-tests for eNpHR3.0 (P= 0.1699,= 0.9338,= 0.0991) and eGFP (P= 0.4979,= 0.3872,= 0.4103). f Light-induced change inpercentage of freezing behavior for d and e, calculated by subtracting freezing values within the first OFF–ON cycle. Unpaired t-test (P= 0.4962, t=0.7018, df= 12). g Illustration of fox urine exposure test (empty cage or water for control groups). h Left, time spent freezing during the exposure test inempty cage (n= 4), water (n= 4), and fox urine (n= 4) groups. Repeated measures two-way ANOVA (F(6, 27)= 1.663, P= 0.1687) and Sidak’s post hoctest (empty cage vs. fox urine, P= 0.3883,= 0.0144,= 0.0028,= 0.0002); water vs. fox urine, P= 0.5258,= 0.0653,= 0.2224,= 0.0002). Right,freezing behavior during the 3–4min period. One-way ANOVA (F(2, 9)= 2.119, P= 0.0062) and Tukey’s post hoc test (empty cage vs. fox urine, P=0.0108; water vs. fox urine, P= 0.0118). i Experimental procedure for fox urine test with photoinhibition of ACC neurons. j, k Time spent freezing duringthe fox urine test was selectively increased by photoinhibition in the eNpHR3.0 group (n= 7) (j) but not in the eGFP group (n= 8) (k). Paired t-tests foreNpHR3.0 (P= 0.0152,= 0.0001,= 0.1520) and eGFP (P= 0.4352,= 0.7963,= 0.9610). l Light-induced change in percentage of freezing behavior for jand k, calculated by subtracting freezing values within the first OFF–ON cycle. Unpaired t-test (P= 0.0049, t= 3.384, df= 13). m Experimental procedurefor water control testing with photoinhibition of ACC neurons. n Time spent freezing during the water control test was not affected by light stimulation (n= 5). Paired t-tests (P= 0.7610,= 0.2585,= 0.2609). Line and bar graphs, mean ± standard error of the mean (s.e.m.). Box-whisker plots, median andinterquartile range with 5-95 percentile distribution. Independent groups of mice were used for d–f and j–l. *P < 0.05, **P < 0.01, ***P < 0.001
NATURE COMMUNICATIONS | DOI: 10.1038/s41467-018-05090-y ARTICLE
NATURE COMMUNICATIONS | (2018) 9:2744 | DOI: 10.1038/s41467-018-05090-y | www.nature.com/naturecommunications 3

changes in freezing during the test (Fig. 1k). A pairwisecomparison confirmed a significant group difference in light-induced change in freezing (Fig. 1l). These results can beinterpreted that silencing ACC activity itself may non-specificallyinduce freezing. To test this possibility, we performed the samebehavioral test in the presence of water instead of fox urine(Fig. 1m). In this condition, light stimulation did not inducefreezing (Fig. 1n), thus excluding the above possibility. Moreover,we found no changes in the locomotor and anxiety behaviors bylight in open field test (Supplementary Fig. 3a–c). Taken together,these results suggest that ACC inhibits freezing response to aninnate threat.
Given this finding, it is possible that ACC activity may bereduced during innate fear expression to promote freezingresponse to the fox urine perhaps by the activation of localinhibitory interneurons. We tested this idea by performing adouble immunostaining analysis for c-fos and glutamic aciddecarboxylase (GAD67) in the water and fox urine condition(Fig. 2a). The number of GAD67+ and double+cells (Fig. 2b)was quantified in a double-blinded manner (see methods). Wefound a significant increase of the percentage number of c-Fos+cells in GAD67+cell population (% co-localization) in miceexposed to the fox urine compared to the control mice exposed towater (Fig. 2c, d). These results are thus consistent with the aboveidea, and support our conclusion that ACC inhibits freezingresponse to an innate threat.
ACC photoactivation reduces the innate fear response. Con-sidering that silencing ACC activity increases innate freezing, wepredicted that artificial activation of the ACC may reduce thefreezing response to fox urine. To test this idea, we optogeneti-cally activated CaMKIIα-positive neurons in the ACC usingChannelrhodopsin-2 (ChR2). For ACC photoactivation, AAVvectors encoding ChR2 fused with Venus (AAV-ChR2) or eGFP(AAV-eGFP), both of which expression were driven by theCaMKIIα promoter, were injected into the bilateral ACC, and473-nm laser light was delivered to the ACC through implanteddual-fiber elements (Fig. 3a and Supplementary Fig. 4). Duringtesting, mice were placed in a cage containing fox urine, and their
freezing behavior was monitored using the same optogeneticmanipulation procedures as Fig. 1 (Fig. 3b). When the light wasturned off, mice exhibited modest levels of freezing, but ChR2-expressing mice exhibited significantly reduced freezing in areversible manner over repeated cycles during the light-on peri-ods (Fig. 3c). By contrast, eGFP-expressing mice showed nosignificant changes in freezing during the test (Fig. 3d). A pair-wise comparison confirmed a significant group difference in light-induced change in freezing (Fig. 3e). We found no changes in thelocomotor and anxiety behaviors by the photoactivation in openfield test (Supplementary Fig. 3d and 3e). These results indicatethat increased activity of CaMKIIα-positive neurons in the ACCinhibits fear response to predator odor, further supporting thatACC inhibits innate freezing response.
ACC photoactivation reduces a conditioned fear response.Consistent with previous studies23,24, our data showed that con-ditioned freezing is not affected by ACC inactivation (Fig. 1d, f).However, it is possible that artificial activation of the ACC affectsthe expression of conditioned freezing. To test this possibility,mice were injected with AAV-ChR2 or AAV-eGFP and trainedfor contextual fear conditioning followed by fear memory test 24h later. During testing, mice were returned to the conditionedcontext and received three light off/on cycles to activate the ACC(Fig. 4a, b). Before light stimulation, mice in both groups dis-played strong freezing in the conditioned context. However,ChR2-expressing mice displayed a robust reduction in freezingwhen the light was turned on in a reversible manner over repe-ated cycles (Fig. 4c). By contrast, eGFP-expressing mice did notshow a light-induced alteration of freezing response during thetest (Fig. 4d). A pairwise comparison confirmed a significantgroup difference in light-induced change in freezing (Fig. 4e).
Next, groups of mice that received AAV-ChR2 or AAV-eGFPinjection were trained for auditory fear conditioning and tested24 h later. During testing, mice received three light off/on cyclesin the presence of the tone CS (Fig. 4f). As expected, miceexhibited robust freezing after CS onset compared with pre-CSbaseline. Consistent with our contextual fear conditioning results,ChR2-expressing mice showed a significant reduction in
GAD67 c-Fos Merged
Wat
erF
ox u
rine
GAD67 c-Fos
Merged
GAD67 c-FosM
erged
*
*
*
*
Water Fox urine
1 h
PerfusionDouble
immunostaining(GAD67, c-Fos)
a b
Water Foxurine
100
80
65
40
20
0
Tot
al c
ount
of G
AD
67+
neur
ons
(per
mou
se)
Water Foxurine
25
20
15
10
5
0
% C
o-lo
caliz
atio
n(G
AD
67+
& c
-Fos
+/G
AD
67+
)*c d
Fig. 2 GABAergic interneurons in the ACC are activated by exposure to fox urine. a Experimental procedure for double immunostaining experiment(GAD67 and c-Fos). Mice were perfused after 1-h exposure to water (n= 5; control group) or fox urine (n= 6). b Representative confocal images showingGAD67+(red) and c-Fos+(green) signals observed in the ACC field. Wedge, GAD67+cell but no c-Fos signal. Yellow asterisk, GAD67 & c-Fosdouble+cell. Right images are magnification of dashed square area. Scale bar, 40 µm. c Total count of GAD67+cells included for the quantitative analysis.Unpaired t-test (P= 0.6313, t= 0.4967, df= 9). d The percentage of GAD67+cells that are co-localized with c-Fos+signals. Unpaired t-test (P= 0.0388,t= 2.417, df= 9). Box-whisker plots are expressed as median, interquartile range with 5-95 percentile distribution. *P < 0.05
ARTICLE NATURE COMMUNICATIONS | DOI: 10.1038/s41467-018-05090-y
4 NATURE COMMUNICATIONS | (2018) 9:2744 | DOI: 10.1038/s41467-018-05090-y | www.nature.com/naturecommunications

conditioned freezing to the tone CS in a reversible manner overrepeated cycles (Fig. 4g). The eGFP-expressing control micedisplayed no significant changes in freezing during the test(Fig. 4h). A pairwise comparison confirmed a significant groupdifference in light-induced change in freezing (Fig. 4i). Takentogether, our results indicate that ACC activation is sufficient toinhibit conditioned fear responses.
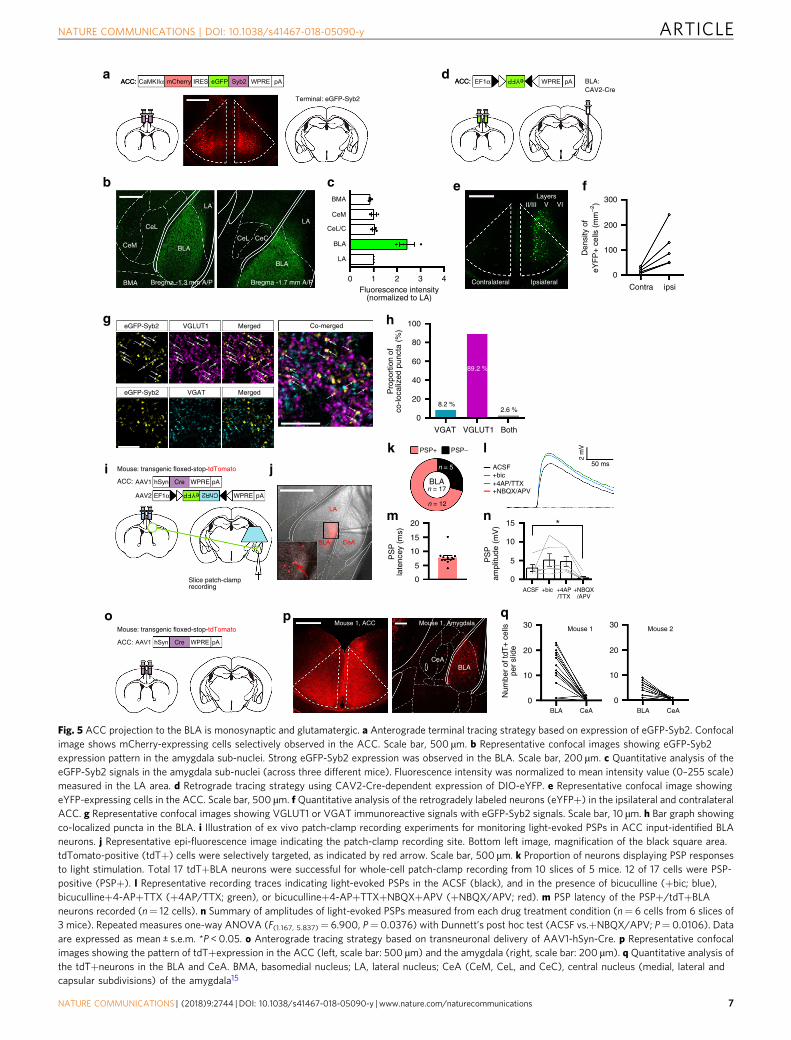
ACC projection to the BLA is monosynaptic and glutamater-gic. As the amygdala is a key brain region controlling fearresponses to both innate and learned threats28, and previousstudies show a strong ACC projection to the amygdala inrodents16,20, we reasoned that an ACC projection to the amygdalamay mediate the inhibition of innate fear behavior. To test thisidea, we first determined the sub-region of the amygdala to whichthe ACC sends a major output projection. The ACC projectionterminals in the amygdala were visualized by the expression ofsynaptobrevin-2 (Syb2, a presynaptic marker33) in the ACCneurons. AAV vector (AAV-mCh-IRES-eGFP-Syb2) carrying thegene of eGFP fused-Syb2 with mCherry-IRES34 was injected intothe bilateral ACC (Fig. 5a, 3 mice), and 6 weeks later we visua-lized eGFP signals in the amygdala with a confocal microscope.Correct placement of the virus injection sites in the ACC wasconfirmed by mCherry expression (Fig. 5a). We observed strongeGFP signals in the BLA consistently across three different mice(Fig. 5b, c), indicating that the BLA is the major ACC projectiontarget sub-nucleus in the amygdala. Previous tracing studies alsoreport similar ACC projection pattern with our data, strongprojection to the BLA but no or very few in the lateral nucleus(LA)16,20. Next, to identify the ACC neurons that project to theamygdala, we performed a retrograde tracing experiment usingcanine adenovirus-2 (CAV2), which is retrogradely transferred tocell somata via axonal retrograde transport35. CAV2 encodingCre-recombinase (CAV2-Cre) was injected into the BLA in theright hemisphere, and the AAV encoding a Cre-dependent eYFP
expression cassette (AAV-EF1α-DIO-eYFP) was injected into thebilateral ACC (5 mice; Fig. 5d). Confocal imaging showed thatneurons with strong eYFP signals were mostly found in layer V ofthe ipsilateral ACC, whereas fewer eYFP signals were found in thecontralateral ACC (Fig. 5e). Quantification analysis confirmedsuch ipsilateral connectivity pattern in all five mice used for thetracing experiment (Fig. 5f), suggesting that BLA-projecting ACCneurons are mainly located in layer V of the ipsilateral ACC.
We next investigated whether the ACC-BLA synapses areexcitatory or inhibitory by performing immunohistochemicalprofiling. Sections of the amygdala expressing eGFP-Syb2 weredouble-immunostained with antibodies against VGLUT1 andVGAT, which are enriched at glutamate- and GABA-containingsynaptic vesicles, respectively36,37. Confocal imaging showed thatthe majority (89.2%) of immunostaining signals co-localized witheGFP-Syb2 puncta were VGLUT1-positive (Fig. 5g, h), whereasthe minority (8.2%) were VGAT-positive. Our data thus suggestthat ACC-BLA synapses are glutamatergic.
To further investigate the nature of the ACC-BLA synaptictransmission, we next recorded ACC-BLA synaptic activity byperforming ex vivo whole-cell patch-clamp recording (Fig. 5i).We adopted a Cre-dependent anterograde transneuronal labelingstrategy using serotype 1-packaged AAV (AAV1)38. Twodifferent AAV constructs (AAV1-hSyn-Cre and AAV2-DIO-ChR2-eYFP) were co-injected into the bilateral ACC of atransgenic mouse line (Ai9) carrying floxed-stop-tdTomato. Inthis experimental design, ChR2 is supposed to be expressed onlyin the neurons co-expressing Cre in the ACC, and thepostsynaptic target neurons of the ACC, if any, would be labelledwith tdTomato by the anterograde transfer of AAV1-hSyn-Crefollowed by Cre-induced excision of the STOP sequence fromfloxed-STOP-tdTomato. Four weeks after the injection, we indeedobserved tdTomato-positive (tdT+) cells in the BLA (Fig. 5j). Wethen made a whole-cell patch clamp onto the tdT+BLA neuronsand recorded the PSP responses induced by light (470 nm)
CaMKIIα ChR2 Venus WPRE pA
CaMKIIα eGFP WPRE pA
ChR2-Venus
Coronal (Bregma A/P +1.0 mm)
Laser OFF OFF ON
3min
1min
1min
3x
Fox urineFox urine
OFF ON OFF ON OFF ON
60
40
20% F
reez
ing
1 2 3
ChR2
** * **
1 2 3
60
40
20
0%
Fre
ezin
g
OFF ON OFF ON OFF ON
eGFP
*–30
–20
–10
0
10
Δ F
reez
ing
(ON
–OF
F)
ChR2 eGFP
a b
c d e
0
Fig. 3 Photoactivation of CaMKIIα-positive neurons in the ACC inhibits the freezing response to an innate threat. a Left, illustration of ChR2-basedactivation of CaMKIIα-positive neurons in the ACC. Right, representative confocal image (coronal slice; A/P+1.0 mm) of ChR2-Venus expression in theACC. Scale bar, 500 µm. b Experimental procedure for fox urine test with photoactivation of ACC neurons. c, d Percentage of time spent freezing duringthe fox urine test was selectively reduced by photoactivation in the ChR2 group (n= 7) (c) but not in the eGFP group (n= 6) (d). Paired t-tests for ChR2(P= 0.0064,= 0.0280,= 0.0058) and eGFP (P= 0.4538,= 0.3552,= 0.8933). e Light-induced change in percentage of freezing behavior, calculated bysubtracting freezing values within the first OFF–ON cycle, for ChR2 (c) and eGFP (d) groups. Unpaired t-test (P= 0.0360, t= 2.387, df= 11). Line graphsare expressed as mean ± s.e.m. Box-whisker plot is expressed as median, interquartile range with 5-95 percentile distribution. *P < 0.05, **P < 0.01
NATURE COMMUNICATIONS | DOI: 10.1038/s41467-018-05090-y ARTICLE
NATURE COMMUNICATIONS | (2018) 9:2744 | DOI: 10.1038/s41467-018-05090-y | www.nature.com/naturecommunications 5

CaMKIIα ChR2 Venus WPRE pA
CaMKIIα eGFP WPRE pA
1 d 2 d
Contextual fear cond. Retention test
Laser OFF OFF ON
3min
1min
1min
3x
OFF ON OFF ON OFF ON
100
80
60
40
20
00
% F
reez
ing
to c
onte
xt
1 2 3
******
ChR2
OFF ON OFF ON OFF ON
100
80
60
40
20
00
% F
reez
ing
to c
onte
xt
1 2 3
eGFP
*
**
–100
–80
–60
–20
–40
0
20
Δ F
reez
ing
(ON
–OF
F)
ChR2 eGFP
Auditory fearcond. Retention test
1 d 2 d
Laser OFF OFF ON
3min
1min
1min
3x
Pre-CS
Pre-CS
OFF ON OFF ON OFF ON
100
80
60
40
20
00
% F
reez
ing
to to
ne
1 2 3
** **
ChR2
Pre-CS
OFF ON OFF ON OFF ON
100
80
60
40
20
0
% F
reez
ing
to to
ne
1 2 3
eGFP
***–100
–80
–60
–20
–40
0
20
Δ F
reez
ing
(ON
–OF
F)
ChR2 eGFP
a
b
c d e
f
g h i
Fig. 4 Photoactivation of CaMKIIα-positive neurons in the ACC inhibits freezing responses to conditioned stimulus. a Illustration of ChR2-basedactivation of CaMKIIα-positive neurons in the ACC. b Experimental procedure for contextual fear conditioning test with photoactivation of ACC neurons.c, d Percentage of time spent freezing during the contextual fear memory test was reduced by photoactivation in the ChR2 group (n= 8) (c). In the eGFPgroup (n= 6) (d), percentage of time spent freezing was reduced during the first OFF–ON cycle but not the second and third cycles. Paired t-tests for ChR2(P < 0.0001, < 0.0001,= 0.0634) and eGFP (P= 0.0261,= 0.7848,= 0.3823). e Light-induced change in percentage of freezing behavior, calculated bysubtracting freezing values within the first OFF–ON cycle, for ChR2 (c) and eGFP (d) groups. Unpaired t-test (P= 0.0011, t= 4.276, df= 12).f Experimental procedure for auditory fear conditioning test with photoactivation of ACC neurons. g, h Percentage of time spent freezing during theauditory fear memory test was selectively reduced by photoactivation in the ChR2 group (n= 9) (g) but not in the eGFP group (n= 7) (h). Wilcoxonmatched-pairs rank tests for ChR2 (P= 0.0039,= 0.3594,= 0.0039) and paired t-tests for eGFP (P= 0.0617,= 0.7975,= 0.1031). i Light-inducedchange in percentage of freezing behavior, calculated by subtracting freezing values within the first OFF–ON cycle, for ChR2 (g) and eGFP (h) groups.Unpaired t-test (P < 0.0001, t= 6.616, df= 14). Line graphs are expressed as mean ± s.e.m. Box-whisker plots are expressed as median, interquartile rangewith 5-95 percentile distribution. *P < 0.05, **P < 0.01, ***P < 0.001
ARTICLE NATURE COMMUNICATIONS | DOI: 10.1038/s41467-018-05090-y
6 NATURE COMMUNICATIONS | (2018) 9:2744 | DOI: 10.1038/s41467-018-05090-y | www.nature.com/naturecommunications
ACC:
Terminal: eGFP-Syb2
BLA
LA
CeL
CeM
BMA
BLA
LA
CeL CeC
Bregma -1.3 mm A/P Bregma -1.7 mm A/P 0 1 2 3 4
BMA
CeM
CeL/C
BLA
LA
Fluorescence intensity(normalized to LA)
ACC: BLA: CAV2-Cre
Contralateral Ipsiateral
II/III V VILayers 300
200
100
0
Den
sity
of
eYF
P+
cel
ls (
mm
–2)
ipsiContra
eGFP-Syb2 VGAT Merged
eGFP-Syb2 VGLUT1 Merged Co-merged
VGAT VGLUT1 Both
100
80
60
40
20
00
Pro
port
ion
ofco
-loca
lized
pun
cta
(%)
8.2 %
89.2 %
2.6 %
hSyn Cre WPRE pAAAV1
EF1α
eYFP ChR2
WPRE pAAAV2
ACC:
Mouse: transgenic floxed-stop-tdTomato
Slice patch-clamprecording
BLA
LA
CeA
BLAn = 17
n = 5
n = 12
ACSF
PSP+ PSP–
+bic+4AP/TTX+NBQX/APV
2 m
V
50 ms
20
5
10
15
0
PS
Pla
tenc
ey (
ms)
ACSF
Mouse 1
BLA CeA BLA CeA
Mouse 2
+bic +4AP/TTX
+NBQX/APV
15
10
*
5
0
10
20
30
0
10
20
30
0
PS
P
ampl
itude
(m
V)
Num
ber
of td
T+
cel
lspe
r sl
ide
Mouse: transgenic floxed-stop-tdTomato
BLACeA
Mouse 1, ACC Mouse 1, Amygdala
a d
b e fc
g h
i j
k l
m n
o p q
α α
Fig. 5 ACC projection to the BLA is monosynaptic and glutamatergic. a Anterograde terminal tracing strategy based on expression of eGFP-Syb2. Confocalimage shows mCherry-expressing cells selectively observed in the ACC. Scale bar, 500 µm. b Representative confocal images showing eGFP-Syb2expression pattern in the amygdala sub-nuclei. Strong eGFP-Syb2 expression was observed in the BLA. Scale bar, 200 µm. c Quantitative analysis of theeGFP-Syb2 signals in the amygdala sub-nuclei (across three different mice). Fluorescence intensity was normalized to mean intensity value (0–255 scale)measured in the LA area. d Retrograde tracing strategy using CAV2-Cre-dependent expression of DIO-eYFP. e Representative confocal image showingeYFP-expressing cells in the ACC. Scale bar, 500 µm. f Quantitative analysis of the retrogradely labeled neurons (eYFP+) in the ipsilateral and contralateralACC. g Representative confocal images showing VGLUT1 or VGAT immunoreactive signals with eGFP-Syb2 signals. Scale bar, 10 µm. h Bar graph showingco-localized puncta in the BLA. i Illustration of ex vivo patch-clamp recording experiments for monitoring light-evoked PSPs in ACC input-identified BLAneurons. j Representative epi-fluorescence image indicating the patch-clamp recording site. Bottom left image, magnification of the black square area.tdTomato-positive (tdT+) cells were selectively targeted, as indicated by red arrow. Scale bar, 500 µm. k Proportion of neurons displaying PSP responsesto light stimulation. Total 17 tdT+BLA neurons were successful for whole-cell patch-clamp recording from 10 slices of 5 mice. 12 of 17 cells were PSP-positive (PSP+). l Representative recording traces indicating light-evoked PSPs in the ACSF (black), and in the presence of bicuculline (+bic; blue),bicuculline+4-AP+TTX (+4AP/TTX; green), or bicuculline+4-AP+TTX+NBQX+APV (+NBQX/APV; red). m PSP latency of the PSP+/tdT+BLAneurons recorded (n= 12 cells). n Summary of amplitudes of light-evoked PSPs measured from each drug treatment condition (n= 6 cells from 6 slices of3 mice). Repeated measures one-way ANOVA (F(1.167, 5.837)= 6.900, P= 0.0376) with Dunnett’s post hoc test (ACSF vs.+NBQX/APV; P= 0.0106). Dataare expressed as mean ± s.e.m. *P < 0.05. o Anterograde tracing strategy based on transneuronal delivery of AAV1-hSyn-Cre. p Representative confocalimages showing the pattern of tdT+expression in the ACC (left, scale bar: 500 µm) and the amygdala (right, scale bar: 200 µm). q Quantitative analysis ofthe tdT+neurons in the BLA and CeA. BMA, basomedial nucleus; LA, lateral nucleus; CeA (CeM, CeL, and CeC), central nucleus (medial, lateral andcapsular subdivisions) of the amygdala15
NATURE COMMUNICATIONS | DOI: 10.1038/s41467-018-05090-y ARTICLE
NATURE COMMUNICATIONS | (2018) 9:2744 | DOI: 10.1038/s41467-018-05090-y | www.nature.com/naturecommunications 7

illumination to stimulate ChR2-expressing ACC axon terminals.Our results showed that 12 of 17 (71%) tdT+BLA cells (from10 slices of 5 mice) displayed successful PSP responses to the lightstimulation (Fig. 5k–m). The latency of light-evoked PSPs was6.4 ± 0.7 ms (n= 12), which is in the range of monosynapticevents (Fig. 5m). To confirm whether light-evoked PSPs recordedfrom BLA cells are either monosynaptic or glutamtergic, wesequentially treated the slices with inhibitors such as bicuculline,tetrodotoxin (TTX)+4-aminopyridine (4-AP), and 2,3-dihy-droxy-6-nitro-7-sulfamoyl-benzo[f]quinoxaline-2,3-dione(NBQX)+D-2-amino-5-phosphonopentanoate (D-APV), andmeasured the effect of such drugs on light-evoked PSPs. Wewere able to maintain stable light-evoked PSP recordings from 6of 12 cells during sequential drug treatments. Although there wasno statistical significance, we observed a tendency that bicucullineapplication slightly enhanced PSP amplitudes, which were notaffected by the additional treatment of 4-AP/TTX (PSP amplitudein mV: ACSF= 3.0 ± 0.9, bicuculline= 5.1 ± 1.7, 4-AP/TTX=4.7 ± 1.3; Fig. 5l, n), indicating that light-evoked PSPs are slightlyregulated by unknown GABAergic inputs and mediated bymonosynaptic events. These PSPs were completely abolishedwhen both NBQX and APV were included in the solution (PSPamplitude in mV: NBQX+APV= 0.4 ± 0.4; Fig. 5l, n). Wereplicated these results by using age-matched 129 × C57Bl/6wildtype mice only injected with AAV-CaMKIIα-ChR2-Venus inthe ACC (Supplementary Fig. 5a–e): our data showed thatrandomly selected BLA cells (11 of 14 cells; 79%) showed light-evoked PSPs, which was not detected from all selected CeA cells(11 cells). Light-evoked PSPs from BLA cells were increased by atreatment with bicuculline but completely diminished by co-application of NBQX and APV (Supplementary Fig. 5c and 5e).These data indicate that the ACC-BLA synapses are mono-synaptic and glutamatergic.
Using the same approach, we performed an anterogradetracing experiment to further examine the ACC projectionpattern in the amygdala (Fig. 5o). Two Ai9 mice were injectedwith the AAV1 anterograde tracer (high titer AAV1-hSyn-Cre),and imaging was performed 8 weeks later to ensure the sufficientexpression of tdTomato. We collected consecutive brain sectionscovering the entire BLA and CeA area (A/P coordinate −1.0 to−1.9 mm), and compared the number of tdT+cells in the BLAand CeA at each slide (Fig. 5p). We observed a predominantexpression of tdT+cells in the BLA (total 204 in mouse 1 and 77cells in mouse 2, respectively; Fig. 5q). In the CeA, very few tdT+cells were detected (total 8 in mouse 1 and 3 cells in mouse 2,respectively). These results are consistent with our eGFP-Syb2-tracing data above (Fig. 5a–c) and ex vivo patch-clamp recordingresults (Fig. 5i–n), indicating that there is a major ACC input tothe BLA and very sparse input to the CeA.
Selective photoactivation of ACC neurons projecting to BLA. Ifthe ACC-BLA projection is critical for the control of innate fearbehavior, the selective activation of ACC neurons projecting tothe BLA should reduce the freezing response to fox urine. To testthis possibility, retrograde tracing viral vector, CAV2-Cre, wasinjected into the bilateral BLA, and Cre-dependent AAV con-structs (DIO-ChR2-eYFP or DIO-eYFP) were injected into thebilateral ACC (Fig. 6a). Consistent with our tracing data (Fig. 5),confocal imaging results showed major expression of ChR2-eYFPor eYFP in neurons in ACC layer V (Fig. 6b). For light delivery,dual-fiber optic elements were implanted into the bilateral ACC.During behavioral testing, mice were placed in a cage containingfox urine, and freezing behavior was monitored over three lightoff/on cycles (Fig. 6c). ChR2-expressing mice showed a light-induced reduction in freezing during the first and second light-on
periods (Fig. 6d), similar to that observed after bulk ACC acti-vation, whereas eYFP-expressing mice showed no significantchanges in freezing (Fig. 6e). A pairwise comparison confirmed asignificant group difference in light-induced change in freezing(Fig. 6f). These results suggest that ACC projection to the BLA isa critical circuit pathway for regulating innate fear response to foxurine.
ACC-BLA projection controls the innate fear response. Todetermine whether the ACC-BLA projection controls innate fearresponse to fox urine, we next employed projection-based opto-genetic approaches. By using AAV vectors, we expressedeNpHR3.0-eYFP or eGFP in CaMKIIα-positive neurons in thebilateral ACC and delivered the light through fiber-optic elementsimplanted in the bilateral amygdala by using the coordinate ofML ±3.2 mm (Supplementary Fig. 6a). During behavioral test,mice were placed in a cage containing fox urine, and freezingbehavior was monitored over three light off/on cycles. We foundthat eNpHR3.0-expressing mice exhibited a significantly higherlevel of freezing during the light-on periods than that during thelight-off periods in a reversible manner over repeated cycles(Supplementary Fig. 6b). By contrast, eGFP-expressing miceshowed no significant changes in freezing during the test (Sup-plementary Fig. 6c). A pairwise comparison confirmed a sig-nificant group difference in light-induced change in freezing(Supplementary Fig. 6d). Because the placement of optic fiber wasbiased to the CeA in this condition (Supplementary Fig. 7a), werepeated the same experiments but with altered fiber-implantation coordinate covering both BLA and CeA areas(M/L ±3.35 mm, Fig. 7a–c and Supplementary Fig. 7b). Samelight-induced behavioral alterations (as in Supplementary Fig. 6)were observed in this condition (Fig. 7d, e). These results thussupport that ACC-BLA projection controls innate freezingresponse to fox urine.
Because the PL cortex is located close to the ACC and also hasa projection to the BLA18,20, it is possible that freezing behaviorchange by our optogenetic manipulation was caused by unin-tended manipulation of PL-BLA projection. To address this issue,we also examined whether the PL-BLA photoinhibtion inducesthe increase of freezing behavior to fox urine (Fig. 7f). A differentcoordinate corresponding to the PL was used for the injection ofAAV-eNpHR3.0, while the coordinate for fiber-optic implant wasidentical to the ACC-BLA experiments. Unlike the ACC-projection eNpHR3.0 group (Fig. 7d), photoinhibition of PLprojection did not induce increased freezing response rather therewas a tendency of decrease in freezing (Fig. 7f, g), thus confirmingthe specificity of our manipulation of ACC projection.
Next, to determine whether activation of ACC-BLA projectionis sufficient to inhibit the innate fear response, we directlystimulated the ACC terminals in the BLA by injecting AAVvectors expressing CaMKIIα promoter-driven ChR2-Venus (oreGFP control) in the bilateral ACC (Fig. 7h) and delivering lightpulses to the BLA area through implanted fiber elements(Supplementary Fig. 7c). Our results showed that ChR2-expressing mice displayed reduced freezing behavior during thelight-on periods of fox urine test (Fig. 7i), whereas no significantchanges were observed in the eGFP control mice (Fig. 7j, k). Wefound no changes in the locomotor and anxiety behaviors by thephotoactivation of ACC-BLA projection (Supplementary Fig. 8),indicating a specific regulation of innate fear behavior byactivation of ACC-BLA projection. The efficient optogeneticmanipulation of ACC-BLA projection in our condition wasconfirmed by ex vivo patch-clamp recordings. We recorded light-evoked PSPs from BLA neurons of slices with expression ofCaMKIIα-driven ChR2-Venus in the ACC, and the light was
ARTICLE NATURE COMMUNICATIONS | DOI: 10.1038/s41467-018-05090-y
8 NATURE COMMUNICATIONS | (2018) 9:2744 | DOI: 10.1038/s41467-018-05090-y | www.nature.com/naturecommunications

delivered to the ACC terminal with similar parameters in animalbehavior tests (Supplementary Fig. 5f–i). The BLA cells showedstable PSP responses to 10 Hz light stimulation with a relativelyhigh PSP-reliability (4 of 5 cells with 100% PSP-reliability;Supplementary Fig. 5g and 5h). None of CeA cells displayeddetectable PSP responses in the same slice (Supplementary Fig. 5gand 5i). Taken together, these results support that the ACC-BLAprojection inhibits innate freezing response.
Specificity of the control function of ACC-BLA projection. Toinvestigate the specificity of the fear response control by ACC-BLA circuit pathway, we first determined whether photoinhibi-tion of ACC-BLA projection affects avoidance response to the foxurine (Supplementary Fig. 9). For this experiment, we used amethod described in previous study in rats29,39 (see methods). Inbrief, we placed a petri dish containing either fox urine or wateras a control at one corner (sample quadrant) and measured thetime duration mice spent at that sample quadrant (Supplemen-tary Fig. 9a). Consistent with the previous report in rats, we alsoobserved a similar avoidance behavior to the fox urine in wild-type mice compared to water control, validating our behavioral
test set-up (Supplementary Fig. 9b). Next we performed the samebehavioral test with mice expressing eNpHR3.0 (or eGFP control)in ACC-BLA projection to examine the effect of inhibiting ACC-BLA projection on the avoidance response to fox urine (Supple-mentary Fig. 9c). In contrast to alteration of the innate freezingbehavior, we found no significant difference in the avoidancebehavior between the eNpHR3.0 and eGFP (control) groups inboth light off and on session (Supplementary Fig. 9e). Theseresults suggest that the regulatory role of ACC-BLA projection isspecific to the freezing behavior. Nevertheless, our results do notcompletely rule out the possibility that ACC-BLA projection maybe involved in regulating other defensive behaviors such as riskassessment2,26.
Next, we examined whether ACC-BLA projection controls fearresponse to other predator odors. For this purpose, we tested theeffect of optogenetic inactivation of the ACC-BLA projection onfreezing response to other predator urines. We first tested thefreezing response to cat urine (Fig. 8a). The eNpHR3.0 wasexpressed in the bilateral ACC, and ACC-BLA projection wasinhibited by the 560-nm light illumination in the BLA as before.In the presence of cat urine (10 ml of 100% wild cat urine
ACC:
EF1α
eYFP
WPRE pA
EF1α
eYFP ChR2
WPRE pA BLA: CAV2-Cre CAV2 -Cre
AAV-DIO-ChR2
AC
CB
LA
Left ACC
Laser OFF OFF ON
3min
1min
1min
3x
Fox urineFox urine
60
40
20
0
% F
reez
ing
OFF ON OFF ON OFF ON
1 2 3
* *
ChR260
40
20
0
% F
reez
ing
OFF ON OFF ON OFF ON
1 2 3
eYFP *
ChR2 eYFP
20
0
–20
–60
–40
Δ F
reez
ing
(ON
–OF
F)
a b
c
d e f
Fig. 6 Photoactivation of ACC neurons projecting to the BLA inhibits the freezing response to an innate threat. a Illustration of retrograde labeling strategyof ACC neurons projecting to the BLA with CAV2-Cre-dependent expression of AAV-DIO-ChR2-eYFP. b Top, representative confocal microscopic imageshowing the expression of DIO-ChR2 in ACC layer V neurons. Bottom, image of 3-D reconstructed neurons (by serial Z-stack confocal imaging) observedin the left ACC area. Scale bar, 500 µm (top) and 100 µm (bottom). c Experimental procedure for fox urine test with photoactivation of ACC neuronsprojecting to the BLA. d, e Percentage of time spent freezing during the fox urine test was selectively reduced by photoactivation in the ChR2 group (n= 6)(d) but not in the eYFP group (n= 6) (e). Wilcoxon matched-pairs rank test for ChR2 (P= 0.0313,= 0.0313,= 0.2188) and eYFP (P= 0.3125,= 0.5625, >0.9999). f Light-induced change in percentage of freezing behavior, calculated by subtracting freezing values within the first OFF–ON cycle, for ChR2(d) and eGFP (e) groups. Mann–Whitney U test (P= 0.0152). Line graphs are expressed as mean ± s.e.m. Box-whisker plot is expressed as median,interquartile range with 5-95 percentile distribution. *P < 0.05
NATURE COMMUNICATIONS | DOI: 10.1038/s41467-018-05090-y ARTICLE
NATURE COMMUNICATIONS | (2018) 9:2744 | DOI: 10.1038/s41467-018-05090-y | www.nature.com/naturecommunications 9

(PeteRikards)), mice exhibited no significant change in freezingresponse with the photoinhibition (Fig. 8b–d). However, whencoyote urine (10 ml of 100% coyote urine (Leg Up Enterprise))was adopted as another predator odor to cause innate fearresponse (Fig. 8e), mice displayed a significant increase infreezing response with photoinhibition of ACC-BLA projectioncompared to eGFP control group (Fig. 8f–h). According to
previous reports, cat urine may induce no or very weak fearresponse including freezing in rodents29,40. Thus, it is likely thatour optogenetic manipulation affected freezing elicited by coyotebut not cat urine because cat urine does not provoke fear strongly.Nevertheless, because both cat and coyote urine provoked similarlevel of freezing at around 15–20%, our results do not exclude thepossibility that ACC-BLA projection does not control innate
CaMKIIα eNpHR3.0 eYFP WPRE pA
CaMKIIα eGFP WPRE pA
Fiber coordinate:M/L ±3.35 mm
BLA BLA
Fox urine
Laser OFF OFF ON
3min
1min
1min
3x
Fox urine
OFF ON OFF ON OFF ON
60
40
20
0
% F
reez
ing
1 2 3
**** *
eNpHR3.0 (ACC projection)
OFF ON OFF ON OFF ON
60
40
20
0
% F
reez
ing
1 2 3
eGFP (ACC projection)
% F
reez
ing
eNpHR3.0 (PL projection)
* * ***
eNpHR3.0 eGFP eNpHR3.0
ACC projection PL projection
40
20
–20
0
Δ F
reez
ing
(ON
–OF
F)
******
NS
CaMKIIα ChR2 Venus WPRE pA
CaMKIIα eGFP WPRE pA
Laser OFF OFF ON
3min
1min
1min
3x
Fox urine
OFF ON OFF ON OFF ON
60
40
20
0
% F
reez
ing
1 2 3
*** *
ChR2 (ACC projection)
OFF ON OFF ON OFF ON
60
40
20
0
% F
reez
ing
1 2 3
eGFP (ACC projection)
***
ChR2 eYFP
20
10
0
–10
–30
–20
Δ F
reez
ing
(ON
–OF
F)
ab c
d e
f g
h
i j k
60
40
20
0
OFF ON OFF ON OFF ON
1 2 3
ARTICLE NATURE COMMUNICATIONS | DOI: 10.1038/s41467-018-05090-y
10 NATURE COMMUNICATIONS | (2018) 9:2744 | DOI: 10.1038/s41467-018-05090-y | www.nature.com/naturecommunications

freezing response to cat urine. Together, these results support thatACC-BLA projection has a general control function for thefreezing response to the predator odor, but not specific to foxurine.
Finally, we examined whether ACC-BLA projection controlsinnate freezing response to a live predator such as a rat. When weexposed mice to the rat (Fig. 8i), mice exhibited a moderate levelof freezing (18.7 ± 3.1%) but showed enhanced freezing responsesby optogenetic inhibition of ACC-BLA projection (Fig. 8j–l).Taken together, these results thus suggest that the ACC-BLAprojection is involved in regulating innate freezing behavior to thegeneral threats rather than specific to the fox urine.
DiscussionHere we show that ACC and its input to the BLA control innatefear response in mice. By using projection-based optogeneticmanipulation approaches, we found that inactivation of ACCinputs in the amygdala caused the enhancement of innate fearresponse. This result provides convincing evidence supportingour conclusion. Given our optogenetic manipulation of ACCterminals in the amygdala included both BLA and CeA areas, it ispossible that ACC input to the CeA, although it is very sparse,may also be involved in such control process. It could be thatsuch enhancement of freezing may be a confounding effectresulting from interference of ACC input function unrelated withfear response control. However, this possibility is unlikely becauseidentical optogenetic inactivation of ACC somata alone did notinduce freezing in the absence of threat and had no effect onfreezing response to a conditioned stimulus. In addition, opto-genetic manipulation of the ACC cell somata or ACC-BLA pro-jection did not change general anxiety level or locomotor activityas shown in the open field test.
Considering previously suggested role of ACC for affective paininformation processing in fear conditioning25,41,42, increaserather than decrease of freezing response by the inhibition ofACC-BLA projection was somewhat an unexpected result. Theunderlying circuit mechanism is unknown in our study. Onepossible idea is that ACC-BLA projection may control the anxietyprovoked in threat situation. In support of this possibility, aprevious study7 showed that activation of the IL-BMA amygdalapathway decreases basal levels of anxiety and also mediates theinhibition of conditioned freezing during extinction, suggestingthe possible link between anxiety control and fear response.Likewise, another study showed that activation of the projectionterminals of BLA neurons in the CeL (BLA-CeL) has anxiolyticeffects43. The upstream brain structure controlling anxiolyticBLA-CeL microcircuit activity has not yet been identified. Itmight be interesting to see whether the BLA neurons mediatingsuch anxiolytic control receive ACC inputs. An alternative pos-sibility is that ACC-BLA circuit directly inhibits the circuitry that
generates freezing behavior. The CeM plays a major role in theexpression of freezing21,28, and a recent study revealed that acircuit pathway from the CeL and CeM to the ventrolateralperiaqueductal gray to the pre-motor nucleus of the medullagenerates freezing behavior44. Considering the known feed-forward inhibitory microcircuit between the CeL and CeM43,45, itis possible that ACC-BLA circuit activation might inhibit CeMoutput (through the CeL) to the downstream freezing behavior-generating circuit.
We show that inhibition of the ACC-BLA projection increasesinnate freezing whereas its activation decreases it. This findingsuggests an interesting idea that inhibition of ACC-BLA pathwaymay be instrumental for innate fear behavior expression and thatACC local inhibitory interneurons are involved during innate fearbehavior. Due to the technical limitations, it is unknown in ourstudy whether ACC-BLA projection is inhibited in response tothe innate threats. Nevertheless, consistent with the idea, ourimmunostaining results (activation of GAD67+cells in the ACCto the fox urine) support the possible involvement of localGABAergic interneurons for the innate fear behavior expression.Although the connectivity between the GABAergic interneurons(activated by innate threats) and ACC-BLA cells is unknown inour study, it is possible that such local inhibitory interneuronsdirectly inhibit ACC-BLA cells to promote freezing response.This is an important hypothesis that needs to be addressed in thefuture study.
A previous study in rat46 investigated the effect of transientactivation or inactivation of the rostal part of ACC (rACC) byusing drug on the acquisition of auditory conditioned fear in rats.Their results show that the inactivation of the rACC decreasedconditioned freezing measured during training. Conversely, acti-vation increased conditioned freezing response. These data seemto be contradictory with our results. Moreover, a recent study inmice shows a role of ACC-BLA circuit for encoding sociallyderived aversive cue information in observational learning47. Onepossible explanation is that ACC may have different regulatoryroles for the expression of conditioned fear during training andduring test 24 h after training. Indeed, the identical inactivation ofthe rostral ACC 24 h after training does not affect the expressionof conditioned freezing46, which is consistent with our eNpHR3.0results. An alternative explanation is that the inconsistency mayresult from the difference in the ACC area manipulated in twostudies. We targeted a more caudal part of the ACC, but the studyby Bissiere et al. targeted the rostral ACC. In this sense, we pro-pose a hypothesis that the caudal and rostral ACC in rodents mayhave distinct roles: the caudal ACC controls innate fear response,while the rostral ACC controls the acquisition of conditioned fearperhaps by processing pain information. Notably, another pre-vious study in rat reports that pharmacological activation of therostral ACC, but not caudal ACC, promotes acquisition of fear
Fig. 7 Optogenetic manipulation of the ACC-BLA projection changes freezing response to an innate threat. a Illustration of eNpHR3.0-based inhibitionstrategy of the ACC terminals in the amygdala. b Representative confocal images showing eNpHR3.0-eYFP terminals in the amygdala. Scale bar, 500 µm.c Experimental procedure for fox urine test with photoinhibition of ACC-amygdala projection. d–f Percentage of time spent freezing during the fox urinetest was selectively increased by photoinhibition in the eNpHR3.0 (ACC projection) group (n= 10) (d), but not in the eGFP (ACC projection) group (n=10) (e) or eNpHR3.0 (PL projection) group (n= 7) (f). Wilcoxon matched-pair rank tests for eNpHR3.0 ACC projection (P= 0.0020,= 0.0039,= 0.019).Paired t-tests for eGFP ACC projection (P= 0.1736,= 0.4154,= 0.1171) and eNpHR3.0 PL projection (P= 0.0024,= 0.0181,= 0.0016). g Light-inducedchange in percentage of freezing behavior for d–f, calculated by subtracting freezing values within the first OFF–ON cycle. One-way ANOVA (F(2, 24)=19.65, P < 0.0001) and Tukey’s post hoc test (eNpHR3.0 ACC projection vs. eGFP ACC projection, P < 0.0001; eNpHR3.0 ACC projection vs. eNpHR3.0 PLprojection, P < 0.0001; eGFP ACC-projection vs. eNpHR3.0 PL-projection, P= 0.7925). h Experimental procedure for fox urine test with ChR2-basedphotoactivation of ACC terminals in the amygdala. i, j Percentage of time spent freezing during the fox urine test was decreased in the ChR2 group (n= 8)(i) but not in the eGFP group (n= 7) (j). Paired t-tests for ChR2 group (P= 0.0007,= 0.0815,= 0.0488) and eGFP group (P= 0.5612,= 0.6859,=0.5114). k Light-induced change in percentage of freezing behavior for i and j, calculated by subtracting freezing values within the first OFF–ON cycle.Unpaired t-test (P= 0.0008, t= 4.370, df= 13). Line graphs are expressed as mean ± s.e.m. Box-whisker plot is expressed as median, interquartile rangewith 5-95 percentile distribution. *P < 0.05, **P < 0.01, ***P < 0.001
NATURE COMMUNICATIONS | DOI: 10.1038/s41467-018-05090-y ARTICLE
NATURE COMMUNICATIONS | (2018) 9:2744 | DOI: 10.1038/s41467-018-05090-y | www.nature.com/naturecommunications 11

memory48. Together, there might be functionally distinct, multiplecell populations in the ACC that mediate different roles in fearprocessing.
Prefrontal brain structures are thought to mediate top-downcontrol of fear responses in threat situations. In rodents, the IL iswell established for its role in the inhibition of learned fear during
extinction, likely through a major output to the BMA6,7,49. It isstill unclear how the ACC-BLA projection is functionally differ-ent from the IL-amygdala projection in the control of fearresponse. It is possible that the two circuits may have separateroles for the regulation of innate (ACC) versus learned (IL) fearresponse. Alternatively, the IL may be specifically recruited for
CaMKIIα eNpHR3.0 eYFP WPRE pA
CaMKIIα eGFP WPRE pA
Cat urine Laser OFF OFF ON
3min
1min
1min
3x
Cat urine
OFF ON OFF ON OFF ON
60
40
20
0
% F
reez
ing
1 2 3
eNpHR3.0
OFF ON OFF ON OFF ON
60
40
20
0
% F
reez
ing
1 2 3
eGFP
eNpHR3.0 eGFP
40
20
–20
–40
0
Δ F
reez
ing
(ON
–OF
F)
Coyote urine Laser OFF OFF ON
3min
1min
1min
3x
Coyote urine
OFF ON OFF ON OFF ON
60
40
20
0
% F
reez
ing
1 2 3
*
*
*
eNpHR3.0
OFF ON OFF ON OFF ON
60
40
20
0
% F
reez
ing
1 2 3
eGFP
*
eNpHR3.0 eGFP
60
40
20
0
–20
Δ F
reez
ing
(ON
–OF
F)
Rat
Rat exposure
Laser OFF OFF ON
3min
1min
1min
3x
60
40
20
0
% F
reez
ing
OFF ON OFF ON OFF ON
1 2 3
** *
eNpHR3.0
OFF ON OFF ON OFF ON
60
40
20
0
% F
reez
ing
1 2 3
eGFP
*
eNpHR3.0 eGFP
60
40
20
0
–20
–60
–40
Δ F
reez
ing
(ON
–OF
F)
a
b c d
e
f g h
i
j k l
ARTICLE NATURE COMMUNICATIONS | DOI: 10.1038/s41467-018-05090-y
12 NATURE COMMUNICATIONS | (2018) 9:2744 | DOI: 10.1038/s41467-018-05090-y | www.nature.com/naturecommunications

the control of fear expression only after extinction49. Because theactivation of ACC-BLA circuit led to a robust inhibition ofconditioned freezing, it is possible that ACC-BLA circuit may beinvolved in the reduction of conditioned freezing during extinc-tion training. Although we focused on the BLA as a downstreambrain area of ACC, the ACC also sends its projection to varioustarget areas in the neocortex and brainstem. Previous data basedon the whole-brain analysis of Synaptophysin-GFP tracing showthat some of fear-related target regions, including the PL, IL, PAGand dorsomedial thalamus, display even stronger intensities thanthe BLA50. Thus, it is possible that these ACC projections mayalso be involved in the control of innate fear behaviors.
Here our findings establish that a projection input from theACC to the BLA is a critical component of the brain circuitrycontrolling innate fear responses to predator-related olfactorystimulus in mice, which might be relevant to fear- and anxiety-related psychiatric disorders in humans.
MethodsMice. 129 × C57Bl/6 mice (male or female, 2–3 months of age) were group-housedon a 12-h light-dark cycle under constant temperature (21 ± 1 °C) and humidity(40–60%). Food and water were supplied ad libitum throughout the experiments.All procedures for animal experiments were approved by the KAIST InstitutionalAnimal Care and Use Committee. For ex vivo patch-clamp experiment using high-titer AAV1-hSyn-Cre, a transgenic mouse line (Ai9) containing floxed-stop-tdTomato (B6;129S6-Gt(ROSA)26Sortm9(CAG-tdTomato)Hze/J; The Jackson Labora-tory) was used. Mice were randomly allocated to the experimental versus controlgroups, except for that number of male and female mice was nearly matched to 1:1ratio for behavior experiments.
DNA constructs. The original eGFP-Syb2-expressing plasmid (pAAV-hSyn-mCherry-IRES-eGFP-Syb2) was provided by Daesoo Kim (KAIST), and the hSynpromoter was replaced by CaMKIIα promoter by sub-cloning. pAAV-EF1a-DIO-hChR2(H134R)-EYFP was kindly provided by Karl Deisseroth (StanfordUniversity).
Viruses. For customized production of AAV1, pAAV and AAV1 serotypepackaging vectors were co-transfected into human embryonic kidney cells bycalcium phosphate transfection. After 60–72 h of incubation, AAV was purifiedfrom transfected cells by iodixanol-gradient ultracentrifugation. Purified solutionwas dissolved in phosphate-buffered saline (PBS), and viral titer was measured byquantitative PCR (Qiagen, Rotor-gene Q). AAV solution with a titer range of 3 to8 × 1011 viral genome per ml was used for the expression of genetic materials.Solution with excessive titer was re-dissolved in PBS by 2- to 3-fold. Prepared AAVmaterials were aliquoted and stored at −80 °C until use.
High titer AAV1-hSyn-Cre (3.2 × 10¹³ GC/ml) and AAV2-EF1α-ChR2-eYFP(3.6 × 10¹² GC/ml) solutions were purchased from Vector BioLab and UNC VectorCore, respectively. CAV2-Cre, with a titer of 6 × 10¹² viral genome per ml, waspurchased from Montpellier vector platform (PVM). Virus solution was aliquotedand stored at −80 °C until use.
Behavior. Contextual fear conditioning was performed in a rectangular acrylicchamber (345 × 90 × 160 mm, W ×D ×H, custom-made) equipped with two sets ofmetallic grid floors (Coulbourn). On Day 1, mice were individually placed into the
box and received three foot shocks (0.5 mA, 2 s) at 30-s intervals. The initial shockonset was 2 min after box entry. Day 2, The contextual fear retention test wasperformed in the same chamber. Three minutes after entry, freezing responses weremonitored over three light delivery cycles (1 min OFF–1 min ON).
Auditory fear conditioning was performed in a square-shaped metallic chamber(178 × 178 × 305mm, W×D ×H, Coulbourn) equipped with a grid floor(Coulbourn). Day 1, as a background odor, 70% ethanol was poured into a traybelow the grid floor. Two minutes after chamber entry, a pure-tone stimulus (2.1kHz, 30 s, 70 dB) was presented. A foot shock (0.5 mA, 2 s) was delivered duringthe last 2 s of the tone delivery (co-termination). Day 2, The auditory fear retentiontest was performed in a rectangular acrylic chamber (345 × 90 × 160 mm, W ×D ×H, custom-made). To provide a different context, the floor was substituted with awhite glossy acrylic plate, and 70% ethanol was not presented. Three minutes afterentry, freezing responses to the tone stimulus (2.1 kHz, 6 min, 70 dB) weremonitored over three light delivery cycles (1 min OFF–1 min ON).
The fox urine exposure test was performed in a similar manner as previouslydescribed27. Three sheets of KimWipes laboratory tissue were fully soaked in 10 mlof 100% red fox urine (Leg Up Enterprise) and evenly piled over the floor of aplastic cage (1-L-sized regular mouse cage, ZoonLab), and mice were placed in thecage for behavioral testing. In control experiments with water, tissue sheets weresoaked in distilled water instead of fox urine. Exposure to other predator urine wasperformed by the same protocol, except for the use of cat (10 ml of 100% wild caturine, PeteRickards) or coyote urine (10 ml of 100% coyote urine, Leg UpEnterprise). For optogenetic experiments, mice were acclimated for 3 min afterentry, and freezing responses were monitored over three light delivery cycles (1 minOFF–1 min ON).
The fox urine avoidance test was performed in a similar procedure as describedin previous literature29,39, but the size of the apparatus was modified for mice. Asquare open field arena (white non-glossy acrylic box, 450 × 450 × 250 mm, W ×D ×H, custom-made) was used as the testing chamber. At the up-left or down-right side of the corner, a 35-mm diameter petri dish which was filled with 1 ml of100% red fox urine (Leg Up Enterprise) or distilled water (control) was placed. Theplacement of sample dish was counterbalanced for every trial. Mice wereintroduced to the opposite corner and monitored for 3 min (or total 6 min foroptogenetic sessions; 3 min OFF and 3min ON). The testing arena was cleansedwith 10% ethanol after every trial.
Similar to a previous literature51, the rat exposure test was performed in a two-chambered acrylic cage (250 × 450 × 250 mm, W ×D ×H, custom-made) whichwas partitioned by a metallic wire mesh. As a modification, hiding tunnel andshelter (for mice) were excluded. A mouse was introduced to one partition of thecage, and then a live rat (Sprague-Dawley, 10-week, male, not treated withamphetamine) was introduced to the opposite partition behind the wire mesh. Foroptogenetic experiments, mice were acclimated for 3 min, and freezing responseswere monitored over three light delivery cycles (1 min OFF–1 min ON). Thetesting chamber was cleansed with 10% ethanol after every trial. A new rat wasused after every three trials.
Open field test was performed in a square arena (white non-glossy acrylic box,450 × 450 × 250 mm, W ×D ×H, custom-made). Mice were introduced to theapparatus, and monitored over three light delivery cycles (3 min OFF–3 min ON).The testing arena was cleansed with 10% ethanol after every trial.
For behavior experiments with optogenetic stimulation, laser light wasgenerated using CrystaLaser diodes (CL561-050-O for 561 nm green light, CL473-050-O for 473 nm blue light) and delivered through surgically implanted fiber-optic elements (Doric lenses). For photoactivation of ChR2-expressing somata andterminals, blue light (473 nm wavelength; 0.2 mW at fiber tip for somata or 0.5 mWat fiber tip for terminals) was delivered as pulses (10 ms width, 10 Hz). Forphotoinhibition of eNpHR3.0-expressing somata and terminals, green light (561nm wavelength; 5 mW at fiber tip) was continuously illuminated.
Mouse behavior was recorded by a CCD camera from above at four framesper second. For scoring of freezing behavior, video files were randomized before
Fig. 8 Photoinhibition of the ACC-BLA projection induces increased freezing response to coyote urine and live rat, but not to cat urine. a Cat urine exposuretest with photoinhibition of the ACC-BLA projection. b, c Percentage of time spent freezing during the cat urine test was not changed in both the eNpHR3.0group (n= 6) (b) and eGFP group (n= 7) (c). Paired t-tests for eNpHR3.0 group (P= 0.6343,= 0.2623,= 0.2775) and Wilcoxon matched-pairs ranktests for eGFP group (P= 0.6875,= 0.6875, > 0.9999). d Light-induced change in percentage of freezing behavior for b and c, calculated by subtractingfreezing values within the first OFF–ON cycle. Unpaired t-test, (P= 0.9761, t= 0.0306, df= 11). e Coyote urine exposure test with photoinhibition of theACC-BLA projection. f, g Percentage of time spent freezing during the coyote urine test was specifically increased in the eNpHR3.0 group (n= 9) (f), butnot in the eGFP group (n= 7) (g). Paired t-tests for eNpHR3.0 group (P= 0.0173,= 0.0470,= 0.0217) and eGFP group (P= 0.9205,= 0.9281,=0.5379). h Light-induced change in percentage of freezing behavior for f and g, calculated by subtracting freezing values within the first OFF–ONcycle. Unpaired t-test (P= 0.0368, t= 2.307, df= 14). i Rat exposure test with photoinhibition of the ACC-BLA projection. j, k Percentage of timespent freezing during the rat exposure test was specifically increased in the eNpHR3.0 group (n= 10) (j), but not in the eGFP group (n= 10) (k). Wilcoxonmatched-pairs rank tests for eNpHR3.0 group (P= 0.0039,= 0.0488,= 0.2324) and eGFP group (P= 0.4316, > 0.9999, > 0.9999). l Light-inducedchange in percentage of freezing behavior for j and k, calculated by subtracting freezing values within the first OFF–ON cycle. Unpaired t-test (P= 0.0356,t= 2.272, df= 18). Line graphs are expressed as mean ± s.e.m. Box-whisker plot is expressed as median, interquartile range with 5-95 percentiledistribution. *P < 0.05, **P < 0.01
NATURE COMMUNICATIONS | DOI: 10.1038/s41467-018-05090-y ARTICLE
NATURE COMMUNICATIONS | (2018) 9:2744 | DOI: 10.1038/s41467-018-05090-y | www.nature.com/naturecommunications 13

counting, and duration of freezing was manually scored using a computer-basedstopwatch software. For tracking of mice during avoidance test and open field test,video files were automatically analyzed using EthoVision software (Noldus).
Surgery for behavior and tracing experiments. For optogenetic manipulationexperiments, mice were anaesthetized by intraperitoneal injection of sodiumpentobarbital (83.3 mg/kg) and fixed in a stereotaxic surgery frame. For ACCinfection, 1.5 μl AAV solution was injected at the following sites relative to bregma:anterior-posterior (A/P)+0.8 mm, medial-lateral (M/L) ±0.35 mm, and dorsal-ventral (D/V) −1.8 mm. We used the viral titer and coordinate conditions foroptimized caudal-specific infection of the ACC (covering A/P+1.4 to+0.0 mm). Ina control experiment targeting the PL area, 1.0 μl AAV solution was injected at A/P+1.7 mm, M/L ±0.35 mm, and D/V −2.0 mm. Two weeks after viral injectionsurgery, mice underwent surgery again for implanting fiber-optic elements (Doriclenses, 200 μm core diameter, 0.22 NA) into ACC or amygdala coordinates (ACC:A/P+0.8 mm, M/L ±0.35 mm, D/V −1.5 mm; amygdala: A/P −1.6 mm, M/L ±3.35mm, D/V −4.5 mm). Mice recovered in their home cages for 1 week beforebehavioral experiments.
For eGFP-Syb2 expression, mice were injected with 1.5 μl AAV-CaMKIIα-mCherry-IRES-eGFP-Syb2 at bilateral ACC coordinates and allowed to recover intheir home cages for 6–8 weeks until sacrifice.
For CAV2-Cre-dependent expression, mice were injected with 0.3 μl CAV2-Creinto the bilateral BLA (A/P −1.6 mm, M/L ±3.35 mm, D/V −4.7 mm) and 1.5 μlAAV-EF1α-DIO-ChR2-eYFP (or AAV-EF1α-DIO-ChR2-eYFP) into the bilateralACC (A/P+0.8 mm, M/L ±0.35 mm, D/V −1.8 mm). Two weeks later, mice forbehavioral experiments underwent surgery for implanting fiber-optic elements intothe ACC (A/P+0.8 mm, M/L ±0.35 mm, D/V −1.5 mm) and were allowed torecover in their home cages until behavioral experiments. Mice for retrogradetracing experiments were sacrificed 2 weeks after the injection surgery withoutundergoing fiber implantation surgery.
Surgery for ex vivo patch-clamp recording experiments. For experiments usingAAV-CaMKIIα-ChR2, wildtype mice of 129 × C57Bl/6 background were used.Mice of 4-week age were injected with 1.5 μl solution of AAV1-CaMKIIα-ChR2into the bilateral ACC (modified coordinate for juvenile mice: A/P+0.7 mm, M/L±0.3 mm, D/V −1.7 mm). Mice were recovered in their home cages for 4 weeksuntil the slice recording experiments.
For experiments with anterograde AAV vector, both high titer AAV1-hSyn-Cre(100 nl) and AAV2-EF1a-DIO-ChR2-eYFP (50 nl) were pressure-injected into thebilateral ACC (A/P+0.7 mm, M/L ±0.3 mm, D/V −1.7 mm) of male Ai9 mice (5−6 weeks old), with a thin glass pipette using Nanojector III (Drummond) and thestereotaxic instrument (Kopf). At least 4 weeks were allowed for anterogradetransfer of AAV1-hSyn-Cre and full expression of ChR2-eYFP in the ACC andtdTomato in the ACC-connected postsynaptic neurons.
Histology. Mice were transcardially perfused with 4% paraformaldehyde (PFA)dissolved in PBS. Dissected brains were incubated in 4% PFA/PBS for an additional8 h after perfusion. For immunohistochemistry, brains were dehydrated in 30%sucrose/PBS for 48 h and sectioned coronally (40 µm thickness) on a −20 °Ccryostat. Brains used for optogenetic experiments were sectioned using a Vibra-tome (Leica) without the dehydration step. Prepared brain sections were stored in0.02% sodium azide dissolved in PBS. For histological analysis, sections were cover-slipped with Vectashield mounting solution (Vector Laboratories) and observedunder a Nikon Eclipse 80i fluorescence microscope or Carl Zeiss LSM780 confocalmicroscope. Through post hoc analysis of the section histology, two mice fromFig. 6d and one mouse from Fig. 6g were excluded from the behavior data due toAAV expression in the rostral ACC and PL area.
Immunohistochemistry. Mice were exposed to fox urine or water for 1 h, andtranscardially perfused with 4% PFA/PBS. Brain sections were prepared asdescribed in Histology section of Methods above. Three or four sections per mouse(covering the PAG, A/P −4.2 mm to −4.8 mm from bregma) were used forstaining experiment. For single staining for c-Fos, sections were incubated withprimary antibody against c-Fos (rabbit, 1:1000, catalog # sc-52, Santa Cruz; dilutedin blocking solution containing 2% goat serum, 0.1% bovine serum albumin, and0.3% triton X-100; 16 h), and then with secondary antibody against rabbit IgG(goat, 1:500, conjugated with Alexa Fluor 594, catalog # A11037, Molecular Probes;2 h). Between antibody incubation steps, samples were rinsed in PBS solution 3–4times. From the immunostained sections, tile-scan images for covering the dorsalPAG and ventral PAG were acquired by confocal observation at 10× magnification(LSM780, Carl Zeiss). To calculate the c-Fos density, the number of c-Fos positivenuclei was automatically quantified using Nikon elements BR software.
For double staining for c-Fos and GAD67, three sections per mouse (coveringthe caudal ACC, A/P+1.10 mm to+0.8 mm from bregma) were used for stainingexperiment. Sections were incubated with primary antibodies (rabbit anti-c-Fos,1:1000, catalog # sc-52, Santa Cruz; and mouse anti-GAD67, 1:1000, catalog#MAB5406, Millipore; 16 h), and then with secondary antibodies (goat anti-rabbitIgG, 1:500, conjugated with Alexa Fluor 488, catalog # A11008; goat anti-mouseIgG, 1:500, conjugated with Alexa fluor 594, catalog # A11005; 2 h). From the
immunostained sections, tile-scan images for covering the left and right ACC fieldswere acquired by confocal observation at 40× magnification (LSM780, Carl Zeiss).Location of GAD67+cell was manually identified (at Alexa 594 channel) followingconstant criteria (>5 µm nucleus diameter, >2 µm cell body thickness). Next, thenumber of c-Fos+nuclei surrounded by the GAD67+cell bodies was quantified,and divided by the total count of GAD67+cells per mouse. For double-blindedanalysis, the counter was not informed with the experimental hypotheses andgroup assignment.
For double staining for VGLUT1 and VGAT, four sections per mouse (A/P−1.20 mm to −1.60 mm from bregma) were used for staining experiment. Sectionswere incubated with primary antibodies (rabbit anti-VGLUT1, 1:1000, catalog #135303; and mouse anti-VGAT, 1:500, catalog #131 011; Synaptic Systems) for 16 h atroom temperature. Sections were then incubated with secondary antibodies (AlexaFluor 405-conjugated anti-rabbit IgG, 1:1000; and Alexa Fluor 647-conjugatedanti-mouse IgG, 1:500; Molecular Probes) for 2 h at room temperature. From thebilateral BLA area of immunostained sections, serial Z-stack images (1 µmthickness, 6-9 planes for each trial) were acquired by confocal observation at 100×magnification (LSM780, Carl Zeiss). In the figure, signals are presented in pseudo-colors for better visibility (eGFP-Syb2 in yellow; VGLUT1-Alexa Fluor 405 inmagenta; VGAT-Alexa Fluor 647 in cyan).
Ex vivo electrophysiology. All chemicals were purchased from Sigma unlessindicated. The standard artificial cerebral spinal fluid (ACSF) consisted of (in mM)124 NaCl, 2.5 KCl, 1.2 NaH2PO4, 24 NaHCO3, 5 HEPES, 2 CaCl2, 2 MgCl2, and 13glucose (pH 7.3). Mice were deeply anesthetized with isoflurane and transcardiallyperfused with ~20 ml of the slicing ACSF containing (in mM) 93 N-methyl-D-glucamine (NMDG)-Cl, 2.5 KCl, 1.2 NaH2PO4, 30 NaHCO3, 20 HEPES, 5 sodiumascorbate, 2 Thiourea, 3 sodium pyruvate, 12 N-acetyl-L-cysteine (NAc), 0.5 CaCl2,10 MgCl2, and 25 glucose (pH 7.3) before the brain was dissected. Coronal slicescontaining the amygdala (400-µm thick) were prepared using a VF-200-OZCompresstome (Precisionary) using the slicing ACSF and recovered at 30–32 °C inthe recovery ACSF (in mM; 104 NaCl, 2.5 KCl, 1.2 NaH2PO4, 24 NaHCO3, 5HEPES, 5 sodium ascorbate, 2 Thiourea, 3 sodium pyruvate, 12 NAc, 2 CaCl2,2 MgCl2, and 13 glucose; pH 7.3) for 1 h before recording. Slices were then placedin a recording chamber, submerged, and continuously perfused (2–3 ml/min) withthe oxygenated standard ACSF (20–25 °C). To isolate glutamatergic synapticresponses, 10 µM bicuculline (Tocris; GABA-A receptor antagonist) was added tothe standard ACSF. To test whether light-evoked synaptic responses were mediatedby glutamatergic synaptic transmission, slices were treated with 2,3-dihydroxy-6-nitro-7-sulfamoyl-benzo[f]quinoxaline-2,3-dione (NBQX, 10 µM; Tocris; AMPAreceptor antagonist) and D-2-Amino-5-Phosphonovaleric acid (D-AP5, 50 µM;Tocris; NMDA receptor antagonist). To isolate monosynaptic EPSP responseselicited by light stimulation, both tetrodotoxin (TTX; 1 μM, Alomone Labs;voltage-gated sodium channel blocker) and 4-aminopyridine (4-AP; 100 μM;voltage-gated potassium channel blocker) were included.
Whole-cell current-clamp recordings were made with a Multiclamp 700Bamplifier (Molecular Devices). Data were filtered at 2 kHz, digitized at 1–5 kHz,stored on a computer, and analyzed offline using pCLAMP 10 (Axon Instruments).BLA neurons were visualized with infrared differential interference optics equippedwith a 40× water-immersion objective lens. Borosilicate glass patch electrodes had aresistance of 3–5MΩ after filling with pipette solution containing (in mM) 140 K-gluconate, 5 KCl, 0.2 EGTA, 2 MgCl2, 4 Mg-ATP, 0.3 Na2-GTP, 10 Na2-phosphocreatine, and 10 HEPES (pH 7.3, 290-300 mOsm).
To induce light-evoked PSPs, high-power blue LED light (at 470 nm; X-Cite)was delivered to the slice through the standard optic path in the microscope(Nikon). Using a 40× objective lens, this configuration could deliver blue light at~8 mW/mm2 over a ~0.20 mm2 area of the recording site. With 0.2–1 ms durationsof LED illumination, these conditions were sufficient to elicit stable excitatory PSPsranging from 1.0 to 10 mV.
Statistical analysis. Statistical analyses were performed using GraphPad Prism 6.Normal distribution of each dataset was tested by Shapiro-Wilk normality test(α= 0.05). Where the normality test failed (P < 0.05), appropriate non-parametrictests were used. To investigate the light-induced effect, freezing scores within eachOFF–ON cycle was compared in a pairwise manner (paired t-test or Wilcoxonmatched-pair rank test). For group-wise comparison purpose, differential freezingscore (Δ) was calculated by subtraction between the first OFF-epoch and ON-epoch scores. These scores were compared by two-tailed unpaired t-test orMann–Whitney U test. Results in avoidance test and open field test were comparedbetween experimental (eNpHR3.0 or ChR2) and eGFP control groups usingrepeated measures (stacked) two-way ANOVA with Sidak’s post hoc test. Samplesize was not predetermined by statistical methods.
Data availability. The data that support the findings of this study are availablefrom authors upon reasonable requests.
Received: 3 June 2017 Accepted: 12 June 2018
ARTICLE NATURE COMMUNICATIONS | DOI: 10.1038/s41467-018-05090-y
14 NATURE COMMUNICATIONS | (2018) 9:2744 | DOI: 10.1038/s41467-018-05090-y | www.nature.com/naturecommunications

References1. Etkin, A., Egner, T. & Kalisch, R. Emotional processing in anterior cingulate
and medial prefrontal cortex. Trends Cogn. Sci. 15, 85–93 (2011).2. LeDoux, J. Anxious: Using the Brain to Understand and Treat Fear and
Anxiety. (Viking, New York, NY, 2015).3. Gass, J. & Chandler, L. The plasticity of extinction: contribution of the
prefrontal cortex in treating addiction through inhibitory learning. Front.Psyciatry 4, 46 (2013).
4. Milad, M. R. & Quirk, G. J. Fear extinction as a model for translationalneuroscience: ten years of progress. Annu. Rev. Psychol. 63, 129–151(2012).
5. Milad, M. R., Rauch, S. L., Pitman, R. K. & Quirk, G. J. Fear extinction in rats:implications for human brain imaging and anxiety disorders. Biol. Psychol. 73,61–71 (2006).
6. Milad, M. R. & Quirk, G. J. Neurons in medial prefrontal cortex signalmemory for fear extinction. Nature 420, 70–74 (2002).
7. Adhikari, A. et al. Basomedial amygdala mediates top-down control of anxietyand fear. Nature 527, 179–185 (2015).
8. Do-Monte, F. H., Quinones-Laracuente, K. & Quirk, G. J. A temporal shift inthe circuits mediating retrieval of fear memory. Nature 519, 460–463(2015).
9. Shackman, A. J. et al. The integration of negative affect, pain and cognitivecontrol in the cingulate cortex. Nat. Rev. Neurosci. 12, 154–167 (2011).
10. Kalin, N. H., Shelton, S. E., Fox, A. S., Oakes, T. R. & Davidson, R. J. Brainregions associated with the expression and contextual regulation of anxiety inprimates. Biol. Psychiatry 58, 796–804 (2005).
11. Mobbs, D. et al. When fear is near: threat imminence elicits prefrontal-periaqueductal gray shifts in humans. Science 317, 1079–1083 (2007).
12. Etkin, A., Egner, T., Peraza, D. M., Kandel, E. R. & Hirsch, J. Resolvingemotional conflict: a role for the rostral anterior cingulate cortex inmodulating activity in the amygdala. Neuron 51, 871–882 (2006).
13. Shin, L. M. et al. An fMRI study of anterior cingulate function inposttraumatic stress disorder. Biol. Psychiatry 50, 932–942 (2001).
14. Uylings, H. B., Groenewegen, H. J. & Kolb, B. Do rats have a prefrontal cortex?Behav. Brain Res. 146, 3–17 (2003).
15. Paxinos, G. & Franklin, K. B. The Mouse Brain in Stereotaxic Coordinates. 2ndedn, (Academic Press, San Diego, CA, 2004).
16. Heidbreder, C. A. & Groenewegen, H. J. The medial prefrontal cortex in therat: evidence for a dorso-ventral distinction based upon functional andanatomical characteristics. Neurosci. Biobehav. Rev. 27, 555–579 (2003).
17. Bicks, L. K., Koike, H., Akbarian, S. & Morishita, H. Prefrontal cortex andsocial cognition in mouse and man. Front. Psychol. 6, 1805 (2015).
18. Sesack, S. R., Deutch, A. Y., Roth, R. H. & Bunney, B. S. Topographicalorganization of the efferent projections of the medial prefrontal cortex in therat: an anterograde tract-tracing study with Phaseolus vulgarisleucoagglutinin. J. Comp. Neurol. 290, 213–242 (1989).
19. Cassell, M. & Wright, D. Topography of projections from the medialprefrontal cortex to the amygdala in the rat. Brain Res. Bull. 17, 321–333(1986).
20. McDonald, A., Mascagni, F. & Guo, L. Projections of the medial and lateralprefrontal cortices to the amygdala: a Phaseolus vulgaris leucoagglutinin studyin the rat. Neuroscience 71, 55–75 (1996).
21. Gross, C. T. & Canteras, N. S. The many paths to fear. Nat. Rev. Neurosci. 13,651–658 (2012).
22. Vazdarjanova, A., Cahill, L. & McGaugh, J. L. Disrupting basolateral amygdalafunction impairs unconditioned freezing and avoidance in rats. Eur. J.Neurosci. 14, 709–718 (2001).
23. Frankland, P. W., Bontempi, B., Talton, L. E., Kaczmarek, L. & Silva, A. J. Theinvolvement of the anterior cingulate cortex in remote contextual fearmemory. Science 304, 881–883 (2004).
24. Goshen, I. et al. Dynamics of retrieval strategies for remote memories. Cell147, 678–689 (2011).
25. Johansen, J. P. & Fields, H. L. Glutamatergic activation of anterior cingulatecortex produces an aversive teaching signal. Nat. Neurosci. 7, 398–403 (2004).
26. Blanchard, D. C., Griebel, G., Pobbe, R. & Blanchard, R. J. Risk assessment asan evolved threat detection and analysis process. Neurosci. Biobehav. Rev. 35,991–998 (2011).
27. Hu, H. et al. Emotion enhances learning via norepinephrine regulation ofAMPA-receptor trafficking. Cell 131, 160–173 (2007).
28. Isosaka, T. et al. Htr2a-expressing cells in the central amygdala control thehierarchy between innate and learned fear. Cell 163, 1153–1164 (2015).
29. Fendt, M. Exposure to urine of canids and felids, but not of herbivores,induces defensive behavior in laboratory rats. J. Chem. Ecol. 32, 2617–2627(2006).
30. Cezario, A. F., Ribeiro-Barbosa, E. R., Baldo, M. V. & Canteras, N. S.Hypothalamic sites responding to predator threats—the role of the dorsal
premammillary nucleus in unconditioned and conditioned antipredatorydefensive behavior. Eur. J. Neurosci. 28, 1003–1015 (2008).
31. Sukikara, M. H., Mota-Ortiz, S. R., Baldo, M. V., Felicio, L. F. & Canteras, N. S.The periaqueductal gray and its potential role in maternal behavior inhibitionin response to predatory threats. Behav. Brain Res. 209, 226–233 (2010).
32. Bittencourt, A. S., Carobrez, A. P., Zamprogno, L. P., Tufik, S. & Schenberg, L.C. Organization of single components of defensive behaviors within distinctcolumns of periaqueductal gray matter of the rat: role of N-methyl-D-asparticacid glutamate receptors. Neuroscience 125, 71–89 (2004).
33. Schoch, S. et al. SNARE function analyzed in synaptobrevin/VAMP knockoutmice. Science 294, 1117–1122 (2001).
34. Xu, W. & Südhof, T. C. A neural circuit for memory specificity andgeneralization. Science 339, 1290–1295 (2013).
35. Kremer, E. J. CAR chasing: canine adenovirus vectors–all bite and no bark? J.Gene Med. 6, S139–S151 (2004).
36. Shabel, S. J., Proulx, C. D., Piriz, J. & Malinow, R. GABA/glutamate co-releasecontrols habenula output and is modified by antidepressant treatment. Science345, 1494–1498 (2014).
37. McIntire, S. L., Reimer, R. J., Schuske, K., Edwards, R. H. & Jorgensen, E. M.Identification and characterization of the vesicular GABA transporter. Nature389, 870–876 (1997).
38. Zingg, B. et al. AAV-mediated anterograde transsynaptic tagging: mappingcorticocollicular input-defined neural pathways for defense behaviors. Neuron93, 33–47 (2017).
39. Wernecke, K. E. et al. Fox urine exposure induces avoidance behavior in rats andactivates the amygdalar olfactory cortex. Behav. Brain Res. 279, 76–81 (2015).
40. Blanchard, D. C. et al. Failure to produce conditioning with low-dosetrimethylthiazoline or cat feces as unconditioned stimuli. Behav. Neurosci.117, 360–368 (2003).
41. Tang, J. et al. Pavlovian fear memory induced by activation in the anteriorcingulate cortex. Mol. Pain 1, 6 (2005).
42. Bliss, T. V., Collingridge, G. L., Kaang, B. K. & Zhuo, M. Synaptic plasticity inthe anterior cingulate cortex in acute and chronic pain. Nat. Rev. Neurosci. 17,485–496 (2016).
43. Tye, K. M. et al. Amygdala circuitry mediating reversible and bidirectionalcontrol of anxiety. Nature 471, 358–362 (2011).
44. Tovote, P. et al. Midbrain circuits for defensive behaviour. Nature 534,206–212 (2016).
45. Kim, J., Zhang, X., Muralidhar, S., LeBlanc, S. A. & Tonegawa, S. Basolateral tocentral amygdala neural circuits for appetitive behaviors. Neuron 93,1464–1479 e1465 (2017).
46. Bissiere, S. et al. The rostral anterior cingulate cortex modulates the efficiencyof amygdala-dependent fear learning. Biol. Psychiatry 63, 821–831 (2008).
47. Allsop, S. A. et al. Corticoamygdala transfer of socially derived informationgates observational learning. Cell 173, 1329–1342.e18 (2018).
48. Malin, E. L., Ibrahim, D. Y., Tu, J. W. & McGaugh, J. L. Involvement of therostral anterior cingulate cortex in consolidation of inhibitory avoidancememory: interaction with the basolateral amygdala. Neurobiol. Learn. Mem.87, 295–302 (2007).
49. Kim, H. S., Cho, H. Y., Augustine, G. J. & Han, J. H. Selective control of fearexpression by optogenetic manipulation of infralimbic cortex after extinction.Neuropsychopharmacology 41, 1261–1273 (2016).
50. © 2011 Allen Institute for Brain Science. Allen Mouse Brain Connectivity Atlas.http://connectivity.brain-map.org/projection/experiment/478376911 (2015).
51. Yang, M. et al. The rat exposure test: a model of mouse defensive behaviors.Physiol. & Behav. 81, 465–473 (2004).
52. Jhang, J. et al. Figshare http://dx.doi.org/10.6084/m9.figshare.6370121 (2018).
AcknowledgementsThe authors thank all laboratory members for critical discussions and helpful comments.The authors also thank M.J. Kim and H.-Y. Cho for assistance with the preparation ofAAV materials. This work was supported by grants from the National Research Foun-dation of Korea (NRF) funded by the Korean Ministry of Science, ICT (MSI;2014R1A2A1A10053821), the Brain Research Program through the NRF(2017M3C7A1031322), an Intelligent Synthetic Biology Center of the Global FrontierProject funded by the MSI (2011-0031955), the KBRI basic research program throughKorea Brain Research Institute funded by the MSI (18-BR-01-03 and 18-BR-04-01), andthe KAIST Future Systems Healthcare Project. J.J. was supported by a National JuniorResearch Fellowship (2013H1A8A1003842) through the NRF.
Author contributionsJ.-H.H. designed and directed the study. J.J. performed surgical, behavioral, optogeneticand tracing experiments. H.L. and H.P. performed electrophysiological experiments andtdTomato tracing experiments. M.S.K. assisted with DNA sub-cloning and preparation of
NATURE COMMUNICATIONS | DOI: 10.1038/s41467-018-05090-y ARTICLE
NATURE COMMUNICATIONS | (2018) 9:2744 | DOI: 10.1038/s41467-018-05090-y | www.nature.com/naturecommunications 15

AAV materials. H.-S.L. performed c-Fos counting analysis. J.J., H.P., and J.-H.H. ana-lyzed the data and wrote the manuscript.
Additional informationSupplementary Information accompanies this paper at https://doi.org/10.1038/s41467-018-05090-y.
Competing interests: The authors declare no competing interests.
Reprints and permission information is available online at http://npg.nature.com/reprintsandpermissions/
Publisher's note: Springer Nature remains neutral with regard to jurisdictional claims inpublished maps and institutional affiliations.
Open Access This article is licensed under a Creative CommonsAttribution 4.0 International License, which permits use, sharing,
adaptation, distribution and reproduction in any medium or format, as long as you giveappropriate credit to the original author(s) and the source, provide a link to the CreativeCommons license, and indicate if changes were made. The images or other third partymaterial in this article are included in the article’s Creative Commons license, unlessindicated otherwise in a credit line to the material. If material is not included in thearticle’s Creative Commons license and your intended use is not permitted by statutoryregulation or exceeds the permitted use, you will need to obtain permission directly fromthe copyright holder. To view a copy of this license, visit http://creativecommons.org/licenses/by/4.0/.
© The Author(s) 2018
ARTICLE NATURE COMMUNICATIONS | DOI: 10.1038/s41467-018-05090-y
16 NATURE COMMUNICATIONS | (2018) 9:2744 | DOI: 10.1038/s41467-018-05090-y | www.nature.com/naturecommunications