RWHAP Part C County of Monterey 2019 Audit Report
251
County of Monterey State of California &RPSUHKHQVLYH $QQXDO )LQDQFLDO 5HSRUW )RU WKH )LVFDO <HDU (QGHG -XQH 3UHSDUHG DQG 6XEPLWWHG E\ WKH 2IILFH RI WKH $XGLWRU&RQWUROOHU 5XSD 6KDK &3$
-
Upload
khangminh22 -
Category
Documents
-
view
2 -
download
0
Transcript of RWHAP Part C County of Monterey 2019 Audit Report

County of Monterey State of California
&RPSUHKHQVLYH�$QQXDO�)LQDQFLDO�5HSRUW
)RU�WKH�)LVFDO�<HDU�(QGHG�-XQH���������
3UHSDUHG�DQG�6XEPLWWHG�E\�WKH�2IILFH�RI�WKH�$XGLWRU�&RQWUROOHU 5XSD�6KDK��&3$

Point Sur State Historical Park
Throughout history, Point Sur has been a navigational hazard, to which many shipwrecked captains can attest. In the 1880s, lighthouses and lightships provided invaluable warnings to the many ships that traveled close to shore, especially during rough weather when protruding headlands could provide them with much-needed shelter. It took mariners 11 years of petitioning the U.S. Lighthouse Service Board before money was allocated for Point Sur in 1886. Three years later, on August 1, 1889, the Lightstation keys were turned over to the first keeper. He and three assistants staffed the lighthouse and fog signal 24 hours a day.
The Point Sur Lightstation sits 361 feet above the surf on a large volcanic rock 19 miles south of Carmel along Highway 1. Point Sur is the only complete turn-of-the century Lightstation open to the public in California and is on the National Register of Historic Places. First lit on August 1, 1889, the lighthouse has remained in continuous operation. Lighthouse keepers and their families lived at the site from 1889 to 1974 when the lighthouse was automated. Today the Lightstation buildings are being restored through the efforts of park staff, State Park volunteers and the non-profit Central Coast Lighthouse Keepers. The Lightstation is open to the public only through docent-led tours.
Cover Photo Credit:
Maria Papurello, Administrative Services Assistant
Auditor-Controller’s Office

COUNTY OF MONTEREYSTATE OF CALIFORNIA
Comprehensive Annual Financial ReportFor the Fiscal Year Ended June 30, 2019
Prepared and Submitted by the Office of the Auditor-ControllerRupa Shah, CPA

This page intentionally left blank

COUNTY OF MONTEREYCOMPREHENSIVE ANNUAL FINANCIAL REPORT
For the Fiscal Year Ended June 30, 2019
TABLE OF CONTENTS
PAGE
INTRODUCTORY SECTIONLetter of Transmittal................................................................................................................................................................................................................................................................................................................................................................................................................................................................................................................................iCertificate of Achievement................................................................................................................................................................................................................................................................................................................................................................................................................................................................................................................................viiDirectory of County Officials................................................................................................................................................................................................................................................................................................................................................................................................................................................................................................................................viiiOrganizational Structure................................................................................................................................................................................................................................................................................................................................................................................................................................................................................................................................ix
FINANCIAL SECTIONIndependent Auditor's Report................................................................................................................................................................................................................................................................................................................................................................................................................................................................................................................................1Management Discussion and Analysis................................................................................................................................................................................................................................................................................................................................................................................................................................................................................................................................4
Basic Financial Statements:
Government-Wide Financial Statements:Statement of Net Position................................................................................................................................................................................................................................................................................................................................................................................................................................................................................................................................20Statement of Activities................................................................................................................................................................................................................................................................................................................................................................................................................................................................................................................................21
Fund Financial Statements:Balance Sheet Governmental Funds................................................................................................................................................................................................................................................................................................................................................................................................................................................................................................................................23Reconciliation of the Governmental Funds Balance Sheet to the Government-Wide Statement ofNet Position ................................................................................................................................................................................................................................................................................................................................................................................................................................................................................................................................24Statement of Revenues, Expenditures and Changes in Fund Balances Governmental Funds................................................................................................................................................................................................................................................................................................................................................................................................................................................................................................................................25Reconciliation of the Statement of Revenues, Expenditures and Changes in Fund Balancesof Governmental Funds to the Government-Wide Statement of Activities - Governmental Activities................................................................................................................................................................................................................................................................................................................................................................................................................................................................................................................................26Statement of Revenues, Expenditures, and Changes in Fund Balances - Budget and Actual General................................................................................................................................................................................................................................................................................................................................................................................................................................................................................................................................27Statement of Revenues, Expenditures, and Changes in Fund Balances - Budget and Actual Road Fund................................................................................................................................................................................................................................................................................................................................................................................................................................................................................................................................28Statement of Revenues, Expenditures, and Changes in Fund Balances - Budget and ActualBehavioral Health................................................................................................................................................................................................................................................................................................................................................................................................................................................................................................................................29Statement of Net Position Proprietary Funds................................................................................................................................................................................................................................................................................................................................................................................................................................................................................................................................30Statement of Revenues, Expenses and Changes in Net Position Proprietary Funds................................................................................................................................................................................................................................................................................................................................................................................................................................................................................................................................32Statement of Cash Flows................................................................................................................................................................................................................................................................................................................................................................................................................................................................................................................................33Statement of Fiduciary Net Position................................................................................................................................................................................................................................................................................................................................................................................................................................................................................................................................35Statement of Changes in Fiduciary Net Position................................................................................................................................................................................................................................................................................................................................................................................................................................................................................................................................36
Notes to the Financial Statements................................................................................................................................................................................................................................................................................................................................................................................................................................................................................................................................37
Required Supplementary Information (Other than MD & A):Schedules Related to OPEB Liability................................................................................................................................................................................................................................................................................................................................................................................................................................................................................................................................84Schedule of Changes in Net Pension Liability and Related Ratios................................................................................................................................................................................................................................................................................................................................................................................................................................................................................................................................86Schedule of the Proportionate Share of the Net Pension Liability................................................................................................................................................................................................................................................................................................................................................................................................................................................................................................................................90Schedule of Pension Contributions................................................................................................................................................................................................................................................................................................................................................................................................................................................................................................................................91
Supplementary Information:
Nonmajor Governmental Funds:Combining Balance Sheet................................................................................................................................................................................................................................................................................................................................................................................................................................................................................................................................94

COUNTY OF MONTEREYCOMPREHENSIVE ANNUAL FINANCIAL REPORT
For the Fiscal Year Ended June 30, 2019
TABLE OF CONTENTS
PAGE
Combining Statement of Revenues, Expenditures and Changes in Fund Balances NonmajorGovernmental Funds................................................................................................................................................................................................................................................................................................................................................................................................................................................................................................................................95
Special Revenue Funds-nonmajor:Combining Balance Sheet Special Revenue-nonmajor................................................................................................................................................................................................................................................................................................................................................................................................................................................................................................................................97Combining Statement of Revenues, Expenditures and Changes in Fund Balances
Special Revenue-nonmajor................................................................................................................................................................................................................................................................................................................................................................................................................................................................................................................................103Special Revenue Funds Budgetary Comparison Schedules:
Budgetary Comparison Schedule County Library................................................................................................................................................................................................................................................................................................................................................................................................................................................................................................................................109Budgetary Comparison Schedule In-Home Support Services................................................................................................................................................................................................................................................................................................................................................................................................................................................................................................................................110Budgetary Comparison Schedule Fish and Game Propagation................................................................................................................................................................................................................................................................................................................................................................................................................................................................................................................................111Budgetary Comparison Schedule WIB - OET................................................................................................................................................................................................................................................................................................................................................................................................................................................................................................................................112Budgetary Comparison Schedule Community Action Partnership................................................................................................................................................................................................................................................................................................................................................................................................................................................................................................................................113Budgetary Comparison Schedule Inclusionary Housing................................................................................................................................................................................................................................................................................................................................................................................................................................................................................................................................114Budgetary Comparison Schedule Community Development................................................................................................................................................................................................................................................................................................................................................................................................................................................................................................................................115Budgetary Comparison Schedule Homeland Security Grant................................................................................................................................................................................................................................................................................................................................................................................................................................................................................................................................116Budgetary Comparison Schedule H&W Realignment................................................................................................................................................................................................................................................................................................................................................................................................................................................................................................................................117Budgetary Comparison Schedule NGEN Operations & Maintenance ................................................................................................................................................................................................................................................................................................................................................................................................................................................................................................................................118Budgetary Comparison Schedule Emergency Medical Service................................................................................................................................................................................................................................................................................................................................................................................................................................................................................................................................119Budgetary Comparison Schedule Local Revenue 2011................................................................................................................................................................................................................................................................................................................................................................................................................................................................................................................................120Budgetary Comparison Schedule Workforce Development Board ................................................................................................................................................................................................................................................................................................................................................................................................................................................................................................................................121Budgetary Comparison Schedule E. Garrison Community Services District................................................................................................................................................................................................................................................................................................................................................................................................................................................................................................................................122Budgetary Comparison Schedule Nacimiento Hydroelectric Operations................................................................................................................................................................................................................................................................................................................................................................................................................................................................................................................................123Budgetary Comparison Schedule Other Water Resources Agencies................................................................................................................................................................................................................................................................................................................................................................................................................................................................................................................................124Budgetary Comparison Schedule County Service Areas................................................................................................................................................................................................................................................................................................................................................................................................................................................................................................................................125Budgetary Comparison Schedule Sanitation Districts................................................................................................................................................................................................................................................................................................................................................................................................................................................................................................................................126Budgetary Comparison Schedule Housing Successor................................................................................................................................................................................................................................................................................................................................................................................................................................................................................................................................127
Debt Service Funds-nonmajor:Combining Balance Sheet Debt Service................................................................................................................................................................................................................................................................................................................................................................................................................................................................................................................................129Combining Statement of Revenues, Expenditures and Changes in Fund Balances Debt Service................................................................................................................................................................................................................................................................................................................................................................................................................................................................................................................................130Debt Service Funds Budgetary Comparison Schedules:
Budgetary Comparison Schedule Debt Service General................................................................................................................................................................................................................................................................................................................................................................................................................................................................................................................................131Budgetary Comparison Schedule Monterey County Financing Authority................................................................................................................................................................................................................................................................................................................................................................................................................................................................................................................................132Budgetary Comparison Schedule Public Improvement Corporation................................................................................................................................................................................................................................................................................................................................................................................................................................................................................................................................133
Capital Projects Funds-nonmajor:Statement of Revenues, Expenditures, and Changes in Fund Balances - Budget and Actual
Facility Master Plan Implementation................................................................................................................................................................................................................................................................................................................................................................................................................................................................................................................................135Combining Balance Sheet Capital Projects-Nonmajor................................................................................................................................................................................................................................................................................................................................................................................................................................................................................................................................136Combining Statement of Revenues, Expenditures and Changes in Fund Balances Capital

COUNTY OF MONTEREYCOMPREHENSIVE ANNUAL FINANCIAL REPORT
For the Fiscal Year Ended June 30, 2019
TABLE OF CONTENTS
PAGE
Projects-Nonmajor................................................................................................................................................................................................................................................................................................................................................................................................................................................................................................................................138Capital Projects Funds Budgetary Comparison Schedules
Budgetary Comparison Schedule Capital Projects................................................................................................................................................................................................................................................................................................................................................................................................................................................................................................................................140Budgetary Comparison Schedule Facilities Project................................................................................................................................................................................................................................................................................................................................................................................................................................................................................................................................141Budgetary Comparison Schedule Other Water Resources Agencies................................................................................................................................................................................................................................................................................................................................................................................................................................................................................................................................142Budgetary Comparison Schedule NGEN Radio Project................................................................................................................................................................................................................................................................................................................................................................................................................................................................................................................................143Budgetary Comparison Schedule East Garrison Capital Projects................................................................................................................................................................................................................................................................................................................................................................................................................................................................................................................................144
Internal Service Funds:Combining Statement of Net Position Internal Service Funds................................................................................................................................................................................................................................................................................................................................................................................................................................................................................................................................146Combining Statement of Revenues, Expenses and Changes in Net Position Internal Service Funds................................................................................................................................................................................................................................................................................................................................................................................................................................................................................................................................147Combining Statement of Cash Flows Internal Service Funds................................................................................................................................................................................................................................................................................................................................................................................................................................................................................................................................148
Agency Funds:Combining Statement of Changes in Assets and Liabilities Agency................................................................................................................................................................................................................................................................................................................................................................................................................................................................................................................................150
Detailed Budget Schedule:Schedule of Expenditures-Budget and Actual on Budgetary Basis General................................................................................................................................................................................................................................................................................................................................................................................................................................................................................................................................152
STATISTICAL SECTION
Net Position by Component,................................................................................................................................................................................................................................................................................................................................................................................................................................................................................................................................156Changes in Net Position................................................................................................................................................................................................................................................................................................................................................................................................................................................................................................................................157Fund Balances, Governmental Funds................................................................................................................................................................................................................................................................................................................................................................................................................................................................................................................................159Changes in Fund Balances, Governmental Funds................................................................................................................................................................................................................................................................................................................................................................................................................................................................................................................................160Assessed Value and Actual Value of Taxable Property................................................................................................................................................................................................................................................................................................................................................................................................................................................................................................................................161Principal Property Taxpayers................................................................................................................................................................................................................................................................................................................................................................................................................................................................................................................................162Property Tax Levies and Collections................................................................................................................................................................................................................................................................................................................................................................................................................................................................................................................................163Debt Service Tax Rate For County And Major Overlapping Government................................................................................................................................................................................................................................................................................................................................................................................................................................................................................................................................164Taxable Sales by Category................................................................................................................................................................................................................................................................................................................................................................................................................................................................................................................................165Transient Occupancy Tax................................................................................................................................................................................................................................................................................................................................................................................................................................................................................................................................166Ratios of Outstanding Debt by Type................................................................................................................................................................................................................................................................................................................................................................................................................................................................................................................................167Legal Debt Margin Information ................................................................................................................................................................................................................................................................................................................................................................................................................................................................................................................................168Pledged Revenue Coverage................................................................................................................................................................................................................................................................................................................................................................................................................................................................................................................................169Direct and Overlapping Bonded Debt................................................................................................................................................................................................................................................................................................................................................................................................................................................................................................................................170Demographics and Economic Statistics................................................................................................................................................................................................................................................................................................................................................................................................................................................................................................................................172Major Industries by Number of Businesses, Employees and Payroll................................................................................................................................................................................................................................................................................................................................................................................................................................................................................................................................173Full-Time Equivalent County Government Employees by Function/Program................................................................................................................................................................................................................................................................................................................................................................................................................................................................................................................................175Operating Indicators by Function/ Program................................................................................................................................................................................................................................................................................................................................................................................................................................................................................................................................176Capital Asset Statistics................................................................................................................................................................................................................................................................................................................................................................................................................................................................................................................................181

This page intentionally left blank

INTRODUCTORY SECTION

This page intentionally left blank

MONTEREY COUNTYAUDITOR - CONTROLLER(831) 755-�����ƒ�)$;����������-�����ƒ�3�2��%2;�����ƒ�6$/,1$6��&$/,)251,$�������
RUPA SHAH, CPAAUDITOR-CONTROLLER
December 20, 2019
To the Honorable Members of the Board of Supervisorsand the Citizens of Monterey County:
The Comprehensive Annual Financial Report (CAFR) of the County of Monterey (County) for the fiscal year ended June 30, 2019, is hereby submitted in compliance with Sections 25250 and 25253 of the Government Code of the State of California. Management assumes full responsibility for the completeness and reliability of the information contained in this report, based upon a comprehensive internal control framework it established for this purpose. Because the cost of internal controls should not exceed anticipated benefits, the objective is to provide reasonable, rather than absolute, assurance that the financial statements are free of any material misstatements.
The independent auditor’s report is located at the front of the financial section of this report. CliftonLarsonAllen LLP has issued an unmodified (“clean”) opinion on the County’s financial statements for the year ended June 30, 2019. Management’s discussion and analysis (MD&A) immediately follows the independent auditor’s report and provides a narrative introduction, overview, and analysis of the financial statements. MD&A complements this letter of transmittal and should be read in conjunction with it.
PROFILE OF THE GOVERNMENT
Overview of the County
History and Geography: Monterey, described as the “greatest meeting of land and sea” celebrated its quadricentennial in 2002. In 1602, Spanish merchant Sebastian Vizcaino became the first European on the Monterey Peninsula. He christened Monterey after the viceroy of New Spain, Count de Monte Rey. Eventually, the City of Monterey served as California’s first capital, where the State constitution was signed in 1849. Monterey County is one of the 27 original California counties, incorporating in 1850.
With an area of about 3,300 square miles, the County of Monterey borders the Pacific Ocean almost at the midpoint of California with 99 miles of coastline. The County is located about 100 miles south of San Francisco and 240 miles north of Los Angeles. It is bordered by Santa Cruz County to the north, San Benito (originally part of Monterey County), Fresno and Kings Counties to the east and San Luis Obispo County to the south.
There are two distinct sub-regions in the County. One is the Monterey Peninsula, world famous for beautiful ocean views, opulent homes, the 17-mile drive, delicious seafood and world-class golf courses. The other, the Salinas Valley, is equally renowned as an area full of fertile farmland, running almost the entire length of the County and is one of the world’s major vegetable producing areas.
The County also benefits from two wilderness areas set aside for recreational enjoyment, consisting of 468,538 total acres. The Los Padres National Forest has 304,035 acres and the Ventana Wilderness totals 164,503 acres.
Structure: The County is a general law county. The County government is comprised of ten elected officials including a five-member Board of Supervisors, the Assessor-Clerk-Recorder, the Auditor-Controller, the District Attorney, the Sheriff and the Treasurer-Tax Collector; all elected to four-year terms. A County Administrative Officer (CAO) is appointed by the Board of Supervisors and functions as the Chief Executive Officer.
i

The accounts of the County are organized on the basis of funds, each of which is considered a separate entity. The operations of each fund are accounted for with a separate set of self-balancing accounts that comprise its assets, liabilities, net assets, revenues and expenditures or expenses as appropriate. Government resources are allocated to and accounted for in individual funds based upon the purposes for which they are to be spent and the means by which the spending activities are controlled.
Services: The County government provides a full range of public services including public safety, roads and facilities, social services, administrative services, health services, sanitation services and leisure services. Typically, the department heads who run these operations, other than the elected department heads, report to the CAO.
Population: The County population has demonstrated consistent growth over the past decade. As of January 2019, the County had population of approximately 445,000. About 98% of the 3,300 square miles in the County are outside of a municipality, with about 24% of the residents living in these unincorporated areas. The City of Salinas serves as the County seat and is the County’s largest city with a population of approximately 163,000. The eleven other incorporated cities are Carmel-by-the-Sea, Del Rey Oaks, Gonzales, Greenfield, King City, Marina, Monterey, Pacific Grove, Sand City, Seaside, and Soledad. (Source: California Department of Finance, Demographic Research Unit)
Component Units
This report includes all the funds of the County of Monterey and the entities described in Note 1 of the Notes. Although all these entities are legally separate from the County, the County Board of Supervisors serve as the governing board of each entity (except for Monterey County Children and Families Commission) and the entities meet the test required by GAAP to be presented as blended and discretely presented component units in the County Financial Statements. In addition, individual financial statements are available for some of the component units and can be obtained by contacting the Office of the Auditor-Controller of the County of Monterey.
Budgetary Process
The County is required by State law to adopt a balanced budget by October 2 of each fiscal year. The annual budget serves as the foundation for the County’s financial planning and control of expenditures. Budgets are adopted for all governmental and proprietary funds. Budgets are adopted through the passage of resolutions by the Board of Supervisors. These resolutions set the County’s limits on expenditures, which cannot be changed except by subsequent amendments to the budget. The legal level of budgetary control is at the Department Budget Unit level. Budget data is prepared on the modified accrual basis consistent with comparable actual amounts.
Encumbrance accounting is utilized during the year for budget control purposes. Unspent encumbered budget appropriations lapse at the end of the fiscal year. Board of Supervisors policy requires re-appropriation of carryover capital improvement projects on an annual basis after review of each project status.
Budget appropriation transfers and amendments are used to appropriate new expenditures, unanticipated revenues or to transfer existing appropriations from one budget unit to another. Transfers and amendments must be approved by the Board of Supervisors.
ii

FACTORS AFFECTING FINANCIAL CONDITION
State Government
The County is a political subdivision of the State of California and as such, its government is subject to State subventions and regulations. Therefore, the County’s financial health is tied closely to the financial condition of the State government. The County cannot predict whether the State will encounter budgetary difficulties in the current or future fiscal years. The County also cannot predict the impact future budgets will have on the County’s finances and operations. Current and future State budget will be affected by national and State economic conditions and other factors outside County’s control.
Local Economy
Monterey County’s economy is primarily based on agribusiness in the Salinas Valley, tourism in the coastal regions, government and non-profit sectors. The trade, transportation and utilities group continue to become a larger part of the Monterey County economy.
Agribusiness: Agribusiness continues to be Monterey County’s No. 1 industry and remains the fourth highest in Ag production among agricultural counties in California. The agriculture industry and related supporting industries provide more than 76,000 full time jobs to the region, representing more than one in four jobs in Monterey County.Crop values fluctuate yearly based on production, market and weather conditions. Monterey County’s total production surpasses over twenty of other states, with a total economic impact of agricultural production exceeding $4 billion annually since 2012.
Agricultural Production
Vegetable Crops64%
Fruit and Nut Crops23%
Livestock and Poultry
3%
Nursery Crops5%
Apiary and Field and Seed
Crops
5%
$4.3 Billion
Tourism: Tourism in Monterey County is a $2.8 billion-dollar industry and is second only to Agribusiness. Tourism also contributed more than25,000 jobs to the local economy. Monterey County’s second largest source of discretionary revenue is Transient Occupancy Tax (TOT). Often referred to as “hotel tax”, TOT is the tax applied on hotel/motel accommodations. The TOT rate for Monterey County is 10.5%. Tourism is reflecting an upward trend in Monterey County with the exception for Fiscal Year 2017. In FY2017, County revenues from TOT were $21 million, a decrease of 7% over FY2016. The decrease of the FY 2017 is attributable to the Soberanes fire, and storm-related road damages in the Big Sur area. TOT revenues for FY19 were $28.6 million, an increase of 14.4% over the prior year.
Transient Occupancy Tax ($millions)
$21.5 $22.8 $21.2
$25.0
$28.6
$0.0
$5.0
$10.0
$15.0
$20.0
$25.0
$30.0
$35.0
2014�2015 2015�2016 2016�2017 2017�2018 2018�2019
iii

Employment: The County’s unemployment rate continues to decline, consistent with State and National trends. The County normally experiences periods of relatively high unemployment as the agribusiness moves from one season to the next. According to the State Employment Development Department reports, the unemployment rate inMonterey County was 4.7% as of June 2019, a decrease of 0.5% compared to the year-ago rate of 5.2%. The state average unemployment rate asof June 2019 was 4.2%.
Unemployment Rate
0.0%
2.0%
4.0%
6.0%
8.0%
10.0%
12.0%
2010 2011 2012 2013 2014 2015 2016 2017 2018 2019
Real Estate / Housing: The average home price in Monterey County has increased compared to last year. This year’s bigger inventory means the buyers may have a bigger selection to choose from; the total number of homes available for sale was up 4.6%. However, property sales in June of 2019 were down 24.5% from May of 2019, and 25.1% down compared to June of 2018.
Long-Term Financial Planning
Three-Year Financial Forecast: In order to provide County policy-makers and the public an updated assessment of the County’s financial conditions, the County Office of Administration develops an annual Three-Year Financial Forecast. This report considers the latest economic developments and includes historical perspective on General Fund revenues and expenditures, an updated current year estimate, and three-year financial outlook.
Capital Improvement Program (Five-Year-Plan): The Capital Improvement Program budgets for the implementation of capital investments, and incorporates its impact on the operating budget, which includedesign, construction, equipment, land purchases and project administration. The program includes projects where costs exceed $100,000, are non-recurring, and have an estimated useful life of five years or more. Additionally, the program assists in measuring debt financing requirements for the County and serves as a platform for identifying needs, related costs, and funding sources.
Debt Administration: The County uses the Sympro Debt Management System to monitor and manage the debt for the County, schools, and special districts. This tool assists management to develop scenarios, monitor market activities, and capitalize on financial opportunities.
County Debt Obligations: The County issued Monterey County Financing Authority 2018 Revenue Refunding Bonds in the aggregate amount of $22.9 million, which refunded all of the outstanding 2008 Financing Authority Revenue Bonds. As a result of this refunding, the County reduced total debt service requirementsover the next 20 years by approximately $6.5 million, which resulted in net present value savings of approximately $5.1 million.
Credit Ratings: The County utilizes all three ratings agencies to provide credit ratings, as needed for both long- and short-term issuances. The County’s long-term bond issuances are subject to a follow-up review every two years. In November 2019, Standard & Poor’s upgraded the County’s General Obligation (GO) rating to AAA, which is the highest rating a public agency can achieve, indicating the County has the highest credit quality and lower levels of credit risk. This achievement was made possible through robust management of the County’s resources including adherence to strong financial policies and practices. Additionally, the County’s rating for Lease Obligation Bonds (COPs) was upgraded to AA+ from AA.
Currently, the ratings for County issued debt are as follows:
FitchRating/Outlook
Moody’sRating/Outlook
S&PRating/Outlook
General Obligation Bonds
AA+ /Stable Aa2 Implied AAA/Stable
Lease Obligation Bonds (COPs)
AA/Stable Aa3 Stable AA+/Stable
iv

The County continues developing strategies to aggressively improve the efficiencies and effectiveness of operations and capitalize on these re-engineering efforts to improve its finances.
Proposed and Subsequent Financings: In December 2019, the County issued 2019 Certificates of Participation (Public Facilities Refinancing) in the amount of $29 million to refund the 2010 and 2009certificates of participation. As a result of this refunding, the County reduced total debt service requirements over the next nine years by approximately $3.7 million, which resulted in net present value savings of approximately $3.6 million.
Relevant Financial Policies
Debt Management Policy: The debt management policy sets forth certain debt management objectives for the County and establishes overall parameters for issuing and administering the County’s debt. The policy allows for issuance of long-term debt to finance major capital improvements. The County carefully assess capital improvement priorities, capital costs, annual debt service capacity, and annual operating and maintenance costs on scheduled improvements in advance of deciding to incur indebtedness.
Investment Management Policy: The Commingled Pool, the County’s pooled deposits and investments, are governed by California Government Code and by a County investment policy. The policy is reviewed annually by the Treasury Oversight Committee and approved annually by the Board of Supervisors. The County’s investment policy stipulates, among other things, approved investment categories, maturity limits, and credit rating minimums for County investments.
Strategic Reserve Policy: Under this policy, the County will commit a portion the General Fund fund balanceas a strategic reserve to provide the County with sufficient working capital and be used to fund settlement of legal judgments against the County in excess of reserves normally designated for litigation, for short-term revenue reductions due to economic downturns, for natural disasters as determined by the County Administrative Officer or Board, and for one-time only state budget reductions that could not be addressed through the annual appropriations for contingencies in the General Fund. The goal of the County is to maintain a strategic reserve equal to ten percent (10%) of the General Fund estimated revenues. The Natividad Medical Center (NMC) strategic reserve designation, established in 2011, is as a sub-designation of the General Fund strategic reserve. During fiscal year 2019, the County continued increasing its reserves by adding $29.0 million to the Strategic Reserve, reaching 9.9% of estimated general fund revenues, $0.5 million away from meeting the 10% funding goal set by Board policy. As of June 30, 2019, the Strategic Reserve balance was $91.5 million – consisting of a General Fund Strategic Reserve at $66.5 million and an NMC Strategic Reserve at $25 million (funded from unrestricted NMC net position moneys to be used only for NMC purposes).
Strategic Reserve (in millions)
38.146.1 46.1
56.1 56.1
27.5
37.5
66.5
14.2
14.2 14.2
14.2 17.8
17.8
25.0
25.0
$0.0
$10.0
$20.0
$30.0
$40.0
$50.0
$60.0
$70.0
$80.0
$90.0
$100.0
2012 2013 2014 2015 2016 2017 2018 2019
NMC
GF
ADDITIONAL AVAILABLE INFORMATION
Copies of this CAFR, the County Final Budgets, the Tax Rate Books, and other documents are available on the internet, www.co.monterey.ca.us/auditor.
v

vi

vii

COUNTY OF MONTEREY
DIRECTORY OF COUNTY OFFICIALS
June 30, 2019
Legislative Branch:Board of Supervisors'LVWULFW����....... ��������������������.Luis A. AlejoDistrict #2.�����������������������.John M. PhillipsDistrict ���������������������.��..��Chris M. Lopez'LVWULFW�������������������������������..Jane Parker'LVWULFW�������������������������..�0DU\�L. Adams
Elected County Officials:Assessor ± County Clerk-Recorder����������������.Stephen L. VagniniAuditor-&RQWUROOHU��������������.....................��..Rupa Shah, CPA'LVWULFW�$WWRUQH\�������������..�������Jeannine PacioniSheriff-&RURQHU������..�����������...........................Steve BernalTreasurer-Tax Collector....������������������Mary A. Zeeb
Appointed Department Heads & Agency Officials:County Administrative Officer������������..�����...Lew C. Bauman$JULFXOWXUDO�&RPPLVVLRQHU����������������...��Henry S. GonzalesChild Support Services Director ������������������Jody Holtzworth&OHUN�RI�WKH�%RDUG����������...������������...Valerie RalphCooperative Extension Director �����������������Maria de la FuenteCounty Counsel.�����.������������������....Charles J. McKeeCounty Librarian....�����������������������.Hillary TheyerEconomic Development Coordinator�������..�..������Anastacia WyattEmergency Communications Director.����������..���Lee Ann MagoskiCivil Rights Officer ��������������..�������Juan P. RodriguezHealth Services Director, Public Administrator.............�����.�Elsa M. Jimenez+XPDQ�5HVRXUFHV�������������������Irma Ramirez-BoughInformation Technology Director. �������������...Eric A. Chatham0LOLWDU\�DQG�9HWHUDQV¶�$IIDLUV Officer.�����....................................Jason CameronNatividad Medical Center Chief Executive Officer..���������Dr. Gary Gray3XEOLF�'HIHQGHU������������������.���Susan ChapmanRegistrar of Voters��������������������&ODXGLR�9DOHQ]XHODResource Management Agency Director..���...�����Carl Holm (DBE Liaison)Social & Employment Services 'LUHFWRU����������������Lori MedinaWater Resources Agency General Manager�................................David Chardavoyne
Appointed by Superior Court:Chief Probation Officer .���������������������Marcia Parsons
viii

Electorate
$VVHVVRU���&RXQW\�&OHUN����5HFRUGHU�
$XGLWRU���&RQWUROOHU��
'LVWULFW�$WWRUQH\��
6KHULII���&RURQHU��
7UHDVXUHU����7D[�&ROOHFWRU�
�
Superior Court - Judges
County Administrative Office
&KLOG�6XSSRUW�6HUYLFHV�
Board of Supervisors
&RRSHUDWLYH�([WHQVLRQ�
+HDOWK�6HUYLFHV�
(PHUJHQF\�&RPPXQLFDWLRQV�
(OHFWLRQV�
,QIRUPDWLRQ�7HFKQRORJ\��
/LEUDU\�6HUYLFHV��
0LOLWDU\��9HWHUDQV�$IIDLUV��
3DUNV�
6RFLDO��(PSOR\PHQW�6HUYLFHV���
5HVRXUFH�0JPW�$JHQF\��
3ODQQLQJ�
%XLOGLQJ�6HUYLFHV��
:DWHU�5HVRXUFHV�$JHQF\�*HQHUDO�0DQDJHU�
3XEOLF�:RUNV�
1DWLYLGDG�0HGLFDO�&HQWHU�&KLHI�([HFXWLYH�2IILFHU�
:DWHU�5HVRXUFHV�$JHQF\��%RDUG�RI�'LUHFWRUV�
&LYLO�5LJKWV�2IILFH��
1DWLYLGDG�0HGLFDO�&HQWHU��%RDUG�RI�7UXVWHHV�
&RXQW\�&RXQVHO��
3UREDWLRQ�
County of Monterey Organizational Structure
County Elected
Officials
&RXUW�([HFXWLYH�2IILFHU�
'LVWULFW��� 'LVWULFW��� 'LVWULFW���
'LVWULFW����
'LVWULFW���
&OHUN�RI�WKH�%RDUG�
+XPDQ�5HVRXUFHV�
$JULFXOWXUDO��&RPPLVVLRQHU�
(FRQRPLF�'HYHORSPHQW�
3XEOLF�'HIHQGHU�
ix

This page intentionally left blank

Financial Section

This page intentionally left blank

CliftonLarsonAllen LLP CLAconnect.com
INDEPENDENT AUDITORS’ REPORT
Board of Supervisors County of Monterey, California
Report on the Financial Statements
We have audited the accompanying financial statements of the governmental activities, the business-type activities, the discretely presented component unit, each major fund, and the aggregate remaining fund information of the County of Monterey, California (County), as of and for the year ended June 30, 2019, and the related notes to the financial statements, which collectively comprise the County’s basic financial statements as listed in the table of contents.
Management’s Responsibility for the Financial Statements
Management is responsible for the preparation and fair presentation of these financial statements in accordance with accounting principles generally accepted in the United States of America; this includes the design, implementation, and maintenance of internal control relevant to the preparation and fair presentation of financial statements that are free from material misstatement, whether due to fraud or error.
Auditor’s Responsibility
Our responsibility is to express opinions on these financial statements based on our audit. We did not audit the financial statements of the Monterey County Children and Families Commission, which represent 100 percent of the assets, net position, and revenues of the discretely presented component unit. Those statements were audited by other auditors, whose report has been furnished to us, and our opinion, insofar as it relates to the amounts included for the discretely presented component unit, is based solely on the report of the other auditors. We conducted our audit in accordance with auditing standards generally accepted in the United States of America and the standards applicable to financial audits contained in Government Auditing Standards, issued by the Comptroller General of the United States. Those standards require that we plan and perform the audit to obtain reasonable assurance about whether the financial statements are free from material misstatement.
An audit involves performing procedures to obtain audit evidence about the amounts and disclosures in the financial statements. The procedures selected depend on the auditor’s judgment, including the assessment of the risks of material misstatement of the financial statements, whether due to fraud or error. In making those risk assessments, the auditor considers internal control relevant to the entity’s preparation and fair presentation of the financial statements in order to design audit procedures that are appropriate in the circumstances, but not for the purpose of expressing an opinion on the effectiveness of the entity’s internal control. Accordingly, we express no such opinion. An audit also includes evaluating the appropriateness of accounting policies used and the reasonableness of significant accounting estimates made by management, as well as evaluating the overall presentation of the financial statements.
We believe that the audit evidence we have obtained is sufficient and appropriate to provide a basis for our audit opinions.
Opinions
In our opinion, based on our audit and the report of other auditors, the financial statements referred to above present fairly, in all material respects, the respective financial position of the governmental activities, the business-type activities, the discretely presented component unit, each major fund, and the aggregate remaining fund information of the County, as of June 30, 2019, and the respective changes in financial position, and where applicable, cash flows thereof and the respective budgetary comparison for the General, Behavioral Health and Road Funds for the year then ended in accordance with accounting principles generally accepted in the United States of America.
1

Board of Supervisors County of Monterey, California
Emphasis of Matter
As described in Note 21 to the basic financial statements, prior period adjustments were recorded for the correction of errors in the prior year financial statements. Our opinions are not modified with respect to this matter.
Other Matters
Required Supplementary InformationAccounting principles generally accepted in the United States of America require that the management’s discussion and analysis, schedule of changes in net OPEB liability and related ratios, schedule of OPEB contributions, schedule of changes in net pension liability and related ratios, schedule of proportionate share of the net pension liability, and the schedule of pension contributions, as listed in the table of contents, be presented to supplement the basic financial statements. Such information, although not a part of the basic financial statements, is required by the Governmental Accounting Standards Board who considers it to be an essential part of financial reporting for placing the basic financial statements in an appropriate operational, economic, or historical context. We have applied certain limited procedures to the required supplementary information in accordance with auditing standards generally accepted in the United States of America, which consisted of inquiries of management about the methods of preparing the information and comparing the information for consistency with management’s responses to our inquiries, the basic financial statements, and other knowledge we obtained during our audit of the basic financial statements. We do not express an opinion or provide any assurance on the information because the limited procedures do not provide us with sufficient evidence to express an opinion or provide any assurance.
Other Information Our audit was conducted for the purpose of forming opinions on the financial statements that collectively comprise the County of Monterey's basic financial statements. The introductory section, combining and individual nonmajor fund financial statements and schedules, and statistical section are presented for purposes of additional analysis and are not a required part of the basic financial statements.
The combining and individual nonmajor fund financial statements and schedules are the responsibility of management and were derived from and relate directly to the underlying accounting and other records used to prepare the basic financial statements. Such information has been subjected to the auditing procedures applied in the audit of the basic financial statements and certain additional procedures, including comparing and reconciling such information directly to the underlying accounting and other records used to prepare the basic financial statements or to the basic financial statements themselves, and other additional procedures in accordance with auditing standards generally accepted in the United States of America. In our opinion, the information is fairly stated, in all material respects, in relation to the basic financial statements as a whole.
The introductory and statistical sections have not been subjected to the auditing procedures applied in the audit of the basic financial statements, and accordingly, we do not express an opinion or provide any assurance on them.
2

3

This page intentionally left blank

COUNTY OF MONTEREYManagement Discussion and Analysis
The information in this section is not covered by the Independent Auditor's Report, but is presented as requiredsupplementary information for the benefit of the readers of the CAFR. As management of the County, we offer readers of the County's financial statements this narrative overview and analysis ofthe financial activities of the County for the fiscal year ended June 30, 2019. We encourage readers to consider theinformation presented here in conjunction with additional information that we have furnished in the County's BasicFinancial Statements, which immediately follow this section. All amounts, unless otherwise indicated, are expressed inmillions.
FINANCIAL HIGHLIGHTS The assets and deferred outflows of resources of the County exceeded its liabilities and deferred inflow of resources at
the close of the fiscal year by $818.3 (net position). Of this amount, $(116.2) represents unrestricted net position.Restricted net position of $230.0 represents resources that are subject to external restrictions on their use and areavailable to meet the County’s ongoing obligations related to programs with external restrictions. The remaining $704.5represents the County’s investment in capital assets, less any related outstanding debt used to acquire those assets (netinvestment in capital assets). These capital assets are used to provide services to citizens and are not available for futurespending. (See Table 1 – Net Position.)
The County’s total net position increased by $122.7 during the current fiscal year. The increase in net position representsthe degree to which revenues exceeded expenses, an indication that the financial position of the County is improving. Inaddition, there was a prior year adjustment of $8.1 million that effected the beginning net position. (See Table 1 – NetPosition and Table 2 – Change in Net Position.)
As of June 30, 2019, the County’s governmental funds reported total ending fund balances of $448.6. Ending fundbalance increased by $22.5 primarily due to the $34.2 excess of revenues over expenditures and net proceeds of $1.1 onthe Monterey County Financing Authority 2018 Revenue Refunding Bonds and defeasance of the 2008 MontereyCounty Financing Authority Revenue Bonds, Series A (Salinas Valley Water Project). The increases were reduced bythe $12.8 of transfers out over transfers in. Of the total fund balance amount, $157.5, or 35.1% is limited in how theresources can be used (assigned fund balance). The Board of Supervisors self-imposed limitations of the use of $113.8,or 25.4% of fund balance for future plans, projects, and purposes such as those identified in the strategic reserve policyfor economic uncertainties, natural disasters, and legal settlements (committed fund balance). Approximately $174.5, or38.9% is restricted by legislative code, grants, or debt instruments (restricted fund balance). Inventories & prepaid itemsthat are (1) not in spendable form, or (2) legally or contractually required to be maintained intact make up $0.7, or 0.1%of fund balance (nonspendable fund balance). The remaining $2.3, or 0.5% is available for future spending and is notconstrained by either outside parties or the County’s legislative body (unassigned fund balance). (See further discussionin Financial Analysis of the County’s Funds beginning on page 10).
At the end of the fiscal year 2018-19, the General Fund unassigned fund balance decreased by $1.5 to $2.4 from theprior year unassigned fund balance. The decrease was due to the use of unrestricted funds for expenditures not meetingthe restrictions of the revenues contributing to the increase in fund balance. Commitments increased by $29.0 to $91.5.The increase was entirely attributable to transfers to the Strategic Reserve by the General Fund. The assigned fundbalance of $81.5 is an increase of $1.5 from the prior year assigned fund balance, as discussed above. The restrictedfund balance increased $0.4 to $29.2 due to the amount of restricted revenues received exceeded the expenditures thatmet the requirements of the restrictions. The nonspendable fund balances (described above) reported $0.7. (See furtherdiscussion in Financial Analysis of the County’s Funds beginning on page 10.
The total long-term debt for the current fiscal year decreased by $15.5, or 5.9% due to the annual debt service paymentsand the amortization of premiums for Certificates of Participation. Also contributing to the decrease was the defeasanceof 2008 Monterey County Financing Authority Revenue Bonds, Series A. (See Table 4 – Long-Term Debt.)
OVERVIEW OF THE FINANCIAL STATEMENTSManagement’s discussion and analysis is intended to serve as an introduction to the County’s financial statements. TheCounty’s financial statements include three components:
Governmentwide Financial Statements
4

COUNTY OF MONTEREYManagement Discussion and Analysis
Fund Financial Statements
Notes to the Financial Statements Government-wide Financial Statements are designed to provide readers with a broad overview of the County’s finances,in a manner similar to a private-sector business and are presented on a full accrual basis.The Statement of Net Position presents information on all of the County’s assets, liabilities, and deferred outflows/inflowsof resources, with the difference reported as net position. Over time, increases or decreases in net position may serve as auseful indicator of whether the financial position of the County is improving or deteriorating.
Net Position = (Assets + Deferred Outflow of Resources) - (Liabilities + Deferred Inflow of Resources)The Statement of Activities presents information showing how the County's net position changed during the most recentfiscal year. All changes in net position are reported as soon as the underlying event giving rise to the change occurs,regardless of the timing of related cash flows (accrual basis of accounting). The statement reports items resulting in cashflows in future fiscal periods (e.g. uncollected taxes and earned, but unused, vacation leave) as revenues and expenses.The Governmentwide Financial Statements distinguish functions of the County that are principally supported by taxes andintergovernmental revenues (governmental activities) from other functions that are intended to recover all or a significantportion of their costs through user fees and charges (business-type activities). The governmental activities grouped byfunction of the County include General Government, Public Safety and Protection, Public Ways and Facilities, Health andSanitation, Public Assistance, Education, and Recreation and Cultural Services. The County has two business-typeactivities: Natividad Medical Center and the Parks and Lake Resort.The government-wide financial statements include not only the County itself (known as the primary government), but alsolegally separate entities for which the County is financially accountable (known as component units). If a component unit'stotal debt is expected to be repaid entirely by the County, if the component unit provides services entirely to the County, orif the component unit has substantially the same governing board as the County and there is a financial benefit or burdenrelationship or County management has operational responsibility for a component unit, then the component will beclassified as a blended component unit. If a component unit does not meet any of the preceding requirements it will bepresented as a discrete component unit. A list of the County's blended component units can be found in Note 1 of the Notesto Financial Statements section. The County has one discretely presented component unit, the Monterey County Childrenand Families Commission.The government-wide financial statements can be found on page 20 of this report.Fund Financial Statements provide a narrower view of the County's finances. A fund is a grouping of related accounts thatis used to maintain control over resources that have been segregated for specific activities or objectives. The County, likeother state and local governments, uses fund accounting to ensure and demonstrate compliance with finance-related legalrequirements. Fund financial statements provide a narrower view of the County's finances.The funds of the County can be divided into three categories:
Governmental Funds
Proprietary Funds
Fiduciary Funds
Governmental funds include general, special revenue, debt service, and capital project funds. Governmental funds are usedto account for essentially the same functions reported as governmental activities in the government-wide financialstatements. However, unlike the government-wide financial statements, governmental fund financial statements focus onnear-term inflows and outflows of spendable resources, as well as on balances of spendable resources available at the endof the fiscal year. Such information may be useful in evaluating a government’s near-term financing requirements.Because the focus of governmental funds is narrower than that of the government-wide financial statements, it is useful tocompare the information presented for governmental funds with similar information presented for governmental activities inthe government-wide financial statements. By doing so, readers may better understand the long-term impact of the County’snear-term financing decisions. Both the governmental funds’ balance sheet and the governmental funds’ statement ofrevenues, expenditures, and changes in fund balances provide a reconciliation to the government-wide financial statementsin order to facilitate this comparison between governmental funds and governmental activities.The County maintains over 130 individual governmental funds. For financial reporting purposes, these funds have beencombined into four groupings. The County segregates within the governmental funds the major funds: General Fund,
5

COUNTY OF MONTEREYManagement Discussion and Analysis
Behavioral Health Fund, Road Fund and a grouping for all nonmajor funds. Information is presented separately in theGovernmental Funds Balance Sheet and in the Governmental Funds Statement of Revenues, Expenditures, and Changes inFund Balances for the major funds according to the rules stated in Government Accounting Standards Board Statement No.34 (GASB 34). Other governmental funds (special revenue funds including various special districts governed by the County's governingBoard, debt service funds, and capital projects funds) are combined into a single, aggregated presentation. Individual funddata for each of these nonmajor governmental funds is provided in the form of combining statements located in theSupplementary Information section of this report.The County adopts an annual appropriated budget for all its operating funds. A budgetary comparison schedule has beenprovided for the General Fund, on page 27 to demonstrate performance against this budget. For individual fund budgetcomparisons for the Nonmajor Special Revenue, Capital Project and Debt Service funds please see the supplementaryinformation schedules.The governmental funds’ financial statements can be found on pages 23 and 25 of this report.Proprietary funds include both Internal Service and Enterprise Funds and are presented on a full accrual basis similar togovernment-wide financial statements.Internal service funds are used to accumulate and allocate costs internally among the County's various functions. TheCounty has four Internal Service Funds which are used to account for the general liability and workers’ compensationinsurance activities and other benefit programs. Because these services predominantly benefit governmental rather thanbusiness-type functions, they are included within governmental activities in the government-wide financial statements. Enterprise Funds are used to report the same functions presented as business-type activities in the government-widefinancial statements. The County maintains two Enterprise Funds to account for the County hospital (Natividad MedicalCenter) and Parks and Lake Resort activities.The proprietary fund’s financial statements can be found on pages 30 of this report.Fiduciary funds are used to account for resources held for the benefit of parties outside the County. Fiduciary funds includeinvestment trust, pension trust, and agency funds. Fiduciary funds are not reflected in the government-wide financialstatements because the resources of those funds are not available to support the County’s own programs. The accountingused for fiduciary funds is much like that used for proprietary funds. The County maintains three different types of fiduciary funds. The Investment Trust Fund is used to report resources held intrust for legally separate entities’ portion of cash in the Treasurer’s Investment Pool. The Private Purpose Trust Fund is usedto report resources held in trust for the former redevelopment agencies obligation retirement activities. Lastly, the Agencyfunds account for various local governments’ assets.The fiduciary funds’ financial statements can be found on pages 35 and 36 of this report.Notes to Financial Statements provide additional information that is essential to a full understanding of the data providedin the Governmentwide and Fund Financial Statements. The notes to financial statements can be found on pages 37 of thisreport.Required Supplementary Information presents certain required supplementary information concerning the County’s 1)net OPEB liability and OPEB contributions, 2) net pension liability and contributions schedules for pension benefits.Required supplementary information can be found on page 84 of this report.Combining and individual fund statements and schedules provide information for nonmajor governmental funds,internal service funds, and fiduciary funds are presented immediately following the required supplementary information.Combining and individual fund statements and schedules can be found on pages 94 of this report.
6

COUNTY OF MONTEREYManagement Discussion and Analysis
GOVERNMENT-WIDE FINANCIAL ANALYSISAs noted earlier, net position over time may serve as a useful indicator of a government’s financial position. Other factors,such as market conditions, should be considered in measuring the County's overall financial position. The net position of theCounty was $818.3 at the close of the current fiscal year (Table 1 – Net Position).
TABLE 1 - County of Monterey's Net Position (in millions)
TotalGovernmental
ActivitiesBusiness-type
Activities Total Dollar2019 2018 2019 2018 2019 2018 Change
Current and other assets $ 740.2 $ 703.6 $ 226.6 $ 160.6 $ 966.8 $ 864.2 $ 102.6Capital assets 826.2 771.3 117.7 118.4 943.9 889.7 54.2
Total Assets 1,566.4 1,474.9 344.3 279.0 1,910.7 1,753.9 156.8
Unamortized losses on refunding debts 0.4 2.1 1.6 2.6 2.0 4.7 (2.7)Deferred pensions 117.0 113.8 35.5 33.9 152.5 147.7 4.8Deferred OPEB 5.6 - 1.7 - 7.3 - 7.3Total Deferred Outflows of Resources 123.0 115.9 38.8 36.5 161.8 152.4 9.4
Current and other liabilities 98.7 94.5 64.1 67.2 162.8 161.7 1.1Long term liabilities 879.5 885.6 194.1 199.3 1,073.6 1,084.9 (11.3)
Total Liabilities 978.2 980.1 258.2 266.5 1,236.4 1,246.6 (10.2)
Deferred pensions 13.1 18.4 2.9 8.0 16.0 26.4 (10.4)Unamortized gains on refunding debts 0.8 - 0.2 - 1.0 - 1.0Deferred OPEB 0.6 - 0.2 - 0.8 - 0.8
Total Deferred Inflows of Resources 14.5 18.4 3.3 8.0 17.8 26.4 (8.6)
Net investment in capital assets 626.8 573.7 77.7 75.0 704.5 648.7 55.8Restricted 229.2 237.8 0.8 0.6 230.0 238.4 (8.4)Unrestricted (159.3) (180.1) 43.1 (19.5) (116.2) (199.6) 83.4Total Net Position $ 696.7 $ 631.4 $ 121.6 $ 56.1 $ 818.3 $ 687.5 $ 130.8
Net investment in capital assets: The largest portion of the County’s net position, $704.5 or 86.1% reflects its netinvestment in capital assets, (land, buildings, roads, bridges, machinery and equipment) less any related outstanding debtused to acquire those assets. The County uses these capital assets to provide services to citizens; consequently, these assetsare not available for future spending. Although the County’s investment in its capital assets is reported net of related debt, itshould be noted that the resources needed to repay this debt must be provided from other sources, since the capital assetsthemselves cannot be used.Restricted net position: The restricted componet of the County’s net position, $230.0 or 28.1%, represents resources thatare subject to constraints by either external creditors or government entities or by law through constitutional provisions orenabling legislation. The major restrictions on the County’s net position are imposed by state and federal restrictions forallocations to areas such as: health and sanitation, recreation and culture, debt service, and housing and redevelopment.Restricted net position decreased by $8.4, or 3.5% as a result of spent portion of the restricted resources being higher thisfiscal year compared to the last fiscal year.
7

COUNTY OF MONTEREYManagement Discussion and Analysis
Unrestricted net position: The County’s unrestricted net position balance of $(116.2) is primarily the result of the County'sunfunded pension and Other Postemployment Benefits (OPEB) liabilities. Unrestricted net position increased by $83.4compared to prior year primarily driven by the strong year in the County's General Fund and the increase it the County'sstrategic reserves. The overall increase in unrestricted net position represents $27.5 gain from governmental activities and$64.2 gain from business-type activities.
TABLE 2 - County of Monterey's Changes in Net Position (in millions)
Governmental Business-Type TotalActivities Activities Total Dollar Percent
2019 2018 2019 2018 2019 2018 Change Change
RevenuesProgram Revenue:
Charges for service $ 133.2 $ 151.1 $ 368.6 $ 351.8 $ 501.8 $ 502.9 $ (1.1) %-0.2Operating grants and contributions 442.3 438.2 0.1 - 442.4 438.2 4.2 %1.0Capital grants and contributions 45.8 68.2 - - 45.8 68.2 (22.4) %-32.8
General revenue:Property tax 170.4 159.4 - - 170.4 159.4 11.0 %6.9Sales tax & sales in lieu 23.7 18.0 - - 23.7 18.0 5.7 %31.7Transient occupancy taxes 28.6 25.0 - - 28.6 25.0 3.6 %14.4Other taxes 29.7 27.6 - - 29.7 27.6 2.1 %7.6Unrestricted investment earnings 31.3 21.8 4.6 1.8 35.9 23.6 12.3 %52.1Tobacco settlement revenues 4.3 4.4 - - 4.3 4.4 (0.1) %-2.3Other revenues 0.9 2.4 0.7 1.3 1.6 3.7 (2.1) %-56.8
Total revenues 910.2 916.1 374.0 354.9 1,284.2 1,271.0 13.2 %1.0
ExpensesGeneral government 63.4 58.0 - - 63.4 58.0 5.4 %9.3Public safety and protection 294.2 288.0 - - 294.2 288.0 6.2 %2.2Public ways and facilities 29.9 35.7 - - 29.9 35.7 (5.8) %-16.2Health and Sanitation 213.9 193.7 - - 213.9 193.7 20.2 %10.4Public assistance 201.0 197.6 - - 201.0 197.6 3.4 %1.7Education 9.9 9.1 - - 9.9 9.1 0.8 %8.8Recreation and cultural services 26.7 19.1 - - 26.7 19.1 7.6 %39.8Interest on long-term debt 7.6 10.3 - - 7.6 10.3 (2.7) %-26.2Natividad Medical Center - - 308.1 294.7 308.1 294.7 13.4 %4.5Parks and Lake Resort - - 6.8 7.4 6.8 7.4 (0.6) %-8.1
Total expenses 846.6 811.5 314.9 302.1 1,161.5 1,113.6 47.9 %4.3
Change in net position before transfers andspecial and extraordinary items 63.6 104.6 59.1 52.8 122.7 157.4 (34.7) %-22.0
Transfers (6.4) 60.9 6.4 (60.9) - - - %-Change in net position 57.2 165.5 65.5 (8.1) 122.7 157.4 (34.7) %-22.0
Net position, beginning 631.4 496.6 56.1 68.0 687.5 564.6 122.9 %21.8Prior Period Adjustment 8.1 (30.7) - (3.8) 8.1 (34.5) 42.6 %-123.5
Net position, ending $ 696.7 $ 631.4 $ 121.6 $ 56.1 $ 818.3 $ 687.5 $ 130.8 %19.0
Governmental Activities Governmental activities increased the County’s net position by $57.2, or $108.3, less than theprior year increase of $165.5. Of the $57.2 million increase, $63.6 is the amount that program and general revenuesexceeded expenses, as discussed in the following sections. The remaining $(6.4) was attributable to the transfer of $(3.9) toNatividad Medical Center (NMC) for funding of a capital project, a transfer of $0.5 by NMC to the Health Department forresidency support, and a transfer of $(2.3) to Parks Lake and Resort Operations to cover the prior year's deficit and provideoperational cash and another $(0.7) for the General Fund subsidy of debt payment.
8

COUNTY OF MONTEREYManagement Discussion and Analysis
Revenues Revenue for Governmental activities (not including transfers, special and extraordinary items) decreased from$916.1 to $910.2, or $5.9. In the preceding fiscal year 2017/18, there was a one-time recognition of restricted revenues invarious areas, resulting in the reduction from prior year revenues. These are discussed in the following sections.
Charges for services decreased by $17.9, from $151.1 to $133.2. The decrease is mainly attributable to the reduction inHealth fees of $13.2 due to the prior year one-time recognition of previously unearned restricted fees. Public Safetyand Protection increased by $4.7, again, due to the prior year recognition of previously unearned restricted revenue. Themodest increase of $1.3 in Public Assistance and $0.1 in Recreations and Cultural services were offset by the deceasesof $1.0 in General Government and $0.3 in Public Ways and Facilities .
Operating Grants and Contributions increased by $4.1, or 0.9%. There were small increases of $3.9 for Public Waysand Facilities due to an increase in Highway Users' Tax and $3.6 in Public Safety and Protection from State and Federalaid. The increases were offset by a $1.9 decrease in Public Assistance due to smaller caseloads and $1.3 decrease inHealth and Sanitation. The remaining change is a combination of increases of $0.1 and $0.2 in General Government andEducation, respectively; and a decrease of $0.5 in Recreation and Cultural Services.
Capital grants and Contributions decreased by $22.4, or 32.8%. The decrease of $9.5 in General Government is mostlya result of State funding received in the prior year for the Juvenile Hall and Jail projects and the decrease of $12.9 inPublic Ways and Facilities for roads.
Property taxes increased by $11.0, or 6.9% as the housing market continues to improve and housing values increase.
Transient Occupancy Taxes increased by $3.6, or 14.4%. This increase is attributable to a strong economy contributingto the increase in revenues from tourism.
Sales and Use Taxes increased $5.7, or 31.7%. The increase in tourism over the prior year, discussed above, contributedto the $2.8 increase in general sales taxes. Revenues from Measure X increased by $2.9 having an additional positiveimpact on sales tax revenues.
Other Taxes increased by $2.1, or 7.6% due to the increased revenues in cannabis business taxes.
The increase of $9.5, or 43.6% in Investment Earnings is a result of higher liquidity in the investment pool and increasedrevenue from the use of property from the Laguna Seca Track operations.
Other Revenues decreased by $1.5, or 62.5% due to several General Fund departments incorrectly recordingprogrammatic revenues as general revenues in the prior year.
Expenses Total governmental expenses increased by $35.1 or 4.3% to $846.6. The largest contributors to the change weregeneral government, public safety, public ways and facilities, health and sanitation, public assistance, education, recreationand cultural services, and interest on long-term debt::
General government expenses increased by $5.4 or 9.3%. The main driver was due to increases in IT Department'sfinancing structure. Beginning in FY 2017-18, the ITD no longer billed general fund customers for countywide services.Instead, ITD received funding through the budget process as do other departments. Increasing salary and benefits costsdue to the new labor agreements, rising pension costs, higher health insurance premiums, and lower reimbursements.County Counsel contributed to the increase mostly due to lower Countywide Cost Allocation Plan (COWCAP) creditand offset by lower internal billing and higher salary and benefits costs. RMA also contributed to the increase. The maindrivers are: cost increase in building maintenance and COWCAP charges. The increases were offset by increases inCOWCAP reimbursement in County Administrative Office and Human Resources.
Public safety and protection expenses increased by $6.2 or 2.2%. The main drivers were due to the increase indepreciation, loss in sale of capital assets, salaries and benefits increase, and pension expenses. The increase was offsetby the decrease in other expenses. The decreases in other expenses were mainly due to lower general liability insurance,internal data process services, and other professional services. The increase in depreciation was related to completedconstruction projects and asset purchases. The loss in sale of capital assets was due to retirement, disposal,demolishment, or removal of building assets during the building inventory audit.
Public ways and facilities expenses decreased by $5.8 or 16.2%. The decreases were mainly due to lower buildingmaintenance costs in Schilling complex and lower utilities costs due to electricity credits. Salaries and benefits savingsdue to vacancies also contribute to the decrease.
9

COUNTY OF MONTEREYManagement Discussion and Analysis
Health and sanitation expenses increased by $20.2 or 10.4%. Majority of the increase was due to increased clientpopulation and the service level in Clinics Services, Behavioral Health, and Whole Person Care (WPC). The increasewas offset by Public Health due to AB 85 implementation where the local health revenues were redirected to the Stateand decreased the service level.
Public assistance expenses increased by $3.4 or 1.7%. The main drivers were Countywide Cost Allocation Plan(COWCAP) Charges, salaries and benefits, a 3.5% statutory increase for the In-Home Supportive Services (IHSS), and achange in program policy for General Assistance which increased grant payments for the indigent population. Theincreases were offset by decreased Public Assistance Programs payments due to decreased caseload.
Education expenses increased by $0.8 or 8.8%. Majority of the increase was due to higher Countywide Cost AllocationPlan (COWCAP) charges and additional purchases of books and computer related products
Recreation and cultural services expenses increased by $7.6 or 39.8%. The increases were mainly due to the LagunaSeca management fees paid to SCRAMP due to increased racing events and activities. Additional maintenance projectsat the Laguna Seca track also contributed to the increase.
Interest on long-term debt decreased by $2.7 or 26.2%. The decrease was mostly due to savings from the refunding ofoutstanding 2007 Certificates of Participation (COPs), in FY 2018, and the refunding of outstanding 2008 RevenueBonds at the beginning of FY 2019.
As shown in the following chart, program revenues are less than the expenses in all functional areas. The difference ofprogram expenses over program revenue is $225.3.
Expenses & Program Revenues- Governmental Activities
Program revenues are not intended to fully support governmental programs. This presentation is meant to show the net costof each program prior to allocation of general revenues. The net cost of $225.3 of these programs is funded by generalrevenues of $288.9.
10

COUNTY OF MONTEREYManagement Discussion and Analysis
Total revenue by sources for governmental activities is shown on the following chart.
Revenues by Source - Governmental Activities
Business-type Activities Natividad Medical Center ("Center") is the major Enterprise Fund reported in this section. TheCenter is owned and operated by the County and governed by the County Board of Supervisors with the assistance of aseparate Board of Trustees. As a County entity, the Center is mandated to treat patients, regardless of ability to pay. Theother Enterprise Fund is the Parks and Lake Resort ("Parks") fund which provides an assortment of outdoor and recreationalactivities associated with, and on the lands surrounding, Lake San Antonio and Lake Nacimiento.The Center experienced a net operating gain of $57.6 and a net non-operating gain of $4.8 in fiscal year 2018-19. Inaddition, this year's change in net position is also attributable to the effect of operating transfers in of $4.0 and operatingtransfers out of $0.5. Overall financial results brought the fiscal year with an ending net position balance of $121.0, whichis 120% higher than last year's balance of $55.1.Parks experienced a net operating loss of $2.2 and a net non-operating loss of $0.1, but still resulted to a net $0.7 netincrease in net position due to operating transfers in of $3.0 from General fund. Losses are mainly due to actual expensesexceeding budget while actual revenues were lower than budgeted amounts. High costs for deferred maintenance, repairsand other professional services fees are the major expenses that exceeded the budget. These activities brought the endingnet position to a negative balance of $2.7, which is 19.2% higher than last year's negative balance of $3.4.
FINANCIAL ANALYSIS OF THE COUNTY’S FUND BALANCESGovernmental Funds County uses fund accounting to ensure and demonstrate compliance with finance-related legalrequirements. The focus of the County’s governmental funds is to provide information on near-term inflows, outflows, andbalances of spendable resources. Such information is useful in assessing the County’s financing requirements.As of the end of the fiscal year, the County’s governmental funds reported total fund balances of $448.6, an increase of$22.5 from the prior year total fund balances of 426.1. The net increase is mainly from the $34.2 excess of revenues overexpenditures, reduced by the $11.7 excess of other financing uses over financing sources, majority of which is the $12.8 nettransfers out to Internal Service Funds and the Center.The components of fund balance are:
Nonspendable, approximately $0.7 or 0.1% of total fund balance is made up of inventories and prepaid expenditures.
Restricted balances of $174.5 or 38.9%, which can only be used as stipulated by legislative code, grants or debtinstruments.
Committed funds of $113.8 or 25.4%, delegated by the Board of Supervisors as set aside for specific purposes. Themain component is $91.5 of strategic reserve commitments set aside in the General Fund. Refer to Note 9 for completedetails.
11

COUNTY OF MONTEREYManagement Discussion and Analysis
Assigned funds of $157.5 or 35.1% are earmarked to meet the County’s current and future needs. The majority of thesefunds are held in special revenue funds to be used for the purpose of those funds while the remaining is set-aside forspecific purposes in the General Fund (see Fund Balance section of Note 9: of this report for additional information).
Unassigned funds of $2.3 or 0.5% represents the General Fund’s resources that are not classified in the four previouscategories and are considered available for spending at the government’s discretion.
General Fund is the main operating fund of the County. All County activities not included in a separate fund are includedin the General Fund. The unassigned fund balance at June 30, 2019, totaled $2.4 while the total fund balance increased to$205.1 from $175.7 due to revenue and transfers-in exceeding the expenditure and transfers-out for this fund. Revenuedeclined by $2.1. Contributing to the decline was the decrease of $11.2 in Charges for Services mainly due to the one-timerecognition of restricted revenues in the prior year. Aid from Other Governmental Agencies decreased by $10.3 as a resultof a $6.0 loss of Federal and State reimbursements for CalWORKs and other services due to lower caseloads, a $2.8decrease in SB90 (State mandated programs) reimbursements from the State, and a $2.7 reduction in disaster relief from theprior year. The losses were mitigated by an increase of $1.2 in State aid for Public Defender, Sheriff, and Public SafetySales Tax. Licenses and Permits decreased by $4.3 largely due to the one-time recognition in the prior year of $4.0 inrestricted revenues with the remaining $0.3 decrease in business and construction permits. Miscellaneous revenues declined$1.4 due to a $1.6 reduction from the prior year reimbursements from outside agencies for emergency communicationsdispatch services which was offset by $0.2 in minor increases across other departments. These revenue losses were abatedby a $16.4 increase in property taxes, sales and use taxes, and an increase of $0.8 in the collection of Cannabis tax. As well,there were increases in rents and concessions of $5.7 related to the continued rise in use of Laguna Seca and a $2.3 increasein interest earnings. Expenditures in total increased $16.4. Recreation & Culture expenditures increased mainly due to the$7.9 spent on capital projects at Laguna Seca. The remaining amount can be attributed to continued increases across allfunctions in employee salaries, health care and other benefits, and PERS contribution increases.Road Fund The Road Fund qualified and/or remains to be treated as a major fund again in fiscal year 2019. The RoadFund fund balance was $10.2 in fiscal year 2018, and increased by approximately $7.4 in fiscal year 2019 to $17.6. Theincrease was mainly due to actual revenue exceeding budget by $2.3, and actual expenditure is lower than budget by $4.6.The budgeted amount for transfers-in was achieved with almost the same actual amount of $5.4. Revenues only slightlydecreased by $0.7 from the prior fiscal year even with Federal and State aids reduced by $3.5, as it was offset by $2.9increase in taxes was due to two new revenue streams, Measure X and SB 1. Expenditures appear consistent with prioryear's amounts with only a slight decrease of $0.6, or 1.7% compared to prior fiscal year. None of the Road Fund's fundbalance is unassigned with $16.1 allocated for restricted purposes, $0.4 is committed, and the balance of $1.1 is assigned. Behavioral Health, a consistent major fund, was established to segregate the revenues and expenditures associated withmental health and substance abuse programs. Behavioral Health has a total fund balance of $42.4, of which $24.7 isrestricted by grantors, $14.7 is committed, and $3.0 is assigned. The total fund balance decreased by $0.2, which is still asignificant improvement compared to the budgeted decrease in fund balance of $1.9. Compared to budgets, revenues werelower by $3.2, or 3.3% due to $4.2 budgeted government aids that were not received. Despite this, the reduction in fundbalance, as mentioned earlier, is not as significant due to the offsetting savings from expenditures, being lower than budgetby $2.5, coupled with another $2.4 increase in net financing sources mainly from the $5.6 savings from budgeted transfersout that was no longer necessary for this fiscal year. Compared to last year's expenditures, this year's $121.2 is higher by$14.2, with $3.5 increase in various salaries and other employee benefits, and $9.6 total increase in hospital charges,medical services and other professional services in line with the various programs of the fund.Facility Master Plan Implementation qualified as a major fund in fiscal year 2019. As of June 30, 2019, the fund balancereached $45.1, from last year's $62.5. The 28% decrease is mainly attributable to a significant decrease in other financingsources (transfers in) compared to prior year ($79.0 in 2018 versus only $0.2 in 2019). The components of this fund balanceis as follows: Restricted $17.3, Committed $-, and Assigned $27.7.Other Governmental Funds The sum of the fund balances of the non-major governmental funds increased $3.4, from abalance of $135.1, as restated, to a balance of $138.5. The increase was mainly in the Special Revenue Funds, whichincreased by $6.1. Revenues exceeded transfers out in the Local Revenue Fund by $1.1, and H & W Realignment Aid fromother governmental agencies exceeded net transfers by $1.8. For the Library Fund, East Garrison Community ServicesDistrict, Workforce Development Board, and Count Service Areas revenues exceeded expenditures and transfers by $0.9,$0.8, $0.4, and $0.5, respectively. In the Debt Service Fund, expenditures exceeded revenues and net transfers by $1.4primarily due to the defeasance of 2008 Monterey County Financing Authority (MCFA) Revenue Bonds and the issue of the2018 MCFA Revenue Refunding Bonds reducing fund balance to $1.9. For the Capital Projects Fund, Capital Outlayexceeded revenues and transfer-in by $1.3.
12

COUNTY OF MONTEREYManagement Discussion and Analysis
Proprietary Funds Natividad Medical Center and Parks comprise the Enterprise Funds which are also the component ofthe business-type activities. Included in the Proprietary Funds are the activities of Internal Service Funds. There arecurrently four Internal Service Funds, named and described as follows. The General Liability Fund deals with generalinsurances and risk management. The Worker's Compensation Fund records activities related to employee claims. TheBenefit Programs Fund oversees other employee benefits such as dental and vision plans. And lastly and most recentlyadded, the Resource Planning which handles the County's Enterprise Resource Planning (ERP) and Vehicle ResourcePlanning (VRP) requirements.For the Center and Parks performance and operating results, please refer to Business-type activities above.
GENERAL FUND BUDGETARY HIGHLIGHTS
Original Budget to Final Budget
Original FinalIncrease
(Decrease)Estimate revenues $ 544.8 $ 551.8 $ 7.0Appropriations $ 633.5 $ 641.8 $ 8.3
Estimated revenues increase of $7.0:The final estimated revenue budget increased compared to the original budget by 1.3%. This was a net effect of final budgetbeing higher than adopted budget in some revenue categories and lower in the others, and is explained as follows:
The increase in Taxes of $1.0 was due to an anticipated increase in on-going Cannabis program;
The increase in Fines, forfeitures, and penalties of $0.2 was due to an anticipated increase in civil settlements fromDistrict Attorney’s Office and unanticipated performance penalties assessed to ambulance provider in EmergencyMedical Services;
The increase of $7.1 in Aid from other governmental agencies was due to $3.8 increase in accounting correction of CareBased Incentives (CBI) payments that resulted in the budget adjustment from Charges for Services to Aid from othergovernmental agencies in Clinic Services. $2.0 increase was due to various programs with additional anticipated fundingfrom IHSS Public Authority Program, housing program for veterans, and Area Agency on Aging for senior supportservices in Social Services. $1.3 increase was due to budget adjustments for anticipated receipt of grants from variousdepartments in State-County Assessor Program, Victim and Witness Assistance Program, Tobacco Grant, andUnclaimed Gas Tax and State Mill Assessment;
The decrease of $0.7 in Charges for services was due to $3.0 decrease in accounting correction of Care Based Incentives(CBI) payments that resulted in the budget adjustment from Charges for Services to Aid from other governmentalagencies in Clinic Services which was offset by $1.0 increase of budget adjustments in anticipating the additionaldispatching services from outside participating agencies in Emergency Communication Department and $1.3 fromSheriff’s Office due to services provided for unanticipated special events;
The decrease of $0.6 in Miscellaneous revenues was due to $0.7 decrease in in accounting correction of Care BasedIncentives (CBI) payments that resulted in the budget adjustment from Miscellaneous revenues to Aid from othergovernmental agencies in Clinic Services and $0.1 decrease in Districted Attorney's midyear budget adjustment due toservice level decrease which was offset by $0.2 increase in Resource Management Agency and Emergency MedicalServices' midyear budget adjustment due to additional reimbursable project and service level increase.
13

COUNTY OF MONTEREYManagement Discussion and Analysis
Appropriations increase of $8.3:Appropriation budgets were increased to reflect the anticipated receipt of the above funding sources. The most significantappropriation changes are noted as follows:
Increase in Sheriff in the amount of $1.3 to cover operational and administration costs such as the Cyber SecurityProject, cover one-time costs associated with the development of the operation plan to provide security for the 2019 U.S.Open Golf Tournament at Pebble Beach and to cover other unexpected personnel costs;
Increase in Emergency Communications in the amount of $1.1 to cover operational costs at the Monterey CountyEmergency Communication Center;
Increase in Social Services in the amount of $1.0 to cover County-share costs associated with wage increases for In-Home Support Services Providers (per new agreement);
Increase in appropriations in the Agriculture Commissioner to cover for capital project costs for the AgriculturalCommissioner Facility Development Project in the amount of $0.7;
Increase in Social Services-Military and Veterans Affairs in the amount of $0.7 to cover costs for the rehabilitation ofhousing units for formerly incarcerated veterans via an agreement with the Veterans Transition Center of MontereyCounty;
Increase in appropriations in County Counsel Risk Management in the amount of $0.5 to fund fuel spill remediationcosts at the Lakes.
Final Budget to Actual
Final ActualIncrease
(Decrease)Revenues $ 551.8 $ 551.5 $ (0.3)Expenditures $ 641.7 $ 594.0 $ 47.7
Actual revenues were lower than final budget by $0.3 or 0.1%. This was a net effect of actual revenues being lower thanbudget in some revenue categories and higher than budget in the others, and is explained as follows: Actual revenues were lower than budgeted as follows:
$2.2 in Licenses, permits, and franchises was mainly due to fewer Building Permits issued, the anticipation of a fee studyand fee increases did not materialize, and reduced Business Licenses which was offset by unanticipated Franchise FeeSettlement, electric franchise payments, and an accounting change to recognize additional revenues from Public,Educational, and Governmental Access Channels (PEG) liability account;
$25.7 in Aid from other governmental agencies was a result of lower than anticipated receipts in the following: 1) $20.1in Social Services due to a correlated reduction in services/expenditures in the Public Assistance Programs.Additionally, insufficient administrative advances, unusual delays on reimbursement for health-related programs, andfinal reimbursement for the Workforce Innovation and Opportunity Act (WIOA) program was not received by the 60-day accrual period. Also, revenue was less than expected in the administrative unit because of less reimbursableexpenditures in salary and benefits due to prolonged staff vacancies, capital lease costs and savings in contractexpenditures. 2) $5.9 in Health due to reduced CBI incentive payments and grants in Whole Person Care, AB 85, andvarious Public Health programs including Tobacco Control, Transportation Program, and Whole Child Model. 3) 1.0 inChild Support Services due to less reimbursable expenditures in salaries, benefits, and IT charges. 4) Lower receipts of$1.5 in various other departments including District Attorney, Parks (RMA), and Probation contributed to the remainingbalance which was offset by increased revenues of $2.8 in the following: 1) $1.6 of unanticipated receipts in CAO due tothe State Criminal Alien Assistance (SCAAP) grant, SB 90 reimbursements, VLF revenues, and FEMA/Statereimbursements for winter storm repairs. 2) $1.2 unanticipated receipts in Public Defender and Sheriff due to an increaseof State reimbursements made for state prison activity claims and the additional Sales Tax collected;
$6.1 in Charges for service was mostly due to reduced service levels in Clinic Services, shorter inspection period inProduce Inspection Program, and a reduction in cost recovery eligible expenses in Revenue Division of Treasury. The
14

COUNTY OF MONTEREYManagement Discussion and Analysis
decrease was offset by an accounting change to recognize revenues in a deposit liability account in Planning Division ofRMA.
Actual revenues were higher than budgeted as follows:
$26.3 in Taxes was a result of higher than anticipated receipts in the following: 1) $4.8 due to higher Property andTransfer Taxes as a result of higher housing prices and assessed values. 2) $11.6 higher than budgeted Cannabis Tax. 3)$6.7 increase in Transient Occupancy Tax due to higher than anticipated tourism and U.S Open event. 4) $3.2 increasein Sales and Use Taxes due to higher than anticipated consumer consumption;
$5.0 in Revenue from use of money and property was largely due to higher than anticipated revenues in events at LagunaSeca of $2.0 and $3.0 due to higher than expected return on investment;
$2.4 in Miscellaneous revenues was higher than anticipated mostly due to an accounting change to recognize revenues inan unearned revenue liability account from Military & Veterans Rehab, Domestic Violence, and Children Trust Fund. Ahigher than anticipated revenue from the Wraparound Trust Account for the Out of Home Care programs and TobaccoSettlement receipts also contributed to the increase.
Actual expenditures were less than budget by $47.7 or 7.4%. Major areas of expenditures savings include:
$15.2 in Social Services mainly attributable to the following: (i) $4.6 in savings due lower-than-planned caseloads inCalWORKS entitlement programs, (ii) $3.2 in salary savings due to prolonged vacancies from hiring challenges, (iii)$3.1 in savings due to reduced building leases, (iv) $2.3 in savings due to decreased contract services, (v) $0.8 in lessthan anticpated capital expenditures; and (vi) $0.6 in savings from reduced charges from Information Technology;
$14.4 in Health Department as a result of an 19% vacancy rate primarly in clinics and significant salary savings due tovacancies;
$4.9 in Resource Management Agency primarly due to salary savings from vacancies ($3.1) and lower buildingmaintenance and utility costs ($1.2);
$3.1 in Information Technology resulting from $1.1 in salary savings due to unplanned vacancies, $1.0 less in vendorand services costs and $1.0 in lower-than-planned reimbursements;
$2.4 in Probation attributable to the following: (i) $1.8 in expenditures not incurred related to grant and State programsfor personnel salary and benefits, professional services and data programming services, (ii) $0.4 in salary savings forvacancies and containment of overtime and (iii) $0.2 in cost savings from institutional supplies;
$1.4 in County Counsel mainly driven by salary savings associated with unanticipated personnel vacancies and unusedappropriations associated with teh Lake San Antonio remediation project;
$0.9 in Public Defender mainly due to lower than anticipated trial expenses and salary savings from vacancies;
$0.9 in Treasurer-Tax Collector mainly due to salaries and benefits savings resulting from vacant positions;
$0.7 in Assessor-County Clerk Recorder mainly due to salaries and benefits savings resulting from vacant positions;
$0.6 in Emergency Communications due to unused appropriations for equipment purchases and lower than anticipatedcharges from Technology Department;
$0.6 in Agricultural Commissionner mainly due to salaries and benefits savings resulting from vacant positions;
$0.5 in Elections due to savings in ballot printing services and less temporary employee costs due to fewer-than-plannedlocal elections;
$0.5 in Child Support Services mainly due to salaries and benefits savings resulting from vacant positions;
$0.5 in District Attorney mainly due to salaries and benefits savings resulting from vacant positions.
15

COUNTY OF MONTEREYManagement Discussion and Analysis
CAPITAL ASSETSThe County’s investment in capital assets for its governmental and business-type activities as of June 30, 2019, amount to$826.3 and $117.8, respectively (net of accumulated depreciation). This investment is in a broad range of capital assetsincluding land, structures and improvements, equipment, intangible assets, infrastructure, and construction in progress.
TABLE 3 - County of Monterey's Capital AssetsGovernmental Business-Type Total
Activities Activities Total Dollar2019 2018 2019 2018 2019 2018 Change
Land $ 190.8 $ 190.8 $ - $ - $ 190.8 $ 190.8 $ - %-Structures and improvements 349.5 309.2 174.2 178.0 523.7 487.2 36.5 %7.5Equipment 130.5 124.7 126.8 115.9 257.3 240.6 16.7 %6.9Intangible assets 20.7 20.6 - - 20.7 20.6 0.1 %0.5Infrastructure 611.0 606.6 - - 611.0 606.6 4.4 %0.7Construction in Progress (CIP) 213.0 186.0 7.1 2.8 220.1 188.8 31.3 %16.6
Total Capital Assets 1,515.5 1,437.9 308.1 296.7 1,823.6 1,734.6 89.0 %5.1
Accumulated Depreciation (689.2) (658.5) (190.3) (178.2) (879.5) (836.7) (42.8) %5.1
Total $ 826.3 $ 779.4 $ 117.8 $ 118.5 $ 944.1 $ 897.9 $ 46.2 %5.1
Capital Assets
The County both purchases and constructs/develops capital assets throughout the year. Capital projects are generallycompleted over multiple fiscal years. Costs accumulate within the construction in progress (CIP) account until thecompletion of projects. At completion, all costs of a project are totaled then transferred to the appropriate capital assetclassification. In the current year, CIP had a net increase of $27.0 for governmental activities. This was the result ofcompleting 34 projects costing $52.8 and on-going/new construction costs of $79.8.Major construction in progress events during the current fiscal year included the following:
Public Works incurred $14.1 in capitalizable costs for on-going projects with the majority of the costs spent on PaloColorado - Repair Damaged Road/Culvert $3.9 ,"Hwy 1 Climbing Lane-CVR to RVR" $3.9 and Blanco road overlayproject $3.3.
Architectural Services incurred $60.7 in capitalizable costs for on-going projects, with the majority of costs spent on theJail Expansion/Housing Addition, New Juvenile Hall Building and East-West Wing Renovation.
16

COUNTY OF MONTEREYManagement Discussion and Analysis
Major projects that were completed during the year include the East-West Wing Renovation for total cost of $37.9.The accompanying government-wide financial statements include the capitalizable costs of those assets that were eithercompleted during the fiscal year or considered CIP at year-end. Additional information on the County’s capital assets can befound in Note 5 of this report.
DEBT ADMINISTRATIONState statutes limit the amount of general obligation debt a government entity may issue to 1.25% of the total assessedvaluation of property within the County. The current legal debt limitation of the County is $846.0. The County’s long-termissues payable is $245.1, but none is applicable to the debt limit. The following schedule does not include the liabilities forself-insurance, compensated absences, and estimated landfill closure, which are components of the long-term liabilitiesbalance of $391.7. (See Note 8– Long-Term Liabilities).At June 30, 2019, the County had total long-term debt outstanding of $245.1. This was a decrease of $15.5 or 5.9% from theprior year balance of $260.6. The decrease was primarily due to the $9.6 decrease in Certificates of Participation resultingfrom the refunding of the 2007 COPs in FY 2018. Contributing to the decrease were $8.5 in annual debt service paymentsand $1.1 in amortization of premiums related to long-term debt. Revenue Bonds decreased by $2.7 due $1.5 in annual debtservice payments and amortization of premiums and $1.2 for the $27.8 defeasance of 2008 Monterey County FinancingAuthority (MCFA) Revenue Bonds, Series A (Salinas Valley Water Project) which was offset by the increase of $26.6 fornew MCFA 2018 Revenue Refunding Bonds (See Note 8-Advance Refunding).
TABLE 4 - County of Monterey's Long-Term Debt (in millions)Governmental Business-Type Total
Activities Activities Total Dollar Percent2019 2018 2019 2018 2019 2018 Change Change
Certificates of participation $ 138.2 $ 144.1 $ 41.5 $ 45.2 $ 179.7 $ 189.3 $ (9.6) %-5.1Revenue bonds 25.6 28.3 - - 25.6 28.3 (2.7) %-9.5Loans payable 20.3 21.4 - - 20.3 21.4 (1.1) %-5.1Notes payable 4.5 5.7 - - 4.5 5.7 (1.2) %-21.1Capital leases 14.9 15.8 - - 14.9 15.8 (0.9) %-5.7Other bonds and notes 0.1 0.1 - - 0.1 0.1 - %-
Total $ 203.6 $ 215.4 $ 41.5 $ 45.2 $ 245.1 $ 260.6 $ (15.5) %-5.9
Long-Term Debt
Additional information on the County’s long-term debt can be found in Note 8 of this report.
17

COUNTY OF MONTEREYManagement Discussion and Analysis
ECONOMIC ANALYSIS AND NEXT YEAR’S BUDGET AND RATESThe following paragraphs briefly summarizes results of fiscal year 2018-2019 as well as the County's budgets for the nextfiscal year 2019-2020:
General fund, the County's largest fund that supporting the basic governmental functions related to public safety, landuse and environment, health and sanitation, public assistance, education and recreation, as well as finance andadministration, had a total of $677.1 million in appropriations in the fiscal year 2018-2019 Adopted Budget, withsubsequent modifications throughout the fiscal year to increase total appropriations to $689.8 million, a $12.7 millionadditional appropriations. Financing sources are primarily from budgeted revenue of $544.8 and operating transfers of$113.4, also both modified by a total of $7 million to accomodate appropriations increases, with the remaining amunt tobe financed by use of fund balance, as final budget was projected with a $24.6 million excess of expenditures overrevenues. However, this fiscal year ended with a better operating result than the budget, with a $29.42 million excess ofrevenues over expenditures. Despite the $0.3 million shortfall of the actual against budgeted revenues, this year'sfavorable result is attributable to the $47.7 million savings between budget and actual expenditures, and the $6.6 millionmore of other financing sources compared to budet. Adopted Budget summary for the fiscal year 2018-2019 reports5,238 full-time employees, total budget for all funds of $1.5 billion, including $60.5 million additional use of fundbalance, $27.5 million set aside for Strategic Reserve and $4.7 million for contingency appropriation. For general fund,total adopted budget of $677.1 million used $18.2 million of the fund balance, and additional $5.7 million resulting fromits revenue and expense budget modifications. (Source: Summary of the FY 2018-19 Adopted Budget)
Meanwhile, the upcoming fiscal year 2019-2020, Adopted Budget Summary presents the County revenues and expensesfor all funds totaling to $1.5 billion, with 5,361.5 full-time employee positions. Majority of the revenue sources areexpected to come from the $578.5 million budget for intergovernmental revenue, $402.5 million from charges forvarious County-rendered services. Likewise, more funding sources aim to produce $272.2 million revenues from taxes,licenses and permits, and revenues from fines, forfeitures, and penalties. Revenue from money and property use for$40.2 million, $16.2 of miscellaneous revenue, and $204.5 million of other financing sources, such as operatingtransfers, also comprise the revenue budget. Accordingly, the corresponding $1.5 billion expenditure budget is allocatedamong the functions with $166.2 million for General Government, $11.7 million for Education, $294.6 million forPublic Assistance, $385.6 million for Public Safety, $657.7 million for Health and Sanitation and $28.1 million forRecreation and Culture.
Of the overall County budget for the fiscal year 2019-2020, Adopted Budget allocated $687.5 million in appropriationsfor General Fund, to be financed by estimated General Fund revenue of $669.8 million and $17.7 million use of fundbalance. This year's General Fund appropriations are budgeted for various programs and functions allocated as follows:37.5% or $258.1 million to Public Safety, 31% or $213.2 million to Public Assistance, 15% or $103 million to Healthand Sanitation, 13% or $89 million to General Government, 3.4% or $23.7 million to Recreation and Culture, and 0.1%or $0.5 million to Education.
For fiscal year 2019-2020, the estimated General Fund revenue of $669.8 million consists of program revenues and non-program revenues. Program revenues, primarily from Federal and State sources, are typically provided for statutorypurposes and must legally be spent on designated activities or statutoriy-required programs. Program revenues includeoperating and capital grants and various restricted contributions. Non-program revenues are the County's discretionaryfunds, critical in addressing local priorities, and providing matching funds to leverage Federal and State grants to meetthe maintenance of effort requirements. These include property taxes, transient occupancy taxes, sales and use tax,vehicle license fees, and other revenues sourced from local government. The primary driver in the non-program,discretionary revenue growth has been the property taxes due to higher home value assessements. For this fiscal year,$231.6 million of the total estimated General Fund revenues, are expected to come from non-program revenue sources.(Source: Summary of the FY 2019-20 Adopted Budget)
18

COUNTY OF MONTEREYManagement Discussion and Analysis
REQUESTS FOR INFORMATIONThis financial report is designed to provide our citizens, taxpayers, customers, investors and creditors with a generaloverview of the County’s finances and to demonstrate the County’s accountability for the money it receives. If you havequestions about this report or need additional information, contact the County of Monterey, Office of Auditor-Controller,168 West Alisal Street, Salinas, CA 93901.
19

BASIC FINANCIAL STATEMENTS -GOVERNMENT-WIDE FINANCIAL STATEMENTS

This page intentionally left blank

COUNTY OF MONTEREYStatement of Net Position
June 30, 2019
Primary GovernmentComponent
UnitGovernmental
ActivitiesBusiness-Type
Activities TotalChildren &
Families CommASSETSCash and investments:
Held in County treasury $ 549,576,768 $ 123,630,785 $ 673,207,553 $ 7,116,360Held with trustee 1,156,092 - 1,156,092 1,881,388Other bank accounts 6,541,763 45,505 6,587,268 -Imprest 13,610 3,680 17,290 150Restricted 231,977 - 231,977 -
Receivables (net) 159,194,471 95,670,013 254,864,484 1,424,163Inventories 399,634 4,738,198 5,137,832 -Prepaid items 385,139 4,470,039 4,855,178 2,311Internal balances 1,946,710 (1,946,710) - -Notes receivable 20,789,964 - 20,789,964 -Capital assets:
Nondepreciable 403,793,413 7,065,839 410,859,252 -Depreciable, net 422,425,404 110,659,892 533,085,296 14,251
Total assets 1,566,454,945 344,337,241 1,910,792,186 10,438,623
DEFERRED OUTFLOWS OF RESOURCESUnamortized losses on refunding debts 421,027 1,597,225 2,018,252 -Deferred pensions 117,012,727 35,464,972 152,477,699 -Deferred OPEB 5,625,895 1,678,076 7,303,971 -
Total deferred outflows of resources 123,059,649 38,740,273 161,799,922 -
LIABILITIESAccounts payable and other accrued liabilities 47,172,178 59,067,761 106,239,939 1,776,815Accrued salaries and benefits 20,991,436 4,266,488 25,257,924 23,707Accrued interest payable 1,959,629 714,347 2,673,976 -Accrued liabilities 280,467 - 280,467 -Deposits from others 12,698,530 10,000 12,708,530 -Unearned revenues 15,830,074 - 15,830,074 -Long-term liabilities:
Due within one year 56,331,404 15,583,894 71,915,298 41,576Due beyond one year 280,349,145 39,471,053 319,820,198 69,020Net pension liability 512,663,439 130,396,117 643,059,556 -Net OPEB liability 30,129,753 8,653,118 38,782,871 -
Total liabilities 978,406,055 258,162,778 1,236,568,833 1,911,118
DEFERRED INFLOWS OF RESOURCESDeferred pensions 13,054,462 2,922,709 15,977,171 -Unamortized gains on refunding debts 790,387 201,331 991,718 -Deferred OPEB 578,662 166,340 745,002 -
Total deferred inflows of resources 14,423,511 3,290,380 17,713,891 -NET POSITIONNet investment in capital assets 626,801,165 77,652,887 704,454,052 6,108Restricted for:
Health and sanitation 81,145,405 - 81,145,405 200,000Public assistance 29,611,817 - 29,611,817 -Public protection 26,187,271 - 26,187,271 -Public ways and facilities 16,637,115 - 16,637,115 -Recreation and culture 153,733 854,324 1,008,057 -Capital projects 17,409,772 - 17,409,772 -Debt service 1,059,329 - 1,059,329 -Housing and redevelopment 8,387,415 - 8,387,415 -General government 48,607,483 - 48,607,483 -
Unrestricted (159,315,477) 43,117,145 (116,198,332) 8,321,397Total net position $ 696,685,028 $ 121,624,356 $ 818,309,384 $ 8,527,505
The accompanying notes are an integral part of these financial statements.20

COUNTY OF MONTEREYStatement of Activities
For the Fiscal Year Ended June 30, 2019
Program Revenues
Fees, Fines, Operating Capital
Expensesand Charges for
ServicesGrants and
ContributionsGrants and
Contributions
Function/Programs
Primary Government: Governmental activities:
General government $ 63,448,161 $ 30,091,566 $ 6,465,587 $ 44,576,491Public safety and protection 294,152,482 42,229,623 89,966,309 137,478Public ways and facilities 29,885,340 3,063,308 18,698,303 662,699Health and Sanitation 213,880,154 53,871,909 143,671,127 90,900Public assistance 200,967,755 2,866,199 183,172,644 -Education 9,925,076 134,378 213,389 380,626Recreation and cultural services 26,695,041 959,305 77,926 -Interest on long-term debt 7,625,654 - - -
Total governmental activities 846,579,663 133,216,288 442,265,285 45,848,194Business-type activities:
Natividad Medical Center 308,181,016 364,239,772 - -Parks and Lake Resort 6,813,109 4,358,096 88,357 -
Total business-type activities 314,994,125 368,597,868 88,357 -Total primary government $ 1,161,573,788 $ 501,814,156 $ 442,353,642 $ 45,848,194
Component Unit:Children and Families Commission $ 6,127,616 $ - $ 5,469,292 $ -
Total component unit: $ 6,127,616 $ - $ 5,469,292 $ -
General Revenues: Taxes:
Property taxSales and use taxesTransient occupancy taxesOther taxes
Unrestricted interest and investment earningsTobacco settlement revenuesOther revenues
TransfersTotal general revenues and transfers
Change in net positionNet position - beginning of year, as restatedNet position - end of year
The accompanying notes are an integral part of these financial statements.21

COUNTY OF MONTEREYStatement of Activities
For the Fiscal Year Ended June 30, 2019
Net (Expenses) Revenues and Changes in Net Position
Primary GovernmentComponent
UnitGovernmental
ActivitiesBusiness-type
Activities TotalsChildren &
Families Comm
$ 17,685,483 $ - $ 17,685,483 $ -(161,819,072) - (161,819,072) -
(7,461,030) - (7,461,030) -(16,246,218) - (16,246,218) -(14,928,912) - (14,928,912) -
(9,196,683) - (9,196,683) -(25,657,810) - (25,657,810) -
(7,625,654) - (7,625,654) -(225,249,896) - (225,249,896) -
- 56,058,756 56,058,756 -- (2,366,656) (2,366,656) -- 53,692,100 53,692,100 -
$ (225,249,896) $ 53,692,100 $ (171,557,796) $ -
$ (658,324)$ (658,324)
$ 170,410,312 $ - $ 170,410,312 $ -23,716,919 - 23,716,919 -28,607,881 - 28,607,881 -29,672,181 - 29,672,181 -31,282,643 4,621,658 35,904,301 173,497
4,257,928 - 4,257,928 -926,459 722,046 1,648,505 32,964
(6,430,124) 6,430,124 - -282,444,199 11,773,828 294,218,027 206,461
57,194,303 65,465,928 122,660,231 (451,863)639,490,725 56,158,428 695,649,153 8,979,368
$ 696,685,028 $ 121,624,356 $ 818,309,384 $ 8,527,505
The accompanying notes are an integral part of these financial statements.22

This page intentionally left blank

BASIC FINANCIAL STATEMENTS –FUND FINANCIAL STATEMENTS

This page intentionally left blank

COUNTY OF MONTEREYBalance Sheet
Governmental FundsJune 30, 2019
General Road FundBehavioral
HealthFacility MasterPlan Projects
OtherGovernmental Total
AssetsCash and investments:
Held in County Treasury $220,418,753 $ 28,249,973 $ 42,345,595 $ 54,257,340 $ 99,669,750 $ 444,941,411Held with trustee - - - - 1,156,092 1,156,092Imprest cash 11,510 300 - - 1,800 13,610Restricted cash 231,977 - - - - 231,977Other bank accounts 1,566,055 - - - - 1,566,055
Receivables 66,306,038 1,611,221 21,837,522 43,268,196 25,346,985 158,369,962Due from other funds 2,181,831 - - - 83,748 2,265,579Inventories 399,634 - - - - 399,634Prepaid items and other assets 262,566 - - - - 262,566Notes receivables - - - - 20,789,964 20,789,964
Total assets 291,378,364 29,861,494 64,183,117 97,525,536 147,048,339 629,996,850
LiabilitiesVouchers and accounts payable 22,614,447 2,236,927 9,103,849 9,221,921 2,303,701 45,480,845Accrued salaries and benefits 18,111,979 382,198 2,160,648 - 336,611 20,991,436Due to other funds - - - - 83,748 83,748Deposits from others 6,291,907 6,043,572 - - 363,051 12,698,530Unearned revenues 12,676,055 3,113,117 - - 40,902 15,830,074
Total liabilities 59,694,388 11,775,814 11,264,497 9,221,921 3,128,013 95,084,633
Deferred inflows of resourcesUnavailable revenue 26,546,837 533,577 10,507,810 43,253,255 5,436,892 86,278,371
Fund balancesNonspendable 662,200 - - - - 662,200Restricted 29,167,926 16,103,605 24,719,329 17,341,212 87,122,812 174,454,884Committed 91,461,322 380,277 14,703,236 - 7,214,664 113,759,499Assigned 81,487,612 1,068,221 2,988,245 27,709,148 44,207,917 157,461,143Unassigned 2,358,079 - - - (61,959) 2,296,120
Total fund balances 205,137,139 17,552,103 42,410,810 45,050,360 138,483,434 448,633,846Total liabilities, deferred
inflows of resources andfund balances $291,378,364 $ 29,861,494 $ 64,183,117 $ 97,525,536 $ 147,048,339 $ 629,996,850
The accompanying notes are an integral part of these financial statements.23

COUNTY OF MONTEREYReconciliation of the Governmental Funds Balance Sheet to
the Government-Wide Statement of Net Position - Governmental ActivitiesJune 30, 2019
Fund Balance - Total governmental funds $ 448,633,846
Amounts reported for governmental activities in the statement of net position are different because:
Capital assets used in governmental activities are not financial resources and, therefore, are notreported in the governmental funds. 826,218,817
Other long-term assets are not available to pay for current period expenditures and, therefore, arereported as unavailable revenue in the governmental funds. 86,278,371
Internal service funds (ISF) are used by the County to charge the cost of general liability andworkers' compensation insurance and other employee benefits to individual funds. The assetsand liabilities of the internal service funds are included in governmental activities in thestatement of net position. 34,478,444
Internal service funds capital asset, included in governmental activities capital assets and in ISF netposition amounts (19,859,609)
14,618,835
Deferred outflows of resources related to OPEB are not recognized as expenditures in thegovernmental funds 5,625,895
Pension contributions are reported as deferred outflow of resources in the statement of net position. 117,012,727
Long-term liabilities, including bonds payable, are not due and payable in the current period andtherefore are not reported in the governmental funds. Interest on long-term debt is not accrued ingovernmental funds, but rather is recognized as an expenditure when due. All liabilities arereported in the statement of net position. Balances as of June 30, 2019, are:
Bonds and notes payable $ (42,470,876)Certificate of participation (121,092,369)Unamortized premium on certificates of participation and bonds (20,585,496)Unamortized losses on refunding debts 421,027Unamortized gains on refunding debts (790,387)Capital lease obligations (14,899,549)Accrued interest on long-term debt (1,959,629)Compensated absences (39,691,011)Estimated landfill closure and postclosure costs (832,973)Net OPEB liability (30,129,753)Net pension liability (512,663,439)
(784,694,461)
Deferred inflows of resources related to pensions are not recognized as revenues in thegovernmental funds (13,054,462)
Deferred inflows of resources related to OPEB are not recognized as revenues in the governmentalfunds (578,662)
Adjustment necessary to close Internal Service Funds activities. This is the cumulative excess ofrevenues over expenses allocable to business-type activities. (3,375,878)
Net positions of governmental activities $ 696,685,028
The accompanying notes are an integral part of these financial statements.24

COUNTY OF MONTEREYStatement of Revenues, Expenditures and Changes in Fund Balances
Governmental FundsFor the Fiscal Year Ended June 30, 2019
General Road FundBehavioral
HealthFacility MasterPlan Projects
OtherGovernmental Total
RevenuesTaxes $227,678,136 $ 9,525,367 $ - $ - $ 13,856,873 $ 251,060,376Licenses, permits, and franchises 21,817,896 380,277 - - 35,402 22,233,575Fines, forfeitures, and penalties 8,760,803 - 97,637 - 843,157 9,701,597Revenue from use of money and
property 25,367,025 179,775 592,187 (585,944) 3,663,661 29,216,704Aid from other governmental
agencies 185,297,384 23,796,359 91,259,182 46,243,756 138,661,115 485,257,796Charges for services 74,454,076 1,064,534 2,002,399 - 20,373,370 97,894,379Miscellaneous revenues 8,102,320 311,794 326,672 117,608 895,185 9,753,579
Total revenues 551,477,640 35,258,106 94,278,077 45,775,420 178,328,763 905,118,006
ExpendituresCurrent:
General government 48,692,462 - - - 959,509 49,651,971Public protection 247,753,990 - - - 15,938,282 263,692,272Public ways and facilities - 33,279,939 - - 731,131 34,011,070Health and sanitation 80,930,551 - 121,233,591 - 3,868,631 206,032,773Public assistance 189,577,592 - - - 7,602,284 197,179,876Education 317,288 - - - 9,159,524 9,476,812Recreation and cultural
services 26,826,462 - - - - 26,826,462Debt service:
Principal - - - - 9,388,511 9,388,511Interest and debt service costs - - - - 8,293,393 8,293,393
Capital outlay - - - 59,478,103 6,917,517 66,395,620Total expenditures 594,098,345 33,279,939 121,233,591 59,478,103 62,858,782 870,948,760
Excess (deficiency) of revenuesover (under) expenditures (42,620,705) 1,978,167 (26,955,514) (13,702,683) 115,469,981 34,169,246
Other financing sources (uses)Transfers in 104,595,113 5,397,106 29,886,737 220,119 22,284,040 162,383,115Transfers out (32,609,952) - (3,175,823) (3,996,113) (135,403,912) (175,185,800)Issuance of debt - - - - 22,890,000 22,890,000Premium on debt issuance - - - - 3,690,065 3,690,065Debt Defeasance - - - - (25,531,628) (25,531,628)Sale of capital assets 53,248 23,202 4,300 - 5,045 85,795
Total other financing sources(uses) 72,038,409 5,420,308 26,715,214 (3,775,994) (112,066,390) (11,668,453)
Net change in fund balances 29,417,704 7,398,475 (240,300) (17,478,677) 3,403,591 22,500,793
Fund balances, beginning of year 175,719,435 10,153,628 42,651,110 62,529,037 135,079,843 426,133,053
Fund balances, end of year $205,137,139 $ 17,552,103 $ 42,410,810 $ 45,050,360 $ 138,483,434 $ 448,633,846
The accompanying notes are an integral part of these financial statements.25
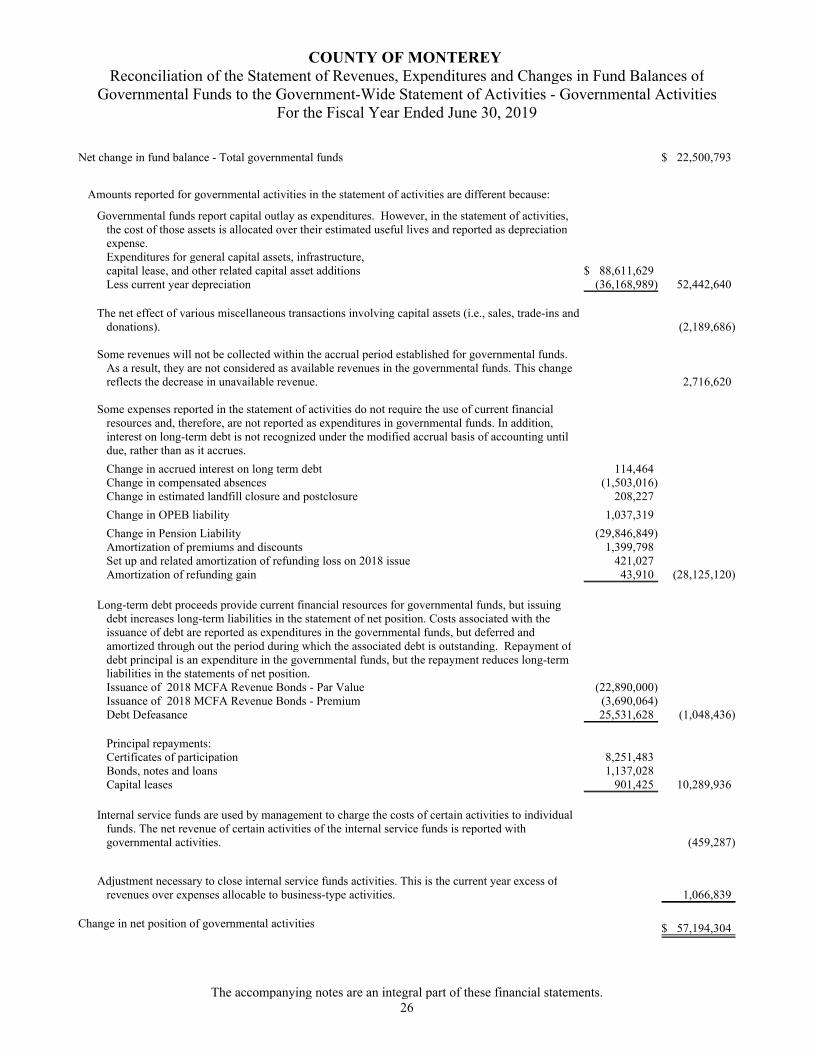
COUNTY OF MONTEREYReconciliation of the Statement of Revenues, Expenditures and Changes in Fund Balances of
Governmental Funds to the Government-Wide Statement of Activities - Governmental ActivitiesFor the Fiscal Year Ended June 30, 2019
Net change in fund balance - Total governmental funds $ 22,500,793
Amounts reported for governmental activities in the statement of activities are different because:
Governmental funds report capital outlay as expenditures. However, in the statement of activities,the cost of those assets is allocated over their estimated useful lives and reported as depreciationexpense.Expenditures for general capital assets, infrastructure, capital lease, and other related capital asset additions $ 88,611,629Less current year depreciation (36,168,989) 52,442,640
The net effect of various miscellaneous transactions involving capital assets (i.e., sales, trade-ins anddonations). (2,189,686)
Some revenues will not be collected within the accrual period established for governmental funds.As a result, they are not considered as available revenues in the governmental funds. This changereflects the decrease in unavailable revenue. 2,716,620
Some expenses reported in the statement of activities do not require the use of current financialresources and, therefore, are not reported as expenditures in governmental funds. In addition,interest on long-term debt is not recognized under the modified accrual basis of accounting untildue, rather than as it accrues. Change in accrued interest on long term debt 114,464Change in compensated absences (1,503,016)Change in estimated landfill closure and postclosure 208,227Change in OPEB liability 1,037,319Change in Pension Liability (29,846,849)Amortization of premiums and discounts 1,399,798Set up and related amortization of refunding loss on 2018 issue 421,027Amortization of refunding gain 43,910 (28,125,120)
Long-term debt proceeds provide current financial resources for governmental funds, but issuingdebt increases long-term liabilities in the statement of net position. Costs associated with theissuance of debt are reported as expenditures in the governmental funds, but deferred andamortized through out the period during which the associated debt is outstanding. Repayment ofdebt principal is an expenditure in the governmental funds, but the repayment reduces long-termliabilities in the statements of net position.Issuance of 2018 MCFA Revenue Bonds - Par Value (22,890,000)Issuance of 2018 MCFA Revenue Bonds - Premium (3,690,064)Debt Defeasance 25,531,628 (1,048,436)
Principal repayments:Certificates of participation 8,251,483Bonds, notes and loans 1,137,028Capital leases 901,425 10,289,936
Internal service funds are used by management to charge the costs of certain activities to individualfunds. The net revenue of certain activities of the internal service funds is reported withgovernmental activities. (459,287)
Adjustment necessary to close internal service funds activities. This is the current year excess ofrevenues over expenses allocable to business-type activities. 1,066,839
Change in net position of governmental activities $ 57,194,304
The accompanying notes are an integral part of these financial statements.26

COUNTY OF MONTEREYStatement of Revenues, Expenditures, and Changes in Fund Balances - Budget and Actual
GeneralFor the Fiscal Year Ended June 30, 2019
Budgeted Amounts
Original Final Actual AmountsVariance withFinal Budget
RevenuesTaxes $ 200,326,729 $ 201,331,552 $ 227,678,136 $ 26,346,584Licenses, permits, and franchises 24,001,981 24,001,981 21,817,896 (2,184,085)Fines, forfeitures, and penalties 8,535,900 8,776,835 8,760,803 (16,032)Revenue from use of money and property 20,336,335 20,400,547 25,367,025 4,966,478Aid from other governmental agencies 203,887,859 210,956,296 185,297,384 (25,658,912)Charges for services 81,291,617 80,511,621 74,454,076 (6,057,545)Miscellaneous revenues 6,379,128 5,772,578 8,102,320 2,329,742
Total revenues 544,759,549 551,751,410 551,477,640 (273,770)
ExpendituresCurrent:
General government 66,538,527 65,399,193 48,692,462 16,706,731Public protection 253,486,595 256,160,717 247,753,990 8,406,727Health and sanitation 91,081,589 95,422,516 80,930,551 14,491,965Public assistance 202,385,369 204,721,463 189,577,592 15,143,871Education 421,034 421,034 317,288 103,746Recreation and cultural services 19,633,284 19,633,284 26,826,462 (7,193,178)
Total expenditures 633,546,398 641,758,207 594,098,345 47,659,862
Excess (deficiency) of revenues over (under)expenditures (88,786,849) (90,006,797) (42,620,705) 47,386,092
Other financing sources (uses):Transfers in 113,434,892 113,434,892 104,595,113 (8,839,779)Transfers out (43,563,718) (48,009,983) (32,609,952) 15,400,031Sale of capital assets - - 53,248 53,248
Total other financing sources (uses) 69,871,174 65,424,909 72,038,409 6,613,500
Net changes in fund balances (18,915,675) (24,581,888) 29,417,704 53,999,592Fund balances, beginning 175,719,435 175,719,435 175,719,435 -
Fund balances, ending $ 156,803,760 $ 151,137,547 $ 205,137,139 $ 53,999,592
The accompanying notes are an integral part of these financial statements.27

COUNTY OF MONTEREYStatement of Revenues, Expenditures, and Changes in Fund Balances - Budget and Actual
Road FundFor the Fiscal Year Ended June 30, 2019
Budgeted Amounts
Original FinalActual
AmountsVariance withFinal Budget
RevenuesTaxes $ 5,484,774 $ 5,484,774 $ 9,525,367 $ 4,040,593Licenses, permits, and franchises 90,000 90,000 380,277 290,277Revenue from use of money and property 20,235 20,235 179,775 159,540Aid from other governmental agencies 24,837,833 24,837,833 23,796,359 (1,041,474)Charges for services 1,616,184 1,616,184 1,064,534 (551,650)Miscellaneous revenues 931,449 931,449 311,794 (619,655)
Total revenues 32,980,475 32,980,475 35,258,106 2,277,631
ExpendituresCurrent:
Public ways and facilities 37,905,747 37,905,747 33,279,939 4,625,808Total expenditures 37,905,747 37,905,747 33,279,939 4,625,808
Excess (deficiency) of revenues over (under)expenditures (4,925,272) (4,925,272) 1,978,167 (2,348,177)
Other financing sources (uses)Transfers in 5,319,831 5,319,831 5,397,106 77,275Transfers out (8,257) (8,257) - 8,257Sale of capital assets - - 23,202 23,202
Total other financing sources (uses) 5,311,574 5,311,574 5,420,308 108,734Net changes in fund balances 386,302 386,302 7,398,475 7,012,173Fund balances, beginning 10,153,628 10,153,628 10,153,628 -Fund balances, ending $ 10,539,930 $ 10,539,930 $ 17,552,103 $ 7,012,173
The accompanying notes are an integral part of these financial statements.28

COUNTY OF MONTEREYStatement of Revenues, Expenditures, and Changes in Fund Balances - Budget and Actual
Behavioral HealthFor the Fiscal Year Ended June 30, 2019
Budgeted Amounts
Original FinalActual
Amounts Variance withFinal Budget
RevenuesFines, forfeitures, and penalties $ 150,000 $ 150,000 $ 97,637 $ (52,363)Revenue from use of money and property 154,578 154,578 592,187 437,609Aid from other governmental agencies 89,024,550 95,449,744 91,259,182 (4,190,562)Charges for services 1,760,000 1,760,000 2,002,399 242,399Miscellaneous revenues - - 326,672 326,672
Total revenues 91,089,128 97,514,322 94,278,077 (3,236,245)
ExpendituresCurrent:
Health and sanitation 126,159,886 123,769,266 121,233,591 2,535,675Total expenditures 126,159,886 123,769,266 121,233,591 2,535,675
Excess (deficiency) of revenues over (under)expenditures (35,070,758) (26,254,944) (26,955,514) (700,570)
Other financing sources (uses):Transfers in 33,134,432 33,134,432 29,886,737 (3,247,695)Transfers out - (8,815,814) (3,175,823) 5,639,991Sale of capital assets - - 4,300 4,300
Total other financing sources (uses) 33,134,432 24,318,618 26,715,214 2,396,596Net changes in fund balances (1,936,326) (1,936,326) (240,300) 1,696,026Fund balances, beginning 42,651,110 42,651,110 42,651,110 -Fund balances, ending $ 40,714,784 $ 40,714,784 $ 42,410,810 $ 1,696,026
The accompanying notes are an integral part of these financial statements.29

COUNTY OF MONTEREYStatement of Net Position
Proprietary FundsJune 30, 2019
Business-Type Activities -Enterprise Funds
GovernmentalActivities
NatividadMedical Center
NonmajorEnterprise Fund-
Parks Lake &Resort Operations
Total EnterpriseFunds Internal Service
AssetsCurrent assets:
Cash and cash equivalents $ 123,603,792 $ 26,993 $ 123,630,785 $ 104,635,357Imprest cash 3,680 - 3,680 -Other bank accounts 40,541 4,964 45,505 4,975,708Receivables (net) 94,146,673 1,523,340 95,670,013 824,509Due from other funds - - - 567,081Inventories 4,738,198 - 4,738,198 -Prepaid expenses 4,470,039 - 4,470,039 122,573
Total current assets 227,002,923 1,555,297 228,558,220 111,125,228
Noncurrent assets:Advances to other funds - - - 2,573,676Capital assets:
Non-depreciable 7,065,839 - 7,065,839 -Depreciable, net 109,062,025 1,597,867 110,659,892 19,859,609
Total noncurrent assets 116,127,864 1,597,867 117,725,731 22,433,285
Total assets 343,130,787 3,153,164 346,283,951 133,558,513
Deferred Outflows of ResourcesUnamortized losses on refunding debts 1,597,225 - 1,597,225 -Deferred pensions 35,464,971 - 35,464,971 -Deferred OPEB 1,678,076 - 1,678,076 -
Total deferred outflows of resources 38,740,272 - 38,740,272 -
LiabilitiesCurrent liabilities:
Accounts payable, deposits and accrued liabilities 58,694,183 383,577 59,077,760 1,691,332Accrued salaries and benefits 4,086,108 180,380 4,266,488 -Accrued interest payable 714,347 - 714,347 -Other liabilities - - - 280,467Due to other funds - 2,748,912 2,748,912 -Current portion of claims liability - - - 21,678,405Current portion of long-term debt 15,583,894 - 15,583,894 1,274,448
Total current liabilities 79,078,532 3,312,869 82,391,401 24,924,652
Long-term liabilities:Advances from other funds - 2,573,676 2,573,676 -Claims liability - - - 70,922,399Bonds and notes payable 37,729,571 - 37,729,571 3,233,018Net pension liability 130,396,118 - 130,396,118 -Net OPEB liability 8,653,118 - 8,653,118 -Compensated absences 1,741,482 - 1,741,482 -
Total long-term liabilities 178,520,289 2,573,676 181,093,965 74,155,417
Total liabilities 257,598,821 5,886,545 263,485,366 99,080,069
continuedThe accompanying notes are an integral part of these financial statements.
30

COUNTY OF MONTEREYStatement of Net Position
Proprietary FundsJune 30, 2019
Business-Type Activities -Enterprise Funds
GovernmentalActivities
NatividadMedical Center
NonmajorEnterprise Fund-
Parks Lake &Resort Operations
Total EnterpriseFunds Internal Service
Deferred Inflows of ResourcesDeferred pensions 2,922,709 - 2,922,709 -Deferred OPEB 166,340 - 166,340 -Unamortized gains on refunding debts 201,331 - 201,331 -
Total deferred inflows of resources 3,290,380 - 3,290,380 -
Net PositionNet investment in capital assets 76,055,021 1,597,867 77,652,888 19,859,609Restricted for recreation and culture - 854,324 854,324 -Unrestricted (deficit) 44,926,837 (5,185,572) 39,741,265 14,618,835
Total net position 120,981,858 (2,733,381) 118,248,477 $ 34,478,444
Adjustment to reflect the consolidation of internal servicefunds activities related to enterprise fund 3,730,534 (354,655) 3,375,879
Net position of business-type activities $ 124,712,392 $ (3,088,036) $ 121,624,356
The accompanying notes are an integral part of these financial statements.31

COUNTY OF MONTEREYStatement of Revenues, Expenses and Changes in Net Position
Proprietary FundsFor the Fiscal Year Ended June 30, 2019
Business-Type Activities -Enterprise Funds
GovernmentalActivities
NatividadMedical Center
NonmajorEnterprise Fund-
Parks Lake &Resort
Operations
TotalEnterprise
FundsInternalService
Operating revenues:Net patient services revenues $ 358,130,173 $ - $ 358,130,173 $ -Charges for services - 15 15 42,236,045Other operating revenues 4,630,732 4,358,903 8,989,635 10,754,227
Total operating revenues 362,760,905 4,358,918 367,119,823 52,990,272
Operating expenses:Salaries and benefits 193,235,759 93,701 193,329,460 4,996,449Services and supplies 30,232,584 6,149,918 36,382,502 11,745,370Claims expense - - - 39,216,868Purchased services 57,815,980 - 57,815,980 -Depreciation 17,118,469 220,666 17,339,135 5,282,237Other expenses 6,786,468 89,805 6,876,273 362,191
Total operating expenses 305,189,260 6,554,090 311,743,350 61,603,115
Net operating income (loss) 57,571,645 (2,195,172) 55,376,473 (8,612,843)
Non-operating revenues (expenses):Intergovernmental revenue - 88,357 88,357 -Interest income 4,647,509 (25,851) 4,621,658 2,362,011Interest expense (2,012,177) (171,760) (2,183,937) (258,460)Rental income 1,478,867 - 1,478,867 -Other non-operating revenues 720,000 1,225 721,225 (322,559)
Total non-operating revenues (expenses) 4,834,199 (108,029) 4,726,170 1,780,992Net income (loss) before transfers and capital
contributions 62,405,844 (2,303,201) 60,102,643 (6,831,851)Transfers in 3,975,735 2,954,389 6,930,124 6,372,564Transfers out (500,000) - (500,000) -
Change in net position 65,881,579 651,188 66,532,767 (459,287)
Net position, beginning of year 55,100,279 (3,384,569) 51,715,710 34,937,731
Net position, end of year $ 120,981,858 $ (2,733,381) $ 118,248,477 $ 34,478,444
Change in net position, from above $ 65,881,579 $ 651,188 $ 66,532,767Adjustment to reflect the consolidation of internal service
funds activities related to enterprise funds (979,579) (87,260) (1,066,839)
Change in net position of business-type activities $ 64,902,000 $ 563,928 $ 65,465,928
The accompanying notes are an integral part of these financial statements.32

COUNTY OF MONTEREYStatement of Cash Flows
Proprietary FundsFor the Fiscal Year Ended June 30, 2019
Business-Type Activities -Enterprise Funds
GovernmentalActivities
NatividadMedicalCenter
NonmajorEnterprise Fund-
Parks &Lake Resort
TotalEnterprise
Funds
InternalServiceFunds
Cash flows from operating activities:Cash received from patients and third party payors $ 338,123,972 $ - $ 338,123,972 $ -Cash receipts from customers - 4,091,203 4,091,203 10,754,227Cash receipts from interfund charges - - - 41,644,889Cash paid to employees for services (185,478,850) (93,701) (185,572,551) (4,630,684)Cash paid to suppliers for good and services (99,044,391) (6,357,936) (105,402,327) (45,053,361)Cash paid to other funds for services provided - - - (2,814,861)
Net cash provided (used) by operating activities 53,600,731 (2,360,434) 51,240,297 (99,790)
Cash flows from noncapital financing activities:Grants revenues received 720,000 88,357 808,357 -Transfers from other funds 3,975,735 2,954,389 6,930,124 6,372,564Transfers to other funds (500,000) - (500,000) -Due from other funds - - - (27,602)Due to other funds - 108,109 108,109 (3,004,433)
Net cash provided (used) by noncapital financingactivities 4,195,735 3,150,855 7,346,590 3,340,529
Cash flows from capital and related financing activities:Collection of advances - - - 567,082Repayment of advances - (567,081) (567,081) -Principal paid on capital related debt (3,551,376) - (3,551,376) (1,212,419)Interest paid on capital related debt (1,873,115) (171,760) (2,044,875) (258,460)Payments related to the acquisition of capital assets (16,624,852) - (16,624,852) (1,841,723)Collections related to dispositions of capital assets - 1,225 1,225 (322,559)
Net cash provided (used) by capital and related financingactivities (22,049,343) (737,616) (22,786,959) (3,068,079)
Cash flows from investing activities:Cash received from rental income 1,478,867 - 1,478,867 -Interest payments received 4,647,511 (25,851) 4,621,660 2,362,011Net cash provided (used) by investing activities 6,126,378 (25,851) 6,100,527 2,362,011
Net increase (decrease) in cash and cash equivalents 41,873,501 26,954 41,900,455 2,534,671
Cash and cash equivalents, July 1 81,774,512 5,003 81,779,515 107,076,394Cash and cash equivalents, June 30 $ 123,648,013 $ 31,957 $ 123,679,970 $ 109,611,065
Reconciliation of cash and cash equivalents tostatement of net position
Cash and cash equivalents $ 123,603,792 $ 26,993 $ 123,630,785 $ 104,635,357Imprest cash 3,680 - 3,680 -Other bank accounts 40,541 4,964 45,505 4,975,708
Total cash and cash equivalents $ 123,648,013 $ 31,957 $ 123,679,970 $ 109,611,065
continuedThe accompanying notes are an integral part of these financial statements.
33

COUNTY OF MONTEREYStatement of Cash Flows
Proprietary FundsFor the Fiscal Year Ended June 30, 2019
Business-Type Activities -Enterprise Funds
GovernmentalActivities
NatividadMedicalCenter
NonmajorEnterprise Fund-
Parks &Lake Resort
TotalEnterprise
Funds
InternalServiceFunds
Reconciliation of operating income to net cashProvided by operating activities:Operating income (loss) $ 57,571,645 $ (2,195,172) $ 55,376,473 $ (8,612,843)Adjustments to reconcile operating income to net
Cash provided (used) by operating activities:Depreciation and amortization 17,118,469 220,666 17,339,135 5,282,237(Increase) decrease in receivables (24,636,933) (267,715) (24,904,648) (591,156)(Increase) decrease in inventories (747,216) - (747,216) -(Increase) decrease in prepaid items 891,074 - 891,074 -Increase (decrease) in accounts payable (44,590,989) (118,213) (44,709,202) (177,513)Increase (decrease) in deferred outflows - pension 7,859,959 - 7,859,959 -Increase (decrease) in deferred outflows - OPEB (130,602) - (130,602) -Increase (decrease) in other accrued liabilities 40,237,772 - 40,237,772 (47,782)Increase (decrease) in other salaries and benefits 1,447,872 - 1,447,872 -Increase (decrease) in compensated absences 1,091,267 - 1,091,267 -Increase (decrease) in post-employment liability (207,985) - (207,985) -Increase (decrease) in deferred inflows - pension (5,225) - (5,225) -Increase (decrease) in deferred inflows - OPEB 29,178 - 29,178 -Increase (decrease) in pension liability (2,327,555) - (2,327,555) -Increase (decrease) in claims liability - - - 4,047,267
Total adjustments (3,970,914) (165,262) (4,136,176) 8,513,053Net cash provided (used) by operating activities $ 53,600,731 $ (2,360,434) $ 51,240,297 $ (99,790)
The accompanying notes are an integral part of these financial statements.34

COUNTY OF MONTEREYStatement of Fiduciary Funds Net Position
June 30, 2019
InvestmentTrust
Private PurposeTrust Agency
AssetsCash and investments held in County Treasury $1,031,654,407 $ 2,349,350 $ 18,336,043Other bank accounts - - 5,524,005Taxes receivable - - 30,209,752Due from other funds - - 5,681,915Long-term receivables - 27,938 -Property held for resale - 24,068 -Depreciable, net - 784,806 -
Total assets 1,031,654,407 3,186,162 59,751,715
LiabilitiesAccounts payable - 621,194 1,682,787Due to other funds - - 5,681,915Deposits from others - 112,284 -Unearned revenues - 45,153 -Assets held as agency for others - - 52,387,013
Total liabilities - 778,631 59,751,715
Net positionNet position held in trust for investment pool and other
governments 1,031,654,407 2,407,531 -Total net position $1,031,654,407 2,407,531 -
The accompanying notes are an integral part of these financial statements.35

COUNTY OF MONTEREYStatement of Changes in Fiduciary Funds Net Position
For the Fiscal Year Ended June 30, 2019
InvestmentTrust
Private PurposeTrust
AdditionsProperty taxes $ - $ 2,033,876Contributions to investment pool 1,870,093,487 -Interest income 19,321,995 48,668
Total additions 1,889,415,482 2,082,544
DeductionsDistributions from investment pool 1,785,830,580 -Administrative expenses - 2,274,191Depreciation - 206,758
Total deductions 1,785,830,580 2,480,949Change in net position 103,584,902 (398,405)
Net position, beginning of year 928,069,506 2,805,935Net position, end of year $1,031,654,408 $ 2,407,530
The accompanying notes are an integral part of these financial statements.36

NOTES TO FINANCIAL STATEMENTS
The notes provided in the financial section are considered an integral and essential part of adequate disclosure and fairpresentation of this report. The notes include a summary of significant accounting policies for the County, and othernecessary disclosure of pertinent matters relating to the financial position of the County. The notes express significantinsight to the financial statements and are conjunctive to understanding the rationale for presentation of the financialstatements and information contained in this document.

This page intentionally left blank

COUNTY OF MONTEREYNotes to the Financial Statements
For the Fiscal Year Ended June 30, 2019
Note 1: Summary of Significant Accounting Policies
A. The Financial Reporting Entity
The County of Monterey, California (County) was created pursuant to general law as a subdivision of the State of California.The County is governed by a five-member elected Board of Supervisors (County Board) with legislative and executive controlof the County. As required by generally accepted accounting principles (GAAP) in the United States of America, theaccompanying financial statements present the County (the primary government) and its component units, entities for which theCounty is considered to be financially accountable. Blended component units, though they are legally separate entities, are insubstance part of the County's operations. Thus, blended component units are presented as funds of the County. The discretelypresented component units, on the other hand, are reported in separate columns in the government-wide financial statements toemphasize that they are not considered as an integral part of the primary government. The County's financial statements includeall financial activities for which the primary government is financially accountable or closely related.
Blended Component Units
Although they are legally separate from the County, the following blended component units are reported as if they were a partof the County because the Monterey County Board of Supervisors also serves as the governing board of each component unit.In addition, the primary government has operational responsibility for the component units:
Monterey County Water Resources Agency, including Storm Drain Maintenance District No. 2 and Gonzales SloughMaintenance District – All County Service Areas
All County Sanitation Districts except Seaside County Sanitation District
Nacimiento Hydroelectric Operations
Monterey County Financing Authority
Monterey County Public Improvement Corporation
Community Facilities District 2006-1, East Garrison Public Financing Authority
Complete financial statements of the Monterey County Financing Authority and Monterey County Public ImprovementsCorporation can be obtained by contacting the County of Monterey, Auditor-Controller, P.O. Box 390, Salinas, CA 93902.
Discretely Presented Component Units
Monterey County Children and Families Commission (Commission) was established under the provisions of the CaliforniaChildren and Families Act. The Commission is a legally separate entity governed by a board of seven members. Three membersare representatives of the County’s health care departments, County’s social services departments and the Board of Supervisors.The County Board of Supervisors may remove any Commission member at any time. Since the County Board of Supervisorscan impose their will on the Commission, the Commission is considered a discretely presented component unit of the County.Separately issued statements may be obtained by contacting the Commission at 1125 Baldwin Street, Salinas, CA 93906.
The Monterey County Board of Supervisors appoints a voting majority of the governing boards of the following entities;however, such entities are excluded from the accompanying financial statements due to the fact that (1) the County is not able toimpose its will on the entity and (2) there is not a financial benefit/burden relationship between the County and the entity:
Monterey County Housing Authority
Monterey Bay Unified Air Pollution Control District
All Cemetery Districts
Community Facilities
Carmel Highlands Fire Protection District
Mid-Carmel Valley Fire Protection District
Mission Soledad Rural Fire Protection District
37

COUNTY OF MONTEREYNotes to the Financial Statements
For the Fiscal Year Ended June 30, 2019
Note 1: Summary of Significant Accounting Policies (continued)
A. The Financial Reporting Entity (continued)
Salinas Rural Fire Protection District
North County Public Recreation District
B. Basis of Presentation
In accordance with GASB Statement No. 34, "Basic Financial Statements and Management's Discussion and Analysis for Stateand Local Governments," the financial statements consist of the following:
Government-Wide financial statements,
Fund financial statements, and
Notes to the financial statements.
Government-Wide Financial Statements
The government-wide financial statements consist of the Statement of Net Position and the Statement of Activities and reportinformation on all of the nonfiduciary activities of the primary government and its component units. All fiduciary activities arereported only in the fund financial statements. All internal balances in the statement of net position have been eliminated withthe exception of those representing balances between governmental activities and the business-type activities, which arepresented as internal balances. Eliminations have been made to minimize the double counting of internal activities. Thesestatements distinguish between the governmental and business-type activities of the County and between the County and itsdiscretely presented component units. Governmental activities, which are normally supported by taxes, intergovernmentalrevenues, and other nonexchange transactions, are reported separately from business-type activities, which rely to a significantextent on fees charged to external customers. Likewise, the County is reported separately from certain legally separatecomponent units for which the County is financially accountable.
The Statement of Activities presents a comparison between program expenses and program revenues for each segment of thebusiness-type activities of the County and for each function of the County’s governmental activities. Program expenses includedirect expenses, which are clearly identifiable with a specific function, and allocated indirect expenses. Program revenuesinclude 1) charges paid by the recipients of goods or services offered by the programs and 2) grants and contributions that arerestricted to meeting the operational or capital requirements of a particular program. Revenues that are not classified asprogram revenues, including all taxes, are presented instead as general revenues.
While separate government-wide and fund financial statements are presented, they are interrelated. The governmental activitiescolumn incorporates data from governmental funds and internal service funds, while business-type activities incorporate datafrom the County's enterprise funds. Separate financial statements are provided for governmental funds, proprietary funds, andfiduciary funds, even though the latter are excluded from the government-wide financial statements. As a general rule, the effectof interfund activity has been eliminated from the government-wide financial statements. Exceptions to this general rule arepayments for services where the amounts are reasonably equivalent in value to the interfund services provided and othercharges between the County’s funds. Elimination of these charges would distort the direct costs and program revenues reportedfor the various functions
Fund Financial Statements
The fund financial statements provide information about the County’s funds, including fiduciary funds and blended componentunits. Separate statements for each fund category – governmental, proprietary and fiduciary – are presented. The emphasis offund financial statements is on major governmental and enterprise funds, which are each displayed in a separate column. Allremaining governmental and enterprise funds are separately aggregated and reported as nonmajor funds.
38

COUNTY OF MONTEREYNotes to the Financial Statements
For the Fiscal Year Ended June 30, 2019
Note 1: Summary of Significant Accounting Policies (continued)
B. Basis of Presentation (continued)
Proprietary funds distinguish operating revenues and expenses from nonoperating items. Operating revenues and expensesgenerally result from providing services and producing and delivering goods in connection with a proprietary fund’sprincipal ongoing operation. The principal operating revenues of the County’s enterprise funds and internal service fundsare charges to customers for sales and services. Operating expenses for enterprise funds and internal service funds includethe cost of sales and services, administrative expenses, and depreciation on capital assets. All revenues and expenses notmeeting this definition are reported as nonoperating revenues and expenses.
The County reports the following major governmental funds:
General Fund is used to account for all revenues and expenditures necessary to carry out basic governmental activitiesof the County that are not accounted for through other funds. For the County, the General Fund includes such activitiesas general government, public safety and protection, public ways and facilities, health and sanitation, public assistance,education and recreation and cultural services.
The Road Fund carries out public ways activities of traffic engineering, project and community development, design,construction, and operation of the county road, bridge, and utility infrastructure and receives state highway users tax andstate and federal aid and grants.
The Behavioral Health Fund carries out governmental activities of the County that relate to alcohol, drug, and mentalhealth services. The primary source of revenue for this fund is state and federal grants and aid.
The Facilities Master Plan Implementation Fund is established to account for capital projects undertaken with debt inorder to adhere to reporting requirements and assure the County is on schedule with project implementation andcompletion. Current projects include the Courthouse (north, east and west wings), New Juvenile Hall, and Jail Houseaddition.
The County reports the following major enterprise fund:
The Natividad Medical Center (NMC) accounts for hospital operations involved in providing health services to Countyresidents. Revenues are principally fees for patient services, payments from federal and state programs such asMedicare, Medi-Cal and Short Doyle, realignment revenues and subsidies from the General Fund. For more detailedinformation on NMC, refer to the Natividad Medical Center audit report.
The County reports the following additional fund types:
Internal Service Funds account for the County’s self-insurance programs including workers’ compensation, generalliability insurance, other employee benefit plans that include vision, dental, long term disability, and other miscellaneousemployee benefits; and resource planning to provide funds for capital projects that require replacement, maintenance, orupgrades during the life of the asset.
The Investment Trust Fund accounts for the assets of legally separate entities that deposit cash with the CountyTreasurer. These entities include school and community college districts and other special districts governed by localboards, regional boards and authorities. These funds represent the assets, primarily cash and investments, and the relatedliability of the County to disburse these monies on demand.
The Agency Funds account for assets held by the County as an agent for various local governments. Since they arecustodial in nature they do not involve measurement of results of operations, nor do they have equity accounts since allassets are due to individuals or entities at some future time. These funds include pass through funds established for thedistribution of tax collections for State, cities and town.
The Private Purpose Trust Fund accounts for the former redevelopment obligation retirement activities
39

COUNTY OF MONTEREYNotes to the Financial Statements
For the Fiscal Year Ended June 30, 2019
Note 1: Summary of Significant Accounting Policies (continued)
B. Basis of Presentation (continued)
During the course of operations, the County has activity between funds for various purposes through due from/to otherfunds and advances to/from other funds. While these balances are reported in fund financial statements, certain eliminationsare made in the preparation of the government-wide financial statements. Balances between those funds included in thegovernmental activities (i.e., the governmental and the internal service funds) are eliminated so that only the net amount isreported as internal balances in the governmental activities column. Similarly, balances between those funds included in thebusiness-type activities (i.e., the enterprise funds) are eliminated so that only the net amount is included as internal balancesin the business-type activities column.
Certain activities occur during the year involving transfers of resources between funds. In fund financial statements theseamounts are reported at gross as transfers in/out. While reported in fund financial statements, certain eliminations are madein the preparation of the government-wide financial statements. Transfers between those funds included in the governmentalactivities are eliminated so that only the net amount is included as transfers in the governmental activities column. Similarly,balances between those funds included in the business-type activities are eliminated so that only the net amount is includedas transfers in the business-type activities column.
C. Measurement Focus and Basis of Accounting
The accounting and financial reporting treatment is determined by the applicable measurement focus and basis ofaccounting. Measurement focus indicates the type of resources being measured, and the basis of accounting indicates thetiming of transactions or events for recognition in the financial statements.
The government-wide financial statements are reported using the economic resources measurement focus and the accrualbasis of accounting, as are the proprietary fund and fiduciary fund financial statements (excluding agency funds). Revenuesare recorded when earned and expenses are recorded when liabilities are incurred, regardless of when the related cash flowstake place. Non-exchange transactions, in which the County gives (or receives) value without directly receiving (or giving)equal value in exchange, include property and sales taxes, grants, entitlements and donations. On an accrual basis, revenuesfrom property taxes are recognized in the fiscal year for which the taxes are levied. Revenues from sales tax are recognizedwhen the underlying transactions take place. Revenues from grants, entitlements and donations are recognized in the fiscalyear in which all eligibility requirements have been satisfied.
Governmental funds are reported using the current financial resources measurement focus and the modified accrual basisof accounting. Under this method, revenues are recognized when "susceptible to accrual" (i.e. when they become bothmeasurable and available). "Measurable" means the amount of the transaction can be determined and "available" means thatrevenues are collectible within the current period or soon enough thereafter to be used to pay liabilities of the current period.Property tax revenues are recognized in the current year if they are collected within 60 days of year-end. For all otherrevenues, the County considers revenues to be available if they are collected within 120 days of the end of the current fiscalperiod. Revenues not considered available are recorded as deferred inflows of resources. The County's other primaryrevenue sources: investment income, intergovernmental revenues, and charges for services have been treated as "susceptibleto accrual" under the modified accrual basis. Licenses and permits, fines, forfeitures and penalties, and other revenues arenot considered "susceptible to accrual" under the modified accrual basis and are recorded as revenues when received.Expenditures generally are recorded when a liability is incurred. However, debt service expenditures, as well asexpenditures related to compensated absences and claims and judgements, are recorded when payment is due.
D. Cash and Investments
The County follows the practice of pooling cash and investments of all funds with the County Treasurer, except for certainrestricted funds which are generally held by outside custodians and classified as “Cash and investments with fiscal agents”on the accompanying financial statements. Interest earned on pooled investments is allocated to the funds entitled to receiveinterest based on the average daily cash balance of each fund for the quarter in which the interest was earned.
For purposes of the Statement of Cash Flows, the proprietary fund types consider all highly liquid investments with amaturity date of three months or less at the time of purchase to be cash equivalents. Proprietary fund types deposits with theCounty Treasurer are demand-type deposits and are therefore considered to be cash equivalents.
40

COUNTY OF MONTEREYNotes to the Financial Statements
For the Fiscal Year Ended June 30, 2019
Note 1: Summary of Significant Accounting Policies (continued)
D. Cash and Investments (continued)
Investment in the Treasurer’s Pool
Statutes authorize the County to invest its surplus cash in obligations of the U.S. Treasury, agencies and instrumentalities,corporate bonds rated P-1 by Standard & Poor’s Corporation or A-1 by Moody’s Investor Service, bankers’ acceptances,certificates of deposit, commercial paper, repurchase agreements, and the State of California Local Agency InvestmentFund. Gains and losses are recognized upon sale based upon the specific identification method. Investments are reported atfair value. The fair values of investments are obtained by using quotations obtained from independent published sources.
The fair value of participants’ position in the County’s investment pool is the same as the value of the pool shares. Themethod used to determine the value of participants’ equity withdrawn is based on the book value of the participants’percentage at the date of such withdrawal.
E. Inventories and Prepaid Items
Inventories are stated at cost (first-in, first-out basis) for governmental funds and lower of cost (first-in, first-out basis) ormarket for proprietary funds. Inventory recorded by governmental funds includes postage and materials, fleet vehicles andparts and supplies for roads. Governmental fund inventories are recorded as expenditures at the time the inventory isconsumed. Similarly, the consumption method is used for prepaid items where certain payments to vendors reflect costsapplicable to future periods and are recorded as prepaid items in both the government-wide and fund financial statements.Reported inventories and prepaid items of governmental funds are equally offset by a corresponding nonspendable portionof fund balance to indicate that they are not expendable available financial resources.
Inventory recorded in the proprietary funds mainly consists of maintenance supplies as well as pharmaceutical suppliesmaintained by NMC. Inventory is expensed as the supplies are consumed.
F. Property Taxes
Property taxes attach as an enforceable lien on secured and unsecured property as of January 1, and are levied as of July 1.Secured property taxes are due in two installments on November 1 and February 1 and become delinquent on December 10and April 10, respectively. Unsecured property taxes are due on July 1 and become delinquent, if unpaid, on August 31. TheCounty bills and collects its own property taxes and also collects such taxes for cities, schools, and special districts.
G. Capital Assets
Capital assets (including infrastructure) are recorded at historical cost or estimated historical cost if actual historical cost isnot available. Donated capital assets, donated works of art and similar items, and capital assets received in a serviceconcession arrangement are reported at the estimated acquisition value. Capital assets include public domain (infrastructure)general capital assets consisting of certain improvements including roads, bridges, lighting system, drainage system, damsand water systems. The County defines capital assets as assets with an initial, individual cost of $5,000 or more and anestimated useful life in excess of one year. For infrastructure and buildings, the capitalization threshold is $100,000. Thecosts of normal maintenance and repairs that do not add to the value of the asset or materially extend asset lives are notcapitalized. Capital assets used in operations are depreciated or amortized (assets under capital leases) using the straight-linemethod over the lesser of the capital lease period or their estimated useful lives in the government-wide statements andproprietary funds.
The estimated useful lives are as follows:
Infrastructure (except for the maintainedpavement subsystem) 15 to 50 years
Structures and improvements 40 to 50 yearsEquipment 3 to 25 years
The County has four networks of infrastructure assets – roads, lighting, drainage system, dams and water system.
41

COUNTY OF MONTEREYNotes to the Financial Statements
For the Fiscal Year Ended June 30, 2019
Note 1: Summary of Significant Accounting Policies (continued)
H. Compensated Absences (Accrued Vacation, Paid-Time-Off, Sick Leave, and Compensatory Time)
Vacation and Paid-Time-Off
Unused vacation and paid-time-off (PTO) leaves may be accumulated up to a specified maximum cap based on anemployee’s bargaining unit or management group. Vacation and PTO leaves are paid to the employee at the time ofseparation from County employment. Some County employees have an option to buy back up to 80 hours of vacation orPTO leave.
The current portion of the liability for vacation and PTO leaves is based on an estimated percentage of employees that willseparate from County employment in the next fiscal year (turnover rate), applied to the total liability for vacation and PTOleaves.
Sick Leave
Sick Leave can be accumulated indefinitely. Upon retirement or death, unused sick leave is paid up to 500 hours or 750hours if an employee opts to exchange time to pay for health benefits. All unused sick leave above the 500-750 hours or anyunused sick leave for employees separated from the County for other reasons is forfeited.
Compensatory Time
Compensatory time-off can be accrued in lieu of overtime payments. An employee can accumulate compensatory time-offup to 240 hours or 480 hours for public safety and seasonal workers. The compensatory time-off balances are expected to beused within the next fiscal year. All compensatory time-off balances are considered current year liabilities.The Countyincludes its share of Social Security and Medicare taxes payable on behalf of the employees in the accrual for compensatedabsences.
I. Pensions
In government-wide financial statements, retirement plans (pensions) are required to be recognized and disclosed using theaccrual basis of accounting (see Note 10 and the required supplementary information (RSI) section immediately followingthe Notes to Financial Statements), regardless of the amount recognized as pension expenditures on the governmental fundstatements, which use the modified accrual basis of accounting.
In general, the County recognizes a net pension liability, which represents the excess of the total pension liability over thefiduciary net position of the pension reflected in the actuarial reports provided by the California Public EmployeesRetirement System (CalPERS) for its plans. The net pension liability is measured as of the County’s prior fiscal year-end.Changes in the net pension liability are recorded, in the period incurred, as pension expense or as deferred inflows ofresources or deferred outflows of resources depending on the nature of the change. The changes in net pension liability thatare recorded as deferred inflows of resources or deferred outflows of resources (that arise from changes in actuarialassumptions or other inputs and differences between expected or actual experience) are amortized over the weightedaverage remaining service life of all participants in the respective pension plan and are recorded as a component of pensionexpense beginning with the period in which they are incurred.
For purposes of measuring the net pension liability and deferred outflows/inflows or resources relating to pensions andpension expense, information about the fiduciary net position of the County’s pension plans with CalPERS, additionsto/deductions from the plan’s fiduciary net position have been determined on the same basis as they are reported byCalPERS. For this purpose, benefit payments (including refunds of employee contributions) are recognized when due andpayable in accordance with the benefits terms of each plan. Investments are reported at fair value.
J. Other Postemployment Benefits (OPEB)
For purposes of measuring the net OPEB liability, deferred outlflows of resources and deferred inflows of resources relatedto OPEB, and OPEB expense, information about the fiduciary net position of the County's OPEB Plan (OPEB Plan) andadditions to/deductions from the OPEB Plan's fiduciary net position have been determined on the same basis as they arereported by the California Employers' Retiree Benefit Trust (CERBT). For this purpose, the OPEB Plan recognizes benefitpayments when due and payable in accordance with the benefit terms. Investments are reported at fair value, except formoney market investments and participating interest-earning investment contracts that have a maturity at the time ofpurchase of one year or less, which are reported at cost.
42

COUNTY OF MONTEREYNotes to the Financial Statements
For the Fiscal Year Ended June 30, 2019
Note 1: Summary of Significant Accounting Policies (continued)
K. Lease Obligations
The County leases assets under both operating and capital lease agreements. In the government-wide and proprietary funds'financial statements, capital leases and the related lease obligations are reported as liabilities in the applicable governmentalactivities or proprietary funds Statement of Net Position.
L. Long-Term Debt
In the government-wide financial statements and the proprietary fund types in the fund financial statements, long-term debtand other long-term obligations are reported as liabilities in the applicable governmental activities, business-type activities,or proprietary fund statement of net position. Bond premiums and discounts are deferred and amortized over the life of thebonds using a method that approximates the effective interest method. Bond issuance costs are reported as expenses in theperiod incurred. Bonds payable are reported net of the applicable bond premium or discount. Gains or losses from advancerefundings are deferred and amortized as interest expense over the life of the new refunding debt.
In the fund financial statements, governmental fund types recognize bond premiums and discount, during the current period.Issuance costs, whether or not withheld from the actual debt proceeds received, are reported as debt service expenditures.
M. Interfund Transactions
Interfund transactions are reflected as either loans, services provided/(received), reimbursements or transfers. Loans arereported as receivables and payables as appropriate, are subject to elimination upon consolidation and are referred to aseither “due to/from other funds” (i.e., the current portion of interfund loans) or “advances to/from other funds” (i.e., thenoncurrent portion of interfund loans). Any residual balances outstanding between the governmental activities and thebusiness-type activities are reported in the government-wide financial statements as “internal balances”. Advances betweenfunds, as reported in the fund financial statements, are offset by a corresponding nonspendable portion of fund balance toindicate that they are not available for appropriation and are not expendable available financial resources.
Services provided/(received), deemed to be at market or near market rates, are treated as revenues andexpenditures/expenses. Reimbursements are when one fund incurs a cost, charges the appropriate benefiting fund andreduces its related cost as a reimbursement. All other interfund transactions are treated as transfers. Transfers betweengovernmental or proprietary funds are netted as part of the reconciliation to the government-wide presentation.
N. Deferred Outflows and Inflows of Resources
In addition to assets, the statement of financial position will sometimes report a separate section for deferred outflows ofresources. This separate financial statement element represents a consumption of net position by the County that is appliesto a future reporting period(s) and so will not be recognized as an outflow of resources (expense/expenditure) until then.The County has deferred outflows of resources related to unamortized losses on refunding debts (Note 7) and related topensions (Note 10) and OPEB (Note 11). The losses on refunding result from the difference in carrying value of refundeddebt and its reacquisition price. This amount is deferred and amortized over the shorter of the life of the refunded debt orthe refunding debt.
In addition to liabilities, the statement of financial Position will sometimes report a separate section for deferred inflows ofresources. This separate financial statement element represents an acquisition of net position that applies to a futureperiod(s) and so will not be recognized as an inflow of resources (revenue) until that time. The County has deferred inflowsof resources related to unavailable revenues (Note 4) reported under the modified accrual basis of accounting in thegovernmental funds balance sheet and related to deferred gain on unamortized gains on refunding debts (Note 7), pensions(Note 10) and OPEB (Note 11) in its proprietary and government-wide financial statements. The governmental funds reportunavailable revenues from property taxes, advances from federal and state, and other sources as appropriate. These amountsare deferred and recognized as revenues in the period the amounts become available. The gain on refunding results from thedifference in carrying value of refunded debt and its reacquisition price. This amount is deferred and amortized over theshorter of the life of the refunded debt or refunding debt.
43

COUNTY OF MONTEREYNotes to the Financial Statements
For the Fiscal Year Ended June 30, 2019
Note 1: Summary of Significant Accounting Policies (continued)
O. Estimates
The preparation of financial statements in conformity with generally accepted accounting principles (GAAP) requiresmanagement to make estimates and assumptions that affect certain reported amounts and disclosures. Accordingly, actualresults could differ from those estimates.
P. Budget Process
In accordance with the provisions of Sections 29000 and 29143, inclusive, of the California Government Code and otherstatutory provisions, commonly known as the County Budget Act, the County prepares a budget for each fiscal year on orbefore August 30. Budgeted expenditures are enacted into law through the passage of an Appropriation Ordinance. Thisordinance mandates the maximum authorized expenditures for the fiscal year and cannot be exceeded except by subsequentamendments to the budget by the County’s Board of Supervisors.
An operating budget is adopted each fiscal year for the majority of the Governmental Funds. Expenditures are controlled atthe appropriation unit level for the County. Appropriation unit level expenditures may not legally exceed appropriations.Any amendments or transfers of appropriations between departments or funds are authorized by the County Administrator’soffice and must be approved by the Board of Supervisors. Supplementary appropriations normally financed by unanticipatedrevenues during the year must be approved by the Board of Supervisors. Budgeted amounts in the budgetary financialschedules are reported as originally adopted and as amended during the fiscal year by resolutions approved by the Board ofSupervisors.
The Actual Amounts reported in the budgetary statements and schedules matches to the basis used to present the basicfinancial statements in accordance with generally accepted accounting principles (GAAP).
Q. Net Position
The government-wide and business-type activities financial statements utilize a net position presentation. Net positionrepresent the difference between assets plus deferred outflow of resources and liabilities plus deferred inflow of resourcesand are displayed in three components:
Net Investment in Capital Assets – This category groups all capital assets, including infrastructure, into one component ofnet position. Accumulated depreciation and the outstanding balances of debt that are attributable to the acquisition,construction or improvement of these assets reduce the balance in this category.
Restricted Net Position – This category represents net position that are subject to constraints either (1) externally imposedby creditors (such as debt covenants), grantors, contributors, or laws or regulations of other governments or (2) imposed bylaw through constitutional provisions or enabling legislation.
Unrestricted Net Position – This category represents net position of the County, not restricted for any project or otherpurpose.
When both restricted and unrestricted net position is available, restricted resources are used first, then unrestricted resourcesas they are needed.
R. Fund Balance
Fund balance of governmental funds is reported in the following categories based on the nature of limitations confining theuse of resources for specific purposes:
Nonspendable fund balance – This category represents amounts that cannot be spent because they are either not spendablein form or legally or contractually required to remain intact.
Restricted fund balance – This category represents amounts with constraints placed on their use by those external to theCounty, including creditors, grantors, contributors or laws and regulations of other governments. It also includes constraintsimposed by law through constitutional provisions or enabling legislation.
44

COUNTY OF MONTEREYNotes to the Financial Statements
For the Fiscal Year Ended June 30, 2019
Note 1: Summary of Significant Accounting Policies (continued)
R. Fund Balance (continued)
Committed fund balance – This category represents amounts that can only be used for specific purposes determined byformal action (ordinance) of the County’s highest level of decision-making authority (the Board of Supervisors) and thatremain binding unless removed in the same manner. The underlying action (ordinance) that imposed the limitation needs tooccur no later than the close of the reporting period.
Assigned fund balance – This category represents amounts that are constrained by the County’s intent to be used for specificpurposes as determined by the Board of Supervisors via resolution or budget adoption process.
Unassigned fund balance – This category represents the residual classification that includes amounts not contained in theother classifications.The General Fund should be the only fund that reports a positive unassigned fund balance amount. Inother governmental funds other than the General Fund, if expenditures incurred for specific purposes exceed the amountsthat are restricted, committed or assigned to those purposes, it may be necessary to report a negative fund balance in thatfund.
Sometimes the County will fund outlays for a particular purpose from both restricted and unrestricted resources (committed,assigned, and unassigned fund balances). To determine the amounts to report as restricted, committed, assigned, andunassigned fund balances in the governmental fund financial statements, a flow assumption must be made about the order inwhich the resources are considered to be applied. The County’s board establishes, modifies or rescinds fund balancecommitments by passage of an ordinance and assignments by passage of a resolution. When restricted and unrestrictedresources are available for use, The County considers restricted fund balance to have been depleted before unrestricted fundbalance is applied. Further, in circumstances when an expenditure is made for a purpose for which amounts are available inmultiple fund balance classifications, fund balance is generally depleted in the order of restricted, committed, assigned, andunassigned.
Fund Balance Policy
The County’s goal is to use unrestricted fund balance as a source to finance one-time investments, reserves and/orcommitments. Committed, assigned and unassigned fund balances are considered unrestricted. The County’s generalfinancial guidelines permit the County’s Board of Supervisors to use unbudgeted unassigned fund balance in the followingmanner as recommended by the County Administrative Officer:
1. A capital project fund
2. Productivity investment assignment
3. Strategic reserve equal to 10 percent of current general fund revenues
4. One-time investments or assignments
Strategic Reserve Policy
The County has established a strategic reserve reported as a separate committed fund balance constraint. The target fundinglevel is equal to ten percent of the total general fund final budgeted estimated revenues. Funding for the strategic reserve isappropriated annually by the Board of Supervisors as part of the budget approval
The purpose of the County’s general fund strategic reserve is to:
1. Fund settlement of legal judgments against the County in excess of reserves normally designated for litigation.
2. Cover short-term revenue reductions due to economic downturns, for natural disasters as determined by the CountyAdministrative Officer or the Board of Supervisors, and for one-term only State budget reductions that could not beaddressed through the annual appropriations for contingencies in the general fund.
The County has also established a strategic reserve reported as a separate committed fund balance constraint as theNatividad Medical Center Strategic Reserve. The Natividad Medical Center Strategic Reserve is funded with unrestrictedNMC net position and can be used only for Natividad Medical Center purposes, as determined by the County’s Board ofSupervisors based on recommendations of the NMC Board of Trustees.
45

COUNTY OF MONTEREYNotes to the Financial Statements
For the Fiscal Year Ended June 30, 2019
Note 1: Summary of Significant Accounting Policies (continued)
S. Implementation of Governmental Accounting Standards Board (GASB) Statements
The following Governmental Accounting Standards Board (GASB) Statements have been implemented in the currentfinancial statements:
In November 2016, the GASB issued GASB Statement No. 83, Certain Asset Retirement Obligations. This Statementaddresses accounting and financial reporting for certain asset retirement obligations (AROs). This statement establishescriteria for determining the timing and pattern of recognition of a liability and a corresponding deferred outflow of resourcesfor AROs.
In March 2018, the GASB issued GASB Statement No. 88, Certain Disclosures Related to Debt, Including DirectBorrowings and Direct Placements. Among other things, Statement 88 clarifies which liabilities governments should includein their note disclosures related to debt. Statement No. 88 requires that all debt disclosures present direct borrowings anddirect placements of debt separately from other types of debt. Statement No. 88 defines debt for purposes of disclosure innotes to financial statements as a liability that arises from a contractual obligation to pay cash (or other assets that may beused in lieu of cash) in one or more payments to settle an amount that is fixed at the date the contractual obligation isestablished. Statement No. 88 also requires governments to disclose additional essential debt-related information for alltypes of debt.
The County is currently evaluating its accounting practices to determine the potential impact on the financial statements forthe following GASB Statements:
In January 2017, the GASB issued GASB Statement No. 84, Fiduciary Activities. This Statement establishes criteria foridentifying fiduciary activities of all state and local governments. The focus of the criteria generally is on (1) whether agovernment is controlling the assets of the fiduciary activity and (2) the beneficiaries with whom a fiduciary relationshipexists. Separate criteria are included to identify fiduciary component units and postemployment benefit arrangements thatare fiduciary activities. The Statement is effective for the County’s fiscal year ending June 30, 2020.
In June 2017, the GASB issued GASB Statement No. 87, Leases. The objective of this Statement is to better meet theinformation needs of financial statement users by improving accounting and financial reporting for leases by governments.This Statement increases the usefulness of governments’ financial statements by requiring recognition of certain lease assetsand liabilities for leases that previously were classified as operating leases and recognized as inflows of resources oroutflows of resources based on the payment provisions of the contract. It establishes a single model for lease accountingbased on the foundational principle that leases are financings of the right to use an underlying asset. Under this Statement, alessee is required to recognize a lease liability and an intangible right to use leased asset, and a lessor is required torecognize a lease receivable and a deferred inflow of resources, thereby enhancing the relevance and consistency ofinformation about governments’ leasing activities. The Statement is effective for the County’s fiscal year ending June 30,2021.
In June 2018, the GASB issued GASB Statement No. 89, Accounting for Interest Cost Incurred before the end of aconstruction period. Statement 89 establishes guidance designed to enhance the relevance and comparability of informationabout capital assets and the cost of borrowing for a reporting period. It also simplifies accounting for interest cost incurredbefore the end of a construction period. For financial statements prepared using the economic resources measurement focus,interest cost incurred before the end of a construction period should be recognized as an expense in the period in which thecost is incurred. Such interest cost should not be capitalized as part of the historical cost of a capital asset. For financialstatements prepared using the current financial resources measurement focus, interest incurred before the end of aconstruction period should continue to be recognized as an expenditure on a basis consistent with governmental fundaccounting principles. The Statement is effective for the County’s fiscal year ending June 30, 2021.
In August 2018, the GASB issued GASB Statement No. 90, Majority Equity Interests. Statement 90 clarifies the accountingand financial reporting requirements for a state or local government’s majority equity interest in an organization thatremains legally separate after acquisition. Under Statement 90 a government entity should report its majority equity interestin a legally separate organization as an investment if that equity interest meets the GASB’s definition of an investment. Fora majority equity interest in a legally separate entity that does not meet the definition of an investment, Statement 90requires a government to report the legally separate entity as a component unit. Statement 90 also establishes guidance forremeasuring assets and liabilities of wholly acquired governmental organizations that remain legally separate. That guidancebrings the reporting of those acquisitions in line now with existing standards that apply to acquisitions that do not remain
46

COUNTY OF MONTEREYNotes to the Financial Statements
For the Fiscal Year Ended June 30, 2019
Note 1: Summary of Significant Accounting Policies (continued)
S. Implementation of Governmental Accounting Standards Board (GASB) Statements (continued)
legally separate. The Statement is effective for the County’s fiscal year ending June 30, 2020.
In May 2019, the GASB issued GASB Statement No. 91, Conduit Debt Obligations. The primary objectives of thisStatement are to provide a single method of reporting conduit debt obligations by issuers and eliminate diversity in practiceassociated with (1) commitments extended by issuers, (2) arrangements associated with conduit debt obligations, and (3)related note disclosures. This Statement achieves those objectives by clarifying the existing definition of a conduit debtobligation; establishing that a conduit debt obligation is not a liability of the issuer; establishing standards for accountingand financial reporting of additional commitments and voluntary commitments extended by issuers and arrangementsassociated with conduit debt obligations; and improving required note disclosures. The Statement is effective for theCounty's fiscal year ending June 30, 2022.
Note 2: Cash and Investments
The County Treasurer is responsible for managing the investment pool with deposits from the County, all County schooldistricts, and various special districts within the County pursuant to California Government Code Section 53600. The Stateof California statutes require certain special districts and other governmental entities to maintain their cash surplus with theCounty Treasurer. The County investment pool is not registered with the Securities and Exchange Commission as aninvestment company. Investments made by the Treasurer are regulated by the California Government Code and by theCounty's investment policy. The objectives of the County investment policy, in order of priority, are safety, liquidity, andyield. The County Board annually reviews the County Investment Policy, and all amendments to the policy require theCounty's Board approval.
As of June 30, 2019, the County’s cash, deposits and investments were as follows:
PooledWith Fiscal
Agents Other TotalImprest cash and cash on hand $ 108,064 $ - $ 65,004 $ 173,068Deposits with financial institutions 4,065,393 6,098,188 9,201,367 19,364,948Outstanding warrants and wires (23,168,322) - - (23,168,322)Investments 1,751,658,578 33,612 - 1,751,692,190
Totals $ 1,732,663,713 $ 6,131,800 $ 9,266,371 $ 1,748,061,884
Total cash and investments at June 30, 2019, were presented on the County’s financial statements as follows:
Primary government $ 681,200,181Investment trust fund 1,031,654,407Agency funds 23,860,048Private purpose trust fund 2,349,350Discretely presented component unit 8,997,898
Total cash and investments $ 1,748,061,884
Investments
The following table identifies the investment types that are authorized for the County by the California Government Code orthe County’s investment policy, wherever is more restrictive. The table also identifies certain provisions of the County’sinvestment policy that address interest rate risk, credit risk, and concentration risk.
47

COUNTY OF MONTEREYNotes to the Financial Statements
For the Fiscal Year Ended June 30, 2019
Note 2: Cash and Investments (continued)
Authorized Investment TypeMaximumMaturity
MaximumPercentage of
Portfolio
MaximumInvestment in One
IssuerLocal agency bonds 5 years None 5%U.S. treasury obligations 5 years None NoneState of California obligations 5 years None 10%U.S. agency securities 5 years None NoneBanker's acceptances 180 days 40% 5%Commercial paper 270 days 40% 5%Negotiable CDs/CD placement service 5 years 30% 5%Repurchase agreements 1 year 20% NoneReverse repurchase agreements 92 days 20% NoneMedium term notes 5 years 30% 5%Mutual/money market funds N/A 20% 10%Collateralized bank deposits 5 years None 5%Mortgage pass-through securities 5 years 20% 5%Time deposits 2 years None NoneLocal Agency Investment Fund (LAIF) N/A None* NoneSupranational Debt Obligations 5 years 30% None
* The investment policy limits the pool's investments in LAIF to $65,000,000 per account, regardless of the percentage thisrepresents.
At June 30, 2019, the County had the following investments:
Interest Rates Maturities Par Fair ValueWAM(Years)
Investments in investment poolFederal agency obligations 0.875% - 3.00% 7/19/2019 - 2/13/2024 $ 94,380,000 $ 93,968,211 0.78U.S. treasury obligations 0.75% - 3.125% 7/15/2019 - 5/15/2024 890,750,000 879,973,565 1.25Medium term notes 1.10% - 5.20% 6/23/2021 - 4/1/2024 232,555,000 232,725,904 1.34Negotiable CDs 1.84% - 3.08% 8/2/2019 - 4/2/2021 42,900,000 42,894,388 1.02Commercial paper 2.68% - 3.00% 8/12/2019 - 12/6/2019 65,300,000 63,966,072 0.25Asset Backed Securities 1.950% 8/15/2022 10,000,000 9,841,406 3.13Supranationals 1.126% - 1.626% 11/27/2019 - 9/14/2020 47,975,000 46,960,033 0.84Municipal Bonds 2.800% 4/1/2021 290,000 290,012 1.75Money market mutual funds Variable On Demand 8,013,347 8,013,348 -California asset management program Variable On Demand 117,100,000 117,100,000 -CalTRUST Variable On Demand 206,025,638 206,025,638 -California Local Agency Investment Fund Variable On Demand 49,900,000 49,900,000 -
Total investment pool excludingdefaulted securities $1,765,188,985 $1,751,658,577 -
Weighted average maturity for pool 0.92
Default securitiesLehman Brothers medium-term notes N/A In Default $ 10,000,000 $ - -
Total investment pool $1,775,188,985 $ 1,751,658,577
Investments outside investment poolCash held with fiscal agent
Money market mutual funds Variable On Demand $ 33,612 $ 33,612 -Total outside investment pool $ 33,612 $ 33,612 -
48

COUNTY OF MONTEREYNotes to the Financial Statements
For the Fiscal Year Ended June 30, 2019
Note 2: Cash and Investments (continued)
Interest Rate Risk
Interest rate risk is the risk that changes in market interest rates will adversely affect the fair value of an investment.Generally, the longer the maturity of an investment, the greater the sensitivity of its fair value to changes in market interestrates. While the County does not address interest rate risk specifically in its investment policy, one of the ways that theCounty manages its exposure to interest rate risk is by purchasing a combination of shorter term and longer terminvestments and by timing cash flows from maturities so that a portion of the portfolio is maturing or coming close tomaturity evenly over time as necessary to provide the cash flow and liquidity needed for operations. The County limits itsexposure to interest rate risk inherent in its portfolio by managing the investment maturities, the weighted average maturityof its portfolio, as well as limiting the weighted average maturity to two years or less.
Credit Risk and Concentration of Credit Risk
Credit risk is the risk that an issuer or other counterparty to an investment will not fulfill its obligations. Concentration ofcredit risk is the risk of loss attributed to the magnitude of an investment in a single issuer. The County Treasurer mitigatesthese risks by holding a diversified portfolio of high quality investments. The adopted investment policy contains specificlimitations on investments by credit quality, maturity length and the maximum allocation by asset class. In all instances, theadopted investment policy is equal to or more restrictive than applicable codified statutes.
Commercial paper obligations must be rated a minimum of F1 by Fitch, P1 by Moody’s or A1 by Standard & Poor’s.Corporate bonds must be rated A or better by one of these three rating agencies. In addition, total exposure of all assetclasses to any single issuer shall not exceed 10% of the 12-month projected minimum size of the portfolio, other thansecurities issued by the U.S. Government, its agencies and sponsored enterprises.
49

COUNTY OF MONTEREYNotes to the Financial Statements
For the Fiscal Year Ended June 30, 2019
Note 2: Cash and Investments (continued)
The following is a summary of the credit quality distribution and concentration of credit risk by investment type as apercentage of the County Investment Pool’s fair value at June 30, 2019.
Moody'sStandard &
Poor's % of PortfolioU.S. treasury obligations* Aaa AA+ %44.63U.S. treasury obligations* Not rated A-1 %5.71Federal agency obligations* Aaa AA %0.56Federal agency obligations* Aaa AA+ %4.15Federal agency obligations* Not rated AA+ %0.59Federal agency obligations* Not rated Not rated %0.02Asset backed securities Aaae Not rated %0.56Commercial paper P-1 A-1 %3.69Supranationals Aaa AAA %2.71Negotiable CDs A1 A+ %0.01Negotiable CDs Aa2 A+ %0.02Negotiable CDs P-1 A-1 %0.79Negotiable CDs Not rated A-1 %0.58Negotiable CDs Not rated AA- %1.02Medium-term notes A1 A %1.56Medium-term notes A1 A+ %2.32Medium-term notes A1 AA %0.31Medium-term notes A1 AA- %0.60Medium-term notes A1 Not rated %0.51Medium-term notes A2 A %0.90Medium-term notes A2 A- %0.58Medium-term notes A2 A+ %0.59Medium-term notes A3 A %0.65Medium-term notes A3 A- %0.03Medium-term notes A3 AA- %0.26Medium-term notes A3 BBB+ %0.53Medium-term notes Aa1 AA+ %0.80Medium-term notes Aa2 AA %1.08Medium-term notes Aa2 AA- %0.12Medium-term notes Aa3 A+ %0.29Medium-term notes Aa3 AA- %1.08Medium-term notes Aaa A %0.02Medium-term notes Aaa AAA %0.72Medium-term notes Baa1 BBB+ %0.28Medium-term notes Not rated AA- %0.01Municipal Obligations Aa3 AA- %0.02Money market mutual funds Aaa AAA %0.04Money market mutual funds Not rated Not rated %0.41California asset management fund Not rated AAA %6.67CalTrust Aaa AAA %6.54CalTrust Not rated Not rated %5.20California Local Agency Investment Fund Not rated Not rated %2.84
Total %100.00
*Credit ratings of obligations of the U.S. government are exempt from disclosure. However, the County has chosen toinclude the information for completeness.
50

COUNTY OF MONTEREYNotes to the Financial Statements
For the Fiscal Year Ended June 30, 2019
Note 2: Cash and Investments (continued)
As of the year ended June 30, 2019, none of the Federal Agency Obligations, individually, were more than 5% of theCounty’s pooled investments.
Custodial Credit Risk
Custodial credit risk for investments is the risk that the County will not be able to recover the invested securities that are inthe possession of an outside party. The County’s investment policy requires the use of a safekeeping agent to mitigatecustodial risk. Securities are invested on a “Delivery vs. Payment” basis using the custodian agent. In no case does theCounty engage in securities purchases that are held in broker or dealer accounts. At June 30, 2019, the County’s investmentpool had no securities exposed to custodial risk.
Custodial Credit Risk - Deposits
The custodial credit risk for deposits is the risk that, in the event of the failure of a depository financial institution, theCounty will not be able to recover its deposits or to recover collateral securities that are in the possession of an outsideparty. The risk is mitigated in that, of the County's bank balance of $4,065,393 as of June 30, 2019, $275,000 is insured bythe Federal Depository Insurance Corporation. The California Government Code and the County's investment policy do notcontain legal or policy requirements that would limit custodial credit risk for deposits except that a financial institutionsecures deposits of state or local governmental unit by pledging securities in an undivided collateral pool held by adepository regulated under state law. The market value of the pledged securities in the collateral pool must equal at least110% of the total amount deposited by the public agencies.
Local Agency Investment Fund
The County Treasurer’s Pool maintains an investment in the State of California Local Agency Investment Fund (LAIF).LAIF is part of the Pooled Money Investment Account (PMIA), an investment pool consisting of funds held by the state inaddition to those deposited in LAIF. All PMIA funds are managed by the Investment Division of the State Treasurer’sOffice. This fund is not registered with the Securities and Exchange Commission as an investment company, but is requiredto invest according to California Government Code. Participants in the pool include voluntary and involuntary participants,such as special districts and school districts for which there are legal provisions regarding their investments. The LocalInvestment Advisory Board (Board) has oversight responsibility for LAIF. The Board consists of five members asdesignated by State Statute.
At June 30, 2019, the County’s investment position in LAIF was $49.9 million, which approximates fair value and is thesame as the value of the pool shares which is determined on an amortized cost basis. The total amount invested by all publicagencies in PMIA on that day was $106.0 billion. Of that amount, 1.77% was invested in structured notes and asset-backedsecurities with the remaining 98.23% invested in other non-derivative financial products.
Investment Trust of California Joint Powers Authority Pool
The County Treasurer’s Pool maintains an investment in the Investment Trust of California Joint Powers Authority Pool(CalTRUST). CalTRUST is not registered with the Securities and Exchange Commission as an investment company, but isoverseen by a Board of Trustees composed of officials of the public agencies that participate in CalTRUST. The fair valueof the County’s position in the pool is approximately the same as the value of the pool shares.
California Asset Management Program Joint Powers Authority Pool
The County Treasurer’s Pool maintains an investment in the California Asset Management Program Joint Powers AuthorityPool (CAMP). CAMP is not registered with the Securities and Exchange Commission as an investment company, but isoverseen by a Board of Trustees composed of officials of the public agencies that participate in CAMP. CAMP’sinvestments are limited to those permitted by Government Code Section 53601. The fair value of the County’s position inthe pool is approximately the same as the value of the pool shares.
County Investment Pool Condensed Financial Statements
The following represents a condensed statement of net position and changes in net position for the Treasurer’s investmentpool as of June 30, 2019:
51

COUNTY OF MONTEREYNotes to the Financial Statements
For the Fiscal Year Ended June 30, 2019
Note 2: Cash and Investments (continued)
Statement of net positionNet position for pool participants $ 1,732,663,713Equity of internal pool participants $ 693,892,946Equity of external pool participants 1,038,770,767
Total net position $ 1,732,663,713Statement of changes in net position
Net investment earnings $ 33,215,467Investment expenses (1,167,597)Net contribution from pool participants 158,099,912Change in net position 190,147,782Net position at July 1, 2018 1,542,515,931Net position at June 30, 2019 $ 1,732,663,713
The County has not provided nor obtained any legally binding guarantees during the fiscal year ended June 30, 2019, tosupport the value of shares in the pool.
Fair Value Measurements
The Pool categorizes its fair value measurements within the fair value hierarchy established by generally acceptedaccounting principles. The hierarchy is based on the valuation inputs used to measure the fair value of the asset. Thehierarchy gives the highest priority to unadjusted quoted prices in active markets for identical assets or liabilities (Level 1measurements) and the lowest priority to unobservable inputs (Level 3 measurements). The investments in an externalinvestment pool are not subject to reporting within the level hierarchy. The three levels of the fair value hierarchy aredescribed as follows:
Level 1: Inputs to the valuation methodology are unadjusted quoted prices for identical assets or liabilities in activemarkets that the County has the ability to access.
Level 2: Inputs to the valuation methodology include: Quoted prices for similar assets or liabilities in active markets;Quoted prices for identical or similar assets or liabilities in inactive markets; Inputs other than quoted pricesthat are observable for the asset of liability; Inputs that are derived principally from or corroborated byobservable market data by correlation or other means.
Level 3: Inputs to the valuation methodology are unobservable and significant to the fair value measurement.
52

COUNTY OF MONTEREYNotes to the Financial Statements
For the Fiscal Year Ended June 30, 2019
Note 2: Cash and Investments (continued)
The County's cash equivalents and investments by fair value measurement as of June 30, 2019:
Fair Value Measurement
Fair Value
Quoted Prices inActive markets for
Identical Assets(Level 1)
Observable Inputsother than quoted
market prices(Level 2)
UnobservableInputs
(Level 3)Investments - Fair Value Level
Commercial Paper $ 63,966,072 $ - $ 63,966,072 $ -Corporate Notes 232,725,904 - 232,725,904 -Negotiable CDs 42,894,388 - 42,894,388 -US Treasuries 879,973,565 879,973,565 - -Investment Contract - - - -Federal Agencies 93,968,211 - 93,968,211 -Asset backed securities 9,841,406 - 9,841,406 -Supranationals 46,960,033 - 46,960,033 -Municipal bonds 290,012 - 290,012 -
Total investments measured at fair value $ 1,370,619,591 $ 879,973,565 $ 490,646,026 $ -
Investments Not Subject to Fair ValueHierarchy:Money market mutual funds 8,046,960California asset management program 117,100,000CalTRUST 206,025,638California Local Agency Investment
Fund 49,900,000Total pooled and directed investments $ 1,751,692,189
Note 3: Interfund Transactions
The composition of interfund balances as of June 30, 2019, is as follows:
Due to/from other Funds
Amounts due to and from other funds are to assist the Parks Lake & Resort Operations with cash flow lags and to repay theGeneral Liability fund for capital assets obtained as part of the Lakes Settlement in fiscal year 2008.
Receivable fund Payable fund Amount
General fund Other enterprise fund $ 2,181,8312,181,831
Other governmental funds Other governmental funds 83,74883,748
Internal service funds Other enterprise fund 567,081567,081
Total $ 2,832,660
53

COUNTY OF MONTEREYNotes to the Financial Statements
For the Fiscal Year Ended June 30, 2019
Note 3: Interfund Transactions (continued)
Advances To/From other Funds
The interfund advances include the long term portion of the Parks & Lake Resort Enterprise fund's repayment agreement toGeneral Liability fund for the assets obtained in the Lakes Settlement in fiscal year 2007-08.
Receivable fund Payable fund Amount
Internal service funds Other enterprise fund $ 2,573,676
Total 2,573,676
Transfers
Transfers are indicative of funding for capital projects, debt service, subsidies of various County operations, and re-allocations of special revenues. Transfers between funds for the year ended June 30, 2019, were as follows:
Transfer from Transfer to Amount
General fund Behavioral Health $ 2,120,590Road fund 5,397,106Facility master plan implementation 220,119Other governmental funds 15,545,184Other enterprise fund 2,954,389Internal service funds 6,372,564
32,609,952
Behavioral Health General fund 3,175,823
Facility master plan implementation Other governmental funds 20,378Natividad Medical Center 3,975,735
3,996,113
Other governmental funds General fund 100,919,288Behavioral Health 27,766,146Other governmental funds 6,718,478
135,403,912
Natividad Medical Center General fund 500,000
500,000
Total $ 175,685,801
54

COUNTY OF MONTEREYNotes to the Financial Statements
For the Fiscal Year Ended June 30, 2019
Note 4: Receivables
Receivables as of June 30, 2019, for the County’s individual major, nonmajor, internal service, and enterprise funds are asfollows:
Governmental funds:
General Road FundBehavioral
HealthFacility MasterPlan Projects
OtherGovernmental
TotalGovernmental
Funds
Receivables:Accounts - net $ 27,665,280 $ 174 $ 400,061 $ 14,941 $ 1,296,812 $ 29,377,268Taxes receivable 4,326,185 - - - 1,217,149 5,543,334Due from other agencies 34,314,573 1,611,047 21,437,461 43,253,255 19,507,244 120,123,580Interest - - - - 3,325,780 3,325,780
Totals $ 66,306,038 $ 1,611,221 $ 21,837,522 $ 43,268,196 $ 25,346,985 $ 158,369,962
Proprietary funds:NatividadMedicalCenter
Parks Lake& Resort
Operations
TotalEnterprise
FundsInternalService
Receivables:Accounts - net $45,636,792 $ 1,523,340 $47,160,132 $ 824,509Due from other agencies 48,509,881 - 48,509,881 -
Totals $94,146,673 $ 1,523,340 $95,670,013 $ 824,509
At June 30, 2019, accounts receivables reported by Natividad Medical Center were reduced by allowances for doubtfulaccounts and contractual adjustments as follows:
Allowance for doubtful accounts $ 23,150,560Allowance for contractual adjustments 118,821,356
Totals $ 141,971,916
Governmental funds report unavailable revenue in connection with receivables for revenues considered unavailable toliquidate liabilities of the current period. Governmental funds also defer revenue recognition in connection with resourcesthat have been received, but not yet earned. As of June 30, 2019, the various components of unavailable revenue andunearned revenue in the governmental funds were as follows:
Receivables collected after the period of availabilityUnavailable Revenue - Accounts receivable $ 2,707,345Unavailable Revenue - Taxes receivable 5,158,576Unavailable Revenue - Due from other agencies 75,171,067Unavailable Revenue - Interest receivable 3,241,383
Total Unavailable Revenue 86,278,371Unearned Revenues - Grant advances prior to meeting all
eligibility requirements 15,830,074Total Unavailable and Unearned Revenue $ 102,108,445
55

COUNTY OF MONTEREYNotes to the Financial Statements
For the Fiscal Year Ended June 30, 2019
Note 5: Capital Assets
Capital asset activity for the year ended June 30, 2019 was as follows:
RestatedBalance
July 1, 2018 Additions Retirements TransfersBalance
June 30, 2019Governmental activitiesCapital assets, not being depreciated:
Land $ 190,805,848 $ - $ - $ - $ 190,805,848Construction in progress 185,969,329 79,853,954 - (52,835,718) 212,987,565
Total capital assets, not being depreciated 376,775,177 79,853,954 - (52,835,718) 403,793,413Capital assets, being depreciated:
Infrastructure 606,552,498 22,578 - 4,376,620 610,951,696Structures and improvements 309,227,705 4,389,369 (11,248,355) 47,118,957 349,487,676Equipment 124,726,027 6,600,242 (2,179,141) 1,340,141 130,487,269Intangible assets 20,590,907 127,886 - - 20,718,793
Total capital assets, being depreciated 1,061,097,137 11,140,075 (13,427,496) 52,835,718 1,111,645,434Less accumulated depreciation for:
Infrastructure (403,120,181) (13,971,947) - - (417,092,128)Structures and improvements (149,299,449) (17,728,538) 9,098,953 - (157,929,034)Equipment (101,777,979) (5,999,755) 1,598,181 - (106,179,553)Intangible assets (4,268,330) (3,750,985) - - (8,019,315)
Total accumulated depreciation (658,465,939) (41,451,225) 10,697,134 - (689,220,030)Total capital assets, being depreciated,
net 37,155,240 (30,311,150) (8,300,262) 52,835,718 422,425,404Governmental activities capital assets, net $ 779,406,375 $ 49,542,804 $ (2,730,362) $ - $ 826,218,817
BalanceJuly 1, 2018 Additions Retirements Transfers
BalanceJune 30, 2019
Business-type activitiesCapital assets, not being depreciated:
Construction in progress $ 2,818,760 $ 4,247,079 $ - $ - $ 7,065,839Total capital assets, not being depreciated 2,818,760 4,247,079 - - 7,065,839
Capital assets, being depreciated:Structures and improvements 177,970,261 885,716 (4,690,303) - 174,165,674Equipment 115,890,135 11,492,057 (553,745) - 126,828,447
Total capital assets, being depreciated 293,860,396 12,377,773 (5,244,048) - 300,994,121Less accumulated depreciation for:
Structures and improvements (91,558,404) (9,133,492) 4,690,303 - (96,001,593)Equipment (86,680,738) (8,205,643) 553,745 - (94,332,636)
Total accumulated depreciation (178,239,142) (17,339,135) 5,244,048 - (190,334,229)Total capital assets, being depreciated,
net 115,621,254 (4,961,362) - - 110,659,892Business-type activities capital assets, net $ 118,440,014 $ (714,283) $ - $ - $ 117,725,731
56

COUNTY OF MONTEREYNotes to the Financial Statements
For the Fiscal Year Ended June 30, 2019
Note 5: Capital Assets (continued)
Depreciation
Depreciation expense was charged to governmental functions as follows:
General government $ 12,053,423Public safety and protection 8,314,084Public ways and facilities 12,349,202Health and sanitation 1,945,457Public assistance 447,170Education 117,618Recreation and cultural services 942,034Depreciation on capital assets held by the county internal service funds are
charged to various functions based on their usage of the assets. 5,282,237Total depreciation expense - Governmental functions $ 41,451,225
Depreciation expense was charged to the business-type activities as follows:
Natividad Medical Center $ 17,118,469Parks Lake and Resort Operations 220,666
Total depreciation expense - Business-type activities $ 17,339,135
Note 6: Leases
Operating Leases
The County has commitments under long-term and personal property operating lease agreements. During the fiscal yearended June 30, 2019, the County paid rents on these leases of $3,826,825. Future minimum lease payments are as follows:
GovernmentalActivities
Business-TypeActivities
Year Ended June 30:2020 $ 5,878,173 $ 1,896,8762021 5,617,572 168,2392022 5,510,544 -2023 5,510,544 -2024 4,958,484 -2025-2028 16,560,964 -Total minimum lease payments $ 44,036,281 $ 2,065,115
Operating Leases - Natividad Medical Center
As of June 30, 2019, the Center does not expect to receive a minimum rental income from operating leases for vacant officespaces located on its campus as these are cancellable at any time. Total rental income under operating lease agreementsduring the year ended June 30, 2019 was $1,478,867.
Capital Leases
The County has entered into certain capital lease arrangements under which the related structures and equipment willbecome the property of the County when all terms of the lease agreements are met. The lease agreements qualify as a capitalleases for accounting purposes and, therefore, have been recorded at the present value of future minimum lease payments asof the inception date.
57

COUNTY OF MONTEREYNotes to the Financial Statements
For the Fiscal Year Ended June 30, 2019
Note 6: Leases (continued)
The following is a schedule of capital assets acquired through capital leases as of June 30, 2019:
GovernmentalActivities
Structures and improvements $ 17,240,416Equipment 461,721Less: Accumulated amortization (1,366,469)
Totals $ 16,335,668
The current year's amortization related to capital assets under capital leases for governmental activities was $392,109 and isincluded in the governmental activities depreciation/amortization of $41,451,225.
The following is a schedule of future minimum lease payments, as of June 30, 2019:
GovernmentalActivities
Year Ended June 30:2020 $ 1,951,1502021 1,947,1052022 1,947,1052023 1,947,1052024 1,918,9012025-2029 9,594,5052030 1,918,901
Totals 21,224,772Less: Amount representing interest (6,325,223)
Present value of future minimumlease payments $ 14,899,549
Note 7: Deferred Outflow and Inflow of Resources for Refunding
The issuance of the Monterey County Financing Authority 2018 Revenue Refunding Bonds refunded the 2008A Bonds,resulting in a deferred loss. Additional information is available in Note 8 Long-Term Liabilities. The summary of thedeferred outflow and inflow of resources reported on the Statement of Net Position for the year ended June 30, 2019, are asfollows:
BalanceJuly 1, 2018 Additions Deletions
BalanceJune 30, 2019
Unamortized losses onrefunding debts:Governmental Activities $ - $ 449,095 $ 28,068 $ 421,027Business-type Activities 2,025,053 - 427,828 1,597,225
Total $ 2,025,053 $ 449,095 $ 455,896 $ 2,018,252
BalanceJuly 1, 2018 Additions Deletions
BalanceJune 30, 2019
Unamortized gains onrefunding debts:
Governmental Activities $ 834,297 $ - $ 43,910 $ 790,387 Business-type Activities 212,516 - 11,185 201,331 Total $ 1,046,813 $ - $ 55,095 $ 991,718
58

COUNTY OF MONTEREYNotes to the Financial Statements
For the Fiscal Year Ended June 30, 2019
Note 8: Long-Term Liabilities
Legal Debt Limit
The County’s legal debt limit for the year ended June 30, 2019, was $846.0 million. This limit is based on 1.25% of the netassessed valuation of property within the County. The County’s outstanding long-term issues payable is approximately$208.2 million, but none is applicable to the debt limit. The County has complied with all significant debt covenants.
Advance Refunding
The County issued Monterey County Financing Authority 2018 Revenue Refunding Bonds (“the Bonds”) in the aggregateamount of $22,890,000. The Bonds mature on September 1, 2037, and are callable on September 1, 2028. The Bonds arebeing issued to (i) refund all of the $32,855,000 Monterey County Financing Authority Revenue Bonds, Series A (SalinasValley Water Project), originally issued on July 30, 2008 and currently outstanding in the aggregate principal amount of$27,780,000 (the “2008 Bonds”), (ii) fund a debt service fund for the Bonds, and (iii) pay the cost incurred in connectionwith the issuance of the Bonds. The advance refunding met the requirements of an in-substance debt defeasance and the2008 Bonds were removed from the County’s government-wide financial statements.
As a result of the advance refunding, the County reduced total debt service requirements over the next 20 years by$6,496,290, which resulted in an economic gain (difference between the present value of the debt service payments on theold and new debt) of $5,102,775.
59

COUNTY OF MONTEREYNotes to the Financial Statements
For the Fiscal Year Ended June 30, 2019
Note 8: Long-Term Liabilities (continued)
Summary of Long-Term Liabilities
Maturity Interest Rates Principal InstallmentsDate ofIssue
AmountAuthorized
OutstandingJune 30, 2019
Governmental activitiesCertificates of participation
2017 Public Facilities Refunding 2037 3.0% - 5.0% $ 223,386 -$ 5,798,533 2017 $ 74,682,250 $ 71,193,625(defeased the 2007 issuefor Monterey County)2015 Public Facilities Issue 2046 3.0% - 5.0% $ 750,000-$2,870,000 2015 48,440,000 46,105,000(finance capital improvements at the
Schilling Place Complex, andfund renovations of the east andwest wings of the courthouse)
2018 Revenue Refunding Bonds -Water Resources 2037 3.0% - 5.0% $730,000 - $ 1,720,000 2018 22,890,000 21,860,000
(defeased 2008A Revenue RefundingBonds-originally issued to financethe Salinas Valley Water Project)
NGEN Issue 2023 3.95% $508,887 - $818,645 2010 8,518,628 3,793,744(finance acquisition, construction and
installation of communicationssystem)
Revenue bonds - Special DistrictsAgencies under Board of Supervisors 2026 5.0% $5,400 - $37,000 1981-96 1,244,700 256,000
Revenue bonds - Water ResourcesAgencies under Board of Supervisors 2038 4.0% - 5.0% $550,000 - $ 2,085,000 2008 32,855,000 -(Refunded by 2018 Revenue
Refunding Issue-Originallyfinanced the Salinas Valley waterproject)
Notes payable - Parks & Recreation(acquire recreational properties)San Antonio Lakes Resort 2023 5.0% $33,095 2007 4,185,000 1,216,985Lake Nacimiento Resort 2023 5.0% $89,478 2007 11,315,000 3,290,478
Loans payable - Bureau of ReclamationAgencies under Board of Supervisors 2037 1.65% - 7.63% $16,847 - $1,207,699 1995 35,035,790 20,282,876(infrastructure and facility
improvements)Special assessment bonds with
governmental commitment:General County-Chualar Water
District 2025 4.25% - 7.2% $4,000 - $26,000 1984-93 257,000 72,000(infrastructure and facility
improvements) $ 239,423,368 $ 168,070,708
Business-type activitiesCertificates of Participation
(NMC Improvements)2017 COP Refunding 2037 3.0% - 5.0% $ 11,614 -$ 301,467 2017 3,882,750 3,701,3752009 Refunding 2024 2% - 5.25% $2,175,000 - $4,225,000 2009 43,700,000 19,125,0002010 Refunding 2027 2% - 4% $65,000 - $4,920,000 2010 17,845,000 17,275,000
$ 65,427,750 $ 40,101,375
60

COUNTY OF MONTEREYNotes to the Financial Statements
For the Fiscal Year Ended June 30, 2019
Note 8: Long-Term Liabilities (continued)
The following is a summary of long-term liabilities transactions for the year ended June 30, 2019:
BalanceJuly 1, 2018 Additions Deletions
BalanceJune 30, 2019
Amount DueWithin One
YearGovernmental activities:
Certificates of participation 2017 issue $ 74,682,250 $ - $ 3,488,625 $ 71,193,625 $ 3,830,834Unamortized premium 14,443,321 - 791,415 13,651,906 -
Certificates of participation 2015 issue $ 46,915,000 - 810,000 46,105,000 845,000Unamortized premium 3,606,503 - 132,349 3,474,154 -
Certificates of participation NGEN program 4,468,231 - 674,486 3,793,745 701,128Revenue bonds 28,094,000 22,890,000 28,868,000 22,116,000 790,000
Unamortized premium 245,405 3,690,064 476,033 3,459,436 -Notes from direct borrowings 27,070,789 - 2,280,446 24,790,343 2,346,344Special assessment bonds 83,000 - 11,000 72,000 11,000Capital leases 15,800,975 - 901,426 14,899,549 961,552Compensated absences 38,187,995 30,000,467 28,497,451 39,691,011 24,958,913Estimated self-insurance liabilities 88,553,537 39,216,867 35,169,600 92,600,804 21,678,405Estimated landfill postclosure costs 1,041,200 - 208,227 832,973 208,227
Total governmental activities $ 343,192,206 $ 95,797,398 $ 102,309,058 $ 336,680,546 $ 56,331,403Business-type activities:
Certificates of participation $ 43,652,750 $ - $ 3,551,375 $ 40,101,375 $ 3,739,166Unamortized premium (discount) 1,573,875 - 206,512 1,367,363 -
Net certificates of participation 45,226,625 - 3,757,887 41,468,738 3,739,166Compensated absences 12,494,944 13,790,378 12,699,111 13,586,211 11,844,728
Total business-type activities $ 57,721,569 $ 13,790,378 $ 16,456,998 $ 55,054,949 $ 15,583,894
Estimated self-insurance liabilities are liquidated by the internal service funds. Compensated absences are generallyliquidated by the General Fund, related special revenue funds and the enterprise funds. Estimated landfill postclosure costsare liquidated from the General Fund.
Payment Requirements for Debt Service
As of June 30, 2019, annual debt service requirements of governmental activities to maturity are as follows:
Year Ending Bonds Payable Certificates of Participation Notes from Direct BorrowingsJune 30 Principal Interest Principal Interest Principal Interest2020 $ 801,000 $ 1,042,801 $ 5,376,962 $ 5,632,330 $ 2,346,344 $ 759,7662021 801,000 1,009,219 5,535,208 5,386,735 2,415,710 667,4552022 833,000 975,947 5,870,406 5,109,968 2,488,729 571,4902023 871,000 941,236 6,149,954 4,818,161 1,570,536 486,0992024 908,000 900,686 5,955,393 4,524,574 1,090,549 452,9012025-2029 5,104,000 3,770,185 29,803,738 18,230,118 5,545,542 1,827,5312030-2034 6,445,000 2,339,812 28,855,881 10,389,090 5,749,347 1,050,0932035-2039 6,425,000 599,718 15,664,828 5,195,280 3,583,586 220,7342040-2044 - - 12,250,000 2,390,000 - -2045- 2046 - - 5,630,000 217,833 - -
$ 22,188,000 $ 11,579,604 $ 121,092,370 $ 61,894,089 $ 24,790,343 $ 6,036,069
61

COUNTY OF MONTEREYNotes to the Financial Statements
For the Fiscal Year Ended June 30, 2019
Note 8: Long-Term Liabilities (continued)
As of June 30, 2019, annual debt service requirements of business-type activities to maturity are as follows:
Year Ending Certificates of ParticipationJune 30 Principal Interest2020 $ 3,739,167 $ 1,694,8592021 3,888,614 1,506,5052022 4,127,205 1,302,7092023 4,332,583 1,082,6712024 4,533,251 871,9962025 - 2029 18,076,262 1,699,8562030 - 2034 1,099,119 180,2562035 - 2039 305,174 17,970
$ 40,101,375 $ 8,356,822Pledged Revenues
The Monterey County Financing Authority has pledged certain specified assessments, all Hydroelectric Facility netrevenues, all ad valorem taxes and all annexation fees to secure the payment of principal and interest on the bonds inaccordance with the terms and the provisions of the Indenture. The Indenture provides that the pledge shall constitute a firstlien on all such assets. Proceeds from the 2008A bonds provided financing for the Salinas Valley Water Project – an effortto halt further seawater intrusion, provide flood protection, and create new water supplies for the Salinas Valley. During thefiscal year ended June 30, 2019, the Monterey County Financing Authority 2018 Revenue Refunding Bonds refunded the2008A Bonds (see paragraph "Advance Refunding"). Total principal and interest remaining on the 2018 RevenueRefunding Bonds is $33,383,231 payable through June 2034. Principal paid for the current fiscal year was $1,030,000 andinterest paid was $693,220. Net pledged revenues for the fiscal year ended June 30, 2019, were $2,280,951.
Note 9: Net Position/Fund Balances
Net Position
Net investment in capital assets was comprised of the following:
GovernmentalActivities
Business-TypeActivities
Capital assets, net of accumulated depreciation $ 826,218,817 $ 117,725,731Unamortized losses on refunding debts 421,027 1,597,225Unamortized gains on refunding debts (790,387) (201,331)Outstanding principal of capital-related debt (199,048,292) (41,468,738)
Net investment in capital assets $ 626,801,165 $ 77,652,887
The government-wide statement of net position reports $230,053,664 of restricted net position, of which $ 7,949,017 isrestricted by enabling legislation.
62

COUNTY OF MONTEREYNotes to the Financial Statements
For the Fiscal Year Ended June 30, 2019
Note 9: Net Position/Fund Balances (continued)
Fund Balances
Fund balances are presented in the following categories: nonspendable, restricted, committed, assigned, and unassigned. Adetailed schedule of fund balances at June 30, 2019, is as follows:
General RoadBehavioral
Health
Facility MasterPlan
Implementation
OtherGovernmental
Funds Total
Nonspendable:Inventory and prepaid items $ 662,200 $ - $ - $ - $ - $ 662,200
Restricted for:Capital projects - - - 17,341,212 68,560 17,409,772Debt service - - - - 1,059,329 1,059,329General 5,354,228 - - - - 5,354,228Health and sanitation 15,907,076 - 24,719,329 - 30,175,511 70,801,916Public assistance 1,681,603 - - - 27,518,570 29,200,173Public protection 6,071,286 - - - 19,913,427 25,984,713Public ways and facilities - 16,103,605 - - - 16,103,605Recreation and cultural services 153,733 - - - - 153,733Successor agencies - - - - 8,387,415 8,387,415
Total restricted 29,167,926 16,103,605 24,719,329 17,341,212 87,122,812 174,454,884
Committed for:General government - - - - 718,115 718,115Health and sanitation - - 14,703,236 - - 14,703,236County service areas - - - - 668,207 668,207Other water resources agencies - - - - 3,154,613 3,154,613Public ways and facilities - 380,277 - - 2,673,729 3,054,006Strategic reserve - general fund 66,461,322 - - - - 66,461,322Strategic reserve - NMC 25,000,000 - - - - 25,000,000
Total committed 91,461,322 380,277 14,703,236 - 7,214,664 113,759,499
Assigned to:Building Improvement and
Replacement Reserve 11,198,577 - - - - 11,198,577Contingency 6,720,468 - - - - 6,720,468Cannabis tax 21,198,756 - - - - 21,198,756Capital project 4,070,894 - - - - 4,070,894Disaster assistance 2,345,309 - - - - 2,345,309Encumbrance 244,627 - - - - 244,627General capital assignment 7,092,599 - - - - 7,092,599Health clinics 1,520,000 - - - - 1,520,000Information tech charges mitigation 1,169,006 - - - - 1,169,006Laguna seca track 1,840,970 - - - - 1,840,970Non-recoverable cost 2,998,557 - - - - 2,998,557Productivity investment program 169,351 - - - - 169,351Public safety sales tax revenue 2,376,910 - - - - 2,376,910Purpose of fund - 1,068,221 2,988,245 27,709,148 44,207,917 75,973,531Social services 9,743 - - - - 9,743Terminations 8,038,138 - - - - 8,038,138Vehicle replacement 10,493,707 - - - - 10,493,707
Total assigned 81,487,612 1,068,221 2,988,245 27,709,148 44,207,917 157,461,143
Unassigned fund balance 2,358,079 - - - (61,959) 2,296,120
Total fund balances $205,137,139 $ 17,552,103 $ 42,410,810 $ 45,050,360 $ 138,483,434 $ 448,633,846
63

COUNTY OF MONTEREYNotes to the Financial Statements
For the Fiscal Year Ended June 30, 2019
Note 10: Pension Plans
A. General Information About the Pension Plans
Plan Description
The County’s defined benefit pension plans; Miscellaneous Plan of the County of Monterey (County MP) and Safety Plan ofthe County of Monterey (County SP) provide pensions for all permanent full-time general and public safety employeesrespectively of the County. The County’s blended component unit, Monterey County Water Resources Agency’s (MCWRA)defined benefit pension plan; MCWRA Miscellaneous Plan (MCWRA MP) provides pensions for all permanent full-timegeneral employees of MCWRA. County MP and County SP are agent multiple-employer defined benefit pension plans andMCWRA MP is a cost-sharing multiple-employer defined benefit pension plan. All three plans are administered by theCalifornia Public Employees’ Retirement System (CalPERS), which acts as a common investment and administrative agentfor participating public employers with the State of California. CalPERS provides retirement, disability, and death benefitsto plan members and beneficiaries. Benefit provisions and other requirements are established by State statutes within thePublic Employees Retirement Law. CalPERS issues a separate comprehensive annual financial report (CAFR). Copies ofthe CalPERS annual financial report may be obtained by contacting the CalPERS Executive Office, 400 Q Street,Sacramento, CA 95811.
Benefits Provided
County MP, County SP, and MCWRA MP provide retirement, disability, and death benefits. Retirement benefits are basedon years of service, final average compensation, and retirement age. Employees terminating before accruing five years ofretirement service credit forfeit the right to receive retirement benefits unless they establish reciprocity with another publicagency within a prescribed time period. Non-vested employees who terminate service are entitled to withdraw theiraccumulated contributions plus accrued interest. Employees who terminate service after earning five years of retirementservice credit may leave their contributions on deposit and elect to take a deferred retirement.
Service related disability benefits are provided to safety (County SP) members and are based on final compensation. Non-service related disability benefits are provided to members of all three plans. The benefit is based on final compensation,multiplied by service, which is determined as follows:
service is CalPERS credited service, for members with less than 10 years of service or greater than 18.518 years ofservice; or
service is CalPERS credited service plus the additional number of years that the member would have worked until age60, for members with at least 10 years but not more than 18.518 years of service.
Death benefits are based upon a variety of factors including whether the participant was retired or not.
Annual cost-of-living adjustments (COLAs) are provided in all plans beginning the second calendar year after the year ofretirement at 2 percent.
There are two classes of employees under each plan: Classic (employees joined CalPERS prior to January 1, 2013) andPEPRA (Public Employees’ Pension Reform Act of 2013 – employees joined CalPERS on or after January 1, 2013).Classic level is closed for new entrants in all plans.
64
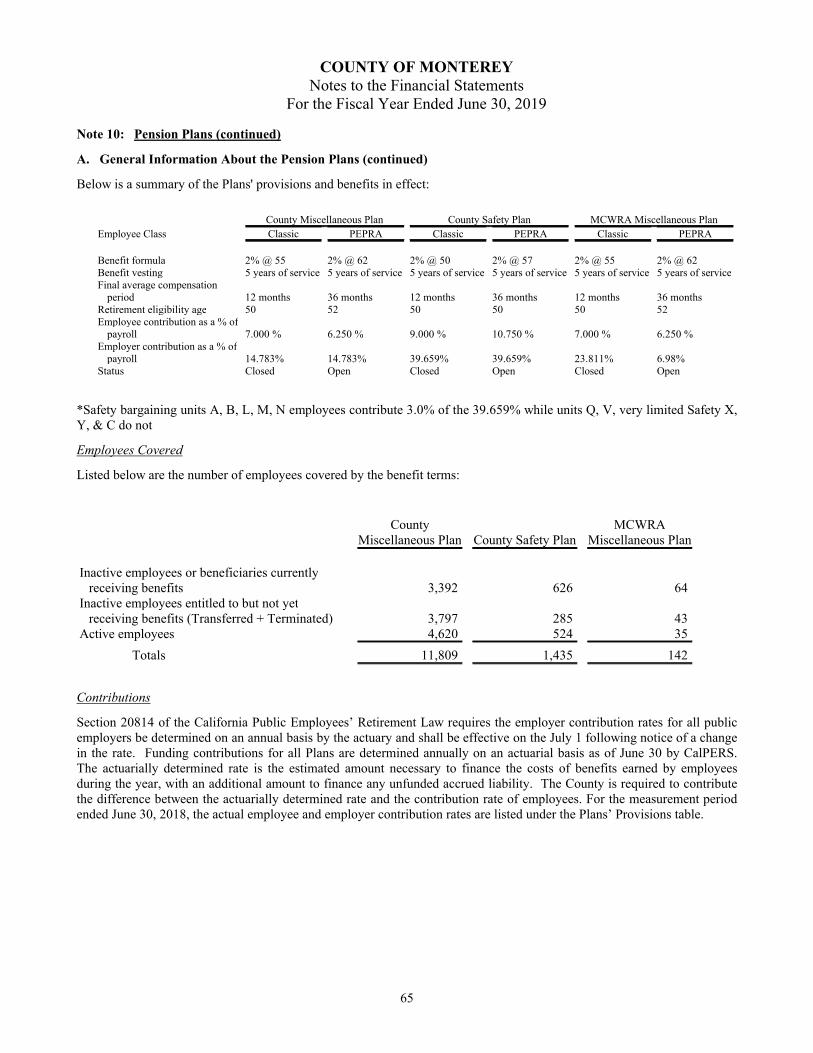
COUNTY OF MONTEREYNotes to the Financial Statements
For the Fiscal Year Ended June 30, 2019
Note 10: Pension Plans (continued)
A. General Information About the Pension Plans (continued)
Below is a summary of the Plans' provisions and benefits in effect:
County Miscellaneous Plan County Safety Plan MCWRA Miscellaneous PlanEmployee Class Classic PEPRA Classic PEPRA Classic PEPRA
Benefit formula 2% @ 55 2% @ 62 2% @ 50 2% @ 57 2% @ 55 2% @ 62Benefit vesting 5 years of service 5 years of service 5 years of service 5 years of service 5 years of service 5 years of serviceFinal average compensation
period 12 months 36 months 12 months 36 months 12 months 36 monthsRetirement eligibility age 50 52 50 50 50 52Employee contribution as a % of
payroll 7.000 % 6.250 % 9.000 % 10.750 % 7.000 % 6.250 %Employer contribution as a % of
payroll 14.783% 14.783% 39.659% 39.659% 23.811% 6.98%Status Closed Open Closed Open Closed Open
*Safety bargaining units A, B, L, M, N employees contribute 3.0% of the 39.659% while units Q, V, very limited Safety X,Y, & C do not
Employees Covered
Listed below are the number of employees covered by the benefit terms:
CountyMiscellaneous Plan County Safety Plan
MCWRAMiscellaneous Plan
Inactive employees or beneficiaries currentlyreceiving benefits 3,392 626 64
Inactive employees entitled to but not yetreceiving benefits (Transferred + Terminated) 3,797 285 43
Active employees 4,620 524 35Totals 11,809 1,435 142
Contributions
Section 20814 of the California Public Employees’ Retirement Law requires the employer contribution rates for all publicemployers be determined on an annual basis by the actuary and shall be effective on the July 1 following notice of a changein the rate. Funding contributions for all Plans are determined annually on an actuarial basis as of June 30 by CalPERS.The actuarially determined rate is the estimated amount necessary to finance the costs of benefits earned by employeesduring the year, with an additional amount to finance any unfunded accrued liability. The County is required to contributethe difference between the actuarially determined rate and the contribution rate of employees. For the measurement periodended June 30, 2018, the actual employee and employer contribution rates are listed under the Plans’ Provisions table.
65

COUNTY OF MONTEREYNotes to the Financial Statements
For the Fiscal Year Ended June 30, 2019
Note 10: Pension Plans (continued)
B. Net Pension Liability
The County’s net pension liability for each Plan is measured as the total pension liability, less the pension plan’s fiduciarynet position. The net pension liability of each of the Plans is measured as of June 30, 2018, using an annual actuarialvaluation as of June 30, 2017 rolled forward to June 30, 2018 using standard update procedures.
Actuarial Assumptions
The June 30, 2018 total pension liabilities were based on the following actuarial assumptions:
County MiscellaneousPlan County Safety Plan
MCWRAMiscellaneous Plan
Actuarial cost method Entry age normal Entry age normal Entry age normal
Actuarial assumptions:Discount rate %7.15 %7.15 %7.15Inflation %2.50 %2.50 %2.50Salary increase Varies by entry age
and serviceVaries by entry age
and serviceVaries by entry age
and serviceMortality rate table (1)
Derived using CalPERS's Membership Data for all Funds
Postretirement benefit increase Contract COLA up to 2.0% until Purchasing Power ProtectionAllowance Floor on Purchasing Power applies, 2.50% thereafter
(1) The Mortality table used was developed based on CalPERS's specific data. The table includes 15 years of mortalityimprovement using the Society of Actuaries Scale 90% of scale MP 2016. For more details on this table, pleaserefer to the December 2017 experience study report (based on CalPERS demographic data from 1997 to 2015) thatcan be found on the CalPERS website.
Discount Rate
The discount rate used to measure the total pension liability was 7.15 percent for each Plan. The projection of cash flowsused to determine the discount rate assumed that contributions from plan members will be made at the current membercontribution rates and that contributions from employers will be made at statutorily required rates, actuarially determined.Based on those assumptions, the Plan's fiduciary net position was projected to be available to make all projected futurebenefit payments of current plan members. Therefore, the long-term expected rate of return on plan investments wasapplied to all periods of projected benefit payments to determine the total pension liability.
Long-Term Expected Rate of Return
The long-term expected rate of return on pension plan investments was determined using a building-block method in whichexpected future real rates of return (expected returns, net of pension plan investment expense and inflation) are developedfor each major asset class.
The long-term expected rate of return includes both short-term and long-term market return expectations as well as theexpected pension fund cash flows. Using historical returns of all of the funds' asset classes, expected compound (geometric)returns were calculated over the short-term (first 10 years) and the long-term (11+ years) using a building-block approach.Using the expected nominal returns for both short-term and long-term, the present value of benefits was calculated for eachfund. The expected rate of return was set by calculating the rounded single equivalent expected return that arrived at thesame present value of benefits for cash flows as the one calculated using both short-term and long-term returns. Theexpected rate of return was then set equal to the single equivalent rate calculated above and adjusted to account for assumed
66
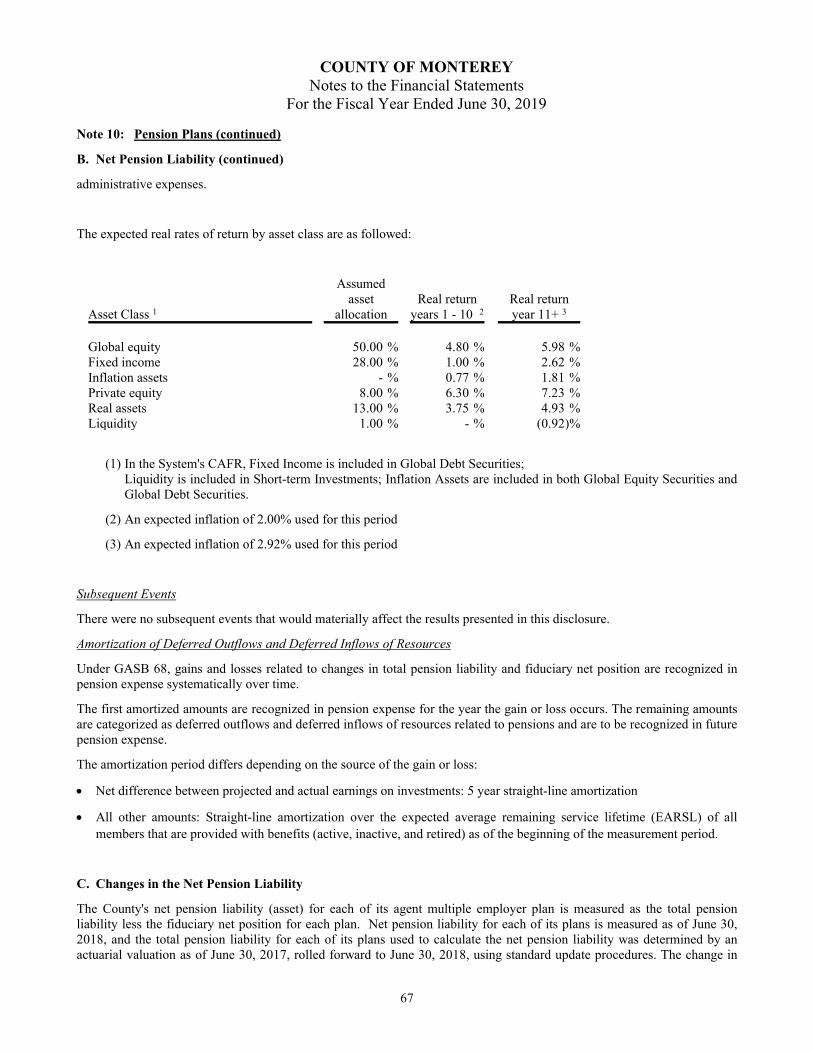
COUNTY OF MONTEREYNotes to the Financial Statements
For the Fiscal Year Ended June 30, 2019
Note 10: Pension Plans (continued)
B. Net Pension Liability (continued)
administrative expenses.
The expected real rates of return by asset class are as followed:
Asset Class 1
Assumedasset
allocationReal return
years 1 - 10 2Real returnyear 11+ 3
Global equity %50.00 %4.80 %5.98Fixed income %28.00 %1.00 %2.62Inflation assets %- %0.77 %1.81Private equity %8.00 %6.30 %7.23Real assets %13.00 %3.75 %4.93Liquidity %1.00 %- %(0.92)
(1) In the System's CAFR, Fixed Income is included in Global Debt Securities;Liquidity is included in Short-term Investments; Inflation Assets are included in both Global Equity Securities andGlobal Debt Securities.
(2) An expected inflation of 2.00% used for this period
(3) An expected inflation of 2.92% used for this period
Subsequent Events
There were no subsequent events that would materially affect the results presented in this disclosure.
Amortization of Deferred Outflows and Deferred Inflows of Resources
Under GASB 68, gains and losses related to changes in total pension liability and fiduciary net position are recognized inpension expense systematically over time.
The first amortized amounts are recognized in pension expense for the year the gain or loss occurs. The remaining amountsare categorized as deferred outflows and deferred inflows of resources related to pensions and are to be recognized in futurepension expense.
The amortization period differs depending on the source of the gain or loss:
Net difference between projected and actual earnings on investments: 5 year straight-line amortization
All other amounts: Straight-line amortization over the expected average remaining service lifetime (EARSL) of allmembers that are provided with benefits (active, inactive, and retired) as of the beginning of the measurement period.
C. Changes in the Net Pension Liability
The County's net pension liability (asset) for each of its agent multiple employer plan is measured as the total pensionliability less the fiduciary net position for each plan. Net pension liability for each of its plans is measured as of June 30,2018, and the total pension liability for each of its plans used to calculate the net pension liability was determined by anactuarial valuation as of June 30, 2017, rolled forward to June 30, 2018, using standard update procedures. The change in
67

COUNTY OF MONTEREYNotes to the Financial Statements
For the Fiscal Year Ended June 30, 2019
Note 10: Pension Plans (continued)
C. Changes in the Net Pension Liability (continued)
the net pension liability (asset) for each plan is as follows:
County Miscellaneous PlanIncrease (Decrease)
Total PensionLiability
Plan FiduciaryNet Position
Net PensionLiability/(Asset)
Balance at June 30, 2017 $ 1,737,331,266 $ 1,323,064,712 $ 414,266,554Changes in the year:
Service cost 50,511,029 - 50,511,029Interest on total pension liability 122,660,308 - 122,660,308Changes in benefit terms - - -Changes in assumptions (9,939,254) - (9,939,254)Differences between expected and actual experience 85,675 - 85,675Benefit payments, including refunds of employee
contributions (74,721,030) (74,721,030) -Administrative expenses - (2,061,884) 2,061,884Plan to plan resource movement - (3,284) 3,284Contributions - employees - 22,323,442 (22,323,442)Contributions - employer - 42,227,433 (42,227,433)Net investment income - 111,633,416 (111,633,416)Change in Employer's Proportionate Share 156,095 118,875 37,220Other miscellaneous income/(expense) 1 - (3,915,553) 3,915,553Net Changes 88,752,823 95,601,415 (6,848,592)
Balance at June 30, 2018 $ 1,826,084,089 $ 1,418,666,127 $ 407,417,962
County Safety PlanIncrease (Decrease)
Total PensionLiability
Plan FiduciaryNet Position
Net PensionLiability/(Asset)
Balance at June 30, 2017 $ 651,857,419 $ 429,867,373 $ 221,990,046Changes in the year:
Service cost 14,949,233 - 14,949,233Interest on total pension liability 46,316,764 - 46,316,764Changes in benefit terms - - -Changes of assumptions (3,444,367) - (3,444,367)Differences between expected and actual experience 6,304,456 - 6,304,456Benefit payments, including refunds of employee contributions (28,810,424) (28,810,424) -Administrative expenses - (669,852) 669,852Plan to plan resource movement - (1,066) 1,066Contributions - employees - 5,017,206 (5,017,206)Contributions - employer - 18,792,681 (18,792,681)Net investment income - 36,255,035 (36,255,035)Other miscellaneous income/(expense) 1 - (1,272,060) 1,272,060Net changes 35,315,662 29,311,520 6,004,142
Balance at June 30, 2018 $ 687,173,081 $ 459,178,893 $ 227,994,188
(1) During Fiscal Year 2017-18, as a result of Governmental Accounting Standards Board Statement (GASB) No. 75,
68

COUNTY OF MONTEREYNotes to the Financial Statements
For the Fiscal Year Ended June 30, 2019
Note 10: Pension Plans (continued)
C. Changes in the Net Pension Liability (continued)
Accounting and Financial Reporting for Postemployment Benefit Plans Other than Pensions (GASB 75), CalPERSreported its proportionate share of activity related to postemployment benefits for participation in the State ofCalifornia's agent OPEB plan. Accordingly, CalPERS recorded a one-time expense as result of the adoption of GASB75.
Additionally, CalPERS employees participate in various State of California agent pension plans and during Fiscal Year2017-18, CalPERS recorded a correction to previously reported financial statements to properly reflect itsproportionate share of activity related to pensions in accordance with GASB Statement No. 68, Accounting andFinancial Reporting for Pensions (GASB 68).
The County's net pension liability for MCWRA (a cost-sharing plan) is measured as a proportionate share of the plan's netpension liability as of June 30, 2018. The total pension liability used to calculate the net pension liability was determined byan actuarial valuation as of June 30, 2017, rolled forward to June 30, 2018, using standard update procedures. The County'sproportions of the net pension liability for the CalPERS plans were actuarially determined as of the valuation date.
The following table shows the proportionate share of the risk pool collective net pension liability over the measurementperiod.
MCWRAIncrease (Decrease)
Total PensionLiability
Plan FiduciaryNet Position
Net PensionLiability/(Asset)
Balance at June 30, 2017 $ 31,115,346 $ 23,319,481 $ 7,795,865Net changes during measurement period 1,148,446 1,296,904 (148,458)
Balance at June 30, 2018 $ 32,263,792 $ 24,616,385 $ 7,647,407
Sensitivity of the Net Pension Liability to Change in the Discount Rate
The following presents the net pension liability of the County for each Plan, calculated using the discount rate for each Plan,as well as what the County’s net pension liability would be if it were calculated using a discount rate that is 1-percentagepoints lower or 1-percentage point higher than the current rate:
CountyMiscellaneous
PlanCounty Safety
Plan
MCWRAMiscellaneous
Plan
1% Decrease %6.15 %6.15 %6.15Net Pension Liability $ 656,422,095 $ 325,498,040 $ 12,011,767Current Discount Rate %7.15 %7.15 %7.15Net Pension Liability 407,417,962 $ 227,994,188 $ 7,647,4071% Increase %8.15 %8.15 %8.15Net Pension Liability $ 201,609,704 $ 148,134,185 $ 4,044,697
The Pension Plan's Fiduciary Net Position
Detailed information about the pension fund’s fiduciary net position is available in the CalPERS CAFR. CalPERS adheresto the reporting requirements established by the Governmental Accounting Standards Board (GASB). Two types of fundsused – Fiduciary Funds and Proprietary Funds – to account for its activities follow accrual basis of accounting.Contributions to the pension trust funds are recognized in the period in which the contributions are due pursuant to legal
69

COUNTY OF MONTEREYNotes to the Financial Statements
For the Fiscal Year Ended June 30, 2019
Note 10: Pension Plans (continued)
C. Changes in the Net Pension Liability (continued)
requirements. Benefits and refunds are recognized when due and payable in accordance with the terms of each plan.Investments are reported at fair value using a variety of different techniques.
D. Pension Expenses and Deferred Outflows/Inflows of Resources Related to Pensions
For the year ended June 30, 2019, the County recognized pension expense of $74,718,447 for its Miscellaneous (CountyMP), $30,985,352 Safety (County SP) plans; and $727,895 for its Water Resources Agency Miscellaneous plan (MCWRAMP). Pension expense represents the change in the net pension liability during the measurement period, adjusted for actualcontributions and the deferred recognition of changes in investment gain/loss, actuarial gain/loss, actuarial assumptions ormethod, and plan benefits. At June 30, 2019, the County reported deferred outflows of resources and deferred inflows ofresources related to pensions from the following sources:
Miscellaneous Plan Safety Plan MCWRA TotalDeferred
Outflows ofResources
DeferredInflows ofResources
DeferredOutflows ofResources
DeferredInflows ofResources
DeferredOutflows ofResources
DeferredInflows ofResources
DeferredOutflows ofResources
DeferredInflows ofResources
Changes of assumptions $ 50,366,199 $ (7,627,801) $ 19,514,648 $(3,314,703) $ 871,827 $ (213,668) $ 70,752,674 $ (11,156,172)Differences between expected and
actual experience 876,401 (971,969) 4,766,784 (3,219,129) 293,417 (99,848) 5,936,602 (4,290,946)Net difference between projected and
actual earnings on pension planinvestments 3,288,018 - 1,296,586 - 37,807 - 4,622,411 -
Differences between employer'scontributions and proportionateshare of contributions - - - - - (513,618) - (513,618)
Change in employer's proportion - - - - 108,899 (16,435) 108,899 (16,435)Pension contributions subsequent to
the measurement date 49,821,403 - 20,669,311 - 566,399 - 71,057,113 -
Total $104,352,021 $ (8,599,770) $ 46,247,329 $(6,533,832) $ 1,878,349 $ (843,569) $152,477,699 $ (15,977,171)
$71,057,113 reported as deferred outflows of resources related to pensions resulting from County contributions subsequentto the measurement date will be recognized as a reduction of the net pension liability in the year ending June 30, 2020.Other amounts reported as deferred outflows of resources and deferred inflows of resources related to pensions will berecognized in future pension expense as follows:
Deferred Outflows/(Inflows) of ResourcesYear EndingJune 30:
MiscellaneousPlan Safety Plan MCWRA Total
2020 $ 38,346,223 $ 13,068,238 $ 560,878 $ 51,975,3392021 25,024,680 9,885,803 273,640 35,184,1232022 (13,184,552) (2,815,873) (297,353) (16,297,778)2023 (4,255,503) (1,093,982) (68,784) (5,418,269)Thereafter - - - -
45,930,848 19,044,186 468,381 65,443,415
70

COUNTY OF MONTEREYNotes to the Financial Statements
For the Fiscal Year Ended June 30, 2019
Note 11: Other Postemployment Benefits (OPEB)
A. General Information about the OPEB Plan
Plan Description
The County of Monterey Retiree Healthcare Plan (Plan) is an agent multiple-employer defined benefit healthcare plan. ThePlan provides healthcare insurance benefits to eligible retirees. Benefit provisions are established and may be amended bythe County.
Benefits Provided
The County provides retiree medical benefits through the California Public Employees’ Retirement System healthcareprogram. The County contributes the Public Employees’ Medical and Hospital Care Act (PEMHCA) minimum requiredemployer contribution ($136 per month in 2019) towards the retiree monthly premium for eligible retirees participating inPEMHCA.
Participants Covered by Benefit Terms
At June 30, 2018, the measurement date, the following employees were covered by the benefit terms:
Inactive employees or beneficiaries currently receiving benefitpayments 955
Inactive employees entitled to but not yet receiving benefit payments 1,521Active employees 4,822
Total 7,298
Contributions
The contribution requirements of the plan members and the County are established and may be amended by the County. TheCounty prefunds all or a portion of the plan through the California Employers’ Retiree Benefit Trust (CERBT). Employeesare not required to contribute to the Plan. For the fiscal year ended June 30, 2019, the County paid a total of $7,286,673 tothe OPEB trust (CERBT). Of this amount, $1,597,673 was paid for healthcare insurance benefits for eligible retirees,$1,068,000 was an implicit rate subsidy, and $4,621,000 was paid to fund future retirees’ healthcare.
B. Net OPEB Liability
The County reported a net OPEB liability of $38,782,871 at June 30, 2019. The County's OPEB liability was measured asof June 30, 2018, and the total OPEB liability used to calculate the net OPEB liability was determined by an actuarialvaluation as of June 30, 2017, updated to June 30, 2018.
Actuarial Assumptions
The total OPEB liability in the June 30, 2017, actuarial valuation was determined using the following actuarial assumptions,applied to all periods included in the measurement, unless otherwise specified.
Salary increases Aggregate 3% and merit increases based on CalPERS1997-2015 Experience Study
Medical trend Non-Medicare - 7.5% for 2019, decreasing to anultimate rate of 4% in 2076 and later years
PEMHCA minimum increases 4.25% annuallyDiscount rate 6.75%Investment rate of return 6.75% - expected County contributions projected to
keep sufficient plan assets to pay all benefits from trust. Inflation 2.75% per annum
71

COUNTY OF MONTEREYNotes to the Financial Statements
For the Fiscal Year Ended June 30, 2019
Note 11: Other Postemployment Benefits (OPEB) (continued)
B. Net OPEB Liability (continued)
A long-term expected rate of return of 6.75 percent on OPEB plan investments was determined using a model of stochasticsimulations of geometric average return over twenty years for each major asset class. The rate was derived based onCERBT's investment Strategy 1 target allocation and it includes a 2.75 percent long-term inflation assumption. The targetallocation and best estimates of arithmetic real rates of return for each major asset class are summarized in the followingtable:
Asset ClassTarget
Allocation
Long-TermExpected RealRate of Return
Global Equity 57% 4.8%Fixed Income 27% 1.5%Treasury Inflation-Protected Securities (TIPS) 5% 1.3%Real Estate Investment Trusts (REITs) 8% 3.8%Commodities 3% 0.8%
Total 100%
Discount Rate
The discount rate used to measure the total OPEB liability was 6.75 percent. The projection of cash flows used to determinethe discount rate assumed that County contributions will be made at rates equal to the actuarially determined contributionrates. Based on those assumptions, the OPEB plan's fiduciary net position was projected to be available to make allprojected OPEB payments for current active and inactive employees. Therefore, the long-term expected rate of return onOPEB plan investments was applied to all periods of projected benefit payments to determine the total OPEB liability.
C. Changes in Net OPEB Liability
The County net OPEB liability is measured as of the total OPEB liability less the fiduciary net position. The change in thenet OPEB liability is as follows:
Increase (Decrease)Total OPEB
LiabilityPlan FiduciaryNet Position
Net OPEBLiability
(a) (b) (a) - (b)Balances at 6/30/18 $ 67,531,000 $ 27,606,000 $ 39,925,000Changes for the year:
Service cost 3,306,508 - 3,306,508Interest 4,689,517 - 4,689,517Differences between expected and
actual experience - - -Contributions - employer - 6,972,371 (6,972,371)Net investment income - 2,217,043 (2,217,043)Benefit payments (2,726,371) (2,726,371) -Administrative expense - (51,260) 51,260Net changes 5,269,654 6,411,783 (1,142,129)
Balances at 6/30/19 72,800,654 34,017,783 38,782,871
72

COUNTY OF MONTEREYNotes to the Financial Statements
For the Fiscal Year Ended June 30, 2019
Note 11: Other Postemployment Benefits (OPEB) (continued)
C. Changes in Net OPEB Liability (continued)
Sensitivity of the Net OPEB Liability to Changes in the Discount Rate
The following presents the net OPEB liability of the County, as well as what the County's net OPEB liability would be if itwere calculated using a discount rate that is 1-percentage-poing lower (5.75 percent) or 1-percent-point higher (7.75percent) than the current discount rate:
1% Decrease(5.75%)
Discount Rate(6.75%)
1% Increase(7.75%)
Net OPEB liability (asset) $ 49,059,929 $ 38,782,871 $ 30,323,252
Sensitivity of the Net OPEB Liability to Changes in Healthcare Cost Trend Rates
The following presents the net OPEB liability of the County, as well as what the County's net OPEB liability would be if itwere calculated using healthcare costs trend rates that is 1-percentage-poing lower or 1-percent-point higher than the currenthealthcare cost trend rate:
1% Decrease Current Trend 1% IncreaseNet OPEB liability (asset) $ 28,292,317 $ 38,782,871 $ 51,991,116
OPEB Plan Fiduciary Net Position
Detailed information about the OPEB plan's fiduciary net position is available in the separately issued CERBT's financialreport. That report may be obtained by contacting CalPERS, Executive Office, 400 P Street, Sacramento, California,95814.
D. OPEB Expense and Deferred Outflows of Resources and Deferred Inflows of Resources Related to OPEB
For the fiscal year ended June 30, 2019, the County recognized OPEB expense of $5,957,243. At June 30, 2019, the Countyreported deferred outflows of resources and deferred inflows of resources related to OPEB from the following sources:
Deferred Outflowsof Resources
Deferred Inflowsof Resources
Net difference between projected and actualearnings on OPEB plan investments $ - $ (745,002)
Employer contributions made subsequent to themeasurement date 7,303,971 -Total 7,303,971 (745,002)
The amounts reported as deferred outflows of resources and deferred inflows of resources related to OPEB are recognizedin OPEB expenses as follows:
Year EndingJune 30, Amount2019 $ (225,500)2020 (225,500)2021 (223,500)2022 (70,502)2023 -
73

COUNTY OF MONTEREYNotes to the Financial Statements
For the Fiscal Year Ended June 30, 2019
Note 12: Joint Powers Agreement
Natividad Medical Center (NMC) is a member of and participates in a professional liability self-insurance program(Program) through BETA Healthcare Group (BETA), joint powers authority formed pursuant to the government code of theState of California. BETA members are city, county, district, and private not-for-profit hospitals and healthcare facilities inCalifornia. Amounts paid by each member to BETA represent actuarially determined assessments of claims payable andestimated incurred but not reported claims that are adjusted periodically based on the claims experience for each member ateach hospital. Claims in excess of specified amounts are the responsibility of individual program participants.
After a deductible, BETA provides payment in full for healthcare liability claims subject to limits established at $30 millionin the aggregate for the entity, with professional liability coverage for medical providers subject to $1 million per claim and$3 million aggregate limits. Also, after a $25,000 deductible, BETA provides payment on covered directors, officers andtrustee liability claims up to $10 million per occurrence and in the aggregate. The Center's contribution to the Program wasapproximately $937,138 in 2019.
Condensed financial information of the Program for the calendar year ended December 31, 2018, (audited by Larson &Rosenberger LLP) is as follows:
Cash and investments $ 577,199,941Other assets 68,203,833
Total assets $ 645,403,774Loss reserves $ 281,393,828Other liabilities 120,159,330Net position 243,850,616
Total liabilities and net position $ 645,403,774Total revenues $ 119,792,891Total expenses (104,080,030)
Revenue in excess of expenses before member surplus fundscontributed, change in net unrealized gains on investments, andmember dividends $ 15,712,861
Financial statements for the Program can be obtained from Beta Healthcare Group, 1443 Danville Blvd., Suite 200, Alamo,CA 94507-1973.
In January 1997, the County entered into a Joint Powers Agreement with the City of Salinas, the City of Gonzales, the Cityof Greenfield, the City of King, and the City of Soledad creating the Salinas Valley Waste Authority (Authority). Thepurpose of the Authority, established by the Joint Powers Agreement, is to undertake and perform: solid waste planning andprogram management, including collection services and siting; and the transfer and disposal of solid waste generated withineach of the parties’ jurisdictional boundaries. The Authority administers the agreement pursuant to the joint powersprovision of the Government Code of the State of California.
Financial statements for the Authority can be obtained from Salinas Valley Solid Waste Authority, 128 Sun St, Ste. 101,Salinas, CA 93901.
74

COUNTY OF MONTEREYNotes to the Financial Statements
For the Fiscal Year Ended June 30, 2019
Note 12: Joint Powers Agreement (continued)
Condensed financial information of the Authority for the fiscal year ended June 30, 2019, is as follows:
Current assets $ 28,293,095Other assets 4,497,012Capital assets, net 31,238,688Deferred outflows of resources 2,410,103
Total assets and deferred outflows of resources $ 66,438,898Closure liability $ 3,698,748Other liabilities 50,310,708
Total liabilities $ 54,009,456Deferred inflows of resources 52,354
Net position (deficit) $ 12,377,088Total operating revenues $ 22,819,068Total operating expenses (16,337,140)Other revenues and expenses 446,352
Change in Net Position $ 6,928,280
On December 22, 2016, the County entered into a Joint Exercise of Powers Agreement (JPA) with the Monterey CountyWater Resources Agency (a blended component unit), City of Salinas, City of Soledad, City of Gonzales, City ofGreenfield, King City and Castroville Community Services District, for the purpose of forming a Ground SustainableAgency and achieving groundwater sustainability in the Salinas Valley Ground Water Basin. Established in 2017, underCalifornia's Sustainable Groundwater Management Act, the Salinas Valley Basin Groundwater Sustainability Agency (theAgency) is tasked with the ambitious goal of developing a comprehensive ground sustainability plan by 2020 andimplementing the plan to achieve basin sustainability by 2040. The County has no continuing financial liability and doesnot expect any financial burden from its participation in the Agency. Separate financial statements of the JPA can beobtained by contacting the Agency.
Note 13: Landfill Closure and Post Closure Costs
State and federal laws and regulations require the County to place a final cover on all landfill sites when closed and, forthirty years after, perform mandated maintenance and monitoring functions at those sites. All County owned landfills areclosed, thus only the liability for future maintenance and monitoring activities is shown on the statement of net position. Theestimated liability and total costs for the landfill sites are shown below:
Landfill SitePost Closure
ActivitiesGroundwaterMonitoring
Post ClosureLiability
Bradley $ 55,433 $ 92,881 $ 148,314San Ardo II 55,433 92,881 148,314Lake San Antonio North Shore 55,433 92,881 148,314Lake San Antonio South Shore 55,433 - 55,433San Ardo I 55,433 - 55,433Parkfield I 55,433 - 55,433Parkfield II 55,433 - 55,433Chualar 55,433 - 55,433Arroyo Seco / Greenfield 55,433 - 55,433Lockwood 55,433 - 55,433
Totals $ 554,330 $ 278,643 832,973Landfill costs as of June 30, 2019 12,775,699Total estimated costs to June 30, 2023 $ 13,608,672
75

COUNTY OF MONTEREYNotes to the Financial Statements
For the Fiscal Year Ended June 30, 2019
Note 13: Landfill Closure and Post Closure Costs (continued)
Post closure activities are comprised of costs which are estimated equally per site for the five remaining years. The liabilityand total costs are estimated annually based on the premise that all equipment, facilities and services required to monitorand maintain the landfill sites were acquired as of June 30, 2019. Actual total costs may be higher due to future changes intechnology or landfill laws and regulations.
The County is required by state and federal laws and regulations to provide annual funding to finance future post closurecare costs. The County is in compliance with these regulations, establishing appropriations for these activities, based on theannual estimated liability, in each year’s annual budget.
Note 14: Commitments and Contingencies
In prior years, the Monterey County Water Resources Agency (MCWRA), a blended component unit of Monterey County,entered into an agreement with the Monterey One Water/M1W (formerly known as Monterey County Water PollutionControl Agency/MCWPCA) to provide tertiary treated water. Monterey One Water built the tertiary water treatment plantand the MCWRA built the distribution pipelines from the plant to the users. Both projects were financed by loans betweeneach agency and the Bureau of Reclamation and/or State Water Resources Control Board. A special assessment wasestablished and is collected by the MCWRA. Based on the agreement between the MCWRA and the Monterey One Water,the financing and operating expenses incurred by Monterey One Water on this project are paid by this special assessment onan advance basis from the MCWRA. The loans entered into directly between Monterey One Water and the lenders are notincluded in the County’s financial statements.
As of June 30, 2019, the outstanding loan balances of the Monterey One Water related to the above project are as follows:
Loan from the Bureau of Reclamation $ 11,486,584
Litigation
The County has been named as a defendant in numerous lawsuits and claims arising in the normal course of operations. Inthe aggregate, these lawsuits and claims seek monetary damages in significant amounts. To the extent, the outcome of suchlitigation has been determined to result in probable loss to the County; such loss has been recorded in the accompanyingbasic financial statements. In the opinion of County Counsel and management, the ultimate outcome of the remaining claimscannot be determined at this time.
Arbitrage
The Tax Reform Act of 1986 instituted certain arbitrage restrictions with respect to the issuance of tax-exempt bonds afterAugust 31, 1986. Arbitrage regulations deal with the investment of all tax-exempt bond proceeds at an interest yield greaterthan the interest yield paid to bondholders. Generally, all interest paid to bondholders can be retroactively rendered taxableif applicable rebates are not reported and paid to the Internal Revenue Service (IRS) at least every five years. During thecurrent year, the County performed calculations of excess investment earnings on various bonds and financings, and at June30, 2019, does not expect to incur a significant liability.
Grant Entitlement
The County is a participant in a number of federal and state assisted programs. These programs are subject to complianceaudits by the grantors. The audits of these programs for the fiscal year ended June 30, 2019, and certain earlier years havenot been completed. Accordingly, the County’s compliance with applicable program requirements is not completelyestablished. The amount, if any, of expenditures which may be disallowed by the grantors cannot be determined at this time.Management believes it has adequately provided for potential liabilities, if any, which may arise from the grantor’s audits.
Hospital Regulatory Environment
The healthcare industry is subject to numerous laws and regulations of federal, state, and local governments. These laws andregulations include, but are not necessarily limited to, matters such as licensure, accreditation, government healthcareprogram participation requirements, reimbursement for patient services, and Medicare and Medi-Cal fraud and abuse.
76

COUNTY OF MONTEREYNotes to the Financial Statements
For the Fiscal Year Ended June 30, 2019
Note 14: Commitments and Contingencies (continued)
Recently, government activity has increased with respect to investigations and allegations concerning possible violations offraud and abuse statutes and regulations by healthcare providers. NMC is subject to routine surveys and reviews by federal,state, and local regulatory authorities. NMC also has received inquiries from healthcare regulatory authorities regarding itscompliance with laws and regulations. Although NMC management is not aware of any violations of laws and regulations, ithas received corrective action requests as a result of completed and on-going surveys from applicable regulatory authorities.Management continually works in a timely manner to implement operational changes and procedures to address allcorrective action requests from regulatory authorities. Breaches of these laws and regulations and non-compliance withsurvey correction action requests could result in expulsion from government healthcare programs together with theimposition of significant fines and penalties, as well as significant repayments for patient services previously billed.Compliance with such laws and regulations can be subject to future government review and interpretation, as well asregulatory actions unknown or unasserted at this time.
Construction Commitments
At June 30, 2019, the County had ongoing construction commitments that totaled approximately $228.4 million.
Note 15: Non-Commitment Debt
Community Facilities District No. 2006-1 Special Tax Bonds (Series 2016 Bonds)
On December 6, 2016, $9,540,000 of Special Tax Bonds were issued by Community Facilities District No. 2006-1, EastGarrison Public Financing Authority, County of Monterey, State of California ("the District"). The Special Tax Bonds wereissued pursuant to the Mello-Roos Community Facilities Act of 1982, as amended, and are payable from a portion of certainspecial taxes to be levied on property within the boundaries of the District. Of the amount issued, $1.5 million wasdistributed to the District, and $6.5 million to Marina Coast Water District from the property owners to reimburse thedeveloper for the construction of infrastructure within the East Garrison community.
The County is acting as an agent of the District in collecting assessments and special taxes, forwarding the collections toother paying agents or directly to bondholders, and initiating any necessary foreclosure proceedings. Because of theCounty's limited obligation in connection with the District's debt, related transactions are reflected in an Agency Fund.Major capital outlay expenditures related to these bonds are accounted for in the East Garrison CFD Capital Projects Fund.The Special Tax Bonds are not a general obligation of the County, and neither the faith and credit nor the taxing power ofthe County is pledged to the payment of the bonds. The principal amount of the debt outstanding at June 30, 2019 was$9,185,000. Accordingly, such obligations are not included in the accompanying basic financial statements.
Subsequent to year end, the District issued Series 2019 Bonds in parity with the Series 2016 Bonds. Refer to Note 22.
Note 16: Natividad Medical Center - Net Patient Service Revenue
Net patient service revenue is comprised of the following for the year ended June 30, 2019:
Revenue at established rates $ 1,198,732,397Medicare contractual allowance (208,775,909)Medi-Cal contractual allowance (495,169,367)Allowances for other payors and indigent accounts (179,788,429)Provision for bad debts (28,578,401)
Net patient service revenue before additional funding 286,420,291California's Medi-Cal hospital waiver 29,556,313Managed care supplemental funding 37,449,926Senate Bill 1732 4,703,643
Additional funding 71,709,882Net patient service revenue $ 358,130,173
77

COUNTY OF MONTEREYNotes to the Financial Statements
For the Fiscal Year Ended June 30, 2019
Note 16: Natividad Medical Center - Net Patient Service Revenue (continued)
The Natividad Medical Center (Center) has agreements with third-party payors to provide for payments to the Center atamounts different than established rates. A summary of the basis of the payment arrangements with major third-party payorsis as follows:
Medicare – Inpatient acute care services rendered to Medicare program beneficiaries are paid at predetermined prospectiverates per discharge. These rates vary according to the diagnostic related group that the patient’s condition is classifiedunder. Services other than inpatient acute care are paid based on a reimbursement methodology specific to the type ofservice, which generally entails reimbursement rates at the lower of costs, charges, or a published limit. The Center isreimbursed at a tentative rate during the year that is later subject to final settlement after submission and audit of an annualcost report.
Medi-Cal – Inpatient acute care services rendered to Medi-Cal program beneficiaries are reimbursed based on a per diemrate. Outpatient hospital services are reimbursed based on a published fee schedule. The Center is reimbursed at a per diemrate during the year.
Short Doyle – Inpatient acute services rendered to County mental health patients under the Short Doyle program arereimbursed based on a per diem rate specified in an agreement between the Center and the Monterey County HealthDepartment.
Other Third Party Payors – The Center contracts with numerous employers, other county departments, and health plans toprovide health care services to their beneficiaries. Reimbursement varies by contract and can be based on a combination ofper diem, fee schedule, or percent of charges payment rates.
During the year ended June 30, 2019, patients for which reimbursement was calculated under the third-party payor programscomprised approximately 100% of the Center’s gross patient service revenues, as follows:
Other third parties %25.7Medi-Cal %50.8Medicare %21.5Short Doyle %2.0
Total %100.0
California’s Medi-Cal Hospital Waiver
In 2005, California enacted Senate Bill 1100 ("SB 1100") to implement a federal Medicaid hospital financing waiver("waiver") that governs fee-for-service inpatient hospital payments for its public hospitals, which include the Center.SB1100 is designed to protect baseline Medicaid funding for the Center from 2006 through 2010 – at a minimumparticipants will receive the Medicaid inpatient hospital payments they received in 2005 adjusted for yearly changes incosts. SB 1100 also allows the Center to receive additional waiver growth funding subject to the availability of funds.Payments to the Center under SB 1100 include a combination of Medi-Cal inpatient FFS payments, Medi-CalDisproportionate Share (DSH) payments and Safety Net Care Pool (SNCP) payments. The federal economic stimuluspackage enacted in 2009, which increases California’s federal DSH allotment and the federal matching rate for FFSpayments, increases the net payment amounts under the waiver to the Center for the period October 2008 through December2010.
The original waiver expired in August 2010 and a second five-year Section 1115 Medicaid waiver agreement was signed onNovember 2, 2010, which was effective from November 1, 2010, to October 31, 2015. In December 2015 a third-five yearSection 1115 Medical Waiver was approved for the period of December 30, 2015 through December 31, 2020. The newwaiver is titled “Medi-Cal 2020” and will expand coverage and the safety net, promote public hospital delivery systemimprovements, and improve care coordination. The new waiver model offers federal funds for public hospitals that willrequire the expansion of coverage to low income people and transform care so that it is more coordinated, efficient, patient-centered and value based. Unlike the previous two waivers, the current waiver states that the federal payments will be tied tocore performance measures and targets. Although the federal inpatient hospital financing waiver and the new section 1115
78

COUNTY OF MONTEREYNotes to the Financial Statements
For the Fiscal Year Ended June 30, 2019
Note 16: Natividad Medical Center - Net Patient Service Revenue (continued)
are designed to ensure a predictable Medicaid funding level and provide growth funding, the full financial impact of thesechanges in the future cannot be determined. While the new waiver is effective through December 31, 2020, there exists anuncertainty surrounding the continued receipt of waiver payments through the date.
In total, the Center estimated waiver payments of approximately $14.3 million for the year ended June 30, 2019.
In addition to the waiver, the Center received Delivery System Reform Incentive Payments ("DSRIP") payments. Under theMedi-Cal 2020 Waiver, DSRIP will be known as PRIME. Public hospitals may receive PRIME funds to improve thequality of care they provide and the health of the population they serve. PRIME funds can be used for infrastructuredevelopment, innovation and redesign, population-focused improvement, and urgent improvement in care. The Centerestimated $14.3 million for the year ended June 30, 2019, as part of California's Medi-Cal hospital waiver payments. Thesefunds are reported as other operating revenue, as they are considered reimbursement of costs for specific qualifyingexpenditures that must be approved by Department of Health Care Services ("DHCS"), rather than direct patient care.
The Center participates in the Medi-Cal Redesign Waiver Demonstration Program with the California Medical AssistanceCommission.
Managed Care Supplemental Funding
The Center is a State-Designated Disproportionate Share Hospital and, through its mission and population served, is eligibleto participate in state/federal Medicaid revenue enhancement waivers. Pursuant to Section 14164 of the Welfare andInstitutions Code, the County may transfer funds to the Department of Health Care Services (DHCS) to be used as theassessment fee and the non-federal share of Medi-Cal managed care capitation rate increased for the County OrganizedHealth System (COHS) administered by Central California Alliance for Health for the period of June 1, 2018, through July31, 2019. This mechanism, known as IGT, will allow DHCS to use these funds for draw down enhanced federal financialparticipation in the funding of the Medi-Cal program. The gross payment, less the IGT returned to the County and taxespaid by the COHS to the State, will be available to the Center as a rate supplement.
Hospital fee – The Center is also eligible for the California Hospital Fee Program (the "Program"), which, in November2009, was signed into California state law. The program establishes a series of Medicaid supplemental payments fundedthrough a "Quality Assurance Fee" and a "Hospital Fee Program," which are imposed on certain California hospitals. Theeffective date of the Hospital Fee Program is April 1, 2009, through December 31, 2010, and is predicated in part on theenhanced Federal Medicaid Assistance Percentage ("FMAP") contained in the American Reinvestment and Recovery Act("ARRA"). The Hospital Fee Program makes supplemental payments to hospitals for various health care services andsupports the State's effort to maintain health care coverage for children. The Center, as a designated public hospital, isexempt from paying the "Quality Assurance Fee"; however, the Center is eligible to receive supplemental payments underthe Hospital Fee Program. The Hospital Fee Program became effective in fiscal year 2011 after approval from the Centersfor Medicare and Medicaid Services ("CMS"). In November 2016, the hospital fee program and all of its statutoryprovisions and protections were made permanent through the passage of the Medi-Cal Funding and Accountability Act(Proposition 52). For Fiscal Year ending June 30, 2019, $2.5 million is included in net patient service revenue.
The Center also received under the Hospital Fee Program, a direct grant component payment of $3.6 million in 2019 fromDHCS.
The legislation states that the direct grants are in support of health care expenditures, which do not constitute Medi-Calpayments. Accordingly, these grants are considered as government-mandated non-exchange transactions according toGASB Statement No. 33, Accounting and Financial Reporting for non-exchange Transactions. Non-exchange transactionsfor GASB reporters are generally not reported as components of income from operations according to GASB StatementNo.34, Basic Financial Statements -and Management's Discussion and Analysis – for State and Local Governments. Assuch, GASB would require the grants to be recognized as non-operating grant and contribution revenue in the financialstatements.
The Center concludes that the payments received from Central California Alliance for Health are not contributions and areconsidered exchange transactions because the revenue is an augmentation of Medi-Cal reimbursement for patient servicesprovided and reduces the contractual adjustment of the specific payor category in the period the supplemental payment isrecognized.
79

COUNTY OF MONTEREYNotes to the Financial Statements
For the Fiscal Year Ended June 30, 2019
Note 16: Natividad Medical Center - Net Patient Service Revenue (continued)
Assembly Bill 915 – State of California Assembly Bill 915, Public Hospital Outpatient Services SupplementalReimbursement Program, provides for supplemental reimbursement equal to the federal share of unreimbursed facility costsincurred by public hospital outpatient departments. This supplemental payment covers only Medi-Cal fee-for-serviceoutpatient services. The supplemental payment is based on each eligible hospital's certified public expenditures ("CPE"),which are matched with federal Medicaid funds. For the year ended June 30, 2019, the Center recorded revenue of $3.6million, included in managed care and other funding.
Meaningful use of electronic health records
Under certain provisions of the American Recovery and Reinvestment Act of 2009 (“ARRA”), federal incentive paymentsare available to hospitals, physicians, and certain other professionals (“Providers”) when they adopt, implement or upgrade(“AIU”) certified health record (“EHR”) technology or become “meaningful users,” as defined under ARRA, of EHRtechnology in ways that demonstrate improved quality, safety, and effectiveness of care. Providers can become eligible forannual Medicare incentive payments by demonstrating meaningful use of EHR technology in each period over four periods.Medicaid providers can receive their initial incentive payment by satisfying AIU criteria, but must demonstrate meaningfuluse of EHR technology in subsequent years in order to qualify for additional payments.
Hospitals may be eligible for both Medicare and Medicaid EHR incentive payments; however, physicians and otherprofessionals may be eligible for either Medicare or Medicaid incentive payments, but not both. Hospitals that aremeaningful users under the Medicaid EHR incentive payment program are deemed meaningful users under the MedicaidEHR incentive payment program and do not need to meet additional criteria imposed by a state. Medicaid EHR incentivepayments to providers are 100 percent federally funded and administered by the states. CMS established calendar year 2011as the first year states could offer EHR incentive payments. Before a state may offer EHR incentive payments, the state mustsubmit and CMS must approve the state’s incentive plan.
Senate Bill (SB) 1732 – The Center participates in the SB 1732 program, which provides supplemental Medi-Calreimbursement to qualifying hospitals for a portion of their debt service on revenue bonds that were issued to financeconstruction or maintenance of a new facility. To qualify for SB 1732, the Center must be a State-DesignatedDisproportionate Share Hospital facility and be a Medi-Cal contracting hospital. The SB 1732 program reimbursementsreflect the Center's annual debt multiplied by a ratio of the Center's paid Medi-Cal patient days to total patient days. Sincethe funds received are supplemental Medi-Cal payments, the payments are applied against the Medi-Cal contractualallowance, increasing net patient service revenue. The Center recognized funding under this program, of approximately $4.7million for 2019.
Note 17: Related Party Transactions
Incorporated in 1988, the Natividad Medical Foundation (Foundation) is a non-profit, non-governmental organizationseparately incorporated from the Center. Recognizing the need for quality health care and decreased funding from theFederal, State, and local levels, community leaders accepted the responsibility of providing financial assistance to theCenter and developed the Natividad Medical Foundation.
The criteria established in GASB 39, Determining Whether Certain Organizations are Component Units, determineswhether the Foundation is reported as a component unit of the Center. Since the revenues reported by the Foundation are notsignificant to the Center, the Foundation is not a component unit of the Center, but is a related party.
As part of providing financial assistance to the Center, the Foundation is the administrator for the following contracts andgrants:
Family Residency Training Program (Song-Brown) – The Center has multiple contracts with the Office of Statewide HealthPlanning and Development through August 15, 2021, to provide training for family practice residents under the direction ofthe Director of Family Practice Residency Training Program within the Center. The Foundation serves as fiscaladministrator of the program and as such is entitled to 8% of awarded funds to cover administrative costs.
The Foundation manages the receipts and disbursements for the various programs. Remaining cash balance on hand oramounts due to the Foundation due to timing of transactions are reflected as due from (to) the Center. As administrator ofthe contracts and grants, for the calendar year ended December 31, 2019, the Foundation has recorded $20,517 of contractsand grant administration revenues.
80

COUNTY OF MONTEREYNotes to the Financial Statements
For the Fiscal Year Ended June 30, 2019
Note 17: Related Party Transactions (continued)
The following is a summary of the program transactions for the year ended December 31, 2019:
Contracts and grant receipts $ 379,575Disbursements 266,507Accounts payable included $12,054 due to the Center for payment of restricted funds.
The Foundation also has an agreement with the Center for January 1, 2008 through December 31, 2008 - extended throughDecember 31, 2019, to provide philanthropic services defined as “capital campaign planning and fundraising; communityoutreach in connection with fundraising, preparing and submitting foundation grant applications; administering current andfuture foundation grants; and supporting and coordinating NMC/NMF joint community relations" to philanthropicallysupport the capital needs at NMC.
Note 18: Insurance and Contingent Liabilities
The County is a certified State of California Self-Insured Public Entity. The County accounts for its risk financing activitiesusing General Liability (GL) and Workers' Compensation (WC) internal service funds (ISFs). The County accrues liabilitiesfor the ultimate cost of claims and expenses associated with GL-ISF and WC-ISF claims. The liabilities and claims costscharged back to the County departments are based upon results of annual actuarial reports prepared by Bickmore andAssociates, the County's actuary of record. Claim costs are based on, but not limited to: claim frequency and severity, claimloss value incurred but not reported, allocated loss adjustment expenses and unallocated loss adjustment expenses.
The County's Excess GL program is insured by "A Rated" insurance companies, providing coverage in excess of theCounty's self-insured retention (SIR). The County paid a total annual premium of $1,739,917 for Excess GL premiums. TheCounty's current GL claims - Third Party Administrator (TPA) is Intercare Holdings.
Additionally, Excess WC coverage is provided by the California State Association of Counties - Excess Insurance Authority(CSAC-EIA). CSAC is a joint powers authority, whose purpose is to develop and fund programs of excess insurance formember counties. The CSAC-EIA Board of Directors, consisting of representatives from member counties, provides forCSAC-EIA's structured governance. The County paid total annual excess WC premiums of $1,935,541. CSAC-EIA'sfinancial statements can be obtained at: CSAC-EIA, 3017 Gold Canal Drive, Rancho Cordova, CA 95670.
The County was previously insured via traditional domestic workers' compensation insurance (e.g., either through AIG orLiberty Mutual) during the period of July 1, 1996, through June 30, 2002. All pending claims, incurred/reported, prior toJuly 1, 1996, and subsequent to June 30, 2002, and all subsequent open pending claims remain part of the County's self-insured workers' compensation program. Currently, the WC claims are administered by the County's WC TPA, IntercareHoldings.
The County also participates in the CSAC "All Risk - Property Insurance Program". The County's "All Risk" deductible is$25,000, per occurrence. Primary coverage is provided by private insurance, excess of deductible, with limits of $25 millionper occurrence, and shared limits of $600 million (e.g., subject to policy coverage terms, applicable limits, sub-limits,endorsements and exclusions). The County currently insures over $1 billion in structural and contents (real property) valuesand has paid a total annual premium of $914,086. The property insurance program premiums are allocated to the Countydepartments based upon premium rate and square footage occupied.
Changes in the balance of claims liabilities during fiscal years 2018-19 and 2017-18 for all self-insurance risks areapproximately as follows:
2018-19 2017-18Unpaid claims, beginning of year $ 88,553,538 $ 80,310,789Estimated claims incurred 39,216,867 30,017,368Claim payments (35,169,600) (21,774,619)
Unpaid claims, end of year $ 92,600,805 $ 88,553,538
81

COUNTY OF MONTEREYNotes to the Financial Statements
For the Fiscal Year Ended June 30, 2019
Note 19: Stewardship, Compliance and Accountability
Deficit Fund Balances/Net Position
The General Liability internal service fund had deficit net position of $7,356,845 as of June 30, 2019. The County settledfor a $15,500,000 Notes Payable in fiscal year 2007-08 from its Lakes Resort which caused the deficit in the fund. The Noteamount with interest was approved to be paid in full by the County Board over 15 years. This fund experienced deficit sevenyears ago when the County was on a pay-as-you-go basis. The County approved a 5-year plan to fund the deficit in fiscalyear 2004-05. The original 5-year funding plan was successfully completed. The payment of the Lake Resorts’ liability iscorrecting the deficit, and the gradual recovery of prior losses will help correct the deficit.
The Park and Lake Resort enterprise fund has a deficit net position of $2,733,381 as of June 30, 2019. This fund wasconverted from a special revenue fund to an enterprise fund in fiscal year 2010-11. Due to the drought conditions inCalifornia and the insufficient fee structure, the fund has experienced the deficit. The County's General Fund has made asignificant contribution to this fund in fiscal year 2014, offsetting the entire annual net loss of the fund and reducing theprior year deficit. The General Fund intends to contribute in the future until the fund has stabilized.
Despite not having a deficit fund balance anymore, for two years now since fiscal year ended June 30, 2016, it is importantto provide this update on Road fund which ended the fiscal year with a positive fund balance of $17,552,103 as of June 30,2019. This is another outstanding year since it recovered from the negative fund balance of $2,707,005 in fiscal year endedJune 30, 2017. This year resulted to a net increase in fund balance of $7,398,475. This fund carries out public waysactivities of traffic engineering, project and community development, design, construction, and operation of county road,bridge, and utility infrastructure and receives state highway users tax and state and federal aid and grants.
The Office of Employment Training (OET) moved with the General fund beginning fiscal year 2018-2019. With thistransition, an operating transfer out from General fund for $264,139 closed OET's negative fund balance. OET's function isto provide comprehensive employment and training services to adult dislocated worker and youth participants and to assistjob seekers to find opportunities in the labor market, which are now under the County's Department of Social Services.
Fiscal year 2018-19 has resulted to a negative fund balance of $61,959 for In-Home Support Services fund. This fund isalso under non-major Special Revenue Funds, which handle programs that provide services to aged, blind and disabledresidents needing assistance in their homes. The deficit on this fund was due to the timing difference between the programexpenditures and the expected grant reimbursements. Anticipated aids to cover the expenses for public assistance were notreceived in the same fiscal year nor were they available within the 60-day availability period, so they were reclassified asunavailable revenue.
Note 20: Tax Abatements
The County provides tax abatements through the California Land Conservation Act, known commonly as the WilliamsonAct. The Williamson Act is a statewide program enacted in Monterey County in 1968 in which the owner enters into acontract with the County to maintain his land in agricultural production. In exchange the owner is eligible for a reduction ofhis taxable values. Contracts enacted in 1968 were for a term of ten years. Contracts after 1968 were for a term of 20 years.Contracts automatically renew each year unless the owner files a notice of non renew with the Board of Supervisors. Toqualify to enter into a contract the owner should have a minimum of 100 acres (40 acres of prime), and should have a grossagricultural income of $8,000 per year for three of the last five years. Owners may go together to create enough land toqualify. The compatible uses available are specified in the contract. The Farmland Security Zone became effective inMonterey County in 1998. This measure ensures that prime farmland will get an additional 35% reduction in taxable value.
For the fiscal year ended June 30, 2019, Williamson Act related tax abatements were approximately $8.7 million.
Note 21: Restatement of Net Position and Fund Balances
Adjustments resulting from errors or a change to comply with provisions of current accounting standards and financialreporting practices are treated as adjustments to prior periods. Accordingly, the County reports these changes asrestatements of beginning fund balance or net position.
A prior period adjustment was made to the governmental activities' beginning net position to reflect the capitalization of
82

COUNTY OF MONTEREYNotes to the Financial Statements
For the Fiscal Year Ended June 30, 2019
Note 21: Restatement of Net Position and Fund Balances (continued)
prior year costs for infrastructure and structures and improvements.
The impact of the restatements on the net position as previously reported is presented below:
Government-wide Financial Statements
GovernmentalActivities
Net position at July 1, 2018, as previously stated $ 631,359,222Adjustment to capitalize prior year costs in governmental funds 8,131,503
Net position at July 1, 2018, as restated $ 639,490,725
Note 22: Subsequent Events
The County evaluated subsequent events from July 1, 2019 through December 20, 2019, the date financial statements wereavailable to be issued. The following subsequent events were noted:
County of Monterey 2019 Certificates of Participation (Public Facilities Refinancing)
On December 11, 2019, the County issued 2019 Certificates of Participation (Public Facilities Refinancing) ("theCertificates") in the aggregate amount of $29,005,000. The Certificates are being issued to (i) refund all of the outstandingCertificates of Participation (2009 Refinancing Project) (the "2009 Certificates"), (ii) refund of all of the outstandingCertificates of Participation (2010 Refinancing Project) (the "2010 Certificates"), and (iii) pay the cost incurred inconnection with the issuance of the Certificates. The interest rate is 5% with the final maturity due on October 1, 2027.Interest on the Certificates is payable semiannually on April 1 and October 1 of each year, commencing April 2020.Principal payments will be paid on an annual basis through the maturity date.
Community Facilities District No. 2006-1 Special Tax Bonds (Series 2019 Bonds)
On November 14, 2019, Community Facilities District No. 2006-1 (East Garrison Project), East Garrison Public FinancingAuthority, County of Monterey, State of California ("the District") issued the Community Facilities District No. 2006-1(East Garrison Project), East Garrison Public Financing Authority, County of Monterey, State of California, Special TaxBonds, Series 2019 (the "Series 2019 Bonds") in the amount of $11,060,000. The Series 2019 Bonds are special obligationsof the District and are payable solely from revenues derived from certain annual Special Taxes to be levied on certaintaxable land within the District and from other funds pledged under the Indenture. The Series 2019 Bonds are being issuedin parity with the Community Facilities District No. 2006-1 (East Garrison Project), East Garrison Public FinancingAuthority, County of Monterey, State of California, Special Tax Bonds, Series 2016 (the "Series 2016 Bonds)", which aredescribed on Note 15.
The proceeds of the Series 2019 Bonds will be used to (i) finance certain public improvements; (ii) fund a reserve fund; and(iii) pay costs of issuing the Series 2019 Bonds. The Series 2019 Bonds have a maturity date of September 1, 2049. Neitherthe full faith and credit nor the taxing power of the County is pledged to the payment of the Series 2019 Bonds.Accordingly, such obligations are not included in the accompanying basic financial statements.
83

This page intentionally left blank

REQUIRED SUPPLEMENTARY INFORMATION

This page intentionally left blank

COUNTY OF MONTEREYRequired Supplementary Information
For the Fiscal Year Ended June 30, 2019
SCHEDULE OF CHANGES IN NET OPEB LIABILITY AND RELATED RATIOSLast Ten Fiscal Years*
2019 2018Total OPEB Liability
Service Cost $ 3,306,508 $ 3,210,000Interest 4,689,517 4,348,000Changes of Benefit Terms - -Difference Between Expected and Actual Experience - -Changes of Assumptions - -Benefit Payments, Including Refunds of Employee Contributions (2,726,371) (2,453,000)Net Change in Total OPEB Liability 5,269,654 5,105,000Total OPEB Liability - Beginning 67,531,000 62,426,000Total OPEB Liability - Ending (a) $ 72,800,654 $ 67,531,000
Plan Fiduciary Net PositionContributions - Employer 6,972,371 5,073,000Contributions - Employee - -Net Investment Income 2,217,043 2,387,000Benefit Payments, Including Refunds of Employee Contributions (2,726,371) (2,453,000)Other Changes in Fiduciary Net Position (51,260) (12,000)Net Change in Fiduciary Net Position 6,411,783 4,995,000Plan Fiduciary Net Position - Beginning 27,606,000 22,611,000Plan Fiduciary Net Position - Ending (b) $ 34,017,783 $ 27,606,000
Plan Net OPEB Liability/(Asset) - Ending (a) - (b) $ 38,782,871 $ 39,925,000Plan Fiduciary Net Position as a Percentage of the Total OPEB
Liability %46.00 %40.88Covered-Employee Payroll** $399,446,000 $330,588,000Plan Net OPEB Liability/(Asset) as a Percentage of Covered-
Employee Payroll %9.00 %12.08
* This schedule is intended to show information for ten years. Additional years will be displayed as they become available.
** Determined for the twelve-month period ending on June 30, 2018 (Measurement Date).
84

COUNTY OF MONTEREYRequired Supplementary Information
For the Fiscal Year Ended June 30, 2019
SCHEDULE OF OPEB CONTRIBUTIONSLast Ten Fiscal years*
2019 2018
Actuarially Determined Contribution $ 7,620,000 $ 7,165,000Contributions in Relation to the Actuarially Determined
Contribution 7,303,971 6,972,000Contribution Deficiency (Excess) $ 316,029 $ 193,000Covered-Employee Payroll** $416,335,728 $399,446,000Contribution as a Percentage of Covered-Employee Payroll %1.80 %2.00
* This schedule is intended to show information for ten years. Additional years will be displayed as they become available
** Determined for the twelve-month period ending on June 30, 2019 (fiscal year end).
Notes to Schedule
The actuarial methods and assumptions used to set the actuarially determined contributions for Fiscal Year 2017-18 werefrom the June 30, 2017 valuation date.
Actuarial cost method Entry age normal, Level percentage payroll
Amortization method Level percentage payroll
Remaining amortization period Approximately 16 years remaining as of June 30, 2017
Asset valuation method Investment gains and losses spread over a five-year rolling period
Discount rate 7.25%
General inflation 3.00%
Medical trend Non-medicare (7%), decreasing to an ultimate rate of 5.0% in 2021 and later years. Medicare (7.2%) decreasing to an ultimate rate of 5.0% in 2021 and later years.
Mortality improvement Mortality projected fully generational with Scale MP-2014 modified to converge to ultimate rates in 2022
85

COUNTY OF MONTEREYRequired Supplementary Information
For the Fiscal Year Ended June 30, 2019
Schedule of Changes in Net Pension Liability and Related RatiosLast Ten Fiscal Years*
Miscellaneous Plan
2018 2017 2016 2015 2014
Total pension liabilityService cost 50,511,029 48,599,853 41,097,374 38,758,180 37,919,451Interest on total pension liability 122,660,308 116,595,855 110,554,592 104,227,023 98,401,770Charges of benefit terms - - - - -Changes of assumptions (9,939,254) 98,334,006 - (25,708,249) -Difference between expected and actual experience 85,675 (1,897,655) 3,021,512 (5,164,441) -Benefit payments, including refunds of employee
contributions (74,721,030) (68,551,573) (63,987,386) (59,645,438) (54,905,897)Change in employer's proportionate share 156,095 (16,871) 4,560,083 - -
Net change in total pension liability 88,752,823 193,063,615 95,246,175 52,467,075 81,415,324
Total pension liability - beginning 1,737,331,266 1,544,267,651 1,449,021,476 1,396,554,401 1,315,139,077
Total pension liability - ending (a) 1,826,084,089 1,737,331,266 1,544,267,651 1,449,021,476 1,396,554,401
Plan fiduciary net pensionContributions - employees 22,323,442 21,055,994 20,475,011 19,027,910 18,329,326Contributions - employer 42,227,433 40,333,457 37,466,772 31,775,780 27,839,162Net Investment Income 111,633,416 133,502,263 6,337,893 26,539,331 175,983,207Benefit payments, including refunds of employee
contributions (74,721,030) (68,551,573) (63,987,386) (59,645,438) (54,905,897)Administrative expense (2,061,884) (1,769,495) 730,695 1,352,697 -Plan to plan resource movement (3,284) 177 (492) (466,265) -Other miscellaneous income/(expense)1 (3,915,553) - - - -Change in employer's proportionate share 118,875 (13,094) (3,500,759) - -
Net change in plan fiduciary net position 95,601,415 124,557,729 3,061,862 15,878,621 167,245,798
Plan fiduciary net position - beginning2 1,323,064,712 1,198,506,983 1,195,445,121 1,179,566,500 1,012,320,702
Plan fiduciary net position - ending (b) 1,418,666,127 1,323,064,712 1,198,506,983 1,195,445,121 1,179,566,500
Net pension liability - ending (a) - (b) 407,417,962 414,266,554 345,760,668 253,576,355 216,987,901
Plan fiduciary net position as a percentage of the totalpension liability %77.69 %76.16 %77.61 %82.50 %84.46
Covered payroll 319,646,331 311,248,370 292,258,379 269,289,126 259,499,676Net pension liability as a percentage of covered payroll %127.46 %133.10 %118.31 %94.17 %83.62
1) During Fiscal Year 2017-18, as a result of Governmental Accounting Standards Board Statement (GASB) No. 75,Accounting and Financial Reporting for Postemployment Benefit Plans Other than Pensions (GASB 75), CalPERSreported its proportionate share of activity related to postemployment benefits for participation in the State ofCalifornia's agent OPEB plan. Accordingly, CalPERS recorded a one-time expense as a result of the adoption ofGASB 75.
Additionally, CalPERS employees participate in various State of California agent pension plans and during Fiscal Year2017-18, CalPERS recorded a correction to previously reported financial statements to properly reflect itsproportionate share of activity related to pensions in accordance with GASB Statement No. 68, Accounting andFinancial Reporting for Pensions (GASB 68).
2) Includes any beginning year of adjustment.
86

COUNTY OF MONTEREYRequired Supplementary Information
For the Fiscal Year Ended June 30, 2019
Schedule of Changes in Net Pension Liability and Related RatiosLast Ten Fiscal Years
Miscellaneous Plan
Notes to Schedule:Benefit Changes: The figures above do not include any liability impact that may have resulted from plan changes whichoccurred after June 30, 2017 valuation date. This applies for voluntary benefit changes as well as any offers of Two YearsAdditional Service Credit (a.k.a. Golden Handshakes).
Changes of Assumptions: In 2018, demographic assumptions and inflation rate were changed in accordance to theCalPERS Experience Study and Review of Actuarial Assumptions December 2017. There were no changes in the discountrate. In 2017, the discount rate was reduced from 7.65 percent to 7.15 percent. In 2016, there were no changes. In 2015,amounts reported reflect an adjustment of the discount rate from 7.5 percent (net of administrative expense) to 7.65 percent(without a reduction for pension plan administrative expense.) In 2014, amounts reported were based on the 7.5 percentdiscount rate.
* This schedule is intended to show information for ten years. Additional years will be displayed as they become available.
87

COUNTY OF MONTEREYRequired Supplementary Information
For the Fiscal Year Ended June 30, 2019
Schedule of Changes in Net Pension Liability and Related RatiosLast Ten Fiscal Years*
Safety Plan
2018 2017 2016 2015 2014
Total pension liabilityService cost 14,949,233 14,648,978 13,120,502 12,994,101 12,851,917Interest on total pension liability 46,316,764 43,913,660 42,184,786 40,037,212 37,995,536Charge of benefit terms - - - - -Changes of assumptions (3,444,367) 38,100,026 - (10,182,750) -Differences between expected and actual experience 6,304,456 (5,484,464) (1,088,628) (1,418,672) -Benefit payments, including refunds of employee contributions (28,810,424) (27,115,598) (24,770,649) (23,095,395) (22,028,663)
Net change in total pension liability 35,315,662 64,062,602 29,446,011 18,334,496 28,818,790
Total pension liability - beginning 651,857,419 587,794,817 558,348,806 540,014,310 511,195,520
Total pension liability - ending (a) 687,173,081 651,857,419 587,794,817 558,348,806 540,014,310
Plan fiduciary net pensionContributions - employer 18,792,681 16,846,914 15,456,197 14,143,949 14,444,054Contributions - employee 5,017,206 4,697,110 4,714,002 (4,623,587) (4,670,204)Net investment income 36,255,035 43,510,662 2,016,611 (8,668,988) (58,212,266)Benefit payments, including refunds of employee contributions (28,810,424) (27,115,598) (24,770,649) (23,095,395) (22,028,663)Administrative expense (669,852) (579,512) 240,935 444,425 -Plan to plan resource movement (1,066) (184) - 483,447 -Other miscellaneous income/(expense)1 (1,272,060) - - - -
Net change in plan fiduciary net position 29,311,520 37,359,392 (2,824,774) 4,380,151 55,297,861
Plan fiduciary net position - beginning2 429,867,373 392,507,981 395,332,755 390,952,604 335,654,743
Plan fiduciary net position - ending (b) 459,178,893 429,867,373 392,507,981 395,332,755 390,952,604
Net pension liability - ending (a) - (b) 227,994,188 221,990,046 195,286,836 163,016,051 149,061,706
Plan fiduciary net position as a percentage of the total pensionliability %66.82 %65.94 %66.78 %70.80 %72.40
Covered payroll 53,292,119 50,658,579 52,065,484 50,805,839 48,098,494Net Pension Liability as a percentage of covered payroll %427.82 %438.21 %375.08 %320.86 %309.91
1) During Fiscal Year 2017-18, as a result of Governmental Accounting Standards Board Statement (GASB) No. 75,Accounting and Financial Reporting for Postemployment Benefit Plans Other than Pensions (GASB 75), CalPERSreported its proportionate share of activity related to postemployment benefits for participation in the State ofCalifornia's agent OPEB plan. Accordingly, CalPERS recorded a one-time expense as a result of the adoption ofGASB 75.
Additionally, CalPERS employees participate in various State of California agent pension plans and during Fiscal Year2017-18, CalPERS recorded a correction to previously reported financial statements to properly reflect itsproportionate share of activity related to pensions in accordance with GASB Statement No. 68, Accounting andFinancial Reporting for Pensions (GASB 68).
2) Includes any beginning year of adjustment.
88

COUNTY OF MONTEREYRequired Supplementary Information
For the Fiscal Year Ended June 30, 2019
Schedule of Changes in Net Pension Liability and Related RatiosLast Ten Fiscal Years
Safety Plan
Notes to Schedule:Benefit Changes: The figures above do not include any liability impact that may have resulted from plan changes whichoccurred after June 30, 2017 valuation date. This applies for voluntary benefit changes as well as any offers of Two YearsAdditional Service Credit (a.k.a. Golden Handshakes).
Changes of Assumptions: In 2018, demographic assumptions and inflation rate were changed in accordance to theCalPERS Experience Study and Review of Actuarial Assumptions December 2017. There were no changes in the discountrate. In 2017, the discount rate was reduced from 7.65 percent to 7.15 percent. In 2016, there were no changes. In 2015,amounts reported reflect an adjustment of the discount rate from 7.5 percent (net of administrative expense) to 7.65 percent(without a reduction for pension plan administrative expense.) In 2014, amounts reported were based on the 7.5 percentdiscount rate.
*This schedule is intended to show information for ten years. Additional years will be displayed as they become available.
89

COUNTY OF MONTEREYRequired Supplementary Information
For the Fiscal Year Ended June 30, 2019
Schedule of the Proportionate Share of the Net Pension LiabilityLast Ten Fiscal Years*
MCWRA
2018 2017 2016 2015 2014MCWRA's proportion of the net pension liability/(asset) %0.19 %0.19 %0.19 %0.18 %0.08MCWRA's proportionate share of net pension liability/(asset) 7,647,407 7,795,865 6,675,070 5,054,398 4,856,853MCWRA's covered payroll 2,861,315 2,861,315 3,169,019 3,447,710 3,537,912MCWRA's proportionate share of the net pension liability/(asset) as a
percentage of covered payroll %267.27 %272.46 %210.64 %146.60 %137.28MCWRA's proportionate share of the fiduciary net position as a percentage of
the plan's total pension liability %76.30 %74.95 %76.11 %80.92 %81.36
Note to Schedule:Change in Benefit Terms: There were no changes to benefit terms that applied to all members of the Public Agency Pool.
Change in Assumptions: In 2018, demographic assumptions and inflation rate were changed in accordance to the CalPERSExperience Study and Review of Actuarial Assumptions December 2017. There were no changes in the discount rate.
*Amounts presented above were determined as of June 30. Historical information is required only for measurementperiods for which GASB Statement No. 68 is applicable. This schedule is presented to illustrate the requirement to showinformation for 10 years. However, until a full 10-year trend is compiled, the information will be presented for those yearsfor which information is available.
90

COUNTY OF MONTEREYRequired Supplementary Information
For the Fiscal Year Ended June 30, 2019
Schedule of Pension ContributionsLast Ten Fiscal Years*
Miscellaneous Plan
2019 2018 2017 2016 2015 2014Actuarially determined contribution 49,477,120 42,179,163 39,474,883 37,466,772 31,775,780 27,839,162Contributions in relation to the actuarially
determined contribution (49,821,403) (43,928,804) (40,556,395) (37,891,199) (32,301,171) (27,839,162)
Contribution deficiency (excess) (344,283) (1,749,641) (1,081,512) (424,427) (525,391) -
Covered payroll** 334,031,327 319,646,331 311,248,370 292,258,379 269,289,126 259,499,676Contribution as a percentage of covered
payroll %14.92 %13.74 %13.03 %12.96 %11.80 %10.73
Notes to Schedule:
* Amounts presented above were determined as of June 30. Historical information is required only for measurementperiods for which GASB Statement No. 68 is applicable. This schedule is presented to illustrate the requirement to showinformation for 10 years. However, until a full 10-year trend is compiled, the information will be presented for thoseyears for which information is available.
** Covered payroll represents compensation on which contributions to a pension plan are based in accordance with GASBStatement No. 82, Pension Issues - An Amendment of GASB Statements No. 67, No. 68, and No. 73.
91

COUNTY OF MONTEREYRequired Supplementary Information
For the Fiscal Year Ended June 30, 2019
Schedule of Pension ContributionsLast Ten Fiscal Years*
Safety Plan
2019 2018 2017 2016 2015 2014Actuarially determined contribution 21,859,497 19,467,968 17,955,292 15,456,197 14,143,949 14,444,054Contributions in relation to the actuarially
determined contribution (20,669,311) (17,488,488) (15,533,142) (14,051,250) (12,545,370) (14,444,054)
Contribution deficiency (excess) 1,190,186 1,979,480 2,422,150 1,404,947 1,598,579 -
Covered payroll** 55,585,077 53,292,119 50,658,579 52,065,484 50,812,684 48,098,494Contribution as a percentage of covered
payroll %37.19 %32.82 %30.66 %26.99 %24.69 %30.03
Notes to Schedule:
* Amounts presented above were determined as of June 30. Historical information is required only for measurementperiods for which GASB Statement No. 68 is applicable. This schedule is presented to illustrate the requirement to showinformation for 10 years. However, until a full 10-year trend is compiled, the information will be presented for thoseyears for which information is available.
** Covered payroll represents compensation on which contributions to a pension plan are based in accordance with GASBStatement No. 82, Pension Issues - An Amendment of GASB Statements No. 67, No. 68, and No. 73.
92

COUNTY OF MONTEREYRequired Supplementary Information
For the Fiscal Year Ended June 30, 2019
Schedule of Pension ContributionsLast Ten Fiscal Years*
MCWRA Plan2019 2018 2017 2016 2015 2014
Actuarially determined required contribution 752,092 627,396 595,671 498,177 390,160 367,067Contributions in relation to the actually
required contribution (566,399) (522,172) (561,727) (520,964) (394,424) (367,067)
Contribution deficiency (excess) 185,693 105,224 33,944 (22,787) (4,264) -
Covered payroll** 2,788,104 2,861,315 3,282,276 3,169,019 3,447,710 3,537,912Contribution as a percentage of covered
payroll %20.31 %18.25 %17.11 %16.44 %11.44 %10.38
Notes to Schedule:* Amounts presented above were determined as of June 30. Historical information is required only for measurement
periods for which GASB Statement No. 68 is applicable. This schedule is presented to illustrate the requirement to showinformation for 10 years. However, until a full 10-year trend is compiled, the information will be presented for thoseyears for which information is available.
** Covered payroll represents compensation on which contributions to a pension plan are based in accordance with GASBStatement No. 82, Pension Issues - An Amendment of GASB Statements No. 67, No. 68, and No. 73.
93

SUPPLEMENTARY INFORMATION

This page intentionally left blank

Combining Balance SheetNonmajor Governmental Funds
June 30, 2019
SpecialRevenue Debt Service
CapitalProjects Total
AssetsCash and investments:
Held in County Treasury $ 87,912,669 $ 1,877,746 $ 9,879,335 $ 99,669,750Held with trustee 1,122,479 33,613 - 1,156,092Imprest cash 1,800 - - 1,800
Receivables 24,748,989 1,331 596,665 25,346,985Due from other funds 83,748 - - 83,748Notes receivables 20,775,014 - 14,950 20,789,964
Total assets $ 134,644,699 $ 1,912,690 $ 10,490,950 $ 147,048,339
LiabilitiesVouchers and accounts payable $ 1,721,259 $ - $ 582,442 $ 2,303,701Accrued salaries and benefits 336,611 - - 336,611Due to other funds 83,748 - - 83,748Deposits from others 254,255 - 108,796 363,051Unearned revenues 18,756 - 22,146 40,902
Total liabilities 2,414,629 - 713,384 3,128,013
Deferred inflows of resourcesUnavailable revenue 5,273,277 552 163,063 5,436,892
Total deferred inflows of resources 5,273,277 552 163,063 5,436,892
Fund balancesRestricted 85,994,923 1,059,329 68,560 87,122,812Committed 7,214,664 - - 7,214,664Assigned 33,809,165 852,809 9,545,943 44,207,917Unassigned (61,959) - - (61,959)
Total fund balances 126,956,793 1,912,138 9,614,503 138,483,434Total liabilities, deferred inflows of resources
and fund balances $ 134,644,699 $ 1,912,690 $ 10,490,950 $ 147,048,339
94

COUNTY OF MONTEREYCombining Statement of Revenues, Expenditures and Changes in Fund Balances
Nonmajor Governmental FundsFor the Fiscal Year Ended June 30, 2019
SpecialRevenue Debt Service
CapitalProjects Total
Revenues:Taxes $ 13,856,873 $ - $ - $ 13,856,873Licenses, permits, and franchises 35,402 - - 35,402Fines, forfeitures, and penalties 843,157 - - 843,157Revenue from use of money and property 1,919,105 1,569,573 174,983 3,663,661Aid from other governmental agencies 136,577,812 - 2,083,303 138,661,115Charges for services 20,233,819 13,681 125,870 20,373,370Miscellaneous revenues 598,698 - 296,487 895,185
Total revenues 174,064,866 1,583,254 2,680,643 178,328,763
Expenditures:Current:
General government 959,509 - - 959,509Public protection 15,938,282 - - 15,938,282Public ways and facilities 731,131 - - 731,131Health and sanitation 3,868,631 - - 3,868,631Public assistance 7,602,284 - - 7,602,284Education 9,159,524 - - 9,159,524
Debt service:Principal - 9,388,511 - 9,388,511Interest and debt service costs - 8,293,393 - 8,293,393
Capital outlay - - 6,917,517 6,917,517Total expenditures 38,259,361 17,681,904 6,917,517 62,858,782
Excess (deficiency) of revenues over (under)expenditures 135,805,505 (16,098,650) (4,236,874) 115,469,981
Other financing sources (uses):Transfers in 5,158,081 13,846,599 3,279,360 22,284,040Transfers out (134,827,638) (203,210) (373,064) (135,403,912)Issuance of debt - 22,890,000 - 22,890,000Premium on debt issuance - 3,690,065 - 3,690,065Debt Defeasance - (25,531,628) - (25,531,628)Sale of capital assets 5,045 - - 5,045
Total other financing sources (uses) (129,664,512) 14,691,826 2,906,296 (112,066,390)
Net change in fund balances 6,140,993 (1,406,824) (1,330,578) 3,403,591Fund balances, beginning of year, as restated 120,815,800 3,318,962 10,945,081 135,079,843Fund balances, end of year $ 126,956,793 $ 1,912,138 $ 9,614,503 $ 138,483,434
95

SPECIAL REVENUE FUNDS
Special revenue funds are used to account for the proceeds of specific revenue sources (other thanexpendable trusts or major capital projects) that are legally restricted to expenditures for specifiedpurposes.

SPECIAL REVENUE FUNDS
County Library – Established as a special taxing authority under the County Library Law of 1911 and, as such, is fundedprimarily through its own share of property tax to provide library services to residents of Monterey County.
In-Home Support Services – Program to provide services to aged, blind and disabled persons who are unable to remain intheir homes without assistance.
Fish and Game Propagation – Administration of the County’s Fish and Game Commission, which consists of fifteenmembers, three from each supervisorial district to oversee allocation of fish and game fine monies.
WIB-OET – In 2016, Office of Employment Training and Workforce Investment Board were combined as WIB-OET,whose functions focus on the design, implementation and oversight of youth and adult employment training services. Thisfund receives federal funds to support its programs.
Community Action Partnership – Administration of the Community Services Block Grant for provision of specifiedprograms to advance and advocate for the low-income population.
Inclusionary Housing – To facilitate the development of lower income housing throughout Monterey County through eitherdirect grants or low interest rate loans.
Community Development - Created for a variety of economic development activities including loans made to businesses andindividuals.
Homeland Security Grant – Created to separate the grant funds activities from operational expenditures of the Office ofEmergency Services (OES).
Health & Welfare Realignment – Administers the state realignment funding of sales tax revenue, vehicle license fees and theCounty’s maintenance of efforts for health and social services programs.
NGEN Operations & Maintenance – This fund provides for the operations and maintenance cost of NGEN equipment.
Emergency Medical Services – Established at the beginning of 1989 to provide for the collection and distribution of fineproceeds authorized by the California State Legislature’s adoption of Senate Bill 612.
Local Revenue Fund – Pursuant to AB 118, this fund was created to receive sales tax revenue and vehicle license feerealignment funds.
Nacimiento Hydroelectric Operations – Responsible for the management of Nacimiento hydroelectric operations inMonterey County.
Workforce Development Board – Facilitates the coordination between the public and private sector in focusing resources toeffectively educate, train and place individuals with the necessary resources and skill-set to meet employer demands.
East Garrison Community Services District (CSD) – Facilitates the collection and disbursement of funds for designatedservices provided in the East Garrison project. County and District services include security patrol operations, streetmaintenance, drainage maintenance and park or open space maintenance, and administration.
Other Water Resources Agencies – Responsible for the management of groundwater resources and flood control protectionin Monterey County.
County Service Areas – Provide a variety of services to the unincorporated developments within the County including stormdrain and surface water disposal, street and sidewalk maintenance, street lighting, wastewater reclamation and open spacemaintenance.
Sanitation Districts – Administers and maintains four sanitation districts, operating costs are funded with user fees andproperty taxes.
Housing Successor Fund – Includes the set aside fund of the former Redevelopment Agency of the County of Monterey fortax increment revenues set aside for low to moderate income housing projects. Redevelopment Agency was dissolved underAB 1X26 as of February 1, 2012 and the fund is now administered by the County acting as a housing successor.
96

COUNTY OF MONTEREYCombining Balance Sheet
Special RevenueJune 30, 2019
Library Fund
In-HomeSupportServices
Fish & GamePropagation
Fund OET
Assets
Cash and investments:Held in County Treasury $ 2,054,861 $ 267 $ 37,076 $ -Held with trustee - - - -Imprest cash 1,700 - - -
Receivables 206,417 299,669 - -Due from other funds - - - -Notes receivables - - - -
Total assets $ 2,262,978 $ 299,936 $ 37,076 $ -
LiabilitiesVouchers and accounts payable $ 134,056 $ 8,162 $ - $ -Accrued salaries and benefits 72,663 24,064 - -Due to other funds - 30,000 - -Deposits from others - - - -Unearned revenues - - - -
Total liabilities 206,719 62,226 - -
Deferred inflows of resourcesUnavailable revenue 182,188 299,669 - -
Fund balancesRestricted - - - -Committed - - - -Assigned 1,874,071 - 37,076 -Unassigned - (61,959) - -
Total fund balances 1,874,071 (61,959) 37,076 -Total liabilities, deferred inflows of
resources and fund balances $ 2,262,978 $ 299,936 $ 37,076 $ -
continued97

COUNTY OF MONTEREYCombining Balance Sheet
Special RevenueJune 30, 2019
CommunityAction
PartnershipInclusionary
HousingCommunity
DevelopmentHomeland
Security Grant
Assets
Cash and investments:Held in County Treasury $ 225,765 $ 729,384 $ 1,620,481 $ 284,798Held with trustee - - 1,122,479 -Imprest cash - - - -
Receivables 94,109 4,168 2,411,118 147,221Due from other funds - - 53,748 -Notes receivables - 376,507 13,292,081 -
Total assets $ 319,874 $ 1,110,059 $ 18,499,907 $ 432,019
LiabilitiesVouchers and accounts payable $ 69,052 $ 317 $ 323,139 $ 47,092Accrued salaries and benefits - - - 52,167Due to other funds - - - -Deposits from others - - - -Unearned revenues - - - 2,531
Total liabilities 69,052 317 323,139 101,790
Deferred inflows of resourcesUnavailable revenue - 211 2,114,033 9,431
Fund balancesRestricted 238,457 - 13,292,081 320,798Committed - 469,897 - -Assigned 12,365 639,634 2,770,654 -Unassigned - - - -
Total fund balances 250,822 1,109,531 16,062,735 320,798Total liabilities, deferred inflows of
resources and fund balances $ 319,874 $ 1,110,059 $ 18,499,907 $ 432,019
continued98

COUNTY OF MONTEREYCombining Balance Sheet
Special RevenueJune 30, 2019
H&WRealignment
NGEN Operations& Maintenance
EmergencyMedical Service
Fund
Assets
Cash and investments:Held in County Treasury $ 23,766,813 $ 269,559 $ 1,686,064Held with trustee - - -Imprest cash - - -
Receivables 8,602,713 8,677 11,664Due from other funds 30,000 - -Notes receivables - - -
Total assets $ 32,399,526 $ 278,236 $ 1,697,728
LiabilitiesVouchers and accounts payable $ - $ - $ 135,393Accrued salaries and benefits - - -Due to other funds - - -Deposits from others - - -Unearned revenues - - -
Total liabilities - - 135,393
Deferred inflows of resourcesUnavailable revenue - - 11,615
Fund balancesRestricted 32,399,526 - 1,343,435Committed - 248,218 -Assigned - 30,018 207,285Unassigned - - -
Total fund balances 32,399,526 278,236 1,550,720Total liabilities, deferred inflows of
resources and fund balances $ 32,399,526 $ 278,236 $ 1,697,728
continued99

COUNTY OF MONTEREYCombining Balance Sheet
Special RevenueJune 30, 2019
Local RevenueFund 2011
WorkforceDevelopment
Board
E. GarrisonCommunity
Services District
Assets
Cash and investments:Held in County Treasury $ 21,062,234 $ 39,676 $ 2,766,584Held with trustee - - -Imprest cash - - -
Receivables 8,950,977 635,956 5,720Due from other funds - - -Notes receivables - - -
Total assets $ 30,013,211 $ 675,632 $ 2,772,304
LiabilitiesVouchers and accounts payable $ - $ 190,627 $ 7,768Accrued salaries and benefits - 11,822 -Due to other funds - 53,748 -Deposits from others - - -Unearned revenues - 625 -
Total liabilities - 256,822 7,768
Deferred inflows of resourcesUnavailable revenue - 111,975 3,100
Fund balancesRestricted 30,013,211 - -Committed - - 2,673,729Assigned - 306,835 87,707Unassigned - - -
Total fund balances 30,013,211 306,835 2,761,436Total liabilities, deferred inflows of
resources and fund balances $ 30,013,211 $ 675,632 $ 2,772,304
continued100

COUNTY OF MONTEREYCombining Balance Sheet
Special RevenueJune 30, 2019
Agencies Under Board of SupervisorsNacimiento
HydroelectricOperations
Other WaterResourcesAgencies
County ServiceAreas
Assets
Cash and investments:Held in County Treasury $ 1,493,339 $ 18,372,862 $ 10,951,321Held with trustee - - -Imprest cash - 100 -
Receivables 503,728 1,519,396 81,306Due from other funds - - -Notes receivables - - -
Total assets $ 1,997,067 $ 19,892,358 $ 11,032,627
LiabilitiesVouchers and accounts payable $ 67,495 $ 337,460 $ 163,043Accrued salaries and benefits 3,801 135,383 -Due to other funds - - -Deposits from others - 254,255 -Unearned revenues - 15,600 -
Total liabilities 71,296 742,698 163,043
Deferred inflows of resourcesUnavailable revenue 422,798 928,130 53,792
Fund balancesRestricted - - -Committed 1,038,585 2,116,028 668,207Assigned 464,388 16,105,502 10,147,585Unassigned - - -
Total fund balances 1,502,973 18,221,530 10,815,792Total liabilities, deferred inflows of
resources and fund balances $ 1,997,067 $ 19,892,358 $ 11,032,627
continued101

COUNTY OF MONTEREYCombining Balance Sheet
Special RevenueJune 30, 2019
Agencies Under Board of Supervisors
SanitationDistricts
HousingSuccessor Total
Assets
Cash and investments:Held in County Treasury $ 1,221,320 $ 1,330,265 $ 87,912,669Held with trustee - - 1,122,479Imprest cash - - 1,800
Receivables 138,800 1,127,350 24,748,989Due from other funds - - 83,748Notes receivables - 7,106,426 20,775,014
Total assets $ 1,360,120 $ 9,564,041 $ 134,644,699
LiabilitiesVouchers and accounts payable $ 188,379 $ 49,276 $ 1,721,259Accrued salaries and benefits 36,711 - 336,611Due to other funds - - 83,748Deposits from others - - 254,255Unearned revenues - - 18,756
Total liabilities 225,090 49,276 2,414,629
Deferred inflows of resourcesUnavailable revenue 8,985 1,127,350 5,273,277
Fund balancesRestricted - 8,387,415 85,994,923Committed - - 7,214,664Assigned 1,126,045 - 33,809,165Unassigned - - (61,959)
Total fund balances 1,126,045 8,387,415 126,956,793Total liabilities, deferred inflows of
resources and fund balances $ 1,360,120 $ 9,564,041 $ 134,644,699
102

COUNTY OF MONTEREYCombining Statement of Revenues, Expenditures and Changes in Fund Balances
Special RevenueFor the Fiscal Year Ended June 30, 2019
Library Fund
In-HomeSupportServices
Fish & GamePropagation
Fund OET
Revenues:Taxes $ 8,769,584 $ - $ - $ -Licenses, permits, and franchises - - - -Fines, forfeitures, and penalties - - 15,411 -Revenue from use of money and property 29,740 (607) 967 -Aid from other governmental agencies 207,416 313,579 - -Charges for services 133,557 - - -Miscellaneous revenues 381,626 398 - -
Total revenues 9,521,923 313,370 16,378 -
Expenditures:Current:
General government - - - -Public protection - - 33,074 -Public ways and facilities - - - -Health and sanitation - - - -Public assistance - 737,310 - -Education 9,159,524 - - -
Total expenditures 9,159,524 737,310 33,074 -Excess (deficiency) of revenues over (under)
expenditures 362,399 (423,940) (16,696) -
Other financing sources (uses):Transfers in 499,786 182,224 10,500 264,139Transfers out - - - -Sale of capital assets - - - -
Total other financing sources (uses) 499,786 182,224 10,500 264,139
Net change in fund balances 862,185 (241,716) (6,196) 264,139Fund balances, beginning of year, as restated 1,011,886 179,757 43,272 (264,139)Fund balances, end of year $ 1,874,071 $ (61,959) $ 37,076 $ -
continued103

COUNTY OF MONTEREYCombining Statement of Revenues, Expenditures and Changes in Fund Balances
Special RevenueFor the Fiscal Year Ended June 30, 2019
CommunityAction
PartnershipInclusionary
HousingCommunity
DevelopmentHomeland
Security Grant
Revenues:Taxes $ - $ - $ - $ -Licenses, permits, and franchises - - - -Fines, forfeitures, and penalties - - - -Revenue from use of money and property 858 23,027 255,097 3,618Aid from other governmental agencies 528,978 - 473,432 677,692Charges for services - 3,815 - -Miscellaneous revenues - - 54,122 -
Total revenues 529,836 26,842 782,651 681,310
Expenditures:Current:
General government - 254,315 - -Public protection - - - 562,853Public ways and facilities - - - -Health and sanitation - - - -Public assistance 449,099 - 1,113,696 -Education - - - -
Total expenditures 449,099 254,315 1,113,696 562,853Excess (deficiency) of revenues over (under)
expenditures 80,737 (227,473) (331,045) 118,457
Other financing sources (uses):Transfers in 415 - - -Transfers out - - - -Sale of capital assets - - - -
Total other financing sources (uses) 415 - - -
Net change in fund balances 81,152 (227,473) (331,045) 118,457Fund balances, beginning of year, as restated 169,671 1,337,003 16,393,780 202,341Fund balances, end of year $ 250,823 $ 1,109,530 $ 16,062,735 $ 320,798
continued104

COUNTY OF MONTEREYCombining Statement of Revenues, Expenditures and Changes in Fund Balances
Special RevenueFor the Fiscal Year Ended June 30, 2019
H & WRealignment
NGEN Operations& Maintenance
EmergencyMedical Service
Fund
Revenues:Taxes $ - $ - $ -Licenses, permits, and franchises - - -Fines, forfeitures, and penalties - - 827,746Revenue from use of money and property - 34,878 32,432Aid from other governmental agencies 63,236,637 - -Charges for services - 796,595 -Miscellaneous revenues - - 17,231
Total revenues 63,236,637 831,473 877,409
Expenditures:Current:
General government - 548,377 -Public protection - - -Public ways and facilities - - -Health and sanitation - - 487,792Public assistance - - -Education - - -
Total expenditures - 548,377 487,792Excess (deficiency) of revenues over (under)
expenditures 63,236,637 283,096 389,617
Other financing sources (uses):Transfers in 3,367,970 - -Transfers out (64,831,547) - -Sale of capital assets - - -
Total other financing sources (uses) (61,463,577) - -
Net change in fund balances 1,773,060 283,096 389,617Fund balances, beginning of year, as restated 30,626,466 (4,860) 1,161,103Fund balances, end of year $ 32,399,526 $ 278,236 $ 1,550,720
continued105

COUNTY OF MONTEREYCombining Statement of Revenues, Expenditures and Changes in Fund Balances
Special RevenueFor the Fiscal Year Ended June 30, 2019
Local RevenueFund 2011
WorkforceDevelopment
Board
E. GarrisonCommunity
Services District
Revenues:Taxes $ - $ - $ -Licenses, permits, and franchises - - -Fines, forfeitures, and penalties - - -Revenue from use of money and property - (716) 52,551Aid from other governmental agencies 63,454,587 6,743,879 -Charges for services - - 1,317,906Miscellaneous revenues - 10,255 -
Total revenues 63,454,587 6,753,418 1,370,457
Expenditures:Current:
General government - - -Public protection - - -Public ways and facilities - - 233,767Health and sanitation - - -Public assistance - 5,302,179 -Education - - -
Total expenditures - 5,302,179 233,767Excess (deficiency) of revenues over (under)
expenditures 63,454,587 1,451,239 1,136,690
Other financing sources (uses):Transfers in - 656,447 -Transfers out (62,358,379) (1,689,100) (367,334)Sale of capital assets - - -
Total other financing sources (uses) (62,358,379) (1,032,653) (367,334)
Net change in fund balances 1,096,208 418,586 769,356Fund balances, beginning of year, as restated 28,917,003 (111,751) 1,992,080Fund balances, end of year $ 30,013,211 $ 306,835 $ 2,761,436
continued106

COUNTY OF MONTEREYCombining Statement of Revenues, Expenditures and Changes in Fund Balances
Special RevenueFor the Fiscal Year Ended June 30, 2019
Agencies Under Board of SupervisorsNacimiento
HydroelectricOperations
Other WaterResourcesAgencies
County ServiceAreas
Revenues:Taxes $ - $ 2,625,965 $ 2,208,664Licenses, permits, and franchises - 35,402 -Fines, forfeitures, and penalties - - -Revenue from use of money and property 31,958 960,372 234,125Aid from other governmental agencies - 938,216 2,298Charges for services 708,881 15,850,799 452,303Miscellaneous revenues - 135,066 -
Total revenues 740,839 20,545,820 2,897,390
Expenditures:Current:
General government - - -Public protection 490,038 14,852,317 -Public ways and facilities - - 497,364Health and sanitation - - 1,921,214Public assistance - - -Education - - -
Total expenditures 490,038 14,852,317 2,418,578Excess (deficiency) of revenues over (under)
expenditures 250,801 5,693,503 478,812
Other financing sources (uses):Transfers in - 14,293 -Transfers out - (5,507,878) -Sale of capital assets - - -
Total other financing sources (uses) - (5,493,585) -
Net change in fund balances 250,801 199,918 478,812Fund balances, beginning of year, as restated 1,252,172 18,021,612 10,336,980Fund balances, end of year $ 1,502,973 $ 18,221,530 $ 10,815,792
continued107

COUNTY OF MONTEREYCombining Statement of Revenues, Expenditures and Changes in Fund Balances
Special RevenueFor the Fiscal Year Ended June 30, 2019
Agencies Under Board of Supervisors
SanitationDistricts
HousingSuccessor Total
Revenues:Taxes $ 252,660 $ - $ 13,856,873Licenses, permits, and franchises - - 35,402Fines, forfeitures, and penalties - - 843,157Revenue from use of money and property 26,076 234,729 1,919,105Aid from other governmental agencies 1,098 - 136,577,812Charges for services 957,963 12,000 20,233,819Miscellaneous revenues - - 598,698
Total revenues 1,237,797 246,729 174,064,866
Expenditures:Current:
General government - 156,817 959,509Public protection - - 15,938,282Public ways and facilities - - 731,131Health and sanitation 1,459,625 - 3,868,631Public assistance - - 7,602,284Education - - 9,159,524
Total expenditures 1,459,625 156,817 38,259,361Excess (deficiency) of revenues over (under)
expenditures (221,828) 89,912 135,805,505
Other financing sources (uses):Transfers in 162,307 - 5,158,081Transfers out (73,400) - (134,827,638)Sale of capital assets 5,045 - 5,045
Total other financing sources (uses) 93,952 - (129,664,512)
Net change in fund balances (127,876) 89,912 6,140,993Fund balances, beginning of year, as restated 1,253,921 8,297,503 120,815,800Fund balances, end of year $ 1,126,045 $ 8,387,415 $ 126,956,793
108

COUNTY OF MONTEREYBudgetary Comparison Schedule
Library FundFor the Fiscal Year Ended June 30, 2019
Budgeted Amounts
Original Final Actual AmountsVariance withFinal Budget
Revenues:Taxes $ 8,985,664 $ 8,985,664 $ 8,769,584 $ (216,080)Revenue from use of money and property 1,038 1,038 29,740 28,702Aid from other governmental agencies 346,790 346,790 207,416 (139,374)Charges for services 158,247 158,247 133,557 (24,690)Miscellaneous revenues 255,000 255,000 381,626 126,626
Total revenues 9,746,739 9,746,739 9,521,923 (224,816)
Expenditures:Current:
Education 10,273,287 10,273,287 9,159,524 1,113,763Total expenditures 10,273,287 10,273,287 9,159,524 1,113,763
Excess (deficiency) of revenues over(under) expenditures (526,548) (526,548) 362,399 888,947
Other financing sources (uses):Transfers in 535,539 535,539 499,786 (35,753)
Total other financing sources (uses) 535,539 535,539 499,786 (35,753)
Net change in fund balances 8,991 8,991 862,185 853,194Fund balances, beginning 1,011,886 1,011,886 1,011,886 -Fund balances, ending $ 1,020,877 $ 1,020,877 $ 1,874,071 $ 853,194
109

COUNTY OF MONTEREYBudgetary Comparison Schedule
In-Home Support ServicesFor the Fiscal Year Ended June 30, 2019
Budgeted Amounts
Original Final Actual AmountsVariance withFinal Budget
Revenues:Revenue from use of money and property $ - $ - $ (607) $ (607)Aid from other governmental agencies 535,790 535,790 313,579 (222,211)Miscellaneous revenues - - 398 398
Total revenues 535,790 535,790 313,370 (222,420)
Expenditures:Current:
Public assistance 790,882 790,882 737,310 53,572Total expenditures 790,882 790,882 737,310 53,572
Excess (deficiency) of revenues over(under) expenditures (255,092) (255,092) (423,940) (168,848)
Other financing sources (uses):Transfers in 255,092 255,092 182,224 (72,868)
Total other financing sources (uses) 255,092 255,092 182,224 (72,868)
Net change in fund balances - - (241,716) (241,716)Fund balances, beginning (36,477) (36,477) 179,757 (216,234)Fund balances, ending $ (36,477) $ (36,477) $ (61,959) $ (25,482)
110

COUNTY OF MONTEREYBudgetary Comparison ScheduleFish & Game Propagation Fund
For the Fiscal Year Ended June 30, 2019
Budgeted Amounts
Original Final Actual AmountsVariance withFinal Budget
Revenues:Fines, forfeitures, and penalties $ 7,196 $ 7,196 $ 15,411 $ 8,215Revenue from use of money and property 791 791 967 176
Total revenues 7,987 7,987 16,378 8,391
Expenditures:Current:
Public protection 31,977 42,277 33,074 9,203Total expenditures 31,977 42,277 33,074 9,203
Excess (deficiency) of revenues over(under) expenditures (23,990) (34,290) (16,696) 17,594
Other financing sources (uses):Transfers in 10,500 10,500 10,500 -
Total other financing sources (uses) 10,500 10,500 10,500 -
Net change in fund balances (13,490) (23,790) (6,196) 17,594Fund balances, beginning 43,272 43,272 43,272 -Fund balances, ending $ 29,782 $ 19,482 $ 37,076 $ 17,594
111

COUNTY OF MONTEREYBudgetary Comparison Schedule
OETFor the Fiscal Year Ended June 30, 2019
Budgeted Amounts
Original Final Actual AmountsVariance withFinal Budget
Revenues:
Expenditures:Current:
Public assistance $ 2,385 $ 2,385 $ - $ 2,385Total expenditures 2,385 2,385 - 2,385
Excess (deficiency) of revenues over(under) expenditures (2,385) (2,385) - 2,385
Other financing sources (uses):Transfers in - - 264,139 264,139
Total other financing sources (uses) - - 264,139 264,139
Net change in fund balances (2,385) (2,385) 264,139 266,524Fund balances, beginning (264,139) (264,139) (264,139) -Fund balances, ending $ (266,524) $ (266,524) $ - $ 266,524
112

COUNTY OF MONTEREYBudgetary Comparison ScheduleCommunity Action Partnership
For the Fiscal Year Ended June 30, 2019
Budgeted Amounts
Original Final Actual AmountsVariance withFinal Budget
Revenues:Revenue from use of money and property $ - $ - $ 858 $ 858Aid from other governmental agencies 557,580 557,580 528,978 (28,602)
Total revenues 557,580 557,580 529,836 (27,744)
Expenditures:Current:
Public assistance 558,278 558,278 449,099 109,179Total expenditures 558,278 558,278 449,099 109,179
Excess (deficiency) of revenues over(under) expenditures (698) (698) 80,737 81,435
Other financing sources (uses):Transfers in 698 698 415 (283)
Total other financing sources (uses) 698 698 415 (283)
Net change in fund balances - - 81,152 81,152Fund balances, beginning 169,671 169,671 169,671 -Fund balances, ending $ 169,671 $ 169,671 $ 250,823 $ 81,152
113

COUNTY OF MONTEREYBudgetary Comparison Schedule
Inclusionary HousingFor the Fiscal Year Ended June 30, 2019
Budgeted Amounts
Original Final Actual AmountsVariance withFinal Budget
Revenues:Revenue from use of money and property $ 25,000 $ 25,000 $ 23,027 $ (1,973)Charges for services 7,500 7,500 3,815 (3,685)
Total revenues 32,500 32,500 26,842 (5,658)
Expenditures:Current:
General government 968,200 968,200 254,315 713,885Total expenditures 968,200 968,200 254,315 713,885
Excess (deficiency) of revenues over(under) expenditures (935,700) (935,700) (227,473) 708,227
Net change in fund balances (935,700) (935,700) (227,473) 708,227Fund balances, beginning 1,337,003 1,337,003 1,337,003 -Fund balances, ending $ 401,303 $ 401,303 $ 1,109,530 $ 708,227
114

COUNTY OF MONTEREYBudgetary Comparison Schedule
Community DevelopmentFor the Fiscal Year Ended June 30, 2019
Budgeted Amounts
Original FinalActual
AmountsVariance withFinal Budget
Revenues:Revenue from use of money and property $ 115,200 $ 115,200 $ 255,097 $ 139,897Aid from other governmental agencies 1,376,025 1,376,025 473,432 (902,593)Charges for services 50,000 50,000 - (50,000)Miscellaneous revenues - - 54,122 54,122
Total revenues 1,541,225 1,541,225 782,651 (758,574)
Expenditures:Current:
Public assistance 3,198,283 3,198,283 1,113,696 2,084,587Debt service:
Interest and debt service costs 700 700 - 700Total expenditures 3,198,983 3,198,983 1,113,696 2,085,287
Excess (deficiency) of revenues over (under)expenditures (1,657,758) (1,657,758) (331,045) 1,326,713
Net change in fund balances (1,657,758) (1,657,758) (331,045) 1,326,713Fund balances, beginning 16,393,780 16,393,780 16,393,780 -Fund balances, ending $ 14,736,022 $ 14,736,022 $ 16,062,735 $ 1,326,713
115

COUNTY OF MONTEREYBudgetary Comparison Schedule
Homeland Security GrantFor the Fiscal Year Ended June 30, 2019
Budgeted Amounts
Original Final Actual AmountsVariance withFinal Budget
Revenues:Revenue from use of money and property $ - $ - $ 3,618 $ 3,618Aid from other governmental agencies 517,020 638,292 677,692 39,400
Total revenues 517,020 638,292 681,310 43,018
Expenditures:Current:
Public protection 517,020 638,292 562,853 75,439Total expenditures 517,020 638,292 562,853 75,439
Excess (deficiency) of revenues over(under) expenditures - - 118,457 (32,421)
Net change in fund balances - - 118,457 118,457Fund balances, beginning 202,341 202,341 202,341 -Fund balance, ending $ 202,341 $ 202,341 $ 320,798 $ 118,457
116

COUNTY OF MONTEREYBudgetary Comparison Schedule
H&W RealignmentFor the Fiscal Year Ended June 30, 2019
Budgeted Amounts
Original Final Actual AmountsVariance withFinal Budget
Revenues:Aid from other governmental agencies $ 62,310,598 $ 64,670,705 $ 63,236,637 $ (1,434,068)
Total revenues 62,310,598 64,670,705 63,236,637 (1,434,068)Excess (deficiency) of revenues over
(under) expenditures 62,310,598 64,670,705 63,236,637 (1,434,068)
Other financing sources (uses):Transfers in 3,617,970 5,079,436 3,367,970 (1,711,466)Transfers out (71,422,200) (75,243,773) (64,831,547) 10,412,226
Total other financing sources (uses) (67,804,230) (70,164,337) (61,463,577) 8,700,760
Net change in fund balances (5,493,632) (5,493,632) 1,773,060 7,266,692Fund balances, beginning, as restated 30,626,466 30,626,466 30,626,466 -Fund balance, ending $ 25,132,834 $ 25,132,834 $ 32,399,526 $ 7,266,692
117

COUNTY OF MONTEREYBudgetary Comparison Schedule
NGEN Operations & MaintenanceFor the Fiscal Year Ended June 30, 2019
Budgeted Amounts
Original Final Actual AmoutsVariance withFinal Budget
Revenues:Revenue from use of money and property $ - $ - $ 34,878 $ 34,878Charges for services 1,154,424 1,154,424 796,595 (357,829)
Total revenues 1,154,424 1,154,424 831,473 (322,951)
Expenditures:Current:
General government 1,154,424 1,154,424 548,377 606,047Total expenditures 1,154,424 1,154,424 548,377 606,047
Excess (deficiency) of revenues over(under) expenditures - - 283,096 283,096
Net change in fund balances - - 283,096 (928,998)Fund balances, beginning (4,860) (4,860) (4,860) -Fund balances, ending $ (4,860) $ (4,860) $ 278,236 $ (928,998)
118

COUNTY OF MONTEREYBudgetary Comparison ScheduleEmergency Medical Service Fund
For the Fiscal Year Ended June 30, 2019
Budgeted Amounts
Original Final Actual AmountsVariance withFinal Budget
Revenues:Fines, forfeitures, and penalties $ 750,000 $ 750,000 $ 827,746 $ 77,746Revenue from use of money and property 7,000 7,000 32,432 25,432Miscellaneous revenues 15,000 15,000 17,231 2,231
Total revenues 772,000 772,000 877,409 105,409
Expenditures:Current:
Health and sanitation 797,000 797,000 487,792 309,208Total expenditures 797,000 797,000 487,792 309,208
Excess (Deficiency) of Revenues Over(Under) Expenditures (25,000) (25,000) 389,617 414,617
Net change in fund balances (25,000) (25,000) 389,617 414,617Fund balances, beginning 1,161,103 1,161,103 1,161,103 -Fund balances, ending $ 1,136,103 $ 1,136,103 $ 1,550,720 $ 414,617
119
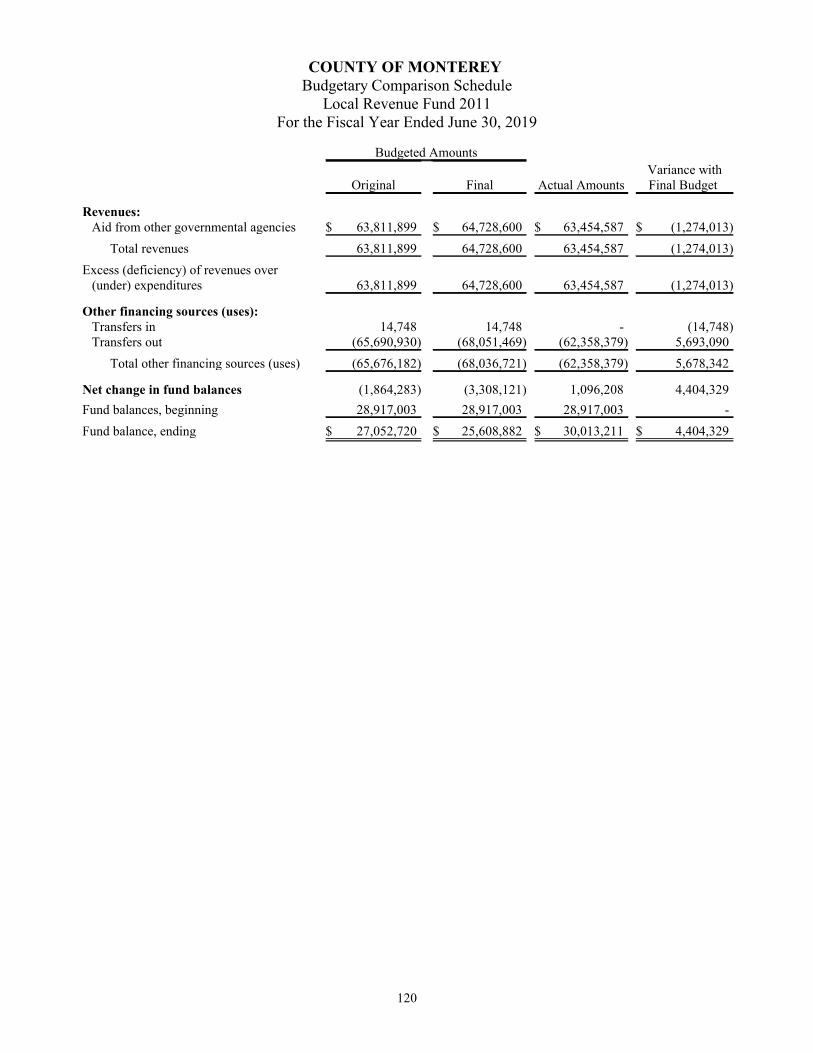
COUNTY OF MONTEREYBudgetary Comparison Schedule
Local Revenue Fund 2011For the Fiscal Year Ended June 30, 2019
Budgeted Amounts
Original Final Actual AmountsVariance withFinal Budget
Revenues:Aid from other governmental agencies $ 63,811,899 $ 64,728,600 $ 63,454,587 $ (1,274,013)
Total revenues 63,811,899 64,728,600 63,454,587 (1,274,013)Excess (deficiency) of revenues over
(under) expenditures 63,811,899 64,728,600 63,454,587 (1,274,013)
Other financing sources (uses):Transfers in 14,748 14,748 - (14,748)Transfers out (65,690,930) (68,051,469) (62,358,379) 5,693,090
Total other financing sources (uses) (65,676,182) (68,036,721) (62,358,379) 5,678,342
Net change in fund balances (1,864,283) (3,308,121) 1,096,208 4,404,329Fund balances, beginning 28,917,003 28,917,003 28,917,003 -Fund balance, ending $ 27,052,720 $ 25,608,882 $ 30,013,211 $ 4,404,329
120

COUNTY OF MONTEREYBudgetary Comparison ScheduleWorkforce Development Board
For the Fiscal Year Ended June 30, 2019
Budgeted Amounts
Original Final Actual AmountsVariance withFinal Budget
Revenues:Revenue from use of money and property $ - $ - $ (716) $ (716)Aid from other governmental agencies 7,658,146 7,658,146 6,743,879 (914,267)Miscellaneous revenues - - 10,255 10,255
Total revenues 7,658,146 7,658,146 6,753,418 (904,728)
Expenditures:Current:
Public assistance 6,427,901 6,427,901 5,302,179 1,125,722Total expenditures 6,427,901 6,427,901 5,302,179 1,125,722
Excess (deficiency) of revenues over(under) expenditures 1,230,245 1,230,245 1,451,239 220,994
Other financing sources (uses):Transfers in 669,755 669,755 656,447 (13,308)Transfers out (1,900,000) (1,900,000) (1,689,100) (210,900)
Total other financing sources (uses) (1,230,245) (1,230,245) (1,032,653) (224,208)
Net change in fund balances - - 418,586 418,586Fund balances, beginning (111,751) (111,751) (111,751) -Fund balances, ending $ (111,751) $ (111,751) $ 306,835 $ 418,586
121

COUNTY OF MONTEREYBudgetary Comparison Schedule
E. Garrison Community Services DistrictFor the Fiscal Year Ended June 30, 2019
Budgeted Amounts
Original Final Actual AmountsVariance withFinal Budget
RevenuesRevenue from use of money and property $ 14,000 $ 14,000 $ 52,551 $ 38,551Charges for services 1,050,000 1,050,000 1,317,906 267,906
Total revenues 1,064,000 1,064,000 1,370,457 306,457
ExpendituresPublic ways and facilities 892,120 892,120 233,767 658,353
Total expenditures 892,120 892,120 233,767 658,353Excess (deficiency) of revenues over (under)
expenditures 171,880 171,880 1,136,690 964,810
Other financing sources (uses):Transfers out (367,334) (367,334) (367,334) -
Total other financing sources (uses) (367,334) (367,334) (367,334) -
Net change in fund balances (195,454) (195,454) 769,356 964,810Fund balances, beginning 1,992,080 1,992,080 1,992,080 -Fund balances, ending $ 1,796,626 $ 1,796,626 $ 2,761,436 $ 964,810
122

COUNTY OF MONTEREYBudgetary Comparison Schedule
Nacimiento Hydroelectric OperationsFor the Fiscal Year Ended June 30, 2019
Budgeted Amounts
Original Final Actual AmountsVariance withFinal Budget
Revenues:Revenue from use of money and property $ 1,000 $ 1,000 $ 31,958 $ 30,958Charges for services 594,000 594,000 708,881 114,881
Total revenues 595,000 595,000 740,839 145,839
Expenditures:Current:
Public protection 569,695 684,580 490,038 194,542Total expenditures 569,695 684,580 490,038 194,542
Other financing sources (uses):
Net change in fund balances 25,305 (89,580) 250,801 340,381Fund balances, beginning 1,252,172 1,252,172 1,252,172 -Fund balance, ending $ 1,277,477 $ 1,162,592 $ 1,502,973 $ 340,381
123

COUNTY OF MONTEREYBudgetary Comparison ScheduleOther Water Resources Agencies
For the Fiscal Year Ended June 30, 2019
Budgeted Amounts
Original Final Actual AmountsVariance withFinal Budget
RevenuesTaxes $ 1,355,304 $ 1,355,304 $ 2,625,965 $ 1,270,661Licenses, permits, and franchises 32,659 32,659 35,402 2,743
Revenue from use of money and property 566,555 2,443,630 960,372 (1,483,258)
Aid from other governmental agencies 895,164 895,164 938,216 43,052Charges for services 15,448,021 15,448,021 15,850,799 402,778Miscellaneous revenues - - 135,066 135,066
Total revenues 18,297,703 20,174,778 20,545,820 371,042
ExpendituresCurrent:
Public protection 20,891,623 24,029,537 14,852,317 9,177,220Total expenditures 20,891,623 24,029,537 14,852,317 9,177,220
Excess (deficiency) of revenues over(under) expenditures (2,593,920) (3,854,759) 5,693,503 9,548,262
Other financing sources (uses):Transfers in 105,000 105,000 14,293 (90,707)Transfers out (105,000) (6,328,287) (5,507,878) 820,409
Total other financing sources (uses) - (6,223,287) (5,493,585) 729,702
Net change in fund balances (2,593,920) (10,078,046) 199,918 10,277,964Fund balances, beginning 18,021,612 18,021,612 18,021,612 -Fund balances, ending $ 15,427,692 $ 7,943,566 $ 18,221,530 $ 10,277,964
124

COUNTY OF MONTEREYBudgetary Comparison Schedule
County Service AreasFor the Fiscal Year Ended June 30, 2019
Budgeted Amounts
Original Final Actual AmountsVariance withFinal Budget
RevenuesTaxes $ 2,153,647 $ 2,153,647 $ 2,208,664 $ 55,017Revenue from use of money and property 78,759 78,759 234,125 155,366Aid from other governmental agencies 2,419 2,419 2,298 (121)Charges for services 419,973 419,973 452,303 32,330
Total revenues 2,654,798 2,654,798 2,897,390 242,592
ExpendituresCurrent:
Public ways and facilities 1,406,199 1,516,123 497,364 1,018,759Health and sanitation 2,265,668 2,342,982 1,921,214 421,768
Total expenditures 3,671,867 3,859,105 2,418,578 1,440,527Excess (deficiency) of revenues over
(under) expenditures (1,017,069) (1,204,307) 478,812 1,683,119
Net change in fund balances (1,017,069) (1,204,307) 478,812 1,683,119Fund balances, beginning 10,336,980 10,336,980 10,336,980 -Fund balances, ending $ 9,319,911 $ 9,132,673 $ 10,815,792 $ 1,683,119
125

COUNTY OF MONTEREYBudgetary Comparison Schedule
Sanitation DistrictsFor the Fiscal Year Ended June 30, 2019
Budgeted Amounts
Original Final Actual AmountsVariance withFinal Budget
RevenuesTaxes $ 235,850 $ 235,850 $ 252,660 $ 16,810Licenses, permits, and franchises 200 200 - (200)Revenue from use of money and property 1,833 1,833 26,076 24,243Aid from other governmental agencies 750 750 1,098 348Charges for services 1,091,000 1,091,000 957,963 (133,037)
Total revenues 1,329,633 1,329,633 1,237,797 (91,836)
ExpendituresCurrent:
Health and sanitation 1,256,532 2,124,609 1,459,625 664,984Total expenditures 1,256,532 2,124,609 1,459,625 664,984
Excess (deficiency) of revenues over(under) expenditures 73,101 (794,976) (221,828) 573,148
Other financing sources (uses):Transfers in - 104,807 162,307 57,500Transfers out (73,400) (73,400) (73,400) -Sale of capital assets - - 5,045 5,045
Total other financing sources (uses) (73,400) 31,407 93,952 62,545
Net change in fund balances (299) (763,569) (127,876) 573,148Fund balances, beginning 1,253,921 1,253,921 1,253,921 -Fund balances, ending $ 1,253,622 $ 490,352 $ 1,126,045 $ 573,148
126

COUNTY OF MONTEREYBudgetary Comparison Schedule
Housing SuccessorFor the Fiscal Year Ended June 30, 2019
Budgeted Amounts
Original FinalActual
AmountsVariance withFinal Budget
RevenuesRevenue from use of money and property $ 208,100 $ 208,100 $ 234,729 $ 26,629Charges for services - - 12,000 12,000
Total revenues 208,100 208,100 246,729 38,629
ExpendituresCurrent:
General government 1,022,220 1,022,220 156,817 865,403Total expenditures 1,022,220 1,022,220 156,817 865,403
Net change in fund balances (814,120) (814,120) 89,912 904,032Fund balances, beginning 8,297,503 8,297,503 8,297,503 -Fund balances, ending $ 7,483,383 $ 7,483,383 $ 8,387,415 $ 904,032
127

This page intentionally left blank

DEBT SERVICE FUNDS
Debt service funds are used to account for the accumulation of resources for, and the payment of,general long-term debt principal, interest and related costs. The County debt service funds providefor the repayment of debt, other than those financed by proprietary funds, for certificates ofparticipation, revenue bonds and short-term borrowing.

DEBT SERVICE FUNDS
Debt Service General – Created to assure the County meets all the debt service obligations in connection withthe County’s adopted financing policies and State statutes so that the County’s credit ratings continue at thecurrent positive levels. The debt is managed by the Auditor-Controller’s Office in coordination with the ChiefAdministrative Office.
County Financing Authority – Established to support the debt service activities funding the County’s portion ofthe construction of the Salinas Valley Water Project. The fund is managed by the Auditor-Controller’s Officeand the Water Resources Agency.
Public Improvement Corporation – The Corporation assists the County in acquiring, purchasing, constructing,improving and financing real property, facilities and equipment needed for County operations. With Countyassistance, the Corporation acts as a conduit between the County and bond holders. The Auditor-Controller’soffice is the oversight agency for all funds provided by the Corporation for capital projects.
128

COUNTY OF MONTEREYCombining Balance Sheet
Debt ServiceJune 30, 2019
Debt ServiceGeneral
MontereyCounty
FinancingAuthority
PublicImprovementCorporationDebt Service Total
AssetsCash and investments:
Held in County Treasury $ 852,809 $ 1,023,587 $ 1,350 $ 1,877,746Held with trustee - 10,389 23,224 33,613
Receivables 552 779 - 1,331Total assets $ 853,361 $ 1,034,755 $ 24,574 $ 1,912,690
Liabilities
Deferred inflows of resourcesUnavailable revenue 552 - - 552
Total deferred inflows of resources 552 - - 552
Fund balancesRestricted - 1,034,755 24,574 1,059,329Assigned 852,809 - - 852,809
Total fund balances 852,809 1,034,755 24,574 1,912,138Total liabilities, deferred inflows of
resources and fund balances $ 853,361 $ 1,034,755 $ 24,574 $ 1,912,690
129

COUNTY OF MONTEREYCombining Statement of Revenues, Expenditures and Changes in Fund Balances
Debt ServiceFor the Fiscal Year Ended June 30, 2019
Debt ServiceGeneral
MontereyCounty
FinancingAuthority
PublicImprovementCorporationDebt Service Total
RevenuesRevenue from use of money and property $ 2,364 $ 88,678 $ 1,478,531 $ 1,569,573Charges for services 13,681 - - 13,681
Total revenues 16,045 88,678 1,478,531 1,583,254
ExpendituresDebt service:
Principal 1,137,028 3,278,372 4,973,111 9,388,511Interest and debt service costs 643,792 1,816,637 5,832,964 8,293,393
Total expenditures 1,780,820 5,095,009 10,806,075 17,681,904Excess (deficiency) of revenues over (under)
expenditures (1,764,775) (5,006,331) (9,327,544) (16,098,650)
Other financing sources (uses):Transfers in 1,764,890 2,739,539 9,342,170 13,846,599Transfers out (203,210) - - (203,210)Premium on debt issuance - 3,690,065 - 3,690,065Issuance of debt - 22,890,000 - 22,890,000Debt Defeasance - (25,531,628) - (25,531,628)
Total other financing sources (uses) 1,561,680 3,787,976 9,342,170 14,691,826
Net change in fund balance (203,095) (1,218,355) 14,626 (1,406,824)Fund balances, beginning 1,055,904 2,253,110 9,948 3,318,962Fund balances, ending $ 852,809 $ 1,034,755 $ 24,574 $ 1,912,138
130

COUNTY OF MONTEREYBudgetary Comparison Schedule
Debt Service GeneralFor the Fiscal Year Ended June 30, 2019
Budgeted Amounts
Original Final Actual AmountsVariance withFinal Budget
RevenuesRevenue from use of money and property $ - $ - $ 2,364 $ 2,364Charges for services 15,941 15,941 13,681 (2,260)
Total revenues 15,941 15,941 16,045 104
ExpendituresDebt service:
Principal 70,000 1,141,160 1,137,028 4,132Interest and debt service costs 19,341 643,341 643,792 (451)
Total expenditures 89,341 1,784,501 1,780,820 3,681Excess (deficiency) of revenues over
(under) expenditures (73,400) (1,768,560) (1,764,775) 3,785
Other financing sources (uses)Transfers in 73,400 1,768,560 1,764,890 (3,670)Transfers out - (975,366) (203,210) (772,156)
Total other financing sources (uses) 73,400 793,194 1,561,680 (775,826)
Net change in fund balances - (975,366) (203,095) 772,271Fund balances, beginning 1,055,904 1,055,904 1,055,904 -Fund balances, ending $ 1,055,904 $ 80,538 $ 852,809 $ 772,271
131

COUNTY OF MONTEREYBudgetary Comparison Schedule
Monterey County Financing AuthorityFor the Fiscal Year Ended June 30, 2019
Budgeted Amounts
Original Final Actual AmountsVariance withFinal Budget
RevenuesRevenue from use of money and property $ - $ 85,970 $ 88,678 $ 2,708
Total revenues - 85,970 88,678 2,708
ExpendituresDebt service:
Principal 1,030,000 3,278,372 3,278,372 -Interest and debt service costs 693,220 1,826,127 1,816,637 9,490
Total expenditures 1,723,220 5,104,499 5,095,009 9,490Excess (deficiency) of revenues over
(under) expenditures (1,723,220) (5,018,529) (5,006,331) 12,198
Other financing sources (uses):Transfers in - - 2,739,539 2,739,539Premium on debt issuance - 3,690,065 3,690,065 -Issuance of debt - 25,138,372 22,890,000 (2,248,372)Debt Defeasance - (25,531,628) 25,531,628 -
Total other financing sources (uses) - 3,296,809 3,787,976 491,167
Net change in fund balances (1,723,220) (1,721,720) (1,218,355) 503,365Fund balances, beginning 2,253,110 2,253,110 2,253,110 -Fund balances, ending $ 529,890 $ 531,390 $ 1,034,755 $ 503,365
132

COUNTY OF MONTEREYBudgetary Comparison Schedule
Public Improvement Corporation Debt ServiceFor the Fiscal Year Ended June 30, 2019
Budgeted Amounts
Original Final Actual AmountsVariance withFinal Budget
RevenuesRevenue from use of money and property $ 14,741,844 $ 14,741,844 $ 1,478,531 $ (13,263,313)Fines, forfeitures, and penalties 1,500,000 1,500,000 - (1,500,000)
Total revenues 16,241,844 16,241,844 1,478,531 (14,763,313)
ExpendituresDebt service:
Principal 8,524,486 8,524,486 4,973,112 3,551,374Interest and debt service costs 7,712,358 7,712,358 5,832,963 1,879,395
Total expenditures 16,236,844 16,236,844 10,806,075 5,430,769Excess (deficiency) of revenues over
(under) expenditures 5,000 5,000 (9,327,544) (9,332,544)
Other financing sources (uses):Transfers in - - 9,342,170 9,342,170
Total other financing sources (uses) - - 9,342,170 9,342,170
Net change in fund balances 5,000 5,000 14,626 9,626Fund balances, beginning 9,948 9,948 9,948 -Fund balances, ending $ 14,948 $ 14,948 $ 24,574 $ 9,626
133

This page intentionally left blank

CAPITAL PROJECT FUNDS
Capital project funds are used to account for financial resources to be used for implementation andconstruction of specific Board approved capital equipment or facilities in a timely and cost-effectivemanner. The following are the County’s nonmajor capital project funds, other than those financed byproprietary funds.

CAPITAL PROJECT FUNDS
Major Capital Project Fund
Facilities Master Plan Implementation – Established to account for capital projects undertaken with debt inorder to adhere to reporting requirements and assure the County is on schedule with project implementation andcompletion. Current projects include the Courthouse Complete (north, east and west wings), New JuvenileHall, and Jail House Addition.
Nonmajor Capital Project Fund
Capital Projects Fund – Created to provide for capital improvements, replacement and construction of newCounty facilities. The fund is administered by the Architectural Services Division within the ResourceManagement Agency.
Facilities Maintenance Projects Fund – Provides for major maintenance including remodeling, improving,renovation, and upgrading of existing County facilities. The fund is administered by the Public WorksDepartment within the Resource Management Agency.
Other Water Resources Funds – Provides for construction of the Salinas River Diversion Facility portion andNacimiento Spillway Modification portion of the Salinas Valley Water Project.
NGEN Radio Project – Provides for the design/build project to make the radio system compliant with theFederal Communications Commission mandate.
East Garrison CFD – Provides for the acquisition, construction, and operation of public capital facilities in EastGarrison.
134

COUNTY OF MONTEREYStatement of Revenues, Expenditures, and Changes in Fund Balances - Budget and Actual
Facility Master Plan ProjectsFor the Fiscal Year Ended June 30, 2019
Budgeted Amounts
Original Final Actual AmountsVariance withFinal Budget
Revenues:Revenue from use of money and property $ 200,000 $ 200,000 $ (585,944) $ (785,944)Aid from other governmental agencies 41,956,596 41,956,596 46,243,756 4,287,160Miscellaneous revenues 353,016 353,016 117,608 (235,408)
Total revenues 42,509,612 42,509,612 45,775,420 3,265,808
Expenditures:Capital outlay 66,705,607 66,705,607 59,478,103 7,227,504
Total expenditures 66,705,607 66,705,607 59,478,103 7,227,504Excess (deficiency) of revenues over
(under) expenditures (24,195,995) (24,195,995) (13,702,683) 10,493,312
Other financing sources (uses):Transfers in 21,312,873 21,312,873 220,119 (21,092,754)Transfers out (32,563,756) (32,563,756) (3,996,113) 28,567,643
Total other financing sources (uses) (11,250,883) (11,250,883) (3,775,994) 7,474,889
Net change in fund balances (35,446,878) (35,446,878) (17,478,677) 17,968,201Fund balances, beginning 62,529,037 62,529,037 62,529,037 -Fund balance, ending $ 27,082,159 $ 27,082,159 $ 45,050,360 $ 17,968,201
135

COUNTY OF MONTEREYCombining Balance Sheet
Capital ProjectsJune 30, 2019
Capital ProjectsFund
FacilitiesProject Fund
Other WaterResourcesAgencies
Assets
Cash and investments:Held in County Treasury $ 3,450,556 $ 3,741,139 $ 1,139,397
Receivables - 51,222 524,568Notes receivables 14,950 - -
Total assets 3,465,506 3,792,361 1,663,965
LiabilitiesVouchers and accounts payable 156,902 303,243 78,525Deposits from others - - -Unearned revenues 22,146 - -
Total liabilities 179,048 303,243 78,525
Deferred inflows of resourcesUnavailable revenue - 1,275 141,186
Total deferred inflows of resources - 1,275 141,186
Fund balancesRestricted - - 68,560Assigned 3,286,458 3,487,843 1,375,694
Total fund balances 3,286,458 3,487,843 1,444,254Total liabilities, deferred inflows of resources and fund
balances $ 3,465,506 $ 3,792,361 $ 1,663,965
continued136

COUNTY OF MONTEREYCombining Balance Sheet
Capital ProjectsJune 30, 2019
NGEN RadioProject
East GarrisonCapital Projects Total
Assets
Cash and investments:Held in County Treasury $ 970,123 $ 578,120 $ 9,879,335
Receivables - 20,875 596,665Notes receivables - - 14,950
Total assets 970,123 598,995 10,490,950
LiabilitiesVouchers and accounts payable 1,041 42,731 582,442Deposits from others - 108,796 108,796Unearned revenues - - 22,146
Total liabilities 1,041 151,527 713,384
Deferred inflows of resourcesUnavailable revenue - 20,602 163,063
Total deferred inflows of resources - 20,602 163,063
Fund balancesRestricted - - 68,560Assigned 969,082 426,866 9,545,943
Total fund balances 969,082 426,866 9,614,503Total liabilities, deferred inflows of resources and fund
balances $ 970,123 $ 598,995 $ 10,490,950
137

COUNTY OF MONTEREYCombining Statement of Revenues, Expenditures and Changes in Fund Balances
Capital ProjectsFor the Fiscal Year Ended June 30, 2019
Capital ProjectsFund
FacilitiesProject Fund
Other WaterResourcesAgencies
RevenuesRevenue from use of money and property $ 75,363 $ 101,269 $ (18,041)Aid from other governmental agencies - 9,969 2,073,334Charges for services - 125,870 -Miscellaneous revenues - - -
Total revenues 75,363 237,108 2,055,293
ExpendituresCapital outlay 1,323,714 1,994,890 1,990,437
Total expenditures 1,323,714 1,994,890 1,990,437Excess (deficiency) of revenues over (under) expenditures (1,248,351) (1,757,782) 64,856
Other financing sources (uses)Transfers in 746,191 361,375 2,171,794Transfers out - - (14,337)
Total other financing sources (uses) 746,191 361,375 2,157,457
Net change in fund balances (502,160) (1,396,407) 2,222,313Fund balances, beginning 3,788,618 4,884,250 (778,059)Fund balances, ending $ 3,286,458 $ 3,487,843 $ 1,444,254
continued138

COUNTY OF MONTEREYCombining Statement of Revenues, Expenditures and Changes in Fund Balances
Capital ProjectsFor the Fiscal Year Ended June 30, 2019
NGEN RadioProject
East GarrisonCapital Projects Total
RevenuesRevenue from use of money and property $ 198 $ 16,194 $ 174,983Aid from other governmental agencies - - 2,083,303Charges for services - - 125,870Miscellaneous revenues - 296,487 296,487
Total revenues 198 312,681 2,680,643
ExpendituresCapital outlay 1,367,468 241,008 6,917,517
Total expenditures 1,367,468 241,008 6,917,517Excess (deficiency) of revenues over (under) expenditures (1,367,270) 71,673 (4,236,874)
Other financing sources (uses)Transfers in - - 3,279,360Transfers out - (358,727) (373,064)
Total other financing sources (uses) - (358,727) 2,906,296
Net change in fund balances (1,367,270) (287,054) (1,330,578)Fund balances, beginning 2,336,352 713,920 10,945,081Fund balances, ending $ 969,082 $ 426,866 $ 9,614,503
139

COUNTY OF MONTEREYBudgetary Comparison Schedule
Capital Projects FundFor the Fiscal Year Ended June 30, 2019
Budgeted Amounts
Original Final Actual AmountsVariance withFinal Budget
RevenuesRevenue from use of money and property $ 25,444 $ 25,444 $ 75,363 $ 49,919
Total revenues 25,444 25,444 75,363 49,919
ExpendituresCapital outlay 1,365,339 1,978,049 1,323,714 654,335
Total expenditures 1,365,339 1,978,049 1,323,714 654,335Excess (deficiency) of revenues over
(under) expenditures (1,339,895) (1,952,605) (1,248,351) 704,254
Other financing sources (uses):Transfers in - 208,291 746,191 537,900Transfers out (225,000) (225,000) - 225,000
Total other financing sources (uses) (225,000) (16,709) 746,191 762,900
Net change in fund balances (1,564,895) (1,969,314) (502,160) 1,467,154Fund balances, beginning 3,788,618 3,788,618 3,788,618 -Fund balances, ending $ 2,223,723 $ 1,819,304 $ 3,286,458 $ 1,467,154
140

COUNTY OF MONTEREYBudgetary Comparison Schedule
Facilities Project FundFor the Fiscal Year Ended June 30, 2019
Budgeted Amounts
Original Final Actual AmountsVariance withFinal Budget
RevenuesRevenue from use of money and property $ 49,576 $ 49,576 $ 101,269 $ 51,693Aid from other governmental agencies - - 9,969 9,969Charges for services - - 125,870 125,870
Total revenues 49,576 49,576 237,108 187,532
ExpendituresCapital outlay 2,227,585 2,227,585 1,994,890 232,695
Total expenditures 2,227,585 2,227,585 1,994,890 232,695Excess (deficiency) of revenues over
(under) expenditures (2,178,009) (2,178,009) (1,757,782) 420,227
Other financing sources (uses):Transfers in 2,227,585 2,227,585 361,375 (1,866,210)
Total other financing sources (uses) 2,227,585 2,227,585 361,375 (1,866,210)
Net change in fund balances 49,576 49,576 (1,396,407) (1,445,983)Fund balances, beginning 4,884,250 4,884,250 4,884,250 -Fund balances, ending $ 4,933,826 $ 4,933,826 $ 3,487,843 $ (1,445,983)
141

COUNTY OF MONTEREYBudgetary Comparison ScheduleOther Water Resources Agencies
For the Fiscal Year Ended June 30, 2019
Budgeted Amounts
Original Final Actual AmountsVariance withFinal Budget
RevenuesRevenue from use of money and property $ - $ - $ (18,041) $ (18,041)Aid from other governmental agencies 4,172,000 4,172,000 2,073,334 (2,098,666)
Total revenues 4,172,000 4,172,000 2,055,293 (2,116,707)
ExpendituresCapital outlay 3,655,794 3,655,794 1,990,437 1,665,357
Total expenditures 3,655,794 3,655,794 1,990,437 1,665,357Excess (deficiency) of revenues over
(under) expenditures 516,206 516,206 64,856 (451,350)
Other financing sources (uses):Transfers in 891,794 891,794 2,171,794 1,280,000Transfers out - (14,337) (14,337) -
Total other financing sources (uses) 891,794 877,457 2,157,457 1,280,000
Net change in fund balances 1,408,000 1,393,663 2,222,313 828,650Fund balances, beginning (778,059) (778,059) (778,059) -Fund balances, ending $ 629,941 $ 615,604 $ 1,444,254 $ 828,650
142

COUNTY OF MONTEREYBudgetary Comparison Schedule
NGEN Radio ProjectFor the Fiscal Year Ended June 30, 2019
Budgeted Amounts
Original Final Actual AmountsVariance withFinal Budget
RevenuesRevenue from use of money and property $ 25,000 $ 25,000 $ 198 $ (24,802)
Total revenues 25,000 25,000 198 (24,802)
ExpendituresCapital outlay 1,369,511 1,369,511 1,367,468 2,043
Total expenditures 1,369,511 1,369,511 1,367,468 2,043Excess (deficiency) of revenues over
(under) expenditures (1,344,511) (1,344,511) (1,367,270) (22,759)
Other financing sources (uses):Transfers in - - - -
Total other financing sources (uses) - - - -
Net change in fund balances (1,344,511) (1,344,511) (1,367,270) (22,759)Fund balances, beginning 2,336,352 2,336,352 2,336,352 -Fund balances, ending $ 991,841 $ 991,841 $ 969,082 $ (22,759)
143

COUNTY OF MONTEREYBudgetary Comparison Schedule
East Garrison Capital ProjectsFor the Fiscal Year Ended June 30, 2019
Budgeted Amounts
Original Final Actual AmountsVariance withFinal Budget
Revenues:Revenue from use of money and property $ - $ - $ 16,194 $ 16,194Charges for services 1,100,000 1,100,000 - (1,100,000)Miscellaneous revenues 352,000 352,000 296,487 (55,513)
Total revenues 1,452,000 1,452,000 312,681 (1,139,319)
Expenditures:Capital outlay 1,452,000 1,452,000 241,008 1,210,992
Total expenditures 1,452,000 1,452,000 241,008 1,210,992Excess (deficiency) of revenues over
(under) expenditures - - 71,673 71,673
Other financing sources (uses):Transfers out (358,727) (358,727) (358,727) -
Total other financing sources (uses) (358,727) (358,727) (358,727) -
Net change in fund balances (358,727) (358,727) (287,054) 71,673Fund balances, beginning 713,920 713,920 713,920 -Fund balance, ending $ 355,193 $ 355,193 $ 426,866 $ 71,673
144

INTERNAL SERVICE FUNDS
Internal service funds are used to account for the financing of goods or services provided by onedepartment or agency to other departments, or agencies of the County, or to other governments on a cost-reimbursement basis. Financing requirements are based upon actuarial studies that provide severalscenarios that estimate ultimate losses. The County has adopted policies to fund each of these funds atthe 70% confidence level. Each participant department of the fund’s services contributes to the recoveryof expenses based on the participant department’s loss history and exposure to risk. All funds aremanaged by the Risk Management Division of the County Administrative Office.

INTERNAL SERVICE FUNDS
General Liability Fund – Created to provide for all liability judgments, settlements, and claims against theCounty, including claims that are not covered by the County’s excess insurance policy.
Workers Compensation Fund – Created to provide for all workers compensation judgments, settlements, andclaims against the County, including prevention expenses and the Return-to-Work program.
Benefit Programs Fund – Created to provide for various benefit programs supported by contributions fromCounty departments, employees and retired employees. Programs include Dental and Vision Benefits foremployees and dependents, Employee Assistance, Long Term Disability, Retiree Sick Leave Conversion andother miscellaneous programs.
Resource Planning Fund – Created to provide funds for capital projects that require replacement, maintenance,or upgrades during the life of the asset. The fund serves to establish a capital funding process, generating fundsover the life of an asset, and thereby minimizing fiscal impacts to operations.
145

COUNTY OF MONTEREYCombining Statement of Net Position
Internal Service FundsJune 30, 2019
GeneralLiability Fund
Worker'sComp Fund
BenefitPrograms Fund
ResourcePlanning Total
AssetsCurrent assets:
Cash and cash equivalents $ 6,523,963 $ 81,993,483 $ 11,963,617 $ 4,154,294 $ 104,635,357Other bank accounts 2,900,000 1,636,707 439,001 - 4,975,708Receivables (net) 213,029 611,480 - - 824,509Due from other funds 567,081 - - - 567,081Prepaid expenses 122,573 - - - 122,573
Total current assets 10,326,646 84,241,670 12,402,618 4,154,294 111,125,228
Noncurrent assets:Advances to other funds 2,573,676 - - - 2,573,676Capital assetsDepreciable, net - - - 19,859,609 19,859,609
Total noncurrent assets 2,573,676 - - 19,859,609 22,433,285Total assets 12,900,322 84,241,670 12,402,618 24,013,903 133,558,513
LiabilitiesCurrent liabilities:
Accounts payable, deposits and accrued liabilities 102,246 1,145,201 195,331 248,554 1,691,332Other liabilities - - 280,467 - 280,467Current portion of claims liability 6,828,956 13,670,944 1,178,505 - 21,678,405Current portion of long-term debt 1,274,448 - - - 1,274,448
Total current liabilities 8,205,650 14,816,145 1,654,303 248,554 24,924,652Long-term liabilities:
Claims liability 8,818,499 62,103,900 - - 70,922,399Bonds and notes payable 3,233,018 - - - 3,233,018
Total long-term liabilities 12,051,517 62,103,900 - - 74,155,417Total liabilities 20,257,167 76,920,045 1,654,303 248,554 99,080,069
Net position:Net investment in capital assets - - - 19,859,609 19,859,609Unrestricted (deficit) (7,356,845) 7,321,625 10,748,315 3,905,740 14,618,835
Total net position $ (7,356,845) $ 7,321,625 $ 10,748,315 $ 23,765,349 $ 34,478,444Total liabilities and net position $ 12,900,322 $ 84,241,670 $ 12,402,618 $ 24,013,903 $ 133,558,513
146

COUNTY OF MONTEREYCombining Statement of Revenues, Expenses and Changes in Net Position
Internal Service FundsFor the Fiscal Year Ended June 30, 2019
GeneralLiability
FundWorker's
Comp Fund
BenefitPrograms
FundResourcePlanning Total
Operating revenues:Charges for services $ 12,058,002 $ 20,476,000 $ 6,348,425 $ 3,353,618 $ 42,236,045Other operating revenues 28 5,588,936 5,165,263 - 10,754,227
Total operating revenues 12,058,030 26,064,936 11,513,688 3,353,618 52,990,272
Operating expenses:Salaries and benefits - - 4,996,449 - 4,996,449Services and supplies 6,000,434 4,449,619 1,021,062 274,255 11,745,370Claims expense 10,167,260 22,537,513 6,512,095 - 39,216,868Depreciation - - - 5,282,237 5,282,237Other expenses 310,765 29,973 26,646 (5,193) 362,191
Total operating expenses 16,478,459 27,017,105 12,556,252 5,551,299 61,603,115Net operating income (loss) (4,420,429) (952,169) (1,042,564) (2,197,681) (8,612,843)
Non-operating revenues (expenses):Interest income 391,830 1,647,441 307,641 15,099 2,362,011Interest expense (258,460) - - - (258,460)Other non-operating revenues - - - (322,559) (322,559)
Total non-operating revenues (expenses) 133,370 1,647,441 307,641 (307,460) 1,780,992Net income (loss) before transfers and capital
contributions (4,287,059) 695,272 (734,923) (2,505,141) (6,831,851)
Transfers in 32,123 - - 6,340,441 6,372,564Change in net position (4,254,936) 695,272 (734,923) 3,835,300 (459,287)
Net position, beginning of year (3,101,909) 6,626,353 11,483,238 19,930,049 34,937,731
Net position, end of year $ (7,356,845) $ 7,321,625 $ 10,748,315 $23,765,349 $ 34,478,444
147

COUNTY OF MONTEREYCombining Statement of Cash Flows
Internal Service FundsFor the Fiscal Year Ended June 30, 2019
GeneralLiability Fund
Worker'sComp Fund
BenefitPrograms
FundResourcePlanning Total
Cash flows from operating activitiesCash receipts from customers $ 28 $ 5,588,936 $ 5,165,263 $ - $ 10,754,227Cash receipts from interfund charges 11,847,661 20,060,747 6,348,813 3,387,668 41,644,889Cash paid to employees for services - - (4,630,684) - (4,630,684)Cash paid to suppliers for goods and services (14,488,129) (22,266,356) (7,873,483) (425,393) (45,053,361)Cash paid to other funds for services provided (1,722,249) (843,903) (253,903) 5,194 (2,814,861)
Net cash provided by operating activities (4,362,689) 2,539,424 (1,243,994) 2,967,469 (99,790)
Cash flows from noncapital financingactivities:
Transfers from other funds 32,123 - - 6,340,441 6,372,564Due from other funds (27,602) - - - (27,602)Due to other funds - - - (3,004,433) (3,004,433)
Net cash provided (used) by noncapitalfinancing activities 4,521 - - 3,336,008 3,340,529
Cash flows from capital and relatedfinancing activities:
Collection of advances 567,082 - - - 567,082Principal payments on COPS, bonds and loans (1,212,419) - - - (1,212,419)Interest payments on COPS, bonds and loans (258,460) - - - (258,460)Payments related to acquisition of capital
assets - - - (1,841,723) (1,841,723)Collections related to dispositions of capital
assets - - - (322,559) (322,559)
Net cash provided (used) by capital andrelated financing activities (903,797) - - (2,164,282) (3,068,079)
Cash flow from investing activitiesInterest payments received 391,830 1,647,441 307,641 15,099 2,362,011
Net cash provided (used) by investingactivities 391,830 1,647,441 307,641 15,099 2,362,011
Net increase (decrease) in cash and cash equivalents (4,870,135) 4,186,865 (936,353) 4,154,294 2,534,671Cash and cash equivalents, July 1 14,294,098 79,443,325 13,338,971 - 107,076,394Cash and Cash Equivalents, June 30 9,423,963 83,630,190 12,402,618 4,154,294 109,611,065
Reconciliation of cash and cash equivalentsto Statement of net position
Cash and cash equivalents 6,523,963 81,993,483 11,963,617 4,154,294 104,635,357Other bank accounts 2,900,000 1,636,707 439,001 - 4,975,708
Total cash and cash equivalents 9,423,963 83,630,190 12,402,618 4,154,294 109,611,065
continued148

COUNTY OF MONTEREYCombining Statement of Cash Flows
Internal Service FundsFor the Fiscal Year Ended June 30, 2019
GeneralLiability Fund
Worker'sComp Fund
BenefitPrograms
FundResourcePlanning Total
Reconciliation of operating income to netcash provided by operating activities:
Operating income (loss) (4,420,429) (952,169) (1,042,564) (2,197,681) (8,612,843)Adjustments to reconcile operating income to
net cash provided (used) by operatingactivities:Depreciation and amortization - - - 5,282,237 5,282,237(Increase) decrease in accounts receivable (210,341) (415,253) 388 34,050 (591,156)Increase (decrease) in accounts payable (36,234) 264,666 (254,808) (151,137) (177,513)Increase (decrease) in accrued liabilities - - (47,782) - (47,782)Increase (decrease) in claims liability 304,315 3,642,180 100,772 - 4,047,267Total adjustments 57,740 3,491,593 (201,430) 5,165,150 8,513,053Net cash provided (used) by operating
activities $ (4,362,689) $ 2,539,424 $ (1,243,994) $ 2,967,469 $ (99,790)
149

AGENCY FUNDS

This page intentionally left blank

COUNTY OF MONTEREYCombining Statement of Changes in Assets and Liabilities
Agency FundsFor the Fiscal Year Ended June 30, 2019
BalanceJuly 1, 2018 Additions Deductions
BalanceJune 30, 2019
Clearing and revolving fundsAssets:
Cash and investments held in County Treasury $ 8,616,913 $ - $ 7,102,746 $ 1,514,167Total assets $ 8,616,913 $ - $ 7,102,746 $ 1,514,167
Liabilities:Accounts payable $ 2,936,179 $ - $ 1,422,011 $ 1,514,168Assets held as agency for others 5,680,734 - 5,680,734 -
Total liabilities $ 8,616,913 $ - $ 7,102,745 $ 1,514,168Taxes and interest
Assets:Cash and investments held in County Treasury $ 2,516,625 $ - $ 2,516,625 $ -Taxes receivable 26,178,724 4,031,028 - 30,209,752
Total assets $ 28,695,349 $ 4,031,028 $ 2,516,625 $ 30,209,752Liabilities:
Accounts payable $ 22,036 $ 6,049 $ - $ 28,085Due to other funds - 5,681,915 - 5,681,915Assets held as agency for others 28,673,313 - 4,173,560 24,499,753
Total liabilities $ 28,695,349 $ 5,687,964 $ 4,173,560 $ 30,209,753Departmental
Assets:Cash and investments held in County Treasury $ 14,138,597 $ 1,346,618 $ - $ 15,485,215Other bank accounts 4,997,301 526,704 - 5,524,005Due from other funds - 5,681,915 - 5,681,915
Total assets $ 19,135,898 $ 7,555,237 $ - $ 26,691,135Liabilities:
Accounts payable $ 29,533 $ 111,002 $ - $ 140,535Assets held as agency for others 19,106,365 7,444,236 - 26,550,601
Total liabilities $ 19,135,898 $ 7,555,238 $ - $ 26,691,136
continued150

COUNTY OF MONTEREYCombining Statement of Changes in Assets and Liabilities
Agency FundsFor the Fiscal Year Ended June 30, 2019
BalanceJuly 1, 2018 Additions Deductions
BalanceJune 30, 2019
TransitAssets:
Cash and investments held in County Treasury $ 3,359,217 $ - $ 2,039,183 $ 1,320,034Total assets $ 3,359,217 $ - $ 2,039,183 $ 1,320,034
Liabilities:Assets held as agency for others $ 1,093,200 $ 226,834 $ - $ 1,320,034
Total liabilities $ 1,093,200 $ 226,834 $ - $ 1,320,034
Community Facilities DistrictsAssets:
Cash and investments held in County Treasury $ 9,475 $ 7,151 $ - $ 16,626Total assets $ 9,475 $ 7,151 $ - $ 16,626
Liabilities:Assets held as agency for others 9,475 7,151 - 16,626
Total liabilities $ 9,475 $ 7,151 $ - $ 16,626
Total all agency fundsAssets:
Cash and investments held in County Treasury $ 26,374,810 $ 1,353,769 $ 11,658,554 $ 18,336,043Other bank accounts 4,997,301 526,704 - 5,524,005Taxes receivable 26,178,724 4,031,028 - 30,209,752Due from other funds - - - 5,681,915
Total assets $ 57,550,835 $ 5,911,501 $ 11,658,554 $ 59,751,715Liabilities:
Accounts payable $ 2,987,748 $ 117,051 $ 1,422,011 $ 1,682,788Due to other funds - - - 5,681,915Assets held as agency for others 54,563,087 7,671,070 9,854,294 52,387,013
Total liabilities $ 57,550,835 $ 7,788,121 $ 11,276,305 $ 59,751,716
151

DETAILED BUDGET SCHEDULES

This page intentionally left blank

COUNTY OF MONTEREYSchedule of Expenditures-Budget and Actual
GeneralFor the Fiscal Year Ended June 30, 2019
Budgeted Amounts
Original FinalActual
AmountsVariance withFinal Budget
General GovernmentAnnual County Audit $ 211,201 $ 45,261 $ 19,051 $ 26,210Architectural Services 532,026 532,026 485,204 46,822Assessor 6,300,137 6,555,137 5,861,376 693,761Auditor-Controller 456,040 642,548 458,044 184,504Board of Supervisors 3,992,324 3,992,324 3,927,926 64,398CAO - Administration / Finance / Budget (1,385,857) (1,353,833) (1,357,094) 3,261CAO Auxiliary Services 160,979 160,979 20,275 140,704CAO-Community Engagement & Strategic
Advocacy 492,767 665,699 551,681 114,018Clerk of the Board 912,793 912,793 783,508 129,285Contingencies 4,650,681 569,191 - 569,191Contracts & Purchasing (5,336) (5,336) (12,355) 7,019County Counsel 838,921 838,921 213,599 625,322County Memberships 889,776 889,776 782,222 107,554Courier & Mail Services (1,711) (1,711) (11,779) 10,068Development Set-Aside 1,987,454 1,987,454 1,987,454 -Elections 4,155,378 4,155,378 3,453,772 701,606Emergency Communications 10,975,981 12,120,645 11,476,247 644,398Enterprise Risk 195,000 710,000 176,127 533,873Equal Opportunity Office 278,501 130,570 43,643 86,927Facilities Services 861,029 861,029 (55,209) 916,238Fleet Operations 1,354,379 1,354,379 (1,665,303) 3,019,682Human Resources (728,511) (728,511) (851,330) 122,819Information Technology Systems 17,317,409 17,317,409 14,260,196 3,057,213Insurance & Other General Expenditures 77,500 287,375 100,410 186,965Intergovernmental / Legislative Affairs 1,161,462 1,288,506 1,194,869 93,637Other Financing Uses (2,780,136) (2,480,136) (5,482,497) 3,002,361Property Management 473,366 473,366 339,254 134,112Records Retention 15,528 328,508 279,019 49,489Risk Management - - 4 (4)Surveyor 1,212,808 1,212,808 1,070,733 142,075Treasurer - Tax Collector 8,017,504 8,017,504 7,081,079 936,425Utilities 3,920,564 3,920,564 3,572,533 348,031Special Districts Administration (1,430) (1,430) (10,197) 8,767
Total general government 66,538,527 65,399,193 48,692,462 16,706,731
continued152

COUNTY OF MONTEREYSchedule of Expenditures-Budget and Actual
GeneralFor the Fiscal Year Ended June 30, 2019
Budgeted Amounts
Original FinalActual
AmountsVariance withFinal Budget
Public Safety and ProtectionAgriculture Commissioner 11,122,745 11,196,789 10,653,640 543,149Animal Services 2,399,928 2,399,928 1,992,815 407,113Building Services 6,428,851 6,479,630 5,416,750 1,062,880Child Support Services 11,145,527 11,145,527 10,590,052 555,475Clerk-Recorder 2,495,845 2,637,303 2,558,693 78,610Contributions 3,710,847 3,910,847 3,692,096 218,751Courts 7,846,286 7,977,717 7,977,717 -District Attorney 26,016,876 26,403,181 25,942,468 460,713Economic Opportunity Administration 868,688 888,688 823,152 65,536Environmental Services 1,327,287 1,327,287 1,103,351 223,936Grand Jury 159,336 159,336 116,950 42,386Litter Control 377,086 502,086 470,565 31,521Office of Emergency Services 908,760 908,760 908,477 283Planning Services 4,439,012 4,674,136 4,285,202 388,934Probation 49,629,521 49,629,521 47,250,334 2,379,187Public Defender 13,051,840 13,051,840 12,135,078 916,762Public Guardian / Administrator 1,948,675 1,948,675 1,905,200 43,475RMA Administration 5,023,756 5,023,756 4,037,478 986,278Sheriff - Admin & Enforcement Ops 46,246,201 47,556,182 47,572,186 (16,004)Sheriff - Coroner Operations 2,287,012 2,287,012 2,287,011 1Sheriff - Custody Operations 46,324,674 46,324,674 46,309,359 15,315Sheriff - Inmate Medical Costs 9,727,842 9,727,842 9,725,416 2,426
Total public safety and protection 253,486,595 256,160,717 247,753,990 8,406,727
Health and SanitationChildren's Medical Services 5,163,704 5,163,704 4,396,955 766,749Clinic Services 54,085,367 58,035,538 49,181,805 8,853,733County Disposal Sites 223,474 223,474 181,217 42,257Emergency Medical Services 154,897 347,532 326,095 21,437Environmental Health 10,347,379 10,545,500 8,449,835 2,095,665Health Department Admininistration 1,456,486 1,456,486 1,621,700 (165,214)Public Health 19,650,282 19,650,282 16,772,944 2,877,338
Total health and sanitation 91,081,589 95,422,516 80,930,551 14,491,965
continued153

COUNTY OF MONTEREYSchedule of Expenditures-Budget and Actual
GeneralFor the Fiscal Year Ended June 30, 2019
Budgeted Amounts
Original FinalActual
AmountsVariance withFinal Budget
Public AssistanceCommunity Programs 1,647,737 2,054,158 2,057,055 (2,897)Entitlement Programs 74,033,180 75,043,337 70,468,860 4,574,477Entitlement Programs - Gen. Assistance 1,299,712 1,299,712 1,175,352 124,360Military & Veterans' Services 1,182,467 1,832,467 1,503,979 328,488Office for Employment & Training 2,061,619 2,061,619 2,024,269 37,350Senior & Aging Services 2,114,060 2,561,076 2,476,096 84,980Social Services 120,046,594 119,869,094 109,871,981 9,997,113
Total public assistance 202,385,369 204,721,463 189,577,592 15,143,871
EducationCooperative Extension Service 421,034 421,034 317,288 103,746
Total education 421,034 421,034 317,288 103,746
Recreation and Cultural ServicesParks 3,779,134 3,779,134 3,175,180 603,954Laguna Seca Track 15,854,150 15,854,150 23,651,282 (7,797,132)
Total recreation and culture services 19,633,284 19,633,284 26,826,462 (7,193,178)
Total general fund $ 633,546,398 $ 641,758,207 $ 594,098,345 $ 47,659,862
154

This page intentionally left blank

STATISTICAL SECTION

Statistical Section
The information in this section is not covered by the Independent Auditor’s Report, but is presented as supplemental datafor the benefit of the readers of the Comprehensive Annual Financial Report. The objectives of statistical sectioninformation are to provide financial statement users with additional historical perspective, context, and detail to assist inusing the information in the financial statements, notes to financial statements, and required supplementary information tounderstand and assess the County's economic condition.
Financial Trends
These schedules contain trend information to help the reader understand how the County’s financial performance and well-being have changed over time. (Schedule 1-4)
Revenue Capacity
These schedules contain information to help the reader assess the County’s most significant local revenue sources, propertytax and sales tax. (Schedule 5-10)
Debt Capacity
These schedules present information to help the reader assess the affordability of the County’s current levels of outstandingdebt and the County’s ability to issue additional debt in the future. (Schedule 11-13)
Demographic and Economic Information
These schedules offer demographic and economic indicators to help the reader understand the socioeconomic environmentwithin which the County’s financial activities take place. (Schedule 14-16)
Operating Information
These schedules contain service and infrastructure data to help the reader understand how the information in the County’sfinancial report relates to the services the County provides and the activities it performs. (Schedule 17-18)
155

Schedule 1COUNTY OF MONTEREYNet Position by Component,
Last Ten Fiscal Years (in thousands)(Accrual Basis of Accounting)
Fiscal Year2010 2011 2012 2013 2014 2015 2016 2017 2018 2019
Governmental activities:Net investment in capital assets 499,457 483,233 488,760 510,497 476,707 493,398 441,551 507,422 573,659 626,801Restricted 107,568 101,554 28,366 23,429 58,531 75,295 153,788 147,046 233,669 229,199Unrestricted 26,595 53,903 122,822 144,625 179,220 (157,025) (136,368) (157,830) (180,147) (159,315)Total Governmental Activities Net
Position 633,620 638,690 639,948 678,551 714,458 411,668 458,971 496,638 627,181 696,685
Business-type activities:Invested in capital assets, net of related
debt 49,185 49,257 52,590 56,799 64,921 76,209 74,272 78,269 75,026 77,653Restricted - - - - - 101 845 604 604 854Unrestricted 44,468 61,905 64,116 57,815 54,336 (39,095) (16,865) (10,842) (19,472) 43,117Total Business-Type Activities Net
Position 93,653 111,162 116,706 114,614 119,257 37,215 58,252 68,031 56,158 121,624
Total Primary government:Net investment in capital assets 548,642 532,490 541,350 567,296 541,628 569,607 515,823 585,691 648,685 704,454Restricted 107,568 101,554 28,366 23,429 58,531 75,396 154,633 147,650 234,273 230,054Unrestricted 71,063 115,808 186,938 202,440 233,556 (196,120) (153,233) (168,672) (199,619) (116,198)
Total Primary Government Net Position 727,273 749,852 756,654 793,165 833,715 448,883 517,223 564,669 683,339 818,310
Notes:1. Accounting standards require that net position be reported in the three components in the financial statements: net investment in capital assets;
restricted; and unrestricted. Net position are considered restricted when (1) externally imposed by creditors (such as debt covenants), grantors,contributor, or laws or regulations of other governments or (2) imposed by law through constitutional provisions or enabling legislation.
156

Schedule 2COUNTY OF MONTEREY
Changes in Net PositionLast Ten Fiscal Years (in thousands)
(Accrual Basis of Accounting)
Fiscal Year Ended June 30,2010 2011 2012 2013 2014 2015 2016 2017 2018 2019
Expense (by function)Governmental activities:
General government 89,451 63,092 65,283 68,114 62,834 64,747 60,364 52,580 57,968 $ 63,448Public safety and protection 168,427 188,103 195,539 202,351 215,556 225,461 230,062 255,735 288,016 294,152Public ways and facilities 47,463 46,695 28,340 28,382 30,513 29,676 31,793 37,027 35,677 29,885Health and Sanitation 123,966 126,050 125,339 123,088 133,639 147,810 162,094 184,533 193,742 213,880Public assistance 168,968 171,299 157,884 161,214 168,359 171,051 180,651 197,944 197,637 200,968Education 7,808 8,212 7,731 7,807 8,373 8,876 9,316 9,939 9,111 9,925Recreation and cultural services 10,963 8,855 4,934 4,485 5,342 6,041 6,441 11,850 19,103 26,695Interest on long-term debt 9,750 9,545 10,202 9,483 8,656 8,248 10,083 10,681 10,324 7,627
Total governmental activitiesexpenses 626,796 621,851 595,252 604,924 633,272 661,910 690,804 760,289 811,578 846,580Business-type activities:
Natividad Medical Center 205,760 169,335 176,269 179,531 184,553 213,033 234,616 263,623 294,713 308,181Parks and Lake Resort - 3,410 10,129 10,075 8,502 6,118 5,546 5,932 7,446 6,813
Total business type activitiesexpenses 205,760 172,745 186,398 189,606 193,055 219,151 240,162 269,555 302,159 314,994
Total primary government expenses 832,556 794,596 781,650 794,530 826,327 881,060 930,967 1,029,844 1,113,737 1,161,574
Program Revenues (by function)Governmental activities:Charges for services:
General government 25,187 27,033 22,950 24,166 22,855 25,265 26,482 28,828 31,088 $ 30,092Public safety and protection 18,753 27,856 37,752 38,503 38,654 41,729 43,159 42,071 46,943 42,230Public ways and facilities 19,700 18,126 3,391 3,875 3,309 3,715 4,984 2,803 3,379 3,063Health and sanitation 35,502 34,284 35,548 40,233 37,201 43,476 47,342 50,228 67,115 53,872Public assistance 1,591 2,102 3,122 2,231 2,574 - 107 223 1,618 2,866Education 381 698 411 323 149 157 154 155 156 134Recreation and cultural services 6,353 5,310 5,276 1,241 957 1,472 1,593 2,447 832 959Operating grants and
contributions 318,962 324,371 323,675 353,380 354,894 393,283 399,091 414,960 438,209 442,265Capital grants and contributions - 10,752 11,168 11,119 5,370 3,140 4,219 9,781 68,186 45,848
Total governmental activitiesrevenues 426,429 450,532 443,293 475,071 465,963 512,238 527,130 551,496 657,526 621,329
Business-type activities:Charges for services:
Natividad Medical Center 208,170 196,348 172,536 170,180 181,565 216,345 258,456 292,732 345,748 364,240Parks and Lake Resort - 1,045 8,476 7,325 4,727 2,874 3,833 4,340 6,066 4,359
Operating grants andcontributions - 5,455 160 941 96 - 2 26 23 88
Capital grants and contributions 11,156 - - 1,574 - 392 - - - -Total business-type activities
revenues 219,326 202,848 181,172 180,020 186,388 219,611 262,291 297,098 351,837 368,687Total primary government program
revenues 645,755 653,380 624,465 655,091 652,351 731,849 789,421 848,594 1,009,363 990,016
Net (expense) revenueGovernmental activities (200,367) (171,319) (151,959) (129,853) (167,309) (149,672) (163,674) (208,793) (154,052) (225,251)Business-type activities 13,566 30,103 (5,226) (9,586) (6,667) 460 22,129 27,543 49,678 53,693
Total primary net expense (186,801) (141,216) (157,185) (139,439) (173,976) (149,212) (141,545) (181,250) (104,374) (171,558)
157

Schedule 2COUNTY OF MONTEREY
Changes in Net PositionLast Ten Fiscal Years (in thousands)
(Accrual Basis of Accounting)
Fiscal Year Ended June 30,2010 2011 2012 2013 2014 2015 2016 2017 2018 2019
General Revenues & OtherChanges in Net PositionGovernmental activities:
Taxes:Property tax 130,817 128,310 126,298 124,796 128,477 135,415 143,365 150,772 159,373 $ 170,410Sales and use taxes 5,379 7,125 8,856 8,754 9,688 11,901 11,741 10,339 18,010 23,717Transient occupancy and otherTransient occupancy taxes 21,170 17,140 20,049 25,399 28,102 25,912 22,834 21,279 24,960 28,608Other taxes - - - - - - 12,857 15,678 27,620 29,672
21,170 17,140 20,049 25,399 28,102 25,912 35,691 36,957 52,580 58,280Unrestricted grants &
contributions 11,610 - - - - - - - - -Unrestricted interest and
investment earnings 4,091 3,058 7,661 7,779 8,666 10,517 12,160 15,842 21,842 31,283Miscellaneous 5,860 3,958 4,244 8,215 10,485 9,286 5,747 6,250 6,784 5,184Transfers (2,050) 12,889 (335) (6,488) (862) (1,898) 2,274 19,552 60,892 (6,430)Special item - (447) (13,557) - - - - - - -
Total governmental activities 176,877 172,033 153,216 168,455 184,556 191,132 210,978 239,712 319,481 282,444Business-type activities:
Unrestricted interest andinvestment earnings - 293 369 311 217 214 457 888 1,806 4,622
Miscellaneous - - 10,068 7,433 4,950 5,440 725 899 1,315 722Transfers - (12,889) 335 6,488 862 1,898 (2,274) (19,552) (60,892) 6,430
Total business-type activities - (12,596) 10,772 14,232 6,029 7,552 (1,091) (17,765) (57,770) 11,774
Total primary government 176,877 159,437 163,988 182,687 190,585 198,684 209,887 221,947 261,711 294,218
Change in Net PositionGovernmental activities (23,490) (28,334) 1,257 38,602 17,247 41,460 47,304 30,919 165,429 57,193Business-type activities 13,566 17,507 5,546 4,646 (638) 8,012 21,038 9,778 (8,092) 65,466
Total primary government (9,924) (10,827) 6,803 43,248 16,609 49,472 68,342 40,697 157,337 122,660
158

Schedule 3COUNTY OF MONTEREY
Fund Balances, Governmental FundsLast Ten Fiscal Years (in thousands)
(Modified Accrual Basis of Accounting)
2011 2010
General FundReserved 7,600 -Unreserved 80,731 -
Total general fund 88,331 -
All Other Governmental FundsReserved 20,764 -
Debt service 13,240 -Unreserved, reported in:
Special revenue funds 40,372 -Capital project funds 73,033 -Other designations 6,986 -
Total all other governmental funds 154,395 -
Total governmental funds balances 242,726 -
2012 2013 2014 2015 2016 2017 2018 2019
General FundNonspendable 196 262 251 371 328 433 574 662Restricted - 448 534 913 12,463 12,461 28,753 29,168Committed 52,293 60,293 60,293 70,293 73,893 45,300 62,500 91,461Assigned 37,065 38,329 39,275 62,598 56,181 76,633 80,031 81,488Unassigned 2,386 5,520 17,552 6,615 6,018 8,695 3,862 2,358
Total general fund 91,940 104,852 117,905 140,790 148,883 143,522 175,720 205,137
All Other Governmental FundsNonspendable 93 2,571 239 145 119 119 121 -Restricted 28,366 45,354 57,997 81,258 124,519 128,891 151,200 145,287Committed 1,932 3,510 6,932 9,801 12,280 15,994 19,032 22,298Assigned 70,316 63,770 58,005 51,571 57,560 84,383 81,219 75,974Unassigned (35) - - (15) (17) (3,506) (1,159) (62)
Total all other governmental funds 100,672 115,205 123,173 142,760 194,461 225,881 250,413 243,497
Total governmental funds balances 192,612 220,057 241,078 283,550 343,344 369,403 426,133 448,634
Notes:1. In FY 2010-11 the County implemented GASB 54 under which governmental fund balances are reported as nonspendable, restricted,
committed, assigned, and unassigned. FY 2009-10 fund balances have been recharacterized to comply with GASB54 in order to facilitate year-to-year comparisons.
159

Schedule 4COUNTY OF MONTEREY
Changes in Fund Balances, Governmental FundsLast Ten Fiscal Years(in thousands)
(Modified Accrual Basis of Accounting)
Fiscal Year Ended June 30,2010 2011 2012 2013 2014 2015 2016 2017 2018 2019
Revenues:Taxes 162,221 153,657 156,251 159,052 167,007 173,418 190,999 197,487 230,271 $ 251,060Licenses, permits, and franchises 11,144 14,546 13,864 17,155 18,587 20,831 20,545 21,427 26,282 22,234Fines, forfeitures, and penalties 10,398 9,735 9,769 10,216 8,486 9,447 9,807 8,979 9,563 9,702Revenue from use of money and
property 4,839 5,311 6,921 7,181 6,909 8,178 10,718 14,261 20,869 29,217Aid from other governmental
agencies 320,663 336,495 330,210 362,079 361,406 384,407 392,091 427,029 460,941 485,258Charges for services 92,417 81,543 79,050 73,073 77,780 84,808 93,608 95,387 111,148 97,894Miscellaneous revenues 9,055 9,076 8,950 12,966 12,125 11,618 8,295 9,348 11,389 9,754
Total revenues 610,737 610,363 605,015 641,722 652,300 692,708 726,064 773,918 870,463 905,119
Expenditures:Current:
General government 82,245 51,599 49,817 48,960 48,892 52,032 57,826 45,167 50,046 49,652Public protection 166,184 186,448 203,349 201,730 214,653 224,710 235,078 249,925 264,009 263,692Public ways and facilities 43,937 39,629 27,090 27,024 25,058 24,049 25,396 34,039 34,674 34,011Health and sanitation 123,491 125,794 125,564 127,261 132,906 147,202 165,157 178,813 187,639 206,033Public assistance 167,982 171,904 158,786 162,926 168,031 170,529 182,527 205,531 195,755 197,180Education 7,721 8,415 7,745 7,796 8,281 8,798 9,419 9,402 8,675 9,477Recreation and cultural
services 11,574 10,428 4,783 4,155 4,801 5,249 5,866 11,635 18,451 26,826Debt service:
Interest and debt service costs 8,953 8,676 9,311 8,913 8,157 7,868 9,359 9,504 9,855 8,293Principal 4,920 5,289 5,987 6,615 6,533 6,732 6,962 7,977 18,382 9,389
Capital outlay 34,949 11,206 12,868 12,549 10,182 23,462 23,559 32,319 79,827 66,396
Total expenditures 651,956 619,388 605,300 607,929 627,494 670,631 721,149 784,312 867,313 870,949Excess (deficiency) of revenue over
(under) expenditures (41,219) (9,025) (285) 33,793 24,806 22,077 4,915 (10,394) 3,150 34,170
Other financing sources (uses):Premium on issuance of debt 863 8,519 - - - - 3,970 - 15,037 3,690Inception of capital leases 85 - - - - - - - - -Transfers in 57,030 36,671 41,462 97,359 114,285 177,944 147,409 182,195 248,186 162,383Transfers out (57,030) (27,533) (41,797) (103,847) (116,484) (179,223) (145,135) (162,643) (187,780) (175,186)Lease proceeds - - - 60 - - - 17,240 126 -Issuance of debt - - - - - - 48,440 - 74,682 22,890Debt Defeasance - - - - - - - - - 25,532Capital lease - - - - - 32 - - - -Sale of capital assets 245 341 725 81 51 87 197 208 256 86Total other financing sources
(uses) 1,193 17,998 390 (6,347) (2,148) (1,160) 54,880 37,000 150,507 (11,669)
Special ItemSpecial items - - - - - (230) - - - -
Extraordinary item:Extraordinary items (2,171) (447) (13,593) - - - - - - -
Net change in fund balances: (42,197) 8,526 (13,488) 27,446 22,658 20,687 59,796 26,606 153,657 22,501Debt Service as a percentage of non-
capital expenditures %2.32 %2.33 %2.66 %2.68 %2.42 %2.28 %2.39 %2.42 %3.67 %2.26
(principal and interest) divided by (total expenditures less capital expenditures)Notes:1. 2010 Interest and Principal re-stated post CAFR.
160

Schedule 5COUNTY OF MONTEREY
Assessed Value and Actual Value of Taxable PropertyLast Ten Fiscal Years
(in thousands of dollars)
June 30Secured
RollUnsecured
Roll Exemptions
NetAssessed
Valuations
TotalDirect
Tax Rate2010 $ 50,655,874 $ 2,254,022 $ (1,679,121) $ 51,230,775 1.00%2011 48,774,186 2,116,423 (1,770,929) 49,119,680 1.00%2012 48,980,011 2,103,408 (1,856,776) 49,226,643 1.00%2013 49,595,091 2,122,678 (1,914,519) 49,803,250 1.00%2014 51,396,835 2,159,991 (2,009,761) 51,547,065 1.00%2015 54,354,520 2,231,717 (2,119,791) 54,466,446 1.00%2016 57,571,743 2,333,413 (2,196,512) 57,708,644 1.00%2017 60,242,461 2,370,771 (2,324,855) 60,288,377 1.00%2018 63,625,023 2,475,907 (2,455,639) 63,645,291 1.00%2019 67,593,587 2,557,084 (2,474,441) 67,676,230 1.00%
Source: Monterey County Property Tax Records
Notes:1. Secured property is generally the real property, which is defined as land, mineral, timber, and improvements such as buildings,
structures, crops, trees and vines. Also included in secured roll are unitary properties, including railroads and utilities, which cross thecountry and are assessed by the State Board of Equalization.
2. Unsecured property is generally personal property, including machinery, equipment, office tools, supplies, mobile homes,and aircraft.
3. Exempt properties include numerous full and partial exclusions/exemptions provided.4. Article XIIIA, added to the California Construction by Proposition 13 in 1978, fixed the based for valuation of property
subject to taxes at the full cash value. Additionally, Proposition 13 limits the property tax rate to 1% of assessed value,plus the rate necessary to fund local voter-approved bonds and special assessments.
161

Schedule 6COUNTY OF MONTEREYPrincipal Property Taxpayers
For the Fiscal Year Ended June 30, 2019 and June 30, 2010
2019 2010
Tax PayerType ofBusiness
TaxableAssessed
Value($'000) Rank
Percentage ofTotal County
AssessedValue
TaxableAssessed
Value ($'000) Rank
Percentage ofTotal County
AssessedValue
Pebble Beach Company Tourism - 1 -% - 2 -%
Pacific Gas & Electric Company Utility - 2 -% - 3 -%
Chevron USA Inc Petroleum - 3 -% - -
Dynergy Moss Landing LLC Utility - 4 -% - 1 -
Aera Energy LLC Utility - 5 -% - 5 -
D'Arrigo Bros Co Agriculture - 6 -% - 10 -%
Northridge Owner LP Retail - 7 -% - 9 -%
AAT Del Monte LLC Real Estate - 8 -% - -%
California-America Water Company Utility - 9 -% - 8.-
Scheid Vineyards California Inc Agriculture - 10 -% - -%
Texaco Inc Utility - - - 4 -%
Texaco Inc Utility - - - -%
Pacific Bell Telephone Company Utility - - - 6 -%
Pacific Oceanside Holding Real Estate - - - 7 -%
Pacific Wine Partners LLC Agriculture - - - -%
Ten Largest Taxpayers' Total - -% -%
All Other Taxpayers' Total - -% - -%
Total - -% - -%
Source: County of Monterey Property Tax Records
Note:For Total Taxable Assessed Value refer to Schedule 5 "Assessed Value and Actual Value of Taxable Property".
162

Schedule 7COUNTY OF MONTEREY
Property Tax Levies and CollectionsLast Ten Years
(in thousand of dollars)
(1) (2) (3) (4)FiscalYear
TaxesLevied
Collected within theFiscal Year of the Levy Collections Total Collections to Date
EndedJune 30
for theFiscal Year Amount
Percentageof Levy
inSubsequent
Years
Taxes LeviedCurrent andDelinquent Amount
Percentageof Levy
2010 $ 585,686 $ 565,453 %96.55 $ 24,288 $ 613,523 $ 589,741 %96.122011 566,445 552,997 %97.63 22,076 646,268 575,073 %88.982012 573,255 561,891 %98.02 12,842 619,428 574,733 %92.782013 582,546 572,426 %98.26 11,742 603,021 584,168 %96.872014 602,945 595,209 %98.72 11,067 601,215 606,276 %100.842015 638,813 631,178 %98.80 9,701 608,897 640,879 %105.252016 679,997 672,613 %98.91 10,070 627,324 682,683 %108.822017 708,862 701,198 %98.92 6,531 660,406 707,729 %107.172018 749,030 739,622 %98.74 6,834 700,507 746,456 %106.562019 800,083 787,856 %98.47 9,299 821,548 797,155 %97.03
Source: Monterey County Property Tax Records.
Notes: 1. Includes Secured, Unsecured, and Unitary Taxes levied for the county itself, school districts, cities and special districts
under the supervision of their own governing boards. Includes adjustments to the tax rolls from the levy date todelinquency date.
2. Includes amounts collected by the County on behalf of itself, school districts, cities and special districts underthe supervision of their own governing boards.
3. Includes adjustments to the levy. Taxes levied less collections to date equal the delinquent taxes receivable. 4. Includes taxes levied (current and delinquent) related to collections for the year.
163

Schedule 8COUNTY OF MONTEREY
Debt Service Tax Rate For County And Major Overlapping GovernmentPer $100 of Assessed Value
Last Ten Fiscal Years
For Fiscal Year Ended June 30,2019 2018 2017 2016 2015 2014 2013 2012 2011 2010
County direct ratesGeneral 14.592533 14.771872 14.676180 14.650911 14.741656 14.813889 14.813870 14.784135 14.751079 14.637790Library 1.160721 1.163969 1.161050 1.163189 1.170153 1.179298 1.177428 1.172425 1.164689 1.160636County Service Areas &
Sanitation 0.112473 0.114429 0.114835 0.137412 0.102427 0.153308 0.116691 0.117764 0.115144 0.039874Water Resources 0.358293 0.361855 0.363468 0.357201 0.358306 0.358991 0.361016 0.361484 0.362362 0.359210
City ratesCarmel 0.919484 0.928584 0.925324 0.917630 0.904430 0.913139 0.903411 0.827081 0.822621 0.802125Del Rey Oaks 0.073633 0.074358 0.075784 0.073900 0.072360 0.073054 0.072828 0.074288 0.077210 0.077751Gonzales 0.068991 0.072192 0.074007 0.074625 0.075226 0.076742 0.077329 0.078314 0.077412 0.080418Greenfield 0.053842 0.055499 0.056536 0.057209 0.060089 0.059165 0.058289 0.059535 0.059437 0.059250King City 0.129211 0.129605 0.129815 0.132241 0.133946 0.131165 0.130737 0.131056 0.135188 0.139766Marina 0.344972 0.364489 0.342913 0.342603 0.345570 0.375805 0.380745 0.381047 0.387057 0.380330Monterey 1.152602 1.143935 1.157047 1.155348 1.103643 1.158205 1.167624 1.179693 1.197878 1.170677
Pacific Grove 0.825886 0.824130 0.819703 0.805354 0.807166 0.821313 0.820216 0.807094 0.810753 0.796683Salinas 2.310360 2.343531 2.363633 2.341976 2.329014 2.263236 2.282341 2.292314 2.306384 2.353403Sand City 0.013088 0.013921 0.014689 0.015332 0.016233 0.017156 0.017815 0.018024 0.018044 0.017297Seaside 0.271064 0.273837 0.275050 0.275665 0.276836 0.277707 0.276452 0.279856 0.282226 0.274028Soledad 0.060610 0.059097 0.057585 0.057346 0.057528 0.053927 0.054407 0.055514 0.055508 0.057976
Successor agency rates 8.154961 7.734818 7.586144 8.367956 8.248791 8.026337 7.915752 8.008584 8.082739 8.482595
School district 60.826832 63.681940 61.357629 60.882411 61.016724 62.254048 62.677332 62.531706 62.474742 62.127529
Fire district rates 4.013157 3.947294 3.849456 3.755478 3.766515 3.800211 3.806164 3.840794 3.829219 3.870595
Other special districtrates 4.557387 4.596391 4.599152 4.436213 4.413387 4.458292 4.444871 4.438881 4.414108 4.387779
Source: Monterey County Records
164

Schedule 9COUNTY OF MONTEREY
(Unincorporated)Taxable Sales by Category
Last Ten Fiscal Years(amounts expressed in thousands)
Type of Business 2010 2011 2012 2013 2014 2015 2016 2017 2018 2019Apparel stores $ 8,865 $ 9,136 $ 9,027 $ 9,154 $ 9,255 $ 8,493 $ 8,661 $ 8,138 $ 8,248 $ 7,597General merchandise 3,578 1,599 1,592 1,593 1,649 1,748 1,719 1,837 618 395Packaged Liquor - - - 3,689 6,763 7,801 - - - -Food stores 50,928 50,849 51,776 51,658 54,887 58,200 56,359 46,171 45,371 45,219Furniture and appliances - - - 10,821 11,515 14,514 - - - -Eating and drinking places 72,054 73,180 67,903 67,564 73,437 73,350 82,741 90,783 87,238 95,187Building materials 102,333 109,815 123,689 127,745 139,121 144,064 125,980 131,715 134,741 148,293Auto dealers and suppliers 28,009 27,298 36,650 35,465 36,475 38,867 36,171 40,692 49,315 47,265Service stations 127,507 153,660 151,103 147,993 147,047 143,251 130,627 119,799 124,227 150,663Other retail stores 37,600 62,940 49,131 49,061 50,780 48,748 64,342 71,242 76,599 87,817All other outlets 412,485 359,381 384,214 388,015 428,300 500,605 526,970 543,916 566,652 712,970
Totals 843,359 847,858 875,085 892,758 959,229 1,039,641 1,033,570 1,054,293 1,093,009 1,295,406
County direct sales tax rate %0.08 %0.08 %0.08 %0.08 %0.08 %0.08 %0.08 %0.09 %0.08 %0.09
Source: State of California Board of Equalization and The HdL Companies
Notes:Due to confidentiality issues, the names of the ten largest revenue payers are not available. The categories presented are intended toprovide alternative information regarding the sources of the county's revenues.
Method changed from calendar to Fiscal Year in FY 10-11
165

Schedule 10COUNTY OF MONTEREY
Transient Occupancy TaxActual Receipts
Last Ten Fiscal Years
FiscalYear
AnnualRevenue ($)
GrowthRate
2010 13,312,712 -8.40%2011 14,249,048 7.03%2012 16,722,512 17.36%2013 17,945,479 7.31%2014 19,881,258 10.79%2015 21,479,840 8.04%2016 22,834,344 8.04%2017 21,279,324 -6.81%2018 24,959,537 -6.81%2019 28,607,881 14.62%
Source:Monterey County Treasurer- Tax Collector Transient Occupancy Tax StatementsFinancial system data effective FY 2019
166

Schedule 11COUNTY OF MONTEREY
Ratios of Outstanding Debt by TypeLast 10 years (in thousands, except per capita)
As of Fiscal Year 2018 - 19
Governmental Activities Business-Type Activities
FiscalYear
Certificatesof
ParticipationCapitalLeases
RDANotes
RevenueBonds
LongTermLoans
SpecialAssessment
Bonds
GeneralObligation
Bonds
JudgmentObligation
Bonds
Certificatesof
ParticipationCapitalLeases
LongTermLoans
TotalPrimaryGov (1)
PerCapita
(2)
Percentageof
PersonalIncome (2)
2010 132,800 256 36 33,848 43,365 150 - 3,275 67,995 83 - 281,808 687 %1.622011 137,689 151 36 33,241 41,445 143 - 2,505 66,615 - 13,571 295,396 712 %1.682012 133,385 459 - 32,613 39,543 136 - 1,705 63,890 - 10,666 282,397 669 %1.632013 128,870 132 - 31,957 37,594 129 - 870 61,070 - 7,699 268,321 629 %1.462014 124,134 76 - 31,277 35,597 121 - - 58,130 - 4,668 254,003 592 %1.322015 119,182 76 - 30,356 33,549 113 - - 55,055 - 1,573 239,904 556 %1.212016 168,120 52 - 30,294 31,447 104 - - 52,889 - - 282,906 652 %1.312017 161,701 16,507 - 29,526 29,289 94 - - 49,350 - - 286,467 658 %1.252018 144,115 15,801 - 28,339 27,071 83 - - 45,143 - - 260,552 595 %1.092019 138,218 14,900 - 25,575 24,790 72 - - 41,469 - - 245,024 658 %1.00
Note: Details regarding the County's outstanding debt can be found in the notes to the financial statements.
(1) Includes all debt shown for Government and Business-Type Activities(2) Population and total personal income can be found in Schedule 15 - Demographics and Economic Statistics
167

Schedule 12COUNTY OF MONTEREY
Legal Debt Margin Information Last 10 Fiscal Years (in thousands)
Legal Debt Margin Calculation for Fiscal Year Ended June 30, 2019Net assessed value 67,676,230Debt Limit 1.25% of net assessed value $845,953Debts applicable to limit:
General Obligation bonds $0Less:Amount set aside for $0repayment of debt $0
Net debt applicable to limit $0Legal Debt Margin $ 845,953
Fiscal Year Ended June 30Fiscal Year 2019 2018 2017 2016 2015 2014 2013 2012 2011 2010Debt Limit 845,953 795,566 753,605 721,358 680,831 644,338 622,541 615,333 613,996 640,385Less: Total Net Debt
Applicable to Limit 0 0 0 0 0 0 0 0 0 -
Legal Debt Margin 845,953 795,566 753,605 721,358 680,831 644,338 622,541 615,333 613,996 640,385
Total net debt applicable to thelimit as a percentage of debtlimit %0.0 %0.0 %0.0 %0.0 %0.0 %0.0 %0.0 %0.0 %0.0 %0.0
Notes:1. Article XIII A of the California State Constitution and Senate Bill 1656, Statutes of 1978, provided for changing assessed value from 25%
of cash value to full cash value. Hence, the 5% limitation on general obligation bond indebtedness imposed by Section 29909 of theGovernment Code became 1.25% of assessed value
2. For net assessed value refer to Schedule 5 "Assessed Value and Actual Value of Taxable Property"3. Re-Stated due to 2010 misstated Assessed Values, corrected post 09/10 CAFR.
168

Schedule 13COUNTY OF MONTEREY
Pledged Revenue CoverageLast Ten Fiscal Years
As of Fiscal Year 2018 - 19
Sanitation Revenue Bonds Water Revenue Bonds Special Assessment BondsDebt Service Debt Service Debt Service
Fiscal YearEnded June
30
SanitationCharges and
Other
Less:Operating Expenses
NetAvailableRevenue Principal Interest Coverage
WaterCharges and
Other
Less:Operating Expenses
NetAvailableRevenue Principal Interest Coverage
SpecialAssessmentCollections Principal Interest Coverage
2010 $ 1,312,106 $ 1,115,506 $ 196,600 $ 53,000 $ 51,500 $ 1.88 $ 2,028,699 $ 912,582 $ 1,116,117 $ - $1,597,913 $ 0.70 $ 14,696 $ 6,000 $ 9,754 $ 0.932011 1,204,279 1,321,821 (117,542) 57,000 48,750 (1.11) 2,110,335 4,077 2,106,258 550,000 1,586,913 0.99 14,714 7,000 9,499 0.892012 1,257,397 1,320,702 (63,305) 59,000 45,350 (0.61) 2,050,681 4,277 2,046,404 570,000 1,564,513 0.96 14,402 7,000 8,888 0.912013 1,166,240 1,236,358 (70,118) 62,000 42,950 (0.67) 2,107,965 3,902 2,104,063 595,000 1,544,188 0.98 14,314 7,000 8,437 0.932014 1,611,549 1,158,715 452,834 66,000 39,850 4.28 2,137,961 - 2,137,961 615,000 1,522,963 1.00 14,596 8,000 7,958 0.912015 1,011,695 1,295,122 (283,427) 48,000 24,850 (3.89) 2,267,256 3,902 2,263,354 640,000 1,497,863 1.06 15,252 8,000 7,448 0.992016 979,530 1,503,832 (524,302) 51,000 22,450 (7.14) 2,249,065 3,400 2,245,665 670,000 1,468,313 1.05 14,334 9,000 6,907 0.902017 1,452,013 1,603,607 (151,594) 54,000 19,900 (2.05) 2,341,265 3,095 2,338,170 700,000 1,434,063 1.10 15,209 10,000 6,301 0.932018 882,996 1,356,076 (473,080) 56,000 17,200 (6.46) 2,196,936 3,095 2,193,841 735,000 1,402,781 1.03 15,466 11,000 5,632 0.932019 1,160,334 1,361,546 (201,212) 59,000 14,400 (2.74) 2,280,951 - 2,280,951 1,030,000 693,220 1.32 13,947 11,000 4,930 0.88
Note: Details regarding the County's outstanding debt can be found in the notes to the financial statements. Sanitation, Water, and Other charges include property tax revenues andinvestment earnings. Where expenses exceed revenues in any one year, excess revenues from prior years (Fund Balance) were used to meet debt requirements.
169

Schedule 14COUNTY OF MONTEREY
Direct and Overlapping Bonded DebtAs of June 30, 2019
2018-19 Assessed Valuation (includes unitary utility valuation) $ 67,676,230
DIRECT AND OVERLAPPING TAX AND ASSESSMENT DEBT (1)PercentageApplicable
Debt atJune 30, 2019
Hartnell Community College District %99.820 $ 203,255,148Monterey Peninsula Community College District 100 124,803,522Carmel Unified School District 100 23,738,445Monterey Peninsula Unified School District 100 231,313,610North Monterey County Unified School District 100 32,525,000Pacific Grove Unified School District 100 41,506,000Soledad Unified School District 100 55,148,859South Monterey County Joint Union High School District 98.864 26,189,074Salinas Union High School District and School Facilities Improvement District 100 95,277,176Alisal Union School District 100 59,498,205Greenfield Union School District 100 31,205,830Salinas City School District 100 41,601,475Santa Rita Union School District 100 20,241,975Washington Union School District 100 10,610,000Other School Districts Various 44,921,015City of Marina 100 7,195,000Soledad Community Hospital District 100 210,000Community Facilities Districts 100 12,667,542City 1915 Act Bonds 100 8,460,000Special District 1915 Act Bonds 100 3,765,000Monterey County Water Resources Agency Benefit Assessment District Zone 2C 100 25,319,436Monterey County Special Assessment Bonds 100 72,000TOTAL DIRECT AND OVERLAPPING TAX AND ASSESSMENT DEBT $ 1,099,524,312
DIRECT AND OVERLAPPING GENERAL GOVERNMENT DEBT: (1)PercentageApplicable
Debt atJune 30, 2019
Monterey County Certificates of Participation %100 $ 138,218,431Monterey County Revenue Bonds 100 256,000Monterey County Notes Payable 100 4,507,464Monterey County Loans Payable 100 20,282,877Monterey County Capital Leases 100 14,899,549Monterey County Board of Education Certificates of Participation 100 1,415,000North Monterey County Unified School District Certificates of Participation 100 4,975,000South Monterey County Joint Union High School District General Fund Obligations 98.864 9,925,946Other School District General Fund Obligations Various 48,168,048City of Carmel General Fund Obligations 100 5,215,000City of Carmel Pension Obligation Bonds 100 2,605,000City of Gonzales General Fund Obligations 100 6,619,574City of Greenfield General Fund Obligations 100 1,103,330City of Monterey General Fund Obligations 100 5,920,000City of Pacific Grove Pension Obligation Bonds 100 6,227,042City of Salinas Certificates of Participation 100 114,054,378City of Seaside Cutino Park Lease Revenue Bonds 100 5,060,000City of Seaside Measure X Lease Revenue Bonds 100 11,020,000City of Seaside Pension Obligation Bonds 100 3,825,000Monterey County Fire Protection District Pension Obligation Bonds 100 6,045,000Pajaro/Sunny Mesa Community Services District Genreal Fund Obligations 100 275,000
TOTAL GROSS DIRECT AND OVERLAPPING GENERAL GOVERNMENT DEBT - 410,617,639Less: City of Seaside Measure X Lease Revenue Bonds supported by sales tax revenues - 11,020,000TOTAL NET DIRECT AND OVERLAPPING TAX AND ASSESSMENT DEBT $ 399,597,639
OVERLAPPING TAX INCREMENT DEBT (Successor Agencies) 100 $ 49,045,554
TOTAL DIRECT DEBT $ 203,555,757TOTAL GROSS OVERLAPPING DEBT 1,355,631,750
170

Schedule 14COUNTY OF MONTEREY
Direct and Overlapping Bonded DebtAs of June 30, 2019
TOTAL NET OVERLAPPING DEBT 1,344,611,750GROSS COMBINED TOTAL DEBT 1,559,187,507NET COMBINED TOTAL DEBT (2) $ 1,548,167,507
Ratios to 2018-2019 Assessed Valuation: Total Direct and Overlapping Tax and Assessment Debt %1.62Total Direct Debt (203,555,757) %0.30Gross Combined Total Debt %2.30Net Combined Total Debt %2.29
Ratios to Redevelopment Incremental Valuation ($5,439,840,500):Total Overlapping Tax Increment Debt %0.90
Notes:1. Percentage of overlapping debt applicable to county is estimated using taxable assessed property value. Applicable percentages
were estimated by determining the portion of the overlapping district's assessed value that is within the boundaries of thecounty divided by the district's total taxable assessed value.
2. Excludes tax and revenue anticipation notes, enterprise revenue, mortgage revenue, and tax allocation bonds andnon-bonded capital lease obligations.
171

Schedule 15COUNTY OF MONTEREY
Demographics and Economic StatisticsLast Ten Fiscal Years
(1) (2) (3) (4) (5) (6)Calendar
Year PopulationPer Capita
IncomeTotal Personal
IncomeMedian
AgeSchool
EnrollmentUnemployment
Rate
2009 410,370 $ 42,356 $ 17,381,644 32 70,523 %11.82010 415,057 42,176 17,574,000 33 70,949 %12.82011 421,898 41,138 17,355,940 33 72,666 %12.42012 426,762 43,034 18,365,298 33 73,460 %11.42013 428,826 44,851 19,233,171 33 74,684 %10.12014 431,344 46,109 19,889,054 34 75,997 %9.12015 433,898 49,836 21,623,627 34 76,768 %8.12016 435,232 52,448 22,827,059 34 77,517 %7.62017 437,907 54,395 23,819,797 34 77,954 %7.22018 435,594 56,193 24,477,179 35 77,923 %4.7
Sources:1. U.S. Census Bureau-As of July 1, 2018, Released March 20192. U.S. Department of Commerce, Bureau of Economic Analysis3. U.S. Department of Commerce, Bureau of Economic Analysis (in thousands).4. U.S. Census Bureau, American Community Survey5. California Department of Education, Education Demographics Unit for 2018-196. California Employment Development; Labor Market Info Division
Notes:Population data estimates are as of July 2019
Per capita personal income was computed using preliminary Census Bureau midyear population estimates.Total personal income is in thousand of dollarsSchool enrollment data includes Kindergarten through grade 12Unemployment rate is based on annual rate
172

Schedule 16COUNTY OF MONTEREY
Major Industries by Number of Businesses, Employees and PayrollLast Ten Years
MSA and Industry2009Total
2010Total
2011Total
2012Total
2013Total
2014Total
2015Total
2016Total
2017Total
2018Total
SALINAS MSATotal
No.of Businesses 11,770 10,668 12,022 11,195 11,717 12,123 12,180 12,274 12,681 13,380No.of Employees 146,140 148,321 150,224 155,869 158,846 166,546 170,385 170,383 173,386 178,844Payroll (in thousands) 1,283,015 1,341,043 1,406,249 1,450,658 1,507,712 1,585,102 1,684,581 1,823,620 1,868,529 1,946,321
AgricultureNo.of Businesses 546 529 529 532 540 546 539 520 530 548No.of Employees 54,635 56,258 58,401 60,673 62,874 66,033 67,029 66,347 67,159 69,481Payroll (in thousands) 380,582 416,294 448,534 472,663 520,761 557,753 596,901 658,994 675,089 702,286
UtilitiesNo.of Businesses 21 19 20 21 21 22 20 20 20 21No.of Employees 500 482 557 868 872 763 789 784 804 788Payroll (in thousands) 11,086 10,735 14,754 19,317 21,089 18,131 20,427 21,753 22,014 21,481
Construction and MiningNo.of Businesses 930 866 824 787 825 857 886 914 951 1,049No.of Employees 4,578 4,314 3,997 4,673 4,823 5,080 5,538 6,067 6,416 6,790Payroll (in thousands) 59,777 54,275 51,117 58,685 62,188 65,513 75,409 91,161 94,666 101,151
ManufacturingNo.of Businesses 255 256 244 248 265 267 259 264 271 289No.of Employees 5,861 5,457 5,869 5,287 5,439 5,337 5,685 5,529 5,759 5,538Payroll (in thousands) 56,038 57,445 66,066 63,429 59,826 60,774 65,737 69,340 73,079 69,305
Wholesale TradeNo.of Businesses 402 391 377 377 368 386 384 375 366 375No.of Employees 4,940 5,281 5,120 5,480 5,227 5,496 5,459 5,548 5,868 5,923Payroll (in thousands) 74,947 79,735 83,299 88,422 92,922 88,835 94,037 101,499 99,856 101,941
Retail TradeNo.of Businesses 1,221 1,227 1,200 1,195 1,175 1,227 1,199 1,212 1,188 1,199No.of Employees 14,877 15,251 15,530 15,812 16,144 16,146 16,366 16,356 16,241 16,684Payroll (in thousands) 107,453 111,004 122,602 120,195 120,072 123,709 128,116 134,773 134,980 141,741
Transportation and WarehousingNo.of Businesses 241 239 227 230 239 253 269 266 283 313No.of Employees 3,032 2,942 2,715 3,085 3,309 3,847 3,907 3,817 3,493 3,352Payroll (in thousands) 34,856 36,081 36,164 37,895 40,049 45,023 48,726 46,978 45,508 44,062
InformationNo.of Businesses 98 106 99 102 102 93 84 88 87 93No.of Employees 1,671 1,619 1,532 1,525 1,517 1,361 1,325 1,126 1,036 1,028Payroll (in thousands) 24,735 23,894 24,061 23,229 23,947 21,563 23,019 17,431 15,534 14,268
Finance and InsuranceNo.of Businesses 363 367 363 345 333 341 333 354 349 366No.of Employees 2,857 2,630 2,528 2,480 2,235 2,136 2,247 2,354 2,430 2,514Payroll (in thousands) 47,648 46,824 43,452 46,190 43,238 41,400 45,027 49,584 51,645 51,634
Real Estate, Rental and LeasingNo.of Businesses 393 386 360 369 380 396 387 382 390 421No.of Employees 1,730 1,745 1,654 1,753 1,639 1,743 1,781 1,803 1,933 2,032Payroll (in thousands) 15,087 15,752 17,044 17,891 18,071 18,431 20,113 22,487 22,408 24,369
ServicesNo.of Businesses 7,300 7,509 7,779 6,989 7,469 7,735 7,820 7,879 8,246 8,706No.of Employees 51,459 52,342 52,321 54,233 54,767 58,604 60,259 60,652 62,247 64,714Payroll (in thousands) 470,805 489,004 499,157 502,741 505,549 543,970 567,068 609,620 633,751 674,084
Source: Employment Development, Labor Market Information
173

Schedule 16COUNTY OF MONTEREY
Major Industries by Number of Businesses, Employees and PayrollLast Ten Years
Notes:1. Data are confidential if there are fewer that 3 businesses in a category or one employer makes up 80 percent or more of the employment
in a category2. Data are suppressed because confidential data could be extrapolated if these totals were included3. Figures are as per third quarter of the calendar year.4. Data do not include totals of government employment5. Rules instituted by the Federal Bureau of Labor Statistics after September 11, prohibit state departments of labor or
economic security from publicly identifying the names of individual employers. County of Monterey has removed theMajor Employers' data from the statistical section. GASB Statement No 44 allows employment by industry data to bepublished insead of Major Employers' data.
6. Mining industry has been combined with the Construction industry starting in 2009
174

Schedule 17COUNTY OF MONTEREY
Full-Time Equivalent County Government Employees by Function/ProgramApproved Budget Positions
Fiscal Year Ended June 30,
Function/Program 2010 2011 2012 2013 2014 2015 2016 2017 2018 2019General government 472.5 454.5 425.6 440.5 593.8 536.5 537.5 568.5 591.5 565.7Public protection 1,224.5 1,176.0 1,052.0 1,147.0 1,193.0 1,288.3 1,268.3 1,314.0 1,310.0 1,300.5Public ways and facilities 339.0 298.5 277.5 273.5 123.0 114.0 114.0 86.0 86.0 83.0Health and sanitation 809.8 772.9 761.3 793.8 851.0 893.3 869.8 1,099.3 1,097.3 1,043.8Public assistance 806.0 842.0 751.2 802.0 862.0 893.0 874.0 921.0 910.0 871.0Recreation and Education 153.5 143.0 139.0 140.0 137.0 124.0 107.0 116.0 87.0 120.0Hospital 770.9 840.1 839.0 863.4 886.1 990.9 994.9 1,218.1 1,219.1 1,255.3
Total governmental positions 4,576.2 4,527.0 4,245.6 4,460.2 4,645.9 4,840.0 4,765.5 5,322.9 5,300.9 5,288.2Special District:Water Resource Agency 63.0 63.0 63.0 55.0 55.0 51.0 51.0 46.0 46.0 49.0
Total Positions: 4,639.2 4,590.0 4,308.6 4,515.2 4,700.9 4,891.0 4,816.5 5,368.9 5,346.9 5,288.2
Source: Monterey County Adopted Budget Book Position Information
Note: Public ways and facilities include Resources Management Agency.
175

Schedule 18COUNTY OF MONTEREY
Operating Indicators by Function/ ProgramLast Ten Fiscal Years
2010 2011 2012 2013 2014 2015 2016 2017 2018 2019GENERAL GOVERNMENT
Assessor
Deeds processed 18,504 16,789 15,991 15,280 14,000 16,000 15,018 15,159 13,349 15,420Recorder -County Clerk
Documents recorded 85,686 86,769 85,915 91,818 76,016 75,012 78,850 82,662 82,852 78,341
Marriage licenses issued 2,625 2,889 2,842 2,814 3,226 3,133 3,017 3,116 2,978 2,871 1
Fictitious business names filed 2,664 2,815 2,486 2,342 2,585 2,688 2,618 2,547 2,464 2,679 1
PUBLIC PROTECTIONEmergency Communications
911 and non-emergency calls 650,000 611,666 674,576 623,669 614,476 719,248 756869 748161 744281 741,261 1
CAD incidents 597,303 588,077 571,100 568,587 590,777 591,137 520,060 520060 587085 593,392 1
District Attorney's Office
Felonies and misdemeanors reviewed 14,139 16,126 14,517 13,311 19,248 17,186 16,331 16,422 18,586 18,815
Child Support Services
Cases 19,366 18,184 18,065 17,085 16,477 16,422 15,957 15,589 15,013 14,448
Public Defender
Felonies 5,689 5,835 5,706 6,070 5,937 4,599 3,585 5,472 4,856 2,077
Misdemeanors 10,545 10,643 10,069 9,617 8,197 8,147 14,763 16,529 14,310 8,174
Juveniles 2,185 2,384 2,155 1,775 1,416 1,078 1,208 1,593 1,270 645
Mental Health and Probate unavail unavail unavail 265 385 661 211 266 298 100
Court Assigned Counsel
Felonies 824 645 694 806 604 447 283 374 325 389
Misdemeanors 491 428 481 505 312 327 444 401 307 431
Juveniles 512 548 378 202 97 98 116 192 111 261
Truancy Filings/Appearances unavail unavail unavail 312 / 1,761 324 / 1,548 324/2,003 368 / 1,856 261/1,651 unavail/2,518 198/2430 1
Sexual Violent Predators (SVP) 1 1 2 0 0 0 0 0 0 1
State Prison Cases unavail unavail unavail unavail 64 54 112 120 166 250
176

Schedule 18COUNTY OF MONTEREY
Operating Indicators by Function/ ProgramLast Ten Fiscal Years
2010 2011 2012 2013 2014 2015 2016 2017 2018 2019
Sheriff -Administration and Enforcement Bureau
Warrants received 11,622 9,629 9,967 9,732 9,234 10,810 13,858 12,256 11,902 12,165 1
Felony and misdemeanor offenses reported 5,272 4,120 4,334 4,582 3,760 4,170 4,250 4,221 4,031 unavail 1
Sheriff- Joint Gang Task Force
Felony and misdemeanor arrests 625 527 372 264 168 108 unavail unavail unavail unavail 5,6
Task Force and/or Gang Awareness 29 11 12 14 12 15 unavail unavail unavail unavail 5,6
Sheriff- Custody Operations Bureau
Prisoners booked 15,982 15,035 12,052 11,574 11,480 13,586 14,252 12,484 10,719 12,756 1
Average daily prisoner population 1,018 1,051 1,040 1,101 974 926 929 912 900 893 1
Court transportation 22,743 24,239 22,092 22,298 22,511 23,411 17,538 18,500 18,500 18,643 1
Probation
Juvenile referrals 3,102 5,043 2,585 1706 1526 1238 2179 2670 2092 1,948
Standard reports 3,246 2,464 2,547 2955 3138 2813 2841 2924 2182 2,002
Supervision 9,011 7,319 8,074 7027 6911 6500 6565 5947 6395 6,764
Juvenile Institutions and Alternative Program
Admissions 1,376 1,406 1,461 1,540 1,479 1,214 1,109 851 929 836
Sheriff-Coroner
Total investigations 994 1,045 1,054 1,071 1,050 1,100 1,200 1,168 1,133 1,090 1
Coroner's cases 315 301 302 339 320 350 378 586 359 359 1
Planning
Discretionary permits initiated 561 561 703 807 866 1,069 1,222 1,283 1,813 1,791
Building Services
Building and grading permits 2,273 2,025 2,177 2,216 2,452 2,942 3,345 3,429 3,640 3,419
Plan checks 1,141 1,267 1,195 1,268 2,412 1,820 1,546 1,607 1,546 1,393
Building inspections 9,685 12,659 8,876 9,350 12,024 13,932 14,100 10,851 29,988 24,775 8
177

Schedule 18COUNTY OF MONTEREY
Operating Indicators by Function/ ProgramLast Ten Fiscal Years
2010 2011 2012 2013 2014 2015 2016 2017 2018 2019
PUBLIC WAYS AND FACILITIES:
Public Works
Road miles maintained 1,157 1,157 1,234 1,234 1,234 1,234 1,235 1,236 1,242 1,258
Bridges maintained 173 173 173 173 174 174 174 174 174 175
Water Resources - - - - - - - - - -
Total water deliveries- acre- feet 17,355 19,992 20,446 22,275 22,784 21,028 18,482 16,970 21,354 17,516 1
Nacimiento Hydro Project kilowatt hours 9,905,705 15,613,560 14,326,724 4,996,952 3,463,653 940,824 594,682 10,771,771 13,680,397 9,530,793 1
HEALTH AND SANITATION
Animal Field Services
Licenses sold / Citations issued 3,000 7,364 8,065 6,026 5,908 5,843 6,751 5,605 5,419 4,617
Service calls 7,000 6,164 3,281 3,451 3,120 4,345 4,506 3,755 2,759 1,362
Animals admitted to shelter 2,900 4,592 4,124 3,853 3,023 2,472 2,662 2,787 2,273 2,222
Health
Public health nursing home visits 13,380 15,066 14,908 9,140 7,781 5,815 6,993 4,820 852 192
Laboratory tests 42,000 42,780 33,226 35,058 37,392 40,408 39,098 40,688 41,978 35,853
Clinic Services
Primary care clinic visits 163,544 162,969 169,645 169,144 159,519 170,419 179,984 183,193 194,469 195,739
Mental Health
Inpatient services (days) 1,940 4,566 2,941 2,369 2,645 2,837 2,108 1,860 2,323 2,661
Locked facilities (days) 8,130 2,434 12,237 9,841 12,757 13,543 15,717 13,818 16,094 17,809
Public Guardian
Conservatorship cases 263 363 325 348 353 341 326 362 317 314
Representative payee cases 394 407 421 424 382 375 285 215 221 260
Alcohol and Drug Programs
Methadone maintenance dosing 46,431 46,117 49,355 50,926 58,321 67,613 75,813 79,963 88,230 88,785
Narcotic treatment program counseling 25,292 25,557 26,720 27,737 31,180 34,655 40,994 48,659 58,383 494,218 10
Residential bed days 39,091 25,842 24,947 23,860 26,962 29,655 28,360 26,183 23,833 19,446
178

Schedule 18COUNTY OF MONTEREY
Operating Indicators by Function/ ProgramLast Ten Fiscal Years
2010 2011 2012 2013 2014 2015 2016 2017 2018 2019Children's Medical Services
CCS Referrals reviewed for medical eligibility 3,000 3,195 2,267 2,152 2,072 2,130 2,158 2,120 2,080 2,501
CCS Referrals opened for medical services 1,820 2,012 1,343 1,226 1,036 1,200 1,172 1,136 1,106 1,326
CHDP review preventive health screens 14,200 11,525 13,675 19,332 19,408 21,573 19,810 20,264 0 0
CHDP patient tracking for follow-up screens 2,300 1,906 1,798 2,153 2,751 2,377 1,230 2,119 318 157
PUBLIC ASSISTANCESocial Services
Food Stamps and Medi-Cal 38,335 42,079 44,588 48,133 49,369 50,920 52,194 48,743 44,948 39,691 1
CWS permanent placement 264 202 179 155 189 216 261 241 220 197Adult Protective Services & In-Home
Supportive Services 3,801 3,885 3,994 3,974 3,933 4,264 4,326 4,494 4,722 4,985CalWORKs/TANF Benefits Caseloads
Ongoing 5,737 6,122 6,147 5,905 5,709 5,262 4,842 4,174 3,666 3,143 1
Employment services 3,244 3,482 3,559 3,921 2,968 3,156 2,799 2,337 1,975 1,616 1
Childcare services 419 357 329 204 210 217 234 212 210 178
Out-of-Home Care, Average Monthly Caseload
Foster care ongoing 387 295 290 347 387 442 452 393 388 390 1
Court dependent children 3 7 8 1 2 0 0 28 40 5
Aid to adoptions 757 720 708 675 660 675 701 752 777 821
In-Home Support Services- Client Services paidcases
Personal care services program 3,233 3,339 3,450 3,412 3,198 3,614 3,668 3,943 4,133 4,362
Residual/ Waiver Plus 436 452 455 470 552 365 325 292 310 320
Aid to Indigents
Regular general assistance 394 484 617 699 673 636 523 408 429 454 3
Military and Veterans Affair caseload items
Claims filed 1,544 1,546 1,040 1,690 1,477 1,786 2,066 1,729 1,519 1,364 1,4
Veterans transported to VA Medical 952 1,007 888 1,016 1,056 823 882 745 771 648 1
179

Schedule 18COUNTY OF MONTEREY
Operating Indicators by Function/ ProgramLast Ten Fiscal Years
2010 2011 2012 2013 2014 2015 2016 2017 2018 2019
EDUCATION
Library
Customers visiting library 996,045 950,922 958,852 885,633 889,397 873,444 934,585 761,655 768,556 684,329 1
Public Library computer sessions 275,344 223,855 200,713 162,313 166,699 170,287 150,920 154,627 92,304 122,726 1
Virtual visits to Library websites unavail unavail unavail 225000 247500 222750 240570 262,439 255,106 222,337 1
Total Circulation 803899 666319 649117 602849 542515 573661 620206 583,402 490,845 496,215 9
Reference Questions 127068 144960 110022 111122 105337 81682 75097 72,307 59,165 91,549 9
RECREATION AND CULTURAL SERVICES
Parks
Visitors 533,264 501,867 702,018 1,113,456 989,569 623,411 622,346 435,422 672,422 553,910 2,7
Source: County of Monterey Departmental Records Notes:
1. Data for prior years may change as more updated information becomes available 2. Data updated when new study is performed every 3-4 years 3. As of FY2009, reporting both regular and interim caseloads. Prior to 2009, reported only regular caseload. 4. Data system change in FY 2012, prior system collected data differently. 5. As of FY2015, the Task Force's mission has been changed to focus on target driven investigations and narcotics and is collecting data on different categories as listedpreviously. 6. During FY2016, the Task Force was dissolved. 7. FY2017 lower due to Soberanes Fire 8. Prior to FY2018, Inspection numbers were counted base on STOPS not Inspection COUNTS, Often, one-stop includes multiple inspections. 9. New statistic reported in FY 2019. Data provided for the prior 10 years. 10. Per department, billing was changed to minutes from # of 10 minute increments.
180

Schedule 19COUNTY OF MONTEREY
Capital Asset StatisticsLast Ten Fiscal Years
For Fiscal Year Ended June 30, 2019
2010 2011 2012 2013 2014 2015 2016 2017 2018 2019
General Government
Buildings 11 14 14 14 14 18 18 18 18 33
Vehicles 112 76 127 92 83 106 97 205 205 205
Heavy Equipment 9 3 3 7 6 6 5 19 19 19
Communication Tower 6 6 6 6 6 9 9 9 9 14
Public Protection
Buildings 26 24 25 25 25 28 28 28 28 34
Vehicles 453 458 473 450 447 444 338 347 347 347
Boats - 2 2 1 1 1 1 1 1 1
Heavy Equipment 24 48 48 49 13 12 11 25 25 25
Public Ways & Facilities (Road Dept)
Bridges 173 173 173 173 174 174 174 174 175 175
Culverts (ft) 218,749 218,749 218,749 218,749 218,749 218,969 218,969 220,777 221,000 221,000
Drain System Inlets 226 230 230 230 230 231 235 235 238 238
Drain System Pipe (ft) 68,752 68,752 68,752 68,752 68,752 68,752 72,000 72,000 72,000 72,000
Fuel Stations 3 3 3 3 3 3 3 3 3 3
Heavy Road Equipment 76 60 83 83 95 92 111 103 103 103
Lift Stations 21 15 15 15 15 15 15 15 15 15
Maintained Road Miles (paved) 1,157 1,157 1,234 1,234 1,234 1,234 1,234 1,236 1,232 1,257
Maintenance District Facility Buildings 5 5 5 5 5 5 5 5 5 5
Public Parks & Open Space Acreage 4 4 4 4 4 4 4 4 4 4
Road Lane Miles 2,611 2,611 2,611 2,611 2,611 2,611 2,611 2,611 2,611 2,661
Sanitary Heavy Equipment 2 1 1 1 1 1 1 1 - -
Sanitary Sewer Lines(miles) 60 60 42 42 42 42 42 42 39 39
Street Light 380 380 380 380 380 380 380 380 380 384
Traffic Signals 39 21 21 28 28 27 28 28 28 29
Vehicles 102 133 73 100 74 63 240 94 94 94
Water Resources2
Dams 2 2 2 2 2 2 2 2 - -
Salinas River Diversion Facility 1 1 1 1 1 1 1 1 1 1
Heavy Equipment 7 7 6 6 10 10 10 20 20 20
Hydro-Electric Plants 1 1 1 1 1 1 1 1 1 1
Levees 1 1 1 1 1 1 1 1 1 1
Pump Stations 5 5 5 5 5 5 5 5 5 5
Reclamation Ditches 1 1 1 1 1 1 1 1 1 1
Vehicles 29 29 28 27 22 23 23 25 25 25
Petrero Tide Gate 1 1 1 1 1 1 1 1 1 1
Homes 2 2 2 2 2 2 2 2 2 2
Pipe Miles 50 50 50 50 50 50 50 50 50 50
Wells 21 21 21 21 21 21 21 21 21 21
Booster Pumps 3 3 3 3 3 3 3 3 3 3
181

Schedule 19COUNTY OF MONTEREY
Capital Asset StatisticsLast Ten Fiscal Years
For Fiscal Year Ended June 30, 2019
2010 2011 2012 2013 2014 2015 2016 2017 2018 2019Health
Buildings 15 14 14 14 14 14 14 14 14 25
Vehicles 148 145 151 130 120 130 154 153 153 153
Heavy Equipment - - - - - - - 3 3 3
Public Assistance
Buildings 5 5 2 1 1 5 5 5 5 25
Vehicles 118 105 108 104 100 107 99 97 97 97
Recreation and Cultural Services
Basketball courts 1 1 1 1 1 1 1 1 3 3
Boats 15 13 13 15 34 42 26 40 40 40
Buildings 176 176 176 176 176 176 176 176 173 173
Heavy Equipment 34 34 34 34 37 37 91 190 190 190
Lakes Acres 10,000 10,000 10,000 10,000 10,000 10,000 10,000 10,000 10,000 10,000
Land Acres 12,750 13,566 13,566 14,325 16,873 16,873 16,873 16,873 16,873 16,873
Parks 9 9 9 10 10 10 9 9 8 8
Tennis Courts 1 1 1 1 1 1 1 1 1 1
Vehicles 130 120 120 117 112 98 98 115 115 115
Communication Tower 1 1 1 1 1 1 1 1 1 1
Education
Bookmobiles 3 4 3 3 3 3 3 3 3 3
Buildings 6 6 6 3 3 6 6 6 6 6
Vehicles 14 15 15 15 17 17 23 18 18 18
Heavy Equipment - - - - 1 1 4 5 5 5
Source:Owned buildings and parcels from General Services "Real Property Specialist Reports".Vehicles & Heavy Equipment from General Services "Fleet Focus Equipment Inventory List".Departmental Records
Note:Reporting differences in assets between fiscal years due to updated information sources.
(1) information not previously reported
182

COUNTY OF MONTEREY
SINGLE AUDIT REPORT
YEAR ENDED JUNE 30, 2019
CLAconnect.com
WEALTH ADVISORY
OUTSOURCING
AUDIT, TAX, AND CONSULTING

COUNTY OF MONTEREY TABLE OF CONTENTS
YEAR ENDED JUNE 30, 2019
INDEPENDENT AUDITORS’ REPORT ON INTERNAL CONTROL OVER FINANCIAL REPORTING AND ON COMPLIANCE AND OTHER MATTERS BASED ON AN AUDIT OF FINANCIAL STATEMENTS PERFORMED IN ACCORDANCE WITH GOVERNMENT AUDITING STANDARDS 1
INDEPENDENT AUDITORS’ REPORT ON COMPLIANCE FOR EACH MAJOR FEDERAL PROGRAM, REPORT ON INTERNAL CONTROL OVER COMPLIANCE, AND REPORT ON THE SCHEDULE OF EXPENDITURES OF FEDERAL AWARDS REQUIRED BY THE UNIFORM GUIDANCE 3
SCHEDULE OF EXPENDITURES OF FEDERAL AWARDS 6
NOTES TO SCHEDULE OF EXPENDITURES OF FEDERAL AWARDS 11
SCHEDULE OF FINDINGS AND QUESTIONED COSTS 13
SUPPLEMENTARY SCHEDULES OF THE DEPARTMENT OF COMMUNITY SERVICES AND DEVELOPMENT 15

CliftonLarsonAllen LLP CLAconnect.com
(1)
INDEPENDENT AUDITORS’ REPORT ON INTERNAL CONTROL OVER FINANCIAL REPORTING
AND ON COMPLIANCE AND OTHER MATTERS BASED ON AN AUDIT OF FINANCIAL STATEMENTS PERFORMED IN ACCORDANCE WITH GOVERNMENT AUDITING STANDARDS
The Honorable Board of Supervisors County of Monterey Salinas, California We have audited, in accordance with the auditing standards generally accepted in the United States of America and the standards applicable to financial audits contained in Government Auditing Standards issued by the Comptroller General of the United States, the financial statements of the governmental activities, the business-type activities, the discretely presented component unit, each major fund, and the aggregate remaining fund information of the County of Monterey (the County), as of and for the year ended June 30, 2019, and the related notes to the financial statements, which collectively comprise the County’s basic financial statements, and have issued our report thereon dated December 20, 2019. Our report includes a reference to other auditors who audited the financial statements of Monterey County Children and Families Commission, as described in our report on the County’s financial statements. This report does not include the results of other auditors’ testing of internal control over financial reporting or compliance and other matters that are reported on separately by those auditors. Internal Control over Financial Reporting
In planning and performing our audit of the financial statements, we considered the County’s internal control over financial reporting (internal control) to determine the audit procedures that are appropriate in the circumstances for the purpose of expressing our opinions on the financial statements, but not for the purpose of expressing an opinion on the effectiveness of the County’s internal control. Accordingly, we do not express an opinion on the effectiveness of the County’s internal control.
A deficiency in internal control exists when the design or operation of a control does not allow management or employees, in the normal course of performing their assigned functions, to prevent, or detect and correct, misstatements on a timely basis. A material weakness is a deficiency, or a combination of deficiencies, in internal control, such that there is a reasonable possibility that a material misstatement of the entity's financial statements will not be prevented, or detected and corrected on a timely basis. A significant deficiency is a deficiency, or a combination of deficiencies, in internal control that is less severe than a material weakness, yet important enough to merit attention by those charged with governance.

The Honorable Board of Supervisors County of Monterey
(2)
Our consideration of internal control was for the limited purpose described in the first paragraph of this section and was not designed to identify all deficiencies in internal control that might be material weaknesses or significant deficiencies and therefore, material weaknesses or significant deficiencies may exist that have not been identified. We did identify certain deficiencies in internal control, described in the accompanying Schedule of Findings and Questioned Costs as item 2019-001 that we consider to be a material weakness.
Compliance and Other Matters
As part of obtaining reasonable assurance about whether the County’s financial statements are free from material misstatement, we performed tests of its compliance with certain provisions of laws, regulations, contracts, and grant agreements, noncompliance with which could have a direct and material effect on the determination of financial statement amounts. However, providing an opinion on compliance with those provisions was not an objective of our audit, and accordingly, we do not express such an opinion. The results of our tests disclosed no instances of noncompliance or other matters that are required to be reported under Government Auditing Standards.
County’s Response to Findings
The County’s response to the finding identified in our audit is described in the accompanying Schedule of Findings and Questioned Costs. The County’s response was not subjected to the auditing procedures applied in the audit of the financial statements and, accordingly, we express no opinion on it.
Purpose of this Report
The purpose of this report is solely to describe the scope of our testing of internal control and compliance and the results of that testing, and not to provide an opinion on the effectiveness of the entity's internal control or on compliance. This report is an integral part of an audit performed in accordance with Government Auditing Standards in considering the entity’s internal control and compliance. Accordingly, this communication is not suitable for any other purpose.
CliftonLarsonAllen LLP
Roseville, California December 20, 2019

CliftonLarsonAllen LLP CLAconnect.com
(3)
INDEPENDENT AUDITORS’ REPORT ON COMPLIANCE FOR EACH MAJOR FEDERAL
PROGRAM; REPORT ON INTERNAL CONTROL OVER COMPLIANCE; AND REPORT ON THE SCHEDULE OF EXPENDITURES OF FEDERAL AWARDS
REQUIRED BY THE UNIFORM GUIDANCE The Honorable Board of Supervisors County of Monterey Salinas, California Report on Compliance for Each Major Federal Program
We have audited County of Monterey’s compliance with the types of compliance requirements described in the OMB Compliance Supplement that could have a direct and material effect on each of County of Monterey’s major federal programs for the year ended June 30, 2019. County of Monterey’s major federal programs are identified in the summary of auditors’ results section of the accompanying schedule of findings and questioned costs. Management’s Responsibility Management is responsible for compliance with federal statutes, regulations, and the terms and conditions of its federal awards applicable to its federal programs.
Auditors’ Responsibility
Our responsibility is to express an opinion on compliance for each of County’s major federal programs based on our audit of the types of compliance requirements referred to above. We conducted our audit of compliance in accordance with auditing standards generally accepted in the United States of America; the standards applicable to financial audits contained in Government Auditing Standards, issued by the Comptroller General of the United States; and the audit requirements of Title 2 U.S. Code of Federal Regulations Part 200, Uniform Administrative Requirements, Cost Principles, and Audit Requirements for Federal Awards (Uniform Guidance). Those standards and the Uniform Guidance require that we plan and perform the audit to obtain reasonable assurance about whether noncompliance with the types of compliance requirements referred to above that could have a direct and material effect on a major federal program occurred. An audit includes examining, on a test basis, evidence about County’s compliance with those requirements and performing such other procedures as we considered necessary in the circumstances. We believe that our audit provides a reasonable basis for our opinion on compliance for each major federal program. However, our audit does not provide a legal determination of County’s compliance.

The Honorable Board of Supervisors County of Monterey
(4)
Opinion on Each Major Federal Program In our opinion, the County complied, in all material respects, with the types of compliance requirements referred to above that could have a direct and material effect on each of its major federal programs for the year ended June 30, 2019.
Report on Internal Control over Compliance
Management of the County is responsible for establishing and maintaining effective internal control over compliance with the types of compliance requirements referred to above. In planning and performing our audit of compliance, we considered the County’s internal control over compliance with the types of requirements that could have a direct and material effect on each major federal program to determine the auditing procedures that are appropriate in the circumstances for the purpose of expressing an opinion on compliance for each major federal program and to test and report on internal control over compliance in accordance with the Uniform Guidance, but not for the purpose of expressing an opinion on the effectiveness of internal control over compliance. Accordingly, we do not express an opinion on the effectiveness of the County’s internal control over compliance.
A deficiency in internal control over compliance exists when the design or operation of a control over compliance does not allow management or employees, in the normal course of performing their assigned functions, to prevent, or detect and correct, noncompliance with a type of compliance requirement of a federal program on a timely basis. A material weakness in internal control over compliance is a deficiency, or a combination of deficiencies, in internal control over compliance, such that there is a reasonable possibility that material noncompliance with a type of compliance requirement of a federal program will not be prevented, or detected and corrected, on a timely basis. A significant deficiency in internal control over compliance is a deficiency, or a combination of deficiencies, in internal control over compliance with a type of compliance requirement of a federal program that is less severe than a material weakness in internal control over compliance, yet important enough to merit attention by those charged with governance. Our consideration of internal control over compliance was for the limited purpose described in the first paragraph of this section and was not designed to identify all deficiencies in internal control over compliance that might be material weaknesses or significant deficiencies. We did not identify any deficiencies in internal control over compliance that we consider to be material weaknesses. However, material weaknesses may exist that have not been identified.
The purpose of this report on internal control over compliance is solely to describe the scope of our testing of internal control over compliance and the results of that testing based on the requirements of the Uniform Guidance. Accordingly, this report is not suitable for any other purpose.

The Honorable Board of Supervisors County of Monterey
(5)
Report on Schedule of Expenditures of Federal Awards Required by the Uniform Guidance
We have audited the financial statements of the governmental activities, the business-type activities, the discretely presented component unit, each major fund, and the aggregate remaining fund information of the County, as of and for the year ended June 30, 2019, and have issued our report thereon dated December 20, 2019, that contained an unmodified opinion on those financial statements. We did not audit the Monterey County Children and Families Commission, which represents 100 percent of the assets, liabilities and revenues of the discretely presented component unit, as of and for the year ended June 30, 2019. Those financial statements were audited by other auditors, whose reports thereon have been furnished to us, and our opinions, insofar as they relate to the amounts included for the Commission are based solely on the reports of the other auditors. Our audit was conducted for the purpose of forming an opinion on the financial statements as a whole. The accompanying schedule of expenditures of federal awards is presented for purposes of additional analysis as required by the Uniform Guidance and is not a required part of the financial statements. Such information is the responsibility of management and was derived from and relates directly to the underlying accounting and other records used to prepare the financial statements. The information has been subjected to the auditing procedures applied in the audit of the financial statements and certain additional procedures, including comparing and reconciling such information directly to the underlying accounting and other records used to prepare the financial statements or to the financial statements themselves, and other additional procedures in accordance with auditing standards generally accepted in the United States of America. In our opinion, based on our audit and the report of other auditors, the schedule of expenditure of federal awards is fairly stated in all material respects in relation to the financial statements as a whole. Supplementary Schedules
The supplementary schedules of the Department of Community Services and Development have not been subjected to auditing procedures applied in the audit of the basic financial statements and, accordingly, we express no opinion on them.
CliftonLarsonAllen LLP
Roseville, California December 20, 2019

COUNTY OF MONTEREY SCHEDULE OF EXPENDITURES OF FEDERAL AWARDS (CONTINUED)
YEAR ENDED JUNE 30, 2019
See accompanying Notes to Schedule of Expenditures of Federal Awards.
(6)
Federal Pass-Through ExpendituresCFDA Entity Identifying Federal to Number Number Expenditures Subrecipients
U.S. Department of AgricultureDirect Programs:
Very Low to Moderate Income Housing Loans Outstanding Loan Balance 10.410 48,405$ -$
Passed through State Department of Food and Agriculture:Plant and Animal Disease, Pest Control, and Animal Care 10.025 18-8506-0484-CA 197,194 - Plant and Animal Disease, Pest Control, and Animal Care 10.025 AP18PPQFO000C047 106,213 - Plant and Animal Disease, Pest Control, and Animal Care 10.025 AP18PPQFO000C405 79,583 - Plant and Animal Disease, Pest Control, and Animal Care 10.025 AP18PPQFO000C047 8,688 - Plant and Animal Disease, Pest Control, and Animal Care 10.025 AP18PPQFO000C405 13,720 - Plant and Animal Disease, Pest Control, and Animal Care 10.025 AP18PPQFO000C047 10,227 - Plant and Animal Disease, Pest Control, and Animal Care 10.025 AP18PPQFO000C405 10,848 - Plant and Animal Disease, Pest Control, and Animal Care 10.025 18-8506-1317-CA 50,569 - Plant and Animal Disease, Pest Control, and Animal Care 10.025 18-0619-11-SF 96,904 - Plant and Animal Disease, Pest Control, and Animal Care 10.025 18-8506-1211-CA 22,288 - Plant and Animal Disease, Pest Control, and Animal Care 10.025 18-8506-1211-CA 6,457 - Plant and Animal Disease, Pest Control, and Animal Care 10.025 AP19PPQFO000C009 84,967 - Plant and Animal Disease, Pest Control, and Animal Care 10.025 AP19PPQFO000C009 24,677 - Plant and Animal Disease, Pest Control, and Animal Care 10.025 18-0410-000-SA 11,522 - Plant and Animal Disease, Pest Control, and Animal Care 10.025 AP18PPQFO000C522 16,120 - Plant and Animal Disease, Pest Control, and Animal Care 10.025 18-0299-000-FR 18,859 - Plant and Animal Disease, Pest Control, and Animal Care 10.025 18-0342-000-SA 5,665 -
Subtotal 764,501 -
Passed through the State Department of Education:School Nutrition Program 10.560 164,628 -
Passed through the State Department of Social Services:State Administrative Matching Grants for Food Stamp Program 10.561 10,948,400 -
Passed through State Department of Aging:State Administrative Matching Grants for Food Stamp Program 10.561 SP-1718-32 4,796 4,796 State Administrative Matching Grants for Food Stamp Program 10.561 SP-1819-32 54,436 45,526
Passed through the State Department of Public Health:Supplemental Nutrition Assistance Program - Education 10.561 16-10155 760,744 173,243
Subtotal SNAP Cluster 11,768,376 -
Special Supplemental Nutrition Program for Women, Infants, and Children - Admin. Costs 10.557 16-10155 4,358,533 -
Total U.S. Department of Agriculture 17,104,443$ 223,565$
U.S. Department of CommerceDirect Programs:
EDA Revolving Loan Fund 11.307 34,423 - EDA Revolving Loan Fund - Outstanding Loan Balance 11.307 510,841 -
Subtotal 545,264 -
Total U.S. Department of Commerce 545,264$ -$
U.S. Department of Housing and Urban DevelopmentPassed through State Department of Housing and Community Development:
Community Development Block Grants/Entitlement Grants 14.218 Entitlement/
Urban County 793,003 698,440 Community Development Block Grants/Entitlement Grants (outstanding loan) 14.228 3,228,250 -
Home Investment Partnership Program (program income) 14.239 2,715 - Home Investment Partnership Program (outstanding loan) 14.239 8,607,773 -
Subtotal 8,610,488 -
Total U.S. Department of Housing and Urban Development 12,631,741$ 698,440$
Federal Grantor/Pass-through Grantor/Program Title

COUNTY OF MONTEREY SCHEDULE OF EXPENDITURES OF FEDERAL AWARDS (CONTINUED)
YEAR ENDED JUNE 30, 2019
See accompanying Notes to Schedule of Expenditures of Federal Awards.
(7)
Federal Pass-Through ExpendituresCFDA Entity Identifying Federal to Number Number Expenditures SubrecipientsFederal Grantor/Pass-through Grantor/Program Title
U.S. Department of JusticeDirect Programs:
Monterey County Veterans Treatment Court Enhancement Project 16.585 2017-VV-BX-0059 148,439$ -$
Drug Enforcement Administrator 16.922 2019-31 1,891 - Equitable Sharing Fund 16.922 17,596 -
Subtotal 19,487 -
Passed through the Governor's Off ice of Emergency Services:Victims of Crime Act (VOCA) 16.575 XC16 01 0270 243,829 224,412 County Victim Services Program (VOCA) Probation 16.575 XC16 01 0270 25,539 - County Victim Services Program (VOCA) District Attorney 16.575 XC16 01 0270 4,550 - County Victim Services Program (VOCA) Health 16.575 XC16 01 0270 6,000 - Victim Witness Assistance Program 16.575 VW18 36 0270 708,850 - Underserved Victim Advocacy and Outreach Program 16.575 XV15 01 0270 219,806 - Underserved Child and Youth Advocacy Program 16.575 XV16 01 0270 361,155 -
Subtotal 1,569,729 224,412
Total U.S. Department of Justice 1,737,655$ 224,412$
U.S. Social Security AdministrationDirect Programs:
Social Security Incentive Program 16.755 44,200 -
Total U.S. Department of Commerce 44,200$ -$
U.S. Department of LaborPassed through the North Central Counties Consortium:
WIOA Adult 201 17.258 K9110028 293,037 108,744 WIOA Adult 202 17.258 K9110028 1,562,211 636,556 WIOA Adult 500 17.258 K9110028 366,762 WIOA Dislocated Worker 501 17.258 K9110028 374,027 159,602 WIOA Dislocated Worker 502 17.258 K9110028 1,411,757 734,756 WIOA Youth 301 17.259 K9110028 1,859,440 1,118,322 WIOA Rapid Response 540 17.278 K9110028 39,397 --WIOA Rapid Response 541 17.278 K9110028 195,736 --WIOA Rapid Response L.a. 292 17.278 K9110028 11,112 --WIOA Rapid Response L.a. 293 17.278 K9110028 43,714 --
Subtotal - WIOA Cluster 6,157,193 2,757,980
Total U.S. Department of Labor 6,157,193$ 2,757,980$
U.S. Department of TransportationPassed through the State Department of Transportation:
Highw ay Planning and Construction 20.205 BRLS-5944 (068) 993,379 - Highw ay Planning and Construction 20.205 BHLO-5944 (099) 57,805 - Highw ay Planning and Construction 20.205 BHLO-5944 (100) 44,688 - Highw ay Planning and Construction 20.205 BRLS-5944 (098) 34,930 - Highw ay Planning and Construction 20.205 BRLO-5944 (102) 31,750 - Highw ay Planning and Construction 20.205 BRLO-5944 (103) 156,630 - Highw ay Planning and Construction 20.205 RSTPLE-5944 (111) 110,406 - Highw ay Planning and Construction 20.205 DEM101 5944 (112) 341,018 - Highw ay Planning and Construction 20.205 BPMPL-5944(122) 16,582 - Highw ay Planning and Construction 20.205 STPLX-5944 (124) 12,588 - Highw ay Planning and Construction 20.205 HSIPL-5944 (127) 202,501 - Highw ay Planning and Construction 20.205 HSIPL-5944 (130) 34,661 - Highw ay Planning and Construction 20.205 STPLZ-5944 (041) 61,125 -
Subtotal 2,098,063 -

COUNTY OF MONTEREY SCHEDULE OF EXPENDITURES OF FEDERAL AWARDS (CONTINUED)
YEAR ENDED JUNE 30, 2019
See accompanying Notes to Schedule of Expenditures of Federal Awards.
(8)
Federal Pass-Through ExpendituresCFDA Entity Identifying Federal to Number Number Expenditures SubrecipientsFederal Grantor/Pass-through Grantor/Program Title
Passed through the State Off ice of Traff ic Safety:STVS- Safe Travels Via Salinas 20.600 PS18019 62,684$ -$ Alcohol & Drug Impaired Vertical Prosecution Program 20.601 DI19009 235,126 - Drug/Alcohol Treatment Court 20.608 AL1723 117,870 - Monterey County DUI Court 20.608 DI18018 103,964 - Monterey County DUI Court 20.608 DI19010 109,000 -
Subtotal - Office of Traff ic Safety Cluster 628,644 -
Total U.S. Department of Transportation 2,726,707$ -$
U.S. Food and Drug AdministrationPassed through Association of Food and Drug Officials
Retail Program Standards Grant Program 91.103 G-SP-1809-06195 2,000 2,000
Total U.S. Elections Administration Commission 2,000$ 2,000$
U.S. Department of Health and Human ServicesPassed through the State Department of Aging:
Special Programs for the Aging, Title III, Part B, Grants for Supportive Services and Senior Centers 93.044 AP-1819-32 458,618 248,176 Special Programs for the Aging, Title III, Part C, Nutrition Services 93.045 AP-1819-32 387,005 298,915 Special Programs for the Aging, Title III, Part C, Nutrition Services 93.045 AP-1819-32 471,154 425,218 Nutrition Services Incentive Program 93.053 AP-1819-32 179,374 179,374
Subtotal - Aging Cluster 1,496,151 1,151,683
Special Programs for the Aging, Title VII, Chapter 3, Programs for Prevention of Elder Abuse, Neglect, and Exploitation 93.041 AP-1819-32 5,424 5,424 Special Programs for the Aging, Title VII, Chapter 2, Long Term Care Ombudsman Services for Older Individuals 93.042 AP-1819-32 35,242 35,242 Special Programs for the Aging, Title III, Part D, Disease Prevention and Health Promotion Services 93.043 AP-1819-32 33,411 33,411 National Family Caregiver Support, Title III, Part E 93.052 AP-1819-32 228,695 202,916 Medicare Enrollment Assistance Program 93.071 MI-1718-32 6,857 19,295 Medicare Enrollment Assistance Program 93.071 MI-1819-32 22,208 6,171 State Health Insurance Assistance Program 93.324 HI-1718-32 91,845 82,636
Passed through the State Department of Alcohol and Drug Programs:Block Grants for Prevention and Treatment of Substance Abuse 93.959 2,273,819 -
Passed through the State Department of Child Support Services:Child Support Enforcement 93.563 6,663,885 -
Passed through the State Department of Community Services and Development:Community Services Block Grant 93.569 18F-5027 343,161 151,269 Community Services Block Grant 93.569 19F-4027 251,348 163,315
Subtotal - CSBG Cluster 594,509 314,584
Passed through the State Department of Health Care Services:Tuberculosis Control Program 93.116 1827BAS00/1827FSIE00 66,936 -
Targeted Case Management/Medi-Cal Administrative Activities 93.778 18-95001/27-17 EVRGRN 320,788 - MCAH - Maternal Child & Adolescent Health Title XIX 93.778 2018-27 108,837 - Medical Assistance Program (Medi-Cal Administration) 93.778 1,647,664 -
Subtotal 2,077,289 -
AIDS Master Agreement - HIV Care Program 93.917 15-11065/18-10878 281,683 - AIDS Master Agreement - HIV Supplemental Care Program 93.917 16-10851 198,918 -
AIDS Master Agreement - Minority AIDS Initiative HRSA Part B 93.917 15-11065/18-10878 22,723 - AIDS Master Agreement - Prevention Program 93.917 15-10942/18-10763 91,496 - AIDS Master Agreement - Prevention Augmentation 93.917 18-10582 24,417 -
Subtotal 619,237 -
Maternal Child & Adolescent Health (MCAH) - ACA PREP 93.092 18-10238 216,108 - Subtotal 216,108 -

COUNTY OF MONTEREY SCHEDULE OF EXPENDITURES OF FEDERAL AWARDS (CONTINUED)
YEAR ENDED JUNE 30, 2019
See accompanying Notes to Schedule of Expenditures of Federal Awards.
(9)
Federal Pass-Through ExpendituresCFDA Entity Identifying Federal to Number Number Expenditures SubrecipientsFederal Grantor/Pass-through Grantor/Program Title
Passed through the State Department of Public Health:Maternal Child & Adolescent Health (MCAH) 93.994 2018-27 168,256$ -$ California Children's Service (CCS) 93.994 875,618 - Health Care for Children in Foster Care (HCPCFC) 93.994 225,245 - Psychotropic Medication Monitoring and Oversight (HCPCFC) 93.994 32,178 -
Subtotal 1,301,297 -
Public Health Emergency Preparedness 93.069 17-10174 364,587 - Striving to Prevent Youth Violence Everyw here 93.136 6 NH28CE002396-03-03 299,495 - Child Lead Poisoning Prevention Program (CLPPP) 93.197 17-10246 127,694 - Immunization Assessment Program 93.268 17-10333 165,323 - RTI-Child Health and Human Development Extramural Research 93.865 R01HD075787 6,265 - Hospital Preparedness Program (HPP) 93.889 17-10174 211,216 - Assistance Program for Chronic Disease Prevention & Control 1305 93.945 14-10959 46,639 - Child Health Disability Prevention (CHDP) 93.991 N/A 167,034 -
Passed through the State Department of Mental Health:Federal McKinney Projects for Assistance in Transition from Homelessness (PATH) Grant 93.150 2X068SM016005-12 96,278
Substance Abuse and Mental Health Services Administration (SAMHSA)Block Grant (includes Children's System of Care (CSOC) Grant) 93.958 1U79SM56058 1,674,617 -
Passed through the State Department of Social Services:Temporary Assistance for Needy Families - Administration 93.558 20,069,635 -
Temporary Assistance for Needy Families - Assistance 93.558 4,440,456 Subtotal - TANF Cluster 24,510,091 -
Refugee and Entrant Assistance State/Replacement Designee Administered Programs 93.566 751 -
Adoption and Legal Guardianship Incentive Payments 93.603 100,092
Title IV-E Placement / Foster Care (Probation) 93.658 933,171 - Group Home Visits (Probation) 93.658 304,416 - Child Welfare Services - OIP (Probation) 93.658 22,978 - Continuum of Care Reform (Probation) 93.658 5,356 - Commercially Sexually Exploited Children (Probation) 93.658 4,644 - Foster Care - Title IV-E (Administration) 93.658 3,529,248 - Foster Care - Title IV-E (Assistance) 93.658 3,845,864 -
Subtotal 8,645,677 -
Adoption Assistance Program (Administration) 93.659 711,708 - Adoption Assistance Program (Assistance) 93.659 5,049,231 -
Subtotal 5,760,939 -
Guardianship Assistance (Administration) 93.090 2,329 - Guardianship Assistance (Assistance) 93.090 222,672 -
Subtotal 225,001 -
Medical Assistance Program - Adult Protective Services County Services Block Grant 93.778 771,544 - Medical Assistance Program - Child Welfare Services IV-E 93.778 1,018,175 - Medical Assistance Program - In-Home Supportive Services Public Authority - Administrative Costs 93.778 19,154,278 -
Subtotal 20,943,997 -
Social Services Block Grant 93.667 198,274 - Medical Assistance Program - In-Home Supportive Services 93.667 2,206,354 -
Subtotal 2,404,628 -
Promoting Safe and Stable Families 93.556 263,174 - Community-Based Child Abuse Prevention Grants 93.590 22,841 - Child Welfare Services – State Grants 93.645 200,451 - Chafee Foster Care Independence Program 93.674 107,102 -
Total U.S. Department of Health and Human Services 82,076,805$ 1,851,362$

COUNTY OF MONTEREY SCHEDULE OF EXPENDITURES OF FEDERAL AWARDS (CONTINUED)
YEAR ENDED JUNE 30, 2019
See accompanying Notes to Schedule of Expenditures of Federal Awards.
(10)
Federal Pass-Through ExpendituresCFDA Entity Identifying Federal to Number Number Expenditures SubrecipientsFederal Grantor/Pass-through Grantor/Program Title
U.S. Department of Homeland SecurityPassed through Governor's Off ice of Emergency Services (Cal OES):
Bay Area Urban Areas Security Initiative 97.007 77,966$ -$ Emergency Management Performance Grant 97.042 107,226 -
Homeland Security Grant 2018 97.067 514,752 - Operation Stonegarden 97.067 2017-0083 56,868 -
Subtotal 571,620 -
Total U.S. Department of Homeland Security 756,812$ -$
Total Expenditures of Federal Awards 123,782,820$ 5,757,759$

COUNTY OF MONTEREY NOTES TO SCHEDULE OF EXPENDITURES OF FEDERAL AWARDS
YEAR ENDED JUNE 30, 2019
(11)
NOTE 1 BASIS OF PRESENTATION
The accompanying schedule of expenditures of federal awards presents the activity of all federal awards programs of the County of Monterey for the year ended June 30, 2019. The information in this schedule is presented in accordance with the requirements of Title 2 U.S. Code of Federal Regulations (CFR) Part 200, Uniform Administrative Requirements, Cost Principles, and Audit Requirements for Federal Awards (Uniform Guidance).
NOTE 2 SUMMARY OF SIGNIFICANT ACCOUNTING POLICIES
Expenditures reported on the schedule are reported on the modified accrual basis of accounting. Such expenditures are recognized following the cost principles contained in the Uniform Guidance, wherein certain types of expenditures are not allowable or are limited as to reimbursement. Therefore, some amounts presented in the schedule may differ from amounts presented in, or used in the preparation of, the financial statements.
NOTE 3 CATALOG OF FEDERAL DOMESTIC (CFDA) NUMBERS
The program titles and CFDA numbers were obtained from the federal or pass-through grantor or the 2019 Catalog of Federal Domestic Assistance. When no CFDA number had been assigned to a program, the two-digit federal agency identifier and the federal contract number were used. When there was no federal contract number, the two-digit federal agency identifier and the word “unknown” were used.
NOTE 4 INDIRECT COST RATE
The County did not elect to use the 10 percent de minimis indirect cost rate as covered in 2 CFR §200.414. Uniform Guidance §200.510(6) requires the County to disclose whether or not it elected to use the 10 percent de minimis cost rate that §200.414(f) allows for nonfederal entities that have never received a negotiated indirect cost rate.
NOTE 5 LOANS WITH CONTINUING COMPLIANCE REQUIREMENTS
Outstanding federally-funded program loans, with a continuing compliance requirement, carried balances as of June 30, 2019 as follows:
Loans with Continuing
Outstanding Compliance CFDA Federal Program Loans Requirements 10.410 Very Low to Moderate Income Housing $ - $ 48,405 11.307 EDA Countywide Revolving Loan Fund 510,841 510,841 14.228 Community Development Block
Grant/States Program 3,228,250 3,298,449 14.239 Home Investment Partnership Program
Program 8,607,773 8,680,150

COUNTY OF MONTEREY NOTES TO SCHEDULE OF EXPENDITURES OF FEDERAL AWARDS (CONTINUED)
YEAR ENDED JUNE 30, 2019
(12)
NOTE 6 PASS-THROUGH ENTITIES’ IDENTIFYING NUMBER
When federal awards were received from a pass-through entity, the schedule of expenditures of federal awards shows, if available, the identifying number assigned by the pass-through entity. When no identifying number is shown, the County determined that no identifying number is assigned for the program or the County was unable to obtain an identifying number from the pass-through entity.
NOTE 7 DEPARTMENT OF AGING FEDERAL/STATE SHARE
The California Department of Aging (CDA) requires agencies that receive CDA funding to display state-funded expenditures discretely along with federal expenditures. The County expended the following state and federal amounts under these grants:
CFDA Contract Federal State Number Number Expenditures Expenditures10.561 SP-1718-32 4,796$ -$ 10.561 SP-1819-32 54,436 - 93.041 SP-1819-32 5,424 - 93.042 SP-1819-32 35,242 - 93.043 SP-1819-32 33,411 - 93.044 SP-1819-32 458,618 67,665 93.045 SP-1819-32 387,005 38,342 93.045 SP-1819-32 471,154 44,756 93.052 SP-1819-32 228,695 - 93.053 SP-1819-32 179,374 - 93.071 MI-1718-32 6,857 - 93.071 MI-1819-32 22,208 - 93.324 HI-1718-32 91,845 -
N/A AP-1819-32 - 32,275 N/A HI-1718-32 - 125,066 N/A HI-1718-32 - 59,152
Total 1,979,065$ 367,256$

COUNTY OF MONTEREY SCHEDULE OF FINDINGS AND QUESTIONED COSTS
YEAR ENDED JUNE 30, 2019
(13)
Section I – Summary of Auditors’ Results
Financial Statements
1. Type of auditors’ report issued: Unmodified
2. Internal control over financial reporting:
Material weakness(es) identified? x yes no
Significant deficiency(ies) identified? yes x none reported
3. Noncompliance material to financial statements noted? yes x no
Federal Awards
1. Internal control over major federal programs:
Material weakness(es) identified? yes x no
Significant deficiency(ies) identified? yes x none reported
2. Type of auditors’ report issued on compliance for major federal programs: Unmodified
3. Any audit findings disclosed that are required
to be reported in accordance with 2 CFR 200.516(a)? yes x no
Identification of Major Federal Programs CFDA Number(s) Name of Federal Program or Cluster 10.557 WIC Special Supplemental Nutrition Program 10.561 Supplemental Nutrition Assistance Program 93.558 Medical Assistance Program 93.658 Foster Care 93.659 Adoptions Assistance Program Dollar threshold used to distinguish between Type A and Type B programs: $ 3,000,000 Auditee qualified as low-risk auditee? yes x no

COUNTY OF MONTEREY SCHEDULE OF FINDINGS AND QUESTIONED COSTS
YEAR ENDED JUNE 30, 2019
(14)
Section II – Financial Statement Findings 2019 – 001 Type of Finding:
Material Weakness in Internal Control over Financial Reporting Condition: During our audit, the County notified us that it had restated beginning net position by $8.1 million to account for capital asset transactions that were not properly capitalized in previous years and to retire projects costs that should not have been capitalized. Criteria or specific requirement: All capital expenditures meeting the criteria and capitalization threshold formally established by the County should be capitalized rather than expensed in the County's government-wide financial statements. The County should also update its capital asset records to reflect all capital asset acquisitions, including construction in progress. Context: The amount of the misstatement is material to the County's government-wide financial statements. Effect: Capital assets were understated by $8.1 million. Cause: The Resources Management Agency (RMA) department tracks construction in progress (CIP) costs by project using work orders in a Cost Accounting System (WinCAMS). Annually, the department generates a report from WinCAMS by work order to compile CIP costs for reporting to the Auditor-Controller’s Office. Beginning in fiscal year (FY) 2016-17, RMA began using work order series 6XXX to track Winter Storm Costs, which many happened to be CIP. At the time, the Accountant I was following procedures that identified CIP work order series, which did not include the 6XXX series. This same staff person prepared the FY 2017-18 CIP costs as well, using the same procedures. The staff resigned, which prompted this task to be reassigned for FY2018-19. Repeat Finding: The audit finding is not a repeat finding from the prior year. Recommendation: We recommend RMA update its procedures to include the analysis of all work orders in its cost accounting system when compiling CIP costs. We further recommend the Auditor-Controller's Office and RMA perform a high level review of CIP reconciliations and project costs to identify any missing CIP additions as well as transactions that should not have been capitalized in accordance with the County's capitalization policy. Views of responsible officials: There is no disagreement with the audit finding.
Section III – Findings and Questioned Costs – Major Federal Programs Our audit did not disclose any matters required to be reported in accordance with 2 CFR 200.516(a).

COUNTY OF MONTEREY SUPPLEMENTARY SCHEDULE OF THE DEPARTMENT OF
COMMUNITY SERVICES AND DEVELOPMENT STATEMENT OF REVENUES AND EXPENDITURES (SEE INDEPENDENT AUDITORS' REPORT, PAGES 1 AND 2)
(15)
CSD Contract No. 18F-5027 (CSBG – $506,144)
For the Period January 1, 2018 through December 31, 2018
January 1, 2018 July 1, 2018 Total Total
through through Audited Reported Total
June 30, 2018 December 31, 2018 Costs Expenses Budget
REVENUEGrant Revenue 75,402$ 430,742$ 506,144$ 506,144$
Advance 123,387 (123,387) - -
Total Revenue 198,789 307,355 506,144 506,144
EXPENDITURESAdministration:
Salaries and Wages 29,970 68,906 98,876 98,876$ 98,876
Fringe Benefits 17,181 36,031 53,212 53,212 53,212
Operating Expenses 2,386 467 2,853 2,853 2,855
Other Costs 14,025 17,178 31,203 31,203 31,201
Subtotal Administrative Costs 63,562 122,582 186,144 186,144 186,144
Program Costs:
Subcontractor services 129,626 190,374 320,000 320,000 320,000
Subtotal Program Costs 129,626 190,374 320,000 320,000 320,000
Total Expenditures 193,188 312,956 506,144 506,144$ 506,144
REVENUE OVER (UNDER) COSTS 5,601$ (5,601)$ -$ -$
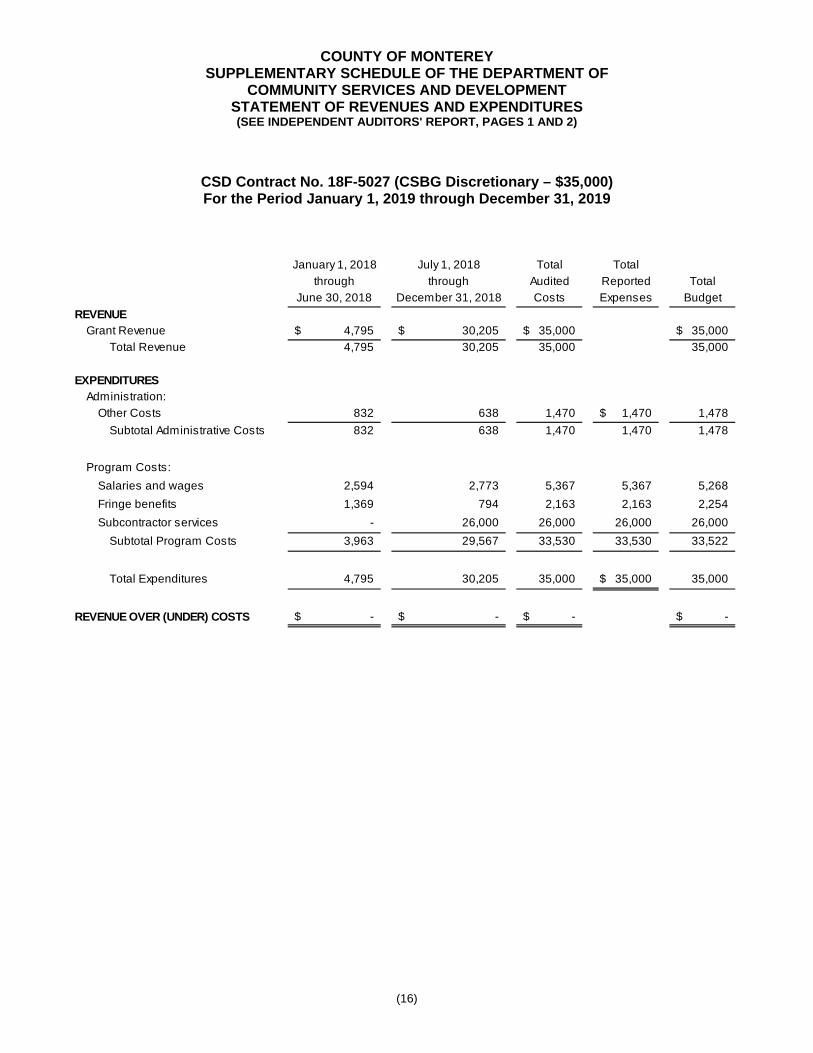
COUNTY OF MONTEREY SUPPLEMENTARY SCHEDULE OF THE DEPARTMENT OF
COMMUNITY SERVICES AND DEVELOPMENT STATEMENT OF REVENUES AND EXPENDITURES (SEE INDEPENDENT AUDITORS' REPORT, PAGES 1 AND 2)
(16)
CSD Contract No. 18F-5027 (CSBG Discretionary – $35,000) For the Period January 1, 2019 through December 31, 2019
January 1, 2018 July 1, 2018 Total Total
through through Audited Reported Total
June 30, 2018 December 31, 2018 Costs Expenses Budget
REVENUEGrant Revenue 4,795$ 30,205$ 35,000$ 35,000$
Total Revenue 4,795 30,205 35,000 35,000
EXPENDITURESAdministration:
Other Costs 832 638 1,470 1,470$ 1,478
Subtotal Administrative Costs 832 638 1,470 1,470 1,478
Program Costs:
Salaries and wages 2,594 2,773 5,367 5,367 5,268
Fringe benefits 1,369 794 2,163 2,163 2,254
Subcontractor services - 26,000 26,000 26,000 26,000
Subtotal Program Costs 3,963 29,567 33,530 33,530 33,522
Total Expenditures 4,795 30,205 35,000 35,000$ 35,000
REVENUE OVER (UNDER) COSTS -$ -$ -$ -$

COUNTY OF MONTEREY SUPPLEMENTARY SCHEDULE OF THE DEPARTMENT OF
COMMUNITY SERVICES AND DEVELOPMENT STATEMENT OF REVENUES AND EXPENDITURES (SEE INDEPENDENT AUDITORS' REPORT, PAGES 1 AND 2)
(17)
CSD Contract No. 19F-4027 (CSBG – $500,384)
For the Period January 1, 2019 through December 31, 2019
January 1, 2019 Total Total
through Audited Reported Total
June 30, 2019 Costs Expenses Budget
REVENUEGrant Revenue 125,461$ 125,461$ 500,384$
Total Revenue 125,461 125,461 500,384
EXPENDITURESAdministration:
Salaries and Wages 38,279 38,279 38,279$ 95,702
Fringe Benefits 18,383 18,383 18,383 34,762
Operating Expenses 18,969 18,969 18,969 13,363
Other Costs 10,976 10,976 10,976 36,557
Subtotal Administrative Costs 86,607 86,607 86,607 180,384
Program Costs:
Subcontractor services 163,316 163,316 163,316 320,000
Subtotal Program Costs 163,316 163,316 163,316 320,000
Total Expenditures 249,923 249,923 249,923$ 500,384
REVENUE OVER (UNDER) COSTS (124,462)$ (124,462)$ -$

COUNTY OF MONTEREY SUPPLEMENTARY SCHEDULE OF THE DEPARTMENT OF
COMMUNITY SERVICES AND DEVELOPMENT STATEMENT OF REVENUES AND EXPENDITURES (SEE INDEPENDENT AUDITORS' REPORT, PAGES 1 AND 2)
(18)
CSD Contract No. 19F-4027 (CSBG Discretionary – $30,000) For the Period January 1, 2019 through December 31, 2019
January 1, 2019 Total Total
through Audited Reported Total
June 30, 2019 Costs Expenses Budget
REVENUEGrant Revenue -$ -$ 30,000$
Total Revenue - - 30,000
EXPENDITURESAdministration:
Other Costs 235 235 235$ 955
Subtotal Administrative Costs 235 235 235 955
Program Costs:
Salaries and wages 962 962 962 3,407
Fringe benefits 228 228 228 1,138
Subcontractor services - - - 24,500
Subtotal Program Costs 1,190 1,190 1,190 29,045
Total Expenditures 1,425 1,425 1,425$ 30,000
REVENUE OVER (UNDER) COSTS (1,425)$ (1,425)$ -$

MONTEREY COUNTY
AUDITOR - CONTROLLER (831) 755-5040 ▪ FAX (831) 755-5098 ▪ P.O. BOX 390 ▪ SALINAS, CALIFORNIA 93902
RUPA SHAH, CPA AUDITOR-CONTROLLER
The County of Monterey respectfully submits the following corrective action plan for the year ended June 30, 2019. Audit period: July 1, 2018 – June 30, 2019 The findings from the schedule of findings and questioned costs are discussed below. The findings are numbered consistently with the numbers assigned in the schedule. FINDINGS—FINANCIAL STATEMENT AUDIT MATERIAL WEAKNESS 2019-001 Capital Assets
Recommendation: CLA recommends RMA update its procedures to include the analysis of all work orders in its cost accounting system when compiling CIP costs. CLA further recommends the Auditor-Controller's Office and RMA perform a high level review of CIP reconciliations and project costs to identify any missing CIP additions as well as transactions that should not have been capitalized in accordance with the County's capitalization policy. Explanation of disagreement with audit finding: There is no disagreement with the audit finding. Action taken in response to finding: RMA has updated the procedures to include the requirement that all work orders be included when pulling CIP costs. There is also another level of review that has been added, which requires the Finance Manager responsible for capital assets to approve the final report. Name(s) of the contact person(s) responsible for corrective action: Jesus Yanez-Loeza, Chief Deputy Auditor-Controller Planned completion date for corrective action plan: June 30, 2020
FINDINGS—FEDERAL AWARD PROGRAMS AUDITS There were no findings in the current year that require a corrective action plan. If there are questions regarding this plan, please call Jesus Yanez-Loeza at 831-755-5284

MONTEREY COUNTY
AUDITOR - CONTROLLER (831) 755-5040 ▪ FAX (831) 755-5098 ▪ P.O. BOX 390 ▪ SALINAS, CALIFORNIA 93902
RUPA SHAH, CPA AUDITOR-CONTROLLER
The County of Monterey respectfully submits the following summary schedule of prior audit findings for the year ended June 30, 2019. Audit period: July 1, 2017 – June 30, 2018 The findings from the prior audit’s schedule of findings and questioned costs are discussed below. The findings are numbered consistently with the numbers assigned in the prior year. FINDINGS—FINANCIAL STATEMENT AUDIT 2018 – 001 Material Weakness in Internal Control over Financial Reporting Condition: During the review of unearned revenue, CLA noted the County recorded a prior period adjustment of $8.5 million to correct an erroneous adjustment made by a department in the prior year to transfer funds between the General Fund and the H&W Realignment Fund. Instead of recording the budgeted transfer between the two funds to transfer cash from the General Fund to the H&W Realignment Fund, the department improperly adjusted unearned revenue and revenue in the General Fund resulting in a debit balance to unearned revenue. Status: Corrective action was taken. FINDINGS— FEDERAL AWARD PROGRAMS AUDITS There were no federal award program audit findings in the prior year. If there are questions regarding this schedule, please call Jesus Yanez-Loeza, Chief Deputy Auditor-Controller, at 831-755-5284.