
Rutherford Appleton Laboratory Annual Report 2001-2002
239
COUNCIL FOR THE CENTRAL LABORATORY OF THE RESEARCH COUNCILS Central Laser Facility Rutherford Appleton Laboratory Annual Report 2001-2002
-
Upload
khangminh22 -
Category
Documents
-
view
1 -
download
0
Transcript of Rutherford Appleton Laboratory Annual Report 2001-2002

COUNCIL FOR THE CENTRAL LABORATORY
OF THE RESEARCH COUNCILS
Central Laser FacilityRutherford Appleton LaboratoryAnnual Report 2001-2002

Council for the Central Laboratory of the Research Councils 2002
Enquiries about copyright, reproduction and requests foradditional copies of this report should be addressed to:
The Central Laboratory of the Research CouncilsLibrary and Information ServicesRutherford Appleton LaboratoryChiltonDidcotOxfordshireOX11 0QXTel: 01235 445384 Fax: 01235 446403E-mail: [email protected]
ISSN 1358-6254
Neither the Council nor the Laboratory accept any responsibility for loss ordamage arising from the use of information contained in any of theirreports or in any communication about their tests or investigations.

i Central Laser Facility Annual Report 2001/2002
Central Laser Facility
Rutherford Appleton Laboratory
Annual Report 2001/2002
Central Laser FacilityRutherford Appleton LaboratoryChilton, DidcotOxfordshire OX11 0QXTel. 44 (0) 1235 445655Fax. 44 (0) 1235 445888E-mail. [email protected] site. http://www.clf.rl.ac.uk
RAL Report No. RAL-TR-2002-013
The front cover shows a large aperture compressiongrating being inspected by Trevor Winstone after itsinstallation in the Vulcan Petawatt CompressionChamber.(Photograph courtesy of RAL Photographic Section).
ISBN 0902376217

Acknowledgements
Central Laser Facility Annual Report 2001/2002 ii
AcknowledgementsThe production team for this Annual Report was as follows:
Editor Brian WybornOverall Co-ordination Alison BrownProduction Dave BurgessChapter Editors David Neely, Tony Parker, Colin Danson, Graeme HirstSection Editors Rob Clarke, David Neely, Margaret Notley, Roger Evans, Andrew Langley, Pavel Matousek,
Stan Botchway, Waseem Shaikh, Colin Danson, Mike Towrie, Cristina Hernandez-Gomez, Ian RossTechnical Support Chris Reason, RAL BITD.
This report is available on the CLF’s Web Page Ref. http://www.clf.rl.ac.uk/.
The document has been reproduced by the RAL Reprographics Section.
Thanks to all the above for their contribution towards producing this report and of course to all the authors for their submissions.
Contents
Central Laser Facility Annual Report 2001/2002iii
ContentsForeword 1
M H R Hutchinson
Overview of the Central Laser Facility 2
C B Edwards
High Power Laser Programme 3
High Power Laser Programme – Short Pulse Plasma PhysicsFast Electron Generation and Transport in Solid Matter Irradiated at Relativistic Intensities by Rear-SideSelf-Radiation Diagnostics — Evidence of vxB Electron Acceleration 4J J Santos, F Amiranoff, S D Baton, M Koenig, E Martinolli, L Gremillet, H Popescu, D Batani, A Bernardinello,E Perelli, F Scianitti,T Hall, M H Key, A J Mackinnon, R R Freeman, R A Snavely, C Andersen, J King, J M Hill,R B Stephens, T E Cowan, D Neely, R J Clarke
Experimental Observations of the Weibel Instability in High Intensity Laser Solid Interactions 7M S Wei, F N Beg, A E Dangor, A Gopal, M Tatarakis, K Krushelnick, E L Clark, P A Norreys, R J Clarke,K Lancaster, K W D Ledingham, P McKenna, T McCanny, I Spencer, M Zepf
Fast electron heating in ultra-intense laser-solid interaction using high brightness shifted Kα spectroscopy 10
E Martinolli, M Koenig, L Gremillet, J J Santos, F Amiranoff, S D Baton, D Batani, F Scianitti, E Perelli-Cippo,T A Hall, M H Key, A J Mackinnon, R R Freeman, R A Snavely, J A King, C Andersen, J M Hill, R B Stephens,T E Cowan, A Ng, T Ao, D Neely, R J Clarke
Determination of high energy proton origin in laser-solid interaction 13M Zepf, F N Beg, AE Dangor, A Gopal, K Krushelnick, M Tatarakis, U Wagner, M S Wei, P A Norreys,R J Clarke, E L Clark
Double-sided laser illumination of high Z targets using Vulcan 16P McKenna, K W D Ledingham, I Spencer, T McCanny, R P Singhal, F N Beg, K Krushelnick, M S Wei, A Gopal,A E Dangor, P A Norreys, K L Lancaster, R J Clarke, S Hawkes, M Zepf, E L Clark, R D Edwards
Medical Isotope Production using Proton Beams Generated by Vulcan 19I Spencer, K W D Ledingham, R P Singhal, T McCanny, P McKenna, E L Clark, K Krushelnick, M Zepf, F N Beg,M Tatarakis, A E Dangor, P A Norreys, R J Clarke, R M Allott, I N Ross
A Nearly Real Time Electron Temperature Diagnostic using Isotope Production in Tantalum 22I Spencer, K W D Ledingham, P McKenna, R P Singhal, T McCanny, K Krushelnick, F N Beg,, M Tatarakis,A E Dangor, M Zepf, E L Clark, R D Edwards, M A Sinclair, P A Norreys, R J Clarke, R M Allott
Imaging of thin solid objects with a laser produced proton beam via multiple scattering 26L Romagnani, M Borghesi, O Willi, D H Campbell, A Schiavi
Nuclear Physics and Potential Transmutation with the Vulcan Laser 29J Galy, J Magill, R Schenkel, P McKenna, K W D Ledingham, I Spencer, T McCanny, R P Singhal, F N Beg,K Krushelnick, M S Wei, P A Norreys, K L Lancaster, R J Clarke, E L Clark
Proton Beam Generation from Double-sided Illuminations of Solid Target by High Intensity Short Pulse Lasers 32M S Wei, F N Beg, A E Dangor, A Gopal, M Tatarakis, K Krushelnick, E L Clark, K W D Ledingham, P McKenna,T McCanny, I Spencer, P A Norreys, R J Clarke, K L Lancaster, M Zepf
Ion heating and thermonuclear neutron production from high intensity subpicosecond laser pulses interacting withunderdense plasmas 34S Fritzler, V Malka, Z Najmudin, K Krushelnick, C Marle, B Walton, M S Wei, A E Dangor, R J Clarke
The production of energetic electrons from the interaction of an intense laser pulse with an underdense plasma 37Z Najmudin, K Krushelnick, E L Clark, M Tatarakis, A Modena, A E Dangor, J Faure, V Malka, D Gordon,C Joshi, R Clarke
Magnetic field measurements from polarimetry of XUV harmonics 41U Wagner, P Norreys, R Evans, D Neely, R Clarke, M Tatarakis, F N Beg, A Gopal, I Watts, M S Wei,A E Dangor, K Krushelnick, E L Clark, M Zepf
High Power Laser Programme - X-ray Laser and Long Pulse Plasma PhysicsAbsorption spectroscopy of Al XIII Ly-α Radiation by a Fe XXIV plasma 43
A Gouveia, J Hawreliak, I R Al’miev, P Sondhauss, J S Wark , O Renner, D M Chambers, P A Pinto, R S Marjoribanks,Tianjiao Liang
X-ray Laser Thomson Scattering 45F Y Khattak, D Riley, R Keenan, S Topping, A M McEvoy, J Angulo, C L S Lewis, M Notley, D Neely

Contents
Central Laser Facility Annual Report 2001/002 iv
Measurement of the duration of X-ray lasing pumped by Vulcan CPA 47Y Abou-Ali, M Edwards, G J Tallents, R Keenan, CLS Lewis, S Topping, O Guilbad, A Klisnick, D Ros,R Clarke, D Neely, M Notley
Development of X-ray lasers for applications 50
R Keenan, S Hubert, C L S Lewis, S J Topping, M Notley, D Neely
Soft X-ray interferometry with a transmission grating 53S J Topping, C L S Lewis, R Keenan, A M McEvoy, M Notley, D Neely
Uniform plasma production from thin foils 55R A D Grundy, C Courtois, R G Evans, N C Woolsey, P Helander, K G McClements, R O Dendy, J L Collier,R Heathcote, A Johnson, M M Notley, P A Norreys
Ray tracing analysis of the interaction of opposing exploding foils 58R A D Grundy, N C Woolsey
High Power Laser Programme - Theory and ComputationStimulated Synchrotron Radiation from Ultra-intense, Circularly Polarized Laser Light in Plasma 60L J Hill, H C Barr
Double ionization processes in the R-matrix Floquet approach 62H W van der Hart, L Feng
Non-Hermitian Floquet Dynamics of Argon Atoms 64M Plummer, C J Noble
Simulations of Ponderomotively Generated Magnetic Fields 66R G Evans
Birefringence in Unmagnetized Relativistic Plasmas 69J Moore, R G Evans
A Binary Collision Model for the PIC Code ’OSIRIS’ 71R G Evans
High-order wave-mixing by molecular ions in intense, ultrashort laser pulses 72D Dundas, J F McCann, K T Taylor
Atomic data for Ni-like Gd XXXVII 74K M Aggarwal, F P Keenan, P H Norrington, G J Pert, S J Rose
High Power Laser Programme - Femtosecond Pulse PhysicsMultiple Ionisation Suppression of Ar+ Ions in an Intense Laser Field 77T R J Goodworth, S L Stebbings, W R Newell, J B Greenwood, I M G Johnston, I D Williams, A J Langley,E J Divall, C J Hooker
Characterisation of the Astra Laser in Proton Acceleration Experiments 79P McKenna, K W D Ledingham, I Spencer, T McCanny, R P Singhal, A J Langley, P S Foster, C Ziener,E J Divall, C J Hooker, D Neely, P A Norreys, R J Clarke, K Krushelnick, E L Clark
Novel Target Drive Mechanisms for High Repetition Rate Laser-Solid Interaction Experiments 82P McKenna, K W D Ledingham, I Spencer, T McCanny, R P Singhal, M Harman, P Hatton, D Neville,P Brummitt, P S Foster, A J Langley, D Neely, E J Divall, C J Hooker, R J Clarke, R M Allott
Table-Top Proton Acceleration Using Astra 83I Spencer, K W D Ledingham, P McKenna, T McCanny, R P Singhal, K Krushelnick, E L Clark,P A Norreys, R J Clarke, P S Foster, D Neely, A J Langley, E J Divall, C J Hooker, J R Davies
VUV/ Soft X-ray Emission from Laser-Preplasma Interactions with Picosecond and Femtosecond Pulses 86J T Costello, J S Hirsch, E T Kennedy, J-P Mosnier, A Murphy, A Neogi, P Dunne, D Kilbane, G O’Sullivan,C L S Lewis, S Topping, R Clarke, E Divall, P Foster, C Hooker, A Langley, D Neely
Lasers for Science Facility Programme 89
Lasers for Science Facility Programme - ChemistryTime-resolved infrared absorption study of 4-dimethylaminobenzonitrile (DMABN) in acetonitrile and methanol 90C Ma, W M Kwok, D Phillips, M W George, D C Grills, A W Parker, M Towrie, P Matousek, W T Toner
Time-resolved resonance Raman and transient absorption study of locally excited states of 4-aminobenzonitrile(ABN) and 4-dimethylaminobenzonitrile (DMABN) 92C Ma, W M Kwok, D Phillips, A W Parker, M Towrie, P Matousek, W T Toner

Contents
Central Laser Facility Annual Report 2001/2002v
Picosecond Time-resolved Infrared Spectroscopy in Supercritical Fluids 94X-Z Sun, D C Grills, O S Jina, K Stanley, M W George, P Matousek, M Towrie, A W Parker
Photo-induced metal-metal bond splitting of Os carbonyl clusters 96F W Vergeer, F Hartl, D J Stufkens, P Matousek, M Towrie
Early Excited-State Dynamics of Re Complexes with a Photoisomerising Styrylpyridine Ligand 98
Kerr gated resonance Raman study of tetracyclines and their complexes with divalent metal ions 100S Schneider, G Brehm, M Schmitt, C Leypold, M Reiher, P Matousek, M Towrie
Picosecond time-resolved fluorescence of Tetracycline and its complexes with Mg++ or Ca++ 103S Schneider, G Brehm, M Schmitt, C Leypold, P Matousek, M Towrie
Picosecond TR3 Studies of Complexes with DNA-Intercalating and Related Ligands: Some New Investigations of Fe(II)Spin Crossover Complexes and of Ru(II) Polypyridyl Species 106C Brady, C G Coates, J J McGarvey, K L Ronayne, W R Browne, J G Vos, P Matousek, M Towrie, A W Parker
Nanosecond Time-Resolved Resonance Raman Spectroscopy of Functional (diimine)Re(CO)3(L) Complexes 108J D Lewis, J N Moore, I P Clark
Photosensitization of Singlet Oxygen by Oxazole Yellow 110E Tuite, F Dickinson, I P Clark
Picosecond Studies of Ruthenium and Rhenium dipyridophenazine complexes in solution and when bound topolynucleotides 111J M Kelly, C M Creely, M M Feeney , S Hudson , W J Blau, B Elias, A Kirsch-De Mesmaeker,P Matousek, M Towrie, A W Parker
Infrared Ion Dip and Ultraviolet Spectroscopy of 4-Phenyl Imidazole, its Tautomer, 5-Phenyl Imidazole, and its MultiplyHydrated Clusters 115F O Talbot, L C Snoek, N A Macleod, P Butz, J P Simons, R T Kroemer
Towards an understanding of multiply hydrated tryptophan clusters in the gas phase 117L C Snoek, N A Macleod, F O Talbot, P Butz, J P Simons, R T Kroemer
Rate Coefficients for the Transfer of OH(X23/2, v = 1, j) between Λ-Doublet and Rotational Levels in Collisions with
He, Ar, N2 and HNO3 119K M Hickson, C M Sadowski, I W M Smith
Reaction of O(3P) with vibrationally excited methane 121H Kelso, F Ausfelder, D A Henderson, K G McKendrick
Molecular Young’s slits: Interference effects in the UV photodissociation of hydrogen peroxide 124A J Alexander
Picosecond Time-resolved Photoelectron Spectroscopy as a Probe of Intramolecular Dynamics in para-Fluorotoluene 126J A Davies, K L Reid, M Towrie, P Matousek
REMPI-LIF studies of simple ion-molecule reactions 128M J Frost, C R J Sharpe
Time-resolved imaging with lanthanide complexes 130R J Aarons, B P Burton-Pye, S Faulkner, S W Botchway, A W Parker, S Topley, A Beeby, J S Snaith, A Ashraf,J Notta
Lasers for Science Facility Programme - BiologyExposure of mammalian cells to soft x-rays: effects on gap junctional intercellular communication and its implicationsfor the study of the radiation-induced ‘bystander’ effect 132G O Edwards, R A Meldrum, C W Wharton, J K Chipman, S W Botchway, G J Hirst, W Shaikh, A Bodey, S Topley
Investigation of ‘Hyperluminescence’ produced by Multiphoton Excitation of 5-Hydroxytryptophan 135R H Bisby, D Tobin, S Botchway, I Clark, A W Parker
Following Adenovirus Entry in Living Cells by Fluorescence Lifetime Microscopy 137M L Martin-Fernandez, M J Tobin, S V Jones, G R Jones, S W Botchway
Induction of localized UV photoproducts in cell nuclear DNA by 3-photon near infrared absorption 139R A Meldrum, C W Wharton, S W Botchway, G J Hirst, S Topley
Lasers for Science Facility Programme - PhysicsPrepulse enhanced EUV yield from a xenon gas-jet laser produced plasma 142G Kooijman, R de Bruijn, K Koshelev, F Bijkerk, W Shaikh, A Bodey, G Hirst

Contents
Central Laser Facility Annual Report 2001/002 vi
A New Approach to the Production of High Resolution X-ray Masks 145J A Cairns, M R Davidson, G J Berry, A G Fitzgerald, J Thomson, W Shaikh, G Hirst, A Bodey
Fibre Bragg grating fabrication using fluoride excimer laser for sensing and communication applications 147T Sun, S Pal, J Mandal, K T V Grattan
Molecular Nanostructures Fabricated by Photolithographic Processes 150S Sun, K S L Chong, G J Leggett
Progress with the King’s College Laboratory Scanning X-Ray Microscope 152A G Michette, S J Pfauntsch, A K Powell, T Graf, D Losinski, C D McFaul, G J Hirst, W Shaikh
Terahertz generation at semiconductor surfaces 154E H Linfield, A G Davies, M B Johnston, A Dowd
Laser Processing of Thin Film Phosphors for Flat Screen Displays 158W M Cranton, D Koutsogeorgis, S Liew, B Nassuna, R Ranson, C B Thomas
Femtosecond Non-Linear Laser Spectroscopy 161R Devonshire, M Jinno
Laser Science and Development 163
Laser Science and Development - Vulcan PetawattVulcan Petawatt Upgrade Overview 164C B Edwards
Installation of the Compressor and Interaction Chambers and associated engineering hardware for theVulcan Petawatt Upgrade 165B E Wyborn, P A Brummitt, A J Frackiewicz, J A C Govans, B J Gray, S Hancock, P E Hatton, P Holligan,A R Jackson, W J Lester, Z A Miljus, D R Neville, D A Pepler, M R Pitts, C J Reason, J K Rodgers,D A Rodkiss, A G Ryder, G N Wiggins, R W W Wyatt
Vacuum system commissioning for Vulcan Petawatt Interaction and Compression Chambers 168P A Brummitt, D Rodkiss
Petawatt Interaction and Compression Chamber Vacuum control 169P Holligan, R W W Wyatt
Petawatt Mirror / Grating Mount Alignment Control System 170P Holligan, RWW Wyatt, K Rogers, G Wiggins, M Dominey
Gain Measurements on the Petawatt 208 mm Amplifier Chain 171D Pepler, C Danson, J Collier, C Edwards, S Hawkes, A Kidd, T Winstone, R Wyatt
Reconfiguration of the Vulcan Front End Systems 172C Hernandez-Gomez, J Collier, J Smith
“Double Decker” Stretcher Design for the Petawatt Upgrade 173J Collier, C Hernandez-Gomez
Commissioning of the Vulcan OPCPA preamplifier 175C Hernandez-Gomez, J Collier, M Csatari, J Smith
Radiation shielding for the interaction chamber in Target Area Petawatt 177C Ziener, P E Hatton, P N M Wright, R J Clarke, C B Edwards, D Neely, D A Rodkiss, B E Wyborn
Laser area 4 beam delivery and diagnostics commissioning 179S Hawkes, J Collier, S Hancock
Adaptive Optics for the Petawatt upgrade 181J Collier, C Hooker, S Hawkes, C Edwards, C Haefner, K Braeur
Laser Science and Development - VulcanBeam splitter implementation for proton radiography 183S Hawkes
Disc amplifier Flash Lamp Test Facility 184R W W Wyatt, C Aldis, A Frackiewicz, D A Pepler, M Pitts, C Reason, R Wellstood
The Manufacture of Random Phase Plates and Phase Zone Plates 185T Boland, D Pepler, T B Winstone, C Danson

Contents
Central Laser Facility Annual Report 2001/2002vii
Laser Science and Development - AstraThe New Target Area Drive System 187E Divall, P Holligan
Astra laser development 188C J Hooker, A J Langley, E J Divall
The dependence of the specular reflectivity of plasma mirrors on laser intensity, pulse duration and angle of incidence 190C Ziener, P S Foster, E J Divall, C J Hooker, M H R Hutchinson, A J Langley, D Neely
Time-of-Flight corroboration of “conventional” ultra high intensity measurement 192C Ziener, P S Foster, E J Divall, C J Hooker, A J Langley, D Neely
Laser Science and Development - Lasers for Science FacilityFluorescence Suppression in Resonance Raman Spectroscopy using Combined Kerr Gated and SERDS Technique andAutomated Spectrum Reconstruction 195P Matousek, M Towrie, A W Parker
Development of Raman Tweezers 198A D Ward, A W Parker, S W Botchway, M Towrie
Self-Drilled Spatial Filter for a Multi-Pulse Picosecond Ultraviolet Laser System 200A J Bodey, G J Hirst, W Shaikh
Laser Science and Development - Laser Optics and Laser DesignProgress in the construction of large-aperture adaptive mirrors 201C J Hooker, J L Collier, C Spindloe
The Performance of a Stable High-gain Diode-pumped Nd:YLF Amplifier 202I N Ross , M Csatari
Applications of OPCPA in Compact High Average and Peak Power (CHAPP) Lasers 206I N Ross
Laser Science and Development - InstrumentationLaNSA project: Filling process for BC505 liquid scintillator 207K L Lancaster, H Habara, P Norreys, J Govans, C Cornish, A Jackson, T Strange, G Mant
Neutron Spectroscopy with Large Area TIME-of-FLIGHT Detector Array 208H Habara, K L Lancaster, P A Norreys
Appendices 211
Operational StatisticsVulcan Operational Statistics 212A Kidd, T Boland, C Danson
Astra Operational Statistics 214A J Langley
LSF Operational Statistics 215S M Tavender, M Towrie, A W Parker
Publications 219
Panel Membership and CLF Structure 227
Author Index 231

Foreword
1 Central Laser Facility Annual Report 2001/2002
This report contains scientific accounts of the work which has beencarried out at the Central Laser Facility (CLF) of the CCLRC’sRutherford Appleton Laboratory by its users and staff during thefinancial year 2001-02. The year has again been extremelyproductive with very strong scientific programmes carried out inVulcan, Astra and the Lasers for Science Facility (LSF).
The Vulcan laser has continued to provide the focus of the verystrong international research programme in laser plasma interactions.The short-pulse, high-intensity programme has benefited fromfurther increases in the available intensity to 1020W/cm2 using thetechnique of chirped pulse amplification. Areas of study haveincluded the physics relevant to fast ignition for inertial fusionenergy, photo-induced nuclear physics, proton production forapplications in imaging, plasma diagnostics and medicine and theproduction and measurement of ultra-high magnetic fields.Complementary studies in high-intensity physics have also beencarried out using the high repetition rate Astra laser. A strongscientific programme on the development and application of X-raylasers pumped by Vulcan operating in the long pulse mode has alsobeen carried out.
The unique laser and diagnostic facilities provided by the LSF has continued to enable a diverse programme of research across abroad range of topics in physics, chemistry and biology. Using the Picosecond Infrared Absorption and Transient Excitation(PIRATE) laser system and the Kerr gate technique for fluorescence suppression, time-resolved resonance Raman and absorptionspectroscopy of a wide range of molecules of basic chemical and biological interest have been studied. In addition, the laser loanpool has continued to enable a wide range of research in UK university research groups through the provision of specialist lasers andtheir technical support.
The research being carried out within the CLF by scientists from UK universities, and, through international agreements, fromEurope and the USA, continues to be of the highest quality. The next years will bring new opportunities and challenges. Thecompletion of the Petawatt upgrade for Vulcan will increasingly provide an international focus for research on ultra-high fieldphysics and, with the wide range of facilities and expertise within the CLF, we can again look forward to exciting research across abroad range of science.
Foreword
M H R Hutchinson
Central Laser Facility, CLRC Rutherford Appleton Laboratory, Chilton, Didcot, Oxon., OX11 0QX, UK
Email address: [email protected]
Overview of the Central Laser Facility
Central Laser Facility Annual Report 2001/2002 2
Laser Facilities for Users
The Central Laser Facility (CLF) is a world leading centre forresearch using lasers. Facilities available to users include theVulcan Nd: glass laser which delivers multi- TW beams to twotarget areas, the Astra ultra- short pulse interaction facilitybased on titanium sapphire laser technology, a range of state ofthe art table top laser systems and specialised diagnosticinstruments within the Lasers for Science Facility and the LaserLoan Pool.
VulcanVulcan is a highly versatile large scale Nd: glass laserinstallation which delivers a maximum of 2.5 kJ of energy in itssix 10 cm and two 15 cm beamlines to two target areas, each ofwhich is equipped with frequency conversion optics to enableboth 1µm and 0.5 µm operation of all beams. A range of pulsedurations are available from 100 ps to 20 ns in variousgeometries.
A short pulse (700 fs) high irradiance (~1020 W cm-2) chirpedpulse amplification (CPA) capability is available, with vacuumpropagation to target and reflective beam focusing optics.Additional low energy beams, including sub- picosecond CPAprobes, are provided for diagnostics with high temporalresolution. The system is fully characterised and equipped withadvanced diagnostics.
Vulcan Petawatt Upgrade
A 3 year development of Vulcan’s CPA beamline to thePetawatt level began in April 1999. The project involves theaddition of 20 cm disc amplifiers, the construction of a largeaperture vacuum beam compressor and a new target chamberwithin a new target area building.
The new building was handed over in January 2001. Thevacuum compressor and target chamber were delivered inAugust and commissioned by December 2001. Followingvacuum tests and thorough cleaning of the chambers, the largeaperture mirror mounts, beam optics and compression gratingswere installed during the first quarter of 2002.
The first Petawatt user experiment is scheduled for beamtimeduring November and December 2002.
Lasers for Science Facility (LSF)The LSF operates a suite of state of the art table- top lasersystems and associated instrumentation giving users access tohighly tunable (vuv - ir) and variable pulse width (ns to fs) laserradiation. This includes lasers for ns and ps time- resolvedstudies. The time resolved resonance Raman (TR3) facilityoffers a unique 4 ps optical shutter fluorescence rejectionsystem and a state-of-the-art dual wavelength kHz femtosecondsynchronised pump-probe apparatus based on OPA technology.There is also a high average power laser plasma x-ray sourceand a fast gated (100 ps) confocal microscopy laboratory.
The high brightness PIRATE facility (Picosecond InfraredAbsorption and Transient Excitation) provides twoindependently tunable beams across the mid infra red region ofthe spectrum for pump / probe experiments. Pirate and theps-TR3 apparatus is used for a wide range of experiments inchemistry, physics, biological and material sciences.
Laser Loan Pool
Commercial laser systems are available from the Laser LoanPool for periods of up to 4 months at the user’s homelaboratory. Systems available include nanosecond tunableYAG pumped dye lasers (with frequency up-conversion anddown-conversion covering the spectral region from 205 nm to4500 nm), an excimer laser operating down to 157 nm, a CWfrequency doubled argon ion laser and an all solid-statefemtosecond Titanium Sapphire laser tunable between 680 nmand 1020 nm. A wide range of ancillary and diagnosticequipment is also available to support user experiments.
Astra
The Astra facility is based on titanium sapphire lasertechnology which gives users access to high intensity laserpulses at 10 Hz repetition rate.
The facility supplies laser pulses to two target areassimultaneously. Target Area I provides pulses of 50fs durationwith an energy of 10 mJ, producing irradiance on target inexcess of 1016 W.cm-2. The Target Area II currently delivers300 mJ in 50fs with target irradiance at 1018 W.cm-2 regime.
Engineering Services
Mechanical, electrical and computing support is provided forthe operation of the laser facilities at the CLF, for theexperimental programmes on these facilities and for the CLF’sresearch and development activities. Access to mechanical andelectrical CAD tools and workshop facilities enable a rapidresponse to be provided to users.
Access to Facilities
The mechanism for awarding access to beamtime at all CCLRCfacilities is changing following the conclusion of the secondstage of the Quinquennial Review of the CCLRC. From April2003, beamtime will be awarded and funded by CCLRC. Forthe latest information please visit the CCLRC Web site at:www.clrc.ac.uk/QReview/QR_FacilityAccess_07_02.htm. Forfurther information, please contact Mrs. Alison Brown([email protected]).
During the period covered by this report, beamtime at all CLFfacilities has been available for European researchers and theircollaborators through the EU Access to Large ScaleInfrastructure programme. The CLF hopes to continue thisarrangement in the forthcoming Sixth Framework Programmethrough a joint application with other European laser facilities.For information on calls for proposals, eligibility criteria, etc.please contact Colin Danson (c.danson@ rl.ac.uk).
Hiring of the facilities and access to CLF expertise is alsoavailable on a commercial basis for industrial research anddevelopment. Please contact Mrs. Alison Brown for furtherinformation.
CLF Web site
Further information on the CLF, its facilities and the scientificprogrammes is available on the CLF Web site athttp://www.clf.rl.ac.uk.
Overview of the Central Laser Facility
C B Edwards
Central Laser Facility, CLRC Rutherford Appleton Laboratory, Chilton, Didcot, Oxon, OX11 0QX, UK
Main contact email address: [email protected]

High Power Laser Programme
3 Central Laser Facility Annual Report 2001/2002
High Power Laser Programme
1) Short Pulse Plasma Physics
2) X-ray Laser and Long Pulse Plasma Physics
3) Theory and Computation
4) Femtosecond Pulse Physics
High Power Laser Programme – Short Pulse Plasma Physics
Central Laser Facility Annual Report 2001/2002 4
Introduction
For several years now we have been studying the generationand the transport of fast electrons in solid matter1-4) within thecontext of the fast ignitor scheme in inertial confinementfusion5). This concept is based on relativistic electronsgeneration by the interaction of an ultra-intense laser pulse witha dense plasma, electron transport in the over-critical matter andfinally its energy deposition in the region wrapping the nuclearfuel. Understanding of the physical mechanisms involved inthese steps is crucial for the success of fuel ignition.
Our main goal has been to characterize the energy distributionof the fast electrons produced by short and intense laserirradiation and the geometry of its transport through solidmatter. For that purpose we have implemented differentdiagnostics of the target rear side visible emission. Time-integrated and time-resolved images obtained in previousexperiments performed on the LULI 100 TW laser facility hadalready shown a very bright and short signal preceding the longemission of the cooling and expanding plasma heated by thefast electrons flux 3,6). Because of the very short duration of theinitial burst - less than 2 ps for a 100 µm Al target 6) - it isinterpreted as a signature of fast electron jets crossing thetarget-vacuum boundary. The measured signal spreading half-angle was ~17°. This signal has been explained as OpticalTransition Radiation (OTR) emitted by electrons crossing thetarget/vacuum boundary, or by the synchrotron-like radiationemitted by these electrons when they circulate outside the targetbefore being forced back by the electrostatic field. Theestimated ~1013 electrons population would have a temperatureof a few hundred keV corresponding to a total kinetic energy of~1 J 3).
In this report we present results on time-integrated images andtime-resolved spectra of the optical self-emission of flat targetsrear side, from the RAL-CLF experimental campaign. As atLULI6), a 2ω bright component, corresponding to the secondharmonic of the laser light, has been observed. This emission isexplained by the acceleration of short bunches of electrons bythe vxB force in front of the target.
Experimental Setup and Results
The experiment was performed on the RAL-CLF Vulcan laserfacility. The 1 ps, 1.054 µm laser pulse with an energy up to90 J was focused by a f/3.5 off-axis parabola at normal
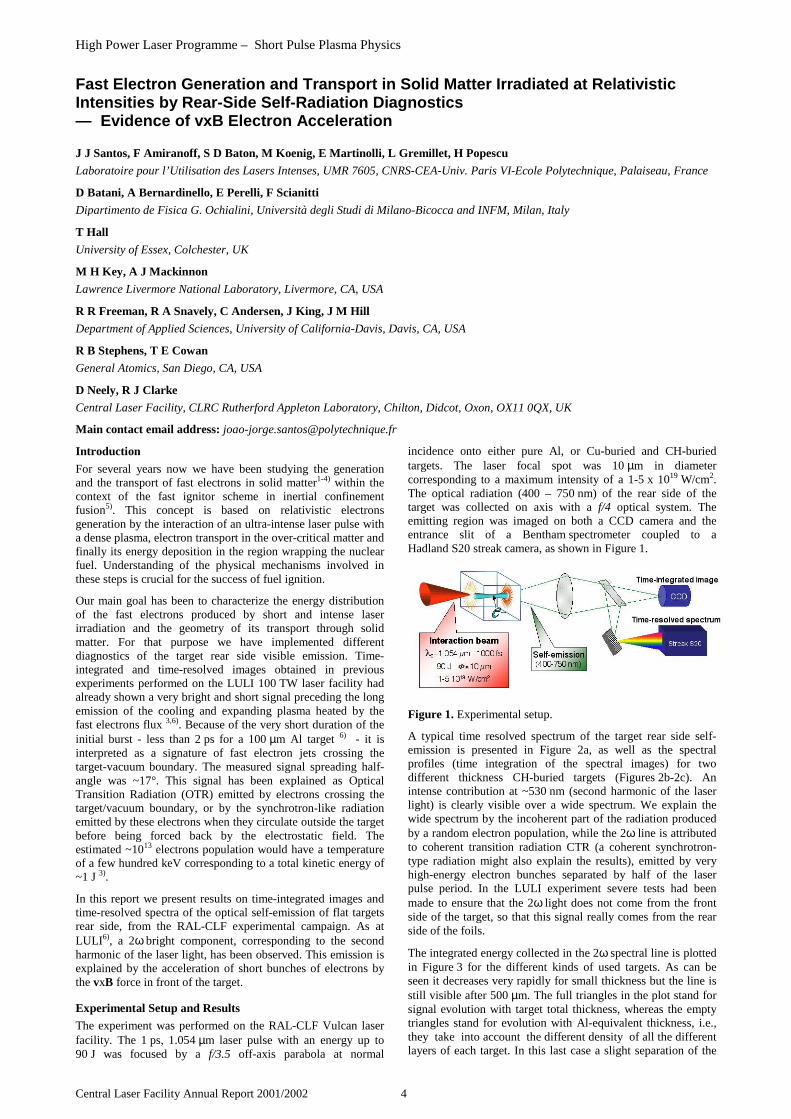
incidence onto either pure Al, or Cu-buried and CH-buriedtargets. The laser focal spot was 10 µm in diametercorresponding to a maximum intensity of a 1-5 x 10¹⁹ W/cm2.The optical radiation (400 – 750 nm) of the rear side of thetarget was collected on axis with a f/4 optical system. Theemitting region was imaged on both a CCD camera and theentrance slit of a Bentham spectrometer coupled to aHadland S20 streak camera, as shown in Figure 1.
Figure 1. Experimental setup.
A typical time resolved spectrum of the target rear side self-emission is presented in Figure 2a, as well as the spectralprofiles (time integration of the spectral images) for twodifferent thickness CH-buried targets (Figures 2b-2c). Anintense contribution at ~530 nm (second harmonic of the laserlight) is clearly visible over a wide spectrum. We explain thewide spectrum by the incoherent part of the radiation producedby a random electron population, while the 2ω line is attributedto coherent transition radiation CTR (a coherent synchrotron-type radiation might also explain the results), emitted by veryhigh-energy electron bunches separated by half of the laserpulse period. In the LULI experiment severe tests had beenmade to ensure that the 2ω light does not come from the frontside of the target, so that this signal really comes from the rearside of the foils.
The integrated energy collected in the 2ω spectral line is plottedin Figure 3 for the different kinds of used targets. As can beseen it decreases very rapidly for small thickness but the line isstill visible after 500 µm. The full triangles in the plot stand forsignal evolution with target total thickness, whereas the emptytriangles stand for evolution with Al-equivalent thickness, i.e.,they take into account the different density of all the differentlayers of each target. In this last case a slight separation of the
Fast Electron Generation and Transport in Solid Matter Irradiated at RelativisticIntensities by Rear-Side Self-Radiation Diagnostics— Evidence of vxB Electron Acceleration
J J Santos, F Amiranoff, S D Baton, M Koenig, E Martinolli, L Gremillet, H Popescu
Laboratoire pour l’Utilisation des Lasers Intenses, UMR 7605, CNRS-CEA-Univ. Paris VI-Ecole Polytechnique, Palaiseau, France
D Batani, A Bernardinello, E Perelli, F Scianitti
Dipartimento de Fisica G. Ochialini, Università degli Studi di Milano-Bicocca and INFM, Milan, Italy
T Hall
University of Essex, Colchester, UK
M H Key, A J Mackinnon
Lawrence Livermore National Laboratory, Livermore, CA, USA
R R Freeman, R A Snavely, C Andersen, J King, J M Hill
Department of Applied Sciences, University of California-Davis, Davis, CA, USA
R B Stephens, T E Cowan
General Atomics, San Diego, CA, USA
D Neely, R J Clarke
Central Laser Facility, CLRC Rutherford Appleton Laboratory, Chilton, Didcot, Oxon, OX11 0QX, UK
Main contact email address: [email protected]

High Power Laser Programme – Short Pulse Plasma Physics
5 Central Laser Facility Annual Report 2001/2002
CH-buried targets (in blue) from the completely metallic ones isvisible, which could be interpreted as a higher inhibition forelectron flux in the CH-layers.
Figure 2. a) Typical time-resolved spectrum showing anintense contribution at 530 nm. The lower graphics are thespectral profiles integrated in time for CH-buried targets withtotal thickness: b) 102 µm. c) 352 µm.
The coherent light at 2ω is also seen on the time-integratedimages (cf. Figure 4): a bright ring-shape interference pattern,which could only be produced by coherent radiation, was seenwhen acquisition was made in all the optical range (top imagesFigure 4). If we suppress the 2ω component by means of amagenta filter, the interference pattern disappears (bottomimages on Figure 4), leaving just a weaker and wide smoothcloud.
Figure 3. 2ω coherent radiation integrated energy as functionof the target total thickness (full triangles) or as function of theAl-equivalent thickness (empty triangles).
Discussion
When interacting with a plasma, the energy of a laser beam canbe absorbed by various mechanisms. In particular, at relativisticregimes of interaction, the electrons’ quiver velocity in the laserfield is so high that the Lorentz component of the force (the so-called vxB force) can accelerate them longitudinally. Thisacceleration mechanism can generate ultra short bunches ofrelativistic electrons separated by half the period of the laserfield (see Figure 5 on the left). Such electron bursts emitted atthe rate of two per laser period had already been observed inparticle-in-cell simulations of fast electron transport throughdense matter7,8). If the electrons do not dephase and remainbunched in their propagation till they reach the target-vacuumboundary (and we expect it at least from the more relativistic),the individual fields due to each electron add coherently forwavelengths much larger than the bunch length. This leads to amuch higher emitted power proportional to the square of thenumber of electrons N2, instead of N in the incoherent case. Inthe case electrons are bunched in successive short bunches
separated by a time delay δT, the emission is coherent forwavelengths close to cδT.
Figure 4. CCD time-integrated images. The upper imageswere acquired using all the visible spectral range and show aring-shape interference pattern. The lower ones were acquiredfiltering off the 2ω component. The correspondingtransmissivity functions are shown on the left.
The plot presented on Figure 5 on the right is the result of apure ballistic calculation for the evolution within the target oftwo successive electron bunches separated by half the laserpulse period. Each bunch had an electron distribution with atemperature of 2 MeV. The normalized electron flux throughthe rear surface is plotted, for three target thicknesses, as afunction of the time delay relative to the arrival of the fastestparticles. We can see that the electron bunches broaden andmerge for large target thickness. This calculation allows us toconclude that only the more relativistic electrons, with a kineticenergy higher than twice the electron distribution temperature,remain bunched and have a significant contribution to thecoherent signal emitted at the target rear side.
Figure 5. Schematic illustration of the vxB acceleration ofrelativistic electron bunches (left). Evolution of the electronicflux through the rear surface for three target thicknesses and a2 MeV electron temperature (right).
Figure 6. Evolution of the 2ω coherent energy with targettotal thickness for three temperatures of the electrondistribution. The triangles are the experimental points for thedifferent kinds of targets.

High Power Laser Programme – Short Pulse Plasma Physics
Central Laser Facility Annual Report 2001/2002 6
The evolution of this signal’s absolute energy with targetthickness is represented in Figure 6 for three different electrondistribution temperatures.
In this purely ballistic model the energy contained in the 2ωpeaks is basically given by the expression:
2ωE ∝ 2N2
P(2ω)
where N is the total number of electrons within the bunches andP(2ω) depends on the target thickness, the electron energy
distribution and on the radiation model energy conversionefficiency (we have considered a transition radiation model).From the width of the observed spectral lines at2ω (~ 20 nm FWHM) we can estimate the number of thebunches involved to be ~ 30. Comparing with experimental data(represented by the triangles, as in Figure 3) we see that data iswell fitted for a temperature of ~2MeV and an energy of 12 µJper bunch.
Conclusions
The emission at 2ω from the back of thick targets irradiated bya laser beam at high intensity has been detected, both byspectral analysis and by a circular interference pattern in time-integrated images. This is the evidence for the acceleration ofultra-short relativistic electron bunches at 2ω by the vxB forcein the interaction region. It could also be the second harmonicdue to bunches of electrons emitted at ω. However, there are nophysical mechanisms which could explain such electronemission. First estimates show that the total energy in thoseelectron bunches is a modest fraction (~10-5) of the laser energy,and that they have an energy distribution with a temperature ofa few MeV. These high energy electron bunches are thendistinct from the lower energy population detected in a previousexperiment3), where we had filtered off the 2ω component ofthe spectra, and could be responsible for the jets observedbefore by shadowgraphy1).
Acknowledgments
The authors would like to thank the technical staff of the CLFfor their help in running this experiment. This work has beensupported by the European Laser Facility Access Program(contract HPRI-CT-1999-00010). One of us (J.J.S.) wasfinanced by MCT (Portugal) under the contact PRAXIS XXIBD/18108/98.
References
1. L. Gremillet et al.Phys. Rev. Lett. 83, 24, 5015 (1999)
2. F. Pisani et al.Phys. Rev. E 62, 5, R5927 (2000)
3. J.J. Santos et al.Phys. Rev. Lett. 89, 2, 025001 (2002)
4. E. Martinolli et al.Submitted to Phys. Rev. Lett. (2002)
5. M. Tabak et al.Phys. Plasmas 1, 5 1626 (1994)
6. S.D. Baton et al.Rapport d’Activité LULI 2001, Ecole Polytechnique,France, 2002
7. B. F. Lasinski et al.Phys. of Plasmas 6, 5, 2041 (1999)
8. A.J. Mackinnon et al.Phys. Rev. Lett. 88, 215006 (2002)
High Power Laser Programme – Short Pulse Plasma Physics
7 Central Laser Facility Annual Report 2001/2002
Introduction
Recently, there has been significant interest in the study of fastelectron propagation in solid density plasmas particularly due topotential applications with regard to the fast ignition scheme1)
for inertial confinement fusion, in which laser-producedenergetic electrons are envisaged to penetrate into the pre-compressed fuel core to ignite the fusion spark. In this way, theseparation of the heating and compression stages in inertialconfinement fusion significantly reduces the total energyrequirements for the driving beams and greatly relaxes thesymmetry conditions as well.
Electron beams having energies of tens of MeV have alreadybeen produced in short pulse high intensity laser solidinteractions2). The number of hot electrons is of the order of1013 with a temperature of 1~2 MeV. The current carried bythese electron beams is significantly above the Alfvén current:
IA=1.7×10⁴βγ ≈ 30KA for γ = 2
Here IA is the limiting electron beam current in vacuum, β= v/cand γ is the relativistic Lorenz factor (γ =(1-β2)-1/2.
When the fast electron beam generated by a high intensity shortpulse laser near the vacuum plasma interface penetrates into asolid target, the return current induced in the bulk cold plasmaeffectively balances the fast electron current so that currentslarger than the Alfvén current limit can propagate. Such twocounter-propagating streams are subject to the well-knownWeibel instability2), which can generate strong magnetic fieldstransverse to the fast electron beam direction. These magneticfields can consequently cause the electron beam to break up intosmall filaments. Linear analysis of the Weibel instability in thetwo-fluid model has studied the dynamics of this instability3,4).Considerable numerical simulation work has been done on suchfast electron propagation and the related formation of magneticchannels in the overdense plasmas4-7). An essential feature ofthese simulations is the break-up of the current into very smallcurrent filaments in the overdense plasma and the subsequentcoalescence of these filaments.
A single highly collimated electron beam has already beenconfirmed experimentally inside transparent glass targets and atthe rear surface of the plastic targets in high intensity laser solidinteractions8). However, until now, filamentary structuresresulting from the Weibel Instability have not yet been observedexperimentally.
In this report, we present the first experimental observations ofthe fine structures of the Weibel instability induced in a highintensity laser produced fast electron beam. The speckle-likeoff-normal electron filaments have consistently been observedin our high intensity laser interaction experiments using thingold foil targets.
Experimental Set-up and Diagnostic Tools
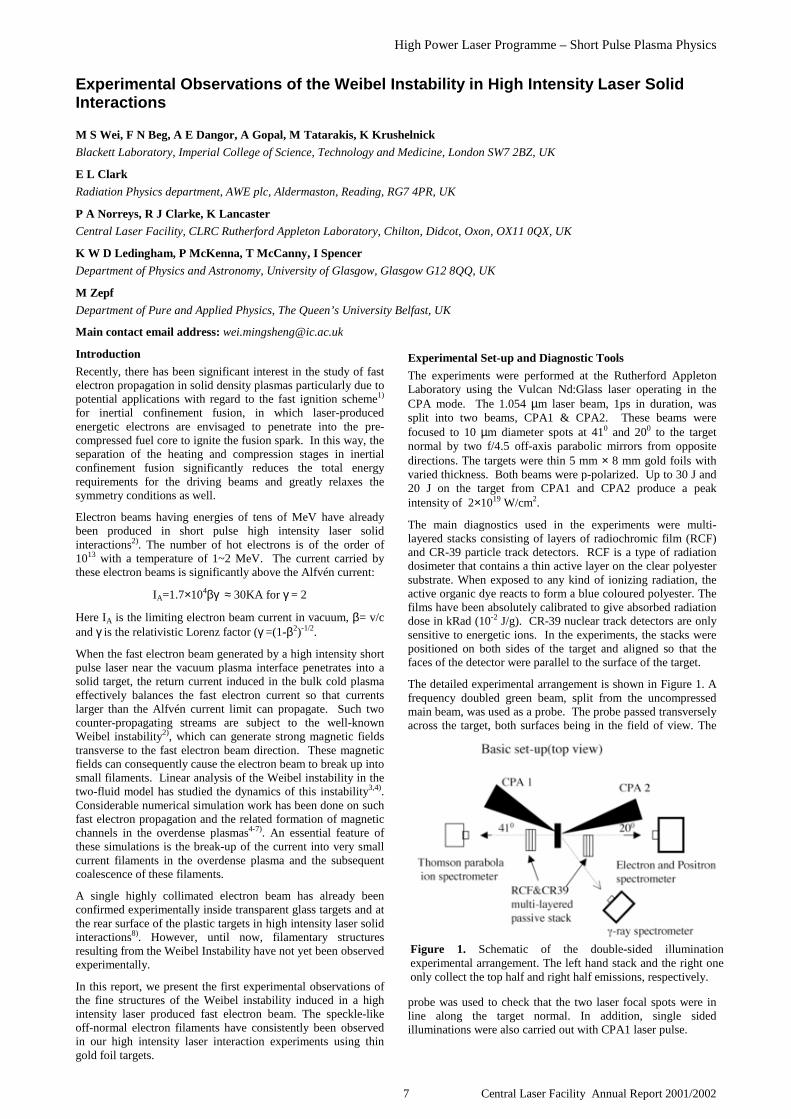
The experiments were performed at the Rutherford AppletonLaboratory using the Vulcan Nd:Glass laser operating in theCPA mode. The 1.054 µm laser beam, 1ps in duration, wassplit into two beams, CPA1 & CPA2. These beams werefocused to 10 µm diameter spots at 410 and 200 to the targetnormal by two f/4.5 off-axis parabolic mirrors from oppositedirections. The targets were thin 5 mm × 8 mm gold foils withvaried thickness. Both beams were p-polarized. Up to 30 J and20 J on the target from CPA1 and CPA2 produce a peakintensity of 2×10¹⁹ W/cm2.
The main diagnostics used in the experiments were multi-layered stacks consisting of layers of radiochromic film (RCF)and CR-39 particle track detectors. RCF is a type of radiationdosimeter that contains a thin active layer on the clear polyestersubstrate. When exposed to any kind of ionizing radiation, theactive organic dye reacts to form a blue coloured polyester. Thefilms have been absolutely calibrated to give absorbed radiationdose in kRad (10-2 J/g). CR-39 nuclear track detectors are onlysensitive to energetic ions. In the experiments, the stacks werepositioned on both sides of the target and aligned so that thefaces of the detector were parallel to the surface of the target.
The detailed experimental arrangement is shown in Figure 1. Afrequency doubled green beam, split from the uncompressedmain beam, was used as a probe. The probe passed transverselyacross the target, both surfaces being in the field of view. The
probe was used to check that the two laser focal spots were inline along the target normal. In addition, single sidedilluminations were also carried out with CPA1 laser pulse.
Experimental Observations of the Weibel Instability in High Intensity Laser SolidInteractions
M S Wei, F N Beg, A E Dangor, A Gopal, M Tatarakis, K Krushelnick
Blackett Laboratory, Imperial College of Science, Technology and Medicine, London SW7 2BZ, UK
E L Clark
Radiation Physics department, AWE plc, Aldermaston, Reading, RG7 4PR, UK
P A Norreys, R J Clarke, K Lancaster
Central Laser Facility, CLRC Rutherford Appleton Laboratory, Chilton, Didcot, Oxon, OX11 0QX, UK
K W D Ledingham, P McKenna, T McCanny, I Spencer
Department of Physics and Astronomy, University of Glasgow, Glasgow G12 8QQ, UK
M Zepf
Department of Pure and Applied Physics, The Queen’s University Belfast, UK
Main contact email address: [email protected]
Figure 1. Schematic of the double-sided illuminationexperimental arrangement. The left hand stack and the right oneonly collect the top half and right half emissions, respectively.

High Power Laser Programme – Short Pulse Plasma Physics
Central Laser Facility Annual Report 2001/2002 8
(a) (b) (c)
Figure 2. Scanned RCF images show the existence of the speckle-like off normal electron beam when two CPA beams werecoincident in time. The left edge of (a) is at target normal direction. (a) and (b) are the front and deeper layers in the right stackrespectively. (c) is a magnified view of a small region of (b) with magnification 1000. The detectors were 5 cm by 5 cm.
(a) (b) (c)
Figure 3. The raw scanned RCF images in the single sided illumination shot with only CPA1. Two separated emissions are shown.The detector stack was 5 cm behind a 20 µm thick gold target. (a) is the front layer of the stack, (b) and (c) are in the deeper layers.The big electron beamlets are clearly visible at the similar off-normal direction as that in double illumination shots.
Experimental Results
Typical images of the radiochromic films are presented inFigure 2 which show the existence of an off-normal electronbeam. Scanned RCF images (a) and (b) are from the same shotwhen the target was illuminated on both sides with two laserbeams coincident in time. Except for the lower energy electronand proton emission due to the CPA2 laser produced plasma(only seen in the first two front layers of the RC films), therewas the higher energy off-normal electron beam recorded on allthe RC films in the stack, which is on the right side 5 cm fromthe targets. The evidence that the beam consists of electronsrather than ions was obtained by comparing the signals on theRC film and the subsequent CR39 pieces in the stack, which didnot show any signal. The collimated off-normal off-axis intenseelectron beam was emitted at 200 from the target normal withfull emission cone angle of 110. A distinct feature of theelectron beam is that it has a very fine speckle-like emissionpattern which can be seen in Figure 2 (c). Image (c) is a closerview of a small square region of (b) with magnification 1000.
Such electron beams were also observed when the delaybetween CPA1 and CPA2 laser pulses was varied by up to 2 ps.It is noted that these variations did not affect the behaviour ofthe electron beam. From the RCF absorbed dose, it is estimatedthat the beam consists of 1012 electrons.
Experiments with only CPA1 laser beam single sidedillumination were carried out with similar laser energy as that inthe double sided shots. Figure 3 presents the raw scannedimages of the RCF of the stack which was positioned behind thetarget. In this shot the centre of the detector was at the targetnormal. Two separate signals are clearly visible. The significantemission along target normal is mainly due to energetic protons,
which was confirmed by the CR39 data. The off-normal off-axis signals are due to electrons. These are at the same directionas the off-normal electron beams observed in doubleillumination cases. The beam was formed by dozens ofseparated large speckle-like electron jets. The biggest specklehas a radius of approximately 500 µm and is seen almost in thecentre of the off-normal beamlets surrounded by relativelysmaller speckles with diameters of the order of 250 µm. In thedeeper RCF layers of the stack, only a couple of large specklesexist. The angular spread of the off-normal electron beamproduced in the single sided illumination is similar to thoseproduced by the double sided illuminations. The onlysignificant difference is the speckle size. Therefore, it isreasonable to assume that all the off-normal electron beamswere produced by the CPA1 laser pulse which then propagatedthrough the solid density plasma reaching the detectors on theother side. The different emission structures in the double andsingle sided illuminations are very likely due to the significantchanges of the conditions for fast electron transport inside thesolid density plasma in the two different schemes.
TLD dosimeter measurement9) indicated that CPA1 laser pulsehas much higher energy than that of CPA2. The ratio was about3/2, which confirmed that CPA1 took the dominant role duringthe double sided illuminations.
It should also be noted that the electron spectra measured by anelectron spectrometer10) along the target normal in both schemesare very similar in terms of energy and temperature. But thenumber of the electrons in double sided illumination seemed tobe reduced by a factor of 3 compared to that from single sidedshots.

High Power Laser Programme – Short Pulse Plasma Physics
9 Central Laser Facility Annual Report 2001/2002
Discussion
These observations are consistent with the fast electron beambreaking into filaments due to the Weibel instability as theypropagate in the overdense plasma.
Linear analysis of the Weibel instability including electronkinetic effects and resistivity and 2-D PIC simulations done bySentoku et al 5), which include relativistic binary collisions,suggests that the growth rates of shorter wavelengths aresignificantly reduced when the initial plasma temperature ishigh. In a collisional plasma, the growth rates of the fast modesare suppressed due to the plasma kinetic effects and the spectralpeak of the growth rate shifts to long wavelength modes in thelater stage due to the coalescence of the quasistatic magneticchannels.
Comparing this analysis with our experiments in the singleillumination case, the background plasma can be assumed to becold. Consequently, plasma kinetic effects are very importantin the evolution of the Weibel instability. The much largerelectron beamlets seem to agree well qualitatively with thesimulation results. On the other hand, the fast electronpropagation in the overdense plasma in the double sided schemecan be compensated at least partially by the counter propagatinghot electron beam produced on the other side. The plasmas insuch cases are much hotter than in the single sided scheme.Therefore, the filament sizes are much smaller. From this pointof view, our experimental data agrees very well with thesimulation predictions.
It is worth pointing out that the direction of the off-normalelectron beam in the single sided illumination shots becamerandom when the laser energy was increased. The emissionpattern also changed from one having a large speckle structureto a very fine structure pattern. More experiments are needed tostudy this intriguing phenomenon.
Acknowledgements
The author would like to acknowledge the assistance of the staffof the Central Laser Facility of the Rutherford AppletonLaboratory. This work was funded by UK Engineering andPhysical Sciences Research Council (EPSRC).
References
1. M. Tabak et al., Phys. Plasmas. 1, 1626 (1994)
2. M. I. K. Santala et al., Phys. Rev. Lett. 84, 1459 (2000); K.B. Wharton et al., Phys. Rev. Lett. 81, 995 (1998); G.Malka et al., Phys. Rev. Lett. 78, 3314 (1997); M. H. Keyet al., Phys. Plasma. 5, 1966 (1998)
3. E.S.Weibel, Phys. Rev. Lett. 2, 83 (1959)
4. F. Pegoraro et al., Phys. Rev. E 56, 963 (1997); F. Califanoet al., Phys. Rev. E. 57, 7048 (1998)
5. Y. Sentoku et al., Phys. Plasmas. 7, 689 (2000); Y.Sentoku et al., Phys. Rev. E. 65, 046408 (2002)
6. M. Honda, J. Meyer-ter-Vehn, and A.Pukhov, Phys.Plasma. 7, 1302 (200); Pukhov and J.Meyer-ter-Vehn,Phys. Rev. Lett. 79, 2686 (1997); B. F. Lasinski et al.,Phys. Plasmas. 6, 2041 (1999)
7. L. Gremillet et al., Phys. Plasmas. 9, 941 (2002)
8. M. Tatarakis et al., Phys.Rev.Lett. 81, 999 (1998); M.Borghesi et al., Phys. Rev. Lett. 83, 4309 (1999); L.Gremillet et al., Phys. Rev. Lett. 83,,5015 (1999)
9. R D Edwards, private communication, 2001
10. P McKenna et al, Central Laser Facility Annual Report2001/2002, RAL-TR-2002-013, 16, (2002)

High Power Laser Programme – Short Pulse Plasma Physics
Central Laser Facility Annual Report 2001/2002 10
Introduction
In the fast ignition1) approach to the inertial confinement fusiona few kJ of fast electrons produced by an intense laser pulseshould deposit their energy in the dense DT fuel in a small area(µm size) and heat it to a high temperature ( keV),enough to ignite thermonuclear reactions2). One of the keyissues is therefore the amount of energy which can be carriedand deposited in the target by the electrons. Several experimentshave been performed in order to study fast electron transport insolid targets by means of optical techniques3, 4), X-raydiagnostics5-9), proton measurements10, 11) and magnetic fieldmeasurements12). Important results have already been obtainedon some geometric aspects of the electron transport: thepresence of fast-electron jets, the directionality of the beam, thehuge self-generated magnetic fields associated with the fastelectron current, the role of the target conductivity. However,only a few experiments have been performed regarding aquantitative measurement of the heating induced in the targetbulk13, 14). Only X-ray diagnostics can give a direct insight intothis process.
In our experiment, Kα line emission spectroscopy (at Å)has been successfully used to determine the ionization stage andinfer the temperature of an aluminium fluorescer layer (buriedin a multilayer target), which was heated by the fast electroncurrent. We note that in the same experiment other diagnosticssuch as time-resolved, rear side, optical imaging and X-ray Kαimaging were also implemented, which results are described inother contributions to this report (see J J Santos, M H Key). Asthe emitting atoms are ionized by collision with fast electrons,the Kα line is shifted towards shorter wavelength by severaltens of mÅ, due to the lower screening of the nucleus by thebound electrons15). The fast electron range and temperaturewere also inferred from the total Kα yield emitted by thealuminium layer and by an additional copper fluorescent layer.The results were compared with simulations performed with the3D hybrid collisional electromagnetic transport code PâRIS16).As the intensity of the shifted lines is usually weak for theexpected range of temperature ( eV) 17) and thebremsstrahlung noise level can be high, a good photoncollection efficiency is required as well as a high S/N ratio.Therefore, we designed for this experiment a Braggspectrograph based on a conically bent crystal, which provides a
high brightness and a good spectral resolution over a widespectral range (7 - 8.5 Å), chosen to include the Kα, the He-αand Ly-α region. Contrary to traditional flat crystals, the conicalone strongly focuses the spectrum onto a narrow focus line, asfirst described by Hall18).
Experimental set-up
The Vulcan laser CPA pulse was focused at normal incidenceby a f/3.5 off-axis parabolic mirror onto a flat multilayer target,shown in Figure 1. The small focal spot ( µm) allows ahigh irradiance (1-5 1019 Wcm-2) to be reached. About 10-40 %of the laser energy is expected to be transferred to electrons7, 8),which are accelerated to several 100 keV. The target is typicallycomposed of three layers. The front propagation layer is madeof aluminium of varying thickness in the range 10 - 300 µm.We do not detect the X-rays coming from this layer. Two20 µm-thick fluorescer layers were also buried in the target. Thefirst one is copper, whose bright Kα line is detectable at the 5th
order ( at 1.5 Å ) by the spectrograph. This layer also stops theX-rays coming from the first layer. The second fluorescer isaluminium and emits the shifted Kα lines (at Å). The effectof the photoionization of the Al layer by the X-rays from the Culayer was also considered.
Figure 1. Cu fluorescent layers buried into multilayer targets.
The spectrograph looks at the target rear side at a 40 degreesangle from the laser axis and at 31 cm from the target. We useda 7 cm by 4 cm potassium acid phtalate (KAP) crystal(2d = 26.64 Å, integrated reflectivity = 8 10-4 at 8 Å), whosesurface is bent about a conical surface (half angle17.48 degrees), which corresponds to an average bending radius
Fast electron heating in ultra-intense laser-solid interaction using high brightnessshifted Kα spectroscopy
E Martinolli, M Koenig, L Gremillet, J J Santos, F Amiranoff, S D Baton
Laboratoire pour l’Utilisation des Lasers Intenses, Ecole Polytechnique, Palaiseau, 91128, France
D Batani, F Scianitti, E Perelli-Cippo
Dipartimento di Fisica G Occhialini, Università degli Studi di Milano-Bicocca, Milano, 20126, Italy
T A Hall
University of Essex, Colchester, Essex, CO4 3SQ, UK
M H Key, A J Mackinnon,
Lawrence Livermore National Laboratory, Livermore, CA 94550-9234, USA
R R Freeman, R A Snavely, J A King, C Andersen, J M Hill
University of California Davis, Davis, CA 95616, USA
R B Stephens, T E Cowan
General Atomics, San Diego, CA 92121-1122, USA
A Ng, T Ao
Department of Physics & Astronomy, University of British Columbia, Vancouver, B.C. V6T 1Z1, Canada
D Neely, R J Clarke
Central Laser Facility, CLRC Rutherford Appleton Laboratory, Chilton, Didcot, Oxon, OX 0Q11, UK
Main contact email address: [email protected]

High Power Laser Programme – Short Pulse Plasma Physics
11 Central Laser Facility Annual Report 2001/2002
of 9 cm. The dispersion of the spectrograph is 26.9 mm / Å,while the spectral resolution (λ / ∆λ by the finite size of the emission region (up to 200 µm). On thespatial axis the spectrograph forms an image of the emissionregion with a magnification of 1. However, the spatialresolution (above 200 µm) is limited by the intrinsic aberrationsassociated with the focusing of the conical geometry and by thecrystal defects. Because of the high radiation field typical ofshort pulse-solid interaction, a DEF X-ray film was used as adetector instead of a CCD camera and positioned at 62 cm fromthe target. The film was then analyzed using a 16-bitdensitometer. As the conical geometry is cumbersome to studyanalytically, a 3D-ray tracing code was used to choose all theparameters of the spectrograph in order to maximize thefocusing.
Figure 2. Simplified diagram of the conical crystal.
Due to the high sensitivity of the spectrograph performance tothe crystal alignment, a two-step procedure was used. First, a10 µm diameter fiber optic was used as a point source on aseparate optical bench. The fiber emits visible laser rays whichare then reflected by the crystal surface and focused onto aCCD camera. The relative positions and angles are adjusted toobtain the best focalization, i.e. the narrowest possible linefocus, according to the ray-tracing code This is found to beapproximately 200 µm (500 µm including the low intensitylateral wings) over the whole dispersion range. Thespectrograph as a whole is then positioned into the vacuumchamber so that the alignment pin (corresponding to the source)is brought onto a point corresponding to the centre of the targetrear surface, by means of target alignment viewers.
Experimental results
We present in Figure 3 an example of the spectra obtained,corresponding to an Al 11µm - Cu 25µm - Al 16 µm target.
Figure 3. Experimental spectrum obtained with aAl 11 - Cu 25 - Al 16 µm target. Energy on target was 45 J.
The Al Kα line appears at the left of the spectrum as well as thefirst shifted line, which corresponds to the 5+ ionization state(oxygen like). The Al 0+ to Al 4+ transitions are blended in thebig “cold” peak. At the right side, the cold Cu Kα I and II lines(reflected at 5th order) are present. Their separation being mÅ, the corresponding spectral resolution is at least 500,
as expected. Looking at the whole series of shots on multilayertargets, we found that the 5+ shifted line is visible in targetswith a front layer thickness up to 100 µm. The 6+ is visible onlyin the thinnest targets, with no front layer. The intensity of thecold and 5+ lines is plotted vs. the thickness of the front layer inFigure 4. The copper Kα line (not shown) shows a similarexponential decay to the aluminum one. From these data we canestimate the (exponential) range of the fast electron current,which is !µm.
Figure 4. Kα line intensity from the aluminium fluorescentlayer (Al-Cu-Al targets) as a function of the thickness of thefront aluminium layer. Laser energy on target was in the range30-45 J.
We compared the measured fast electron range with a MonteCarlo simulation. A Maxwellian electron distribution with aninitial 0° divergence was supposed and the experimental valuesof energy and spot size were used. We obtained the bestagreement for a 300-400 keV distribution temperature.
The experimental intensity ratio of the hot Kα line to the coldone (shown in Figure 5 left) was 20% and does not show anyparticular time trend vs. the thickness.
Figure 5. (Left) Experimental ratio of the hot (5+) to cold Al " # $% & $ 'range 30-45 J. (Right) Ionic fractions of solid densityaluminium vs. the temperature from UBCAM code19).
We briefly note that there is another process, besides the 5+ionization, not distinguishable with our spectral resolution,which may contribute to the observed shifted peak. It is thedouble KL ionization, in which the initial state has two electronvacancies instead of one. The intensity of this transition linewas measured in short pulse laser-solid experiments, althoughunder different conditions, and found to be ( 'ordinary Kα peak weakly temperature dependent20). In ourconditions, the 5+ ionization due to the fast electron targetheating is supposed to be the dominant process.
We therefore used the atomic physics UBCAM code to computethe ionic fractions of solid aluminium heated up to a few times10 eV at LTE. The 5+ state appears to progressively account for1% up to 20% of the ratio to the cold line (2+ - 4+ states), if thetarget is heated in the range 20 - 35 eV. Therefore we canassume 20 eV as a lower limit for the temperature. However,

High Power Laser Programme – Short Pulse Plasma Physics
Central Laser Facility Annual Report 2001/2002 12
the experimental situation is more complicated for severalreasons. First, the heated spot at target rear side is smaller thanthe fast electron beam size: Kα photons coming from moreexternal cold regions contribute to the cold peak, lowering theobserved line ratio. Second, fast electrons both heat andproduce Kα (pump = probe), so the dynamics of this highlytransient process should be considered in a self-consistenttransport model. We performed a preliminary analysis with thehelp of the PâRIS hybrid transport code, in which an on-linecalculation of the ionic fractions (based on the UBCAM code)and the corresponding Kα emission were added. In the case ofbare aluminium targets (the only ones currently handled by thecode) and for the experimental conditions, the code shows that atemperature of 30 eV at target rear side would be in agreementwith the observed ratio. However, the femtosecond time stepused in the code in order to describe the relativistic electronstransport (which lasts 1-2 ps for a typical target), would notallow a priori to use LTE ionization for the heating and theKα emission. This is because the electron-ion relaxation time(approximately 5 fs for cold aluminium) is greater than the timestep. A time-dependent heating model is currently beingstudied.
Conclusions
Kα emission spectroscopy of an aluminium fluorescer layerhas been successfully used to study the fast electron transportand heating in sub-picosecond laser interaction with multilayersolid targets. This work is relevant in the context of the fastignition studies. In particular the spectrally shifted Kα lineshave been observed as a diagnostic for the target heating due tothe fast electron current. A high brightness conical crystalBragg spectrograph has been designed for this experiment, inorder to detect the expected weak signal.
Acknowledgements
The authors gratefully acknowledge the Vulcan laser, targetarea and target fabrication staff of the Central Laser Facility.This work has been supported by the EU Laser Facility AccessProgram (contract N° HPRI-CT-1999-00010) and by the FemtoProgram of the European Science Foundation. One of us (JJS)was supported by a grant of the Portuguese Government (MCT,PRAXIS XXI BD/18108/98).
References
1. M Tabak et al.Phys. of Plasmas 1, 1626, (1994)
2. S Atzeni et al.Jap. J. Appl.Phys. 34, 1980 (1995)
3. M Tatarakis et al.PRL 5, 999, (1998)
4. L Gremillet et al.PRL 83, 5015, (1999)
5. M I K Santala et al.PRL 84, 1459, (2000)
6. D Batani et al.PRE 61, 5725, (2000)
7. F Pisani et al.PRE 62, R5927, (2000)
8. M H Key et al.Phys. of Plasmas 5, 1966, (1998)
9. K B Wharton et al.PRL 81, 822, (1998)
10. M Zepf et al.Phys. of Plasmas 8, 2323, (2001)
11. R A Snavely et al.PRL 85, 2945, (1999)
12. M Tatarakis et al.Phys. of Plasmas 9, 2244, (2002)
13. J A Koch et al.PRE 65, 016410, (2001)
14. E Martinolli et al.submitted to PRL, (2002)
15. L L HouseAstrophys. J. Suppl. Ser. 18, 21, (1969)
16. L Gremillet et al.Phys. of Plasmas 9, 941, (2002)
17. A Rousse et al.PRE 50, 2200, (1994)
18. T A HallJ.Phys.E:Sci.Instrum. 17, 110, (1984)
19. G Chiu and A NgPRE 59, 1024, (1999)
20. J C Gauthier et al.PRE 52, 2963, (1995)

High Power Laser Programme – Short Pulse Plasma Physics
13 Central Laser Facility Annual Report 2001/2002
Introduction
If a solid target is irradiated with relativistic intensities highenergy protons can be observed at the rear of the target1). Asignificant amount of the incident laser energy (>10%)2) isconverted into protons with Ep>1 MeV, giving rise to a compactand reasonably efficient source of protons which may be ofinterest to a range of applications. However, there is still somedisagreement as to the precise mechanism underlying theacceleration and also the proton source.
Acceleration mechanisms which have been suggested includesheath acceleration which generates large electric fields at therear of the target2) and fields set up at the front or inside thetarget1,3) . The origin of the accelerating field at the rear of thetarget is readily understood. During the interaction the highintensity laser light couples its energy efficiently into a beam offast electrons. These fast electrons then propagate to the rear ofthe target and set up a strong electrostatic field upon exitingwhich forces the electrons back into the target and drags protonsand ions out of the target. Charge separation also occurs at thecritical surface over short distances at the front of the target, dueto the ponderomotive force of the laser pulse. This acceleratesprotons to approximately the ponderomotive energy of the laser(up to 4 MeV for 1020Wcm-2) as a result of hole boring and/orthe propagation of an electrostatic shock4). Toupin et al5), forexample, predict a collimated, multi-MeV ion beam that isdirected into the target for small density scale-lengths,predictions that are supported by some experimental evidence6).The predicted ion energies are low compared to those that havebeen observed to emerge from the rear of the target, but theseacceleration processes may be the origin of some of the fastestprotons that receive an initial ‘kick’ and that are acceleratedmore efficiently in subsequent fields7).
Strong fields are also set up inside the target in response to thehot electrons propagating into the target, since charge neutralitymust be maintained by a suitable return current. The electricfield required to set-up this return current will also accelerateions and protons inside the target. The return current is stronglyaffected by collisions and the resulting electric field can beestimated from the target resistivity8). These fields can extendover large distances in the target (the penetration depth of thehot electron beam) and their magnitude depends strongly on theresistivity experienced by the return current.
Present computational modeling of these plasmas is only oflimited use in elucidating the question of the relative strength ofthe accelerating electric fields. Particle--in--Cell codes (PIC)frequently do not include collisions, assume that the plasma isalready hot (electron temperature ~ 1 keV) for numericalreasons and at ~10% of solid density to reduce computationtime. By contrast in the experiments the target is initially a coldsolid. Consequently there is some doubt as to the validity of PICsimulations for predicting material conditions and electrontransport inside a target which is rapidly evolving from a coldsolid to hot dense plasma. However, PIC codes typicallyprovide accurate predictions for high intensity short pulse laser
experiments in low density plasmas or at surfaces of solidtargets. Results from three dimensional simulations9) showprotons accelerated up to 6 MeV for Iλ2 = 1019 Wcm-2 µm2, byfields at the rear of the target, where the PIC code should bereasonably accurate. This is lower than the experimentalobservation of 10 MeV at 6x10¹⁸ Wcm-2µm2 and 20 MeV at1019 Wcm-2µm2. They also predict a divergence of around 10°full width angle for the lower energy protons rather than the40-60° observed experimentally. It is worth noting that 2Dcodes predict higher energies due to the lower dimensionalityand should therefore not be directly compared to theexperimental results. Alternative modeling techniques such ashybrid PIC/fluid codes8) are capable of capturing the transitionfrom cold solid to plasma and do predict large acceleratingelectric fields in the target. The fields predicted to exist insidethe target are, however, not large enough to explain the largeproton energies observed experimentally. Since the resistivity isnot calculated self-consistently (typically approximated by theSpitzer expression), the code may well underestimate themagnitude of the fields. Effects such as the lower hybridinstability10) are expected to result in enhanced resistivity andthus higher field strengths.
The most direct evidence for the origin of the protons and theacceleration mechanism involved comes from experiments byMaksimchuk et al.3), using selective deuterium contaminationof the target, where the origin of the protons was determined tobe from the front surface. Furthermore, the energy of protonswas found to increase with increasing target thickness in therange of 0.1-10 µm, which is consistent with an accelerationmechanism near the front of the target.
On the other hand the proton beam tends to be aligned to therear target surface normal in most experiments and experimentsusing wedge shaped targets have observed a proton beam fromboth rear surfaces2). This suggests that the rear surface stronglyinfluences the proton acceleration and that acceleration directlyfrom the rear surface may dominate. Further support for thishypothesis has come from recent experiments, which show thatthe proton beam can be suppressed by forming a plasma on therear surface11). Clearly, it is possible that several accelerationmechanisms are operating simultaneously. A fundamentaldifficulty is to measure the various acceleration mechanismsindependently. In a typical experiment, hydrogen is present onall target materials in the form of surface contaminants (andpossibly trapped within the lattice structure of the target), whichmakes it difficult to determine the various contributions.
Experiment
The protons were detected using stacks of CR39 nuclear trackdetectors, radio-chromic film (RCF) and materials for nuclearactivation. Since the protons are decelerated as they passthrough subsequent layers of the detector stack, one can obtainimages of the proton angular distributions at different energieson a single shot1).
The approach taken in the experiment described here is toselectively contaminate one side of the target with hydrogen by
Determination of high energy proton origin in laser-solid interaction
M Zepf
Physics Department, School of Mathematics and Physics, Queen’s University, Belfast, BT7 1NN, UK
F N Beg, AE Dangor, A Gopal, K Krushelnick, M Tatarakis, U Wagner, M S Wei
Blackett Laboratory, Imperial College of Science, Technology and Medicine, London SW7 2BZ, UK
P A Norreys, R J Clarke
Central Laser Facility, CLRC Rutherford Appleton Laboratory, Chilton, Didcot, Oxon, OX11 0QX, UK
E L Clark,
AWE, Aldermaston, UK
Main contact email address: [email protected]

High Power Laser Programme – Short Pulse Plasma Physics
Central Laser Facility Annual Report 2001/2002 14
coating it with a suitable compound while minimising thegeneral hydrocarbon surface contamination by heating thetarget. The temperature at which all surface contamination boilsoff reliably is in excess of 1000°C. Unfortunately, suchtemperatures are above the typical boiling point of mosthydrocarbon compounds, which could be used to coat thetarget. Consequently, the temperature was chosen as acompromise between boiling off the contaminants whileretaining the coating. Therefore, some contamination is stillpresent on all surfaces during the experiment. The targettemperature was typically 300-400°C. At this temperature weobserved that the hydrocarbon contamination was significantlyreduced and the integrity of the coating was maintained. Thecoating consisted of PEEK (Polyetheretherketone), which has amelting point of 250°C but retains a high viscosity far beyondthe melting point. Figure 1 shows a comparison of the ionspectra taken from a heated and an unheated pure aluminumtarget showing a significant reduction in the overall protonsignal.
Figure 1. (a) Comparison of proton spectra from the heated(dotted line) and unheated Al targets (solid line).(b) comparison of the carbon6+ spectrum from heated andunheated Al targets. A clear reduction in proton and carbonnumbers is visible. Carbon energies are enhanced due to thereduction of protons. These spectra were measured at the frontside of the target using a Thomson parabola.
Our measurements indicate that this reduction of thecontamination is sufficient to distinguish between the signalfrom the front and the back. Figure 2 a-c shows typical protondata recorded with RCF and CR39 detector stacks from aninteraction with a square, unheated Al target of 100 µmthickness. The features can be categorised into threequalitatively distinct regions. First, there is a cross--like patternthat extends to very large angles from the centre of symmetry.Secondly there is a ring of enhanced signal, which is clearlyvisible on the CR39 track detector data and thirdly there is afeature at the centre of the ring that corresponds to the area ofhighest exposure on the RCF. The ring structure contracts withincreasing proton energy, while the feature at the centre appearsto contain no high energy contribution and is only visible on thelow energy layer at the front of the detector stack.
The cross structure is found to be dependent on the shape,transverse size and orientation of the target. In the case of asquare target the cross is aligned to the principal axes of thetarget and is only visible if the targets are sufficiently small(< 1 cm). The protons responsible for the cross pattern appear tooriginate from the front of the target and are then transportedaround the target, as is evidenced by the shadow thatcorresponds to the glass target mounting stalk in the bottom armof the feature in Figure 2 a. When the target is rotated the crosspattern rotates correspondingly. Also, the intensity of thecrosspattern diminishes with increasing target size, as can beseen by comparing Figures 2 a and d. In this case, theacceleration takes place by well understood mechanisms at thefront of the target during the plasma expansion and the protonsare deflected around the target by magnetic fields.
By contrast, the ring structure and central feature do not dependon the size and orientation of the target, and are therefore notgenerated in the same manner, but rather are emitted from therear surface of the target.
However, in this case the use of heated targets can aid ourunderstanding of the observed signal. Figure 3 contrasts twotargets consisting of 100 µm Al and 20 µm of PEEK. The top ofFigure 3 shows the data taken from a shot with the PEEK on thefront of the target and the bottom shows a shot when the PEEKwas on the back. The ring structure is only clearly visible whenthe PEEK is on the front of the heated target. The rings in thiscase are quite broad, which is characteristic of plastic targetsunder all conditions. When the PEEK is on the rear of theheated target the signal in the ring structure is significantlyreduced and gives way to a faint signal on the CR39. Thissuggests that the protons that form the rings originate on or nearthe front surface. Since the ring structure also contains thehighest energy protons, it appears that the overall acceleratingpotential experienced by these protons is larger than for those atthe rear of the target. The total potential may well consist ofcontributions from several or all the mechanisms outlinedabove. This result agrees well with the finding that the ringstructure gives way to uniform disks of emitted protons as thetarget thickness is reduced below 25 µm12). This behavior canbe understood in terms of the magnetic fields that are generatedinside the solid density plasma as the electron beam propagatesthrough it. In order to deflect all protons of a given energy bythe same amount, regardless of their initial radial position, theyhave to pass through the same length of magnetic field. Theangular spread of up to 60° full width of the rings is also inreasonably good agreement with deflection anticipated fromfields predicted to be present inside the target1). By contrast PICsimulations predict fields at the rear of the target that are onlysufficient to create ring structures of <10° full width9). It is alsointeresting to note that the ring structure is not always centredon the target normal. Particularly for thinner targets there can besubstantial deviations (~20°) from the target normal of the ring(or disk in the case of thin targets) structure12), providing furtherevidence that rings and the central feature are generatedseparately.
Figure 2. (a-c) images from a detector stack showing thetypical features observed for cold targets. Parameters wereI= 1019Wcm-2, 100 µm Al target. (a) data taken using RCF film(Proton energy E>3 MeV. (b) CR39 data (E=5MeV). (c) dosederived from (a). Three spatially distinct contributions areindicated. (d-e) series of corresponding data taken from a heated Al targetunder otherwise identical conditions. (d) E> 1 MeV (RCF)(e)E=3 MeV (CR39) and (f) E=6 MeV (CR39). The signal levelis significantly reduced on the heated target and the rings visiblein b) have (almost) disappeared. The absence of the crosspattern is due to the significantly larger spatial extent of theheated target. Angles in (b) are half angles and apply to (a)-(f).
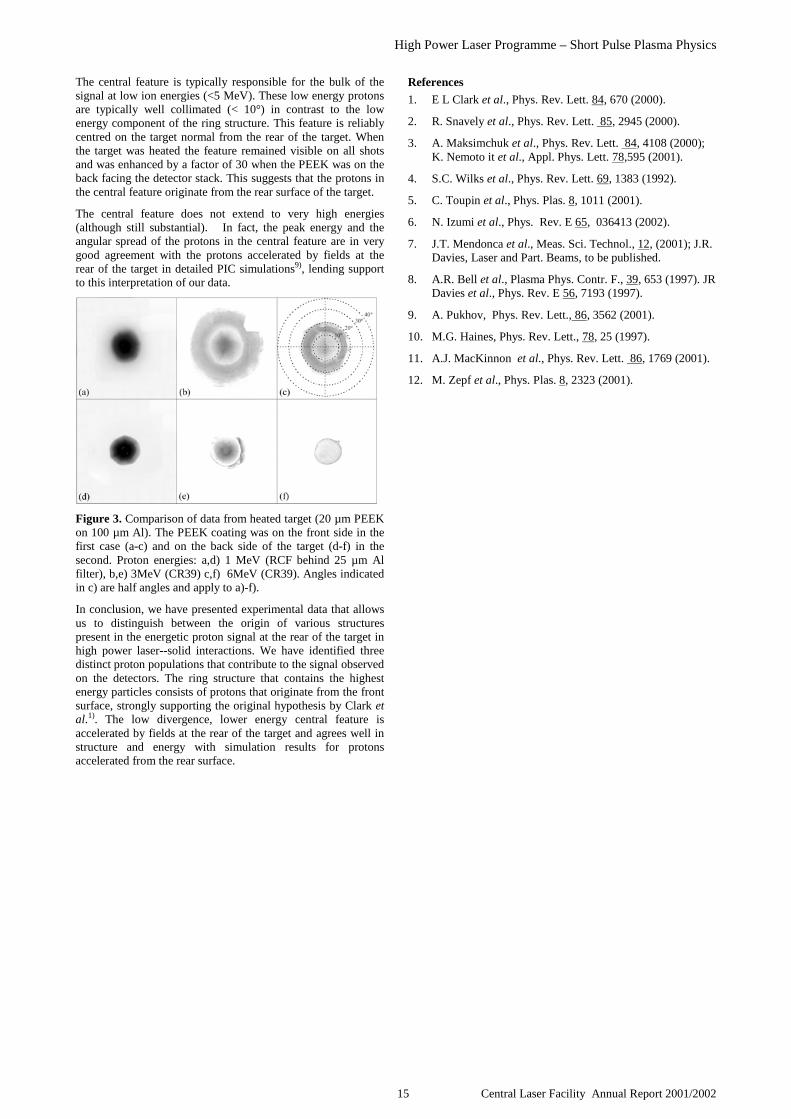
High Power Laser Programme – Short Pulse Plasma Physics
15 Central Laser Facility Annual Report 2001/2002
The central feature is typically responsible for the bulk of thesignal at low ion energies (<5 MeV). These low energy protonsare typically well collimated (< 10°) in contrast to the lowenergy component of the ring structure. This feature is reliablycentred on the target normal from the rear of the target. Whenthe target was heated the feature remained visible on all shotsand was enhanced by a factor of 30 when the PEEK was on theback facing the detector stack. This suggests that the protons inthe central feature originate from the rear surface of the target.
The central feature does not extend to very high energies(although still substantial). In fact, the peak energy and theangular spread of the protons in the central feature are in verygood agreement with the protons accelerated by fields at therear of the target in detailed PIC simulations9), lending supportto this interpretation of our data.
Figure 3. Comparison of data from heated target (20 µm PEEKon 100 µm Al). The PEEK coating was on the front side in thefirst case (a-c) and on the back side of the target (d-f) in thesecond. Proton energies: a,d) 1 MeV (RCF behind 25 µm Alfilter), b,e) 3MeV (CR39) c,f) 6MeV (CR39). Angles indicatedin c) are half angles and apply to a)-f).
In conclusion, we have presented experimental data that allowsus to distinguish between the origin of various structurespresent in the energetic proton signal at the rear of the target inhigh power laser--solid interactions. We have identified threedistinct proton populations that contribute to the signal observedon the detectors. The ring structure that contains the highestenergy particles consists of protons that originate from the frontsurface, strongly supporting the original hypothesis by Clark etal.1). The low divergence, lower energy central feature isaccelerated by fields at the rear of the target and agrees well instructure and energy with simulation results for protonsaccelerated from the rear surface.
References
1. E L Clark et al., Phys. Rev. Lett. 84, 670 (2000).
2. R. Snavely et al., Phys. Rev. Lett. 85, 2945 (2000).
3. A. Maksimchuk et al., Phys. Rev. Lett. 84, 4108 (2000);K. Nemoto it et al., Appl. Phys. Lett. 78,595 (2001).
4. S.C. Wilks et al., Phys. Rev. Lett. 69, 1383 (1992).
5. C. Toupin et al., Phys. Plas. 8, 1011 (2001).
6. N. Izumi et al., Phys. Rev. E 65, 036413 (2002).
7. J.T. Mendonca et al., Meas. Sci. Technol., 12, (2001); J.R.Davies, Laser and Part. Beams, to be published.
8. A.R. Bell et al., Plasma Phys. Contr. F., 39, 653 (1997). JRDavies et al., Phys. Rev. E 56, 7193 (1997).
9. A. Pukhov, Phys. Rev. Lett., 86, 3562 (2001).
10. M.G. Haines, Phys. Rev. Lett., 78, 25 (1997).
11. A.J. MacKinnon et al., Phys. Rev. Lett. 86, 1769 (2001).
12. M. Zepf et al., Phys. Plas. 8, 2323 (2001).

High Power Laser Programme – Short Pulse Plasma Physics
Central Laser Facility Annual Report 2001/2002 16
Introduction
The Vulcan laser, focused to intensities up to 1020 Wcm-2 andinteracting with solid and gaseous targets, has proven to be anefficient, bright source of energetic particles, includingelectrons1), protons2), heavy ions3), neutrons4), and γ-rays5).Energetic particles so-generated are finding applications inmany traditional areas of science including nuclear physics6).With the imminent upgrade of Vulcan to Petawatt status andintensities of the order of 1021 Wcm-2, these particle beams willbecome even brighter, and more exotic particles will beproduced.
Of current interest is the search for novel methods of producingintense (>1010 Bq) positron beams for use in many diverseapplications including surface science, positroniumspectroscopy and positron interaction physics7). Ultra-intenselasers may provide a solution to the difficulties of producingpositron sources by conventional methods. In principle theelectric field at the focus of a laser could pull electron-positronpairs from a vacuum. An E field of the order of 1016 V/cm isrequired, which corresponds to a focused intensity of5x1028 Wcm-2, orders of magnitude higher than is currentlyachievable. The hot plasma created at a laser focus howeverprovides a practical medium for pair production. For laserirradiance Iλ2 ≈ 1019 Wcm-2µm2 , the electron quiver motion ina laser field increases beyond 2m0c
2 (where m0 is the rest massof the electron), the pair production threshold is exceeded, andelectron/positron pairs are produced. This occurs directly viatrident electron-ion collisions and indirectly via the creation ofBremsstrahlung gamma radiation, which interacts with nuclei toproduce electron/positron pairs (the Bethe-Heitler process).These processes are discussed further in8,9) .
To date, positron production has been demonstrated at LLNL10)
and Garching11) using single ultra-intense pulses focused ontosolid targets and gaseous targets with a high Z converter,respectively. In the present study we have sought to testexperimentally a new arrangement involving double-sidedillumination of a high Z foil target to enhance pair productionrates. The possibility of using counter-propagating ultra-intense(>1019 Wcm-2) laser pulses in this way has been modelled by anumber of groups12-14) . In this arrangement the hot electron-positron plasma produced at the laser focus is confined by thelaser ponderomotive pressure on the front and back of thetarget, with additional confinement in the lateral direction dueto the induced magnetic fields. A sufficiently confined hotdense plasma should lead to an increased pair production rate.Electron-positron plasmas exist in a variety of astrophysicalenvironments including neutron stars, pulsars and quasars, andthe production of these plasmas in the laboratory is thereforealso of great interest from an astrophysical point of view 9).
This report describes our first experiment involving this novelhigh intensity double-sided illumination arrangement.Spectrometers have been developed to measure both electronand positron energy distributions up to 15 MeV. Electronenergy spectra are compared for single and double illuminationof Au foil targets. It is planned to extend the experiment to thehigher intensities available on the Petawatt branch of Vulcan inthe near future.
Experimental
The experiment used the ultra-intense CPA beam-line of theVulcan laser15). The CPA beam was split after the finalamplifier and the two halves of the beam were focused ontoeither side of the gold foil target. Various target thicknesses inthe range 1 to 50 µm were studied. A maximum energy of 40 Jin each laser pulse limited the focused intensity on each side ofthe target to below 1019 Wcm-2. The arrangement is shownschematically in Figure 1.
After irradiation of the foil with the laser pulses the plasmaproduced expands freely. A number of diagnostics were used todetect the high energy particle and radiation produced,including two magnetic spectrometers with fields of the order2.5 kGauss. Plastic collimators were used at the entrance of thespectrometers to stop electrons without producing unwantedBremsstrahlung radiation. The spectrometers, which were eachsurrounded in 6 ton of lead to shield against the flash of X-raysfrom the laser plasma, were positioned 40 degrees apart toobtain angular information on the electron and positronsproduced.
Figure 2 shows the design of the spectrometers in more detail,including the particle trajectories within the magnetic field as
Double-sided laser illumination of high Z targets using Vulcan
P McKenna, K W D Ledingham*, I Spencer, T McCanny, R P Singhal
Department of Physics and Astronomy, University of Glasgow, Glasgow G12 8QQ, UK
* also at AWE plc, Aldermaston, Reading RG7 4PR, UK
F N Beg, K Krushelnick, M S Wei, A Gopal, A E Dangor
Blackett Laboratory, Imperial College, London SW7 2BZ, UK
P A Norreys, K L Lancaster, R J Clarke, S Hawkes
Central Laser Facility, CLRC Rutherford Appleton Laboratory, Chilton, Didcot, Oxon, OX11 0QX, UK
M Zepf
Department of Pure and Applied Physics, The Queen’s University of Belfast, Belfast BT7 1 NN, UK
E L Clark, R D Edwards
AWE plc, Aldermaston, Reading RG7 4PR, UK
Main contact email address: [email protected]
40 °
Double CPAlaser pulses
Gold foiltarget
Plasticscintillator/PMTs
Magneticspectrometers
Plastic andlead shielding
Electrons andpositrons
Figure 1. Experiment arrangement.
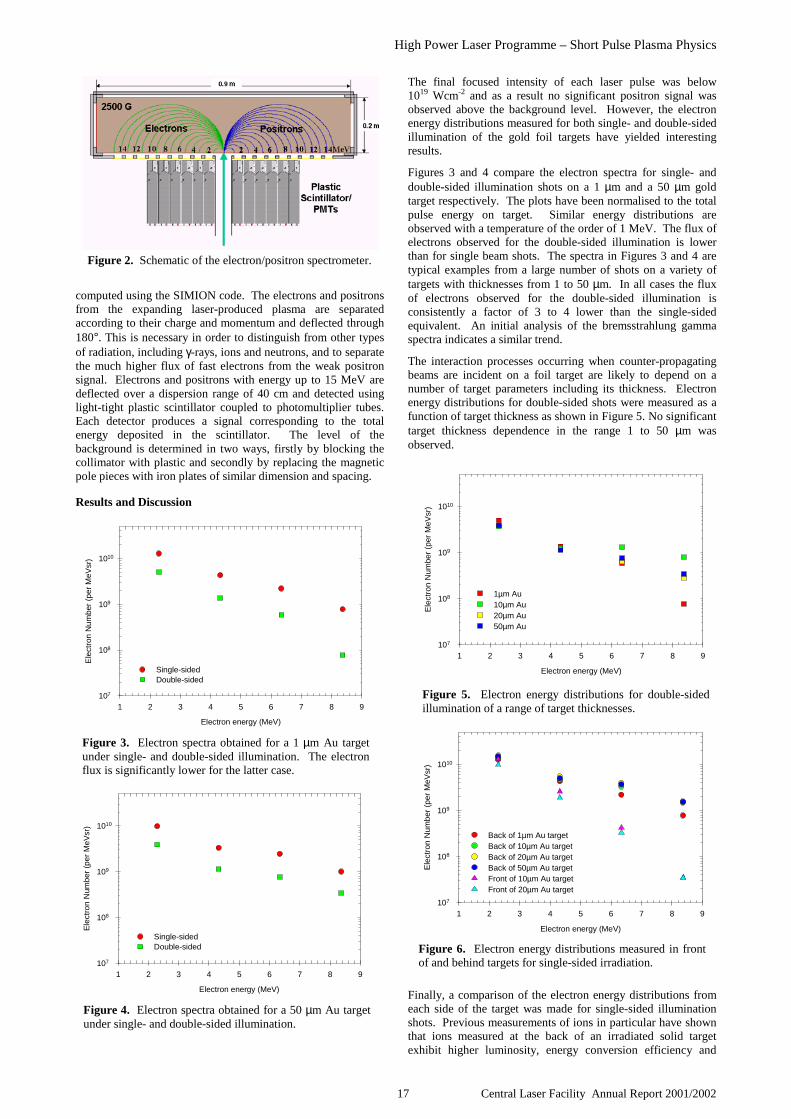
High Power Laser Programme – Short Pulse Plasma Physics
17 Central Laser Facility Annual Report 2001/2002
computed using the SIMION code. The electrons and positronsfrom the expanding laser-produced plasma are separatedaccording to their charge and momentum and deflected through180°. This is necessary in order to distinguish from other typesof radiation, including γ-rays, ions and neutrons, and to separatethe much higher flux of fast electrons from the weak positronsignal. Electrons and positrons with energy up to 15 MeV aredeflected over a dispersion range of 40 cm and detected usinglight-tight plastic scintillator coupled to photomultiplier tubes.Each detector produces a signal corresponding to the totalenergy deposited in the scintillator. The level of thebackground is determined in two ways, firstly by blocking thecollimator with plastic and secondly by replacing the magneticpole pieces with iron plates of similar dimension and spacing.
Results and Discussion
The final focused intensity of each laser pulse was below1019 Wcm-2 and as a result no significant positron signal wasobserved above the background level. However, the electronenergy distributions measured for both single- and double-sidedillumination of the gold foil targets have yielded interestingresults.
Figures 3 and 4 compare the electron spectra for single- anddouble-sided illumination shots on a 1 µm and a 50 µm goldtarget respectively. The plots have been normalised to the totalpulse energy on target. Similar energy distributions areobserved with a temperature of the order of 1 MeV. The flux ofelectrons observed for the double-sided illumination is lowerthan for single beam shots. The spectra in Figures 3 and 4 aretypical examples from a large number of shots on a variety oftargets with thicknesses from 1 to 50 µm. In all cases the fluxof electrons observed for the double-sided illumination isconsistently a factor of 3 to 4 lower than the single-sidedequivalent. An initial analysis of the bremsstrahlung gammaspectra indicates a similar trend.
The interaction processes occurring when counter-propagatingbeams are incident on a foil target are likely to depend on anumber of target parameters including its thickness. Electronenergy distributions for double-sided shots were measured as afunction of target thickness as shown in Figure 5. No significanttarget thickness dependence in the range 1 to 50 µm wasobserved.
Finally, a comparison of the electron energy distributions fromeach side of the target was made for single-sided illuminationshots. Previous measurements of ions in particular have shownthat ions measured at the back of an irradiated solid targetexhibit higher luminosity, energy conversion efficiency and
Figure 2. Schematic of the electron/positron spectrometer.
Electron energy (MeV)
1 2 3 4 5 6 7 8 9
Ele
ctro
n N
umbe
r (p
er M
eVsr
)
107
108
109
1010
Single-sidedDouble-sided
Figure 3. Electron spectra obtained for a 1 µm Au targetunder single- and double-sided illumination. The electronflux is significantly lower for the latter case.
Electron energy (MeV)
1 2 3 4 5 6 7 8 9
Ele
ctro
n N
umbe
r (p
er M
eVsr
)
107
108
109
1010
Single-sidedDouble-sided
Figure 4. Electron spectra obtained for a 50 µm Au targetunder single- and double-sided illumination.
Electron energy (MeV)
1 2 3 4 5 6 7 8 9
Ele
ctro
n N
umbe
r (p
er M
eVsr
)
107
108
109
1010
1µm Au10µm Au20µm Au50µm Au
Figure 5. Electron energy distributions for double-sidedillumination of a range of target thicknesses.
Electron energy (MeV)
1 2 3 4 5 6 7 8 9
Ele
ctro
n N
umbe
r (p
er M
eVsr
)
107
108
109
1010
Back of 1µm Au targetBack of 10µm Au targetBack of 20µm Au targetBack of 50µm Au targetFront of 10µm Au targetFront of 20µm Au target
Figure 6. Electron energy distributions measured in frontof and behind targets for single-sided irradiation.

High Power Laser Programme – Short Pulse Plasma Physics
Central Laser Facility Annual Report 2001/2002 18
well defined beam characteristics, compared to ions detectedfrom the laser illuminated side (see Reference 16 and otherreferences therein). As shown in Figure 6, in the present studyhigher electron temperatures were consistently observed fromthe back of the target regardless of its thickness. The flux ofhigh energy electrons was also considerably higher than thatmeasured from the irradiated side.
Conclusions
A first experimental study involving high-intensity double-sidedirradiation of solid targets has been undertaken. Double-sidedillumination has been found to materially change the dynamicsof the laser-solid interaction, as compared to single beam shots.This is manifested in a reproducible change in the flux ofelectrons detected. The techniques and experience developedduring this experiment will be used on a future experiment onthe Petawatt branch of Vulcan and will seek to verify plasmaconfinement and enhance electron-positron pair production.
References
1. M. I. K. Santala et al., Phys. Rev. Lett. 86, 1227 (2001).
2. E. L. Clark et al., Phys. Rev. Lett. 84, 670 (2000).
3. E. L. Clark et al., Phys. Rev. Lett. 85, 1654 (2000).
4. P. A. Norreys et al., Plasma. Phys. Control. Fusion 40,175 (1998).
5. P. A. Norreys et al., Phys. Plasmas. 6 , 2150 (1999).
6. K. W. D. Ledingham et al., Phys. Rev. Lett. 84, 899(2000).
7. T. D. Steiger et al., Nucl. Inst. Meth. A 299, 255 (1990).
8. H. Takabe, Progress of Theoretical Physics Supplement143, 202 (2001).
9. K. Nakashima and H. Takabe, Phys. Plasmas. 9, 1505(2002).
10. T. E. Cowan et al., Nucl. Inst. Meth. A455, 130 (2000).
11. C. Gahn et al., Appl. Phys. Lett. 77 , 2662 (2000).
12. E. P. Liang, S. C. Wilks, and M. Tabak, Phys. Rev. Lett.81, 4887 (1998).
13. B. Shen and J. Meyer-ter-Vehn, Phys. Rev E 65, 016405(2001).
14. H. M. Fried et al., Phys. Rev. D. 63 , 125001 (2001).
15. C.N. Danson et al., J. Mod. Opt. 45, 1653 (1998).
16. M. Zepf et al., Phys. Plasmas. 8, 2323 (2001).
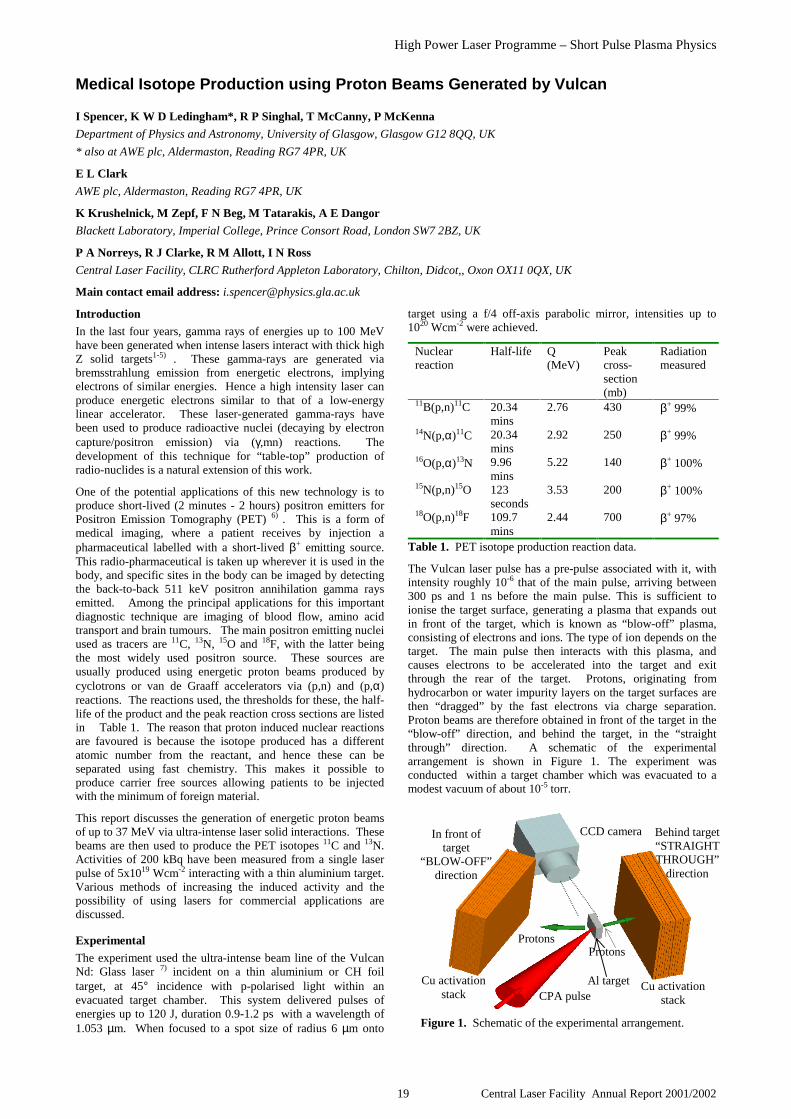
High Power Laser Programme – Short Pulse Plasma Physics
19 Central Laser Facility Annual Report 2001/2002
Introduction
In the last four years, gamma rays of energies up to 100 MeVhave been generated when intense lasers interact with thick highZ solid targets1-5) . These gamma-rays are generated viabremsstrahlung emission from energetic electrons, implyingelectrons of similar energies. Hence a high intensity laser canproduce energetic electrons similar to that of a low-energylinear accelerator. These laser-generated gamma-rays havebeen used to produce radioactive nuclei (decaying by electroncapture/positron emission) via (γ,mn) reactions. Thedevelopment of this technique for “table-top” production ofradio-nuclides is a natural extension of this work.
One of the potential applications of this new technology is toproduce short-lived (2 minutes - 2 hours) positron emitters forPositron Emission Tomography (PET) 6) . This is a form ofmedical imaging, where a patient receives by injection apharmaceutical labelled with a short-lived β+ emitting source.This radio-pharmaceutical is taken up wherever it is used in thebody, and specific sites in the body can be imaged by detectingthe back-to-back 511 keV positron annihilation gamma raysemitted. Among the principal applications for this importantdiagnostic technique are imaging of blood flow, amino acidtransport and brain tumours. The main positron emitting nucleiused as tracers are 11C, 13N, 15O and 18F, with the latter beingthe most widely used positron source. These sources areusually produced using energetic proton beams produced bycyclotrons or van de Graaff accelerators via (p,n) and (p,α)reactions. The reactions used, the thresholds for these, the half-life of the product and the peak reaction cross sections are listedin Table 1. The reason that proton induced nuclear reactionsare favoured is because the isotope produced has a differentatomic number from the reactant, and hence these can beseparated using fast chemistry. This makes it possible toproduce carrier free sources allowing patients to be injectedwith the minimum of foreign material.
This report discusses the generation of energetic proton beamsof up to 37 MeV via ultra-intense laser solid interactions. Thesebeams are then used to produce the PET isotopes 11C and 13N.Activities of 200 kBq have been measured from a single laserpulse of 5x10¹⁹ Wcm-2 interacting with a thin aluminium target.Various methods of increasing the induced activity and thepossibility of using lasers for commercial applications arediscussed.
Experimental
The experiment used the ultra-intense beam line of the VulcanNd: Glass laser 7) incident on a thin aluminium or CH foiltarget, at 45° incidence with p-polarised light within anevacuated target chamber. This system delivered pulses ofenergies up to 120 J, duration 0.9-1.2 ps with a wavelength of1.053 µm. When focused to a spot size of radius 6 µm onto
target using a f/4 off-axis parabolic mirror, intensities up to1020 Wcm-2 were achieved.
Nuclearreaction
Half-life Q(MeV)
Peakcross-section(mb)
Radiationmeasured
11B(p,n)11C 20.34mins
2.76 430 β+ 99%
14N(p,α)11C 20.34mins
2.92 250 β+ 99%
16O(p,α)13N 9.96mins
5.22 140 β+ 100%
15N(p,n)15O 123seconds
3.53 200 β+ 100%
18O(p,n)18F 109.7mins
2.44 700 β+ 97%
Table 1. PET isotope production reaction data.
The Vulcan laser pulse has a pre-pulse associated with it, withintensity roughly 10-6 that of the main pulse, arriving between300 ps and 1 ns before the main pulse. This is sufficient toionise the target surface, generating a plasma that expands outin front of the target, which is known as “blow-off” plasma,consisting of electrons and ions. The type of ion depends on thetarget. The main pulse then interacts with this plasma, andcauses electrons to be accelerated into the target and exitthrough the rear of the target. Protons, originating fromhydrocarbon or water impurity layers on the target surfaces arethen “dragged” by the fast electrons via charge separation.Proton beams are therefore obtained in front of the target in the“blow-off” direction, and behind the target, in the “straightthrough” direction. A schematic of the experimentalarrangement is shown in Figure 1. The experiment wasconducted within a target chamber which was evacuated to amodest vacuum of about 10-5 torr.
Medical Isotope Production using Proton Beams Generated by Vulcan
I Spencer, K W D Ledingham*, R P Singhal, T McCanny, P McKenna
Department of Physics and Astronomy, University of Glasgow, Glasgow G12 8QQ, UK
* also at AWE plc, Aldermaston, Reading RG7 4PR, UK
E L Clark
AWE plc, Aldermaston, Reading RG7 4PR, UK
K Krushelnick, M Zepf, F N Beg, M Tatarakis, A E Dangor
Blackett Laboratory, Imperial College, Prince Consort Road, London SW7 2BZ, UK
P A Norreys, R J Clarke, R M Allott, I N Ross
Central Laser Facility, CLRC Rutherford Appleton Laboratory, Chilton, Didcot,, Oxon OX11 0QX, UK
Main contact email address: [email protected]
Cu activationstack CPA pulse
ProtonsProtons
Al target
CCD cameraIn front oftarget
“BLOW-OFF”direction
Behind target“STRAIGHTTHROUGH”
direction
Cu activationstack
Figure 1. Schematic of the experimental arrangement.

High Power Laser Programme – Short Pulse Plasma Physics
Central Laser Facility Annual Report 2001/2002 20
Results and Discussion
To characterise the proton beam, and to produce radioisotopes,different activation samples were placed in the target chamber,behind the target, in the “straight through” direction at adistance 10 mm from the target, and in front of the target,directed along the target normal, at a distance 50 mm from thetarget, in the “blow-off” direction. The time taken to extract thesamples from the target chamber after irradiation was a fewminutes, as the chamber must be returned to atmosphericpressure before the samples could be removed. These sampleswere then transferred to a nuclear laboratory for analysislimiting the lifetimes of the activated samples that could bemeasured to a few minutes or more. These practicalities are atemporary inconvenience, and will be resolved in futureexperiments.
The energy spectrum of the accelerated protons weredetermined by placing activation stacks in both the “blow-off”and “straight through” directions. These consisted of 9 piecesof copper foil, 100 µm thick, plus a 1 mm piece.
Previous results from Clark et al. 8) show that the protons areemitted in the “straight through” direction in a cone half angleof 30°. The protons in the “blow-off” direction are emitted in acone half angle of 20°. The copper activation stacks werepositioned such that all of the protons were incident on thestacks and hence a spatially integrated measurement was made.
Copper undergoes the nuclear reaction 63Cu(p,n)63Zn whenbombarded with protons of energies greater than 4.15 MeV.The resulting Zn isotope is radioactive, and decays via β+
emission with a half life of 38.1 mins. Positrons slow down insolids, and annihilate at rest with free electrons, producing twophotons of 511 keV, at 180° to each other. These annihilationphotons were detected using two 3 inch x 3 inch NaIscintillation detectors, set up to detect 511 keV photons, andoperated in coincidence. The efficiency of the coincidencesystem was measured using a calibrated 22Na source, and hencethe absolute activity, i.e. the number of (p,n) reactions inducedin each copper piece in the stack, could be determined.
Knowing the 63Cu(p,n)63Zn cross section, which is shown inFigure 2 9), the number of protons incident on each piece ofcopper in the stack can be found, and hence a proton energyspectrum can be built up. Each piece of copper in the stackrepresents an energy “bin”, because protons are slowed down incopper. Figure 3 shows typical energy spectra of the emittedprotons from the front and rear of the target. It is clear thatmore energetic protons are observed in the “straight through”direction, having energies up to a diagnostic limit of 37 MeV.The proton beam in the blow-off direction has a maximum
energy of 25 MeV. Fitting a non-relativistic Maxwellian orexp(-E/kT) distribution to the spectra where E is the protonenergy and T is the proton temperature, the temperatures for thefront and back proton beams are 1.4 and 2.9 MeV respectively.Care has to be taken when taking these activity measurementsto account for contributions from competing reactions. Thereaction 63Cu(p,p+n)62Cu takes place for proton energies above10.9 MeV, but the isotope 62Cu can be distinguished from 63Znas it has a much shorter half life of 9.8 mins. The cross sectionfor this reaction is also much lower compared to the reaction63Cu(p,n)62Cu. The contribution from this reaction wasaccounted for when calculating the proton energy spectrum andfound to have a negligible effect on the shape of the calculatedspectrum.
It can be seen from the spectra shown in Figure 3 that around8×1012 protons are produced in the “straight through” direction(and around 5×10¹² in the blow-off). As stated previously,these protons are present as hydrocarbon or water impuritylayers on the rear target surface. Preliminary static SIMSanalysis have revealed a hydrocarbon layer of about 5 nm onthe surfaces of the aluminium targets. A simple calculationassuming that the impurity layer consists of water moleculesshows that to produce 1012 protons, the area involved must begreater than 55x55 µm, which is a factor of 10 greater than thelaser focal spot region.
Different samples were placed in the target chamber and werebombarded with energetic protons from the intense laser-solidinteraction. Samples were chosen to produce isotopes ofrelevance to the nuclear medicine community.
First, a boron sample of circular geometry with diameter 50 mmand 3 mm thick was placed in front of the target, in the “blow-off” direction, prior to the laser irradiation. The inducedactivity in the boron sample was then measured in thecoincidence unit following the laser interaction. From thedecay curve obtained (Figure 4) it is clear from the measuredhalf-life of 20.3±0.4 mins that the isotope produced was 11C(accepted value 20.34 mins) which is used in medical imagingfor Positron Emission Tomography, or PET. The 11B nucleiundergo (p,n) reactions to form 11C, and the cross section forthis reaction is shown in Figure 2. By extrapolating the curve, itcan be seen that the activity at the time of laser irradiation was200 kBq.
A sample of silicon nitride (SiN4) of dimensions 20x20 mm andthickness 1.75 mm was placed in front of the target. The siliconnuclei, when bombarded with protons in the present energyrange, produce isotopes with lifetimes of a few seconds, and asmall amount of the 2.5 min 30P isotope. Hence because of the
0
100
200
300
400
500
600
700
800
0 5 10 15 20 25 30
Energy/MeV
Cro
ss s
ecti
on
/mb
18O(p,n)18F
11B(p,n)11C
63Cu(p,n)63Zn
14N(p,α)11C
16O(p,α)13N
63Cu(p,p+n)62Cu12C(n,2n)11C
12C(γ,n)11C
Figure 2. Cross sections for the reactions discussed.
1.E+05
1.E+06
1.E+07
1.E+08
1.E+09
1.E+10
1.E+11
1.E+12
5 15 25 35 45Proton Kinetic Energy /MeV
Nu
mb
er o
f P
roto
ns
per
MeV Behind target - "straight
through" direction
In front of target - "blow-off"
direction
Figure 3. Proton spectra obtained from copper activationstacks in front of and behind the target.

High Power Laser Programme – Short Pulse Plasma Physics
21 Central Laser Facility Annual Report 2001/2002
finite transfer time they could not be detected in our currentarrangement, and can therefore be neglected.
The activity of the silicon nitride sample as a function of timewas measured following laser irradiation, and is shown inFigure 4. As with the boron activation, the isotope 11C wasproduced, but this time via the reaction 14N(p,α)11C. Theactivity at time zero (laser irradiation) was two orders ofmagnitude lower than the boron activation, at 2 kBq, but this isnot surprising, since the cross section for this reaction is muchlower (Figure 2).
Conclusions
It has been shown that protons of energies up to 37 MeV can begenerated when an ultra-intense laser interacts with solidtargets. These energetic protons can then be used to induce(p,n) and (p,α) reactions in various materials, to produceradioisotopes that are used in nuclear medicine, specificallyPositron Emission Tomography (PET). Activities of 2x10⁵ Bqof the isotope 11C have been measured.
Although 11C is a useful isotope for PET, the favoured isotopeat the moment is 18F. The reaction usually employed to producethis isotope is 18O(p,n)18F. The cross section for this reaction isshown against the 11B(p,n)11C reaction in Figure 2. Theintegrated cross section for the 18F producing reaction is abouthalf that of the 11C reaction, hence it is feasible that the Vulcanlaser could produce 105 Bq of 18F per shot, operating at1020 Wcm-2.
A typical patient dose for PET is 5 mCi (1.85x10⁸ Bq) althoughup to 20 mCi (7.4x10⁸ Bq) sources are necessary so that fastchemistry can be performed to separate the tracer from theinactive carrier. Assuming that a Vulcan type laser coulddeliver 10 Hz, then the integrated activity after 500 seconds isabout 109 Bq, or 27 mCi. If this source was generated by a 1 Jpulse typical of table-top lasers then a kHz repetition rate wouldbe required. Further improvement in the production rate will beachieved by optimising the laser pre-pulse, and as statedpreviously, the target material and surface treatment. Also, ithas been shown that the proton spectrum from the back of thetarget is more energetic, which could also lead to higheractivities since the cross-sections for the relevant reactionsextend to this current limit of 37 MeV. Yamigiwa and Koga 10)
have estimated that 18F yields as high as 1014 Bq (2.7x10³ Ci),two orders of magnitude higher than standard cyclotrons can begenerated if the laser intensity were increased to 1021 Wcm-2.
At present a smaller scale laser operating at 1kHz and 0.2 J perpulse is proposed11) which would approach the required
irradiance on target to provide sufficiently intense 18F sources.The proposed design contains a Nd: YLF laser system (100 psmode-locked oscillator and several diode-pumped amplifiers)operating at a wavelength of 1.047 µm and generating 1 Jpulses at 1 kHz repetition rate using a total peak pump power of100 kW (quasi-cw). The output of this laser is used to pump anoptical parametric chirped pulse amplifier (OPCPA) whichamplifies chirped pulses at a wavelength of 2 µm up to anenergy of 0.3 J. These pulses are compressed to 30 fs andfocused to a sub-10 µm spot size to generate intensities inexcess of 1019 Wcm-2. Although this laser is based on currenttechnology and the basis of the proton generation process hasbeen established, the complete system will operate in a regimeat the forefront of laser physics and technology. A full study ofsuch a system described here is the basis of a new researchproposal11).
Finally, it has been shown that beams of cyclotron producedenergetic protons can be used to treat tumours, with greaterefficiency than conventional X-radiotherapy, because protonshave more suitable dE/dx curves than gamma-rays. Protonswith their characteristic “Bragg Peak”12) deposit almost all oftheir energy just before coming to rest in materials . Thismeans that proton beam energies can be tuned to efficientlytreat tumours, once the position of the tumour is determined bytechniques such as PET. The energy required for protononcology is typically 150 MeV. The irradiance required togenerate protons of energies of 150 MeV required for protononcology is 5×10²¹ Wcm-2µm2 13). There have been a number ofnumerical simulations that confirm that protons with energies of150 MeV or larger are generated with these intensities on target.These intensities, however, require energies on target of 100 Jin 30 fs in a 10 µm diameter focal spot with lasers operating at1 µm wavelength. These parameters are extreme but onepossible development of an oncology laser might be based onan upgrade of the PET laser described earlier. This laser willoperate at 2 µm rather than 1 µm, and consequently the energyrequired to reach an irradiance of 5×10²¹ Wcm-2µm2 is reducedto 25 J per pulse. This is a significant saving on the energyrequirement compared with the Ti-S laser, but is still two ordersof magnitude larger than the 0.2 J level of the PET laser.
In summary, it has been shown that high-intensity lasers can beused to produce short-lived positron-emitting nuclei, and thecommercial applications of this new science are well withinreach in the next few years.
References
1. P. A. Norreys et al., Phys. Plasmas. 6, 2150 (1999).
2. T. W. Phillips et al., Rev. Sci. Inst. 70, 1213 (1999).
3. K. W. D. Ledingham and P. A. Norreys, Contemp. Phys40, 367 (1999).
4. K. W. D. Ledingham et al., Phys. Rev. Lett. 84, 899(2000).
5. T. E. Cowan et al., Phys. Rev. Lett. 84, 903 (2000).
6. R. Nutt, Mol. Imag. Biol. 4, 11 (2001).
7. C. Danson et al., J. Mod. Opt. 45, 1653 (1998).
8. E. L. Clark et al., Phys. Rev. Lett. 84, 670 (2000).
9. EXFOR www nuclear reaction database,http://iaeand.iaea.or.at/exfor/
10. M. Yamigiwa and J. Koga, J. Phys. D. 32, 2526 (1999).
11. N. Ross, to be published.
12. Indiana University Cyclotron Facility Website,http://www.Iucf.indiana.edu/MPRI/about.htm
13. E. L. Clark et al., Phys. Rev. Lett. 85, 1654 (2000).
Figure 4. Decay curves for the activated boron and siliconnitride samples, showing that the isotope 11C was producedvia the reactions 11B(p,n)11C and 14N(p,α)11C.
1.E+00
1.E+01
1.E+02
1.E+03
1.E+04
1.E+05
1.E+06
0 50 100 150 200 250 300
Time/min
Act
ivit
y/B
q
11B(p,n)11C half-life 20.31+0.4 mins
14N(p,α)11C half-life 20.13+0.5 mins
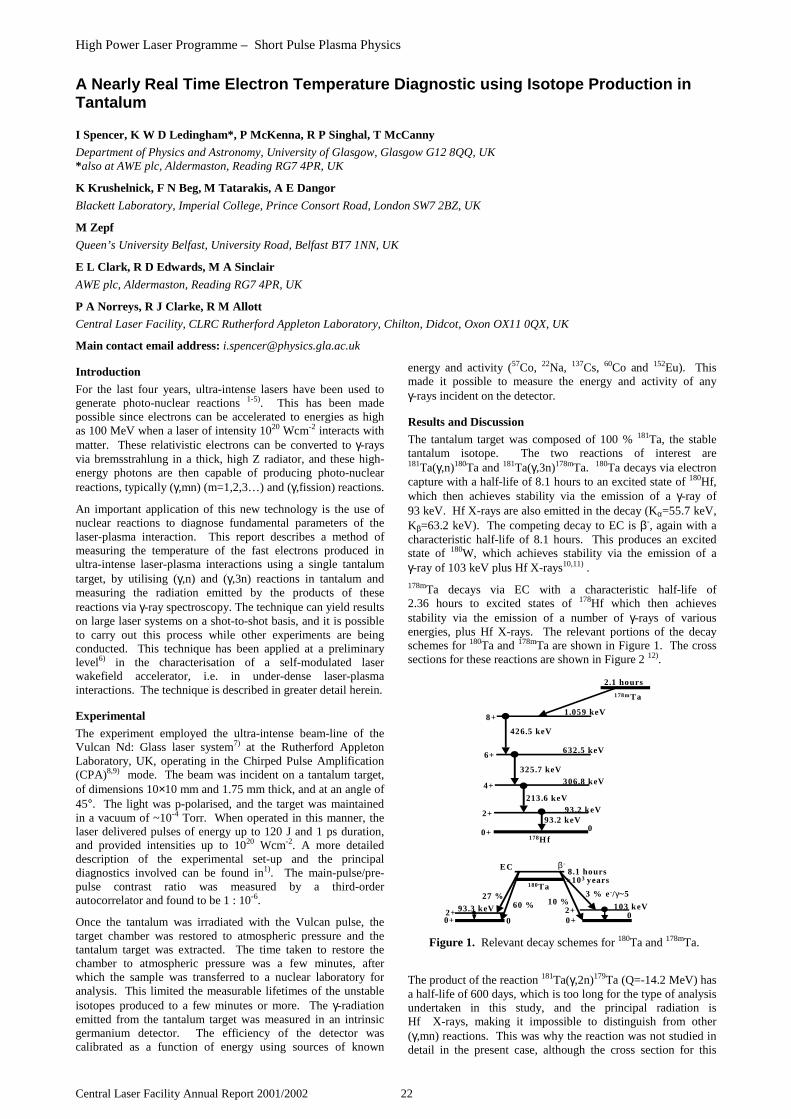
High Power Laser Programme – Short Pulse Plasma Physics
Central Laser Facility Annual Report 2001/2002 22
Introduction
For the last four years, ultra-intense lasers have been used togenerate photo-nuclear reactions 1-5). This has been madepossible since electrons can be accelerated to energies as highas 100 MeV when a laser of intensity 1020 Wcm-2 interacts withmatter. These relativistic electrons can be converted to γ-raysvia bremsstrahlung in a thick, high Z radiator, and these high-energy photons are then capable of producing photo-nuclearreactions, typically (γ,mn) (m=1,2,3…) and (γ,fission) reactions.
An important application of this new technology is the use ofnuclear reactions to diagnose fundamental parameters of thelaser-plasma interaction. This report describes a method ofmeasuring the temperature of the fast electrons produced inultra-intense laser-plasma interactions using a single tantalumtarget, by utilising (γ,n) and (γ,3n) reactions in tantalum andmeasuring the radiation emitted by the products of thesereactions via γ-ray spectroscopy. The technique can yield resultson large laser systems on a shot-to-shot basis, and it is possibleto carry out this process while other experiments are beingconducted. This technique has been applied at a preliminarylevel6) in the characterisation of a self-modulated laserwakefield accelerator, i.e. in under-dense laser-plasmainteractions. The technique is described in greater detail herein.
Experimental
The experiment employed the ultra-intense beam-line of theVulcan Nd: Glass laser system7) at the Rutherford AppletonLaboratory, UK, operating in the Chirped Pulse Amplification(CPA)8,9) mode. The beam was incident on a tantalum target,of dimensions 10×10 mm and 1.75 mm thick, and at an angle of45°. The light was p-polarised, and the target was maintainedin a vacuum of ~10-4 Torr. When operated in this manner, thelaser delivered pulses of energy up to 120 J and 1 ps duration,and provided intensities up to 1020 Wcm-2. A more detaileddescription of the experimental set-up and the principaldiagnostics involved can be found in1). The main-pulse/pre-pulse contrast ratio was measured by a third-orderautocorrelator and found to be 1 : 10-6.
Once the tantalum was irradiated with the Vulcan pulse, thetarget chamber was restored to atmospheric pressure and thetantalum target was extracted. The time taken to restore thechamber to atmospheric pressure was a few minutes, afterwhich the sample was transferred to a nuclear laboratory foranalysis. This limited the measurable lifetimes of the unstableisotopes produced to a few minutes or more. The γ-radiationemitted from the tantalum target was measured in an intrinsicgermanium detector. The efficiency of the detector wascalibrated as a function of energy using sources of known
energy and activity (57Co, 22Na, 137Cs, 60Co and 152Eu). Thismade it possible to measure the energy and activity of anyγ-rays incident on the detector.
Results and Discussion
The tantalum target was composed of 100 % 181Ta, the stabletantalum isotope. The two reactions of interest are181Ta(γ,n)180Ta and 181Ta(γ,3n)178mTa. 180Ta decays via electroncapture with a half-life of 8.1 hours to an excited state of 180Hf,which then achieves stability via the emission of a γ-ray of93 keV. Hf X-rays are also emitted in the decay (Kα=55.7 keV,Kβ=63.2 keV). The competing decay to EC is β-, again with acharacteristic half-life of 8.1 hours. This produces an excitedstate of 180W, which achieves stability via the emission of aγ-ray of 103 keV plus Hf X-rays10,11) .178mTa decays via EC with a characteristic half-life of2.36 hours to excited states of 178Hf which then achievesstability via the emission of a number of γ-rays of variousenergies, plus Hf X-rays. The relevant portions of the decayschemes for 180Ta and 178mTa are shown in Figure 1. The crosssections for these reactions are shown in Figure 2 12).
The product of the reaction 181Ta(γ,2n)179Ta (Q=-14.2 MeV) hasa half-life of 600 days, which is too long for the type of analysisundertaken in this study, and the principal radiation isHf X-rays, making it impossible to distinguish from other(γ,mn) reactions. This was why the reaction was not studied indetail in the present case, although the cross section for this
A Nearly Real Time Electron Temperature Diagnostic using Isotope Production inTantalum
I Spencer, K W D Ledingham*, P McKenna, R P Singhal, T McCanny
Department of Physics and Astronomy, University of Glasgow, Glasgow G12 8QQ, UK*also at AWE plc, Aldermaston, Reading RG7 4PR, UK
K Krushelnick, F N Beg, M Tatarakis, A E Dangor
Blackett Laboratory, Imperial College, Prince Consort Road, London SW7 2BZ, UK
M Zepf
Queen’s University Belfast, University Road, Belfast BT7 1NN, UK
E L Clark, R D Edwards, M A Sinclair
AWE plc, Aldermaston, Reading RG7 4PR, UK
P A Norreys, R J Clarke, R M Allott
Central Laser Facility, CLRC Rutherford Appleton Laboratory, Chilton, Didcot, Oxon OX11 0QX, UK
Main contact email address: [email protected]
6+
4+
2+
0+
426.5 keV
325.7 keV
213.6 keV
93.2 keV
8+1.059 keV
632.5 keV
306.8 keV
93.2 keV
0
178mTa
2.1 hours
178H f
>103 years8.1 hours
103 keV
3 % e-/γ~510 %
180Ta
0
β -EC
2+0+
93.3 keV2+00+
60 %27 %
Figure 1. Relevant decay schemes for 180Ta and 178mTa.

High Power Laser Programme – Short Pulse Plasma Physics
23 Central Laser Facility Annual Report 2001/2002
reaction is shown in Figure 2 for comparison with the (γ,n) and(γ,3n) processes.
The tantalum sample was analyzed using the germaniumdetector described above which was shielded in lead andcoupled to a multi-channel analyzer (MCA). The sample wasmeasured for 1 hour. It is also important to measure thecontribution from any background radiation. The backgroundspectrum was taken over a period of 12 hours to improve thecounting statistics, then the overall counting rate was divided by12 to show its strength relative to the tantalum signal. Figure 3shows a typical spectrum obtained in the region 0-500 keV withthe background contribution overlapped. Many lines areobserved, most notably the 93.6 keV peak (accepted value93.3 keV) which is emitted by both 180Ta and 178mTa, and the103.3 keV peak which is emitted solely by 180Ta.
A strong case for the presence of 178mTa can be made byexamining an interesting feature of the decay scheme for thisisotope 10,11) . There is a cascade of transitions from the 8+level of 178Hf to 6+, 4+, 2+, then to the ground state via theemission of γ-rays of energies 426.5, 325.7, 213.6 and93.2 keV. The intensities of these peaks are all equal, and thesepeaks are evident in Figure 3 (experimentally measured values426.0, 325.3, 213.4 and 93.6 keV). This gives an automaticefficiency calibration for the detector, in addition to themeasurement made using calibration sources. These lines arealso a unique fingerprint and evidence of the presence of 178mTa.Even though the 93.6 keV peak has a contribution from 180Ta,the observation of the other three lines provides proof of thepresence of 178mTa, meaning that γ-rays of energy greater than
22 MeV - the energy threshold for the reaction181Ta(γ,3n)178mTa - were produced in the laser-plasmainteraction.
The 328 keV peak is a background peak, and its source hasbeen identified as 207Bi. In future experiments, this peak will beeliminated by improved shielding of the germanium detector.The peaks at 111.0, 121.0 and 148.4 keV are as yet unidentified,but since this study requires signals from 180Ta and 178mTaalone, they do not cause any ambiguity.
As well as measuring the energies of the γ-rays emitted from thetantalum sample, another method for isotope identification is tomeasure the decay of the sample. Since radioisotopes all havecharacteristic half-lives, a positive measurement coupled withthe energy measurements increases the reliability of theidentification.
To measure the decay of the γ-ray activity of the sample, fourmeasurements lasting one hour were taken. The areas of thepeaks were then measured as a function of time. The mostuseful peaks are at 103 keV (180Ta) and 426 keV (178mTa) sincethese are unique to the two isotopes in question, and occur inareas of the spectrum which are uncontaminated frombackground contributions. Figure 4 shows the areas of thesepeaks as a function of time, where t=0 is the time of laserirradiation. From this decay data, the half-lives of the peakswere established. The 103 keV peak half-life was found to be7.4±0.3 hours. The accepted value for 180Ta is 8.1 hours. Thedecay was only measured over one half-life. To yield moreaccurate results the decay should have been monitored forlonger, but this was not possible due to experimentalconstraints. A more detailed measurement will be carried out infuture studies. The half-life measurement obtained however,coupled with the energy measurement of the peak is more thanadequate to identify the source of this radiation as 180Ta,produced via the reaction 181Ta(γ,n)180Ta. The half-life of the426 keV peak was found to be 2.2±0.2 hours (accepted valuefor 178mTa=2.36 hours). This provides unambiguous evidencethat the source of this peak is 178mTa, produced via the reaction181Ta(γ,3n)178mTa. The result obtained is closer to the acceptedvalue than for the 180Ta peak because the decay was monitoredfor almost ten half-lives, as opposed to just one for the previousmeasurement.
The long analysis time described is only to ascertain theprocedure, whereas once established, temperaturemeasurements can be made in a few minutes and certainlybefore the next pulse in large laser systems.
0
100
200
300
400
5 10 15 20 25 30 35 40Energy/MeV
Cro
ss s
ecti
on
/ m
b 181Ta(γ,n)180Ta
181Ta(γ,2n)179Ta
181Ta(γ,3n)178mTa
Figure 2. Cross sections for the reactions studied.
1
10
100
1000
10000
0 100 200 300 400 500
Energy / keV
Co
un
ts in
1 h
ou
r
TantalumsampleBackground
Hf X-rays
93.6 keV
103.3213.4 325.3
331.5
328.0
426.0
Figure 3. Tantalum spectrum in the region 0-500 keV.
1
10
100
1000
10000
0 200 400 600 800 1000 1200 1400
Time / minute
Act
ivit
y (p
eak
area
ove
r 1
ho
ur)
Figure 4. Decay plots of the two peaks in question. Half-lifemeasurements confirm the presence of 180Ta and 178mTa.
181Ta(γ,n)180Ta : t1/2 7.4±0.4 hours
181Ta(γ,3n)180Ta :t1/2 2.2±0.2 hours
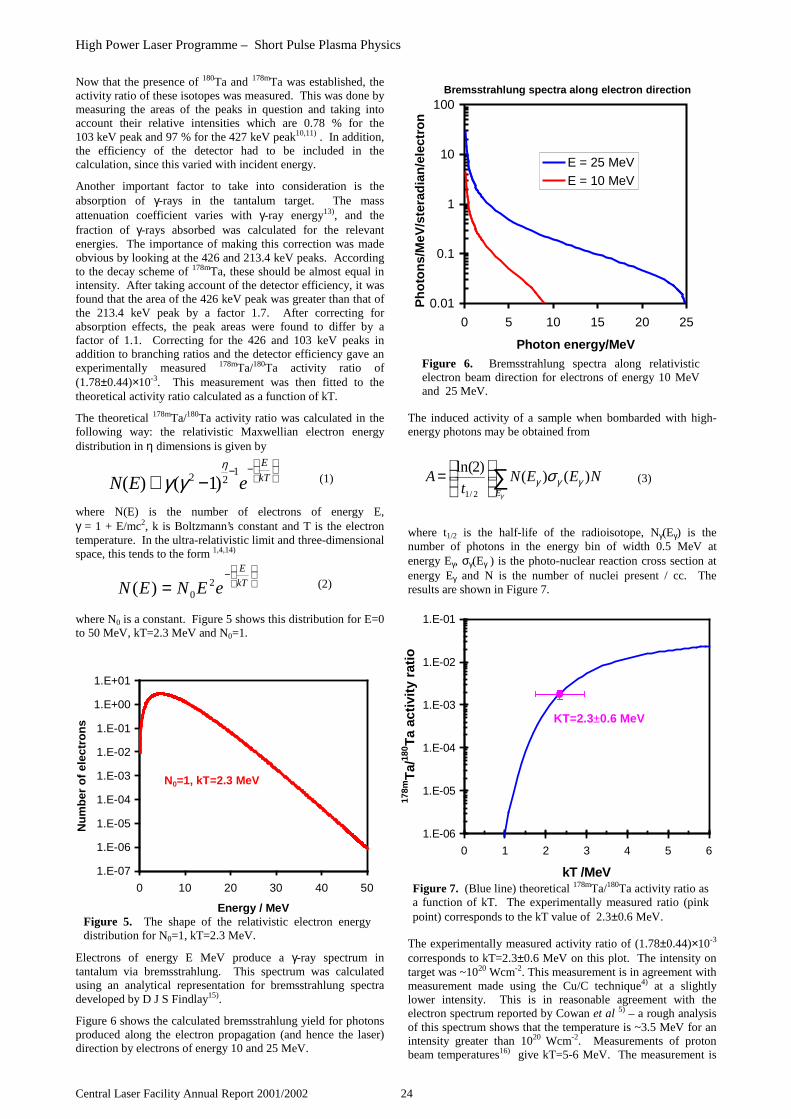
High Power Laser Programme – Short Pulse Plasma Physics
Central Laser Facility Annual Report 2001/2002 24
Now that the presence of 180Ta and 178mTa was established, theactivity ratio of these isotopes was measured. This was done bymeasuring the areas of the peaks in question and taking intoaccount their relative intensities which are 0.78 % for the103 keV peak and 97 % for the 427 keV peak10,11) . In addition,the efficiency of the detector had to be included in thecalculation, since this varied with incident energy.
Another important factor to take into consideration is theabsorption of γ-rays in the tantalum target. The massattenuation coefficient varies with γ-ray energy13), and thefraction of γ-rays absorbed was calculated for the relevantenergies. The importance of making this correction was madeobvious by looking at the 426 and 213.4 keV peaks. Accordingto the decay scheme of 178mTa, these should be almost equal inintensity. After taking account of the detector efficiency, it wasfound that the area of the 426 keV peak was greater than that ofthe 213.4 keV peak by a factor 1.7. After correcting forabsorption effects, the peak areas were found to differ by afactor of 1.1. Correcting for the 426 and 103 keV peaks inaddition to branching ratios and the detector efficiency gave anexperimentally measured 178mTa/180Ta activity ratio of(1.78±0.44)×10-3. This measurement was then fitted to thetheoretical activity ratio calculated as a function of kT.
The theoretical 178mTa/180Ta activity ratio was calculated in thefollowing way: the relativistic Maxwellian electron energydistribution in η dimensions is given by
where N(E) is the number of electrons of energy E,γ = 1 + E/mc2, k is Boltzmann’s constant and T is the electrontemperature. In the ultra-relativistic limit and three-dimensionalspace, this tends to the form 1,4,14)
where N0 is a constant. Figure 5 shows this distribution for E=0to 50 MeV, kT=2.3 MeV and N0=1.
Electrons of energy E MeV produce a γ-ray spectrum intantalum via bremsstrahlung. This spectrum was calculatedusing an analytical representation for bremsstrahlung spectradeveloped by D J S Findlay15).
Figure 6 shows the calculated bremsstrahlung yield for photonsproduced along the electron propagation (and hence the laser)direction by electrons of energy 10 and 25 MeV.
The induced activity of a sample when bombarded with high-energy photons may be obtained from
where t1/2 is the half-life of the radioisotope, Nγ(Eγ) is thenumber of photons in the energy bin of width 0.5 MeV atenergy Eγ, σγ(Eγ ) is the photo-nuclear reaction cross section atenergy Eγ and N is the number of nuclei present / cc. Theresults are shown in Figure 7.
The experimentally measured activity ratio of (1.78±0.44)×10-3
corresponds to kT=2.3±0.6 MeV on this plot. The intensity ontarget was ~1020 Wcm-2. This measurement is in agreement withmeasurement made using the Cu/C technique4) at a slightlylower intensity. This is in reasonable agreement with theelectron spectrum reported by Cowan et al 5) – a rough analysisof this spectrum shows that the temperature is ~3.5 MeV for anintensity greater than 1020 Wcm-2. Measurements of protonbeam temperatures16) give kT=5-6 MeV. The measurement is
Figure 7. (Blue line) theoretical 178mTa/180Ta activity ratio asa function of kT. The experimentally measured ratio (pinkpoint) corresponds to the kT value of 2.3±0.6 MeV.
1.E-06
1.E-05
1.E-04
1.E-03
1.E-02
1.E-01
0 1 2 3 4 5 6
kT /MeV
178m
Ta/
180 T
a ac
tivi
ty r
atio
KT=2.3±0.6 MeV
Bremsstrahlung spectra along electron direction
0.01
0.1
1
10
100
0 5 10 15 20 25
Photon energy/MeV
Ph
oto
ns/
MeV
/ste
rad
ian
/ele
ctro
n
E = 25 MeVE = 10 MeV
Figure 6. Bremsstrahlung spectra along relativisticelectron beam direction for electrons of energy 10 MeVand 25 MeV.
∑
=
γ
γγγ σE
NEENt
A )()()2ln(
2/1
(3)(1)
−−
−∝ kT
E
eEN1
22 )1()(η
γγ
−
= kT
E
eENEN 20)( (2)
1.E-07
1.E-06
1.E-05
1.E-04
1.E-03
1.E-02
1.E-01
1.E+00
1.E+01
0 10 20 30 40 50
Energy / MeV
Nu
mb
er o
f el
ectr
on
s
N0=1, kT=2.3 MeV
Figure 5. The shape of the relativistic electron energydistribution for N0=1, kT=2.3 MeV.

High Power Laser Programme – Short Pulse Plasma Physics
25 Central Laser Facility Annual Report 2001/2002
in good agreement with the j×B ponderomotive modeldescribed by Wilks et al 17) and confirmed experimentally byMalka and Miquel18), where, for p-polarization and obliqueincidence, kT is of the order 0.511(√1+Iλ2/1.37×1018/2-1)MeV. For Iλ2=1020 Wcm-2µm2, kT is calculated to be 2.6 MeV.Measurements made by Santala et al.6) using a similar techniqueat a preliminary level gave a kT value of 4.4 MeV at similarintensities, although this experiment involved a laser-gasinteraction which is known to give higher electron temperaturesthan laser-solid interactions19). If the data were not correctedfor absorption effects, the kT value measured would be of theorder 5 MeV, which, for a laser-solid interaction at intensitiesup to 1020 Wcm-2 would be higher than expected and observedin other measurements. Therefore, the measurement madeappears to be reasonable.
Conclusions
It has been shown that higher-order photo-nuclear reactions canbe used to measure the electron temperature when an ultra-intense laser pulse interacts with a solid tantalum target.Analysis of the specific peaks described is recommended sincethey are unambiguous for the isotopes 180Ta and 178mTa. Forhigher laser intensities and hence higher electron and photonenergies, this technique should still be applicable since onesimply looks for evidence of higher order reactions using thesame spectroscopic technique and choosing thoughtfully thereactions that will yield unambiguous peaks. In particular,181Ta(γ,4n)177Ta (Q=29.0 MeV) and 181Ta(γ,5n)176Ta(Q=37.3 MeV) look like very useful reactions for thistechnique. 177Ta has a half life of 2.36 days, and unambiguousγ-ray lines at 113.0 and 208.4 keV. 176Ta has a half-life of8.08 hours, and a cascade of transitions with the highest energy1115.9 keV, then many others of lower energy with the sameintensity, yielding a unique fingerprint similar in nature to thatof 178mTa shown above, but with different γ-ray lines. Thistechnique can provide temperature measurements on a shot-to-shot basis, even while other experiments (e.g. angulardistribution measurements) are being conducted. The techniqueis also applicable for gas target interactions if the tantalumsample is placed in the path of the fast electron beam. Otheractivation samples may also prove useful, and a full studyinvolving higher order reactions in other high Z materials isplanned for the future in order to find the most suitable materialfor the electron spectra obtained at various laser intensities.
References
1. P. A. Norreys et al., Phys. Plasmas. 6, 2150 (1999).
2. T. W. Phillips et al., Rev. Sci. Inst. 70, 1213 (1999).
3. K. W. D. Ledingham and P. A. Norreys, Contemp. Phys40, 367 (1999).
4. K. W. D. Ledingham et al., Phys. Rev. Lett. 84, 899(2000).
5. T. E. Cowan et al., Phys. Rev. Lett. 84, 903 (2000).
6. M. I. K. Santala et al., Phys. Rev. Lett. 86, 1227 (2001).
7. C. Danson et al., J. Mod. Opt. 45, 1653 (1998).
8. M. D. Perry and G. Mourou, Science 264, 917 (1994).
9. D. Strickland and G. Mourou, Opt. Comm. 56, 219 (1985).
10. R. B. Firestone, V. S. Shirley, and C. M. Chu, Table ofIsotopes 8th Edition 1998 update, (Wiley, New York,1998).
11. J. Magill, Nuclides 2000 (2000)
12. IAEA, EXFOR www nuclear reaction database,http://iaeand.iaea.or.at/exfor/ (2000)
13. J. H. Hubbell and S. M. Seltzer, NIST X-ray massattenuation coefficients,http://aeldata.phy.nist.gov/PhysRefData/XrayMassCoef/cover.html (2002)
14. J. R. Davies, Phys. Rev E 65, 026407 (2002).
15. D. J. S. Findlay, Nucl. Inst. Meth. A276, 598 (1989).
16. M. Roth et al., Phys. Rev. Lett. 86, 436 (2001).
17. S. C. Wilks et al., Phys. Rev. Lett. 69, 1383 (1992).
18. G. Malka and J. L. Miquel, Phys. Rev. Lett. 77, 75 (1996).
19. D. Umstadter, Phys. Plasmas. 8, 1774 (2001).

High Power Laser Programme – Short Pulse Plasma Physics
Central Laser Facility Annual Report 2001/2002 26
Introduction
The idea of using proton beams for radiography purposes hascirculated for several years1,2). Conventional accelerators havebeen employed as suitable sources of protons for theseapplications. Charged particle optics was used to obtain parallelbeams and only radiographs of macroscopic objects could berealized. Basically three different proton radiographytechniques have been developed in the past. The first and mostobvious one is based on the stopping of protons when theyencounter an obstacle thicker than their stopping range. Asecond method is based on the energy loss of protons when theycross an object thinner than their stopping range but still thickenough to absorb a detectable fraction of their energy. Finally athird method is possible that is based on multiple small anglescattering due to Coulomb collisions in the obstacle. Since thismethod doesn’t require stopping or energy loss of the protons, itis clearly suitable for radiography of very thin objects.
We present here a possible application of laser produced protonbeams to imaging of thin solid objects via multiple small anglescattering. The term imaging rather than radiography appliessince the intrinsic magnification properties of the diverginglaser produced proton beams play an important role 3-5).
We then present a quantitative interpretation of theexperimental results based on Monte Carlo simulations of thepropagation of protons in matter. Numerical simulations havebeen performed using the SRIM simulation code 6,7). We havedeveloped PV Wave routines to elaborate the results fromsimulations.
Finally proton imaging technique is briefly compared withprevious experiments on proton radiography with conventionalaccelerators.
Experimental set-up
Al target Detector
CPA pulse
Proton beam
Object under test
Figure 1. Experimental set-up for proton imaging.
The Vulcan Nd:glass laser operating in the Chirped PulseAmplification mode (CPA) has been used in the experiment.This laser provides pulses at 1.054 µm in wavelength, 1ps induration and with energies up to 100 J. To generate the protonbeam 3-5) the laser beam is focused in the centre of a thinmetallic target by an F/3.5 off-axis parabola. In order to avoidundesired reflections back to the laser cavity an incident angleof 15º with the target normal is chosen. The focal spot isbetween 8 and 10 µm in diameter at full width at halfmaximum, containing 30-40% of the total energy and giving
intensities up to 5-7 x 10¹⁹ W/cm2. The targets mainly used togenerate the proton beam were 1-2 mm wide and 3-25 µm thickAl foils. Even if the targets nominally do not contain hydrogen,hydrocarbon contaminants that are always present on the targetsurfaces ensure a suitable source of protons. The detector usedto reveal the proton beam is typically placed at 20-22 mm fromthe main target. The object under test, i.e. the object to beimaged, is usually placed 1-2 mm after the proton source. Thisleads to a geometrical magnification between 10 and 22. Apicture of a typical experimental set-up is shown in Figure 1.
The detector used to reveal the proton beams consists of a stackof several layers of radiochromic films (RCF)3-5). Each RCFcontains one or more layers of active gel, sensitive to ionizingradiation, sandwiched between polyester foils and eventuallykept together by thin adhesive substrates. The RCF, transparentbefore irradiation, develops a blue color upon exposure toionizing radiation. The change in the optical density can bemeasured with transmission densitometers, film scanners orspectrophotometers.
Experimental results
Al target Al foil Detector
Proton beam
CPA
(a)
Al target Cu grid Detector
Proton beam
CPA
(b)
Figure 2. Experimental set-up for proton imaging of an Al foil(a) and of a Cu grid (b).
Imaging of several objects of different material, thickness andshape has been realized. In Figure 2 (a) the experimental set-upfor the imaging of a 25 µm Al foil is shown. The foil wasperpendicular to the proton beam propagation axis coveringabout 3/4 of the proton beam cross section. The distancebetween the proton source and the foil was 2 mm while the
Imaging of thin solid objects with a laser produced proton beam via multiplescattering
L Romagnani, M Borghesi
Department of Pure and Applied Physics, The Queen’s University, Belfast
O Willi
Institut für Laser-und-Plasmaphysic,Heinrich-Heine-Universität, Düsseldorf, Germany
D H Campbell, A Schiavi
The Blackett Laboratory, Imperial College of Science, Technology and Medicine, London
Main contact email address: [email protected]

High Power Laser Programme – Short Pulse Plasma Physics
27 Central Laser Facility Annual Report 2001/2002
X
Foil edge
Size of the Al foil
Optical Density
0.1
0.3
0.5
0.8
1.6 (a)
(b)
Figure 3. (a) Image of the Al foil obtained with 20 Mevprotons. (b) Correspondent optical density variation across thebeam cross-section.
detector was positioned at 22 mm from the source. In Figure 3(a) the image of the Al foil on the detector obtained with20 Mev protons is reported. In Figure 3 (b) the correspondingoptical density variation across the beam cross-section isshown. Only the edge of the Al foil produces a perturbation inthe proton beam cross section. Far away from the edge theproton beam is not perturbed by the presence of the Al foil. Thisis expected since the stopping range of 20 MeV protons in Al isabout 2.1 mm, i.e. far more than the foil thickness. The origin ofthe beam perturbation in correspondence with the foil edge willbe explained later.
In Figure 2 (b) the experimental set-up for the imaging of a Cumesh is shown. The mesh was formed by 25 µm wires with100 µm spacing and was placed 1 mm after the proton source.The detector was at 22 mm from the source giving ageometrical magnification of 22. In Figure 4 (a) the image ofthe grid on the detector obtained with 20 Mev protons isreported. In Figure 4 (b) the corresponding optical densityvariation across the beam cross-section is shown. In this case acomplete image of the mesh can be distinguished. This cannotbe due to the stopping of the protons when crossing the meshwires. In fact the stopping range of 20 MeV protons in Cu isabout 800 µm, i.e. far larger than the thickness of the meshwires. The image cannot be due to the energy loss of protonswhen crossing the wires either. In fact the energy loss of20 MeV protons after a path of 25 µm in Cu is just ∆E/E -2.Taking into account the detector response this would lead to avariation in the optical density of ~ 10-4, the observed variationbeing ~ 0.2.
Data interpretation and modeling
In previous publications3-4), the shadow of the mesh in theproton beam cross section was tentatively attributed to electricalcharge-up, possibly due to precursor electrons. In reality such
X
Optical Density
0.1 0.3 0.5 0.8 1.6
(a)
(b)
Figure 4. (a) Image of the Cu grid obtained with 20 Mevprotons and (b) correspondent optical density variation acrossthe beam cross-section. The whole shape of the grid can bedistinguished in the image and deep minima can be observed inthe optical density variation.
an effect does not seem to be required to explain theobservations, as scattering alone can produce patterns that arequalitatively similar to the ones observed experimentally.
A possible interpretation of the experimental data is as follows.Because of multiple small angle scattering by the ions inside theobject under test, protons that propagate through the objectsuffer a larger lateral spread compared to protons that propagatein vacuum. At the edges of the object the difference in thelateral spreads produces a perturbation in the beam intensityprofile. Far away from the edges the beam is unperturbed,provided that the object is much thinner than the protonstopping range. If the transverse size of the object is larger thanthe perturbation width then the perturbations due to differentedges do not superimpose and only the contour of the object isvisible in the image. This corresponds to the foil case, whereactually only one edge intercepted the beam. If instead thetransverse size of the object is smaller than the perturbations’width then the perturbations due to two adjacent edges cansuperimpose producing deep minima in the intensity profile.This corresponds to the mesh case, where the two edges of asingle wire are only 25 µm far from each other. As aconsequence the whole mesh structure can be recognized in theimage while deep minima can be observed in the optical densityvariation across the beam cross section.
Numerical modeling of the experimental results has beencarried out. The SRIM (Stopping Range of Ions in Matter)code6,7) was used to simulate the propagation of protons invacuum or through the object and to calculate their finaldistributions in the detector for a given angle of emission fromthe source. We developed numerical routines that superimposethe proton distributions corresponding to the different angles ofemission so reconstructing portions of the beam cross-section.

High Power Laser Programme – Short Pulse Plasma Physics
Central Laser Facility Annual Report 2001/2002 28
Portions of the image of the object on the detector and thecorrespondent optical density variation can so be obtained. Itshould be pointed out that SRIM appears to underestimatesomehow the lateral spread due to multiple scattering8-10).
(a)
(b)
Figure 5. Calculated optical density variation across the beamcross-section for the foil case (a) and for the grid case (b).
As an example of results from numerical modeling in Figure 5the optical density variations across the beam cross-sectioncalculated for the Al foil (a) and for the Cu mesh (b) are shown.The graphs reproduce well the experimental data from aqualitative point of view, even if the contrast values are higher.The difference can be imputed mainly to the not perfectestimation of the lateral spread by SRIM and to some physicaleffects not included up to now in the numerical model, such asthe finite size of the proton source and the broad protonspectrum. It is expected that, when included in the model, boththese effects should contribute to keep down the contrast tovalues closer to the experimental values.
Comparison with previous experiments
Proton radiography using proton beams from conventionalaccelerators has been reported1,2) where charged particle opticswas used to obtain parallel beams. When using a parallel beamthe distance between the object under test and the detector hasto be chosen properly. In fact the width of the perturbationcorresponding to a single edge of the object is proportional tolθs, where l is the distance between the object and the detectorand θs is the angular spread of protons that propagates throughthe object. If too large a distance l is chosen then perturbationsoriginating from more than two edges can superimpose, sodestroying the image of the object on the detector. Moreoveronly radiographs of macroscopic objects can be realized sincethe magnification of a parallel beam is 1.
By contrast using diverging beams the distance of the detectorfrom the object is not a critical parameter because the beamdivergence can compensate for the angular spread due toscattering. Moreover imaging of microscopic objects can beperformed thanks to the intrinsic magnification properties of thebeam. The combination of the beam divergence with thepossibility of placing the detector far away from the object leadsto a large freedom in the values of the magnification that can bereached. In the experiment magnification between 10 and 22have been used, but higher magnification values can be easilyreached. Laser produced proton beams are particularly suitablefor proton imaging since they are divergent and apparentlyoriginating from a point source less than 10 µm in diameter.
Conclusion
It has been shown that proton imaging via multiple scattering isa sensitive technique for imaging of very thin solid objects.Overall it appears to be a promising and sensitive technique forthe detection of density perturbations of relatively smallamplitude. In a laser-plasma context there is scope, for example,for its application to detect the growth of hydrodynamicinstability. In particular the use of protons can be useful inconditions (e.g. the interior of a dense target) in which other,more established techniques (i.e. x-ray radiography) may be ofdifficult application.
References
1. A M KohelerScience, 160 303, (1968)
2. D West and A C SherwoodNature, 239 157, (1972)
3. M Borghesi et al, CLF RAL Annual Report (2000-2001)
4. M Borghesi et al, Plasma Phys. Control. Fusion 43 A267,(2001)
5. M Borghesi et al, Phys. Plasmas 9 2214, (2002)
6. J F Ziegler, The Stopping and Range of Ions in Matter, Vol1, Pergamon Press, New York (1985)
7. www.srim.org
8. C Michelet et al, Nucl. Instr. And Meth. B 181 157, (2001)
9. G Kuri et al, Nucl. Instr. And Meth. B 111 234, (1996)
10. J H Liang, Nucl. Instr. and Meth.. B 134 157, (1998)
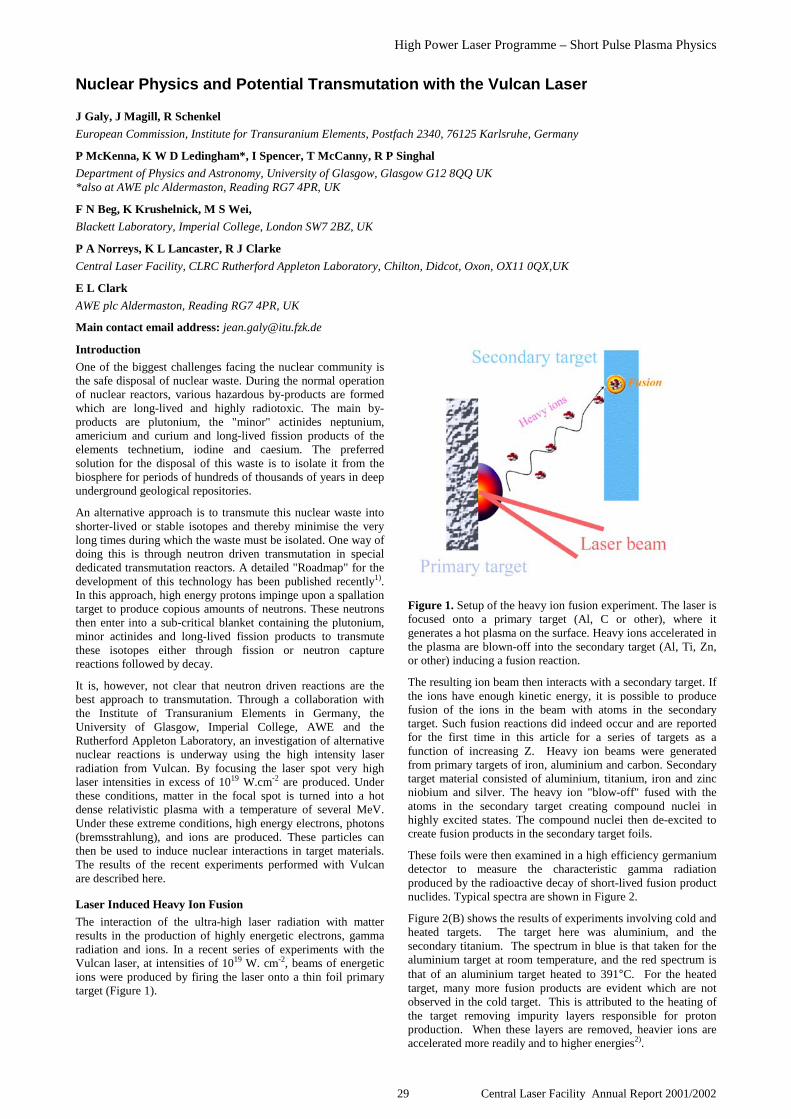
High Power Laser Programme – Short Pulse Plasma Physics
29 Central Laser Facility Annual Report 2001/2002
Introduction
One of the biggest challenges facing the nuclear community isthe safe disposal of nuclear waste. During the normal operationof nuclear reactors, various hazardous by-products are formedwhich are long-lived and highly radiotoxic. The main by-products are plutonium, the "minor" actinides neptunium,americium and curium and long-lived fission products of theelements technetium, iodine and caesium. The preferredsolution for the disposal of this waste is to isolate it from thebiosphere for periods of hundreds of thousands of years in deepunderground geological repositories.
An alternative approach is to transmute this nuclear waste intoshorter-lived or stable isotopes and thereby minimise the verylong times during which the waste must be isolated. One way ofdoing this is through neutron driven transmutation in specialdedicated transmutation reactors. A detailed "Roadmap" for thedevelopment of this technology has been published recently1).In this approach, high energy protons impinge upon a spallationtarget to produce copious amounts of neutrons. These neutronsthen enter into a sub-critical blanket containing the plutonium,minor actinides and long-lived fission products to transmutethese isotopes either through fission or neutron capturereactions followed by decay.
It is, however, not clear that neutron driven reactions are thebest approach to transmutation. Through a collaboration withthe Institute of Transuranium Elements in Germany, theUniversity of Glasgow, Imperial College, AWE and theRutherford Appleton Laboratory, an investigation of alternativenuclear reactions is underway using the high intensity laserradiation from Vulcan. By focusing the laser spot very highlaser intensities in excess of 1019 W.cm-2 are produced. Underthese conditions, matter in the focal spot is turned into a hotdense relativistic plasma with a temperature of several MeV.Under these extreme conditions, high energy electrons, photons(bremsstrahlung), and ions are produced. These particles canthen be used to induce nuclear interactions in target materials.The results of the recent experiments performed with Vulcanare described here.
Laser Induced Heavy Ion Fusion
The interaction of the ultra-high laser radiation with matterresults in the production of highly energetic electrons, gammaradiation and ions. In a recent series of experiments with theVulcan laser, at intensities of 1019 W. cm-2, beams of energeticions were produced by firing the laser onto a thin foil primarytarget (Figure 1).
Figure 1. Setup of the heavy ion fusion experiment. The laser isfocused onto a primary target (Al, C or other), where itgenerates a hot plasma on the surface. Heavy ions accelerated inthe plasma are blown-off into the secondary target (Al, Ti, Zn,or other) inducing a fusion reaction.
The resulting ion beam then interacts with a secondary target. Ifthe ions have enough kinetic energy, it is possible to producefusion of the ions in the beam with atoms in the secondarytarget. Such fusion reactions did indeed occur and are reportedfor the first time in this article for a series of targets as afunction of increasing Z. Heavy ion beams were generatedfrom primary targets of iron, aluminium and carbon. Secondarytarget material consisted of aluminium, titanium, iron and zincniobium and silver. The heavy ion "blow-off" fused with theatoms in the secondary target creating compound nuclei inhighly excited states. The compound nuclei then de-excited tocreate fusion products in the secondary target foils.
These foils were then examined in a high efficiency germaniumdetector to measure the characteristic gamma radiationproduced by the radioactive decay of short-lived fusion productnuclides. Typical spectra are shown in Figure 2.
Figure 2(B) shows the results of experiments involving cold andheated targets. The target here was aluminium, and thesecondary titanium. The spectrum in blue is that taken for thealuminium target at room temperature, and the red spectrum isthat of an aluminium target heated to 391°C. For the heatedtarget, many more fusion products are evident which are notobserved in the cold target. This is attributed to the heating ofthe target removing impurity layers responsible for protonproduction. When these layers are removed, heavier ions areaccelerated more readily and to higher energies2).
Nuclear Physics and Potential Transmutation with the Vulcan Laser
J Galy, J Magill, R Schenkel
European Commission, Institute for Transuranium Elements, Postfach 2340, 76125 Karlsruhe, Germany
P McKenna, K W D Ledingham*, I Spencer, T McCanny, R P Singhal
Department of Physics and Astronomy, University of Glasgow, Glasgow G12 8QQ UK*also at AWE plc Aldermaston, Reading RG7 4PR, UK
F N Beg, K Krushelnick, M S Wei,
Blackett Laboratory, Imperial College, London SW7 2BZ, UK
P A Norreys, K L Lancaster, R J Clarke
Central Laser Facility, CLRC Rutherford Appleton Laboratory, Chilton, Didcot, Oxon, OX11 0QX,UK
E L Clark
AWE plc Aldermaston, Reading RG7 4PR, UK
Main contact email address: [email protected]
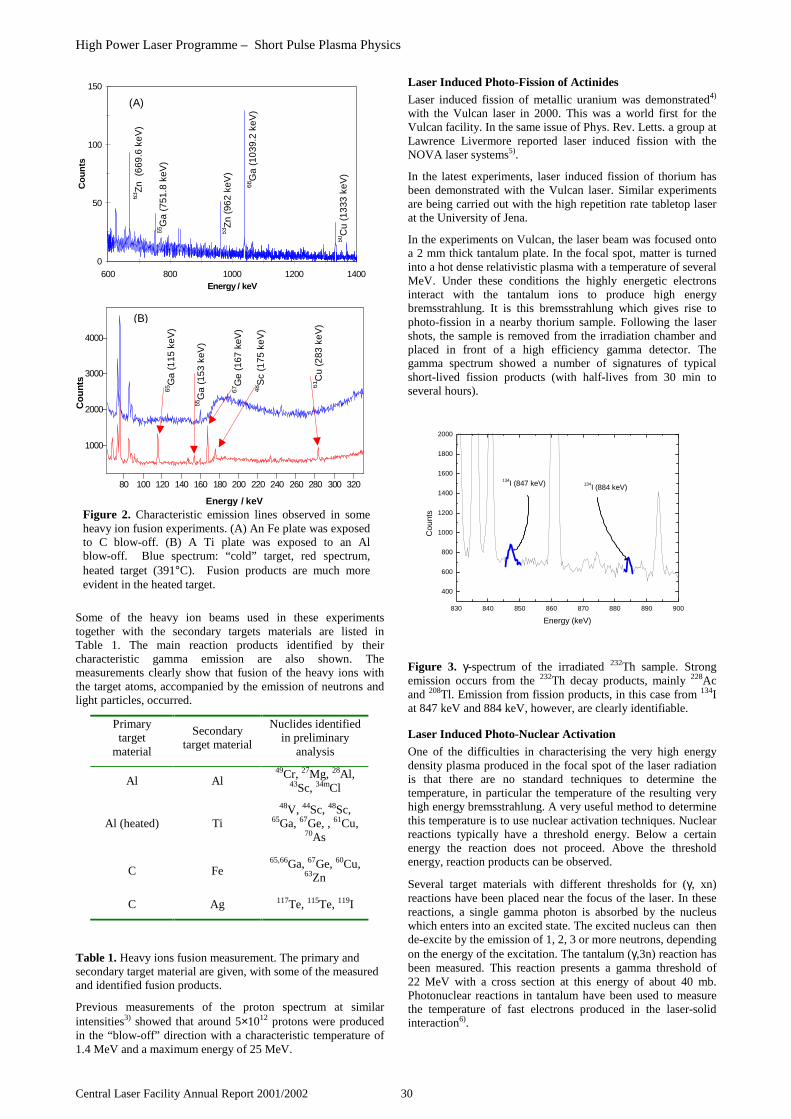
High Power Laser Programme – Short Pulse Plasma Physics
Central Laser Facility Annual Report 2001/2002 30
Some of the heavy ion beams used in these experimentstogether with the secondary targets materials are listed inTable 1. The main reaction products identified by theircharacteristic gamma emission are also shown. Themeasurements clearly show that fusion of the heavy ions withthe target atoms, accompanied by the emission of neutrons andlight particles, occurred.
Primarytarget
material
Secondarytarget material
Nuclides identifiedin preliminary
analysis
Al Al49Cr, 27Mg, 28Al,
43Sc, 34mCl
Al (heated) Ti
48V, 44Sc, 48Sc,65Ga, 67Ge, , 61Cu,
70As
C Fe65,66Ga, 67Ge, 60Cu,
63Zn
C Ag 117Te, 115Te, 119I
Table 1. Heavy ions fusion measurement. The primary andsecondary target material are given, with some of the measuredand identified fusion products.
Previous measurements of the proton spectrum at similarintensities3) showed that around 5×10¹² protons were producedin the “blow-off” direction with a characteristic temperature of1.4 MeV and a maximum energy of 25 MeV.
Laser Induced Photo-Fission of Actinides
Laser induced fission of metallic uranium was demonstrated4)
with the Vulcan laser in 2000. This was a world first for theVulcan facility. In the same issue of Phys. Rev. Letts. a group atLawrence Livermore reported laser induced fission with theNOVA laser systems5).
In the latest experiments, laser induced fission of thorium hasbeen demonstrated with the Vulcan laser. Similar experimentsare being carried out with the high repetition rate tabletop laserat the University of Jena.
In the experiments on Vulcan, the laser beam was focused ontoa 2 mm thick tantalum plate. In the focal spot, matter is turnedinto a hot dense relativistic plasma with a temperature of severalMeV. Under these conditions the highly energetic electronsinteract with the tantalum ions to produce high energybremsstrahlung. It is this bremsstrahlung which gives rise tophoto-fission in a nearby thorium sample. Following the lasershots, the sample is removed from the irradiation chamber andplaced in front of a high efficiency gamma detector. Thegamma spectrum showed a number of signatures of typicalshort-lived fission products (with half-lives from 30 min toseveral hours).
830 840 850 860 870 880 890 900
400
600
800
1000
1200
1400
1600
1800
2000
134I (884 keV)134I (847 keV)
C
ount
s
Energy (keV)
Figure 3. γ-spectrum of the irradiated 232Th sample. Strongemission occurs from the 232Th decay products, mainly 228Acand 208Tl. Emission from fission products, in this case from 134Iat 847 keV and 884 keV, however, are clearly identifiable.
Laser Induced Photo-Nuclear Activation
One of the difficulties in characterising the very high energydensity plasma produced in the focal spot of the laser radiationis that there are no standard techniques to determine thetemperature, in particular the temperature of the resulting veryhigh energy bremsstrahlung. A very useful method to determinethis temperature is to use nuclear activation techniques. Nuclearreactions typically have a threshold energy. Below a certainenergy the reaction does not proceed. Above the thresholdenergy, reaction products can be observed.
Several target materials with different thresholds for (γ, xn)reactions have been placed near the focus of the laser. In thesereactions, a single gamma photon is absorbed by the nucleuswhich enters into an excited state. The excited nucleus can thende-excite by the emission of 1, 2, 3 or more neutrons, dependingon the energy of the excitation. The tantalum (γ,3n) reaction hasbeen measured. This reaction presents a gamma threshold of22 MeV with a cross section at this energy of about 40 mb.Photonuclear reactions in tantalum have been used to measurethe temperature of fast electrons produced in the laser-solidinteraction6).
0
50
100
150
600 800 1000 1200 1400Energy / keV
Co
un
ts
63Z
n (
669.
6 ke
V)
(A)
65G
a (7
51.8
keV
)
63Z
n (9
62 k
eV)
66G
a (1
039.
2 ke
V)
60C
u (1
333
keV
)
1000
2000
3000
4000
80 100 120 140 160 180 200 220 240 260 280 300 320
Energy / keV
Co
unt
s
65G
a (1
15 k
eV)
65G
a (1
53 k
eV)
67G
e (1
67 k
eV)
48S
c (1
75 k
eV)
61C
u (2
83 k
eV)
(B)
Figure 2. Characteristic emission lines observed in someheavy ion fusion experiments. (A) An Fe plate was exposedto C blow-off. (B) A Ti plate was exposed to an Alblow-off. Blue spectrum: “cold” target, red spectrum,heated target (391°C). Fusion products are much moreevident in the heated target.
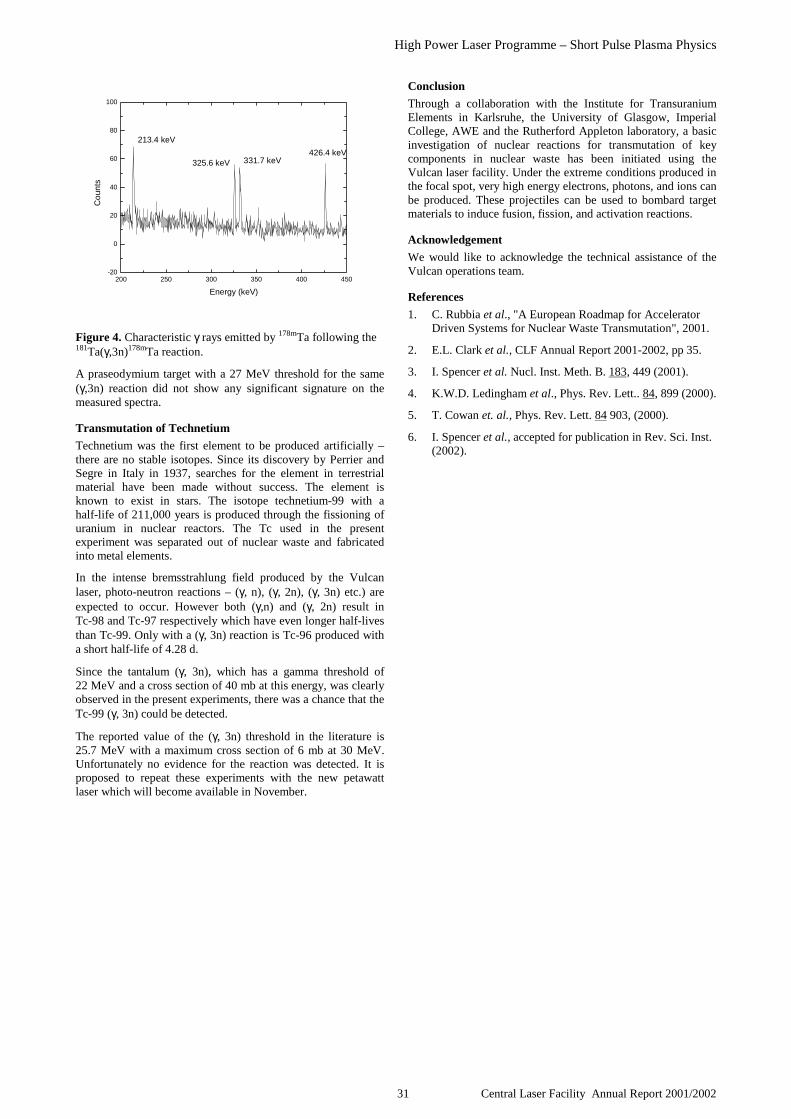
High Power Laser Programme – Short Pulse Plasma Physics
31 Central Laser Facility Annual Report 2001/2002
200 250 300 350 400 450-20
0
20
40
60
80
100
426.4 keV331.7 keV325.6 keV
213.4 keV
C
ount
s
Energy (keV)
Figure 4. Characteristic γ rays emitted by 178mTa following the181Ta(γ,3n)178mTa reaction.
A praseodymium target with a 27 MeV threshold for the same(γ,3n) reaction did not show any significant signature on themeasured spectra.
Transmutation of Technetium
Technetium was the first element to be produced artificially –there are no stable isotopes. Since its discovery by Perrier andSegre in Italy in 1937, searches for the element in terrestrialmaterial have been made without success. The element isknown to exist in stars. The isotope technetium-99 with ahalf-life of 211,000 years is produced through the fissioning ofuranium in nuclear reactors. The Tc used in the presentexperiment was separated out of nuclear waste and fabricatedinto metal elements.
In the intense bremsstrahlung field produced by the Vulcanlaser, photo-neutron reactions – (γ, n), (γ, 2n), (γ, 3n) etc.) areexpected to occur. However both (γ,n) and (γ, 2n) result inTc-98 and Tc-97 respectively which have even longer half-livesthan Tc-99. Only with a (γ, 3n) reaction is Tc-96 produced witha short half-life of 4.28 d.
Since the tantalum (γ, 3n), which has a gamma threshold of22 MeV and a cross section of 40 mb at this energy, was clearlyobserved in the present experiments, there was a chance that theTc-99 (γ, 3n) could be detected.
The reported value of the (γ, 3n) threshold in the literature is25.7 MeV with a maximum cross section of 6 mb at 30 MeV.Unfortunately no evidence for the reaction was detected. It isproposed to repeat these experiments with the new petawattlaser which will become available in November.
Conclusion
Through a collaboration with the Institute for TransuraniumElements in Karlsruhe, the University of Glasgow, ImperialCollege, AWE and the Rutherford Appleton laboratory, a basicinvestigation of nuclear reactions for transmutation of keycomponents in nuclear waste has been initiated using theVulcan laser facility. Under the extreme conditions produced inthe focal spot, very high energy electrons, photons, and ions canbe produced. These projectiles can be used to bombard targetmaterials to induce fusion, fission, and activation reactions.
Acknowledgement
We would like to acknowledge the technical assistance of theVulcan operations team.
References
1. C. Rubbia et al., "A European Roadmap for AcceleratorDriven Systems for Nuclear Waste Transmutation", 2001.
2. E.L. Clark et al., CLF Annual Report 2001-2002, pp 35.
3. I. Spencer et al. Nucl. Inst. Meth. B. 183, 449 (2001).
4. K.W.D. Ledingham et al., Phys. Rev. Lett.. 84, 899 (2000).
5. T. Cowan et. al., Phys. Rev. Lett. 84 903, (2000).
6. I. Spencer et al., accepted for publication in Rev. Sci. Inst.(2002).
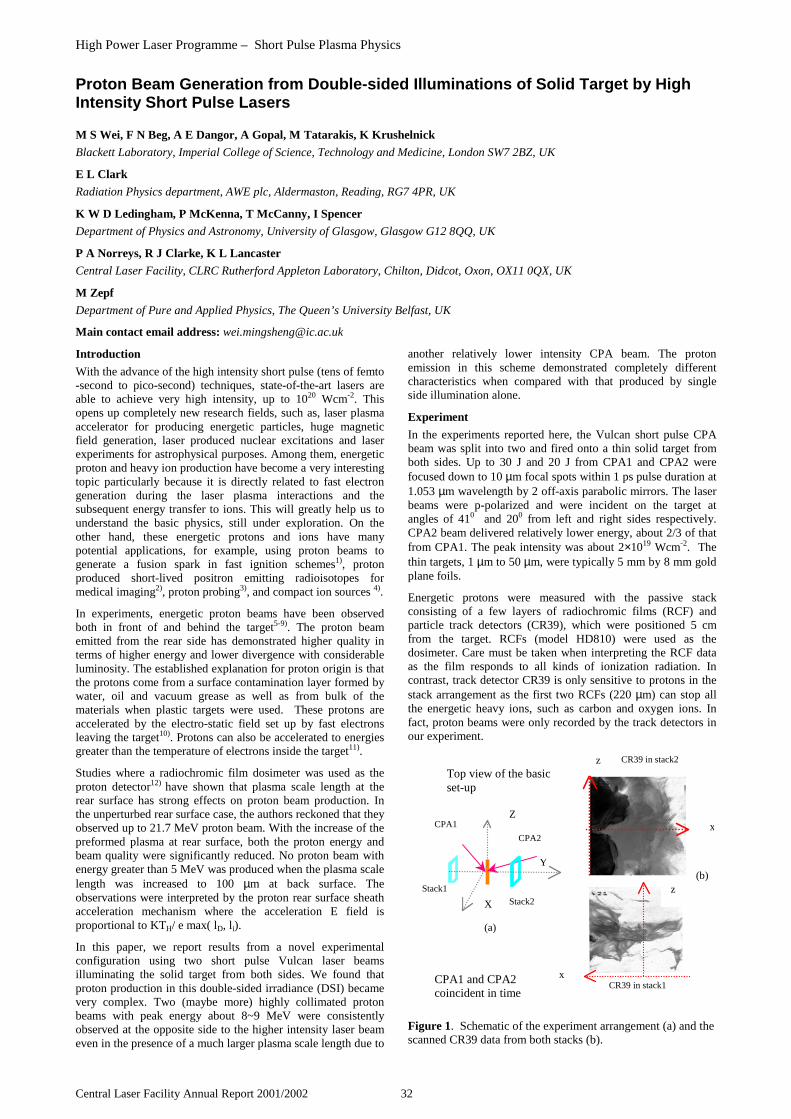
High Power Laser Programme – Short Pulse Plasma Physics
Central Laser Facility Annual Report 2001/2002 32
Introduction
With the advance of the high intensity short pulse (tens of femto-second to pico-second) techniques, state-of-the-art lasers areable to achieve very high intensity, up to 1020 Wcm-2. Thisopens up completely new research fields, such as, laser plasmaaccelerator for producing energetic particles, huge magneticfield generation, laser produced nuclear excitations and laserexperiments for astrophysical purposes. Among them, energeticproton and heavy ion production have become a very interestingtopic particularly because it is directly related to fast electrongeneration during the laser plasma interactions and thesubsequent energy transfer to ions. This will greatly help us tounderstand the basic physics, still under exploration. On theother hand, these energetic protons and ions have manypotential applications, for example, using proton beams togenerate a fusion spark in fast ignition schemes1), protonproduced short-lived positron emitting radioisotopes formedical imaging2), proton probing3), and compact ion sources 4).
In experiments, energetic proton beams have been observedboth in front of and behind the target5-9). The proton beamemitted from the rear side has demonstrated higher quality interms of higher energy and lower divergence with considerableluminosity. The established explanation for proton origin is thatthe protons come from a surface contamination layer formed bywater, oil and vacuum grease as well as from bulk of thematerials when plastic targets were used. These protons areaccelerated by the electro-static field set up by fast electronsleaving the target10). Protons can also be accelerated to energiesgreater than the temperature of electrons inside the target11).
Studies where a radiochromic film dosimeter was used as theproton detector12) have shown that plasma scale length at therear surface has strong effects on proton beam production. Inthe unperturbed rear surface case, the authors reckoned that theyobserved up to 21.7 MeV proton beam. With the increase of thepreformed plasma at rear surface, both the proton energy andbeam quality were significantly reduced. No proton beam withenergy greater than 5 MeV was produced when the plasma scalelength was increased to 100 µm at back surface. Theobservations were interpreted by the proton rear surface sheathacceleration mechanism where the acceleration E field isproportional to KTH/ e max( lD, li).
In this paper, we report results from a novel experimentalconfiguration using two short pulse Vulcan laser beamsilluminating the solid target from both sides. We found thatproton production in this double-sided irradiance (DSI) becamevery complex. Two (maybe more) highly collimated protonbeams with peak energy about 8~9 MeV were consistentlyobserved at the opposite side to the higher intensity laser beameven in the presence of a much larger plasma scale length due to
another relatively lower intensity CPA beam. The protonemission in this scheme demonstrated completely differentcharacteristics when compared with that produced by singleside illumination alone.
Experiment
In the experiments reported here, the Vulcan short pulse CPAbeam was split into two and fired onto a thin solid target fromboth sides. Up to 30 J and 20 J from CPA1 and CPA2 werefocused down to 10 µm focal spots within 1 ps pulse duration at1.053 µm wavelength by 2 off-axis parabolic mirrors. The laserbeams were p-polarized and were incident on the target atangles of 410 and 200 from left and right sides respectively.CPA2 beam delivered relatively lower energy, about 2/3 of thatfrom CPA1. The peak intensity was about 2×10¹⁹ Wcm-2. Thethin targets, 1 µm to 50 µm, were typically 5 mm by 8 mm goldplane foils.
Energetic protons were measured with the passive stackconsisting of a few layers of radiochromic films (RCF) andparticle track detectors (CR39), which were positioned 5 cmfrom the target. RCFs (model HD810) were used as thedosimeter. Care must be taken when interpreting the RCF dataas the film responds to all kinds of ionization radiation. Incontrast, track detector CR39 is only sensitive to protons in thestack arrangement as the first two RCFs (220 µm) can stop allthe energetic heavy ions, such as carbon and oxygen ions. Infact, proton beams were only recorded by the track detectors inour experiment.
Figure 1. Schematic of the experiment arrangement (a) and thescanned CR39 data from both stacks (b).
Proton Beam Generation from Double-sided Illuminations of Solid Target by HighIntensity Short Pulse Lasers
M S Wei, F N Beg, A E Dangor, A Gopal, M Tatarakis, K Krushelnick
Blackett Laboratory, Imperial College of Science, Technology and Medicine, London SW7 2BZ, UK
E L Clark
Radiation Physics department, AWE plc, Aldermaston, Reading, RG7 4PR, UK
K W D Ledingham, P McKenna, T McCanny, I Spencer
Department of Physics and Astronomy, University of Glasgow, Glasgow G12 8QQ, UK
P A Norreys, R J Clarke, K L Lancaster
Central Laser Facility, CLRC Rutherford Appleton Laboratory, Chilton, Didcot, Oxon, OX11 0QX, UK
M Zepf
Department of Pure and Applied Physics, The Queen’s University Belfast, UK
Main contact email address: [email protected]
CPA1 and CPA2coincident in time
X
Y
CPA2
ZCPA1
Stack1
Stack2
Top view of the basicset-up
(a)
CR39 in stack2
x
z
x
z
CR39 in stack1
(b)
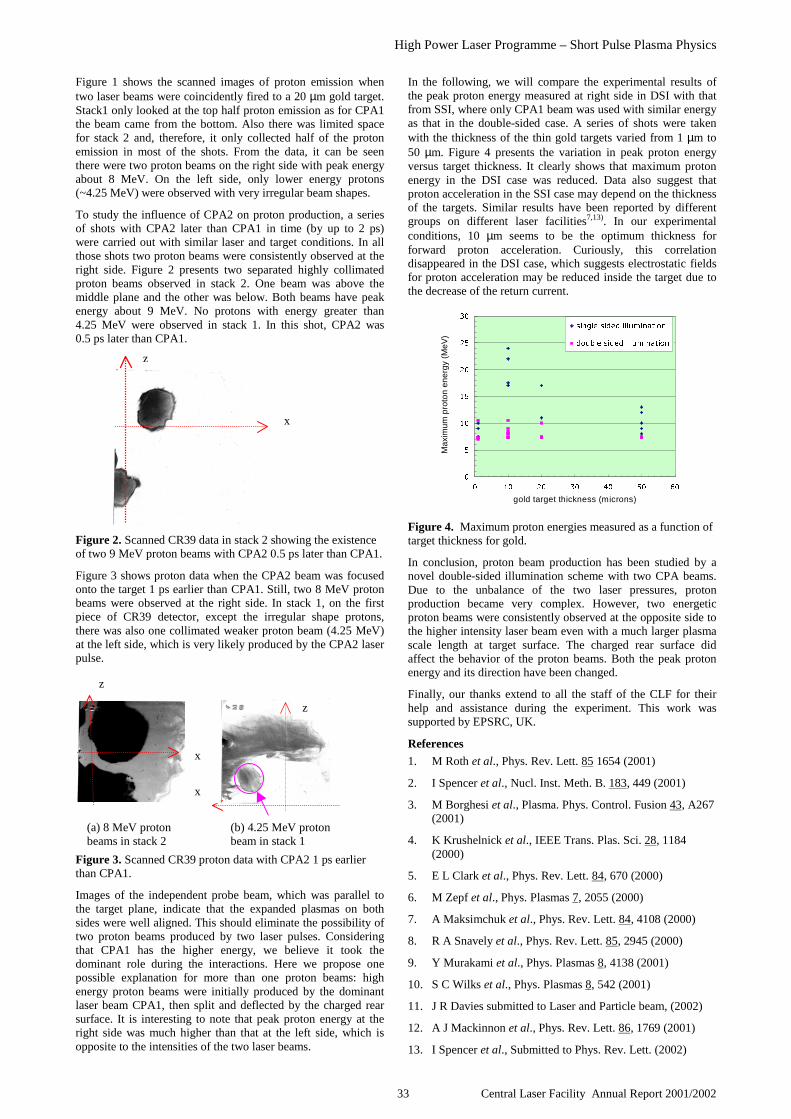
High Power Laser Programme – Short Pulse Plasma Physics
33 Central Laser Facility Annual Report 2001/2002
x
z
(b) 4.25 MeV protonbeam in stack 1
x
z
(a) 8 MeV protonbeams in stack 2
gold target thickness (microns)
Max
imum
pro
ton
ener
gy (
MeV
)
x
z
Figure 1 shows the scanned images of proton emission whentwo laser beams were coincidently fired to a 20 µm gold target.Stack1 only looked at the top half proton emission as for CPA1the beam came from the bottom. Also there was limited spacefor stack 2 and, therefore, it only collected half of the protonemission in most of the shots. From the data, it can be seenthere were two proton beams on the right side with peak energyabout 8 MeV. On the left side, only lower energy protons(~4.25 MeV) were observed with very irregular beam shapes.
To study the influence of CPA2 on proton production, a seriesof shots with CPA2 later than CPA1 in time (by up to 2 ps)were carried out with similar laser and target conditions. In allthose shots two proton beams were consistently observed at theright side. Figure 2 presents two separated highly collimatedproton beams observed in stack 2. One beam was above themiddle plane and the other was below. Both beams have peakenergy about 9 MeV. No protons with energy greater than4.25 MeV were observed in stack 1. In this shot, CPA2 was0.5 ps later than CPA1.
Figure 2. Scanned CR39 data in stack 2 showing the existenceof two 9 MeV proton beams with CPA2 0.5 ps later than CPA1.
Figure 3 shows proton data when the CPA2 beam was focusedonto the target 1 ps earlier than CPA1. Still, two 8 MeV protonbeams were observed at the right side. In stack 1, on the firstpiece of CR39 detector, except the irregular shape protons,there was also one collimated weaker proton beam (4.25 MeV)at the left side, which is very likely produced by the CPA2 laserpulse.
Figure 3. Scanned CR39 proton data with CPA2 1 ps earlierthan CPA1.
Images of the independent probe beam, which was parallel tothe target plane, indicate that the expanded plasmas on bothsides were well aligned. This should eliminate the possibility oftwo proton beams produced by two laser pulses. Consideringthat CPA1 has the higher energy, we believe it took thedominant role during the interactions. Here we propose onepossible explanation for more than one proton beams: highenergy proton beams were initially produced by the dominantlaser beam CPA1, then split and deflected by the charged rearsurface. It is interesting to note that peak proton energy at theright side was much higher than that at the left side, which isopposite to the intensities of the two laser beams.
In the following, we will compare the experimental results ofthe peak proton energy measured at right side in DSI with thatfrom SSI, where only CPA1 beam was used with similar energyas that in the double-sided case. A series of shots were takenwith the thickness of the thin gold targets varied from 1 µm to50 µm. Figure 4 presents the variation in peak proton energyversus target thickness. It clearly shows that maximum protonenergy in the DSI case was reduced. Data also suggest thatproton acceleration in the SSI case may depend on the thicknessof the targets. Similar results have been reported by differentgroups on different laser facilities7,13). In our experimentalconditions, 10 µm seems to be the optimum thickness forforward proton acceleration. Curiously, this correlationdisappeared in the DSI case, which suggests electrostatic fieldsfor proton acceleration may be reduced inside the target due tothe decrease of the return current.
Figure 4. Maximum proton energies measured as a function oftarget thickness for gold.
In conclusion, proton beam production has been studied by anovel double-sided illumination scheme with two CPA beams.Due to the unbalance of the two laser pressures, protonproduction became very complex. However, two energeticproton beams were consistently observed at the opposite side tothe higher intensity laser beam even with a much larger plasmascale length at target surface. The charged rear surface didaffect the behavior of the proton beams. Both the peak protonenergy and its direction have been changed.
Finally, our thanks extend to all the staff of the CLF for theirhelp and assistance during the experiment. This work wassupported by EPSRC, UK.
References
1. M Roth et al., Phys. Rev. Lett. 85 1654 (2001)
2. I Spencer et al., Nucl. Inst. Meth. B. 183, 449 (2001)
3. M Borghesi et al., Plasma. Phys. Control. Fusion 43, A267(2001)
4. K Krushelnick et al., IEEE Trans. Plas. Sci. 28, 1184(2000)
5. E L Clark et al., Phys. Rev. Lett. 84, 670 (2000)
6. M Zepf et al., Phys. Plasmas 7, 2055 (2000)
7. A Maksimchuk et al., Phys. Rev. Lett. 84, 4108 (2000)
8. R A Snavely et al., Phys. Rev. Lett. 85, 2945 (2000)
9. Y Murakami et al., Phys. Plasmas 8, 4138 (2001)
10. S C Wilks et al., Phys. Plasmas 8, 542 (2001)
11. J R Davies submitted to Laser and Particle beam, (2002)
12. A J Mackinnon et al., Phys. Rev. Lett. 86, 1769 (2001)
13. I Spencer et al., Submitted to Phys. Rev. Lett. (2002)

High Power Laser Programme – Short Pulse Plasma Physics
Central Laser Facility Annual Report 2001/2002 34
Introduction
The generation of energetic particles and radiation from intenselaser-plasma interactions is a new and rapidly evolving branchof physics and of particular interest for two important reasons.Firstly, these plasmas are efficient sources of bright, energetic,and strongly collimated electron 1), proton 2), and gamma raybeams3) which may have a wide range of applications.Secondly, measurements of these beams provide a usefulplasma diagnostic technique and can elucidate much of thefundamental physics which occurs in these interactions.Recently, there have been important observations andsimulations of neutron generation during the interaction of highintensity lasers with matter at solid or near-solid densities 4).These neutrons are generated by laser produced ion beams insolid deuterated targets via D(d; n)3He reactions and canprovide information on the spectrum of the accelerateddeuterons as well as heating processes which occur during theseinteractions. In contrast, the study of ion dynamics in theinteraction of intense lasers with underdense plasmas hasreceived less attention, even though it is well known that suchinteractions can produce energetic ions. For example, anintense laser pulse passing through a plasma causes the radialdisplacement of electrons due to its ponderomotive force,Fp = – mec
2 (1 + a2/2)1/2, where a is the normalized vectorpotential of the laser. This results in an impulsive accelerationof the ions, often called a “Coulomb explosion”. The maximumion energy that can be produced by this process is equal to theirponderomotive energy, U = Zmec
2(γ-1), where γ is therelativistic quiver velocity of electrons in the laser field givenby γ = (1 + a2/2)1/2. For modern laser systems which reachrelativistic intensities (a > 1), the energy of “Coulombexplosion” ions can reach several MeV 5, 6).
Furthermore, the interaction of intense laser pulses withunderdense plasmas can generate extremely high currentelectron beams 7). It is well known that such intense electronbeams, where the beam particle density nb is comparable to theambient plasma density ne, have a stopping power in plasmaseveral orders of magnitude greater than the classical Coulomb-collision stopping power. Much of this enhanced stopping canbe attributed to heating of the ions either by the beam or by theself-generated return current. This can result in significantlyhigher ion plasma temperatures 8).
In this report we present the first experimental evidence ofneutron generation due to the interaction of an intense laserpulse with an underdense deuterium plasma. These results showthat it is possible for the ions in these interactions to reach thekeV energies required for the D(d, n)3He reaction. Moreover,since the neutrons produced by these reactions have littleinteraction with the ambient matter, one can obtain informationconcerning the ion kinetics by studying the yield, spectrum andangular distribution of the emitted neutrons. From thesestudies, we find that the measured neutron yield cannot beexplained solely by the propagation of the “Coulombexplosion” ions through the ambient D2 gas. It is deduced thatplasma ions are heated to fusion temperatures by a non-collisional heating mechanism.
Experiment
The experiment was performed on the Vulcan:CPA laser. Thelaser produced pulses with a duration of 0.8 to 1 ps and anenergy of up to 62 J on target, at a wavelength of 1.05 µm.Using a f/4 off-axis parabolic mirror, the laser beam wasfocused onto the edge of a D2 gas jet produced by a 1 mmdiameter sonic nozzle, which was located 1 mm below thefocus. The waist of the focal spot, w0, was 20 µm, resulting in apeak intensity of up to 2 x 10¹⁹ W/cm2. Interferometric studieswere used to characterise both the density and gas profile 9).Plasma densities in the range 1 x 10¹⁹ to 1 x 1020cm-3
could beselected by changing the gas-jet backing pressure. In addition,the density was verified on each shot by forward RamanScattering measurements. In this way, the density and spatialdimensions of the plasma and gas were accurately known oneach shot, in contrast with other experimental geometries,where these parameters are more difficult to accuratelymeasure.
The time-of- flight (TOF) technique was used to obtain theneutron energy spectrum and angular distribution 10). For thismeasurement, the detectors used were 5 cm diameter cylindricalNE102 scintillators, which had a rise time of 1.5 ns. Thesewere coupled to the windows of photomultiplier (PM) tubes.The output of the PM tubes were read by oscilloscopes, with a500 ps sampling rate. Up to five of these detectors were usedsimultaneously at various distances from 1.9 to 5.5 m from theinteraction region and at angles, of 0 to 180 degrees relative tothe direction of propagation of the laser beam, z, in thehorizontal (x; z)-plane. They were calibrated relative to oneanother by swapping their position for different shots under thesame conditions. To suppress background signals due toscattered neutrons and those generated by other processes, up to53 cm long tapered collimators of polyethylene and lead wereused. These pointed directly towards the interaction region,ensuring only neutrons generated there reached the detectors. Atypical TOF trace is shown in the inset of Figure 1. It is notedthat all the detectors gave similar traces on any given shot,irrespective of their angle. The prompt signal is the flash due toBremsstrahlung generated by the energetic electrons that areproduced in this interaction 7). The peak at 187 ns is producedby neutron events having an energy En of 2:5 ± 0:2 MeV. Thisenergy is characteristic for neutrons produced by thermonuclearD(d; n)3He fusion reactions. The short neutron pulse confirmsthat these neutrons are not due to (γ, n) processes, which wouldproduce a broader spectrum. To ensure that the peak was due tothe D(d;n)3He reaction, additional shots with helium as a targetgas were performed. In this case, no neutron peak wasobserved. The TOF signals were converted to an energyspectrum. An example spectrum for a detector at an angle of67 degrees, is shown by the solid line in Figure 1. Simulationswith the Monte-Carlo neutron transportation code MCNP 11)
confirmed that no significant broadening of signal occurredonce the neutrons passed the target chamber. Thus, thespectrum of the emitted neutrons is simply determined by thekinematics of the original D(d;n)3He reaction 12). The isotropyand approximate Gaussian profile of the neutron spectrum is
Ion heating and thermonuclear neutron production from high intensitysubpicosecond laser pulses interacting with underdense plasmas
S Fritzler, V Malka
Laboratoire d’Optique Appliquee, ENSTA, UMR7639, CNRS, Ecole Polytechnique, 91761 Palaiseau, France
Z Najmudin, K Krushelnick, C Marle, B Walton, M S Wei, A E Dangor
Blackett Laboratory, Imperial College of Science, Technology and Medicine, London SW7 2BZ, UK
R J Clarke
Central Laser Facility, CLRC Rutherford Appleton Laboratory, Chilton, Didcot, Oxon, OX11 0QX, UK
Main contact email address: [email protected]

High Power Laser Programme – Short Pulse Plasma Physics
35 Central Laser Facility Annual Report 2001/2002
what would be expected for an originally Maxwellian deuteronprofile. Hence by assuming such an initial profile, the deuterontemperature required to produce the measured neutron energyspectrum can be deduced13). The neutron peak shown by thesolid line in Figure 1 implies an ion temperature of about 1 keV.
Special attention was paid to a precise determination of theneutron yield. These additional measurements were made bynuclear activation of 115In, where the resulting metastable 116Indecays with a half-life of 54 min to 116Sn, by β- decay. Thethickness of the activation target must be chosen to increase theefficiency of neutron capture, but not significantly affect theemitted electrons. The thickness used was 100 mg/cm2, whichis close to the optimum of 90 mg/cm2 (see Reference 14 andreferences therein). The total cross-section, of 115In is severalhundred mb for thermal neutrons 15). Therefore, the indiumfoils were stacked at different distances, within a polyethylenebrick, which acted as a moderator. This brick was placed atclosest 9 cm from the interaction, and at an angle of 90 degrees.To reduce measurement of scattered neutrons and thosegenerated by other processes, the bricks were shielded by extralayers of polyethylene.
Since this activation can also be due to a resonance of the 115Innucleus from epithermal neutrons of 1.46 eV, the foils wereshielded with cadmium, which has an approximately 100 timeshigher cross-section for thermal neutrons. The difference inactivity between shielded and unshielded indium foils gives theactivation due to thermal neutrons. The β- decay was measuredusing a Geiger-Muller counter which had a very lowbackground due to the special low-activity lead shielding used.The number of neutrons on the activation detector was thencalculated from the activity, as a function of distance 14). Sincethe angular distribution was also measured by the TOFdetectors, and found to be almost isotropic for these shots, thetotal yield of neutrons can be estimated. A maximum of1.0 ± 0.2 x 10⁶ neutrons per shot was observed. An estimate forthe expected yield can be made for a Maxwellian velocitydistribution 16). Assuming that the confinement duration is aboutthe plasma dissassembly time, one finds that the heated volumemust be of the order of twice the original laser spot size timesthe gas-jet length. Since this calculation is extremely sensitiveto the exact form of the deuteron energy profile, this order ofmagnitude agreement demonstrates that our initial assumptionon the deuteron energy profile being Maxwellian was valid.
To assess if the observed neutron yield could be due to theCoulomb explosion accelerated ions, the spectrum of these ionswas measured. This was performed using a Thomson parabolaion spectrometer positioned 40 cm from the focal spot and at an
angle of 90 degrees. CR-39 nuclear track detectors recorded thedispersed ions. As has been previously measured, the energeticion emission was sharply peaked in this direction5). This wasconfirmed by using radiochromic film, which is sensitive to thedose produced by the expelled ions. In these experiments about2 x 1011
deuterons accelerated above 100 keV and up to amaximum energy of (1:2 ± 0:2) MeV were observed as can beseen in Figure 3. Equating this to the ponderomotive potentialU indicates that the averaged intensities in the focal spot wereas expected of the order 1019 W/cm2
.
Calculating the likely yield that these ions produce as theytravel through the ambient gas surrounding the plasma, onefinds that no more than 104
neutrons could have been producedin this way. To demonstrate this more clearly, a 200 µm thickand 5 mm wide solid deuterated plastic (CD2) target was placed2.5 mm away from the interaction at the same angle as theThomson parabola. The purpose of this target is to simulate thebeam-target interaction of the expelled ions as they passthrough the stationary ambient gas, but obviously with a muchhigher reaction rate due to the higher density of deuterons in thesolid. This resulted in a significant enhancement of the neutronsignal, as expected. The increase in yield is more than oneorder of magnitude, as shown by the dashed line in Figure 1.
As can be seen in Figure 2, the energy of the emitted neutronfrom a beam-target D(d; n)3He reaction is a function of therelative angle of observation to the deuteron momentum. Thebroad neutron spectrum, when the deuterated target is present,reflects that there is a continuous deuteron distribution for theD(d; n)3He reaction up to an energy of (1.0 ± 0.1) MeV.Furthermore, the distribution of the deuterons incident on thetarget can be calculated using the differential cross-section forthe D(d;n)3He reaction 10), and the stopping cross-section withinthe solid CD2. This calculation reveals that the neutrons wereproduced by a Maxwellian distribution of deuterons withtemperature Tcalc of (186 ± 39) keV.
This compares with the ion temperature measured by theThomson parabola Texp of (216 ± 36) keV, as shown in Figure 3below. Therefore, it is clear that the broad neutron spectrumwith the solid target is the result of the radial beam of deuteronsexpelled from the plasma from the Coulomb explosion.However, it is also clear that the interaction of this distributionwith the ambient deuterium gas cannot account for the narrowneutron spectrum obtained without the external target.
This is further emphasized by the angular dependence of theneutron emission with and without the external CD2 target, aspresented in Figure 4. In the case of (d; n) reactions with thebeam of deuterons generated by the Coulomb explosion, anangular variation in the distribution can be observed with aminimum in the laser propagation direction, since this direction
Figure 1. Neutron spectrum for detector at an angle of67 degrees without the secondary CD2 target (solid line), andwith CD2 (dashed line). The inset shows a TOF signalrepresentative for all angles. For these shots, nd was5. 1019cm–3 and the laser energy about 62 J.
Figure 2. Neutron energy as a function of the relative angleof observation between incident deuteron and expelledneutron for D(d; n)3He reactions.

High Power Laser Programme – Short Pulse Plasma Physics
Central Laser Facility Annual Report 2001/2002 36
is orthogonal to the motion of all of the accelerated ions 10). Incontrast the thermonuclear fusion neutrons generated directly inthe plasma have a more isotropic emission profile in yield andtemperature.
From these measurements it is clear that the neutron productionwithout an external target cannot be ascribed to a beam targetreaction, but is the result of a much more isotropic thermaldistribution of ions. Both the measurements of total neutronyield and its spectrum indicate that neither the yield nor theheating process exhibit a very strong dependence with theplasma deuteron density. Averaging the temperature over allthese points gives a mean temperature of about 1 keV.
It is well known that the interaction of an intense laser pulsewith underdense plasma can result in efficient absorption of thelaser pulse. This can lead to the production not only of beams ofenergetic electrons but also to a hot thermal bulk of electrons17). However it is also evident that for the range of densitiesexplored in this study, the time for the electrons to equilibratewith the ions is well in excess of the disassembly time for theplasma. For our conditions, τeq is more than 1 ns. Hence thision heating must be the result of direct non-collisional heatingmechanisms that occur on the time scale of the laser pulse. Thesimplest explanation for the ion heating is due to variations inthe Coulomb potential caused by the ponderomotive expulsionof charge by the laser pulse. This is quite likely due to thepresence of self-focusing and other propagation instabilitiesunder these conditions. However, it is also noted that bysystematically varying the plasma density, a correlation wasobserved between the neutron yield and the generation ofenergetic electrons. As has been noted previously, the electrons
are generated by wave-breaking 1) and result in a hot electrontail in the distribution with a total current approaching theAlfven limit 7). At densities nWB below the wavebreaking limitof about 1:5 x 1019cm-3, both neutron and hot electron yieldsdropped dramatically. However above this deuteron density,the neutron yield showed no great variation with density.Recent simulations have shown that the filamentation andpropagation instabilities of such high current electron beams ina plasma can result in collisionless heating of the ions 18). Thus,this result may be of interest for such applications as fast-ignitorheating of fusion capsules, since it would allow for the use ofhigher intensity ignitor beams for which the laser couplingefficiency can be higher 19).
In summary, we have observed the generation of (1:0 ± 0:2) x106
thermonuclear fusion neutrons from the interaction of anintense laser pulse with an underdense plasma. These neutronsare generated by D(d; n)3He reactions in the plasma which isheated to fusion temperatures on the time-scale approaching thelaser pulse duration. It is therefore possible to measure the iontemperature of the underdense plasma, which was found to bein the range of 1 keV. Finally it is noted that no special attentionwas given to maximizing the neutron yield in this experiment.It is expected that using a pulse guided over a longer distancecan increase the efficiency of energy transfer to deuterons 6).Moreover it has been demonstrated that a small CD2 target canincrease the neutron yield by over an order of magnitude. It isthought that a longer interaction length coupled to a solid CD2
target, that stops all of the radially ejected deuterons, couldsignificantly enhance the neutron production. This may makethis interaction an attractive source for applications that requirebright and short duration pulses of neutrons.
References
1. Modena et al., Nature 377, 606 (1995).
2. E. L. Clark et al., Phys. Rev. Lett. 85, 1654 (2000); S. P.Hatchett et al., Phys. Plasmas 7, 2076 (2000).
3. M. H. Key et al., Phys. Plasmas 5, 1966 (1998); P. A.Norreys et al., Phys. Plasmas 6, 2150 (1999).
4. P. A. Norreys et al., Plasma Phys. Contr. Fusion 40, 175(1998); G. Pretzler et al., Phys. Rev. E 58, 1165 (1998); L.Disdier et al., Phys. Rev. Lett. 82, 1454 (1999); C. Toupinet al., Phys. Plasmas 8, 1011 (2001); T. Ditmire et al.,Nature 398, 489 (1999).
5. K. Krushelnick et al., Phys. Rev. Lett. 83, 737 (1999).
6. V. V. Goloviznin et al., J. Phys. D 31, 3243 (1998).
7. M. I. K. Santala et al., Phys. Rev. Lett. 86, 1227 (2001).
8. R. B. Miller, Intense Charged Particle Beams, PlenumPress, New York (1982).
9. V. Malka et al., Rev. Sci. Inst. 71, 2329 (2000).
10. J. B. Marion, R. Fowler, Ed., Fast Neutron Physics, Part I,Interscience Publishers, Inc., New York (1960).
11. J. F. Briesmeister, Ed., Program MCNP , Los Alamosreport LA-12625-M (1993).
12. H. Wepstra and A. Audi, Nucl. Phys. A 432, 1 (1985).
13. H. Hutchinson, Principles of Plasma Diagnostics,Cambridge University Press, Cambridge (1987).
14. E. Segre, Nuclei and Particles, (The Benjamin/CummingsPublishing Company, Reading, 1975).
15. Hughes, Neutron Cross Sections, BNL 325 (1958).
16. J. D. Huba, NRL Plasma Formulary, Washington (2000).
17. K.-C. Tzeng and W. B. Mori, Phys. Rev. Lett. 81,104(1998).
18. M. Honda et al., Phys. Rev. Lett. 85, 2128 (2000).
19. M. Tabak et al., Phys. Plas. 5, 1626 (1994).
Figure 3. Deuteron spectrum from Coulomb explosion asmeasured by the Thomson parabola (squares) and ascalculated from the TOF signal (dashed line).
Figure 4. Angular distribution of neutrons with (squares)andwithout (stars) the solid CD2 target, for two typical shots, thelatter showing a more isotropic thermal distribution of ions.

High Power Laser Programme – Short Pulse Plasma Physics
37 Central Laser Facility Annual Report 2001/2002
Introduction
The advent of Chirped-Pulse Amplification has pushed themaximum intensities that can be produced by pulsed lasers tonew highs. Within the next few years, several lasers withpowers greater than a Petawatt (1015 W) will come intooperation in research laboratories around the world. It will bepossible to focus these lasers to intensities greater than1021 Wcm-2. The interaction of such laser pulses with matter isof great interest not only because of the new frontiers of physicsthat can be investigated, but also because of the manyapplications which have been envisaged for such interactions.In particular, these interactions will be the source of energeticparticles with energies of interest for nuclear physicsapplications.
For example, it has long been supposed that plasma may be anideal medium for acceleration of particles to extremely highenergies1). This is due to the large electric fields, which can besupported in plasmas. For a relativistic plasma wave (one witha phase velocity close to the speed of light), the wavenumber issimply kp = ωp/c, where ωp is the plasma frequency,ωp = ne2/ω0me. The electric field associated with a sinusoidalvariation in charge density due to the plasma wave of thisdensity and wavenumber is then simply:-
Emax = c(men0 /ε0)1/ 2 ≈ 0.96(n0(cm−3))1 /2Vcm−1.
For n0 = 1019 cm-3, Emax = 300 GeVm-1, about 104 times greaterthan the electric field attainable in present day high energyaccelerators, due to the limitations of electrical breakdown.Tajima and Dawson1), when proposing the use of plasmas foracceleration purposes, suggested several methods of generatingsuch relativistic plasma waves of high amplitude, using eitherlasers or particle beam drivers. They also noted that such largeamplitude relativistic waves could be produced by instabilitiesof an intense laser pulse propagating in a plasma.
When an intense laser passes through a plasma, it can bescattered collectively by low level oscillations within theplasma. Such collective scattering is common in laser plasmainteraction where the laser wavelength can be much greater thanthe Debye length of the initially cold and dense plasma. Suchscattering can be thought of as a scattering off quanta of plasmaoscillations, ωs = ω0 ± ωp, where ωs is the scattered photonenergy and ω0 is the incident photon energy. Thesuperposition of the incident and scattered photon can result in amodulation of the laser pulse at the plasma frequency, ωp. Thismodulation through the action of the ponderomotive force canresonantly drive growth of the plasma waves. Since the plasmaoscillations have to be in phase with the laser modulations,which travel at the laser group velocity, the plasma wave musthave a phase velocity that equals the laser group velocity. For asufficiently underdense plasma (ne << ncr = ε0meωp /e
2), this willbe close to the speed of light, (since in a plasma the dispersionrelation for an electromagnetic wave is c2k2=ω0
2 (1 - ne/ncr)1/2.
As the plasma wave grows the scattering rate increases,
resulting in a distribution of energy to satellites of the initiallaser pulse, and a modulation of the laser pulse. Hence inanalogy to the scattering from atomic media, this process isoften called Stimulated Raman Scattering 2,3).
The result of this increasing unstable modulation of the laserpulse is an increasing growth in the plasma wave amplitude, sothat it is possible for the amplitude of the plasma wave to reacha density perturbation close to the initial ambient density of theplasma. When this happens it becomes possible for the plasmawave to self-trap electrons with sufficient velocity relative tothe correlated motion of electrons within the plasma wave.Indeed if the plasma wave amplitude greatly exceeds the intialambient plasma density (as it may do, from non-linearsteepening of the plasma wave), then a large bunch of electronswhich form part of the plasma wave can become dephased(when excessively driven) from the plasma wave, and ratherthan feeling a returning force, will experience an accelerationfrom the next phase of the plasma wave. Since in this largeamplitude electric field the electrons can reach relativisticspeeds very quickly, these electrons can then remain in phasewith the accelerating field and be accelerated to very highenergies. This process is known as wavebreaking and can resultin the production of a very large current of relativisticelectrons4).
Laser parameters, target area set-up, spectrometer andelectron beam diagnostics
The experiments detailed in this report were performed at theRutherford Appleton Laboratory with the Vulcan:CPA laser.The Vulcan:CPA laser can generate laser pulses with up to100 J on target in a 1 ps pulse. Wavefront distortion in thebeam due to thermal lensing in the amplifiers is corrected with astatic adaptive optic. This allows the beam to be focused to aroughly 2 times diffraction limited beam. In the experimentsdetailed here the laser beam was focused to a spot diameter ofroughly 10 µm (FWHM), resulting in intensities well in excessof 1019 Wcm-2, when focused in vacuum.
To prevent ionisation defocusing of the laser beam beforereaching focus, the laser beam is focused on the edge of a high-density gradient gas-jet. The density profile of the nozzle hadbeen previously measured by interferometry 5). The nozzle hasbeen optimised to ensure that the vacuum-gas interface is assharp as possible whilst retaining a flat density profile withinthe gas itself. The density of neutrals is varied by varying thebacking pressure on the jet, and is found to vary almost linearly.Hydrogen or helium is generally used in these experiments,which ensures that the plasma density produced remainsuniform, without the intensity dependent ionisation profile thatcharacterises the interaction with other gases at these laserintensities. This also ensures that the gas jet is free from clusterformation. The gas jet densities measured in this experiment areconsistent with the full ionisation of the neutrals (2 electrons permolecule) as measured by interferometry.
The production of energetic electrons from the interaction of an intense laser pulsewith an underdense plasma
Z Najmudin, K Krushelnick, E L Clark, M Tatarakis, A Modena and A E Dangor
Plasma Physics, Imperial College of Science, Technology and Medicine, London, SW7 2BZ, UK
J Faure, V Malka
LULI, Ecole Polytechnique, Palaiseau, France
D Gordon, C Joshi
University of California, Los Angeles, CA 90095, USA
R Clarke
Central Laser Facility, CLRC Rutherford Appleton Laboratory, Chilton, Didcot, Oxon, OX11 0QX, UK
Main contact email address: [email protected]

High Power Laser Programme – Short Pulse Plasma Physics
Central Laser Facility Annual Report 2001/2002 38
The spectrum of the beam transmitted through the gas jet isattenuated by reflecting off a glass plate before directing it outof the vacuum chamber. Reflecting optics are used for alltransport of the beam, including the lens for collimation andfocusing. This ensures a neutral response of the optical system,as well as reducing modifications in the spectrum that may arisefrom self-phase modulation of the beam passing through optics.Furthermore, the spectral response of the system is calibratedwith a black-body emitter placed at the focal plane of the laserbeam. The beam is focused on a spectrometer and the spectrumdetected with a 16-bit (high dynamic range) CCD camera. Theglass plate for collecting the transmitted light has a small holein it to allow any electrons accelerated by the interaction to passwithout scattering or energy absorption. The electron beam ispassed into an electron spectrometer, which consists of anevacuated chamber placed between the poles of anelectromagnet of radius 5 cm, which has a maximum magneticfield (uniform between the poles) of about 1 Tesla. Thedispersed electrons are detected either with individual siliconbarrier detectors (of circular area 2 each), or a series of100 strip detectors, each 500 µm by 5 cm (total area 5 cm by5 cm). In either case, the detectors are biased, and the currentgenerated by ionising radiation in the diodes’ depletion regionis measured on oscilloscopes. When using the strip detectors,two sets of detectors were used simultaneously, one either sideof the undeviated direction of the beam. Thus one set ofdetectors can be used to detect the accelerated electrons whilstthe other gives a measure of the noise per shot, whichprincipally is from x-rays produced in the collimator, and so issymmetric around the undeviated beam. Indeed the samedetectors used to measure noise can be used to measure ionspectra as well, since due to their slower time-of-flight inreaching the detectors, they can be easily differentiated from theprompt x-ray noise on the oscilloscope traces. A combinationof time-of-flight and magnetic deflection can determine theparticular ion state detected. However it is noted that in theseexperiments with gaseous targets, one observes no ion signals inthe directly forward direction. A schematic of the set-up isshown in Figure 1.
Raman scattering
The laser pulse is found to be highly unstable to plasma Ramantype instabilities. In particular, the transmitted beam becomesheavily modulated due to Forward Raman Scattering (FRS).Indeed it has been found previously that as the pulse lengthdecreases from around 3 ps to less than 1 ps with similarenergies, Raman scattering at larger angles is suppressed infavour of direct forward Raman scattering6). But even at suchhigh intensities, where FRS growth rates are at a maximum7), itis predicted from the analytic growth rates that the direct Ramanforward scattering cannot grow with sufficient e-foldings to
completely modulate the laser pulse, if it were to grow directlyfrom thermal noise8). Indeed irrespective of intensity, scatteringof laser energy at larger angles (sideways, or directlybackwards), should always have a greater growth rate thandirect forward scattering. This is because laser light can bescattered directly by a 3-wave process for the large anglescattering, where the incoming photon and the scattered one canbe wave-matched with a plasmon. However, this is not true ofthe FRS, which can only take place through the action of a fourwave process – both upshifted and downshifted scattered wavesare required in this mechanism for wavematching. Fortunately3D particle-in-cell (PIC) simulations are now possible whichcan adequately describe the behaviour of the laser beam,including the complex interplay between several differentinstabilities9,10).
It is observed in such simulations that off-angle Ramaninstabilities do indeed have a much larger growth rate, and cancause severe scattering from the front of the pulse, resulting inlocalised pump depletion. This large intensity ramp is then ableto drive a large amplitude plasma wave, which can act as asufficiently large seed to stimulate the growth of FRS. OnceFRS is initiated, the smaller kp plasma wave destroys thefavourable long length uniform density plasma in which largeangle instabilities thrive, and this, along with the plasma heatingdue to these initial instabilities, can effectively damp the largeangle Raman Scattering at later times.
The evidence for this behaviour is clearly seen in Figure 2a.
This shows the transmitted laser light spectrum for two differentdensities. Figure 2a shows up to 8 satellite frequencies of thetransmitted light on the blue-shifted side of the fundamentallaser frequency, plotted as log of intensity. The satellites arevery clearly differentiated from one another, and are constantlyspaced by intervals of the plasma frequency. The spectrum hasa similar character on the red side of the fundamental.
However, one basic difference exists between plasma Ramanscattering and molecular Raman scattering, and that is theexcitation of the plasma wave. The plasmons that constitute theplasma wave are not fixed quantum states. As the plasma wave
electrons dispersed by magnet
X-rays
Transmitted beam diagnostics: Spectrum, far-field,
Off-axis parabola
Vulcan CPA in
Magnet
interaction target (supersonic gas-jet)
strip detector
Figure 1. Experimental Set-up.
Figure 2. Transmitted beam spectra with :-a) ne = 4 . 1018 cm-3 and I = 2 . 1019 Wcm-2
b) ne = 7.5 . 1018 cm-3 and I = 1 . 1019 Wcm-2
(a)
(b)

High Power Laser Programme – Short Pulse Plasma Physics
39 Central Laser Facility Annual Report 2001/2002
grows to large amplitude, in particular when the plasma waveamplitude δn approaches the initial plasma density n0, then theplasma wave can no longer be described as the linearsuperposition of the generated ωp plasmons. Indeed the densityhighs tend to form peaks whereas the lows form shallowtroughs. This non-linearly steepened plasma wave can befourier-decomposed into its harmonic constituents as follows:-
nm
n0=
mm
2m −1m!
δn
n0
m
where nm is the amplitude of the m-th harmonic of the plasmawave of peak amplitude δn/n0.
One can therefore see why sidebands are so efficientlygenerated even though the growth of the FRS predicts that in1 ps there is barely enough time for the first electromagneticsideband to grow to large amplitude. Evidently the cascading isevidence of scattering from the non-linear steepened plasmawave, rather than a step-wise scattering of the successiveelectromagnetic sidebands off a linear plasma wave (i.e. onethat has a harmonic content only at ωp).
Evidence of wavebreaking
Clearly increasing the growth of the plasma wave due to furtherincreases in the FRS growth rate, cannot lead to an indefinitelyincreasing plasma wave amplitude. Mori et al. have derived thespatio-temoral growth rates for the FRS instability in therelativistic regime (a0 > 1) 7). They find that the FRS growthrate actually saturates with intensity and in this regime one canonly achieve further plasma wave growth by its dependence ondensity. This is shown in Figure 2b, where a higher density isused with all other parameters the same as in Figure 2a. Thesidebands can still be discerned in this Figure (with a slightlygreater seperation due to the dependence of the plasmafrequency on density p = nee
2 0 m. However, the sidebandsare noticeably broader. This is even though the scattering isover the same pulse length as before. This increased widthsuggests that the scattering plasma wave is losing coherence.
Energetic electron production and the dependence onwavebreaking
The exact reason for this loss of coherence is demonstrated bythe spectrum of electrons accelerated by the generated plasmawave, Figure 3. Figure 3 shows that even at 4 x 1018 cm-3, whenthe plasma wave is still coherent, there are a significant numberof electrons accelerated to quite high energy (up to 13 MeVbefore they fall below the detection limit of our detector). Thisis necessarily due to the hot temperature that such plasmas canreach due to the optical field ionisation, and the presence ofother large angle electron plasma oscillations. In the largeelectric fields of the plasma wave, it is possible to furtheraccelerate these electrons to high energies, even if they are nottrapped for long distances by the plasma wave. However one
can see that as the density is increased to 7.5 x 1018 cm-3, thenumber and maximum energy of the electrons increasesmarkedly. This is even more so the case as the plasma wavegrowth rate is increased at yet higher densities. One can see thatnot only is the maximum energy of the electron distributionincreasing, but that it is gaining a significant “tail” to thedistribution that can no longer be fitted with a singleMaxwellian profile. If one considers all the electronsaccelerated, not just those within the acceptance cone of ourdetector, one finds upwards of 1012 relativistic electrons, or inother words practically all the electrons from within the focalvolume over a Rayleigh length. Clearly such a huge fraction ofaccelerated electrons cannot be simply explained by trapping ofhot electrons. The electrons are actually generated bywavebreaking4). The push on the electrons forming the peaks ofthe non-linear plasma wave is so great, that the restoring forcethey generate is no longer sufficient to return them to theirinitial displacement. Indeed charge sheets can crosslongitudinally, such that instead of feeling a returning force,some of the electrons - those travelling in the same direction asthe phase velocity of the plasma wave - can feel a continuingacceleration in the direction in which they were travelling.Once they can reach relativistic speeds, they can stay in phasewith the plasma wave until they gain enough energy that theybegin to outrun the wave and so become de-phased from it. Asimple treatment that considers sinusoidal plasma wave, showsthat the maximum energy to which electrons can be acceleratedbefore de-phasing is of the order 2 γp
2δn/n0·mec2, where γp is the
relativistic factor of the plasma wave, and in the underdenseregime is roughly given by γp ω0/ωp. So for densities around1019 cm-3, γp approximately 100 MeV. Therefore once the wave fully breaks,one can see that a significant number of electrons areaccelerated until they are de-phased from the wave.
Hence the broadening of the satellites in the transmitted spectrais a clear signature of the onset of wave-breaking. Indeed at thehigher densities, the broadening is so severe that it becomesdifficult to distinguish the individual satellites. Note also thatthere is clear evidence of the increased growth of the FRS athigher density from Figure 2a to Figure 2b even though theintensity of the second shot was slightly lower. This reiteratesthe weak dependence of the FRS growth rates on intensity inthis regime.
Results using the strip detectors instead of the individualsilicon barrier detectors
The use of the strip array allows one to obtain a higherresolution energy spectrum of the accelerated electrons, andalso allows a slightly greater collection and thus highersensitivity, Figure 4. This particular shot was taken at a densityof around 2 x 1019 cm-3, for which the maximum expected lineardephased energy is 50 MeV. Clearly some electrons areaccelerated beyond this energy. Indeed a few electrons are
Figure 3. Electron spectra for a variety of different densities.
104
105
106
107
108
109
1010
14012010080604020
Electron Kinetic Energy (MeV)
Spectrometer Limit
Ele
ctro
ns /
Mev
/ste
radi
an
Figure 4. Highest energy electrons recorded using stripdetectors.

High Power Laser Programme – Short Pulse Plasma Physics
Central Laser Facility Annual Report 2001/2002 40
accelerated at more than twice this energy. It has beensuggested by Gordon et al.11), that this acceleration beyond thelinear dephasing limit may well be due to the influence of thelarge current of electrons initially accelerated by thewavebreaking. In effect this initial bunch of electrons can set-up a large wake in its tail as it travels through the plasma andcan accelerate electrons trailing behind to even higher energies,in an almost two step process.
Discussion
It has been shown that an intense laser beam travelling throughunderdense plasma is highly susceptible to the Raman ForwardScatter Instability. This instability can grow to large amplitudedue to the pulse erosion of the front of the intense pulse. Thegrowth can be sufficient to fully modulate the laser beam and togrow a large amplitude plasma wave in its wake. Wave-breaking of this plasma wave can efficiently produce an intensesource of energetic electrons. The possibility of using theseintense electron sources has already been shown for manyapplications, such as the generation of short-livedradioisotopes12), gamma-ray radiography13) , and neutronproduction14). As higher repetition rate lasers with theseintensities become progressively more available, the prospect ofthese uses with a high repetition rate electron source 15)
becoming common appears to be possible.
References
1. T.Tajima and J. Dawson, “Laser electron accelerator,”Physical Review Letters 43, 267 (1979).
2. J. F. Drake, P. K. Kaw, Y. C. Lee et al., “Parametricinstabilities of electromegnetic waves in plasmas,” Physicsof Fluids 17 (4), 778 (1974).
3. D. W. Forslund, J. M. Kindel, and E. L. Lindman, “Theoryof stimulated scattering processes in laser-irradiatedplasmas,” Physics of fluids 18 (8), 1002 (1975).
4. Modena, Z. Najmudin, A. E. Dangor et al., “Electronacceleration from the breaking of relativistic plasmawaves.,” Nature 377, 606 (1995).
5. V. Malka, C. Coulaud, J. P. Geindre et al.,“Characterization of neutral density profile in a wide rangeof pressure of cylindrical pulsed gas jets,” Review ofScientific Instruments 71 (6), 2329-2333 (2000).
6. Z. Najmudin, “Parametric Instabilities in the Interaction ofHigh-Intensity Short-Pulse Lasers with Under-DensePlasmas,” , Imperial College, University of London, 1995.
7. W. B. Mori, C. D. Decker, D.E. Hinkel et al., “Ramanforward scattering of short-pulse high-intensity lasers,”Physical Review Letters 72 (10), 1482 (1994).
8. Z. Najmudin, R. Allott, F. Amiranoff et al., “Measurementof forward Raman scattering and electron accelerationfrom high-intensity laser-plasma interactions at 527 nm,”IEEE Transactions On Plasma Science 28 (4), 1084-1089(2000).
9. C. D. Decker, W. B. Mori, and T. Katsouleas, “Particle-in-Cell Simulations of Raman Forward Scattering from Short-Pulse High-Intensity lasers,” Physical Review E 50,R3338-R3341 (1994).
10. D. F. Gordon, B. Hafizi, P. Sprangle et al., “Seeding of theforward Raman instability by ionization fronts and Ramanbackscatter,” Physical Review E 64, 046404 (2001).
11. D. Gordon, K. C. Tzeng, C. E. Clayton et al., “Observationof electron energies beyond the linear dephasing limit froma laser-excited relativistic plasma wave,” Physical ReviewLetters 80 (10), 2133-6 (1998).
12. M. I. K. Santala, Z. Najmudin, E. L. Clark et al.,“Observation of a hot high-current electron beam from aself- modulated laser wakefield accelerator,” PhysicalReview Letters 86 (7), 1227-1230 (2001).
13. R. D. Edwards, M. A. Sinclair, T. J. Goldsack et al.,“Gamma - radiography using a laser-plasma accelerator,”To appear in Applied Physics Letters (2002).
14. W. P. Leemans, D. Rodgers, P. E. Catravas et al.,“Gamma-neutron activation experiments using laserwakefield accelerators,” Physics of Plasmas 8, 2510 (2001)
15. V. Malka, J. Faure, J. R. Marques et al., “Characterizationof electron beams produced by ultrashort (30 fs) laserpulses,” Physics of Plasmas 8 (6), 2605-2608 (2001)

High Power Laser Programme – Short Pulse Plasma Physics
41 Central Laser Facility Annual Report 2001/2002
Introduction
The interaction of an ultra-strong electromagnetic wave withmatter is of great interest for fundamental and applied physics.In particular, recent developments in high-power, short-pulselaser-technology have facilitated the construction of100 Tera-Watt lasers. These machines have allowedfundamental interactions between an electromagnetic-field(with intensities up to 1020 W/cm2) and a nearly solid-densityplasma to be studied experimentally for the first time. Theplasma is created quasi-instantaneously when the leading edgeof the laser pulse irradiates the solid surface. The strongly non-linear interaction between the electromagnetic-field and theplasma gives rise to ultra-strong DC-magnetic fields. Thesefields can be generated by strong return currents due to charge-separation between electron and ions, caused by theponderomotive force of the laser-pulse 1,2,3) . Consequently themeasurement of these DC-fields is essential for understandingthe fundamental nature of the laser solid-density-plasmainteraction and the properties of the plasma itself. This reportwill discuss the development of a new method for measuringthese fields which has been successfully implemented in anexperiment 4,5). In this experiment, magnetic fields up to700 MG have been measured for the first time.
Experiment
The experimental set-up is shown in Figure 1.
The CPA-beam from Vulcan (0.7-1 ps, 1054 nm, 100 J ontarget) is focused by an f/4.8 Parabola to a spot size of 7-10 µm,resulting in intensities up to 1020 W/cm2. The magnetic fieldinside the plasma has been measured by observing the changeof the polarisation properties of the self-generated harmonicsemitted from the critical surface 6). These harmonics propagatethrough the magnetised area inside the plasma. Computersimulations performed with a PIC-code show that for thechosen geometry the magnetic field is perpendicular to thepropagation direction of the harmonics 3). Therefore the changeof the polarisation-properties is due to the Cotton-Mouton-effect. Hence the magnetic field inside the plasma can bedetermined by measuring the change of the polarisation
properties. For this purpose a multi-channel VUV-polarimeterwas constructed.
To perform magnetic-field measurements with harmonics ofhigher order than 5, a VUV-polarimeter is needed, as thewavelength of these harmonics are below 200 nm for theNd-glass-laser Vulcan, that operates at 1053 nm. Such apolarimeter has been built and was successfully used in theexperiment. The set-up of the instrument is shown in Figure 1.The VUV-polarisers are a triple-mirror-configuration, which arepartially polarising due to the Fresnel-refection on the gold-coated mirror surfaces. Two VUV-polarisers were set-uporthogonally to measure the p- and the s-component of theharmonics. The polarised beams are then focused onto the slitof an Acton spectrometer, enabling the simultaneousmeasurement of the higher order harmonics. An openmicrochannel-plate (MCP) coupled to a charge-coupled-device(CCD) by a fiber-optic-bundle was used as the detector.
Results
The magnetic-field can be calculated from the measureds/p-ratio. The measurement of these high order harmonics wasperformed with the VUV-polarimeter described in the lastsection. A set of raw data acquired during the experiment isshown in Figure 2.
Magnetic field measurements from polarimetry of XUV harmonics
U Wagner, P Norreys, D Neely, R Clarke
Central Laser Facility, CLRC Rutherford Appleton Laboratory, Chilton, Didcot, Oxon, OX11 0QX, UK
R G Evans
Physics Department, University of York, York, YO10 5DD
M Tatarakis, F N Beg, A Gopal, I Watts, M S Wei, A E Dangor, K Krushelnick
Blackett Laboratory, Imperial College of Science, Technology and Medicine, London SW7 2BZ, UK
E L Clark
Radiation Physics department, AWE plc, Aldermaston, Reading, RG7 4PR, UK
M Zepf
Department of Pure and Applied Physics, The Queen’s University Belfast, UK
Main contact email address: [email protected]
Figure 1. Experimental setup.
Figure 2. Raw data from MCP (7th to 25th harmonic).
Figure 3. Magnetic field calculated from VUV data.

High Power Laser Programme – Short Pulse Plasma Physics
Central Laser Facility Annual Report 2001/2002 42
The magnetic field calculated from this data is shown inFigure 3. The most notable feature in the data obtained withthis polarimeter is the jump from 14 a.u. to 25 a.u. in fieldstrength at the 11th harmonic. If we assume a field strength of400 MG for the lower order harmonics (7th to 10th), as obtainedfrom the optical-UV-polarimetric measurements 4), then thehigher order harmonics propagate through a plasma with amagnetic field of 700 MG. Detailed 2.5-dimensional particle-in-cell-computer-simulations predict DC-fields of 650 MG, ingood agreement with our observations 5).
Conclusion
The measurements described here have been the first detailedstudy of near GigaGauss magnetic fields in laser-produced-plasmas. A VUV-spectrometer was constructed and deployedto measure magnetic-fields in laser-produced-plasmas for thefirst time. These measurements indicate DC-fields up to700 MG in good agreements with detailed computersimulations. The VUV-polarimeter is essential to diagnosemulti-GigaGauss DC-magnetic-fields that are expected to begenerated with the new Vulcan PetaWatt-laser. Moreover thereare many interesting physical problems, such as the precisetopology of the magnetic-field, generated around the criticalsurface, which need to be addressed in future experiments.
References
1. R. N. Sudan., Phys. Rev. Letters,70, 3075 (1993).
2. J. A. Stamper. et al., Phys. Rev. Letters, 26, 1012 (1971).
3. Pukhov.A et al., Phys. Rev. Letters, 76, 3975 (1996).
4. M. Tatarakis et al., Nature, 415, 280 (2002).
5. M. Tatarakis et al., Physics of Plasmas, 9, 2244 (2002).
6. P. A. Norreys. et al., Phys. Rev. Letters, 76, 1832 (1996).

High Power Laser Programme – X-ray Laser and Long Pulse Plasma Physics
43 Central Laser Facility Annual Report 2001/2002
Introduction
Photopumped X-Ray Lasers have posed a considerableexperimental challenge for several decades. Althoughphotopumping was one of the first X-Ray laser schemes to beproposed1) and despite simulations showing that lasing can beachieved with this scheme, its experimental demonstration hasso far proved unsuccessful.
The photopumping scheme relies on having a frequency matchbetween spectral lines of two different elements at differentionization stages. In this way the emission from a pump plasmashould couple to the coincident transition in the second plasmaand pump the populations of the upper level that should thendecay to an intermediate level, thus achieving populationinversion. A number of possible schemes has been noted in theliterature2).
We performed a photopumping experiment in Target Area Eastwith the Aluminium Iron Scheme3). Even though we have notbeen able to observe lasing, we have observed absorption of theH-like Aluminium Ly-α radiation by the Li-like Iron 5-2transitions – a necessary condition for the photopumped laser tooccur.
The Aluminium Iron photopumping Scheme
This Scheme uses a line coincidence between the Al XIII 1s-2ptransitions at 7.1749Å and 7.1695Å, and the Fe XXIV 2s-5plines at 7.1667Å and 7.1726Å. The Al Ly-α emission couples tothe iron transition exciting the 5p level. The remaining n=5levels are then populated by collisional mixing. Lasing isexpected to occur by the decay of the n=5 levels of the ironplasma into n=4 giving the XUV lasing lines at around 70Å.
Figure 1. Simplified Grotrian diagram of the Aluminium-Ironphotopumping scheme.
Previous simulations4) predicted that gain could be achieved inthe lasing line. However we were unable to confirm thisexperimentally.
Experimental setup
Three of the Vulcan main six beams were set up in line focusgeometries irradiating the target from one side and creating theline focus in the North-South direction of the chamber. Themain diagnostic used was a vertical variant Johann spectrometer(VJS). This is a crystal spectrometer that allows very highresolution without compromise of luminosity5). In the later partof the experiment this was replaced by a non-imaging flat fieldspectrometer in order to observe the expected lasing line in theXUV region. Both of these instruments were used on axis withthe line focus direction on target surface.
Figure 2. Experimental setup inside TAE target chamberVJS-Vertical Johann Spectrometer. DCV-Double CrystalVertical dispersion spectrometer.
Absorption and fluorescence measurements
Prior to attempting a proper photopumped X-ray laserexperiment we undertook a series of spectroscopicmeasurements in the 7Å region to try to characterize thepumping mechanism as best as possible.
Using a target geometry as seen in Figure 3 composite targetsmade of 0.2mm wide Aluminium foils on the side of Iron foilsof variable width created two parallel streaming plasmas. Thissetup allowed us to observe the profile of the Al Ly-α emissionas it crossed the different lengths of iron plasma.
For the proper photopumping experiment we used a differenttarget geometry where an Al foil overlaps an Iron foil and thefocal region is set over the intersection of the two materials(right hand side of Figure 3).
Absorption spectroscopy of Al XIII Ly-α Radiation by a Fe XXIV plasma
A Gouveia, J Hawreliak, I R Al’miev, P Sondhauss, J S Wark
Department of Physics, Clarendon Laboratory, University of Oxford, Parks Road, Oxford OX13PU, UK
O Renner
Institute of Physics, Czech Academy of Sciences. 18221 Prague, Czech Republic
D M Chambers, P A Pinto
Steward observatory, University of Arizona, Tucson, AZ85721, USA
R S Marjoribanks
Department of Physics, McLennan Physical Laboratories, University of Toronto, Toronto, Ontario M5S 1A7, Canada
Tianjiao Liang
Institute of physics,Beijing, China
Main contact email address: [email protected]

High Power Laser Programme – X-ray Laser and Long Pulse Plasma Physics
Central Laser Facility Annual Report 2001/2002 44
We also attempted to measure the fluorescence of the 5-2 Irontransitions as a function of the Al Ly-α pumping by setting theVJS spectrometer to look at a different (2p-5d) iron transitionsin the proper photopumping geometry. However analysis of theresults to date is not conclusive.
Figure 3. Schematic of the target geometries used.
In Figures 4 and 5 one can see comparative lineouts of thespectrum obtained with a pure Aluminium target and with theone observed by an Al-Fe target with the same experimentalconditions. A significant decrease in the Al Ly-α emission canbe seen in the lower frequency side of the spectrum.
Figure 4. Comparative lineouts of the spectra obtained in theabsorption geometry at 100µm from the target surface. Solidline: 0.2mm of Aluminium behind 1 mm of Iron. Dotted line:0.2mm of Aluminium.
We are attempting to model this phenomenon with a full 3Dradiation transfer post-processor to MED103 that takes intoaccount the characteristics of the VJS spectrometer. Simpler 1Dsimulations made prior to this experiment predicted thatabsorption of the iron line would occur.
Figure 5. Lineouts of the spectra obtained in the absorptiongeometry:at 150µm from the target surface. Solid line: 0.2mmof Aluminium behind 1 mm of Iron. Dotted line: 0.2mm ofAluminium.
Conclusions
In the context of a photo-pumped X-ray laser experiment wehave observed absorption of the Aluminium XIII Ly-α emissionby the 2s-5p transition in a Fe XXIV plasma. This result shouldallow us to modify our models and better understand theradiation transfer and atomic physics of the photopumpingmechanism.
References
1. A. V. Vinogradov et. al Sov. J. Quant. Elect., 5, No.1 July 1975 pp 59
2. Joseph Nilsen,Applied Optics, 31, No. 24 pp 4957 (1992)
3. Y. T. Lee et. al.JQSRT, 43, No 4 pp 335-345 (1990)
4. I. R. Almiev, S. J. Rose, J.S. WarkJQSRT, 71 pp 129-138 (2001)
5. O. Renner et. al.Rev. Sci. Instrum, 68 (6) pp 2393 (1997)
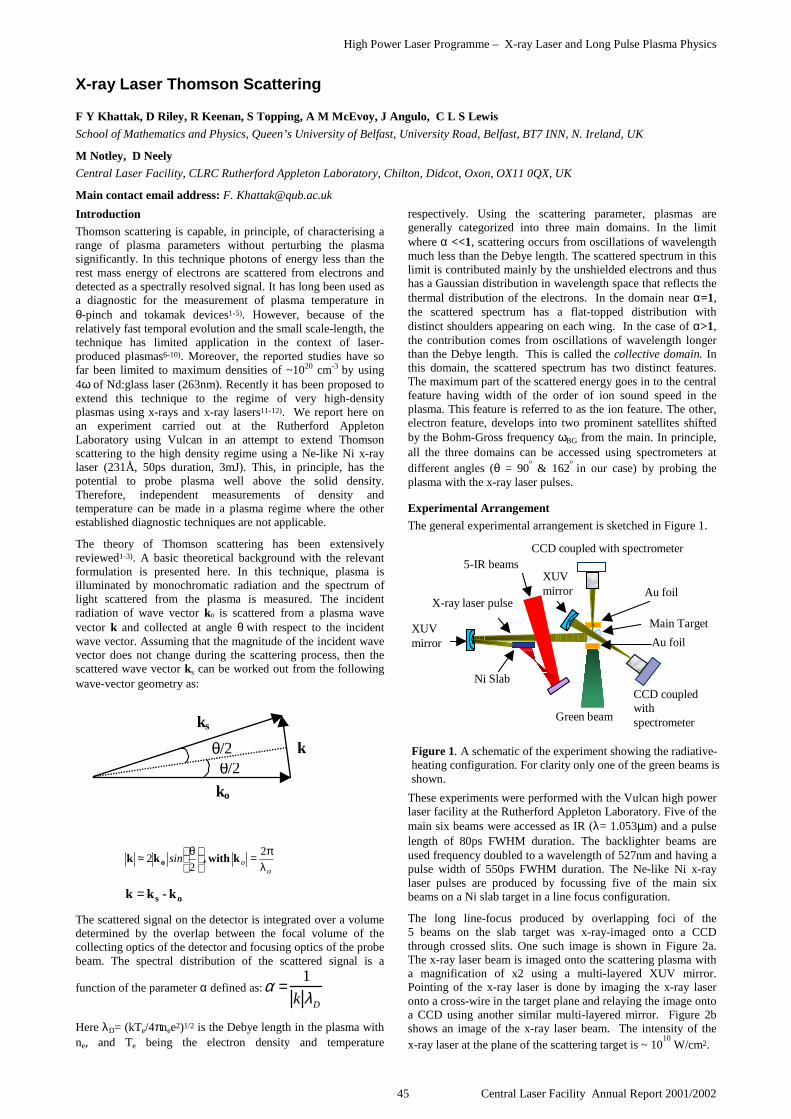
High Power Laser Programme – X-ray Laser and Long Pulse Plasma Physics
45 Central Laser Facility Annual Report 2001/2002
Introduction
Thomson scattering is capable, in principle, of characterising arange of plasma parameters without perturbing the plasmasignificantly. In this technique photons of energy less than therest mass energy of electrons are scattered from electrons anddetected as a spectrally resolved signal. It has long been used asa diagnostic for the measurement of plasma temperature inθ-pinch and tokamak devices1-5). However, because of therelatively fast temporal evolution and the small scale-length, thetechnique has limited application in the context of laser-produced plasmas6-10). Moreover, the reported studies have sofar been limited to maximum densities of ~1020 cm-3 by using4ω of Nd:glass laser (263nm). Recently it has been proposed toextend this technique to the regime of very high-densityplasmas using x-rays and x-ray lasers11-12). We report here onan experiment carried out at the Rutherford AppletonLaboratory using Vulcan in an attempt to extend Thomsonscattering to the high density regime using a Ne-like Ni x-raylaser (231Å, 50ps duration, 3mJ). This, in principle, has thepotential to probe plasma well above the solid density.Therefore, independent measurements of density andtemperature can be made in a plasma regime where the otherestablished diagnostic techniques are not applicable.
The theory of Thomson scattering has been extensivelyreviewed1-3). A basic theoretical background with the relevantformulation is presented here. In this technique, plasma isilluminated by monochromatic radiation and the spectrum oflight scattered from the plasma is measured. The incidentradiation of wave vector ko is scattered from a plasma wavevector k and collected at angle θ with respect to the incidentwave vector. Assuming that the magnitude of the incident wavevector does not change during the scattering process, then thescattered wave vector ks can be worked out from the followingwave-vector geometry as:
oosin
λπ=
θ≈ 2
22 k with , kk o
os k- kk =
The scattered signal on the detector is integrated over a volumedetermined by the overlap between the focal volume of thecollecting optics of the detector and focusing optics of the probebeam. The spectral distribution of the scattered signal is a
function of the parameter α defined as:α =1
k λD
Here λD= (kTe/4πnee2)1/2 is the Debye length in the plasma withne, and Te being the electron density and temperature
respectively. Using the scattering parameter, plasmas aregenerally categorized into three main domains. In the limitwhere α <<1, scattering occurs from oscillations of wavelengthmuch less than the Debye length. The scattered spectrum in thislimit is contributed mainly by the unshielded electrons and thushas a Gaussian distribution in wavelength space that reflects thethermal distribution of the electrons. In the domain near α=1,the scattered spectrum has a flat-topped distribution withdistinct shoulders appearing on each wing. In the case of α>1,the contribution comes from oscillations of wavelength longerthan the Debye length. This is called the collective domain. Inthis domain, the scattered spectrum has two distinct features.The maximum part of the scattered energy goes in to the centralfeature having width of the order of ion sound speed in theplasma. This feature is referred to as the ion feature. The other,electron feature, develops into two prominent satellites shiftedby the Bohm-Gross frequency ωBG from the main. In principle,all the three domains can be accessed using spectrometers atdifferent angles (θ = 90
o
& 162o
in our case) by probing theplasma with the x-ray laser pulses.
Experimental Arrangement
The general experimental arrangement is sketched in Figure 1.
These experiments were performed with the Vulcan high powerlaser facility at the Rutherford Appleton Laboratory. Five of themain six beams were accessed as IR (λ= 1.053µm) and a pulselength of 80ps FWHM duration. The backlighter beams areused frequency doubled to a wavelength of 527nm and having apulse width of 550ps FWHM duration. The Ne-like Ni x-raylaser pulses are produced by focussing five of the main sixbeams on a Ni slab target in a line focus configuration.
The long line-focus produced by overlapping foci of the5 beams on the slab target was x-ray-imaged onto a CCDthrough crossed slits. One such image is shown in Figure 2a.The x-ray laser beam is imaged onto the scattering plasma witha magnification of x2 using a multi-layered XUV mirror.Pointing of the x-ray laser is done by imaging the x-ray laseronto a cross-wire in the target plane and relaying the image ontoa CCD using another similar multi-layered mirror. Figure 2bshows an image of the x-ray laser beam. The intensity of thex-ray laser at the plane of the scattering target is ~ 10
10 W/cm2.
X-ray Laser Thomson Scattering
F Y Khattak, D Riley, R Keenan, S Topping, A M McEvoy, J Angulo, C L S Lewis
School of Mathematics and Physics, Queen’s University of Belfast, University Road, Belfast, BT7 INN, N. Ireland, UK
M Notley, D Neely
Central Laser Facility, CLRC Rutherford Appleton Laboratory, Chilton, Didcot, Oxon, OX11 0QX, UK
Main contact email address: F. [email protected]
CCD coupled with spectrometer
XUV mirror
X-ray laser pulse
XUV mirror
Green beam
CCD coupled with spectrometer 5-IR beams
Ni Slab
Au foil
Au foil
Main Target
Figure 1. A schematic of the experiment showing the radiative-heating configuration. For clarity only one of the green beams isshown.
k
θ/2
ks
θ/2
ko

High Power Laser Programme – X-ray Laser and Long Pulse Plasma Physics
Central Laser Facility Annual Report 2001/2002 46
The scattering plasma is generated using two differentconfigurations, radiative-heating and direct heating. In theradiative-heating case, the two backlighter beams are focusedonto two foils (0.1µm thick gold coated onto 0.9µm mylar) oneeach on the two opposite sides of the 3µm thick, 0.5mm squarescattering target. The focal spot and the energy of the beams arevaried to change the irradiance on the Au foil. The x-raysproduced from the gold foils are used to irradiate the CH foiland generate uniform density plasma. The distance between thetwo foils is varied between 6mm and 10mm. In the second case,the main CH target is directly irradiated from opposite sideswith two beams each having intensity of 5x10¹² - 8x10¹³ W/cm2
on the target. The plane of the main target makes a 45o anglewith the horizontal as well as vertical in order to help reduce theabsorption of the scattered signal.
The scattered signal is imaged onto CCDs with the aid of twoflat-field imaging spectrometers at 90o, and 162o with a spectralresolution of ~ 10-4. The imaging mirror of a 28o spectrometer isreplaced with a multi-layered mirror placed inside the chamberon the opposite side of the target to have a spectrometer at 162o.The CCD on the 90o spectrometer is replaced with a streakcamera to resolve the scattered signal from the plasma emissionand to avoid saturation of the detectors.
Discussion
Because of the very small Thomson cross-section(6.65x10⁻²⁵ cm2 for free electrons), it requires a reasonablyhigh-energy probe beam to detect a signal above the noise level.That is, one should have a signal to noise level greater than 1.The noise level can be estimated from the continuum plasmaemission. Figure 3 shows the threshold of laser intensityrequired for the probe beam to have signal to noise level of theThomson signal detected at the two spectrometers. It can beseen that by decreasing the time-bandwidth of the detector, theintensity of the probe required at the target also reduces. In caseof the 10µs detector bandwidth, the threshold is very close tothe intensity of the x-ray laser available on target(~1010 W/cm2). It is, therefore, required to replace the timeintegrated CCD with a time resolved detector (an x-ray streakcamera, for example) to resolve the scattered signal from theself-emission. Our calculations and simulations, to appear in alater publication, indicate that the plasma can be probed at atime when there is less emission as well as transparent to thex-ray laser. This could be tried in future with the use of a timeresolved detector instead of a time integrated CCD. Althoughthe experiment was not successful in the sense of gettingscattered spectrum, enough is learnt to make it worth tryingnext time.
References
1. E.E. Salpeter, Phys. Rev. 120, 1528 (1960)
2. D.E. Evans and J. Katzenstein, Rep. Prog. Phys. 32, 207(1969)
3. J. Sheffield, Plasma Scattering of ElectromagneticRadiation, Academic Press, New York (1975)
4. S.A. Ramsden and W. E. R. Davies, Phys. Rev. Lett. 16,303 (1966)
5. N. C. LuhmanJr. And W. A. Peebles, in , Laser Handbook,edited by M. Bass and M. L. Stitch, North-Holland,Amsterdam, 5, 455 (1985)
6. B. La Fontaine et al., Phys. Plasmas 1, 2329, (1994)
7. S. H. Glenzer et al., Phys. Rev. Lett., 82, 97, (1999)
8. S. H. Glenzer et al., Phys. Plasmas 6, 2117, (1999)
9. Kano and K. Nakatani, Rev. Sci. Instrum., 71, 2716, 2000
10. J. Hawreliak et al., J. Quant. Spectosc. Radiat. Transfer 71,383 (2001)
11. O. L. Landen et al., J. Quant. Spectosc. Radiat. Transfer71, 465 (2001)
12. H. A. Baldis et al., J. Phys. IV, France 11 Pr2-469, (2001)
(b)(a)
Figure 2. (a) Cross-slit x-ray image of the line focus(b) X-ray laser imaged onto a cross-wire.
1.E+04
1.E+06
1.E+08
1.E+10
1.E+12
1 10 100
Temperature (eV)
Pro
be
Inte
nsi
ty (
W/c
m2) 162 o 90 o Detector Bandw idth 10µ s
Detector Bandwidth 100ps
Figure 3. Threshold of the x-ray laser to overcome thebackground noise level for two different detector-bandwidths.
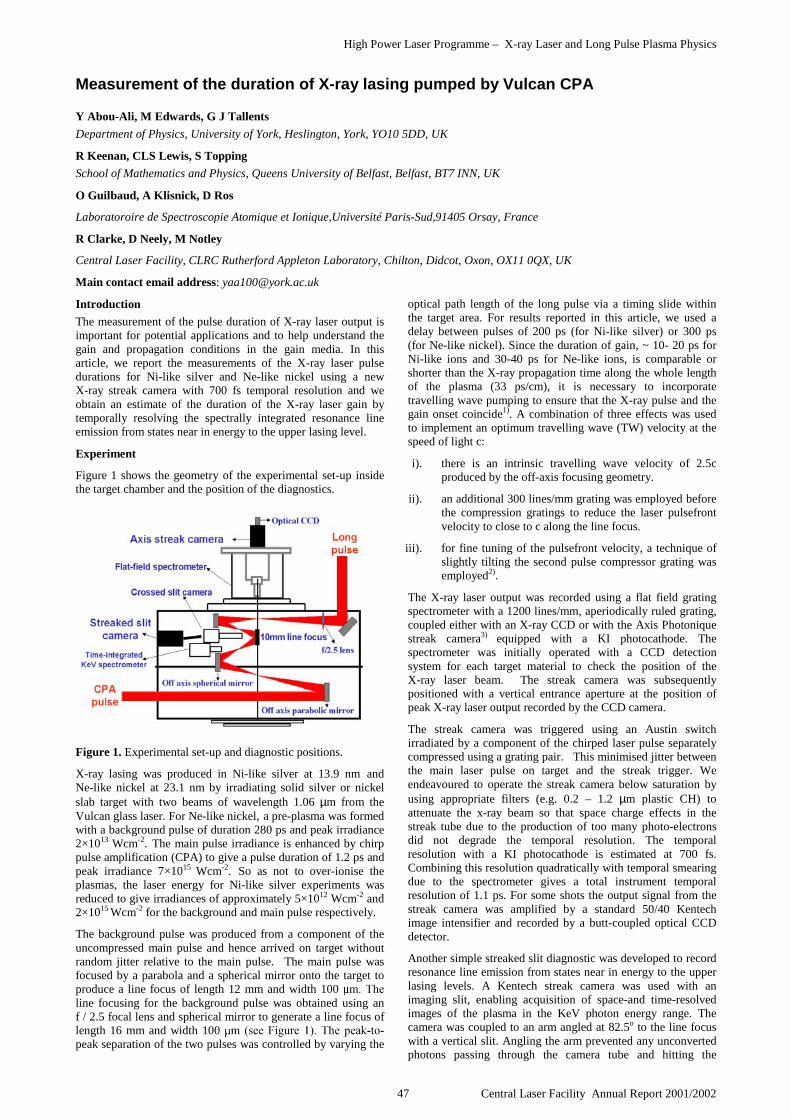
High Power Laser Programme – X-ray Laser and Long Pulse Plasma Physics
47 Central Laser Facility Annual Report 2001/2002
Introduction
The measurement of the pulse duration of X-ray laser output isimportant for potential applications and to help understand thegain and propagation conditions in the gain media. In thisarticle, we report the measurements of the X-ray laser pulsedurations for Ni-like silver and Ne-like nickel using a newX-ray streak camera with 700 fs temporal resolution and weobtain an estimate of the duration of the X-ray laser gain bytemporally resolving the spectrally integrated resonance lineemission from states near in energy to the upper lasing level.
Experiment
Figure 1 shows the geometry of the experimental set-up insidethe target chamber and the position of the diagnostics.
Figure 1. Experimental set-up and diagnostic positions.
X-ray lasing was produced in Ni-like silver at 13.9 nm andNe-like nickel at 23.1 nm by irradiating solid silver or nickelslab target with two beams of wavelength 1.06 µm from theVulcan glass laser. For Ne-like nickel, a pre-plasma was formedwith a background pulse of duration 280 ps and peak irradiance2×1013 Wcm-2. The main pulse irradiance is enhanced by chirppulse amplification (CPA) to give a pulse duration of 1.2 ps andpeak irradiance 7×10¹⁵ Wcm-2. So as not to over-ionise theplasmas, the laser energy for Ni-like silver experiments wasreduced to give irradiances of approximately 5×10¹² Wcm-2 and2×1015 Wcm-2 for the background and main pulse respectively.
The background pulse was produced from a component of theuncompressed main pulse and hence arrived on target withoutrandom jitter relative to the main pulse. The main pulse wasfocused by a parabola and a spherical mirror onto the target toproduce a line focus of length 12 mm and width 100 line focusing for the background pulse was obtained using anf / 2.5 focal lens and spherical mirror to generate a line focus oflength 16 mm and width 100 peak separation of the two pulses was controlled by varying the
optical path length of the long pulse via a timing slide withinthe target area. For results reported in this article, we used adelay between pulses of 200 ps (for Ni-like silver) or 300 ps(for Ne-like nickel). Since the duration of gain, ~ 10- 20 ps forNi-like ions and 30-40 ps for Ne-like ions, is comparable orshorter than the X-ray propagation time along the whole lengthof the plasma (33 ps/cm), it is necessary to incorporatetravelling wave pumping to ensure that the X-ray pulse and thegain onset coincide1). A combination of three effects was usedto implement an optimum travelling wave (TW) velocity at thespeed of light c:
i). there is an intrinsic travelling wave velocity of 2.5cproduced by the off-axis focusing geometry.
ii). an additional 300 lines/mm grating was employed beforethe compression gratings to reduce the laser pulsefrontvelocity to close to c along the line focus.
iii). for fine tuning of the pulsefront velocity, a technique ofslightly tilting the second pulse compressor grating wasemployed2).
The X-ray laser output was recorded using a flat field gratingspectrometer with a 1200 lines/mm, aperiodically ruled grating,coupled either with an X-ray CCD or with the Axis Photoniquestreak camera3) equipped with a KI photocathode. Thespectrometer was initially operated with a CCD detectionsystem for each target material to check the position of theX-ray laser beam. The streak camera was subsequentlypositioned with a vertical entrance aperture at the position ofpeak X-ray laser output recorded by the CCD camera.
The streak camera was triggered using an Austin switchirradiated by a component of the chirped laser pulse separatelycompressed using a grating pair. This minimised jitter betweenthe main laser pulse on target and the streak trigger. Weendeavoured to operate the streak camera below saturation byusing appropriate filters (e.g. 0.2 – 1.2 µm plastic CH) toattenuate the x-ray beam so that space charge effects in thestreak tube due to the production of too many photo-electronsdid not degrade the temporal resolution. The temporalresolution with a KI photocathode is estimated at 700 fs.Combining this resolution quadratically with temporal smearingdue to the spectrometer gives a total instrument temporalresolution of 1.1 ps. For some shots the output signal from thestreak camera was amplified by a standard 50/40 Kentechimage intensifier and recorded by a butt-coupled optical CCDdetector.
Another simple streaked slit diagnostic was developed to recordresonance line emission from states near in energy to the upperlasing levels. A Kentech streak camera was used with animaging slit, enabling acquisition of space-and time-resolvedimages of the plasma in the KeV photon energy range. Thecamera was coupled to an arm angled at 82.5o to the line focuswith a vertical slit. Angling the arm prevented any unconvertedphotons passing through the camera tube and hitting the
Measurement of the duration of X-ray lasing pumped by Vulcan CPA
Y Abou-Ali, M Edwards, G J Tallents
Department of Physics, University of York, Heslington, York, YO10 5DD, UK
R Keenan, CLS Lewis, S Topping
School of Mathematics and Physics, Queens University of Belfast, Belfast, BT7 INN, UK
O Guilbaud, A Klisnick, D Ros
Laboratoroire de Spectroscopie Atomique et Ionique,Université Paris-Sud,91405 Orsay, France
R Clarke, D Neely, M Notley
Central Laser Facility, CLRC Rutherford Appleton Laboratory, Chilton, Didcot, Oxon, OX11 0QX, UK
Main contact email address: [email protected]

High Power Laser Programme – X-ray Laser and Long Pulse Plasma Physics
Central Laser Facility Annual Report 2001/2002 48
phosphor screen. The vertical imaging slit was placed at adistance of 43 cm from the target and the camera entrancehorizontal timing slit was 24 cm away from the vertical slitgiving an imaging slit magnification of 0.56. The vertical slitwidth was 270 µm to give spatial resolution of ∼ 0.7 mm alongthe line focus length. The streak camera was equipped with agold photocathode and a 500 µm wide slit which sets a timeresolution of ∼ 6 ps. A filter of 2.4 µm thick aluminum wasemployed so that emission in the 0.8 – 2.1 nm wavelength rangewas recorded with the diagnostic. The emission is dominated byresonance line emission for both Ni-like silver (resonanceemission in the range 1.7 to 2.2 nm) and Ne-like nickel(resonance emission in the range 1 to 1.4 nm).
A CCD x-ray crossed-slit camera using two orthogonal slitswith different magnification along the target length and widthmonitored the line focus plasma uniformity and overlap of thelaser pulse. A KAP crystal spectrometer with space resolvingslit measured the time integrated resonance line emission ofNe-like nickel with a spatial resolution along the plasma line of300 µm.
ResultsThe temporal variation of the Ni-like silver output at 13.9 nm asrecorded with the streaked spectrometer using an imageintensifier is shown in Figure 2. The output shows a sharp risewith a slow fall in output as is expected from modellingstudies4). The X-ray laser pulse duration (full-width at half-maximum FWHM) was measured as 3.7 ± 0.5 ps by fitting thelasing output with the predictions of a simple model developedby Strati and Tallents5). When not employing an imageintensifier we measured a silver output with an approximatelyGaussian shape, but again with 3 ps pulse duration.
Figure 2. The temporal variation of X-ray lasing at 13.9 nm forNi-like silver. An image intensifier was used with the streakcamera. A 10 mm long silver target was irradiated with peakirradiance of 3.1×10¹² Wcm-2 in the 280 ps background pulseand 1.2×10¹⁵ Wcm-2 in the 1.2 ps main pulse with peak-to-peakseparation of 200 ps. The output was filtered with 1.2 µmplastic (CH). The FWHM X-ray laser duration was measuredto be 3.7 ps. A model fit for R = 10-6, peak small signal gain of23 cm-1 and a gain duration of 22 ps is shown as a thick brokenline.
The temporal variation of the Ne-like nickel output at 23.1 nmas recorded with the streaked spectrometer using an imageintensifier is shown in Figure 3. It is likely that the observeddouble humped temporal profile for Ne-like nickel output at23.1 nm arises because of saturation effects in the streakcamera. The X-ray laser pulse duration (full-width at half-maximum FWHM) was measured as 10.7 ± 1 ps by fitting thelasing output with the predictions of a simple model5). A pulseduration of 3.5± 0.5 ps (full width at half maximum) wasobserved for the Ni-like silver line at 16.1 nm. This 16.1 nm
line is probably largely pumped by resonant 3d → 4f photo-absorption6).
Figure 3. The temporal variation of X-ray lasing at 23.1 nmfor Ne-like nickel. An image intensifier was used with thestreak camera. A 6 mm long nickel target was irradiated withpeak irradiance 6 ×10¹² Wcm-2 in the 280 ps backgroundpulse and 5×10¹⁵ Wcm-2 in the 1.2 ps main pulse with peak-to-peak separation of 300 ps. The output was filtered by0.2 µm plastic (CH). The FWHM x-ray laser duration wasmeasured to be 10.7 ps. A model fit for R = 10-6, peak smallsignal gain of 60 cm-1, and a gain duration of 35 ps, isshown as a thick broken line.
A sample streaked slit output showing spatial resolution of0.7 mm along the target length and temporal resolution of 6 psis given in Figure 4. Emission from the pre-plasma followed bythe emission associated with the 1.2 ps main pulse is clearlyapparent. This known time delay between the pulses has beenused to calibrate the streaked slit camera streak speed. The mainpulse emission occurs at times determined by the travellingwave irradiation.
Figure 4. Streaked slit camera image showing the plasma background and main laser pulses incident onto a nickel target.The relative intensity scale is also shown.
The emission associated with the short pulse laser has measuredfwhm duration of 22 ± 2 ps for silver and 35 ± 3 ps for nickeltargets. We may expect the duration of this emission to be anupper bound on the gain duration.
Assuming that the leading edge of the main pulse emissioncorresponds to the time of laser light reaching the target, wemeasured the travelling wave velocity at the leading edge of themain pulse to be 0.95± 0.05c (Figure 5). This measurement is inagreement with measurements made using an optical streakcamera viewing scattered laser light from the line focus duringthe setting-up of the travelling wave grating.
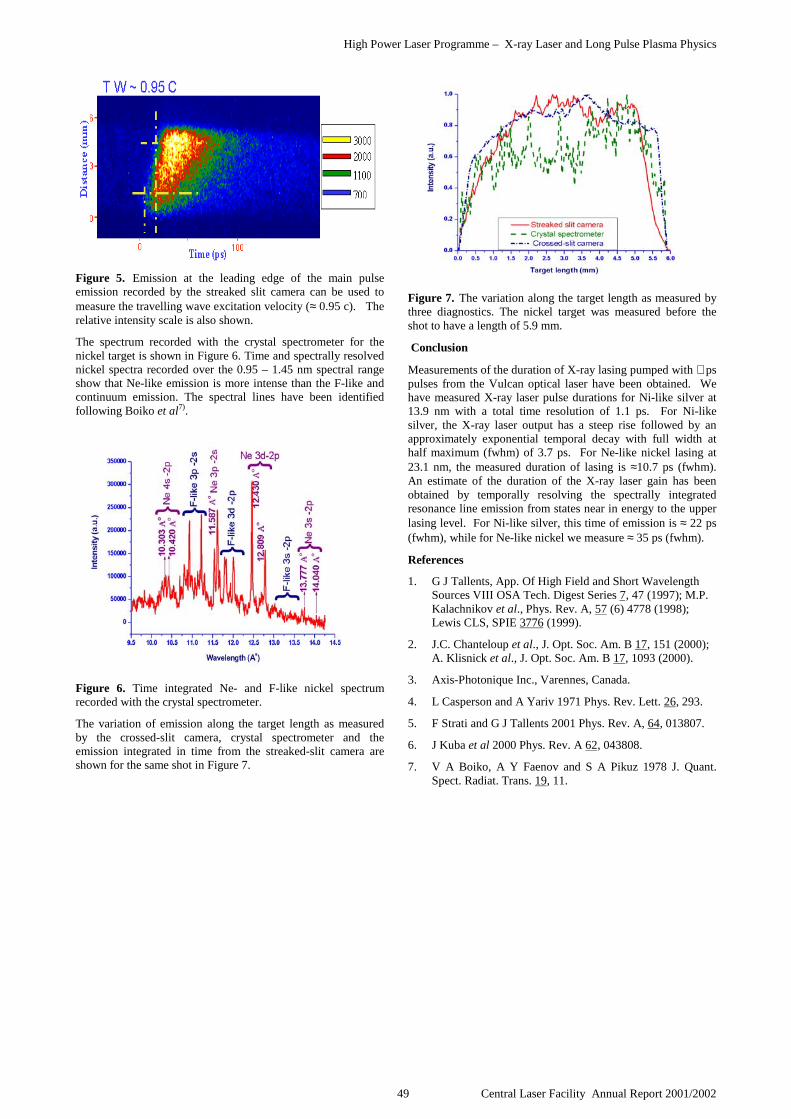
High Power Laser Programme – X-ray Laser and Long Pulse Plasma Physics
49 Central Laser Facility Annual Report 2001/2002
Figure 5. Emission at the leading edge of the main pulseemission recorded by the streaked slit camera can be used tomeasure the travelling wave excitation velocity (≈ 0.95 c). Therelative intensity scale is also shown.
The spectrum recorded with the crystal spectrometer for thenickel target is shown in Figure 6. Time and spectrally resolvednickel spectra recorded over the 0.95 – 1.45 nm spectral rangeshow that Ne-like emission is more intense than the F-like andcontinuum emission. The spectral lines have been identifiedfollowing Boiko et al7).
Figure 6. Time integrated Ne- and F-like nickel spectrumrecorded with the crystal spectrometer.
The variation of emission along the target length as measuredby the crossed-slit camera, crystal spectrometer and theemission integrated in time from the streaked-slit camera areshown for the same shot in Figure 7.
Figure 7. The variation along the target length as measured bythree diagnostics. The nickel target was measured before theshot to have a length of 5.9 mm.
Conclusion
Measurements of the duration of X-ray lasing pumped with ∼ pspulses from the Vulcan optical laser have been obtained. Wehave measured X-ray laser pulse durations for Ni-like silver at13.9 nm with a total time resolution of 1.1 ps. For Ni-likesilver, the X-ray laser output has a steep rise followed by anapproximately exponential temporal decay with full width athalf maximum (fwhm) of 3.7 ps. For Ne-like nickel lasing at23.1 nm, the measured duration of lasing is ≈10.7 ps (fwhm).An estimate of the duration of the X-ray laser gain has beenobtained by temporally resolving the spectrally integratedresonance line emission from states near in energy to the upperlasing level. For Ni-like silver, this time of emission is ≈ 22 ps(fwhm), while for Ne-like nickel we measure ≈ 35 ps (fwhm).
References
1. G J Tallents, App. Of High Field and Short WavelengthSources VIII OSA Tech. Digest Series 7, 47 (1997); M.P.Kalachnikov et al., Phys. Rev. A, 57 (6) 4778 (1998);Lewis CLS, SPIE 3776 (1999).
2. J.C. Chanteloup et al., J. Opt. Soc. Am. B 17, 151 (2000);A. Klisnick et al., J. Opt. Soc. Am. B 17, 1093 (2000).
3. Axis-Photonique Inc., Varennes, Canada.
4. L Casperson and A Yariv 1971 Phys. Rev. Lett. 26, 293.
5. F Strati and G J Tallents 2001 Phys. Rev. A, 64, 013807.
6. J Kuba et al 2000 Phys. Rev. A 62, 043808.
7. V A Boiko, A Y Faenov and S A Pikuz 1978 J. Quant.Spect. Radiat. Trans. 19, 11.

High Power Laser Programme – X-ray Laser and Long Pulse Plasma Physics
Central Laser Facility Annual Report 2001/2002 50
Introduction
This report describes the further development of the five beamsetup for pumping X-ray lasers (XRLs) at Vulcan. The initialwork was carried out on the Sm XRL1) at 73 Å and the pumpconfiguration has been extended to the Ne-like Ge and Ni XRLsat 196 and 231 Å respectively. This is now the routineconfiguration with the ‘long’, 100 ps, pump beams. TheseXRLs are mainly being developed with a view to applicationssuch as Non-linear optics and Thomson scattering with XRLs.The optimisation of the target retraction for the Ge XRL wascarried out for the radiography program with the length scancarried out at a later date. The Ni XRL at 231 Å was initiallydeveloped and characterised for the Non-linear optics work2).The further characterisation of the source properties, presentedas imaging work here, has been carried out as its use extends toother applications such as Thomson scattering3) and an XRLinterferometer4).
Experimental Setup
The use of a prepulse has improved the brightness of X-RayLasers to the point where they can be used in applications.However, for target lengths beyond ~15 mm, into saturationmode, a double target arrangement had to be used, thealignment of which was critical. The lower density gradient andlarger gain region produced with the prepulse technique hadreduced refraction to the point where single long targets couldbe used. Five beams of Vulcan could be used to irradiate asingle target, typically 25 mm long, which is much easier toalign. The 25 mm long target provides a saturated XRL but stillallows good uniformity at an intensity of 5x10¹³ W/cm2. Thisfive beam technique has provided saturated XRL outputs fromSm1) and the Ge and Ni XRLs discussed below.
For all the experiments the targets were irradiated by 5 beamsof the Vulcan Nd:glass laser at 1.05 µm. Line foci 100 µm wideand 20 mm long were generated using a lens and off axisspherical mirror5). These were displaced axially to produceuniform illumination and timed along the target so that eachbeam was incident on target centre at the same time. The beamswere configured as shown in Figure 1(a) with one beam on axis,two at ±30o and two at ±60o. The beams were displaced alongthe axis as shown in Figure 1(b) with each beam delayedaccording to its position and positioned to provide maximumsymmetry about the axis. The target base was mounted on aSony magnascale so the target could be accurately retracted adistance d (see Figure 1(a)). This target retraction of a few 10sof µms allowed the beams arriving at an angle to heat the sameregion of the preformed plasma. Instead of creating two gainregions at the top and bottom, the target retraction should allowall beams creating the conditions for gain to arrive at the samesmall area of pre-plasma on axis. Without the retraction thebeams at +30o and +60o (and conversely those at -30o and -60o)could create a separate gain region above (and below) the axis.
Five beams, 80 ps duration with 40 J per beam, were distributedalong a 25 mm x 100 µm line focus giving an on-targetintensity of up to 5x10¹³ W/cm2. A prepulse with variable delaywas generated in the laser area by splitting the oscillator pulseinto two before the preamplifiers of Vulcan. For the Geoptimisation, carried out during radiography experiments6), thecentral, on-axis beam, was extended so that it could illuminate
the entire target and be used as the prepulse energy source. TheNe-like Ni x-ray laser at 231 Å was characterised fully in the 5beam setup for a four wave sum difference mixing (FWSDM)experiment2). This XRL is now used as a source and as such hasbeen further characterised through the imaging described below.
Beam
at +60 o Beam on axis
Beam at -30o
Beam at +30 o
Bea
m a
t -60
o
Plasma
d
100 µmtarget
100 µm wide focal plane of beams
Beam on axis
Beam at -60o
Beam at -30o
Beam at +60o
Beam at +30o
25 mm
100 µm
Figure 1. Sketch of five beam irradiation of a single target100 µm wide x 25 mm long (a) side view showing how targetretraction, d, allows the 5 beams to heat the same region ofpreplasma and (b) front view showing displacement of beamsalong the axis.
The main diagnostic for the XRL was a time integrated, angleresolving, axial grazing incidence flat-field spectrometer (FFS)with a 1200 lines mm-1 aperiodic ruled grating, coupled to aback-thinned CCD with 24 µm pixels. A crossed slits cameraand a KAP crystal spectrometer monitored the uniformity andionisation balance along the target.
The XRL was imaged at high magnification using Mo/Simultilayer X-ray mirrors onto a 13 µm pixel CCD with aresolution better than 5 µm. The setup for imaging the Ni XRLwith two spherical mirrors at x40 total magnification (x2 fromXRM1 and x20 from XRM2) is shown in Figure 2.
Development of X-ray lasers for applications
R Keenan, S Hubert, C L S Lewis, S J Topping
Department of Pure and Applied Physics, Queen’s University Belfast, Belfast, BT7 1NN
M Notley, D Neely
Central Laser Facility, CLRC Rutherford Appleton Laboratory, Chilton, Didcot, Oxon, OX11 0QX, UK
Main contact email address: [email protected]
a)
b)

High Power Laser Programme – X-ray Laser and Long Pulse Plasma Physics
51 Central Laser Facility Annual Report 2001/2002
+Z
u
v
1-5 µm Al filter
XRM1RoC = 1mD= 50 mm
M= ~x2
B T CCD, 13 µm pixels26x 13 mm2
XRM2RoC = 0.5mD= 25 mm
M= ~x10 or x20
Figure 2. Imaging the XRL at high mag using two sphericalmultilayer X-ray mirrors (XRM).
For the absolute numbers presented below, a knowledge andbest estimate of the detection parameters is required. The FFSmeasures the angular divergence but makes no measure of thevertical divergence as this is in the dispersion direction. This istaken account of by estimating the vertical as 3 times thehorizontal divergence, as can be seen from the imaging shots,and combining this with the collection angle of thespectrometer. A best estimate of the grating reflectivity is madeat 5%. The transmission of the Al filter is taken from Henke7).The final assumption is the conversion efficiency of the CCDfrom photons to counts which is taken to be 2 photons/count fora 196 Å photon for the specific detector used here. The countson the CCD are integrated in the horizontal direction and acrossthe spectral width of the laser line, a background is subtracted,and the assumptions described above used to get the totalnumber of photons and hence the total output at the XRLwavelength. For the imaging case the total output is morereadily obtained as the reflectivity of the mirrors has beencalibrated.
Results
Ne-like Ge XRL at 196 Å
Initial optimisation of the target retraction was carried out usingthe flat-field spectrometer as the main diagnostic. This scan,shown in Figure 3, demonstrates the positive effect of retractingthe target with a retraction of between 70-100 µm producing thebrightest output. However no knowledge of how the verticaldivergence is changing can be gained from the FFS and onlythrough the imaging discussed below is the retraction trulyoptimised.
0
1
2
3
0 50 100 150Target retraction / µm
Out
put /
mJ
Figure 3. Optimisation of target retraction on FFS for Ge.
Images are shown in Figure 4 of the XRL 3 cm from the exitpoint taken at x18 magnification. With a target retraction of70 µm, from the FFS optimisation, there is a double lobedstructure but at 90 µm the output is optimised. It can clearly beseen that target retraction is important, not only to achievemaximum brightness, but also the large, relatively uniform areaneeded particularly for radiography.
The obvious double lobed structure for a retraction of 70 µm isfrom the beams above and below axis creating separate gain
regions. Only when the target is retracted 90 µm do all thebeams heat the same region, though still creating an XRL muchlarger in the vertical direction. This beam shape is highlyreproducible as Figure 4c) shows with many shots taken at thisretraction. The optimised target retraction depends mainly onthe configuration of the prepulse, where the objective is creationof a single quasi-homogeneous gain region.
0 500 1000
500
1000
0 500 1000
500
1000
0 500 1000
500
1000
µm
µm
µm
µm
µm
µm
µm
µm
µm
µm
µm
µm
µm
µm
0 500 1000
500
1000
0 500 1000
500
1000
0 500 1000
500
1000
0 500 1000
500
1000
Figure 4. Optimisation of target retraction through imaging theGe XRL 3 cm from the exit point showing (a) 70 (b) 80 and(c) 90 µm.
Ne-like Ni XRL at 231 Å
The Ni XRL has already been characterized2). Further work wascarried out here with the setup shown in Figure 2. Images weretaken at the lower magnification (x10 from XRM) at variousdistances, z, from best focus of XRM1 by moving XRM2 too.
The images in Figure 5 show the spot size decreasing as we getto best focus with similar images at –10 and –20 cm showing itincreasing again. At the plane corresponding to ~5 cm from theexit point, we have a beam with a FWHM of 380x800 µm and asimilar shape to the Ge images, i.e. at vertical divergence2-3 times the horizontal divergence.
Figure 5. Images taken at +20, +10 and 0 cm from best focus.
The graph in Figure 6 shows the FWHM in both the horizontaland vertical directions as we go through best focus of XRM1. Inthe plane of best focus of XRM1 the spot size is ~300 µm.Given the magnification of this mirror is x2 this corresponds toan exit point size of ~150 µm. The FWHM size shown for+20 cm is an underestimate as the beam is overfilling the CCDat this point.
a)
c)
b)

High Power Laser Programme – X-ray Laser and Long Pulse Plasma Physics
Central Laser Facility Annual Report 2001/2002 52
0
500
1000
1500
2000
-30 -20 -10 0 10 20 30z / cm
Size
/ µ
m
FWHM vertical
FWHM horizontal
Figure 6. FWHM size of beam at various points through focusof XRM1.
Images were also taken at various distances z for different targetretractions. The target retraction for Ni was optimised at bestfocus and at a total magnification of x40. A retraction of100 µm gave the highest output in an exit point FWHM of180x180 µm. Figure 7 shows the total output from the imagesfor various target retraction.
0
1
2
3
4
5
0 50 100 150 200Target retraction / µm
Out
put /
mJ
Figure 7. Optimisation of target retraction through imaging theexit point of the Ni XRL.
The reproducibility of the source was also verified at variousretractions and positions through focus. Figure 8 shows twoshots taken at 75 µm retraction and best focus, with an on targetenergy of 180 ± 2 J both producing a 3 mJ output in an exitpoint FWHM of ~150x150 µm.
Figure 8. Shot to shot reproducibility of exit point.
Conclusions
The five beam setup has now been optimised such that a highlyreproducible output of ~3 mJ is obtained for both the Ne-likeGe and Ni XRL at 196 and 231 Å respectively. Target retractionhas been optimised through imaging allowing production of awell-defined source suitable for applications.
References
1. R Keenan et al. Central Laser Facility Annual Report1998/99, RAL-TR-1999-062, 56, (1999)
2. S J Topping, R. Keenan, et al.J. Phys. IV France, 11, 487, (2001)
3. D Riley et al“Potential for Thomson Scatter with an X-ray laser”Submitted to IEEE (2002)
4. S J Topping, R. Keenan, et al. Central Laser FacilityAnnual Report 2001/2002, RAL-TR-2002-013, 53, (2002)
5. I N Ross, J Boon, R Corbett, A Damerell, P Gottfeldt,C Hooker, M H Key, G Kiehn, C L S Lewis, O WilliApplied Optics, 26, 1584, (1987)
6. E Wolfrum et al. Central Laser Facility Annual Report1998/99, RAL-TR-1999-062, 43, (1999)
7. B L Henke, E M Gullickson, J C DavisAt. Data Nucl. Data Tables, 54, 181, (1993)

High Power Laser Programme – X-ray Laser and Long Pulse Plasma Physics
53 Central Laser Facility Annual Report 2001/2002
Introduction
Interferometry measurements of the Ne-like Ni X-ray laser(XRL) at 23.1 nm had previously shown a degree of coherencewas present in the beam1). A Lloyds mirror was used to split theXRL beam and create an overlap region, which was imaged athigh magnification to a CCD camera. A new XUVinterferometer has been designed based on a transmissiongrating (TG) and a set of Hoya plates to improve the fringevisibility measurements. Knowledge of the coherence propertiesof the XRL beam is important for applications such as in non-linear optics2).
Transmission Gratings
The transmission gratings consist of a 1.4 x 1.4 mm siliconnitride substrate, 50 nm thick onto which, a gold resist grating isdeposited with a periodicity of 1000 lines/mm. The substrate issuspended across a 5 x 5 mm silicon frame to allow safehandling of the TGs3). A 2000 lines/mm grating was alsoavailable.
At Queens University the TGs were characterized to estimatethe transmission efficiency into the diffracted orders. A laser-produced plasma is formed by focusing pulses of a frequencydoubled Q-switched Nd:YAG laser onto a solid lead cylinderlocated inside a vacuum chamber. The laser operates at 10 Hzwith a pulse length of 7 ns and pulse energies up to 500 mJ.With a focal spot diameter of ~ 50 µm the resulting intensity onthe lead target is of the order of ~ 1012 W/cm2.
An X-ray mirror (XRM) with a reflectivity of ~ 20% and anarrow bandpass of ~ 30 Å centred around 23.1 nm is used toimage the plasma and focus it onto the TG at ~ x2magnification. The transmission grating introduces diffractioninto the reflected and focused beam producing positive andnegative diffracted orders and a straight through beam. A CCDcamera with an Aluminium filter in place is then used toexamine the diffracted beams, see Figure 1.
The 1000 and 2000 lines/mm TGs had similar characteristicsshowing 4% transmission into the straight through and 3%transmission into 1st order.
The incident intensity was calculated with the focused beamdirectly onto the CCD and without the TG in place. The resultsshowed good shot to shot reproducibility.
Experiment
The Ne-like Ni XRL is created from a plasma column producedfrom 5 beams at 1.054 µm in a line focus set-up. The beams arefirst focused to a point (surrogate focus) using a series of f/2.5lenses. A set of spherical mirrors is then used to image thesurrogate focus to the target plane. The spherical mirrorsoperate off axis and as a result a large astigmatism is introducedinto the beams producing two line foci. One focus is a line,which is set within the plane of incidence and the beams areoverlapped along the axis to create a uniform line focus, seeFigure 2.
The beams have a pulse duration of 80 ps with an averageenergy of ~ 40 J per beam and when distributed across a100 µm x 25 mm line focus gave an on target intensity of theorder of ~ 1013 W/cm2. A 10% pre-pulse was set 2 ns ahead of
Soft X-ray interferometry with a transmission grating
S J Topping, C L S Lewis, R Keenan, A M McEvoy
School of Mathematics and Physics, Queens University of Belfast, Belfast, BT7 1NN, UK
M Notley, D Neely
Central Laser Facility, CLRC Rutherford Appleton Laboratory, Chilton, Didcot, Oxon, OX11 0QX, UK
Main contact email address: [email protected]
XRL Drive Beams~ 200 J in 80 ps
Soft X-rayCCD
XRLλ = 23.1 nm
f/2.5 lens
Spherical Mirrors
XRM1 m ROC
TG Interferometer
XRM0.5 m ROC
XRL Drive Beams~ 200 J in 80 ps
Soft X-rayCCD
XRLλ = 23.1 nm
f/2.5 lens
Spherical Mirrors
XRM1 m ROC
TG Interferometer
XRM0.5 m ROC
Figure 2. Experimental set-up of XRL Interferometer.
1st order 3%
Straightthrough 4%
2nd order
1000 lines/mm TG
1st order 3%
2nd order
2000 lines/mm TG
1st order 3%
Straightthrough 4%
2nd order
1000 lines/mm TG
1st order 3%
2nd order
2000 lines/mm TG
(a) (b)
Figure 1. Straight through and diffracted orders from(a) 1000 lines/mm TG and (b) 2000 lines/mm TG.

High Power Laser Programme – X-ray Laser and Long Pulse Plasma Physics
Central Laser Facility Annual Report 2001/2002 54
the main drive beams and the solid Ni slab target retracted100 µm off axis to maximize the XRL output.
The illumination uniformity and ionisation balance weremonitored on a shot to shot basis using a crossed slit cameraand Bragg spectrometer. The images showed reasonably gooduniformity along the line focus and indicated our Ni plasma wasin the desired Ne-like state. The Ne-like Ni XRL was driveninto saturation for a 25 mm long target.
The output was monitored with an on axis grazing incidenceflat-field spectrometer with a 1200 lines/mm aperiodic ruledgrating and a soft X-ray CCD. The XRL was found to have amaximum output of ~ 5 mJ, a FWHM divergence of ~ 10 mradand a refraction angle of ~ 8 mrad which is consistent withprevious results4).
The XRL beam is focused onto a cross-wire on theinterferometer at ~x2 magnification with a 1m ROC XRM. TheTG is set a fixed distance of 2 cm from the focused XRL beam.The TG then produces positive and negative diffracted ordersand a straight through beam. The straight through beam isblocked and the diffracted orders are overlapped using Hoyaplates at grazing incidence angles, see Figure 3. The overlappedregion containing fringes is then imaged using a 0.5m ROCXRM and relayed to the CCD with an overall magnification of~ x20. By changing the angle of the Hoya plates it was possibleto vary the fringe spacing in the overlap region.
The XRMs had a reflectivity of ~ 20% and a narrow bandpassof ~ 30 Å centred around 23.1 nm. A series of baffles were usedto reduce the amount of scattered light in the imaging systemand obtain a clean signal with low background. The pointing ofthe XRL beam onto the cross-wire was checked using a visiblediode laser coupled to an optical fibre, the output of which wasplaced at the XRL exit point. The 1000 and 2000 lines/mm TGsintroduce 23.1 mrad and 46.2 mrad diffraction respectively intothe 1st order XRL beamlets.
Straight Through 1st order1st order
0 (mrad) 24.5-24.5
0(mrad)
-12.3
12.3Straight Through 1st order1st order
0 (mrad) 24.5-24.5
0(mrad)
-12.3
12.3
Figure 4. Straight through and 1st order of the Ne-like Ni XRLbeam through 1000 lines/mm TG.
To test the transmission of the XRL beam through the TG theHoya plates and zero order block were removed. The secondrelay XRM was moved to image a plane 5 cm from the1000 lines/mm TG to look at the diffracted orders and thestraight through at x10 magnification, see Figure 4. Theestimated transmission efficiency with respect to an incidentXRL beam with an output of 3 mJ, showed 1% into the straightthrough and 1% into 1st order.
For the interferometry shots an aperture ~ (1 x 1 mm) wasplaced in front of the XRM to sample a section of the XRLbeam. The 2000 lines/mm TG was used, the zero order blockwas positioned and the Hoya plates were set to 20.7 mrad whichcorresponds to a fringe spacing of ~ 4 - 5 µm in the overlapregion. The overlap region was then imaged, at ~ 40 cm fromthe TG with the 0.5m ROC XRM at ~ x12 magnification.Figure 5 shows an expanded image of the overlap region wherewe would expect to see fringes of ~ 50 µm. Analysis of theimage showed that no fringes were present.
0.3(mm)
0.8 (mm) 1.60
0.6
0
sample of expected fringe size
0.3(mm)
0.8 (mm) 1.60
0.6
0
sample of expected fringe size
Figure 5. Overlap region imaged at x12 magnification.
Conclusions
This is a preliminary attempt to develop a novel interferometerfor plasma density diagnostics. Characterisation of the TGsshowed sufficient transmission of the XRL beam for theinterferometer to work. Further progress will be reported at alater date.
References
1. S.J. Topping, R. Keenan, et al, J. Phys. IV France 11, 487(2001)
2. S.J. Topping, R. Keenan, et al, Central Laser FacilityAnnual Report 1999-2000, RAL-TR-2000-034, 56 (2000)
3. P. Anastasi, Fabrication Services & Technology, England
TG
Cross-Wire Hoya Plates (6 cm) Overlap Region
Zero Order Block2 cm 4.5 cm 26 cm
TG
Cross-Wire Hoya Plates (6 cm) Overlap Region
Zero Order Block2 cm 4.5 cm 26 cm
Figure 3. XUV Transmission Grating Interferometer.

High Power Laser Programme – X-ray Laser and Long Pulse Plasma Physics
55 Central Laser Facility Annual Report 2001/2002
Introduction
Recent high power laser experiments have explored thepossibility of studying collisionless shock processes relevant tosupernova remnants in the laboratory.1,2) These experimentsrequired the production of large area, 1-dimensional, low-density plasmas with physical characteristics matched to thosebelieved typical of a Supernova Remnant (SNR).1,3) Aconvenient method of producing such a plasma was throughlaser explosion of thin plastic foils. However, the resultingplasmas were found to have density non-uniformities thatimpaired the data quality. Experimental data indicated that twosignificant causes for these non-uniformities were initial foilquality and the laser focal spot intensity profile. The initial foilquality was improved through target preparation procedures,and remains an area of study. Two-dimensional hydrodynamicsimulations of the foil-laser interaction show that the resultingplasma density uniformity is sensitive to the initial laserintensity profile.4) Furthermore, imprinted laser intensityvariations will persist as density non-uniformities for severalhundred ps. This is due to the supersonic nature of the plasmaexpansion.5)
The pattern of laser intensity non-uniformity will in generalvary in space and time, and indeed many smoothing techniquesare based on the rapid motion of imposed high spatial frequencyintensity structures and rely on lateral thermal conductionbetween the critical surface and ablation front for smoothing.Examples are random phase plates6) (RPP), phase zone plates7)
(PZP), induced spatial incoherence8), and smoothing by spectraldispersion9). Any laser imprint may be interpreted in terms ofEquation (1) where a fractional change in ablation pressure ∆p,due to a fractional change in intensity ∆I with spatialirregularities of scale length L is smoothed by a factor n.10) Thecritical surface and ablation front are initially in contact and theseparation, D, will increase in time until a steady separation isachieved.
∆p
p= n
∆I
I→ n = exp
−4πD
L
(1)
This separation represents the smoothing region; intensityfluctuation scales below this separation will be smoothed bylateral transport. Consequently smoothing is ineffective duringthe initial period of laser irradiation.
An alternative smoothing approach is to move the criticalsurface from the ablation front before laser irradiation, forexample using a radiatively heated low-density foam bufferedtarget.11) Unfortunately, none of these smoothing methods issuited to the ablation of thin foil targets and in particular toapplications where the plasma expansion should be uniform andthe leading edge of the plasma, in this case, or the rear surfaceis of interest.
Improving the uniformity of the exploding plasma demandsuniform target illumination during the initial phase of the laserinteraction. Here we describe a smoothing technique, where alow energy prepulse is spatially smoothed immediately beforethe foil target. Following separation of the critical surface from
the ablation front the foil is irradiated with the (non-uniform)high-energy beams.
Experiment
The experiment was conducted in Target Area East of theVulcan Nd:Glass laser. The target geometry consisted of two100 nm thick foils mounted on copper holders, separated by1 mm and placed face parallel, see Figure 1. The foils areproduced by thermal evaporation onto glass slides. Individual2 mm square sections of foil were floated off the glass in awater bath and attached by surface tension to photo-fabricated50 µm thick copper holders. The foil holders are 2 mm by 7 mmstrips with a 1.2 mm diameter hole centred 1 mm above thebottom end over which the foil sits. This is identical to the typeof mount used in our previous experiments1), where the size isdictated by the Helmholtz coil target arrangement.
On some experiments a 75 µm diameter pinhole was mounted20 mm before the right hand foil and aligned along the centralaxis of the foil. This pinhole spatially filtered the prepulse.
Focal spotφ=1 mm
20 mm
Pinholeφ=50µm
Laser30 J,15 ps, f/20
Probe
Figure 1. Target geometry showing the parallel foils and foilholders, the pinhole placement and prepulse and probe beamconfiguration.
∅
µ
!"#$ # #
% ##&&
' #
(#& ∅ )##
Figure 2. Experimental set up showing the beam configurationand diagnostics arrangement.
The Vulcan set up is shown in Figure 2 and consists of the mainbeams, a probe and a prepulse. All the beams were seeded bythe same Nd:YLF oscillator to eliminate timing jitter, thisoscillator delivered a 1.053 µm, 80 ps FWHM pulse with 2 nmbandwidth. The main beams, used in radial geometry, werefocused through f/10 lenses and PZP or RPP to produce a 1 mm
Uniform plasma production from thin foils
R A D Grundy, C Courtois, R G Evans, N C Woolsey
Department of Physics, University of York, Heslington, York. YO10 5DD, UK
P Helander, K G McClements, R O Dendy
EURATOM/UKAEA Fusion Association, Culham Science Centre, Abingdon, Oxfordshire OX14 3DB, UK
J L Collier, R Heathcote, A Johnson, M M Notley, P A Norreys
Central Laser Facility, CLRC Rutherford Appleton Laboratory, Chilton, Didcot, Oxon, OX11 0QX, UK
Main contact email address: [email protected]
Prepulse
Probe

High Power Laser Programme – X-ray Laser and Long Pulse Plasma Physics
Central Laser Facility Annual Report 2001/2002 56
diameter focal spot on each foil with an average irradiance of~1014 W.cm-2. The prepulse and probe beams were bothcompressed in air using grating pairs.
A prepulse was used on some experimental shots to preform aplasma on the right hand foil. The beam with FWHM of17±5 ps, was focused with an f/35 achromatic lens onto thepinhole as shown in Figure 1. This irradiates the right hand foilwith a spatially smooth beam at an average irradiance of1013 W.cm-2. The timing of the beams was arranged such thatthe prepulse could arrive between 100ps and 0 before the maindrive beams. The long focal length optic enabled the use of arelatively large pinhole, diameter 75 µm, and minimisedpinhole closure during the laser pulse.
The probe, with pulse length of 15±5 ps FWHM, was frequencydoubled and delayed relative to the main beams by 0 and 1ns,and used to image the plasmas. The probe gave near diffractionlimited imaging over a 3 mm2 area at a magnification of x3.5 ina plane centred on the two foils. This was achieved using a108 mm diameter f/2.5 doublet with spacing of 10.4 mm tocollect the beam 284 mm from the target. The focus of the lenswas contained under vacuum before entering a 108 mmdiameter aspheric f/10 lens 1700 mm from the target. Thisproduced an image 966.9 mm behind the f/10 lens with a 10 µmresolution.
Electron density structures were recorded using a dark fieldSchlieren12) diagnostic array. The probe beam is split into threeequal intensity channels using a combination of 30/70 and50/50 beam splitters. These channels formed schlieren imagesusing circular stops of diameter 1.1 mm, 1.6 mm, and 2.1 mm.These correspond to a sensitivity to deflections due to uniformelectron density gradients in a 1 mm thick plasma of2.2 x 1018, 3.2 x 10¹⁸ , and 4.2 x 1018 cm-3.mm-1 respectively.The degree of deflection is a path integral though the cylindricalplasma, which needs to be considered for a more accurateinterpretation of the data12). The images were recorded on TeliCS3910 8 bit CCDs with 7 µm square pixels.
The focal spot on the left foil in Figures 1 and 2 was imagedwith an optical system similar to that used with the probe. Inthis case the image was recorded onto a 16-bit CCD. CCDbased pinhole cameras imaged X-ray emission from the right-hand foil at 37.5° to the foil surface normal and the collision ofthe two foils.
Results
Time integrated focal spot profiles are shown in Figure 3. Thecross-section was averaged over a 50 µm wide strip through the
centre of the spot. This profile, peaked at the centre, was typicalof PZP and RPP focusing of two beams on the left-hand foil.
The central peak feature is believed to result from flaws in thePZP manufacture and moving the focus of both beams back by2 mm to 5 mm reduced the intensity of this peak as shown inFigure 3. Measured focal spots indicate high spatial frequencystructures with a peak-peak separation of between 16 to 20 µm.
The effect of the PZP and RPP (at 5 mm defocus) is clear inFigure 4. These images are composites of three differentschlieren measurements. Each separate schlieren channel isassigned a primary colour and the resulting image provides acontour map of areas of electron density gradient perpendicularto the probe propagation in the plasma.
Figure 4. Schlieren image of the left CH foils taken 500 ps afterirradiation with ~85 J. a) shows focusing with PZP, andb) focusing with RPP. The laser approaches from the left of theimages. The blue, green and red images were recorded with1.1mm, 1.6mm, 2.1mm diameter circular stops that correspondto electron density gradients above 2.2x1018 cm-3.mm-1,3.2x1018 cm-3.mm-1 and 4.2x1018 cm-3.mm-1 respectively.
Both images show two vertical features corresponding to thefront (laser irradiated) and back surfaces of the plasma as theleft and right hand features respectively. The shape of theschlieren features is indicative of the envelope of the focus. Theschlieren images also show filament structures with a spacing of9 to 10 µm. As the schlieren image shows both the rising andfalling slope of any electron density feature the scale of thesefilaments is 20 µm, a scale to the structure observed in Figure 3.
Figure 5. Schlieren images of two colliding CH plasmas,recorded 500 ps after irradiation with PZP focussed beams and~90 J on each foil. Laser beams approach from the left and rightof the image. The blue and green images were recorded with1.1mm and 1.6mm diameter circular stops, which correspond toelectron density gradients of at least 2.2 x 1018 cm-3.mm-1 and3.2 x 1018 cm-3.mm-1 respectively.
0.5 mm0.5 mma) b)
0.5 mm
-0.6 -0.4 -0.2 0 0.2 0.4 0.6
Distance / mm
Nor
mal
ised
Inte
nsity
Figure 3. Focal spot profiles created using two main beamswith PZPs (blue) and RPPs (red) defocused by 5mm.

High Power Laser Programme – X-ray Laser and Long Pulse Plasma Physics
57 Central Laser Facility Annual Report 2001/2002
The interaction of two CH plasmas 500 ps after laser irradiationis shown in Figure 5. This composite image clearly illustratesthe effect of the central intensity spike due to the PZP,particularly on the right-hand foil. At this time the leadingedges of the plasmas, in the centre of Figure 5, are expected tohave interpenetrated by ~200 µm. Again horizontal electrondensity structure is observed, and is believed to be due to laserimprint.
The influence of a smoothed prepulse is shown in Figures 6;here schlieren images are taken 350 ps following the explosionof the right hand foil (see Figure 2). A 1.1mm diameter stop isused so gradients above 2.2 x 1018 cm-3.mm-1 are observed.
With no prepulse, Figure 6a, density filaments are clearlyobserved, and these structures are observed at all times. Thehorizontal filaments observed on the rear, non-irradiated, faceof the foil are due to laser imprinting. Figures 6b, and 6c show areduction in filamentation; in both cases this results from thesmoothed prepulse that irradiated the foil target before the mainPZP focused beams. Significant smoothing was observed in anarrow timing window. Prepulse timing is critical to obtainsmoothing and optimum exploding foil performance. Anoptimum centre-to-centre prepulse to main beam delay was80 ps.
This timing window occurs because the prepulse must arrivebefore the main pulse, see Figure 7, and a critical surface shouldform and detach before the main pulse irradiation. Further, themain pulse must irradiate the target before the plasma densityfalls below critical.
0
200
400
600
800
-200 -100 0 100 200
Time (ps)
Inte
nsity
(10
11 W
.cm
-2)
Figure 7. The curves illustrate the importance of relative timingbetween the prepulse and the main beams. In red is the mainpulse with FHWM of 80 ps, and the prepulse (FWHM of 17 ps)60ps early in black, and 80ps early in blue. 80 ps was theoptimum timing.
Conclusion
RPP and PZP focusing techniques are often used to form largearea focal spots and plasmas. However, these methods producehigh spatial frequency intensity non-uniformities, which inducepressure modulations across the target that can drive electrondensity filaments. These filaments persist in supersonicexploding plasmas used here and impair experimental data.Here we described a successful method of laser smoothingusing a pinhole to spatially filter a short duration prepulse topreform a plasma. This improved plasma uniformity sufficientlythat filamentation was not detectable by our diagnostics with10 µm spatial resolution and above 2.2 x 1018 cm-3.mm-1.
References
1. Woolsey NC, Ali YA, Evans RG, Grundy RAD, et al.Physics of Plasmas, 8, 5, 2439-2445, (2001)
2. Woolsey NC et al. CLF Annual Report 1999-2000,RAL-TR-2000-034, 42 (2000)
3. Woolsey NC et al. CLF Annual Report 1999-2000,RAL-TR-2000-034, 59 (2000)
4. Evans RG and Woolsey NC CLF Annual Report 1999-2000, RAL-TR-2000-034, 77 (2000)
5. Helander P, et al. CLF Annual Report 2000-2001,RAL-TR-2001-030, 58 (2001)
6. Y Kato, et al.Phys Rev Lett 53, 11, 1057 (1984)
7. R H Lehmberg, A J Schmitt, S E BodnerJ Appl Phys 62, 7, 2680 (1987)
8. S Skupsky, et al.J Appl Phys 66, 8, 3456 (1989)
9. A. R. Jones.J Appl Phys D, 2, 1789--1791 (1969)
10. Manheimer WM, Colombant DG and Gardner JHPhys Fluids, 25, 1644 (1982)
11. Hoarty D, Iwase A, Meyer C, Edwards J, and Willi OPhys. Rev Lett. 78, 3322 (1997)
12. Grundy RAD, et al. CLF Annual Report 2001-2002,RAL-TR-2002-013, 58 (2002)
a)
b)c)
Figure 6. The effect of a smoothed prepulse on a CHfoil is illustrated by three experiments. The rearsurface of the foil is shown. The schlieren image in a)is recorded with no pre-pulse, in b) and c) theprepulse heats the foil from the right in 60ps, and80ps before the drive beams respectively. The imageswere recorded 350ps after foil irradiation with themain beams using a 1.1mm diameter stop.
(a)
(b)
(c)
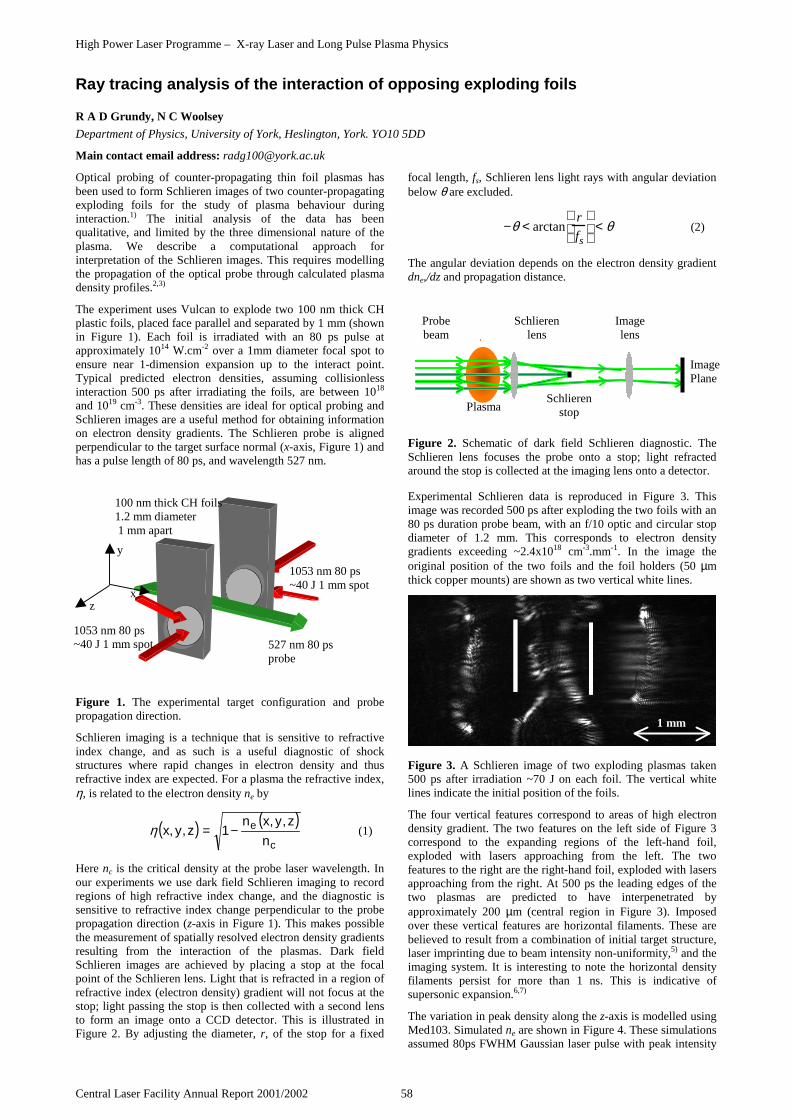
High Power Laser Programme – X-ray Laser and Long Pulse Plasma Physics
Central Laser Facility Annual Report 2001/2002 58
Optical probing of counter-propagating thin foil plasmas hasbeen used to form Schlieren images of two counter-propagatingexploding foils for the study of plasma behaviour duringinteraction.1) The initial analysis of the data has beenqualitative, and limited by the three dimensional nature of theplasma. We describe a computational approach forinterpretation of the Schlieren images. This requires modellingthe propagation of the optical probe through calculated plasmadensity profiles.2,3)
The experiment uses Vulcan to explode two 100 nm thick CHplastic foils, placed face parallel and separated by 1 mm (shownin Figure 1). Each foil is irradiated with an 80 ps pulse atapproximately 1014 W.cm-2 over a 1mm diameter focal spot toensure near 1-dimension expansion up to the interact point.Typical predicted electron densities, assuming collisionlessinteraction 500 ps after irradiating the foils, are between 1018
and 1019 cm-3. These densities are ideal for optical probing andSchlieren images are a useful method for obtaining informationon electron density gradients. The Schlieren probe is alignedperpendicular to the target surface normal (x-axis, Figure 1) andhas a pulse length of 80 ps, and wavelength 527 nm.
Figure 1. The experimental target configuration and probepropagation direction.
Schlieren imaging is a technique that is sensitive to refractiveindex change, and as such is a useful diagnostic of shockstructures where rapid changes in electron density and thusrefractive index are expected. For a plasma the refractive index,η, is related to the electron density ne by
( ) ( )c
e
n
zyxnzyx
,,1,, −=η (1)
Here nc is the critical density at the probe laser wavelength. Inour experiments we use dark field Schlieren imaging to recordregions of high refractive index change, and the diagnostic issensitive to refractive index change perpendicular to the probepropagation direction (z-axis in Figure 1). This makes possiblethe measurement of spatially resolved electron density gradientsresulting from the interaction of the plasmas. Dark fieldSchlieren images are achieved by placing a stop at the focalpoint of the Schlieren lens. Light that is refracted in a region ofrefractive index (electron density) gradient will not focus at thestop; light passing the stop is then collected with a second lensto form an image onto a CCD detector. This is illustrated inFigure 2. By adjusting the diameter, r, of the stop for a fixed
focal length, fs, Schlieren lens light rays with angular deviationbelow θ are excluded.
−θ < arctanr
fs
< θ (2)
The angular deviation depends on the electron density gradientdne,/dz and propagation distance.
Figure 2. Schematic of dark field Schlieren diagnostic. TheSchlieren lens focuses the probe onto a stop; light refractedaround the stop is collected at the imaging lens onto a detector.
Experimental Schlieren data is reproduced in Figure 3. Thisimage was recorded 500 ps after exploding the two foils with an80 ps duration probe beam, with an f/10 optic and circular stopdiameter of 1.2 mm. This corresponds to electron densitygradients exceeding ~2.4x1018 cm-3.mm-1. In the image theoriginal position of the two foils and the foil holders (50 µmthick copper mounts) are shown as two vertical white lines.
Figure 3. A Schlieren image of two exploding plasmas taken500 ps after irradiation ~70 J on each foil. The vertical whitelines indicate the initial position of the foils.
The four vertical features correspond to areas of high electrondensity gradient. The two features on the left side of Figure 3correspond to the expanding regions of the left-hand foil,exploded with lasers approaching from the left. The twofeatures to the right are the right-hand foil, exploded with lasersapproaching from the right. At 500 ps the leading edges of thetwo plasmas are predicted to have interpenetrated byapproximately 200 µm (central region in Figure 3). Imposedover these vertical features are horizontal filaments. These arebelieved to result from a combination of initial target structure,laser imprinting due to beam intensity non-uniformity,5) and theimaging system. It is interesting to note the horizontal densityfilaments persist for more than 1 ns. This is indicative ofsupersonic expansion.6,7)
The variation in peak density along the z-axis is modelled usingMed103. Simulated ne are shown in Figure 4. These simulationsassumed 80ps FWHM Gaussian laser pulse with peak intensity
Ray tracing analysis of the interaction of opposing exploding foils
R A D Grundy, N C Woolsey
Department of Physics, University of York, Heslington, York. YO10 5DD
Main contact email address: [email protected]
527 nm 80 psprobe
1053 nm 80 ps~40 J 1 mm spot
1053 nm 80 ps~40 J 1 mm spot
100 nm thick CH foils1.2 mm diameter 1 mm apart
x
y
z
ImagePlane
Schlierenlens
Imagelens
Schlierenstop
Probebeam
Plasma
1 mm

High Power Laser Programme – X-ray Laser and Long Pulse Plasma Physics
59 Central Laser Facility Annual Report 2001/2002
of 1014 W.cm-2, and 100 nm thick CH plastic foils. Med103 is afluid model and cannot model collisionless interactions normagnetic fields. Simply adding the ne from two plasmas canapproximate the interpenetration of two non-interacting, non-magnetised counter-streaming plasmas. This is the approachused in Figure 4 where the solid lines represent the summedresults and the dotted lines the Med103 simulations of singlefoils. The evolutions of the approximated electron densityprofile at 300 ps, 400 ps, and 500 ps after the peak of the laserpulse are shown. The derivative dne/dz can give some indicationof the electron gradients that may be expected, and may becompared with experimental data.
160
120
80
40
0
n e [
x1018
cm
-3]
-1.5 -1.0 -0.5 0.0 0.5 1.0 1.5Position [mm]
0.3 0.4 0.5
Figure 4. Med103 electron density profiles at 0.3, 0.4, and0.5 ns following the explosion of the foils placed at ±0.5 mm.The dotted curves show the simulations and solid curves thesum.
However, a more quantitative interpretation requires furtheranalysis that considers the radial symmetry of the plasmas (inthe xy-plane). The probe beam will be refracted along the paththrough the plasma in the y-axis (due to dne/dy) and the z-axis.The information along the z-axis is of most interest. This is aproblem that can be addressed using a ray-tracing approach.
As a probe beam propagates through a plasma of varyingelectron density the path of the ray is deviated according to thelocal refractive index η shown in equation (1). Under theassumption of geometric optics (i.e. the refractive index changeis small compared to the wavelength of light) the propagationpath of any given ray can be modelled 3) according to:-
∂2r
∂τ 2 = −12
Aλ2 ∂ne∂x
ˆ x (3)
Where A is a constant, r is the position of the ray and x is thedirection of the local density gradient. Equation (3) is solved fora large ensemble of rays using an iterative leap-frog routine.The computer model was benchmarked against analytic results4)
obtained for beam propagation in a spherically symmetricdensity profile using a distance of closest approach method. Themodel was found to be both stable and accurate.
The computer model assumes an axial density profile similar toFigure 4. The effect of a finite laser spot size was approximatedby a top-hat function, on the assumption that phase zone platesformed the focal spot and plasma expansion does not exceed thefocal spot diameter, therefore approximately 1-dimensional.
The plasma is divided in a series of zones and a uniform arrayof rays (typical 106 rays) propagated across this cylindricallysymmetric plasma. The angular deviation for a ray is calculatedduring each iteration. On completion of the ray tracecalculation, the predicted Schlieren image is then reconstructedby; a) removing rays with deflection angles below those in theinequality (2), and b) projecting the remaining rays back to themid-point of the simulated plasma. This is equivalent tomodelling a perfect optical imaging system. The imaged raysare binned to represent the effect of the experimental CCDdetector.
A ray tracing result for interpenetrating 100 nm thick CHplasmas with an initial separation of 1 mm and a delay of500 ps is shown in Figure 5. This ray tracing result is comparedand overlaid on the data shown in Figure 3. There is notemporal averaging to account for the 80 ps probe duration.
Figure 5. Comparison of a simulated Schlieren image inyellow with the experimental result taken from Figure 3.
Figure 5 clearly illustrates the correlation between theexperimental data and the ray tracing results. The position andshape of the central two features, which are of most interest, iscorrectly predicted. The positions of these features from thelaser-irradiated surfaces of the two foils are not as accuratelymatched.
We note the vertical modulation of intensity in the experimentaldata, particularly over a broad area of the right hand foil. Thesefeatures in low-density plasma highlight plasma filamentation.This filamentation is attributed to the initial target foil quality,and imprinting by the drive laser beams.5) These simulations donot model the affect of target nor laser intensity non-uniformities and are not expected to reproduce such features.
Schlieren images of colliding plasmas described here are three-dimensional in nature. The data may be approximatelyinterpreted using 1-dimension hydrodynamic simulations andcomparing the calculated electron density gradients.Comparison with experiment has been problematic and has ledto the development of a procedure based on ray tracing though acylindrically symmetric plasma. The simulated results broadlyreproduce experimental data, under the assumption of non-interacting counter-streaming plasma flow; the model will beused to interpret future experimental data. These simulationresults have enabled the design of a higher resolution, bothspatial and temporal, Schlieren diagnostic for use in futureexperiments5).
References
1. Woolsey NC, Ali YA, Evans RG, Grundy RAD, et al.Physics of Plasmas, 8, 5, 2439-2445, (2001)
2. Noll R, Claus R, Weikl B and Herziger GApplied Optics, 25, 5, 769-774, (1986)
3. Decker GW, Deutsch R, Kies W and Rybach JApplied Optics, 24, 6, 823-828, (1985)
4. G PertPlasma Physics, 25, 4, 387-419, (1983)
5. Grundy RAD, et al. CLF Annual Report 2001-2002,RAL-TR-2002-013, 55, (2002)
6. Evans RG and Woolsey NC CLF Annual Report 1999-2000, RAL-TR-2000-034, 77 (2000)
7. Helander P, et al. CLF Annual Report 2000-2001,RAL-TR-2001-030, 58 (2001)

High Power Laser Programme – Theory and Computation
Central Laser Facility Annual Report 2001/2002 60
Introduction
Electrons in the field of a circularly polarized laser pulse travelin circles with constant speed and radius. At ultrahighintensities individual electrons achieve relativistic speeds andgive rise to synchrotron emission into harmonics of the laserdriver up to some maximum cut-off1). In plasma, electrondensity fluctuations are necessary to generate net synchrotronradiation; this arises from the anharmonic oscillation ofelectrons across a density gradient. If these harmonics are phasematched with plasma waves then growth can be seen via amechanism similar to stimulated Raman scattering (SRS). Atultrahigh intensities the process becomes parametricallyunstable; hence stimulated harmonic generation (SHG) occurs.Growth can be seen for all harmonics up to a predicted cut-off,after which growth decays exponentially with harmonicnumber. At intensities of 1021 Wcm-2 for a 1µm laser we seeharmonic emission with wavelengths well into the hard x-rayregion.
A simplified, but general dispersion relationship for theparametric instability of ultra-intense, circularly polarized, laserlight in plasma of arbitrary density was presented in an earlierreport2). The resulting difference equation, much simpler inform than previous work3), reproduces familiar results andexpressions for Raman growth rates and stimulated harmonicgeneration.
The following work describes analysis where the differenceequation may be solved in underdense plasma by transforminginto a more tractable form involving Bessel functionsummations. This low-density analysis links our dispersionrelation to other separate but related studies in the field4).Expressions are derived for the growth rates of the generatedharmonics for all scattering angles. The dependence onharmonic number and emission angle is the same as thatgoverning the synchrotron radiation emitted into harmonicsfrom an electron in arbitrary circular motion.
The Difference Equation
The main result of our previous report was the differenceequation:
( ) ( ) 0,, 0
2
2
=++Φ∑=
−=
kkk nnn
nn ωωα
where, letting n kn = k + nk0 and s = k⊥ v0,
( ) ( )( ) ( ) ( )
( ) ( ) ( )
( ) ( )11
2
2
11
11
1111
2220
0
,4,
,,2,
,
1
,
1
42,
,,
±±±
±±
±±
−−++
=
+−=
+
++∆=
kk
kkk
kkkk
k
ωωα
ωω
ωωωα
ωωω
ωωωα
D
s
DD
s
DD
sv
Dpr
D( k) ( k) are the familiar dispersion relations for lightwaves and electron plasma waves. Here v0 is the electronoscillation velocity, which is directly related to the strength ofthe laser via the intensity parameter a0 (the normalized peakvector potential eA0/m0c
2), by v0 = a0 a ( a = (1+a02)1/2 is the
relativistic mass increase of the electrons in the field of the
laser). The laser modifies the plasma frequency such thatωpr
2 = ωp2/γa. Times are normalized to the inverse of the laser
driver frequency, 0-1, velocities to c and lengths to 0..
This is a 4th order linear difference equation for a scalarunknown with scalar coefficients. When expressed in matrixform the coefficients form the elements of an infinite symmetricpenta-diagonal matrix. Solutions to the system are found bynumerical root finding methods from which growing solutionscan easily be extracted. Figure 1 shows contour plots ofnormalized growth rates (Γ/ω0) in the (kx , k⊥ ) plane forunderdense plasma. These figures show for fixed ωpr
2 = 0.1 theemergence of harmonic generation with increasing intensity andare consistent with previous studies3).
Figure 1. Normalized growth rates for 0 = 1, 2, 5 and10 (a, b, c and d). For a) and b) contours start at a minimum of0.05 and increment by 0.05. For c) and d) contours start at 0.1and increment by 0.1.
Rarefied Plasma Dispersion Relation
We begin by expressing the difference equation in the form of apair of coupled second order difference equations, which can besolved in terms of Bessel functions of the first kind. In effect wehave converted the penta-diagonal form with simple elementsinto a dense matrix form involving Bessel functions. However,for the case of ‘rarefied’ plasma ( pr
2 << 1) headway can bemade although this can still correspond to quite high densities inultra-intense situations. We arrive at a general dispersion << 1:
012
02
=Ω
+ ∑l
lpr
D
FDω
with the mode frequency, ωn = Nω0 + Ω and
( ) ),()()()(2
221
21
20
nnnllll DDandsJsJsJv
F kω=−−= −+
Restricting attention to stimulated harmonic generation, weassume that a single harmonic is resonant, DN harmonic number N. Isolating this resonant denominator we
have:- NprN
Nl l
lpr FDD
D
FD 0
20
22 ωω −=
+Ω ∑
≠
FN then reduces to
Stimulated Synchrotron Radiation from Ultra-intense, Circularly Polarized LaserLight in Plasma
L J Hill, H C Barr
Physics Department, University of York, Heslington, York, YO10 5HZ
Main contact email address: [email protected]

High Power Laser Programme – Theory and Computation
61 Central Laser Facility Annual Report 2001/2002
( ) ( )22220 )(cot)( sJsJvF NNNN θ+′=
where s = Nv0 N in the low density limit. N is the emissionangle relative to the laser propagation direction.
Non-relativistic intensities
In the low intensity limit, s << 1, further reduction of thisequation is possible. Growth rates for simple three waveinteractions can be calculated assuming phase matching such DN
( )2
12102
1
cos1sin2
sin!
)2/()( NN
NNN
prN N
NvN θθθω +
=Γ −
This expression for the growth rate applies to SRS (N=1) andSHG (N>1) except for forwards SRS which is a four-waveinteraction. For high harmonics this growth rate peaks close toexact side scattering. Using Stirling’s formula the growth rate is
Npr
N
ev
≈Γ
221 0
2
1
πω
We see from these expressions the dominance of stimulatedRaman scattering over harmonic emission in the weaklycoupled limit.
Relativistic intensities
!" >> pr, 2 term dominates in the left hand side of the equation. Wecan write DN = (N+ )2 pr
2 – kN2 – where is a
mismatch factor. Optimum growth arises when this mismatch iszero so that
Npr FN
D
20
23 ω
−=Ω
For the low frequency fluctuation D0 2 2 sin2 N/2), so
that the growth rate is
3
1
22
2sin2
2
3N
NprN FN
=Γ θω
This is exactly the expression obtained by Sakharov &Kirsanov4). Assuming N and consideringrelativistic laser intensities so that the normalized electronvelocity, v0 , gives s = N and FN N(N)]2 —4/3.This decrease of the growth rate with harmonic number iscountered by the increase in the wavenumber of the lowfrequency fluctuation k, so that:
[ ] 9/13/23/123/2 48.0)(2
3 −≈′=Γ NNJN prNprN ωω
Then for high harmonics at relativistic intensities, the growthrate falls off with N at a slow rate until N = Nmax a
3. This isthe same dependence that appears for stimulated backscatteredharmonic generation from linearly polarized pulses5). For alinearly polarized laser, only odd harmonics exist in the back-scattered (θN = π) direction5), whereas for circular polarizationFN shows only the fundamental is non-zero in the back-scattered direction but both odd and even harmonics can exist atoff axis angles.
The form of FN from the low-density dispersion relationrecovers exactly the same dependence on harmonic number andemission angle that is obtained for the synchrotron radiationfrom a single electron in circular orbit. This dependence
emerges generally for rarefied plasma densities without makingassumptions either about far field or about coherent orincoherent scattering.
An electron in circular orbit at relativistic speed emits a narrowpencil of light in the direction of motion contained within arange of angles a. Viewed from a particular direction(kN), this is observed only for a short time and hence contains abroad range of frequencies up to a
30. Since the motion is
periodic this is at the discrete set of harmonic frequenciesN 0. If the lifetime of the radiation is finite for, say, an
ultra-intense, ultra-short pulse this will give width to theharmonic lines. For example a pulse of duration 500fs implies aline width of 0 . The power radiated into a solidangle d Nth harmonic is proportional to FN :-
NN FN
c
e
d
dP 220
2
2ω
π=
ΩThe two terms in FN relate to radiation polarizations both in andout of the plane of the electron orbit and are of comparablemagnitudes except for the cos N dependence.
For high harmonic numbers N >> 1, asymptotic forms for FN
are available. These show strong emission for harmonicnumbers N and angles N satisfying
( ) 13
3/222 <+− δθγ a
N
When the maximum harmonic number is Nmax a3.
Conclusions
Following on from our previous report we have presented someresults of growth rates calculated from the difference equation.These results and others are in agreement with previous resultsfrom other studies given in the references.
For rarefied plasma we have linked our work to that ofSakharov & Kirsanov. Indeed the exact same expressions havebeen derived. Upon testing the assumptions made by theaforementioned authors we conclude that the rarefied plasmaassumptions given are valid for densities of pr
2 -3. In thisregime, growth rates directly from the difference equation agreewith those calculated from the Bessel function formula givenabove to within a relative error of 10%. At higher intensities thedifference equation must be used to obtain correct growth rates.
The expression for rarefied plasma growth rates at relativisticlaser intensities is seen to recover the exact same dependenciesas the well-known result obtained for the synchrotron radiationfrom a single electron in circular orbit.
References
1. J. D. JacksonClassical Electrodynamics, 2nd ed. (Wiley, New York,1975), Chap 14.
2. H. C. Barr and L. J. HillCLF Annual Report 2000-2001, RAL-TR-2001-030, 59(2001)
3. B. Quesnel, P. Mora J. C. Adam, S. Guérin, A. Héron andA. Laval Phys. Rev. Lett. 78 2132 (1997)
4. A. S. Sakharov and V. I. KirsanovPhys. Plasmas. 4 3382 (1997)
5. P. Sprangle and E. Esarey Phys. Rev. Lett. 67 15 2021 (1991)

High Power Laser Programme – Theory and Computation
Central Laser Facility Annual Report 2001/2002 62
Introduction
The theoretical description of atoms and ions in strong laserfields is of essential importance to understand the atomicresponse to the laser field in detail. One of the topics that hasreceived great attention over the last decade is the relativeimportance of double and single ionization. This ratio is ofinterest in two different types of laser fields: low frequency andhigh intensity, as well as high frequency and ‘low’ intensity.
Many theoretical methods have focused on double versus singleionization for atoms subjected to a high-intensity low-frequencylaser field. Walker et al1) demonstrated that double ionizationwas significantly more pronounced in the atomic response thancould be expected from a single-active-electron picture. Theseexperiments provided the impetus for many theoreticalapproaches to describe the non-perturbative behaviour of two-electron systems in intense laser fields2-5).
Recent developments in the generation of high-intensity X-raylaser sources6) have recently stimulated interest in thetheoretical description of double ionization processes at highfrequencies. At these frequencies only a few photons arerequired to eject two electrons from the atom. However, suchphotons may not only ionize the atom; they may also besufficiently energetic to ionize singly charged ions. At thesephoton energies, the competition between sequential and non-sequential double ionization probes the influence of electronicinteractions on the atomic behaviour.
Several different types of methods exist for the description ofatoms in strong laser fields. In a time-dependent approach, onesolves the Schrödinger equation for an atom subjected to a shortintense laser pulse directly. In a time-independent approach, oneuses the Floquet-Fourier Ansatz to transform the time-dependent Schrödinger equation into a time-independent one.
The time-independent R-matrix Floquet approach5) is bestsuited when the number of photons absorbed is relatively small.As a consequence of the Fourier-Floquet Ansatz, the atomicwavefunction must be determined for each net number ofphotons absorbed or emitted. In order to keep the calculationsfeasible, it is necessary to restrict the total net number ofphotons absorbed or emitted.
The R-matrix Floquet approach has presently only been appliedto investigate single ionization processes. In order to describedouble ionization processes within the R-matrix Floquetapproach, we have combined R-matrix Floquet theory withB-spline basis sets for the description of the two-electroncontinuum. B-spline basis sets were introduced for atomicphysics calculations about 15 years ago7). Since B-spline basissets allow continuum effects to be included in a straightforwardmanner, they are now widely used in theoretical atomicphysics8).
We have chosen to study He for our initial calculations ondouble photoionization within the R-matrix Floquet approach,since He is the simplest two-electron atom. A schematicdiagram of the He energy levels is given in Figure 1, where wehave highlighted the energy levels that we are particularlyinterested in: the 1s2 ground state, and the lowest doubly excitedstate 2s2. These states are chosen because of the large amount ofexperimental and theoretical data available for the 1s2 state, andbecause the competition between autoionization andphotoionization for doubly-excited states is important for thedynamics of atoms in strong laser fields.
Figure 1. Schematic energy diagram of He. Our focus is ondouble and single photoionization of He initially in the 1s2 and2s2 states. Two distinct photoabsorption pathways for the 2s2
state are indicated.
Double photoionization using B-spline basis sets
We have first established that B-spline basis sets are well suitedfor the description of the double continuum by examining therelation between double and single photoionization of He in the1s2 ground state within perturbation theory. This process hasbeen studied extensively over the last decade, since this processmeasures the importance of electron interactions within atoms.The photon is absorbed by a single electron; a many-electronresponse thus indicates energy transfer from one electron to theother.
In order to describe the two-electron continuum, we describe itin terms of products of B-spline basis functions. B-splines arepiecewise polynomials with maximum smoothness. They arehighly suited to describe smooth functions, such as atomic wavefunctions. Although B-splines are non-orthogonal functions,their limited extent means that each B-spline has a non-zerooverlap with a small number of other spline functions. Thismeans that the matrix calculations generally involve bandedmatrices.
Results for the ratio between single and double ionization ofground-state He9) are shown in Figure 2, and are compared toother theoretical and experimental data10,11). The agreementwith the converged close-coupling calculations10) is highlysatisfactory. The differences close to threshold are due to thepresent method having difficulty in describing outgoingelectrons with identical energy. These differences can inprinciple be reduced by enlarging the box size. The agreementwith experiment11) is also quite good with a difference of lessthan 5% above a photon energy of 120 eV.
Combining B-spline basis sets and R-matrix Floquet theory
After demonstrating the appropriateness of the B-spline basisset for describing the two-electron continuum, we haveintegrated the B-spline basis sets into R-matrix Floquet theory.We thus describe the full motion of the two electrons in eachFloquet block. The main changes involve the determination ofthe Floquet R-matrix and the data input routines.
Double ionization processes in the R-matrix Floquet approach
H W van der Hart, L Feng
Department of Applied Mathematics and Theoretical Physics, Queen’s University Belfast, Belfast BT7 1NN
Main contact email address: [email protected]

High Power Laser Programme – Theory and Computation
63 Central Laser Facility Annual Report 2001/2002
Figure 2. Ratio between double and single photoionization forground-state He. Results using the B-spline basis (solid blackline) are compared to experimental results11) (purple circles) andother theoretical results10) (dashed blue line).
Firstly, we have investigated single photoionization from theground state of He within this approach. The results obtainedusing the new code are in excellent agreement with the previousresults. It should be emphasized that the R-matrix Floquetapproach employs a more sophisticated approach to describingthe asymptotic wave functions than the previous calculations,and that minor differences between the two sets of results wouldnot be unexpected. However, the agreement gives us confidencein the accuracy of the approach.
One of the problems of the R-matrix Floquet approach fordouble ionization is the computational requirement. A properdescription of the double continuum requires an extensive basisset. In the R-matrix Floquet approach, we need to multiply thisbasis set by the number of Floquet blocks included in thecalculation. In order to keep the calculation manageable on a2Gb PC, we have only included the minimum number ofFloquet blocks, namely 2.
Despite the limitation to 2 Floquet blocks, there are still newphysical processes that can be investigated using this approach:the competition between double and single ionization when theinitial state is a doubly excited state. In this case, as shown inFigure 1, several pathways involving the absorption of a photonlead to ionization. Firstly, direct photoabsorption can lead tosingle as well as double photoionization of 2s2. Secondly, the2s2 state may autoionize to the 1s state of He+ with the emissionof an electron. Following autoionization, the 1s state of He+
may absorb a photon, possibly exciting the 2p state of He+.
Figure 3 shows the ratio for double to single photoionization forthe 2s2 state of He embedded in a laser field with an intensity of5x1011 W/cm2 as obtained by the R-matrix Floquet approachwith B-spline basis sets12). The results are compared toexperimental results for double photoionization of Be13), andHe11). Since the two valence electrons of the Be ground state arein 2s2, the theoretical results and the experimental results for Beare expected to be similar. The similarity with the He results ismore surprising, although electron-electron effects are expectedto be strong for both types of states.
Figure 3 shows that the ratio between double and singlephotoionization is very similar for the He 2s2 state and theBe 1s22s2 state with a relative difference of about 20%. Themain difference with the He results can be seen around a final-state energy of 0.72 a.u. At this particular final-state energy, the1s – 2p transition in He+ becomes resonant, so that the dominantphotoabsorption process is autoionization of 2s2 followed byexcitation of the residual He+ ion to the 2p state. Since reachingthis final state requires absorption of one photon, the ratio
between double and single ionization, involving the absorptionof a single photon, decreases rapidly at a final-state energy of0.6 a.u. This decrease is absent in the He results since theground state of He cannot autoionize.
Figure 3. Ratio between double and single ionization involvingphotoabsorption. Present results for the 2s2 state of He (solidline, filled circles) are compared to experimental results for Be(filled triangles) and ground-state He (open circles).
Conclusions
We have extended the R-matrix Floquet approach to enable thestudy of double ionization of atoms embedded in strong laserfields. This has been achieved by combining R-matrix-Floquettheory and B-spline basis sets. The accuracy of the approach isverified by examining the ratio between single and doublephotoionization of ground-state He. We have determined thebranching ratios for several photoabsorption processes that canlead to either single or double ionization. We havedemonstrated that the ratio between double and singlephotoionization may be crucially dependent on the presence ofresonances for the singly ionized target.
References
1. B Walker, B Sheehy, L F DiMauro, P Agostini, K JSchafer and K C Kulander, Phys. Rev. Lett. 73, 1227(1994).
2. J S Parker, L R Moore, K J Meharg, D Dundas and K TTaylor, J. Phys. B 34, L69 (2001).
3. J B Watson, A Sanpera, D G Lappas, P L Knight and KBurnett, Phys. Rev. Lett. 78, 1884 (1997).
4. P G Burke, P Francken and C J Joachain, J. Phys. B 24,761 (1991).
5. J Zhang and P Lambropoulos, Phys. Rev. Lett. 77, 2186(1996).
6. J Andruszkow et al, Phys. Rev. Lett. 85, 3825 (2000).
7. W R Johnson and J Sapirstein, Phys. Rev. Lett. 57, 1126(1986).
8. H Bachau, E Cormier, P Decleva, J E Hansen andF Martín, Rep. Prog. Phys. 64, 1815 (2001).
9. H W van der Hart and L Feng, J. Phys. B 34, L601 (2001).
10. A S Kheifets and I Bray, Phys. Rev. A 54, R995 (1996).
11. J A R Samson, W C Stolte, Z-X He, J N Cutler, Y Lu andR J Bartlett, Phys. Rev. A 57, 1906 (1998).
12. L Feng and H W van der Hart, submitted for publication.
13. R Wehlitz and S B Whitfield, J. Phys. B 34, L719 (2001).

High Power Laser Programme – Theory and Computation
Central Laser Facility Annual Report 2001/2002 64
Floquet theory simplifies the solution of the time-dependentSchrödinger equation for an atom in a strong laser field byassuming the laser intensity varies slowly with time. Theresulting quasi time-independent Schrödinger equation may besolved accurately using R-matrix theory even for multielectronatoms and ions. Numerical solutions of the corresponding time-dependent Schrödinger equation have so far been limited eitherto one or two active electrons or to simplified targetdescriptions. In those cases where both Floquet and numericalsolutions are available, the two are found to agree provided thelaser pulse varies slowly over the cycle time of the laser.
Using R-matrix-Floquet theory we have studied the multiphotonionization rate for argon atoms in a KrF laser field. Thecalculations predict resonance effects in the ionization rate forlaser intensities in the range 1012 - 1014 W/cm2. The resonantprocesses are manifested as strongly avoided crossings of thecalculated Floquet quasi-energies. We have also shown thatthese field-atom resonances strongly influence thecorresponding harmonic generation rates. The calculations forAr atoms in a 248 nm laser field show strong enhancements ofthe 3, 5 and 7-th harmonics at relatively low laser intensities.These enhancements are expected to be experimentallyobservable. Similar calculations to investigate multiphotonionization and harmonic generation by Neon atoms arecontinuing.
Floquet Dynamics
Floquet dynamics techniques provide a framework forconsidering shorter pulses where the usual Floquet approachwould be invalid. In particular they allow the transfer of fluxbetween the field-dressed states to be followed as the intensityof the laser pulse sweeps through the region of quasi-energyavoided crossings. In effect the Floquet states provide a basis inwhich to expand solutions of the time-dependent Schrödingerequation.
A non-Hermitian Floquet theory of this type has been tested byDay et al (2000) 2) against numerical solutions of the time-dependent Schrödinger equation for hydrogen atoms in a strongshort laser pulse. It is assumed that the time evolution of theexpansion coefficients of the time-dependent states is slowcompared to the time-dependence of the Floquet state itself. Thelatter time-dependence may then be removed using theorthogonality properties of the Floquet states. Day et alobtained good agreement between the Floquet dynamics andfull numerical solutions.
We have extended the Floquet dynamics method to treatmultielectron atoms using R-matrix-Floquet states. In this initialstudy we have not taken full account of wave functions whichextend beyond the R-matrix sphere. As a consequence errors areintroduced into the results for the higher lying Floquet states inthe regions near strongly avoided quasi-energy crossings.Numerical studies have been carried out to check theprocedures introduced to minimize these effects. In future workthese long-range effects will be taken fully into account.Floquet dynamics calculations have been carried out to studyhow multiphoton ionization of Ar atoms depends on the shapeof the laser pulse.
The results in Figure 1, below, show Floquet state probabilitiesfor a seven Floquet state calculation of Argon in a 248 nm sin2
laser pulse with peak intensity 1.1 x 10¹⁴ W/cm2. The statescorrespond to the quasi-energies described previously 3) . At thebeginning and end of the pulse the Floquet states are field-free
atomic states. Significant population of the excited states isobserved. By controlling the pulse shape the Floquet statepopulation can be controlled. These numerical experiments mayserve as a guide to experiment.
0 5 10 15 20 25 30 35 40Time (optical cycles)
0
0.1
0.2
0.3
0.4
0.5
0.6
0.7
0.8
0.9
1
1.1
Flo
quet
sta
te p
roba
bilit
y
Floquet state probabilities for Ar in a 248nm pulse(sin
2 pulse, 40 optical cycles, peak intensity 1.1x10
14 Wcm
−2)
1S
e
5s1P
o
1F
o
3d1P
o
Figure 1. Floquet state probabilities during a 248nm pulse.
We have extended these experiments to study coherent controlof field-free atomic state populations via asymmetric pulseshapes. The results will be published shortly.
The probability of populating a particular state at the end of thelaser pulse is shown in Figure 2. Laser pulses with lengths up to40 optical cycles have been considered. In each case the pulse istaken to have a sin2 amplitude and the fraction of the pulselength over which the intensity is increasing is varied. Thisfraction is indicated in the legend for each of the curves in thefigure. It is clear that the population of a state at the end of thepulse may be significantly altered depending on the pulse shape.For example, it is seen that the population of the 3d1P0 state isenhanced by a sharply rising pulse with a slow decay and isreduced for a slowly rising pulse.
0 10 20 30 40
Pulse length (optical cycles)
0
0.02
0.04
0.06
0.08
0.1
Sta
te p
roba
bilit
y at
end
of p
ulse
0.10.250.50.750.9
State probabilities for Ar after a 248nm pulse(sin
2 pulses, peak intensity 1.1x10
14 Wcm
-2)
3d1P
o
1F
o
5s1P
o
Figure 2. State probabilities after a 248 nm pulse.
Non-Hermitian Floquet Dynamics of Argon Atoms
M Plummer, C J Noble
CLRC Daresbury Laboratory, Daresbury, Warrington, Cheshire, WA4 4AD
Main contact email address: [email protected]

High Power Laser Programme – Theory and Computation
65 Central Laser Facility Annual Report 2001/2002
Future work
Various improvements to our implementation of the Floquetdynamics approach are being developed and will be used inmore general studies of the multiphoton ionization of the inertgases. This work will involve the use of large-scale parallelcalculations.
Future work will concentrate on developing methods forobtaining numerical solutions to the time-dependentSchrödinger equation for multielectron atoms. Techniques suchas time-dependent R-matrix theory will be investigated. It isexpected that these new techniques will provide insight onmultiphoton processes involving very short (attosecond) laserpulses and pulse intensities above 1015 W/cm2.
References
1. M Plummer and C J Noble, J.Phys.B:At.Mol.Opt.Phys. 35L51 (2002)
2. H C Day, B Piraux and R M Potvliege, Phys. Rev. Phys. A61 031402 (2000).
3. M Plummer and C J Noble, J.Phys.B:At.Mol.Opt.Phys. 33L807 (2000)

High Power Laser Programme – Theory and Computation
Central Laser Facility Annual Report 2001/2002 66
Introduction
Magnetic fields can be generated in initially unmagnetised laserproduced plasmas by a variety of effects which have theircommon origin in Faraday's equation ∂B/∂t = curl E. Theelectric field is obtained from a general Ohm's law1) andmagnetic field generation occurs due to non-parallel density andtemperature gradients, due to the ponderomotive light pressureand due to currents and instabilities in the plasma.
The equation for the evolution of magnetic field approximatesto
)1
(curl)(curl4
22
ee
pne
cc
t∇+×+∇=
∂
∂BvB
B
πσ (1)
where pe includes the electron pressure and the ponderomotivepressure. Magnetic fields of some tens of MGauss areobserved2) at irradiances of 1014 - 1015 Wcm-2 due to the densityand temperature gradients but fields of Gigagauss magnitudeare predicted to occur3), and have recently been measured4) atirradiances around 1019Wcm-2 due to the gradient ofponderomotive pressure.
Geometric Effects on the Magnetic Field Distribution
Figure 1. Osiris simulation of the quasi DC magnetic fieldsgenerated by a laser at normal incidence.
The original simulations of ponderomotively generatedmagnetic fields5,6) considered lasers at normal incidence and thegenerated magnetic fields are toroidal around the laser focalspot. For comparison with the later simulations Figure 1 showsa simulation using the 2-1/2D PIC code OSIRIS7) for anincident irradiance of 1019 Wcm-2 on a plasma with a lineardensity ramp increasing to 15nc. The features A, B, C label
respectively the magnetic fields generated by the density andtemperature gradients (at low density), by the ponderomotiveforce (around critical density) and by the Weibel instability(small features within the focal spot). Obviously in the normalincidence case the magnetic fields are of equal magnitude andopposite polarity either side of the focal spot.
The experimental measurements of GGauss magnetic fields byTatarakis et al4) used a laser incident at 45 degrees and thismakes a surprisingly major difference to the magnetic fieldgeometry, Figure 2. Equation 1 contains diffusion andadvection terms as well as the source term and in the hightemperature plasma the magnetic field is efficiently advectedaway from the source region by the electron flow.
Figure 2. Schematic of the 45 degree simulation geometry.
Figure 3. Osiris simulation of the quasi-DC magnetic field at45 degree incidence.
Simulations of Ponderomotively Generated Magnetic Fields
R G Evans
Physics Department, University of York, York, YO10 5DD
Main contact email address: [email protected]

High Power Laser Programme – Theory and Computation
67 Central Laser Facility Annual Report 2001/2002
The difference from Figure 1 is striking, Figure 3. The gradientof ponderomotive pressure now has components into and awayfrom the target and the field generated on the low density side israpidly advected away by the electron expansion while the fieldon the high density side is largely confined. The result is thatthe positive polarity field on the high density side is intense andcompact while the negative polarity field on the low densityside is weak and diffuse. The total flux is the same for bothpolarities except where the field is advected out of thesimulation box.
The simulations of the quasi-DC magnetic field are very robustagainst changes in the density gradient, maximum density andlaser polarisation which together change the DC magnetic fieldby no more than 20%. The magnetic field rises only a littlemore slowly than the laser rise time of 20 fs in the simulationand then the peak magnetic field stays fairly constant althoughits position moves as laser 'hole-boring' proceeds.
Intensity Scaling and Comparison with Experiment
Figure 4 shows the peak DC magnetic field in the Osirissimulations together with the experimental measurements ofTatarakis et al4) and the scaling with the ponderomotivepotential as would be expected from Sudan's analytical model3).Agreement with experiment is excellent although theexperimental data shows signs of having a weaker dependenceon irradiance. The agreement with Sudan's model is also goodbut the simulations fall increasingly below the model atirradiances above 1020Wcm-2 where plasma motion due to holeboring becomes more rapid.
Figure 4. Intensity dependence of the DC magnetic field fromthe simulations and from experimental measurements.
Associated Plasma Density and Electric Fields
The technique for measuring magnetic fields in Reference4) isthrough the effects on the propagation of laser harmonic light.Given the likelihood of producing GGauss magnetic fields atirradiances over 1021Wcm-2 it is interesting to speculate as towhether these regions of highly magnetised plasma could beobserved in X-ray emission so as to measure the effect of thehuge fields on the bound energy levels. From the Osirissimulations it is possible to assign electron and ion densities tothe region of magnetised plasma by calculating the densities onthe high and low density sides of the magnetic field maximumwhere the field has fallen to half the peak value. Figure 5shows these densities as a function of irradiance.
The density of the magnetised plasma increases from a fractionof critical density at 1018Wcm-2 to over 10 times critical densityat 1021Wcm-2. At the higher densities a plasma of a fewmicrons in size will be readily detectable in its X-ray emission
even though the duration of the magnetised phase may be lessthan 1 ps. Figure 5 also shows that the electron and iondensities are not equal and so the non-neutral plasma must alsohave an associated DC electric field. Osiris can also calculatethe quasi DC electric field and this turns out to be remarkablylarge as shown in Figure 6 at an irradiance of 1020Wcm-2. Thepeak value of the electric field is around 2x10¹¹Vcm-1 and inspectroscopic terms this electric field will dominate themagnetic field in its effect on the energies of bound electrons.
Figure 5. Plasma density associated with the magnetic fields.
Figure 6. Quasi DC electric fields in the Osiris simulations.
Since Faraday's Law suggests that the time derivative of Bdepends on curl E, it might seem reasonable that the electricfield would decay to zero faster than the magnetic field once thelaser drive is turned off. This has also been investigated usingOsiris with some very short laser pulses of 60fs duration but theresults (Figure 7) show that the electric field persists after thelaser pulse and its ratio to the magnetic field stays remarkably
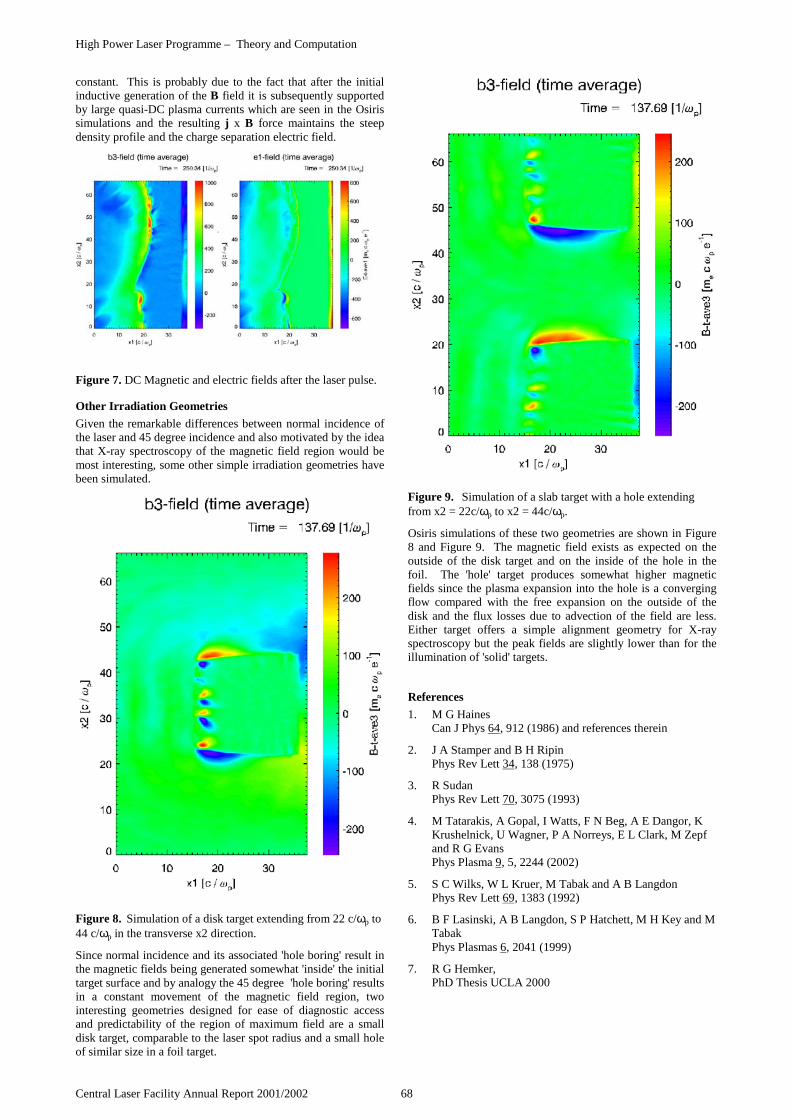
High Power Laser Programme – Theory and Computation
Central Laser Facility Annual Report 2001/2002 68
constant. This is probably due to the fact that after the initialinductive generation of the B field it is subsequently supportedby large quasi-DC plasma currents which are seen in the Osirissimulations and the resulting j x B force maintains the steepdensity profile and the charge separation electric field.
Figure 7. DC Magnetic and electric fields after the laser pulse.
Other Irradiation Geometries
Given the remarkable differences between normal incidence ofthe laser and 45 degree incidence and also motivated by the ideathat X-ray spectroscopy of the magnetic field region would bemost interesting, some other simple irradiation geometries havebeen simulated.
Figure 8. Simulation of a disk target extending from 22 c/ωp to44 c/ωp in the transverse x2 direction.
Since normal incidence and its associated 'hole boring' result inthe magnetic fields being generated somewhat 'inside' the initialtarget surface and by analogy the 45 degree 'hole boring' resultsin a constant movement of the magnetic field region, twointeresting geometries designed for ease of diagnostic accessand predictability of the region of maximum field are a smalldisk target, comparable to the laser spot radius and a small holeof similar size in a foil target.
Figure 9. Simulation of a slab target with a hole extendingfrom x2 = 22c/ωp to x2 = 44c/ωp.
Osiris simulations of these two geometries are shown in Figure8 and Figure 9. The magnetic field exists as expected on theoutside of the disk target and on the inside of the hole in thefoil. The 'hole' target produces somewhat higher magneticfields since the plasma expansion into the hole is a convergingflow compared with the free expansion on the outside of thedisk and the flux losses due to advection of the field are less.Either target offers a simple alignment geometry for X-rayspectroscopy but the peak fields are slightly lower than for theillumination of 'solid' targets.
References
1. M G HainesCan J Phys 64, 912 (1986) and references therein
2. J A Stamper and B H RipinPhys Rev Lett 34, 138 (1975)
3. R SudanPhys Rev Lett 70, 3075 (1993)
4. M Tatarakis, A Gopal, I Watts, F N Beg, A E Dangor, KKrushelnick, U Wagner, P A Norreys, E L Clark, M Zepfand R G EvansPhys Plasma 9, 5, 2244 (2002)
5. S C Wilks, W L Kruer, M Tabak and A B LangdonPhys Rev Lett 69, 1383 (1992)
6. B F Lasinski, A B Langdon, S P Hatchett, M H Key and MTabakPhys Plasmas 6, 2041 (1999)
7. R G Hemker,PhD Thesis UCLA 2000

High Power Laser Programme – Theory and Computation
69 Central Laser Facility Annual Report 2001/2002
Introduction
Optical birefringence in magnetised plasmas is well known andis described by the Faraday effect for propagation along themagnetic vector and the Cotton-Mouton effect for propagationperpendicular to B. The birefringence and its associated cutofffrequencies have been used recently1) for the measurement ofGigagauss magnetic fields in laser produced plasmas atirradiances around 1020Wcm-2.
What is not often appreciated is that in relativistic plasmas,even in the absence of a magnetic field, the velocity dependenceof the relativistic mass and the distinction between thelongitudinal and transverse masses of the electron can causebirefringence in some special cases when the electrondistribution function is not isotropic.
Dielectric Tensor and the Dispersion Relation
In the absence of collisions the starting point is the relativisticVlasov equation2):
0)( 0 =∇⋅×++∇⋅+∂
∂f
c
mc
ef
c
t
fpHpEp
γ
µ
γ
where p is the momentum in units of mc and m is the electronrest mass. Labelling the coordinate axes 1,2,3 and consideringa wave propagating in the 1 direction ie k = (k,0,0), the plasmadielectric function χ may be obtained by linearising therelativistic Vlasov equation to obtain,
KI2
2
ω
ωp−=
where the components of the tensor K are given by
p30
21
21
2
2
2
11)/(
dfcap
p
c
aK ∫ −
−=
γγ
γ
p30
21
111
)/(
)/(df
cap
capp
c
aKK i
ii ∫ −
−==
γγ
γ
pp3
030
21
2
2
)/()1( d
fdf
cap
pp
c
aK ij
jiij ∫∫ +
−−=
γδ
γγ
a = ω/k is the phase velocity of the wave, f0 is the unperturbeddistribution function and i=2,3 in the second equation andi=2,3; j=2,3 in the third equation..
The dispersion relation is obtained from the dielectric tensor χby requiring that
0)(
0)(
0
32
33232131
32322
22121
313212111
=−++
=+−+
=++
EnEE
EEnE
EEE
χχχ
χχχ
χχχ
where n = c/a is the refractive index for the wave.
Using the above expression for χ in terms of the tensor K weobtain the determinant
022
3322
322
312
2322
22222
212
132
122
1122
=
−−−−
−−−−
−−−
ckKKK
KckKK
KKK
ppp
ppp
ppp
ωωωω
ωωωω
ωωωω
The element in the upper left-hand corner of the determinant iscontributed by the longitudinal mode, and the other twodiagonal elements are contributed by the transverse modes for2-polarisation and 3-polarisation respectively. The off diagonalelements, when non-zero, couple the various modes together.
For any momentum distribution for which
),,()( 32100
pppff =p
examination of the integrals for Kij shows that
0| ji11 === ≠ijii KKK (i = 2,3; j = 2,3)
so the dielectric tensor and the determinant in the dispersionrelation become diagonal and the three modes uncouple.However the integrals K22 and K33 may still be different and theplasma will be birefringent with principal planes in the 2 and3 axes.
The integrals for Kij will in general have poles at p1 = γa/cwhich will give rise to Landau damping but if we confineourselves to the fast electromagnetic modes with phase velocitygreater than c then the Landau damping will be absent.
Two Electron-Stream Plasma
As a simple example of a relativistic distribution that gives riseto strong birefringence consider a plasma composed of twocounter-propagating electron streams:
( ))()()()(2
1),,( 020231321
0pppppppppf ++−= δδδδ
This makes Kij diagonal and directions 2 and 3 are the principalpolarisation axes.
The refractive indices for the two transverse modes are:
222
222 1
p
pn
Ω
Ω
βω +−= and
2
223 1
ω
pn
Ω−=
where Ωp2 = ωp
2/γ and β,γ are the Lorentz factors associatedwith the momentum p0.
The cut off frequencies from the above refractive indices aresimply ω2
2 = ωp2/γ3 and ω3
2 = ωp2/γ, i.e. they are determined
respectively by the longitudinal and transverse masses γ3m andγm.
Birefringence in Unmagnetized Relativistic Plasmas
J Moore
Mechanical Engineering Department, Imperial College of Science and Technology, London SW7 2BX
R G Evans
Physics Department, University of York, York, YO10 5DD
Main contact email address: [email protected]

High Power Laser Programme – Theory and Computation
Central Laser Facility Annual Report 2001/2002 70
The expressions for the two refractive indices show that for thenon-relativistic case (β << 1), n2 ≅ n3 and for the stronglyrelativistic case (γ >> 1), n2 ≅ n3 ≅ 1. The degree ofbirefringence is maximised for moderately relativistic cases andFigure 1 shows the dispersion in both transverse polarisationsfor the case p0 = 1.37 which maximises the birefringence atω/ωp = 2.0 i.e. the quarter critical density in the non-relativisticlimit. The ratio n2/n3 in this case is only 1.00873 and we seethat for moderately under-dense plasmas the relativisticallyinduced birefringence is always small. The birefringence canbe very large for frequencies close to or below the non-relativistic cut off frequency, i.e. the plasma frequency.
Figure 1. The refractive indices for each polarisation in thecase of a two stream electron distribution function. Theabscissa 'omega' is the ratio of the wave frequency ω to thenon-relativistic plasma frequency ωp.
Relevance to Harmonic ’Cut Off’ Measurements
The recent observations of Ggauss magnetic fields in laserproduced plasmas have observed that the harmonics of the laserlight have their polarisation rotated by an amount that increaseswith irradiance and decreases with the order of the harmonic.In extreme cases one polarisation of the harmonic is suppressed,which is attributed to the cut off of the X-wave in the CottonMouton effect.
The relativistic effects described here will in principlecomplicate the interpretation of the polarisation data since theselaser plasmas are known have very large populations ofmoderately relativistic electrons (γ ~ 5). However we believethat the relativistic effects are small since the major populationsof laser accelerated electrons are in the direction of the laser Evector and in the direction of propagation k (due to v x Bacceleration). This means that the principal axes of thepolarisation ellipse are in the directions of the laser E and Bfields and, since the harmonics are believed to be produced withthe same polarisation as the laser, they are created in one of theprincipal planes and not subject to any rotation.
Also the modification of the refractive index due to relativisticeffects always reduces the cut off frequencies below the normalplasma frequency and so will not cause any harmonics to besuppressed. On the contrary the relativistic effects reduce theeffects of the magnetic fields since the Larmor frequency isreduced by the increasing electron mass so the true magneticfields may well be even greater than those inferred using non-relativistic expressions for the Cotton-Mouton effect.
Experimental Observation of the Relativistic Birefringence
The model example of a two stream distribution function showsthat for electromagnetic waves significantly above the
non-relativistic plasma frequency the birefringence ismaximised by having electron energies which are onlymoderately relativistic implying that the laser intensity requiredis modest by the standards of modern CPA lasers. Largerdegrees of birefringence occur if the plasma is probed withwaves at or below the normal plasma frequency but, in a realexperiment, using lower frequency waves raises the difficulty of'end effects' in a non-uniform plasma column, and probing thebirefringence with light above the plasma frequency makes fora cleaner experiment.
A laser plasma experiment designed to maximise theobserveability of the relativistic birefringence would require theplasma to have a large fraction of moderately relativisticelectrons and for the distribution function to be anisotropic.This suggests the use of a low density plasma where the mainlaser can penetrate a long plasma column and all plasmaelectrons will be subject to the relativistic quiver motion of themain laser which produces motion only in the plane of E and k.The time for electron collisions to isotropise this motion isorders of magnitude longer than the typical laser pulse durationof 1ps. A coaxial and parallel propagating probe beam ofdifferent frequency from the main laser and polarised at 450 willthen have its plane of polarisation rotated in traversing theplasma column.
Based on the simple two stream model of birefringence, theoptimal intensity for the main beam will be around3 x 1018Wcm-2 to give the optimal p0 = 1.37 as described aboveand a plasma column length of 100µm at quarter critical densityis required to resolve the less than 1% difference in refractiveindices for the two polarisations.
The 100µm Rayleigh length is easily achieved at this modestintensity and the plasma requirements are within the capabilitiesof gas-jet targets. A sub-picosecond probe beam at awavelength not simply related to the main laser is technicallypossible but not currently available. The timing of the probelaser and discrimination of the probe beam from the vastly moreintense main laser will be among the main experimentalchallenges.
References
1. M Tatarakis, A Gopal, I Watts, F N Beg, A E Dangor, KKrushelnick, U Wagner, P A Norreys, E L Clark, M Zepfand R G EvansPhys Plasma 9, 5, 2244 (2002)
2. B KursonogluNuclear Fusion 1, 213 (1961)
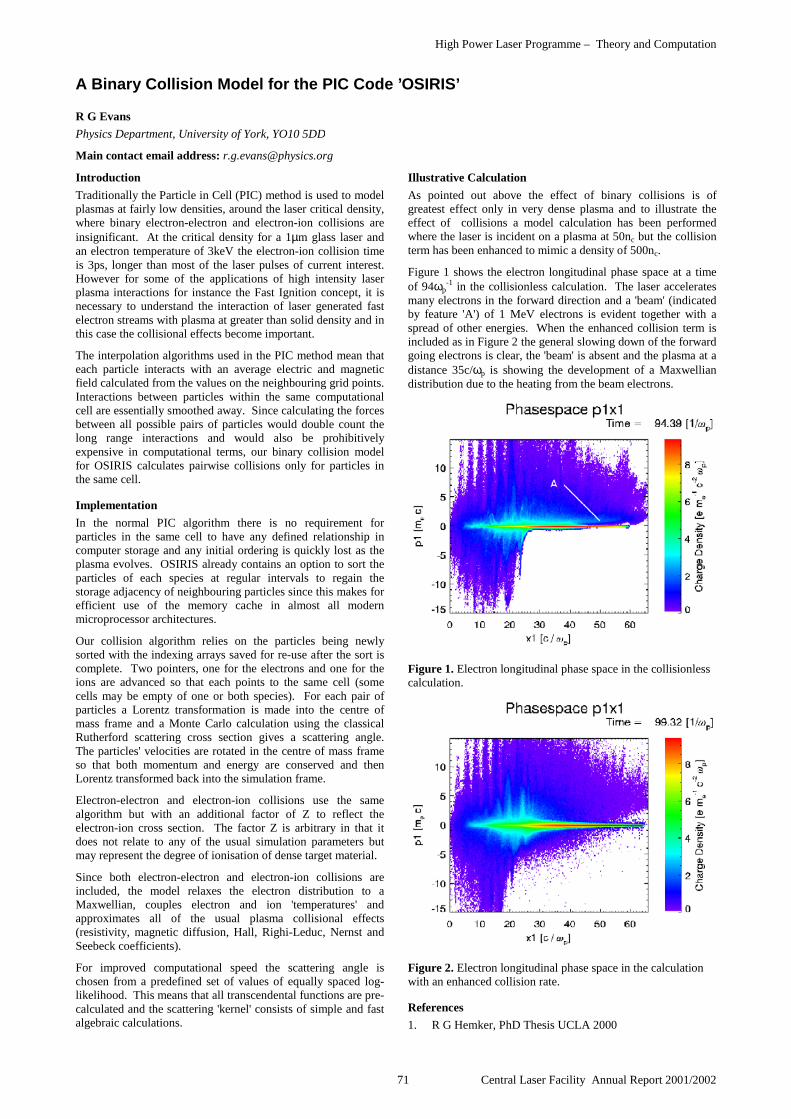
High Power Laser Programme – Theory and Computation
71 Central Laser Facility Annual Report 2001/2002
Introduction
Traditionally the Particle in Cell (PIC) method is used to modelplasmas at fairly low densities, around the laser critical density,where binary electron-electron and electron-ion collisions areinsignificant. At the critical density for a 1µm glass laser andan electron temperature of 3keV the electron-ion collision timeis 3ps, longer than most of the laser pulses of current interest.However for some of the applications of high intensity laserplasma interactions for instance the Fast Ignition concept, it isnecessary to understand the interaction of laser generated fastelectron streams with plasma at greater than solid density and inthis case the collisional effects become important.
The interpolation algorithms used in the PIC method mean thateach particle interacts with an average electric and magneticfield calculated from the values on the neighbouring grid points.Interactions between particles within the same computationalcell are essentially smoothed away. Since calculating the forcesbetween all possible pairs of particles would double count thelong range interactions and would also be prohibitivelyexpensive in computational terms, our binary collision modelfor OSIRIS calculates pairwise collisions only for particles inthe same cell.
Implementation
In the normal PIC algorithm there is no requirement forparticles in the same cell to have any defined relationship incomputer storage and any initial ordering is quickly lost as theplasma evolves. OSIRIS already contains an option to sort theparticles of each species at regular intervals to regain thestorage adjacency of neighbouring particles since this makes forefficient use of the memory cache in almost all modernmicroprocessor architectures.
Our collision algorithm relies on the particles being newlysorted with the indexing arrays saved for re-use after the sort iscomplete. Two pointers, one for the electrons and one for theions are advanced so that each points to the same cell (somecells may be empty of one or both species). For each pair ofparticles a Lorentz transformation is made into the centre ofmass frame and a Monte Carlo calculation using the classicalRutherford scattering cross section gives a scattering angle.The particles' velocities are rotated in the centre of mass frameso that both momentum and energy are conserved and thenLorentz transformed back into the simulation frame.
Electron-electron and electron-ion collisions use the samealgorithm but with an additional factor of Z to reflect theelectron-ion cross section. The factor Z is arbitrary in that itdoes not relate to any of the usual simulation parameters butmay represent the degree of ionisation of dense target material.
Since both electron-electron and electron-ion collisions areincluded, the model relaxes the electron distribution to aMaxwellian, couples electron and ion 'temperatures' andapproximates all of the usual plasma collisional effects(resistivity, magnetic diffusion, Hall, Righi-Leduc, Nernst andSeebeck coefficients).
For improved computational speed the scattering angle ischosen from a predefined set of values of equally spaced log-likelihood. This means that all transcendental functions are pre-calculated and the scattering 'kernel' consists of simple and fastalgebraic calculations.
Illustrative Calculation
As pointed out above the effect of binary collisions is ofgreatest effect only in very dense plasma and to illustrate theeffect of collisions a model calculation has been performedwhere the laser is incident on a plasma at 50nc but the collisionterm has been enhanced to mimic a density of 500nc.
Figure 1 shows the electron longitudinal phase space at a timeof 94ωp
-1 in the collisionless calculation. The laser acceleratesmany electrons in the forward direction and a 'beam' (indicatedby feature 'A') of 1 MeV electrons is evident together with aspread of other energies. When the enhanced collision term isincluded as in Figure 2 the general slowing down of the forwardgoing electrons is clear, the 'beam' is absent and the plasma at adistance 35c/ωp is showing the development of a Maxwelliandistribution due to the heating from the beam electrons.
Figure 1. Electron longitudinal phase space in the collisionlesscalculation.
Figure 2. Electron longitudinal phase space in the calculationwith an enhanced collision rate.
References
1. R G Hemker, PhD Thesis UCLA 2000
A Binary Collision Model for the PIC Code ’OSIRIS’
R G Evans
Physics Department, University of York, YO10 5DD
Main contact email address: [email protected]

High Power Laser Programme – Theory and Computation
Central Laser Facility Annual Report 2001/2002 72
Introduction
Intense laser heating of molecules results in extremely fastelectron ejection, superheated ion fragments and high frequencysecondary radiation. Even in simple diatomic molecules thecomplexity of the system of interacting ions, electrons andphotons leads to a rich variety of processes1). The high-qualityfacilities at the Central Laser Facility have been used in recentyears to characterize the variety and propensity of theseprocesses in diatoms, in particular by developing diagnostics ofthe processes through measurements of the ion fragmentcharges and energies2-4). However, detailed measurements onthe response of the hydrogen molecule and molecular ion2-4)
have only recently become available. Importantly, thesesystems are accessible to first-principles many-body theory andthus direct comparisons can be made. This report presentstheoretical simulations for high-order wave-mixing processes,harmonic generation and multiphoton ionization for thehydrogen molecular ion in ultrashort pulses.
Harmonic generation and multiphoton ionization
In this paper we simulate dissociative ionization and high-orderwave mixing by direct numerical solution of the time-dependentSchrödinger equation using grid methods 5). For optical pulsesmuch shorter than the rotational period of the molecule, themolecular axis orientation can be considered as fixed during theinteraction time. Ultrashort pulse interaction is effectivelysudden on the rotational relaxation timescale and only ultrafastvibrations and electronic motions are excited. For parallelelectronic transitions the resulting 2+1+1 dimensional linearPDE can be solved directly on a parallel computer. For ourcalculations we used the SGI-Origin2000 and Cray-T3Ecomputers at CSAR (Manchester) for this task. An example ofthe electronic orbital dynamics is shown in Figure 1. Here wefix the nuclear motion at equilibrium separation, and theelectronic probability density is plotted in cylindrical polar z, at three instants during the pulse. The lightis polarized along the z-axis taken as the internuclear axis.The results shown correspond to an established theoretical peak intensity 6x10¹⁴ W cm-2. The first frame represents theunperturbed ground state orbital, the second frame the orbitalafter 3 optical cycles, and the third frame the highly diffuseorbital after 9 cycles. This figure simply serves as an illustrationof the highly distorted and fragmented nature of the electronicwavefunction under such intense external forces. The transfer ofenergy from the laser is most clearly seen in the ionization andmolecular fragmentation. However it also manifests itselfthrough the generation of high-order harmonic generation. Wehave found that the efficiency of this process, and the profile ofthe spectrum, is strongly dependent on the nuclear motion.Clearly moving nuclei will change the shape of the potentialwell and thus modify the entire electronic spectrum.Furthermore, the break up of the nuclear wavepacket creates adiffuse scattering centre that affects the electron-ion collisions.In Figure 2 we present results for harmonic generation for a 14 W cm-2
where the nuclear motion is anchored at the equilibrium bondlength. The spectrum is a conventional series of odd-orderharmonics that steadily and rapidly decrease in intensity withincreasing order. On the other hand, allowing for dissociationand ionization gives a much different picture of the radiativescattering. In Figure 3, we see the presence of strong even-and odd-order harmonics. The molecular expansion allowsinversion symmetry breaking and the production of even order
peaks. This in turn results from a strong localization of themolecular orbital in polarized atomic states which are symmetrymixtures. The process occurs over femtosecond timescales asthe dissociation proceeds. We also note that the intensity ofharmonic generation is enhanced by this dynamical effect in thehigher order peaks, for example the 10th harmonic. In physicalterms the diffusion of the nuclear wavepacket provides anextended site for the electron-nucleus rescattering leading toenhancement of this process.
Figure 1. Evolution of the electronic orbital density for thehydrogen molecular ion in an intense laser field. Threesnapshots of the motion are taken after 0, 3 and 9 opticalcycles, respectively reading from left to right, and top tobottom. The red regions indicate high electron density, and thescales are in atomic units.
Wave-mixing
In Figure 4 we present results for high-order wave mixingprocesses at very high intensity in the hydrogen molecular ion.The simulations are for fixed nuclei at equilibrium separationand we consider mixing between a source of linearly polarized !" # $!"% &fragments from two-colour strong-field ionization anddissociation of hydrogen using a &'( !second harmonic, have been studied by the group at ImperialCollege5). In our calculations, the spectral density of emittedradiation shows high-order wave-mixing and harmonicgeneration. The data corresponds to simulations for a pulse of
High-order wave-mixing by molecular ions in intense, ultrashort laser pulses
D Dundas, J F McCann, K T Taylor
Dept of Applied Mathematics and Theoretical Physics, Queen’s University Belfast, Belfast BT7 1NN
Main contact email address: [email protected]

High Power Laser Programme – Theory and Computation
73 Central Laser Facility Annual Report 2001/2002
40 cycles. The emission spectrum is greatly extended andcontains sharp lines with a low plateau extending to the 30th
harmonic. The extended plateau for low-frequency light isconsistent with the conversion of large amplitude free-electronrecollisions. The emission signal is quite sensitive to therelative phase of the fields. Since the field amplitudes arecomparable, the colour interference fringes in time have strongconstructive interference will enhance field-ionization of themolecule. Figure 4 shows results for a zero phase differencebetween the fundamental and its second harmonic. For a phase #) we find the plateau extendsto the 35th harmonic. Given the variety of parameters ofrelative phase and intensity, this problem requires furtherinvestigation to determine general properties of the systembefore including nuclear dynamics. The effect of nuclearmotion for high-freqency light is very significant as we haveshown in Figure 3. Moreover, typical timescales of Ti;Sapphirepulses of 100 fs mean that rotational effects are no longernegligible. Another highly significant factor found inexperiments is the relative polarizations of the colours 6). Theeffects of molecular axis and polarization orientation requirehigher dimensional simulations, and this is an effect we intendto investigate in the near future.
Figure 2. Power spectral density for harmonic generation withthe nuclei fixed at the equilibrium separation. Photon angular , with peak intensity 6x10¹⁴ W cm-2.
Figure 3. Power spectral density for harmonic generation with ) with peak intensity 6x10¹⁴ W cm-2.
Figure 4. Spectral density of emitted radiation showing high-order wave-mixing and harmonic generation from the hydrogenmolecular ion for * !" $!" peak intensity 3 x10¹⁴ W cm-2 . The harmonic order is in termsof the longer wavelength.
Conclusions
Simulations of the dynamics of the hydrogen molecular ionsubjected to intense ultrashort laser pulses were studiedincluding the vibrational nuclear motion quantally and withoutmaking the Born-Oppenheimer approximation. Results for one-colour and two-colour high-order harmonic generation andwave mixing were obtained. We find the dissociation processgreatly amplifies high-order harmonic generation and createsnew even-order frequencies. High-order wave-mixing is highlysensitive to relative phase and highly efficient. It remains to beseen how the effects of quantum nuclear dynamics will modifythis spectrum.
References
1. J H Posthumus et al.Molecules and clusters in intense laser fields (C.U.P. 2001)
2. J H Sanderson, R V Thomas, W A Bryan, W R Newell, AJ Langley and P F Taday J. Phys. B: At. Mol. Opt. Phys. 31, L599 (1998).
3. I D Williams, P McKenna et al. J. Phys. B: At. Mol. Opt. Phys. 33 2743 (2000)
4. Frasinski LJ, Plumridge J, Posthumus JHPhys. Rev. Lett. 86 2541 (2001)
5. D DundasPhys. Rev. A 65, 023408 (2002)
6. Y L Shao, D J Fraser, M H R Hutchinson, J Larsson, J PMarangos and J W G TischJ. Mod. Opt. 43, 1063 (1996)

High Power Laser Programme – Theory and Computation
Central Laser Facility Annual Report 2001/2002 74
Introduction
Recently we have reported1,2) results for collision strengths (Ω)and effective collision strengths (Υ) for resonance transitions inNi-like Gd XXXVII. For calculating wavefunctions, weemployed the GRASP code of Dyall et al3) and for thecomputations of Ω we adopted the recent DARC program ofNorrington and Grant5). While calculating the values of Υ,which are very simply related to the excitation and de-excitationrate coefficients, we included the contribution of resonances,which had a pronounced effect on many transitions, asdemonstrated in our recent work2). For some of the transitions,the values of Υ were enhanced by an order of magnitude even attemperatures ~106 K. On the other hand, the earlier availablecorresponding results of Hagelstein4) were found to beoverestimated, by up to a factor of four for some of thetransitions, because he performed his calculations of Ω only atenergies above thresholds. Therefore, our recently reportedresults of Ω and Υ are the most accurate available today.However, such results have so far been completed and reportedfor the resonance transitions only, whereas data for othertransitions are also required in the modelling of laser plasmas.The corresponding calculations for these transitions are still inprogress, but in this short report we present our results of Ω fortransitions from the lowest five levels of the (1s22s22p6)3s23p23d10 and 3s23p63d94s configurations to higher levels ofthe 3s23p63d94p, 3s23p63d94d and 3s23p63d94f configurations ofGd XXXVII. The results of Ω are reported at 4 representativeenergies of 200, 400, 600 and 800 Ry. We hope these resultswill be helpful in modelling calculations. The values of Υ forthese transitions are not yet available, but results for Ω for alltransitions and in a wider range of energy can be obtained onrequest from the first author.
Calculation Details
For the computations of energy levels and radiative rates, wehave included the lowest 107 fine-structure levels arising fromthe (1s22s22p6) 3s23p23d10, 3s23p63d94, 3s23p53d104 and3s3p63d104 configurations. The specific list of these energylevels has already been reported1). However, the correspondingcalculations for Ω are restricted to the lowest 59 levels becauseof computational limitations. CI has been included among theabove listed configurations, and the option of EAL (extendedaverage level), in which the weighted trace of a Hamiltonian isminimised, is chosen in the GRASP code. The calculations fullyinclude the relativistic effects, and are in the jj coupling scheme.Further details of the calculations can be found in our earlierpublication1).
Collision strengths have been computed in a wide energy rangebelow 800 Ry. A large range of partial waves (J been included in order to obtain converged results for Ω.However, this range is not sufficient for the convergence of Ωin allowed transitions. Therefore, a top-up based on the sumrules has also been included. Results of Ω for resonance
transitions at 4 representative energies of 200, 400, 600 and800 Ry have already been presented, compared, and discussedby Aggarwal et al1). In this report we present similar results inTable 1 for transitions from the lowest 5 levels to higher excitedlevels. No other results are available in the literature forcomparisons, but the accuracy of our calculations has alreadybeen discussed in earlier publications1,2). A complete set ofresults for both Ω and Υ for all transitions among the lowest 59levels of Gd XXXVII will soon be available.
References
1. K. M. Aggarwal, P. H. Norrington, K. L. Bell, F. P.Keenan, G. J. Pert, and S. J. Rose,J.Phys. B 32 5067 (1999)
2. K. M. Aggarwal, F. P. Keenan, P. H. Norrington, G.J.Pert, and S. J. Rose,J.Phys. B 35 L127 (2002)
3. K. G. Dyall, I. P. Grant, C. T. Johnson, F. A. Parpia and E.P. Plummer,Comput. Phys. Commun. 55 425 (1989)
4. P. L. Hagelstein,Phys. Rev. A 34 874 (1986)
5. P. H. Norrington and I. P. Grant,Comput. Phys. Commun. - in preperation (2002)
Atomic data for Ni-like Gd XXXVII
K M Aggarwal, F P Keenan
Department of Pure & Applied Physics, Queen’s University, Belfast BT7 1NN, UK
P H Norrington
Dept. of Applied Maths & Theoretical Physics, Queen’s University, Belfast BT7 1NN, UK
G J Pert
Department of Physics, University of York, Heslington, York, YO19 5DD, UK
S J Rose
AWE plc, Aldermaston, Reading RG7 4PR, UK
Main contact email address: [email protected]

High Power Laser Programme – Theory and Computation
75 Central Laser Facility Annual Report 2001/2002
Table 1. Collision strengths (Ω) for transitions from the lowest 5 levels of the (1s22s22p6) 3s23p23d10 and 3s23p63d94s configurations tohigher levels of the 3s23p63d94p, 3s23p63d94d and 3s23p63d94f configurations of Gd XXXVII. (a-b ≡ a × 10-b).
Transition Energy (Ry) Transition Energy (Ry)I - J 200 400 600 800 I - J 200 400 600 8001 - 2 4.453-4 1.793-4 9.393-5 5.689-5 2 - 15 1.443-5 8.226-6 7.748-6 8.036-61 - 3 2.792-3 3.331-3 3.645-3 3.860-3 2 - 16 1.091-3 1.328-3 1.550-3 1.780-31 - 4 1.983-4 7.876-5 4.115-5 2.493-5 2 - 17 2.931-3 3.638-3 4.228-3 4.864-31 - 5 1.935-3 2.266-3 2.476-3 2.625-3 2 - 18 6.530-2 6.934-2 7.290-2 7.815-21 - 6 5.095-4 1.945-4 9.899-5 5.960-5 2 - 19 5.481-2 5.737-2 6.027-2 6.472-21 - 7 1.185-3 1.104-3 1.111-3 1.129-3 2 - 20 1.001-1 1.065-1 1.120-1 1.201-11 - 8 3.617-4 1.335-4 6.798-5 4.094-5 2 - 21 1.036-1 1.100-1 1.157-1 1.241-11 - 9 3.930-3 6.460-3 8.270-3 9.695-3 2 - 22 6.361-4 1.837-4 9.328-5 6.210-51 - 10 6.343-4 2.396-4 1.239-4 7.526-5 2 - 23 2.394-1 2.574-1 2.719-1 2.916-11 - 11 3.804-4 1.377-4 6.852-5 4.072-5 2 - 24 4.854-2 5.137-2 5.391-2 5.763-21 - 12 8.589-3 1.494-2 1.946-2 2.302-2 2 - 25 1.129-2 1.140-2 1.184-2 1.260-21 - 13 7.180-4 6.776-4 6.914-4 7.089-4 2 - 26 1.371-1 1.470-1 1.548-1 1.659-11 - 14 1.530-4 5.934-5 3.065-5 1.864-5 2 - 27 1.298-4 3.639-5 1.675-5 9.564-61 - 15 1.152-3 1.721-3 2.193-3 2.582-3 2 - 28 3.348-4 3.561-4 3.724-4 3.936-41 - 16 1.059-3 9.985-4 1.011-3 1.031-3 2 - 29 7.388-6 2.584-6 1.623-6 1.109-61 - 17 2.327-4 7.862-5 3.731-5 2.136-5 2 - 30 6.531-5 6.640-5 6.896-5 7.321-51 - 18 1.027-3 4.013-4 2.153-4 1.348-4 2 - 31 3.133-4 3.347-4 3.500-4 3.705-41 - 19 1.190-3 7.861-4 7.263-4 7.244-4 2 - 32 2.686-4 2.871-4 3.019-4 3.255-41 - 20 1.190-3 8.702-4 8.333-4 8.421-4 2 - 33 1.581-5 1.199-5 1.032-5 1.043-51 - 21 6.413-4 1.988-4 9.140-5 5.101-5 2 - 34 1.190-4 1.252-4 1.447-4 1.373-41 - 22 7.481-4 2.844-4 1.541-4 9.904-5 2 - 35 9.246-5 2.691-5 1.266-5 7.305-61 - 23 1.298-3 4.370-4 2.144-4 1.250-4 2 - 36 5.802-1 7.198-1 8.160-1 8.955-11 - 24 8.545-4 2.812-4 1.351-4 7.827-5 2 - 37 2.926-3 1.755-3 1.453-3 1.359-31 - 25 3.777-3 4.650-3 5.213-3 5.605-3 2 - 38 2.661-3 2.824-3 2.941-3 3.021-31 - 26 7.135-4 3.689-4 3.135-4 3.059-4 2 - 39 7.881-3 8.375-3 8.733-3 9.196-31 - 27 3.732-3 3.761-3 3.800-3 3.831-3 2 - 40 1.278-2 1.368-2 1.436-2 1.516-21 - 28 6.571-4 2.435-4 1.291-4 8.134-5 2 - 41 7.378-3 6.666-3 6.771-3 7.106-31 - 29 7.649-4 2.551-4 1.236-4 7.168-5 2 - 42 3.413-2 3.639-2 3.793-2 3.893-21 - 30 2.429-3 2.988-3 3.359-3 3.618-3 2 - 43 2.035-3 1.575-3 1.536-3 1.581-31 - 31 6.929-4 2.519-4 1.291-4 7.808-5 2 - 44 1.787-2 1.896-2 1.980-2 2.086-21 - 32 1.110-3 6.964-4 6.335-4 6.294-4 2 - 45 1.770-2 1.847-2 1.921-2 2.025-21 - 33 1.519-3 1.407-3 1.470-3 1.542-3 2 - 46 6.813-3 6.418-3 6.555-3 6.859-31 - 34 5.870-4 1.746-4 7.771-5 4.240-5 2 - 47 2.254-2 2.369-2 2.472-2 2.606-21 - 35 6.217-2 6.448-2 6.558-2 6.631-2 2 - 48 1.405-3 6.159-4 4.759-4 4.455-41 - 36 3.537-4 1.218-4 6.123-5 3.746-5 2 - 49 5.715-4 3.040-4 2.596-4 2.523-41 - 37 6.767-3 1.266-2 1.711-2 2.066-2 2 - 50 1.500-4 1.693-4 1.834-4 1.971-41 - 38 5.757-4 1.962-4 9.625-5 5.600-5 2 - 51 1.822-5 1.471-5 1.481-5 1.564-51 - 39 2.281-3 1.883-3 1.951-3 2.080-3 2 - 52 6.296-6 7.428-6 7.065-6 7.537-61 - 40 1.607-3 5.088-4 2.393-4 1.367-4 2 - 53 8.464-5 1.014-4 9.209-5 9.693-51 - 41 1.030-3 6.800-4 6.783-4 7.114-4 2 - 54 4.105-6 4.446-6 3.959-6 4.153-61 - 42 1.458-3 4.260-4 1.945-4 1.101-4 2 - 55 1.777-5 2.056-5 1.892-5 2.059-51 - 43 8.849-4 2.471-4 1.084-4 5.966-5 2 - 56 4.293-5 5.356-5 5.671-5 6.183-51 - 44 1.053-3 3.594-4 2.165-4 1.687-4 2 - 57 7.243-4 5.403-4 4.738-4 4.497-41 - 45 7.531-4 1.978-4 8.488-5 4.567-5 2 - 58 3.231-4 1.896-4 1.437-4 1.250-41 - 46 9.976-4 2.777-4 1.233-4 6.814-5 2 - 59 1.294-4 3.601-5 1.878-5 1.311-51 - 47 5.576-4 2.507-4 2.267-4 2.336-4 3 - 4 1.009-2 6.600-3 5.955-3 6.100-31 - 48 3.998-3 4.708-3 5.070-3 5.286-3 3 - 5 6.827-3 4.406-3 4.130-3 4.348-31 - 49 6.701-2 1.086-1 1.320-1 1.488-1 3 - 6 4.044-1 5.343-1 5.458-1 5.650-11 - 50 1.631-3 5.183-4 2.445-4 1.400-4 3 - 7 1.942-0 2.568-0 2.614-0 2.712-01 - 51 9.128-4 2.609-4 1.177-4 6.600-5 3 - 8 2.425-2 3.078-2 3.739-2 4.447-21 - 52 8.182-4 2.301-4 1.015-4 5.578-5 3 - 9 3.706-2 4.713-2 5.690-2 6.770-21 - 53 8.871-4 5.820-4 5.857-4 6.174-4 3 - 10 1.356-3 4.038-4 1.936-4 1.148-41 - 54 6.650-4 2.330-4 1.505-4 1.242-4 3 - 11 1.652-0 2.087-0 2.497-0 2.931-01 - 55 3.371-3 3.844-3 4.116-3 4.288-3 3 - 12 1.121-0 1.416-0 1.688-0 1.986-01 - 56 6.438-4 1.592-4 6.544-5 3.440-5 3 - 13 1.168-0 1.477-0 1.773-0 2.077-01 - 57 2.676-4 1.064-4 5.797-5 3.659-5 3 - 14 7.957-6 2.247-6 1.143-6 6.696-71 - 58 2.413-3 3.121-3 3.540-3 3.825-3 3 - 15 8.760-3 1.094-2 1.279-2 1.474-21 - 59 2.256-1 3.353-1 4.146-1 4.770-1 3 - 16 2.799-3 3.517-3 4.151-3 4.782-32 - 3 1.348-2 8.089-3 6.850-3 6.497-3 3 - 17 1.113-4 1.254-4 1.444-4 1.653-42 - 4 4.979-3 3.046-3 2.775-3 2.844-3 3 - 18 4.577-4 1.420-4 7.545-5 5.166-52 - 5 1.741-2 1.086-2 9.569-3 9.644-3 3 - 19 1.423-1 1.519-1 1.602-1 1.721-12 - 6 1.943-0 2.563-0 2.681-0 2.769-0 3 - 20 1.026-2 1.038-2 1.081-2 1.155-22 - 7 1.390-0 1.830-0 1.897-0 1.964-0 3 - 21 4.686-2 4.947-2 5.199-2 5.576-22 - 8 2.157-3 2.724-3 3.117-3 3.218-3 3 - 22 6.514-2 6.985-2 7.351-2 7.863-22 - 9 3.209-5 9.818-6 5.467-6 4.199-6 3 - 23 1.624-3 4.590-4 2.370-4 1.279-42 - 10 3.621-0 4.591-0 5.529-0 6.487-0 3 - 24 1.036-1 1.111-1 1.170-1 1.252-12 - 11 3.131-1 3.945-1 4.701-1 5.547-1 3 - 25 9.828-2 1.055-1 1.110-1 1.187-12 - 12 6.178-4 1.861-4 9.094-5 5.525-5 3 - 26 5.372-2 5.716-2 6.015-2 6.431-22 - 13 1.607-0 2.027-0 2.420-0 2.838-0 3 - 27 1.437-2 1.546-2 1.624-2 1.730-22 - 14 5.630-6 4.159-6 4.557-6 4.483-6 3 - 28 7.777-6 4.182-6 3.511-6 3.424-6

High Power Laser Programme – Theory and Computation
Central Laser Facility Annual Report 2001/2002 76
Transition Energy (Ry) Transition Energy (Ry)I - J 200 400 600 800 I - J 200 400 600 800
3 - 29 2.329-4 2.456-4 2.568-4 2.729-4 4 - 44 1.938-6 2.267-6 2.423-6 2.364-63 - 30 2.746-5 2.557-5 2.596-5 2.715-5 4 - 45 8.929-5 1.016-4 1.062-4 1.170-43 - 31 1.850-4 1.950-4 2.028-4 2.142-4 4 - 46 2.115-5 2.316-5 2.423-5 2.719-53 - 32 1.772-4 1.894-4 1.988-4 2.119-4 4 - 47 4.936-6 1.100-6 5.032-7 3.751-73 - 33 1.419-4 1.487-4 1.568-4 1.684-4 4 - 48 1.989-5 1.933-5 2.042-5 2.266-53 - 34 6.452-5 6.643-5 7.175-5 7.915-5 4 - 49 8.091-5 2.712-5 1.730-5 1.415-53 - 35 7.410-3 8.084-3 8.479-3 8.949-3 4 - 50 4.744-3 4.870-3 5.046-3 5.310-33 - 36 4.997-2 6.020-2 6.790-2 7.407-2 4 - 51 1.793-2 1.918-2 2.001-2 2.056-23 - 37 3.626-1 4.505-1 5.110-1 5.598-1 4 - 52 8.624-3 9.208-3 9.616-3 1.014-23 - 38 1.177-4 3.018-5 1.347-5 7.792-6 4 - 53 1.169-3 3.078-4 1.773-4 7.589-53 - 39 9.182-4 7.930-4 8.299-4 8.846-4 4 - 54 1.700-2 1.837-2 1.923-2 2.029-23 - 40 1.867-3 1.602-3 1.603-3 1.665-3 4 - 55 1.226-3 7.418-4 6.776-4 6.865-43 - 41 2.272-2 2.425-2 2.542-2 2.621-2 4 - 56 5.826-3 5.727-3 5.895-3 6.029-33 - 42 1.501-3 3.949-4 2.090-4 9.683-5 4 - 57 8.686-5 9.086-5 9.371-5 9.675-53 - 43 1.160-2 1.247-2 1.306-2 1.378-2 4 - 58 4.736-5 3.167-5 2.701-5 2.557-53 - 44 1.067-3 4.922-4 3.943-4 3.748-4 4 - 59 5.649-4 4.575-4 4.791-4 5.105-43 - 45 6.390-3 6.227-3 6.429-3 6.790-3 5 - 6 3.716-3 4.420-3 4.533-3 4.683-33 - 46 1.737-2 1.854-2 1.937-2 2.045-2 5 - 7 5.741-4 6.805-4 7.008-4 7.254-43 - 47 6.706-3 6.429-3 6.566-3 6.709-3 5 - 8 1.106-0 1.464-0 1.514-0 1.567-03 - 48 1.748-2 1.885-2 1.971-2 2.079-2 5 - 9 1.190-0 1.565-0 1.658-0 1.713-03 - 49 6.132-3 6.609-3 6.904-3 7.266-3 5 - 10 3.439-5 1.037-5 6.513-6 5.706-63 - 50 4.024-5 4.176-5 4.584-5 4.999-5 5 - 11 1.564-2 2.010-2 2.218-2 2.297-23 - 51 4.702-5 4.584-5 4.762-5 5.042-5 5 - 12 2.156-2 2.770-2 3.053-2 3.155-23 - 52 2.738-5 3.221-5 3.057-5 3.229-5 5 - 13 4.385-3 5.645-3 6.462-3 6.708-33 - 53 2.567-5 2.239-5 2.208-5 2.222-5 5 - 14 2.386-4 7.197-5 3.328-5 1.982-53 - 54 1.975-5 2.265-5 2.689-5 2.642-5 5 - 15 1.614-1 2.035-1 2.428-1 2.861-13 - 55 4.261-5 5.665-5 5.394-5 5.887-5 5 - 16 2.807-0 3.560-0 4.282-0 5.027-03 - 56 1.217-5 1.061-5 1.053-5 1.085-5 5 - 17 1.047-0 1.323-0 1.581-0 1.853-03 - 57 5.011-5 4.065-5 3.901-5 3.914-5 5 - 18 3.571-4 3.747-4 3.969-4 4.325-43 - 58 2.712-4 1.716-4 1.327-4 1.153-4 5 - 19 8.046-6 3.213-6 2.204-6 1.847-63 - 59 1.684-3 1.777-3 1.841-3 1.924-3 5 - 20 7.337-5 7.424-5 7.844-5 8.572-54 - 5 9.657-3 6.856-3 6.230-3 6.034-3 5 - 21 9.769-5 9.795-5 1.026-4 1.110-44 - 6 6.165-4 7.139-4 7.331-4 7.582-4 5 - 22 5.440-6 1.985-6 1.134-6 8.439-74 - 7 1.850-5 5.068-6 2.857-6 2.387-6 5 - 23 6.374-6 3.012-6 2.242-6 2.081-64 - 8 1.248-0 1.648-0 1.703-0 1.764-0 5 - 24 7.347-5 6.977-5 7.197-5 7.721-54 - 9 1.716-1 2.249-1 2.366-1 2.448-1 5 - 25 1.786-4 1.839-4 1.927-4 2.077-44 - 10 8.331-6 2.677-6 1.763-6 1.438-6 5 - 26 6.262-4 6.674-4 7.062-4 7.631-44 - 11 1.576-2 2.028-2 2.228-2 2.310-2 5 - 27 7.876-3 8.341-3 8.772-3 9.414-34 - 12 2.499-2 3.214-2 3.654-2 3.783-2 5 - 28 6.380-2 6.785-2 7.132-2 7.640-24 - 13 9.302-6 3.500-6 2.612-6 2.560-6 5 - 29 5.055-2 5.300-2 5.563-2 5.966-24 - 14 3.992-1 5.053-1 6.049-1 7.120-1 5 - 30 7.697-2 8.174-2 8.587-2 9.195-24 - 15 1.015-0 1.283-0 1.533-0 1.798-0 5 - 31 2.014-3 1.644-3 1.621-3 1.695-34 - 16 9.778-4 2.906-4 1.395-4 8.332-5 5 - 32 1.941-1 2.087-1 2.200-1 2.356-14 - 17 9.281-1 1.174-0 1.406-0 1.645-0 5 - 33 3.228-2 3.400-2 3.561-2 3.802-24 - 18 1.275-4 1.323-4 1.402-4 1.529-4 5 - 34 1.008-1 1.079-1 1.135-1 1.214-14 - 19 4.598-6 2.041-6 1.315-6 1.122-6 5 - 35 1.414-2 1.520-2 1.592-2 1.688-24 - 20 2.613-5 2.663-5 2.816-5 3.057-5 5 - 36 6.423-2 7.705-2 8.685-2 9.484-24 - 21 3.579-4 3.795-4 4.018-4 4.346-4 5 - 37 1.179-2 1.371-2 1.529-2 1.664-24 - 22 2.032-4 2.156-4 2.299-4 2.501-4 5 - 38 2.281-7 8.144-8 5.432-8 3.153-84 - 23 2.604-6 9.009-7 6.124-7 5.739-7 5 - 39 1.285-4 1.442-4 1.550-4 1.663-44 - 24 1.276-4 1.320-4 1.392-4 1.505-4 5 - 40 8.639-5 8.706-5 9.111-5 9.703-54 - 25 1.215-4 1.263-4 1.329-4 1.428-4 5 - 41 6.769-6 4.725-6 2.660-6 2.176-64 - 26 3.261-6 2.071-6 1.063-6 9.813-7 5 - 42 3.921-6 1.288-6 7.352-7 8.326-74 - 27 5.110-5 1.412-5 6.406-6 3.623-6 5 - 43 3.812-5 4.642-5 5.508-5 6.347-54 - 28 1.792-3 1.588-3 1.599-3 1.683-3 5 - 44 3.983-5 4.835-5 5.687-5 6.546-54 - 29 1.025-1 1.095-1 1.153-1 1.236-1 5 - 45 1.145-5 6.050-6 6.174-6 5.045-64 - 30 3.021-2 3.194-2 3.351-2 3.584-2 5 - 46 7.292-6 4.672-6 2.565-6 2.149-64 - 31 6.382-2 6.858-2 7.212-2 7.709-2 5 - 47 1.445-4 1.534-4 1.535-4 1.659-44 - 32 1.225-3 3.408-4 1.594-4 9.462-5 5 - 48 5.849-5 6.900-5 8.250-5 8.318-54 - 33 7.670-2 8.245-2 8.672-2 9.266-2 5 - 49 1.639-3 1.759-3 1.853-3 1.965-34 - 34 4.874-2 5.211-2 5.478-2 5.850-2 5 - 50 9.062-3 9.378-3 9.741-3 1.026-24 - 35 9.113-5 2.595-5 1.198-5 6.821-6 5 - 51 6.655-3 6.032-3 6.104-3 6.370-34 - 36 1.030-2 1.191-2 1.331-2 1.445-2 5 - 52 4.928-3 4.725-3 4.856-3 5.119-34 - 37 3.824-2 4.630-2 5.227-2 5.707-2 5 - 53 2.863-2 3.049-2 3.197-2 3.305-24 - 38 7.725-6 9.559-6 1.108-5 1.211-5 5 - 54 1.723-3 8.580-4 7.186-4 6.978-44 - 39 9.116-6 6.609-6 6.449-6 7.009-6 5 - 55 1.767-2 1.868-2 1.952-2 2.063-24 - 40 1.043-4 1.130-4 1.192-4 1.277-4 5 - 56 1.820-2 1.905-2 1.987-2 2.097-24 - 41 2.931-6 7.757-7 5.027-7 3.111-7 5 - 57 1.215-4 1.110-4 1.085-4 1.094-44 - 42 3.653-7 3.343-7 3.589-7 4.031-7 5 - 58 5.968-5 3.058-5 2.134-5 1.770-54 - 43 4.095-5 4.785-5 5.238-5 5.665-5 5 - 59 7.133-3 7.665-3 8.055-3 8.505-3

High Power Laser Programme – Femtosecond Pulse Physics
77 Central Laser Facility Annual Report 2001/2002
Introduction
It is well understood, both theoretically and experimentally that,when exposed to high intensity, ultrafast laser pulses, multipleionisation of atoms is substantially enhanced by non-sequentialprocesses near the threshold intensity for ionisation1). Currently,the model which best describes these non-sequential effects isthe recollision model2,3). Under this interpretation, the primaryelectron tunnel ionises through the finite potential barrierformed by the interaction of the laser electric field with theatomic potential. The liberated electron is then accelerated inthe laser field and, depending on the initial phase, can return tothe singly charged ion core with collision energies up to 3.17UP,where UP is the classical ponderomotive energy in the field1).Thus, secondary ionisation of the target proceeds throughinteraction between the returning electron and the ionic core.Most recently, the effects of Coulomb focusing on therecolliding electron have also been considered4), whereby theelectron trajectory in the laser field is electrostaticallychanneled towards the ionic core, further enhancing theprobability of non-sequential events. Experimentally, these non-sequential events have been observed through large reductionsin ionisation rates near threshold for circularly polarized fields,and more recently from the momentum distribution of the recoilions5) as well as coincidence measurements between ions andejected electrons6). Suppression of non-sequential ionisation hasalso been observed when the target is exposed to very shortlaser pulses of just a few optical cycles7). Currently allexperimental investigations have concentrated on neutral atomictargets, in particular the rare gases, but it is important toinvestigate a wide range of targets in order to test the validity ofthe current theory. In light of this, we report on the first directinvestigation of intense field ionisation of a positive atomic ion.
Experimental Configuration
Our ion beam apparatus has been used previously to provideunambiguous insight into the fragment dynamics of the H2
+
molecular ion, and is described in detail elsewhere8). Ar+ ionsare produced in an oscillating electron type discharge sourceand momentum selected by a bending magnet to produce a wellcollimated 1 kV ion beam. In addition to groundstate ions, ourions source also generates low lying excited states, permittingstrong field ionisation studies from the ensemble of Ar+
metastable states lying between 16 and 19 eV.
60 fs laser pulses at a wavelength of 790 nm from the AstraTi:Sapphire laser are focused using f/25 optics to produce afocal spot of 16 µm diameter which intersects the ion beamperpendicularly in the interaction region. The focusing lens ismounted on a computer driven, precision translation stage,which could be driven a distance of 25 mm parallel to the laserbeam axis (z-axis), with respect to the optimum focusingposition. In this way lower laser intensities were accessed withincreased interaction volumes, thus enhancing the sensitivity ofthe instrument. Post interaction, ions were deflected into a45 degree parallel plate analyser, such that the ionised productscould be detected in an off-axis channel electron multiplier,while the primary Ar+ beam was collected in a well-baffledFaraday cup.
Results and Discussion
Figure 1 shows ion yields for both (i) Ar2+ and (ii) Ar3+
resulting from ionisation of Ar+ at a laser intensity close to thelimit of the Ar3+ non-sequential regime. Ions were extracted
through a 0.9 mm slit, thus restricting detection to the verycentre of the focal volume. Following correction for theseindividual interaction volumes, the Ar3+/Ar2+ production ratiowas found to be just 0.007 ± 0.002 for the ion target. Underequivalent conditions, a neutral Ar target afforded a ratio of0.038 ± 0.002. Thus at this intensity Ar3+ production is stronglysuppressed when Ar+ rather than neutral Ar provides the initialtarget.
Multiple Ionisation Suppression of Ar+ Ions in an Intense Laser Field
T R J Goodworth, S L Stebbings, W R Newell
Department of Physics & Astronomy, University College London, Gower Street, London, WC1E 6BT, UK
J B Greenwood, I M G Johnston, I D Williams
Department of Physics, Queen’s University Belfast, Belfast, BT7 1NN, UK
A J Langley, E J Divall, C J Hooker
Central Laser Facility, CLRC Rutherford Appleton Laboratory, Chilton, Didcot, Oxon, OX11 0QX, UK
Main contact email address: [email protected]
-0.02
0
0.02
0.04
0.06
0.08
2.7 2.9 3.1 3.3 3.5
Ar3+ (x50)
Ar2+
Time of Flight (µs)
Ion
Yie
ld (
arb.
uni
ts)
(i)
(ii)
Figure 1. Strong field ionisation of an Ar+ beam with theparallel plate analyser tuned for maximum transmission of(i) Ar2+ and (ii) Ar3+ (50 times vertical scaling).
0
2x10⁻¹⁰
4x10⁻¹⁰
6x10⁻¹⁰
-25 -20 -15 -10 -5 0 5 10 15 20 25
(b)
(a)
Z Position (mm)
Inte
grat
ed Io
n Y
ield
(ar
b.)
Figure 2. Ar2+ ion yield from Ar+ as a function of focaldetuning along the z-axis, perpendicular to the ion beam,for laser intensities (a) 1016 Wcm-2, and (b) 5 x 10¹⁵ Wcm-2.

High Power Laser Programme – Femtosecond Pulse Physics
Central Laser Facility Annual Report 2001/2002 78
Figure 2 shows the Ar2+ signal obtained from strong fieldionisation of the primary ion beam, at a peak intensity of1016 Wcm-2, as a function of focal detuning with respect toz = 0. Each point represents the integral under the Ar2+ peak inthe corresponding time of flight spectrum. The central narrowpeak is due to sequential ionisation of groundstate Ar+.Conversely, the broad peaks at large z (i.e. lower intensity)depict ionisation of metastable components with lowerionisation potentials (9 – 11 eV) than the Ar+ groundstate(27.6 eV). These peaks also highlight the expected profileresulting from the interplay of increasing interaction volumewith decreasing intensity as the lens moves away from zero9).For this interpretation to be valid, the z = 0 groundstate peakmust disappear rapidly in comparison to the metastable peaks asthe laser intensity decreases. This is clearly confirmed by Figure2b, in which the laser intensity was decreased by a factor oftwo. The slight decrease in the z position of the ionisedmetastable peaks as the intensity is reduced is a result of thechange in the intensity dependent confocal volume.
In order to quantify this intensity dependent behavior, both thegroundstate Ar2+ peaks at z = 0 and the metastable (z = 12) peakwere monitored as a function of laser intensity. Figure 3 showsthese intensity dependent Ar2+ ion yields following volumenormalisation. The low intensity curve (1011 - 1013 Wcm-2) wasobtained at a focal detuning of z = 12, whereas the higherintensity curve (1014 - 1016 Wcm-2) was obtained with the lenspositioned upon focus. As expected from intensity arguments,the lower curve arises purely from the ensemble of metastablestates. Conversely, the high intensity curve arises fromionisation of both groundstate and metastable Ar+ ions; inessence a mixed beam. The component of the high intensityAr2+ curve lying below 1014 Wcm-2 has a slope of 0.5,indicative of the onset of saturated ionisation from Ar+
metastables in the diffraction rings surrounding the Airy disk10).
Quasiclassical tunneling (ADK) theory11) has been employed tocalculate the ionisation rate of groundstate Ar+ for the computedinteraction volume. As shown in Figure 3, a direct fit to the highintensity Ar2+ curve has been obtained following subtraction ofthe estimated metastable contribution. The value of the effectiveprinciple quantum number (n* = 1.44) used in this fit is in good
agreement with the accepted value of n* = 1.4, thus confirmingthe interpretation of our intensity plot.
The problem of multiple ionisation of rare gas atoms has alsobeen studied theoretically by Becker and Faisal using intense-field S-matrix techniques12). In such cases, integrating over theexperimental volume and normalising to the saturation intensityprovides good agreement with a large number of experimentalinvestigations. In particular, theory has been confirmed for theneutral Ar target by comparison to the benchmark work ofLarochelle et al13). Whilst differences in pulse length andinteraction volume forbid a direct comparison, it is stillbeneficial to compare the current work to that of Becker andFaisal for both the neutral Ar target and the Ar+ ion. Close tothe upper limit of the non-sequential intensity regime,theoretical calculations provide an Ar3+/Ar2+ ratio of 0.04, froman Ar target, and 0.03 from the ionic target. However underidentical conditions, ADK predictions for purely sequentialionisation give a ratio of 0.01, much closer to the present workat 0.007. Thus, although dominant in the case of the neutraltarget, non-sequential Ar3+ production processes appear to beabsent in the case of the ion target. These results confirm thatthe removal of an electron prior to interaction with the laserpulse comprehensively suppresses non-sequential mechanisms,leaving only the sequential ionisation contribution. This work14)
has also shown that the initial charge state of the target plays animportant role in determining the mechanisms for multipleionisation, in contradiction to previous predictions.
Study of this novel system has opened up experimental studiesof multiple ionisation in a strong laser field, which to date havebeen limited to a small range of neutral atoms, to the use ofpositive ions for direct study. In this initial study we haveshown that there are dramatic differences between the strongfield ionisation of neutral and singly charged Ar, demonstratingthe need for further experimental and theoretical work forpositive ion targets.
References
1. See for example: M Protopapas, C H Keitel and P LKnight, Rep. Prog. Phys. 60, 389 (1997)L F DiMauro and P Agostini, Adv. At. Mol. Opt. Phys. 35,79 (1995)
2. P B Corkum, Phys. Rev. Lett. 71, 1994 (1993)
3. H van der Hart, J. Phys. B. 33, L699 (2000)
4. G L Yudin and M Y Ivanov, Phys. Rev. A. 63, 033404(2001)
5. R Moshammer et al, Phys. Rev. Lett. 84, 447 (2000)
6. R Lafon et al, Phys. Rev. Lett. 86, 2762 (2001)
7. V R Bhardwaj et al, Phys. Rev. Lett. 86, 3522 (2001)
8. I D Williams et al, J. Phys. B. 33, 2743 (2000)
9. P Hansch , M A Walker and L D van Woerkom, Phys.Rev. A. 54, 4 (1996)
10. L Zhang, L J Frasinski and K Codling, J. Phys. B. 27, 3427(1994)
11. M V Ammosov, N B Delone and V P Krainov, Zh. Eskp.Teor. Fiz. 91, 2008 (1986)
12. A Becker and F H M Faisal, J. Phys. B. 32, L335 (1999)
13. S Larochelle, A Talebpour and S L Chin, J. Phys. B. 31,2101 (1998)
14. J B Greenwood et al, Phys. Rev. Lett. 88, 233001 (2002)
10-9
10-7
10-5
10-3
1011 1012 1013 1014 1015 1016
Laser Intensity (Wcm-2)
Inte
grat
ed Io
n Y
ield
(ar
b.)
1016
10-4
5x10¹⁵ 2x10¹⁶
5x10⁻⁵
5x10⁻⁴
Figure 3. Ar2+ ion yields from an Ar+ target as a function oflaser intensity. Low intensity data (squares) taken at a focaldetuning of z = 12, high intensity data (triangles) taken onfocus. Circles show the metastable subtracted component,representing Ar2+ production from groundstate Ar+. The dashedcurve illustrates an ADK fit, with an expanded view shown inthe inset.

High Power Laser Programme – Femtosecond Pulse Physics
79 Central Laser Facility Annual Report 2001/2002
Introduction
The acceleration of beams of protons using ultra-high intensitylasers has been widely studied in the past few years (for a recentreview see Mendonça et al. 2001).1) In particular protonacceleration from solid targets with thicknesses greater than thewavelength of the incident laser light has received a great dealof interest, partially because the proton energies measured arehigher than with gas, cluster or thin solid targets 1). Most of thiswork was performed on large-scale, single-shot laser systems,although it is envisaged that smaller-scale higher repetition ratelasers providing multi-terawatt pulses at intensities above1018 Wcm-2 will provide the basis for further systematic study.
To begin to look seriously at designing dedicated laser systemsto accelerate ions for various applications, the question of theoptimum laser pulse conditions needs to be addressed. This isonly possible via careful and full characterisation of the variouspulse parameters in laser-based acceleration experiments. Inthis article we present a study of proton acceleration using well-characterised pulses from the Astra laser system. Proton energydistributions as a function of laser intensity are presented.
Laser Pulse Characterisation
The Astra multi-terawatt laser was employed in this study.Langley et al (2000) 2) provide a detailed description of thelaser system. Here we present measurements made tocharacterise the laser pulse parameters for the present study.
Pulse Duration
A single-shot autocorrelator was used to measure the pulseduration at the output of the compressor. To avoid stretchingthe pulse to be measured, all reflective optics (apart from apellicle beam splitter) were used to deliver pulses to the 250 µmthick doubling crystal used in the autocorrelator. Figure 1shows a typical measurement of a compressed pulse obtained
during the present study. A Gaussian fit to the trace is alsoshown. The mean value of 5 measurements determined thepulse duration (full width at half maximum (FWHM)) to be60 fs. At the exit of the compressor the laser pulses werelinearly polarised with the E-vector vertical.
Contrast Ratio and Pre-Pulse Activity
In experiments involving short-pulse laser illumination of solidtargets, prepulse activity pre-heats the target, causing it to ionisebefore the arrival of the main pulse. The level and timing ofionising prepulse and amplified spontaneous emission (ASE)defines the plasma expansion and density scale length duringthe interaction with the main modelocked pulse. Wharton et al(2001) 4) demonstrated that even non-ionising pre-pulses withintensities of the order of 109 Wcm-2 can substantially alterhigh-intensity laser-solid interactions.
Whereas it is impossible to completely eliminate prepulseactivity, it is important to keep it to a minimum. To helpachieve this the Astra laser contains three KD*P Pockels cells(EM510. Leysop Ltd.), which have a manufacturer's specifiedoptical rise-time of 0.25 ns. Two are placed within the first,10-pass Ti-S amplifier stage and the third is placed between thefirst and second amplifiers. Each Pockels cell is placedbetween two crossed, Glan-Taylor polarising elements. ThePockels cells serve three roles within the laser. Firstly, they actas a pulse picker at a repetition rate of 10 Hz, secondly theyserve to minimise the energy of pre-pulses on target and thirdlythey reduce the amplification of spontaneous emission (ASE).
Characterisation of the Astra Laser in Proton Acceleration Experiments
P McKenna, K W D Ledingham*, I Spencer, T McCanny, R P Singhal
Department of Physics and Astronomy, University of Glasgow, Glasgow G12 8QQ, UK * also at AWE plc, Aldermaston, Reading RG7 4PR, UK
A J Langley, P S Foster, C Ziener, E J Divall, C J Hooker, D Neely, P A Norreys, R J Clarke
Central Laser Facility, CLRC Rutherford Appleton Laboratory, Chilton, Didcot, Oxon, OX11 0QX, UK
K Krushelnick
Blackett Laboratory, Imperial College, Prince Consort Road, London SW7 2BZ, UK
E L Clark
AWE plc, Aldermaston, Reading RG7 4PR, UK
Main contact email address: [email protected]
Time (fs)
-140 -120 -100 -80 -60 -40 -20 0 20 40 60 80 100 120 140
Nor
mal
ised
Sig
nal
-0.1
0.0
0.1
0.2
0.3
0.4
0.5
0.6
0.7
0.8
0.9
1.0
1.1
MeasurementGaussian Fit
Figure 1. Autocorrelation measurement of a compressedpulse.
Time (ps)
-10 -8 -6 -4 -2 0 2 4 6 8 10 12 14 16 18
Thi
rd-o
rder
am
plitu
de s
igna
l
10-6
10-5
10-4
10-3
-4 -3 -2 -1 0 1 2 3 4
0.0
0.2
0.4
0.6
0.8
1.0
S S
Figure 2. Third-Order Amplitude Diagnostic (TOAD) trace ofthe output pulse. The main logarithmic plot shows the traceobtained at maximum sensitivity. The satellite peaks S are dueto reflections in the TOAD. The inset shows the correspondingtrace obtained at low sensitivity and provides a calibration of themagnitude of the main trace.

High Power Laser Programme – Femtosecond Pulse Physics
Central Laser Facility Annual Report 2001/2002 80
The pulse-picking role is necessary because, as mentionedabove, the femtosecond laser oscillator operates with an outputrepetition rate of 76 MHz and provides a train of pulses spaced13 ns apart. The Ti-S amplifiers, however, are pumped at arepetition rate of 10 Hz, and gain is present within eachamplifier crystal for several microseconds. The Pockels cellstherefore serve to pick pulses for amplification whilstdiscriminating against the amplification of all other pulses inthe train. Photo-diode measurements of the laser pulse showedthat the best ratio between the energy of the preceding pulse(13 ns prior to the main amplified pulse) and the energy of themain pulse is 5 x 10⁻⁸. Lastly the two Pockels cells placedwithin the first amplifier are particularly important for removingunwanted ASE. The amplified pulses make 5 passes throughthe TiS crystal and are then passed through the Pockels cell pairbefore being injected back into the amplifier for a further fivepasses. The first amplifier has an overall gain of 106 and thePockels cells are very effective at removing the amplification ofspontaneous emission.
To characterise the prepulse and ASE activity in the presentstudy a third-order amplitude diagnostic (TOAD) measurementwas carried out on the compressed pulses. The main purpose ofa TOAD measurement is to highlight the intensity distributionin the wings of the main pulse. The main logarithmic trace inFigure 2 was obtained with the TOAD operated at its maximumsensitivity. At 10 ps before the main pulse, the background is atthe 10-6 level or better since this represents the sensitivity limitof the TOAD. The background level rises to 10-5 at 4 ps and10-4 at 1.5 ps before the arrival of the main pulse. The twosatellite peaks (S) are caused by reflections in the triplingcrystal of the autocorrelator (This was established by changingthe crystal to one of different thickness and observing a changein the delay between the two peaks.) These reflections producea weak post pulse for both the red (790 nm) and blue (395 nm)pulses which, when cross-correlated with the main red and bluepulses, result in two satellite peaks – one (apparently) beforeand the other after the central peak.
The linear plot in the inset of Figure 2 was obtained with theTOAD operated at low sensitivity by attenuating the energy ofthe input pulses. The low sensitivity scan serves to calibrate themagnitude of the high sensitivity data. It also demonstrates theinstrument response of the TOAD which at ~200 fs is more thanadequate for the measurement of contrast over the required tensof picoseconds time-window.
The Astra multi-terawatt laser is capable of delivering focusedintensities above 1019 Wcm-2 on target. The distribution on therising edge of the pulses as indicated by the TOADmeasurement represents an intensity of 1014 Wcm-2, 4 ps beforethe peak of the pulse, rising to 1015 Wcm-2 at about 1 ps.Assuming the plasma produced expands thermally at 107 cms-1,a plasma scale length of the order of 0.4 µm is estimated.
Focused Intensity
An f/3, 15.1 cm focal length off-axis, parabolic mirror was usedto focus the beam onto target. Due to the quantity of debris thatcan be generated in high-repetition rate laser-solid interactionsit was necessary to shield the gold coating on this optic with atransparent plastic pellicle. The pellicle is 10 µm thick andtherefore has a low B-integral and does not affect the overallfocus quality.
To determine the size and quality of the laser focal spot amicroscope objective was used to image it onto a CCD camera.The spatial resolution of the system has been calibrated tomeasure the focal spot size. The beam energy was attenuated tofacilitate this measurement. Figure 3 shows a typical image,where best focus corresponded to a FWHM spot size of 2.5 µm,which is almost diffraction limited. 41% of the total energy ontarget was determined to be contained within FWHM of thisspot. The maximum energy on target was 225 mJ, as
determined with a calorimeter positioned in the beam path justin front of the focusing optic. Using these maximum pulseparameters the focused intensity within FWHM of the mainfocal spot is calculated to be (3.0 ± 1.8) x 1019 Wcm-2.
To calibrate the intensity experimentally, a Time-of-Flight(ToF) spectrometer has been developed to measure ionproduction within the laser focus. The intensity is determinedby comparing the measured stages of ionisation of a target gaswith predictions of an atomic ionisation model. This techniqueis widely used in the study of Atomic and MolecularPhysics/Chemistry in laser fields of the order of 1016 Wcm-2. Itworks particularly well when the observed ToF spectra can bestatistically averaged over a number of laser shots and istherefore suitable in the present study with a laser repetition rateof up to 10 Hz at a reduced pulse energy. The technique isdetailed in a separate article in this report (C. Ziener et al)6).The intensity determined by measuring the ion yields in thisway was found to be in good agreement to within a factor of 1.5with the calculated intensity.
Proton Diagnostics
Measurements of the proton energy spectra were carried outusing a 'Thomson parabola' spectrometer with CR-39 plasticnuclear track detector, as shown schematically in Figure 4.CR-39 can be used to detect protons with energies above100 keV.
The spectrometer was located along the target normal direction(and therefore the laser axis) at a distance of 2.2 m behind thetarget. A 1 mm aperture was positioned to subtend a solid angleof 0.1 µsr. Between the two poles of the spectrometer, parallelelectric and magnetic fields were established in oppositedirections along the X-axis of Figure 4. For a positivelycharged ion this resulted in an electric force in the +X directionand a magnetic force in a downward direction along the Y-axis.In this way ions entering through the defining apertureexperienced a parabolic deflection between the poles accordingto their velocity. Although ions of different charge-to-massratio (q/m) are separated into distinct parabolas, only protonswere detected in the present study.
The characteristic proton parabolas were imprinted on pieces ofCR-39 located at a distance of 35 cm behind the spectrometer.As protons come to rest, the energy they deposit causes
2.5 µm
Figure 3. Focal spot image obtained with a CCD camera.
Tapetarget
CR-39 Thomsonparabola
Focusingparabola
Aperture
0.35 m
2.2 m
Protons
Y
XZ
Figure 4. Schematic of proton diagnostic set-up.

High Power Laser Programme – Femtosecond Pulse Physics
81 Central Laser Facility Annual Report 2001/2002
structural damage to the plastic material. After etching theplastic in NaOH solution for several hours, a series of small pitsvisible under a microscope provides the signature of the ions. Aspectrum is unfolded by sampling the number of pits in variousenergy bins along the parabola. Figure 5 shows an example of apiece of CR-39 illustrating some of the parabolas obtained inthe present study. The sharpness of the trace depends on theacceptance angle of the instrument and hence the aperture size.The traces all result from protons, but produced under varyingexperimental conditions. The measurements were made withthe same target (25 µm thick aluminium), but trace (A) wasobtained at an intensity of 7.4 x 10¹⁸ Wcm-2, with (B) and (C)resulting from measurements at 6.2 x 10¹⁸ Wcm-2 and5.2 x 1018 Wcm-2 respectively. The parabolas were separatedby changing the electric field strength in the spectrometerbetween measurements. Fields of strength 3 kVcm-1, 2 kVcm-1
and 1 kVcm-1 were used for traces (A), (B) and (C)respectively. The magnetic field was held constant at a value of0.1 T as determined by the fixed position of the permanentmagnetic pole pieces. The result was a change in deflectionalong the X-axis for each measurement and therefore a changein the resulting parabola. In this way various parameter scanscould be made with a single piece of CR-39. This avoided theneed to recycle the vacuum conditions to change the detectorfrequently and thus made full advantage of the high repetitionrate of the laser and the moving target mechanisms. Trace (D)in Figure 5 was made at a laser intensity of 7.4 x 10¹⁸ Wcm-2 (aswith (A)), but with the electric field turned off. This line tracehighlights the magnetic deflection in the downward directionalong the Y-axis. A measurement of this nature was routinelymade after each parameter scan and at the initial parametercondition to check reproducibility in the unfolded spectrum.
Additional pieces of CR-39 with up to 8 steps of mylar filterwere positioned at various angles from target normal in themain target chamber. The filters had thickness up to 20 µm,which provided a proton spectrum of cut-off energies up to1 MeV. These were used to provide measurements on thedirectionality and angular spread of the proton beams.
Experimental Results
Proton measurements as a function of focused laser intensity forlow energy (< 200 mJ) pulses are presented here. Figure 6shows proton energy distributions measured behind a 25 µm Altarget, irradiated at normal incidence with laser intensitiesbetween 5.2 x 10¹⁸ Wcm-2 and 7.4 x 10¹⁸ Wcm-2. The overallshape of the spectra are quite similar and in good overallagreement with the results of Maksimchuk et al (2000) 5) for a1.8 µm Al target at intensities up to 3 x 10¹⁸ Wcm-2.Maksimchuk 5) presents maximum proton energy of about1.5 MeV to 2.0 MeV for a 25 µm Al target at a laser intensity of1.5 x 1018 Wcm-2. The maximum proton energies in the presentresults for the same target thickness are lower, increasing fromabout 0.4 MeV to 0.8 MeV over the intensity range studied.
Measurements were also made with copper target foils, whichyielded maximum proton energies similar to the aluminiumtarget.
In Figure 7 a similar set of measurements is presented for a23 µm mylar target for intensities between 5.8 x 10¹⁸ Wcm-2
and 8.2 x 10¹⁸ Wcm-2. As with the aluminium target, themaximum energy to which protons are accelerated is observedto scale with intensity. However, the maximum proton energiesare higher for the mylar target than for the metal targets. This iscontrary to the results of Maksimchuk 5) who observed nosignificant difference in the maximum energy of protons fordifferent materials.
Conclusions
The importance of good pulse characterisation in multi-terawattlaser-solid interactions is highlighted. The design anddevelopment of a dedicated laser system for proton accelerationwill benefit from systematic studies of this nature using wellcharacterised laser parameters.
References
1. J. T. Mendonça, J. R. Davies, and M. Eloy, Meas. Sci.Tech. 12, 1801 (2001).
2. J. Langley et al., Central Laser Facility Annual Report1999/2000, RAL-TR-2000-034, 196 (2000).
3. D. Strickland and G. Mourou, Opt. Comm. 56, 219 (1985).
4. K. B. Wharton et al., Phys. Rev E 64, 025401(R) (2001).
5. A. Maksimchuk et al., Phys. Rev. Lett. 84, 4108 (2000).
6. C Ziener et al., Central Laser Facility Annual Report2001/2002, RAL-TR-2002-013, 192 (2002).
X
Y
A
BC
Zerodeflection
point
DFigure 5. Proton parabolas imprinted on CR-39. Themeasurements were made with 25 µm Al target. The laserintensity was A,D: 7.4×10¹⁸ Wcm-2; B: 6.2×10¹⁸ Wcm-2 andC: 5.2×10¹⁸ Wcm-2. The electric field within the spectrometerwas maintained at A: 3 kV/cm; B: 2 kV/cm; C: 1 kV/cm andD: no electric field.
Proton energy (keV)
0 200 400 600 800 1000 1200 1400 1600
Num
ber
of p
roto
ns /
(50
keV
.sr.
shot
)
106
107
108
109
1010
8.2 x 10¹⁸ Wcm-2
7.1 x 10¹⁸ Wcm-2
5.8 x 10¹⁸ Wcm-2
Figure 7. Scaling of the energy distribution ofprotons with laser intensity on a 23 µm mylar target.
Figure 6. Scaling of the energy distribution of protonswith laser intensity on a 25 µm Al target.
Proton energy (keV)
100 200 300 400 500 600 700 800 900
Num
ber
of p
roto
ns /
(50
keV
.sr.
shot
)
106
107
108
109
1010
7.4 x 10¹⁸ Wcm-2
6.2 x 10¹⁸ Wcm-2
5.2 x 10¹⁸ Wcm-2

High Power Laser Programme – Femtosecond Pulse Physics
Central Laser Facility Annual Report 2001/2002 82
Introduction
When a laser pulse with peak intensity of the order of1019 Wcm-2 interacts with a thin solid target (of the order of10 µm) the target material breaks down resulting in acharacteristic hole centred on the laser focal point. Each laserpulse must therefore be focused onto fresh target material. Theuse of a laser with the repetition rate of a few Hz such as Astrademands the adoption of a mechanical system to advance thetarget material in synchronisation with the laser pulse train.This facilitates a large number of laser shots to be taken beforethe vacuum conditions in the interaction chamber are recycledto replace the target. More importantly, integrating over manyshots improves the systematics and quantity of data obtained.Two target mount arrangements were developed for use in thepresent study to accommodate Cu, Al and mylar targets withthickness between 0.2 µm and 125 µm.
Target drive system designs
Figure 1 shows a double-reel set up employed for 10 mm widetape targets. This mounting system was used with both plasticand metal tapes with thickness above 10 µm. A computer-controlled stepper motor facilitated motion of the reels in eitherdirection with the target tape moving across two support rods,each a few mm to either side of the laser focus. The drive wasdesigned to operate at a velocity that ensured the tape remainedunder tension, and therefore flat, but not deformed. Experienceshowed that tapes thinner than 10 µm could not be used for thisreason. Typically nearly 200 laser shots were taken on a 2 mlong tape. In this way, measurements could be carried out forextended periods facilitating various parameter scans. Targettapes were loaded on spare reels in advance to ensure rapidtarget changeover.
A second target mount mechanism, shown in Figure 2, involvedsandwiching thin target foils (< 10 µm) between two halves of acircular wheel. A stepper motor was used to rotate the wheel, toadvance each target to the laser focus. Although only 24 shotscould be taken between each changeover, several targets ofdiffering material and thickness could be mounted on a singlewheel.
Experiment and Results
The target drives described were used in a proton accelerationexperiment. The experiment involved the use of a ThomsonParabola spectrometer with CR39 detectors, to measure the fluxand energy of the protons emitted from the laser-solidinteraction.
To experimentally establish if the target mount mechanisms ofFigures 1 and 2 had any influence on the interaction process, thesame target material was irradiated using both arrangements andthe reproducibility of the energy distribution of protons emittedwas checked. Figure 3 shows the corresponding spectrameasured at the back of the 36 µm mylar targets irradiated atnormal incidence. A total of 50 laser shots were made on themoving tape target and a maximum of 24 shots on the wheel-mounted target. The averaged laser intensities were7.2 x 1018 Wcm-2 and 7.5 x 10¹⁸ Wcm-2 respectively. The data
have been normalised to present the number of protonsobserved per shot (in 1 steradian and within a 50 keV energybin). Both spectra have a characteristic plateau over a similarenergy range. The highest energy points represent a cutoff,above which no protons were detected. There is a smalldifference of about 200 keV in comparing the maximumenergies observed, but otherwise the spectra are quite similar.
Conclusions
Target systems have been designed to realise the full potentialof a high-repetition rate laser system, specifically Astra in thisstudy, for high-intensity experiments. Specifically, the noveltarget designs were used very successfully in proton productionexperiments, making it possible to integrate over many shots.These targets coupled with the 2 Hz repetition rate of the laserprovided a large quantity of systematic and reproduciblemeasurements, and made it possible to resolve the optimumconditions for a range of target conditions for protonacceleration.
Novel Target Drive Mechanisms for High Repetition Rate Laser-Solid InteractionExperiments
P McKenna, K W D Ledingham*, I Spencer, T McCanny, R P Singhal
Department of Physics and Astronomy, University of Glasgow, Glasgow G12 8QQ, UK*also AWE plc, Aldermaston, Reading RG7 4PR, UK
M Harman, P Hatton, D Neville, P Brummitt, P S Foster, A J Langley, D Neely, E J Divall, C J Hooker, R J Clarke,R M Allott
Central Laser Facility, CLRC Rutherford Appleton Laboratory, Chilton, Didcot, Oxon, OX11 0QX, UK
Main contact email address: [email protected]
Reels
Target tape
Support rods
Laser
Figure 1. Double reelarrangement for tape targets.
Laser
Mountingwheels
Target foil
Figure 2. Wheelarrangement for thintarget foils.
Proton energy /keV
0 200 400 600 800 1000 1200 1400 1600
Pro
ton
yiel
d /(
50 k
eV.s
r.sh
ot)
106
107
108
109
1010
1011
Tape target mountWheel target mount
Figure 3. Energy distribution of protons as measured witha 36 µm mylar target mounted in both the 'tape-target' and'wheel-target' mounts.
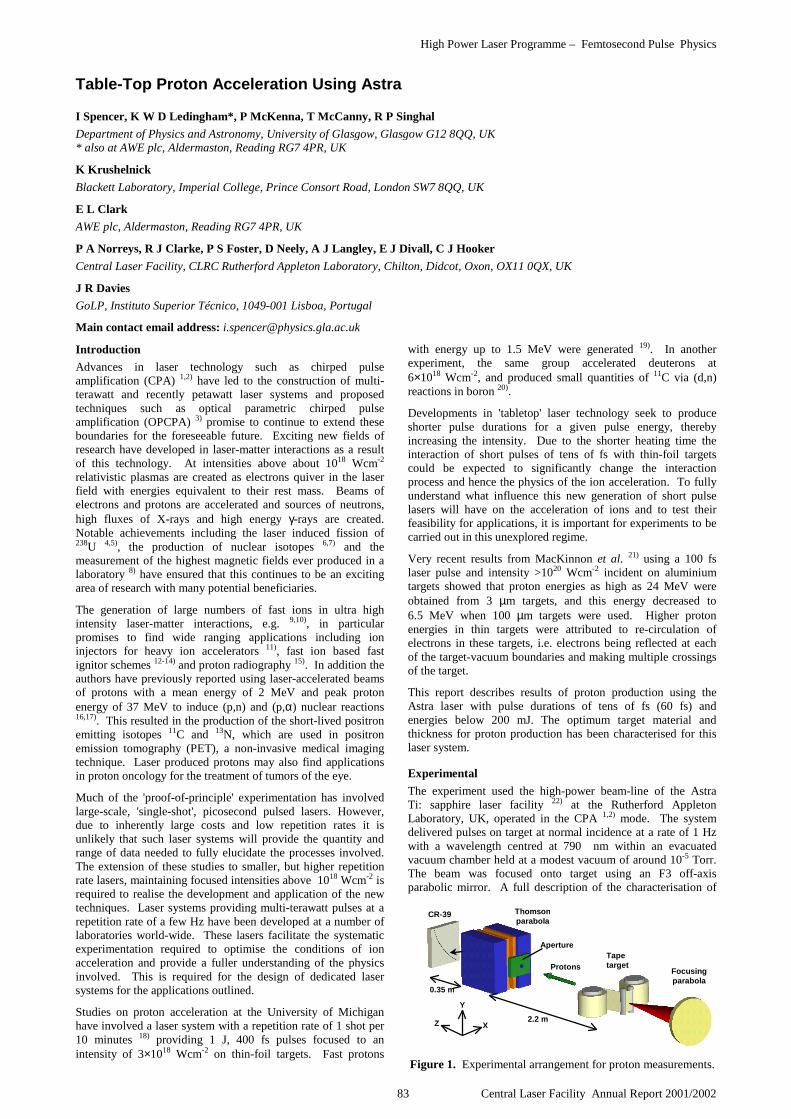
High Power Laser Programme – Femtosecond Pulse Physics
83 Central Laser Facility Annual Report 2001/2002
Introduction
Advances in laser technology such as chirped pulseamplification (CPA) 1,2) have led to the construction of multi-terawatt and recently petawatt laser systems and proposedtechniques such as optical parametric chirped pulseamplification (OPCPA) 3) promise to continue to extend theseboundaries for the foreseeable future. Exciting new fields ofresearch have developed in laser-matter interactions as a resultof this technology. At intensities above about 1018 Wcm-2
relativistic plasmas are created as electrons quiver in the laserfield with energies equivalent to their rest mass. Beams ofelectrons and protons are accelerated and sources of neutrons,high fluxes of X-rays and high energy γ-rays are created.Notable achievements including the laser induced fission of238U 4,5), the production of nuclear isotopes 6,7) and themeasurement of the highest magnetic fields ever produced in alaboratory 8) have ensured that this continues to be an excitingarea of research with many potential beneficiaries.
The generation of large numbers of fast ions in ultra highintensity laser-matter interactions, e.g. 9,10), in particularpromises to find wide ranging applications including ioninjectors for heavy ion accelerators 11), fast ion based fastignitor schemes 12-14) and proton radiography 15). In addition theauthors have previously reported using laser-accelerated beamsof protons with a mean energy of 2 MeV and peak protonenergy of 37 MeV to induce (p,n) and (p,α) nuclear reactions16,17). This resulted in the production of the short-lived positronemitting isotopes 11C and 13N, which are used in positronemission tomography (PET), a non-invasive medical imagingtechnique. Laser produced protons may also find applicationsin proton oncology for the treatment of tumors of the eye.
Much of the 'proof-of-principle' experimentation has involvedlarge-scale, 'single-shot', picosecond pulsed lasers. However,due to inherently large costs and low repetition rates it isunlikely that such laser systems will provide the quantity andrange of data needed to fully elucidate the processes involved.The extension of these studies to smaller, but higher repetitionrate lasers, maintaining focused intensities above 1018 Wcm-2 isrequired to realise the development and application of the newtechniques. Laser systems providing multi-terawatt pulses at arepetition rate of a few Hz have been developed at a number oflaboratories world-wide. These lasers facilitate the systematicexperimentation required to optimise the conditions of ionacceleration and provide a fuller understanding of the physicsinvolved. This is required for the design of dedicated lasersystems for the applications outlined.
Studies on proton acceleration at the University of Michiganhave involved a laser system with a repetition rate of 1 shot per10 minutes 18) providing 1 J, 400 fs pulses focused to anintensity of 3×10¹⁸ Wcm-2 on thin-foil targets. Fast protons
with energy up to 1.5 MeV were generated 19). In anotherexperiment, the same group accelerated deuterons at6×1018 Wcm-2, and produced small quantities of 11C via (d,n)reactions in boron 20).
Developments in 'tabletop' laser technology seek to produceshorter pulse durations for a given pulse energy, therebyincreasing the intensity. Due to the shorter heating time theinteraction of short pulses of tens of fs with thin-foil targetscould be expected to significantly change the interactionprocess and hence the physics of the ion acceleration. To fullyunderstand what influence this new generation of short pulselasers will have on the acceleration of ions and to test theirfeasibility for applications, it is important for experiments to becarried out in this unexplored regime.
Very recent results from MacKinnon et al. 21) using a 100 fslaser pulse and intensity >1020 Wcm-2 incident on aluminiumtargets showed that proton energies as high as 24 MeV wereobtained from 3 µm targets, and this energy decreased to6.5 MeV when 100 µm targets were used. Higher protonenergies in thin targets were attributed to re-circulation ofelectrons in these targets, i.e. electrons being reflected at eachof the target-vacuum boundaries and making multiple crossingsof the target.
This report describes results of proton production using theAstra laser with pulse durations of tens of fs (60 fs) andenergies below 200 mJ. The optimum target material andthickness for proton production has been characterised for thislaser system.
Experimental
The experiment used the high-power beam-line of the AstraTi: sapphire laser facility 22) at the Rutherford AppletonLaboratory, UK, operated in the CPA 1,2) mode. The systemdelivered pulses on target at normal incidence at a rate of 1 Hzwith a wavelength centred at 790 nm within an evacuatedvacuum chamber held at a modest vacuum of around 10-5 Torr.The beam was focused onto target using an F3 off-axisparabolic mirror. A full description of the characterisation of
Table-Top Proton Acceleration Using Astra
I Spencer, K W D Ledingham*, P McKenna, T McCanny, R P Singhal
Department of Physics and Astronomy, University of Glasgow, Glasgow G12 8QQ, UK* also at AWE plc, Aldermaston, Reading RG7 4PR, UK
K Krushelnick
Blackett Laboratory, Imperial College, Prince Consort Road, London SW7 8QQ, UK
E L Clark
AWE plc, Aldermaston, Reading RG7 4PR, UK
P A Norreys, R J Clarke, P S Foster, D Neely, A J Langley, E J Divall, C J Hooker
Central Laser Facility, CLRC Rutherford Appleton Laboratory, Chilton, Didcot, Oxon, OX11 0QX, UK
J R Davies
GoLP, Instituto Superior Técnico, 1049-001 Lisboa, Portugal
Main contact email address: [email protected]
Figure 1. Experimental arrangement for proton measurements.
Tapetarget
CR-39 Thomsonparabola
Focusingparabola
Aperture
0.35 m
2.2 m
Protons
Y
XZ

High Power Laser Programme – Femtosecond Pulse Physics
Central Laser Facility Annual Report 2001/2002 84
the various laser parameters is the subject of another publication23). Briefly, the system delivered pulses on target of 200 mJ andduration 60 fs. The contrast ratio was measured to be 1:10-6 orbetter at 10 ps before the main pulse, rising to 1:10-5 at 4 ps and10-4 at 1.5 ps 23). The maximum intensity on target wascalculated to be 7×10¹⁸ Wcm-2, and corroborated bymeasurements of multiple ionisation stages of argon 23).
Measurements of ion emission were made using a ThomsonParabola spectrometer 24-26) backed with CR39. Theexperimental set-up is shown in Figure 1. CR39 is a plasticnuclear track detector which is sensitive to ions greater than100 keV / nucleon, and insensitive to X-rays and electrons.Each ion incident on the CR39 is recorded as a single pit, andsince their energy can be calculated by the extent they aredeflected in the spectrometer, spectral information i.e. numbersand energy can be obtained. Data were accumulated over 24 or50 shots for every target.
Another experimental arrangement involved positioning CR39detectors close to the rear of the target in order to make spatiallyintegrated measurements of proton emission. Results of thisstudy are described in the next section.
Results
The experimental set-up described above was used to measurethe energy spectrum of protons emitted from targets of mylar,aluminium and copper targets of various thickness. The spectraobtained for each material with the highest cut-off energies areshown in Figure 2. The highest energy shown on each spectrumrepresents the cut-off energy. The optimum thicknesses werebetween 23 and 36 µm for mylar and ~12-13 µm for bothaluminium and copper, and the maximum proton energyobtained was 1.5 MeV with a mean energy of 250 keV, using a23 µm thick mylar target. The metal targets gave lowermaximum energies, 950 keV for Al, and 850 keV for Cu. It isinstructive to plot the maximum proton energies as a function oftarget thickness, and this is shown in Figure 3 for mylar,aluminium and copper targets. Figure 3 shows clearly that lowproton energies are obtained for thin targets, reaching anoptimum (which is ~3 times as thick for mylar compared withaluminium and copper) and an eventual decrease in energy forthicknesses greater than the optimum.
Figure 4 shows the total proton flux ≥400 keV for the targetsused. For the metals, this number was an order of magnitudelower than that of mylar. This is consistent with resultsobtained on the Petawatt at LLNL which operated at the higher
energy of 500 J and longer pulse length of 500 fs 10). It showsthat surface contaminants are not the only source of protons.
Spatially integrated measurements were made for a number ofmylar, aluminium and copper targets by positioning CR39 closebehind the target. The protons were emitted in a cone of halfangle 22° and the distribution was isotropic. No “ring” or“disc” structure 9,27) was observed in contradiction tomeasurements in higher energy, longer pulse experiments. Thismay be characteristic of the 60 fs pulse duration and 200 mJpulse energy used in the present experiment.
Discussion
The results presented for both plastic and metal targets showalmost no proton emission from targets of thickness similar tothe laser wavelength, then an increasing maximum energy up toan optimum thickness, then this energy falls off for increasingthickness. It is believed that the acceleration mechanisms fortargets of thickness similar to the laser wavelength are verydifferent from that of thicker targets 28). The decrease inmaximum proton energy after the optimum might be explainedby collisional energy loss in the target. Interestingly, in the caseof mylar, the optimum thickness appears to be 2cτ where c isthe speed of light and τ is the laser pulse length.
MacKinnon et al. 21) observed the highest proton energies fromthin targets of the order of the laser wavelength, then a sharpdecrease going to thicker targets up to ~10 µm, then a slower
Figure 2. Spectra with highest cut-off energy for mylar,aluminium and copper targets. The highest energy pointshown on each spectrum is the cut-off energy.
1.E+05
1.E+06
1.E+07
1.E+08
1.E+09
1.E+10
0 250 500 750 1000 1250 1500 1750
Energy / keV
Mylar 23 micronMylar 36 micronAluminium 12 micronCopper 12.5 micron
Pro
ton
s/50
keV
/ste
rad
ian
/sh
ot
Figure 4. Number of protons ≥400 keV as a function oftarget thickness for mylar, aluminium and copper.
1.E+07
1.E+08
1.E+09
1.E+10
1.E+11
0 25 50 75 100
Target Thickness / micron
Pro
ton
s>40
0 ke
V/s
tera
dia
n MylarAluminiumCopper
Figure 3. Maximum proton energies measured as a function oftarget thickness for mylar copper and aluminium. The highestenergies were produced with mylar targets, and the optimumthickness for mylar is ~3× thicker than that of the metals.
0
500
1000
1500
2000
0 25 50 75 100Thickness / micron
Max
Pro
ton
En
erg
y / k
eV
Aluminium
copper
mylar
High Power Laser Programme – Femtosecond Pulse Physics
85 Central Laser Facility Annual Report 2001/2002
decrease for targets up to 100 µm. High proton energiesobserved for thin targets was attributed to increased recycling ofelectrons in the target (reflections between front and rearsurfaces) for the thinnest targets of the order of the laserwavelength, which was verified via PIC simulations.
This is in contradiction to the present results, but may beexplained in terms of pre-pulse activity. The contrast ratio ofthe laser used in MacKinnon et al. was of the order 1010 whichwould give a pre-pulse intensity of 1010 Wcm-2. This would notaffect the target surface significantly prior to the arrival of themain pulse. In the present experiment, the contrast ratio was106 at 10 ps before the main pulse, and increased after this. Apre-pulse intensity of 7×10¹² Wcm-2 would certainly ionise thefront target surface and generate a plasma in front of the targetprior to the arrival of the main pulse. Pre-plasma formation onthe front surface effectively increases the target thickness andwould lead to less than perfect electron reflection. For targetsof the order of the laser wavelength pre-plasma formation onthe rear would also be expected, which has been shown toperturb proton emission from the rear 29,30). It is possible that ahigher contrast ratio in the present experiment would haveproduced higher energy protons for the thinnest targets used,and this will be investigated in future experiments. In fact,MacKinnon et al. stated that the proton signal was sometimeslost for thin targets, and this was attributed to an increase in pre-pulse activity since the pre-pulse proved difficult to control.
By comparing the results found here with those of Maksimchuket al., 19), several similarities are observed. Firstly, the protonenergies obtained are very similar, including a maximumenergy of 1.5 MeV. Also, the spectral shapes show a strikingresemblance, with a flattening off of the spectrum prior to asharp cut-off in both cases. Interestingly, even though theresults obtained are extremely similar, the difference in laserparameters between the present case and that of Maksimchuk etal. is as follows: the pulse length is a factor of seven shorter,the pulse energy a factor of five lower and the intensity here is afactor of two higher.
When comparing aluminium, the maximum proton energyobtained here was 800 keV compared to 1.5 MeV in 19), eventhough the intensity herein was a factor of two higher. Itappears that the reduced pulse length affects the accelerationmechanisms and leads to lower proton energies for similarintensities. The much lower pulse energy may also affect theacceleration mechanisms, although it is believed that this shouldonly affect the electron and subsequently proton flux. In thepresent case, the conversion efficiency from the laser to protonshas been estimated to be 0.7 %. This is encouraging for thefuture of table-top laser based proton acceleration, and furtherdetails of the implications of this finding can be found in 23).
Maksimchuk et al.19) saw also a dependence of pre-pulseintensity with the proton energies observed, and found amaximum. In this experiment, the pre-pulse arrived ~50 psbefore the main pulse, and the optimum pre-pulse intensity wasfound at 1015 Wcm-2. However, MacKinnon et al.21) foundoptimum conditions by minimising the pre-pulse intensity andusing thin targets of ~3 µm. The pre-pulse obviously plays avital role in fast proton production, and this factor must beinvestigated further in future experiments.
The ponderomotive potential Up for I=6×10¹⁸ Wcm-2 andλ=0.8 µm is 486 keV. The temperature of the hottest protonspectrum obtained in this study is 208 keV, over a factor of 2lower. However, if the dominant absorption mechanism intofast electrons is ponderomotive j×B heating, then maximumproton energies of around 500 keV would be expected 28).Proton energies 3 times higher than this have been measured. Itis obvious that other proton acceleration mechanisms are atwork, and that the pulse duration and contrast ratio of the laserplays an important role in proton production.
Conclusions
A study of proton emission from a table-top 1 Hz laser systemoperating at 60 fs, 200 mJ and 7×10¹⁸ Wcm-2 interacting withsolid targets has been made. The proton energies obtained havebeen investigated for various target materials and thicknesses.Optimum conditions have been found and the highest energy of1.5 MeV was obtained with mylar targets. It is obvious that thelaser pulse duration and contrast ratio play important roles inthe characteristics of proton acceleration, in terms of energiesobtained and the spatial distribution. A large quantity ofsystematic and reproducible measurements was made to resolvethe optimum targets for proton acceleration, which was madepossible by the 1 Hz repetition rate of the laser. The resultsherein look promising in terms of table-top high-repetition ratelaser proton acceleration and applications in terms ofconversion efficiency to protons and the energies obtained.
References1. D. Strickland and G. Mourou, Opt. Comm. 56, 219 (1985).
2. M. D. Perry and G. Mourou, Science 264, 917 (1994).
3. I. N. Ross et al., Las. Part. Beams. 17, 331 (1999).
4. K. W. D. Ledingham et al., Phys. Rev. Lett. 84, 899(2000).
5. T. E. Cowan et al., Phys. Rev. Lett. 84, 903 (2000).
6. T. W. Phillips et al., Rev. Sci. Inst. 70, 1213 (1999).
7. K. W. D. Ledingham and P. A. Norreys, Contemp. Phys40, 367 (1999).
8. M. Tatarakis et al., Nature 415, 280 (2002).
9. E. L. Clark et al., Phys. Rev. Lett. 84, 670 (2000).
10. R. A. Snavely et al., Phys. Rev. Lett. 85, 2945 (2000).
11. K. Krushelnick et al., IEEE Trans. Plas. Sci. 28, 1184(2000).
12. M. Tabak et al., Phys. Plasmas. 1, 1626 (1994).
13. M. Roth et al., Phys. Rev. Lett. 86, 436 (2001).
14. R. Kodama et al., Nature 412, 798 (2001).
15. M. Borghesi et al., Plasma. Phys. Control. Fusion 43,A267 (2001).
16. M. I. K. Santala et al., Appl. Phys. Lett. 78, 19 (2001).
17. I. Spencer et al., Nucl. Inst. Meth. B 183, 449 (2001).
18. N. Saleh et al., Rev. Sci. Inst. 71, 2305 (2000).
19. A. Maksimchuk et al., Phys. Rev. Lett. 84, 4108 (2000).
20. K. Nemoto et al., Appl. Phys. Lett. 78, 595 (2001).
21. A. J. Mackinnon et al., Phys. Rev. Lett. 88, 215006 (2002).
22. A. J. Langley et al., Central Laser Facility Annual Report1999/2000, RAL-TR-2000-034, 196 (2000).
23. P. McKenna et al., submitted to Rev. Sci. Inst. (2002).
24. M. R. Wehr, J. A. Richards Jr, and T. W. Adair III, Physicsof the Atom, (Addison-Wesley Publishing Company,1983).
25. K. Krushelnick et al., Phys. Rev. Lett. 83, 737 (1999).
26. E. L. Clark et al., Phys. Rev. Lett. 85, 1654 (2000).
27. Y. Murakami et al., Phys. Plasmas. 8, 4138 (2001).
28. J. T. Mendonça, J. R. Davies, and M. Eloy, Meas. Sci.Tech. 12, 1801 (2001).
29. A. J. Mackinnon et al., Phys. Rev. Lett. 86, 1769 (2001).
30. 30. M. Roth et al., Nucl. Inst. Meth. A. 464, 201 (2001).

High Power Laser Programme – Femtosecond Pulse Physics
Central Laser Facility Annual Report 2001/2002 86
Introduction
Laser produced plasmas, formed when a high peak power laserpulse is focused onto a sample (usually in vacuo) are wellknown to be intense sources of deep UV to x-ray radiation.Such laser plasma light sources (LPLS) have many applicationsin UV to x-ray microscopy, lithography and analyticalspectroscopy. The exact nature of the formation, expansion andradiation emitted from the plasma depends on many factorssuch as the laser pulse width, laser wavelength, target structure,etc. There is currently much interest in the generation ofvacuum-UV (VUV) to x-ray radiation from ultrashort(100 fsec – 100 psec) laser produced plasmas1). At the ultrashortend of the time scale the goal is to produce an intensesubpicosecond x-ray probe. Given the short lifetime of the innershell hole state, the production of Kα radiation by collisionswith rapidly heated plasma electrons has gained much currencyand proven to be a promising mechanism. Yields of up to1010 photons/sr for 3d elements look possible 2). However, sucha probe is going to be of relatively narrow bandwidth whichlimits its applicability to e.g., spectroscopic measurements. Onthe other hand, although longer pulse laser plasmas are capableof producing broadband extreme-UV continuum emission theshortest pulses to date have been on the 100 ps timescale forplasmas heated by 7 ps UV pulses 3).
Motivation
The present study is motivated by a desire to explore the dividebetween the interaction of short (150 ps) and ultrashort (80 fs)pulses with long pulse (ns) pre-plasmas with a view to reachinga compromise source delivering broad spectral range and shortduration. Traditionally LPLS experiments have concentrated ondirect laser-solid (usually metal) interactions. However, forsome years now a number of studies on the effects of highpower laser interaction with a pre-plasma have beenundertaken. Almost universally, they have demonstrated anincrease flux (mainly in the EUV) emitted compared to directlaser target interaction 4). The increase in EUV flux is largelyattributed to an increase in the plasma scale length andconcomitant laser light absorption efficiency and emittingvolume enhancement. Many such experiments worked with apre-pulse, optically split from the main beam. However, in mostcases the pre-plasma was formed by the (unwanted) amplifiedspontaneous emission (ASE) from the short pulse laseramplifier and hence not in any properly controlled fashion.Experiments on interaction of ultrashort pulses with electro-optically synchronised nanosecond laser generated plasmascould provide well defined experimental conditions forcontrolled exploration of the interaction and its modelling. Onespecific advantage of long pulse pre-plasmas is that they tend tobe more homogeneous thereby reducing refraction of the mainpulse out of the plasma and improving coupling efficiency.
Experiments
Pre-plasmas were formed by focusing the 8 ns output pulsefrom a Continuum Surelite laser onto flat slabs of Cu toirradiances in the range 1010 – 1011 W.cm-2 via a simple f/10plano-convex lens. They were subsequently heated by either150 ps or 80 fs pulses carrying up to 400 mJ and 200 mJrespectively. The laser systems were electro-opticallysynchronised permitting positive or negative time delays of upto 1000s ns with a jitter of < 500 ps. Pulse to pulse delays andjitter were measured on fast photodiodes coupled to a LeCroy9362C, 100 ps/ point, 3 Ghz bandwidth oscilloscope. Theoverlap of focal spots on the Cu slab target was checked using aCCD camera with a high magnification objective. Followingimage capture and analysis, precision laser focusing optic drivespermitted alignment of each laser’s focal spot to better than10 µm. For the 150 ps + 8 ns dual laser plasma experiments,VUV spectra were recorded on a 1m normal incidence vacuumspectrometer (Acton Research VM521) equipped with a1200 grooves/mm grating. The spectrometer was operated withan entrance slit width of 50 µm, yielding a resolution of ca.1000 at 50 nm. Readout was via a back illuminated CCD(Andor, 256 x 1024 array with 26x 26 µm2 pixels). In the caseof the 80 fs + 8ns dual laser plasma experiments x-ray emissionwas recorded on a KAP flat crystal spectrometer equipped withfront illuminated Andor CCD readout. The entrance apertureincluded a thin (thickness 5 µm) Mylar filter/window for softradiation rejection. The ultrashort pulse was focused by aparaboloid to a spot size of ~ 5 µm diameter (potentialirradiance of up to 1019 W.cm-2).
Results - VUV Experiments
In Figure 1 we show a comparison between a sum of individualps + ns spectra and a synchronised dual ps/ns plasma spectrumwhere a significant gain in flux is observed for the latter case.
VUV/ Soft X-ray Emission from Laser-Preplasma Interactions with Picosecond andFemtosecond Pulses
J T Costello, J S Hirsch, E T Kennedy, J-P Mosnier, A Murphy, A NeogiNational Centre for Plasma Science and Technology, School of Physical Sciences, Dublin City University, Glasnevin, Dublin 9,Ireland
P Dunne, D Kilbane, G O’SullivanDepartment of Physics, University College Dublin, Dublin 4, Ireland
C L S Lewis, S ToppingDepartment of Pure and Applied Physics, Queen’s University of Belfast, Belfast BT7 1NN, Northern Ireland, UK
R Clarke, E Divall, P Foster, C Hooker, A Langley, D NeelyCentral Laser Facility, CLRC Rutherford Appleton Laboratory, Chilton, Didcot, Oxon, OX11 0QX, UK
Main contact email address: [email protected]
0
5000
10000
15000
20000
25000
30000
35000
40000
45000
40 45 50 55 60
Wavelength (nm)
Co
un
ts
ps & ns Fired Together
Sum of ps & ns
Figure 1. Comparison between synchronised and summedps/ns laser generated plasma spectra.

High Power Laser Programme – Femtosecond Pulse Physics
87 Central Laser Facility Annual Report 2001/2002
The delay between the (ns) pre-plasma and the main picosecondbeam was 20 ns. The focal spot size was ~ 250 µm in eachcase. The spectral distributions for both traces are very similarindicating almost identical plasma conditions. This is largelytrue at all time delays as is evident from Figure 2 where weshow a 3D plot illustrating the time history of the VUV spectra.
Since the spectrometer is set to gather all light even from anextended plasma source the conclusion is that the emittingvolume must simply be larger in the synchronised case. This isnot unexpected since the pre-plasma provides a longer scalelength thereby increasing the volume of pumped plasma andefficiency of collisional absorption and hence the emitting size/brightness. Time resolved VUV imaging and space/timeresolved spectroscopic experiments are planned to confirm thishypothesis. Further experiments on the effect of pre-plasmaconditions (known to affect the plasma scale length5)) areplanned. Analysis of the spectra is ongoing in order to clarifythe ionization balance.
In Figure 3 we summarise the time history of the VUV flux gainwhere a peak value of 3.5 at an inter-laser pulse delay of 10 nsis evident indicating an optimum value in the heated volume atthis time delay.
Results – Soft X-ray Experiments
For the experiments with the synchronised fs/ns laser generatedplasmas we opted to look in the soft x-ray range(7–11 Angstroms) where the Ne-like and neighbouring ionstages of Cu predominantly emit. Up to 200mJ/ 80 fs pulsesfrom Astra were focused to a spot size of diameter ca. 6 µmwhile the ns pulses were focused to a 50 µm diameter spot andoverlapped on target. Peak on target irradiances approached1019 W.cm-2 and a few times 1012 W.cm-2 respectively. A weakspectrum was obtainable using an 800 mJ/8ns pulse only at anirradiance of ~ 5 x 10¹² W.cm-2 and an estimated plasma
temperature of ~500 eV. In direct target interaction the emissionfrom the femtosecond generated plasmas was predominantlyhard x-ray in nature and tended to swamp the CCD even at‘low’ power (~50 mJ/pulse). A strong component offluorescence x-rays is also likely as high energy electronsimpinged on the spectrometer entrance window. Attempts toreduce it with a fixed B-field on the entrance aperture failed.Hence the CCD essentially recorded direct and fluorescentx-ray emission within its sensitivity range (1 – 10 keV but canextend even higher with reduced sensitivity ). In a sense thesystem is a total x-ray (relative) flux detector and we use theoutput in a far from rigorous but indicative manner to followtrends in the total x-ray signal.
Briefly we observed a largely linear dependence of detectedx-ray flux with pulse energy in the 10 – 200 mJ range in thecase of the interaction of the 80 fs pulse directly with the Cuslab. Inspection of Figure 3 in Reference 6) shows a similartrend in integrated x-ray emission above 30 keV (although a 3/2power law dependence is mentioned by the authors).
In the case of a pre-plasma the total x-ray signal displayed astrong dependence on time delay between pre-plasma emissionand the ultra-intense pulse (Figure 4). The x-ray signal peaks atan inter-plasma delay of 20 ns or so.
The (normalised) x-ray signal for plasmas generated with the80 fs pulse only is 0.45 and a similar value is obtained for thetwin synchronised plasma experiments where both laser peaksare overlapped (0 ns – point not shown). Murnane et al. 7) havealready alluded to the fact that a pre-plasma is likely to be anecessary condition for efficient hard x-ray (HXR) generation.The above result would seem to indicate that not only is this sobut there is a clear dependence on pre-plasma conditions andhence a comprehensive hard photon and particle spectroscopyexperiment is warranted. It also pointed out in 7) that the HXRpulse duration are not yet known.
References
1. G Kulcsar et al. Phys.Rev.Lett 84, 5149 (2000)
2. Ch Reich, P Gibbon, I Uschmann & E Forster,Phys.Rev.Lett 84, 4846 (2000)
3. Meighan et al., J.Phys.B:At.Mol.Opt.Phys 33, 1159 (2000)
4. U Teubner, G Kuhnle and F P Schafer, Appl.Phys.B 54,493 (1992)
5. J A Cobble et al., J.Appl.Phys 69, 3369 (1991)
6. Kmetec et al., Phys.Rev.Lett 68, 1527 (2000)
7. Murnane et al, Appl.Phys.B 58, 261 (1994)
10 1000.0
0.1
0.2
0.3
0.4
0.5
0.6
0.7
0.8
0.9
1.0
1.1
Nor
mal
ised
X-r
ay F
lux
Time Delay (ns)
Figure 4. Scaling of (relative) X-ray signal with delaybetween pre (ns) and main (fs) pulses.
Figure 2. VUV spectral distribution as a function of inter-laser time delay.
2
2.2
2.4
2.6
2.8
3
3.2
3.4
3.6
0 10 20 30 40Time (ns)
VU
V F
lux
Gai
n
Figure 3. VUV flux gain as a function of interlaser time delay.

Lasers for Science Facility Programme
89 Central Laser Facility Annual Report 2001/2002
Lasers for Science Facility Programme
1) Chemistry
2) Biology
3) Physics
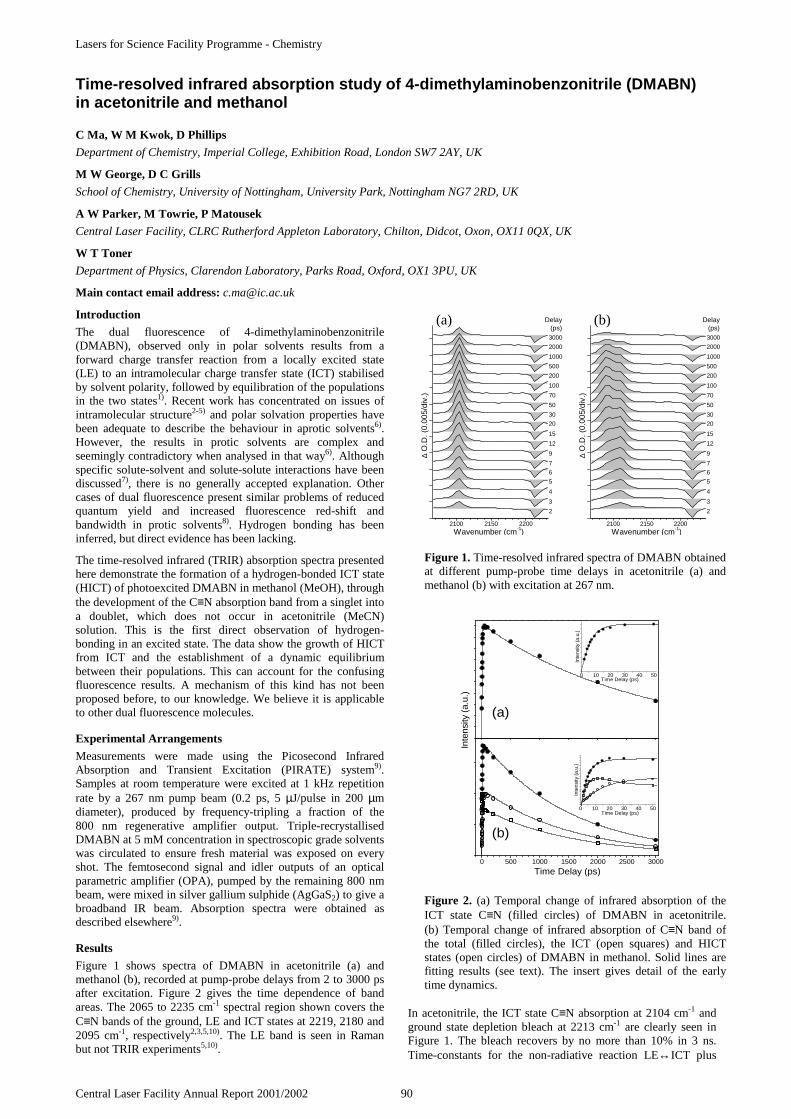
Lasers for Science Facility Programme - Chemistry
Central Laser Facility Annual Report 2001/2002 90
Introduction
The dual fluorescence of 4-dimethylaminobenzonitrile(DMABN), observed only in polar solvents results from aforward charge transfer reaction from a locally excited state(LE) to an intramolecular charge transfer state (ICT) stabilisedby solvent polarity, followed by equilibration of the populationsin the two states1). Recent work has concentrated on issues ofintramolecular structure2-5) and polar solvation properties havebeen adequate to describe the behaviour in aprotic solvents6).However, the results in protic solvents are complex andseemingly contradictory when analysed in that way6). Althoughspecific solute-solvent and solute-solute interactions have beendiscussed7), there is no generally accepted explanation. Othercases of dual fluorescence present similar problems of reducedquantum yield and increased fluorescence red-shift andbandwidth in protic solvents8). Hydrogen bonding has beeninferred, but direct evidence has been lacking.
The time-resolved infrared (TRIR) absorption spectra presentedhere demonstrate the formation of a hydrogen-bonded ICT state(HICT) of photoexcited DMABN in methanol (MeOH), throughthe development of the C≡N absorption band from a singlet intoa doublet, which does not occur in acetonitrile (MeCN)solution. This is the first direct observation of hydrogen-bonding in an excited state. The data show the growth of HICTfrom ICT and the establishment of a dynamic equilibriumbetween their populations. This can account for the confusingfluorescence results. A mechanism of this kind has not beenproposed before, to our knowledge. We believe it is applicableto other dual fluorescence molecules.
Experimental Arrangements
Measurements were made using the Picosecond InfraredAbsorption and Transient Excitation (PIRATE) system9).Samples at room temperature were excited at 1 kHz repetitionrate by a 267 nm pump beam (0.2 ps, 5 µJ/pulse in 200 µmdiameter), produced by frequency-tripling a fraction of the800 nm regenerative amplifier output. Triple-recrystallisedDMABN at 5 mM concentration in spectroscopic grade solventswas circulated to ensure fresh material was exposed on everyshot. The femtosecond signal and idler outputs of an opticalparametric amplifier (OPA), pumped by the remaining 800 nmbeam, were mixed in silver gallium sulphide (AgGaS2) to give abroadband IR beam. Absorption spectra were obtained asdescribed elsewhere9).
Results
Figure 1 shows spectra of DMABN in acetonitrile (a) andmethanol (b), recorded at pump-probe delays from 2 to 3000 psafter excitation. Figure 2 gives the time dependence of bandareas. The 2065 to 2235 cm-1 spectral region shown covers theC≡N bands of the ground, LE and ICT states at 2219, 2180 and2095 cm-1, respectively2,3,5,10). The LE band is seen in Ramanbut not TRIR experiments5,10).
In acetonitrile, the ICT state C≡N absorption at 2104 cm-1 andground state depletion bleach at 2213 cm-1 are clearly seen inFigure 1. The bleach recovers by no more than 10% in 3 ns.Time-constants for the non-radiative reaction LE↔ICT plus
Time-resolved infrared absorption study of 4-dimethylaminobenzonitrile (DMABN)in acetonitrile and methanol
C Ma, W M Kwok, D Phillips
Department of Chemistry, Imperial College, Exhibition Road, London SW7 2AY, UK
M W George, D C Grills
School of Chemistry, University of Nottingham, University Park, Nottingham NG7 2RD, UK
A W Parker, M Towrie, P Matousek
Central Laser Facility, CLRC Rutherford Appleton Laboratory, Chilton, Didcot, Oxon, OX11 0QX, UK
W T Toner
Department of Physics, Clarendon Laboratory, Parks Road, Oxford, OX1 3PU, UK
Main contact email address: [email protected]
0 500 1000 1500 2000 2500 3000
0 10 20 30 40 50
0 10 20 30 40 50
(b)
Inte
nsity
(a.
u.)
Time Delay (ps)
Inte
nsity
(a.
u.)
Time Delay (ps)
(a)
Inte
nsity
(a.
u.)
Time Delay (ps)
(a) (b)
2100 2150 2200
Delay (ps)
3000
2000
1000
500
200
100
70
50
30
20
15
12
9
7
6
5
4
3
2
∆ O
.D. (
0.00
5/di
v.)
Wavenumber (cm-1)2100 2150 2200
Delay (ps)
3000
2000
1000
500
200
100
70
50
30
20
15
12
9
7
6
5
4
3
2
∆ O
.D. (
0.00
5/di
v.)
Wavenumber (cm-1)
Figure 1. Time-resolved infrared spectra of DMABN obtainedat different pump-probe time delays in acetonitrile (a) andmethanol (b) with excitation at 267 nm.
Figure 2. (a) Temporal change of infrared absorption of theICT state C≡N (filled circles) of DMABN in acetonitrile.(b) Temporal change of infrared absorption of C≡N band ofthe total (filled circles), the ICT (open squares) and HICTstates (open circles) of DMABN in methanol. Solid lines arefitting results (see text). The insert gives detail of the earlytime dynamics.

Lasers for Science Facility Programme - Chemistry
91 Central Laser Facility Annual Report 2001/2002
decay (lines in Figure 2(a)), are 6.4 ps (equilibration) and 2.7 ns(decay). Using 0.030 for the quantum yield, rates forfluorescence, internal conversion to the ground state (IC) andintersystem crossing (ISC) are found to be 1.1 x 10⁷, 2.6 x 10⁷
and 3.4 x 10⁸ s-1. We have observed similar TRIR kinetics inTHF and triacetin, but with different time constants. Our resultsagree with many fluorescence studies indicating promptformation of LE and fast equilibration of LE/ICT populations,with rates and ratio varying with solvent.
The results are very different in methanol (Figures 1(b) and2(b)). As the C≡N infrared absorption grows, the band can beresolved into components at 2091 and 2109 cm-1, reachingconstant relative intensities by ~50 ps. The total intensity has5.5 ps and 1.6 ns time-constants for growth and decay and thedoublet structure develops with a 13 ps time-constant (lines inFigure 2(b)) but is not resolvable at the earliest times. Thecomponent widths are significantly broader than the groundstate bleach indicating that some faster processes orinhomogeneous effects are also involved. Qualitatively similarresults were obtained in ethanol and butanol. The ground statebleach recovers with a 5 ns time constant. The much more rapidbleach recovery in methanol when compared to acetonitrileindicates a strongly enhanced internal conversion (IC) rate tothe ground state. This is consistent with the large deuterationeffect on DMABN fluorescence in alcohol solvents7).
The doublet structure is clearly due to an interaction that occursin protic MeOH after charge separation, but not aprotic MeCN.We attribute it to hydrogen-bonding in the ICT state. Since theweak solvent dependence of DMABN ground state vibrationalspectra indicates no bonding, we conclude that chargeseparation is a necessary precursor. The high negative chargedensity on the cyano electron acceptor region of ICT stateDMABN would be expected to facilitate bonding at this site inthe presence of a proton donor alcohol, the electron acceptorgroup in turn becoming a proton acceptor. The 13 ps doubletdevelopment timescale agrees with the 10-15 ps for thehydrogen bonding of ground state N-methylacetamide inMeOH11), and we note that the 20 cm-1 shift of C=O in that caseis comparable with the 18 cm-1 C≡N shift we observe, and theresolution of the components is similar. Since hydrogen-bonding is highly sensitive to solute-solvent orientation anddistance, one would expect the rate for this intermolecularinteraction to reflect specific solvent reorganisation timescales,and it is significant that the ~18 ps forward reaction time-constant one can deduce from the results above lies close to the15.8 ps for solvent-solvent bond breaking and R-OH rotation inmethanol12).
We therefore interpret the data in terms of two charge-transferstates, ICT and HICT. The dynamics may be complex, as maybe reflected in the bandwidths of the doublet componentsrelative to the bleach, but we have used a simple decompositionof the doublet into two superposed components of equal widthto make an approximate assessment of the properties of the twoICT states. The kinetics are well described by sequential non-radiative transitions leading to equilibrium populations:LE↔ICT↔HICT, followed by decay (lines in Figure 2(b)),though a small amount of direct LE↔HICT cannot beexcluded. Since the total C≡N intensity is in the same ratio tothe ground state bleach in both solvents and the downshift ofthe C≡N component at 2109 cm-1 in MeOH from the groundstate bleach is the same as that of singlet in MeCN, it is taken tobelong to a “free” ICT state similar to that formed in MeCN.
Since the three excited states, LE, ICT and HICT, co-exist, ourresults imply that the fluorescence in protic solvent is asuperposition of three overlapping bands: the fluorescence istriple, not dual. We believe that the presence of a hydrogen-bonding interaction accounts for the abnormal further red-shifting and broadening of the red fluorescence in protic relativeto aprotic solvents, and that much of the confusion in the
literature arises from treating both protic and aprotic cases interms of a simple dual fluorescence model.
We conclude that the data demonstrate the existence of twocharge transfer states of photoexcited DMABN in methanol,ICT and HICT, where HICT is hydrogen-bonded. ICT ispopulated from the locally excited state and a dynamicequilibrium between the populations of the two charge transferstates is established on a 13 ps timescale. The internalconversion rate of the HICT state is very much larger than thatof ICT and is mainly responsible for the reduced quantum yieldin MeOH. A three-state mechanism for dual fluorescencemolecules in protic solvents has not been proposed before. Itcan account for the main anomalies in fluorescence spectra. Theresults lead to a substantially better understanding of the long-term controversial dual fluorescence phenomenon. It alsoillustrates the power of the high resolution, high sensitivityTRIR technique employed and the ability to follow theformation of excited state bonding in real time.
References
1. E Lippert, W Rettig, V Bonacic-Koutecky, F Heisel, J AMieheAdv. Chem. Phys., 68 1, (1987)
2. W M Kwok, C Ma, P Matousek, A W Parker, D Phillips,W T Toner, M Towrie, S UmapathyJ. Phys. Chem. A., 105 984, (2001)
3. M Hashimoto, H HamaguchiJ. Phys. Chem., 99 7875, (1995)
4. H OkamotoJ. Phys. Chem. A, 104 4182, (2000)
5. C Chudoba, A Kummrow, J Dreyer, J Stenger, E T JNibbering, T Elsaesser, K A ZachariasseChem. Phys. Lett., 309 357, (1999)
6. P Changenet, P Plaza, M M Martin, Y H. Meyer J. Phys. Chem. A, 101 8186, (1997), and referencestherein
7. R J Visser, C A G O Varma, J Konijnenberg, P BergwerfJ. Chem. Soc., Faraday Trans. II, 79 347, (1983)
8. T Okada, M Uesugi, G Kohler, K Rechthaler, KRotkiewicz, W Rettig, G GrabnerChem. Phys., 241 327, (1999)
9. M Towrie, D C Grills, J Dyer, J A Weinstein, P Matousek,R Barton, P D Bailey, N Subramaniam, W M Kwok, CMa, D Phillips, A W Parker, M W GeorgeAppl. Spectrosc., submitted
10. C Ma, W M Kwok, P Matousek, A W Parker, D Phillips,W T Toner, M TowrieJ. Phys. Chem. A, 106 3294, (2002)
11. S Woutersen, Y Mu, G Stock, P HammChem. Phys., 266 137, (2001)
12. M L Horng, J A Gardecki, A Papazyan, M MaroncelliJ. Phys. Chem., 99 17311, (1995)

Lasers for Science Facility Programme - Chemistry
Central Laser Facility Annual Report 2001/2002 92
Introduction
DMABN undergoes an intramolecular charge transfer (ICT)reaction from a locally excited (LE) excited state to an ICT statein polar solvents, and often used as a model compound. Thestructure of the LE state has been investigated by rotationallyresolved electronic spectroscopy in the gas phase1,2) andpicosecond time-resolved resonance Raman (ps-TR3)3) andtime-resolved infrared (TRIR)4) spectroscopy in solution.Conflicting results have been presented. Some gas phase studiessuggest the LE state has a 22o or 30o twist between the planes ofthe amino group and phenyl ring1) but a planar LE structure issuggested by others, for example, the super-cooled molecularjet study of Salgado et al2). Solution phase studies are in not identified. Theoretical studies are also in conflict. Ab initioRCIS work by Scholes et al5) and Lommatzsch et al6) supportsthe twisted conformation, but calculations using CASSCF, andsome other semi-empirical methods, with and without solventeffects, lend support to a planar geometry6,7). Recently, thepossibility of a slightly wagged LE conformation has also beensuggested7).
In contrast to DMABN, ABN does not undergo theintramolecular charge transfer (ICT) reaction in either the gas orsolution phase and only normal fluorescence can be observed,even in polar solvents. The absence of the ICT fluorescence inABN has been attributed to an increased energy gap betweenthe two lowest excited states and a low amino group donorstrength8). It has often been taken as a model for the LE state ofDMABN. From gas phase rotationally resolved excitationspectroscopy studies, pyramidal or planar structure has beensuggested6). Based on a comparison of the experimental TRIRspectrum with CASSCF calculations, Chudoba et al and Dreyeret al proposed a conformation with a pyramidal amino group7).However, this view contradicts theoretical work predicting aplanar structure for the S1 state of ABN6).
To clarify and establish the structural and electronic propertiesof the LE states of DMABN and ABN, we obtained ps Kerrgate TR3 (ps-K-TR3) spectra over the 800 - 2400 cm-1 range.Spectra of methyl-deuterated DMABN (DMABN-d6) were usedto help assign modes related to the dimethylamino group. Tofind suitable TR3 probe wavelengths for the TR3 experimentsand also to help identify the intermediate species probed, thetransient absorption (TA) of ABN and DMABN was measured.In order to relate the experimental observations to excited statestructure, equilibrium geometries and vibrational frequencieswere calculated by the ab initio RCIS method.
Experimental Arrangements
Time-resolved experiments were carried out using a systembased on optical parametric amplifiers. Transient absorbancespectra were measured under “magic angle” conditions usingthe arrangement described in Reference 3 with a pumpwavelength of 267 nm. The ps-K-TR3 spectra of the LE statesof ABN and DMABN were obtained using the methodsdescribed in References 3 and 9, with pump and probewavelengths of 267 and 460 nm, respectively. TR3 spectra of
the LE state of DMABN and DMABN-d6 were obtained with267/600 nm pump/probe wavelengths. Each spectrum shown isthe sum of 3 individual background-subtracted spectra withaccumulation times typically of 2000 seconds. The spectra werenot corrected for variations in spectral throughput and detectorefficiency.
Acetonitrile Raman bands were used to calibrate the spectrawith an estimated accuracy in absolute frequency of +/- 10 cm-1.Sample concentrations were 1-5 x 10⁻³ mol dm-3. UV absorptionmeasurements before and after sample use revealed nodegradation.
Results
Transient absorption spectra of ABN and DMABN in hexaneand acetonitrile, excited at 267 nm, are shown in Figure 1. Thefine structure is due to uncorrected instrumental effects. TheABN spectra (Figure 1a) resemble the spectrum of DMABN innon-polar hexane (Figure 1b) and change little with time. Thereis no significant solvent dependence for ABN, in contrast to thewell-known behaviour of DMABN, where there is no ICTreaction in non-polar solvent but an isobestic point at ~455 nmindicates the picosecond timescale transfer from LE to ICT inacetonitrile10). These observations are in good agreement withthe scenario that LE states of similar properties are formed inABN in either polar or non-polar solvent and in DMABN innon-polar solvent.
Figure 1. Transient absorption spectra of ABN (a) andDMABN (b) in hexane and acetonitrile with excitation at267 nm, at 50 ps delay time.
The ps-K-TR3 experiments were carried out for ABN andDMABN with pump and probe wavelengths 267 and 460 nm,respectively, and ps-TR3 measurements of DMABN andDMABN-d6 were made at 600 nm probe wavelength where theKerr gate was not required. The probe wavelengths used areindicated by arrows in Figure 1. The pump wavelength falls intothe lowest absorption band of ABN and DMABN. The spectraobtained are shown in Figure 2.
Time-resolved resonance Raman and transient absorption study of locally excitedstates of 4-aminobenzonitrile (ABN) and 4-dimethylaminobenzonitrile (DMABN)
C Ma, W M Kwok, D Phillips
Department of Chemistry, Imperial College, Exhibition Road, London SW7 2AY, UK
A W Parker, M Towrie, P Matousek
Central Laser Facility, CLRC Rutherford Appleton Laboratory, Chilton, Didcot, Oxon, OX11 0QX, UK
W T Toner
Department of Physics, Clarendon Laboratory, Parks Road, Oxford, OX1 3PU, UK
Main contact email address: [email protected]
450 500 550 600 650 700
0
2
4
6
∆ O
.D. (
x 1
0 -3
)
Wavelength (nm)
0
1
2
3
4
460 nm
Hexane
DMABN (b)Acetonitrile
ABN (a)
600 nm
460 nm
Hexane
Acetonitrile

Lasers for Science Facility Programme - Chemistry
93 Central Laser Facility Annual Report 2001/2002
LE state S0 state
ABN DMABN DMABN-d6 ABN DMABN DMABN-d6 Assignment
Experiment cc-pVZD 6-31G(d) Experiment 6-31G(d) Experiment 6-31G(d) Experiment Experimenta Experimenta
C≡N 2172 (1.0) 2288 2299 2176 (1.0) 2294 2178 (1.0) 2294 2211 2210 2210
19a (ring CC streching) 1481 (1.5) 1437 1446 1467 (1.4) 1477 1454 (3.2) 1466 1518 1523 1515
δMe (methyl deformation) 1416 (1.1) 1420 1122 1414 1134
ν(ph-N) 1367 (0.4) 1295 1297 1357 (0.6) 1357 1351 (2.4) 1360 1314 1370 1375
3(ring CH bending) 1289 (0.2)* 1272 1288 1325 (0.3)* 1308 1285 (0.2)* 1309 1299 1306 1306
ν(ph-CN), 9a (ring CH bending) 1189 (0.6) 1141 1143 1168 (1.5) 1154 1166 (1.5) 1166 1209 1227 1227
9a (ring CH bending), ν(ph-CN) 1135 (0.6) 1109 1124 1113 (1.0) 1136 1102 (2.0) 1142 1174 1180 1178
Table 1. Observed and calculated Raman band frequencies and their assignment for the LE states of ABN, DMABN and DMABN-d6. Observed ground state frequencies are included for comparison. aReference 11. *Weak features of uncertain assignment.
The DMABN spectrum at 600 nm probe wavelength (c) is verysimilar to that previously obtained in cyclohexane using a615 nm probe3). The spectrum of DMABN-d6 in non-polarsolvent (d) has not been reported previously. Bands appearingbetween ~1000 and 1600 cm-1 are not well resolved in the460 nm DMABN spectrum (b), but the C 2180 cm-1 is clearly seen and we note that it is absent in polarsolvents at 400 nm probe wavelength but has been observed at2095 cm-1 using 330 nm probe wavelength at 50 ps delay.Interference effects may occur in resonance Raman scatteringwhen the absorption bands of electronic states overlap, as islikely to be the case here. There may also be mode mixing. Inthe absence of Raman excitation profiles, band intensitiestherefore give only a qualitative indication of molecularproperties and no definite conclusions can be drawn, but wetake the data to indicate that Sn states of similar character areresonant with LE at both 460 and 600 nm (or there is a singlevery broad state in this region). The spectrum of ABN inmethanol at 460 nm probe wavelength (a) closely resembles the600 nm spectrum of DMABN in hexane (c), indicating that bothmolecules have LE and Sn states of similar character and ABNdoes not form the ICT state in polar solvent.
Figure 2. Picosecond Kerr-gated time-resolved resonanceRaman spectra of ABN in methanol (a) and DMABN in hexane(b) with 267 nm pump and 460 nm probe wavelength at 50 psdelay time. Picosecond time-resolved resonance Raman spectraof DMABN (c) and DMABN-d6 (d) in cyclohexane with267 nm pump and 600 nm probe wavelength at 50 ps delaytime. *indicates improper solvent band subtraction.
Band positions and relative intensities obtained usingunconstrained Lorentzian fits are summarized in Table 1.Tentative assignments, RCIS calculated frequencies12) andfrequencies of the corresponding bands in the ground states areincluded in the table for comparison. The assignments are basedon DMABN/DMABN-d6 isotopic shifts and the RCISfrequency calculations.
It is important to note that all the spectra in Figure 2 show theC -1, corresponding to the same ~30 cm-1
downshift for ABN and DMABN relative to the ground state.This indicates a decrease of the C interpreted as being due to a similar degree of partiallocalisation of transferred charge on the cyano anti-bondingorbital in the LE states of both molecules.
Most of the recorded bands in the LE states of both ABN andDMABN were observed at frequencies shifted from groundstate values. Besides the C ! "#mode dominated by Wilson 19a has ~37 cm-1 downshift while $%-1 from theground to LE state. We note that these frequency shiftsobserved using TR3 in this and our previous work are not seenin the TRIR experiments4).
We conclude that the experimental fluorescence, transientabsorption and TR3 spectra of the LE states of ABN andDMABN are very similar, indicating similar electronic andvibrational properties. Based on general agreement between theexperimental and calculated frequencies, a planar structure hasbeen suggested for the LE state of both the molecules.
References
1. O Kajimoto, H Yokoyama, Y Ooshima, Y EndoChem. Phys. Lett., 179 455, (1991)
2. F P Salgado, J Herbich, A G M Kunst, R P RettschnickJ. Phys. Chem. A, 103 3184, (1999)
3. W M Kwok, C Ma, D Phillips, P Matousek, A W Parker,M Towrie, J. Phys. Chem. A, 104 4188, (2000)
4. C Chudoba, A Kummrow, J Dreyer, J Stenger, E T JNibbering, T Elsaesser, K A ZachariasseChem. Phys. Lett., 309 357, (1999)
5. G D Scholes, D Phillips, I R GouldChem. Phys. Lett., 266 521, (1997)
6. U Lommatzsch, B Brutschy, Chem. Phys., 234 35, (1998)
7. J Dreyer, A Kummrow, J. Am. Chem. Soc., 122 2577,(2000)
8. K A Zachariasse, Chem. Phys. Lett., 320 8, (2000)
9. W M Kwok, C Ma, P Matousek, A W Parker, D Phillips,W T Toner, M Towrie, S Umapathy, J. Phys. Chem. A,105 984, (2001)
10. C Ma, W M Kwok, D Phillips, P Matousek, A W Parker,M Towrie, W T Toner , CLF RAL. Ann. Rep., 107, (1999-2000)
11. W M Kwok, I Gould, C Ma, M Puranik, S Umapathy, PMatousek, A W Parker, D Phillips, W T Toner, M TowriePhys. Chem.Chem. Phys., 3 2424, (2001)
12. C Ma, W M Kwok, P Matousek, A W Parker, D Phillips,W T Toner, M Towrie, J. Phys. Chem., 106 3294, (2002)
800 1000 1200 1400 1600 1800 2000 2200 2400
Wavenumber (cm-1)
Rel
ativ
e in
tens
ity
2172
1481
1367
1289
11891135
2180
2176
14671416
135711681113
2178
1351
12851166
11021454
(a)
(b)
(c)
(d)
*

Lasers for Science Facility Programme - Chemistry
Central Laser Facility Annual Report 2001/2002 94
Introduction
Research into supercritical fluids (SCFs) has growndramatically in recent years. This is in part due to the promisethey hold as environmentally friendly alternatives to the toxicorganic solvents commonly used in industry. Any substancewhose pressure and temperature exceed their critical values (pc
and Tc respectively) is called a supercritical fluid1). Thesefluids are a curious hybrid of gases and liquids and theirphysical properties are generally intermediate between the two.Furthermore, near the critical point their physical properties(e.g. density, viscosity, dielectric constant etc.) become highlytuneable with small changes in pressure and temperature. Thismeans that the solvating power of an SCF can be controlled,allowing the desired reaction rate and selectivity of a chemicalprocess to be achieved, with the added advantage that removalof the solvent is simply a matter of releasing the pressure andreturning to the gaseous state.
It is of vital importance that we fully understand chemicalreactivity and reaction mechanisms in SCFs, together withfundamental processes such as vibrational relaxation andsolvation, since these are often very different than inconventional solvents. Pump-probe time-resolved spectroscopyis an excellent technique for such studies since it allows thekinetics of fast processes to be measured directly on timescalesdown to femtoseconds.
Time-resolved spectroscopy in SCFs has largely been limited toUV/visible transient absorption and fluorescence. However,vibrational spectroscopy such as time-resolved infrared (TRIR)spectroscopy offers advantages over these techniques since itallows the direct structural characterisation of transientspecies2). UV pumped TRIR on the nanosecond and longertimescale has previously been applied to supercritical fluidsamples2). Also, on the picosecond timescale IR pumped TRIRspectroscopy has been perfomed in SCFs3). However, UVpumped TRIR in SCFs on the ps/fs timescale has not beenreported, largely due to limitations in the physical and opticalproperties of cell window materials.
Spectroscopic studies in SCFs require an optical cell that iscapable of withstanding the high pressures involved.Furthermore, the windows must be optically transparent to allthe beams used in the experiment. For TRIR this means that thewindows must be transparent throughout the UV/visible andinfrared regions. High pressure cells have previously been usedfor nanosecond TRIR in SCFs and these employed thick(ca. 10 mm) CaF2 windows2), which were capable ofwithstanding pressures in excess of 5000 psi and which werecompletely transparent from the UV to IR. Unfortunately, thefs/ps UV pulses used in ultrafast TRIR spectroscopy wouldgenerate undesirable non-linear effects such as filamentationand white-light continuum generation in the thick CaF2
windows and therefore these cells are unsuitable for sub-nanosecond TRIR. In order to prevent non-linear effects thewindows must be below a critical thickness, determined fromthe parameters of the optical pulses and window material. Forflash photolysis experiments in the UV/visible region this is notsuch a problem since optical materials exist (e.g. sapphire ordiamond) that are suitably transparent and strong enough towithstand high-pressures at low thickness. For TRIR the choiceof optical material is more limited.
In this paper we describe the design and construction of a newoptical cell for ps/fs TRIR spectroscopy in SCFs and high-pressure liquids. Using the recently developed PIRATE facilitywe have performed preliminary ps-TRIR experiments,examining the vibrational relaxation dynamics of short livedreactive intermediates generated by the photolysis of Cr(CO)6 insupercritical fluid solution.
Experimental
The PIRATE facility for broadband ps-TRIR spectroscopy haspreviously been described in detail4). Briefly, the systememploys broadband (ca. 150 cm-1) 150 fs IR pulses to probe thesample. These are dispersed over 64-element linear IR arraydetectors and processed in real time at the 1 kHz repetition rateof the laser system.
The design of the new high-pressure cell is shown in Figure 1.The cell was required to safely withstand pressures andtemperatures up to 5000 psi and ca. 50 °C respectively and havea small internal volume. For these reasons it was constructedfrom thick walled 316 stainless steel. Furthermore, it had toincorporate two optical windows that are transparent throughoutthe UV/visible and mid-IR and which can withstand themaximum working pressure whilst being thin enough to preventnon-linear optical effects with the fs UV pulses.
The most suitable window material in terms of opticaltransparency and mechanical strength was MgF2. Although itstransmitting range (ca. 83300 – 1300 cm-1) is slightly narrowerthan that of the related CaF2, it is stronger, with an apparentelastic limit of 7200 psi compared with 5300 psi for CaF2. Inorder to estimate an upper limit for the thickness of the MgF2
windows, below which non-linear optical effects would beavoided, we made use of the B integral concept. The B integralis useful for predicting the onset of self-phase modulation andself-focusing of ultrashort laser pulses in optical windows. Avalue of ≤ 1 is considered low enough to prevent these effects.The equation is given below,
∫=L
dzzIn
B0
2 ).(2
λπ
where n2 is the non-linear refractive index of the windowmaterial, λ the laser wavelength, I(z) the intensity of the laserpulse and L the interaction length. Using typical parameters ofthe PIRATE laser system it was found that a maximum MgF2
thickness of 2 mm would give a B integral of 1.
Figure 1. Cross-section of the new high-pressure ps-TRIR cell.
Picosecond Time-resolved Infrared Spectroscopy in Supercritical Fluids
X-Z Sun, D C Grills, O S Jina, K Stanley, M W George
School of Chemistry, University of Nottingham, University Park, Nottingham, NG7 2RD, UK
P Matousek, M Towrie, A W Parker
Central Laser Facility, CLRC Rutherford Appleton Laboratory, Chilton, Didcot, Oxon, OX11 0QX, UK
Main contact email address: [email protected]

Lasers for Science Facility Programme - Chemistry
95 Central Laser Facility Annual Report 2001/2002
In order to calculate the dimensions of the windows andwindow apertures, required to safely withstand a workingpressure of 5000 psi, standard window pressure formulae wereused. These suggested that with 2 mm thick circular MgF2
windows with a diameter of 6 mm, a safe window aperturewould be 2 mm. The high-pressure cell is connected, by meansof 1/16" o.d. stainless steel tubing, into a high-pressurerecirculating flow system containing the solution under studyand a conventional high-pressure cell2) for online FTIRmonitoring.
Results and Discussion
We have demonstrated the potential of the supercriticalps-TRIR apparatus by performing a series of experiments insupercritical and high-pressure liquid solutions, monitoringchanges in the ν(CO) absorptions of a transition metal carbonylcomplex following UV excitation. The ν(CO) bands of metalcarbonyls are intense and narrow and provide an excellentprobe of the electronic and structural environment around themetal centre.
Vibrational Relaxation Dynamics of Transition MetalCarbonyls
The redistribution and dissipation of excess energy invibrationally excited molecules has long been the subject ofintense study and is a key factor governing chemical reactivity.Transition metal carbonyl complexes offer an interestingopportunity to study vibrational relaxation since the frequenciesof the ν(CO) vibrations are virtually isolated from othermolecular vibrations and solvent modes. This lack of couplingoften leads to relaxation lifetimes that are 1 or 2 orders ofmagnitude longer than those of typical molecular vibrations.
Heilweil and co-workers have previously used broadbandps-TRIR to measure the vibrational relaxation ofM(CO)5(hexane) transients (M = Cr, Mo or W) in hexanesolution5). These alkane complexes were generated by thephotoejection of a CO molecule from a M(CO)6 precursor andthe subsequent rapid solvation of M(CO)5 by a solventmolecule. Relaxation lifetimes of the ν(CO) modes (from thev=1 to v=0 levels) were found to be ca. 160 ps. Fayer haspreviously measured the relaxation dynamics of W(CO)6 in aseries of supercritical fluids using IR pump-IR probe TRIR onthe ps timescale3) and has found that in noble gases therelaxation lifetime is significantly extended to ca. 1 ns. Thetunability of SCFs permits a study of the effect of reactionenvironment on vibrational energy relaxation. Our aim was touse ps-TRIR to investigate the relaxation dynamics of the ’hot’solvated intermediates, Cr(CO)5(L) generated by UV excitationof Cr(CO)6 in a range of SCFs and SCFs doped with hexane.
Figure 2 shows a series of ps-TRIR spectra obtained after the267 nm excitation of Cr(CO)6 in supercritical Xe (scXe)(1250 psi, 25 °C) doped with CO (60 psi). CO was added to thesolution to make it photoreversible, thus preventing rapiddecomposition of Cr(CO)6 during the experiment. Aninstantaneous bleaching of the parent T1u ν(CO) band isobserved together with the generation of an extremely broadabsorption centred around 1945 cm-1. This new band isassigned to the overlapping absorptions of the photogeneratedCr(CO)5(Xe) complex in a series of high-lying vibrationallevels. This narrows and slightly blue shifts over the nextca. 20 ps into four overlapping bands, assigned to the lowfrequency a1 and e ν(CO) modes of Cr(CO)5(Xe) in the v=1(1950 and 1916 cm-1) and v=0 (1964 and 1937 cm-1) vibrationalenergy levels. Rapid narrowing and blue shifting of ν(CO)absorption features in M(CO)5(hexane) (M = Cr, Mo, W)complexes have previously been observed and were attributedto the vibrational relaxation of low frequency modes coupled tothe CO stretches5). For the remainder of the experiment, up to1 ns, the v=1 bands decay as the v=0 bands increase in intensity,
forming two well-resolved a1 and e absorptions. It should benoted that the high frequency a1 mode of Cr(CO)5(Xe), which isexpected to appear at ca. 2090 cm-1, is extremely weak in the IRand was not monitored in these experiments.
2050 2000 1950
Wavenumber (cm-1)
∆A
bsor
banc
e
1900
5 ps
1 ps
10 ps
20 ps
50 ps
100 ps
200 ps
350 ps
1000 ps
Figure 2. ps-TRIR spectra shown at selected time delaysbetween 1 and 1000 ps following 267 nm excitation of Cr(CO)6
in scXe (1250 psi, 25 °C) in the presence of CO (60 psi).
In order to measure the rate of v=1→0 vibrational relaxation ofCr(CO)5(Xe), kinetic traces were constructed by plotting theabsorbances of the v=1 and v=0 a1 bands of Cr(CO)5(Xe) versustime delay. These produced a decay and a growth respectively,which both fitted to a single exponential function to give avibrational relaxation lifetime under these conditions of110 ± 20 ps. These experiments were repeated in scAr, liquidCO2 and scAr doped with hexane. The results of these studiessuggest that under the conditions of our experiments, thedominating relaxation pathway is that of vibration-vibrationresonance energy transfer between Cr(CO)5(L) and free CO orliquid CO2. This is because the high frequency a1 mode ofCr(CO)5(L), at ca. 2090 cm-1, is completely overlapped with theextremely intense IR bands of CO and CO2. Futureexperiments in the absence of added CO will be used to probethis mechanism.
Conclusions
We have demonstrated UV pumped TRIR spectroscopy in SCFson the picosecond time scale and have shown the potential ofthese experiments to monitor vibrational relaxation processes.
References
1. T CliffordFundamentals of Supercritical FluidsOxford University Press, Oxford (1999)
2. M W George, M Poliakoff and J J TurnerAnalyst, 119 551, (1994)
3. D J Myers, M Shigeiwa, M D Fayer and B J CherayilJ. Phys. Chem., 104 2402, (2000)
4. M Towrie, P D Bailey, R Barton, P Matousek,A W Parker, M W George and D C GrillsCLF Annual Report 2000/2001, RAL-TR-2001-030, 165,(2001)
5. T P Dougherty and E J HeilweilChem. Phys. Lett., 227 19, (1994)
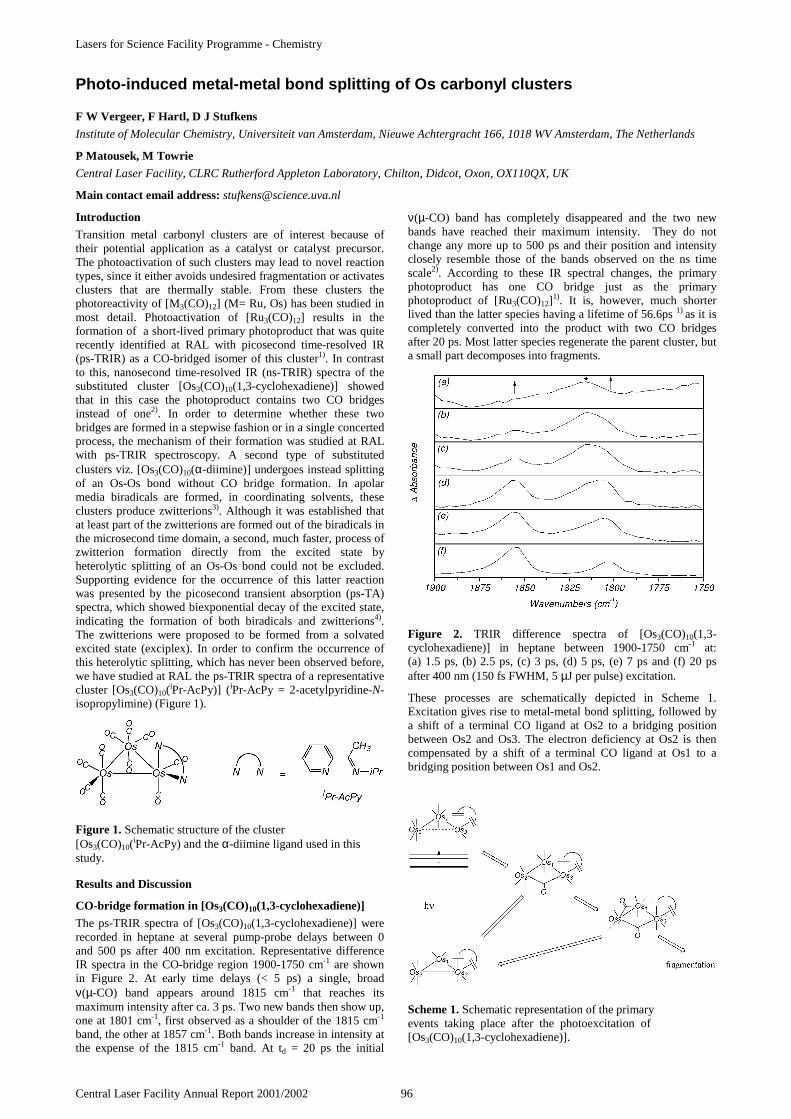
Lasers for Science Facility Programme - Chemistry
Central Laser Facility Annual Report 2001/2002 96
Introduction
Transition metal carbonyl clusters are of interest because oftheir potential application as a catalyst or catalyst precursor.The photoactivation of such clusters may lead to novel reactiontypes, since it either avoids undesired fragmentation or activatesclusters that are thermally stable. From these clusters thephotoreactivity of [M3(CO)12] (M= Ru, Os) has been studied inmost detail. Photoactivation of [Ru3(CO)12] results in theformation of a short-lived primary photoproduct that was quiterecently identified at RAL with picosecond time-resolved IR(ps-TRIR) as a CO-bridged isomer of this cluster1). In contrastto this, nanosecond time-resolved IR (ns-TRIR) spectra of thesubstituted cluster [Os3(CO)10(1,3-cyclohexadiene)] showedthat in this case the photoproduct contains two CO bridgesinstead of one2). In order to determine whether these twobridges are formed in a stepwise fashion or in a single concertedprocess, the mechanism of their formation was studied at RALwith ps-TRIR spectroscopy. A second type of substitutedclusters viz. [Os3(CO)10(α-diimine)] undergoes instead splittingof an Os-Os bond without CO bridge formation. In apolarmedia biradicals are formed, in coordinating solvents, theseclusters produce zwitterions3). Although it was established thatat least part of the zwitterions are formed out of the biradicals inthe microsecond time domain, a second, much faster, process ofzwitterion formation directly from the excited state byheterolytic splitting of an Os-Os bond could not be excluded.Supporting evidence for the occurrence of this latter reactionwas presented by the picosecond transient absorption (ps-TA)spectra, which showed biexponential decay of the excited state,indicating the formation of both biradicals and zwitterions4).The zwitterions were proposed to be formed from a solvatedexcited state (exciplex). In order to confirm the occurrence ofthis heterolytic splitting, which has never been observed before,we have studied at RAL the ps-TRIR spectra of a representativecluster [Os3(CO)10(
iPr-AcPy)] (iPr-AcPy = 2-acetylpyridine-N-isopropylimine) (Figure 1).
Figure 1. Schematic structure of the cluster[Os3(CO)10(
iPr-AcPy) and the α-diimine ligand used in thisstudy.
Results and Discussion
CO-bridge formation in [Os3(CO)10(1,3-cyclohexadiene)]
The ps-TRIR spectra of [Os3(CO)10(1,3-cyclohexadiene)] wererecorded in heptane at several pump-probe delays between 0and 500 ps after 400 nm excitation. Representative differenceIR spectra in the CO-bridge region 1900-1750 cm-1 are shownin Figure 2. At early time delays (< 5 ps) a single, broadν(µ-CO) band appears around 1815 cm-1 that reaches itsmaximum intensity after ca. 3 ps. Two new bands then show up,one at 1801 cm-1, first observed as a shoulder of the 1815 cm-1
band, the other at 1857 cm-1. Both bands increase in intensity atthe expense of the 1815 cm-1 band. At td = 20 ps the initial
ν(µ-CO) band has completely disappeared and the two newbands have reached their maximum intensity. They do notchange any more up to 500 ps and their position and intensityclosely resemble those of the bands observed on the ns timescale2). According to these IR spectral changes, the primaryphotoproduct has one CO bridge just as the primaryphotoproduct of [Ru3(CO)12]
1). It is, however, much shorterlived than the latter species having a lifetime of 56.6ps 1) as it iscompletely converted into the product with two CO bridgesafter 20 ps. Most latter species regenerate the parent cluster, buta small part decomposes into fragments.
Figure 2. TRIR difference spectra of [Os3(CO)10(1,3-cyclohexadiene)] in heptane between 1900-1750 cm-1 at:(a) 1.5 ps, (b) 2.5 ps, (c) 3 ps, (d) 5 ps, (e) 7 ps and (f) 20 psafter 400 nm (150 fs FWHM, 5 µJ per pulse) excitation.
These processes are schematically depicted in Scheme 1.Excitation gives rise to metal-metal bond splitting, followed bya shift of a terminal CO ligand at Os2 to a bridging positionbetween Os2 and Os3. The electron deficiency at Os2 is thencompensated by a shift of a terminal CO ligand at Os1 to abridging position between Os1 and Os2.
Scheme 1. Schematic representation of the primaryevents taking place after the photoexcitation of[Os3(CO)10(1,3-cyclohexadiene)].
Photo-induced metal-metal bond splitting of Os carbonyl clusters
F W Vergeer, F Hartl, D J Stufkens
Institute of Molecular Chemistry, Universiteit van Amsterdam, Nieuwe Achtergracht 166, 1018 WV Amsterdam, The Netherlands
P Matousek, M Towrie
Central Laser Facility, CLRC Rutherford Appleton Laboratory, Chilton, Didcot, Oxon, OX110QX, UK
Main contact email address: [email protected]
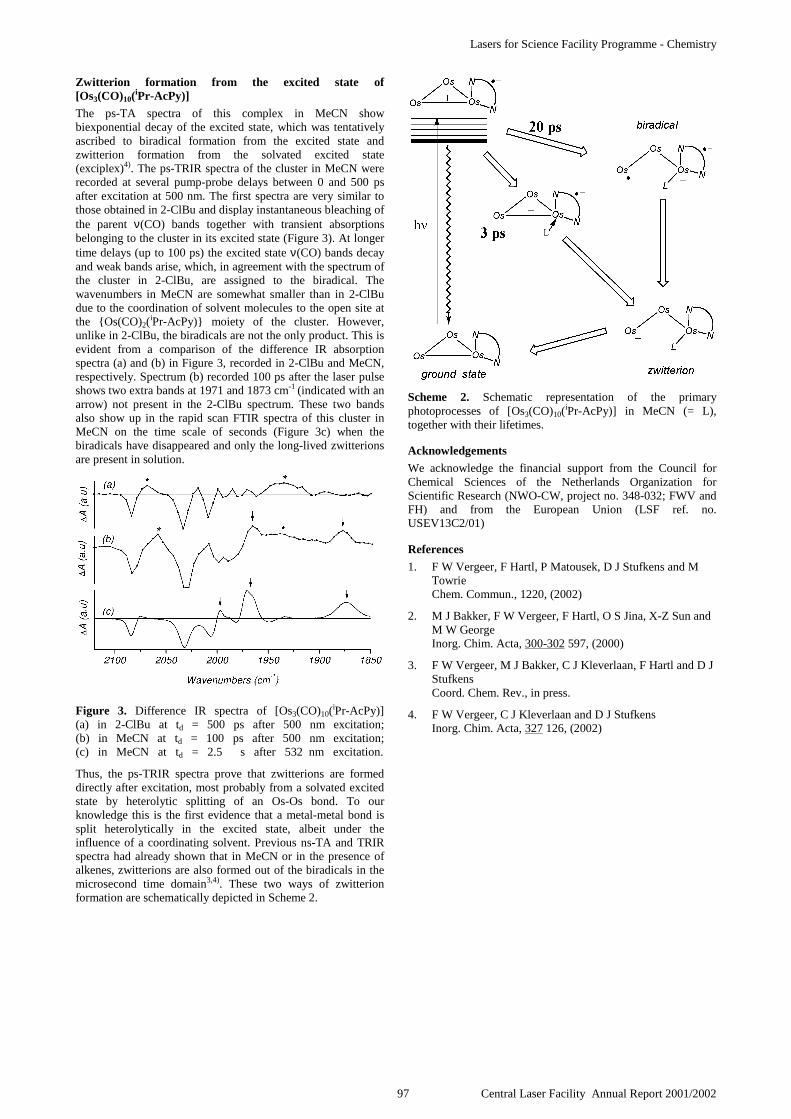
Lasers for Science Facility Programme - Chemistry
97 Central Laser Facility Annual Report 2001/2002
Zwitterion formation from the excited state of[Os3(CO)10(
iPr-AcPy)]
The ps-TA spectra of this complex in MeCN showbiexponential decay of the excited state, which was tentativelyascribed to biradical formation from the excited state andzwitterion formation from the solvated excited state(exciplex)4). The ps-TRIR spectra of the cluster in MeCN wererecorded at several pump-probe delays between 0 and 500 psafter excitation at 500 nm. The first spectra are very similar tothose obtained in 2-ClBu and display instantaneous bleaching ofthe parent ν(CO) bands together with transient absorptionsbelonging to the cluster in its excited state (Figure 3). At longertime delays (up to 100 ps) the excited state ν(CO) bands decayand weak bands arise, which, in agreement with the spectrum ofthe cluster in 2-ClBu, are assigned to the biradical. Thewavenumbers in MeCN are somewhat smaller than in 2-ClBudue to the coordination of solvent molecules to the open site atthe Os(CO)2(
iPr-AcPy) moiety of the cluster. However,unlike in 2-ClBu, the biradicals are not the only product. This isevident from a comparison of the difference IR absorptionspectra (a) and (b) in Figure 3, recorded in 2-ClBu and MeCN,respectively. Spectrum (b) recorded 100 ps after the laser pulseshows two extra bands at 1971 and 1873 cm-1 (indicated with anarrow) not present in the 2-ClBu spectrum. These two bandsalso show up in the rapid scan FTIR spectra of this cluster inMeCN on the time scale of seconds (Figure 3c) when thebiradicals have disappeared and only the long-lived zwitterionsare present in solution.
Figure 3. Difference IR spectra of [Os3(CO)10(iPr-AcPy)]
(a) in 2-ClBu at td = 500 ps after 500 nm excitation;(b) in MeCN at td = 100 ps after 500 nm excitation;(c) in MeCN at td = 2.5 s after 532 nm excitation.
Thus, the ps-TRIR spectra prove that zwitterions are formeddirectly after excitation, most probably from a solvated excitedstate by heterolytic splitting of an Os-Os bond. To ourknowledge this is the first evidence that a metal-metal bond issplit heterolytically in the excited state, albeit under theinfluence of a coordinating solvent. Previous ns-TA and TRIRspectra had already shown that in MeCN or in the presence ofalkenes, zwitterions are also formed out of the biradicals in themicrosecond time domain3,4). These two ways of zwitterionformation are schematically depicted in Scheme 2.
Scheme 2. Schematic representation of the primaryphotoprocesses of [Os3(CO)10(
iPr-AcPy)] in MeCN (= L),together with their lifetimes.
Acknowledgements
We acknowledge the financial support from the Council forChemical Sciences of the Netherlands Organization forScientific Research (NWO-CW, project no. 348-032; FWV andFH) and from the European Union (LSF ref. no.USEV13C2/01)
References
1. F W Vergeer, F Hartl, P Matousek, D J Stufkens and MTowrieChem. Commun., 1220, (2002)
2. M J Bakker, F W Vergeer, F Hartl, O S Jina, X-Z Sun andM W GeorgeInorg. Chim. Acta, 300-302 597, (2000)
3. F W Vergeer, M J Bakker, C J Kleverlaan, F Hartl and D JStufkensCoord. Chem. Rev., in press.
4. F W Vergeer, C J Kleverlaan and D J StufkensInorg. Chim. Acta, 327 126, (2002)

Lasers for Science Facility Programme - Chemistry
Central Laser Facility Annual Report 2001/2002 98
Introduction
Photochemical trans-cis isomerisation of a C=C or N=N bond isa much studied problem that is relevant to chemicalmanipulation of optical information (vision) and to moleculardevices. For example, supramolecules containing theseisomerisable bonds can change their shape and physicalproperties on irradiation, acting as switches. Generally, it isunderstood that trans-cis isomerisation is ultrafast ( ≤200 fs)and involves ππ* excited states. Several time-resolvedabsorption (TA) and resonance Raman (TR3) studies have beenperformed on simple model molecules such as stilbene or evenlarge functional molecules like rhodopsine. The isomerisationmechanism and underlying excited-state dynamics are expectedto change profoundly when an isomerising molecule iscoordinated to a metal atom, whose presence will bothintroduce new excited states and modify the behaviour of ππ*excited states of the organic ligand. The most important newexcited states are the metal-to-ligand charge transfer (MLCT)states which involve transfer of electron density either to theisomerising ligand or to another ancillary ligand present in thecoordination sphere.
ReOC
OC
Cl
CO
N
NN
ReOC
OC
CO
N
N
+
Figure 1. Schematic structures of [Re(Cl)(stpy)2(CO)3] (left)and [Re(stpy)(CO)3(bpy)]+ (right).
In this report, we describe our recent investigations of thenature and dynamics of excited states of two molecules:[Re(Cl)(stpy)2(CO)3] and [Re(stpy)(CO)3(bpy)]+, where stpy isthe isomerisable styrylpyridine ligand, Figure 1. Besides thestpy-localized intraligand (IL) ππ* excited states, bothcomplexes can have Re→stpy MLCT excited states. Inaddition, a low-lying Re→bpy MLCT excited state is expectedfor the latter complex.
Time-resolved visible absorption spectrum of[Re(Cl)(stpy)2(CO)3] (Figure 2a) shows a strong absorption atwavelengths shorter than 530 nm with a long tail extending intothe red spectral region. The signal is fully developed within theinstrument time-resolution, ≤400 fs. The absorption at shortwavelengths decays with a biexponential kinetics: ca. 1 and11 ps, leaving a residual long-lived weak absorption over thewhole spectral region investigated. Kerr-gate time-resolvedemission spectrum (Figure 3a) exhibits a broad signal at450 nm, that decays with a lifetime of ca. 1.6 ps, which is(within the experimental accuracy) identical to the shortcomponent of the TA decay. This observation shows that theinitial transient observed in TA is an excited state and not aphotochemical intermediate. The TR3 spectrum (Figure 4a)shows peaks at ca. 1020 (w), 1225(m), 1325 (w) and
1511 (s) cm-1 that are developed within the instrument timeresolution and decay with an 11 ps lifetime. The spectral patternindicates that the 11 ps transient is a stpy-localized ππ* ILexcited state. The time-resolved IR spectrum (Figure 5a) of[Re(Cl)(stpy)2(CO)3] measured at 1 ps after excitation showstwo broad bands at ca 1960 and 2062 cm-1 that disappearwithin the next picosecond, concomitantly with the emissiondecay and the fast component of the TA decay. These twobands are shifted upwards from the ground-state IR bands,indicating that they belong to a Re→stpy MLCT excited state.The 1 ps spectrum also contains a broad band with an apparentmaximum at 2016 cm-1 that is shifted slightly downwards fromthe ground state band at 2024 cm-1. Therefore, it is assigned to aππ* IL excited state, called IL(a). Over the next picosecond,this band rises in intensity and sharpens to form a maximum at2014 cm-1. TRIR spectra reveal that this IL(a) state convertsinto another ππ* state, IL(b), with a 12 ps time-constant,concomitantly with the TA and TR3 decay. This is manifestedby the decay of the 2014 cm-1 maximum and formation ofanother maximum at 2018 cm-1, accompanied by bandnarrowing. The bleached ground-state bands at 1886 and1920 cm-1 also decay with a 12 ps lifetime while weak bands atapproximately 1902 and 1926 cm-1 grow in. (Analysis of the1850 - 1950 cm-1 spectral region is complicated due to a strongoverlap of the bands belonging to the ground-state andphotoproduced transient).
400 450 500 550 600 6 50 700
Wavelength /nm
0 ps 1 ps 5 ps 12 ps 20 ps 150 ps
(b)
(a)
∆ A
bsor
banc
e
2 ps 4 ps 20 ps 500 ps
Figure 2. Time-resolved visible absorption spectrum, measuredafter excitation at 400nm (a): [Re(Cl)(stpy)2(CO)3] indichloromethane (b): [Re(stpy)(CO)3(bpy)]+ in acetonitrile.
The TA spectrum of [Re(stpy)(CO)3(bpy)]+ (Figure 2b) evolveswith distinctly different dynamics than that of[Re(Cl)(stpy)2(CO)3]. The TA grows with a rise-time of 2 psrise, followed by a 15 ps decay to leave a weak, long-livedresidual absorption. The TA rise is concomitant with a decay(3.7 ps) of emission at 440 nm, (Figure 3b) showing that the TArise is due to conversion of a weakly absorbing excited stateeither to another excited state or a photochemical intermediate.Accordingly with this dynamics, TR3 shows an approximately2 ps followed by a ca. 20 ps decay. The TR3 spectrum of[Re(stpy)(CO)3(bpy)]+ (Figure 4b) (1020 (w), 1225 (w),1350 (w) and 1539 (s) cm-1) is very similar to that of[Re(Cl)(stpy)2(CO)3], showing that the secondarily populatedexcited state of [Re(stpy)(CO)3(bpy)]+ has a ππ*(stpy) IL
Early Excited-State Dynamics of Re Complexes with a PhotoisomerisingStyrylpyridine Ligand
M Busby, A , Jr.
Department of Chemistry, Queen Mary, University of London, Mile End Road, London E1 4NS, UK
Main contact email address: A [email protected]
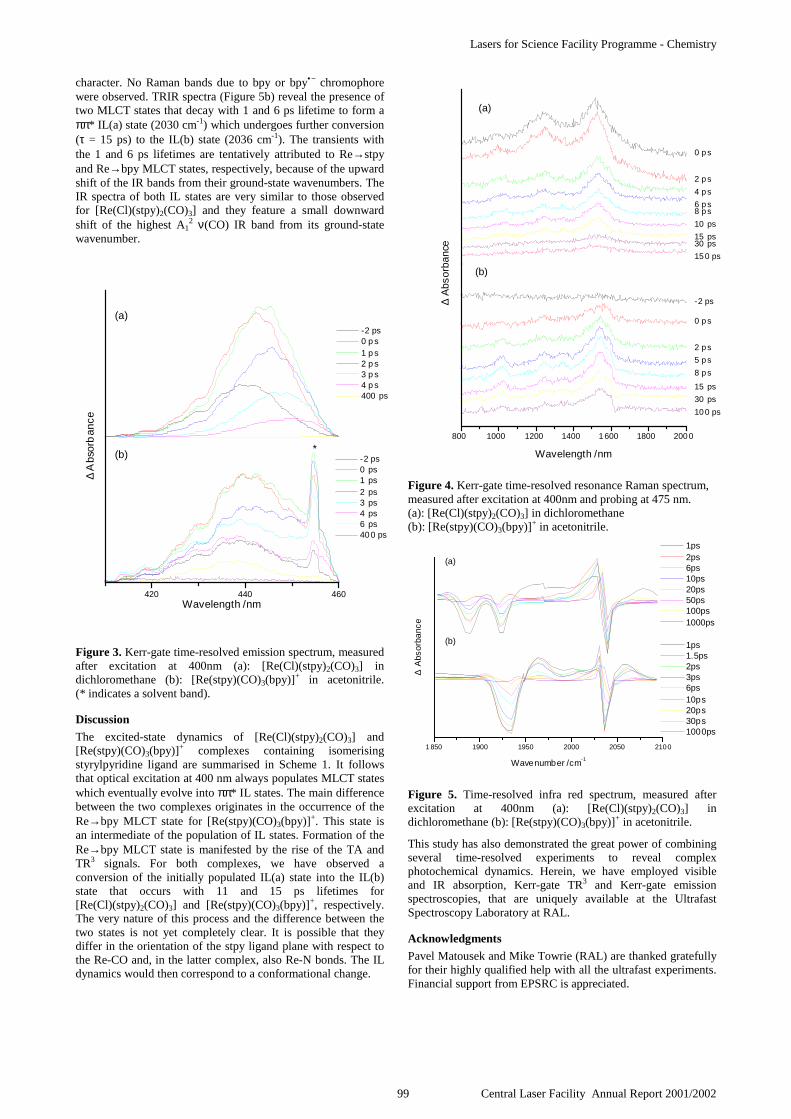
Lasers for Science Facility Programme - Chemistry
99 Central Laser Facility Annual Report 2001/2002
character. No Raman bands due to bpy or bpy•− chromophorewere observed. TRIR spectra (Figure 5b) reveal the presence oftwo MLCT states that decay with 1 and 6 ps lifetime to form aππ* IL(a) state (2030 cm-1) which undergoes further conversion(τ = 15 ps) to the IL(b) state (2036 cm-1). The transients withthe 1 and 6 ps lifetimes are tentatively attributed to Re→stpyand Re→bpy MLCT states, respectively, because of the upwardshift of the IR bands from their ground-state wavenumbers. TheIR spectra of both IL states are very similar to those observedfor [Re(Cl)(stpy)2(CO)3] and they feature a small downwardshift of the highest A1
2 ν(CO) IR band from its ground-statewavenumber.
420 440 460
* -2 ps 0 ps 1 ps 2 ps 3 ps 4 ps 6 ps 400 ps
Wavelength /nm
-2 ps 0 p s 1 p s 2 p s 3 p s 4 p s 400 ps
(b)
(a)
∆ A
bsor
ban
ce
Figure 3. Kerr-gate time-resolved emission spectrum, measuredafter excitation at 400nm (a): [Re(Cl)(stpy)2(CO)3] indichloromethane (b): [Re(stpy)(CO)3(bpy)]+ in acetonitrile.(* indicates a solvent band).
Discussion
The excited-state dynamics of [Re(Cl)(stpy)2(CO)3] and[Re(stpy)(CO)3(bpy)]+ complexes containing isomerisingstyrylpyridine ligand are summarised in Scheme 1. It followsthat optical excitation at 400 nm always populates MLCT stateswhich eventually evolve into ππ* IL states. The main differencebetween the two complexes originates in the occurrence of theRe→bpy MLCT state for [Re(stpy)(CO)3(bpy)]+. This state isan intermediate of the population of IL states. Formation of theRe→bpy MLCT state is manifested by the rise of the TA andTR3 signals. For both complexes, we have observed aconversion of the initially populated IL(a) state into the IL(b)state that occurs with 11 and 15 ps lifetimes for[Re(Cl)(stpy)2(CO)3] and [Re(stpy)(CO)3(bpy)]+, respectively.The very nature of this process and the difference between thetwo states is not yet completely clear. It is possible that theydiffer in the orientation of the stpy ligand plane with respect tothe Re-CO and, in the latter complex, also Re-N bonds. The ILdynamics would then correspond to a conformational change.
800 1000 1200 1400 1 600 1800 200 0
30 ps
10 ps
6 p s
2 p s
10 0 ps
30 ps
15 ps
8 p s
5 p s
2 p s
0 p s
-2 ps
15 ps
15 0 ps
8 p s
4 p s
0 p s
(b)
Wavelength /nm
(a)
∆ A
bsor
banc
e
Figure 4. Kerr-gate time-resolved resonance Raman spectrum,measured after excitation at 400nm and probing at 475 nm.(a): [Re(Cl)(stpy)2(CO)3] in dichloromethane(b): [Re(stpy)(CO)3(bpy)]+ in acetonitrile.
1 850 1900 1950 2000 2050 2100
1ps 1.5ps 2ps 3ps 6ps 10ps 20ps 30ps 1000ps
Wavenumber /cm-1
(b)
(a)
1ps 2ps 6ps 10ps 20ps 50ps 100ps 1000ps
∆ A
bsor
banc
e
Figure 5. Time-resolved infra red spectrum, measured afterexcitation at 400nm (a): [Re(Cl)(stpy)2(CO)3] indichloromethane (b): [Re(stpy)(CO)3(bpy)]+ in acetonitrile.
This study has also demonstrated the great power of combiningseveral time-resolved experiments to reveal complexphotochemical dynamics. Herein, we have employed visibleand IR absorption, Kerr-gate TR3 and Kerr-gate emissionspectroscopies, that are uniquely available at the UltrafastSpectroscopy Laboratory at RAL.
Acknowledgments
Pavel Matousek and Mike Towrie (RAL) are thanked gratefullyfor their highly qualified help with all the ultrafast experiments.Financial support from EPSRC is appreciated.

Lasers for Science Facility Programme - Chemistry
Central Laser Facility Annual Report 2001/2002 100
Introduction
During the last fifty years, Tetracycline and several of itsderivatives (see Scheme 1) have been successfully employed asantibiotics. Due to their extensive and sometimes improperapplication, most bacteria have developed various resistancemechanisms. One of these relies on the synthesis of a so-calledantiporter protein, TetA, which is located in the cell membraneand eliminates the tetracyclines from the cell via an activetransport. The protein synthesis is regulated on the transcriptionlevel by the repressor protein TetR. In the absence ofantibiotics, TetR is bound to the operator DNA (TetO), therebypreventing transcription of the genes which encode TetR andTetA. In the presence of minute amounts of antibiotics, theseare, before they can harm the cell by binding to the ribosomes,incorporated in the two binding pockets of dimer TetR, therebyinducing allosteric changes which result in a dissociation ofTetR from the DNA. (For a review on all aspects related totetracyclines, Reference 1 is recommended).
X1 X2 R X3
Tetracycline H OH CH3 H
Minocycline N(Me)2 H H H
Oxicycline H OH CH3 OH
Doxicycline H H CH3 OH
Methacycline H (CH2)/2 (CH2)/2 H
Scheme 1. Chemical structures of investigated compounds.
An aspect of major importance in understanding the pharmaco-kinetical properties of drugs and the mechanism of their actionis that of acid-base equilibria. An orally administered drug willmost likely change its protonation state during its passagethrough the acidic stomach and the alkaline intestinal tract. Thischange influences its solubility in an aqueous environment, itspermeability through membranes and its binding constant to thereceptor site. In the case of tetracyclines, the situation is mademore complicated by two additional facts: (i) Mostpharmacologically active derivatives contain three functionalgroups which can be subject to protonation – deprotonationequilibria. Furthermore, it is generally believed that the fullyprotonated species (tcH3
+ in Scheme 2) adopts a geometrydifferent from that of the completely deprotonated species (tc=);
(ii) It is well-established that tetracyclines bind to manyproteins preferentially, if not exclusively, as complexes withmetal ions. In body fluids, the predominant divalent metal ionsare Mg++ and Ca++. Therefore, most of the investigationsconcentrated on the effect of these two ions. The conclusionsconcerning the site of metal ion binding appear very often to becontradictory. It could, however, be that the experimentalconditions (pH, concentrations, etc.) were not similar enough tojustify a direct comparison of the published results.
tcH3+ tcH2° + H+ tcH- + 2H+ tc= + 3H+
Scheme 2. Deprotonation scheme of tetracyclines.
In view of the medical importance of the describeddependencies e. g. for the bioavailability of these drugs in bloodplasma, we decided to apply resonance-enhanced Ramanspectroscopy to collect further information about similaritiesand differences in drug behaviour under well-definedconditions. Since vibrational spectra only yield indirectinformation about the molecular geometry, extensive quantumchemical model calculations are necessary to deduce moredetailed conclusions. Nevertheless, a phenomenologicalinterpretation already yields useful information.
Materials and Methods
Tetracyclines and solvents were used as supplied by themanufacturers. For preparation of samples, the compounds weredissolved in H2O (D2O). In order to assure complete protonation(deuteration), 1 n HCl (DCl) was added until pH2 (pD2) wasreached. Alternatively, 0.1 n NaOH (NaOD) was added until thesolution showed pH 11 (pD 11). Stock solutions of MgCl2,CaCl2 and EuCl3, respectively, in H2O (D2O) were then addedto the alkaline solutions of the tetracyclines until the ratiotetracycline : metal ion approached unity. Depending onconcentration and kind of tetracycline and nature of the metalion, the formed complexes stayed in solution or precipitated. Inthe latter case, acid was added until the precipitation dissolvedagain (the corresponding pH (pD) is reported with the results).
For monitoring the (time-resolved) resonance Raman spectra(λpr = 400 nm) the newly developed technique using a fast Kerrgate for fluorescence rejection was applied2). Alternatively, UV-pulses (λex = 280 nm) were employed which matched a highertransition of the ring BCD chromophore and the first transitionof the ring A chromophore3).
Concentration of the tetracyclines was chosen such that theabsorbance at 400 nm was as close as possible to 2/mm(limitation by solubility).
Results and Discussion
Tetracyclines comprise two different π-electronic systems(chromophores), a smaller one located on ring A, and a largerone located on rings BCD (see Scheme 1). Since the NIR-FTRaman spectra of tetracyclines contain, like the IR spectra, alarge number of closely lying bands, an assignment tocalculated normal coordinates is impossible without furtherinformation. Such information can be provided via the
Kerr gated resonance Raman study of tetracyclines and their complexes withdivalent metal ions
S Schneider, G Brehm, M Schmitt, C Leypold, M Reiher
Institut für Physikalische und Theoretische Chemie, Friedrich-Alexander-Universität Erlangen-Nürnberg, D-91058 Erlangen,Germany
P Matousek, M Towrie
Central Laser Facility, CLRC Rutherford Appleton Laboratory, Chilton, Didcot, Oxon, OX11 0QX, UK
Main contact email address: [email protected]
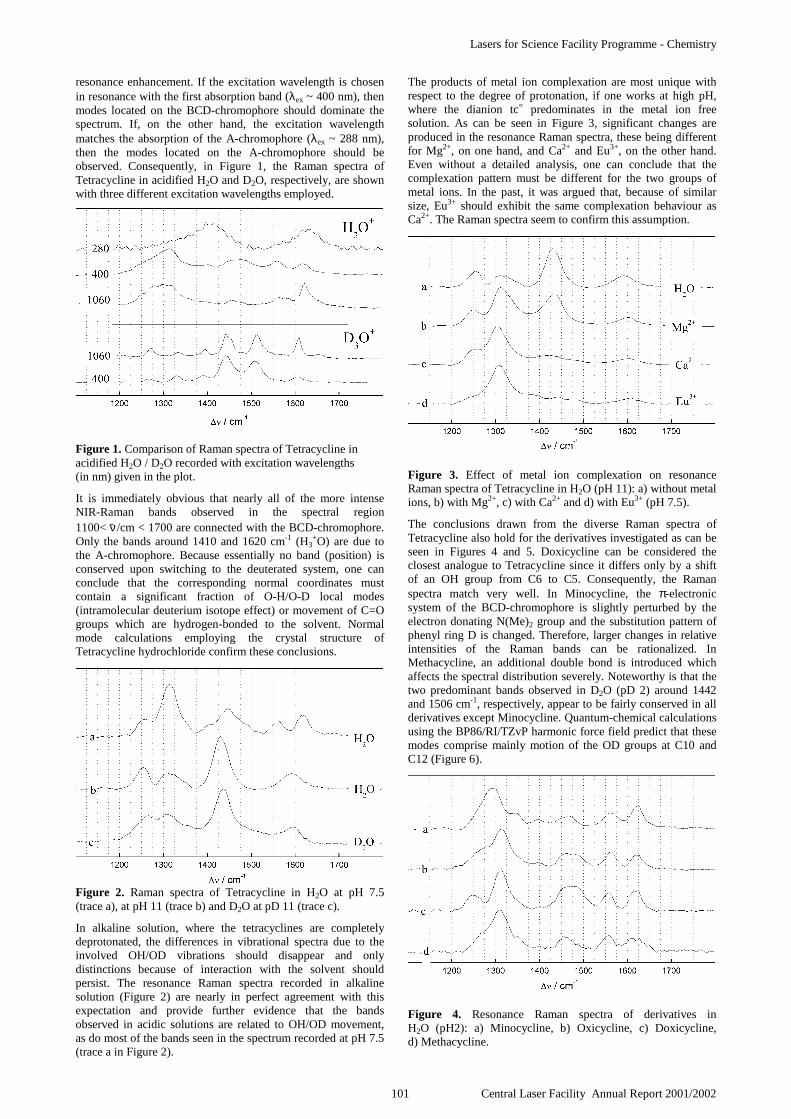
Lasers for Science Facility Programme - Chemistry
101 Central Laser Facility Annual Report 2001/2002
resonance enhancement. If the excitation wavelength is chosenin resonance with the first absorption band (λex ~ 400 nm), thenmodes located on the BCD-chromophore should dominate thespectrum. If, on the other hand, the excitation wavelengthmatches the absorption of the A-chromophore (λex ~ 288 nm),then the modes located on the A-chromophore should beobserved. Consequently, in Figure 1, the Raman spectra ofTetracycline in acidified H2O and D2O, respectively, are shownwith three different excitation wavelengths employed.
Figure 1. Comparison of Raman spectra of Tetracycline inacidified H2O / D2O recorded with excitation wavelengths(in nm) given in the plot.
It is immediately obvious that nearly all of the more intenseNIR-Raman bands observed in the spectral region1100< ν /cm < 1700 are connected with the BCD-chromophore.Only the bands around 1410 and 1620 cm-1 (H3
+O) are due tothe A-chromophore. Because essentially no band (position) isconserved upon switching to the deuterated system, one canconclude that the corresponding normal coordinates mustcontain a significant fraction of O-H/O-D local modes(intramolecular deuterium isotope effect) or movement of C=Ogroups which are hydrogen-bonded to the solvent. Normalmode calculations employing the crystal structure ofTetracycline hydrochloride confirm these conclusions.
Figure 2. Raman spectra of Tetracycline in H2O at pH 7.5(trace a), at pH 11 (trace b) and D2O at pD 11 (trace c).
In alkaline solution, where the tetracyclines are completelydeprotonated, the differences in vibrational spectra due to theinvolved OH/OD vibrations should disappear and onlydistinctions because of interaction with the solvent shouldpersist. The resonance Raman spectra recorded in alkalinesolution (Figure 2) are nearly in perfect agreement with thisexpectation and provide further evidence that the bandsobserved in acidic solutions are related to OH/OD movement,as do most of the bands seen in the spectrum recorded at pH 7.5(trace a in Figure 2).
The products of metal ion complexation are most unique withrespect to the degree of protonation, if one works at high pH,where the dianion tc= predominates in the metal ion freesolution. As can be seen in Figure 3, significant changes areproduced in the resonance Raman spectra, these being differentfor Mg2+, on one hand, and Ca2+ and Eu3+, on the other hand.Even without a detailed analysis, one can conclude that thecomplexation pattern must be different for the two groups ofmetal ions. In the past, it was argued that, because of similarsize, Eu3+ should exhibit the same complexation behaviour asCa2+. The Raman spectra seem to confirm this assumption.
Figure 3. Effect of metal ion complexation on resonanceRaman spectra of Tetracycline in H2O (pH 11): a) without metalions, b) with Mg2+, c) with Ca2+ and d) with Eu3+ (pH 7.5).
The conclusions drawn from the diverse Raman spectra ofTetracycline also hold for the derivatives investigated as can beseen in Figures 4 and 5. Doxicycline can be considered theclosest analogue to Tetracycline since it differs only by a shiftof an OH group from C6 to C5. Consequently, the Ramanspectra match very well. In Minocycline, the π-electronicsystem of the BCD-chromophore is slightly perturbed by theelectron donating N(Me)2 group and the substitution pattern ofphenyl ring D is changed. Therefore, larger changes in relativeintensities of the Raman bands can be rationalized. InMethacycline, an additional double bond is introduced whichaffects the spectral distribution severely. Noteworthy is that thetwo predominant bands observed in D2O (pD 2) around 1442and 1506 cm-1, respectively, appear to be fairly conserved in allderivatives except Minocycline. Quantum-chemical calculationsusing the BP86/RI/TZvP harmonic force field predict that thesemodes comprise mainly motion of the OD groups at C10 andC12 (Figure 6).
Figure 4. Resonance Raman spectra of derivatives inH2O (pH2): a) Minocycline, b) Oxicycline, c) Doxicycline,d) Methacycline.

Lasers for Science Facility Programme - Chemistry
Central Laser Facility Annual Report 2001/2002 102
Figure 5. Resonance Raman spectra of derivatives inD2O (pD2): a) Minocycline, b) Oxicycline, c) Doxicycline,d) Methacycline.
Figure 6. Calculated normal coordinates of deuteratedTetracycline assigned to the Raman bands seen at 1442 cm-1
(top) and 1506 cm-1 (bottom).
In view of the above, it is not surprising that the Raman spectraof the corresponding Mg2+-complexes recorded at pH 11 (notshown) also resemble each other very closely thus givingevidence that the complexation pattern is the same in allderivatives investigated. Furthermore, the changes provideevidence against the suggestion that complexation could occurat a functional group of the A-chromophore and supportO10 – O11 as the chelation site for Mg2+. The band observedaround 1430 cm-1 in both alkaline H2O and D2O is, according tothe normal mode calculations, connected with the hydroxidegroup at C12a. That its intensity is reduced upon complexationwith Ca2+, but not upon complexation with Mg2+, is, in ouropinion, strong evidence for complexation of Ca2+ toO12 – OH12a at high pH.3)
Summary and Conclusion
The attainable concentration of the tetracycline derivativesinvestigated is high enough to record, due to the resonanceenhancement obtained with 400 nm excitation, Raman spectrawith high S/N. Most of the intense bands are related to theBCD-chromophore with high contribution of the OH/OD localmodes. The changes in band position upon metal ioncomplexation confirm the suggestion that the complexation siteis at the BCD- rather than at the A-chromophore.
Acknowledgements
Financial support by Deutsche Forschungsgemeinschaft(SFB 583) and Fonds der Chemischen Industrie is gratefullyacknowledged. We appreciate a grant by the European UnionTMR Large Scale Facility Access Programme. We also thankHOVIONE for donation of samples (Minocycline andMethacycline).
References
1. Tetracyclines in Biology, Chemistry and Medicineedited by M. Nelson, W. Hillen and R.A. Greenwald,(2001) Birkhäuser Verlag, Switzerland
2. P Matousek, M Towrie, A W ParkerJ. Raman Spectrosc. 33, 238 (2002)
3. M O Schmitt, S SchneiderPhysChemComm 9 (2000)

Lasers for Science Facility Programme - Chemistry
103 Central Laser Facility Annual Report 2001/2002
Introduction
Since the discovery of the antibiotic action of Tetracycline in1947, a large number of derivatives has been synthesized andsuccessfully applied. In recent years, the use of many of themhas been reduced due to the fact that numerous bacteriadeveloped efficient resistance mechanisms. Consequently, amajor effort is presently put into the investigation of the variousbacterial strategies. One of them relies on the active transportby a membrane-located antiporter protein, TetA, whosesynthesis is down-regulated by the so called TetR protein1). Inthe absence of tetracyclines, the latter is bound to the DNA. Iftetracyclines penetrate into the bacterial cell, they are, ascomplexes with already present Mg++ or Ca++, bound by TetR.As a consequence of effector binding, allosteric changes areinduced in the binding domain of TetR causing dissociation ofTetR from the DNA and thereby allowing the transcription ofthe genes encoding TetR and TetA.
The binding constants of various tetracyclines in a specificmutant of one of the 8 different naturally occurring classes ofTetR proteins can vary by 10 orders of magnitude. If theantibiotic action of a certain derivative has to be evaluated, onemust determine separately whether this compound is bound and,if yes, whether the dissociation is induced effectively.
One common procedure to determine binding constants is bymeans of fluorescence titration. This technique works generallyboth for the determination of complexation constants betweentetracyclines and the chosen metal ions and the binding of thetetracycline / metal ion complex in the homodimeric TetRprotein. The main reason for the effectiveness of fluorescencetitration is the phenomenological observation that thefluorescence yield of the tetracycline / metal ion complexes ishigher than that of metal free tetracyclines and thatincorporation into the binding pocket is accompanied byanother significant increase in fluorescence yield. The reasonsfor such a behaviour are by no means understood and, to thebest of our knowledge, not even the pH-dependence of thefluorescence kinetics of metal free tetracyclines nor that of itsmetal ion complexes.
Scheme 1. Chemical structure of Tetracycline.
Tetracycline (see Scheme 1 for structure) must be considered asa three protic acid. In water, the first deprotonation step(pKa1 ≈ 3.3) involves the proton at O3, the second (pKa2 ≈ 7.7)the proton bound to the diketone moiety involving O11 and O12
and the third one (pKa3 ≈ 9.5) the proton at the dimethylaminogroup bound to C42). In view of the well-known effect of intra-and intermolecular hydrogen bonding on the rate ofradiationless processes, one immediately suspects that theexcited state lifetimes of the four species: fully protonated form,tcH3
+, the neutral form, tcH20, the monoanion, tcH-, and the
dianion, tc=, should show the following ordering:
τ (tcH3+) ≤ τ (tcH2
0) < τ (tcH-) ≤ τ (tc=)
This proposed ordering of lifetimes could be modified due tothe conformational change, which, according to evidence fromCD spectroscopy, should occur when going from acidic to basicsolution or by formation of specific intermolecular hydrogenbonds.
Because of the importance of metal ion complexation forbinding the effector in the TetR protein, numerous studies havebeen performed to elucidate their association constants and thesite of complexation. Based on the results of differentspectroscopic techniques, one can conclude that at pH around 7,both Mg++ and Ca++ bind to O10 and O11. This agrees also withthe binding pattern of the [7Cl-tetracycline-Mg]+ complexembedded in TetR(D). At higher pH, the binding pattern isdifferent for Ca++ and Mg++ 2).
The aim of the research described in this contribution wastwofold: (i) We wanted to establish a set of excited statelifetimes for a series of tetracycline derivatives, which are usedin antibacterial and / or new non-antibacterial applications assolid basis for the interpretation of fluorescence experimentsengaging these compounds under different experimentalconditions, and (ii) we wanted to find an explanation for thevariation of excited state lifetimes with environment.
Materials and Methods
Tetracyclines and solvents were used as supplied by themanufacturers. Concentration of the solutes was chosen suchthat optical density at the excitation wavelength (λex ~ 266 nm)was about 2/mm.
For monitoring the time-resolved emission spectra, theexperimental set-up developed for recording of Kerr gatedRaman spectra was employed3). Since the sample is flowed inan open jet, one must consider quenching by oxygen as anunwanted side effect. Keeping in mind the solubility of oxygenin water, one can say that the decay times of the short-livedspecies should not be falsified. The lifetimes of the long-livedspecies can, however, appear with significantly reduced values.
Results and Discussion
Whereas the red absorption band, which is due solely to theBCD chromophore (see Scheme 1 and Figure 1), shows apronounced wavelength shift upon changing pH, absorbance isless dependent on pH at the chosen excitation wavelength(λex = 266 nm). Accordingly, one finds a variation of the steadystate emission maximum with pH. The calculated Stokes shiftappears unusually large indicating either a significantreorganisation of the solute’s geometry and / or a large changein solute – solvent interaction. To exploit the latter point, H2O,D2O and H2O/MeOH mixtures were applied as solvents.
Picosecond time-resolved fluorescence of Tetracycline and its complexes with Mg++
or Ca++
S Schneider, G Brehm, M Schmitt, C Leypold
Institut für Physikalische und Theoretische Chemie, Friedrich-Alexander-Universität Erlangen-Nürnberg, D-91058 Erlangen,Germany
P Matousek, M Towrie
Central Laser Facility, CLRC Rutherford Appleton Laboratory, Chilton, Didcot, Oxon, OX11 0QX, UK
Main contact email address: [email protected]

Lasers for Science Facility Programme - Chemistry
Central Laser Facility Annual Report 2001/2002 104
Figure 1. Calculated absorption spectra of Tetracycline indifferent states of protonation in H2O: tcH3
+ (a), tcH20 (b),
tcH- (c) and tc2- (d).
In Figure 2, the time evolution of the (spectrally not corrected)fluorescence of tcH3
+ in H2O is shown. It is immediatelyevident that there are at least three different contributions: (i) anextremely fast decaying component between 400 and 500 nm,(ii) a fast decaying component and (iii) a longer-lived one in therange 500 to 700 nm. The steady state emission spectrum is inaccord with the time-resolved spectra because it shows themaximum around 600 nm, but in addition a second, weakerband around 450 nm.
Figure 2. Time-resolved fluorescence spectra (λex = 266 nm) offully protonated Tetracycline, tcH3
+, in H2O. Time delays ∆tare: 0, 2, 4, 8, 16, 100 and 500 ps. For comparison, the steadystate emission spectrum (ss.) for λex = 365 nm is also shown(R denotes the Raman band of water).
Figure 3. Initial spectral distribution (∆t = 0) observed forTetracycline in acidic H2O (a), D2O (b) and H2O/MeOH (c).
The time evolution of the fluorescence spectra in D2O andH2O/MeOH is qualitatively similar. However, the relativecontribution of the extremely fast decaying component is largerin D2O and smaller in H2O/MeOH (Figure 3). Noteworthy isthat the spectral distribution above about 550 nm is solventindependent.
The choice of the solvent has also a significant influence on thefluorescence-decay kinetics as shown in Figure 4. In deuteratedsolvent - which implies partial deuteration of the solute - thedecay times become larger (τ2 = 70 ps (D2O) versusτ2 = 25 ps (H2O) ). This can be taken as evidence that intra- andintermolecular hydrogen bonding is an essential factor in theradiationless decay of the excited state. In H2O/MeOH, theultrafast decaying component is too weak for a reliable lifetimedetermination; the medium decay time is even longer than in thecase of D2O (τ2 ≈ 90 ps). This again is in accord withexpectation since MeOH should establish weakerintermolecular hydrogen bonds.
Furthermore, one finds that the spectral distribution of neitherthe “blue” nor of the “red” fluorescence seems to change in thetime range 0 – 25 ps. This means that whatever mechanism iscausing the large Stokes shift, it must occur on a (sub-)picosecond time scale.
Figure 4. Normalized fluorescence decay of Tetracycline inacidic H2O (a), D2O (b) and H2O/MeOH (c) monitored around450 nm (a′, b′, c′) and 620 nm, respectively (a, b, c) (see alsoarrows in Figure 2).
Around pH 5, Tetracycline should exist in H2O preferentially inits zwitterionic form (tcH±). In accordance with the results ofsteady state measurements, the spectral distribution of the majorcomponent with medium decay time (τ2 ≈ 40 ps) exhibits only asmall hypsochromic shift versus the acidic solution (Figure 5,trace a). This can be rationalized because deprotonation at O3should have only a minor effect on the (photophysical)properties of the BCD chromophore. Interestingly enough, onefinds again a “blue” component with very short lifetime (givingrise to a shoulder in the steady state fluorescence spectra).
At pH above about 10, the dianion tc=, which lacks the proton atO12, is the predominant form in H2O. Therefore, it is notsurprising that now the steady state fluorescence spectrum isshifted hypsochromically by about 70 nm (Figure 5, trace c).The time-resolved spectra appear to decay uniformly across thewhole spectral region, although not mono-exponentially (Figure6). The relative amount of the longer-lived component is largerat pH11 than at pH8.5 thus explaining why the totalfluorescence intensity increases significantly at high pH. Sincethe initial spectral distribution is, however, nearly equal at pH11and pH 8.5, the emission spectra of the monoanion tcH- mustresemble closely that of the dianion tc=. This conclusion canagain be rationalized in view of the small interaction between
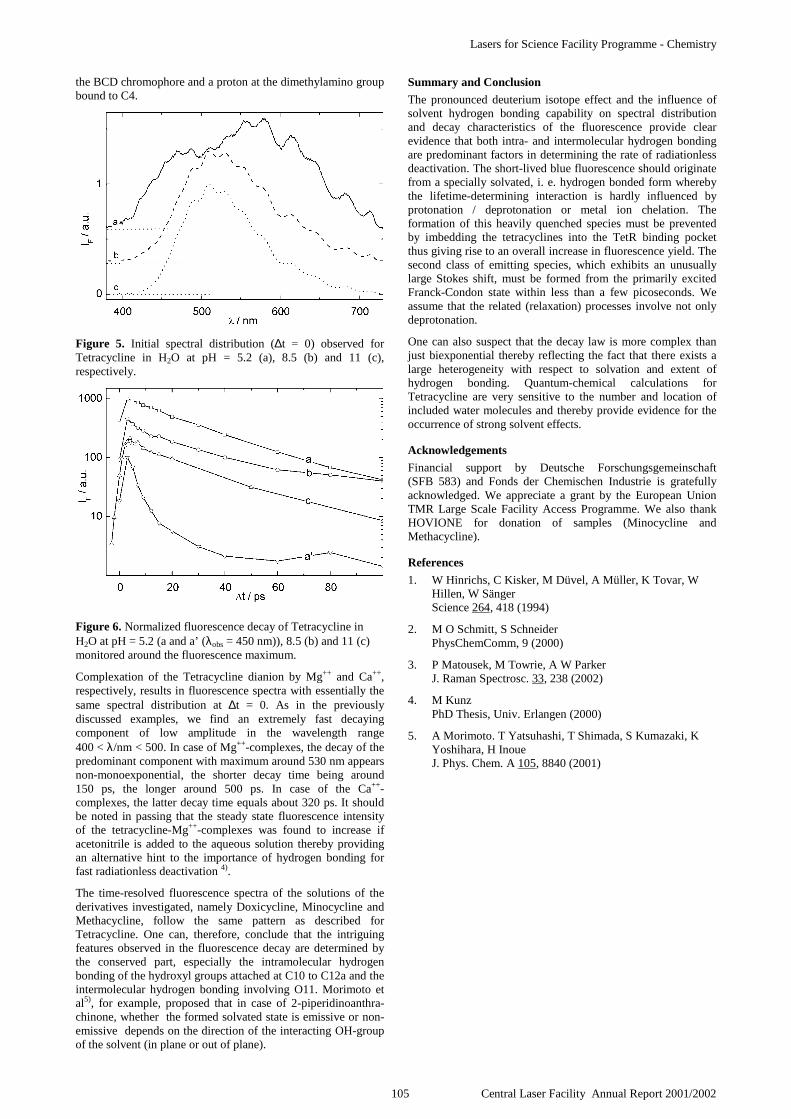
Lasers for Science Facility Programme - Chemistry
105 Central Laser Facility Annual Report 2001/2002
the BCD chromophore and a proton at the dimethylamino groupbound to C4.
Figure 5. Initial spectral distribution (∆t = 0) observed forTetracycline in H2O at pH = 5.2 (a), 8.5 (b) and 11 (c),respectively.
Figure 6. Normalized fluorescence decay of Tetracycline inH2O at pH = 5.2 (a and a’ (λobs = 450 nm)), 8.5 (b) and 11 (c)monitored around the fluorescence maximum.
Complexation of the Tetracycline dianion by Mg++ and Ca++,respectively, results in fluorescence spectra with essentially thesame spectral distribution at ∆t = 0. As in the previouslydiscussed examples, we find an extremely fast decayingcomponent of low amplitude in the wavelength range400 < λ/nm < 500. In case of Mg++-complexes, the decay of thepredominant component with maximum around 530 nm appearsnon-monoexponential, the shorter decay time being around150 ps, the longer around 500 ps. In case of the Ca++-complexes, the latter decay time equals about 320 ps. It shouldbe noted in passing that the steady state fluorescence intensityof the tetracycline-Mg++-complexes was found to increase ifacetonitrile is added to the aqueous solution thereby providingan alternative hint to the importance of hydrogen bonding forfast radiationless deactivation 4).
The time-resolved fluorescence spectra of the solutions of thederivatives investigated, namely Doxicycline, Minocycline andMethacycline, follow the same pattern as described forTetracycline. One can, therefore, conclude that the intriguingfeatures observed in the fluorescence decay are determined bythe conserved part, especially the intramolecular hydrogenbonding of the hydroxyl groups attached at C10 to C12a and theintermolecular hydrogen bonding involving O11. Morimoto etal5), for example, proposed that in case of 2-piperidinoanthra-chinone, whether the formed solvated state is emissive or non-emissive depends on the direction of the interacting OH-groupof the solvent (in plane or out of plane).
Summary and Conclusion
The pronounced deuterium isotope effect and the influence ofsolvent hydrogen bonding capability on spectral distributionand decay characteristics of the fluorescence provide clearevidence that both intra- and intermolecular hydrogen bondingare predominant factors in determining the rate of radiationlessdeactivation. The short-lived blue fluorescence should originatefrom a specially solvated, i. e. hydrogen bonded form wherebythe lifetime-determining interaction is hardly influenced byprotonation / deprotonation or metal ion chelation. Theformation of this heavily quenched species must be preventedby imbedding the tetracyclines into the TetR binding pocketthus giving rise to an overall increase in fluorescence yield. Thesecond class of emitting species, which exhibits an unusuallylarge Stokes shift, must be formed from the primarily excitedFranck-Condon state within less than a few picoseconds. Weassume that the related (relaxation) processes involve not onlydeprotonation.
One can also suspect that the decay law is more complex thanjust biexponential thereby reflecting the fact that there exists alarge heterogeneity with respect to solvation and extent ofhydrogen bonding. Quantum-chemical calculations forTetracycline are very sensitive to the number and location ofincluded water molecules and thereby provide evidence for theoccurrence of strong solvent effects.
Acknowledgements
Financial support by Deutsche Forschungsgemeinschaft(SFB 583) and Fonds der Chemischen Industrie is gratefullyacknowledged. We appreciate a grant by the European UnionTMR Large Scale Facility Access Programme. We also thankHOVIONE for donation of samples (Minocycline andMethacycline).
References
1. W Hinrichs, C Kisker, M Düvel, A Müller, K Tovar, WHillen, W SängerScience 264, 418 (1994)
2. M O Schmitt, S SchneiderPhysChemComm, 9 (2000)
3. P Matousek, M Towrie, A W ParkerJ. Raman Spectrosc. 33, 238 (2002)
4. M KunzPhD Thesis, Univ. Erlangen (2000)
5. A Morimoto. T Yatsuhashi, T Shimada, S Kumazaki, KYoshihara, H InoueJ. Phys. Chem. A 105, 8840 (2001)
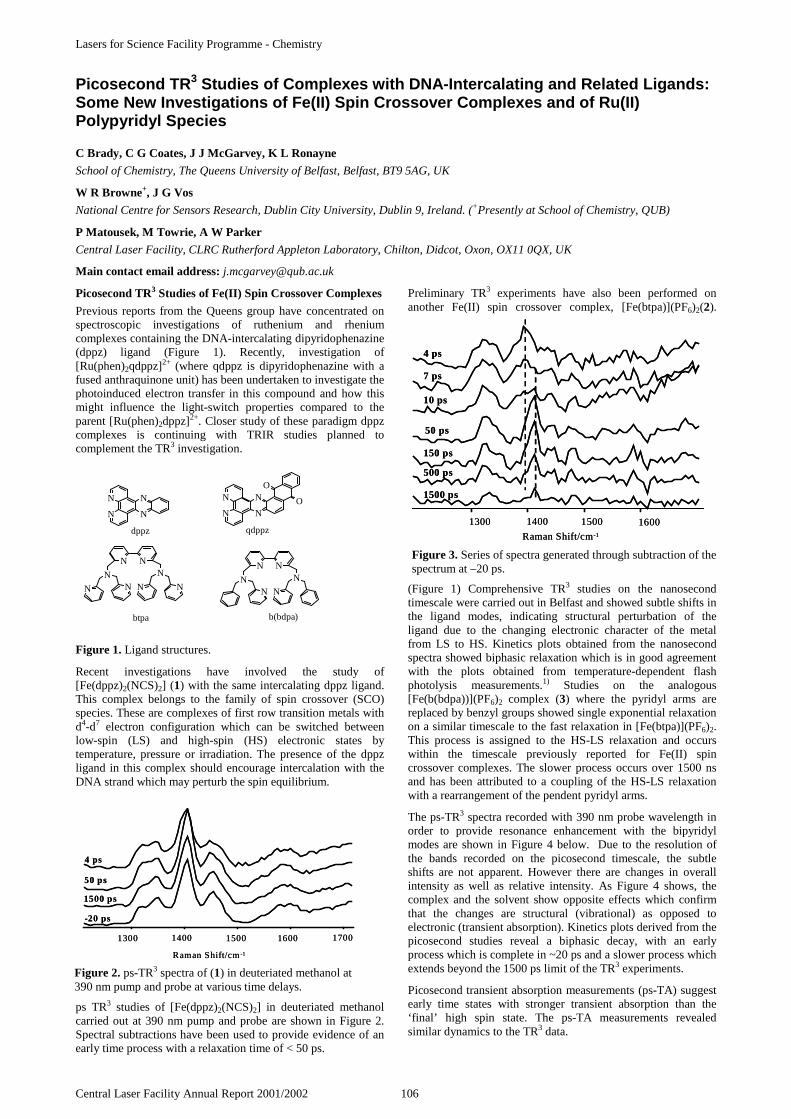
Lasers for Science Facility Programme - Chemistry
Central Laser Facility Annual Report 2001/2002 106
Picosecond TR3 Studies of Fe(II) Spin Crossover Complexes
Previous reports from the Queens group have concentrated onspectroscopic investigations of ruthenium and rheniumcomplexes containing the DNA-intercalating dipyridophenazine(dppz) ligand (Figure 1). Recently, investigation of[Ru(phen)2qdppz]2+ (where qdppz is dipyridophenazine with afused anthraquinone unit) has been undertaken to investigate thephotoinduced electron transfer in this compound and how thismight influence the light-switch properties compared to theparent [Ru(phen)2dppz]2+. Closer study of these paradigm dppzcomplexes is continuing with TRIR studies planned tocomplement the TR3 investigation.
Figure 1. Ligand structures.
Recent investigations have involved the study of[Fe(dppz)2(NCS)2] (1) with the same intercalating dppz ligand.This complex belongs to the family of spin crossover (SCO)species. These are complexes of first row transition metals withd4-d7 electron configuration which can be switched betweenlow-spin (LS) and high-spin (HS) electronic states bytemperature, pressure or irradiation. The presence of the dppzligand in this complex should encourage intercalation with theDNA strand which may perturb the spin equilibrium.
ps TR3 studies of [Fe(dppz)2(NCS)2] in deuteriated methanolcarried out at 390 nm pump and probe are shown in Figure 2.Spectral subtractions have been used to provide evidence of anearly time process with a relaxation time of < 50 ps.
Preliminary TR3 experiments have also been performed onanother Fe(II) spin crossover complex, [Fe(btpa)](PF6)2(2).
(Figure 1) Comprehensive TR3 studies on the nanosecondtimescale were carried out in Belfast and showed subtle shifts inthe ligand modes, indicating structural perturbation of theligand due to the changing electronic character of the metalfrom LS to HS. Kinetics plots obtained from the nanosecondspectra showed biphasic relaxation which is in good agreementwith the plots obtained from temperature-dependent flashphotolysis measurements.1) Studies on the analogous[Fe(b(bdpa))](PF6)2 complex (3) where the pyridyl arms arereplaced by benzyl groups showed single exponential relaxationon a similar timescale to the fast relaxation in [Fe(btpa)](PF6)2.This process is assigned to the HS-LS relaxation and occurswithin the timescale previously reported for Fe(II) spincrossover complexes. The slower process occurs over 1500 nsand has been attributed to a coupling of the HS-LS relaxationwith a rearrangement of the pendent pyridyl arms.
The ps-TR3 spectra recorded with 390 nm probe wavelength inorder to provide resonance enhancement with the bipyridylmodes are shown in Figure 4 below. Due to the resolution ofthe bands recorded on the picosecond timescale, the subtleshifts are not apparent. However there are changes in overallintensity as well as relative intensity. As Figure 4 shows, thecomplex and the solvent show opposite effects which confirmthat the changes are structural (vibrational) as opposed toelectronic (transient absorption). Kinetics plots derived from thepicosecond studies reveal a biphasic decay, with an earlyprocess which is complete in ~20 ps and a slower process whichextends beyond the 1500 ps limit of the TR3 experiments.
Picosecond transient absorption measurements (ps-TA) suggestearly time states with stronger transient absorption than the‘final’ high spin state. The ps-TA measurements revealedsimilar dynamics to the TR3 data.
Picosecond TR3 Studies of Complexes with DNA-Intercalating and Related Ligands:Some New Investigations of Fe(II) Spin Crossover Complexes and of Ru(II)Polypyridyl Species
C Brady, C G Coates, J J McGarvey, K L Ronayne
School of Chemistry, The Queens University of Belfast, Belfast, BT9 5AG, UK
W R Browne+, J G Vos
National Centre for Sensors Research, Dublin City University, Dublin 9, Ireland. (+Presently at School of Chemistry, QUB)
P Matousek, M Towrie, A W Parker
Central Laser Facility, CLRC Rutherford Appleton Laboratory, Chilton, Didcot, Oxon, OX11 0QX, UK
Main contact email address: [email protected]
N
N N
NO
O
N N
N N
N N N N
N N
N N
N N
N
N N
N
qdppz
btpa b(bdpa)
dppz
Raman Shift/cm-1
15001300 1400 1600 1700
-20 ps
4 ps
50 ps
1500 ps
Raman Shift/cm-1
15001300 1400 1600 1700
-20 ps
4 ps
50 ps
1500 ps
Figure 2. ps-TR3 spectra of (1) in deuteriated methanol at390 nm pump and probe at various time delays.
7 ps
4 ps
10 ps
50 ps
150 ps
500 ps
1500 ps
Raman Shift/cm-1
15001300 1400 1600
7 ps
4 ps
10 ps
50 ps
150 ps
500 ps
1500 ps
Raman Shift/cm-1
15001300 1400 1600
Figure 3. Series of spectra generated through subtraction of thespectrum at –20 ps.

Lasers for Science Facility Programme - Chemistry
107 Central Laser Facility Annual Report 2001/2002
Figure 4. ps-TR3 of (2) in acetonitrile at 390 nm pump andprobe at various time delays.
The analogous [Fe(b(bdpa))](PF6)2 complex whichdemonstrated single exponential relaxation in the nanosecondexperiments also showed biphasic decay in the picosecondstudies. This eliminates contribution from the rearrangement ofthe pendent pyridyl arms to this early process.
This initial fast process is not unique to this family of spincrossover complexes. As mentioned earlier, [Fe(dppz)2(NCS)2]also revealed a process with a relaxation time of <50 ps.Whether this is attributable to population of the HS (5T2) statefrom the MLCT state is uncertain. The studies carried out so farat the CLF on these SCO systems provide significant parallelswith recent picosecond TA studies reported from a USLaboratory2) and will be the subject of further study.
Picosecond Spectroscopy to Probe Initial States of RuPolypyridyl Complexes
With regard to application of these complexes as sensitisers insolar cell devices, interest in the early photophysical processeshas increased dramatically in recent years. This interest arisesfrom the proposal that direct injection of electrons from thosestates is a competitive process to intersystem crossing to thelowest 3MLCT manifold. Improving the quantum efficiency ofelectron transfer to semiconductors and thereby improvingconversion efficiency is desirable, as is a better understandingof these short lived states. The timescale of injection of anelectron into nanocrystalline TiO2 has been estimated at lessthan 1 ps, with some estimates as low as 25 fs. It has beensuggested that fast electron transfer from states energeticallyhigher than the lowest 3MLCT excited states not only increasesthe efficiency of the sensitisers but also precludes deactivationby potentially photoreactive 3MC states.
We have carried out ultrafast studies on a range of Rupolypyridyl complexes, including triazole-based systems.However, some of the most fundamentally significant resultshave arisen from studies with [Ru(bpy)3]
2+. For [Ru(bpy)3]2+ the
efficiency of ISC from 1MLCT states and the lowest 3MLCTstates is almost universally taken to be unity. We have used,picosecond time resolved luminescence spectroscopy to studythe early time processes which occur subsequent to excitation of[Ru(bpy)3]
2+.
The emission spectrum recorded from time resolvedluminescence studies 2 ps after excitation together with thesteady state absorption and emission (3MLCT) spectra for thecomplex are shown in Figure 5. The emission at 520 nm rapidlydecays to the long lived 3MLCT emission. The decay is lessthan 3 ps and shows no change in emission λmax during thecourse of its decay. (The decay is below the limit of resolutionof the ps systems).
ps-TR3 spectra of Ru(bpy)3 in water and acetonitrile were alsorecorded. The pure excited state spectra are displayed inFigure 6. A kinetic plot derived from these subtractions isshown in Figure 7. Although there is evidence of an earlyprocess in both solvents, there are subtle differences betweenthem. These findings are under further investigation.
Acknowledgements
We thank EPSRC (Grant GR/M45696) for access to USL.
References
1. S Schenker, P C Stein, J A Wolny, C Brady, J JMcGarvey, H Toftlund and A HauserInorg. Chem., 40, 134, (2001)
2. J E Monat and J K McCuskerJ. Am. Chem. Soc., 122, 4092, (2000)
1350 1400 1450 1500 1550 1600 1650
-20 ps
4 ps
7 ps50 ps
500 ps
Solvent
Solvent
Com plex
Raman Shift/cm -1
1350 1400 1450 1500 1550 1600 1650
-20 ps
4 ps
7 ps50 ps
500 ps
Solvent
Solvent
Com plex
Raman Shift/cm -1
350 400400 450 500500 550 600600 650 700700 750 800800
0.1
0.2
0.1
0.2
Em
issi
on in
tens
ity/
arbi
trar
y un
its
Abs
orba
nce/
AU
Wavelength/nm
350 400400 450 500500 550 600600 650 700700 750 800800
0.1
0.2
0.1
0.2
Em
issi
on in
tens
ity/
arbi
trar
y un
its
Abs
orba
nce/
AU
Wavelength/nm
Figure 5. Absorption spectrum (black), steady state emission(red) of [Ru(bpy)3]
2+ and emission spectrum at 2 ps after laserexcitation in water at 298 K. (spectral intensity is adjusted forclarity).
180014001000600
0ps
2ps
20ps
4ps
250ps
750ps
Raman Shift / cm-1180014001000600
0ps2ps
20ps
4ps
250ps
750ps
Raman Shift / cm-1
(a) (b)
180014001000600
0ps
2ps
20ps
4ps
250ps
750ps
Raman Shift / cm-1180014001000600
0ps2ps
20ps
4ps
250ps
750ps
Raman Shift / cm-1
(a) (b)
Figure 6. Pure excited state spectra of Ru(bpy)3 (ground statesubtracted, not normalised). Pump = 400 nm; probe = 350 nm(a) in water and (b) in acetonitrile.
0
50
100
150
200
250
0 50 100 150 200 250 300Time Delay / ps
Rel
ativ
e In
tens
ity
CH3CN
H2O
0
50
100
150
200
250
0 50 100 150 200 250 300Time Delay / ps
Rel
ativ
e In
tens
ity
CH3CN
H2O
Figure 7. Kinetics derived from pure excited state spectra inFigure 6. Intensity of 1288 cm-1 band plotted against time.

Lasers for Science Facility Programme - Chemistry
Central Laser Facility Annual Report 2001/2002 108
Introduction
The metal-to-ligand charge-transfer (MLCT) excited states of(NN)ReI(CO)3L complexes (where NN = diimine, andL = Cl, Br, etc.) have been well characterized. The (NN•−)ReII(CO)3L, which has a lifetime typically on the orderof 50-150 ns dependent on the identity of the NN and Lligands.1) Complexes in which L is an electron donor canundergo intramolecular electron transfer in the MLCT state,from L to ReII, to create a ligand-to-ligand charge-transfer(LLCT) excited state, (bpy•−)ReI(CO)3L•+, which cannot beaccessed directly by photon absorption (Scheme 1).
(NN)ReI(CO)3L
(NN• -)ReII(CO)3L
hv
GROUND
MLCT
LLCTkr + knr
kFET
kBET
(NN• -)ReI(CO)3L•+
Scheme 1.
Systems such as these, which create charge-separated excitedstates, have potential applications as optical probes andswitches, and as light-harvesting subunits in supramolecularassemblies. Previous studies of the MLCT states of this type ofcomplex have generally involved time-resolved UV/visabsorption and emission and, in some cases, time-resolvedinfrared2) and resonance Raman spectroscopy.3) The LLCTstates of complexes which undergo photophysics according toScheme 1 have been studied directly in a few cases, using time-resolved UV/vis absorption (TRVIS) spectroscopy, but only avery limited number of time-resolved vibrational studies ofthese LLCT states have been reported.3)
We have synthesised the (NN)Re(CO)3L complex 1 and modelcompounds 2-4 (Scheme 2).4) The azacrown ether of 1selectively binds alkali and alkaline earth metal cations, and thecomplex acts as an ion-selective optical probe. Using ultrafastand nanosecond TRVIS spectroscopy, we have shown thatexcitation transfers electron density away from the azacrownnitrogen atom in the MLCT state, lowering the associationconstant for ion binding and ejecting a cation from theazacrown in bound complexes 1-Mn+. After ejection of thecation, ultrafast relaxation to the LLCT state occurs accordingto Scheme 1, placing a positive charge at the azacrown nitrogenatom and effectively blocking geminate recombination. TheLLCT state decays to the ground state on the nanosecondtimescale, and the thermal equilibrium is ultimately restored ascation rebinding occurs from solution. Thus, 1-Mn+ undergoes aphoto-controlled ion release and recapture cycle. Very feworganometallic ion switches such as this have been reported.
Initial studies at RAL have involved investigations of 1 and itsmodels 2-4 using nanosecond time-resolved resonance Raman(TR3) spectroscopy: the aim of the experiments was to recordTR3 spectra of the excited states in the photo-controlled ion-release cycle.
1
O
O
N
O
O
Re
CO
COCO
N
NN
NH O
+
N
Re
CO
COCO
N
NN
NH O
+
2 3
Re
CO
COCO
N
NN
NH O
+
Re
CO
COCO
N
NCl
4
Scheme 2.
Results and discussion
The ground-state MLCT absorption bands of 1-4 occur at350-400 nm. All of the complexes have MLCT excited-stateTRVIS spectra with (bpy•−)-localised bands at 370 nm.Complexes 1 and 2, where L includes a dialkylamino electron-donor group, undergo sub-nanosecond electron transfer tocreate LLCT states which have TRVIS spectra with both a(bpy•−)-localised band at 370 nm and a (R2N•+)-localised bandat 500 nm.5)
Single-colour pulsed-laser experiments using 385 nm as bothpump and probe wavelengths enabled both ground- and excited-state resonance Raman bands of 1-4 to be observed. Ground-state bands were identified by comparison with cw resonanceRaman spectra recorded in York. Excited-state bands wereidentified by their increase in relative intensity with an increasein pulsed-laser energy.
The ground-state Raman bands of model compounds 3 and 4(Figure 1a) are assigned to bpy modes and one ν(CO) mode.6)
The excited-state bands of 3 and 4 (Figure 1c) are assigned tobpy•− modes of the MLCT state, as reported in the literature.6)
The ground-state Raman bands of functionalised complexes 1and 2 (Figure 2a) are much stronger that those of the modelcompounds recorded under comparable conditions, and they are
Nanosecond Time-Resolved Resonance Raman Spectroscopy of Functional(diimine)Re(CO)3(L) Complexes
J D Lewis, J N Moore
Department of Chemistry, The University of York, Heslington, York, YO10 5DD, UK
I P Clark
Central Laser Facility, CLRC Rutherford Appleton Laboratory, Chilton, Didcot, Oxon, OX11 OQX, UK
Main contact email address: [email protected]
Figure 1. Resonance Raman spectra of 3 recorded with(a) 350.6 nm cw excitation; (b) 385 nm pulsed excitation with(c) a difference spectrum showing MLCT excited-state bands of 3.
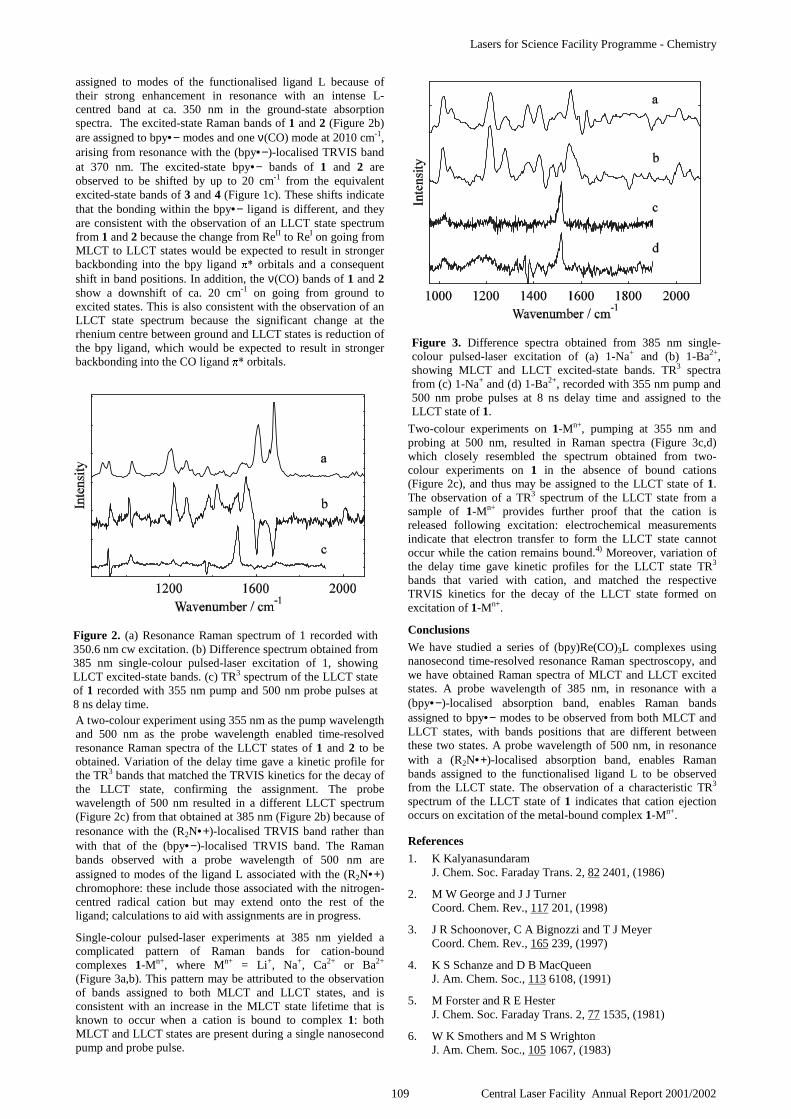
Lasers for Science Facility Programme - Chemistry
109 Central Laser Facility Annual Report 2001/2002
assigned to modes of the functionalised ligand L because oftheir strong enhancement in resonance with an intense L-centred band at ca. 350 nm in the ground-state absorptionspectra. The excited-state Raman bands of 1 and 2 (Figure 2b)are assigned to bpy•− modes and one ν(CO) mode at 2010 cm-1,arising from resonance with the (bpy•−)-localised TRVIS bandat 370 nm. The excited-state bpy•− bands of 1 and 2 areobserved to be shifted by up to 20 cm-1 from the equivalentexcited-state bands of 3 and 4 (Figure 1c). These shifts indicatethat the bonding within the bpy•− ligand is different, and theyare consistent with the observation of an LLCT state spectrumfrom 1 and 2 because the change from ReII to ReI on going fromMLCT to LLCT states would be expected to result in strongerbackbonding into the bpy ligand orbitals and a consequentshift in band positions. In addition, the ν(CO) bands of 1 and 2show a downshift of ca. 20 cm-1 on going from ground toexcited states. This is also consistent with the observation of anLLCT state spectrum because the significant change at therhenium centre between ground and LLCT states is reduction ofthe bpy ligand, which would be expected to result in strongerbackbonding into the CO orbitals.
A two-colour experiment using 355 nm as the pump wavelengthand 500 nm as the probe wavelength enabled time-resolvedresonance Raman spectra of the LLCT states of 1 and 2 to beobtained. Variation of the delay time gave a kinetic profile forthe TR3 bands that matched the TRVIS kinetics for the decay ofthe LLCT state, confirming the assignment. The probewavelength of 500 nm resulted in a different LLCT spectrum(Figure 2c) from that obtained at 385 nm (Figure 2b) because ofresonance with the (R2N•+)-localised TRVIS band rather thanwith that of the (bpy•−)-localised TRVIS band. The Ramanbands observed with a probe wavelength of 500 nm areassigned to modes of the ligand L associated with the (R2N•+)chromophore: these include those associated with the nitrogen-centred radical cation but may extend onto the rest of theligand; calculations to aid with assignments are in progress.
Single-colour pulsed-laser experiments at 385 nm yielded acomplicated pattern of Raman bands for cation-boundcomplexes 1-Mn+, where Mn+ = Li+, Na+, Ca2+ or Ba2+
(Figure 3a,b). This pattern may be attributed to the observationof bands assigned to both MLCT and LLCT states, and isconsistent with an increase in the MLCT state lifetime that isknown to occur when a cation is bound to complex 1: bothMLCT and LLCT states are present during a single nanosecondpump and probe pulse.
Two-colour experiments on 1-Mn+, pumping at 355 nm andprobing at 500 nm, resulted in Raman spectra (Figure 3c,d)which closely resembled the spectrum obtained from two-colour experiments on 1 in the absence of bound cations(Figure 2c), and thus may be assigned to the LLCT state of 1.The observation of a TR3 spectrum of the LLCT state from asample of 1-Mn+ provides further proof that the cation isreleased following excitation: electrochemical measurementsindicate that electron transfer to form the LLCT state cannotoccur while the cation remains bound.4) Moreover, variation ofthe delay time gave kinetic profiles for the LLCT state TR3
bands that varied with cation, and matched the respectiveTRVIS kinetics for the decay of the LLCT state formed onexcitation of 1-Mn+.
Conclusions
We have studied a series of (bpy)Re(CO)3L complexes usingnanosecond time-resolved resonance Raman spectroscopy, andwe have obtained Raman spectra of MLCT and LLCT excitedstates. A probe wavelength of 385 nm, in resonance with a(bpy•−)-localised absorption band, enables Raman bandsassigned to bpy•− modes to be observed from both MLCT andLLCT states, with bands positions that are different betweenthese two states. A probe wavelength of 500 nm, in resonancewith a (R2N•+)-localised absorption band, enables Ramanbands assigned to the functionalised ligand L to be observedfrom the LLCT state. The observation of a characteristic TR3
spectrum of the LLCT state of 1 indicates that cation ejectionoccurs on excitation of the metal-bound complex 1-Mn+.
References
1. K KalyanasundaramJ. Chem. Soc. Faraday Trans. 2, 82 2401, (1986)
2. M W George and J J TurnerCoord. Chem. Rev., 117 201, (1998)
3. J R Schoonover, C A Bignozzi and T J MeyerCoord. Chem. Rev., 165 239, (1997)
4. K S Schanze and D B MacQueenJ. Am. Chem. Soc., 113 6108, (1991)
5. M Forster and R E HesterJ. Chem. Soc. Faraday Trans. 2, 77 1535, (1981)
6. W K Smothers and M S WrightonJ. Am. Chem. Soc., 105 1067, (1983)
Figure 2. (a) Resonance Raman spectrum of 1 recorded with350.6 nm cw excitation. (b) Difference spectrum obtained from385 nm single-colour pulsed-laser excitation of 1, showingLLCT excited-state bands. (c) TR3 spectrum of the LLCT stateof 1 recorded with 355 nm pump and 500 nm probe pulses at8 ns delay time.
Figure 3. Difference spectra obtained from 385 nm single-colour pulsed-laser excitation of (a) 1-Na+ and (b) 1-Ba2+,showing MLCT and LLCT excited-state bands. TR3 spectrafrom (c) 1-Na+ and (d) 1-Ba2+, recorded with 355 nm pump and500 nm probe pulses at 8 ns delay time and assigned to theLLCT state of 1.

Lasers for Science Facility Programme - Chemistry
Central Laser Facility Annual Report 2001/2002 110
Introduction
Asymmetric cyanine dyes were developed in the early ‘90s ashighly sensitive fluorescent probes for DNA. However, insingle molecule imaging studies it became clear that the dyesphotonick the DNA backbone. Subsequent mechanistic studiesdemonstrated an unusually high double strand break yield1). Theinvolvement of various reactive oxygen species, includingsinglet oxygen, in photosensitized DNA damage, as well as inphotobleaching of the free and bound dyes was implicated byindirect scavenger studies and ESR spin trapping2).
Our primary aim in these investigations was to confirm andquantify, by direct detection of its luminescence, the generationof 1O2 by the excited states of YO-Pro-1 (1), YOYO-1 (2) andunmodified Oxazole Yellow (YO, 3), both free in solution andwhen bound to DNA at different nucleotide/dye ratios (P/D).The dyes intercalate at P/D > 4, and beyond saturation also bindexternally, either as monomers or stacked dimers.
N
O
CH3
CH NCH3
N
O
CH3
CH N(CH2)3 N
CH3
CH3
CH3
N
O
CH3
CH N(CH2)3 N
CH3
CH3
(CH2)3
N
O
CH3
CH(H2C)3NN
CH3
CH3
1 2
3
Experimental
The dyes were from Molecular Probes as solutions in DMSO,which was rigorously removed for these experiments. Emissionwas detected at 1270 nm at which energy only 1O2 should emit.Excitation was at 489 nm (Coumarin 102 in MeOH pumped byan XeCl excimer laser at 308 nm) with pulse width ~14 ns andenergy ~1 mJ. Detection was at 90° with a liquid N2-cooledNorth Coast EO-817P fitted with a 1270 nm interference filter(30 nm FWHM). Typically, 32 traces were averaged. Solutionswere prepared in D2O with free dyes in pure solvent and dyesbound to [poly(dA-dT)]2, [poly(dG-dC)]2, or calf thymus (CT)DNA in D2O buffered with 50 mM phosphate (pH 6.9).Samples were excited in quartz tubes (4 mm i.d.).
Results and Discussion
Table 1. 1O2 quantum yields and dye quenching constants.
Excitation of the YO dyes (~300 µM) at 489 nm producedluminescence at 1270 nm that decayed with a lifetime (~40 µs)substantially longer than the fluorescence of the dyes (~2 ns),although shorter than expected for 1O2 in D2O. Rose Bengal(RB) sensitization under the same conditions gave the expectedlifetime of 62 ns. Therefore, YO dyes do produce 1O2 but alsoappear to quench it. Scavenging experiments had implicatedsinglet oxygen in the photobleaching of YOYO-1 but radicals inthe photobleaching of YO-Pro-12). However, we found that 1O2
is generated by both YO-Pro-1 and YOYO-1, although thequantum yield of 1O2 production (Φ∆, estimated with respect to
that of RB) is notably higher for the dimer (Table 1). Theseresults suggest that YO-Pro-1 undergoes electron transfer with1O2 it has produced to generate superoxide which dismutates tohydroxyl radicals (in a Fenton cycle) that subsequently destroythe dye. In contrast, YOYO is apparently directly decomposedby a chemical reaction with the singlet oxygen it generates.
The quenching of 1O2 by the dyes was further investigated bymeasuring the luminescence as a function of YO concentration(Figure 1). Whilst the signal intensity increased with increasingdye concentration, the lifetime became shorter. Extrapolation ofthe decay rate to zero dye concentration gave a lifetime of68 µs. Quenching was confirmed by independent observation ofa reduced lifetime of RB-sensitized 1O2 in the presence ofYO-Pro-1 and YOYO (Table 1), similar to the effect of azide.
Scavenger studies had also implicated 1O2 in the highly efficientphotocleavage caused by externally bound dye (P/D<4), whilstradicals were implicated in the low efficiency cleavage byintercalated dye. However, once again, singlet oxygenluminescence was detected under all conditions (Figure 2) forall dyes. Argon bubbling reduced the luminescence intensity, asexpected. The shorter lifetime at P/D=1 is likely due toquenching by dye rather than DNA.
Clearly, excited state YO dyes can produce singlet oxygen bothwhen free in solution and when bound to DNA. The nature andbehaviour of the dye excited state (presumably the lowesttriplet) involved remain to be clarified however.
References
1. B Akerman, E Tuite, Nucl. Acids Res., 24 1080, (1996).
2. C Kanony, B Akerman and E Tuite, J. Am. Chem. Soc.,123 7985, (2001).
Photosensitization of Singlet Oxygen by Oxazole Yellow
E Tuite, F Dickinson
Department of Chemistry, Bedson Building, University of Newcastle, Newcastle upon Tyne, NE1 7RU, UK
I P Clark
Central Laser Facility, CLRC Rutherford Appleton Laboratory, Chilton, Didcot, Oxon, OX11 0QX, UK
Main contact email address: [email protected]
φ∆ (%) kq (M-1 s-1)
YO 1.7 2×10⁷
YO-Pro-1 0.6 1×10⁹
YOYO-1 2.4 6×10⁶
0 200 400 600 800 1000 1200 1400 1600 18000.014
0.016
0.018
0.020
0.022
0.024
0.026
0.028
0.030
0.032
0.034
1/τ
(µs-1
)
[Oxazole Yellow] (µM)
Figure 1. Quenching of the 1O2 luminescence decay by YO.
0 100 200 300-0.1
0.0
0.1
0.2
0.3
0.4
0.5
Sign
al (
mV
)
Time (µs)
YO + CT-DNA P/D = 10 YO + CT-DNA P/D = 10 + Ar YO + CT-DNA P/D = 1
Figure 2. 1O2 luminescence decays for DNA-bound YO.

Lasers for Science Facility Programme - Chemistry
111 Central Laser Facility Annual Report 2001/2002
Introduction
Metal polypyridyl complexes are finding extensive uses both asphotophysical probes and as photochemical reagents.1) Forapplications with DNA, dipyridophenazine (dppz) complexeshave attracted special attention as the dppz ligand canintercalate between the base pairs of the polynucleotide. Inparticular [Ru(phen)2(dppz)]2+ (phen = 1,10-phenanthroline)has been studied in detail as the complex, which is essentiallynon-luminescent in water, becomes emissive when bound toDNA.2) The reasons for this behaviour have been elucidated bypicosecond spectroscopy.3)
Another group of ruthenium complexes, which show interestingbehaviour with DNA, are complexes such as [Ru(TAP)2(L)]2+,(TAP = 1,4,5,8-tetraazaphenanthrene; L = bpy, phen, TAP),because the electron accepting ability of the TAP ligand makesthe excited states capable of oxidising guanine.
[Ru(TAP)2(L)]2+* + G [Ru(TAP)2 (L)]+ + G.+ (1)
The initial electron transfer can lead to enhanced yield of strandbreaks and to adduct formation.4) While direct evidence forelectron transfer has been obtained with guanosinemonophosphate,5) the process in DNA is too fast to measureusing nanosecond methods and must occur on a picosecondtime scale. A further disadvantage of complexes such as[Ru(TAP)2(phen)]2+ is that their mode of binding is uncertain.For this reason we have chosen to carry out a picosecond studyof [Ru(TAP)2(dppz)]2+, which is expected to intercalate intoDNA in a fashion similar to that of [Ru(phen)2(dppz)]2+, yethave an oxidizing power comparable to [Ru(TAP)2(phen)]2+.
To elucidate the specific interactions of the excited states of thecomplexes with DNA it is desirable to work with definedsequence DNA. As a first step we compare the transientabsorption (TA) spectroscopy of the metal complexes whenbound to the double-stranded synthetic polynucleotides[poly(dG-dC)]2 and [poly(dA-dT)]2. These experiments need to was achieved by using a well-stirred solution in a (5 mm)2
quartz cuvette. Sample decomposition during the course of theexperiment was found to be negligible.
[Ru(TAP)2(dppz)]2+ The absorption spectrum of the complexin aqueous buffer is shown in Figure 1. The complex shows astrong absorption in the region 400-500 nm, as expected forMLCT transitions. Interestingly the strong bandscorresponding to the intraligand transitions foundfor each of [Ru(phen)2(dppz)]2+, fac-[(dppz)Re(CO)3(py)]+ andthe free ligand in the region 350 - 400 nm are not readilyvisible with this complex. The picosecond processes of thecomplex [Ru(TAP)2(dppz)]2+ in aqueous buffer and whenintercalated into polynucleotides have been studied followingtransient absorption changes after excitation with a 400 fs pulseof 400 nm light. At this wavelength it is probable that themolecule will be excited partly to a excited state and partly to its MLCT states.
The transient spectra in aqueous buffer were recorded atintervals between 4 and 1500 ps after excitation. It wasobserved that there were substantial spectroscopic changesoccurring only over the first 100 ps. Figure 2 shows the spectraat 4 ps, 100 ps and 1000 ps. The nature of this fast process(lifetime 43 ± 4 ps) is uncertain but it could involve conversion MLCT excited state. The latter is very long-lived (1090 ns) andhas been shown by transient resonance Raman spectroscopy(TR3) to correspond to an excited state where the electron islocated on one of the TAP ligands.6)
In the presence of [poly(dA-dT)]2 a similar rapid partial decayof the absorption at ca. 520 nm is noted (lifetime 36 ± 8 ps).
Picosecond Studies of Ruthenium and Rhenium dipyridophenazine complexes insolution and when bound to polynucleotides
J M Kellya, C M Creelyb, M M Feeneya , S Hudsona , W J Blaub
aDepartment of Chemistry and bDepartment of Physics, University of Dublin, Trinity College, Dublin 2, Ireland
B Elias, A Kirsch-De Mesmaeker
Departement de Chimie Organique Physique, Universite Libre de Bruxelles, Brussels B-1050, Belgium
P Matousek, M Towrie, A W Parker
Central Laser Facility, CLRC Rutherford Appleton Laboratory, Chilton, Didcot, Oxon, OX11 0QX, UK
Main contact email address: [email protected]
200 300 400 5000
1
2
3
Abs
orba
nce/
arb
Wavelength/nm
[Ru(TAP)2dppz]2+
[Ru(TAP)2dppz]2+ + poly[dG-dC]
2
Figure 1. UV/visible absorption spectra of[Ru(TAP)2(dppz)]2+ (8 x 10⁻⁶ M) in (a) 10 mM phosphatebuffer and (b) with the addition of [poly(dG-dC)]2
(1.6 x 10⁻⁴ M nucleotide).
400 450 500 550 600 650
-0.025
-0.020
-0.015
-0.010
-0.005
0.000
0.005
∆ ab
s/ar
b
Wavelength/nm
4 ps 100 ps 1000 ps
Figure 2. Transient absorption spectra observed at 4,100and 1000 ps following laser excitation (400 fs; 400 nm) of[Ru(TAP)2(dppz)]2+ (8 x 10⁻⁵ M) in 10 mM phosphatebuffer.

Lasers for Science Facility Programme - Chemistry
Central Laser Facility Annual Report 2001/2002 112
By contrast, in the presence of [poly(dG-dC)]2 a strong increasein absorption in this wavelength region is observed with alifetime of 480 ± 40 ps. (Figure 3) This is consistent with theformation of [Ru(TAP)2(dppz)]+ through electron transfer fromthe guanine to the excited state. Similar results are obtainedwhen the complex is intercalated into calf thymus DNA (GCcontent 42%) although the magnitude of the “grow-in” of theabsorption is less.6) The back electron transfer reaction is tooslow to be measured with this equipment, proceeding with alifetime greater than 1 ns.
The driving force for reaction (1) can be estimated knowing thereduction potential for the excited state Eo([Ru(TAP)2(dppz)]2+*
/[Ru(TAP)2(dppz)]+) (1.42 V) (vs NHE) 7) and the oxidationpotential of guanine. However the value for the latter is stillcontentious. A value of ca. 1.33 V 8a) had been determined forguanosine. More recently the value for guanosine has beenredetermined as 1.58 V 8b) and a value of 1.53 V for[poly(dG-dC)]2 has been found to give a good fit for theelectron transfer reactions of thionine and variouspolynucleotides.9) It is clear therefore that reaction (1) is atbest only weakly exergonic and the slowness of the backreaction is consistent with the predictions of Marcus theory.
fac-[(R2dppz)Re(CO)3(py)]+
(R = F, H, Me; py = pyridine). These complexes, which areexpected to intercalate into DNA,10) are attractive as DNAprobes as they possess strong IR absorptions due to the COstretch vibrations. Transient IR should be an effective means ofdetermining the nature of the excited state it is known that for
similar dppz complexes the triplet !"#states lie close in energy10) and of identifying the speciesformed in redox reactions. As a preliminary to picosecondinfrared transient absorption (PIRATE) measurements, we havecarried out UV/vis TA studies. The derivatives have beenselected as we anticipate that both the oxidising power andnature of the lowest excited state can be controlled by theelectron-withdrawing or electron-donating properties of thesubstituent on the dppz ligand.
The 350 – 400 nm section of the UV/Visible spectrum (Figure4) of each of the compounds is dominated by the intraligand band, although a weaker MLCT transition alsooccurs in this wavelength range.
Figure 5 shows the transient spectra observed after the laserexcitation at 400 nm. At 4 ps a broad absorption with amaximum at 470 nm and a shoulder at ca. 540 nm is evident.An increase in intensity (ca. 5 %) at the maximum is thenobserved over the first 100 ps, with only very small changesoccurring elsewhere. At 1000 ps the final spectrum isessentially identical to that reported by Schanze andcoworkers10) for fac-[(dppz)Re(CO)3(4-Mepy)]+ and is assignedto the 3IL π-π∗ (dppz) excited state. The nature of the processoccurring in the first 100 ps is still uncertain. Possibilitiesinclude (i) the conversion of an initially formed MLCT state tothe π-π∗ (dppz) or (ii) the conversion from singlet to tripletstate. It is interesting that PIRATE studies with this complexshow vibrational cooling within its CO vibrations over this timerange.11) To further elucidate this phenomenon we have alsostudied the transient spectra of the free dppz ligand (Figure 6).
400 450 500 550 600 650
-0.010
-0.008
-0.006
-0.004
-0.002
0.000
0.002
0.004
0 200 400 600 800 1000 1200 1400
0.0005
0.0010
0.0015
0.0020
0.0025
∆ ab
s/ar
b
Time/ps
∆ ab
s/ar
b
Wavelength/nm
4 ps 100 ps 1000 ps
Figure 3. a) Transient absorption spectra observed at4,100 and 1000 ps following laser excitation(400 fs; 400 nm) of [Ru(TAP)2(dppz)]2+ (8 x 10⁻⁵ M) in10 mM phosphate buffer in the presence of [poly(dG-dC)]2
(1.6 x 10 –3 M nucleotide). Inset: Growth of absorption at510 nm over 4 - 1000 ps.
Wavelength (nm)
250 300 350 400 450
Abs
orpt
ion
0
1
DiFdppz complexDppz ComplexDiMedppz complex
Figure 4. UV/visible absorption Spectra of fac-[(R2dppz)Re(CO)3(py)]+, (R = F, H, Me) (1.7 x 10⁻⁴ M;1.5 x 10⁻⁴ M and 1.7 x 10⁻⁴ M resp.) in acetonitrilesolution.
400 450 500 550 600 6500.000
0.005
0.010
0.015
0.020
∆ ab
s/ar
b
Wavelength/nm
4 ps 10 ps 100 ps 500 ps 1000 ps
Figure 5. Transient absorption spectra observed at variousdelays following laser excitation (400 fs; 400 nm) of fac-[(dppz)Re(CO)3(py)]+ in acetonitrile solution.
400 450 500 550 600 6500.000
0.002
0.004
0.006
0.008
0.010
0.012
∆ ab
s/ar
b
Wavelength/nm
10 ps 500 ps
Figure 6. Transient absorption spectra observed at 10and 500 ps following laser excitation (400 fs; 400 nm) ofdppz in acetonitrile solution.
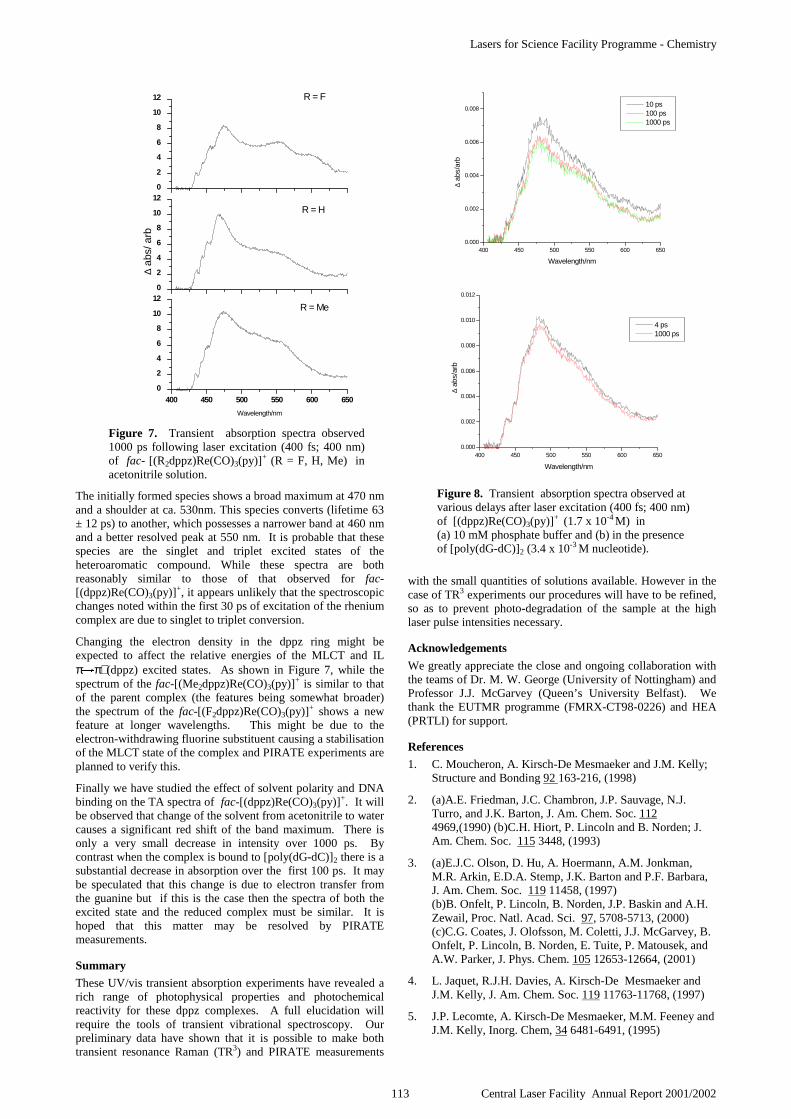
Lasers for Science Facility Programme - Chemistry
113 Central Laser Facility Annual Report 2001/2002
The initially formed species shows a broad maximum at 470 nmand a shoulder at ca. 530nm. This species converts (lifetime 63± 12 ps) to another, which possesses a narrower band at 460 nmand a better resolved peak at 550 nm. It is probable that thesespecies are the singlet and triplet excited states of theheteroaromatic compound. While these spectra are bothreasonably similar to those of that observed for fac-[(dppz)Re(CO)3(py)]+, it appears unlikely that the spectroscopicchanges noted within the first 30 ps of excitation of the rheniumcomplex are due to singlet to triplet conversion.
Changing the electron density in the dppz ring might beexpected to affect the relative energies of the MLCT and ILπ π∗ (dppz) excited states. As shown in Figure 7, while thespectrum of the fac-[(Me2dppz)Re(CO)3(py)]+ is similar to thatof the parent complex (the features being somewhat broader)the spectrum of the fac-[(F2dppz)Re(CO)3(py)]+ shows a newfeature at longer wavelengths. This might be due to theelectron-withdrawing fluorine substituent causing a stabilisationof the MLCT state of the complex and PIRATE experiments areplanned to verify this.
Finally we have studied the effect of solvent polarity and DNAbinding on the TA spectra of fac-[(dppz)Re(CO)3(py)]+. It willbe observed that change of the solvent from acetonitrile to watercauses a significant red shift of the band maximum. There isonly a very small decrease in intensity over 1000 ps. Bycontrast when the complex is bound to [poly(dG-dC)]2 there is asubstantial decrease in absorption over the first 100 ps. It maybe speculated that this change is due to electron transfer fromthe guanine but if this is the case then the spectra of both theexcited state and the reduced complex must be similar. It ishoped that this matter may be resolved by PIRATEmeasurements.
Summary
These UV/vis transient absorption experiments have revealed arich range of photophysical properties and photochemicalreactivity for these dppz complexes. A full elucidation willrequire the tools of transient vibrational spectroscopy. Ourpreliminary data have shown that it is possible to make bothtransient resonance Raman (TR3) and PIRATE measurements
with the small quantities of solutions available. However in thecase of TR3 experiments our procedures will have to be refined,so as to prevent photo-degradation of the sample at the highlaser pulse intensities necessary.
Acknowledgements
We greatly appreciate the close and ongoing collaboration withthe teams of Dr. M. W. George (University of Nottingham) andProfessor J.J. McGarvey (Queen’s University Belfast). Wethank the EUTMR programme (FMRX-CT98-0226) and HEA(PRTLI) for support.
References
1. C. Moucheron, A. Kirsch-De Mesmaeker and J.M. Kelly;Structure and Bonding 92 163-216, (1998)
2. (a)A.E. Friedman, J.C. Chambron, J.P. Sauvage, N.J.Turro, and J.K. Barton, J. Am. Chem. Soc. 1124969,(1990) (b)C.H. Hiort, P. Lincoln and B. Norden; J.Am. Chem. Soc. 115 3448, (1993)
3. (a)E.J.C. Olson, D. Hu, A. Hoermann, A.M. Jonkman,M.R. Arkin, E.D.A. Stemp, J.K. Barton and P.F. Barbara,J. Am. Chem. Soc. 119 11458, (1997)(b)B. Onfelt, P. Lincoln, B. Norden, J.P. Baskin and A.H.Zewail, Proc. Natl. Acad. Sci. 97, 5708-5713, (2000)(c)C.G. Coates, J. Olofsson, M. Coletti, J.J. McGarvey, B.Onfelt, P. Lincoln, B. Norden, E. Tuite, P. Matousek, andA.W. Parker, J. Phys. Chem. 105 12653-12664, (2001)
4. L. Jaquet, R.J.H. Davies, A. Kirsch-De Mesmaeker andJ.M. Kelly, J. Am. Chem. Soc. 119 11763-11768, (1997)
5. J.P. Lecomte, A. Kirsch-De Mesmaeker, M.M. Feeney andJ.M. Kelly, Inorg. Chem, 34 6481-6491, (1995)
400 450 500 550 600 6500.000
0.002
0.004
0.006
0.008
∆ ab
s/ar
b
Wavelength/nm
10 ps 100 ps 1000 ps
400 450 500 550 600 6500.000
0.002
0.004
0.006
0.008
0.010
0.012
∆ ab
s/ar
b
Wavelength/nm
4 ps 1000 ps
Figure 8. Transient absorption spectra observed atvarious delays after laser excitation (400 fs; 400 nm)of [(dppz)Re(CO)3(py)]+ (1.7 x 10⁻⁴ M) in(a) 10 mM phosphate buffer and (b) in the presenceof [poly(dG-dC)]2 (3.4 x 10⁻³ M nucleotide).
400 450 500 550 600 6500
2
4
6
8
10
12R = Me
Wavelength/nm
0
2
4
6
8
10
12
R = F
R = H
∆ ab
s/ a
rb
0
2
4
6
8
10
12
Figure 7. Transient absorption spectra observed1000 ps following laser excitation (400 fs; 400 nm)of fac- [(R2dppz)Re(CO)3(py)]+ (R = F, H, Me) inacetonitrile solution.

Lasers for Science Facility Programme - Chemistry
Central Laser Facility Annual Report 2001/2002 114
6. C.G. Coates, P. Callaghan, J.J. McGarvey, J.M. Kelly, L.Jacquet and A. Kirsch-De Mesmaeker, J. Mol. Struct. 59815-25, (2001)
7. Ortmans, Ph.D. thesis, Universite Libre de Bruxelles, 1996
8. (a) S.V. Jovanovic and M.G. Simic, J. Phys. Chem. 90974-978, (1986)(b) S. Steenken and S.V. Jovanovich, J. Am. Chem. Soc.119 617-618, (1997)
9. G.D. Reid, D.J. Whittaker, M.A. Day, D.A. Turton, V.Kayser, J.M. Kelly and G. S. Beddard, J. Am. Chem. Soc.124 5518-5527, (2001)
10. H.D. Stoeffler, N.B. Thornton, S.L. Temkin and K.S.Schanze, J. Am. Chem. Soc. 117 7119-7128, (1995)
11. M.W. George, personal communication.

Lasers for Science Facility Programme - Chemistry
115 Central Laser Facility Annual Report 2001/2002
Introduction
In the amino acid, histidine, the presence of both >NH and >N:sites in the imidazole ring allows it to function both as a donorand an acceptor in a hydrogen-bonded environment. Itscombined operation as an acceptor (from the hydroxyl group ofa serine residue) and a donor (to the carboxylate ion in anaspartate residue) in the hydrogen-bonded triad sites is thoughtto play a crucial role in promoting the enzyme’s catalyticactivity1). To study the incidence and mechanism of protontransfer along water chains, a logical strategy forexperimentalists, proposed by Leutwyler2), includes threecomponents: “the construction of a molecular ‘scaffold’ withdefined proton injection and extraction sites (into and out of thewater chain); a triggering event (typically photon absorption);and detection of the result of proton transfer (into or through theH-bonded chain).” Two recent studies of the electronic spectraof jet-cooled 4-phenyl imidazole (4PI), its singly hydratedcomplex, and its tautomer, 5-phenyl imidazole (5PI), conductedat intermediate3) and high4) resolution, represent the first step inthis sequence. Using the LSF loan laser system to record theirspectroscopic signatures, we came to the conclusion that 4PI isplanar in its ground electronic state (S0) but its tautomer, 5PI, istwisted about the inter-ring axis by 27o; in the S1 state bothtautomers become planar. Proton transfer between the twonitrogen sites would result in tautomeric inter-conversionbetween the 4- and 5-PI clusters.
Results
R2PI spectra of the hydrated clusters of 4PI, recorded in themass channels, 4PI.(H2O)n=0-4
+, are shown in Figure 1. Theydisplay series of resolved vibronic bands in the region34600-35100 cm-1 (~200 cm-1 to the red of the monomer’sspectrum), associated with the S1←S0 transition. Many bandsappear in more than one mass channel, reflecting the incidenceof extensive cluster ion fragmentation. In order to establish theirindividual assignments unambiguously, their IR ion-dip spectrawere recorded in all mass channels. Bands due to 4PI(H2O)2,
4PI(H2O)3, and 4PI(H2O)4 clusters all appear in the 4PI(H2O)2+
mass channel and are labelled “A...D” in Figure 1.
4PI. The IR-UV ion dip spectra of the monomers of 4PI and5PI display a single intense band associated with the ν(NH)stretching vibration, lying at 3514 cm-1 (4PI) and 3506 cm-1
(5PI) respectively, close to the liquid phase value5) of~3500 cm-1 (see Figure 2).
Figure 2. IR ion dip spectra of (a) 4PI and 5PI and(b) 4PI.(H2O).
4PI(H2O). Only one mono-hydrated cluster (origin band at34865 cm-1) could be identified in the UV ‘hole-burned’MS-R2PI spectrum recorded in the ion channel associated with4PI(H2O)+. The corresponding IR ion dip spectrum (shown inFigure 2-b)) displays the ‘free’, symmetric and anti-symmetricstretches of the water molecule, lying at 3656 and 3747 cm-1,respectively. The ν(NH) stretching band at 3409 cm-1, isdisplaced by 104 cm-1 to the red of the monomer frequency.Such a shift clearly indicates an NH→Owater hydrogen bond,with the water molecule acting as an acceptor at the >NH site ofthe imidazole ring.
4PI(H2O)2. Only one band (band D at 34925 cm-1) wasassociated with the doubly hydrated cluster. This was confirmedby its IR ion-dip spectrum (recorded in the 4PI(H2O)+ masschannel to minimise contamination from higher clusters) shownin Figure 3-a). The band at 3596 cm-1 is typical for an OH →πhydrogen bond. This clearly identifies the conformer as W2B’(shown in the Figure), which is the only structure showing aband in this region (at 3623 cm-1). The NH frequency of theimidazole is now at 3317 cm-1, further shifted to the red due tocooperativity in the NH →OH →OH →π daisy chain ofH-bonds.
4PI(H2O)3. Two bands in the R2PI spectra (labelled A and C inFigure 1) were associated with the n=3 cluster. Band A isactually a composite band with three components at 34890,34891 and 34893 cm-1 (see inset in Figure 1-a)). The centralband (34891 cm-1) appears in the n=2, 3 and 4 mass channels
Infrared Ion Dip and Ultraviolet Spectroscopy of 4-Phenyl Imidazole, its Tautomer,5-Phenyl Imidazole, and its Multiply Hydrated Clusters
F O Talbot, L C Snoek, N A Macleod, P Butz, J P Simons
Physical and Theoretical Chemistry Laboratory, South Parks Road, Oxford OX1 3QZ, UK
R T Kroemer
Molecular Modelling & Design, Discovery Research Oncology, Pharmacia, Viale Pasteur 10, 20114 Nerviano (MI) Italy
Main contact email address: [email protected]
Figure 1. (a) One-colour-R2PI spectra recorded in the4PI.(H2O)n=1..4 mass channels, in the 34600-35100 cm-1 region.The arrow indicates the position of the monomer’s band origin.(b) R2PI spectrum of the 4PI.(H2O)4 cluster, obtained bysubtracting the spectrum recorded in the n=5 channel from thatin the n=4 mass channel.

Lasers for Science Facility Programme - Chemistry
Central Laser Facility Annual Report 2001/2002 116
and is associated with the n=4 cluster. The other two, whichboth generate the same IR spectrum, whether monitored in then=2 or n=3 cluster ion channel, are associated with an n=3cluster. The IR spectrum (see Figure 3-b)) recorded whenmonitoring the third band at 34893 cm-1, clearly indicates itsassociation with an n=3 cluster. The spectra recorded whenmonitoring band C were identical to those shown in Figure 3-b)and are not presented.
Figure 3. IR ion dip spectra of multiply hydrated clusters of4PI.
As shown in Figure 3-b), the predicted frequencies of the moststable conformer (W3chain) give a very good match with theexperimental band positions. A scan at higher resolution in the“free-OH” region clearly identifies three bands, confirming theassignment to the most stable conformer, “W3chain”.
4PI(H2O)4.. The UV R2PI spectrum of the n=4 cluster shows aprogression of four bands reflecting the excitation of a lowfrequency mode, with a frequency ~30 cm-1. This spectrum wasobtained following subtraction of the n=5 spectrum from theone recorded in the n=4 channel and is shown as an inset inFigure 1. The IR ion-dip spectrum of 4PI(H2O)4, recorded whenmonitoring the most intense band of the progression (band A’scentral component at 34891 cm-1), is shown in Figure 3-c); anidentical spectrum was also recorded on the band at 34922 cm-1.Four features appear in the 3400 cm-1 region, at 3226, 3317,3387 and 3424 cm-1, in good agreement with the ab initiocalculations for conformer W4chain (the most stable calculatedconformer) shown in Figure 3-c).
Conclusion
Clusters of 4-phenylimidazole with up to four water moleculeshave been investigated under supersonic expansion conditions.Their separately resolved IR/UV ion dip spectra, coupled withthe results of ab initio calculations, have provided sufficientinformation to allow their individual structural assignment. Ineach case, the water molecules bind primarily to the NH site ofthe imidazole ring. The clusters with n≥2 form linear waterchains, in which the proton donating terminus bridges either to the imidazole ring. Structures in which water molecules areseparately bound at the >NH and >N: sites to provide a “donor-imidazole-acceptor” unit are not generated; the only way toform such a structure appears to be through a “water wire”bridge, benefiting from cooperative effects in the chain ofhydrogen bonds. However, the resolved UV and IR spectra ofthe chain clusters (n=2...4) remain discrete, and provide noevidence of proton transfer either in the excited or in the groundelectronic state of the clusters.
References
1. T.E.Creighton, Proteins, Structures and MolecularProperties, 2nd. Edition, W.H.Freeman and Company,New York, Ch. 9,(1997)
2. S.Coussan, M.Meuwly and S.Leutwyler, J.Chem.Phys.,114, 3524, (2001)
3. M.R. Hockridge, E.G. Robertson, J.P. Simons, Chem.Phys. Letters, 302, 538, (1999)
4. M.R. Hockridge, E.G. Robertson, J.P. Simons, D.R. Borst,T.M. Korter, D.W. Pratt, Chem. Phys. Letters, 334, 31,(2001)
5. H. Wolff, E. Wolff, Spectrochim. Acta, ,27A, 2109, (1971)

Lasers for Science Facility Programme - Chemistry
117 Central Laser Facility Annual Report 2001/2002
Introduction
The preferred structures of amino acids, isolated in the gasphase, always appear to be neutral, i.e., non zwitter-ionic. Evenfor the most basic isolated amino acid, arginine, which offers astrongly proton accepting guanidine side chain, both infrared1)
and high level, ab initio computational data2) point to itspreferred neutral structure(s).
In the condensed phase the situation is quite different: zwitter-ionic structures can be stabilised in ionic solids such as KBr,and in aqueous solutions over a wide range of pH. Comparisonsbetween computational modelling and experimental vibrational,and circular diochroism (VCD) spectra (of L-alanine) suggestthe operation of specific local interactions between explicitwater molecules and the dissolved zwitter-ions, as well as withthe more remote solvent environment3). The optimised ab initiomodelled structures of L-alanine also suggest a conformationalreorganisation of the hydrated amino acid.
Experimental investigations of isolated, hydrated amino acidclusters are sparse. Peteanu and Levy4) reported in 1988, aresonant two photon ionisation (R2PI) spectrum associated withtryptophan-water cluster(s) generated in a free jet expansion,together with a corresponding time of flight mass spectrumwhich showed cluster ion signals in the Trp·W1,2
+ and possibly,but very weakly, in the Trp·W3
+ mass channels. Interpretationof the R2PI spectrum, which was recorded in the Trp·W1
+ masschannel, was restricted by the multiplicity of potential bindingsites and side chain conformations; with hindsight, theappearance of Trp·Wn>1
+ cluster ions, together with thepossibility of extensive cluster ion fragmentation, might alsocloud its assignment to singly hydrated cluster(s) only. A laserinduced fluorescence (LIF) spectrum attributed to (singly)hydrated tryptophan clusters was also reported in the followingyear5).
The enormous advances in ab initio computational methodssince Peteanu and Levy’s pioneering work, together with recentsuccess in assigning the low-lying conformational structures ofphenylalanine6) and tryptophan7) in the gas phase, have set thescene for a new investigation of neutral (i.e., non ‘cationised’)amino acid hydrate clusters, which can address the difficultissue of their structural assignment. Where are the preferredwater binding sites in the singly and/or multiply hydratedclusters? What are their preferred amino acid side chainconformations and how do they depend upon the level ofhydration? Can zwitter-ionic structures be stabilised in the gasphase, solely by hydration and can they be accessed undersupersonic expansion conditions, and identified?
Methodology
The strategies employed to address these questions combinethermal evaporation, and also laser desorption of the amino acidinto an expanding pulsed supersonic jet of moist argon, withmass-selected R2PI and ultraviolet hole-burning spectroscopy,infrared ion dip (RIDIR) spectroscopy, and crucially, the resultsof ab initio computation. The strategies are powerful and wellestablished and although they have been severely tested by thepresent exploration, they have allowed a start to be made onanswering at least some of the questions listed above and raisedsome interesting new ones.
Results and discussion
The results of an extended series of ab initio structuralcalculations for singly, doubly and triply hydrated clusters oftryptophan, exploring in particular their dependence on themethod of calculation and on the size and composition of thebasis sets employed, are presented elsewhere8).
The MS-R2PI spectrum of tryptophan and its hydrated clusters,generated through thermal evaporation into the pulsed argonexpansion and recorded in the Trp·W1
+ mass channel, is shownin Figure 1(a), together with a series of ultraviolet hole-burnspectra recorded in (b) the Trp+ and (c) Trp·W1
+ channels.
probe on R(W1 mass channel)
probe on P(Trp mass channel)+
probe on P(W1 mass channel)
Figure 1. (a) R2PI spectrum of tryptophan in the Trp·(H2O)1+
mass channel; UV-UV holeburn spectra of feature P in: (b) theTrp·(H2O)1
+ mass channel, and (c) the Trp+ mass channel.(d) UV-UV holeburn spectrum of feature R in the Trp·(H2O)1
+
mass channel.
When the principal banded system P, which appears strongly inthe R2PI spectrum (a), is compared with the hole-burn spectrumassociated with the most intense feature labelled P1, the twoband progressions do not quite coincide. System P appears to bea blend of two overlapping electronic band systems. When thehole-burn spectrum of band P1 is recorded in the Trp+ monomerchannel (c), the banded system is replaced by a broad feature,on the grounds of its infrared spectrum8) a previously unnoticed,resonant monomer conformer. None of the weaker features,T,Q,R,S, etc., is associated with system P, and can therefore beassigned to different carriers (e.g. band R in Figure 1(d)).
The infrared spectrum recorded in the Trp·W1+ mass channel,
with the probe (ionisation) laser centred on peak P1, is shown inFigure 2 (black, central trace). It is a surprisingly rich spectrum,containing far more features than could be accommodated by anassignment to a single, singly hydrated tryptophan cluster:
1. at least two ‘free’ OH stretch modes around 3710-20 cm-1,
2. two weakly bound OH modes, around 3640-60 cm-1,
3. NHindole at 3422 cm-1,and NHas modes around 3400 cm-1,
4. strongly bound OH modes, associated with the broadbands around 3340, 3170 and 3070 cm-1.
Towards an understanding of multiply hydrated tryptophan clusters in the gasphase
L C Snoek, N A Macleod, F O Talbot, P Butz, J P Simons
Physical and Theoretical Chemistry Laboratory, South Parks Road, Oxford OX1 3QZ, UK
R T Kroemer
Molecular Modelling & Design, Discovery Research Oncology, Pharmacia, Viale Pasteur 10, 20114 Nerviano (MI) Italy
Main contact email address: [email protected]
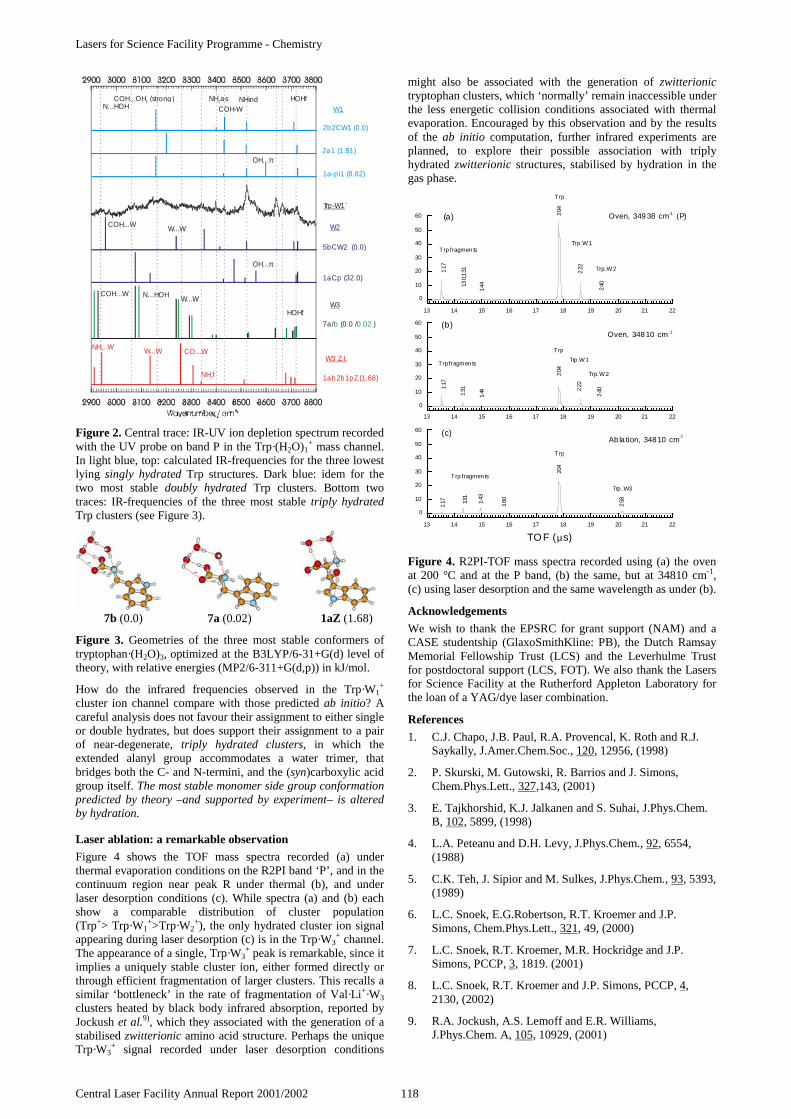
Lasers for Science Facility Programme - Chemistry
Central Laser Facility Annual Report 2001/2002 118
NHind HOHfNH as2COH...OH (strong)2
Trp-W1+
2b2CW1 (0.0)
2a1 (1.51)
1a-pi1 (8.82)
OH...π
COH-W
5bCW2 (0.0)
1aCp (32.0)
OH...π
7a/ (0.0 / )b 0.02
1ab2b1pZ (1.68)
NH ..W3
NH f3
W1
W2
W3
W3 Z.I.
COH...W N...HOH
W...W
W...W
CO...W
N...HOH
HOHf
W...WCOH...W
Figure 2. Central trace: IR-UV ion depletion spectrum recordedwith the UV probe on band P in the Trp·(H2O)1
+ mass channel.In light blue, top: calculated IR-frequencies for the three lowestlying singly hydrated Trp structures. Dark blue: idem for thetwo most stable doubly hydrated Trp clusters. Bottom twotraces: IR-frequencies of the three most stable triply hydratedTrp clusters (see Figure 3).
7b (0.0) 7a (0.02) 1aZ (1.68)
Figure 3. Geometries of the three most stable conformers oftryptophan·(H2O)3, optimized at the B3LYP/6-31+G(d) level oftheory, with relative energies (MP2/6-311+G(d,p)) in kJ/mol.
How do the infrared frequencies observed in the Trp·W1+
cluster ion channel compare with those predicted ab initio? Acareful analysis does not favour their assignment to either singleor double hydrates, but does support their assignment to a pairof near-degenerate, triply hydrated clusters, in which theextended alanyl group accommodates a water trimer, thatbridges both the C- and N-termini, and the (syn)carboxylic acidgroup itself. The most stable monomer side group conformationpredicted by theory –and supported by experiment– is alteredby hydration.
Laser ablation: a remarkable observation
Figure 4 shows the TOF mass spectra recorded (a) underthermal evaporation conditions on the R2PI band ‘P’, and in thecontinuum region near peak R under thermal (b), and underlaser desorption conditions (c). While spectra (a) and (b) eachshow a comparable distribution of cluster population(Trp+> Trp·W1
+>Trp·W2+), the only hydrated cluster ion signal
appearing during laser desorption (c) is in the Trp·W3+ channel.
The appearance of a single, Trp·W3+ peak is remarkable, since it
implies a uniquely stable cluster ion, either formed directly orthrough efficient fragmentation of larger clusters. This recalls asimilar ‘bottleneck’ in the rate of fragmentation of Val·Li+·W3
clusters heated by black body infrared absorption, reported byJockush et al.9), which they associated with the generation of astabilised zwitterionic amino acid structure. Perhaps the uniqueTrp·W3
+ signal recorded under laser desorption conditions
might also be associated with the generation of zwitterionictryptophan clusters, which ‘normally’ remain inaccessible underthe less energetic collision conditions associated with thermalevaporation. Encouraged by this observation and by the resultsof the ab initio computation, further infrared experiments areplanned, to explore their possible association with triplyhydrated zwitterionic structures, stabilised by hydration in thegas phase.
13 14 15 16 17 18 19 20 21 22
0
10
20
30
40
50
60 (c)
258
204
160
117 13
1
143
Trp .W3
Trp fragmen ts
Trp
Ab la tion, 34810 cm-1
TO F (µs)
13 14 15 16 17 18 19 20 21 22
0
10
20
30
40
50
60 (b)
2402
22
204
1441311
17
Trp fragmen ts
Trp.W2
Trp .W1
Trp
Oven, 34810 cm -1
13 14 15 16 17 18 19 20 21 22
0
10
20
30
40
50
60 (a)
240
222
204
14413
0,1
31117
T rp fragmen ts
Trp.W2
Trp.W1
Trp
Oven, 349 38 cm-1 (P)
Figure 4. R2PI-TOF mass spectra recorded using (a) the ovenat 200 °C and at the P band, (b) the same, but at 34810 cm-1,(c) using laser desorption and the same wavelength as under (b).
Acknowledgements
We wish to thank the EPSRC for grant support (NAM) and aCASE studentship (GlaxoSmithKline: PB), the Dutch RamsayMemorial Fellowship Trust (LCS) and the Leverhulme Trustfor postdoctoral support (LCS, FOT). We also thank the Lasersfor Science Facility at the Rutherford Appleton Laboratory forthe loan of a YAG/dye laser combination.
References
1. C.J. Chapo, J.B. Paul, R.A. Provencal, K. Roth and R.J.Saykally, J.Amer.Chem.Soc., 120, 12956, (1998)
2. P. Skurski, M. Gutowski, R. Barrios and J. Simons,Chem.Phys.Lett., 327,143, (2001)
3. E. Tajkhorshid, K.J. Jalkanen and S. Suhai, J.Phys.Chem.B, 102, 5899, (1998)
4. L.A. Peteanu and D.H. Levy, J.Phys.Chem., 92, 6554,(1988)
5. C.K. Teh, J. Sipior and M. Sulkes, J.Phys.Chem., 93, 5393,(1989)
6. L.C. Snoek, E.G.Robertson, R.T. Kroemer and J.P.Simons, Chem.Phys.Lett., 321, 49, (2000)
7. L.C. Snoek, R.T. Kroemer, M.R. Hockridge and J.P.Simons, PCCP, 3, 1819. (2001)
8. L.C. Snoek, R.T. Kroemer and J.P. Simons, PCCP, 4,2130, (2002)
9. R.A. Jockush, A.S. Lemoff and E.R. Williams,J.Phys.Chem. A, 105, 10929, (2001)
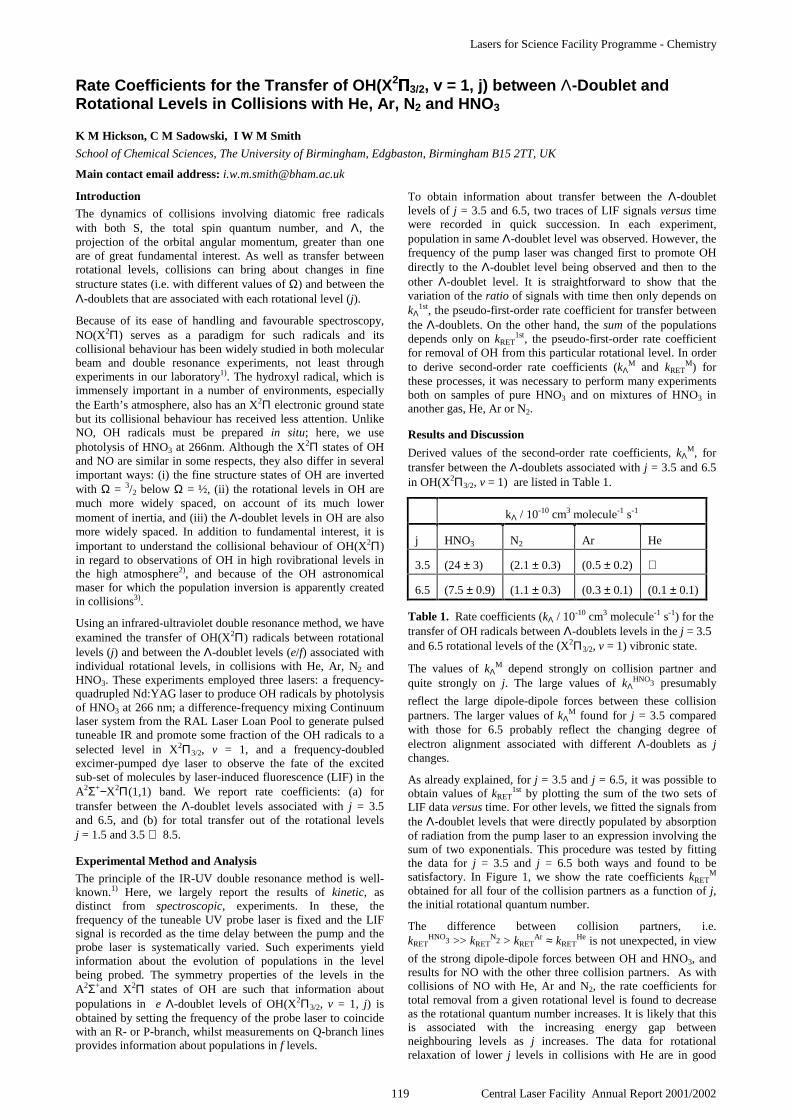
Lasers for Science Facility Programme - Chemistry
119 Central Laser Facility Annual Report 2001/2002
Introduction
The dynamics of collisions involving diatomic free radicalswith both S, the total spin quantum number, and Λ, theprojection of the orbital angular momentum, greater than oneare of great fundamental interest. As well as transfer betweenrotational levels, collisions can bring about changes in finestructure states (i.e. with different values of Ω) and between theΛ-doublets that are associated with each rotational level (j).
Because of its ease of handling and favourable spectroscopy,NO(X2Π) serves as a paradigm for such radicals and itscollisional behaviour has been widely studied in both molecularbeam and double resonance experiments, not least throughexperiments in our laboratory1). The hydroxyl radical, which isimmensely important in a number of environments, especiallythe Earth’s atmosphere, also has an X2Π electronic ground statebut its collisional behaviour has received less attention. UnlikeNO, OH radicals must be prepared in situ; here, we usephotolysis of HNO3 at 266nm. Although the X2Π states of OHand NO are similar in some respects, they also differ in severalimportant ways: (i) the fine structure states of OH are invertedwith Ω = 3/2 below Ω = ½, (ii) the rotational levels in OH aremuch more widely spaced, on account of its much lowermoment of inertia, and (iii) the Λ-doublet levels in OH are alsomore widely spaced. In addition to fundamental interest, it isimportant to understand the collisional behaviour of OH(X2Π)in regard to observations of OH in high rovibrational levels inthe high atmosphere2), and because of the OH astronomicalmaser for which the population inversion is apparently createdin collisions3).
Using an infrared-ultraviolet double resonance method, we haveexamined the transfer of OH(X2Π) radicals between rotationallevels (j) and between the Λ-doublet levels (e/f) associated withindividual rotational levels, in collisions with He, Ar, N2 andHNO3. These experiments employed three lasers: a frequency-quadrupled Nd:YAG laser to produce OH radicals by photolysisof HNO3 at 266 nm; a difference-frequency mixing Continuumlaser system from the RAL Laser Loan Pool to generate pulsedtuneable IR and promote some fraction of the OH radicals to aselected level in X2Π3/2, v = 1, and a frequency-doubledexcimer-pumped dye laser to observe the fate of the excitedsub-set of molecules by laser-induced fluorescence (LIF) in theA2Σ+−X2Π(1,1) band. We report rate coefficients: (a) fortransfer between the Λ-doublet levels associated with j = 3.5and 6.5, and (b) for total transfer out of the rotational levelsj = 1.5 and 3.5 8.5.
Experimental Method and Analysis
The principle of the IR-UV double resonance method is well-known.1) Here, we largely report the results of kinetic, asdistinct from spectroscopic, experiments. In these, thefrequency of the tuneable UV probe laser is fixed and the LIFsignal is recorded as the time delay between the pump and theprobe laser is systematically varied. Such experiments yieldinformation about the evolution of populations in the levelbeing probed. The symmetry properties of the levels in theA2Σ+and X2Π states of OH are such that information aboutpopulations in e Λ-doublet levels of OH(X2Π3/2, v = 1, j) isobtained by setting the frequency of the probe laser to coincidewith an R- or P-branch, whilst measurements on Q-branch linesprovides information about populations in f levels.
To obtain information about transfer between the Λ-doubletlevels of j = 3.5 and 6.5, two traces of LIF signals versus timewere recorded in quick succession. In each experiment,population in same Λ-doublet level was observed. However, thefrequency of the pump laser was changed first to promote OHdirectly to the Λ-doublet level being observed and then to theother Λ-doublet level. It is straightforward to show that thevariation of the ratio of signals with time then only depends onkΛ
1st, the pseudo-first-order rate coefficient for transfer betweenthe Λ-doublets. On the other hand, the sum of the populationsdepends only on kRET
1st, the pseudo-first-order rate coefficientfor removal of OH from this particular rotational level. In orderto derive second-order rate coefficients (kΛ
M and kRETM) for
these processes, it was necessary to perform many experimentsboth on samples of pure HNO3 and on mixtures of HNO3 inanother gas, He, Ar or N2.
Results and Discussion
Derived values of the second-order rate coefficients, kΛM, for
transfer between the Λ-doublets associated with j = 3.5 and 6.5in OH(X2Π3/2, v = 1) are listed in Table 1.
kΛ / 10-10 cm3 molecule-1 s-1
j HNO3 N2 Ar He
3.5 (24 ± 3) (2.1 ± 0.3) (0.5 ± 0.2)
6.5 (7.5 ± 0.9) (1.1 ± 0.3) (0.3 ± 0.1) (0.1 ± 0.1)
Table 1. Rate coefficients (kΛ / 10-10 cm3 molecule-1 s-1) for thetransfer of OH radicals between Λ-doublets levels in the j = 3.5and 6.5 rotational levels of the (X2Π3/2, v = 1) vibronic state.
The values of kΛM depend strongly on collision partner and
quite strongly on j. The large values of kΛHNO3 presumably
reflect the large dipole-dipole forces between these collisionpartners. The larger values of kΛ
M found for j = 3.5 comparedwith those for 6.5 probably reflect the changing degree ofelectron alignment associated with different Λ-doublets as jchanges.
As already explained, for j = 3.5 and j = 6.5, it was possible toobtain values of kRET
1st by plotting the sum of the two sets ofLIF data versus time. For other levels, we fitted the signals fromthe Λ-doublet levels that were directly populated by absorptionof radiation from the pump laser to an expression involving thesum of two exponentials. This procedure was tested by fittingthe data for j = 3.5 and j = 6.5 both ways and found to besatisfactory. In Figure 1, we show the rate coefficients kRET
M
obtained for all four of the collision partners as a function of j,the initial rotational quantum number.
The difference between collision partners, i.e.kRET
HNO3 >> kRETN2 > kRET
Ar ≈ kRETHe is not unexpected, in view
of the strong dipole-dipole forces between OH and HNO3, andresults for NO with the other three collision partners. As withcollisions of NO with He, Ar and N2, the rate coefficients fortotal removal from a given rotational level is found to decreaseas the rotational quantum number increases. It is likely that thisis associated with the increasing energy gap betweenneighbouring levels as j increases. The data for rotationalrelaxation of lower j levels in collisions with He are in good
Rate Coefficients for the Transfer of OH(X23/2, v = 1, j) between Λ-Doublet and
Rotational Levels in Collisions with He, Ar, N2 and HNO3
K M Hickson, C M Sadowski, I W M Smith
School of Chemical Sciences, The University of Birmingham, Edgbaston, Birmingham B15 2TT, UK
Main contact email address: [email protected]

Lasers for Science Facility Programme - Chemistry
Central Laser Facility Annual Report 2001/2002 120
agreement with the ab initio calculations of Esposti et al4). Inparticular, the increase in kRET
Ar and kRETHe from j = 1.5 to 3.5 is
reproduced and is presumably, in part, due to the fact that alltransfers from j = 1.5 are necessarily endothermic.
Summary and Prognosis
The research reported here has added substantially to ourknowledge of the collisional behaviour of OH(X2Π). It has ledto two papers, one accepted for publication5), one in the finalstages of preparation6). The data on transfer between pairs ofΛ-doublets associated with the same rotational level are the firstof their kind and should stimulate further theoretical work. Theresults on rotational energy transfer constitute the mostextensive data set yet for transfer from rotational levels inOH(X2Π).
Nevertheless, despite our successes, our measurements oncollisions involving OH can be said to have only scratched thesurface of what might, and indeed should, be done. Only lack oftime has prevented us from measuring state-to-state ratecoefficients, including in the definition of both initial and finalstates the Λ-doublet, as well as the rotational, level. Theory4)
suggests that there should be a strong dependence of state-to-state rate coefficients for rotational energy transfer onΛ-doublet level and this prediction needs to be checked byexperiment. A second extension of the present work would beto obtain data on still higher j levels by decreasing the timedelay between the pulses from the photolysis and pump lasers,in a manner similar to that used in experiments on NO in levelsup to j = 40.5. Finally, it would be of great interest to extend ourmeasurements to very low temperatures, just as we did forNO.1(e) Besides fundamental interest, such measurementsshould have great relevance to the mechanism of the OHastronomical maser.
At present, work is in progress on the behaviour of state-selected CN(X2Σ+, v = 2, N) radicals in collisions with N2 andC2H2. In N2, collisions can only lead to rotational energytransfer and we find rate coefficients for total collisional lossthat fall steeply from N = 0 to N = 57. With C2H2, collisions canlead to reaction or rotational energy transfer. By comparing therate coefficients for total removal with the sum of state-to-staterate coefficients for rotational energy transfer, we expect to beable to obtain rate coefficients for reaction of CN in specificrotational levels with C2H2. Measurements onCN(X2Σ+, v = 2, N = 0) have demonstrated that this approach is
possible. We expect to report exciting and unique results on thissystem in the next CLF Annual Report.
References
1. M. J. Frost, M. Islam and I. W. M. Smith Can. J. Chem.,1994, 72, 606 (b) M. Islam, I. W. M. Smith and J. W.Wiebrecht J. Phys. Chem., 1994, 98, 9285 (c) M. Islam, I.W. M. Smith and J. W. WiebrechtJ. Chem. Phys., 1995,103, 9676 (d) P. L.James, I. R. Sims and I. W. M. SmithChem. Phys. Lett., 1997, 272,412 (e) P. L. James, I. R.Sims, I. W. M. Smith, M. H. Alexanderand M. Yang J.Chem. Phys., 1998, 109, 3882 (f) M. Islam, I. W.M. Smithand M. H. Alexander Chem. Phys. Lett., 1999, 305, 311(g)M. Islam, I. W. M. Smith and M. H. Alexander Phys.Chem. Chem. Phys., 2000, 2, 473
2. K. W. Holtzclaw, B. L. Upschulte, G. E. Caledonia, J. F.Croni, B. D. Green, S. J. Lipson, W. A. M. Blumberg andJ. A. Dodd J. Geophys. Res. 1997, 102A, 4521
3. (a) M. J. Reid and J. M. Moran Ann. Rev. Astron.Astrophys., 1981, 19, 231(b) M. Elitzur Rev. Mod. Phys., 1982, 54, 1225(c) J. J. ter Meulin Molecules in Astrophysics: Probes andProcesses, IAU Sympos. 178, ed. E. F. van Dishoeck,(Kluwer, Dordrecht, 1997) p. 241
4. A. D. Esposti, A. Berning and H.-J. Werner J. Chem.Phys., 1995, 103, 2067
5. K. M. Hickson, C. M. Sadowski and I. W. M. Smith J.Phys. Chem A, 2002, in press.
6. K. M. Hickson, C. M. Sadowski and I. W. M. Smith Phys.Chem Chem. Phys., 2002, in preparation.
j
1.5 2.5 3.5 4.5 5.5 6.5 7.5 8.5
k RE
T /
10- 10
cm
3 mo
lecu
le-1
s-1
0
1
2
3
4
5
6
7
HNO3N2ArHe
Figure 1. Second - order rate coefficients(kRET / 10-10 cm3 molecule-1 s-1) for total transferof OH(X2Π3/2, v = 1, j) to other rotational levels
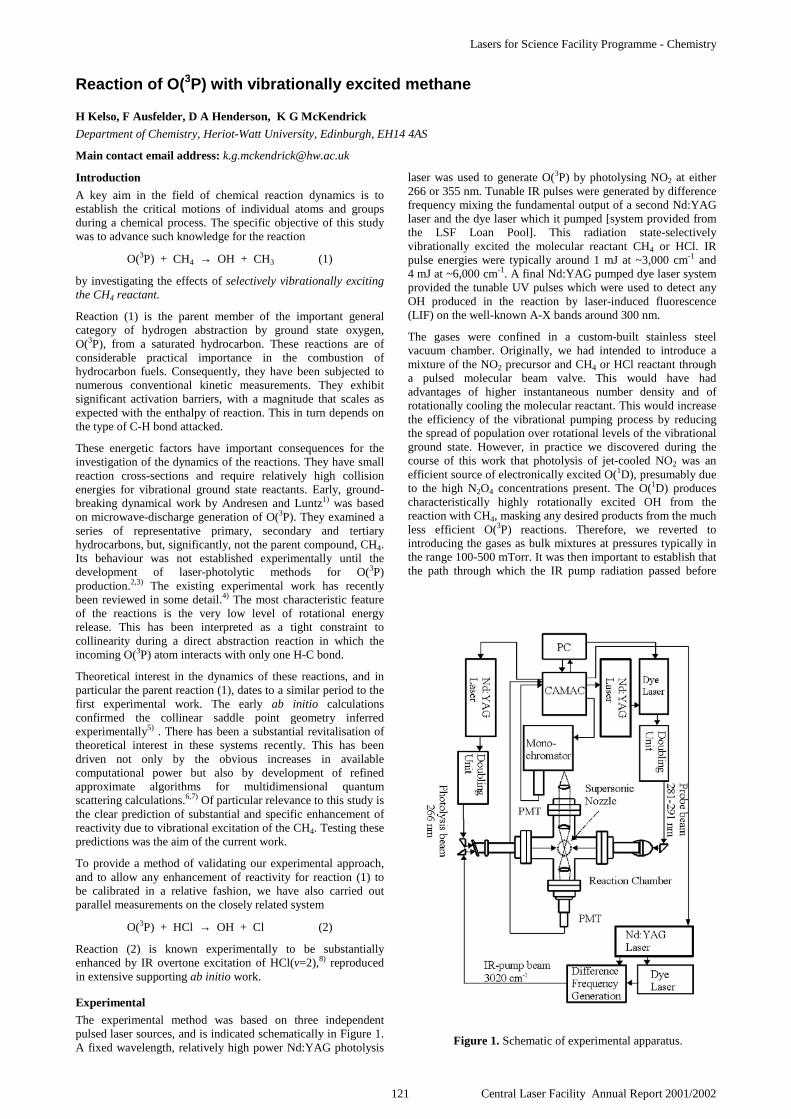
Lasers for Science Facility Programme - Chemistry
121 Central Laser Facility Annual Report 2001/2002
Introduction
A key aim in the field of chemical reaction dynamics is toestablish the critical motions of individual atoms and groupsduring a chemical process. The specific objective of this studywas to advance such knowledge for the reaction
O(3P) + CH4 → OH + CH3 (1)
by investigating the effects of selectively vibrationally excitingthe CH4 reactant.
Reaction (1) is the parent member of the important generalcategory of hydrogen abstraction by ground state oxygen,O(3P), from a saturated hydrocarbon. These reactions are ofconsiderable practical importance in the combustion ofhydrocarbon fuels. Consequently, they have been subjected tonumerous conventional kinetic measurements. They exhibitsignificant activation barriers, with a magnitude that scales asexpected with the enthalpy of reaction. This in turn depends onthe type of C-H bond attacked.
These energetic factors have important consequences for theinvestigation of the dynamics of the reactions. They have smallreaction cross-sections and require relatively high collisionenergies for vibrational ground state reactants. Early, ground-breaking dynamical work by Andresen and Luntz1) was basedon microwave-discharge generation of O(3P). They examined aseries of representative primary, secondary and tertiaryhydrocarbons, but, significantly, not the parent compound, CH4.Its behaviour was not established experimentally until thedevelopment of laser-photolytic methods for O(3P)production.2,3) The existing experimental work has recentlybeen reviewed in some detail.4) The most characteristic featureof the reactions is the very low level of rotational energyrelease. This has been interpreted as a tight constraint tocollinearity during a direct abstraction reaction in which theincoming O(3P) atom interacts with only one H-C bond.
Theoretical interest in the dynamics of these reactions, and inparticular the parent reaction (1), dates to a similar period to thefirst experimental work. The early ab initio calculationsconfirmed the collinear saddle point geometry inferredexperimentally5) . There has been a substantial revitalisation oftheoretical interest in these systems recently. This has beendriven not only by the obvious increases in availablecomputational power but also by development of refinedapproximate algorithms for multidimensional quantumscattering calculations.6,7) Of particular relevance to this study isthe clear prediction of substantial and specific enhancement ofreactivity due to vibrational excitation of the CH4. Testing thesepredictions was the aim of the current work.
To provide a method of validating our experimental approach,and to allow any enhancement of reactivity for reaction (1) tobe calibrated in a relative fashion, we have also carried outparallel measurements on the closely related system
O(3P) + HCl → OH + Cl (2)
Reaction (2) is known experimentally to be substantiallyenhanced by IR overtone excitation of HCl(v=2),8) reproducedin extensive supporting ab initio work.
Experimental
The experimental method was based on three independentpulsed laser sources, and is indicated schematically in Figure 1.A fixed wavelength, relatively high power Nd:YAG photolysis
laser was used to generate O(3P) by photolysing NO2 at either266 or 355 nm. Tunable IR pulses were generated by differencefrequency mixing the fundamental output of a second Nd:YAGlaser and the dye laser which it pumped [system provided fromthe LSF Loan Pool]. This radiation state-selectivelyvibrationally excited the molecular reactant CH4 or HCl. IRpulse energies were typically around 1 mJ at ~3,000 cm-1 and4 mJ at ~6,000 cm-1. A final Nd:YAG pumped dye laser systemprovided the tunable UV pulses which were used to detect anyOH produced in the reaction by laser-induced fluorescence(LIF) on the well-known A-X bands around 300 nm.
The gases were confined in a custom-built stainless steelvacuum chamber. Originally, we had intended to introduce amixture of the NO2 precursor and CH4 or HCl reactant througha pulsed molecular beam valve. This would have hadadvantages of higher instantaneous number density and ofrotationally cooling the molecular reactant. This would increasethe efficiency of the vibrational pumping process by reducingthe spread of population over rotational levels of the vibrationalground state. However, in practice we discovered during thecourse of this work that photolysis of jet-cooled NO2 was anefficient source of electronically excited O(1D), presumably dueto the high N2O4 concentrations present. The O(1D) producescharacteristically highly rotationally excited OH from thereaction with CH4, masking any desired products from the muchless efficient O(3P) reactions. Therefore, we reverted tointroducing the gases as bulk mixtures at pressures typically inthe range 100-500 mTorr. It was then important to establish thatthe path through which the IR pump radiation passed before
Reaction of O(3P) with vibrationally excited methane
H Kelso, F Ausfelder, D A Henderson, K G McKendrick
Department of Chemistry, Heriot-Watt University, Edinburgh, EH14 4AS
Main contact email address: [email protected]
Figure 1. Schematic of experimental apparatus.
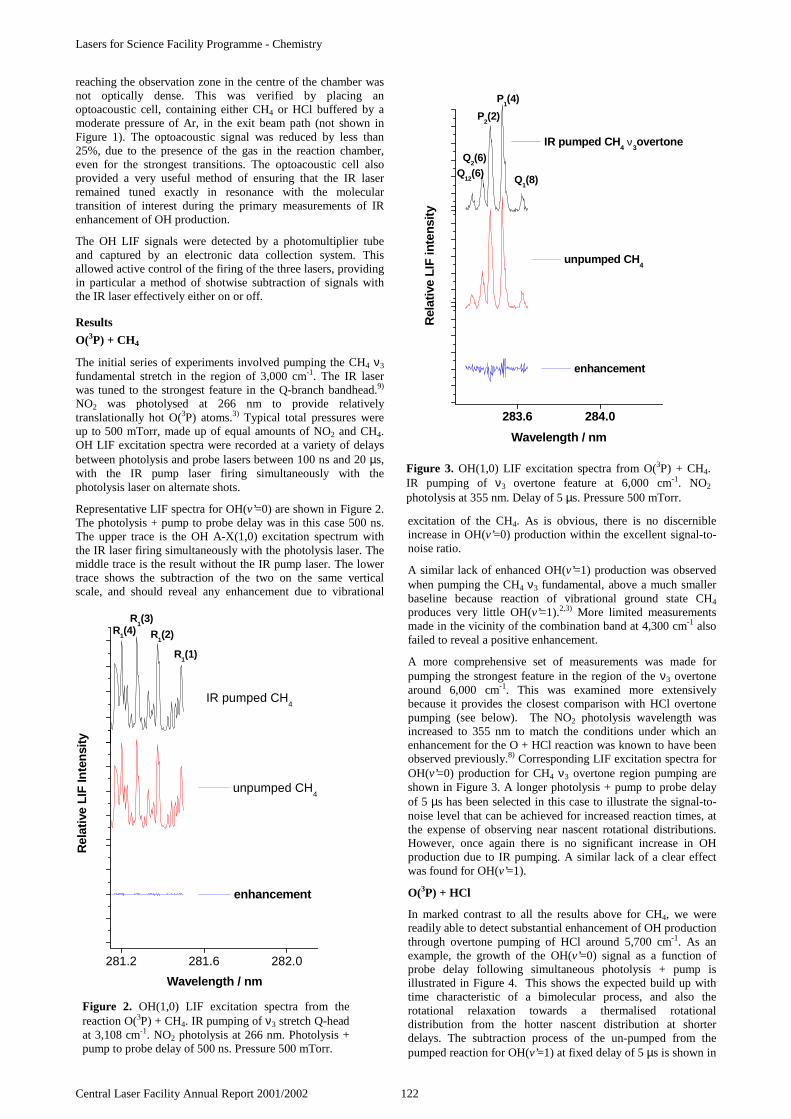
Lasers for Science Facility Programme - Chemistry
Central Laser Facility Annual Report 2001/2002 122
reaching the observation zone in the centre of the chamber wasnot optically dense. This was verified by placing anoptoacoustic cell, containing either CH4 or HCl buffered by amoderate pressure of Ar, in the exit beam path (not shown inFigure 1). The optoacoustic signal was reduced by less than25%, due to the presence of the gas in the reaction chamber,even for the strongest transitions. The optoacoustic cell alsoprovided a very useful method of ensuring that the IR laserremained tuned exactly in resonance with the moleculartransition of interest during the primary measurements of IRenhancement of OH production.
The OH LIF signals were detected by a photomultiplier tubeand captured by an electronic data collection system. Thisallowed active control of the firing of the three lasers, providingin particular a method of shotwise subtraction of signals withthe IR laser effectively either on or off.
Results
O(3P) + CH4
The initial series of experiments involved pumping the CH4 ν3
fundamental stretch in the region of 3,000 cm-1. The IR laserwas tuned to the strongest feature in the Q-branch bandhead.9)
NO2 was photolysed at 266 nm to provide relativelytranslationally hot O(3P) atoms.3) Typical total pressures wereup to 500 mTorr, made up of equal amounts of NO2 and CH4.OH LIF excitation spectra were recorded at a variety of delaysbetween photolysis and probe lasers between 100 ns and 20 µs,with the IR pump laser firing simultaneously with thephotolysis laser on alternate shots.
Representative LIF spectra for OH(v’=0) are shown in Figure 2.The photolysis + pump to probe delay was in this case 500 ns.The upper trace is the OH A-X(1,0) excitation spectrum withthe IR laser firing simultaneously with the photolysis laser. Themiddle trace is the result without the IR pump laser. The lowertrace shows the subtraction of the two on the same verticalscale, and should reveal any enhancement due to vibrational
excitation of the CH4. As is obvious, there is no discernibleincrease in OH(v’=0) production within the excellent signal-to-noise ratio.
A similar lack of enhanced OH(v’=1) production was observedwhen pumping the CH4 ν3 fundamental, above a much smallerbaseline because reaction of vibrational ground state CH4
produces very little OH(v’=1).2,3) More limited measurementsmade in the vicinity of the combination band at 4,300 cm-1 alsofailed to reveal a positive enhancement.
A more comprehensive set of measurements was made forpumping the strongest feature in the region of the ν3 overtonearound 6,000 cm-1. This was examined more extensivelybecause it provides the closest comparison with HCl overtonepumping (see below). The NO2 photolysis wavelength wasincreased to 355 nm to match the conditions under which anenhancement for the O + HCl reaction was known to have beenobserved previously.8) Corresponding LIF excitation spectra forOH(v’=0) production for CH4 ν3 overtone region pumping areshown in Figure 3. A longer photolysis + pump to probe delayof 5 µs has been selected in this case to illustrate the signal-to-noise level that can be achieved for increased reaction times, atthe expense of observing near nascent rotational distributions.However, once again there is no significant increase in OHproduction due to IR pumping. A similar lack of a clear effectwas found for OH(v’=1).
O(3P) + HCl
In marked contrast to all the results above for CH4, we werereadily able to detect substantial enhancement of OH productionthrough overtone pumping of HCl around 5,700 cm-1. As anexample, the growth of the OH(v’=0) signal as a function ofprobe delay following simultaneous photolysis + pump isillustrated in Figure 4. This shows the expected build up withtime characteristic of a bimolecular process, and also therotational relaxation towards a thermalised rotationaldistribution from the hotter nascent distribution at shorterdelays. The subtraction process of the un-pumped from thepumped reaction for OH(v’=1) at fixed delay of 5 µs is shown in
281.2 281.6 282.0
Wavelength / nm
enhancement
Rel
ativ
e LI
F In
ten
sity
unpumped CH4
R1(4)
R1(3)
R1(2)
R1(1)
IR pumped CH4
Figure 2. OH(1,0) LIF excitation spectra from thereaction O(3P) + CH4. IR pumping of ν3 stretch Q-headat 3,108 cm-1. NO2 photolysis at 266 nm. Photolysis +pump to probe delay of 500 ns. Pressure 500 mTorr.
283.6 284.0
Wavelength / nm
enhancement
Rel
ativ
e LI
F in
tens
ity
unpumped CH4
Q12
(6)Q
2(6)
P2(2)
Q1(8)
P1(4)
IR pumped CH4 ν
3overtone
Figure 3. OH(1,0) LIF excitation spectra from O(3P) + CH4.IR pumping of ν3 overtone feature at 6,000 cm-1. NO2
photolysis at 355 nm. Delay of 5 µs. Pressure 500 mTorr.

Lasers for Science Facility Programme - Chemistry
123 Central Laser Facility Annual Report 2001/2002
Figure 5. Unlike the corresponding CH4 results in Figures 1-3,the enhanced signal due to IR pumping is unmistakable andeasily outweighs that present from the unpumped reaction.
Discussion
Our principal observation is that IR pumping of CH4 does notproduce any enhanced OH production from the O(3P) + CH4
reaction above the level of our limiting signal-to-noise. This isthe case for pumping either the ν3 fundamental stretch at3,000 cm-1, the strongest feature in the overtone region around6,000 cm-1, or, less fully investigated, the combination bandnear 4,300 cm-1. Production of both OH(v’=0) and (v’=1) wereinvestigated and are equally unaffected.
This behaviour is in marked contrast to O(3P) + HCl, where wereadily observe that overtone pumping of HCl(v’=2) producessubstantially increased production of both OH(v’=0) and (v’=1),in line with previous independent observations.8) This willallow us to make a direct relative comparison between thereactivity of CH4 and HCl containing similar amounts ofvibrational energy. One factor which clearly favours theobservation of an effect for O(3P) + HCl is the approximatelyorder of magnitude stronger IR absorption for the HCl overtonethan for the CH4 ν3overtone.9) We will take this into account ina future quantitative analysis of the relative reactivities of thepumped molecules.
We will also compare this qualitatively surprising result withthe quantitative predictions of reduced-dimensional quantumscattering calculations.6,7) This requires the predicted excitationfunctions to be averaged over the experimental collisionalenergy distributions. The fraction of the sample excited by theIR pump laser must also be estimated from the knownabsorption strengths and the experimental pulse energies.
When fully analysed these results will provide the firstexperimental information on the effects of vibrational excitationfor this important elementary reaction and provide a new test ofthe current understanding of its mechanism.
References
1. P. Andresen and A. C. Luntz,J. Chem. Phys., 72, 5842, (1980).
2. G. M. Sweeney, A. Watson, K. G. McKendrick,J. Chem. Phys., 106, 9172, (1997).
3. F. Ausfelder, H. Kelso and K. G. McKendrick,Phys. Chem. Chem. Phys., 4, 473, (2002).
4. F. Ausfelder and K. G. McKendrick,Prog. React. Kinet. Mech., 25, 299, (2000).
5. S. P. Walch and T. H. Dunning, Jr.,J. Chem. Phys., 72, 3221, (1980).
6. D. C. Clary,Phys. Chem. Chem. Phys., 1, 1173, (1999);J. Palma and D. C. Clary,J. Chem. Phys., 112, 1859, (2000);J. Palma and D. C. Clary,Phys. Chem. Chem. Phys., 2, 4105;J. Palma and D. C. Clary,J. Chem. Phys., 115, 2188, (2001).
7. H.-G. Yu and G. Nyman,J. Chem. Phys., 112, 238, (2000).
8. D. J. Rakestraw, K. G. McKendrick and R. N. Zare,J. Chem. Phys., 87, 7341, (1987);R. Zhang, W. J. van der Zande, M. J. Bronikowski and R.N. Zare,J. Chem. Phys., 94, 2704, (1991).
9. HITRAN96, L. S. Rothman et al., JQRST, 60, 665, (1998).
315.2 315.4 315.6 315.8
Wavelength / nm
enhancement
P12
(2)
Rel
ativ
e L
IF in
tens
ity
unpumped HCl
Q1(9)
P1(4)
Q2(7)
IR pumped HCl v=2
Figure 5. OH(1,1) LIF excitation spectra from reactionO(3P) + HCl. H35Cl pumped on R(3) of overtone at5,720 cm-1. Photolysis + pump to probe delay 5 µs.NO2 photolysis at 355 nm. Pressure 300 mTorr.
281.8 281.9 282.0 282.1
R2(4)
R2(9)
IR pumped HCl v=2
20 µs 10 µs 1 µs 0.5 µs 0.3 µs
Wavelength / nm
Rel
ativ
e L
IF in
ten
sity
Figure 4. OH(1,0) LIF excitation spectra as a function ofphotolysis + IR pump to probe delay for the reaction O(3P)+ HCl. H35Cl pumped on R(3) of overtone at 5,720 cm-1.NO2 photolysis at 355 nm. Pressure 500 mTorr.

Lasers for Science Facility Programme - Chemistry
Central Laser Facility Annual Report 2001/2002 124
Introduction
The directional properties of angular momentum have beenwidely used as a means to understanding the processes thatoccur when molecules dissociate or are ionised1). More recentlythere has been a surge of interest in measurements ofinterference between angular momentum states arising frommultiple pathways in molecular photodissociation2). However,most experimental studies to-date have been limited tomeasurements of coherent alignment or orientation of atomicphotofragments.
The present work demonstrates the first measurement ofelectronic orientation of a diatomic fragment OH(2Π) resultingfrom the ultraviolet photolysis of H2O2 at wavelengths330 to 370 nm. The results show a strong coherent orientationof OH fragments, resulting from dissociation via multipleelectronic states.
Experimental setup
60% w/v aqueous hydrogen peroxide was gently distilled undervacuum and stored in a glass bulb. The vapour was constantlyflowed through a PTFE coated stainless steel reaction cell at aconstant pressure below 100 mTorr.
The second harmonic (532 nm) output from a SureliteContinuum III-10 YAG laser was used to pump two dye lasers.Tunable photolysis radiation in the range 330 – 370 nm wasobtained from the doubled output of a Continuum ND6000 dyelaser. The probe radiation was obtained from a Sirah dye laser(GS-R-2400), which was doubled to approximately 308 nm.
Both laser pulses were circularly polarised using zero-orderquartz quarter waveplates. The polarisation of the probe pulsewas flipped between left (LCP) or right (RCP) circularlypolarised light on a shot-to-shot basis by synchronizing the laserto the stress cycle of a fused-silica photoeleastic modulator(Hinds PEM-90D). The probe pulse was temporally delayed(~10 ns) from the photolysis pulse, and the pulses were spatiallyoverlapped at the centre of the reaction cell. Followingabsorption of the photolysis radiation, the H2O2 moleculesdissociate, and the resulting OH radicals are detected by theprobe pulse, using (1+1) laser-induced fluorescence (LIF),collecting the fluorescence without polarisation analysis.
Doppler lineshapes D(ν) were obtained by scanning the probelaser wavelength over individual rotational lines in the (0,0)band of the A–X electronic transition. Composite sum anddifference profiles Diso(ν) = DLCP(ν) + DRCP(ν) (independent ofproduct orientation), and Daniso(ν) = DLCP(ν) − DRCP(ν) (dependsonly on product orientation) were fitted by Monte Carlosimulations to obtain the degree of orientation of the OHmolecules.
Results
The photodissociation of H2O2 at around 350 nm is known toproceed via at least two electronic states of different symmetry:
these are believed to be the A~ 1A(perpendicular ⊥ ) and the
B~ 1B(parallel ||) states3). The distribution of directions of theOH molecule products in the laboratory frame can beparameterised by the so-called beta parameter (β):
with D(θ) the angular distribution of the velocity vector of theproducts in the laboratory frame, and P2 the second Legendrepolynomial:
)(cosP1)( 2 θβθ +=D (1)
The limits of β = +2 and –1 indicate || and ⊥ transitionsrespectively. Figure 1 shows that at ~250 nm the dissociation is
mostly via the A~
state, with an increasing contribution from
the B~
state at longer wavelengths. As can be seen from Figure1, the β for dissociation of Cl2 are very similar to those of H2O2,suggesting that the molecules are very similar electronically,and this is borne out by the orientation results below.
240 280 320 360 400 440
-1.0
-0.5
0.0
0.5
1.0
1.5
2.0 parallel
Ani
sotr
opy
para
met
er
Photolysis wavelength / nm
Cl2
H2O
2
perpendicular
Figure 1. Anisotropy parameter (β) for H2O2 and Cl2 as takenfrom References 3 and 4. The shaded bar indicates thewavelength range of the present study.
Composite profiles Daniso(ν) show that the OH molecules areoriented in the laboratory frame. The orientation of the angularmomentum of the OH molecules in the laboratory frame (A10)can be written in terms of molecule frame orientation parametera1Q(p):
θθβφθ 2112
121010 sin)(||,acos)(a)1(),( ⊥+⊥+= +A (2)
In Equation 2, the a10(⊥ ) represents an incoherent orientation
parameter that arises solely from dissociation via the A~
(⊥ )state, and a11+(||,⊥ ) represents coherent orientation that resultsfrom interference between || and ⊥ transitions. By usingEquation 2 to model the Daniso(ν) composite profiles, we candetermine the coherent molecule frame contributions to the totalorientation.
The contribution due to the coherent a11+(||,⊥ ) measured for theJ = 0.5 state of OH, using the PQ12(N = 1) rotational line in theOH LIF spectrum is shown in Figure 2. The coherentorientation is nearly zero at 330 nm and increases at longerwavelengths. The trend closely follows the results for β shownin Figure 1. If the observed a11+(||,⊥ ) results from interferencebetween multiple states, we would expect the followingrelationship to hold:
φββ ∆−+∝⊥+ cos)2)(1()(||,a11 (3)
Molecular Young’s slits: Interference effects in the UV photodissociation ofhydrogen peroxide
A J Alexander
Department of Chemistry, University of Edinburgh, West Mains Road, Edinburgh, EH9 3JJ
Main contact email address: [email protected]

Lasers for Science Facility Programme - Chemistry
125 Central Laser Facility Annual Report 2001/2002
where ∆φ is the phase difference between the radial parts of theoutgoing rotational wavefunctions. In essence, what wemeasure is akin to a Young’s slit experiment, where the twopathways involve two different electronic states of themolecule. Equation 3 shows that we would expect a11+(||,⊥ ) togo to zero when β is purely || or purely ⊥ , and the amplitude canbe maximal when we have an equal mixture of || and ⊥transitions (β = 0.5). The trend for H2O2 shown in Figure 2 isin good qualitative agreement with Equation 3.
330 340 350 360 370
-0.04
0.00
0.04
0.08
0.12
0.16
H2O
2
Cl2
Orie
ntat
ion
a 11±
Photolysis wavelength / nm
Figure 2. Coherent orientation moment a11+(||,⊥ ) for OH(J=0.5)and a11−(||,⊥ ) for Cl(J = 0.5).
The most remarkable observation, however, is that the resultsare very similar to previous measurements of the orientation ofCl(2P1/2) atoms in the same wavelength region5). The results areshown for comparison in Figure 2. The orientation parameter
plotted for Cl atoms is the φββ ∆−+∝⊥− sin)2)(1()(||,a11 ,
which is dependent on the sine of the phase difference, ratherthan the cosine. Also, in comparing the plots in Figure 2, onemust take account of the differences in the β parameters foreach molecule: these are displaced with respect to wavelength,as shown in Figure 1.
The β parameter and orientation results for H2O2 and Cl2, andindeed for HOCl (not shown here) are all very similar. Wewould expect that a much greater degree of averaging overproduct pathways would be required to model the H2O2 resultsdue to the increased number of atoms. In spite of the implicitaveraging involved, the coherent electronic orientation ofOH(2Π) was measured. These effects are more general thanpreviously explored, and not limited to atomic products ofsimple diatomic species, as might first have been expected.
Acknowledgements
I wish to thank the Royal Society for a University ResearchFellowship, and Mark Brouard (Oxford Univeristy) and PetrosRakitzis (FORTH IESL) for helpful discussions. The loan of adye laser system from the Lasers for Science Facility of theRutherford Appleton Laboratory is gratefully acknowledged.
References
1. H Sato, Chem. Rev., 101 2687, (2001)
2. A J Alexander and R N Zare, Acc. Chem. Res., 33 199,(2000)
3. M Brouard, M T Martinez, C J Milne, J P Simons, Chem.Phys. Lett., 165 423 (1990)
4. P C Samartzis, B L G Bakker, T P Rakitzis, D H Parker, TN Kitsopoulos, J. Chem. Phys., 110 5201 (1999)
5. Z H Kim, A J Alexander, T P Rakitzis, S A Kandel, R NZare, Faraday Discuss., 113 27 (1999)
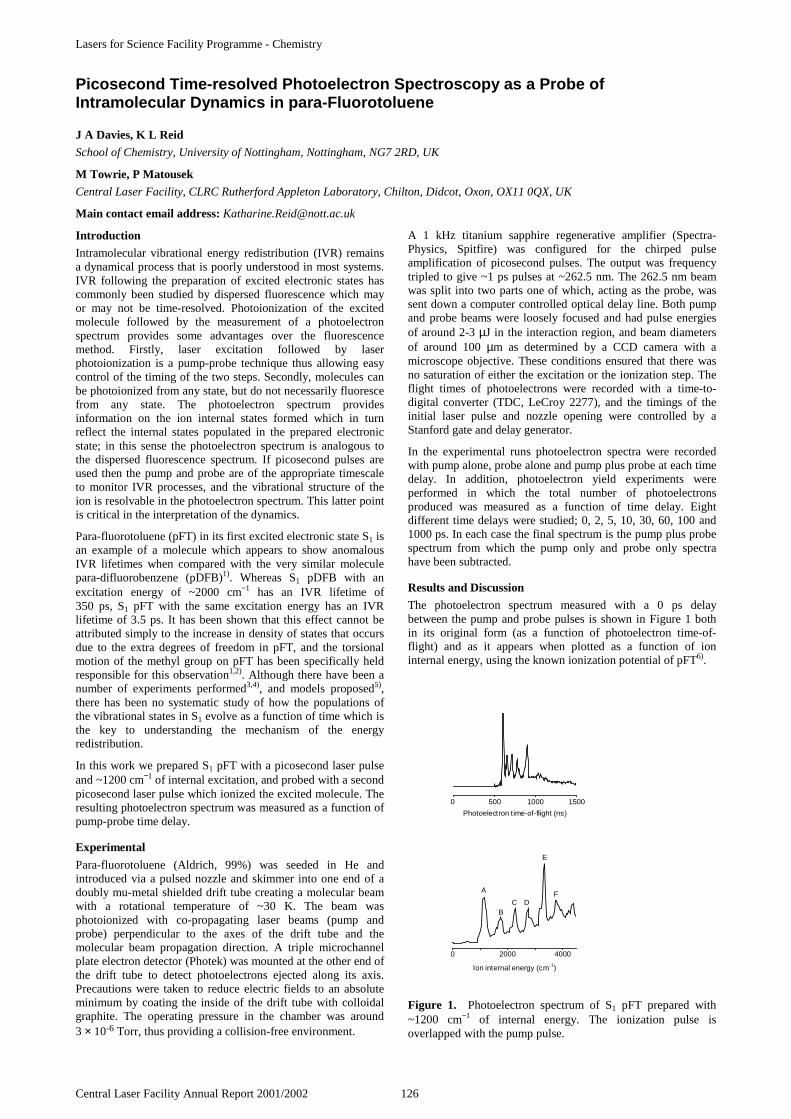
Lasers for Science Facility Programme - Chemistry
Central Laser Facility Annual Report 2001/2002 126
Introduction
Intramolecular vibrational energy redistribution (IVR) remainsa dynamical process that is poorly understood in most systems.IVR following the preparation of excited electronic states hascommonly been studied by dispersed fluorescence which mayor may not be time-resolved. Photoionization of the excitedmolecule followed by the measurement of a photoelectronspectrum provides some advantages over the fluorescencemethod. Firstly, laser excitation followed by laserphotoionization is a pump-probe technique thus allowing easycontrol of the timing of the two steps. Secondly, molecules canbe photoionized from any state, but do not necessarily fluorescefrom any state. The photoelectron spectrum providesinformation on the ion internal states formed which in turnreflect the internal states populated in the prepared electronicstate; in this sense the photoelectron spectrum is analogous tothe dispersed fluorescence spectrum. If picosecond pulses areused then the pump and probe are of the appropriate timescaleto monitor IVR processes, and the vibrational structure of theion is resolvable in the photoelectron spectrum. This latter pointis critical in the interpretation of the dynamics.
Para-fluorotoluene (pFT) in its first excited electronic state S1 isan example of a molecule which appears to show anomalousIVR lifetimes when compared with the very similar moleculepara-difluorobenzene (pDFB)1). Whereas S1 pDFB with anexcitation energy of ~2000 cm−1 has an IVR lifetime of350 ps, S1 pFT with the same excitation energy has an IVRlifetime of 3.5 ps. It has been shown that this effect cannot beattributed simply to the increase in density of states that occursdue to the extra degrees of freedom in pFT, and the torsionalmotion of the methyl group on pFT has been specifically heldresponsible for this observation1,2). Although there have been anumber of experiments performed3,4), and models proposed5),there has been no systematic study of how the populations ofthe vibrational states in S1 evolve as a function of time which isthe key to understanding the mechanism of the energyredistribution.
In this work we prepared S1 pFT with a picosecond laser pulseand ~1200 cm−1 of internal excitation, and probed with a secondpicosecond laser pulse which ionized the excited molecule. Theresulting photoelectron spectrum was measured as a function ofpump-probe time delay.
Experimental
Para-fluorotoluene (Aldrich, 99%) was seeded in He andintroduced via a pulsed nozzle and skimmer into one end of adoubly mu-metal shielded drift tube creating a molecular beamwith a rotational temperature of ~30 K. The beam wasphotoionized with co-propagating laser beams (pump andprobe) perpendicular to the axes of the drift tube and themolecular beam propagation direction. A triple microchannelplate electron detector (Photek) was mounted at the other end ofthe drift tube to detect photoelectrons ejected along its axis.Precautions were taken to reduce electric fields to an absoluteminimum by coating the inside of the drift tube with colloidalgraphite. The operating pressure in the chamber was around3 × 10-6 Torr, thus providing a collision-free environment.
A 1 kHz titanium sapphire regenerative amplifier (Spectra-Physics, Spitfire) was configured for the chirped pulseamplification of picosecond pulses. The output was frequencytripled to give ~1 ps pulses at ~262.5 nm. The 262.5 nm beamwas split into two parts one of which, acting as the probe, wassent down a computer controlled optical delay line. Both pumpand probe beams were loosely focused and had pulse energiesof around 2-3 µJ in the interaction region, and beam diametersof around 100 µm as determined by a CCD camera with amicroscope objective. These conditions ensured that there wasno saturation of either the excitation or the ionization step. Theflight times of photoelectrons were recorded with a time-to-digital converter (TDC, LeCroy 2277), and the timings of theinitial laser pulse and nozzle opening were controlled by aStanford gate and delay generator.
In the experimental runs photoelectron spectra were recordedwith pump alone, probe alone and pump plus probe at each timedelay. In addition, photoelectron yield experiments wereperformed in which the total number of photoelectronsproduced was measured as a function of time delay. Eightdifferent time delays were studied; 0, 2, 5, 10, 30, 60, 100 and1000 ps. In each case the final spectrum is the pump plus probespectrum from which the pump only and probe only spectrahave been subtracted.
Results and Discussion
The photoelectron spectrum measured with a 0 ps delaybetween the pump and probe pulses is shown in Figure 1 bothin its original form (as a function of photoelectron time-of-flight) and as it appears when plotted as a function of ioninternal energy, using the known ionization potential of pFT6).
0 2000 4000
F
E
DCB
A
Ion internal energy (cm−1)
0 500 1000 1500
Photoelectron time-of-flight (ns)
Figure 1. Photoelectron spectrum of S1 pFT prepared with~1200 cm−1 of internal energy. The ionization pulse isoverlapped with the pump pulse.
Picosecond Time-resolved Photoelectron Spectroscopy as a Probe ofIntramolecular Dynamics in para-Fluorotoluene
J A Davies, K L Reid
School of Chemistry, University of Nottingham, Nottingham, NG7 2RD, UK
M Towrie, P Matousek
Central Laser Facility, CLRC Rutherford Appleton Laboratory, Chilton, Didcot, Oxon, OX11 0QX, UK
Main contact email address: [email protected]

Lasers for Science Facility Programme - Chemistry
127 Central Laser Facility Annual Report 2001/2002
This photoelectron spectrum has never been recorded before toour knowledge, and neither are the ion vibrational frequenciesknown so that only a provisional assignment could be made.This was done partly by analogy with pDFB7), and with theknown excitation and dispersed fluorescence spectra of pFT3,8),and partly by assuming that the first small peak in Figure 1 isdue to 00 in the ion; work is in progress to analysephotoelectron spectra following the excitation of other levels inS1 with nanosecond laser pulses to confirm this assignment9).The provisional assignment appears in Table 110). The ionvibrational frequencies are compared with the correspondingfrequencies of the same modes in S1
8). There are discrepanciesin the literature over the numbering of the vibrational modes.We have followed strict Mulliken notation11) in which ν8 is theC-CH3 stretch (ν6 in Reference 12) and is the prepared mode inS1 at the experimental wavelength, and ν13 is a ring bend (ν11 inReference 12). The important point to note is that there is goodresolution of ion vibrational states in this spectrum; this wouldnot have been the case had the experiment been performed withfemtosecond pulses as is common for time-resolvedphotoelectron spectroscopy13).
Peak Position(cm−1)
Assignment S1 8)
(cm−1)
A 1151 81 1194
B 1756 ?
C 2280 82 2388
D 2723 82131 2796
E 3328 83 3582
F 3732 83131 3990
Table 1. Provisional assignment of peaks appearing in thephotoelectron spectrum in Figure 1.
Figure 2 shows photoelectron spectra for three time delays. It isclear that the vibrational structure deteriorates as the time delayincreases, as has also been observed in reported dispersedfluorescence spectra1,3). This loss of structure is caused by IVRand the data shown in Figure 2 is of sufficient quality for us toquantify the timescale of the redistribution process and followthe behaviour of the populations of individual ion vibrationalstates which in turn reflect populations in S1. We are currentlyworking on this quantitative analysis of the dynamics, and onmodelling the redistribution process10).
Conclusions
We have demonstrated that picosecond time-resolvedphotoelectron spectroscopy is a powerful tool with which tostudy intramolecular dynamics. We have measured the firstphotoelectron spectra of S1 para-fluorotoluene and shown thatthey evolve dramatically over a 100 ps timescale. Quantitativeanalysis of the dynamical behaviour of S1 pFT is in progressand will be published in due course.
Acknowledgements
We would like to thank Paul Hockett for his assistance in theassignment of the photoelectron spectrum.
0 2000 4000
Ion Internal Energy (cm−1)
Figure 2. Photoelectron spectra as a function of ion internalenergy as in Figure 1 but for three excitation-ionization timedelays; 5 ps (top), 30 ps (middle) and 60 ps (bottom).
References
1. C S Parmenter and B M Stone, J. Chem. Phys. 84, 4710(1986)
2. See, for example, D R Borst and D W Pratt, J. Chem.Phys. 113, 3658 (2000); Q Ju, C S Parmenter, T A Stoneand Z Q Zhao, Is. J. Chem. 37, 379 (1997)
3. See, for example, D B Moss and C S Parmenter, J. Chem.Phys. 98, 6897 (1993)
4. J S Baskin, T S Rose and A H Zewail, J. Chem. Phys. 88,1458 (1988)
5. See, for example, P J Timbers, C S Parmenter and D BMoss, J. Chem. Phys. 100, 1028 (1994); C C Martens andW P Reinhardt, J. Chem. Phys. 93, 5621 (1990)
6. K Takazawa, M Fujii and M Ito, J. Chem. Phys. 99, 3205(1993)
7. E Sekreta, K S Viswanathan and J P Reilly, J. Chem. Phys.90, 5349 (1989)
8. K Okuyama, N Mikami and M Ito, J. Phys. Chem. 89,5617 (1985)
9. S Bellm, P Whiteside, P Hockett and K L Reid, inpreparation
10. J A Davies, P Hockett, K L Reid, M Towrie and PMatousek, in preparation
11. R S Mulliken, J. Chem. Phys. 23, 1997 (1955); C GHickman, J R Gascooke and W D Lawrance, J. Chem.Phys. 104, 4887 (1996)
12. A A Jarzecki, E R Davidson, Q Ju and C S Parmenter, Int.J. Quant. Chem. 72, 249 (1999)
13. See, for example, D R Cyr and C C Hayden, J. Chem.Phys. 104, 771 (1996)

Lasers for Science Facility Programme - Chemistry
Central Laser Facility Annual Report 2001/2002 128
Introduction
Molecular ions are important species in a range of environmentsincluding weakly-ionised plasmas which encompass mostelectrical discharges, technological plasmas and the terrestrialand other planetary ionospheres. The modelling of ionconcentrations and optical emissions from these environmentsrequires a detailed knowledge of the kinetics of individualparticipating chemical reactions. In recent work,1) we havereported the use of a technique by which ions are formed byResonance Enhanced Multiphoton Ionisation (REMPI) andprobed by Laser Induced Fluorescence (LIF) to measure thekinetics of reactions involving the N2
+ ion. In those studies, weionised N2 molecules via the a 1Πg electronic state and probedLIF in the B 2Σu
+ - X 2Σg+ electronic band of N2
+. Using thisscheme, the ionisation step is rather inefficient whereas the LIFdetection is facile. We therefore wished to investigate theopposite case where the ionisation step is relatively facile andthe LIF detection rather more demanding. With these factors inmind, it was proposed to study the NO+ ion. This ion isimportant in weakly-ionised plasmas and is often regarded as a‘terminal’ ion owing to the low ionisation potential of NO.However, the scarcity of optical studies on the ion led Albrittonet al.2) to conclude ‘the NO+ ion has only grudgingly given upinformation about its structure’. For the proposed experiments,NO was to be ionised in the A 2Σ+, v'=0 - X 2Π , v"=0 electronicband. This ionisation is known to produce NO+ ions almostexclusively in the lowest vibrational state.3-5) It was envisagedthat NO+ ions would then be probed in theA1Π– X 1Σ+ electronic band by two photon LIF. It wasrecognised that these would be challenging experiments sincewe were unaware of any previous reports of the application ofthis technique to the NO+ ion.
Experimental
The experimental approach employed has been described indetail in a previous publication.1) For these experiments, nitricoxide was ionised using the unfocused output of a frequency-doubled Nd:YAG pumped dye laser operating at ~226 nm. TheNO+ ions so formed were to be probed by a second frequency-doubled Nd:YAG pumped dye laser (from the EPSRC LaserLoan pool) operating with a fundamental output in the505-525 nm range. LIF was detected through a lithium fluoridewindow using a solar blind photomultiplier tube (HamamatsuR1081) which has minimal sensitivity at wavelengths above230 nm.
Results
Although we had previously recorded ionisation spectra for NOin the A 2Σ+ - X 2Π electronic band, we encountered unforeseenproblems in achieving this during the initial stages of the loanperiod. In order to monitor excitation in this band we choseeither to record ion signals with a parallel plate electrode systemor detect LIF using a photomultiplier tube. For the latter, wecould use either single or two photon excitation. However,neither of these schemes resulted in the predicted spectra. Themain source of the problem was that, whilst intense spectralfeatures were observed using excitation at 220 nm (or 440 nmin the case of two photon LIF), spectra recorded at wavelengths~226 nm did not produce spectra which were immediatelyrecognisable as arising from NO (i.e. no discernible bandheads).As examples, Figure 1a shows a single photon LIF spectrumrecorded at wavelengths ~226nm and Figure 1b shows a twophoton LIF spectrum recorded at wavelengths ~440 nm. The
reason for these problems required extensive investigativework. When working with NO, purity is always of someconcern and, owing to the large absorption cross-sections fortransitions in the A 2Σ+, v'=0 - X 2Π , v"=0 band, the opticaldensity of samples requires careful consideration.
However, neither of these proved to be the source of ourproblems. Instead, it was found that the excitation laserfundamental output was shifted from the expected value by~16 nm. Whilst this would have been rather more obvious withother molecules, we were initially (mistakenly) drawn to theconclusion that we were recording spectra in theNO B2Π- X 2Π band. In fact, the spectrum of Figure 1brepresents transitions in the A 2Σ+, v'=0 - X 2Π , v"=0 bandwhilst those in Figure 1a at a recorded wavelength of ~226 nmarise from high rotational lines of the A 2Σ+, v'=0 - X 2Π , v"=1at an actual wavelength of ~234 nm.
Once this problem was rectified, we were able to record andassign NO spectra with confidence. We embarked upon ourtarget experiments by incorporating the second frequency-doubled dye laser system to probe NO+. Figure 2 shows asample spectrum recorded at a pressure of 100 mTorr and delayof 1µs between the ionisation and probe lasers. Thediscontinuities in Figure 2 (highlighted with asterisks) markpositions where the ionisation laser was blocked during thescan. Further investigation showed that the recorded spectrawere reliant upon the wavelength of the ionisation laser beingcoincident with a transition in the A 2Σ+ - X 2Π electronic band.The spectral coverage of Figure 2 is in the region of the A 1Π,v'=3 - X 1Σ+ , v"=0 vibronic band of NO+. It is immediatelyobvious from Figure 2 that only broad (LIF) spectral featureswere observed. This was rather puzzling since far narrower
REMPI-LIF studies of simple ion-molecule reactions
M J Frost, C R J Sharpe
Department of Chemistry, Heriot-Watt University, Riccarton, Edinburgh, EH14 4AS
Main contact email address: [email protected]
.0 438.5 439.0 439.5 440.0 440.5 441.0 441.5 442.0
Wavelength / nm
.6 225.8 226.0 226.2 226.4 226.6 226.8 227.0 227.2
(b)
(a)
Figure 1. Single photon (a) and two photon (b) LIFspectra of NO.

Lasers for Science Facility Programme - Chemistry
129 Central Laser Facility Annual Report 2001/2002
spectral features were expected. One consideration waswhether excitation via the W 1∆ state may have been leading tospectral complications but this seemed unlikely. Broad spectralfeatures were also observed in the regions ~263 and ~252 nm;the positions for the A 1Π, v’=2 - X 1Σ+ , v"=0 and A 1Π, v’=4 -X 1Σ+ , v"=0 vibronic bands, respectively. Again, afterextensive investigations we were led to conclude that the loanlaser was operating in a ‘broadband’ mode although it should benoted that the output bandwidth was sufficiently narrow toprovide efficient frequency-doubling.
Following a service visit, the problem with the laser wasrectified and the experiments repeated. This time, narrowspectral features were observed as shown in Figure 3. Again,these features required the pump laser to be on-resonance with atransition in the A 2Σ+, v'=0 - X 2Π , v"=0 electronic band ofNO.
Of particular note was the spectral congestion observed with noclearly-identifiable bandhead as expected in the NO+ spectrum.Further, these spectral features were evident without focusing ofthe LIF probe laser. We therefore concluded that these featuresdid not arise from NO+. We believe that these features arisefrom states populated following collisional relaxation of theintermediate A 2Σ+, v'=0 state. There are a number of importantpoints to note in this regard. First, the frequency of the secondlaser is such that the detected levels lie below the a 4Π state ofNO. Given the combination of pump and probe frequencies andknowing the ionisation potential of NO, leads us to concludethat the probed levels must correspond to the removal of at least(E/hc =) 8300 cm-1 from excited molecules. Therefore theselevels lie below v=19 of the NO X-state. However, theobserved transitions cannot be reliably assigned using theLIFBASE spectral simulation programme6) . An additionalpoint to note is that these spectral features have a range offluorescence lifetimes ranging from 10 ns or less, to hundredsof microseconds (see Figure 3). Whilst attempts were made todiscriminate against these spectral features and enhance anyNO+ LIF through use of focused radiation and short delay timesbetween ionisation and probe lasers, these were unsuccessfulduring the very limited time remaining in the loan period.
Conclusion
We have had a rather frustrating loan period and encountered anumber of problems which have ranged pretty much from thesublime to the ridiculous. Unfortunately, this left us with only ashort time to address the goal of this work. Our attempts tostudy the NO+ ion by a REMPI-LIF technique have beenunsuccessful owing to unexpected, intense fluorescence signalsfrom states populated in the collisional relaxation of theintermediate state used in the REMPI scheme. It is notunreasonable to believe that a suitable production and detectionscheme for the study of NO+ is possible but time constraints didnot allow an exploration of these.
References
1. M.J. Frost and C.R.J. Sharpe.,Phys. Chem. Chem. Phys., 3, 4536, (2001)
2. D.L. Albritton, A.L. Schmeltekopf and R.N. ZareJ. Chem. Phys., 71, 3271, (1979)
3. J.C. Miller and R.N. Compton,J. Chem. Phys., 84, 675, (1986)
4. K.S. Viswanathan, E. Sekreta and J.P. Reilly,J. Phys. Chem., 90, 5658, (1986)
5. D.C. Jacobs, R.J. Madix and R.N. Zare,J. Chem. Phys., 85, 5469, (1986)
6. J. Luque and D.R. Crosley,“LIFBASE : Database and Spectral Simulation Programme(Version 1.5)”SRI International Report MP99-009 (1999)
256.0 256.5 257.0 257.5 258.0 258.5 259.0 259.5 260.0
Wavelength / nm
Figure 2 . LIF spectrum recorded in the region of the NO+
A 1Π, v'=3 - X 1Σ+ , v"=0 band. (Asterisks denote positions atwhich the excitation laser was blocked).
* *
257.50 257.55 257.60 257.65 257.70 257.75 257.80
Wavelength / nm
Figure 3 . LIF spectra recorded following A 2Σ+,v'=0 - X 2Π , v"=0 excitation at 100 mTorr pressure of NO andwith a delay of 1µs between the excitation and LIF probe lasers.Spectra (a) and (b) were recorded with unfocused and focusedLIF probe beam radiation, respectively, and fluorescenceintegrated in a 200 ns interval with no delay. Spectrum (c) wasrecorded with unfocused LIF probe beam radiation andfluorescence integrated over a 130 ns gate, delayed by 70 nsfrom the LIF probe beam.
(a)
(b)
(c)

Lasers for Science Facility Programme - Chemistry
Central Laser Facility Annual Report 2001/2002 130
Luminescent lanthanide ions have long (µs to ms) luminescencelifetimes. This provides an easy means of differentiatingluminescence arising from lanthanide complexes fromfluorescence arising from organic molecules. This isparticularly useful when designing optical probes formicroscopy of living systems, where it is necessary todistinguish between signals arising from the probe and thosearising from background autofluorescence.
We have previously shown that lanthanide ions can be used intime gated imaging microscopy, and that lifetime maps can bederived from calculating the luminescence decay rate constantfor each pixel in an image.1) Our current interests in this areacentre on the application of these techniques.
Lanthanide complexes designed to recognize cells
Tuftsin is a bioactive tetrapeptide internalized by macrophages;it has been considered a suitable targeting vector for such celltypes,2) particularly as macrophages are found in highconcentrations around tumour cells and in areas ofinflammation. We have been investigating the attachment ofthis peptide sequence to lanthanide complexes with a view toproviding ‘smart’ imaging agents.
A simple tuftsin conjugate (1) was prepared by coupling of aDOTA derivative (2) to a protected tuftsin moiety via the lysineside chain as shown in Scheme 1, followed by subsequentdeprotection and complexation with Tb3+. The luminescenceproperties of the complex were characterized in solution in H2Oand D2O, and the luminescence lifetimes (1.71 ms and 2.58 msrespectively) were used to establish the inner sphere hydrationnumber (0.7).3) In all respects these corresponded to valuesexpected for an eight-coordinate terbium complex with a singlecoordinated water molecule, with principal emission maxima at480, 545 and 590 nm.
Initial imaging experiments were carried out on silica particles,following laser excitation by the third harmonic of a
neodymium:YAG laser (355nm). Time resolved images wereobtained by using a time gated image intensifier interposedbetween the microscope optics and the image intensifier, andsynchronized with the laser pulse. Images of a typical particleand a corresponding lifetime map are shown in Figure 1.
Studies on macrophage-like leukaemia cell lines were not sosuccessful. Active uptake of tuftsin conjugates has beenreported,2) but we could see no evidence for internalization ofthe macrophage complex in this case. There may be a numberof reasons for this: for instance, the highly polar complex maybe too close to the peptide, resulting in perturbation of theuptake pathway. Further studies are ongoing, and areconcentrating on variation of the point of attachment of thecomplex, and on the influence of incorporating spacer groupsinto the conjugate. We are also investigating the use of cell-surface receptor antagonists, which do not need to beinternalized by the cell before selective imaging becomespossible.
Luminescent lanthanides have sharp, quasi-atomic, emissionlines: this makes it possible to address more than one lanthanide
Time-resolved imaging with lanthanide complexes
R J Aarons, B P Burton-Pye, S Faulkner
Department of Chemistry, University of Manchester, Oxford Road, Manchester, M13 9PL
S W Botchway, A W Parker, S Topley
Central Laser Facility, CLRC Rutherford Appleton Laboratory, Chilton, Didcot, Oxon, OX11 0QX, UK
A Beeby
Department of Chemistry, University of Durham, South Road, Durham, DH1 3LE
J S Snaith, A Ashraf, J Notta
School of Chemical Sciences, University of Birmingham, Edgbaston, Birmingham, B15 2TT
Main contact email address: [email protected]
NN
N N
H H
HH
NN
N N
OBn
O
OButO
ButO
O
ButOO
NN
N N
OH
O
OButOButO
O
ButOO
i) Peptide coupling and deprotectionii) TbCl3,MeOH
N
N N
N
NO
O
O
OO
O
O
H
HN
O
H2N
N
O
HN
O
OHO
NH
H2N
HN
OH
Tb3+
H2, Pd/C
i) BrCH2CO2But, MeCN, 298Kii) BrCH2CO2Bn DMF, 373K
Scheme 1. Synthesis of a tuftsin conjugate.
Figure 1. Visible image (left) and lifetime image of a silicaparticle labelled with the tuftsinconjugate.
Parallel addressing of lanthanide complexes
NN
N N
OH
O
OHO
HO
O
HOO
NN
N N
NHMe
O
NHMeO
MeHN
O
MeHNO
N
N
N
N
N NN N
4
5
6
HNN
N N
OHO
HO
O
HOO
3

Lasers for Science Facility Programme - Chemistry
131 Central Laser Facility Annual Report 2001/2002
complex at once. Such parallel addressing is potentiallyimportant in speeding up the drug discovery process, since itoffers the potential of carrying out several assayssimultaneously.4) It also offers potential for encodingapplications in the security industry, since lanthanide complexescan be used to form an alphabet based on the wavelengths oftheir luminescence and the associated luminescence lifetime.
With a view to demonstrating the potential of paralleladdressing in imaging applications, we carried out a study on arange of lanthanide complexes using the experimental set-updescribed above. A series of particles were doped with a rangeof lanthanide complexes (e.g. Ln.3-6), and time-gated imagesand lifetime maps were obtained for mixtures of the particles.5)
Figure 2 shows a white light image obtained for a mixture ofTb.3 and Tb.4, which have different luminescence lifetimes.Lifetime mapping allows the particles to be identified withoutdifficulty.
Similarly, interference filters can be used to separate the signalsfrom different lanthanide ions. For instance, Eu3+ has principalemission bands at 595, 620 and 690 nm, while those of Tb3+ arefound at 480, 545 and 590 nm, with a weaker band around620 nm. Thus interference filters can be used to view individualmetals by concentrating on non-overlapping bands.
The images in Figure 3 show a pair of particles, one of which islabelled with Tb.5 while the other is labelled with Eu.6. When a545 ± 25nm interference filter is used, only the Tb.5 labelledparticle is visible, and it can be addressed alone. Similarly,when a 700±25 nm interference filter is used, only the particlelabelled with Eu.6 is visible.
We are currently developing methods for linking chromophoressuch as these to a solid support, with a view to developing thetechnique further.
References
1. A Beeby, I M Clarkson, S Faulkner, S Botchway, D Parkerand A W ParkerJ. Photochem. Photobiol. B Biol, (2000), 57, 83.
2. A A Amascato Ann. NY Acad. Sci. 1983, 419, 114
3. R J Aarons, A Ashraf, B P Burton-Pye, J Notta, J S Snaithand S Faulkner, manuscript in preparation
4. S Faulkner, D Parker and J A G Williams, Chapter 4 in‘Supramolecular Science, Where it is and where it isgoing’, eds. R Ungaro and E Dalcanale, Kluwer, 1999.
5. R J Aarons, A Beeby, S W Botchway, B P Burton-Pye, AW Parker, S Topley and S Faulkner, manuscript inpreparation.
Figure 2. Visible image and lifetime map of silicaparticles labelled with Tb.3 (right hand particle) and Tb.4(left hand particle).
Figure 3. Images of silica particle labelled with Tb.5 andEu.6: visible image (left), time-gated image using a 545nminterference filter (centre), time-gated image with a 700nminterference filter (right).

Lasers for Science Facility Programme - Biology
Central Laser Facility Annual Report 2001/2002 132
Introduction
As part of a larger study employing technologies developed atthe CLF to study inter- and intra-cellular dynamics, we havebeen studying the effects of laser plasma generated soft x-rayson gap junctional intercellular communication (GJIC) inmammalian cells, and the associated ‘bystander’ effect. Insummary, our data demonstrate that exposure of cells to softx-rays significantly reduces GJIC in a dose dependent manner.Furthermore, through the development of advanced maskingand micropositioning techniques, we have been able todemonstrate inhibition of GJIC in ‘bystander’ cells, which arenot directly exposed but are in contact with target cells.
Gap Junctional Intercellular Communication
Gap junctions are organelles that form between mammaliancells, creating a pore that allows cytoplasmic continuity. Thebasic unit of a gap junction is the connexin protein and to dateat least 14 mammalian connexins have been characterized.Connexins are comprised of four transmembrane domains, anintracellular loop, intracellular amino- and carboxy-termini, andtwo extracellular loops. Connexins join to form a hexamerknown as a connexon: this is a hemichannel, that is, one half ofa gap junction (Figure 1a). Connexons are transported to the
cell membrane, where the extracellular loops dock with theextracellular loops of connexins on neighbouring cells to form agap junction (Figure 1b). Once assembled, gap junctions allowthe passage by diffusion of molecules of less than 1 kDa in sizebetween cells. Since these molecules include cell messengers,gap junctions are important for control of cellular functionacross a population of contacting cells.
Rat liver epithelial cells, cell line WB-F344, provide an idealsubject for our studies as they form confluent monolayers ofcells that readily communicate via connexin43 gap junctions.Initially it was planned to assess the effects of soft x-rays onGJIC by means of microinjection. However, the incidence of
low frequency vibrations hindered our progress, asmicroinjection requires a very stable environment. Thus, analternative approach was required: this took the form of theGapFRAP assay1) (fluorescence redistribution afterphotobleaching via gap junctions). Cells were incubated withthe fluorescent dye carboxyfluorescein diacetate (CFDA),following which they were washed in phosphate buffered saline(PBS) and placed in fresh culture medium. CFDA is taken upinto cells, and converted into a fluorescent by-product that ismembrane impermeable but able to pass from cell to cell viagap junctions. Dishes of cells were observed under the confocalmicroscope (BioRad MRC 500) and excited with the 488 nmline of an argon:ion laser, and an image, ‘prebleach’, wasrecorded. Using the zoom function on the confocal microscope,a single cell was selected, and five passes of the argon:ion laser,operating at full power (<1 mW at the microscope stage),bleached the dye in this cell. The microscope was returned tothe previous configuration, and an image, ‘postbleach’, wascaptured. At four minutes post-bleaching a final image wascaptured, and the degree of redistribution of fluorescence intothe photobleached cell was determined using the ScionImagecomputer program. Redistribution of fluorescence was clearlyobserved (Figure 2). When cells were incubated with the GJICinhibitor 18αGlycyrrhetinic Acid, this redistribution offluorescence was reduced to 30.6 ±4.5 %, which was shown tobe significant (P<0.001).
Gap junctions have been implicated in the spread of damagefrom cell to cell, and it has been suggested that cell-celluncoupling by means of closing gap junctions could prevent thespread of such damaging molecules2). The spread of damagefrom exposed to unexposed cells has been termed the‘bystander’ effect and is of great interest in radiobiology. It hasbeen shown that when cells are exposed to low doses ofα-particles, stress responses (micronucleus formation, p53phosphorylation) are observed in more cells than predicted tohave been exposed at the dose used (0.3 cGy)3). In the presenceof a gap junction inhibitor (lindane), the number of cellsshowing stress responses was significantly reduced3). At higher
Exposure of mammalian cells to soft x-rays: effects on gap junctional intercellularcommunication and its implications for the study of the radiation-induced‘bystander’ effect
G O Edwards, R A Meldrum, C W Wharton, J K Chipman
School of Biosciences, The University of Birmingham, Edgbaston, Birmingham, B15 2TT
S W Botchway, G J Hirst, W Shaikh, A J Bodey, S Topley
Central Laser Facility, CLRC Rutherford Appleton Laboratory, Chilton, Didcot, Oxon, OX11 0QX, UK
Main contact email address: [email protected]
Connexin Connexon
A
Cell 1
Cell 2
Passage of molecules
B
Connexon
Gap Junction
Connexin Connexon
A
Connexin Connexon
A
Cell 1
Cell 2
Passage of molecules
B
Connexon
Gap Junction
Cell 1
Cell 2
Passage of molecules
B
Connexon
Gap Junction
Figure 1. Structure of a gap junction. A: the connexon(hemichannel), formed from six connexins. B: Asingle junction, formed when hemichannels onadjacent cells dock.
Untreated 18αGA
Prebleach
Postbleach
+4 min
Figure 2. Images of untreated WB-F344 cells and cellstreated with the gap junction blocker 18αGlycyrrhetinicAcid, demonstrating the GapFRAP technique Assessmentof GJIC .

Lasers for Science Facility Programme - Biology
133 Central Laser Facility Annual Report 2001/2002
doses, death of unexposed cells in contact with exposed cellshas been observed4). Such experiments are useful in that theycan demonstrate that exposure to ionizing radiation results instress responses in more cells than have been irradiated.
Exposure of cells to soft x-rays
The laser plasma generated x-ray source at the CLF producesCu x-rays that are of sufficiently low energy and penetration(1.1 keV) to affect only the cells that are exposed. Theproduction of such x-rays has been outlined elsewhere, but insummary, a high power pulsed UV laser is focused onto amoving copper target within a vacuum, thus generating aplasma4). X-rays are given off from the plasma at a rate of up to3 Gy s-1, and are passed through a 3 µm aluminium filter, whichis opaque to UV. In order to collimate the x-ray source, 25 µmand 100 µm slits of length 3 mm were machined in a disk ofstainless steel, 13 µm in thickness. Previous work hasdemonstrated that illumination through the 25 µm slit producesa sharp-edged pattern of irradiation 25 µm wide4, 5).
Irradiation of discrete regions of cells was determined byexposure of a radiochromic material, Gaffchromic film, glued tothe base of a cell culture dish. Culture dishes were constructedfrom 35 mm diameter glass rings fitted with 1 µm Hostaphanbases. Cells were cultured in a dish, and stained with afluorescent dye. The dish was then placed onto the x-ray source,and exposed to 100 Gy soft x-rays. An image of the 100 µm slitwas clearly visible on the Gaffchromic film (Figure 3a). Theconfocal was then used to capture an image of cells growing atthe same position, and when the two images were combined itcould be seen that the configuration of the equipmentsuccessfully allowed us to irradiate very distinct regions of cells(Figure 3b).
Figure 3. A: Image of soft x-rays collimated through 100 µmslit, developed using Gaffchromic film attached to the base of acell growth chamber. B: Image of the same slit, superimposedwith image of fluorescently labeled WB-F344 cells growing inthe chamber the Gaffchromic film was attached to.
Effects of soft x-rays on GJIC
In order to determine the effects of soft x-rays on GJIC, cellswere loaded with CFDA and exposed to doses of 1, 3 and 5 Gysoft x-rays. GapFRAP was carried out to determine the degreeof communication that could be observed. Irradiation reducedcommunication in a dose-dependent manner (Figure 4).Exposure of cells to 1 Gy reduced communication to82.8 ±7.1 % (P=0.057) of communication in untreated cells,3 Gy to 54.5 ±5.5 % (P<0.01) and 5 Gy to 24.0 ±5.4 %(P<0.001).
To elucidate the mechanism behind this reduction incommunication, a biochemical technique known as westernblotting was carried out. Western blotting involves isolatingproteins from a sample of cells, separating them byelectrophoresis, transferring them to a membrane, and detectingspecific proteins using specific antibodies.
Gap junction closure involves the connexin becoming‘hyperphosphorylated’, which can be detected by alteredelectrophoretic mobility as observed on a western blot. Entiredishes of WB-F344 cells were exposed to 5 Gy soft x-rays, andtotal protein was isolated. A 15 µg aliquot of this sample wasanalysed, along with samples of protein from untreated cellsand cells that had been treated with the gap junction inhibitorTPA (previously demonstrated 6) to inhibit GJIC by means ofhyperphosphorylation of connexin43). When compared tountreated cells, cells treated with TPA and cells exposed to5 Gy soft x-rays showed hyperphosphorylation of connexin43(data not shown).
Figure 5. Images of the micropositioners from the x-ray sourceand the stage of the confocal microscope, and (upside down) thecell growth chamber holder. Coloured circles indicatetriangulation points for one position of irradiation.
Effects of soft x-rays on ‘bystander’ cells
Once the effect of soft x-rays on GJIC in directly illuminatedcells had been assessed, it became desirable to assess the effectsof soft x-rays on indirectly irradiated, ‘bystander’ cells. To dothis, a highly precise relocation micropositioning system wasdeveloped, so that we could target cells that had been directlyirradiated and distinguish them from cells that had not beendirectly irradiated and determine the spatial relationshipsbetween such areas. The x-ray source and the confocal stagewere modified by the addition of a series of recesses, allowing aclamp that held the cell culture dish to be positioned by meansof triangulation between three points (Figure 5). The stage onthe confocal microscope was controlled by a computer runningan ‘in-house’ computer program (programmed onLabVIEW™). Six regions of illumination were defined,detected on Gaffchromic film, and the confocal stage was
1 0 0 µ m 1 0 0 µ m
A B
1 0 0 µ m1 0 0 µ m 1 0 0 µ m1 0 0 µ m
A B
0
20
40
60
80
100
120
Treatment
% C
omm
unic
atio
n Un
18aGA
1 Gy
3 Gy
5 Gy
Figure 4. Graph representing % communication in directlyexposed cells. Error bars represent standard error of themean.

Lasers for Science Facility Programme - Biology
Central Laser Facility Annual Report 2001/2002 134
calibrated using this so that the computer could send the stageto an exact region of illumination. By doing this, it was possibleto reposition the stage to investigate cells a known distancefrom the illuminated region.
GapFRAP was carried out on cells exposed to soft x-rays(1, 3 and 5 Gy) through the 100 µm slit. Samples weretransferred to the confocal microscope, and themicropositioning system allowed us to initially locate theirradiated region of cells, and then move to a positionapproximately 100 µm (ca. 4-5 cells) away from this region,where cells were unirradiated. Results obtained (Figure 6)demonstrate inhibition of GJIC: 1 Gy reduced redistribution offluorescence to 78.9 ±5.9 % (P<0.05), and 3 and 5 Gy reducedredistribution of fluorescence to 59.3 ±5.1 % (P<0.01) and69.0 ±10.0 % (P<0.01), respectively. Thus, communication inbystander cells is reduced by exposure to soft x-rays. However,when we compare the redistribution of fluorescence in cellsdirectly exposed to 5 Gy to bystander cells where target cellswere exposed to 5 Gy, a large difference in communication wasobserved (24.0 ±5.4% compared to 69.0 ±10.0%).
0
20
40
60
80
100
120
Treatment
% C
omm
unic
atio
n Un
18aGA
1 Gy
3 Gy
5 Gy
Figure 6. Graph representing % communication in bystandercells. Error bars represent standard error of the mean.
Conclusions
a. We have developed techniques to allow illumination offinely defined regions of a population of cells with softx-rays.
b. Exposure of cells to soft x-rays reduces GJIC in a dose-dependent manner, which is associated withhyperphosphorylation of connexin43.
c. By employing an identical micropositioning system on thex-ray source and confocal microscope stage, and incombination with precise computer-control of the stage, weare able to select regions of cells that have not been directlyirradiated for analysis.
d. This technological development has allowed us to begin tostudy the bystander effect with excellent spatial clarity, andwe can demonstrate that soft x-rays have an inhibitoryeffect on GJIC in unexposed ‘bystander’ cells neighbouringirradiated cells.
e. Although very low doses of exposure may elicit stressresponses in bystander cells, a slight increase in dose caninhibit GJIC and it can be postulated that this would preventthe spread of toxic molecules to bystander cells.
References
1. M L Cotrina, J H C Lin, A Alaves-Rodrigues, S Liu, J Li,H Azmi-Ghadimi, J Kang, CCG Naus and M NedergaardProc Natl Acad Sci USA 95, 15735 (1998)
2. C Peracchia, X G Wang and L L PeracchiaMethods 20, 188 (2000)
3. EI Azzam, S M de Toledo and J B LittleProc Natl Acad Sci USA 98, 473 (2001)
4. R A Meldrum, G O Edwards, J K Chipman, C W Wharton,S W Botchway, G J Hirst and W ShaikhCLF Annual Report 2000/2001, RAL-TR-2001-030,117(2001)
5. R A Meldrum, G O Edwards, J K Chipman, C W Wharton,S W Botchway, G J Hirst and W ShaikhInternational Congress Series 1236, 289 (2002)
6. P Ren, P P Mehta and RJ RuchCarcinogenesis 19, 169 (1998)

Lasers for Science Facility Programme - Biology
135 Central Laser Facility Annual Report 2001/2002
Introduction
Investigations have been undertaken in an attempt to identifythe species responsible for the unusual “hyperluminescence” of5-hydroxyindoles. On intense illumination with near-infraredfemtosecond laser pulses, hyperluminescence, with λmax ca.500 nm, from these compounds is observed at considerablylonger wavelength than normal fluorescence (λmax 340 nm)excited with one photon ultraviolet excitation 1,2). Experimentshave been undertaken in the Nanosecond Laboratory to studycombined ultraviolet and visible excitation, whilst in theConfocal Microscope Laboratory the Ti:sapphire laser has beenused to characterize the hyperluminescence arising from nearinfrared multiphoton excitation of 5-hydroxytryptophan.
The 5-hydroxyindole structure is of interest from a biochemicalviewpoint because it is part of the serotonin(5-hydroxytryptamine, an important neurotransmitter) andbecause substitution of tryptophan by 5-hydroxytryptophanwithin specific proteins has been used to study theirintracellular localization 3). Near-infrared three-photonexcitation of the ultraviolet fluorescence of serotonin has beenused to image its distribution within live cells 4). Differences inmultiphoton excitation spectra allow some discriminationbetween the ultraviolet fluorescence of serotonin andbackground luminescence. Further opportunity to selectivelyobserve serotonin and related molecules arises from thehyperluminescence emission maximum at 500 nm 1,2) which isat longer wavelength than the fluorescence emission of manycellular components. The overall process leading tohyperluminescence has been resolved into a four-photon step inwhich an unknown transient species is produced, followed bytwo-photon excitation of the intermediate 1).
Results and Discussion
Figure 1 shows the luminescence observed on excitation of aneutral aqueous solution of 5-hydroxytryptophan with ananosecond UV (308 nm) laser pulse, followed by probing witha 430 nm laser pulse to excite fluorescence from aphotochemical product. The results show that maximumluminescence is observed when the probe laser pulse is delayedby between 10 and 100 µs. The intensity of the emission wasquenched by about 20% in oxygen-saturated solution, comparedwith deaerated solutions.
Figure 2 shows that the emission spectrum, with a maximum at500 nm, measured with dual wavelength nanosecond laserexcitation coincides almost exactly with that observed onmultiphoton excitation employing a Ti:sapphire laser(120 fs, ca. 720-800 nm). The small discrepancy between thespectra may be a result of considerable correction factorsapplied to the data as a result of the very different spectralresponse of the detectors (photomultiplier and CCD array) usedfor the two measurements. The excitation spectrum of thehyperluminescence was also measured using the tunability ofthe Ti:sapphire laser. The results show an excitation peak at740 nm. The power dependence at this wavelength has not yetbeen determined.
The identity of the species producing hyperluminescence isunknown, but one possibility that has been suggested is the5-indoxyl radical produced by one-electron oxidation of5-hydroxytryptophan through photoionisation 1). This process isknown to occur in alkali solution at 248 nm 5). On laser flashphotolysis (308 nm) of 5-hydroxytryptophan in neutral solution,we have observed formation of a species with an absorptionspectrum, λmax 410 nm, very similar to that of the 5-indoxylradical 6). However in the laser flash photolysis experimentsthis transient is only partially quenched by ascorbate.Complementary pulse radiolysis studies undertaken at the FreeRadical Research Facility at the Daresbury Laboratory(FRRF@DL) confirm that the 5-indoxyl radical is completelyreduced by ascorbate with a second order rate constant of ca.
Investigation of ‘Hyperluminescence’ produced by Multiphoton Excitation of5-Hydroxytryptophan
R H Bisby, D Tobin
BioSciences Research Institute, University of Salford, Salford, M5 4WT
S Botchway, I Clark, A W Parker
Central Laser Facility,CLRC Rutherford Appleton Laboratory, Chilton, Didcot, Oxon., OX11 0QX, UK
Main contact email address: [email protected]
0
50000
100000
150000
200000
250000
420 440 460 480 500 520 540 560 580 600 620
Wavelength (nm)
Inte
nsit
y (A
rbit
ary
Uni
ts)
a
b
c
d
e
Figure 1. Emission spectra recorded on excitation of5-hydroxytryptophan in neutral solution with nanosecond laserpulses – a) probe (430 nm) pulse only; b) pump pulse (308 nm)only. The remaining curves show spectra with both lasers andwith the probe pulse delayed by c) 10 ns; d) 1 µs and e) 100 µs.
02468
101214161820
400 500 600 700 800 900
Wavelength((
nm)
Rel
ativ
e em
issi
onin
tens
ity
Figure 2. Multiphoton infrared excitation spectrum ( and emission spectra from nanosecond experiment(dashed line) and from multiphotophotoninfraredexcitation (O) for hyperluminescence from5-hydroxytryptophan.
Wavelength (nm)
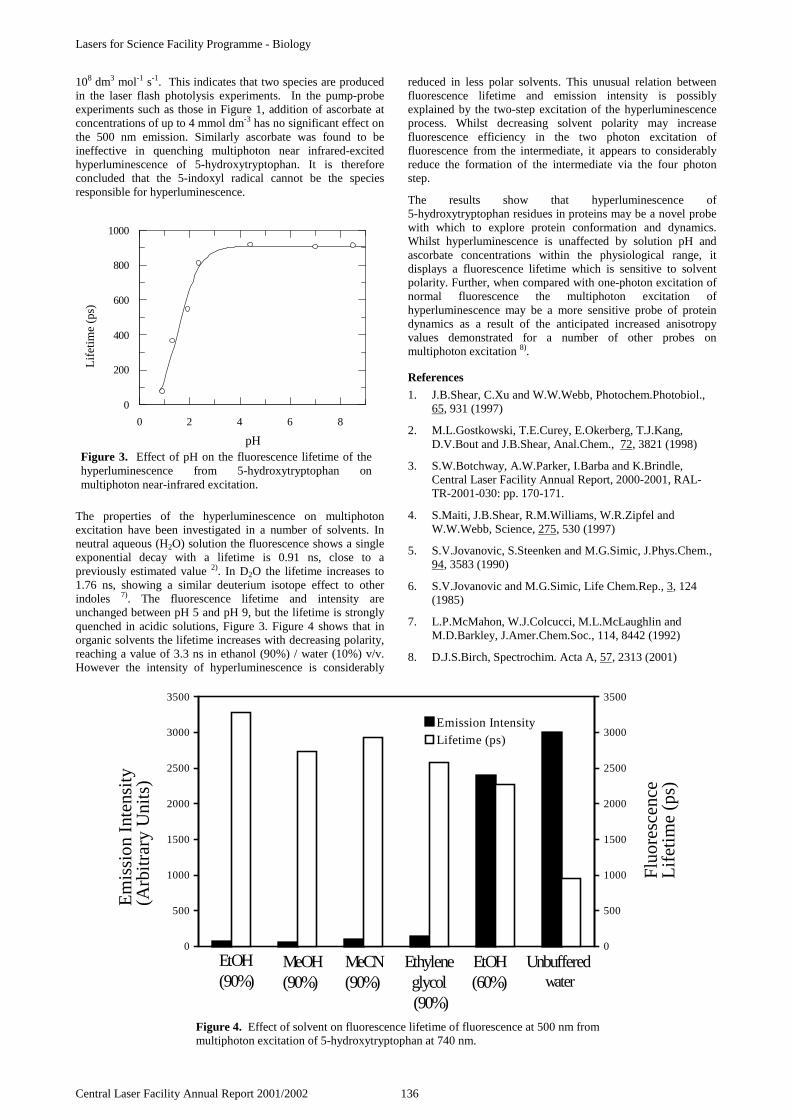
Lasers for Science Facility Programme - Biology
Central Laser Facility Annual Report 2001/2002 136
108 dm3 mol-1 s-1. This indicates that two species are producedin the laser flash photolysis experiments. In the pump-probeexperiments such as those in Figure 1, addition of ascorbate atconcentrations of up to 4 mmol dm-3 has no significant effect onthe 500 nm emission. Similarly ascorbate was found to beineffective in quenching multiphoton near infrared-excitedhyperluminescence of 5-hydroxytryptophan. It is thereforeconcluded that the 5-indoxyl radical cannot be the speciesresponsible for hyperluminescence.
The properties of the hyperluminescence on multiphotonexcitation have been investigated in a number of solvents. Inneutral aqueous (H2O) solution the fluorescence shows a singleexponential decay with a lifetime is 0.91 ns, close to apreviously estimated value 2). In D2O the lifetime increases to1.76 ns, showing a similar deuterium isotope effect to otherindoles 7). The fluorescence lifetime and intensity areunchanged between pH 5 and pH 9, but the lifetime is stronglyquenched in acidic solutions, Figure 3. Figure 4 shows that inorganic solvents the lifetime increases with decreasing polarity,reaching a value of 3.3 ns in ethanol (90%) / water (10%) v/v.However the intensity of hyperluminescence is considerably
reduced in less polar solvents. This unusual relation betweenfluorescence lifetime and emission intensity is possiblyexplained by the two-step excitation of the hyperluminescenceprocess. Whilst decreasing solvent polarity may increasefluorescence efficiency in the two photon excitation offluorescence from the intermediate, it appears to considerablyreduce the formation of the intermediate via the four photonstep.
The results show that hyperluminescence of5-hydroxytryptophan residues in proteins may be a novel probewith which to explore protein conformation and dynamics.Whilst hyperluminescence is unaffected by solution pH andascorbate concentrations within the physiological range, itdisplays a fluorescence lifetime which is sensitive to solventpolarity. Further, when compared with one-photon excitation ofnormal fluorescence the multiphoton excitation ofhyperluminescence may be a more sensitive probe of proteindynamics as a result of the anticipated increased anisotropyvalues demonstrated for a number of other probes onmultiphoton excitation 8).
References
1. J.B.Shear, C.Xu and W.W.Webb, Photochem.Photobiol.,65, 931 (1997)
2. M.L.Gostkowski, T.E.Curey, E.Okerberg, T.J.Kang,D.V.Bout and J.B.Shear, Anal.Chem., 72, 3821 (1998)
3. S.W.Botchway, A.W.Parker, I.Barba and K.Brindle,Central Laser Facility Annual Report, 2000-2001, RAL-TR-2001-030: pp. 170-171.
4. S.Maiti, J.B.Shear, R.M.Williams, W.R.Zipfel andW.W.Webb, Science, 275, 530 (1997)
5. S.V.Jovanovic, S.Steenken and M.G.Simic, J.Phys.Chem.,94, 3583 (1990)
6. S.V.Jovanovic and M.G.Simic, Life Chem.Rep., 3, 124(1985)
7. L.P.McMahon, W.J.Colcucci, M.L.McLaughlin andM.D.Barkley, J.Amer.Chem.Soc., 114, 8442 (1992)
8. D.J.S.Birch, Spectrochim. Acta A, 57, 2313 (2001)
86420
1000
800
600
400
200
0
pH
Lif
etim
e (p
s)
Figure 3. Effect of pH on the fluorescence lifetime of thehyperluminescence from 5-hydroxytryptophan onmultiphoton near-infrared excitation.
Lif
etim
e (p
s)
0
500
1000
1500
2000
2500
3000
3500
0
500
1000
1500
2000
2500
3000
3500
Emission IntensityLifetime (ps)
Em
issi
on I
nten
sity
(Arb
itra
ry U
nits
)
Fluo
resc
ence
Lif
etim
e (p
s)
SOLVENT
Unbuffered water
EtOH(60%)
Ethyleneglycol (90%)
MeCN(90%)
MeOH(90%)
EtOH(90%)
Figure 4. Effect of solvent on fluorescence lifetime of fluorescence at 500 nm frommultiphoton excitation of 5-hydroxytryptophan at 740 nm.

Lasers for Science Facility Programme - Biology
137 Central Laser Facility Annual Report 2001/2002
Introduction
Adenoviruses (Ads) are infectious virions of significant interestin gene therapy, mainly due to their many advantages as vectorsfor gene delivery. These advantages include very high titers,their ability to infect both dividing and quiescent cells of manytypes, and their availability as replication-deficient particles thatcan carry large DNA insets (for a review see Reference 1).
Ads are non-enveloped, double-stranded DNA viruses, about90 nm in diameter, and are commonly sub-divided intoserotypes based on their ability to induce specific neutralisingantibodies2). For subgroup C Ads, which includes the mostextensively studied serotypes 2 (Ad2) and 5 (Ad5), the primaryreceptor is the 46 kDa transmembrane Coxsackie-Adenovirusreceptor (CAR)4).
To deliver their genome into the cell nucleus Ads need totransverse three formidable cell barriers, the plasma,endosomal, and nuclear membranes, and in order to achieve thisthey must highjack the machinery that cells have developed forprotein and nucleic acid trafficking. The first interaction of thefibre with the host-cell through CAR is followed by theinteraction between the Ad’s penton-base with cellular αvβ3and αvβ5 vitronectin-binding integrins5). Then bound Ads arerapidly endocytosed into clathrin-coated vesicles via a processregulated by lipid kinases, actin-modulating small GTPases, anddynamin5). From endosomes the fibre-less Ad particles aresomehow able to break the membrane of the surroundingendosome and escape into the cytosol via a poorly understoodpH-dependent mechanism5). Once in the cytosol Ads usemicrotubules and microtubule-depending motors to betransported to the nuclear membrane, where they bind nuclearpore complexes and ultimately make use of the cell nucleus as asite for replication6).
Understanding the mechanism by which internalised Adsescape from acidified endocytic vesicles is important todetermine the strategy used by these viruses for efficienttranslocation of viral DNA, a key requirement for efficient Ad-mediated gene transfer1). To shed some light in this process wehave carried out fluorescence lifetime imaging measurementson live Ad5 labelled with a pH-sensitive fluorescein tag as theyenter CHO-CAR cells. These cells overexpress the CARreceptor to a level of a few hundred molecules per cell, andtherefore have an increased sensitivity for the virus7). Here wepresent preliminary data obtained at the CLF showing thepotential of the method to image pH-dependent viral traffickingprocess in cells.
Results
We have used 2-photon laser excitation and the confocalmicroscopy facilities at the CLF to determine the localisation offluorescein-labelled Ad5 particles during entry in CHO-CARcells (Figure 1) at the same time as we recorded thefluorescence decay profile of individual virus particles on apixel-by-pixel basis. The fluorescence decay of the fluoresceinprobe is pH-sensitive, and can therefore report on the degree ofacidification of the environment surrounding the internalisedAd5 particles. Figure 2 shows a fluorescence image of singleAd5 particles bound to the plasma membrane of CHO-CARcells recorded using a CW Ar+ laser and the BioRAD confocal
microscope facility at the CLF. We used these data to check thedegree of Ad5 labelling in the samples and select a plane offocus.
A pulsed Ti:Sa laser was used in conjunction with a Becker &Hickel card (SPC-700 time-correlated single photon countingimaging Module) to collect the fluorescence decay of individualfluorescein-labelled virus particles for each pixel. Virus bindingto cells is temperature-independent; consequently, by coolingthe cells, the attachment step can be experimentally separatedfrom penetration, which only occurs at temperatures above37°C 5).
Figure 1. Transmission image of CHO-CAR cells beforeexposure to Ad5 particles. The cells are approximately 20 µm indiameter.
Figure 2. Fluorescence confocal image of fluorescein-labelledAd5 particles bound to CHO-CAR cells at 4oC. The smallerspots show individual virus particles labelled with about 1000fluorescein molecules.
Labelled Ad5 were also imaged using 2-photon pulsedexcitation (Figure 3). The corresponding fluorescence lifetimeimage map showing the average lifetime of fluorescence decaydata taken 10 minutes after raising the temperature to 37oC isshown in Figure 4.
Following Adenovirus Entry in Living Cells by Fluorescence Lifetime Microscopy
M L Martin-Fernandez, M J Tobin, S V Jones, G R Jones
Synchrotron Radiation Department, CLRC Daresbury Laboratory, Daresbury, Warrington, Cheshire, WA4 4AS
S W Botchway
Central Laser Facility, CLRC Rutherford Appleton Laboratory, Chilton, Didcot, Oxon, OX11 0QX, UK
Main contact email address: [email protected]

Lasers for Science Facility Programme - Biology
Central Laser Facility Annual Report 2001/2002 138
Figure 3. 2-photon fluorescence image of fluorescein-labeledAd5 particles bound to CHO-CAR cells collected about tenminutes after raising the sample temperature from 4oC to 37oC.
Figure 4. Fluorescence lifetime image map showing differentdegrees of environment acidification around internalised Ad5particles. The colour coding indicates shorter fluorescencelifetime values (red = more acidic) and longer fluorescencelifetimes (blue).
Conclusions
The data presented in this report are the results of preliminaryexperiments using fluorescence lifetime imaging to follow Adentry in live cells. This method has not been applied before invirology and much more work is required to obtain quantitativeresults. We are in the process of combining the method withtime-lapse microscopy to be able to measure a series offluorescence lifetime image maps on the same field of viewfrom which the time course of acidification can be obtained.Despite being early days, the pioneer data obtained at the CLFclearly demonstrate the potential of fluorescence lifetimemicroscopy for the study of viral trafficking processes.
We thank the BBSRC for funding this work through grantC09632. We also thank the Instrumentation Department atCLRC for financing our access to the CLF facility. Thanks arealso due to Dr. Gareth Derbyshire for his invaluable help tocarry out these experiments.
References
1. W C Russell.J. Gen. Virol. DOI:10.1099/vir.0.17217-0(2000)
2. U F Greber, M Willetts, P Webster, and A Helenius. Cell,75:477-486 (1993).
3. H Liebermann , R Mental, U Baur, P Pring-Akerblom, RDolling, S Modrow, and W Seidel. J. Virol. 72:9121-9130(1998).
4. X Wang and J M Bergelson.J. Virol. 73(3) 2559-2562(1999).
5. K Wang. T Guan, D A Cheresh, and G R Nemerow , M J.J Virol. 74(6) 2731-2739 (2000).
6. G R Whitaker, M Kann, and A Helenius. Ann. Rev. CellDev. Biol. 16:627-651(2000).
7. D McDonald, L. Stockwin, T Matzow, ME Blair Zajdel,and G E Blair. Gene Therapy 6:1512-1519 (1999).

Lasers for Science Facility Programme - Biology
139 Central Laser Facility Annual Report 2001/2002
Introduction
Two-photon and three-photon excitation processes haverecently generated interest because localization of the photonicinteraction is possible within a femtolitre volume 1,2). Inbiological studies, two and three photon phenomena have beenapplied mainly to imaging microscopy, where fluorescenceexcitation by multiphoton absorption can provide unique three-dimensional detail with sub-micron resolution. Near infrared(NIR) multiphoton microscopy is becoming the tool of choicefor biological imaging as it allows non-destructive multiphotonfluorescence excitation in biological materials 3). Localisedinduction of DNA damage is a major goal of cell biologists whostudy DNA repair dynamics, intra-cellular signaling processesand cell-cell communication.
In a programme which set out to apply multiphoton near infra-red and micro-UV irradiation methods to study a hotly disputedquestion about the dynamics of the DNA repair processes, wesuccessfully used near diffraction limited 750 nm near infra-redlaser radiation to induce sub-micron sized areas of DNA UVphotoproducts in H1C1 (rat liver epithelial) cell nuclei.
Laser irradiation of cells
The original program was designed to address a vigorouslydisputed question concerning the extent of mobility of the repairproteins and/or the DNA in the removal of damaged sites. Thecentral question is whether proteins which function in the moregeneral replication, transcription as well as nucleotide excisionrepair processes are fixed at nuclear matrix sites 4), translocatealong the DNA, or diffuse in three dimensional pathways 5) tofind repair sites.
Recent findings from protein mobility experiments in livingcells indicate that many kinds of nuclear factors move rapidlyand exchange quickly with multiple targets, but some factorsmay reside in long term complexes 6).
Scientists are becoming increasingly aware that methodologycan influence the nature or interpretation of the results obtained,thus techniques which can interrogate systems at the singlemolecular level and on sub-second time scale are necessary. ForDNA repair studies the ultimate goal would be to study singlerepair sites as dense areas of DNA lesions would obscure thefiner details of protein interactions. As a first step towards this,DNA damage must be induced in the cell in as small an areaand quantity as possible.
The experimental set up is as illustrated below. A 750nm laserbeam from a Spectra-Physics Tsunami titanium-sapphire laser,pulse length 120fs, was focused through an Olympus Planapo40x objective with a focal length of 2mm and numericalaperture 0.85. Live cells growing on a glass coverslip werebrought into focus under white light and positioned using amicro-manipulator stage so that the beam would center on a cellnucleus. The power output of the laser was attenuated withneutral density filters to give a final power density of 10mW atthe stage. The peak power of the IR laser beam that induced UVphotoproducts detected by immunostaining, was calculated tobe ca. 190 GW/cm2. DNA damage was induced and detected ata minimum laser power of 10mW when the dwell time at each 2) was 25ms. A dwell time of 50ms gaverise to more intense images (not shown). The laser beam wasguided by a galvanometric scanning mirror moving at a rate ofabout 1kHz and was interfaced with computer software thatdefined a chosen pattern.
Induction of localized UV photoproducts in cell nuclear DNA by 3-photon nearinfrared absorption
R A Meldrum, C W Wharton
School of Biosciences, University of Birmingham, Edgbaston, Birmingham , B15 2TT , UK
S W Botchway, G J Hirst, S Topley
Central Laser Facility, CLRC Rutherford Appleton Laboratory, Chilton, Didcot, Oxon, OX11 0QX, UK
Main contact email address: [email protected]
Cell dish with glass orsilica base
Dish base750nm IR laser light
250nm UV equivalent from 3 photon absorption of750nm NIR by mammalian cell
Objective
Incoming infrared laser beam
Microscopeobjective
Galvo scanner mirror
Figure 1. Experimental arrangement.

Lasers for Science Facility Programme - Biology
Central Laser Facility Annual Report 2001/2002 140
Induction of focused UV photoproducts in DNA by 3-photonnear infra-red absorption.
The photoproducts induced in DNA by one-photon absorptionaround 260nm, the peak absorption of DNA, are cyclobutanepyrimidine dimers (CPDs) and 6-4 photoproducts. The image inFigure 2 demonstrates that triple infra-red (IR) photonabsorption may be used to induce CPDs in cell nuclear DNA.The damage can also be generated in a precise and distinctpattern with nanometer three-dimensional resolution.
Figure 2. Triple Infra-red induced damage.
This image shows the letters DNA outlined by immunostainedCPDs. The nuclei of the cells are visible as the DNA iscounterstained red with propidium iodide. The cell cytoplasm isnot visible. The minimum diameter of these nuclei is10 microns. The pattern is made up of 200 pixel points,therefore damage induced in the range of one individual pixelwill be confined to an area of less than 500nm. This indicatesthat the focused resolution obtained by 3-photon IR induction ofCPDs is much higher than that obtained by one photoninduction of CPDs in cell nuclei 7).
Collateral two-photon IR damage in cells
To be useful for DNA repair studies it is important that theinduction of specific damage in the DNA by focused three-photon near infra-red laser irradiation does not create significantcollateral damage by two and one photon process.Approximations of the volumes affected by single photon andmulti-photon from 750nm laser excitation can be estimated bymodeling. The models used so far are based on Gaussian beamsfocused using a microscope objective with numerical apertureof 1.2 with an arbitrary choice of beam size at the objective.
Figure 3. Affected volume of one-photon 750nm NIRintensities.
Figure 3 shows the calculated affected volume of one-photon750nm intensities. This shows the axial direction (vertical) andequatorial (horizontal). The colours represent the intensity ofthe laser beam which is greatest at the centre (red) and
decreases as outlined by the contours extending outward.Initial measurements (data not shown) made on the staining ofthe DNA damage by the fluorescent labeled antibody suggestthat the minimum intensity from the beam that gives rise to thephotoproducts is 50% (green/yellow contours). At 50%intensity contours the volume of the one-photon affectedvolume is 0.814µ equatorial direction. The two-photon affected volume is !volume affected by three-photon absorption is " # ##
A B
Figure 4. Two-photon, 750nm affected volume (A) and three-photon 750nm affected volume (B).
It can be seen from Figures 3 and 4 that the shapes of the oneand two and three-photon excitation profiles differ.
The calculations neglected phase aberrations caused byrefractive index changes and intensity changes due toabsorption that may be important in the case of 3-photon,750nm absorption. Further work will be carried out to estimatemore accurately the size of affected volumes and increase theresolution of the minimum spot size obtainable. It is estimatedthat we can increase the resolution of the minimum damage spotby a factor of ten. However, even at the present resolution nocollateral radiation will spread outside the cell nucleus that is10-20 µm in size.
Two-photon excitation from 750nm radiation will give rise toabsorbance at 375nm. At this wavelength flavins and NADHare potential endogenous cellular absorbers. The majorlocalization site of these co-enzymes is in the mitochondria thatare situated in the cytoplasm. The techniques which we havedescribed here will confine two-photon reactions in the cellnucleus, thus it is unlikely that significant absorption will occurat 375nm and collateral effects from this radiation will beminimal.
The maximum photon flux density from focused near infra-redlaser irradiation that leads to optical breakdown in water isgreater than 450 GWcm-2 8), considerably higher than theintensity of 190 GWcm-2 used to induce DNA damage in ourexperiments. It is noteworthy that femtosecond lasermicroscopy of living cells has been performed for severalminutes with a peak intensity of about 200 GWcm-2 withoutimpact on cellular reproduction or viability 3). This suggests thatthe consequence of the radiation that the cells were exposed toin our experiments is confined to the DNA damage illustrated.
Repair of photoproducts induced by three-photon nearinfra-red absorption
Cells were irradiated using the pattern seen in Figure 2 andreplaced in a CO2 incubator at 37oC. Figure 5 shows the typicalloss in intensity and definition of the staining of CPDs when thecells were incubated for one hour before staining.

Lasers for Science Facility Programme - Biology
141 Central Laser Facility Annual Report 2001/2002
Figure 5. Loss of intensity of staining after incubation.
Since these cells were in the quiescent state of growth, thedisappearance of lesions is most likely to represent repair of thelesions. Diffusion of the DNA could also cause loss in thedefinition of the pattern, but cells that had been irradiated withthe same focused pattern showed even lighter staining in alocalized region following 2 hours post-irradiation incubation(micrograph not shown). In quiescent cells, it is unlikely thatdiffusion of the DNA in time course could account for theapparent disappearance of the lesions. When a cell relocationsystem is used, detailed mapping of the lesions over a timecourse will be possible. If this is carried out on repair inhibitedcells or repair deficient cells, the movement of lesions due toDNA diffusion will be distinguishable.
Focused damage patterns were also traced on the cell nucleusby focusing the near infra-red laser beam through a100 x objective as well as the 40 x objective used to create theDNA damage illustrated above. As the 100 x objective wasused with glycerine but the 40 x times was used dry, thisdemonstrates that the 3-photon NIR induced DNAphotoproducts can be produced under variable conditions.
References
1. Kawata, S., Sun, H.B., Tanaka, T. & Takada, K. Finerfeatures for functional microdevices- Micro-machines canbe created with higher resolution using two-photonabsorption. Nature 412, 697-698 (2001)
2. He, G.S., Markowicz, P.P., Lin, T.C., Prasad, P.N.Observation of stimulated emission by direct three-photonexcitation. Nature 415: 767-770 (2002)
3. König, K. Multiphoton microscopy in the life sciences.Journal of Microscopy, 200, 83-104 (2000).
4. P.R.Cook. (1999) Molecular Biology – The organization ofreplication and transcription Science, 284, 1790-1795
5. N.P.Stanford, M.D.Szczelkun, J.F.Marko and S.E.Halford(2000) One and three-dimensional pathways for proteins toreach specific DNA sites. EMBO Journal, 19, 6546-6557
6. G.L.Hager, C.Elbi and M.Becker (2002) Protein dynamicsin the nuclear compartment. Current Opinion in Geneticsand Development, 12, 137-141
7. Volker, M., Mone, M. J., Karmakar, P., van Hoffen, A.,Schul, W., Vermeulaen, W., Hoeijmakers, J. H. J., vanDriel, R., van Zeeland, A. A., & Mullenders, L. H. F.Sequential assembly of the nucleotide excision repairfactors in vivo. Molecular Cell 8, 213-224 (2001).
8. Hammer, D.X., Thomas, R.J., Noojin, G.D., Rockwell,B.A., Kennedy, P.K. and Roach, W.P. Experimentalinvestigation of ultrashort pulse laser-induced breakdownthresholds in aqueous media. IEEE J. Quant. Electron. 62,963-976 (1996)

Lasers for Science Facility Programme - Physics
Central Laser Facility Annual Report 2001/2002 142
Introduction
Laser produced plasmas (LPPs) based on either gaseous, clusteror liquid target material are prospective sources of ExtremeUltraviolet (EUV) radiation for future lithography applications.This is primarily because of their low debris production rate andconvenient target material supply. However, the conversionefficiency (CE) of laser light into EUV radiation is low ascompared to solid target LPPs. In general, gaseous targets,including cluster and liquid targets, are produced by sonic1) orsupersonic2) expansion of gas through a pulsed or continuousnozzle. Most frequently xenon is used, firstly because the Xespectrum contains high intensity broadband structures around11 and 13-14 nm. Secondly, because of its noble gas nature,xenon will not deposit on surfaces at room temperature, and nocontamination occurs. This is crucial for application in EUVlithography (EUVL). At the laser plasma and XUV opticsgroup at FOM Rijnhuizen research is done on a laser plasmaEUV source based on a pulsed supersonic xenon jet. In order toincrease EUV yield several approaches have been investigated.Preshaping the target gas density distribution by applying atransparent buffer gas close to the target showed more than anorder of magnitude increase in EUV yield3). This reportdiscusses experiments aimed at further increasing the EUVyield by application of a short intense laser prepulse toprecondition the xenon target gas prior to the creation of theEUV emitting plasma by a main laser pulse.
Experimental set-up
The set-up used in the experiments is shown in Figure 1. Ashort (4 ps), high intensity (~1015 W/cm2), low energy (10 mJ)248 nm laser prepulse4) efficiently ionized the target material.Then, after a certain time delay, the preplasma was furtherheated by a main pulse of moderate intensity (Continuum 8000frequency doubled Nd:YAG, 532 nm,6 ns,1013 W/cm2, 350 mJ).The variable time delay between prepulse and main pulse wasmeasured using a fast photodiode. After the preplasma wasgenerated it further evolved, i.e. expanded, cooled, recombined,and set the target conditions, like electron density andtemperature, for the subsequent main pulse.
reflection grating spectrograph
broadband EUV pinhole camera
pre pulsemain pulse
gas feedthrough
lenses++
nozzle
photodiode
vacuum vessel
narrowband EUV diagnostics
reflection grating spectrograph
broadband EUV pinhole camera
pre pulsemain pulse
gas feedthrough
lenses++
nozzle
photodiode
vacuum vessel
narrowband EUV diagnostics
Figure 1. Experimental set-up.
Varying the time delay between the pulses therefore offered usthe possibility of changing the target preconditioning for mainpulse coupling, and consequently of optimizing EUV emission.Three different diagnostics were used to study emission fromthe plasma. A differentially pumped pinhole camera consistingof a 50 µm pinhole and a back thinned CCD (Reflex s.r.o.)filtered by 50 nm Si3N4/100 nm Nb imaged the broadbandemission of the plasma (7-16 nm FWHM) with 10 timesmagnification. Narrowband EUV yield (13.5 nm, 0.4 nmFWHM bandwidth) was monitored by a diagnostic toolconsisting of a calibrated curved Mo/Si multilayer mirror and afiltered junction diode (so-called Flying Circus5-7)). Spectrallyresolved emission was imaged by a 1200 lines/mm reflectiongrating on a second differentially pumped back thinned CCD(Andor DH425-V). A 211 nm zirconium filter was used toselect EUV wavelengths. The angle between the two laserbeams was approximately 20o. Using a 10 µm pinhole, picturesof plasma generated on a solid slab target placed above thenozzle indicated that the focal spots of pre- and main pulse were~10µm respectively ~30 µm in diameter and coincided within~30 µm.
Results
Figure 2 shows both the EUV broadband yield, obtained byintegrating the intensity of pinhole images, and the EUVnarrowband yield at 13.5 nm versus time delay. All points arenormalized to the yield measured when no prepulse wasapplied. The xenon backing pressure, i.e. the pressure in thereservoir behind the nozzle, was 10 bar. An increase in EUVyield at 13.5 nm yield is seen for delays up to 300 ns, whilemaximum increase is a factor 2.5 at 140 ns. The broadbandyield increases between 30 ns and 200 ns delay when applyingthe prepulse. The maximum increase is a factor 1.8 at 160 nsdelay. The broadband yield appears to decrease initially fordelays shorter than 30 ns. For delays longer than 200 ns thebroadband yield decreases with a maximum decrease of a factor3 at 300 ns. Note that prepulse instabilities may account for thelarge deviation of some measuring points in Figure 2.
0.0
0.5
1.0
1.5
2.0
2.5
3.0
0 50 100 150 200 250 300 350delay (ns)
norm
aliz
ed y
ield
EUV broadbandEUV at 13,5 nm
0.0
0.5
1.0
1.5
2.0
2.5
3.0
0 50 100 150 200 250 300 350delay (ns)
norm
aliz
ed y
ield
EUV broadbandEUV at 13,5 nm
Figure 2. Normalized narrowband and broadband EUV yieldversus prepulse-main pulse delay at 10 bar xenon backingpressure.
Prepulse enhanced EUV yield from a xenon gas-jet laser produced plasma
G Kooijman, R de Bruijn, K Koshelev*, F Bijkerk
FOM Institute for Plasma Physics Rijnhuizen, P.O. Box 1207, 3430 BE Nieuwegein, the Netherlands* also at ISAN, RAS, Troitsk, Russia
W Shaikh, A J Bodey, G Hirst
Central Laser Facility, CLRC Rutherford Appleton Laboratory, Chilton, Didcot, Oxon, OX11 0QX, UK
Main contact email address: [email protected]

Lasers for Science Facility Programme - Physics
143 Central Laser Facility Annual Report 2001/2002
At higher backing pressures, thus higher initial target gasdensities, a similar dependence of yield on delay was found.However the optimum delay, i.e. at maximum EUV yieldincrease, appeared to decrease with increasing backing pressure:at 15 bar an increase by a factor ~2.2 at 130 ns in narrowband-and a factor ~1.8 at 150 ns in broadband yield was found. At20 bar the narrowband- and broadband yield had a maximumincrease by a factor ~2.2 respectively ~1.5, both at 100 ns delay.
When applying the main pulse only, the measured narrowband-and broadband EUV yield were found to be independent onbacking pressure within the error bars. Furthermore the size ofthe broadband EUV emitting part of the plasma did not changesignificantly for different backing pressures and delays. Itamounted to 66 ± 6 µm perpendicular- and 130 ± 10 µmparallel to the laser beams (FWHM).
Pinhole images indicated that, above a certain time delay, the(centre) position of the plasma shifted in the direction of theincident laser beams. Figure 3 shows the displacement ∆xplasma,being the difference in the position of the plasma when aprepulse was applied and the position of the plasma withoutprepulse, versus delay for 10, 15 and 20 bar backing pressure.It can be seen that the threshold delay, above which the plasmaposition started to shift, decreases with increasing backingpressure: from 145 ± 5 ns to 120 ± 20 ns and 65 ± 15 ns for 10,15 and 20 bar respectively. Remarkable is that, especially at 10and 15 bar, the threshold delay appears to coincide with theoptimal delay for EUV yield increase.
Spectrally resolved emission of a plasma generated withoutprepulse at 10 bar backing pressure is shown in Figure 4.Especially high emission around 10.8 nm and 11.1 nm can beseen. Due to technical problems no spectra of sufficient qualitycould be recorded at (other) comparable experimentalconditions of Figure 2 and 3.
-20
0
20
40
60
80
100
120
0 50 100 150 200 250 300 350
delay (ns)
∆xpl
asm
a(µ
m)
10 bar15 bar20 bar
-20
0
20
40
60
80
100
120
0 50 100 150 200 250 300 350
delay (ns)
∆xpl
asm
a(µ
m)
∆xpl
asm
a∆x
plas
ma
(µm
)
10 bar15 bar20 bar
Figure 3. Shift in plasma position versus delay for three xenonbacking pressures.
0
0.2
0.4
0.6
0.8
1.0
105 115 125 135wavelength (Å )
Inte
nsity
(a.
u.)
110 120 1300
0.2
0.4
0.6
0.8
1.0
105 115 125 135wavelength (Å )
Inte
nsity
(a.
u.)
110 120 130
Figure 4. Xenon spectrum at 10 bar backing pressure withoutprepulse.
Discussion
The gain in narrowband- and broadband EUV, Figure 2, istentatively explained by a change of the dominant xenonionization stages with delay. Broadband EUV is known to beemitted by roughly Xe8+ to Xe12+ 8,9), while 13.5 nm radiation ismainly from Xe10+. The Xe spectrum in Figure 4 suggests an‘overheated’ plasma10), with dominant ionization stages higherthan Xe10+, and consequently low EUV yield at 13.5 nm.However, some broadband emission can be present from e.g.Xe12+. Application of the prepulse alters conditions for themain pulse such that it is less absorbed (density decreases dueto preplasma expansion). This results in a colder plasma. Thebroadband EUV emitting ionization stages Xe8+ to Xe12+ thenbecome relatively more populated, and an increase inbroadband yield results. Since Xe10+ becomes more populated,the narrowband yield at 13.5 nm also increases.
At the optimum delay (~140 ns) the main ionization stages willbe Xe8+ to Xe12+, with Xe10+ being the highest populated stage.This explains the fact that optimum delay for both broadband-and narrowband yield was about the same. At longer delays thebroadband yield decreases again, because the higher ionizationstages Xe11+ and Xe12+ start to disappear. Xe10+ also becomesless populated resulting in a decrease in yield at 13.5 nm.
Eventually, at delays >200 ns, the plasma becomes so ‘cold’,that the broadband EUV emitting ionization stages are hardlypopulated at all, and a decrease in yield even compared to thenon-prepulse case results. The narrowband yield is not (much)less than in the non-prepulse case for these long delays, becausethe population of Xe10+ may be comparable. Note that a reverseshift from lower to higher ionization stages, due to an increasein temperature (thus main pulse absorption) with delay, could inprinciple also explain the results. This is however less likelyconsidering the ‘overheated’ nature of the spectrum taken forinitial target conditions (no prepulse).
The relatively long delay in the order of 100 ns at which theeffect of yield increase was observed is noteworthy. Numericalmodeling to determine the preplasma parameters such aselectron density and temperature on such a timescale iscurrently undertaken. Note that the velocity of xenon gas in thejet is estimated to be ~290 m/s (Mach number is 4.8), calculatedat the nozzle’s orifice, giving a gas displacement of ~29 µm in100 ns. This may also have to be taken into account.
The shift of the plasma position as given in Figure 3 indicatesthat the main pulse interacted with expanding target material.The observed threshold delay may indicate a point where targetmaterial began to expand outside the initial boundaries of thegas jet, shifting the ‘front’ of the laser target interaction volumefrom the jet boundary towards the incoming main pulse laserbeam. When assuming that the expansion induced by theprepulse started at the center of the jet, the (average) expansionvelocity has to be in the order of 103 m/s, with the radius of thegas jet being 150 µm. The velocity with which the position ofthe plasma shifts above the threshold delays (thus the slope ofthe graphs in Figure 3) is of about the same magnitude. Thisvelocity corresponds to a plasma temperature of ~2 eV forsingle ionized xenon, which is plausible because a few ns afterthe prepulse a low temperature, weakly ionized plasma isexpected to remain due to expansion and recombination.
Conclusion
A short, intense, low energy prepulse was used to enhance EUVyield from a laser produced plasma generated on a supersonicxenon gas jet.
Yield increase was observed on a relatively large 100 ns delaytimescale with a maximum of a factor ~2.5 at ~140 ns delay(for 10 bar backing pressure). Most probably, without aprepulse, an overheated plasma was generated by the mainpulse. Prepulse application then resulted in less overheating by

Lasers for Science Facility Programme - Physics
Central Laser Facility Annual Report 2001/2002 144
decreasing the main laser pulse absorption. Spectralmeasurements (in a wider wavelength range) on plasmasgenerated by a comparable Nd:YAG laser are expected toprovide verification on this in the near future.
Acknowledgements
This work is part of the research programme of the ‘Stichtingvoor Fundamenteel Onderzoek der Materie (FOM)’, which isfinancially supported by the ‘Nederlandse organisatie voorWetenschappelijk Onderzoek (NWO)’. The authors gratefullyacknowledge financial support by the EU for providing accessto the CLF and the EPSRC Engineering Instrument Pool.
References
1. X-ray emission from laser irradiated gas puff targets; H.Fiedorowicz et al.; Appl. Phys. Lett., 62 (22), pp. 1-3, 1993.
2. High-power extreme ultraviolet source based on gas jets; G.D. Kubiak et al.; SPIE 3331, 81-89, 1998.
3. Characterization of a novel double gas-jet laser plasmaEUV source; R. de Bruijn et al.; SPIE 3997, p.157, 2000.
4. A plasma light source for the VUV spectral region; W.Shaikh; IEEE journal of quantum electronics, Vol.5, no.6,Nov/Dec 1999.
5. Flying Circus EUV source comparison, absolute yield,absolute yield fluctuations and contamination, R. Stuik etal.; Second SEMATECH Workshop on Extreme UVLithography, San Francisco, International Sematech Vol.CD,http://www.sematech.org/public/news/conferences/euvl2000/documents/102_SRC14_stuik.PDF (2000).
6. Linearity of P-N junction photodiodes under pulsedirradiation; R. Stuik, F. Bijkerk; SPIE Vol. 4688, 2002.
7. Calibration of Flying Circus EUV diagnostics; R. Stuik, F.Bijkerk; Nuclear Instruments and Methods A, submitted2002.
8. Analysis of the 4p64d84f and 4p54d10 configurations ox XeX and some highly excited levels of Xe VIII and Xe IXions; S. S. Churilov, Y. N. Joshi; Physica Scripta, vol. 65,40-45, 2002.
9. S.S. Churilov, private communication.
10. Highly ionized xenon spectra (95-260 Å) excited in TFRtokamak plasmas; C. Breton et al.; Physica Scripta, vol. 37,33-37, 1988.
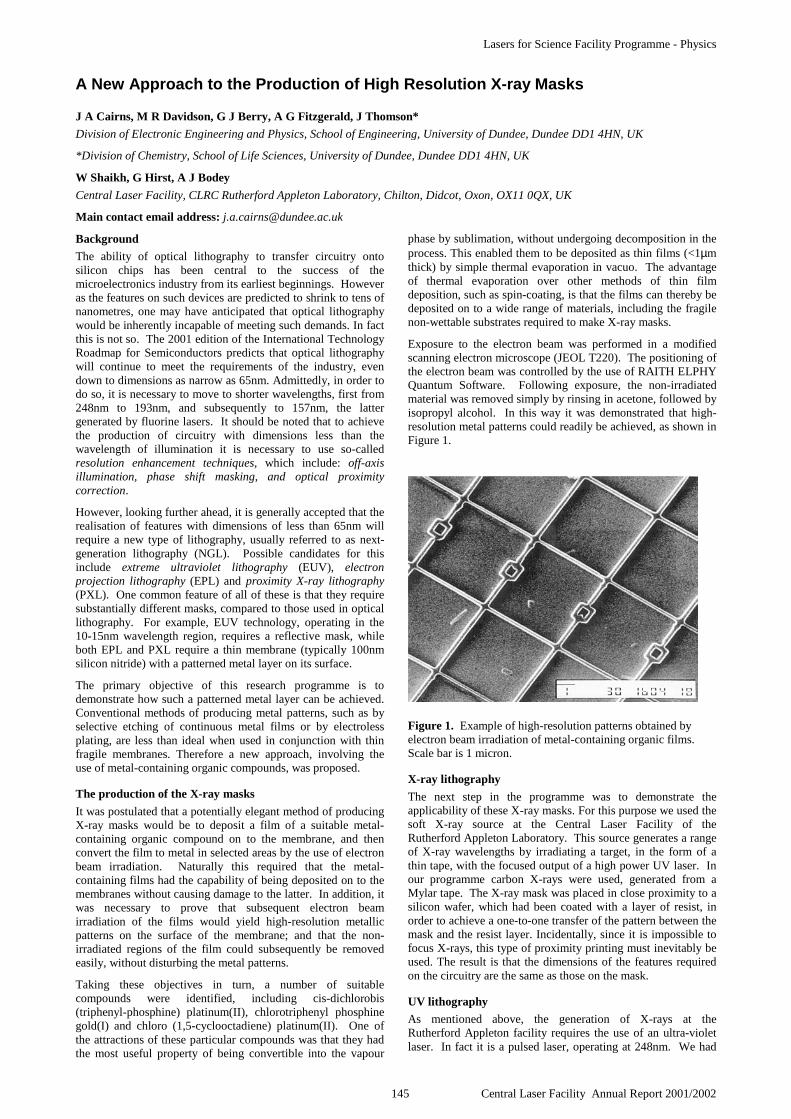
Lasers for Science Facility Programme - Physics
145 Central Laser Facility Annual Report 2001/2002
Background
The ability of optical lithography to transfer circuitry ontosilicon chips has been central to the success of themicroelectronics industry from its earliest beginnings. Howeveras the features on such devices are predicted to shrink to tens ofnanometres, one may have anticipated that optical lithographywould be inherently incapable of meeting such demands. In factthis is not so. The 2001 edition of the International TechnologyRoadmap for Semiconductors predicts that optical lithographywill continue to meet the requirements of the industry, evendown to dimensions as narrow as 65nm. Admittedly, in order todo so, it is necessary to move to shorter wavelengths, first from248nm to 193nm, and subsequently to 157nm, the lattergenerated by fluorine lasers. It should be noted that to achievethe production of circuitry with dimensions less than thewavelength of illumination it is necessary to use so-calledresolution enhancement techniques, which include: off-axisillumination, phase shift masking, and optical proximitycorrection.
However, looking further ahead, it is generally accepted that therealisation of features with dimensions of less than 65nm willrequire a new type of lithography, usually referred to as next-generation lithography (NGL). Possible candidates for thisinclude extreme ultraviolet lithography (EUV), electronprojection lithography (EPL) and proximity X-ray lithography(PXL). One common feature of all of these is that they requiresubstantially different masks, compared to those used in opticallithography. For example, EUV technology, operating in the10-15nm wavelength region, requires a reflective mask, whileboth EPL and PXL require a thin membrane (typically 100nmsilicon nitride) with a patterned metal layer on its surface.
The primary objective of this research programme is todemonstrate how such a patterned metal layer can be achieved.Conventional methods of producing metal patterns, such as byselective etching of continuous metal films or by electrolessplating, are less than ideal when used in conjunction with thinfragile membranes. Therefore a new approach, involving theuse of metal-containing organic compounds, was proposed.
The production of the X-ray masks
It was postulated that a potentially elegant method of producingX-ray masks would be to deposit a film of a suitable metal-containing organic compound on to the membrane, and thenconvert the film to metal in selected areas by the use of electronbeam irradiation. Naturally this required that the metal-containing films had the capability of being deposited on to themembranes without causing damage to the latter. In addition, itwas necessary to prove that subsequent electron beamirradiation of the films would yield high-resolution metallicpatterns on the surface of the membrane; and that the non-irradiated regions of the film could subsequently be removedeasily, without disturbing the metal patterns.
Taking these objectives in turn, a number of suitablecompounds were identified, including cis-dichlorobis(triphenyl-phosphine) platinum(II), chlorotriphenyl phosphinegold(I) and chloro (1,5-cyclooctadiene) platinum(II). One ofthe attractions of these particular compounds was that they hadthe most useful property of being convertible into the vapour
phase by sublimation, without undergoing decomposition in theprocess. This enabled them to be deposited as thin films (<1µmthick) by simple thermal evaporation in vacuo. The advantageof thermal evaporation over other methods of thin filmdeposition, such as spin-coating, is that the films can thereby bedeposited on to a wide range of materials, including the fragilenon-wettable substrates required to make X-ray masks.
Exposure to the electron beam was performed in a modifiedscanning electron microscope (JEOL T220). The positioning ofthe electron beam was controlled by the use of RAITH ELPHYQuantum Software. Following exposure, the non-irradiatedmaterial was removed simply by rinsing in acetone, followed byisopropyl alcohol. In this way it was demonstrated that high-resolution metal patterns could readily be achieved, as shown inFigure 1.
Figure 1. Example of high-resolution patterns obtained byelectron beam irradiation of metal-containing organic films.Scale bar is 1 micron.
X-ray lithography
The next step in the programme was to demonstrate theapplicability of these X-ray masks. For this purpose we used thesoft X-ray source at the Central Laser Facility of theRutherford Appleton Laboratory. This source generates a rangeof X-ray wavelengths by irradiating a target, in the form of athin tape, with the focused output of a high power UV laser. Inour programme carbon X-rays were used, generated from aMylar tape. The X-ray mask was placed in close proximity to asilicon wafer, which had been coated with a layer of resist, inorder to achieve a one-to-one transfer of the pattern between themask and the resist layer. Incidentally, since it is impossible tofocus X-rays, this type of proximity printing must inevitably beused. The result is that the dimensions of the features requiredon the circuitry are the same as those on the mask.
UV lithography
As mentioned above, the generation of X-rays at theRutherford Appleton facility requires the use of an ultra-violetlaser. In fact it is a pulsed laser, operating at 248nm. We had
A New Approach to the Production of High Resolution X-ray Masks
J A Cairns, M R Davidson, G J Berry, A G Fitzgerald, J Thomson*
Division of Electronic Engineering and Physics, School of Engineering, University of Dundee, Dundee DD1 4HN, UK
*Division of Chemistry, School of Life Sciences, University of Dundee, Dundee DD1 4HN, UK
W Shaikh, G Hirst, A J Bodey
Central Laser Facility, CLRC Rutherford Appleton Laboratory, Chilton, Didcot, Oxon, OX11 0QX, UK
Main contact email address: [email protected]

Lasers for Science Facility Programme - Physics
Central Laser Facility Annual Report 2001/2002 146
observed that our films exhibited a strong absorption in thisregion of the spectrum, and so we exposed them directly to thelaser source and found that they decomposed readily to metal.
This observation opens up a potentially attractive method ofproducing metal-rich patterns on surfaces, in essentially a one-step operation. Figure 2 shows a pattern transfer, achieved bypassing the UV beam through a photomask in contact with oneof the metal-containing films.
Figure 2. Example of platinum lines transferred by UVirradiation. Scale bar 10µm.
Several analytical techniques were used to investigate the natureof this process in more detail..1-4) For example, X-rayphotoelectron spectroscopy (Figure 3) confirmed theprogressive transition of the film to a more metallic state underthe influence of increasing UV irradiation, while thecorresponding progressive decomposition of the organiccomponents was monitored by the use of infrared spectroscopy(Figure 4).
Figure 3. XPS analysis of UV irradiated films.
Figure 4. Infrared analysis results from UV irradiated organoplatinum films.
Conclusions
It has been demonstrated that X-ray masks can be fabricated bythe use of the metal-containing compounds described in thisresearch study.
Furthermore, it has been shown that metal-rich features can beproduced by direct UV irradiation of the same compounds.
Acknowledgements
This work was funded by EPSRC, Grant Number GR/M41223.The authors would also like to thank Dr A. Hourd,Compugraphics International Ltd., for the production ofphotomasks used in this work.
References
1. M R Davidson, G J Berry, Y Fan, J A Cairns and JThomson, Institute of Physics Conference Series, 168,215-218, 2001.
2. G J Berry, J A Cairns, M R Davidson, Y C Fan, A GFitzgerald, A H Fzea, J Lobban, P McGivern, J Thomsonand W Shaikh, Materials Research SymposiumProceedings, 624, 249-254, 2000.
3. G J Berry, J A Cairns, M R Davidson, Y C Fan, A GFitzgerald, J Thomson, W Shaikh, Applied SurfaceScience, 162: 504-507, 2000
4. M R Davidson, Y Fan, G J Berry, J A Cairns, and A GFitzgerald. Accepted for publication in MikrochimicaActa.
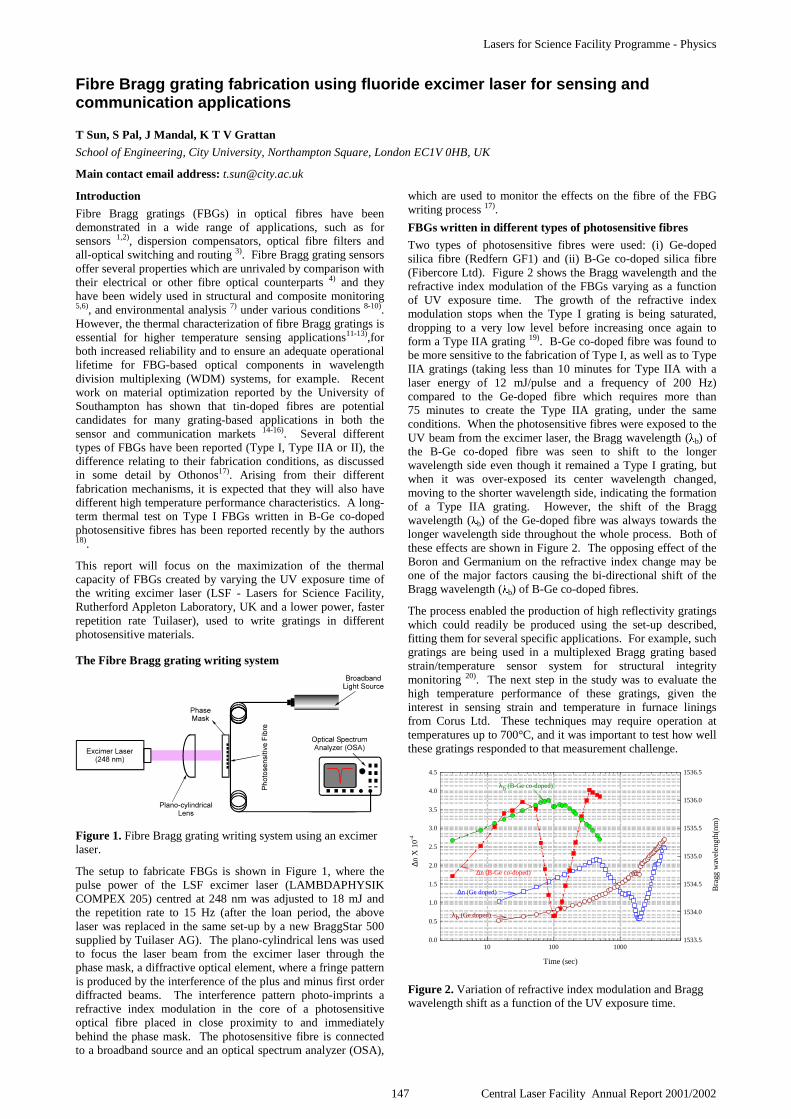
Lasers for Science Facility Programme - Physics
147 Central Laser Facility Annual Report 2001/2002
Introduction
Fibre Bragg gratings (FBGs) in optical fibres have beendemonstrated in a wide range of applications, such as forsensors 1,2), dispersion compensators, optical fibre filters andall-optical switching and routing 3). Fibre Bragg grating sensorsoffer several properties which are unrivaled by comparison withtheir electrical or other fibre optical counterparts 4) and theyhave been widely used in structural and composite monitoring5,6), and environmental analysis 7) under various conditions 8-10).However, the thermal characterization of fibre Bragg gratings isessential for higher temperature sensing applications11-13),forboth increased reliability and to ensure an adequate operationallifetime for FBG-based optical components in wavelengthdivision multiplexing (WDM) systems, for example. Recentwork on material optimization reported by the University ofSouthampton has shown that tin-doped fibres are potentialcandidates for many grating-based applications in both thesensor and communication markets 14-16). Several differenttypes of FBGs have been reported (Type I, Type IIA or II), thedifference relating to their fabrication conditions, as discussedin some detail by Othonos17). Arising from their differentfabrication mechanisms, it is expected that they will also havedifferent high temperature performance characteristics. A long-term thermal test on Type I FBGs written in B-Ge co-dopedphotosensitive fibres has been reported recently by the authors18).
This report will focus on the maximization of the thermalcapacity of FBGs created by varying the UV exposure time ofthe writing excimer laser (LSF - Lasers for Science Facility,Rutherford Appleton Laboratory, UK and a lower power, fasterrepetition rate Tuilaser), used to write gratings in differentphotosensitive materials.
The Fibre Bragg grating writing system
Figure 1. Fibre Bragg grating writing system using an excimerlaser.
The setup to fabricate FBGs is shown in Figure 1, where thepulse power of the LSF excimer laser (LAMBDAPHYSIKCOMPEX 205) centred at 248 nm was adjusted to 18 mJ andthe repetition rate to 15 Hz (after the loan period, the abovelaser was replaced in the same set-up by a new BraggStar 500supplied by Tuilaser AG). The plano-cylindrical lens was usedto focus the laser beam from the excimer laser through thephase mask, a diffractive optical element, where a fringe patternis produced by the interference of the plus and minus first orderdiffracted beams. The interference pattern photo-imprints arefractive index modulation in the core of a photosensitiveoptical fibre placed in close proximity to and immediatelybehind the phase mask. The photosensitive fibre is connectedto a broadband source and an optical spectrum analyzer (OSA),
which are used to monitor the effects on the fibre of the FBGwriting process 17).
FBGs written in different types of photosensitive fibres
Two types of photosensitive fibres were used: (i) Ge-dopedsilica fibre (Redfern GF1) and (ii) B-Ge co-doped silica fibre(Fibercore Ltd). Figure 2 shows the Bragg wavelength and therefractive index modulation of the FBGs varying as a functionof UV exposure time. The growth of the refractive indexmodulation stops when the Type I grating is being saturated,dropping to a very low level before increasing once again toform a Type IIA grating 19). B-Ge co-doped fibre was found tobe more sensitive to the fabrication of Type I, as well as to TypeIIA gratings (taking less than 10 minutes for Type IIA with alaser energy of 12 mJ/pulse and a frequency of 200 Hz)compared to the Ge-doped fibre which requires more than75 minutes to create the Type IIA grating, under the sameconditions. When the photosensitive fibres were exposed to theUV beam from the excimer laser, the Bragg wavelength ( b) ofthe B-Ge co-doped fibre was seen to shift to the longerwavelength side even though it remained a Type I grating, butwhen it was over-exposed its center wavelength changed,moving to the shorter wavelength side, indicating the formationof a Type IIA grating. However, the shift of the Braggwavelength ( b) of the Ge-doped fibre was always towards thelonger wavelength side throughout the whole process. Both ofthese effects are shown in Figure 2. The opposing effect of theBoron and Germanium on the refractive index change may beone of the major factors causing the bi-directional shift of theBragg wavelength ( b) of B-Ge co-doped fibres.
The process enabled the production of high reflectivity gratingswhich could readily be produced using the set-up described,fitting them for several specific applications. For example, suchgratings are being used in a multiplexed Bragg grating basedstrain/temperature sensor system for structural integritymonitoring 20). The next step in the study was to evaluate thehigh temperature performance of these gratings, given theinterest in sensing strain and temperature in furnace liningsfrom Corus Ltd. These techniques may require operation attemperatures up to 700°C, and it was important to test how wellthese gratings responded to that measurement challenge.
Time (sec)
10 100 10000.0
0.5
1.0
1.5
2.0
2.5
3.0
3.5
4.0
4.5
1533.5
1534.0
1534.5
1535.0
1535.5
1536.0
1536.5
Bra
gg w
avel
engt
h(nm
)
λb (Ge doped)
∆n (Ge doped)
∆n (B-Ge co-doped)
λb (B-Ge co-doped)
∆n X
10-4
Figure 2. Variation of refractive index modulation and Braggwavelength shift as a function of the UV exposure time.
Fibre Bragg grating fabrication using fluoride excimer laser for sensing andcommunication applications
T Sun, S Pal, J Mandal, K T V Grattan
School of Engineering, City University, Northampton Square, London EC1V 0HB, UK
Main contact email address: [email protected]

Lasers for Science Facility Programme - Physics
Central Laser Facility Annual Report 2001/2002 148
Long-term thermal characteristics of various gratings
The four gratings fabricated above have been subjected to aseries of long-term thermal exposure tests at 100°C, 200°C andthen up to 750°C with a temperature increment of 50°C andtheir long term thermal decay process is shown in Figure 3. Itwas observed that up to 200°C, there was little change inreflectivity for all the gratings, but above this temperature, thedecay first started for a Type I B-Ge co-doped FBG and soon arapid decay occurred at ~ 300oC. Reaching a temperature of350oC erased the grating completely within a few more hours.However, the B-Ge co-doped Type IIA grating remained almostunaffected up to ~ 400oC and only at 450°C could the rapiddecay of the reflectivity be seen. This occurred until 500°C wasreached, the temperature at which the grating was washed outcompletely. This confirms that Type IIA gratings can survive attemperatures higher by comparison with those for Type Igratings, even though the photosensitive materials used are thesame.
0 5000 10000 15000 20000 25000 30000 35000
0
20
40
60
80
100
% R
efle
ctiv
ity
Elapsed time (Minutes)
B-Ge co-doped Type I B-Ge co-doped Type IIA Ge-doped Type I Ge-doped Type IIA
Temperature (Deg C)100
200 250 300 350 400 450 500 550 600 650700 750
Figure 3. Decay of Ge-doped and B-Ge co-doped Type I andType IIA gratings for long term thermal testing.
In addition, the work has shown that different photosensitivefibres have demonstrated different high temperatureperformance, which was also shown in Figure 3. The Ge-dopedType I and Type IIA FBGs are more able, by comparison toB-Ge co-doped FBGs, to sustain these high temperatures, wherethe Type I can withstand a temperature of 600oC with ~45% ofreflectivity at an almost negligible decay rate. The demarcationpoint for the Type IIA is 650oC, with it retaining more than55% of its reflectivity. Unlike the sudden decay of B-Geco-doped FBGs at certain temperatures, the Ge-doped FBGsrevealed a much slower rate of decay with each increment of50°C during this study.
The Bragg wavelength shift with temperature has been widelyused for temperature sensing or temperature compensation overa lower temperature range 19). However, as shown in Figure 4,at each particular temperature the drift of the Bragg wavelengthwith elapsed time was observed for each grating, taking~ 10 hours to stabilize. The rate of change is slightly differentfrom one FBG to another. Figure 5 shows the Braggwavelength shift with temperature after the stabilization hasoccurred (sampled 24 hours after each increment oftemperature). The curves were almost linear but with slightlydifferent slopes. The temperature sensitivities of the gratingswere estimated by using a linear curve fitting of the data foreach type of grating. The sensitivity for the B-Ge Type Igrating showed 9.57 pm/ °C but for the Type IIA the dynamicrange increased by 100°C, at the cost of a slightly lower valueof sensitivity of 9.07 pm/ °C. The corresponding sensitivityvalues for the Ge-doped Types I and IIA FGBs were12.80 pm/ °C and 12.35 pm/ °C respectively.
0 5000 10000 15000 20000 25000 30000
1536
1538
1540
1542
600550500450400350300250200100
Temperature (deg C)
Bra
gg w
avel
engt
h sh
ift (
nm)
Elapsed Time (Minutes)
B-Ge co-doped Type I Ge-doped Type I
Figure 4. Bragg wavelength shift with elapsed time at eachspecific temperature.
0 100 200 300 400 500 600 700 8001534
1536
1538
1540
1542
1544
1546
Bra
gg w
avel
engt
h, λ
b (nm
)
Temperature (deg C)
B-Ge co-doped Type I B-Ge co-doped Type IIA Ge-doped Type I Ge-doped Type IIA
Figure 5. Bragg wavelength shift with temperature.
Conclusions
The above work has successfully demonstrated that FBGs canbe tailored in such a way as to sustain high temperatures of upto 750°C, by writing Type IIA gratings on Ge-dopedphotosensitive fibres. Work is continuing and being carried outto optimize the photosensitive materials as well as the writingparameters, for example, finding the best conditions of UVexposure energy and exposure time, to maximize the thermalcapacities of FBGs.
Acknowledgement
The authors would like to thank the staff of the Central LaserFacility for their assistance and support throughout theexperiment. The experiment was supported by EPSRC throughseveral schemes including the INTErSECT FaradayPartnership. The authors would also like to acknowledge thesupport from Commonwealth Scholarship Commission of ACUfor one of us (SP) and the supply of the Redfern fibres for thisexperiment from Victoria University, Melbourne based on ourlong term collaboration between these two institutions.
References
1. A D Kersey, M A Davis, H J Patrick, M LeBlanc, K PKoo, C G Askins, M A Putnam and E J Friebele, J.Lightw. Technol., 15, 1442, (1997)
2. Y J Rao, Meas. Sci. Technol., 8, 355, (1997)

Lasers for Science Facility Programme - Physics
149 Central Laser Facility Annual Report 2001/2002
3. D Payne, EPSRC Laser Applications Theme Day,Manchester, (2002)
4. D Betz, L Staudigel, M N Trutzel, M Schmuecker, EHuelsmann, U Czernay, 15th Optical Fibre SensorsConference, Technical Digest, 55, (2002)
5. R Willsch, W Ecke and H Bartelt, 15th Optical FibreSensors Conference, Technical Digest, 49, (2002)
6. E Udd, K Black, W Schulz, S Kreger and M Kunzler, D,Heider, 15th Optical Fibre Sensors Conference, TechnicalDigest, 59, (2002)
7. R Falciai, A G Mignani and A Vannini, Sensors andActuators B – Chemical 74, 74, (2001)
8. A Fernandez, B Brichard, P Borgeermans, F Berghmans,M Decreton, P Megret, M Blondel and A Delchambre, 15th
Optical Fibre Sensors Conference, Technical Digest, 63,(2002)
9. S W James and R P Tatam, 15th Optical Fibre SensorsConference, Technical Digest, 87, (2002)
10. M Winz, K Stump and T K Plant, 15th Optical FibreSensors Conference, Technical Digest, 195, (2002)
11. J Canning, M Englund and K Sommer, Proceedings of the14th International Conference on Optical Fiber Sensors,postdeadline paper, 1, (2000)
12. R J Schroeder, T Yamate and E Udd, Proceedings of SPIE,3746, 42, (1999)
13. T Wavering, J Greene, S Meller, T Bailey, C Kozikowski,S Lenahan, K Murphy, M Camden, L Simmons,Proceedings of SPIE, 3538, 58, (1999)
14. G Brambilla, H J Booth, E K Illy, L Reekie, H Rutt and LDong, Abstracts and Programme of In-fibre Bragg gratingsand special fibres, The Institute of Physics, (2001)
15. G Brambilla, T P Newson and H Rutt, Abstracts andProgramme of In-fibre Bragg gratings and special fibres,The Institute of Physics, (2001)
16. D Razafimahatratra, P Niay, M Douay, B Pumellec and IRiant, Applied Optics, 39, 1924, (2000)
17. A Othonos, Optical fibre sensor technology, advancedapplications – Bragg gratings and distributed sensors (edsK T V Grattan and B T Meggitt), Kluwer AcademicPublishers, 79, (2000)
18. T Sun, K T V Grattan, S A Wade, D I Forsyth and W MSun, 1st International Symposium on Optical and QuantumTechnology (invited paper), Bangkok, Thailand,November 2001, 24, (2001)
19. R Kashyap, Fiber Bragg Gratings, Academic Press, (1999)
20. Y M Gebremichael, B T Meggitt, W J O Boyle, W Li, K TV Grattan, L Boswell, B McKinley, K A Aarnes & LKvenild, Proceedings of the 11th Conference on Sensorsand their Applications XI, 3-6 September 2001, London,UK, 341, (2001).
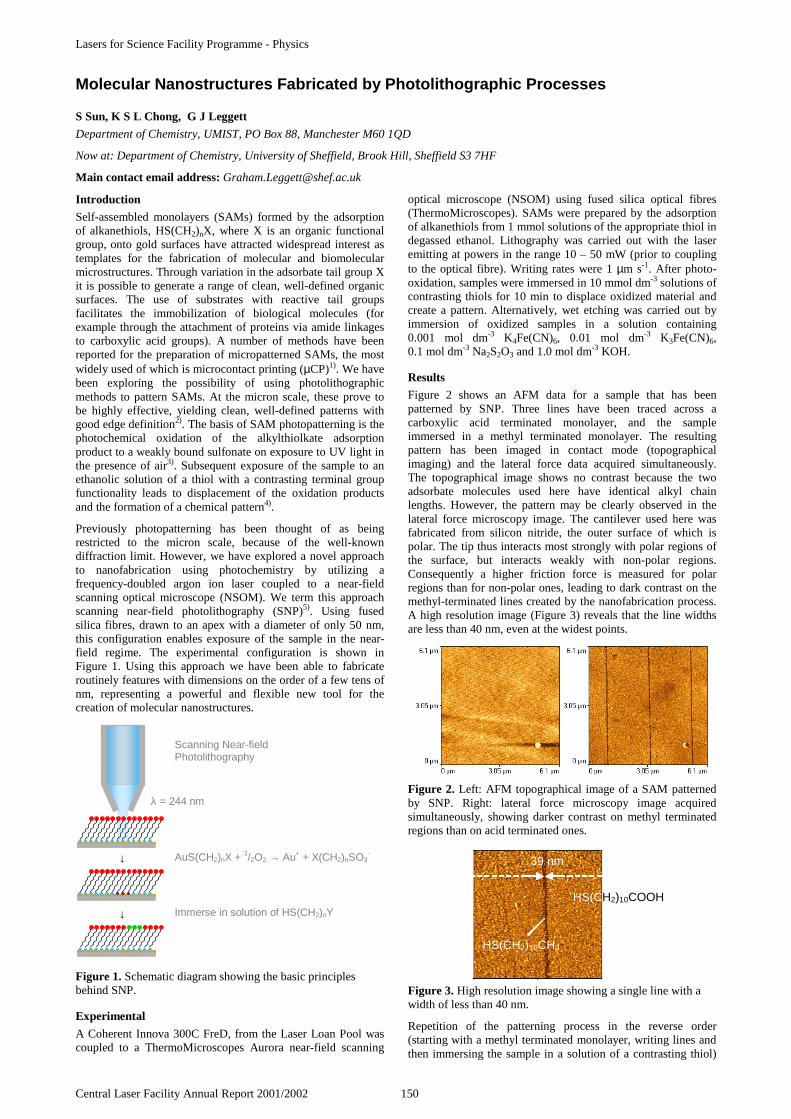
Lasers for Science Facility Programme - Physics
Central Laser Facility Annual Report 2001/2002 150
Introduction
Self-assembled monolayers (SAMs) formed by the adsorptionof alkanethiols, HS(CH2)nX, where X is an organic functionalgroup, onto gold surfaces have attracted widespread interest astemplates for the fabrication of molecular and biomolecularmicrostructures. Through variation in the adsorbate tail group Xit is possible to generate a range of clean, well-defined organicsurfaces. The use of substrates with reactive tail groupsfacilitates the immobilization of biological molecules (forexample through the attachment of proteins via amide linkagesto carboxylic acid groups). A number of methods have beenreported for the preparation of micropatterned SAMs, the mostwidely used of which is microcontact printing (µCP)1). We havebeen exploring the possibility of using photolithographicmethods to pattern SAMs. At the micron scale, these prove tobe highly effective, yielding clean, well-defined patterns withgood edge definition2). The basis of SAM photopatterning is thephotochemical oxidation of the alkylthiolkate adsorptionproduct to a weakly bound sulfonate on exposure to UV light inthe presence of air3). Subsequent exposure of the sample to anethanolic solution of a thiol with a contrasting terminal groupfunctionality leads to displacement of the oxidation productsand the formation of a chemical pattern4).
Previously photopatterning has been thought of as beingrestricted to the micron scale, because of the well-knowndiffraction limit. However, we have explored a novel approachto nanofabrication using photochemistry by utilizing afrequency-doubled argon ion laser coupled to a near-fieldscanning optical microscope (NSOM). We term this approachscanning near-field photolithography (SNP)5). Using fusedsilica fibres, drawn to an apex with a diameter of only 50 nm,this configuration enables exposure of the sample in the near-field regime. The experimental configuration is shown inFigure 1. Using this approach we have been able to fabricateroutinely features with dimensions on the order of a few tens ofnm, representing a powerful and flexible new tool for thecreation of molecular nanostructures.
Figure 1. Schematic diagram showing the basic principlesbehind SNP.
Experimental
A Coherent Innova 300C FreD, from the Laser Loan Pool wascoupled to a ThermoMicroscopes Aurora near-field scanning
optical microscope (NSOM) using fused silica optical fibres(ThermoMicroscopes). SAMs were prepared by the adsorptionof alkanethiols from 1 mmol solutions of the appropriate thiol indegassed ethanol. Lithography was carried out with the laseremitting at powers in the range 10 – 50 mW (prior to couplingto the optical fibre). Writing rates were 1 µm s-1. After photo-oxidation, samples were immersed in 10 mmol dm-3 solutions ofcontrasting thiols for 10 min to displace oxidized material andcreate a pattern. Alternatively, wet etching was carried out byimmersion of oxidized samples in a solution containing0.001 mol dm-3 K4Fe(CN)6, 0.01 mol dm-3 K3Fe(CN)6,0.1 mol dm-3 Na2S2O3 and 1.0 mol dm-3 KOH.
Results
Figure 2 shows an AFM data for a sample that has beenpatterned by SNP. Three lines have been traced across acarboxylic acid terminated monolayer, and the sampleimmersed in a methyl terminated monolayer. The resultingpattern has been imaged in contact mode (topographicalimaging) and the lateral force data acquired simultaneously.The topographical image shows no contrast because the twoadsorbate molecules used here have identical alkyl chainlengths. However, the pattern may be clearly observed in thelateral force microscopy image. The cantilever used here wasfabricated from silicon nitride, the outer surface of which ispolar. The tip thus interacts most strongly with polar regions ofthe surface, but interacts weakly with non-polar regions.Consequently a higher friction force is measured for polarregions than for non-polar ones, leading to dark contrast on themethyl-terminated lines created by the nanofabrication process.A high resolution image (Figure 3) reveals that the line widthsare less than 40 nm, even at the widest points.
Figure 2. Left: AFM topographical image of a SAM patternedby SNP. Right: lateral force microscopy image acquiredsimultaneously, showing darker contrast on methyl terminatedregions than on acid terminated ones.
Figure 3. High resolution image showing a single line with awidth of less than 40 nm.
Repetition of the patterning process in the reverse order(starting with a methyl terminated monolayer, writing lines andthen immersing the sample in a solution of a contrasting thiol)
Molecular Nanostructures Fabricated by Photolithographic Processes
S Sun, K S L Chong, G J Leggett
Department of Chemistry, UMIST, PO Box 88, Manchester M60 1QD
Now at: Department of Chemistry, University of Sheffield, Brook Hill, Sheffield S3 7HF
Main contact email address: [email protected]
Scanning Near-fieldPhotolithography
AuS(CH2)nX + 3/2O2 → Au+ + X(CH2)nSO3-
Immerse in solution of HS(CH2)nY
λ = 244 nm
↓
↓
HS(CH2)10CH3
HS(CH2)10COOH
39 nm
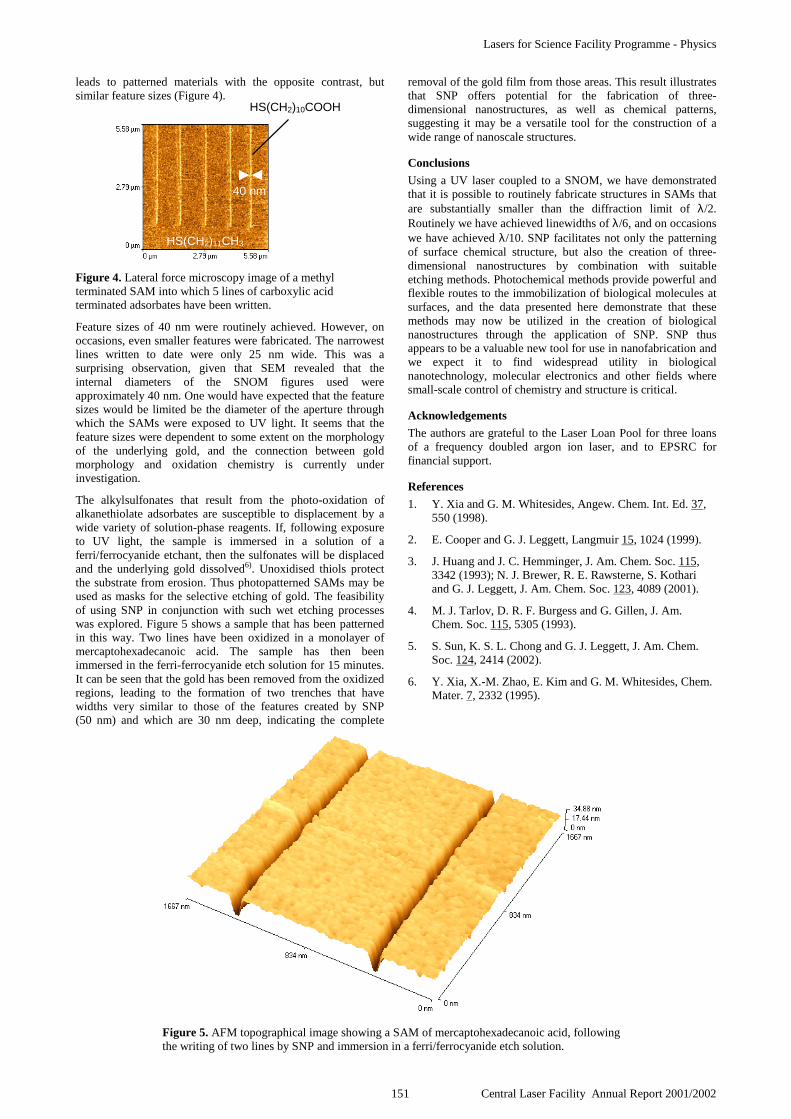
Lasers for Science Facility Programme - Physics
151 Central Laser Facility Annual Report 2001/2002
leads to patterned materials with the opposite contrast, butsimilar feature sizes (Figure 4).
Figure 4. Lateral force microscopy image of a methylterminated SAM into which 5 lines of carboxylic acidterminated adsorbates have been written.
Feature sizes of 40 nm were routinely achieved. However, onoccasions, even smaller features were fabricated. The narrowestlines written to date were only 25 nm wide. This was asurprising observation, given that SEM revealed that theinternal diameters of the SNOM figures used wereapproximately 40 nm. One would have expected that the featuresizes would be limited be the diameter of the aperture throughwhich the SAMs were exposed to UV light. It seems that thefeature sizes were dependent to some extent on the morphologyof the underlying gold, and the connection between goldmorphology and oxidation chemistry is currently underinvestigation.
The alkylsulfonates that result from the photo-oxidation ofalkanethiolate adsorbates are susceptible to displacement by awide variety of solution-phase reagents. If, following exposureto UV light, the sample is immersed in a solution of aferri/ferrocyanide etchant, then the sulfonates will be displacedand the underlying gold dissolved6). Unoxidised thiols protectthe substrate from erosion. Thus photopatterned SAMs may beused as masks for the selective etching of gold. The feasibilityof using SNP in conjunction with such wet etching processeswas explored. Figure 5 shows a sample that has been patternedin this way. Two lines have been oxidized in a monolayer ofmercaptohexadecanoic acid. The sample has then beenimmersed in the ferri-ferrocyanide etch solution for 15 minutes.It can be seen that the gold has been removed from the oxidizedregions, leading to the formation of two trenches that havewidths very similar to those of the features created by SNP(50 nm) and which are 30 nm deep, indicating the complete
removal of the gold film from those areas. This result illustratesthat SNP offers potential for the fabrication of three-dimensional nanostructures, as well as chemical patterns,suggesting it may be a versatile tool for the construction of awide range of nanoscale structures.
Conclusions
Using a UV laser coupled to a SNOM, we have demonstratedthat it is possible to routinely fabricate structures in SAMs thatare substantially smaller than the diffraction limit of λ/2.Routinely we have achieved linewidths of λ/6, and on occasionswe have achieved λ/10. SNP facilitates not only the patterningof surface chemical structure, but also the creation of three-dimensional nanostructures by combination with suitableetching methods. Photochemical methods provide powerful andflexible routes to the immobilization of biological molecules atsurfaces, and the data presented here demonstrate that thesemethods may now be utilized in the creation of biologicalnanostructures through the application of SNP. SNP thusappears to be a valuable new tool for use in nanofabrication andwe expect it to find widespread utility in biologicalnanotechnology, molecular electronics and other fields wheresmall-scale control of chemistry and structure is critical.
Acknowledgements
The authors are grateful to the Laser Loan Pool for three loansof a frequency doubled argon ion laser, and to EPSRC forfinancial support.
References
1. Y. Xia and G. M. Whitesides, Angew. Chem. Int. Ed. 37,550 (1998).
2. E. Cooper and G. J. Leggett, Langmuir 15, 1024 (1999).
3. J. Huang and J. C. Hemminger, J. Am. Chem. Soc. 115,3342 (1993); N. J. Brewer, R. E. Rawsterne, S. Kothariand G. J. Leggett, J. Am. Chem. Soc. 123, 4089 (2001).
4. M. J. Tarlov, D. R. F. Burgess and G. Gillen, J. Am.Chem. Soc. 115, 5305 (1993).
5. S. Sun, K. S. L. Chong and G. J. Leggett, J. Am. Chem.Soc. 124, 2414 (2002).
6. Y. Xia, X.-M. Zhao, E. Kim and G. M. Whitesides, Chem.Mater. 7, 2332 (1995).
HS(CH2)10COOH
40 nm
HS(CH2)11CH3
Figure 5. AFM topographical image showing a SAM of mercaptohexadecanoic acid, followingthe writing of two lines by SNP and immersion in a ferri/ferrocyanide etch solution.

Lasers for Science Facility Programme - Physics
Central Laser Facility Annual Report 2001/2002 152
Introduction
Although the previous version of the laboratory x-raymicroscope1) was successful in obtaining images of testspecimens, its performance was compromised by severallimitations. These included the following.
• The image acquisition time should, ideally, be limited bythe repetition rate of the laser used to form the x-ray sourceplasma. However, the best scan rate that was achieved was≈1 Hz; this was because the scanning was done by movingthe tape target mechanism using stepper motors, and thelarge mass that had to be moved resulted in a long settlingtime.
• The alignment of the x-ray optical elements (zone plateand order-selecting aperture) was done using manuallydriven stages, resulting in a tedious and lengthy procedure.
• The x-ray beam was taken off in a horizontal direction,leading to vertical specimen mounting. This was a left-over from synchrotron based microscopes, and is clearlynot ideal for hydrated specimens.
• The image resolution should have been ≈0.2 µm, with themajor contribution coming from the demagnified sourcesize. However, the best that was achieved was ≈0.4 µm,due to vibrations and (primarily) electrical noise in thedetector2).
In order to overcome these limitations several potentialimprovements to the x-ray microscope are planned, and some ofthese have been tested as described below. Two which do notneed further discussion here are the motorisation of all movablecomponents and the minimisation of vibrations using anisolation table.
Beam Scanning
In order to overcome the limitation on scanning speed, sourcescanning will be replaced by beam scanning using galvanometermirrors. This still moves the source point, keeping the specimenstationary as in the original concept of the scanned sourcemicroscope1), but a lot less mass needs to be moved. For ahorizontal beam, when the tape surface is vertical, twoorthogonal mirrors are used, each scanning at up to 800 Hz (fora vertical beam, this has to be modified slightly, as describedbelow). The imaging time is thus determined by the laserrepetition rate, as required. The full angular range of the mirrorsis ±30°, but for a 20 µm field of view, which is typical in x-raymicroscopy, the range is only ±1°. Over this range the rotationsare essentially hysteresis free and so a “snake” scan pattern canbe used, rather than raster scanning, eliminating fly-back timeand thus allowing faster imaging. The noise on the rotations is≈15 µrad which, allowing for demagnification by the zoneplate, corresponds to a step of ≈8.5 nm on the specimen; thisdoes not degrade the image resolution to any significant extent.
Horizontal Specimen Mounting
All synchrotron-based x-ray microscopes use horizontal x-raybeams and therefore vertical specimen mounting. This isbecause x-ray reflection through 90°, requiring a mirror tooperate at 45° incidence angle, is extremely inefficient evenusing multilayer mirrors. However, with a laser-plasma source
it is relatively simple to tilt the target surface to allow x-rays tobe observed in the vertical direction. A modification to thepreviously used tape target drive has shown that this is feasible,without affecting the tape driving, and a new drive is now beingdesigned to incorporate this.
Using a vertical beam does have one implication for the designof the scanning mechanism. Scanning the laser beam along theslope direction of the target surface would cause the beam to goout of focus, requiring a (slow) mechanical step to refocus it.The scan range would also be limited by the width of the tape.Since a mechanical step is needed in any case, the mirror scan isredundant, and so in this configuration the slow scan directionwill be performed using a stepper motor to move the target andfocusing lens together. The target drive will be made lighterthan before, and a settling time τ of a few milliseconds shouldbe achieved. For an N×N image this will only increase theimaging time by Nτ ms, small compared to the total imagingtime.
With a horizontal beam the x-ray microscope is at an angle of45° to the incoming laser beam, so that the target surface is setat an angle of 22.5° to the beam. For a vertical beam themicroscope axis is at 90° to the laser beam, which could resultin a different distribution of spectral intensity. Spectra in thetwo directions, from a Mylar tape target, have therefore beentaken with a transmission grating spectrometer3).
Unfortunately it was not possible to compare these directly,since a grating which had lasted over 130,000 laser shots in thehorizontal direction broke almost immediately when thespectrometer was moved to the vertical direction. At first thiswas thought to be due to chance, but another grating and then amembrane also broke very quickly. This suggests that the debrisis enhanced in the vertical direction, which could be due to thevertical polarisation of the laser beam or to the beam profile.Subsequent experiments, currently being analysed, have beencarried out to characterise this. It should be noted that the debriswill not be a problem for microscopy since the spectrometergrating was much closer (12 cm) to the source than the vacuumwindow prior to the zone plate (40 cm) for microscopy. It willstill be important to minimise debris, however, for a highrepetition rate source as the dust cloud which builds up aroundthe source point has to be cleared before the next laser pulsesince it causes the focused beam to expand. This leads to a
Progress with the King’s College Laboratory Scanning X-Ray Microscope
A G Michette, S J Pfauntsch, A K Powell, T Graf, D Losinski, C D McFaul
Department of Physics, King’s College London, Strand, UK
G J Hirst, W Shaikh
Central Laser Facility, CLRC Rutherford Appleton Laboratory, Chilton, Didcot, Oxon, OX11 0QX, UK
Main contact email address: [email protected]
2 2.5 3 3.5 4Wavelength [nm]
Inte
nsit
y [a
u] C Heα
C Lyαvertical
horizontal×
Ti Filter
Figure 1. Comparison of vertical and horizontal spectra from aMylar tape target.
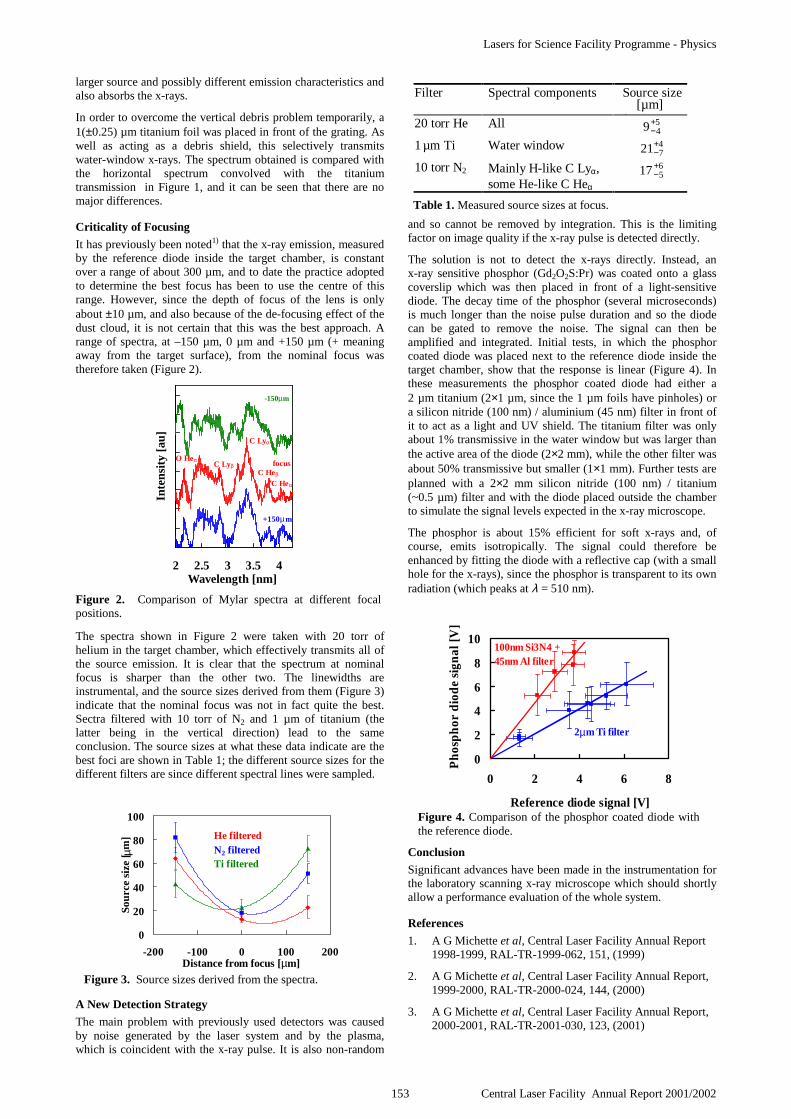
Lasers for Science Facility Programme - Physics
153 Central Laser Facility Annual Report 2001/2002
larger source and possibly different emission characteristics andalso absorbs the x-rays.
In order to overcome the vertical debris problem temporarily, a1(±0.25) µm titanium foil was placed in front of the grating. Aswell as acting as a debris shield, this selectively transmitswater-window x-rays. The spectrum obtained is compared withthe horizontal spectrum convolved with the titaniumtransmission in Figure 1, and it can be seen that there are nomajor differences.
Criticality of Focusing
It has previously been noted1) that the x-ray emission, measuredby the reference diode inside the target chamber, is constantover a range of about 300 µm, and to date the practice adoptedto determine the best focus has been to use the centre of thisrange. However, since the depth of focus of the lens is onlyabout ±10 µm, and also because of the de-focusing effect of thedust cloud, it is not certain that this was the best approach. Arange of spectra, at –150 µm, 0 µm and +150 µm (+ meaningaway from the target surface), from the nominal focus wastherefore taken (Figure 2).
The spectra shown in Figure 2 were taken with 20 torr ofhelium in the target chamber, which effectively transmits all ofthe source emission. It is clear that the spectrum at nominalfocus is sharper than the other two. The linewidths areinstrumental, and the source sizes derived from them (Figure 3)indicate that the nominal focus was not in fact quite the best.Sectra filtered with 10 torr of N2 and 1 µm of titanium (thelatter being in the vertical direction) lead to the sameconclusion. The source sizes at what these data indicate are thebest foci are shown in Table 1; the different source sizes for thedifferent filters are since different spectral lines were sampled.
A New Detection Strategy
The main problem with previously used detectors was causedby noise generated by the laser system and by the plasma,which is coincident with the x-ray pulse. It is also non-random
and so cannot be removed by integration. This is the limitingfactor on image quality if the x-ray pulse is detected directly.
The solution is not to detect the x-rays directly. Instead, anx-ray sensitive phosphor (Gd2O2S:Pr) was coated onto a glasscoverslip which was then placed in front of a light-sensitivediode. The decay time of the phosphor (several microseconds)is much longer than the noise pulse duration and so the diodecan be gated to remove the noise. The signal can then beamplified and integrated. Initial tests, in which the phosphorcoated diode was placed next to the reference diode inside thetarget chamber, show that the response is linear (Figure 4). Inthese measurements the phosphor coated diode had either a2 µm titanium (2×1 µm, since the 1 µm foils have pinholes) ora silicon nitride (100 nm) / aluminium (45 nm) filter in front ofit to act as a light and UV shield. The titanium filter was onlyabout 1% transmissive in the water window but was larger thanthe active area of the diode (2×2 mm), while the other filter wasabout 50% transmissive but smaller (1×1 mm). Further tests areplanned with a 2×2 mm silicon nitride (100 nm) / titanium(~0.5 µm) filter and with the diode placed outside the chamberto simulate the signal levels expected in the x-ray microscope.
The phosphor is about 15% efficient for soft x-rays and, ofcourse, emits isotropically. The signal could therefore beenhanced by fitting the diode with a reflective cap (with a smallhole for the x-rays), since the phosphor is transparent to its ownradiation (which peaks at λ = 510 nm).
Conclusion
Significant advances have been made in the instrumentation forthe laboratory scanning x-ray microscope which should shortlyallow a performance evaluation of the whole system.
References
1. A G Michette et al, Central Laser Facility Annual Report1998-1999, RAL-TR-1999-062, 151, (1999)
2. A G Michette et al, Central Laser Facility Annual Report,1999-2000, RAL-TR-2000-024, 144, (2000)
3. A G Michette et al, Central Laser Facility Annual Report,2000-2001, RAL-TR-2001-030, 123, (2001)
2 2.5 3 3.5 4Wavelength [nm]
Inte
nsit
y [a
u]
-150µm
+150µm
focus
C Lyα
C LyβO Heα
C Heα
C Heβ
*
Figure 2. Comparison of Mylar spectra at different focalpositions.
0
20
40
60
80
100
-200 -100 0 100 200Distance from focus [µm]
Sour
ce s
ize
[ µm
] He filteredN2 filteredTi filtered
Figure 3. Source sizes derived from the spectra.
Table 2. Measured source sizesFilter Spectral components Source size
[µm]20 torr He All 5
49+−
1 µm Ti Water window 4721+
−
10 torr N2 Mainly H-like C Lyα,some He-like C Heα
6517+
−
[µm]
Table 1. Measured source sizes at focus.
0
2
4
6
8
10
0 2 4 6 8
Reference diode signal [V]
Pho
sph
or d
iod
e si
gnal
[V]
2µm Ti filter
100nm Si3N4 +45nm Al filter
Figure 4. Comparison of the phosphor coated diode withthe reference diode.
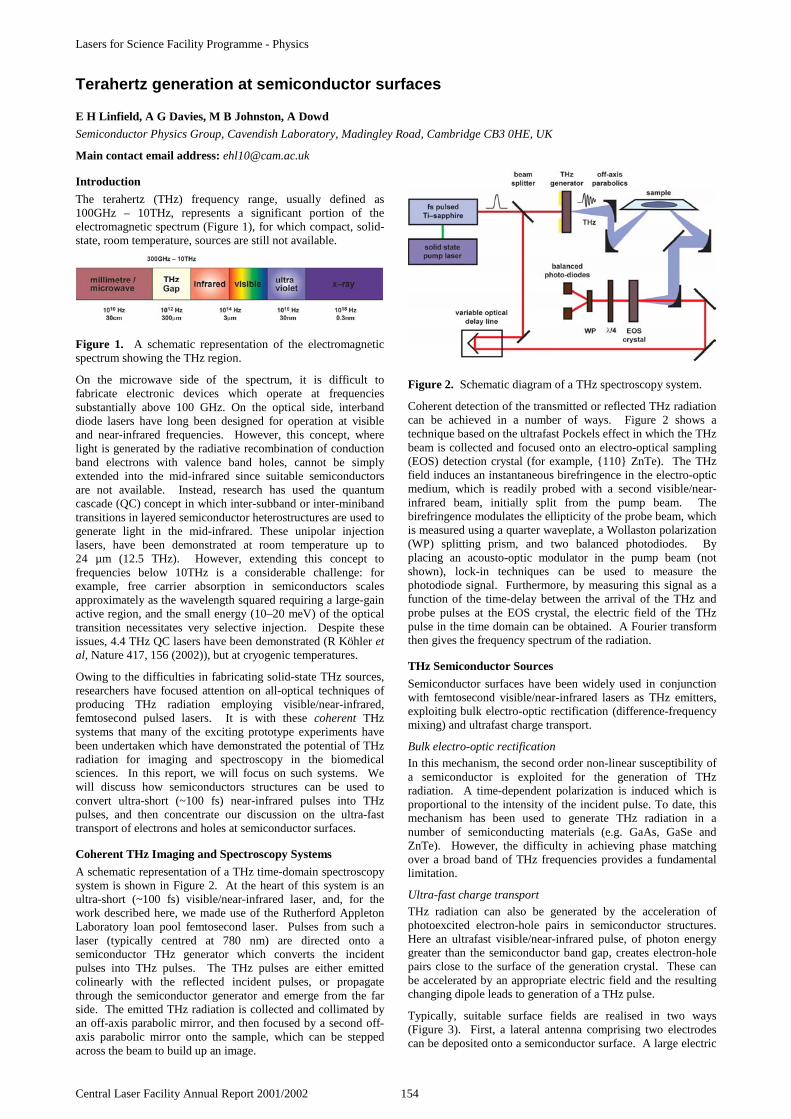
Lasers for Science Facility Programme - Physics
Central Laser Facility Annual Report 2001/2002 154
Introduction
The terahertz (THz) frequency range, usually defined as100GHz – 10THz, represents a significant portion of theelectromagnetic spectrum (Figure 1), for which compact, solid-state, room temperature, sources are still not available.
Figure 1. A schematic representation of the electromagneticspectrum showing the THz region.
On the microwave side of the spectrum, it is difficult tofabricate electronic devices which operate at frequenciessubstantially above 100 GHz. On the optical side, interbanddiode lasers have long been designed for operation at visibleand near-infrared frequencies. However, this concept, wherelight is generated by the radiative recombination of conductionband electrons with valence band holes, cannot be simplyextended into the mid-infrared since suitable semiconductorsare not available. Instead, research has used the quantumcascade (QC) concept in which inter-subband or inter-minibandtransitions in layered semiconductor heterostructures are used togenerate light in the mid-infrared. These unipolar injectionlasers, have been demonstrated at room temperature up to24 µm (12.5 THz). However, extending this concept tofrequencies below 10THz is a considerable challenge: forexample, free carrier absorption in semiconductors scalesapproximately as the wavelength squared requiring a large-gainactive region, and the small energy (10–20 meV) of the opticaltransition necessitates very selective injection. Despite theseissues, 4.4 THz QC lasers have been demonstrated (R Köhler etal, Nature 417, 156 (2002)), but at cryogenic temperatures.
Owing to the difficulties in fabricating solid-state THz sources,researchers have focused attention on all-optical techniques ofproducing THz radiation employing visible/near-infrared,femtosecond pulsed lasers. It is with these coherent THzsystems that many of the exciting prototype experiments havebeen undertaken which have demonstrated the potential of THzradiation for imaging and spectroscopy in the biomedicalsciences. In this report, we will focus on such systems. Wewill discuss how semiconductors structures can be used toconvert ultra-short (~100 fs) near-infrared pulses into THzpulses, and then concentrate our discussion on the ultra-fasttransport of electrons and holes at semiconductor surfaces.
Coherent THz Imaging and Spectroscopy Systems
A schematic representation of a THz time-domain spectroscopysystem is shown in Figure 2. At the heart of this system is anultra-short (~100 fs) visible/near-infrared laser, and, for thework described here, we made use of the Rutherford AppletonLaboratory loan pool femtosecond laser. Pulses from such alaser (typically centred at 780 nm) are directed onto asemiconductor THz generator which converts the incidentpulses into THz pulses. The THz pulses are either emittedcolinearly with the reflected incident pulses, or propagatethrough the semiconductor generator and emerge from the farside. The emitted THz radiation is collected and collimated byan off-axis parabolic mirror, and then focused by a second off-axis parabolic mirror onto the sample, which can be steppedacross the beam to build up an image.
Figure 2. Schematic diagram of a THz spectroscopy system.
Coherent detection of the transmitted or reflected THz radiationcan be achieved in a number of ways. Figure 2 shows atechnique based on the ultrafast Pockels effect in which the THzbeam is collected and focused onto an electro-optical sampling(EOS) detection crystal (for example, 110 ZnTe). The THzfield induces an instantaneous birefringence in the electro-opticmedium, which is readily probed with a second visible/near-infrared beam, initially split from the pump beam. Thebirefringence modulates the ellipticity of the probe beam, whichis measured using a quarter waveplate, a Wollaston polarization(WP) splitting prism, and two balanced photodiodes. Byplacing an acousto-optic modulator in the pump beam (notshown), lock-in techniques can be used to measure thephotodiode signal. Furthermore, by measuring this signal as afunction of the time-delay between the arrival of the THz andprobe pulses at the EOS crystal, the electric field of the THzpulse in the time domain can be obtained. A Fourier transformthen gives the frequency spectrum of the radiation.
THz Semiconductor Sources
Semiconductor surfaces have been widely used in conjunctionwith femtosecond visible/near-infrared lasers as THz emitters,exploiting bulk electro-optic rectification (difference-frequencymixing) and ultrafast charge transport.
Bulk electro-optic rectification
In this mechanism, the second order non-linear susceptibility ofa semiconductor is exploited for the generation of THzradiation. A time-dependent polarization is induced which isproportional to the intensity of the incident pulse. To date, thismechanism has been used to generate THz radiation in anumber of semiconducting materials (e.g. GaAs, GaSe andZnTe). However, the difficulty in achieving phase matchingover a broad band of THz frequencies provides a fundamentallimitation.
Ultra-fast charge transport
THz radiation can also be generated by the acceleration ofphotoexcited electron-hole pairs in semiconductor structures.Here an ultrafast visible/near-infrared pulse, of photon energygreater than the semiconductor band gap, creates electron-holepairs close to the surface of the generation crystal. These canbe accelerated by an appropriate electric field and the resultingchanging dipole leads to generation of a THz pulse.
Typically, suitable surface fields are realised in two ways(Figure 3). First, a lateral antenna comprising two electrodescan be deposited onto a semiconductor surface. A large electric
Terahertz generation at semiconductor surfaces
E H Linfield, A G Davies, M B Johnston, A Dowd
Semiconductor Physics Group, Cavendish Laboratory, Madingley Road, Cambridge CB3 0HE, UK
Main contact email address: [email protected]
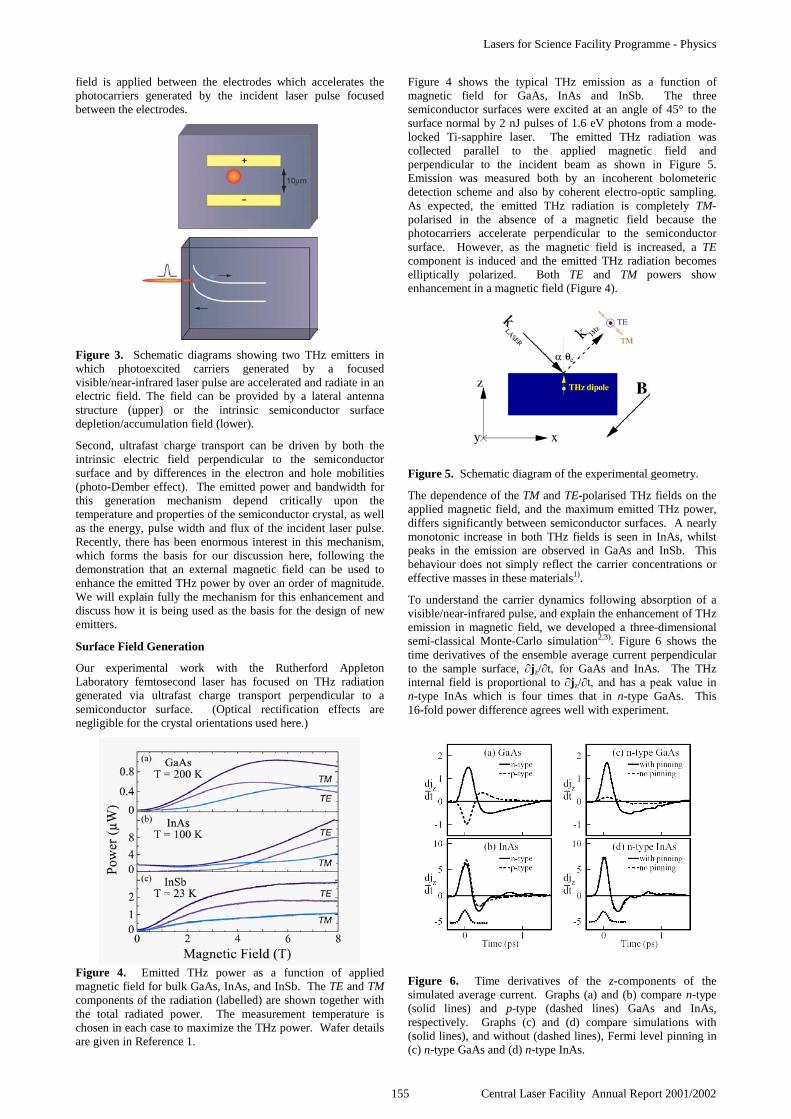
Lasers for Science Facility Programme - Physics
155 Central Laser Facility Annual Report 2001/2002
field is applied between the electrodes which accelerates thephotocarriers generated by the incident laser pulse focusedbetween the electrodes.
Figure 3. Schematic diagrams showing two THz emitters inwhich photoexcited carriers generated by a focusedvisible/near-infrared laser pulse are accelerated and radiate in anelectric field. The field can be provided by a lateral antennastructure (upper) or the intrinsic semiconductor surfacedepletion/accumulation field (lower).
Second, ultrafast charge transport can be driven by both theintrinsic electric field perpendicular to the semiconductorsurface and by differences in the electron and hole mobilities(photo-Dember effect). The emitted power and bandwidth forthis generation mechanism depend critically upon thetemperature and properties of the semiconductor crystal, as wellas the energy, pulse width and flux of the incident laser pulse.Recently, there has been enormous interest in this mechanism,which forms the basis for our discussion here, following thedemonstration that an external magnetic field can be used toenhance the emitted THz power by over an order of magnitude.We will explain fully the mechanism for this enhancement anddiscuss how it is being used as the basis for the design of newemitters.
Surface Field Generation
Our experimental work with the Rutherford AppletonLaboratory femtosecond laser has focused on THz radiationgenerated via ultrafast charge transport perpendicular to asemiconductor surface. (Optical rectification effects arenegligible for the crystal orientations used here.)
Figure 4. Emitted THz power as a function of appliedmagnetic field for bulk GaAs, InAs, and InSb. The TE and TMcomponents of the radiation (labelled) are shown together withthe total radiated power. The measurement temperature ischosen in each case to maximize the THz power. Wafer detailsare given in Reference 1.
Figure 4 shows the typical THz emission as a function ofmagnetic field for GaAs, InAs and InSb. The threesemiconductor surfaces were excited at an angle of 45° to thesurface normal by 2 nJ pulses of 1.6 eV photons from a mode-locked Ti-sapphire laser. The emitted THz radiation wascollected parallel to the applied magnetic field andperpendicular to the incident beam as shown in Figure 5.Emission was measured both by an incoherent bolometericdetection scheme and also by coherent electro-optic sampling.As expected, the emitted THz radiation is completely TM-polarised in the absence of a magnetic field because thephotocarriers accelerate perpendicular to the semiconductorsurface. However, as the magnetic field is increased, a TEcomponent is induced and the emitted THz radiation becomeselliptically polarized. Both TE and TM powers showenhancement in a magnetic field (Figure 4).
Figure 5. Schematic diagram of the experimental geometry.
The dependence of the TM and TE-polarised THz fields on theapplied magnetic field, and the maximum emitted THz power,differs significantly between semiconductor surfaces. A nearlymonotonic increase in both THz fields is seen in InAs, whilstpeaks in the emission are observed in GaAs and InSb. Thisbehaviour does not simply reflect the carrier concentrations oreffective masses in these materials1).
To understand the carrier dynamics following absorption of avisible/near-infrared pulse, and explain the enhancement of THzemission in magnetic field, we developed a three-dimensionalsemi-classical Monte-Carlo simulation2,3). Figure 6 shows thetime derivatives of the ensemble average current perpendicularto the sample surface, jz/ GaAs and InAs. The THzinternal field is proportional to jz/ inn-type InAs which is four times that in n-type GaAs. This16-fold power difference agrees well with experiment.
Figure 6. Time derivatives of the z-components of thesimulated average current. Graphs (a) and (b) compare n-type(solid lines) and p-type (dashed lines) GaAs and InAs,respectively. Graphs (c) and (d) compare simulations with(solid lines), and without (dashed lines), Fermi level pinning in(c) n-type GaAs and (d) n-type InAs.

Lasers for Science Facility Programme - Physics
Central Laser Facility Annual Report 2001/2002 156
If the semiconductor surface energy bands lie within the bulkbandgap, Fermi level pinning and band-bending occur, leadingto the formation of a surface depletion or accumulation region.The resulting electric field will separate photo-excited electronsand holes, forming a dipole perpendicular to the surface that canemit THz radiation. By changing from n-type to p-type doping,the field direction is reversed producing a change in dipolepolarity and hence a change in sign of the THz transient.
A photo-Dember field can also occur at a semiconductorsurface after photoexcitation. In a typical semiconductor,electrons have a larger diffusion coefficient than holes. Afterphoto-excitation, the electron population diffuses more rapidlythan the hole population but in the absence of a surfaceboundary, there is no net dipole field, since the centre of chargedoes not change. In the vicinity of the surface, however,reflection or capture causes the net electron and hole chargecentres to move away from the surface. The greater diffusivityof the electrons produces a perpendicular dipole which leads toTHz emission. Now, changing the semiconductor doping fromn- to p-type has no effect on the sign of the emitted THz pulse.
These simulations reproduce the larger THz electric-fieldamplitudes (and hence powers) observed experimentally inInAs when compared with GaAs, and demonstrate that InAs isprimarily a photo-Dember emitter while GaAs is primarily asurface field emitter.
In order to explain the dramatic enhancement of THz emissionwith magnetic field (Figure 4), We modeled the carrierdynamics for both InAs and GaAs in magnetic fields rangingfrom 0 to 8 T, and calculated the amplitude and three-dimensional orientation of the THz emitting dipole2,3). Thecoupling of the radiation out of the semiconductor is stronglyaffected by the dipole orientation with respect to thesemiconductor surface.
Figure 7. Three spatial components of the time derivative ofaverage current density for n-type (a) GaAs and (b) InAs atB = 0 T (dashed lines) and B = 8 T (solid lines). The dottedcurve represents the intensity profile of the exciting laser pulse.The vertical axis range in (b) is 4x that of (a).
Figures 7(a) and 7(b) show the simulated time derivatives of thecurrent densities in n-type GaAs and n-type InAs, respectively,during and after photoexcitation. The dashed lines show thesituation with no magnetic field present. In this case, the onlynet acceleration of carriers (j/the only asymmetries in the system are the surface boundaryand surface electric field, both of which are rotationallysymmetric about the z-axis. The solid lines represent asimulation with a magnetic field of 8 T. Although there is littlechange to the strength of the dipole as the magnetic field isincreased, the x and y components of j/ Lorentz force produces a net acceleration of carriers in the x-yplane and rotates the THz dipole. This is much less pronounced
in InAs compared with GaAs, because inter-valley scattering isa much more important electron scattering process in InAs thanin GaAs. The large effective mass of electrons scattered intothe L valleys then limits the rotation of the photogenerateddipole, and hence the relative magnitude of the lateral j/components.
In order to be measured in free space, the THz radiationgenerated within the semiconductor of refractive index nI ~ 3.5must be transmitted into a medium of refractive index ne ~ 1.0.It is clear that any radiation generated outside a cone of aboutθi < 17° (measured from the surface normal) will be totallyinternally reflected. Fresnel transmission coefficients were usedto calculate the emission pattern resulting from radiationgenerated within this cone2,3,4).
Figure 8. Calculated polar radiation patterns for GaAs at(a) B = 0 T and (b) B = 8 T. The horizontal lines represent thesemiconductor surface. The ‘bow tie’ pattern below the surfaceshows the radiation within the semiconductor; the pattern abovethe surface shows the free-space emission. The vector Bindicates the magnitude field direction.
Figure 8(a) shows the ‘bow-tie’ radiation pattern of the powerproduced inside the GaAs at B = 0 T, together with the radiationpattern emitted from GaAs into free space. The amount ofradiation emitted is very low because of the small overlapbetween the (shaded) emission cone and the internal radiationpattern. Figure 8(b) shows the situation at B = 8 T. Theinternal radiation pattern shows the rotation of the TM-emittingTHz dipole from being parallel to the z-axis to beingapproximately perpendicular to the magnetic-field vector. A TEcomponent also emerges. In this case there is now considerableoverlap between the internal radiation pattern and the emissioncone, and hence the corresponding free-space radiation patternis much larger. For InAs, there is only a small rotation of theTHz dipole (not shown) and hence the enhancement of the free-space radiation is much less. The enhancement in total THzpower emitted at θe = 45° between 0 and 8 T has been measuredexperimentally to be 35x for GaAs and 8x for InAs. Here, thecalculated values are 15x and 4x, respectively. These resultsare in reasonable agreement considering the simplicity of thesemi-classical simulation, and possible differences between theexperimental and simulation parameters.
To confirm further our interpretation of the experimentalresults, we have calculated the expected radiation pattern from(100) InAs in the absence of an applied magnetic field as theangle of incident optical pulse and detected THz radiation arealtered. Figure 9 shows the experimentally measured THzradiation patterns, as the incident laser pulse is progressivelyfocused to a spot size of 80 same order as the wavelength of the emitted THz radiation, andhence the dipole acts as a point source, as assumed in thetheoretical simulations.

Lasers for Science Facility Programme - Physics
157 Central Laser Facility Annual Report 2001/2002
Figure 9. Schematic diagram and results for an experiment inwhich emitted THz radiation is measured as a function of theoptical pulse incidence angle and the THz detection angle forbulk InAs at 300K. Results are shown for three differentfocusing conditions of the incident optical pulse. Red and bluerepresent high and low signals respectively.
From the 80 micron data, a polar plot of the experimental datais obtained, Figure 10, in which the incident optical pulse anddetected THz radiation angles are altered concurrently tomaintain a reflection geometry. Excellent agreement betweentheory and experiment is obtained1).
Figure 10. Calculated (blue) and measured (red) polarradiation patterns for InAs at B = 0 T. The line at 45°represents the detection direction used in the magnetic fieldstudies (Figure 4).
Figure 11. Polar radiation patterns from InAs on GaAsemitters excited with a 920nm femtosecond pulse. The incidentradiation (being below the GaAs band gap) passes through theGaAs and excites a THz dipole in the InAs layer. The resultingTHz emission is collected with much greater efficiency with aprism (b) rather than planar (a) geometry. This is seen in theexperimentally measured radiation patterns (red).
Having obtained a good understanding of the THz generationmechanism in bulk semiconductors, and the origin of theobserved enhancement in a magnetic field, we proceeded to
design a new type of emitter based on a prism4,5,6) , Figure 11.Excitation was achieved using a 920nm optical pulse whichwould pass through the GaAs without adsorption, but was thenadsorbed in the underlying InAs layer. Use of a prism geometryallows a far more effective coupling of the dipole radiation outof the THz emitter, and this is reflected by the measured polarradiation patterns given in Figure 11. This new technique hasbeen both published and patented by the investigators. We havealso investigated grating patterning the semiconductor surfaceas a means of improving the outcoupling of THz radiation7,8).
Conclusions
We have discussed THz radiation from semiconductor surfacesexcited by ultra-fast optical pulses9). Through a semiclassicalMonte Carlo model, we have shown that the primary THzemission mechanism from InAs is based on the photo-Dembereffect, whilst surface depletion fields dominate in GaAs2,3). Theeffect of magnetic field on these systems has been calculatedand the observed enhancement of THz power with magneticfield found to be predominantly caused by a reorientation of theTHz dipole with respect to the surface dielectric boundary,rather than by an increase in the dipole strength1). Oncetransmission through the semiconductor-air dielectric interfaceis considered, the experimentally observed enhancement inemission is reproduced. These results suggested that a magneticfield was not necessary to obtain an order-of-magnitudeenhancement in THz power, and a similar enhancement wasproduced by modifying the dipole orientation with respect tothe dielectric–air interface using a prism4,5,6).
Acknowledgements
AGD and EHL acknowledge the support of the Royal Societyand Toshiba Research Europe Limited, respectively. This workwas supported by EPSRC (UK), and we gratefully acknowledgethe loan of a femtosecond laser system by the RutherfordAppleton Laboratory.
References
1. M B Johnston, A Corchia, A Dowd, E H Linfield, A GDavies, R McLaughlin, D D Arnone, and M Pepper,Physica E, 13 896, (2002)
2. M B Johnston, D M Whittaker, A Corchia, A G Davies,and E H Linfield, J. Appl. Phys. 91 2104, (2002)
3. M B Johnston, D M Whittaker, A Corchia, A G Davies,and E H Linfield. Phys. Rev. B 65 165301, (2002)
4. M B Johnston, D M Whittaker, A Dowd, A G Davies, E HLinfield, X Li, and D A Ritchie, in press (Optics Letters)
5. D M Whittaker, M B Johnston, A Corchia, A Dowd, A GDavies, and E H Linfield, to be published in theproceedings of ICPS (2002)
6. M B Johnston, D M Whittaker, A Dowd, A G Davies andE H Linfield, poster presentation at the Tenth IEEEInternational Conference on THz Electronics, and to bepublished in the IEEE proceedings.
7. A Dowd, M B Johnston, D M Whittaker, S Vijendran, A GDavies, and E H Linfield, to be published in theproceedings of ICPS (2002)
8. A Dowd, M B Johnston, D M Whittaker, A G Davies andE H Linfield, oral presentation at the Tenth IEEEInternational Conference on THz Electronics, and to bepublished in the IEEE proceedings.
9. A G Davies, E H Linfield and M B Johnston, to bepublished in J. Phys. Med. Biol.

Lasers for Science Facility Programme - Physics
Central Laser Facility Annual Report 2001/2002 158
Introduction
The Displays Research Group at Nottingham Trent Universityhas been working with the LSF since 1997 to investigateexcimer laser processing of thin films suitable for use in flatscreen display applications. Initial work, funded by the EPSRC,demonstrated the feasibility of using pulsed laser annealing toenhance the luminescence of thin film ZnS:Mn phosphors foruse in miniature high intensity displays. Following this earlywork, the investigations have progressed to include thin filmphosphors used in mid-size instrumentation display panels, withthe result being the demonstration of a technique for phosphorprocessing that could be suitable for large volume manufacture.More recently, access to the NSL5 fluoride laser via the LSFLoan Pool has facilitated the investigation of laser processingfor alternative wide band-gap thin film phosphors andcathodoluminescent phosphors. This report presents the initialresults from the work performed at NTU using the Loan PoolNSL5 laser.
Background
In the field of emissive flat panel displays, thin filmelectroluminescence (TFEL) is a technology that has been asubject of commercial and scientific interest for over 4 decades.Display panels based on this technology have been utilisedwhere ruggedness, reliability, high contrast, and high viewingangles are required; such as in medical, transport, and militaryapplications. In a novel TFEL device configuration, reflectedlateral emission from TFEL devices has been shown byresearch at Nottingham Trent University (NTU) to demonstratethe feasibility of high intensity luminous emission from fixedlegend miniature displays 1). These laterally emitting thin filmelectroluminescent (LETFEL) displays are intended for use inlow cost see-through head mounted systems, where luminancesin excess of 3000cdm-2 are required, but without the need for afull graphics display. Realisation of these high luminancesrelies upon optimising the internal light generation processes ofTFEL devices by optimising the materials processing of theconstituent thin films.
At the heart of these LETFEL, and indeed all inorganicemissive displays, is a light emitting layer composed of a wideband-gap polycrystalline phosphor. Phosphors underinvestigation at NTU include thin films of ZnS:Mn (3.68eV),SrS:Cu,Ag and SrS:Ce (4.4eV), and Y2O3:Eu (5.9eV). Eachof these materials is of interest for TFEL display applications,although the primary research area for the Y2O3 basedphosphor is for a light emitting thermographic sensor. Inaddition, thin films phosphors such as ZnS:Cu are underinvestigation for cathodoluminescent display applications - suchas night vision and image intensifiers.
Prior Work with The LSF
Critical to the luminescent efficiency of a TFEL device is anannealing treatment, which allows for the effectiveincorporation of luminescent dopant ions within the host lattice(activation). Commercial TFEL devices are typically fabricatedon glass substrates and are subjected to a post deposition annealat 500ºC for ~ 1hr. Since 1997, EPSRC funded work at theLSF has demonstrated that pulsed laser annealing using a highenergy flouride excimer laser is an effective means of activatingthe phosphor by achieving significantly higher temperatureslocalised to the phosphor thin film 2). It is a combination of thehigher processing temperatures attained and the localisation ofthe heat dissipation to within the phosphor layer that leads to a
major enhancement in phosphor performance. This is due tothe joint requirement for the phosphor layer to act as a lightemitting material, and as the electron transport medium forluminescent excitation. High annealing temperatures arerequired to form an efficient phosphor, but the annealingprocess is detrimental to the electron emission process thatprovides the source of excitation. By localising the annealingeffect to the light generating region, excimer laser processinghas been demonstrated to be a viable means of spatiallyseparating the optimisation of the light generating and electronemitting regions of a TFEL structure. Devices incorporating aZnS:Mn thin film phosphor were subjected to 20ns pulses ofKrF Excimer laser irradiation at 248nm. The optical systemsused for beam delivery provided variable energy densities from300-1500mJ/cm2. At 248nm, the absorption coefficient of ZnShas been determined to be 3.33x105 cm-1 for crystalline ZnS and3.15x105 cm-1 for polycrystalline ZnS:Mn thin films, hence theenergy absorption is contained within ~ 300nm of the thin filmsurface. This initial work was undertaken at the x-raylaboratory of the LSF, with the help of Graeme Hirst and histeam. Additional work on this system was used to demonstratea potential scanning technique for larger area irradiation ofZnS:Mn based TFEL panels.
Colour Displays
ZnS:Mn is an efficient EL phosphor, but is limited to broad-band yellow emission - hence it is used in the commerciallysuccessful monochrome TFEL displays. Achieving full colourhas historically been a problem for these displays, due to theinefficiency of the blue phosphors. However, with the loan ofthe NSL5 laser to NTU, we have recently demonstrated that thelaser annealing technique is also suitable for this wide band-gapphosphor.
Experimental Technique
For the initial phase of the loan pool work, the phosphorsinvestigated were ZnS:Mn (0.43%), and SrS:Cu,Ag(0.2%,0.4%). ZnS:Mn was investigated to ensure that theresults obtained previously at the x-ray lab at RAL couldconfidently be repeated within the facility at NTU. TheSrS:Cu,Ag phosphor is a potential blue emitting TFEL material.Phosphors were investigated for luminescence viaphotoluminescent (PL) excitation, electroluminescent (EL)excitation, and cathodoluminescent (CL) excitation asappropriate. The NSL5 laser (Lambda Physik LPX 205,248nm/193nm 20ns) was installed within the clean-roomfacility at NTU and the optical arrangement was set up asdescribed previously 2). Samples of thin film phosphors weredeposited by rf-magnetron sputtering and housed in a pressurecell during irradiation to minimise ablation. Various numbersof laser irradiations were used with the fluence varied from 0.3to 1.5 J/cm2, while the samples were in an overpressure of Ar(150 psi). For the PL measurements a UV laser (He-Cd, 326nm,16mW) provided the excitation, an optical fibre collected thegenerated light and directed it to an Ocean Optics (S2000)spectrometer. The EL devices were characterised on a probestation located in a dark enclosure, driven by a sinusoidal waveat 5 kHz with a p-p voltage of 364Volts, and the generated lightwas collected by an optical fibre and fed to the spectrometer.Finally the CL was measured in a vacuum chamber with anelectron beam at 6 kVolts and beam current 0.3mA with thegenerated light being collected and directed to the spectrometervia an optical fibre.
Laser Processing of Thin Film Phosphors for Flat Screen Displays
W M Cranton, D Koutsogeorgis, S Liew, B Nassuna, R Ranson, C B Thomas
The Nottingham Trent University
Main contact email address: [email protected]

Lasers for Science Facility Programme - Physics
159 Central Laser Facility Annual Report 2001/2002
Results and Discussion.
Initial experimentation involved only single laser annealingpulses and the resulting PL and EL improvement for ZnS:Mnthin films is shown in Figure 1. Both curves, demonstratingimprovement, show the same trend, requiring a minimumfluence of ~0.5 J/cm2 (threshold fluence) to induce anyluminescence improvement. This is further enhanced withincreasing the fluence until ~1.2J/cm2 when the improvement issaturated. These results are consistent with previous work,demonstrating the transferability of the technique betweenexperimental systems. The previously reported modelling of thelaser annealing process 3) suggests that with laser annealing thefront surface of the phosphor reaches temperatures in excess of2000ºC, for nanoseconds only, while the back surface, thatforms the interface between the phosphor and the insulator,does not exceed ~500ºC. Hence, the interface states that act asdonors of hot electrons are preserved, since the criticaltemperature is not exceeded. The knee observed at 1.2J/cm2 isattributed to reduction of the phosphor thickness due toprobable ablation 4). Therefore a laser pulse of adequate fluencecan achieve highly localised annealing of the phosphor filmonly.
For the case of EL characterisation, multiple pulse irradiationexperiments (Figure 2) show that one pulse is beneficial but notas significant as two pulses, which showed the bestimprovement at ~1.3J/cm2. Three pulses have proven to bedetrimental for EL, suggesting that two pulses induce a heattreatment that does not reach the back surface of the phosphor,unlike three pulses, which also probably causes excessiveablation. These results extend the information on the processthat has been demonstrated to improve over thermal annealing,producing EL devices of higher luminance and better electricalcharacteristics.
Laser processing of SrS:Cu,Ag based TFEL devices was alsosuccessful - most critically as a viable annealing technique forrf-sputtered films of this phosphor, as compared to thermal andrapid thermal annealing which resulted in unusable films.Thin films were deposited and characterised initially forstructural stability and also luminescence via photoluminescentexcitation. With thermal annealing, at the temperaturesreported as necessary for viable luminescence (up to 800°C 5) ),crazing of the films prevented fabrication of EL devices. Adetailed matrix of deposition and annealing parameters was
investigated, varying the substrate temperature from 100°C to400°C, and with annealing, both thermal and rapid thermal upto 800°C. The result of this study was that reliable filmsexhibiting luminescent behaviour were only achievable at lowdeposition temperatures, up to 200°C, and with no annealing.However for the TFEL devices produced from these films, theluminance was too weak to provide reliable measurements.
Figure 2. Electroluminescence improvement of ZnS:Mn basedTFEL devices with one, two and three laser annealing pulses.Curves normalised to the as-deposited films.
For the laser annealing study, SrS:Cu,Ag thin films, grown at200°C, onto 200nm thick layers of Y2O3, were exposed to 20nspulsed irradiation at varying fluences using the KrF irradiation.Viable TFEL devices were obtained with single pulseirradiation fluences in the range of 0.4 –1.5 Jcm-2. The effectof the higher fluence was to enhance the film crystallinity, asindicated by increased XRD intensity from the SrS (111) peak,which is consistent with the ZnS:Mn crystallinity enhancementdemonstrated previously. Reproducible films for TFEL deviceswere obtained at the higher fluences, which were consequentlyused for the device fabrication used here. Figure 3 shows theblue/green emission spectrum of the EL devices fabricatedusing the laser processing technique.
Finally, laser processing of ZnS:Mn films on glass substratesfor CL applications was investigated, with a similar result to theZnS:Mn EL devices in that one pulse is again beneficial, whiletwo or three show further improvement, although ablationeffects dominate at higher fluences with three pulses. Theresults, shown in Figure 4 clearly demonstrate the enhancement
0
1
2
3
4
5
6
7
8
9
0 0.5 1 1.5 2
Laser fluence (J/cm2)
Lu
min
ance
(a.
u.)
EL
PL
Figure 1. Photo-luminescence and electro-luminescenceimprovement for ZnS:Mn thin films with one laserannealing pulse. Both curves are normalised to the as-deposited film performance.
SrS:Cu,Ag TFEL device EL spectra vs Laser Annealing
0
200
400
600
800
1000
1200
1400
400 450 500 550 600 650 700
Wavelength (nm)
Inte
nsi
ty (
arb
)
Figure 3. EL emission spectra as a function of laserannealing with 248 KrF irradiation for SrS:Cu,AgTFEL devices driven at 640 V pk-Pk
IncreasingFluence
0
1
2
3
4
5
6
7
8
0 300 600 900 1200 150
Fluence (mJ/cm2)
EL
inte
nsi
ty (
a.u
.)
1 Pulse
2 Pulses
3 Pulses

Lasers for Science Facility Programme - Physics
Central Laser Facility Annual Report 2001/2002 160
in CL emission from these thin films as a result of the laserirradiation technique, hence highlighting the potential forapplication to a wide variety of flat screen display materials.Currently, films of ZnS:Cu phosphor are being investigated.This phosphor material is used as the CL screen in imageintensifiers, and thin films are of interest for enhanceduniformity and reduced graininess in the final image which is aproblem with powder based screens used. However, theluminous intensity from thin films has to date been insufficientfor practical applications. Hence, the potential demonstratedhere for luminescent enhancement via laser processing mayhelp to solve this problem.
Additional work currently utilising the loan pool system isconcerned with examining the use of the ArF 193nm emissionfor Y2O3 (5.9eV) based phosphors. Preliminary results areencouraging, once again highlighting the diverse potential ofthis materials processing technique.
References
1. C B Thomas, R Stevens, W M Cranton.; 1996 SIDInternational Symposium. Digest of Technical Papers. FirstEdition. Soc. Inf. Display. 1996, pp.365-9.
2. D.C. Koutsogeorgis, E.A. Mastio, W.M. Cranton and C.B.Thomas. Thin Solid Films, 383, No. 1-2, Feb. 2001, pp.31-33.
3. E.A. Mastio, W.M. Cranton, C.B. Thomas, E. Fogarassy,S. de Unamuno. Pulsed KrF laser annealing of RFsputtered ZnS:Mn thin films. Applied Surface Science,138-139, Jan. 1999, pp. 35-39.
4. E.A. Mastio, E. Fogarassy, W.M. Cranton, C.B. Thomas.Ablation study on pulsed KrF laser annealedelectroluminescent ZnS:Mn/Y2O3 multilayers depositedon Si. Applied Surface Science, 154-155, No. 1-4, Feb.2000, pp. 35-39.
5. H.M. Menkara, W. Park, M.Chaichimansour, T.C. Jones,B.K. Wagner, C.J. Summers, and S.Sun; 4th Int. phosphorConf. / 9th Int. Workshop on EL, Bend (Oregon) ExtendedAbstracts, p. 191 –194.
0
1
2
3
4
5
6
7
8
0 300 600 900 1200 1500
Fluence (mJ/cm2)
CL
in
ten
sity
(a
.u.)
1 pulse
2 pulses
3 pulses
Figure 4. Cathodoluminescence improvement ofZnS:Mn thin films with one, two and three laserannealing pulses. Curves normalised to the as-depositedfilms.
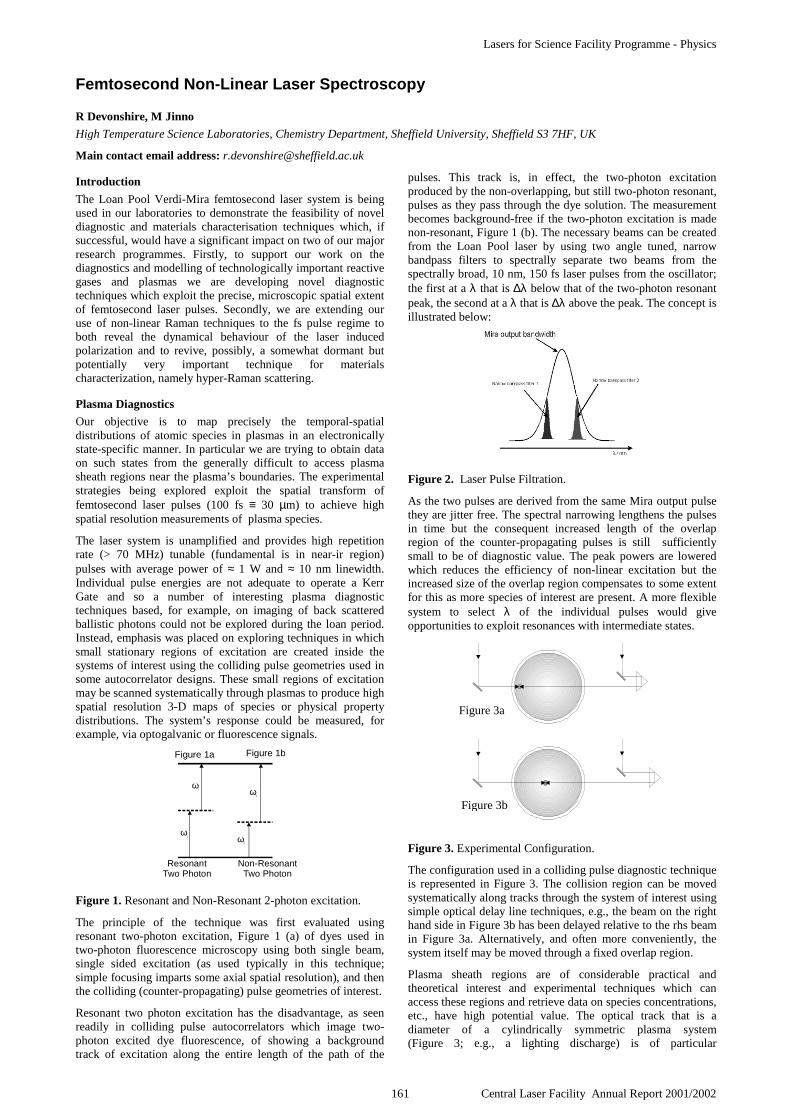
Lasers for Science Facility Programme - Physics
161 Central Laser Facility Annual Report 2001/2002
Introduction
The Loan Pool Verdi-Mira femtosecond laser system is beingused in our laboratories to demonstrate the feasibility of noveldiagnostic and materials characterisation techniques which, ifsuccessful, would have a significant impact on two of our majorresearch programmes. Firstly, to support our work on thediagnostics and modelling of technologically important reactivegases and plasmas we are developing novel diagnostictechniques which exploit the precise, microscopic spatial extentof femtosecond laser pulses. Secondly, we are extending ouruse of non-linear Raman techniques to the fs pulse regime toboth reveal the dynamical behaviour of the laser inducedpolarization and to revive, possibly, a somewhat dormant butpotentially very important technique for materialscharacterization, namely hyper-Raman scattering.
Plasma Diagnostics
Our objective is to map precisely the temporal-spatialdistributions of atomic species in plasmas in an electronicallystate-specific manner. In particular we are trying to obtain dataon such states from the generally difficult to access plasmasheath regions near the plasma’s boundaries. The experimentalstrategies being explored exploit the spatial transform offemtosecond laser pulses (100 fs ≡ 30 µm) to achieve highspatial resolution measurements of plasma species.
The laser system is unamplified and provides high repetitionrate (> 70 MHz) tunable (fundamental is in near-ir region)pulses with average power of ≈ 1 W and ≈ 10 nm linewidth.Individual pulse energies are not adequate to operate a KerrGate and so a number of interesting plasma diagnostictechniques based, for example, on imaging of back scatteredballistic photons could not be explored during the loan period.Instead, emphasis was placed on exploring techniques in whichsmall stationary regions of excitation are created inside thesystems of interest using the colliding pulse geometries used insome autocorrelator designs. These small regions of excitationmay be scanned systematically through plasmas to produce highspatial resolution 3-D maps of species or physical propertydistributions. The system’s response could be measured, forexample, via optogalvanic or fluorescence signals.
ω1
ω1
ω2
ω3
ResonantTwo Photon
Non-ResonantTwo Photon
Figure 1a Figure 1b
Figure 1. Resonant and Non-Resonant 2-photon excitation.
The principle of the technique was first evaluated usingresonant two-photon excitation, Figure 1 (a) of dyes used intwo-photon fluorescence microscopy using both single beam,single sided excitation (as used typically in this technique;simple focusing imparts some axial spatial resolution), and thenthe colliding (counter-propagating) pulse geometries of interest.
Resonant two photon excitation has the disadvantage, as seenreadily in colliding pulse autocorrelators which image two-photon excited dye fluorescence, of showing a backgroundtrack of excitation along the entire length of the path of the
pulses. This track is, in effect, the two-photon excitationproduced by the non-overlapping, but still two-photon resonant,pulses as they pass through the dye solution. The measurementbecomes background-free if the two-photon excitation is madenon-resonant, Figure 1 (b). The necessary beams can be createdfrom the Loan Pool laser by using two angle tuned, narrowbandpass filters to spectrally separate two beams from thespectrally broad, 10 nm, 150 fs laser pulses from the oscillator;the first at a λ that is ∆λ below that of the two-photon resonantpeak, the second at a λ that is ∆λ above the peak. The concept isillustrated below:
Figure 2. Laser Pulse Filtration.
As the two pulses are derived from the same Mira output pulsethey are jitter free. The spectral narrowing lengthens the pulsesin time but the consequent increased length of the overlapregion of the counter-propagating pulses is still sufficientlysmall to be of diagnostic value. The peak powers are loweredwhich reduces the efficiency of non-linear excitation but theincreased size of the overlap region compensates to some extentfor this as more species of interest are present. A more flexiblesystem to select λ of the individual pulses would giveopportunities to exploit resonances with intermediate states.
Figure 3. Experimental Configuration.
The configuration used in a colliding pulse diagnostic techniqueis represented in Figure 3. The collision region can be movedsystematically along tracks through the system of interest usingsimple optical delay line techniques, e.g., the beam on the righthand side in Figure 3b has been delayed relative to the rhs beamin Figure 3a. Alternatively, and often more conveniently, thesystem itself may be moved through a fixed overlap region.
Plasma sheath regions are of considerable practical andtheoretical interest and experimental techniques which canaccess these regions and retrieve data on species concentrations,etc., have high potential value. The optical track that is adiameter of a cylindrically symmetric plasma system(Figure 3; e.g., a lighting discharge) is of particular
Femtosecond Non-Linear Laser Spectroscopy
R Devonshire, M Jinno
High Temperature Science Laboratories, Chemistry Department, Sheffield University, Sheffield S3 7HF, UK
Main contact email address: [email protected]
Figure 3a
Figure 3b

Lasers for Science Facility Programme - Physics
Central Laser Facility Annual Report 2001/2002 162
experimental convenience and theoretical interest. The two-photon technique represented in Figure 3 has the potential toprovide spatial profiles along such tracks for a much greaterproportion of the track’s length than is possible with currentlyused techniques. For example, present single beam, line ofsight, techniques are unable to access near wall regions sensiblybecause of the strong refractive effects of the walls at largeangles of incidence. Evanescent wave techniques are able toaccess these near wall regions but not so conveniently andpractically as being investigated here.
As an example of the specific systems we are investigating theGrotrian diagram of mercury below shows a strategy for thenon-resonant two-photon excitation of the 7 1S0 excited statefrom the ground state with detection via the 408 nm emission tothe 6 3P1 resonance state. The work extends earlier studieswhere we achieved spatial resolution by focusing of a pumpbeam into a low pressure Hg discharge and detecting the excitedstates using the optogalvanic effect1).
Figure 4. Grotrian Diagram for Mercury.
Non-linear Raman Techniques
Hyper-Raman Scattering: We are establishing a database ofreference Raman spectra of materials of interest in light sourcescience and technology (see www.shef.ac.uk/~htsl/raman/). Thespectra are used to support studies of lamp chemistry 2). Thespectra are measured using Raman microscopy because it iscompatible with the length scales present in the referencesamples and samples requiring analysis. Many materials ofinterest give featureless Raman spectra with this techniquebecause of their crystal structures; for example, the alkalihalides are compounds where dipole modes are forbidden inRaman. These modes can often be observed using thecomplementary technique of infrared absorption but thistechnique does not have the versatility and convenience ofRaman microscopy. We are evaluating a new technique thatwill make it possible to obtain both Raman and “infrared”spectra from the same instrument. The concept is to adapt aconventional Raman microscope to accept an alternative laserexcitation source that would excite hyper-Raman scattering; thedetection system required being identical to that used by the“standard” laser source (typically a dc Argon ion laser). Thecombined instrument would uniquely be able to measure bothRaman and infrared spectra. The pulse stream from the Verdi-Mira system is ideally suited to be such an excitation source.The pulses have the necessary peak power for non-linearexcitation of Raman scattering and the laser-material interactionin the fs regime minimises sample damage.
To realise the instrument we are modifying a commercial514 nm Raman microscope to accept either 514 nm (dc or fs) or1028 nm fs laser excitation (N.B. the long wave optic set for theMira is required). The fs laser excitation is being delivered tothe sample using low transmission loss hollow optical fibresdeveloped by a Japanese group3). The vibrational modes seen inhyper-Raman using 1028 nm fs excitation will complement
those seen in spontaneous Raman using 514 nm excitation and,in addition, make it possible to see “silent” modes.
When available the technique will be applied to a range oftechnologically important materials that are of interest to thegroup; these include metal halides, oxides of aluminium,silicon, titanium, etc., and doped silica glasses. It is expectedthat it significantly enhance the range of our analyticalinvestigations. It could impact several other areas also.
Coherent anti-Stokes Raman Scattering (CARS): We haveexploited the CARS technique for some time to providespatially and temporally resolved spectra of species in reactivegases and plasmas4). Computer simulation of the spectra leadsto information on species identity, temperature, pressure andrelative concentration. The spatial resolution when using afolded-BOXCARS configuration is typically 50 µm x 50 µm x1 mm and the temporal resolution is defined by the few nspulses from the Nd:YAG pump and dye lasers.
We are attempting to perform fs CARS measurements ofplasmas using the basic Verdi-Mira system. The CARS pumpand Stokes beams are derived from the 2nd harmonic andfundamental, respectively, of the Mira. This configuration givesaccess to Raman resonances in the range from approximately9,000 cm-1 to 13, 000 cm-1 (N.B. requires both mid and longrange optics sets to achieve this range). This is a region knownfrom previous work in our laboratories to be rich with Ramanresonances from species that are not well characterised andwhich are probably dication species. Our previous CARS workto investigate this region was restrained by the constant need tochange dyes in the dye laser to achieve the full range of interest.
The peak powers of the “pump” and “Stokes” beams from theMira are comparable to those achieved in typical Nd:YAGCARS systems but the repetition rate and overall mark-spaceratio are considerably greater. A major aim of the work with theloan system is to demonstrate whether or not the advantages ofthe fs system over the Nd:YAG translate into a more efficientCARS signal recovery (N.B. a 200 MHz lock-in detectionsystem is used in the fs CARS experiments). Aside from thepotential for gains in signal recovery there is the importantadded dimension of operating CARS in the fs time-frequencydomain and we anticipate new layers of information on thecollision processes in operating plasmas5, 6).
References
1. M Duncan and R Devonshire, Chem. Phys. Lett., 187 545(1991)
2. R J Forrest, R Devonshire, C V Varanasi and T RBrumleve, Appl. Spectrosc., 56 (2002)
3. Y Matsuura, et al, J. Appl. Phys., 91 887, (2002)
4. D S Payne, G J Wilson and R Devonshire, Chem. Phys.Lett., 332 58, (2000)
5. T Lang et al, J. Chem. Phys., 115 5418, (2001)
6. M Scmitt et al, Chem. Phys. Lett., 280 339 (1997)

Laser Science and Development
163 Central Laser Facility Annual Report 2001/2002
Laser Science and Development
1) Vulcan Petawatt
2) Vulcan
3) Astra
4) Lasers for Science Facility
5) Laser Optics and Laser Design
6) Instrumentation

Laser Science and Development – Vulcan Petawatt
Central Laser Facility Annual Report 2001/2002 164
Figure 1. Petawatt Compression Grating.
The project to upgrade the ultra-short pulse CPA beam ofVulcan to the Petawatt level began on 1st April, 1999. Theupgrade, funded through an EPSRC Research Grant, willdeliver an energy on target of 500J in a pulse of 500 fs durationgiving a focused target irradiance in the 1021W.cm-2 regime.
A summary of some of the main areas of activity in the year tothe end of March 2002 is given below. Further details aredescribed in articles following.
Laser oscillator and pre-amplifier
The compression of the amplified pulse to 500 fs at the outputof the Vulcan system depends critically on the spectralbandwidth of the stretched pulse. While the oscillator producespulses of extremely short duration, the gain profile of Vulcan’sNd:glass amplifiers imparts significant spectral narrowing,thereby reducing the bandwidth of the stretched pulse andlimiting the pulse duration of the compressed pulse.
In order to minimize the gain narrowing effects, OpticalParametric Chirped Pulse Amplification (OPCPA) is being usedat the front end of Vulcan. This technique, pioneered at theCLF, provides pre-amplification of the oscillator pulse up to thelevel of 20mJ with virtually no reduction of bandwidth. Thisreduces the energy gain required from the Nd:glass amplifiersand will enable the 500 fs specification for the upgrade to bemet. A further important advantage of the OPCPA approach isthat it operates at 10Hz, greatly simplifying alignment and pulseoptimization.
Nova amplifier commissioning
The delivery of a 500J pulse to target has required substantialmodifications and additions to the power conditioning and discamplifier architecture. The first phase of this work was thereplacement of the capacitor bank to provide additional drivefor the CPA beamline. This work was completed in April 2001as described in last year’s Annual Report.
The second phase has been the installation and commissioningof three 208mm disc amplifiers, made available to the projectby the U.S. Dept. of Energy following the closure of NOVA.
These amplifiers have been refurbished in the CLF clean roomsand modified to use the same large bore lamps as are fitted tothe existing 150mm amplifiers. This improves efficiency,simplifies the pulse forming networks and reduces the numberof spares that are required to underpin operations.
The three amplifiers have been installed and tested and a beamenergy in excess of 750J has been obtained at the output, givingconfidence that the upgrade energy specification will be met.
Compression chamber
The compression and target chambers were delivered to theRAL site in August 2001 and installed into the new Petawatttarget area under the watchful eyes of many employees andvisitors to the Chilton site!
The compression chamber was supplied as three separate tankswhich were manoeuvered precisely into their correct positionsand then welded to form a single vacuum vessel. Followingcommissioning of the vacuum system and an extensive cleaningprogramme, the large aperture optical mounts were installedand tested, followed by the installation of the beam deliveryoptics and compression gratings (see Figure 1).
Project Management
The project has been managed according to the CCLRC’sCorporate Project Management procedures. The ProjectManagement Committee, which oversees the project, is chairedby Dr A D Taylor, Deputy CE CCLRC, Director ISIS andincludes Prof. J Wark and Dr D Riley (Vulcan userrepresentatives), Ms. J Nicholson and Mr D Harman (EPSRC),Prof. MHR Hutchinson (Director, CLF) and Dr C B Edwards(Project Manager).
Vulcan Petawatt Upgrade Overview
C B Edwards
Central Laser Facility, CLRC Rutherford Appleton Laboratory, Chilton, Didcot, Oxon, OX11 0QX, UK
Main contact email address: [email protected]

Laser Science and Development – Vulcan Petawatt
165 Central Laser Facility Annual Report 2001/2002
Introduction
Last year we reported on the design of the Vulcan PetawattCompressor Chamber 1) and Interaction Chamber 2). This articlesets out the progress made on the construction of the vesselsand their installation, together with associated engineeringhardware, in the new target area.
Manufacture
The compressor chamber which holds the two large aperturegratings was fabricated 3), from mild steel and subsequentlynickel plated 4), in three main parts: two cylindrical vessels thathouse the optics and a rectangular interconnecting section. Itsvolume is ~ 120 m3 and it weighs ~ 70 tonnes.
The interaction chamber houses the final turning mirror,focusing parabola, target and experimental diagnostics.Weighing in at ~ 60 tonnes, the chamber was constructed 5)
from 100 mm thick steel plate and similarly nickel plated.
Installation
On the 20th August 2001 the compressor and interactionchambers were delivered to the Rutherford AppletonLaboratory. During the following day a large crane was used tounload the chambers which were then manoeuvred into positionin the Petawatt target area. The following paragraphs andphotos 1 - 6 describe this installation.
Following delivery, the north tank of the compression chamberwas offloaded, brought inside the building and roughlypositioned. The compressor tunnel section was then broughtinto the area and fully inserted into the north tank. Lastly thesouth tank was brought in and positioned. The tunnel sectionwas then partially withdrawn from the north tank and insertedinto the south tank. The chamber was aligned relative to thepredetermined interaction point marked on the floor. Next theinteraction chamber was transported into the building andpositioned relative to the compression chamber and theinteraction point.
Installation of the Compressor and Interaction Chambers and associatedengineering hardware for the Vulcan Petawatt Upgrade
B E Wyborn, P A Brummitt, A J Frackiewicz, J A C Govans, B J Gray, S Hancock, P E Hatton, P Holligan,A R Jackson, W J Lester, Z A Miljus, D R Neville, D A Pepler, M R Pitts, C J Reason, J K Rodgers, D A Rodkiss,A G Ryder, G N Wiggins, R W W Wyatt
Central Laser Facility, CLRC Rutherford Appleton Laboratory, Chilton, Didcot, Oxon, OX11 0QX, UK
Main contact email address: [email protected]
Photo 2. The north tank of the compressor chamberbeing positioned inside the target area.
Photo 4. The interconnecting tunnel of thecompressor chamber being positioned between the twotanks.
Photo 1. The north tank of the compressor chamber beingbrought into the building.
Photo 3. The interconnecting tunnel of the compressor vesselbeing brought into the building.

Laser Science and Development – Vulcan Petawatt
Central Laser Facility Annual Report 2001/2002 166
Photo 5. The interaction chamber being offloaded. Photo 6. The interaction chamber being positioned inthe target area.
Photo 7. The vacuum spatial filter tubes beingassembled.
Photo 8. The vacuum spatial filter completed.
Photo 9. Compressor and Interaction Chambers installed with associated engineering hardware.

Laser Science and Development – Vulcan Petawatt
167 Central Laser Facility Annual Report 2001/2002
Once the chambers were in their final position the concretefloor was drilled and the chambers bolted down 6). The threeparts of the compressor chamber were welded together and leaktested. To complete the plating of the chambers, nickel wasbrush plated to the inner welds on the compressor chamber, theinside of the tunnel and the machined ‘O’ ring seal on theinteraction chamber 7) . The outside of the compressor chamberwas also painted.
In October 2001, the vacuum spatial filter tubes (VSF) andpinhole chamber were aligned to the compressor chamber andto the 208 amplifier chain already established in LA4 (seephotos 7 & 8).
The chambers, VSF and interconnecting parts were verythoroughly cleaned and the vacuum and let up systemscommissioned as described elsewhere 8). The large gate valveand interconnecting pipe between the two chambers wascarefully installed and leak tested.
In tandem to the work on the main components outlined above alot of activity took place installing the various services neededi.e. interlocks, cooling water, nitrogen, computer network,control network, trigger/signal network, local power, intercoms,surveillance cameras, floor tiling and completion of concreteshielding walls.
The area was handed over to become a clean area for lasercommissioning just prior to Christmas 2001 bar the stairwayover the compressor chamber which was installed in January2002 (see Photo 9).
Conclusions
With a lot of hard work by many people the building shell ofAugust 2001 was converted into a clean area with all theinfrastructure ready for optics installation and commissioning tocarry on by Christmas 2001.
References
1. C N Danson, Central Laser Facility Annual Report2000/2001, RAL-TR-2001-030, pg 148
2. C Ziener, Central Laser Facility Annual Report 2000/2001,RAL-TR-2001-030, pg 150
3. Metalcraft, Chatteris, Cambridge, PE16 6SA
4. NiTec, Chesterfield, Derbyshire, S41 9RX
5. Kvaerner Metals, Sheffield, S9 4EX
6. Btex, Newbury, Berkshire, RG145SH
7. SIFCO, Redditch, Worcs., B98 9HD
8. P A Brummitt, Central Laser Facility Annual Report2001/2002, RAL-TR-2002-013, pg 168

Laser Science and Development – Vulcan Petawatt
Central Laser Facility Annual Report 2001/2002 168
IntroductionThe vacuum system for the interaction and compressionchambers was designed to allow evacuation of the chambers tobe carried out within set performance goals and to maintain aclean environment within the chambers.
Chamber cleaning process
Once the chambers were installed it was essential that they werethoroughly cleaned before the vacuum system could becommissioned. The system was initially cleaned using apetroleum based cleaning agent. This was used to clean off theinitial contamination from the inside of the chambers left overfrom when the chambers were manufactured. The chamberswere cleaned several times using this method. Once it was feltthat the initial dirt layers were removed from the chambers, theywere then cleaned with Isopropyl Alcohol. This again wascarried out several times until there was no residual dirt beingremoved when a swab was taken.
Vacuum pump installation
The vacuum pump installation was carried out in two parts. Theroughing pumps were installed prior to installation of thechambers. This could be carried out due to their location withinthe plant room. Once the chambers had been installed andcleaned the rest of the vacuum system could be installed. Thehigh vacuum pumping systems were installed first. The highvacuum pumps are sets of turbo molecular pump, a rotary vanebacking pump and a high vacuum valve. The high vacuumpump sets required electrical and air services to be installed.There are three sets of high vacuum pumps in total, two on theinteraction chamber and one on the compression chamber.Once the high vacuum systems were fully installed theconnection of the roughing system could be completed. Thiswas done through the connection of a 160mm-diameter pipelinefrom the plant room through to the two chambers.
Let up system installation
The majority of the let up system is located within a plant room.So, as with the vacuum roughing system, much of theinstallation of the let up system could be done prior toinstallation of the chambers. The system consists of two oil freeair compressors, an air-drying unit, various levels of filteringand an air receiver. All of this is housed within the plant room.After installation of the chambers the let up system wasconnected to the chambers using 50mm diameter stainless steelpipeline. Due to the nature of the system and the cleanlinessrequirements, this pipeline system was supplied pre-cleaned andbagged ready for installation.
Vacuum system testing
Before any of the optical mounts or optics themselves could beinstalled inside the chambers a thorough test of the vacuumsystem was required. The testing had two important goals: totest the performance of the vacuum system; and to check howclean the system was. Initial testing was carried out using thevacuum system. These initial tests were used to provideinformation on how leak tight the chamber was, so that anyleaks may be found and fixed. This was important because thechamber had to be below a certain pressure before carrying outcleanliness tests using a residual gas analyser. During the initialpump-down tests the chamber was tested for leaks using aHelium leak detector. On initial test there were some leaks
which were found and fixed. Once the system had beenpumped for the required time a pressure suitable for the residualgas analyser was reached. This equipment could then beutilized for the cleanliness tests.
Cleanliness tests
Due to the requirement for cleanliness inside the chambers, aresidual gas analyser was used to provide important informationon the state of the chamber. Tests were carried out after theinitial pumping tests and the results analyzed. The datarecorded was compared with data from existing Vulcan systemsto give direct comparison with the current systems in use. Theinitial results were favorable, giving similar levels ofcleanliness to the chamber in target area west. The chamberswere cleaned thoroughly again after initial tests to try andimprove on the current level of cleanliness. Followingcleaning, further tests were carried out and final results wereobtained showing that the new chambers now exceed the bestlevels of cleanliness of any of the other Vulcan vacuumsystems. This was considered acceptable enough to proceedwith the installation of the optics and mounts.
Performance tests
Once the system had been commissioned the performance ofthe vacuum pumping system could then be evaluated. Thespecification performance against true system performance forthe interaction chamber is shown in Table 1 below and themeasured performance of the vacuum system for thecompression chamber is shown in Table 2.
Pressure Specification Performance
10-3 mbar 20 Minutes 16 Minutes
10-4 mbar 60 Minutes 60 Minutes
Table 1. Vacuum system performance for interaction chamber.
Pressure Specification Performance
10-3 mbar 2 Hours 2 Hours
10-4 mbar 24 Hours 24 Hours
Table 2. The measured performance of the compressionchamber against the specification.
The results show that the specification has been fully met by thevacuum system.
Conclusion
The commissioning of the vacuum system has been completedto the required time-scale and fully meets the performancecriteria set upon it. The system has been fully tested to allowthe best possible vacuum environment for the opticalcomponents and laser to operate effectively.
References
1. Leybold Vacuum, Plough Lane, London, UK
2. Pfeiffer Vacuum, 2-4 Cromwell Business Centre, NewportPagnell, UK
Vacuum system commissioning for Vulcan Petawatt Interaction and CompressionChambers
P A Brummitt, D Rodkiss
Central Laser Facility, CLRC Rutherford Appleton Laboratory, Chilton, Didcot, Oxon, OX11 0QX, UK
Main contact email address: [email protected]

Laser Science and Development – Vulcan Petawatt
169 Central Laser Facility Annual Report 2001/2002
From the beginning of the Vulcan Petawatt upgrade project aconscious decision was made to move away from the practice ofdeveloping in house hardware driven from a PC, and to workwith commercially available products intended for this type ofoperation.
The system has been designed to provide uncomplicated controlof joint or independent chamber evacuation and let-upprocesses, using a ‘Schneider Momentum Modular PLC’system. Control of the components involved, and theirsequence of operation is initiated from a ‘Magelis’ user terminalthat uses a colour graphics screen to provide monitoring of thesystem status. A high level of personnel safety is programmedinto the control procedures, and components can be drivenmanually or through automatic control as required.
The PLC modules deployed consist of digital I/O units withrelay outputs and analogue inputs. The digital I/O is used tooperate solenoid valves and return the valve position status,whilst the relay outputs are used to engage the contactors thatsupply the vacuum pumps. An analogue signal is taken fromthe gauge controller which allows the chamber pressure to bedisplayed on the graphics screen. A schematic diagram is alsodisplayed showing pump operation and valve position, withvarious pump down and let up options available to the operator.
Different stages of password protection are included to protectagainst misuse, and a Castell key safety lockout system hasbeen installed to prevent pump and valve operation that couldendanger personnel. Operator keys are also required to start thepumping process for both compressor and interaction chambers.
Petawatt Interaction and Compression Chamber Vacuum control
P Holligan, R W W Wyatt
Central Laser Facility, CLRC Rutherford Appleton Laboratory, Chilton, Didcot, Oxon, OX11 0QX, UK
Main contact email address: [email protected]
Figure 1. Magelis display showing schematic diagram of vacuum system.

Laser Science and Development – Vulcan Petawatt
Central Laser Facility Annual Report 2001/2002 170
The Petawatt upgrade presented an opportunity to introduce anew style of control and alignment hardware based oncommercially available products to provide greater flexibilityfor future expansion, and reliable operation in the harshenvironment that TAP is expected to present.
The Alignment control is split into two separate systems. Theseare the Compression Chamber Alignment System that controlsall the large optics inside the chamber, and the InteractionChamber Control System, which provides stepper motor controlfor the two large optical components, and dc motor control forthe target mounts.
Both systems use a control PC linked via Ethernet to a numberof Parker 6K8 motion controllers. The motion controllersgenerate the control signals that are sent to the relevant motordrive. The Compression Chamber Control System is run on adedicated network to eliminate any unauthorised movement ofoptical components. The software which provides the userinterface is written in LabVIEW, and allows the operatorflexible control of all of the mounts inside the chamber. Aseparate stepper motor control rack also linked to thecompression chamber has been installed to control mirror slidesused to dump high energy before the beam reaches thediagnostic instrumentation.
The Interaction chamber control system consists of 10 Steppermotor drives that are used to control a Turning Mirror, andParabolic lens mounts, whilst Target Mounts inside the chamberare controlled through a 48volt dc motor drive system. Thecontrol software is written in Visual Basic to provide a userinterface for alignment purposes, and control signals regardingshot type etc., required by the main Vulcan control PC. Aremote pad designed and built in house provides a remote userinterface to the control software, allowing users to move stepperand dc motors whilst away from the control desk. The remotepad also displays the Sony Magnescale position feedback forthe mount selected to aid alignment.
To protect against the expected EM noise generated during ahigh power shot, filters have been used on all mains and dcsupplies, and ferrite beads attached to all susceptible cabling.
High quality shielded twisted pairs cable has been used on theMagnescale unit as ferrite beading interfered with the controlsignals.
Petawatt Mirror / Grating Mount Alignment Control System
P Holligan, RWW Wyatt, K Rogers, G Wiggins, M Dominey
Central Laser Facility, CLRC Rutherford Appleton Laboratory, Chilton, Didcot, Oxon, OX11 0QX, UK
Main contact email address: P [email protected]
Figure 2. Main user interface page for compressor mirror / grating control.
Figure 1. Specific mirror / grating mount control interface.

Laser Science and Development – Vulcan Petawatt
171 Central Laser Facility Annual Report 2001/2002
In order to achieve the 500 J in 500 fs necessary for thePetawatt Laser Facility a 208 mm diameter disc amplifier chainhas been installed on the Vulcan Laser Facility. Previousmeasurements 1) have been reported that were made on a single208 amplifier but we now report on the performance of thethree stage 208 amplifier chain.
The output from beam 8 of Vulcanwas directed into the newlycommissioned laser bay Laser AreaFour (LA4), the use of which hasbeen taken over from Target AreaTwo (TA2). The full beam size ofbeam 8 was slightly apodised tobring the beam diameter down to180 mm which is the working beamdiameter for the amplifiers. Thenormal disc amplifiers (108 mmdiameter and 150 mm diameter)were used to produce a 25 J pulse(derived from a broadband, long-pulse oscillator) which was directedthrough the 208 mm amplifiers ontolaser burn paper. This burn is shownin Figure 1 and shows a good overallbeam uniformity with only one ortwo small diffraction centresindicating minor damage spots in the208 mm amplifier chain.
The small signal and saturated gain of the 208 mm amplifierchain were measured in a similar fashion to previousexperiments. The beam was directed from the end of laser areathree (LA3) through the 208 mm amplifier chain, (situated inLA4) with the resultant beam energy being measured by awhole-beam calorimeter. This was positioned further“downstream” in order to reduce the background energy readingthat the firing of the flashlamps would otherwise have induced.
Figure 2 shows part of the 208 mm amplifier chain and finalsteering optics during commissioning. The right-hand wallshown in the photo was in fact a temporary structure and thefull-beam laser calorimeter was positioned beyond these optics.
To ascertain the small signal gain of the amplifiers, a range ofenergy shots (up to ~20 J input) were taken with the full beam,using either individual amplifiers or all three amplifierstogether. This latter data is shown in Figure 3 at the lower-leftend of the best-fit Franz Norvic saturated laser gain curve. The
small signal gain taken from thiscurve is 8.27 (i.e. 2.02 peramplifier).
Because the calorimeter was unableto withstand more than ~ 200 J, tomeasure the saturated gain, furthershots were initially taken with asmaller beam size. The beam wasapodised to 76 mm diameter whichfrom the shots subsequently takengave equivalent energies of 72 J inand 440 J out i.e. a saturated gain forthis level of drive, of 6.1.
In order to confirm the saturatedgain using the full 180 mm beamdiameter, further measurement wasundertaken using an uncoated high-power laser window as a beam-splitter / sampler. The beam-splitterwas placed at the output of the 208amplifier chain at an angle of 13.5ºwhich then reflected 7.1% of thebeam into the calorimeter. The
remainder of the pulse passed through the window onto burnpaper (encapsulated in a plastic laminate to minimize the debrisblow-off.) With this arrangement a shot was fired with 122 J inand 792 J obtained out of the three stage 208 amplifier chain.This data is shown in Figure 3 and shows excellent agreementwith the lower energy measurements.
References
1. “Gain Measurements on a 208 mm Amplifier” D Pepler etal. CLF Annual Report 1999 / 2000. (RAL-TR-2000-034)p 187.
Gain Measurements on the Petawatt 208 mm Amplifier Chain
D Pepler, C Danson, J Collier, C Edwards, S Hawkes, A Kidd, T Winstone, R Wyatt
Central Laser Facility, CLRC Rutherford Appleton Laboratory, Chilton, Didcot, Oxon, OX11 0QX, UK
Main contact email address: [email protected]
Figure 1. Laser burn taken in LA4 after propagatingthrough the three stage 208 mm diameter amplifierchain. The burn is approximately 180 mm in diameter.
0
250
500
750
1000
0 25 50 75 100 125 150Input energy, J
Out
put e
nerg
y, J
Figure 3. Graph showing the input energy to output energy gaincurve for the three stage 208 mm amplifier chain. The solid line is aFranz Norvic gain curve that has been fitted to the data points.
Figure 2. Photograph of LA4 during the commissioning phase,showing the last two 208 mm disc amplifiers and some of theturning mirrors. The final beam expansion optics are situatedbehind the temporary wall (at right).

Laser Science and Development – Vulcan Petawatt
Central Laser Facility Annual Report 2001/2002 172
Introduction
A new front end for the Vulcan laser has been configured toaccommodate the Vulcan Petawatt upgrade. The existingOscillator Room has been extended by the addition of theadjacent room, which used to be the Vulcan Clean room. Therewere two main reasons to extend the room: to accommodate thenew Petawatt stretcher and an oscillator and stretcher previouslylocated in the laser area. The Petawatt stretcher will use a largeoptical table 3.75 m long by 1.5 m wide and could not beaccommodated in the former oscillator room. The extension ofthe oscillator room has enabled the centralization of all the CPAFront End systems.
The pulse generation systems for the Chirped Pulseamplification (CPA) for Target Area West (TAW), East (TAE)and Petawatt (TAP), including a new Optical ParametricChirped Pulse Amplification (OPCPA) preamplifier, are nowlocated in the new Front End room.
This consists of 3 ultra short pulse oscillators, 3 stretchers andan OPCPA preamplifier and a Q-Switched 10 Hz pump laser.These systems are individually detailed below. A schematic ofthe Front End is shown in Figure 1. The organization of systemshas been designed such that it allows the independent operationof all three areas.
TAW CPA configuration
The seed pulses for the TAW configuration are produced by aTime Bandwidth commercial oscillator. The GLX-100 is anoscillator with Nd: Glass as the active medium. It is modelocked by a state of the art device known as a semiconductorSaturable Absorber Mirror (SAM). The 80 MHz cavityproduces 170 fs pulses at 1nJ per pulse. Each pulse is stretchedusing a double passed refractive confocal telescopic stretcher 1)
and injected into Vulcan. The telescope produces an effectivegrating separation of 3.5 m to match the compressor separationin TAW. The stretcher produces a group velocity dispersion ofapproximately 150 ps/nm 1). The SAM oscillator has5 nm FWHM resulting in a 750 ps stretched pulse duration,which is subsequently gain narrowed in Vulcan to 350 ps.
TAE short pulse configuration
Target area East operations can require long pulse operationsfrom 600 ps to 2 ns or short pulse operations at 80 ps. For theshort pulse operations the oscillator used is YLF 1. This was thefirst oscillator used in Vulcan for CPA operations. It has beenlocated in the extension to the oscillator room from inside thelaser area. An in-house designed Nd:YLF Additive PulseModelocked system, it produces pulses of 1.8 ps duration at 1nJper pulse 2).A double passed stretcher stretches the pulse from2.5ps to 80ps. This stretcher has also been relocated from thelaser area to the new Front End room. This pulse is not usuallycompressed, however there is the capability to do so in TAE.
TAP CPA configuration
The seed pulses for the TAP configuration are produced by aSpectra Physics Tsunami oscillator. It is a commercial KerrLens Modelocked (KLM) oscillator using Ti:Sapphire as theactive medium. It is pumped by the Millennia X, a commercialdiode pumped Nd:Yag laser. This oscillator emits a train of 5nJpulses 120fs long at a repetition rate of 80MHz. The TargetArea Petawatt stretcher is a four pass Offner reflectiveStretcher. The stretcher has become a Double Decker design 3).The 100fs pulse from the Ti:S oscillator is stretched to a pulse4.8 ns long. In addition to the stretcher and oscillator there is anew front end preamplifier 4) which will amplify the pulses upto energies at the mJ level. This OPCPA amplifier is pumpedby the Nd:YAG Continuum laser: This customized commercialpump laser is a frequency doubled Nd:YAG laser which emits atrain of 1J pulses with a wavelength of 532nm at a repetitionrate of 10Hz .
References
1. J. Collier et al. CLF Annual Report 1996/97, RAL-TR-97-045, pg 188
2. Z. Chang et al. CLF Annual Report 1992, RAL-92-020,pg 94
3. J. Collier et al. CLF Annual Report 2001/2, RAL-TR-2002-013, pg 173
4. C. Hernandez-Gomez. CLF Annual Report 2001/2, RAL-TR-2002-013, pg 175
Reconfiguration of the Vulcan Front End Systems
C Hernandez-Gomez, J Collier, J Smith
Central Laser Facility, CLRC Rutherford Appleton Laboratory, Chilton, Didcot, Oxon, OX11 0QX
Main contact email address: [email protected]
Entrance
YLF
Osc
illato
r
Current OR
Fire
Exit
Do
ors
PumpLaser
OPC
PA
YLF
Osc
illato
r
Figure 1. Schematic of the Front End.
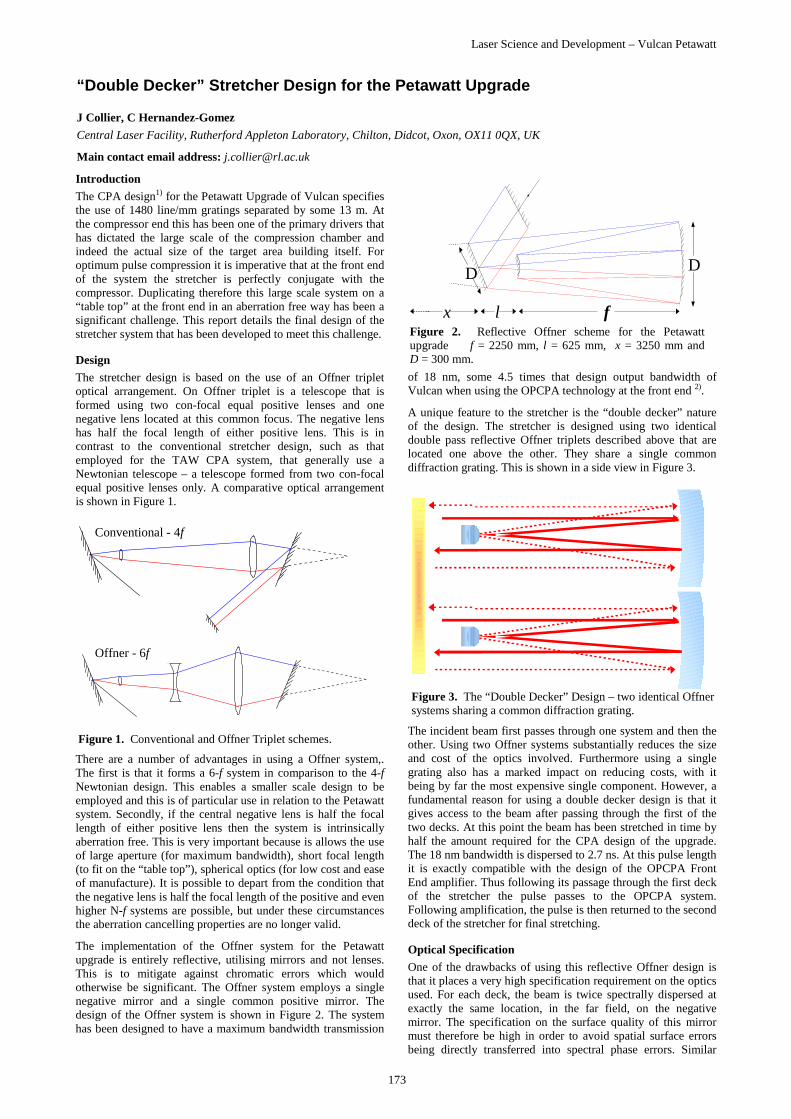
Laser Science and Development – Vulcan Petawatt
173 Central Laser Facility Annual Report 2001/2002
Introduction
The CPA design1) for the Petawatt Upgrade of Vulcan specifiesthe use of 1480 line/mm gratings separated by some 13 m. Atthe compressor end this has been one of the primary drivers thathas dictated the large scale of the compression chamber andindeed the actual size of the target area building itself. Foroptimum pulse compression it is imperative that at the front endof the system the stretcher is perfectly conjugate with thecompressor. Duplicating therefore this large scale system on a“table top” at the front end in an aberration free way has been asignificant challenge. This report details the final design of thestretcher system that has been developed to meet this challenge.
Design
The stretcher design is based on the use of an Offner tripletoptical arrangement. On Offner triplet is a telescope that isformed using two con-focal equal positive lenses and onenegative lens located at this common focus. The negative lenshas half the focal length of either positive lens. This is incontrast to the conventional stretcher design, such as thatemployed for the TAW CPA system, that generally use aNewtonian telescope – a telescope formed from two con-focalequal positive lenses only. A comparative optical arrangementis shown in Figure 1.
There are a number of advantages in using a Offner system,.The first is that it forms a 6-f system in comparison to the 4-fNewtonian design. This enables a smaller scale design to beemployed and this is of particular use in relation to the Petawattsystem. Secondly, if the central negative lens is half the focallength of either positive lens then the system is intrinsicallyaberration free. This is very important because is allows the useof large aperture (for maximum bandwidth), short focal length(to fit on the “table top”), spherical optics (for low cost and easeof manufacture). It is possible to depart from the condition thatthe negative lens is half the focal length of the positive and evenhigher N-f systems are possible, but under these circumstancesthe aberration cancelling properties are no longer valid.
The implementation of the Offner system for the Petawattupgrade is entirely reflective, utilising mirrors and not lenses.This is to mitigate against chromatic errors which wouldotherwise be significant. The Offner system employs a singlenegative mirror and a single common positive mirror. Thedesign of the Offner system is shown in Figure 2. The systemhas been designed to have a maximum bandwidth transmission
of 18 nm, some 4.5 times that design output bandwidth ofVulcan when using the OPCPA technology at the front end 2).
A unique feature to the stretcher is the “double decker” natureof the design. The stretcher is designed using two identicaldouble pass reflective Offner triplets described above that arelocated one above the other. They share a single commondiffraction grating. This is shown in a side view in Figure 3.
The incident beam first passes through one system and then theother. Using two Offner systems substantially reduces the sizeand cost of the optics involved. Furthermore using a singlegrating also has a marked impact on reducing costs, with itbeing by far the most expensive single component. However, afundamental reason for using a double decker design is that itgives access to the beam after passing through the first of thetwo decks. At this point the beam has been stretched in time byhalf the amount required for the CPA design of the upgrade.The 18 nm bandwidth is dispersed to 2.7 ns. At this pulse lengthit is exactly compatible with the design of the OPCPA FrontEnd amplifier. Thus following its passage through the first deckof the stretcher the pulse passes to the OPCPA system.Following amplification, the pulse is then returned to the seconddeck of the stretcher for final stretching.
Optical Specification
One of the drawbacks of using this reflective Offner design isthat it places a very high specification requirement on the opticsused. For each deck, the beam is twice spectrally dispersed atexactly the same location, in the far field, on the negativemirror. The specification on the surface quality of this mirrormust therefore be high in order to avoid spatial surface errorsbeing directly transferred into spectral phase errors. Similar
“Double Decker” Stretcher Design for the Petawatt Upgrade
J Collier, C Hernandez-Gomez
Central Laser Facility, Rutherford Appleton Laboratory, Chilton, Didcot, Oxon, OX11 0QX, UK
Main contact email address: [email protected]
Conventional - 4f
Offner - 6f
Figure 1. Conventional and Offner Triplet schemes.
fl
DD
xFigure 2. Reflective Offner scheme for the Petawattupgrade f = 2250 mm, l = 625 mm, x = 3250 mm andD = 300 mm.
Figure 3. The “Double Decker” Design – two identical Offnersystems sharing a common diffraction grating.

Laser Science and Development – Vulcan Petawatt
Central Laser Facility Annual Report 2001/2002 174
arguments apply to the common positive mirror. Great care hasbeen taken to assess the effect in time of spatial surface errorson the optics. The optical specifications that have applied to thecomponents are such that any residual surface errors will notintroduce a temporal distortion that is outside that that arisesthrough the 4.5 x bandwidth clip in the stretcher and the softspectral apodization that is applied by propagation through thecompressor. Details of these can be found in Reference 1. Thedetails of the optical specification of the various componentsare listed in the table below. All components are protected goldcoated.
Comp. Size
mm
Rad.
mm
Surface p-v
(at λ= 1µm)
Surface rms
(at λ= 1µm)
PositiveMirror
305 x60
4500 λ / 50 λ / 250
NegativeMirror
120 x10
-2250 λ / 50 λ / 250
Retro 200 x25
Inf λ / 25 λ / 125
Grating 350 x150
Inf λ / 25 λ / 125
Table 1. Optical Component Specifications.
The stretcher is housed on a single 4.0 m x 1.5 m optical table.The path length through the double decker system is about 52 mduring which the majority of its time is spent spatially spectrallydispersed. It is important therefore that the optical table andstretcher are environmentally enclosed to prevent air turbulenceinducing spectral phase errors through air refractive indexvariations that would otherwise substantially affect the pulsecompressibility. An artists impression of the completed systemis shown in Figure 4 below.
Conclusion
A novel table top double decker stretcher system has beendesigned for the Petawatt upgrade that is conjugate with thecompressor. The design enables a Stretch-Amplify-Stretcharchitecture to be implemented for the Petawatt upgrade byretaining compatibility with the OPCPA system. A key driverfor the design has been to retain spectral phase purity and asufficiently large bandwidth transmission that pulse fidelity anda high contrast is preserved upon compression.
References
1. J. Collier et al, “CPA Design Considerations for theVulcan Petawatt Upgrade”, CLF Annual Report 1999-2000, RAL-TR-2000-034, pg 174
2. C. Hernandez-Gomez et al, “Commissioning of the VulcanOPCPA Pre-Amplifier” , CLF Annual Report 2001/2,RAL-TR-2002-013, pg 175
Figure 4. An artist’s impression of the completed stretcher.

Laser Science and Development – Vulcan Petawatt
175 Central Laser Facility Annual Report 2001/2002
Introduction
We describe the new Preamplifier for the Vulcan laser basedon the Optical Parametric Chirped Pulse Amplificationtechnique 1-2). The preamplifier has been designed on the basisof results obtained with a test bed preamplifier 3) .
Description
The front end system is formed by an oscillator, a stretcher, thepreamplifier and a pump laser. The seed is generated by acommercial Kerr mode-locked. oscillator with Ti:Sapphire asthe active medium. This oscillator generates an 80 MHz pulsetrain of 5 nJ pulses. Each pulse is 120 fs long and has FWHMbandwidth of 15 nm centred at 1053 nm. A single pulse isselected for amplification and is stretched in time using one ofthe Vulcan stretchers. The amplifier is designed for a stretchedseed pulse 2.4 ns long.
The OPCPA preamplifier is shown in Figure 1. Theamplification of the seed is achieved in three single-pass stages.Stage one and two have been designed to be identical with again of 103. Stage three is used to saturate the process and hasbeen designed with different parameters to give a gain of 102.The non linear medium used for the amplification is ß - BariumBorate (BBO) for all the stages. Each crystal is kept in an ovenat 40o C. The pump laser used is a custom-commercialQ-switched Nd:YAG. It is a Single Longitudinal Mode laserthat generates a train of 1J pulses at 10Hz. The pulselength is15 ns with a Gaussian shape and a wavelength of 532 nm. Theoutput is split into two beams by using the combination ofλ/ 2 waveplate and plate polariser. The beam transmittedthrough the thin polariser is used to pump stages one and twoand the reflected beam is used to pump stage three.
The pump beam for stages one and two contains 400 mJ in a9 mm diameter beam and is demagnified to 6 mm. The central3 ns are sliced by a fast Pockel cell such that the pump pulse hasan almost top hat temporal profile. Immediately after the slicingthe beam is split by a 50/50 splitter to feed stages one and two.A polariser in each stage isolates the 3 ns vertically polarisedpulse and then injects it into each stage. Each 3 ns pump pulsecontains 40 mJ and is further demagnified by a factor of 4 prior
to injection in the crystals. The maximum pump intensity is400 MW/cm2 . The near field of the pump pulse is an imagerelay of the near field of beam inside the pump laser to ensure agood spatial profile in each stage. The pump pulse that feedsstage three is image relayed from the laser by a one to onetelescope. This beam is sliced by a second Pockel cell, such thatthe central 3ns pulse is injected via a thin poliser into stagethree. This pump beam is then demagnified by a factor of 3.3.This 3ns pulse contains 100 mJ of energy with a maximumintensity of 200 MW/cm2.
The seed is demagnified to a 0.5 mm diameter beam and ishorizontally polarised. The pump and seed pulses aresynchronised in time using an SRS delay unit. The seed isinjected slightly non-collinear with respect to the pump into allthree stages. The phase matching is achieved by angle tuning.The nearfield of the pump pulse is larger than the seed in stagesone and two to compensate for the walk off. The amplifiedsignal is image relayed to stage two with a one to onetelescope, after amplification in stage one. The idler is disposedof by the use of a pinhole at the focus of the relay telescopemaking use of the non-collinear geometry. After stage two theamplified signal is expanded by a 3.2 magnification telescopeprior to the injection into stage three and the idler is disposed ofby a similar pinhole to stage one. In stage three the beamdiameters of pump and seed are very similar. The idler is againdisposed of by the use of a one to one telescope and pinhole.
Implementation with Vulcan
The OPCPA amplifier as a standalone system has beendesigned to deliver an output energy of 1 mJ/nm, and remainscompatible with both Target Area West (TAW) and TargetArea Petawatt (TAP) configurations.
The TAW configuration requires a stretched pulse 2.4ns long.This is achieved using a telescopic stretcher which is formed bya pair of 1740 l/mm diffraction gratings separated by a confocaltelescope. The available bandwidth is 16nm.
The spectrum of the amplified seed and un-amplified seedspectra are shown in Figure 2. It shows all the bandwidth isamplified in the OPCPA amplifier.
Commissioning of the Vulcan OPCPA preamplifier
C Hernandez-Gomez, J Collier, M Csatari, J Smith
Central Laser Facility, CLRC Rutherford Appleton Laboratory, Chilton, Didcot, Oxon, OX11 0QX
Main contact email address: [email protected]
Stage 3
Stage 2
Stage 1
Polariser
Polariser
Polariser
Beam splitter50/50 s
Figure 1. OPCPA Preamplifier layout.

Laser Science and Development – Vulcan Petawatt
Central Laser Facility Annual Report 2001/2002 176
The output energy from the OPCPA preamplifier needs to fulfila 10% stability requirement for its use in Vulcan. Thereforestability measurements were carried out. Figure 3 shows theoutput over 2000 shots. The stability is within the ± 10%,required for Vulcan. Occasionally there is a drop in the energy.This low energy output is caused by the pump laser not beingseeded to a single mode. The important feature is that there isnever a high energy output, above the 10%. This could becatastrophic for Vulcan, as it could result in a high energy shot,above the maximum energies permitted.
The OPCPA preamplifier has subsequently been configured forPW operations. For the TAP configuration the stretched pulse is4.8ns. This is to be achieved by using a four-pass Offnerstretcher system, using a single 1480 l/mm grating with aneffective separation of 13 m, operated at a 470 input angle. Thestretched pulse will be 2.4 ns after the first double pass.Therefore at this pulse length it can be amplified by the OPCPApreamplifier and after amplification re-injected into thePetawatt stretcher for a second double pass to achieve therequired 4.8ns pulse length. The bandwidth available will be18nm.
However a temporary stretcher has been built for the initialcommissioning of the Petawatt system, due to the long lead ofthe optics for the Offner stretcher. This telescopic stretcher is9.3m long with an effective separation of 13m. It is a doublepass system with a single grating and lens. There is a hard clipof the spectrum at the lens and folding mirror such that thebandwidth is limited to 7.4nm. These stretched pulses were theninjected into the OPCPA amplifier for amplification and theninjected into the Vulcan laser.
The beam is then injected into the rod and disk chain, bypassingthe 9 mm rod amplifiers. Energy tests were carried out todemonstrate the compatibility of the OPCPA preamplifier withthe Vulcan laser in the TAW and Petawatt configuration. Theenergy delivered using the OPCPA preamplifiers was 100 J ona full beam for TAW and 80 J on the apodised beam forPetawatt.
The stretched pulses amplified by OPCPA can propagatethrough the Vulcan laser without further amplification andcompressed using the Petawatt compressor. An auto-correlationof these pulses is shown in Figure 4. The pulse was successfullycompressed to 430 fs.
Conclusion
A new Front End preamplifier has been commissioned for theVulcan laser system The beam amplified in the OPCPApreamplifier has played an important role in the alignment andcommissioning of the Petawatt compressor.
References
1. Ross et al, Optics Communications, 144, (1997) 125
2. Dubietis et al, Optics Communications, 88, (1992) 437
3. Collier et al, Applied Optics, 38, No. 36, (1999) 7486
Duration 430 fs FWHM
-3.8 -1.9 0.0 1.9 3.8
0
50
100
150
200
250
Time [ps]
Figure 4. OPCPA Vacuum compression (vertical scale inarbitrary units).
1.9
2.4
2.9
3.4
3.9
4.4
1040 1045 1050 1055 1060 1065 1070
Wavelength [nm]
Unamplified- 0.5 nJ
Amplified - 20 mJ
Figure 2. Spectra of the seed and amplified seed (vertical scale inarbitrary units).
0
0.5
1
1.5
2
2.5
3
3.5
4
0 50 100 150 200 250 300
Time [s]
Ou
tpu
t
Series1
Figure 3. Stability measurements (vertical scale in arbitraryunits).

Laser Science and Development – Vulcan Petawatt
177 Central Laser Facility Annual Report 2001/2002
Introduction
If a super-intense laser interacts with a solid target, a substantialpart of the laser energy can be converted into kinetic energy ofelectrons, protons and heavy ions. When these fast particlesinteract with matter, their kinetic energy is converted intox-rays, γ-rays and neutrons. It is necessary to build radiationshielding, so that no ionising radiation or neutrons can escapefrom the target area. This radiation shielding could interferewith the experimental geometry, so maximum flexibility wasalso a main objective for the shielding design.
Design of the radiation shielding
For experiments in Target Area Petawatt where up to 500 J ontarget at an intensity of 1021 W/cm2 can be delivered, theγ-radiation dose produced during one laser shot is predicted tobe up to 130 mSv @ 5m from the interaction point1). Assuming300 shots per year, the total annual dose would be 39 Sv peryear @ 5m from the target. The Maximum Permissible AnnualDose for a member of the public (MPAD) is 1mSv per year.Taking into account an additional factor of 2 for safety, thenecessary attenuation factor provided by the radiation shieldingis 8 × 10⁴.
To achieve the attenuation, the radiation shielding of TargetArea Petawatt consists of several elements as shown in Figure1. The whole chamber is enclosed with 150 mm of lead as γ-rayshield and 100 mm of high density polyethylene for moderatingand absorbing the neutrons produced. This first step ensures thatthe dose in the target area for a single high intensity shot on asolid target is below the MPAD. Safety measures are in placewhich ensure that it is impossible for people to be in the targetarea during a disk shot for laser safety and radiation safetyreasons. The walls of the target area consist of 60 cm ofconcrete to attenuate the radiation further below the MPADeven for 300 high radiation yield shots per year.
To ensure the best possible flexibility it was decided to use leadbricks of 200×100×50mm3 to build the γ-ray shielding aroundthe interaction chamber. The lead walls are held in place by theplastic neutron shielding. On the roof, chevron shaped leadblocks have been used to reduce the possibility of radiationleakages even further. ISIS provided a significant quantity oflead to the CLF which reduced the shielding cost considerably.The total amount of lead provided by ISIS was about 55t andabout 45t of new lead had to be purchased.
A number of ports necessary for experiments scheduled for thefirst year of operations were singled out. Steel frames are usedto support the lead around these ports. All ports have to becovered (backfilled) with the same amount of lead and plastic asthe whole interaction chamber. Labyrinths from Lead blockswill be used for the feedthrough ports. For the higher ports onthe south and the north side of the chamber, special steel framesto hold the backfill will be used. It was necessary to build acomplete housing for the vacuum pumps on the east side of theinteraction chamber to ensure the integrity of the radiationshielding.
To shield the entrance tube of the interaction chamber, aninternal shielding wall of 50mm of lead and 100mm of plasticwill be installed. There will also be an external collimator builtfrom lead bricks in a steel frame around the tube .
High density polyethylene sheets will be mounted outside thelead for neutron shielding. Since there is no concrete roof abovethe target area, borated high density polyethylene will be usedfor the roof of the interaction chamber. This ensures a sufficientneutron shielding and prevents any neutron sky-shine.
The entrance door of the interaction chamber is covered by alabyrinth built from concrete blocks with the dimensions1830×610×610 mm3. This will enable very quick access to theinteraction chamber between laser shots. The concrete works asγ-shield as well as neutron shield. Because the thickness is notquite sufficient for full energy shots, the interior of the concretelabyrinth will be lined by 100 mm of lead bricks.
In all, the shielding will require about 100t of lead and 50t ofconcrete.
Commissioning of the radiation shielding
During the first experiment, a very careful commissioning ofthe complete radiation shielding will be done. The γ−ray as wellas the neutron dose will be measured as a function of laserenergy and intensity on target inside the chamber, outside thechamber in the target area and outside the target area. The doseproduced on each shot will be measured during the wholeexperiment. The intensity will be increased slowly from50 J (100 TW) to the full energy of 500 J. This will ensure thatthe results are directly comparable to previous dosemeasurements made in Target Area West.
During the experiment the level of activity for the targets used,the target mounts and the interior of the target chamber will alsobe measured.
Installation of the radiation shielding in TAP
Figure 2 shows the lead shielding of the west and the north wallalmost completely installed. The I-beam on top of the lead onthe north wall is bolted to the interaction chamber for stabilityreasons. All the frames around the ports are bolted to thechamber as well.
Radiation shielding for the interaction chamber in Target Area Petawatt
C Ziener, P E Hatton, P N M Wright, R J Clarke, C B Edwards, D Neely, D A Rodkiss, B E Wyborn
Central Laser Facility, CLRC Rutherford Appleton Laboratory, Chilton, Didcot, Oxon, OX11 0QX, UK
Main contact email address: [email protected]
1
2
3
45
6
7
N
Figure 1. Layout of the interaction chamber with theradiation shielding: 1) lead, 2) high-density polyethylene,3) concrete labyrinth, 4) Internal shielding, 5) Collimatoraround the entrance tube, 6) housing around the vacuumpumps, 7) Aluminium lining.

Laser Science and Development – Vulcan Petawatt
Central Laser Facility Annual Report 2001/2002 178
In Figure 3 the steel frame work and the lead for the shieldingaround the vacuum pumps are shown. A removable lid designenables quick access to all the ports for maintenance and in caseof failures.
Figure 2. Lead shielding of the north and west walls of theinteraction chamber. The two ports alongside the entrance doorwill be used as an optical port and a feedthrough portrespectively. The lower port in the north wall is also afeedthrough port.
Figure 3. Lead housing for the vacuum system of theinteraction chamber partially installed.
The whole interior of the interaction chamber has been linedwith 20mm thick aluminium plates. This ensures, that a largeportion of the particles are stopped in a low-Z material thusshifting the Bremsstrahlung spectrum to lower energies. Thisdown-shifting of the γ-ray energies increases the efficiency ofthe external shielding. The Aluminium lining will also preventthe chamber walls (mostly iron) from becoming activated afterseveral experiments. An additional advantage of this particulardesign of the Aluminium lining is the possibility to take outsingle plates and modify them, to enable the mounting ofequipment and/or diagnostics.
Figure 4. The interior of the interaction chamber with almostall of the Aluminium plates in place.
Figure 5. The concrete labyrinth for shielding the entrance ofthe interaction chamber.
The installation of the radiation shielding is a major engineeringtask but necessary for the safe operation of the new Target AreaPetawatt.
A commissioning experiment run during August 2002 willverify the radiological safety of the shielding design andconstruction.
References1. R. Allott, P. Wright, C.Danson, C. Edwards, D. Neely,
P.Norreys, D. Rodkiss, B. Wyborn, Central Laser FacilityAnnual Report 1999-2000, RAL-TR-2000-034, pg 177

Laser Science and Development – Vulcan Petawatt
179 Central Laser Facility Annual Report 2001/2002
Introduction
An integral part of the Vulcan Petawatt upgrade was thecommissioning of a new laser area. This new area servedseveral purposes: to increase the energy from 120J to 600J1);provide beam delivery and local alignment lasers for TargetArea Petawatt (TAP); forward going diagnostics for TAPoperations; retro diagnostics for compressor commissioning andan adaptive optics wavefront sensor channel.
Beam delivery and local alignment lasers
Figure 1 shows the layout of laser area 4. For normal TAPoperations the output of the 208mm-amplifier chain is injectedin to the expanding Vacuum Spatial Filter (VSF) andcompressor. The two mirrors used to propagate the beam are99% reflective, generating two forward going diagnosticchannels. The first comprises the adaptive optics sensor channelwhile the second generates the forward going near-field, far-field, calorimeter channel and a spare channel into which aspectrometer or radial shear interferometer 2) can be installed.
The TAP local alignment laser is generated in LA4. This isinjected into the TAP beam line using a slide mirror asindicated in Figure 1.
Forward going diagnostics
Figure 2 details the forward going diagnostics. A Fresnelreflection off the first optic in the diagnostics suite generates afar field channel, which has a magnification of 10X to increasesensitivity for pointing stability and monitoring encircled
energy in the focal spot. The near field CCD camera images theoutput of the 208mm-amplifier chain. This is a useful diagnosticfor monitoring clipping and diffraction on the beam whichwould cause damage to the diffraction gratings in thecompressor. The final channel is a multifunctional channel andcomprises a re-collimated 20mm beam, which can either beused for taking wavefront measurements with a radial shearinterferometer, or spectral information with a spectrometer.
Adaptive optics sensor channel and calorimetry
The adaptive optics sensor channel provides closed loopwavefront feedback for the adaptive optic 3). The leakage fromthe first mirror in LA4 is passed through a focus and re-collimated at the 10mm aperture. This is then passed through amicro lens array, which generates an array of focal spots at its40mm focal length. These are then imaged on to a CCD camera.A shutter is used to protect the sensor channel when high-energy shots are delivered to TAP. The calorimeter for the208mm amplifiers is also located here. A beam splitter andnegative lens generate a 15mm collimated beam for thecalorimeter.
Retro diagnostics and Local alignment beam
Part of the compressor set up procedure requires an alignmentbeam to be propagated through the compressor, retro-reflectedthrough the spatial filter and focused to a far-field. In order toset the parallelism of the gratings, the retro reflected far-fieldspots from the two wavelengths should be exactly on top ofeach other. For increased sensitivity in this procedure a thirdwavelength, 1064nm is also available. Figure 4 shows the dualwavelength laser and retro diagnostics. The two lasers haveorthogonal polarisation and with the use of a cube polariser areco-linearly injected through a diffraction-limited pinhole. A50% beam splitter is used to propagate the expanding beamfrom the dual wavelength laser to the collimating lens (as inFigure 1). This beam splitter in turn allows a retro-reflectedbeam from the compressor to be propagated through it and then
Laser area 4 beam delivery and diagnostics commissioning
S Hawkes, J Collier, S Hancock
Central Laser Facility, CLRC Rutherford Appleton Laboratory, Chilton, Didcot, Oxon, OX11 0QX, UK
Main contact email address: [email protected]
Adaptive optics sensor and calorimeter
Forward going diagnostics
Retro diagnostics and alignment laser
208mm amplifier chain
TAP spatial filter
Figure 1. Laser area 4 schematic.
Figure 2. Forward going diagnostics.
Figure 3. Adaptive optics sensor channel.

Laser Science and Development – Vulcan Petawatt
Central Laser Facility Annual Report 2001/2002 180
subsequently split several times to generate a number ofdiagnostics channels.
The diagnostics available for the return beam include: a wide-field far-field camera; a narrow-field, or magnified, far-fieldcamera; a driven equivalent plane far-field camera and a radialshear interferometer. Two optics are used to split the returnbeam and turn it through 900. This is because a convergingbeam propagated through a beam splitter will impose a certaindegree of astigmatism on the beam. However the amount ofastigmatism generated is angle specific, and is significantlysmaller when propagated through a beam splitter orientated at22.50, than one at 450.
Results obtained using LA 4 diagnostics
The first significant result from the LA4 commissioning was thegeneration of a near diffraction limited beam. This will serve asboth the TAP local alignment laser and the reference beam forthe adaptive optics system. The 180mm beam generated showedsome aberrations from the 350*260 beam delivery optics, butstill showed a flatness of better than 1/5th of a wave peak tovalley. Presented in Figure 5 are the interferogram of thealignment beam and far-field obtained from the retrodiagnostics.
Conclusions
The LA4 alignment beams, diagnostics, and beam deliverysystems have been successfully used in the commissioning ofthe TAP spatial filter and compressor. This included setting theparallelism of the diffraction gratings to within the tolerancesrequired to generate the short pulses required by the upgrade.The LA4 set up has also been successfully used in an IHP EUEuropean access experiment studying adaptive optics as well asthe trials for the CLF developed adaptive optics system.
References
1. Gain Measurements on the Petawatt 208 mm AmplifierChain, D. Pepler et al, CLF Annual Report 2001/02, RAL-TR-2002-013, pg 171
2. A radial shear interferometer, C Hernandez-Gomez et al,CLF Annual Report 1997/98, RAL-TR-1998-080, pg 165
3. Adaptive optics trials on Vulcan, S. Hawkes et al, CLFAnnual Report 2000/01, RAL-TR-2001-030, pg 153
Figure 5. Inteferogram and far field of LA 4 laser.
Figure 4. Retro diagnostics.

Laser Science and Development – Vulcan Petawatt
181 Central Laser Facility Annual Report 2001/2002
Introduction
For optimum performance of the Petawatt upgrade, the dynamiccorrection of wavefront errors that arise from propagationthrough the optical chain of Vulcan is necessary. An adaptiveoptic development programme has therefore been in progressthroughout the Petawatt upgrade. Previous reports havehighlighted the specific technical details with regard to thisprogramme 1-2) and the reader is referred to these for additionalinformation. This article reports on the final commissioning ofthe adaptive optics system on Vulcan for the Petawatt upgrade.The wavefront sensor was located in LA4 after the 208 mmamplifiers and the deformable mirror located mid chain in LA1.
Specification
The specification for closed loop operation of the adaptiveoptics system for use with Vulcan is for a cycle time faster than1Hz, correction to 1.5 times the diffraction limit, and a highlevel of immunity to electrical noise. The relatively modestclosed loop time arises from the type of errors that the system isrequired to compensate. These are principally those arisingfrom static aberrations of the optics in the beamline and slowlyvarying distortions caused by the thermal gradients set up in theoptics during the course of firing laser shots throughout the day.With a repetition frequency of three laser shots per hour atmost, the need for faster loop times is not justified.
Vulcan already operates with a beam quality of approximately 3times the diffraction limit, and reduction of a factor of 2 willgive an increase in intensity on target of a factor of four. Inaddition, when considering the ultimate performance capabilityof the chirped pulse amplification (CPA) beamline, thewavefront quality determines the compressibility of the chirpedpulse and influences the contrast ratio.
The effect of electrical pickup, transient magnetic fields, etc. isa very serious issue. The system must operate in a hostileelectrical and magnetic environment. It is vital that the systemdoes not exhibit failure modes which could cause catastrophicdamage to the laser itself, by inducing beam focusing, forexample, or causing wasted shots through undesirable changesin beam pointing or beam quality.
System Design
The wavefront sensors that were employed for the developmentof this system have been either a Hartman array (array ofapertures) or an AZP Hartman array (array of Fresnel amplitudezone plates). This type of sensor actually measures wavefrontgradient and has worked satisfactorily in previous trials.However, when deployed on Vulcan with sensing at a 200 mm
aperture it was discovered that its performance was degraded,
with an appreciable loss in signal to noise ratio. It was replacedby a Shack Hartman sensor (array of refractive lenses), whichalso measures gradient, and which operates on an appropriatelyde-magnified beam. This has been found to work significantlybetter. The Shack Hartman system produces an average of 2-3times increase in spot centroid displacement. This array is acommercially available product, comprising a 40x40 micro-lensarray with individual lens focal length of 40 mm. The lens pitchis 0.6 mm.
The deformable mirror used to effect wavefront correction is anin-house design based on a bi-morph piezo-electric architecture,the details of which are contained in the citations. The mirrorhas 61 electrodes and produces at each electrode a localisedchange to the radius of curvature of the beam proportional to anapplied voltage.
A PC applies the appropriate control algorithm, as reported inthe citations, coupling the sensor and the mirror. One pointhowever to note about the control process is that it is modal inthe way that it couples the sensor to the mirror. There is anexternal control over the number of modes that are presentwithin the algorithm, which is important because the lowerpower modes (or higher spatial order modes) tend to bedominated by noise.
System Performance
The results presented below using the adaptive optic correctorinclude 3 datasets; ao15, ao25 and ao61. Each set refers to themaximum number of modes that is used in the correctionalgorithm. In the case of ao61, all the modes contribute to thecorrection. For ao25, only the 25 highest power modes areincluded and for ao15 only the highest 15.
Data set “169” corresponds to the replacement of thedeformable mirror with a flat, static reflector while “ref”corresponds to a “perfect” beam that provides the referencewavefront for the system. A summary of the results is shown inthe table below.
It is interesting to note that with the limited amount of dataavailable at this time, there seems to be little difference betweenthe p-v flatness of the wavefront between the best adaptiveresult, ao25, and the flat mirror. Indeed the non-optimised modenumber results actually show an inferior wavefront comparedwith the static mirror. The second column of wavefront datawas obtained from the raw data in the first column by removingall but the first 45 terms of the Zernike expansion of thewavefront in an attempt to filter out the effects of noise in thefringe pattern. Again, the same behaviour is observed.
Adaptive Optics for the Petawatt upgrade
J Collier, C Hooker, S Hawkes, C Edwards
Central Laser Facility, CLRC Rutherford Appleton Laboratory, Chilton, Didcot, Oxon, OX11 0QX, UK
C Haefner, K Braeur
Phelix, GSI, Planckstrasse 1, D-64291, Darmstadt, Germany
Main contact email address: [email protected]
Phase r.m.s Phase r.m.s StrehlRatio StrehlRatio 2nd moment(waves) (Z45 terms) (no filter) (after Zern. filter) (arb. units)
ref Reference beam 0.091 0.088 0.725 0.74 44
169 169mm static mirror 0.134 0.132 0.434 0.481 72
AO15 Matrix truncated at 15 elements 0.189 0.135 0.497 0.514 62
AO25 Matrix truncated at 25 elements 0.133 0.128 0.477 0.51 52
AO63 Matrix not truncated 0.189 0.184 0.276 0.288 -
File Description

Laser Science and Development – Vulcan Petawatt
Central Laser Facility Annual Report 2001/2002 182
Strehl ratio analysis is shown in the 5th and 6th columns, firstlyusing the raw wavefront data and secondly using the Zernikefiltered case. The ao15 result shows a small improvement overthe static mirror. It is important to note that the Strehl ratio hasbeen calculated from the wavefront data alone, and a uniform“top-hat” near field beam profile has been assumed.
The 2nd moment far field beam width measurement was madeusing the algorithms proposed by Giesen 3) and applied to thefar field images shown in Figure 1. This method uses aniterative approach to determine the aperture within which themoment is calculated, to reduce the effects of noise at largedistance from the centroid of the beam. First, the background issubtracted and the data is first windowed by eye, and the secondmoment, centred on the centroid of the distribution, calculatedin both x and y propagation directions. The window is thenresized horizontally and vertically to 3 times the value of themoment in the x and y axes. The moments are then re-calculated and the window re-sized as before. This process isrepeated until the value of the 2nd moment converges.
The results of the second moment analysis clearly show animprovement in the case of ao25 over the static mirror. Thecorresponding far field images are shown in Figure 1 above. Itis clear from the measurement of the 2nd moment far field beamwidth, and also from the far field images shown above, thatthere is a clear improvement in the focal spot using the adaptivecorrector compared with the static mirror. In the case of ao25,the focal spot quality approaches that of the reference beam.
Both ao15 and ao25 show a significant visual improvement inthe far field, in agreement with the 2nd moment analysis. Thereis clear evidence of the first outer ring of the Airy pattern inboth. It is not possible to differentiate between these twoimages visually due to the lower exposure of the ao25 image.The dynamic range of the measurement is also rather limited,with the peak of the ao25 image at approximately 6 bits abovethe noise level.
It can be seen from the table that the performance of thecorrector system as diagnosed through far field images and the2nd moment analysis gives a different result from that impliedby the wavefront analysis. This will be the subject of furtherstudy outside the project.
Environmental effects
Environmental stability of the system was not tested extensivelyduring the programme reported here but has been investigatedpreviously. There is no evidence that the system is affected bythe electrical environment in which it is required to operate.Both the sensor and actuator are located in close proximity(<2m) to the disc amplifiers and their associated pulsed powercircuits. However, the earliest electrical activity prior to a shotoccurs 2 ms in advance. Previous measurements have shownthat it takes typically 25 ms for the deformable mirror torespond to a voltage stimulus. Thus, the observed insensitivityto shot noise is not surprising.
Summary
The latest version of the adaptive optics correction system hasbeen tested on the Vulcan CPA beamline. The system wasoperated closed loop at 7Hz, using the Vulcan c.w. alignmentbeam as a source.
The far-field intensity distribution of the beam with the adaptivecorrector in the line was significantly improved, as evidencedby far field imaging and 2nd moment width measurement.
In order to carry out final system tests with the Vulcan facilityat full beam energy it will be necessary to install a fast shutterin order to protect the AO sensor and beam diagnostics fromdamage.
References
1. Central Laser Facility Annual Report 2000/2001, RAL-TR-2001-030, pgs 153, 175 & 177
2. Central Laser Facility Annual Report 1998/99, RAL-TR-1999-062, pg 199
3. Giesen, ISO/FDIS/11146 (to be published)
a b
c d
Figure 1. Far Field patterns under different configurations -a) reference beam, b) uncorrected beam “169”, c) correctionwith 15 modes “ao15” and d) correction with 25 modes“ao25”.
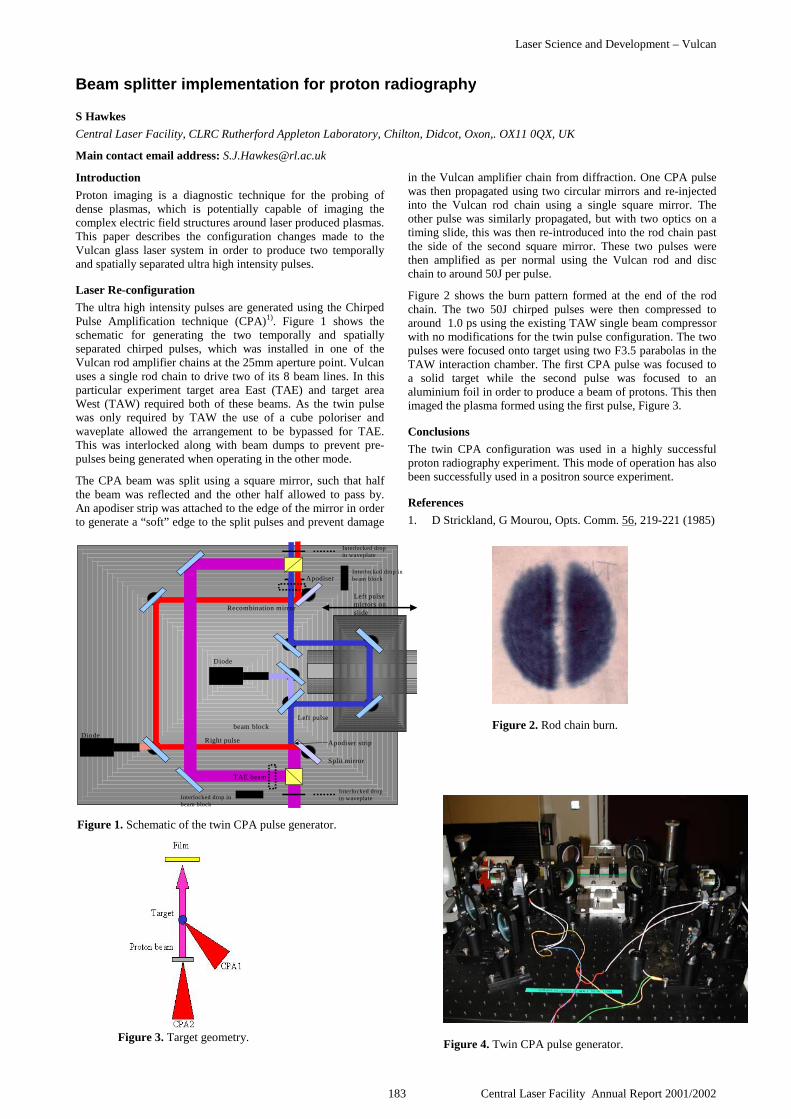
Laser Science and Development – Vulcan
183 Central Laser Facility Annual Report 2001/2002
DiodeRight pulse
beam blockLeft pulse
Diode
Split mirror
Left pulsemirrors onslide
Apodiser
Apodiser strip
Interlocked dropin waveplate
Interlocked dropin waveplate
TAE beam
Recombination mirror
Interlocked drop inbeam block
Interlocked drop inbeam block
Figure 1. Schematic of the twin CPA pulse generator.
Introduction
Proton imaging is a diagnostic technique for the probing ofdense plasmas, which is potentially capable of imaging thecomplex electric field structures around laser produced plasmas.This paper describes the configuration changes made to theVulcan glass laser system in order to produce two temporallyand spatially separated ultra high intensity pulses.
Laser Re-configuration
The ultra high intensity pulses are generated using the ChirpedPulse Amplification technique (CPA)1). Figure 1 shows theschematic for generating the two temporally and spatiallyseparated chirped pulses, which was installed in one of theVulcan rod amplifier chains at the 25mm aperture point. Vulcanuses a single rod chain to drive two of its 8 beam lines. In thisparticular experiment target area East (TAE) and target areaWest (TAW) required both of these beams. As the twin pulsewas only required by TAW the use of a cube poloriser andwaveplate allowed the arrangement to be bypassed for TAE.This was interlocked along with beam dumps to prevent pre-pulses being generated when operating in the other mode.
The CPA beam was split using a square mirror, such that halfthe beam was reflected and the other half allowed to pass by.An apodiser strip was attached to the edge of the mirror in orderto generate a “soft” edge to the split pulses and prevent damage
in the Vulcan amplifier chain from diffraction. One CPA pulsewas then propagated using two circular mirrors and re-injectedinto the Vulcan rod chain using a single square mirror. Theother pulse was similarly propagated, but with two optics on atiming slide, this was then re-introduced into the rod chain pastthe side of the second square mirror. These two pulses werethen amplified as per normal using the Vulcan rod and discchain to around 50J per pulse.
Figure 2 shows the burn pattern formed at the end of the rodchain. The two 50J chirped pulses were then compressed toaround 1.0 ps using the existing TAW single beam compressorwith no modifications for the twin pulse configuration. The twopulses were focused onto target using two F3.5 parabolas in theTAW interaction chamber. The first CPA pulse was focused toa solid target while the second pulse was focused to analuminium foil in order to produce a beam of protons. This thenimaged the plasma formed using the first pulse, Figure 3.
Conclusions
The twin CPA configuration was used in a highly successfulproton radiography experiment. This mode of operation has alsobeen successfully used in a positron source experiment.
References
1. D Strickland, G Mourou, Opts. Comm. 56, 219-221 (1985)
Beam splitter implementation for proton radiography
S Hawkes
Central Laser Facility, CLRC Rutherford Appleton Laboratory, Chilton, Didcot, Oxon,. OX11 0QX, UK
Main contact email address: [email protected]
Figure 2. Rod chain burn.
Figure 3. Target geometry.Figure 4. Twin CPA pulse generator.

Laser Science and Development – Vulcan
Central Laser Facility Annual Report 2001/2002 184
The assembly of Vulcan laser Disc Amplifiers is a preciselydocumented closely monitored process, by which the highperformance and long term reliability of the amplifiers can bestbe assured. A part of the process involves the selection and testof the amplifier flash lamps, calling for close inspection of tubequality, and dynamic pulsed power tests. Dynamic tests areperformed upon each occasion that it is necessary to handlelamps or lamp arrays, and possibly incur damage, or mechanicalstress on the lamps. Therefore tests are carried out after theinitial lamp quality inspection, and at two other significantpoints of amplifier construction.
The lamp test facility used until this time provided for adequatesingle lamp testing, but it contained obsolete technology andwas technically difficult to support. It was considered that amore accurate simulation of the amplifier circuit could now beprovided off line using the amplifier test facility if we were todesign a suitable housing to contain two lamps coupled in seriesas they are in the amplifier circuits.
The amplifier test facility is equipped withfull Camac control, circuit monitoring, anddata acquisition through an Ethernet link toa PC as in Vulcan, and in principle duallamp testing was considered to be possibleif a suitable lamp housing could beprovided. It also required an extension tothe control software to provide forautomated cycling, and close datamonitoring to initiate shut down in theevent of deviation from pre set limits.
A new lamp test housing was designed andconstructed in house, using componentparts manufactured in stainless steel offsite. It has two isolated chambers to housethe lamps, and these are top sealed withindependent clip on lids that provide easeof access for lamp changes. Completeisolation of the lamps is essential in theevent of the catastrophic failure of a lamp.The lamp mountings are a close replicationof those used in amplifiers to simulate themounting condition. They are constructedon a solid stainless steel base that iselectrically isolated from the case, butelectrically connected to the pulsed powerreturn line, thereby providing a currentreturn path in the event of catastrophicfailure. This stray ground current, and thelamp current are monitored via currenttransformer networks mounted on theamplifier junction box, and connected toPC driven Camac based TransientRecorders. Ports for the exit of lamp leadsare provided at each end of the housing,and a filtered cooling fan provides air flowalong the lamps as in amplifiers. The unit ismounted on a trolley to provide mobilitythat will allow the lamps to be loaded andremoved for storage in the adjacentamplifier assembly clean room. Simplyplugging in to one channel of theappropriate source provides pulsed power,and the whole system is Castel Keyinterlocked for safe remote operation. Data
from all tests is saved to disk, and hard copies are provided oncompletion of each test run.
The lamps are discharged twenty times at energy levels up tofull power plus 10% after inspection, and again after installationinto amplifier shells without the discs. In the fully assembledamplifier they are discharged ten times at full power.
The lifetime of the lamps is a function of the discharge energy,and the level at which they are nominally run on Vulcan willgive a lifetime of at least 104 discharges. Each amplifier haseight lamps connected in series coupled pairs, to dissipate amaximum total energy of 200kJ.
The fully enhanced test facility has proved to be a great success.A replica of the on line system using state of the art technologythroughout with a high degree of operational safety built in, ithas effectively streamlined the whole amplifier construction andtest process.
Disc amplifier Flash Lamp Test Facility
R W W Wyatt, C Aldis, A Frackiewicz, D A Pepler, M Pitts, C Reason, R Wellstood
Central Laser Facility, CLRC Rutherford Appleton Laboratory, Chilton, Didcot, Oxon, OX11 0QX, UK
Main contact email address: [email protected]
Figure 1. A flashlamp being loaded into the dual flashlamp tester by AndyFrackiewicz.
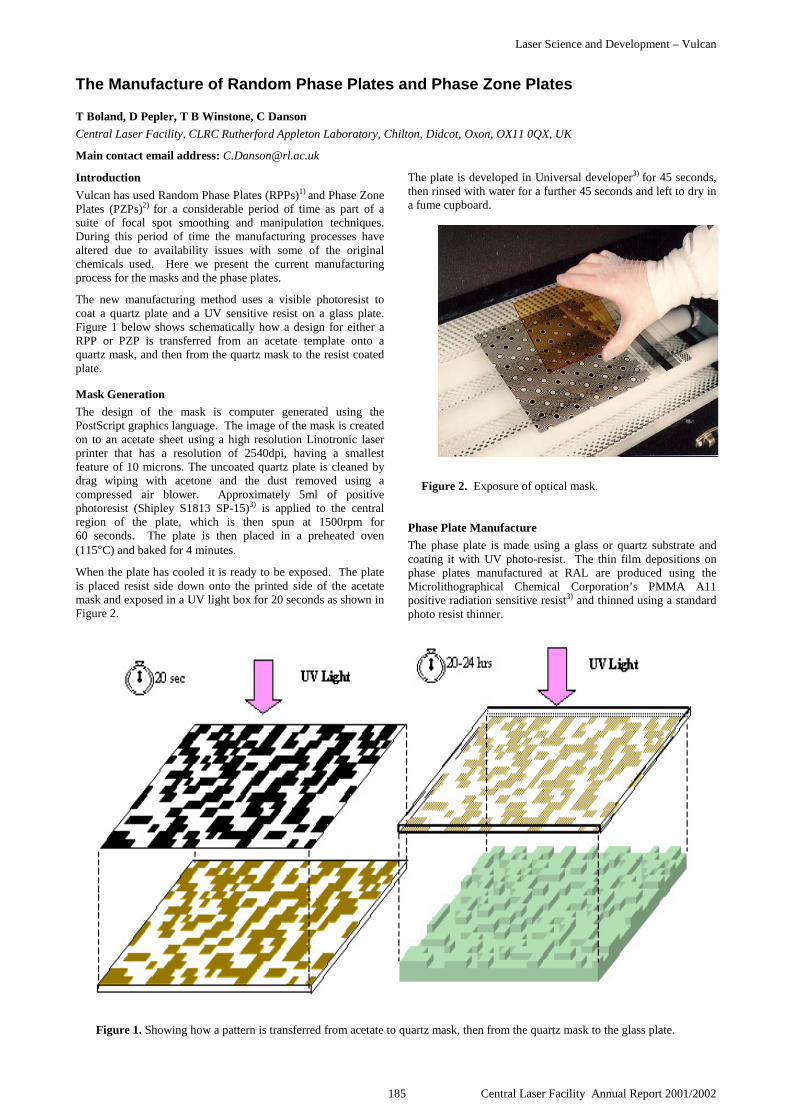
Laser Science and Development – Vulcan
185 Central Laser Facility Annual Report 2001/2002
Introduction
Vulcan has used Random Phase Plates (RPPs)1) and Phase ZonePlates (PZPs)2) for a considerable period of time as part of asuite of focal spot smoothing and manipulation techniques.During this period of time the manufacturing processes havealtered due to availability issues with some of the originalchemicals used. Here we present the current manufacturingprocess for the masks and the phase plates.
The new manufacturing method uses a visible photoresist tocoat a quartz plate and a UV sensitive resist on a glass plate.Figure 1 below shows schematically how a design for either aRPP or PZP is transferred from an acetate template onto aquartz mask, and then from the quartz mask to the resist coatedplate.
Mask Generation
The design of the mask is computer generated using thePostScript graphics language. The image of the mask is createdon to an acetate sheet using a high resolution Linotronic laserprinter that has a resolution of 2540dpi, having a smallestfeature of 10 microns. The uncoated quartz plate is cleaned bydrag wiping with acetone and the dust removed using acompressed air blower. Approximately 5ml of positivephotoresist (Shipley S1813 SP-15)3) is applied to the centralregion of the plate, which is then spun at 1500rpm for60 seconds. The plate is then placed in a preheated oven(115°C) and baked for 4 minutes.
When the plate has cooled it is ready to be exposed. The plateis placed resist side down onto the printed side of the acetatemask and exposed in a UV light box for 20 seconds as shown inFigure 2.
The plate is developed in Universal developer3) for 45 seconds,then rinsed with water for a further 45 seconds and left to dry ina fume cupboard.
Phase Plate Manufacture
The phase plate is made using a glass or quartz substrate andcoating it with UV photo-resist. The thin film depositions onphase plates manufactured at RAL are produced using theMicrolithographical Chemical Corporation’s PMMA A11positive radiation sensitive resist3) and thinned using a standardphoto resist thinner.
The Manufacture of Random Phase Plates and Phase Zone Plates
T Boland, D Pepler, T B Winstone, C Danson
Central Laser Facility, CLRC Rutherford Appleton Laboratory, Chilton, Didcot, Oxon, OX11 0QX, UK
Main contact email address: [email protected]
Figure 1. Showing how a pattern is transferred from acetate to quartz mask, then from the quartz mask to the glass plate.
Figure 2. Exposure of optical mask.
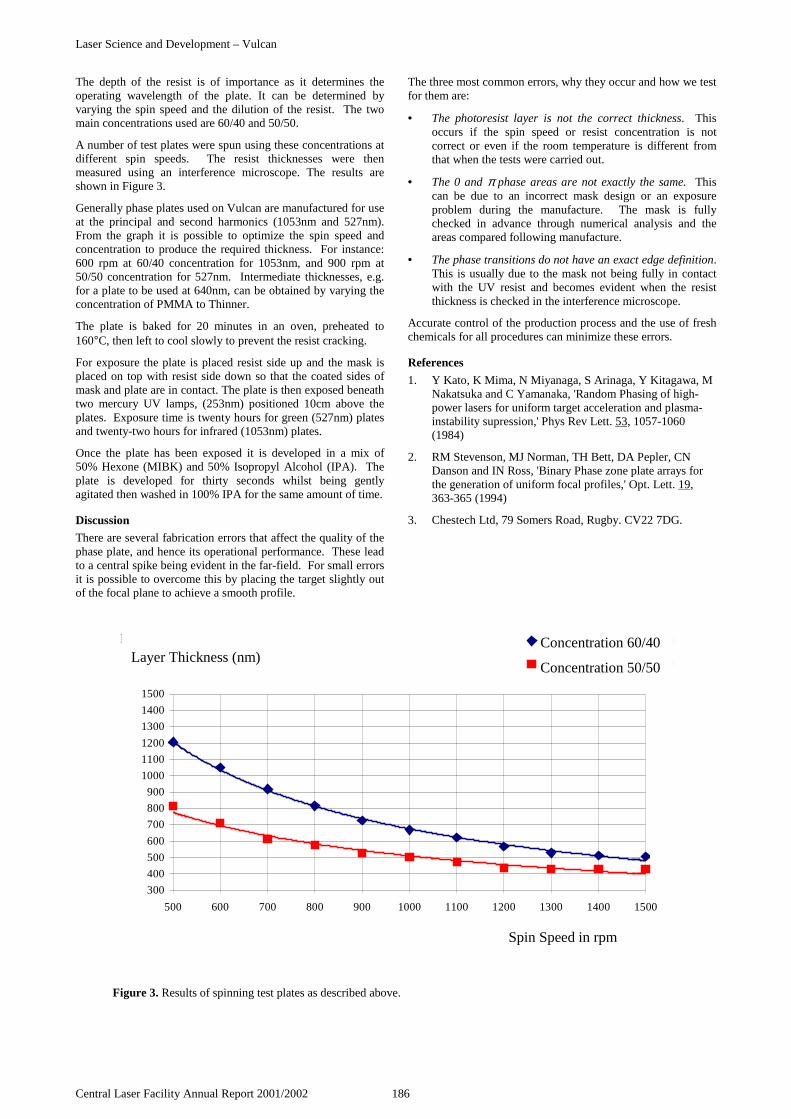
Laser Science and Development – Vulcan
Central Laser Facility Annual Report 2001/2002 186
The depth of the resist is of importance as it determines theoperating wavelength of the plate. It can be determined byvarying the spin speed and the dilution of the resist. The twomain concentrations used are 60/40 and 50/50.
A number of test plates were spun using these concentrations atdifferent spin speeds. The resist thicknesses were thenmeasured using an interference microscope. The results areshown in Figure 3.
Generally phase plates used on Vulcan are manufactured for useat the principal and second harmonics (1053nm and 527nm).From the graph it is possible to optimize the spin speed andconcentration to produce the required thickness. For instance:600 rpm at 60/40 concentration for 1053nm, and 900 rpm at50/50 concentration for 527nm. Intermediate thicknesses, e.g.for a plate to be used at 640nm, can be obtained by varying theconcentration of PMMA to Thinner.
The plate is baked for 20 minutes in an oven, preheated to160°C, then left to cool slowly to prevent the resist cracking.
For exposure the plate is placed resist side up and the mask isplaced on top with resist side down so that the coated sides ofmask and plate are in contact. The plate is then exposed beneathtwo mercury UV lamps, (253nm) positioned 10cm above theplates. Exposure time is twenty hours for green (527nm) platesand twenty-two hours for infrared (1053nm) plates.
Once the plate has been exposed it is developed in a mix of50% Hexone (MIBK) and 50% Isopropyl Alcohol (IPA). Theplate is developed for thirty seconds whilst being gentlyagitated then washed in 100% IPA for the same amount of time.
Discussion
There are several fabrication errors that affect the quality of thephase plate, and hence its operational performance. These leadto a central spike being evident in the far-field. For small errorsit is possible to overcome this by placing the target slightly outof the focal plane to achieve a smooth profile.
The three most common errors, why they occur and how we testfor them are:
• The photoresist layer is not the correct thickness. Thisoccurs if the spin speed or resist concentration is notcorrect or even if the room temperature is different fromthat when the tests were carried out.
• The 0 and π phase areas are not exactly the same. Thiscan be due to an incorrect mask design or an exposureproblem during the manufacture. The mask is fullychecked in advance through numerical analysis and theareas compared following manufacture.
• The phase transitions do not have an exact edge definition.This is usually due to the mask not being fully in contactwith the UV resist and becomes evident when the resistthickness is checked in the interference microscope.
Accurate control of the production process and the use of freshchemicals for all procedures can minimize these errors.
References
1. Y Kato, K Mima, N Miyanaga, S Arinaga, Y Kitagawa, MNakatsuka and C Yamanaka, 'Random Phasing of high-power lasers for uniform target acceleration and plasma-instability supression,' Phys Rev Lett. 53, 1057-1060(1984)
2. RM Stevenson, MJ Norman, TH Bett, DA Pepler, CNDanson and IN Ross, 'Binary Phase zone plate arrays forthe generation of uniform focal profiles,' Opt. Lett. 19,363-365 (1994)
3. Chestech Ltd, 79 Somers Road, Rugby. CV22 7DG.
300
400
500
600
700
800
900
1000
1100
1200
1300
1400
1500
500 600 700 800 900 1000 1100 1200 1300 1400 1500
Spin Speed/rpm
Layer Thickness/nm Concentration 60/40
Concentration 50/50
Spin Speed in rpm
Layer Thickness (nm)Concentration 60/40
Concentration 50/50
Figure 3. Results of spinning test plates as described above.
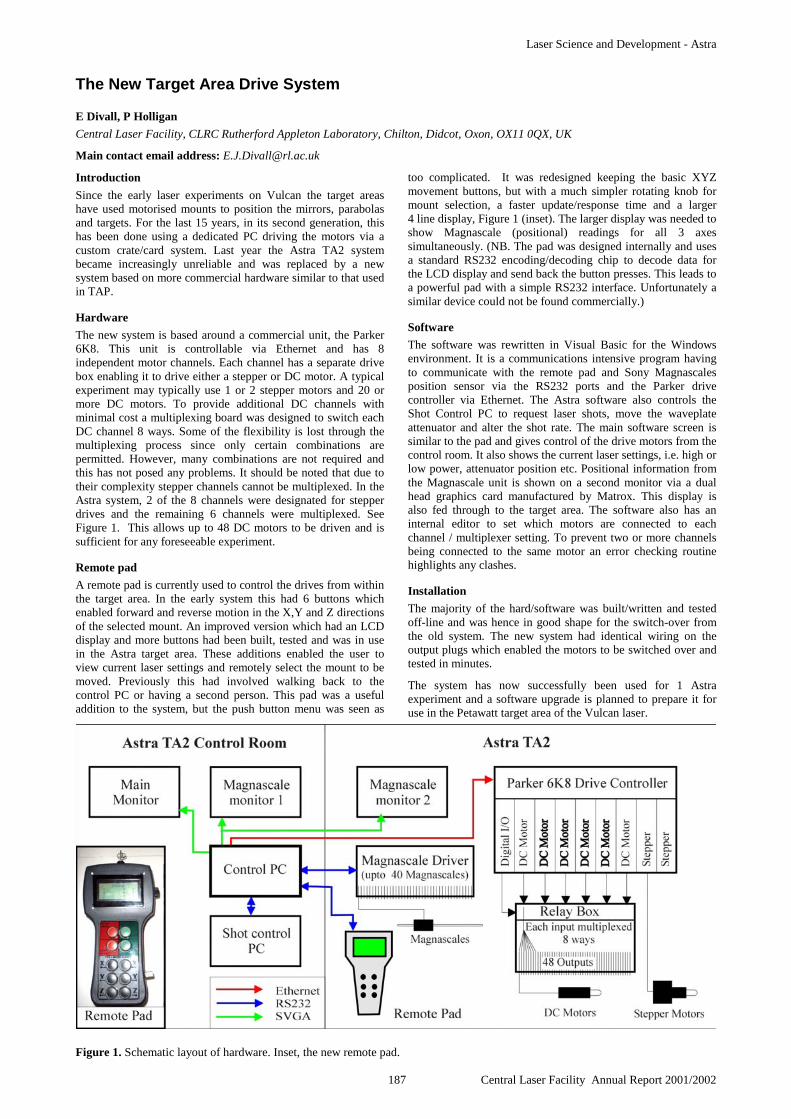
Laser Science and Development - Astra
187 Central Laser Facility Annual Report 2001/2002
Introduction
Since the early laser experiments on Vulcan the target areashave used motorised mounts to position the mirrors, parabolasand targets. For the last 15 years, in its second generation, thishas been done using a dedicated PC driving the motors via acustom crate/card system. Last year the Astra TA2 systembecame increasingly unreliable and was replaced by a newsystem based on more commercial hardware similar to that usedin TAP.
Hardware
The new system is based around a commercial unit, the Parker6K8. This unit is controllable via Ethernet and has 8independent motor channels. Each channel has a separate drivebox enabling it to drive either a stepper or DC motor. A typicalexperiment may typically use 1 or 2 stepper motors and 20 ormore DC motors. To provide additional DC channels withminimal cost a multiplexing board was designed to switch eachDC channel 8 ways. Some of the flexibility is lost through themultiplexing process since only certain combinations arepermitted. However, many combinations are not required andthis has not posed any problems. It should be noted that due totheir complexity stepper channels cannot be multiplexed. In theAstra system, 2 of the 8 channels were designated for stepperdrives and the remaining 6 channels were multiplexed. SeeFigure 1. This allows up to 48 DC motors to be driven and issufficient for any foreseeable experiment.
Remote pad
A remote pad is currently used to control the drives from withinthe target area. In the early system this had 6 buttons whichenabled forward and reverse motion in the X,Y and Z directionsof the selected mount. An improved version which had an LCDdisplay and more buttons had been built, tested and was in usein the Astra target area. These additions enabled the user toview current laser settings and remotely select the mount to bemoved. Previously this had involved walking back to thecontrol PC or having a second person. This pad was a usefuladdition to the system, but the push button menu was seen as
too complicated. It was redesigned keeping the basic XYZmovement buttons, but with a much simpler rotating knob formount selection, a faster update/response time and a larger4 line display, Figure 1 (inset). The larger display was needed toshow Magnascale (positional) readings for all 3 axessimultaneously. (NB. The pad was designed internally and usesa standard RS232 encoding/decoding chip to decode data forthe LCD display and send back the button presses. This leads toa powerful pad with a simple RS232 interface. Unfortunately asimilar device could not be found commercially.)
Software
The software was rewritten in Visual Basic for the Windowsenvironment. It is a communications intensive program havingto communicate with the remote pad and Sony Magnascalesposition sensor via the RS232 ports and the Parker drivecontroller via Ethernet. The Astra software also controls theShot Control PC to request laser shots, move the waveplateattenuator and alter the shot rate. The main software screen issimilar to the pad and gives control of the drive motors from thecontrol room. It also shows the current laser settings, i.e. high orlow power, attenuator position etc. Positional information fromthe Magnascale unit is shown on a second monitor via a dualhead graphics card manufactured by Matrox. This display isalso fed through to the target area. The software also has aninternal editor to set which motors are connected to eachchannel / multiplexer setting. To prevent two or more channelsbeing connected to the same motor an error checking routinehighlights any clashes.
Installation
The majority of the hard/software was built/written and testedoff-line and was hence in good shape for the switch-over fromthe old system. The new system had identical wiring on theoutput plugs which enabled the motors to be switched over andtested in minutes.
The system has now successfully been used for 1 Astraexperiment and a software upgrade is planned to prepare it foruse in the Petawatt target area of the Vulcan laser.
Figure 1. Schematic layout of hardware. Inset, the new remote pad.
The New Target Area Drive System
E Divall, P Holligan
Central Laser Facility, CLRC Rutherford Appleton Laboratory, Chilton, Didcot, Oxon, OX11 0QX, UK
Main contact email address: [email protected]
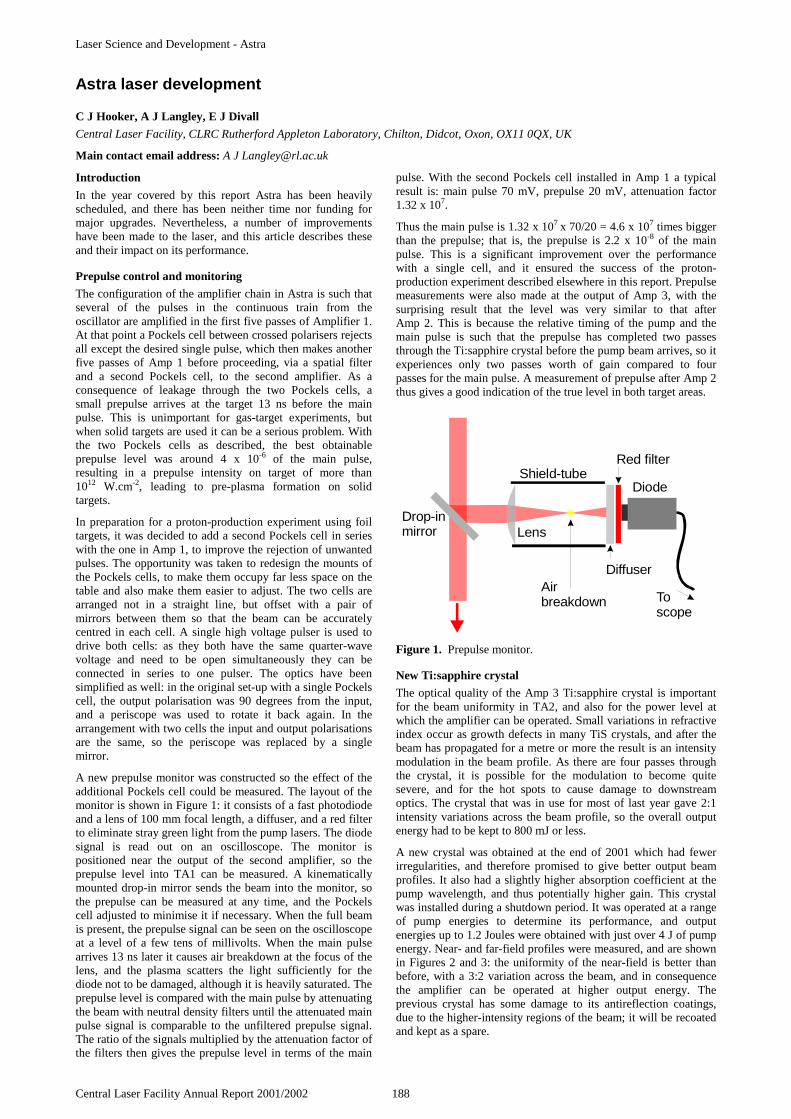
Laser Science and Development - Astra
Central Laser Facility Annual Report 2001/2002 188
Introduction
In the year covered by this report Astra has been heavilyscheduled, and there has been neither time nor funding formajor upgrades. Nevertheless, a number of improvementshave been made to the laser, and this article describes theseand their impact on its performance.
Prepulse control and monitoring
The configuration of the amplifier chain in Astra is such thatseveral of the pulses in the continuous train from theoscillator are amplified in the first five passes of Amplifier 1.At that point a Pockels cell between crossed polarisers rejectsall except the desired single pulse, which then makes anotherfive passes of Amp 1 before proceeding, via a spatial filterand a second Pockels cell, to the second amplifier. As aconsequence of leakage through the two Pockels cells, asmall prepulse arrives at the target 13 ns before the mainpulse. This is unimportant for gas-target experiments, butwhen solid targets are used it can be a serious problem. Withthe two Pockels cells as described, the best obtainableprepulse level was around 4 x 10⁻⁶ of the main pulse,resulting in a prepulse intensity on target of more than1012 W.cm-2, leading to pre-plasma formation on solidtargets.
In preparation for a proton-production experiment using foiltargets, it was decided to add a second Pockels cell in serieswith the one in Amp 1, to improve the rejection of unwantedpulses. The opportunity was taken to redesign the mounts ofthe Pockels cells, to make them occupy far less space on thetable and also make them easier to adjust. The two cells arearranged not in a straight line, but offset with a pair ofmirrors between them so that the beam can be accuratelycentred in each cell. A single high voltage pulser is used todrive both cells: as they both have the same quarter-wavevoltage and need to be open simultaneously they can beconnected in series to one pulser. The optics have beensimplified as well: in the original set-up with a single Pockelscell, the output polarisation was 90 degrees from the input,and a periscope was used to rotate it back again. In thearrangement with two cells the input and output polarisationsare the same, so the periscope was replaced by a singlemirror.
A new prepulse monitor was constructed so the effect of theadditional Pockels cell could be measured. The layout of themonitor is shown in Figure 1: it consists of a fast photodiodeand a lens of 100 mm focal length, a diffuser, and a red filterto eliminate stray green light from the pump lasers. The diodesignal is read out on an oscilloscope. The monitor ispositioned near the output of the second amplifier, so theprepulse level into TA1 can be measured. A kinematicallymounted drop-in mirror sends the beam into the monitor, sothe prepulse can be measured at any time, and the Pockelscell adjusted to minimise it if necessary. When the full beamis present, the prepulse signal can be seen on the oscilloscopeat a level of a few tens of millivolts. When the main pulsearrives 13 ns later it causes air breakdown at the focus of thelens, and the plasma scatters the light sufficiently for thediode not to be damaged, although it is heavily saturated. Theprepulse level is compared with the main pulse by attenuatingthe beam with neutral density filters until the attenuated mainpulse signal is comparable to the unfiltered prepulse signal.The ratio of the signals multiplied by the attenuation factor ofthe filters then gives the prepulse level in terms of the main
pulse. With the second Pockels cell installed in Amp 1 a typicalresult is: main pulse 70 mV, prepulse 20 mV, attenuation factor1.32 x 107.
Thus the main pulse is 1.32 x 107 x 70/20 = 4.6 x 10⁷ times biggerthan the prepulse; that is, the prepulse is 2.2 x 10⁻⁸ of the mainpulse. This is a significant improvement over the performancewith a single cell, and it ensured the success of the proton-production experiment described elsewhere in this report. Prepulsemeasurements were also made at the output of Amp 3, with thesurprising result that the level was very similar to that afterAmp 2. This is because the relative timing of the pump and themain pulse is such that the prepulse has completed two passesthrough the Ti:sapphire crystal before the pump beam arrives, so itexperiences only two passes worth of gain compared to fourpasses for the main pulse. A measurement of prepulse after Amp 2thus gives a good indication of the true level in both target areas.
Figure 1. Prepulse monitor.
New Ti:sapphire crystal
The optical quality of the Amp 3 Ti:sapphire crystal is importantfor the beam uniformity in TA2, and also for the power level atwhich the amplifier can be operated. Small variations in refractiveindex occur as growth defects in many TiS crystals, and after thebeam has propagated for a metre or more the result is an intensitymodulation in the beam profile. As there are four passes throughthe crystal, it is possible for the modulation to become quitesevere, and for the hot spots to cause damage to downstreamoptics. The crystal that was in use for most of last year gave 2:1intensity variations across the beam profile, so the overall outputenergy had to be kept to 800 mJ or less.
A new crystal was obtained at the end of 2001 which had fewerirregularities, and therefore promised to give better output beamprofiles. It also had a slightly higher absorption coefficient at thepump wavelength, and thus potentially higher gain. This crystalwas installed during a shutdown period. It was operated at a rangeof pump energies to determine its performance, and outputenergies up to 1.2 Joules were obtained with just over 4 J of pumpenergy. Near- and far-field profiles were measured, and are shownin Figures 2 and 3: the uniformity of the near-field is better thanbefore, with a 3:2 variation across the beam, and in consequencethe amplifier can be operated at higher output energy. Theprevious crystal has some damage to its antireflection coatings,due to the higher-intensity regions of the beam; it will be recoatedand kept as a spare.
Astra laser development
C J Hooker, A J Langley, E J Divall
Central Laser Facility, CLRC Rutherford Appleton Laboratory, Chilton, Didcot, Oxon, OX11 0QX, UK
Main contact email address: A J [email protected]
Drop-inmirror Lens
Shield-tubeDiode
Diffuser
Red filter
Toscope
Airbreakdown
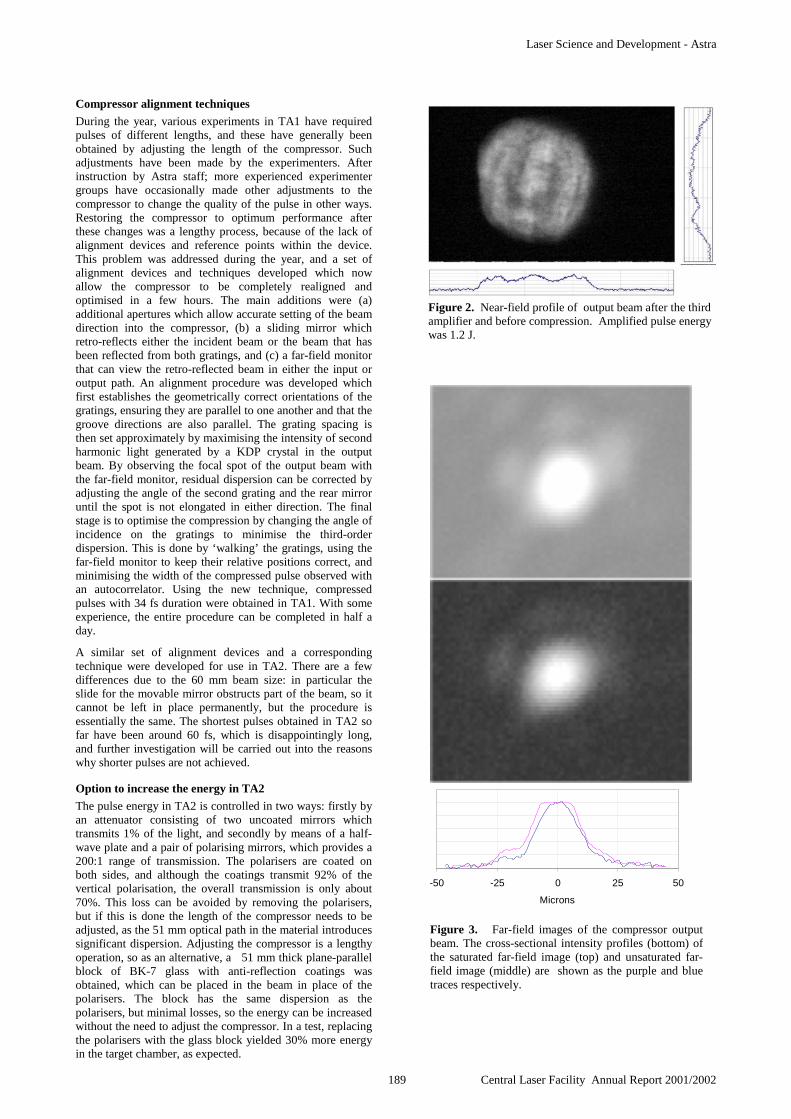
Laser Science and Development - Astra
189 Central Laser Facility Annual Report 2001/2002
Compressor alignment techniques
During the year, various experiments in TA1 have requiredpulses of different lengths, and these have generally beenobtained by adjusting the length of the compressor. Suchadjustments have been made by the experimenters. Afterinstruction by Astra staff; more experienced experimentergroups have occasionally made other adjustments to thecompressor to change the quality of the pulse in other ways.Restoring the compressor to optimum performance afterthese changes was a lengthy process, because of the lack ofalignment devices and reference points within the device.This problem was addressed during the year, and a set ofalignment devices and techniques developed which nowallow the compressor to be completely realigned andoptimised in a few hours. The main additions were (a)additional apertures which allow accurate setting of the beamdirection into the compressor, (b) a sliding mirror whichretro-reflects either the incident beam or the beam that hasbeen reflected from both gratings, and (c) a far-field monitorthat can view the retro-reflected beam in either the input oroutput path. An alignment procedure was developed whichfirst establishes the geometrically correct orientations of thegratings, ensuring they are parallel to one another and that thegroove directions are also parallel. The grating spacing isthen set approximately by maximising the intensity of secondharmonic light generated by a KDP crystal in the outputbeam. By observing the focal spot of the output beam withthe far-field monitor, residual dispersion can be corrected byadjusting the angle of the second grating and the rear mirroruntil the spot is not elongated in either direction. The finalstage is to optimise the compression by changing the angle ofincidence on the gratings to minimise the third-orderdispersion. This is done by ‘walking’ the gratings, using thefar-field monitor to keep their relative positions correct, andminimising the width of the compressed pulse observed withan autocorrelator. Using the new technique, compressedpulses with 34 fs duration were obtained in TA1. With someexperience, the entire procedure can be completed in half aday.
A similar set of alignment devices and a correspondingtechnique were developed for use in TA2. There are a fewdifferences due to the 60 mm beam size: in particular theslide for the movable mirror obstructs part of the beam, so itcannot be left in place permanently, but the procedure isessentially the same. The shortest pulses obtained in TA2 sofar have been around 60 fs, which is disappointingly long,and further investigation will be carried out into the reasonswhy shorter pulses are not achieved.
Option to increase the energy in TA2
The pulse energy in TA2 is controlled in two ways: firstly byan attenuator consisting of two uncoated mirrors whichtransmits 1% of the light, and secondly by means of a half-wave plate and a pair of polarising mirrors, which provides a200:1 range of transmission. The polarisers are coated onboth sides, and although the coatings transmit 92% of thevertical polarisation, the overall transmission is only about70%. This loss can be avoided by removing the polarisers,but if this is done the length of the compressor needs to beadjusted, as the 51 mm optical path in the material introducessignificant dispersion. Adjusting the compressor is a lengthyoperation, so as an alternative, a 51 mm thick plane-parallelblock of BK-7 glass with anti-reflection coatings wasobtained, which can be placed in the beam in place of thepolarisers. The block has the same dispersion as thepolarisers, but minimal losses, so the energy can be increasedwithout the need to adjust the compressor. In a test, replacingthe polarisers with the glass block yielded 30% more energyin the target chamber, as expected.
Figure 2. Near-field profile of output beam after the thirdamplifier and before compression. Amplified pulse energywas 1.2 J.
-50 -25 0 25 50
Microns
Figure 3. Far-field images of the compressor outputbeam. The cross-sectional intensity profiles (bottom) ofthe saturated far-field image (top) and unsaturated far-field image (middle) are shown as the purple and bluetraces respectively.

Laser Science and Development - Astra
Central Laser Facility Annual Report 2001/2002 190
Introduction
Superintense lasers today approach peak intensities greaterthan 1021 W/cm2. The intensity 1ns to 10 ps before the peakof the pulse is usually in the order of 10-8 to 10-6 times themain pulse intensity, due to either amplified spontaneousemission (ASE) from the various laser amplifiers or non idealrecompression of the pulse in chirped pulse amplificationlaser systems. An intensity of 1013 W/cm2 creates a plasmaon all known target materials. This in turn means that themain laser pulse interacts not with the solid target but with apreformed plasma. It was shown recently 1), that evennonionizing prepulses with intensities as low as 108 W/cm2
can change the laser matter interaction considerably.
It is very hard to achieve an intensity contrast ratio betterthan 10-10 directly in the laser amplifier. One possibletechnique to “clean” the laser pulse after the amplification isthe use of plasma mirrors 2). If the laser intensity on atransparent material is chosen so that only the leading edge ofthe main ultrashort pulse is above the threshold for plasmaproduction, prepulses or a pedestal with a lower intensity willbe transmitted. The created plasma does not have sufficienttime to expand during the rise time of the laser pulse. Themain laser pulse therefore interacts with an overdense plasmawith a very steep density gradient. These so called “plasmamirrors” can have very high reflectivity. The interaction ofthe laser pulse with the plasma mirror depends on a largenumber of parameters, e.g. angle of incidence, pulse duration,temporal pulse shape, and intensity on target.
Although there have been some experiments using dielectricmaterials as plasma mirrors 2,3), no systematic investigationconcerning the specular reflectivity as a function of pulseduration and angle of incidence has been published to ourknowledge. Since this is important for the design of almostevery experiment involving plasma mirrors, we carried out anexperiment measuring the specular reflectivity as function ofintensity for two different laser pulse durations and threedifferent angles of incidence.
Experimental setup
The experiments were carried out at the Astra laser facility ofthe CLF. By adjusting the length of the compressor, the pulseduration was changed to 90 fs and 500 fs respectively. Thepulse shape was diagnosed with a scanning third-orderautocorrelator. In the case of the shorter pulse, the intensity1ps before the peak of the laser pulse was 10-5 times the peakintensity. No distinct pre-pulses have been found within50ps before the laser pulse with a contrast ratio >10-5. Thecontrast ratio of the pre-pulse 4 ns before the main pulse wasmeasured with a photo diode to be 4 x10⁻⁸.
To avoid averaging over a large angle of incidence, the60mm diameter laser beam was focused by an off-axisparabolic mirror with a focal length of 1016 mm. Thisresulted in an F-number of 17, giving a cone of less than 3.5ºopening angle.
The focal spot was 20 µm x 26 µm, thus the maximumintensity on target was 4 x 10¹⁷ W/cm2. To vary the intensityon target either the target was moved out of focus to increasethe area and decrease the intensity or the energy of the laserwas adjusted by rotating a half wave plate, which is mountedbetween two polarisers. For each shot, the energy of the leak
pulse of a high reflective mirror was measured with a calibratedphoto diode to account for pulse-to-pulse fluctuations. Thereflected energy was measured with an energy-meter. To avoiddamage of the calorimeter, a calibrated neutral density (ND) filterwas placed in front of it. The transmission of the ND filter wascarefully checked to be constant over the whole energy rangeinvestigated.
A polished fused silica substrate mounted on an xyz-stage wasused as target. It was moved after each shot to ensure that a freshsurface was hit by the next shot.
Figure 1. Experimental setup.
Results
In the figures, each data point represents a single laser shot. Noaveraging has been done. The specular reflectivity of the fusedsilica substrate as a function of intensity is shown in Figure 2. Thepulse duration was 90 fs and the angle of incidence 6.5º.
Figure 2. Specular reflectivity for a pulse duration of 90 fs and anangle of incidence of 6.5º . The intensity was varied by movingthe target out of focus (full squares) and by decreasing the laserenergy at different target positions (open symbols).
At intensities below 1014 W/cm2 we measured a specularreflectivity of a few percent, which is the expected value for anuncoated fused silica substrate. Above a threshold intensity of1014 W/cm2 the specular reflectivity rises up to 80% at an intensityof about 3 x 10¹⁵ W/cm2. It stays at this level and decreases forintensities above 3 x 10¹⁶ W/cm2 very rapidly. The thresholdintensity of 1014 W/cm2 agrees very well with the damagethreshold measurements of Kautek 4). The rapid fall in specularreflectivity could be due to non specular reflection, scattering, orincreased absorption. Since the size of the calorimeter was onlyslightly larger than the diameter of the beam and there was noadditional measurement of transmission and non specularreflection, it is not possible to determine the reason for the
The dependence of the specular reflectivity of plasma mirrors on laser intensity,pulse duration and angle of incidence
C Ziener, P S Foster, E J Divall, C J Hooker, M H R Hutchinson, A J Langley, D Neely
Central Laser Facility, CLRC Rutherford Appleton Laboratory, Chilton, Didcot, Oxon, OX11 0QX, UK
Main contact email address: [email protected]
xyz-
stage
Parabolic
Mirror
f=1016mm
Fused Silica
Substrate
Energy-
Meter
Neutral Density
Filter
Neutral Density
Filter
Ti:Sapphire
Laser
E=200 mJ
=90 fs, 500 fs
Measurement
of I0

Laser Science and Development - Astra
191 Central Laser Facility Annual Report 2001/2002
decrease in specular reflectivity. As can be seen, the specularreflectivity for intensities below 1016 W/cm2 is independentof the way the intensity was reduced (increasing the beamdiameter or decreasing the laser energy). That means, that thespecular reflectivity is independent from the spot diameter fordiameters bigger than 400 µm.
Figure 3. Specular reflectivity for a pulse duration of 90 fsand an angle of incidence of 18º.
Figure 4. Specular reflectivity for a pulse duration of 90 fsand an angle of incidence of 45º.
The measurements with a pulse duration of 90 fs and anangle of incidence of 18º (Figure 3) and 45º (Figure 4) showthe same behavior. The threshold where the specularreflectivity starts to increase is again at approximately1014 W/cm2. The intensity where the maximum of thespecular reflectivity is reached is also about the same as for6.5º. The maximum specular reflectivity measured for 18ºwas 75% and for 45º it was 65%. Smaller reflectivities forlarger angles of incidence have been seen in previousmeasurements for various target materials. Mostly this
behavior is due to an increased absorption (e.g. resonanceabsorption, vacuum heating) at higher intensities.
We also carried out measurements with a laser pulse duration of500 fs. The results for an angle of incidence of 6º are shown inFigure 5, and the results for 19º in Figure 6 respectively. Thespecular reflectivity starts to increase at an intensity of about1013 /cm2. This is in very good agreement with the damagethreshold measurements 4). In this paper the damage threshold for500 fs is about a factor of 8 smaller than in the case of 90 fs.
Figure 6. Specular reflectivity for a pulse duration of 500 fs andan angle of incidence of 19º.
The maximum specular reflectivity measured was 70% for bothangles of incidence. For intensities larger than a few times1016 W/cm2 the same very rapid drop-off in specular reflectivityas for the 90 fs pulses was measured.
Discussion
To summarise our results, we have measured the specularreflectivity of a plasma mirror for 800 nm laser pulses for a largenumber of parameters. Pulses with durations of 90 fs and 500 fswere focused with an F/17 off-axis parabolic mirror onto apolished fused silica target. The specular reflectivity wasmeasured for angles of incidence from 6º to 45º and for intensitiesfrom 1012 W/cm2 to 4 x 10¹⁷ W/cm2. In all cases the specularreflectivity increases if the intensity rises above a certain thresholdintensity. This threshold intensity is about 1014 W/cm2 for a pulseduration of 90 fs and 1013 W/cm2 for 500 fs pulses. This differenceis in very good agreement with former measurements of damagethresholds for fused silica. The maximum specular reflectivitymeasured was between 65% and 80%. For intensities above5 x 1016 W/cm2 the specular reflectivity dropped very rapidly tolow values. This behavior can be explained with the increase innon-specular reflection and/or the increase in absorption.
The measurements clearly show that for the application of plasmamirrors the intensity necessary for a high reflectivity has to bewithin one order of magnitude.
References
1. K.B. Wharton, C.D. Boley, A.M. Komashko,A.M. Rubenchik, J. Zweiback, J. Crane, G. Hays,T.E. Cowan, and T. Ditmire; Phys Rev E, 64 (2): art. no.025401 (2001)
2. H.C. Kapteyn, M.M. Murnane, A. Szoke, R.W. Falcone;Opt. Lett. 16, 490 (1991)
3. S. Backus, H.C. Kapteyn, M.M. Murnane, D.M. Gold,H. Nathel, and W. White; Opt. Lett. 18, 134 (1993)
4. W. Kautek, J. Krüger, M. Lenzner, S. Sartania,Ch. Spielmann, and F. Krausz; Appl. Phys. Lett. 69, 3146(1996)
Figure 5. Specular reflectivity for a pulse duration of500fs and an angle of incidence of 6º.
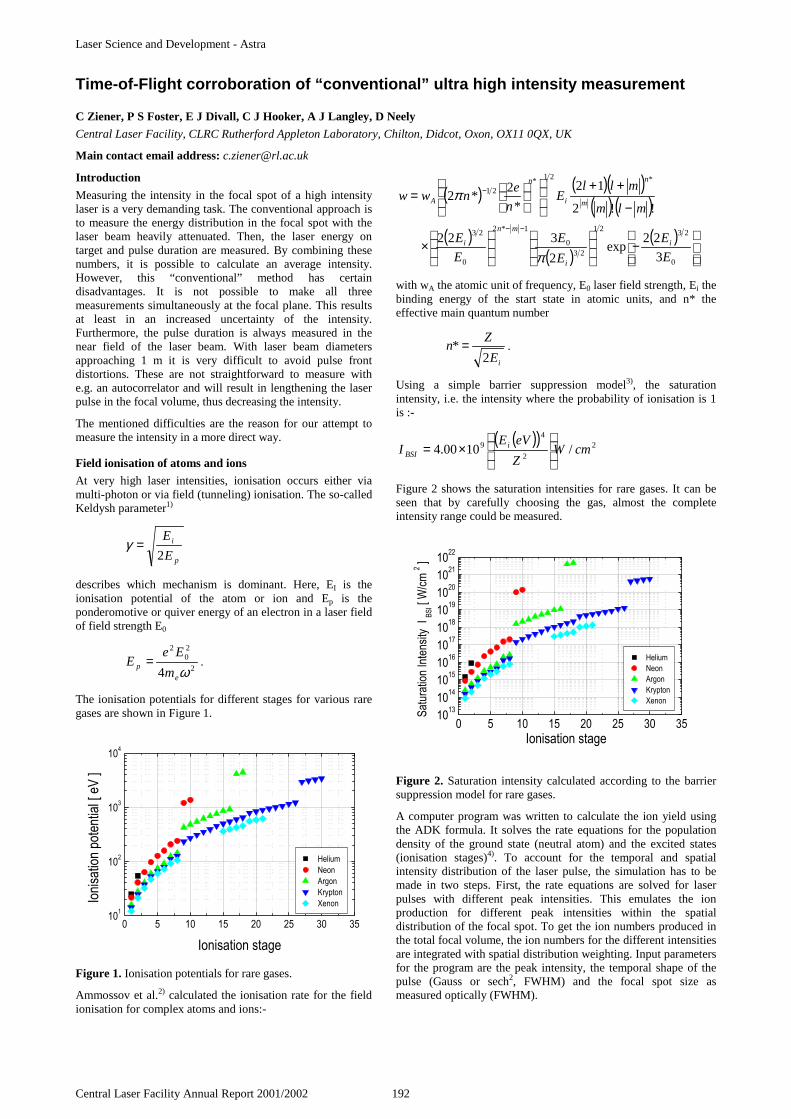
Laser Science and Development - Astra
Central Laser Facility Annual Report 2001/2002 192
Introduction
Measuring the intensity in the focal spot of a high intensitylaser is a very demanding task. The conventional approach isto measure the energy distribution in the focal spot with thelaser beam heavily attenuated. Then, the laser energy ontarget and pulse duration are measured. By combining thesenumbers, it is possible to calculate an average intensity.However, this “conventional” method has certaindisadvantages. It is not possible to make all threemeasurements simultaneously at the focal plane. This resultsat least in an increased uncertainty of the intensity.Furthermore, the pulse duration is always measured in thenear field of the laser beam. With laser beam diametersapproaching 1 m it is very difficult to avoid pulse frontdistortions. These are not straightforward to measure withe.g. an autocorrelator and will result in lengthening the laserpulse in the focal volume, thus decreasing the intensity.
The mentioned difficulties are the reason for our attempt tomeasure the intensity in a more direct way.
Field ionisation of atoms and ions
At very high laser intensities, ionisation occurs either viamulti-photon or via field (tunneling) ionisation. The so-calledKeldysh parameter1)
p
i
E
E
2=γ
describes which mechanism is dominant. Here, EI is theionisation potential of the atom or ion and Ep is theponderomotive or quiver energy of an electron in a laser fieldof field strength E0
2
20
2
4 ωe
pm
EeE = .
The ionisation potentials for different stages for various raregases are shown in Figure 1.
Figure 1. Ionisation potentials for rare gases.
Ammossov et al.2) calculated the ionisation rate for the fieldionisation for complex atoms and ions:-
( ) ( )( )( ) ( )
( )( )
( )
−
×
−
++
=
−−
−
0
2321
230
1*2
0
23
*21*21
3
22exp
2
322
!!2
12
*
2*2
E
E
E
E
E
E
mlm
mllE
n
enww
i
i
mn
i
m
n
i
n
A
π
π
with wA the atomic unit of frequency, E0 laser field strength, Ei thebinding energy of the start state in atomic units, and n* theeffective main quantum number
iE
Zn
2* = .
Using a simple barrier suppression model3), the saturationintensity, i.e. the intensity where the probability of ionisation is 1is :-
( )( ) 2
2
49 /1000.4 cmW
Z
eVEI i
BSI
×=
Figure 2 shows the saturation intensities for rare gases. It can beseen that by carefully choosing the gas, almost the completeintensity range could be measured.
Figure 2. Saturation intensity calculated according to the barriersuppression model for rare gases.
A computer program was written to calculate the ion yield usingthe ADK formula. It solves the rate equations for the populationdensity of the ground state (neutral atom) and the excited states(ionisation stages)4). To account for the temporal and spatialintensity distribution of the laser pulse, the simulation has to bemade in two steps. First, the rate equations are solved for laserpulses with different peak intensities. This emulates the ionproduction for different peak intensities within the spatialdistribution of the focal spot. To get the ion numbers produced inthe total focal volume, the ion numbers for the different intensitiesare integrated with spatial distribution weighting. Input parametersfor the program are the peak intensity, the temporal shape of thepulse (Gauss or sech2, FWHM) and the focal spot size asmeasured optically (FWHM).
Time-of-Flight corroboration of “conventional” ultra high intensity measurement
C Ziener, P S Foster, E J Divall, C J Hooker, A J Langley, D Neely
Central Laser Facility, CLRC Rutherford Appleton Laboratory, Chilton, Didcot, Oxon, OX11 0QX, UK
Main contact email address: [email protected]

Laser Science and Development - Astra
193 Central Laser Facility Annual Report 2001/2002
Experimental setup
The experiments were carried out in Target Area 2 of theAstra laser system. Three flat Gold coated mirrors were usedto steer the laser beam onto a Gold coated parabolic mirror.The latter has an effective focal length of 151.3 mm, adiameter of 75 mm and an off-axis distance of 55 mmresulting (for a 60 mm beam) in an F-number ofapproximately 2.5.
The ToF apparatus itself was a three-plate set-up of theWiley-McLaren type4). An electron multiplier was used asthe detector and the signal was stored by means of a fastdigital oscilloscope. The position of the ToF plates as well asthe position of the parabolic mirror could be adjusted byremote control with the vacuum chamber evacuated.
The target chamber was pumped down to a pressure less than1x10-6 mbar by a combination of turbo pumps and a coldfinger filled with liquid Nitrogen. It was then back filled withArgon to pressures in the range 3 to 6 x 10⁻⁶ mbar. A fine-control valve was used to regulate the flow of gas into thechamber. The feedline to this valve was pumped prior to use,to ensure a high purity of target gas at the interaction region.A field of strength 1.25 kVcm-1 was established across thisregion to extract the argon ions produced within theionisation region of the laser focus towards the detector. Thisresulted in a temporal separation of the ions according totheir mass-to-charge ratio (m/z) along the 100 cm flight-path.Each ionisation state detected was represented by a peak on aToF spectrum recorded on a digital storage oscilloscope.
Determination of the intensity by means of measuringfocal spot size, pulse length and energy in the focal spot
Using a second order autocorrelator, the pulse length wasmeasured to be 60 fs.
At first the throughput of the compressor was measured. Theenergy in front of the entrance window of the compressorwas 570 mJ, the energy right after the compressor was225 mJ, thus giving a throughput of 40%.
2.5 m2.5 m
Figure 3. Focal spot imaged onto a CCD camera.
The size of the focal spot was measured by imaging theheavily attenuated low power beam with a microscopeobjective onto a CCD camera as shown in Figure 3. We thenmeasured the spot size for different z-positions, to look forastigmatism. The result of the z-scan is shown in Figure 4. Itcan be seen that there is still a slight astigmatism, although itis not clear if it originates directly from the laser or frommisalignment of the parabolic mirror. The spot size howeveris very small (about 2.5 µm), which is almost diffraction
limited. About 40% of the energy is contained within the FWHMof the focal spot.
Figure 4. Focal spot size as a function of the longitudinal position.
Combining the three measurements (energy, intensity distribution,and pulse length) resulted in an optically measured peak intensityof 3.0 x 10¹⁹ W/cm2.
Determination of the intensity by means of measuring the ionproduction of the focused laser beam with a ToF spectrometer
A typical time-of-flight spectrum for Argon is shown in Figure 5.The Ar pressure was 5.5x10⁻⁶ mbar. The optically measured laserintensity was 4.0x10¹⁷ W/cm2. Clearly, Argon ionisation stages upto 8+ can be seen.
Figure 5. Typical time-of-flight spectrum for Argon. The peaksfor ionisation stages up to Ar8+ and the main peaks for thebackground impurities are indicated.
For higher intensities (>1.0x10¹⁸ W/cm2), the peaks for the higherionisation stages disappeared and only the lowest ionisation stagesof Argon together with the background peaks could be measured.This unexpected behavior is probably the result of shieldingeffects. For high intensities, a great number of low charged ionsare produced in the vicinity of the focal spot. If the ion density ishigh enough, the ions shield the focal region from the extractionfield of the time-of-flight spectrometer. Thus for measuring ultra-high intensities it is necessary to go to ultra-high vacuumchambers (background pressure <10-9 mbar).
Since the lowest background pressure in our experiment was7.0x10-7 mbar, it was not possible to measure the intensity at highpower directly. We measured therefore the intensity in the lowpower operational mode of the Astra laser. The attenuation isachieved by inserting two AR coated mirrors instead of two HRcoated mirrors. This takes place after the last transmissive optics.The influence of reflective optics including the compressorgratings is independent from the laser energy or intensity. It is

Laser Science and Development - Astra
Central Laser Facility Annual Report 2001/2002 194
therefore possible to extrapolate the intensity measurementsat low power to full power by simply measuring the ratio ofthe energy delivered to target in both operational modes.
Figure 6. Time-of-flight spectrum for Argon for a laserintensity of 3.8x10¹⁸ W/cm2.
The ion yield was measured by recording the time-of-flightspectra at a certain intensity and averaging over 10 lasershots. The area under the peaks for each ionisation stagewere then integrated to get the total yield. Figure 7 shows theion yield for an Argon pressure of 6x10⁻⁶ mbar.
Figure 7. Ion yield as function of the peak intensity forArgon at a pressure of 6x10⁻⁶ mbar (symbols). Also shownare the ion yields as calculated with the simulation program(solid lines).
Also shown are the ion yields calculated with the simulationprogram mentioned above. The input parameter wereFWHMtime = 60 fs, pulse shape sech2, focal spot sizeFWHMspatial=2.5 µm. The calculated ion yields for thedifferent ionisation stages were all multiplied by the samenumber to get the best fit with the simulated curves. Theintensities of the measured data had to be scaled up by afactor of 1.5 also to provide the best fit as can be seen inFigure 7.
Discussion
Since measuring the intensity in the focal spot of an ultra-highintensity laser is an extremely difficult task, we made time-of-flight measurements to corroborate our “conventional” intensitymeasurement. We compared the intensity as calculated using“conventionally” measured pulse parameters to an intensity scaledetermined by fitting experimentally measured ion yields to anatomic ionisation model. The values are found to be in goodagreement to within a factor of 1.5. Because of difficulties whichstem from shielding effects within the ToF apparatus at very highintensities, the ToF spectra were recorded at an attenuated energyand hence the calibration was carried out at intensities up to1017 W/cm2. Since the attenuation occurred after the lasttransmissive optic in the laser system, no additional distortion ofthe pulse is expected as the pulse energy is scaled up to themaximum energy used. We can therefore justify scaling up thefocused intensity. The full power intensity of the Astra lasersystem in this experiment was (3.0 ± 1.8) x 1019 W/cm2 on target.
References
1. L.V. Keldysh, JETP 20, 1307 (1965)
2. M.V. Ammossov, N.B. Delone, and V.P. Krainov, Sov.Phys. JETP 64, 1191 (1986)
3. H. Bethe and E. Salpeter; Quantum Mechanics of One-AndTwo-Electron Atoms, New York: Plenum, 1977
4. F. Dammasch, PhD Thesis, Berlin 2001
5. W. C. Wiley and I. H. McLaren, Rev. Sci. Inst. 26, 1150(1955)

Laser Science and Development – Lasers for Science Facility
195 Central Laser Facility Annual Report 2001/2002
Introduction
Resonance Raman spectra obtained using a probe beamwavelength matched to an electronic absorption band haveexceptional sensitivity and selectivity that is particularly usefulwhen studying complex samples as those found in biology.Unfortunately, fluorescence is often intense and limitsobservations to only strong Raman bands. In many cases, theprobe beam may also induce fluorescence in contaminants orthe solvent - and in biological or industrial cases particularly,the concentration of the molecule under study may be low.
Recently we have developed an efficient rejection device basedon a 4 ps optical Kerr shutter1,2), separating Raman light fromfluorescence in the time domain. The fluorescence suppressionratio achievable by the technique depends on the fluorescencelifetime and can be up to ~105 for long lived fluorescencespecies (> 1 µs) and ~102 - 104 for lifetimes in the range of~ 1 - 100 ns.
For the measurement of the most emissive samples we haveadvanced the Kerr gating method3) by combining it with theconventional shifted excitation Raman differencespectroscopy4,5) (SERDS). The SERDS technique relies onobtaining two Raman spectra using two slightly different probewavelengths separated by an amount comparable with thebandwidth of the measured Raman bands (typically10-20 cm-1). The subtraction of the two spectra, S'λ and S'λ-δ,from each other produces a difference spectrum, D = S'λ - S'λ-δ,from which the Raman signal can be reconstructed. Thistechnique has been shown to be able to reach the photon shotlevels which otherwise are very difficult to attain with intensefluorescence backgrounds4).
Experimental
The basic principle of the optical Kerr gate has been describedin our earlier publications1,2). The Kerr gate setup consists of a2 mm long cell filled with CS2 and two 41x41 mm Glan Taylorpolarisers. The Kerr gate is followed by a spectrometer(Triplemate). A home built filter stage by-pass option was usedfor better transmission. The probe laser line was blocked fromentering the spectrometer using a glass edge absorbing filter. Aconcentrated solution of copper sulphate in water in a 1 cmthick optical cell was placed in front of the spectrometer toblock the residual 800 nm gating beam. The spectrometergrating density was 600 lines per mm.
Raman scattered light was collected at 90o to the probe beamdirection. A liquid nitrogen cooled, back illuminated CCDcamera with an array 2000 x 800 pixels (Jobin Yvon Ltd) wasused to record Raman spectra. The CCD was binned verticallyacross 400 pixels and horizontally across 5 pixels. One countcorresponds to one photoelectron. The sample solution wasre-circulated in an open liquid jet of 0.5 mm diameter.
The Raman spectra were collected by alternating every 10 sbetween the two shifted probe wavelengths. The probewavelength and pulse duration were ~532 nm and 1 ps,respectively. The pulse energy was 5 µJ and repetition rate1 kHz. The beam was focused to ~200 µm in the sample.
The versatile optical parametric generator/amplifier(OPG/OPA) technology adopted in our system3) allowed us togenerate the two excitation wavelengths in a very simple way.The OPG generated a broadband seed beam which was
spectrally dispersed using a grating and the selected wavelengthsteered into the OPA stage using an optogalvanic mirror. Themoving galvanometer mirror permits automatic alternationbetween the two spectrally shifted probe wavelengths, eachcycle being synchronised with the CCD readout. The spectralshift δ was set to 28 cm-1, which is well within the OPAacceptance bandwidth and no other adjustment to the OPG/OPAsystem was needed. The setup suffered from a slight pointingchange but this would be eliminated if the optical path wasreconfigured to enable the grating itself to be rotated betweenthe two positions or by re-imaging the grating plane onto theoptogalvanic mirror.
Results
To test the performance of the combined Kerr gated andSERDS approach we have chosen the laser dye rhodamine 6G(Rh6G), one of the most difficult samples a Ramanspectroscopist can expect to be confronted with. The samplewas prepared at concentration 1x10⁻³ mol.dm-3 in methanol andthe probe was tuned to 532 nm providing an efficient means offluorescence excitation. Under these conditions the Ramanspectrum was measured under the maximum fluorescenceemission of Rh6G. The fluorescence lifetime in methanol atthis concentration is ~4 ns7,8). The fluorescence backgroundwithout applying any rejection method was measured to be upto 20,000,000 counts/s (see Figure 1). First, each of thesuppression techniques was used on their own demonstrating
Fluorescence Suppression in Resonance Raman Spectroscopy using CombinedKerr Gated and SERDS Technique and Automated Spectrum Reconstruction
P Matousek, M Towrie, A W Parker
Central Laser Facility, CLRC Rutherford Appleton Laboratory, Chilton, Didcot, Oxon, OX11 0QX, UK
Main contact email address: [email protected]
-50
50
150
250
350
800 1000 1200 1400 1600 1800
wavenumber (cm-1)
inte
nsity
(co
unts
/s)
*
0
5,000,000
10,000,000
15,000,000
20,000,000
25,000,000
800 1000 1200 1400 1600 1800
wavenumbers )
inte
nsity
(co
unts
/s)
reconstructed Raman spectrum
*
-1 (cm
Figure 1. The resonance Raman spectrum of Rh6G inmethanol without and with the combined Kerr gate &SERDS method with 532 nm excitation wavelength underthe maximum of fluorescence emission. The bottom figureshows both the experimental data (o) and fit (solid line). Theoverall accumulation time was 800 s. The asteriskdesignates a methanol peak. The spectra were reconstructedusing the fitting Method 1.

Laser Science and Development – Lasers for Science Facility
Central Laser Facility Annual Report 2001/2002 196
that if used individually they could not recover the Ramansignal under these extreme conditions.
On the other hand, the combined Kerr gate and SERDSapproach enabled us to observe clean resonance Raman signalof Rh6G (see Figure 1) with an S/N ratio of 1:0.1 to 1:1. ThisS/N level matches the calculated photon shot noise limitestimated from the remaining fluorescence after the Kerr gateand represents an improvement by more than a factor of10 in S/N on what each technique could provide individually.
In a separate experiment, for comparison, we have obtained aRaman spectrum of Rh6G measured at 595 nm underpre-resonance condition (see Figure 2). In this experiment onlythe Kerr gate was needed to suppress the tail of still intensefluorescence emission in the detection region ~ 650 nm. TheRaman spectrum was obtained with good S/N and was found tobe very similar to the non-resonance Raman spectrum of Rh6Gobtained using FT-Raman technique by M. Majoube et al9).The pre-resonance Raman spectrum has also a closeresemblance to our resonance Raman spectrum shown inFigure 1 below 1400 cm-1 region but differs substantially in theupper wavenumber region believed to be due to the resonanceeffect enhancing different sets of bands. A similar pattern wasobserved between surface enhanced Raman (@1064 nm) andsurface enhanced resonant Raman (@458 nm) spectra of Rh6Gin the above work9).
Raman Spectrum Reconstruction
Method 1 - Numerical FittingThe signal obtained from the described combined technique isin a form of difference spectrum, such as that obtained from theSERDS method alone, from which Raman spectrum needs to bereconstructed. To do this we fitted the measured differencespectrum to Lorentzian bands with purpose written softwareusing a method described in Reference4). The reconstructedspectrum is shown in Figure 1. It is important to note that thisprocedure is subject to some uncertainty, particularly, in theregions where several bands overlap. A more thorough methodwas proposed by Bell et al5) involving the measurement anddata processing of three shifted spectra (0, δ and 2δ) instead oftwo.
Method 2 - Simple Linear Data ManipulationTo eliminate any subjective factors from the reconstructionprocess and to enable automation we have developed a newalgorithm that performs the reconstruction in a very simple way.The spectrum is directly recovered from raw differencespectrum by performing only a linear data manipulation on thedifference spectrum array. The algorithm is as follows:
Sn = Sn-∆ + Dn (1)
where Dn and Sn are the intensities of the difference andreconstructed spectra, respectively, for the n-th data point of the
array. The wavenumber separation between n-th and n-∆ -thdata points is approximately equal to the down shift δ.
For this method to be applicable, the difference spectrum musthave a 'blank' region with absence of any Raman bands that issubstantially wider than the SERDS shift δ (in most cases~100 cm-1 is sufficient). Conveniently, such a blank region canoften be found just above the finger print region, i.e. at1700-2800 cm-1. The spectrum reconstruction must be initiatedfrom the blank region of the spectrum moving towards theregion containing Raman bands. In the Methods 2 and 3 (seelater) we assume that the blank region is at lower array indexvalues which correspond to higher wavenumbers. The arraycan be reversed prior to the analysis if this is not the case.
In this approach, we rely on the fact that by starting thereconstruction from the blank spectral region we are able toidentify the first pixel in the differential spectrum that exhibits arise due to a Raman peak and its intensity then originates solelyfrom the intensity of the spectrum S'λ which is 'closer' to theblank region than the downshifted spectrum S'λ-δ that is still'blank' at this point. Therefore the intensity of this pixel isdirectly equal to the corresponding intensity within thereconstructed spectrum. Also it is equal to the intensity of thepixel within S'λ-δ spectrum downshifted by ∆ and therefore weknow how much to add to the difference spectrum D at thedownshifted point to compensate for the effect of thesubtraction of shifted spectrum S'λ-δ.
Method 2 however can only be used if the SERDS shift δ isapproximately equal to the separation between some integralnumber of pixels within the spectrum array. If a reasonablematch cannot be found then a more thorough method describedbelow needs to be applied. Another solution is to increase thenumber of data points within the array using a linearinterpolation until an acceptable match exists. One always hasto bear in mind, however, that this is always an approximationas the inter-pixel separation is typically constant in nanometers,not wavenumbers. The Method 3 described below provides asolution to all of these limitations.
Method 3 - Linear Data Manipulation with InterpolationA more rigorous approach applicable even to cases wheremismatch between the inter-pixel separation and shift δ existsinvolves the refinement of the Method 2 by adding a datainterpolation step. Let us assume that the spectral array Dconsists of two columns: wavenumbers and correspondingintensities, [wn,Dn]. The computer routine then startsreconstructing the spectrum following the algorithm givenbelow:
step 1 find a pair of points within the D array with indexes xand x+1 for which the following logical operation istrue (wx> wn + δ) AND (wx+1 ≤ wn + δ)
step 2 calculate the value Sn-∆ by the linear interpolationbetween the data points Sx and Sx+1
Sn-∆ = (wn+δ-wx)*(Sx+1-Sx)/(wx+1-wx)+Sx
step 3 Sn = Sn-∆ + Dn
step 4 perform the above starting from step 1 for the nextdata point n+1
The algorithm can be recast into a simple single formula:
)]()[(
*])/())([(
1
1
111
∂+≤∂+>
+−−−∂++=
+
−
=++∑
nxnx
n
xxxxxxxnnn
wwANDww
SwwSSwwDS(2)
The last term in the sum in the square brackets is a logicaloperation being 1 if TRUE and 0 if FALSE.
100
200
300
400
500
600
700
800
800 1000 1200 1400 1600 1800
wavenumber (cm-1)
inte
nsity
(cou
nts/
s)))
Figure 2. Pre-resonance Raman spectrum of Rh6G inmethanol (1x10⁻³ mol.dm-3) obtained with Kerr gateapproach only at an excitation wavelength of 595 nm on atail of fluorescence emission. The accumulation time was200 s. The solvent spectrum was subtracted.

Laser Science and Development – Lasers for Science Facility
197 Central Laser Facility Annual Report 2001/2002
Figure 3 shows the resonance Raman spectrum of Rh6Greconstructed using the above methods from differencespectrum. All the three methods yielded virtually identicalspectra. However, a superior S/N was obtained using the fittingMethod 1 and linear manipulation with data interpolationMethod 3. Out of these, the most convenient is clearly Method3, linear manipulation with data interpolation, offeringsimplicity, high S/N and most importantly has none of theambiguity involved in using fitting Method 1. In addition,Method 3 can be performed on line automatically at high speed,e.g. during data collection. Method 3 is also directly applicableto the conventional SERDS technique.
800 1000 1200 1400 1600 1800
wavenumber (cm-1)
inte
nsity
i)
ii)
iii)
Figure 3. The Rh6G spectrum reconstructed from thedifference spectrum using different methods: (i) numericalfitting (Method 1), (ii) simple linear data manipulation(Method 2) and (iii) linear data manipulation with interpolation(Method 3). The spectra are offset for clarity.
In the reconstructions shown in Figure 3 a residual curvedbackground present in the reconstructed spectra was removedby fitting a second order polynomial function. This backgroundis believed to originate from small pointing changes associatedwith changing wavelength by δ in our setup as discussed earlierand could be eliminated.
Conclusion
By combining the Kerr gating fluorescence suppression methodwith the conventional SERDS technique we have been able toobtain an exceptionally high level of fluorescence suppressionnot attainable using the two approaches individually. In a testexperiment, the resonance Raman spectrum of Rh6G(1x10⁻³ mol.dm-3 in methanol) was measured under itsfluorescence maximum. The method allowed the photon shotnoise level to be reached providing the detection limit forRaman spectra ~106 times lower than the level of fluorescencewith an 800 s acquisition time. Its ultra high sensitivity holdsgreat promise for selective probing of complex biologicalsystems using resonance Raman in the near UV or visible, incases, where selective resonance Raman enhancement ofsample subcomponents or chromophores is desired.
We have also described a new, simple algorithm (Method 3) forreconstructing Raman spectrum from SERDS spectra with theabsence of any subjective steps such as those present in theconventional fitting approach. Method 3 enables fastreconstruction in an automated way, for example, during dataacquisition.
References
1. P Matousek, M Towrie, A Stanley and A W Parker Appl.Spectrosc., 53 1485, (1999)
2. P Matousek, M Towrie, C Ma, W M Kwok, D Phillips, WT Toner and A W Parker J. Raman Spectrosc, 32 983,(2001)
3. P Matousek, M Towrie and A W Parker J. RamanSpectrosc., 33 238, (2002)
4. A P Shreve, N J Cherepy and R A Mathies Appl.Spectrosc., 46 707, (1992)
5. S E J Bell, E S O Bourguignon and A Dennis Analyst, 1231729, (1998)
6. M Towrie, A W Parker, W Shaikh and P Matousek Meas.Sci. Technol., 9 816, (1998)
7. J-C Gumy and E Vauthey J.Phys.Chem., 100 8628, (1996)
8. C Zander, M Sauer, K H Drexhage, D S Ko, A Schulz, JWolfrum, L Brand, C Eggeling and C A M Seidel Appl.Phys. B-Lasers and Optics, 63 517, (1996)
9. M Majoube and M Henry Spectrochim. Acta A, 47 1459,(1991)
Appendix
An example of the computer routine for Method 3 written inMathematica 4.0:
nx = 163; (*number of points in the spectrum*)d = 28; (*SERDS shift*)scl = 1/1.1; (*correction factor accounting for differences in originalSERDS spectral intensities*)init = 10; (*starting pixel for data analysis*)offst = 200; (*enables offset within D to be corrected*)a = -1500; (*polynomial background param - 0th*)b = 16.8; (*polynomial background param - 1st*)c = 0.2; (*polynomial background param - 2nd*)dt = ReadList["d:\\kerrpls\\serdsraw.txt", Number, Number];n = Table[i, i^2, i, 1, nx];S = Table[0, i, 1, nx];Do[S[[n]] = N[dt[[n]][[2]] - offst + scl*Sum[((dt[[n]][[1]] + d - dt[[ix]][[1]])*(S[[ix + 1]] - S[[ix]])/(dt[[ix + 1]][[1]] - dt[[ix]][[1]]) + S[[ix]])* If[And[dt[[ix]][[1]] > dt[[n]][[1]] + d, dt[[ix + 1]][[1]] <= dt[[n]][[1]] + d], 1, 0], ix, 1, n - 2]], n, init, nx - 1]Do[S[[n]] = S[[n]] - a - b*n - c*n*n, n, 1, nx];RS = Table[dt[[i]][[1]], S[[i]], i, 1, nx];ListPlot[dt, PlotJoined -> True]ListPlot[RS, PlotJoined -> True, PlotRange -> All, 1000, 2000]OUT1 = OpenWrite["SERDS.out", FormatType -> FortranForm,PageWidth -> 200]Do[Write[OUT1, RS[[i]][[1]], x, RS[[i]][[2]]], i, nx]Close[OUT1]Remove["Global‘*"]

Laser Science and Development – Lasers for Science Facility
Central Laser Facility Annual Report 2001/2002 198
Introduction
The optical tweezers apparatus recently constructed in the laserMicroscope Laboratory has been used successfully to capture,manipulate and measure forces on a wide range of particles,including mammalian cells, bacteria, spores and polymerbeads1,2). This is possible through the generation of an opticalpotential using a high numerical aperture microscope objectivelens to create a tightly focused laser beam. Recently, a numberof new experimental studies have been reported3) whichcombine optical tweezers with a range of spectroscopictechniques to allow the probing of individual cells. The
wavelength of the trapping laser beam is selected to provide thespectroscopic light source and acquisition of the spectra isoptimised by collection with a high power microscopeobjective. The techniques used to date include fluorescence andabsorption, but of particular interest is the use of Ramanspectroscopy to characterise the chemical species within singleoptically trapped microdroplets, beads and biological cells. Thisis potentially a powerful tool for use by biologists andbiochemists and may provide a means of identifyingabnormalities within living cells and also allow the monitoring
of chemical changes that occur during cell death.
In this report we detail the combination of two areas ofexpertise within the LSF, namely optical tweezers and Ramanspectroscopy, and detail our preliminary investigations onbiological cells.
Experimental
The experimental set-up is shown in Figure 1 and schematicallyin Figure 2. Of particular note is that the system relies on asingle near infrared CW laser to both produce the optical trapand generate the Raman spectra. For this there are two opticalpathways. The first (solid lines) is primarily for conditioningand positioning the laser beam to create an optical trap. Thesecond pathway (broken lines) directs the back scattered Ramanlight from the sample through the microscope and to thespectrometer.
The apparatus consists of a Ti:Sa laser (3900, Spectra-Physics)pumped with a cw Argon ion laser (Innova 90-5-UV, Coherent)to produce a beam at 785 nm, with an average power of300 mW. The polarisation of the beam is rotated with a halfwave plate to match the orientation of the spectrometer gratings.The beam is then passed through two sets of beam expansionoptics (L1 to L4), reflected from a holographic notch filter(HNF-785, Kaiser Optical Systems) and directed into themicroscope (Leica DM IRB). Here, a dichroic mirror reflects(> 750 nm) the beam through the objective lens (x63, NA 1.2,Leica Microsystems) where the optical trap is formed.
The Raman light scattered from the focal point is collimated bythe objective lens and passes back along the same opticalpathway but through the HNF-785 filter. This is used as adichroic beam splitter, which at an incident angle of 18° reflectsthe 785 nm beam and transmits the Raman signal above810 nm. A second edge filter is used to clean up the signal priorto focusing the beam onto the entrance slit of the spectrometer(SpectraPro-500, Acton Research Corporation) and detector(LN/CCD-1024, Princeton Instruments). To allow observationof the trapped particles, light (< 750 nm) from the microscopelamp is used to image the sample onto a CCD camera.
Results
Calibration of the spectrometer was performed by focusing in toa sample vial of toluene (Spectroscopic grade, Aldrich).Recorded wavenumbers are accurate to within 5 cm-1. The
Development of Raman Tweezers
A D Ward, A W Parker, S W Botchway, M Towrie
Central Laser Facility, CLRC Rutherford Appleton Laboratory, Chilton, Didcot, Oxon, OX11 0QX, UK
Main contact email address: [email protected]
MicroscopeObjectiveHNF-785Edge Filter
M M
M
M
M
L1
L2L3 L4
DMSpectrograph
CCD
L
Ti:Sa Argon Ion
Filter
M
λ/2 Plate
Figure 2. Schematic diagram of the Raman Tweezers optical set-up.
Figure 1. Photograph showing the Raman Tweezersapparatus being used by Dr Andy Ward, LSF.

Laser Science and Development – Lasers for Science Facility
199 Central Laser Facility Annual Report 2001/2002
Raman collection optics were adjusted to optimise the signal,and assignment of the peaks was made from standard spectra.
To demonstrate the system’s ability to obtain a Raman spectrumfrom a trapped particle a polystyrene particle (2.6 µm diameter,Interfacial Dynamics Corporation) was captured in the opticaltweezers and the trapping optics were adjusted to align thetrapping position with the Raman detector optics. The spectrum,shown in Figure 3, has the background noise subtracted byacquiring a spectrum under identical conditions but withouthaving a particle trapped. In practice it was found that blockingthe laser for a short time allows the particle to diffuse awayfrom the trapping location. The peak at 1001 cm-1 is inagreement with that of published spectra3).
Having calibrated and aligned the spectrometer and optics, asolution of healthy yeast cerevisae and sacromyces pombe cellswere examined using the Raman tweezers. Several cells wereindividually trapped and the Raman spectra recorded asdescribed above. A typical spectrum is shown in Figure 4(A).Broad peaks are observed at 1085, 1309, 1444 and 1657 cm-1.The spectra were noted to vary slightly in relative intensitiesbetween individual cells. To verify observations made inliterature the yeast sample was denatured, by both boiling andbleaching. Confirmation of cell death was given from the lackof growth after overnight incubation and also observation ofbacteria in the interior of the cells. The Raman signature fromthe dead cells is shown in Figure 4(B). Spectra A and B aresimilar, which is contrary to the literature findings where acomplete loss of signal was reported for the dead cells3). Theexperiment was repeated to verify these findings.
Other biological materials that were characterised with theRaman tweezers include mammalian cells and bacteria. Thespectra of these objects are shown in Figure 4(C) and 4(D). Themammalian cell whilst having similar peak positions has amuch weaker signal suggesting that the composition of the cellmembrane may play a significant part in generating the Ramansignature.
Conclusions and future outlook
We have demonstrated that the combination of optical tweezersand Raman spectroscopy can be used to characterise singlemicron sized particles and biological cells. The apparatusdeveloped here has trapped cells up to 20 microns in size. Ourpreliminary findings have cast doubt upon claims made inliterature for distinguishing between dead and healthy cells3)
although the ability to use Raman spectroscopy at the intensitiesthat can be readily achieved holds much future promise forutilizing the technique. New developments may lead to betterfingerprinting of the biological cells and exciting newapplications in the biosciences field. Future work may includestudying the feasibility of creating enhanced resonance effectsin an optical trapping environment by co-trapping cells with
nanometer sized metal clusters. In addition, a Raman confocalmicroscope could be constructed, using a two-laser set-up, oneto hold a cell and the second to scan areas within that cell forchemical identification. A range of hybrid optical tweezingtechniques can now be envisaged to study dispersed biologicalspecimens in vitro using spectroscopic methods that arecurrently available in the LSF.
Acknowledgement
Yeast cells were kindly provided by T. Humphery, MRC,Harwell.
References
1. Laser tweezers – Lattice forces in 2-D crystallinemonolayers, R. Aveyard, B.P. Binks, J.H. Clint, P.D.I.Fletcher, B. Neumann V.N. Paunov, J. Annesley, D. Nees,A.W. Parker, A.D. Ward, A.N. Burgess, Central LaserFacility Annual Report 2000-2001, RAL-TR-2001-030,107-108
2. Measurement of long range repulsive forces betweencharged colloidal particles adsorbed at an oil-waterinterface. R. Aveyard et al. Phys.Rev.Lett, 88 (24): art. no.246102, 2002
3. Near-infrared Raman spectroscopy of single opticallytrapped biological cells, C. Xie, M.A. Dinno, Y. Li, OpticsLetters 2001, 27(4), 249-251.
0
500
1000
1500
2000
2500
3000
3500
4000
500 700 900 1100 1300 1500 1700 1900
Raman shift / cm-1
Rel
ativ
e in
tens
ity
Figure 3. NIR Raman Spectrum and image (see inset) of anoptically trapped polystyrene latex bead. The acquisition timeis 10 seconds using an input laser power of 120 mW.
0
500
1000
1500
2000
500 700 900 1100 1300 1500 1700 1900 2100
Raman shift / cm-1
Rel
ativ
e in
ten
sity
A
B
C
D
Figure 4. NIR Raman Spectra for a range of optically trappedbiological specimens. A; a single healthy cerevisae yeast cell(see inset image); B; a yeast cell from the same sample afterovernight bleaching; C; a mammalian cell and D; bacteria. Allspectra were accumulated over 10 seconds and using an inputlaser power of 48 mW for A and B and 120 mW for C and D.

Laser Science and Development – Lasers for Science Facility
Central Laser Facility Annual Report 2001/2002 200
Introduction
The Laser-Plasma X-ray Laboratory houses a powerful, pulsedUV laser system which, when its beam is focused onto a densetarget, generates intense pulses of soft X-rays. The timestructure of the laser beam consists of macropulses delivered atup to 100 Hz. Each macropulse contains eight 5 ps micropulsesspaced over a 15 ns period. The laser system is a hybrid one,with a front end operating at 746 nm, followed by a frequencytripler and a final, double-passed krypton fluoride (KrF)amplifier, giving an average power of up to 12 W at 249 nm.
The frequency tripler effectively removes low-intensitycomponents of the pulse train, delivering “clean” UV pulses tothe KrF amplifier. However, as well as providing significantamplification of the picosecond pulses, the KrF laser alsoproduces nanosecond background light in the form of amplifiedspontaneous emission (ASE). This can be sufficiently intense topreheat the target in advance of the picosecond pulses and canthereby affect the X-ray generation1). The ASE can alsode-pump the laser medium, limiting the amplifier’s gain2).
The Spatial Filter
The ASE from the KrF laser is much less spatially coherentthan the short pulse beam, so it can be reduced by spatialfiltering, whereby the beam is focused through a pinhole whichremoves divergent components. A self-drilling spatial filter hasbeen built with a number of features to enhance performance:
i) Spatial filtering canpotentially achieve twoaims: a reduction ofnanosecond ASE, and animprovement in beamquality of the picosecondpulses. However, since thepicosecond pulses are farmore intense than thenanosecond ones, filteringthem greatly increases therate of pinhole damage.For this reason it wasdecided to concentrate onASE removal and carryout only minimal shortpulse filtering.
The best way to ensurethat the bulk of thepicosecond light passesthrough the pinhole is toallow the short pulses todrill their own hole in situ.The resulting pinholeshave a typical diameter of100 µm which, with f/16
focusing, corresponds to 10 times the diffraction-limited (firstAiry minimum) spot size. Of course the expected depth of focuswould be only ~60 µm, (significantly less than the substratethickness). Furthermore the holes are drilled over many shots,with possible shot-to-shot variations in position. Therefore, therelatively large hole size does not necessarily reflect the beamquality of a single macropulse. Misalignment of the 8-beammultiplexer can also make the macropulse spot larger than theindividual micropulses.
ii) Beam direction may drift in a laser system as a result ofthermal fluctuation and vibration in optical components; if afixed pinhole is used then the beam becomes misaligned. Anadvantage of self-drilled pinholes is that they maintain highshort pulse transmission, irrespective of long term beam drifts.
iii) Irradiation at high intensities can ablate material from thepinhole, reducing the amount of ASE removed from the beamand limiting the pinhole lifetime. The conventional material forcommercial pinholes is stainless steel, which absorbs UV light.However in initial tests (see below) their lifetime proved to beunacceptably short. A more successful approach is to refractand scatter the ASE without absorption in the pinhole material.A 200 µm thick fused silica substrate was used for its UVtransparency and non-crystalline structure, which inhibitscracking during drilling. It was bead-blasted to texture bothsurfaces, increasing the scattering of unwanted light.
iv) The diameter of the beam on its first pass through theamplifier is kept low (~3 mm) to minimise overlap with thefull-aperture return beam. The spatial filter also acts as the X6beam expander which is needed to convert the beam size.
v) The gain of the amplifier lasts for approximately 25 ns. Thisis a relatively short time for each macropulse to travel throughthe gain medium, with a change in direction and beam sizebetween the passes. Purpose-built lenses and mirror mountshave been used to minimise the path length in the spatial filter.
Results
In order to quantify the effect of filtering, the average power ofthe beam was measured ~1 m after the second pass through theamplifier with the short pulses both off and on. The twomeasurements were combined to give a ratio R (see Equation 1)which was near 1 if the beam was dominated by picosecondpulses and much lower if there was significant ASE.
on pulseshort Power with
off pulseshort Power with -on pulseshort Power withR = (1)
R was typically 0.3 when the spatial filter contained no pinhole,whereas a self-drilled pinhole increased it to 0.7. Although thepinhole caused a slight decrease in total laser power, an increaseof up to 60% in X-ray yield was observed. This may have beendue to increased power in the short pulses or, perhaps, toreduced plasma formation before their arrival.
Self-drilled steel pinholes were tried but their lifetime was lessthan an hour at a laser pulse rate of 12.5 Hz. By comparison, thefused silica pinholes lasted for tens of hours before a similarASE increase was reached.
In conclusion, the use of a self-drilled fused silica pinhole leadsto an increase in soft X-ray yield, probably due to acombination of increased picosecond pulse power and reducedpre-plasma from ASE. The pinhole needs no alignment, eitherinitially or during use, and its lifetime is long enough foreffective operation.
References
1. See for example J Yu, Z Jiang, J C Kieffer and A KrolPhysics of Plasmas, 6 1318, (1999)
2. E C Harvey, C J Hooker, M H Key, A K Kidd,J M D Lister, M J Shaw and W T LelandJ Appl Phys, 70 5238, (1991)
Self-Drilled Spatial Filter for a Multi-Pulse Picosecond Ultraviolet Laser System
A J Bodey, G J Hirst, W Shaikh
Central Laser Facility, CLRC Rutherford Appleton Laboratory, Chilton, Didcot, Oxon, OX11, UK
Main contact email address: [email protected]
Figure 1. Spatial Filter Layout.

Laser Science and Development – Laser Optics and Laser Design
201 Central Laser Facility Annual Report 2001/2002
Introduction
In last year’s Annual Report 1) we described the development of150 mm aperture bimorph adaptive mirrors using single wafersof piezoceramic (lead zirconate-titanate or PZT). These mirrorswere made by the novel method of attaching the thinnestobtainable (2 mm) PZT discs to the Pyrex glass substrate, thenthinning the PZT to the required 200 micron thickness byconventional optical grinding. This article describes furtherdevelopments of the construction technique, which were neededto solve problems experienced with the first mirrors.
Failure of prototypes VP2 and VP3
The two single-wafer mirrors VP2 and VP3 were assembled, aswere all previous mirrors in the CLF’s adaptive opticsprogramme, using a conductive fabric between the substrate andthe PZT to act as the common ground for all the actuators.Inevitably it is hard to ensure that the adhesive layer in whichthe fabric lies is free from bubbles. VP2 and VP3 wereassembled by an external contractor using a UV-curingadhesive, and both showed significant numbers of bubblesbetween the substrate and the fabric, as viewed through the faceof the glass. It became clear that there were also bubblesbetween the fabric and the PZT, giving rise to areas of lowadhesion. While the face of the mirror was polished, the PZTwas covered with copper tape to prevent charge build-up whichwould have caused distortion of the figure. On VP2 the thinnedPZT fractured while the tape was being removed, the piecewhich detached being the same shape as one of the bubbles onthe PZT side, faintly visible from the front of the mirror. VP3suffered a similar problem while being annealed to reduce thecurvature induced by adhesive shrinkage: in this case a bubbleexpanded sufficiently to crack the PZT. Following thesefailures, an alternative assembly technique was devised toeliminate the fabric.
New assembly technique
The PZT discs as supplied have a conducting layer of silver oneach face: this is applied so the manufacturer can polarise thematerial with an electric field. Provided electrical contact ismade with this layer, it will act as the ground plane instead ofthe fabric.
In the new technique, shown in Figure 1, the electricalconnection is provided by pieces of copper screening tape,which has an electrically-conducting adhesive. The tape is stuckto one side of the PZT, then folded over on itself to form a tab,which is also glued to the substrate. The tape is 60 micronsthick, and the PZT is 120 mm in diameter, so the volume ofadhesive required to cover the area of the PZT can becalculated. The inner end of each piece of tape is cut to a
90 degree corner that faces the centre of the mirror: this dividesthe flow of adhesive near the edge of the PZT and prevents airbecoming trapped. The PZT was laid on a flat surface (an oldplane mirror) with the tape uppermost, and the required volumeof adhesive, plus a 10% excess, was placed in the centre. Thepool of adhesive was examined carefully, and any bubbles wereremoved with a needle. The substrate was lowered slowly ontothe adhesive until contact was made and the adhesive began toflow outwards in an expanding circle. Initially, the weight of thesubstrate was sufficient to keep the film of adhesive spreadingout, with gentle pressure being applied manually to keep itcentred on the substrate, and to keep the substrate itself centredon the PZT. Once the film of adhesive had become too thin toflow under the weight of the substrate alone, the assembly wasloaded with a second flat mirror and a 7 kilogram weight, andleft for several hours, after which a bead of adhesive could beseen all round the edge of the PZT. The weight was removed,and the mirror assembly was given a 3 minute exposure on aUV light box to cure the adhesive. The excess cured adhesivewas removed to avoid possible problems in the grinding stage.A few small bubbles were visible in the adhesive layer, butnone of them was larger than 1 mm in diameter.
Formation of the electrodes
The original plan for forming the electrode pattern was tosputter copper onto the PZT, then form the desired pattern ofelectrodes in a layer of photoresist so the copper between themcould be etched away. In practice, the resist did not havesufficient resistance to the etching solution, and large areas ofthe electrodes were removed as well. The reverse technique wasthen adopted, i.e. a photoresist mask was made in the form ofthe desired boundaries between electrodes, and the process ofresist coating, exposure and development was repeated until agood mask was obtained. The PZT was then activated usinghexamethyl disilazane (which fortunately does not dissolve theresist), and sputtered with copper. Typically, a copper layer of1 to 1.5 microns can be put down in one or two minutes withoutoverheating the assembly and melting the resist. When thecoated side was washed with acetone, the resist dissolved,leaving the required electrode structure on the PZT. The patternused was shown in Reference 1, Figure 4: it has 61 actuators, 49of which are within the beam footprint and have equal areas.There are 12 larger actuators outside the beam area providingslope control at the beam edges. The electrical resistancebetween adjacent electrodes was greater than 20 MΩ.
Mirror housing and mounting
An improved housing was designed to hold the mirror andprotect the connecting wires at the back. As the mirror has only61 actuators, there are 3 spare channels in the driver box. Twoof these were designated for tip and tilt, and were led out toBNC connectors on the back plate of the housing. Themicrometers on the mirror mount were replaced with linearpiezoelectric drivers having a range of +/- 10 microns: thesewere connected to the BNC sockets. Tip and tilt motions arethus incorporated into the mirror response, and can be correctedin the closed loop.
References
1. C J Hooker, L Coffey and J L Collier, CLF Annual Report2000-2001, RAL-TR-2001-030, pg 175
Progress in the construction of large-aperture adaptive mirrors
C J Hooker, J L Collier, C Spindloe
Central Laser Facility, CLRC Rutherford Appleton Laboratory, Chilton, Didcot, Oxon, OX11 0QX, UK
Main contact email address: [email protected]
Figure 1. Cross-section of new design of adaptive mirror.

Laser Science and Development – Laser Optics and Laser Design
Central Laser Facility Annual Report 2001/2002 202
Introduction
The work reported here is directed towards meeting therequirements for a photo-injector laser to generate the electronbunches suitable for injection into the proposed future CERNlinear accelerator (CLIC). Table 1. indicates the principalperformance specification for this photo-injector laser.
UV energy/pulse 5 µJ
Pulse duration 10 ps
Wavelength <270 nm
Time between pulses 2.13 ns
Pulse train duration 91.6 µs
Repetition rate 100 Hz
Energy stability <0.1%
Table 1. Photo-cathode specifications.
Figure 1 illustrates the basic system design to meet thespecification in Table 1.
PCGATE
APODISER
RELAY CYL RELAY LENS CYL LENS
RELAY FHG RELAY PHOTO-CATHODE
Diode-pumped Nd:YLF amplifiersCw mode-locked Nd:YLF
oscillator
Figure 1. Basic design of the photo-injector laser system.
A high average power cw mode-locked Nd:YLF laser operatingat 500MHz serves as the oscillator. The oscillator pulses areamplified and frequency converted to the fourth harmonicbefore relaying to the photo-cathode of the accelerator.
STACKED DIODE ARRAY
WATER COOLINGSILICA TUBE
AMPLIFIER ROD
MIRROR COATINGS
Figure 2. Schematic of the amplifier head.
The principal aspect of this laser system requiring developmentis the design and operation of the amplifiers. These must beefficient to minimise the cost of the pump diode arrays, havehigh gain to minimise the number of amplifiers and must showa very high degree of output stability. For cost and simplicity acylindrical pumping cavity design is used as shown in Figure 2.
Such a design is best matched to a rod diameter of about 10mmbut can work well for smaller rods if a simple lens is inserted infront of each diode array.
The average power limit of this Nd:YLF amplifier is given byits fracture limit of approximately 18W/cm, this being themaximum rate of deposition of heat per unit length of rod.Since the thermal dissipation into Nd:YLF due to the quantumdefect is 32% of the excited state pump rate then it follows thatthe maximum extractable power is a factor (1-0.32)/0.32 higherthan the fracture limit, or 56W/cm. For example a 10cm rodcould give a maximum output power of about 500W.Techniques to increase the fracture limit, such as that used forNd:YAG1, may enable this limit to be extended.
Figure 3. The four-pass amplifier geometry.
The amplifier must be operated to give a high gain but also withheavy gain saturation in order to achieve high efficiency andstability of the output power. We used a four pass geometry asshown in Figure 3. However for such a high gain system it willbe important to establish the gain limit set by pump depletionresulting from amplified spontaneous emission. Such a limitcould be a serious problem if too many passes are used with tooclose an optical coupling between passes.
For optimisation of the performance a multi-pass analysis ofthis amplifier was carried out.
Analysis
The analysis is given for Nd:YLF but can readily be used forother materials and amplifier designs. The examples used willbe for the test amplifier as used for all the experimental resultsgiven below.
The amplifier is most stable when it is operated in a 'quasi-steady-state' mode in which the excited state population levelsreach an equilibrium level during the pump pulse, this being abalance between the input pump power reaching the upper laserlevel (pump rate) and the sum of the power lost to the amplifiedbeam and to amplified spontaneous emission (ASE), or:
flR
satinoutp
BGFIII
τ+
η+−= 1ln. (1)
where:inoutp III ,, are the pump rate, output intensity and
input intensity respectively
Fsat = saturation fluence; G = amplifier gain
Rη = splitting ratio in the upper laser level
flτ = fluorescence lifetime of the excited state
and where B is the increase in the excited state decay rateresulting from ASE. BP for any position P in the rod can becalculated from:
( )∫ π
αα=rod
P dVr
rfB
24
exp (2)
The Performance of a Stable High-gain Diode-pumped Nd:YLF Amplifier
I N Ross
Central Laser Facility, CLRC Rutherford Appleton Laboratory, Chilton, Didcot, Oxon, OX11 0QX, UK
M Csatari
Department of Optical and Quantum Electronics, University of Szeged, dom ter 9, H-6720 Szeged, Hungary
Main contact email address: [email protected]

Laser Science and Development – Laser Optics and Laser Design
203 Central Laser Facility Annual Report 2001/2002
where: f = fraction of excited state population fluorescing
at the laser wavelength; α = gain coefficient; and the integralis evaluated over the volume of the rod and must includesurface reflections.
Equation 1 needs to be reformulated to apply to our 4-pass testamplifier. Assuming a constant beam size from pass to passand an intra-pass loss of L, Equation 1 can be re-written as:
( ) ( )GfIGfI inp 21 += (3)
Where:
( ) ( ) ( ) ( ) 1111 232431 −+−+−+−= LGLGLLGLGLGf and
( )flR
sat BGFGf
τ+
η= )1(ln
2
and where: G = single pass gain of amplifier
For a 4-pass amplifier with good decoupling (for example along distance) between passes and for a rod with a diffuse barrelsurface, an approximate expression for B is:
( ) GldB 3.005.0= (4)
for a rod of length l and diameter d .
For the pulse trains being considered valid results can beobtained by assuming a cw input beam.
The extraction efficiency ( ex) of the amplifier, is defined hereas the ratio of the intensity increase of the amplified beam to thepump rate:
p
inoutex I
II −=η (5)
Since the ASE loss increases with gain, there will necessarily bea compromise between efficiency and gain.
For our 4-pass test amplifier Figure 4 shows the calculatedvariation of efficiency with 4-pass gain and predicts that gainsof more than 104 can be obtained with Nd:YLF without a majorreduction in efficiency.
Two measures of stability can also be assessed in steady state
operation by differentiating Equation 1 to give:
ininp dIfdGfIfdI 121 )’’( ++= (6)
Use of the substitution inout IGLI ..)1( 43−= leads to an
equation for the interdependence between changes in input,pump and output intensities:
( ) ( )in
ininin
out
outin
p
pp I
dIIfIff
G
I
dIIff
G
I
dII
−+−+= 11212 ’’
4’’
4(7)
where ’,’ 21 ff are the differentials of f1 and f2 respectively
with respect to G. For the test amplifier with measured values of9 for G, 4.7kW/cm2 for
outI , and 0.2 for L this reduces to:
in
in
p
p
out
out
I
dI
I
dI
I
dI163.085.1 += (8)
The stability for the laser system is consequently largelydetermined by the stability of the pumping rate of the finalamplifier and can support much larger variations for the input.
Having established the expected performance in the steady statemode it is useful to consider the dynamics of reaching thesteady state. To do this we calculate the response of theamplifier in the presence of a time-varying pump and inputsignal beam. This is described by the spatial and temporalchanges to the amplifier gain coefficient. For an input pulsetrain with a time separation of s between pulses the incrementalchange in the gain coefficient from one pulse to the next hasthree contributions: the increase due to pumping; the loss dueto fluorescence enhanced by amplified spontaneous emission;and the depletion by the previous pulse. The net change isgiven by:
( )sat
R
fl
SSp
sat
R
F
tzFtzBtz
l
tzI
Ftz
),(),()1(),(,),(
ηα−
τ+τα
−τη
=α∆ (9)
where:Rη = level splitting ratio in the upper laser state and it
is assumed that the equilibrium in the level populations is re- S.
and where ( )tzF , = the sum of the pulse fluences in all passes
at position z and time t. and is given by
( )
α+α+
α+α+
α+α+
α
=
∫ ∫
∫ ∫
∫ ∫∫
l l
z
l z
l l
z
z
in
dztzdztzL
dztzdztzL
dztzdztzL
dztz
tFtzF
0
3
0 0
2
0
0
),(),(3exp
),(),(2exp
),(),(exp
),(exp
),(
(10)
Solving these equations for the test 4-pass amplifier with aconstant fluence input pulse train gives an output fluence of theform shown in Figure 5.
0 100 200 300 400 500 600Pump duration (microsec)
0.0
0.2
0.4
0.6
0.8
1.0
Out
put i
nten
sity
(ar
b. u
nit)
Figure 5. Calculated evolution of amplified beam.
1 10 100 1000 10000Gain
0.4
0.5
0.6
0.7
0.8
0.9
1.0
Ext
ract
ion
effic
ienc
y
Figure 4. The variation of the efficiency of extractionof pump power with the amplifier gain.

Laser Science and Development – Laser Optics and Laser Design
Central Laser Facility Annual Report 2001/2002 204
It can be seen that perfectly steady-state operation is achieved.
Test amplifier performance
An amplifier head was constructed to the design shown inFigure 2 and used to pump a 5mm diameter by 50mm long rodof Nd:YLF. 5 QCW 1kW stacked diode arrays (Thales) weredistributed around the rod as shown in Figure 2 and anadditional lens in front of each array ensured efficient opticalcoupling to the rod. The diode wavelengths were in the range798 to 802 nm to provide good absorption efficiency for bothpolarisations2) . Repetition rate was normally 5Hz with pump
The input seed beam was provided by an 800mW CW Nd:YLFlaser (Crystalaser) and the injection optics of the 4-passgeometry gave a beam size of 4mm in the first pass andadjustable down to 1mm in the final pass. The propagationdistance between passes of 1m ensured low ASE pass-to-passcoupling and good beam overlap in all passes.
Gain and saturation
Figure 6 shows the fluorescence distribution in the rod forpumping with individual diode arrays and with all five arraystogether. The effect of pump polarisation is seen since the topdiode polarisation at the rod is 's' which is more stronglyabsorbed by the rod, and the bottom diodes are mostly 'p'polarisation at the rod and the absorption is less. The combinedeffect of all diodes provides quite uniform pumping asillustrated in the centre 'saturated gain' distribution.
The ability of the amplifier to generate high gain is shown inFigure 7 by the measured evolution of the small signal gain profile for which the best match to the measured curve gave acombined pump cavity transfer and rod absorption efficiency of53%. The peak gain achieved was 5x10⁵ with a backgroundASE intensity measured at the 10-3 level.
At an input power of 450mW into the first pass it was possibleto strongly saturate the amplifier, giving the evolution of outputintensity shown also in Figure 7. This is seen to be in goodagreement with the calculated profile, and in this case the intensity at 7kW/cm2 which is 8x the saturation intensity forNd:YLF. The amplified beam has a flat-top of diameter 2.5mmcontaining a peak power of 380W, in comparison with the un-amplified approximately Gaussian profile with FWHM of 1mm.
Stability
The output pulse train stability is a critical requirement for thistype of laser system (Table 1), and this must be maintainableover periods of perhaps several hours. The proposed designaims to achieve the best possible stability by using diodepumping and by relying on heavy saturation of the amplifiers toprovide a strong clamp on the output intensity. As indicated bythe earlier 'steady-state' analysis such a design largely confines
the problem to stabilising the pump rate in the final amplifier.This is dependent on two principal factors: the current to thediode array, and the temperature of the coolant, the latter havinga strong influence on the diode spectrum and hence theabsorption efficiency of the laser rod. In our system the diodedriver was stable to about 0.5% long term and the temperatureof the coolant was maintained to 0.5deg. Evidently both of thesecould be improved.
Stability measurements were conducted using an InGaAsphotodiode which has a very low temperature coefficient at1047nm and is not sensitive to background visible radiation,together with an oscilloscope with stability in the region of0.1%. Allowing a period of at least 30 minutes for stabilisation,the long term stability of the output power was measured and isshown in Figure 8.
0 10 20 30 40 50 60Time (min)
0.0
0.2
0.4
0.6
0.8
1.0
Sat
urat
ed a
mpl
ified
sig
nal (
r.s.
)
0.70 % RMS stability
Figure 8. Long-term stability of the amplified beam.
Figure 6. Pump distributions for individual and all 5 diodes.
0 100 200 300 400 500 600 700Time (microsec)
0E+0
1E+5
2E+5
3E+5
4E+5
5E+5
6E+5
Sm
all s
igna
l gai
n
Measured
Calculated
0 200 400 600 800Pumping time (microsec)
0E+0
1E+3
2E+3
3E+3
4E+3
5E+3
6E+3
7E+3
Gai
n
Measured
Calculated
Figure 7. The calculated and measured gain of the amplifierfor small signal and under heavy saturation.

Laser Science and Development – Laser Optics and Laser Design
205 Central Laser Facility Annual Report 2001/2002
The rms stability was measured at less than 0.7% over a periodof one hour. This excellent performance was achieved withoutspecial precautions to stabilise the mechanics and environmentand without any feedback stabilisation system. A demonstrationof the insensitivity to variations of the amplifier input power isshown in Figure 9. A factor of 10 attenuation of the input led toa reduction of only a few % in the output of the amplifier in thisheavily saturated mode.
Thermal aberrations in the amplifier
For many potential applications the optical integrity of theamplified beam is important and one reason for selectingNd:YLF as the gain medium was its much reduced thermallensing in comparison with materials such as Nd:YAG3. Aradial shear Sagnac interferometer placed in the amplified beamwas used to assess the thermal lensing, and the recordedinterferograms were analysed using a CCD, frame store andsoftware package (OFA). Examples of interferograms recordedfor the pumped amplifier and for both orientations are shownextrapolated up to the fracture limit of the rod in Figure 10 for10 watts average thermal power dissipated in the rod.
A Zernike analysis of these interferograms yielded significantcoefficients only for primary astigmatism and defocus,indicating that the aberration can be effectively compensatedusing cylindrical lenses. Using the measured Zernikecoefficients, the Strehl ratio was calculated and plotted inFigure 11 with an extrapolation to higher powers. This allowscalculation of the maximum power which is possible withoutastigmatic compensation.
Conclusions
We have proposed and analysed a 'quasi-steady-state' mode ofoperation for a QCW diode-pumped laser amplifier for use in aphoto-injector system. Under heavy saturation this amplifier hashigh extraction efficiency and is highly stable, being onlysensitive to changes in its diode pump power and temperature.In multi-pass operation the amplifier also has high gain and isvery insensitive to changes in input beam energy or power.
A simple design of amplifier based on Nd:YLF has beenconstructed and tested. Its performance provided goodverification for the analytical predictions for gain andefficiency, and the optical quality of the amplifier at highaverage power was assessed. The most promising aspect of thisamplifier has been the measured output pulse stability. At0.7%rms over 1 hour this competes favourably with thepreviously best lasers and can be improved using a more stablediode-laser power supply and coolant temperature.
References
1. J.Marion Appl.Phys.Lett. 47, 694, (1985)
2. N.P.Barnes, M.E.Storm, P.L.Cross, M.W.Skolaut IEEEJQE QE-26, 558, (1990)
3. J.E.Murray IEEE J.Q.E.19, 488, (1983)
Figure 10. Interferograms of the output beam forboth orientations and for 10 watts power of thermallydeposited power.
Figure 9. Low sensitivity of the amplified signal to a largeattenuation of the input signal.
Figure 11. Dependence of Strehl Ratio on thermal power.
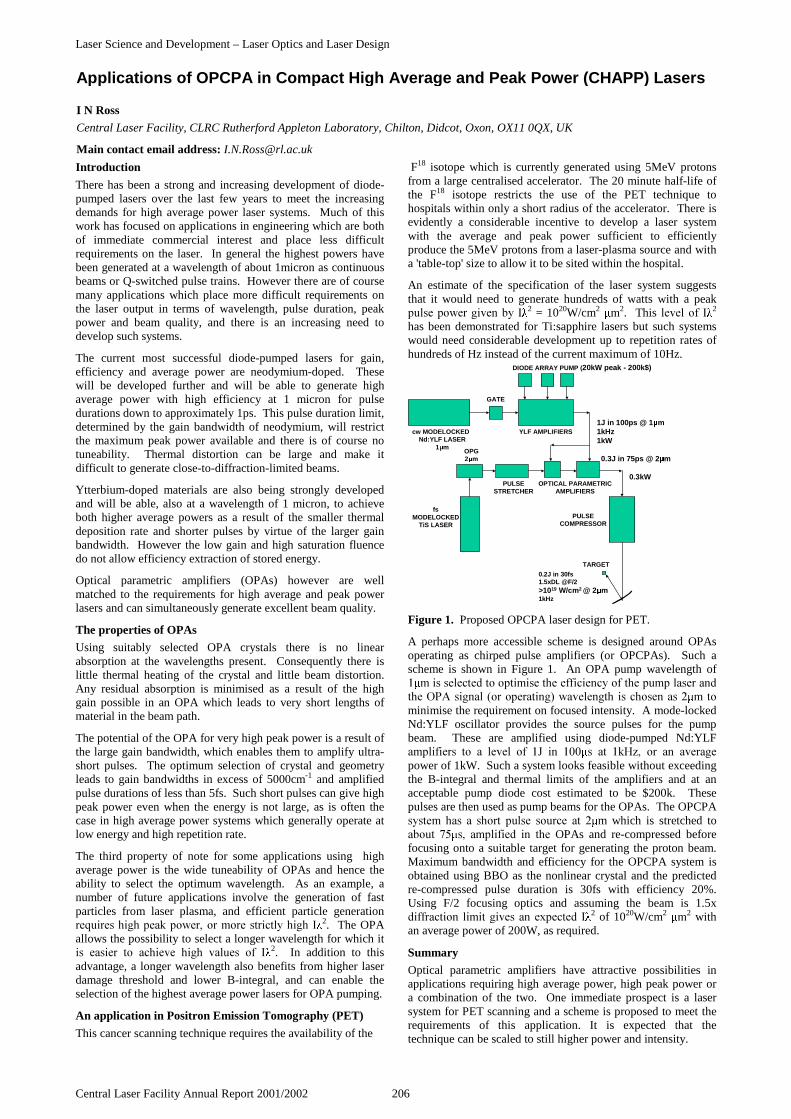
Laser Science and Development – Laser Optics and Laser Design
Central Laser Facility Annual Report 2001/2002 206
Introduction
There has been a strong and increasing development of diode-pumped lasers over the last few years to meet the increasingdemands for high average power laser systems. Much of thiswork has focused on applications in engineering which are bothof immediate commercial interest and place less difficultrequirements on the laser. In general the highest powers havebeen generated at a wavelength of about 1micron as continuousbeams or Q-switched pulse trains. However there are of coursemany applications which place more difficult requirements onthe laser output in terms of wavelength, pulse duration, peakpower and beam quality, and there is an increasing need todevelop such systems.
The current most successful diode-pumped lasers for gain,efficiency and average power are neodymium-doped. Thesewill be developed further and will be able to generate highaverage power with high efficiency at 1 micron for pulsedurations down to approximately 1ps. This pulse duration limit,determined by the gain bandwidth of neodymium, will restrictthe maximum peak power available and there is of course notuneability. Thermal distortion can be large and make itdifficult to generate close-to-diffraction-limited beams.
Ytterbium-doped materials are also being strongly developedand will be able, also at a wavelength of 1 micron, to achieveboth higher average powers as a result of the smaller thermaldeposition rate and shorter pulses by virtue of the larger gainbandwidth. However the low gain and high saturation fluencedo not allow efficiency extraction of stored energy.
Optical parametric amplifiers (OPAs) however are wellmatched to the requirements for high average and peak powerlasers and can simultaneously generate excellent beam quality.
The properties of OPAs
Using suitably selected OPA crystals there is no linearabsorption at the wavelengths present. Consequently there islittle thermal heating of the crystal and little beam distortion.Any residual absorption is minimised as a result of the highgain possible in an OPA which leads to very short lengths ofmaterial in the beam path.
The potential of the OPA for very high peak power is a result ofthe large gain bandwidth, which enables them to amplify ultra-short pulses. The optimum selection of crystal and geometryleads to gain bandwidths in excess of 5000cm-1 and amplifiedpulse durations of less than 5fs. Such short pulses can give highpeak power even when the energy is not large, as is often thecase in high average power systems which generally operate atlow energy and high repetition rate.
The third property of note for some applications using highaverage power is the wide tuneability of OPAs and hence theability to select the optimum wavelength. As an example, anumber of future applications involve the generation of fastparticles from laser plasma, and efficient particle generation 2. The OPAallows the possibility to select a longer wavelength for which it 2. In addition to thisadvantage, a longer wavelength also benefits from higher laserdamage threshold and lower B-integral, and can enable theselection of the highest average power lasers for OPA pumping.
An application in Positron Emission Tomography (PET)
This cancer scanning technique requires the availability of the
F18 isotope which is currently generated using 5MeV protonsfrom a large centralised accelerator. The 20 minute half-life ofthe F18 isotope restricts the use of the PET technique tohospitals within only a short radius of the accelerator. There isevidently a considerable incentive to develop a laser systemwith the average and peak power sufficient to efficientlyproduce the 5MeV protons from a laser-plasma source and witha 'table-top' size to allow it to be sited within the hospital.
An estimate of the specification of the laser system suggeststhat it would need to generate hundreds of watts with a peak 2 = 1020W/cm2 2. This 2
has been demonstrated for Ti:sapphire lasers but such systemswould need considerable development up to repetition rates ofhundreds of Hz instead of the current maximum of 10Hz.
DIODE ARRAY PUMP (20kW peak - 200k$)
YLF AMPLIFIERS
GATE
cw MODELOCKEDNd:YLF LASER
1 m
fsMODELOCKED
TiS LASER
OPG2 m
OPTICAL PARAMETRICAMPLIFIERS
PULSECOMPRESSOR
PULSESTRETCHER
TARGET
1J in 100ps @ 1 m1kHz1kW
0.3J in 75ps @ 2 m
0.3kW
0.2J in 30fs1.5xDL @F/2>1019 W/cm2 @ 2 m1kHz
Figure 1. Proposed OPCPA laser design for PET.
A perhaps more accessible scheme is designed around OPAsoperating as chirped pulse amplifiers (or OPCPAs). Such ascheme is shown in Figure 1. An OPA pump wavelength of ! minimise the requirement on focused intensity. A mode-lockedNd:YLF oscillator provides the source pulses for the pumpbeam. These are amplified using diode-pumped Nd:YLF " ## $% power of 1kW. Such a system looks feasible without exceedingthe B-integral and thermal limits of the amplifiers and at anacceptable pump diode cost estimated to be $200k. Thesepulses are then used as pump beams for the OPAs. The OPCPA ! m which is stretched to &' OPAs and re-compressed beforefocusing onto a suitable target for generating the proton beam.Maximum bandwidth and efficiency for the OPCPA system isobtained using BBO as the nonlinear crystal and the predictedre-compressed pulse duration is 30fs with efficiency 20%.Using F/2 focusing optics and assuming the beam is 1.5x ( 2 of 1020W/cm2 2 withan average power of 200W, as required.
Summary
Optical parametric amplifiers have attractive possibilities inapplications requiring high average power, high peak power ora combination of the two. One immediate prospect is a lasersystem for PET scanning and a scheme is proposed to meet therequirements of this application. It is expected that thetechnique can be scaled to still higher power and intensity.
Applications of OPCPA in Compact High Average and Peak Power (CHAPP) Lasers
I N Ross
Central Laser Facility, CLRC Rutherford Appleton Laboratory, Chilton, Didcot, Oxon, OX11 0QX, UK
Main contact email address: [email protected]
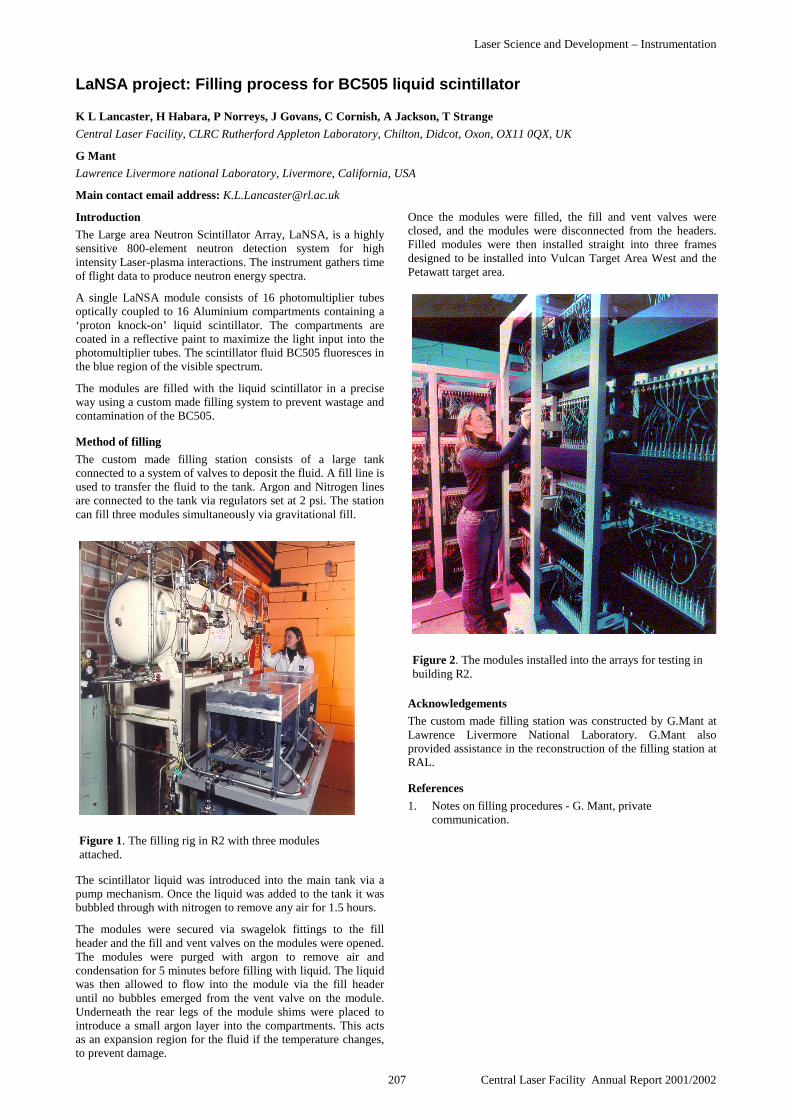
Laser Science and Development – Instrumentation
207 Central Laser Facility Annual Report 2001/2002
Introduction
The Large area Neutron Scintillator Array, LaNSA, is a highlysensitive 800-element neutron detection system for highintensity Laser-plasma interactions. The instrument gathers timeof flight data to produce neutron energy spectra.
A single LaNSA module consists of 16 photomultiplier tubesoptically coupled to 16 Aluminium compartments containing a‘proton knock-on’ liquid scintillator. The compartments arecoated in a reflective paint to maximize the light input into thephotomultiplier tubes. The scintillator fluid BC505 fluoresces inthe blue region of the visible spectrum.
The modules are filled with the liquid scintillator in a preciseway using a custom made filling system to prevent wastage andcontamination of the BC505.
Method of filling
The custom made filling station consists of a large tankconnected to a system of valves to deposit the fluid. A fill line isused to transfer the fluid to the tank. Argon and Nitrogen linesare connected to the tank via regulators set at 2 psi. The stationcan fill three modules simultaneously via gravitational fill.
The scintillator liquid was introduced into the main tank via apump mechanism. Once the liquid was added to the tank it wasbubbled through with nitrogen to remove any air for 1.5 hours.
The modules were secured via swagelok fittings to the fillheader and the fill and vent valves on the modules were opened.The modules were purged with argon to remove air andcondensation for 5 minutes before filling with liquid. The liquidwas then allowed to flow into the module via the fill headeruntil no bubbles emerged from the vent valve on the module.Underneath the rear legs of the module shims were placed tointroduce a small argon layer into the compartments. This actsas an expansion region for the fluid if the temperature changes,to prevent damage.
Once the modules were filled, the fill and vent valves wereclosed, and the modules were disconnected from the headers.Filled modules were then installed straight into three framesdesigned to be installed into Vulcan Target Area West and thePetawatt target area.
Acknowledgements
The custom made filling station was constructed by G.Mant atLawrence Livermore National Laboratory. G.Mant alsoprovided assistance in the reconstruction of the filling station atRAL.
References
1. Notes on filling procedures - G. Mant, privatecommunication.
LaNSA project: Filling process for BC505 liquid scintillator
K L Lancaster, H Habara, P Norreys, J Govans, C Cornish, A Jackson, T Strange
Central Laser Facility, CLRC Rutherford Appleton Laboratory, Chilton, Didcot, Oxon, OX11 0QX, UK
G Mant
Lawrence Livermore national Laboratory, Livermore, California, USA
Main contact email address: [email protected]
Figure 1. The filling rig in R2 with three modulesattached.
Figure 2. The modules installed into the arrays for testing inbuilding R2.

Laser Science and Development – Instrumentation
Central Laser Facility Annual Report 2001/2002 208
Introduction
Recent developments in high power lasers have allowed thestudy of new regimes of laser-matter interactions relevant toastrophysics1), nuclear physics2), and fusion energy research3,4).In the context of inertial fusion energy research, the 'fast ignitor'(FI) concept5) was proposed in order to relax the strictconditions for ignition in terms of plasma instability injectingan energy driver such as fast electrons and ions. It is thereforeimportant for FI to understand how to accelerate the electronsand ions generated in ultra-intense laser-plasma interactions andalso how the particles propagate into the super-critical.
There have already been many reports in both simulation andexperiment that demonstrate a number of different accelerationmechanisms. Some of these suggest the acceleration stronglydepends upon the laser and the plasma conditions, such as thelaser polarization, intensity and the density scale-length6). Inparticular, recent simulations predict that the energy of theaccelerated ions suddenly increases with higher laser intensityand that the ion acceleration direction is changed from thelongitudinal (or laser) direction to the transverse direction asplasma density scale-length is increased7). Therefore,measurement of the accelerated ion momentum distributionhelps us to understand the laser-plasma interactions undervarious controlled conditions.
Neutron spectroscopy is one of the most fascinating methods toinvestigate the accelerated ion distribution processes generatedby ultra-intense laser-plasma interactions (using beam-fusionneutron spectroscopy)8,9). For this purpose, we are re-constructing the multi-channel neutron spectrometer, LaNSA10,11). The system records the timing when the neutronsare detected at each scintillator in the array. These timings areconverted into neutron spectrum via the time-of-flight (TOF)method. Neutron energy spectra taken at several differentdirections can then be used to determine the momentumdistribution of the accelerated ions by taking into account theDoppler shifts of neutron spectra from 2.45MeV for eachviewing angle. In this paper, we discuss the re-commissioningof the LaNSA system and the future experiments that areplanned for the RAL PW laser system.
Neutron Spectroscopy
Usually in measuring the ion momentum distribution, directobservation of ions with plastic nuclear track detectors such as aCR-39 was used. However, the ion motion is likely to bestrongly affected by large electric and/or magnetic fields in theplasma. Neutron spectroscopy, on the other hand, has theadvantage that neither the target potential nor the self-generatedmagnetic fields can affect the motion of neutrons generated inthe target. Unfortunately, the measurement of the neutronspectrum from just one direction does not give us the three-dimensional ion momentum distribution. It is necessary tomeasure the neutron spectra from at least two differentdirections to obtain the ion momentum distribution in the target.
Figure 1 shows an example of neutron spectra generated bybeam-fusion nuclear reactions from three different viewingangles. The s-polarized, 1µm laser light was obliquely incidentonto a CD 5µm target from 40 degrees from target normal at anintensity of 1019W/cm2. The solid lines in all figures show theobserved neutron spectra.
Figure 1(a) shows experimental spectra at three observationangles: 90° or parallel to the target surface (solid line), 56°
(dashed line) and 1° (dotted line) to the target normal,respectively. The peak of the spectra from the front side of thetarget shifts to lower energy (2.2MeV at 56°, 1.9MeV at 1°)from 2.45 MeV given by D-D thermal neutron energy whilethere is almost no shift in the spectra along the target surfacedirection (solid line). These shifts suggest that ions areaccelerated into the target inside taking account of themomentum conservation, which is similar to a Doppler effecton the neutron spectra. To investigate the precise momentumdistribution of the ions, we performed 3D Monte-Carlosimulations to compare the calculated spectra with theexperimental results. Figure 1(b) shows the well fittedcalculated spectra at the same viewing angle as the experiments,which indicates that the ions are accelerated into the target,exactly opposite to the target normal direction. The iondistribution is shown in Figure 1(c) as a contour plot projectedon the x-y plane from the 3-D distribution. The distributioncollimation in the target rear direction is given as a momentumratio of Px:Py:Pz=2.3:1:1. The ion energy to the x-directioncorresponding to the direction into the target is 330keV whereasthe energy to the y and z-direction is about 70keV.
Large area Neutron Spectroscopy Array (LaNSA)
The neutron detector that we are re-constructing for the nextgeneration experiments is the multi-channel spectrometer,LaNSA10,11), which originally consisted of 960 channels ofscintillator-photo-multiplier detectors. In order to measure theneutron angular distribution, these modules will be divided intothree separate units, each of which has 240 channels. Theneutron detectors consist of an array of Thorn-EMI9902KB05photo-multipliers coupled to BC505 liquid scintillator. Theelectrical signals are delivered to a Time-Digital-Converter(TDC), which records the arrival time of the signal via adiscriminator. These timings are collected and then convertedinto a neutron spectrum through the time-of-flight (TOF)method. The data acquisition of the system is based on a PC tocontrol all CAMAC and Fastbus modules.
These three modules will be positioned in target area PetaWatt(TAP) and target area west (TAW) of the Vulcan laser facilityat the Rutherford Appleton Laboratory. Figure 2 shows aschematic image of the neutron array for one spectrometer in
Neutron Spectroscopy with Large Area TIME-of-FLIGHT Detector Array
H Habara, K L Lancaster, P A Norreys
Central Laser Facility, CLRC Rutherford Appleton Laboratory, Chilton, Didcot, Oxon, OX11 0QX, UK
Main contact email address: [email protected]
0.018-0.036 -0.018 0.0Px/Mc
0.036-0.036
-0.018
0.0
0.018
0.036
Py/
Mc
target surface
vacuum
target inside
incidence laser
(c)
1.5 2.0 2.5 3.0 3.5
90°
56°
1°
(b)
1.5 2.0 2.5 3.0 3.5energy [MeV]
(a)
coun
ts [
a.u.
]
1.0
0.0
90°56°
1°
Figure 1. An example of (a) neutron spectra, (b) well-fittedcalculated spectra (same energy units) and (c) the well-fitted ion momentum. distribution.
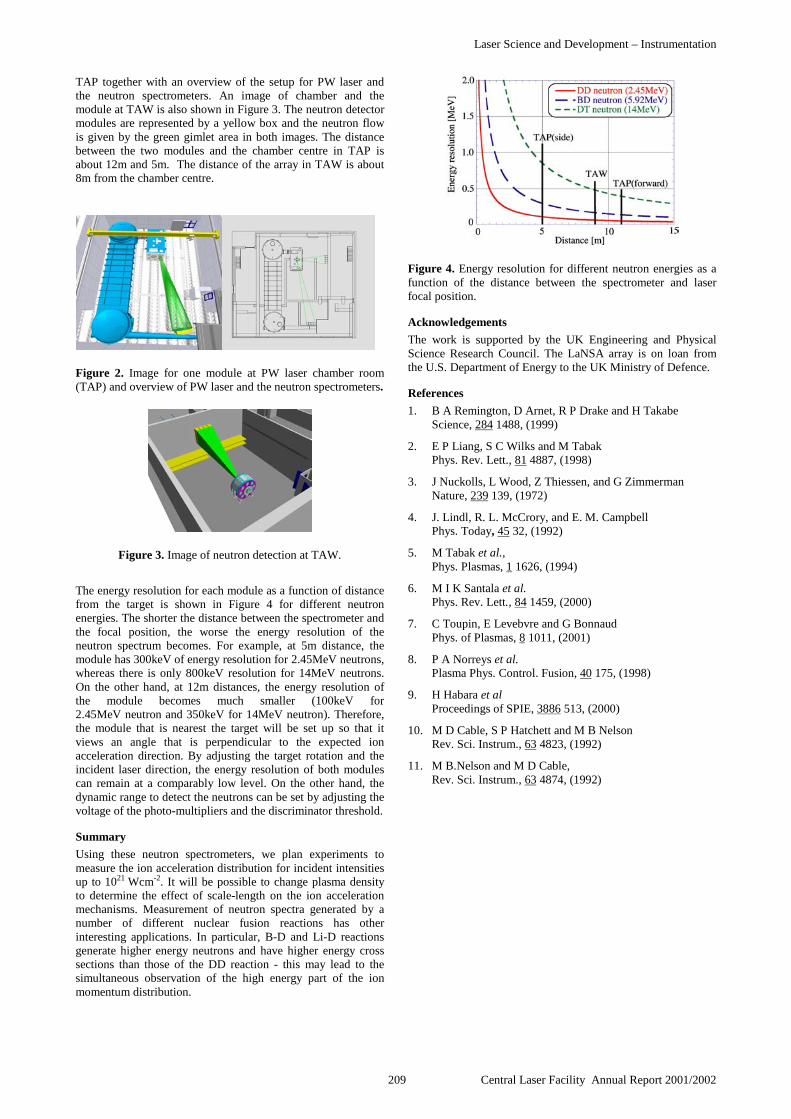
Laser Science and Development – Instrumentation
209 Central Laser Facility Annual Report 2001/2002
TAP together with an overview of the setup for PW laser andthe neutron spectrometers. An image of chamber and themodule at TAW is also shown in Figure 3. The neutron detectormodules are represented by a yellow box and the neutron flowis given by the green gimlet area in both images. The distancebetween the two modules and the chamber centre in TAP isabout 12m and 5m. The distance of the array in TAW is about8m from the chamber centre.
Figure 2. Image for one module at PW laser chamber room(TAP) and overview of PW laser and the neutron spectrometers.
Figure 3. Image of neutron detection at TAW.
The energy resolution for each module as a function of distancefrom the target is shown in Figure 4 for different neutronenergies. The shorter the distance between the spectrometer andthe focal position, the worse the energy resolution of theneutron spectrum becomes. For example, at 5m distance, themodule has 300keV of energy resolution for 2.45MeV neutrons,whereas there is only 800keV resolution for 14MeV neutrons.On the other hand, at 12m distances, the energy resolution ofthe module becomes much smaller (100keV for 2.45MeV neutron and 350keV for 14MeV neutron). Therefore,the module that is nearest the target will be set up so that itviews an angle that is perpendicular to the expected ionacceleration direction. By adjusting the target rotation and theincident laser direction, the energy resolution of both modulescan remain at a comparably low level. On the other hand, thedynamic range to detect the neutrons can be set by adjusting thevoltage of the photo-multipliers and the discriminator threshold.
Summary
Using these neutron spectrometers, we plan experiments tomeasure the ion acceleration distribution for incident intensitiesup to 1021 Wcm-2. It will be possible to change plasma densityto determine the effect of scale-length on the ion accelerationmechanisms. Measurement of neutron spectra generated by anumber of different nuclear fusion reactions has otherinteresting applications. In particular, B-D and Li-D reactionsgenerate higher energy neutrons and have higher energy crosssections than those of the DD reaction - this may lead to thesimultaneous observation of the high energy part of the ionmomentum distribution.
Figure 4. Energy resolution for different neutron energies as afunction of the distance between the spectrometer and laserfocal position.
Acknowledgements
The work is supported by the UK Engineering and PhysicalScience Research Council. The LaNSA array is on loan fromthe U.S. Department of Energy to the UK Ministry of Defence.
References
1. B A Remington, D Arnet, R P Drake and H TakabeScience, 284 1488, (1999)
2. E P Liang, S C Wilks and M TabakPhys. Rev. Lett., 81 4887, (1998)
3. J Nuckolls, L Wood, Z Thiessen, and G ZimmermanNature, 239 139, (1972)
4. J. Lindl, R. L. McCrory, and E. M. CampbellPhys. Today, 45 32, (1992)
5. M Tabak et al.,Phys. Plasmas, 1 1626, (1994)
6. M I K Santala et al.Phys. Rev. Lett., 84 1459, (2000)
7. C Toupin, E Levebvre and G BonnaudPhys. of Plasmas, 8 1011, (2001)
8. P A Norreys et al.Plasma Phys. Control. Fusion, 40 175, (1998)
9. H Habara et alProceedings of SPIE, 3886 513, (2000)
10. M D Cable, S P Hatchett and M B NelsonRev. Sci. Instrum., 63 4823, (1992)
11. M B.Nelson and M D Cable,Rev. Sci. Instrum., 63 4874, (1992)

Appendices – Operational Statistics
211 Central Laser Facility Annual Report 2001/2002
Schedules and Operational Statistics
1) Vulcan
2) Astra
3) Lasers for Science Facility

Appendices – Operational Statistics, Vulcan
Central Laser Facility Annual Report 2001/2002 212
Vulcan has completed an active experimental year, with 12 fullexperiments taking place between April 2001 and March 2002in the two main target areas, East (TAE) and West (TAW). Theperiod followed the Vulcan scheduled downtime to install thecapacitor bank in preparation for the arrival of componentsfrom LLNL for the Petawatt upgrade. The schedule slipped bytwo weeks at the start of this period in order to completecapacitor bank testing.
Table 1 below shows the operational schedule for the year, andillustrates the shot rate statistics for each experiment. Numbersin parentheses indicate the total number of full energy lasershots delivered to target, followed by the number of these thatfailed.
The total number of full disc amplifier shots that have beenfired this year is 1,029 with 94 of these failing to meet userrequirements. The EPSRC Facility Access Agreement (FAA)requires Vulcan to be at least 90% reliable. The overall shotfailure rate to target for the year is 9.1%. This compares with4.6% during both 2000-2001 and 1999-2000 and 5.4% for theprevious year. Analysis of the reasons for failure of theindividual shots enables a breakdown of these causes intospecific categories.
The FAA also requires that the laser system be available, duringthe four week periods of experimental data collection, from09:00 to 17:00 hours, Monday to Thursday, and from 09:00 to16:00 hours on Fridays (a total of 156 hours). The laser has notalways met the startup target of 9:00 am but it has beencommon practice to operate the laser well beyond the standardcontracted finish time on several days during the week and tooperate during some weekends.
On average, Vulcan has been available for each experiment forapproximately 118 hours during contracted hours and 164 hoursoverall. However, each experiment has also experienced anaverage of 5 hours of laser downtime.
Figure 1 (next page) shows the identified failure modes andtheir individual failure rates.
This information enables servicing and equipmentrefurbishment to be focused on the most serious sources ofsystem downtime. Figure 1 shows the most serious causes offailed shots to be the 9mm amplifiers (36%), oscillators (23%)and timing (22%). Improvements to the system continue to bemade by targeting the main causes of failure. The three maincauses of failure for 2000-2001 were the oscillators (25%),energy low (unspecified) (16%) and the disk amplifiers (13%).
PERIOD TAE TAW
23 Apr – 3 June
GR/N36806 – C Lewis
Non-linear XRL
(83, 27)
GR/L79151 – AE Dangor
Beat-wave
(72, 3)
11 Jun – 22 Jul
GR/L72718 – J Wark
Radiation transport
(142, 10)
GR/M82936 – K Krushelnick
Magnetic fields with CPA
(116, 6)
30 Jul – 9 Sep
GR/R12626 – N Woolsey
Astrophysics simulations
(88, 14)
Euro – M Koenig
Electron deposition with CPA
(71, 2)
24 Sep – 4 Nov
GR/R09572 – D Riley
X-ray scattering
(64, 7)
GR/N36554 – G Tallents
TW X-ray laser
(81, 7)
12 Nov – 23 Dec
LLNL – G Collins
Equation of state
(73, 3)
GR/N33188 – K Ledingham
Solid targets
(63, 6)
14 Jan – 24 Feb
Direct Access – D Riley
Thomson scattering with an X-ray laser
(77, 9)
GR/M82936 – K Krushelnick
Magnetic fields with CPA
(99, 5)
Table 1. Experimental schedule for the period April 2001 – March 2002.
Vulcan Operational Statistics
A Kidd, T Boland, C Danson
Central Laser Facility, CLRC Rutherford Appleton Laboratory, Chilton, Didcot, Oxon. OX11 0QX, UK
Main contact email address [email protected]

Appendices – Operational Statistics, Vulcan
213 Central Laser Facility Annual Report 2001/2002
Figure 1. Analysis of Vulcan failure modes.
Failed Shots for 01-02 Experiments
Oscillator 23%
Disc Amplifiers0%
Human Error 9%
Attenuators0%
Timing 22%
Pockel Cells1%
Alignment9%
Faraday 0%
9mm Amplifiers36%

Appendices – Operational Statistics, Astra
Central Laser Facility Annual Report 2001/2002 214
A total of 30 scheduled experiment weeks were carried outwith the Astra laser during the reporting period April 2001 toMarch 2002. The EPSRC sponsored 63 % of the experimentswhilst the remainder were sponsored by the EU. All of theexperiments were physics based.
The Astra laser was available for experiments for an averageof 90 % of the time in normal daytime hours duringscheduled experiments. In all experiments 100 % of daytimedown-time was made up in out-of-hours working. Reliabilitydefined as the time the laser was available as a percentage ofthe total time provided to scheduled experiments was 93 %.
We have had the opportunity to carry out about 10 weeks oflaser optimisation this year. The details of the upgradesimplemented in this time are described in detail elsewhere inthis report.
In summary though we have improved the contrast ratio of thelaser’s 13 ns pre-pulse to 2 x 10⁻⁸ of the main pulse – an importantimprovement for all surface plasma experiments. A new TiScrystal was also installed during the year. The laser is nowcapable of providing over 1 J into target area. Partly due todiffraction grating inefficiencies, only 25-30% of this energyreaches target and it is the aim of next year’s development work toinstall new and more efficient gratings.
Astra has proved itself to be an efficient and effective operationalfacility this year capable of delivering 5 TW pulses of 50 fsduration with focused intensities up to 1019 Wcm-2. A suite ofdiagnostics are in place to support experiments – a single-shotautocorrelator to monitor pulse duration, laser energy, far andnear-field detectors are in place to monitor the laser through theday. A third-order correlator is also available.
Astra Operational Statistics
A J Langley
Central Laser Facility, CLRC Rutherford Appleton Laboratory, Chilton, Didcot, Oxon., OX11 0QX, UK
Main contact email address: [email protected]
Date Target Area 1 (ATA1) Target Area 2 (ATA2)2 Apr Maintenance9 Apr
16 Apr Krushelnick23 Apr (IC)30 Apr Wakefield studies7 May
14 May
21 May
28 May Krushelnick4 Jun
11 Jun
18 Jun Hooker25 Jun (Oxford)2 Jul Capillary waveguides for driving short-wavelength lasers9 Jul
16 Jul
23 Jul
30 Jul
6 Aug Riley13 Aug (QUB)20 Aug Plasmon correlation studies27 Aug
3 Sep -24Sep
System optimisation
1 Oct
8 Oct
15 Oct Ledingham22 Oct (Glasgow)29 Oct Proton generation5 Nov
12 Nov –31 Dec
System optimisation
7 Jan Maintenance14 Jan
21 Jan Costello28 Jan (Dublin)4 Feb X-ray spectroscopy11 Feb Mitchell18 Feb (University of Rennes)25 Feb Laser ionisation studies of prepared ions4 Mar Training11 Mar
18 Mar Costello25 Mar
Table 1. Astra Experiment Schedule 2001/2002.

Appendices – Operational Statistics, Lasers for Science Facility
215 Central Laser Facility Annual Report 2001/2002
RAL-based experiments
In the reporting period (April 2001 to March 2002), 21different User groups performed a total of 54 experiments inthe LSF laboratories at RAL. A total of 3814 hours lasertime was scheduled throughout the year and 4348 hoursdelivered with only 186 hours downtime. Across the fundingCouncils the weeks scheduled were 80 to EPSRC, 3 to theMRC, 1 to BBSRC, 10 to Commercial Users and 14 toEuropean Users giving 108 weeks delivered to the Usercommunity overall. Once again, a wide spread of disciplineswas covered and a breakdown is shown in Figure 1 with theRAL-Based schedule Table 1. A total of 19 publications, 9conference papers, and 2 PhD theses were published duringthe reporting year.
Loan Pool
The Loan Pool delivered 349 weeks of laser time in the reportingperiod. Downtime was 27 weeks and was mainly due to teethingproblems and misalignment of the new laser systems and thefluoride excimer being unallocated for 14 weeks. In the laserloans there were 5 groups new to the Loan Pool. The chemistrycommunity was once again the biggest user with nearly 80% ofallocated time but there were also applications for the cw lasers tostudy biological systems using LIF and confocal imaging. Thebreakdown is shown in Figure 2. The Loan Pool schedule isshown in Table 2. There was a total of 19 publications,4 conference papers and 1 PhD theses published during thereporting year.
Table 1. LASERS for SCIENCE FACILITY RAL-BASED SCHEDULE: 2001-2
Date Laser MicroscopeLaboratory
Nanosecond ScienceLaboratory
Ultrafast SpectroscopyLaboratory
X-Ray and UVLaboratory
02-Apr-01 MAINTENANCE D PHILLIPS (IC) GR/L84001 NL1C1/01
K REID(Nottingham)
09-Apr-01 COMMERCIAL Photoelectron angulardistributions as
MAINTENANCE
16-Apr-01 a probe ofintramolecular
23-Apr-01 dynamicalprocesses
COMMERCIALQ00/165
30-Apr-01 GR/M83759 US5C1/01
07-May-01 LSF USER MEETING AND WORKSHOP14-May-01 MAINTENANCE P MATOUSEK Beam
development US3P1/01C WHARTON(Birmingham)
21-May-01 C WHARTON(Birmingham)
MAINTENANCE Intracellular dynamics
28-May-01 Intracellular dynamicsGR/N19052 CM3P1/01
A VLCEK (QMWC)Dynamics of
GR/N19052 XU2P1/01
04-Jun-01 organometallics GR/N11414US2C1/01
11-Jun-01 MAINTENANCE D PHILLIPS(Imperial College)
H REEHAL (SBU)
18-Jun-01 K BRINDLE (C’bridge)8/E11895 CM2B1/01A
Dynamics of Charge Transfer TFCS Photovoltaics
25-Jun-01 COMMERCIAL MAINTENANCE ReactionsGR/L84001 US7C1/01
EPSRC ABTGR/N19052 XU2P1/01
02-Jul-01 J J McGARVEY (QUB)DNA Interactions
09-Jul-01 GR/M45696US1C1/01
J CAIRNS (Dundee)Production
16-Jul-01 J KELLY (Ireland) of X-ray masksGR/M41223 XU1E1/01
23-Jul-01 DNA photoxidation byRhenium Carbonyl
COMMERCIALQ00/165
LSF Operational Statistics
S M Tavender, M Towrie, A W Parker
Central Laser Facility, CLRC Rutherford Appleton Laboratory, Chilton, Didcot, Oxon., OX11 0QX, UK
Main contact email address [email protected]
Figure 1. RAL-based experiments.
Number of experiments per subject group
Biochemistry6%
Chemistry59%
Physics27%Engineering
8%Figure 2. Loan Pool RAL-based experiments.
Number of experiments per subject group
Biology4%
Engineering14%
Physics4%
Chemistry78%

Appendices – Operational Statistics, Lasers for Science Facility
Central Laser Facility Annual Report 2001/2002 216
Date Laser MicroscopeLaboratory
Nanosecond ScienceLaboratory
Ultrafast SpectroscopyLaboratory
X-Ray and UVLaboratory
30-Jul-01 J MOORE(York)
Compounds
06-Aug-01 Ns TR3 spectroscopy offunctional
USEV7C1/01
13-Aug-01 (diimine) Re (CO)3
complexesM GEORGE (Nottingham)
20-Aug-01 C WHARTON (B’ham)Multiphoton irradiation
EPSRC ABTGR/R01316 NL2C1/01 P.I.R.A.T.E.
C WHARTON (B’ham)Multiphoton irradiation
27-Aug-01 of cellular components toinvestigate
of cellular components toinvestigate
03-Sep-01 intra-cellular dynamicsGR/N19052 CM4P2/01
GR/M40486US11C2/01
intra-cellular dynamicsGR/N19052 XU2P2/01
10-Sep-01 MAINTENANCE MAINTENANCE D PHILLIPS(Imperial College)
17-Sep-01 Reorganisation Dynamicsaccompanying Charge
24-Sep-01 A WARD (CLF)Characterisation of
Transfer Reactions andrelaxation
MAINTENANCE
01-Oct-01 Tweezers CM5P2/01 EPSRC DA GR/L84001US10C2/01
08-Oct-01 R BISBY Excitation of freeradicals CM6B2/01
MAINTENANCE
15-Oct-01 R BISBY (Salford)NL6C2/01 EPSRC DA
J McGARVEY (QUB)DNA Interactions
R De BRUIJN(The Netherlands)
22-Oct-01 GR/M45696US8C2/01
Dynamics of EUV emitting
29-Oct-01 A WARD TweezerCharacterisation CM5P2/01
A VLCEK (QMWC)Organometallic complexes
micro-droplet plasmas
05-Nov-01 GR/N11414US9C2/01
XUEV25P2/01
12-Nov-01 D STUFKENS (TheNetherlands)
J CAIRNS (Dundee)Production
19-Nov-01 Metal-Metal bond splitting of of X-ray masksGR/M41223 XU5E2/01
26-Nov-01 COMMERCIALDTI SMART
M CHESTERS(Nottingham)
Os carbonyl clusters
03-Dec-01 A WARD TweezerCharacterisation CM5P2/01
UV Resonance Raman Studies of
USEV13C2/01
10-Dec-01 C WHARTON (B’ham)GR/N19052 CM8P3/01
Adsorbates onMetal Surfaces
M GEORGE (Nottingham)
MAINTENANCE
17-Dec-01 COMMERCIALDTI SMART
NL3C1/01EPSRC DA
P.I.R.A.T.E.
XMAS/NEW YEAR07-Jan-02 MAINTENANCE GR/M40486
US18C3/01
14-Jan-02 C WHARTON (B’ham)GR/N19052 CM8P3/01
MAINTENANCE C WHARTON (B’ham)GR/N19052 CM8P3/01
21-Jan-02 MAINTENANCE J McGARVEY (QUB DNAInteractions)
28-Jan-02 COMMERCIAL GR/M45696 US15C3/01 J CAIRNS X-ray masksGR/M41223 XU9E3/01
04-Feb-02 COMMERCIALDTI SMART
E TUITE (Newcastle)DNA damageNL10C3/01
A VLCEK (QMWC)Photochemical dynamics
dynamics11-Feb-02 of organometallic complexesGR/N11414 / US16C3/01
P O’NEILL (MRC)Energy dependence
18-Feb-02 S SCHNEIDERPhotophysical processes in
bridged
for the induction of base damagein DNA
25-Feb-02 S FAULKNER CM7C3/01Macrophage Luminescence
D PHILLIPS (IC)Dynamics of charge
organic electron donor-acceptor systems
USE42C1/99
by low energy photonsXU8B3/01
04-Mar-02 TransferGR/R29062/ NL7C3/01
K REID(Nottingham)
11-Mar-02 Photoelectron angulardistributions as a
A MICHETTE(Kings)
18-Mar-02 probe of intramoleculardynamical processes
Development of the laboratoryscanning x-ray
25-Mar-02 GR/M83759US17C3/01
microscope GR/N28061/01XU7P3/01

Appendices – Operational Statistics, Lasers for Science Facility
217 Central Laser Facility Annual Report 2001/2002
Table 2. LASERS for SCIENCE FACILITY LOAN POOL SCHEDULE: 2001-2
Date NSL1POWERLITE/SIRAH + DFG
NSL2SURELITE III-
10/SIRAH
NSL3SURELITE III-
10/ SIRAH
NSL4Continuum
8010/ND6000
NSL5FluorideExcimer
NSL6Nd:YAG/Dye/SHG
CWL2VERDI/MIRA+ SHG & THG
CW3 FrequencyDoubled Argon
IonApr 2 LACZIK STACE REID SMITH SIMONS LINFIELD LEGGATT
9 (Oxford) Cluster Spectroscopy (Nottingham) (Birmingham) (Oxford) (Cambridge) (UMIST)
16 LP22E3/00 in Helium UNALLOCATED
23 Nanodroplets LP18C3/00 State-
30 LP19C3/00 selected Zwitterions in Development Nanometre
May 7 BELMONT and state- The gas phase of an Scale
14 (Exeter) SPECTRON/ PDL2RETIRED
ALEXANDER to-state all-optical Photolithography
21 A study of the AWARDED TOWHEELER Leicester
(Edinburgh) rotational SERVICE high power
28 shallow angle energy AT terahertz
Jun 4 scattering and STACE "Molecular transfer RAL source
11 Transmission (Sussex) Young’s Slits": in
18 Characteristics in understanding OH(X2II) LP6C1/01 LP21P3/00
25 the sea’s INSTALL/ NO Rydberg interference in
Jul 2 Near COMMISS-IONING
Spectroscopy dissociation LP23C3/00
9 Surface Powerlite in Helium dynamics LP3C1/01 SIMONS INSTALLATION/
16 Volume Sirah+ Nanodroplets (Oxford) COMMISSIONING
23 DFG SUN Verdi/ MIRA LEGGATT
30 McK’RICK Surelite SMITH (City) + SHG & THG (UMIST)
Aug 6 Herriot-Watt) Installation (Birmingham) TAYLOR
13 LP1E1/01 Fabrication of (IC)
20 GCR11RETIRED
LP5C1/01 State- Bragg gratings Structure and
27 AWARDEDTO
selected using high pulsed conformation of Spectroscopic Nanometre
Sept 3 MACKENZIE LP4C1/01 and state- laser power adrenaline and and dynamic Scale
10 (Warwick) Dynamics SPECTRONRETIRED
to-state in rare-earth noradrenaline SHG studies of Photolithography
17 of the AWARDED TOCOSTEN (H’Watt)
rotational doped optical the LP11C2/01
24 Reaction of energy fibre, for electrochemical
Oct 1 O(3P) STACE transfer sensing and oxidation of
8 with (Sussex) SERVICE & in communications silicon
15 Vibrationally REALIGNMENT OH(X2II) applications LP10C1/01
22 Excited Electronic GERMANY/
29 Methane spectra RAL LP9E1/01 LP11C2/01
Nov 5 of benzene SIMONS
12 molecules LP13C1/01 (Oxford)
19 trapped LP8B1/00 CHESTERS
26 LP2C1/01 in helium CRANTON An investigation (RAL/Nottingham)
Dec 3 droplets SMITH (NTU) of the IR and UV UV Resonance
10 (Birmingham) spectra of DEVONSHIRE Raman Studiesof17 McKENDRICK FROST multiply (Sheffield) Adsorbates on
24 (Herriot-Watt) (Herriot-Watt) State-Selectedand
Laser processing hydrated 4- Metal Surfaces
31 State-to-State of thin film and 5-phenyl: NL3C1/01
Jan 72002
LP12C2/01 Rate phosphors imidazole
14 Constants for for flat A model for Novel Plasma
21 REMPI-LIF Inelastic and screen displays proton Diagnostic LEGGATT
28 STACE studies of simple Reactive wires? Techniques (UMIST)
Feb 4 Dynamics of the (Sussex) ion-molecule Collisions which exploit the
11 Reaction of 0(3P) Electronic Reactions of CN(X2 LP17C3/01 precise,
18 with vibrationally spectra microscopic Nanometre
25 excited methane of benzene scale, spatial Scale
Mar 4 molecules LP15E2/01 SIMONS extent Photolithography
11 trapped LP16C3/01 (Oxford) of fs laser pulses
18 in helium
25 droplets CRANTON

Appendices – Publications
219 Central Laser Facility Annual Report 2001/2002
Publications
1) High Power Laser Progamme - Vulcan Laser
2) High Power Laser Progamme - Astra Laser
3) Lasers for Science Facility Programme
4) Laser Science and Development

Appendices – Publications
Central Laser Facility Annual Report 2001/2002 220
High Power Laser ProgrammeVulcan LaserJOURNAL PUBLICATIONS, BOOKS AND PUBLISHEDPROCEEDINGS
K M Aggarwal, F P Keenan, S J RoseElectron impact excitation of Al XIII: collision strengths andrate coefficientsProc X-Ray Lasers 2000, J de Phys IV 11 (Pr2) 309-312 (2001)
K M Aggarwal, P H Norrington, K L Bell, F P Keenan,G J Pert, S J RoseElectron impact excitation of Gd XXXVII and radiative rates forNi-like ions with 60 Z 90Proc X-Ray Lasers 2000, J de Phys IV 11 (Pr2) 313-316 (2001)
I R Al'Miev, S J Rose, J S WarkFurther simulations of the gain in a K XIX/Cl XVII resonantlyphotopumped X-ray laserJ Quant Spectr & Rad Trans 70 (1) 11-24 (2001)
D Batani, F Pisani, A Bernardinello, A Antonicci, F Amiranoff,M Koenig, E Martinolli, S Baton, T Hall, C Rousseaux,W Nazarov, PA Norreys, A Djaoui, D NeelyFast electron transport in dense matterProc Int Conf Lasers 2000, 409-416, publ STS Press,McLean, VA, USA (2001)
A Bernardinello, D Batani, A Antonicci, F Pisani, M Koenig,L Gremillet, F Amiranoff, S Baton, E Martinolli, C Rousseaux,T A Hall, P Norreys, A DjaouiEffects of self-generated electric and magnetic fields in laser-generated fast electron propagation in solid materials: Electricinhibition and beam pinchingLaser and Particle Beams 19 (1) 59-65 (2001)
G A Blair, J Frisch, K Honhavaara, T Kamps, F Poirier,I N Ross, M Ross, H Schlarb, P Schmuser, S Schreiber,D Sertore, N Walker, M Wendt, K WittenburgProposing a laser based beam size monitor for the future linearcolliderProc 2001 Particle Accelerator Conference, vol 2, 1339-1341,publ IEEE, Piscataway, NJ, USA (2001)
M Borghesi, H D Campbell, M Galimberti, L A Gizzi,A J MacKinnon, W Nazarov, A Schiavi, O WilliPropagation issues and fast particle source characterization inlaser-plasma interactions at intensities exceeding 1019 W/cm2
Proc SPIE 4424 414-417 (2001)
M Borghesi, D H Campbell, A Schiavi, H Gessner, O Willi,A J MacKinnon, P K Katel, R Snavely, S Hatchett, L A Gizzi,M Galimberti, R J Clarke, R Allott, S Hawkes, H RuhlFast particle generation in ultra-intense interactionexperiments and applicationsProc Int Conf Lasers 2000, 451-458, publ STS Press,McLean, VA, USA (2001)
M Borghesi, A Schiavi, D H Campbell, M G Haines, O Willi,A J MacKinnon, L A Gizzi, M Galimberti, R J Clarke, H RuhlProton imaging: a diagnostic for inertial confinementfusion/fast ignitor studiesPlasma Physics & Controlled Fusion 43 (12A) A267-A276(2001)
R D Edwards, M A Sinclair, T J Goldsack, K Krushelnick,F N Beg, E L Clark, A E Dangor, Z Najmudin, M Tatarakis,B Walton, M Zepf, K W D Ledingham, I Spencer, P A Norreys,R J Clarke, R Kodama, Y Toyama, M TampoCharacterization of a gamma-ray source based on alaser-plasma accelerator with applications to radiographyAppl Phys Letts 80 (12) 2129-2131 (2002)
M Galimberti, A Giulietti, D Giulietti, L A Gizzi, M Borghesi,H D Campbell, A Schiavi, O WilliGamma-ray measurements in relativistic interactions withunderdense plasmasProc SPIE 4424 512-515 (2001)
L A Gizzi, M Galimberti, A Giulietti, D Giulietti, P Tomassini,M Borghesi, D H Campbell, A Schiavi, O WilliRelativistic laser interactions with preformed plasma channelsand gamma-ray measurementsLaser & Particle Beams 19 (2) 181-186 (2001)
J Hawreliak, D Chambers, S Glenzer, R S Marjoribanks,M Notley, P Pinto, O Renner, P Sondhauss, R Steel, S Topping,E Wolfrum, P Young, J S WarkA Thomson scattering post-processor for the MEDUSAhydrocodeJ Quant Spectr & Rad Trans 71 (2-6) 383-395 (2001)
R Keenan, C L S Lewis, S J Topping, G J Tallents, F Strati,G J Pert, A Klisnick, D Ros, J Kuba, R Smith, P V Nickles,K A Janulewicz, F Bortolotto, A G MacPhee, R J Clarke,R AllottDevelopments in X-ray laser pumping with travelling wave atVulcanProc X-Ray Lasers 2000, J de Phys IV 11 (Pr2) 47-50 (2001)
R E King, G J Pert, S P McCabe, P A Simms, A G MacPhee,C L S Lewis, R Keenan, R M N O’Rourke, G J Tallents,S J Pestehe, F Strati, D Neely, R AllottSaturated X-ray lasers at 196 and 73 picosecond traveling-wave excitationPhys Rev A 64 (5) 053810 (2001)
A Klisnick, J Kuba, D Ros, R Smith, P Fourcade, G Jamelot,J-L Miquel, J F Wyart, C Chenais-Popovics, R Keenan,S J Topping, C L S Lewis, F Strati, G J Tallents, D Neely,R Clarke, J Collier, A G MacPhee, F Bortolotto, P V Nickles,K A JanulewiczGeneration of a transient short pulse X-ray laser using atraveling-wave sub-ps pump pulseProc X-Ray Lasers 2000, J de Phys IV 11 (Pr2) 11-17 (2001)
A Klisnick, J Kuba, D Ros, R Smith, G Jamelot,C Chenais-Popovics, R Keenan, S J Topping, C L S Lewis,F Strati, G J Tallents, D Neely, R Clarke, J Collier,A G MacPhee, F Bortolotto, P V Nickels, K A JanulewiczDemonstration of a 2-ps transient X-ray laserPhys Rev A 65 (3) 033810 (2002)
R Kodama, P A Norreys, K Mima, A E Dangor, R G Evans,H Fujita, Y Kitagawa, K Krushelnick, T Miyakoshi,N Miyanaga, T Norimatsu, S J Rose, T Shozaki, K Shigemori,A Sunahara, M Tampo, K A Tanaka, Y Toyama, Y Yamanaka,M ZepfFast heating of ultrahigh-density plasma as a step towardslaser fusion ignitionNature 412 (6849) 798-802 (2001)
J Kuba, A Klisnick, D Ros, R Smith, G Jamelot,C Chenais Popovics, R Keenan, S J Topping, C L S Lewis,F Strati, G J Tallents, D Neely, A G MacPhee, R J Clarke,J Collier, P V Nickles, K A Janulewicz, F BortolottoTemporal resolution of a transient pumping X-ray laserProc X-Ray Lasers 2000, J de Phys IV 11 (Pr2) 43-46 (2001)
K W D LedinghamFrom single ion to single pionProc 10th International Symposium on Laser ionization andApplications Incorporating RIS, AIP Conf Proc 584 67-72(2001)

Appendices – Publications
221 Central Laser Facility Annual Report 2001/2002
R W Lee, H A Baldis, R C Cauble, O L Landen, J S Wark,A Ng, S J Rose, C Lewis, D Riley, J-C Gauthier, P AudebertPlasma-based studies on 4th generation light sourcesProc 19th Advanced ICFA beam Dynamics Workshop,AIP Conf Proc 581 45-58 (2001)
Z Najmudin, M Tatarakis, A Pukhov, E L Clark, R J Clarke,A E Dangor, J Faure, V Malka, D Neely, M I K Santala,K KrushelnickMeasurements of the inverse Faraday effect from relativisticlaser interactions with an underdense plasmaPhys Rev Letts 87 (21) 215004 (2001)
G J PertX-ray lasers pumped by ultra-short light pulsesProc X-Ray Lasers 2000, J de Phys IV 11 (Pr2) 181-187 (2001)
G J PertThe transition from uni-directional to bi-directional behaviourin amplified spontaneous emission lasersOpt Comm 191 (1-2) 113-23 (2001)
S J Pestehe, G J TallentsA model for opacity measurements across expanding X-raylaser mediaProc X-Ray Lasers 2000, J de Phys IV 11 (Pr2) 333-336 (2001)
S J Pestehe, G J TallentsEscape factors for laser-plasmasJ Quant Spectr & Rad Trans 72 (6) 853-878 (2002)
S J RoseThe radiative opacity at the Sun centre - a code comparisonstudyJ Quant Spectr & Rad Trans 71 (2-6) 635-638 (2001)
I Spencer, K W D Ledingham, R P Singhal, T McCanny,E L Clark, K Krushelnick, M Zepf, F N Beg, M Tatarakis,C Escoda, M Norrefeldt, A E Dangor, P A Norreys, R J Clarke,R M AllottHigh-intensity laser generation of proton beams for theproduction of β+ sources used in positron emission tomographyProc 10th International Symposium on Laser ionization andApplications Incorporating RIS, AIP Conf Proc 584 73-78(2001)
I Spencer, K W D Ledingham, R P Singhal, T McCanny,P McKenna, E L Clark, K Krushelnick, M Zepf, F N Beg,M Tatarakis, A E Dangor, P A Norreys, R J Clarke, R M Allott,I N RossLaser generation of proton beams for the production ofshort-lived positron emitting radioisotopesNucl Instr & Meth in Phys Res B 183 (3-4) 449-458 (2001)
F Strati, G J TallentsGroup speed effects in saturated soft X-ray lasers in transientcollisional excitation regime driven with travelling wavepumpingProc X-Ray Lasers 2000, J de Phys IV 11 (Pr2) 297-300 (2001)
F Strati, G J TallentsAnalytical modeling of group-velocity effects in saturatedsoft-X-ray lasers pumped with a picosecond traveling-waveexcitationPhys Rev A 64 (1) 013807 (2001)
G J Tallents, F Strati, J Y Lin, R Smith, S J Pestehe, G J Pert,C L S Lewis, A G MacPhee, R KeenanShort pulse pumped X-ray lasersProc X-Ray Lasers 2000, J de Phys IV 11 (Pr2) 59-66 (2001)
M Tatarakis, I Watts, F N Beg, E L Clark, A E Dangor,A Gopal, M G Haines, P A Norreys, U Wagner, M S Wei,M Zepf, K KrushelnickLaser technology - Measuring huge magnetic fieldsNature 415 (6869) 280-280 (2002)
S J Topping, R Keenan, C L S Lewis, R M N O'Rourke,A G MacPhee, S Dobosz, G J Tallents, M Notley, D NeelyProgress in FWSD non-linear effects with XRLsProc X-Ray Lasers 2000, J de Phys IV 11 (Pr2) 487-490 (2001)
L M Upcraft, G J PertComputational modelling of a Ne-like-Ar collisionally pumpedOFI X-ray laserProc X-Ray Lasers 2000, J de Phys IV 11 (Pr2) 205-208 (2001)
W Wei, J Zhang, S J RoseEffects of the radiation field on the physical processes oflaser-produced plasmasActa Physica Sinica 50 (8) 1517-1520 (2001)
O Willi, D H Campbell, A Schiavi, M Borghesi, M Galimberti,L A Gizzi, W NazarovPropagation of an ultra intense laser beam through underdenseand overdense plasmasProc Int Conf Lasers 2000, 425-432, publ STS Press,McLean, VA, USA (2001)
E Wolfrum, A M Allen, I Al'Miev, T W Barbee, P D S Burnett,A Djaoui, C Iglesias, D H Kalantar, R W Lee, R Keenan,M H Key, C L S Lewis, A M Machacek, B A Remington,S J Rose, R O'Rourke, J S WarkMeasurements of the XUV mass absorption coefficient of anoverdense liquid metalJ Phys B – At Mol Opt Phys 34 (17) L565-L570 (2001)
N C Woolsey, Y A Ali, R G Evans, R A D Grundy, S J Pestehe,P G Carolan, N J Conway, R O Dendy, P Helander,K G McClements, J G Kirk, P A Norreys, M M Notley,S J RoseCollisionless shock and supernova remnant simulations onVULCANPhysics of Plasmas 8 (5) 2439-2445 (2001)
N C Woolsey, Y Abou-Ali, R Evans, R A Grundy, S J Pestehe,P Carolan, N Conway, R O Dendy, P Helander,K G McClements, J G Kirk, P A Norreys, M M Notley,S J RoseSupernova remnant simulation experiments on VULCANProc SPIE 4424 484-491 (2001)
N C Woolsey, Y A Ali, R G Evans, R A D Grundy, S J Pestehe,P G Carolan, N J Conway, R O Dendy, P Helander,K G McClements, J G Kirk, P A Norreys, M Notley, S J RoseResponse to "Comment on ’Collisionless shock and supernovaremnant simulations on VULCAN’ " [Phys. Plasmas 9, 727(2002)]Physics of Plasmas 9 (2) 729-730 (2002)
M Zepf, E L Clark, K Krushelnick, F N Beg, C Escoda,A E Dangor, M I K Santala, M Tatarakis, I F Watts,P A Norreys, R J Clarke, J R Davies, M A Sinclair,R D Edwards, T J Goldsack, I Spencer, K W D LedinghamFast particle generation and energy transport in laser-solidinteractionsPhysics of Plasmas 8 5 2323-2330 (2001)
PUBLISHED DURING 2000/2001
C L S Lewis, G J TallentsA review of Ni-like X-ray laser experiments undertaken usingthe VULCAN laser at the Rutherford Appleton LaboratoryComptes Rendus Serie IV 1 (8) 1053-1065 (2000)
IN PRESS AT END OF 2001/2002
M Borghesi, S Bulanov, D H Campbell, R J Clarke,T Z Esirkepov, M Galimberti, L A Gizzi, A J MacKinnon,N M Naumova, F Pegoraro, H Ruhl, A Schiavi, O WilliMacroscopic evidence of soliton formation in multiterawattlaser-plasma interactionPhys Rev Letts 88 (13) 135002 (2002)

Appendices – Publications
Central Laser Facility Annual Report 2001/2002 222
M Borghesi, D H Campbell, A Schiavi, M G Haines, O Willi,A J MacKinnon, P Patel, L A Gizzi, M Galimberti, R J Clarke,F Pegoraro, H Ruhl, S BulanovElectric field detection in laser-plasma interaction experimentsvia the proton imaging techniquePhysics of Plasmas 9 (5) 2214-2220 (2002)
M Tatarakis, A Gopal, I Watts, F N Beg, A E Dangor,K Krushelnick, U Wagner, P A Norreys, E L Clark, M Zepf,R G EvansMeasurements of ultrastrong magnetic fields during relativisticlaser-plasma interactionsPhysics of Plasmas 9 (5) 2244-2250 (2002)
I Watts, M Zepf, E L Clark, M Tatarakis, K Krushelnick,A E Dangor, R M Allott, R J Clarke, D Neely, P A NorreysDynamics of the critical surface in high-intensity laser-solidinteractions: Modulation of the XUV harmonic spectraPhys Rev Letts 88 (15) 155001 (2002)
CONFERENCE PRESENTATIONS
OECD Global Science Forum Workshop on CompactHigh-Intensity Short-Pulse Lasers, Kyoto, Japan(May 2001)
K W D LedinghamNuclear physics with high intensity lasers
UK Workshop on Positron Physics and Applications,Swansea, UK (Jun 2001)
K W D Ledingham, P McKenna, I Spencer, R P Singhal,T McCanny, E L Clark, K Krushelnick, M Zepf, F N Beg,M Tatarakis, M-S Wei, A Gopal, A E Dangor, P A Norreys,R J Clarke, R M Allott, I N RossLaser-induced nuclear physics and applications
21st ICFA Beam Dynamics Workshop, Stony Brook, USA(Jun 2001)
P A NorreysVulcan PW laser, review on electron and ion acceleration andX-ray experiments in Europe
Euroconference on Advanced Diagnostics for Magnetic andInertial Fusion, Varenna, Italy (Sept 2001)
M BorghesiImaging of plasmas using proton beams generated byultra-intense laser pulses
P A Norreys, K L Lancaster, H HabaraAdvanced concepts in fast ignition and the relevant diagnostics
2nd International Conference on Fusion Sciences andApplications, Kyoto, Japan (Sept 2001)
P M Celliers, G W Collins, D Hicks, L B Da Silva,A McKinnon, R Cauble, S J Moon, R J Wallace, B A Hammel,M Koenig, A Benuzzi, G Huser, E Henry, D Batani, I Masclet,B Marchet, M Rebec, Ch Reverdin, N Dague, O Willi, J Pasley,H Gessner, D Neely, M Notley, C DansonShock Hugoniot and optical measurements of strongly shockedwater
G W Collins, P M Celliers, D Bradley, D Hicks, L B Da Silva,A McKinnon, R Cauble, S J Moon, H Baldis, W Hsing,B A Hammel, M Koenig, A Benuzzi, G Huser, R Jeanloz,K Lee, L R Benedetti, E Henry, D Batani, P Loubeyre, O Willi,J Pasley, H Gessner, D Neely, M Notley, C DansonRecreating planetary cores with high intensity lasers
M H R HutchinsonHigh power laser applications research in the EU
S Jacquemot, G Jamelot, E Fill, P Nickles, G Tallents, G Pert,C L S LewisThe European X-ray laser network
M H Key, F Amiranoff, C Andersen, D Batani, S D Baton,T Cowan, N Fisch, R Freeman, L Gremillet, T Hall, S Hatchett,J Hill, J King, J Koch, M Koenig, B Lasinski, B Langdon,A MacKinnon, E Martinolli, P Norreys, P Parks,E Perelli-Cippo, M Rabec le Gloahec, M Rosenbluth,C Rousseaux, J J Santon, F Scianitti, R Snavely, R StephensStudies of energy transport by relativistic electrons in thecontext of fast ignition
Z Najmudin, K Krushelnick, A E Dangor, B Walton, A Gopal,U Wagner, S Fritzler, V Malka, R J ClarkeStudies on electron acceleration in plasmas at RutherfordAppleton Laboratories
P A Norreys, K Krushelnick, A E Dangor, M Tatarakis,E L Clark, M Zepf, K LedinghamRelativistic laser-plasmas & fast ignition studies at theRutherford Appleton Laboratory
J R Pasley, O Willi, A Iwase, W NazarovTamping of indirectly-driven targets
O Renner, P K Patel, D M Chambers, S H Glenzer,R S Marjoribanks, J Hawreliak, E Wolfrum, J S WarkLine reversal between components of the A1 Ly α doublet
A Schiavi, D H Campbell, O Willi, M Borghesi, H RuhlE-field structures and anomalous proton stopping in laserproduced plasmas
K A Tanaka, R Kodama, Y Kitagawa, K Fujita, H Fujita,M Heya, N Izumi, T Jitsuno, K Mima, N Miyanaga,H Nishimura, T Norimatsu, Y Sentoku, K Shigemori,A Sunahara, S Akamatsu, T Matsusita, T Miyakoshi, F Otani,T Shozaki, M Tanpo, S Tohyama, T Yamanaka, P A Norreys,M ZepfReview of fast ignition related research at ILE Osaka university
N C Woolsey, R O Dendy, R A D Grundy, J G Kirk,K G McClements, P Helander, P A Norreys, S J RoseCollisionless shock experiments with applications toastrophysics
Euroconference on Short Pulse Superstrong Laser PlasmaInteractions, San Feliu de Guixols, Spain (Sept-Oct 2001)
M BorghesiLaser-generated protons and applications
R GrundyCollisionless shock and supernova remnant simulations onVulcan
P McKennaLaser induced nuclear physics
P NorreysAdvanced geometries for fast ignition
J PasleyTamped ablation in indirectly driven target
G TallentsAdvancement in X-ray laser
N WoolseyCollisionless shock experiments with application toastrophysics

Appendices – Publications
223 Central Laser Facility Annual Report 2001/2002
43rd Annual Meeting of the APS Division of Plasma Physics,Los Angeles, USA (Nov 2001)
E Clark, M Zepf, F Beg, M Tatarakis, R Clarke, M Wei,A Gopal, U Wagner, A E Dangor, P A Norreys, K KrushelnickProton measurements from ultra intense laser plasmainteractions
D G Hicks, P M Celliers, G W Collins, L B Da Silva,A J Mackinnon, R Cauble, S J Moon, R J Wallace,B A Hammel, M Koenig, A Benuzzi, G Huser, E Henry,D Batani, P Loubeyre, O Willi, J Pasley, H Gessner, R Jeanloz,K M Lee, L R Benedetti, D Neely, M M Notley, C DansonLaser-driven shocks in water pre-compressed by diamond anvilcells
K Krushelnick, F N Beg, A Gopal, M Tatarakis, M-S Wei,E L Clark, A E Dangor, U Wagner, P A Norreys, M ZepfPolarimetry measurements of high order harmonics fromintense laser solid interactions
B R Walton, Z Najmudin, M-S Wei, C Marle, K Krushelnick,A E Dangor, R J Clarke, M J Poulter, C Hernandez-Gomez,S Hawkes, D Neely, C N Danson, J L Collier, S Fritzler,V MalkaShort pulse laser beatwave experiments using the VULCANlaser facility
4th International Conference on High Energy DensityLaboratory Astrophysics, Ann Arbor, USA (Feb 2002)
P A Norreys, C Courtois, R A D Grundy, R O Dendy,R G Evans, P Helander, K G McClements, J G Kirk,J L Collier, M M Notley, N C WoolseyExperimental studies of collisionless shocks with applications toastrophysics
P A Norreys, U Wagner, D Neely, R Clarke, M Tatarakis,I Watts, M Zepf, E Clark, M Haines, A E Dangor,K KrushelnickMeasurement of superstrong magnetic fields with PW lasers
29th Annual UK Plasma Physics Conference, Belfast, UK(Mar 2002)
M BorghesiPoint-projection probing with laser-produced protons
E ClarkProton and ion acceleration in ultra intense laser plasmainteractions
E L Clark, M Zepf, F N Beg, M Tatarakis, M Wei, A Gopal,U Wagner, A E Dangor, P A Norreys, K KrushelnickProton and ion acceleration in ultra intense laser plasmainteractions
R EvansSimulations of DC magnetic fields produced by ultra highintensity
A Gopal, M Tatarakis, F N Beg, E L Clark, A E Dangor,K W D Ledingham, P McKenna, P A Norreys, I Spencer,M-S Wei, M Zepf, K KrushelnickMagnetic field measurements during high intensity short pulselaser solid target interactions
R Keenan, C L S Lewis, S J Topping, J S Wark, E WolfrumDevelopment of X-ray lasers for radiogrphic applications
D Riley, C Lewis, F Khattak, R Keenan, S Topping,A McEvoy, J AnguloX-ray laserThomson scattering
S J Topping, R Keenan, C L S Lewis, R O’Rourke, S DoboszFWSD non-linear effects with XRLs in a gas jet plasma
M Wei, F N Beg, E L Clark, A E Dangor, A Gopal,K W D Ledingham, P McKenna, P A Norreys, I Spencer,M Tatarakis, M Zepf, K KrushelnickStudy of electron and proton beam generation from double sideillumination of solid targets with high intensity laser pulses
M Zepf, R Kodama, P A Norreys, K Mima, A E Dangor,R G Evans, H Fujita, Y Kitagawa, K Krushelnick, T Miyagoshi,N Miyanaga, T Norimatsu, S J Rose, T Shozaki, K Shigemori,A Sunahara, M Tampo, K A Tanaka, Y Toyama, T YamanakaCPA laser heating of cone guided implosion targets
THESES
J PesteheSpectroscopy of X-ray laser mediaPh D, University of York
I SpencerLaser induced nuclear physicsPh D, University of Glasgow
F StratiExperimental and theoretical characterisation of short pulseX-ray lasersPh D, University of York
High Power Laser Programme – Astra LaserJOURNAL PUBLICATIONS, BOOKS AND PUBLISHEDPROCEEDINGS
A A A El-Zein, P McKenna, W A Bryan, I M G Johnston,T R J Goodworth, J H Sanderson, I D Williams, W R Newell,P F Taday, E J Divall, A J LangleyA detailed study of multiply charged ion production within ahigh intensity laser focusProc 10th International Conferecnce on the Physics of HighlyCharged Ions, Physica Scripta T92 119-121 (2001)
P Graham, K W D Ledingham, R P Singhal, S M Hankin,T McCanny, X Fang, C Kosmidis, P Tzallas, P F Taday,A J LangleyOn the fragment ion angular distributions arising from thetetrahedral molecule CH3IJ Phys B – At Mol Opt Phys 34 (20) 4015-4026 (2001)
P Graham, K W D Ledingham, R P Singhal, S M Hankin,T McCanny, X Fang, P F Taday, A J Langley, C KosmidisAngular distributions of fragment ions arising from tetrahedralCH3I and isomer identification using intense laser fieldsLaser and Particle Beams 19 (2) 187-193 (2001)
S M Hankin, L Robson, A D Tasker, K W D Ledingham,T McCanny, R P Singhal, C Kosmidis, P Tzallas, A J Langley,P F Taday, E J DivallUltrafast laser time-of-flight mass analysis of laser-desorbedatoms and moleculesProc 10th International Symposium on Laser ionization andApplications Incorporating RIS, AIP Conf Proc 584 14-19(2001)
L Robson, A D Tasker, S M Hankin, K W D Ledingham,R P Singhal, X Fang, T McCanny, C Kosmidis, P Tzallas,A J Langley, P F Taday, E J DivallAnalysis of polycyclic aromatic hydrocarbons (PAHs) usingnanosecond laser desorption/femtosecond ionization laser massspectrometry (FLMS)Proc 10th International Symposium on Laser ionization andApplications Incorporating RIS, AIP Conf Proc 584 291-296(2001)
D J Spence, A Butler, S M HookerFirst demonstration of guiding of high-intensity laser pulses ina hydrogen-filled capillary discharge waveguideJ Phys B - At Mol Opt Phys 34 (21) 4103-4112 (2001)

Appendices – Publications
Central Laser Facility Annual Report 2001/2002 224
D J Spence, A Butler, S M HookerInvestigation of a novel hydrogen plasma waveguide forhigh-intensity laser pulsesProc Applications of High-Field and Short Wavelength SourcesIX, OSA Trends in Optics & Photonics 65 TuE21 (2001)
A D Tasker, L Robson, S M Hankin, K W D Ledingham,R P Singhal, X Fang, T McCanny, C Kosmidis, P Tzallas,A J Langley, P F Taday, E J DivallUltrafast laser analysis of nitro-PAHs using laserdesorption/femtosecond ionization mass spectrometryLaser and Particle Beams 19 (2) 205-208 (2001)
P Tzallas, C Kosmidis, J G Philis, K W D Ledingham,T McCanny, R P Singhal, S M Hankin, P F Taday, A J LangleyIonization/dissociation of thiazole and thiazolidine induced bystrong laser fieldsChem Phys Letts 343 (1-2) 91-98 (2001)
I D Williams, P McKenna, B Srigengan, I M G Johnston,W A Bryan, J H Sanderson, A El-Zein, T R J Goodworth,W R Newell, P F Taday, A J LangleyIntense laser field studies of positive ionsProc 16th International Conference on Application ofAccelerators in Research & Industry, AIP Conf Proc 576 44-47(2001)
IN PRESS AT END OF 2001/2002
J B Greenwood, I M G Johnston, P McKenna, I D Williams,T R J Goodworth, J H Sanderson, W A Bryan, A A A El-Zein,W R Newell, A J Langley, E J DivallSuppression of multiple ionization of atomic ions in intenseultrafast laser pulsesPhys Rev Letts 88 (23) 233001 (2002)
J H Sanderson, T R J Goodworth, A El-Zein, W A Bryan,W R Newell, A J Langley, P F TadayCoulombic and pre-Coulombic geometry evolution of carbonylsulfide in an intense femtosecond laser pulse, determined bymomentum imagingPhys Rev A 65 (4) 043403 part B (2002)
CONFERENCE PRESENTATIONS
221st American Chemical Society National Meeting,San Diego, USA (Apr 2001)
K W D Ledingham, A D Tasker, L Robson, S M Hankin,R P Singhal, P McKenna, X Fang, T McCanny, C Kosmidis,P Tzallas, A J Langley, P F Taday, E J DivallIntense laser irradiation of molecules
CLEO/Europe-EQEC Focus Meeting, Munich, Germany(Jun 2001)
K Osvay, G Kurdi, J Klebniczki, M Csatári, I N Ross,E J Divall, C J Hooker, A J LangleyNoncollinear optical paramteric amplification of femtosecondUV pulses
Workshop on 2nd Generation Laser & Plasma Accelerators,Presqu’ile de Giens, France (Jun 2001)
D J Spence, A Butler, S M HookerGuiding of high-intensity laser pulses in a hydrogen-filledcapillary discharge
D J Spence, S M HookerInvestigation of a hydrogen plasma waveguide
Ultrafast Optics 2001, Montebello, Canada (Jul 2001)
K Osvay, G Kurdi, J Klebniczki, M Csatári, I N Ross,E J Divall, C J Hooker, A J LangleyBroadband amplification of ultraviolet laser pulses
Applications of High Field and Short WavelengthSources IX, Palm Springs, USA (Oct 2001)
D J Spence, A Butler, S M HookerInvestigation of a novel hydrogen plasma waveguide for high-intensity laser pulses
12th Conference on Ultrafast Processes in Spectroscopy,Florence, Italy (Oct-Nov 2001)
K Osvay, G Kurdi, J Klebniczki, M Csatári, I N RossOptical parametric amplification of femtosecond laser pulses at400 nm
Science of Superstrong Laser Interactions, Hayama, Japan(Mar 2002)
K W D Ledingham, P McKenna, I Spencer, R P Singhal,T McCanny, E L Clark, K Krushelnick, M Zepf, F N Beg,M Tatarakis, M-S Wei, A Gopal, A E Dangor, P A Norreys,R J Clarke, R M Allott, I N RossLaser induced nuclear physics
15th Dutch Physical Society Symposium on Plasma Physicsand Radiation Technology, Lunteren, The Netherlands(Mar 2002)
S M Hooker, A Butler, A J Gonsalves, C M McKennaThe hydrogen-filled capillary discharge waveguide
29th Annual UK Plasma Physics Conference, Belfast, UK(Mar 2002)
C Ziener, P S Foster, E J Divall, C J Hooker,M H R Hutchinson, A J Langley, D NeelySpecular reflectivity of plasma mirrors as a function ofintensity, pulse duration and angle of incidence
Lasers for Science Facility ProgrammeJOURNAL PUBLICATIONS, BOOKS AND PUBLISHEDPROCEEDINGS
S Ameer-Beg, S M Ormson, R G Brown, P Matousek,M Towrie, E T J Nibbering, P Foggi, F V R NeuwahlUltrafast measurements of excited state intramolecular protontransfer (ESIPT) in room temperature solutions of3-hydroxyflavone and derivativesJ Phys Chem A 105 (15) 3709-3718 (2001)
S W Botchway, I Barba, K Brindle, A W ParkerDevelopment of a time correlated single photon countingmultiphoton laser scanning confocal microscope – studies inbiological fluorescence lifetime imaging9th European Conference on the Spectroscopy of BiologicalMolecules, Eds V Kopecky, K Ruszova, J Stepanek, vol 2, 158,ISBN 80-238-7356-3, Charles University, Prague (2001)
C G Coates, P Callaghan, J J McGarvey, J M Kelly, L Jacquet,A Kirsch-De MesmaekerSpectroscopic studies of structurally similar DNA-bindingruthenium (II) complexes containing the dipyridophenazineligandJ Molec Struct 598 (1) 15-25 (2001)
C G Coates, J Olofsson, M Coletti, J J McGarvey, B Onfelt,P Lincoln, B Norden, E Tuite, P Matousek, A W ParkerPicosecond time-resolved resonance Raman probing of thelight-switch states of [Ru(Phen)2dppz]2+
J Phys Chem B 105 (50) 12653-12664 (2001)
J P Connelly, S W Botchway, L Kunz, D Pattison, A W Parker,A J MacRobertTime-resolved fluorescence imaging of photosensitiserdistributions in mammalian cells using a picosecond laserline-scanning microscopeJ Photochem Photobiol A – Chem 142 (2-3) 169-175 (2001)

Appendices – Publications
225 Central Laser Facility Annual Report 2001/2002
N Everall, T Hahn, P Matousek, A W Parker, M TowriePicosecond time-resolved Raman spectroscopy of solids:capabilities and limitations for fluorescence rejection and theinfluence of diffuse reflectanceAppl Spectr 55 (12) 1701-1708 (2001)
W M Kwok, I Gould, C Ma, M Puranik, S Umapathy,P Matousek, A W Parker, D Phillips, W T Toner, M TowrieVibrational studies of ground state 4-dimethylaminobenzonitrile(DMABN) and its ring deuterated isotopomer DMABN-d4
Phys Chem Chem Phys 3 (12) 2424-2432 (2001)
W M Kwok, C Ma, A W Parker, D Phillips, M Towrie,P Matousek, X Zheng, D L PhillipsPicosecond time-resolved resonance Raman observation of theiso-CH2Cl-I and iso-CH2I-Cl photoproducts from the"photoisomerization" reactions of CH2ICl in the solution phaseJ Chem Phys 114 (17) 7536-7543 (2001)
W M Kwok, C Ma, D Phillips, A W Parker, M Towrie,P Matousek, D L PhillipsPicosecond time-resolved resonance Raman observation ofiso-CH2Br-I following A-band photodissociation of CH2BrI inthe solution phaseChem Phys Letts 341 (3-4) 292-298 (2001)
C Ma, W M Kwok, P Matousek, A W Parker, D Phillips,W T Toner, M TowrieResonance Raman study of ring deuterated4-dimethylaminobenzonitrile (DMABN-d4): the ground, ICTand triplet statesJ Photochem Photobiol A – Chem 142 (2-3) 177-185 (2001)
C Ma, W M Kwok, P Matousek, A W Parker, D Phillips,W T Toner, M TowrieTime-resolved study of the triplet state of4-dimethylaminobenzonitrile (DMABN)J Phys Chem A 105 (19) 4648-4652 (2001)
A Malnasi-Csizmadia, M Kovacs, R J Woolley, S W Botchway,C R BagshawThe dynamics of the relay loop tryptophan residue in theDictyostelium myosin motor domain and the origin ofspectroscopic signalsJ Biol Chem 276 (22) 19483-19490 (2001)
P O’Neill, A W Parker, M A Plumb, L D A SiebbelesGuanine modification following ionisation of DNA occurspredominantly via intra- not interstrand charge migration: Anexperimental and theoretical studyJ Phys Chem B 105 (22) 5283-5290 (2001)
S Schneider, J Kurzawa, A Stockmann, R Engl, J Daub,P Matousek, M TowriePhotoinduced electron transfer in phenothiazine and pyrenebased dyades studied by picosecond time-gated RamanspectroscopyChem Phys Letts 348 (3-4) 277-284 (2001)
L C Snoek, R T Kroemer, M R Hockridge, J P SimonsConformational landscapes of aromatic amino acids in the gasphase: infrared and ultraviolet ion dip spectroscopy oftryptophanPhys Chem Chem Phys 3 (10) 1819-1826 (2001)
A Vlcek, I R Farrell, D J Liard, P Matousek, M Towrie,A W Parker, D C Grills, M W GeorgeEarly photochemical dynamics of organometallic compoundsstudied by ultrafast time-resolved spectroscopic techniquesJ Chem Soc Dalton Trans 2002 (5) 701-712 (2002)
J A Weinstein, D C Grills, M Towrie, P Matousek, A W Parker,M W GeorgePicosecond time-resolved infrared spectroscopic investigationof excited state dynamics in a PtII diimine chromophoreChem Comms 2002 (4) 382-383 (2002)
S M A Wright, I R Sims, I W M SmithVibrational relaxation of highly excited NCNO in collisionswith He, Ar and N2
Phys Chem Chem Phys 3 (12) 2203-2208 (2001)
PUBLISHED DURING 1999/2000
E A Mastio, C B Thomas, W M Cranton, E FogarassyThe effects of multiple KrF laser irradiations on theelectroluminescence and photoluminescence of rf-sputteredZnS:Mn-based electroluminescent thin film devicesAppl Surf Sci 157 (1-2) 61-66 (2000)
C J Randall, C Murray, K G McKendrickState-specific collisional coupling of the CH A 2∆ and B 2Σ-
statesPhys Chem Chem Phys 2 (4) 461-472 (2000)
PUBLISHED DURING 2000/2001
R H Bisby, A W ParkerStructure of the radical from one-electron oxidation of4-hydroxycinnamateFree Radical Res 35 (1) 85-91 (2001)
D Chastaing, S D Le Picard, I R Sims, I W M Smith,W D Geppert, C Naulin, M CostesRate coefficients and cross-sections for the reactions of C(3PJ)atoms with methylacetylene and alleneChem Phys Letts 331 (2-4) 170-176 (2000)
W D Geppert, D Reignier, T Stoecklin, C Naulin, M Costes,D Chastaing, S D Le Picard, I R Sims, I W M SmithComparison of the cross-sections and thermal rate constants forthe reactions of C(3PJ) atoms with O2 and NOPhys Chem Chem Phys 2 (13) 2873-2882 (2000)
D C Koutsogeorgis, E A Mastio, W M Cranton, C B ThomasPulsed KrF laser annealing of ZnS:Mn laterally emitting thinfilm electroluminescent displaysThin Solid Films 383 (1-2) 31-33 (2001)
M Mons, I Dimicoli, B Tardivel, F Puizzi, E G Robertson,J P SimonsEnergetics of the gas phase hydrates of trans-formanilide: amicroscopic approach to the hydration sites of the peptide bondJ Phys Chem A 105 (6) 969-973 (2001)
E G Robertson, M R Hockridge, P D Jelfs, J P SimonsIR-UV ion-depletion and fluorescence spectroscopy of2-phenylacetamide clusters: hydration of a primary amidePhys Chem Chem Phys 3 (5) 786-795 (2001)
E G Robertson, J P SimonsGetting into shape: conformational and supramolecularlandscapes in small biomolecules and their hydrated clustersPhys Chem Chem Phys 3 (1) 1-18 (2000)
IN PRESS AT END OF 2001/2002
J Dyer, D C Grills, P Matousek, A W Parker, M Towrie,J A Weinstein, M W GeorgeRevealing the photophysics offac-[(dppz-12-NO2)Re(CO)3(4-Me2Npy)]+: a picosecondtime-resolved IR studyChem Comms 2002 (8) 872-873 (2002)
C Ma, W M Kwok, P Matousek, A W Parker, D Phillips,W T Toner, M TowrieExcited states of 4-aminobenzonitrile (ABN) and4-dimethylaminobenzonitrile (DMABN): time-resolvedresonance Raman, transient absorption, fluorescence and abinitio calculationsJ Phys Chem A 106 (14) 3294-3305 (2002)

Appendices – Publications
Central Laser Facility Annual Report 2001/2002 226
P Mojzes, P Praus, V Baumruk, P-Y Turpin, P Matousek,M TowrieStructural features of two distinct molecular complexes ofcopper(II) cationic porphyrin and deoxyribonucleotidesBiopolymers 67 (4-5) 278-281 (2002)
S J Pestehe, G J Tallents, I C E Turcu, Y Abou-Ali, G Hirst,M Powers, W ShaikhEfficiency of 1.5 - 4.5 keV x-ray production from 2 ps durationKrF laser pulses incident onto solid targetsJ Phys D 35 (11) 1117-1122 (2002)
F W Vergeer, F Hartl, P Matousek, D J Stufkens, M TowrieFirst direct observation of a CO-bridged primary photoproductof [Ru3(CO)12] by picosecond time-resolved IR spectroscopyChem Comms 2002 (11) 1220-1221 (2002)
CONFERENCE PRESENTATIONS
9th European Conference on the Spectroscopy of BiologicalMolecules, Prague, Czech Republic (Sept 2001)
S W Botchway, I Barba, K Brindle, A W ParkerDevelopment of a time correlated single photon countingmultiphoton laser scanning confocal microscope – studies inbiological fluorescence lifetime imaging
Laser Science and DevelopmentJOURNAL PUBLICATIONS, BOOKS AND PUBLISHEDPROCEEDINGS
J Collier, C Hernandez-Gomez, R Allott, C Danson, A HallA single-shot third-order autocorrelator for pulse contrast andpulse shape measurementsLaser & Particle Beams 19 (2) 231-235 (2001)
M H R Hutchinson, D Neely, B E WybornVulcan Upgrade: a petawatt laser facility for experiments at1021 W cm-2
Proc SPIE 4424 63-69 (2001)
P Matousek, M Towrie, C Ma, W M Kwok, D Phillips,W T Toner, A W ParkerFluorescence suppression in resonance Raman spectroscopyusing a high-performance picosecond Kerr gateJ Raman Spectr 32 (12) 983-988 (2001)
K Osvay, G Kurdi, J Klebniczki, M Csatári, I N RossDemonstration of high gain amplification of femtosecondultraviolet laser pulsesAppl Phys Letts 80 (10) 1704-1706 (2002)
I N Ross, C J Hooker, P DombiEfficient generation of large diffraction gratings with a gratinginterferometerAppl Opt 40 (34) 6153-6156 (2001)
IN PRESS AT END OF 2001/2002
P Matousek, M Towrie, C Ma, W M Kwok, D Phillips,W T Toner, A W ParkerFluorescence background suppression in Raman spectroscopyusing combined Kerr gated and shifted excitation Ramandifference techniquesJ Raman Spectr 33 (4) 238-242 (2002)
CONFERENCE PRESENTATIONS
10th International Conference on Time-ResolvedVibrational Spectroscopy, Okazaki, Japan (May 2001)
P Matousek, M Towrie, A W Parker, W M Kwok, C Ma,D Phillips, W T TonerFluorescence suppression in picosecond TR3 spectroscopy
OECD Global Science Forum Workshop on CompactHigh-Intensity Short-Pulse Lasers, Kyoto, Japan(May 2001)
M H R HutchinsonEvolution toward “user facility” role
M H R HutchinsonHigh intensity laser programme at the Rutherford AppletonLaboratory
I RossNew approach toward ultrahigh power generation
21st ICFA Beam Dynamics Workshop, Stony Brook, USA(Jun 2001)
I N RossA laser system for the CLIC drive beam photo-injector option
International Adaptive Optics Workshop, Albuquerque,USA (July 2001)
J Collier, C Hooker, S Hawkes, I Ross, C B Edwards,C Reason, C N Danson, C Hernandez-Gomez, C Haefner,P NeumayerAdaptive correction of an ultra-high intensity laser system
QEP15, Glasgow, UK (Sept 2001)
S Hawkes, J Collier, C Hooker, C Danson, C Edwards,C Hernandez-Gomez, C Haefner, C Reason, I RossAdaptive optics development for ultra high intensity lasers
C Hernandez-Gomez, C Aldis, R Allott, P Brummitt, R Clarke,J Collier, C N Danson, C B Edwards, A Frackiewicz, J Govans,S Hancock, M Harman, P Hatton, S Hawkes, P Holligan,C Hooker, M H R Hutchinson, A Jackson, A Kidd, T Knott,W Lester, D Neely, M Notley, D Pepler, M Pitts, C Reason,D Rodkiss, I Ross, R Wellstood, G Wiggins, T Winstone,R Wyatt, B Wyborn, C ZeinerVulcan: a petawatt laser facility for experiments at 1021 W/cm2
2nd International Conference on Fusion Sciences andApplications, Kyoto, Japan (Sept 2001)
C N Danson, C B Edwards, M H R Hutchinson, D Neely,B WybornThe Vulcan Petawatt interaction facility
AILU Technical Meeting, RAL, UK (Sept 2001)
C N DansonIntroduction to the Vulcan Petawatt
Diffractive Optics 2001 – EOS Topical Meeting 30,Budapest, Hungary (Oct 2001)
D A Pepler, P M Godfrey, C N DansonAxial line-focus with a binary-phase Fresnel zone plate
Raman Spectroscopy in Archaeology and Art History,London, UK (Nov 2001)
P Matousek, M Towrie, A W ParkerFluorescence suppression in resonance Raman spectroscopy
The Pittsburgh Conference – PITTCONN 2002,New Orleans, USA (Mar 2002)
P Matousek, M Towrie, A W ParkerFluorescence suppression in resonance Raman spectroscopy byoptical Kerr gating
29th Annual UK Plasma Physics Conference, Belfast, UK(Mar 2002)C N Danson, C B Edwards, M H R Hutchinson, D Neely,B WybornThe Vulcan petawatt interaction facility

Appendices - Panel Membership and CLF Structure
227 Central Laser Facility Annual Report 2001/2002
PANEL MEMBERSHIP ANDCLF STRUCTURE

Appendices - Panel Membership and CLF Structure
Central Laser Facility Annual Report 2001/2002 228
PANEL MEMBERSHIP
HIGH POWER LASER DIRECT ACCESS PANEL 2001/02
Professor G J Pert (Chairman)Department of PhysicsUniversity of York
Professor W GrahamPlasma & Laser Interaction PhysicsQueens University, Belfast
Dr J-C J GauthierLULIParis, France
Mr D A Pepler (Secretary)Rutherford Appleton Laboratory
Mr P C ThompsonAWEAldermaston
Dr P A NorreysRutherford Appleton Laboratory
Professor M G HainesPlasma Physics GroupImperial College
Research Council Representative:Mrs C Exton (until November 2001)Ms J Nicholson (from November 2001)EPSRC
VULCAN SCHEDULING ADVISORY PANEL 2001/02
Professor D D Burgess (Chairman)Imperial College, London
Professor C L S LewisDepartment of Pure and Applied PhysicsQueen’s University of Belfast
Professor J WarkOxford Universsity
Dr K Krushelnick deputising for Professor M G HainesPlasma Physics GroupImperial College
Mr C N Danson (Secretary)Rutherford Appleton Laboratory
Mr P C ThompsonAWEAldermaston
Dr P A NorreysRutherford Appleton Laboratory
Professor G PertUniversity of York
Research Council Representative:Ms J NicholsonEPSRC
LASERS for SCIENCE FACILITY PANEL 2001/02
Dr R Bisby (Chairman)Department of Biological SciencesUniversity of Salford
Professor J A CairnsDepartment of Electronic Engineering & PhysicsUniversity of Dundee
Dr R DevonshireDepartment of ChemistrySheffield University
Dr I P Clark (Secretary) (until October 2001)Ms S Tavender (Secretary) (from October 2001)Rutherford Appleton Laboratory
Dr K G McKendrickDepartment of ChemistryHerriot-Watt University
Dr W R NewellDepartment of Physics & AstronomyUniversity College London
Research Council Representatives:Dr A BramleyEPSRCMrs C Exton (until October 2001)Dr A McCaig (from October 2001Ms J Nicholson (from October 2001)EPSRCDr C ThompsonBBSRC

Appendices - Panel Membership and CLF Structure
229 Central Laser Facility Annual Report 2001/2002
CLF EURO EXPERIMENTS PANEL 2001/02
Professor C L S Lewis (Chairman)Department of Pure and Applied PhysicsQueen’s University of Belfast
Professor C FotakisInstitute of Electronic Structure and LaserFORTH, Greece
Professor D PhillipsDepartment of ChemistryImperial College
Dr S W Botchway (Secretary)Rutherford Appleton Laboratory
Mr C N Danson (Contract Manager)Rutherford Appleton Laboratory
Dr G MatthieussentLaboratoire Physique Gaz et Plasmas, Universite Paris XI -CNRS, France
Professor J Meyer-ter-VehnMax-Planck-Institut für QuantenoptikGarching, Germany
Dr Karel RohlenaInstitut of PhysicsPrague
Professor J KossanyiCNRS – Laboratoire des Materiaux MoléculairesThiais, France

Appendices - Panel Membership and CLF Structure
Central Laser Facility Annual Report 2001/2002 230
CENTRAL LASER FACILITY STRUCTURE 2001/02
DirectorProf Henry Hutchinson
Associate Director – High Power LasersDr Chris Edwards
Astra Finance & Administration
Prof Henry [email protected]
Mrs Alison [email protected]
Lasers for Science Facility Engineering and Technology
Dr Tony [email protected]
Mr Brian [email protected]
Target Areas Laser Research & Development
Dr David [email protected]
Dr Ian [email protected]
Vulcan Physics
Mr Colin [email protected]
Dr Peter [email protected]

Appendices - Author Index
Central Laser Facility Annual Report 2001/2002231
Author Index
Aarons R J, 130Abou-Ali Y, 47Aggarwal K M, 74Al’miev I R, 43Aldis C, 184Alexander A J, 124Allott R M, 19, 22, 82Amiranoff F, 4, 10Andersen C, 4, 10Angulo J, 45Ao T, 10Ashraf A, 130Ausfelder F, 121Barr H C, 60Batani D 4, 10Baton S D, 4, 10Beeby A, 130Beg F N, 7, 13, 16, 19, 22, 29, 32, 41Bernardinello A, 4Berry G J, 145Bijkerk F, 142Bisby R H, 135Blau W J, 111Bodey A J, 132, 142, 145, 200Boland T, 185, 212Borghesi M, 26Botchway S W, 130, 132, 135, 137, 139, 198Brady C, 106Braeur K, 181Brehm G, 100, 103Browne W R, 106Brummitt P A, 82, 165, 168Burton-Pye B P, 130Busby M, 98Butz P, 115, 117Cairns J A, 145Campbell D H, 26Chambers D M, 43Chipman J K, 132Chong K S L, 150Clark E L, 7, 13, 16, 19, 22, 29, 32, 37, 41, 79,83Clark I P, 108, 110, 135Clarke R J, 4, 7, 10, 13, 16, 19, 22, 29, 32, 34,37, 41, 47, 79, 82, 83, 86, 177Coates C G, 106Collier J L, 55, 171, 172, 173, 175, 179, 181,201Cornish C, 207Costello J T, 86Courtois C, 55Cowan T E, 4, 10Cranton W M, 158Creely C M, 111Csatari M, 175, 202Dangor A E, 7, 13, 16, 19, 22, 32, 34, 37, 41Danson C, 171, 185, 212Davidson M R, 145Davies A G, 154Davies J A, 126Davies J R, 83de Bruijn R, 142Dendy R O, 55
Devonshire R, 161Dickinson F, 110Divall E J, 77, 79, 82, 83, 86, 187, 188, 190,192Dominey M, 170Dowd A, 154Dundas D, 72Dunne P, 86Edwards R D, 16, 22Edwards M, 47Edwards G O, 132Edwards C B, 2, 164, 171, 177, 181Elias B, 111Evans R G, 41, 55, 66, 69, 71Faulkner S, 130Faure J, 37Feeney M M, 111Feng L, 62Fitzgerald A G, 145Foster P S, 79, 82, 83, 86, 190, 192Frackiewicz A J, 165, 184Freeman R R, 4Fritzler S, 34Frost M J, 128Galy J, 29George M W, 90, 94Goodworth T R J, 77Gopal A, 7, 13, 16, 32, 41Gordon D, 37Gouveia A, 43Govans J A C, 165, 207Graf T, 152Grattan K T V, 147Gray B J, 165Greenwood J B, 77Gremillet L, 4, 10Grills D C, 90, 94Grundy R A D, 55, 58Guilbad O, 47Habara H, 207, 208Haefner C, 181Hall T A, 4, 10Hancock S, 165, 179Harman M, 82Hartl F, 96Hatton P E, 82, 165, 177Hawkes S, 16, 171, 179, 181, 183Hawreliak J, 43Heathcote R, 55Helander P, 55Henderson D A, 121Hernandez-Gomez C, 172, 173, 175Hickson K M, 119Hill J M, 4, 10Hill L J, 60Hirsch J S, 86Hirst G J, 132, 139, 142, 145, 152, 200Holligan P, 165, 169, 170, 187Hooker C J, 77, 79, 82, 83, 86, 181, 188, 190,192, 201Hubert S, 50Hudson S, 111Hutchinson M H R, 1, 190

Appendices - Author Index
Central Laser Facility Annual Report 2001/2002 232
Jackson A R, 165, 207Jina O S, 94Jinno M, 161Johnson A, 55Johnston I M G, 77Johnston M B, 154Jones G R, 137Jones S V, 137Joshi C, 37Keenan R, 45, 47, 50, 53Keenan F P, 74Kelly J M, 111Kelso H, 121Kennedy E T, 86Key M H, 4, 10Khattak F Y, 45Kidd A, 171, 212Kilbane D, 86King J A, 4, 10Kirsch-De Mesmaeker A, 111Klisnick A, 47Koenig M 4, 10Kooijman G, 142Koshelev K, 142Koutsogeorgis D, 158Kroemer R T, 115, 117Krushelnick K, 7, 13, 16, 19, 22, 29, 32, 34,37, 41, 79, 83Kwok W M, 90, 92Lancaster K L, 7, 16, 29, 32, 207, 208Langley A J, 77, 79, 82, 83, 86, 188, 190, 192,214Ledingham K W D, 7, 16, 19, 22, 29, 32, 79,82, 83Leggett G J, 150Lester W J, 165Lewis C L S, 45, 47, 50, 53, 86Lewis J D, 108Leypold C, 100, 103Liang Tianjiao, 43Liew S, 158Linfield E H, 154Losinski D, 152Ma C, 90, 92Mackinnon A J, 4, 10Macleod N A, 115, 117Magill J, 29Malka V, 34, 37Mandal J, 147Mant G, 207Marjoribanks R S, 43Marle C, 34Martin-Fernandez M L, 137Martinolli E, 4, 10Matousek P, 90, 92, 94, 96, 100, 103, 106,111, 126, 195McCann J F, 72McCanny T, 7, 16, 19, 22, 29, 32, 79, 82, 83McClements K G, 55McEvoy A M, 45, 53McFaul C D, 152McGarvey J J, 106McKendrick K G, 121
McKenna P, 7, 16, 19, 22, 29, 32, 79, 82, 83Meldrum R A, 132, 139Michette A G, 152Miljus Z A, 165Modena A, 37Moore J, 69Moore J N, 108Mosnier J-P, 86Murphy A, 86Najmudin Z, 34, 37Nassuna B, 158Neely D, 4, 10, 41, 45, 47, 50, 53, 79, 82, 83,86, 177, 190, 192Neogi A, 86Neville D R, 82, 165Newell W R, 77Ng A, 10Noble C J, 64Norreys P A, 7, 13, 16, 19, 22, 32, 41, 55, 79,83, 207, 208Norrington P H, 74Notley M, 45, 47, 50, 53, 55Notta J, 130O’Sullivan G, 86Pal S, 147Parker A W, 90, 92, 94, 106, 111, 130, 135,195, 198, 215Pepler D A, 165, 171, 184, 185Perelli E, 4Perelli-Cippo E, 10Pert G J, 74Pfauntsch S J, 152Phillips D, 90, 92Pinto P A, 43Pitts M R, 165, 184Plummer M, 64Popescu H, 4Powell A K, 152Ranson R, 158Reason C J, 165, 184Reid K L, 126Reiher M, 100Renner O, 43Riley D, 45Rodgers J K, 165Rodkiss D A, 165, 168, 177Rogers K, 170Romagnani L, 26Ronayne K L, 106Ros D, 47Rose S J, 74Ross I N, 19, 202, 206Ryder A G, 165Sadowski C M, 119Santos J J, 4, 10Schenkel R, 29Schiavi A, 26Schmitt M, 100, 103Schneider S, 100, 103Scianitti F, 4, 10Shaikh W, 132, 142, 145, 152, 200Sharpe C R J, 128Simons J P, 115, 117

Appendices - Author Index
Central Laser Facility Annual Report 2001/2002233
Sinclair M A, 22Singhal R P, 16, 19, 22, 29, 79, 82, 83Smith I W M, 119Smith J, 172, 175Snaith J S, 130Snavely R A, 4, 10Snoek L C, 115, 117Sondhauss P, 43Spencer I, 7, 16, 19, 22, 29, 32, 79, 82, 83Spindloe C, 201Stanley K, 94Stebbings S L, 77Stephens R B, 4, 10Strange T, 207Stufkens D J, 96Sun X-Z, 94Sun T, 147Sun S, 150Talbot F O, 115, 117Tallents G J, 47Tatarakis M, 7, 13, 19, 22, 32, 37, 41Tavender S M, 215Taylor K T, 72Thomas C B, 158Thomson J, 145Tobin D, 135Tobin M J, 137Toner W T, 90, 92Topley S, 130, 132, 139Topping S J, 45, 47, 50, 53, 86Towrie M, 90, 92, 94, 96, 100, 103, 106, 111,126, 195, 198, 215Tuite E, 110van der Hart H W, 62Vergeer F W, 96Jr A, 98Vos J G, 106Wagner U, 13, 41Walton B, 34Ward A D, 198Wark J S, 43Watts I, 41Wei M S, 7, 13, 16, 29, 32, 34, 41Wellstood R, 184Wharton C W, 132, 139Wiggins G N, 165, 170Willi O, 26Williams I D, 77Winstone T B, 171, 185Woolsey N C, 55, 58Wright P N M, 177Wyatt R W W, 165, 169, 170, 171, 184Wyborn B E, 165, 177Zepf M, 7, 13, 16, 19, 22, 32, 41Ziener C, 79, 177, 190, 192