Rubber bush - Distribution, invasiveness, biology and control
125
Page 1 of 125 Project code: B.NBP.0622 Prepared by: Shane D Campbell 1 , Michael J Lawes 2 , Enock O Menge 2 , Chris C O’Donnell 1,3 and Meg J Humphrys 4 Department of Agriculture and Fisheries 1 , Charles Darwin University 2 , University of Queensland 3 , and the Northern Territory Department of Land Resource Management 4 . Date published: 15 May 2015 ISBN: PUBLISHED BY Meat and Livestock Australia Limited Locked Bag 991 NORTH SYDNEY NSW 2059 Distribution, invasiveness, biology and control of rubber bush (Calotropis procera) in northern Australia Meat & Livestock Australia acknowledges the matching funds provided by the Australian Government to support the research and development detailed in this publication. This publication is published by Meat & Livestock Australia Limited ABN 39 081 678 364 (MLA). Care is taken to ensure the accuracy of the information contained in this publication. However MLA cannot accept responsibility for the accuracy or completeness of the information or opinions contained in the publication. You should make your own enquiries before making decisions concerning your interests. Reproduction in whole or in part of this publication is prohibited without prior written consent of MLA. final report
-
Upload
khangminh22 -
Category
Documents
-
view
1 -
download
0
Transcript of Rubber bush - Distribution, invasiveness, biology and control

Page 1 of 125
Project code: B.NBP.0622
Prepared by: Shane D Campbell1, Michael J Lawes2, Enock O Menge2, Chris C O’Donnell1,3 and Meg J Humphrys4
Department of Agriculture and Fisheries1, Charles Darwin University2, University of Queensland3, and the Northern Territory Department of Land Resource Management4.
Date published: 15 May 2015
ISBN:
PUBLISHED BY
Meat and Livestock Australia Limited
Locked Bag 991
NORTH SYDNEY NSW 2059
Distribution, invasiveness, biology and
control of rubber bush (Calotropis
procera) in northern Australia
Meat & Livestock Australia acknowledges the matching funds provided by the Australian
Government to support the research and development detailed in this publication.
This publication is published by Meat & Livestock Australia Limited ABN 39 081 678 364 (MLA). Care is taken to ensure the accuracy of the information contained in this publication. However MLA cannot accept responsibility for the accuracy or completeness of the information or opinions contained in the publication. You should make your own enquiries before making decisions concerning your interests. Reproduction in whole or in part of this publication is prohibited without prior written consent of MLA.
final report

B.NBP.0622 - Distribution, Invasiveness, Biology and Control or Rubber Bush in Northern Australia
Page 2 of 125
Abstract
We investigated the weed risk posed by rubber bush (Calotropis procera) on rangelands in
northern Australia. Rubber bush establishes most prolifically in disturbed environments
where there is reduced plant competition. Mature plants have remarkable survivability and
seed profusely. Mating (solid pollinia transfer) relies on specific insect (Hymenoptera)
pollinators during warm months (October-February). Fruit production is aided by self-
compatibility, peaking in medium-density (250-500 individuals/ha) stands. Low but similar
fruit production per plant occurs at low stand densities, but in large dense stands pollinator
limitation causes low fruit set per plant. Each fruit contains ~430 wind-dispersed seeds.
Some seeds (~7.5%) are blown >1 km making range expansion of 1 km every 2-3 years
possible. Seeds have high germinability (85-100%), no dormancy, and germination success
is temperature and moisture dependent. Seeds exposed to high soil surface temperatures
rarely germinate, while buried seeds germinate without fail. Overall, rubber bush exerts
considerable propagule pressure resulting in significant invasive potential. Distribution
modelling shows that currently it has not saturated its potential range. The milkweed bug
Oncopeltus fasciatus affects the fruit, and natural dieback events also reduce populations in
some areas. Several herbicides can be used effectively to control rubber bush using a range
of techniques. Mechanical methods require that the root system is severed 10-20 cm below
ground, and that follow-up control is undertaken to treat new plants favoured by the
disturbance.

B.NBP.0622 - Distribution, Invasiveness, Biology and Control or Rubber Bush in Northern Australia
Page 3 of 125
Executive Summary Several prioritisation processes have listed rubber bush (Calotropis procera) as an important
economic and environmental weed in northern Australia’s rangelands. However, there has
been conjecture regarding whether rubber bush spread is a symptom of poor land condition,
and whether dense infestations can occur on well-managed lands. We addressed these
questions, as well as how best to control it, in this MLA funded collaborative research project
(July 2010-May 2015).
Under normal field conditions, post-germination and sapling mortality of rubber bush is
generally high and if there are high plant densities, reproductive maturity is delayed. Once
mature, plants have remarkable survivability and are capable of profuse seed production.
The mating system requires specific insect pollinators (Hymenoptera) and is plant density-
dependent. Plants tend to flower between 4 to 11 months and are capable of producing pods
after 12 months.
The complex flower morphology forces the withdrawal of solid pollinia by the pollinator,
limiting pollination to larger wasp and bee species. In some areas (e.g. the Northern
Territory), many or all of these insects may be absent during the colder months, which
means that most fruit set occurs in hotter months, even though rubber bush flowers year-
round. Fruit production per plant (fecundity) peaks at intermediate population densities
(250-500 plants/ha). Generally, low pollinator pressure limits rubber bush fruit production at
high population densities and, to a lesser extent, at low population densities too, because
there is low pollen transfer efficiency between widely scattered plants.
Rubber bush seeds are wind dispersed. Some seeds (~7.5%) are blown >1 km so range
expansion of 1 km every 2-3 years is possible. With the exception of one insect species
(Oncopeltus fasciatus) that is a pre-dispersal seed predator, there are no post-dispersal
seed predators. The seeds are highly germinable resulting in a short lived seed bank
(<2 years) if favourable temperature and rainfall conditions occur. Therefore, land managers
can effectively control rubber bush patches in a 2-3 year timeframe by targeting mature
individuals first, prioritising the eradication of small isolated populations and mature
singletons wherever they occur, and following up with seedling control. Where control of all
mature plants cannot be achieved in one year, thinning plants in the first year so they are
below intermediate densities as much as possible, will exploit the density-dependent
reproduction of the plant, thus reducing pod production and replenishment of soil seed
banks.
Rubber bush is not overly competitive in intact rangelands and establishes mostly in
disturbed environments where plant competition is reduced. In exclosure experiments, seeds
germinated mainly on disturbed ground after being buried. Treatments that removed grass
cover and turned over the soil surface displayed the best germination success (10-20%).
When rubber bush and barley Mitchell grass (Astrebla pectinata) were grown together in
competition trials, barley Mitchell grass suppressed the shoot and root mass of rubber bush,
while rubber bush reduced the shoot mass of the grass species. Thus, grazing should be
managed to maintain a healthy pasture to supress the establishment and growth of rubber
bush. Otherwise, dense stands capable of reducing the herbage yield of grasses are more
likely to establish.

B.NBP.0622 - Distribution, Invasiveness, Biology and Control or Rubber Bush in Northern Australia
Page 4 of 125
Although rubber bush has a foothold throughout northern Australia, distribution modelling
shows that currently it has not saturated its potential range, with large areas still under
threat. Mean temperature, wind speed, beef density, distance to roads, mean rainfall and, to
a lesser extent, vegetation type, were the most important factors influencing the distribution
of rubber bush. Under climate change, the future potential distribution of rubber bush will
extend into the southern and eastern parts of the Northern Territory, border regions of
Western Australia, and western Queensland. Contraction of suitable conditions in the north-
western region of the Northern Territory is likely. Overall, the future climate scenario predicts
there will be more suitable areas across northern Australia for rubber bush. This highlights
the need to manage this species as an invasive weed.
Several new herbicide options for rubber bush control have been identified. Foliar spraying
using two chemicals (2,4-D amine and imazapyr/glyphosate) gave satisfactory mortality, but
efficacy was best on smaller plants (≤1.5 m in height). A range of options for treating low
densities or small patches were also found, including methods that can be incorporated into
routine activities (such as checking bores). They include: the use of triclopyr/picloram
(Access™) applied in a diesel mixture using basal bark techniques; cut stumping using neat
glyphosate or a picloram based gel on small-medium sized plants; and ground applications
of the residual herbicides hexazinone and tebuthiuron. For treatment of large dense
infestations, aerial applications of tebuthiuron were found to be highly effective, but must
comply with vegetation management laws of respective states and territories.
In terms of mechanical control, high mortality is achievable provided plant stems are severed
10–20 cm below ground. If not, a large proportion of stems reshoot vigorously from the root
collar. Large-scale seedling recruitment should be expected after any mechanical treatment,
necessitating the need for follow-up control over at least two years to avoid re-infestation of
sites. Natural large-scale dieback was also observed at several sites in Queensland and
more recently in the Northern Territory. While there is a historical precedent for diebacks of
rubber bush associated with long runs of drier than usual years in the Victoria River District,
in this project a leaf spot disease (Passalora calotropidis) has been implicated. Further
research is recommended to ascertain the exact cause or synergy of causes (e.g. low
rainfall may promote leaf spot), which resulted in a 96% decline since December 2012 in a
population in the Gulf of Carpentaria Region.
Overall, rubber bush has the potential to be a medium risk invasive species in northern
Australia. Like most weed species, the life history of rubber bush is adapted to efficient seed
dispersal and early germination of seed, but it cannot easily invade intact pastures and
habitat. Consequently, rubber bush favours disturbed sites and its invasive potential is, in
large, part due to land management practices that cause disturbance to intact habitat
(roadsides, stock yards, around bores). Seed and pollination biology and wind dispersal of
seed combine to ensure that reproduction is density-dependent. This density dependence
should be exploited when controlling rubber bush, by destroying mature plants wherever they
occur, by repeated thinning of established stands to low density stands. These can be
managed more easily and removed within a two year period. The removal of isolated
singletons is essential to slow rates of invasion across the landscape. Control measures
should be monitored over at least a 2-3 year period. Rubber bush has not spread to the full
extent of its potential current range, and climate change scenarios suggest that its range will
expand in the future. Thus, controlling rubber bush now is encouraged to avoid future spread
and loss of pastoral productivity.

B.NBP.0622 - Distribution, Invasiveness, Biology and Control or Rubber Bush in Northern Australia
Page 5 of 125
Table of Contents
1 Background .................................................................................................................. 9
2 Projective Objectives ................................................................................................. 10
3 Ecology and Invasiveness ......................................................................................... 10
3.1 Reproduction .............................................................................................................. 11
3.1.1 Methodology ................................................................................................ 11
3.1.1.1 Flower morphology ...................................................................................... 11
3.1.1.2 Mating system and pollination ecology ....................................................... 11
3.1.1.3 Breeding system .......................................................................................... 12
3.1.1.4 Flowering and fruiting phenology ................................................................ 12
3.1.2 Results ......................................................................................................... 13
3.1.2.1 Flower morphology ...................................................................................... 13
3.1.2.2 Mating system and pollination ecology ....................................................... 15
3.1.2.3 Breeding system .......................................................................................... 17
3.1.2.4 Flowering and fruiting phenology ................................................................ 17
3.2 Seed longevity ........................................................................................................... 20
3.2.1 Methodology ................................................................................................ 20
3.2.2 Results ......................................................................................................... 21
3.3 Seed biology and fruit production .............................................................................. 23
3.3.1 Methodology ................................................................................................ 23
3.3.2 Results ......................................................................................................... 24
3.4 Seed Dispersal .......................................................................................................... 30
3.4.1 Methodology ................................................................................................ 30
3.4.1.1 Dispersal modes .......................................................................................... 30
3.4.1.2 Dispersal kernels ......................................................................................... 30
3.4.2 Results ......................................................................................................... 30
3.4.2.1 Dispersal modes .......................................................................................... 30
3.4.2.2 Dispersal kernels ......................................................................................... 31
3.5 Competition and invasiveness ................................................................................... 32
3.5.1 Methodology ................................................................................................ 32
3.5.1.1 Exclosure experiment .................................................................................. 32
3.5.1.2 Competition experiment .............................................................................. 32
3.5.2 Results ......................................................................................................... 33
3.5.2.1 Exclosure experiment .................................................................................. 33

B.NBP.0622 - Distribution, Invasiveness, Biology and Control or Rubber Bush in Northern Australia
Page 6 of 125
3.5.2.2 Competition experiment .............................................................................. 33
3.6 Distribution and rate of spread .................................................................................. 34
3.6.1 Methodology ................................................................................................ 34
3.6.2 Results ......................................................................................................... 35
3.7 Discussion .................................................................................................................. 39
3.7.1 Reproduction ............................................................................................... 40
3.7.2 Seed dispersal and biology ......................................................................... 41
3.7.3 Competitiveness and invasiveness ............................................................. 43
3.7.4 Distribution and rate of spread .................................................................... 44
3.7.5 Controlling rubber bush ............................................................................... 45
3.8 Weed risk assessment of rubber bush ...................................................................... 47
4 Control........................................................................................................................ 48
4.1 Site Details ................................................................................................................. 48
4.2 Control treatments trialled ......................................................................................... 49
4.3 Statistical analyses .................................................................................................... 51
4.4 Foliar and basal bark herbicides ............................................................................... 52
4.4.1 Methodology ................................................................................................ 52
4.4.1.1 Preliminary foliar screening trial .................................................................. 52
4.4.1.2 Rate refinement and seasonality foliar trial and comparison of two basal
bark techniques ........................................................................................... 54
4.4.1.3 Effect of water type and temperature on efficacy of foliar applications of
metsulfuron-methyl ...................................................................................... 56
4.4.2 Results ......................................................................................................... 57
4.4.2.1 Preliminary foliar screening trial .................................................................. 57
4.4.2.2 Rate refinement and seasonality trial .......................................................... 59
4.4.2.3 Effect of water type and temperature on efficacy of foliar applications of
metsulfuron-methyl ...................................................................................... 61
4.5 Cut stump and frill applications ................................................................................. 62
4.5.1 Methodology ................................................................................................ 62
4.5.1.1 Initial cut stump and frilling trial ................................................................... 62
4.5.1.2 Rate response of glyphosate using the cut stump technique ..................... 62
4.5.2 Results ......................................................................................................... 63
4.5.2.1 Initial cut stump and frilling trial ................................................................... 63
4.5.2.2 Rate response of glyphosate using the cut stump technique ..................... 65
4.6 Ground and aerially applied residual herbicides ....................................................... 66
4.6.1 Methodology ................................................................................................ 66

B.NBP.0622 - Distribution, Invasiveness, Biology and Control or Rubber Bush in Northern Australia
Page 7 of 125
4.6.1.1 Screening trial .............................................................................................. 66
4.6.1.2 Influence of season, placement and application rate on efficacy of ground
applications of tebuthiuron .......................................................................... 67
4.6.1.3 Refinement of application rates and placement of tebuthiuron .................. 67
4.6.1.4 Efficacy of aerial applications of tebuthiuron (Graslan™)........................... 68
4.6.1.5 Rate response of liquid hexazinone ............................................................ 69
4.6.2 Results ......................................................................................................... 70
4.6.2.1 Screening trial .............................................................................................. 70
4.6.2.2 Influence of season, placement and application rate on efficacy of ground
applications of tebuthiuron .......................................................................... 70
4.6.2.3 Refinement of application rates and placement of tebuthiuron .................. 71
4.6.2.4 Efficacy of aerial applications of tebuthiuron (Graslan™)........................... 72
4.6.2.5 Rate response of liquid hexazinone ............................................................ 75
4.7 Testing of the most promising herbicide treatments in the Northern Territory ......... 76
4.7.1 Methodology ................................................................................................ 76
4.7.2 Results ......................................................................................................... 78
4.8 Mechanical control ..................................................................................................... 79
4.8.1 Methodology ................................................................................................ 79
4.8.1.1 Effect of cutting depth .................................................................................. 79
4.8.1.2 Stick raking demonstration .......................................................................... 79
4.8.2 Results ......................................................................................................... 79
4.8.2.1 Effect of cutting depth .................................................................................. 79
4.8.2.2 Stick raking demonstration .......................................................................... 81
4.9 Dieback monitoring .................................................................................................... 82
4.9.1 Methodology ................................................................................................ 82
4.9.2 Results ......................................................................................................... 83
4.10 Discussion .................................................................................................................. 84
4.10.1 Foliar herbicides .......................................................................................... 84
4.10.2 Basal bark applications ............................................................................... 86
4.10.3 Cut stumping and frilling .............................................................................. 86
4.10.4 Ground and aerially applied residual herbicides ......................................... 86
4.10.5 Testing of the most promising herbicide treatments in the Northern
Territory........................................................................................................ 88
4.10.6 Mechanical control ....................................................................................... 88
4.10.7 Dieback monitoring ...................................................................................... 89
4.11 Conclusion ................................................................................................................. 90
B.NBP.0622 - Distribution, Invasiveness, Biology and Control or Rubber Bush in Northern Australia
Page 8 of 125
5 Recommendations ..................................................................................................... 91
5.1 Identification of the most practical and cost-effective control options for rubber bush
................................................................................................................................... 93
5.2 Managing rubber bush in different environments and with different levels of rubber
bush intrusion............................................................................................................. 95
5.3 Recommendations for future research and dissemination of key findings to
stakeholders ............................................................................................................... 97
6 Success in achieving objectives ................................................................................ 99
7 Acknowledgements .................................................................................................. 101
8 Publications from the research ................................................................................ 102
8.1 Articles submitted or under preparation .................................................................. 103
9 References ............................................................................................................... 104
10 Appendices .............................................................................................................. 110
10.1 Appendix 1: Seed longevity paper on rubber bush published in the Rangeland
Journal. .................................................................................................................... 110
10.2 Appendix 2: Environmental layers used for modelling, the timeframe they cover and
their source. ............................................................................................................. 120
10.3 Appendix 3: Tests and response curves associated with distribution modelling. .. 122
10.4 Appendix 4: Supporting data for responses to the WRA questions. ...................... 123
10.5 Appendix 5: Updated WRA for rubber bush in the Australian environment using the
DAF system. ............................................................................................................ 125

B.NBP.0622 - Distribution, Invasiveness, Biology and Control or Rubber Bush in Northern Australia
Page 9 of 125
1 Background
Rubber bush (Calotropis procera), a native of tropical and subtropical Africa and Asia (Grace
2006), is spreading across northern Australia (Grace 2006). However, its current distribution
is only a small proportion of its potential distribution, which could include most of the
rangelands of northern Australia (Grace 2006).
Thick infestations of rubber bush (Plate 1) reduce pastoral production and native biodiversity
(Grace 2006). The plant is toxic, although there are few reports of domestic animals dying
from it (Grace 2006). During dry periods, cattle will browse rubber bush plants and can keep
them in check. Whether rubber bush is a highly competitive plant capable of replacing
pastures in good condition, or a weed of disturbed or degraded areas (Bastin et al. 2003,
Grace 2006) is the subject of the research presented in this report.
A national literature review (Grace 2006) and the outcomes of a MLA sponsored rubber bush
workshop (Tennant Creek 2007), established that there was a paucity of information
available on rubber bush in Australia, and identified key research needed to fully understand
its invasiveness and how best to control it.
In 2010, MLA approved and funded a collaborative research project on rubber bush,
involving the Department of Agriculture and Fisheries, Charles Darwin University and the
Northern Territory Department of Land Resource Management with input from a range of
stakeholders. The priority was to better understand the invasiveness, biology/ecology and
distribution of this invasive weed and how to control it in a range of situations.
Plate 1. A thick rubber bush infestation in the Barkly Tablelands region of the Northern Territory
B.NBP.0622 - Distribution, Invasiveness, Biology and Control or Rubber Bush in Northern Australia
Page 10 of 125
2 Projective Objectives
1. Describe key aspects of rubber bush ecology relevant to management.
2. Quantify the distribution and rate of spread of rubber bush at several locations.
3. Quantify the invasiveness of rubber bush under different disturbance regimes and land
types using a series of competition and exclusion studies.
4. Develop improved control options including:
4.1 Complete testing of products that can be used as part of day-to-day activities to
control isolated rubber bush plants.
4.2 Trial and compare current and new herbicide products for control of rubber bush.
4.3 Conduct a seasonality trial to quantify efficacy of herbicides under different
seasonal conditions and growth stages.
4.4 Monitor the effectiveness of aerial applications of tebuthiuron for broad-scale
control of rubber bush in suitable habitats.
5. Monitor areas being affected by a dieback phenomenon to quantify whether rubber bush
plants recover or eventually die, which will have significant implications on the
population dynamics of infestations.
6. Identify the most practical and cost-effective control options for rubber bush.
7. Develop recommendations for managing rubber bush in different environments and with
different levels of rubber bush intrusion.
3 Ecology and Invasiveness
Invasiveness is the ability of a plant to establish, reproduce and disperse within an
ecosystem and has been associated with reductions in native plant richness (Grice 2006,
Benke et al.et al. 2011). Biological invasions can cause irreversible losses of biodiversity
(Oliveira et al. 2009). Thus, it is important to evaluate the invasiveness of rubber bush for at
least three reasons. Firstly, the transition of a plant from naturalised to invasive status must
be understood to manage it effectively – often the transition is the culmination of many
concurrent synergistic processes that may escape notice. Secondly, this knowledge is
required to support decision making at a policy level (i.e. plant categorisation) and, thirdly, to
address knowledge gaps that may exist regarding the species in northern Australia.
Researching the invasiveness of a weed has the obvious potential benefit of predicting its
invasive potential prior to introduction or after introduction (Grime 1979, Hodgson et al.et al.
1999, Pheloung et al. 1999, Morales & Aizen 2002, Ricciardi & Cohen 2007, Richardson &
Rejmánek 2011). In their discussion of concepts and definitions, Richardson et al.et al.
(2000) advised of the importance of having clearly defined, widely accepted terminology to
describe the status of alien plants, so as not to confound the objective formulation of
priorities for management and, in our case, research. While agreeing with this view, we
adopt the following definitions proposed by Richardson et al. (2000) and others:
a) Invasive plants are naturalised plants that reproduce offspring, often in large
numbers, at considerable distances from parent plants.
b) Weeds are plants that grow at sites where they are not wanted and that usually have
detectable economic or environmental effects.
The methods of estimating invasiveness are based on four principles, namely, that
invasiveness is due to a) introduction history; b) species traits; c) ecological processes; and

B.NBP.0622 - Distribution, Invasiveness, Biology and Control or Rubber Bush in Northern Australia
Page 11 of 125
d) evolutionary processes. In terms of introduction history, the question is whether invasion
is caused primarily by propagule pressure; for species traits, the question is whether
invasiveness is enhanced by fitness or dispersal traits; for ecological processes, the
question is whether realised niches facilitate invasiveness. Finally, in terms of evolutionary
processes, it is whether the plant has evolved and increased its competitive ability in the
introduced range (Van Kleunen et al. 2010). We adopt the working hypothesis in this report
that the invasiveness of rubber bush arises due to a combination or combinations of the
above.
It is argued that rapid evolution challenges the prediction of invasiveness (Whitney & Gabler
2008), and rapid evolution could be a factor in the recent spread of rubber bush. However,
given its distribution worldwide, length of residence and the qualities it shows in very diverse
environments, including Brazil and Hawaii, it would have had to evolve extremely quickly in
several different directions within fairly short periods to develop novel mutualisms, yet
aspects of its phenotype are remarkably consistent. In particular, the rubber bush present in
Australia shows very little flower polymorphism (Forster 1998), compared to flowers in the
native range that are sometimes white, for example, suggesting that the local populations
may have developed from a few initial introductions. Finally, strong selection in alien species
within a new range is thought to destroy all but the pre-adapted individuals (Mack et al.
2000). The process of assessing the invasiveness of rubber bush entails identifying and
quantifying functional traits that enable the plant to be a “winner” where others are “losers”
(Hodgson et al. 1999). As rubber bush’s invasiveness has become evident in Australia within
a relatively short period (~25-50 years), measurement of its invasiveness needs to take into
account its introduction history, species traits and ecological processes. For this reason, our
study largely excluded evolutionary trends.
3.1 Reproduction
3.1.1 Methodology
3.1.1.1 Flower morphology
The gross and fine structures of the rubber bush flower that contribute to successful fruiting
were investigated. A series of laboratory and field experiments were undertaken to evaluate
the determinants of pollination success, such as flower anthesis, pollinia viability and
sucrose production.
3.1.1.2 Mating system and pollination ecology
Pollinators and their flower visitation behaviours were monitored at Tennant Creek
(19°42'56.28" S 134°17'36.05"E), Helen Springs (18°25'16.64"S 133°53'35.49"E), Sandover
(21°48'16.70"S 135°6'38.21"E), Muckaty (18°38'4.76"S 133°49'44.11"E) and Katherine.
(14°28'8.03"S 132°20'27.42"E) over three years. The pollinator status of an insect was
verified by examining whether individuals of the species carried pollinia or not. To determine
visitation behaviour, video clips of equal length (10 minutes) were recorded on a branch of
each of five focal plants at each site during peak insect visitation activity. The effect of
flowering plant density on pollinator visitation rates, and consequently the reproductive
performance of individual plants, was assessed by recording fruit set on focal plants at
known population densities over the same period.

B.NBP.0622 - Distribution, Invasiveness, Biology and Control or Rubber Bush in Northern Australia
Page 12 of 125
3.1.1.3 Breeding system
Four rubber bush populations were examined in breeding system experiments, namely
Katherine (KA), Helen Springs Roadside (HSR), Helen Springs Hillside (HSH) and Tennant
Creek (TC). A sample of 165 plants (330 umbels) distributed as follows: 85 at KA, 40 at HS
(R), 20 at HS (H), and 20 at TC, were examined.
One umbel per plant was bagged to test for autogamy. For each umbel, all open flowers
were removed and buds bagged in netting to exclude pollinators. On the same plant, all
flowers on one umbel were hand-pollinated with pollen from that plant, all the flowers on
another umbel were hand-pollinated with pollen from a different population 2-5 km away, and
then bagged. Hand-pollination was achieved using a pin to gently open the stigmatic slit and
insert a single pollinium into the stigmatic chamber. A third umbel was bagged after
removing open flowers without hand-pollination. After two weeks, the abscission of petals
and formation of small bulbous swellings at the base of the flower was taken as evidence of
the onset of fruiting. The level of self-compatibility was determined by calculating the self-
compatibility index (i.e. the ratio of fruit formed in selfed to crossed flowers). A plant was
considered self-incompatible if the ratio was <0.2 (Etcheverry et al. 2008).
To determine if seedling growth differed depending on whether they originated from selfed or
crossed fruit, seeds (n = 116) from selfed and crossed fruit from one plant at Helen Springs
were germinated in a greenhouse. Emerging seedlings were allowed to grow for three
months and their height, leaf length and width were then measured. This experiment was
repeated for selfed and crossed seeds from KA and HS (R), to assess if there are population
level differences in the performance of selfed and crossed seedlings.
3.1.1.4 Flowering and fruiting phenology
The flowering and fruiting phenology of plants may contribute to their invasive character,
particularly if their phenology helps to ensure reproductive success under diverse climatic
conditions. In addition, it has been observed that climate change modifies the phenology of
both plants and animals (Visser & Both 2005, Cleland et al. 2007), and could consequently
influence existing mutualisms. The flowering and fruiting phenologies of rubber bush were
monitored over a period of two years across nine sites located in Queensland and the
Northern Territory (Table 1), to determine the length of the fruiting season relative to the
flowering season. At the Queensland sites, we recorded the sizes of plants, checked for the
presence/absence of flowers and recorded the number of fruit on focal plants every month,
while at the Northern Territory sites, we recorded the stem numbers and sizes, plant height,
crown width, number of umbels and fruit on focal plants monthly.

B.NBP.0622 - Distribution, Invasiveness, Biology and Control or Rubber Bush in Northern Australia
Page 13 of 125
Table 1. Names and coordinates of the phenology observation sites.
Site name Coordinates
Big Bend
Bluff Downs
19°51'15.4"S 146°08'33.5"E
19°40'29.4"S 145°32'04.1"E
Helen Springs Paddock 18°24'50.0"S 133°53'40.6"E
Helen Springs Hillside 18°27'39.3"S 133°55'09.7"E
Muckaty Bore 18°38'01.2"S 133°50'37.4"E
Muckaty Paddock 19°05'40.3"S 145°16'07.4"E
Christmas Creek Trainline 19°05'40.3"S 145°16'07.4"E
Nardoo 18°21'33.6"S 139°31'00.4"E
Tennant Creek 19°42'50.4"S 134°17'26.0"E
3.1.2 Results
3.1.2.1 Flower morphology
Rubber bush has a complex flower with pollen contained in sacs called pollinia, whose
successful transfer requires insect vectors (Plate 2a-b., Plate 3). The stigmatic disc is
~5.5 mm wide and 5.32 mm deep. The nectar is held in cuculli and the depth of the nectaries
determines the type of insects that can access the nectar.
There was some variation (significantly different at two sites – Table 2) in the measured
morphology of the flower. Very few flowers (<1%) on plants in recently established stands
possessed square rather than pentagonal stigmatic discs – perhaps an indicator of
increased negative allelic frequencies due to high levels of inbreeding.
Table 2. Comparison of flower sizes of rubber bush across sites.
Site Width of stigmatic disc (mm)
mean ± s.e.
Height of the staminal column
(mm) mean ± s.e.
SO 5.58 ± 0.05a1 5.10 ± 0.06a
MU 5.58 ± 0.04a 5.42 ± 0.06b
HS 5.60 ± 0.04b 5.33 ± 0.04a
TC 5.07 ± 0.04b 5.42 ± 0.03a
1Means are presented with their standard errors and within columns different letters denote
significant differences at P < 0.05.
B.NBP.0622 - Distribution, Invasiveness, Biology and Control or Rubber Bush in Northern Australia
Page 14 of 125
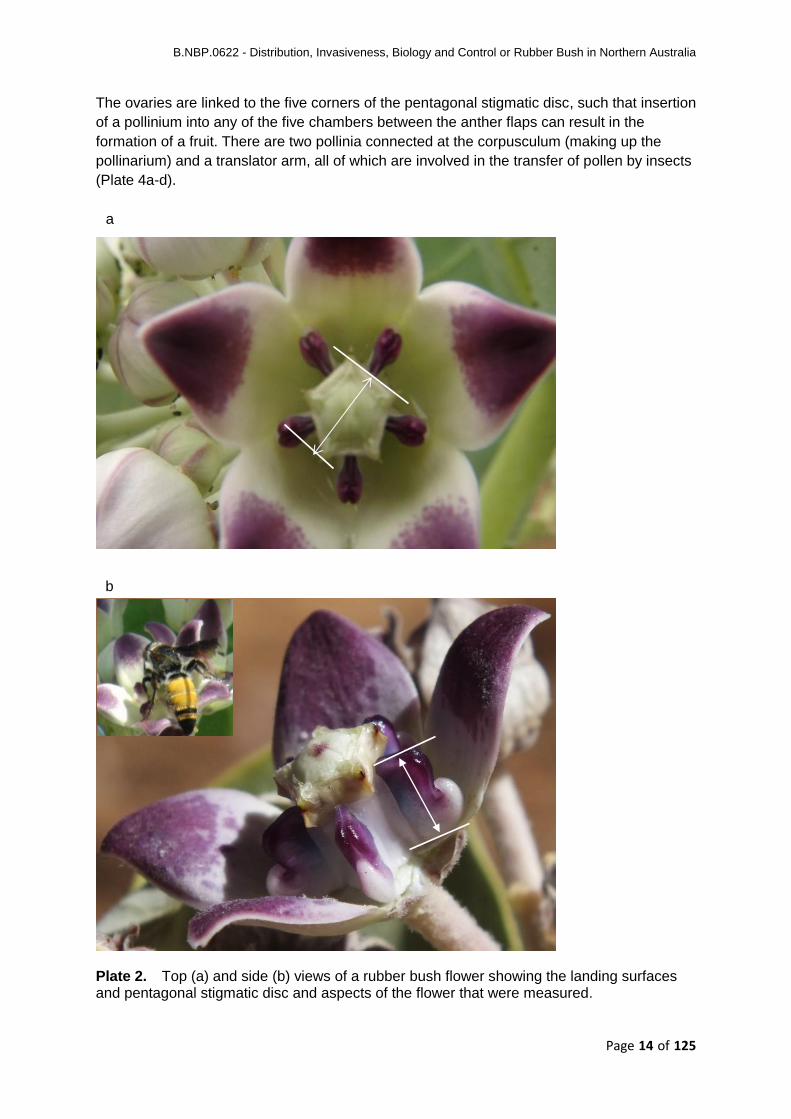
The ovaries are linked to the five corners of the pentagonal stigmatic disc, such that insertion
of a pollinium into any of the five chambers between the anther flaps can result in the
formation of a fruit. There are two pollinia connected at the corpusculum (making up the
pollinarium) and a translator arm, all of which are involved in the transfer of pollen by insects
(Plate 4a-d).
Plate 2. Top (a) and side (b) views of a rubber bush flower showing the landing surfaces and pentagonal stigmatic disc and aspects of the flower that were measured.
a
b

B.NBP.0622 - Distribution, Invasiveness, Biology and Control or Rubber Bush in Northern Australia
Page 15 of 125
Plate 3. Microscopic structure of a rubber bush flower: (a) position of the pollinarium, with
intact corpusculum and translator arm of an (b) extracted pollinarium. Abbreviations:
g - groove, c – corpusculum, ta – translator arm, af – anther flaps, p – pollinium (Greenfield
2013).
Plate 4. Scanning electron micrograph of the fine structure of the rubber bush flower. Abbreviations: c-corpusculum, ca – cavity, g – groove, ov - ovary, o – ovules, p – pollinium, ta – translator arm, sc – stigmatic chamber, tr – trichomes, v- vesicle. Scale bar = 500 μm (Greenfield 2013).
3.1.2.2 Mating system and pollination ecology
The size of the stigmatic disc and the arrangement of the nectaries relative to the opening of
each stigmatic chamber on the flower are adaptations that attract generalist Hymenopteran
pollinators, such as carpenter bees (Xylocopa aruana), honey bees (Apis mellifera) and
wasps, to land on the flower and vector pollen.
There was a gradual species shift in the Hymenopteran pollinator assemblage along a north
to south gradient of the sample sites, with carpenter bees and honey bees forming most of
the pollinator community in Katherine, and wasps being dominant at the southern end of the
gradient. Moving towards the central regions of Australia, the pollinator assemblage
predominantly comprised various families of larger wasps (Table 3). Two species of wasps,
namely Delta latreillei and Sphex fumipennis, were particularly common pollinators across
sites, other than Katherine, while other wasp species were only found at specific sites.
21
A
B
C
D
Figure 2.4. Scanning electron micrograph (SEM) of structures of Calotropis
procera. (A, B, C, D). (A) Pollinium, with groove (g). (B) Lateral view of
ovaries, with outer wall removed to display ovules. (C) Pollinium in position in
the anther sac. (D) Cuculli and vesicle with trichomes (tr). Abbreviations: bend
(b), cavity (ca), corpusculum (c), groove (g), guide rails (gr), ovules (o), ovaries
(ov), pollinium (p), stigmatic chamber (sc), translator arms (ta), trichomes (tr),
vesicle (v). Scale bar = 500 µm.

B.NBP.0622 - Distribution, Invasiveness, Biology and Control or Rubber Bush in Northern Australia
Page 16 of 125
The wasps were most active during the hottest times of the day (1030h-1530h). Pollinator
visitation patterns (Table 3) indicated a high proportion of within plant pollen transfer
(geitonogamy) in most populations, and insects probed 4-5 open flowers on an umbel before
moving to another umbel on the same plant.
All insect vectors (Table 3) were absent during the colder months of the year (April to
August) and thus there were few or no fruit on rubber bush plants during these months.
Insect visitors started appearing on flowers at the beginning of September, and the first wave
of mature fruit set seeds towards the end of October (i.e. after about eight weeks).
Table 3. Species of bees and wasps, their size (length), visitation patterns and the site(s) where they were found. Visitation patterns* FF – flower to flower on the same umbel; UU – umbel to umbel on same plant; PP – plant to plant.
Family Sub-family Name Pattern* Locations where found
Length (cm)
Vespidae Eumeninae Delta latreillei FF TC, HS, SO 3
Epiodynerus nigrocintus
FF HS 1.5
Abispa ephippium UU TC 2.5
Polistinae Polistes signata UU/FF HS, TC 1.3
Apidae Apinae Apis mellifera FF KA, TC 1
Anthophoridae Xylocopinae Xylocopa aruana UU KA 2.2
Megachilidae Megachilinae Hackerapis sp. UU HS 0.9
Lithurginae Lithurgus sp. UU HS 1.5
Sphecidae Sceliphrinae Sceliphron laetum UU/FF TC, MU 3
Sphecinae Sphex fumipennis PP MU, TC, HS, SO
2.4
Sphex sericius FF TC 2
Prionyx sp. FF/UU TC, SO 2.3
Sphex sp. FF TC 2.2
Crabronidae Bembicinae Sphecius pectoralis FF MU 2.7
Pompilidae Pepsinae Hemipepsis sp. UU HS, MU 2.5
Pompilinae Heterodontonyx australis
UU HS 1.6
Pompilinae Turneromyia sp. FF TC, SO 1.5
Scoliidae Scoliinae Trisciloa ferruginea FF TC, SO 2
Radumeris radula FF TC 4.2

B.NBP.0622 - Distribution, Invasiveness, Biology and Control or Rubber Bush in Northern Australia
Page 17 of 125
The probability of successful pollinium transfer was low (~0.04%), but the effect of one
successful transfer, in terms of viable seeds per fruit, is significant due to the large number
of pollen grains contained in one pollinium (~450-500) that accords with the number of seeds
per fruit.
3.1.2.3 Breeding system
Overall, 30.7% of all hand pollinations across sites were successful, of which 57.1% were in
crossed and 42.9% in selfed flowers. Fruit abortion was common in manipulated and un-
manipulated plants, particularly during the peak fruiting season. The self-compatibility index
for HS Roadside was 0.29, for TC 1.18, for HS Hillside 0.01, for KA 1.29, while only crossed
flowers formed fruit at the MU site. We conclude that rubber bush is a facultative out-crosser,
capable of both selfing and crossing.
Seedlings from crossed seed did not differ significantly from the selfed seeds in a number of
leaves, but grew taller and had a significantly larger overall leaf surface area than those from
selfed seed (F1, 114 = 5.2, P = 0.02). The mean crossed seedling height was 9.37 ± 0.24 cm
and selfed 7.27 ± 0.34 cm (mean ± SE; applies to all other data presented in a similar
manner, unless stated otherwise), while mean number of leaves was 5.51 ± 0.12 per
seedling. In a separate but similar experiment involving selfed and crossed seeds from
different populations and plants (i.e. HS and KA), crossbred HS seedlings had significantly
heavier root and shoot mass and grew taller than the selfed seedlings, however, no
difference was observed in KA seedlings in all measured parameters (Fig. 1).
3.1.2.4 Flowering and fruiting phenology
The flowering and fruiting trends observed at the four sites in Queensland were different
from those in the Northern Territory, in that Queensland sites tended to fruit all year round,
while the Northern Territory plants ceased fruiting in winter altogether, although they were in
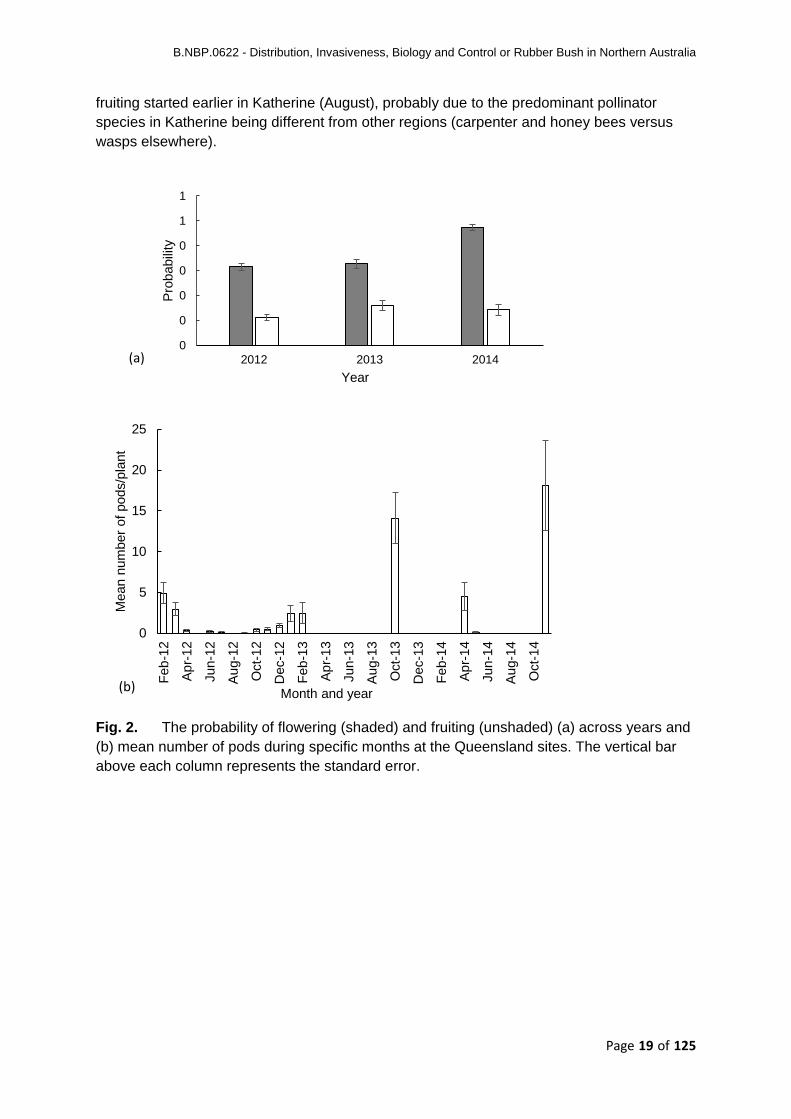
flower. An increase in the number of flowers in 2014 did not result in a concurrent increase in
the number of fruit compared to the previous years at the Queensland sites (Fig. 2), the
probability of fruiting remained stable, which may be indicative of stagnating pollinator
numbers. At all sites in the Northern Territory, the mean number of pods peaked in January
and the fruiting season was shorter in 2012 compared to 2013 (Fig. 3.) Year to year fruiting
differences were not related to the level of flowering as plants were in flower throughout the
year (Fig. 4), but there were few or no fruit during the colder winter months due to insects
overwintering (hibernating).

B.NBP.0622 - Distribution, Invasiveness, Biology and Control or Rubber Bush in Northern Australia
Page 18 of 125
Fig. 1. Mean shoot mass, root mass, number of leaves and height after three months, of
crossed and selfed seedlings grown from seed in a greenhouse experiment. The vertical bar
above each column represents the standard error.
Across seasons and years, a total of 1240 phenology observations were made in the
Northern Territory and Queensland locations. The Queensland data were analysed to
characterise how the number of flowers and fruits varied across months and years (Fig. 2).
The overall mean number of pods/plant across sites and months at the Queensland sites
was 2.04 ± 0.33 (n = 673). Some sites had significantly higher mean fruit occurrences/month
than others (i.e. Big Bend 11.16 ± 3.96 compared with Christmas Creek 0.93 ± 0.24). Both
month and site had a significant influence on the number of fruit (i.e. not all months had the
same number of fruits: month F17, 568 = 9.53, P < 0.05; site F3, 568 = 15, P < 0.05). It is worth
noting that even a few umbels can produce fruit provided there are pollinators. The Northern
Territory sites had an overall mean of 65.55 ± 3.29 umbels/plant/month and 5.08 ± 0.58
pods/plant/month (n = 567) (Fig. 3). Rubber bush plants flowered throughout the year
(Fig. 4), with minor variation in the mean number of umbels/plant/month among sites;
however, fruit set occurred mainly from September to February in the Northern Territory,
whilst low numbers of fruit were found all year round in Queensland. It is worth noting that
0
0
0
0
0
0
0
0
0
0R
oot
mass (
mg)
Selfed Crossed
HS
KA
0
1
2
3
4
5
6
7
Selfed Crossed
Num
ber
of
leaves
KA
HS
0
0
0
0
0
0
0
Selfed Crossed
Shoot
mass (
mg)
KA
HS
0
5
10
15
20
25
30
35
40
Selfed Crossed
Heig
ht
(mm
)
KA
HS
B.NBP.0622 - Distribution, Invasiveness, Biology and Control or Rubber Bush in Northern Australia
Page 19 of 125
fruiting started earlier in Katherine (August), probably due to the predominant pollinator
species in Katherine being different from other regions (carpenter and honey bees versus
wasps elsewhere).
Fig. 2. The probability of flowering (shaded) and fruiting (unshaded) (a) across years and
(b) mean number of pods during specific months at the Queensland sites. The vertical bar
above each column represents the standard error.
0
0
0
0
0
1
1
2012 2013 2014
Pro
babili
ty
Year
(a)
0
5
10
15
20
25
Feb
-12
Ap
r-1
2
Jun
-12
Au
g-1
2
Oct-
12
Dec-1
2
Feb
-13
Ap
r-1
3
Jun
-13
Au
g-1
3
Oct-
13
Dec-1
3
Feb
-14
Ap
r-1
4
Jun
-14
Au
g-1
4
Oct-
14
Mean n
um
ber
of
pods/p
lant
Month and year(b)

B.NBP.0622 - Distribution, Invasiveness, Biology and Control or Rubber Bush in Northern Australia
Page 20 of 125
Fig. 3. Mean number of pods/plant/month in the Northern Territory populations. The vertical
bar above each column represents the standard error.
Fig. 4. Mean number of umbels/plant/month in the Northern Territory populations. The
vertical bar above each column represents the standard error.
3.2 Seed longevity
3.2.1 Methodology
The potential longevity of rubber bush seeds was quantified in a seed burial trial undertaken
at the Tropical Weeds Research Centre in Charters Towers between 2009 and 2012. Seeds
were exposed to different soil types (clay and river loam), levels of pasture cover (present
and absent) and burial depths (0, 2.5, 10 and 20 cm). Two fresh seed lots were tested at
separate times to determine if exposure to different environmental conditions influenced
seed longevity. An initial collection of ripe follicles of rubber bush was undertaken in
December 2008 from two locations: 43 km south-east (20°13’S, 146°38’E) and 15 km north-
0
5
10
15
20
25
30
35
40
Dec Jan Feb Mar Apr May Jun Jul Aug Sep Oct Nov
Mean n
um
ber
of
fruit/p
lant
Month
Mean pods/plant 2012
Mean pods/plant 2013
0
20
40
60
80
100
120
140
160
180
Dec Jan Feb Mar Apr May Jun Jul Aug Sep Oct Nov
Mean u
mbels
/pla
nt/m
onth
Month
Mean umbels 2012
Mean umbels 2013

B.NBP.0622 - Distribution, Invasiveness, Biology and Control or Rubber Bush in Northern Australia
Page 21 of 125
west of Charters Towers (19°59’S, 146°30 E). This was before commencement of the rubber
bush project but is included to allow comparison with a second collection of seeds that was
made possible due to funding from the project. The second seed lot was collected in October
2011 from an infestation of rubber bush located in the Gulf of Carpentaria Region (18°13’S,
140°38’E). Full details on the methodology and results are provided in a scientific paper
published by The Rangeland Journal (see Appendix 1).
3.2.2 Results
Annual rainfall, recorded at the experimental site between 2009 and 2012, was consistently
greater than the long-term mean for Charters Towers (658 mm), averaging 1105, 1323,
1037, 832 mm per annum, respectively. For the first five months of 2013 before the second
seed lot finished being tested in May 2013, 452 mm of rainfall was recorded (Fig. 5). Despite
high annual rainfall, the first and second seed lots were exposed to different seasonal
patterns of rainfall, particularly in the first 12 months, which was a critical period in the
longevity of soil seed banks of rubber bush. After burial in March 2009, the first seed lot
received 118 mm of rainfall for the remainder of the autumn period. This was followed by a
very dry winter and spring period where only 21 mm of rainfall were recorded, before the
onset of a wet summer where 493 mm fell. In contrast, the second seed lot buried in January
2012 received 218 mm of rainfall in February, followed by 319 mm during autumn. Even the
winter period received high rainfall with 189 mm being recorded. However, the following
spring was dry (32 mm) and summer rainfall was below average, with 294 mm recorded
(Fig. 5).
Fig. 5. Monthly rainfall (■ mm) at the research site between March 2009 and May 2013, and the average monthly rainfall (□ mm) for Charters Towers associated with burial duration for seed lot 1( _____ ) and seed lot 2 (ӿӿӿӿ).
0
50
100
150
200
250
300
350
400
450
500
J M M J S N J M M J S N J M M J S N J M M J S N J M M
2009 2010 2011 2012 2013
Rain
fall
(mm
)
Years and Months

B.NBP.0622 - Distribution, Invasiveness, Biology and Control or Rubber Bush in Northern Australia
Page 22 of 125
In the first seed lot, initial seed viability and germinability was high, averaging 85.0 ± 2.4%
(per cent of total seed number) and 100% (per cent of viable seeds), respectively. Following
burial, significant burial depth × burial duration (P < 0.001) and soil type × burial duration
(P < 0.01) interactions were recorded for seed viability. In contrast, the level of pasture cover
did not have a significant influence (P > 0.05) on seed viability over time. Viability declined
most rapidly in the first three months, particularly in seed lots that were buried. After six
months, 1% of buried seeds remained viable, compared with 28% of surface-located seeds
(Fig. 6). This rapid decline in viability coincided with high germination of seeds in the field in
the first three months after burial. On average, 92% of seeds germinated within three months
if buried, significantly more (P < 0.05) than surface-located seeds which averaged only 38%
(Fig. 7). No viable seeds were retrieved from buried seed lots after 18 months, whilst
surface-located seed lots had no viable seed after 24 months.
Fig. 6. Viability (%) at the time of testing of the first seed lot of rubber bush as affected by burial depth (□ 0 cm, ■ 2.5 cm, ░10 cm and ▓ 20 cm) and burial duration. The vertical bar indicates the least significant difference at P=0.05.
Fig. 7. The proportion (%) of the first (□) and second (■) seeds lot of rubber bush that germinated in the field at different depths, three months after burial. The vertical bar indicates the least significant difference at P=0.05.
0
10
20
30
40
50
60
70
80
90
100
0 3 6 12 18 24 36
Via
bili
ty (
%)
Burial duration (months)
0
10
20
30
40
50
60
70
80
90
100
0 2 10 20
Germ
ination (
%)
Burial depth (cm)

B.NBP.0622 - Distribution, Invasiveness, Biology and Control or Rubber Bush in Northern Australia
Page 23 of 125
With regards soil type, a more rapid rate of decline in viability occurred in the clay soil
compared with the river loam soil (Fig. 8). No viable seeds were retrieved from the clay soil
after 18 months, whilst nil viability was recorded in the river loam soil at the 24-month
retrieval.
Fig. 8. Viability of the first and second seed lots of rubber bush as affected by soil type (○ clay and ∆ river loam) and burial duration. Vertical bars indicate the least significant difference at P=0.05.
In the second seed lot, initial seed viability and germinability was extremely high, averaging
99.5 ± 0.1% (per cent of total seed number) and 100% (per cent of viable seeds),
respectively. Following burial, viability was significantly affected by burial duration (P < 0.05),
but not by soil type, pasture cover or burial depth (P = 0.93). The rate of decline in viability
was faster than that of the first seed lot tested.
After 3 months, no viable seed was recorded across all burial depths, soil types and pasture
cover treatments. However, subsequent 6 and 12 month assessments recorded 0.1%
viability. No viable seeds were retrieved from any seed lots 15, 18 or 24 months after burial.
As for the first seed lot, the rapid decline in viability was associated with a high percentage of
seeds germinating in the field, particularly those buried below ground. Surface-located seeds
averaged 82% germination after three months compared with 99% for those buried between
2 and 20 cm (Fig. 7).
3.3 Seed biology and fruit production
3.3.1 Methodology
The reproductive capacity and the relationship between size and reproductive performance
of rubber bush plants were investigated at five sites (HS Hillside, HS Roadside, MU
Paddock, MU Bore and TC) over a period of two years. Additionally, the mean number of
seeds per fruit was determined at six populations (Cowan Downs (CD), Bluff Downs (BD),
Helen Springs (HS), Muckaty (MU) Tennant Creek (TC) and Katherine (KA)) across
Queensland and the Northern Territory.
0
10
20
30
40
50
60
70
80
90
100
0 3 6 12 18 24 0 3 6 12 15
1st seed lot 2nd seed lot
Via
bili
ty (
%)
Seed lot and burial duration (months)

B.NBP.0622 - Distribution, Invasiveness, Biology and Control or Rubber Bush in Northern Australia
Page 24 of 125
Life history traits, including seed germination traits, are important indicators of plant
invasiveness, because they influence individual establishment and survival. Plasticity of trait
response constrains range expansion into new environments. Accordingly, we examined the
effects of environmental temperature on both individual seed production (mean numbers of
seeds per fruit) and germination performance (germinability G; mean germination time MGT)
of rubber bush across an environmental (temperature and rainfall) gradient in northern
Australia. The germination response is closely related to the ability of an invasive species to
establish and spread at a locality. Seeds were collected from the seven locations mentioned
above across the Northern Territory and Queensland (Fig. 9) and their characteristics (i.e.
number of seeds per pod, mass), ability to germinate at different depths (0, 3 and 6 cm) and
at different temperatures (20, 25, 30, 35, 40 and 45 °C) were tested together with the
germination response to water stress. The temperature levels used simulated soil
temperature levels observed in the field.
A total of 103 plants were grown in a greenhouse to assess growth at different plant
densities densities (i.e. 2, 3, 4, 6, 8 and 12 seedlings/pot, 3 replicates) and age at
reproductive maturity. At the age of nine months, several plants had outgrown the
greenhouse, therefore a subsample of 31 plants (2, 3, 4, 6, 7 and 9) were selected and
followed to the end of the experiment. The minimum age at first flowering was recorded. It
was taken that once plants flowered they could form fruit, however, competition for
pollinators meant smaller plants need to grow taller (~2 years) to attract pollinators.
Fig. 9. Locations of Rubber Bush populations from which seed samples were collected (Grey contours are isohyets; Geoscience 2010).
3.3.2 Results
The density of plants differed significantly between MU and MUB and the remainder of the
sites, and density at a site influenced the number of fruit set on individual plants (Fig. 10).
The number of flowers on a plant was only significantly different at TC (Table 4). Among the
studied populations, the density of rubber bush plants was lowest at TC site, while the mean
number of fruit set was higher at the site by a wide margin compared to the rest of the sites
(i.e. HSH, HSR, MU, MUB).

B.NBP.0622 - Distribution, Invasiveness, Biology and Control or Rubber Bush in Northern Australia
Page 25 of 125
Table 4. Reproductive parameters of rubber bush estimated at five populations in the Northern Territory (HSH-Helen Springs Hillside, HSR-Helen Springs Roadside, MU-Muckaty, MUB – Muckaty bore, TC – Tennant Creek).
Variable Site
HSH HSR MU MUB TC
Mean density
(plants/ha)*
510±25.5a 520±39.7a 690±49.5b 840±51.3b 393.4±20.8a
Mean pods/plant 4.1 7.0 5.7 0.9 68.7
Mean seed output/plant
1776 3032 2469 390 29761
Mean plant height (m)
1.83±0.1 2.7±0.1 2.42±0.1 2.96± 0.1 3.02±0.2
Adjusted umbels/plant*
58.19a 43.19a 56.55a 36.8a 121.68b
Flowers/Umbel* 11.30±0.47bc 11.5±0.91bc 10.0±0.47b 6.40±0.22a 12.7± 0.96c
Ratio of flowers : fruit
160.38 70.96 99.21 261.69 22.49
*Values within the row with different letters are significantly different (P < 0.05).
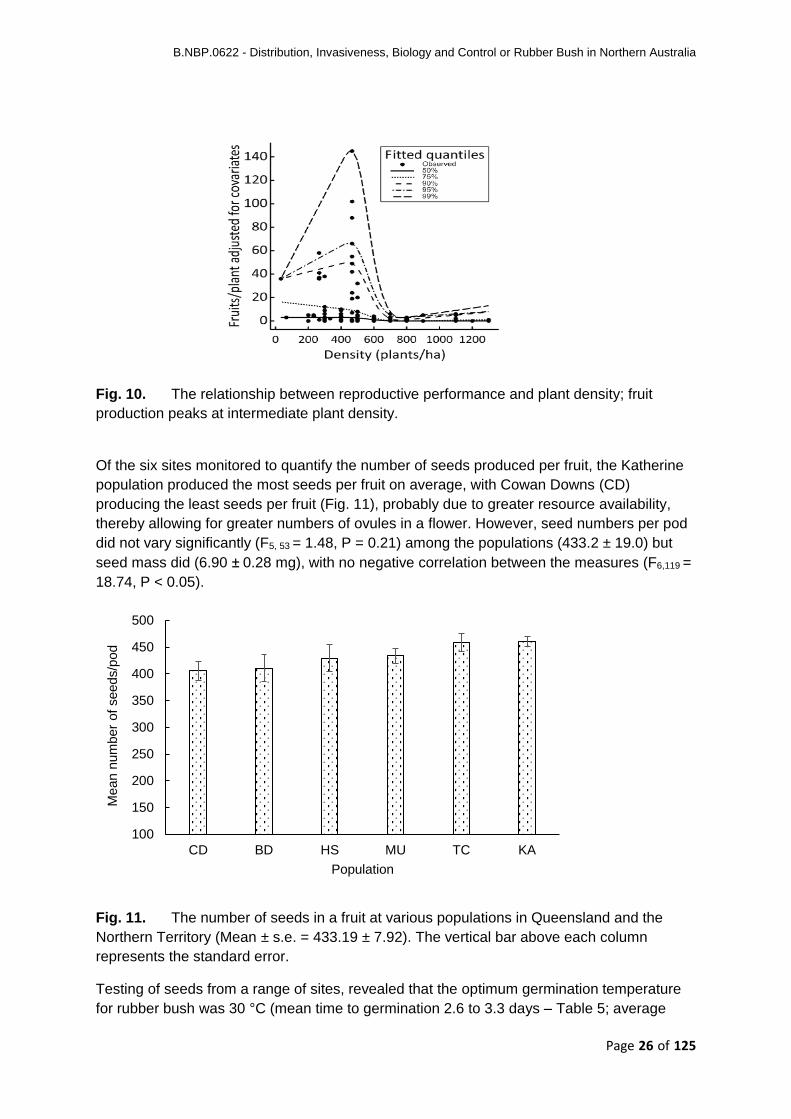
There was no Allee effect (i.e. no monotonic decline in mean individual fitness at lower
densities or population size) and fruit production per plant (fecundity) was lower above and
below intermediate densities (250-500 plants/ha) of flowering plants (Fig. 10). Low pollinator
pressure at low plant densities and pollinator satiation (i.e. greater than normal pollen
limitation) at high plant densities may account for these fruit production trends. In support of
this proposition, per plant pollinator visitation rates were low at low and high plant densities,
and greatest at intermediate densities, while pollen supplementation experiments showed
that rubber bush is pollinator limited even at intermediate densities.
B.NBP.0622 - Distribution, Invasiveness, Biology and Control or Rubber Bush in Northern Australia
Page 26 of 125
Fig. 10. The relationship between reproductive performance and plant density; fruit
production peaks at intermediate plant density.
Of the six sites monitored to quantify the number of seeds produced per fruit, the Katherine
population produced the most seeds per fruit on average, with Cowan Downs (CD)
producing the least seeds per fruit (Fig. 11), probably due to greater resource availability,
thereby allowing for greater numbers of ovules in a flower. However, seed numbers per pod
did not vary significantly (F5, 53 = 1.48, P = 0.21) among the populations (433.2 ± 19.0) but
seed mass did (6.90 ± 0.28 mg), with no negative correlation between the measures (F6,119 =
18.74, P < 0.05).
Fig. 11. The number of seeds in a fruit at various populations in Queensland and the
Northern Territory (Mean ± s.e. = 433.19 ± 7.92). The vertical bar above each column
represents the standard error.
Testing of seeds from a range of sites, revealed that the optimum germination temperature
for rubber bush was 30 °C (mean time to germination 2.6 to 3.3 days – Table 5; average
100
150
200
250
300
350
400
450
500
CD BD HS MU TC KA
Mean n
um
ber
of
seeds/p
od
Population
B.NBP.0622 - Distribution, Invasiveness, Biology and Control or Rubber Bush in Northern Australia
Page 27 of 125
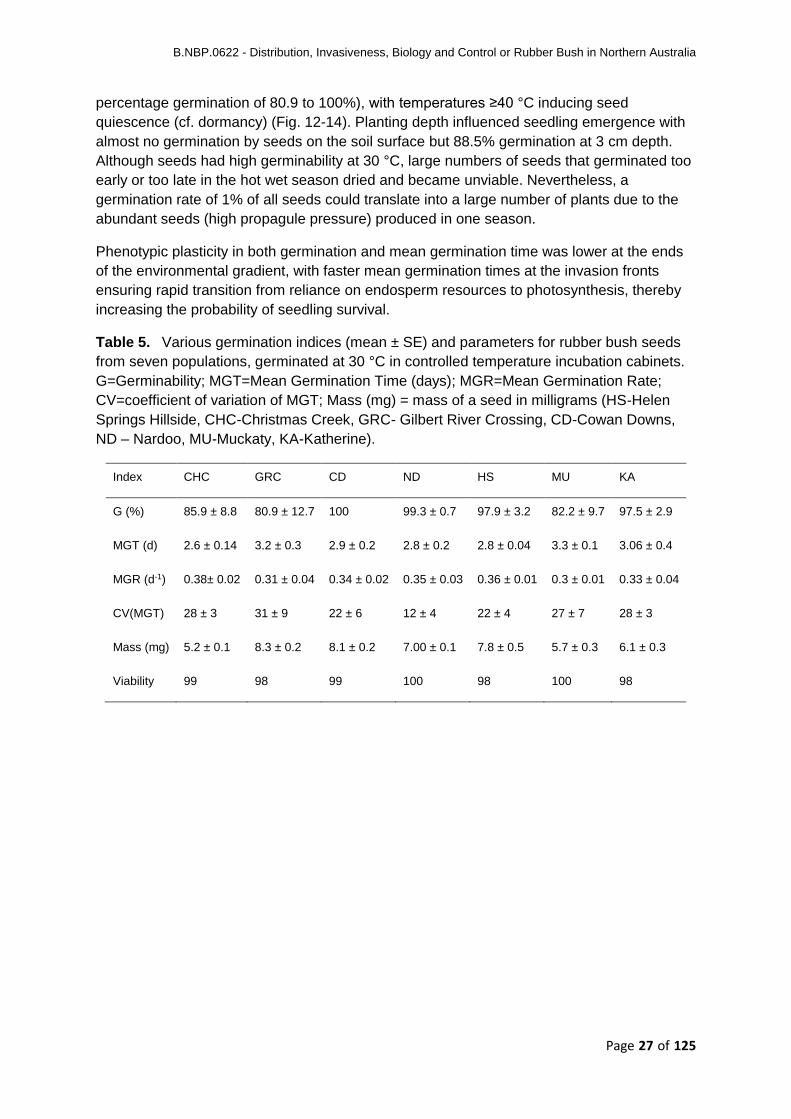
percentage germination of 80.9 to 100%), with temperatures ≥40 °C inducing seed
quiescence (cf. dormancy) (Fig. 12-14). Planting depth influenced seedling emergence with
almost no germination by seeds on the soil surface but 88.5% germination at 3 cm depth.
Although seeds had high germinability at 30 °C, large numbers of seeds that germinated too
early or too late in the hot wet season dried and became unviable. Nevertheless, a
germination rate of 1% of all seeds could translate into a large number of plants due to the
abundant seeds (high propagule pressure) produced in one season.
Phenotypic plasticity in both germination and mean germination time was lower at the ends
of the environmental gradient, with faster mean germination times at the invasion fronts
ensuring rapid transition from reliance on endosperm resources to photosynthesis, thereby
increasing the probability of seedling survival.
Table 5. Various germination indices (mean ± SE) and parameters for rubber bush seeds
from seven populations, germinated at 30 °C in controlled temperature incubation cabinets.
G=Germinability; MGT=Mean Germination Time (days); MGR=Mean Germination Rate;
CV=coefficient of variation of MGT; Mass (mg) = mass of a seed in milligrams (HS-Helen
Springs Hillside, CHC-Christmas Creek, GRC- Gilbert River Crossing, CD-Cowan Downs,
ND – Nardoo, MU-Muckaty, KA-Katherine).
Index CHC GRC CD ND HS MU KA
G (%) 85.9 ± 8.8 80.9 ± 12.7 100 99.3 ± 0.7 97.9 ± 3.2 82.2 ± 9.7 97.5 ± 2.9
MGT (d) 2.6 ± 0.14 3.2 ± 0.3 2.9 ± 0.2 2.8 ± 0.2 2.8 ± 0.04 3.3 ± 0.1 3.06 ± 0.4
MGR (d-1) 0.38± 0.02 0.31 ± 0.04 0.34 ± 0.02 0.35 ± 0.03 0.36 ± 0.01 0.3 ± 0.01 0.33 ± 0.04
CV(MGT) 28 ± 3 31 ± 9 22 ± 6 12 ± 4 22 ± 4 27 ± 7 28 ± 3
Mass (mg) 5.2 ± 0.1 8.3 ± 0.2 8.1 ± 0.2 7.00 ± 0.1 7.8 ± 0.5 5.7 ± 0.3 6.1 ± 0.3
Viability 99 98 99 100 98 100 98

B.NBP.0622 - Distribution, Invasiveness, Biology and Control or Rubber Bush in Northern Australia
Page 28 of 125
Fig. 12. (a) Probability of seed germination for a given temperature (R2= -0.35, F5, 6299
=437.95, P<0.001), and (b) Mean germinability of seeds from different populations across all
temperature levels. The vertical bar above each column represents the standard error.
Fig. 13. (a) Mean germination time for all seed samples at various temperatures, and (b)
Mean germination time of seeds from different populations (sites arranged from highest to
lowest summer temperature). The vertical bar above each column represents the standard
error.
0
0
0
0
0
0
0
Mean g
erm
inabili
ty
Population
0
0
1
1
2
2
3
3
Mean g
erm
ination t
ime (
d)
acro
ss t
em
pera
ture
levels
Population
0
1
2
3
4
5
6
20 25 30 35 40 45
Mean g
erm
ination t
ime (
d)
Temperature (° C)
0
0
0
0
0
0
0
0
20 25 30 35 40 45
Pro
babili
ty o
f germ
ination
Temperature (oC)
(b)
(a) (b)
(a)

B.NBP.0622 - Distribution, Invasiveness, Biology and Control or Rubber Bush in Northern Australia
Page 29 of 125
Fig. 14. Germination performance at 30 and 35 ºC of rubber bush seeds from different
populations. The vertical bar above each column represents the standard error.
The effect of water stress (Water potential-MPa) on seed germinability depended on the
temperature. Optimum germination temperature was modified by an interaction between
water potential and the germination temperature, for instance higher germination percentage
was attained at 20 °C across water potentials (Fig. 15) and the effect was significant (F2,372 =
275.5, P < 0.05).
.
Fig. 15. Germination temperatures of rubber bush seeds at various water potentials. The
vertical bar above each column represents the standard error.
0
0
0
0
0
0
0
0
0
0
1
CHC GRC CD ND HS MU KA
Pre
dic
ted g
erm
inabili
ty
Population from East to West
30°C
35°C
0
10
20
30
40
50
60
70
80
90
100
0 0 0 0
Germ
ination p
erc
ent
Water potential (MPa)
20
30
40

B.NBP.0622 - Distribution, Invasiveness, Biology and Control or Rubber Bush in Northern Australia
Page 30 of 125
In the age to reproductive maturity study, plants grown at low density (2 plants/pot) had few
resource constraints, displayed rapid growth and flowered at 11 months of age. At higher
seedling densities (≥ 6 plants/pot), plant growth was suppressed over time, with individuals
growing slowly if at all. Thus plant density at establishment and at maturity had significant
negative effects on plant size (stem diameter; F5, 30 = 9.94, P < 0.001 and height F5, 30 = 5.82,
P = 0.001). Small plant size results in a competitive disadvantage for pollinators that delays
reproduction even if plants produce flowers.
3.4 Seed Dispersal
3.4.1 Methodology
3.4.1.1 Dispersal modes
A search of the literature and anecdotal evidence was used to identify the modes of
dispersal that have been reported for rubber bush.
3.4.1.2 Dispersal kernels
Seed dispersal was investigated at three sites in the Barkly Region that differed in
topography. Two sites had flat terrain while one was hilly. Tests were performed during
windy, gentle breeze and calm periods of the day, to obtain different wind speeds. Each
time, freshly harvested seeds (with wings or pappi) were released from various heights and
their dispersal distance measured. Before each simulation, the ground at the experimental
site was inspected to ensure there were no residual seeds. The direction of dispersal on
release was marked. The distances travelled by seeds were sampled by distance categories
or bins, and seeds at different distances were counted in quadrats.
3.4.2 Results
3.4.2.1 Dispersal modes
The search of the literature in combination with anecdotal evidence indicated that rubber
bush is mainly wind dispersed, although other mechanisms, such as water and human
mediated dispersal (e.g. contaminated vehicles and machinery), play a role. Rubber bush is
currently spreading down several water courses and the dispersal of seeds on
vehicles/machinery or by human beings occurs, but probably plays a minor role compared to
wind. We also observed limited instances (Plate 5) where rubber bush seedlings were
emerging from cattle dung, but do not believe that the fruits are generally sought after by
livestock as a food source. It is most likely that they are inadvertently consumed at some
locations during periods when cattle actively eat the leaves and smaller stems of rubber
bush.

B.NBP.0622 - Distribution, Invasiveness, Biology and Control or Rubber Bush in Northern Australia
Page 31 of 125
Plate 5. Rubber bush seedlings emerging from cattle dung.
Rubber bush seeds possess a coma (silky tuft) that confers buoyancy, both in air and water.
On particularly hot days, the seeds are lifted by thermal currents, and once they attain a
certain height, may be transported over relatively long distances (>1 km). In the Barkly
Tablelands, there are few impediments to the movement of airborne seeds as most of the
vegetation is short, or predominantly grassland. Secondly, there are few topographical
barriers, such as mountains, and wind dispersal efficiency is maximised. In the Gulf of
Carpentaria, it is reported that many seeds float on water, thus some rubber bush
populations occur on the shores of islands, interfering with turtle nesting (Bill Jackson,
personal communication).
3.4.2.2 Dispersal kernels
The dispersal distance of rubber bush seeds was bimodal and depended on the degree of
uplift attained by the seeds at the point of release. The seeds attained higher uplift in gentle
wind during hot weather when thermal air currents were strongest. Seeds can be blown long
distances after attaining sufficient uplift. Most seeds, however, landed between 10 and
40 metres from the parent plant, with approximately 7.5% of the seeds blown out of sight.
Some of the key factors that determined how high a seed was carried included the
temperature of the ground surface, which creates thermal currents, seed terminal velocity,
wind speed and the height from which the seed was released (Fig. 16). The milkweed bug
(Oncopeltus fasciatus) was common on branches and below the canopies of rubber bush
plants (Enock Menge, personal observation). It laid eggs in fruit and fed on seeds that fell
under the canopy of parent plants, thus seeds that dispersed farther escaped predation.
Field observations of young populations that were adjacent to older ones at the three sites
showed that groups of seedlings are likely to establish at distances of 1000-1500 m from
parent populations after long-distance dispersal. The near dispersal kernel has a greater
proportion of seeds falling between 5-20 meters from the parent plant and is responsible for
localised population saturation.

B.NBP.0622 - Distribution, Invasiveness, Biology and Control or Rubber Bush in Northern Australia
Page 32 of 125
Fig. 16. Dispersal kernel of rubber bush seeds at various wind speeds.
3.5 Competition and invasiveness
3.5.1 Methodology
3.5.1.1 Exclosure experiment
The competitive ability of rubber bush was assessed by sowing seeds on plots subjected to
various levels of disturbance within fenced exclosures at two sites with different soil and
environmental conditions. The soil at Helen Springs was mainly deep and black cracking
clay soil, while at Katherine, the soil was red and sandy. Helen Springs receives about
500 mm annual rainfall while Katherine receives ~1200 mm annual rainfall.
At Helen Springs, there were 12 exclosures while at Katherine, there were 10 exclosures,
each with 10 treatment subplots per exclosure. Each of the subplots was treated by one of
the following: CL – the grass was clipped to simulate light grazing, CLHO – the grass was
clipped and the subplot hoed, CLSD – clipped and then seeds broadcast on the ground,
CLHOSD – clipped, hoed and seeds broadcast on the ground, HO – hoed removing all
grass, HOSD – hoed and seeds raked into the soil to simulate high levels of disturbance, GZ
– plot outside the exclosure, grazed, GZSD – outside the exclosure, grazed but seeds
broadcast on the ground, UN – undisturbed, UNSD – undisturbed and seeds broadcast on
the ground. Germination performance was monitored for a month. The experiment was
repeated twice at each site, i.e. November 2011 and 2012 at Helen Springs; and March and
November 2014 at Katherine.
3.5.1.2 Competition experiment
Barley Mitchell grass seeds (Astrebla pectinata) were collected from several plants from
Helen Springs and grown in pots in a greenhouse together with and separately from rubber
bush seeds collected from the same site. Plants were grown in pots filled with cleaned river
sand and were irrigated twice daily for five minutes. Growth performance indicators, such as
height, stem diameter, leaf width and length, were recorded. The grass and rubber bush
-2
8
18
28
38
48
58
0-5 5 to 10 10 to 15 15-20 20-25 25-30 30-35 …... Beyondsight
Per
cen
tage
of
see
ds
Distance class (m)
7.3 (km/hr) 13 (km/hr) 20 (km/hr) 22 (km/hr)

B.NBP.0622 - Distribution, Invasiveness, Biology and Control or Rubber Bush in Northern Australia
Page 33 of 125
seedlings were harvested after three months and the shoot and root dry matter of both
species determined. Plant material was dried for 72 hours in an oven at 60 °C and weighed.
The performance of each species in mixture was compared with their performance in
monoculture.
3.5.2 Results
3.5.2.1 Exclosure experiment
At both field sites (i.e. Katherine and Helen Springs), the experimental evidence that seeds
need to be covered by soil to germinate was confirmed. Earlier laboratory experiments
demonstrated that temperature was an important determinant of germination performance
and that soil cover likely helped to modify the temperature environment thus enhancing
germination. At both HS and KA, no seed germination was recorded in undisturbed subplots
where seeds were sown on the soil surface (Fig. 17).
The treatments (subplots) represented increasing levels of disturbance to the soil surface
and, accordingly, increasingly disturbed conditions for rubber bush seed germination. The
treatments that removed grass cover, as well as turned over the soil surface, displayed the
best germination success at both Helen Springs and Katherine (10-20%; F9, 119 = 12.7, P
< 0.001; and F 9, 89 = 3.9, P < 0.05 respectively). A Mantel Test to compare germination
performances at HS and KA showed they were comparable (r = 0.56).
Fig. 17. Germination of seeds in exclosure plots at different levels of disturbance. CL – clipped, HO – hoed, CLHO – clipped and hoed, UNSD – undisturbed and seeded, CLSD – clipped and seeded, GZSD – grazed and seeded, CLHOSD – clipped hoed and seeded, and HOSD – hoed and seeded.
3.5.2.2 Competition experiment
The shoot mass of barley Mitchell grass was significantly reduced (F1, 106 = 15.42, P < 0.05)
when grown together with rubber bush (0.06 ± 0.01 g) compared to the monoculture
(0.1 ± 0.01 g). In contrast, the mean root mass of barley Mitchell grass was not significantly
different between the mixed (0.03 ± 0.004 g) and monoculture grass treatments
(0.04 ± 0.01).
The root biomass of rubber bush plants was significantly reduced by the presence of grass
seedlings in the same medium (F1, 132 = 37.51, P < 0.05). Mean root mass of rubber bush in
mixed culture was 0.05 ± 0.01 g compared to 0.13 ± 0.01g when grown as a monoculture.
0
5
10
15
20
25
% G
erm
ination
Treatment type - Helen Springs
0
2
4
6
8
10
12
14
% G
erm
ination
Treatment type - Katherine
B.NBP.0622 - Distribution, Invasiveness, Biology and Control or Rubber Bush in Northern Australia
Page 34 of 125
Similarly, the shoot biomass of rubber bush plants was significantly reduced (F1, 132 = 41.84,
P < 0.05), with mean shoot mass in monoculture averaging 0.31 ± 0.03 g, compared to only
0.1 ± 0.01 g in mixed culture.
Whereas rubber bush affects the development of the shoot in the grass species, the grass
species is a stronger competitor as it reduces both the shoot and root biomass of rubber
bush. The reduction in the shoot mass of barley Mitchell grass suggests that pasture
production is likely to be reduced within rubber bush infestations.
3.6 Distribution and rate of spread
3.6.1 Methodology
Several sources were used to compile a comprehensive list of rubber bush occurrences
throughout Australia. Locations were sourced from the online database Australia’s Living
Atlas (ALA 2014) as well as various Herbaria. In addition, rubber bush locations from
surveys undertaken by the Northern Territory Department of Land Resource Management
(Weeds Branch), together with records from on-ground surveys throughout the Northern
Territory carried out by the authors during this study, were included. In total, 5976 rubber
bush occurrence records were collated for mainland Australia. Most records were confined
to northern Australia and data and analyses were accordingly restricted to this region.
The MaxEnt tool (MaxEnt version 3.3.3k) available at http://www.cs.princeton.edu/
~schapire/maxent/ was used to model the current and potential distribution of rubber bush.
MaxEnt is a species distribution modelling software package that uses presence-only data to
estimate species’ potential distributions by finding the maximum entropy distribution (Elith
et al. 2006, Philips et al. 2006, Dudík 2007). The environmental variables that characterise
the environment at the species detection localities constrain the output distribution, and
these constraints are expressed as simple functions of the environmental variables called
features. A suite of environmental variables relating to the topography, fire history, soil
properties, climate and land use of the Northern Territory, were identified for inclusion in the
modelling to determine the major factors that were contributing to the spread of rubber bush
(Appendix 2).
As strong co-linearity can influence the results of MaxEnt models, a Principal Components
Analysis (PCA) was run on all continuous variables, using the GenStat Statistical Package
(VSN International 2012), prior to model building. PCA was conducted using a correlation
matrix (i.e. data were standardised to account for differences in unit measurements between
variables) on all of the data layers, except the categorical variables. If variables were
strongly correlated with one another, then the variable with the largest combined PC1 and
PC2 scores was selected for inclusion in MaxEnt modelling, while all other correlated
variables were discarded.
Jack-knife tests and response curves were used to determine the importance of each
environmental variable and to illustrate the effect of selected variables on the probability of
rubber bush occurrence (Appendix 3). Jack-knife tests provide an alternative estimate of
variable importance where each variable is excluded in turn, and a model created with the
remaining variables, then a model is created using each variable in isolation. Response
curves plot the specific environmental variables on the x-axis and the predicted probability of
suitable conditions, as defined by the logistic output, on the y-axis. Upwards trends for

B.NBP.0622 - Distribution, Invasiveness, Biology and Control or Rubber Bush in Northern Australia
Page 35 of 125
variables indicate a positive relationship and downward movements represent a negative
relationship; the magnitude of these movements indicates the strength of the relationship.
The MaxEnt model produced 10 species-distribution probability maps based on ten-fold
cross-validation. The 10 probability maps were then averaged to obtain a habitat suitability
map for rubber bush.
MaxEnt also offers a ‘projection’ option which allowed us to model the potential distribution
of rubber bush under predicted changed climate conditions. The model was first trained on
the environmental variables corresponding to current climate conditions, and then projected
using the same future climate scenario variables. We sourced future climate spatial data
from the Tropical Data Hub (https://eresearch.jcu.edu.au/tdh). To reduce uncertainty in
single global circulation model (GCM) predictions and offset errors in individual GCMs, we
used a multi-model ensemble average from the 18 GCMs provided for the RCP 4.5 emission
scenario (Gleckler et al. 2008, Pierce et al. 2009). We projected future potential distribution
using mean daily temperature (BioClim1) and mean annual rainfall (BioClim12), as they
were the only environmental variables available that corresponded to those used in the
current climate models.
A weed risk assessment (WRA) was also performed using the information generated from
the current research project and the published literature as inputs into the WRA tool
developed by the Commonwealth Department of Agriculture, Forestry and Fisheries
(Department of Agriculture 2015).
3.6.2 Results
Currently, rubber bush is mainly confined to the Northern Territory, northern Queensland and
north eastern border regions of Western Australia (Fig. 18). A closer inspection of the
presence data (based on when locations were recorded) over the last four decades, shows
that this species has expanded its range since the 1940s and still continues to spread. This
is aided mainly by a mixed mating system, a pollination system that is generalized at the
level of Order Hymenoptera - widely distributed effective pollinators in northern Australia,
and efficient wind dispersal of seed. Range expansion was assessed as part of evaluating
the weed risk posed by rubber bush. The main environmental predictors of current
distribution were distance to roads (25.3%), average rainfall (21%), mean temperature (21%)
wind (14.6%), beef density (13.6%) and vegetation type (4.6%). The models showed that the
current potential distributional range of rubber bush has not been saturated.

B.NBP.0622 - Distribution, Invasiveness, Biology and Control or Rubber Bush in Northern Australia
Page 36 of 125
Fig. 18. Current distribution of rubber bush across northern Australia (1940-2012) based on the sources outlined previously.
The projected distribution based on the future climate scenario extended further eastward
within the Northern Territory’s Roper-McArthur, Barkly and Alice Springs regions
(Fig. 19a-c), spreading into Queensland’s Carpentaria and Western regions. There was also
some projected spread into Cape York Peninsula. In Western Australia the main
concentration of projected spread was in the north-west and north-east regions with some
spread occurring into the northern Kimberley region of Western Australia. A slight
contraction of suitable conditions in the Northern Territory’s Darwin-Daly region and in the
arid centre around Alice Springs was also projected. Overall, the future climate scenario
predicts there will be more suitable conditions throughout the Northern Territory for rubber
bush (Fig. 20). Thus, rubber bush has not saturated its current potential distribution, and
climate change projections indicate that it will expand its current range in all surrounding
states.
Model performance was good (mean AUC±SD = 0.897 ± 0.021). Change in temperature,
based on the projected variables, provides more novel climatic conditions suitable for rubber
bush expansion than rainfall. Similar to the current potential distribution model, distance to
roads, average rainfall, mean temperature, wind, beef density and vegetation type were
included in the projection model. The projection model was expanded to include the whole of
northern Australia from northern Queensland to Western Australia. The model predictions
consistently showed a southward expansion of the suitable range of rubber bush under
projected future climate scenarios. In the Northern Territory, there is reduction in the current
non-suitable range under future climatic conditions (25.7%), while the increase in the
suitable range is considerable (between 22.2-715.8%; Table 6).

B.NBP.0622 - Distribution, Invasiveness, Biology and Control or Rubber Bush in Northern Australia
Page 37 of 125
Fig. 19. Current and potential future distribution of rubber bush across northern Australia: (a) Current environment suitability, (b) future environment suitability (under climate change) and (c) areas most at risk of future spread. For figures a and b, areas classified as less than 0.1 (clear) are unsuitable, with suitability increasing thereafter up to the most favourable areas with ratings of 0.6-1 (orange and red). For figure c, the greatest spread is anticipated in areas classified as >0.1 (red).

B.NBP.0622 - Distribution, Invasiveness, Biology and Control or Rubber Bush in Northern Australia
Page 38 of 125
Fig. 20. Potential future distribution of rubber bush in the Northern Territory. Red, orange and yellow colours show high probability of suitable conditions for rubber bush, while green and blue colours represent low predicted probability of suitable conditions. White areas indicate areas not suitable for rubber bush.
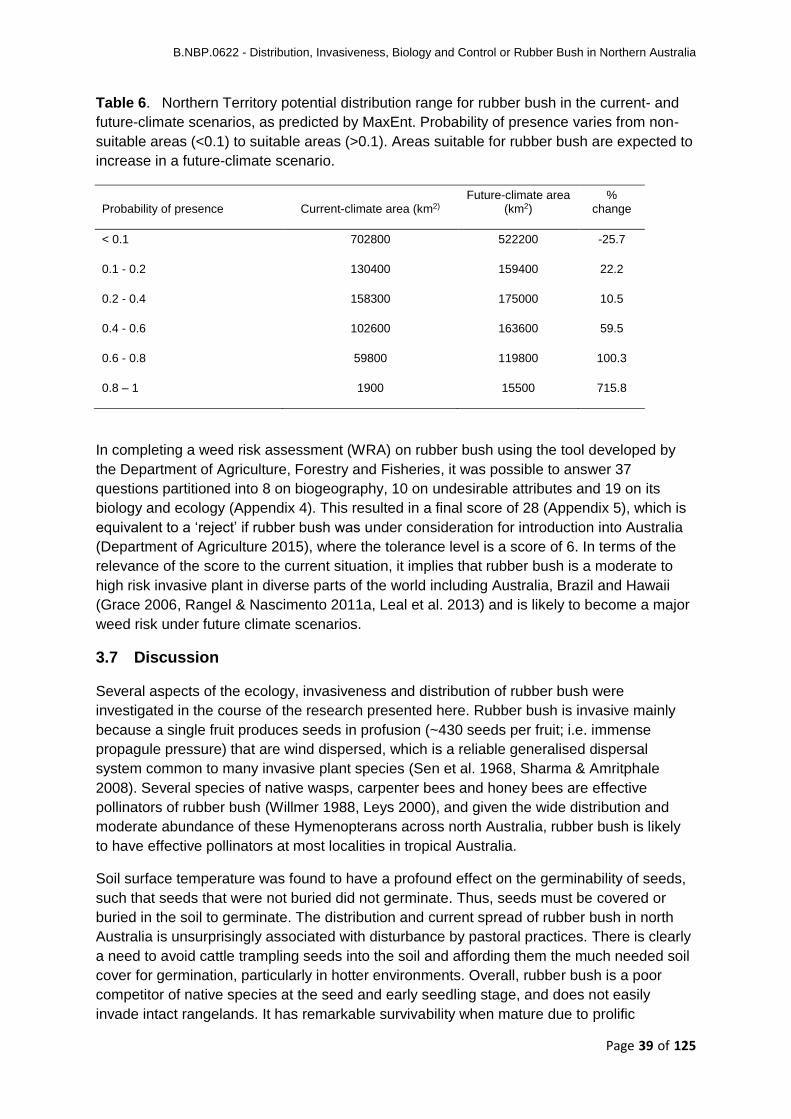
B.NBP.0622 - Distribution, Invasiveness, Biology and Control or Rubber Bush in Northern Australia
Page 39 of 125
Table 6. Northern Territory potential distribution range for rubber bush in the current- and
future-climate scenarios, as predicted by MaxEnt. Probability of presence varies from non-
suitable areas (<0.1) to suitable areas (>0.1). Areas suitable for rubber bush are expected to
increase in a future-climate scenario.
Probability of presence Current-climate area (km2) Future-climate area
(km2) %
change
< 0.1 702800 522200 -25.7
0.1 - 0.2 130400 159400 22.2
0.2 - 0.4 158300 175000 10.5
0.4 - 0.6 102600 163600 59.5
0.6 - 0.8 59800 119800 100.3
0.8 – 1 1900 15500 715.8
In completing a weed risk assessment (WRA) on rubber bush using the tool developed by
the Department of Agriculture, Forestry and Fisheries, it was possible to answer 37
questions partitioned into 8 on biogeography, 10 on undesirable attributes and 19 on its
biology and ecology (Appendix 4). This resulted in a final score of 28 (Appendix 5), which is
equivalent to a ‘reject’ if rubber bush was under consideration for introduction into Australia
(Department of Agriculture 2015), where the tolerance level is a score of 6. In terms of the
relevance of the score to the current situation, it implies that rubber bush is a moderate to
high risk invasive plant in diverse parts of the world including Australia, Brazil and Hawaii
(Grace 2006, Rangel & Nascimento 2011a, Leal et al. 2013) and is likely to become a major
weed risk under future climate scenarios.
3.7 Discussion
Several aspects of the ecology, invasiveness and distribution of rubber bush were
investigated in the course of the research presented here. Rubber bush is invasive mainly
because a single fruit produces seeds in profusion (~430 seeds per fruit; i.e. immense
propagule pressure) that are wind dispersed, which is a reliable generalised dispersal
system common to many invasive plant species (Sen et al. 1968, Sharma & Amritphale
2008). Several species of native wasps, carpenter bees and honey bees are effective
pollinators of rubber bush (Willmer 1988, Leys 2000), and given the wide distribution and
moderate abundance of these Hymenopterans across north Australia, rubber bush is likely
to have effective pollinators at most localities in tropical Australia.
Soil surface temperature was found to have a profound effect on the germinability of seeds,
such that seeds that were not buried did not germinate. Thus, seeds must be covered or
buried in the soil to germinate. The distribution and current spread of rubber bush in north
Australia is unsurprisingly associated with disturbance by pastoral practices. There is clearly
a need to avoid cattle trampling seeds into the soil and affording them the much needed soil
cover for germination, particularly in hotter environments. Overall, rubber bush is a poor
competitor of native species at the seed and early seedling stage, and does not easily
invade intact rangelands. It has remarkable survivability when mature due to prolific
B.NBP.0622 - Distribution, Invasiveness, Biology and Control or Rubber Bush in Northern Australia
Page 40 of 125
resprouting (Csurhes 2009, Biosecurity-Queensland 2013). Thus, ripping and burning are
not suitable or effective control methods of rubber bush. Resprouting allows rubber bush to
persist through the latter disturbances and regenerate from the soil seed bank when
conditions are suitable.
3.7.1 Reproduction
The synorganisation of the flower, while apparently complex and unusual in an invasive
species, provides reproductive assurance through self-compatibility and the transfer of
hundreds of pollen grains in solid pollinia (agglutinated pollen grains in a single sac) in one
pollination event. The successful transfer of a single pollinium results in several hundred
seeds produced per fruit and, under normal circumstances, the propagule pressure that
confers considerable invasive potential (Eisikowitch 1986b, Forster 1998, Fabricante et al.
2013).
The mutualism between generalised Hymenopteran pollinators and this invasive plant
species is a good example of a functional form of biotic interaction that influences invasion
success. We investigated the pollination ecology of rubber bush with the latter premise in
mind. In some instances, invasive plants are unable to spread in a new environment due to
reproductive failure brought about by a lack of suitable pollinators (failure of pollination
mutualism). This is usually taken into account when evaluating the weed risk posed by a
plant species. The rubber bush flower has a complex morphology and a pollination system
requiring the extraction of solid pollinia (pollen sacs) by the pollinator which, in turn, limits
pollination to larger wasps and a few larger bee species (Ali & Ali 1989). Nevertheless,
several native Hymenopterans with wide distribution in northern Australia are capable of
pollinating it. Some of the wasp species are native to dry and hot areas, and their life
histories require that they hibernate over winter (Evans 1966, Leys 2000, Tryjanowski et al.
2010). Thus although rubber bush flowers year-round, fruit set generally only occurs during
the hotter and wetter months of summer in the Northern Territory and exposes rubber bush
to pollinator limitation, whereas it fruits throughout the year in Queensland (Moodley et al.
2015).
Shifts in climate and/or range expansion by both rubber bush and pollinator species could
extend the fruiting season and accelerate invasion by rubber bush, bearing in mind that it
only takes one successful pollination event, even a self-pollination event, for the production
of hundreds of seeds in a single fruit. Interestingly, the mean number of seeds per fruit
(~430 seeds) for Australian populations is almost twice the number per fruit observed in
populations in India (native range) (230 ± 19 [x̄ ± SE]) (Sharma & Amritphale 2008). The
latter may arise because the Australian environment is more resource rich and thus more
pollen grains are produced in the pollinium, as well as more ovules in the fruits. Whatever
the explanation, more seeds per fruits exerts twice the propagule pressure on the Australian
environment, and highlights the greater invasive potential of rubber bush in Australia than
elsewhere where it is also considered a weed.
Wind dispersal poses one important challenge for invasive plants – that is, the lack of mates
when plants establish as singletons (Lipow & Wyatt 2000, Petanidou et al. 2012, Chrobock
et al. 2013). When plants are not self-compatible, the single individual is unable to reproduce
until a second plant establishes and this slows the process of invasion. Invasive species
however, are known to have a facultative breeding system where they can reproduce

B.NBP.0622 - Distribution, Invasiveness, Biology and Control or Rubber Bush in Northern Australia
Page 41 of 125
through self-fertilisation or cross-pollination (Petanidou et al. 2012). Rubber bush uses self-
compatibility to achieve reproductive assurance that confers significant invasive potential
and is also able to cross breed.
The flowering and fruiting phenology of plants may contribute to their invasive
characteristics, particularly if their phenology helps to ensure reproductive success under
diverse climatic conditions. In addition, climate change modifies the phenology of both plants
and animals (Visser & Both 2005, Cleland et al. 2007), and could consequently influence
existing mutualisms in the future. In Australia, rubber bush has a characteristically long
flowering season. This is thought to be a response to low pollinator pressure (Alonso 2004,
Chrobock et al. 2013), which ultimately results in stand density-dependent rates of fruiting
and seed set. In its native range, rubber bush flowers for a short period of the year (Willmer
1988, Sharma & Amritphale 2008). The long flowering season in Australia and other invaded
regions maximises reproductive opportunity (and invasive potential) where Hymenopteran
pollinators are generally at low densities and even absent during the winter months (Evans
1966). Under future climate scenarios, temperatures are predicted to increase and the wet
season is likely to be shorter and the dry season longer. Thus, it is likely that the fruiting
season for rubber bush will be longer. Management from year to year will need to factor in
the observed changes in the lengths of seasons. Rubber bush stands in the northern regions
of the range of rubber bush where pollinators do not ‘over-winter’ (or hibernate) should be a
high priority for control.
3.7.2 Seed dispersal and biology
Rubber bush seeds possess a coma (silky tuft) that is an adaptation for wind dispersal, and
our observations show that wind dispersal is responsible for localised population saturation.
Major long distance dispersal events, such as from continent to continent or from region to
region, were almost certainly mediated by humans. However, we could not ascertain if
humans have continued to disperse rubber bush seeds, and the genetic analyses needed to
determine whether rubber bush has expanded its range from several or a few points of
introduction (Cain et al. 2000) is a future research priority (see Section 5.3). Human
supported seed dispersal could release the invasion process and rubber bush populations
from low genetic diversity caused by the limitations of a self-compatible breeding system
(Ward 2006).
At the local level, wind dispersal is an effective and reliable dispersal agent of rubber bush
seeds. The overall local dispersal kernel across all sites and conditions was bimodal where
most of the seeds were dispersed to a near distance and a small percentage (~7.5%) of the
seeds was blown beyond sight, potentially contributing to long-distance dispersal. Seed
uplifting probability sets an upper bound on the probability of long-distance colonisation
(Nathan et al. 2002). Thermal currents are common in the Barkly region particularly when
there is strong sunshine and gentle wind. Although the proportion of seeds that were uplifted
was less than 0.1 in this study, this low incidence is still important because a viable
population can start with a single plant. Careful management of grazing is critical, particularly
for paddocks that are downwind from any large infestations, because with 7.5% of seeds
dispersing over relatively long distances, these plants escape the challenges associated with
high-density populations, such as competition for resources and pollinators, consequently
having high establishment success and thus need to be eradicated.

B.NBP.0622 - Distribution, Invasiveness, Biology and Control or Rubber Bush in Northern Australia
Page 42 of 125
The near dispersal kernel had a greater proportion of seeds falling between 5-20 m from the
parent plants, thus over time, plants that are close together are likely to have higher than
expected genetic similarities, and consequently inbreeding. This is indirectly supported by
evidence of lower phenotypic plasticity of germination traits in populations at potential
invasion fronts in both the west and east of rubber bushes range in north Australia.
Nevertheless, small founder populations in wind dispersed species have been reported to
attain rapid genetic and demographic homogenization thus overcoming negative effects of
inbreeding (Machon et al. 2003).
Rubber bush plants produce thousands of wind-dispersed seeds during the fruiting season.
Wind dispersal causes seed to be deposited at random in different microsite conditions.
Thus, unsurprisingly, rubber bush seeds are adapted to cope with these varied conditions,
for example, by having quiescent (Yang et al. 2012) seeds. Ordinarily, non-dormant seeds
cannot complete germination when one or more of the primary requirements (temperature,
moisture, light, oxygen) is sub-optimal, such as if the temperature is not in a critical range
(Dalling et al. 2011). In dormant seed, the seed coat prevents imbibition and the seed has to
undergo certain treatment(s) to break dormancy, such as scarification, chilling or several
drying and cooling cycles. In contrast, quiescent seeds germinate immediately conditions are
suitable and do not require strictly defined dormancy-breaking events to germinate. Rubber
bush seeds are mostly quiescent and were observed to produce a gelatinous water retaining
substance around the emerging radical when germination was interrupted, which offers
some protection in the short-term to fluctuating environmental conditions (Huang et al. 2008,
Yang et al. 2012). Although seed lots used in our study exhibited high germinability, the
literature does report a few instances of low-level dormancy in rubber bush. Between 2%
and 35% of rubber bush seeds collected from an Indian population (Amritphale et al. 1984)
and ≤ 6% from a Brazilian population, were reported to be dormant (Labouriau & Valadares
1976). Low-level dormancy may prolong the longevity of some rubber bush seed banks
beyond those reported in the current study.
Surprisingly, at low water potential, rubber bush seeds mostly germinated at temperatures
below 30 °C, perhaps an indication that water stress lowers the optimum germination
temperature in rubber bush, as in some other wind dispersed species, such as Egyptian
broomrape (Orobanche aegyptiaca) (Kebreab et al. 1999, Kebreab & Murdoch 2000) that
are adapted to dry environments. Imbibed seeds deteriorate rapidly if conditions are not
conducive to germination (e.g. exposed on the soil surface or an unsuitable substrate), and
have much reduced viability and longevity (of the order of a few months). Combined with
profuse seed production and wind dispersal, seed quiescence thus ensures rubber bush
maximises opportunities within its regeneration niche.
The high germination rates of rubber bush seed under hot tropical temperatures in our study
was consistent with those reported in a Brazilian study (Labouriau & Valadares 1976), where
germination was highest between 23 and 33 °C. It is plausible that longevity could be
extended in areas that receive periods of extreme temperatures (too hot or cold) that may
prevent germination. For example, Labouriau & Valadares (1976) recorded little germination
once temperatures reached ≥34 °C, but germination of these same seeds once
temperatures fell to 30 °C. Besides these potential inhibitory effects on germination, surface
seeds exposed to very high temperatures in summer may become unviable.
B.NBP.0622 - Distribution, Invasiveness, Biology and Control or Rubber Bush in Northern Australia
Page 43 of 125
The ability of rubber bush to germinate in soils at depth suggests that light is not a necessary
condition for germination and is consistent with findings of Leal et al. (2013) who reported
high germination under a range of light intensities ranging from 0 to 100%.
In summary, the high germinability of rubber bush seed results in it having a relatively short
lived seed bank (<2 years) if favourable temperature and rainfall conditions prevail (Bebawi
et al. 2015). It is therefore dependent on regular replenishment from reproductive adult
plants for substantial seedling emergence. Consequently, large scale recruitment is most
likely within the first 12 months of control programs, and land managers could potentially
achieve effective control of rubber bush patches in a 2-3 year timeframe, if they are able to
kill all original plants and undertake follow-up control frequently enough to prevent any new
plants from reaching reproductive maturity. This is based on the assumption that
replenishment of the seed bank is not occurring from external sources (e.g. wind and water
dispersal). With regards to the frequency that follow up control would need to be undertaken,
plants in the age to reproductive maturity study took at least 11 months to flower at low plant
densities. In a pot trial in Queensland, plants took an average of six months to flower (range
of 4-8 months) and 13.5 months (range of 13-14 months) to produce pods (Bebawi et al.
2015). Therefore, follow up control activities undertaken ~12 monthly should avoid
replenishment of soil seed banks, although six monthly intervals would be preferable, to
provide two opportunities to find and control any new plants before they reach reproductive
maturity.
3.7.3 Competitiveness and invasiveness
As a general rule, invasive species that have generalised breeding systems and seed
biology, tend to overlap with native species in habitat and resource use, and are thus not
good competitors and cannot easily invade intact native habitat (Lockwood et al. 2007).
Support for competitive resistance of intact native habitats to invasion by weed species
comes from grasslands (Petryna et al. 2002) and shrublands (Keeley et al. 2003). Rubber
bush is no exception to this rule and displayed no to low rates of establishment in intact
native habitat, but establishment rates of 10-20% of seeds in disturbed native habitat,
particularly where superficial soils had been turned over by disturbance (see Vincke et al.
2010), for example by cattle or on roadside berms. Once established, rubber bush plants
persist even in arid environments, mainly due to superior drought resistance of mature plants
(Boutraa 2010, Boutraa & Akhkha 2010, Tezara et al. 2011) and the ability to re-sprout
(Grace 2006).
Our competition experiment demonstrated that rubber bush suppressed the shoot mass of
the native barley Mitchell grass. However, the grass species was a more effective
competitor, reducing both the root and shoot mass of rubber bush. Interactions between an
invading species and a native one may take many forms including allelopathy (Cheam
1984a,b) and exploitation competition (i.e. differential efficiency of resource acquisition)
(Vance 1984). Any reduction in grass production is a major concern to graziers as pastures
are the main feed resource for cattle. Thus, rubber bush is an undesirable component of
rangelands because, where established in paddocks, it does reduce the amount of pasture
produced by native grass species. In contrast, Cheam (1984a,b) showed that the invasive
buffel grass (Cenchrus ciliaris) had a competitive interaction with rubber bush, such that
rubber bush was excluded by the grass. Overall, rubber bush is not overly competitive and

B.NBP.0622 - Distribution, Invasiveness, Biology and Control or Rubber Bush in Northern Australia
Page 44 of 125
does not easily invade intact rangeland, accounting for why it is most abundant in disturbed
rangelands.
Understanding the relationship between disturbance and establishment success is essential
because disturbance is an important component of any ecosystem that shapes community
species composition (Hobbs & Huenneke 1992). Disturbance may facilitate plant species
invasions (Hierro et al. 2006). Our exclosure experiments clearly demonstrated under natural
conditions in the field that seeds deposited on the soil surface were unlikely to germinate,
but germinated at rates of 10-20% where the soil treatments simulated trampling and
turnover by cattle. Thus, in the wild, although rubber bush produces numerous efficiently
dispersed seeds, populations do not always grow as fast as expected. The need to manage
propagule pressure (i.e. prevent successful seedling establishment) was clearly indicated in
the exclosure experiments.
From observations in the field, rubber bush populations are often associated with areas
receiving high grazing pressure by cattle (e.g. close to watering points) and facilitated by
animal/mechanical disturbance, as predicted by Hierro et al. (2006). Cattle bury rubber bush
seeds ensuring high germination. Surprisingly, the role of soil type on the germination
performance of rubber bush seeds in the exclosures was negligible, as there was no
difference between black cracking soils (Barkly Tablelands) and red sandy soils (Katherine).
3.7.4 Distribution and rate of spread
Two important ecological questions are central to determining the invasiveness of rubber
bush: (1) does the current distribution of rubber bush cover all of its environmentally
determined potential distribution; and (2) will the range of the species expand or contract
with climate change? To answer these questions we used species distribution models
(SDM’s). The ability to predict future species distributions is important and has become
common due to the availability of powerful software packages that are able to match the
occurrences of a species with environmental variables (Philips et al. 2006, Thuiller et al.
2009). These features are then used as constraints for predicting future distribution.
Maximum Entropy Modelling (MaxEnt) tool is one such software package (Philips & Dudik
2007) and has been used with high reliability in several cases (i.e. Kumar & Stohlgren 2009)
and was adopted for our study. Among the predictor variables of current distribution of
rubber bush, the most important were mean distance to roads, mean rainfall and mean
temperature. The other environmental factors were wind (speed and direction) and beef
density. Vegetation type had only a slight influence (4.6%) on current rubber bush
distribution, which is consistent with our current understanding of the species’ ecology. Mean
distance to roads and beef density are factors associated with rangeland management
practices that may predispose an area to infestation. For example, during the dry season the
maintenance of roads on properties and animal trampling around watering points buries
seeds, thus improving the likelihood of seed germination at these disturbed sites. Currently
rubber bush occupies only a part of its potential range, and furthermore, its occurrence is
closely associated with road infrastructure, bores, mustering yards and disused mine sites.
Thus, its range expansion is strongly associated with range management practices/human
activity. Some minor changes in infrastructure (such as use of water tanks in place of
earthen dams or ‘turkey nests’) may help mitigate this mode of spread. A review of grazing
management practices may be warranted in some cases depending on the invasive risk
profile of a property.

B.NBP.0622 - Distribution, Invasiveness, Biology and Control or Rubber Bush in Northern Australia
Page 45 of 125
Projecting rubber bush distribution under future climate conditions, we used mean rainfall
and mean temperature, which we have demonstrated have significant effects on seed
germination. Temperature may have other effects besides directly acting as a cue for various
physiological processes. It affects pollinator-flower mutualisms in that temperature
determines availability of pollinators (Eisikowitch 1986b, Willmer 2011). Because rubber
bush is wind dispersed, the dispersal distances will be influenced by topography and
changes to wind dynamics under future climate (Nathan & Muller-Landau 2000, Nathan et al.
2011). Based on temperature and rainfall projections of future climate scenarios, rubber
bush may expand its range by between 22.2-715.8% across the Northern Territory and the
neighbouring states. There are low-density populations of rubber bush in the Kimberley
region of Western Australia, and the species tolerates salty soils to establish on beach sand
in the Gulf of Carpentaria where it interferes with turtle breeding. Rubber bush has, however,
not occupied all its suitable range mainly because of scarcity of suitable microsites (i.e.
disturbed sites) and dispersal limitations. Projected climate changes are likely to lengthen
the fruiting season of existing populations and increase the invasive capacity. Properties that
neighbour large infestations are at risk, thus a regional approach to the management of
rubber bush is advisable. Overall, the future climate scenario predicts there will be more
suitable conditions for rubber bush throughout the Northern Territory and neighbouring
States. This prediction is similar to the predicted spread of other woody weeds such as
prickly acacia (Vachellia nilotica) (Kriticos et al. 2003) and parkinsonia (Parkinsonia
aculeata) (Van Klinken et al. 2009).
3.7.5 Controlling rubber bush
While the ultimate aim of any control program would be the total eradication of rubber bush
this is not always possible at a site for logistical reasons, cost, and because regeneration
from soil seed banks or by resprouting will inevitably demand several follow-up treatments.
The dispersal mechanisms of rubber bush also means that reinvasion from neighbouring
infestations is also a possibility. Nevertheless, our research findings provide some best
practice guidelines for managing rubber bush:
1. Timing control activities to coincide with winter (cooler months or dry season in the
Northern Territory) is not only practical and advisable, but also likely to achieve greater
success because pollinators are not abundant and thus, the few plants that escape
treatment will produce relatively fewer fruit in the following summer season.
2. With fruit production peaking at intermediate stand densities (isolated = 1-100 plants in
an area at densities of 1-5 plants/ha; low density = <250 plants/ha; medium density =
250-500 plants/ha; high density >500 plants/ha), management of this weed should take
advantage of low pollinator pressure at low stand densities to aid in controlling
naturalised stands:
a. Because ‘low’ density populations are pollen limited and produce fewer fruits per
plant, control programs should aim at initially reducing stand densities to no
reproductive trees standing and then undertake follow-up to remove seedlings that
may appear afterwards.
b. High density stands are pollinator limited and produce as many fruits per plant as low
density stands. Controlling these often large populations may best be achieved in
stages (for logistical or cost reasons), provided that stand densities are reduced to
low levels in one year, and there is follow-up treatment as soon as possible to
remove survivors and recruits, preferably within 6 months.

B.NBP.0622 - Distribution, Invasiveness, Biology and Control or Rubber Bush in Northern Australia
Page 46 of 125
c. On no account should control methods leave stands in medium density condition,
because at these densities reproduction is optimised and maximum numbers of fruits
per plant are produced. One is essentially farming rubber bush and maximising fruit
production under these conditions.
d. Where triage is required at a locality containing various densities, landholders should
consider targeting medium density stands first, then high density stands, followed by
low density and isolated stands.
e. Control (removal of individuals) activities should aim at killing all rubber bush plants
at a locality within two consecutive years. A follow-up third year is advisable to
remove regeneration by seeding and from the soil seed bank.
f. Lastly, isolated trees must be removed wherever encountered because a self-
compatible breeding system allows single individuals to exert considerable propagule
pressure, and establish a stand with in a few years if pollinators are present.
3. Avoid putting cattle into paddocks or disturbing established rubber bush stands during
the fruiting and seeding period (September to February). This will minimise burial of seed
through trampling by cattle, and in turn, germination and seedling establishment will be
much reduced.
4. Avoidance of grazing on such paddocks during fruiting may also help minimise
germination and establishment of new plants. Intense grazing pressure on a paddock
that removes ground cover will lead to the establishment of rubber bush if seeds are
present in the soil. Pastoralists can reduce establishment rates by avoiding putting cattle
into paddocks that have fruiting rubber bush plants in them.
5. Where livestock feed on rubber bush without negative effects (e.g. parts of the Barkly
and Katherine regions and in the Gulf of Carpentaria) (Plate 6), allowing them to browse
on the plants just before the onset of summer, and the peak flowering period, may also
disrupt reproduction by rubber bush. However, this management practice should not be
seen as a replacement for direct control methods that remove plants; only as an aid to
thinning stands.
Plate 6. A rubber bush stand after severe browsing by cattle in the Barkly region.
B.NBP.0622 - Distribution, Invasiveness, Biology and Control or Rubber Bush in Northern Australia
Page 47 of 125
6. At this time, no native herbivores are known that regulate rubber bush stand density. A
seed eating insect (Oncopeltus fasciatus) was found on fruits or below the canopy at
several of the sites in the Northern Territory and further research is required to
investigate its bio-control potential. Natural large-scale dieback of stands was also
observed at several sites in Queensland (See section 4.10.7) and more recently, in the
Barkly Tablelands Region of the Northern Territory. While there is a historical precedent
for diebacks of dense rubber bush stands, associated with long runs of drier than usual
years in the 1980s in the Victoria River District (Foran et al. 1985, Bastin et al. 2003), in
the diebacks observed in this project a leaf spot disease has been implicated. Further
research is recommended to ascertain the exact cause or synergy of causes (e.g. low
rainfall may promote leaf spot), which resulted in a 96% decline since December 2012 in
a population in the Gulf of Carpentaria Region.
7. A recommended practice is to ensure that all motor vehicles used in the transportation of
stock from infested to uninfested areas are cleaned of contamination, and hay from
infested areas should not be taken to uninfested areas. Anecdotal evidence suggests
that seeds also float on water, thus giving rise to populations on islands off Queensland’s
Gulf of Carpentaria. Control of rubber bush along water courses is thus a priority.
8. Mean temperature is predicted to increase under future climate conditions, with a shorter
wet season and a warmer and longer dry season. Thus, the fruiting season for rubber
bush is likely to be longer and aid further range expansion into regions adjacent to its
current range. Management from year-to-year will need to factor in the observed
changes in the lengths of fruiting seasons and interventions must be timed to occur
before fruit set, which in turn, may be determined by the timing of abundance of
Hymenopteran pollinators. Monitoring the latter may provide insights on when to initiate
removal of rubber bush in seasonally cooler parts of its range. In terms of the influence
of phenology on management strategies, the same strategy cannot be followed in
Queensland and the Northern Territory.
9. Rubber bush management zones could be established from Western Australia through
the Northern Territory to Queensland based on population sizes. On the basis of
available data, rubber bush populations in areas south of the 20th Parallel are sparse and
could be targeted for eradication. Populations found in areas between the 20th and the
14th parallels are mostly extensive and dense. These populations require a combination
of maintenance management and grazing management to minimize establishment of
new plants. Reduction in populations in the severely invaded areas should become
evident on infested properties within three to four years (i.e. 3-4 wet seasons). Locations
to the east of the Tablelands Highway and west of Alice Springs, have generally proven
less susceptible to rubber bush invasion over the last several decades. These locations
should be monitored continuously because if they get invaded, it will be a sign of the
failure of certain environmental filters that have limited the extensive colonisation of the
areas.
3.8 Weed risk assessment of rubber bush
Rubber bush has the reproductive capacity, efficient seed dispersal mechanisms, adaptation
of germination responses to unpredictable environmental conditions and plant longevity as a
result of resprouting, all of which make it currently a low to moderately invasive plant species

B.NBP.0622 - Distribution, Invasiveness, Biology and Control or Rubber Bush in Northern Australia
Page 48 of 125
in the Australian environment, with the potential to become a high risk weed in the future. A
weed risk assessment using the DAF Weed Risk Assessment system and incorporating the
findings of this project produced a score of 28. On the basis of tolerance limits proposed
under the DAF system, 7 is the basis for ‘rejecting’ a species under evaluation (Department
of Agriculture 2015) (See Appendix 4). Additionally, the plant is already invasive in Brazil
where it was introduced around the same time as in Australia (Grace 2006, Leal et al. 2013)
and in Hawaii (PIER 2011). Certain regional populations, such as those on the Barkly
Tableland and the Victoria River district, have had long residence and act as source
populations for future spread.
A regional approach to their management is warranted to mitigate risks to adjoining areas
where rubber bush has yet to establish. Like most weed species, the life history of rubber
bush is adapted to seed dispersal and early germination of seed, and it cannot easily invade
intact pastures and habitat. Consequently, rubber bush favours disturbed sites and its
invasive potential is, in large, part due to land management practices that cause disturbance
to intact habitat (roadsides, stock yards, around bores). Seed and pollination biology related
to the mode of seed dispersal cause reproduction to be density-dependent. This density
dependence should be exploited in controlling rubber bush by destroying mature plants
wherever they occur, by repeated thinning of established stands to low density stands and
the removal of isolated plants. Control measures should be applied over at least a 2-3 year
period. Rubber bush has not spread to the full extent of its potential current range and
climate change scenarios suggest that its range will expand in the future. Thus, controlling
rubber bush now is encouraged to avoid future spread and loss of pastoral productivity.
4 Control
4.1 Site Details
Chemical and mechanical control of rubber bush was investigated on cattle properties or
sites adjoining neighbouring properties. There were six trial sites in total including four in far
north Queensland and two in the Northern Territory (Fig. 21). The sites in the Gulf of
Carpentaria in Queensland (Sites 1, 2 and 3) were all located in pulled gidyea (Acacia
cambagei) country with the soils primarily shrinking and expanding deep, red, brown or grey
cracking clays. At site 4, scattered rubber bush was growing within the ballast of the old
railway line that had connected Greenvale to Townsville. It was the only woody vegetation
present but would have originally been eucalypt woodland and the soil under the ballast
material was a dark brown to yellow brown sandy loam. Sites 5 and 6 were both located in
the Mitchell grass Bioregion of the Northern Territory, where the soils are characteristically
uniform fine-textured soils (vertisols) and typically grey or brown cracking-clays (Fisher et al.
2002).

B.NBP.0622 - Distribution, Invasiveness, Biology and Control or Rubber Bush in Northern Australia
Page 49 of 125
Fig. 21. The location of field sites where control research was undertaken on rubber bush during the project.
Annual rainfall received at the sites whilst trials were being undertaken is shown in Table 7
and was based on SILO data drill output (Queensland Government 2015). Long term mean
average rainfall for each site is also presented and was obtained from records of the closest
official Bureau of Meteorology location that measured rainfall. The information was accessed
using Climate Data Online (Bureau of Meteorology 2015).
Table 7. Annual rainfall (mm) received at control sites whilst research was being undertaken and the long term average for these sites based on SILO data drill output.
Year Site 1 Site 2 Site 3 Site 4 Site 5 Site 6
2011 907 936 970 740
2012 724 726 706 666
2013 432 439 285 484
2014 513 534 462 690 940
2015* 184 179 163 466 327
Long term mean
708 708 612 649 400 454
*up until 28 March 2015
4.2 Control treatments trialled
In total, 11 separate trials were undertaken to test the efficacy of numerous herbicides
applied using a range of techniques. Three trials focussed on finding additional foliar options
to the two chemicals (metsulfuron-methyl and imazapyr) that are currently registered in a
minor use permit issued by the Australian Pesticides and Veterinary Medicines Authority
(APVMA; PER 12497). Initially, a preliminary screening experiment was undertaken,

B.NBP.0622 - Distribution, Invasiveness, Biology and Control or Rubber Bush in Northern Australia
Page 50 of 125
followed by a rate refinement trial, which incorporated a seasonality component. A third
study focussed on trying to explain the poor efficacy of metsulfuron-methyl when compared
with previous research findings reported in Vitelli et al. (2008). Cut stump and frilling
applications were tested in an initial trial incorporating two herbicides, which was followed by
a specific experiment to refine rates for glyphosate using the cut stump technique. Testing of
residual herbicides for control of rubber bush was undertaken, with an initial screening of
hexazinone and tebuthiuron based products demonstrating their potential. Three further
studies (two on tebuthiuron and one on hexazinone) were then undertaken to refine rates.
Besides different rates, the tebuthiuron trials incorporated placement position and
seasonality into the experimental design. Efficacy of aerial applications of tebuthiuron was
also monitored following commercial applications on the property where site 4 was located.
With most of the application techniques mentioned above used in several trials, a full
description is provided below to avoid duplication in subsequent sections (Table 8).
Thereafter, reference is only made to the application technique tested in respective trials.
Table 8. Application techniques implemented during the control research, the equipment used and how herbicides were applied.
Application technique Description
Foliar – backpack
applicator
A 15 L back pack sprayer (Swissmex®) with an adjustable solid
cone nozzle was used, with the foliage of each plant sprayed to
the point of run-off.
Foliar – spray rig An 800 L capacity dual reel Quik Spray® unit was used. It was
operated at 400 kpa pressure to spray the whole plant (foliage and
stems) to the point of run-off.
Basal bark - traditional An 8 L handheld pneumatic sprayer (Swissmex®) with a 0.6 m
wand and an adjustable full cone nozzle was used to spray the
entire circumference of the lower 30-40 cm of each plant stem.
Spraying continued until the mixture had soaked in and started
running down the stem.
Basal bark - thinline An 8 L handheld pneumatic sprayer (Swissmex®) with a 0.6 m
wand and an adjustable full cone nozzle was used to spray the
entire circumference of the lower 5 cm of each plant stem.
Spraying continued until the mixture had soaked in and started
running down the stem.
Cut stump Plants were usually cut off as close to the ground level as possible
(unless otherwise specified) using a brush cutter with a metal
blade attachment. Once cut, the herbicide mixture was
immediately (within ~5 seconds) applied to the cut surface. For
glyphosate and triclopyr/picloram (Access™) applications, an 8 L
handheld pneumatic sprayer (Swissmex®) with a 0.6 m wand and
an adjustable full cone nozzle was used, with the cut area sprayed
until the point of runoff. Picloram gel (Vigilant™) applications
involved applying a 3-5 mm thick layer of the gel over the cut
surface.

B.NBP.0622 - Distribution, Invasiveness, Biology and Control or Rubber Bush in Northern Australia
Page 51 of 125
Application technique Description
Frilling A series of blazes were inserted into the stems of rubber bush
~20-30 cm above ground at ~10 cm intervals using a tomahawk.
Chemical was then inserted into the cuts at predetermined rates.
Hand application of
granular tebuthiuron
(Graslan™) and
hexazinone (several
products)
A portable set of scales was used to accurately obtain the quantity
required based on the canopy area of individual rubber bush
plants. The granules were then applied by hand to either the base
of plants and/or evenly distributed under the canopy, depending on
the experimental design and methodology of respective
experiments.
Spotgun® application
of liquid hexazinone
(Velpar® L)
A Spotgun® was used to apply individual applications of either 2 or
4 mL of herbicide mixture per metre of plant height. Spot
applications were made at the base of rubber bush plants and if
several were applied they were spread out evenly around the base
of the plant.
Aerial application of
tebuthiuron
(Graslan™)
All aerial applications of tebuthiuron (Graslan™) were coordinated
by Dow AgroSciences with pellets distributed using a fixed wing
aircraft. The aircraft operated on a swathe width of 22 m and
application was carried out using a half overlap pattern.
Besides the herbicide research, the potential of mechanical control was also evaluated
through an initial trial to identify the cutting depth needed to kill plants, followed by a stick
raking demonstration. Monitoring of a dieback phenomenon was also undertaken to quantify
whether it would have a long term impact on rubber bush populations and, if so, to consider
implications for implementation of control activities.
The methodology, results and discussion associated with the findings of the various trials is
covered in the following sections.
4.3 Statistical analyses
For all trials where percentage mortality was based on experimental units comprising several
plants (usually 10-20), analysis of variance using Genstat (Version 16) was undertaken to
determine if significant treatment differences occurred at P < 0.05. If there were, Fishers
Protected l.s.d. test was used to determine which treatment means differed from each other.
For some data sets, arcsine transformations were undertaken, particularly if there was a
concentration of data close to zero and 100%. However, before doing so, the value of 0%
was substituted by (1/4n) and the value of 100% by (100 -1/4n), as described by Steel &
Torrie (1981).
For trials where the experimental units were individual plants, analysis of individual tree
survival data was undertaken using a Generalised Linear Model on binomial proportions.
This was applicable to the cutting depth trial and the experiment that investigated the

B.NBP.0622 - Distribution, Invasiveness, Biology and Control or Rubber Bush in Northern Australia
Page 52 of 125
influence of season, placement and application rate on efficacy of ground applications of
tebuthiuron.
Because of the pseudo-replication that had to be applied to monitor the efficacy of aerial
applications of tebuthiuron, testing for significant treatment differences using analysis of
variance has not been undertaken. Instead, for each treatment applied, average data and
associated standard errors (x̄ ± s.e.) are presented for respective monitoring periods.
Changes over time are then discussed on a treatment by treatment basis.
4.4 Foliar and basal bark herbicides
4.4.1 Methodology
4.4.1.1 Preliminary foliar screening trial
A split plot experiment was established in April 2011 at site 1, with herbicide treatments
allocated to main plots and size class allocated to sub plots. Main plots averaged ~10×10 m
in size and were separated by a two metre buffer. Each treatment was replicated three
times.
In total, 22 treatments (Table 9) were selected for spraying onto 10 small (≤1.5 m) and 10
medium sized plants (>1.5 to 3 m). Either one or two rates of commercially available
chemicals containing the active ingredients 2,4-D amine, 2,4-D amine + metsulfuron-methyl,
2,4-D/picloram, aminopyralid/fluroxypyr, fluroxypyr, glyphosate, metsulfuron-methyl, triclopyr,
triclopyr/picloram, and triclopyr/picloram/aminopyralid were selected for spraying using a
backpack applicator (see Table 8). Four new products not commercially available at the time
were also included. Three of these [aminopyralid/metsulfuron-methyl (Stinger™), 2,4-
D/picloram/aminopyralid (FallowBoss™Tordon™), triclopyr/picloram/aminopyralid (Tordon™
Regrowth Master)] are now commercially available, but one is not, and after discussion with
the manufacturer, it will not be progressed at this stage. As such, for commercial in
confidence reasons the efficacy data will not be presented in this report. For comparative
purposes, metsulfuron-methyl, the currently recommended foliar herbicide in the Minor Use
Permit (PER12497) for control of rubber bush in pastures, was included. An untreated
control plus the most frequently used herbicide application of basal barking (see Table 8)
using triclopyr/picloram (Access™) was also included for comparison. When a chemical’s
label indicated a particular wetting agent was needed, it was included at the recommended
rate (Table 9).

B.NBP.0622 - Distribution, Invasiveness, Biology and Control or Rubber Bush in Northern Australia
Page 53 of 125
Table 9. Herbicides and rates applied during the screening trial on rubber bush, which included 20 foliar treatments compared against a basal bark treatment and a control (untreated).
Herbicide (Active ingredient)
Trade name Rates applied
g a.i./100L
g or mL product/100L
2,4-D amine (625 g/L)* Amine 625 500 800
2,4-D amine (625 g/L)* Amine 625 625 1000
2,4-D (300 g/L)/picloram (75 g/L) Tordon™ 75-D 195/49 650
2,4-D (300 g/L)/picloram (75 g/L)/aminopyralid (7.5 g/L)
FallowBoss™ Tordon™
180/45/5 600
2,4-D amine (625 g/L) + metsulfuron-methyl (600 g/kg)*
Amine 625 +Brush-Off®
250+12 400+20
2,4-D amine (625 g/L) + metsulfuron-methyl (600 g/kg)*
Amine 625 + Brush-Off®
500+18 800+30
Aminopyralid (10 g/L)/ fluroxypyr (140 g/L)
Hotshot™ 7/98 700
Aminopyralid (375 g/L)/metsulfuron-methyl (300 g/L)*
Stinger™ 15/12 40
Aminopyralid (375 g/L)/metsulfuron-methyl (300 g/L)*
Stinger™ 23/18 60
Fluroxypyr (333 g/L)* Starane™ Advanced 300 900
Glyphosate (470 g/L) Roundup® Dual Salt Technology®
470 1000
Glyphosate (540 g/L) † Roundup PowerMAX®
470 870
Metsulfuron-methyl (600 g/kg)* Brush-Off® 12 20
Metsulfuron-methyl (600 g/kg)* Brush-Off® 18 30
Triclopyr (600 g/L) Garlon™ 600 360 600
Triclopyr (200 g/L)/picloram (100 g/L) ‡
Tordon™ Double Strength
100/50 500
Triclopyr (200 g/L)/picloram (100 g/L)/aminopyralid (25 g/L) ‡
Tordon™ Regrowth Master
120/60/15 600
Triclopyr (300 g/L)/picloram (100 g/L) /aminopyralid (8 g/L)*
Grazon™ extra 225/75/6 750
Triclopyr (240 g/L)/picloram (120 g/L) (in diesel)
Access™ 400/200 1667
Control (untreated) n/a
*BS1000, †Pulse® or ‡Uptake™ were added as wetting agents at 100, 200 or 500 mL of
product/100 L, respectively.

B.NBP.0622 - Distribution, Invasiveness, Biology and Control or Rubber Bush in Northern Australia
Page 54 of 125
Prior to application of treatments, all small and medium sized plants to be treated were
tagged and their height, basal diameter and number of stems were recorded. On average,
small plants had a height of 0.67 ± 0.01 m, a basal diameter of 1.74 ± 0.09 cm and 1.24 ±
0.02 stems. In contrast, medium sized plants had an average height of 1.87 ± 0.01 m, a
basal diameter of 8.61 ± 0.08 cm and 3.40 ± 0.05 stems.
All plants were very healthy at the time of spraying which was undertaken between
18-21 April 2011. Following implementation of treatments, mortality was assessed at 14
(June 2012) and 24 months (April 2013) after treatment (MAT).
4.4.1.2 Rate refinement and seasonality foliar trial and comparison of two basal bark
techniques
The experiment was established in April 2012 at site 2 using a completely randomised
design, incorporating 30 treatments each replicated three times. Fifteen of these were
initially applied in autumn to primarily refine rates, with four of these also applied in winter,
spring and summer to quantify if there were any seasonal influences. Experimental units
comprised discrete clumps of 15 medium sized (1.5 to <3 m high) rubber bush plants.
A total of 12 foliar herbicide treatments were selected (Table 10); the three most effective
herbicides from the screening trial (i.e. 2,4-D amine, glyphosate, and triclopyr/picloram/
aminopyralid); a slightly higher rate of 2,4-D/picloram/aminopyralid, the same two rates of
metsulfuron-methyl as used in the first trial, a mixture of 2,4-D amine + metsulfuron-methyl,
and two rates of imazapyr/glyphosate.
The metsulfuron-methyl treatments were repeated because of the poor results achieved in
the first trial, which were inconsistent with the findings from earlier herbicide trials
undertaken on rubber bush (Vitelli et al. 2008). Imazapyr/glyphosate was also included at
two rates. Imazapyr alone had proven effective previously (Vitelli et al. 2008) and with
glyphosate demonstrating high efficacy in the first trial, this herbicide warranted inclusion. An
untreated control plus basal barking using triclopyr/picloram (Access™) was added for
comparison. A new thinline basal bark technique for application of triclopyr/picloram
(Access™) was also opportunistically included to collect efficacy data, and to compare it
against the traditional basal bark technique. These treatments were implemented in autumn
between 30 April and 2 May 2012.
The seasonality component involved spraying the lower rates of the foliar herbicides 2,4-D
amine (500 g a.i./100 L), glyphosate (470 g a.i./100 L), metsulfuron methyl (12 g a.i./100 L)
and triclopyr/picloram/aminopyralid (150/50/4 g a.i./100 L) and the traditional basal bark
application of triclopyr/picloram in winter (19-20 July 2012), spring (31 October to
2 November 2012) and summer (6-8 February 2013).

B.NBP.0622 - Distribution, Invasiveness, Biology and Control or Rubber Bush in Northern Australia
Page 55 of 125
Table 10. Herbicides and rates applied during the rate refinement and seasonality trial, which included 12 foliar treatments, compared against two basal bark treatments and a control (untreated).
Herbicide (Active ingredient)
Trade name Rates applied‡
g a.i./100L g or mL product/100L
2,4-D amine (625 g/L) Amine 625 500 800
2,4-D amine (625 g/L) Amine 625 625 1000
2,4-D (300 g/L)/picloram (75 g/L)/aminopyralid (7.5 g/L)
FallowBoss™ Tordon™
195/49/5 650
2,4-D amine (625 g/L) + metsulfuron-methyl (600 g/kg)
Amine 625 + Associate®
500+12 800+20
Glyphosate (570 g/L) Roundup® attack™ 470 825
Glyphosate (570 g/L) Roundup® attack™ 570 1000
Imazapyr (150g/L)/glyphosate (150 g/L)
Arsenal® Xpress 97.5/97.5 650
Imazapyr (150g/L)/glyphosate (150 g/L)
Arsenal® Xpress 150/150 1000
Metsulfuron-methyl (600 g/kg) Associate® 12 20
Metsulfuron-methyl (600 g/kg) Associate® 18 30
Triclopyr (300 g/L)/picloram (100 g/L) /aminopyralid (8 g/L)
Grazon™ extra 150/50/4 500
Triclopyr (300 g/L)/picloram (100 g/L) /aminopyralid (8 g/L)
Grazon™ extra 225/75/6 750
Triclopyr (240 g/L)/picloram (120 g/L) (in diesel)*
Access™ 400/200 1667
Triclopyr (240 g/L)/picloram (120 g/L) (in diesel) †
Access™ 2400/1200 10000
Control n/a
*Traditional basal bark technique applied to bottom 30 cm of stem.
†Thinline basal bark technique applied to bottom 5 cm of stem.
‡For all foliar treatments, the surfactant BS1000 was added at a rate of 100 mL/100 L.
Prior to allocation of treatments, the selected rubber bush plants were tagged and their
height and basal diameter recorded. On average, plants were 2.10 ± 0.01 m high and had a
basal diameter of 11 ± 0.1 cm. On the day before spraying was due to occur for respective
seasonal times, leaf coverage (proportion of maximum leaf cover expressed as a
percentage) and the presence of flowering or podding on plants was recorded.

B.NBP.0622 - Distribution, Invasiveness, Biology and Control or Rubber Bush in Northern Australia
Page 56 of 125
Following implementation of treatments, the level of leaf brownout was recorded after
6-7 weeks and mortality was assessed at 12 and 24 MAT.
Foliar spraying and basal bark spraying was undertaken using the same equipment and
application methods used in the screening trial (See Table 8). The only exception was the
thinline basal bark technique where only the lower 5 cm of the stem was sprayed, compared
with 30-40 cm for the traditional technique.
Temperature and humidity conditions during spraying at the different seasonal times were
measured using a pen-type digital thermometer/hygrometer (Table 11). A Kestrel 1000®
handheld wind meter was used to record wind speeds.
Table 11. Average temperature (ºC), humidity (%) and wind speed (km/hr) at the different seasonal times that foliar spraying was undertaken.
Environmental
conditions
Seasonal conditions
Autumn Winter Spring Summer
Temperature (ºC) 34 25 35 35
Humidity (%) 43 30 45 45
Wind speed (km/hr) 0.5 1.7 0.7 0.9
4.4.1.3 Effect of water type and temperature on efficacy of foliar applications of
metsulfuron-methyl
The poor efficacy obtained using metsulfuron-methyl in the earlier two trials (see results
section) contrasted greatly with published information from previous research (Vitelli et al.
2008) which reported high mortality when applied at 12 g a.i./100 L. Water quality and
ambient temperatures at the time of spraying are two possible factors that could have
contributed to this variability. To test this assumption, a field experiment was initiated in
October 2011 at site 1, incorporating a 2×2 factorial component. Factor A comprised two
types of water (town and bore) and Factor B two temperature conditions at the time of
spraying (moderate and hot). An untreated control was also included for comparison.
Treatments were laid out using a completely randomised design, replicated three times.
Experimental units comprised 15 medium sized plants located within plots that were ~10 m ×
10 m in size. Prior to allocation of treatments all selected plants were tagged and their
height, basal diameter and number of stems were recorded. On average, plants were 2.36 ±
0.05 m high, with a basal diameter of 11 ± 0.7 cm and 3 ± 0.2 stems.
Foliar spraying and monitoring of climatic conditions (temperature and wind speed) were
undertaken in a similar manner to the previous trials. Town water for the trial came from the
Charters Towers water supply and bore water from a bore located within 5 km of the trial
site. To achieve different temperature conditions under which spraying was undertaken,
moderate treatment applications were conducted between 7–10 am, and hot treatment
B.NBP.0622 - Distribution, Invasiveness, Biology and Control or Rubber Bush in Northern Australia
Page 57 of 125
applications between 1-4 pm. This resulted in a 10 ºC difference between the moderate and
hot treatments, which averaged 27 ºC and 37 ºC, respectively.
Following implementation of treatments, mortality was assessed at 8 (20 June 2012), 12
(30 October 2012) and 24 MAT (2 November 2013).
4.4.2 Results
4.4.2.1 Preliminary foliar screening trial
Significant differences (P < 0.01) in rubber bush mortality were recorded at 14 and 24 MAT
between the 22 herbicide treatments as well as the two size classes. There was also a
significant (P < 0.01) herbicide × size class interaction (Fig. 22). For some treatments, the
level of mortality increased between the 14 and 24 MAT assessments, but during this time
plants became affected by a form of dieback which appears to have increased mortality
further, rather than the herbicides themselves. For example, in the control treatment
(untreated) mortality was <4% 14 MAT but increased to an average of 20% 24 MAT. As
such, emphasis is placed on the 14 MAT assessments to distinguish differences associated
with efficacy of the herbicide treatments.
Over all size classes, three foliar herbicides gave >90% mortality 14 MAT. They were the
highest rate of 2,4-D amine (Amine 625), the 540 g a.i./L formulation of glyphosate
(Roundup PowerMax®), and triclopyr/picloram/aminopyralid (Grazon™ extra). In
comparison, basal barking using triclopyr/picloram (Access™) in a diesel carrier averaged
89%, which was not significantly different to the aforementioned herbicides. Despite being
applied at the same rate of active ingredient, the two glyphosate treatments differed
significantly (P > 0.05) from each other. The one containing potassium salt only (Roundup
PowerMax®) demonstrated higher efficacy than the one containing both potassium and
mono-ammonium salts (Roundup® Dual Salt Technology®).
In terms of size classes, small plants were much more susceptible to foliar spraying, with
average mortality of 73% recorded 14 MAT, compared with 42% mortality of medium sized
plants.
The significant herbicide × size class interaction was associated with several of the herbicide
treatments, which demonstrated low efficacy on medium sized plants but high efficacy on
small plants. This was most pronounced for the lower rates of 2,4-D amine (Amine 625) and
2,4-D amine + metsulfuron methyl (Amine 625 + Brush-Off®), and the single rates of
2,4-D/picloram (Tordon™ 75-D), aminopyralid/fluroxypyr (Hotshot™), the 470 g a.i./L
formulation of glyphosate (Roundup® Dual Salt Technology®), fluroxypyr (Starane™
advanced), triclopyr (Garlon™ 600), triclopyr/picloram Tordon™ Double Strength, and
Triclopyr/picloram/aminopyralid (Tordon™ Regrowth Master).
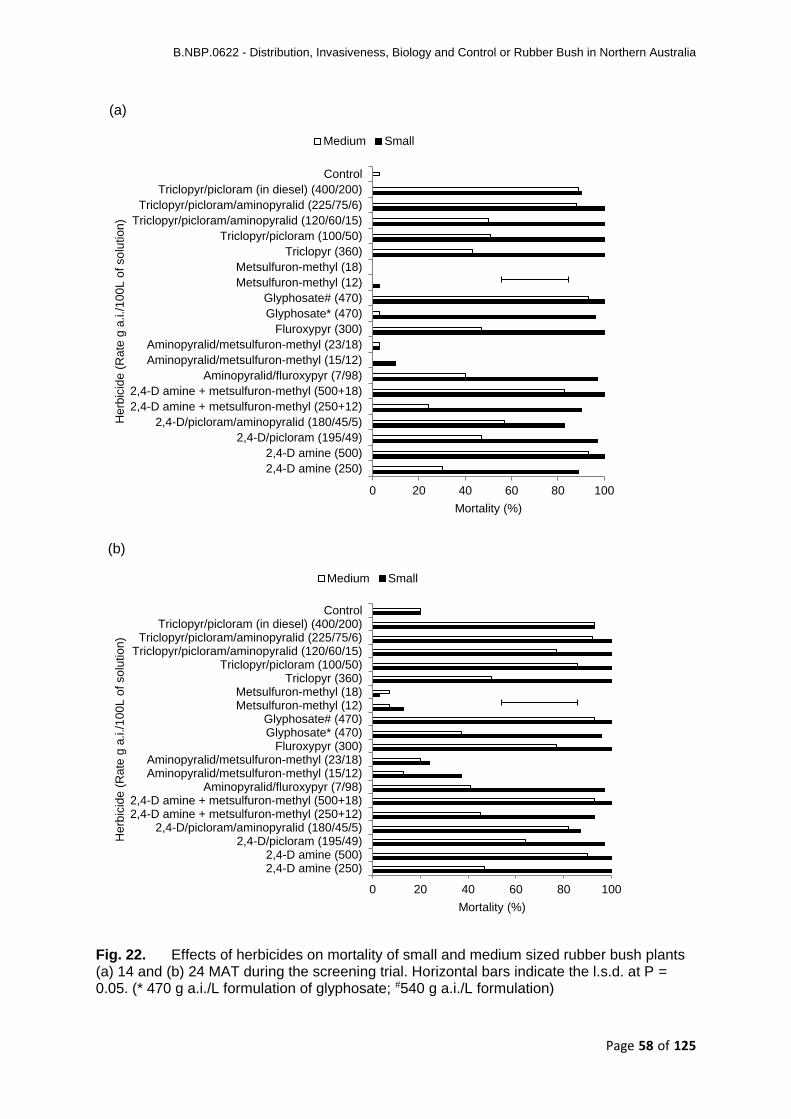
B.NBP.0622 - Distribution, Invasiveness, Biology and Control or Rubber Bush in Northern Australia
Page 58 of 125
Fig. 22. Effects of herbicides on mortality of small and medium sized rubber bush plants (a) 14 and (b) 24 MAT during the screening trial. Horizontal bars indicate the l.s.d. at P = 0.05. (* 470 g a.i./L formulation of glyphosate; #540 g a.i./L formulation)
0 20 40 60 80 100
2,4-D amine (250)
2,4-D amine (500)
2,4-D/picloram (195/49)
2,4-D/picloram/aminopyralid (180/45/5)
2,4-D amine + metsulfuron-methyl (250+12)
2,4-D amine + metsulfuron-methyl (500+18)
Aminopyralid/fluroxypyr (7/98)
Aminopyralid/metsulfuron-methyl (15/12)
Aminopyralid/metsulfuron-methyl (23/18)
Fluroxypyr (300)
Glyphosate* (470)
Glyphosate# (470)
Metsulfuron-methyl (12)
Metsulfuron-methyl (18)
Triclopyr (360)
Triclopyr/picloram (100/50)
Triclopyr/picloram/aminopyralid (120/60/15)
Triclopyr/picloram/aminopyralid (225/75/6)
Triclopyr/picloram (in diesel) (400/200)
Control
Mortality (%)
He
rbic
ide
(R
ate
g a
.i./
100
L o
f so
lutio
n)
(a)
Medium Small
0 20 40 60 80 100
2,4-D amine (250)2,4-D amine (500)
2,4-D/picloram (195/49)2,4-D/picloram/aminopyralid (180/45/5)
2,4-D amine + metsulfuron-methyl (250+12)2,4-D amine + metsulfuron-methyl (500+18)
Aminopyralid/fluroxypyr (7/98)Aminopyralid/metsulfuron-methyl (15/12)Aminopyralid/metsulfuron-methyl (23/18)
Fluroxypyr (300)Glyphosate* (470)Glyphosate# (470)
Metsulfuron-methyl (12)Metsulfuron-methyl (18)
Triclopyr (360)Triclopyr/picloram (100/50)
Triclopyr/picloram/aminopyralid (120/60/15)Triclopyr/picloram/aminopyralid (225/75/6)
Triclopyr/picloram (in diesel) (400/200)Control
Mortality (%)
He
rbic
ide
(R
ate
g a
.i./
100
L o
f so
lutio
n)
(b)
Medium Small

B.NBP.0622 - Distribution, Invasiveness, Biology and Control or Rubber Bush in Northern Australia
Page 59 of 125
4.4.2.2 Rate refinement and seasonality trial
Significant differences (P < 0.05) in initial leaf brownout and mortality (12 and 24 MAT)
occurred between herbicide treatments applied to refine rates for foliar control of rubber
bush (i.e. those applied between 30 April and 2 May 2012). All herbicide treatments caused
greater than 90% brownout of the original leaf material present at the time of spraying, with
only the two rates of metsulfuron-methyl (94-95%) and the lower rate of imazypyr/glyphosate
(93%) not causing 100% brownout. However, this high brownout did not translate to high
mortality in all treatments.
Of the foliar herbicides, imazapyr/glyphosate achieved ≥98% mortality 24 MAT at both rates
applied and the highest rate of 2,4-D amine recorded 91% mortality (Fig. 23).
2,4-D/picloram/aminopyralid achieved a moderate level of control (78%) after 24 months with
the remainder recording ≤60% mortality. Metsulfuron-methyl was the worst performing
herbicide, with mortality ≤23% for both rates applied. Both basal bark applications gave
100% control.
All control plants remained alive at the end of the study but they had been severely affected
by dieback (as reported in the screening trial); in most instances their original stems had
been killed and they had reshot from the base. Plants remaining alive after herbicide
treatment were also affected by the dieback and, for most treatments, there was an increase
in mortality between the 12 and 24 MAT assessments.
Fig. 23. Effect of herbicides on mortality of rubber bush plants 12 and 24 MAT during the second trial. The horizontal bar indicates the l.s.d. at P = 0.05.
0 20 40 60 80 100
2,4-D amine (500)
2,4-D amine (625)
2,4-D/picloram/aminopyralid (195/49/5)
2,4-D amine + metsulfuron-methyl (500+12)
Glyphosate (470)
Glyphosate (570)
Imazapyr/glyphosate (97.5/97.5)
Imazapyr/glyphosate (150/150)
Metsulfuron-methyl (12)
Metsulfuron-methyl (18)
Triclopyr/picloram/aminopyralid (150/50/4)
Triclopyr/picloram/aminopyralid (225/75/6)
Triclopyr/picloram (in diesel) (400/200)
Triclopyr/picloram (in diesel) (2400/1200)
Control
Mortality (%)
He
rbic
ide
s (
Ra
tes a
pp
lied
g a
.i./
10
0L
)
24MAT 12MAT
24MAT
12MAT

B.NBP.0622 - Distribution, Invasiveness, Biology and Control or Rubber Bush in Northern Australia
Page 60 of 125
With regards the seasonality component, plants sprayed during the winter period had a
greater proportion of leaf material than those in autumn, spring and summer, which ranged
between 53-60%. Almost all plants (≥98%) had flowers present during winter and spring
applications, compared with 71 and 85% during the autumn and summer periods,
respectively. Only a small percentage of plants had pods on them (3-8%) when sprayed,
across the four seasonal times (Table 12).
Table 12. The proportion of leaf on plants and the percentage of plants with flowers and
pods at the different seasonal times when foliar and basal bark spraying was undertaken.
Plant measurements Seasonal conditions
Autumn Winter Spring Summer
Leaf on plants (%) 60 73 57 53
Flowering plants (%) 71 98 99 85
Plants with pods (%) 8 3 5 4
A significant season × herbicide interaction (P < 0.001) for the level of initial brownout and
subsequent plant mortality occurred at both 12 and 24 MAT. Within treatment variability
increased markedly between the 12 and 24 MAT treatments, which coincided with increased
prevalence of dieback (Fig. 24).
The majority of treatments caused major brownout (>90%) of leaves present on plants at the
time of spraying, except summer applications of glyphosate (40%) and winter applications of
metsulfuron-methyl (30%). Mortality however, differed markedly. The basal bark application
of triclopyr/picloram consistently gave 98-100% mortality, while metsulfuron-methyl gave
high mortality (98% 24 MAT) in summer, but low mortality (≤11%) for the other seasonal
times. Highest mortality of 2,4-D amine (57-76%) was achieved following summer, autumn
and winter applications. Mortality of glyphosate and triclopyr/picloram/aminopyralid
treatments varied the least with seasons 12 MAT, but was consistently low (<50% 24 MAT).
Treatment costs (exclusive of the wetting agent) for the most effective foliar herbicides
(2,4-D amine, imazapyr/glyphosate) were calculated and compared against those currently
registered in PER12497 (metsulfuron-methyl and imazapyr). Calculations were based on
April 2015 prices and the average amount applied to plants during the trial (i.e.
1030 mL/plant). 2,4-D amine (800-1000 mL of Amine 625/100 L of mixture) and
imazapyr/glyphosate (650-1000 mL of Arsenal® Xpress/100 L of mixture) cost $0.05-$0.06
and $0.50-$0.78/plant, respectively. In comparison, metsulfuron methyl (20 g of
Brush-Off®/100 L of mixture) and imazapyr (500 mL of Unimaz™/100 L of Mixture) cost
$0.04 and $0.40/plant, respectively. For the basal bark treatments, the traditional and
thinline techniques cost $1.02 and $1.76/plant, respectively. This was based on the price of
Access™ in April 2015, $1.34 for diesel, and applications of 390 and 195 mL of mixture/plant
for the traditional and thinline techniques, respectively.

B.NBP.0622 - Distribution, Invasiveness, Biology and Control or Rubber Bush in Northern Australia
Page 61 of 125
Fig. 24. Effect of four foliar and one basal bark* herbicide on rubber bush mortality 12 and 24 MAT, following spraying in summer, autumn, winter or spring. Vertical bars indicate the l.s.d. (at P = 0.05) for respective monitoring times.
4.4.2.3 Effect of water type and temperature on efficacy of foliar applications of
metsulfuron-methyl
As for the previous two trials, initial efficacy (8-12 MAT) of foliar applications of metsulfuron-
methyl was generally poor (<50%) across all treatments. While, there were still some
significant treatment differences 8 MAT, this was not the case thereafter.
At 8 MAT a significant difference (P < 0.05) in mortality occurred between temperature
treatments but not water type treatments (P > 0.05), neither was there a significant
interaction between the two factors (P > 0.05). Mortality was highest when spraying was
undertaken under moderate temperature conditions compared with hot temperatures,
averaging 44% and 26% respectively. Overall, all herbicide treatments recorded significantly
higher mortality (P < 0.05) than the untreated control. All untreated control plants remained
alive 8 MAT, whilst on average, 35% of herbicide treated plants were dead.
At 12 and 24 MAT, no significant differences were detected between water types or
temperature treatments and there was no significant interaction (P > 0.05). There was still,
however, a significant difference between all herbicide treatments and the untreated control.
Across all treatments (including the control) mortality increased over time, which seemed to
coincide with the appearance of dieback on plants. At 12 and 24 MAT, control plots
averaged 4 and 36%, respectively. In contrast, herbicide treated plants averaged 48 and
83% mortality after 12 and 24 months, respectively.
0
10
20
30
40
50
60
70
80
90
100
2,4
-D a
min
e (
50
0)
Gly
phosate
(470)
Me
tsu
lfu
ron
-meth
yl (1
2)
Triclo
pyr/
pic
lora
m/a
min
opyra
lid(1
50
/50
/4)
Tri
clo
pyr/
pic
lora
m (
in d
iese
l)(4
00
/20
0)*
2,4
-D a
min
e (
50
0)
Gly
phosate
(470)
Me
tsu
lfu
ron
-meth
yl (1
2)
Triclo
pyr/
pic
lora
m/a
min
opyra
lid(1
50
/50
/4)
Tri
clo
pyr/
pic
lora
m (
in d
iese
l)(4
00
/20
0)*
12 24
Mo
rta
lity (
%)
Herbicides and MAT
Summer Autumn Winter Spring
12MAT24MAT

B.NBP.0622 - Distribution, Invasiveness, Biology and Control or Rubber Bush in Northern Australia
Page 62 of 125
4.5 Cut stump and frill applications
4.5.1 Methodology
4.5.1.1 Initial cut stump and frilling trial
Triclopyr/picloram (Access™) is included in a minor use permit (PER12497) for the control of
rubber bush using the cut stump and basal bark techniques, however it has to be mixed in
diesel. To test other practical options that landholders could easily transport around as part
of day to day activities, an efficacy trial using cut stump and frilling techniques was
undertaken using the readily available herbicide glyphosate and a picloram gel that comes in
an easily transportable tube.
A 3×3 factorial experiment was implemented in June 2011 at site 1 using a randomised
complete block experimental design. Factor A comprised three herbicide treatments
[untreated control, glyphosate (Roundup PowerMax® which contained 540 g a.i./L), picloram
gel (Vigilant™ which contained 43 g a.i./L)]. Factor B was three application techniques (cut
stump at ground level or at 20 cm, or frilling). All treatment combinations were replicated
three times and experimental units consisted of clusters of 15 medium sized rubber bush
plants.
Prior to allocation of treatments all selected plants were tagged, and their height, basal
diameter and number of stems was recorded. On average, they were 2.14 ± 0.02 m high,
had a basal area of 70.16 ± 1.56 cm2 and 4.1 ± 0.06 stems.
Cut stump and frilling treatments were applied on 21/22 June 2011 using the methodology
described in Table 8. Glyphosate was applied neat onto the cut surface for the cut stump
treatment and at a rate of ~2 mL of product per cut for the frilling treatment. Picloram gel
applications involved applying a 3-5 mm thick layer of the gel over the cut surface for cut
stump treatments and ~2 mL of product per cut for the frilling treatment.
Mortality assessments were undertaken at 12 (24/25 June 2012) and 25 MAT (26/27 July
2013).
4.5.1.2 Rate response of glyphosate using the cut stump technique
Based on the findings of the initial cut stump and frill trial, a randomised complete block
experiment was implemented at site 1 in July 2012 to identify the minimal application rate of
glyphosate that would still cause high mortality of rubber bush. To achieve this, the efficacy
of two different concentrations of glyphosate applied to cut stumps at 2-3 rates was tested.
The standard 360 g a.i./L formulation (Roundup®) was included at 120, 180 and 360 g a.i/L
of spray solution. A stronger 570 g a.i./L formulation (Roundup® Attack™) was also included
at 190 and 570 g a.i./L of spray solution. For treatments that did not involve neat applications
of herbicide, water was added to make the required concentrations. A control treatment was
also included for comparison, which involved cutting plants but not applying any herbicide.
In total there were six treatments, each replicated three times, with experimental units
comprising clusters of 15 medium sized plants. Prior to allocation of treatments, all selected
plants were tagged, and their height, basal diameter and number of stems were recorded,
along with whether they were flowering and/or podding. On average, plants were 2.07 ±
0.01 m high, had a basal diameter of 10 ± 0.01 cm and 2.75 ± 0.1 stems. They were all
flowering but only 6% had pods on them at the time.

B.NBP.0622 - Distribution, Invasiveness, Biology and Control or Rubber Bush in Northern Australia
Page 63 of 125
Treatments were applied on 23-24 July 2012 using the cut stump methodology outlined in
Table 8. Mortality assessments were undertaken at 12 (23 July 2013) and 24 MAT
(23 July 2014).
4.5.2 Results
4.5.2.1 Initial cut stump and frilling trial
At both 12 and 24 MAT, a significant (P < 0.05) herbicide treatment × application technique
interaction influenced mortality of rubber bush plants (Fig. 25). Differences were most
pronounced at 12 MAT with dieback becoming very prevalent thereafter and confounding the
results.
At 12 MAT minimal mortality (<10%) occurred if plants were cut stumped (at either the base
or 20 cm) or frilled but not treated with any herbicide. If neat glyphosate (540 g a.i./L) was
applied following frilling or cut stumping at the base, high mortality (>95%) was achieved.
This was not the case for plants cut stumped at 20 cm above ground, where mortality
averaged only 9%. The application of picloram paste following frilling or cut stumping
resulted in 87–98% mortality, with all three application techniques not significantly different
from each other (P > 0.05).
At 24 MAT, mortality in the nil herbicide treatments had increased to 71-78% across the
three application techniques. The glyphosate and picloram gel herbicide treatments
exhibited high mortality following cut stumping and frilling, although cut stumping at 20 cm
using glyphosate still produced poorer results (80% mortality) than the other treatment
combinations (>95% mortality).
The cost of herbicide for cut stumping was similar for both application heights (i.e. ground
level or 20 cm) but varied markedly between the glyphosate and picloram gel treatments,
averaging $0.15 and $3.50/plant, respectively. This was based on April 2015 prices and an
average dose of 17 and 21 mL/plant for the glyphosate and picloram gel treatments,
respectively. Similarly for frilling, glyphosate was cheaper than the picloram gel, averaging
$0.16 and $2.00/plant, respectively. This was based on April 2015 prices and an average
dose of 18 and 21 mL/plant for the glyphosate and picloram gel treatments, respectively.

B.NBP.0622 - Distribution, Invasiveness, Biology and Control or Rubber Bush in Northern Australia
Page 64 of 125
Fig. 25. The efficacy of nil (control), glyphosate (540 g a.i./L) and picloram gel (43 g a.i./L) herbicide applications on mortality of rubber bush plants (a) 12 and (b) 24 MAT, using the cut stump (base and 20 cm aboveground) and frilling techniques. Within graphs, columns followed by the same letter are not significantly different (P < 0.05).
c
a
b
c
abab
c
c
ab
0
20
40
60
80
100
Control Glyphosate 480 Picloram
Mort
alit
y (
%)
12 M
AT
Herbicide treatment
Frilling
Cut stump base
Cut stump 20 cm
(a)
b
a a
b
a a
bb
a
0
20
40
60
80
100
Control Glyphosate 480 Picloram
Mort
alit
y (
%)
24 M
AT
Herbicide treatment
(b)

B.NBP.0622 - Distribution, Invasiveness, Biology and Control or Rubber Bush in Northern Australia
Page 65 of 125
4.5.2.2 Rate response of glyphosate using the cut stump technique
At 12 MAT plant mortality was ≥73% for all treatments that received a glyphosate application
after plants were cut stumped and was significantly higher (P < 0.05) than the control
treatment which averaged 2% mortality (Table 13). Mortality tended to increase with
increasing concentration of glyphosate in the mixture applied to treat plants and at 360 g
a.i./L of mixture and higher mortality was ≥98% (Fig. 26).
At 24 MAT mortality had continued to increase in all treatments, including the control, and
appeared to coincide with the increased presence of dieback more so than the effect of the
treatments.
The cost of herbicide to treat individual plants ranged from $0.06 to $0.26, generally
increasing as the concentration of glyphosate in the mixture applied to the cut stumps
increased. This was based on April 2015 prices for the glyphosate products used and
applications of between 9-32 mL of glyphosate product/plant, depending on the rate and
concentration of particular products. The quantity of mixture applied ranged between
28-32 mL/plant across the five herbicide treatments.
Table 13. The mortality of rubber bush 12 and 24 MAT following cut stump application of
two glyphosate formulations at 2-3 rates. Within columns, mortality values followed by the
same letter are not significantly different (P < 0.05) from each other.
Herbicide (active ingredient)
Trade name Rates (g
a.i./L Spray
solution
Cost/plant
($)
Mortality (%)
12 MAT 24 MAT
Glyphosate (360 g/L) Roundup® 120 0.06 73c 87b
Glyphosate (360 g/L) Roundup® 180 0.10 76bc 89ab
Glyphosate (360 g/L) Roundup® 360 0.21 98ab 100a
Glyphosate (570 g/L) Roundup®
Attack™
190 0.08 82abc 91ab
Glyphosate (570 g/L) Roundup®
Attack™
570 0.26 100a 100a
Control 2d 29c
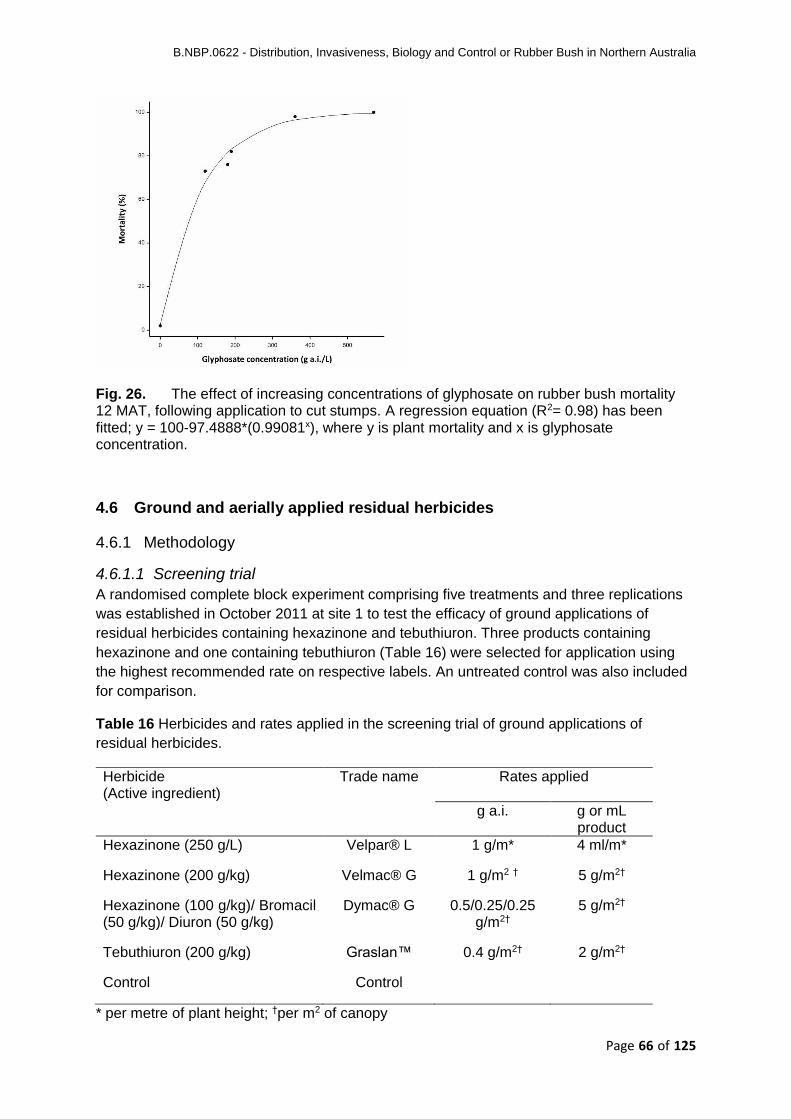
B.NBP.0622 - Distribution, Invasiveness, Biology and Control or Rubber Bush in Northern Australia
Page 66 of 125
Fig. 26. The effect of increasing concentrations of glyphosate on rubber bush mortality 12 MAT, following application to cut stumps. A regression equation (R2= 0.98) has been fitted; y = 100-97.4888*(0.99081x), where y is plant mortality and x is glyphosate concentration.
4.6 Ground and aerially applied residual herbicides
4.6.1 Methodology
4.6.1.1 Screening trial
A randomised complete block experiment comprising five treatments and three replications
was established in October 2011 at site 1 to test the efficacy of ground applications of
residual herbicides containing hexazinone and tebuthiuron. Three products containing
hexazinone and one containing tebuthiuron (Table 16) were selected for application using
the highest recommended rate on respective labels. An untreated control was also included
for comparison.
Table 16 Herbicides and rates applied in the screening trial of ground applications of
residual herbicides.
Herbicide (Active ingredient)
Trade name Rates applied
g a.i. g or mL product
Hexazinone (250 g/L) Velpar® L 1 g/m* 4 ml/m*
Hexazinone (200 g/kg) Velmac® G 1 g/m2 † 5 g/m2†
Hexazinone (100 g/kg)/ Bromacil (50 g/kg)/ Diuron (50 g/kg)
Dymac® G 0.5/0.25/0.25 g/m2†
5 g/m2†
Tebuthiuron (200 g/kg) Graslan™ 0.4 g/m2† 2 g/m2†
Control Control
* per metre of plant height; †per m2 of canopy

B.NBP.0622 - Distribution, Invasiveness, Biology and Control or Rubber Bush in Northern Australia
Page 67 of 125
Treatments were applied to clusters of 10 plants spaced at least four metres apart from each
other and from neighbouring clusters. Prior to application of treatments, plants to be treated
were tagged and their height, basal diameter, number of stems, and average canopy size
were recorded. On average, they were 2.3 ± 0.03 m high, with a basal diameter of 10.6 ±
0.23 cm, 3.3 ± 0.09 stems, and an average canopy width of 2.22 ± 0.05 m.
Treatments were applied (see Table 8 for details) on 6 November 2011 at the selected rates
(Table 9) with the chemical placed around the base of plants as close as possible. Given the
root structure of rubber bush, which mostly comprises a large tap root and a few lateral
roots, this was considered the best approach to maximise uptake of the herbicide.
Mortality assessments were undertaken at 8 (21 July 2011), 12 (30 October 2012), 18
(25 May 2013) and 24 MAT (30 October 2013).
4.6.1.2 Influence of season, placement and application rate on efficacy of ground
applications of tebuthiuron
A completely randomised factorial experiment was established in February 2011 at site 4 to
test the efficacy of ground applications of tebuthiuron (Graslan™) applied at two seasonal
times (summer and spring), two placement positions (at the base or evenly under the
canopy) and four rates (0, 0.2, 0.4 and 0.8 g a.i. per m2 of canopy cover). Experimental units
comprised individual rubber bush plants, with each treatment replicated 15 times.
Prior to application of treatments, plants to be treated were tagged and their height, basal
diameter, and average canopy size were recorded. On average, they were 1.91 ± 0.06 m
high, with a basal diameter of 6.39 ± 0.31 cm and a canopy width of 1.68 ± 0.07 m.
Summer treatments were implemented on 15 February 2011 and spring treatments on 20
September 2011. The selected rates were applied either to the base of plants or evenly
distributed under the canopy of plants as outlined in Table 8.
Mortality assessments at 24 MAT were undertaken on 15 February 2013 and
24 September 2013 for summer and spring applications, respectively.
4.6.1.3 Refinement of application rates and placement of tebuthiuron
A completely randomised factorial experiment was established in October 2011 at site 3 to
test the efficacy of ground applications of tebuthiuron (Graslan™) at two placement positions
(at the base or evenly under the canopy) and four rates (0, 0.4 0.6 and 0.8 g a.i. per m2 of
canopy cover). Experimental units comprised 10 individual rubber bush plants that were
spaced over 3 m apart, with each treatment replicated three times.
Prior to application of treatments, plants to be treated were tagged and their height, basal
diameter, number of stems and average canopy size were recorded. On average, they were
2.40 ± 0.02 m high, had a basal diameter of 11.74 ± 0.22 cm, 3.6 ± 0.02 stems, and a
canopy width of 2.54 ± 0.04 m. They were all flowering but only 3% had pods on them at the
time.
Treatments were implemented on 7 November 2011 by applying the selected rates of
tebuthiuron either to the base of plants or evenly distributing it under the canopy of plants as
outlined in Table 8.

B.NBP.0622 - Distribution, Invasiveness, Biology and Control or Rubber Bush in Northern Australia
Page 68 of 125
Mortality assessments were undertaken at 12 (6 November 2012) and 24 MAT (1 November
2013).
4.6.1.4 Efficacy of aerial applications of tebuthiuron (Graslan™)
Opportunistic monitoring of aerial applications of tebuthiuron (Graslan™) were undertaken in
the vicinity of site 3 after the landholder used Dow AgroSciences to undertake control of
gidyea regrowth that contained rubber bush, along with some patches of other invasive
weeds such as parkinsonia.
In November 2011, 295 ha were treated, mostly at a rate of 2.5 kg a.i./ha, although a few
strips were flown by the aircraft at 3 and 3.5 kg a.i./ha to test the response to higher rates. In
November 2012, an additional 465 ha were treated at 2.5 kg a.i./ha and ~25 ha were treated
at 2 kg a.i./ha to test if a lower rate would control the gidyea regrowth and rubber bush.
Prior to treatment, three transects 2 m wide by 40 m long were established in each area
designated to receive a specific rate of tebuthiuron. (Note that three transects were
shortened to 25–30 m due to higher densities of plants.) For both 2011 and 2012
applications, three 40 m transects were also established in neighbouring untreated areas
that were similar in vegetation structure to the treated areas. All plants within transects had
their height and basal diameter measured, and whether they were flowering and/or podding
at the time of treatment, were recorded.
The density of rubber bush in the first treatment area averaged 3800 ± 300, 8000 ± 900,
4800 ± 2000 and 6000 ± 500 plants/ha for the untreated control and 2.5, 3 and 3.5 kg a.i./ha
treatments, respectively. In the second area, the control and 2.0 and 2.5 kg a.i./ha
treatments averaged 15 600 ± 3 900, 38 400 ± 13 000 and 19 300 ± 3600 plants/ha,
respectively.
Despite differences in the density of plants between treatments, the size structure (in terms
of height) was fairly similar for both areas treated (i.e. in 2011 and 2012).The demography of
the transects suggested that they were both in the expansion stage with plants less than 1 m
in height the dominant size class (Fig. 27).

B.NBP.0622 - Distribution, Invasiveness, Biology and Control or Rubber Bush in Northern Australia
Page 69 of 125
Fig. 27. The size class structure (height) of rubber bush plants in the first and second areas treated with aerial applications of tebuthiuron. The bar above each vertical column represents the standard error of the mean.
Quarterly assessments of transects were undertaken for three years following the 2011
treatments, and six monthly assessments were undertaken for two years following the 2012
treatments. Each time, plant mortality and the appearance of any new seedlings within
transects was recorded. Unfortunately, two of the untreated control transects associated with
the 2011 treatments had to be discarded due to them being accidentally treated with
tebuthiuron.
4.6.1.5 Rate response of liquid hexazinone
Promising preliminary results from the screening trial of several residual herbicides led to the
establishment of a completely randomised experiment in September 2012 at site 2 to refine
rates for liquid hexazinone (i.e. Velpar® L). There were six treatments, each replicated three
times. Experimental units comprised clusters of 15 plants spaced at least four metres apart
from each other and from neighbouring clusters.
The treatments comprised five rates of hexazinone (0, 0.25, 0.5, 0.75 and 1 g a.i./m of plant
height) with water added to respective rates, if required, to enable a 4 mL dose of mixture to
be applied per metre of plant height. A neat application of 0.5 g a.i per metre of plant height
was also included and equated to an application of 2 mL of product per metre of plant height.
It was included to test whether the volume of liquid was important for effective application of
liquid hexazinone.
Prior to application of treatments, plants to be treated were tagged and their height, basal
diameter, and whether they had flowers and/or pods were recorded. On average, they were
2.32 ± 0.02 m high and had a basal diameter of 11.43 ± 0.19 cm. All plants were flowering
but only 2% had pods.
Treatments were implemented (see application details in Table 8) on 3 November 2012 by
applying doses of respective treatment mixtures to the base of plants.
0
10
20
30
40
50
60
70
80
90
<1 1-2 2-3 >3
Pro
po
rtio
n o
f o
rig
ina
l p
lan
ts (
%)
Plant height (m)
First treatments
Second treatments

B.NBP.0622 - Distribution, Invasiveness, Biology and Control or Rubber Bush in Northern Australia
Page 70 of 125
Mortality assessments at 24 MAT were undertaken on the 9 November 2014.
4.6.2 Results
4.6.2.1 Screening trial
A significant difference (P < 0.05) occurred between herbicide treatments at 8, 12, 18 and
24 MAT. The granular hexazinone was the fastest acting herbicide and
hexazinone/bromacil/diuron the slowest, with the liquid hexazinone and tebuthiuron in
between (Fig. 28). Nevertheless, by 24 MAT all herbicide treatments exhibited high mortality
(97-100%) and were significantly different to the untreated control, which averaged 30%.
This mortality in control treatments appears to be associated with a dieback phenomenon
which started affecting plants between 8 and 12 MAT. Despite differences in the rate of
mortality over time between herbicide treatments, their effect on rubber bush plants was
similar. Initially, chlorosis of the leaves occurred which was followed by stem death and then
some reshooting at the base. This regrowth then became chlorotic and the plants eventually
died.
Fig. 28. Efficacy (% mortality) of four ground applied residual herbicides on rubber bush compared against an untreated control, 8, 12, 18 and 24 MAT. For each assessment time, bars with the same letters are not significantly different from each other (P < 0.05).
4.6.2.2 Influence of season, placement and application rate on efficacy of ground
applications of tebuthiuron
February applications of tebuthiuron resulted in low mortality (19.7 ± 1.3%) of rubber bush
24 MAT, irrespective of the rate applied or the placement position. Spring applications
resulted in significantly higher mortality (P < 0.05) particularly as the application rate
increased (Fig. 29). Placement position (i.e. at the base or evenly distributed under the
bd
c
b
b
b
a a
a
a
a a
b
cd
b
a
b
bc
a a
0
10
20
30
40
50
60
70
80
90
100
8 12 18 24
Mort
alit
y (
%)
Months after treatment (MAT)
Control
Hexazinone (liquid)
Hexazinone (granular)
Hexazinone/diuron/bromacil
Tebuthiuron

B.NBP.0622 - Distribution, Invasiveness, Biology and Control or Rubber Bush in Northern Australia
Page 71 of 125
canopy) did not have a significant influence (P > 0.05) but there was a trend towards higher
mortality at the lowest rate of tebuthiuron if placed at the base of plants.
Fig. 29. The effect of tebuthiuron rates on mortality of rubber bush 24 MAT at site 4 following spring application. Bars with the same letters are not significantly different from each other (P < 0.05).
4.6.2.3 Refinement of application rates and placement of tebuthiuron
There was no significant difference (P > 0.05) in mortality between the rates of herbicide
applied or the placement position of the herbicide and no significant rate × placement
interaction (P > 0.05). All herbicide treatments were, however, significantly different to the
untreated control (P < 0.05). At 12 and 24 MAT, the average mortality of control plants was
7% and 50%, respectively. In contrast, the herbicide treatments average mortality was 81%
12 MAT with this increasing to 100% 24 MAT (Fig. 30). Between 12 and 24 MAT some
control plants started showing evidence that they may have come in contact with
tebuthiuron. Initially, chlorosis of the leaves occurred which was followed by stem death and
then some reshooting at the base. This regrowth then became chlorotic and the plants
eventually died.
The cost of herbicide to treat individual plants with the lowest effective rate of 2 g/m2 was
$0.18, which was based on April 2015 prices for Graslan™ and an average application of
11 g/plant.
d
c
b
a
0
10
20
30
40
50
60
70
80
0 0 0 0
Mort
alit
y (
%)
Application rate (g a.i./m2 canopy)

B.NBP.0622 - Distribution, Invasiveness, Biology and Control or Rubber Bush in Northern Australia
Page 72 of 125
Fig. 30. Differences in mortality between untreated and tebuthiuron treatments (across all rates and placement positions) at site 3, 12 and 24 MAT. For each assessment time, bars with the same letters are not significantly different from each other (P < 0.05).
4.6.2.4 Efficacy of aerial applications of tebuthiuron (Graslan™)
In the first area treated aerially with tebuthiuron in November 2011, high mortality of rubber
bush was recorded 24 MAT, even at the lowest rate of 2.5 kg a.i./ha (Fig. 31). In contrast,
rubber bush in the neighbouring untreated area rapidly increased in density during the first
12 months of monitoring, before natural attrition of young seedlings occurred. Nevertheless,
there was still the equivalent of 14 375 and 11 750 plants/ha after 24 and 36 months,
respectively. The first seedling in treated transects was recorded 30 MAT and by 36 MAT
there were on average 31.25 ± 31.25 seedlings/ha, across all tebuthiuron treatments.
At the time, the application cost to apply tebuthiuron aerially at the designated rates ranged
between ~$185-$220/ha, but treatment cost will vary depending on the distance from an
aerial spray contractor’s base, proximity of an airfield to the site to be treated, and any bulk
discounts that may be available from suppliers (Graham Fossett, personal communication).
b
a
b
a
0
20
40
60
80
100
Untreated(12 MAT)
Treated(12 MAT)
Untreated(24 MAT)
Treated(24 MAT)
Mort
alit
y (
%)

B.NBP.0622 - Distribution, Invasiveness, Biology and Control or Rubber Bush in Northern Australia
Page 73 of 125
Fig. 31. Average plant density over time for transects treated with 2.5, 3 and 3.5 kg a.i. of tebuthiuron/ha in 2011 and an untreated control. The bar above each vertical column represents the standard error of the mean (No error bars are presented for the control treatment, because only one transect was monitored after two control transects were accidentally treated with tebuthiuron).
In the second area treated aerially with tebuthiuron (in November 2012), mortality was again
high for transects that received 2.5 kg a.i./ha, although a small proportion (3.5%) of plants
remained alive 24 MAT. In contrast, the 2 kg a.i./ha treatment failed to kill 23% of the original
plants (Plate 7). The untreated control experienced a slight decrease in density over time
(Fig. 32) despite 444 new seedlings/ha being recorded over the two years. New seedlings
were recorded within 6 months in the 2 and 2.5 kg a.i./ha treatments and averaged 267 ±
267 and 125 ± 72/ha for the two years after treatment, respectively.
0
5000
10000
15000
20000
25000
Control 2.5 kg a.i./ha 3 kg a.i./ha 3.5 kg a.i./ha
Pla
nt
density (
No./ha)
Treatments
Initial
1 year
2 years
3 years

B.NBP.0622 - Distribution, Invasiveness, Biology and Control or Rubber Bush in Northern Australia
Page 74 of 125
Fig. 32. Average plant density over time for transects treated with 2.0 and 2.5 kg a.i. of tebuthiuron/ha in 2012 and an untreated control. The bar above each vertical column represents the standard error of the mean.
0
5000
10000
15000
20000
25000
30000
35000
40000
45000
50000
Control 2 kg a.i./ha 2.5 kg a.i./ha
Pla
nt
density (
No./ha)
Treatments
Initial
6 months
12 months
18 months
24 months

B.NBP.0622 - Distribution, Invasiveness, Biology and Control or Rubber Bush in Northern Australia
Page 75 of 125
Plate 7. Rubber bush transects prior to aerial applications (November 2011) in the first treated area of 2 (top left) and 2.5 kg a.i./ha (bottom left) and 24 MAT (November 2013) for the 2 (top right) and 2.5 kg a.i./ha (bottom right) treatments.
4.6.2.5 Rate response of liquid hexazinone
Two years after implementation of treatments, a highly significant difference in plant mortality
was recorded (P < 0.001). All hexazinone treatments exhibited greater than 90% mortality
and were not significantly different from each other, irrespective of the rate applied (Fig. 33).
They were, however, all significantly different to the untreated control which averaged 29%
mortality 24 MAT.

B.NBP.0622 - Distribution, Invasiveness, Biology and Control or Rubber Bush in Northern Australia
Page 76 of 125
The amount of liquid applied in individual doses did not make a significant difference
(P > 0.05) with efficacy at a rate of 0.5 g a.i./metre of plant height similar irrespective of
whether a neat 2 mL or a diluted 4 mL (equal parts herbicide and water) dose was applied.
The cost of herbicide to treat individual plants with 2 and 4 mL of hexazinone/m of plant
height was $0.13 and $0.28, respectively. This was based on April 2015 prices for Velpar® L
and an average application of 11 g/plant.
Fig. 33. The mortality () of liquid hexazinone applied in 4 mL doses at 0, 0.25, 0.5, 0.75 and 1 g a.i./m of plant height. The efficacy of a neat application of 0.5 g a.i/m of plant height applied using 2 mL doses is also included (■) for comparison, along with a least significant bar to highlight differences between treatments at P = 0.05.
4.7 Testing of the most promising herbicide treatments in the Northern
Territory
4.7.1 Methodology
To test whether the most promising ground applied herbicide treatments identified from the
Queensland research would perform consistently for rubber bush elsewhere, a trial was
established in the Northern Territory. This trial was also intended as a demonstration for
landholders interested in management of rubber bush. Northern Territory staff from the
Department of Land Resource Management also coordinated the implementation of two
demonstrations in the Barkly Tablelands on the use of aerial applications of tebuthiuron to
control rubber bush, based on the findings of the Queensland work. However, the efficacy of
the demonstrations was not fully apparent at the time of completion of the rubber bush
project and consequently is not incorporated into this report.
With regards to efficacy of ground applications, in May 2014 a randomised complete block
experiment comprising 12 treatments (Table 17), each replicated three times, was
established in the Barkly Tablelands region. Two replicates were located at site 5, whilst the
0
10
20
30
40
50
60
70
80
90
100
0 0 0 0 0 1
Mort
alit
y (
%)
Rate of hexazinone (g a.i./m of plant height)

B.NBP.0622 - Distribution, Invasiveness, Biology and Control or Rubber Bush in Northern Australia
Page 77 of 125
third was at site 6. Each block had plots sufficient in size (an average of 361 m2 per plot) to
contain 20 medium to large sized rubber bush plants.
The foliar treatments were applied in May 2014 using a Quik Spray® unit (see Table 8 for
application details). Both traditional and thinline basal bark treatments and cut stump
applications were also applied in May 2014 (see Table 8). Ground applications of the
residual herbicides tebuthiuron and hexazinone were manually applied towards the end of
October 2014.
Rubber bush plants were evaluated for live growth six months after application (November
2014) for the foliar, basal bark and cut stump treatments. However, due to the onset of the
wet season, only two replicates could be completed. Further assessments of these
treatments, as well as the ground applied residual herbicides, will continue after cessation of
the project.
Table 17. Herbicide treatments implemented in the northern Territory based on the findings
from the Queensland trials.
Control method
Herbicide
(Active ingredient)
Trade name Application rate
(g a.i.)
Basal bark
(Traditional)
Triclopyr/picloram Access™ 40/20 g a.i./10 L mixture
Basal bark
(Thinline)
Triclopyr/picloram Access™ 240/120 g a.i./10 L mixture
Cut stump Triclopyr/picloram Access™ 40/20 g a.i./10 L mixture
Cut stump Glyphosate Squareup 360™
360 g a.i./1 L (neat)
Cut stump Picloram Vigilant™ 43 g a.i./kg (neat)
Foliar 2,4-D amine Amine 625 625 g a.i./100 L mixture
Foliar Metsulfuron-methyl Brush-off® 12 g a.i/100 L mixture
Foliar Metsulfuron-methyl
+
Triclopyr/picloram
Brush-Off®
+
Picloram + Triclopyr 400
12 g a.i/100 L mixture
+
150/50 g a.i./100 L mixture
Soil applied Tebuthiuron Graslan™ 0.3 g a.i./m2 of canopy cover
Soil applied Tebuthiuron Graslan™ 0.4 g a.i./m2 of canopy cover
Soil applied Hexazinone Velpar® L 1 g a.i/m of height (neat)
Control
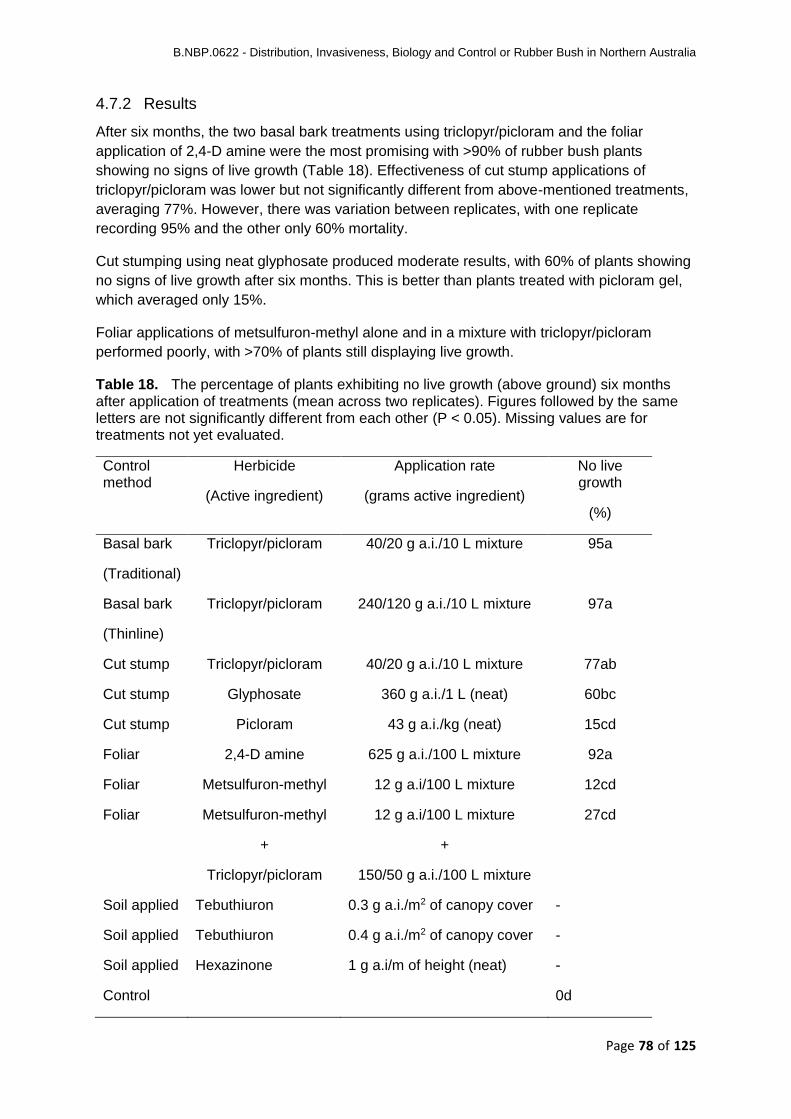
B.NBP.0622 - Distribution, Invasiveness, Biology and Control or Rubber Bush in Northern Australia
Page 78 of 125
4.7.2 Results
After six months, the two basal bark treatments using triclopyr/picloram and the foliar
application of 2,4-D amine were the most promising with >90% of rubber bush plants
showing no signs of live growth (Table 18). Effectiveness of cut stump applications of
triclopyr/picloram was lower but not significantly different from above-mentioned treatments,
averaging 77%. However, there was variation between replicates, with one replicate
recording 95% and the other only 60% mortality.
Cut stumping using neat glyphosate produced moderate results, with 60% of plants showing
no signs of live growth after six months. This is better than plants treated with picloram gel,
which averaged only 15%.
Foliar applications of metsulfuron-methyl alone and in a mixture with triclopyr/picloram
performed poorly, with >70% of plants still displaying live growth.
Table 18. The percentage of plants exhibiting no live growth (above ground) six months after application of treatments (mean across two replicates). Figures followed by the same letters are not significantly different from each other (P < 0.05). Missing values are for treatments not yet evaluated.
Control method
Herbicide
(Active ingredient)
Application rate
(grams active ingredient)
No live growth
(%)
Basal bark
(Traditional)
Triclopyr/picloram 40/20 g a.i./10 L mixture 95a
Basal bark
(Thinline)
Triclopyr/picloram 240/120 g a.i./10 L mixture 97a
Cut stump Triclopyr/picloram 40/20 g a.i./10 L mixture 77ab
Cut stump Glyphosate 360 g a.i./1 L (neat) 60bc
Cut stump Picloram 43 g a.i./kg (neat) 15cd
Foliar 2,4-D amine 625 g a.i./100 L mixture 92a
Foliar Metsulfuron-methyl 12 g a.i/100 L mixture 12cd
Foliar Metsulfuron-methyl
+
Triclopyr/picloram
12 g a.i/100 L mixture
+
150/50 g a.i./100 L mixture
27cd
Soil applied Tebuthiuron 0.3 g a.i./m2 of canopy cover -
Soil applied Tebuthiuron 0.4 g a.i./m2 of canopy cover -
Soil applied Hexazinone 1 g a.i/m of height (neat) -
Control 0d

B.NBP.0622 - Distribution, Invasiveness, Biology and Control or Rubber Bush in Northern Australia
Page 79 of 125
4.8 Mechanical control
4.8.1 Methodology
4.8.1.1 Effect of cutting depth
A completely randomised experiment comprising four treatments was initiated on 7 October
2011 at site 1. The aim of this experiment was to determine if mortality of rubber bush plants
would occur if the main tap root was severed beneath the soil surface, similar to what is
achieved using cutter bar and bladeplough style equipment. Treatments involved an
untreated control (not cut) and three cutting depths (0, 10 and 20 cm below ground).
Experimental units were individual rubber bush plants spaced over 2 m apart, with each
treatment replicated 15 times. Prior to application of treatments, plants to be treated were
tagged and their height and basal diameter were recorded. On average, they were
1.72 ± 0.03 m high and had an average basal diameter of 7.63 ± 0.16 cm.
A mattock was used to sever the roots for the below-ground cuts (i.e. 10 and 20 cm) and a
forestry-type pruning saw was used to cut stems level with the ground surface for the 0 cm
treatment. Once treatments were implemented, the exact depth that cuts were made was
measured, and averaged 11.2 ± 0.55 cm and 19 ± 0.36 cm for the 10 and 20 cm below
ground treatments, respectively.
Post-treatment mortality assessments were undertaken 4 (February 2012), 8
(26 June 2012), 12 (30 October 2012), 16 (11 February 2013), 21 (27 July 2013) and
24 MAT (27 October 2013). If plants were alive, the number of stems, their height and
whether there were any flowers or pods were recorded.
4.8.1.2 Stick raking demonstration
In February 2012, the manager of the property used a front-end loader with a stick rake
attachment to clear ~5 ha of dense rubber bush near site 1. To estimate the efficacy of this
technique, a 25 m × 25 m area was demarcated within the 5 ha area, two weeks prior to
treatment application. The location (from a fixed point), height and basal diameter of all
plants were then recorded in the 25 m x 25 m area. Post treatment assessments were
undertaken 5 (21 July 2012) and 13 MAT (March 2013) to quantify the level of mortality of
original plants and the amount of seedling regrowth. Observations of flowering and podding
were also made during post treatment assessments.
4.8.2 Results
4.8.2.1 Effect of cutting depth
Cutting height had a significant (P < 0.05) effect on the mortality of rubber bush plants. All
plants cut at ground level reshot after treatment, whilst all plants cut at 10 or 20 cm below
ground were killed (Fig. 34). Some mortality of control and 0 cm plants occurred from
12 MAT (October 2012) onwards and coincided with the appearance of dieback during this
time.

B.NBP.0622 - Distribution, Invasiveness, Biology and Control or Rubber Bush in Northern Australia
Page 80 of 125
Fig. 34. The effect of cutting depth on mortality of rubber bush plants 8, 12, 21 and 24 MAT. Within each assessment time, bars with the same letters are not significantly different from each other (P < 0.05).
Cutting plants off close to ground level caused them to vigorously reshoot, with the number
of stems peaking at 7.4 ± 0.54 (4 MAT), more than twice the number of stems compared to
control plants at the same time (Fig. 35). The height of cut plants also increased rapidly, and
by 12 MAT they were only 26 cm shorter than untreated control plants (Fig. 35). At 8 MAT all
cut plants were flowering again and by 12 MAT a small percentage (15%) were podding. The
impacts of the dieback resulted in a rapid reduction in plant height in both the control and 0
cm treatment from 12 MAT onwards. While plants responded to dieback by reshooting from
the base (mainly between 12 and 16 MAT), many of these stems eventually died. By
24 MAT, the average number of live stems per plant was less than two for both control and 0
cm treatments (Fig. 35).
b
b b
b
b
b
b b
a a a aa a a a
0
10
20
30
40
50
60
70
80
90
100
8 12 21 24
Mo
rta
lity (
%)
Months after treatment
Control 0 cm 10 cm below ground 20 cm below ground

B.NBP.0622 - Distribution, Invasiveness, Biology and Control or Rubber Bush in Northern Australia
Page 81 of 125
Fig. 35. Changes in (a) stem number and (b) plant height for live control plants and those cut off at ground level (0 cm treatment). Vertical bars represent the standard error.
4.8.2.2 Stick raking demonstration
Thirteen months after stick raking was undertaken, 36% of the original plants remained alive,
with all having reshot from the base after being cut-off close to ground level. There were also
784 new seedlings/ha, which was more than the original population density of 496 plants/ha.
When combined with surviving plants, the total rubber bush population 13 MAT was
976 plants/ha, an increase of 97% compared to the original density. Surviving original plants
averaged 1.13 m in height with 50% flowering, but only 8% with pods on them. New
seedlings ranged between 30-75 cm in height.
0
1
2
3
4
5
6
7
8
9
0 4 8 12 16 21 24
Ste
m n
um
ber
Months after treatment
(a)
0
0
1
1
2
2
0 4 8 12 16 21 24
Pla
nt
heig
ht
(m)
Months after treatment
Control
0 cm
(b)

B.NBP.0622 - Distribution, Invasiveness, Biology and Control or Rubber Bush in Northern Australia
Page 82 of 125
4.9 Dieback monitoring
4.9.1 Methodology
To understand the population impacts of a dieback phenomenon that started affecting rubber
bush plants in control trials undertaken at the Gulf of Carpentaria field sites, six transects
were established in a dieback affected area (~2 ha) of site 1 in December 2012. Transects
were two metres wide and long enough (9 to 35 m) to contain ~70 plants. When the
transects were established, the majority of plants (57%) had an average basal diameter of
2-5 cm (Fig. 36). Small plants (<2 cm basal diameter) comprised 26% of the population and
large plants (>10 cm basal diameter) only 3%.
Dieback assessments were undertaken using a 1-5 rating scale (Table 19), where 1 was no
affect and 5 was death of plants. Assessments were undertaken 7 (27 July 2013), 11
(3 November 2013), 17 (5 May 2014) and 23 months (5 November 2014) after establishment
of the transects. Each time, dieback assessments of each plant were made and the number
of new seedlings and their location were recorded. Whether plants were flowering or podding
was also noted.
Table 19. Rating scores used to quantify the affect that the dieback was having on rubber bush plants within transects at site 1.
Rating score Description
1 No affect
2 Branch tip death, leaves dropping off
3 Branch death, reshooting from main stem
4 Branch and stem death, may be reshooting from base
5 Dead
Fig. 36. The initial size class structure (average basal diameter) of the dieback affected area at site 1. The bar above each vertical column represents the standard error of the mean.
0
10
20
30
40
50
60
70
<2 2-5 5-10 >10
% o
f pla
nts
in tra
nsects
Average basal diameter (cm)

B.NBP.0622 - Distribution, Invasiveness, Biology and Control or Rubber Bush in Northern Australia
Page 83 of 125
4.9.2 Results
Over the two years of monitoring, 96% of the original 28 250 ± 4950 plants/ha died and only
50 seedlings/ha were recruited, mostly in the first seven months. Consequently, there was
only 1250 ± 1100 plants/ha present in December 2014 (Fig. 37).
The level of damage imposed by the dieback on plants increased over time (Fig. 38), with
many plants initially rated 3 or 4 progressing to a rating of 5 (i.e. dead) two years later
(Plate 8). At the time of initial assessments, six percent of plants had flowers, however no
flowering was recorded in subsequent monitoring. No podding was recorded throughout the
entire monitoring period, including at the time of the initial assessment.
Fig. 37. Changes in rubber bush density (plants/ha) over time in dieback affected transects. The bar above each vertical column represents the standard error of the mean.
Fig. 38. Damage assessment ratings (see Table 19) for each monitoring period, expressed as a percentage of live plants.
0
5000
10000
15000
20000
25000
30000
35000
Dec 12 May 13 Dec 13 May 14 Dec 14
Pla
nt
density (
No./ha)
Monitoring dates
0%
10%
20%
30%
40%
50%
60%
70%
80%
90%
100%
Dec 12 May 13 Dec 13 May 14 Dec 14
Pla
nt
dam
age r
ating
Monitoring dates
54321

B.NBP.0622 - Distribution, Invasiveness, Biology and Control or Rubber Bush in Northern Australia
Page 84 of 125
Plate 8. Rubber bush plants within a dieback transect at the start (December 2012) (left) of monitoring and two years later (November 2014) (right) at site 1.
4.10 Discussion
The control research in this project expanded on previous studies (Vitelli et al. 2008), by
confirming some of the results obtained in this earlier research, as well as identifying several
additional options capable of giving effective control of rubber bush. Though it was a difficult
plant to achieve consistently high efficacy using some techniques (particularly foliar
applications), others such as basal barking and ground and aerial applications of residual
herbicides, consistently caused high mortality. The pilot mechanical trial identified the level
of damage needed to kill rubber bush, but results from a stick raking demonstration
highlighted a capacity to rapidly replace killed plants through new seedlings. During the
course of the control research, a dieback phenomenon started deleteriously affecting rubber
bush plants, and appeared to have an impact on the efficacy of some of the applied
treatments (particularly foliar spraying). Regular monitoring of transects at an affected site
indicated that it could have a major impact on populations. Detailed discussion on the results
of the various techniques tested and the impacts of the dieback are provided below.
4.10.1 Foliar herbicides
In the trials undertaken, high mortality was achieved with foliar spraying using some
herbicides, but there were inconsistences between trials, between the seasonal times that
applications were made, and between previously reported trials (Vitelli et al. 2008). The size
of plants also appears to have been an influence on herbicide efficacy; overall, mortality
tended to be higher for smaller plants.

B.NBP.0622 - Distribution, Invasiveness, Biology and Control or Rubber Bush in Northern Australia
Page 85 of 125
Imazapyr/glyphosate, 2,4-D amine and metsulfuron-methyl were the only herbicides to give
high mortality of the larger rubber bush plants in Trial 2, for at least one of the application
times. Vitelli et al. (2008) had previously reported excellent mortality of rubber bush using
imazapyr at rates of 125-250 g a.i./100 L. In the current study, the lower rate of
imazapyr/glyphosate contained only 97.5 g a.i. of imazapyr/100 L of solution, but there was
an equal proportion of glyphosate that could have been contributing to mortality of rubber
bush. Nevertheless, restrictions associated with imazapyr means that chemicals containing
this active ingredient can only be applied in situations such as roadsides and right of ways,
not in pastures. Metsulfuron-methyl is currently the most cost effective option for treating a
range of broadleaf weeds in pastures, and has previously been reported to give high
mortality of rubber bush when applied at a rate of 12 g a.i./100 L (Vitelli et al. 2008). In the
current trials, high mortality was achieved only once at an application rate of 12 g a.i./100 L,
but for the rest of the times it was sprayed, efficacy was poor, even at an application rate of
18 g a.i./100 L. Anecdotally, several landholders have reported similar variation in mortality
after using this herbicide, bringing into question whether it should be recommended as a
reliable option for treating rubber bush. In contrast, 2,4-D amine consistently gave good
control of rubber bush during autumn applications, but a higher rate (625 g a.i./100 L) was
needed to provide high mortality of the larger plants in trial 2. However, even at the higher
rate, 2,4-D amine would be a more cost effective alternative than most of the other options,
except metsulfuron-methyl.
In conclusion, the results from the trials suggest that efficacy from foliar spraying can be
reliably high if applied to small to medium plants up to 1.5 m high. More variation occurs
when treating larger plants, so alternate control techniques, such as basal barking, should
be considered. 2,4-D amine and imazapyr based products could give good efficacy in non-
pasture situations, whilst in pastures 2,4-D amine would be most applicable. Despite the
variability of metsulfuron-methyl, the fact that high mortality was achieved in summer during
the seasonality trial, in combination with its excellent efficacy in previous studies (Vitelli et al.
2008), suggests that landholders should test it in their situations along with options such as
2,4-D amine. These two chemicals are compatible and could be included in a mixture at little
extra expense given the low cost of metsulfuron-methyl. While this combination did not
perform any better in the current studies than 2,4-D amine on its own, it may do so in some
situations and would also control a broader range of other weeds that may be growing in
association with rubber bush. To maximise uptake of herbicide by rubber bush, it is
recommended that landholders not only spray the foliage of rubber bush, but also the stems.
The presence of dieback was a confounding factor during the foliar trials, and appeared to
be at least partly responsible for increasing the variability of the results within treatments as
well as increasing mortality over time. While some plant death in untreated controls was
most likely associated with dieback, herbicide treated plants may possibly have been more
susceptible to the dieback following treatment. This is ironic as, in hindsight, some of the
plants could have been affected by the dieback at the time treatments were applied which
may have contributed to the poorer than expected results. Previous research on the woody
weed rubber vine (Cryptostegia grandiflora) has shown that efficacy of foliar applications of
herbicide is reduced by increasing presence of the leaf rust Maravalia cryptostegiae (Vitelli &
Madigan 1999). This could possibly be similar for rubber bush and land managers should
therefore only spray plants when they are in healthy condition and with maximum leaf
coverage that is ideally not affected by any leaf diseases.

B.NBP.0622 - Distribution, Invasiveness, Biology and Control or Rubber Bush in Northern Australia
Page 86 of 125
4.10.2 Basal bark applications
The inclusion of basal bark treatments in the foliar trials for comparative purposes provided
the opportunity to confirm the efficacy of triclopyr/picloram using both the traditional method
and the newer thinline technique. Vitelli et al. (2008) had previously reported up to 87%
mortality using the traditional basal bark technique. In the current study, mortality exceeded
95% mortality across both techniques and irrespective of the season of application.
Anecdotally however, some landholders have had mixed results basal barking rubber bush.
This could be associated with the different bark structure of rubber bush compared with
several other woody weeds that they may have been used to, such as prickly acacia. Rubber
bush has a corky bark that soaks up more chemical before run-off, which is recommended
for basal barking. The spray mixture does not spread as easily as it does for some other
plants, so it is critical that the applicator directly sprays all the way around the plant.
Basal barking for control of rubber bush using triclopyr/picloram has been included in a
minor use permit (PER12497) for several years, but the manufacturer of this product is now
progressing full label registration for both the traditional and thinline techniques.
4.10.3 Cut stumping and frilling
Cut stumping using triclopyr/picloram (Access™) mixed in diesel has been previously
identified as an effective technique for controlling isolated plants and low density infestations
of rubber bush (Vitelli et al. 2008). The current research has found that good control can also
be obtained through neat applications of glyphosate or pasting the cut surface with a
picloram based gel, particularly when plants are cut off close to ground level. Both these
options have the added advantages of requiring no mixing with diesel and being easy to
transport. Furthermore, equipment to cut plants off does not need to be sophisticated for
small plants; pruning saws and a range of garden clippers are more than adequate and easy
to carry around. As plants become larger, more heavy duty equipment, such as brush cutters
and chainsaws, will be required. For these plants, triclopyr/picloram (Access™) may be the
best herbicide to apply after the plants are cut off close to ground level. The plants used in
the trials were of a medium size and efficacy on larger plants cannot be guaranteed. This
may be a possible reason for the poor results obtained in the Northern Territory trial (see
below). Alternatively, dieback may have made the plants more susceptible to the imposed
treatments and potentially contributed to the high mortality that was obtained. Nevertheless,
these techniques warrant being considered for inclusion in a revision of the current minor
use permit (PER12497) for control of small to medium sized plants, but in the interim some
additional plants of varying sizes will be treated to support the previous findings.
Frilling also proved effective using both glyphosate and picloram gel herbicides but, given
the multi-stemmed nature of rubber bush, it would be a time consuming exercise for treating
anything but isolated or very low density infestations. Nevertheless, not much equipment
needs to be transported and frilling will also be considered for inclusion in the minor use
permit.
4.10.4 Ground and aerially applied residual herbicides
Both ground and aerial applications of residual herbicides proved highly effective at
controlling rubber bush plants. Distribution of chemical over the whole infested area, such as

B.NBP.0622 - Distribution, Invasiveness, Biology and Control or Rubber Bush in Northern Australia
Page 87 of 125
in aerial application, also minimises seedling regrowth. Where individual plants were treated,
large scale seedling recruitment was observed at times in between the treated areas.
Across all of the trials undertaken, the lowest rate of tebuthiuron that was still capable of
causing high mortality of rubber bush was 2.5 kg a.i./ha (i.e. 0.25 g a.i./m2). A rate of
2.0 kg a.i./ha was ineffective when applied either to individual plants based on canopy size
or when evenly distributed through aerial applications. This is similar to previous research by
Vitelli et al. (2008) who reported ≤20% mortality following application of tebuthiuron at rates
of 1.5-2.0 kg a.i./ha.
Efficacy of tebuthiuron was best if applied prior to the onset of the wet season and not during
it, which is consistent with the recommendations on the labels of respective products for
treatment of woody vegetation (including weeds) generally. There also did not appear to be
any difference in efficacy between placing it directly at the base of plants or spreading it
evenly under the canopy of plants when treating individual plants or using a broad-scale
application based on a unit area.
Variation in the efficacy of tebuthiuron between sites (particularly between site 4 and those in
the Gulf of Carpentaria [sites 1-3]) when applied at comparable rates may have been
associated with soil type differences. The clay soils in the Gulf of Carpentaria appeared to be
conducive to high mortality, although feedback from chemical company representatives
following commercial applications on two neighbouring properties in that region suggested
that, in some instances, differences in clay content had an influence on mortality (Graham
Fossett, personal communication). On the property next door to where site 3 was located, a
rate of 3.0 kg a.i./ha of tebuthiuron was required on a fine textured (medium clay) soil to
achieve comparable control to that recorded at site 3 using 2.0 kg a.i/ha (Graham Fossett,
personal communication). Reeves (unpublished data) also reported poor efficacy of
tebuthiuron when applied at rates of 0.4-1.0 g a.i./m2 in northern Western Australia on a
sandier soil type.
Based on the findings, a revision of the current minor use permit (PER12497) will be
submitted to include both ground and aerial applications of tebuthiuron. However, given the
potential variability of tebuthiuron, before commencing broad-scale control of rubber bush, it
may be advantageous for land managers to firstly determine its efficacy on a smaller scale
and at a few rates for their particular soil types. This will help identify whether it will be an
effective option for them. If native vegetation is also present amongst the rubber bush, any
existing vegetation management laws would need to be considered for respective states and
territories before applying tebuthiuron. If after considering all these factors, aerial application
of tebuthiuron is considered the most cost effective option, the use of reputable aerial
operators with suitable application equipment and mapping technology will ensure accurate
product placement.
Liquid hexazinone proved highly effective in killing rubber bush at rates ranging from 0.25 to
1 g a.i./m of plant height. However, like tebuthiuron, the poor efficacy reported following its
use previously (Reeves, unpublished data) could be associated with site specific differences,
such as soil types. Testing on a small scale should therefore be undertaken before
conducting broad-scale control. In the interim, liquid hexazinone will be included for
consideration by the APVMA in a revision of the current minor use permit (PER12497), most
likely at a rate of 0.5-1 g a.i./m, with the lower rate for small plants (≤1.5 m) and the higher

B.NBP.0622 - Distribution, Invasiveness, Biology and Control or Rubber Bush in Northern Australia
Page 88 of 125
rate for larger ones. If approved, land managers will also have to consider any existing
vegetation management laws for respective states and territories before applying
hexazinone.
4.10.5 Testing of the most promising herbicide treatments in the Northern Territory
Basal barking with triclopyr/picloram mixed with diesel using both the traditional and newer
thinline technique demonstrated high mortality in the Northern Territory trial, consistent with
the Queensland trials and the findings of Vitelli et al. (2008). Similarly, 2,4-D amine was also
the best of the foliar treatments which is similar to the findings from Queensland, although
some variation occurred between trials in Queensland.
Discrepancies between the Queensland and Northern Territory trials occurred in the efficacy
of cut stump applications. In Queensland, the application of neat glyphosate and a picloram
gel caused high mortality, but results were poor in the Northern Territory. Triclopyr/picloram
(Access™) also gave mixed results in the Northern Territory when applied as a cut stump
treatment, which contrasts with earlier work by Vitelli et al. (2008), who reported high
mortality.
While no efficacy data was yet available on the soil applied residual herbicides in the
Northern Territory at completion of the project, personal observations after 11 months
suggested that they were performing in a similar manner to the Queensland trials at the
same time, and should end up providing high mortality. The aerial demonstrations of
tebuthiuron also looked promising and consistent with the Queensland findings at a
comparable stage, with small plants observed to be dead and any large plants remaining
alive displaying severe necrosis.
Overall, the results reaffirm previous discussions that there could be treatment variation for
several of the treatments identified for rubber bush, and that small areas should be treated
first to confirm whether good efficacy can be achieved using a particular technique/product
before implementing large scale control activities. This will avoid unnecessary expenditure
and minimise the amount of follow up control that may be needed.
4.10.6 Mechanical control
The cutting depth trial quantified the potential to obtain high mortality of rubber bush using
equipment, such as cutter bars and blade ploughs, capable of severing the roots system of
plants. Those that cut the plant off at ground level will cause minimal mortality. The plants
will reshoot vigorously and end up with many more stems than were there initially. This will
make follow up control even more difficult. The stick raking demonstration resulted in
moderate mortality. Surviving plants were mostly those that had been cut/broken off at
ground level. This demonstration also showed the propensity of rubber bush to re-establish
through seedling recruitment, which for many weeds is often promoted under the disturbed
conditions created by mechanical techniques (McKenzie et al. 2004; Bebawi et al. 2011).
Such promotion of seedling regrowth can be advantageous if follow up control is undertaken
before these plants reach reproductive maturity. This is particularly pertinent for rubber bush
given its short seed longevity with most seedling regrowth likely to occur within the first 24
months after implementation of treatments. If this seedling regrowth is controlled, under most
situations landholders should expect minimal seedling recruitment thereafter, unless
previous conditions have been dry and not conducive to germination, or if further seed input

B.NBP.0622 - Distribution, Invasiveness, Biology and Control or Rubber Bush in Northern Australia
Page 89 of 125
is occurring from external sources (i.e. through wind or water dispersal from neighbouring
infestations). If follow up control is not undertaken, initial mechanical control can exacerbate
the problem and facilitate rapid expansion of rubber bush in infested areas.
4.10.7 Dieback monitoring
Over the two years that monitoring was undertaken, high mortality of rubber bush plants
occurred from a dieback phenomenon that was first observed at the site in 2012. The
symptoms were consistent with those of a leaf spot disease (Passalora calotropidis) that was
reported by Wilkinson et al. (2005) after the senior author collected it in 2002 from rubber
bush plants growing on sand dunes near the township of Karumba, north Queensland. At the
time, this was the first recording of this disease in Australia, but since then it has been
observed at several locations in Queensland and the Northern Territory. Wilkinson et al.
(2005) reported that in the early stages, the disease expresses itself as a dark lesion on
either surface of the leaf with a halo of chlorotic yellow tissue. As the lesion increases in
size, the chlorotic zone spreads, bounded by the leaf veins. On the lower leaf surface, the
dark centres grow in size and eventually become covered in mycelium, bearing spores in
poorly defined concentric rings. As the disease progresses, the entire leaf becomes yellow,
followed by abscission. In the absence of supporting leaves, the branch tips die back,
extending to the whole branch as the disease progresses (Wilkinson et al. 2005). During the
current project, all of these symptoms were observed. Plants appeared capable of
reshooting vigorously if the initial branches were killed, but this new growth often became
infected at some stage and, in most instances, the plants eventually died.
Passalora calotropidis was included in a list of fungal pathogens of rubber bush and was
mentioned as a potential biological control agent (Baretto et al. 1999) for countries where it
had invaded. Baretto et al. (1999) also suggested that the fact that it was already present in
several countries throughout Central and South America indicated that it may have been
spread or introduced at the same time rubber bush was introduced. If this was the case for
Australia, it has been here earlier than first reported by Wilkinson et al. (2005), as rubber
bush has been in the country for a long time, with reports of it being naturalised at two
locations in northern Queensland in 1935 (Grace 2006). This is plausible, because Australia
was not included in the large mycological study undertaken on rubber bush by Baretto et al.
(1999).
While P. calotropidis is considered the most likely cause of the dieback being observed on
rubber bush, several other pathogens have been isolated from stem sections of dieback
infected plants (Isahak 2013). Some of these, when sprayed onto seedlings of rubber bush,
demonstrated an ability to cause similar symptoms to those observed in the field, resulting in
high mortality rates. Further research is needed to quantify exactly what causal agent is
responsible for the widespread dieback being observed. This work could also lead into
possible opportunities for development of a mycoherbicide for rubber bush.
Irrespective of the causal agent, the presence of a damaging dieback that is affecting the
population dynamics of rubber bush needs to be factored into management strategies.
Monitoring of affected areas needs to continue to determine whether it will persist and
provide long term impacts on populations. If dieback does persist, it could be an alternate
explanation for the large reduction in rubber bush that was observed at a vegetation
monitoring site in the Victoria River district of the Northern Territory (Bastin et al. 2003). At
B.NBP.0622 - Distribution, Invasiveness, Biology and Control or Rubber Bush in Northern Australia
Page 90 of 125
the time, the decline in rubber bush was attributed to a combination of competition from
perennial grasses and a series of years that received below average rainfall during the wet
season. This could be the reason, but it is also feasible that the dieback had reached this
location and started having a deleterious effect on the rubber bush plants. If the dieback was
reducing the vigour of rubber bush plants, this may also have provided a more competitive
advantage to the pasture grasses present.
Whilst the unintentional introduction of P. calotropidis may provide a level of biocontrol on
rubber bush in Australia, several promising insects have also been identified overseas and
warrant investigation (Dhileepan 2014). In particular, there are three pre-dispersal seed
predators, the Aak weevil (Paramecops farinosus), the Aak fruit fly (Dacus persicus) in the
Indian subcontinent and the Sodom apple fruit fly (Dacus longistylus) in the Middle East
(Dhileepan 2014). In Australia there are no native Calotropis species and only two native
Australian genera – Cynanchum and Tylophora (with 23 species) in the same tribe
Asclepiadeae as Calotropis spp. This makes rubber bush an ideal target for classical
biological control in Australia (Dhileepan 2014).
4.11 Conclusion
The control research has emphasised the importance of choosing the correct technique
depending on the size and density of rubber bush and the situation it is growing in. Ensuring
the selected technique is applied correctly is also important to avoid variable results. Smaller
plants are much easier to kill than large mature ones, and it is critical that infestations are
treated as soon as possible after discovery, thereby reducing the opportunity for populations
to expand and spread. This will minimise control costs, which is important as there are no
cheap options to effectively treat large dense infestations and, in most instances, it would be
difficult to recoup the investment through increased productivity of the land. Several options
that could be applied to control isolated rubber bush plants or small patches found during
day to day activities (such as when checking bores) have been identified in this project and
do not require a lot of equipment (e.g. such as hand application of tebuthiuron). For
landholders trying to control large dense infestations, aerial application of tebuthiuron has
proven a highly effective option, but there may be variability across soil types and legislative
restrictions in timbered areas that landholders will have to consider. These options, along
with any of the other effective herbicide treatments identified in this project, will be included
in a revised minor use permit for control of rubber bush. For some, respective chemical
companies will be approached to see if they would be willing to progress label registration.
Already, label registration is occurring for basal bark control of rubber bush using
triclopyr/picloram (Access™) mixed with diesel. The influence of a dieback phenomenon
during the project has been an unexpected factor that has not only confounded some of the
research findings, but also provided some promise that a level of population control may be
imposed on rubber bush infestations in the absence of traditional control work. However,
more work is needed to determine the long term implications of this dieback and
commencement of a complimentary biocontrol program to source and introduce some of the
promising insects that have been identified by other researchers (Dhileepan 2014) would be
advantageous.

B.NBP.0622 - Distribution, Invasiveness, Biology and Control or Rubber Bush in Northern Australia
Page 91 of 125
5 Recommendations
The ecological, invasiveness, spread/distribution and control research reported in previous
sections has identified key findings that land managers should take into consideration when
developing management strategies for control of rubber bush. These include:
Most of the seed produced by rubber bush is dispersed locally, but a small percentage
(~7.5%) can be blown considerable distances (>1 km) by wind, allowing it to potentially
extend its range fairly rapidly (1 km every 2-3 years). Consequently, land managers
need to be on the look-out for this weed over their whole property and not just in the
immediate vicinity of infestations, or along watercourses, which is another vector for
spread.
Plants established through long-distance dispersal (i.e. outliers) escape from the
challenges associated with established high-density populations, such as competition
for resources and pollinators, and could therefore potentially grow faster and reach
reproductive maturity more quickly. Furthermore, self-compatibility and solid pollinia
(with hundreds of pollen grains) confer reproductive assurance so that one successful
pollination event, even self-pollination, means that a single mature plant can establish a
stand of rubber bush within 2-3 years. Maintenance of healthy pastures will slow the
growth and development of rubber bush and increase mortality of young plants, but
control of small outbreaks in new areas (i.e. not previously known to have rubber bush)
or outliers arising from core infestations, should be a priority to prevent establishment or
slow the spread of rubber bush, respectively.
Where rubber bush is scattered over the landscape, control should be undertaken
before the population reaches densities (~250-550 plants/ha) that are conducive to
maximum fecundity, which will facilitate exponential increases in plant density under
favourable environmental conditions.
Given the variability in reproduction that can occur across locations, largely due to the
presence or absence of pollinators, land managers should monitor populations prior to
implementation of control activities, particularly their reproduction (e.g. how many pods
they are producing). This will give them an appreciation of the level of seedling
recruitment that they can expect, which may influence the control options they choose to
use. For example, if there have been lots of seeds produced and the soil seed bank is
high, the use of residual herbicides might be applicable to minimise seedling
establishment.
Rubber bush tends to have a short-lived seed bank (<2 years) under average or above
average rainfall conditions, due to its seed characteristics (high germinability and
minimal dormancy). It is therefore dependent on regular replenishment from
reproductive adult plants for substantial seedling emergence/regrowth to occur.
Consequently, large scale recruitment is most likely to occur within the first 12 months of
control programs, and land managers could potentially achieve effective control of
rubber bush patches in a 2-3 year timeframe if they are able to kill all original plants, and
undertake follow-up control frequently enough to prevent any new plants from reaching
reproductive maturity. This is based on the assumption that replenishment of the seed
bank is not occurring from external sources (e.g. wind and water dispersal). The
frequency that follow up control would need to be undertaken would be ~12 monthly to
avoid replenishment of soil seed banks, although six monthly intervals would be
preferable to provide two opportunities to find and control any new plants before they

B.NBP.0622 - Distribution, Invasiveness, Biology and Control or Rubber Bush in Northern Australia
Page 92 of 125
reach reproductive maturity. If broad-scale control of residual herbicides has been
implemented, the timing of follow up control may possibly be extended until the residual
activity ceases (could be up to 2-3 years).
Where livestock feed on rubber bush without negative effects, allowing them to browse
on the plants before the onset of summer when they are most reproductive, may be a
useful strategy for disrupting reproduction of rubber bush.
Seedling emergence and establishment will be enhanced through disturbances such as
overgrazing, the trampling effect of livestock during wet periods, and implementation of
mechanical techniques. Pastoralists could reduce establishment rates by avoiding
putting cattle into paddocks that have fruiting rubber bush plants in them to avoid
trampling effects.
Rubber bush does not appear to be an overly competitive plant, so setting stocking
rates that maintain pastures in healthy condition will reduce seedling emergence and
survival, and slow the growth and development of plants. However, if thick stands of
rubber bush have established, they will reduce pasture production and will need to be
controlled to increase the productivity of the land. In some instances, re-sowing with
suitable pasture species may be required.
Individual plants or small patches of rubber bush could be effectively treated using a
number of herbicide techniques, some of which require minimal equipment easily
carried by most forms of transport used on properties (e.g. all-terrain vehicles, utilities
etc.). These include hand applications of tebuthiuron (e.g. Graslan™), backpack
spraying of liquid hexazinone (e.g. Velpar® L), basal barking (either traditional or
thinline) using triclopyr/picloram (Access™), and cut stumping with glyphosate based
products, a picloram gel (Vigilant™ II), or triclopyr/picloram (Access™). For cut
stumping, a wide range of equipment (from hand saws and garden clippers up to brush
cutters with metal blade attachments) could potentially be used, depending on the size
and density of rubber bush. Correct application of all techniques is critical, as rubber
bush will reshoot otherwise.
Application of some foliar herbicides (e.g. 2,4-D amine, imazapyr) could also be
effective for scattered to medium density infestations, with efficacy most likely to be best
on smaller plants (<1.5 m) and those that are in very healthy condition with maximum
leaf coverage at the time. Because efficacy appears to be best when the whole plant is
thoroughly sprayed, there appears to be minimal scope for effectively using aerially-
applied foliar herbicides for control of rubber bush.
For broad-scale control of dense rubber bush, aerial application of tebuthiuron is the
most cost effective herbicide treatment that can provide high mortality of original plants
and residual control of seedling growth. This technique will be restricted to areas
permissible under vegetation management legislation of respective states and
territories, and some variability in efficacy may occur between soil types.
Control of rubber bush using mechanical treatments could be effective using equipment
(e.g. blade ploughs, cutter bars) that cuts plants off below ground (e.g. 10–20 cm). If
plants are only cut off at ground level, such as by bulldozers or graders, a large
proportion may reshoot vigorously. Large scale seedling regrowth should be expected
after mechanical control, unless plants have not produced many pods in the previous
years. Stimulating the emergence of seedlings can be beneficial by helping deplete the
seed bank more rapidly. However, land managers need to be able to control this
seedling growth before it reaches reproductive maturity and starts replenishing the seed

B.NBP.0622 - Distribution, Invasiveness, Biology and Control or Rubber Bush in Northern Australia
Page 93 of 125
bank, otherwise the problem can be exacerbated. Therefore, follow up control should be
planned at the time of implementation of mechanical techniques.
The long term implications of a dieback phenomenon on rubber bush populations in
northern Australia are not fully apparent at this stage, but dieback can reduce
reproduction and plant densities. Land managers planning on controlling infestations
that may be displaying signs of dieback need to consider the best time to initiate
activities. If it is becoming widely established and starting to adversely affect the growth
and reproduction of rubber bush, immediate action may not be necessary, except
perhaps to kill any healthy plants. It may be more appropriate to allow natural attrition to
occur with follow up control of surviving plants undertaken later on. Conversely,
implementing control when the plant is less vigorous from the dieback may increase the
effectiveness of control programs particularly if the seed bank is lower than normal.
However, the immediate efficacy of some techniques (such as foliar spraying) would be
reduced by the dieback.
On a broader scale, distribution modelling shows that, although rubber bush has a
foothold throughout northern Australia, it has not saturated its potential range with large
areas still under threat. Furthermore, under climate change, the future potential
distribution of rubber bush may extend into new areas, including the southern and
eastern parts of the Northern Territory, border regions of Western Australia, and western
Queensland. Land managers in prone areas need to be made aware of rubber bush by
responsible authorities/agencies, and encouraged to control plants in the early stages of
invasion if found, to prevent it impacting on livestock enterprises. Strategically, rubber
bush management zones could be established from Western Australia through the
Northern Territory to Queensland based on population sizes as recommended in section
3.7.5.
5.1 Identification of the most practical and cost-effective control options for
rubber bush
Based on the findings from the rubber bush project, previous research studies (Reeves,
unpublished data; Vitelli et al. 2008), and anecdotal evidence provided by
individuals/organisations that have actively controlled rubber bush, an attempt has been
made to identify the most practical and cost-effective control options for rubber bush
(Table 20). An economic evaluation of control techniques was not an official objective of the
rubber bush project, but in identifying the most appropriate techniques, comparative costings
developed by Vitelli et al. (2008) were used in the decision making process. It is also
important to note that some of the specific herbicides that will be recommended for
respective techniques are not currently registered for control of rubber bush. Approval will be
sought from the APVMA for their inclusion in a revision of PER12497.

B.NBP.0622 - Distribution, Invasiveness, Biology and Control or Rubber Bush in Northern Australia
Page 94 of 125
Table 20. Evaluation of the suitability of potential control options for rubber bush at different
densities.
Technique Appropriate densities*
Suitability† Comments
Mechanical -(grubbing plants out)
I,L A range of machines could be used including front-end loaders, graders and bulldozers. They will be ineffective if the plant is only cut-off at ground level and not completely removed.
Mechanical -(severing the root system off below ground)
L,M,D A range of equipment could be used including front (i.e. Ellrott plough®) and back mounted blade ploughs and cutter bar devices attached to various sized machines, ranging from tractors to large bull dozers. For broad-scale control using machinery, large scale seedling recruitment may occur.
Foliar spraying I,L,M Generally best on smaller plants (<1.5 m) that are in healthy condition at the time of application and not affected by dieback.
Cut stump I,L A range of equipment could be used from pruning saws to brush cutters with metal blades. Plants should be cut-off close to ground level and the cut stump sprayed within 5 seconds. Neat glyphosate‡ and a picloram gel (Vigilant™ II‡) (smaller plants only) and triclopyr/picloram (Access™) at a rate of 1 L/ 60 L of diesel would be options to apply to the cut stumps.
Basal bark I,L,M Can be applied all year round to treat all size classes using triclopyr/picloram (Access™). Both the traditional and thinline‡ technique can be effective, but it is critical that the stem is sprayed to the point of runoff all the way around and to the required height: 30-40 cm for the traditional rate of 1 L/60 L of diesel and 5 cm for the thinline technique using 1 L/10 L of diesel.
Hand application of tebuthiuron (e.g. Graslan™)‡
I,L,M Rates ranging from 0.3–0.4 g a.i./m2 of canopy should provide good control of original plants, although there could be some soil type differences. If soil seed banks are high at the time of application significant seedling regrowth outside of the herbicide impact zone (i.e. between treated plants) may occur.

B.NBP.0622 - Distribution, Invasiveness, Biology and Control or Rubber Bush in Northern Australia
Page 95 of 125
Technique Appropriate densities*
Suitability† Comments
Spot gun application of liquid hexazinone (e.g. Velpar L) ‡
I,L,M Rates ranging from 0.5–1 g a.i./m of plant height (higher rate for larger plants) should provide good control of original plants, although there could be some soil type differences. If soil seed banks are high at the time of application significant seedling regrowth between treated plants may occur.
Aerial application of tebuthiuron‡
H Rates ranging between 2.5-3 kg a.i./ha should provide good control. Most appropriate for infestations in habitats with low tree cover and away from watercourses. Not only controls the original plants but also provides residual control to minimise seedling regrowth. Need to consider vegetation management legislation and variability across soil types.
Fire L,M,H Based on anecdotal evidence only and individual one off fires. Whether a regular fire regime would impose a level of control is unknown, but warrants investigation.
*Appropriate densities: I – Isolated (1-100 plants in an area at densities of 1-5 plants/ha),
L – low <250 plants/ha), M – medium (250-500 plants/ha), H – high (>500 plants/ha)
†Suitability of control options: - low - moderate - very good
‡Not currently registered, but approval will be sought from the APVMA for their inclusion
in a revision of PER12497. The thinline basal bark technique for rubber bush will be
registered in the future by Dow AgroSciences, the manufacturer of Access™.
5.2 Managing rubber bush in different environments and with different levels
of rubber bush intrusion
Taking into consideration the suite of techniques that could be used to control rubber bush,
recommendations are provided for managing it in different environments and with different
levels of rubber bush intrusions (Table 21).

B.NBP.0622 - Distribution, Invasiveness, Biology and Control or Rubber Bush in Northern Australia
Page 96 of 125
Table 21. Recommendations for managing rubber bush in different environments.
Situation Density* Recommendation
Mitchell grass
downs country or
areas that have
been cleared
previously (e.g.
gidyea country)
I,L,M Individual plants or small patches could be controlled in
numerous ways using herbicides, including cut stumping,
basal barking, spot gun application of liquid hexazinone,
hand application of tebuthiuron or foliar spraying.
For low to medium densities, basal barking, spot gun
application of liquid hexazinone or hand application of
tebuthiuron would be the recommended techniques. For
the latter two options, some variation in efficacy between
soil types may occur, so testing on a small scale first
would be advisable. Foliar applications could also be
used but would be best on smaller plants.
Machinery capable of cutting the plants off below ground
could give good results, but the localised disturbance
may promote seedling recruitment.
H Aerial application of tebuthiuron would be the most cost
effective technique to control not only the original
infestation but also to provide residual control to
minimise seedling regrowth. Rates may need to vary
depending on soil type.
Mechanical control may be a preferred option if
landholders want to control rubber bush as well as
regrowth of native vegetation (e.g. gidyea) that had been
previously cleared. The use of blade ploughs or cutter
bar devices that cut plants off below ground should give
good control but seedling regrowth may be significant
and require follow up control.
If follow up control of light to medium density regrowth is
required, basal barking, spot gun application of liquid
hexazinone or hand application of tebuthiuron would be
appropriate techniques. For dense seedling regrowth,
some natural attrition may occur but foliar spraying whilst
the seedlings are still small should be an effective option.
Before commencing either aerial herbicide applications
or mechanical control, vegetation management
regulations of respective states/territories will need to be
considered. Re-establishing a competitive pasture
should also be a priority and may require re-seeding.

B.NBP.0622 - Distribution, Invasiveness, Biology and Control or Rubber Bush in Northern Australia
Page 97 of 125
Situation Density* Recommendation
Timbered areas
including along
riparian corridors.
I,L,M,H For all densities, control options are largely restricted to
individual herbicide techniques, particularly basal
barking. Cut stumping would be suitable for small
outbreaks and foliar spraying could be used for up to
medium level densities, particularly where populations
contain a large proportion of smaller plants. Ground
application of residual herbicides will be restricted in this
environment due to potential off target damage to native
tree species and in some cases proximity to water
courses.
Agricultural non-crop
areas, commercial
and industrial areas,
fence lines and
rights-of-way.
I,L,M In these environments, densities tend to range from new
outbreaks of individual plants, to small patches, to
medium density situations. Repeated cut stump, basal
bark or foliar spraying using imazapyr based herbicides
would be most effective for ongoing control of rubber
bush in these situations. Consideration could be given to
the use of liquid hexazinone or hand application of
tebuthiuron if there is limited risk to non-target plants.
*Appropriate densities: I – Isolated (1-100 plants in an area at densities of 1-5 plants/ha),
L – low <250 plants/ha), M – medium (250-500 plants/ha), H – high (>500 plants/ha)
5.3 Recommendations for future research and dissemination of key findings
to stakeholders
Whilst the research undertaken within this project has greatly increased our knowledge of
the ecology, invasiveness, spread/distribution and control of rubber bush, it has also
identified some additional research that could be pursued to advance management of rubber
bush in Australia. This includes:
Genetic research to determine the genetic variability within Australian populations and to
quantify the inter-relatedness of populations across northern Australia – whether rubber
bush has established from multiple introductions or not, will assist with planning effective
regional management strategies. This information would also be beneficial if a biological
control program was to be initiated, particularly if the country of origin can be determined.
Implementation of biological control research to build on opportunistic sampling
undertaken whilst researchers have been looking for agents for other priority weeds (e.g.
bellyache bush and prickly acacia). Whilst a dieback phenomenon is currently affecting
infestations at several locations and may provide a level of biocontrol on rubber bush in
Australia, several promising insects have also been identified overseas and warrant
investigation. In particular, there are three pre-dispersal seed predators, the Aak weevil
(Paramecops farinosus), the Aak fruit fly (Dacus persicus) in the Indian subcontinent and
the Sodom apple fruit fly (Dacus longistylus) in the Middle East (Dhileepan 2014). In
Australia there are no native Calotropis species and only two native Australian genera –
B.NBP.0622 - Distribution, Invasiveness, Biology and Control or Rubber Bush in Northern Australia
Page 98 of 125
Cynanchum and Tylophora (with 23 species) in the same tribe Asclepiadeae as
Calotropis spp. This makes rubber bush an ideal target for classical biological control in
Australia (Dhileepan 2014).
Further research to quantify the impacts of rubber bush on productivity of livestock
enterprises and on biodiversity. The competition research undertaken in this project
through a pot trial demonstrated that rubber bush can affect pasture yields. Field
research to quantify density thresholds where pasture production is adversely affected,
along with supporting economic analysis to show if there are any financial impacts at an
enterprise level, would be desirable.
On-going monitoring of the impacts of the dieback phenomenon on rubber bush to
confirm the causal agent, and determine long term implications from a management
perspective.
Testing of some of the most effective control options on different soil types. A lot of the
control research in this project was undertaken on clay soils. Anecdotal evidence and the
findings from previous research suggest that efficacy may possibly be different on other
soil types, particularly red soils. Residual herbicides are most likely to be influenced by
soil type and it would be advantageous if they were tested on other soil types,
particularly red soils.
More demonstration style activities to test some of the best control strategies identified
during the project on a larger scale. This will further extend the findings of the research
to stakeholders, whilst allowing collection of some economic data. Completion of a cost
benefit-analysis would also help guide decision making, but some additional field data on
the impact of rubber bush on pasture production may need to be collected beforehand.
Investigations into livestock-rubber bush interactions to ascertain whether there are any
toxicity risks, what the triggers are that cause animals to eat it readily at times in some
situations, but not others, and whether utilisation by livestock can be incorporated more
into management strategies for control of rubber bush.
Quantifying whether fire regimes involving a series of fires could impose population level
control of rubber bush in suitable environments.
To disseminate the key recommendation from the project and maximise adoption,
particularly by the grazing industry, we have commenced several initiatives and recommend
several others that could be undertaken with further funding support. They include:
Running a series of field days in the major regions being impacted by rubber bush. A
well-attended event was held in the Gulf of Carpentaria in Queensland (Nardoo Station)
during July 2013. It would be beneficial to also hold similar events in locations where
rubber bush is only in the early stages of invasion, but predicted to expand if not
controlled through early intervention.
A wide range of community group, natural resource management and government staff
involved in weed management have either been directly/indirectly involved in the rubber
bush project, and are now well placed to provide the latest recommendations for
management of rubber bush, either on an individual basis or at relevant events (e.g. field
days).
Weed fact sheets on priority weeds are produced by state/territory agencies responsible
for overseeing pest management in these jurisdictions. Those on rubber bush are either
currently being updated or will be in the near future to incorporate key
findings/recommendations from the project. In particular, a wider range of control options

B.NBP.0622 - Distribution, Invasiveness, Biology and Control or Rubber Bush in Northern Australia
Page 99 of 125
will be included and more detail on the ecology of rubber bush will be provided. These
fact sheets are often the primary source of information for those trying to manage
problematic weeds and are one of the first documents to show up during internet
searches.
To compliment these fact sheets, a technical note is also currently being compiled by the
Northern Territory Government, which will focus more specifically on the outcomes of the
rubber bush project and the implications for management of rubber bush.
A priority will be to liaise with respective chemical companies to obtain label registrations
where possible for the most effective herbicide options identified during the project.
Already, steps are underway to include rubber bush on the Access™ herbicide label. A
revision of a current minor use permit (PER12497) which is due to expire on the
31 December 2015 will also be submitted and include additional recommendations from
the projects findings (such as ground and aerial application of tebuthiuron). Having
registered herbicide options means that those responsible for giving advice (such as
suppliers of rural products) will not only be able to provide legal recommendations, but
they will also be able to more easily find recommendations for rubber bush through
mechanisms such as fact sheets, chemical company brochures/websites and pesticide
search engines (e.g. Infopest www.infopest.com.au/, and the APVMA website
www.apvma.gov.au/).
As mentioned in the research recommendations section, the establishment of some
demonstration/adaptive management sites in strategic areas would be advantageous if
additional funding could be procured. This will not only further extend the findings of the
project and allow testing of management options on a larger scale, but also hopefully
prove a catalyst for affected landholders to work together to combat this weed. Given its
dispersal mechanisms (e.g. wind and water) an individual approach will not be as
effective as a collective response involving neighbouring properties.
The undertaking of a social science survey would also be beneficial to find out first hand,
any barriers that may prevent adoption of management strategies for rubber bush and
how these could be overcome.
Finally, opportunities for the use of social media and other technologies to extend key
messages from the project should be explored. For example, the control research
highlighted the importance of correct application of several of the techniques used.
Production of YouTube videos that explain the application of individual techniques would
be invaluable for those not experienced with them and/or control of rubber bush.
6 Success in achieving objectives
Performance is reviewed against each of the seven objectives.
1. Describe key aspects of rubber bush ecology relevant to management.
This objective was achieved. The project has investigated in detail several aspects of the
ecology of rubber bush including its reproductive biology, flowering and fruiting phenology,
age to reproductive maturity, seed bank persistence and dispersal mechanisms.
2. Quantify the distribution and rate of spread of rubber bush at several locations.

B.NBP.0622 - Distribution, Invasiveness, Biology and Control or Rubber Bush in Northern Australia
Page 100 of 125
This objective was achieved. The spread of rubber bush has been investigated at two levels:
(1) seed dispersal kernels were investigated at a local scale; and (2) the current and
potential distribution of rubber bush has been modelled at a landscape scale. For the former,
the ability to disperse seeds was investigated at three sites in the Barkly Region of the
Northern Territory that differed in topography. For the latter, two important ecological
questions central to determining the invasiveness of this species had to be answered,
namely: (1) does the current distribution of rubber bush cover all its potential distribution
range or not? and (2) will the range of the species expand or contract with climate change?
These questions were answered using species distribution models (SDMs) that covered
northern Australia.
3. Quantify the invasiveness of rubber bush under different disturbance regimes and land
types using a series of competition and exclusion studies.
This objective was achieved. Field experiments incorporating different levels of competition
and disturbance were conducted twice near Katherine on a red soil site, and twice on the
Barkly Tableland (Helen Springs Station) on a black soil site.
4. Develop improved control options including:
4.1. complete testing of products that can be used as part of day-to-day activities to
control isolated rubber bush plants
4.2. trial and compare current and new herbicide products for control of rubber bush
4.3. conduct a seasonality trial to quantify efficacy of herbicides under different seasonal
conditions and growth stages
4.4. monitor the effectiveness of aerial applications of tebuthiuron for broad-scale control
of rubber bush in suitable habitats.
All control objectives were achieved. A range of products and techniques were tested for
control of isolated plants including cut stump applications using glyphosate or a picloram gel,
both traditional and thinline basal bark techniques using triclopyr/picloram mixed with diesel,
and ground applications of soil applied residual herbicides. Two extensive foliar herbicide
trials were completed to compare current and new herbicide products, some of which had
not been put on the market at the time of testing. A seasonality trial incorporating summer,
autumn, winter and spring applications of four foliar and one basal bark applied herbicide
was undertaken. We also investigated why one of the foliar herbicides (metsulfuron-methyl)
identified as being highly effective in previous research performed poorly in the current
project. To do this, efficacy under different water types and temperatures at the time of
application was tested. The effectiveness of aerial applications of tebuthiuron was monitored
in two trials. The first involved three rates (12.5, 15 and 17 kg of product/ha) and based on
preliminary findings resulted in further applications (10 and 12.5 kg of product/ha) to see if
even lower rates would be effective and potentially reduce application costs.
A pilot mechanical trial was also implemented to ascertain the level of damage necessary to
cause high mortality of rubber bush. This was supported by a demonstration where rubber
bush was controlled using a stick rake mounted on the front of a large front end loader, with
the level of mortality and seedling regrowth recorded.

B.NBP.0622 - Distribution, Invasiveness, Biology and Control or Rubber Bush in Northern Australia
Page 101 of 125
5. Monitor areas being affected by a dieback phenomenon to quantify whether rubber bush
plants recover or eventually die, which will have significant implications on the population
dynamics of infestations.
This objective was achieved. Six transects each containing at least 70 rubber bush plants
were established in the Gulf of Carpentaria region of Queensland and monitored at six
monthly intervals for two years. At commencement of the monitoring, the site was heavily
infested with dieback and all recorded plants displayed some level of damage.
6. Identify the most practical and cost-effective control options for rubber bush.
This objective was achieved and is incorporated into the recommendations section of the
final report. The most practical and cost-effective control options were identified after careful
consideration of the key findings from the control research undertaken in the current project,
the findings from previous herbicide research undertaken in northern Queensland, and the
lessons learnt from several landholders who had been undertaking control activities on their
properties for several years.
7. Develop recommendations for managing rubber bush in different environments and with
different levels of rubber bush intrusion.
This objective was achieved and was developed after consideration of all available
information at the time, including the outcomes from the current project, previous research
findings from both in Australia and overseas, and the personal experiences of landholders,
government weed officers and other stakeholders (e.g. Natural Resource Management
bodies and community groups) involved in rubber bush management.
7 Acknowledgements
This project would not have been possible without the support of Meat & Livestock Australia
Limited and our respective organisations.
The project also benefited from the input of a wide range of other individuals and
organisations. In particular, we are very grateful to the landowners who allowed us to
undertake field research on their properties, including John Nelson (Cowan Downs), Peter
and Ann Woollett (Nardoo), the Mathews family (Christmas Creek), the Smith family (Bluff
Downs), Kidman and Co. (Helen Springs), and the managers of: Cowan Downs Station (Ben
Stanger), Helen Springs Station (initially Geoff Murrell and then Chris Towne), Rockhampton
Downs Station (Luke Evans) and Muckaty Station (Ray Aylett).
Over the course of the project, a rubber bush advisory committee provided oversight of the
research undertaken and gave critical feedback to ensure outcomes would improve the
understanding of this weed and how to manage it. Committee members during the life of the
project included Allan Andrews, Chris Brown, Shane Campbell, Charles Curry, Tiffany Daley,
Keith Ferdinands, Graham Hardwick, Tanya Howard, Ben Lynes, Geoff Murrell, Mike Lawes,
Scott Middleton, Suzanne Shearer, Dionne Walsh, Madonna Wilson, Naomi Wilson and
James Wright.

B.NBP.0622 - Distribution, Invasiveness, Biology and Control or Rubber Bush in Northern Australia
Page 102 of 125
The ecology, invasiveness, and spread research was greatly enhanced through the
contributions made by Dr Sean Bellairs (seed biology), Alyson Stobo-Wilson (MaxEnt
modelling of distribution), Dr Don Franklin, Michele Greenfield (Honours thesis on mating
and breeding systems), and Kaitlyn Andrews (laboratory assistance) from Charles Darwin
University. Current (Dr Louis Elliott and Phil Hickey) and former staff (Dr Keith Ferdinands
and Michelle Kassman) from the Northern Territory Department of Land Resource
Management assisted with several aspects including spread modelling. Dr Cameron
McConchie and Heidee Brown from the Northern Territory Department of Primary Industries
and Fisheries provided expertise on mating and breeding and insect identification,
respectively. Dr Graham Brown from the Northern Territory Museum also helped identify
insects found on rubber bush plants. Kelli Pukallus and Judy Clark from the Queensland
Department of Agriculture and Fisheries provided invaluable support by establishing and
regularly monitoring field sites in northern Queensland to help determine flowering and
podding patterns of rubber bush. We also sincerely thank Dr Faiz Bebawi and his team from
the Queensland Department of Agriculture and Fisheries for quantifying the seed longevity of
rubber bush.
The control research in Queensland would not have been possible without the technical and
operational assistance provided by Laura Roden, Christopher Crowley, Kirsty Gough, Carl
Andersen, Kyle Risdale and Rodney Stevenson.
Daniel Steel, Chris Brown and Rowena Eastick from the Northern Territory Department of
Land Resource Management helped with establishing the Northern Territory rubber bush
control trial to evaluate the best options identified from the Queensland work.
The input of Associate Professor Vic Galea and his team from the University of Queensland
is greatly appreciated, for assisting with investigations into the cause of the dieback
phenomenon on rubber bush.
The writing up of the control research benefited from statistical support provided by Angela
Anderson, formatting by Kylee Clark and reviewing by Barbara Madigan, Emma Carlos, Faiz
Bebawi and Joe Scanlan.
We are also grateful to Graham Fossett and Ken Springall from Dow AgroSciences who
worked with landholders Peter and Ann Woollet to aerially treat pulled gidyea regrowth
containing rubber bush. This provided an opportunity to monitor the efficacy of different
application rates of tebuthiuron for control of rubber bush.
8 Publications from the research
Bebawi FF, Campbell SD, Mayer RJ (2015) Seed bank longevity and age to reproductive
maturity of Calotropis procera (Aiton) W.T. Aiton in the dry tropics of northern Queensland.
The Rangeland Journal 37, 239-247.
Campbell S, Roden L, Crowley C (2013) Calotrope (Calotropis procera): A weed on the
move in northern Queensland. In ‘Proceedings of the 12th Queensland Weed Symposium’.
(eds. M O’Brien, J Vitelli, D Thornby) pp. 11-14 (The Weed Society of Queensland:
Brisbane, Australia)

B.NBP.0622 - Distribution, Invasiveness, Biology and Control or Rubber Bush in Northern Australia
Page 103 of 125
Campbell S, Heard T, Galea V, van Klinken R (2013) Where do we stand with weeds from a
research perspective. In ‘Proceedings of the Northern Beef Research Update Conference’.
pp. 43-48 (North Australia Beef Research Council: Gympie, Australia)
Humphrys M, Campbell S, Steel D (2015) Expanding the range of control options for
Calotropis procera (rubber bush) in the Barkly Tablelands. In ‘Proceedings of the 18th
Australian Rangelands Conference’ (Australian Rangelands Society: Alice Springs;
Northern Territory)
8.1 Articles submitted or under preparation
Menge EO, Bellairs SM, Lawes MJ. Germination patterns of Calotropis procera (Aiton) W.T.
Aiton R. Br. (Apocynaceae) seeds from different populations in Australia. Weed
Research (In revision).
Menge EO, McConchie CA, Brown G, Lawes MJ. Pollinator guild and mating system of
Calotropis procera (Ait.) W.T. Aiton (Asclepiadaceae) in an invaded range. Conference
(Submitted).
Menge EO, McConchie CA, Lawes MJ. Density dependence in Calotropis procera (Ait.) R.Br.
(Apocynaceae) - an invasive milkweed. Austral Ecology (In revision).
Menge EO, Wilson A, Oliveira SLJ, Lawes MJ. Evaluating the potential distributional range
of Calotropis procera (Ait.) R.Br. (Apocynaceae), using MaxEnt models. Environmental
Monitoring and Assessment (In preparation).
Menge EO, Bellairs S, McConchie CA, Lawes MJ. The invasiveness of Calotropis procera –
An updated Weed Risk Assessment. Plant Protection Quarterly (In preparation).

B.NBP.0622 - Distribution, Invasiveness, Biology and Control or Rubber Bush in Northern Australia
Page 104 of 125
9 References
ALA (2014) Atlas of Living Australia: Global Biodiversity Information Facility. Available at:
www.ala.org.au/
Ali T, Ali SI (1989) Pollination biology of Calotropis procera subsp. hamiltonii
(Asclepiadaceae). Phyton (Austria) 29, 175-188.
Alonso C (2004) Early Blooming’s Challenges: Extended Flowering Season, Diverse
Pollinator Assemblage and the Reproductive Success of Gynodioecious Daphne laureola.
Annals of Botany 93, 61-66.
Amritphale D, Gupta JC, Iyengar S (1984) Germination polymorphism in sympatric
populations of Calotropis procera. Oikos 42, 220-224.
Baretto RW, Evans HC, Pomella A.W.V. (1999). Fungal pathogens of Calotropis procera
(rubber bush), with two new records from Brazil. Australasian Plant Pathology 28, 126-
130.
Bastin GN, Ludwig JA, Eager R W, Liedloff AC, Andison RT, and Cobiac MD (2003)
Vegetation changes in a semiarid tropical savanna, northern Australia: 1973–2002. The
Rangeland Journal 25, 3–19.
Bebawi FF, Vitelli JS, Campbell SD, Mayer RJ (2011) Impact of control strategies on
bellyache bush (Jatropha gossypiifolia L.) mortality, seedling recruitment, population
dynamics, pasture yield and cost analysis. The Rangeland Journal 33, 277-286.
Bebawi FF, Campbell SD, Mayer RJ (2015) Seed bank longevity and age to reproductive
maturity of Calotropis procera (Aiton) W.T. Aiton in the dry tropics of northern
Queensland. The Rangeland Journal 37, 239-247.
Benke KK, Steel JL, Weiss JE (2011) Risk assessment models for invasive species:
Uncertainty in rankings from multi-criteria analysis. Biological Invasions 13, 239-253.
Biosecurity-Queensland (2013). ‘Calotrope: Calotropis procera.’ (State of Queensland:
Brisbane).
Boutraa T (2010) Growth Performance and Biomass Partitioning of the Desert Shrub
Calotropis Procera under Water Stress Conditions. Research Journal of Agriculture and
Biological Sciences 6, 20-26.
Boutraa T, Akhkha A (2010) Photosynthesis Rates and Growth Responses of the Desert
Shrub Calotropis procera to NaCl Salinity. Journal of International Environmental
Application and Science 5, 214-224.
Brandao M (1995) Calotropis procera (Ait.) R.Br. : A problem pasture invader in Minas
Gerais. Daphne Revista do Herbário PAMG da EPAMIG 5, 68-71.
Bureau of Meteorology (2015) Climate Data Online. Available at:
www.bom.gov.au/climate/data (accessed 28 March 2015).
Cain ML, Milligan BG, Strand AE (2000) Long-distance seed dispersal in plant populations.
American Journal of Botany 87,1217-1227.
Campbell S, Roden L, Crowley C (2013) Calotrope (Calotropis procera): A weed on the
move in northern Queensland. In ‘Proceedings of the 12th Queensland Weed
Symposium’. (eds. M O’Brien, J Vitelli, D Thornby) (The Weed Society of Queensland:
Brisbane, Australia).
Cheam AH (1984a) A natural herbicide against calotrope. Journal of Agriculture, Western
Australia 25, 42-43.
B.NBP.0622 - Distribution, Invasiveness, Biology and Control or Rubber Bush in Northern Australia
Page 105 of 125
Cheam AH (1984b) Allelopathy in Buffel grass (Cenchrus ciliaris L.) Part 1 Influence of Buffel
grass association on calotrope (Calotropis procera (Ait.) W.T. Ait.) Australian Weeds
3,133-136.
Chrobock T, Weiner CN, Werner M, Blüthgen N, Fischer M, van Kleunen M (2013) Effects of
native pollinator specialization, self-compatibility and flowering duration of European plant
species on their invasiveness elsewhere. Journal of Ecology 101, 916-923.
Cleland EE, Chuine I, Menzel A, Mooney HA, Schwartz MD (2007) Shifting plant phenology
in response to global change. Trends in Ecology and Evolution 22, 357-365.
Council of Heads of Australasian Herbaria (1999-2013) ‘Australasia's Virtual Herbarium.’
(Council of Heads of Australasian Herbaria: Australia).
CSIRO (2013) ‘Historical occurrence of Calotropis procera in Australia.’ (Atlas of Living
Australia: CSIRO).
Csurhes S (2009) ‘Weed Risk Assessment: Calotrope (Calotropis procera).’ Biosecurity
Queensland, Brisbane).
Dalling J. Adam W, Davis S, Schutte BJ, Arnold AE (2011) Seed survival in soil: interacting
effects of predation, dormancy and the soil microbial community. Journal of Ecology 99,
89-95.
Department of Agriculture, Fisheries and Forestry (2015) ‘The Weed Risk Assessment
System’. (Australian Government: Canberra).
Dhileepan K (2014) Prospects for the classical biological control of Calotropis procera
(Apocynaceae) using coevolved insects. Biocontrol Science and Technology 24, 977-998.
Dudík M (2007) ‘Maximum entropy density estimation and modelling geographic distributions
of species.’ (Princeton University).
Eisikowitch D (1986) Morpho-ecological aspects on the pollination of Calotropis procera
(Asclepiadaceae) in Israel. Plant Systematics and Evolution 152, 185-194.
Elith J, Graham CH, Anderson RP, Dudík M, Ferrier S, Guisan A, Hijmans RJ, Huettmann F,
Leathwick JR, Lehmann A, Lohmann JLiLG, Loiselle BA, Manion G, Moritz C, Nakamura
M, Nakazawa Y, Overton J.McCM, Townsend Peterson A, Phillips SJ, Richardson K,
Scachetti-Pereira R, Schapire RE, Soberón J, Williams S, Wisz MS, Zimmermann NE
(2006) Novel methods improve prediction of species’ distributions from occurrence data.
Ecography 29,129-151.
Etcheverry AV, Aleman MM, Fleming TF (2008) Flower morphology, pollination biology and
mating system of the complex flower of Vigna caracalla (Fabaceae: Papilionoideae).
Annals of Botany 102, 305-316.
Evans HE (1966) The behaviour patterns of solitary wasps. Annual Review of Entomology
11, 123-154.
Fabricante JR, Oliveira MNAd, Siqueira Filho JAd (2013) Aspectos da ecologia de Calotropis
procera (Apocynaceae) em uma área de Caatinga alterada pelas obras do Projeto de
Integração do Rio São Francisco em Mauriti, CE. Rodriguésia 64, 647-654.
Fisher A, Baker B, Woinarski J (2002) ‘Mitchell Grass Downs, Northern Territory -
Bioregional case study.’ (Parks and Wildlife Commission of the Northern Territory
Department of Infrastructure, Planning and Environment: Darwin).
Foran BD, Bastin G, and Hill B (1985) The Pasture Dynamics and Management of two
Rangeland Communities in the Victoria River District of the Northern Territory. Australian
Rangeland Journal 7,107-113.
Forster PI (1992) A taxonomic account of the genus Calotropis R.Br. (Asclepiadaceae) in
Australia. Nuytsia 8, 201-208.

B.NBP.0622 - Distribution, Invasiveness, Biology and Control or Rubber Bush in Northern Australia
Page 106 of 125
Forster PI (1998) A taxonic account of the genus Calotropis R. Br. (Asclepiadaceae) in
Australia. Nuytsia 8, 201-208.
Francis JK (2004). ‘Calotropis procera.’ (International Institute of Tropical Forestry:
Department of Agriculture, United States).
Geoscience (2010) ‘Thematic map-Administrative boundaries’ (Geoscience Australia)
Gleckler PJ, Taylor KE, Doutriaux C (2008) Performance metrics for climate models. Journal
of Geophysical Research 113:D06104.
Grace BS (2006) The biology of Australian weeds 45. Calotropis procera (Aiton) W.T.Aiton.
Plant Protection Quarterly 21,152-160.
Greenfield ML (2013) ‘The reproduction biology and breeding system of the invasive weed
Calotropis procera (Asclepiadoideae).’ (Charles Darwin University: Darwin).
Grice AC (2006) The impacts of invasive plant species on the biodiversity of Australian
rangelands. The Rangeland Journal 28, 27-35.
Grice AC, Martin TG (2005) ‘The management of weeds and their impact on biodiversity in
the rangelands.’ (The CRC for Australian Weed Management: Townsville).
Grime JP (1979) ‘Plant strategies and vegetation processes.’ (John Wiley and Sons, Inc.:
New York).
Hierro JL, Villarreal D, Eren Ö, Graham JM, Callaway RM (2006) Disturbance facilitates
invasion: The effects are stronger abroad than at home. American Naturalist 168,144-
156.
Hobbs RJ, Huenneke LF (1992) Disturbance, diversity, and invasion: Implications for
conservation. Conservation Biology 6, 324-337.
Hodgson JG, Wilson PJ, Hunt R, Grime JP, and Thompson K (1999) Allocating C-S-R plant
functional types: a soft approach to a hard problem. Oikos 85, 282-294.
Huang Z, Boubriak I, Osborne DJ, Dong M, Gutterman Y (2008). Possible role of pectin-
containing mucilage and dew in repairing embryo DNA of seeds adapted to desert
conditions. Annals of Botany 101, 277-283.
Isahak S (2013) ‘Preliminary investigations of fungi as biological control agents for Calotropis
procera.’ (University of Queensland: Gatton Campus).
Kebreab E, Murdoch AJ (2000) The effect of water stress on the temperature range for
germination of Orobanche aegyptiaca seeds. Seed Science Research 10,127-133.
Kebreab E, Murdoch AJ, Gate E (1999) Modelling the effects of water stress and
temperature on germination rate of Orobanche aegyptiaca seeds. Journal of
Experimental Botany 50, 655-664.
Keeley JE, Lubin D, Fotheringham CJ (2003) Fire and grazing impacts on plant diversity and
alien plant invasions in the southern Sierra Nevada. Ecological Applications 13, 1355-
1374.
Kriticos DJ, Sutherst RW, Brown JR, Adkins SW, Maywald GF (2003) Climate change and
the potential distribution of an invasive alien plant: Acacia nilotica ssp. indica in Australia.
Journal of applied ecology 40,111-124.
Kumar S, Stohlgren TJ (2009) MaxEnt modeling for predicting suitable habitat for threatened
and endangered tree Canacomyrica monticola in New Caledonia. Journal of Ecology and
Natural Environment 1, 94-98.
Labouriau LG, Valadares MEB (1976) On the germination of seeds of Calotropis procera
(Ait) Ait. Anais da Academia Brasileira de Ciências 48, 263-284.
Leal LC, Maiado MV, Lopes AV, Leal IR (2013) Germination responses of the invasive
Calotropis procera (Ait.) R.Br. (Apocynaceae): comparisons with seeds from two

B.NBP.0622 - Distribution, Invasiveness, Biology and Control or Rubber Bush in Northern Australia
Page 107 of 125
ecosystems in northeastern Brazil. Annals of the Brazilian Academy of Sciences 85,
1025-1034.
Leys R (2000) A revision of the Australian carpenter bees, genus Xylocopa Latreille,
subgenera Koptortosoma Gribodo and Lestis Lepeletier and Serville (Hymenoptera :
Apidae). Invertebrate Taxonomy 14, 115-136.
Lipow SR, Wyatt R (2000) Single Gene Control of Postzygotic Self-Incompatibility in Poke
Milkweed, Asclepias exaltata L. Genetics 154, 893-907.
Lockwood JL, Hoopes MF, Marchetti MP (2007) ‘Invasion Ecology.’ (Blackwell Publishing:
Oxford).
Lottermoser BG (2011) Colonisation of the rehabilitated Mary Kathleen uranium mine site
(Australia) by Calotropis procera: Toxicity risk to grazing animals. Journal of Geochemical
Exploration 111:39-46.
Machon N, Bardin P, Mazer SJ, Moret J, Godelle B, Austerlitz F (2003) Relationship
between genetic structure and seed and pollen dispersal in the endangered orchid
Spiranthes spiralis. New Phytologist 157, 677-687.
Mack RN, Simberloff DW, Lonsdale M, Evans H, Clout M, Bazzaz FA (2000) Biotic invasions
: Causes, epidemiology, global consequences, and control. Ecological Applications 10,
689-710.
Madhu S, Tara JS, Sharma B (2013). Bionomics of Aak weevil, Paramecops farinosa
(Wiedemann) (Coleoptera: Curculionidae) a pest of Calotropis procera (Ait.) R.Br. in
Jammu Division of J & K State (India) Munis. Entomology and Zoology 8, 756-766.
McKenzie JR, Pattison MJ, Steele KE, Campbell SD, Vitelli JS (2004) Controlling dense
infestations of parkinsonia (Parkinsonia aculeata L.) In ‘Proceedings of the 14 Australian
Weeds Conference’. (Eds. BM Sindel, SB Johnson) pp. 176-178 (Weed Society of New
South Wales: Sydney).
Moeller D A, Geber MA, Eckhart VM, Tiffin P (2012) Reduced pollinator service and elevated
pollen limitation at the geographic range limit of an annual plant. Ecology 93, 1036-1048.
Moodley D, Geerts S, Richardson DM, Wilson JRU (2015) The importance of pollinators and
autonomous self-fertilization in the early stages of plant invasions: Banksia and Hakea
(Proteaceae) as case studies. Plant Biology, on line version.
Morales CL, Aizen MA (2002) Does invasion of exotic plants promote invasion of exotic
flower visitors? A case study from the temperate forests of the southern Andes. Biological
Invasions 4, 87-100.
Nathan R, Katul GG, Bohrer G, Kuparinen A, Soons MB, Thompson SE, Trakhtenbrot A,
Horn HS (2011) Mechanistic models of seed dispersal by wind. Theoretical Ecology 4,
113-132.
Nathan R, Katul GG, Horn HS, Thomas SM, Oren R, Avissar R, Pacala SW, Levin SA
(2002) Mechanisms of long-distance dispersal of seeds by wind. Nature 418, 409-413.
Nathan R, Muller-Landau HC (2000). Spatial patterns of seed dispersal, their determinants
and consequences for recruitment. Trends in Ecology and Evolution 15, 278-285.
Nelson LS, Weil A, Goldfrank LR, Shih RD, Balick MJ (2007). ‘Handbook of Poisonous and
Injurious Plants.’ (New York Botanical Garden: New York).
Oliveira SHFd, Negreiros D, Fernandes GW, Barbosa NPU, Rocha R, Almeida-Cortez JS
(2009) Seedling growth of the invader Calotropis procera in ironstone rupestrian field and
seasonally dry forest soils. Neotropical Biology and Conservation 4, 69-76.
Parsons WT, Cuthbertson EG (2001). Noxious weeds of Australia. CSIRO publishing,
Melbourne.

B.NBP.0622 - Distribution, Invasiveness, Biology and Control or Rubber Bush in Northern Australia
Page 108 of 125
Petanidou T, Godfree RC, Song DS, Kantsa A, Dupont YL, Waser NM (2012). Self-
compatibility and plant invasiveness: Comparing species in native and invasive ranges.
Perspectives in Plant Ecology, Evolution and Systematics 14, 3-12.
Petryna L, Moora M, Nunes CO, Cantero JJ, Zobel M 2002 Are invaders disturbance-
limited? Conservation of mountain grasslands in Central Argentina. Applied Vegetation
Science 5, 195-202.
Pheloung A, Swarbrick J, Roberts B (1999) ‘Weed Risk Analysis of a Proposed Importation
of Bulk Maize (Zea mays) from the USA’: (AQIS: Canberra).
Phillips SJ, Anderson RP, Schapire RE (2006) Maximum entropy modeling of species
geographic distributions. Ecological Modelling 190, 231-259.
Phillips SJ, Dudik M (2007) Modeling of species distributions with Maxent: new extensions
and a comprehensive evaluation. Ecography 31, 161-175.
PIER (2011) ‘Pacific Island Ecosystems at Risk.’ (Institute of Pacific Islands Forestry).
Pierce DW, Barnett TP, Santer BD, Gleckler PJ, Thiemens MH (2009) Selecting Global
Climate Models for Regional Climate Change Studies. Proceedings of the National
Academy of Sciences of the United States of America 106, 8441-8446.
Queensland Government (2015) Enhanced Meteorological Datasets, SILO Data Drill. Available at: www.longpaddock.qld.gov.au/silo/ (accessed 28 March 2015).
Radunz BL, Wilson G, Beere G (1983) ‘Toxicity experiments of rubberbush to cattle and
sheep.’ (Department of Regional Development, Primary Industry, Fisheries and
Resources: Katherine, NT).
Rangel ES, Nascimento MT (2011) Occurrence of Calotropis procera (Ait.) R. Br.
(Apocynaceae) as an invasive species in restinga vegetation. Acta Botanica Brasilica 25,
657-663.
Ricciardi A, Cohen J (2007) The invasiveness of an introduced species does not predict its
impact. Biological Invasions 9, 309-315.
Richardson DM, Pyšek P, Rejmánek M, Barbour M, Panetta FD, West CJ (2000)
Naturalization and invasion of alien plants: concepts and definitions. Diversity and
Distributions 6, 93-107.
Richardson DM, Rejmánek M (2011) Trees and shrubs as invasive alien species-a global
view. Diversity and Distributions 17, 788-809.
Sen DN, Chawan DD, Chatterji UN (1968) Diversity in germination of seeds in Calotropis
procera R.Br. population. Österreichische botanische Zeitschrift 115, 6-17.
Sharma S, Amritphale D (2008) Light environment in pre- and post-dehiscent fruits affects
seed germination in Calotropis procera. Environmental and Experimental Botany 62, 45-
53.
Smith NM (2002) ‘Weeds of the wet/dry tropics of Australia.’ (Northern Territory Environment
Centre: Darwin).
Sobrinho MS, Tabatinga GM, Machado IC, Lopes AV (2013) Reproductive phenological
pattern of Calotropis procera (Apocynaceae), an invasive species in Brazil: annual in
native areas; continuous in invaded areas of caatinga. Acta Botanica Brasilica 27, 456-
459.
Steel GD, Torrie JH (1981) ‘Principles and procedures of statistics: a biometrical approach.’
(McGraw-Hill Book Company: Singapore).
Tezara W, Colombo R, Coronel I, Marín O (2011) Water relations and photosynthetic
capacity of two species of Calotropis in a tropical semi-arid ecosystem. Annals of Botany
107, 397-405.

B.NBP.0622 - Distribution, Invasiveness, Biology and Control or Rubber Bush in Northern Australia
Page 109 of 125
Thuiller W, Lafourcade B, Engler R, Araujo MB (2009) BIOMOD - a platform for ensembe
forecasting of species distributions. Ecography 32, 369-373.
Tryjanowski P, Pawlikowski T, Pawlikowski K, Banaszak-Cibicka W, Sparks TH (2010) Does
climate influence phenological trends in social wasps (Hymenoptera: Vespinae) in
Poland? European Journal of Entomology 107, 203-208.
Van Kleunen M, Dawson W, Schlaepfer D, Jeschke JM, Fischer M (2010) Are invaders
different? A conceptual framework of comparative approaches for assessing
determinants of invasiveness. Ecology Letters 13, 947-958.
Van Klinken RD, Lawson BE, Zalucki MP (2009) Predicting invasions in Australia by a
Neotropical shrub under climate change: the challenge of novel climates and parameter
estimation. Global Ecology and Biogeography 18, 688-700.
Vance RR (1984) Interference competition and the coexistence of two competitors on a
single limiting resource. Ecology 65, 1349-1357.
Vincke C, Diedhiou I, Grouzis M (2010) Long term dynamics and structure of woody
vegetation in the Ferlo (Senegal). Journal of Arid Environments 74, 268-276.
Visser ME, Both C (2005) Shifts in phenology due to global climate change: the need for a
yardstick. Proceedings of The Royal Society B 272, 2561-2569.
Vitelli J and Madigan B (1999) Effect of rust on the efficacy of foliar applied herbicides on
rubber vine. In ‘Proceedings of the 12th Australian Weeds Conference’. (Eds. AC Bishop,
M Boersma, CD Barnes) pp. 238-241. (Tasmanian Weed Society, Devenport).
Vitelli J, Madigan B, Wilkinson P, van Haaren P (2008) Calotrope (Calotropis procera)
control. The Rangeland Journal 30:339-348.
Ward S (2006) Genetic Analysis of Invasive Plant Populations at Different Spatial Scales.
Biological Invasions 8, 541-552.
Whitney KD, Gabler CA (2008). Rapid evolution in introduced species, 'invasive traits' and
recipient communities: challenges for predicting invasive potential. Diversity and
Distributions 14, 569-580.
Wilkinson PM, Thomas-Hall S, Marney TS, Shivas RG (2005) First record of Passalora
calotropidis in Australia and its generic position. Australasian Plant Pathology 34, 95-98.
Willmer P (2011) ‘Pollination and floral ecology. 1st edition.’ (Princeton University Press:
Princeton).
Willmer PG (1988) The Role of Insect Water Balance in Pollination Ecology: Xylocopa and
Calotropis. Oecologia 76:430-438.
Yang X, Baskin CC, Baskin JM, Liu G, Huang Z. 2012. Seed mucilage improves seedling
emergence of a sand desert shrub. PLoS One 7:e34597.

B.NBP.0622 - Distribution, Invasiveness, Biology and Control or Rubber Bush in Northern Australia
Page 110 of 125
10 Appendices
10.1 Appendix 1: Seed longevity paper on rubber bush published in the
Rangeland Journal

B.NBP.0622 - Distribution, Invasiveness, Biology and Control or Rubber Bush in Northern Australia
Page 111 of 125
CSIRO PUBLISHING
The Rangeland Journal, 2015, 37, 239-247
http://dx.doi.org/10.1071/RJ14130
Seed bank longevity and age to reproductive maturity of Calotropis
procera (Aiton) W.T. Aiton in the dry tropics of northern Queensland
Faiz F. Bebawi A,C, Shane D. CampbellA and Robert J. MayerB
ABiosecurity Queensland, Department of Agriculture and Fisheries, Tropical Weeds Research Centre, PO Box 187, Charters Towers, Qld 4820, Australia. BAgri-Science Queensland, Department of Agriculture and Fisheries, Maroochy Research Station, 47 Mayers Road, Nambour, Qld 4560, Australia. CCorresponding author. Email: [email protected]
Abstract. Understanding the reproductive biology of Calotropis procera (Aiton) W.T. Aiton, an invasive weed of
northern Australia, is critical for development of effective management strategies. Two experiments are reported on.
In Experiment 1 seed longevity of C. procera seeds, exposed to different soil type (clay and river loam), pasture cover
(present and absent) and burial depth (0, 2.5, 10 and 20 cm) treatments were examined. In Experiment 2 time to reach
reproductive maturity was studied. The latter experiment included its sister species, C. gigantea (L.) W.T. Aiton, for
comparison and two separate seed lots were tested in 2009 and 2012 to determine if exposure to different
environmental conditions would influence persistence. Both seed lots demonstrated a rapid decline in viability over
the first 3 months and declined to zero between 15 and 24 months after burial. In Experiment 1, longevity appeared to
be most influenced by rainfall patterns and associated soil moisture, burial depth and soil type, but not the level of
pasture cover. Experiment 2 showed that both C. procera and C. gigantea plants could flower once they had reached
an average height of 85 cm. However, they differed significantly in terms of basal diameter at first flowering with C.
gigantea significantly smaller (31 mm) than C. procera (45 mm). On average, C. gigantea flowered earlier (125 days
vs 190 days) and set seed earlier (359 days vs 412 days) than C. procera. These results suggest that, under similar
conditions to those that prevailed in the present studies, land managers could potentially achieve effective control of
patches of C. procera in 2 years if they are able to kill all original plants and treat seedling regrowth frequently
enough to prevent it reaching reproductive maturity. This suggested control strategy is based on the proviso that
replenishment of the seed bank is not occurring from external sources (e.g. wind and water dispersal).
Additional keywords: calotrope, giant rubber bush, reproductive maturity, rubber bush, seed persistence, seed
viability.
Received 11 December 2014, accepted 18 March 2015, published online 14 April 2015
Introduction
Calotropis procera (Aiton) W.T. Aiton is a native
species of tropical Africa, Arabia and Asia (Everist
1974; Forster 1992). It has become naturalised in South
Africa, Australia, South-western USA, Mexico, Pacific
and Caribbean Islands, Venezuela, Brazil and Paraguay
(Holm et al. 1979; Parsons and Cuthbertson 2001;
Weber 2003). In Australia, it is most commonly known
as calotrope or rubber bush, and is believed to have been
introduced as a garden plant or from seed in packing of
Afghan cameleers’ equipment (Hall 1967; Smith 2011).
It has become naturalised in several areas in north
Queensland, the Northern Territory and the Kimberley
region of Western Australia (Gardner and Bennetts 1956;
Chippendale and Murray 1963; Everist 1974; Forster
1992; Department of Agriculture, Fisheries and Forestry
2013).
Most reproduction of C. procera is from seeds which
have a silky pappus which not only facilitates wind-
dispersal over several hundred metres (Francis 2002;
Staples and Herbst 2005) but also flotation in water thus
promoting dispersal along water bodies, including
irrigation and drainage channels (Brandao 1995).
Three species of Calotropis have been reported in the
literature – C. procera, C. gigantea (giant rubber bush)
and C. acia Buch-Ham (Ali 1980; Rahman and Wilcock
1991). In India, three varieties of C. procera (Rajarkah,
Suklarkah and Sveta mandarah) have been identified in
the region of Dhanvantari Nigantu (Sharma et al. 2011).
Although both C. procera and C. gigantea are commonly
found in Australia (Forster 1992; Parsons and
Cuthbertson 2001; Smith 2011; Discover Nature at JCU
2013), there have been no reports of different varieties
being present.
In Australia, C. procera is considered an invasive
weed that threatens the sustainability of pasture
production, particularly in the dry tropics of north
Queensland (Kleinschmidt and Johnson 1977; Forster
1992; Martin 1996; Vitelli et al. 2008; Campbell et al.
2013), in the Northern Territory (Miller 2003) and in
Western Australia in the Kimberley region (Forster

B.NBP.0622 - Distribution, Invasiveness, Biology and Control or Rubber Bush in Northern Australia
Page 112 of 125
1992; Smith 2011). It has the ability to form dense
infestations, which are difficult and costly to control
(Grace 2006; Vitelli et al. 2008). Adoption of pasture
management practices that promote perennial grasses
(Crothers and Newbound 1998; Milson 2000; Parsons
and Cuthbertson 2001), in conjunction with chemical
control is a recommended strategy for management of
C. procera invading the tropical savannahs of northern
Australia (Vitelli et al. 2008). Currently available
information on the ecology and biology of C. procera
does not allow an assessment of how frequently control
activities would need to be undertaken and for what
duration to achieve effective control.
Parsons and Cuthbertson (2001) tentatively
suggested that C. procera flowers once plants are 2 years
old. Long et al. (2008) predicted that seeds would persist
for between 1 and 3 years, after C. procera was
subjected to a laboratory-based, controlledaging test
along with 12 other emerging and common weeds of
Queensland. To test these assumptions/predictions, two
experiments were undertaken. Experiment 1 determined
the effect of soil type, pasture cover and burial depth on
seed longevity of fresh seeds of C. procera and was
repeated to test the influence of different environmental
conditions, particularly soil moisture. Experiment 2
determined the age to reproductive maturity (flowering
and seed production) of both C. procera and its sister
species, C. gigantea (L.) W.T. Aiton]. Calotropis
gigantea was included for comparison with C. procera,
to gain an insight into the relative invasiveness of these
two species, which appear capable of growing in similar
environments in the dry tropics of northern Australia
(Dunlop 1987; Forster 1992; Parsons and Cuthbertson
2001; Smith 2011; Discover Nature at JCU 2013).
Materials and methods
Experiment 1: seed longevity
Site description
The experimental site (38 m x 36 m) was located in
the grounds of the Tropical Weeds Research Centre,
Charters Towers, north Queensland (20º09’S, 146º26’E;
elevation 318 m). It was large enough for the longevity
of up to 12 different seed lots of various weed species to
be tested at any one time under the same treatment
conditions.
The site was fenced to exclude livestock, rabbits and
kangaroos. It had been previously cleared of woody
vegetation and had a ground cover that comprised buffel
grass [Cenchrus ciliaris L.], Indian couch [Bothrichloa
pertusa (L.) A.Camus]; dark wiregrass (Aristida calycina
R.Br.), purpletop chloris (Chloris inflata Link), Red
Natal grass [Melinis repens (Willd.) Zizka], feathertop
rhodes grass (Chloris virgata Sw.), sabi grass [Urochloa
mosambicensis (Hack.) Dandy], budda pea
(Aeschynomene indica L.) and siratro [Macroptilium
atropurpureum (DC.) Urb.].
Long-term mean annual rainfall for Charters Towers
is 658mm with 76% of this occurring during the summer
months (December–February) (BOM 2012). The mean
maximum daily temperature ranges in summer between
32.6ºC and 34.8ºC and in winter (June–August) between
24.8ºC and 26.6ºC. Specific details on rainfall and
ambient temperature at the field site during the study
were measured using an on-site automatic weather
station (Campbell Scientific, Logan, UT, USA).
Seed collection
An initial collection of ripe follicles of C. procera
was undertaken in December 2008 from two locations:
43 km south-east (20º13’S, 146º38’E) and 15 km north-
west of Charters Towers (19º59’S, 146º30’E). Follicles
were placed in jackets of aluminium mosquito gauze
(1m2) to dry for 2 weeks in a dry glasshouse before seeds
were extracted and pooled. Six-hundred and forty
subsamples of 50 seeds were then randomly selected and
placed in bags of shade cloth (4 cm x 4 cm x 0.5 cm;
1.1mm x 2.4 mm mesh size) to simplify seed retrieval
while maximising soil/seed contact.
A second seed collection of ripe follicles was
undertaken in October 2011 from an infestation of
C. procera located in the Gulf of Carpentaria Region
(18º13’S, 140º38’E), 820 km north-west of Charters
Towers. The same procedure as that used for the initial
seed collection was followed for selection and
containment of seed lots.
Experimental design
A factorial combination of 2 soil types x 2 pasture
levels x 9 retrieval times x 4 seed burial depths was
implemented in four blocks in a multiple split-plot
design as described in the following paragraphs.
The main plot treatments were established in March
2008 by digging eight trenches (1.0 m wide x 0.5 m deep x 36 m long) 2 m apart. The soil/landform into which the
trenches were dug was heavy clay loam. The trenches
were then grouped into four blocks, each comprising two
neighbouring trenches. In each block, one trench was
randomly filled with river loam and the other with clay
soil that had been collected in the vicinity of Charters
Towers. These soils arecommonsoil types in the vicinity
of Charters Towers on which C. procera can occur.
To establish the subplots, half of each trench (i.e.
18 m) was randomly allocated to be kept bare (i.e.
pasture excluded) through physical removal of all
vegetation whereas the other half was allowed to
revegetate from the local seed bank and encroachment
from the 2-m buffer strips. After 6 months (September
2008), the revegetated portions (i.e. pasture present) had
a dense cover of pasture that was ~40–50 cm high.
The pasture present and pasture excluded portions of
each trench were divided into 12 1-m-long by 1-m-wide
sections with a 50-cm buffer in between, to enable
longevity testing of up to 12 seed lots of various weed
species at any one time. For both the first and second
seed lots of C. procera, subplots were implemented by
first randomly selecting one of the 1-m-long sections in
both the pasture present and pasture excluded portions of
each trench. Within this 1-m-long x 1-m-wide section of
trench, nine 12–15-cm-diameter cylindrical holes were
dug to a depth of 30 cm using a manually operated auger.
They were positioned so that there were three rows each

B.NBP.0622 - Distribution, Invasiveness, Biology and Control or Rubber Bush in Northern Australia
Page 113 of 125
containing three holes, equal distances apart. Each hole
was randomly allocated one of nine retrieval dates.
These holes were then filled with a cylindrical PVC pipe
(11 cm in diameter x 30 cm in height) containing seed
bags that had been buried at the designated burialthe
depths using the same soil within respective trenches.
Seed lots randomly selected to be tested at time zero
were not buried, but directly subjected to germination
and viability testing.
The PVC pipes were perforated at the base and also
had four holes drilled on the sides to allow for drainage.
Blotting paper was placed at the base and in the holes to
prevent soil loss but allow free drainage. Pipes were
systematically filled on site using ~6.5 kg of soil, with a
bag of seeds placed at depths of 0, 2.5, 10 and 20 cm.
The top of the PVC pipe was then covered with rabbit
mesh wire to prevent loss of bags containing seeds
placed on the soil surface (0 cm in depth). Sensors
connected to two separate data loggers (DT85 model – Data Electronics Pty Ltd, Brisbane, Qld, Australia) were
inserted at each burial depth in dummy PVC pipes that
were buried at the head of each soil trench to monitor
soil temperature (Type K steel encased thermocouples)
and soil moisture (SM200) on an hourly basis.
The first seed lot of C. procera was buried in March
2009 with retrievals designated to occur 3, 6, 12, 18, 24,
36, 48, 60 and 72 months after burial or until no viable
seeds were recorded for two consecutive retrievals. The
second seed lot was buried in January 2012, with
retrievals designated to occur 3, 6, 12, 15, 18, 24, 36, 48
and 60 months after burial. On each retrieval date, one
PVC pipe from each replicate of the 16 soil type x pasture cover plots was randomly retrieved. The bags
containing buried seeds were then removed from the
PVC pipes and washed gently to remove attached soil
particles.
Germination and viability testing
To determine ‘germinability’, remaining intact seeds
were removed from the bags and placed in Petri dishes
(9 cm diameter) containing two layers of ‘Whatman No.
1’ filter paper moistened with 10 mL of distilled water.
These dishes were then placed into a growth cabinet set
at 30ºC/20ºC day/night with alternating 12 h of light and
dark. Germinable seeds (identified by radicle emergence)
were counted and removed daily for 14 days. Seeds that
did not germinate were checked for dormancy using the
tetrazolium method (Moore 1985). Seed viability
(germinable + dormant) was expressed as a per cent of
total seeds initially buried.
At the 3-month retrieval, the number of seeds that
germinated in the packets was also recorded by counting
emerged seedlings. However, this was not possible in
later retrievals due to disintegration of emerged
seedlings.
Experiment 2: days to flowering and seed production,
plant height and basal diameter
The experiment was conducted at the Tropical
Weeds Research Centre between September 2006 and
December 2008. A completely randomised design with
six replications was used to grow single plants of
C. procera and C. gigantea in plastic pots (40 cm in
diameter x 40 cm in depth) filled with garden soil potting
mix. Pots were regularly watered to field capacity. Seeds
of both C. procera and C. gigantea were collected in
August 2006 and came from pods near the Gregory
River (Fig. 1) in the Gulf of Carpentaria (18º57’S,
139º27’E). Three seeds of C. procera and C. gigantea
were initially sown and seedlings were subsequently
thinned 3 weeks after emergence to one plant per pot.
Number of seeds per pod of C. procera and C. gigantea
averaged 486 ± 10.1 (n = 14) and 127 ± 12.2 (n = 14),
respectively.
Plant height (cm) and basal diameter (mm) at
flowering and seed production (when first swollen
follicle was observed) were recorded for each plant,
along with days to flowering and seed production.
Data analyses
GENSTAT was used for all statistical analyses
(GENSTAT 8.1, VSN International, Hemel Hempstead,
Hertfordshire, UK) and Fisher’s least significant
differences test was used to determine differences
between treatments whenever analysis showed treatment
effects to be statistically significant (P < 0.05). All
statistical analysis concerning seed germination and
viability was undertaken on arcsine-transformed data,
which was later backtransformed for display.
Fig. 1. Distinct follicle size and shape and inflorescences colour and form of C. procera (back) and
C. gigantean (front).

B.NBP.0622 - Distribution, Invasiveness, Biology and Control or Rubber Bush in Northern Australia
Page 114 of 125
In Experiment 1, viability data was analysed using a
multiple split-plot ANOVA as dictated by the
experimental design: 4 blocks x 2 soil types split for 2
pasture levels split for 9 retrieval times split for 4 burial
depths. All other data was only analysed at a single time
(i.e. germination at 3 months) or was an average over
time (i.e. soil moisture content and temperature), and
was thus subjected to an analysis of 4 blocks x 2 soil
types split for 2 pasture levels split for 4 burial depths.
For Experiment 2, all measurements undertaken on
C. procera and C. gigantea were subjected to one-way
ANOVA using a completely randomised design.
Results
Experiment 1 – seed longevity
Rainfall and soil moisture
Annual rainfall, recorded at the site between 2009
and 2012, was consistently greater than the long-term
mean for Charters Towers (658 mm), averaging 1105,
1323, 1037, 832 mm per annum, respectively. For the
first 5 months of 2013 before the second seed lot finished
being tested in May 2013, 452 mm of rainfall was
recorded (Fig. 2).
Despite high annual rainfall, the first and second seed
lots were exposed to different seasonal patterns of
rainfall, particularly in the first 12 months, which was a
critical period in the longevity of soil seed banks of
C. procera. After burial in March 2009, the first seed lot
received 118 mm of rainfall for the remainder of the
autumn period. This was followed by a very dry winter
and spring period where only 21mm of rainfall were
recorded, before the onset of a wet summer where
493 mm fell. In contrast, the second seed lot buried in
January 2012 received 218 mm of rainfall in February
followed by 319 mm during autumn. Even the winter
period received high rainfall with 189mm being
recorded. However, the following spring was dry
(32 mm) and summer rainfall was below average, with
294 mm recorded (Fig. 2).
The prevailing rainfall resulted in no significant
difference (P > 0.05) in average daily proportion of soil
moisture content conditions between the first and second
seed lots (average of 0.1%), when calculated for the full
duration of burial. However, during the first 3 months
when rainfall patterns differed markedly and major
reductions in seed viability occurred, average proportion
of daily soil moisture content was significantly higher
(P < 0.01) for the second seed lot than the first one,
averaging 0.14 and 0.08, respectively.
Soil type, pasture cover and soil depth did not have a
significant effect (P > 0.05) on average daily soil
moisture content for the first and second seed lots, when
calculated for the full duration of burial. If calculated for
the first 3 months of burial when major changes in
viability occurred, there was no significant difference
(P > 0.05) during testing of the second seed lot, but a
significant soil type x pasture cover interaction (P < 0.05) occurred during testing of the first seed lot. The
clay soil had consistently higher soil moisture content
than the river loam and the pasture-excluded plots had
higher soil moisture contents than those where pasture
was present, with differences greatest in the clay soil
treatment (Fig. 3).
Temperature conditions
The second seed lot was exposed to slightly higher
(26.8ºC) average daily soil temperatures than the first
seed lot (26.3ºC) when averaged across all soil types,
levels of pasture cover and burial depths (P < 0.05).
During burial of both seed lots, soil type did not have a
significant effect (P > 0.05) on average daily soil
temperatures, but both the level of pasture cover and
burial depth did (P < 0.05). Temperatures were higher in
the absence of pasture cover (Fig. 4) and there was a
positive correlation between average daily soil
temperature and burial depth (r = 0.98) (Fig. 4).
050
100150200250300350400450500
J M M J S N J M M J S N J M M J S N J M M J S N J M M
2009 2010 2011 2012 2013
Rai
nfa
ll (m
m)
Years and Months
Fig. 2. Monthly rainfall (■ mm) at the research site between March 2009 and May 2013, and the average
monthly rainfall (□ mm) for Charters Towers associated with burial duration for seed lot 1(_____) and
seed lot 2 (ӿӿӿӿ).

Page 115 of 125
Seed viability
First seed lot. Initial seed viability and germinability
was high, averaging 85.0 ± 2.4% (per cent of total seed
number) and 100% (per cent of viable seeds),
respectively. Following burial, significant burial depth x
burial duration (P < 0.001) and soil type x burial
duration (P < 0.01) interactions were recorded for seed
viability. In contrast, the level of pasture cover did not
have a significant influence (P > 0.05) on seed viability
over time.
Viability declined most rapidly in the first 3 months,
particularly in seed lots that were buried. After 6 months,
<1% of buried seeds remained viable, compared with
28% of surfacelocated seeds (Fig. 5). This rapid decline
in viability coincided with high germination of seeds in
the field in the first 3 months after burial. On average,
92% of seeds germinated within 3 months if buried,
significantly more (P < 0.05) than surfacelocated seeds,
which averaged only 38% (Fig. 6). No viable seeds were
retrieved from buried seed lots after 18 months, whereas
surface-located seed lots had no viable seed after 24
months.
Fig. 3. Average proportion of daily soil moisture content recorded during the
first 3 months of burial of the first seed lot, as affected by soil type (clay □ and river loam ■) and level of pasture cover. Vertical bar indicates the least
significant difference at P = 0.05.
With regards soil type, a more rapid rate of decline in
viability occurred in the clay soil compared with the
river loam soil (Fig. 7). No viable seeds were retrieved
from the clay soil after 18 months, whereas nil viability
was recorded in the river loam soil at the 24-month
retrieval.
Second seed lot. Initial seed viability and
germinability was extremely high, averaging 99.5 ±
0.1% (per cent of total seed number) and 100% (per cent
of viable seeds), respectively. Following burial, viability
was significantly affected by burial duration (P < 0.05),
but not by soil type, pasture cover or burial depth (P =
0.93). The rate of decline in viability was faster than that
of the first seed lot tested.
After 3 months, no viable seed was recorded across
all burial depths, soil types and pasture cover treatments.
However, subsequent 6- and 12-month assessments
recorded 0.1% viability. No viable seeds were retrieved
from any seed lots 15, 18 or 24 months after burial. As
for the first seed lot, the rapid decline in viability was
associated with a high percentage of seeds germinating
in the field, particularly those buried below ground.
Surface-located seeds averaged 82% germination after
3 months compared with 99% for those buried between
2.5 and 20 cm (Fig. 6).
Experiment 2 – days to flowering and seed
production,plant height and basal diameter
Plant height and basal diameter at flowering
Plant height at flowering did not differ significantly
between C. procera and C. gigantea (P > 0.05),
averaging 85 ± 2 cm. In contrast, C. procera had a
significantly larger (P < 0.05) basal diameter at flowering
than C. gigantea, averaging 45mm and 31 mm,
respectively.
Fig. 4. Average daily soil temperature (ºC) recorded during burial of the first and second seed lots,as affected by
pasture cover (□ present and ■ absent) and soil depth. Vertical bars indicate the leastsignificant difference at P = 0.05.
0
0
0
0
0
0
0
0
0
0
No Grass GrassPro
po
rtio
n o
f so
il m
ois
ture
co
nte
nt
Pasture cover
23
24
25
26
27
28
29
30
31
32
Firstseedlot
Secondseedlot
0 2.5 10 20 0 2.5 10 20
First seed lot Second seed lot
Pasture cover Soil depth (cm)
Soil
tem
per
atu
re (
°C)
Variables

B.NBP.0622 - Distribution, Invasiveness, Biology and Control or Rubber Bush in Northern Australia
Page 116 of 125
Days to flowering and seed production,
Significant differences (P < 0.05) in days to
flowering occurred between C. procera and C. gigantea
(Fig. 8). Plants of C. gigantea took between 116 and 146
days to flower (average, 125 days) after germination,
whereas C. procera took between 125 and 250 days
(average, 190 days). Similarly, days to seed production
differed significantly (P < 0.05), with C. gigantea
producing seed between 352 and 365 days after
germination (average, 359 days), compared with 399–425 days for C. procera (average, 412 days).
Fig. 5. Viability (%) at the time of testing of the first seed lot of C. procera as
affected by burial depth (□ 0 cm, ■ 2.5 cm, ░ 10 cm and ▓ 20 cm) and burial
duration. Vertical bars indicate the least significant difference at P = 0.05.
Fig. 6. The proportion (%) of the first (□) and second (■) seeds lot of C.
procera that germinated in the field at different depths, 3 months after burial.
Vertical bar indicates the least significant difference at P = 0.05.
Discussion
Under the prevailing environmental conditions
experienced during the study, seed longevity of
C. procera was relatively short (15–24 months) and
young plants demonstrated the potential to flower and
produce seeds within 6 and 14 months, respectively.
Seed longevity
Based on a dichotomous key, developed by
Thompson et al. (1997) and which classifies seed
longevity into three categories [transient (viable ≤1
year), short-term persistent (viable 1–5 year) and long-
term persistent (viable ≥5 year)], our results suggest that
C. procera has a short-term persistent seed bank
depending on prevailing conditions. This is consistent
with the earlier prediction of Long et al. (2008), who
suggested that seeds would persist for between 1 and 3
years.
Germination and viability testing revealed that the
seeds of C. procera had high viability and germinability,
and should, therefore, readily germinate under
favourable field conditions. Francis (2002) reported a
similar finding with 89% germination recorded 64 days
after sowing seeds in a potting mix. Similarly, Leal et al.
(2013) recorded greater than 95% germination in fresh
seeds after 35 days from two populations in north-eastern
Brazil.
Calotropis procera seeds readily germinated after
rainfall with an associated rapid decline in the proportion
of viable seeds remaining over time. This was most
evident in the second seed lot tested where <1% viability
was recorded after 3 months. These seeds received much
more rainfall in the first 3 months after burial than the
first seed lot, and consequently would have had more
favourable conditions for germination to occur. This
differential response between the two seed lots highlights
the influence of prevailing environmental conditions on
seed longevity, as reported previously (Chambers and
MacMahon 1994; Baskin and Baskin 2001). Given that
both seed lots were tested during above-average rainfall
conditions, it is feasible that seed banks of C. procera
could persist for longer during droughts due to
0
10
20
30
40
50
60
70
80
90
100
0 3 6 12 18 24 36
Via
bilit
y (
%)
Burial duration (months)
0
10
20
30
40
50
60
70
80
90
100
0 2 10 20
Ger
min
atio
n (%
)
Burial depth (cm)
0
10
20
30
40
50
60
70
80
90
100
0 3 6 12 18 24 0 3 6 12 15
1st seed lot 2nd seed lot
Via
bil
ity
(%
)
Seed lot and burial duration (months)
Fig. 7. Viability of the first and second seed lots of C. procera as affected by soil type (○ clay an ∆ river
loam) and burial duration. Vertical bars indicate the least significant difference at P = 0.05.

B.NBP.0622 - Distribution, Invasiveness, Biology and Control or Rubber Bush in Northern Australia
Page 117 of 125
Fig. 8. Average days from the emergence of the first seedling to flowering
and seed production of C. procera (□) and C. gigantea (■). Vertical bars
indicate the least significant difference at P = 0.05.
fewer opportunities to germinate and this warrants
investigation. Studies on Lantana camara L. (lantana)
and Jatropha gossypiifolia L. (bellyache bush) have
highlighted major differences in the persistence of soil
seed banks due to soil moisture availability. Vivian-
Smith and Panetta (2009) predicted that the longevity of
soil seed banks of L. camara could be reduced by 8 years
under high soil moisture content conditions when
compared with sites that received natural seasonal
rainfall. Similarly, a rainfall-exclusion experiment found
that the longevity of seed banks of J. gossypiifolia could
be extended from ~3 to 4 years under natural rainfall
conditions to greater than 10 years in the absence of
rainfall (Bebawi et al. 2012).
The more rapid decline in viability of the first seed
lot when buried in clay soils compared with loams is also
most likely due to differences in soil moisture content.
The clay soil had higher average daily soil moisture
content than the river loam during the first 3 months
(autumn) of the experiment, before going into a dry
winter. This would have provided more favourable
conditions for germination of C. procera seed that was in
a highly germinable state at the time. A similar
occurrence was reported for J. gossypiifolia, whose seed
bank was depleted quicker due to greater seedling
emergence under the higher soil moisture conditions in a
clay soil compared with a red duplex soil (Bebawi et al.
2012). A more rapid decline in viability of seeds, located
below ground compared with those on the surface, has
also been reported for other weeds (Panetta 2001;
Bebawi et al. 2012) and often attributed to greater soil
moisture availability, although there are several factors
that could have an influence such as seedsoil contact,
such as aeration, light availability, temperature and
dormancy (Bekker et al. 1998; Benvenuti et al. 2001;
Harrison et al. 2007; Vivian-Smith and Panetta 2009). In
our study, differences in average daily soil moisture
between surfacelocated seeds and those buried below
ground were not detected during testing of either seed
lots, but this may have been associated with placement of
the sensors, which had to be partially buried to keep
them in place.
The high germination of C. procera under the
prevailing temperatures of the present study was
consistent with those reported in a Brazilian study
(Labouriau and Valadares 1976), where germination was
highest between 23ºC and 33ºC. It is plausible that
longevity could be extended in areas that receive periods
of extreme temperatures (too hot or cold) that may
prevent germination. For example, Labouriau and
Valadares (1976) recorded little germination once
temperatures reached 34ºC or above. Besides these
potential inhibitory effects, surface seeds exposed to very
high temperatures in summer could possibly lose
viability. Ooi et al. (2009) indicated that soil
temperatures, which increase as a result of global
warming, may approach thresholds for seed death in
ecosystems where high temperatures are already
apparent. They found that, among other plant species, the
initial viability of the physically dormant seeds of
Tephrosia sphaerospora F. Muell. (Fabaceae) declined
rapidly from almost 100% to 58% after 70 days exposure
to high predicted soil temperatures (70/25ºC).
The ability of C. procera to germinate in the field at
depth suggests that light is not necessary and is
consistent with findings from Leal et al. (2013) who
reported high germination under a range of light
intensities ranging from 0% to 100%. However, the
general location of seeds of C. procera in the soil profile
has not been clarified in this study, nor has the ability of
seedlings to emerge from depth. It is important to note
that, although the seed lots used in this study exhibited
high germinability, the literature does report limited
instances of low-level dormancy in C. procera. Between
2% and 35% of C. procera seeds collected from an
Indian population (Amritphale et al. 1984) and up to 6%
from a Brazil population were reported to be dormant
(Labouriau and Valadares 1976). The presence of
dormancy may prolong the longevity of seed banks of
C. procera beyond those reported in the present study.
Flowering and seed production
The average time taken for C. procera to produce
seeds in the present study was slightly less (412 days)
than the 2 years suggested by Parsons and Cuthbertson
(2001). Plants did, however, have access to abundant soil
moisture and differential responses could occur under
drier field conditions or due to different levels of
competition from desirable native and/or pasture species.
The large lag time observed between flowering and seed
production also warrants further consideration to
determine whether this is a normal occurrence or not. It
was much longer for C. procera than for C. gigantea
(190 days vs 125 days) and was the main reason for the
large difference between these two species in the time
taken for plants to reach the seed production stage. Both
species rely on insect pollination for reproduction
(Wanntorp 1974; Ramakrishna and Arekal 1979; Morse
1981; Eisikowitch 1986; Ali and Ali 1989; Grace 2006)
and perhaps differences in availability of pollinators
could influence when flowers are fertilised and pod
production occurs. Additionally, differences in pod size
and number of seeds produced per pod may also explain
differences between these two species in time taken to
reach reproductive maturity, as more time will be
required by C. procera compared with C. gigantea to
produce the higher energy requirements (given similar
photosynthetic area). It is also likely that the prolific
production of seeds by C. procera (485.7 ± 10.1)
compared with C. gigantea (126.5 ± 12.2) may be
0
100
200
300
400
500
600
700
Flowering Seed production
No. of
days
Plant variables

B.NBP.0622 - Distribution, Invasiveness, Biology and Control or Rubber Bush in Northern Australia
Page 118 of 125
contributing to the pre-dominance of the former in the
Australian rangelands.
Management implications
The short longevity of seeds of C. procera highlights
the vulnerability of this species in terms of its soil seed
bank, which makes it highly amenable for control and
possible eradication from an area. It is notable that the
apparently successful eradication program targeting a
very large incursion of kochia [Bassia scoparia (L.)
A.J.Scott] in Western Australia has involved a species
whose seeds are short-lived (Dodd and Randall 2002).
Based on the findings of the present study, land
managers controlling C. procera can expect a high
density of seedling regrowth in the first 12 months under
average or above-average rainfall conditions. If this
seedling regrowth is treated along with any original
plants that may have been missed or not controlled
effectively, little germination should occur as the
resident soil seed bank should be very low thereafter. In
terms of the frequency of control activities, annual
surveillance and treatment of plants should be sufficient
in most years to prevent new plants from producing
seeds and replenishing soil seed banks. However, as both
Calotropis species investigated in this study produced
seed as early as September (spring), it would be
advisable to commence control operations at the onset of
spring.
Given its dispersal mainly by wind and water, there
is a risk that seed dispersal from neighbouring areas or
external sources could occur resulting in ongoing
recruitment. This will be particularly pertinent for land
managers with large infestations that cannot all be
controlled at the same time.
Acknowledgements
Thanks are extended to the Queensland Department
of Agriculture and Fisheries and to Meat and Livestock
Australia for providing financial support. Special thanks
are extended to Charles Curry, Noleen Ferguson and
Trevor Meldrum for supplying seeds of C. procera for
research purposes. We also thank Dr J. Scanlan, and Mrs
Barbara Madigan for reviewing the manuscript. The
technical assistance of C. Crowley, K. Gough, K. Thorp,
R. Stevenson, K. Risdale, and C. Andersen is also
acknowledged.
References
Ali, S. I. (1980). The subspecies of Calotropis procera.
Notes of The Royal Botanic Garden, Edinburgh 38,
287–290.
Ali, T., and Ali, S. I. (1989). Pollination biology of
Calotropis procera subsp. hamiltonii
(Asclepiadaceae). Phyton 29, 175–188.
Amritphale, D., Gupta, J. C., and Iyengar, S. (1984).
Germination polymorphism in sympatric populations
of Calotropis procera. Oikos 42, 220–224.
doi:10.2307/3544796
Baskin, C. C., and Baskin, J. M. (2001). Some
procedures for dormancy break and germination of
difficult seeds. In: ‘Native Plant Propagation and
Restoration Strategies’. Oregon State University
Nursery Technology Cooperative and Western
Forestry and Conservation Association, 12–13
Dec. 2001. (Eds D. L. Haase and R. Rose.) pp. 29–34.
(Oregon State University: Eugene, OR.)
Bebawi, F. F., Campbell, S. D., and Mayer, R. J. (2012).
Persistence of bellyache bush (Jatropha gossypifolia
L.) soil seed banks. The Rangeland Journal 34, 429–438. doi:10.1071/RJ12051
Bekker, R. M., Bakker, J. P., Grandin, U., Kalamees, R.,
Milberg, P., Poschlod, P., Thompson, K., and
Eillems, J. H. (1998). Seed size, shape, and vertical
distribution in the soil: indicators of seed longevity.
Functional Ecology 12, 834–842.
doi:10.1046/j.1365-2435. 1998.00252.x
Benvenuti, S., Macchia, M., and Miele, S. (2001). Light,
temperature and burial depth effects on Rumex
obtusifolius seed germination and emergence. Weed
Research 41, 177–186. doi:10.1046/j.1365-
3180.2001. 00230.x
BOM (2012). Mean annual rainfall and maximum daily
temperature ranges. Available at: www.bom.gov.au
(accessed 22 October 2012).
Brandao, M. (1995). Calotropis procera (Ait.) R. Br.: a
problem pasture invader in Minas Gerais. Daphne.
Revista do Herbário PAMG da EPAMIG 5, 68–71.
Campbell, S., Roden, L., and Crowley, C. (2013).
Calotrope (Calotropis procera): a weed on the move
in northern Queensland. In: ‘Weeds – Everyone’s
Business. Proceedings of the 12th Queensland
Symposium’. (Eds M. O’Brien, J. Vitelli and D.
Thornby.) pp. 11–14. (The Weed Society of
Queensland: Brisbane, Qld.)
Chambers, J. C., and MacMahon, J. A. (1994). A day in
the life of a seed: movements and fates of seeds and
their implications for natural and managed systems.
Annual Review of Ecology and Systematics 25, 263–292. doi:10.1146/annurev.es.25.110194.001403
Chippendale, G. M., and Murray, L. R. (1963).
‘Poisonous Plants of the Northern Territory.’ Northern Territory Administration Animal Industry
Branch Extension Article No. 2. pp. 85–88.
(Northern Territory Administration: Darwin, NT.)
Crothers, M., and Newbound, S. (1998). ‘Rubber Bush.’ Agnote F64. (Northern Territory Department of
Primary Industries and Fisheries: Darwin, NT.)
Department of Agriculture, Fisheries and Forestry
(2013). Calotrope distribution 2011/12. Available at:
www.daff.qld.gov.au/data/assets/
pdf_file/0020/77303/IPA-Calotrope-PP41.pdf
(accessed 23 January 2015).
Discover Nature at JCU (2013). NQ Weeds by scientific
name. Available at: www.jcu.edu.au (accessed 15
August 2013).
Dodd, J., and Randall, R. P. (2002). Eradication of
kochia (Bassia scoparia (L.) A.J.Scott,
Chenopodiaceae) in Western Australia. In:
‘Proceedings 13th Australian Weeds Conference’. (Eds H. Spafford Jacob, J. Dodd and J. H. Moore.)
pp. 300–303. (Plant Protection Society of Western
Australia: Perth, WA.)

B.NBP.0622 - Distribution, Invasiveness, Biology and Control or Rubber Bush in Northern Australia
Page 119 of 125
Dunlop, C. R. (1987). ‘Checklist of Vascular Plants of
the Northern Territory.’ (Conservation Commission
of the Northern Territory: Darwin, NT.)
Eisikowitch, D. (1986). Morpho-ecological aspects of
the pollination of Calotropis procera
(Asclepiadaceae) in Israel. Plant Systematics and
Evolution 152, 185–194. doi:10.1007/BF00989426
Everist, S. L. (1974). ‘Poisonous Plants of Australia.’ (Angus and Robertson: London, UK.)
Forster, P. I. (1992). A taxonomic account of the genus
Calotropis R.Br. (Ascalepiadaceae) in Australia.
Nuytsia 8, 201–208.
Francis, J. K. (2002). Calotropis procera, International
Institute of Tropical Forestry, U.S. Department of
Agriculture, Forest Service. Available at:
www.fs.fed.us/global/iitf/pdf/shrubs/Calotropis%20p
rocera.pdf (accessed 15 August 2013).
Gardner, C. A., and Bennetts, H. W. (1956). ‘Toxic
Plants of Western Australia.’ pp. 153–156. (West
Australian Newspapers, Periodical Division: Perth,
WA.)
Grace, B. S. (2006). The biology of Australian weeds 45.
Calotropis procera (Aiton) W.T.Aiton. Plant
Protection Quarterly 21, 152–160.
Hall, N. H. (1967). ‘Noxious weeds: Rubber Bush.’ Primary Industries Branch, Northern Territory
Administration, Pamphlet No. 13. (Northern
Territory Government: Darwin, NT.)
Harrison, S. K., Regnier, E. E., Schmoll, J. T., and
Harrison, J.M.(2007). Seed size and burial effects on
giant ragweed (Ambrosia trifida) emergence and seed
demise. Weed Science 55, 16–22. doi:10.1614/WS-
06-109.1
Holm, L., Doll, J., Holm, E., Pancho, J., and Herberger,
J. (1979). ‘A Geographical Atlas of World Weeds.’ (John Wiley & Sons: New York.)
Kleinschmidt, H., and Johnson, R. W. (1977). ‘Weeds of
Queensland.’ (Government Printer: Brisbane, Qld.)
Labouriau, L. G., and Valadares,M. E.B. (1976).On the
germination of seeds of Calotropis procera (Ait.)
Ait.f. Anais da Academia Brasileira de Ciencias 48,
236–284.
Leal, L. C., Meiado, M. V., Lopes, A. V., and Leal, I. R.
(2013). Germination responses of the invasive
Calotropis procera (Ait.) R.Br. (Apocynaceae):
comparisons with seeds from two ecosystems in
north-eastern Brazil. Anais da Academia Brasileira
de Ciencias 85, 1025–1034. doi:10.1590/ S0001-
37652013000300013
Long, R. L., Panetta, F. D., Steadman, K. J., Probert, R.,
Bekker, R. M., Brooks, S., and Adkins, S. W. (2008).
Seed persistence in the field may be predicted by
laboratory-controlled aging. Weed Science 56, 523–528. doi:10.1614/WS-07-189.1
Martin, C. C. (1996). Weed control in tropical ley
farming systems: a review. Australian Journal of
Experimental Agriculture 36, 1013–1023.
doi:10.1071/EA9961013
Miller, I. L. (2003). ‘Declared Weeds of the Northern
Territory.’ Information Sheet 7. (Department of
Business, Industry and Resource Development:
Darwin, NT.)
Milson, J. (2000). ‘Trees and Shrubs of North-West
Queensland.’ (Department of Natural Resources:
Brisbane, Qld.)
Moore, R. P. (1985). ‘Handbook on Tetrazolium
Testing.’ (International Seed Testing Association:
Zurich, Switzerland.)
Morse, D. H. (1981). Modification of bumble bee
foraging: the effect of milkweed pollinia. Ecology
62, 89–97. doi:10.2307/1936672
Ooi, M. K. J., Auld, T. D., and Denham, A. J. (2009).
Climate change and bet-hedging: interactions
between increased soil temperatures and seed bank
persistence. Global Change Biology 15, 2375–2386.
doi:10.1111/ j.1365-2486.2009.01887.x
Panetta, F. D. (2001). Seedling emergence and seed
longevity of the tree weeds Celtis sinensis and
Cinnamomum camphora. Weed Research 41, 83–95.
doi:10.1046/j.1365-3180.2001.00220.x
Parsons, W. T., and Cuthbertson, E. G. (2001). ‘Noxious
Weeds of Australia.’ 2nd edn. (CSIRO Publishing:
Melbourne.)
Rahman, M. A., and Wilcock, C. C. (1991). A taxonomic
revision of Calotropis (Ascelepiadaceae). Nordic
Journal of Botany 11, 301–308. doi:10.1111/j.1756-
1051.1991.tb01408.x
Ramakrishna, T. M., and Arekal, G. D. (1979).
Pollination biology of Calotropis gigantea. Current
Science 48, 212–213.
Sharma, A. K., Kharb, R., and Kaur, R. (2011).
Pharmacognostical aspects of Calotropis procera
(Ait.) R.Br. International Journal of Pharma and Bio
Sciences 2, 480–488.
Smith, N. M. (2011). ‘Weeds of Northern Australia – A
Field Guide.’ (Environment Centre NT Inc.: Darwin,
NT.)
Staples, G. W., and Herbst, D. R. (2005). ‘A Tropical
Garden Flora. Plants Cultivated in the Hawaiian
Islands and Other Tropical Places.’ (Bishop Museum
Press: Honolulu, HI.)
Thompson, K., Bakker, J. P., and Bekker, R. M. (1997).
‘Soil Seed Banks of NW Europe: Methodology,
Density and Longevity.’ (Cambridge University
Press: Cambridge, UK.)
Vitelli, J., Madigan, B., Wilkinson, P., and van Haaren,
P. (2008). Calotrope (Calotropis procera) control.
The Rangeland Journal 30, 339–348.
doi:10.1071/RJ07064
Vivian-Smith, G., and Panetta, F. D. (2009). Lantana
(Lantana camara) seed bank dynamics: seedling
emergence and seed survival. Invasive Plant Science
Management 2, 141–150. doi:10.1614/IPSM-08-
130.1
Wanntorp, H. E. (1974). Calotropis gigantea
(Asclepiadaceae) and Xylocopa tenuiscapa
(Hymenoptera, Apidae): studies in flower
morphology and pollination biology. Svensk Botanisk
Tidskrift 68, 25–32.
Weber, E. (2003). ‘Invasive Plant Species of the
World:AReference Guide to Environmental Weeds.’ (CABI Publishing: Wallingford, UK.)

Page 120 of 125
10.2 Appendix 2: Environmental layers used for modelling, the timeframe they cover and their source.
Variable Time frame Source
Topography Elevation 1996 U.S. Geological Survey https://lta.cr.usgs.gov/get_data/
NVIS major vegetation groups*†‡ 2012 Australian Dept. Environment http://www.environment.gov.au/metadataexplorer/
Minimum annual bare ground cover 2011 Australian Dept. Agriculture http://data.daff.gov.au/anrdl/metadata_files/pb_mcas11g9ablm03111a01.xml
Maximum annual bare ground cover 2011 Australian Dept. Agriculture http://data.daff.gov.au/anrdl/metadata_files/pb_mcas11g9ablm03111a01.xml
Fire history Years since last burnt 2000-2013 North Australian Fire Information http://nafi3-dev.firenorth.org.au/nafi3/
Fire Frequency 2000-2013 North Australian Fire Information http://nafi3-dev.firenorth.org.au/nafi3/
Soil properties Soil fertility 2011 Australian Dept. Agriculture http://data.daff.gov.au/anrdl/metadata_files/pb_mcas11g9ablm03111a01.xml
Soil pH (0-30cm) 2011 ASRIS http://www.asris.csiro.au/themes/NationalGrids.html#NationalGrids_Downloads
Clay content percentage (0-30cm) 2011 ASRIS http://www.asris.csiro.au/themes/NationalGrids.html#NationalGrids_Downloads
Soil bulk density (0-30cm) 2011 ASRIS http://www.asris.csiro.au/themes/NationalGrids.html#NationalGrids_Downloads
Plant available water capacity 2011 ASRIS http://www.asris.csiro.au/themes/NationalGrids.html#NationalGrids_Downloads
Climate Potential evapotranspiration 1961-1990 Bureau of Meteorology http://www.bom.gov.au/climate/averages/maps.shtml
Actual evapotranspiration 1961-1990 Bureau of Meteorology http://www.bom.gov.au/climate/averages/maps.shtml
Water availability index 1961-1990 Bureau of Meteorology http://www.bom.gov.au/climate/averages/maps.shtml
Average daily temperature annual* 1961-1990 Bureau of Meteorology http://www.bom.gov.au/climate/averages/maps.shtml
Average minimum daily temperature annual 1961-1990 Bureau of Meteorology http://www.bom.gov.au/climate/averages/maps.shtml
Average maximum daily temperature annual 1961-1990 Bureau of Meteorology http://www.bom.gov.au/climate/averages/maps.shtml
Average rainfall annual* 1961-1990 Bureau of Meteorology http://www.bom.gov.au/climate/averages/maps.shtml
Average rain days >25mm annual 1961-1990 Bureau of Meteorology http://www.bom.gov.au/climate/averages/maps.shtml
Average rain days >10mm annual 1961-1990 Bureau of Meteorology http://www.bom.gov.au/climate/averages/maps.shtml
Average rainfall during wet season (October to April) annual 1961-1990 Bureau of Meteorology http://www.bom.gov.au/climate/averages/maps.shtml
Average rainfall during dry season (April to November) annual 1961-1990 Bureau of Meteorology http://www.bom.gov.au/climate/averages/maps.shtml

B.NBP.0622 - Distribution, Invasiveness, Biology and Control or Rubber Bush in Northern Australia
Page 121 of 125
Variable Time frame Source
Average relative humidity at 9am annual 1976-2005 Bureau of Meteorology http://www.bom.gov.au/climate/averages/maps.shtml
Average relative humidity at 3pm annual 1976-2005 Bureau of Meteorology http://www.bom.gov.au/climate/averages/maps.shtml
Average wind speed (km/hr)* † 1975-2013 CSIRO https://data.csiro.au/dap/home?execution=e2s1
Land use Australia land use*†‡ 2012 Australian Dept. Agriculture http://data.daff.gov.au/anrdl/metadata_files/pb_luausg9abll20140506_11a.xml
Beef density*† 2011 Australian Dept. Agriculture http://data.daff.gov.au/anrdl/metadata_files/pb_mcas11g9ablm03111a01.xml
Number of bores (NT)
(QLD)
(WA)
2014
2014
2014
NT Dept. Land and Resource Management
QLD Dept. Natural Resource Management
WA Dept. of Water
http://daff.gov.au/abares/aclump/pages/landuse/datadownload.aspx
https://www.dnrm.qld.gov.au/mapping-data/queensland-globe
Distance to minor roads (km)* 2011 Australian Dept. Agriculture http://data.daff.gov.au/anrdl/metadata_files/pb_mcas11g9ablm03111a01.xml
Minor roads* 2011 Australian Dept. Agriculture http://data.daff.gov.au/anrdl/metadata_files/pb_mcas11g9ablm03111a01.xml
Future climate Annual mean temperature (BIO1) † 2005 WorldClim http://wallaceinitiative.org/climate_2012/tdhtools/Search/DataDownload.php
Annual precipitation (BIO12) † 2005 WorldClim http://wallaceinitiative.org/climate_2012/tdhtools/Search/DataDownload.php
*Variables used in MaxEnt model building for potential C. procera distribution. †Variables used in MaxEnt model building for future C. procera distribution. ‡Categorical variables (not used in PCA).

Page 122 of 125
10.3 Appendix 3: Tests and response curves associated with distribution
modelling.
Fig. 1. Jackknife test for evaluating the relative importance of environmental variables for Calotropis procera in northern Australia.
Fig. 2. Response curves for (a) average daily temperature, (b) beef density, (c) average rainfall (d) wind and (e) distance to roads. Response curves illustrate how logistic prediction changes as each variable is varied while keeping all other environmental variables at their average. Lines show the mean ± 1 SE of the response taken from ten models replicated through cross-validation.

B.NBP.0622 - Distribution, Invasiveness, Biology and Control or Rubber Bush in Northern Australia
Page 123 of 125
10.4 Appendix 4: Supporting data for responses to the WRA questions.
A. Biogeography E. Menge 2015
Supporting data
1 Domestication/ cultivation
1.01 Is the species highly domesticated? If answer is 'no' go to 2.01
N
1.02 Is species naturalised where grown?
1.03 Does the species have weedy races?
2 Climate and Distribution
2.01 Species suited to Australian climates (0-low; 1-intermediate; 2-high)
2 (Menge, pers. observ.; CSIRO 2013)
2.02 Quality of climate match data (0-low; 1-intermediate; 2-high)
2 (Council of Heads of Australasian Herbaria 1999-2013, CSIRO 2013)
2.03 Broad climate suitability (environmental versatility)
Y (Ali & Ali 1989, Forster 1992, Smith 2002, Rangel & Nascimento 2011b, CSIRO 2013)
2.04 Native or naturalised in regions with extended dry periods
Y (Bastin et al. 2003a, Grace 2006, Vitelli et al. 2008)
2.05 Does the species have a history of repeated introductions outside its natural range?
Y (Parsons & Cuthbertson 2001, Rangel & Nascimento 2011b)
3 Weed Elsewhere: (interacts with 2.01 to give a weighted score)
3.01 Naturalised beyond native range Y (Brandao 1995, Parsons & Cuthbertson 2001, Francis 2004, Fabricante et al. 2013)
3.02 Garden/amenity/disturbance weed
Y (Menge, pers. observ.,Csurhes 2009)
3.03 Weed of agriculture/horticulture/forestry
Y (Grace 2006, Rangel & Nascimento 2011b, Sobrinho et al. 2013)
3.04 Environmental weed Y (Fisher et al. 2002)
3.05 Congeneric weed Y (Grice & Martin 2005)
B. Biology/Ecology
4 Undesirable traits
4.01 Produces spines, thorns or burrs N
4.02 Allelopathic N (Cheam 1984a,b)
4.03 Parasitic
4.04 Unpalatable to grazing animals N (Radunz et al. 1983, Grace 2006)
4.05 Toxic to animals N (Radunz et al. 1983)
4.06 Host for recognised pests and pathogens
4.07 Causes allergies or is otherwise toxic to humans
Y (Francis 2004, Nelson et al. 2007, Lottermoser 2011)
4.08 Creates a fire hazard in natural ecosystems
N (Vitelli et al. 2008)
4.09 Is a shade tolerant plant at some stage of its life cycle
4.1 Grows on infertile soils Y (Eisikowitch 1986a, Grace 2006, Csurhes 2009, Fabricante et al. 2013)
4.11 Climbing or smothering growth habit
N (Forster 1992)
4.12 Forms dense thickets Y (Parsons & Cuthbertson 2001, Grace 2006)
5 Plant Type
5.01 Aquatic N (Eisikowitch 1986b)
5.02 Grass N (Forster 1992)

B.NBP.0622 - Distribution, Invasiveness, Biology and Control or Rubber Bush in Northern Australia
Page 124 of 125
5.03 Nitrogen fixing woody plant N (Forster 1992)
5.04 Geophyte Y (Eisikowitch 1986a, Tezara et al. 2011)
6 Reproduction 6.01 Evidence of substantial reproductive failure in native habitat
Y (Madhu et al. 2013)
6.02 Produces viable seed Y (Menge, pers. observ., Sen et al. 1968, Labouriau & Valadares 1976, Ali & Ali 1989)
6.03 Hybridises naturally
6.04 Self-fertilisation Y Menge, pers. observ.
6.05 Requires specialist pollinators Y (Menge, pers. observ., Eisikowitch 1986a, Ali & Ali 1989)
6.06 Reproduction by vegetative propagation
Y (Vitelli et al. 2008)
6.07 Minimum generative time (years)
1.5 (Menge, pers. observ., Bebawi et al. 2015)
7 Dispersal mechanisms
7.01 Propagules likely to be dispersed unintentionally
Y (Parsons & Cuthbertson 2001)
7.02 Propagules dispersed intentionally by people
7.03 Propagules likely to disperse as a produce contaminant
Y (Parsons & Cuthbertson 2001)
7.04 Propagules adapted to wind dispersal
Y (Forster 1992, Grace 2006, Bebawi et al. 2015)
7.05 Propagules buoyant Y (Csurhes 2009)
7.06 Propagules bird dispersed
7.07 Propagules dispersed by other animals (externally)
7.08 Propagules dispersed by other animals (internally)
8 Persistence attributes
8.01 Prolific seed production Y Menge, pers. observ.
8.02 Evidence that a persistent propagule bank is formed (>1 yr)
N (Bebawi et al. 2015)
8.03 Well controlled by herbicides Y (Vitelli et al. 2008, Campbell et al. 2013)
8.04 Tolerates or benefits from mutilation, cultivation or fire
Y (Vitelli et al. 2008)
8.05 Effective natural enemies present in Australia
N (Moeller et al. 2012, Madhu et al. 2013, Dhileepan 2014)

B.NBP.0622 - Distribution, Invasiveness, Biology and Control or Rubber Bush in Northern Australia
Page 125 of 125
10.5 Appendix 5: Updated WRA for rubber bush in the Australian
environment using the DAF system.