Large Sites, Large Settlements? Regional mega-centres in the Pre-Pottery Neolithic B.
Upload
khangminh22Category
view
0download
0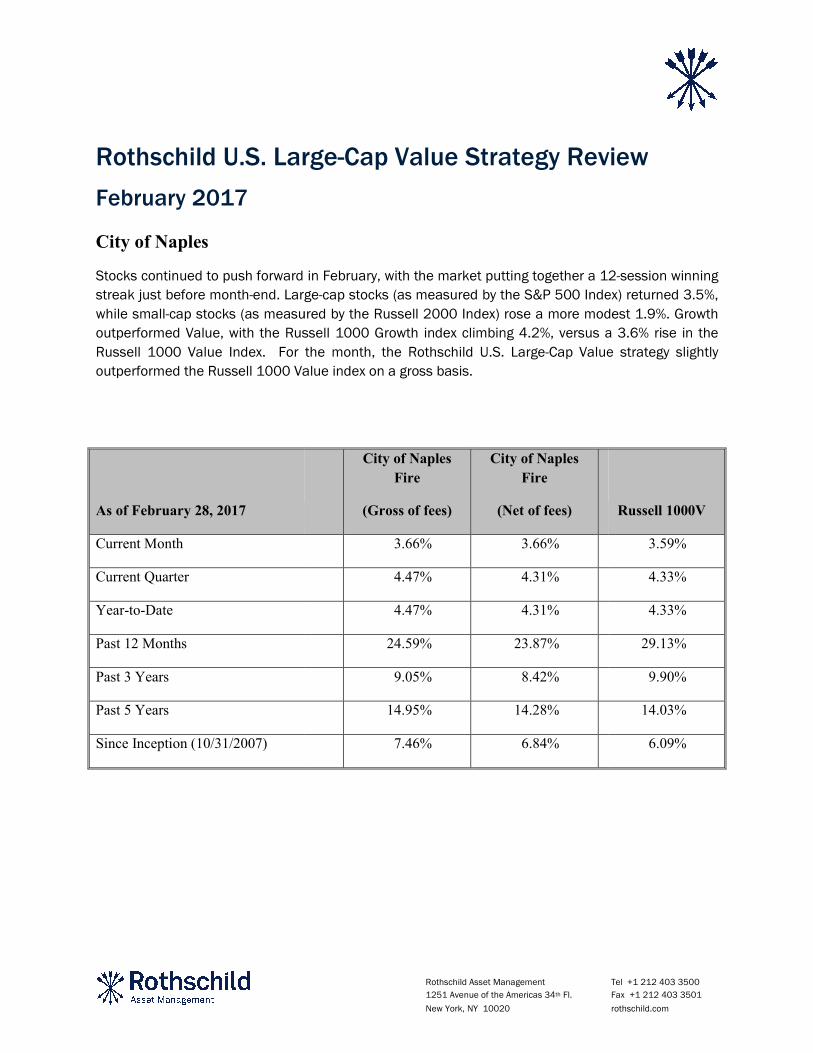
Rothschild U.S. Large
February 2017
City of Naples
Stocks continued to push forward in February, with the market putting together a 12
streak just before month-end. Large
while small-cap stocks (as measured by the Russell 2000 Index) rose
outperformed Value, with the Russell 1000 Growth index climbing 4.2%, versus
Russell 1000 Value Index. For the m
outperformed the Russell 1000 Value
As of February 28, 2017
Current Month
Current Quarter
Year-to-Date
Past 12 Months
Past 3 Years
Past 5 Years
Since Inception (10/31/2007)
Rothschild Asset Management
1251 Avenue of the Americas 34th Fl.
New York, NY 10020
Large-Cap Value Strategy Review
Stocks continued to push forward in February, with the market putting together a 12
end. Large-cap stocks (as measured by the S&P 500 Index) returned 3.5%,
cap stocks (as measured by the Russell 2000 Index) rose a more modest 1.9%. Growth
outperformed Value, with the Russell 1000 Growth index climbing 4.2%, versus a 3.6% rise in the
For the month, the Rothschild U.S. Large-Cap Value
Russell 1000 Value index on a gross basis.
City of Naples
Fire
(Gross of fees)
City of Naples
Fire
(Net of fees)
3.66% 3.66%
4.47% 4.31%
4.47% 4.31%
24.59% 23.87%
9.05% 8.42%
14.95% 14.28%
7.46% 6.84%
Tel +1 212 403 3500
Fax +1 212 403 3501
rothschild.com
Review
Stocks continued to push forward in February, with the market putting together a 12-session winning
cap stocks (as measured by the S&P 500 Index) returned 3.5%,
a more modest 1.9%. Growth
a 3.6% rise in the
Value strategy slightly
Russell 1000V
3.59%
4.33%
4.33%
29.13%
9.90%
14.03%
6.09%
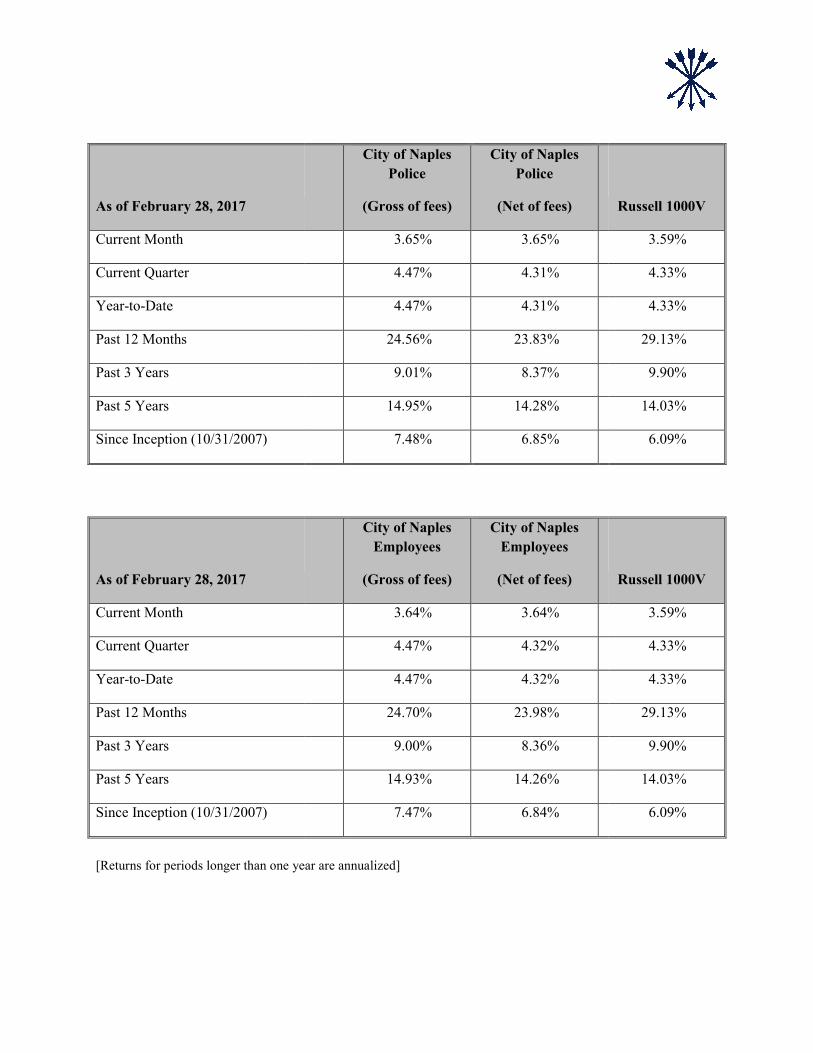
As of February 28, 2017
Current Month
Current Quarter
Year-to-Date
Past 12 Months
Past 3 Years
Past 5 Years
Since Inception (10/31/2007)
As of February 28, 2017
Current Month
Current Quarter
Year-to-Date
Past 12 Months
Past 3 Years
Past 5 Years
Since Inception (10/31/2007)
[Returns for periods longer than one year are annualized]
City of Naples
Police
(Gross of fees)
City of Naples
Police
(Net of fees)
3.65% 3.65%
4.47% 4.31%
4.47% 4.31%
24.56% 23.83%
9.01% 8.37%
14.95% 14.28%
7.48% 6.85%
City of Naples
Employees
(Gross of fees)
City of Naples
Employees
(Net of fees)
3.64% 3.64%
4.47% 4.32%
4.47% 4.32%
24.70% 23.98%
9.00% 8.36%
14.93% 14.26%
7.47% 6.84%
[Returns for periods longer than one year are annualized]
Russell 1000V
3.59%
4.33%
4.33%
29.13%
9.90%
14.03%
6.09%
Russell 1000V
3.59%
4.33%
4.33%
29.13%
9.90%
14.03%
6.09%

Healthcare stocks (up 7.1%), followed by those in the Consumer Staples (up 6.0%) and Financial
Services (up 5.2%) sectors, led the Russell 1000 Value benchmark. Laggards included
2.2%), Telecommunications (down 0.8%), and Basic Materials (up 0.6%). Sector allocation was
negative, with overweight to Basic Materials and Consumer Services stocks. Overall, stock selection
was positive, with contributors in Financial Servic
more than offset by detractors in Consumer Staples, Healthcare, and Technology.
On a stock specific basis, the largest contributors to relative performance
Ameriprise (up 17.8%). The compa
Department of Labor’s fiduciary standard rule to be delayed or terminated
(up 13.4%) reported strong earnings
in a study evaluating its ability to decrease
cardiovascular events. Eli Lilly and Company (up 8
an additional dataset for a rheumatoid art
been pushed higher following Washington
stocks being one of the main beneficiaries
Our detractors included supermarket chain
same-store-sales trends which continued to deteriorate during the month of February.
Company (down 5.2%), one of the world’s largest oil field service companies, is highly exposed to a
recovery in demand for pressure pumping and well completion in North America. As oil stocks have
generally experienced a decline in the first two months of the year, the company suffered a greater
decline in its stock price compared to its competitors.
class exploration and production (E&P)
lead to 20%+ production growth over the next several years.
weaken, EOG tends to fall more than the m
though the company reported excellent metrics for the December quarter in late February.
.
Although major indices have hit all
example, in 1999, extreme valuations were fueled by high volume and excessive leverage, whereas
both measures are considerably lower today. We continue to focus on stocks with relatively attractive
valuations and the potential to exceed investors’ expectations.
Please see the accompanying Market Review for our comments on the stock market and the
economy.
Chris Kaufman
Healthcare stocks (up 7.1%), followed by those in the Consumer Staples (up 6.0%) and Financial
led the Russell 1000 Value benchmark. Laggards included
2.2%), Telecommunications (down 0.8%), and Basic Materials (up 0.6%). Sector allocation was
negative, with overweight to Basic Materials and Consumer Services stocks. Overall, stock selection
was positive, with contributors in Financial Services, Manufacturing, Energy, and Basic Materials
more than offset by detractors in Consumer Staples, Healthcare, and Technology.
On a stock specific basis, the largest contributors to relative performance in February
. The company rallied on strong earnings as well as the potential for the
standard rule to be delayed or terminated in the near future
earnings. The company’s new cholesterol agent met its primary endpoint
decrease low-density lipoprotein and reduce the risk of
Eli Lilly and Company (up 8.2%) had a strong month due to a presentation of
for a rheumatoid arthritis drug in development. Additionally share
following Washington policy changes on drug pricing, with pharmaceutical
the main beneficiaries.
supermarket chain Kroger Co. (down 6.0%). The company suffered from
which continued to deteriorate during the month of February.
%), one of the world’s largest oil field service companies, is highly exposed to a
ssure pumping and well completion in North America. As oil stocks have
generally experienced a decline in the first two months of the year, the company suffered a greater
decline in its stock price compared to its competitors. EOG Resources, Inc. (down 4.
(E&P) company, with a diversified resource base that is expected to
lead to 20%+ production growth over the next several years. Like other E&Ps, when energy stocks
than the major integrates. That was the case this month
reported excellent metrics for the December quarter in late February.
Although major indices have hit all-time highs, comparisons to prior peaks may be less relevant. For
in 1999, extreme valuations were fueled by high volume and excessive leverage, whereas
both measures are considerably lower today. We continue to focus on stocks with relatively attractive
valuations and the potential to exceed investors’ expectations.
see the accompanying Market Review for our comments on the stock market and the
Paul Roukis, CFA
Healthcare stocks (up 7.1%), followed by those in the Consumer Staples (up 6.0%) and Financial
led the Russell 1000 Value benchmark. Laggards included Energy (down
2.2%), Telecommunications (down 0.8%), and Basic Materials (up 0.6%). Sector allocation was
negative, with overweight to Basic Materials and Consumer Services stocks. Overall, stock selection
, and Basic Materials
in February included
potential for the
in the near future. Amgen
its primary endpoint
the risk of
a presentation of
hares have also
policy changes on drug pricing, with pharmaceutical
suffered from
which continued to deteriorate during the month of February. Halliburton
%), one of the world’s largest oil field service companies, is highly exposed to a
ssure pumping and well completion in North America. As oil stocks have
generally experienced a decline in the first two months of the year, the company suffered a greater
Resources, Inc. (down 4.5%) is a best-in-
company, with a diversified resource base that is expected to
s, when energy stocks
this month, even
reported excellent metrics for the December quarter in late February.
time highs, comparisons to prior peaks may be less relevant. For
in 1999, extreme valuations were fueled by high volume and excessive leverage, whereas
both measures are considerably lower today. We continue to focus on stocks with relatively attractive
see the accompanying Market Review for our comments on the stock market and the
Managing Director
Rothschild Asset Management Inc.
March 10, 2017
DisclaimerDisclaimerDisclaimerDisclaimer
This commentary is for informational purposes only and is not intended to and does not provide a recommendation with respect to any
security. It does not constitute an offer, or a solicitation of an offer, to buy or sell any securities, and it does not take
financial position or particular needs or investment objectives of any individual or entity. Nothing in this commentary const
should be construed as, accounting, tax or legal advice. The information contained in this commentary was obtained fr
we believe to be reliable, but we do not guarantee its accuracy or completeness. Statements regarding future prospects may no
realized, and past performance is not necessarily indicative of future results. Any reference to an index is n
investments are equivalent to the index in risk. The information and opinions contained in this commentary are subject to cha
without notice. This commentary has been prepared for Rothschild Asset Management institutional c
should be construed as an offer, invitation or solicitation of
any security or to engage in any other transactions.
Managing Director
Rothschild Asset Management Inc.
is for informational purposes only and is not intended to and does not provide a recommendation with respect to any
security. It does not constitute an offer, or a solicitation of an offer, to buy or sell any securities, and it does not take
financial position or particular needs or investment objectives of any individual or entity. Nothing in this commentary const
should be construed as, accounting, tax or legal advice. The information contained in this commentary was obtained fr
we believe to be reliable, but we do not guarantee its accuracy or completeness. Statements regarding future prospects may no
realized, and past performance is not necessarily indicative of future results. Any reference to an index is not intended to imply that our
investments are equivalent to the index in risk. The information and opinions contained in this commentary are subject to cha
without notice. This commentary has been prepared for Rothschild Asset Management institutional clients. Nothing in this commentary
should be construed as an offer, invitation or solicitation of an offer to invest in a fund or strategy managed by Rothschild, to purchase
any security or to engage in any other transactions.
is for informational purposes only and is not intended to and does not provide a recommendation with respect to any
security. It does not constitute an offer, or a solicitation of an offer, to buy or sell any securities, and it does not take into account the
financial position or particular needs or investment objectives of any individual or entity. Nothing in this commentary constitutes, or
should be construed as, accounting, tax or legal advice. The information contained in this commentary was obtained from sources that
we believe to be reliable, but we do not guarantee its accuracy or completeness. Statements regarding future prospects may not be
ot intended to imply that our
investments are equivalent to the index in risk. The information and opinions contained in this commentary are subject to change
lients. Nothing in this commentary
managed by Rothschild, to purchase

Market Review
February 2017
Stocks continued to push forward
streak just before month-end. Large
while small-cap stocks (as measured by the Russell 2000 Index) rose
outperformed Value, with the Russell 1000
Russell 1000 Value Index.
Economic news was largely positive
average of initial unemployment claims falling to 234,250, the lowest level since 1973.
payrolls rose by a seasonally-adjust
from the Institute for Supply Management showed that its manufacturing index increased 1.7 points
to 57.7 (with a reading above 50 considered expansionary) in February, the sixth consecutive
monthly advance. On the other hand, Q4 2016 GDP growth came in at a so
with positive personal consumption offset by a downward revision for business investment.
Citing overall improvement in the economy,
Fed’s preferred inflation measure) reading of 1.9%,
interest rates as soon as the Committee’s mid
potential rate hike has confirmation of economic growth, or because they are more focused on
possible tailwinds from fiscal policy, market reaction has been sanguine.
Oil prices continued to wrestle with competing forces, with disciplined follow
cuts by members of the Organization of the Petroleum Exporting Countries (OPEC)
that U.S. shale producers are preparing to increase output.
to an uptick in infrastructure spending and other
supply, as U.S. crude stockpiles recently
Reversing a benign trend earlier in the month, one common measure of volatility rose for six
consecutive days in the latter half of the month, even as equities rallied. Investors may have been
looking to hedge risk ahead of President Trump’s address to Congress in early March.
Defying conventional wisdom, stock and bond prices have rallied together recently. Some have
interpreted this phenomenon as the bond market’s rejection of the reflation trade (since bond prices
would normally tend to fall as inflation rises), while others believe that low yields globally is fueling
demand for U.S. bonds (even as stocks are also attractive).
Although major indices have hit all
example, in 1999, extreme valuations were fueled by high volume and excessive leverage, whereas
both measures are considerably lower today.
Stocks continued to push forward in February, with the market putting together a 12
Large-cap stocks (as measured by the S&P 500 Index) returned
measured by the Russell 2000 Index) rose a more modest
, with the Russell 1000 Growth index climbing 4.2%, versus a
largely positive. The labor picture remains strong, with the four
average of initial unemployment claims falling to 234,250, the lowest level since 1973.
adjusted 235,000 from the prior month and above expections
the Institute for Supply Management showed that its manufacturing index increased 1.7 points
to 57.7 (with a reading above 50 considered expansionary) in February, the sixth consecutive
On the other hand, Q4 2016 GDP growth came in at a somewhat muted 1.9%,
with positive personal consumption offset by a downward revision for business investment.
improvement in the economy, as well as a personal consumption expenditure (the
Fed’s preferred inflation measure) reading of 1.9%, the Federal Reserve signaled that it may raise
interest rates as soon as the Committee’s mid-March meeting. Either because investors view a
rate hike has confirmation of economic growth, or because they are more focused on
fiscal policy, market reaction has been sanguine.
wrestle with competing forces, with disciplined follow-through in
members of the Organization of the Petroleum Exporting Countries (OPEC)
that U.S. shale producers are preparing to increase output. Optimism for increased demand related
infrastructure spending and other economic activity may be tempered with increased
supply, as U.S. crude stockpiles recently hit a record 520 million barrels.
Reversing a benign trend earlier in the month, one common measure of volatility rose for six
consecutive days in the latter half of the month, even as equities rallied. Investors may have been
f President Trump’s address to Congress in early March.
Defying conventional wisdom, stock and bond prices have rallied together recently. Some have
interpreted this phenomenon as the bond market’s rejection of the reflation trade (since bond prices
normally tend to fall as inflation rises), while others believe that low yields globally is fueling
demand for U.S. bonds (even as stocks are also attractive).
Although major indices have hit all-time highs, comparisons to prior peaks may be less relevan
example, in 1999, extreme valuations were fueled by high volume and excessive leverage, whereas
both measures are considerably lower today.
in February, with the market putting together a 12-session winning
cap stocks (as measured by the S&P 500 Index) returned 3.5%,
a more modest 1.9%. Growth
%, versus a 3.6% rise in the
The labor picture remains strong, with the four-week moving
average of initial unemployment claims falling to 234,250, the lowest level since 1973. Nonfarm
ed 235,000 from the prior month and above expections. Data
the Institute for Supply Management showed that its manufacturing index increased 1.7 points
to 57.7 (with a reading above 50 considered expansionary) in February, the sixth consecutive
mewhat muted 1.9%,
with positive personal consumption offset by a downward revision for business investment.
as well as a personal consumption expenditure (the
he Federal Reserve signaled that it may raise
Either because investors view a
rate hike has confirmation of economic growth, or because they are more focused on
through in production
members of the Organization of the Petroleum Exporting Countries (OPEC) offset by signs
Optimism for increased demand related
economic activity may be tempered with increased
Reversing a benign trend earlier in the month, one common measure of volatility rose for six
consecutive days in the latter half of the month, even as equities rallied. Investors may have been
f President Trump’s address to Congress in early March.
Defying conventional wisdom, stock and bond prices have rallied together recently. Some have
interpreted this phenomenon as the bond market’s rejection of the reflation trade (since bond prices
normally tend to fall as inflation rises), while others believe that low yields globally is fueling
comparisons to prior peaks may be less relevant. For
example, in 1999, extreme valuations were fueled by high volume and excessive leverage, whereas
R. Daniel Oshinskie, CFA
Chief Investment Officer, U.S. Equities
Rothschild Asset Management Inc.
March 10, 2017
DisclaimerDisclaimerDisclaimerDisclaimer
This commentary is for informational purposes only and is not intended to and does not provide a recommendation with respect
security. It does not constitute an offer, or a solicitation of an offer, to buy or sell any securities, and it does not tak
financial position or particular needs or investment objectives of any individual or entity. Nothing in this commentary const
should be construed as, accounting, tax or legal advice. The information contained in this commentary
we believe to be reliable, but we do not guarantee its accuracy or completeness. Statements regarding future prospects may no
realized, and past performance is not necessarily indicative of future results. Any reference
investments are equivalent to the index in risk. The information and opinions contained in this commentary are subject to cha
without notice. This commentary has been prepared for Rothschild Asset Management
should be construed as an offer, invitation or solicitation of an offer to invest in a fund
any security or to engage in any other transactions.
Rothschild Asset Management Tel
1251 Avenue of the Americas 34th Fl. Fax
New York, NY 10020 roths
, U.S. Equities
Rothschild Asset Management Inc.
This commentary is for informational purposes only and is not intended to and does not provide a recommendation with respect
security. It does not constitute an offer, or a solicitation of an offer, to buy or sell any securities, and it does not tak
financial position or particular needs or investment objectives of any individual or entity. Nothing in this commentary const
should be construed as, accounting, tax or legal advice. The information contained in this commentary was obtained from sources that
we believe to be reliable, but we do not guarantee its accuracy or completeness. Statements regarding future prospects may no
realized, and past performance is not necessarily indicative of future results. Any reference to an index is not intended to imply that our
investments are equivalent to the index in risk. The information and opinions contained in this commentary are subject to cha
without notice. This commentary has been prepared for Rothschild Asset Management institutional clients. Nothing in this commentary
should be construed as an offer, invitation or solicitation of an offer to invest in a fund or strategy managed by Rothschild, to purchase
any security or to engage in any other transactions.
+1 212 403 3500
Fax +1 212 403 3501
rothschild.com
This commentary is for informational purposes only and is not intended to and does not provide a recommendation with respect to any
security. It does not constitute an offer, or a solicitation of an offer, to buy or sell any securities, and it does not take into account the
financial position or particular needs or investment objectives of any individual or entity. Nothing in this commentary constitutes, or
was obtained from sources that
we believe to be reliable, but we do not guarantee its accuracy or completeness. Statements regarding future prospects may not be
to an index is not intended to imply that our
investments are equivalent to the index in risk. The information and opinions contained in this commentary are subject to change
institutional clients. Nothing in this commentary
managed by Rothschild, to purchase

Strictly confidential
Portfolio Summary and Holdings
Begin Date:
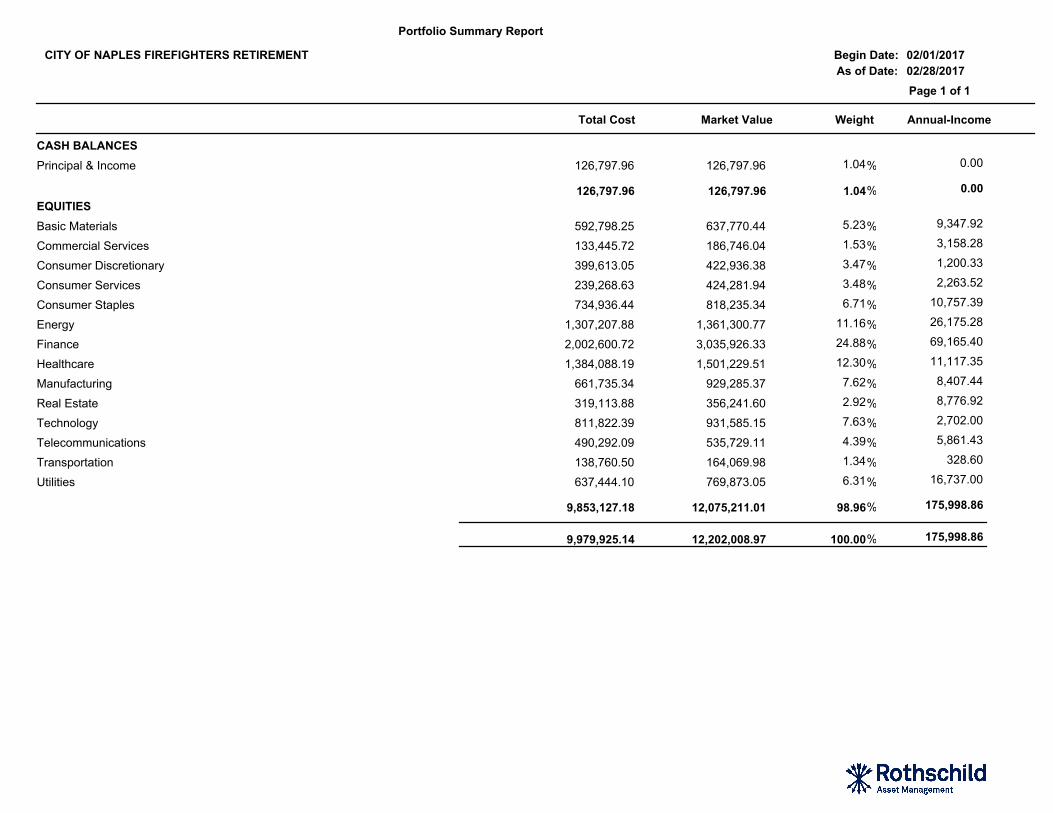
Portfolio Summary Report
As of Date:
02/01/2017
02/28/2017
CITY OF NAPLES FIREFIGHTERS RETIREMENT
Page 1 of 1
Market Value Weight Annual-IncomeTotal Cost
CASH BALANCES
0.00 1.04 126,797.96 126,797.96Principal & Income %
126,797.96 126,797.96 1.04 0.00%
EQUITIES
9,347.92 5.23 637,770.44 592,798.25Basic Materials %
3,158.28 1.53 186,746.04 133,445.72Commercial Services %
1,200.33 3.47 422,936.38 399,613.05Consumer Discretionary %
2,263.52 3.48 424,281.94 239,268.63Consumer Services %
10,757.39 6.71 818,235.34 734,936.44Consumer Staples %
26,175.28 11.16 1,361,300.77 1,307,207.88Energy %
69,165.40 24.88 3,035,926.33 2,002,600.72Finance %
11,117.35 12.30 1,501,229.51 1,384,088.19Healthcare %
8,407.44 7.62 929,285.37 661,735.34Manufacturing %
8,776.92 2.92 356,241.60 319,113.88Real Estate %
2,702.00 7.63 931,585.15 811,822.39Technology %
5,861.43 4.39 535,729.11 490,292.09Telecommunications %
328.60 1.34 164,069.98 138,760.50Transportation %
16,737.00 6.31 769,873.05 637,444.10Utilities %
9,853,127.18 12,075,211.01 98.96 175,998.86%
9,979,925.14 12,202,008.97 100.00 175,998.86%

Begin Date:
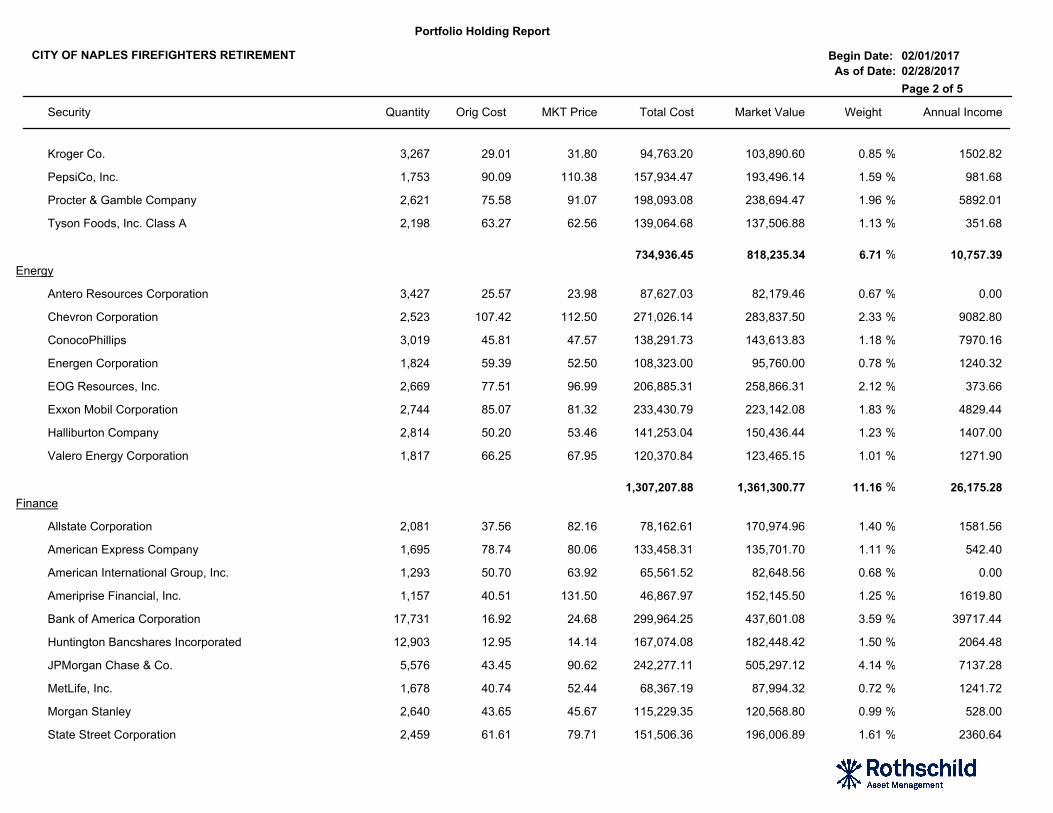
Portfolio Holding Report
As of Date:
02/01/2017
02/28/2017
CITY OF NAPLES FIREFIGHTERS RETIREMENT
Page 1 of 5
Security Quantity Orig Cost Total Cost Market Value Weight Annual IncomeMKT Price
CASH BALANCES
Principal & Income
%Cash 0 0.00 1.00 126,797.96 126,797.96 1.04 0.00
126,797.96 126,797.96 1.04 0.00%
EQUITIES
Basic Materials
%Dow Chemical Company 4,087 53.65 62.26 219,268.69 254,456.62 2.09 5231.36
%LyondellBasell Industries NV 1,535 88.78 91.24 136,281.59 140,053.40 1.15 2456.00
%Nucor Corporation 2,442 61.06 62.57 149,111.55 152,795.94 1.25 1660.56
%WestRock Co. 1,684 52.34 53.72 88,136.42 90,464.48 0.74 0.00
592,798.25 637,770.44 5.23 9,347.92%
Commercial Services
%Waste Management, Inc. 2,547 52.39 73.32 133,445.72 186,746.04 1.53 3158.28
133,445.72 186,746.04 1.53 3,158.28%
Consumer Discretionary
%Home Depot, Inc. 515 79.39 144.91 40,885.54 74,628.65 0.61 82.40
%PulteGroup, Inc. 5,863 20.16 22.05 118,198.51 129,279.15 1.06 938.08
%PVH Corp. 1,199 112.09 91.60 134,390.26 109,828.40 0.90 179.85
%Skechers U.S.A., Inc. Class A 4,254 24.95 25.67 106,138.74 109,200.18 0.89 0.00
399,613.05 422,936.38 3.47 1,200.33%
Consumer Services
%CBS Corporation Class B 2,250 45.30 65.92 101,923.09 148,320.00 1.22 1080.00
%Comcast Corporation Class A 4,388 25.33 37.42 111,158.45 164,198.96 1.35 0.00
%Time Warner Inc. 1,138 23.01 98.21 26,187.09 111,762.98 0.92 1183.52
239,268.63 424,281.94 3.48 2,263.52%
Consumer Staples
%Hershey Company 1,335 108.67 108.35 145,081.02 144,647.25 1.19 2029.20
Begin Date:
Portfolio Holding Report
As of Date:
02/01/2017
02/28/2017
CITY OF NAPLES FIREFIGHTERS RETIREMENT
Page 2 of 5
Security Quantity Orig Cost Total Cost Market Value Weight Annual IncomeMKT Price
%Kroger Co. 3,267 29.01 31.80 94,763.20 103,890.60 0.85 1502.82
%PepsiCo, Inc. 1,753 90.09 110.38 157,934.47 193,496.14 1.59 981.68
%Procter & Gamble Company 2,621 75.58 91.07 198,093.08 238,694.47 1.96 5892.01
%Tyson Foods, Inc. Class A 2,198 63.27 62.56 139,064.68 137,506.88 1.13 351.68
734,936.45 818,235.34 6.71 10,757.39%
Energy
%Antero Resources Corporation 3,427 25.57 23.98 87,627.03 82,179.46 0.67 0.00
%Chevron Corporation 2,523 107.42 112.50 271,026.14 283,837.50 2.33 9082.80
%ConocoPhillips 3,019 45.81 47.57 138,291.73 143,613.83 1.18 7970.16
%Energen Corporation 1,824 59.39 52.50 108,323.00 95,760.00 0.78 1240.32
%EOG Resources, Inc. 2,669 77.51 96.99 206,885.31 258,866.31 2.12 373.66
%Exxon Mobil Corporation 2,744 85.07 81.32 233,430.79 223,142.08 1.83 4829.44
%Halliburton Company 2,814 50.20 53.46 141,253.04 150,436.44 1.23 1407.00
%Valero Energy Corporation 1,817 66.25 67.95 120,370.84 123,465.15 1.01 1271.90
1,307,207.88 1,361,300.77 11.16 26,175.28%
Finance
%Allstate Corporation 2,081 37.56 82.16 78,162.61 170,974.96 1.40 1581.56
%American Express Company 1,695 78.74 80.06 133,458.31 135,701.70 1.11 542.40
%American International Group, Inc. 1,293 50.70 63.92 65,561.52 82,648.56 0.68 0.00
%Ameriprise Financial, Inc. 1,157 40.51 131.50 46,867.97 152,145.50 1.25 1619.80
%Bank of America Corporation 17,731 16.92 24.68 299,964.25 437,601.08 3.59 39717.44
%Huntington Bancshares Incorporated 12,903 12.95 14.14 167,074.08 182,448.42 1.50 2064.48
%JPMorgan Chase & Co. 5,576 43.45 90.62 242,277.11 505,297.12 4.14 7137.28
%MetLife, Inc. 1,678 40.74 52.44 68,367.19 87,994.32 0.72 1241.72
%Morgan Stanley 2,640 43.65 45.67 115,229.35 120,568.80 0.99 528.00
%State Street Corporation 2,459 61.61 79.71 151,506.36 196,006.89 1.61 2360.64

Begin Date:
Portfolio Holding Report
As of Date:
02/01/2017
02/28/2017
CITY OF NAPLES FIREFIGHTERS RETIREMENT
Page 3 of 5
Security Quantity Orig Cost Total Cost Market Value Weight Annual IncomeMKT Price
%SunTrust Banks, Inc. 4,355 41.30 59.49 179,875.40 259,078.95 2.12 6968.00
%Wells Fargo & Company 3,404 38.62 57.88 131,450.59 197,023.52 1.61 2995.52
%Berkshire Hathaway Inc. Class B 489 78.47 171.42 38,371.99 83,824.38 0.69 0.00
%Chubb Limited 1,771 119.49 138.17 211,621.89 244,699.07 2.01 2408.56
%Discover Financial Services 2,529 28.79 71.14 72,812.10 179,913.06 1.47 0.00
2,002,600.72 3,035,926.33 24.88 69,165.40%
Healthcare
%Amgen Inc. 640 128.69 176.53 82,358.94 112,979.20 0.93 0.00
%Celgene Corporation 1,224 116.53 123.51 142,636.15 151,176.24 1.24 0.00
%Danaher Corporation 1,356 80.91 85.55 109,707.18 116,005.80 0.95 135.60
%Eli Lilly and Company 2,662 73.38 82.81 195,345.57 220,440.22 1.81 5217.52
%Gilead Sciences, Inc. 1,396 91.11 70.48 127,184.18 98,390.08 0.81 0.00
%Johnson & Johnson 1,445 96.62 122.21 139,622.05 176,593.45 1.45 1849.60
%Medtronic plc 1,890 83.90 80.91 158,568.17 152,919.90 1.25 378.00
%Pfizer Inc. 6,893 31.59 34.12 217,734.72 235,189.16 1.93 3032.92
%UnitedHealth Group Incorporated 1,057 141.39 165.38 149,444.67 174,806.66 1.43 31.71
%Hill-Rom Holdings, Inc. 944 65.13 66.45 61,486.56 62,728.80 0.51 472.00
1,384,088.19 1,501,229.51 12.30 11,117.35%
Manufacturing
%Fluor Corporation 1,639 48.41 55.39 79,340.99 90,784.21 0.74 1048.96
%General Electric Company 5,171 19.88 29.81 102,776.18 154,147.51 1.26 3309.44
%Northrop Grumman Corporation 898 109.53 247.09 98,358.37 221,886.82 1.82 1436.80
%Parker-Hannifin Corporation 1,352 142.51 154.84 192,670.50 209,343.68 1.72 973.44
%Raytheon Company 611 58.07 154.15 35,481.33 94,185.65 0.77 488.80
%Stanley Black & Decker, Inc. 1,250 122.49 127.15 153,107.97 158,937.50 1.30 1150.00
661,735.34 929,285.37 7.62 8,407.44%

Begin Date:
Portfolio Holding Report
As of Date:
02/01/2017
02/28/2017
CITY OF NAPLES FIREFIGHTERS RETIREMENT
Page 4 of 5
Security Quantity Orig Cost Total Cost Market Value Weight Annual IncomeMKT Price
Real Estate
%Equity LifeStyle Properties, Inc. 1,460 55.63 79.62 81,223.19 116,245.20 0.95 2555.00
%Kimco Realty Corporation 4,196 25.32 24.25 106,222.16 101,753.00 0.83 3188.96
%Prologis, Inc. 2,708 48.62 51.05 131,668.53 138,243.40 1.13 3032.96
319,113.88 356,241.60 2.92 8,776.92%
Technology
%Apple Inc. 747 92.72 136.99 69,261.97 102,331.53 0.84 0.00
%Cisco Systems, Inc. 6,074 26.93 34.18 163,569.08 207,609.32 1.70 0.00
%Hewlett Packard Enterprise Co. 2,705 21.27 22.82 57,542.04 61,728.10 0.51 0.00
%Intel Corporation 5,895 34.96 36.20 206,100.58 213,399.00 1.75 471.60
%Microsoft Corporation 2,788 49.90 63.98 139,118.79 178,376.24 1.46 2230.40
%QUALCOMM Incorporated 2,977 59.20 56.48 176,229.94 168,140.96 1.38 0.00
811,822.40 931,585.15 7.63 2,702.00%
Telecommunications
%AT&T Inc. 9,385 36.13 41.79 339,040.15 392,199.15 3.21 1407.75
%Verizon Communications Inc. 2,892 52.30 49.63 151,251.94 143,529.96 1.18 4453.68
490,292.09 535,729.11 4.39 5,861.43%
Transportation
%Delta Air Lines, Inc. 3,286 42.23 49.93 138,760.50 164,069.98 1.34 328.60
138,760.50 164,069.98 1.34 328.60%
Utilities
%American Electric Power Company, Inc. 2,082 54.70 66.97 113,882.89 139,431.54 1.14 3914.16
%DTE Energy Company 1,534 74.41 101.38 114,146.43 155,516.92 1.27 3804.32
%Edison International 2,468 59.82 79.74 147,631.40 196,798.32 1.61 0.00
%Public Service Enterprise Group Inc 3,331 43.10 45.98 143,562.44 153,159.38 1.26 4730.02
%Xcel Energy Inc. 2,859 41.35 43.71 118,220.94 124,966.89 1.02 4288.50

Begin Date:
Portfolio Holding Report
As of Date:
02/01/2017
02/28/2017
CITY OF NAPLES FIREFIGHTERS RETIREMENT
Page 5 of 5
Security Quantity Orig Cost Total Cost Market Value Weight Annual IncomeMKT Price
637,444.10 769,873.05 6.31 16,737.00%
9,979,925.16 12,202,008.97 100.00 175,998.86%
Strictly confidential
Purchases and Sales
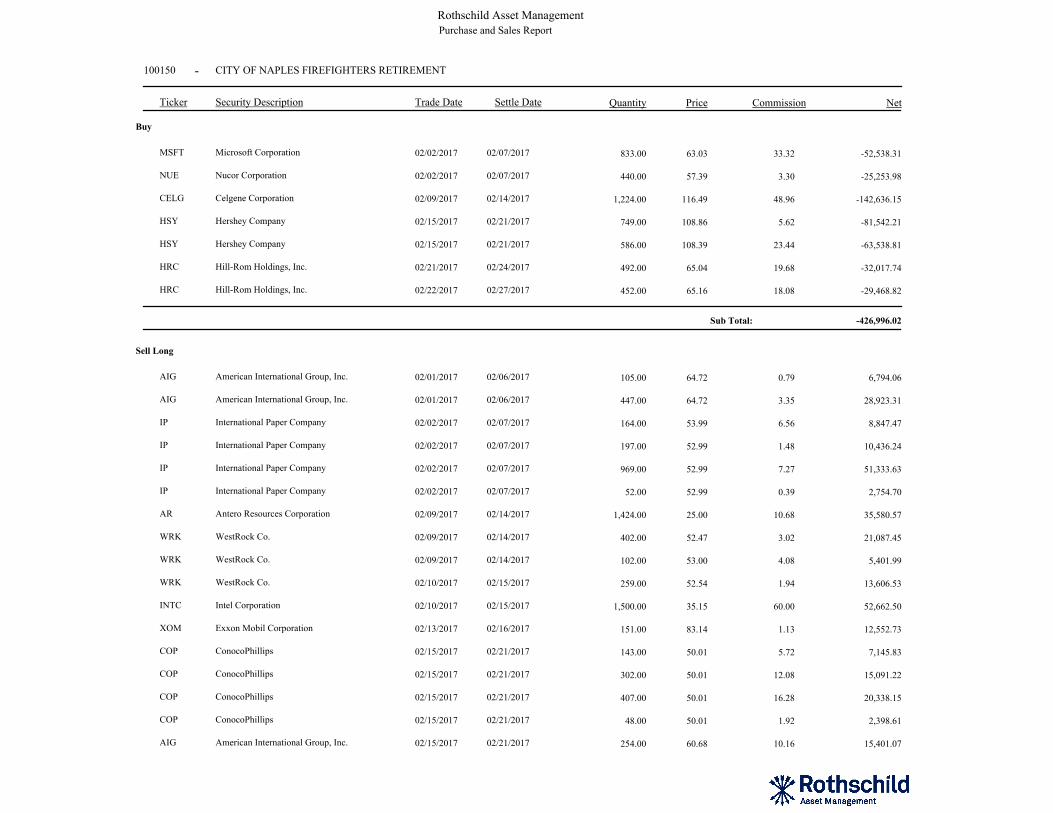
100150 CITY OF NAPLES FIREFIGHTERS RETIREMENT
Rothschild Asset ManagementPurchase and Sales Report
Ticker Security Description Trade Date Quantity Price Commission Net
-
Settle Date
Buy
MSFT Microsoft Corporation 02/02/2017 833.00 63.03 33.32 -52,538.3102/07/2017
NUE Nucor Corporation 02/02/2017 440.00 57.39 3.30 -25,253.9802/07/2017
CELG Celgene Corporation 02/09/2017 1,224.00 116.49 48.96 -142,636.1502/14/2017
HSY Hershey Company 02/15/2017 749.00 108.86 5.62 -81,542.2102/21/2017
HSY Hershey Company 02/15/2017 586.00 108.39 23.44 -63,538.8102/21/2017
HRC Hill-Rom Holdings, Inc. 02/21/2017 492.00 65.04 19.68 -32,017.7402/24/2017
HRC Hill-Rom Holdings, Inc. 02/22/2017 452.00 65.16 18.08 -29,468.8202/27/2017
-426,996.02Sub Total:
Sell Long
AIG American International Group, Inc. 02/01/2017 105.00 64.72 0.79 6,794.0602/06/2017
AIG American International Group, Inc. 02/01/2017 447.00 64.72 3.35 28,923.3102/06/2017
IP International Paper Company 02/02/2017 164.00 53.99 6.56 8,847.4702/07/2017
IP International Paper Company 02/02/2017 197.00 52.99 1.48 10,436.2402/07/2017
IP International Paper Company 02/02/2017 969.00 52.99 7.27 51,333.6302/07/2017
IP International Paper Company 02/02/2017 52.00 52.99 0.39 2,754.7002/07/2017
AR Antero Resources Corporation 02/09/2017 1,424.00 25.00 10.68 35,580.5702/14/2017
WRK WestRock Co. 02/09/2017 402.00 52.47 3.02 21,087.4502/14/2017
WRK WestRock Co. 02/09/2017 102.00 53.00 4.08 5,401.9902/14/2017
WRK WestRock Co. 02/10/2017 259.00 52.54 1.94 13,606.5302/15/2017
INTC Intel Corporation 02/10/2017 1,500.00 35.15 60.00 52,662.5002/15/2017
XOM Exxon Mobil Corporation 02/13/2017 151.00 83.14 1.13 12,552.7302/16/2017
COP ConocoPhillips 02/15/2017 143.00 50.01 5.72 7,145.8302/21/2017
COP ConocoPhillips 02/15/2017 302.00 50.01 12.08 15,091.2202/21/2017
COP ConocoPhillips 02/15/2017 407.00 50.01 16.28 20,338.1502/21/2017
COP ConocoPhillips 02/15/2017 48.00 50.01 1.92 2,398.6102/21/2017
AIG American International Group, Inc. 02/15/2017 254.00 60.68 10.16 15,401.0702/21/2017
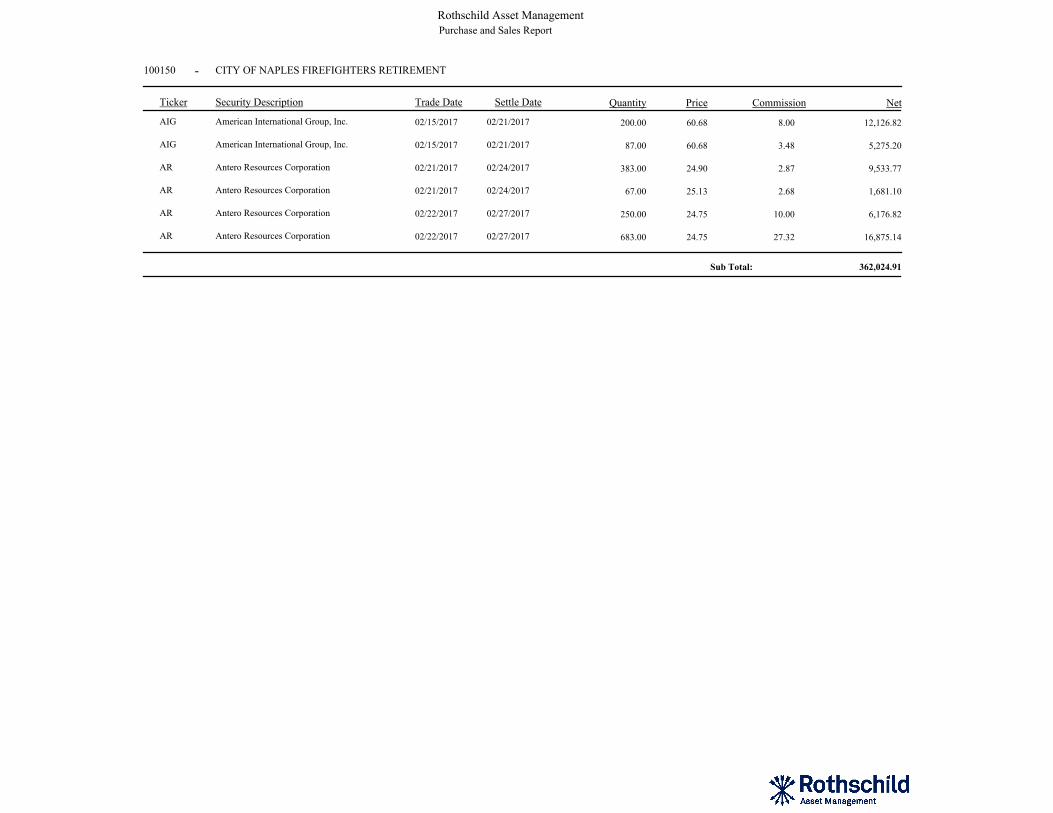
100150 CITY OF NAPLES FIREFIGHTERS RETIREMENT
Rothschild Asset ManagementPurchase and Sales Report
Ticker Security Description Trade Date Quantity Price Commission Net
-
Settle Date
AIG American International Group, Inc. 02/15/2017 200.00 60.68 8.00 12,126.8202/21/2017
AIG American International Group, Inc. 02/15/2017 87.00 60.68 3.48 5,275.2002/21/2017
AR Antero Resources Corporation 02/21/2017 383.00 24.90 2.87 9,533.7702/24/2017
AR Antero Resources Corporation 02/21/2017 67.00 25.13 2.68 1,681.1002/24/2017
AR Antero Resources Corporation 02/22/2017 250.00 24.75 10.00 6,176.8202/27/2017
AR Antero Resources Corporation 02/22/2017 683.00 24.75 27.32 16,875.1402/27/2017
362,024.91Sub Total:

Strictly confidential
Portfolio Summary and Holdings
Begin Date:
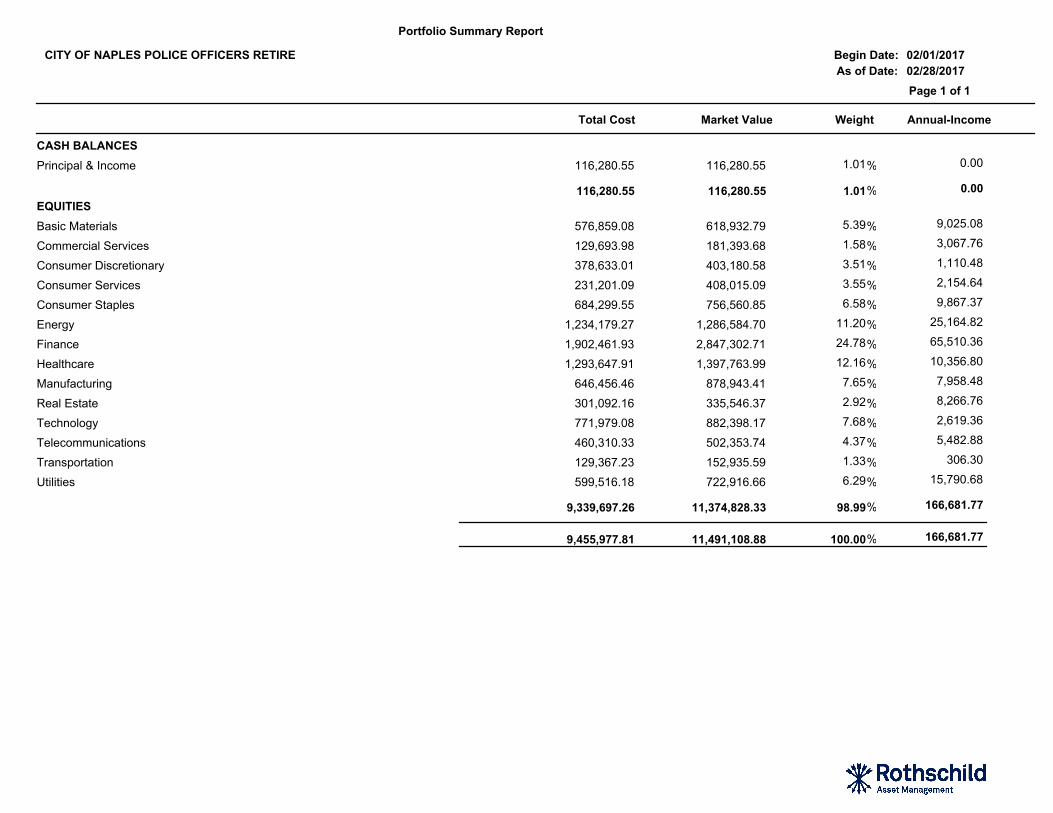
Portfolio Summary Report
As of Date:
02/01/2017
02/28/2017
CITY OF NAPLES POLICE OFFICERS RETIRE
Page 1 of 1
Market Value Weight Annual-IncomeTotal Cost
CASH BALANCES
0.00 1.01 116,280.55 116,280.55Principal & Income %
116,280.55 116,280.55 1.01 0.00%
EQUITIES
9,025.08 5.39 618,932.79 576,859.08Basic Materials %
3,067.76 1.58 181,393.68 129,693.98Commercial Services %
1,110.48 3.51 403,180.58 378,633.01Consumer Discretionary %
2,154.64 3.55 408,015.09 231,201.09Consumer Services %
9,867.37 6.58 756,560.85 684,299.55Consumer Staples %
25,164.82 11.20 1,286,584.70 1,234,179.27Energy %
65,510.36 24.78 2,847,302.71 1,902,461.93Finance %
10,356.80 12.16 1,397,763.99 1,293,647.91Healthcare %
7,958.48 7.65 878,943.41 646,456.46Manufacturing %
8,266.76 2.92 335,546.37 301,092.16Real Estate %
2,619.36 7.68 882,398.17 771,979.08Technology %
5,482.88 4.37 502,353.74 460,310.33Telecommunications %
306.30 1.33 152,935.59 129,367.23Transportation %
15,790.68 6.29 722,916.66 599,516.18Utilities %
9,339,697.26 11,374,828.33 98.99 166,681.77%
9,455,977.81 11,491,108.88 100.00 166,681.77%
Begin Date:
Portfolio Holding Report
As of Date:
02/01/2017
02/28/2017
CITY OF NAPLES POLICE OFFICERS RETIRE
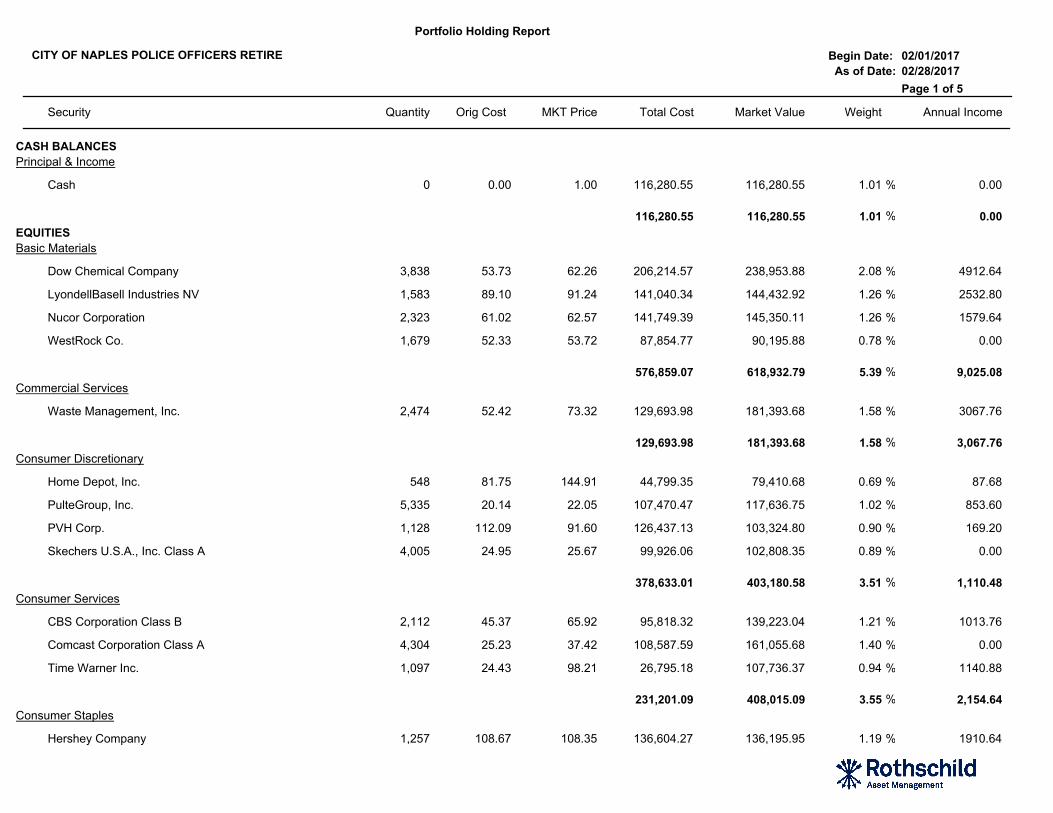
Page 1 of 5
Security Quantity Orig Cost Total Cost Market Value Weight Annual IncomeMKT Price
CASH BALANCES
Principal & Income
%Cash 0 0.00 1.00 116,280.55 116,280.55 1.01 0.00
116,280.55 116,280.55 1.01 0.00%
EQUITIES
Basic Materials
%Dow Chemical Company 3,838 53.73 62.26 206,214.57 238,953.88 2.08 4912.64
%LyondellBasell Industries NV 1,583 89.10 91.24 141,040.34 144,432.92 1.26 2532.80
%Nucor Corporation 2,323 61.02 62.57 141,749.39 145,350.11 1.26 1579.64
%WestRock Co. 1,679 52.33 53.72 87,854.77 90,195.88 0.78 0.00
576,859.07 618,932.79 5.39 9,025.08%
Commercial Services
%Waste Management, Inc. 2,474 52.42 73.32 129,693.98 181,393.68 1.58 3067.76
129,693.98 181,393.68 1.58 3,067.76%
Consumer Discretionary
%Home Depot, Inc. 548 81.75 144.91 44,799.35 79,410.68 0.69 87.68
%PulteGroup, Inc. 5,335 20.14 22.05 107,470.47 117,636.75 1.02 853.60
%PVH Corp. 1,128 112.09 91.60 126,437.13 103,324.80 0.90 169.20
%Skechers U.S.A., Inc. Class A 4,005 24.95 25.67 99,926.06 102,808.35 0.89 0.00
378,633.01 403,180.58 3.51 1,110.48%
Consumer Services
%CBS Corporation Class B 2,112 45.37 65.92 95,818.32 139,223.04 1.21 1013.76
%Comcast Corporation Class A 4,304 25.23 37.42 108,587.59 161,055.68 1.40 0.00
%Time Warner Inc. 1,097 24.43 98.21 26,795.18 107,736.37 0.94 1140.88
231,201.09 408,015.09 3.55 2,154.64%
Consumer Staples
%Hershey Company 1,257 108.67 108.35 136,604.27 136,195.95 1.19 1910.64

Begin Date:
Portfolio Holding Report
As of Date:
02/01/2017
02/28/2017
CITY OF NAPLES POLICE OFFICERS RETIRE
Page 2 of 5
Security Quantity Orig Cost Total Cost Market Value Weight Annual IncomeMKT Price
%Kroger Co. 2,985 29.35 31.80 87,618.69 94,923.00 0.83 1373.10
%PepsiCo, Inc. 1,642 90.80 110.38 149,100.83 181,243.96 1.58 919.52
%Procter & Gamble Company 2,374 76.43 91.07 181,445.83 216,200.18 1.88 5336.75
%Tyson Foods, Inc. Class A 2,046 63.31 62.56 129,529.93 127,997.76 1.11 327.36
684,299.55 756,560.85 6.58 9,867.37%
Energy
%Antero Resources Corporation 3,179 25.58 23.98 81,304.31 76,232.42 0.66 0.00
%Chevron Corporation 2,445 107.17 112.50 262,040.76 275,062.50 2.39 8802.00
%ConocoPhillips 2,946 45.64 47.57 134,466.38 140,141.22 1.22 7777.44
%Energen Corporation 1,715 59.39 52.50 101,849.49 90,037.50 0.78 1166.20
%EOG Resources, Inc. 2,461 77.67 96.99 191,134.17 238,692.39 2.08 344.54
%Exxon Mobil Corporation 2,604 84.51 81.32 220,052.89 211,757.28 1.84 4583.04
%Halliburton Company 2,599 50.22 53.46 130,510.94 138,942.54 1.21 1299.50
%Valero Energy Corporation 1,703 66.25 67.95 112,820.34 115,718.85 1.01 1192.10
1,234,179.28 1,286,584.70 11.20 25,164.82%
Finance
%Allstate Corporation 1,960 38.74 82.16 75,921.31 161,033.60 1.40 1489.60
%American International Group, Inc. 1,194 51.36 63.92 61,322.86 76,320.48 0.66 0.00
%Ameriprise Financial, Inc. 1,061 39.72 131.50 42,143.00 139,521.50 1.21 1485.40
%Bank of America Corporation 17,141 16.95 24.68 290,491.21 423,039.88 3.68 38395.84
%Berkshire Hathaway Inc. Class B 449 80.47 171.42 36,129.23 76,967.58 0.67 0.00
%Chubb Limited 1,667 119.50 138.17 199,211.76 230,329.39 2.00 2267.12
%Discover Financial Services 2,499 29.79 71.14 74,443.91 177,778.86 1.55 0.00
%Huntington Bancshares Incorporated 12,149 12.95 14.14 157,310.13 171,786.86 1.50 1943.84
%JPMorgan Chase & Co. 5,027 45.89 90.62 230,701.09 455,546.74 3.96 6434.56
%MetLife, Inc. 1,536 41.58 52.44 63,869.29 80,547.84 0.70 1136.64

Begin Date:
Portfolio Holding Report
As of Date:
02/01/2017
02/28/2017
CITY OF NAPLES POLICE OFFICERS RETIRE
Page 3 of 5
Security Quantity Orig Cost Total Cost Market Value Weight Annual IncomeMKT Price
%Morgan Stanley 2,582 43.65 45.67 112,697.90 117,919.94 1.03 516.40
%State Street Corporation 2,295 61.65 79.71 141,488.93 182,934.45 1.59 2203.20
%SunTrust Banks, Inc. 3,807 41.43 59.49 157,737.49 226,478.43 1.97 6091.20
%Wells Fargo & Company 3,452 38.86 57.88 134,158.74 199,801.76 1.74 3037.76
%American Express Company 1,590 78.51 80.06 124,835.08 127,295.40 1.11 508.80
1,902,461.93 2,847,302.71 24.78 65,510.36%
Healthcare
%Amgen Inc. 596 129.69 176.53 77,296.42 105,211.88 0.92 0.00
%Celgene Corporation 1,153 116.53 123.51 134,362.32 142,407.03 1.24 0.00
%Danaher Corporation 1,200 80.91 85.55 97,086.00 102,660.00 0.89 120.00
%Eli Lilly and Company 2,503 73.38 82.81 183,677.68 207,273.43 1.80 4905.88
%Gilead Sciences, Inc. 1,191 93.98 70.48 111,929.64 83,941.68 0.73 0.00
%Hill-Rom Holdings, Inc. 889 65.13 66.45 57,904.22 59,074.05 0.51 444.50
%Johnson & Johnson 1,284 97.73 122.21 125,485.44 156,917.64 1.37 1643.52
%Medtronic plc 1,848 83.90 80.91 155,044.43 149,521.68 1.30 369.60
%Pfizer Inc. 6,460 31.77 34.12 205,239.94 220,415.20 1.92 2842.40
%UnitedHealth Group Incorporated 1,030 141.38 165.38 145,621.82 170,341.40 1.48 30.90
1,293,647.91 1,397,763.99 12.16 10,356.80%
Manufacturing
%Fluor Corporation 1,421 48.64 55.39 69,111.07 78,709.19 0.69 909.44
%General Electric Company 5,004 23.80 29.81 119,086.98 149,169.24 1.30 3202.56
%Northrop Grumman Corporation 844 113.15 247.09 95,497.68 208,543.96 1.81 1350.40
%Parker-Hannifin Corporation 1,273 142.51 154.84 181,412.54 197,111.32 1.72 916.56
%Raytheon Company 622 59.98 154.15 37,305.21 95,881.30 0.83 497.60
%Stanley Black & Decker, Inc. 1,176 122.49 127.15 144,042.98 149,528.40 1.30 1081.92
646,456.46 878,943.41 7.65 7,958.48%
Begin Date:
Portfolio Holding Report
As of Date:
02/01/2017
02/28/2017
CITY OF NAPLES POLICE OFFICERS RETIRE
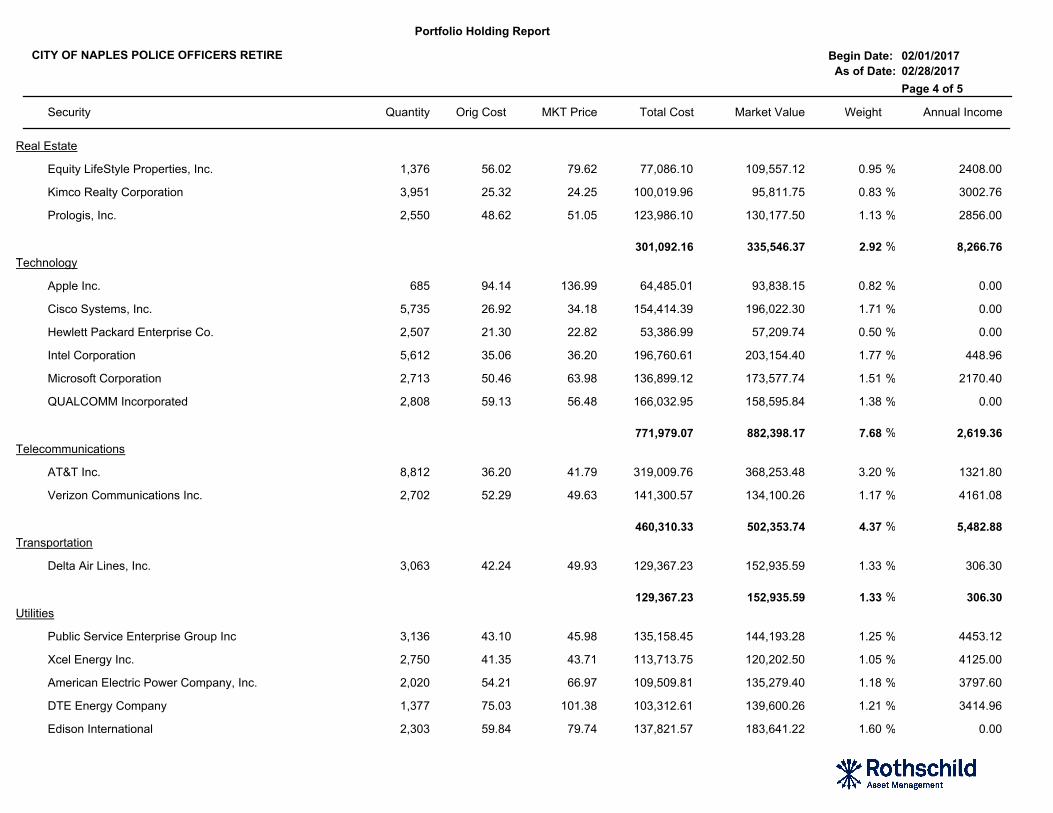
Page 4 of 5
Security Quantity Orig Cost Total Cost Market Value Weight Annual IncomeMKT Price
Real Estate
%Equity LifeStyle Properties, Inc. 1,376 56.02 79.62 77,086.10 109,557.12 0.95 2408.00
%Kimco Realty Corporation 3,951 25.32 24.25 100,019.96 95,811.75 0.83 3002.76
%Prologis, Inc. 2,550 48.62 51.05 123,986.10 130,177.50 1.13 2856.00
301,092.16 335,546.37 2.92 8,266.76%
Technology
%Apple Inc. 685 94.14 136.99 64,485.01 93,838.15 0.82 0.00
%Cisco Systems, Inc. 5,735 26.92 34.18 154,414.39 196,022.30 1.71 0.00
%Hewlett Packard Enterprise Co. 2,507 21.30 22.82 53,386.99 57,209.74 0.50 0.00
%Intel Corporation 5,612 35.06 36.20 196,760.61 203,154.40 1.77 448.96
%Microsoft Corporation 2,713 50.46 63.98 136,899.12 173,577.74 1.51 2170.40
%QUALCOMM Incorporated 2,808 59.13 56.48 166,032.95 158,595.84 1.38 0.00
771,979.07 882,398.17 7.68 2,619.36%
Telecommunications
%AT&T Inc. 8,812 36.20 41.79 319,009.76 368,253.48 3.20 1321.80
%Verizon Communications Inc. 2,702 52.29 49.63 141,300.57 134,100.26 1.17 4161.08
460,310.33 502,353.74 4.37 5,482.88%
Transportation
%Delta Air Lines, Inc. 3,063 42.24 49.93 129,367.23 152,935.59 1.33 306.30
129,367.23 152,935.59 1.33 306.30%
Utilities
%Public Service Enterprise Group Inc 3,136 43.10 45.98 135,158.45 144,193.28 1.25 4453.12
%Xcel Energy Inc. 2,750 41.35 43.71 113,713.75 120,202.50 1.05 4125.00
%American Electric Power Company, Inc. 2,020 54.21 66.97 109,509.81 135,279.40 1.18 3797.60
%DTE Energy Company 1,377 75.03 101.38 103,312.61 139,600.26 1.21 3414.96
%Edison International 2,303 59.84 79.74 137,821.57 183,641.22 1.60 0.00
Begin Date:
Portfolio Holding Report
As of Date:
02/01/2017
02/28/2017
CITY OF NAPLES POLICE OFFICERS RETIRE
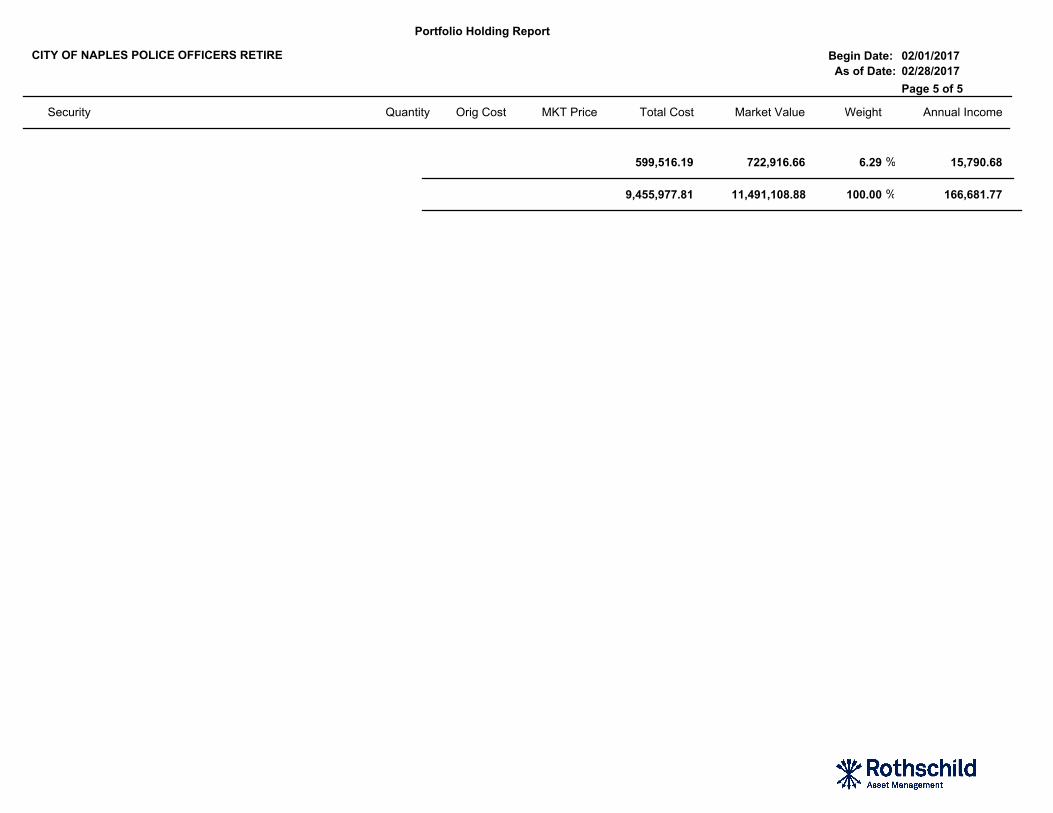
Page 5 of 5
Security Quantity Orig Cost Total Cost Market Value Weight Annual IncomeMKT Price
599,516.19 722,916.66 6.29 15,790.68%
9,455,977.81 11,491,108.88 100.00 166,681.77%

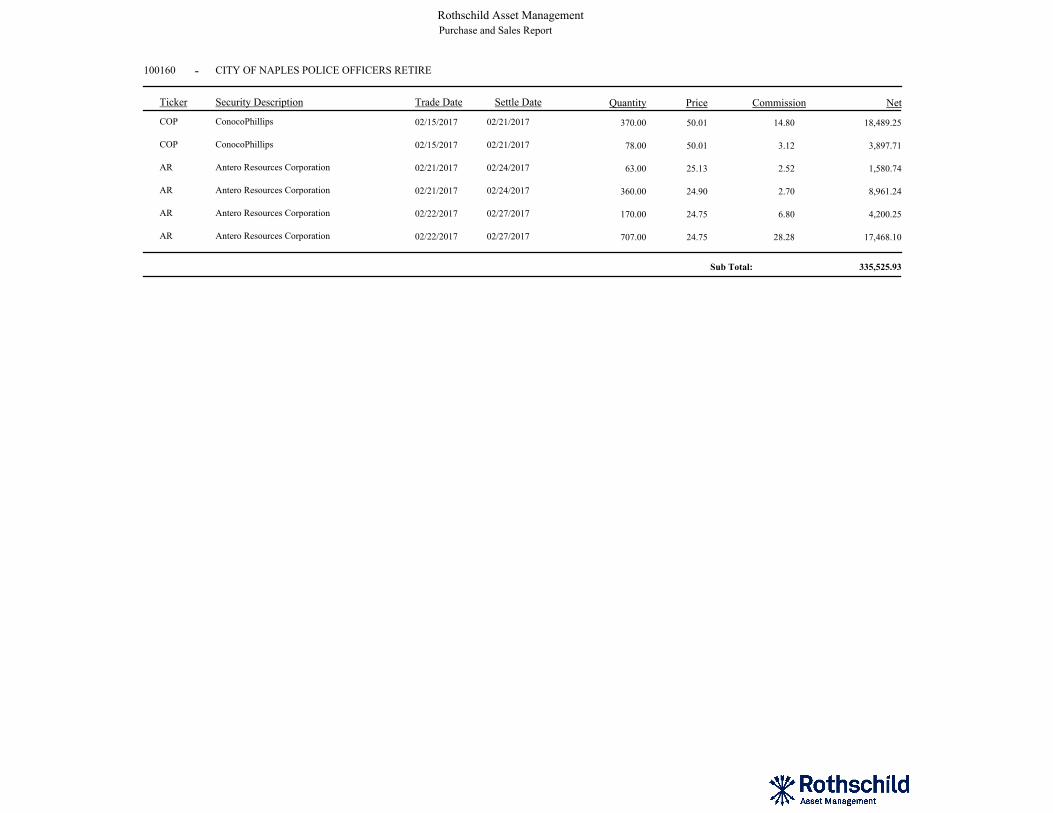
Strictly confidential
Purchases and Sales
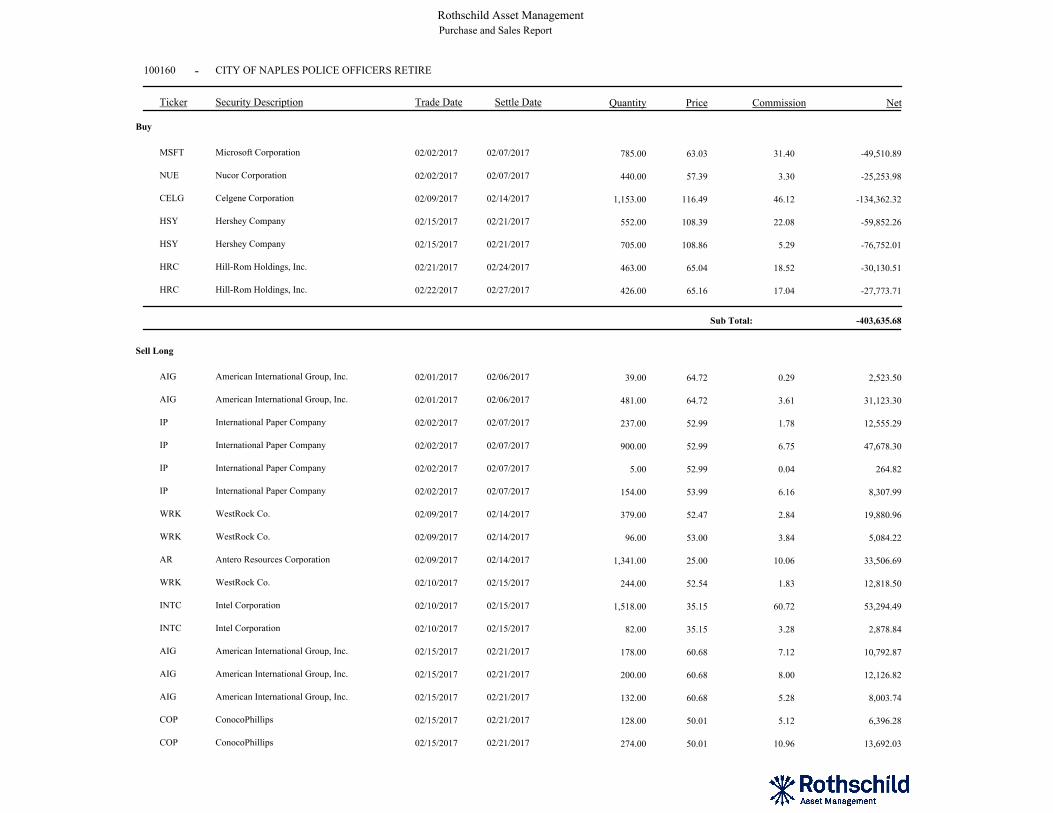
100160 CITY OF NAPLES POLICE OFFICERS RETIRE
Rothschild Asset ManagementPurchase and Sales Report
Ticker Security Description Trade Date Quantity Price Commission Net
-
Settle Date
Buy
MSFT Microsoft Corporation 02/02/2017 785.00 63.03 31.40 -49,510.8902/07/2017
NUE Nucor Corporation 02/02/2017 440.00 57.39 3.30 -25,253.9802/07/2017
CELG Celgene Corporation 02/09/2017 1,153.00 116.49 46.12 -134,362.3202/14/2017
HSY Hershey Company 02/15/2017 552.00 108.39 22.08 -59,852.2602/21/2017
HSY Hershey Company 02/15/2017 705.00 108.86 5.29 -76,752.0102/21/2017
HRC Hill-Rom Holdings, Inc. 02/21/2017 463.00 65.04 18.52 -30,130.5102/24/2017
HRC Hill-Rom Holdings, Inc. 02/22/2017 426.00 65.16 17.04 -27,773.7102/27/2017
-403,635.68Sub Total:
Sell Long
AIG American International Group, Inc. 02/01/2017 39.00 64.72 0.29 2,523.5002/06/2017
AIG American International Group, Inc. 02/01/2017 481.00 64.72 3.61 31,123.3002/06/2017
IP International Paper Company 02/02/2017 237.00 52.99 1.78 12,555.2902/07/2017
IP International Paper Company 02/02/2017 900.00 52.99 6.75 47,678.3002/07/2017
IP International Paper Company 02/02/2017 5.00 52.99 0.04 264.8202/07/2017
IP International Paper Company 02/02/2017 154.00 53.99 6.16 8,307.9902/07/2017
WRK WestRock Co. 02/09/2017 379.00 52.47 2.84 19,880.9602/14/2017
WRK WestRock Co. 02/09/2017 96.00 53.00 3.84 5,084.2202/14/2017
AR Antero Resources Corporation 02/09/2017 1,341.00 25.00 10.06 33,506.6902/14/2017
WRK WestRock Co. 02/10/2017 244.00 52.54 1.83 12,818.5002/15/2017
INTC Intel Corporation 02/10/2017 1,518.00 35.15 60.72 53,294.4902/15/2017
INTC Intel Corporation 02/10/2017 82.00 35.15 3.28 2,878.8402/15/2017
AIG American International Group, Inc. 02/15/2017 178.00 60.68 7.12 10,792.8702/21/2017
AIG American International Group, Inc. 02/15/2017 200.00 60.68 8.00 12,126.8202/21/2017
AIG American International Group, Inc. 02/15/2017 132.00 60.68 5.28 8,003.7402/21/2017
COP ConocoPhillips 02/15/2017 128.00 50.01 5.12 6,396.2802/21/2017
COP ConocoPhillips 02/15/2017 274.00 50.01 10.96 13,692.0302/21/2017
100160 CITY OF NAPLES POLICE OFFICERS RETIRE
Rothschild Asset ManagementPurchase and Sales Report
Ticker Security Description Trade Date Quantity Price Commission Net
-
Settle Date
COP ConocoPhillips 02/15/2017 370.00 50.01 14.80 18,489.2502/21/2017
COP ConocoPhillips 02/15/2017 78.00 50.01 3.12 3,897.7102/21/2017
AR Antero Resources Corporation 02/21/2017 63.00 25.13 2.52 1,580.7402/24/2017
AR Antero Resources Corporation 02/21/2017 360.00 24.90 2.70 8,961.2402/24/2017
AR Antero Resources Corporation 02/22/2017 170.00 24.75 6.80 4,200.2502/27/2017
AR Antero Resources Corporation 02/22/2017 707.00 24.75 28.28 17,468.1002/27/2017
335,525.93Sub Total:
Strictly confidential
Portfolio Summary and Holdings
Begin Date:
Portfolio Summary Report
As of Date:
02/01/2017
02/28/2017
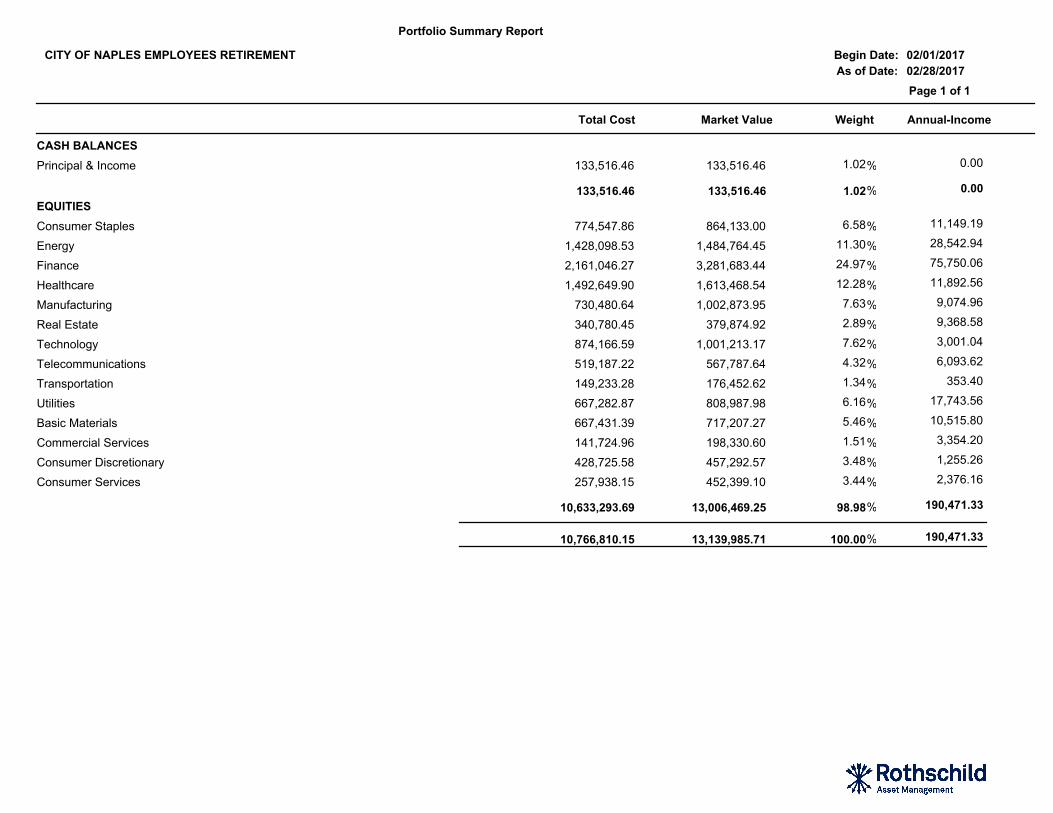
CITY OF NAPLES EMPLOYEES RETIREMENT
Page 1 of 1
Market Value Weight Annual-IncomeTotal Cost
CASH BALANCES
0.00 1.02 133,516.46 133,516.46Principal & Income %
133,516.46 133,516.46 1.02 0.00%
EQUITIES
11,149.19 6.58 864,133.00 774,547.86Consumer Staples %
28,542.94 11.30 1,484,764.45 1,428,098.53Energy %
75,750.06 24.97 3,281,683.44 2,161,046.27Finance %
11,892.56 12.28 1,613,468.54 1,492,649.90Healthcare %
9,074.96 7.63 1,002,873.95 730,480.64Manufacturing %
9,368.58 2.89 379,874.92 340,780.45Real Estate %
3,001.04 7.62 1,001,213.17 874,166.59Technology %
6,093.62 4.32 567,787.64 519,187.22Telecommunications %
353.40 1.34 176,452.62 149,233.28Transportation %
17,743.56 6.16 808,987.98 667,282.87Utilities %
10,515.80 5.46 717,207.27 667,431.39Basic Materials %
3,354.20 1.51 198,330.60 141,724.96Commercial Services %
1,255.26 3.48 457,292.57 428,725.58Consumer Discretionary %
2,376.16 3.44 452,399.10 257,938.15Consumer Services %
10,633,293.69 13,006,469.25 98.98 190,471.33%
10,766,810.15 13,139,985.71 100.00 190,471.33%

Begin Date:
Portfolio Holding Report
As of Date:
02/01/2017
02/28/2017
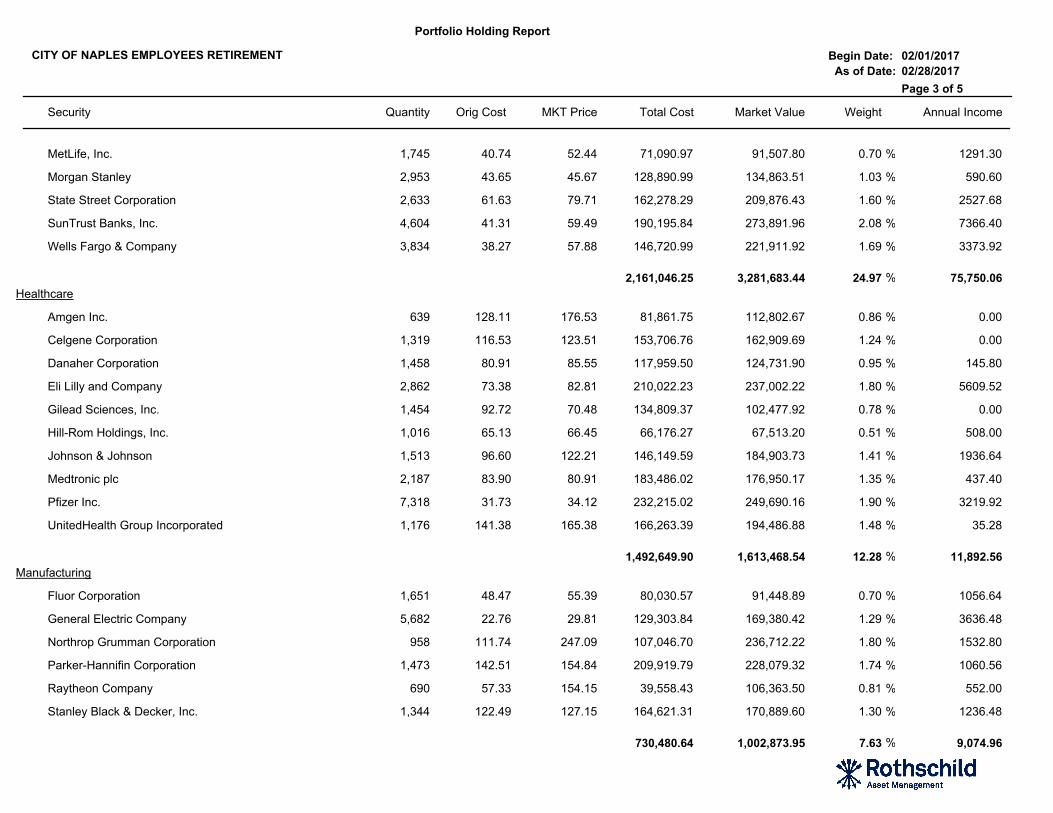
CITY OF NAPLES EMPLOYEES RETIREMENT
Page 1 of 5
Security Quantity Orig Cost Total Cost Market Value Weight Annual IncomeMKT Price
CASH BALANCES
Principal & Income
%Cash 0 0.00 1.00 133,516.46 133,516.46 1.02 0.00
133,516.46 133,516.46 1.02 0.00%
EQUITIES
Basic Materials
%Dow Chemical Company 4,562 53.47 62.26 243,939.71 284,030.12 2.16 5839.36
%LyondellBasell Industries NV 1,791 89.69 91.24 160,636.07 163,410.84 1.24 2865.60
%Nucor Corporation 2,663 61.01 62.57 162,471.16 166,623.91 1.27 1810.84
%WestRock Co. 1,920 52.28 53.72 100,384.46 103,142.40 0.79 0.00
667,431.40 717,207.27 5.46 10,515.80%
Commercial Services
%Waste Management, Inc. 2,705 52.39 73.32 141,724.96 198,330.60 1.51 3354.20
141,724.96 198,330.60 1.51 3,354.20%
Consumer Discretionary
%Home Depot, Inc. 613 78.12 144.91 47,888.37 88,829.83 0.68 98.08
%PulteGroup, Inc. 6,023 20.26 22.05 122,047.96 132,807.15 1.01 963.68
%PVH Corp. 1,290 112.09 91.60 144,591.54 118,164.00 0.90 193.50
%Skechers U.S.A., Inc. Class A 4,577 24.95 25.67 114,197.71 117,491.59 0.89 0.00
428,725.58 457,292.57 3.48 1,255.26%
Consumer Services
%CBS Corporation Class B 2,372 46.61 65.92 110,547.82 156,362.24 1.19 1138.56
%Comcast Corporation Class A 4,788 25.22 37.42 120,732.17 179,166.96 1.36 0.00
%Time Warner Inc. 1,190 22.40 98.21 26,658.16 116,869.90 0.89 1237.60
257,938.15 452,399.10 3.44 2,376.16%
Consumer Staples
%Hershey Company 1,438 108.67 108.35 156,274.62 155,807.30 1.19 2185.76

Begin Date:
Portfolio Holding Report
As of Date:
02/01/2017
02/28/2017
CITY OF NAPLES EMPLOYEES RETIREMENT
Page 2 of 5
Security Quantity Orig Cost Total Cost Market Value Weight Annual IncomeMKT Price
%Kroger Co. 3,586 28.82 31.80 103,354.29 114,034.80 0.87 1649.56
%PepsiCo, Inc. 1,896 89.91 110.38 170,468.93 209,280.48 1.59 1061.76
%Procter & Gamble Company 2,614 74.92 91.07 195,828.90 238,056.98 1.81 5876.27
%Tyson Foods, Inc. Class A 2,349 63.27 62.56 148,621.13 146,953.44 1.12 375.84
774,547.87 864,133.00 6.58 11,149.19%
Energy
%Antero Resources Corporation 3,656 25.57 23.98 93,485.77 87,670.88 0.67 0.00
%Chevron Corporation 2,801 107.81 112.50 301,981.60 315,112.50 2.40 10083.60
%ConocoPhillips 3,256 45.86 47.57 149,306.64 154,887.92 1.18 8595.84
%Energen Corporation 1,961 59.39 52.50 116,459.03 102,952.50 0.78 1333.48
%EOG Resources, Inc. 2,894 78.25 96.99 226,459.30 280,689.06 2.14 405.16
%Exxon Mobil Corporation 2,916 85.10 81.32 248,150.70 237,129.12 1.80 5132.16
%Halliburton Company 3,212 50.14 53.46 161,041.59 171,713.52 1.31 1606.00
%Valero Energy Corporation 1,981 66.24 67.95 131,213.89 134,608.95 1.02 1386.70
1,428,098.52 1,484,764.45 11.30 28,542.94%
Finance
%Allstate Corporation 2,292 37.48 82.16 85,903.49 188,310.72 1.43 1741.92
%American Express Company 1,719 78.89 80.06 135,613.86 137,623.14 1.05 550.08
%American International Group, Inc. 1,329 50.63 63.92 67,285.28 84,949.68 0.65 0.00
%Ameriprise Financial, Inc. 1,296 36.52 131.50 47,331.33 170,424.00 1.30 1814.40
%Bank of America Corporation 19,790 16.94 24.68 335,227.72 488,417.20 3.72 44329.60
%Berkshire Hathaway Inc. Class B 550 78.24 171.42 43,029.51 94,281.00 0.72 0.00
%Chubb Limited 1,920 119.48 138.17 229,398.35 265,286.40 2.02 2611.20
%Discover Financial Services 2,881 28.00 71.14 80,676.66 204,954.34 1.56 0.00
%Huntington Bancshares Incorporated 13,890 12.95 14.14 179,854.21 196,404.60 1.49 2222.40
%JPMorgan Chase & Co. 5,727 44.97 90.62 257,548.76 518,980.74 3.95 7330.56
Begin Date:
Portfolio Holding Report
As of Date:
02/01/2017
02/28/2017
CITY OF NAPLES EMPLOYEES RETIREMENT
Page 3 of 5
Security Quantity Orig Cost Total Cost Market Value Weight Annual IncomeMKT Price
%MetLife, Inc. 1,745 40.74 52.44 71,090.97 91,507.80 0.70 1291.30
%Morgan Stanley 2,953 43.65 45.67 128,890.99 134,863.51 1.03 590.60
%State Street Corporation 2,633 61.63 79.71 162,278.29 209,876.43 1.60 2527.68
%SunTrust Banks, Inc. 4,604 41.31 59.49 190,195.84 273,891.96 2.08 7366.40
%Wells Fargo & Company 3,834 38.27 57.88 146,720.99 221,911.92 1.69 3373.92
2,161,046.25 3,281,683.44 24.97 75,750.06%
Healthcare
%Amgen Inc. 639 128.11 176.53 81,861.75 112,802.67 0.86 0.00
%Celgene Corporation 1,319 116.53 123.51 153,706.76 162,909.69 1.24 0.00
%Danaher Corporation 1,458 80.91 85.55 117,959.50 124,731.90 0.95 145.80
%Eli Lilly and Company 2,862 73.38 82.81 210,022.23 237,002.22 1.80 5609.52
%Gilead Sciences, Inc. 1,454 92.72 70.48 134,809.37 102,477.92 0.78 0.00
%Hill-Rom Holdings, Inc. 1,016 65.13 66.45 66,176.27 67,513.20 0.51 508.00
%Johnson & Johnson 1,513 96.60 122.21 146,149.59 184,903.73 1.41 1936.64
%Medtronic plc 2,187 83.90 80.91 183,486.02 176,950.17 1.35 437.40
%Pfizer Inc. 7,318 31.73 34.12 232,215.02 249,690.16 1.90 3219.92
%UnitedHealth Group Incorporated 1,176 141.38 165.38 166,263.39 194,486.88 1.48 35.28
1,492,649.90 1,613,468.54 12.28 11,892.56%
Manufacturing
%Fluor Corporation 1,651 48.47 55.39 80,030.57 91,448.89 0.70 1056.64
%General Electric Company 5,682 22.76 29.81 129,303.84 169,380.42 1.29 3636.48
%Northrop Grumman Corporation 958 111.74 247.09 107,046.70 236,712.22 1.80 1532.80
%Parker-Hannifin Corporation 1,473 142.51 154.84 209,919.79 228,079.32 1.74 1060.56
%Raytheon Company 690 57.33 154.15 39,558.43 106,363.50 0.81 552.00
%Stanley Black & Decker, Inc. 1,344 122.49 127.15 164,621.31 170,889.60 1.30 1236.48
730,480.64 1,002,873.95 7.63 9,074.96%
Begin Date:
Portfolio Holding Report
As of Date:
02/01/2017
02/28/2017
CITY OF NAPLES EMPLOYEES RETIREMENT
Page 4 of 5
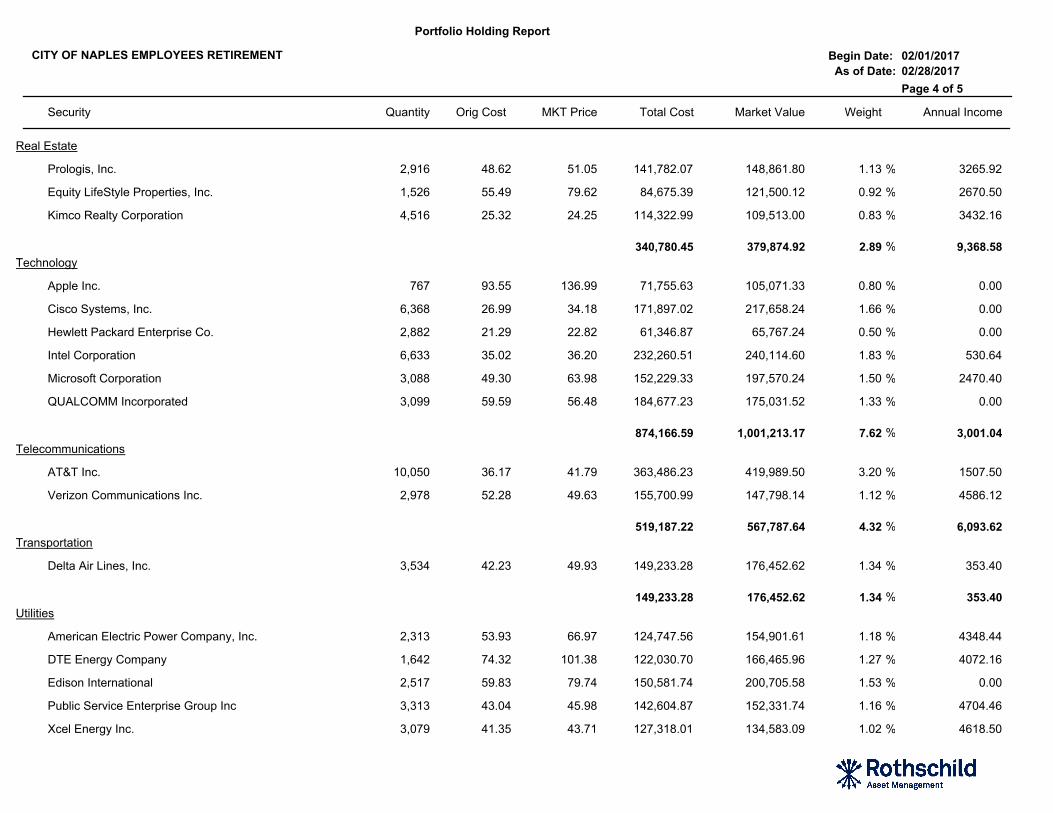
Security Quantity Orig Cost Total Cost Market Value Weight Annual IncomeMKT Price
Real Estate
%Prologis, Inc. 2,916 48.62 51.05 141,782.07 148,861.80 1.13 3265.92
%Equity LifeStyle Properties, Inc. 1,526 55.49 79.62 84,675.39 121,500.12 0.92 2670.50
%Kimco Realty Corporation 4,516 25.32 24.25 114,322.99 109,513.00 0.83 3432.16
340,780.45 379,874.92 2.89 9,368.58%
Technology
%Apple Inc. 767 93.55 136.99 71,755.63 105,071.33 0.80 0.00
%Cisco Systems, Inc. 6,368 26.99 34.18 171,897.02 217,658.24 1.66 0.00
%Hewlett Packard Enterprise Co. 2,882 21.29 22.82 61,346.87 65,767.24 0.50 0.00
%Intel Corporation 6,633 35.02 36.20 232,260.51 240,114.60 1.83 530.64
%Microsoft Corporation 3,088 49.30 63.98 152,229.33 197,570.24 1.50 2470.40
%QUALCOMM Incorporated 3,099 59.59 56.48 184,677.23 175,031.52 1.33 0.00
874,166.59 1,001,213.17 7.62 3,001.04%
Telecommunications
%AT&T Inc. 10,050 36.17 41.79 363,486.23 419,989.50 3.20 1507.50
%Verizon Communications Inc. 2,978 52.28 49.63 155,700.99 147,798.14 1.12 4586.12
519,187.22 567,787.64 4.32 6,093.62%
Transportation
%Delta Air Lines, Inc. 3,534 42.23 49.93 149,233.28 176,452.62 1.34 353.40
149,233.28 176,452.62 1.34 353.40%
Utilities
%American Electric Power Company, Inc. 2,313 53.93 66.97 124,747.56 154,901.61 1.18 4348.44
%DTE Energy Company 1,642 74.32 101.38 122,030.70 166,465.96 1.27 4072.16
%Edison International 2,517 59.83 79.74 150,581.74 200,705.58 1.53 0.00
%Public Service Enterprise Group Inc 3,313 43.04 45.98 142,604.87 152,331.74 1.16 4704.46
%Xcel Energy Inc. 3,079 41.35 43.71 127,318.01 134,583.09 1.02 4618.50

Begin Date:
Portfolio Holding Report
As of Date:
02/01/2017
02/28/2017
CITY OF NAPLES EMPLOYEES RETIREMENT
Page 5 of 5
Security Quantity Orig Cost Total Cost Market Value Weight Annual IncomeMKT Price
667,282.88 808,987.98 6.16 17,743.56%
10,766,810.15 13,139,985.71 100.00 190,471.33%

Strictly confidential
Purchases and Sales
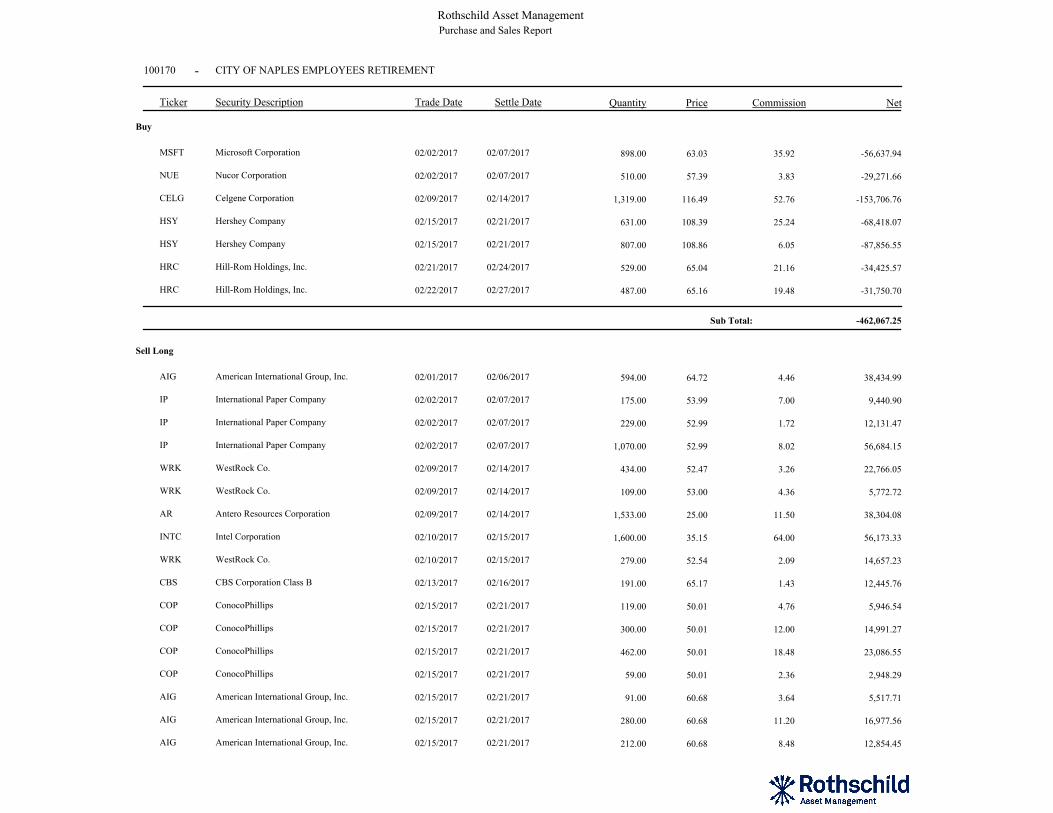
100170 CITY OF NAPLES EMPLOYEES RETIREMENT
Rothschild Asset ManagementPurchase and Sales Report
Ticker Security Description Trade Date Quantity Price Commission Net
-
Settle Date
Buy
MSFT Microsoft Corporation 02/02/2017 898.00 63.03 35.92 -56,637.9402/07/2017
NUE Nucor Corporation 02/02/2017 510.00 57.39 3.83 -29,271.6602/07/2017
CELG Celgene Corporation 02/09/2017 1,319.00 116.49 52.76 -153,706.7602/14/2017
HSY Hershey Company 02/15/2017 631.00 108.39 25.24 -68,418.0702/21/2017
HSY Hershey Company 02/15/2017 807.00 108.86 6.05 -87,856.5502/21/2017
HRC Hill-Rom Holdings, Inc. 02/21/2017 529.00 65.04 21.16 -34,425.5702/24/2017
HRC Hill-Rom Holdings, Inc. 02/22/2017 487.00 65.16 19.48 -31,750.7002/27/2017
-462,067.25Sub Total:
Sell Long
AIG American International Group, Inc. 02/01/2017 594.00 64.72 4.46 38,434.9902/06/2017
IP International Paper Company 02/02/2017 175.00 53.99 7.00 9,440.9002/07/2017
IP International Paper Company 02/02/2017 229.00 52.99 1.72 12,131.4702/07/2017
IP International Paper Company 02/02/2017 1,070.00 52.99 8.02 56,684.1502/07/2017
WRK WestRock Co. 02/09/2017 434.00 52.47 3.26 22,766.0502/14/2017
WRK WestRock Co. 02/09/2017 109.00 53.00 4.36 5,772.7202/14/2017
AR Antero Resources Corporation 02/09/2017 1,533.00 25.00 11.50 38,304.0802/14/2017
INTC Intel Corporation 02/10/2017 1,600.00 35.15 64.00 56,173.3302/15/2017
WRK WestRock Co. 02/10/2017 279.00 52.54 2.09 14,657.2302/15/2017
CBS CBS Corporation Class B 02/13/2017 191.00 65.17 1.43 12,445.7602/16/2017
COP ConocoPhillips 02/15/2017 119.00 50.01 4.76 5,946.5402/21/2017
COP ConocoPhillips 02/15/2017 300.00 50.01 12.00 14,991.2702/21/2017
COP ConocoPhillips 02/15/2017 462.00 50.01 18.48 23,086.5502/21/2017
COP ConocoPhillips 02/15/2017 59.00 50.01 2.36 2,948.2902/21/2017
AIG American International Group, Inc. 02/15/2017 91.00 60.68 3.64 5,517.7102/21/2017
AIG American International Group, Inc. 02/15/2017 280.00 60.68 11.20 16,977.5602/21/2017
AIG American International Group, Inc. 02/15/2017 212.00 60.68 8.48 12,854.4502/21/2017

100170 CITY OF NAPLES EMPLOYEES RETIREMENT
Rothschild Asset ManagementPurchase and Sales Report
Ticker Security Description Trade Date Quantity Price Commission Net
-
Settle Date
AR Antero Resources Corporation 02/21/2017 72.00 25.13 2.88 1,806.5602/24/2017
AR Antero Resources Corporation 02/21/2017 411.00 24.90 3.08 10,230.7502/24/2017
AR Antero Resources Corporation 02/22/2017 255.00 24.75 10.20 6,300.3602/27/2017
AR Antero Resources Corporation 02/22/2017 749.00 24.75 29.96 18,505.8202/27/2017
385,976.54Sub Total:
Copyright © 2022 FDOKUMEN