Rosemary Ndonyo Likwa final_researchmodule.pdf - UNZA ...
251
-
Upload
khangminh22 -
Category
Documents
-
view
0 -
download
0
Transcript of Rosemary Ndonyo Likwa final_researchmodule.pdf - UNZA ...


i
© Copyright 2019 by LAMU
All rights reserved. No part of this publication may be reproduced, stored in a retrieval system,
or transmitted in any form or by means, electronic, or mechanical, including photocopying,
recording or otherwise without the prior permission in writing of the Lusaka Apex Medical
University (LAMU), Faculty of Public Health, Charles Lwanga Campus in Lusaka, Zambia.
Exceptional purpose for criticism or review can be granted as permitted under the copyright
above.
Inquiries concerning reproduction or patent rights and requests for additional training materials
should be addressed to:
The Dean, The Faculty of Public Health Lusaka Apex Medical University P.O. Box 31909 Lusaka Zambia Tel:+ 260 96367670/ 976051832 E‐Mail: [email protected] Website: www.lamu.edu.zm

ii
ACKNOWLEDGEMENTS
The Lusaka Apex Medical University, Faculty of Public Health wishes to acknowledge the tireless
invaluable contributions of Dr Rosemary Ndonyo Likwa, Senior Lecturer, a consultant, Part‐time
lecturer and Course‐Coordinator for Research Methodology & Proposal Development Course
MPH 651, from the University of Zambia, School of Public Health, Department of Population
Studies & Global Health, for the development and write‐up of the Course Module, that
culminated into eight (8) distinct research modules: Philosophical approach to research;
Research Methodology, Proposal Development, Analysis & Scientific Report Writing Skills
Modules for the Course Code: MPH 651. Special thanks is further indebted to Ms Faustina
Mwenda, the Post Graduate Program Coordinator and the entire Faculty for the constructive
review of the module components.

iii
CONTRIBUTORS
NAME ORGANIZATION DESIGNATION
Rosemary Ndonyo Likwa UNZA PhD, Senior Lecturer/Consultant
Faustina Mweenda LAMU MPH, Lecturer/ Coordinator

iv
FOREWORD
It should be emphasized that the ultimate goal of any national health‐ development process
is to enable its people to reach a level of health that enables them to participate actively in
the social and economic quality life of the community in which they live. To attain this
objective, existing health systems must be redirected to achieve equitable reallocation of
resources for health implying: total coverage, increased accessibility to primary health care
services, and effective referral to secondary and tertiary levels of care. It is also relevant to
develop appropriate mechanisms to promote effective community participation in the
promotion and maintenance of health.
Such redirection of health systems may require changes in health care planning and policies,
and in the organization and administration of health and related public health services
alongside financing, budgeting of systems and procedures, and application of appropriate
technology.
The vision of introducing an Open Distance Learning (ODL) approach for post graduate
training program for health professionals & related in the field of Public Health place much
emphasis on knowledge production, scientific innovation and closer convergence between
research and sustainable development in response to the outlined 2030 Global Sustainable
Development Goals achievement. Furthermore, the envisioned quality delivery of
postgraduate public health education would reduce the skill gaps in health systems’ key
development priority areas, and demonstrate the pathways for the transformation of
research outcomes into innovative products or policies.
The national health system goals and priorities focus more on Public Health priorities, with a
view of improving the health of the Zambian people to enable them contribute to the social
and economic development of the country. This entails its commitment towards prevention,
care, treatment and adherence to all resolutions of disease burden for the Zambian people.
The Public Health priorities set by the sectors that focus on: Primary Health care services;
Maternal, neonatal and Child health; Communicable diseases, such as malaria, HIV and AIDS,
STIs, and Tuberculosis (TB); Non communicable diseases (NCDs); Neglected Tropical Diseases
(NTDS); Epidemic control and public health surveillance; Environmental health and food
safety; health service referral system; and health promotion and education are imperative to
the provision of quality research innovation and transformation.
Zambia’s Master Plan towards eradication of Neglected Tropical Diseases (NTDs) by the 2020
advocates for integration and enhancing innovative research approaches to provide
information in the control and eradication of such diseases that have posed a challenge over
decades. Lack of integration towards prevention, control and case management of neglected
tropical diseases implies knowledge gaps in in the integration of activities. In Zambia, there
are recognized eight (8) major Neglected Tropical Diseases stated as: Lymphatic Filariasis;
Leprosy; Schistosomiasis (bilharzia); Trachoma; Soil Transmitted Helminthes (STH); Human

v
African Trypanosomiasis (HAT); Cysticercosis; and Rabies. The country is also considering the
possibility of including Onchocerciasis among the priority diseases based on the endemicity
of the disease in the neighbouring countries and the global demand for elimination.
To effect changes in the public health priorities requires detailed and accurate information
on needs, possibilities and consequences of recommended actions. Such information may be
inadequate or often unreliable. As a result, decisions are based on assumptions and
unjustified conclusions and often result in inappropriate policy choices, the consequences of
which are only discovered after implementation.
Research is a systematic search for information and new knowledge and serves two purposes
in accelerating advances in health: First, as a basic or traditional research necessary to
generate new knowledge and technologies to deal with major unresolved health problems.
Second, as applied research necessary to the process of identifying priority problems, and to
design and evaluate policies and programs that will be of the greatest benefit by using existing
knowledge and available resources, both financial and human.
The module of Public Health Research capacity has been designed for post graduate training
of health professionals and related with the intent of pursuing a Master of Science (MSc) in
Public Health, or by research, through an Open Distance Learning (ODL) approach, at this
Lusaka Apex Medical University (LAMU) thrive to fulfil the national & global obligation of
scientific innovative Knowledge production for overcoming the Public Health Priority
challenges.
To build the research capacity, the module has been structured into eight (8) main distinct
parts: The epistemology of science and link to research; philosophy and basic concepts of
research; research methodology & qualitative research methods; research proposal
development & project management; quantitative data analysis & interpretation; and
scientific research report writing skills.
The Vice Chancellor Dean Lusaka Apex Medical University Faculty of Public Health Lusaka Apex Medical University

vi
INTRODUCTION
Welcome to Module 5 on Research Methodology and Proposal Development Course: MPH 651.
Research is a logical and systematic search for new and useful information while research
methodology is a way to systematically solve a research problem by applying research theory and
methods. This module is an introduction to research theory and methods in medical public health
studies and biological sciences, and is a core course module of the program. It outlines the steps
involved in the research process and protocol development, using a mix of research methods
(quantitative and qualitative methods) and operationalizes methodological concepts and their
applications. It conceptualizes variables and their measurements; study designs including the
management of a research project. Other components include: techniques of data collection,
quality control of data and analysis; ethics in research, and writing research proposals and
scientific writing; information search and use of bibliographical soft‐ware; conference
presentations and critical review of scientific literature. The scientific methodology of this
application explicates the accepted criteria for empirical objectivity (truth) based on the methods
and techniques for verification to produce claims for knowledge. Aspects of evaluation research
and computer applications to expose students to knowledge of statistical software packages for
data analysis and interpretation, and gaining access to computerized literature search further
forms parts of this methodological approach. The students will also learn how to develop a
critical and engaged attitude to research design so as to become critical users of scientific
literatures. Additionally students will be provided with knowledge on how to improve quality,
effectiveness and equity of public health and health care services through provision of a scientific
evidence basis that focuses on developing strong integrated epidemiological qualifications.
The philosophical epistemology of research concepts, methodological applications and proposal
development are organized into eight (8) important Sub‐modules: Modules 5.1‐5.3 of this
module will be devoted to the understanding of the epistemology of research concepts related
to the terminology, purposes, and its basic characteristics. It provides a further holistic grounded
realities of principles of research, problem definition & identification alongside conceptualizing a
problem analysis, and in the formulation of a statement of problem. Other components of this
contextual units will include the scientific literature review process, formulation of research
questions, hypotheses and objectives. Furthermore, you will be expected to critically review the
relevant scientific literature to consolidate a better understating of the nature of the problem for
investigation. These theories provides the initial conceptual foundations and the basic elements
of research.
Modules 5.4‐5.5 will provide a comprehensive concepts of research methodology components
of conceptualizing the research variables, study designs including ascertaining validity and
reliability of research findings, sampling, study population and selection criteria, data collection
methods and tools focusing on questionnaire design and attitudinal measurements, research
ethics and Data analysis and management. Other components of this section include the
vii
triangulation methodology, qualitative behavioral research methods and evaluation research
methods, while the latter Modules 5.6‐5.8 will be concentrated on the issues of research
proposal development covering steps in developing a research proposal, project management,
data analysis and interpretation, and dissertation/thesis report writing skills for a scientific
report. It has included the component of manuscript write‐up for a peer‐review journal
publication, respectively. The final version of this Module 5.9 encompasses the summary of the
entire module components presented in the document. This will enable the student(s) recast and
articulate the scientific knowledge of empirical research for innovative evidence.
The Module further examines the scientific approach to the meaning of ‘Science’ in a holistic
approach, and the approaches to knowledge, including the various assumptions of science
(Nachmias et al. 1987 & 2008) required in understanding the link to research. The scientific
approach includes issues of the role of methodology, scientific revolution and the research
process
We hope that you will reflect on the contents and activities of this module coupled with your
experience in your area of specialization or discipline. This will help you to develop competences
to be able to develop and manage your research project relevant for promoting Public Health in
disease prevention and control, and for achieving your academic goal in your field of expertise.
AIM
To develop capacity building in the methodological skills required to a successfully completion of
a research project and make a sound report to the scientific community among MSc
postgraduates students pursuing Public Health Sciences.
MODULE OBJECTIVES
At the end of the module, the students should be able to:
(1) Appraise research practices in the medical Public Health sciences so that they can apply
them to their own projects;
(2) Determine the basic approaches to scientific knowledge, principles of research and
distinguish between basic and applied research.
(3) Identify a research problem, formulate a research question and hypothesis in ways that
are amenable to statistical analysis;
(4) Critically appraise the design, analysis and interpretation of studies developed using other
theories.
(5) Demonstrate necessary skills and abilities to debate priority setting challenges in global
health disease prevention connecting animal, humans and zoonotic diseases A

viii
(6) Apply a scientific style of writing in presentation of research and be able to present research
findings, defend their project results in the context of their respective disciplines by making
informed decisions about the scientific and analytical frameworks sustaining these disciplines.
COURSE MODULE COMPETENCES
At the end of this course module, students should be able to:
1. Demonstrate the capacity of ability to plan and implement a research project for empirical
evidence.
2. Publish and disseminate the research results to the wide community audience including
the relevant industries for innovative informed policy decisions and programming.
The following section presents the description of the structure of the Module and its linkages to
other modules that has been broadly organised into nine (9) main module components.
MODULE STRUCTURE & LINKAGES
The Module is taught as the ‘Core Course’, meaning that it is imperative and one of the basic
requirements that all students undertaking the Masters programme must attend. It has a pre‐
requisite links to other modules of biostatistics, epidemiology, and computer applications, with
relevance to applied key research areas of the programme achievement in Public Health. The
Module is broadly divided into nine (9) main distinct Module components, with several sub‐
topics. Modules 5.1‐ 5.3 are devoted to the scientific approach to empirical research;
philosophical epistemology that examines the conceptual foundation of research; and the basic
elements of research, while Modules 5.4‐5.8 focus mainly on research methodology, including
aspects of qualitative research methods, triangulation methodology and evaluation research;
steps in developing a research proposal for empirical evidence and research project
management; data analysis and interpretation skills; Dissertation/thesis for a scientific report
and manuscript publication writing skills; and referencing writing style processes and appendix
alignment. The last component Module 5.9 features the overall module summary to synthesize
the important aspects of this module.
TEACHING METHODS
Learning will be based on open distance learning process of delivering lectures and
exercises/practical on some relevant sub‐topics by using moodle computer software to upload
relevant information required for student learning.
A provision of video conference for student‐ lecturer interaction to enhance learning process will
be applied as need arises.

ix
COURSE MODULE LEARNING TIME: HOURS & CREDITS
Six (6) lecture hours and 4 practical/seminar hours per week for a period of 13 weeks considering
that one semester is equivalent to 13 weeks. Credits calculated at 10 hours per credit. The total
amount of lecture hours and credits for each part and the total for the whole course are
summarized below:
Table 1: Credits and Contact Hours for Research Module Units
Unit Component Description Lecture/Theory Practical/Seminars Total
Hour Credit Hour Credit Hour Credit
1 Scientific Approach to Empirical Research
3 0.3 0 0.0 3 0.3
2 Philosophical Epistemology of Research
6 0.6 2 0.2 8 0.8
3 Basic Elements of Research: Problems & Conceptual Analysis
6 0.6 2 0.2 8 0.8
4 Research Methodology 27 2.7 12 1.2 39 3.9
5 Qualitative Research Methods & Analysis
12 1.2 4 0.4 16 1.6
6 Research Proposal Development & Management
12 1.2 6 0.6 18 1.8
7 Data Analysis & Interpretation 21 2.1 10 1.0 31 3.1
8 Scientific Research Report & Journal Manuscript Publication Writing Skills
6 0.6 4 0.4 10 1.0
Total 72 7.2 40 4.0 112 11.2
ASSESSMENT & EXAMINATIONS
Continuous Assessment: 40%
1 Assessment: 15%
1Group exercise/Practical: 10%
1 Test: 15%
Final Examination: 60%

x
NEEDY HELP?
In case you have difficulties, please get in touch with the following contact Person:
The Course Coordinator,
MPH Post Graduate Programme
Lusaka Apex Medical University
Faculty of Public Health
Charles Lwanga Campus
P. O. Box 31909,
Lusaka
Zambia
Tel: +260 96367670/976051832
Email: [email protected]

xi
MODULE COMPONENT SUMMARY OUTLINE:
Module 5.1: Scientific Approach to Empirical Research
Module 5.2: Philosophical Epistemology of Research
Module 5.3: Basic Problems of Research: Problems & Conceptual Analysis
Module 5.4: Research Methodology
Module 5.5: Qualitative Research Methods & Analysis
Module 5.6: Research Proposal Development & Management
Module 5.7: Data Analysis & Interpretation of Quantitative Data
Module 5.8: Scientific Report Writing Skills: Dissertation/Thesis and
Publication Manuscripts
Module 5.9: Module Summary
xii
Prescribed Additional Readings
1. Chava Frankfort‐Nachmias & David Nachmias (2008). Research Methods in the Social
Science, 7th Edition, ISBN: 13: 978‐0‐7167‐5510‐0
2. Chava Nachmias and David Nachmias (1987). Research Methods in the Social Sciences, 2nd
Edition, Edward Arnold Publishers LTD, London. ISBN: 0‐7131‐6283‐X
3. Erickson, B.H., and Nosanchuk (1987). Understanding Data: an introduction to exploratory
and Confirmatory Data analysis for students in Social Sciences. Open University Press:
ISBN: 0 335 00252 8
4. Stinchcombe, Arthur L (2005). The Logic of Social Science Research. Chicago, University of
Chicago Express
5. Michael Quinn Patton (1990). Qualitative Evaluation and Research Methods, 2nd Edition,
Page Publications: ISBN: 0‐8039‐3779‐2
6. Jacques Barzum and Henry F. Graff (1992), The Modern Researcher: The Classic Work on
Research and Writing: ISBN: 0‐15‐562513‐6
7. Oppenheim A.N (1986). Questionnaire Design and Attitudinal Measurement, Gower:
ISBN: 0 566 05297 0
8. Varkevisser,C.M., Pathmanathan,I., Brownlee, A (1991). Designing and Conducting Health
Systems Research Projects: Proposal Development and Field Works: Health
9. Wayne W. Daniel (2010). Biostatistics: Basic Concepts and Methodology for the Health
Sciences, 9th Edition, Wiley INC: ISBN: 978‐0‐470‐41333‐3
10. Betty R. Kirkwood and Jonathan A. C. Sterne (2006). Medical Statistics, 2nd Edition,
Blackwell: ISBN: 978‐0‐86542‐871‐3
11. Indra Pathmanathan and N.I. Nik‐Safiah (2000). Training of Trainers and Facilitators for
Health Systems Research, Vol.5. IDRC 286e: ISBN: 0‐88936‐589‐X
Apart from the prescribed additional readings stated, you are expected to read widely around all
the topics covered in this Module. You may find the references provided at the end of the Module
useful, but you could, also, explore other sources of information, particularly in the internet,
which has voluminous websites with invaluable information.
xiii
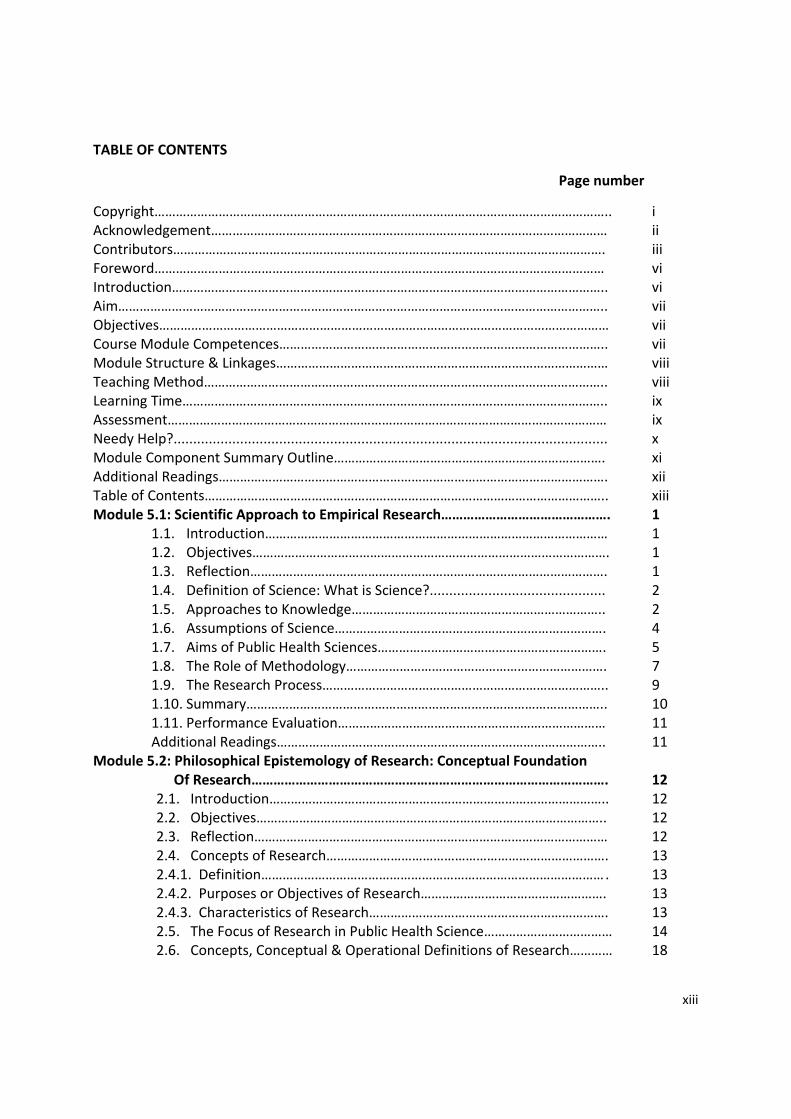
TABLE OF CONTENTS
Page number
Copyright……………………………………………………………………………………………………………….. i Acknowledgement………………………………………………………………………………………………… ii Contributors…………………………………………………………………………………………………………. iii Foreword……………………………………………………………………………………………………………… vi Introduction………………………………………………………………………………………………………….. vi Aim……………………………………………………………………………………………………………………….. vii Objectives……………………………………………………………………………………………………………… vii Course Module Competences……………………………………………………………………………….. vii Module Structure & Linkages………………………………………………………………………………… viii Teaching Method………………………………………………………………………………………………….. viii Learning Time……………………………………………………………………………………………………….. ix Assessment…………………………………………………………………………………………………………… ix Needy Help?............................................................................................................... x Module Component Summary Outline…………………………………………………………………. xi Additional Readings………………………………………………………………………………………………. xii Table of Contents………………………………………………………………………………………………….. xiii Module 5.1: Scientific Approach to Empirical Research………………………………………. 1
1.1. Introduction…………………………………………………………………………………… 1 1.2. Objectives………………………………………………………………………………………. 1 1.3. Reflection………………………………………………………………………………………. 1 1.4. Definition of Science: What is Science?............................................. 2 1.5. Approaches to Knowledge…………………………………………………………….. 2 1.6. Assumptions of Science…………………………………………………………………. 4 1.7. Aims of Public Health Sciences………………………………………………………. 5 1.8. The Role of Methodology………………………………………………………………. 7 1.9. The Research Process…………………………………………………………………….. 9 1.10. Summary……………………………………………………………………………………….. 10 1.11. Performance Evaluation………………………………………………………………… 11 Additional Readings……………………………………………………………………………….. 11
Module 5.2: Philosophical Epistemology of Research: Conceptual Foundation Of Research……………………………………………………………………………………. 12 2.1. Introduction………………………………………………………………………………….. 12 2.2. Objectives…………………………………………………………………………………….. 12 2.3. Reflection……………………………………………………………………………………… 12 2.4. Concepts of Research……………………………………………………………………. 13 2.4.1. Definition…………………………………………………………………………………… . 13 2.4.2. Purposes or Objectives of Research……………………………………………. 13 2.4.3. Characteristics of Research…………………………………………………………. 13 2.5. The Focus of Research in Public Health Science……………………………… 14 2.6. Concepts, Conceptual & Operational Definitions of Research………… 18

xiv
2.7. Theory: Functions & Types……………………………………………………………….. 19 2.8. Models……………………………………………………………………………………………… 21 2.9. Summary………………………………………………………………………………………….. 22 2.10. Performance Evaluation……………………………………………………….…… 23 Additional Readings………………………………………………………………………………… ……. 23 Module 5.3: Basic Elements of Research: Problems & Conceptual Analysis…………….. 24 3.1. Introduction……………………………………………………………………………………………. 24 3.2. Objectives………………………………………………………………………………………………. 24 3.3. Reflection……………………………………………………………………………………………….. 24 3.4. Research Problems…………………………………………………………………………………… 25 3.4.1. Problem Identification, Selection & Prioritization………………………………….. 25 3.4.2. Problem analysis…………………………………………………………………………………… 28 3.4.3. Formulation of Statement of Problem………………………………………………….. 33 3.5. Literature Review……………………………………………………………………………………. 34 3.6. Research Questions, Hypotheses, and Objective Formulation…………………. 39 3.7. Summary…………………………………………………………………………………………………. 45 3.8. Performance Evaluation…………………………………………………………………………… 45 Additional Readings………………………………………………………………………………………… 46 Module 5.4: Research Methodology…………………………………………………………………………. 47 4.1. Introduction………………………………………………………………………………………………. 47 4.2. Objectives…………………………………………………………………………………………………. 47 4.3. Reflection………………………………………………………………………………………………….. 48 4.4. Variables……………………………………………………………………………………………………. 48 4.5. Study Designs & Limitations……………………………………………………………………….. 54 4.5.1, Non Intervention Studies…………………………………………………………………………. 56 4.5.1.1. Exploratory Studies……………………………………………………………………………….. 56 4.5.1.2. Descriptive Studies………………………………………………………………………………… 57 4.5.1.3. Comparative or Analytical Studies…………………………………………………………. 58 4.5.2. Intervention or Experimental Study Designs…………………………………………….. 62 4.5.2.1. Experimental or Clinical Study Design……………………………………………………. 62 4.5.2.2. Quasi‐Experimental Study Design………………………………………………………….. 64 4.6. Validity & Reliability…………………………………………………………………………………….. 64 4.7. Study Population & Sampling………………………………………………………………………. 67 4.7.1. Study Population………………………………………………………………………………………. 67 4.7.2. Definition of Sampling, Probability and Non‐ Probability Sampling…………… 68 4.7.3. Sampling Methods…………………………………………………………………………………… 68 4.7.4. Sample Size Determination ……………………………………………………………………… 72 4.8. Data Collection Methods……………………………………………………………………………… 80 4.9. Triangulation or Mixed Methods…………………………………………………………………. 87 4.10. Designing Structured Interview Schedule & Questionnaire………………………… 88 4.11. Attitudinal Measurements………………………………………………………………………… 94 4.12. Pilot Study & Pre‐testing Methodology……………………………………………………… 97 4.13. Data Processing & Analysis……………………………………………………………………… 100 4.14. Research Ethical Considerations……………………………………………………………… 110

xv
4.15. Summary…………………………………………………………………………………………………… 116 4.16. Performance Evaluation………………………………………………………………………………117 Additional Readings……………………………………………………………………………………………. 118 Module 5.5: Qualitative Research Methods…………………………………………………………………..119 5.1. Introduction………………………………………………………………………………………………….119 5.2. Objectives………………………………………………………………………………………………………119 5.3. Reflection………………………………………………………………………………………………………119 5.4. Definition of Behavioral or Qualitative Research……………………………………………119 5.5. Culture and Behavioral Research……………………………………………………………………120 5.6. Qualitative Research Methods & Designs………………………………………………………121 5.7. Qualitative Data Analysis………………………………………………………………………………………… 129 5.8. Confirming Validation of qualitative Data……………………………………………………. 135 5.9. Qualitative Data Report Writing………………………………………………………………….. 135 5.10.Summary………………………………………………………………………………………………………135 5.11. Performance Evaluation………………………………………………………………………………136 Additional Readings………………………………………………………………………………………………136 Module 5.6: Research Proposal Development & Project Management………………………… 137 6.1. Introduction………………………………………………………………………………………………… 137 6.2. Objectives………………………………………………………………………………………………………137 6.3. Reflection………………………………………………………………………………………………………137 6.4. Definition of a Research Proposal………………………………………………………………… 138 6.5. Steps in Writing a Research Proposal & Project Management……………………… 138 6.6. Summary……………………………………………………………………………………………………… 145 6.7. Performance Evaluation…………………………………………………………………………………146 Additional Readings………………………………………………………………………………………………146 Module 5.7: Data Analysis & Interpretation of Quantitative Data……………………………… 147 7.1. Introduction……………………………………………………………………………………………………147 7.2. Objectives……………………………………………………………………………………………………….147 7.3. Reflection………………………………………………………………………………………………………. 147 7.4. Basic Concepts of Statistical Analysis……………………………………………………………… 148 7.5. Steps in Data Analysis…………………………………………………………………………………….. 152 7.6. Preparation for Data Analysis: Data Processing………………………………………………. 152 7.7. Data Analysis & Guiding Principles…………………………………………………………………. 153 7.7.1. Quantitative Data……………………………………………………………………………………….. 154 7.7.2. Qualitative Data………………………………………………………………………………………….. 155 7.7.3. Computer Output………………………………………………………………………………………… 156 7.8. Description of Variables: Frequency Distribution, Figures & Means………………… 158 7.8.1. Frequency Distributions…………………………………………………………………………………159 7.8.2. Percentages, Proportions, Ratios & Rates…………………………………………………….. 162 7.8.3. Figures………………………………………………………………………………………………………… 164 7.8.4. Measures of Central Tendency………………………………………………………………….. 167 7.9. Cross‐Tabulations of Quantitative Data…………………………………………………………. 169 7.9.1. Designing Cross‐Tabulations………………………………………………………………………. 170 7.9.2. Different Types of Cross‐Tabulations………………………………………………………….. 170
xvi
7.9.3. Constructing Cross‐Tabulations Appropriate for Research Objectives or Variables………………………………………………………………………………………… 172 7.9.4. General Hints When Constructing Tables……………………………………………… 173 7.9.5. Dealing with Confounding Variables: Stratification & Matching…………… 174 7.10. Description of Variables: Measures of Dispersion and Normal Distribution…175 7.10.1. Measures of Dispersion…………………………………………………………………………… 175 7.10.2. Normal Distribution………………………………………………………………………………… 177 7.10.3. Determining Sample Representation to Whole Population……………………. 179 7.11. Choosing Significant Tests………………………………………………………………………… 184 7.11.1. Significant Tests……………………………………………………………………………………… 184 7.11.2. How Significant Tests Work……………………………………………………………………… 185 7.11.3. Choosing a Significant Test……………………………………………………………………… 186 7.11.4. Determining Differences between the Groups………………………………………… 187 7.11.5. Measuring Associations between Variables………………………………………………189 7.12. Determining Differences between Groups: Unpaired and Paired Observations…………………………………………………………… 189 7.12.1. Determining Differences between Groups for Analysis of Unpaired Observations…………………………………………………………………………… 190 7.12.2. Determining Differences between Groups: Analysis of Paired Observations………………………………………………………………………………… 197 7.13. Measuring Risk in Case‐Control Studies…………………………………………………… 200 7.14. Performance Evaluation……………………………………………………………………………… 207 Additional Readings…………………………………………………………………………………………………207 Module 5.8: Scientific Report Writing Skills: Dissertations/Theses & Manuscript publications………………………………………………………………………… 208 8.1. Introduction……………………………………………………………………………………………………208 8.2. Objectives……………………………………………………………………………………………………… 208 8.3. Reflection……………………………………………………………………………………………………… 209 8.4. Steps in Preparing the Thesis……………………………………………………………………….. 209 8.5. General Requirements of the Thesis…………………………………………………………….. 211 8.6. Writing a Thesis……………………………………………………………………………………………. 215 8.6.1. Content…………………………………………………………………………………………………….. 215 8.6.2. Developing your Writing Style………………………………………………………………….. 219 8.6.3. Layout of Thesis or Report………………………………………………………………………… 221 8.6.4. Writing the First Draft……………………………………………………………………………….. 221 8.6.5. Checking the Final Draft……………………………………………………………………………. 223 8.6.6. Producing the Manuscript…………………………………………………………………………. 223 8.6.7. Production of Illustrations………………………………………………………………………….. 224 8.6.8. Using References, Appendices and Footnotes…………………………………………….. 224 8.7. Summary……………………………………………………………………………………………………….. 225 8.8. Performance Evaluation…………………………………………………………………………………. 226 Additional Readings………………………………………………………………………………………………. 226 Module 5.9: Module Summary……………………………………………………………………………………… 228 References……………………………………………………………………………………………………………………… 230

xvii

1
LUSAKA APEX MEDICAL UNIVERSITY FACULTY OF PUBLIC HEALTH MPH RESEARCH METHODS, PROPOSAL DEVELOPMENT & SCIENTIFIC REPORT WRITING MODULE 5 2019
MODULE 5.1 SCIENTIFIC APPROACH TO EMPIRICAL RESEARCH
1.1 INTRODUCTION The Module 5.1 introduces you to the concepts of the scientific approach of empirical research. The first part of this module explains the meaning of ‘science’, in other words, what is ‘science?’ while, the subsequent sections elaborate the various approaches to knowledge, assumptions to science, the linkage aims to social and health sciences, the role of methodology and the emerging scientific revolution. It ends with a comprehensive summary of the topics covered to better understand the scientific approach to research that will assist you to respond to the performance exercises to be provided to you at the end of this module section to demonstrate the ability of your understanding of scientific concepts taught.
1.2. OBJECTIVES By the end of the sessions in this Module, you should be able to:
(1) Demonstrate the basic understanding of scientific approach to empirical research (2) Discuss the holistic approaches of knowledge and assumptions of science in
cultivating the empirical evidence required for problem‐solving. (3) Demonstrate the extent to which the scientific evolution and understanding the
role of methodology provide basis for yielding plausible scientific evidence.
1.3. REFLECTION 1) In your own understanding, what is the meaning of ‘Science?’ 2) What does the scientific approach have to offer to those who take an interest in the
problems of the community? 3) How can we acquire reliable knowledge about those aspects of human experiences
that are considered social, political, economic and psychological in nature? 4) How can the scientific approach be of value in understanding phenomena such as
mortality, disease, domestic violence, high fertility, poverty, unemployment, democratic governance and bureaucracy, or self‐actualization?
Well, whether you have considered them or not, pose for a little while, reflect and write down your own understanding of these four concept questions.
We want to imagine that within your own understanding of these four linked concepts, one way to answer these questions is to first of all define science and then to take a look at the scientific approach, its assumptions, goals and attributes, and compare them with other approaches to knowledge. We hope that you will have a clearer understanding of the concepts by the time we get to the end of this module.

2
LUSAKA APEX MEDICAL UNIVERSITY FACULTY OF PUBLIC HEALTH MPH RESEARCH METHODS, PROPOSAL DEVELOPMENT & SCIENTIFIC REPORT WRITING MODULE 5 2019
1.4. DEFINITION OF ‘SCIENCE:’ WHAT IS SCIENCE?
‘Science’ cannot be easily defined. Scientists and scholars themselves define the term science in different ways and employ it in different contexts. Several definitions arise: To some, science is a prestigious undertaking; to others, science is a body of true knowledge; and others still it means an objective investigation of empirical phenomena (Walter and Wallace 1971:11; Nachmias et al. 1987:3). In other contemporary scholars in the English Oxford Dictionary and the Collins Sociology Dictionary have relative similar definitions of science. The English version of understanding science states it as ‘a branch of knowledge involving systematized observation and experiment on a specific subject’(Thompson 1996: 814), while the Collins have emerged with three differentiated definitions: the first one being any systematic study of physical or social phenomena; second, the study of physical and social phenomena where it involves observations, experiments, appropriate quantification and the search for universal general laws and explanations; and third being any specific branch of knowledge of a specific subject (Jary et al. 1995: 576).
Other scholars view the difficulty encountered in attempting to define science arises from the tendency to confuse the content of science with its methodology (Nachmias et al.1987). Whenever a branch of factual knowledge is rejected by science, it is always on the basis of its methodology. Furthermore, it is worth to note that much of the content of science is constantly changing: knowledge regarded as scientific at present may become unscientific in the future.
We may now conclude that: Science is a reflection of a body of true knowledge involving systematic observation and experiment on a specific subject to yield an objective investigation of empirical phenomena. Considering all the attributes of science, it implies that science is knowledge, hence research is a scientific approach to true knowledge. Science is not particular body of any knowledge, but science is united by its methodology. For these reasons we shall apply the term science in this section and in other parts of the module to mean all knowledge collected by the means of the scientific methodology.
1.5. APPROACHES TO KNOWLEDGE
The word science is derived from the Latin word scientia, itself from Latin sciens, the present participle of scire, “to know.” Throughout history, knowledge has been acquired by various modes or approaches. The scientific approach is the only mode by which people have attempted to understand their environment and themselves. There are three general modes that have served the purpose of acquiring knowledge: the authoritarian mode, the mystical mode, and rationalistic mode. A distinction among these modes is the manner in which each vests confidence in the producer of knowledge (that is, Who says so?), the procedure by which knowledge is produced (that is, How do you know?), and in the effect of the knowledge produced (that is, What difference does it make?) (Walter and Wallace 1971:11).
Authoritarian Mode: In the authoritarian mode, knowledge is looked for by referring to those who are socially or politically defined as qualified producers of knowledge. These may be oracles in tribal societies, archbishops in theocratic societies, kings in monarchical societies and individuals occupying scientific roles (lecturers, professors, directors etc) in technocratic societies. Within any society, different authorities may be sought to produce knowledge for different phenomena. For example, in a Catholic community, the pope possesses undisputed
3
LUSAKA APEX MEDICAL UNIVERSITY FACULTY OF PUBLIC HEALTH MPH RESEARCH METHODS, PROPOSAL DEVELOPMENT & SCIENTIFIC REPORT WRITING MODULE 5 2019
authority on matters views as religious. Undisputed authority is also possessed by Soviet Academy of Sciences, which in 1950 argued that statistical theories based on probability are non‐scientific. This decision was an abortive attempt to resolve the contradiction between the determinism of materialism and theory of probability. In the authoritarian mode, the knowledge‐seeker attributes the ability to produce knowledge to the social or political authority of the knowledge‐producer. The procedure whereby the seeker solicits this authority affects the nature of the authority’s response, but not the seeker’s confidence in the response. Furthermore, although the effects of an item of knowledge obtained by this mode can lead to the eventual replacement of authority, a large number of refutations is required before this happens.
Mystical Mode: In the mystical mode, knowledge is solicited from the prophets, divines, gods, mediums and other supernaturally knowledgeable authorities. In this sense, the mystical mode is similar to the authoritarian mode. However, it differs from the latter in its dependence on manifestations of supernatural signs and on the psychophysical state of the knowledge‐consumer. For example, the rites surrounding the process of prophetic healing are aimed at persuading the consumer of the supernatural powers. The mystical mode depends, to a large extent, on applying ritualistic and ceremonial procedures to the consumer. Under conditions of most likelihood depression, helplessness and intoxication, the knowledge‐consumer is most willing to accept items of knowledge produced by the mystical mode. The confidence in the knowledge produced in this manner decreases as the number of disconfirmations increases or as the educational level of people advances.
Rationalistic Mode: Lastly, rationalism is a school in philosophy that holds the ideology that the totality of knowledge can be acquired by strict adherence to the forms and rules of logic. The underlying assumptions of rationalism are that:
(1) The human mind can apprehend the world independently of observable phenomena, and
(2) Forms of knowledge exist that are prior to our experiences.
In other words, the concern of the rationalistic mode is with what must be true in principle, and what is logically possible and permissible.
To the rationalist, abstract logic is a normative master of science, which makes it possible to separate scientific propositions from unsound thinking. According to classical rationalists, Aristotle had explored once and for all the entire subject of logic as the structure of knowledge and truth. The German Philosopher Immanuel Kant (1724‐1824 in Nachmias 1987) further elaborated the theory of logic that our minds impress a certain pattern on the observational world. This pattern is in terms of space and time. What is of interest to us is that the statements of logic and mathematics, for example, according to Kant and others, tell us something about our experiences. Such statements of knowledge are produced by pure reason, for it is the mind that stamps them upon reality. Pure mathematics on the other hand, consists of statements that are universally valid, certain and independent of the empirical world. For example, the statements of pure geometry are considered to be absolute and true by definition and virtue of their logical forms. It is worth noting that the contemporary rationalists value more pure mathematics than the empirical content of formal logic, yet both of these attributes are important instruments to the scientific approach.
4
LUSAKA APEX MEDICAL UNIVERSITY FACULTY OF PUBLIC HEALTH MPH RESEARCH METHODS, PROPOSAL DEVELOPMENT & SCIENTIFIC REPORT WRITING MODULE 5 2019
Having examined the various modes of knowledge, we will now examine the assumptions of Science to prove claims for knowledge.
1.6. ASSUMPTIONS OF SCIENCE
The scientific approach is grounded or depends on a set of fundamental assumptions that are ‘unproved ‘and ‘unprovable.’ They are necessary prerequisites for the conduct of scientific discourse and represent those issues in the area of the philosophy of science that is termed epistemology‐ the study of the foundations of knowledge. By examining these assumptions, we can better understand the scientific approach and its claim for superiority over other approaches to knowledge. The examples of these assumptions are:
‘Nature is orderly and regular’: This basic assumption of the scientific approach entails that there exists a definite regularity and order in the natural universe or world and events do not occur haphazardly. Even within a rapidly changing environment, it is assumed that there is a degree of order and regularly and that change itself displays patterns that can be understood.
We learn that the concept of nature does not refer to supernatural forces. In science, nature entails all those empirically observable objects, conditions, and phenomena that exist independently of human intervention or control, but also include the human being as a biological system. The laws of nature do not prescribe, but rather describe what actually is happening (Nachmias et al. 2008). It is further stated that order and regularity in nature are not necessarily inherent in the phenomena. For example, there is no logically compelling reason why spring should follow winter, but winter follows autumn, autumn follows summer, and summer follows spring. The seasons do and regularly so, and this regularity underlies observable conditions and phenomena, such as cold weather, rain, hot, dry, and other observable events, including growing seasons. We can conclude that nature being orderly and regular is a basic scientific assumption.
‘We can know nature’: The assumption that ‘we can know nature’ is the assumption that nature is orderly and that there are laws of nature. It expresses a basic conviction that human beings are just as much part of nature as other natural objects, conditions and phenomena. Although we possess unique and distinctive characteristics, we can be understood and explained by the same methods by which we study nature. Individuals and community phenomena exhibit sufficient recurrent, orderly, and empirically demonstrable patterns to be amenable to scientific investigation. The human mind is not only capable of knowing nature, but also of knowing itself and the minds of others.
‘Knowledge is superior to ignorance’: Closely related to the assumption that we can know nature and ourselves is the idea that knowledge should be pursued both for its own sake and for perfecting human conditions. The contention that knowledge is superior to ignorance does not mean that everything in nature can or will be known. Rather, it is assumed that scientific knowledge is tentative and changing. Things that we did not know in the past we know at present, and current knowledge could be modified in the future. Truth in science is relative to the evidence, the methods, and the theories employed. It should be noted that scientific knowledge threatens the old ways of doing things, and that it is detrimental to tranquillity, stability, and the status quo. In exchange, the scientific approach can offer only tentative truth that is relative to the existing state of knowledge. Note that there are both the strength, weaknesses and threats of the scientific approach.
5
LUSAKA APEX MEDICAL UNIVERSITY FACULTY OF PUBLIC HEALTH MPH RESEARCH METHODS, PROPOSAL DEVELOPMENT & SCIENTIFIC REPORT WRITING MODULE 5 2019
‘All natural phenomena have natural causes’: the assumption that all natural phenomena have natural causes epitomizes the scientific evolution. It has placed the scientific approach in opposition to fundamentalist religion, on the other hand, and spiritualism and magic on the other. The assumption implies that natural events have natural causes or antecedents. It rejects counter‐assumption that forces other than those found in nature operate to cause the occurrence of natural events. Until scientists can account for the occurrence of phenomena in natural terms, they reject the argument that some other supernatural explanation is necessary. The main function of this assumption is to direct scientific research away from supernatural forces and towards the regularities and order that underlie natural phenomena. Once delineated, such regularities can serve as evidence for cause‐and –effect relationships.
‘Nothing is self‐evident’: Scientific knowledge is not self‐evident, but claims for truth must be demonstrated objectively. Tradition, subjective beliefs, and common sense could not be exclusively relied upon in the verification of scientific knowledge. Possibilities for error are always present, and even the simplest ideas call for objective verification. It is not incidental that scientific thinking is sceptical and critical.
‘Knowledge is derived from the acquisition of experience’: If science is to tell us anything about the real world it must be empirical, that is, it must rely on perceptions, experience, and observations. Perception is a fundamental tenet of the scientific approach, and it is achieved through our senses: ‘science assumes that a communication link between a human being and the external universe is maintained through his/her own sense impressions. Knowledge is held to be a product of one’s experience, as facets of the physical, biological, and social world play upon senses’ (Gideon et al. 1968: 25). It is worth noting that not all phenomena are directly experienced and observed. Observation is not immediately given, or entirely detached from scientific terms, concepts, and theories. As the British philosopher of science, Sir Karl Popper wrote:
‘The naïve empiricist ….. thinks that we begin by collecting and arranging our experiences, and so ascend the ladder of science…… But if I am ordered: “record what you are experiencing” I shall
hardly know how to obey this ambiguous order. Am I to report that I am writing: that I hear a bell ringing; a newsboy shouting; a loud‐speaker droning; or am I to report, perhaps, that these noises
irritate me?... A science needs points of view, and theoretical problems.’ (Popper 1961:106).
The assumption entails that the scientific acquisition of experience should be based upon empirical observations to produce verifiable knowledge.
1.7. AIMS OF PUBLIC HEALTH SCIENCES
Having explicated the assumptions of science, we are now in a position to address the question raised earlier: What does science have to offer to those who take an interest in community health problems? The ultimate goal of public health sciences is to produce an accumulating body of reliable knowledge. Such knowledge would enable us to ‘explain’, ‘predict’, and ‘understand’ empirical phenomena that interest us. A reliable body of knowledge could be put to use to improve the human condition, or quality of life. We need to consider, what are scientific explanations? When can we make predictions? When are we justified in claiming that we understand empirical phenomena?

6
LUSAKA APEX MEDICAL UNIVERSITY FACULTY OF PUBLIC HEALTH MPH RESEARCH METHODS, PROPOSAL DEVELOPMENT & SCIENTIFIC REPORT WRITING MODULE 5 2019
a) SCIENTIFIC EXPLANATION
The public health sciences and more so in social sciences aim to provide general explanations to “Why” question. When asking for an explanation of why a given phenomenon has taken place, scientists ask for a systematic and an empirical analysis of those causal factors in a given situation that are responsible for the occurrence of the phenomenon.
There are basic types of explanations: Deductive and Probabilistic explanations. The classification is based upon the kinds of generalizations that explanation employs.
Deductive (conclusive) Explanation: A deductive explanation calls for a universal generalization, a statement of the conditions under which the generalization holds true, an event to be explained, and applies the rules of formal logic. In a deductive explanation, a phenomenon is explained by demonstrating that it can be concluded from an established universal law. For example: explanation for the return of an object thrown in the air would be based on the law of gravitation. It implies that if all objects exercise a mutual attraction on one another, then any given object is expected to behave in the similar manner with respect to earth. The essential feature of a universal law is that it purports to encompass all cases that fall within the class to which it applies – either past, present or future.
Probabilistic Explanation: Probability explanation has no scientific explanation that is based on laws of universal form. For example, a particular increase in a government expenditure in a country could be explained by suggesting that it happened in response to the severe economic conditions incurred in the country that attributed to the increase in government expenditure. This explanation provides links to the phenomenon of severe economic conditions and the effect on the government expenditure. The connection cannot be expressed by a law of universal form because not every case of adverse economic condition brings an increase in government expenditures. What can be suggested further is that there is a high probability that severe economic conditions will bring increase in government expenditures, or that a high percent of all cases that were investigated, severe economic conditions led to increase in government expenditures. General explanations of this type are referred to as ‘’ probabilistic or inductive explanations” and they derive from probabilistic generalizations. A probabilistic explanation makes use of generalization that express an arithmetical ratio between phenomena, or generalizations that expresses tendencies.
b) PREDICTION
Deductive and probabilistic explanations constitute one important component of scientific knowledge. Prediction constitutes the other. Prediction is making forecast or future assumption of a true or factual reality. The ability to make correct predictions can be viewed as the first quality for identifying what science is: if one knows something to be true, she/he is in a position to predict; where prediction is impossible, there is no knowledge. For example, if one knows that human resource programmes solve unemployment problems, one can predict that current rates of unemployment are temporary and unemployment is bound to disappear.
The expectations that scientific knowledge should lead to accurate predictions is based on the argument that if it is true that X causes Y, and that X is present , then the prediction that Y will
7
LUSAKA APEX MEDICAL UNIVERSITY FACULTY OF PUBLIC HEALTH MPH RESEARCH METHODS, PROPOSAL DEVELOPMENT & SCIENTIFIC REPORT WRITING MODULE 5 2019
occur can be made. It is assumed that if the Universal law‐ deductive explanation or the probabilistic explanation is both known and true that the prevailing conditions are sufficient for predicting the outcome.
c) AS SENSE OF UNDERSTANDING
The third component of scientific knowledge is ‘a sense of understanding.’ The meaning of the term ‘understanding’ is used in two different senses: the empathic understanding and predictive understanding. These usage terms derive from the social science perspective view as both humanistic and scientific, and considering that social scientists are observers as well as participants in the subject matter of their disciplines, which on the other hand does no exclude the public health scientists. For example, a sequence of conception, birth, nursing and weaning represent the biological reality of parenthood. In analysing the human parenthood, we find, in addition to the biological reality, a complex of attributes dealing with the license to have children, responsibilities for their care (ill health alike) and schooling, rights to make some decisions on their behalf, and obligations to launch them by certain social rituals. All these attributes represent the social reality of parenthood, which should not be ignored in understanding social or health sciences that constitute a human behaviour.
In a ’empathic understanding’ implies a form of understanding and explanation achieved by imagining oneself in the role of the social actors whose actions one seeks to understand or explain, while empathy means a feeling of being able to experience what another person is experiencing (Jary et al.1995). Empathy is central to person centred counselling with a view that the client’s problems can only be understood by the counsellor through experiencing the client’s phenomenological field. It also provides techniques of meaningful understanding and explanation in social research.
1.8. ROLE OF METHODOLOGY
Science is not united by its subject matter, but rather by its methodology. What sets the scientific approach, apart from other modes of acquiring knowledge, are the assumptions upon which it is based and its methodology.
The scientific methodology is a system of explicit rules and procedures upon which research is based and against which claims for knowledge are evaluated. The rules and procedures are constantly improved: ‘scientists look for new methods and techniques of observation, inferences, generalization and analysis.’ As these are developed and found congruent or suitable with the underlying assumptions of the scientific approach, they are incorporated into the system of rules that make the scientific methodology. The scientific methodology is self‐correcting.
RULES OF METHODOLOGY
There are three (3) distinct rules of methodology: Communication, constructive criticism (reasoning), and Scientific progress (inter‐subjectivity).
Rules of Communication: A major function of methodology is to facilitate communication between the scientists who either shared or want to share a common experience. Furthermore, by making rules of methodology explicit, public and accessible, the framework for replication and constructive criticism is set forth. Replication, that is, the repetition of the same investigation in exactly the same way either by the same scientists or other scientists is
8
LUSAKA APEX MEDICAL UNIVERSITY FACULTY OF PUBLIC HEALTH MPH RESEARCH METHODS, PROPOSAL DEVELOPMENT & SCIENTIFIC REPORT WRITING MODULE 5 2019
a safeguard against error or deception. Constructive criticism implies that as soon as one makes claims for knowledge, we can ask questions, such as the following:
“Does the explanation (prediction) follow logically from the assumption?”
“ Are the observations correct?”
“What were the methods of observations?”
“Was the testing valid?”
“Weren’t other factors interfering in drawing conclusions?”
“Shouldn’t the findings be taken as evidence that another explanation is correct?” and so on.
Rules for Reasoning: Empirical observations or facts don’t “speak of themselves.” The scientific methodology explicates the logical foundations of reasoned knowledge. The most essential tool of the scientific approach, along with factual observations, is logic‐ the system of valid reasoning about factual observations that permits reliable inferences to be drawn from them. ‘Logic,’ as the study of the foundations and principles of reasoning, is crucial to the scientific approach that the science of many subject matters is called the logic of them, e.g. biology, microbiology, geology, anthropology and so on.
The scientific methodology demands competence in logical reasoning and analysis. Rules for classification and definitions, forms of deductive and probabilistic (inductive) inferences, theories of probability, sampling procedures, system of calculi, and rules of measurements are the methodological tool kit of the social and medical scientists. Through the use of logic, science progresses systematically and the scientific body of knowledge is itself systematic. The logical procedures inherent in the scientific methodology take the form of closely interwoven series of procedures that support each other or, at least, do not contradict each other. In this way, the scientific methodology enhances the internal consistency of claims for empirical knowledge.
Rules for Inter‐subjectivity (scientific progress): Logic is concerned with valid reasoning, not with empirical truth or verified facts. A fact is either certainly or probably true when objective evidence exists to support it. On the other hand, a claim for knowledge is valid when the conclusion necessarily follows from the assumptions made originally.
Given that the criteria for empirical objectivity and the methods for verification are products of the human mind, the term ‘inter‐subjectivity’ is more appropriate than objectivity. To be ‘inter‐subjective,’ means that knowledge in general and the scientific methodology in particular have to be transmissible: That is ‘a type of knowledge that can be transmitted from any person who has such knowledge to any other person who does not have it, but who can grasp the meaning of symbols or terms (words, signs) used in communication and perform operations if any, described in these communications’ (Nachmias et al. 1987:18). This is why, if one scientist conducts an investigation, another scientist replicate it and compares the two sets of findings. If the methodology is correct and (we assume) the conditions have not changed, we would expect the findings to be similar. The significance of inter‐subjectivity is that one scientist can understand and evaluate the methods of others and perform similar observations so as to verify the empirical facts. The methodological requirement for inter‐
9
LUSAKA APEX MEDICAL UNIVERSITY FACULTY OF PUBLIC HEALTH MPH RESEARCH METHODS, PROPOSAL DEVELOPMENT & SCIENTIFIC REPORT WRITING MODULE 5 2019
subjectivity is the evidence that empirical observations are uncontaminated by any factors saving those common to all observers.
1.9. THE RESEARCH PROCESS
Scientific knowledge is knowledge provable by both reason and experience (observation). ‘Logical validity’ and ‘empirical verification’ are the criteria employed by scientists ‘to evaluate claims for knowledge.’ These two criteria are translated into the research activities of scientists through ‘the research process.’
A ‘research process’ is viewed as: ‘the overall scheme of scientific activities in which scientists engage in order to produce knowledge’. It is the paradigm of scientific inquiry.
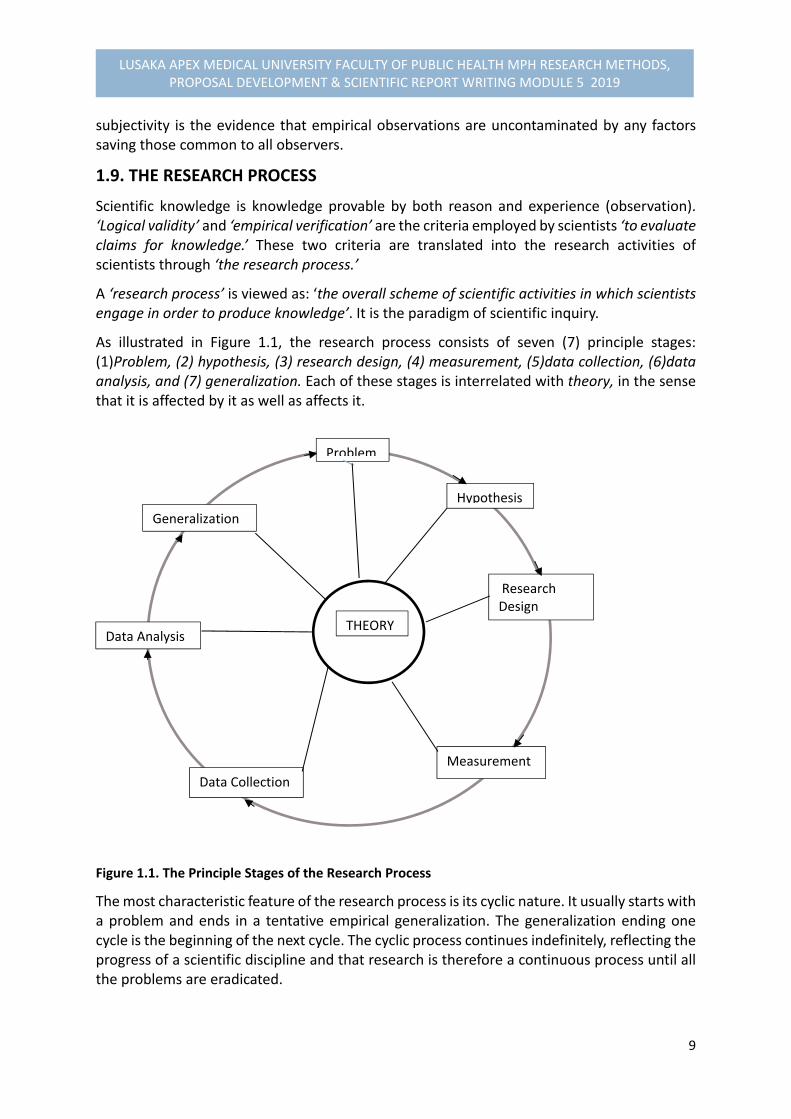
As illustrated in Figure 1.1, the research process consists of seven (7) principle stages: (1)Problem, (2) hypothesis, (3) research design, (4) measurement, (5)data collection, (6)data analysis, and (7) generalization. Each of these stages is interrelated with theory, in the sense that it is affected by it as well as affects it.
Figure 1.1. The Principle Stages of the Research Process
The most characteristic feature of the research process is its cyclic nature. It usually starts with a problem and ends in a tentative empirical generalization. The generalization ending one cycle is the beginning of the next cycle. The cyclic process continues indefinitely, reflecting the progress of a scientific discipline and that research is therefore a continuous process until all the problems are eradicated.
THEORY
Problem
Hypothesis
Research Design
Measurement
Data Collection
Data Analysis
Generalization

10
LUSAKA APEX MEDICAL UNIVERSITY FACULTY OF PUBLIC HEALTH MPH RESEARCH METHODS, PROPOSAL DEVELOPMENT & SCIENTIFIC REPORT WRITING MODULE 5 2019
Furthermore, the research process is also self‐correcting. Tentative generalization to research problems are tested logically and empirically. If these generalization are rejected, new ones are formulated and tested. In the process of reformulation all the research operations are re‐evaluated because the rejection of a tentative generalization might be due not to its being valid, but to deficiencies in performing the research operations. For example, a generalization that economic crises lead to increased government spending will be rejected if it cannot be logically validated and empirically verified. The generalization might also be rejected even if it is true, if procedures for validation and verification (for example, research design, measurements, data analysis) are deficient. To minimize the risk of rejecting true generalization, one re‐examines each of the stages in the research process prior to the formulation of new generalizations.
Finally, it should be noted that the research process is a rational reconstruction of scientific practice. In practice, the research process may occur in a variety of ways: (1) Sometimes quickly, or slowly; (2) Sometimes with very high degree of formalization and vigor, or quite informal, self‐consciously and intuitively, (3) Sometimes through the interaction of several scientists in distinct roles (such as theorists, research directors, interviewers, methodologists, sampling expert, statistician, etc); and (4) through efforts of a single scientist. Our logical reconstruction of the research process is not intended to be inflexible, but rather to convey the underlying themes of either social of health research.
1.10. SUMMARY
We have now reached the end of our Module 5.1 sessions for this first part. I hope you have grasped the concepts taught diligently in order to apply them to other parts of the module. We covered that: Science is united by its methodology, not by its subject matter. What sets the scientific approach apart from other modes of acquiring knowledge are the assumptions upon which it is grounded and its methodology. The assumptions of the scientific approach are explained as: nature is orderly; we can know nature; knowledge is tentative but superior to ignorance; natural phenomena have natural causes; nothing is self‐evident; and knowledge is derived from the acquisition of experience. The methodology of the scientific approach serves three major purposes: rules for communication; rules for logical and valid reasoning; and rules for inter‐subjectivity. These three systems of rules allow us to understand, explain, and predict our environments and ourselves in a manner that other systems for generating knowledge (that is, the authoritarian, the mystical, and the rationalistic) cannot allow us to do. Scientific knowledge is knowledge provable by both reason and evidence of sense (empirical). The scientific methodology requires strict adherence to the rules of logic and observation. Such adherence should not be seen as encouraging conformity and dogma. The research

11
LUSAKA APEX MEDICAL UNIVERSITY FACULTY OF PUBLIC HEALTH MPH RESEARCH METHODS, PROPOSAL DEVELOPMENT & SCIENTIFIC REPORT WRITING MODULE 5 2019
process is cyclic in nature with seven principle stages and self‐correcting. Rational criticism should be the heart of scientific enterprise, and science ought to be a revolution in permanence. The claims for knowledge are accepted only if they are congruent with the assumptions of science and its methodology.
1.11. PERFOMANCE EVALUATION: EXERCISES Before we leave this part of the module, reflect for a moment on your understanding on the modes of knowledge acquisition and then answer the following questions in the box provided. Send your answers by e‐mail to the Coordinator using the above address provided to you earlier in this module: Exercise #1:
1. What are three (3) modes or methods of acquiring knowledge? 2. Which one of the three modes is best suitable for scientific approach? And why? 3. Give examples of one advantage and one disadvantage of each of the three modes?
NB: Note that it is an exercise to test your understanding, but not copy writer.
Additional Readings
1. Chava Frankfort‐Nachmias & David Nachmias (2008). Research Methods in the Social
Science, 7th Edition, ISBN: 13: 978‐0‐7167‐5510‐0
2. Chava Nachmias and David Nachmias (1987). Research Methods in the Social Sciences,
2nd Edition, Edward Arnold Publishers LTD, London. ISBN: 0‐7131‐6283‐X
3. Stinchcombe, Arthur L (2005). The Logic of Social Science Research. Chicago, University
of Chicago Express
4. Varkevisser,C.M., Pathmanathan,I., Brownlee, A. (1991). Designing and Conducting
Health Systems Research Projects: Proposal Development and Field Works: Health
Systems Research Training Series, ISBN: 0‐88936‐585‐7
5. Wayne W. Daniel (2010). Biostatistics: Basic Concepts and Methodology for the Health
Sciences, 9th Edition, Wiley INC: ISBN: 978‐0‐470‐41333‐3
6. Sears, Alan (2005). A Good Book in Theory: A Guide to Theoretical Thinking in the Social
Sciences. Orchard Parck, NY: Broadview Press
12
LUSAKA APEX MEDICAL UNIVERSITY FACULTY OF PUBLIC HEALTH MPH RESEARCH METHODS, PROPOSAL DEVELOPMENT & SCIENTIFIC REPORT WRITING MODULE 5 2019
MODULE 5.2 PHILOSOPHICAL EPISTEMOLOGY OF RESEARCH
2.1. INTRODUCTION In the previous sessions of the first part of the module, we learnt about the scientific approach
to empirical research by articulating the meaningful understanding of science, assumptions
to science and the various modes of acquiring knowledge including the basic rules of
methodology and its purposes. In the second part of the module, we shall demonstrate
further the basic understanding of the conceptual foundations of research. Scientific
Knowledge is knowledge provable by both reason and experience. This implies that medical
or social scientists operate at two (2) distinct interrelated levels employing conceptual or
theoretical and observational or empirical levels. Research product is the interaction of these
two levels. This Module 5.2 introduces you further to the basics of the conceptual or
theoretical level and the relations between theory, models and empirical research. It include
provision of defining a concept and conceptual definitions, the meaning of research and its
characteristics.
2.2. OBJECTIVES
By the end of the sessions of this Module 5.2, you should be able to:
(1) Demonstrate the basic understanding of defining research, purposes and its characteristics, including the concepts applied in research.
(2) Discuss the relationships between theory, models and the empirical research. (3) Demonstrate the ability to formulate and provide a practical explanation of a
theoretical conceptual framework. (4) Describe the various components of the health system as a basis for
understanding public health research 2.3. REFLECTION
Try to reflect your own understanding on the four questions inserted in the following box below:
Questions: (1) In your own words, what is research? (2) What is a concept? (3) How do you define the conceptual definitions of conceptual and practical? (4) In your understanding, what could be the purposes of research in Public Health?
Well, pose for a little while, reflect and write down your own understanding on these four (4) questions.

13
LUSAKA APEX MEDICAL UNIVERSITY FACULTY OF PUBLIC HEALTH MPH RESEARCH METHODS, PROPOSAL DEVELOPMENT & SCIENTIFIC REPORT WRITING MODULE 5 2019
We want to imagine that within your own understanding of these linked concepts, one way to answer these questions is to first of all establish the meaning of ‘research’ and then dwell on the other aspects of research and the conceptual definitions.
1.4. CONCEPTS OF RESEARCH
1.4.1. DEFINITION What is Research? We define ‘Research’ as ‘the systematic collection, analysis and interpretation of data to
answer a certain question or solve a problem.’
1.4.2. PURPOSES OR OBJECTIVES OF RESEARCH
What are major Purposes of Research?
Research serves two (2) major purposes in acceleration of advances in health:
1) First, basic research‐ which is necessary to generate new knowledge and
technologies to deal with major unresolved problems.
2) Second, applied research‐ which is necessary to identify priority problems and
to design and evaluate policies and programmes that will deliver the greatest
health benefit and making optimal use of available resources.
During the past three decades, there has been a rapid revolution of concepts and research
approaches to support managerial aspects of health development. Many of these have been
described by specific terms, such as operations research, health services research, health
manpower research, policy and economic analysis, applied research, decision‐making
research, health systems research (HSR) and the more contemporary concept of
implementation research. Each of these has made crucial contributions to the development
of research in public health (WHO 1990, 1996).
1.4.3. CHARACTERISTICS OF RESEARCH
Research has four (4) major distinct characteristics which are:
It demands a clear statement of the problem.
It requires a plan‐ it is not aimlessly “looking” for something in the hopes that you
will “come across a solution.”
It builds on existing data, using both positive and negative findings; and
14
LUSAKA APEX MEDICAL UNIVERSITY FACULTY OF PUBLIC HEALTH MPH RESEARCH METHODS, PROPOSAL DEVELOPMENT & SCIENTIFIC REPORT WRITING MODULE 5 2019
New data should be collected as required and be organised in such a way that they
answer the original research question(s).
Research is a continuous process, the generalization of the findings ends with another circle
of reviewing data for that generalization if the unresolved problems remain unchanged.
2.5. THE FOCUS OF RESEARCH IN PUBLIC HEALTH (PHR)
Public Health Research (PHR) is ultimately concerned with improving the health of a community, by enhancing the efficiency and effectiveness of the “health system” in the context of prevention, control and promotion of the human wellbeing as an integral part of overall process of social and economic development.
What is meant by a “health System”?
A HEALTH SYSTEM may be described as:
A set of cultural beliefs about health and illness that forms the basis for health seeking behaviour and health‐promoting behaviour;
The institutional arrangements within which that behaviour occurs; and
The socioeconomic, political, and physical context for those beliefs and institutions.
In summary, it consists of what people ‘believe’ and ‘know’ about health and illness, and what
they do to remain healthy and cure diseases. Beliefs and action are usually connected. For
example, if in a society, people perceive evil ancestor‐spirits as a cause of disease, there will
be specialists and rituals to appease those spirits. If they see germs as the cause, they look for
modern (biomedical) health care.
If the modern health care is a recent introduction, people may accept services, but the beliefs
and knowledge to support this behaviour may not have been fully developed. Health workers
should, therefore, be aware of the indigenous explanations for illness so that “biomedical”
explanations can be adapted to these deeply rooted indigenous concepts.
The institutional arrangements within which health behaviour occurs encompasses more than
the delivery of medical care through public health services. They include all individuals, groups
and institutions that directly and indirectly contribute to health, these may differ from society
to society, but usually cover the following components:
1. The Individuals, family and community: The individuals, family and community
assume a vital responsibility for health promotion as well as for the curative care of its
members. In any society, it is stated that 70‐90% of all curative activities may take

15
LUSAKA APEX MEDICAL UNIVERSITY FACULTY OF PUBLIC HEALTH MPH RESEARCH METHODS, PROPOSAL DEVELOPMENT & SCIENTIFIC REPORT WRITING MODULE 5 2019
place within the network. This is supported by several studies carried out in Western
and non‐western societies (Scrimshaw and Hurtado 1984; Varkevisser et al. 1991)1.
2. Health Care services: The health care services consist of public sector health services
and the private sector services. For the Public sector services include:
Health workers at village or community level, mobile health services, rural health
clinics or posts, and their outreach services (e.g. midwifery, family medicine,
sanitation, nutrition, malaria control etc.)
Health centres, Urban clinics, district hospitals, and huge multispecialty hospitals
with their various support services, such as laboratory, radiology, pharmaceuticals
etc.
Institutions responsible for health personnel, health financing, health information
management system (informants) and the physical infrastructure.
The number, type, distribution and quality of services provided by these services
influence health and wellbeing of people.
For those for Private sector may include:
Folk or traditional medicine with traditional birth attendants, herbalists and
diviners who may identify natural and supernatural causes of diseases and treat
them accordingly.
The large numbers of non‐ western professionalized healing systems (e.g.
Chinese, Ayurvedic, Yunani, homeopathic, chiropractic, etc). In some countries,
these belong to the public sector.
Private “modern” medical practice, legal or illegal
The Pharmaceutical sector (private or parastatals); and
Non‐governmental health care services ( e.g. Churches, Red Cross, etc).
The relative importance of these components varies in different societies
3. Health Related Sectors: These include:
Agriculture and food distribution
Education (formal & non‐formal)
Water & sanitation
Transport and communication
All these sectors contribute to health, either directly or indirectly
1 See also Foster et al. (1978), and Park K. (2011). Preventive and Social Medicine 18th edition.

16
LUSAKA APEX MEDICAL UNIVERSITY FACULTY OF PUBLIC HEALTH MPH RESEARCH METHODS, PROPOSAL DEVELOPMENT & SCIENTIFIC REPORT WRITING MODULE 5 2019
Public Health Research is multidisciplinary
The aim of public health research is to provide relevant information to make decisions on
solving problems for the health systems concerned with public health. It should be recognized
that many of the issues in the area of concern (see Figure 2.1.) are interrelated and interact
with issues in other areas. Research in public health must therefore recognize this. The
research skills needed might need to come from a variety of disciplines e.g. medical (both
human and animals), epidemiology & population, behavioural science, economics, etc. to
demonstrate that public health in multidisciplinary in nature.
Figure 2.1 and Figure 2.2 illustrate the types of disciplines that may be needed in public health
research focused on these various areas of concern with the public health system
(Varkervisser et al. 1991).
Figure 2.1. Multidisciplinary Skills in Public Health Research (adapted from Varkevisser et al.1991)
POLICY: Political science Policy analysis Technology assessment Epidemiology, Economics
ENVIRONMENT: Epidemiology Population/Geography Environmental sciences Biology
MANAGEMENT:Strategic Planning Management sciences Health Economics
DIRECT SERVICES: Clinical Epidemiology Quality Assurance Biomedical Sciences Behavioural Sciences Operation Research Epidemiology
INDIVIDUALS & FAMILIES: Epidemiology Behavioural Science Social work Health promotion
COMMUNITY: Behavioural sciences Epidemiology Social work Community development Health promotion

17
LUSAKA APEX MEDICAL UNIVERSITY FACULTY OF PUBLIC HEALTH MPH RESEARCH METHODS, PROPOSAL DEVELOPMENT & SCIENTIFIC REPORT WRITING MODULE 5 2019
Figure 2.2: Areas of Major Concern within Public Health system . Priority health needs . Equity in distribution of resources . Acceptance & dignity of cultural & humanitarian values p P
∙ Agreement with policy ∙ Effectiveness & efficiency In supporting direct services
(financial support, equipment Training & supervision)
∙ Development of adequate Monitoring & evaluation
∙ Provision of clean water air, water and sanitation ∙ Adequate disposal of industrial Wastes ∙ Preservation of natural resources ∙ Development of instruments & practices for promoting health ∙ Community participation In health activities ∙ Assessment of physical, mental & Socioeconomic needs ∙ Potential for addressing specific health Problems & needs ∙Appropriateness of services (covering priority needs) ∙Effectiveness (Quality) ∙ Efficiency (timely & Resources) ∙ Acceptability ∙Accessibility of services
Even the simple research that is done at the operational level may require research skills from different disciplines (e.g. epidemiology, demography, sociology, and management) to provide sufficient and relevant information to support decision‐making. Therefore, training capacity in public health research includes relevant aspects from various research disciplines, depending upon the nature of the health problem. The next sections of this Unit will examine the conceptual definitions of research for holistic understanding of what is involved in research.
POLICY:∙The role of public health in national development plan
ENVIRONMENT:∙Improvement of living conditions
ADMINISTRATION & MANAGEMENT:
COMMUNITY: INDIVIDUALS &FAMILIES:
DIRECT SERVICES:

18
LUSAKA APEX MEDICAL UNIVERSITY FACULTY OF PUBLIC HEALTH MPH RESEARCH METHODS, PROPOSAL DEVELOPMENT & SCIENTIFIC REPORT WRITING MODULE 5 2019
2.6. CONCEPTS, CONCEPTUAL & OPERATIONAL DEFINITIONS OF RESEARCH DEFINITION What is a concept? A concept is a significant symbolic language in research. It is an abstraction representing an object or a certain phenomenon. For example, “social status,” “role,” “power,” “intelligence,” and “perception” are common concepts in political science, sociology and psychology. For those, such as “health status,” “availability,” “accessibility,” “incidence” and “prevalence” are common in medical sciences and management sciences. Each scientific discipline develops its unique set of concepts and to scientists, this constitutes a language outside “jargon.”
FUNCTIONS OF CONCEPTS Concepts serve a number of important functions in research which are:
First, they are the foundation of communication and thought. Without a set of agreed‐upon concepts, intersubjective communication in impossible. Concepts are abstracted from sense impression and are used to convey and transmit perceptions and information.
Second, concepts introduce a point of view‐ a way of looking at empirical phenomena. The concept enables scientists to relate to aspect of reality and give it a common quality implying that it acts as a sensitizer of experience and perception, opening new realms of observation and clothing others.
Third, is that concepts are means of classification and generalization. Scientists categorize, structure, order and generalize their experiences and observations in terms of concepts as Nachmias (1981) put it.
TYPES OF CONCEPTS There are two important types of Concepts: (a) conceptual definitions and (b) operational definitions
(a) Conceptual Definitions
What are Conceptual Definitions? Definitions that describe concepts using other concepts are called conceptual definitions. For example, “power” has been conceptually defined as the ability of an actor (e.g. individual, group, state etc) to get another actor to do something, while “age” is conceptually defined as the life expectancy of survival chance of a person or a living species to the current period in years, months, weeks, days or hours.
19
LUSAKA APEX MEDICAL UNIVERSITY FACULTY OF PUBLIC HEALTH MPH RESEARCH METHODS, PROPOSAL DEVELOPMENT & SCIENTIFIC REPORT WRITING MODULE 5 2019
(b) Operational Definitions
What are Operational Definitions? An operational definition is a set of procedures that describe the activities one should perform in order to establish empirically the existence or degree of existence of a concept. In short, it is how you will measure the concept by applying “indicators” and “scales of measurements” as necessary tools to establish empirical evidence. For example, an operational definition of “length” would specify a procedure involving the use of a ruler or a tape for determining the length of distance between two points. An operational definition of “weight” would specify how weight is determined by means of an appropriate instrument, for instance, a scale. Many concepts, especially in social sciences, are operationally defined solely on the strength of reactions to specific stimuli, conditions or situation because the physical manipulation of individuals or events is either impossible or unethical. Even if we could manipulate individuals through certain operations‐ say, induce fear in a laboratory situation‐ it would involve a number of critical ethical dilemmas, including the rights of scientists to do and the personal rights of the researched individuals.
2.7. THEORY: FUNCTIONS & TYPES Having dealt with the concepts, conceptual and operational definitions, we now turn to the aspect of “ theory” as the major concept in empirical research. Although scientists agree that one of the most important functions of empirical research is‐ to contribute to the development and refinement of theory and that theory enhances the goals of science, little is known of the concept of “theory”.
DEFINITION OF THEORY What is the Meaning of Theory in Research? Theory means different things to different people. Some scientists identify theory with any kind of conceptualization, Concepts such as power, social status and democracy, when defined and used in interpretations of empirical phenomena are equated with theory. It means that any conceptualization as opposite to observation is theory. Others view theory as the “history iof ideas,” while some view it in a narrow term as‐ a logical‐deductive system consisting of a set of interrelated concepts from which testable proportions can be deductively derived.

20
LUSAKA APEX MEDICAL UNIVERSITY FACULTY OF PUBLIC HEALTH MPH RESEARCH METHODS, PROPOSAL DEVELOPMENT & SCIENTIFIC REPORT WRITING MODULE 5 2019
TYPES OF THEORY There are four levels of theory classified: ad hoc classificatory system; taxonomies; conceptual frameworks; and theoretical systems.
(a) Ad hoc classificatory system An ad hoc classificatory system consists of arbitrary categories constructed in order to organize and summarize empirical observations. For example, the classification of individuals’ response to the questionnaire item “All groups can live in harmony in this country without changing the system in any way” into four categories “strongly agree,” “Agree,” “Disagree,” “Strongly Disagree,” constitutes an ad hoc classification system.
(b) Taxonomies The second level of theory is the categorical system, or taxonomy. It consist of a system of categories constructed to fit the empirical observations so that relationships among categories can be described. Taxonomies have two functions: First, they specify the unit of empirical reality to be analysed and indicate how the unit may be described. The second function is‐ to summarize and describe, such as in descriptive studies, like those concerned with the empirical distributions of one or more categories of taxonomy. Taxonomies do not offer explanations, but they only describe empirical phenomena by fitting them into a set of categories. To know the concepts that represent the phenomena. For example, marital status, education status, and their distributions, for example how many married, single , divorced , or never in school, primary, secondary etc provide taxonomy of events.
(c) Conceptual Frameworks The third level of theory is the conceptual frameworks. Here descriptive categories are systematically placed within a broad structure (frame) of explicit assumed propositions. For example communication theory serves as an example of conceptual framework as illustrated in Figure 2.3. In the framework, the central concepts are: information source; transmitter; Channel noise; receiver and destination, while the sequential feedback is to perform the function of continuity. The concepts such as signal transmission, destination and communication net and channel noise are used to analyse and explain empirical observations and a systematic image of the communication reality.
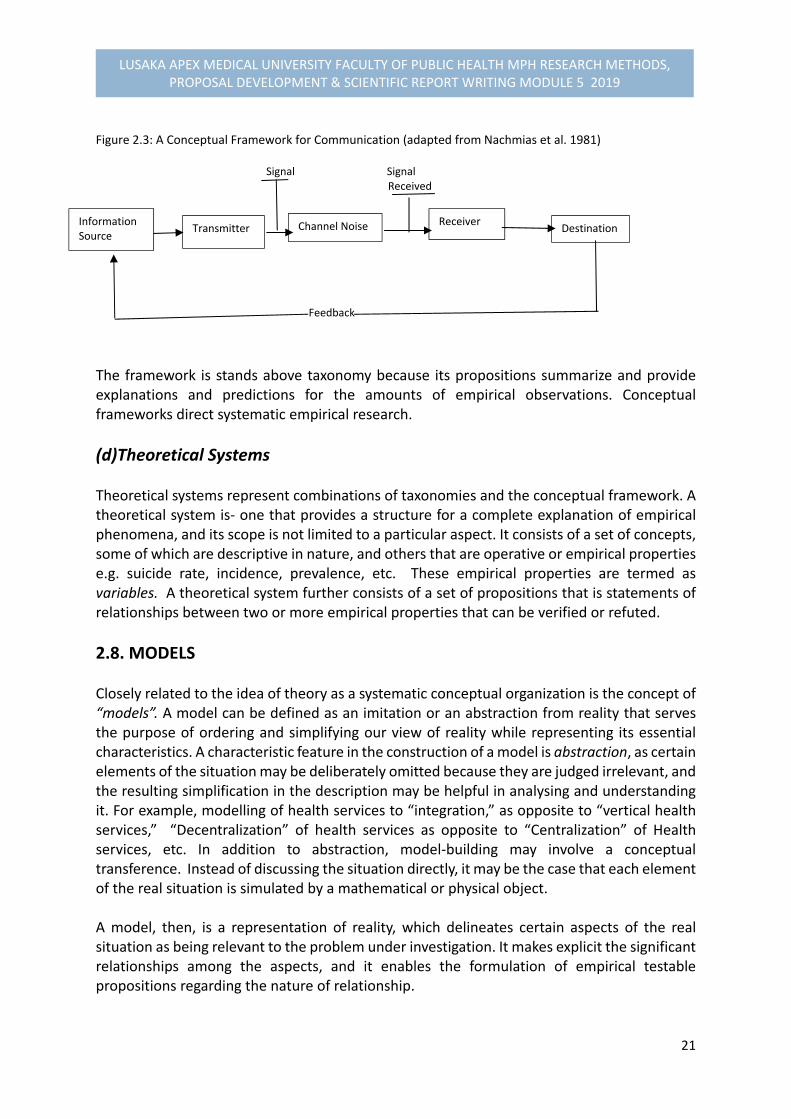
21
LUSAKA APEX MEDICAL UNIVERSITY FACULTY OF PUBLIC HEALTH MPH RESEARCH METHODS, PROPOSAL DEVELOPMENT & SCIENTIFIC REPORT WRITING MODULE 5 2019
Figure 2.3: A Conceptual Framework for Communication (adapted from Nachmias et al. 1981) Signal Signal Received
Feedback
The framework is stands above taxonomy because its propositions summarize and provide explanations and predictions for the amounts of empirical observations. Conceptual frameworks direct systematic empirical research.
(d)Theoretical Systems Theoretical systems represent combinations of taxonomies and the conceptual framework. A theoretical system is‐ one that provides a structure for a complete explanation of empirical phenomena, and its scope is not limited to a particular aspect. It consists of a set of concepts, some of which are descriptive in nature, and others that are operative or empirical properties e.g. suicide rate, incidence, prevalence, etc. These empirical properties are termed as variables. A theoretical system further consists of a set of propositions that is statements of relationships between two or more empirical properties that can be verified or refuted.
2.8. MODELS Closely related to the idea of theory as a systematic conceptual organization is the concept of “models”. A model can be defined as an imitation or an abstraction from reality that serves the purpose of ordering and simplifying our view of reality while representing its essential characteristics. A characteristic feature in the construction of a model is abstraction, as certain elements of the situation may be deliberately omitted because they are judged irrelevant, and the resulting simplification in the description may be helpful in analysing and understanding it. For example, modelling of health services to “integration,” as opposite to “vertical health services,” “Decentralization” of health services as opposite to “Centralization” of Health services, etc. In addition to abstraction, model‐building may involve a conceptual transference. Instead of discussing the situation directly, it may be the case that each element of the real situation is simulated by a mathematical or physical object. A model, then, is a representation of reality, which delineates certain aspects of the real situation as being relevant to the problem under investigation. It makes explicit the significant relationships among the aspects, and it enables the formulation of empirical testable propositions regarding the nature of relationship.
Information Source
Transmitter Channel Noise Receiver Destination
22
LUSAKA APEX MEDICAL UNIVERSITY FACULTY OF PUBLIC HEALTH MPH RESEARCH METHODS, PROPOSAL DEVELOPMENT & SCIENTIFIC REPORT WRITING MODULE 5 2019
Models can also be used to gain insight into phenomena that cannot be directly observed. In policy analysis, for example, models are used to estimate the value of various alternative courses of action on which a decision maker might take action. In other words, the models provide a more explicit basis for choice than subjective judgement.
2.9. SUMMARY We learnt in this second part of the module that:
Research is a systematic collection, analysis and interpretation of data to answer a certain question to solve a problem. Research has two major purposes: to provide basic research necessary to generate new knowledge and technologies to deal with unresolved problems, and second for applied research to identify priority problems, and design and evaluate policies and programmes.
Characteristics of research constitutes four levels: Demands a statement of problem, requires a plan, builds on existing data, and new data to answer original research questions.
Public health is dynamic and constitutes variety of disciplines to respond to public health priorities. Research in public health should focus on a multidisciplinary level to address the areas of concerns to provide sufficient and relevant information to support decision‐making.
On the concepts of research and their definitions, one of the most significant symbols in science is the concept. Science begins by forming concepts to describe the empirical situation and advances by relating these concepts into theoretical systems. Concepts enable effective communication, they introduce a point of view, they are means for classification and generalization, and they serve as the building blocks of propositions, theories and hypotheses to be learnt later.
To serve their functions, concepts have to be clear, precise, and agree‐upon. This is achieved by conceptual and operational definitions. A conceptual definition describes concepts using primitive and derived terms. Operational definition explicate the set of procedures and activities that one should perform in order to observe empirically the phenomena represented by the concepts. Operational definitions connect the conceptual‐theoretical level with the empirical‐observational.
Even though scientists are in agreements that theory is the ultimate achievement of scientific undertakings, there are divergent views concerning the meaning and structure of theory. At present four levels of theory can be distinguished: ad hoc classificatory system, taxonomies, conceptual frameworks, and theoretical systems.
Models are often used by scientists to represent systematically certain aspects of the real situation. Models are abstractions from reality that serve the purpose of ordering and simplifying views of reality, while still representing its essential attributes. Models are also used to gain insight of phenomena that cannot be directly observed.
23
LUSAKA APEX MEDICAL UNIVERSITY FACULTY OF PUBLIC HEALTH MPH RESEARCH METHODS, PROPOSAL DEVELOPMENT & SCIENTIFIC REPORT WRITING MODULE 5 2019
2.10. PERFORMANCE EVALUATION: EXERCISES
Exercise #2:
The exercise for this part of module is for you to review the concepts of research, its definition, characteristics and the role of research in public health. Reflect on these issues and write down whether they would be relevant to your line of thought for the public health problems you intent to investigate by responding to the following questions: 1). Define research and its role in public health? 2) In what way are characteristics of research useful in developing a research proposal? 3) What is your understanding of the differences between a “conceptual framework” and a “model?” Provide an example of each element NB: Submit your work after a week for assessment.
Additional Readings
1. Chava Frankfort‐Nachmias & David Nachmias (2008). Research Methods in the Social
Science, 7th Edition, ISBN: 13: 978‐0‐7167‐5510‐0
2. Park K. 2011. Preventive and Social medicine, 18th
Edition. 3. Varkevisser,C.M., Pathmanathan,I., Brownlee, A. (1991). Designing and Conducting
Health Systems Research Projects: Proposal Development and Field Works: Health
Systems Research Training Series, ISBN: 0‐88936‐585‐7
4. Wayne W. Daniel (2010). Biostatistics: Basic Concepts and Methodology for the Health
Sciences, 9th Edition, Wiley INC: ISBN: 978‐0‐470‐41333‐3
5. Sears, Alan (2005). A Good Book in Theory: A Guide to Theoretical Thinking in the Social
Sciences. Orchard Parck, NY: Broadview Press

24
LUSAKA APEX MEDICAL UNIVERSITY FACULTY OF PUBLIC HEALTH MPH RESEARCH METHODS, PROPOSAL DEVELOPMENT & SCIENTIFIC REPORT WRITING MODULE 5 2019
MODULE 5.3
BASIC ELEMENTS OF RESEARCH: PROBLEMS & CONCEPTUAL ANALYSIS
3.1. INTRODUCTION Whether the research is carried out under the “Theory‐then‐ Research” or the “Research‐then‐ Theory strategy, the terms research problem, problem identification and prioritization, conceptual problem analysis, Formulation of statement of problem, Literature Review, Conceptual problem analysis, research questions, hypothesis, research objectives, variables and relation are the basic elements of research. They help transform an idea into concrete research operations. This Module 5.3 introduces you to these basic terms to discuss and exemplify the use of these basic terms in the context of the research process.
3.2. OBJECTIVES
By the end of this Module sessions, you should be able to: (1) Demonstrate the basic understanding of the terms research problem, problem
identification and prioritization, statement of problem, research questions, hypothesis, research objectives and variables.
(2) Discuss and apply the use of these basic elements of research in the context of research process to your relevant research problem for investigation.
(3) Describe the process of formulating conceptual problem analysis, interpretation, and relation, and the techniques of formulating a statement of problem for the research proposal you will be developing during the course
(4) Demonstrate the scientific techniques of writing a literature review. (5) Identify and describe the differential relationships between factors and variables
3.3. REFLECTION
Before presenting to you the various sessions of in this Module, try to reflect on the following questions relating to some basic research terms in your own understanding outlined in the Box below: Reflection Exercise:
1) What is the meaning of a research problem? 2) How do you identify and prioritize a problem for a research? 3) What is a research question?
Write down your answers on a paper and later compare your attempted answers with what will be taught.
Whether your answers are right or wrong, we will now begin by explaining the basic understanding of these research terms for the initial development of the research process as stated in the introduction and objectives of this unit module.
25
LUSAKA APEX MEDICAL UNIVERSITY FACULTY OF PUBLIC HEALTH MPH RESEARCH METHODS, PROPOSAL DEVELOPMENT & SCIENTIFIC REPORT WRITING MODULE 5 2019
3.4. RESEARCH PROBLEMS What is a Research Problem? In the beginning of the research process discussed earlier in Unit 1 is the “problem.” First of all, “The scientist is a person with a problem, or she or he is nothing”. A “Problem” is an intellectual stimulus calling for an answer in the form of scientific inquiry. For example, what is the prevalence of HIV status in Zambia? What factors can explain the incidence of diarrhoeal diseases associated with cholera among population in urban cities? How can inflation be contracted? Are all problems amenable to scientific investigation. To provide the concrete understanding of a problem, there are must be available information required to define the research problem situation. One thing to note is that not all intellectual stimuli can be empirically studies, and not all human behaviour is guided by scientific knowledge. We note in our previous session on assumptions of science themselves that are empirically non‐researchable. They are neither proved nor provable. Similarly, a question such as “will western civilization disappear?” cannot be empirically investigated.
3.4.1. PROBLEM IDENTIFICATION, SELECTION & PRIORITIZATION The identification and selection of a problem for empirical investigation involve series of activities: First, Exploring the Problem (as starting point):
1) Search for Information through, literature review, record review and observations or discussions with potential people which will be discussed in the subsequent sections of this Unit.
2) Determine conditions to facilitate problem identification. What are these conditions?: A problem for investigation depends on three conditions:
First, there should be a perceived difference or discrepancy between what exists and the ideal or planned situation.
Second, reasons or factors for the difference should be unclear so that it makes sense to develop a research question.
Third, there should be provision for more than one possible answer to the question or solution to the problem.
Example of a problem situation: “In District X with population of 145,000, sanitary conditions are poor‐ 5% of households have latrines. Diseases associated with poor sanitation, such as hepatitis, gastro‐enteritis and worms are very common. The Ministry of Health has initiated a sanitation project that aims at increasing the number of households with latrines by
26
LUSAKA APEX MEDICAL UNIVERSITY FACULTY OF PUBLIC HEALTH MPH RESEARCH METHODS, PROPOSAL DEVELOPMENT & SCIENTIFIC REPORT WRITING MODULE 5 2019
15% each year. The project provides materials and the community should provide labour. Two years later, less than half of the target has been reached.” Discrepancy‐ 35% of the households should have latrines, but only 15% do have them Research question‐ What factors can explain this difference? Possible answers or reasons: The reasons could be related to: a) Service‐related factors, such as conflicts in the supply of materials; inadequate
skills; and efficiency of sanitary staff, or lack of supervision. b) Community‐related factors, such as lack of understanding of the relationship
between disease occurrence and sanitation, or considered not a priority. c) Behavioural related factors, such as attitude of community members and
providers towards sanitation project, or d) Policy related factors, such as lack of policy guidelines to influence provider’s
standard application of community participation measures with that of community members.
Second, Prioritizing Problems for Investigation: Public Health Research is intended to provide information for decision‐making to improve the health care system. The selection and analysis of the problem for research should involve those who are responsible for the health care of the community. Each problem that is proposed for research has to be judged according to certain criteria.
Criteria for selecting research topic (s) are seven (7) in all and are: 1) Relevance: You need to consider a problem as being perceived as important by asking
the following questions, such as how large or wide spread is the problem?, who si affected?, how severe is the problem? (i.e in terms morbidity and mortality). Consider the discrepancy existing in relation to interventions provided to improve the problem situation.
2) Avoidance of Duplication: You need to consider carefully whether you can find answer to the problem in already available unpublished or published information. If so, you should drop the topic from the list, or review the methodology carefully for differences before you replicate the topic.
3) Feasibility: consider the complexity of the problem in relation to the resources you will require to carry out study. The thought should be given to first to personnel (human resource), time, equipment and money that are locally available, and exploring the possibility of obtaining technical and financial assistance from external sources.
4) Political Acceptability: In this part, you need to consider whether the research topic will gain interest and support to the authorities. This may increase the chance that the results of the study will be implemented. You need to make an effort to involve policymakers at an early stage to limit chances for confrontation later.
5) Applicability of Possible Results and Recommendations: You need further to ask a question whether is it likely that the recommendations from the study will be applied or not. This will depend on the approval by the authorities, and the availability of resources for implementing the recommendations.
6) Urgency of Data Needed: Consider how urgently results be needed for making decisions, by considering which research should be done first and which can be done later.
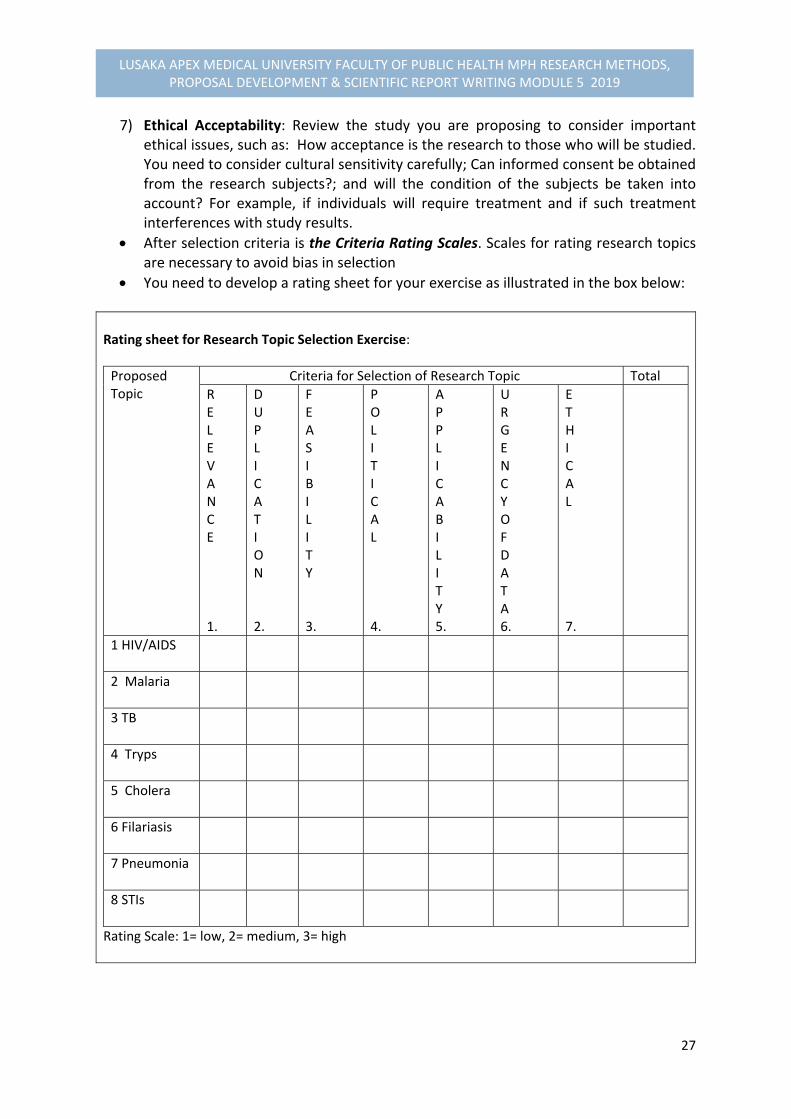
27
LUSAKA APEX MEDICAL UNIVERSITY FACULTY OF PUBLIC HEALTH MPH RESEARCH METHODS, PROPOSAL DEVELOPMENT & SCIENTIFIC REPORT WRITING MODULE 5 2019
7) Ethical Acceptability: Review the study you are proposing to consider important ethical issues, such as: How acceptance is the research to those who will be studied. You need to consider cultural sensitivity carefully; Can informed consent be obtained from the research subjects?; and will the condition of the subjects be taken into account? For example, if individuals will require treatment and if such treatment interferences with study results.
After selection criteria is the Criteria Rating Scales. Scales for rating research topics are necessary to avoid bias in selection
You need to develop a rating sheet for your exercise as illustrated in the box below: Rating sheet for Research Topic Selection Exercise:
Proposed Topic
Criteria for Selection of Research Topic Total
R E L E V A N C E 1.
D U P L I C A T I O N 2.
F E A S I B I L I T Y 3.
P O L I T I C A L 4.
A P P L I C A B I L I T Y 5.
U R G E N C Y O F D A T A 6.
E T H I C A L 7.
1 HIV/AIDS
2 Malaria
3 TB
4 Tryps
5 Cholera
6 Filariasis
7 Pneumonia
8 STIs
Rating Scale: 1= low, 2= medium, 3= high
28
LUSAKA APEX MEDICAL UNIVERSITY FACULTY OF PUBLIC HEALTH MPH RESEARCH METHODS, PROPOSAL DEVELOPMENT & SCIENTIFIC REPORT WRITING MODULE 5 2019
Third, Analysis & Statement of Problem which will be discussed in the following sub section of this Unit module.
3.4.2. PROBLEM ANALYSIS
IMPORTANCE OF PROBLEM ANALYSIS Analysis provides a critical attention to the various aspects of the problem. Therefore, a systematic analysis of the problem is a very crucial step in designing the research because it:
Enables you who is concerned to pool your knowledge of the problem.
Clarifies the problem and the possible factors or causes that may contribute to it and the effects of the problem, and
Facilitates decisions concerning the focus and scope of the research.
STEPS IN ANALYZING THE PROBLEM Step 1: Clarify the areas of concern within the health system in relation to the problem: Areas of concern within the health system are often expressed in broad or vague terms by health workers. For example,
“Care of diabetic patients needs or factor review”.
“Outpatient Services must be evaluated.”
“Bypassing of peripheral facilities should be investigated.” You should then clarify the issues by listing all the problems in the area of concern as they perceive them. Remember that a research problem exists when there is a discrepancy between “what is” and “what should be.” Therefore, the perceived problems should be worded in such a way as to illustrate this discrepancy. For example, health workers may determine that the general concern that “care of diabetic patients needs review” includes the following problems or factors:
Insufficient awareness of diabetes and of self‐care measures among diabetic patients and their relatives;
Insufficient peripheral facilities for long term follow‐up care;
Excessive rate of readmissions among diabetics;
Inappropriate management of complications in diabetic patients;
High rate of diabetic complications;
Poor compliance of patients with therapy; etc
Step 2: Further specify and describe the core problem or outcome problem.
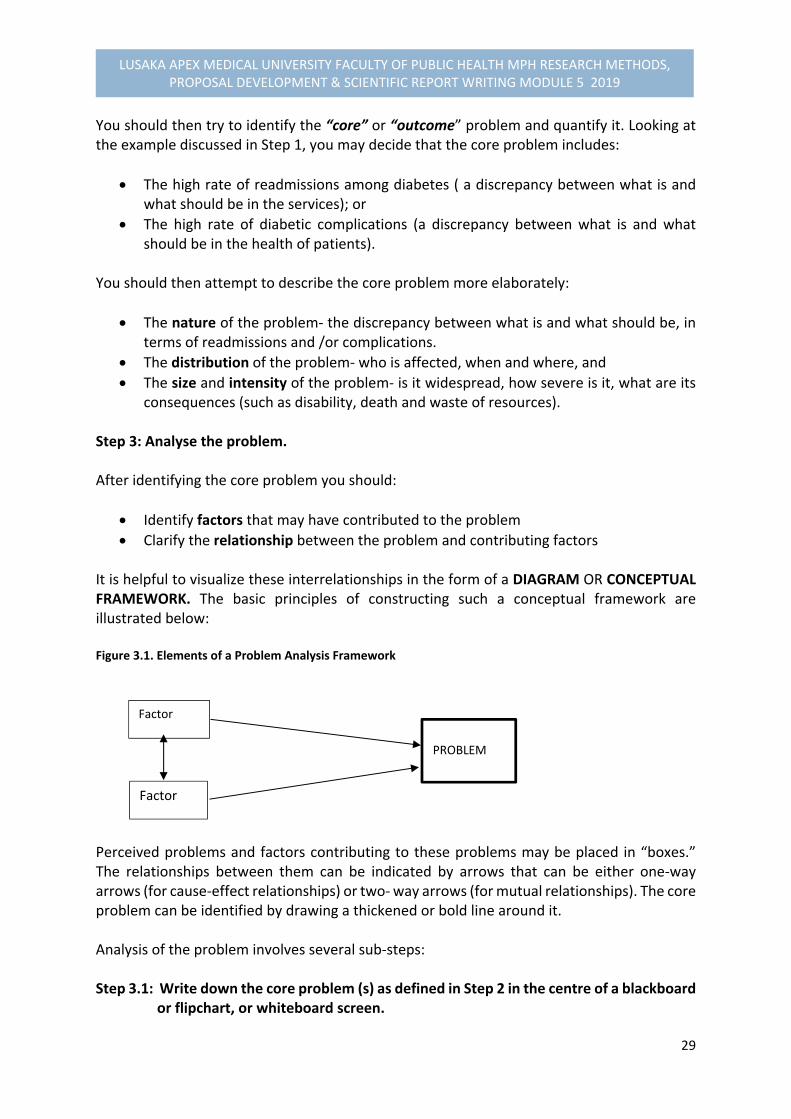
29
LUSAKA APEX MEDICAL UNIVERSITY FACULTY OF PUBLIC HEALTH MPH RESEARCH METHODS, PROPOSAL DEVELOPMENT & SCIENTIFIC REPORT WRITING MODULE 5 2019
You should then try to identify the “core” or “outcome” problem and quantify it. Looking at the example discussed in Step 1, you may decide that the core problem includes:
The high rate of readmissions among diabetes ( a discrepancy between what is and what should be in the services); or
The high rate of diabetic complications (a discrepancy between what is and what should be in the health of patients).
You should then attempt to describe the core problem more elaborately:
The nature of the problem‐ the discrepancy between what is and what should be, in terms of readmissions and /or complications.
The distribution of the problem‐ who is affected, when and where, and
The size and intensity of the problem‐ is it widespread, how severe is it, what are its consequences (such as disability, death and waste of resources).
Step 3: Analyse the problem. After identifying the core problem you should:
Identify factors that may have contributed to the problem
Clarify the relationship between the problem and contributing factors It is helpful to visualize these interrelationships in the form of a DIAGRAM OR CONCEPTUAL FRAMEWORK. The basic principles of constructing such a conceptual framework are illustrated below: Figure 3.1. Elements of a Problem Analysis Framework
Perceived problems and factors contributing to these problems may be placed in “boxes.” The relationships between them can be indicated by arrows that can be either one‐way arrows (for cause‐effect relationships) or two‐ way arrows (for mutual relationships). The core problem can be identified by drawing a thickened or bold line around it. Analysis of the problem involves several sub‐steps: Step 3.1: Write down the core problem (s) as defined in Step 2 in the centre of a blackboard or flipchart, or whiteboard screen.
Factor
Factor
PROBLEM
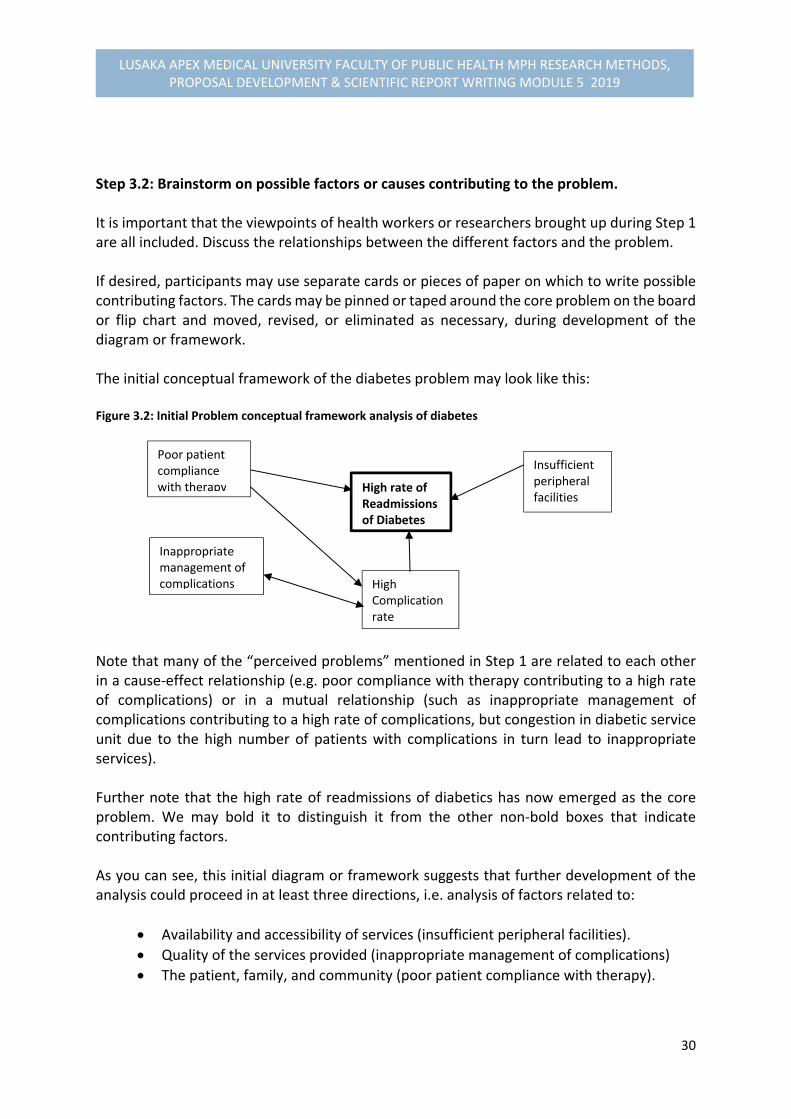
30
LUSAKA APEX MEDICAL UNIVERSITY FACULTY OF PUBLIC HEALTH MPH RESEARCH METHODS, PROPOSAL DEVELOPMENT & SCIENTIFIC REPORT WRITING MODULE 5 2019
Step 3.2: Brainstorm on possible factors or causes contributing to the problem. It is important that the viewpoints of health workers or researchers brought up during Step 1 are all included. Discuss the relationships between the different factors and the problem. If desired, participants may use separate cards or pieces of paper on which to write possible contributing factors. The cards may be pinned or taped around the core problem on the board or flip chart and moved, revised, or eliminated as necessary, during development of the diagram or framework. The initial conceptual framework of the diabetes problem may look like this: Figure 3.2: Initial Problem conceptual framework analysis of diabetes
Note that many of the “perceived problems” mentioned in Step 1 are related to each other in a cause‐effect relationship (e.g. poor compliance with therapy contributing to a high rate of complications) or in a mutual relationship (such as inappropriate management of complications contributing to a high rate of complications, but congestion in diabetic service unit due to the high number of patients with complications in turn lead to inappropriate services). Further note that the high rate of readmissions of diabetics has now emerged as the core problem. We may bold it to distinguish it from the other non‐bold boxes that indicate contributing factors. As you can see, this initial diagram or framework suggests that further development of the analysis could proceed in at least three directions, i.e. analysis of factors related to:
Availability and accessibility of services (insufficient peripheral facilities).
Quality of the services provided (inappropriate management of complications)
The patient, family, and community (poor patient compliance with therapy).
High rate of Readmissions of Diabetes
Poor patient compliance with therapy
Inappropriate management of complications High
Complication rate
Insufficient peripheral facilities
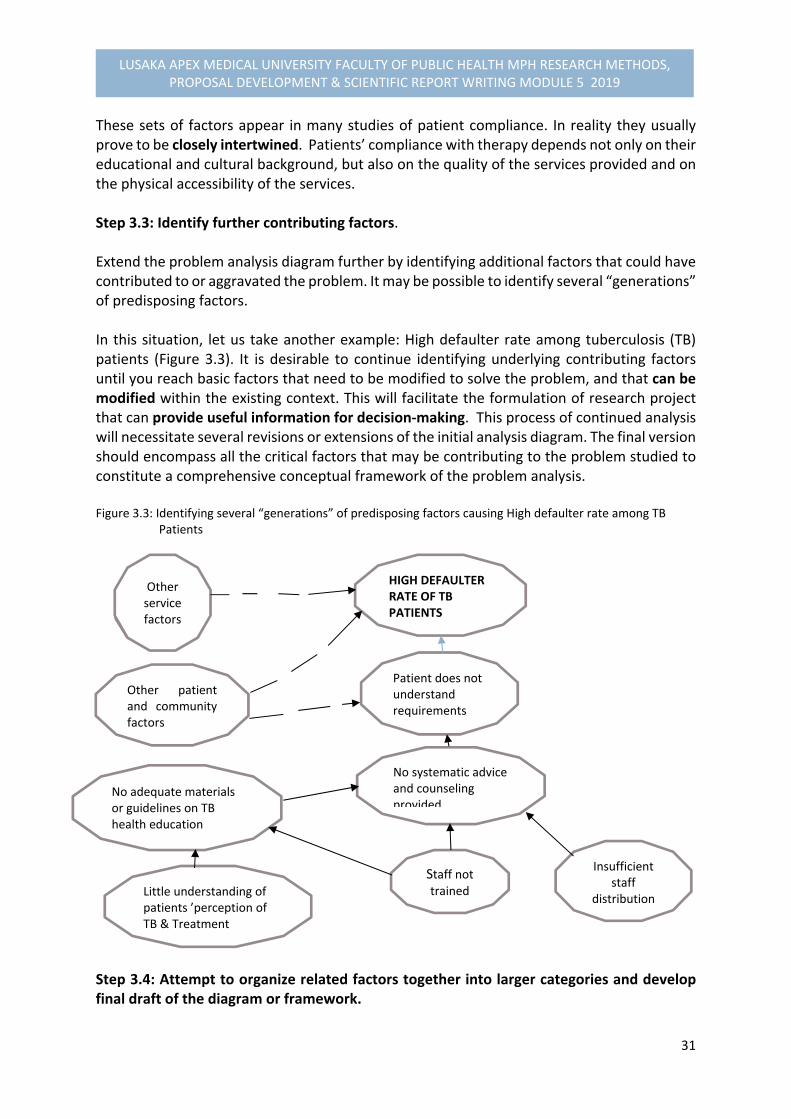
31
LUSAKA APEX MEDICAL UNIVERSITY FACULTY OF PUBLIC HEALTH MPH RESEARCH METHODS, PROPOSAL DEVELOPMENT & SCIENTIFIC REPORT WRITING MODULE 5 2019
These sets of factors appear in many studies of patient compliance. In reality they usually prove to be closely intertwined. Patients’ compliance with therapy depends not only on their educational and cultural background, but also on the quality of the services provided and on the physical accessibility of the services. Step 3.3: Identify further contributing factors. Extend the problem analysis diagram further by identifying additional factors that could have contributed to or aggravated the problem. It may be possible to identify several “generations” of predisposing factors. In this situation, let us take another example: High defaulter rate among tuberculosis (TB) patients (Figure 3.3). It is desirable to continue identifying underlying contributing factors until you reach basic factors that need to be modified to solve the problem, and that can be modified within the existing context. This will facilitate the formulation of research project that can provide useful information for decision‐making. This process of continued analysis will necessitate several revisions or extensions of the initial analysis diagram. The final version should encompass all the critical factors that may be contributing to the problem studied to constitute a comprehensive conceptual framework of the problem analysis. Figure 3.3: Identifying several “generations” of predisposing factors causing High defaulter rate among TB Patients
Step 3.4: Attempt to organize related factors together into larger categories and develop final draft of the diagram or framework.
Other patient and community factors
HIGH DEFAULTER RATE OF TB PATIENTS
Patient does not understand requirements
No systematic advice and counseling provided
No adequate materials or guidelines on TB health education
Staff not trained
Insufficient staff
distributionLittle understanding of patients ’perception of TB & Treatment
Other service factors
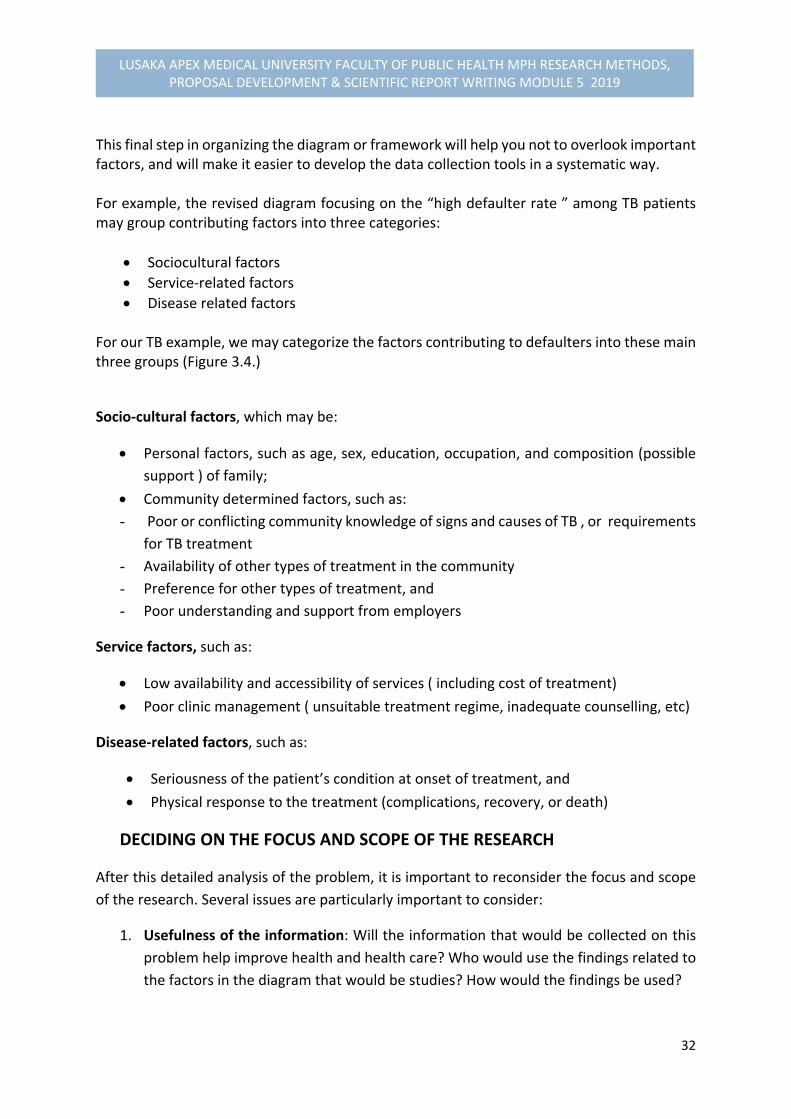
32
LUSAKA APEX MEDICAL UNIVERSITY FACULTY OF PUBLIC HEALTH MPH RESEARCH METHODS, PROPOSAL DEVELOPMENT & SCIENTIFIC REPORT WRITING MODULE 5 2019
This final step in organizing the diagram or framework will help you not to overlook important factors, and will make it easier to develop the data collection tools in a systematic way. For example, the revised diagram focusing on the “high defaulter rate ” among TB patients may group contributing factors into three categories:
Sociocultural factors
Service‐related factors
Disease related factors For our TB example, we may categorize the factors contributing to defaulters into these main three groups (Figure 3.4.)
Socio‐cultural factors, which may be:
Personal factors, such as age, sex, education, occupation, and composition (possible
support ) of family;
Community determined factors, such as:
- Poor or conflicting community knowledge of signs and causes of TB , or requirements
for TB treatment
- Availability of other types of treatment in the community
- Preference for other types of treatment, and
- Poor understanding and support from employers
Service factors, such as:
Low availability and accessibility of services ( including cost of treatment)
Poor clinic management ( unsuitable treatment regime, inadequate counselling, etc)
Disease‐related factors, such as:
Seriousness of the patient’s condition at onset of treatment, and
Physical response to the treatment (complications, recovery, or death)
DECIDING ON THE FOCUS AND SCOPE OF THE RESEARCH
After this detailed analysis of the problem, it is important to reconsider the focus and scope
of the research. Several issues are particularly important to consider:
1. Usefulness of the information: Will the information that would be collected on this
problem help improve health and health care? Who would use the findings related to
the factors in the diagram that would be studies? How would the findings be used?
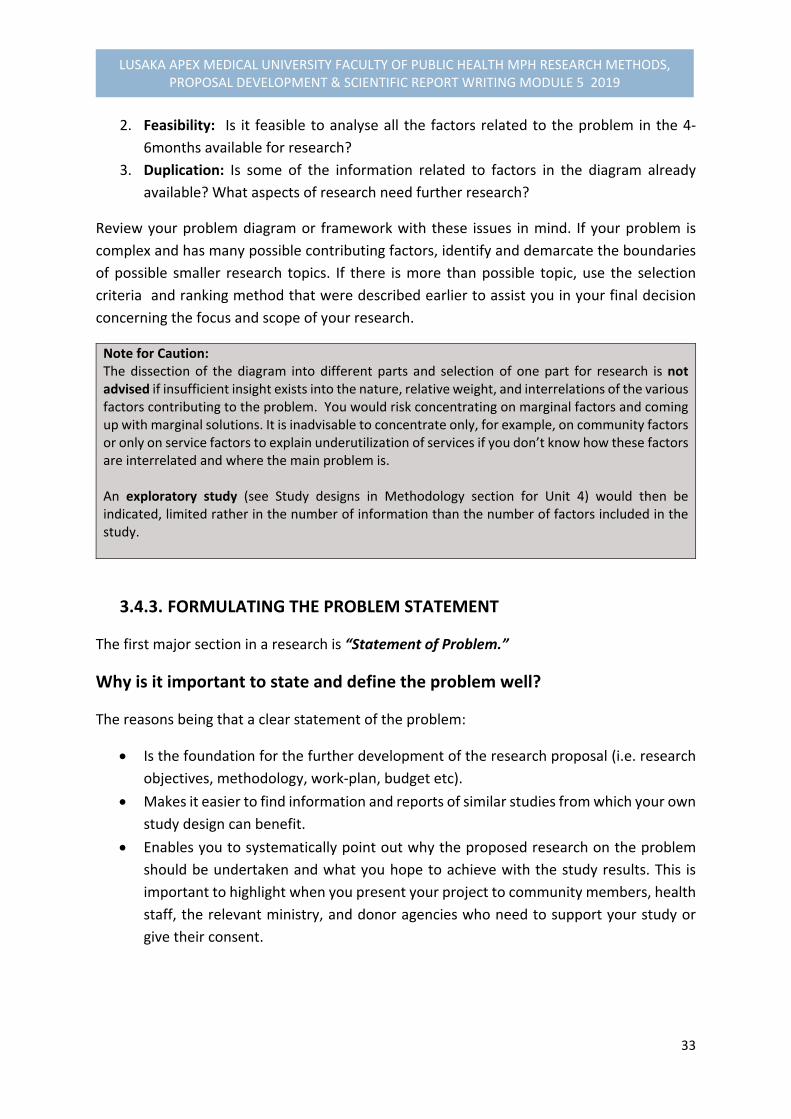
33
LUSAKA APEX MEDICAL UNIVERSITY FACULTY OF PUBLIC HEALTH MPH RESEARCH METHODS, PROPOSAL DEVELOPMENT & SCIENTIFIC REPORT WRITING MODULE 5 2019
2. Feasibility: Is it feasible to analyse all the factors related to the problem in the 4‐
6months available for research?
3. Duplication: Is some of the information related to factors in the diagram already
available? What aspects of research need further research?
Review your problem diagram or framework with these issues in mind. If your problem is
complex and has many possible contributing factors, identify and demarcate the boundaries
of possible smaller research topics. If there is more than possible topic, use the selection
criteria and ranking method that were described earlier to assist you in your final decision
concerning the focus and scope of your research.
Note for Caution: The dissection of the diagram into different parts and selection of one part for research is not advised if insufficient insight exists into the nature, relative weight, and interrelations of the various factors contributing to the problem. You would risk concentrating on marginal factors and coming up with marginal solutions. It is inadvisable to concentrate only, for example, on community factors or only on service factors to explain underutilization of services if you don’t know how these factors are interrelated and where the main problem is. An exploratory study (see Study designs in Methodology section for Unit 4) would then be indicated, limited rather in the number of information than the number of factors included in the study.
3.4.3. FORMULATING THE PROBLEM STATEMENT
The first major section in a research is “Statement of Problem.”
Why is it important to state and define the problem well?
The reasons being that a clear statement of the problem:
Is the foundation for the further development of the research proposal (i.e. research
objectives, methodology, work‐plan, budget etc).
Makes it easier to find information and reports of similar studies from which your own
study design can benefit.
Enables you to systematically point out why the proposed research on the problem
should be undertaken and what you hope to achieve with the study results. This is
important to highlight when you present your project to community members, health
staff, the relevant ministry, and donor agencies who need to support your study or
give their consent.
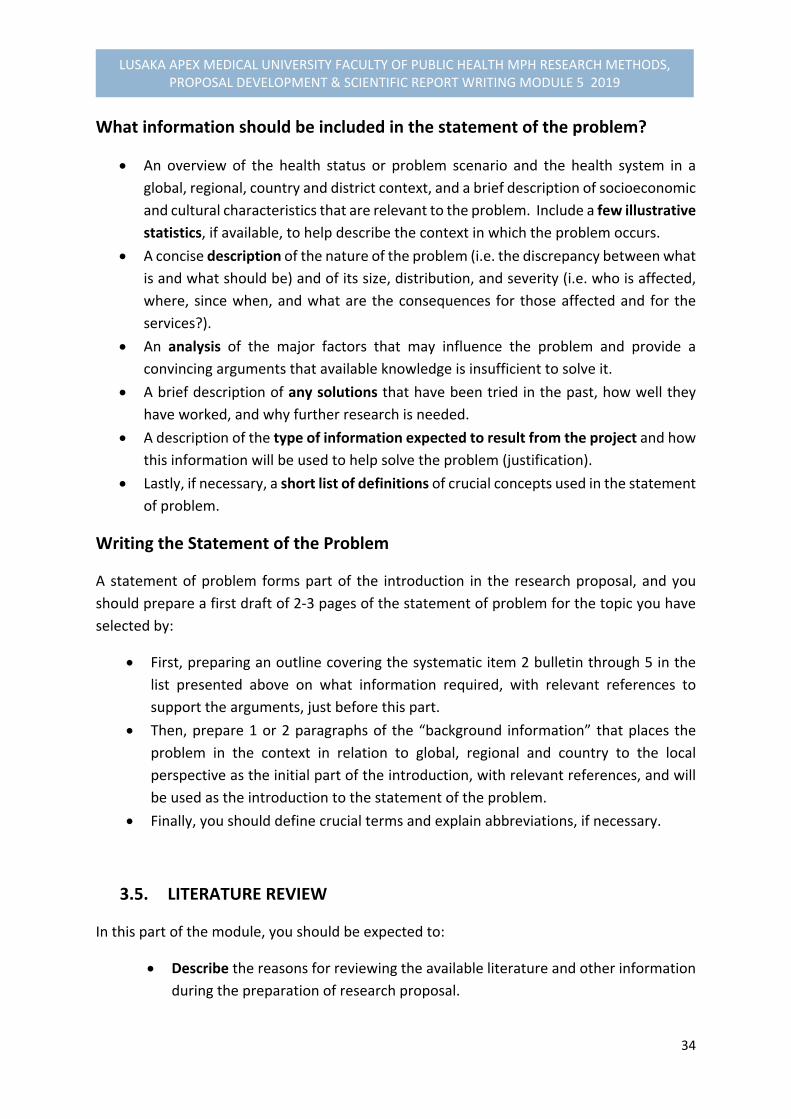
34
LUSAKA APEX MEDICAL UNIVERSITY FACULTY OF PUBLIC HEALTH MPH RESEARCH METHODS, PROPOSAL DEVELOPMENT & SCIENTIFIC REPORT WRITING MODULE 5 2019
What information should be included in the statement of the problem?
An overview of the health status or problem scenario and the health system in a
global, regional, country and district context, and a brief description of socioeconomic
and cultural characteristics that are relevant to the problem. Include a few illustrative
statistics, if available, to help describe the context in which the problem occurs.
A concise description of the nature of the problem (i.e. the discrepancy between what
is and what should be) and of its size, distribution, and severity (i.e. who is affected,
where, since when, and what are the consequences for those affected and for the
services?).
An analysis of the major factors that may influence the problem and provide a
convincing arguments that available knowledge is insufficient to solve it.
A brief description of any solutions that have been tried in the past, how well they
have worked, and why further research is needed.
A description of the type of information expected to result from the project and how
this information will be used to help solve the problem (justification).
Lastly, if necessary, a short list of definitions of crucial concepts used in the statement
of problem.
Writing the Statement of the Problem
A statement of problem forms part of the introduction in the research proposal, and you
should prepare a first draft of 2‐3 pages of the statement of problem for the topic you have
selected by:
First, preparing an outline covering the systematic item 2 bulletin through 5 in the
list presented above on what information required, with relevant references to
support the arguments, just before this part.
Then, prepare 1 or 2 paragraphs of the “background information” that places the
problem in the context in relation to global, regional and country to the local
perspective as the initial part of the introduction, with relevant references, and will
be used as the introduction to the statement of the problem.
Finally, you should define crucial terms and explain abbreviations, if necessary.
3.5. LITERATURE REVIEW
In this part of the module, you should be expected to:
Describe the reasons for reviewing the available literature and other information
during the preparation of research proposal.

35
LUSAKA APEX MEDICAL UNIVERSITY FACULTY OF PUBLIC HEALTH MPH RESEARCH METHODS, PROPOSAL DEVELOPMENT & SCIENTIFIC REPORT WRITING MODULE 5 2019
Describe the resources that are available for carrying out such a review.
Prepare index card, note book or computer entries that summarizes important
information obtained from literature, or interviews with key informants.
Prepare a review of literature and other information pertaining to the research
proposal that will present background data and information supporting your
intended research.
Why is it Important to Review Already Available Information When Developing
a research proposal?
It prevents you from duplicating work that has been done before.
It helps you to find out what others have learned and reported on the problem you
want to study. This may assist you in refining your statement of the problem.
It helps you to become familiar with the various types of methodology that might be
used in your study.
It should provide you with convincing arguments for why your particular research
project is needed.
What are possible Sources of Information?
Individual research experts, programme managers, groups and organizations.
Published information( books, articles, indexes and abstract journals); and
Unpublished information (other research proposals in related fields, reports, records,
and computer data bases).
Where can we find these different Sources?
Different sources of information can be consulted and reviewed at various levels of the
administrative system within your country and internationally as provided below:
Administrative levels and Examples of Resources
Community, District Level or Provincial Levels:
Clinics and hospitals based data from routine statistics, registers;
Opinions, beliefs of key informants (through interviews)
Clinical observations, reports of critical incidents etc
Local surveys, annual reports;
Statistics issued at provincial, and district levels;
Books, articles, newspapers, mimeographed reports etc. National Level:
Articles from national journals, books identified during literature search at university and other national libraries, WHO,UNICEF Libraries, UNFPA, etc
Documentation, reports, and raw data from: - The relevant ministries - Central Statistics Offices
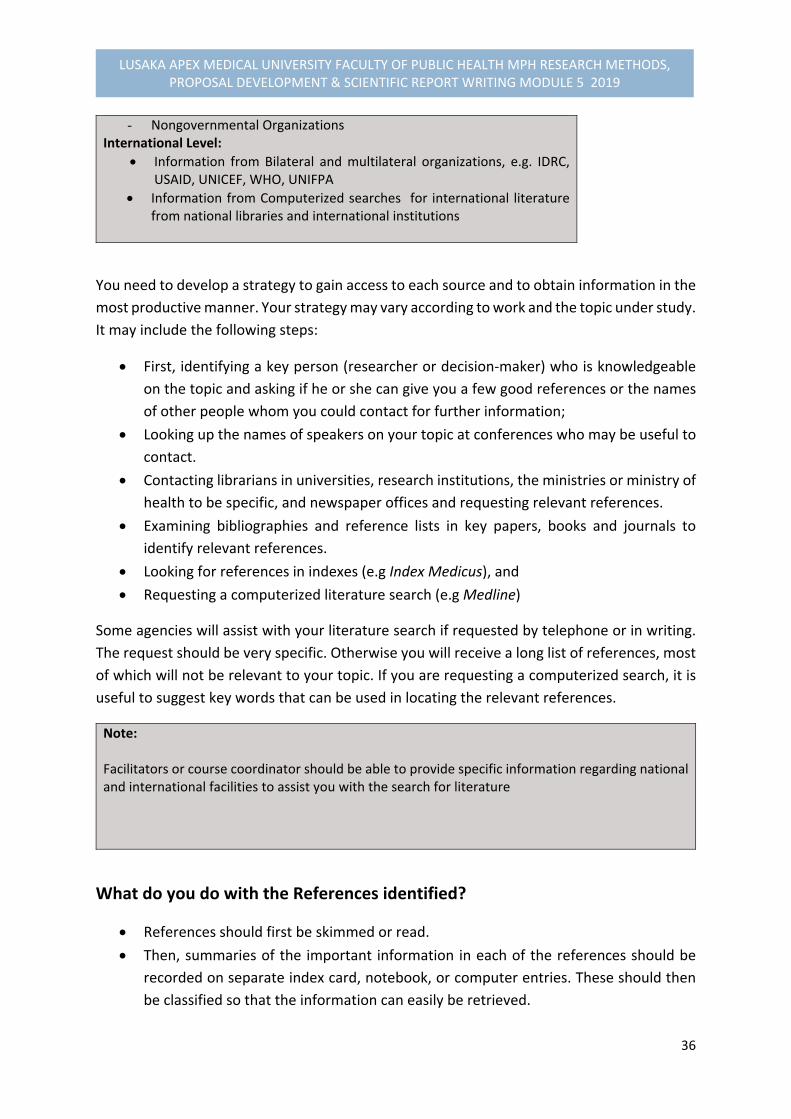
36
LUSAKA APEX MEDICAL UNIVERSITY FACULTY OF PUBLIC HEALTH MPH RESEARCH METHODS, PROPOSAL DEVELOPMENT & SCIENTIFIC REPORT WRITING MODULE 5 2019
- Nongovernmental Organizations International Level:
Information from Bilateral and multilateral organizations, e.g. IDRC, USAID, UNICEF, WHO, UNIFPA
Information from Computerized searches for international literature from national libraries and international institutions
You need to develop a strategy to gain access to each source and to obtain information in the
most productive manner. Your strategy may vary according to work and the topic under study.
It may include the following steps:
First, identifying a key person (researcher or decision‐maker) who is knowledgeable
on the topic and asking if he or she can give you a few good references or the names
of other people whom you could contact for further information;
Looking up the names of speakers on your topic at conferences who may be useful to
contact.
Contacting librarians in universities, research institutions, the ministries or ministry of
health to be specific, and newspaper offices and requesting relevant references.
Examining bibliographies and reference lists in key papers, books and journals to
identify relevant references.
Looking for references in indexes (e.g Index Medicus), and
Requesting a computerized literature search (e.g Medline)
Some agencies will assist with your literature search if requested by telephone or in writing.
The request should be very specific. Otherwise you will receive a long list of references, most
of which will not be relevant to your topic. If you are requesting a computerized search, it is
useful to suggest key words that can be used in locating the relevant references.
Note: Facilitators or course coordinator should be able to provide specific information regarding national and international facilities to assist you with the search for literature
What do you do with the References identified?
References should first be skimmed or read.
Then, summaries of the important information in each of the references should be
recorded on separate index card, notebook, or computer entries. These should then
be classified so that the information can easily be retrieved.
37
LUSAKA APEX MEDICAL UNIVERSITY FACULTY OF PUBLIC HEALTH MPH RESEARCH METHODS, PROPOSAL DEVELOPMENT & SCIENTIFIC REPORT WRITING MODULE 5 2019
Finally, a literature review should be written.
Information on an index card should be organized in such a way that you can easily find all
data you will need for your report as follows:
1. For an article, the following information should be noted:
Author (s) (surname followed by initials). Title of the article. Name of Journal, year; volume
number, article number; page numbers of article:
Example: Findlay AM, Cranston S. What’s in a research agenda? An evaluation of research
developments in the arena of skilled international migration. Journal of IDPR, 2015, 37(1):
17‐31
2. For a book, the following information should be noted:
Author (s) (surname followed by initials).Title of book. Edition. Place. Publisher, year: number
of pages in a book.
Example: Abramson JH. Survey methods in community medicine.2nd ed. Edinburgh: Churchill
Livingstone 1979: 229
3. For a chapter in a book, the citation can include:
Author (s) of chapter (surname followed by initials. Chapter title. In: Editors of book (surname
followed by initials). eds., Title of book. Place: Publisher, year: page numbers of chapter.
Example: Winikoff B, Castle MA. The Influence of maternal employment on infant feeding.
In: Winikoff B, Castle MA, Laukaran VH, eds. Feeding Infants in four societies: causes and
consequences of mothers’ choices. New York: Greenwood Press, 1988: 121‐145
This information recorded in a standard format, such as that suggested above, can then easily
be used as part of your list of references for the proposal. The formats suggested above have
been adopted as standard by over 300 biomedical journals and sometime referred to as “the
Vancouver System.” For more information, see International Committee of Medical Journal
Editors (1988). Other references follow IDRC’s house style (Varkevisser et al. 1991).
The index card or computer entry (one for each reference) could contain quotations and
information, such as:
Key words;
A summary of the contents of the book or the article, concentrating on information
relevant to your study ; and a brief analysis of the content, with comments such as:
- Appropriateness of the methodology;
- Important aspects of the study; and
38
LUSAKA APEX MEDICAL UNIVERSITY FACULTY OF PUBLIC HEALTH MPH RESEARCH METHODS, PROPOSAL DEVELOPMENT & SCIENTIFIC REPORT WRITING MODULE 5 2019
- How information from the study can be used in your research.
Note: Index cards or computer entries can be used to summarize information obtained from other sources, such as informal discussions, reports of local health statistics, and internal reports.
How do you write a review of Literature?
There are a number of steps you should take when preparing a review of available literature
and information:
First, organize your index cards in groups of related statements according to which
aspect of the problem they touch upon
Then, decide in which order you want to discuss the various issues. If you discover you
have not yet found literature or information on some aspects of your problem that
you suspect are important, make a special effort to find literature.
Finally, write a coherent discussion of one or two pages in your words, using all
relevant references with themes to illustrate the factors explored by other studies.
You can refer to the references more fully in the text, putting the surname of the
author (s) and year (s) of publication referred to between brackets, e.g. (Shiba 1988,
or Costa et al. 2017). If this system of citation is used, the references at the end of the
proposal should be listed in alphabetical order.
Possible Bias in the Literature Review
Bias in the literature or in a review of the literature‐ is a distortion of the available information in such a way that if it reflects opinions or conclusions that do not represent the real situation.
It is useful to be aware of various types of bias. This will help you to be critical of the existing
literature. If you have reservations about certain references, or if you find conflicting opinions
in the literature, discuss these openly and critically. Such a critical attitude may also help you
avoid biases in your own study. Common types of bias in literature include:
Playing down controversies and differences in one’s own study results;
Restricting references to those that support the point of view of the author; and
Drawing generalizations from just one case or small study.
Ethical Considerations
The types of bias mentioned above would put the scientific integrity of the responsible
researcher in question. Careless presentation and interpretation of data may put readers who

39
LUSAKA APEX MEDICAL UNIVERSITY FACULTY OF PUBLIC HEALTH MPH RESEARCH METHODS, PROPOSAL DEVELOPMENT & SCIENTIFIC REPORT WRITING MODULE 5 2019
want to use the study findings on the wrong track. This may have serious consequences, in
terms of time and money spent on research, and may even lead to wrong decisions affecting
people’s health.
A serious act for which a researcher can be taken to court is the presentation of research
results, or scientific publications from other writers without quoting the author. In this
regard, appropriate referencing procedures should always be followed in research proposal
as well as in research reports.
Individual Exercise on Literature Review Writing Skills
1. Review literature relevant to your proposal 2. As first step, you should review at least two (2) articles, report. Or books on index card, or
blank sheets of paper. 3. Then, the information should be put together in a review of 1‐2 pages. Make sure that
references are cited correctly, preferably by citing the actual authors as given in the examples within the session.
Note: Emphasize that the review of the literature should be thorough and critical. Only references that relate directly to the proposed research should be cited and discussed. Irrelevant literature should not be mentioned.
3.6. FORMULATION OF RESEARCH QUESTIONS, HYPOTHESES AND
OBJECTIVES
The next sessions present to you the techniques of constructing the research questions,
hypotheses and the research objectives. In these sessions, you should be expected to:
State and describe the characteristics of research questions and hypotheses on how
they should be applied in your proposed research project.
State the reasons for writing the objectives for your research project
Define and describe the differences between general and specific objectives
Define the characteristics of research objectives.
Prepare research objectives in an appropriate format for the project you are
developing.
FORMULATION OF RESEARCH QUESTIONS
Research questions are problems about relationships among factors. Example:
What factors can explain or determine urban health?
What is in a Research Agenda?
Why are health professionals in less developed countries migrating to other countries?
40
LUSAKA APEX MEDICAL UNIVERSITY FACULTY OF PUBLIC HEALTH MPH RESEARCH METHODS, PROPOSAL DEVELOPMENT & SCIENTIFIC REPORT WRITING MODULE 5 2019
Why is immunization low during rainy season?
Does racial school integration enhance education? Such research questions are transformed into hypotheses, which are tested by experiment, usually by means of significant statistical inferences.
Strategies for Developing Research Question (s)
You need to know your area, or field of interest. This helps to familiarize with the area on which your research focuses.
Widen the scope of your experience. You should not be limited by the research in the specific field you are researching, but make attempt to know researchers in other fields as well and those from other disciplines. Contact and discussing with practitioners may give a different perspective on what the research questions are.
Consider using techniques for enhancing creativity. There are available literature on creativity relevant to the process of generating research questions.
Methods for enhancing creativity Include:
- Brain‐storming; - Nominal group techniques; and - Delphi technique.
A nominal group technique‐ is a group discussion to obtain a consensus from a group on a topic where decision‐making can be guided by the perceptions and opinions of various group members. The individual’s expression is followed by voting, followed by a further discussion and another round of discussion, voting, ranking and summarizing results. This is done by the initial individual listing of ideas on paper and displaying lists produced on pieces of papers and then, displaying lists produced for discussion (follow similar example on peoples’ views discussed in the previous sessions on problem analysis regarding clarifying the areas of concern related to diabetic condition). Area of concern may be stated in form of statements or related factors by participants. These related statements or factors can then be transformed into research question (s).
Delphi technique – means getting together a group of persons, either those who are involved directly in the project, or a range of colleagues with interest in the focus of research. Each individual is then asked to generate independently up to three specific questions in the chosen area. The responses from individuals are collected to form all members’ contributions and then categorized.
The techniques for enhancing creativity are primarily concerned with groups in the initial stage of research as a group process and enlisting the help of others.
41
LUSAKA APEX MEDICAL UNIVERSITY FACULTY OF PUBLIC HEALTH MPH RESEARCH METHODS, PROPOSAL DEVELOPMENT & SCIENTIFIC REPORT WRITING MODULE 5 2019
HYPOTHESES
What are Hypotheses?
Hypotheses are tentative answers to the research problem questions. They are predictions of
relationships between one or more factors and the problem under study, which can be tested.
Tentative hypotheses can provide a useful bridge between the research question and the
design of the inquiry.
Examples of hypotheses
The examples of hypotheses include:
The degree of urban health in cities varies directly with urbanization and
technological development.
The persistence incidence of diarrhoeal diseases in children is influenced by seasonal
variation
Kinship influence on reproductive decision‐making differentiate women’s attitudes
and practice of reproductive behaviour between ethnic groups of societies
Hypotheses are expressed in the form of a relationship between independent (factor) and
dependent (Core problem) variables,
When a researcher suggests a hypothesis, he or she has no assurance that it will be
verified. When a hypothesis is constructed, and if it is rejected, another one is put
forward. If it is accepted, it is incorporated into the scientific body of knowledge.
In interpreting the results, if there is statistically significant between the two means of
variables, we then reject the null hypothesis (h₀) and becomes a true hypothesis. If we
conclude that the observed difference is not statistically significant, we then accept the
null hypothesis.
The results are determined by the application of a significant level of statistics, such as
Pearson’s Chi‐Square test (X²) to estimate the probability value (p‐value), which takes the
value of 0.05, expressing the likelihood of finding a difference by chance when there is no
real or little difference observed. It is the borderline or intermediate difference. For a
statistically significant difference between the two means, the p‐value is smaller than
0.05 to 0.000. If no statistically significant differences observed, the p‐value is larger or
greater than 0.05 to 0.06, 0.07, or 0.1 and so on.
Sources of Hypotheses and Research Questions

42
LUSAKA APEX MEDICAL UNIVERSITY FACULTY OF PUBLIC HEALTH MPH RESEARCH METHODS, PROPOSAL DEVELOPMENT & SCIENTIFIC REPORT WRITING MODULE 5 2019
The sources of hypotheses and the research questions cam derive from theories, directly from
observations, intuitively, or the combination of these.
Characteristics of Research Hypotheses
The research hypotheses have common characteristics which include:
Must be clear, meaning that there should be a relationship between the independent
and dependent variables
Value free, that is there should be no introduction of researcher’s bias
They are specific to state that they should be measurable.
Amenable to empirical tested statistically.
FORMUALTION OF RESEARCH OBJECTIVES
The Objectives of research summarise what is to be achieved by the study. These objectives
should be closely related to the statement of the problem and are required to answer
questions pertaining to:
Why do we want to carry out the research?
What do we hope to achieve?
In these guiding principle questions, we are then expected in this session to be able to:
State the reasons or purposes for writing objectives for your research project.
Define and describe the differences between general and specific objectives.
Define the characteristics of research objectives, and
Prepare research objectives in an appropriate format for the project you are
developing.
Objectives should be closely related to the statement of the problem. For example, if the
problem identified is “low utilization of under‐five clinics,” the general objective in this would
be “to identify the reasons or factors associated with low utilization to solve the problem, or
to find solutions for improving under‐five clinics in district X.”
The general objective of a study states what is expected to be achieved by the study in general terms. It is possible to break down a general objective into smaller, logically connected parts. These are normally referred to as specific objectives.
Specific objectives as being referred to as the breakdown of the general objective should
systematically address the various aspects of the problem as defined under the “Statement
43
LUSAKA APEX MEDICAL UNIVERSITY FACULTY OF PUBLIC HEALTH MPH RESEARCH METHODS, PROPOSAL DEVELOPMENT & SCIENTIFIC REPORT WRITING MODULE 5 2019
of the problem” and the key factors that are assumed to influence or cause the problem. They
should specify what you will do in your study, where, and for what purpose.
Given the example of general objective “to identify the reasons or factors associated with low
utilization of Under‐five clinics in District X to find solutions” could be broken down into the
following specific objectives:
Determine the level of utilization of Under‐five clinics in Chipata District over the
years 2017 and 2018 as compared with the target set.
Identify the variation in the utilization of under‐five clinics in relation to season, type
of clinic service and type of children served.
Determine whether distance from home to clinic and quality of services influence
acceptability of services among mothers.
Describe the socio‐economic and cultural characteristics that may influence the
mothers’ utilization of services (this objective may be broken down into several sub‐
objectives).
Provide recommendations to all parties concern to develop plan for implementing
the solutions to improve the use of under‐five clinics.
Note that the first objective focuses on quantifying the problem. This is necessary in many
studies for verification. Often use can be made of available statistics or of the health
information system.
Objective bulletin 2 further specifies the problem by looking at the distribution. Objectives in
bulletin 3 & 4 examines possible factors that may influence the problem, and objective
bulletin 5 indicates how the results will be used.
Note: An objective focusing on how the results will be used should be included in every applied study
Why should research objectives be developed?
The formulation of objectives will help you to:
Focus the study, narrowing it down to essentials.
Avoid collection of data that are not necessary for understanding and solving the
problem you have identified, and
Organize the study in clearly defined parts of phases
How should you state your objectives?
Take care that the objectives of your study:
44
LUSAKA APEX MEDICAL UNIVERSITY FACULTY OF PUBLIC HEALTH MPH RESEARCH METHODS, PROPOSAL DEVELOPMENT & SCIENTIFIC REPORT WRITING MODULE 5 2019
Cover the different aspects of the problem and its contributing factors
Are clearly phrased in operational terms, specifying exactly what you are going to do,
where and for what purpose.
Are realistic considering the local situation, and
Use action verbs that are specific to be evaluated. Examples of action verbs are: to
determine, appreciate, describe, identify, establish, calculate, compare and verify.
Avoid the use of non‐action verbs, such as: to understand, to appreciate, to
understand, or to study.
Keep in mind that when the project is evaluated, the results will be compared with the
objectives. If the objectives have not been specified out clearly, the project cannot be
evaluated. Using the example on utilization of children’s clinics given earlier, we may develop
more appropriate specific objectives, such as:
To compare the level of utilization of the children’s clinic among various
socioeconomic groups.
To establish the pattern of utilization of children’s clinic services in various seasons
of the year.
To verify whether increasing distance between the home and the health facility
reduces the level of utilization of the children’s clinic services.
To describe mothers’ perceptions of the quality of services provided at the children’s
clinics.
You are now required to attempt formulating your own objectives for your project. Follow
the guide provided in the box for the exercise.
Exercises: Objective Formulation: Use the analysis diagram as the starting point for formulating objectives focusing on:
Further quantifying and specifying the problem, if required.
Exploring the key factors or major groups of factors that in your opinion might influence or cause the problem; and
Any other research activities you may propose 1. Prepare a general objective and specific objectives for the research proposal you are
developing. 2. After formulating your objectives ask yourself the following questions:
Do the objectives deal with all aspects of the research problem in a logical and coherent way?
Are the objectives defined in operational terms that can be measured? Realistic?
Do they indicate where the study will be conducted?
Do they include the development of recommendations or solutions for how the research results will be used to solve the problem?
Submit your assignment to your facilitator for assessment.
45
LUSAKA APEX MEDICAL UNIVERSITY FACULTY OF PUBLIC HEALTH MPH RESEARCH METHODS, PROPOSAL DEVELOPMENT & SCIENTIFIC REPORT WRITING MODULE 5 2019
3.7. SUMMARY
The third part of this module has elaborated the themes of research problems and analysis by providing a greater detailed explanation of the meaning of a research problem and the process of identifying a research problem for an investigation. We began by explaining the concept of the problem stating that:
A research problem is “an intellectual stimulus calling for an answer in the form of scientific inquiry “by providing examples to demonstrate that some problems are amenable to scientific investigations, while others are not. To provide a better understanding of a problem, there must be available information required to define the research problem situation.
The process of identifying and selecting a problem for empirical investigation involve series of activities, which include: first, exploring the problem as a starting point, to search for information through different sources and determining the conditions that facilitate the problem identification as – discrepancy, reasons or factors, and establish possible answers to the problem. Second is the process of prioritizing problems for investigations, which involve applying the criteria for selecting research topic (s) and the method of rating scales demonstrated with examples. Third, analysis and formulation of the statement of problem.
The process of analysis and formulation of the statement of problem requires steps to be followed in identifying the factors and core problem (outcome) that should be displayed in a diagram. The problem analysis diagram should demonstrate the relationship links within factors and the core problem. The final framework should be structured or organized in such a way that it reflects sub‐groups of factors in relation to: socio‐economic & cultural factors; service‐related factors, behavioural factors, etc. (see examples in text).
A statement of problem is the most important part of the empirical investigation as it is the foundation for further development of the research proposal (i.e. research objectives, methodology, work‐plan, budget etc). It makes it easier to find information and reports of similar studies from which your own study design can benefit, and enables you to systematically point out why the proposed research on the problem should be undertaken and what you hope to achieve with the study results. We elaborated further the type of information required and the techniques of formulating the statement of problem.
In the context of the problem scenario, concept of literature review and its importance in the empirical investigation were described, alongside the concepts and techniques of formulating research questions, hypotheses and research objectives.
3.8 Performance Evaluation: Exercises Exercise #: Take your problem analysis diagram you had constructed for your research proposal,
1. Formulate your general objective 2. Develop your specific objectives
46
LUSAKA APEX MEDICAL UNIVERSITY FACULTY OF PUBLIC HEALTH MPH RESEARCH METHODS, PROPOSAL DEVELOPMENT & SCIENTIFIC REPORT WRITING MODULE 5 2019
Additional Readings
1. Chava Frankfort‐Nachmias & David Nachmias (2008). Research Methods in the Social
Science, 7th Edition, ISBN: 13: 978‐0‐7167‐5510‐0
2. Varkevisser,C.M., Pathmanathan,I., Brownlee, A. (1991). Designing and Conducting
Health Systems Research Projects: Proposal Development and Field Works: Health
Systems Research Training Series, ISBN: 0‐88936‐585‐7
3. Bailey Kenneth,D (1994). Methods of Social Research, 4th Edition, NY. Free Press
4. Bimbaum, Michael H (2001). Introduction to Behavioural Research on the Internent.
Upper Saddle River, NJ: Prentice‐Hall
5. Dochartaigh, Niall R (2001). The Internet Research Handbook: A Practical Guide for
Students and Researchers in the Social Sciences. Thousand Oak, CA: Sage Publication
6. Hansen, Hans V., and Robert E. Pinto, eds. (1995). Fallacies: Classical and
Contemporary Readings. University Park, PA: Benn State Press
7. Hart, Chris (1998). Doing Literature Review: Releasing the Social Science Research
Imagination, London: Sage Publication
47
LUSAKA APEX MEDICAL UNIVERSITY FACULTY OF PUBLIC HEALTH MPH RESEARCH METHODS, PROPOSAL DEVELOPMENT & SCIENTIFIC REPORT WRITING MODULE 5 2019
MODULE 5.4: RESEARCH METHODOLOGY
4.1 INTRODUCTION We learnt from the previous earlier sessions that scientific methodology is a system of explicit rules and procedures upon which research is based and against which claims for knowledge are evaluated. In this part of the module, the sessions will be devoted to the rules (i.e communication, reasoning and inter‐subjectivity) and procedures aligned to empirical investigation. These rules are adherent to methodological procedures, which involve: the concepts of variables and measurements; study designs & their validity and reliability to empirical evidence; sampling & selection criteria of study population; Data collection methods & tools; pilot and pretesting the methodology; Data processing & analysis; the ethical considerations; and the application of triangulation methodology in yielding empirical evidence.
4.2. OBJECTIVES By the end of this module sessions, you should be able to:
(1) Demonstrate the ability of understanding the concepts of defining variables and discuss the differences between the dependent and independent variables, numerical and categorical variables, and how they are used in research designs.
(2) Identify the variables that will be measured in the research project you are designing and develop operational definitions with indicators for those variables that cannot be measured directly.
(3) Describe different types of study designs, uses, limitations and how the study design can influence the validity and reliability of study results.
(4) Demonstrate the understanding of describing the techniques involved in sampling pertaining to the components and characteristics, including sampling methods and determining the sample size calculation and discuss the problem of bias when selecting a sample.
(5) Describe the various methods of data collection, their uses and limitations for both quantitative and qualitative methods, the techniques of designing questionnaire, pretesting and the plan for data collection.
(6) Identify and describe important issues related to sorting, quality control and processing of data, and how data is analysed and interpreted based on the objectives and variables of the study and the application of triangulation methodology.
(7) Prepare a plan for the processing and analysis of data that include data master sheets and dummy tables, and describe the ethical considerations for the research proposal you are developing.
48
LUSAKA APEX MEDICAL UNIVERSITY FACULTY OF PUBLIC HEALTH MPH RESEARCH METHODS, PROPOSAL DEVELOPMENT & SCIENTIFIC REPORT WRITING MODULE 5 2019
4.3. Reflection Attempt from the following questions to recapitulate on your understanding of some of the research methodological issues: Box: Reflection exercises:
1. What is a research methodology? 2. What are the components of research methodology?
Whether your answers are right or wrong, we will try to elaborate them clearly for you to be able to apply them in your planned research project.
4.4. VARIABLES WHAT ARE VARIABLES? Research problems are conveyed with a set of concepts. In order to move from the conceptual to the empirical level, concepts are converted into ‘variables.’ It is as variables that our concepts will eventually appear in hypotheses and be tested. A VARIABLE is a characteristic of a person, object or phenomenon that can take on different values
A simple example is a person’s age. The variable ‘age’ can take on different values because a person can be 20 years, 25 years, 30 years and so on. Concepts are converted into variables by ‘mapping’ them into a set of values. For example, assigning numbers (one type of values) to objects is a mapping of a set of objects into a set of numbers. A variable is an empirical property that takes on two or more values. If a property can change in value, it can be regarded as a variable. For example, ‘marital status’ is a variable because it can be differentiated by at least four (4) distinct values: single (never been married), married, divorced, and widow. Similarly, ‘social status’ is a variable because it can be assigned by at least five distinct values: lower, lower middle, middle, upper middle, and upper. When a variable has only two (2) values, it is termed as a ‘dichotomous variable.’ For purposes of research, it is important to make an analytical distinctions between the different types of variables, which are: Dependent variable, independent variables, numerical variables (continuous), categorical variables (discrete), and Confounding variables (control variables)
49
LUSAKA APEX MEDICAL UNIVERSITY FACULTY OF PUBLIC HEALTH MPH RESEARCH METHODS, PROPOSAL DEVELOPMENT & SCIENTIFIC REPORT WRITING MODULE 5 2019
DEPENDENT AND INDEPENDENT VARIABLES Since in research we often look for causal explanations associated with the problem, it is important to make distinction between Dependent and Independent variables. The DEPENDENT VARIABLE is a variable that is used to describe the problem under study. The INDEPENDENT VARIABLEs‐ are variables that are used to describe or measure the factors assumed to cause or at least influence the problem.
For example, in a study of the relationship between ‘smocking’ and ‘lung cancer’, ‘suffering from lung cancer’ (with the values yes, no) would be the dependent variable, and ‘smoking’ ( varying from not smoking to smoking more than three packets of cigarettes a day) is the independent variable. Whether a variable is dependent or independent is determined by the ‘statement of the problem’ and the ‘objectives of study.’ It is important when designing a study to clearly state which variable is the dependent and which ones are the independent variables. For example, if a researcher investigates why people smoke, ‘smoking’ is the dependent variable, and ‘pressure from peers to smoke’ is the independent variable. EXERCISE: Look at your analysis diagram and give an example of a dependent variable and an independent variable in your study.
Although in everyday language we may speak of possible ‘CAUSES’ of problems, in scientific language we prefer to speak of ASSOCIATIONS between variables, unless a causal relationship can be proven. If we find an association between smoking and cancer, we can say smoking causes cancer, only if we can both demonstrate that the cancer was developed after the patient started smoking and that there are no other factors that may have caused both cancer and the habit of smoking. Nervous people, for example, may both smoke more and suffer from cancer than persons who are not nervous.
CONFOUNDING (CONTROL) VARIABLES The function of confounding variables (or control variables in some books) in empirical research is to reduce the risk of attributing explanatory power to independent variables that in fact are not responsible for the occurrence of variation in the dependent variable.
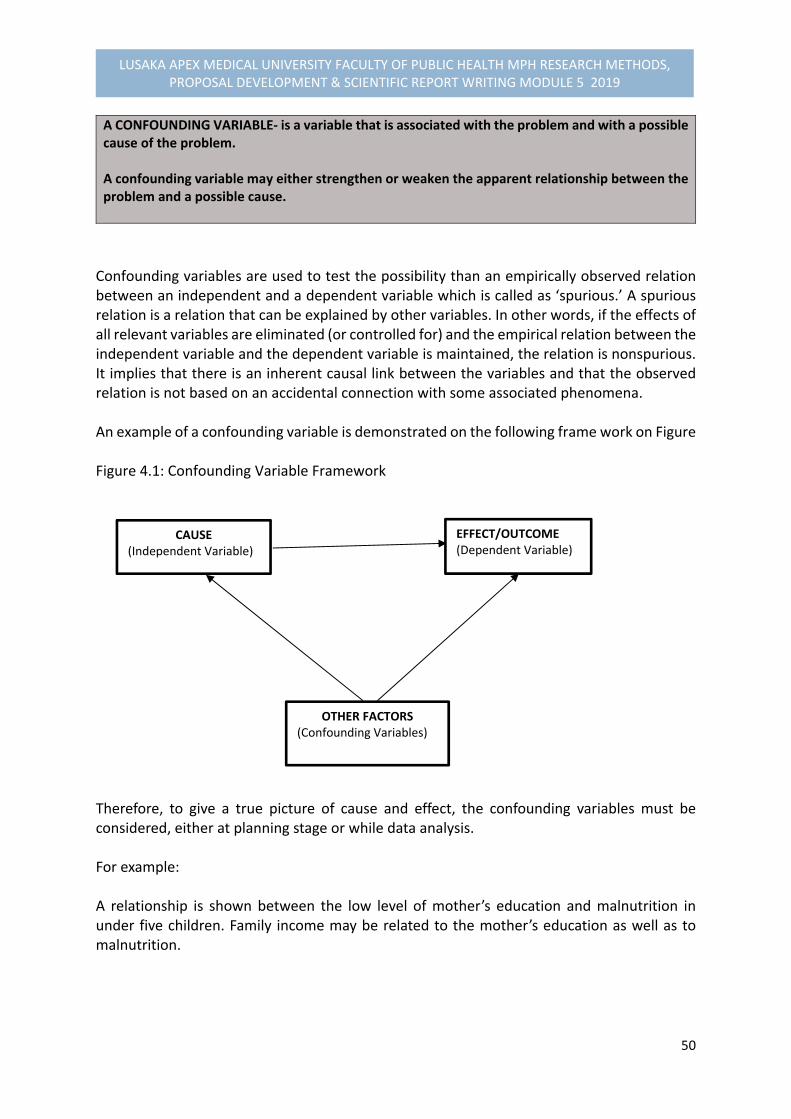
50
LUSAKA APEX MEDICAL UNIVERSITY FACULTY OF PUBLIC HEALTH MPH RESEARCH METHODS, PROPOSAL DEVELOPMENT & SCIENTIFIC REPORT WRITING MODULE 5 2019
A CONFOUNDING VARIABLE‐ is a variable that is associated with the problem and with a possible cause of the problem. A confounding variable may either strengthen or weaken the apparent relationship between the problem and a possible cause.
Confounding variables are used to test the possibility than an empirically observed relation between an independent and a dependent variable which is called as ‘spurious.’ A spurious relation is a relation that can be explained by other variables. In other words, if the effects of all relevant variables are eliminated (or controlled for) and the empirical relation between the independent variable and the dependent variable is maintained, the relation is nonspurious. It implies that there is an inherent causal link between the variables and that the observed relation is not based on an accidental connection with some associated phenomena. An example of a confounding variable is demonstrated on the following frame work on Figure Figure 4.1: Confounding Variable Framework
Therefore, to give a true picture of cause and effect, the confounding variables must be considered, either at planning stage or while data analysis. For example: A relationship is shown between the low level of mother’s education and malnutrition in under five children. Family income may be related to the mother’s education as well as to malnutrition.
CAUSE (Independent Variable)
EFFECT/OUTCOME(Dependent Variable)
OTHER FACTORS(Confounding Variables)
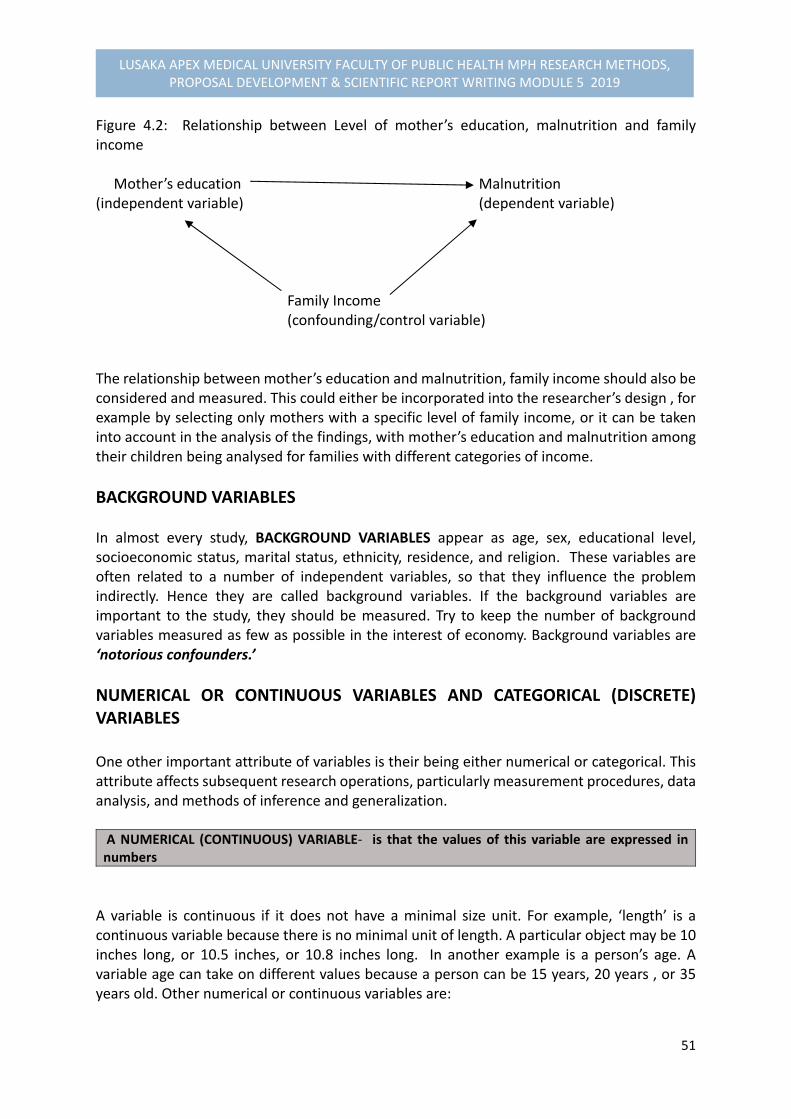
51
LUSAKA APEX MEDICAL UNIVERSITY FACULTY OF PUBLIC HEALTH MPH RESEARCH METHODS, PROPOSAL DEVELOPMENT & SCIENTIFIC REPORT WRITING MODULE 5 2019
Figure 4.2: Relationship between Level of mother’s education, malnutrition and family income Mother’s education Malnutrition (independent variable) (dependent variable) Family Income (confounding/control variable) The relationship between mother’s education and malnutrition, family income should also be considered and measured. This could either be incorporated into the researcher’s design , for example by selecting only mothers with a specific level of family income, or it can be taken into account in the analysis of the findings, with mother’s education and malnutrition among their children being analysed for families with different categories of income.
BACKGROUND VARIABLES In almost every study, BACKGROUND VARIABLES appear as age, sex, educational level, socioeconomic status, marital status, ethnicity, residence, and religion. These variables are often related to a number of independent variables, so that they influence the problem indirectly. Hence they are called background variables. If the background variables are important to the study, they should be measured. Try to keep the number of background variables measured as few as possible in the interest of economy. Background variables are ‘notorious confounders.’
NUMERICAL OR CONTINUOUS VARIABLES AND CATEGORICAL (DISCRETE) VARIABLES One other important attribute of variables is their being either numerical or categorical. This attribute affects subsequent research operations, particularly measurement procedures, data analysis, and methods of inference and generalization. A NUMERICAL (CONTINUOUS) VARIABLE‐ is that the values of this variable are expressed in numbers
A variable is continuous if it does not have a minimal size unit. For example, ‘length’ is a continuous variable because there is no minimal unit of length. A particular object may be 10 inches long, or 10.5 inches, or 10.8 inches long. In another example is a person’s age. A variable age can take on different values because a person can be 15 years, 20 years , or 35 years old. Other numerical or continuous variables are:

52
LUSAKA APEX MEDICAL UNIVERSITY FACULTY OF PUBLIC HEALTH MPH RESEARCH METHODS, PROPOSAL DEVELOPMENT & SCIENTIFIC REPORT WRITING MODULE 5 2019
Weight –expressed in kilograms or in pounds
Distance between homes and clinic facility‐ expressed in kilometres, or minutes walking distance
Monthly income‐ expressed in dollars, kwachas, or rupees Unlike continuous variables, CATEGORICAL OR D1SCRETE VARIABLES do not have a minimal size unit. The amount of money in your bank at this moment is an example of a discrete variable because currency has a minimal unit. One can have K101.21, or K204.50. In general all quantities of a discrete variable are multiples of the minimum unit size. Categories are different values of a variables. For example, the variable sex has two values, ‘male’ and ‘female’, which are distinct categories displayed as “nominal data”. CATEGORICAL VARIABLES‐ the values of the variables are expressed in categories
Other examples of categorical variables are shown in Table 2 below. Table 4.1: Examples of Categorical Variables Variables Categories
Colour Outcome of disease Staple food eaten
Red
Blue
Green etc
Recovery
Chronic illness
Death
Maize
Millet
Rice
Cassava
FACTORS REPHRASED AS VARIABLES When looking at your analysis diagram, you will notice that most of what we called ‘factors’, for convenience sake, are in fact variables which have negative values. As we conduct our study and try to determine to what extent these variables play a role, we have to formulate the variables in a neutral way, so that they can take on positive as well as negative values. The Table below presents examples of negative “factors” and how they can be rephrased as “variables.”
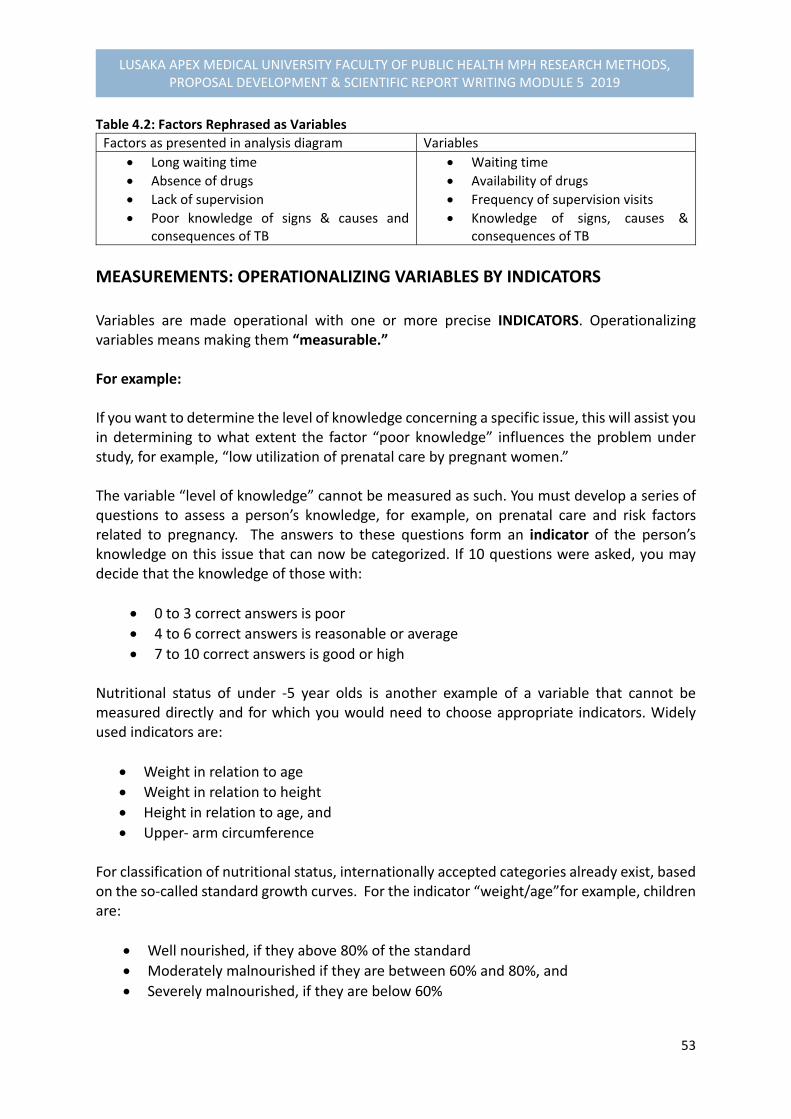
53
LUSAKA APEX MEDICAL UNIVERSITY FACULTY OF PUBLIC HEALTH MPH RESEARCH METHODS, PROPOSAL DEVELOPMENT & SCIENTIFIC REPORT WRITING MODULE 5 2019
Table 4.2: Factors Rephrased as Variables
Factors as presented in analysis diagram Variables
Long waiting time
Absence of drugs
Lack of supervision
Poor knowledge of signs & causes and consequences of TB
Waiting time
Availability of drugs
Frequency of supervision visits
Knowledge of signs, causes & consequences of TB
MEASUREMENTS: OPERATIONALIZING VARIABLES BY INDICATORS Variables are made operational with one or more precise INDICATORS. Operationalizing variables means making them “measurable.” For example: If you want to determine the level of knowledge concerning a specific issue, this will assist you in determining to what extent the factor “poor knowledge” influences the problem under study, for example, “low utilization of prenatal care by pregnant women.” The variable “level of knowledge” cannot be measured as such. You must develop a series of questions to assess a person’s knowledge, for example, on prenatal care and risk factors related to pregnancy. The answers to these questions form an indicator of the person’s knowledge on this issue that can now be categorized. If 10 questions were asked, you may decide that the knowledge of those with:
0 to 3 correct answers is poor
4 to 6 correct answers is reasonable or average
7 to 10 correct answers is good or high
Nutritional status of under ‐5 year olds is another example of a variable that cannot be measured directly and for which you would need to choose appropriate indicators. Widely used indicators are:
Weight in relation to age
Weight in relation to height
Height in relation to age, and
Upper‐ arm circumference For classification of nutritional status, internationally accepted categories already exist, based on the so‐called standard growth curves. For the indicator “weight/age”for example, children are:
Well nourished, if they above 80% of the standard
Moderately malnourished if they are between 60% and 80%, and
Severely malnourished, if they are below 60%

54
LUSAKA APEX MEDICAL UNIVERSITY FACULTY OF PUBLIC HEALTH MPH RESEARCH METHODS, PROPOSAL DEVELOPMENT & SCIENTIFIC REPORT WRITING MODULE 5 2019
SCALES OF MEASUREMENT (OPTIONAL) As variables and indicators have different values, it is often possible to scale or rank them. Scaling is easy in the case of numerical variables. These can be scaled in different ways:
1. Continuous Scale: This consists of a continuum of measurements. For example, age, Weight in kilogram or grams; Haemoglobin level in blood in grams per litre, etc
2. Ordinal Scale: Numerical variables can be categorized and categories can then be ranked in increasing or decreasing order.
For example: High income (K30,000) Middle Income (K15,000) Low Income (K5,000) Or Age distribution within 5 year interval: 10‐ 14 years 15‐19 Years 20‐24 Years, etc
3. Nominal data‐ involves no ranking order in categories, e.g. sex (male, female); stable food eaten ( maize, millet, cassava, etc).
Examples of scales of measurement, such as continuous, ordinal, and nominal data require different statistical tests.
RELATIONS A “relation” in research always means a relationship between two or more variables. When we say that variable X and variable Y are related, we mean that there is something “common” to both variables. For example, if we say that education and income are related, we mean that the two “go together” that they co‐vary. The co‐variation is what education and income have in common, stating that individuals with higher education have higher income. Establishing a relation in empirical research consists of determining which values of one variable co‐vary with values of one or more other variables. The researcher systematically pairs values of one variable with values of other variables.
4.5. STUDY DESIGNS & LIMITATIONS In this section, we shall attempt to describe study designs used in epidemiological research studies and their limitations. The second objective will be to describe the extent to which study designs can influence validity and reliability of research findings, and to identify the most appropriate study design for the research proposal you are developing.
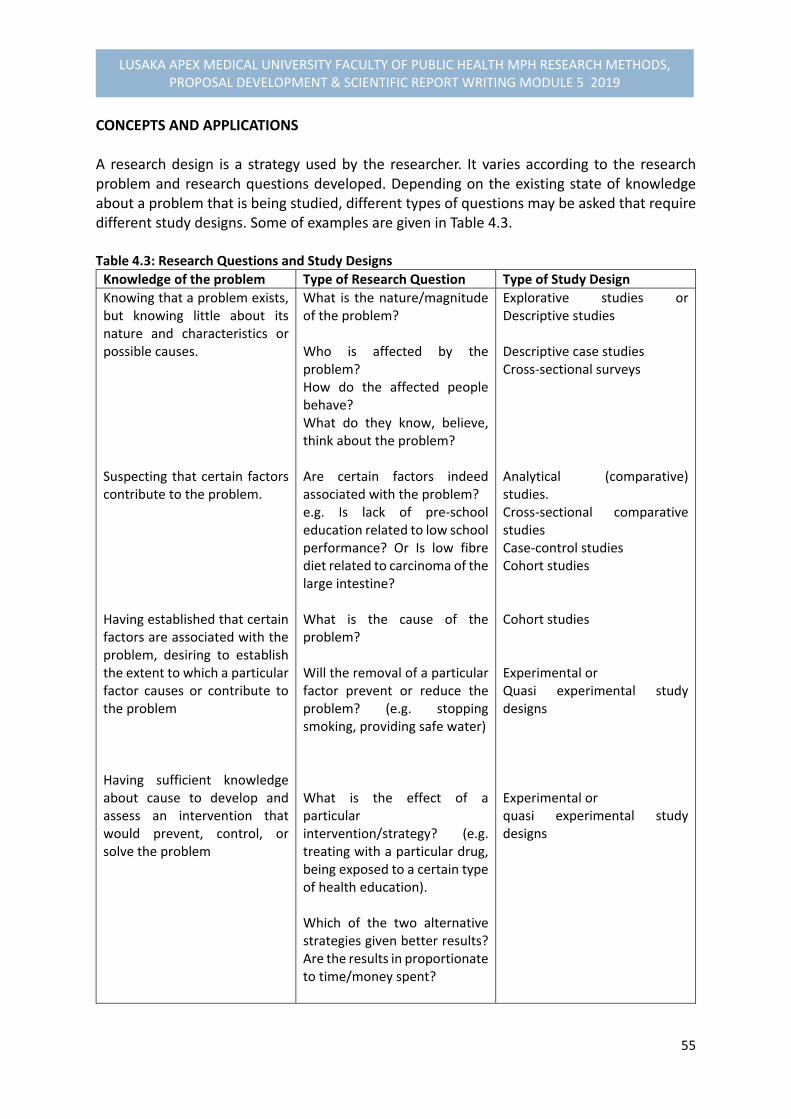
55
LUSAKA APEX MEDICAL UNIVERSITY FACULTY OF PUBLIC HEALTH MPH RESEARCH METHODS, PROPOSAL DEVELOPMENT & SCIENTIFIC REPORT WRITING MODULE 5 2019
CONCEPTS AND APPLICATIONS A research design is a strategy used by the researcher. It varies according to the research problem and research questions developed. Depending on the existing state of knowledge about a problem that is being studied, different types of questions may be asked that require different study designs. Some of examples are given in Table 4.3. Table 4.3: Research Questions and Study Designs
Knowledge of the problem Type of Research Question Type of Study Design
Knowing that a problem exists, but knowing little about its nature and characteristics or possible causes. Suspecting that certain factors contribute to the problem. Having established that certain factors are associated with the problem, desiring to establish the extent to which a particular factor causes or contribute to the problem Having sufficient knowledge about cause to develop and assess an intervention that would prevent, control, or solve the problem
What is the nature/magnitude of the problem? Who is affected by the problem? How do the affected people behave? What do they know, believe, think about the problem? Are certain factors indeed associated with the problem? e.g. Is lack of pre‐school education related to low school performance? Or Is low fibre diet related to carcinoma of the large intestine? What is the cause of the problem? Will the removal of a particular factor prevent or reduce the problem? (e.g. stopping smoking, providing safe water) What is the effect of a particular intervention/strategy? (e.g. treating with a particular drug, being exposed to a certain type of health education). Which of the two alternative strategies given better results? Are the results in proportionate to time/money spent?
Explorative studies or Descriptive studies Descriptive case studies Cross‐sectional surveys Analytical (comparative) studies. Cross‐sectional comparative studies Case‐control studies Cohort studies Cohort studies Experimental or Quasi experimental study designs Experimental or quasi experimental study designs
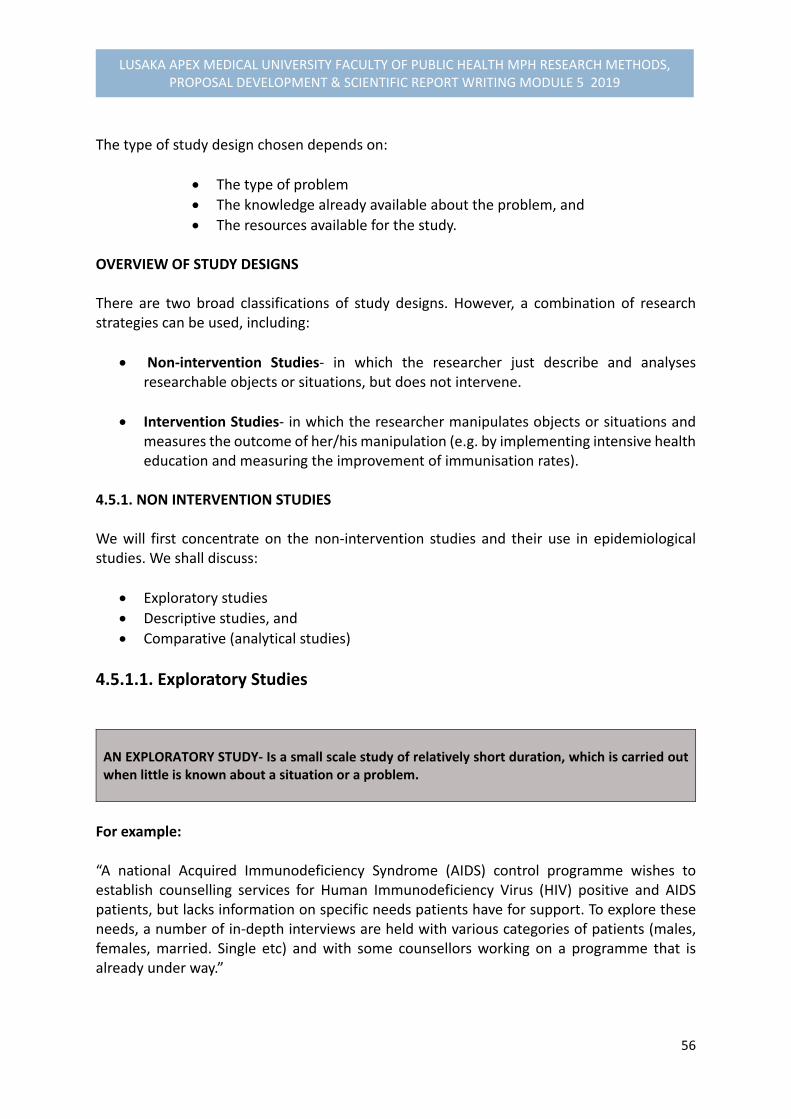
56
LUSAKA APEX MEDICAL UNIVERSITY FACULTY OF PUBLIC HEALTH MPH RESEARCH METHODS, PROPOSAL DEVELOPMENT & SCIENTIFIC REPORT WRITING MODULE 5 2019
The type of study design chosen depends on:
The type of problem
The knowledge already available about the problem, and
The resources available for the study. OVERVIEW OF STUDY DESIGNS There are two broad classifications of study designs. However, a combination of research strategies can be used, including:
Non‐intervention Studies‐ in which the researcher just describe and analyses researchable objects or situations, but does not intervene.
Intervention Studies‐ in which the researcher manipulates objects or situations and measures the outcome of her/his manipulation (e.g. by implementing intensive health education and measuring the improvement of immunisation rates).
4.5.1. NON INTERVENTION STUDIES We will first concentrate on the non‐intervention studies and their use in epidemiological studies. We shall discuss:
Exploratory studies
Descriptive studies, and
Comparative (analytical studies)
4.5.1.1. Exploratory Studies
AN EXPLORATORY STUDY‐ Is a small scale study of relatively short duration, which is carried out when little is known about a situation or a problem.
For example: “A national Acquired Immunodeficiency Syndrome (AIDS) control programme wishes to establish counselling services for Human Immunodeficiency Virus (HIV) positive and AIDS patients, but lacks information on specific needs patients have for support. To explore these needs, a number of in‐depth interviews are held with various categories of patients (males, females, married. Single etc) and with some counsellors working on a programme that is already under way.”
57
LUSAKA APEX MEDICAL UNIVERSITY FACULTY OF PUBLIC HEALTH MPH RESEARCH METHODS, PROPOSAL DEVELOPMENT & SCIENTIFIC REPORT WRITING MODULE 5 2019
When doing exploratory studies, we DESCRIBE the needs of various categories of patients and the possibilities for action. We may want to go further and try to explain the differences we observe (e.g in the needs of male and female AIDS patients) or to identify causes of problems. Then we need to COMPARE groups.
Note: Comparison is a fundamental research strategy to identify variables that help explain why one group of persons or objects differs from another
We could compare, for example:
Two health centres that are functioning and two other that do not function satisfactory to detect the possible causes of functioning of peripheral services.
One community with high and another with low participation in health activities to identify factors that contribute to community participation
Exploratory studies gain in explanatory value if we approach the problem from different angles at the same time. In the study that is looking for causes of low percentage of supervised deliveries, it may be very useful to include observations and interviews with health staff in maternity centres that should serve the mothers in question and interviews with their supervisors, including mothers themselves.
Note: If the problem and its contributing factors are not well defined, it is always advisable to do ‘an exploratory study before embarking on a large‐scale study
4.5.1.2. Descriptive Studies A DECSRIPTIVE STUDY involves the systematic collection and presentation of descriptive data to give a clear picture of a particular situation by describing that situation
Descriptive studies can be carried out on a small or large scale:
i. Small Scale: Descriptive case‐studies: Descriptive case‐studies describe in‐depth the characteristics of one or a limited number of “cases”. A case may be, for example, a patient, a health centre, or a village. Such a study can provide useful insight into a problem. Case‐studies are common in social sciences,
58
LUSAKA APEX MEDICAL UNIVERSITY FACULTY OF PUBLIC HEALTH MPH RESEARCH METHODS, PROPOSAL DEVELOPMENT & SCIENTIFIC REPORT WRITING MODULE 5 2019
management sciences, and clinical medicine. For example, in clinical medicine, the characteristic of unrecognized illness may be documented as a case study. This is often the first step toward building up a clinical picture of that illness.
ii. Large Scale: Cross Sectional Surveys: If one wishes to test whether the findings pertain to a larger population, a more extensive cross‐sectional survey has to be designed. Cross‐sectional surveys aim at quantifying the distribution of certain variables in a study population at one point of time. They may cover for example:
Physical characteristics of people, materials, or the environment, like in Prevalence surveys (e.g. bilharzia, leprosy, rabies etc) or Evaluation of coverage ( e.g. immunization, latrines, malaria control etc)
Socioeconomic characteristics of people, like their age, education, marital status, number of children, income etc
Behaviour of people and the knowledge, attitudes, beliefs, and opinion that may help to explain the behaviour
Events that occurred in the population, such as morbidity, mortality, fertility, movements, marriage etc.
Cross‐sectional surveys cover a sample of the population. If a cross‐ sectional study covers the total population, it is called a “Census”. A cross‐sectional survey may be repeated to measure changes over time in the characteristics that were studies. The surveys may be very large, with hundred or even thousand units. In these cases only limited number of variables will usually be include to avoid problems with analysis and report writing.
4.5.1.3. Comparative or Analytical Studies
An ANALYTICAL STUDY‐ attempts to establish causes or risk factors for certain problems. This is done by comparing two or more groups some of which have or developed the problem and some of which have not
Three commonly used types of analytical studies for discussion are summarised in Figure 4.3.

59
LUSAKA APEX MEDICAL UNIVERSITY FACULTY OF PUBLIC HEALTH MPH RESEARCH METHODS, PROPOSAL DEVELOPMENT & SCIENTIFIC REPORT WRITING MODULE 5 2019
Figure 4.3: Types of Analytical Studies
i. Cross‐sectional comparative studies
Many cross‐sectional surveys focus on comparing as well as describing groups. For example, a survey on malnutrition may wish to establish:
The percentage of malnourished children in a certain population;
Socio‐economic, physical, political variables that influence the availability of food;
Feeding practices; and
The knowledge, beliefs, and opinions that influence these practices In this example, the researcher will not only describe these variables, but by comparing malnourished and well‐ nourished children, he or she will try to determine which socioeconomic, behavioural, and other independent variables have contributed to malnutrition. In any comparative study, one has to watch out for CONFOUNDING OR INTERVENING variables.
ii. Case‐Control Studies In a CASE‐CONTROL STUDY‐ the investigator compares one group among whom a problem is present (CASE) with another group where the problem is absent (CONTROL) to identify what factors have contributed to the problem.
Figure 4.4 shows an illustration of a case‐control study focusing on the events that occurred in the past to present moments: Figure 4.4. Diagram of a Case‐Control Study2
2 Adapted from Varkevisser et al. 2000
Analytical Studies
Case‐Control Studies
Cross‐sectional comparative Studies
Cohort Studies
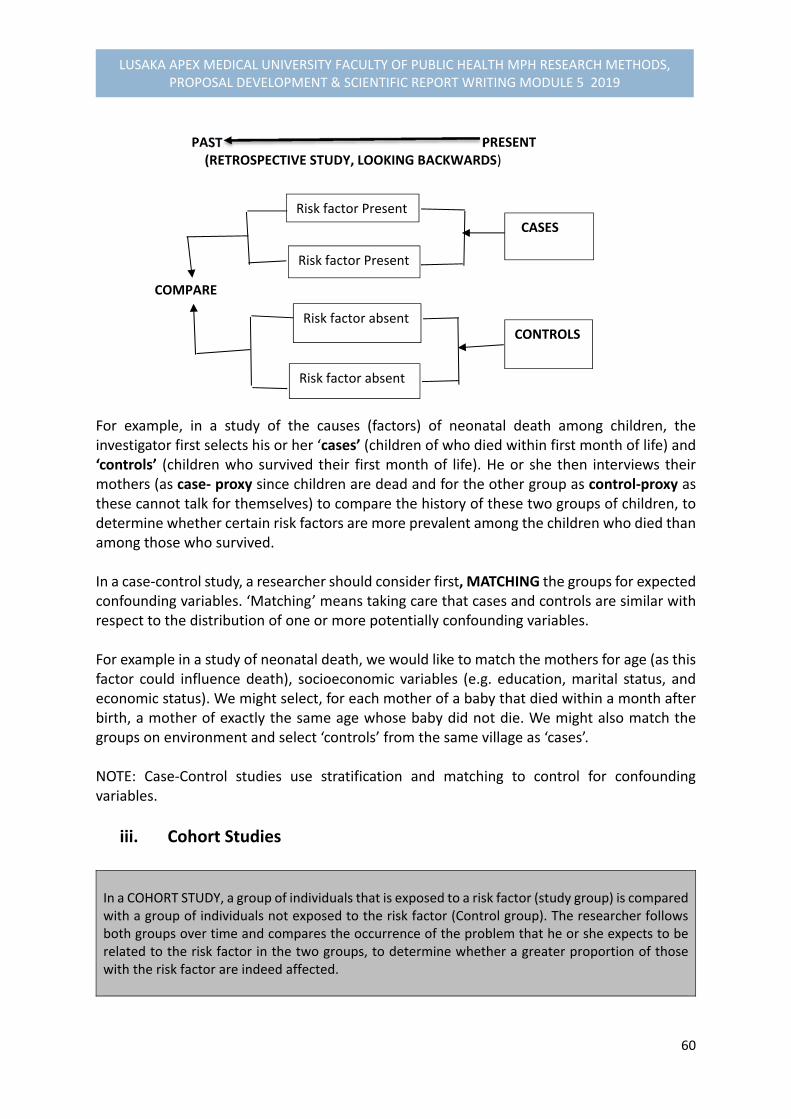
60
LUSAKA APEX MEDICAL UNIVERSITY FACULTY OF PUBLIC HEALTH MPH RESEARCH METHODS, PROPOSAL DEVELOPMENT & SCIENTIFIC REPORT WRITING MODULE 5 2019
PAST PRESENT (RETROSPECTIVE STUDY, LOOKING BACKWARDS)
COMPARE
For example, in a study of the causes (factors) of neonatal death among children, the investigator first selects his or her ‘cases’ (children of who died within first month of life) and ‘controls’ (children who survived their first month of life). He or she then interviews their mothers (as case‐ proxy since children are dead and for the other group as control‐proxy as these cannot talk for themselves) to compare the history of these two groups of children, to determine whether certain risk factors are more prevalent among the children who died than among those who survived. In a case‐control study, a researcher should consider first, MATCHING the groups for expected confounding variables. ‘Matching’ means taking care that cases and controls are similar with respect to the distribution of one or more potentially confounding variables. For example in a study of neonatal death, we would like to match the mothers for age (as this factor could influence death), socioeconomic variables (e.g. education, marital status, and economic status). We might select, for each mother of a baby that died within a month after birth, a mother of exactly the same age whose baby did not die. We might also match the groups on environment and select ‘controls’ from the same village as ‘cases’. NOTE: Case‐Control studies use stratification and matching to control for confounding variables.
iii. Cohort Studies
In a COHORT STUDY, a group of individuals that is exposed to a risk factor (study group) is compared with a group of individuals not exposed to the risk factor (Control group). The researcher follows both groups over time and compares the occurrence of the problem that he or she expects to be related to the risk factor in the two groups, to determine whether a greater proportion of those with the risk factor are indeed affected.
Risk factor Present
Risk factor Present
Risk factor absent
Risk factor absent
CASES
CONTROLS

61
LUSAKA APEX MEDICAL UNIVERSITY FACULTY OF PUBLIC HEALTH MPH RESEARCH METHODS, PROPOSAL DEVELOPMENT & SCIENTIFIC REPORT WRITING MODULE 5 2019
A well‐known example of a cohort study is the ‘Framingham study’ of smokers and non‐smokers that was conducted to determine the importance of smoking as a risk factor for developing lung cancer. A study may start with one large cohort. After the cohort is selected, the researcher may then determine who is exposed to the risk factor (e.g. smoking) and who is not, and follow the two groups over time to determine whether the study group develops a higher prevalence of lung cancer than the control group. If it is not possible to select a cohort and divide it into a study group and a control group, two cohorts may be chosen, one in which a risk factor is present (study group) and another one in which it is absent (control group). In all other respects the two groups should be as alike as possible. The control group should be selected at the same time as the study group, and both should be followed with the same intensity (see Figure 4.5). Figure 4.5. Illustration of a Cohort Study
PRESENT FUTURE (PROSPECTIVE STUDY, LOOKING FORWARD)
COMPARE
USES AND LIMITATIONS OF DIFFERENT TYPES OF ANALYTICAL STUDIES You may use any of the three analytical studies to investigate possible causes of a problem For example, if you assume there is a causal relationship between the use of a certain water source and the incidence of diarrhoea among children under five years of age in a village with different water sources:
You can select a group of children under 5 years and check at regular intervals (e.g. every 2 weeks) whether the children have had diarrhoea and how serious it was. Children using the suspected sources and those using other sources of water supply will be compared with regard to the incidence of diarrhoea ( Cohort study)
You can also conduct a case‐control study. For example, you may compare children who present themselves at a health centre with diarrhoea (cases) during a particular period of time with children presenting themselves with other complaints of the same severity, for example acute respiratory infections (controls) during the same time and determine which source of drinking water they had sued.
Exposed to Risk
Factor
Not Exposed to
Risk Factor
Problem Present
Problem not present
Problem Present
Problem not Present
62
LUSAKA APEX MEDICAL UNIVERSITY FACULTY OF PUBLIC HEALTH MPH RESEARCH METHODS, PROPOSAL DEVELOPMENT & SCIENTIFIC REPORT WRITING MODULE 5 2019
In a cross‐sectional comparative study, you could interview mothers to determine how often their children have diarrhoea during the past month, obtain information on their sources of drinking water, and compare the source of drinking water of children who did and did not have diarrhoea.
Cross‐sectional comparative studies and case‐control studies are usually preferred to cohort studies financial and practical reasons. Cross‐sectional comparative studies and case‐control studies are relatively quick and inexpensive to undertake. With cross‐sectional comparative studies, the number of stratifications is limited by the size of the study. The major problem with the case‐control studies is the selection of appropriate control groups. The matching of cases and controls has to be done with care. Cohort studies are the only sure way to establish causal relationships. However, they take longer than case‐control studies and labour intensive, and expensive. The major problems are usually related to the identification of all cases in a study population, especially if the problem has a low incidence, and to the inability to follow up all persons included in the study over a number of years because of population movements.
4.5.2. INTERVENTION OR EXPERIMENTAL STUDY DESIGNS In intervention studies, the researcher manipulates a situation and measures the effects of the manipulation. Usually (this is not always) two groups are compared, one in which the intervention takes place (e.g. treatment with a certain drug), and the other group remains untouched, or no manipulation (e.g giving a false drug, or with a placebo). There are TWO types of intervention studies:
Experimental studies, and
Quasi experimental studies
4.5.2.1. Experimental/ OR Clinical Study Design An experimental study design is the only type of study design that can actually prove causation.
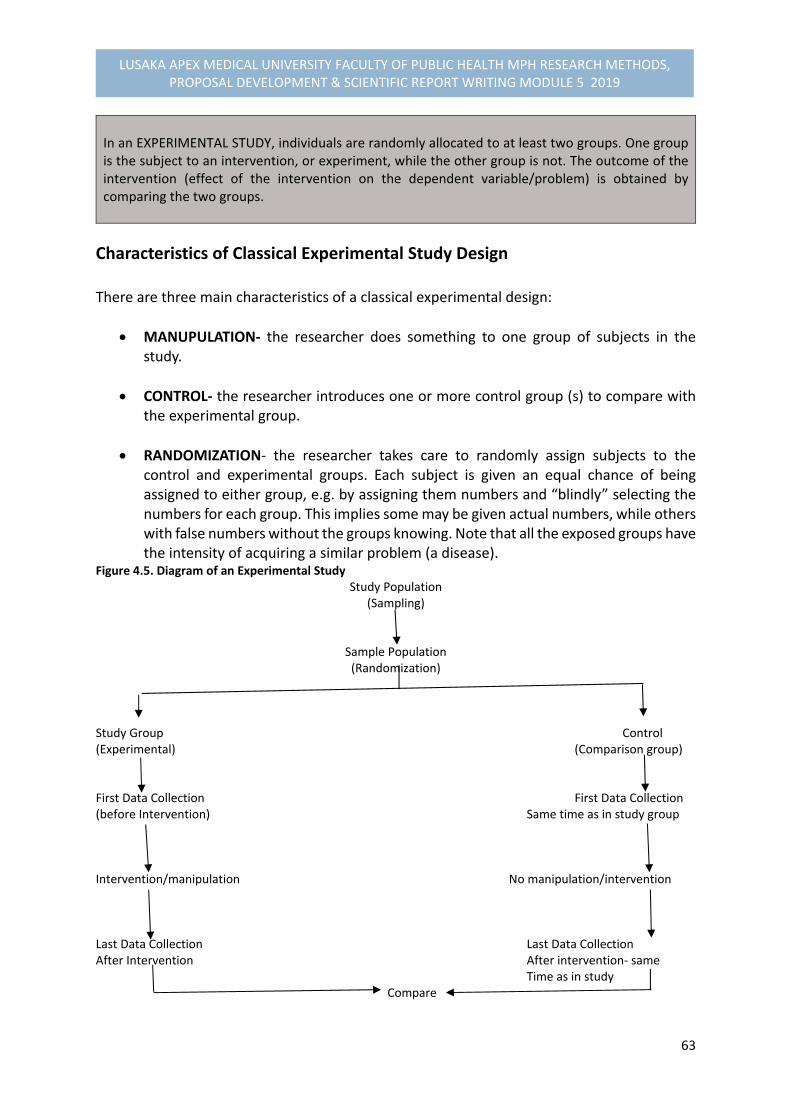
63
LUSAKA APEX MEDICAL UNIVERSITY FACULTY OF PUBLIC HEALTH MPH RESEARCH METHODS, PROPOSAL DEVELOPMENT & SCIENTIFIC REPORT WRITING MODULE 5 2019
In an EXPERIMENTAL STUDY, individuals are randomly allocated to at least two groups. One group is the subject to an intervention, or experiment, while the other group is not. The outcome of the intervention (effect of the intervention on the dependent variable/problem) is obtained by comparing the two groups.
Characteristics of Classical Experimental Study Design There are three main characteristics of a classical experimental design:
MANUPULATION‐ the researcher does something to one group of subjects in the study.
CONTROL‐ the researcher introduces one or more control group (s) to compare with the experimental group.
RANDOMIZATION‐ the researcher takes care to randomly assign subjects to the control and experimental groups. Each subject is given an equal chance of being assigned to either group, e.g. by assigning them numbers and “blindly” selecting the numbers for each group. This implies some may be given actual numbers, while others with false numbers without the groups knowing. Note that all the exposed groups have the intensity of acquiring a similar problem (a disease).
Figure 4.5. Diagram of an Experimental Study Study Population
(Sampling)
Sample Population (Randomization)
Study Group Control (Experimental) (Comparison group) First Data Collection First Data Collection (before Intervention) Same time as in study group Intervention/manipulation No manipulation/intervention Last Data Collection Last Data Collection After Intervention After intervention‐ same Time as in study Compare
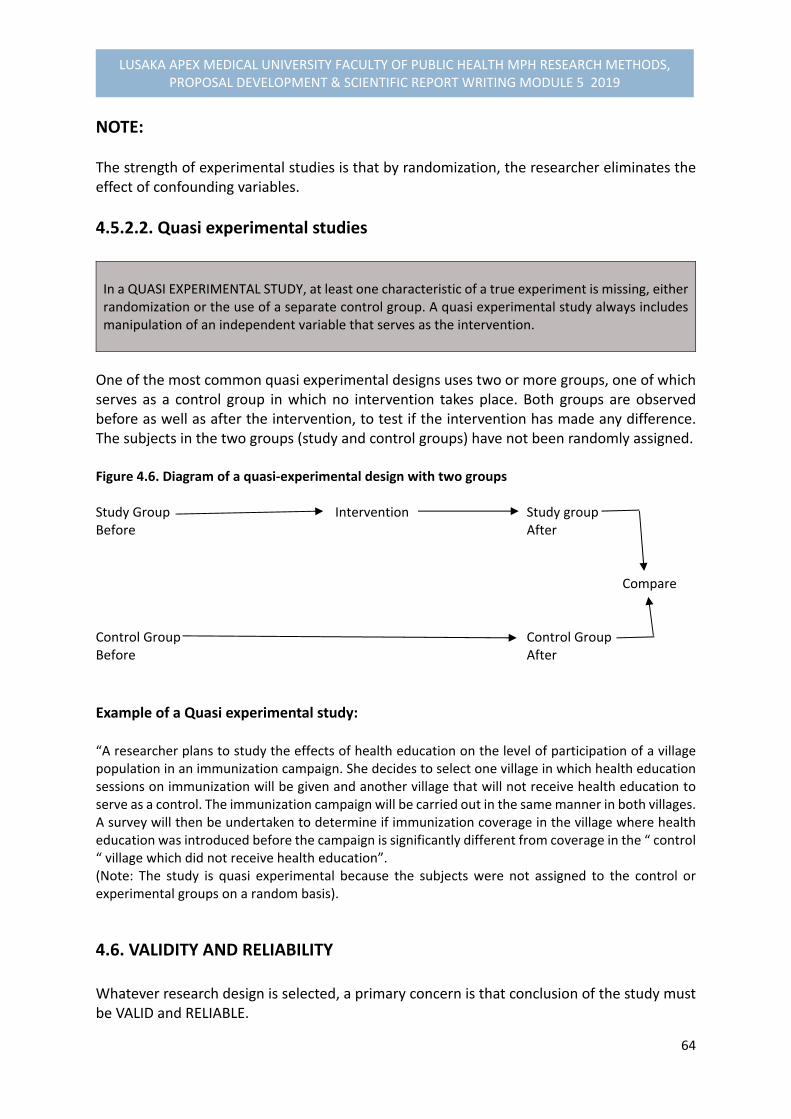
64
LUSAKA APEX MEDICAL UNIVERSITY FACULTY OF PUBLIC HEALTH MPH RESEARCH METHODS, PROPOSAL DEVELOPMENT & SCIENTIFIC REPORT WRITING MODULE 5 2019
NOTE: The strength of experimental studies is that by randomization, the researcher eliminates the effect of confounding variables.
4.5.2.2. Quasi experimental studies In a QUASI EXPERIMENTAL STUDY, at least one characteristic of a true experiment is missing, either randomization or the use of a separate control group. A quasi experimental study always includes manipulation of an independent variable that serves as the intervention.
One of the most common quasi experimental designs uses two or more groups, one of which serves as a control group in which no intervention takes place. Both groups are observed before as well as after the intervention, to test if the intervention has made any difference. The subjects in the two groups (study and control groups) have not been randomly assigned. Figure 4.6. Diagram of a quasi‐experimental design with two groups Study Group Intervention Study group Before After Compare Control Group Control Group Before After
Example of a Quasi experimental study: “A researcher plans to study the effects of health education on the level of participation of a village population in an immunization campaign. She decides to select one village in which health education sessions on immunization will be given and another village that will not receive health education to serve as a control. The immunization campaign will be carried out in the same manner in both villages. A survey will then be undertaken to determine if immunization coverage in the village where health education was introduced before the campaign is significantly different from coverage in the “ control “ village which did not receive health education”. (Note: The study is quasi experimental because the subjects were not assigned to the control or experimental groups on a random basis).
4.6. VALIDITY AND RELIABILITY Whatever research design is selected, a primary concern is that conclusion of the study must be VALID and RELIABLE.

65
LUSAKA APEX MEDICAL UNIVERSITY FACULTY OF PUBLIC HEALTH MPH RESEARCH METHODS, PROPOSAL DEVELOPMENT & SCIENTIFIC REPORT WRITING MODULE 5 2019
What are validity and reliability of research findings? A VALIDITY means that the conclusions of the findings are TRUE A RELIABILITY means that someone else using the same method in the same circumstances should be able to obtain the similar findings.
Example: In a four different teams of Researchers set out to determine body weights of three children whose weights were: 10kg, 15kg, and 20kg as TRUE BODY WEIGHTS. Team 1: CHILD True Body Weights First Set of Results A 10kg 8kg B 15kg 18kg C 20kg 19kg Conclusion: First set is not valid because the body weights are not the true weights. It is not reliable because the weights are sometimes too high and sometimes too low. Team 2: CHILD True Body Weights Second Set of Results A 10kg 11kg B 15kg 16kg C 20kg 19kg Conclusion: The second set of results is not valid because the body weights are not the true body weights. It is reliable because the results are too high by the same proportion (10%) for every child. Team 3: CHILD True Body Weights Third Set of Results A 10kg 10.15 kg B 15kg 14.85 kg C 20kg 20.33 kg

66
LUSAKA APEX MEDICAL UNIVERSITY FACULTY OF PUBLIC HEALTH MPH RESEARCH METHODS, PROPOSAL DEVELOPMENT & SCIENTIFIC REPORT WRITING MODULE 5 2019
Conclusion: The third set of results is fairly valid because the results are almost the true body weights. They are not reliable because two weights are too high and one is too low and the proportions by which they differ from the true body weight is different for each child. Team 4: CHILD True Body Weights Fourth Set of Results A 10kg 10 kg B 15kg 15 kg C 20kg 20 kg Conclusion: The fourth set of results is both valid and reliable because they are the same as the true body weights and these results are obtained for every child.
Selection of study design for eliminating threats to validity Researchers should always try to eliminate threats to validity through the selection of appropriate study designs. In descriptive studies, information is collected from a sample and the findings are often used to make conclusions about the population. Threats to validity may cause UNTRUE conclusion of findings.
Confounding Variables‐ may be threats to validity of results because some may tend to weaken or strengthen the apparent cause of the problem.
History‐ For example, if a programme which has been already established had gained its popularity by an influential person, e.g. Head of state or any, may affect validity of results.
Different subject loss‐ particularly in case‐control and cohort studies
Bias in selection
In appropriate designing of Instruments‐ can produce distorted data
Strategies, or Approaches for Eliminating Threats to Validity:
Appropriate selection of study design Appropriate selection of control groups and follow up mechanisms Random assignment of subjects to the groups Before and after measurement data collection Careful designing and pre‐testing research data collection instruments, or pilot study
to test effectiveness of the methodology.

67
LUSAKA APEX MEDICAL UNIVERSITY FACULTY OF PUBLIC HEALTH MPH RESEARCH METHODS, PROPOSAL DEVELOPMENT & SCIENTIFIC REPORT WRITING MODULE 5 2019
There are must be adequate knowledge of environmental events (e.g. sensitivity to external events like cultural traditions, holidays etc).
4.7. STUDY POPULATION & SAMPLING In this part of the Module unit, the components will be devoted to:
Explaining the terminology of sampling, its meaning
Components of sampling
Study population
Sampling Methods
Sample size determination, by applying statistical formulae of calculating a sample size.
4.7.1. STUDY POPULATION Study population has to be clearly defined before determining a sample size, or sampling methods to be applied. For example, it can be defined according to population characteristics, such as age, gender, residence, economic status, education status, religion or ethnicity. Apart from population characteristics, a study population can be a village, household, institution, records etc. Each study population consists of STUDY UNITS. How study population and units are defined depend on the problem. For Example: Table 4.4: Study Population & Study Units in Relation to Problem Problem Study Population Study Unit
Malnutrition related to weaning among 6‐24 months children in District X
All Children 6‐24 months in District X
One Child between 6‐24 months old
High drop ‐out rates in Primary schools in district Y
All primary schools in District Y One Primary school in District Y
Poor Record‐Keeping for TB patients registered in Hospital Z
All TB records in Hospital Z One TB record in Hospital Z
68
LUSAKA APEX MEDICAL UNIVERSITY FACULTY OF PUBLIC HEALTH MPH RESEARCH METHODS, PROPOSAL DEVELOPMENT & SCIENTIFIC REPORT WRITING MODULE 5 2019
4.7.2. DEFINITIONS: SAMPLING, PROBABILITY & NON‐PROBABILITY SAMPLING What is sampling? SAMPLING – is a selection of a number of study units from a defined STUDY POPULATION STUDY POPULATION can be people, objects, animal species etc.
Some studies may involve a small numbers of people and others all of them can be include. To draw a sample from the total population, it is necessary to focus on a large population for the inclusion of some of its members in the investigation. COMPONENTS & CHARACERISTICS OF SAMPLING
There are two main components of sampling involving:
SAMPLE SIZE DETERMINATION
SAMPLING METHODS There are four main Characteristics of sampling that are considered which are:
Study Population‐ What is the group from which we want to draw a sample?
Sample Size‐ How many people do we need in our sample?
Sampling Methods‐ How will these people be selected?
Representativeness, or generalization‐ Is the sample drawn be representative to that population? To draw conclusions that are valid for the whole or total population.
A representative sample has all the important characteristics of the population from which it is drawn. For example: To interview 100 mothers to obtain a complete picture of the weaning practices in district X, you would select these mothers from a representative sample of villages. Interviewing mothers from <5 clinics only may not constitute a representative of mothers under study.
4.7.2. SAMPLING METHODS: PROBABILITY & NON‐PROBABILITY SAMPLING METHODS One Important Issue to consider in influencing the choice of the appropriate sampling method is the SAMPLING FRAME.

69
LUSAKA APEX MEDICAL UNIVERSITY FACULTY OF PUBLIC HEALTH MPH RESEARCH METHODS, PROPOSAL DEVELOPMENT & SCIENTIFIC REPORT WRITING MODULE 5 2019
A SAMPLING FRAME is the listing of all that units that compose the study population ( i.e. population characteristics)
Types of Sampling Methods There are two general types of sampling methods commonly used which are:
Probability Sampling Methods
Non‐ Probability sampling methods
A. PROBABILITY SAMPLING METHOD A PROBABILITY SAMPLING‐ is a random selection of study units by chance from a defined study population. A probability sampling ensures that each unit of the sample is chosen on the basis of chance. All units of the study population should have an equal or at least a known chance of being included in the sample. A probability sampling requires that a listing of all study units (sampling frame) exists or can be compiled.
Types of Probability Sampling Methods The following are the various types of probability sampling methods:
Simple random sampling
Systematic Sampling
Stratified sampling
Cluster sampling
Multistage sampling
Simple Random Sampling Method A simple random sampling method is the simplest method of probability sampling involving:
Making a numbered list of all the units in the population from which you want to draw a sample (i.e. sampling frame).
Deciding on the size of the sample
Selecting the required number of the sampling units, using either a lottery method, or a table of random numbers.

70
LUSAKA APEX MEDICAL UNIVERSITY FACULTY OF PUBLIC HEALTH MPH RESEARCH METHODS, PROPOSAL DEVELOPMENT & SCIENTIFIC REPORT WRITING MODULE 5 2019
For Example: A simple random sample of 50 students is to be selected from a school of 250 students. Using a list of all 250 students, each student is given a number (1 to 250), and these numbers are written on small pieces of papers. All the 250 papers are put in a box, after which the box is shaken vigorously to ensure randomization. Then, 50 papers are taken out of the box and the numbers are recorded. The students belonging to these numbers will constitute the sample (i.e. a sample of 50 students) drawn from a defined population.
Systematic Sampling Method In a SYSTEMATIC SAMPLING, individuals are chosen at regular intervals, for example every 5th person, from the sampling frame.
You will randomly select a number to tell you where to start selecting individuals from the list. For example, If a systematic sampling methods is used to select a sample of 100 from a total number of 1,200 students in a school. The sampling interval would be every 12th person will be eligible for selection. The sampling fraction in this case is calculated as: 100 (sample size required) 1 ‐‐‐‐‐‐‐‐‐‐‐‐‐‐‐‐‐‐‐‐‐‐‐‐‐‐‐‐‐‐‐‐‐‐‐ = ‐‐‐‐‐‐ 1,200 (study population) 12
The sampling interval becomes 12
The systematic sampling is usually less time consuming and easier to perform than simple random sampling.
Stratified Sampling STRATIFIED SAMPLING is the division of sampling frame into groups or strata, according to characteristics, such as residence (urban & rural) or different age‐groups, or different socio‐economic status of high cost areas and low cost areas, or even distance.
Random or systematic samples of predetermined size will then have to be obtained from each group (stratum) Stratified sampling is only applied when proportion of the study population belonging to each group is known.
71
LUSAKA APEX MEDICAL UNIVERSITY FACULTY OF PUBLIC HEALTH MPH RESEARCH METHODS, PROPOSAL DEVELOPMENT & SCIENTIFIC REPORT WRITING MODULE 5 2019
Cluster Sampling CLUSTER SAMPLING‐ is a selection of groups of geographical study units
Clusters are often geographical units, for example, provinces, districts, villages, or organizational units, like clinics, hospitals, and training institutions.
Multistage Sampling A MULTISTAGE SAMPLING is a selection of study units in phases or stages involving different types of other sampling methods, e.g using simple random method, then systematic etc
Multistage sampling procedure is carried out in stages or phases and usually involves more than one sampling methods. For example, you may decide by selecting a province using another method, then district, villages, households up to your respondents. All these may require different sampling methods.
Advantages of Cluster and Multistage sampling Methods
A sampling frame of clusters is sufficient. It is within the clusters that you need to list and sample the individual units Sample is easier to select than a simple random sample of similar size. Applicable for cross‐sectional descriptive studies or surveys.
B. NON PROBABILITY SAMPLING
Non probability sampling involves no random sampling applied.
Types of Non Probability Sampling
Convenience sampling
Purposive sampling
Quota sampling
Snowball sampling
72
LUSAKA APEX MEDICAL UNIVERSITY FACULTY OF PUBLIC HEALTH MPH RESEARCH METHODS, PROPOSAL DEVELOPMENT & SCIENTIFIC REPORT WRITING MODULE 5 2019
Convenience Sampling A convenience sampling is a method in which for convenience sake the study units that happen to be available at the time of data collection are selected in the sample. Convenience sampling does not produce representative findings
Purposive Sampling The principle of selection in purposive sampling is the researcher’s judgement as to typicality or interest, or conditions. It can be as a result of the prevailing conditions affecting the population that the researcher would be interested in as rationale for the study.
Quota Sampling Quota sampling is a method that ensures that a certain number of sample units from different categories with specific characteristics appear in the sample so that all these characteristics are represented. For example, if the researcher is interested in economic status of respondents, or a certain age‐group, he/or she may include more units of measurements, and therefore would need to increase the sample by extending to 3 or 4 days over to obtain desired sample.
Snowball Sampling In a snowball sampling, the researcher identifies one or more individuals from the population of interest for interviews. After they have been interviewed, they are used as informants to identify other members of the population, who are themselves used as informants, and so on. Snowball sampling is a useful approach when there is difficult in identifying respondents, or members of the population.
4.7.3. SAMPLE SIZE DETERMINATION SAMPLE SIZE‐ is determined to provide representative of the whole population.
One has to determine the most adequate size of the sample. A Large sample is more representative, but very expensive. A Small sample is much less representative, but less expensive

73
LUSAKA APEX MEDICAL UNIVERSITY FACULTY OF PUBLIC HEALTH MPH RESEARCH METHODS, PROPOSAL DEVELOPMENT & SCIENTIFIC REPORT WRITING MODULE 5 2019
Any value of a variable obtained from the sample (e.g. a mean) can be considered as an estimate of the corresponding population value.
Criterion for Deciding on Sample Size A major criterion used in deciding on sample size in the extent to which there is a representative of the population is to take into account the availability of resources interms of:
Time
Manpower
Transport. And
Money A sample size must be large enough to:
Allow for reliable analysis of cross‐ tabulation.
Provide the desired levels of accuracy in the estimates of parameters ( measurements of units)
Test for the significance of differences between groups.
Terminologies Used in Determining Sample Size
1) Confidence Interval‐ It is a range of values which likely encompasses the parameter (measurement).
2) Confidence Limits which are the Lower and Upper limits. For example, a 95% confidence interval (c. i) of 152 to 164 cm for the mean height of a population of women means that you are 95% certain that the real population mean, which you cannot know exactly unless you measure the heights of all women, lies between 152 and 164 cm, implying that 152 is the lower confidence limit and 164 is the upper confidence limit. Calculation of the confidence interval takes into account the Standard error.
3) Standard Error‐ gives an estimate of the degree to which the samples mean varies from the population mean. It is computed on the basis of the Standard deviation. For example, A standard error of 95% confidence interval of a sample mean from numerical data is calculated by dividing standard deviation by the square root of the
sample size. The formula becomes: s.e= standard deviation/ sample size or SD/n, Standard error is the standard deviation of the estimator, or the square root of the variance of an estimator. Error means deviation from what actually exists in the population. The deviation is accounted for the laws of chance or probability. For example, a population that is just by chance is 60% female, you can conclude that the population is 60% female. Few samples can happen by chance. Standard error gives an estimate of the degree to which the sample mean varies from the population mean. It is computed on the basis of the standard deviation.

74
LUSAKA APEX MEDICAL UNIVERSITY FACULTY OF PUBLIC HEALTH MPH RESEARCH METHODS, PROPOSAL DEVELOPMENT & SCIENTIFIC REPORT WRITING MODULE 5 2019
4) Standard Deviation‐ is a measure which describes how much individual measurements differ on the average from the sample mean.
Guiding Questions for Calculating Minimum Sample Size Requirement To calculate the minimum sample size required, you need first to consider the following questions:
What are reasonable estimates of key proportion(s), rates, means etc to be measured in the study?
What degree of accuracy do we want to have in the study?
What is the size of the population that the sample is to represent? And
What is the minimum difference we expect to find significant? For the sample size formulae, the following abbreviations are used: n = sample size s = Standard deviation e = Standard error required size by applying the use of margin of error for ± 2 times the size of the standard error, if a precision (power) of a 95% confidence interval is required. If the precision of 99% is required, the margin of error is ± 3 times the size of standard error, and if the precision of 90% is required, the margin of error is ± 1 times the size of standard error. r = rate p = percentage or proportion The desirable sample size is determined by the expected variation in the data. The more varied the data are, the larger the sample size you will need to attain the level of accuracy. The sample size increases accuracy of data by: training interviewers or pretesting of data collection tools. For cross‐sectional and analytical studies, precise calculations are necessary for the desired sample size. For the explorative studies, it is also important to consider that the sample size is large enough to reflect important variations in the population. For example: In a study on attitudes towards family planning, you may decide to interview three (3) categories of informants: nonusers, female users and male users, and you may start with 20 to 30 interviews per category. Such an example may require a large sample size.
75
LUSAKA APEX MEDICAL UNIVERSITY FACULTY OF PUBLIC HEALTH MPH RESEARCH METHODS, PROPOSAL DEVELOPMENT & SCIENTIFIC REPORT WRITING MODULE 5 2019
Confidence Interval Estimation Confidence interval is estimated as statistics ± d x standard error (dxe), where ‘d’ expresses the degree of accuracy (confidence) for the choice of precision or power (confidence) of minimum significant difference is expressed as follows:
99% confidence, d = 3 (2.58)
95% confidence, d = 2 (1.96)
90% confidence, d = 1 (1.28)
75% confidence, d = 0.7 (0.67)
‘e’ is the standard error for the required precision , and d x e = ½ width of the confidence interval. In calculating a sample size, it is assumed that in a normal distributed variable, approximately 95% of all possible sample means lie within two standard errors of the population mean. It means that we can be 95% sure that the population mean, of which we want to have the best possible estimate lies within two standard errors of our sample mean. Statistically, you can present the calculated sample mean by ± 2s.e. called 95% confidence interval. It means that you are about 95% certain that the population mean is within the interval.
Steps for Sample Size Calculation For Example: In a descriptive study in a certain village, you want to measure with a certain precision the proportion of children aged 12‐23 months who are vaccinated against measles using a simple random. The following steps are taken into account: Step 1. Estimate how big the proportion might be (say 80%). Step 2. Choose the margin of error you will allow in the estimate of the proportion (say ±10%). This means that if in the survey indeed 80% of the children are found to be vaccinated, this proportion will probably between 70 and 90% in the whole study population from which the sample was drawn. Step 3. Choose a precision (power e.g. at 95%, 99% or 90% confidence interval) with which you want to be confident that the vaccination coverage in the whole population is indeed between 70 and 90 % (i.e. ± 80% and the difference is 10%). You can never be 100% sure. Do you want to be 95% sure or 99% sure?. This estimates the degree of accuracy or precision. Step 4. Using a single proportion formula for 95% c.i where the width of confidence interval to estimate the standard error is 10%. For 95% confidence, d is 2, dx2 = ½ width of 10 % =5, 2e= 5, e= 2.5. The sample size gives:
76
LUSAKA APEX MEDICAL UNIVERSITY FACULTY OF PUBLIC HEALTH MPH RESEARCH METHODS, PROPOSAL DEVELOPMENT & SCIENTIFIC REPORT WRITING MODULE 5 2019
n = p (100‐P) 80 (100‐80) 80x20 ‐‐‐‐‐‐‐‐‐‐‐‐ = ‐‐‐‐‐‐‐‐‐‐‐‐‐‐‐‐‐ = ‐‐‐‐‐‐‐‐‐ = 256 sample size e² 2.5² 6.25 Accounting for the Z value as 1.96 for 95% confidence interval as the power, as a percentage point of the normal distribution corresponding to the two sided significance level, i.e. if the significance level is 5% or 95%, Z= 1.96. Accounting for the ‘Z’ value for 95% confidence, the formula is altered and the sample size would be: n = z² p(100‐p) 1.96² x80x20 ‐‐‐‐‐‐‐‐‐‐‐‐‐‐‐ = ‐‐‐‐‐‐‐‐‐‐‐‐‐‐‐‐‐‐‐ = 983 sample size e² 6.25 The sample size becomes larger
Calculating Standard Error for Sample Size Estimation For example: The weights of a random sample of 11 three year old children were taken. The sample mean was 16 kg and the standard deviation of the sample was 2kg. The standard error is :
211 = 0.6 kg Estimating the 95% confidence interval is: 16± (2 x 0.6) = gives a range of = 14.8 to 17.2 kg It means that we are approximately 95% certain that the mean weight of all three year old children lies between 14.8 and 17.2 kg, giving a difference of 2.4 for the width of confidence interval. The width of confidence interval is 2.4. For 95% confidence interval, the degree of accuracy is 2, therefore s.e. for the population mean to calculate for a sample size is: d x e = ½ width of c.i (2,4)= 1.2 2e = 1.2. e = 0.6 Then calculate sample size after calculating the standard error, e, using appropriate formulae and proportions, rates, means etc.
77
LUSAKA APEX MEDICAL UNIVERSITY FACULTY OF PUBLIC HEALTH MPH RESEARCH METHODS, PROPOSAL DEVELOPMENT & SCIENTIFIC REPORT WRITING MODULE 5 2019
Other Formulae Categories for Calculating Sample Size3 The formulae for calculating the required sample size are divided into two categories:
First, Studies measuring one variable with certain precision (power), e.g. a mean, a rate, or a proportion.
Second, for studies seeking to demonstrate a significant difference between two groups
1. Measuring One Variable
In the formulae below, the following abbreviations are used: n, Sample size s, Standard deviation e, Required size of standard error (or margin of error) is used for ± 2 times the size of the
standard error if a precision (power) of 95% is required. If a precision of 99% is required, the margin of error is ± 3 times the size of the standard error.
r, rate p, percentage (proportion)
1.1. Single Mean In a study that indicates the mean weight of new born babies expected to be 3000 grams. Weights are approximately normally distributed and 95% of the birth weights are probably between 2000 and 4000 grams, therefore the standard deviation would be 500 grams (i.e. calculated at difference of ±1000 grams divided by two sided normally distributed confidence interval gives 500 grams). The desired 95% confidence interval is 2950 to 3050 (calculated as
±3000 (2x 500= 2x25= 50) gives a range of 2950 to 3050), so the standard error would be 25 grams. The required sample size would be: n = s² = 500² = 250,000 = 400 new born babies ‐‐‐‐ ‐‐‐‐‐‐‐ ‐‐‐‐‐‐‐‐‐‐‐ e² 25² 625
1.2. Single Rate The maternal mortality ratio in a country is expected to be 70 per 10,000 live births. A survey is planned to determine the maternal mortality rate with a 95% confidence interval of 60 to
3 Adapted from Kirkwood , B and Sterne J. 2003. Medical Statistics 2nd Edition, Blackwell Scientific Publications, UK; and In Varkevisser C, and Pathmanathan I.1991. Designing and Conducting Health Systems Research Projects: Part 1: Proposal Development & Fiedwork, Volume 2, IDRC‐287e.1
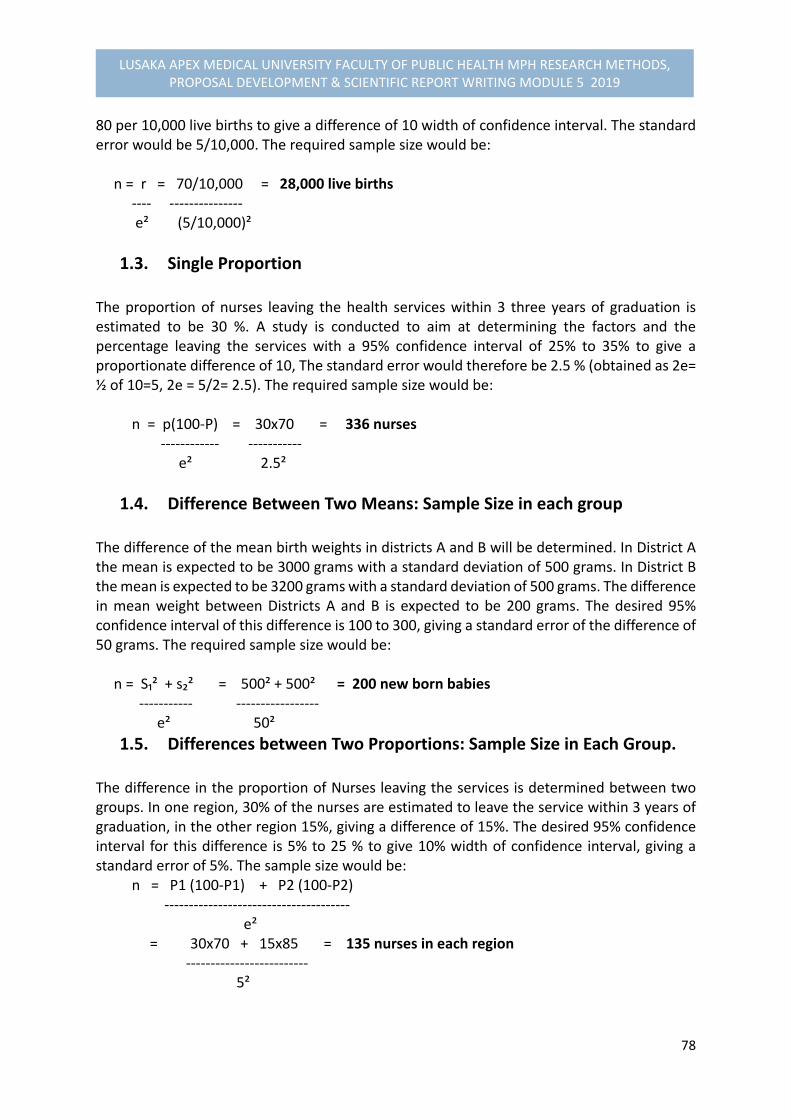
78
LUSAKA APEX MEDICAL UNIVERSITY FACULTY OF PUBLIC HEALTH MPH RESEARCH METHODS, PROPOSAL DEVELOPMENT & SCIENTIFIC REPORT WRITING MODULE 5 2019
80 per 10,000 live births to give a difference of 10 width of confidence interval. The standard error would be 5/10,000. The required sample size would be: n = r = 70/10,000 = 28,000 live births ‐‐‐‐ ‐‐‐‐‐‐‐‐‐‐‐‐‐‐‐ e² (5/10,000)²
1.3. Single Proportion
The proportion of nurses leaving the health services within 3 three years of graduation is estimated to be 30 %. A study is conducted to aim at determining the factors and the percentage leaving the services with a 95% confidence interval of 25% to 35% to give a proportionate difference of 10, The standard error would therefore be 2.5 % (obtained as 2e= ½ of 10=5, 2e = 5/2= 2.5). The required sample size would be: n = p(100‐P) = 30x70 = 336 nurses ‐‐‐‐‐‐‐‐‐‐‐‐ ‐‐‐‐‐‐‐‐‐‐‐ e² 2.5²
1.4. Difference Between Two Means: Sample Size in each group The difference of the mean birth weights in districts A and B will be determined. In District A the mean is expected to be 3000 grams with a standard deviation of 500 grams. In District B the mean is expected to be 3200 grams with a standard deviation of 500 grams. The difference in mean weight between Districts A and B is expected to be 200 grams. The desired 95% confidence interval of this difference is 100 to 300, giving a standard error of the difference of 50 grams. The required sample size would be: n = S₁² + s₂² = 500² + 500² = 200 new born babies ‐‐‐‐‐‐‐‐‐‐‐ ‐‐‐‐‐‐‐‐‐‐‐‐‐‐‐‐‐ e² 50²
1.5. Differences between Two Proportions: Sample Size in Each Group. The difference in the proportion of Nurses leaving the services is determined between two groups. In one region, 30% of the nurses are estimated to leave the service within 3 years of graduation, in the other region 15%, giving a difference of 15%. The desired 95% confidence interval for this difference is 5% to 25 % to give 10% width of confidence interval, giving a standard error of 5%. The sample size would be: n = P1 (100‐P1) + P2 (100‐P2) ‐‐‐‐‐‐‐‐‐‐‐‐‐‐‐‐‐‐‐‐‐‐‐‐‐‐‐‐‐‐‐‐‐‐‐‐‐‐ e² = 30x70 + 15x85 = 135 nurses in each region ‐‐‐‐‐‐‐‐‐‐‐‐‐‐‐‐‐‐‐‐‐‐‐‐‐ 5²

79
LUSAKA APEX MEDICAL UNIVERSITY FACULTY OF PUBLIC HEALTH MPH RESEARCH METHODS, PROPOSAL DEVELOPMENT & SCIENTIFIC REPORT WRITING MODULE 5 2019
2. Significant Difference Between Two Groups In the formulae below, the following abbreviations are used to calculate sample size: n, sample size s, standard deviation e, required size of standard error (margin of error) r, rate p, percentage u, one‐sided percentage point of the normal distribution corresponding to 100% ‐the
power. The power is the probability of finding a significant result. If the power is 75%, u = 0.67 and if the power is 90%, u = 1.28.
v, percentage point of the normal distribution corresponding to the two‐sided significance level, if the significant level is 95%, or 5% (as usual), v = 1.96.
2.1. Comparison of Two Means: Sample Size in Each group The birth weight in district A and B will be compared. In District A the mean birth weight is expected to be 3000 grams with a standard deviation of 500 grams. In District B the mean is expected to be 3200 grams with a standard error of 500 grams. The required sample size to demonstrate with a likelihood of 90% significant difference between the mean weights in district A and B would be: n = (u+v)² (s₁² + s₂²) = (1.28 + 1.96)² (500² +500² = 131 new born babies in each district ‐‐‐‐‐‐‐‐‐‐‐‐‐‐‐‐‐‐‐‐‐‐‐‐ ‐‐‐‐‐‐‐‐‐‐‐‐‐‐‐‐‐‐‐‐‐‐‐‐‐‐‐‐‐‐‐‐‐‐ ( m₁ ‐ m₂ )² 3200 – 3000
2.2. Comparison of Two Rates: Sample Size in Group The maternal mortality rates in urban and rural areas will be compared. In the rural areas the maternal mortality is expected to be 100 per 10,000 and in the urban areas is 50 per 10,000 live births. The required sample size to show with a likelihood of a 90% significant difference between the maternal mortality in the urban and rural areas would be: n = (u +v)² ( r₁ + r₂) = (1.28 + 1.96) ( 100/10,000 + 50/10,000
‐‐‐‐‐‐‐‐‐‐‐‐‐‐‐‐‐‐‐‐‐‐‐ ‐‐‐‐‐‐‐‐‐‐‐‐‐‐‐‐‐‐‐‐‐‐‐‐‐‐‐‐‐‐‐‐‐‐‐‐‐‐‐‐‐‐‐‐‐‐‐‐‐‐‐‐ r₁ ‐r₂ (100/10.000 – 50/10,000)² = 6299 live births in each area
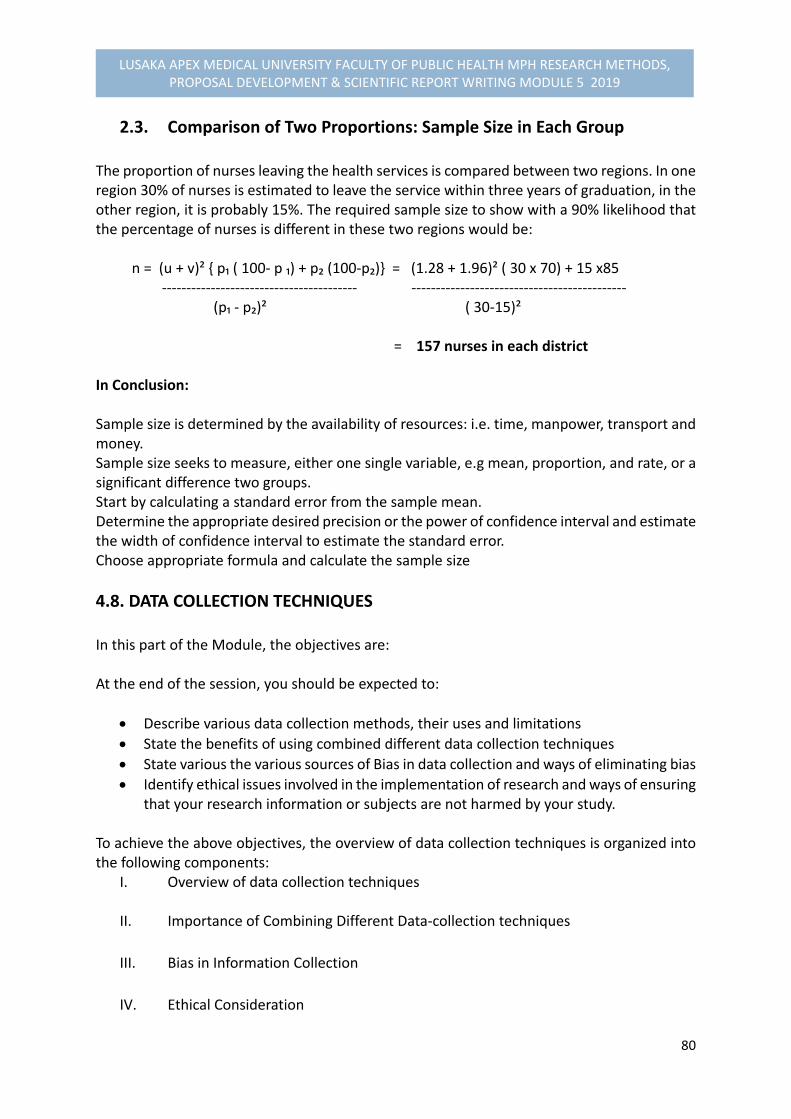
80
LUSAKA APEX MEDICAL UNIVERSITY FACULTY OF PUBLIC HEALTH MPH RESEARCH METHODS, PROPOSAL DEVELOPMENT & SCIENTIFIC REPORT WRITING MODULE 5 2019
2.3. Comparison of Two Proportions: Sample Size in Each Group The proportion of nurses leaving the health services is compared between two regions. In one region 30% of nurses is estimated to leave the service within three years of graduation, in the other region, it is probably 15%. The required sample size to show with a 90% likelihood that the percentage of nurses is different in these two regions would be: n = (u + v)² { p₁ ( 100‐ p ₁) + p₂ (100‐p₂)} = (1.28 + 1.96)² ( 30 x 70) + 15 x85
‐‐‐‐‐‐‐‐‐‐‐‐‐‐‐‐‐‐‐‐‐‐‐‐‐‐‐‐‐‐‐‐‐‐‐‐‐‐‐‐ ‐‐‐‐‐‐‐‐‐‐‐‐‐‐‐‐‐‐‐‐‐‐‐‐‐‐‐‐‐‐‐‐‐‐‐‐‐‐‐‐‐‐‐‐ (p₁ ‐ p₂)² ( 30‐15)² = 157 nurses in each district
In Conclusion: Sample size is determined by the availability of resources: i.e. time, manpower, transport and money. Sample size seeks to measure, either one single variable, e.g mean, proportion, and rate, or a significant difference two groups. Start by calculating a standard error from the sample mean. Determine the appropriate desired precision or the power of confidence interval and estimate the width of confidence interval to estimate the standard error. Choose appropriate formula and calculate the sample size
4.8. DATA COLLECTION TECHNIQUES In this part of the Module, the objectives are: At the end of the session, you should be expected to:
Describe various data collection methods, their uses and limitations
State the benefits of using combined different data collection techniques
State various the various sources of Bias in data collection and ways of eliminating bias
Identify ethical issues involved in the implementation of research and ways of ensuring that your research information or subjects are not harmed by your study.
To achieve the above objectives, the overview of data collection techniques is organized into the following components:
I. Overview of data collection techniques
II. Importance of Combining Different Data‐collection techniques
III. Bias in Information Collection
IV. Ethical Consideration

81
LUSAKA APEX MEDICAL UNIVERSITY FACULTY OF PUBLIC HEALTH MPH RESEARCH METHODS, PROPOSAL DEVELOPMENT & SCIENTIFIC REPORT WRITING MODULE 5 2019
I. Overview of Data‐ Collection Techniques Data collection techniques allow us to systematically collect information about our objects of study (i.e. people, objects, phenomena) and about the settings in which they occur. In the collection of data, we have to be systematic. If data are collected haphazardly, it will be difficult to answer our research questions in a conclusive way. Various data collection techniques can be used, such as:
Using available information in form of desk review, or secondary data source
Observation
Interviewing (face‐to‐face)
Administering written questionnaires
Focus group discussions (see Unit 5)
Other data‐ collection techniques (se Unit 5)
Using Available Information There is usually a large volume of data already collected by others. Locating sources and retrieving the information is a good starting point in any data collection effort. Analysis of the information system data, census data, unpublished reports, and publications in archives and libraries or in offices at the various levels of health and health‐related services may be a study in itself. It forms part of a study in which other data‐collection techniques are also used. To retrieve data from available sources, the researcher will have to design an instrument such as a checklist, or compilation sheet. In designing such instruments, it is important to inspect the layout of the source of documents from which data are to be extracted and design the compilation sheet so that items can be transferred in the order in which they appear in the source document. The advantage of using existing data is that data‐collection is inexpensive. However, there are limitations that can be noted: First is that it may be difficult to gain access to the records or reports required, and the information may be incomplete for the information required. Another limitation is that sometimes data may be outdated and variations of data collection methods used. The researcher should check for such sources of possible error or bias when using available data.
Observing Observation is a technique that involves systematically selecting, watching and recording behaviour and characteristics of living species, objects or phenomena.

82
LUSAKA APEX MEDICAL UNIVERSITY FACULTY OF PUBLIC HEALTH MPH RESEARCH METHODS, PROPOSAL DEVELOPMENT & SCIENTIFIC REPORT WRITING MODULE 5 2019
Observation of human behaviour‐ is a much used data‐collection technique. It can be undertaken in different ways:
Participant Observation: the observer takes part in the situation he or she observes.
Nonparticipant Observation: The observer watches the situation openly or concealed, but does not participate
Observations serve different purposes: First, they can give additional more accurate information on behaviour of people than the interview or questionnaire. Second, Observations can check on information collected, such as on sensitive topics alcohol or drug use, stigmatization of leprosy, tuberculosis, or AIDS patients, or they may be a primary source of information. Observation of a human behaviour can form part of any study, but as they are time consuming, they are mostly used in small‐scale studies. Observations can be made on objects. For example, the presence or absence of pit latrines and its state of cleanliness can be observed. If the observations are made using a defined scale, they are called measurements. Measurements usually require additional tools. For example, in nutritional surveillance, we measure weight and height by using weighing scales and a measuring board. We use thermometers for measuring body temperature; and microscope for determining organisms.
Interviewing An interview is a face‐to‐face interactive data collection technique that involves oral questioning of the respondents, either individually, or as a group. Answers posed during an interview can be recorded by writing them down, either during the interview itself filled in a questionnaire, or immediately after the interview, or tape recording the response. Interviews can be conducted with varying degree of flexibility. The two extremes are “high” and “low” degree of flexibility, described below:
High degree of flexibility: For example, interviews using an interview schedule, to ensure that all issues are discussed, but allowing flexibility in timing and the order in which the questions are asked. The interviewer may ask additional questions on the spot to gain as much useful information as possible. Questions are open‐ended: The respondent is unrestricted in what or how he or she answers.

83
LUSAKA APEX MEDICAL UNIVERSITY FACULTY OF PUBLIC HEALTH MPH RESEARCH METHODS, PROPOSAL DEVELOPMENT & SCIENTIFIC REPORT WRITING MODULE 5 2019
The unstructured or loosely structured method of asking questions can be used for interviewing individuals as well as groups of key informants, like details concerning focus group discussion elaborated in Unit 5 of this module.
Low degree of flexibility For example, interviews using a questionnaire with a fixed list of questions in a standardized format that have fixed or categorized answers.
Administering Written Questionnaire A written questionnaire, also referred to as self‐administered questionnaire is a data collection tool in which written questions are presented that are to be answered by the respondents in written form. Written questionnaires can be administered by mail with clear instructions, or in group of individuals in one place allowing the respondents to fill in the questionnaires themselves.
Other Data Collection Techniques (see Unit 5)
Nominal group technique Delphi technique
Life histories
Scales
Essays
Case studies
Mapping
Differences between Data‐Collection Techniques and Data‐Collection Tools The distinction between techniques and tools applied in data collection are tabulated in the following Table 4. 5 below: Table 4.5. Data‐Collection Techniques and Tools Data‐collection Techniques Data‐collection Tools
Using available information Observing Interviewing Administering written questionnaires
Checklist, data‐compilation forms Eyes and other senses, pen and paper, watch, scales, microscope, etc. Interview schedule questionnaire, Interview question guide, tape recorder Questionnaire
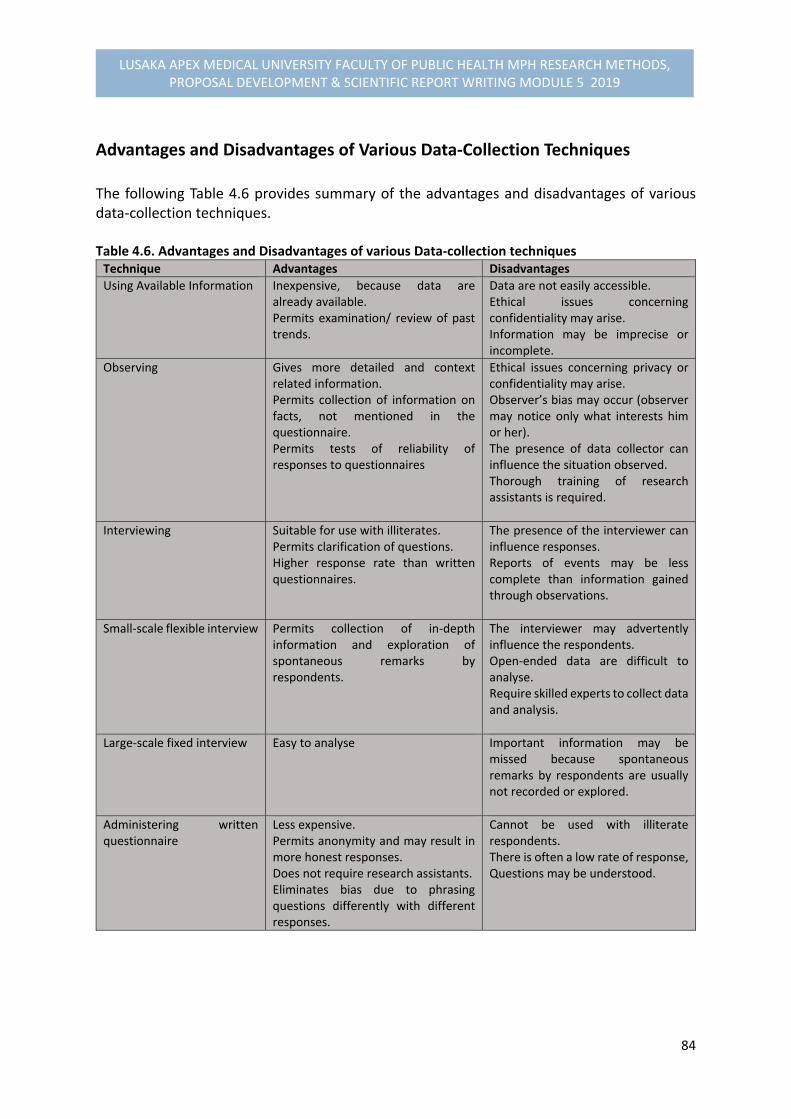
84
LUSAKA APEX MEDICAL UNIVERSITY FACULTY OF PUBLIC HEALTH MPH RESEARCH METHODS, PROPOSAL DEVELOPMENT & SCIENTIFIC REPORT WRITING MODULE 5 2019
Advantages and Disadvantages of Various Data‐Collection Techniques The following Table 4.6 provides summary of the advantages and disadvantages of various data‐collection techniques. Table 4.6. Advantages and Disadvantages of various Data‐collection techniques Technique Advantages Disadvantages
Using Available Information
Inexpensive, because data are already available. Permits examination/ review of past trends.
Data are not easily accessible. Ethical issues concerning confidentiality may arise. Information may be imprecise or incomplete.
Observing
Gives more detailed and context related information. Permits collection of information on facts, not mentioned in the questionnaire. Permits tests of reliability of responses to questionnaires
Ethical issues concerning privacy or confidentiality may arise. Observer’s bias may occur (observer may notice only what interests him or her). The presence of data collector can influence the situation observed. Thorough training of research assistants is required.
Interviewing
Suitable for use with illiterates.Permits clarification of questions. Higher response rate than written questionnaires.
The presence of the interviewer can influence responses. Reports of events may be less complete than information gained through observations.
Small‐scale flexible interview
Permits collection of in‐depth information and exploration of spontaneous remarks by respondents.
The interviewer may advertently influence the respondents. Open‐ended data are difficult to analyse. Require skilled experts to collect data and analysis.
Large‐scale fixed interview
Easy to analyse Important information may be missed because spontaneous remarks by respondents are usually not recorded or explored.
Administering written questionnaire
Less expensive.Permits anonymity and may result in more honest responses. Does not require research assistants. Eliminates bias due to phrasing questions differently with different responses.
Cannot be used with illiterate respondents. There is often a low rate of response,Questions may be understood.
85
LUSAKA APEX MEDICAL UNIVERSITY FACULTY OF PUBLIC HEALTH MPH RESEARCH METHODS, PROPOSAL DEVELOPMENT & SCIENTIFIC REPORT WRITING MODULE 5 2019
II. Importance of Combining Different Data‐Collection Techniques Researchers often use a combination of flexible and less flexible research techniques. Flexible techniques such as:
Loosely structured interviews using open‐ended questions;
Focus group discussions; and
Participant observation The above techniques are also called QUALITATIVE research methods. They produce qualitative information, which is often recorded in narrative form. QUALITATIVE RESEARCH TECHNIQUES –involve the identification and exploration of a number of related variables that give INSIGHT into the nature and causes of certain problems and into the consequences of the problem for those affected.
Structured questionnaires that enable the researcher to quantify pre‐ or post‐categorized answers to questions are an example of QUANTITATIVE research techniques or methods. The answers to questions can be counted and expressed numerically. QUANTITATIVE RESEARCH TECHNIQUES –are used to QUANTIFY the size, distribution and association of certain variables in a study population.
Both qualitative and quantitative research techniques are often used within a single study. For example: It has been observed that in country X that children between 1 and 2 ½ years suffer from nutritional disorder (e.g. malnutrition). A study could be designed to address this problem may employ application of the following stages:
Focus group discussions (FGDs) with 2 to 5 groups of mothers, or in‐depth interviews with 10 mothers to identify the feeding pattern and types of food given to those children and their adherence to those feeds (explorative study).
A cross‐sectional survey, testing the relevant findings of the exploratory study on a large scale can be employed.

86
LUSAKA APEX MEDICAL UNIVERSITY FACULTY OF PUBLIC HEALTH MPH RESEARCH METHODS, PROPOSAL DEVELOPMENT & SCIENTIFIC REPORT WRITING MODULE 5 2019
The second quantitative part of study would be used to determine what percentages of the mothers follow various feeding practices and reasons for their behaviour based on the socio‐economic characteristics.
III. Bias in information Collection BIAS in information collection is a distortion that results in the information not being representative of the true situation
Possible Sources of Bias during Data Collection
1. Defective Instruments
Questionnaires with: Fixed or closed questions on topics about which too little is known; Open‐ended questions without guidelines on how to ask or to answer them; Vaguely phrased questions; or Questions placed in an illogical order.
Weighing scales that are not standardized.
These sources of bias can be prevented by carefully planning the data‐collection process and by pretesting the data‐collection tools. 2. Observer Bias
Observer bias can easily occur during observation or loosely structured group or individual interviews. There is a risk that the data collector will see or hear only things in which he or she is interested or will miss information that is critical to the research. Observation protocols and guidelines for conducting loosely structured interviews should be prepared, and training and practice should be provided to data collectors in using both of these tools. It is highly recommended that data collectors work in pairs when using flexible research techniques and discuss and interpret the data immediately after collecting it. 3. Effect of the Interview on the informant
This is a possible factor in all interview situations. The informant may mistrust the intention of the interview and dodge certain questions or give misleading answers. Such a bias can be reduced by adequately introducing the purpose of the study to
87
LUSAKA APEX MEDICAL UNIVERSITY FACULTY OF PUBLIC HEALTH MPH RESEARCH METHODS, PROPOSAL DEVELOPMENT & SCIENTIFIC REPORT WRITING MODULE 5 2019
informants, by taking sufficient time for the interview, and by assuring informants that data collected will be confidential.
IV. Ethical Considerations During Data‐Collection As we develop our data‐ collection techniques, we need to consider whether our research procedures are likely to cause any physical or emotional harm to respondents. Harm may be caused by:
Violating informants’ right to privacy by posing sensitive questions or by gaining access to records that may contain personal data.
Observing the behaviour or informants without their being aware; or
Failing to observe or respect certain cultural values, traditions, or taboos.
Several methods for dealing with these issues may be recommended:
Obtaining informed consent before study or interview begins;
Not exploring sensitive issues before a good relationship has been established with the informant; and
Ensuring the confidentiality of data collected.
4.9. TRIANGULATION OR MIXED METHODS One important way to strengthen a study design is through ‘triangulation’ , or the combination of different methodologies in the study of the same phenomena or programmes. This can mean using several kinds of methods or data, including using both qualitative and quantitative approaches. Denzin (1978) has identified four basic types of triangulation: (1) data triangulation‐ the use of a variety of data sources in a study; (2) investigator triangulation‐ the use of several different researchers or evaluators with varied disciplines or expertise; (3) theory triangulation‐ the use of multiple perspectives to interpret a single set of data; and (4) methodological triangulation‐ the use of multiple methods to study a single problem or programme. The term ‘triangulation’ is taken from land surveying. Knowing a single landmark only locates you somewhere along the line in a direction from the landmark, whereas with two landmarks you can take bearings in two directions and locate yourself at their intersection. The logic of triangulation is based on the premise that:

88
LUSAKA APEX MEDICAL UNIVERSITY FACULTY OF PUBLIC HEALTH MPH RESEARCH METHODS, PROPOSAL DEVELOPMENT & SCIENTIFIC REPORT WRITING MODULE 5 2019
‘no single method ever adequately solves the problem of rival causal factors…. Because each method reveals different aspects of empirical reality, multiple methods of observations must be employed. This is termed triangulation. I now offer as a final methodological rule, the principle, that multiple methods should be used in every investigation’ (Denzin 1978:28).
Therefore, triangulation is ideal in qualitative or behavioural research. It can also be expensive. An evaluation’s limited budget, short time‐frame and political constraints will affect the amount of triangulation that is practical. Triangulation can be achieved within a qualitative inquiry strategy by combining different kinds of qualitative methods and mixing purposive samples. It is also possible to achieve triangulation by combining qualitative and quantitative methods.
4.10. DESIGNING INTERVIEW SCHEDULES AND QUESTIONNAIRES, In this part of the Module, we expect that at the end of this session, you should be able to:
1. Distinguish between various stages in questionnaire design.
2. Demonstrate appropriate techniques for wording questions and designing
questionnaires to ensure maximum quality of responses.
3. Identify appropriate data‐collection techniques for your study
4. Prepare your data‐collection tools, taking care that you cover all important variables in relation to the objectives of your study.
The main components of sessions for this part are as follows:
I. Introduction; II. Types of questions; III. Steps in developing a questionnaire; and IV. Attitudinal Measurements
I. Introduction Interviews and self‐administered questionnaires are probably the most widely used research techniques. Designing good questioning tools forms an important and time‐consuming phase in the development of research proposals. Once the decision has been made to use these techniques, the following questions should be considered:
What exactly do we want to know, according to the objectives and variables we identified earlier? Is questioning the right technique to obtain all answers, or do we need additional techniques, such as observations or analysis of records?
89
LUSAKA APEX MEDICAL UNIVERSITY FACULTY OF PUBLIC HEALTH MPH RESEARCH METHODS, PROPOSAL DEVELOPMENT & SCIENTIFIC REPORT WRITING MODULE 5 2019
Of whom will we ask questions and what technique will we use? Do we understand the topic sufficiently to design a questionnaire, or do we need some loosely structured interviews with key informants, or a FGD first to orient ourselves?
Are our informants mainly literate or illiterate? If illiterate the use of self‐administered questionnaire is not necessary.
How large is the sample that will be interviewed? Studies with many respondents often use highly structured questionnaires, whereas smaller studies allow more flexibility and may use questionnaires with a number of open‐ended questions.
II. Types of Questions Before examining the steps for designing a questionnaire, we need to review the types of questions used in a questionnaire. Depending on how questions are asked and recorded, we can distinguish two major types of possible questions:
Open‐ended questions; and
Closed or fixed questions
OPEN‐ENDED QUESTIONS permit free responses that should be recorded in the respondent’s own words. The respondent is not given any possible answers to choose from.
Such questions are useful to obtain information on:
Facts with which the researcher is not very familiar.
Opinions, attitudes and suggestions of informants, or
Sensitive issues.
For example
‘Can you describe exactly what the traditional birth attendant did when your labour
started?’
‘What do you think are the reasons for a high drop‐out rate of village health committee
members?’
‘What would you do if you noticed that your daughter in school had a relationship with a
teacher?’

90
LUSAKA APEX MEDICAL UNIVERSITY FACULTY OF PUBLIC HEALTH MPH RESEARCH METHODS, PROPOSAL DEVELOPMENT & SCIENTIFIC REPORT WRITING MODULE 5 2019
Closed Questions
CLOSED QUESTIONS offer a list of possible options or answers from which the respondents must choose.
When designing closed questions one should try to:
Offer a list of options that are exhaustive and mutually exclusive, and
Keep the number of options as few as possible.
Closed questions are useful if the range of possible responses is known.
For example
“What is your marital status?” 1. Single 2. Married/Living together 3. Separated/Divorced/ widowed
“Have you ever gone to a local community health worker for treatment?”
1. Yes 2. No
“How useful would you say the activities of the village health committee have been in the development of the village?”
1. Extremely useful 2. Very useful 3. Useful 4. Not very useful 5. Not useful at all
Using attitude scales is advisable only in face‐to‐face interviews with literates if the various options for each answer are provided for the respondents on a card they can look at while making their choice. If the researcher only reads the options, the respondents might not consider all options equally and the scale will not accurately measure the attitudes.
Advantages and Disadvantages of Open‐ended and Closed Questions The following Table 4.7 summarizes the advantages and disadvantages of open‐ended and closed questions, and conditions for optimal use.

91
LUSAKA APEX MEDICAL UNIVERSITY FACULTY OF PUBLIC HEALTH MPH RESEARCH METHODS, PROPOSAL DEVELOPMENT & SCIENTIFIC REPORT WRITING MODULE 5 2019
Table 4.7. Advantages and Disadvantages of Open‐ended and Closed Questions, and Conditions for optimal Use Open‐ended Questions Closed Questions
Advantages Issues not previously thought of when planning the study may be explored, thus providing valuable new insights into the problem. Information provided spontaneously is likely to be more valid than answers suggested in the options from which the informant must choose. Information provided in the respondent’s own words may be useful as examples, or illustrations that add value and interest to the final report.
AdvantagesAnswers can be recorded easily. Analysis easy
Disadvantages Skilled interviewers are needed to get the discussion started and focused on relevant issues and to record all important information. Analysis is time‐consuming and requires experience.
DisadvantagesClosed questions are less suitable for face‐to‐face interviews with non‐literates. Respondents may choose options they would not have thought of themselves‐ leading to questions being bias, and important information missed.
Suggestions Thoroughly train and supervise the interviewers, or select experienced people. Pre‐test open‐ended questions, if possible pre‐categorise common responses, and leave enough space for answers.
SuggestionsUse closed questions only on issues that are simple. Pre‐test to see if all categories cover all possibilities. Closed questions should be combined with open‐ended questions.
In practice, a questionnaire usually has a combination of open‐ended and closed questions,
arranged in such a way that the discussion flows as naturally as possible. Interview questions
are often asked as open‐ended questions, but to facilitate recording and analysis, possible
answers are to a large extent pre‐categorized.
III. Steps in Designing A questionnaire4
Designing a good questionnaire is tasking and takes several drafts. In the first draft, we should
concentrate on the content. The second draft, we should examine critically at the formulation
and sequencing of the questions. Then scrutinize the format of the questionnaire. Finally, we
should test‐ run through to check whether the questionnaire gives us the information we
require and whether both we and the respondents feel at ease with it. Usually the
questionnaire will need some further adaptation before we can use it for actual data
collection.
Before designing a questionnaire, it is also important to distinguish the following:
4 Adopted from Sudman Bradman (1983, Oppenheim (1986) and Varkervisser et al. (1991)

92
LUSAKA APEX MEDICAL UNIVERSITY FACULTY OF PUBLIC HEALTH MPH RESEARCH METHODS, PROPOSAL DEVELOPMENT & SCIENTIFIC REPORT WRITING MODULE 5 2019
Deciding the objectives of the study and the hypotheses or variables to be
investigated.
Reviewing the relevant literature, discussions with informants and interested bodies.
Designing the study and making the variables specific to a situation.
Designing or adapting the necessary research methods and techniques; pilot work
and revision of the research instruments.
The sampling process: selection of the area and the people to be approached.
The field‐work stage: data –collection and returns.
Processing the data, coding the responses, and preparing punch cards.
The statistical analysis (simple at first, but becoming more complex); testing for
statistical significance.
Assembling the results and testing the hypotheses
Writing up the results: relating the findings to other research; drawing conclusions
and interpretation.
The subject of questionnaire design is intimately related to the general plan or design of the
study or survey.
A questionnaire is not just a list of questions or a form to be filled out. It is essentially a
scientific instrument for measurement and for collection of particular kinds of data. Like all
such instruments, it has to be specially designed according to particular specifications and
with specific aims or objectives in mind, and the data it yields are subject to error.
Step 1: Content
Take your objectives and variables as your starting point.
Describe what questions will be needed to measure or define your variables to reach your
objectives.
When designing the questionnaire, you should reconsider the variables you have chosen, and
if necessary, add, drop or change some. You may even change some of your objectives at this
stage.
Step 2: Formulating questions
Formulate one or more questions that will provide the information needed for each
variable.
Take care that questions are specific and precise enough that different respondents do not
interpret them differently. For example, a question such as, “where do community members
usually seek treatment when they are sick?” cannot be asked in such a general term because

93
LUSAKA APEX MEDICAL UNIVERSITY FACULTY OF PUBLIC HEALTH MPH RESEARCH METHODS, PROPOSAL DEVELOPMENT & SCIENTIFIC REPORT WRITING MODULE 5 2019
each respondent may have different thing in mind when answering such a question. Rather,
the question as a rule has to be broken down into different parts. For example, on could:
Concentrate on illness that has occurred in a family over the past 14 days, and ask
what has been done to treat it from the onset; or
Concentrate on a number of diseases, and ask whether they have occurred in the
family over a couple of months, and what has been done to treat each one of them.
Check whether each question measures one thing at a time
For example, the question, “How long an interval would you and your husband prefer between
two successive births?” would be better be divided into two questions because husband’s
views could be different from that of the wife on the birth interval.
Avoid leading questions
A question is leading if it suggests a certain answer. For example, the question, “Do you agree
that the district health team should visit each health centre monthly?” hardly leaves room for
“no” or for other options. It should be phrased as: “Do you think that district health team
should visit each health centre? If yes, how often?”
Avoid words with double or vaguely defined meanings and emotionally laden words
For example, concepts such as, “nasty health staff, lazy patients, or unhealthy food” should be
omitted.
Step 3: Sequencing of questions
Design your interview schedule or questionnaire to be “consumer friendly.”
The sequence of questions must be logical for the respondent and allow as much as
possible for a “natural” discussion, even in more structured interviews.
At the beginning of the interview, keep questions concerning “background variables”,
e.g. age, religion, education, marital status, occupation, or ethnicity (tribe) to a
minimum. If possible, pose most of these questions later in the interview.
Respondents may be reluctant to provide personal information early in an interview.
Start with an interesting but controversial question (preferably open) that is directly
related to the subject of the study.
Pose more sensitive questions as late as possible in the interview, e.g. questions
pertaining to income, political matters, sexual behaviour, or diseases with stigma
attached to them.
Use simple, everyday language.
Make the questionnaire as short as possible.

94
LUSAKA APEX MEDICAL UNIVERSITY FACULTY OF PUBLIC HEALTH MPH RESEARCH METHODS, PROPOSAL DEVELOPMENT & SCIENTIFIC REPORT WRITING MODULE 5 2019
Step 4: Formatting the questionnaire
When you finalize your questionnaire, be sure that:
Each questionnaire has a heading, and space to insert the number, data, and location
of the interview. No name should be required for anonymity. You may add the name
of the interviewer to facilitate quality control of data.
Layout is such that questions belonging together appear together visually. If the
questionnaire is long, you may use subheadings for group of questions.
Boxes for pre‐categorized answers are placed in a consistent manner on the right half
of the page (see annex 1 for a structured questionnaire).
Sufficient space should be provided for open‐ended questions
If you use a computer, the right margin of the page should be reserved for boxes
intended for computer codes.
Your questionnaire should be consumer and user friendly.
Step 5: Translation
If interviews will be conducted in one or more languages, the questionnaire has to be
translated
4.11. ATTITUDINAL MEASUREMENTS
What is an attitude? An attitude is a “state of readiness, a tendency to act or react in a certain manner when confronted with certain stimuli.” Attitudes are reflected in an individual’s behaviour, whether ‘positively,’ or ‘negatively. ‘The individual’s attitudes are present, but dominant most of the time, and they become expressed in speech or other behaviour only when the object of the attitude is perceived. Attitudes are reinforced by beliefs (the cognitive component) and often attract strong feelings (the emotional component) that will lead to particular forms of behaviour (the action tendency component). For more elaborate understanding of attitude theory, Oppenheim and others (1986) provides a detailed explanation.
Attitude –Scaling Methods Attitude scales consist of more attitude statements, with which respondent is asked to agree or disagree. By having many items of attitudinal responses, we can reduce the effects of one‐sided responses. The number of attitude statements or responses are scaled or rated. To enhance the quality of the attitude –scaling methods, there are principles of measurements that should be followed.
95
LUSAKA APEX MEDICAL UNIVERSITY FACULTY OF PUBLIC HEALTH MPH RESEARCH METHODS, PROPOSAL DEVELOPMENT & SCIENTIFIC REPORT WRITING MODULE 5 2019
Principles of Attitude Measurement Let us examine, for a moment, what is involved in the construction and evaluation of any attitude measurement tool. We shall take consideration of the following principles to arrive at attitude measurements:
1. Uni‐dimensionability or homogenerity: This means that the scale should be about one thing at a time as purely as possible, i.e. the ruler should measure length, but not temperature, or weight. In the case of attitude scales, problems arise because the manifest contents of the items may be a poor guide to what the items actually measure. A need for correlation techniques is required to find out how the items “hang together” and which of them are “correct, or pure.”
2. Linearity and equal intervals, or equal appearing intervals: This means that the scale should follow the straight‐line model, and that some sort of scoring systems should be devised, preferably to be based on interchangeable units. Such units may be convenient for statistical application.
3. Reliability: This is the indispensable attribute of consistency. If the same measure was applied to the same object today and next week, the results should be relatively identical. The greater length and diversity of attitude scales make them, the more reliable they become, than single questions.
4. Validity: This tells us whether the scale measures what it is supposed to measure. 5. Reproducibility: When we say that a man or a woman weighs 150 kilograms, we mean
that the pointer on the scales will move from 0 to 150. From the score of 150, we can reproduce exactly which units on the scale were covered and which ones were not covered. For example, with the symptoms of the different stages of an illness, it would be helpful if they could be ordered or scaled in terms of their degree of seriousness.
There are four best‐ known methods of attitude scaling. If you wish to study attitude‐patterning or explore theories of attitudes, then probably the “Likert procedure” will be the most relevant. If you wish to study attitude change, or the hierarchial structure of an attitude, then Guttman’s method might be preferable. If you are studying group differences, then you should probably select to use the Thurstone procedures, or application of “Social‐Distance Scale”, and so on. In this part, we will discuss the “Likert scales” as they are less laborious.
Likert Scales5 The attitude Likert scaling method is primarily concerned with the principle of “unidimensionality”‐ making sure that all the items would measure the same thing. He also made attempt of getting subject themes in a trial sample to place themselves on an attitude continuum for each statement, running from “strongly agree” to “agree” “ uncertain,” “disagree” and “strongly disagree.” These Five positions are given simple weights of 5, 4,3,2, and 1 for scoring purposes.
5 Adopted from Oppenheim, A.N. ( 1986:143‐143), Questionnaire Design and attitude Measurement (Gower)
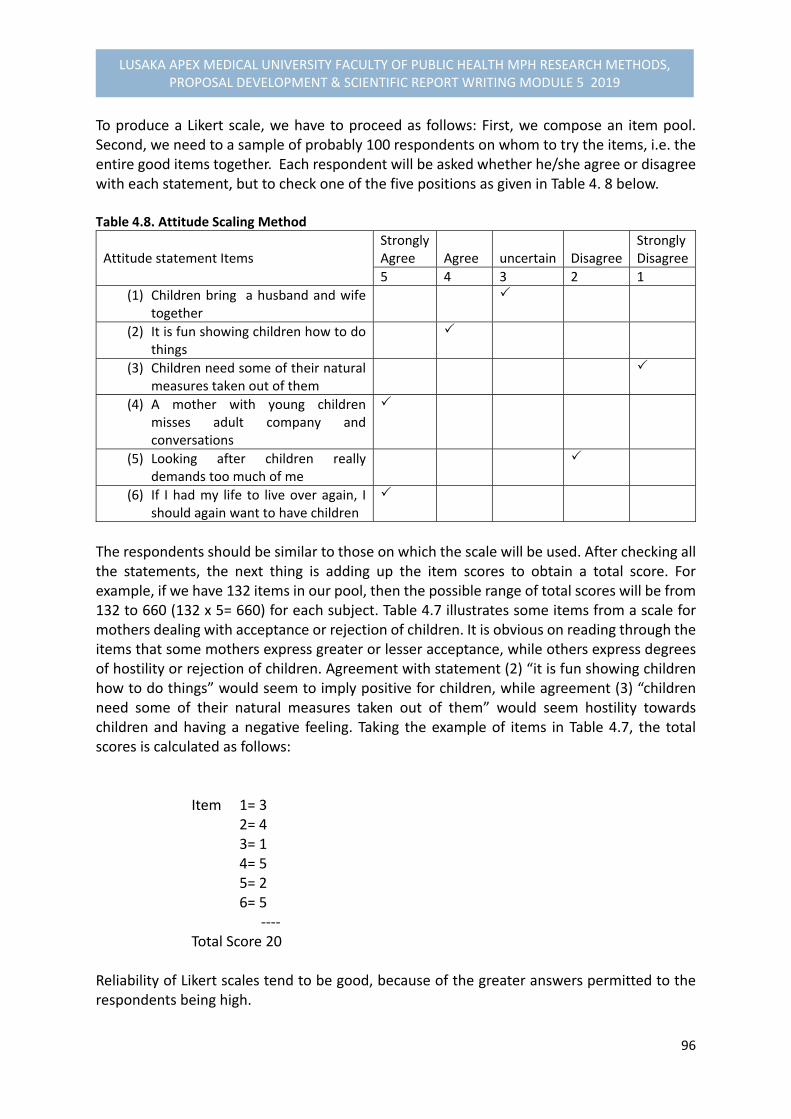
96
LUSAKA APEX MEDICAL UNIVERSITY FACULTY OF PUBLIC HEALTH MPH RESEARCH METHODS, PROPOSAL DEVELOPMENT & SCIENTIFIC REPORT WRITING MODULE 5 2019
To produce a Likert scale, we have to proceed as follows: First, we compose an item pool. Second, we need to a sample of probably 100 respondents on whom to try the items, i.e. the entire good items together. Each respondent will be asked whether he/she agree or disagree with each statement, but to check one of the five positions as given in Table 4. 8 below. Table 4.8. Attitude Scaling Method
Attitude statement Items
StronglyAgree
Agree
uncertain
Disagree
Strongly Disagree
5 4 3 2 1
(1) Children bring a husband and wife together
(2) It is fun showing children how to do things
(3) Children need some of their natural measures taken out of them
(4) A mother with young children misses adult company and conversations
(5) Looking after children really demands too much of me
(6) If I had my life to live over again, I should again want to have children
The respondents should be similar to those on which the scale will be used. After checking all the statements, the next thing is adding up the item scores to obtain a total score. For example, if we have 132 items in our pool, then the possible range of total scores will be from 132 to 660 (132 x 5= 660) for each subject. Table 4.7 illustrates some items from a scale for mothers dealing with acceptance or rejection of children. It is obvious on reading through the items that some mothers express greater or lesser acceptance, while others express degrees of hostility or rejection of children. Agreement with statement (2) “it is fun showing children how to do things” would seem to imply positive for children, while agreement (3) “children need some of their natural measures taken out of them” would seem hostility towards children and having a negative feeling. Taking the example of items in Table 4.7, the total scores is calculated as follows:
Item 1= 3 2= 4 3= 1 4= 5 5= 2 6= 5 ‐‐‐‐ Total Score 20 Reliability of Likert scales tend to be good, because of the greater answers permitted to the respondents being high.
97
LUSAKA APEX MEDICAL UNIVERSITY FACULTY OF PUBLIC HEALTH MPH RESEARCH METHODS, PROPOSAL DEVELOPMENT & SCIENTIFIC REPORT WRITING MODULE 5 2019
4.12. PILOT STUDY AND PRETESTING THE METHODOLOGY
Objectives At the end of this session, you should be able to:
1. Describe the components of a pre‐test or pilot study that will allow you to test and revise your proposed research methodology before starting the actual data collection.
2. Plan and carry out pre‐tests of research components for the proposal being developed
What is a pre‐test or pilot study of the methodology?
A PRETEST refers to a small scale trial of a particular research component. A PILOT STUDY is the process of carrying out a preliminary study, going through the entire research procedure with a small sample.
Why do we carry out a pre‐test or pilot study?
Several reasons exist for carrying out a pre‐test or a pilot study:
A pre‐test or a pilot study serves as a trial run that allows us to identify potential
problems in the proposed study.
Pre‐test or pilot study enables us to revise the methods and logistics of data
collection before starting the actual field work. Good deal of time, effort and money
can be saved in the long run.
Pre‐testing is simpler and less time consuming than conducting an entire study. Most
studies prefer pre‐test than pilot study.
What aspects of your research methodology can be evaluated during pre‐
testing?
1. Reaction of the respondents to the research procedures can be observed in the pre‐
test to determine:
Availability of the study population and how respondents’ daily work schedule can
be best suspected;
Acceptability of the methods used to establish contact with the study population;
Acceptability of questions asked; and
Willingness of the respondents to answer the questions and collaborate with the
study.
2. The data‐collection tools can be pretested to determine:
98
LUSAKA APEX MEDICAL UNIVERSITY FACULTY OF PUBLIC HEALTH MPH RESEARCH METHODS, PROPOSAL DEVELOPMENT & SCIENTIFIC REPORT WRITING MODULE 5 2019
Whether the tools you use allow you to collect the required information and whether
those tools are reliable.
How much time is needed to administer the questionnaire, to conduct observations
or focus group interviews, and to make the measurement.
Whether there is any need to revise the format or presentation of questionnaires or
interview schedules, including whether:
- The sequence of the questions is logical
- The wording of the questions is clear
- Translations are accurate
- Space for answers is sufficient.
- There is a need to pre‐categorize some answers or to change closed questions into
open‐ended questions
- Need to adjust codes
- Need for additional instructions in the questionnaires.
3. Sampling Procedures can be checked to determine:
Whether the instructions to obtain the sample are followed in the same way by all
staff involved.
How much time is needed to locate individuals to be included in the study.
4. Staffing and activities of the research team can be checked to determine:
How successful the training of the research team has been.
What the work output of each member of the staff is.
How well the research team works together.
Whether the logistical support is adequate.
The reliability of the results when instruments or test are administered by different
members of the research team.
Whether staff supervision is adequate.
The pre‐test can be seen as a period of extra training for the research team in which
sensitivity to the needs and wishes of the study population can be developed.
5. Procedures for data processing and analysis can be evaluated during the pre‐test.
Items that can be assessed include:
Appropriateness of data master sheets and dummy tables and ease of use.
Effectiveness of the system for quality control of data collection.
Appropriateness of statistical procedures.
Clarity and ease with which the collected data can be interpreted.
6. The proposed work plan and budget for research activities can be assessed during
the pre‐test. Issues that cab evaluated include:
Appropriateness of the amount of time allowed for the different activities of
planning, implementation, supervision, coordination and administration.
99
LUSAKA APEX MEDICAL UNIVERSITY FACULTY OF PUBLIC HEALTH MPH RESEARCH METHODS, PROPOSAL DEVELOPMENT & SCIENTIFIC REPORT WRITING MODULE 5 2019
When do we carry out a pre‐test?
You may consider:
Pre‐testing at least your data‐collection tools, either during the workshop, or
immediately in the actual field situation.
Pre‐test 1‐2 weeks before starting field work with the research team to allow time for
revision.
Which components should be assessed during the pre‐test?
1. Pre‐test during the workshop
Depending on how closely the pre‐test situation resembles the area in which the actual
fieldwork will be carried out, it may be possible to pre‐test:
The reaction of respondents to the research procedures and to questions related to
sensitive issues.
The appropriateness of study design (s) and research tools selected for the of the
study, e.g. validity: Do they collect the information you need?; and reliability: Do they
collect the data in a precise way?
The appropriateness of format and wording of questionnaires and interview
schedule, and the accuracy of the translations.
The time needed to carry out interviews, observations and group interviews.
The feasibility of the designed sampling procedures
The feasibility of the designed procedures for data processing and analysis.
2. Pre‐test in the actual research area
The following considerations may be useful:
What difficulties do you expect in the implementation of your proposal? Think of
any possible sources of bias in data‐collection techniques and sampling, and ethical
issues you considered during the preparation of your plan for data collection, Can
some of these potential problems be overcome by adapting a research design?
If you feel you have little experience with a certain data‐collection technique you
may want to do some extra practice during the pre‐test.
Which parts of your study will be most costly and time –consuming?
Questionnaires used in large surveys, for example, should be tested, and those for
translation.

100
LUSAKA APEX MEDICAL UNIVERSITY FACULTY OF PUBLIC HEALTH MPH RESEARCH METHODS, PROPOSAL DEVELOPMENT & SCIENTIFIC REPORT WRITING MODULE 5 2019
4.13. DATA PROCESSING AND ANALYSIS
The session provides an understating of the process of planning for data processing and
analysis for the proposal you are developing. Such a plan helps the researcher assure that at
the end of the study:
All the information he or she needs has indeed been collected, and in a standardized
way; and He or she has not collected unnecessary data that will never be analysed.
This implies that the plan for data processing and analysis must be made after careful
consideration of the objectives of the study as well as the list of variables.
The procedures for the analysis of data collected through quantitative and qualitative
techniques are quite different. Therefore, one must also consider the design(s) of study and
the different data‐collection techniques used when making a plan for data processing and
analysis.
For quantitative data, the starting point in analysis is usually a descriptive of the data for each
variable for all the study units included in the sample.
For qualitative data, it is more a matter of describing, summarizing and interpreting data, in
a content or thematic form, obtained for each study unit, or for each group of study units.
Here the researcher starts analysing while collecting the data so that questions that remain
unanswered, or new questions that come up can be addressed before data collections is over
(see MODULE 5.5) .
Preparations of a plan for data processing and analysis will provide you with better insights
into the feasibility of the analysis to be performed as well as the resources that are required.
It also provides an important review of the appropriateness of your data collection tools.
Note: The plan for processing and analysis of data must be prepared before the data is collected in the field so that it is still possible to make changes in the list of variables or the data‐collection tools.
At the end of this session, you should be able to:
1. Identify important issues related to sorting quality control and processing of data. 2. Describe how data can best be analysed and interpreted based on the objectives and
variables of study.

101
LUSAKA APEX MEDICAL UNIVERSITY FACULTY OF PUBLIC HEALTH MPH RESEARCH METHODS, PROPOSAL DEVELOPMENT & SCIENTIFIC REPORT WRITING MODULE 5 2019
3. Prepare a plan for the processing and analysis of data, including data master sheets
and dummy tables for the research proposal you are developing.
What should the Plan include?
When making a plan for data processing and analysis, the following issues should be
considered:
Sorting Data
Performing Quality‐control checks
Data Processing, and
Data Analysis
I. Sorting Data
An appropriate system for sorting data is important for facilitating subsequent processing and
analysis.
If you have different study populations, for example, community health workers, community
health committees, and the general population, you obviously would number the
questionnaires separately.
In a comparative study, it is best to sort the data right after collection into the two or three
groups that you will be comparing during data analysis.
For example, in a study concerning the factors associated with acceptability of family planning
services, users and nonusers would be basic categories. In a case‐control study, the cases are
to be compared with the controls, therefore the two categories would be considered.
It is useful to number the questionnaire belonging to each of these categories separately right
after they are sorted.
For example, the questionnaire administered to users of family planning services could be
numbered as: U1,U2, U3, etc, and those for nonusers to be: N1, N2, N3, etc.
II. Performing Quality‐Control Checks
Usually the data have already been checked in the field to ensure that the information has
been properly collected and recorded. However, before and after data processing, the
information should be checked again for completeness and internal consistency.
102
LUSAKA APEX MEDICAL UNIVERSITY FACULTY OF PUBLIC HEALTH MPH RESEARCH METHODS, PROPOSAL DEVELOPMENT & SCIENTIFIC REPORT WRITING MODULE 5 2019
If a questionnaire has not been filled in completely, you will have MISSING DATA for some of
your variables. If there are many missing items in a particular questionnaire, you may decide
to exclude the whole questionnaire from further analysis.
If an inconsistency is clearly due to a mistake made by the researcher or assistant, for example,
if a person in an earlier question is recorded as being a non‐smoker, whereas all other
questions reveal that he is smoking, it may still be possible to check with the person who
conducted the interview and to correct the answer.
If the inconsistency is less clearly a mistake in recording, it may be possible to return to the
respondent and ask for clarification, for example in a small‐scale study.
If it is not possible to correct information that is clearly inconsistent, you may consider
excluding this particular part of the data from further processing and analysis. If a certain
question produces ambiguous or vague answers throughout, the whole question should be
excluded from further analysis.
Note: A decision to exclude data should be considered carefully as it may affect the validity of the study. Such a decision is ethically correct and it testifies to the scientific integrity of the researcher. You should keep an account of how many answers or questionnaires you had to exclude because of incompleteness or inconsistency, and discuss it in your final report.
If you process your data by computer, quality‐control checks must also include a verification
of how the data has been transformed into codes and subsequently entered into the
computer.
III Data Processing
As you begin planning for data processing, you must make a decision concerning whether to
process and analyse the data:
By manually, using master sheets or manual compilation of the questionnaires, or
By computer, for example, using a microcomputer and existing software, e.g. SSPS,
STATA, Excel or self‐written programmes for data analysis.
Data processing involves:
Categorizing the data
Coding, and
Summarizing the data on master sheets
a) Categorizing

103
LUSAKA APEX MEDICAL UNIVERSITY FACULTY OF PUBLIC HEALTH MPH RESEARCH METHODS, PROPOSAL DEVELOPMENT & SCIENTIFIC REPORT WRITING MODULE 5 2019
Decisions have to be made concerning how to categorize responses.
For categorical variables that are investigated through closed questions or observation, the
categories have been decided upon beforehand.
In interviews, the responses to open‐ended questions, for example, why do you smoke? can
be pre‐categorized to a certain extent, depending on the knowledge of possible answers.
There should always be a category called ‘other, specify……,’ which can only be categorized
afterwards. These responses should be listed and placed in categories that are a logical
continuation of the categories you already have. Answers that are difficult or impossible to
categorize may be put into a separate residual category as ‘others,’ but this category should
not contain more than 5% of the responses obtained, meaning it should be minimum.
For numerical variables, the data are usually collected without any pre‐categorization.
Because you are still discovering the range and the dispersion of the different values of these
variables when you collect your sample, decisions concerning how to categorize numerical
data and how to code are usually made after they have been collected.
b) Coding
If data are entered into a computer for subsequent processing and analysis, it is essential to
develop a CODING SYSTEM.
CODING is a method used to convert or translate the data gathered during the study into symbols appropriate for analysis, e.g. the use of numbers
For computer analysis, each category of a variable is usually give a number, for example, the
answer “yes” may be coded as 1, “no” as 2, and “no response” as 9.
The codes should be entered on the questionnaires or checklists themselves. When finalizing
your questionnaire, for each question, you should insert a box for the code in the right margin
of the page. These boxes should not be used by the interviewer. They are only filled in
afterwards during data processing. Take care that you have as many boxes as the number of
digits in each code.
Note: If you intend to process your data by computer, always consult an experienced person before you finalize your questionnaire
If analysis is done by hand using data master sheets, it is useful to code your data.

104
LUSAKA APEX MEDICAL UNIVERSITY FACULTY OF PUBLIC HEALTH MPH RESEARCH METHODS, PROPOSAL DEVELOPMENT & SCIENTIFIC REPORT WRITING MODULE 5 2019
Coding Conventions
Common responses should have same code in each question as this minimizes mistakes by
coders.
For example:
Yes (or positive response) code ‐ 1 No (or negative response) code ‐ 2 Don’t know code ‐ 9 Codes for Open‐ended questions This can be done only after examining a sample of questionnaires. The most frequently occurring responses should be coded. It may be necessary to group similar types of responses in single categories so as to limit their number. If there are too many categories, it is difficult to make meaningful summaries during analysis. In conclusion, bare in mind that the personnel responsible for computer analysis should be consulted very early in the study, as soon as the questionnaire and dummy tables are finalized.
c) Data Mater Sheets If data are processed by hand, it is often most efficient to summarize the raw data in a so‐ called DATA MASTER SHEET to facilitate analysis. On a master sheet, all the answers of individual respondents are tallied by hand as given in Table 4. 9: Table 4.9.Example of a Master Sheet Resp. Number
Q1: Age (Years)
Q2: Sex Q4: Smoking Q5: No of Cigarettes
M F Yes No No response
1. 30 10
2 41
3 23 15‐20
Etc
Total
Data are easier to tally from the master sheets than from the original questionnaires. Straight counts can be performed for background variables and for all independent variables under study.
Manual Compilation
Questionnaire data may be compiled by hand instead of using master sheets, if it is difficult
or impossible to put the information (such as answers to open‐ended questions) in a master

105
LUSAKA APEX MEDICAL UNIVERSITY FACULTY OF PUBLIC HEALTH MPH RESEARCH METHODS, PROPOSAL DEVELOPMENT & SCIENTIFIC REPORT WRITING MODULE 5 2019
sheet. Hand compilation is also necessary if you want to go back to the raw data to make
additional tabulation in which different variables are related to each other.
Note: In a comparative (analytical study) you should use different master sheets for the two or three groups you are comparing. In a cross sectional study, it may be useful to have several master sheets depending on the nature and objective of the study, and whether you want to compare two or more groups. Great care should be taken when filling in the master sheets. You should verify that all totals correspond to the total number of the study units (respondents). If not, all subsequent analytical work will be based on erroneous figures. There should be special columns for “no response” or missing data to arrive at accurate total figures.
Hand compilation is used when the sample is small.
There are certain procedures that will help ensure accuracy and speed:
1. If only one person is doing the compilation, use manual sorting. If a team of two
persons work together, use either manual sorting or tally counting.
2. Manual sorting can be used only if data on each subject are on a different sheet(s)
3. To do manual sorting, the basic procedure is to:
Take one question at a time
Sort the questionnaire into different piles representing the various response to
the question, examples: male/female; used hospital/ health centre/ traditional
practitioners.
Count the number in each pile.
When you need to sort out subjects who have a certain combination of variables, for example,
females who used each type of health facility, sort the questionnaires into piles according to
the first question, then subdivide the piles according to the response to the other question.
4. To do tally counting, the basic procedure is:
One member of the compiling team reads out the information while the other
records it in the form of a tally, e.g. “111” representing three subjects who have
a particular variable. The exercise continues in a similar manner for other
variables, or more information for the same variable.
Tally count for no more than two variables at one time, e.g. sex plus type of facility
used.

106
LUSAKA APEX MEDICAL UNIVERSITY FACULTY OF PUBLIC HEALTH MPH RESEARCH METHODS, PROPOSAL DEVELOPMENT & SCIENTIFIC REPORT WRITING MODULE 5 2019
If it is necessary to obtain information on three variables, e.g. sex, time of attendance at health
centre and diagnosis, do a manual sorting for the first question, then tally count for the other
two variables.
5. After doing either manual or tally counting check the total number of the subjects or
responses in each question to make sure that there has been no omission or double
count.
Computer Compilation
Before you decide to use a computer, you have to be sure that it will save time or that the
quality of the analysis will benefit from it. Note that feeding the data into a computer costs
time and money. The computer should not be used if your sample is small and the number of
variables large. The lager the sample, the more beneficial the use of a computer will be. Be
sure that the necessary equipment and expertise are available.
Computer compilation consists of the following steps:
1. Choosing an appropriate statistical computer programme, e.g. Statistical Package for
Social Sciences (SPSS) updated version, STATA, Microsoft Excel, Epi Info etc. Note that
for any appropriate version chosen, it would be necessary to have a prior training in
the use and application of these statistical packages before using the computer. A
number of computer programmes are now available on the market that can be sued
to process and analyse research data.
2. Data Entry: To enter data into the computer you have to develop a data entry format
depending on the program you are using. For example, for SPSS Version14, shows two
specification for data entry: variable definitions and codes displayed as “variable view”
and “data view” in symbols of numbers to represent the code for the variable.
3. Verification or validation of data: During data entry, mistakes will creep in. The
computer can print out the data exactly as it has been entered, so the printout should
be checked visually for obvious errors
4. Programming: If you use computer personnel to analyse your data, it is important to
communicate effectively with them. Do not leave the analysis to the computer
specialist. You as a researcher should tell the computer personnel what to do.
5. Computer outputs: The computer can do all kinds of analysis and the results can be
printed. It is important to decide whether each of the tables, graphs and statistical
tests that can be produced make sense and should be used in your report.
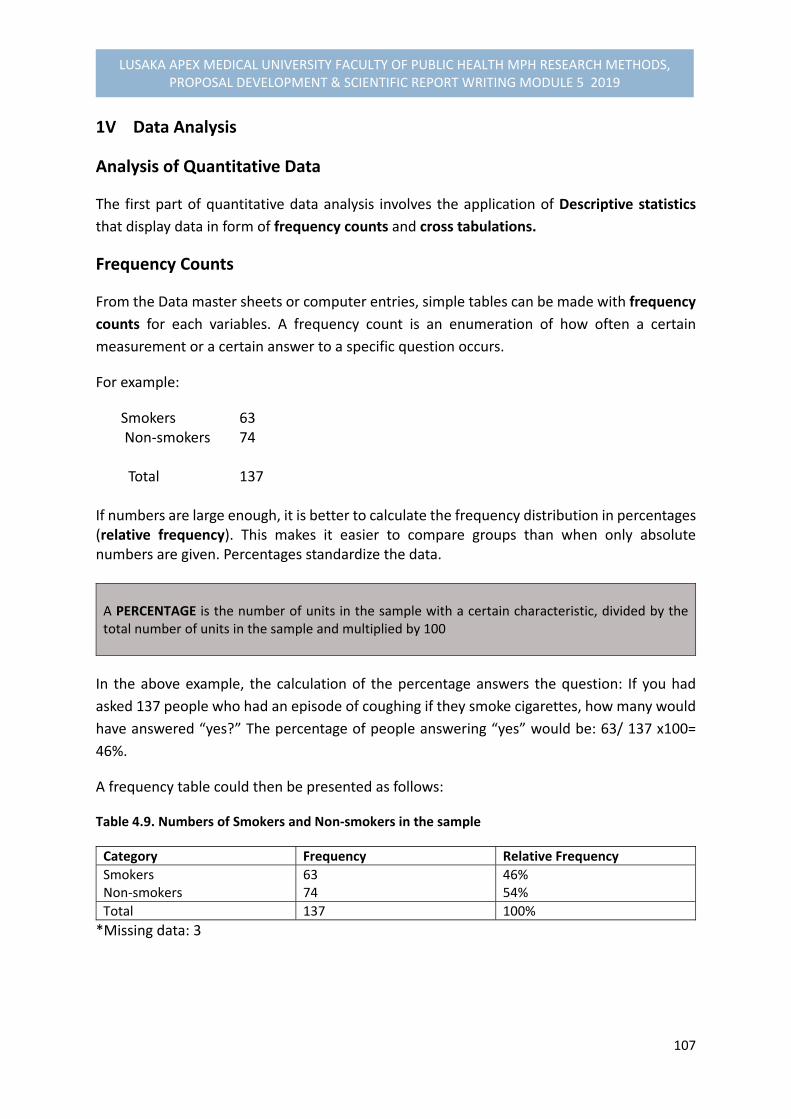
107
LUSAKA APEX MEDICAL UNIVERSITY FACULTY OF PUBLIC HEALTH MPH RESEARCH METHODS, PROPOSAL DEVELOPMENT & SCIENTIFIC REPORT WRITING MODULE 5 2019
1V Data Analysis
Analysis of Quantitative Data
The first part of quantitative data analysis involves the application of Descriptive statistics
that display data in form of frequency counts and cross tabulations.
Frequency Counts
From the Data master sheets or computer entries, simple tables can be made with frequency
counts for each variables. A frequency count is an enumeration of how often a certain
measurement or a certain answer to a specific question occurs.
For example:
Smokers 63 Non‐smokers 74 Total 137 If numbers are large enough, it is better to calculate the frequency distribution in percentages (relative frequency). This makes it easier to compare groups than when only absolute numbers are given. Percentages standardize the data. A PERCENTAGE is the number of units in the sample with a certain characteristic, divided by the total number of units in the sample and multiplied by 100
In the above example, the calculation of the percentage answers the question: If you had
asked 137 people who had an episode of coughing if they smoke cigarettes, how many would
have answered “yes?” The percentage of people answering “yes” would be: 63/ 137 x100=
46%.
A frequency table could then be presented as follows:
Table 4.9. Numbers of Smokers and Non‐smokers in the sample
Category Frequency Relative Frequency
Smokers Non‐smokers
63 74
46% 54%
Total 137 100%
*Missing data: 3
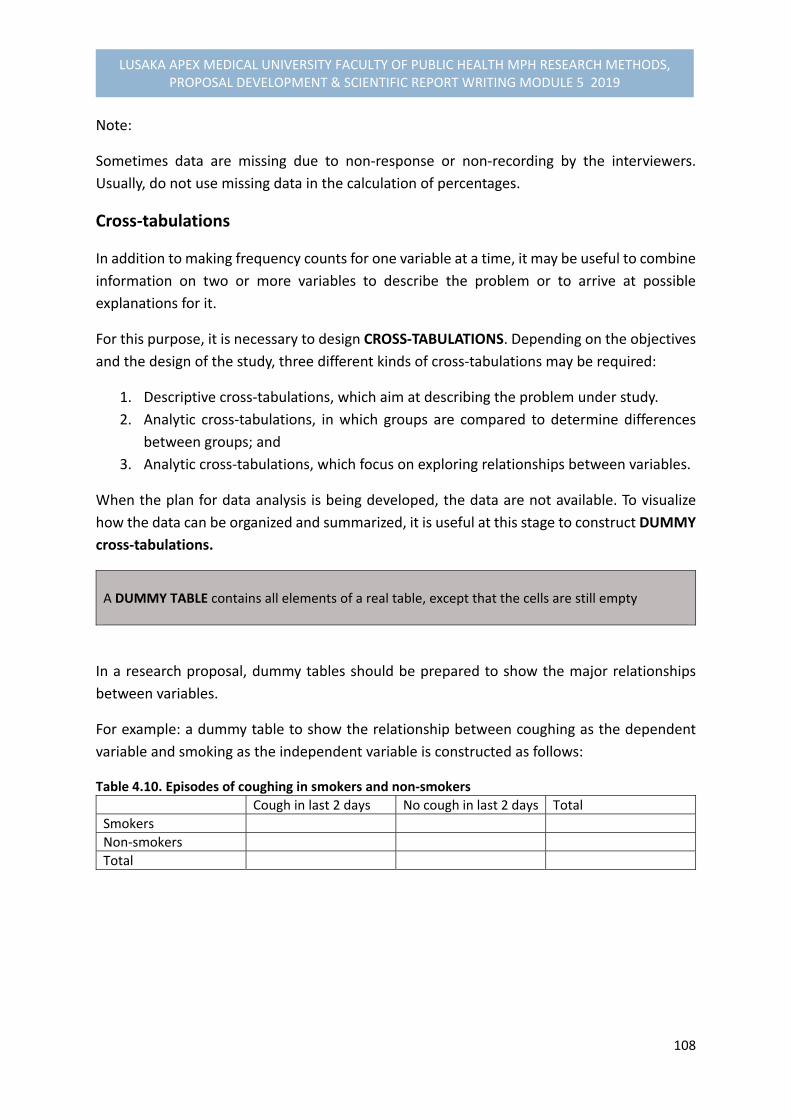
108
LUSAKA APEX MEDICAL UNIVERSITY FACULTY OF PUBLIC HEALTH MPH RESEARCH METHODS, PROPOSAL DEVELOPMENT & SCIENTIFIC REPORT WRITING MODULE 5 2019
Note:
Sometimes data are missing due to non‐response or non‐recording by the interviewers.
Usually, do not use missing data in the calculation of percentages.
Cross‐tabulations
In addition to making frequency counts for one variable at a time, it may be useful to combine
information on two or more variables to describe the problem or to arrive at possible
explanations for it.
For this purpose, it is necessary to design CROSS‐TABULATIONS. Depending on the objectives
and the design of the study, three different kinds of cross‐tabulations may be required:
1. Descriptive cross‐tabulations, which aim at describing the problem under study.
2. Analytic cross‐tabulations, in which groups are compared to determine differences
between groups; and
3. Analytic cross‐tabulations, which focus on exploring relationships between variables.
When the plan for data analysis is being developed, the data are not available. To visualize
how the data can be organized and summarized, it is useful at this stage to construct DUMMY
cross‐tabulations.
A DUMMY TABLE contains all elements of a real table, except that the cells are still empty
In a research proposal, dummy tables should be prepared to show the major relationships
between variables.
For example: a dummy table to show the relationship between coughing as the dependent
variable and smoking as the independent variable is constructed as follows:
Table 4.10. Episodes of coughing in smokers and non‐smokers
Cough in last 2 days No cough in last 2 days Total
Smokers
Non‐smokers
Total

109
LUSAKA APEX MEDICAL UNIVERSITY FACULTY OF PUBLIC HEALTH MPH RESEARCH METHODS, PROPOSAL DEVELOPMENT & SCIENTIFIC REPORT WRITING MODULE 5 2019
Note: It is extremely important to determine before you start collecting the data what tables you will need to assist you in looking for possible explanations of the problem you have identified. This will prevent you from collecting too little or too much data in the field. It will also save you much time in the data‐processing stage. Care should be taken not to embark on an unstructured comparison of all possible variables. The dummy tables to be prepared follow from the specific objectives of the study.
Other Analytical Measures
Measures of central tendency (mean, median, and mode ) and significant statistical tests and
other analysis for numerical data are described further in Unit 7 of this Module)
Analysis of qualitative Data
Qualitative data may be collected through open‐ended questions in self‐administered
questionnaires, individual interviews, focus group discussions, or through observations during
fieldwork. For a detailed description of the analysis of qualitative data refer to Unit 5 of this
module, which provides the basic. Here the concentration is on the analysis of responses
obtained from the open‐ended questions.
Common requested data in open‐ended questions include:
Opinions of respondents on a certain issue
Reasons for a certain behaviour; and
Description of certain procedures, practices, or beliefs/ knowledge with which the
researcher is not familiar.
The data can be analysed in three steps:
Step 1: List the data for each question. Take care to include the source of each item you list so
that you can place it in the original context if required. How you will categorize the
qualitative data depends on the type of data requested. In the case of opinions and
reasons, there may be a limited number of possibilities. Opinions may range from very
positive, neutral to very negative. Data on reasons may require different categories
depending on the topic and the purpose of your question.
Step 2: To establish your categories, first read through the whole list of answers. Then start
giving codes for the answers that you think belong together.
Step 3: Next try to find a label for each category. After some shuffling, you usually end up with
4 to 6 categories. You should enter these categories on the questionnaire and on the
master sheet. If you categorize your responses to open‐ended questions in this way

110
LUSAKA APEX MEDICAL UNIVERSITY FACULTY OF PUBLIC HEALTH MPH RESEARCH METHODS, PROPOSAL DEVELOPMENT & SCIENTIFIC REPORT WRITING MODULE 5 2019
you can: report the percentages of respondents giving reasons or opinions that fall in
each category; and analyse the content of each answer given in particular categories,
to plan what action should be taken
In CONCLUSION, a plan for the processing and analysis of data includes:
A description on whether all or some parts of the data should be processed by hand
or computer.
Preparation of dummy tables for the description of the problem, the comparison of
groups or the establishment of relationships between variables, guided by the
objectives of study.
A decision on the sequence in which tables should be analysed, or in what order data
should be analysed.
A decision on how qualitative data should be analysed
An estimate of how total time needed for analysis and how long particular parts of the
analysis will take.
A decision concerning whether additional staff are required for the analysis, and an
estimate of the total cost of the analysis.
4.14. RESEARCH ETHICAL CONSIDERATIONS
Definitions
Research ethics refer to the ‘codes of conduct in the implementation of research to
produce a systematic and verifiable knowledge.’
The research ethical considerations are ‘issues that should be observed not to encroach
upon the rights, welfare and even cause harm to research participants during data
collection or at analysis phase.’
Research should not be the intent or the interest of the investigators, but the concern of the
participants as well.
Why Concerned About the Research Ethical Considerations?
The research process is the overall scheme of activities in which scientists engage to
produce knowledge, which may require ethical considerations that should be
adhered to protect the researcher and participants.
The ethical dilemma of scientists is the conflict between the right to research and
preserving the right of research participants to self‐ determination, privacy, and
dignity.
111
LUSAKA APEX MEDICAL UNIVERSITY FACULTY OF PUBLIC HEALTH MPH RESEARCH METHODS, PROPOSAL DEVELOPMENT & SCIENTIFIC REPORT WRITING MODULE 5 2019
Ethical issues are considered for self‐determination, privacy and preserve the dignity of the
participants. The ethical issues arise from the kinds of problems to be investigated and
methods used to obtain valid and reliable data. These may be evoked by:
1. The research problem itself, for example, examining determinants of tuberculosis, or
sexual behaviour, or HIV/AIDS require ethical considerations.
2. The setting that the researcher takes place in, for example, a hospital, prison, or public
school, or a village, or a household requires some ethical issues.
3. The methods or procedures required by the research design, for example, exposure
of the experimental group to conditions that may have negative effects on
participants need ethical issues to be considered.
What are Major Ethical Considerations?
1. Informed Consent
There is now wide acceptance of the doctrine that research involving human
participants should be performed with the informed consent of the participants.
Informed consent is absolutely essential whenever participants are exposed to
substantial risks or are asked to forfeit their personal rights.
For example, the United States Department of Health and Human Services guidelines
provide research supported under its grants unless it contains ethical issues and
approved by the Ethics Committee. Similarly, the research ethical approval is also
demanded by the University of Zambia Bio‐Medical Research Ethics Committee, which
requires that a signed consent form should be completed if human research
participants are placed ‘at risk’.
More than eight hundred major research institutions have voluntarily agreed to
comply with the Federal guidelines in the review of all research conducted in their
institutions, whether funded by the Federal governments or not.
When research participants are to be exposed to pain, to physical or emotional injury,
to an invasion of privacy, or to physical or psychological stress, or when they are asked
to surrender temporarily their autonomy, for example in drug research, informed
consent must be fully guaranteed.
Participants should know that their involvement is voluntary at all times.
They should receive a thorough explanation before research of the benefits, rights,
risks and dangers involved as a consequence of their taking part in the research
project.
Reasons for Informed Consent
The idea of informed consent derives from cultural and the legal considerations. It rests upon
the high preference you give to freedom and self‐determination of participants. Informed

112
LUSAKA APEX MEDICAL UNIVERSITY FACULTY OF PUBLIC HEALTH MPH RESEARCH METHODS, PROPOSAL DEVELOPMENT & SCIENTIFIC REPORT WRITING MODULE 5 2019
consent provides a freedom to natural decisions to participate in the research project by
participants for the following reasons:
When persons involved in research risk limit their freedom, they must be asked to
consent to this limitation.
It allows each individual to decide whether or not to participate in a research
project, which reflects a respect for the right of self‐determination and shifts part
of the responsibility to the participant for any negative effects that might occur in
the course of study.
Mature individuals are best able to promote their own well‐being and own
interests, which allow them freedom of choice about their participation in
research.
Finally, from the researcher’s perspective, informed consent reduces their liability
because participants will have a voluntarily agreement to take part in the research
project.
Meaning of Informed Consent
There is now a wide acceptance of the principle of informed consent. Eduard Diener and
Rick Crandall (1987: 36) defined ‘informed consent’ as “the procedure in which individuals
choose whether to participate in an investigation after being informed of facts that would
likely influence their decision.” This involves four elements:
Competence
Voluntarism
Full information; and
Comprehension.
a) Competence
A basic assumption associated with the principle of informed consent is that any decision
made by a responsible mature individual who is given the relevant information will be the
correct decision for providing informed decision.
Persons not having capacity to consent are on the basis of two criteria – either “they have
inadequate mental capacity,” or “they are in situations where there are some questions
about their ability to exercise self‐ determination.”
Those considered incompetent include, young children, comatose medical patients and
mentally challenged patients. When such participants receive direct benefits from their
involvement in a research project, it is considered appropriate for the guardians, parents and
others responsible for such participants to make decisions for them.

113
LUSAKA APEX MEDICAL UNIVERSITY FACULTY OF PUBLIC HEALTH MPH RESEARCH METHODS, PROPOSAL DEVELOPMENT & SCIENTIFIC REPORT WRITING MODULE 5 2019
When direct benefits are not expected and there is some risk of negative effects, may suggest
that the research be prohibited altogether.
b) Voluntarism
Adherence to the principle of informed consent will enhance the freedom of participants to
choose whether or not to take part in a research project. This will guarantee that exposure to
known risks is undertaken voluntarily.
In the research situations that involve institutional settings, such as mental institutions,
hospitals, public schools, or prisons, substantial influence from persons in positions of
authority is involved. For example, a patient in care of a medical researcher may consent to a
treatment because that patient is physically weak or under the influence of the physician.
The ethics of medical experimentation emphasize voluntary consent, but researchers have not
realized some infringements on that voluntarism.
The context for the careful explication of the need for voluntary consent is set in the
professional ethical code, e.g. for medical physicians. This means that the person involved
should have legal capacity to give consent and to exercise free power of choice without the
intervention of any element of force, fraud, deceit, or other form of constraint.
c) Full Information
The Consent must be voluntary and informed. In practice, it is impossible to get a fully
informed consent. Therefore, a strategy of a reasonably informed consent is usually adopted.
The strategy has six basic elements of information for a consent to be reasonably informed:
First, a fair explanation of the procedures to be followed and their purposes.
Second, a description of the attendant discomforts and risks reasonably to be
expected.
Third, a description of the benefits reasonably to be expected
Fourth, a disclosure of appropriate alternative procedures that might be
advantageous to the participant.
Fifth, an offer to answer any inquiries concerning the procedures.
Sixth, an instruction that the person is free to withdraw his or her consent and to
discontinue participation in the project at any time without prejudice to the
participant.
d) Comprehension
A fourth element of informed consent refers to “the confidence that the participant has
provided information for knowing consent when the research procedure is associated with
complex risks.” It indicates an elaborate description of the project,

114
LUSAKA APEX MEDICAL UNIVERSITY FACULTY OF PUBLIC HEALTH MPH RESEARCH METHODS, PROPOSAL DEVELOPMENT & SCIENTIFIC REPORT WRITING MODULE 5 2019
It includes the use of highly educated participants who are most likely to understand the
information, the availability of a consultant to discuss the study with the participant and also
a time lag between the request for participants and the decision to take part in the study, for
example in clinical trial studies, or experimental studies.
A common procedure is to provide an independent measure of comprehension by questioning
the participants or by asking them to respond to questionnaire that test whether they know
the information.
2. Privacy
The ‘right to privacy’ is the freedom of the individual to pick and choose for himself/herself
the time and circumstances under which his/ her attitudes, beliefs, behaviour and opinions
are to be shared with others.
The right to privacy may easily be violated during an investigation or after its completion.
Dimensions of Privacy
Privacy is considered from three different dimensional perspectives:
Sensitivity of information
The setting being observed; and
Dissemination of the information
a) Sensitivity of Information
Sensitivity of information refers to how personal or potentially threatening the information
being given to the researcher. Certain kinds of information are more personal than others,
and may be potentially more threatening.
The greater the sensitivity of information, the more safeguards are called to protect the
privacy of the research participants.
b) Settings Being Observed
The setting of research project may vary from very private to completely public. For example,
a ‘home’ is considered one of the most private settings in most cultures. Intrusions into
people’s homes without their consent are forbidden by law.
Whatever setting is being observed requires some form of consent to gain confidence of the
participants and access to their behaviour.

115
LUSAKA APEX MEDICAL UNIVERSITY FACULTY OF PUBLIC HEALTH MPH RESEARCH METHODS, PROPOSAL DEVELOPMENT & SCIENTIFIC REPORT WRITING MODULE 5 2019
c) Dissemination of Information
The third aspect of privacy concerns the ability to match personal information with the
identity of research participants. For example, information about income remains relatively
private if only a single investigator is informed of it.
When information is publicized with data and names communicated through media, privacy
is seriously invaded.
The more people who can learn about the information, the more concern must be about the
privacy.
3. Anonymity
Applying the right of anonymity requires that the identity of individuals be separated from the
information they give. A participant is considered anonymous when the researcher or other
persons cannot identify particular information with a particular participant.
If the information is given anonymously, with the researcher unable to associate a name with
the data, then the privacy of the participant is secured even through sensitive information
may be revealed. For example, anonymity is maintained in a mail survey in which no
identification numbers are given to the questionnaire before their return.
A respondent to a personal interview cannot be considered anonymous because an
interviewer collects data from an identifiable respondent.
The procedure for ensuring anonymity is if names and other identifiers are linked to the
information by a code number.
Once the data have been prepared for analysis, anonymity can be maintained by seprating
identifying information from the research data.
Further protections are use of passwords to control access to data and automatic monitoring
of the use of files.
4. Confidentiality
Confidentiality is to avoid revealing research information publicly. Investigators have a strict
moral and professional obligation to keep the promise of confidentiality, but there are
circumstances in which it may be difficult or impossible to do so. For example, when
information is required by the judicial authorities or legislative committees.
In the data collection stage, participants should be given clear and accurate statements about
the meaning and limits of confidentiality. For example, a statement of general promise for
gaining confidentiality acceptance or assurance is given as follows:

116
LUSAKA APEX MEDICAL UNIVERSITY FACULTY OF PUBLIC HEALTH MPH RESEARCH METHODS, PROPOSAL DEVELOPMENT & SCIENTIFIC REPORT WRITING MODULE 5 2019
Example 1:
“These interviews will be summarized in group statistics so that no one will learn of your
individual answer. All interviews will be kept confidential, There is a remote chance that you
will be contacted later to verify the fact that you actually conducted the interview and have
conducted it completely and honestly.”
Example 2:
“These interviews are being made to provide average or aggregated statistical evidence in
which individual answers will not be identified or identifiable. We will do everything in our
power to keep your answers completely confidential, only if so ordered by Court and Judge
would we turn over individually identified interviews to any other group or government
agency.”
4.15. Summary
We learnt in this module that research methodology is a process for determining and
describing the various strategies or tools as methodological components to be used for
facilitating the implementation of your research proposal you will be developing to yield
empirical evidence to achieve your objectives. These various components were described as:
Variables that included defining and classifying the study variables and their
measurements, which were broadly classified as‐ “the dependent variable” measuring
the outcome, used to describe the problem under study, and “the Independent
variables” used to describe or measure the factors assumed to cause or at least
influence the problem. Within the independent variables, we further learnt that there
are other variables which are classified as “confounding variables” assumed to
strengthen or weaken the apparent relationship between the problem and the
possible cause. Others discussed were “the background variables, listed as
demographic characteristics appearing as: sex, age, education, socio‐economic status,
marital status, residence, religion and ethnicity and classified further as also notorious
confounders as they influence the problem indirectly. The construction of the variable
indicators for measurements and their scales of measurements (numerical or binary
scale, ordinary scale and for nominal data) were described and constructed.
Study Designs‐ broadly described into two major classifications‐ “Non‐intervention
studies” as explorative, descriptive and analytical study designs (i.e. comparative,
cohort and case‐control studies), and the “intervention studies” ( i.e. experimental
study design or Clinical experimental design and the Quasi‐experimental study
designs. We further discussed their limitations, validity and reliability conclusions, and
threats to validity and the means of overcoming such threats.

117
LUSAKA APEX MEDICAL UNIVERSITY FACULTY OF PUBLIC HEALTH MPH RESEARCH METHODS, PROPOSAL DEVELOPMENT & SCIENTIFIC REPORT WRITING MODULE 5 2019
Sampling composed of sampling methods for both quantitative and qualitative data,
and various formulae for calculating sample sizes for a single proportion, mean, rate
and for differences between two means and two proportions for numerical data. There
are two distinct categories of sampling methods‐ Probability sampling methods (
method used to select subjects randomly by chance, e.g. simple random, systematic
sampling, stratified sampling etc.) and non‐probability sampling method (method
used to select subjects without a random sampling with a higher probability of
introducing bias in selection, such as convenience sampling, quota sampling, snowball,
purposive etc.
Data collection methods and tools for both quantitative and qualitative data (see
examples in this module Unit), including the techniques of constructing a structured
questionnaire, semi‐structured questionnaires and question guides for a focus‐group
discussion that also included‐ the concepts of attitudinal measurements and the
triangulation methodologies of data collection, sources of data and triangulation
analysis of data.
Data Analysis that included the techniques of processing the data‐ coding and
categorizing data and the process of displaying descriptive data (i.e. frequencies and
cross‐tabulation data on analytical tables and figures) and elaborating the differences
between frequencies and cross‐tabulation tables and the modes of displaying data for
numerical data, including the technique of constructing a dummy table. Detailed for
quantitative and qualitative data analysis are further discussed in Module 5.5 and
module 5. 7.
Ethical considerations involved discussing the ethical issues that protect the rights of
individuals or subjects and researchers to adhere to the research projects to be
implemented, and the measures considered for preserving data, such as seeking ethical
research approval from a recognized body, ensuring adequate information and consent
form from those exposed to the study, privacy, confidentiality and anonymity of
information collected.
4.16. Performance Evaluation Exercises
NOTE: You will be expected to attempt two exercises: 1. Assemble your objectives and the conceptual framework problem analysis of your study,
(a) select your variables and state the dependent variable and the independent variables of your study, and (b) Construct a table and state the indicators of measurements and scale of measurements for each of the variable stated.
2. Describe the study design to be used in your research project and provide a justification why such a study design is suitable for the project.
Submit your assignment to your supervisor or lecturer according to the timeframe given to you.
118
LUSAKA APEX MEDICAL UNIVERSITY FACULTY OF PUBLIC HEALTH MPH RESEARCH METHODS, PROPOSAL DEVELOPMENT & SCIENTIFIC REPORT WRITING MODULE 5 2019
Additional Readings
1. Chava Frankfort‐Nachmias & David Nachmias (2008). Research Methods in the Social
Science, 7th Edition, ISBN: 13: 978‐0‐7167‐5510‐0
2. Varkevisser,C.M., Pathmanathan,I., Brownlee, A. (1991). Designing and Conducting
Health Systems Research Projects: Proposal Development and Field Works: Health
Systems Research Training Series, ISBN: 0‐88936‐585‐7
3. Bailey Kenneth,D (1994). Methods of Social Research, 4th Edition, NY. Free Press
4. Bimbaum, Michael H (2001). Introduction to Behavioural Research on the Internent.
Upper Saddle River, NJ: Prentice‐Hall
Recommended Reading
1. Dochartaigh, Niall R (2001). The Internet Research Handbook: A Practical Guide for
Students and Researchers in the Social Sciences. Thousand Oak, CA: Sage Publication
2. Hansen, Hans V., and Robert E. Pinto, eds. (1995). Fallacies: Classical and
Contemporary Readings. University Park, PA: Benn State Press
3. Hart, Chris (1998). Doing Literature Review: Releasing the Social Science Research
Imagination, London: Sage Publication
4. Betty R. Kirkwood and Johnathan A.C. Sterne (2003). Essential Medical Statistics, 2nd
edition. Blackwell Science: 502 pages
5. Alan Bryman & Duncan Cramer. (2005). Quantitative Data Analysis with SPSS 12 and
13: A Guide for Social Scientists
119
LUSAKA APEX MEDICAL UNIVERSITY FACULTY OF PUBLIC HEALTH MPH RESEARCH METHODS, PROPOSAL DEVELOPMENT & SCIENTIFIC REPORT WRITING MODULE 5 2019
MODULE 5.5 QUALITATIVE RESEARCH METHODS
5.1. INTRODUCTION
The Module 5.5 focuses on the role of cultural or behavioural research in influencing health and disease outcomes in communities. The first part of this theme will dwell with the explanation of understanding the term behavioural research and the role it has played in the international Public Health. The following subsequent sections and sub‐themes are concerned with the real application of behavioural research in the context of qualitative research, involving its methodology and the techniques of analysing data & writing a qualitative research report.
5.2. OBJECTIVES
By the end of this module, you should be able to:
(1) Describe the term behavioural research and its relevance to OH approach (2) Apply qualitative research methodology to the relevance themes or topics of One
Health approach in your community or country (3) Demonstrate the ability to understand the distinction between qualitative
research and quantitative research methodologies learnt in other modules.
5.3. REFLECTION In your own understanding, define the following terms?:
1. Behaviour? 2. Behavioural research? 3. Qualitative research?
As you reflect on your understanding of these concepts whether your answers are correct or wrong, we shall discuss them further in the following sections to be able to articulate them adequately.
5.4. DEFINITION OF BEHAVIOURAL Or QUALITATIVE RESEARCH What is behavioural research? Jary and others (2000) define ‘behaviour’ as ‘the alteration, movement or response of any entity, person or animal or system acting within a particular context.’ In other words, ‘it is the externally observable response of an animal or human being to an environmental stimulus.’ The term behavioural research refers to ‘qualitative research’ application or ‘action research’ The research application seeks to explore the behaviour of individuals, through provision of in‐depth or insight information on the beliefs, opinion and solutions for the problems
120
LUSAKA APEX MEDICAL UNIVERSITY FACULTY OF PUBLIC HEALTH MPH RESEARCH METHODS, PROPOSAL DEVELOPMENT & SCIENTIFIC REPORT WRITING MODULE 5 2019
affecting them. The methodology applied in behavioural research involves‐ application of qualitative methods and sampling methods are mostly non‐probability types. Analysis is also of qualitative in nature, or in triangulation form‐ where qualitative data can be transformed into quantitative data for statistical analysis, for example in structured questionnaires where the use of open‐ended questions have been applied. It is concerned with the study of observable responses of human beings and animals which provides comprehensive description and interpretation of bio‐cultural interrelationships between human behaviour, past and present, disease level and health outcomes. Behavioural research provides in‐sight explanations and understanding of the relationships between bio‐sociocultural phenomena and health, and the changing health behaviour in directions believed to promote better health of the human and that of the animals alike.
5.5. CULTURE AND BEHAVIOURAL (PERSONALITY) RESEARCH Culture and personality or simply behavioural research is concerned with the ways in which anthropological knowledge can be used to raise levels of health care. Previous studies in which the problems of interpersonal relations were described between health providers and the clients of different racial groups showed how the role perceptions and cultural differences prevented the most effective therapeutic interaction.
Role of Behavioural or Qualitative) Research in International Public Health
After cold war, major bilateral and multilateral public health programmes in developing countries became part of global assessment. Health workers in cross‐cultural settings became to realize that health and disease are as much social and cultural phenomena as they are biological. Anthropology provided insight into why many programmes were less successful than anticipated and could suggest ways of improvement, through their research methods. Medical anthropology is the term used by anthropologists to describe: First, their research which aims at comprehensive description and interpretation of bio‐cultural interrelationships between human behaviour, past and present, and health and disease levels. Second, enhance professional participation in programme to improve health, through greater understanding of the relationships between bio‐sociocultural phenomena and health, and through the changing of health behaviour in directions believed to promote better health. The following sections will dwell with the application of the behavioural research in the context of qualitative research by demonstrating its methodological approach to public health.

121
LUSAKA APEX MEDICAL UNIVERSITY FACULTY OF PUBLIC HEALTH MPH RESEARCH METHODS, PROPOSAL DEVELOPMENT & SCIENTIFIC REPORT WRITING MODULE 5 2019
5.6. QUALITATIVE RESEARCH METHODS & DESIGNS
Qualitative research methodology application is concerned with the understanding of the various designs that are applied in qualitative research; type of sample size and sampling methods used; data collection methods and tool, and issues of ethical considerations; data quality management; and methods used for analysing qualitative data and interpretation. It will also cover the ways in which qualitative data yielded from the field can be written (report writing. The following provides description of varied study designs employed, with other subsections of the methodology:
QUALITATIVE RESEARCH DESIGNS Qualitative research designs are applicable to behavioural research studies. Common designs applied are:
1. Explorative studies:
An Exploratory study is a small‐scale study of relatively short duration, which is carried out when little is known about a situation or a problem. For example‐ establishing Counselling services for HIV positive and AIDS patients, but lacks information on specific needs patients have for support. To explore these needs, a number of in‐depth interviews are held with various categories of patients (males, females, married, singles etc) and some counselors in the program under way. Exploratory studies describe the needs for various categories of patients and the possibilities for action. You may need to Compare groups (e.g males and females).
Comparison –is a fundamental research strategy to identify variables that help explain why one group of persons or objects differs from another. Small‐scale studies that compare extreme groups are very useful for detecting management problems. For example: performance of health providers in health facility, community participation in malaria control, etc.
Purposes of Exploratory studies:
•To seek new insights
•To explore ways of how to ask questions for further studies
•To assess phenomena in a new situation
Explorative study design is necessary for qualitative data
2. Surveys‐ descriptive in nature:
Small scale surveys are also applicable in behavioural research to determine the behaviour of people, knowledge, attitudes, beliefs and opinions that may help to explain the behaviour (KAP studies).

122
LUSAKA APEX MEDICAL UNIVERSITY FACULTY OF PUBLIC HEALTH MPH RESEARCH METHODS, PROPOSAL DEVELOPMENT & SCIENTIFIC REPORT WRITING MODULE 5 2019
Case –Studies:
Case studies‐ are small scale descriptive study designs‐ describe in depth the characteristics of one or a limited number of cases.‐ A case may be, for example‐ a patient, a health centre, or a village. A descriptive study is a study that includes as subjects, all persons in the population including those who have the disease, and objectives limited to describing the population at that time, e.g. prevalence of disease.
Case studies are common in social sciences, management sciences, and clinical medicine.
‐For example‐ in clinical medicine, the characteristics of unrecognized illness may be documented as a case study‐ a first step towards building up a clinical picture of that illness.
SAMPLING METHOS & SIZE 1. Sample Size Sample size employed in qualitative behavioural research is small, with a maximum number of 20‐30 depending on the type of qualitative methods and design of study. Sample size for focus group discussions (FGDs) are translated in number of FGDs conducted in a study area that constitutes a sample. 1. Sampling methods Sampling methods for qualitative behavioural research are non‐probability in nature which are: a) Purposive sampling The principle of selection in purposive sampling is the researcher‘s judgement as to typically or interest. A sample is built up which enables the researcher to satisfy her or his specific needs in a project. It is an approach commonly used within case studies. b) Convenience sampling It is sometimes used as a cheap and dirty way of doing a sample survey. It does not produce representative findings. It involves choosing the nearest and most convenient persons to act as respondents. The process is continued until the required sample size has been reached. This is probably one of the most widely used and least satisfactory method of sampling (Robson 2002; Patton et al.2002). The term ‘accidental sample’ is sometimes used, but is misleading as it carries some suggestion of randomness, whereas all kinds of largely unspecifiable biases and influences are likely to influence who gets sampled. There are sensible uses of convenience sampling, but they are more to do with getting a feeling for the issues involved, or piloting a proper sample survey.

123
LUSAKA APEX MEDICAL UNIVERSITY FACULTY OF PUBLIC HEALTH MPH RESEARCH METHODS, PROPOSAL DEVELOPMENT & SCIENTIFIC REPORT WRITING MODULE 5 2019
c) Quota Sampling Here the strategy is to obtain representatives of the various elements of a population, usually in the relative proportions in which they occur in the population. If socio‐economic status was considered of importance in a particular survey, then the categories might be used. Interviewers would be given a quota of category. Within the category, convenience sampling is normally used. The interviewer will, for example, seek to interview a given number of, for example, unskilled community health workers, a given number of these unskilled community health workers can be obtained by say, stopping passers‐by to interview them, and will continue until her or his quota for the day is complete. The common use of the term ‘representative’ in quota sampling has to be looked at with some care. The findings are representative only in number, not in terms of the type of persons actually selected. All such means of gathering quota samples are subject to bias. Careful planning, experience and persistence can go some way to addressing obvious biases. If, for example, home visits are involved, avoiding houses where there are fearful dogs or impassable roads may be understandable behaviour on the part of sensitive interviewer, but mitigates against representativeness in householders in the sense of all householders having an equal chance of being selected in the sample. d) Snowball sampling Here the researcher identifies one or more individuals from the population of interest. After they have been interviewed, they are used as informants to identify other members of the population, who are themselves used as informants, and so on. This is a useful approach when there is difficulty in identifying members of the population.
QUALITATIVE DATA COLLECTION METHODS Qualitative methods consist of three kinds of data collection: (1) in‐depth and open‐ended interviews; (2) direct observations; and (3) written documents. Data from interviews consist of direct quotations from people about their experiences, opinions, feelings and knowledge about certain situations or phenomena. Data from observations consist of detailed description of people’s activities, behaviours, actions and full range of interpersonal interactions and organisational processes that are part that are part of observable human experience. Document analysis in qualitative inquiry yields quotations, or entire passages from organizational, clinical or programme records; memoranda and correspondences; official publications and reports; and open‐ended written responses to questionnaire and surveys. Common methods applied are:
Observations
Unstructured Interviews/ Semi‐structured interviews
Focus group discussions
Norminal group technique,
124
LUSAKA APEX MEDICAL UNIVERSITY FACULTY OF PUBLIC HEALTH MPH RESEARCH METHODS, PROPOSAL DEVELOPMENT & SCIENTIFIC REPORT WRITING MODULE 5 2019
Delphi techniques,
Life histories, scales ,essays, case studies, mapping, rapid appraisal techniques,
Participatory research 1. In‐depth and open‐ended interviews
The interview is a kind of conversation, i.e. a face‐to‐face interaction between the interviewer and the interviewee (respondent). Purpose The purpose of interviewing is to find out what is in and on someone else’s mind. The purpose of open‐ended interviewing is to access the perspective of the person being interviewed. People are interviewed to find out from them the things that cannot be observed. Interviews carried out for research purposes are very common to obtain research‐relevant information based on focused contents specified by research objectives of systematic description, prediction or explanation (Patton 2002). Advantages and disadvantages of interviews The interview is a flexible and adaptable way of discovering issues. The human use of language is fascinating, both as a behaviour in its own right and for what lies behind individual’s action. Asking people directly about what is going on is an obvious way of seeking answers to research questions. In‐depth interviews provide inner perspective of individuals on opinions, beliefs, attitudes, knowledge and behaviour about situations or events in the populations. Face –to‐face interviews offer the possibility of modifying one’s line of inquiry, following up interesting responses and investigating underlying motives in a way that postal and other self‐administered questionnaire cannot. Non‐verbal responses too, may give messages which help in understanding the verbal responses, possibly changing or even, in extreme cases reversing its meaning. There are also several disadvantages with interviews. Considerable skill and experience in the interviewer is required. Lack of standardization raises concerns about reliability and biases can be difficult to rule out. Interviewing is time‐consuming.
2. Focus Group Discussions
Characteristics and Uses of FGDs
A focus group discussion is a group discussion of 6‐12 persons guided by a facilitator during which members talk freely and spontaneously about a certain topic. Purpose is to obtain in‐depth information on concepts, perceptions and ideas of the group. It aims at question‐answer interaction.
Focus group discussion technique is useful to:

125
LUSAKA APEX MEDICAL UNIVERSITY FACULTY OF PUBLIC HEALTH MPH RESEARCH METHODS, PROPOSAL DEVELOPMENT & SCIENTIFIC REPORT WRITING MODULE 5 2019
Focus research and develop relevant research hypotheses by exploring in greater depth of problem to be investigated and its possible causes.
Formulate appropriate structured questions for large scale surveys
Supplement information on knowledge, beliefs, attitudes and behaviour already available, but insufficient.
Develop health education messages.
Exploring controversial topics or issues. Conducting a FGD
a) Preparation:
Selection of a Facilitator and Recorder
Recruitment of participants‐ should be the same socio‐economic background. Age and gender composition should facilitate free discussion‐ Obtain information from different categories. e.g. group of men and group of women, or young men/ women and older men/women.
Physical arrangements‐ conducive atmosphere to allow free discussions.
Preparation of a discussion guide‐ Written list of topics and questions is required, e.g
weaning practice of children < 24months, tuberculosis, perception of foot and mouth
disease in animals and so on relevant to your research question.
b) Conducting a Focus Group Discussion:
One of the research team must be facilitator and the other serves as recorder
Functions of Facilitator:
Introduce the session: Research team should introduce themselves and participants
to introduce themselves by name.
Encourage discussion
Encourage involvement
Build rapport, empathize‐ observe non‐verbal communication, or ask your self what
are they saying?
Control rhythm of the meeting‐listen carefully and move the discussion from topic to
topic.
Take time at the end of meeting to summarize, check for agreement and thank the
participants.
Functions of recorder:
Keep record of the content of discussion, emotional reactions and important aspects
of group interaction
Record date, time, place; Names and characteristics of participants

126
LUSAKA APEX MEDICAL UNIVERSITY FACULTY OF PUBLIC HEALTH MPH RESEARCH METHODS, PROPOSAL DEVELOPMENT & SCIENTIFIC REPORT WRITING MODULE 5 2019
Record general description of the group dynamics‐ level of participation, presence of a dominant participant, level of interest and so on.
Record opinions of participants, recorded as much as possible in their own words,e.g key statements.
Record emotional aspects‐e.g reluctance, strong feelings attached to certain opinions and vocabulary used
c) Analysis of Results
After each FGD, facilitator and recorder meet to review and complete notes taken
during the meeting.
Write full report of the discussion using participants’ own words.
List key statements, ideas and attitudes expressed for each topic of discussion.
Code statements using left margin, eg ‘tyf’ for type of food, ‘wp’ for weaning practice
Write comments on right margin.
Further categorize statements for each topic, if required, e.g. compare answers of
different subgroups (e.g answers of young mothers and those above child‐bearing age
on the changes in weaning practices, for example.
Summarize them in matrix or diagram, flowchart or narrative form and interpret the
findings.
Analysis should be in relation to the themes or variables of your study to achieve the
objectives or research question (s).
Select most useful quotations that emerged from the discussions to illustrate the main
ideas.
d) Report Writing:
Start with a description of the selection and composition of the groups of
participants.
Write in relation to the main themes (variables) of the topic (s)
Provide a commentary on the group process, so that the reader can assess the
validity of the reported findings.
Present findings according to list of topics and guided by the objectives of your FGD.
Include quotations whenever possible, particularly key statements.
3. Rapid Appraisal Techniques or Soundings
Rapid appraisal techniques are concerned with obtaining information rapidly without a degree of precision. Rapid appraisal techniques can be used for insufficient data available to
127
LUSAKA APEX MEDICAL UNIVERSITY FACULTY OF PUBLIC HEALTH MPH RESEARCH METHODS, PROPOSAL DEVELOPMENT & SCIENTIFIC REPORT WRITING MODULE 5 2019
identify and describe a health problem. Information is obtained in an easy, quick, and inexpensive way. Useful in the pilot phase of research or for evaluation purposes to strengthen programme development. It involves the use of mixed qualitative methods, e.g. focus group discussions combined with semi‐structured in‐depth interviews for key informants, or observations etc.
4. Participatory Research Participatory research is the involvement of both researchers and target population together. All phases of research (from problem identification, setting the objectives to using the results) are planned and conducted by the researchers and informants/ people affected with the problem. The results of participatory research should be useful to those who participated in the research. This helps to explore and develop approaches interventions to solve community health problem. A good example of participatory research is conducting community diagnosis‐ in which research is conducted with the people and for the people (as research). Without involvement of people, it is likely that researchers or service managers can be likely to collect information only on issues of importance to them.
5. Mapping
Mapping is a valuable qualitative technique for visual displaying relationships and resources. For example: in a water supply project, mapping is invaluable. It can be used to represent the location of wells, distance of the living areas from wells, other water systems etc. It gives researchers a good overview of the physical situation and may help to highlight relationships between variables. It is a useful measure for pre‐stage sampling.
6. Life Histories
Life histories are a special application of interview technique. The technique allows people to tell stories which provide insights into what they consider important .Life‐history taking in a special form is interviewing. It is usually conducted on a very limited number‐maximum 20. Technique is applicable to rural traditional communities .Issues of life‐history are concerned with‐ patterns of reproduction, perceptions of marriage or domestic animal rearing, childbirth, cultural values, lifestyle, etc.
7. Essays
Essays help to explore hidden values and aspirations of affected people and community in which they live. It determines differences in beliefs concerning perceived causes of illness, popular theories of illness causation, rationale for health‐related behaviour and outcomes.
128
LUSAKA APEX MEDICAL UNIVERSITY FACULTY OF PUBLIC HEALTH MPH RESEARCH METHODS, PROPOSAL DEVELOPMENT & SCIENTIFIC REPORT WRITING MODULE 5 2019
8. Nominal Group Techniques
A nominal group technique (NGT)‐ is a group of discussion technique that is useful when one wants to obtain a consensus from a group on a topic where decision‐making can be usefully guided by the perceptions and opinions of the various group members. Sequence of group discussion is usually individual expression followed by ‘ voting’, followed by further discussion and another round of discussion, then voting. The group discussion comes to an end when there is ‘one’ vote. Steps in applying NGT:
Individual listing of ideas on paper
Display of lists produced, followed by discussion
Voting and ranking
Summarising the results
Discussion of the results
Second vote and re‐ranking
There should be a moderator to facilitate discussion and score rates‐ ideas are ranked according to scoring rate of high marks.
9. Observation Observation is a technique that involves systematically selecting, watching and recording behaviour and characteristics of living species, objects or phenomena. Observation of human behaviour is a much‐used data collection technique. It can be undertaken in different ways:
Participant observation: the observer takes part in the situation he or she observes. Non‐participant observation: the Observer watches the situation openly or
concealed, but does not participate.
Observation serves different purposes:
They provide additional accurate information on behaviour of people than interviews or questionnaires.
Observation can provide a check on information collected, e.g. on sensitive topics, such as alcohol, or drug abuse, or stigmatization of HIV/AIDS patients, Leprosy, Tuberculosis and epilepsy.
They may be a primary source of information, such as observations of a field veterinarian officer administering vaccines or treatment to animals.
Observations of Human behaviour can form part of any type of study, but as they are time consuming, they are most often used in small‐scale studies. Observations can also be made on Objects. For example, the presence or absence of a latrine and its state of cleanliness may be observed. If observations are made using a defined scale, they may be called measurements. Measurements usually require additional tools. For example, in nutritional
129
LUSAKA APEX MEDICAL UNIVERSITY FACULTY OF PUBLIC HEALTH MPH RESEARCH METHODS, PROPOSAL DEVELOPMENT & SCIENTIFIC REPORT WRITING MODULE 5 2019
surveillance, we measure weight and height by using weighing scales and a measuring board, and thermometers used for measuring body temperature.
5.7. QUALITATIVE DATA ANALYSIS Qualitative research techniques are used to describe in depth certain procedures, beliefs and knowledge related to health issues among the participants and key informants. These techniques are suitable for exploring the reasons for certain behaviors or opinions of respondents on certain aspects. The researcher ends up with substantial number of pages of written text that need to be analyzed. The use of N’VIVO software that can easily be downloaded from the internet is a useful tool for analysing qualitative data. The other tool is simply the Microsoft word for matrices, graphic interpretation of content data and narratives has played a major role in qualitative analysis.
PRINCIPLES OF QUALITATIVE ANALYSIS:
Procedures and outcomes of qualitative data analysis differ from those of quantitative data analysis. Qualitative analysis is performed in form of ‘Content’ analysis or ‘Theme’ Principles of analyzing data are similar in both qualitative and quantitative analysis. They are:
Application of data processing involving a coding system
Analysis involves displaying data, interpretation and drawing conclusions.
Describe the sample population
Order and reduce or code the data‐ data processing
Involve process of “cutting” and “pasting” ideas or themes extracted from field notes
Use of qualitative computer software packages, such as Intrinsic P4.2, Gutterman, Microsoft word, Lispqual software programme, N’Vivo, etc.or you may analyze manually.
Display summaries of data for easy interpretation
Draw conclusions, and
Develop strategies for testing or confirming findings to prove their validity.
1. Procedures for Processing and Displaying Qualitative Data Description of the sample population
- First step of data processing‐ provide characteristics of sample population, e.g by residence, age, sex, occupation, education, or marital status
- Qualitative data originate from small samples, (e.g a handful of key informants or focus group discussions).
- For example, who were the key informants? How representative were the participants of the groups they represented? etc
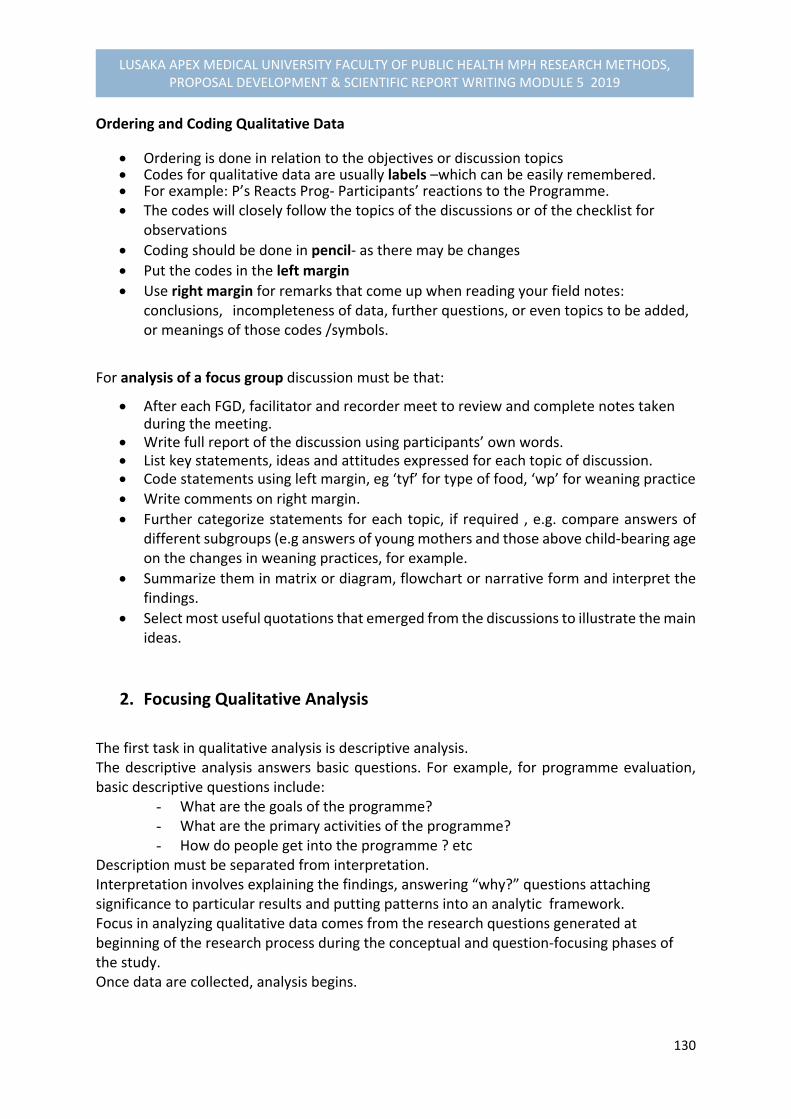
130
LUSAKA APEX MEDICAL UNIVERSITY FACULTY OF PUBLIC HEALTH MPH RESEARCH METHODS, PROPOSAL DEVELOPMENT & SCIENTIFIC REPORT WRITING MODULE 5 2019
Ordering and Coding Qualitative Data Ordering is done in relation to the objectives or discussion topics Codes for qualitative data are usually labels –which can be easily remembered. For example: P’s Reacts Prog‐ Participants’ reactions to the Programme. The codes will closely follow the topics of the discussions or of the checklist for
observations
Coding should be done in pencil‐ as there may be changes
Put the codes in the left margin
Use right margin for remarks that come up when reading your field notes: conclusions, incompleteness of data, further questions, or even topics to be added, or meanings of those codes /symbols.
For analysis of a focus group discussion must be that:
After each FGD, facilitator and recorder meet to review and complete notes taken during the meeting.
Write full report of the discussion using participants’ own words. List key statements, ideas and attitudes expressed for each topic of discussion. Code statements using left margin, eg ‘tyf’ for type of food, ‘wp’ for weaning practice Write comments on right margin.
Further categorize statements for each topic, if required , e.g. compare answers of different subgroups (e.g answers of young mothers and those above child‐bearing age on the changes in weaning practices, for example.
Summarize them in matrix or diagram, flowchart or narrative form and interpret the findings.
Select most useful quotations that emerged from the discussions to illustrate the main ideas.
2. Focusing Qualitative Analysis
The first task in qualitative analysis is descriptive analysis. The descriptive analysis answers basic questions. For example, for programme evaluation, basic descriptive questions include:
- What are the goals of the programme? - What are the primary activities of the programme? - How do people get into the programme ? etc
Description must be separated from interpretation. Interpretation involves explaining the findings, answering “why?” questions attaching significance to particular results and putting patterns into an analytic framework. Focus in analyzing qualitative data comes from the research questions generated at beginning of the research process during the conceptual and question‐focusing phases of the study. Once data are collected, analysis begins.

131
LUSAKA APEX MEDICAL UNIVERSITY FACULTY OF PUBLIC HEALTH MPH RESEARCH METHODS, PROPOSAL DEVELOPMENT & SCIENTIFIC REPORT WRITING MODULE 5 2019
3. Strategies for Analyzing Interviews First decision to be made in analyzing interviews is whether to begin with case analysis or cross‐case analysis Beginning with case analysis means writing a case study for each person interviewed or each unit studied (e.g., reach critical event, each group, and so on). Beginning with cross‐case analysis means grouping together responses from different people to common questions or analyzing different perspectives on central issues or themes. If a standardized open‐ended interview (e.g. semi‐structured interview), it is easy to do cross‐case or cross‐interview analysis for each question in the interview. With an interview guide approach (as in FGDs), answers from different people can be grouped by topics from the guide, but the relevant data won’t be found in the same place in each interview. An interview guide constitutes a descriptive analytical framework for analysis. Begin with individual case studies where variations in individuals are the primary focus of the study. This strategy requires writing a case‐analysis using all the data for each person before doing a cross‐case analysis. For example, if one has studied 10 juvenile delinquents, the analysis could begin by doing a case description of each juvenile before doing cross‐case analysis.
4. Strategies for Analyzing Observations Initial analysis of observational data is facilitated by clarity about how it will be most helpful to present the findings. Options include the following:
- Chronology: Describe what was observed chronologically, over time, to tell the story from beginning to end.
- Key events: Present the data by critical incidents, or major events not necessarily in order of occurrence, but in order of importance.
- Various Settings: Describe various places, sites, settings, or locations (doing case studies of each) before doing cross‐setting pattern analysis.
- - People: If individuals or groups are the primary unit of analysis, then case studies of
people or groups may be the focus for case studies. - Processes: the data may be organized to describe important processes according to
research questions. There must be an initial framework for managing the voluminous data collected during fieldwork.
SUMMARIZING DATA: GRAPHIC DISPLAY IN CHARTS AND FIGURES
After ordering the data, you can summarize them by using the following steps:

132
LUSAKA APEX MEDICAL UNIVERSITY FACULTY OF PUBLIC HEALTH MPH RESEARCH METHODS, PROPOSAL DEVELOPMENT & SCIENTIFIC REPORT WRITING MODULE 5 2019
First step: listing data that belong together: - If you coded the data, list all the data that have been given the same code. - List the data in more condensed form to make it easy to answer research
questions - When listing data, remember to identify the source for each item (interview
number or field note page number, etc)‐ to enable you to go back to its original context.
Second step: Summarize the data graphically in a chart (e.g a matrix) or a figure (e.g diagram, flow chart), or in a narrative form.
Third step: Interpret the data for each graphic display by using the following examples:
MATRIX/TABLE A matrix is a chart that looks like a table, but contains words or themes instead of numbers. Example 1: Use of Matrix For example: Matrix on introduction of soft baby foods among mothers of different age‐groups of Human population Matrix 5. 1: Initiation of baby solid food among women of different ages
Age‐Group
Onset Soft Food
Type of Food
Frequency of SF/Day
Young mothers (20‐30 yrs)
Range: 4‐7months Average: 6 months
‐soft porridge‐soft porridge with pounded groundnuts, Potatoes, fruit biscuits
1‐2 times daily ‐Depends on availability of mother or care taker ‐Depends on appetite
Mothers over reproductive age (>45 yrs)
Range: 5‐11months Average: 8.5 months
Soft porridgeSoft fruits
1‐2 daily ‐Depends on availability .of mother, or caretaker & appetite.
Interpretation: This type of display makes it easy for the researcher to conclude that:
- Young mothers start giving soft foods, on average 2.5 months earlier than the older mother or generation of their own mothers.
- Young mothers use a larger variety of soft weaning foods than older mothers - The two generations do not seem to differ in the frequency with which they give
/gave soft foods to their babies. Matrices are the most common form of graphic display of qualitative data. They can be used to order information in many ways, e.g:
- Time sequence of procedures being investigated. - Type of information - Location of data collection - Type of activity - Reasons for certain behaviour.

133
LUSAKA APEX MEDICAL UNIVERSITY FACULTY OF PUBLIC HEALTH MPH RESEARCH METHODS, PROPOSAL DEVELOPMENT & SCIENTIFIC REPORT WRITING MODULE 5 2019
DIAGRAM A diagram is a figure with boxes or circles containing variables and arrows indicating the relationships between the variables. The focus group discussion on changing weaning practices might provide information on reasons for early or late weaning that we could satisfactorily summarize in diagrams, for example as shown in Figure 5.1 below
Example 2: Use of Diagrams/Root Analysis:
For example:
Figure 5. 1: Reasons for early introduction of soft foods by young mothers of Human Species:
Interpretation:
The findings in figure 1 show variety of factors that influences young mothers to start introducing soft foods to their babies. These range from absenteeism of mothers due to seasonal cultivation and their employment status; peer influences of health workers, male partners, female parents and friends to quality of breast milk or milk. The interpretation can be compared with other groups to draw some conclusions in their differences and similarities (if any). In such situations, it is considered as cross‐case content analysis. Such diagrams can be prepared after one focus group discussions to help to explore the problem even further in subsequent discussions.
Early soft foods
Told by h/worker
Told by husb/mother
Bad milk diarrhoea cultivation
Moth absent At times
Job of mother
134
LUSAKA APEX MEDICAL UNIVERSITY FACULTY OF PUBLIC HEALTH MPH RESEARCH METHODS, PROPOSAL DEVELOPMENT & SCIENTIFIC REPORT WRITING MODULE 5 2019
FLOW CHART A flow Chart is a special type of a diagram that express the logistical sequence of actions or decisions.
Example # 3: Flow Chart Figure 5.2. Action taken by 17 Mothers whose breastfed children (6‐18 months old) had severe diarrhea. Severe Diarrhea
17 children
5 2 4 4 2 No action for a 1 Stopped Administered Consulted 1 Visited health Whole day breast‐feeding SSS Traditional centre
Healer 4 2 Local herbs 1 1 Recovered Died Recovered Recovered Recovered 2 1 4 3 6 Died 1 From the flow chart, we can see that different actions were taken by the 17 mothers who were interviewed. It is amazing that those children who were given salt‐sugar‐solution (SSS) four in total all recovered without any other form of treatment. Three mothers stopped breastfeeding their children, and one of these children died. The other two recovered after being taken to health center. Out of the four who consulted traditional healers, three recovered and one died. All the six mothers who visited the health center, their children recovered.
NARRATIVE TEXT An important part of the presentation of qualitative data will consist of narrative text. The reason why we first discussed graphic display of the findings in charts or figures is that researchers are tempted to go in all directions and lose themselves in details if they start writing straight away. Graphic display such as matrices, diagrams, flow charts and tables will help you stay on track and be as focused as possible. You may present them either in the text

135
LUSAKA APEX MEDICAL UNIVERSITY FACULTY OF PUBLIC HEALTH MPH RESEARCH METHODS, PROPOSAL DEVELOPMENT & SCIENTIFIC REPORT WRITING MODULE 5 2019
or in annexes, with relevant key statements of participants to support the main objective of the study, or variable explored.
5.8. CONFIRMING VALIDATION OF QUALITATIVE DATA
Review objectives and variables of the study to make sure that the research questions are answered.
Review process of the coding systems used and categorization of the responses obtained from the field notes.
Cross check findings obtained from other sources of information, such as key informants, men, or different FGDs performed to detect similarities in responses.
5.9. QUALITATIVE DATA REPORT WRITING Start with a description of the selection and composition of the groups of participants. Provide a commentary on the group process, so that the reader can assess the validity of the reported findings. Present findings according to list of topics and guided by the objectives of your interviews or discussions, just like in quantitative data approach. You must make use of tables or matrices, diagrams, flow charts (if applicable) to interpret data and make inferences or draw conclusions. Include quotations whenever possible, particularly key statements to validate your report. Provision of practical examples and exercises by students
5.10. SUMMARY The 5th module is mainly devoted to the understanding of behavioural research or simply qualitative research. We began by explaining the meaning of behavioural research and cultural research as the action research seeking to explore the behavior of individuals, through provision of in‐depth or insight information on the beliefs, opinion and solutions to the problems affecting people. We further explained to you that behavioural research has two purposes: First, is to aim at providing comprehensive description and interpretation of bio‐cultural interrelationships between human behavior in the past and present, and its relationship to health and disease levels. Second, is to enhance professional participation in programme development,

136
LUSAKA APEX MEDICAL UNIVERSITY FACULTY OF PUBLIC HEALTH MPH RESEARCH METHODS, PROPOSAL DEVELOPMENT & SCIENTIFIC REPORT WRITING MODULE 5 2019
implementation and evaluation to improve health, through greater understanding of the relationships between bio‐sociocultural phenomena and health, and through the changing of health behaviour in directions believed to promote better health. Other components of this Module are concerned with the methodological application of research in terms of‐ designs, sampling, methods of data collection and tools, analysis frameworks, with relevant examples, and the techniques of writing a qualitative research report including the various ways of ensuring data quality. We hope that you have grasped adequately the topics taught. If in doubt, revisit the notes provided in the module or consult your supervisor for clarification. We shall now move on to the next part of this module dealing with the steps involved in developing a research proposal and management described in Module 5.6.
5.11. PERFORMANCE EVALUATION: Practical Field Data Exercises Exercise: 5.1: Conducting a Focus Group Discussion (FGD) Attempt to conduct a focus group discussion for men or women on a topic applicable to your research problem you are developing, analyse and write a report using the guide given to you in this module on the techniques of how to conduct and analyse a FDG, including report writing Note: Submit in Two weeks after the end of this module
Additional Reading
1. Patton Micheal Quinn.2000. Qualitative Evaluation and Research Methods. Second edition, Sage Publication
2. Silverman, David (2004). Doing Qualitative Research: A Practical Handbook, 2nd Edition: Sage Publication
3. Robson Colin. 2002. Real World Research. Fourth edition, Blackwell 4. Walance Robett,B.,Kohatsu Neal. 2008. Public Health & Preventive medicine Fifteenth edition. McGrawHill Medical

137
LUSAKA APEX MEDICAL UNIVERSITY FACULTY OF PUBLIC HEALTH MPH RESEARCH METHODS, PROPOSAL DEVELOPMENT & SCIENTIFIC REPORT WRITING MODULE 5 2019
MODULE 5.6 RESEARCH PROPOSAL DEVELOPMENT & PROJECT MANAGEMENT
6.1. INTRODUCTION Module 5.6 introduces students to the process of developing a research proposal and how to manage the research project. It outlines the concept of the research proposal and the steps involved in developing a research proposal. Other components of this Module include the plan for the techniques of developing a work plan, budget and plan for project administration, monitoring and Utilization of results
6.2. OBJECTIVES
By the end this Module, you should be able to:
(1) Define a research proposal (2) Describe the various steps involved in developing a research proposal (3) Develop a scientific sound research proposal based on the knowledge and skills
acquired for amicable approval to yield empirical evidence (4) Describe the characteristics and purposes of various project planning and scheduling
techniques, such as work scheduling and Gantt Charting. (5) Determine the staff you need for the various tasks in your project and describe why
you need additional staff (research assistants, data collectors, data entry programmers, or supervisors), where you will recruit them, for how long a period you need them and how you will train and supervise them.
(6) Prepare a work schedule, Gantt chart and staffing plan for the project proposal you are developing
(7) Prepare a plan for administration, monitoring, dissemination and fostering the utilization of results for the project proposal being developed.
6.3. REFLECTION You may have been involved in developing a research proposal in one way or the other, try to reflect on your understanding of a research proposal on the following questions:
1. What is a research proposal? 2. What is the purpose of developing a research proposal?
Your answers may be thought to be wrong or correct, the following sections of this Unit will dwell more on the meaning of a research proposal, its purposes and the steps involved in the development of a research proposal and the management of your research project you will be developing.
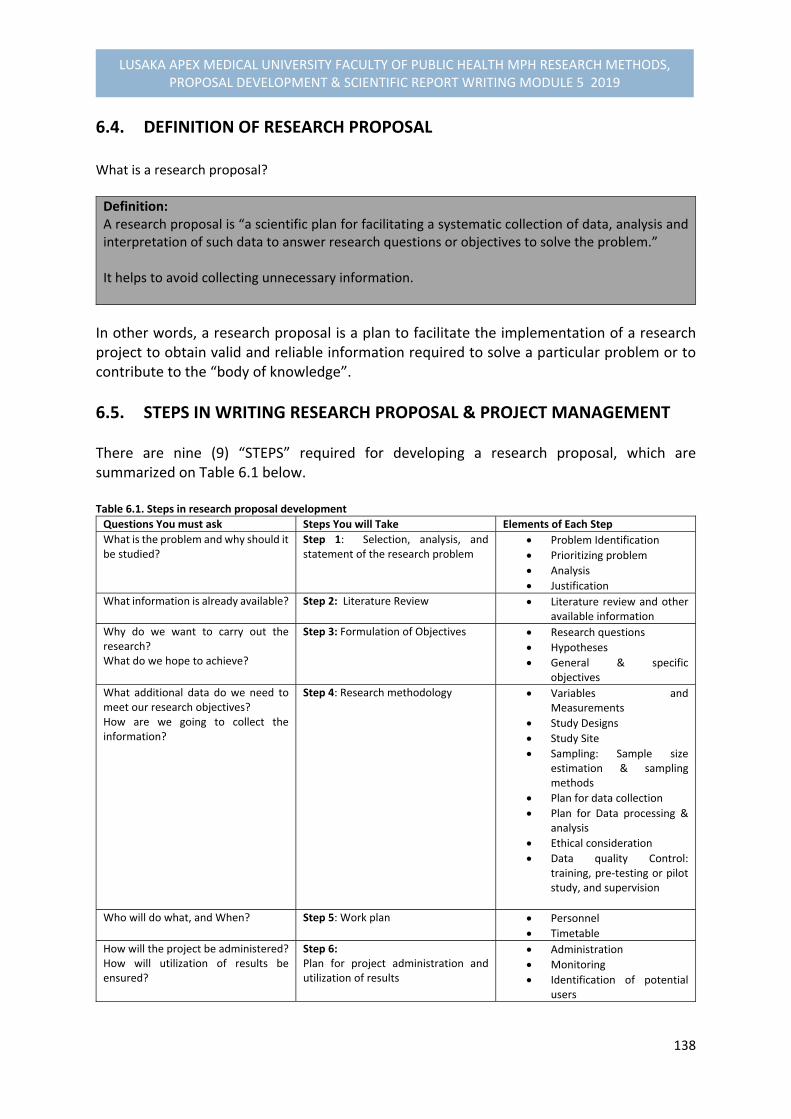
138
LUSAKA APEX MEDICAL UNIVERSITY FACULTY OF PUBLIC HEALTH MPH RESEARCH METHODS, PROPOSAL DEVELOPMENT & SCIENTIFIC REPORT WRITING MODULE 5 2019
6.4. DEFINITION OF RESEARCH PROPOSAL What is a research proposal?
Definition: A research proposal is “a scientific plan for facilitating a systematic collection of data, analysis and interpretation of such data to answer research questions or objectives to solve the problem.” It helps to avoid collecting unnecessary information.
In other words, a research proposal is a plan to facilitate the implementation of a research project to obtain valid and reliable information required to solve a particular problem or to contribute to the “body of knowledge”.
6.5. STEPS IN WRITING RESEARCH PROPOSAL & PROJECT MANAGEMENT
There are nine (9) “STEPS” required for developing a research proposal, which are summarized on Table 6.1 below. Table 6.1. Steps in research proposal development
Questions You must ask Steps You will Take Elements of Each Step
What is the problem and why should it be studied?
Step 1: Selection, analysis, and statement of the research problem
Problem Identification
Prioritizing problem
Analysis
Justification
What information is already available? Step 2: Literature Review Literature review and other available information
Why do we want to carry out the research? What do we hope to achieve?
Step 3: Formulation of Objectives Research questions
Hypotheses
General & specific objectives
What additional data do we need to meet our research objectives? How are we going to collect the information?
Step 4: Research methodology Variables and Measurements
Study Designs
Study Site
Sampling: Sample size estimation & sampling methods
Plan for data collection
Plan for Data processing & analysis
Ethical consideration
Data quality Control: training, pre‐testing or pilot study, and supervision
Who will do what, and When? Step 5: Work plan Personnel
Timetable
How will the project be administered? How will utilization of results be ensured?
Step 6: Plan for project administration and utilization of results
Administration
Monitoring
Identification of potential users

139
LUSAKA APEX MEDICAL UNIVERSITY FACULTY OF PUBLIC HEALTH MPH RESEARCH METHODS, PROPOSAL DEVELOPMENT & SCIENTIFIC REPORT WRITING MODULE 5 2019
What resources do we need to carry out the study? What resources do we have?
Step 7: Budget Material support and equipment
Money
How will we present our proposal to relevant authorities and potential funding agencies?
Step 8: Proposal summary One page summary include:
Problem statement
Main objective & Justification
Methodology
Project activities and Budget in request
How will the final research proposal be formatted and presented?
Step 9: Finalizing the research proposal
Table of Contents: Roman letters (i,ii.iii etc) for summaries & main body contents in numbers as page numbers
Step 1: Formulation of Statement of Research Problem & Justification This section is devoted to the process of formulating the “statement of the problem”, conceptualizing the problem in analysis framework to identify the various factors associated with the problem, which was covered earlier in Unit 3 of this module, and providing the justification why the problem should be investigated. The statement of the problem should be constructed in paragraph form as the first part of the research proposal development to answer a questions, “ what is the problem? Why should it be studied?” (Refer: Table 6.1 above). The description on how to formulate a statement of the problem including the conceptual framework of the problem analysis are detailed in Unit 3 page 42. A page and half is required for the statement of the problem, with relevant references.
Step 2: Literature Review In this step 2, requires 2‐3 pages for the theoretical review of the other available information, depending on the literature available for search. The purpose of the literature search is to provide a justification on why the problem is required for investigation to answer the question‐ “What information is already available for the problem being investigated?
Step 3: Formulation of the Research Questions, Hypotheses (if any) and Objectives The step 3 requires half a page for the research questions, hypotheses and objectives. The objectives should be developed into two forms – the “general objective” and the “specific objectives” as already discussed in Unit 3 to answer the questions: “Why do you want to carry out a research?” and “what do you want to achieve?”
140
LUSAKA APEX MEDICAL UNIVERSITY FACULTY OF PUBLIC HEALTH MPH RESEARCH METHODS, PROPOSAL DEVELOPMENT & SCIENTIFIC REPORT WRITING MODULE 5 2019
Step 4: Research Methodology Step 4 requires writing the sections of your methodology, in paragraph form, to be applied in your proposal as discussed in Unit 4 of this module as follows:
Conceptual Framework of Variables: This is the first part of the research methodology. It states the variables for measurements in your study in relation to your “specific objectives” already constructed, by constructing a table showing a distinction between the “dependent variable (s)” and the “independent variables” The table should constructed in such a way that it includes: variable type, operational definitions, indicators and the scale of measurements ( refer to Unit 4). Provide a narrative description of your variables below the table.
Study Design: State the design of your study and provide a description of your chosen design on how it will be applied in your study, e.g cross sectional descriptive study design, case‐control study design etc.
Study Setting and Study Population: Provide a description of your study sites‐ where are going to conduct your study and to whom are you going to collect information (Study population)? A map can be quite useful to show the distinct sites for your study, and to facilitate sampling. The study population should show the inclusion and the exclusion criteria of the population in the study.
Sampling: sampling has two components: the “Sample size calculation” and the “sampling methods or procedures.” Start with the sample size calculation by choosing an appropriate formula as taught (Refer to Unit 4), depending on your study design to be used. Then move on to another sub‐heading of sampling as “sampling methods” to describe the various sampling methods to be used to select the areas (e.g. provinces, districts, communities, schools or health facilities), households, and finally respondents of your choice. Remember that each stage of sampling may require a different method of sampling’. All these should be explained in the proposal.
Plan for Data collection Techniques or Methods and Tools: State and describe the data collection methods and tools to be applied in your study. Construct your questionnaires/tools and attach them in the annex.
Data Quality Control: Provide a description on ensuring quality control of your data in relation to: (a) Pre‐testing or pilot study; (d) training of research team or research assistants; and (c) Field editing of raw data to check for complete questionnaires that should be described in sub‐sections in your proposal. A page and half is sufficient for this section.
Plan for Data Processing and Analysis: Describe how you will process and analyse your data, e.g. by computer or manually. If by computer, state the statistical software to be
141
LUSAKA APEX MEDICAL UNIVERSITY FACULTY OF PUBLIC HEALTH MPH RESEARCH METHODS, PROPOSAL DEVELOPMENT & SCIENTIFIC REPORT WRITING MODULE 5 2019
used. There should be a preparation of a spread sheet for dada entry and coding of the questionnaire, including statements on the descriptive statistics and application of statistical tests required for association, and stating the variables for further analysis. Construct the “dummy Tables” (i.e. cross tabulation tables with empty cells) for presenting the variables that will require further statistical significant testing in your proposal.
Ethical Considerations: Require a description of ethical considerations to ensure adherence to research ethics of maintaining privacy, confidentiality and anonymity of data or information to be collected, and avoid violation of respondent’s rights and the benefits of that information to the respondents.
A research methodology in a proposal is required to answer questions pertaining to: “What additional data or information do we need to meet our research objectives?” and “How are we going to collect this information?”
Steps 5, 6, & 7: Research Project Management The three steps 5, 6, and 7 constitutes a research project management. The first statement in your proposal should state the period when the study will be required to start and completed, and by whom. This responds to the question: “Who will do what? and When?”
Work‐Plan, Administration and Utilization of Results In a work‐plan, you must provide a description of people in the proposal according to tasks and time frame that should be summarized on a Gantt Chart or chart. What is a Work Plan? A work plan is a schedule, chart or graph that summarizes various research components of a research project and how they fit together clearly. It includes:
1) The tasks to be performed. 2) When the tasks will be performed (timeframe); and 3) Who will perform the tasks and the time each person will spend on them
What is a work schedule? A work schedule is a table that summarizes the tasks to be performed in a research project, duration of each activity, and the personnel responsible.

142
LUSAKA APEX MEDICAL UNIVERSITY FACULTY OF PUBLIC HEALTH MPH RESEARCH METHODS, PROPOSAL DEVELOPMENT & SCIENTIFIC REPORT WRITING MODULE 5 2019
It includes:
1) Tasks to be performed 2) Dates each task should begin and be completed 3) Research team: principal researcher, research assistants, and support staff ( e.g.
drivers, typists, computer programmers, etc) assigned to task 4) Person‐days required by research team members, research assistants and support
staff (i.e. the number of person‐days equals to the number of working days per person).
The period for field‐ work for the research project should not exceed 6 months. Week 1 is the first week after completion of the training workshop or pretesting the methodology as required.
Example of work schedule: Construct a Table: Table 6.2: Field work schedule No. Tasks to be performed Dates Personnel assigned
to Task Person‐days to project
1. Finalize research proposal Week 1‐3: 4‐24 May, 2018
Principal Investigator
1x3= 21 days
2. Submission to ethical review Week 1‐4: 1st‐ 29th
June, 2018 Principal Investigator
1x4=29 days
3. Training of research team Week 2: 9‐13th July 2018
Research Team 1 ( workshop) x 5 days= 5days
What is a Gantt chart? A ‘Gantt chart’ is a planning tool which depicts graphically the order in which various tasks must be completed and the duration of each activity. It is a summary of activities. A Gantt chart should show:
1) Tasks to be performed 2) Who is responsible 3) The time each task is expected to take
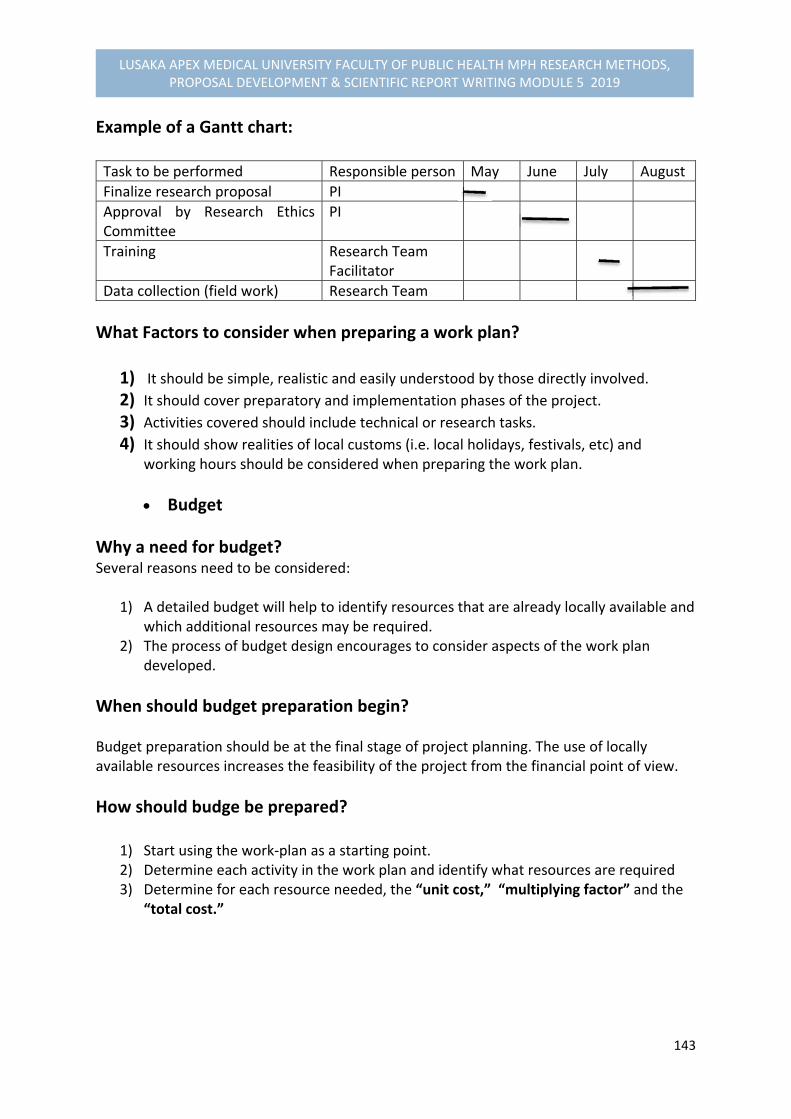
143
LUSAKA APEX MEDICAL UNIVERSITY FACULTY OF PUBLIC HEALTH MPH RESEARCH METHODS, PROPOSAL DEVELOPMENT & SCIENTIFIC REPORT WRITING MODULE 5 2019
Example of a Gantt chart: Task to be performed Responsible person May June July August
Finalize research proposal PI
Approval by Research Ethics Committee
PI
Training Research Team Facilitator
Data collection (field work) Research Team
What Factors to consider when preparing a work plan?
1) It should be simple, realistic and easily understood by those directly involved. 2) It should cover preparatory and implementation phases of the project. 3) Activities covered should include technical or research tasks. 4) It should show realities of local customs (i.e. local holidays, festivals, etc) and
working hours should be considered when preparing the work plan.
Budget
Why a need for budget? Several reasons need to be considered:
1) A detailed budget will help to identify resources that are already locally available and which additional resources may be required.
2) The process of budget design encourages to consider aspects of the work plan developed.
When should budget preparation begin? Budget preparation should be at the final stage of project planning. The use of locally available resources increases the feasibility of the project from the financial point of view.
How should budge be prepared?
1) Start using the work‐plan as a starting point. 2) Determine each activity in the work plan and identify what resources are required 3) Determine for each resource needed, the “unit cost,” “multiplying factor” and the
“total cost.”

144
LUSAKA APEX MEDICAL UNIVERSITY FACULTY OF PUBLIC HEALTH MPH RESEARCH METHODS, PROPOSAL DEVELOPMENT & SCIENTIFIC REPORT WRITING MODULE 5 2019
Example of a budget: Table 6.3: Budget
Budget Item Description Unit Cost Multiplying factor Total cost ( ZK)
Interviewers ZK 500 ( total cost per single item)
5x5 ( number of working days x person days)= 25 days
12,500
Training ZK250 5x 6= 30 days 7,500
Data collection, etc ZK 540 6x10days=60 32,400
Grand Total 52,400
Budget should indicate what resources do you to carry out the study? What resources do you have? The need to consider material support, equipment and money are vital components for the implementation of a research project. Provide a justification for the budget proposed.
Steps 8 & 9: Finalizing a Research Proposal In the final development of a research proposal, the following elements must be considered:
Project summary Provide a one page proposal summary stating: the problem statement or rational in brief, the main objective or purpose of study, methodology in brief, the significant of results, timeframe and where the study will be conducted, and lastly the budget in request.
Table of Contents The table of contents requires the content sections and sub‐sections and page numbers. Page numbers are in two forms: (a) in roman letter page numbers (i. ii, iii, etc) that include‐ summary, table of contents, list of tables, list of figures, acronyms /abbreviations, etc. (b) the second form of page numbering is in “numbers”, which starts at “introduction as page 1” and continues up the end of the document.
List of Tables & Figures This is required on a separate page (s) depending on the number of tables and figures included in the project proposal. It should be constructed as in the table of contents indicating‐ table or figure number followed by the description of the title and page number of that table in the document.
Acronyms or Abbreviations Abbreviations used in the document should also be on a separate page and page number in roman letters.

145
LUSAKA APEX MEDICAL UNIVERSITY FACULTY OF PUBLIC HEALTH MPH RESEARCH METHODS, PROPOSAL DEVELOPMENT & SCIENTIFIC REPORT WRITING MODULE 5 2019
Cover page Cover page is the final product of the research proposal. It should include: Title of study, principal investigator‐ by name and position. Supervisors (if any) by name and position, “month” and “year” that should be centred at the bottom of the cover page to indicate when the project
proposal was completed..
Reference list and Annexes The references or the reference list should be placed at the end of the document before annexes. The reference system should follow the style of citation in the text. If numbers were used, then the reference list should be in numbers and authors not in alphabetical order. If authors have been cited in all the way throughout the whole document, then the references should be in alphabetical order form, starting with surname followed by initials. All primary and subsequent authors should be reflected in the references. All academic students must follow the Harvard academic reference system of aligning to alphabetical style and making prominence of primary authors in the references (see examples in the annex). Annexes are discarded items (e.g. tables, figures, etc) not included in the main documents and can be referred to as annexes, placed at the end of the document after the references.
6.6. SUMMARY In this module, we elaborated on understanding the concept of a research proposal by first defining the meaning of a research proposal and the steps involved in developing a research project for a scientific empirical evidence. The various steps were guided by series of questions at each step to facilitate the level of component development for each proposal stage. We discussed that there were nine (9) steps described that are required for the complete development of a research proposal (see Table 6.1, page 156), starting with the problem statement formulation and ending with finalizing the project proposal. The elements for finalizing the proposal involved construction of a project summary, table of contents, list of tables and figures, acronyms or abbreviation, cover page and references and annexes where pages should be reflected as roman letters appearing at the beginning of the document and in the table of contents, except for references and annexes showing numbers as pages. Other aspects discussed were concerned with the project management involving timeframe and research team to be involved in the project and the role of yourself as the principal investigator in the project, alongside the process on the entire administration of the project. The process on how to construct a work plan involving the use of a Gantt chart and a schedule that included the various activities that should be reflected in a work plan were described. The final process of the project management was the budget that was also constructed and justified, and to be reflected in the project proposal. For further comments on the process of proposal development, contact your supervisor for guidance.

146
LUSAKA APEX MEDICAL UNIVERSITY FACULTY OF PUBLIC HEALTH MPH RESEARCH METHODS, PROPOSAL DEVELOPMENT & SCIENTIFIC REPORT WRITING MODULE 5 2019
6.7. Performance Evaluation Exercise Exercise: Drafting of research proposal: Start drafting your research proposal by applying the various steps described in this module. Seek guidance for draft submission from your supervisor.
Additional Readings
1. Chava Frankfort‐Nachmias & David Nachmias (2008). Research Methods in the Social
Science, 7th Edition, ISBN: 13: 978‐0‐7167‐5510‐0
2. Varkevisser,C.M., Pathmanathan,I., Brownlee, A. (1991). Designing and Conducting
Health Systems Research Projects: Proposal Development and Field Works: Health
Systems Research Training Series, ISBN: 0‐88936‐585‐7
3. Bailey Kenneth,D (1994). Methods of Social Research, 4th Edition, NY. Free Press
4. Bimbaum, Michael H (2001). Introduction to Behavioural Research on the Internet.
Upper Saddle River, NJ: Prentice‐Hall
5. Oppenheim A.N (1966). Questionnaire Design and Attitudinal Measurements, 1st
edition, Gower: 293 pages
Recommended Readings
1. Dochartaigh, Niall R (2001). The Internet Research Handbook: A Practical Guide for
Students and Researchers in the Social Sciences. Thousand Oak, CA: Sage Publication
2. Hansen, Hans V., and Robert E. Pinto, eds. (1995). Fallacies: Classical and
Contemporary Readings. University Park, PA: Benn State Press
3. Hart, Chris (1998). Doing Literature Review: Releasing the Social Science Research
Imagination, London: Sage Publication
4. Betty R. Kirkwood and Johnathan A.C. Sterne (2003). Essential Medical Statistics, 2nd
edition. Blackwell Science: 502 pages
5. Alan Bryman & Duncan Cramer. (2005). Quantitative Data Analysis with SPSS 12 and
13: A Guide for Social Scientists
147
LUSAKA APEX MEDICAL UNIVERSITY FACULTY OF PUBLIC HEALTH MPH RESEARCH METHODS, PROPOSAL DEVELOPMENT & SCIENTIFIC REPORT WRITING MODULE 5 2019
MODULE 5.7 QUANTITATIVE DATA ANALYSIS & INTERPRETATION
7.1 INTRODUCTION
Module 5.7 introduces you to the basic understanding of quantitative and qualitative data analysis application to your preferred computer software packages for statistical analysis that you have learnt for analysing data expected from your research project. The common statistical software packages applicable for health and social sciences alike are: Microsoft Excel, STATA, MINITAB, SAS, SPSS and NCSS (Daniel 2010; Sirkin 1999) for biostatistics applicable to health sciences, and Quantitative Data Analysis with SPSS 12 and 13 window Versions (Alan Bryman et al. 2005) for social sciences are useful tools for analysis. Analytical contents of this Module involves the application of quantitative data analysis and interpretation, while the qualitative analysis has already been dealt with in the previous Module 4.5. The components of this module will involve learning: (a) steps involved in quantitative data analysis; (b) Techniques of data processing and preparation of data for analysis; (c) description of variables and application of descriptive statistical analysis (i.e. Frequency distributions, means, figures, cross‐tabulations in relation to objectives, graphic displays and choosing significant tests); (d) Analysis of paired and unpaired observations for differences between groups, and measure associations between variables ( by applying basic elements of Paired t‐test, Chi‐square test, McNemar’s chi‐square test, Scatter diagram, Regression line and correlation coefficient, Relative risk and odds ratio . The aim is to develop a better understanding on the techniques of analysing and interpretation of quantitative data to be applied in your research project and serves as a pre‐requisite for the advanced bio‐statistics course module to be taught.
7.2 OBJECTIVES At the end of this module, you should be able to:
(1) Demonstrate the ability of understanding the steps involved in quantitative data analysis
(2) Identify and define the basic concepts and procedures required for data analysis and interpretation.
(3) Describe variables for descriptive analysis and determine the type of statistical analysis required.
(4) Analyse, interpret data and draw conclusions related to the objectives of your study (5) Analyse paired and unpaired observations for determining differences between
groups. (6) Determine and measure associations between variables
7.3. REFLECTION Pose for a little while and reflect on the following questions:
1. Define one or two basic techniques required for data analysis? 2. What are the basic steps involved in analysing data?
148
LUSAKA APEX MEDICAL UNIVERSITY FACULTY OF PUBLIC HEALTH MPH RESEARCH METHODS, PROPOSAL DEVELOPMENT & SCIENTIFIC REPORT WRITING MODULE 5 2019
While you are still reflecting on the questions, we will begin by providing an understanding of some basic concepts of statistical analysis which will be followed by steps and techniques to be considered in analysing data.
7.4. BASIC CONCEPTS OF STATISTICAL ANALYSIS It should be realized that statistics has its own vocabulary. Some of the words and phrases encountered in statistics will be new to those not previously exposed to the subject. Other terms may have specialized meanings that are different from the meanings that we are accustomed to associating with these terms. The following are some terms that may be useful to you when analysing your data:
Data The raw material of statistics is data. For our purposes, we may define data as numbers. The two kinds of numbers that we are in statistics are numbers that result from the taking of a measurement, and those that result from the process of counting. For example, when a nurse weighs a patient or takes a patient’s temperature, a measurement, consisting of a number such as 150 pounds or 100 degrees Fahrenheit, is obtained. In a different example, quite a different type of number is obtained when a hospital administrator counts the number of patients – perhaps 20‐ discharged from the hospital on a given day. Each of the three numbers is a datum, and the three together are data.
Statistics The meaning of statistics has implicit explanations. More concretely, we may say that statistics is a field of study concerned with (1) the collection, organization, summarization and analysis of data; and (2) the drawing of inferences about a body of data when only a part of the data is observed (Daniel 2010). The person who performs these statistical activities must be prepared to interpret and communicate the results to someone else as the situation demands. Simply we say that data are numbers, numbers contain information, and the purpose of statistics is‐ to investigate and evaluate the nature and meaning of information.
Sources of Data The performance of statistical activities is motivated by the need to answer a question. For example, clinicians may want answers to questions regarding the relative merits of competing treatment procedures. Administrators may want answers to questions regarding such areas of concern as employee morale or facility utilization. When we determine that the appropriate approach to seeking an answer to a question will require the use of statistics, we begin to search for suitable data to serve as the raw material for our investigation. Such data are usually available from different sources as outlined in the following:

149
LUSAKA APEX MEDICAL UNIVERSITY FACULTY OF PUBLIC HEALTH MPH RESEARCH METHODS, PROPOSAL DEVELOPMENT & SCIENTIFIC REPORT WRITING MODULE 5 2019
Routinely kept records‐ Hospital medical records, for example, contain immense amount of information on patients, while hospital accounting records contain a wealth of data on the facility’s business activities. When the need for data arises, we should look for them first among the routinely kept records.
Surveys‐ If the data needed to answer a question are not available from the routinely kept records, the logical source may be a survey. For example, suppose the administrator of a clinic wishes to obtain information on mode of transportation used by patients to visit the clinic. If admission forms do not contain a question on mode of transportation, we may conduct a survey among patients to obtain such information.
Experiments‐ Frequently the data needed to answer a question are available only as the result of an experiment. For example, a nurse may wish to know which of several strategies is best for maximizing patient compliance. The nurse might conduct an experiment in which the different strategies of motivating compliance are tried with different patients. Subsequent evaluation of the response to the different strategies might enable the nurse to decide which is most effective.
External sources‐ The data needed to answer a question may already exist in the form of published reports, commercially available data banks, or the research literature. In other words, we may find that someone else has already asked the same question, and the answer obtained may be applicable to our present situation.
Biostatistics The tools of statistics are employed in many fields‐ business, education, psychology, agriculture, economics, and so on. When the data analysed are derived from the biological sciences and medicine, a term biostatistics is used to distinguish this particular application of statistical tools and concepts.
Variables If we observe a characteristic, we find that it takes on different values in different persons, places, or things, we then label this characteristic as variable. We do this for the simple reason that the characteristic is not the same when observed in different possessors of it. Some examples of variables include diastolic blood pressure, heart rate, height of adult patients, weights of children, ages of patients, education, residence, and so on.
Quantitative Variables A quantitative variable – is one that can be measured in usual sense. Examples are: measurements on heights of adult patients, weights and ages. Measurements made on quantitative variables convey information regarding amount.

150
LUSAKA APEX MEDICAL UNIVERSITY FACULTY OF PUBLIC HEALTH MPH RESEARCH METHODS, PROPOSAL DEVELOPMENT & SCIENTIFIC REPORT WRITING MODULE 5 2019
Qualitative Variables A qualitative variable‐ is a characteristic involving a measurement that consists of categorizing. For example, religion, ethnicity/ethic group, education status, a person, place or object. We can count the number of persons, places or other characteristics to various categories. These counts or frequencies as they are called, are numbers that we manipulate when our analysis involves qualitative variables.
Random Variable Whenever we determine the height, weight, or age of an individual, the result is frequently referred to as a value of the respective variable. When the values obtained arise as a result chance factors, so that they cannot be exactly predicted in advance, the variable is called a random variable. Example of a random variable is “height.” When a child is born, we cannot predict exactly his or her height at maturity. Attained adult height is the result of numerous genetic and environmental factors. Values generating from measurement procedures are often referred to as observations or measurements.
Discrete Random Variable Variables may be characterized further as to whether they are discrete or continuous. A discrete variable is characterized by gaps or interruptions in the values that it can assume. These gaps or interruptions indicate that absence of values between particular values that the variable can assume. For example, the number of daily admissions to a general hospital is a discrete random variable since the number of admissions each day must be represented by the whole number, such as 0, 1, 2, or 3.
Continuous Random Variable A continuous random variable does not possess the gaps or interruptions characteristic of a discrete random variable. Examples of continuous random variables are: height, weight, and skull circumference.
Population A population consist of humans, animals, machines, places, or cells. A population is defined as a population of entities as the largest collection of entities for which we have an interest at a particular time.
Sample A sample may be defined as a part of a population. Suppose our population consists of the weights of all the primary school children enrolled in a certain school. If we collect for analysis

151
LUSAKA APEX MEDICAL UNIVERSITY FACULTY OF PUBLIC HEALTH MPH RESEARCH METHODS, PROPOSAL DEVELOPMENT & SCIENTIFIC REPORT WRITING MODULE 5 2019
the weights of only a fraction of these children, we have only a part of our population of weights, that is, we have a sample.
Statistical Inference Statistical inference – is the procedure by which we reach a conclusion about a population on the basis of the information contained in a sample that has been drawn from that population.
Measurement Scales You may recall that in the previous Unit 4 of the Methodology we used the word measurement to describe how the variables will be measured by operationalising indicators to include the scales of measurement. Measurement scales result in the categorization of the measurements according to their nature. In understanding the complexity of these terms, we will begin by defining the measurement and the four resulting measurement scales on how they are used in statistics.
Measurement‐ This is defined as the assignment of numbers to objects or events according
to a set of rules.
The Nominal scale‐ The lowest measurement scale is the nominal scale. As the name
implies it consists of “naming” observations or classifying them into mutually exclusively and collectively exhaustive categories. Examples of such dichotomies are, male – female; well‐ sick, Under 65 years of age – 65 and over, child – adult, and married‐ not married, which will produce dichotomies of nominal data.
The Ordinal scale– Whenever observations are not only different from category to
category, but can be ranked according to some criterion by assigning numbers, they are said to be measured on an ordinal scale. For example, patients may be characterised as “unimproved”, “improved,” and “much improved.” Socio‐economic status as “low,” “medium,” and “high.” The function of numbers assigned to ordinal data is to order (or rank) the observations from the lowest to the highest and hence, the term ordinal.
The Interval scale‐ The interval scale is a more sophisticated scale then the nominal or
ordinal in that with this scale not only is it possible to order measurements, but also the distance between any two measurements is known. For example, the difference between a measurement of 20 and a measurement of 30 is equal to the difference between measurements of 30 and 40. The ability to do this implies the use of a unit distance and a zero point, both of which are arbitrary. The selected zero point is not necessarily a true zero in that it does not have to indicate a total absence of the quantity being measured. The best example of an interval scale is the temperature measured in degrees, Fahrenheit or Celsius. The unit of measurement is the degree, and the point of comparison is the arbitrarily chosen “zero degrees,” which does not indicate a lack of heat. The interval scale unlike the nominal or ordinal scales is truly quantitative scale.
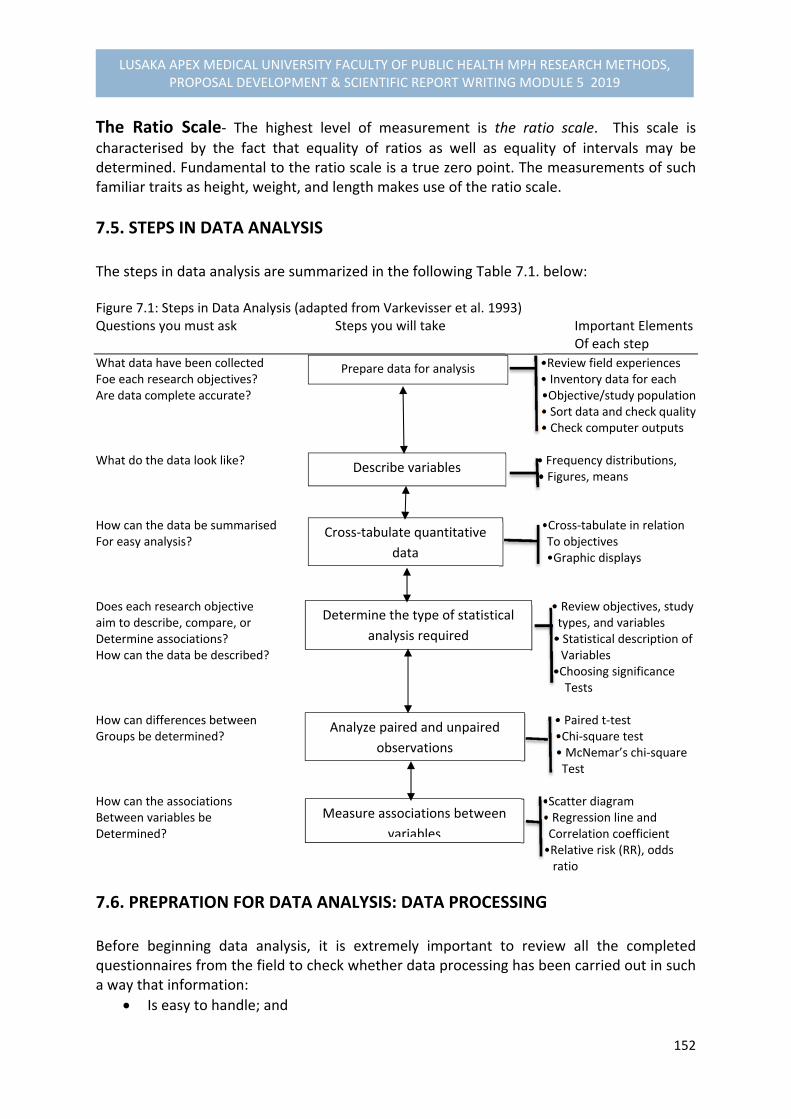
152
LUSAKA APEX MEDICAL UNIVERSITY FACULTY OF PUBLIC HEALTH MPH RESEARCH METHODS, PROPOSAL DEVELOPMENT & SCIENTIFIC REPORT WRITING MODULE 5 2019
The Ratio Scale‐ The highest level of measurement is the ratio scale. This scale is
characterised by the fact that equality of ratios as well as equality of intervals may be determined. Fundamental to the ratio scale is a true zero point. The measurements of such familiar traits as height, weight, and length makes use of the ratio scale.
7.5. STEPS IN DATA ANALYSIS The steps in data analysis are summarized in the following Table 7.1. below: Figure 7.1: Steps in Data Analysis (adapted from Varkevisser et al. 1993) Questions you must ask Steps you will take Important Elements Of each step
What data have been collected •Review field experiences Foe each research objectives? • Inventory data for each Are data complete accurate? •Objective/study population • Sort data and check quality • Check computer outputs What do the data look like? • Frequency distributions, • Figures, means How can the data be summarised •Cross‐tabulate in relation For easy analysis? To objectives •Graphic displays Does each research objective • Review objectives, study aim to describe, compare, or types, and variables Determine associations? • Statistical description of How can the data be described? Variables •Choosing significance Tests How can differences between • Paired t‐test Groups be determined? •Chi‐square test • McNemar’s chi‐square Test How can the associations •Scatter diagram Between variables be • Regression line and Determined? Correlation coefficient •Relative risk (RR), odds ratio
7.6. PREPRATION FOR DATA ANALYSIS: DATA PROCESSING Before beginning data analysis, it is extremely important to review all the completed questionnaires from the field to check whether data processing has been carried out in such a way that information:
Is easy to handle; and
Prepare data for analysis
Describe variables
Cross‐tabulate quantitative
data
Determine the type of statistical
analysis required
Analyze paired and unpaired
observations
Measure associations between
variables

153
LUSAKA APEX MEDICAL UNIVERSITY FACULTY OF PUBLIC HEALTH MPH RESEARCH METHODS, PROPOSAL DEVELOPMENT & SCIENTIFIC REPORT WRITING MODULE 5 2019
Has been checked for mistakes that may have incurred during data collection. To check for such mistakes in your data, you need to ask yourself the following questions:
Have the data been sorted appropriately? Have questionnaires and checklists been numbered in the most convenient way? Can major categories of information be clearly distinguished to facilitate comparison on relevant variables, as required by your research objectives?
Have quality checks been performed on all data for completeness and consistency of information?
Have all data master sheets been filled in with your quantitative data, or if you are using a computer, have all data been entered? Do the total number of responses match the total number of respondents for each variable?
Have all qualitative data been categorized as far as possible? If applicable, has coding been completed? Note that for qualitative data the collection, ordering, summarizing and analysis are, in principle, intertwined, and dealt with in detail already in Module Unit 5.
If you used a computer to process your data, check the frequency counts for each variables in the questionnaire. Also check the computer cross‐tabulations. Details on how to do this are given in Annex 7.1
Before reviewing the data processing procedures, it is strongly advised that you make an INVENTORY of all data available for each OBJECTIVE. This is important if the data required have been collected using different collection tools. For example: Data sources for Objective 3: “Detection of weaknesses in the functioning of MCH services, explaining low utilization of delivery care.”
Questionnaire for mothers, Questions 12, 15‐19, 23
Focus group discussion with health staff, topics 3 & 4
Observations included in checklists Such an inventory will help you to organize data analysis better and, later, report writing.
7.7. DATA ANALYSIS & GUIDING PRINCIPLES When beginning data analysis, we should consider which of our data are QUANTITATIVE and which ones are QUALITATIVE.

154
LUSAKA APEX MEDICAL UNIVERSITY FACULTY OF PUBLIC HEALTH MPH RESEARCH METHODS, PROPOSAL DEVELOPMENT & SCIENTIFIC REPORT WRITING MODULE 5 2019
7.7.1. QUANTITATIVE DATA Quantitative data are expressed in numbers and they are usually presented in FREQUENCY TABLES. From your data master sheets you can easily derive totals for each variable/question, count the number of different answers obtained, and present the information in a frequency table (Annex 7.2). When analysing quantitative data, it is important to reconsider the aim of your study. Is it to:
Describe variables? For example: the distribution of teenage pregnancies in a certain population
Look for differences between groups?
For example: Differences between old settlers and newcomers in a certain area, with respect to income or health status.
Determine associations between variables?
For example: the association between work satisfaction of nurses and the number of staff meetings over the past year.
Cross‐tabulations are the appropriate tool to summarize and analyse the data (Annex 7.3) After frequency distributions and different types of cross‐tabulations have been made, the type of statistical analysis required has to be determined. This includes further description of variables (Annex 7.4.) and selection of appropriate significance tests (Annex 7.5). The most common significance tests are:
Student’s t‐test and the chi‐square test to determine differences between groups if observations are unpaired (Annex 7.6).
The paired t‐test and McNemar’s chi‐square test to determine differences between groups for paired observations (Annex 7.7).
For measuring associations between variables the concepts of regression and correlation (Annex 7.8) and oddis ratio (Annex 7.8) are introduced. Throughout the process of data analysis, it is important to keep in mind that your findings should provide answers to your research questions, thereby meeting your research

155
LUSAKA APEX MEDICAL UNIVERSITY FACULTY OF PUBLIC HEALTH MPH RESEARCH METHODS, PROPOSAL DEVELOPMENT & SCIENTIFIC REPORT WRITING MODULE 5 2019
objectives. You will be expected eventually want to draw conclusions and make recommendations for action, based on your findings.
7.7.2. QUALITAIVE DATA In our previous discussion, you may remember that qualitative data are obtained through:
Open‐ended questions, not pre‐categorized, in questionnaires with predominantly quantifiable data;
Loosely structured interviews (in‐depth interviews) with open‐ended questions directed at key informants (individuals or groups);
Focus group discussions on selected issues, with lists of points to guide the discussions; and
Observations to describe individual or group behaviour. The answers to open‐ended questions may be:
Listed
Categorized (based on your research objectives and common sense, combining the answers that belong together in some 4 to 6 categories);
Labelled or coded;
Inserted, using these codes, in your master sheets, or in the computer; and
Counted, like other quantitative data.
If you are also interested in the CONTENT of each individual answer, for example because you want to start an anti‐smoking campaign in which you will address different categories of smokers, you will further analyse the content of the answers for each category. The major characteristic of analysis of qualitative data is that we analyse them in WORDS, rather than in numbers. Usually, it is useful to summarize qualitative data in diagrams, flow‐charts, or matrices (tables) which help us in our analysis. Module 5.5 has already dealt with the analysis of qualitative data in more details.

156
LUSAKA APEX MEDICAL UNIVERSITY FACULTY OF PUBLIC HEALTH MPH RESEARCH METHODS, PROPOSAL DEVELOPMENT & SCIENTIFIC REPORT WRITING MODULE 5 2019
7.7.3. COMPUTER OUTPUT What is printed out (as hard copy) by the computer is the result of the commands used in the programs to analyse the available data. The accuracy of the information printed out is therefore dependent on:
The data that were entered, and
The programs that were used The saying, “garbage in, garbage out” is very apt for computer processing. It is the responsibility of the investigator to ensure that the information printed out is accurate.
TYPES OF COMPUTER PRINTOUT
1) Lists of Data This is a list of data that were entered into the computer. This printout is helpful if you need to make corrections to the existing data while in the process of validating it.
2) Frequency Count This gives a count (and percentage or relative count) of each variable in the questionnaire. To ensure that the programs are correct, the investigator must be familiar with the format or questionnaire used and the process of data collection. Developing a FLOW‐CHART of the process with pertinent questions and counts of the variables incorporated would help the investigator to check the accuracy of the programs For example:
All study cases (3306 cases)
Was stay in hospital appropriate?
Yes No Don’t Know (1937 cases) (1369 cases) (0 Cases) Was Admission appropriate? Yes No Don’t know (634 Cases) (719 cases) (16 cases)
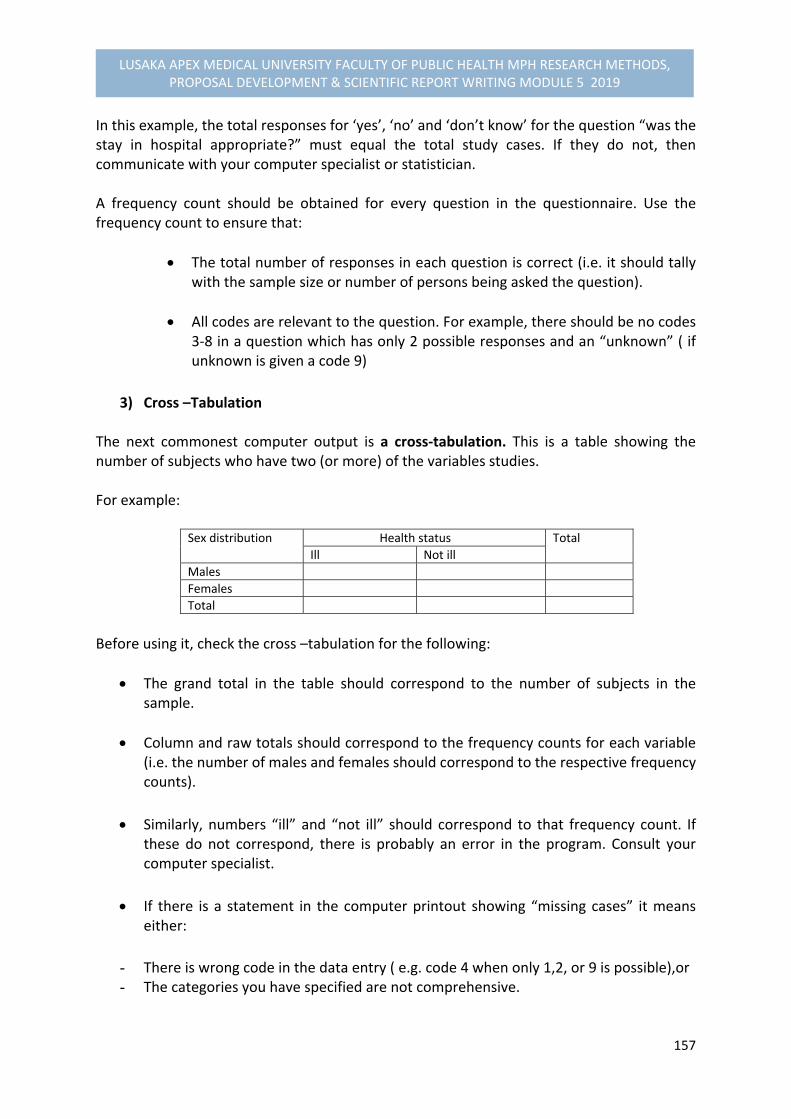
157
LUSAKA APEX MEDICAL UNIVERSITY FACULTY OF PUBLIC HEALTH MPH RESEARCH METHODS, PROPOSAL DEVELOPMENT & SCIENTIFIC REPORT WRITING MODULE 5 2019
In this example, the total responses for ‘yes’, ‘no’ and ‘don’t know’ for the question “was the stay in hospital appropriate?” must equal the total study cases. If they do not, then communicate with your computer specialist or statistician. A frequency count should be obtained for every question in the questionnaire. Use the frequency count to ensure that:
The total number of responses in each question is correct (i.e. it should tally with the sample size or number of persons being asked the question).
All codes are relevant to the question. For example, there should be no codes 3‐8 in a question which has only 2 possible responses and an “unknown” ( if unknown is given a code 9)
3) Cross –Tabulation The next commonest computer output is a cross‐tabulation. This is a table showing the number of subjects who have two (or more) of the variables studies. For example:
Sex distribution Health status Total
Ill Not ill
Males
Females
Total
Before using it, check the cross –tabulation for the following:
The grand total in the table should correspond to the number of subjects in the sample.
Column and raw totals should correspond to the frequency counts for each variable (i.e. the number of males and females should correspond to the respective frequency counts).
Similarly, numbers “ill” and “not ill” should correspond to that frequency count. If these do not correspond, there is probably an error in the program. Consult your computer specialist.
If there is a statement in the computer printout showing “missing cases” it means either:
- There is wrong code in the data entry ( e.g. code 4 when only 1,2, or 9 is possible),or - The categories you have specified are not comprehensive.
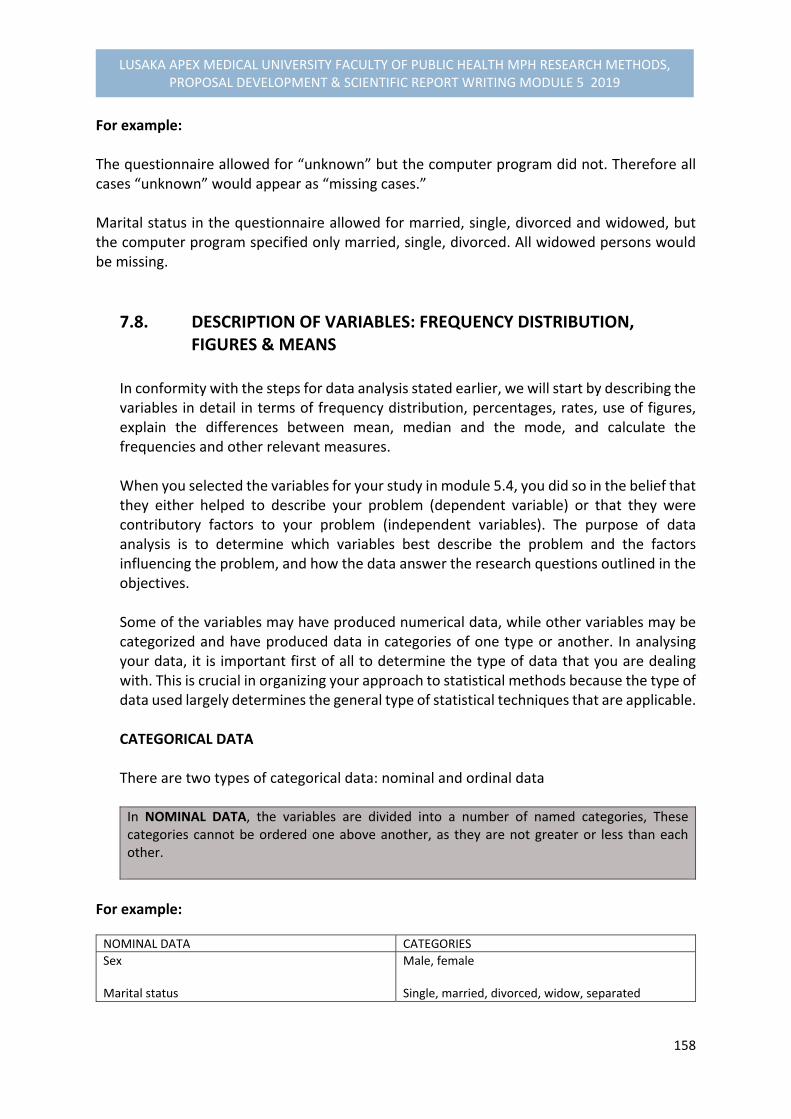
158
LUSAKA APEX MEDICAL UNIVERSITY FACULTY OF PUBLIC HEALTH MPH RESEARCH METHODS, PROPOSAL DEVELOPMENT & SCIENTIFIC REPORT WRITING MODULE 5 2019
For example: The questionnaire allowed for “unknown” but the computer program did not. Therefore all cases “unknown” would appear as “missing cases.” Marital status in the questionnaire allowed for married, single, divorced and widowed, but the computer program specified only married, single, divorced. All widowed persons would be missing.
7.8. DESCRIPTION OF VARIABLES: FREQUENCY DISTRIBUTION, FIGURES & MEANS In conformity with the steps for data analysis stated earlier, we will start by describing the variables in detail in terms of frequency distribution, percentages, rates, use of figures, explain the differences between mean, median and the mode, and calculate the frequencies and other relevant measures. When you selected the variables for your study in module 5.4, you did so in the belief that they either helped to describe your problem (dependent variable) or that they were contributory factors to your problem (independent variables). The purpose of data analysis is to determine which variables best describe the problem and the factors influencing the problem, and how the data answer the research questions outlined in the objectives. Some of the variables may have produced numerical data, while other variables may be categorized and have produced data in categories of one type or another. In analysing your data, it is important first of all to determine the type of data that you are dealing with. This is crucial in organizing your approach to statistical methods because the type of data used largely determines the general type of statistical techniques that are applicable. CATEGORICAL DATA There are two types of categorical data: nominal and ordinal data In NOMINAL DATA, the variables are divided into a number of named categories, These categories cannot be ordered one above another, as they are not greater or less than each other.
For example:
NOMINAL DATA CATEGORIES
Sex Marital status
Male, female Single, married, divorced, widow, separated

159
LUSAKA APEX MEDICAL UNIVERSITY FACULTY OF PUBLIC HEALTH MPH RESEARCH METHODS, PROPOSAL DEVELOPMENT & SCIENTIFIC REPORT WRITING MODULE 5 2019
In ORDINAL DATA, the variables are also divided into a number of categories, but they can be ordered one above another, from lowest to highest or vice versa
For example: ORDINAL DATA CATEGORIES
Level of knowledge Opinion on a statement
Good, average, poor Fully agree, agree, disagree, totally disagree
NUMERICAL DATA We speak of NUMERICAL DATA if they are expressed in numbers
Some numerical variables are essentially discrete, such as numbers of motor accidents, or prices of eggs. The possible values take only a distinct series of numbers. In reality, all numerical data are discrete as recorded, since we round for simplicity. For example:
Height to the nearest centimetre or inch
Temperature in degrees Celsius
Age to the last birthday Numerical data can be examined through:
Frequency distributions
Percentages, proportions, ratios, and rates
Figures
Measures of central tendency We will now discuss these operations one after each other for both categories and numerical data.
7.8.1. FREQUENCY DISTRIBUTIONS A FREQUENCY DISTRIBUTION is a description of data presented in tabular form so that the data will be more manageable. It gives the frequency with which (or the number of times) a particular value appears in the data,

160
LUSAKA APEX MEDICAL UNIVERSITY FACULTY OF PUBLIC HEALTH MPH RESEARCH METHODS, PROPOSAL DEVELOPMENT & SCIENTIFIC REPORT WRITING MODULE 5 2019
In your research project you will have already done straight frequency counts for all variables on the basis of the data master sheets or computer entries by counting the number of responses in each category. We will now briefly summarize some important points.
CATEGORICAL data may have very simple categories. Example 1: To check the accuracy of the clinical diagnosis of malaria, blood slides from 33 patients were examined for malaria parasites. These were: 1. Negative, 2. P. falciparum, and 3. P. vivax. The results are presented in the following frequency distribution: Negative 19 P. falciparum 13 P. vivax 1 TOTAL 33 These data are NOMINAL. A frequency distribution is calculated by simply totalling the number of responses in each category. By looking at the frequency distribution you can conclude that more than half of the patients with clinical diagnosis of malaria actually do not have malaria. Another observation would be that P. falciparum is much more common than P. vivax Example 2: Health personnel from 148 different rural health institutions were asked the following question: “How often have you run out of drugs for the treatment of malaria in the past two years?” This was a closed question with the following possible answers: Never, 1 to 2 times (rarely), 3 to 5 times (occasionally), more than 5 times (frequency). The numbers of responses in each category were totalled to give the following frequency distribution: Never 47 Rarely 71 Occasionally 24 Frequently 6 TOTAL 148 In this example, the data are ORDINAL. The ordering of the categories is important as each category from the top to bottom indicates increasing severity of the problem.

161
LUSAKA APEX MEDICAL UNIVERSITY FACULTY OF PUBLIC HEALTH MPH RESEARCH METHODS, PROPOSAL DEVELOPMENT & SCIENTIFIC REPORT WRITING MODULE 5 2019
The frequency distribution indicates that most clinics either do not or rarely experience shortages of antimalarial drugs, but that it is an occasional problem in about a sixth of the clinics and a severe problem in a few.
In NUMERICAL DATA, procedures for making frequency distributions are very similar to those of for category data, except that now the data have to be grouped in categories. The steps involved in making a frequency distribution are as follows:
1. Select groups for grouping the data 2. Count the number of measurements in each group 3. Add up and check the results
When grouping data, the way the groups are selected can affect what the results are going to look like. Example 3: Numbers of malaria cases are being submitted daily by health centres of District X and you wish to summarize them. Compare the following daily and weekly summaries of the same data: Table 7.1. Daily and weekly summaries of malaria cases in health centres in District X, 2019
Day 1 9 cases Day 2 12 Day 3 11 Day 4 13 Day 5 14 Day 6 13 Day 7 16
Week 1 88 cases
Day 8 16 cases Day 9 16 Day 10 18 Day 11 19 Day 12 16 Day 13 21 Day 14 25
Week 2 131 cases
Day 15 28 cases Day 16 28 Day 17 28 Day 18 32 Day 19 21 Day 20 19 Day 21 12
Week 3 168 cases
Both the daily and weekly summaries show an increasing number of malaria cases. If we present only the weekly data, the improving situation shown on days 19, 20 and 21 will not be reflected. It would, therefore, be better to present the daily data, if you want exactly when the number of reported malaria cases is going down. When grouping data the following rules are important:

162
LUSAKA APEX MEDICAL UNIVERSITY FACULTY OF PUBLIC HEALTH MPH RESEARCH METHODS, PROPOSAL DEVELOPMENT & SCIENTIFIC REPORT WRITING MODULE 5 2019
The groups must not overlap, otherwise there is confusion concerning in which groups
There must be continuity from one group to the next, which means that there must be no gaps. Otherwise some measurements may not fit in a group.
The groups must range from the lowest measurement to the highest measurement so that all of the measurements have a group to which they can be assigned.
The group should normally be of an equal width, so that the counts in different groups can easily be compared.
7.8.2. PERCENTAGES, PROPORTIONS, RATIOS AND RATES PERCENTAGES A PERCENTAGE is the number of units with a certain characteristic divided by the total number of units in a sample and multiplied by 100
Percentages may also be called RELATIVE FREQUENCIES. Percentages standardize the data, which means that they make easier to compare with similar data obtained in another sample of a different size. Example 4: 82 clinics in one district were asked to submit the number of patients treated for malaria in one month. The researchers presented both the frequency distribution and percentages (or Relative frequencies): Table 7.2. Distribution of clinics according to number of patients treated for malaria in one month.
Number of Patients Number of Clinicsᵅ Relative Frequency
0 to 19 20 to 39 40 to 59 60 to 79 80 to 99 100 to 119 120 to 139 140 to 159
25 3 5 11 19 10 4 3
31% 4% 6% 14% 24% 12% 5% 4%
Total 80 100%
ᵅ Data from two clinics missing The frequency of responses in each group is calculated as the percentage of those study elements for which you obtained the data (or the percentage of those interviewees who answered the question).
163
LUSAKA APEX MEDICAL UNIVERSITY FACULTY OF PUBLIC HEALTH MPH RESEARCH METHODS, PROPOSAL DEVELOPMENT & SCIENTIFIC REPORT WRITING MODULE 5 2019
The number of missing data (i.e. people who did not respond to the question) though not included in the calculation, is a useful indication of the adequacy of your data collection. Therefore, this number should be mentioned, for example, as a note to your table (see Table 7.2). PROPORTIONS Sometimes relative frequencies are expressed in proportions instead of percentages. A PROPORTION is a numerical expression that compares one part of the study units to the whole. A proportion can be expressed as a FRACTION or a DECIMALS.
Example 5: Out of a total of 55 patients attending a clinic on a specific day, 22 are males and 33 are females. We may say that the proportion of males is 22/55 or 2/5, which is equivalent to 0.40. (The numerator is 22 and denominator is 55). Note that when a proportion expressed in decimals is multiplied by 100 the value obtained is a percentage. In the example 0.40 is equivalent to 40%. RATIOS A RATIO is a numerical expression which indicates the relationship in quantity, amount and size between two or more parts
In example 5 the ratio of males to females is 22: 33, which is 2:3 RATES A RATE is the quantity, amount or degree of something measured or allowing use of constant measure of population size in a specified period of time
Commonly used rates in the health sector are: •Birth Rate = The number of live births per 1000 population over
a period of one year
•Death rate = The number of deaths per 1000 population over a period of one year
•Infant mortality rate = The number of infant deaths per 1000 live births
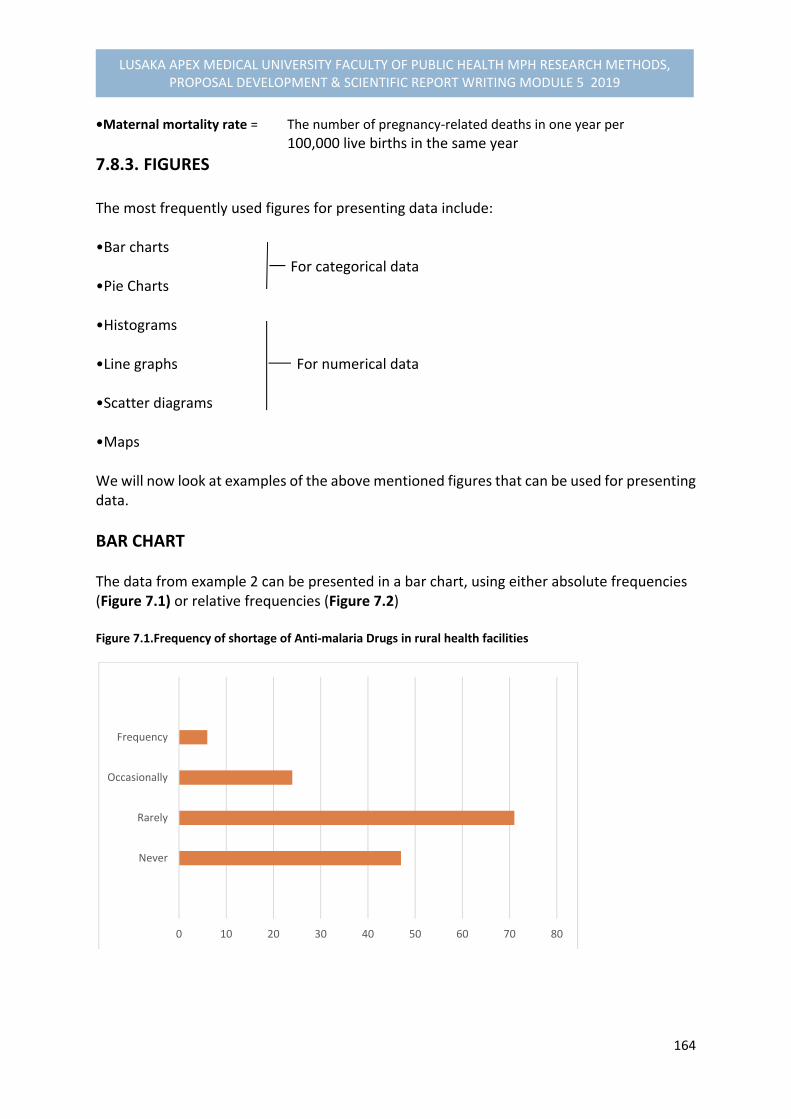
164
LUSAKA APEX MEDICAL UNIVERSITY FACULTY OF PUBLIC HEALTH MPH RESEARCH METHODS, PROPOSAL DEVELOPMENT & SCIENTIFIC REPORT WRITING MODULE 5 2019
•Maternal mortality rate = The number of pregnancy‐related deaths in one year per
100,000 live births in the same year
7.8.3. FIGURES The most frequently used figures for presenting data include: •Bar charts For categorical data •Pie Charts •Histograms •Line graphs For numerical data •Scatter diagrams •Maps We will now look at examples of the above mentioned figures that can be used for presenting data.
BAR CHART The data from example 2 can be presented in a bar chart, using either absolute frequencies (Figure 7.1) or relative frequencies (Figure 7.2) Figure 7.1.Frequency of shortage of Anti‐malaria Drugs in rural health facilities
0 10 20 30 40 50 60 70 80
Never
Rarely
Occasionally
Frequency

165
LUSAKA APEX MEDICAL UNIVERSITY FACULTY OF PUBLIC HEALTH MPH RESEARCH METHODS, PROPOSAL DEVELOPMENT & SCIENTIFIC REPORT WRITING MODULE 5 2019
Figure 7.2. Relative Frequency of Shortage of Anti‐malaria drugs in rural health facilities
PIE CHART A pie chart can be used for the same set of data, providing the reader with a quick overview of the data presented in a different form. A pie chart illustrates the relative frequency of a number of items, i.e. all the segments of the pie chart should add to 100%. Figure 7.3. Relative Frequency of shortage of anti‐malaria drugs in rural health facilities
0 10 20 30 40 50 60
Never
Rarely
Occasionally
Frequency
32%
48%
16%
4%
Never
Rarely
Occasion
Frequency
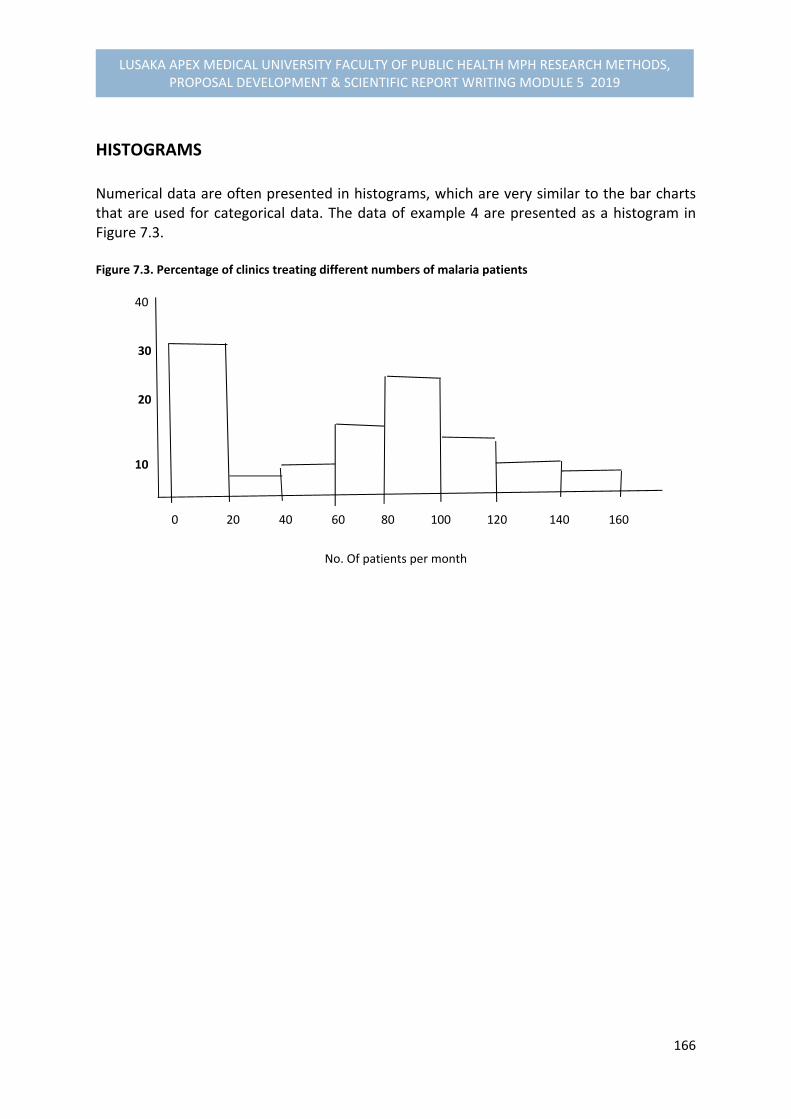
166
LUSAKA APEX MEDICAL UNIVERSITY FACULTY OF PUBLIC HEALTH MPH RESEARCH METHODS, PROPOSAL DEVELOPMENT & SCIENTIFIC REPORT WRITING MODULE 5 2019
HISTOGRAMS Numerical data are often presented in histograms, which are very similar to the bar charts that are used for categorical data. The data of example 4 are presented as a histogram in Figure 7.3. Figure 7.3. Percentage of clinics treating different numbers of malaria patients 40
30
20
10
0 20 40 60 80 100 120 140 160
No. Of patients per month

167
LUSAKA APEX MEDICAL UNIVERSITY FACULTY OF PUBLIC HEALTH MPH RESEARCH METHODS, PROPOSAL DEVELOPMENT & SCIENTIFIC REPORT WRITING MODULE 5 2019
LINE GRAPHS A line graph is particularly useful for numerical data if you wish to show a trend over time. The data from Example 3 can be presented as in Figure 7.4.
It is easy to show two or more distributions on one graph, as long as the lines are easy to distinguish.
SCATTER DIAGRAMS Scatter diagrams are useful for showing information on two variables which are possibly related. The example of a scatter diagram is given in this module unit 7.12, where we are dealing with the concepts of association and correlation.
7.8.4. MEASURES OF CENTRAL TENDENCY Frequency distributions and histograms provide useful ways of looking at a set of observations of a variable. In many circumstances, it is essential to produce them to understand the patterns in the data. However, if one wants to further summarize a set of observations, it is often helpful to use a measure that can be expressed in a single number. First, one would like to have a measure for the centre of the distribution. The three measures that are used for this are the MEAN, the MEDIAN, and the MODE.
0
2
4
6
8
10
12
14
16
18
Day 1 Day 2 Day 3 Day 4 Day 5 Day 6 Day 7
Figure 7.4. Number of malaria patients per day at the health centres in District X
Series 1 Series 2 Series 3

168
LUSAKA APEX MEDICAL UNIVERSITY FACULTY OF PUBLIC HEALTH MPH RESEARCH METHODS, PROPOSAL DEVELOPMENT & SCIENTIFIC REPORT WRITING MODULE 5 2019
MEAN The MEAN (or arithmetic mean) is also known as the AVERAGE. It is calculated by totalling the results of all the observations and dividing by the total number of observations. Note that the mean can only be calculated for numerical data
Example 6:
Measurement of the height of 7 women gave the following results: 141, 141, 143, 144, 145, 146, 155 cm (a total of 1015 cm for 7 measurements) The mean is thus 1015/7, which is 145 cm
MEDIAN The MEDIAN is the value that divides a distribution into two equal halves.
The median is useful when some measurements are much bigger or much smaller than the rest. The mean of such data will be biased toward these extreme values. This is why the mean is not a good measure of the centre of the distribution in this case. The median is not influenced by extreme values. The median value also called the central or halfway value, is obtained in the following way:
List the observations in order of magnitude (from the lowest to the highest value).
Count the number of observations (n)
The median value is the value belonging to observation number (n+1)/2
Example 7 The weights of 7 pregnant women are: 40, 41, 42, 43, 44, 45, and 72 kg The median value is the belonging to observation number (7+1)/2 = the fourth one, which is 43 kg.
169
LUSAKA APEX MEDICAL UNIVERSITY FACULTY OF PUBLIC HEALTH MPH RESEARCH METHODS, PROPOSAL DEVELOPMENT & SCIENTIFIC REPORT WRITING MODULE 5 2019
Note that the mean weight of this set of observations is 47 kg. This is an illustration of how the mean is affected by extreme values (in this case 72 kg) while the median isn’t. If the largest weight in this set of observations had been 51 kg instead of 72 kg, the median would still have been 43 kg, but the mean weight would have been 44 kg.
MODE The MODE is the most frequently occurring value in a set of observations.
The mode is not very useful for numerical data that are continuous. It is most useful for numerical data that have been grouped into classes. In Example 4 (number of patients treated for malaria at clinics) the mode is “0 to 19,” as this outcome is recorded most frequently (25 times out of 80). In Example 1 (clinical diagnosis of malaria), the mode is “negative”. In Example 2 (number of clinics experiencing drug shortages), the mode is “rarely.” In summary, the mean, the median and the mode are all measures of central tendency. The mean is most widely used. It contains more information as the value of each observation is taken into account in its calculation. However, the mean is strongly affected by values far from the centre of the distribution, while the median and the mode aren’t. The calculation of the mean forms the beginning of more complex statistical procedures to describe and analyse data.
7.9. CROSS‐TABULATION OF QUANTITATIVE DATA In this part of session, you should be expected to:
Construct all important cross‐tabulations that will help meet your research objectives.
Identify possible confounding variables that need consideration when explaining relationships between variables, and take appropriate measures to deal with them.
We will now present to you the following issues in order to relate to the above expected objectives:
1. Designing Cross‐Tabulations 2. Discuss different types of Cross‐Tabulations 3. Constructing Cross‐Tabulations appropriate for the research objectives 4. General hints when constructing Tables 5. Dealing with Confounding variables: stratification and Matching
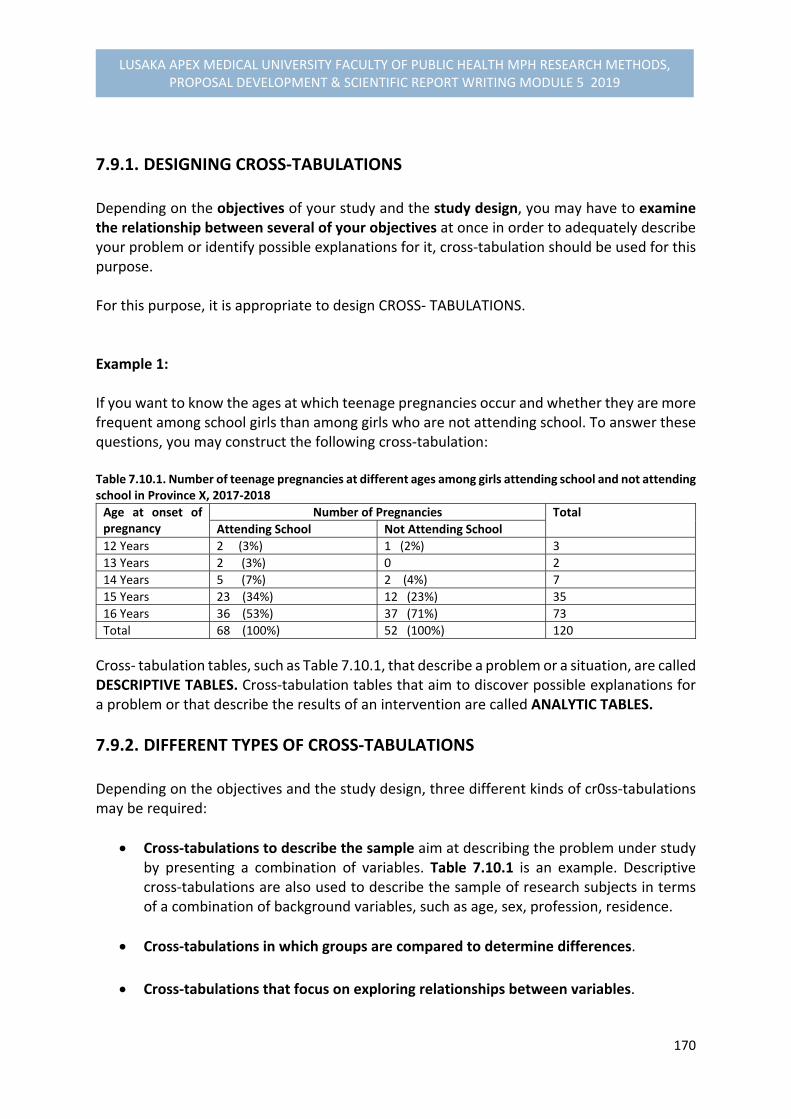
170
LUSAKA APEX MEDICAL UNIVERSITY FACULTY OF PUBLIC HEALTH MPH RESEARCH METHODS, PROPOSAL DEVELOPMENT & SCIENTIFIC REPORT WRITING MODULE 5 2019
7.9.1. DESIGNING CROSS‐TABULATIONS Depending on the objectives of your study and the study design, you may have to examine the relationship between several of your objectives at once in order to adequately describe your problem or identify possible explanations for it, cross‐tabulation should be used for this purpose. For this purpose, it is appropriate to design CROSS‐ TABULATIONS. Example 1: If you want to know the ages at which teenage pregnancies occur and whether they are more frequent among school girls than among girls who are not attending school. To answer these questions, you may construct the following cross‐tabulation: Table 7.10.1. Number of teenage pregnancies at different ages among girls attending school and not attending school in Province X, 2017‐2018
Age at onset of pregnancy
Number of Pregnancies Total
Attending School Not Attending School
12 Years 2 (3%) 1 (2%) 3
13 Years 2 (3%) 0 2
14 Years 5 (7%) 2 (4%) 7
15 Years 23 (34%) 12 (23%) 35
16 Years 36 (53%) 37 (71%) 73
Total 68 (100%) 52 (100%) 120
Cross‐ tabulation tables, such as Table 7.10.1, that describe a problem or a situation, are called DESCRIPTIVE TABLES. Cross‐tabulation tables that aim to discover possible explanations for a problem or that describe the results of an intervention are called ANALYTIC TABLES.
7.9.2. DIFFERENT TYPES OF CROSS‐TABULATIONS Depending on the objectives and the study design, three different kinds of cr0ss‐tabulations may be required:
Cross‐tabulations to describe the sample aim at describing the problem under study by presenting a combination of variables. Table 7.10.1 is an example. Descriptive cross‐tabulations are also used to describe the sample of research subjects in terms of a combination of background variables, such as age, sex, profession, residence.
Cross‐tabulations in which groups are compared to determine differences.
Cross‐tabulations that focus on exploring relationships between variables.

171
LUSAKA APEX MEDICAL UNIVERSITY FACULTY OF PUBLIC HEALTH MPH RESEARCH METHODS, PROPOSAL DEVELOPMENT & SCIENTIFIC REPORT WRITING MODULE 5 2019
Note that tables that are not yet filled in with data are called DUMMY TABLES (described earlier in Module Unit 6 for proposal development).
CROSS‐TABULATIONS DESCRIBING THE SAMPLE In any study which yields quantitative data, whether descriptive or analytic, it is common to first describe the research subjects included in the sample (s) before presenting the actual results of the study. This can be done for separate variables in a simple frequency tables or for a combination of variables in a cross‐table. Example 2: A study was carried out on the degree of job satisfaction (dependent variable) among doctors and nurses in rural and urban areas. To describe the sample a cross‐tabulation was constructed which included the sex and the residence (rural or urban) of doctors and nurses interviewed. This was useful because in the analysis the opinions of male and female staff had to be compared separately for rural and urban areas. Table 7.10.2. Residence and Sex of doctors and nurses
Health workers Residence Total
Rural Urban
Doctors Males 8 (10%) 35 (21%) 43
Females 2 (3%) 16 (10%) 18
Nurses Males 46 (58%) 36 (22%) 82
Females 23 (29%) 77 (47%) 100
Total 79 (100%) 164 (100%) 243
The data in example Table 7.10.2 is listed in absolute figures as well as in relative frequencies (percentages or proportions).
CROSS‐TABULATIONS TO DETERMINE DIFFERENCES BETWEEN GROUPS In comparative studies, such as case‐control studies, cohort studies or (quasi)‐ experimental studies, some objectives will focus on discovering whether any differences exist between two or more groups on particular variables. In such cases, cross‐tabulation of data is necessary. Example 3. In a quasi‐experimental study design of the effect of attendance of mothers at nutrition talks on their level of nutritional knowledge, two groups of mothers were compared: those who did and those who did not attend the nutrition talks. The following dummy cross‐tabulation table (Table 7.10.3) can be prepared.

172
LUSAKA APEX MEDICAL UNIVERSITY FACULTY OF PUBLIC HEALTH MPH RESEARCH METHODS, PROPOSAL DEVELOPMENT & SCIENTIFIC REPORT WRITING MODULE 5 2019
Table 7.10.3. Number of attendants and non‐attendants at nutrition talks with different level of nutritional knowledge
Attendants
Level of nutritional knowledge Total Low Average High
Attendants
Non‐Attendants
Total
In this example, “low,” “ average,” and “ high,” level of nutritional knowledge have to be clearly defined in terms of the rating scores of their measurements according to answers given to questions, e.g. low (0‐5 correct responses), average ( 6‐7 correct responses), and high (8‐10 correct responses), respectively. Note that level of nutritional knowledge is the outcome of the attendance at nutritional talks and considered to be dependent variable. Dependent variables usually are displayed in columns
7.9.3. CONSTRUCTING CROSS‐TABULATIONS APPROPRIATE FOR THE RESEARCH OBJECTIVES
When developing your research proposal, you produced dummy tables for the data you expected to collect (Module 5.6). These dummy tables were made on the basis of the objectives and the study design. Assuming that you have now collected your data and have an idea of their quality and how they can be used, you need to look again in a systematic way at the cross‐tabulations to be made. To construct appropriate cross‐tabulations, it is important that you follow the steps below:
a. Review each specific objective and the method chosen for collecting the relevant data.
b. Formulate hypothetical sentences that you consider to be the type of conclusions
you expect to reach concerning each objective.
For example, in a descriptive study on breast feeding practices, where one of the specific objective is “to determine factors associated with early weaning” expected conclusions could be:
“Mothers who are employed wean their children earlier than those mothers who are not employed.”
“Mothers who did not attend nutrition talks wean their children earlier than mothers who attended nutrition talks.”
173
LUSAKA APEX MEDICAL UNIVERSITY FACULTY OF PUBLIC HEALTH MPH RESEARCH METHODS, PROPOSAL DEVELOPMENT & SCIENTIFIC REPORT WRITING MODULE 5 2019
c. For each “expected conclusion” construct a dummy cross‐tabulation that will enable you to derive at the right conclusion.
d. Perform the appropriate frequency counts (using data master‐sheets) and entre
the results in the cells of the cross‐table.
e. Interpret the table and write a clear conclusion. It is not necessary to describe the content of the table in detail.
EXERCISE 1: Select one specific objective from each of the research projects, formulate “expected conclusions” and construct the appropriate dummy cross‐tabulation.
7.9.4. GENERAL HINTS WHEN CONSTRUCTING TABLES
Make sure that all the categories of the variables presented in the tables have been specified and that they are mutually exclusive (i.e. no overlaps and no gaps).
When making cross‐tabulations, check that the columns and row counts correspond to the frequency counts for each variable.
Also check that the grand totals in the table corresponds to the number of subjects in the sample.
Think of a clear title for each table. Also be sure that the headings of rows and columns leave no room for misinterpretation.
Number your tables and keep them together with the objectives to which they are related. This will assist in organizing your report and ensure that work is not duplicated.
174
LUSAKA APEX MEDICAL UNIVERSITY FACULTY OF PUBLIC HEALTH MPH RESEARCH METHODS, PROPOSAL DEVELOPMENT & SCIENTIFIC REPORT WRITING MODULE 5 2019
7.9.5. DEALING WITH CONFOUNDING VARIABLES: STRATIFICATION AND MATCHING STRATIFICATION If one or more of the objectives of your study focus on exploring relationships among variables, it is important to determine whether there are other factors which influence these relationships. These are known as CONFOUNDING VARIABLES. For example, it might be that the educational level of the mother is such a confounding variable, as it could be related to both the working status of the mother and duration of breastfeeding. Once you have collected your data, the appropriate way of dealing with confounding variables is STRATIFICATION, which involves a SEPARATE analysis for the different levels of this confounding variable. In such a table involving the different levels of education of mothers as a confounding variable, it will require construction of two tables: one for those mothers who have less education, say less than 5 years and another one for those who have 5 or more years of schooling. If you find a SIMILAR association between working status and duration of breastfeeding in both groups of mothers, then this indicates that the educational level of mother is NOT a confounding variable. Further explanations of confounding variables are in 7.12.3 of this Module Unit
MATCHING In Module Unit 4 stated that if at the stage of designing the study a variable is already suspected to be a confounding variable, the effect of this variable may be removed by PAIRING the observations (also called MATCHING). In this procedure, each subject in the study group is matched with another subject in the so‐called control group for the particular confounding variable. For example, for each employed mother with less than 5 years schooling, you would choose a non‐employed mother with a similar educational level. Also for each employed mother with 5 or more years of schooling you would select a non‐employed mother with 5 or more years of schooling. It is important to take into account the fact that data are paired when constructing cross‐tabulations and doing the analysis.
175
LUSAKA APEX MEDICAL UNIVERSITY FACULTY OF PUBLIC HEALTH MPH RESEARCH METHODS, PROPOSAL DEVELOPMENT & SCIENTIFIC REPORT WRITING MODULE 5 2019
The analysis of paired observations will be examined in more detail in 7.13 of this Module Unit.
7.10. DESCRIPTION OF VARIABLES: MEASURES OF DISPERSION AND THE NORMAL DISTRIBUTION
This part of module unit describes some common measures of variation (or variability), which in statistical textbooks are often referred to as measures of dispersion. Furthermore, the concepts of normal distribution, standard error, and confidence interval are introduced. We will need these concepts when we use statistical tests By the end of this module unit, you should be expected to:
Explain what is meant by a range, a percentile, a standard deviation, a normal distribution, a standard error, and a 95% confidence interval.
Calculate ranges, standard deviations, standard errors, and 95% confidence intervals for your own data, where appropriate.
Interpret the results of these calculations.
We will now discuss these parts as follows:
1. Measures of dispersion 2. Normal distribution 3. Determining sample representation to whole population
7.10.1. MEASURES OF DISPERSION RANGE The RANGE of a set of measurements‐ is the difference between the smallest and the largest measurement
For example, if the weights of 7 pregnant women were 40, 41, 42, 43, 44, 47, and 72 kg, the range would be 72‐40 = 32 kg. Although simple to calculate, the range does not tell us anything about the distribution of the values between the two extreme ones.
176
LUSAKA APEX MEDICAL UNIVERSITY FACULTY OF PUBLIC HEALTH MPH RESEARCH METHODS, PROPOSAL DEVELOPMENT & SCIENTIFIC REPORT WRITING MODULE 5 2019
In another example, if the weights of other 7 pregnant women were 40, 46, 46, 46, 50, 60, and 72 kg, the range would also be 72‐40 = 32 kg, although the values would be different from the previous example.
PERCENTILES A second way of describing the variation or dispersion of a set of measurements is to divide the distribution into percentiles. As a matter of fact the concept of percentiles is just an extension of the concept of the median, which may also be called the 50th percentile. PERCENTILES are points which divide all the measurements into 100 equal parts
The 3rd percentile (P3) is the value below which 3% of the measurements lie. The 50th percentile (P50) or the median is the value below which 50% of the measurements lie. The concept of percentiles is used by nutritionists to develop standard growth charts for specific countries.
STANDARD DEVIATION
To determine how much our measurements differ from the mean value, there is a measure which we need when we use statistical tests. This measure is called the STANDARD DEVIATION The STANDARD DEVIATION is a measure which describes how much individual measurements differ, on the average, from the mean.
To obtain the standard deviation of a set of measurements you have to complete the following steps:
1. Calculate the mean of all the measurements
2. Calculate the difference between each individual measurement and the mean
3. Square all these differences
4. Take the sum of all squared differences
5. Divide this sum by the number of measurements minus one
177
LUSAKA APEX MEDICAL UNIVERSITY FACULTY OF PUBLIC HEALTH MPH RESEARCH METHODS, PROPOSAL DEVELOPMENT & SCIENTIFIC REPORT WRITING MODULE 5 2019
6. Finally (since the differences from the mean have been squared), take the square root of the value obtained (in order to get back to the same unit of measurement).
Example 1: 11 children of 3 years of age were weighed and the following weights were obtained: 13, 14, 14, 15, 16, 16, 16, 17, 17, 18, and 20 kg
11. To calculate the standard deviation:
1. We first calculate the mean: the mean is 16 kg.
2. Next, we calculate the distance of each measurement from the mean: 3, 2, 2, 1, 0, 0, 0, 1, 1, 2, 4 (i.e., 16‐13 = 3; 16‐14 = 2; etc).
3. These values are then squared:
9, 4. 4, 1, 0, 0, 0, 1, 1, 4, 16 (i.e. , 3x3 = 9; 2x2 = 4; etc).
4. The sum of these squared difference is 40 (i.e., 9+4 +4….)
5. This sum is divided by the number of measurements minus one ( n‐1=10):
40/10 = 4
6. Finally, we take the square root to obtain the standard deviation from the mean:
4 = 2kg
A large standard deviation shows that there is a wide scatter of measured values around the
mean, while a small standard deviation shows that the individual values are concerned
around the mean with little variation among them.
7.10.2. THE NORMAL DISTRIBUTION
Many variables have a normal distribution. This is a bell shaped curve with most of the values
clustered near the mean and a few values out near the tails. The normal distribution is
symmetrical around the mean. The mean, the median and the mode of a normal distribution
have the same value.

178
LUSAKA APEX MEDICAL UNIVERSITY FACULTY OF PUBLIC HEALTH MPH RESEARCH METHODS, PROPOSAL DEVELOPMENT & SCIENTIFIC REPORT WRITING MODULE 5 2019
Figure 7.10.1. Normal distribution Curve
Frequency
‐
mean
Value of variable
In the following Figure 7.10.2, a histogram of the heights of pregnant women attending an antenatal clinic is shown with the normal distribution curve: Figure 7.10.2. Heights of pregnant women attending an antenatal clinic 90 80 70 Number Of 60 Women 50 40
30
20
10
135 140 145 150 155 160 165 170 175
Heights (cm)
An important characteristic of a normal distributed variable is that 95% of the measurement
have values which are approximately within 2 standard deviation (SD) of the mean,6 as
shown in Figure 7.10.3. below.
6 To be more exact, 95% of the measurement have values which are within 1.96 standard deviations of the mean
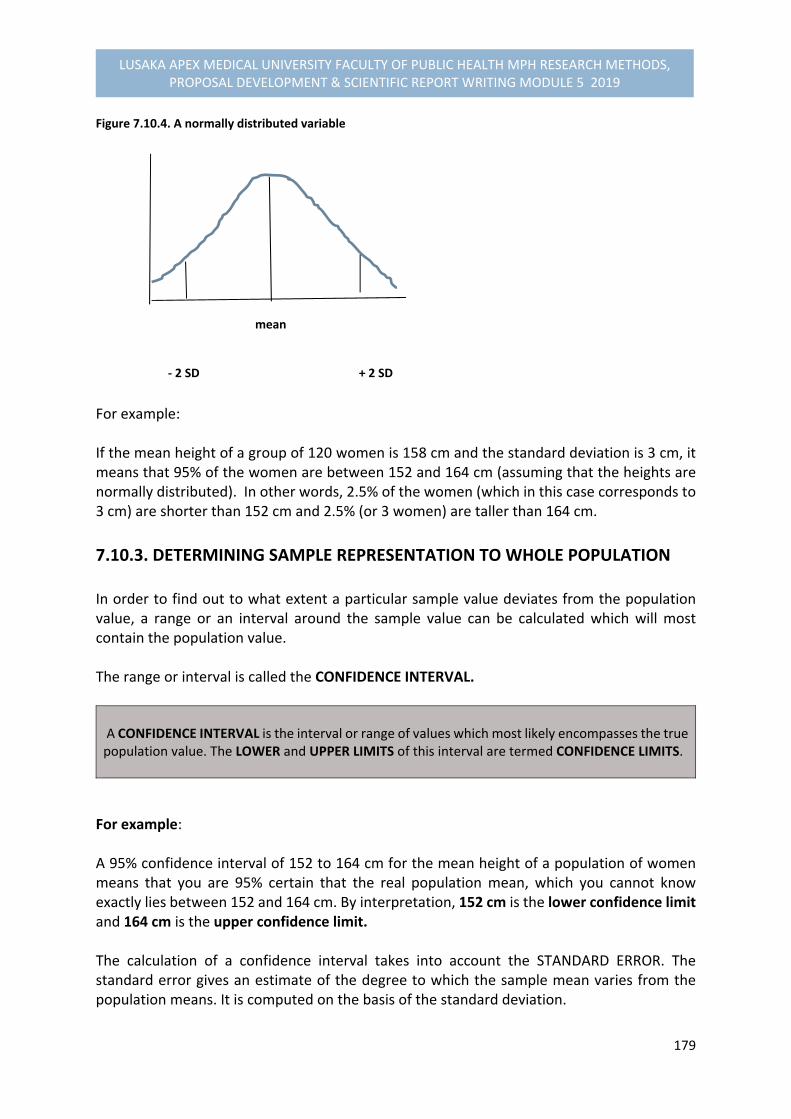
179
LUSAKA APEX MEDICAL UNIVERSITY FACULTY OF PUBLIC HEALTH MPH RESEARCH METHODS, PROPOSAL DEVELOPMENT & SCIENTIFIC REPORT WRITING MODULE 5 2019
Figure 7.10.4. A normally distributed variable
mean ‐ 2 SD + 2 SD
For example: If the mean height of a group of 120 women is 158 cm and the standard deviation is 3 cm, it means that 95% of the women are between 152 and 164 cm (assuming that the heights are normally distributed). In other words, 2.5% of the women (which in this case corresponds to 3 cm) are shorter than 152 cm and 2.5% (or 3 women) are taller than 164 cm.
7.10.3. DETERMINING SAMPLE REPRESENTATION TO WHOLE POPULATION In order to find out to what extent a particular sample value deviates from the population value, a range or an interval around the sample value can be calculated which will most contain the population value. The range or interval is called the CONFIDENCE INTERVAL. A CONFIDENCE INTERVAL is the interval or range of values which most likely encompasses the true population value. The LOWER and UPPER LIMITS of this interval are termed CONFIDENCE LIMITS.
For example: A 95% confidence interval of 152 to 164 cm for the mean height of a population of women means that you are 95% certain that the real population mean, which you cannot know exactly lies between 152 and 164 cm. By interpretation, 152 cm is the lower confidence limit and 164 cm is the upper confidence limit. The calculation of a confidence interval takes into account the STANDARD ERROR. The standard error gives an estimate of the degree to which the sample mean varies from the population means. It is computed on the basis of the standard deviation.
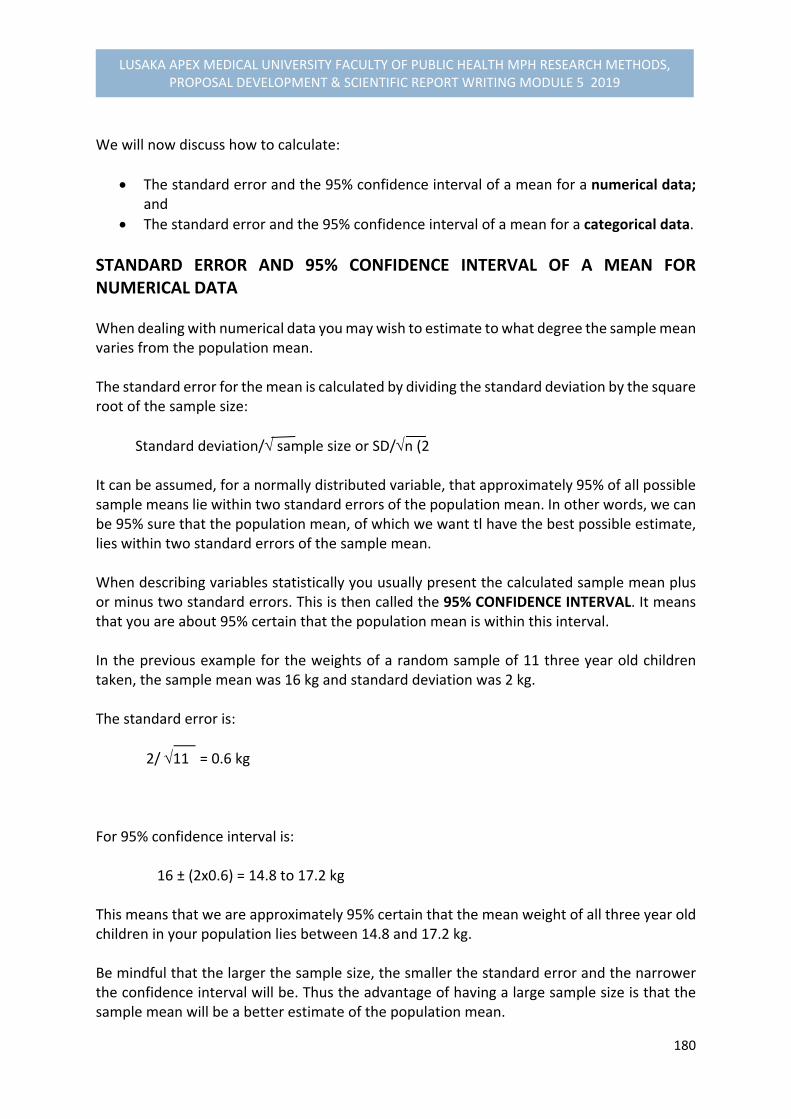
180
LUSAKA APEX MEDICAL UNIVERSITY FACULTY OF PUBLIC HEALTH MPH RESEARCH METHODS, PROPOSAL DEVELOPMENT & SCIENTIFIC REPORT WRITING MODULE 5 2019
We will now discuss how to calculate:
The standard error and the 95% confidence interval of a mean for a numerical data; and
The standard error and the 95% confidence interval of a mean for a categorical data.
STANDARD ERROR AND 95% CONFIDENCE INTERVAL OF A MEAN FOR NUMERICAL DATA When dealing with numerical data you may wish to estimate to what degree the sample mean varies from the population mean. The standard error for the mean is calculated by dividing the standard deviation by the square root of the sample size:
Standard deviation/ sample size or SD/n (2 It can be assumed, for a normally distributed variable, that approximately 95% of all possible sample means lie within two standard errors of the population mean. In other words, we can be 95% sure that the population mean, of which we want tl have the best possible estimate, lies within two standard errors of the sample mean. When describing variables statistically you usually present the calculated sample mean plus or minus two standard errors. This is then called the 95% CONFIDENCE INTERVAL. It means that you are about 95% certain that the population mean is within this interval. In the previous example for the weights of a random sample of 11 three year old children taken, the sample mean was 16 kg and standard deviation was 2 kg. The standard error is:
2/ 11 = 0.6 kg For 95% confidence interval is: 16 ± (2x0.6) = 14.8 to 17.2 kg This means that we are approximately 95% certain that the mean weight of all three year old children in your population lies between 14.8 and 17.2 kg. Be mindful that the larger the sample size, the smaller the standard error and the narrower the confidence interval will be. Thus the advantage of having a large sample size is that the sample mean will be a better estimate of the population mean.

181
LUSAKA APEX MEDICAL UNIVERSITY FACULTY OF PUBLIC HEALTH MPH RESEARCH METHODS, PROPOSAL DEVELOPMENT & SCIENTIFIC REPORT WRITING MODULE 5 2019
If in the above example, the sample size was 20 (instead of 11), the standard error would have been:
2/20 = 0.45 kg and the 95% confidence interval for the mean weight would have been from 15.1 to 16.9 kg.
STANDARD ERROR AND 95% CONFIDENCE INTERVAL OF A PERCENTAGE FOR CATEGORICAL DATA We will now do the same for a percentage that was calculated from CATEGORICAL DATA. For example: Among a sample of 120 TB patients, which was drawn from the total population of TB patients in the country, it was found that 28 (0r 23.3%) did not comply with the out‐patient treatment. The other 92 (or 76.7%) exhibited a satisfactory degree of compliance. We now want to calculate the standard error of the percentage of non‐compliers (23.3%). This si done as follows. The p represents one of the percentages (23.3%) and 100‐p represents the other (76.7%), then the standard error of the percentage is obtained by multiplying them ( 23.3 % x 76.7%), dividing the result by the number in the sample and taking the square root. The formula for the standard error of a percentage is:
P (100‐p ‐‐‐‐‐‐‐‐‐‐‐‐ n In the example, this is: 23.3 x 76.7
‐‐‐‐‐‐‐‐‐‐‐‐‐ = 14.89 = 3.9 n
We now also want to calculate the confidence interval for the percentage of non‐compliers in the whole country. The 95% confidence interval is: 23.3 ± (2x 3.9) which is 15.5% to 31.1%
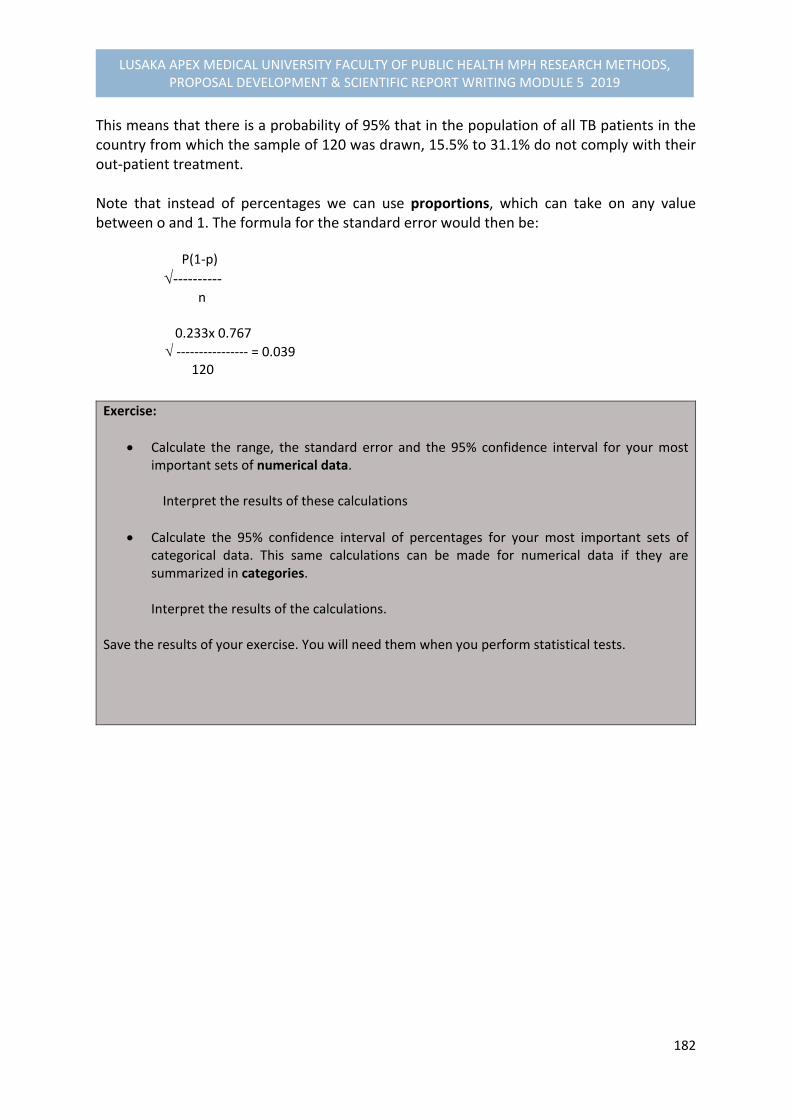
182
LUSAKA APEX MEDICAL UNIVERSITY FACULTY OF PUBLIC HEALTH MPH RESEARCH METHODS, PROPOSAL DEVELOPMENT & SCIENTIFIC REPORT WRITING MODULE 5 2019
This means that there is a probability of 95% that in the population of all TB patients in the country from which the sample of 120 was drawn, 15.5% to 31.1% do not comply with their out‐patient treatment. Note that instead of percentages we can use proportions, which can take on any value between o and 1. The formula for the standard error would then be: P(1‐p)
‐‐‐‐‐‐‐‐‐‐ n 0.233x 0.767
‐‐‐‐‐‐‐‐‐‐‐‐‐‐‐‐ = 0.039 120
Exercise:
Calculate the range, the standard error and the 95% confidence interval for your most important sets of numerical data.
Interpret the results of these calculations
Calculate the 95% confidence interval of percentages for your most important sets of categorical data. This same calculations can be made for numerical data if they are summarized in categories.
Interpret the results of the calculations.
Save the results of your exercise. You will need them when you perform statistical tests.

183
LUSAKA APEX MEDICAL UNIVERSITY FACULTY OF PUBLIC HEALTH MPH RESEARCH METHODS, PROPOSAL DEVELOPMENT & SCIENTIFIC REPORT WRITING MODULE 5 2019
Annex 7.10. 1. Formula for Calculating Standard Deviation Standard deviation (SD) =
x² - {(x)²/n __________ n-1 Where x = each value x² = The square of each value
= the sum of, and n = the number of observations If we apply this formula to the example of weights of 11 three year old children, you will find that it is not as difficult as it first seems. The values x are: 13, 14, 14, 15, 16, 16, 16, 17, 17, 18, 20 kg and n = 11 If we square each value we get: 169, 196, 196, 225, 256, 256, 256, 289, 289, 324, 400
The sum of all the values (x²) is 2856 The sum of all the values (x) is 176
Therefore (x)² is 176² = 30,976 and (x)²/n = 30,976/11 = 2816 Standard deviation = (2856 – 2816) /10= 4 = 2 kg
A faster method to calculate the standard deviation is to use the automatic function built into certain pocket calculators.
184
LUSAKA APEX MEDICAL UNIVERSITY FACULTY OF PUBLIC HEALTH MPH RESEARCH METHODS, PROPOSAL DEVELOPMENT & SCIENTIFIC REPORT WRITING MODULE 5 2019
7.11. CHOOSING A SIGNIFICANT TEST In this part of the module unit involves a further statistical analysis of choosing a significant test. Suppose we find in a study of smoking behaviour that 30% of the men included in the sample are smokers whereas only 20% of the women are qualified as smokers. How should we interpret this result?
The observed difference of 10% might be a TRUE DIFFERENCE, which also exists in the total population from which the sample was drawn
The difference might also be DUE TO CHANCE, in reality there is no difference between
men and women, but the sample of men just happened to differ from the sample of women. One can also say that the observed difference is due to sampling variation.
The third possibility explanation is that the observed difference of 10% is due to detects in the study design‐ referred to as BIAS. With an appropriate study design no such difference would have been found.
In this section, we shall attempt to:
Explain what a significant test is and its purposes.
Use the tables to choose appropriate significant tests for different sets of data.
Choose appropriate significant tests for your data
Our discussions will be based on (a) determining significant tests; (b) How significant tests operate; and (c) choosing a significance test.
7.11.1. SIGNIFICANT TESTS A SIGNIFICANT TEST estimates the likelihood that an observed study result, e.g. a difference between two groups, is due to chance. In other words, a significant test is used to find out whether a study result which is observed in a sample can be considered as a result which exists in the population from which the sample was drawn.
Different significant tests have been developed for different sets of data. In this module unit two matrices will be presented to guide you in choosing the appropriate significant tests for your data. The first matrix (Table 7.12.1) is to be used if you compare groups to detect

185
LUSAKA APEX MEDICAL UNIVERSITY FACULTY OF PUBLIC HEALTH MPH RESEARCH METHODS, PROPOSAL DEVELOPMENT & SCIENTIFIC REPORT WRITING MODULE 5 2019
differences. The second matrix (Table 7.12.2) is to be used if you want to measure associations between variables. In the module unit 7.13 that follows, some of the common significant tests will be discussed in detail, but first we will examine how significant tests work.
7.11.2. HOW SIGNIFICANT TESTS WORK The following are the reasons for using significant tests:
For observing a difference between two groups (or an association between two variables) in your sample.
To know whether the observed difference between the two groups (or the observed association between the variables) represent a real difference (or real association) in the total study population from which the sample was drawn, or whether it just occurred by chance (due to sampling variation).
To determine how likely it is that your result could have occurred by chance, if in the total population no difference exists between the two groups.
If you are measuring an association between two variables, you determine how likely it is that your result occurred by chance (i.e., it occurred due to sampling variation). If it is unlikely (a likelihood of less than 5% or some other predetermined percentage7) that your result occurred by chance, you reject the chance explanation and accept that there is a real difference (or association). You may then say that the difference (association) is statistically significant. If it is likely (a likelihood of 5% or more) that your result occurred by chance, you cannot conclude that a real difference (association) exists. You then say that the difference (association) is not statistically significant NOTE: In statistical terms, the assumption that in the total population no real difference exists between groups ( or that no real association exist between variables) is called NULL HYPOTHESIS
Examples of null hypotheses are:
7 You can choose the p‐value yourself: for example, 0.10, 0.05, 0.01, or even 0.001, depending on how sure you want to be that your conclusion is the right one. The choice of 5% is arbitrary. The researcher may decide on, example, 1% if he or she desires to reduce the likelihood of occurrence by chance.
186
LUSAKA APEX MEDICAL UNIVERSITY FACULTY OF PUBLIC HEALTH MPH RESEARCH METHODS, PROPOSAL DEVELOPMENT & SCIENTIFIC REPORT WRITING MODULE 5 2019
There is no difference in the incidence of measles between vaccinated and non‐
vaccinated children.
Males do not smoke more than females.
There is no association between families’ income and malnutrition in children.
It is important to note that “statistically significant” does not mean that a difference or an association is an important one. The most irrelevant difference will turn out to be statistically significant if a big enough sample is taken. The important difference may fail to reach statistically significance if a small sample is used. The likelihood or PROBABILITY of observing a result by chance is usually expressed as a P‐VALUE
The p‐value is expressed as a proportion. A probability of 5% corresponds to a p‐value of 0.05. A difference or an association is considered significant if p< 0.05. In other words, if the null hypothesis, stating that there is no difference between groups, is true, you would observe a difference in your data only 5 times or less in every 100 samples examined.
7.11.3. CHOOSING A SIGNIFICANT TEST Depending on the aim of study and the type of data collected, you have to choose an appropriate significant test.
NOTE: Before applying any statistical test, state the null hypothesis in relation to the data to which the test is being applied. This will enable you to interpret the result of the test.
If you are determining differences between groups, you need to identify whether you have paired or unpaired observations. Examples of paired and unpaired samples are given in the following sections, which explains the use of the two tables.
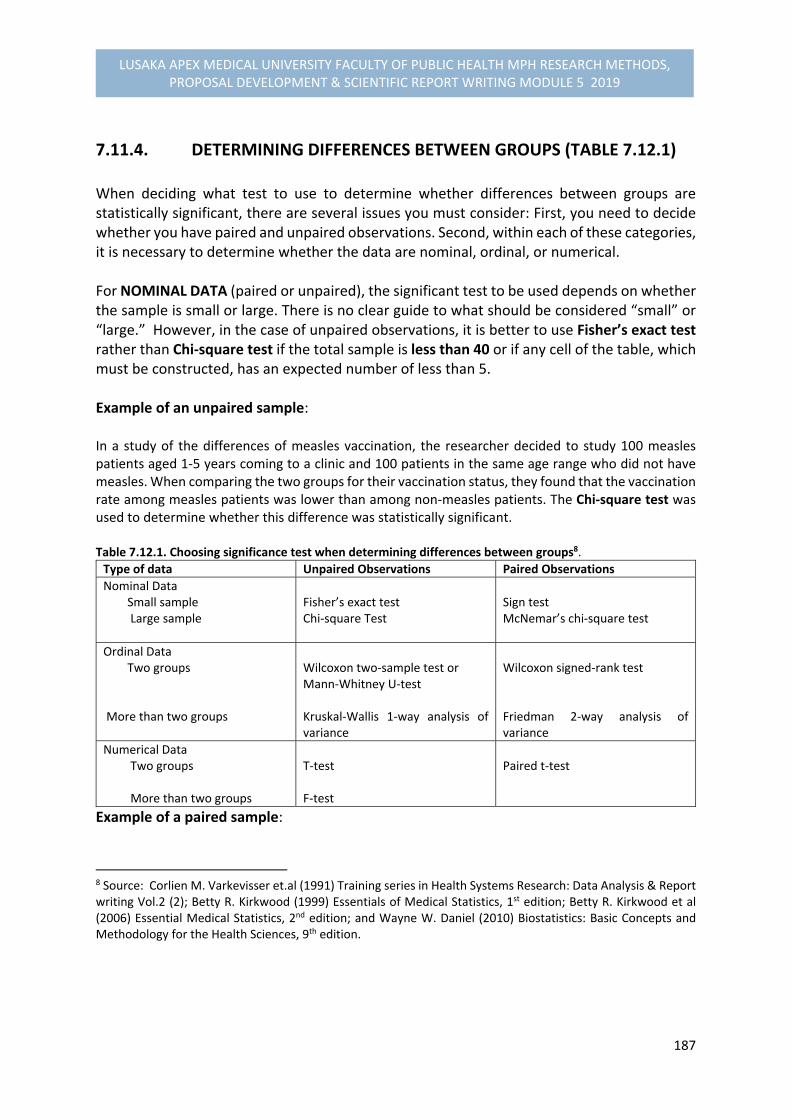
187
LUSAKA APEX MEDICAL UNIVERSITY FACULTY OF PUBLIC HEALTH MPH RESEARCH METHODS, PROPOSAL DEVELOPMENT & SCIENTIFIC REPORT WRITING MODULE 5 2019
7.11.4. DETERMINING DIFFERENCES BETWEEN GROUPS (TABLE 7.12.1) When deciding what test to use to determine whether differences between groups are statistically significant, there are several issues you must consider: First, you need to decide whether you have paired and unpaired observations. Second, within each of these categories, it is necessary to determine whether the data are nominal, ordinal, or numerical. For NOMINAL DATA (paired or unpaired), the significant test to be used depends on whether the sample is small or large. There is no clear guide to what should be considered “small” or “large.” However, in the case of unpaired observations, it is better to use Fisher’s exact test rather than Chi‐square test if the total sample is less than 40 or if any cell of the table, which must be constructed, has an expected number of less than 5. Example of an unpaired sample: In a study of the differences of measles vaccination, the researcher decided to study 100 measles patients aged 1‐5 years coming to a clinic and 100 patients in the same age range who did not have measles. When comparing the two groups for their vaccination status, they found that the vaccination rate among measles patients was lower than among non‐measles patients. The Chi‐square test was used to determine whether this difference was statistically significant. Table 7.12.1. Choosing significance test when determining differences between groups8.
Type of data Unpaired Observations Paired Observations
Nominal Data Small sample Large sample
Fisher’s exact test Chi‐square Test
Sign test McNemar’s chi‐square test
Ordinal Data Two groups More than two groups
Wilcoxon two‐sample test or Mann‐Whitney U‐test Kruskal‐Wallis 1‐way analysis of variance
Wilcoxon signed‐rank test Friedman 2‐way analysis of variance
Numerical Data Two groups More than two groups
T‐test F‐test
Paired t‐test
Example of a paired sample:
8 Source: Corlien M. Varkevisser et.al (1991) Training series in Health Systems Research: Data Analysis & Report writing Vol.2 (2); Betty R. Kirkwood (1999) Essentials of Medical Statistics, 1st edition; Betty R. Kirkwood et al (2006) Essential Medical Statistics, 2nd edition; and Wayne W. Daniel (2010) Biostatistics: Basic Concepts and Methodology for the Health Sciences, 9th edition.
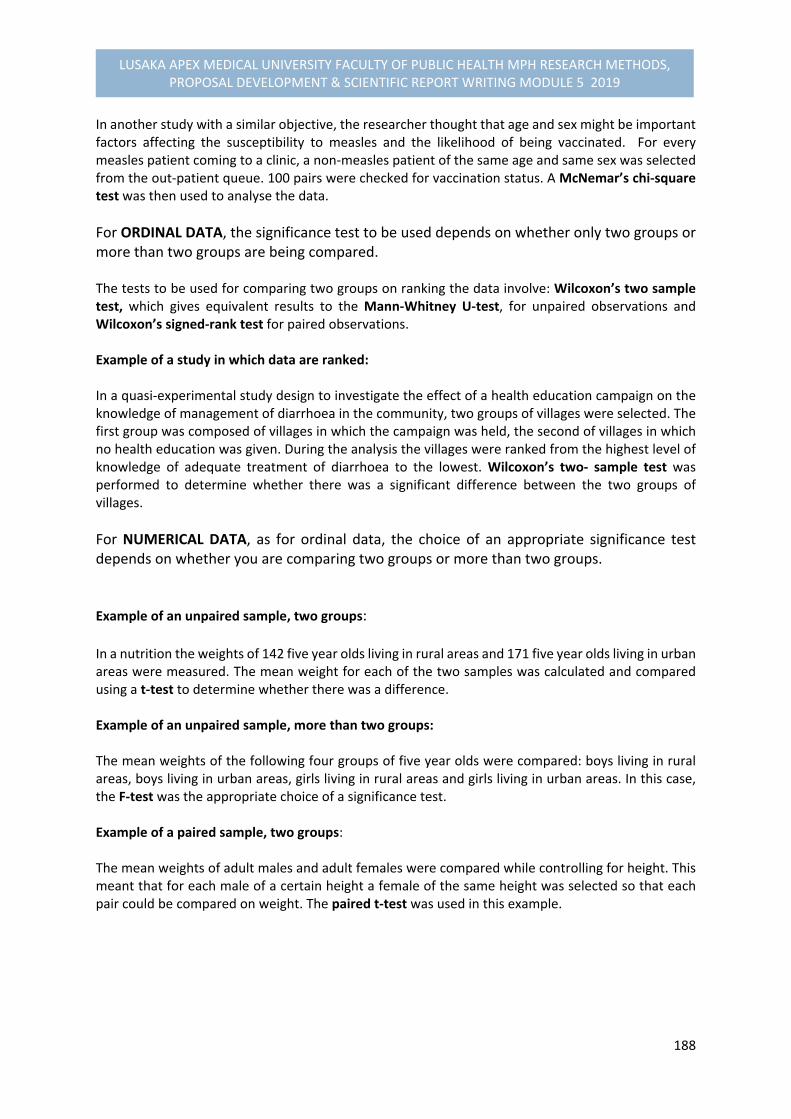
188
LUSAKA APEX MEDICAL UNIVERSITY FACULTY OF PUBLIC HEALTH MPH RESEARCH METHODS, PROPOSAL DEVELOPMENT & SCIENTIFIC REPORT WRITING MODULE 5 2019
In another study with a similar objective, the researcher thought that age and sex might be important factors affecting the susceptibility to measles and the likelihood of being vaccinated. For every measles patient coming to a clinic, a non‐measles patient of the same age and same sex was selected from the out‐patient queue. 100 pairs were checked for vaccination status. A McNemar’s chi‐square test was then used to analyse the data.
For ORDINAL DATA, the significance test to be used depends on whether only two groups or more than two groups are being compared. The tests to be used for comparing two groups on ranking the data involve: Wilcoxon’s two sample test, which gives equivalent results to the Mann‐Whitney U‐test, for unpaired observations and Wilcoxon’s signed‐rank test for paired observations. Example of a study in which data are ranked: In a quasi‐experimental study design to investigate the effect of a health education campaign on the knowledge of management of diarrhoea in the community, two groups of villages were selected. The first group was composed of villages in which the campaign was held, the second of villages in which no health education was given. During the analysis the villages were ranked from the highest level of knowledge of adequate treatment of diarrhoea to the lowest. Wilcoxon’s two‐ sample test was performed to determine whether there was a significant difference between the two groups of villages.
For NUMERICAL DATA, as for ordinal data, the choice of an appropriate significance test depends on whether you are comparing two groups or more than two groups.
Example of an unpaired sample, two groups: In a nutrition the weights of 142 five year olds living in rural areas and 171 five year olds living in urban areas were measured. The mean weight for each of the two samples was calculated and compared using a t‐test to determine whether there was a difference. Example of an unpaired sample, more than two groups: The mean weights of the following four groups of five year olds were compared: boys living in rural areas, boys living in urban areas, girls living in rural areas and girls living in urban areas. In this case, the F‐test was the appropriate choice of a significance test. Example of a paired sample, two groups: The mean weights of adult males and adult females were compared while controlling for height. This meant that for each male of a certain height a female of the same height was selected so that each pair could be compared on weight. The paired t‐test was used in this example.

189
LUSAKA APEX MEDICAL UNIVERSITY FACULTY OF PUBLIC HEALTH MPH RESEARCH METHODS, PROPOSAL DEVELOPMENT & SCIENTIFIC REPORT WRITING MODULE 5 2019
7.11.5. MEASURING ASSOCIATIONS BETWEEN VARIABLES (TABLE 7.12.29) Table 7.12.2. Choosing a significance test when measuring associations between variables
Nominal data Chi‐square test ( if sample is large)
Calculate odds ratio or estimate relative risk (RR)
Ordinal or Numerical data When no linear relationship is suspected
Calculate Spearman’s rho or Kendall’s tau
Significance of Spearman’s rho or Kendall’s tau
Numerical data when a linear relationship is suspected
Calculate Pearson’s correlation coefficient (r)
Significance of Pearson’s correlation coefficient(r)
For NOMINAL DATA the relative risk is a useful measure of association that is often applied in case‐control or cohort studies. Example: In a case‐control study on tuberculosis (TB) in which you looked at type of employment you found that mineworkers were more likely to contract TB than the farmworkers. A chi‐square test confirmed that the difference in the incidence of TB between mineworkers and farmworkers was statistically significant. Calculation of the odds ratio would help to express how much more likely mineworkers were to contract TB than the farmworkers.
For ORDINAL DATA, Spearman’s rank correlation coefficient (rho) or Kendall’s tau can be calculated and tested for significance. For NUMERICAL DATA, when a linear relationship is suspected, Pearson’s correlation coefficient can be calculated and tested for significance.
7.12. DETERMINING DIFFERENCES BETWEEN GROUPS: UNPAIRED AND PAIRED OBSERVATIONS
We will now discussing in details on examining the differences between groups for unpaired and paired observations.
9 Source: Source: Corlien M. Varkevisser et.al (1991) Training series in Health Systems Research: Data Analysis & Report writing Vol.2 (2); Betty R. Kirkwood (1999) Essentials of Medical Statistics, 1st edition; Betty R. Kirkwood et al (2006) Essential Medical Statistics, 2nd edition; and Wayne W. Daniel (2010) Biostatistics: Basic Concepts and Methodology for the Health Sciences, 9th edition.
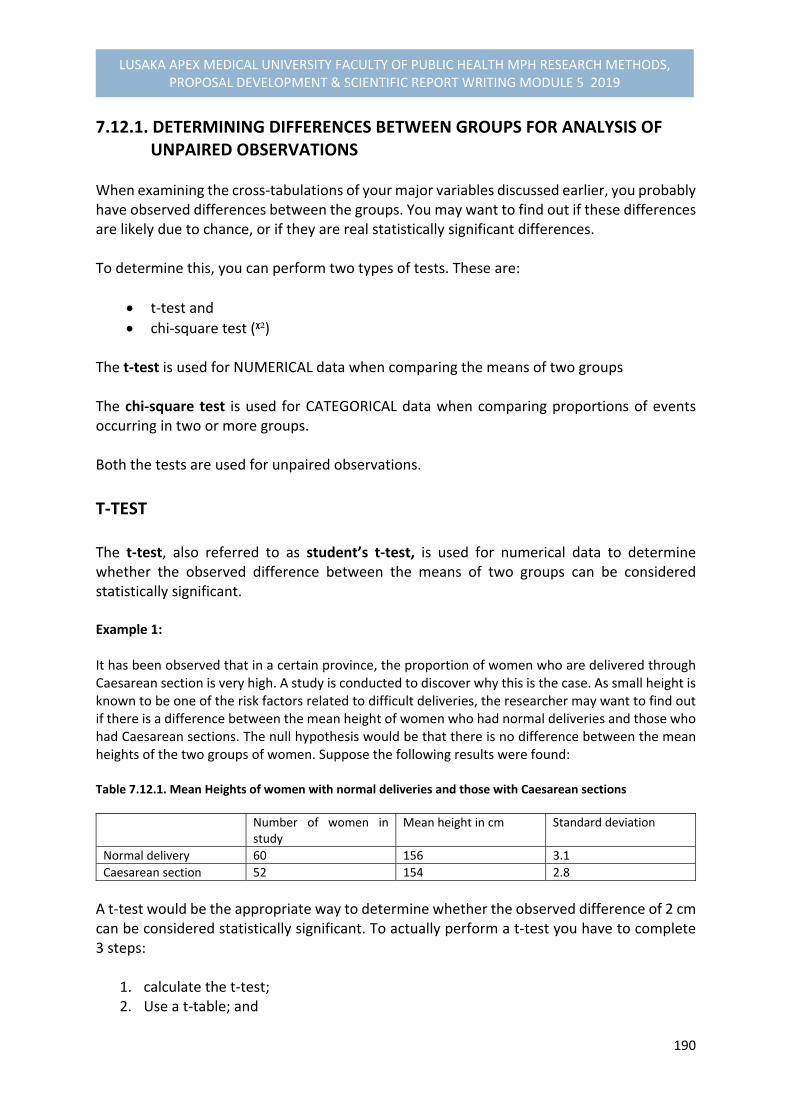
190
LUSAKA APEX MEDICAL UNIVERSITY FACULTY OF PUBLIC HEALTH MPH RESEARCH METHODS, PROPOSAL DEVELOPMENT & SCIENTIFIC REPORT WRITING MODULE 5 2019
7.12.1. DETERMINING DIFFERENCES BETWEEN GROUPS FOR ANALYSIS OF UNPAIRED OBSERVATIONS When examining the cross‐tabulations of your major variables discussed earlier, you probably have observed differences between the groups. You may want to find out if these differences are likely due to chance, or if they are real statistically significant differences. To determine this, you can perform two types of tests. These are:
t‐test and
chi‐square test (ᵡ²) The t‐test is used for NUMERICAL data when comparing the means of two groups The chi‐square test is used for CATEGORICAL data when comparing proportions of events occurring in two or more groups. Both the tests are used for unpaired observations.
T‐TEST The t‐test, also referred to as student’s t‐test, is used for numerical data to determine whether the observed difference between the means of two groups can be considered statistically significant. Example 1: It has been observed that in a certain province, the proportion of women who are delivered through Caesarean section is very high. A study is conducted to discover why this is the case. As small height is known to be one of the risk factors related to difficult deliveries, the researcher may want to find out if there is a difference between the mean height of women who had normal deliveries and those who had Caesarean sections. The null hypothesis would be that there is no difference between the mean heights of the two groups of women. Suppose the following results were found: Table 7.12.1. Mean Heights of women with normal deliveries and those with Caesarean sections
Number of women in study
Mean height in cm Standard deviation
Normal delivery 60 156 3.1
Caesarean section 52 154 2.8
A t‐test would be the appropriate way to determine whether the observed difference of 2 cm can be considered statistically significant. To actually perform a t‐test you have to complete 3 steps:
1. calculate the t‐test; 2. Use a t‐table; and

191
LUSAKA APEX MEDICAL UNIVERSITY FACULTY OF PUBLIC HEALTH MPH RESEARCH METHODS, PROPOSAL DEVELOPMENT & SCIENTIFIC REPORT WRITING MODULE 5 2019
3. Interpret the results.
Step 1: Calculating the T‐Test To calculate the t‐test value, you need to complete the following tasks: a) Calculate the difference between means. In the above example, the difference is 156‐
154 = 2 cm. b) Calculate the standard deviation for each of the study groups. Suppose the standard
deviations shown in Table 7.13.1 were found.
c) Calculate the standard error of the difference between the two means.
The standard error of the difference is given by the following formula: SD�² SD�²
‐‐‐‐‐‐ + ‐‐‐‐‐‐ n� n� Where: SD� is the standard deviation of the first sample SD� is the standard deviation of the second sample n� is the sample size of the first sample n� is the sample size of the second sample For this data, if you take the women with normal deliveries as sample 1 and those with Caesarean sections as sample 2, the standard error of the difference is:
3.1² 2.8² ‐‐‐‐‐‐ + ‐‐‐‐‐‐ = 0.56 60 52
d) Finally, divide the difference between the means by the standard error of the
difference. The value now obtained is the t‐value as: In the above example:
t = 2 = 3.6 ‐‐‐‐ 0.56
Expressed in one single formula:
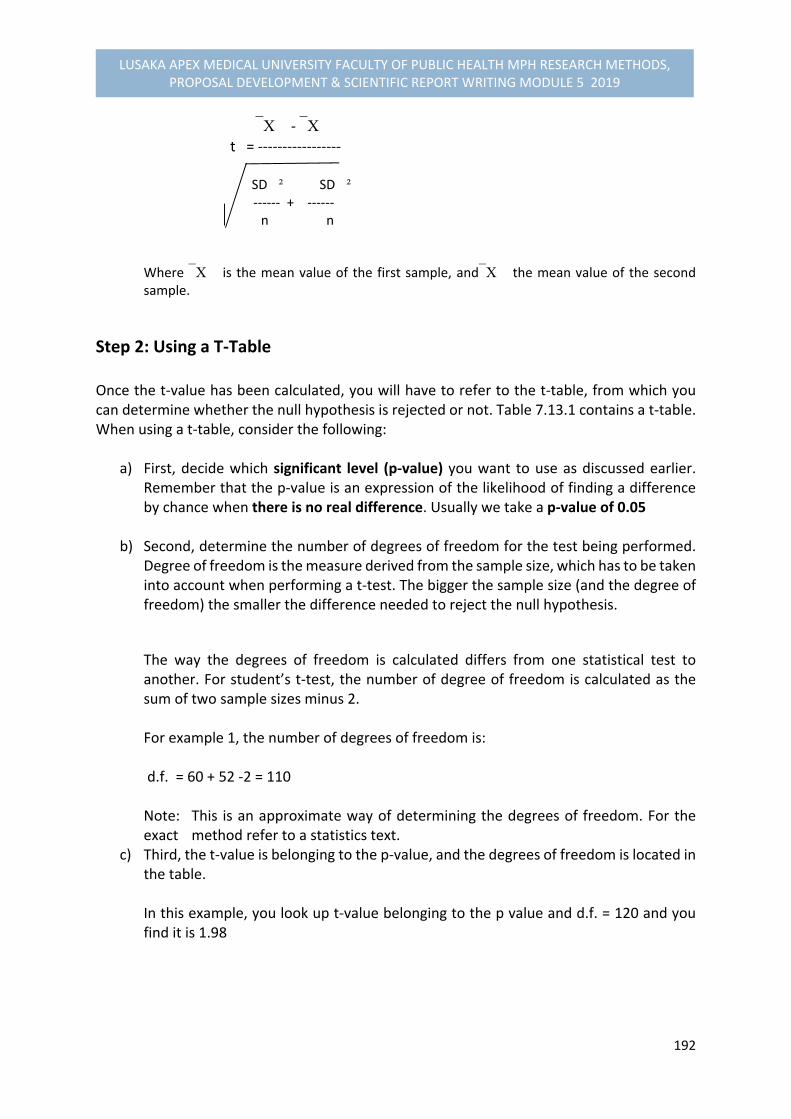
192
LUSAKA APEX MEDICAL UNIVERSITY FACULTY OF PUBLIC HEALTH MPH RESEARCH METHODS, PROPOSAL DEVELOPMENT & SCIENTIFIC REPORT WRITING MODULE 5 2019
� ‐ �
t = ‐‐‐‐‐‐‐‐‐‐‐‐‐‐‐‐‐ SD�² SD�²
‐‐‐‐‐‐ + ‐‐‐‐‐‐ n� n�
Where � is the mean value of the first sample, and� the mean value of the second sample.
Step 2: Using a T‐Table Once the t‐value has been calculated, you will have to refer to the t‐table, from which you can determine whether the null hypothesis is rejected or not. Table 7.13.1 contains a t‐table. When using a t‐table, consider the following:
a) First, decide which significant level (p‐value) you want to use as discussed earlier. Remember that the p‐value is an expression of the likelihood of finding a difference by chance when there is no real difference. Usually we take a p‐value of 0.05
b) Second, determine the number of degrees of freedom for the test being performed.
Degree of freedom is the measure derived from the sample size, which has to be taken into account when performing a t‐test. The bigger the sample size (and the degree of freedom) the smaller the difference needed to reject the null hypothesis.
The way the degrees of freedom is calculated differs from one statistical test to another. For student’s t‐test, the number of degree of freedom is calculated as the sum of two sample sizes minus 2. For example 1, the number of degrees of freedom is: d.f. = 60 + 52 ‐2 = 110 Note: This is an approximate way of determining the degrees of freedom. For the exact method refer to a statistics text.
c) Third, the t‐value is belonging to the p‐value, and the degrees of freedom is located in the table.
In this example, you look up t‐value belonging to the p value and d.f. = 120 and you find it is 1.98
193
LUSAKA APEX MEDICAL UNIVERSITY FACULTY OF PUBLIC HEALTH MPH RESEARCH METHODS, PROPOSAL DEVELOPMENT & SCIENTIFIC REPORT WRITING MODULE 5 2019
Step 3: Interpreting the Result Compare the absolute value of the t‐value calculated in step 1 (i.e. the t‐value) with the t‐value derived from the table in step 2. If the calculated t‐value is larger than the value derived from the table, p‐value is smaller than the value indicated at the top of the column. We then reject the null hypothesis and conclude that there is a statistically significant difference between the two means. If the calculated t‐value is smaller than the value derived from the table, p is larger than the value indicated at the top of the table. We then accept the null hypothesis and conclude that the observed difference is not statistically significant In example 1 the t‐value calculated in step 1 is 3.6, which is larger than the t‐value derived from the table in step 2 (1.98). Thus, p is smaller than 0.05, and we therefore reject the null hypothesis and conclude that the observed difference of 2 cm between the mean heights of women with normal deliveries and women with Caesarean sections is statistically significant. The conclusion can further be expressed in different ways:
We can say that the probability that the observed difference of 2 cm between two groups is due to chance is less than 5%; or
We can also say that the difference between the two groups is 3.6 times the standard error.
If you want to compare mean values of more than two groups (e.g. heights of urban, peri‐
urban, and rural women) you must use the F‐test.
CHI‐SQUARE (²) TEST If you have categorical data, the chi‐square test is used to find out whether observed differences between proportions of events in groups may be considered statistically significant. Example 2: Suppose that in a study of the factors affecting the utilization of antenatal clinics you found that 64% of the women who lived within 10 kilometres of the clinic came for antenatal care, compared to only 47% of those who lived more than 10 kilometres away. This suggests that antenatal care (ANC) is used more often by women who live close to the clinics. The complete results are presented in the following Table:
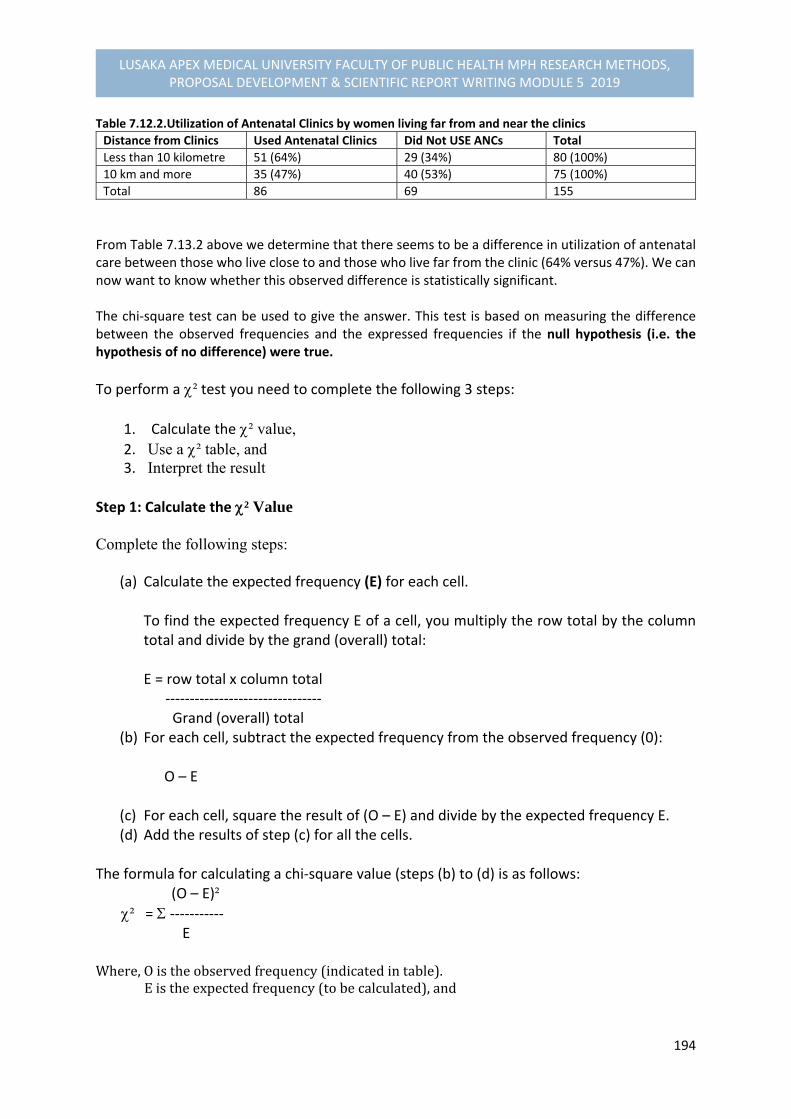
194
LUSAKA APEX MEDICAL UNIVERSITY FACULTY OF PUBLIC HEALTH MPH RESEARCH METHODS, PROPOSAL DEVELOPMENT & SCIENTIFIC REPORT WRITING MODULE 5 2019
Table 7.12.2.Utilization of Antenatal Clinics by women living far from and near the clinics Distance from Clinics Used Antenatal Clinics Did Not USE ANCs Total
Less than 10 kilometre 51 (64%) 29 (34%) 80 (100%)
10 km and more 35 (47%) 40 (53%) 75 (100%)
Total 86 69 155
From Table 7.13.2 above we determine that there seems to be a difference in utilization of antenatal care between those who live close to and those who live far from the clinic (64% versus 47%). We can now want to know whether this observed difference is statistically significant. The chi‐square test can be used to give the answer. This test is based on measuring the difference between the observed frequencies and the expressed frequencies if the null hypothesis (i.e. the hypothesis of no difference) were true.
To perform a ² test you need to complete the following 3 steps:
1. Calculate the ² value, 2. Use a ² table, and 3. Interpret the result
Step 1: Calculate the ² Value Complete the following steps:
(a) Calculate the expected frequency (E) for each cell. To find the expected frequency E of a cell, you multiply the row total by the column total and divide by the grand (overall) total: E = row total x column total ‐‐‐‐‐‐‐‐‐‐‐‐‐‐‐‐‐‐‐‐‐‐‐‐‐‐‐‐‐‐‐‐ Grand (overall) total
(b) For each cell, subtract the expected frequency from the observed frequency (0): O – E
(c) For each cell, square the result of (O – E) and divide by the expected frequency E. (d) Add the results of step (c) for all the cells.
The formula for calculating a chi‐square value (steps (b) to (d) is as follows: (O – E)² ² = ‐‐‐‐‐‐‐‐‐‐‐ E Where,Oistheobservedfrequency(indicatedintable).Eistheexpectedfrequency(tobecalculated),and
195
LUSAKA APEX MEDICAL UNIVERSITY FACULTY OF PUBLIC HEALTH MPH RESEARCH METHODS, PROPOSAL DEVELOPMENT & SCIENTIFIC REPORT WRITING MODULE 5 2019
(thesumof)directsyoutoaddtogethertheproductsof(o–E)²forallthecellsofthetableFortwobytwotable,whichcontains4cells,theformulais:(O�‐E�)² + (O� -E�)² + (O� -E�)² + (O� - E�)²² = ------- -------- ------- --------- E₁ E₂ E₃ E₄
Step 2: Using a ² Table
As for the t‐test, the calculated ² value has to be compared with a theoretical ² value in order to determine whether the null hypothesis is rejected or not. Table 7.13.2 contains a
table of theoretical ² value.
(a) First you must decide on a p‐value. We usually take 0.05.
(b) Then the degrees of freedom have to be calculated. With ² test the number of degrees of freedom is related to the number of cells, i.e. the number of groups or variables you are comparing. The number of degrees of freedom is found by multiplying the number of rows (r ) minus 1 by the number of columns (c ) minus 1:
d.f. = (r‐1) x (c ‐1) For a simple two‐by‐two table, the number of degrees of freedom is 1 (i.e. d.f. = (2‐1) x (2‐1) =1).
(c) Then the ² value belonging to the p‐value and the number of degrees of freedom is
located in the table in order to determine whether the ² value is statistically significant or not.
Step 3: Interpreting the Result As for the t‐ test, the null hypothesis is rejected if p< 0.05, which is the case if the calculated
² value is larger than the theoretical ² value in the table.
Let us now apply the ² test to the data given in example 2‐ utilization of antenatal care. This gives the following results: Step 1(a): The expected frequencies for each cell are calculated as follows: E� = 86 x 80/155= 44.4 E� = 69 x 80/155 = 35.6 E� = 86 x 75 / 155 = 41.6 E� = 69 x 75/155 = 33.4 The observed and expected frequencies are now shown in the following table:

196
LUSAKA APEX MEDICAL UNIVERSITY FACULTY OF PUBLIC HEALTH MPH RESEARCH METHODS, PROPOSAL DEVELOPMENT & SCIENTIFIC REPORT WRITING MODULE 5 2019
Table 7.12.3. Utilization of antenatal clinics, observed and expected frequencies
Distance from clinic Used ANC Did not Use ANC Total
Less than 10 km O� =51, E� =44.4 O� =29, E� =35.6 80
10 km or more O� =35, E� = 41.6 O� =40, E� =33.4 75
Total 86 69 155
Note that the expected frequencies refer to the values we would have expected, given the total numbers of 80 and 75 women in the two groups, if the null hypothesis, stating that there is no difference between the two groups, were true.
Step 1 (b) to 1(d): (51‐44.4)² + ( 29 – 35.6)² + (35 – 41.6)² + (40 ‐33.4)² ² = ‐‐‐‐‐‐‐‐‐‐‐‐‐ ‐‐‐‐‐‐‐‐‐‐‐‐‐‐‐ ‐‐‐‐‐‐‐‐‐‐‐‐‐‐ ‐‐‐‐‐‐‐‐‐‐‐‐‐ 44.4 35.6 41.6 33.4 = 0.98 + 1.22 + 1.05 + 1.30 = 4.55 Step 2: As we have a simple two‐by‐two table the number of degrees of freedom (d.f.) is 1. Use the table of chi‐square values in Table 7.13.2. We have decided before hand on the level of significance of 5% (p‐value = 0.05). As the number of d.f. is 1, we look along that row in the column where p= 0.05. This gives us
the value of 3.84. The ² value of 4.55 calculated is larger than 3.84, which means that the p‐value is smaller than 0.05 (it is even much smaller 0.01). Step 3: We can now conclude that the women living within a distance of 10 km from the clinic use antenatal care significantly more often than those living far away from the clinic. It is important to present your data clearly and to formulate carefully any conclusions based on statistical tests in the final report of your study. NOTE:
The ² test can only be applied if the sample is large enough. The general rule is that the total sample should be at least 40 and the expected frequency in each of the cells should be at least 5. If this is not the case, Fisher’s exact test should be used. If the table is more than a two‐by‐two table, the expected frequency of 1 in 5 cells is allowed to be less than 5.
Unlike the t‐test, the ² test can also be used to compare more than two groups. In that case a table with three or more rows and columns would be designed, rather than a two‐by‐two table.

197
LUSAKA APEX MEDICAL UNIVERSITY FACULTY OF PUBLIC HEALTH MPH RESEARCH METHODS, PROPOSAL DEVELOPMENT & SCIENTIFIC REPORT WRITING MODULE 5 2019
In the above example one could decide to distinguish between three different distances: less than 5 km, 5 to 10 km, and more than 10 km. The data would be then put in a two‐by‐three table. The number of degrees of freedom would be (3‐1)x (2‐1) = 2
Quick formula
A quick formula to calculate the chi‐square value replacing the above step 1 described above would be: If the various numbers in the cross‐table are represented by the letters in the following table:
Condition+ ‐
Total
Exposure Yes No
a b c d
e f
Total g h
Using this example, the quick formula for calculating the chi‐square value is n(ad‐bc)² ² = ------------- Efgh
7.12.2. DETERMINING DIFFERENCES BETWEEN GROUPS: ANALYSIS OF PAIRED OBSERVATIONS In this part of the module unit, we will discuss the various ways of how to identify research studies where pairing or matching of subjects is necessary, and further identify and use of significant tests appropriate for studies using paired data. We will look at the most common used tests for paired observations, which are:
Paired t‐test, and
McNemar’s chi‐square test for nominal data
Meaning of pairing and matching To demonstrate the concept of pairing or matching subjects is illustrated in the following examples: Example 1: A researcher wanted to determine whether a class of students taught with audio‐visual aids received, on an average, better grades than those who are taught without audio‐visual (AV) aids. To minimize
198
LUSAKA APEX MEDICAL UNIVERSITY FACULTY OF PUBLIC HEALTH MPH RESEARCH METHODS, PROPOSAL DEVELOPMENT & SCIENTIFIC REPORT WRITING MODULE 5 2019
the effect of confounding variables, such as social status, previous knowledge of the subjects, and IQ levels, each student in the AV class was paired with another student in the non AV class for these variables. Example 2: During a nutritional survey, a quality‐control exercise was carried out to check the agreement between two observers in measuring children’s weight. In this example, each child acted as his own match.
Example 3: A research team compared schistosomiasis egg counts in two villages. It recognized that egg counts vary with age and sex. It decided to ensure that the samples were comparable with respect to age and sex by selecting subjects in pairs, with one member of each pair from each village who were matched for age and sex.
We will now describe these common used tests for paired observations.
PAIRED T=TEST When dealing with paired (matched) observations, comparison of sample means is performed by a modified t‐test known as the paired t‐test. In the paired t‐test, a single set of differences between the paired observations is used instead of the original two sets of observations. The paired t‐test calculates a value of t as: Mean difference t = ‐‐‐‐‐‐‐‐‐‐‐‐‐‐‐‐‐‐‐‐‐ standard error The number of degrees of freedom is the sample size minus 1 (or the number of paired observations minus 1). To illustrate how the paired t‐test is used, it will be performed on the results of the nutritional survey referred to in example 2 above. The results are as follows:
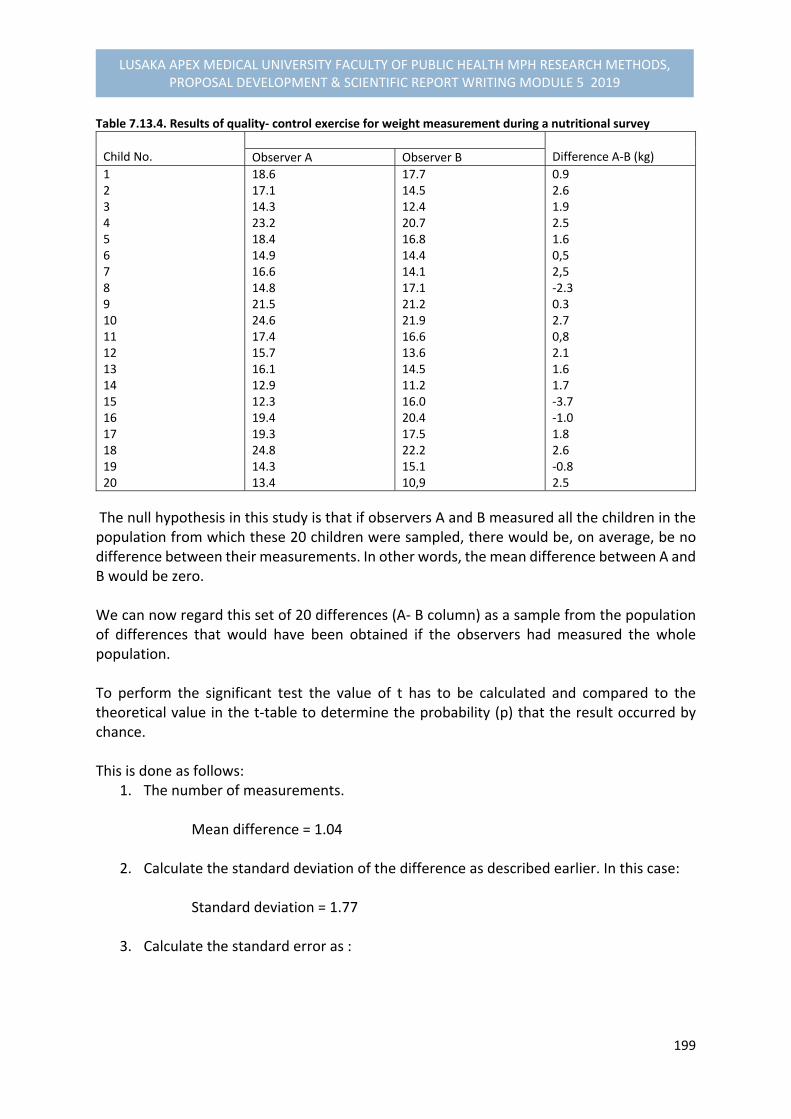
199
LUSAKA APEX MEDICAL UNIVERSITY FACULTY OF PUBLIC HEALTH MPH RESEARCH METHODS, PROPOSAL DEVELOPMENT & SCIENTIFIC REPORT WRITING MODULE 5 2019
Table 7.13.4. Results of quality‐ control exercise for weight measurement during a nutritional survey
Child No.
Difference A‐B (kg) Observer A Observer B
1 2 3 4 5 6 7 8 9 10 11 12 13 14 15 16 17 18 19 20
18.6 17.1 14.3 23.2 18.4 14.9 16.6 14.8 21.5 24.6 17.4 15.7 16.1 12.9 12.3 19.4 19.3 24.8 14.3 13.4
17.714.5 12.4 20.7 16.8 14.4 14.1 17.1 21.2 21.9 16.6 13.6 14.5 11.2 16.0 20.4 17.5 22.2 15.1 10,9
0.9 2.6 1.9 2.5 1.6 0,5 2,5 ‐2.3 0.3 2.7 0,8 2.1 1.6 1.7 ‐3.7 ‐1.0 1.8 2.6 ‐0.8 2.5
The null hypothesis in this study is that if observers A and B measured all the children in the population from which these 20 children were sampled, there would be, on average, be no difference between their measurements. In other words, the mean difference between A and B would be zero. We can now regard this set of 20 differences (A‐ B column) as a sample from the population of differences that would have been obtained if the observers had measured the whole population. To perform the significant test the value of t has to be calculated and compared to the theoretical value in the t‐table to determine the probability (p) that the result occurred by chance. This is done as follows:
1. The number of measurements. Mean difference = 1.04
2. Calculate the standard deviation of the difference as described earlier. In this case:
Standard deviation = 1.77
3. Calculate the standard error as :

200
LUSAKA APEX MEDICAL UNIVERSITY FACULTY OF PUBLIC HEALTH MPH RESEARCH METHODS, PROPOSAL DEVELOPMENT & SCIENTIFIC REPORT WRITING MODULE 5 2019
Standard error = standard deviation ‐‐‐‐‐‐‐‐‐‐‐‐‐‐‐‐‐‐‐‐‐‐‐‐‐ = 1.77 = 0.40 Sample size 20
4. The number of degrees of freedom is the sample size (the number of pairs of observations) minus 1, which in this case is 20 ‐1 = 19
The probability from the table is = 0.05 which allows us to conclude that there is a significant difference between the observers.
7.13. MEASURING RISK IN CASE‐CONTROL STUDIES In this section we will now deal with the concepts of incidence, risk and relative risk, and estimate the relative risk from a case‐control study using the appropriate measures. These measures are:
Odds ratio for unpaired observations McNemar’s estimate of relative risk in a case‐control study.
In a case‐control study, the investigator compares a group of cases, among which the problem that he or she wishes to investigate is present (e.g. a disease or death) with a group of controls, among which the problem is absent (or survived). The researcher makes this comparison to determine what factors may have contributed to the problem. Before we examine the appropriate analysis, we will discuss a few important concepts.
INCIDENCE INCIDENCE is the total number of new cases of a defined condition (for example a disease) that occur during a specified period of time inn a defined population
Example: The total number of new tuberculosis cases in District X in 2016 was 273. We may say that the incidence of tuberculosis in District X in 2016 was 350. INCENDENCE RATE is the total number of new cases of a defined condition that occur during a specified period of time divided by the ‘population at risk.’

201
LUSAKA APEX MEDICAL UNIVERSITY FACULTY OF PUBLIC HEALTH MPH RESEARCH METHODS, PROPOSAL DEVELOPMENT & SCIENTIFIC REPORT WRITING MODULE 5 2019
Example: A District X has a population of 200,000. The incidence of tuberculosis in 2016 was 273/ 200,000 per year, or 137/100,000 per year.
RISK A RISK – is the probability that an event will occur (e.g. an individual will become ill or die) within a specified period of time or age.
Example: A risk of contracting tuberculosis in District X is 137/100,000 per year. The risk may not be the same for various subgroups in the population. Whereas the risk of getting tuberculosis for farmers might be 100/100,000 per year, it may be 200/100,000 per year for mine workers. In this example, mine workers are twice as likely to get tuberculosis. Therefore it may be concluded that being a mine worker is a risk factor for contracting tuberculosis and carries a relative risk of 2. There are several meanings of defining a RISK FACTOR: RISK FACTOR‐ is an attribute or exposure that is associated with an increased probability of a specified outcome, such as the occurrence of a disease; or an attribute or exposure that increases the probability of occurrence of the case or other specified outcome; or a modifiable determinant reducing the probability of occurrence of a disease or other specified outcomes10.
RELATIVE RISK When determining a relative risk we have to consider two subgroups in the study population: a subgroup in which a risk factor is present, and one in which the risk factor is absent. A RELATIVE RISK‐ is a risk of getting a disease in a group with a risk factor divided by the risk of getting the disease in the group without a risk factor. In other words, it is the ratio of the risk of disease or death among the exposed to the risk among the unexposed11.
10 John M. Last (1995). A Dictionary of Epidemiology, 3rd edition 11 John M. Last (1995). A Dictionary of Epidemiology, 3rd edition
202
LUSAKA APEX MEDICAL UNIVERSITY FACULTY OF PUBLIC HEALTH MPH RESEARCH METHODS, PROPOSAL DEVELOPMENT & SCIENTIFIC REPORT WRITING MODULE 5 2019
Note that the higher a relative risk is, the more likely it becomes that the risk factor is causal and not due to confounding variables.
ESTIMATING RELATIVE RISK IN A CASE‐CONTROL STUDY As stated earlier, case‐control studies are conducted to identify risk factors for diseases or conditions. When analysing the results of a case‐control study, it is necessary to construct analytic cross‐tabulations in which the cases and controls are placed in columns, while the different variables which are considered as possible risk factors are placed in rows. If a difference is observed between the cases and controls with regard to a specific variable (risk factor), a chi‐square test can be performed to determine if the difference is statistically significant. However, when this test is performed, the strength of the relationship between the two variables (having or not having the risk factor and having or not having the disease) is not measured. Therefore, one needs a measure of association. The RELATIVE RISK is such a measure of association. This analysis is helpful to us in solving practical problems. If you know of a risk factor and among whom it is present and you also know its relative risk, you can estimate to what extent the incidence of the disease can be reduced by preventive measures (assuming that the risk factor is causal). For example: If you know that smokers are 10 times more likely to develop lung cancer than the non‐smokers, you may assume that a health education campaign that brings down the percentage of smokers in an adult population from 40% to 35% would lead to a dramatic reduction in the incidence of lung cancer.
In case‐control studies, the relative risk usually cannot be calculated because the incidence of the disease in the total population, from which the sample was drawn, is not measured. However, it is possible to estimate the relative risk. We will now discuss procedures for obtaining estimates of relative risk for two different situations for unpaired observations and for paired observations.
ESTIMATING RELATIVE RISK: UNPAIRED OBSERVATIONS For unpaired observations, the relative risk can be estimated by the ODDS RATIO. This is true only if two conditions are met:
The disease has a low incidence in the total population, in both the risk group and not at risk group. Under 0.05 will usually suffice.

203
LUSAKA APEX MEDICAL UNIVERSITY FACULTY OF PUBLIC HEALTH MPH RESEARCH METHODS, PROPOSAL DEVELOPMENT & SCIENTIFIC REPORT WRITING MODULE 5 2019
The control group is representative of the total population.
Example 1: In a case‐control study on smoking as a risk factor for lung cancer, the following data were obtained: Table 7.13.1. Smokers and non‐smokers among cases and controls12.
Lung cancer cases Non‐smoker healthy controls
Smokers (+) 350 184
Non‐smokers (‐ ) 45 216
Total 395 400
We determine from this table that more lung cancers cases smoke than healthy controls. This cannot be
explained by sampling variations (² = 164; d.f. = 1; P < 0.001).
The relative risk for getting lung cancer that is associated with smoking cigarettes is estimated by calculating the ODDS RATIO as follows: ODDS RATIO = 350 x216 ‐‐‐‐‐‐‐‐‐‐‐‐‐ = 9.1 184 x45 Interpretation of ODDS RATIO results: This means that those who smoked in the study were 9.1 times more likely to develop lung cancer than those who did not smoke.
The following are the steps for performing this general type of analysis: STEP 1: Prepare a table Table 7.13.2: Relative risk analysis in cases and controls
Risk Factor Cases Controls Total
Present (+) Absent (‐)
a b c d
e f
Total g h N
STEP 2: Examine whether a difference exists between cases and controls with respect to the
variables that is suspected to be a risk factor. Perform a ² test to determine whether the difference is statistically significant.
12 Adapted from: Corlien M. Varkevisser et al. (1993). Health Systems Research Training Series: Data analysis and report writing, 2(2), IDRC
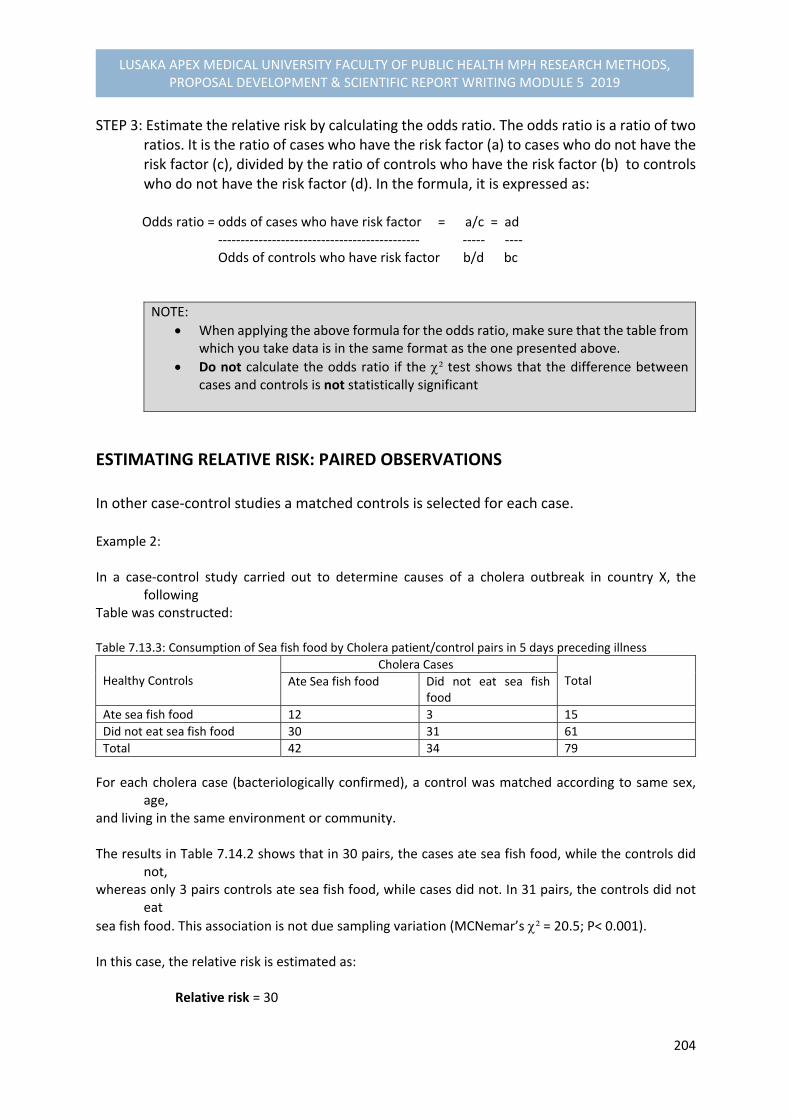
204
LUSAKA APEX MEDICAL UNIVERSITY FACULTY OF PUBLIC HEALTH MPH RESEARCH METHODS, PROPOSAL DEVELOPMENT & SCIENTIFIC REPORT WRITING MODULE 5 2019
STEP 3: Estimate the relative risk by calculating the odds ratio. The odds ratio is a ratio of two ratios. It is the ratio of cases who have the risk factor (a) to cases who do not have the risk factor (c), divided by the ratio of controls who have the risk factor (b) to controls who do not have the risk factor (d). In the formula, it is expressed as:
Odds ratio = odds of cases who have risk factor = a/c = ad ‐‐‐‐‐‐‐‐‐‐‐‐‐‐‐‐‐‐‐‐‐‐‐‐‐‐‐‐‐‐‐‐‐‐‐‐‐‐‐‐‐‐‐‐‐ ‐‐‐‐‐ ‐‐‐‐ Odds of controls who have risk factor b/d bc
NOTE:
When applying the above formula for the odds ratio, make sure that the table from which you take data is in the same format as the one presented above.
Do not calculate the odds ratio if the ² test shows that the difference between cases and controls is not statistically significant
ESTIMATING RELATIVE RISK: PAIRED OBSERVATIONS In other case‐control studies a matched controls is selected for each case. Example 2: In a case‐control study carried out to determine causes of a cholera outbreak in country X, the
following Table was constructed: Table 7.13.3: Consumption of Sea fish food by Cholera patient/control pairs in 5 days preceding illness
Healthy Controls
Cholera Cases Total Ate Sea fish food Did not eat sea fish
food
Ate sea fish food 12 3 15
Did not eat sea fish food 30 31 61
Total 42 34 79
For each cholera case (bacteriologically confirmed), a control was matched according to same sex, age,
and living in the same environment or community. The results in Table 7.14.2 shows that in 30 pairs, the cases ate sea fish food, while the controls did
not, whereas only 3 pairs controls ate sea fish food, while cases did not. In 31 pairs, the controls did not
eat
sea fish food. This association is not due sampling variation (MCNemar’s ² = 20.5; P< 0.001). In this case, the relative risk is estimated as: Relative risk = 30
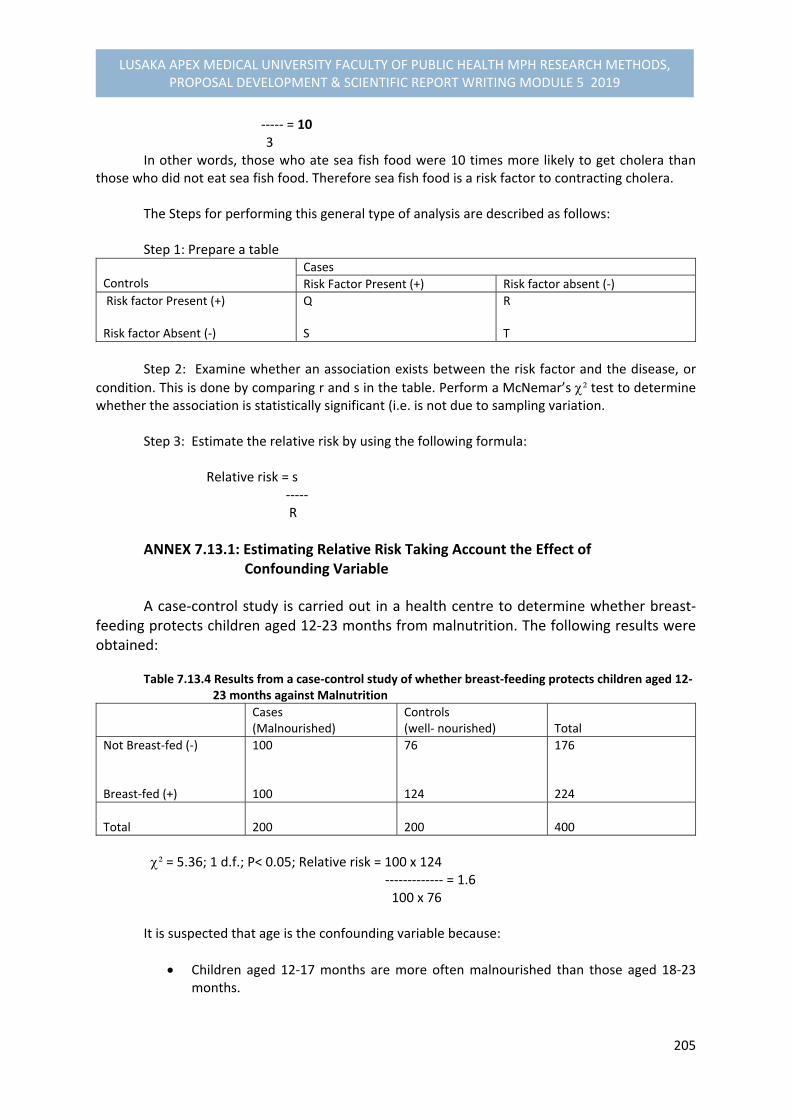
205
LUSAKA APEX MEDICAL UNIVERSITY FACULTY OF PUBLIC HEALTH MPH RESEARCH METHODS, PROPOSAL DEVELOPMENT & SCIENTIFIC REPORT WRITING MODULE 5 2019
‐‐‐‐‐ = 10 3 In other words, those who ate sea fish food were 10 times more likely to get cholera than
those who did not eat sea fish food. Therefore sea fish food is a risk factor to contracting cholera. The Steps for performing this general type of analysis are described as follows: Step 1: Prepare a table
Controls
Cases
Risk Factor Present (+) Risk factor absent (‐)
Risk factor Present (+) Risk factor Absent (‐)
Q S
R T
Step 2: Examine whether an association exists between the risk factor and the disease, or
condition. This is done by comparing r and s in the table. Perform a McNemar’s ² test to determine whether the association is statistically significant (i.e. is not due to sampling variation.
Step 3: Estimate the relative risk by using the following formula: Relative risk = s ‐‐‐‐‐ R
ANNEX 7.13.1: Estimating Relative Risk Taking Account the Effect of Confounding Variable
A case‐control study is carried out in a health centre to determine whether breast‐feeding protects children aged 12‐23 months from malnutrition. The following results were obtained:
Table 7.13.4 Results from a case‐control study of whether breast‐feeding protects children aged 12‐ 23 months against Malnutrition
Cases (Malnourished)
Controls(well‐ nourished) Total
Not Breast‐fed (‐) Breast‐fed (+)
100 100
76 124
176 224
Total
200 200 400
² = 5.36; 1 d.f.; P< 0.05; Relative risk = 100 x 124 ‐‐‐‐‐‐‐‐‐‐‐‐‐ = 1.6 100 x 76 It is suspected that age is the confounding variable because:
Children aged 12‐17 months are more often malnourished than those aged 18‐23 months.

206
LUSAKA APEX MEDICAL UNIVERSITY FACULTY OF PUBLIC HEALTH MPH RESEARCH METHODS, PROPOSAL DEVELOPMENT & SCIENTIFIC REPORT WRITING MODULE 5 2019
More children aged 12‐17 months are breastfed than those aged 18‐23 months. The question now is: How do we analyse these data? The answer is obtained by performing three steps: Step 1: Split up the table into two: Table 7.13.5. Results for children aged 12‐17 months
Cases (Malnourished)
Controls (Well nourished)
Total
Not Breast fed (‐) Breast‐fed (+)
50 (42 %) 70 (58%)
22 (28%) 56 (72%)
72 128
Total
120 (100%)
80 (100 %)
200
² = 3.58; 1 d.f.; P< 0.05; Relative risk = 1.8 Table 7.13.6. Results for Children aged 18‐23 months
Cases (Malnourished)
Controls ( Well nourished)
Total
Not Breast‐fed (‐) Breast‐fed (+)
50 (63%) 30 (37%)
54 (46%) 66 (54%)
104 96
Total 80 (100%) 120 (100%) 200
² = 5.2; 1 d.f.; p< 0.05; Relative risk = 2.0 You will note that for each of the subgroups the relative risk of not breast feeding is higher than that obtained for the group overall (approximately 2). We will then apply an overall significance test and estimate the overall relative risk, so we proceed to next step.
Step 2: Apply an overall significance test using the Mantel‐ Haenszel ² as follows: Oₐ Eₐ (eg/h Vₐ (egfh/n² (n‐1) 12‐17 months 18‐ 23 months
50 50
43.2 41.6
11.1 12.0
Total 100 84.8 23.1
² = ( Oₐ ‐ Eₐ ‐ 0.5)² = (100 – 84.8 – 0.5)² = 9.35; 1 d.f.; p< 0.01 ‐‐‐‐‐‐‐‐‐‐‐‐‐‐‐‐‐‐‐ ‐‐‐‐‐‐‐‐‐‐‐‐‐‐‐‐‐‐‐‐‐‐‐ Vₐ 23.1

207
LUSAKA APEX MEDICAL UNIVERSITY FACULTY OF PUBLIC HEALTH MPH RESEARCH METHODS, PROPOSAL DEVELOPMENT & SCIENTIFIC REPORT WRITING MODULE 5 2019
Step 3: The overall estimate of relative risk is calculated as follows:
ad/n bc/n
12‐17 months 18‐23 months
14.5 16.5
7.7 8.1
Total 31.0 15.8
Relative risk = ad/n = 31.0 = 2.0 ‐‐‐‐‐‐‐ ‐‐‐‐‐‐ bc/n 15.8
7.14. PERFORMANCE EVALUATION EXERCISES:
1. If your data were collected by paired or matched observations, identify the appropriate statistical test and make the necessary calculations and analysis.
2. Calculate the range, the standard deviation and the 95% confidence interval for
your most important sets of numerical data, and interpret the results of these calculations.
3. Calculate the 95% confidence interval of percentages for your most important sets of categorical data, and interpret the results of these calculations.
Additional Readings
1. Corlien M. Varkevisser., Indra Pathmanathan., Ann Brownlee.1993. Health Systems Research Training Series: Data Analysis and Report Writing, Volume 2 Part 2, IDRC, ISBN: 0‐88936‐585‐7
2. John M. Last.1995. A Dictionary of Epidemiology, 3rd edition, IEA, ISBN: 0‐19‐509668‐1
3. Betty R. Kirkwood. 1999. Essentials of Medical Statistics, 1st edition, Blackwell Science, ISBN: 0‐632‐01052‐5
4. Betty R. Kirkwood and Jonathan A.C. Sterne. 2003. Essential Medical Statistics, Second Edition, Blackwell Science, ISBN: 978‐0‐86542‐871‐3
5. Sirkin Mark.R. 1999. Statistics for the Social Sciences, 2nd Edition, Sage Publications, ISBN: 0‐8039‐5145‐0
6. Wayne W. Daniel. 2010. Biostatistics: Basic Concepts and Methodology for the Health Sciences, 9th edition, Wiley, ISBN: 978‐0‐470‐41333‐3
208
LUSAKA APEX MEDICAL UNIVERSITY FACULTY OF PUBLIC HEALTH MPH RESEARCH METHODS, PROPOSAL DEVELOPMENT & SCIENTIFIC REPORT WRITING MODULE 5 2019
MODULE 5.8
SCIENTIFIC REPORT WRITING SKILLS: DISSERTATIONS/THESES & MANUSCRIPT PUBLICATIONS
8.1. INTRODUCTION Writing your research report, viewed in the postgraduate training as a dissertation or thesis, as a higher level scientific report, is not just a necessary tedious work, but a prerequisite to being granted your degree and the means by which you substitute contributions to the scientific body of knowledge. It is an integral and essential component of your postgraduate training. Writing itself is a creative process as it is in writing that ideas are generated and conclusions reached. The skills which you develop while writing your thesis, selection of materials, critical analysis of information, assessment of ideas and written communication will add value throughout your career. It should be realized that writing a thesis is a substantial task involving a magnitude explanation of previous search for facts, organizing principles, narrative skills and conclusions, or explanations that make disconnected facts intelligible (Barzun et al. 2004; Stainisstreet 1995). Therefore, it is necessary to seek guidance as you plan and make progress with your writing. You should seek individual advice from your supervisor and also from colleagues who This module unit provides such guidance on your thesis writing skills and for the development of manuscripts for journal publications. It provides suggestions about dissertation or thesis writing thought to be helpful by those who have written theses and those who have supervised postgraduate students. Considering that postgraduates have to undergo an oral examination or “viva voce”, this module unit contains advice about how to prepare for and conduct yourself in a “viva”. Therefore, the contents of this module unit have been organized into eight (8) major components for a consolidated thesis writing skills which include: requirements of the thesis; scheduling and planning of the thesis; consulting your supervisor; preparing the first draft; Developing your writing skills; revising the drafts; reviewing the final draft; production of the manuscript and illustrations; and using references, appendices and footnotes. The aim is to provide scientific writing skills for the quality production of a postgraduate dissertation or thesis and publication by the students.
8.2. OBJECTIVES By the end of this session, you should be able:
(1) Develop the outline of the main components of your research report or thesis (2) Write drafts of your report in stages or chapters (3) Check the final draft for completeness, possible overlaps, clarity and coherence of writing
style. (4) Draft recommendations, or implications of your research findings for action based on your
thesis.

209
LUSAKA APEX MEDICAL UNIVERSITY FACULTY OF PUBLIC HEALTH MPH RESEARCH METHODS, PROPOSAL DEVELOPMENT & SCIENTIFIC REPORT WRITING MODULE 5 2019
8.3. REFLECTION Reflection Exercise: Make an attempt to reflect on the following questions:
1. What are the basic requirements for writing a thesis? 2. What steps are required in preparing for your research report or thesis?
Whether your answers that you reflected on were correct or not, we will begin by first of all discussing the steps involved in the preparation of your research report, dissertation or thesis.
8.4. STEPS IN PREPARING THE THESIS There are three (3) major preliminary considerations to embark on before writing your research report or thesis:
Step 1: Audience The purpose of a research report or thesis is to convey information to the reader. Therefore, it is important to begin by clarifying in your mind: Who is the reader? Why does he or she want to read the research report or thesis? In a public health research or medical research, it is important to remember that the needs of the audience is not only for the post graduate training or academic institutions, or research community, but the industries or public health sectors to which such information should be used to make a difference in health status of communities. Health managers and community leaders form part of the audience to be availed with information. Even though many research reports, which are meant for scientific disciplines, may not be suitable for managers and lay community people, special attention should be devoted to the simplicity wording of the reports, with emphasis on the findings. Furthermore, it is important to present not only scientific findings, but also the recommendations that take into consideration the local characteristics of the health systems, constraints, feasibility, and usefulness of the proposed solutions. The health managers and the community are the most interested parties in learning “what to do about the problem” than being told “there is a problem.” Research reports should meet the NEEDS OF THE AUDIENCE of the community, health managers, policy makers and researchers.
210
LUSAKA APEX MEDICAL UNIVERSITY FACULTY OF PUBLIC HEALTH MPH RESEARCH METHODS, PROPOSAL DEVELOPMENT & SCIENTIFIC REPORT WRITING MODULE 5 2019
Step 2: How the Reader Reads a Research Report or Thesis Recognizing the “reading strategies” of people or others who read research reports will help you write a good report. You should make an effort to frequently be in constant with your supervisor for guidance. Furthermore, develop a spirit of reading scientific articles in journals or books or presentations at conferences will help you to learn how information is being presented. Remember that your research was done for the purpose of providing “new information.” Therefore, this should be the highlight and focus of the thesis. This “new information” should be summarized as the conclusion of the study. Most readers will begin by reading the conclusions. If this section is interesting, useful, and attractively presented, the reader will look at the other sections. The other sections of the thesis or report are intended to support the conclusions by helping the reader clarify two basic questions in his or her mind:
a. How will this “new information” help improve the health of community? (i.e. what is the problem and the health system in which the problem occurs and how will this information help solve or reduce the problem?
b. Can I “believe” these findings? (i.e. Are the findings valid and reliable?). The research
design, sampling, methods of data collection, and the data analysis will substantiate the validity and reliability.
Note that a report that highlights the methodology sections rather than the conclusions might interest a researcher’s audience, but will not interest the manager audience.
Step 3: Completing the Data Analysis Before you begin the outline and first draft of your report or thesis, you need to review your analysis of data by asking yourself the following questions:
a. Are conclusions appropriate to the specific objectives? Are they comprehensive?
The earlier steps in data analysis should have produced:
One or more conclusions stated as simple sentences; and
One or more analytic tables together with the relevant descriptive statistics or statistical tests to support the conclusions’
Review these conclusions and check whether:
Every specific objective has been dealt with;
All aspects of each objective have been dealt with; and
The conclusions are relevant and appropriate to the objectives.
b. Are further analytic tables needed?

211
LUSAKA APEX MEDICAL UNIVERSITY FACULTY OF PUBLIC HEALTH MPH RESEARCH METHODS, PROPOSAL DEVELOPMENT & SCIENTIFIC REPORT WRITING MODULE 5 2019
If the conclusions are not comprehensive, prepare further “dummy analytic tables” and analyse the data as described in the previous module parts.
c. Have all qualitative data been used to support and specify conclusions drawn from tables?
Once you have completed this review, you need to complete a couple of additional tasks as specified below:
a. State the final conclusions in relation to each objective.
During earlier stages of analysis, every analytic table would have had a conclusion. These conclusions should be reviewed, combined whenever possible, and stated in such a way that the main findings of the study are easily identifiable by a reader who is “scanning “ report.
b. Select supportive tables to appear in the text of the report or thesis.
The number of tables in the body of the report should be very limited. A table should be included only if it illustrates an important conclusion or provides evidence to support it. Where possible, combine information from several analytic tables into one or more and present a summary table in the body of the report (if necessary, more detailed tables can be placed in the annexes). The titles of each table should tell the reader in as few words as possible exactly what the table contains. Columns and raw headings should be brief and self‐explanatory. Compile the conclusions and tables relating to each specific objective and start drafting the report.
Before you start writing your report or thesis, there are other preliminary requirements that should be considered and these are discussed as follows:
8.5. GENERAL REQUIREMENTS OF THE THESIS The following provide a general understanding of the requirements governing production of the thesis:
General Contribution to the Body of Knowledge: Formal general requirements do
exist in the production of theses in any academic institution. For example, an MSc thesis will embrace the results of individual research, while a Ph.D. thesis will embrace the results of individual research which makes an original contribution to learning. All theses should show evidence of a systematic study and ability to relate the results to the general body of knowledge in that subject.
Length, Format and Presentation of Thesis: to ensure a measure of uniformity, there are also more specific normal requirements which govern the length, format and

212
LUSAKA APEX MEDICAL UNIVERSITY FACULTY OF PUBLIC HEALTH MPH RESEARCH METHODS, PROPOSAL DEVELOPMENT & SCIENTIFIC REPORT WRITING MODULE 5 2019
presentation of thesis. You need to find out these requirements at an early stage so that you can plan with them in mind.
Production of Thesis: Although there are specific requirements governing production of the thesis, you should be aware of the following pitfalls:
a. First, your thesis should be highly individual based report. It should contain your ideas about your original work expressed in your own way.
b. Second, do not assume that the likelihood of success is directly related to the length
of the thesis. Your thesis should be long enough to report the results of your research and to discuss their significance. Furthermore, check whether there is a formal limit on the number of words allowed. You should be mindful that a longer thesis will take, the longer it takes to type, and cost more to produce if you are paying the secretary or typist.
Consulting Your Supervisor: is one of the basic requirement in the completion of your thesis and fulfilment of the requirement for the examination and award of your degree. Some of the cardinal issues required as you start writing your thesis relate to:
a. Consult your supervisor(s) as you start the writing phase. At this stage discuss with
your supervisor (s) the overall structure of the thesis. And your strategy for writing it.
b. Try to maintain regular contact with your supervisor (s) for guidance, even when you are fully occupied with writing. You are not expected to operate entirely independently during the writing phase. Writing your thesis is an integral part of your training, guiding and advising you about writing, and therefore, forms an integral part of supervision.
c. Foster frequent shorter consultations or discussions with your supervisor (s) for creative activities, such as planning and in the process of revising to stimulate concentration and enthusiasm for both you and your supervisor.
d. Cultivate the culture of showing sections of your thesis to your supervisor at regular intervals. Do not spend a lot of time getting a section to its final form before showing it to your supervisor (s).
e. Present drafts of your thesis to your supervisor (s) in sections of reasonable length. Your supervisor will not wish to check your thesis one page at a time, or not appreciate you offering them a huge section of the thesis to read in one weekend or a day.
f. At the end of each discussion with your supervisor (s) make an appointment for your next meeting. Agree on what you will be expected to have written and the aspects to be discussed by the next meeting. This will provide you with deadlines for completion

213
LUSAKA APEX MEDICAL UNIVERSITY FACULTY OF PUBLIC HEALTH MPH RESEARCH METHODS, PROPOSAL DEVELOPMENT & SCIENTIFIC REPORT WRITING MODULE 5 2019
of sections of your thesis write‐up. Also be mindful that the responsibility for meeting official deadlines including the final submission of your thesis rests with you.
g. Your supervisor will be busy with other commitments. It is unreasonable to expect him or her to be always and instantly available or reminding you. If questions about your thesis occur to you, make a list and raise the questions at your next meeting with your supervisor.
Scheduling and Planning Thesis Write‐up: are other requirements necessary for the completion of thesis outlined as follows:
a. As with all other major tasks, the most effective approach to thesis writing is to divide
the task into what Stanisstreet (1996) termed as “manageable chunks.” Financial and other constraints restrict the time available to you to complete your thesis. This time must be divided between conducting your research and writing your thesis. You, in consultation with your supervisor, need to estimate at an early stage how much time should be spent on each task. As the work progresses, it may be necessary to modify this estimate, but do not be tempted continually to set back the date at which you will start writing. Every week spent on more research is a week less available for writing.
b. In planning your timetable, work backwards. Set a target data for the submission of
the thesis. Remember that even after you have submitted your thesis, it will take time for your examiners to read the thesis and to arrange a date for the “viva”. This is particularly important if you are going abroad after you have finished your thesis.
c. Having set a target data for the submission of your thesis, allow time for typing, final checking and binding. Remember that many typists undertake thesis work on a part‐time basis and will not be able to give their full time to typing your thesis. Bear in mind that typists get ill and go on holiday. Proof‐ reading itself is a substantial task, therefore, make a realist estimate of the time it will take. If your thesis will require photographs or illustrations, remember that these will take time to produce, even if you have the prepared professionally.
d. Consult your supervisor about when to stop research and start the final writing. Try to make this a reasonable definite changeover, attempting to write a thesis “ in your spare time” while continuing research is rarely effective.
e. Do not underestimate the time that it will take you to write your thesis. Remember that writing a thesis is a major task and time consuming, and that you are not experienced at writing. Ask other postgraduates who are in the middle of writing or who have just finished writing their theses. Almost all will say that writing takes considerable longer than anticipated.
214
LUSAKA APEX MEDICAL UNIVERSITY FACULTY OF PUBLIC HEALTH MPH RESEARCH METHODS, PROPOSAL DEVELOPMENT & SCIENTIFIC REPORT WRITING MODULE 5 2019
f. Allow some time for unforeseen circumstances. For example, during writing, it may become apparent that you should conduct some essential additional research or consult some extra resources.
g. Check whether the University will require notice of your intention to submit your thesis, and how much notice you are required to give. Some notice is usually required to allow the University to make preparations for the examination of the thesis and in some cases, the title of the thesis must be approved.
h. When planning, the first step is to decide, in consultation with your supervisor, on the overall structure of the thesis. Decide whether it will be a sequential series of linked chapters, bracketed by general introduction and general conclusion, or a fully integrated thesis. One advantage of the former structure is that it facilitates the preparation of sections of the work for publication in learned journals.
i. Having made a provisional decision about the content of each chapter or each major section of the thesis, gradually make a more detailed plan of the subsections within each chapter. Develop a system for numbering and standardizing the typeface of the headings and sub‐headings. For example, display major headings in upper case letters, sub‐headings in underlined lower case letters, subsidiary headings in lower case letters:
2 MAIN HEADINGS
2.1 Sub‐headings 2.1.1 Subsidiary headings
This will encourage you to arrange information systematically and to build up your
arguments logically. What you are doing is to make a draft of the contents pages of
the thesis.
h. Now make a timetable for the completion of each of the sections of the first draft of
the thesis. Bear in mind the revision and re‐vision will take considerable time.
i. Start a series of loose‐leaf files or word processor files, one for each section of the
thesis. When you are writing one section ideas will be triggered which might be
suitable for other sections. Note them down and store them in the appropriate file to
act as a memory trigger when you are writing that section.

215
LUSAKA APEX MEDICAL UNIVERSITY FACULTY OF PUBLIC HEALTH MPH RESEARCH METHODS, PROPOSAL DEVELOPMENT & SCIENTIFIC REPORT WRITING MODULE 5 2019
8.6. WRITING A THESIS
Remember that the aim of your research report or thesis is to inform the reader about the
facts derived from your research in a simple, logical and sequential fashion. Avoid confusion
and distracting the reader.
In writing the thesis, it is important to consider:
The CONTENT,
The STYLE of writing,
The LAYOUT of the thesis,
Writing the FIRST DRAFT,
Revising the DRAFTS
Finalizing the thesis
Each of these aspects of the thesis preparations are discussed.
8.6.1. CONTENT
The CONTENT is the MAIN COMPONENTS of your thesis
Your research report or thesis should contain the following components:
Title or cover page Abstract or Summary of Findings & Recommendations Copy right Acknowledgements Dedication (optional) Table of Contents List of tables and figures (if any) List of abbreviations (optional)
1. INTRODUCTION (may include objectives and Statement of problem) 2. STATEMENT OF PROBLEM 3. LITERATURE REVIEW 4. OBJECTIVES 5. METHODOLOGY 6. FINDINGS 7. DISCUSSION 8. CONCLUSIONS & RECOMMENDATIONS
References Annexes/appendices (data collection tools, tables, etc) The findings and conclusions, discussion of findings, and recommendations will form the most
substantial part of your thesis, which should be written from the scratch. For the other
components, such as the introduction and the methodology, you can rely to a large extent on

216
LUSAKA APEX MEDICAL UNIVERSITY FACULTY OF PUBLIC HEALTH MPH RESEARCH METHODS, PROPOSAL DEVELOPMENT & SCIENTIFIC REPORT WRITING MODULE 5 2019
your research proposal, although you may summarize, revise, and sometimes expand certain
sections.
You are therefore strongly advised that you start with the findings and conclusions.
Nevertheless, we will briefly elaborate on each component in which they will finally appear
in your thesis:
Cover Page
The cover page should contain the title of the thesis, your names and your titles and
position (as the author), the University institution that publishes your thesis and for
what purpose (i.e. your postgraduate discipline of the degree award), and the
month and year of publication set at the centre of the bottom page.
Abstract or Summary
The abstract or summary can only be written after the first and even the second
draft of the thesis has been completed. It should be only “ONE PAGE” and contains:
‐ a very brief description of the problem (WHAT)
‐ the main objectives (WHY)
‐ the place of study (WHERE)
‐ the design of study and methods used (HOW)
‐ the main findings and conclusions, followed by
‐ the major , or all recommendations
The summary will be the first part of your thesis that will be read. Therefore, its writing
demands a thorough reflection and is time consuming. It will require several drafts to be
made and each to be discussed in consultation with your supervisor.
Acknowledgements
You may wish to thank those who supported you technically or financially in the
design and implementation of your research and all way through to the writing of
the thesis, especially, the University institution that admitted you to pursue your
degree, your supervisor or supervisors and the sponsors. Also your employer who
had allowed you to invest time in the study, and the respondents may be
acknowledged as well. Other people who supported you further in the fulfilment of
your thesis can be included. Acknowledgements are usually placed right after
summary or at the end of the thesis before the references.
Copy right, dedication (optional)
217
LUSAKA APEX MEDICAL UNIVERSITY FACULTY OF PUBLIC HEALTH MPH RESEARCH METHODS, PROPOSAL DEVELOPMENT & SCIENTIFIC REPORT WRITING MODULE 5 2019
Copy right © symbolizes authorship of the document or thesis and no other person
should plagiarize the written contents or the whole document without authority. It
expresses the factual reality of your work.
Dedication is expressing a special devotion to a friend, parent, child, husband, etc.
on the value of your contributions.
Table of Contents
A table of contents is essential. It gives the reader a quick overview of the major
sections of your report or thesis, and page references.
List of Tables, Figures (optional)
If you have many tables or figures, it is important to list these as well. In a table of
contents type format with page numbers.
List of Abbreviations (optional)
If there are many abbreviations or acronyms in the report, these could be listed in
addition.
The latter four sections should be prepared last, as you have to include the page numbers of
all chapters and subsections in the table of contents, and be sure that there are no mistakes
in the final numbering of tables and figures. The page numbering of the above content
components should be reflected in roman letters (i, ii, etc) to distinguish them from the main
chapters of the thesis where the page numbering starts in actual numbers.
1. INTRODUCTION
The introduction chapter is a relatively easy part of your thesis, as most parts have
been already stated in your earlier proposal. It may be written after a first draft of
your findings has been made. You may slightly revise or make additions to the
corresponding section in your proposal and use it here.
It should contain the Statement of the problem, significance of the results to be
achieved in the study, a brief review of the literature pertaining to your topic, and how
the thesis will be organized for presentation in the text.
This section should include relevant points to help examiner or reader to understand
the problem providing a review of available information on it, and methods of
investigation or solution to the problem. Remember that it serves to lend support to
your thesis, but not to display your ability to read literature.
218
LUSAKA APEX MEDICAL UNIVERSITY FACULTY OF PUBLIC HEALTH MPH RESEARCH METHODS, PROPOSAL DEVELOPMENT & SCIENTIFIC REPORT WRITING MODULE 5 2019
2. LITERATURE REVIEW
This section provides support of other studies related to your work as the “old
evidence” to provide arguments in the context of the problem that has been
investigated. This section has already been dealt in your proposal, but may require
revision or additional literature explored during the study.
This section will be used extensively in the discussion of findings to reaffirm whether
your results searched for factual evidence as yet unknown or possibly, mishandled by
other previous researchers related to your study.
3. OBJECTIVES
The general and specific objectives should be included in the introduction chapter
stated earlier. This may be according to the University institution requirements in
structuring the thesis outline. Others place objectives and hypotheses after literature
review.
4. METHODOLOGY
The methodology you followed which you included in your proposal to facilitate your
study should be described in details. It should include:
‐ the study design,
‐ the study setting,
‐ the variables on which data was collected,
‐ the study population from which the sample was selected,
‐ the sample size and methods of sampling used,
‐ the data collection methods or techniques and tools and by whom,
‐ how data quality control was ensured,
‐ procedures for data analysis, including statistical tests applied, and
‐ the ethical considerations.
If you have deviated from the original study design presented in your research proposal, you
have to explain to what extent and provide the reasons. The consequences of this deviation
for meeting certain objectives of your study should be indicated.
5. FINDINGS
The systematic presentation of your findings and conclusions in relation to the
objectives is the crucial part of your thesis.
A description of the findings may be complemented by a limited number of tables or
graphs that summarize the findings. For those who employed triangulation
methodology of yielding both quantitative data and qualitative data, the text will

219
LUSAKA APEX MEDICAL UNIVERSITY FACULTY OF PUBLIC HEALTH MPH RESEARCH METHODS, PROPOSAL DEVELOPMENT & SCIENTIFIC REPORT WRITING MODULE 5 2019
become lively if you illustrate some of the findings with examples using the
respondents’ own words, or with observations that you recorded during the fieldwork.
6. DISCUSSION
The findings can now be discussed by objective or cluster of related variables. The
discussion should also mention findings from other related studies that support or
contradict your own, that is, to determine differences and similarities with your
findings. It is important to present and discuss the limitations of the study. In the
discussion of findings some general conclusions may be included as well.
7. CONCLUSIONS & RECOMMENDATIONS
The major findings in relation to the objectives should be presented as conclusions in
this section followed by the recommendations.
The recommendations should follow logically from the discussion of the findings. They
may be summarized according to the groups towards which they are directed. For
example: policy makers; health managers or providers; potential clients or the
community at large.
References
In consultation with your supervisor, you should follow the approved academic
referencing system by the University. If the author’s names (surnames) were cited in
the text, then the reference list at the end should be arranged in alphabetical order by
the principal author’s last name. Rarely numbers are used in a thesis, but in some
journals.
Annexes or Appendices
The annexes should contain any additional information needed to enable
professionals, examiner and others to follow your research procedures and the data
analysis.
8.6.2. DEVELOPING YOUR WRITING STYLE
It is misleading to think that academic writing should be pompous and complex. Your aim is
to communicate your ideas to the reader, but not to impress your reader with obscure
vocabulary. In academic writing, elegance comes from simplicity of expression and directness
of style.
Remember that your reader has short of time or may be occupied with other emerging
matters, Therefore the rules for efficient writing style include:
220
LUSAKA APEX MEDICAL UNIVERSITY FACULTY OF PUBLIC HEALTH MPH RESEARCH METHODS, PROPOSAL DEVELOPMENT & SCIENTIFIC REPORT WRITING MODULE 5 2019
Simplicity, keep to the essentials.
Justify, make statements based on facts
Quantify, avoid use of words such as “large”, “small”, but instead say “ almost 65%”
or “one in three” etc.
Be precise and specific to the point.
Inform, not to impress and avoid exaggeration.
Use short sentences.
Use adverbs and adjectives, and be consistent in the use of tenses (past, present
tense). Remember that every report implies previous research whether by the
reporter or by someone else. It is worth noting that a research report is justified by
the attitude and style of the report‐writer, which are derived from the academic
disciplines of history. All in a report is about what happened earlier in the past. For
more details of scholarly writing style, Barzun and Graff (2004, 1997) have provided
the detailed explanations on the classic writing style.
Aim for a style that is clear, accurate, comprehensive and concise. Avoid use of ambiguous
words as they distract your reader and lead to grammatical errors such as qualification of
absolutes (for example, “absolutely perfect”, or “conclusive proof”). Short sentences are easy
to follow.
At times it will be necessary to use a similar form of expression several times. To avoid exact
repetition, use a thesaurus (a book listing words with similar or closely related meanings) to
stimulate ideas for alternative methods of expression.
It is also essential that your argument or discussion is expressed logically. There is a close link
between grammar and logic, and therefore, it is important that you write in a style that is
grammatically correct. Be careful about the use of conjunctions (“and”, “but”, “however” and
so on). For example, “thus” is used when the point to be made is supported by preceding
argument. “However” is used when contradictory evidence is to be introduced.
In general, it is preferable to write in the passive, impersonal mood rather than in the active
mood. For example “Smith (1988) has shown that…” is the active mood; “It has been shown
that… (Smith 1988) is the passive form. Frequent use of the active mood tempts the writer to
produce monotonous list. The passive mood keeps the attention on the evidence or idea, and
facilitates the construction of arguments. However, there may be a few occasions when
maintaining the impersonal mood that it can lead to grammatical contortions. For example,
it is better to say “In my opinion…” rather than “In the opinion of the present writer or
author…”
Finally, distinguish carefully between levels of certainty: proven facts, theories, hypotheses
and opinions. Even if the information is published, it does not mean that the argument is
proven. With quantitative data, distinguish between statistically significant and non‐

221
LUSAKA APEX MEDICAL UNIVERSITY FACULTY OF PUBLIC HEALTH MPH RESEARCH METHODS, PROPOSAL DEVELOPMENT & SCIENTIFIC REPORT WRITING MODULE 5 2019
significant results. For significant results state the level of significance. Avoid errors of logic,
such as claiming proof based on the absence of evidence.
8.6.3. LAYOUT OF THESIS OR REPORT
A good physical layout is important as it will help your report:
Make a good initial impression,
Encourage the reader, and
Give an idea of how the material has been organised so that the reader can make a
quick determination of what he or she will read first.
Particular attention should be paid to make sure that there is:
An attractive layout for the title page and a clear table of contents.
Consistency in the margins and spacing
Consistency in headings and subheadings
Good quality typing and photocopying. Review drafts carefully
Numbering of figures and tables, and provision of clear titles for them, including labels
for the columns and rows, etc.
Accuracy and consistency in quotations and references.
8.6.4. WRITING THE FIRST DRAFT
First, before drafting the thesis, you need to prepare an OUTLINE of your thesis. An outline
will help to organize your thoughts and is an essential step in producing a logical and
sequential report.
An outline should contain:
Headings of the main sections of the thesis
Headings of subsections
Points to be made in each section
A list of tables and figures to illustrate each section
The outline for the findings and conclusions is the most difficult. The first section is usually a
description of the sample, for example in terms of location, age, sex and other background
variables. Then, depending on the study design, you may provide more information on the
problem or dependent variable of your study. Next, should be an analysis of the different an
independent variables in relation to the problem may follow.

222
LUSAKA APEX MEDICAL UNIVERSITY FACULTY OF PUBLIC HEALTH MPH RESEARCH METHODS, PROPOSAL DEVELOPMENT & SCIENTIFIC REPORT WRITING MODULE 5 2019
NOTES: Never start writing an outline. Make sure that all sections to be written have headings and numbers consistent with the outline before they go for typing. Have an outline visible to capture any changes or additions. Type the first draft double spaced with large margins for comments and corrections in the text. Have several copies made of the first draft so that you can keep a copy to work on and the other copy to insert the final revisions for retyping.
As you proceed in preparing for the first draft, you will come to sections of the thesis which
require more creativity and analysis. One approach to such sections is to write down the
theme of the section and then jot down, as they occur in any order, ideas, thoughts, examples,
conclusions and suggestions.
Now arrange these ideas into logical order within an overall framework. The form of the
framework will depend upon the subject matter. For example, it might be historical,
describing the order in which facts were discovered, or ideas evolved. It might reflect a
progression of understanding the discovery, description and explanation of a phenomenon,
or based upon a systematic classification of phenomena or ideas. Be mindful that a “thesis”
is a proposition which you are advancing. Your writing should be directed towards building
up a logical argument, not just towards accumulating information.
If you are writing by hand the first draft, write on alternate lines and leave plenty of space.
This will enable you to make alterations or corrections without rewriting. Write on one side
of the paper only to allow you to add, delete or more sections by “cutting and pasting.”
If possible, aim to produce your thesis using a word‐processor. This will allow you to make
substantial alterations to the text: to add, delete, copy or move blocks of text. Use of a word
processor thus allows you to see and revise as many drafts as required. It encourages you
gradually to improve the thesis. However, bear in mind that unless you are familiar with its
operation, it will take you some time to learn how to use a word processor.
If you and your typist are acquainted with the use of a word‐processor, your work will be
stored in “floppy discs”, but always keep a copy of your floppy discs as a “back‐up”. Also check
in advance that the quality of the printed output of the word processor will be accepted by
the University.
However, most word‐processors have a “search and replace” facility. This allows you to select
a word and replace it throughout your document with another word or phrase. You can
exploit this facility if you frequently need to use a long word or phrase. When you have
finished a section of the thesis, execute the “find and replace” facility to insert the desired
word or phrase in place of abbreviation.
223
LUSAKA APEX MEDICAL UNIVERSITY FACULTY OF PUBLIC HEALTH MPH RESEARCH METHODS, PROPOSAL DEVELOPMENT & SCIENTIFIC REPORT WRITING MODULE 5 2019
Remember that it is your responsibility to make a synthesis of the information. Avoid giving
long lists of examples and leaving the reader to draw the general conclusion. For each point
state the general principle and then illustrate it with example, or give a few examples and
draw them together with a general conclusion
8.6.5. CHECKING THE FINAL DRAFT
After a number of revisions and several drafts, your thesis will be in final draft form. At this
stage, you should check certain details of your thesis as given below:
The text will require checking for a number of different aspects. You will need to check
that the logic of the argument, the grammar, the spelling and the citation of the
references are correct. It is more effective to check different aspects separately, that
is to read through to check the logic and grammar, and then to read through again to
check the spelling.
Some word‐processors have a “spell‐check” facility. This operates by comparing
automatically each word in your document against a “dictionary”. You will need to
confirm that the word‐processor has an English version rather than an American
dictionary.
The citation of references needs to be checked. Errors in the citations of references
are the most common form of error in the theses. Confirm that each reference cited
in the text is given in the reference list or bibliography, that is cited in the correct form,
and that the names and dates agree. As you read through the thesis, mark each
reference in the bibliography as it is cited in the text. You can then check that every
reference in the bibliography is used in the text.
If possible, ask someone also to proof‐read your final draft. It is possible to become
over familiar with sections of your thesis and miss errors which, to a new reader, are
a quite obvious. However, it is unreasonable to expect your supervisor to check drafts.
8.6.6. PRODUCING THE MANUSCRIPT
If you have been using a word processor, or you are a reasonably proficient typist, you will
require the thesis to be typed for you. When your thesis is ready for typing, provide the typist
with written instructions about the layout (line spacing, width of margin and so on) which is
required by the University. Confirm that the typist will be able to complete your thesis.
It is responsibility to ensure that the layout of your thesis conforms to the regulations.
Produce or ask your typist to produce a few pages of script in the final form before
proceeding. Check at this stage that the quality of the typeface or printing is acceptable.

224
LUSAKA APEX MEDICAL UNIVERSITY FACULTY OF PUBLIC HEALTH MPH RESEARCH METHODS, PROPOSAL DEVELOPMENT & SCIENTIFIC REPORT WRITING MODULE 5 2019
8.6.7. PRODUCTION OF ILLUSTRATIONS
Most theses require some form of illustration. Illustration might consist of photographs (for
example, specimens, geographical location or documents), diagrams or representations of
data as graphs, histograms or charts.
Where photographs are needed, each copy of the theses will require photocopies of
photographs, and if line diagrams are required, there must be good quality photocopies of
the original.
Furthermore, all figures (illustrations, tables and diagrams) should be numbered so that they
can be referred to in the text. It is sensible to number figures subsequently within each
chapter or section of the thesis, rather than sequentially throughout the whole thesis. For
example, “Figure 2.3” would be the third figure in the second chapter. This method has the
advantage that if figures are added or removed at a late stage, it is not necessary to
re0number all subsequent figures, but only those in the same chapter.
Each figure should bear a number, title and legend. The legend should contain sufficient
information for the figure to be understood without reference to the main body of the text.
For example, it should include a key to any non‐standard symbols used in the figure. However,
keep the legend concise.
8.6.8. USING REFERENCES, APPENDICES AND FOOTNOTES
References serve a number of purposes. They allow you to credit the authors who originally
made observations or proposed ideas. They indicate the historical order in which discoveries
were made. Finally, they allow your reader to check on details for example, experimental
methods or precise quotations, which it is not appropriate for you to include in your thesis,
by referring to the original source.
To fulfil these purposes, references are cited in a formal manner. In the main body of text,
the author (s) and the year of publication are given. References can be given in the active or
passive form. Avoid using the active form of references too frequently, or your text will
become a list‐like re‐iteration of facts or ideas.
If there are many authors of one publication, the names of the second and subsequent
authors should not be given in the text after the first citation of that reference. The form to
use in this case is “Smith and others (2004) showed that…” or “Smith et al. (2004) showed
that…”. Underlying “et al” indicates that the words would be in italics if printed. Some word
processors and sophisticated typewriters allow you to put text in italics
At the end of your thesis, in the bibliography or references section, you should give more
details of the sources of information. There are different formats which are acceptable, but

225
LUSAKA APEX MEDICAL UNIVERSITY FACULTY OF PUBLIC HEALTH MPH RESEARCH METHODS, PROPOSAL DEVELOPMENT & SCIENTIFIC REPORT WRITING MODULE 5 2019
you should check which format is appropriate to your disciple or the University and you
should keep the format consistent. A common format is to give authors’ names, year of
publication, title of the article, journal, volume and page numbers, for example:
Smith, A., Jones, B & Chitalu K. (2004). Reproductive Behaviour in Rural Population, Journal of Social Sciences and Medicine, 3(1): 25‐51 Note that there is a prominence of the primary or first author for easy access to identify the
author in the references sections.
Journal titles have standardized abbreviations, and you should use the correct abbreviation
or the full title of the journal. There are books in the library which gives lists of standard
abbreviations for journals. As you undertake your research, store your references on file cards
or computer entries in the form which you will finally require at the end. This will enable you
to become familiar with standard journal abbreviations, and will save you rewriting the
reference list in preparation for typing.
References given in the form above should be arranged in alphabetical order in the references
section. If the same authors have published two or more different articles in the same year
distinguish them by referring to them in the text and in the reference list, as “Smith (2004a)”,
“Smith (2004b)” and so on.
Some journals use a numbering system for references. For example, “It has been found that..
[24].” References are then given in full in a numbered reference list. This type of format has
certain advantages for published work as it saves space, but very inconvenient for theses.
References have to be re‐numbered both in the text and in the reference list. Since you may
well cite the same reference in different places in your thesis, this re‐numbering can become
a major task and difficult to be consistent.
Appendices or annexes are used to provide details which are important, but which, if included
in the main body of the text, would disturb the flow of ideas. For theses which report the
results of experimental work and other analytical studies, for example, appendices might be
used for details of experimental techniques, composition of complex solutions, details of
procedures, list of abbreviations, data collection tools or analytical tables that have been
transformed into figures for use in the text, and so on.
Footnotes are used frequently in theses in humanities‐based disciplines, for example for long
citations are needed. In theses for science‐based disciplines, it is appropriate to include it in
the text. If it is not essential, leave it out.
8.7. SUMMARY
As you embark on producing your thesis, it is important to recognize that writing a thesis is
not merely an easy task, but requires series of considerations that should be adhered. Note
that the purpose of your thesis is primarily to provide a general contributions to the body of
226
LUSAKA APEX MEDICAL UNIVERSITY FACULTY OF PUBLIC HEALTH MPH RESEARCH METHODS, PROPOSAL DEVELOPMENT & SCIENTIFIC REPORT WRITING MODULE 5 2019
knowledge. Therefore, the considerations governing the writing of the thesis should be in
conformity with the general requirements of the University to which the authorship of the
thesis is mandated. Some of these required which we had discussed earlier have related to:
The length, format and presentation of thesis and considering the pitfalls that may
arise in thesis write‐up.
Consulting your supervisor at any stage of thesis writing for guidance
Be mindful in the scheduling and planning of the thesis that require developing the
structure and outline of the thesis, and the actual drafting of the first and subsequent
drafts which should be reviewed for corrections.
Developing your writing style that also requires adherence to certain rules regarding:
simplicity and keep to essentials when writing; justify and make statements based on
facts; need to quantify information when interpreting data; to be precise and specific
to the points; and making use of short sentences. Writing style should be written in a
passive form to keep track on the evidence or ideas, and facilitates the construction
of the arguments.
The layout of the thesis that is essential to make good initial impression of your thesis
and gives the reader an idea of how the material has been organised and stimulate
selection of parts to be read first need to be considered.
Importance of reviewing the first and subsequent drafts made before embarking on
writing the final version or production of the manuscript.
Finally, remember to make use of illustrations, appropriate references and approved
formats, and the use of footnotes as required.
8.8. PERFORMANCE EVALUATION
EXERCISE: 1. Make an outline for your thesis if all data have been analysed 2. Start drafting the first part of your thesis, beginning with your findings and conclusions. 3. Develop the chapters on introduction (background, statement of problem and literature
review), objectives, and methodology adapting what you prepared in your proposal 4. Develop a summary and go through your first draft
ADDITIONAL READINGS
1. Barzun Jacgues and Henry F. Graff. (2004). The Modern Researcher: the Classic Work
on Research and Writing‐ Completely Updated for Internet age, 6th edition, ISBN: 13
978‐0‐495‐31870‐5: 322 pages
2. Barzun Jacgues and Henry F. Graff. (1992). The Modern Researcher: Classic Work on
Research and Writing, 5th edition, ISBN: 0‐15‐562513‐6: 409 pages
3. Last. M. John M. (1995). A Dictionary of Epidemiology, 3rd edition, ISBN: 0‐19‐509668

227
LUSAKA APEX MEDICAL UNIVERSITY FACULTY OF PUBLIC HEALTH MPH RESEARCH METHODS, PROPOSAL DEVELOPMENT & SCIENTIFIC REPORT WRITING MODULE 5 2019
4. Corlien M. Varkevisser., Indra Pathmanathan., Anne Brownlee. (1993). Designing and
Conducting Health Systems Research Projects: Data Analysis and Report Writing, 2 (2),
ISBN: 0‐88936‐585‐7: 167 pages
5. Stainisstreet Martin. (1996). Writing Your Thesis: Suggestions for Planning and Writing
Theses and Dissertations in Science‐Based Disciplines, the University of Liverpool: 14
pages
228
LUSAKA APEX MEDICAL UNIVERSITY FACULTY OF PUBLIC HEALTH MPH RESEARCH METHODS, PROPOSAL DEVELOPMENT & SCIENTIFIC REPORT WRITING MODULE 5 2019
5.9. MODULE SUMMARY
We are glad that you have successfully completed the 5th modules of Research Methodology & Proposal Development for the Course Code: MPH 651. We hope that you will be confident and diligent enough to:
Interpret the key concepts of science and scientific methodological approach in research governing the rules: (a) rules for communication; (b) rules for logical and valid reasoning; and (c) rules for inter‐subjectivity. These three systems of rules help to make us understand, explain and predict our environments as we develop ways of generating knowledge, through‐ authoritarian, mystical, or rationalistic mode (Module 5.1)
Theorize the concepts of research by explaining its meaning, purposes and characteristics and the role of research in public health. You should be able to remember that public health is a dynamic discipline in nature that responds to varied public health priorities. Therefore, research in public health should be focused on a multidisciplinary approach to cover major areas of concern within the health systems that are broadly related to: policy‐ set health priority needs, ensure equity allocation of resources and humanitarian values; Administration and management of the health system; Environment‐ for improved living conditions; community‐ for developing instruments and practices for promoting health & enhance community participation; Individuals and families‐ assessment of physical, mental, socio‐economic needs and health problems, and measures for addressing them; and direct services‐ that ensure appropriateness of effective and efficiency services. The module discussed further the concepts of conceptual and operational definitions, the principles of a research process to yield empirical evidence, and the four levels of theory as being: (a) ad hoc classification system; (b) taxonomies; (c) conceptual frameworks; (d) theoretical systems. Models on the other hand, as abstractions from reality are used to gain insight of phenomena that cannot be directly observed (Module 5.2)
Explain the basic elements of research to describe the research problems and the conceptual analysis. In Module 5.3, we elaborated on the process of identifying and setting criteria for selecting a research problem that can involve application of rating scale, formation of a statement of problem and the critical research problem analysis framework, and the literature review and its purposes. Other components discussed included formation of research questions, hypotheses and research objectives.
Describe the process and the components of research methodology (Module 5.4). These included: conceptualizing the variables, classification, operational indicators (making them measurable), and their scales of measurements; Study designs that are classified in two broad categories: Non‐intervention studies and Intervention studies (experimental study design, or clinical trial studies and the quasi‐experimental study design), with their purposes and limitations, valid and reliability of study designs, threats to validity and the measures of overcoming such threats. Other components discussed are: sampling: sample size determinations applying various formulae for calculating sample sizes, and sampling methods‐ both probability and non‐probability methods; data collection methods and tools, and designing a quantitative
229
LUSAKA APEX MEDICAL UNIVERSITY FACULTY OF PUBLIC HEALTH MPH RESEARCH METHODS, PROPOSAL DEVELOPMENT & SCIENTIFIC REPORT WRITING MODULE 5 2019
questionnaires, attitudinal measurements; data processing and analysis of quantitative data; and the ethical considerations, and the application of triangulation methodology.
Describe and Apply behavioural or qualitative research that articulated the designs; qualitative sampling methods; qualitative data collection methods and question guides involving in‐depth interviews (semi structured interviews); focus group discussions, observations and other methods; and thematic content analysis and interpretation involving case‐content and cross‐content analysis, and various modes of display qualitative data (tables‐matrices, diagrams, flow chart and narrative form) (Module 5.5).
Develop a research proposal. The research proposal Module 5.6 elaborated on steps for developing a research proposal and how to manage a research project that involved developing a work‐plan, budget and budget justification, and the role of research team in the project.
Apply the basic concepts of statistical analysis to your research project that involve knowing the concepts of data, statistics, sources of data, biostatistics, variables‐ quantitative and qualitative variables, discrete random variables and continuous. Other aspect covered included concepts of population, sample, statistical inferences and the measurement scales applied in data analysis. Steps in data analysis and the techniques of processing the data, including measures for analysing descriptive variables, performing statistical significance tests for unpaired and paired observations were explained with relevant examples (Module 5.7).
Competently, write your thesis and manuscripts for your publication. We discussed that the purpose of your dissertation or thesis is to primarily provide the general contributions to the body of knowledge to achieve your degree award. Emphasis were made to consider: the contents, length, format and presentation of your thesis; consulting your supervisor(s); scheduling and planning your thesis write up; and developing your writing style‐ emphasizing the use of short sentences, simplicity, keep to essentials and making statements based on facts and constructing them in passive form to keep track on the evidence or ideas, and facilitates the construction of arguments. Finally, remember to adhere to use of illustrations, appropriate references and approved formats when writing the thesis (Module 5.8).

230
LUSAKA APEX MEDICAL UNIVERSITY FACULTY OF PUBLIC HEALTH MPH RESEARCH METHODS, PROPOSAL DEVELOPMENT & SCIENTIFIC REPORT WRITING MODULE 5 2019
References
Alan Bryman & Duncan Cramer. (2005). Quantitative Data Analysis with SPSS 12 and 13: A Guide for Social Scientists Bailey Kenneth, D (1994). Methods of Social Research, 4th Edition, NY. Free Press Barzun Jacgues and Henry F. Graff. (2004). The Modern Researcher: the Classic Work on Research and Writing‐ Completely Updated for Internet age, 6th edition, ISBN: 13 978‐0‐495‐ 31870‐5: 322 pages Barzun Jacgues and Henry F. Graff. (1992). The Modern Researcher: Classic Work on Research and Writing, 5th edition, ISBN: 0‐15‐562513‐6: 409 pages Betty R. Kirkwood and Jonathan A. C. Sterne (2006). Medical Statistics, 2nd Edition, Blackwell: ISBN: 978‐0‐86542‐871‐3 Betty R. Kirkwood and Jonathan A.C. Sterne. 2003. Essential Medical Statistics, Second Edition, Blackwell Science, ISBN: 978‐0‐86542‐871‐3 Betty R. Kirkwood. 1999. Essentials of Medical Statistics, 1st edition, Blackwell Science, ISBN: 0‐632‐01052‐5 Bimbaum, Michael H (2001). Introduction to Behavioural Research on the Internet. Upper Saddle River, NJ: Prentice‐Hall
Chava Frankfort‐Nachmias & David Nachmias (2008). Research Methods in the Social Science,
7th Edition, ISBN: 13: 978‐0‐7167‐5510‐0
Chava Nachmias and David Nachmias (1987). Research Methods in the Social Sciences, 2nd
Edition, Edward Arnold Publishers LTD, London. ISBN: 0‐7131‐6283‐X Dochartaigh, Niall R (2001). The Internet Research Handbook: A Practical Guide for Students and Researchers in the Social Sciences. Thousand Oak, CA: Sage Publication
Erickson, B.H., and Nosanchuk (1987). Understanding Data: an introduction to exploratory and
Confirmatory Data analysis for students in Social Sciences. Open University Press: ISBN: 0
335 00252 8 Last. M. John M. (1995). A Dictionary of Epidemiology, 3rd edition, ISBN: 0‐19‐509668
Jacques Barzum and Henry F. Graff (1992), The Modern Researcher: The Classic Work on
Research and Writing: ISBN: 0‐15‐562513‐6 Hansen, Hans V., and Robert E. Pinto, eds. (1995). Fallacies: Classical and Contemporary Readings. University Park, PA: Benn State Press
Hart, Chris (1998). Doing Literature Review: Releasing the Social Science Research
Imagination, London: Sage Publication Indra Pathmanathan and N.I. Nik‐Safiah (2000). Training of Trainers and Facilitators for Health Systems Research, Vol.5. IDRC 286e: ISBN: 0‐88936‐589‐X
Michael Quinn Patton (1990). Qualitative Evaluation and Research Methods, 2nd Edition, Page
Publications: ISBN: 0‐8039‐3779‐2
Oppenheim A.N (1986). Questionnaire Design and Attitudinal Measurement, Gower: ISBN: 0
231
LUSAKA APEX MEDICAL UNIVERSITY FACULTY OF PUBLIC HEALTH MPH RESEARCH METHODS, PROPOSAL DEVELOPMENT & SCIENTIFIC REPORT WRITING MODULE 5 2019
566 05297 0 Sears, Alan (2005). A Good Book in Theory: A Guide to Theoretical Thinking in the Social Sciences. Orchard Parck, NY: Broadview Press Stainisstreet Martin. (1996). Writing Your Thesis: Suggestions for Planning and Writing Theses and Dissertations in Science‐Based Disciplines, the University of Liverpool: 14 pages
Stinchcombe, Arthur L (2005). The Logic of Social Science Research. Chicago, University of
Chicago Express Sirkin Mark.R. 1999. Statistics for the Social Sciences, 2nd Edition, Sage Publications, ISBN: 0‐ 8039‐5145‐0 Patton Micheal Quinn.2000.Qualitative Evaluation and Research Methods. Second edition, Sage Publication Park K.2011.TextBook of Preventive and Social Medicine. 21st Edition. Banarsidas Bhanot Publishers Robson Colin. 2002. Real World Research. Fourth edition, Blackwell Varkevisser.C.M., Indra Pathmanathan., Anne Brownlee. (1993). Designing and Conducting Health Systems Research Projects: Data Analysis and Report Writing, 2 (2), ISBN: 0‐88936 ‐585‐7: 167 pages Varkevisser,C.M., Pathmanathan,I., Brownlee, A (1991). Designing and Conducting Health Systems Research Projects: Proposal Development and Field Works: Health Wayne W. Daniel (2010). Biostatistics: Basic Concepts and Methodology for the Health Sciences, 9th Edition, Wiley INC: ISBN: 978‐0‐470‐41333‐3

232
LUSAKA APEX MEDICAL UNIVERSITY FACULTY OF PUBLIC HEALTH MPH RESEARCH METHODS, PROPOSAL DEVELOPMENT & SCIENTIFIC REPORT WRITING MODULE 5 2019