Roosevelt School District Curriculum Maps Mathematics 3 Grade
50
1 Roosevelt School District Curriculum Maps Mathematics 3 rd Grade 2016-2017
-
Upload
khangminh22 -
Category
Documents
-
view
0 -
download
0
Transcript of Roosevelt School District Curriculum Maps Mathematics 3 Grade

1
Roosevelt School District Curriculum Maps
Mathematics 3rd Grade 2016-2017
2
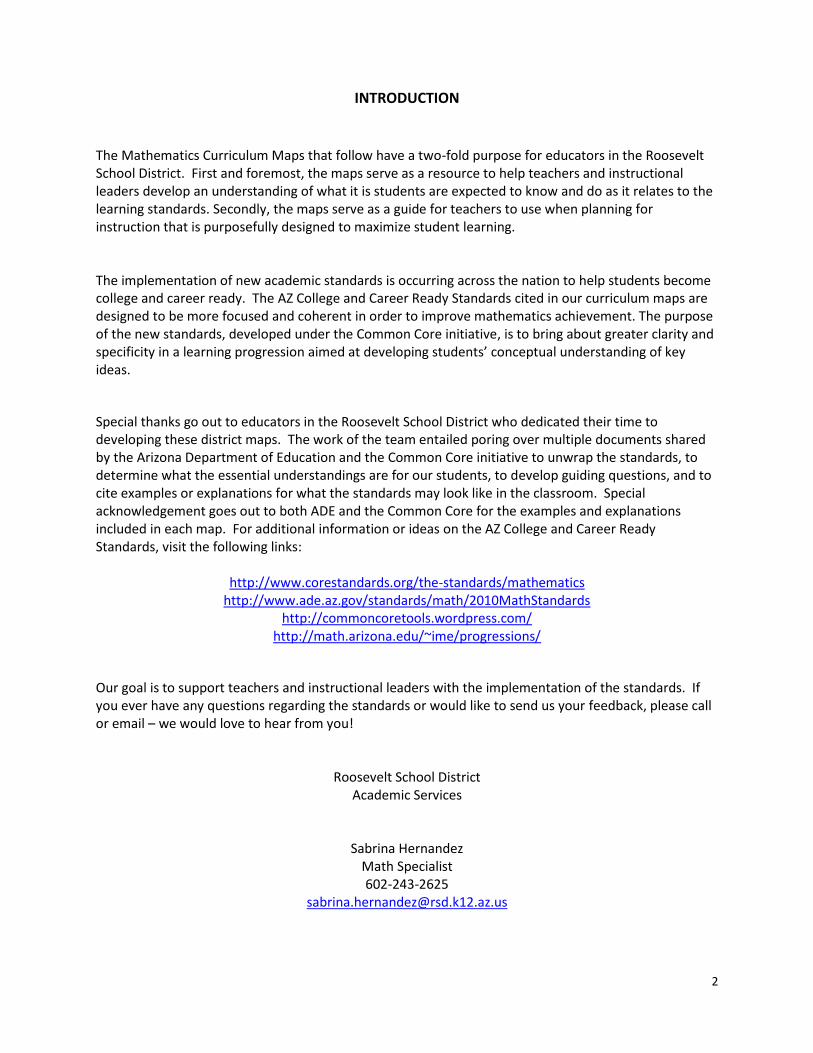
INTRODUCTION The Mathematics Curriculum Maps that follow have a two-fold purpose for educators in the Roosevelt School District. First and foremost, the maps serve as a resource to help teachers and instructional leaders develop an understanding of what it is students are expected to know and do as it relates to the learning standards. Secondly, the maps serve as a guide for teachers to use when planning for instruction that is purposefully designed to maximize student learning. The implementation of new academic standards is occurring across the nation to help students become college and career ready. The AZ College and Career Ready Standards cited in our curriculum maps are designed to be more focused and coherent in order to improve mathematics achievement. The purpose of the new standards, developed under the Common Core initiative, is to bring about greater clarity and specificity in a learning progression aimed at developing students’ conceptual understanding of key ideas.
Special thanks go out to educators in the Roosevelt School District who dedicated their time to developing these district maps. The work of the team entailed poring over multiple documents shared by the Arizona Department of Education and the Common Core initiative to unwrap the standards, to determine what the essential understandings are for our students, to develop guiding questions, and to cite examples or explanations for what the standards may look like in the classroom. Special acknowledgement goes out to both ADE and the Common Core for the examples and explanations included in each map. For additional information or ideas on the AZ College and Career Ready Standards, visit the following links:
http://www.corestandards.org/the-standards/mathematics http://www.ade.az.gov/standards/math/2010MathStandards
http://commoncoretools.wordpress.com/ http://math.arizona.edu/~ime/progressions/
Our goal is to support teachers and instructional leaders with the implementation of the standards. If you ever have any questions regarding the standards or would like to send us your feedback, please call or email – we would love to hear from you!
Roosevelt School District Academic Services
Sabrina Hernandez Math Specialist 602-243-2625
3
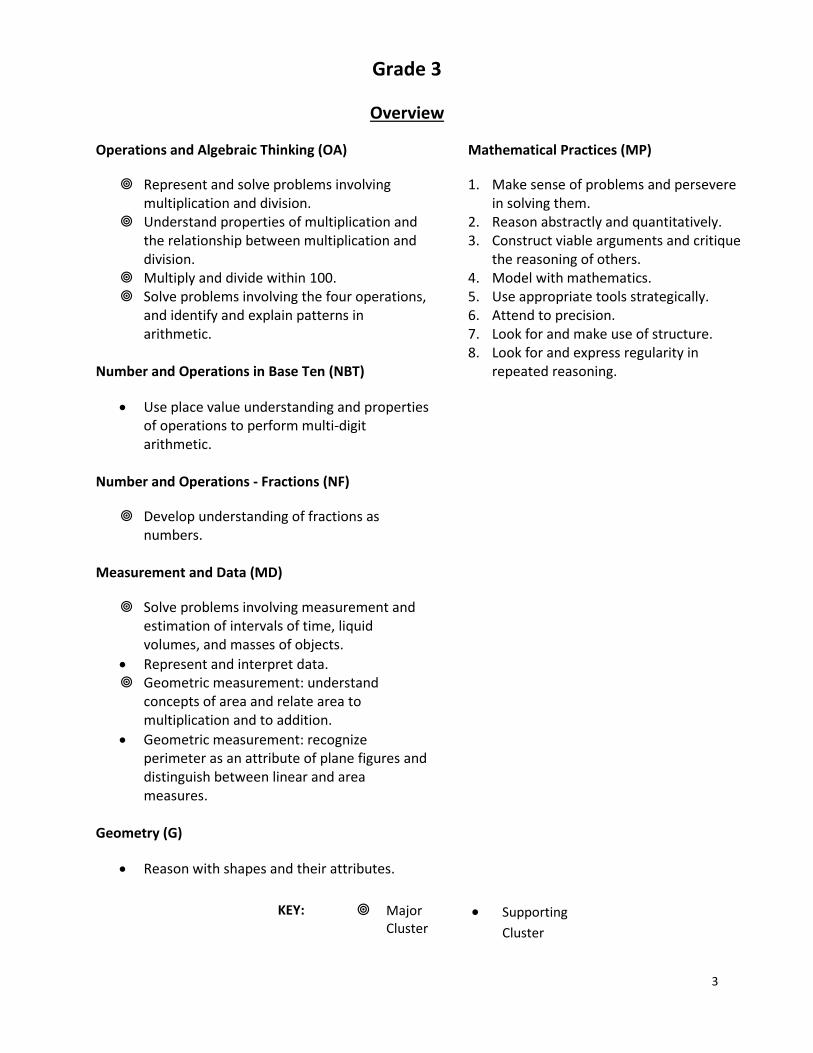
KEY: Major Cluster
Supporting
Cluster
Grade 3
Overview
Operations and Algebraic Thinking (OA)
Represent and solve problems involving multiplication and division.
Understand properties of multiplication and the relationship between multiplication and division.
Multiply and divide within 100. Solve problems involving the four operations,
and identify and explain patterns in arithmetic.
Number and Operations in Base Ten (NBT)
Use place value understanding and properties of operations to perform multi-digit arithmetic.
Number and Operations - Fractions (NF)
Develop understanding of fractions as numbers.
Measurement and Data (MD)
Solve problems involving measurement and estimation of intervals of time, liquid volumes, and masses of objects.
Represent and interpret data. Geometric measurement: understand
concepts of area and relate area to multiplication and to addition.
Geometric measurement: recognize perimeter as an attribute of plane figures and distinguish between linear and area measures.
Geometry (G)
Reason with shapes and their attributes.
Mathematical Practices (MP)
1. Make sense of problems and persevere in solving them.
2. Reason abstractly and quantitatively. 3. Construct viable arguments and critique
the reasoning of others. 4. Model with mathematics. 5. Use appropriate tools strategically. 6. Attend to precision. 7. Look for and make use of structure. 8. Look for and express regularity in
repeated reasoning.

4
Critical Ideas in Third Grade
In Grade 3, instructional time should focus on four critical areas: (1) developing understanding of multiplication and division and strategies for multiplication and division within 100; (2) developing understanding of fractions, especially unit fractions (fractions with numerator 1); (3) developing understanding of the structure of rectangular arrays and of area; and (4) describing and analyzing two-dimensional shapes.
(1) Students develop an understanding of the meanings of multiplication and division of whole numbers through activities and problems involving equal-sized groups, arrays, and area models; multiplication is finding an unknown product, and division is finding an unknown factor in these situations. For equal-sized group situations, division can require finding the unknown number of groups or the unknown group size. Students use properties of operations to calculate products of whole numbers, using increasingly sophisticated strategies based on these properties to solve multiplication and division problems involving single-digit factors. By comparing a variety of solution strategies, students learn the relationship between multiplication and division. (2) Students develop an understanding of fractions, beginning with unit fractions. Students view fractions in general as being built out of unit fractions, and they use fractions along with visual fraction models to represent parts of a whole. Students understand that the size of a fractional part is relative to
the size of the whole. For example, 1/2 of the paint in a small bucket could be less paint than 1/3 of the
paint in a larger bucket, but 1/3 of a ribbon is longer than 1/5 of the same ribbon because when the
ribbon is divided into 3 equal parts, the parts are longer than when the ribbon is divided into 5 equal parts. Students are able to use fractions to represent numbers equal to, less than, and greater than one. They solve problems that involve comparing fractions by using visual fraction models and strategies based on noticing equal numerators or denominators. (3) Students recognize area as an attribute of two-dimensional regions. They measure the area of a shape by finding the total number of same-size units of area required to cover the shape without gaps or overlaps, a square with sides of unit length being the standard unit for measuring area. Students understand that rectangular arrays can be decomposed into identical rows or into identical columns. By decomposing rectangles into rectangular arrays of squares, students connect area to multiplication, and justify using multiplication to determine the area of a rectangle. (4) Students describe, analyze, and compare properties of two-dimensional shapes. They compare and classify shapes by their sides and angles, and connect these with definitions of shapes. Students also relate their fraction work to geometry by expressing the area of part of a shape as a unit fraction of the whole.

5
Roosevelt School District Trimester Pacing
Trimester 1 Trimester 2 Trimester 3
Op
erat
ion
s
&
Alg
ebra
ic T
hin
kin
g 3.OA.A.1 3.OA.A.2 3.OA.A.3 3.OA.A.4 3.OA.B.5 3.OA.B.6 3.OA.C.7 3.OA.D.8 3.OA.D.9
3.OA.A.3 3.OA.B.5 3.OA.C.7 3.OA.D.8 3.OA.D.9
3.OA.D.8
Nu
mb
er a
nd
Op
erat
ion
s
in B
ase
Ten
3.NBT.A.1 3.NBT.A.2
3.NBT.A.3
Nu
mb
er a
nd
Op
erat
ion
s
Frac
tio
ns
3.NF.A.1 3.NF.A.2 3.NF.A.3
3.NF.A.3d
Mea
sure
men
t
&
Dat
a
3.MD.A.1 3.MD.A.2
3.MD.A.5 3.MD.A.6 3.MD.C.7
3.MD.B.3 3.MD.B.4 3.MD.D.8
Geo
met
ry
3.G.A.2
3.G.A.1
Mat
hem
atic
al
Pra
ctic
es
3.MP.1 3.MP.2 3.MP.3 3.MP.4 3.MP.5 3.MP.6 3.MP.7
3.MP.2 3.MP.3 3.MP.6 3.MP.7 3.MP.8
3.MP.1 3.MP.2 3.MP.3 3.MP.5 3.MP.6 3.MP.7

6
Mathematical Practices – Third Grade
Standards Explanations and Examples
Students are expected to:
3.MP.1. Make sense of problems and persevere in solving them.
In third grade, students know that doing mathematics involves solving problems and discussing how they solved them. Students explain to themselves the meaning of a problem and look for ways to solve it. Third graders may use concrete objects or pictures to help them conceptualize and solve problems. They may check their thinking by asking themselves, “Does this make sense?” They listen to the strategies of others and will try different approaches. They often will use another method to check their answers.
3.MP.2. Reason abstractly and quantitatively.
Third graders should recognize that a number represents a specific quantity. They connect the quantity to written symbols and create a logical representation of the problem at hand, considering both the appropriate units involved and the meaning of quantities.
3.MP.3. Construct viable arguments and critique the reasoning of others.
In third grade, students may construct arguments using concrete referents, such as objects, pictures, and drawings. They refine their mathematical communication skills as they participate in mathematical discussions involving questions like “How did you get that?” and “Why is that true?” They explain their thinking to others and respond to others’ thinking.
3.MP.4. Model with mathematics.
Students experiment with representing problem situations in multiple ways including numbers, words (mathematical language), drawing pictures, using objects, acting out, making a chart, list, or graph, creating equations, etc. Students need opportunities to connect the different representations and explain the connections. They should be able to use all of these representations as needed. Third graders should evaluate their results in the context of the situation and reflect on whether the results make sense.
3.MP.5. Use appropriate tools strategically.
Third graders consider the available tools (including estimation) when solving a mathematical problem and decide when certain tools might be helpful. For instance, they may use graph paper to find all the possible rectangles that have a given perimeter. They compile the possibilities into an organized list or a table, and determine whether they have all the possible rectangles.
3.MP.6. Attend to precision.
As third graders develop their mathematical communication skills, they try to use clear and precise language in their discussions with others and in their own reasoning. They are careful about specifying units of measure and state the meaning of the symbols they choose. For instance, when figuring out the area of a rectangle they record their answers in square units.
3.MP.7. Look for and make use of structure.
In third grade, students look closely to discover a pattern or structure. For instance, students use properties of operations as strategies to multiply and divide (commutative and distributive properties).
3.MP.8. Look for and express regularity in repeated reasoning.
Students in third grade should notice repetitive actions in computation and look for more shortcut methods. For example, students may use the distributive property as a strategy for using products they know to solve products that they don’t know. For example, if students are asked to find the product of 7 x 8, they might decompose 7 into 5 and 2 and then multiply 5 x 8 and 2 x 8 to arrive at 40 + 16 or 56. In addition, third graders continually evaluate their work by asking themselves, “Does this make sense?”

7
Using the Curriculum Maps
The District’s curriculum maps are designed to guide teachers through the instructional planning
process. Information in Stage 1 reflects desired learning outcomes for students within a particular topic
and time frame. In addition, the information in Stage 1 provides teachers background knowledge and
examples of student tasks.
In Stage 2, teachers develop an assessment plan to monitor student progress toward learning the
desired skills and concepts established in Stage 1. In addition, the plan outlines the evidence teachers
will collect to determine the depth of understanding their students have gained.
Stage 3 is designed for teachers to look ahead and plan student learning experiences over a specified
period of time. At this point, teachers analyze the desired results and the evidence that will be collected
to create a road map of daily learning objectives. Stage 3 is intended to serve as a catalyst to daily
lesson planning; however, it does not take the place of the traditional lesson plans created by teachers.
Daily lesson plans will be an extension of the work with curriculum maps. Daily plans include the details
necessary for successful instructional design and delivery (i.e., objectives, materials, strategies,
resources, etc.).
Stage 1
Identify Desired Results
Enduring Understandings Big Ideas
Essential Questions
Skills and Knowledge
Stage 2
Determine Acceptable Evidence
(Design Balanced Assessments)
(to assess student progress toward desired results)
Stage 3
Plan Learning Experiences and Instruction
(to support student success on assessments, leading to desired results)
8
Roosevelt School District Third Grade - Curriculum Map – Mathematics
Topic Grade Level
Pacing Trimester
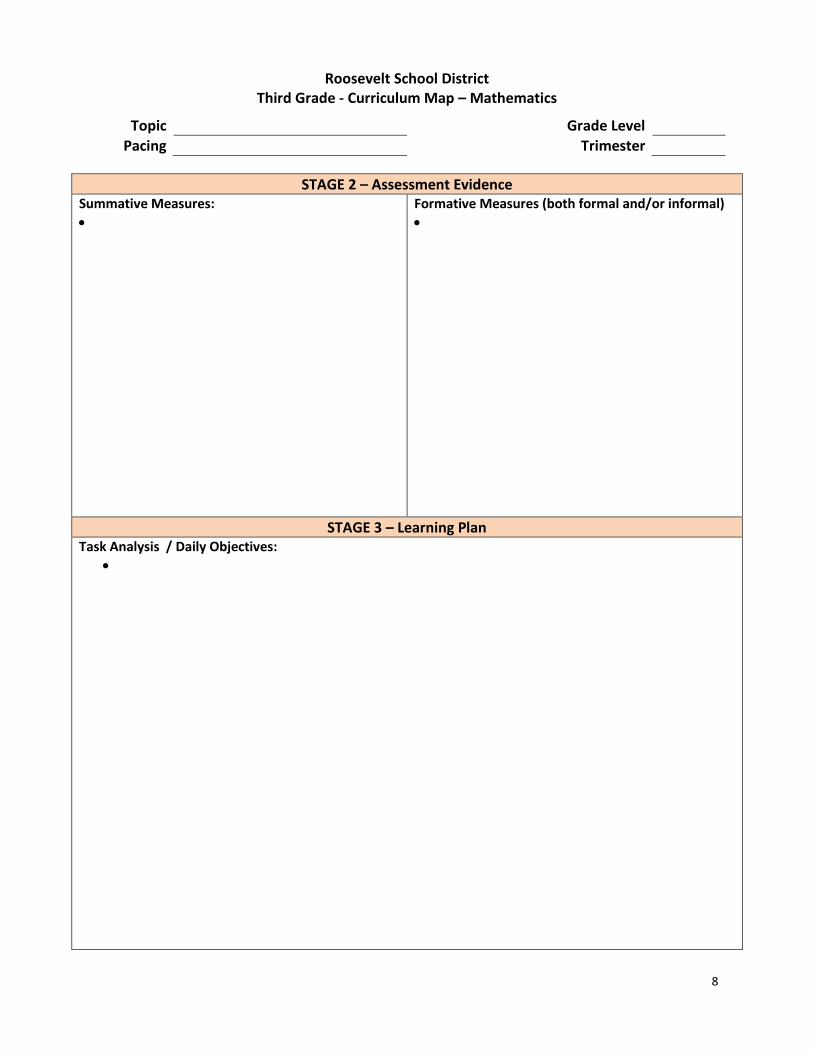
STAGE 2 – Assessment Evidence Summative Measures:
Formative Measures (both formal and/or informal)
STAGE 3 – Learning Plan Task Analysis / Daily Objectives:

9
Trimester 1
Third Grade Mathematics
Roosevelt School District
10
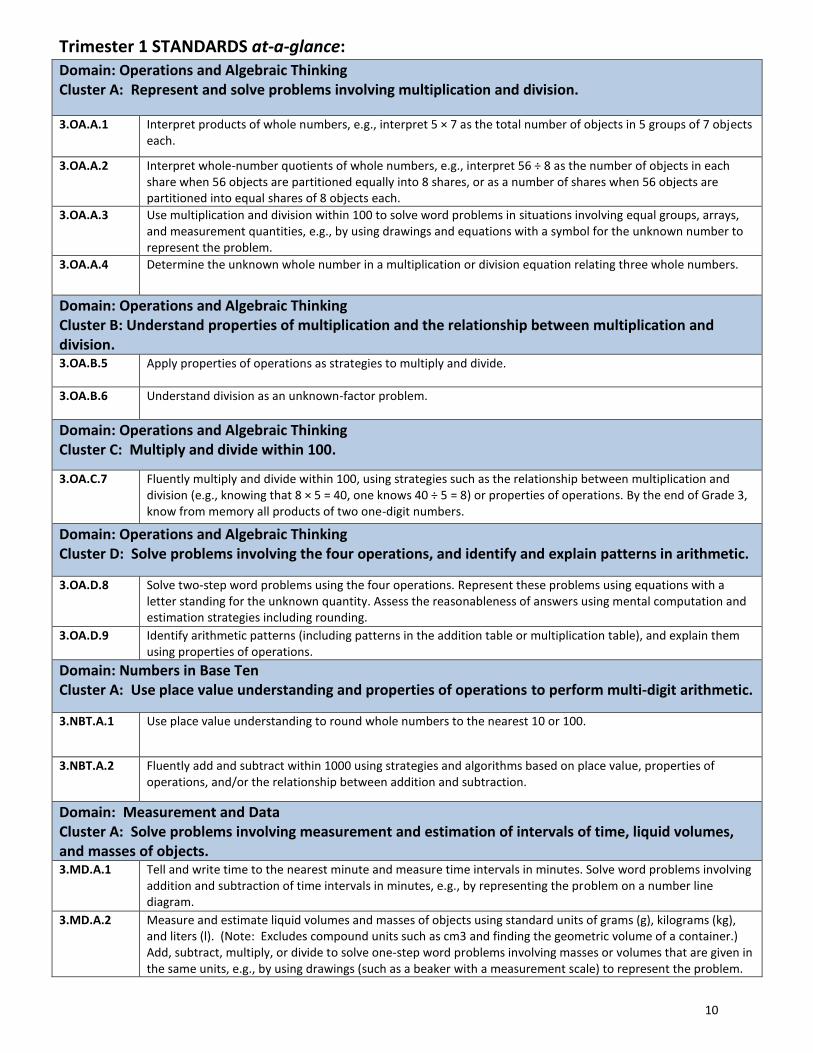
Trimester 1 STANDARDS at-a-glance: Domain: Operations and Algebraic Thinking Cluster A: Represent and solve problems involving multiplication and division.
3.OA.A.1 Interpret products of whole numbers, e.g., interpret 5 × 7 as the total number of objects in 5 groups of 7 objects each.
3.OA.A.2 Interpret whole-number quotients of whole numbers, e.g., interpret 56 ÷ 8 as the number of objects in each share when 56 objects are partitioned equally into 8 shares, or as a number of shares when 56 objects are partitioned into equal shares of 8 objects each.
3.OA.A.3 Use multiplication and division within 100 to solve word problems in situations involving equal groups, arrays, and measurement quantities, e.g., by using drawings and equations with a symbol for the unknown number to represent the problem.
3.OA.A.4 Determine the unknown whole number in a multiplication or division equation relating three whole numbers.
Domain: Operations and Algebraic Thinking Cluster B: Understand properties of multiplication and the relationship between multiplication and division. 3.OA.B.5 Apply properties of operations as strategies to multiply and divide.
3.OA.B.6 Understand division as an unknown-factor problem.
Domain: Operations and Algebraic Thinking Cluster C: Multiply and divide within 100.
3.OA.C.7 Fluently multiply and divide within 100, using strategies such as the relationship between multiplication and division (e.g., knowing that 8 × 5 = 40, one knows 40 ÷ 5 = 8) or properties of operations. By the end of Grade 3, know from memory all products of two one-digit numbers.
Domain: Operations and Algebraic Thinking Cluster D: Solve problems involving the four operations, and identify and explain patterns in arithmetic.
3.OA.D.8 Solve two-step word problems using the four operations. Represent these problems using equations with a letter standing for the unknown quantity. Assess the reasonableness of answers using mental computation and estimation strategies including rounding.
3.OA.D.9 Identify arithmetic patterns (including patterns in the addition table or multiplication table), and explain them using properties of operations.
Domain: Numbers in Base Ten Cluster A: Use place value understanding and properties of operations to perform multi-digit arithmetic.
3.NBT.A.1 Use place value understanding to round whole numbers to the nearest 10 or 100.
3.NBT.A.2 Fluently add and subtract within 1000 using strategies and algorithms based on place value, properties of operations, and/or the relationship between addition and subtraction.
Domain: Measurement and Data Cluster A: Solve problems involving measurement and estimation of intervals of time, liquid volumes, and masses of objects. 3.MD.A.1 Tell and write time to the nearest minute and measure time intervals in minutes. Solve word problems involving
addition and subtraction of time intervals in minutes, e.g., by representing the problem on a number line diagram.
3.MD.A.2 Measure and estimate liquid volumes and masses of objects using standard units of grams (g), kilograms (kg), and liters (l). (Note: Excludes compound units such as cm3 and finding the geometric volume of a container.) Add, subtract, multiply, or divide to solve one-step word problems involving masses or volumes that are given in the same units, e.g., by using drawings (such as a beaker with a measurement scale) to represent the problem.
11
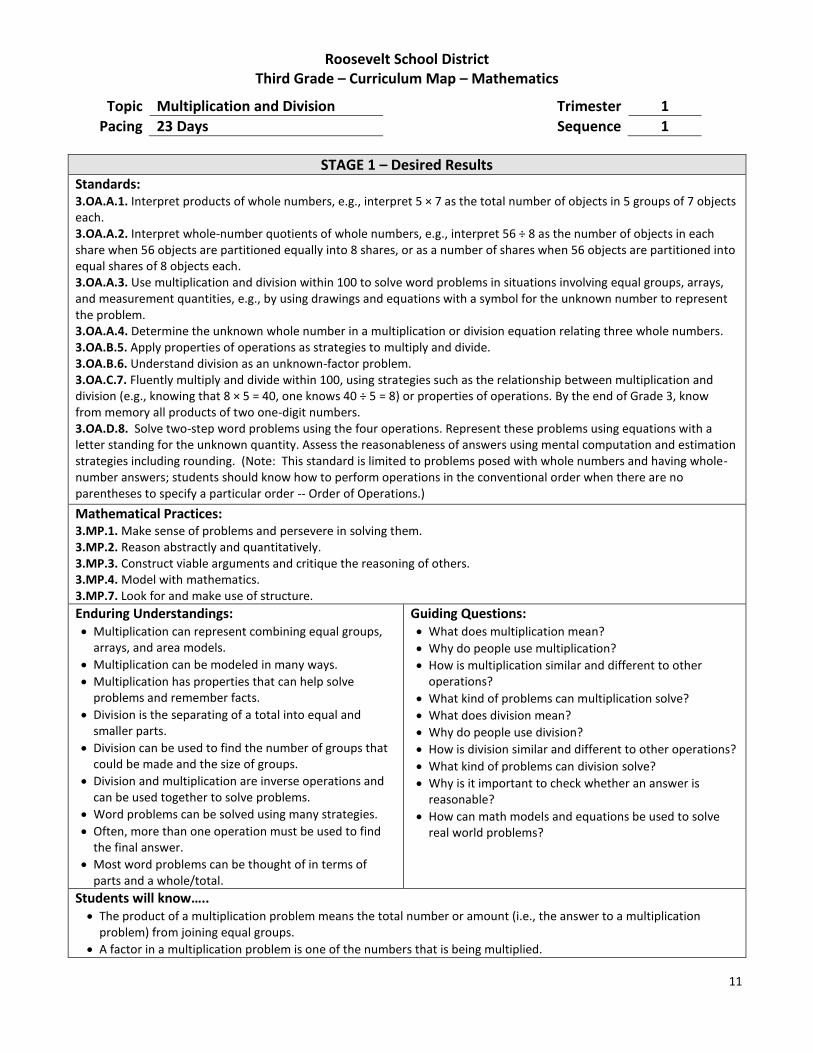
Roosevelt School District
Third Grade – Curriculum Map – Mathematics
Topic Multiplication and Division Trimester 1
Pacing 23 Days Sequence 1
STAGE 1 – Desired Results Standards: 3.OA.A.1. Interpret products of whole numbers, e.g., interpret 5 × 7 as the total number of objects in 5 groups of 7 objects each. 3.OA.A.2. Interpret whole-number quotients of whole numbers, e.g., interpret 56 ÷ 8 as the number of objects in each share when 56 objects are partitioned equally into 8 shares, or as a number of shares when 56 objects are partitioned into equal shares of 8 objects each. 3.OA.A.3. Use multiplication and division within 100 to solve word problems in situations involving equal groups, arrays, and measurement quantities, e.g., by using drawings and equations with a symbol for the unknown number to represent the problem. 3.OA.A.4. Determine the unknown whole number in a multiplication or division equation relating three whole numbers. 3.OA.B.5. Apply properties of operations as strategies to multiply and divide. 3.OA.B.6. Understand division as an unknown-factor problem. 3.OA.C.7. Fluently multiply and divide within 100, using strategies such as the relationship between multiplication and division (e.g., knowing that 8 × 5 = 40, one knows 40 ÷ 5 = 8) or properties of operations. By the end of Grade 3, know from memory all products of two one-digit numbers. 3.OA.D.8. Solve two-step word problems using the four operations. Represent these problems using equations with a letter standing for the unknown quantity. Assess the reasonableness of answers using mental computation and estimation strategies including rounding. (Note: This standard is limited to problems posed with whole numbers and having whole-number answers; students should know how to perform operations in the conventional order when there are no parentheses to specify a particular order -- Order of Operations.)
Mathematical Practices: 3.MP.1. Make sense of problems and persevere in solving them. 3.MP.2. Reason abstractly and quantitatively. 3.MP.3. Construct viable arguments and critique the reasoning of others. 3.MP.4. Model with mathematics. 3.MP.7. Look for and make use of structure. Enduring Understandings: Multiplication can represent combining equal groups,
arrays, and area models.
Multiplication can be modeled in many ways.
Multiplication has properties that can help solve problems and remember facts.
Division is the separating of a total into equal and smaller parts.
Division can be used to find the number of groups that could be made and the size of groups.
Division and multiplication are inverse operations and can be used together to solve problems.
Word problems can be solved using many strategies.
Often, more than one operation must be used to find the final answer.
Most word problems can be thought of in terms of parts and a whole/total.
Guiding Questions: What does multiplication mean?
Why do people use multiplication?
How is multiplication similar and different to other operations?
What kind of problems can multiplication solve?
What does division mean?
Why do people use division?
How is division similar and different to other operations?
What kind of problems can division solve?
Why is it important to check whether an answer is reasonable?
How can math models and equations be used to solve real world problems?
Students will know….. The product of a multiplication problem means the total number or amount (i.e., the answer to a multiplication
problem) from joining equal groups.
A factor in a multiplication problem is one of the numbers that is being multiplied.

12
A factor could represent: o A number of groups. o The number of objects in a group. o The number of rows in an array. o The number of items in a row in an array. o A number or amount that is being repeatedly added. o The number of times to add a number.
The symbol “x” means to multiply.
The symbol “x” can be read as: times, groups of, or rows of.
Multiplication can mean that multiple groups of the same number of objects are being combined (e.g. 7 x 5 could mean 7 groups of 5 objects).
Multiplication can mean that multiple rows with the same number in each row are being combined to form an array.
An array is a model with multiple rows of objects with the same number of objects in every row.
An array can be counted quickly by multiplying the number of rows by the number in each row.
When a number is multiplied by a number that is not zero, the result (product) is greater than the original number.
Repeated addition is performed by adding one factor the number of times shown by the other factor. It can sometimes be used to solve multiplication problems.
A number line can be used to model multiplication by showing equal “jumps” of a size shown by one factor. The other factor tells how many times to “jump” starting at 0.*
Multiplication word problems involve words that can mean groups with the same number of objects, rows of items with the same number in each row, or multiples of the same number.
An unknown is a missing part of an equation. In multiplication it could be the product or one of the factors.
An unknown can be represented by a blank space, a shape, or a letter.
An unknown can be found by multiplying the factors (if the product is the unknown), thinking of a fact that you know (if a factor is missing), or using the inverse operation.
The Commutative Property states that two factors can be multiplied in any order without changing the product.
The Distributive Property says that if you multiply and one factor is an addition equation, we can multiply (distribute) the other factor by each addend and then add the products. Example: 4 x (3+4) = (4x3) + (4x4) = 12 + 16 = 28.
Unknown facts can be found by breaking apart the unknown fact into known facts. The answers to the known facts are added to get the final product.
Sharing and repeated subtraction both involve separating equal groups and are two ways to think about division.
A quotient refers to the result of division (i.e., the answer to a division problem).
The dividend is the total amount that is being shared or divided.
The divisor is the number that refers to the number of groups needed or the number needed in each group.
Division may mean that you are finding the size of a group when you have a total and you know how many groups.
Division may mean that you are finding the number of groups you can make when you have a total and you know the size of the groups you want.
Division word problems usually have a number that means the total (dividend) and a number that means the number that is needed in each group or the number of groups you are trying to make. The question will ask you for the number of groups that could be made or the number that would be in each group.
When one number is divided by a whole number that is not 0 or 1, the quotient is smaller than the dividend.
Multiplication and division have an inverse (opposite) relationship. This relationship can be used to find division facts.
An unknown in a division problem could be the quotient, dividend, or divisor.
If the unknown is the quotient or divisor, you can solve by thinking of what factor is missing to make a complete multiplication fact (e.g. 50 / 5 is like “what times 5 = 50?”; 50 / y = 5 is like “5 times what equals 50”)
If the unknown is the dividend, multiplication can be used to find solve. (e.g. y / 2 = 16; 16 x 2 = y)
An equation can be used to summarize what happens in a word problem.
Sometimes word problems require more than one equation: o If the problem is asking for a total, you may have to use another equation to figure out one of the
addends first. o If the problem is asking for a part, you may have to use another equation to figure out the total or the
other part first.
Reasonableness means that the solution makes sense with the operation or story it belongs to.
Students will be able to….. Solve a multiplication equation by using a variety of strategies.

13
Model a multiplication equation by creating multiple groups with the same amount in each group.
Model a multiplication equation by creating an array with multiple rows with the same amount in each row.
Model a multiplication equation by creating a repeated addition equation with the same number as the addend for the correct amount of times.
Model a multiplication equation by using a number line with the same size jump used the correct amount of times.*
Describe a multiplication equation using the words product and factor (first factor, second factor).
Justify why they chose a specific model to solve a multiplication equation or word problem.
Represent a word problem using a multiplication equation and/or multiplication model.
Explain that the product of a multiplication problem is usually larger than the factors.
Find the unknown in a multiplication problem by using known facts and the inverse relationship of multiplication and division.
Reference the Commutative Property of Multiplication when explaining why two math facts have the same product.
Solve a division equation by using a variety of strategies.
Model a division equation by sharing a number of items (dividend) into a number of groups (divisor). See Example 1.
Model a division equation by sharing a number of items (dividend) into rows with the same number in each row (divisor). See Example 2.
Model a division equation by creating a series of repeated subtraction equations with the same number being subtracted each time.
Model a division equation by using a number line to “jump” backward by the size of the divisor, starting at the dividend, until 0 is reached.
Describe a division equation using the words divisor, dividend, and quotient.
Justify why those chose a specific model to solve a division equation or word problem.
Represent a word problem using a division equation and/or division model.
Explain that the quotient of a division problem is usually smaller than the dividend.
Find the unknown in a division problem by using known facts and the inverse relationship of multiplication and division.
Given a division fact, state a known multiplication fact, and vice versa.
Solve a two-step word problem that requires addition, subtraction, multiplication, and/or division.
Justify the reasonableness of a solution to a word problem.
Skills/Knowledge from Previous Years to Support this Cluster: 2.OA.C.3. Determine whether a group of objects (up to 20) has an odd or even number of members, e.g., by pairing objects or counting them by 2s; write an equation to express an even number as a sum of two equal addends 2.OA.C.4. Use addition to find the total number of objects arranged in rectangular arrays with up to 5 rows and up to 5 columns; write an equation to express the total as a sum of equal addends 2.NBT.A.2. Count within 1000; skip-count by 5s, 10s, and 100s 2.OA.A.1. Use addition and subtraction within 100 to solve one- and two-step word problems involving situations of adding to, taking from, putting together, taking apart, and comparing, with unknowns in all positions, e.g., by using drawings and equations with a symbol for the unknown number to represent the problem.
Instructional Resources: EngageNY Module 1
enVisionMATH Topic 5 (select lessons), Topic 18-1
NCTM Illuminations (www.illuminations.nctm.org) o All About Multiplication o Exploring Equal Sets o Multiplication: It’s in the Cards o Multiply and Conquer
District Math Resources: o Progression for Teaching Multiplication and
Division Facts o Doubling 2s, 5s, and 10s
Academic Vocabulary:
multiplication
factor
product
equal groups
repeated addition
array
number line
Commutative Property
Distributive Property
tape diagram
unknown
division
dividend
divisor
fair sharing
quotient
inverse operation
repeated subtraction
number bonds
Common Errors/Misconceptions: Students think a symbol (? or []) is always the place for the answer. This is especially true when the problem is written as
15 ÷ 3 =? or 15 = ☐ x 3.
Students also think that 3 ÷ 15 = 5 and 15 ÷ 3 = 5 are the same equations. The use of models is essential in helping students eliminate this understanding.
14
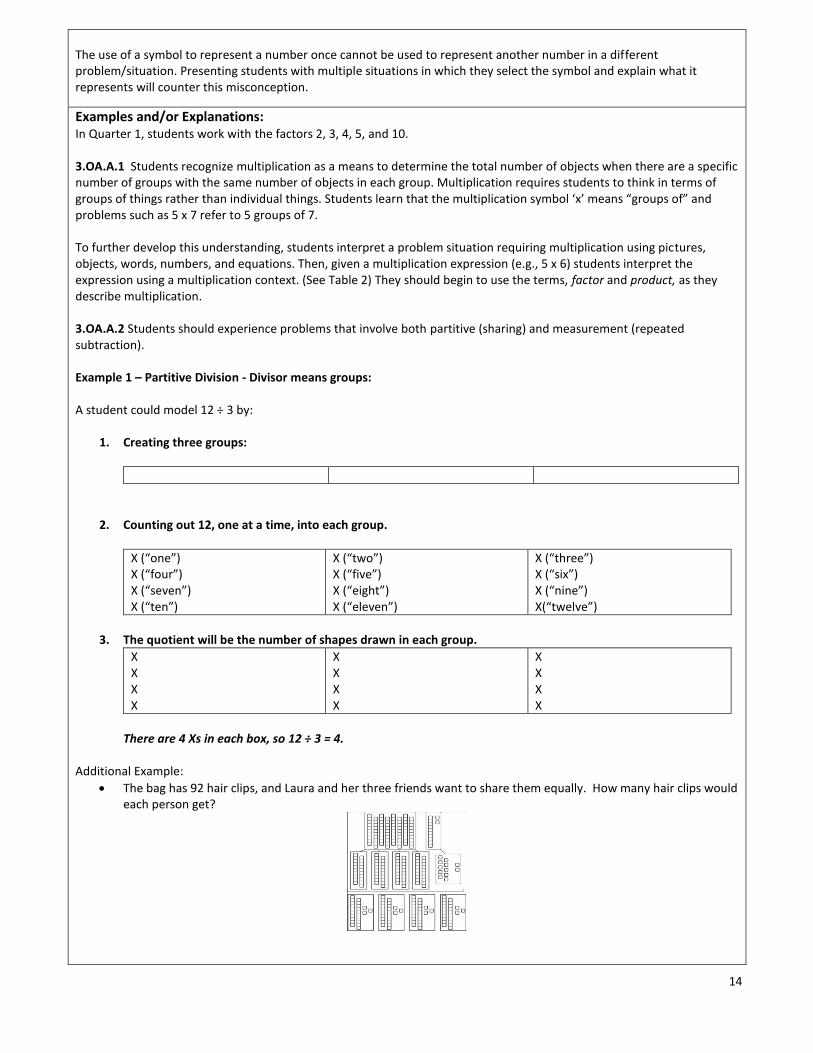
The use of a symbol to represent a number once cannot be used to represent another number in a different problem/situation. Presenting students with multiple situations in which they select the symbol and explain what it represents will counter this misconception.
Examples and/or Explanations: In Quarter 1, students work with the factors 2, 3, 4, 5, and 10. 3.OA.A.1 Students recognize multiplication as a means to determine the total number of objects when there are a specific number of groups with the same number of objects in each group. Multiplication requires students to think in terms of groups of things rather than individual things. Students learn that the multiplication symbol ‘x’ means “groups of” and problems such as 5 x 7 refer to 5 groups of 7. To further develop this understanding, students interpret a problem situation requiring multiplication using pictures, objects, words, numbers, and equations. Then, given a multiplication expression (e.g., 5 x 6) students interpret the expression using a multiplication context. (See Table 2) They should begin to use the terms, factor and product, as they describe multiplication. 3.OA.A.2 Students should experience problems that involve both partitive (sharing) and measurement (repeated subtraction). Example 1 – Partitive Division - Divisor means groups: A student could model 12 ÷ 3 by:
1. Creating three groups:
2. Counting out 12, one at a time, into each group.
X (“one”) X (“four”) X (“seven”) X (“ten”)
X (“two”) X (“five”) X (“eight”) X (“eleven”)
X (“three”) X (“six”) X (“nine”) X(“twelve”)
3. The quotient will be the number of shapes drawn in each group.
X X X X
X X X X
X X X X
There are 4 Xs in each box, so 12 ÷ 3 = 4.
Additional Example:
The bag has 92 hair clips, and Laura and her three friends want to share them equally. How many hair clips would each person get?
15
0 1 2 3 4 5 6 7 8 9 10 11 12
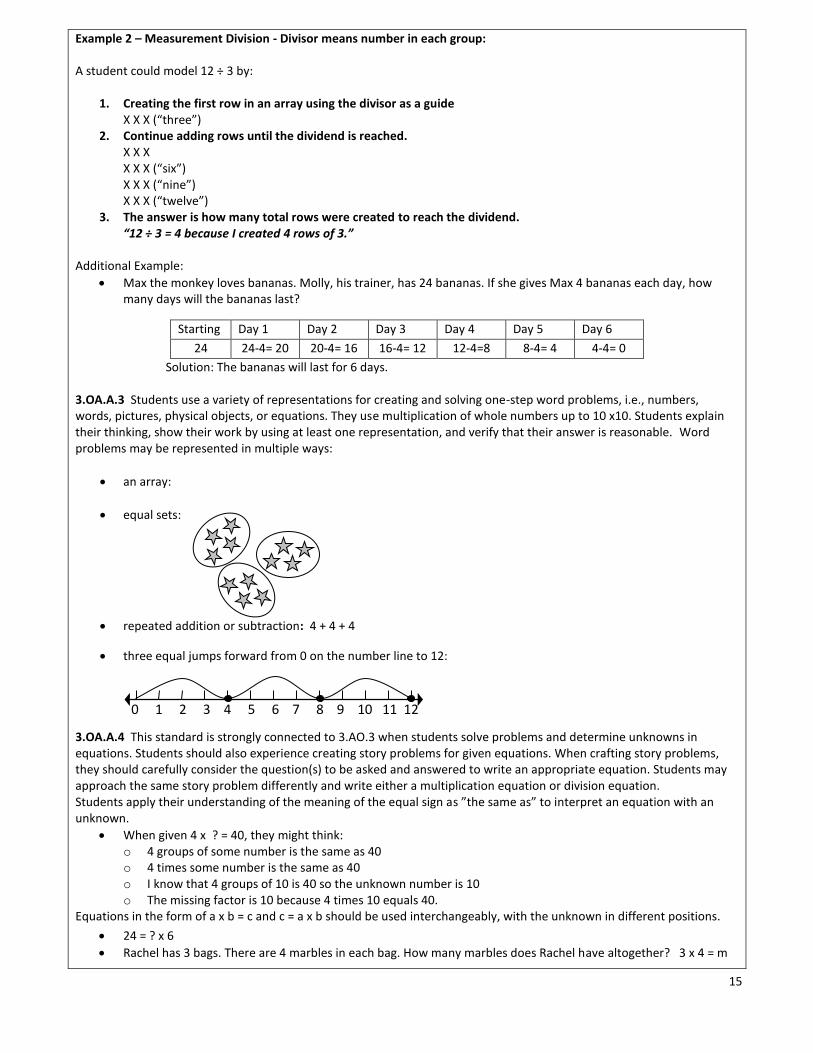
Example 2 – Measurement Division - Divisor means number in each group: A student could model 12 ÷ 3 by:
1. Creating the first row in an array using the divisor as a guide X X X (“three”)
2. Continue adding rows until the dividend is reached. X X X X X X (“six”) X X X (“nine”) X X X (“twelve”)
3. The answer is how many total rows were created to reach the dividend. “12 ÷ 3 = 4 because I created 4 rows of 3.”
Additional Example:
Max the monkey loves bananas. Molly, his trainer, has 24 bananas. If she gives Max 4 bananas each day, how many days will the bananas last?
Starting Day 1 Day 2 Day 3 Day 4 Day 5 Day 6
24 24-4= 20 20-4= 16 16-4= 12 12-4=8 8-4= 4 4-4= 0
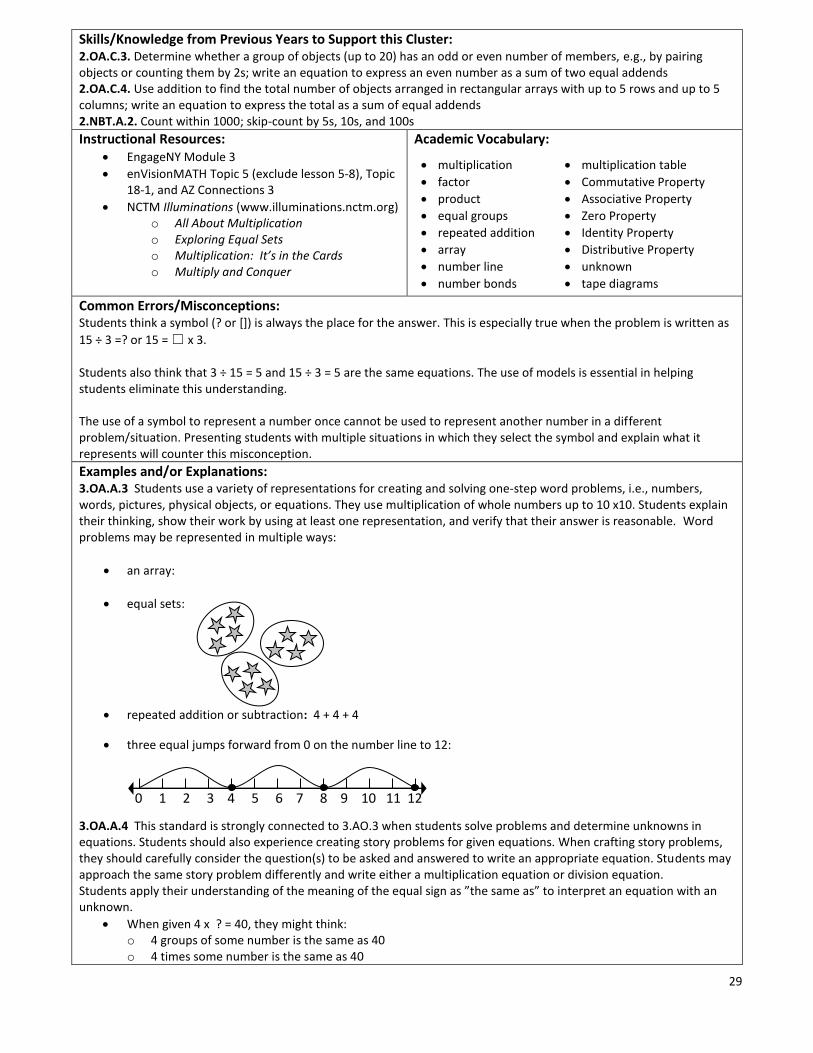
Solution: The bananas will last for 6 days. 3.OA.A.3 Students use a variety of representations for creating and solving one-step word problems, i.e., numbers, words, pictures, physical objects, or equations. They use multiplication of whole numbers up to 10 x10. Students explain their thinking, show their work by using at least one representation, and verify that their answer is reasonable. Word problems may be represented in multiple ways:
an array:
equal sets:
repeated addition or subtraction: 4 + 4 + 4
three equal jumps forward from 0 on the number line to 12: 3.OA.A.4 This standard is strongly connected to 3.AO.3 when students solve problems and determine unknowns in equations. Students should also experience creating story problems for given equations. When crafting story problems, they should carefully consider the question(s) to be asked and answered to write an appropriate equation. Students may approach the same story problem differently and write either a multiplication equation or division equation. Students apply their understanding of the meaning of the equal sign as ”the same as” to interpret an equation with an unknown.
When given 4 x ? = 40, they might think: o 4 groups of some number is the same as 40 o 4 times some number is the same as 40 o I know that 4 groups of 10 is 40 so the unknown number is 10 o The missing factor is 10 because 4 times 10 equals 40.
Equations in the form of a x b = c and c = a x b should be used interchangeably, with the unknown in different positions.
24 = ? x 6
Rachel has 3 bags. There are 4 marbles in each bag. How many marbles does Rachel have altogether? 3 x 4 = m

16
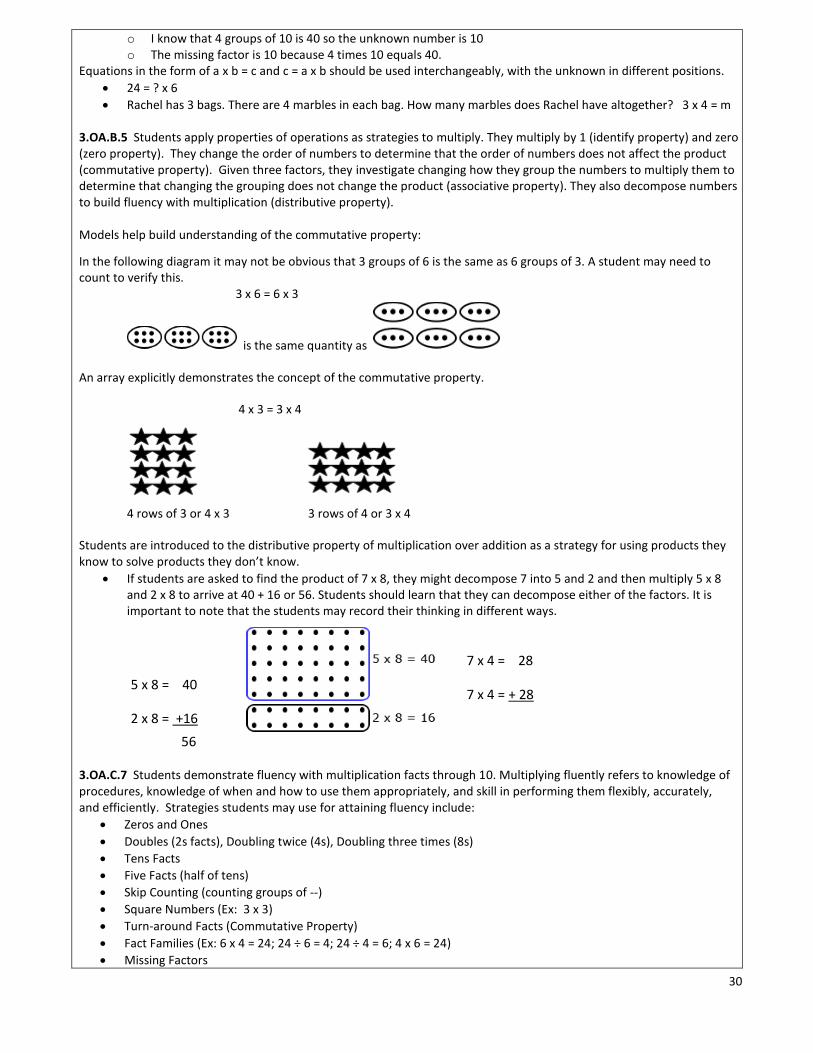
3.OA.B.5 Students apply properties of operations as strategies to multiply. They multiply by 1 (identify property) and zero (zero property). They change the order of numbers to determine that the order of numbers does not affect the product (commutative property). Given three factors, they investigate changing how they group the numbers to multiply them to determine that changing the grouping does not change the product (associative property). They also decompose numbers to build fluency with multiplication (distributive property). Models help build understanding of the commutative property:
In the following diagram it may not be obvious that 3 groups of 6 is the same as 6 groups of 3. A student may need to count to verify this. 3 x 6 = 6 x 3
is the same quantity as
An array explicitly demonstrates the concept of the commutative property.
4 x 3 = 3 x 4
4 rows of 3 or 4 x 3 3 rows of 4 or 3 x 4
Students are introduced to the distributive property of multiplication over addition as a strategy for using products they know to solve products they don’t know.
If students are asked to find the product of 7 x 8, they might decompose 7 into 5 and 2 and then multiply 5 x 8 and 2 x 8 to arrive at 40 + 16 or 56. Students should learn that they can decompose either of the factors. It is important to note that the students may record their thinking in different ways.
56
3.OA.B.6 Multiplication and division facts are inverse operations and that understanding can be used to solve the unknown. Fact family triangles demonstrate the inverse operations of multiplication and division by showing the four possible facts using the same three numbers. Examples:
3 x 5 = 15 5 x 3 = 15
15 ÷ 3 = 5 15 ÷ 5 = 3 3.OA.C.7 Students demonstrate fluency with multiplication facts through 10. Multiplying fluently refers to knowledge of procedures, knowledge of when and how to use them appropriately, and skill in performing them flexibly, accurately, and efficiently. Strategies students may use for attaining fluency include:
Zeros and Ones
Doubles (2s facts), Doubling twice (4s), Doubling three times (8s)
Tens Facts
Five Facts (half of tens)
5 x 8 = 40
2 x 8 = +16
56
7 x 4 = 28
7 x 4 = + 28
56
3 5
15
x or ÷

17
Skip Counting (counting groups of --)
Square Numbers (Ex: 3 x 3)
Turn-around Facts (Commutative Property)
Fact Families (Ex: 6 x 4 = 24; 24 ÷ 6 = 4; 24 ÷ 4 = 6; 4 x 6 = 24)
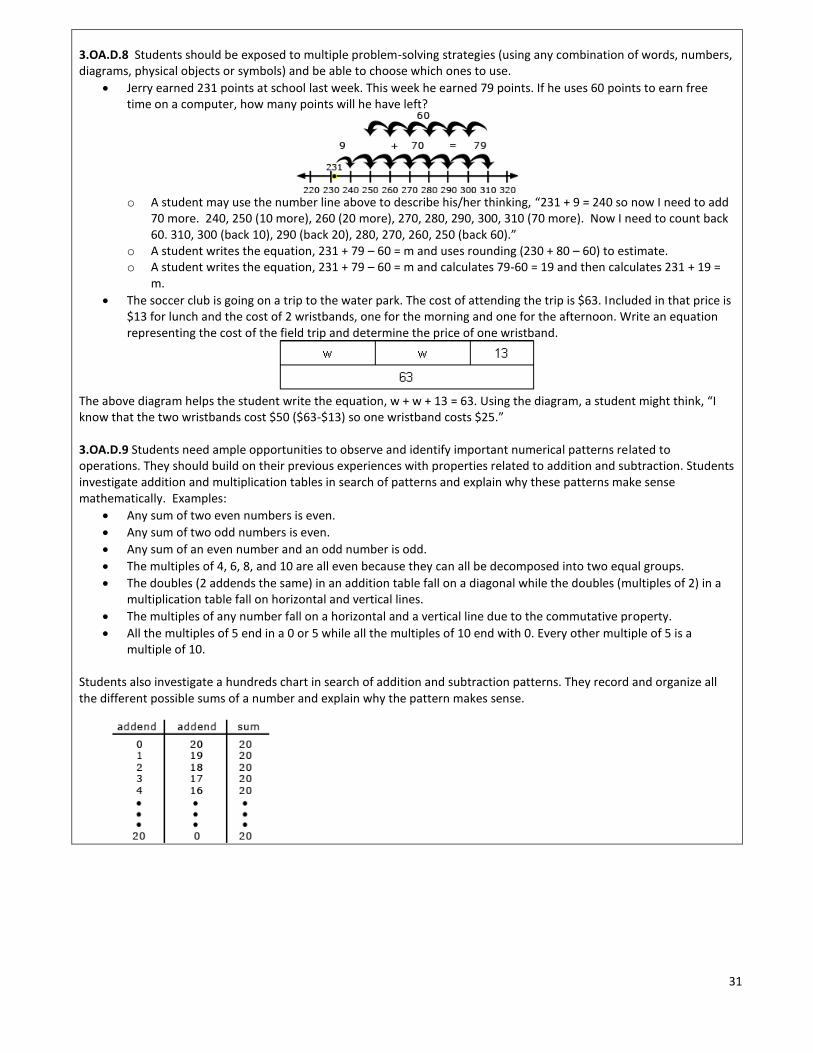
Missing Factors 3.OA.D.8 Students should be exposed to multiple problem-solving strategies (using any combination of words, numbers, diagrams, physical objects or symbols) and be able to choose which ones to use.
Jerry earned 231 points at school last week. This week he earned 79 points. If he uses 60 points to earn free time on a computer, how many points will he have left?
o A student may use the number line above to describe his/her thinking, “231 + 9 = 240 so now I need to add
70 more. 240, 250 (10 more), 260 (20 more), 270, 280, 290, 300, 310 (70 more). Now I need to count back 60. 310, 300 (back 10), 290 (back 20), 280, 270, 260, 250 (back 60).”
o A student writes the equation, 231 + 79 – 60 = m and uses rounding (230 + 80 – 60) to estimate. o A student writes the equation, 231 + 79 – 60 = m and calculates 79-60 = 19 and then calculates 231 + 19 = m.
The soccer club is going on a trip to the water park. The cost of attending the trip is $63. Included in that price is $13 for lunch and the cost of 2 wristbands, one for the morning and one for the afternoon. Write an equation representing the cost of the field trip and determine the price of one wristband.
The above diagram helps the student write the equation, w + w + 13 = 63. Using the diagram, a student might think, “I know that the two wristbands cost $50 ($63-$13) so one wristband costs $25.”

18
Arizona Mathematics Standards
Table 2. Common multiplication and division situations.7
Unknown Product Group Size Unknown (“How many in each group?”
Division)
Number of Groups Unknown
(“How many groups?” Division)
3 x 6 = ? 3 x ? = 18, and 18 ÷ 3 = ? ? x 6 = 18, and 18 ÷ 6 = ?
Equal Groups
There are 3 bags with 6 plums in each bag. How many plums are there in all? Measurement example. You need 3 lengths of string, each 6 inches long. How much string will you need altogether?
If 18 plums are shared equally into 3 bags, then how many plums will be in each bag? Measurement example. You have 18 inches of string, which you will cut into 3 equal pieces. How long will each piece of string be?
If 18 plums are to be packed 6 to a bag, then how many bags are needed? Measurement example. You have 18 inches of string, which you will cut into pieces that are 6 inches long. How many pieces of string will you have?
Arrays,4
Area5
There are 3 rows of apples with 6 apples in each row. How many apples are there? Area example. What is the area of a 3 cm by 6 cm rectangle?
If 18 apples are arranged into 3 equal rows, how many apples will be in each row? Area example. A rectangle has area 18 square centimeters. If one side is 3 cm long, how long is a side next to it?
If 18 apples are arranged into equal rows of 6 apples, how many rows will there be? Area example. A rectangle has area 18 square centimeters. If one side is 6 cm long, how long is a side next to it?
Compare
A blue hat costs $6. A red hat costs 3 times as much as the blue hat. How much does the red hat cost? Measurement example. A rubber band is 6 cm long. How long will the rubber band be when it is stretched to be 3 times as long?
A red hat costs $18 and that is 3 times as much as a blue hat costs. How much does a blue hat cost? Measurement example. A rubber band is stretched to be 18 cm long and that is 3 times as long as it was at first. How long was the rubber band at first?
A red hat costs $18 and a blue hat costs $6. How many times as much does the red hat cost as the blue hat? Measurement example. A rubber band was 6 cm long at first. Now it is stretched to be 18 cm long. How many times as long is the rubber band now as it was at first?
General General a x b = ? a x ? = p, and p ÷ a = ? ? x b = p, and p ÷ b = ?
7The first examples in each cell are examples of discrete things. These are easier for students and should be given before the
measurement examples. 4The language in the array examples shows the easiest form of array problems. A harder form is to use the terms rows and
columns: The apples in the grocery window are in 3 rows and 6 columns. How many apples are in there? Both forms are valuable. 5Area involves arrays of squares that have been pushed together so that there are no gaps or overlaps, so array problems
include these especially important measurement situations.

19
Roosevelt School District Third Grade – Curriculum Map – Mathematics
Topic Time Trimester 1
Pacing 5 Days Sequence 2
STAGE 1 – Desired Results Standards: 3.MD.A.1. Tell and write time to the nearest minute and measure time intervals in minutes. Solve word problems involving addition and subtraction of time intervals in minutes, e.g., by representing the problem on a number line diagram. 3.NBT.A.2. Fluently add and subtract within 1000 using strategies and algorithms based on place value, properties of operations, and/or the relationship between addition and subtraction.
Mathematical Practices: 3.MP.2. Reason abstractly or quantitatively. 3.MP.4. Model with mathematics. 3.MP.6. Attend to precision. 3.MP.7. Look for and make use of structure.
Enduring Understandings: Time is used to organize our lives and communities.
Analogue clocks are organized like number lines.
Elapsed time can be calculated using many strategies that use models, addition, subtraction, and multiplication.
Guiding Questions: Why do people measure time?
How can you calculate how much time has passed?
Students will know….. The passage of time is a measurement of the units of time between one event and another.
The passage of time can be measured in different units (seconds, minutes, hours, days, weeks).
An hour is a group of 60 minutes.
A day is a group of 24 hours.
An analog clock measures and shows time.
The numbers represent hours and minutes.
The short hand is used to name the hour. The number it is after is the current hour.
The longer hand is used to name the minute. You can start at the 12 (0 minutes) and begin to count by 1s to find the minute OR you can count in groups of 5 and add 1 to find the nearest minute.
Benchmark times (in minutes are): o If the minute hand is at the 3, 15 minutes past the hour or “a quarter past” o If the minute hand is at the 6, 30 minutes past the hour or “half past” o If the minute hand at the 9, 45 minutes past the hour, 15 minutes until the next hour, or “quarter till” o If the minute hand is at the 12, 0 minutes past the hour, ___ o’clock.
Making models of clocks or creating a time number line can help solve word problems where time passes.
Students will be able to….. Tell time to the minute using digital and analog clocks.
Convert between units of time.
Determine elapsed time by using a clock and number line.
Skills/Knowledge from Previous Years to Support this Cluster:
2.MD.D.7. Tell and write time from analog and digital clocks to the nearest five minutes, using a.m. and p.m. Instructional Resources:
EngageNY Module 2 Topic A
enVisionMATH: o Topic 17 Lessons 17-1, 17-2 and 17-4 o AZ Connections 10
Model clocks
Academic Vocabulary:
duration
passed time
minute
hour
day
week
month
year
analog clock
digital clock
calendar
Common Errors/Misconceptions: Students often confuse the minute hand and the hour hand. When calculating minutes, students may neglect to count the spaces between the numbers on an analog clock as 5 minute intervals.
20
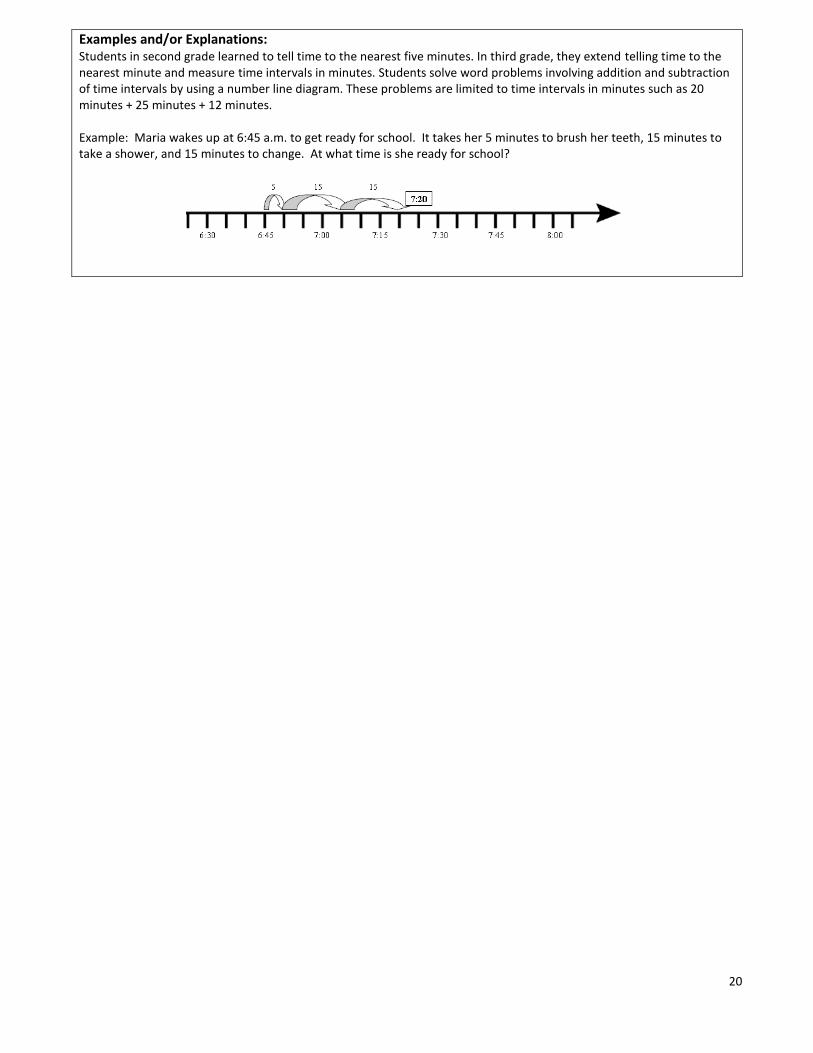
Examples and/or Explanations: Students in second grade learned to tell time to the nearest five minutes. In third grade, they extend telling time to the nearest minute and measure time intervals in minutes. Students solve word problems involving addition and subtraction of time intervals by using a number line diagram. These problems are limited to time intervals in minutes such as 20 minutes + 25 minutes + 12 minutes. Example: Maria wakes up at 6:45 a.m. to get ready for school. It takes her 5 minutes to brush her teeth, 15 minutes to take a shower, and 15 minutes to change. At what time is she ready for school?
21
Roosevelt School District Third Grade – Curriculum Map – Mathematics
Topic Measuring Liquid Volume and Mass Trimester 1
Pacing 7 Days Sequence 3
STAGE 1 – Desired Results Standards: 3.MD.A.2. Measure and estimate liquid volumes and masses of objects using standard units of grams (g), kilograms (kg),
and liters (l). (Note: Excludes compound units such as cm3 and finding the geometric volume of a container.) Add, subtract, multiply, or divide to solve one-step word problems involving masses or volumes that are given in the same units, e.g., by using drawings (such as a beaker with a measurement scale) to represent the problem. (Note: Excludes multiplicative comparison problems -- problems involving notions of “times as much”; see Glossary, Table 2.)
3.NBT.A.2. Fluently add and subtract within 1000 using strategies and algorithms based on place value, properties of operations, and/or the relationship between addition and subtraction.
Mathematical Practices: 3.MP.2. Reason abstractly or quantitatively. 3.MP.4. Model with mathematics. 3.MP.6. Attend to precision. 3.MP.7. Look for and make use of structure.
Enduring Understandings: Common objects can be used to estimate the mass and
capacity of other objects.
Mass and capacity are attributes of objects that can be measured.
Different units are used to measure objects depending on the objects size and the precision needed.
Guiding Questions: How can you measure a solid object?
Why do we use so many words to talk about measurement?
What happens if an object is smaller than the size of a standard unit?
Students will know….. Mass is how much matter is in an object.
Mass is similar to weight.
Mass is measured by metric units (grams and kilograms) and English units (ounces and pounds).
A scale or balance can be used to measure mass.
Grams and ounces are small units of mass: o A gram is about the weight of a large paperclip. o An ounce is about the weight of a slice of bread.
Kilograms and pounds are larger units of mass: o A kilogram is about the weight of a dictionary. o A pound is about the weight of a loaf of bread.
Capacity is a measurement of how much something can hold.
Capacity can be measured by metric units (liter) or English units (cup, pint, quart, gallon).
Common grocery items can be used to estimate capacity. For example: o Water and soda are often sold in liter bottles.
Students will be able to….. Measure the mass of objects using a scale in kilograms and grams.
Measure liquid volume using a measuring cup in liters.
Estimate mass and volume (capacity) using metric units by referencing common objects.
Solve word problems that reference mass and volume (capacity).

22
Skills/Knowledge from Previous Years to Support this Cluster: 2.MD.A.1. Measure the length of an object by selecting and using appropriate tools such as rulers, yardsticks, meter sticks, and measuring tapes. 2.MD.A.3. Estimate lengths using units of inches, feet, centimeters, and meters. 2.MD.A.4. Measure to determine how much longer one object is than another, expressing the length difference in terms of a standard length unit. Instructional Resources:
engageNY Module 2 Topic B
enVisionMATH: o Topic 14 (exclude miles and tons) o Topic 15 Lesson 3 (Liters) and 4 (Metric
Mass)
Scale
Measuring cups
Benchmark examples
Academic Vocabulary:
mass
scale
balance
metric system
U.S. customary system
kilogram
gram
length
inch
foot
yard
capacity
liter
Common Errors/Misconceptions: Students may read the mark on a scale that is below a designated number on the scale as if it was the next number. For example, a mark that is one mark below 80 grams may be read as 81 grams. Students realize it is one away from 80, but do not think of it as 79 grams. Students forget to label the measurement or choose the incorrect unit. Students often focus on size to determine estimates of mass. They can be confused by a big fluffy object and a tiny dense object. Because students cannot tell actual mass until they have handled an object, it is important that teachers do not ask students to estimate the mass of objects until they have had the opportunity to lift the objects and then make an estimate of the mass.
Examples and/or Explanations: 3.MD.A.2 Students need multiple opportunities weighing classroom objects and filling containers to help them develop a basic understanding of the size and weight of a liter, a gram, and a kilogram. Milliliters may also be used to show amounts that are less than a liter.
Students identify 5 things that weigh about one gram. They record their findings with words and pictures. (Students can repeat this for 5 grams and 10 grams.) This activity helps develop gram benchmarks. One large paperclip weighs about one gram. A box of large paperclips (100 clips) weighs about 100 grams so 10 boxes would weigh one kilogram.

23
Roosevelt School District Third Grade – Curriculum Map – Mathematics
Topic Rounding and Measurement Addition and Subtraction Problems Trimester 1
Pacing 11 Days Sequence 4
STAGE 1 – Desired Results Standards: 3.NBT.A.1. Use place value understanding to round whole numbers to the nearest 10 or 100. 3.NBT.A.2. Fluently add and subtract within 1000 using strategies and algorithms based on place value, properties of operations, and/or the relationship between addition and subtraction. 3.MD.A.1. Tell and write time to the nearest minute and measure time intervals in minutes. Solve word problems involving addition and subtraction of time intervals in minutes, e.g., by representing the problem on a number line diagram. 3.MD.A.2. Measure and estimate liquid volumes and masses of objects using standard units of grams (g), kilograms (kg), and liters (l). (Note: Excludes compound units such as cm3 and finding the geometric volume of a container.) Add, subtract, multiply, or divide to solve one-step word problems involving masses or volumes that are given in the same units, e.g., by using drawings (such as a beaker with a measurement scale) to represent the problem. (Note: Excludes multiplicative comparison problems -- problems involving notions of “times as much”; see Glossary, Table 2.)
Mathematical Practices: 3.MP.2. Reason abstractly or quantitatively. 3.MP.4. Model with mathematics. 3.MP.6. Attend to precision. 3.MP.7. Look for and make use of structure.
Enduring Understandings: Estimating helps add and subtract numbers quickly when
precision is not important.
Estimating can help quickly justify whether an answer is reasonable.
Place value organization can help add and subtract large numbers.
Addition and subtraction are inverse operations and can be used together to solve problems and check answers.
Common objects can be used to estimate the mass and capacity of other objects.
Mass and capacity are attributes of objects that can be measured.
Different units are used to measure objects depending on the objects size and the precision needed.
Guiding Questions: Why is it important to check whether an answer is
reasonable?
Why do people estimate?
How does the organization of large numbers help people add and subtract?
How can you measure a solid object?
Why do we use so many words to talk about measurement?
What happens if an object is smaller than the size of a standard unit?
Students will know….. Rounding is one way to estimate. It is used to help change numbers to they are easier to work with quickly or in
your head. Rounding can help explain why an answer is reasonable.
A number line can help round a number: o Figure out which 10s or 100s your number is between. o Determine the “halfway number” o If your number is bigger or the same as the “halfway number,” round to the greater 10 (or 100). o If your number is smaller than the “halfway number,” round to the lower 10 (or 100).
Place value can help round a number: o Identify the digit in the “rounding place.” o Look at the digit to the right of the “rounding place.” o If the digit is less than 5, keep the same digit in the rounding place. If the digit is 5 or greater, add 1 to
the digit in the “rounding place.” o Change all the digits to the right of the “rounding place” to 0.
A sum is the answer to addition equation.
Addends are the numbers that are being added together to create a sum.
24
Addition has properties that can help solve and justify answers: o Commutative (Order) Property says that you can add numbers in any order and the sum will be the
same. o Identity (Zero) Property of Addition says that the sum of zero and any number is that same number. o Associative Property of Addition says that you can group addends in any way and the sum will be the
same.
Addition problems can be solved by using models: o Counters/Tallies: You can draw objects for each addend and count them to find the sum. o Bar Diagram: A bar is drawn and divided into parts. Each part represents an addend. The entire bar
represents the whole (the sum). o Number Line: You can draw “jumps” on a number line. Starting at 0 each “jump” represents an
addend.
Addition problems can be solved by breaking apart addends into place values and rearranging them using the Associative Property (See Example 1).
Addition problems can be solved by breaking apart an addend to make a ten with the other addend using the Associative Property (See Example 2).
Base-10 models can be drawn to show how to regroup a set of 10 blocks of a lower place value to 1 group of a higher place value (Carrying).
Base-10 models can be drawn to show how to regroup 1 block of a higher place value to 10 blocks of a lower place value (Borrowing).
An algorithm is a group of steps that you can follow to solve an equation. The standard algorithm is the one that is usually used, or used by the most people.
The standard algorithm for addition: o Start with the ones place and add the ones. o If the sum is greater than 9, regroup. Add any 10s above the tens place. Record ones below the equal
sign.
o Continue the pattern of add-regroup with each place. The answer to a subtraction problem is called the difference.
The total in a subtraction problem is called the minuend. The part that is being taken away is called the subtrahend.
The standard algorithm for subtraction: o Start with the ones place and think – can I subtract these numbers? o If you can’t subtract, regroup (borrow one from the next biggest place, move it as a ten to the place
you are subtracting). o Continue with the pattern of: ask, regroup, subtract.
Other algorithms can also be used to solve addition and subtraction problems (see Examples): o Partial Sums o Column Addition o Trade-First o Counting Up o Left-to-Right
You can use estimation to justify if your answer is reasonable: o In a general way (e.g., the story asked for a total and my answer is bigger than the other numbers in
the problem) o In a specific way (e.g., I rounded 37 to 40 and 17 to 20. My answer should be close to 60 and it is.)
Mass is how much matter is in an object. It is similar to weight.
Mass is measured by metric units (grams and kilograms) and English units (ounces and pounds).
A scale or balance can be used to measure mass.
Grams and ounces are small units of mass: o A gram is about the weight of a large paperclip. o An ounce is about the weight of a slice of bread.
Kilograms and pounds are larger units of mass: o A kilogram is about the weight of a dictionary. o A pound is about the weight of a loaf of bread.
Capacity is a measurement of how much something can hold.
Capacity can be measured by metric units (liter) or English units (cup, pint, quart, gallon).
Common grocery items can be used to estimate capacity. Example: Water and soda are often sold in liter bottles.
25
Students will be able to….. Round numbers to the nearest 10.
Round numbers to the nearest 100.
Justify rounding to the nearest 10 or 100 by using place value concepts and/or the number line.
Represent a number in multiple forms using place value language (e.g., 17 ones is 1 ten and 7 ones; 34 hundreds is 3 thousands and 4 hundreds).
Justify the reasonableness of a computation by using place value language.
Justify the reasonableness of a computation by using the properties of addition and subtraction.
Use the standard algorithm to solve addition problems with 4-digit numbers.
Use the standard algorithm to solve subtraction problems with 4-digit numbers.
Use multiple algorithms to solve addition and subtraction problems with 4-digit numbers.
Justify the reasonableness of a solution to a word problem by using estimation.
Measure the mass of objects using a scale in kilograms and grams.
Measure liquid volume using a measuring cup in liters.
Estimate mass and volume (capacity) using metric units by referencing common objects.
Solve word problems that reference mass and volume (capacity).
Skills/Knowledge from Previous Years to Support this Cluster: 2.NBT.B.5. Fluently add and subtract within 100 using strategies based on place value, properties of operations, and/or the relationship between addition and subtraction. 2.NBT.B.6. Add up to four two-digit numbers using strategies based on place value and properties of operations. 2.NBT.B.7. Add and subtract within 1000, using concrete models or drawings and strategies based on place value, properties of operations, and/or the relationship between addition and subtraction; relate the strategy to a written method. Understand that in adding or subtracting three-digit numbers, one adds or subtracts hundreds and hundreds, tens and tens, ones and ones; and sometimes it is necessary to compose or decompose tens or hundreds. 2.NBT.B.8. Mentally add 10 or 100 to a given number 100-900, and mentally subtract 10 or 100 from a given number 100-900. 2.NBT.B.9. Explain why addition and subtraction strategies work, using place value and the properties of operations.
Instructional Resources: engageNY Module 2 Topic C-E
enVisionMATH: o Topic 14 (exclude miles and tons) o Topic 15-3 (Liters) and 4 (Metric Mass)
Scale
Measuring cups
Benchmark examples
Academic Vocabulary:
round
mass
scale
balance
metric system
kilogram
gram
capacity
liter
milliliter
Common Errors/Misconceptions: The use of terms like “round up” and “round down” confuses many students. For example, the number 37 would round to 40 or they say it “rounds up”. The digit in the tens place is changed from 3 to 4 (rounds up). This misconception is what causes the problem when applied to rounding down. The number 32 should be rounded (down) to 30, but using the logic mentioned for rounding up, some students may look at the digit in the tens place and take it to the previous number, resulting in the incorrect value of 20. To remedy this misconception, students need to use a number line to visualize the placement of the number and/or ask questions such as: “What tens are 32 between and which one is it closer to?” Developing the understanding of what the answer choices are before rounding can alleviate much of the misconception and confusion related to rounding.
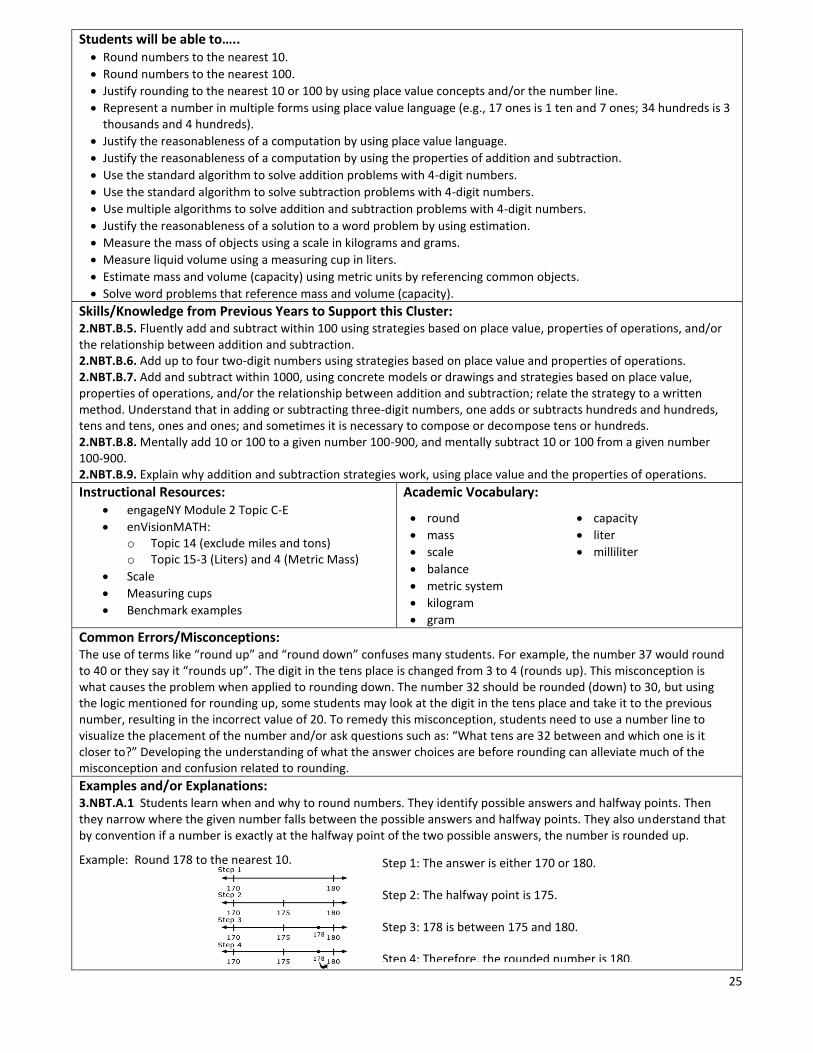
Examples and/or Explanations: 3.NBT.A.1 Students learn when and why to round numbers. They identify possible answers and halfway points. Then they narrow where the given number falls between the possible answers and halfway points. They also understand that by convention if a number is exactly at the halfway point of the two possible answers, the number is rounded up.
Example: Round 178 to the nearest 10.
Step 1: The answer is either 170 or 180.
Step 2: The halfway point is 175.
Step 3: 178 is between 175 and 180.
Step 4: Therefore, the rounded number is 180.
26
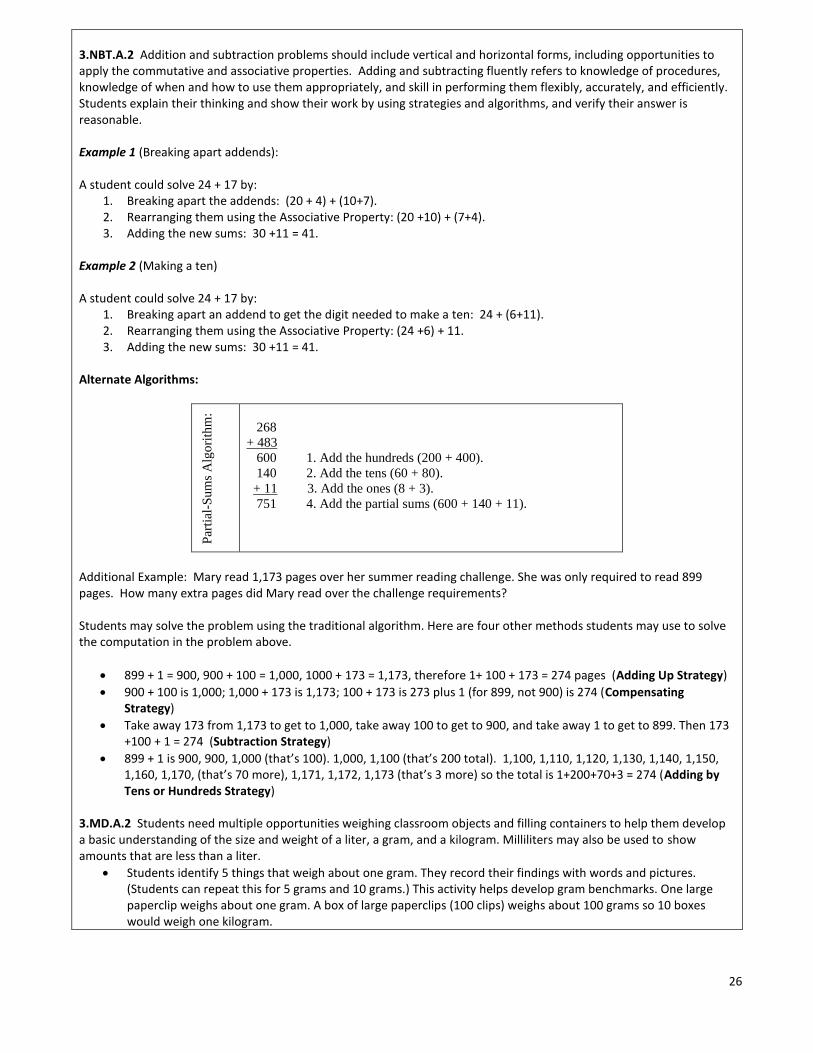
3.NBT.A.2 Addition and subtraction problems should include vertical and horizontal forms, including opportunities to apply the commutative and associative properties. Adding and subtracting fluently refers to knowledge of procedures, knowledge of when and how to use them appropriately, and skill in performing them flexibly, accurately, and efficiently. Students explain their thinking and show their work by using strategies and algorithms, and verify their answer is reasonable. Example 1 (Breaking apart addends): A student could solve 24 + 17 by:
1. Breaking apart the addends: (20 + 4) + (10+7). 2. Rearranging them using the Associative Property: (20 +10) + (7+4). 3. Adding the new sums: 30 +11 = 41.
Example 2 (Making a ten) A student could solve 24 + 17 by:
1. Breaking apart an addend to get the digit needed to make a ten: 24 + (6+11). 2. Rearranging them using the Associative Property: (24 +6) + 11. 3. Adding the new sums: 30 +11 = 41.
Alternate Algorithms:
Par
tial
-Su
ms
Alg
ori
thm
:
268
+ 483
600 1. Add the hundreds (200 + 400).
140 2. Add the tens (60 + 80).
+ 11 3. Add the ones (8 + 3).
751 4. Add the partial sums (600 + 140 + 11).
Additional Example: Mary read 1,173 pages over her summer reading challenge. She was only required to read 899 pages. How many extra pages did Mary read over the challenge requirements? Students may solve the problem using the traditional algorithm. Here are four other methods students may use to solve the computation in the problem above.
899 + 1 = 900, 900 + 100 = 1,000, 1000 + 173 = 1,173, therefore 1+ 100 + 173 = 274 pages (Adding Up Strategy)
900 + 100 is 1,000; 1,000 + 173 is 1,173; 100 + 173 is 273 plus 1 (for 899, not 900) is 274 (Compensating Strategy)
Take away 173 from 1,173 to get to 1,000, take away 100 to get to 900, and take away 1 to get to 899. Then 173 +100 + 1 = 274 (Subtraction Strategy)
899 + 1 is 900, 900, 1,000 (that’s 100). 1,000, 1,100 (that’s 200 total). 1,100, 1,110, 1,120, 1,130, 1,140, 1,150, 1,160, 1,170, (that’s 70 more), 1,171, 1,172, 1,173 (that’s 3 more) so the total is 1+200+70+3 = 274 (Adding by Tens or Hundreds Strategy)
3.MD.A.2 Students need multiple opportunities weighing classroom objects and filling containers to help them develop a basic understanding of the size and weight of a liter, a gram, and a kilogram. Milliliters may also be used to show amounts that are less than a liter.
Students identify 5 things that weigh about one gram. They record their findings with words and pictures. (Students can repeat this for 5 grams and 10 grams.) This activity helps develop gram benchmarks. One large paperclip weighs about one gram. A box of large paperclips (100 clips) weighs about 100 grams so 10 boxes would weigh one kilogram.

27
Roosevelt School District Third Grade – Curriculum Map – Mathematics
Topic Multiplication and Division Trimester 1
Pacing 23 Days* Sequence 5 *Begins in Trimester 1 (16 days) continues into Trimester 2 (7 days)
STAGE 1 – Desired Results Standards: 3.OA.A.3. Use multiplication and division within 100 to solve word problems in situations involving equal groups, arrays, and measurement quantities, e.g., by using drawings and equations with a symbol for the unknown number to represent the problem. 3.OA.A.4. Determine the unknown whole number in a multiplication or division equation relating three whole numbers. 3.OA.B.5.. Apply properties of operations as strategies to multiply and divide. 3.OA.C.7. Fluently multiply and divide within 100, using strategies such as the relationship between multiplication and division (e.g., knowing that 8 × 5 = 40, one knows 40 ÷ 5 = 8) or properties of operations. By the end of Grade 3, know from memory all products of two one-digit numbers. 3.OA.D.8. Solve two-step word problems using the four operations. Represent these problems using equations with a letter standing for the unknown quantity. Assess the reasonableness of answers using mental computation and estimation strategies including rounding. (Note: This standard is limited to problems posed with whole numbers and having whole-number answers; students should know how to perform operations in the conventional order when there are no parentheses to specify a particular order -- Order of Operations.)
3.OA.D.9. Identify arithmetic patterns (including patterns in the addition table or multiplication table), and explain them using properties of operations. For example, observe that 4 times a number is always even, and explain why 4 times a number can be decomposed into two equal addends. 3.NBT.A.3. Multiply one-digit whole numbers by multiples of 10 in the range 10–90 (e.g., 9 × 80, 5 × 60) using strategies based on place value and properties of operations.
Mathematical Practices: 3.MP.1. Make sense of problems and persevere in solving them. 3.MP.3. Construct viable arguments and critique the reasoning of others. 3.MP.4. Model with mathematics. 3.MP.5. Use appropriate tools strategically. 3.MP.7. Look for and make use of structure.
Enduring Understandings: Multiplication has properties that can help solve
problems and remember facts.
Division and multiplication are inverse operations and can be used together to solve problems.
Word problems can be solved using many strategies.
Often, more than one operation must be used to find the final answer.
Most word problems can be thought of in terms of parts and a whole/total.
Number patterns can be used to solve new problems using math facts you know.
Guiding Questions: How is multiplication similar and different to other
operations?
What kind of problems can multiplication solve?
How is division similar and different to other operations?
What kind of problems can division solve?
Why is it important to check whether an answer is reasonable?
How can math models and equations be used to solve real world problems?
Students will know….. Multiplying a factor by a ten can be thought of as creating ____ tens. (e.g. 90 x 5 is like 9x5 tens or 45 tens).
Multiplication word problems involve words that can mean groups with the same number of objects, rows of items with the same number in each row, or multiples of the same number.
An unknown is a missing part of an equation. In multiplication it could be the product or one of the factors.
An unknown can be represented by a blank space, a shape, or a letter.
An unknown can be found by multiplying the factors (if the product is the unknown), thinking of a fact that you know (if a factor is missing), or using the inverse operation.
The Commutative Property states that two factors can be multiplied in any order without changing the product.
The Zero Property states that the product of zero and any factor is zero.
The Identity Property states that the product of one and any factor is that factor.

28
The Associative Property states that factors can be grouped or regrouped in any way without changing the product.
The Distributive Property says that if you multiply and one factor is an addition equation, we can multiply (distribute) the other factor by each addend and then add the products. Example: 4 x (3+4) = (4x3) + (4x4) = 12 + 16 = 28.
Number patterns can be found in the products for multiplication facts with a common factor.
Number patterns can be explained using the properties of multiplication.
Unknown facts can be found by breaking apart the unknown fact into known facts. The answers to the known facts are added to get the final product.
Division word problems usually have a number that means the total (dividend) and a number that means the number that is needed in each group or the number of groups you are trying to make. The question will ask you for the number of groups that could be made or the number that would be in each group.
When one number is divided by a whole number that is not 0 or 1, the result is smaller. (The quotient is smaller than the dividend).
Multiplication and division have an inverse (opposite) relationship. This relationship can be used to find division facts.
An unknown in a division problem could be the quotient, dividend, or divisor.
If the unknown is the quotient or divisor, you can solve by thinking of what factor is missing to make a complete multiplication fact (e.g. 50 / 5 is like “what times 5 = 50?”; 50 / y = 5 is like “5 times what equals 50”))
If the unknown is the dividend, multiplication can be used to find solve. (e.g. y / 2 = 16; 16 x 2 = y)
Because of the Inverse Relationship of multiplication and division, zero cannot be a divisor (nothing times 0 can equal a whole number).
Because of the Zero Property: o Zero divided by any number is 0.
Because of the Identity Property: o Any number divided by itself equals 1. o Any number divided by 1 is that number.
An equation can be used to summarize what happens in a word problem.
Symbols or letters can be used to represent values that a word problem does not tell you.
Sometimes word problems require more than one equation: o If the problem is asking for a total, you may have to use another equation to figure out one of the
addends first. o If the problem is asking for a part, you may have to use another equation to figure out the total or the
other part first.
Reasonableness means that the solution makes sense with the operation or story it belongs to.
Students will be able to….. Multiply one digit factors by multiples of 10.
Explain that the product of a multiplication problem is usually larger than the factors.
Explain why the product of a multiplication problem is not always larger than the factors using the Zero Property and Identity Property of Multiplication.
Justify the solution of a multiplication equation where a factor is 0 or 1 by referencing the Zero or Identity Property of Multiplication.
Find the unknown in a multiplication problem by using known facts and the inverse relationship of multiplication and division.
Reference the Commutative Property of Multiplication when explaining why two math facts have the same product.
Describe patterns in the multiplication table.
Explain patterns in the multiplication table by using the properties of multiplication.
Explain that the quotient of a division problem is usually smaller than the dividend.
Explain why the quotient of a division problem may not be bigger than the dividend using the Identity Property.
Justify the solution of a division equation where a divisor 1 by referencing the Identity Property.
Justify the solution of a division equation where a divisor is 0 by referencing the idea of Inverse Operations. (e.g. “5 ÷ 0 is not possible because there is nothing you can multiply by 0 to get 5.”)
Find the unknown in a division problem by using known facts and the inverse relationship of multiplication and division.
Given a division fact, state a known multiplication fact, and vice versa.
Solve a two-step word problem that requires addition, subtraction, multiplication, and/or division.
Justify the reasonableness of a solution to a word problem.
29
0 1 2 3 4 5 6 7 8 9 10 11 12
Skills/Knowledge from Previous Years to Support this Cluster: 2.OA.C.3. Determine whether a group of objects (up to 20) has an odd or even number of members, e.g., by pairing objects or counting them by 2s; write an equation to express an even number as a sum of two equal addends 2.OA.C.4. Use addition to find the total number of objects arranged in rectangular arrays with up to 5 rows and up to 5 columns; write an equation to express the total as a sum of equal addends 2.NBT.A.2. Count within 1000; skip-count by 5s, 10s, and 100s
Instructional Resources: EngageNY Module 3
enVisionMATH Topic 5 (exclude lesson 5-8), Topic 18-1, and AZ Connections 3
NCTM Illuminations (www.illuminations.nctm.org) o All About Multiplication o Exploring Equal Sets o Multiplication: It’s in the Cards o Multiply and Conquer
Academic Vocabulary:
multiplication
factor
product
equal groups
repeated addition
array
number line
number bonds
multiplication table
Commutative Property
Associative Property
Zero Property
Identity Property
Distributive Property
unknown
tape diagrams
Common Errors/Misconceptions: Students think a symbol (? or []) is always the place for the answer. This is especially true when the problem is written as
15 ÷ 3 =? or 15 = ☐ x 3. Students also think that 3 ÷ 15 = 5 and 15 ÷ 3 = 5 are the same equations. The use of models is essential in helping students eliminate this understanding. The use of a symbol to represent a number once cannot be used to represent another number in a different problem/situation. Presenting students with multiple situations in which they select the symbol and explain what it represents will counter this misconception.
Examples and/or Explanations: 3.OA.A.3 Students use a variety of representations for creating and solving one-step word problems, i.e., numbers, words, pictures, physical objects, or equations. They use multiplication of whole numbers up to 10 x10. Students explain their thinking, show their work by using at least one representation, and verify that their answer is reasonable. Word problems may be represented in multiple ways:
an array:
equal sets:
repeated addition or subtraction: 4 + 4 + 4
three equal jumps forward from 0 on the number line to 12: 3.OA.A.4 This standard is strongly connected to 3.AO.3 when students solve problems and determine unknowns in equations. Students should also experience creating story problems for given equations. When crafting story problems, they should carefully consider the question(s) to be asked and answered to write an appropriate equation. Students may approach the same story problem differently and write either a multiplication equation or division equation. Students apply their understanding of the meaning of the equal sign as ”the same as” to interpret an equation with an unknown.
When given 4 x ? = 40, they might think: o 4 groups of some number is the same as 40 o 4 times some number is the same as 40
30
o I know that 4 groups of 10 is 40 so the unknown number is 10 o The missing factor is 10 because 4 times 10 equals 40.
Equations in the form of a x b = c and c = a x b should be used interchangeably, with the unknown in different positions.
24 = ? x 6
Rachel has 3 bags. There are 4 marbles in each bag. How many marbles does Rachel have altogether? 3 x 4 = m 3.OA.B.5 Students apply properties of operations as strategies to multiply. They multiply by 1 (identify property) and zero (zero property). They change the order of numbers to determine that the order of numbers does not affect the product (commutative property). Given three factors, they investigate changing how they group the numbers to multiply them to determine that changing the grouping does not change the product (associative property). They also decompose numbers to build fluency with multiplication (distributive property). Models help build understanding of the commutative property:
In the following diagram it may not be obvious that 3 groups of 6 is the same as 6 groups of 3. A student may need to count to verify this. 3 x 6 = 6 x 3
is the same quantity as
An array explicitly demonstrates the concept of the commutative property.
4 x 3 = 3 x 4
4 rows of 3 or 4 x 3 3 rows of 4 or 3 x 4
Students are introduced to the distributive property of multiplication over addition as a strategy for using products they know to solve products they don’t know.
If students are asked to find the product of 7 x 8, they might decompose 7 into 5 and 2 and then multiply 5 x 8 and 2 x 8 to arrive at 40 + 16 or 56. Students should learn that they can decompose either of the factors. It is important to note that the students may record their thinking in different ways.
56
3.OA.C.7 Students demonstrate fluency with multiplication facts through 10. Multiplying fluently refers to knowledge of procedures, knowledge of when and how to use them appropriately, and skill in performing them flexibly, accurately, and efficiently. Strategies students may use for attaining fluency include:
Zeros and Ones
Doubles (2s facts), Doubling twice (4s), Doubling three times (8s)
Tens Facts
Five Facts (half of tens)
Skip Counting (counting groups of --)
Square Numbers (Ex: 3 x 3)
Turn-around Facts (Commutative Property)
Fact Families (Ex: 6 x 4 = 24; 24 ÷ 6 = 4; 24 ÷ 4 = 6; 4 x 6 = 24)
Missing Factors
5 x 8 = 40
2 x 8 = +16
56
7 x 4 = 28
7 x 4 = + 28
56
31
3.OA.D.8 Students should be exposed to multiple problem-solving strategies (using any combination of words, numbers, diagrams, physical objects or symbols) and be able to choose which ones to use.
Jerry earned 231 points at school last week. This week he earned 79 points. If he uses 60 points to earn free time on a computer, how many points will he have left?
o A student may use the number line above to describe his/her thinking, “231 + 9 = 240 so now I need to add
70 more. 240, 250 (10 more), 260 (20 more), 270, 280, 290, 300, 310 (70 more). Now I need to count back 60. 310, 300 (back 10), 290 (back 20), 280, 270, 260, 250 (back 60).”
o A student writes the equation, 231 + 79 – 60 = m and uses rounding (230 + 80 – 60) to estimate. o A student writes the equation, 231 + 79 – 60 = m and calculates 79-60 = 19 and then calculates 231 + 19 =
m.
The soccer club is going on a trip to the water park. The cost of attending the trip is $63. Included in that price is $13 for lunch and the cost of 2 wristbands, one for the morning and one for the afternoon. Write an equation representing the cost of the field trip and determine the price of one wristband.
The above diagram helps the student write the equation, w + w + 13 = 63. Using the diagram, a student might think, “I know that the two wristbands cost $50 ($63-$13) so one wristband costs $25.” 3.OA.D.9 Students need ample opportunities to observe and identify important numerical patterns related to operations. They should build on their previous experiences with properties related to addition and subtraction. Students investigate addition and multiplication tables in search of patterns and explain why these patterns make sense mathematically. Examples:
Any sum of two even numbers is even.
Any sum of two odd numbers is even.
Any sum of an even number and an odd number is odd.
The multiples of 4, 6, 8, and 10 are all even because they can all be decomposed into two equal groups.
The doubles (2 addends the same) in an addition table fall on a diagonal while the doubles (multiples of 2) in a multiplication table fall on horizontal and vertical lines.
The multiples of any number fall on a horizontal and a vertical line due to the commutative property.
All the multiples of 5 end in a 0 or 5 while all the multiples of 10 end with 0. Every other multiple of 5 is a multiple of 10.
Students also investigate a hundreds chart in search of addition and subtraction patterns. They record and organize all the different possible sums of a number and explain why the pattern makes sense.

32
Trimester 2
Third Grade Mathematics
Roosevelt School District
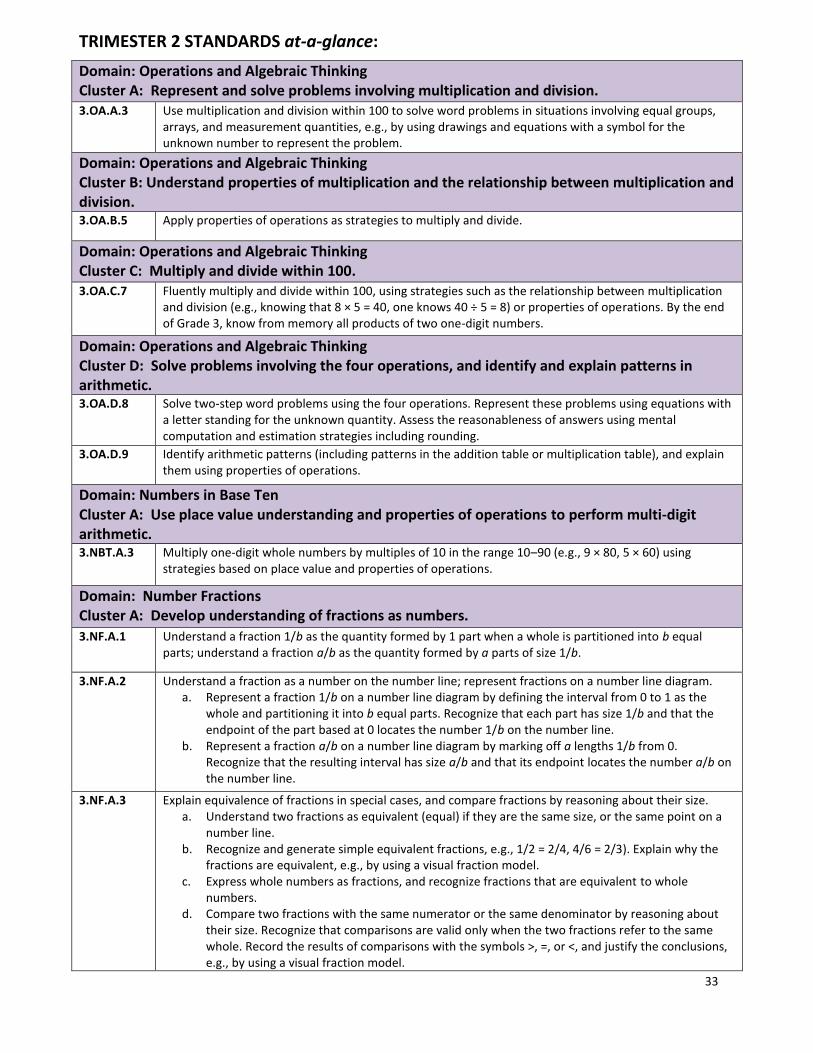
33
TRIMESTER 2 STANDARDS at-a-glance:
Domain: Operations and Algebraic Thinking Cluster A: Represent and solve problems involving multiplication and division. 3.OA.A.3 Use multiplication and division within 100 to solve word problems in situations involving equal groups,
arrays, and measurement quantities, e.g., by using drawings and equations with a symbol for the unknown number to represent the problem.
Domain: Operations and Algebraic Thinking Cluster B: Understand properties of multiplication and the relationship between multiplication and division. 3.OA.B.5 Apply properties of operations as strategies to multiply and divide.
Domain: Operations and Algebraic Thinking Cluster C: Multiply and divide within 100. 3.OA.C.7 Fluently multiply and divide within 100, using strategies such as the relationship between multiplication
and division (e.g., knowing that 8 × 5 = 40, one knows 40 ÷ 5 = 8) or properties of operations. By the end of Grade 3, know from memory all products of two one-digit numbers.
Domain: Operations and Algebraic Thinking Cluster D: Solve problems involving the four operations, and identify and explain patterns in arithmetic. 3.OA.D.8 Solve two-step word problems using the four operations. Represent these problems using equations with
a letter standing for the unknown quantity. Assess the reasonableness of answers using mental computation and estimation strategies including rounding.
3.OA.D.9 Identify arithmetic patterns (including patterns in the addition table or multiplication table), and explain them using properties of operations.
Domain: Numbers in Base Ten Cluster A: Use place value understanding and properties of operations to perform multi-digit arithmetic. 3.NBT.A.3 Multiply one-digit whole numbers by multiples of 10 in the range 10–90 (e.g., 9 × 80, 5 × 60) using
strategies based on place value and properties of operations.
Domain: Number Fractions Cluster A: Develop understanding of fractions as numbers.
3.NF.A.1 Understand a fraction 1/b as the quantity formed by 1 part when a whole is partitioned into b equal parts; understand a fraction a/b as the quantity formed by a parts of size 1/b.
3.NF.A.2 Understand a fraction as a number on the number line; represent fractions on a number line diagram. a. Represent a fraction 1/b on a number line diagram by defining the interval from 0 to 1 as the
whole and partitioning it into b equal parts. Recognize that each part has size 1/b and that the endpoint of the part based at 0 locates the number 1/b on the number line.
b. Represent a fraction a/b on a number line diagram by marking off a lengths 1/b from 0. Recognize that the resulting interval has size a/b and that its endpoint locates the number a/b on the number line.
3.NF.A.3 Explain equivalence of fractions in special cases, and compare fractions by reasoning about their size. a. Understand two fractions as equivalent (equal) if they are the same size, or the same point on a
number line. b. Recognize and generate simple equivalent fractions, e.g., 1/2 = 2/4, 4/6 = 2/3). Explain why the
fractions are equivalent, e.g., by using a visual fraction model. c. Express whole numbers as fractions, and recognize fractions that are equivalent to whole
numbers. d. Compare two fractions with the same numerator or the same denominator by reasoning about
their size. Recognize that comparisons are valid only when the two fractions refer to the same whole. Record the results of comparisons with the symbols >, =, or <, and justify the conclusions, e.g., by using a visual fraction model.
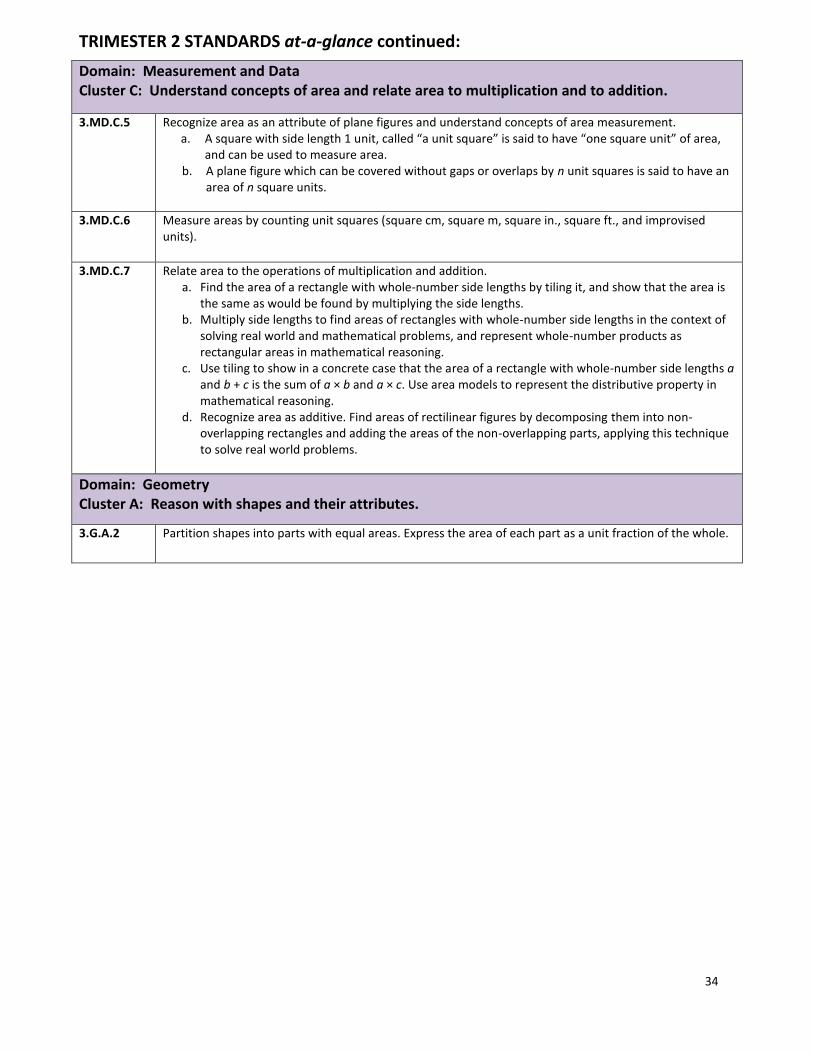
34
TRIMESTER 2 STANDARDS at-a-glance continued:
Domain: Measurement and Data Cluster C: Understand concepts of area and relate area to multiplication and to addition.
3.MD.C.5 Recognize area as an attribute of plane figures and understand concepts of area measurement. a. A square with side length 1 unit, called “a unit square” is said to have “one square unit” of area,
and can be used to measure area. b. A plane figure which can be covered without gaps or overlaps by n unit squares is said to have an
area of n square units.
3.MD.C.6 Measure areas by counting unit squares (square cm, square m, square in., square ft., and improvised units).
3.MD.C.7 Relate area to the operations of multiplication and addition. a. Find the area of a rectangle with whole-number side lengths by tiling it, and show that the area is
the same as would be found by multiplying the side lengths. b. Multiply side lengths to find areas of rectangles with whole-number side lengths in the context of
solving real world and mathematical problems, and represent whole-number products as rectangular areas in mathematical reasoning.
c. Use tiling to show in a concrete case that the area of a rectangle with whole-number side lengths a and b + c is the sum of a × b and a × c. Use area models to represent the distributive property in mathematical reasoning.
d. Recognize area as additive. Find areas of rectilinear figures by decomposing them into non-overlapping rectangles and adding the areas of the non-overlapping parts, applying this technique to solve real world problems.
Domain: Geometry Cluster A: Reason with shapes and their attributes.
3.G.A.2
Partition shapes into parts with equal areas. Express the area of each part as a unit fraction of the whole.
35
Roosevelt School District
Third Grade – Curriculum Map – Mathematics
Topic Multiplication and Area Trimester 2
Pacing 18 Days Sequence 2
STAGE 1 – Desired Results Standards: 3.MD.C.5. Recognize area as an attribute of plane figures and understand concepts of area measurement.
a. A square with side length 1 unit, called “a unit square” is said to have “one square unit” of area, and can be used to measure area.
b. A plane figure which can be covered without gaps or overlaps by n unit squares is said to have an area of n square units.
3.MD.C.6. Measure areas by counting unit squares (square cm, square m, square in., square ft., and improvised units). 3.MD.C.7. Relate area to the operations of multiplication and addition.
a. Find the area of a rectangle with whole-number side lengths by tiling it, and show that the area is the same as would be found by multiplying the side lengths.
b. Multiply side lengths to find areas of rectangles with whole-number side lengths in the context of solving real world and mathematical problems, and represent whole-number products as rectangular areas in mathematical reasoning.
c. Use tiling to show in a concrete case that the area of a rectangle with whole-number side lengths a and b + c is the sum of a × b and a × c. Use area models to represent the distributive property in mathematical reasoning.
d. Recognize area as additive. Find areas of rectilinear figures by decomposing them into non-overlapping rectangles and adding the areas of the non-overlapping parts, applying this technique to solve real world problems.
Mathematical Practices: 3.MP.2. Reason abstractly and quantitatively. 3.MP.3. Construct viable arguments and critique the reasoning of others. 3.MP.6. Attend to precision. 3.MP.7. Look for and make use of structure. 3.MP.8. Look for and express regularity in repeated reasoning.
Enduring Understandings: Area is an important measurement of figures.
Area can be calculated using multiplication properties.
Area models can help solve and justify multiplication problems and equations.
Guiding Questions: How are figures measured?
How can multiplication help you measure a figure?
Students will know….. Area is the amount of space inside a figure that can be covered by unit squares.
A unit square is a square with a side that is one unit long. It can be used to measure area.
Area can be counted by counting the number of unit squares that completely cover the inside of a figure.
Finding area with square units is like creating arrays.
Array can be found by multiplying the length of the sides of a rectangle.
If you know the area of a rectangle, you can use multiplication facts you know to predict the possible sides.
The Distributive Property says that if you multiply and one factor is an addition equation, we can multiply (distribute) the other factor by each addend and then add the products. Example: 4 x (3+4) = (4x3) + (4x4) = 12 + 16 = 28.
Area models can help solve multiplication problems and show the Distributive Property.
Figures can be broken into smaller parts to find the area of each part. The area of the whole figure is the sum of all of the smaller areas.
Breaking a figure into smaller sections can help solve area problems.

36
Students will be able to….. Measure area by counting unit squares.
Measure area of a rectangle with whole number side lengths by tiling.
Show that the area of a rectangle that has been tiled with unit squares is the same as the product of its side lengths.
Calculate area of a rectangle by multiplying side lengths.
Solve a word problem involving area by multiplying side-lengths.
Determine possible side lengths of a rectangle when given the area.
Use tiling and area models to demonstrate the Distributive Property.
Decompose a large figure into smaller rectangular sections.
Calculate the area of a large figure by adding the areas of smaller (non-overlapping) sections.
Skills/Knowledge from Previous Years to Support this Cluster: 2.G.A.2. Partition a rectangle into rows and columns of same-size squares and count to find the total number of them. 2.OA.C.4. Use addition to find the total number of objects arranged in rectangular arrays with up to 5 rows and up to 5 columns; write an equation to express the total as a sum of equal addends.
Instructional Resources: EngageNY Module 4
enVisionMath Topic 16 (exclude 16-7)
graph paper
Academic Vocabulary:
area
unit squares
square units
Distributive Property
Common Errors/Misconceptions: When finding the area of a rectangle by tiling, students must be careful to draw tiles that do not overlap and do not leave any gaps.
Examples and/or Explanations: 3.MD.5 Students develop understanding of using square units to measure area by:
Using different sized square units
Filling in an area with the same sized square units and counting the number of square units
3.MD.6 Using different sized graph paper, students can explore the areas measured in square centimeters and square inches. An interactive whiteboard may also be used to display and count the unit squares (area) of a figure. 3.MD.7 Students tile areas of rectangles, determine the area, record the length and width of the rectangle, investigate the patterns in the numbers, and discover that the area is the length times the width.
Joe and John made a poster that was 4’ by 3’. Mary and Amir made a poster that was 4’ by 2’. They placed their posters on the wall side-by-side so that that there was no space between them. How much area will the two posters cover?
Students use pictures, words, and numbers to explain their understanding of the distributive property in this
context.
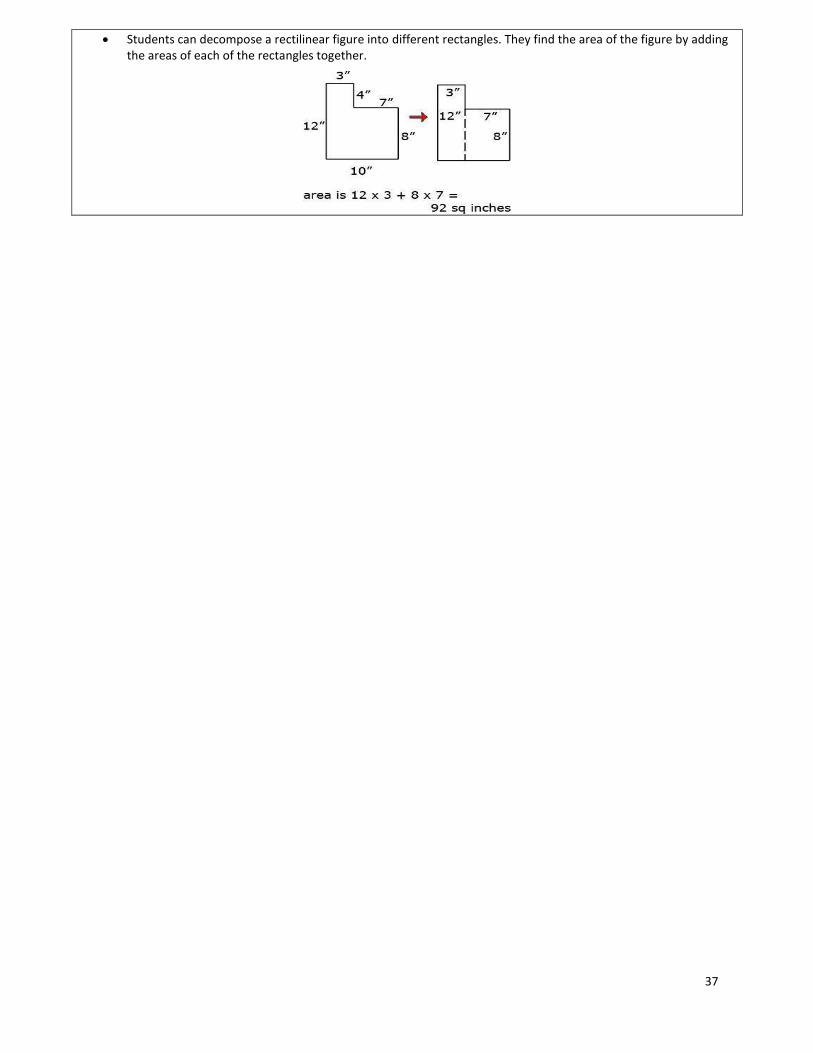
37
Students can decompose a rectilinear figure into different rectangles. They find the area of the figure by adding the areas of each of the rectangles together.
38
Roosevelt School District
Third Grade – Curriculum Map – Mathematics
Topic Fractions Trimester 2
Pacing 32 Days* Sequence 3 *Begins in Trimester 2 (28 days) continues into Trimester 3 (4 days)
STAGE 1 – Desired Results Standards: 3.G.A.2. Partition shapes into parts with equal areas. Express the area of each part as a unit fraction of the whole. 3.NF.A.1 Understand a fraction 1/b as the quantity formed by 1 part when a whole is partitioned into b equal parts; understand a fraction a/b as the quantity formed by a parts of size 1/b. 3.NF.A.2. Understand a fraction as a number on the number line; represent fractions on a number line diagram.
a. Represent a fraction 1/b on a number line diagram by defining the interval from 0 to 1 as the whole and partitioning it into b equal parts. Recognize that each part has size 1/b and that the endpoint of the part based at 0 locates the number 1/b on the number line.
b. Represent a fraction a/b on a number line diagram by marking off a lengths 1/b from 0. Recognize that the resulting interval has size a/b and that its endpoint locates the number a/b on the number line.
3.NF.A.3. Explain equivalence of fractions in special cases, and compare fractions by reasoning about their size. a. Understand two fractions as equivalent (equal) if they are the same size, or the same point on a number line. b. Recognize and generate simple equivalent fractions, e.g., 1/2 = 2/4, 4/6 = 2/3). Explain why the fractions are
equivalent, e.g., by using a visual fraction model. c. Express whole numbers as fractions, and recognize fractions that are equivalent to whole numbers. Examples:
Express 3 in the form 3 = 3/1; recognize that 6/1 = 6; locate 4/4 and 1 at the same point of a number line diagram. d. Compare two fractions with the same numerator or the same denominator by reasoning about their size.
Recognize that comparisons are valid only when the two fractions refer to the same whole. Record the results of comparisons with the symbols >, =, or <, and justify the conclusions, e.g., by using a visual fraction model.
Mathematical Practices: 3.MP.2. Reason abstractly and quantitatively. 3.MP.3. Construct viable arguments and critique the reasoning of others. 3.MP.6. Attend to precision. 3.MP.7. Look for and make use of structure.
Enduring Understandings:
Fraction words are words we use to talk about smaller parts of a larger whole.
Fractions are real numbers that can be found in between whole numbers on the number line.
Many different fractions can name the same amount or same place on the number line.
The numerator of a fraction is an adjective and describes how many.
The denominator of a fraction names the fraction. The larger the denominator, the smaller the unit fraction because the whole must be divided into smaller pieces.
Guiding Questions: How do people talk about parts of a whole shape
or group?
How are fractions similar and different to whole numbers?
What happens to the size of fractions when you change the numerator or denominator?
Students will know….. If a shape is divided into parts that are the same size, each part is called a fraction of the shape.
The whole means a shape, group, or portion of a number line before it is divided into equal parts.
A fraction can be used to describe a part of a shape. The top number (numerator) describes how many parts you are talking about. The bottom number (denominator) describes how many equal parts in all.
When using fractions, the numerator is an adjective and the denominator is a noun. o The numerator tells how many of the denominator. o The denominator tells what kind of fraction you are using.
Fractions can be used to describe points on a number line.
When using fractions on a number line, the space between 0 and 1 is the “whole.”
The denominator tells how many equal parts should be created between 0 and 1 on the number line.
If the denominator (b) is used to divide 0 to 1 evenly, you can count from 0 to identify 1/b, 2/b, 3/b, etc.

39
Equivalent means the same.
Two fractions are equivalent if they are the same size.
Two fractions are equivalent if they are at the same place on the number line.
Multiplication and division facts can be used to identify fractions as equivalent.
Whole numbers can be shown as fractions. If the denominator is 1, the equivalent whole number is the numerator. If the numerator and denominator are the same, it is equivalent to 1.
If two fractions have the same denominator, the larger fraction is the one with the larger numerator.
If two fractions have the same numerator, the larger fraction is the one with the smaller denominator.
Visual fraction models and number lines can help compare fractions.
You can only compare fractions when they are describing the same whole.
Students will be able to….. Divide regions, sets, and lengths into equal parts.
Justify whether a shape has been divided into fractional parts or not. Describe different areas of a shape by using fraction words.
Describe a group of objects by using fraction words.
Represent fractions on a number line diagram.
Use the denominator of a fraction to partition a number line into equal parts.
Generate a list of equivalent fractions for common fractions.
Explain why two fractions are equivalent by using: o Visual fraction models. o The number line. o Multiplication and division facts.
Express a whole number as a fraction.
Compare two fractions with the same numerator using >, <, or =.
Compare two fractions with the same denominator using >, <, or =.
Justify a comparison using a visual fraction model or the number line.
Justify why comparing two fractions that describe different wholes may be invalid.
Skills/Knowledge from Previous Years to Support this Cluster: 2.G.A.2. Partition a rectangle into rows and columns of same-size squares and count to find the total number of them. 2.G.A.3. Partition circles and rectangles into two, three, or four equal shares, describe the shares using the words halves, thirds, half of, a third of, etc., and describe the whole as two halves, three thirds, four fourths. Recognize that equal shares of identical wholes need not have the same shape.
Instructional Resources: EngageNY Module 5
enVisionMATH Topic 12: o Lesson 1 and 2 (Fractions and Regions of Figures) o Lessons 4-7 (Benchmark Fractions, Equivalent
Fractions, Comparing, Fractions on a Number Line)
Fraction Cards Sets
Fraction Tiles
Fraction Model Templates (Strips, Squares, Circles)
Number Lines
Academic Vocabulary:
fraction
whole
numerator
denominator
equivalent fraction
benchmark fraction
visual fraction model
Common Errors/Misconceptions: The idea that the smaller the denominator, the smaller the piece or part of the set, or the larger the denominator, the larger the piece or part of the set, is based on the comparison that in whole numbers, the smaller a number, the less it is, or the larger a number, the more it is. The use of different models, such as fraction bars and number lines, allows students to compare unit fractions to reason about their sizes. Students think all shapes can be divided the same way. Present shapes other than circles, squares or rectangles to prevent students from overgeneralizing that all shapes can be divided the same way. For example, have students fold a triangle into eighths. 1. Fold the triangle into half by folding the left vertex (at the base of the triangle) over to meet the right vertex. 2. Fold in this manner two more times. 3. Have students label each eighth using fractional notation. Then, have students count the fractional parts in the triangle (one-eighth, two-eighths, three-eighths, and so on).
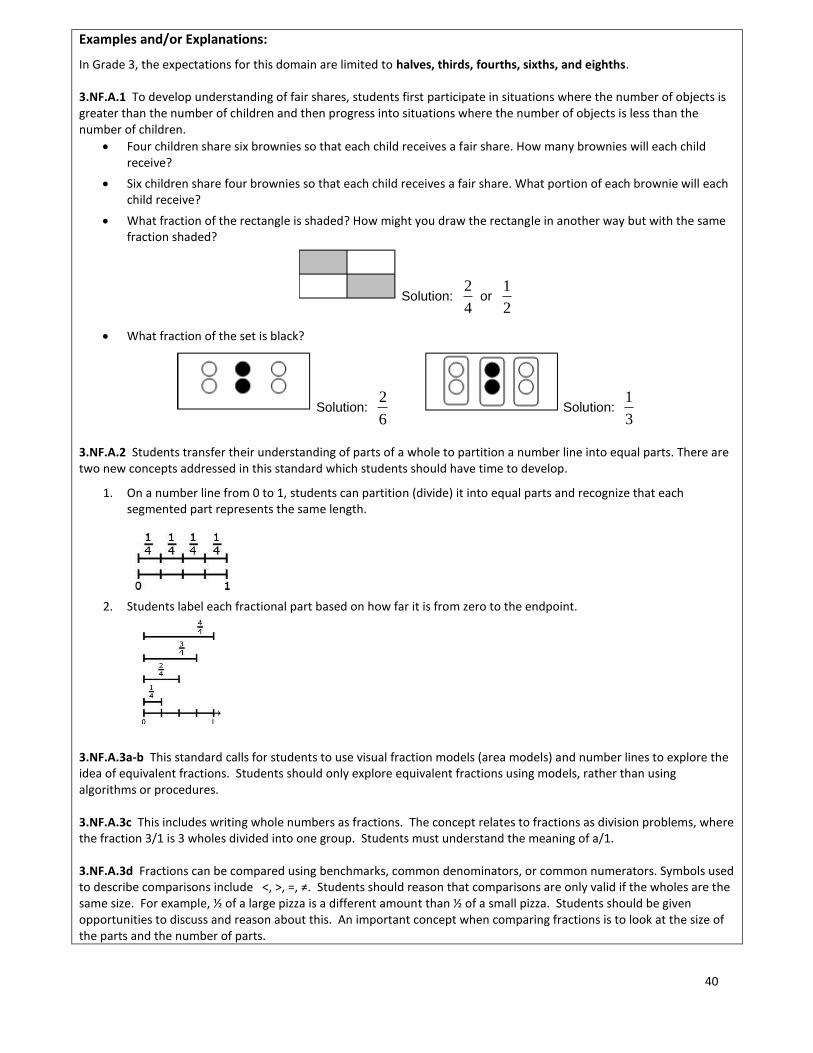
40
Examples and/or Explanations:
In Grade 3, the expectations for this domain are limited to halves, thirds, fourths, sixths, and eighths. 3.NF.A.1 To develop understanding of fair shares, students first participate in situations where the number of objects is greater than the number of children and then progress into situations where the number of objects is less than the number of children.
Four children share six brownies so that each child receives a fair share. How many brownies will each child receive?
Six children share four brownies so that each child receives a fair share. What portion of each brownie will each child receive?
What fraction of the rectangle is shaded? How might you draw the rectangle in another way but with the same fraction shaded?
Solution: 2
4 or
1
2
What fraction of the set is black?
Solution: 2
6 Solution:
1
3
3.NF.A.2 Students transfer their understanding of parts of a whole to partition a number line into equal parts. There are two new concepts addressed in this standard which students should have time to develop.
1. On a number line from 0 to 1, students can partition (divide) it into equal parts and recognize that each segmented part represents the same length.
2. Students label each fractional part based on how far it is from zero to the endpoint.
3.NF.A.3a-b This standard calls for students to use visual fraction models (area models) and number lines to explore the idea of equivalent fractions. Students should only explore equivalent fractions using models, rather than using algorithms or procedures. 3.NF.A.3c This includes writing whole numbers as fractions. The concept relates to fractions as division problems, where the fraction 3/1 is 3 wholes divided into one group. Students must understand the meaning of a/1. 3.NF.A.3d Fractions can be compared using benchmarks, common denominators, or common numerators. Symbols used to describe comparisons include <, >, =, ≠. Students should reason that comparisons are only valid if the wholes are the same size. For example, ½ of a large pizza is a different amount than ½ of a small pizza. Students should be given opportunities to discuss and reason about this. An important concept when comparing fractions is to look at the size of the parts and the number of parts.
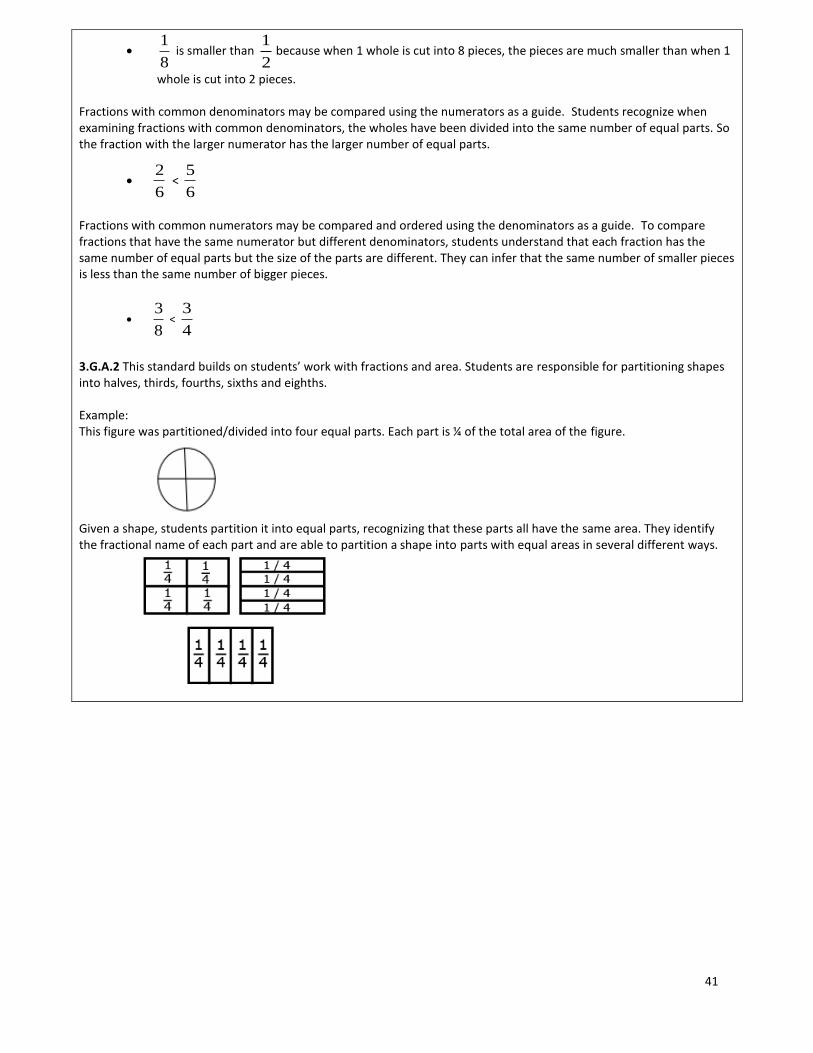
41
1
8 is smaller than
1
2because when 1 whole is cut into 8 pieces, the pieces are much smaller than when 1
whole is cut into 2 pieces.
Fractions with common denominators may be compared using the numerators as a guide. Students recognize when examining fractions with common denominators, the wholes have been divided into the same number of equal parts. So the fraction with the larger numerator has the larger number of equal parts.
6
2 <
6
5
Fractions with common numerators may be compared and ordered using the denominators as a guide. To compare fractions that have the same numerator but different denominators, students understand that each fraction has the same number of equal parts but the size of the parts are different. They can infer that the same number of smaller pieces is less than the same number of bigger pieces.
8
3 <
4
3
3.G.A.2 This standard builds on students’ work with fractions and area. Students are responsible for partitioning shapes into halves, thirds, fourths, sixths and eighths. Example: This figure was partitioned/divided into four equal parts. Each part is ¼ of the total area of the figure.
Given a shape, students partition it into equal parts, recognizing that these parts all have the same area. They identify the fractional name of each part and are able to partition a shape into parts with equal areas in several different ways.

42
Trimester 3
Third Grade Mathematics
Roosevelt School District
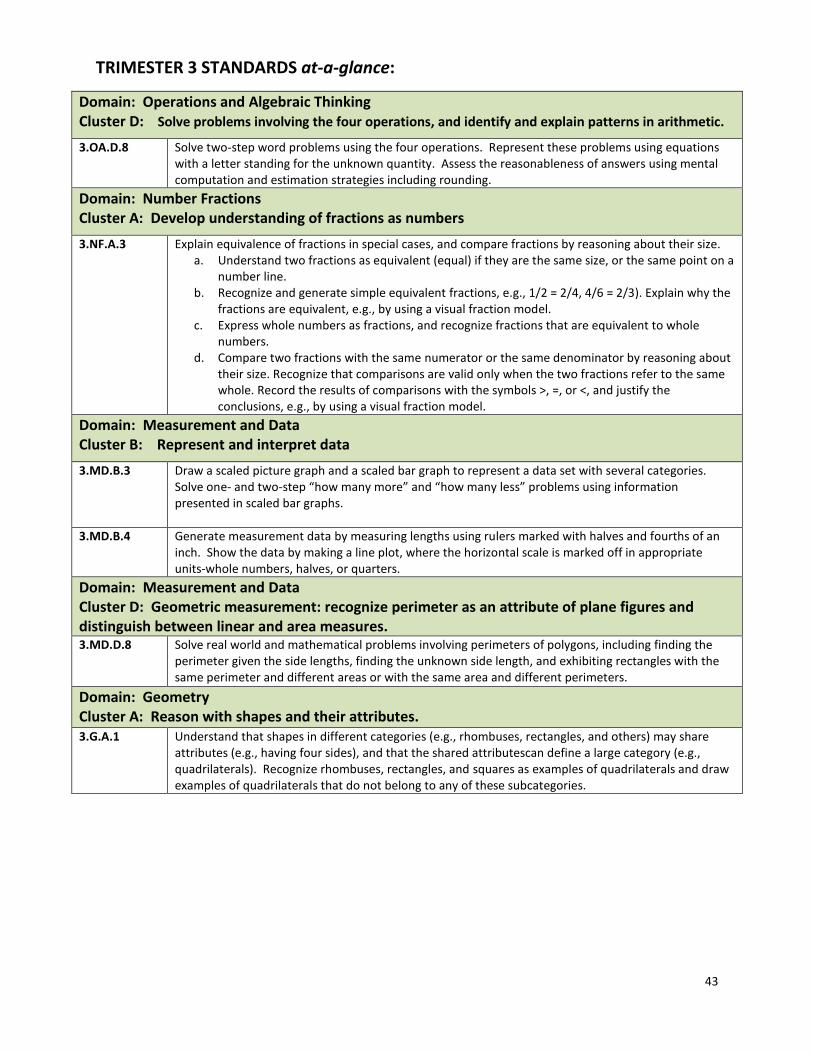
43
TRIMESTER 3 STANDARDS at-a-glance:
Domain: Operations and Algebraic Thinking Cluster D: Solve problems involving the four operations, and identify and explain patterns in arithmetic.
3.OA.D.8 Solve two-step word problems using the four operations. Represent these problems using equations with a letter standing for the unknown quantity. Assess the reasonableness of answers using mental computation and estimation strategies including rounding.
Domain: Number Fractions Cluster A: Develop understanding of fractions as numbers
3.NF.A.3 Explain equivalence of fractions in special cases, and compare fractions by reasoning about their size. a. Understand two fractions as equivalent (equal) if they are the same size, or the same point on a
number line. b. Recognize and generate simple equivalent fractions, e.g., 1/2 = 2/4, 4/6 = 2/3). Explain why the
fractions are equivalent, e.g., by using a visual fraction model. c. Express whole numbers as fractions, and recognize fractions that are equivalent to whole
numbers. d. Compare two fractions with the same numerator or the same denominator by reasoning about
their size. Recognize that comparisons are valid only when the two fractions refer to the same whole. Record the results of comparisons with the symbols >, =, or <, and justify the conclusions, e.g., by using a visual fraction model.
Domain: Measurement and Data Cluster B: Represent and interpret data
3.MD.B.3 Draw a scaled picture graph and a scaled bar graph to represent a data set with several categories. Solve one- and two-step “how many more” and “how many less” problems using information presented in scaled bar graphs.
3.MD.B.4 Generate measurement data by measuring lengths using rulers marked with halves and fourths of an inch. Show the data by making a line plot, where the horizontal scale is marked off in appropriate units-whole numbers, halves, or quarters.
Domain: Measurement and Data Cluster D: Geometric measurement: recognize perimeter as an attribute of plane figures and distinguish between linear and area measures. 3.MD.D.8 Solve real world and mathematical problems involving perimeters of polygons, including finding the
perimeter given the side lengths, finding the unknown side length, and exhibiting rectangles with the same perimeter and different areas or with the same area and different perimeters.
Domain: Geometry Cluster A: Reason with shapes and their attributes. 3.G.A.1
Understand that shapes in different categories (e.g., rhombuses, rectangles, and others) may share attributes (e.g., having four sides), and that the shared attributescan define a large category (e.g., quadrilaterals). Recognize rhombuses, rectangles, and squares as examples of quadrilaterals and draw examples of quadrilaterals that do not belong to any of these subcategories.
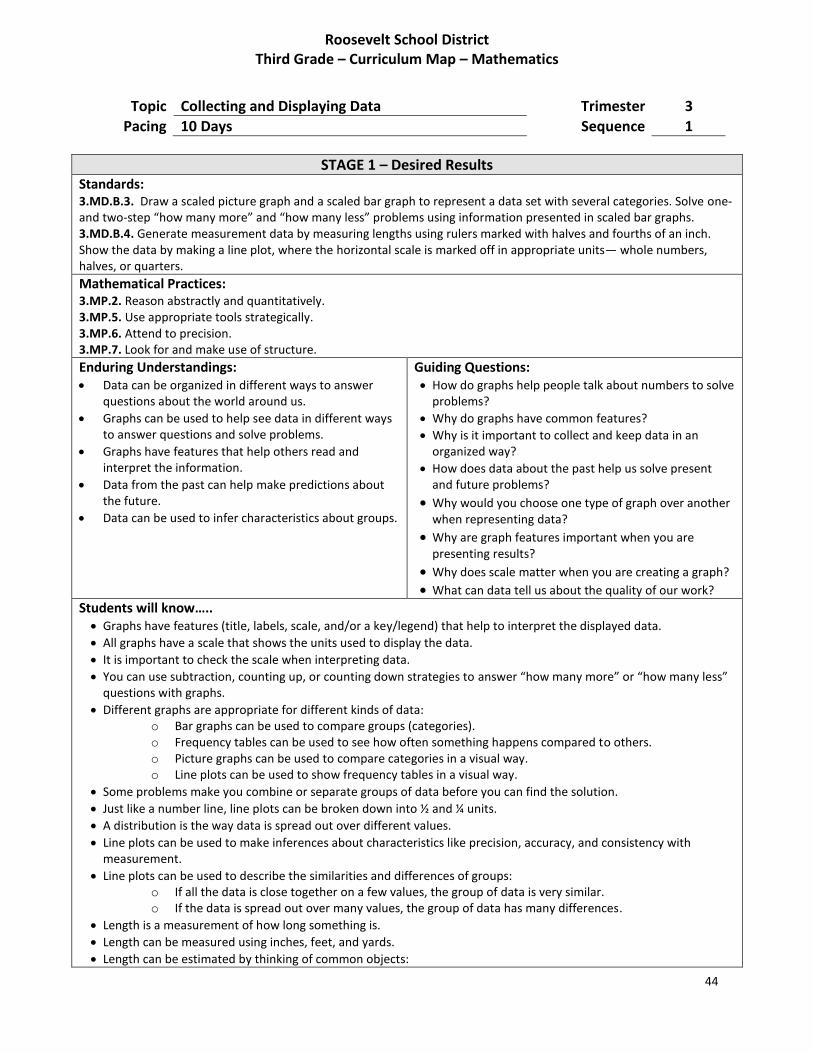
44
Roosevelt School District Third Grade – Curriculum Map – Mathematics
Topic Collecting and Displaying Data Trimester 3
Pacing 10 Days Sequence 1
STAGE 1 – Desired Results Standards: 3.MD.B.3. Draw a scaled picture graph and a scaled bar graph to represent a data set with several categories. Solve one- and two-step “how many more” and “how many less” problems using information presented in scaled bar graphs. 3.MD.B.4. Generate measurement data by measuring lengths using rulers marked with halves and fourths of an inch. Show the data by making a line plot, where the horizontal scale is marked off in appropriate units— whole numbers, halves, or quarters.
Mathematical Practices: 3.MP.2. Reason abstractly and quantitatively. 3.MP.5. Use appropriate tools strategically. 3.MP.6. Attend to precision. 3.MP.7. Look for and make use of structure.
Enduring Understandings: Data can be organized in different ways to answer
questions about the world around us.
Graphs can be used to help see data in different ways to answer questions and solve problems.
Graphs have features that help others read and interpret the information.
Data from the past can help make predictions about the future.
Data can be used to infer characteristics about groups.
Guiding Questions: How do graphs help people talk about numbers to solve
problems?
Why do graphs have common features?
Why is it important to collect and keep data in an organized way?
How does data about the past help us solve present and future problems?
Why would you choose one type of graph over another when representing data?
Why are graph features important when you are presenting results?
Why does scale matter when you are creating a graph? What can data tell us about the quality of our work?
Students will know….. Graphs have features (title, labels, scale, and/or a key/legend) that help to interpret the displayed data.
All graphs have a scale that shows the units used to display the data.
It is important to check the scale when interpreting data.
You can use subtraction, counting up, or counting down strategies to answer “how many more” or “how many less” questions with graphs.
Different graphs are appropriate for different kinds of data: o Bar graphs can be used to compare groups (categories). o Frequency tables can be used to see how often something happens compared to others. o Picture graphs can be used to compare categories in a visual way. o Line plots can be used to show frequency tables in a visual way.
Some problems make you combine or separate groups of data before you can find the solution.
Just like a number line, line plots can be broken down into ½ and ¼ units.
A distribution is the way data is spread out over different values.
Line plots can be used to make inferences about characteristics like precision, accuracy, and consistency with measurement.
Line plots can be used to describe the similarities and differences of groups: o If all the data is close together on a few values, the group of data is very similar. o If the data is spread out over many values, the group of data has many differences.
Length is a measurement of how long something is.
Length can be measured using inches, feet, and yards.
Length can be estimated by thinking of common objects:
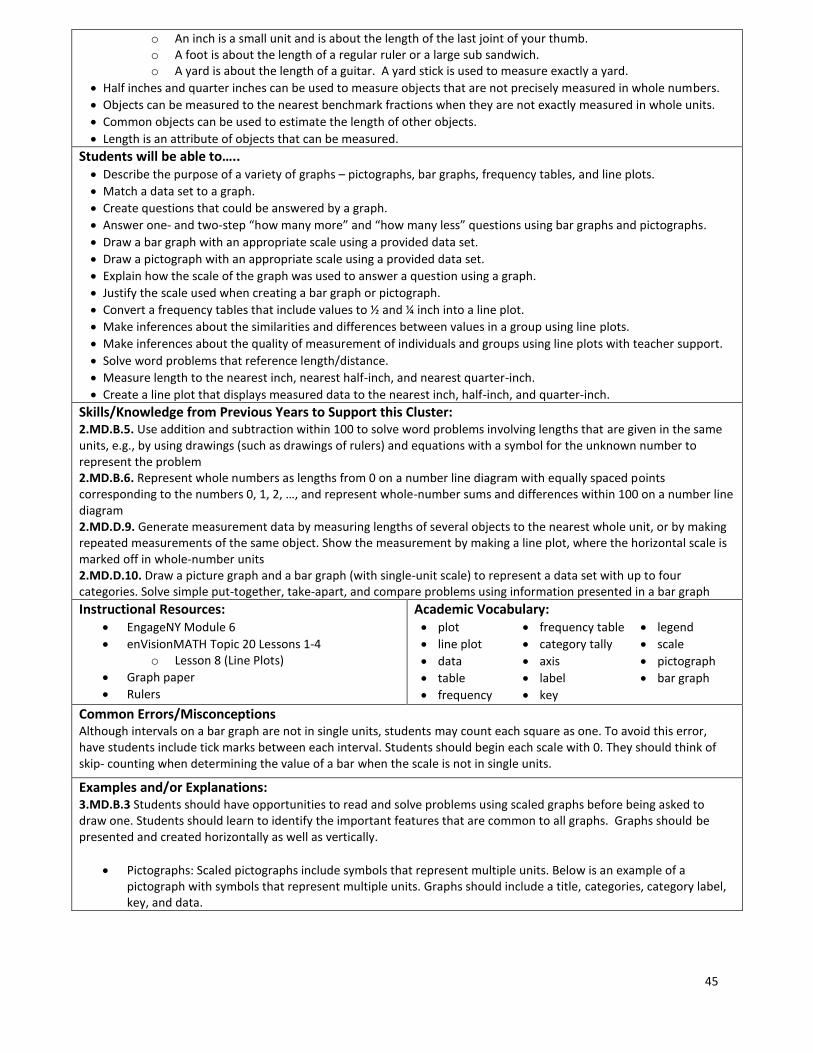
45
o An inch is a small unit and is about the length of the last joint of your thumb. o A foot is about the length of a regular ruler or a large sub sandwich. o A yard is about the length of a guitar. A yard stick is used to measure exactly a yard.
Half inches and quarter inches can be used to measure objects that are not precisely measured in whole numbers.
Objects can be measured to the nearest benchmark fractions when they are not exactly measured in whole units.
Common objects can be used to estimate the length of other objects.
Length is an attribute of objects that can be measured.
Students will be able to….. Describe the purpose of a variety of graphs – pictographs, bar graphs, frequency tables, and line plots.
Match a data set to a graph.
Create questions that could be answered by a graph.
Answer one- and two-step “how many more” and “how many less” questions using bar graphs and pictographs.
Draw a bar graph with an appropriate scale using a provided data set.
Draw a pictograph with an appropriate scale using a provided data set.
Explain how the scale of the graph was used to answer a question using a graph.
Justify the scale used when creating a bar graph or pictograph.
Convert a frequency tables that include values to ½ and ¼ inch into a line plot.
Make inferences about the similarities and differences between values in a group using line plots.
Make inferences about the quality of measurement of individuals and groups using line plots with teacher support.
Solve word problems that reference length/distance.
Measure length to the nearest inch, nearest half-inch, and nearest quarter-inch.
Create a line plot that displays measured data to the nearest inch, half-inch, and quarter-inch.
Skills/Knowledge from Previous Years to Support this Cluster: 2.MD.B.5. Use addition and subtraction within 100 to solve word problems involving lengths that are given in the same units, e.g., by using drawings (such as drawings of rulers) and equations with a symbol for the unknown number to represent the problem 2.MD.B.6. Represent whole numbers as lengths from 0 on a number line diagram with equally spaced points corresponding to the numbers 0, 1, 2, …, and represent whole-number sums and differences within 100 on a number line diagram 2.MD.D.9. Generate measurement data by measuring lengths of several objects to the nearest whole unit, or by making repeated measurements of the same object. Show the measurement by making a line plot, where the horizontal scale is marked off in whole-number units 2.MD.D.10. Draw a picture graph and a bar graph (with single-unit scale) to represent a data set with up to four categories. Solve simple put-together, take-apart, and compare problems using information presented in a bar graph
Instructional Resources: EngageNY Module 6
enVisionMATH Topic 20 Lessons 1-4 o Lesson 8 (Line Plots)
Graph paper
Rulers
Academic Vocabulary: plot
line plot
data
table
frequency
frequency table
category tally
axis
label
key
legend
scale
pictograph
bar graph
Common Errors/Misconceptions Although intervals on a bar graph are not in single units, students may count each square as one. To avoid this error, have students include tick marks between each interval. Students should begin each scale with 0. They should think of skip- counting when determining the value of a bar when the scale is not in single units.
Examples and/or Explanations: 3.MD.B.3 Students should have opportunities to read and solve problems using scaled graphs before being asked to draw one. Students should learn to identify the important features that are common to all graphs. Graphs should be presented and created horizontally as well as vertically.
Pictographs: Scaled pictographs include symbols that represent multiple units. Below is an example of a pictograph with symbols that represent multiple units. Graphs should include a title, categories, category label, key, and data.

46
o How many more books did Juan read than Nancy?
Single Bar Graphs: Students use both horizontal and vertical bar graphs. Bar graphs include a title, scale, scale label, categories, category label, and data.
Students should be exposed to examples of two-step problems involving data analysis. These questions typically require student to combine data before it is compared. Questions may also ask student to compare individual groups to the whole set of data. Students should review examples of pictographs and bar graphs that include a variety of scales related to known multiplication facts. As an extension, students should work on collecting and recording data and making decisions on what graphs to use and how to display the data. Teachers should give students a variety of problems to solve that involve small and large numbers. Teachers should give students the opportunity to compare the way data looks in graphs when different scales are used. Teachers should also give students the opportunity to compare the types of questions that can be answered when data is presented in different graphs (or if a set of data can be presented with a certain type of graph). In addition, it is recommended for teacher’s to guide discussions that focus the students on making inferences about the distribution of data in line plots. For example, a teacher could have multiple students measure the same object to the nearest ¼ inch. The data could be graphed in a line plot and questions regarding precision and accuracy could be explored with teacher support. These discussions provide an authentic way of discussing data with line plots. 3.MD.B.4 Students in second grade measured length in whole units using both metric and U.S. customary systems. It’s important to review with students how to read and use a standard ruler including details about halves and quarter marks on the ruler. Students should connect their understanding of fractions to measuring to one-half and one-quarter inch. Third graders need many opportunities measuring the length of various objects in their environment. Some important ideas related to measuring with a ruler are:
The starting point of where one places a ruler to begin measuring
Measuring is approximate. Items that student’s measure will not always measure exactly ¼, ½ or one whole inch. Students will need to decide on an appropriate estimate length.
Making paper rulers and folding to find the half and quarter marks will help students develop a stronger understanding of measuring length
Students generate data by measuring and create a line plot to display their findings. An example of a line plot is shown
below:
This unit can be integrated in the preparation for a class (or school) Science Fair presentation.

47
Roosevelt School District Third Grade – Curriculum Map – Mathematics
Topic Geometry and Measurement Word Problems Trimester 3
Pacing 36 Days Sequence 2
STAGE 1 – Desired Results Standards: 3.OA.D.8. Solve two-step word problems using the four operations. Represent these problems using equations with a letter standing for the unknown quantity. Assess the reasonableness of answers using mental computation and estimation strategies including rounding. (Note: This standard is limited to problems posed with whole numbers and having whole-number answers; students should know how to perform operations in the conventional order when there are no parentheses to specify a particular order -- Order of Operations.)
3.MD.B.4. Generate measurement data by measuring lengths using rulers marked with halves and fourths of an inch. Show the data by making a line plot, where the horizontal scale is marked off in appropriate units— whole numbers, halves, or quarters. 3.MD.D.8 Solve real world and mathematical problems involving perimeters of polygons, including finding the perimeter given the side lengths, finding an unknown side length, and exhibiting rectangles with the same perimeter and different areas or with the same area and different perimeters. 3.G.A.1. Understand that shapes in different categories (e.g., rhombuses, rectangles, and others) may share attributes (e.g., having four sides), and that the shared attributes can define a larger category (e.g., quadrilaterals). Recognize rhombuses, rectangles, and squares as examples of quadrilaterals, and draw examples of quadrilaterals that do not belong to any of these subcategories.
Mathematical Practices: MP.1. Make sense of problems and persevere in solving them. MP.3. Construct viable arguments and critique the reasoning of others. MP.5. Use appropriate tools strategically. MP.6. Attend to precision.
Enduring Understandings: Word problems can be solved using many strategies.
Often, more than one operation must be used to find the final answer.
Most word problems can be thought of in terms of parts and a whole/total.
Data can be organized in different ways to answer questions about the world around us.
Graphs can be used to help see data in different ways to answer questions and solve problems.
Graphs have features that help others read and interpret the information.
Perimeter is an important measurement of figures.
Shapes can be described by the number and types of features they have.
Shapes can be described by how their features are related.
Shapes can be included in many different groups depending on their attributes.
Guiding Questions: Why is it important to check whether an answer is
reasonable?
How can math models and equations be used to solve real world problems?
Why do graphs have common features
Why would you choose one type of graph over another when representing data?
Why are graph features important when you are presenting results?
How are figures measured?
How are shapes named and grouped?
How can you describe the similarities and differences between figures?
Students will know….. Perimeter is the distance around a figure. It can be calculated by adding up the length of all the sides.
Two rectangles can have the same perimeter but different areas.
Two rectangles can have the same area but different perimeters.
Quadrilaterals are polygons with four sides.
Quadrilaterals can be sorted by the characteristics they share.
Parallel lines are lines that do not cross.
Intersecting lines are lines that cross and have a point in common.
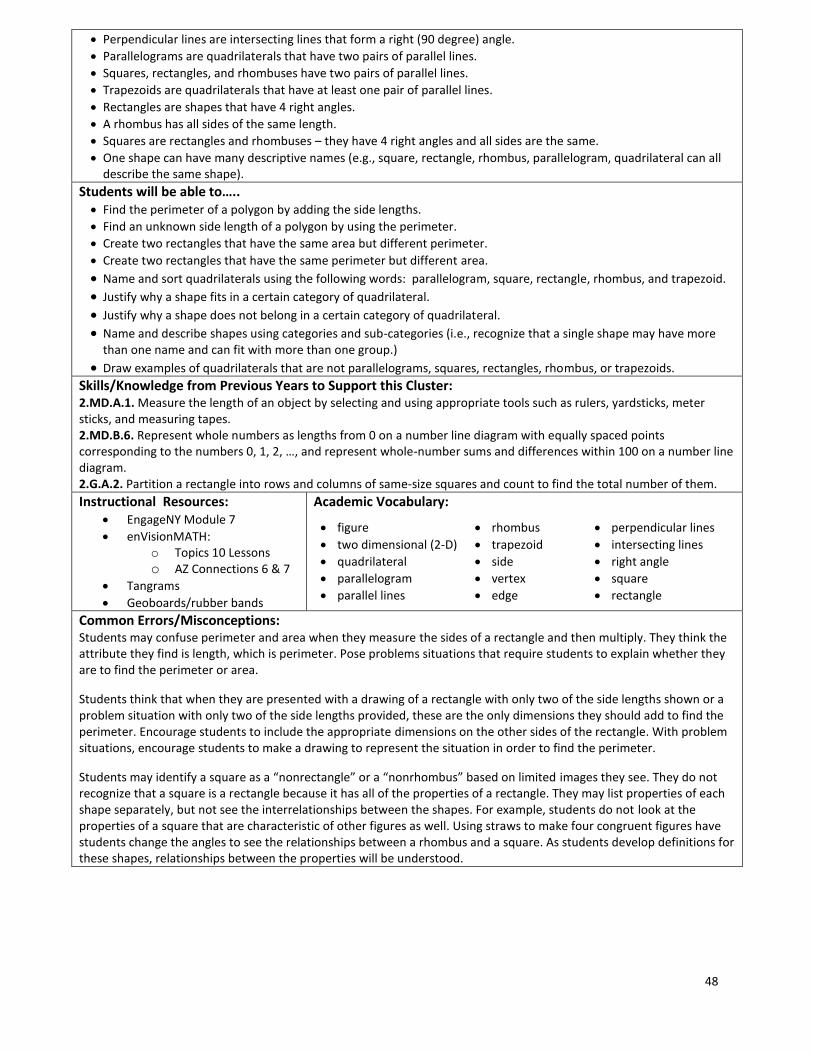
48
Perpendicular lines are intersecting lines that form a right (90 degree) angle.
Parallelograms are quadrilaterals that have two pairs of parallel lines.
Squares, rectangles, and rhombuses have two pairs of parallel lines.
Trapezoids are quadrilaterals that have at least one pair of parallel lines.
Rectangles are shapes that have 4 right angles.
A rhombus has all sides of the same length.
Squares are rectangles and rhombuses – they have 4 right angles and all sides are the same.
One shape can have many descriptive names (e.g., square, rectangle, rhombus, parallelogram, quadrilateral can all describe the same shape).
Students will be able to….. Find the perimeter of a polygon by adding the side lengths.
Find an unknown side length of a polygon by using the perimeter.
Create two rectangles that have the same area but different perimeter.
Create two rectangles that have the same perimeter but different area.
Name and sort quadrilaterals using the following words: parallelogram, square, rectangle, rhombus, and trapezoid. Justify why a shape fits in a certain category of quadrilateral. Justify why a shape does not belong in a certain category of quadrilateral. Name and describe shapes using categories and sub-categories (i.e., recognize that a single shape may have more
than one name and can fit with more than one group.) Draw examples of quadrilaterals that are not parallelograms, squares, rectangles, rhombus, or trapezoids.
Skills/Knowledge from Previous Years to Support this Cluster: 2.MD.A.1. Measure the length of an object by selecting and using appropriate tools such as rulers, yardsticks, meter sticks, and measuring tapes. 2.MD.B.6. Represent whole numbers as lengths from 0 on a number line diagram with equally spaced points corresponding to the numbers 0, 1, 2, …, and represent whole-number sums and differences within 100 on a number line diagram. 2.G.A.2. Partition a rectangle into rows and columns of same-size squares and count to find the total number of them.
Instructional Resources: EngageNY Module 7
enVisionMATH: o Topics 10 Lessons o AZ Connections 6 & 7
Tangrams
Geoboards/rubber bands
Academic Vocabulary:
figure
two dimensional (2-D)
quadrilateral
parallelogram
parallel lines
rhombus
trapezoid
side
vertex
edge
perpendicular lines
intersecting lines
right angle
square
rectangle
Common Errors/Misconceptions: Students may confuse perimeter and area when they measure the sides of a rectangle and then multiply. They think the attribute they find is length, which is perimeter. Pose problems situations that require students to explain whether they are to find the perimeter or area.
Students think that when they are presented with a drawing of a rectangle with only two of the side lengths shown or a problem situation with only two of the side lengths provided, these are the only dimensions they should add to find the perimeter. Encourage students to include the appropriate dimensions on the other sides of the rectangle. With problem situations, encourage students to make a drawing to represent the situation in order to find the perimeter.
Students may identify a square as a “nonrectangle” or a “nonrhombus” based on limited images they see. They do not recognize that a square is a rectangle because it has all of the properties of a rectangle. They may list properties of each shape separately, but not see the interrelationships between the shapes. For example, students do not look at the properties of a square that are characteristic of other figures as well. Using straws to make four congruent figures have students change the angles to see the relationships between a rhombus and a square. As students develop definitions for these shapes, relationships between the properties will be understood.

49
Examples and/or Explanations: 3.OA.D.8 Students should be exposed to multiple problem-solving strategies (using any combination of words, numbers, diagrams, physical objects or symbols) and be able to choose which ones to use.
Jerry earned 231 points at school last week. This week he earned 79 points. If he uses 60 points to earn free time on a computer, how many points will he have left?
o A student may use the number line above to describe his/her thinking, “231 + 9 = 240 so now I need to add
70 more. 240, 250 (10 more), 260 (20 more), 270, 280, 290, 300, 310 (70 more). Now I need to count back 60. 310, 300 (back 10), 290 (back 20), 280, 270, 260, 250 (back 60).”
o A student writes the equation, 231 + 79 – 60 = m and uses rounding (230 + 80 – 60) to estimate. o A student writes the equation, 231 + 79 – 60 = m and calculates 79-60 = 19 and then calculates 231 + 19 =
m.
The soccer club is going on a trip to the water park. The cost of attending the trip is $63. Included in that price is $13 for lunch and the cost of 2 wristbands, one for the morning and one for the afternoon. Write an equation representing the cost of the field trip and determine the price of one wristband.
The above diagram helps the student write the equation, w + w + 13 = 63. Using the diagram, a student might think, “I know that the two wristbands cost $50 ($63-$13) so one wristband costs $25.” 3.MD.B.4 Students in second grade measured length in whole units using both metric and U.S. customary systems. It’s important to review with students how to read and use a standard ruler including details about halves and quarter marks on the ruler. Students should connect their understanding of fractions to measuring to one-half and one-quarter inch. Third graders need many opportunities measuring the length of various objects in their environment. Some important ideas related to measuring with a ruler are:
The starting point of where one places a ruler to begin measuring
Measuring is approximate. Items that student’s measure will not always measure exactly ¼, ½ or one whole inch. Students will need to decide on an appropriate estimate length.
Making paper rulers and folding to find the half and quarter marks will help students develop a stronger understanding of measuring length
Students generate data by measuring and create a line plot to display their findings. An example of a line plot is shown
below:
3.MD.D.8. Students develop an understanding of the concept of perimeter by walking around the perimeter of a room, using rubber bands to represent the perimeter of a plane figure on a geoboard, or tracing around a shape on an interactive whiteboard. They find the perimeter of objects; use addition to find perimeters; and recognize the patterns that exist when finding the sum of the lengths and widths of rectangles. Students use geoboards, tiles, and graph paper to find all the possible rectangles that have a given perimeter (e.g., find the rectangles with a perimeter of 14 cm.) They record all the possibilities using dot or graph paper, compile the possibilities into an organized list or a table, and determine whether they have all the possible rectangles.

50
Given a perimeter and a length or width, students use objects or pictures to find the missing length or width. They justify and communicate their solutions using words, diagrams, pictures, and numbers. Students use geoboards, tiles, graph paper, or technology to find all the possible rectangles with a given area (e.g. find the rectangles that have an area of 12 square units.) They record all the possibilities using dot or graph paper, compile the possibilities into an organized list or a table, and determine whether they have all the possible rectangles. Students then investigate the perimeter of the rectangles with an area of 12.
Area Length Width Perimeter
12 sq. in. 1 in. 12 in. 26 in.
12 sq. in. 2 in. 6 in. 16 in.
12 sq. in 3 in. 4 in. 14 in.
12 sq. in 4 in. 3 in. 14 in.
12 sq. in 6 in. 2 in. 16 in.
12 sq. in 12 in. 1 in. 26 in.
The patterns in the chart allow the students to identify the factors of 12, connect the results to the commutative property, and discuss the differences in perimeter within the same area. This chart can also be used to investigate rectangles with the same perimeter. It is important to include squares in the investigation. 3.G.A.1. In second grade, students identify and draw triangles, quadrilaterals, pentagons, and hexagons. Third graders build on this experience and further investigate quadrilaterals (technology may be used during this exploration). Students recognize shapes that are and are not quadrilaterals by examining the properties of the geometric figures. They conceptualize that a quadrilateral must be a closed figure with four straight sides and begin to notice characteristics of the angles and the relationship between opposite sides. Students should be encouraged to provide details and use proper vocabulary when describing the properties of quadrilaterals. They sort geometric figures (see examples below) and identify squares, rectangles, and rhombuses as quadrilaterals.