
Room Acoustics – An Approach Based on Waves and Particles
45
05/10/2010 1 Room Acoustics – An Approach Based on Waves and Particles Jens Holger Rindel Odeon A/S, Denmark EuroRegio 2010 2 Outline • Introduction • Waves and normal modes in rooms • Diffuse and non-diffuse sound fields • Particles and reflections in rooms – Diffraction – scattering – curved surfaces • Computer modelling • Speech in rooms • Music in rooms • Conclusion
-
Upload
khangminh22 -
Category
Documents
-
view
1 -
download
0
Transcript of Room Acoustics – An Approach Based on Waves and Particles
05/10/2010
1
Room Acoustics – An Approach
Based on Waves and Particles
Jens Holger Rindel
Odeon A/S, Denmark
EuroRegio 2010 2
Outline
• Introduction
• Waves and normal modes in rooms
• Diffuse and non-diffuse sound fields
• Particles and reflections in rooms– Diffraction – scattering – curved surfaces
• Computer modelling
• Speech in rooms
• Music in rooms
• Conclusion

05/10/2010
2
Introduction
EuroRegio 2010 3
Wallace C. Sabine (1868 – 1919)
Setup for measurement of reverberation time using four sets of organ pipes
4
Measured decay times
EuroRegio 2010

05/10/2010
3
5
Measurement resultswith 1 and 4 organ pipes:
Decay times
t1 = 8,69 s
t4 = 9,55 s
Level differences
∆L1 = 10 log 1 = 0,0 dB
∆L4 = 10 log 4 = 6,0 dB
EuroRegio 2010
s 6,810)69,855,9(0,6
60)( 14 =⋅−=−= ttT
The reverberation time is the time for a 60 dB decay; thus:
Waves and normal modes
6
Ripple tank model of an
auditorium (around 1929)
The wave length is visible
EuroRegio 2010

05/10/2010
4
EuroRegio 2010 7
Modes in a rectangular room
⋅
⋅
⋅=
z
z
y
y
x
xl
zn
l
yn
l
xnpp πππ coscoscos0
p : Sound pressure in the room (p0 is maximum)lx, ly, lz : Room dimensionsnx, ny, nz : Natural numbers or 0
Relative sound pressure |p/p0|
EuroRegio 2010 8
Transfer function in a room
At low frequencies the room modes may be
identified by peaks at the natural frequencies
222
2
+
+
=
z
z
y
y
x
xn
l
n
l
n
l
ncf c : Speed of sound (344 m/s)

05/10/2010
5
Normal modes in a room
• Modal overlap
– Number of modes
within the
bandwidth of the
modes
TBr
2,2=
f
NBM r
∆
∆=
• Bandwidth of the modes
9EuroRegio 2010
Schroeder’s limiting frequency
• Modal overlap should be minimum M = 3 for statistical considerations
• This is fulfilled above the limiting frequency
V
Tf st 2000=
T : Reverberation time (s)
V : Volume (m3)
10EuroRegio 2010

05/10/2010
6
Transfer function above fst
EuroRegio 2010 11
Measured sine sweep, 900 – 1000 Hz, A: Reverberant room, B: Dead room
Ref.: Lyon (1969)
Tf
4max ≈∆
Average distance
between maxima in the
transfer function
depends on the
reverberation time
A: ∆fmax = 2 Hz => T = 2 sB: ∆fmax = 12.5 Hz => T = 0.5 s
EuroRegio 2010 12
Natural frequencies in 3D
Frequency space with the modes of in rectangular room.
Volume of 1/8 sphere:(4 π f 3 / 3) / 8 = π f 3 / 6
Volume of one cell: c3 / (8 lx ly lz) = c3 / (8 V)
Total number of modes below f :
3
3
3
3
3
48
6 c
fV
c
VfN
ππ==
This is only the 3-dimensional modes
05/10/2010
7
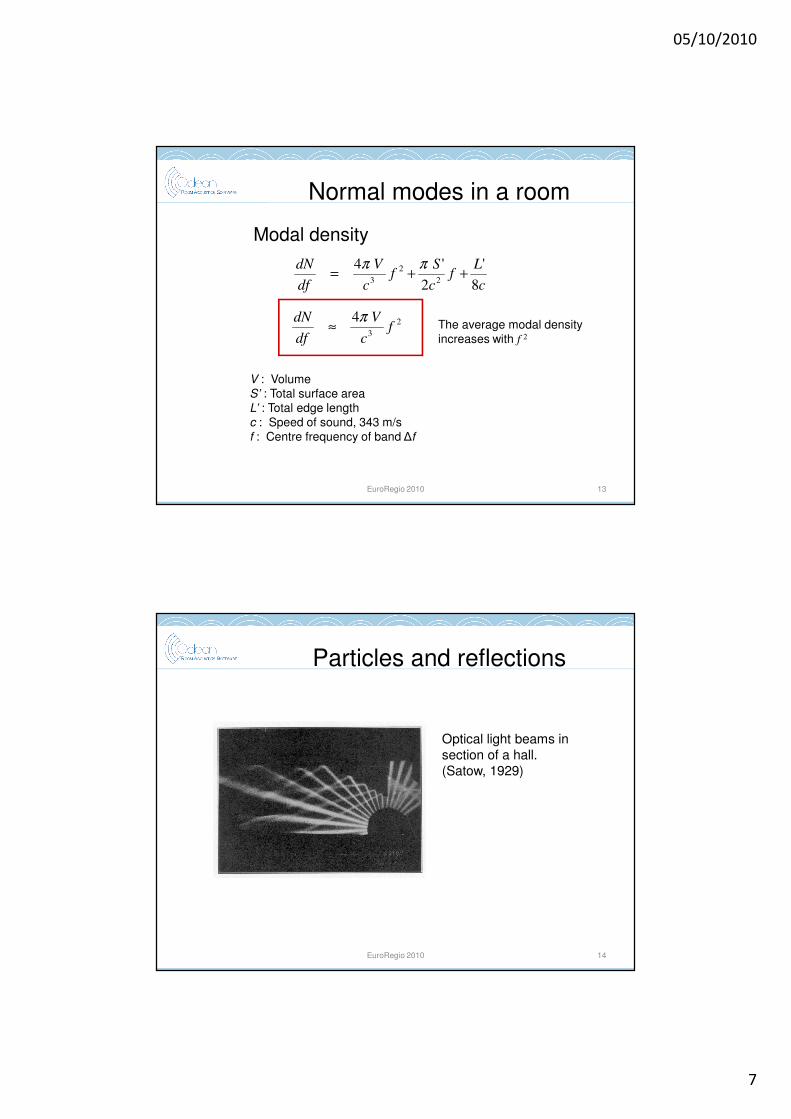
Normal modes in a room
Modal density
c
Lf
c
Sf
c
V
df
dN
8
'
2
'42
2
3++=
ππ
V : VolumeS’ : Total surface areaL’ : Total edge lengthc : Speed of sound, 343 m/sf : Centre frequency of band ∆f
13EuroRegio 2010
The average modal densityincreases with f 2
2
3
4f
c
V
df
dN π≈
Particles and reflections
EuroRegio 2010 14
Optical light beams in
section of a hall.
(Satow, 1929)
05/10/2010
8
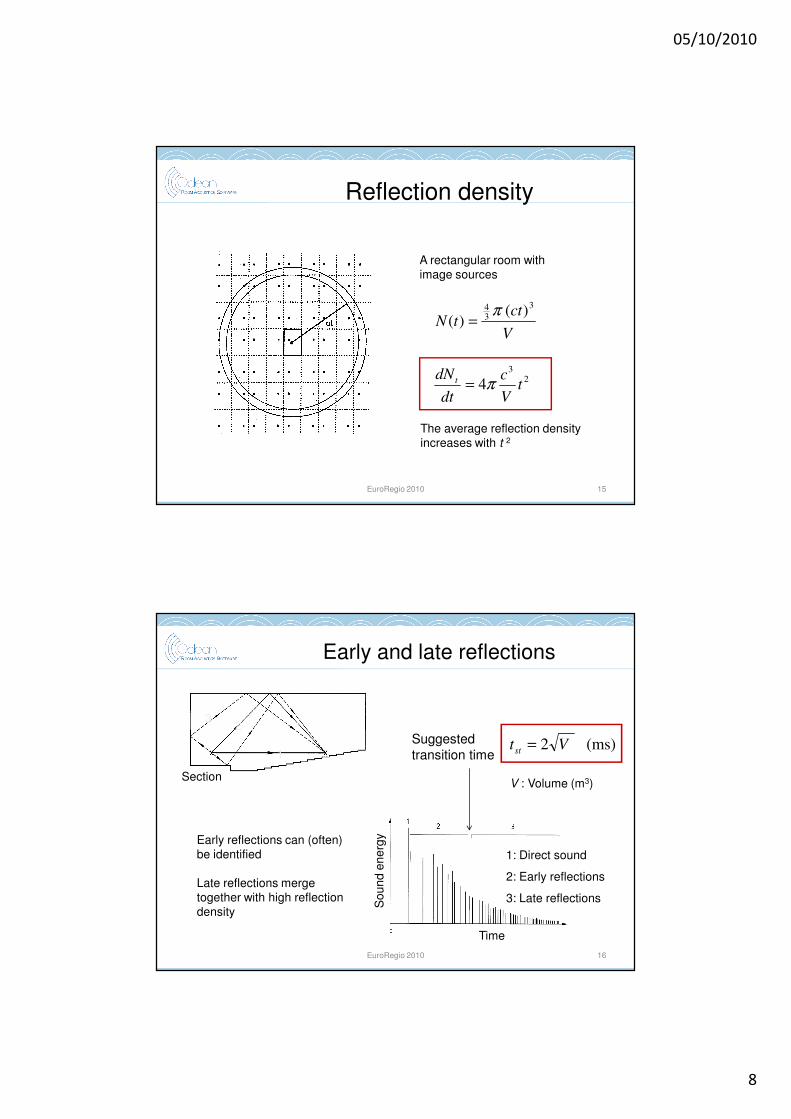
EuroRegio 2010 15
Reflection density
A rectangular room with image sources
The average reflection densityincreases with t 2
V
cttN
3
34 )(
)(π
=
23
4 tV
c
dt
dN t π=
EuroRegio 2010 16
1
23
1: Direct sound
2: Early reflections
3: Late reflections
Early and late reflections
Suggested
transition time(ms) 2 Vtst =
So
un
d e
ne
rgy
Time
SectionV : Volume (m3)
Early reflections can (often)
be identified
Late reflections merge together with high reflection density
05/10/2010
9
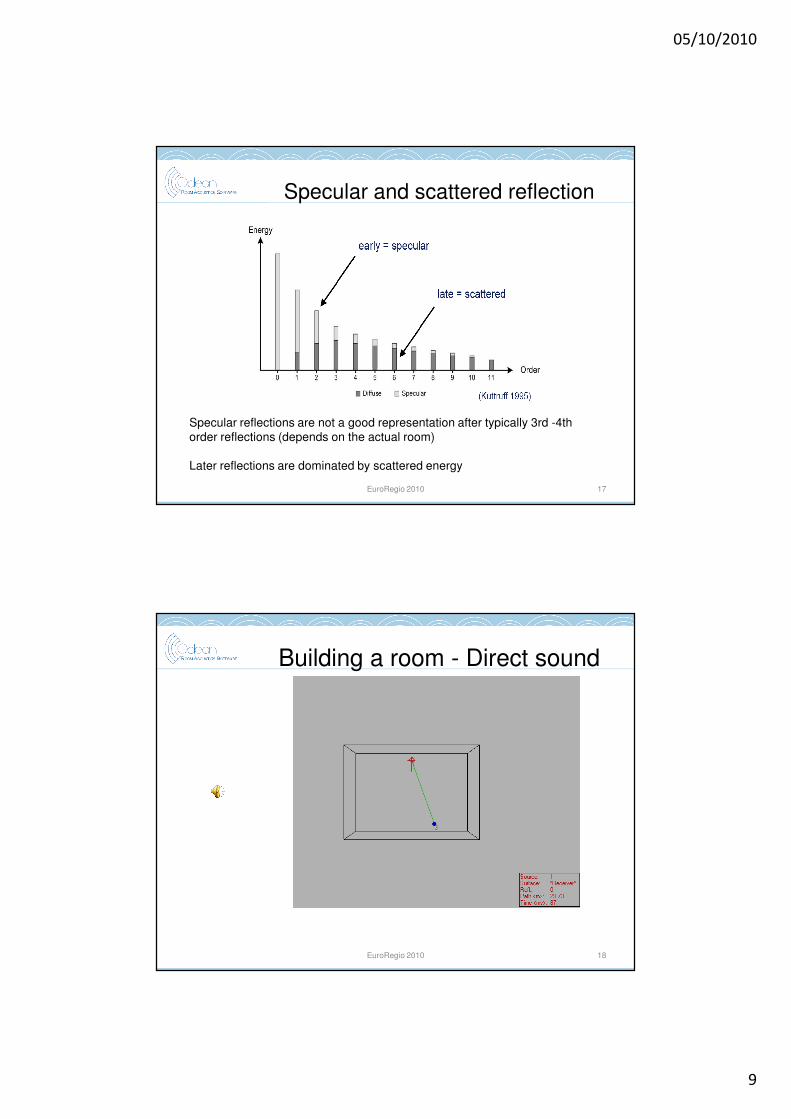
EuroRegio 2010 17
Specular and scattered reflection
Specular reflections are not a good representation after typically 3rd -4th order reflections (depends on the actual room)
Later reflections are dominated by scattered energy
EuroRegio 2010 18
Building a room - Direct sound

05/10/2010
10
EuroRegio 2010 19
One reflecting wall - Echo
1st order image source
Time delay106 ms
EuroRegio 2010 20
Three walls
1st and 2nd orderimage sources shown
Several echoes

05/10/2010
11
EuroRegio 2010 21
Six surfaces
Up to 3rd orderimage sourcesshown
EuroRegio 2010 22
A sound wave represented by a ray
Mean free path
in a 3D diffuse
sound field:
lm = 4V/ S
V : Volume
S : Surface area
NB: It is assumed that all surfaces
have the same absorption
coefficient αm
Energy of sound wave
is reduced by (1- αm)
after each reflection

05/10/2010
12
EuroRegio 2010 23
Sound pressure after n reflections
)1ln(2
0
2
0
2 e)1()( mnn
m pptpαα −⋅⋅=−⋅=
m
i
i lntcl ⋅=⋅=∑t
l
cm
mptp⋅−⋅
⋅=)1ln(
2
0
2 e)(α
60
)1ln(6 )1ln()10ln(6e10
60
Tl
cm
m
Tl
cm
m ⋅−⋅=⋅−⇒=⋅−⋅
− αα
m
m
m
m
c
l
c
lT
αα ⋅
⋅≈
−⋅−
⋅=
8.13
)1ln(
8.1360
General equation for reverberation time
Total path:
⇒⋅=⇒= −62
0
2
60 10)( ptpTt
EuroRegio 2010 24
S
Vlm
4=
U
Sl x
m
π=
xm ll =
3D:
2D:
1D:
General:
m
m
m
m
c
l
c
lT
αα ⋅
⋅≈
−⋅−
⋅=
8.13
)1ln(
8.1360
Reverberation time equations
)1ln(
3.55
mSc
V
α−⋅⋅−
⋅
m
x
c
l
α⋅
⋅8.13
mSc
V
α⋅⋅
⋅3.55
m
x
Uc
S
α⋅⋅
⋅4.43
)1ln(
4.43
m
x
Uc
S
α−⋅⋅−
⋅
)1ln(
8.13
m
x
c
l
α−⋅−
⋅

05/10/2010
13
EuroRegio 2010 25
Eyring and Sabine equations (3D)
)1ln(
3.5560
mSc
VT
α−⋅⋅−
⋅=Eyring:
Sabine:mSc
VT
α⋅⋅
⋅=
3.5560
Approximately the same as Eyring for αm < 0,3
Better when α is different for different surfaces
More correct for very high absorption, αm → 1
Special cases for 3D diffuse field and even distribution of absorption
EuroRegio 2010 26
Non-diffuse rooms
Example: Rectangular room
Direction lm (m) αm T60 (s)
3-dim. (Sabine)
3-dim. (Eyring)
2-dim. (horizontal)
1-dim. (length)
1-dim. (width)
1-dim. (height)
5.7
5.7
10.5
20
10
5
0.30
0.30
0.10
0.10
0.10
0.45
0.76
0.63
4.21
8.02
4.01
0.45

05/10/2010
14
EuroRegio 2010 27
The scattering coefficient, s
(1-s)1
s
Ratio of reflected energy in
non-specular directions
EuroRegio 2010 28
Simulation with ray tracing
Low scattering:s = 0.01
T30 = 1,69 s @ 1 kHz

05/10/2010
15
EuroRegio 2010 29
Simulation with ray tracing
s = 0.05
T30 = 1,40 s @ 1 kHz
EuroRegio 2010 30
Simulation with ray tracing
s = 0.50
T30 = 0,71 s @ 1 kHz

05/10/2010
16
EuroRegio 2010 31
Simulation with ray tracing
s = 1.00
T30 = 0,71 s @ 1 kHz
EuroRegio 2010 32
Non-diffuse rooms
• The sound decay in a room is a complicated mixture of the decay of 1-, 2-, and 3-dimensional modes
• With uneven distribution of absorption the degree of scattering is very important
05/10/2010
17
33
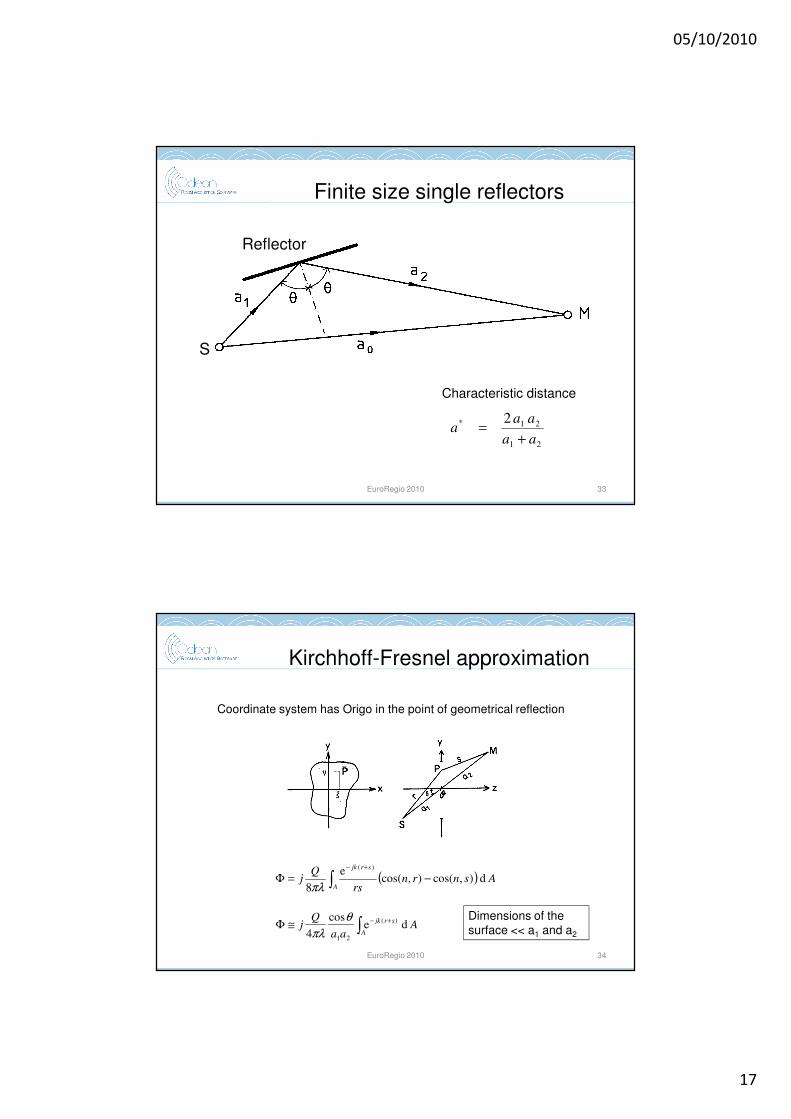
Finite size single reflectors
Reflector
S
EuroRegio 2010
21
21* 2
aa
aaa
+=
Characteristic distance
34
Kirchhoff-Fresnel approximation
( ) Asnrnrs
Qj
A
srjk
d),cos(),cos(e
8
)(
∫ −=Φ+−
πλ
Aaa
Qj
A
srjkde
cos
4
)(
21
∫+−≅Φ
θ
πλ
Dimensions of the surface << a1 and a2
Coordinate system has Origo in the point of geometrical reflection
EuroRegio 2010
05/10/2010
18
35
Transformation of variables
ηθλ
ξλ
⋅⋅
+=
⋅
+=
cos112
112
21
21
aav
aau
( )jNMaa
Qj
aajk
−+
≅Φ+−
21
)( 21e
8π
Rectangular aperture
∫∫−−
=−2
1
22
1
2
dd 22
v
v
vju
u
uj
veuejNM
ππ
( )[ ] ( )[ ])()()()()()()()( 12121212 vSvSjvCvCuSuSjuCuCjNM −−−⋅−−−=−
EuroRegio 2010
36
Cornu’s spiral
Result for an infinite large surface:
This is taken as the reference for the attenuation due to size
( ) zzvCv
dcos)(0
2
2∫= π ( ) zzvSv
dsin)(0
2
2∫= πThe Fresnel integrals:
EuroRegio 2010
05/10/2010
19
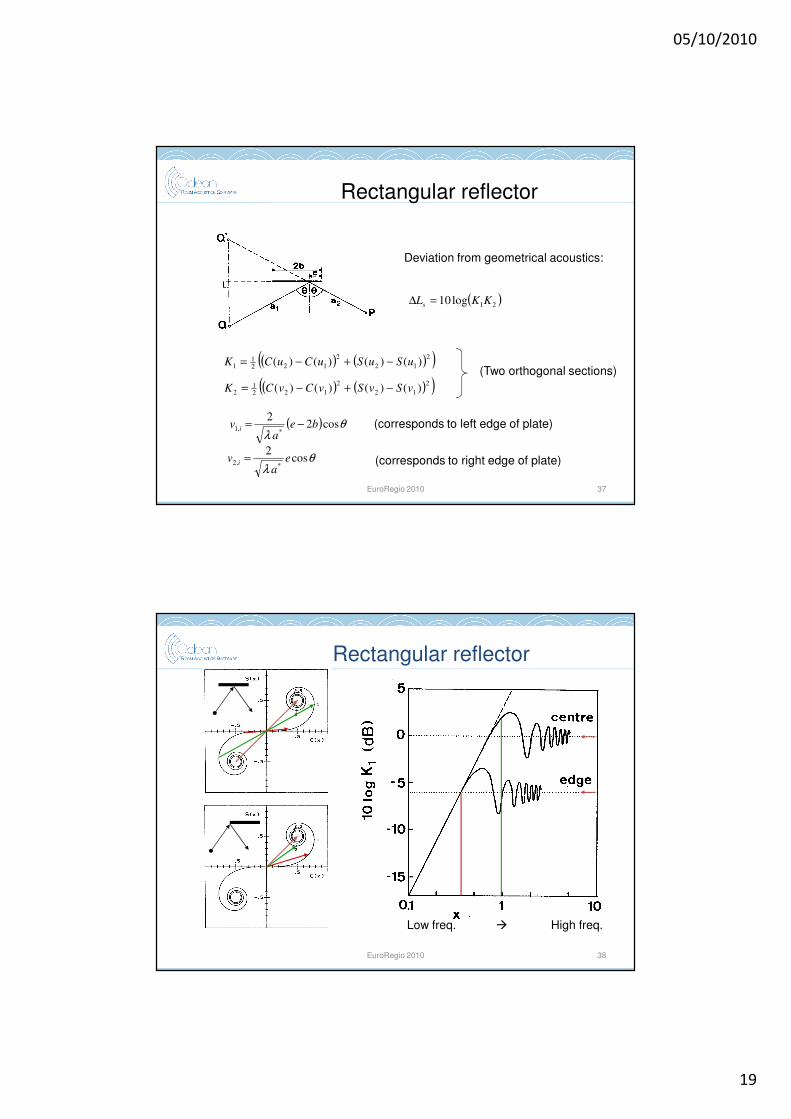
37
Rectangular reflector
( )21log10 KKLs =∆
Deviation from geometrical acoustics:
( ) ( )( )2
12
2
1221
1 )()()()( uSuSuCuCK −+−=
( ) ( )( )2
12
2
1221
2 )()()()( vSvSvCvCK −+−=
( ) θλ
cos22
*,1 bea
v i −=
θλ
cos2
*,2 ea
v i =
(Two orthogonal sections)
(corresponds to left edge of plate)
(corresponds to right edge of plate)
EuroRegio 2010
38
Rectangular reflector
Low freq. � High freq.
EuroRegio 2010
05/10/2010
20
39
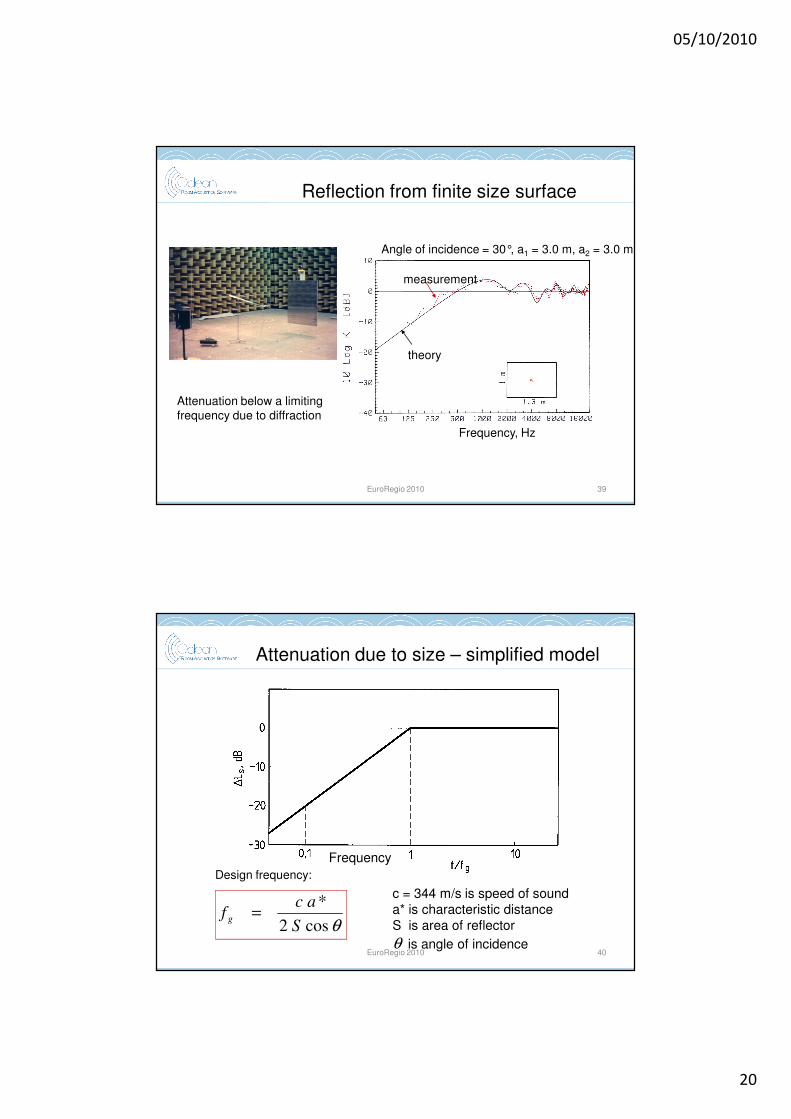
Reflection from finite size surface
Attenuation below a limiting frequency due to diffraction
Angle of incidence = 30°, a1 = 3.0 m, a2 = 3.0 m
Frequency, Hz
theory
measurement
EuroRegio 2010
40
Attenuation due to size – simplified model
c = 344 m/s is speed of sound
a* is characteristic distance
S is area of reflector
θ is angle of incidence
θcos2
*
S
acf g =
Frequency
Design frequency:
EuroRegio 2010

05/10/2010
21
41
Measured directivity of reflection
Plane surface
Diffusing surface
EuroRegio 2010
Ref.: M. Kleiner (1996)
Scattering due to finite size
Scattering due to finite size
EuroRegio 2010 42
2
max,
sinsin
⋅=
Y
Y
X
X
I
I
r
r( )( )0
0
coscos
coscos
ββ
αα
−=
−=
kbY
kaX
Reflected sound intensity in the considered direction
Incident sound
Reflected sound

05/10/2010
22
43
0
0,1
0,2
0,3
0,4
0,5
0,6
0,7
0,8
0,9
1
0 30 60 90 120 150 180
Angle of radiation
ka = 1/4
ka = 1/2
ka = 1
ka = 2
ka = 4
ka = 8
ka = 16
ka = 32
Lambert
0
30
60
90
120
150
180
EuroRegio 2010
Directivity for angle of incidence α0 = 90°
1/1 octave band
44
0
30
60
90
120
150
180
0
0,1
0,2
0,3
0,4
0,5
0,6
0,7
0,8
0,9
1
0 30 60 90 120 150 180
Angle of radiation
ka = 1/4
ka = 1/2
ka = 1
ka = 2
ka = 4
ka = 8
ka = 16
ka = 32
Lambert
Directivity for angle of incidence α0 = 30°
EuroRegio 2010
1/1 octave band Ref.: Rindel, BNAM (2004)
05/10/2010
23
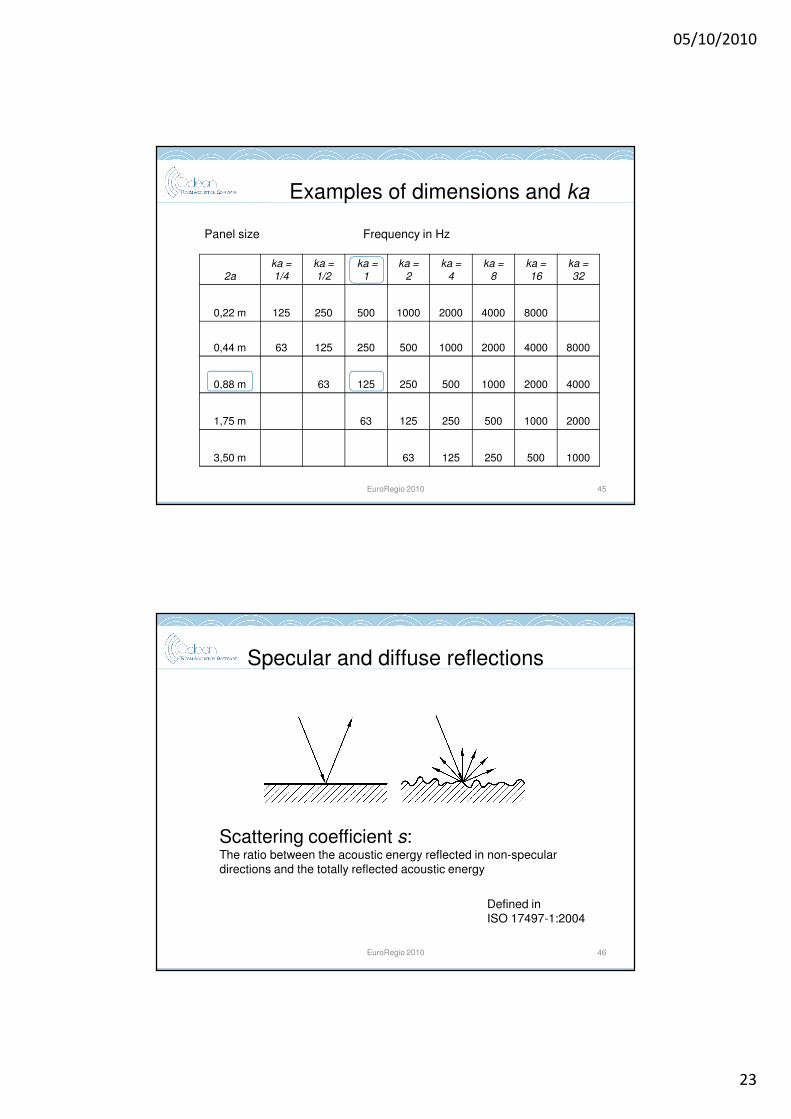
45
Examples of dimensions and ka
2aka = 1/4
ka = 1/2
ka = 1
ka = 2
ka = 4
ka = 8
ka = 16
ka = 32
0,22 m 125 250 500 1000 2000 4000 8000
0,44 m 63 125 250 500 1000 2000 4000 8000
0,88 m 63 125 250 500 1000 2000 4000
1,75 m 63 125 250 500 1000 2000
3,50 m 63 125 250 500 1000
Frequency in HzPanel size
EuroRegio 2010
4646
Specular and diffuse reflections
Scattering coefficient s: The ratio between the acoustic energy reflected in non-speculardirections and the totally reflected acoustic energy
EuroRegio 2010
Defined in
ISO 17497-1:2004

05/10/2010
24
EuroRegio 2010 47
Typical results of scattering coefficients
Ref.: CSTB, France
48
Reflection based scattering coefficient
)1()1(1 sdr SSS −⋅−−=
Energy which is not scattered
due to roughness
Energy which is not scattered
due to diffraction
Resulting specular fraction i.e. not scattered due to roughness or diffraction
EuroRegio 2010
05/10/2010
25
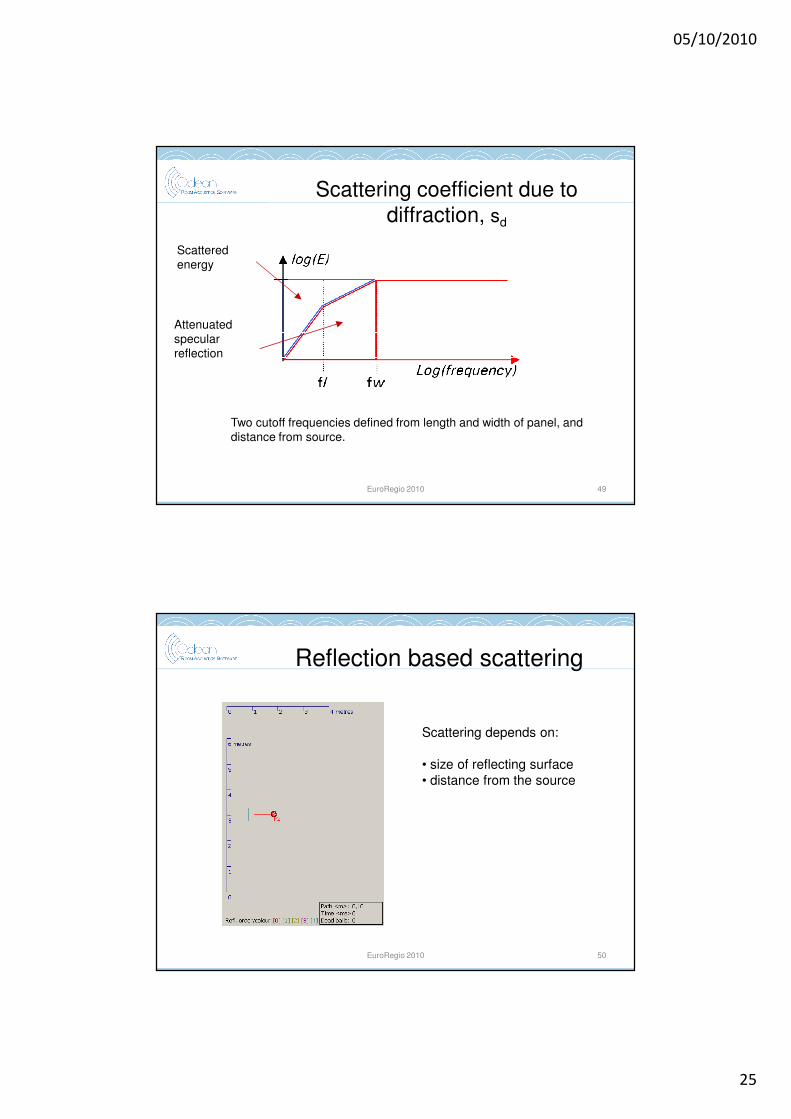
49
Scattering coefficient due to
diffraction, sd
Two cutoff frequencies defined from length and width of panel, and distance from source.
Scattered energy
Attenuated specular reflection
EuroRegio 2010
50
Reflection based scattering
Scattering depends on:
• size of reflecting surface
• distance from the source
EuroRegio 2010
05/10/2010
26
5151
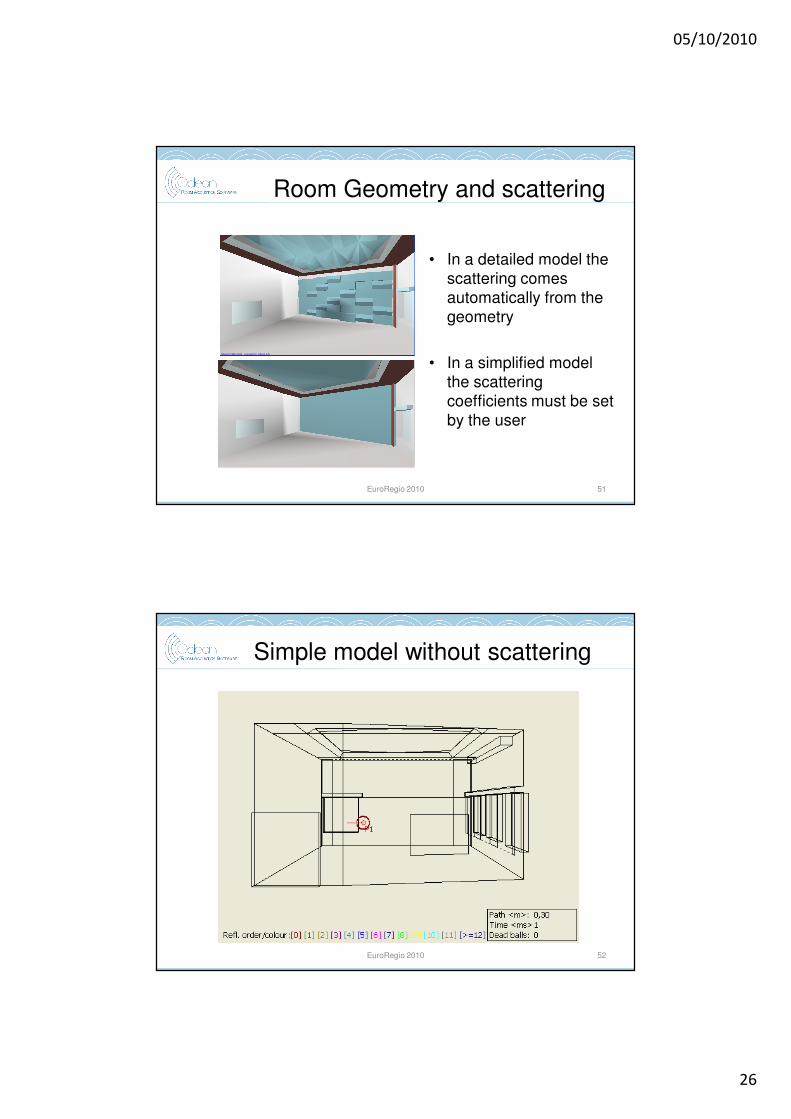
Room Geometry and scattering
• In a detailed model the
scattering comes
automatically from the
geometry
• In a simplified model
the scattering
coefficients must be set
by the user
Odeon©1985-2008 Licensed to: Odeon A/S
EuroRegio 2010
52
Simple model without scattering
52EuroRegio 2010

05/10/2010
27
53
Simple model with scattering
53EuroRegio 2010
54
Detailed model
54EuroRegio 2010
05/10/2010
28
55
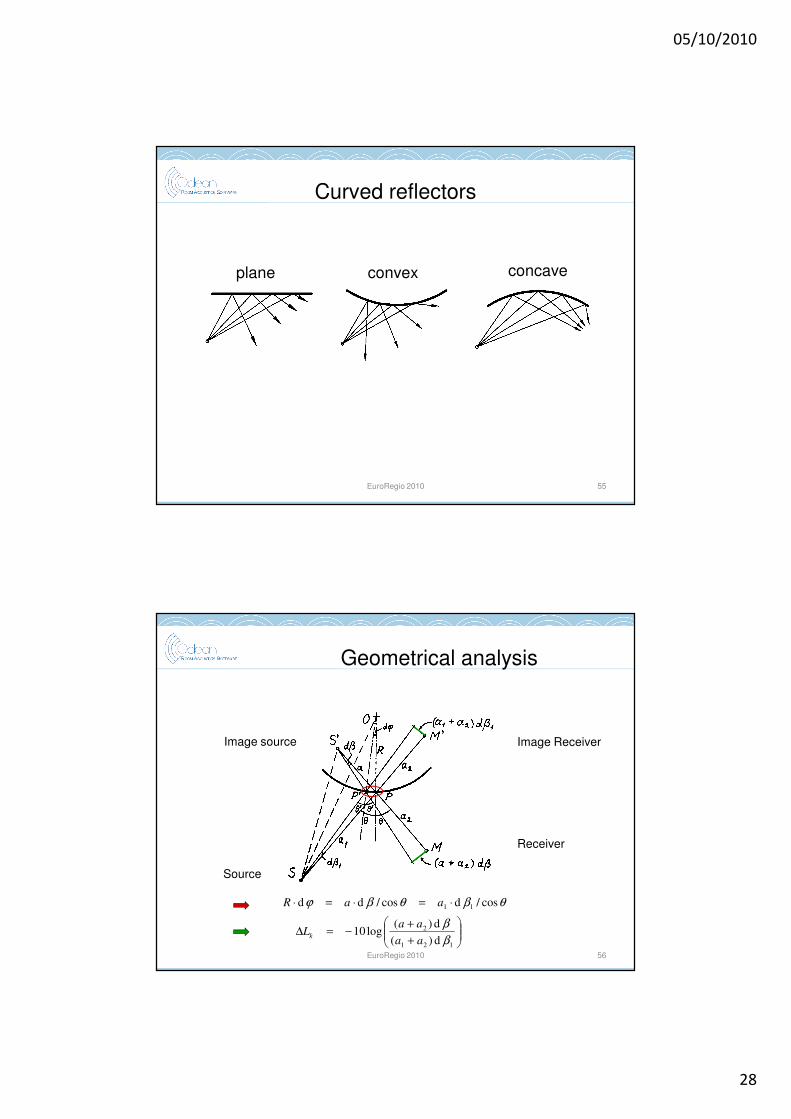
Curved reflectors
plane convex concave
EuroRegio 2010
56
Geometrical analysis
Source
Image source
Receiver
Image Receiver
+
+−=∆
121
2
d)(
d)(log10
β
β
aa
aaLk
θβθβϕ cos/dcos/dd 11 ⋅=⋅=⋅ aaR
EuroRegio 2010

05/10/2010
29
57
Attenuation due to curvature
R > 0 (convex)
R < 0 (concave)
R < 0 (concave)
θcos1log10
*
R
aLk +−=∆
21
21* 2
aa
aaa
+=
EuroRegio 2010
Computer modelling
EuroRegio 2010 58
Schroeder (1970)
05/10/2010
30
59
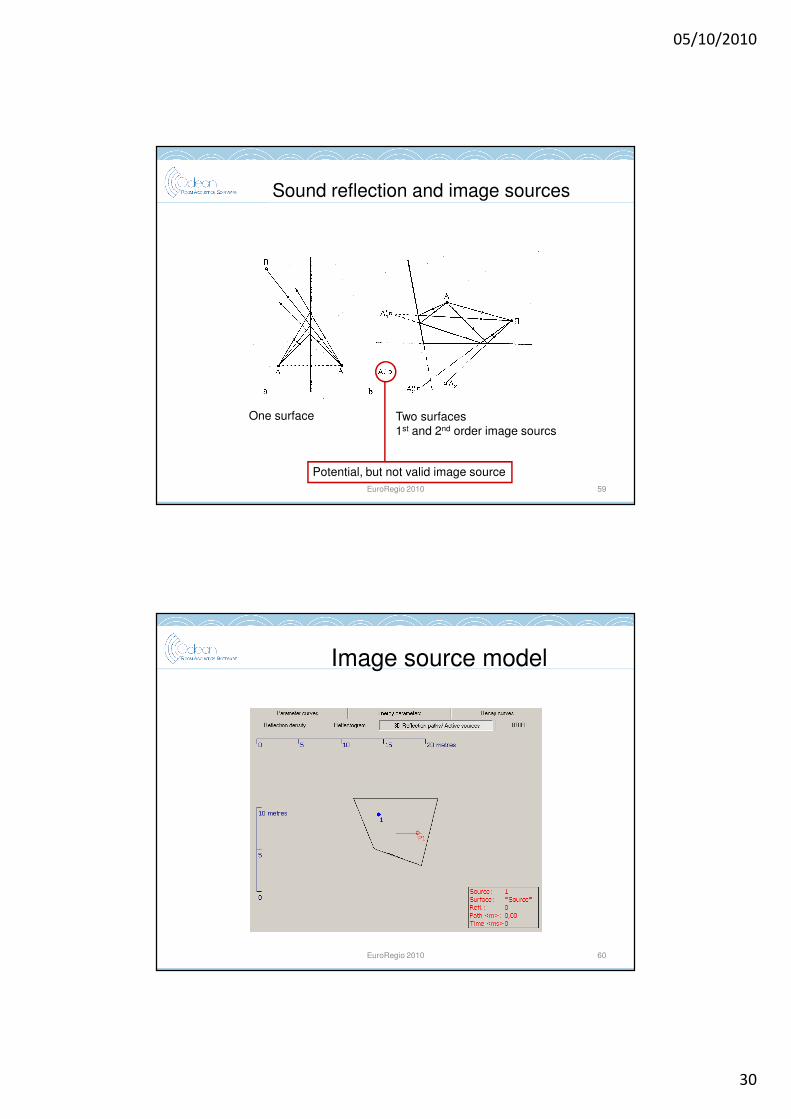
Sound reflection and image sources
One surface Two surfaces1st and 2nd order image sourcs
Potential, but not valid image source
EuroRegio 2010
60
Image source model
EuroRegio 2010

05/10/2010
31
61
Schroeder (1970)
Particle Tracing Model
EuroRegio 2010
62
Particle tracing
EuroRegio 2010

05/10/2010
32
6363
P1
Odeon©1985-2004
Ray tracing – highlighted one ray from source point
Ray Tracing Method
EuroRegio 2010
6464
P1
Odeon©1985-2004
Ray tracing – highlighted one ray from source point
Ray Tracing Method
EuroRegio 2010

05/10/2010
33
6565
P1
Secondary sources created at all reflection points.Each source has time delay and frequency dependent strength according to Ray Tracing history
Ray Tracing Method combined with Visibility Check
EuroRegio 2010
6666
P1
Receiver point collects contributions from all visible secondary sources
Ray Tracing Method combined with Visibility Check
EuroRegio 2010

05/10/2010
34
P2
3
1
6767
α : absorption coefficients : scattering coefficient
receiver
sourceImage source
Image Source MethodFirst order reflection - Specular part of reflection: (1-α)(1-s)
EuroRegio 2010
6868
Image Source MethodFirst order reflection - Diffuse part of reflection : (1-α)s
P2
3
1
α : absorption coefficient
s : scattering coefficient
receiver
source
Many secondary sources
distributed over the reflecting surface
EuroRegio 2010

05/10/2010
35
6969
P2
3
1
Odeon©1985-2005
Reflection paths including 3rd order reflections
Reflectogram
Arrival time: 61.74 ms (0.00 ms rel. direct)
Level of: -6.61 dB (0.00 dB rel. direct)
Azimuth angle: 9.61°, elevation angle: 2.22°
Reflection: 0. order, 1. reflection of 30, source:2
time (seconds rel. direct sound)
0,120,110,10,090,080,070,060,050,040,030,020,010
SP
L (
dB
)
-10
-15
-20
-25
-30
-35
-40
-45
-50
-55
-60
-65
Elevation
-20
-40
-60
-20
-40
-60
-50
-50
Azimuth
-20
-40
-60
-20
-40
-60
-50
-50
Frequency (Hz)
63 250 2000
-7
-8
Odeon©1985-2005
EuroRegio 2010
70
Head Related Transfer Function (HRTF)
Example: Sound incident from the left
Time
Frequency
EuroRegio 2010
Ref.: D. Hammershøj (1993)
05/10/2010
36
7171
AuralisationAuralisation
Anechoic recording, e.g. a trumpet
Result of the convolution
Binaural room impulse response from simulation
Left ear
time (seconds incl. filter delay)
21,81,61,41,210,80,60,40,20
p (
%)
100
50
0
-50
-100
Right ear
time (seconds incl. filter delay)
21,81,61,41,210,80,60,40,20
p (
%)
100
50
0
-50
-100
Odeon©1985-2008 Licensed to: Odeon A/S
EuroRegio 2010
7272
AuralisationAuralisation
Anechoic recording, e.g.
a trumpet
Result of the convolution
Binaural room impulse response from simulation
Left ear
time (seconds incl. filter delay)
21,81,61,41,210,80,60,40,20
p (
%)
100
50
0
-50
-100
Right ear
time (seconds incl. filter delay)
21,81,61,41,210,80,60,40,20
p (
%)
100
50
0
-50
-100
Odeon©1985-2008 Licensed to: Odeon A/S
EuroRegio 2010

05/10/2010
37
7373
AuralisationAuralisation
Anechoic recording, e.g. a trumpet
Result of the convolution
Binaural room impulse response from simulation
Left ear
time (seconds incl. filter delay)
21,81,61,41,210,80,60,40,20
p (
%)
100
50
0
-50
-100
Right ear
time (seconds incl. filter delay)
21,81,61,41,210,80,60,40,20
p (
%)
100
50
0
-50
-100
Odeon©1985-2008 Licensed to: Odeon A/S
EuroRegio 2010
7474
AuralisationAuralisation
Anechoic recording, e.g.
a trumpet
Result of the convolution
Binaural room impulse response from simulation
Left ear
time (seconds incl. filter delay)
21,81,61,41,210,80,60,40,20
p (
%)
100
50
0
-50
-100
Right ear
time (seconds incl. filter delay)
21,81,61,41,210,80,60,40,20
p (
%)
100
50
0
-50
-100
Odeon©1985-2008 Licensed to: Odeon A/S
EuroRegio 2010

05/10/2010
38
Speech in rooms
EuroRegio 2010 75
Vocal communication and ambient noise
The Lombard effect
EuroRegio 2010 76
Ambient noise level, dB(A)
Sp
ee
ch
leve
l (1
m)
dB
(A)
Relaxed
Normal
Raised
Loud
Very loud
Shouting
Vocal effort, ISO 9921:2003
05/10/2010
39
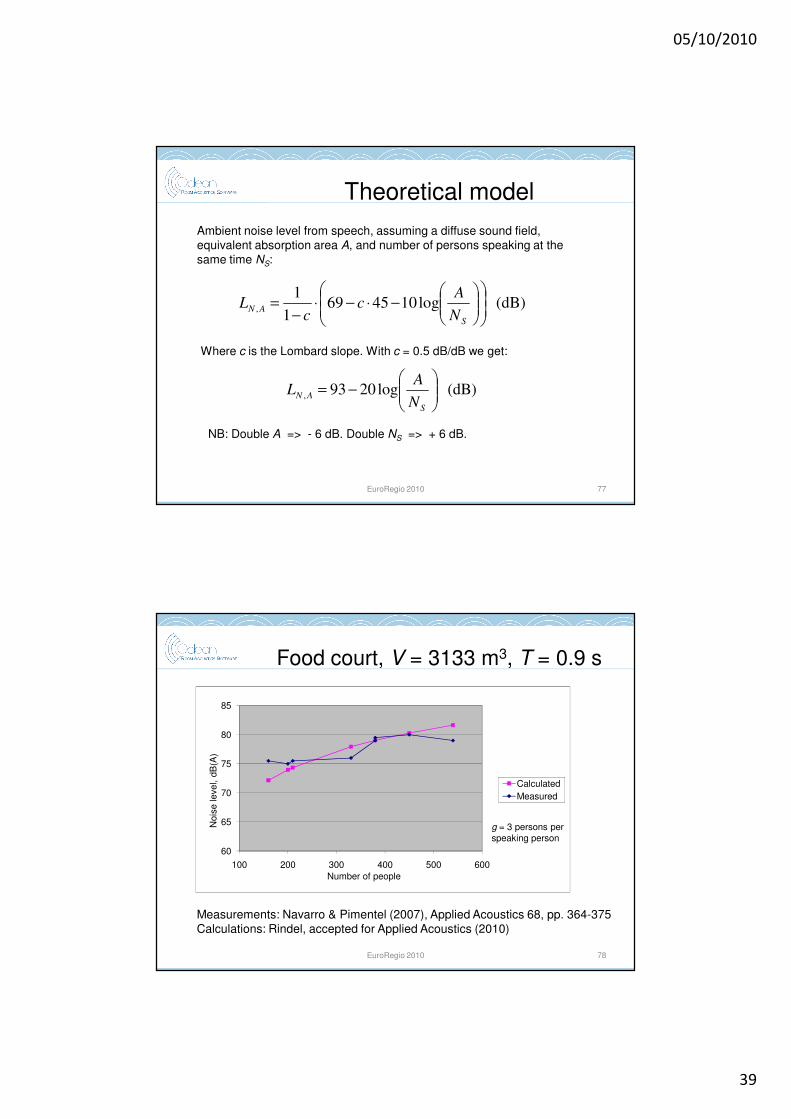
Theoretical model
Ambient noise level from speech, assuming a diffuse sound field, equivalent absorption area A, and number of persons speaking at the same time NS:
77EuroRegio 2010
(dB) log1045691
1,
−⋅−⋅
−=
S
ANN
Ac
cL
Where c is the Lombard slope. With c = 0.5 dB/dB we get:
(dB) log2093,
−=
S
ANN
AL
NB: Double A => - 6 dB. Double NS => + 6 dB.
Food court, V = 3133 m3, T = 0.9 s
Measurements: Navarro & Pimentel (2007), Applied Acoustics 68, pp. 364-375Calculations: Rindel, accepted for Applied Acoustics (2010)
60
65
70
75
80
85
100 200 300 400 500 600
Nois
ele
vel, d
B(A
)
Number of people
Calculated
Measured
g = 3 persons per
speaking person
78EuroRegio 2010
05/10/2010
40
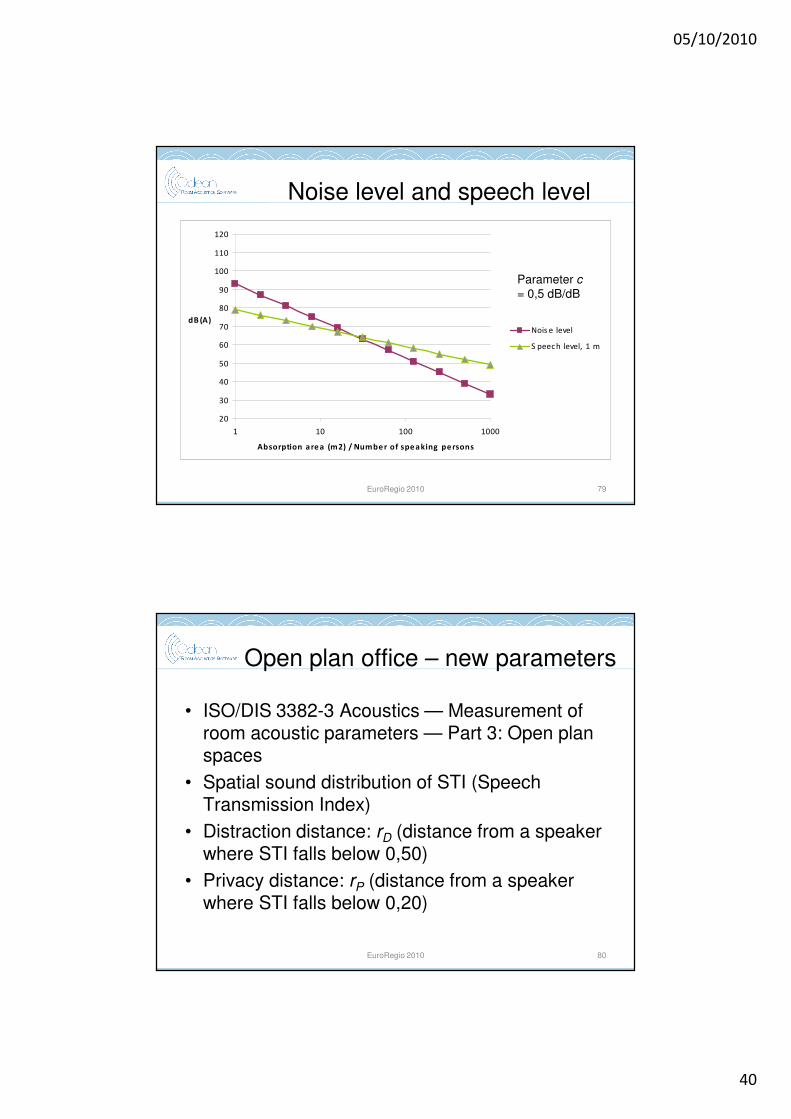
Noise level and speech level
20
30
40
50
60
70
80
90
100
110
120
1 10 100 1000
Absorption are a (m2) / Numbe r of spe aking pe rsons
dB (A)
Nois e level
S peech level, 1 m
Parameter c= 0,5 dB/dB
79EuroRegio 2010
Open plan office – new parameters
• ISO/DIS 3382-3 Acoustics — Measurement of room acoustic parameters — Part 3: Open plan spaces
• Spatial sound distribution of STI (Speech Transmission Index)
• Distraction distance: rD (distance from a speaker where STI falls below 0,50)
• Privacy distance: rP (distance from a speaker where STI falls below 0,20)
80EuroRegio 2010

05/10/2010
41
Open plan office – new parameters
With background noise 35 dBA
Distraction distance: rD = 9.9 m
Privacy distance: rP = 21.8 m
Ref.: Vironen et al. (2009)
81EuroRegio 2010
Music in rooms
EuroRegio 2010 82
05/10/2010
42
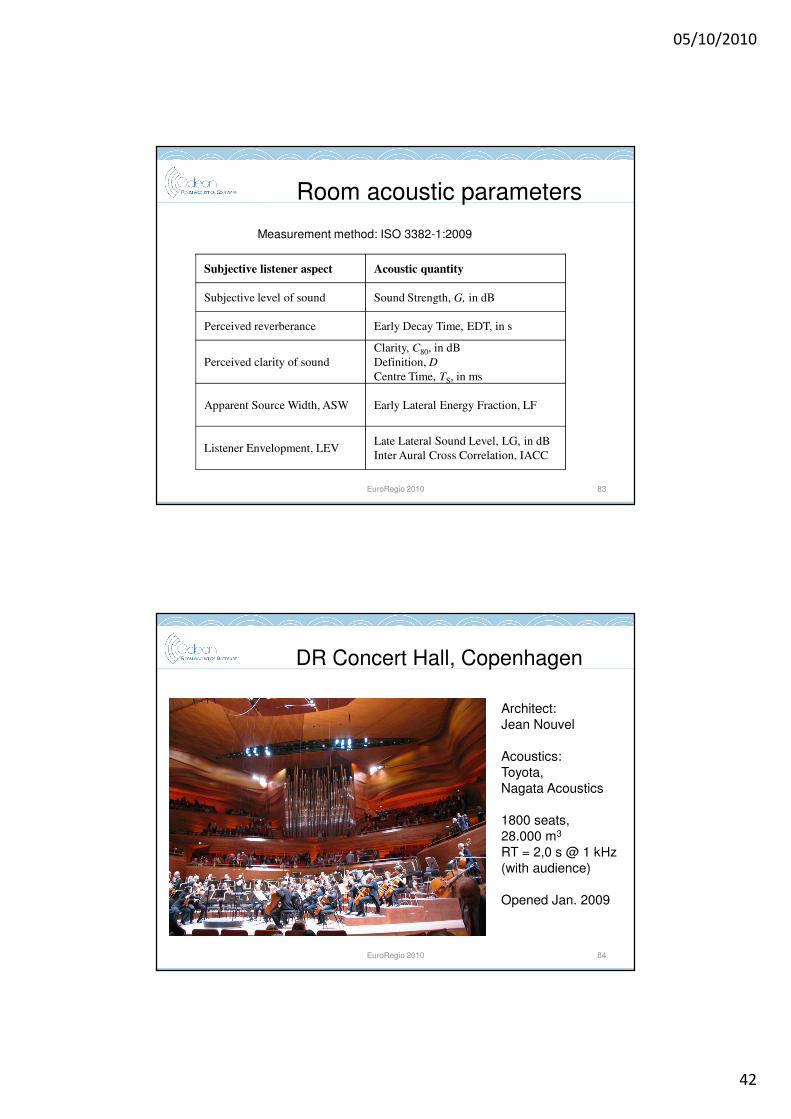
Room acoustic parameters
EuroRegio 2010 83
Subjective listener aspect Acoustic quantity
Subjective level of sound Sound Strength, G, in dB
Perceived reverberance Early Decay Time, EDT, in s
Perceived clarity of sound
Clarity, C80, in dB
Definition, D
Centre Time, TS, in ms
Apparent Source Width, ASW Early Lateral Energy Fraction, LF
Listener Envelopment, LEVLate Lateral Sound Level, LG, in dB
Inter Aural Cross Correlation, IACC
Measurement method: ISO 3382-1:2009
8484
DR Concert Hall, Copenhagen
Architect:
Jean Nouvel
Acoustics:
Toyota,
Nagata Acoustics
1800 seats,
28.000 m3
RT = 2,0 s @ 1 kHz
(with audience)
Opened Jan. 2009
EuroRegio 2010

05/10/2010
43
85
Musical instruments for Mahler’s
1st SymphonyInstrument Number of
sources
Number of
Recordings
Directional
characteristic
1st violin 16 2 Violin
2nd violin 14 2 Violin
Viola 12 1 Violin
Cello 10 1 Omni
Double bass 8 1 Omni
Flute 4 2 Omni
Oboe 4 4 B-Clarinet
Clarinet 5 4 B-Clarinet
Bassoon 3 3 B-Clarinet
French horn 7 7 French horn
Trumpet 4 4 Trumpet
Trombone 3 3 Trumpet
Tuba 1 1 Omni
Percussion 4 4 Omni
Total 95 39 -
EuroRegio 2010
86
Computer model
EuroRegio 2010
Odeon©1985-2008 Licensed to: Odeon A/S
Orchestra setup with 95 sources

05/10/2010
44
8787
Tutti – Position R2
Odeon©1985-2008 Licensed to: Odeon A/S
EuroRegio 2010
88
Brass only – Position R8
EuroRegio 2010
05/10/2010
45
89
Acknowledgementsto orchestra simulation
• The anechoic recordings of the Mahler Symphony were
made by Jukka Pätynen, Ville Pulkki, and Tapio Lokki
from Helsinki University of Technology with musicians
from various Finnish orchestras
• The directional characteristics were measured by Felipe
Otondo (DOREMI project)
• The Odeon model of the concert hall was delivered by
Dr. A.C. Gade
EuroRegio 2010
Conclusion
• Particle tracing and ray tracing are very efficient for room acoustic simulations, if combined with wave-based models for scattering and diffraction
• There is a need for good wave-based simulation models for small rooms and low frequencies (promising results have appeared with the finite difference time domain method, FDTD)
EuroRegio 2010 90