River–groundwater interactions in the Brazilian Pantanal. The case of the Cuiabá River
Upload
autonoma-ptCategory
view
3download
0
River–groundwater interactions in the Brazilian Pantanal.
The case of the Cuiaba River
Pierre Girard*, Carolina J. da Silva, Mara Abdo
Projeto Ecologia Pantanal, Instituto de Biociencias, Universidade Federal de Mato Grosso, Av. Fernando Correia da Costa s/n,
Bairro Coxipo, 78060-900 Cuiaba, MT, Brazil
Received 19 February 2002; accepted 23 June 2003
Abstract
The Pantanal is a vast evaporation plain and sediment accumulation surface that floods annually. It is located in the Upper
Paraguay River Basin, a major source of floodwaters to the Pantanal. The recent construction of a large dam in the upper reach
of the Cuiaba River raises questions: What will be the dam influence on the flood area and duration? What will be the
consequence for groundwater replenishment and permanence of flow in the floodplain channels during the dry period? This
study of the Cuiaba River, within the Pantanal, describes water flow between the river channel and its adjacent floodplain, as
well as relations between the surface water and groundwater near the river. Flooding of the plain adjacent to the Cuiaba River
critically depends on the river stage and proceeds through a complex hydrographic network. No free water table was
encountered; groundwater was confined below clay–silt layers. Two groundwater bodies were distinguished based on their
piezometric behavior. In both cases the river stage variations appeared to control the piezometric heads and the flood was the
main recharge source. The groundwater moved from the river towards the floodplain where it appeared to sustain channel flow
and to maintain soil humidity in depressed areas during the dry period.
q 2003 Published by Elsevier B.V.
Keywords: Pantanal; Flood pulse; Groundwater; Recharge; Ecological stability
1. Introduction
The Pantanal wetland is a vast evaporation plain
and sediment accumulation surface (Junk et al.,
2003) occupying an immense sedimentary
depression. It is located south of the Amazon Basin
and east of the Andes, in the Upper Paraguay River
Basin. Annually, the Upper Paraguay River and
its tributaries flood an area of about 140,000 km2
(Junk, 2000). This land is still in a rather pristine
state and its ecological integrity is tightly linked to
its hydrology (Da Silva, 2000). Recently, however,
environmental disturbances such as deforestation due
to the expansion of the agro-industry and the
consequent erosion and sedimentation have
increased. A new threat, the disruption of the
fundamental seasonal flood pulse by engineering
works such as waterways and large dams, is also
emerging. One of these dams, which started operat-
ing at the end of 1999, is now regulating the flux of
the Cuiaba River, one of the main sources of flood
0022-1694/$ - see front matter q 2003 Published by Elsevier B.V.
doi:10.1016/S0022-1694(03)00235-X
Journal of Hydrology 283 (2003) 57–66
www.elsevier.com/locate/jhydrol
* Corresponding author. Fax: þ55-65-615-8264.
E-mail address: [email protected] (P. Girard).
waters to the Pantanal—the largest river after the
Paraguay River itself.
In spite of the environmental impact study that was
performed before the dam construction, the body of
knowledge concerning the flood hydrology of the
Cuiaba River in the Pantanal is still small. The most
important study was realized by the Conservation
Plan for the Upper Paraguay Basin Project (PCBAP,
1997), whereby the available hydrological data were
inventoried and summarized. Hamilton et al. (1996)
also studied the seasonality of Pantanal rivers in
relation to flood extent. However there is still no
description of how the flooding proceeds and how the
river and groundwater interact.
The aims of this paper are to contribute to the
hydrological knowledge of a reach of the Cuiaba
River located within the Pantanal, to describe water
flow between the river main channel and its adjacent
flood plain, and relations between the surface water
and the groundwater near the river.
2. Study area
The study area is located near a colonial bird
nesting area, locally known as Ninhal Corutuba
(Fig. 1). This Ninhal is on the margin of the Cuiaba
River in the northern portion of the Pantanal. In the
next paragraphs, the Pantanal, the Cuiaba River at
proximity of the study site, and the Ninhal are briefly
described.
There is an emerging body of literature describing
the Pantanal (Adamoli, 1981; Alvarenga et al., 1984;
Da Silva, 2000; Da Silva et al., 2001; Hamilton et al.,
1996; Junk et al., 2003; PCBAP, 1997; RADAM-
BRASIL, 1982) from which the following description
was assembled. The Pantanal is located along the
course of the Upper Paraguay River, an important
tributary of the Parana, one of earth’s largest rivers.
The Upper Paraguay drains an area close to half a
million square kilometers of which two thirds are in
Brazil, in the states of Mato Grosso and Mato Grosso
do Sul. According to topographical elevation this
basin can be subdivided in three physiographic units.
First, the ‘Planalto’ or ‘Plateau’, 250–750 m a.s.l, is
the headwater region. A flat undulating plain con-
stitutes most of the Plateau and it is covered by a more
or less open savanna—locally called ‘cerrado’—that
is now extensively used for agriculture and cattle
ranching. Next, there is the ‘Depression’ at altitudes
ranging from 180 to 250 m. This is a small region with
generally steep slopes that is covered by a dense forest
locally called ‘cerradao’. The last unit is the Pantanal,
from less than 100 to 180 m altitude; it is about half
the size of the Plateau. It is a low relief plain with
hydraulic gradient not exceeding 15 cm/km. Many
large rivers, such as the Paraguay, the Cuiaba, the Sao
Lourenco, the Piquiri, the Taquari, and the Negro
cross this vast plain. This complex hydrographic
network in conjunction with diverse soil types gives
rise to a variety of landscapes within the Pantanal.
These large sub-units are subjected to different
hydrological conditions, and different plant commu-
nities characterize them.
The climate of the Pantanal is marked by a
pronounced dry season from May to September and
a rainy season from October to April. Mean monthly
temperature near Cuiaba City varies between 27.4 8C
in December and 21.4 8C in July. Short-term
ingressions of polar air masses in winter may cause
the temperature to drop as far as 0 8C. Annual rainfall
decreases from 1250 mm in the northern Pantanal to
1089 mm in the south. Evapotranspiration, ranging
from 1100 to 1300 mm yearly (Hamilton et al., 1997;
Ponce, 1995), surpasses precipitation during at least 6
months per year. Mean monthly air humidity varies in
the northern Pantanal from 84% during the rainy
season to below 60% at the end of the dry season,
when the floodplain is dry (Tarifa, 1986).
The annual flooding is caused by the sharp gradient
contrast between the Depression and the plain
(Carvalho, 1986). Some geomorphological constric-
tions, namely rock outcrops, along the Paraguay River
reduce even more the ability of the river to drain away
floodwaters. In addition, local rainfall on the flood-
plains drains slowly, enhancing flooding. The Panta-
nal is essentially a huge, gently sloped basin that
receives runoff from an upland watershed—the
Plateau—twice its size and slowly releases the flood
pulse of those waters through a single, downstream
channel, the Paraguay River (Ponce, 1995).
The annual flood pulse is mono-modal and presents
temporal and spatial variations. Along the main river
channels the annual pulse is sharp and well defined,
driven mainly by river overflow. Farther from
important channels, the flood pulse is more attenuated
P. Girard et al. / Journal of Hydrology 283 (2003) 57–6658
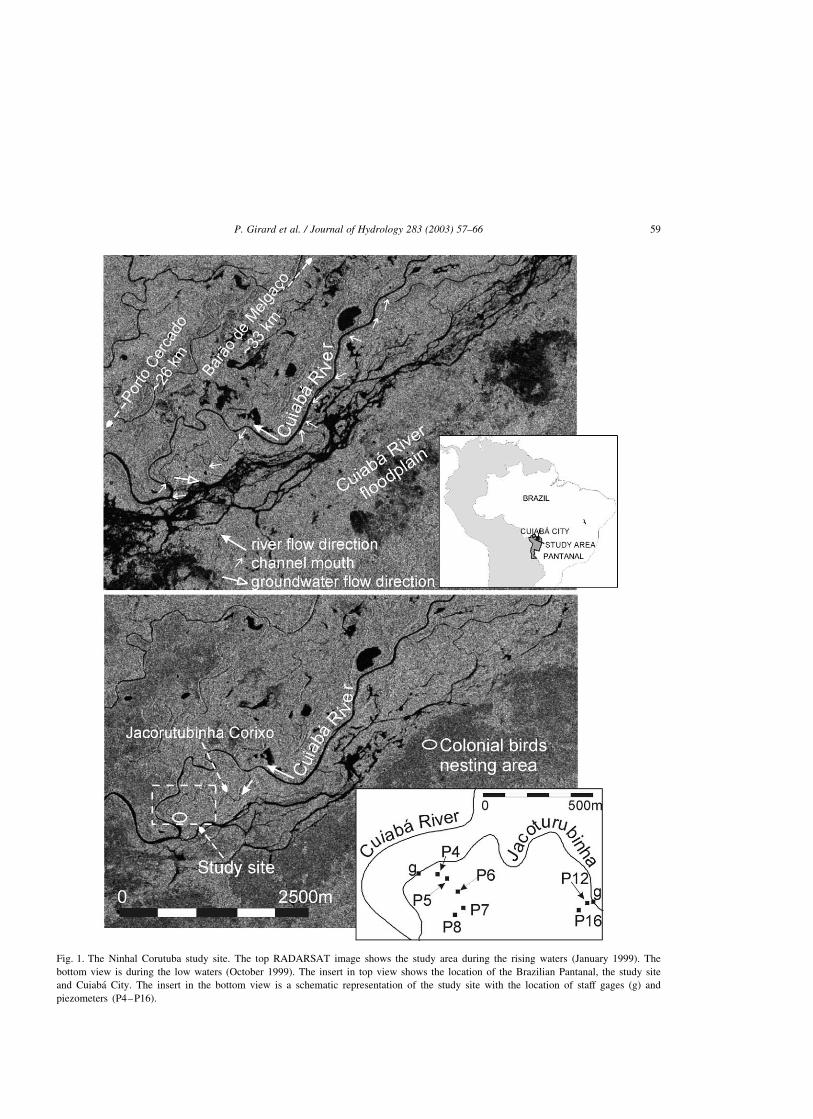
Fig. 1. The Ninhal Corutuba study site. The top RADARSAT image shows the study area during the rising waters (January 1999). The
bottom view is during the low waters (October 1999). The insert in top view shows the location of the Brazilian Pantanal, the study site
and Cuiaba City. The insert in the bottom view is a schematic representation of the study site with the location of staff gages (g) and
piezometers (P4–P16).
P. Girard et al. / Journal of Hydrology 283 (2003) 57–66 59
(Penha et al., 1999). As the surface slope along the
Paraguay is about 3–5 cm/km, and because of the
rock outcrops mentioned earlier, the flood pulse
moves slowly southwards and there is a lag of 4–6
months between the flood peaks in the north and in the
south. Most of the water enters the northern Pantanal,
as the three major contributors are the Paraguay, the
Sao Lourenco and the Cuiaba Rivers. The flood pulse
maintains the biodiversity and health of the Pantanal
ecosystem (Da Silva and Esteves, 1993; Espindola
et al., 1996; Penha et al., 1998, 1999; Resende et al.,
1996; Strussman, 1991).
The vast fluviolacustrine plain of the Cuiaba River
consists of actual alluvium that forms fluvial islands,
marginal levees, and bars. Grain size varies from
sands to clays and most abundant are sandy silt and
clay–silt beds that are often intercalated.
The Ninhal Corutuba is located on the left margin
of the Cuiaba River (Fig. 1). There, the Cuiaba
Channel splits in two and its smaller arm is called
‘Jacorutubinha’. The Ninhal is located where the
Jacorutubinha meets the Cuiaba main Channel
(16828018700S and 56807053600W). In this region the
Cuiaba River flows over its own fluviolacustrine
sediments. Along the river course there is a series of
small lakes seasonally linked to the Cuiaba and
abandoned meanders. There is also a high density of
tie channels in which the water may flow both ways
and other channel types that present a parallel
drainage pattern.
3. Material and methods
3.1. Institutional data acquisition
The Cuiaba River stages were acquired from the
ANEEL (Brazil’s National Agency for Electrical
Energy—www.aneel.gov.br). The complete daily
readings from the Cuiaba, Barao de Melgaco and
Porto Cercado region, from the beginning of 1998
until end of March 1999, were obtained.
3.2. Fluviometric and piezometric data
at the study site
There were two study locations, one in the Ninhal
and one in a nearby riparian forest lacking a bird
nesting area. At both sites staff gages were installed.
They consisted of four wood posts standing about 1 m
above the ground level installed in a stairway fashion
from the top of the left bank levee. The water levels
were measured from the top of the post with a
conventional meter. The accuracy is ^0.001 m.
Standpipe piezometers were installed in both sites.
They consisted of PVC tubes ðf ¼ 32 mmÞ that were
manually slotted in the lower 0.5 m. The slotted
section was covered with a fine mosquito screen.
These instruments were inserted in manually bored
holes ðf ¼ 60 mmÞ: The slotted section was installed
within the aquifer sand formation. The slotted section
was coated with local clean quartz sand and covered
with a concrete plug to prevent floodwater infiltration.
Static level within the piezometer was measured from
the instrument top with a sound indicator. The
accuracy is ^0.005 m. Five piezometers were
installed at the Ninhal (P4–P8) and two at the forest
(P12 and P16) site. Approximate locations of all
instruments are given in Fig. 1.
At each site, the relative elevations of the
instrument tops were determined. The highest instru-
ment at each site (the staff gage on the top of the
Jacorutubinha levee) was arbitrarily assigned an
elevation of 100 m. A transparent tube full of water
was then used to find the elevation of the other
instruments.
Readings from these instruments were obtained at
least once a month from November 1998 to December
1999.
4. Results and discussion
4.1. Hydrological framework
There are no historical fluviometric records in the
Jacorutubinha channel. However, the Cuiaba River
has several fluviometric stations. The longest record,
starting in 1933, is from the Cuiaba City station some
75-km upstream of the study site. The Cuiaba is a
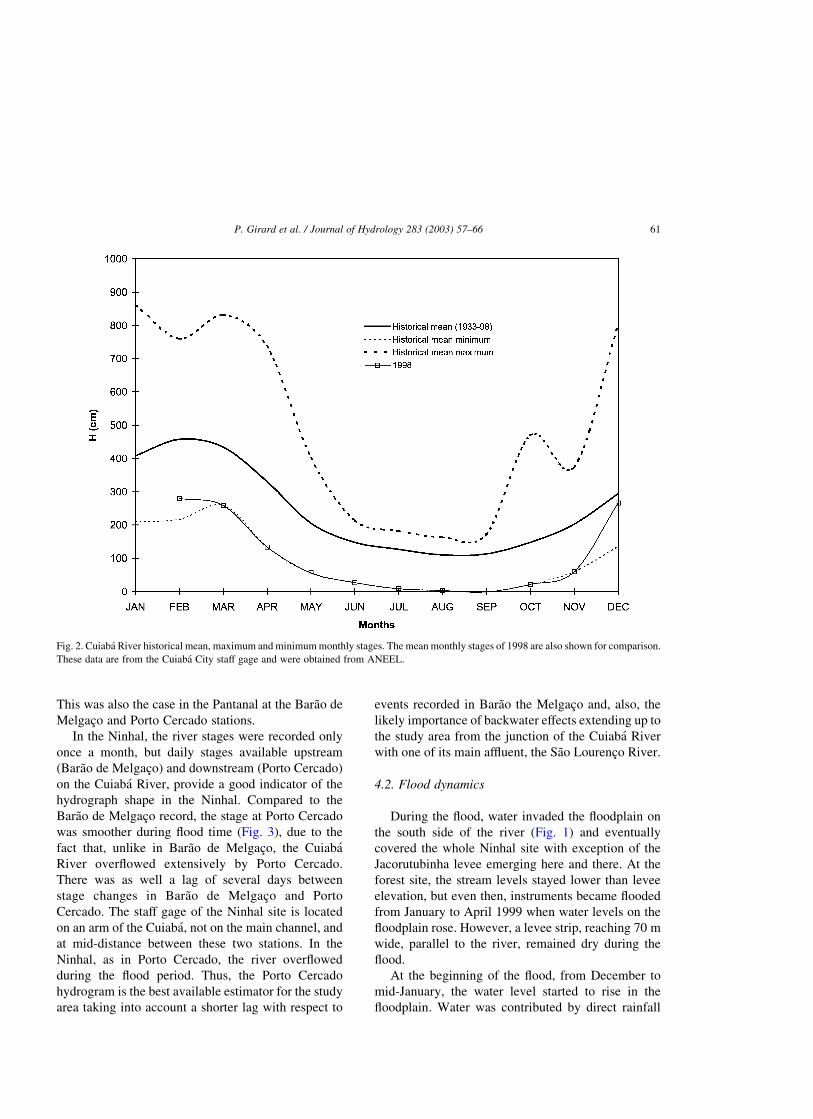
strongly seasonal river and Fig. 2 shows the hydro-
graph of the historical mean monthly stages as well as
the variation of the historical mean monthly minimum
and maximum. The mean monthly stages for the year
1998 are also displayed showing that this was an
atypical year, as the river stages were unusually low.
P. Girard et al. / Journal of Hydrology 283 (2003) 57–6660
This was also the case in the Pantanal at the Barao de
Melgaco and Porto Cercado stations.
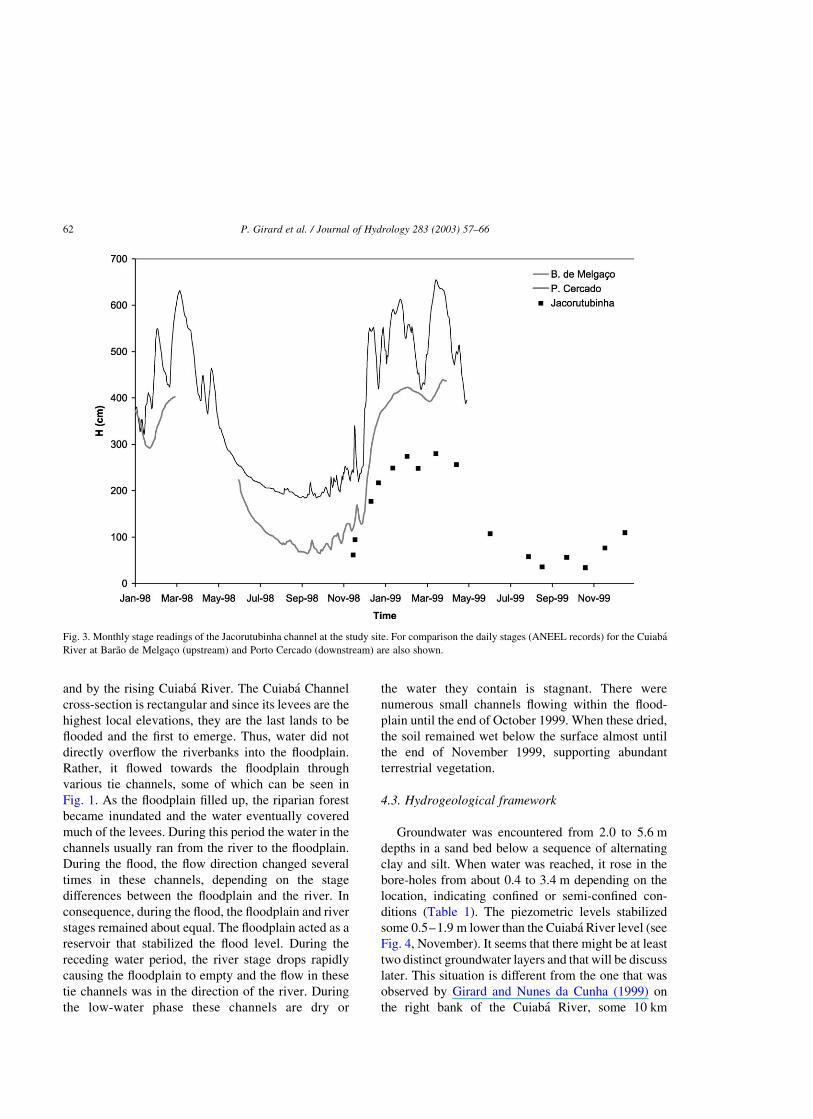
In the Ninhal, the river stages were recorded only
once a month, but daily stages available upstream
(Barao de Melgaco) and downstream (Porto Cercado)
on the Cuiaba River, provide a good indicator of the
hydrograph shape in the Ninhal. Compared to the
Barao de Melgaco record, the stage at Porto Cercado
was smoother during flood time (Fig. 3), due to the
fact that, unlike in Barao de Melgaco, the Cuiaba
River overflowed extensively by Porto Cercado.
There was as well a lag of several days between
stage changes in Barao de Melgaco and Porto
Cercado. The staff gage of the Ninhal site is located
on an arm of the Cuiaba, not on the main channel, and
at mid-distance between these two stations. In the
Ninhal, as in Porto Cercado, the river overflowed
during the flood period. Thus, the Porto Cercado
hydrogram is the best available estimator for the study
area taking into account a shorter lag with respect to
events recorded in Barao the Melgaco and, also, the
likely importance of backwater effects extending up to
the study area from the junction of the Cuiaba River
with one of its main affluent, the Sao Lourenco River.
4.2. Flood dynamics
During the flood, water invaded the floodplain on
the south side of the river (Fig. 1) and eventually
covered the whole Ninhal site with exception of the
Jacorutubinha levee emerging here and there. At the
forest site, the stream levels stayed lower than levee
elevation, but even then, instruments became flooded
from January to April 1999 when water levels on the
floodplain rose. However, a levee strip, reaching 70 m
wide, parallel to the river, remained dry during the
flood.
At the beginning of the flood, from December to
mid-January, the water level started to rise in the
floodplain. Water was contributed by direct rainfall
Fig. 2. Cuiaba River historical mean, maximum and minimum monthly stages. The mean monthly stages of 1998 are also shown for comparison.
These data are from the Cuiaba City staff gage and were obtained from ANEEL.
P. Girard et al. / Journal of Hydrology 283 (2003) 57–66 61
and by the rising Cuiaba River. The Cuiaba Channel
cross-section is rectangular and since its levees are the
highest local elevations, they are the last lands to be
flooded and the first to emerge. Thus, water did not
directly overflow the riverbanks into the floodplain.
Rather, it flowed towards the floodplain through
various tie channels, some of which can be seen in
Fig. 1. As the floodplain filled up, the riparian forest
became inundated and the water eventually covered
much of the levees. During this period the water in the
channels usually ran from the river to the floodplain.
During the flood, the flow direction changed several
times in these channels, depending on the stage
differences between the floodplain and the river. In
consequence, during the flood, the floodplain and river
stages remained about equal. The floodplain acted as a
reservoir that stabilized the flood level. During the
receding water period, the river stage drops rapidly
causing the floodplain to empty and the flow in these
tie channels was in the direction of the river. During
the low-water phase these channels are dry or
the water they contain is stagnant. There were
numerous small channels flowing within the flood-
plain until the end of October 1999. When these dried,
the soil remained wet below the surface almost until
the end of November 1999, supporting abundant
terrestrial vegetation.
4.3. Hydrogeological framework
Groundwater was encountered from 2.0 to 5.6 m
depths in a sand bed below a sequence of alternating
clay and silt. When water was reached, it rose in the
bore-holes from about 0.4 to 3.4 m depending on the
location, indicating confined or semi-confined con-
ditions (Table 1). The piezometric levels stabilized
some 0.5–1.9 m lower than the Cuiaba River level (see
Fig. 4, November). It seems that there might be at least
two distinct groundwater layers and that will be discuss
later. This situation is different from the one that was
observed by Girard and Nunes da Cunha (1999) on
the right bank of the Cuiaba River, some 10 km
Fig. 3. Monthly stage readings of the Jacorutubinha channel at the study site. For comparison the daily stages (ANEEL records) for the Cuiaba
River at Barao de Melgaco (upstream) and Porto Cercado (downstream) are also shown.
P. Girard et al. / Journal of Hydrology 283 (2003) 57–6662
downstream, where a free water table was encoun-
tered. There, when the flood occurred, the groundwater
surface rose to ground or above-ground level. Here,
until the area became flooded, the presence of a clay–
silt cover over the sands impeded the groundwater
from physically rising and the observed piezometric
variations are then believed to be due to water pressure
increase within the confined groundwater layer.
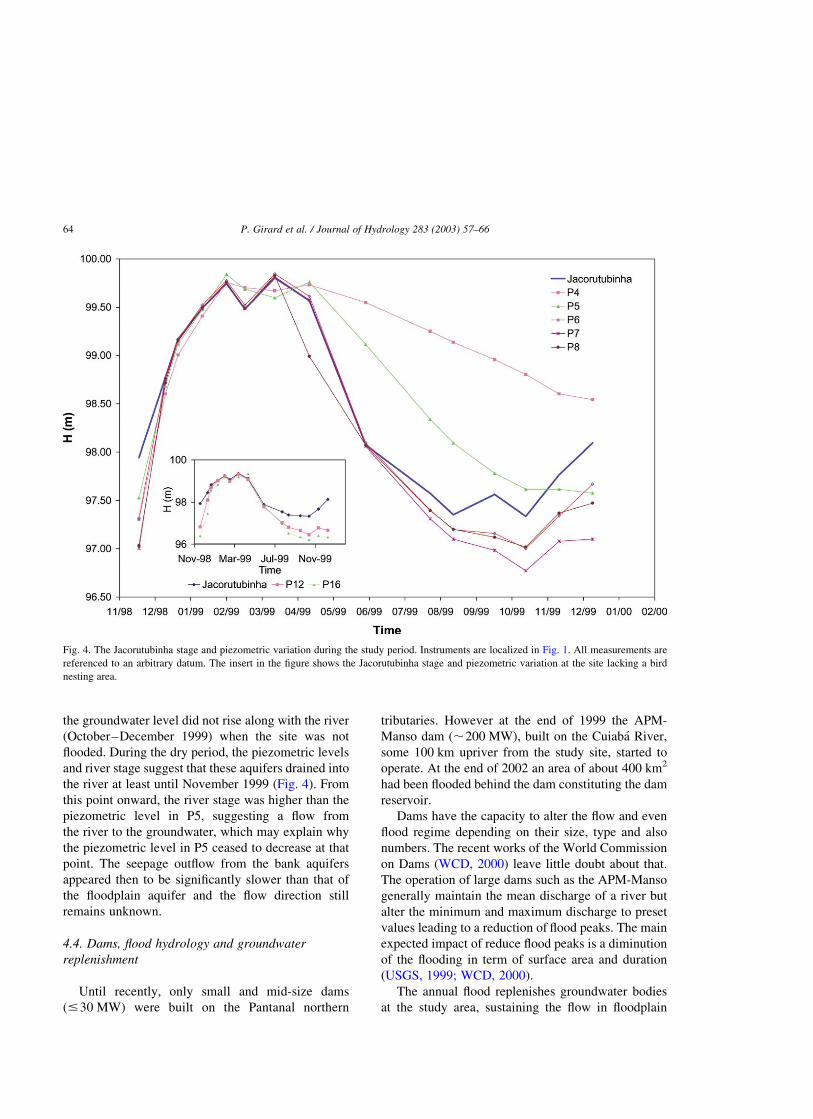
In a general way, the variation of the Jacorutu-
binha’s surface water level appeared to control the
groundwater level fluctuations (Fig. 4), except in two
cases. When the instruments were flooded (Decem-
ber–April), there was very little difference between
the groundwater and river stages. After the flood, the
levels of P6, P7 and P8 as well as P12 and P16
continued to strictly follow the Jacorutubinha stage
until June 1999, when the groundwater, even though
closely following the river level remained lower than
the river. As for P4 and P5, even though their
piezometric head also decreased, the groundwater
level maintained itself well above the river level.
Furthermore, when the river started to rise towards the
end of October, their piezometric levels continued to
drop. One might speculate that they had continued to
do so until the area became flooded again, which had
not yet occurred by the end of December 1999.
4.3.1. Floodplain aquifer
Thus, in one case, illustrated by the synchronous
piezometric variations in P6, P7, P8, P12, and P16, it
seems that there was at least one continuous
groundwater-bearing sand layer at each site or even
one single groundwater body, namely the ‘floodplain
aquifer’. The piezometric levels in this aquifer were
always lower or equal to the river stage and recharge
could occur independently of surface flooding, as it
did when the river level rose in October–December
1999. However, flooding undoubtedly was the main
recharging event. In a previous study, Girard and
Pinto (2000) showed that, once the area became
flooded, the confining layer actually became saturated
and direct recharge of the confined water body by the
surface flood water could occur. At the beginning of
the dry period (June 1999), the aquifer levels became
de-coupled from the river one.
The local flow direction for the floodplain aquifer
was inferred from the piezometric measurements
(Fig. 1). At the forest site the exact groundwater
flow direction could not be deduced, as only two
piezometers were available. However, the apparent
flow direction from the piezometric record in P12 and
P16 during the dry period was in the SW quadrant. At
the Ninhal site, where the hydrographic network is
more complex, the mean true flow direction deduced
from P6, P7 and P8 (Fig. 1) was in the SE quadrant.
Along this direction the hydraulic gradient (in m/m)
varied from 1024 during the flood period to 1022
during low waters. In both cases local flow direction
was towards the southern floodplain away from the
Jacorutubinha channel. The groundwater may thus
have supported channel flow in the floodplain several
months after the flood was over and have contributed
in maintaining soil saturation almost 7 months after
the end of the previous flood.
This indicates that the river may interact with a
large volume of infill alluvium as Castro and
Hornberger (1991) described for mountain stream
channels. During the flood, a fraction of the surface
water could be temporarily stored within this alluvium
to be released during the dry period contributing to the
ecological stability of the river–floodplain system.
4.3.2. Bank aquifers
In the other case, the P4 and P5 groundwater
variations were not congruous with the fluctuations
recorded in the other piezometers and were not very
consistent between themselves indicating that the
aquifers in which they were implanted, namely ‘bank
aquifers’, were hydraulically disconnected from the
floodplain aquifer. Also, the flood appeared to be
the sole recharging event for the bank aquifers, as
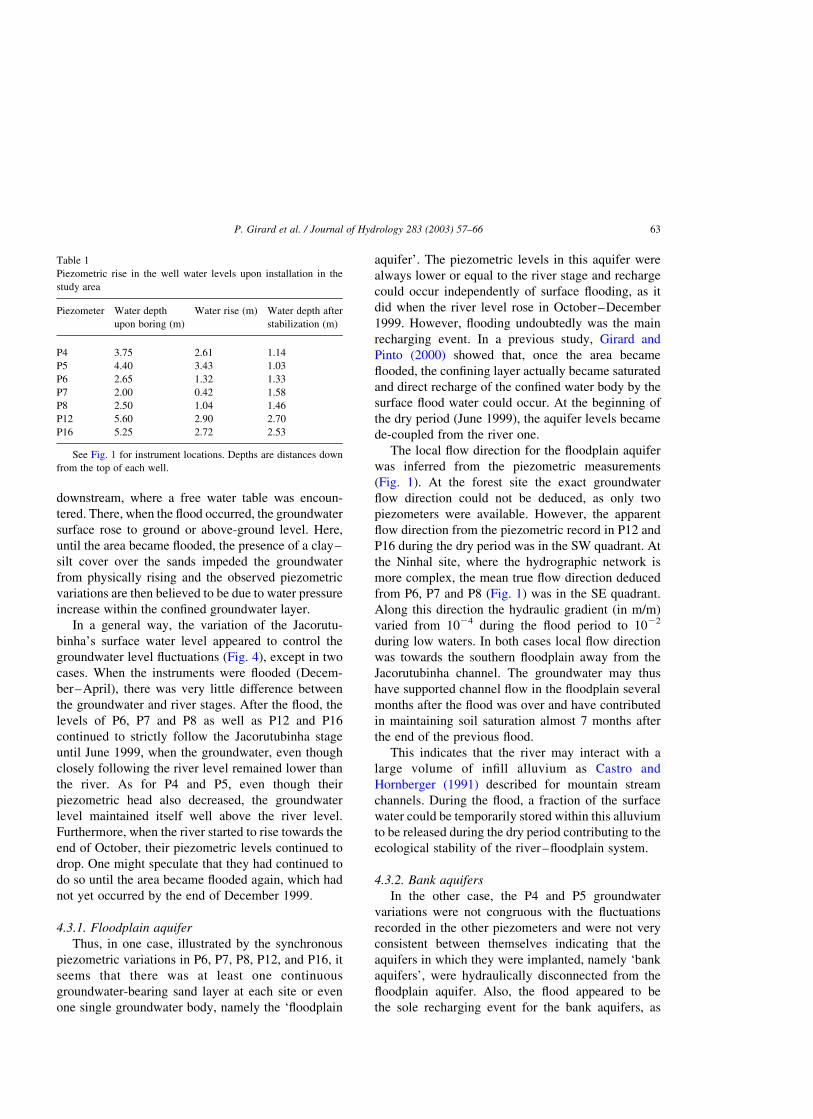
Table 1
Piezometric rise in the well water levels upon installation in the
study area
Piezometer Water depth
upon boring (m)
Water rise (m) Water depth after
stabilization (m)
P4 3.75 2.61 1.14
P5 4.40 3.43 1.03
P6 2.65 1.32 1.33
P7 2.00 0.42 1.58
P8 2.50 1.04 1.46
P12 5.60 2.90 2.70
P16 5.25 2.72 2.53
See Fig. 1 for instrument locations. Depths are distances down
from the top of each well.
P. Girard et al. / Journal of Hydrology 283 (2003) 57–66 63
the groundwater level did not rise along with the river
(October–December 1999) when the site was not
flooded. During the dry period, the piezometric levels
and river stage suggest that these aquifers drained into
the river at least until November 1999 (Fig. 4). From
this point onward, the river stage was higher than the
piezometric level in P5, suggesting a flow from
the river to the groundwater, which may explain why
the piezometric level in P5 ceased to decrease at that
point. The seepage outflow from the bank aquifers
appeared then to be significantly slower than that of
the floodplain aquifer and the flow direction still
remains unknown.
4.4. Dams, flood hydrology and groundwater
replenishment
Until recently, only small and mid-size dams
(#30 MW) were built on the Pantanal northern
tributaries. However at the end of 1999 the APM-
Manso dam (,200 MW), built on the Cuiaba River,
some 100 km upriver from the study site, started to
operate. At the end of 2002 an area of about 400 km2
had been flooded behind the dam constituting the dam
reservoir.
Dams have the capacity to alter the flow and even
flood regime depending on their size, type and also
numbers. The recent works of the World Commission
on Dams (WCD, 2000) leave little doubt about that.
The operation of large dams such as the APM-Manso
generally maintain the mean discharge of a river but
alter the minimum and maximum discharge to preset
values leading to a reduction of flood peaks. The main
expected impact of reduce flood peaks is a diminution
of the flooding in term of surface area and duration
(USGS, 1999; WCD, 2000).
The annual flood replenishes groundwater bodies
at the study area, sustaining the flow in floodplain
Fig. 4. The Jacorutubinha stage and piezometric variation during the study period. Instruments are localized in Fig. 1. All measurements are
referenced to an arbitrary datum. The insert in the figure shows the Jacorutubinha stage and piezometric variation at the site lacking a bird
nesting area.
P. Girard et al. / Journal of Hydrology 283 (2003) 57–6664
channels and also soils saturation, which in turn
contributes to the ecological stability in the flood-
plain. In the Ninhal site, recharge appears to occur
where the groundwater-bearing sand beds outcrop.
Thus, following Darcy’s law, annual recharge volume
will depend, at first approximation, on the area of
outcropping sand beds covered by flood waters, depth
of the flood waters, duration of inundation and the
hydraulic conductivity of the sand beds. Of these
variables, the first three depend on the flood peak, and
a reduction in flood peak will undoubtedly result in
less groundwater replenishment eventually compro-
mising ecological stability.
Furthermore, flooding occurs through tie channels
linking the floodplain and the main river channel.
During the low-waters phase, the bottoms of these
channels are generally exposed and well above the
main river surface. The altitude of the tie channels
bottom varies from one another. However, for the
main river water to enter the tie channels and flooding
of the flood plain to proceed, the main river stage has
to rise above a discrete level that varies from one tie
channel to another. Reduction of the flood peak and
duration may also reduce connectivity between the
floodplain and the main river channel.
5. Conclusion
The results of this study show that the flooding of
the Cuiaba floodplain in the Ninhal Corutuba area is
critically dependent on the river stage. As the river is
flanked by levees impeding direct access to the
floodplain, the water only invades it by flowing
through the tie channels. These only start to flow when
the river stage rises about a certain level.
As well, the flooding is also the main ground-
water replenishment mechanism. Groundwater
recharge is important to maintain floodplain channel
flow during the low waters when they do not
receive direct contribution of the Cuiaba waters
through the tie channels. Groundwater flow also
maintains soil saturation in the depressed parts of
the floodplain.
The recent construction of the Manso hydroelectric
facility, which will regulate the Cuiaba stages,
possibly reducing flood peaks may also alter the
floodplain hydrology. First, shallower floodwaters are
likely to reduce replenishment of the groundwater
bodies in the vicinity of the Cuiaba River. Second,
reduced flood peaks may result in a diminution of the
hydrological connectivity in the area. Both effects
would eventually lead to dryer conditions in the
floodplain during the low waters.
The construction of more reservoirs is planned in
other Pantanal tributaries. These works may also have
the capacity of reducing the flood peaks. It is
important to verify to what extent the observations
made in the Cuiaba floodplain apply to other Pantanal
sub-watersheds.
Acknowledgements
The authors wish to acknowledge the financial
support of the Pantanal Ecology Project (Max Planck
Institute for Limnology/Biosciences Institute—Fed-
eral University of Mato Grosso State) part of the
SHIFT (Studies of Human Impacts on Forests and
Floodplains in the Tropics) program a bilateral
technico-scientific Brazil – Germany cooperation
(CNPq-IBAMA-DLR). The authors are also grateful
to CAPES. Finally the authors thank the reviewers for
their constructive comments.
References
Adamoli, J., 1981. O Pantanal e Suas Relacoes Fitogeograficas com
os Cerrados. Discussao Sobre o Conceito ‘Complexo do
Pantanal’, Congresso Nacional de Botanica, Terezina, 1981.
Sociedade Brasileira de Botanica, vol. 32., p. 109–19 (in
Portuguese).
Alvarenga, S.M., Brasil, A.E., Pinheiro, R., Kux, H.J.H., 1984.
Estudo Geomorfologico aplicado a Bacia do Alto Rio Paraguai e
Pantanais Matogrossense. Boletim Tecnico. Serie Geomorfolo-
gica. Projeto RADAMBRASIL. Rio de Janeiro, RJ, p. 89–187
(in Portuguese).
Carvalho, N.O., 1986. Hidrologia da Bacia do Alto Paraguai, In:
Anais do Simposio Sobre Recursos Naturais e Socio-econom-
icos do Pantanal, 1. Corumba, EMBRAPA, Brasılia, p. 43–8 (in
Portuguese).
Castro, N.M., Hornberger, G.M., 1991. Surface–subsurface water
interactions in alluviated mountain stream channel. Water
Resources Research 27, 1613–1621.
Da Silva, C.J., 2000. Ecological basis for the management of the
Pantanal—Upper Paraguay River basin. In: Smits, A.J.M.,
Nienhuis, P.H., Leuven, RSEW (Eds.), New Approaches to
River Management, Bachuys Publishers, Leiden, pp. 97–117.
P. Girard et al. / Journal of Hydrology 283 (2003) 57–66 65

Da Silva, C.J., Esteves, F.A., 1993. Biomass of three macrophytes in
the Pantanal of the Mato Grosso, Brazil. International Journal of
Ecology and Environmental Sciences 19, 11–23.
Da Silva, C.J., Wantzen, K.M., Nunes da Cunha, C., Machado, F.A.,
2001. Biodiversity in The Pantanal Wetland, Brazil. In: Gopal,
B., Junk, W.J., Davis, J.A. (Eds.), Biodiversity in Wetlands:
Assessment, Function and Conservation, vol. 2. Backhuys
Publishers, Leiden, Netherlands, pp. 187–217.
Espindola, E.G., Matsumura-Tundisi, T., Moreno, I.H., 1996.
Efeitos da dinamica hidrologica do sistema Pantanal Mato
Grossense sobre a estrutura da comunidade fitoplanctonica da
Lagoa Albuquerque (Pantanal Mato Grossense), Mato Grosso
do Sul, Brasil. Acta Limnologica Brasiliensia 8, 13–27.(in
Portuguese).
Girard, P., Nunes da Cunha, C., 1999. Relationship between surface
and groundwater during the flood in the Brazilian Pantanal.
Revista Boliviana de Ecologıa y Conservacion Ambiental 6,
33–40.
Girard, P., Pinto, M.T.C., 2000. Hydrodynamic and hydrochemical
behaviour of the water table in the Cuiaba River flooded riparian
forest, Brazilian Pantanal. Verhandlungen Internationale
Vereinigung Limnologie 27 (4), 1717–1720.
Hamilton, S.K., Sippel, S.J., Melack, J.M., 1996. Inundation
patterns in the Pantanal wetland of South America determined
from passive microwave remote sensing. Archiv fur Hydro-
biologie 137 (1), 1–23.
Hamilton, S.K., Sippel, S.J., Calheiros, D.F., Melack, J.M., 1997.
An anoxic event and other biogeochemical effects of the
Pantanal wetland on the Paraguay River. Limnology and
Oceanography 42, 257–272.
Junk, W.J., 2000. The Amazon and the Pantanal: a critical
comparison and lessons for the future. In: Swarts, F.A., (Ed.),
The Pantanal: Understanding and Preserving the World’s
Largest Wetland, Paragon House, St Paul, MN, pp. 211–224.
Junk, W.J., Da Silva, C.J., Wantzen, K.M., Nunes da Cunha, C.,
Nogueira, F., 2003. The Pantanal of Mato Grosso: status of
ecological research, actual use, and management for sustainable
development. In: Maltby, E., (Ed.), The Wetlands Handbook,
Blackwell Science, Oxford, UK, in press.
PCBAP—Plano de Conservacao da Bacia do Alto Paraguai
(Pantanal), 1997. Diagnostico dos Meios Fısico e Biotico,
Ministerio do Meio Ambiente, dos Recursos Hıdricos e da
Amazonia Legal, (in Portuguese).
Penha, J.M., Da Silva, C.J., Bianchini, I., 1998. Impacto da variacao
do nıvel da agua no ciclo de vida da macrofita Pontederia
cordata var. ovalis (Mart) Solms, em area alagavel do Pantanal
Mato Grossense. Brazilian Journal of Ecology 2, 30–35.(in
Portuguese).
Penha, J.M., Da Silva, C.J., Bianchini, I., 1999. Productivity of the
aquatic macrophytes Pontederia lanceolata Nutt. (Pontederia-
ceae) on the floodplains of the Pantanal Mato-grossense, Brazil.
Wetlands Ecology and Management 7/3, 155–163.
Ponce, V.M., 1995. Hydrologic and Environmental Impact of the
Parana-Paraguay Waterway on the Pantanal of Mato Grosso,
Brazil. A Reference Study, San Diego State University, San
Diego, p. 124.
RADAMBRASIL, 1982. Ministerio das Minas e Energia. Secretaria
Geral. Folha SE.21 Corumba e Parte da Folha SE. 20.
Levantamento de Recursos Naturais, vol. 27, Rio de Janeiro,
p. 452.
Resende, E.K., Pereira, R.A.C., Almeida, V.L.L., Silva, A.G.,
1996. Alimentacao de peixes carnıvoros da planıcie inundavel
do rio Miranda, Pantanal, Mato Grosso do Sul, Brasil.
EMBRAPA, CPAP. Boletim de Pesquisa 3, 1 – 36.(in
Portuguese).
Strussman, C., 1991. Predation on avian eggs by the boid snake,
Eunectes notaeus. Herptological Review 22/4.
Tarifa, J.R., 1986. O Sistema Climatico do Pantanal. Da
Compreensao do Sistema a Definicao de Prioridade de Pesquisa
Climatologica, In: Anais do Simposio Sobre Recursos Naturais
e Socio-economicos do Pantanal, EMBRAPA, Brasılia, p. 9–27
(in Portuguese).
USGS, 1999. Ecological status and trends of the Upper Mississsippi
River System 1998: a report of the Long Term Resource
Monitoring Program. US Geological Survey, Upper Midwest
Environmental Sciences Center, La Crosse, Wisconsin. LTRMP
99-T001, p. 236.
WCD, 2000. Dam and Development. A New Framework for
Decision-Making. The Report of the World Commission on
Dams, Earthscan Publications Ltd, London and Sterling, VA,
p. 404.
P. Girard et al. / Journal of Hydrology 283 (2003) 57–6666
Copyright © 2022 FDOKUMEN