Risks of Paralytic Disease Due to Wild or Vaccine-Derived Poliovirus After Eradication
35
Risk Analysis, Vol. 26, No. 6, 2006 DOI: 10.1111/j.1539-6924.2006.00827.x Risks of Paralytic Disease Due to Wild or Vaccine-Derived Poliovirus After Eradication Radboud J. Duintjer Tebbens, 1,2 Mark A. Pallansch, 3 Olen M. Kew, 3 Victor M. C ´ aceres, 4 Hamid Jafari, 4 Stephen L. Cochi, 4 Roland W. Sutter, 5 R. Bruce Aylward, 5 and Kimberly M. Thompson 1,6∗ After the global eradication of wild polioviruses, the risk of paralytic poliomyelitis from po- lioviruses will still exist and require active management. Possible reintroductions of poliovirus that can spread rapidly in unprotected populations present challenges to policymakers. For example, at least one outbreak will likely occur due to circulation of a neurovirulent vaccine- derived poliovirus after discontinuation of oral poliovirus vaccine and also could possibly result from the escape of poliovirus from a laboratory or vaccine production facility or from an intentional act. In addition, continued vaccination with oral poliovirus vaccines would re- sult in the continued occurrence of vaccine-associated paralytic poliomyelitis. The likelihood and impacts of reintroductions in the form of poliomyelitis outbreaks depend on the policy decisions and on the size and characteristics of the vulnerable population, which change over time. A plan for managing these risks must begin with an attempt to characterize and quantify them as a function of time. This article attempts to comprehensively characterize the risks, syn- thesize the existing data available for modeling them, and present quantitative risk estimates that can provide a starting point for informing policy decisions. KEY WORDS: Bioterrorism; decision analysis; disease outbreak; laboratory containment; polio eradi- cation; risk analysis; vaccine-associated paralytic poliomyelitis; vaccine-derived poliovirus 1 Kids Risk Project, Harvard School of Public Health, Boston, MA, USA. 2 Delft University of Technology, Department of Mathematics, Mekelweg 4, 2628 CD Delft, The Netherlands. 3 Centers for Disease Control and Prevention, National Center for Infectious Diseases, Division of Viral and RickettsialDiseases, Respiratory and Enteric Viruses Branch, Atlanta, GA, USA. 4 Centers for Disease Control and Prevention, National Immuniza- tion Program, Global Immunization Division, Polio Eradication Branch, Atlanta, GA, USA. 5 World Health Organization, Polio Eradication Initiative, CH- 1211 Geneva. 6 Massachusetts Institute of Technology, Sloan School of Manage- ment, Cambridge, MA, USA. ∗ Address correspondence to Kimberly M. Thompson, Sc.D., Har- vard School of Public Health, 677 Huntington Ave., 3rd Floor, Boston, MA 02115, USA; tel: 1-617-432-4285; fax: 1-617-432-3699; [email protected]. 1. INTRODUCTION Historically, three serotypes of wild poliovirus caused frequent infections in young children and re- infections in adults. (1) While the majority of infections lead to mild disease or no symptoms at all, on average approximately one in 200 infections in susceptible individuals causes paralytic poliomyelitis. Currently, use of inactivated poliovirus vaccines (IPV) in high- income countries and the trivalent oral poliovirus vaccine (OPV) in developing countries provide high population immunity against paralytic poliomyelitis in most of the world. The expanded use of these vac- cines reduced the annual global burden of paralytic cases significantly from an estimated 350,000 at the launch of the global Polio Eradication Initiative in 1988 to around 1,000 cases in recent years. (2) With the 1471 0272-4332/06/0100-1471$22.00/1 C 2006 Society for Risk Analysis
-
Upload
independent -
Category
Documents
-
view
1 -
download
0
Transcript of Risks of Paralytic Disease Due to Wild or Vaccine-Derived Poliovirus After Eradication

Risk Analysis, Vol. 26, No. 6, 2006 DOI: 10.1111/j.1539-6924.2006.00827.x
Risks of Paralytic Disease Due to Wild or Vaccine-DerivedPoliovirus After Eradication
Radboud J. Duintjer Tebbens,1,2 Mark A. Pallansch,3 Olen M. Kew,3 Victor M. Caceres,4
Hamid Jafari,4 Stephen L. Cochi,4 Roland W. Sutter,5 R. Bruce Aylward,5 andKimberly M. Thompson1,6∗
After the global eradication of wild polioviruses, the risk of paralytic poliomyelitis from po-
lioviruses will still exist and require active management. Possible reintroductions of poliovirus
that can spread rapidly in unprotected populations present challenges to policymakers. For
example, at least one outbreak will likely occur due to circulation of a neurovirulent vaccine-
derived poliovirus after discontinuation of oral poliovirus vaccine and also could possibly
result from the escape of poliovirus from a laboratory or vaccine production facility or from
an intentional act. In addition, continued vaccination with oral poliovirus vaccines would re-
sult in the continued occurrence of vaccine-associated paralytic poliomyelitis. The likelihood
and impacts of reintroductions in the form of poliomyelitis outbreaks depend on the policy
decisions and on the size and characteristics of the vulnerable population, which change over
time. A plan for managing these risks must begin with an attempt to characterize and quantify
them as a function of time. This article attempts to comprehensively characterize the risks, syn-
thesize the existing data available for modeling them, and present quantitative risk estimates
that can provide a starting point for informing policy decisions.
KEY WORDS: Bioterrorism; decision analysis; disease outbreak; laboratory containment; polio eradi-
cation; risk analysis; vaccine-associated paralytic poliomyelitis; vaccine-derived poliovirus
1 Kids Risk Project, Harvard School of Public Health, Boston, MA,
USA.2 Delft University of Technology, Department of Mathematics,
Mekelweg 4, 2628 CD Delft, The Netherlands.3 Centers for Disease Control and Prevention, National Center for
Infectious Diseases, Division of Viral and RickettsialDiseases,
Respiratory and Enteric Viruses Branch, Atlanta, GA, USA.4 Centers for Disease Control and Prevention, National Immuniza-
tion Program, Global Immunization Division, Polio Eradication
Branch, Atlanta, GA, USA.5 World Health Organization, Polio Eradication Initiative, CH-
1211 Geneva.6 Massachusetts Institute of Technology, Sloan School of Manage-
ment, Cambridge, MA, USA.∗ Address correspondence to Kimberly M. Thompson, Sc.D., Har-
vard School of Public Health, 677 Huntington Ave., 3rd Floor,
Boston, MA 02115, USA; tel: 1-617-432-4285; fax: 1-617-432-3699;
1. INTRODUCTION
Historically, three serotypes of wild polioviruscaused frequent infections in young children and re-infections in adults.(1) While the majority of infectionslead to mild disease or no symptoms at all, on averageapproximately one in 200 infections in susceptibleindividuals causes paralytic poliomyelitis. Currently,use of inactivated poliovirus vaccines (IPV) in high-income countries and the trivalent oral poliovirusvaccine (OPV) in developing countries provide highpopulation immunity against paralytic poliomyelitisin most of the world. The expanded use of these vac-cines reduced the annual global burden of paralyticcases significantly from an estimated 350,000 at thelaunch of the global Polio Eradication Initiative in1988 to around 1,000 cases in recent years.(2) With the
1471 0272-4332/06/0100-1471$22.00/1 C© 2006 Society for Risk Analysis
1472 Tebbens et al.
global eradication of wild polioviruses approaching,(3)
policymakers must identify and evaluate availablepolicies for management of the risk of poliomyelitisafter interruption of wild poliovirus transmission.(4)
Following discussion about the immunization policyafter eradication,(5–10) coordinated cessation of OPVuse for routine or supplemental immunizationemerges as a necessary policy choice to accomplishthe goal of eliminating paralysis due to all wildor vaccine-derived polioviruses.(11,12) Consequently,countries must decide among and implement optionsfor surveillance, stockpiles, outbreak response, con-tainment of poliovirus stocks in laboratories and IPVmanufacturing sites, and management of immuno-deficient poliovirus excretors, and whether to pro-vide routine IPV immunization or cease routine polioimmunization altogether.(4,13,14) Any combination ofthese decisions carries future costs and risks; quan-titative information can assist decisionmakers by in-forming them about the tradeoffs among strategies.Several studies exist on the economic benefits andcosts of wild poliovirus eradication,(15,16) but none todate thoroughly explore quantitatively the risks, costs,and benefits of the future poliomyelitis risk manage-ment options. In developing a decision analytic modelfor poliomyelitis risk management after eradication,analysts must identify the policy options,(4) estimatetheir costs,(17) and associated risks, and characterizeoutbreak consequences using a dynamic transmissionmodel.(18) By integrating all of these components intoa quantitative model, analysts can more comprehen-sively explore the tradeoffs among various options inhealth and economic terms.
Aylward and Cochi presented a framework forcharacterizing the risks of poliomyelitis after eradi-cation using two categories for “risks related to thecontinued use of OPV and risks associated with theunsafe handling of wild polioviruses” (Reference 13,p. 42). The first category included sporadic casesof vaccine-associated paralytic poliomyelitis (VAPP)and the likely occurrence of outbreaks due to vaccine-derived polioviruses (VDPVs).(19) OPV viruses repli-cating for a period of time can revert to neuroviru-lent and transmissible VDPVs through accumulatedmutations in the genome. This can occur as a re-sult of continued person-to-person transmission thatcan ultimately lead to an outbreak of paralytic cases(cVDPVs). In addition, VDPVs could emerge as a re-sult of prolonged intestinal replication of viruses ini-tially obtained through an OPV infection among in-dividuals with severe immunodeficiencies (iVDPVs).The second risk category includes unintentional re-lease of wild poliovirus from an IPV-manufacturing
facility (production of IPV requires growing largeamounts of wild poliovirus) or a laboratory, and inten-tional release of wild polioviruses (i.e., bioterrorism).Unsafe handling of OPV viruses or VDPVs could alsopotentially lead to outbreaks in the future.
While Aylward and Cochi identify most of theserisks and summarize the current frequency and bur-den of disease associated with each, they recognizethat these risks depend strongly on the policies im-plemented after eradication.(13) We aim to quantita-tively assess the probability of VAPP cases and ofpoliomyelitis outbreaks as a function of populationsize, time, future poliomyelitis risk management poli-cies, and income level. For high-income countries, theimmunization policies include only continuation ofthe status quo of routine IPV immunization, while forlow- and middle-income countries they also includecontinued routine OPV use or cessation of polio vac-cinations altogether.(4) We do not address the con-sequences or burden of disease related to outbreaks,which requires the use of a dynamic disease model,(18)
but we discuss the expected burden of VAPP cases indifferent populations. We also do not assess the prob-ability of undetected continued wild poliovirus circu-lation given our focus on the time period that startsafter assurance of successful interruption of wild po-liovirus transmission.
The next section explains the metrics and data weused to assess each risk. We then present the evidenceand provide our best quantitative estimates for eachrisk. We move from the relatively more certain risks(e.g., VAPP from routine OPV use) to the less cer-tain risks (e.g., bioterrorism). Finally, we discuss thelimitations in our risk estimates and the potential useof these results in efforts to inform policymakers. TheAppendix provides details about the available dataand risk calculations.
2. METHODS
2.1. Scope
Following discussions about the risks of cVDPVs,policymakers recognized that minimizing the burdenof paralytic polio requires coordinated global cessa-tion of OPV vaccination as soon as possible after as-surance of the interruption of wild poliovirus trans-mission but not longer than necessary, to avoid therisks associated with OPV use.(12) While the exactyear still remains uncertain, we define T0 as the timewhen the world will implement its poliomyelitis riskmanagement policies for the posteradication era, andconsider an analytical time horizon stretching 20 yearsbeyond. This time horizon enables consideration of

Risks of Paralytic Disease from Poliovirus 1473
the uncertain but important long-term trends, with-out exceeding the limits of reasonable extrapolationsover time.
We do not address the impact of the developmentof a potential new polio vaccine on the risks (e.g., onethat offers the benefits of OPV without causing VAPPor cVDPVs). At this point, any reduction in risk asso-ciated with a new vaccine of unknown properties andthe cost needed for development for a disease that isalmost eradicated remain difficult to project.
We base our quantitative risk estimates on avail-able data from the peer-reviewed literature, confer-ence presentations, or institutional data, and extrapo-late when possible and as needed. For OPV cessationscenarios, however, we face significant challenges inextrapolating from historical data because of the un-precedented susceptibility that will exist in the popu-lation after eradication due to the absence of exposureto live polioviruses. With uncertainty unavoidable, weuse any available qualitative information about therisks, expected trends, and influences over time to de-velop quantitative estimates. We characterize the un-certainty using ranges assuming a triangular distribu-tion that peaks at the base case for most estimates, ora log-normal distribution for skewed inputs with verylong tails, as indicated.
2.2. Stratification by Income Leveland Future Policies
We develop risk functions representing the prob-abilities of outbreaks and VAPP cases for each coun-try for each of the 20 years of the time horizon. To ac-complish this, we stratify the world into four types ofcountries according to the 2002 World Bank incomelevels (i.e., low (LOW), lower middle (LMI), uppermiddle (UMI), or high (HIGH)).(20) While imper-fect, stratification by income level provides a means tocharacterize factors that influence the risks (e.g., dif-ferent levels of routine immunization coverage, vac-cine immunogenicity, and sanitation) that correlatewith wealth. For convenience, we assume that thisstratification does not change over time. For example,in 2001, 2.5, 2.1, 0.5, and 0.9 billion people lived incountries that we classify as low, lower-middle, upper-middle, and high-income, respectively.(20,21)
We use the term scenario to refer to a given set ofrelevant policies for a country in a specified incomelevel (e.g., an upper-middle-income population thatuses IPV for routine immunization, does not carryout supplemental immunization activities (SIAs), andmaintains a strict policy for enforcing laboratory andIPV-manufacturing site containment).(4) Such char-
acterizations represent typical scenarios of classes ofcountries that may experience significantly differentrisks.
2.3. Risk Metrics
We evaluate the risks using two distinct risk met-rics. Given that VAPP incidences represent isolatedevents, we focus on estimating the inputs required toestimate the number of VAPP cases in a given setting.In contrast, the remainder of the risk estimates focuson estimating the probability of outbreaks and notthe number of paralytic cases resulting from them,which would require modeling the dynamics of theoutbreaks.(18)
We define an outbreak as the occurrence of atleast one confirmed case of paralytic poliomyelitisdue to wild or circulating vaccine-derived poliovirus.Thus, in estimating outbreak probabilities we do notconsider virus reintroductions that “die out” as out-breaks (i.e., unsustained chains of transmission thatresult in only asymptomatic infections but no para-lytic cases). However, our definition includes isolatedparalytic cases (with no observed epidemiological linkto other virus isolates or paralytic cases).
We assume that the number of outbreaks followsa Poisson distribution and focus on estimating its pa-rameter, λ, which represents the rate of occurrenceper year.(22) For a relatively small λ (e.g., less than0.2), the Poisson distribution approximates the prob-ability of one event in a year (since the probabilityof one event is Poisson(1) = λe−λ ≈ λ for small λ).We characterize outbreak rates per 100 million peo-ple, recognizing their additivity (i.e., assuming that wecan divide the population into a number of equallysized subpopulations and that the initiating eventsleading to outbreaks follow independent and identicalPoisson distributions). This does not preclude the pos-sibility that the outbreak spreads to different subpop-ulations. Thus, if three outbreaks occurred in low-income countries (with a total population of 25 × 100million) over the last six years, this would translateinto an average estimated rate of occurrence in low-income settings of 3/(6 × 25) = 0.02 per year for eachpopulation of 100 million people, or similarly 0.002outbreaks per year for each population of 10 millionpeople, etc.
3. THE RISK OF VACCINE-ASSOCIATEDPARALYTIC POLIOMYELITIS
OPV contains live, attenuated poliovirusstrains (i.e., Sabin strains) selected for their low

1474 Tebbens et al.
neurovirulence.(1) However, soon after the introduc-tion of OPV it became apparent that in rare instancesinfection with an OPV virus can lead to VAPP, a formof poliomyelitis clinically indistinguishable fromthat caused by wild poliovirus. With massive use ofOPV for routine or supplementary immunization,ample opportunity exists for infection with the OPVvirus due to both administration of the vaccine(i.e., primary infection) and exposure of contacts ofvaccine recipients (i.e., secondary infection with aSabin-like virus). We refer to VAPP cases that occurin vaccinees as recipient VAPP and to those casesassociated with secondary infections as contact VAPP(see the Appendix, Section 1.1).
We express the risk of VAPP in terms of the ratesof paralytic poliomyelitis per primary OPV infectionand per secondary OPV infection, so that the ex-pected number of VAPP cases (V) as a function oftime and the scenario equals:
V = r1 × I1 + r2 × I2,
where r1 = the rate of paralytic poliomyelitis perprimary OPV infection in fullysusceptibles,
r2 = the rate of paralytic poliomyelitis persecondary OPV infection in fullysusceptibles,
I1 = the number of primary OPV infec-tions in fully susceptibles in a year orduring an immunization response as afunction of time and the scenario, and
I2 = the number of secondary OPV infec-tions in fully susceptibles in a year orduring an immunization response as afunction of time and the scenario.
The disadvantage of this approach is the difficultyin estimating the number of susceptibles that typi-cally get infected with OPV. The advantage derivesfrom the direct relationship between OPV infectionsand the total number of VAPP cases, and the util-ity of this method for both routine immunization andoutbreak response situations. We use U.S. data to es-timate rates of 1.9 recipient VAPP cases per millionprimary OPV infections and 3.7 contact VAPP casesper million secondary OPV infections (see the Ap-pendix, Section 1.2).(23–35) Varying assumptions aboutthe denominators yield ranges of 1.6 to 2.2 recipientVAPP cases per million primary OPV infections and2.3 to 10.3 contact VAPP cases per million secondaryOPV infections. Due to limitations in data availableto estimate the risk of VAPP due to monovalent OPV(mOPV) vaccines, we assume equal rates for mOPV
and OPV, although greater uncertainty and serotypevariability exists for mOPV.(36,37)
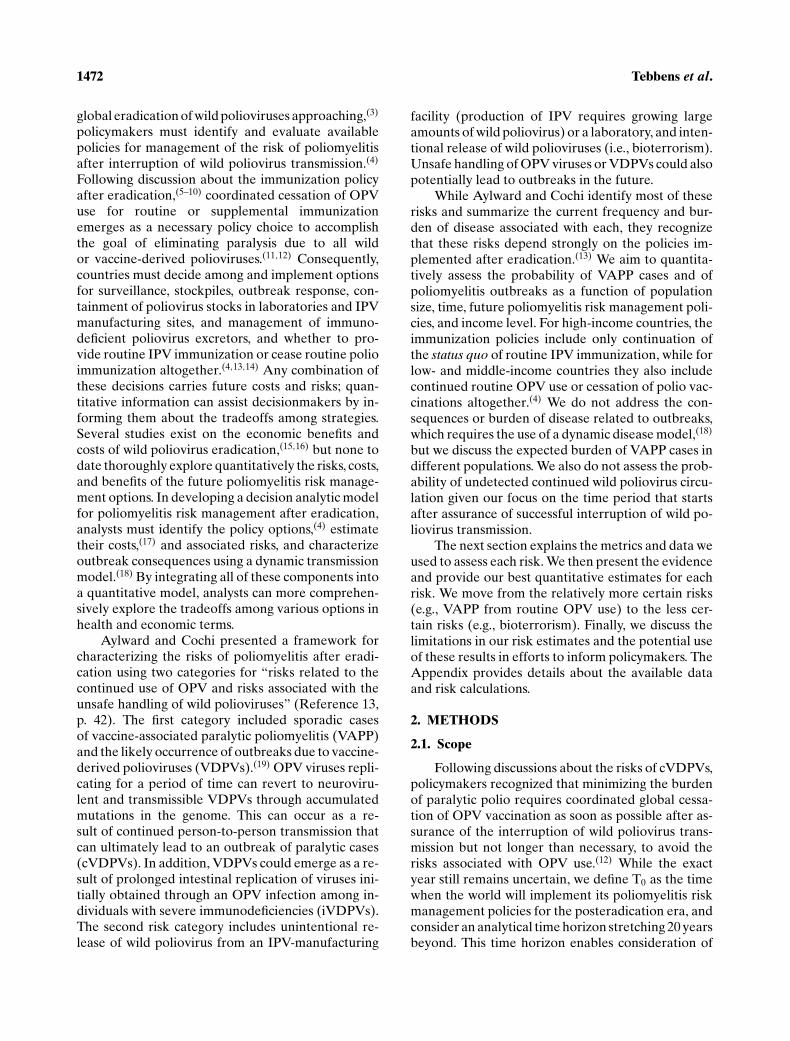
Table I shows inputs and rates for the VAPP riskas a function of several scenarios. The overall basecase VAPP rate per million OPV infections in suscep-tibles due to routine immunization shows little vari-ation across the scenarios. In terms of the risk permillion in a birth cohort, these base case estimatesrange from 1.9 to 2.6 VAPP cases (Table I).
4. THE RISK OF OUTBREAKS DUE TOVACCINE-DERIVED POLIOVIRUSES
Infection with the live OPV virus (or with wildpolioviruses) leads to excretion of a slightly modi-fied virus. If the OPV virus can accumulate sufficientmutations through continued replication, then it canrevert back to a virulent and transmissible form thatmay cause outbreaks similar to wild poliovirus.(19) Thevirologic definition of VDPVs includes those strainswith between 1 and 15% divergence from the origi-nal vaccine strain in the viral protein 1 (VP1) region(by convention, Sabin-like viruses diverge less than1% while wild-type polioviruses consistently divergemore than 15% from the vaccine strain).(19) Severaltypes of VDPVs exist and they warrant different treat-ment with respect to quantifying the risk of VDPVoutbreaks after OPV cessation. In this article we de-fine three mutually exclusive types of VDPV events:� Circulating VDPV (cVDPV) event: isolation
of VDPVs from at least two cases (epidemi-ologically linked) of paralytic poliomyelitis oracute flaccid paralysis (AFP),� Immunodeficient VDPV (iVDPV) event: iso-lation of a VDPV from an immunodeficientperson excreting at least six months after in-fection with the vaccine virus, and� Ambiguous VDPV (aVDPV) event: isolationof VDPVs from a single immunocompetentAFP or paralytic poliomyelitis patient with orwithout additional isolates from contacts, orfrom healthy individuals or the environmentin absence of paralytic cases. (We emphasizethat by definition we consider the occurrenceof at least one confirmed paralytic case as anoutbreak, although we note that not all ana-lysts might use this same definition.)
We discuss the first two risks in separate sub-sections, recognizing that the occurrence of iVDPVevents depends on distinctly different factors thanthe occurrence of cVDPV events, and we assignedeach aVDPV event to one of these two categories
Risks of Paralytic Disease from Poliovirus 1475
Table I. Inputs and Estimates for Prospective Calculation of VAPP Risk
Income Level and OPV Immunization Policy
LOW LMI UMI
Symbol [and
Formula if Derived] Input no SIAs SIAs no SIAs SIAs no SIAs SIAs
US 1980–1997
no SIAs
C Coverage with at least 3 OPV doses 0.68 0.80 0.90 0.95 0.92 0.95 0.75
e Primary take rate for 3 OPV doses
(% seroconverting)
0.71 0.71 0.85 0.85 0.85 0.85 0.95
E Effective take rate for birth cohorts 0.75 0.99 0.90 0.99 0.92 0.99 0.95
r[r=r1∗C∗e +r2∗(E-C∗ e))/E]
Rate of (recipient + contact) VAPP
cases per million (primary +secondary) OPV infections
2.53 2.66 2.15 2.21 2.15 2.21 2.33
rbc [rbc = r∗E] Rate of VAPP cases per million birth
cohort
1.90 2.63 1.93 2.19 1.98 2.19 2.21
Inputs relating to VAPP due to
outbreak response
LOW LMI UMI HIGH
e1 Primary take rate for 1 OPV dose
(trivalent)
0.45 0.65 0.65 0.78
em1 Primary take rate for 1 monovalent
OPV dose (averaging over serotypes)
0.76 0.91 0.91 0.91
Psec Proportion of susceptibles secondarily
infected per mass immunization
round
0.60 0.37 0.30 0.20
r1 = rate of 1.9 recipient VAPP cases per 100 million primary OPV infections (see the Appendix, Section 1.2); r2 = rate of 3.7 contact VAPP
cases per 100 million secondary OPV infections (see the Appendix, Section 1.2)
HIGH = high-income country; LMI = lower-middle-income country; LOW = low-income country; OPV = (trivalent) oral poliovirus vac-
cine; SIAs = supplemental immunization activities; UMI = upper-middle-income country; VAPP = vaccine-associated paralytic poliomyelitis.
depending on the nature of the event and the strengthof the evidence.
4.1. The Probability of cVDPV Outbreaks
4.1.1. Inventory of Confirmed and SuspectedcVDPV Events
Table II separately lists documented episodes ofconfirmed cVDPVs and suspected cVDPVs that re-main classified as aVDPVs given the presence of onlya single paralytic case.(38–46) We further categorize thedata into events before and after 1999, recognizingthat the choice of the time period substantially im-pacts estimates of outbreak frequencies (derived bydividing the number of outbreaks by the time period).The observation that the last wild-type isolate of thedetected VDPV serotype occurred at least three yearsprior to the event (except for the outbreaks in Peruand possibly in Romania in 1980) suggests that theeradication of a serotype may substantially increasethe risk of cVDPVs of that serotype. Consequently, we
believe that estimates of prospective risks of cVDPVsshould focus on events that occurred between 1999and 2005, which represents a seven-year period char-acterized by historically high global OPV use, com-plete elimination of all type 2 wild polioviruses, andelimination of type 3 and type 1 wild polioviruses inmost parts of the world.
Investigators analyzed viruses obtained from sixrecent cVDPV outbreaks with at least two paralyticcases (Hispaniola, Philippines, Madagascar (twice),China, Indonesia) and six recent aVDPVs isolatedfrom AFP cases (Pakistan, Nigeria, Romania, Kaza-khstan, Madagascar (twice)). Reflecting the uncer-tainty about the appropriate interpretation of theaVDPVs, we consider two risk cases (see Table II): (1)the six confirmed cVDPV outbreaks only and (2) all12 cVDPV and aVDPV events after 1999. Note thatwe consider the Dominican Republic outbreak as apart of the Haitian outbreak (i.e., as a single Hispan-iola outbreak) since it began with an imported virusfrom the Haitian outbreak.(42) We classified eventsas occurring on a background of SIAs if any SIAs

1476 Tebbens et al.
Table II. Characterization of cVDPV and aVDPV Events
Number of Last Wild Case or
Time Isolates (% Paralytic Isolate (Excluding Last SIAs
Period Country Serotype Divergence)a Cases Importations) Before Event Scenario Source
Documented cVDPV outbreaks (1999–2005)2005 Indonesia 1 ≥45 (1.1–3.0) 45 1995 2002 LOW, OPV, no SIAs (38)
2005 Madagascar 2 4 (1.1–1.8) 3 1997 2002 LOW, OPV, no SIAs (38)
2004 China (Guizhou) 1 4 (1.0–1.2) 2 < 1985 (WPV2) SNIDs ongoing LMI, OPV, SIAs (39)
2002 Madagascar 2 6 (2.5–3.0) 4 1997 Between 1997 and
1999
LOW, OPV, no SIAs (40)
2001 Philippines 1 4 (3.1–3.5) 3 1993 1997b LMI, OPV, no SIAs (41)
2000–2001 Haiti 1 10 (∼2.6) 8 1989 <1996 LOW, OPV, no SIAs (42)
2000–2001 Dominican
Republicc1 21 (∼1.9) 13 1985 1996 LMI, OPV, no SIAs (42)
Documented cVDPV outbreaks prior to 1999 (i.e., not included in further analysis)1988–1993 Egypt 2 30 (4.0–7.0) 30 1979 (WPV2) Probably none LMI, OPV, no SIAs (43)
Documented aVDPVs with possible circulation (1999–2005)2005 Madagascar 2 4 (2.3–2.7) 1 1997 2002 LOW, OPV, no SIAs (38)
2005 Madagascar 3 8 (1.0–1.8) 1 1997 2002 LOW, OPV, no SIAs (38)
2002–2003 Kazakhstan 2 2 (2.3) 1 <1985 (WPV2) 1999 LMI, OPV, no SIAs (39)
2002 Romania 1 8 (1.1–1.3) 1 <1996 SNIDs ongoing LMI, OPV, SIAs (44)
2002 Nigeria 2 1 (2.4) 1 1998 (WPV2) Ongoing LOW, OPV, SIAs (44)
2000 Pakistan 2 1 (2.3) 1 1997 (WPV2) Ongoing LOW, OPV, SIAs (45)
Documented aVDPVs with possible circulation prior to 1999 (i.e., not included in further analysis)1983 Peru 2 1 (5.8) 1 WPV2 circulation
ongoing
Probably none LMI, OPV, no SIAs (45)
1980 Romania 1 1 (1.2) 1 Limited WPV1
transmission
ongoing
Ongoing LMI, OPV, SIAs (46)
Total number of eventsd cVDPV outbreaks cVDPV outbreaks and aVDPV eventsTotal 7 15
Total 1999–2005 (all on OPV background) 6 12
On OPV with SIAs background 1 4
On OPV without SIAs background 5 8
a Percent divergence refers to the number of nucleotide changes in the VP1 region compared to the parent OPV strain.b However, several provinces not involved in the outbreak conducted SNIDs in 1998 and 1999.c Outbreak involved a strain imported from the Haitian outbreak.d Excluding the cVDPV event in the Dominican Republic since this outbreak involved a strain imported from the Haitian outbreak.
aVDPV = ambiguous vaccine-derived poliovirus; cVDPV = circulating vaccine-derived poliovirus; LMI = lower-middle-income country;
LOW = low-income country; OPV = (trivalent) oral poliovirus vaccine; SIAs = supplemental immunization activities; SNIDs = subnational
immunization days; VP1 = viral protein 1; WPV1, WPV2 = wild poliovirus type 1, 2, respectively.
occurred in the two years preceding the outbreak.In addition to these cVDPV and aVDPV events,the Appendix (Section 2, Table A3) lists aVDPVsthat we did not include in Table II or our risk esti-mates.(38,40,44,47–58) Thus, our risk estimates rely on theevidence of six confirmed cVDPVs or, alternatively,12 combined cVDPVs and aVDPVs in seven yearswith a background of routine OPV immunization,including one confirmed cVDPV or, alternatively,four combined cVDPVs and aVDPVs in seven years
in countries carrying out some form of SIAs, as shownat the bottom of Table II.
4.1.2. Dependence on Time and Scenarios
With continued use of OPV, decreased popu-lation immunity increasingly appears to representa key risk factor for the emergence and spread ofcVDPVs.(19,59) Therefore, we anticipate that in thecontext of routine OPV vaccination, regular SIAs
Risks of Paralytic Disease from Poliovirus 1477
decrease the risk while cessation of SIAs increases therate of occurrence compared to the risk in OPV-usingcountries that conduct SIAs. Furthermore, for eitherSIA policy, population immunity probably correlateswith income because of decreased OPV effective-ness(1) and generally lower routine immunization cov-erage in low-income settings.(21) In addition, poor hy-giene, tropical climate, and crowding all correlate withlow income, and favor the spread of polioviruses andthe emergence of cVDPVs. If OPV use continues butcoverage decreases, this would lead to an increase incVDPV risk over time.
If the world stops OPV use completely, popula-tion immunity levels will decrease with the additionof unvaccinated and unexposed birth cohorts. How-ever, the cessation of OPV use in those scenarios endsthe routine introduction of large amounts of poten-tial VDPVs through vaccination. Few experiences ex-ist with cessation of OPV to estimate the ability ofOPV viruses to persist in such a situation. Since 1962in Cuba and until the early 1990s in several EasternEuropean countries, vaccination occurred exclusivelyduring mass OPV campaigns, with no vaccine avail-able between campaigns and virtual absence of wildpolioviruses during most of these time periods.(60,61)
Studies of the persistence of polioviruses in betweencampaigns in Cuba found no evidence of OPV viruspersisting for longer than a few months,(62–64) andno detected cVDPV events occurred in the monthsbetween the OPV campaigns. However, researchersisolated an aVDPV in Romania in 1980, which thenalso relied exclusively on campaigns (Table II). Fur-thermore, an aVDPV in Belarus (see the Appendix,Table A3) followed cessation of OPV during 1963–1966 in a local population of about 160,000(56) andsuggests some possibility that VDPVs can emerge af-ter stopping OPV use when neighboring populationscontinue using OPV.
IPV vaccination provides less efficiency in pre-venting poliovirus excretion than OPV and offers nobenefits from secondary immunizations.(65–67) Conse-quently, the population protection against infectionsdecreases with time after implementation of a policyof switching to IPV. As with the cessation of poliovaccinations altogether, this increases the likelihoodthat OPV viruses can circulate and become cVDPVs,but at the same time OPV cessation drastically lim-its the prevalence of OPV viruses. Recent experienceof countries transitioning from OPV to IPV providessome insights. New Zealand made a rapid switch fromroutine OPV to IPV immunization in 2002. A studysearching for OPV viruses in several surveillance
systems (pediatric, enterovirus, and environmental)found no VDPVs and a rapid decline in prevalence ofSabin-like viruses in the months following the switchto IPV (with a few isolates up to 11 months afterthe switch probably representing OPV virus impor-tations rather than continued circulation).(68) A type3 outbreak involving viruses derived from an experi-mental OPV strain (i.e., USOL-D-bac, not used any-more) occurred in Poland in 1968 on a backgroundof low, type 3 (nonenhanced potency vaccine) IPV-immunity.(55,59) The very weak evidence in the Polishexperience, which occurred with much lower qual-ity vaccines than currently used, suggests that evenin a temperate climate and upper-middle-income set-ting, VDPVs could emerge, circulate, and cause para-lytic poliomyelitis in the context of imperfect (nonen-hanced potency) IPV-induced protection(59) and thata switch to IPV (with low coverage) does not excludethe possibility of cVDPVs. Uncertainty still exists con-cerning the ability of modern IPV vaccines to reducetransmission of polioviruses in developing countriesdue to the lack of experience with IPV in those set-tings. Most importantly, the experiences in Belarus,Poland, and New Zealand underscore the risk of fail-ing to coordinate the cessation of OPV globally.
For any policy, the population immunity level atT0 impacts the probability of cVDPV outbreaks insubsequent years. Based on the experience in coun-tries that already eradicated polio, it appears realisticto assume that countries may stop conducting SIAsand/or maintaining high population immunity at leastthree years prior to T0. We refer to this as the realisticpopulation immunity (RPI) scenario. Alternatively, ifcountries continue SIAs until T0 or carry out a coor-dinated pulse to bring coverage in all areas up to morethan 90%, this would provide maximum populationimmunity at T0, and we refer to this as the maximumpopulation immunity (MPI) scenario.
4.1.3. Quantification of Probability of OutbreaksDue to cVDPVs
For the calculation of the cVDPV outbreak rates,we assume that if routine OPV use continues therates remain equal to the currently observed rates,and that if routine OPV use ceases in a coordinatedfashion then the rates will decay exponentially ac-cording to a half-life that depends on the scenario(see the Appendix, Section 2 and Table A4). The ini-tial rate depends on whether regular SIAs continueduntil T0. In the event that SIAs continue until T0 andthe policy going forward consists of only routine OPV

1478 Tebbens et al.
Low-income countries
0.000
0.010
0.020
0.030
0.040
0.050
0.060
0.070
0 2 4 6 8 10 12 14 16 18
Time (years) after T0
Lower-middle-income countries
0.000
0.010
0.020
0.030
0.040
0.050
0.060
0.070
0 2 4 6 8 10 12 14 16 18
Time (years) after T0
Po
isso
n r
ate
(1/y
ear)
Upper-middle-income countries
0
0.001
0.002
0.003
0.004
0.005
0.006
0.007
0 2 4 6 8 10 12 14 16 18
High-income countries
0.0E+00
3.0E-07
6.0E-07
9.0E-07
1.2E-06
0 2 4 6 8 10 12 14 16 18
Po
isso
n r
ate
(1/y
ear)
OPV, SIAs OPV, No SIAs, MPI
IPV, No SIAs, MPI No routine, No SIAs, MPI
OPV, No SIAs, RPI IPV, No SIAs, RPI
No routine, No SIAs, RPI
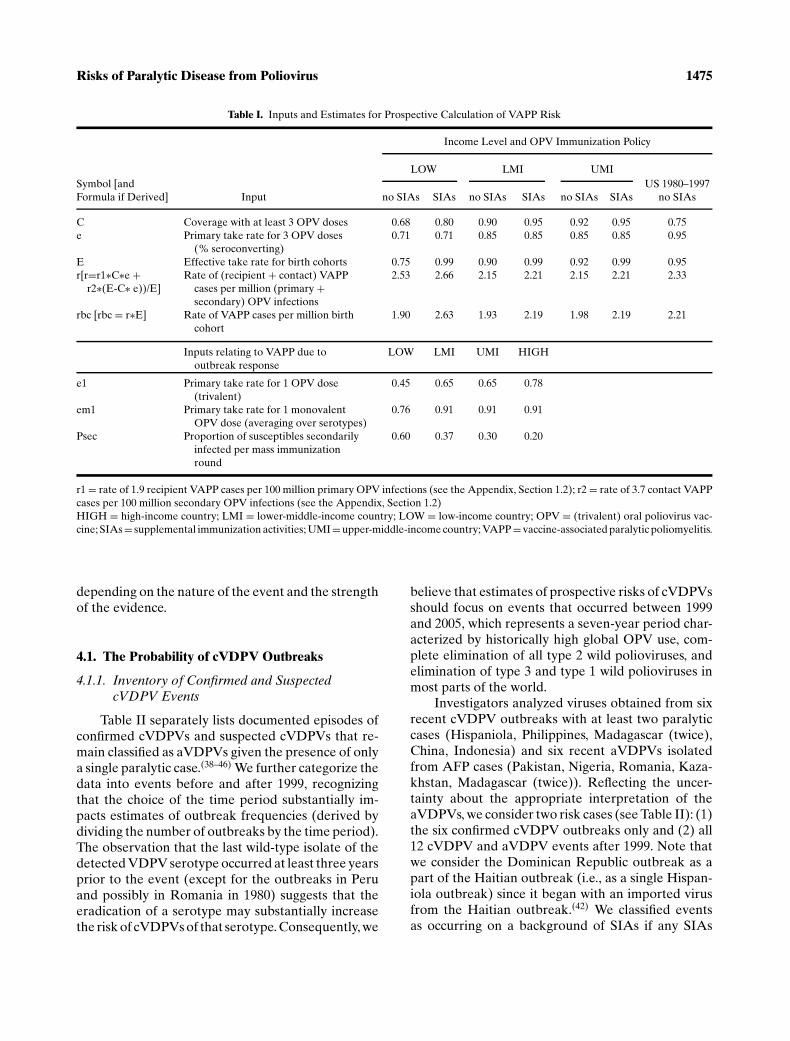
Fig. 1. Yearly (Poisson) rate of occurrence of cVDPV outbreaks per 100 million people, by income level based on only the 6 cVDPV
outbreaks from Table II. The scales on the y-axis are not all equal. (cVDPV = circulating vaccine-derived poliovirus; IPV = inactivated
poliovirus vaccine; MPI = maximum population immunity at T0; OPV = (trivalent) oral poliovirus vaccine; RPI = realistic population
immunity at T0; SIAs = supplemental immunization activities.)
immunization, the rates increase linearly from the cur-rent rate for OPV with SIAs to the rate without SIAs.
We assume that half-lives of the cVDPV risk inIPV-using countries equal half of those in countriesthat stopped polio vaccinations altogether (i.e., therisk disappears twice as fast in IPV-using countries).We assume that high-income countries switched toIPV on average in 1998 and consequently they facenegligible constant risk of cVDPVs (i.e., Poisson rateof one per million per year), with only cVDPV im-portations from any OPV-using countries or escape ofOPV-derived viruses from laboratories possibly lead-ing to cVDPV outbreaks.
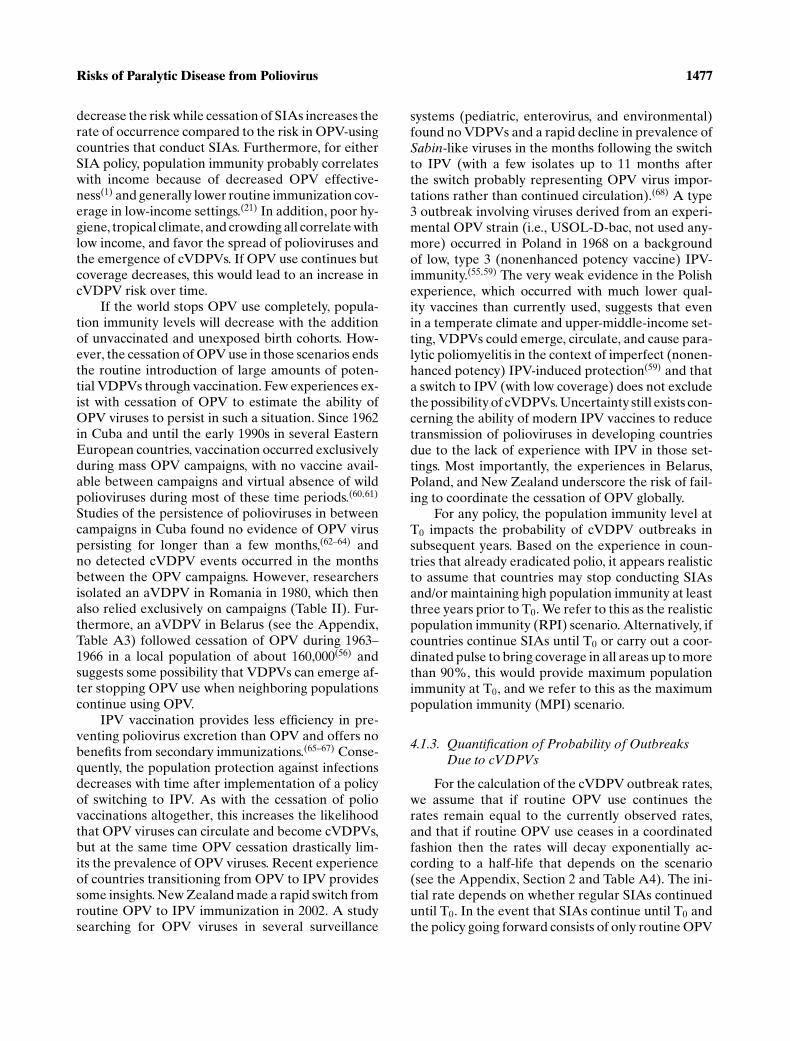
Figs. 1 and 2 show the cVDPV outbreak ratesover time for each policy and income level based ononly the confirmed cVDPVs and on the combinedcVDPVs and aVDPVs during 1999–2005 as listed inTable II, respectively. The inclusion of the aVDPVs aspotential signals of cVDPV risk leads to an increase inthe initial rates, but the shapes of the functions remainequal for both cases (note the different scales used in
the figures). If OPV were to continue, the rate of oc-currence remains constant over time and equal forboth income levels, with a much higher risk expectedin the absence of SIAs than with continued SIAs. IfOPV immunization ceases, the rate starts at the aver-age yearly number of outbreaks per 100 million peo-ple on an OPV background with or without SIAs, de-pending on the population immunity at T0 (RPI orMPI) and then declines quickly to less than 0.0001outbreaks per year per 100 million people within fiveyears at all income levels. The decline occurs mostrapidly with a switch to IPV in upper-middle-incomecountries (corresponding to the shortest half-life) andmost slowly with cessation of all polio vaccinations inlow-income countries (longest half-life). We assume a10-fold lower initial risk for upper-middle-incomecountries compared to low- and lower-middle-incomecountries (assumed to experience similar initial ratesbased on the observed occurrence of events in TableII). Overall, combining the risk estimates for the RPIscenario with the global population forecasts(20,69)

Risks of Paralytic Disease from Poliovirus 1479
Low-income countries
0.000
0.020
0.040
0.060
0.080
0.100
0 2 4 6 8 10 12 14 16 18
Time (years) after T0
Lower-middle-income countries
0.000
0.020
0.040
0.060
0.080
0.100
0 2 4 6 8 10 12 14 16 18
Time (years) after T0
Po
isso
n r
ate
(1/y
ear)
Upper-middle-income countries
0.000
0.002
0.004
0.006
0.008
0.010
0 2 4 6 8 10 12 14 16 18
High-income countries
0.0E+00
3.0E-07
6.0E-07
9.0E-07
1.2E-06
0 2 4 6 8 10 12 14 16 18
Po
isso
n r
ate
(1/y
ear)
OPV, SIAs OPV, No SIAs, MPI
IPV, No SIAs, MPI No routine, No SIAs, MPI
OPV, No SIAs, RPI IPV, No SIAs, RPI
No routine, No SIAs, RPI
Fig. 2. Yearly (Poisson) rate of occurrence of cVDPV outbreaks per 100 million people, by income level based on the 12 cVDPV and aVDPV
events from Table II. The scales on the y-axis are not all equal. (aVDPV = ambiguous vaccine-derived poliovirus; cVDPV = circulating
vaccine-derived poliovirus; IPV = inactivated poliovirus vaccine; MPI = maximum population immunity at T0; OPV = (trivalent) oral
poliovirus vaccine; RPI = realistic population immunity at T0; SIAs = supplemental immunization activities.)
suggests a greater than 95% chance of at least onecVDPV outbreak during the first year after cessationof routine immunization, with that risk declining toless than 6% at the end of the third year. If we insteadassume the MPI scenario, then the probability equalsless than 60% in the first year, declining to less than1% at the end of the third year.
4.2. The Probability of iVDPV-RelatedOutbreaks
4.2.1. Inventory of Confirmed andSuspected iVDPVs
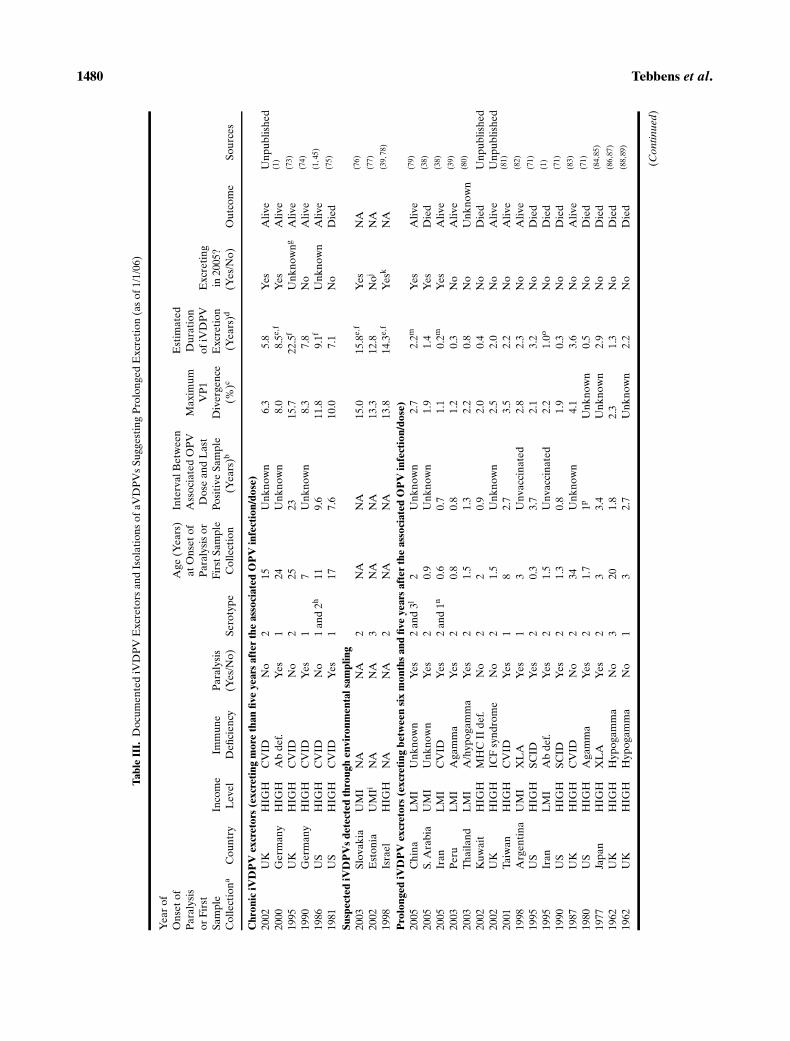
Long-term excretion of iVDPV viruses repre-sents a very rare condition found only among personswith primary immunodeficiencies (PIDs) (see the Ap-pendix, Section 3.1).(70–72) Table III lists iVDPVs de-tected to date.(1,38,39,45,48,71,73–89) Our definition of anoutbreak as at least one paralytic case suggests that weshould count as an outbreak any iVDPV viruses thatspread to the community and cause at least one para-
lytic case. In this context, iVDPV excretors who devel-oped paralytic poliomyelitis themselves do not rep-resent outbreaks, given their original infection withSabin-like viruses (i.e., not with a VDPV virus). Todate, investigators detected or investigated no sub-stantial spread beyond the immunodeficient patientsin Table III,(90) and consequently, while the evidenceprovides some information about the prevalence ofiVDPV excretors, it offers little information aboutthe likelihood of outbreaks associated with iVDPVs.However, recent events in an Amish community inMinnesota demonstrated the possibility of circulationof an iVDPV virus in a low-coverage subpopulationin a high-income country.(48)
While most excretors stopped excreting or diedwithin four years of the associated OPV infection,a limited number of iVDPV excretors (all but onediagnosed with common variable immunodeficiencydisorder) continued to shed virus for well over fiveyears. Based on the distinction of extended excretionpotential, rather than an immunological argument, we
1480 Tebbens et al.
Tabl
eII
I.D
ocu
me
nte
diV
DP
VE
xcr
eto
rsa
nd
Iso
lati
on
so
fa
VD
PV
sS
ug
ge
stin
gP
rolo
ng
ed
Ex
cre
tio
n(a
so
f1
/1/0
6)
Ye
ar
of
On
set
of
Ag
e(Y
ea
rs)
Inte
rva
lB
etw
ee
nE
stim
ate
d
Pa
raly
sis
at
On
set
of
Ass
oci
ate
dO
PV
Ma
xim
um
Du
rati
on
or
Fir
stP
ara
lysi
so
rD
ose
an
dL
ast
VP
1o
fiV
DP
VE
xcr
eti
ng
Sa
mp
leIn
com
eIm
mu
ne
Pa
raly
sis
Fir
stS
am
ple
Po
siti
ve
Sa
mp
leD
ive
rge
nce
Ex
cre
tio
nin
20
05
?
Co
lle
ctio
na
Co
un
try
Le
ve
lD
efi
cie
ncy
(Ye
s/N
o)
Se
roty
pe
Co
lle
ctio
n(Y
ea
rs)b
(%)c
(Ye
ars
)d(Y
es/
No
)O
utc
om
eS
ou
rce
s
Chr
onic
iVD
PV
excr
etor
s(e
xcre
ting
mor
eth
anfiv
eye
ars
afte
rth
eas
soci
ated
OP
Vin
fect
ion/
dose
)2
00
2U
KH
IGH
CV
IDN
o2
15
Un
kn
ow
n6
.35
.8Y
es
Ali
ve
Un
pu
bli
she
d
20
00
Ge
rma
ny
HIG
HA
bd
ef.
Ye
s1
24
Un
kn
ow
n8
.08
.5e,f
Ye
sA
liv
e(1
)
19
95
UK
HIG
HC
VID
No
22
52
31
5.7
22
.5f
Un
kn
ow
ng
Ali
ve
(73
)
19
90
Ge
rma
ny
HIG
HC
VID
Ye
s1
7U
nk
no
wn
8.3
7.8
No
Ali
ve
(74
)
19
86
US
HIG
HC
VID
No
1a
nd
2h
11
9.6
11
.89
.1f
Un
kn
ow
nA
liv
e(1
,45
)
19
81
US
HIG
HC
VID
Ye
s1
17
7.6
10
.07
.1N
oD
ied
(75
)
Susp
ecte
diV
DP
Vs
dete
cted
thro
ugh
envi
ronm
enta
lsam
plin
g2
00
3S
lov
ak
iaU
MI
NA
NA
2N
AN
A1
5.0
15
.8e,f
Ye
sN
A(7
6)
20
02
Est
on
iaU
MIi
NA
NA
3N
AN
A1
3.3
12
.8N
oj
NA
(77
)
19
98
Isra
el
HIG
HN
AN
A2
NA
NA
13
.81
4.3
e,f
Ye
skN
A(3
9,7
8)
Pro
long
ediV
DP
Vex
cret
ors
(exc
reti
ngbe
twee
nsi
xm
onth
san
dfiv
eye
ars
afte
rth
eas
soci
ated
OP
Vin
fect
ion/
dose
)2
00
5C
hin
aL
MI
Un
kn
ow
nY
es
2a
nd
3l
2U
nk
no
wn
2.7
2.2
mY
es
Ali
ve
(79
)
20
05
S.
Ara
bia
UM
IU
nk
no
wn
Ye
s2
0.9
Un
kn
ow
n1
.91
.4Y
es
Die
d(3
8)
20
05
Ira
nL
MI
CV
IDY
es
2a
nd
1n
0.6
0.7
1.1
0.2
mY
es
Ali
ve
(38
)
20
03
Pe
ruL
MI
Ag
am
ma
Ye
s2
0.8
0.8
1.2
0.3
No
Ali
ve
(39
)
20
03
Th
ail
an
dL
MI
A/h
yp
og
am
ma
Ye
s2
1.5
1.3
2.2
0.8
No
Un
kn
ow
n(8
0)
20
02
Ku
wa
itH
IGH
MH
CII
de
f.N
o2
20
.92
.00
.4N
oD
ied
Un
pu
bli
she
d
20
02
UK
HIG
HIC
Fsy
nd
rom
eN
o2
1.5
Un
kn
ow
n2
.52
.0N
oA
liv
eU
np
ub
lish
ed
20
01
Ta
iwa
nH
IGH
CV
IDY
es
18
2.7
3.5
2.2
No
Ali
ve
(81
)
19
98
Arg
en
tin
aU
MI
XL
AY
es
13
Un
va
ccin
ate
d2
.82
.3N
oA
liv
e(8
2)
19
95
US
HIG
HS
CID
Ye
s2
0.3
3.7
2.1
3.2
No
Die
d(7
1)
19
95
Ira
nL
MI
Ab
de
f.Y
es
21
.5U
nv
acc
ina
ted
2.2
1.0
oN
oD
ied
(1)
19
90
US
HIG
HS
CID
Ye
s2
1.3
0.8
1.9
0.3
No
Die
d(7
1)
19
87
UK
HIG
HC
VID
No
23
4U
nk
no
wn
4.1
3.6
No
Ali
ve
(83
)
19
80
US
HIG
HA
ga
mm
aY
es
21
.71
pU
nk
no
wn
0.5
No
Die
d(7
1)
19
77
Jap
an
HIG
HX
LA
Ye
s2
33
.4U
nk
no
wn
2.9
No
Die
d(8
4,8
5)
19
62
UK
HIG
HH
yp
og
am
ma
No
32
01
.82
.31
.3N
oD
ied
(86,8
7)
19
62
UK
HIG
HH
yp
og
am
ma
No
13
2.7
Un
kn
ow
n2
.2N
oD
ied
(88,8
9)
(Con
tinue
d)

Risks of Paralytic Disease from Poliovirus 1481
Tabl
eII
I.(C
ontin
ued)
Ye
ar
of
On
set
of
Ag
e(Y
ea
rs)
Inte
rva
lB
etw
ee
nE
stim
ate
d
Pa
raly
sis
at
On
set
of
Ass
oci
ate
dO
PV
Ma
xim
um
Du
rati
on
or
Fir
stP
ara
lysi
so
rD
ose
an
dL
ast
VP
1o
fiV
DP
VE
xcr
eti
ng
Sa
mp
leIn
com
eIm
mu
ne
Pa
raly
sis
Fir
stS
am
ple
Po
siti
ve
Sa
mp
leD
ive
rge
nce
Ex
cre
tio
nin
20
05
?
Co
lle
ctio
na
Co
un
try
Le
ve
lD
efi
cie
ncy
(Ye
s/N
o)
Se
roty
pe
Co
lle
ctio
n(Y
ea
rs)b
(%)c
(Ye
ars
)d(Y
es/
No
)O
utc
om
eS
ou
rce
s
Imm
unod
efici
entp
erso
nsex
cret
ing
dive
rged
viru
ses,
butn
olo
nger
than
six
mon
ths
afte
rth
eas
soci
ated
OP
Vin
fect
ion
(exc
lude
dfr
omfu
rthe
ran
alys
is)
20
05
US
HIG
HS
CID
No
10
.6U
nv
acc
ina
ted
≥2.3
NA
Ye
sA
liv
e(4
8)
20
05
Sp
ain
HIG
HS
CID
Ye
s2
0.7
Un
kn
ow
n≥2
.5N
AY
es
Ali
ve
(38
)
19
91
US
HIG
HC
VID
Ye
s2
0.7
0.4
1.4
NA
No
Ali
ve
(71
)
19
89
US
HIG
HA
ga
mm
aY
es
10
.60
.31
.1N
AU
nk
no
wn
Un
kn
ow
n(7
1)
19
86
US
HIG
HX
LA
Ye
s2
0.9
0.4
2.0
NA
No
Ali
ve
(71
)
aIn
dic
ate
sy
ea
ro
fo
nse
to
fp
ara
lysi
sfo
rp
ara
lyti
cca
ses
or
ye
ar
of
firs
tsa
mp
leco
lle
ctio
nfo
riV
DP
Ve
xcr
eto
rsw
ith
ou
tp
ara
lysi
s.b
“U
nk
no
wn
”in
this
colu
mn
ind
ica
tes
insu
ffici
en
tin
form
ati
on
ex
ists
tod
ete
rmin
ea
sso
cia
ted
OP
Vd
ose
,o
re
vid
en
cee
xis
tsth
at
ass
oci
ate
din
fect
ion
wa
sse
con
da
ry.
cP
erc
en
td
ive
rge
nce
refe
rsto
the
nu
mb
er
of
nu
cle
oti
de
cha
ng
es
inth
eV
P1
reg
ion
com
pa
red
toth
ep
are
nt
OP
Vst
rain
.d
If(s
tati
stic
all
y)
con
sist
en
tw
ith
reco
rde
dm
uta
tio
nra
teo
fv
iru
s,d
ura
tio
ne
stim
ate
eq
ua
lsin
terv
al
be
twe
en
the
ass
oci
ate
dO
PV
do
sea
nd
last
po
siti
ve
sam
ple
min
us
the
firs
tsi
x
mo
nth
s(d
uri
ng
wh
ich
we
ass
um
ee
xcr
eti
on
of
Sabi
n-li
ke
vir
use
ssi
mil
ar
tov
iru
ses
tha
tim
mu
no
com
pe
ten
tin
div
idu
als
ex
cre
tea
fte
rO
PV
infe
ctio
n).
Oth
erw
ise,
we
est
ima
teth
is
ass
um
ing
am
ole
cula
rcl
ock
wit
ha
rate
of
1%
nu
cle
oti
de
div
erg
en
cep
er
ye
ar.
eT
he
ma
xim
um
VP
1d
ive
rge
nce
refe
rsto
av
iru
sis
ola
ted
at
lea
st1
6m
on
ths
ag
o(a
so
f1
/1/0
6),
the
refo
rew
ea
dd
ed
16
mo
nth
sto
the
du
rati
on
est
ima
te,a
ssu
min
gco
nti
nu
ed
ex
cre
tio
n
du
rin
g2
00
5.
fD
ura
tio
nm
ay
incr
ea
sein
futu
rea
se
xcr
eti
on
con
tin
ue
s.gV
iru
sis
ola
ted
in2
00
4b
ut
no
spe
cim
en
sta
ke
nin
20
05
.hIn
ve
stig
ato
rsis
ola
ted
aty
pe
1iV
DP
Vw
ith
5.4
%V
P1
div
erg
en
cein
19
86
an
dtw
osu
bp
op
ula
tio
ns
of
typ
e2
iVD
PV
sw
ith
10
.9%
an
d1
1.8
%V
P1
div
erg
en
cein
19
92
,re
spe
ctiv
ely
.
No
rece
nt
vir
us
de
tect
ion
occ
urr
ed
,b
ut
no
ev
ide
nce
ex
ists
of
ab
sen
ceo
fe
xcr
eti
on
.i A
lth
ou
gh
the
vir
us
de
tect
ion
occ
urr
ed
ina
nu
pp
er-
mid
dle
-in
com
eco
un
try,
no
furt
he
rd
ete
ctio
ns
occ
urr
ed
.W
ea
ssu
me
the
ex
cre
tor
rep
rese
nts
an
oth
erw
ise
un
ide
nti
fie
dch
ron
ic
ex
cre
tor
wh
ov
isit
ed
fro
ma
hig
h-i
nco
me
cou
ntr
y.In
furt
he
ra
na
lysi
s,w
ecl
ass
ify
the
ex
cre
tor
as
ah
igh
-in
com
ee
xcr
eto
r.j
En
vir
on
me
nta
lsu
rve
illa
nce
fail
ed
tod
ete
ctth
ev
iru
sa
fte
r2
00
2.
kL
ast
po
siti
ve
sam
ple
fro
m2
00
4w
ith
on
lyn
eg
ati
ve
sam
ple
sd
uri
ng
20
05
do
es
no
tn
eg
ate
ex
cre
tio
nin
20
05
.l
Inv
est
iga
tors
iso
late
dty
pe
2iV
DP
Vs
wit
hu
pto
2.3
%V
P1
div
erg
en
cea
nd
aty
pe
3iV
DP
Vs
wit
h2
.7%
VP
1d
ive
rge
nce
.m
Ma
yb
eco
me
ach
ron
ice
xcr
eto
rin
the
futu
reif
ex
cre
tio
nco
nti
nu
es.
nV
iru
sis
Sabi
n2
-Sa
bin
1re
com
bin
an
t,V
P1
div
erg
en
cere
fers
toSa
bin
2.
oD
ura
tio
ne
stim
ate
da
sth
ea
ge
at
on
set
of
pa
raly
sis
min
us
six
mo
nth
s.p
No
tin
clu
din
ga
ne
ura
lis
ola
teo
bta
ine
da
ta
uto
psy
ap
pro
xim
ate
ly4
.3y
ea
ra
fte
rla
stO
PV
do
se.
Ab
de
f.=
an
tib
od
yd
efi
cie
ncy
;A
ga
mm
a=
ag
am
ma
glo
bu
lin
em
ia;
aV
DP
V=
am
big
uo
us
va
ccin
e-d
eri
ve
dp
oli
ov
iru
s;C
VID
=co
mm
on
va
ria
ble
imm
un
od
efi
cie
ncy
dis
ord
er;
IPV
=in
act
iva
ted
po
lio
va
ccin
e;
HIG
H=
hig
h-i
nco
me
cou
ntr
y;
hy
po
ga
mm
a=
hy
po
ga
mm
ag
lob
uli
ne
mia
;IC
F=
Imm
un
od
efi
cie
ncy
-ce
ntr
om
eri
cin
sta
bil
ity
-fa
cia
la
no
ma
lie
s;iV
DP
V
=im
mu
no
de
fici
en
tv
acc
ine
-de
riv
ed
po
lio
vir
us;
LM
I=
low
er-
mid
dle
-in
com
eco
un
try
;M
HC
IId
ef.
=m
ajo
rh
isto
com
pa
tib
ilty
com
ple
xcl
ass
IIm
ole
cule
de
fici
en
cy;
NA
=n
ot
ap
pli
cab
le;
OP
V=
ora
lp
oli
ov
iru
sv
acc
ine
(an
yfo
rmu
lati
on
);S
CID
=se
ve
reco
mb
ine
dim
mu
no
de
fici
en
cyd
iso
rde
r;S
IAs
=su
pp
lem
en
tal
imm
un
iza
tio
na
ctiv
itie
s;U
MI
=u
pp
er-
mid
dle
-in
com
eco
un
try
;V
PI=
vir
al
pro
tein
1;
XL
A=
X-l
ink
ed
ag
am
ma
glo
bu
lin
em
ia.
1482 Tebbens et al.
define for our analysis the following two types ofiVDPV excretors:� Prolonged excretors: individuals excreting
VDPVs at least six months but no longer thanfive years after the associated OPV infection.� Chronic excretors: individuals excretingVDPVs at least five years after the associatedOPV infection.
In the context of OPV cessation, chronic excre-tors carry the greatest risk of reseeding VDPVs in apopulation with much reduced population immunity.However, this type of excretor appears to survive onlyin high- and possibly upper-middle-income countries.During 44 years of widespread OPV use (1962–2005),investigators detected six chronic excretors, 15 pro-longed excretors (including three with uncharacter-ized viruses), and two prolonged excretors with thepotential to become chronic excretors (Table III). Wealso include in our analysis three virus isolates fromthe environment that strongly suggest the presence ofa chronic excretor. In addition, we list five aVDPVswith more than 1% VP1 divergence from the origi-nal OPV strain associated with immunodeficient pa-tients who excreted for less than six months, but weexclude these from further analysis given their shortdurations of excretion. In estimating the duration ofiVDPV excretion, we exclude the first six months ofexcretion because we consider viruses excreted dur-ing that period to be within the period observed withOPV viruses that immunocompetent persons excreteafter immunization or contact exposure. Thus, for vac-cinated iVDPV excretors, we assume that the totalduration of excretion equals the time from the associ-ated OPV infection until the last positive sample mi-nus six months, unless evidence suggests a differentduration of excretion. In those cases (e.g., unvacci-nated iVDPV excretors and environmental iVDPVisolates), we estimate the duration of excretion fromthe divergence of the virus to the original OPV strainand assume a rate of 1% (range 0.9–1.3) nucleotide di-vergence in the VP1 region per year.(91) This amountsto an average duration of excretion of approximately11.5 years for chronic excretors and 1.6 years for pro-longed excretors, and a total of 131 person-years ofiVDPV excretion without occurrence of an outbreak.
4.2.2. Dependence on Time and Scenarios
While the individual risk of becoming an iVDPVexcretor is extremely low, even in the presence ofmassive, global OPV use, the population risk of
iVDPV-related outbreaks may change after T0 forseveral reasons. Among the available immunizationpolicies, OPV routine immunization leads to the high-est prevalence of iVDPV excretors, but high popu-lation immunity reduces the impact and likelihoodof iVDPV-related outbreaks. With cessation of OPVuse, we anticipate that the prevalence of iVDPVs willapproach 0 within several years in developing coun-tries, depending on the duration of excretion and thesurvival of iVDPV excretors, which appears lowestin low-income settings.(92) However, OPV cessationwill limit the ability of the surrounding community tostop transmission of viruses excreted by an iVDPVexcretor. Therefore, the risk of iVDPV-related out-breaks in those instances may initially increase overtime. We emphasize that all of the known chronic ex-cretors occurred in developed countries (i.e., six inhigh-income countries, with an additional three pos-sible iVDPV excretors detected through environmen-tal surveillance in upper-middle or high-income coun-tries), and it remains unclear whether the increasedrisk due to a higher transmissibility of poliovirusesin low-hygiene settings outweighs the decreased riskdue to a shorter survival of immunodeficient peoplein those settings.
Risk management strategies, such as identifi-cation and education of immunodeficient excretorsand/or immunization of their contacts, may furtherreduce the risk of iVDPV-related outbreaks by re-ducing the number of secondary infections from aniVDPV excretor and increasing the immunity bar-rier provided by the immediate surroundings. Al-though attempts to use existing antivirals for oneknown chronic excretor failed,(73) new technology in-volving treatment of iVDPVs with an antiviral maybecome available at some point, which could re-duce the viral output of iVDPV excretors and thusthe risk of iVDPV excretors causing an outbreak.However, this would require substantial investmentin the development of such an antiviral, and giventhat antivirals can reduce excretion only for identi-fied excretors, we remain uncertain about its over-all effectiveness and whether society will make thisinvestment.
4.2.3. Quantification of Probability of OutbreaksDue to iVDPVs
We model the probability of outbreaks due toiVDPVs in any given year as the product of theprevalence of long-term iVDPVs excretors and theconditional probability of an outbreak given the
Risks of Paralytic Disease from Poliovirus 1483
Low-income countries
0
0.000005
0.00001
0.000015
0.00002
0.000025
0.00003
0.000035
0 2 4 6 8 10 12 14 16 18
Time (years) after T0
Upper-middle-income countries
0
0.00005
0.0001
0.00015
0.0002
0.00025
0 2 4 6 8 10 12 14 16 18
Lower-middle-income countries
0
0.000005
0.00001
0.000015
0.00002
0.000025
0.00003
0.000035
0.00004
0 2 4 6 8 10 12 14 16 18
Time (years) after T0
Po
isso
n r
ate
(1/y
ear)
High-income countries
0
0.00002
0.00004
0.00006
0.00008
0.0001
0 2 4 6 8 10 12 14 16 18
Po
isso
n r
ate
(1/y
ear)
Prolonged, OPV background Prolonged, IPV background
Prolonged, No routine Chronic, OPV background
Chronic, IPV background Chronic, No routine
Chronic, any background
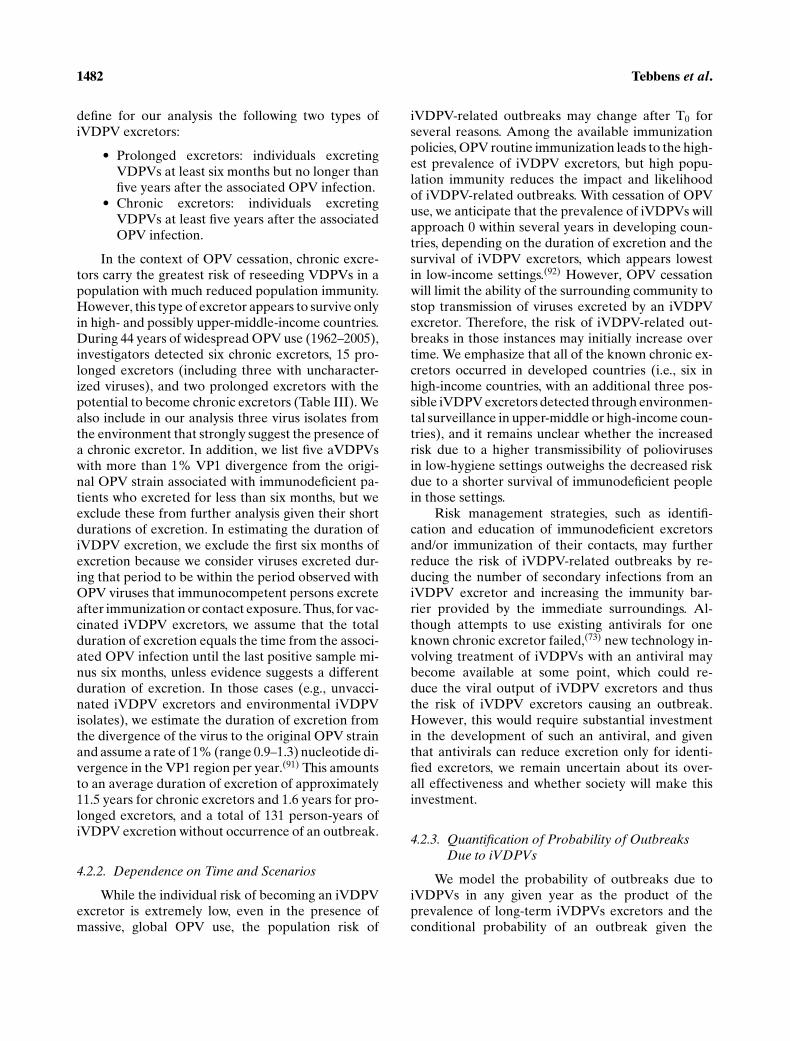
Fig. 3. Yearly (Poisson) rate of occurrence of outbreak due to iVDPVs per 100 million people. For the OPV scenario we assume equal
rates with or without supplemental immunization activities. The scales on the y-axis are not all equal (IPV = inactivated poliovirus vaccine;
iVDPV = immunodeficient vaccine-derived poliovirus; OPV = (trivalent) oral poliovirus vaccine).
presence of at least one iVDPV excretor. While weassume that both the prevalence and the conditionalprobability remain constant if OPV use continues, wemodeled an exponential decay of the prevalence (themean duration of excretion determines the rate) buta linear increase in the conditional probability in thecase of OPV cessation. We calculate the outbreakrates for chronic and prolonged excretors separately(see the Appendix, Section 3.2 and Table A5).
Fig. 3 shows the breakdown of the outbreak ratesby prolonged or chronic excretors by income level.Due to the lack of chronic excretors in low- and lower-middle-income countries, we expect very low Poissonrates despite the increasing conditional probability ofan outbreak given an iVDPV as time since OPV cessa-tion elapses. However, the existence of chronic excre-tors in upper-middle-income countries suggests thatthese countries face the highest risk of iVDPV-relatedoutbreaks in the medium-long term, although if theyswitch to IPV this risk would decrease more rapidly.
High-income countries experience the lowest condi-tional probability of an outbreak given an excretordue to good sanitation (i.e., low virus transmissibility)and population immunity and also experience lowerprevalence of iVDPV excretors than upper-middle-income countries due to the cessation of OPV usedating back to 1998 on average (which reduced theintroduction of new iVDPV excretors into the popula-tion). We based the outbreak rates in Fig. 3 on the ob-served prevalence of prolonged and chronic iVDPVexcretors to date, which probably underestimates thetrue number of excretors (see the Appendix, Sec-tion 3.3). Aggregated globally, the very small annualrisk estimates imply a probability of approximately4% of at least one outbreak due to iVDPVs duringthe 20-year timeframe (assuming IPV continuation inhigh-income countries, but complete cessation else-where), with an approximately 3% probability of atleast one outbreak in upper-middle- and high-incomecountries.
1484 Tebbens et al.
5. THE RISK OF OUTBREAKS DUE TOWILD POLIOVIRUSES
The risk of outbreaks due to wild polioviruses rep-resents the most uncertain risk category. However, weknow wild polioviruses could reemerge through sev-eral pathways and that this risk may dominate as therisks associated with OPV use disappear. While weprovide our current best estimates for these risks, werely on very limited data and judgment as we considertwo types of events that could lead to wild poliovirusoutbreaks after T0:� An unintentional breach in containment of
wild poliovirus stocks in a laboratory or in anIPV manufacturing facility, and� An intentional release of wild poliovirusthrough an act of bioterrorism.
5.1. Unintentional Breach in Containmentof Poliovirus Stocks
5.1.1. Containment Breaches in the Past
Limited reports suggest that reintroduction ofwild poliovirus from an unintentional breach in con-tainment poses the risk of greatest concern forreemerging wild poliovirus after eradication.(6,93–95)
While direct transmission from a laboratory to theenvironment remains theoretically possible (e.g.,through sewage), high levels of population immu-nity probably concealed any such historical labora-tory escapes, which make it difficult to assess thehistoric frequency of these events.(95) Escapes via in-fection of laboratory workers provide some evidenceabout a breach in containment for this pathway. TheWHO reports 12 known cases of poliomyelitis be-tween 1941 and 1976 associated with virus use in labo-ratories infecting laboratory workers, which occurredpredominantly in the prevaccine era and included twodeaths.(95) In addition, researchers isolated a wild po-liovirus in two separate events in the Netherlands; onestrain from the son of a worker in an IPV manufactur-ing facility accidentally exposed to a prototype virusstrain, and one from a child exposed to another refer-ence strain from an unknown origin.(96) These eventsdemonstrate the potential for unintentional virus re-lease into a population through asymptomatic infec-tion of laboratory workers.(6) More recently, inves-tigators isolated viruses closely related to a labora-tory reference strain of type 2 wild poliovirus (i.e.,MEF-1) in India,(97) including from three AFP casesin 2000, five in 2002, and two in 2003 (years that fol-lowed the global elimination of the naturally occur-
ring type 2 wild polioviruses). Finally, the fact that thelast case of smallpox occurred after a laboratory re-lease of virus in the United Kingdom underscores theimportance of managing this risk after eradication of adisease.(95)
5.1.2. Dependence on the Scenario and Time
The probability of an outbreak due to a wild po-liovirus containment breach depends on the amountof virus stocks (i.e., the number of IPV productionsites or laboratories that continue to keep wild po-lioviruses after T0), the probability of virus releasefrom such places, and the likelihood that a release ac-tually leads to an outbreak. WHO published a globalaction plan for laboratory containment aimed at re-ducing the first two risks.(95,98)
Although implementation of containment guide-lines substantially reduces the risks of unintentionalrelease of poliovirus, countries that do not maintainhigh-quality containment after T0 will experience arelatively higher risk of an outbreak. Thus, a coun-try’s decision to maintain/enforce long-term labora-tory containment substantially reduces the risk of anunintentional wild poliovirus release.
We expect that developed countries will continueto maintain the highest numbers of laboratories con-taining (potentially) wild poliovirus infectious mate-rials but also the most rigorous containment. Whilethese countries currently also produce the entireglobal IPV supply,(99) low- or middle-income coun-tries may elect to produce their own IPV for economicreasons if they switch to IPV. The greater likelihoodof outbreaks in these countries, given the generallyhigher transmissibility of polioviruses and uncertaintyabout the protection from IPV against infections, sug-gests an increased risk. This risk motivates some dis-cussion on the feasibility of making IPV from Sabinstrains rather than wild virus strains.(8)
The likelihood that a release of wild virus leads toan outbreak correlates inversely with virus transmissi-bility and the population immunity where the releaseoccurs. As discussed, population immunity dependson the vaccination policy, with increasing time sincestopping OPV use and lower income both implyinglower population immunity.
5.2. Intentional Release
With the anthrax attacks in the United States inthe fall of 2001 demonstrating the reality of bioter-rorism and leading to significant concerns about thepotential use of smallpox as a bioweapon, clearly any

Risks of Paralytic Disease from Poliovirus 1485
discussion of future risks must consider the possibilityof intentional releases of poliovirus. Some proponentsof aggressive biodefense lean toward the assumptionthat society should act as if intentional reintroduc-tion of an eradicated disease will occur with certainty(i.e., with probability 1, although with no time periodspecified), while others argue that the risks remain soremote that they approach 0. In reality, the best esti-mate of the risk lies somewhere in between, and theuncertainty around the best estimate also representsa narrower range. The trend of this risk over timeremains very uncertain, driven by important culturaland political factors. Similar to the other risks involv-ing a release of virus, the conditional probability of anoutbreak given a release increases as population im-munity decreases (i.e., with increased time since theend of vaccination). Given uncertainty and lack ofdata about this risk, we rely on judgment and focuson presenting bounding estimates of the risks and oncharacterizing their potential dependence on the vac-cination policy, such that they increase as populationimmunity decreases in countries that stop vaccination.
5.3. Quantification of Wild PoliovirusOutbreak Risks
As with the risk of iVDPV-related outbreaks, weestimate the Poisson rates for wild poliovirus out-breaks as the product of the probability of a virusrelease and the probability of an outbreak given asingle release. Although we recognized many depen-dencies of the frequency of wild poliovirus outbreaks,we focused on the most significant influences on ouralready very uncertain base case estimates. Table IVdisplays the inputs we use to estimate the risk functionfor wild poliovirus outbreaks. The risk function fol-lows from adding the three possible types of releases(laboratory, IPV production site, or intentional) andmultiplying by the appropriate income level depen-dent conditional probability of an outbreak given arelease. We assume that the conditional probabilityfunctions remain linear over time, similar to those weused for iVDPV-related outbreaks.
We estimate the frequency of virus releases froma laboratory at one per 1,000 years per 100 millionpeople in high- and upper-middle-income countries.However, we assume a five-fold increase in risk forcountries that do not maintain containment guide-lines. Given the likelihood of a much lower prevalenceof laboratories containing polioviruses in low- andlower-middle-income countries, we estimate a 10-foldlower frequency of releases of one per 10,000 years per100 million people in those countries. In aggregate
(using average world population 2010–2029 by in-come level), this amounts to approximately an ex-pected 0.4 releases globally over 20 years (given en-forced containment), with approximately three-foldhigher frequency at the two highest income levels.
Given the current use of large amounts of wild po-lioviruses in IPV production, we assume much higherrisks for release from an IPV manufacturing site (i.e.,for countries that domestically produce IPV). We as-sume that high- and upper-middle-income countrieswill probably produce IPV domestically if their rou-tine immunization policy involves IPV, and we esti-mate a 10-fold higher risk of virus release from IPVproduction sites than from laboratories, or one releaseper 100 years per 100 million people (given main-tained containment). In contrast, we assume that low-and lower-middle-income countries probably will notproduce their own IPV, and consequently we assumea frequency of only one release per 1,000 years per 100million people (this assumes that a small, but nonzerochance exists that these countries might produce IPVdomestically). For universal IPV use, this translatesinto approximately four IPV production site releasesglobally over the entire 20-year period, assuming alinear relationship between the frequency of releasesand amount of IPV use. If a country does not use IPVfor routine immunization, we assume a very low fre-quency (i.e., 10−6) of releases, attributed to the remotepossibility of maintained IPV production capacity foroutbreak response. We suggest future sensitivity anal-yses explore a range of effectiveness of containmentfor IPV production sites and for laboratories.
We estimate the frequency of attempts at inten-tional releases for all countries as equal to virus es-capes from laboratories in developed countries withenforced containment if the policy involves OPVcessation. If not, we estimate a 10-fold lower fre-quency, based on an assumption of less attractivenessof polioviruses as a bioweapon. Given the absenceof historical data and the inherent uncertainty in pre-dicting the future geopolitical situation, we emphasizethe need to vary this frequency over a wide range (seeTable IV).
We multiply the frequency of releases by a con-ditional probability of an outbreak given a release of0.05 in low-income countries at T0 and up to 0.5 at 20years after OPV cessation, and as a result the Pois-son rates reflecting the wild poliovirus outbreak risksall remain small. Fig. 4 shows the outbreak rates overtime for each scenario. The aggregated rates lead to aglobal expected number of wild poliovirus outbreaksfrom any source during 20 years after T0 betweenapproximately 0.02 (continued OPV with SIAs) and
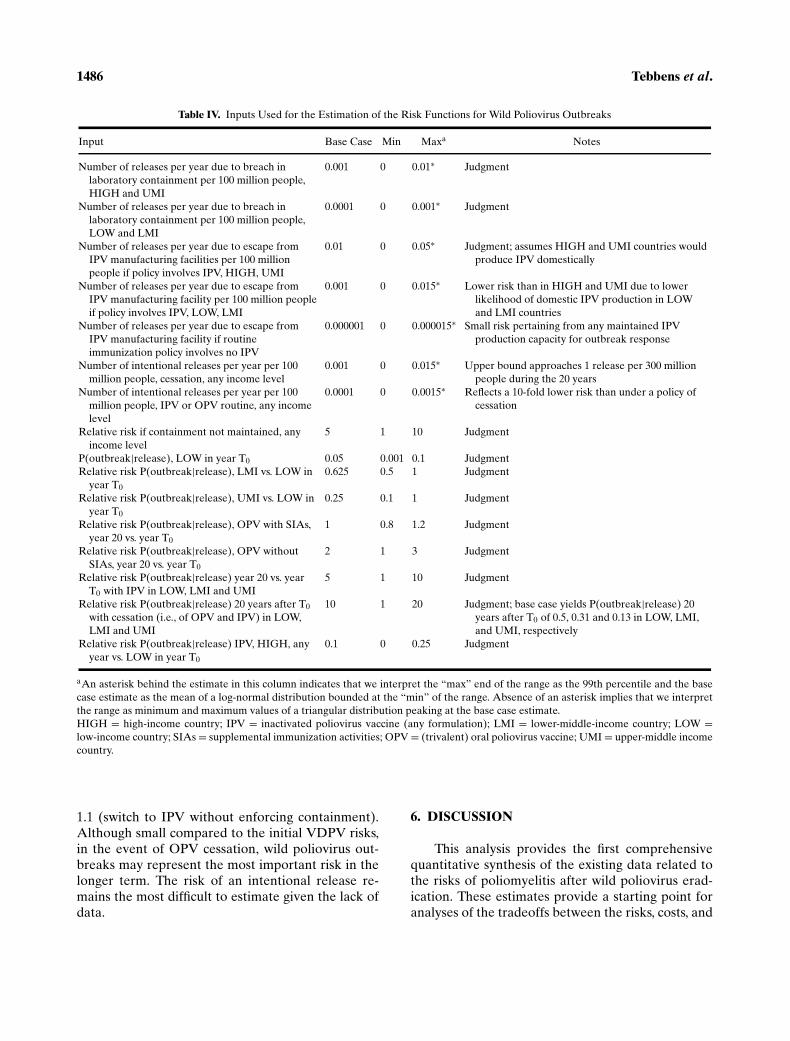
1486 Tebbens et al.
Table IV. Inputs Used for the Estimation of the Risk Functions for Wild Poliovirus Outbreaks
Input Base Case Min Maxa Notes
Number of releases per year due to breach in
laboratory containment per 100 million people,
HIGH and UMI
0.001 0 0.01∗ Judgment
Number of releases per year due to breach in
laboratory containment per 100 million people,
LOW and LMI
0.0001 0 0.001∗ Judgment
Number of releases per year due to escape from
IPV manufacturing facilities per 100 million
people if policy involves IPV, HIGH, UMI
0.01 0 0.05∗ Judgment; assumes HIGH and UMI countries would
produce IPV domestically
Number of releases per year due to escape from
IPV manufacturing facility per 100 million people
if policy involves IPV, LOW, LMI
0.001 0 0.015∗ Lower risk than in HIGH and UMI due to lower
likelihood of domestic IPV production in LOW
and LMI countries
Number of releases per year due to escape from
IPV manufacturing facility if routine
immunization policy involves no IPV
0.000001 0 0.000015∗ Small risk pertaining from any maintained IPV
production capacity for outbreak response
Number of intentional releases per year per 100
million people, cessation, any income level
0.001 0 0.015∗ Upper bound approaches 1 release per 300 million
people during the 20 years
Number of intentional releases per year per 100
million people, IPV or OPV routine, any income
level
0.0001 0 0.0015∗ Reflects a 10-fold lower risk than under a policy of
cessation
Relative risk if containment not maintained, any
income level
5 1 10 Judgment
P(outbreak|release), LOW in year T0 0.05 0.001 0.1 Judgment
Relative risk P(outbreak|release), LMI vs. LOW in
year T0
0.625 0.5 1 Judgment
Relative risk P(outbreak|release), UMI vs. LOW in
year T0
0.25 0.1 1 Judgment
Relative risk P(outbreak|release), OPV with SIAs,
year 20 vs. year T0
1 0.8 1.2 Judgment
Relative risk P(outbreak|release), OPV without
SIAs, year 20 vs. year T0
2 1 3 Judgment
Relative risk P(outbreak|release) year 20 vs. year
T0 with IPV in LOW, LMI and UMI
5 1 10 Judgment
Relative risk P(outbreak|release) 20 years after T0
with cessation (i.e., of OPV and IPV) in LOW,
LMI and UMI
10 1 20 Judgment; base case yields P(outbreak|release) 20
years after T0 of 0.5, 0.31 and 0.13 in LOW, LMI,
and UMI, respectively
Relative risk P(outbreak|release) IPV, HIGH, any
year vs. LOW in year T0
0.1 0 0.25 Judgment
aAn asterisk behind the estimate in this column indicates that we interpret the “max” end of the range as the 99th percentile and the base
case estimate as the mean of a log-normal distribution bounded at the “min” of the range. Absence of an asterisk implies that we interpret
the range as minimum and maximum values of a triangular distribution peaking at the base case estimate.
HIGH = high-income country; IPV = inactivated poliovirus vaccine (any formulation); LMI = lower-middle-income country; LOW =low-income country; SIAs = supplemental immunization activities; OPV = (trivalent) oral poliovirus vaccine; UMI = upper-middle income
country.
1.1 (switch to IPV without enforcing containment).Although small compared to the initial VDPV risks,in the event of OPV cessation, wild poliovirus out-breaks may represent the most important risk in thelonger term. The risk of an intentional release re-mains the most difficult to estimate given the lack ofdata.
6. DISCUSSION
This analysis provides the first comprehensivequantitative synthesis of the existing data related tothe risks of poliomyelitis after wild poliovirus erad-ication. These estimates provide a starting point foranalyses of the tradeoffs between the risks, costs, and

Risks of Paralytic Disease from Poliovirus 1487
Low-income countries
0
0.0005
0.001
0.0015
0 2 4 6 8 10 12 14 16 18
Time (years) after T0
Lower-middle-income countries
0
0.0002
0.0004
0.0006
0.0008
0.001
0 2 4 6 8 10 12 14 16 18
Time (years) after T0
Po
isso
n r
ate
(1/y
ear)
Upper-middle-income countries
0
0.001
0.002
0.003
0.004
0 2 4 6 8 10 12 14 16 18
High-income countries
0
0.0001
0.0002
0.0003
0 2 4 6 8 10 12 14 16 18
Po
isso
n r
ate
(1/y
ear)
OPV, SIAs, Maintain OPV, SIAs, Do not Maintain
OPV, no SIAs, Maintain OPV, no SIAs, Do not Maintain
IPV, no SIAs, Maintain IPV, no SIAs, Do not Maintain
No routine, no SIAs, Maintain No routine, no SIAs, Do not Maintain
Fig. 4. Yearly (Poisson) rate of occurrence of wild polio outbreaks per 100 million people as a function of time and scenario. Maintain
refers to the policy decision to maintain containment standards. Scales on the y-axis are not all equal. (IPV = inactivated poliovirus vaccine;
OPV = trivalent oral poliovirus vaccine; SIAs = supplemental immunization activities.)
benefits of different policy choices. We anticipate thatthis effort will stimulate discussions and iterations ofthe estimates, and we hope that future studies will fur-ther develop these initial estimates and update themas conditions change and knowledge evolves. We em-phasize that our approach relies on using simple func-tions to represent complicated concepts that in realitydepend on many factors, and that these assumptionsmay suffice for some analyses even if they prove in-sufficient for others.
We highlight several limitations of our analysisby emphasizing that some of our key assumptions sig-nificantly simplify the complex reality. For example,our characterization of risk per 100 million peoplerepresents a simplification of the real world in whichviruses spread from one population to another withno recognition of boundaries, as exemplified in recentexportations of poliovirus from Nigeria and India to21 other countries.(100) However, this represents an is-sue for the modeling of the outbreak magnitude ratherthan the frequency of initiating events leading to out-
breaks. Our characterization implies that we view out-break events as independent events, equally likely tooriginate from any subpopulation within an incomelevel. The rates represent the average frequency in ascenario and neglect heterogeneities within incomelevels. This represents an important simplificationof the true variability among countries. For exam-ple, while the validity of our assumption that high-income countries switched to IPV in 1998 appearsvalid on average, the aVDPV event in Taiwan (see theAppendix, Table A3) demonstrates the possibilitythat some high-income countries may continue usingOPV up to T0 and thus face a higher risk of iVDPVsthan countries that switched to IPV earlier.
Also, our framework that models policies overa 20-year time horizon may not represent the pref-erence of countries and may not cover the possiblefuture options that may emerge (e.g., the use of an-tivirals to reduce iVDPV risks). We may also fail toadequately cover all of the potential mixed strategiesthat may truly emerge after T0 (e.g., use of IPV only
1488 Tebbens et al.
until the risks of VDPV outbreaks decrease to a pointwhere stopping IPV vaccination does not lead to a sig-nificant risk). We emphasize that our estimates referto the time period following successful polio eradi-cation in all six World Health Organization (WHO)regions,(101) implying that no more wild poliovirusespersist in any population or the environment, not evenundetected viruses. The biology of polioviruses indi-cates a low probability that the virus will persist in theenvironment.(93) However, high-quality surveillanceremains critical in assuring that no clinical cases occurwithout detection. In a setting of poor surveillance,wild poliovirus strains can continue to circulate foras long as seven years without detection, as recentlyexperienced in Central Africa.(102)
A further limitation of our estimation of the risksassociated with continuation of OPV in most coun-tries lies in the assumption that coverage remains atthe current levels. In reality, resource-scarce coun-tries probably cannot maintain their current cover-age beyond the point of global eradication, and pre-eradication experience demonstrates that coveragedrops in polio-free countries without external finan-cial support. Therefore, the constant outbreak riskestimates for countries continuing OPV may repre-sent a best-case scenario. However, we accounted forthis effect by modeling risk with or without SIAs andassuming that the frequency of recent cVDPV out-breaks reflects a world where still 75% of OPV-usingcountries conduct periodic SIAs.
We anticipate iteration on these risk estimates asevents continue to evolve and further research resultsbecome available. For example, ongoing and future in-vestigations of possible iVDPVs detected through en-vironmental surveillance or the prevalence of asymp-tomatic iVDPV excretors could influence related riskestimates and characterization of the uncertainty. Aninvestigation in Slovakia did not succeed in findingthe individual associated with the detected virus, butfurther research concerning these types of events re-mains very important to fully understanding their im-plications.(76) Understanding the existing uncertain-ties helps to identify priority topics for research.
Our estimation of the VAPP rates ignores anyvariability across different settings of the probabilitythat an OPV infection results in paralysis. Only thetypical proportions of primary and secondary OPVinfections, which follow from setting-specific cover-age levels and primary and effective seroconversionrates, determine the eventual VAPP incidence. Ourapproach also supposes different rates of VAPP perinfection depending on the nature of the infection
(i.e., vaccine administration vs. secondary infection).The base case VAPP rates per million birth cohortfrom Table I (ranging from 1.9 to 2.6 per million birthcohort) yield somewhat lower estimates than recentestimates of the global burden of VAPP, which as-sumed a range of two to four cases per million in abirth cohort.(1,103) The lower end of this range reflectsthe U.S. experience, while the upper end reflects theVAPP incidence in India in 2001 divided by the sizeof the birth cohort. In India in 1999, the cohort riskof VAPP appeared even higher at a rate of seven permillion birth cohort.(104)
Our simple model for the cVDPV outbreak ratesdoes not incorporate several important factors thatinfluence the risk of cVDPV outbreaks. First, ourassumption about the rapidly declining prevalenceof OPV viruses dominates the risk, and it reflects alower-middle-income country (Cuba) with very goodpopulation immunity and sanitation. Extrapolation ofthese results to settings of lower hygiene and/or popu-lation immunity requires caution.(63,105) The observeddecline in detection of OPV viruses corresponds to asituation of OPV cessation immediately after a massimmunization campaign to boost population immu-nity. From a global perspective, a comparable, opti-mal level of population immunity would occur onlyif all currently OPV-using countries discontinue rou-tine OPV use after a final globally synchronized im-munization day just prior to cessation. No experienceexists with countries that stop OPV use in an environ-ment of suboptimal population immunity and poorhygiene, and the decline in virus prevalence in thosesettings may occur much more slowly than in Cuba.
Second, coordinated cessation represents a cru-cial factor. If some countries discontinue OPV whileother countries continue to use OPV, especially neigh-bors, the former provide an ideal opportunity for theemergence of cVDPVs. Evidence of frequent OPVvirus importation in non-OPV-using countries existsnow, with researchers in IPV-using high-income coun-tries regularly isolating OPV viruses through varioussurveillance systems.(68,106) We assume for purposesof our risk estimates that cessation occurs in a coor-dinated fashion. In the event of uncoordinated ces-sation, countries that stop OPV may effectively facean increased risk instead of experiencing a decreasedrisk.
Third, doubling the speed of decay in cVDPVoutbreak rates for IPV versus no routine immuniza-tion represents a fairly arbitrary assumption. How-ever, its impact on the aggregate outbreak risk (i.e.,the integral under the curves in Figs. 1 and 2) remains
Risks of Paralytic Disease from Poliovirus 1489
limited given that both outbreak rates assume thesame starting point. Furthermore, during the periodof the highest cVDPV risk (i.e., soon after OPV cessa-tion) the influence of IPV immunization of infants onthe immunity in the general population likely remainssmall.
Fourth, responding to poliomyelitis outbreakswith mOPV or OPV after cessation of routine OPVvaccination and SIAs represents an important op-portunity for emergence of cVDPVs since any areanot covered by a response would face a risk of im-porting vaccine strains used in response to the out-break. While this risk decreases as a function of theintensity of contact with the outbreak population, re-duced population immunity after OPV cessation im-plies that OPV strains used in the response could, withsome probability, reestablish circulation and createcVDPVs. We currently lack evidence to quantify thisrisk.
Regarding the estimation of the rates of iVDPV-related outbreaks, we emphasize that our basecase analysis includes three possible chronic iVDPVexcretors detected through environmental surveil-lance, and no other evidence exists for the possi-bility of chronic excretors in upper-middle-incomecountries. The interpretation of these environmentaliVDPVs drives the risk in these countries. We alsoassumed zero prevalence of chronic iVDPV ex-cretors in low- and lower-middle-income countries,although it remains possible that in the future im-proved sanitation and medical service in those coun-tries will allow longer survival of persons with severeimmunodeficiencies. This would imply an increasedrisk of iVDPV-related outbreaks in those countries,although probably such excretors would only survivein those subpopulations with the best hygienic condi-tions (and thus the lowest outbreak risk) within thesecountries.
We encountered a number of difficulties in mod-eling the functional relationship between populationimmunity in the different income levels over time andthe conditional probability given a transmissible po-liovirus introduction (see the Appendix, Section 3.2).The linear relationship we assumed simplifies the real-ity and ignores many complexities, and thus interpret-ing the rates of iVDPV or wild poliovirus outbreaksrequires caution. Similarly, very limited data exist tosupport our wild poliovirus release frequencies andconsideration of the uncertainty remains crucial forthe potential use of these estimates for future analy-ses. Improved quantification of the uncertainty in eachrisk might require further iteration and warrant for-
mal expert elicitation.(107) In the context of using therisk estimates presented here in a decision analyticmodel, analysts should appreciate the uncertainty ineach risk estimate.(108) Global, national, and regionalpolicymakers face significant challenges and, most im-portantly, they must decide how to coordinate thetransition to future immunization policies. We believethat discussions should occur soon to allow sufficientopportunity for planning and implementation. Ourestimates of the cVDPV outbreak risk soon after OPVcessation dominate in most scenarios, even with ourassumption of coordinated cessation. If coordinationefforts fail, we expect that the cessation of polio vacci-nations would unnecessarily increase the risk. On theother hand, failure to stop OPV vaccinations virtuallyguarantees increasing numbers of cVDPV outbreaksas SIA activities wane and the global population con-tinues to increase. We further find it imperative thatdecisionmakers continue to plan and begin implemen-tation of processes to develop a vaccine stockpile andto prepare for the likely possibility of an outbreakafter OPV cessation. Clearly, future studies shouldrecognize the existence of potential risks and assesscosts related to developing, maintaining, and using apolio vaccine stockpile. We emphasize that respond-ing to an outbreak with either OPV or mOPV alsorepresents a potential for generating vaccine-derivedpolioviruses, and policymakers must factor this intothe discussions and decisions as they evaluate and de-velop much-needed posteradication response plan(s).Although discussing the magnitude of outbreaks liesbeyond the scope of this article, we emphasize that alate response implies an important risk of large num-bers of paralytic poliomyelitis cases.(14,18,109,110) Thenumber of expected paralytic cases in the event ofan outbreak differs depending on the policies and in-come level and increases as time since OPV cessationelapses.
Given the reality of the risks discussed in this ar-ticle, we emphasize that efforts to minimize and man-age the risks must not promise zero risk or create anexpectation that no outbreaks can occur after erad-ication. Combining all of the risk estimates with theglobal population forecasts(20,69) suggests an approx-imately 50 to 100% chance of at least one outbreakduring the first 20 years after T0 global OPV cessa-tion with the lower bound assuming MPI, cVDPVlow-risk case and maintained containment and thehigher bound assuming RPI, cVDPV high-risk caseand weaker containment. If low- and middle-incomecountries all switch to IPV, the range of risk estimatedecreases to approximately 40% to almost 100%.

1490 Tebbens et al.
With continued OPV use the probability of at leastone outbreak is greater than 99% for either cVDPVrisk case, with more outbreaks expected per year ifcountries stop boosting population immunity by con-ducting SIAs. Thus, the world must prepare for theposteradication transition and commit to sustainederadication and containment, which may require re-defining the goal after interruption of wild poliovirustransmission as continued absence of sustained cir-culation of polioviruses (including VDPVs). In thiscontext, any outbreak that occurs, particularly dur-ing the process of OPV cessation, does not under-mine or undo the achievement of global eradication,and this analysis suggests that policymakers should as-sume some nonzero chance of at least one outbreakduring the transition period and prepare for it.
This article does not deal with other potentiallyimportant risks, including the financial risks that mayimpair the ability to actually implement a preferredpolicy option, in particular the costly option of vac-cinating with IPV indefinitely.(111) Clearly, countriesmust continue to weigh the risks of VAPP and VDPVsassociated with the use of OPV, and the costs associ-ated with any options they choose.
We suggest several important areas for future re-search: the functional relationship between popula-tion immunity in different income levels over time andthe conditional probability of outbreak given a virusintroduction, the sensitivity of detection for iVDPVs,the implications of the environmental iVDPV iso-lates, the uncertain potential of IPV to prevent out-breaks in low-hygiene settings, and the design of out-break response strategies and a vaccine stockpile.Nevertheless, in the context of the risk frameworkpresented by Aylward and Cochi,(13) we believe thatthis article offers a significant step further down thepath of quantification and consequently toward im-proved and more informed decision making.
ACKNOWLEDGMENTS
The authors thank Dr. James Alexander, Ms. Lor-raine Alexander, Dr. Lawrence Barker, Dr. Esther deGourville, Dr. Tracy Lieu, Dr. Nalinee Sangrujee, andDr. Jean Smith for helpful insights, discussions, andcomments. We would particularly like to acknowl-edge the vital contributions of the national and in-ternational staff conducting AFP surveillance in 192countries and who carry out virologic investigationsof AFP cases in the 145 laboratories of the GlobalPolio Laboratory Network. Drs. Duintjer Tebbensand Thompson acknowledge support for their workfrom the CDC under Grant U50/CCU300860,
TS-0675. The findings and conclusions in this articleare those of the authors and do not necessarily repre-sent the views of the funding agency.
APPENDIX
This appendix provides additional background in-formation, details, and formulas for the calculations,and elaborates on some of the assumptions and in-put estimates for each risk. We organize the appendixinto sections for each risk following the structure ofthe main article.
1. Additional Information Related to theVAPP Risk
1.1. Factors Affecting the Risk of VAPP
Table A1 summarizes individual risk factors forcontracting VAPP, including the lack of prior immu-nity, genetic presusceptibility (i.e., primary immunod-eficiencies),(28) infection with type 3 OPV (as opposedto the other two serotypes),(27,36,112,113) and intramus-cular injections.(61,114) The rapid rate of genetic muta-tion among polioviruses means that the viruses thatOPV recipients excrete can evolve and acquire higherneurovirulence than the original vaccine virus. There-fore, secondary OPV infection may present a higherrisk than primary OPV infection (i.e., vaccination) infully susceptible individuals.
At the population level, the risk in terms of ex-pected annual number of VAPP cases due to routineimmunization depends primarily on two factors: theamount of OPV used and the density of susceptibles.In a stable population with a low, constant density ofsusceptibles, the amount of OPV administered yearlyto the birth cohort remains the main factor influenc-ing the incidence of VAPP. In the context of rou-tine OPV use with high coverage, industrialized coun-tries reported relatively consistent rates of paralyticpoliomyelitis of about 0.3 to 0.7 (recipient plus con-tact) VAPP cases per million distributed or admin-istered doses.(25–27,29,113,115,116) These studies also re-ported consistent rates of first-dose recipient VAPPcases ranging from 0.7 to 1.5 cases per million firstdoses.
However, the literature suggests that the popula-tion risk for VAPP does not follow a linear relation-ship in the number of doses. India administered 733million OPV doses in 1999 to about 125 million chil-dren aged less than five years, representing an averageof over five doses per child.(104) Despite a high overall

Risks of Paralytic Disease from Poliovirus 1491
Table AI. Factors Influencing the Risk of VAPP at an Individual Level and During an Outbreak Response After OPV Cessation
Individual Risk Factors Effect
Lack of prior immunity from maternal antibodies, previous wild or OPV virus
infection, or previous IPV vaccination. Age at first OPV dose and birth order
may impact risk (with older siblings benefiting from increased maternal
antibody titers due to recent secondary OPV exposure of their mothers from
vaccination of the first sibling).
Prior immunity eliminates risk of VAPP
Genetic presusceptibility, such as primary immunodeficiencies involving B-cell
system abnormalities (e.g., agammaglobulinemia or
hypogammglobulinemia).(28) No evidence exists that HIV presents a risk
factor.(6) No other currently identifiable genetic predisposition factors exist.
Persons with primary immunodeficiencies face several
1,000-fold higher risk
Frequent intramuscular injections soon after OPV vaccination (provocation
poliomyelitis).(61,114)Increased risk of VAPP
Type 3 OPV virus infection. Recipient or contact VAPP is most frequently
associated with type 3 infections both for (trivalent) OPV and mOPV.(27,37)
Contact VAPP with OPV type 1 occurs very rarely in industrialized countries,
but more frequently in developing countries.(27,112,113)
Highest risk with type 3, then type 2, then type 1
Primary OPV infection (i.e., vaccination) vs. secondary OPV infection. Secondary OPV infection may represent somewhat
higher risk (although little evidence supports this)
Factors influencing population risk during an outbreak response involving OPV Effect
Lack of prior population immunity. Potential for large number of VAPP cases in
postcessation response
Vaccine used in response. Same serotype variability as for individual risk
Amount of OPV used, with more use of OPV leading to more OPV infections,
but coverage and timing influence the proportion of secondary vs. primary
infections and therefore probably the number of VAPP cases.
Functional relationship unclear
Setting-specific seroconversion rates of the vaccine. Higher seroconversion rates
imply a higher proportion of primary OPV infections and therefore probably
a lower number of contact VAPP cases (seroconversion rates appear
generally lower in developing countries).(118)
High seroconversion rates reduce risk of contact VAPP
HIV = human immunodeficiency virus; IPV = inactivated poliovirus vaccine; mOPV = monovalent oral poliovirus vaccine; OPV = (trivalent)
oral poliovirus vaccine; VAPP = vaccine-associated paralytic poliomyelitis.
incidence of approximately 0.18 VAPP cases per mil-lion people that year, this corresponded to a very lowrate of 0.2 cases per million administered doses. Forcomparison, the United States experienced an overallincidence between 1980 and 1995 of only 0.032 VAPPcases per million people annually (i.e., nearly a factorof 6 lower), but this corresponded to a two-fold higherrate of approximately 0.4 cases per million distributeddoses.(25,103,104,117–119)
The lower section of Table A1 lists a num-ber of factors that influence the population risk forVAPP in the event of an outbreak response involvingOPV.(36,118)
1.2. Calculation of the VAPP Rates
Assuming VAPP rates independent of the set-ting, we based our estimates on U.S. data because ofthe large size of the data set, the completeness andconsistency of these data, and our access to them. Atotal of 89 recipient and 58 contact VAPP cases (in-
cluding cases in immunodeficient persons) occurredin the United States during 1980–1997,(23,24,27) for anaverage size of the annual birth cohort of nearly 4million.(31) Three major U.S. surveys provide cover-age estimates among two-year-old children coveringmost of this time period.(33) We assume that the re-sults of the U.S. Immunization Survey of childrenborn through 1983 underestimated the true cover-age by 15%, based on comments in Simpson et al.(33)
We do not adjust data for the National Health In-terview Survey of children born 1989–1991 and theNational Immunization Survey of children born after1991.(30,33) Deriving estimates for missing years fromany available retrospective surveys among preschool-ers(34,35) and interpolating between remaining years,we obtain an average coverage (weighed by birth co-hort sizes) for children born 1980–1997 of approxi-mately 75% (i.e., coverage by age two with three ormore OPV doses). We further assume a primary se-roconversion rate of 95% for three OPV doses (av-eraging over serotype-specific rates)(1) and that on

1492 Tebbens et al.
Table A2. OPV VAPP Rates Estimation Using Reported Cases,(23,24,29) Adjusted Vaccination Coverage (See Text),(33–35) Seroconversion
Rates,(1) and Population Data(31) from the U.S. Between 1980 and 1997
Symbol [and Formula if Derived] Input Value Notes
T Take rate for 3 OPV doses 0.95 Approximate average of
serotype-specific seroconversion rates
E Effective take rate, i.e., proportion of each
birth cohort eventually seroconverting due
to OPV infection
0.95 Judgment
B Average size of US birth cohort 1980–1997 (in
millions)
3.87
C Average coverage with 3 or more OPV doses
by age 2
0.75 See text
I1 [I1 = T ∗ B ∗ C] Number of primary OPV infections (i.e., first
infections in OPV recipients) in each birth
cohort (in millions)
2.76 Count successful trivalent OPV
vaccination as 1 infection although in
reality it amounts to 3 infections. This
cancels out later because we also count
VAPP cases due to all 3 serotypes
I2 [I2 = E ∗ B-I1] Eventual number of secondary OPV
infections in each birth cohort (in millions)
0.91
Y Number of years between 1980 and 1997 18
rV Reported recipient VAPP cases (including
recipient iVAPP), US 1980–1997
89 Includes recipient iVAPP cases
cV Reported contact VAPP cases (including
contact iVAPP), US 1980–1997
58 Includes contact iVAPP cases
cr Completeness of reporting 0.96 Derives from comparing number of
reported cases during 1980–1991 (as of
2004(23,24) with number of cases
expected for this period after
correcting for underreporting(29)
ArV [ArV = rV/(cr ∗ Y)] Average yearly number of recipient VAPP
cases, US 1980–1997 (including recipient
iVAPP)
5.17
AcV [AcV = cV/(cr ∗ Y)] Average yearly number of contact VAPP
cases, US 1980–1997 (including contact
iVAPP)
3.37
r1 [r1 = ArV/I1] Recipient VAPP cases per million primary
OPV infections in fully susceptibles
1.87 Lower bound 1.56 (if C = 0.90) and
upper bound 2.17 (if C = 0.65)
r2 [r2 = AcV/I2] Contact VAPP cases per million secondary
OPV infections in fully susceptibles
3.71 Lower bound 2.28 (if E = 1.0 and C =0.65) and upper bound 10.3 (if C =0.75 and E = 0.8)
RR [RR = r2/r1] Relative risk contact VAPP vs. recipient VAPP 1.98
TVI [tVI=(rV+cV)/(cr ∗ Y ∗ E ∗ B)] Rate of total VAPP cases per million total
(primary and secondary) OPV infections
2.33
iVAPP = immunodeficient VAPP; OPV = (trivalent) oral poliovirus vaccine; VAPP = vaccine-associated paralytic poliomyelitis.
average 95% of each birth cohort eventually sero-converts (with all three serotypes) due to primaryor secondary OPV infections (i.e., the effective takerate).
Using these numbers, Table A2 shows the break-down by primary and secondary infections, and theVAPP rates that follow. This results in rates of 1.9 re-cipient VAPP cases per million OPV infections and3.7 contact VAPP cases per million secondary OPVinfections.
The effective take rate estimate (of 95%) impactsonly the contact VAPP rate. Although the true effec-
tive take rate remains uncertain, given generally highseroprevalence in children by age five,(30,32) its rangemost likely does not exceed 80% to 100% for U.S.cohorts born since 1980. Using these bounds yields arange for the contact VAPP rate of 3.1 to 10.3 per mil-lion secondary OPV infections. However, this impliesa very limited range of 2.1 to 2.6 total VAPP casesper total number of OPV infections in susceptibles(i.e., aggregating recipient and contact VAPP). Theaverage vaccination coverage drives the ratio of pri-marily to secondarily infected individuals and there-fore the difference in risk estimates for recipient and

Risks of Paralytic Disease from Poliovirus 1493
contact VAPP per infection. For example, if we varythe average coverage between 65% (i.e., the averagewithout correcting for underestimation) and 90%(i.e., the coverage in the 1990s), we obtain contactVAPP rates of 2.6 and 9.2 cases per million secondaryOPV infections, respectively (with other inputs keptat their base case values).
Only 16 of the 58 contact VAPP patients observedbetween 1980 and 1997 were born during that time pe-riod and onset of contact VAPP occurred at an aver-age age of approximately 25 years.(23,24) This approachimplicitly assumes that the same number of contactVAPP cases reported between 1980 and 1997 wouldeventually occur in the cohort born between 1980 and1997 given the same level of routine OPV vaccination.However, the United States switched to a sequentialIPV-OPV schedule in 1997 and to an all-IPV sched-ule in 2000 (and consequently members of this birthcohort would no longer experience potential casesof contact VAPP), so we cannot verify this assump-tion. Increased vaccination coverage reported during1980–1997 correlated inversely with the proportion ofcontact VAPP cases in that birth cohort.(23,24,27)
For outbreak response after OPV cessation,mOPV is emerging as the preferred vaccine given itsmore efficient seroconversion compared to trivalentOPV(37,118) and given that trivalent OPV would un-necessarily reintroduce poliovirus serotypes not re-lated to the outbreak.(14) Therefore, we must considerthe VAPP risk associated with potential mOPV usefor outbreak response. While we can rely on exten-sive data about VAPP from trivalent OPV use, limiteddocumented experience exists with VAPP cases fromwidespread mOPV use. Only four large population-based studies in the United States and Hungary pro-vide some limited basis for quantitative estimates forVAPP associated with mOPV.(37) Domok describesthe only data set in the context of widespread mOPVuse for largely susceptible birth cohorts,(36) but thetype 3 mOPV strain used at the time probably doesnot reflect the properties of the currently used strains.Given the limitations in the available data, we assumesimilar risks as we obtained for trivalent OPV, includ-ing the wide uncertainty ranges that remain consistentwith the variability across serotypes based on the ex-perience in Hungary (Reference 36, Table 2 ).
Note that both in the calculation of the observedrisk of VAPP (Table A2) and in the estimation of thefuture risk of VAPP (Table I), we neglected the influ-ence of maternal antibodies. The fact that newbornsmay benefit from some level of antibodies, which de-cays at a half-life of about 28 days,(120) implies thatsome proportion of first OPV infections, especially
those associated with doses given at early age, donot represent OPV infections in fully susceptibles.Consequently, by implicitly counting each first infec-tion as an infection to a fully susceptible, we prob-ably overestimate the number of OPV infections infully susceptibles, resulting in lower VAPP rates (i.e.,r1 and r2) because we overestimate the denomina-tor of potentially VAPP-causing infections (recallingthat presence of antibodies protects against VAPP).However, if we assume that the extent of overesti-mation in the calculation of VAPP rates in the pastequals that in the prospective estimation of the num-ber of secondary infections (i.e., I1 and I2), then theeffects of neglecting maternal antibodies cancel outwhen multiplying the VAPP rates by the numbers ofOPV infections. In the event of a massive outbreak re-sponse with OPV, this approach might underestimatethe number of VAPP cases because only a very smallproportion of first OPV infections would then occurin infants still protected through maternal antibodies.
2. Calculation of cVDPV Outbreak Rates
For completeness, Table A3 lists documentedaVDPV events that we did not include in our analy-sis given weak evidence for circulation or their emer-gence from settings unrepresentative of the currentsituation (e.g., the event in Poland appears to have in-volved widespread circulation but did not involve anOPV strain currently in use). Table A4 (top) shows theaverage annual frequency of cVDPV outbreaks per100 million people in low- or lower-middle-incomesettings both with and without SIAs during 1999–2005based on the outbreaks counted in Table II.
Two competing trends drive this risk after OPVcessation: (1) a rapid decline in the prevalence ofvaccine-derived viruses, which implies a decreasedoutbreak risk, and (2) a decrease in population immu-nity as newborn children remain unvaccinated, whichimplies an increased outbreak risk. Conditioning onthe prevalence leads to the following expression forthe probability of a cVDPV outbreak:
P(cVDPV outbreak)
= P(prevalence ≥ 1 virus)
× P(outbreak | prevalence ≥ 1 virus)
+ P(prevalence = 0 viruses)
× P(outbreak | prevalence = 0 viruses)
= P(prevalence ≥ 1 virus)
× P(outbreak | prevalence ≥ 1 virus)

1494 Tebbens et al.
Table A3. aVDPV Events Not Included in the Risk Estimatesa
Number of
Income Isolates (% Paralytic
Year Country Level Serotype Divergence)b Cases Notes Sources
2005 Cambodia LOW 3 2 (1.9–2.1) 1 Patient immunocompetent but community
spread undetected (as of 1/1/2006)cUnpublished
2005 US HIGH 1 4 (∼ 2–2.5)d 0 In religious community with very low IPV
coverage; one additional infected
immunocompromised child listed in
Table III
(48)
2004 Japan HIGH 2 1 (1.2) 0 Single isolate from a healthy child obtained
during a stool survey
(38)
2004 Syria LMI 2 1 (1.1) 1 In context of high national OPV coverage Unpublished
2004 Lao PDR LOW 2 3 (1.1) 1 In context of local gaps in OPV coverage Unpublished
2003 Mongolia LOW 1 1 (1.3) 0 In context of high national OPV coverage (44)
2002 Taiwan HIGH 1 and 2 2 (1.1–1.3) 1 Type 1 (1.1% divergence) isolated from an
AFP case, type 2 (1.3% divergence) from a
contact
Unpublished
2002 Zimbabwe/
Ireland
LOW/ HIGH 1 17 (1.1–1.5) 0 All viruses isolated in Ireland over a
4-month period from a healthy child born
from an HIV-positive mother and
vaccinated in Zimbabwe
(50)
2001 Syria LMI 2 3 (1.3–1.5) 1–3 In context of high national OPV coverage;
total number of cases uncertain
Unpublished
2001 Madagascar LOW 2 1 (1.0) 1 Unrelated to Madagascar cVDPV outbreak
but also in context of very low OPV
coverage
(40)
1999 Russia LMI 1 1 (2.6) 1 Isolate from an orphanage (51)
1999 Russia LMI 3 1 (1.8) 0 Isolate from an orphanage (52)
1994 Japan HIGH 2 1 (1.4) 0 Isolate from sewage (53,54)
1968 Poland UMI 3 8 (NR) 464 Outbreak virus related to USOL-D-Bac
strain; background of poor IPV-induced
immunity; percent divergence from Sabinstrain not reported and not applicable
because the starting point was a
USOL-D-Bac strain
(55)
1965 Belarus LMI 2 9 (1.1) 0 In context local OPV cessation; only the
most divergent among the 9 isolates
showed more than 1% VP1 divergence
(56)
aFurther VDPVs with little over 1% VP1 divergence and weak evidence for significant spread of, or insufficient information about, the virus
have been detected through AFP or other surveillance in recent years.(38,39,44,47,49,57,58)
bPercent divergence refers to the number of nucleotide changes in the VP1 region compared to the parent OPV strain.cThis event was confirmed as a cVDPV outbreak with the detection of a second AFP case in January 2006dVirus presumably originated from a separate, unidentified prolonged excretor.
AFP = acute flaccid paralysis; aVDPV = ambiguous vaccine-derived poliovirus; cVDPV = circulating vaccine-derived poliovirus; HIGH =high-income country; IPV = inactivated poliovirus vaccine; LMI = lower-middle-income country; LOW = low-income country; NR = not
reported; OPV = (trivalent) oral poliovirus vaccine; SIAs = supplemental immunization activities; SNIDs = subnational immunization
days; UMI = upper-middle-income country; VP1 = viral protein 1.
The first term on the right-hand side of the equa-tion declines over time after OPV cessation. Threedata sets from Cuba where OPV cessation occurstwice a year consistently show sharp declines in virusprevalence with different virus detection methods(i.e., serology, stool samples of children, environmen-
tal sampling).(62,64) Fig. A1 shows the limited serol-ogy data and the best-fit exponential decay curve forunvaccinated infants reflecting secondary exposureto circulating OPV viruses following a National Im-munization Day (NID). The stool samples and envi-ronmental sampling data also show rapid decay.(62,64)

Risks of Paralytic Disease from Poliovirus 1495
Table A4. Inputs to the cVDPV Outbreak Risk Estimation, Based on Frequency of Events During 1999–2005 (See Table II),
Country-Specific Policies of OPV Vaccination During This Period and 2000–2005 Population Data(69)
cVDPVs and
Input cVDPVs aVDPVs Note
Calculation of initial risk on OPV backgroundY Number of years considered 7 7 1
Nsia Number of outbreaks on OPV with SIAs background 1999–2005,
LOW or LMI
1 4
Nnosia Number of outbreaks on OPV without SIAs background
1999–2005, LOW or LMI
5 8
P Population in OPV-using countries 1999–2005 (in 100 millions),
LOW or LMI
48 48 2
F Fraction of OPV-using population in countries conducting SIAs 0.75 0.75 3
Lsia [Lsia = Nsia/(Y ∗ P ∗ F)] Average annual frequency of outbreaks on background of OPV
with SIAs per 100 million people at risk, LOW or LMI
0.004 0.016
Lnosia [Lnosia
= Nnosia/(Y ∗ P ∗ (1-F))]
Average annual frequency of outbreaks on background of OPV
without SIAs per 100 million people at risk, LOW or LMI
0.060 0.095
Other inputs (all by assumption/judgment) Base case Min Max Note
RRumi Relative risk UMI vs. LOW or LMI 0.1 0.05 0.5
Hlowstop Half-life (LOW, stop) in years 0.5 0.25 1
Hlmistop Half-life (LMI, stop) in years 0.4 0.25 1
Humistop Half-life (UMI, stop) in years 0.2 0.1 0.5
RRhipv Relative half-life with IPV vs. stop 0.5 0.33 1
Kopv Decay constant (any income level, any OPV continuation policy) 0 0 0 4
Lhigh Risk in HIGH 0.000001 0 0.00001 5
Y Number of years to reach OPV without SIAs level after stopping
SIAs
3 1 5 6
1 1999–2005 by assumption.2 Assumes all low- and lower-middle-income countries used OPV during 1999–2005.3 Equals sum of population of countries doing SIAs in each year of 1999–2003 divided by world population minus high-income countries
times five years. This assumes the ratio remained constant through 2005. We characterize the uncertainty using a triangular distribution
over the range 0.5 to 0.9 peaking at 0.75.4 This decay implies that the risk is constant over time if OPV use continues.5 Reflects a small risk of any cVDPV importations or escapes of OPV-derived viruses from a laboratory. We characterize the uncertainty
using a log-normal distribution with mean at the base case estimate and 99th percentile at the “Max” value.6 This input determines how fast the rate for OPV-using countries stopping SIAs increases to the OPV without SIAs level if population
immunity is optimal at T0 (i.e., assuming SIAs continue until T0 or a coordinated immunization push is held at T0). We assume the increase
is linear.
aVDPV = ambiguous vaccine-derived poliovirus; cVDPV = circulating vaccine-derived poliovirus; HIGH = high-income country;
IPV = inactivated poliovirus vaccine; LMI = lower-middle-income country; LOW = low-income country; SIAs = supplemental immuniza-
tion activities; OPV = (trivalent) oral poliovirus vaccine; UMI = upper-middle-income country.
Although the prevalence of OPV viruses does notequal the probability that prevalence of virus exceeds1, we assume that both decline at a similarly rapidrate.
The second term on the right-hand side of theequation depends on many factors, including thetransmissibility of polioviruses and immunity to infec-tions in the population. While random virus mutationsand person-to-person spread ultimately determinewhether a virus leads to an outbreak, population im-
munity thresholds (dependent on the transmissibil-ity of the virus) probably play an important role inthe potential for outbreaks given the prevalence of avirus.(121) If we knew exactly the population immunityprofile and transmissibility of the virus, we could moreconfidently predict that either the probability of anoutbreak given the prevalence of at least one virus ap-proaches 1 (population immunity below threshold) orthat the probability approaches 0 (population immu-nity above threshold). However, we remain uncertain

1496 Tebbens et al.
y = 0.464e-1.5251x
0
0.05
0.1
0.15
0.2
0.25
0.3
0.35
0.4
0.45
0.5
0 0.5 1 1.5 2 2.5 3 3.5 4 4.5
Months born after NID
Pro
po
rtio
n s
ero
po
sit
ive
Proportion seropositive (type 2)
Exponential fit
Fig. A1. Reduction in seroprevalence of
unvaccinated infants born between
national immunization days (NIDs) in
Cuba (Reference 64, Table 3). Given the
lack of maternal antibodies at age of
sample collection (i.e., prior to next NID)
and absence of routine immunization
between NID rounds, seropositivity
indicates prior (secondary) exposure to
circulating oral polio vaccine viruses. The
fit corresponds to an exponential decay
with a half-life of approximately 0.45
months. The same data set showed a
faster decay for the other two serotypes
(Reference 64, Table 3).
about the true transmissibility of OPV viruses as theyevolve toward VDPVs and the effective immunitythat polio vaccines provide against infections. Inaddition, important variability exists both in the im-munity and the transmissibility even within incomestrata (e.g., contact patterns in populations, serotypes,hygiene, climate, and seasons). Consequently, al-though clearly the conditional probability of an out-break given the prevalence of at least one virus willincrease with time after OPV cessation, the time atwhich immunity decreases to below the threshold ina given population remains challenging to predict.
We make the simplifying assumption that thisconditional probability increases at a much slowerrate than the exponential decay of the virus preva-lence, which implies that the first term on the right-hand side dominates. Given this assumption, we ap-proximate the resulting decline in the overall risk byan exponential decay, distinct from the virus preva-lence decay, with a decay parameter k, where k rep-resents the aggregate effect of the two competingtrends. Consequently, the following generic formularepresents our characterization of the Poisson rate ofoccurrence of cVDPV outbreaks in low- and middle-income countries, with the inputs shown in the lowersection of Table A4:
λcVDPV
= {λwithout SIAs + (λwith SIAs − λwithout SIAs) × 1MPI}× rrincome × Exp[−k × (1 − 1OPV) × y],
where
λwith SIAs = the initial average annual frequency ofcVDPV outbreaks per 100 million peo-ple on a background of OPV with SIAsin low- and lower-middle-income coun-tries,
λwithout SIAs = the initial average annual frequency ofcVDPV outbreaks per 100 million peo-ple on a background of OPV withoutSIAs in low- and lower-middle-incomecountries,
rrincome = the relative initial frequency of cVDPVoutbreaks compared to low- and lower-middle-income countries,
k = the constant of the exponential de-cay of the rate of occurrence (equalsLn(0.5)/half-life and depends on thescenarios),
1MPI = 1 with maximum population immunityat T0 or 0 with realistic population im-munity,

Risks of Paralytic Disease from Poliovirus 1497
1OPV = 1 for policies involving OPV and 0 oth-erwise, and
y = the year after T0.
To capture the impact of the population immu-nity at T0, we assume for the RPI scenario that theinitial Poisson rate equals the average frequency ofcVDPV outbreaks on a background of OPV withoutSIAs, while for the MPI scenario we assume that itequals the average frequency of cVDPV outbreaks ona background of OPV with SIAs. For a policy of con-tinued OPV without SIAs, but with maximum popula-tion immunity at T0, we linearly increase the Poissonrate to the λwithout SIAs level over N years, where N =3 at the base case:
λcVDPV = [λwith SIAs + (λwithout SIAs
− λwith SIAs) × y/N] × rrincome, if y ≤ N
λwithout SIAs × rrincome, if y > N
where N = number of years to reach λwithout SIAs levelafter stopping SIAs.
3. Additional Information Related to the Riskof Outbreak Caused by iVDPVs
3.1. Studies Addressing the Incidence of Long-TermExcretion Among Individualswith PIDs
Two recent investigations of the likelihood oflong-term excretion in individuals with PIDs foundno long-term excretors among 384 persons with PIDsin Italy,(72) the United States, Brazil, Mexico, andthe United Kingdom.(70) Both studies concluded thatlong-term excretion appears rare, and Halsey et al.reported a 95% confidence interval upper bound of1.0% for the probability of observing 0 iVDPV excre-tors among 306 persons with immunoglobulin G de-ficiencies.(70) With the prevalence of individuals withPIDs who could potentially excrete long term roughlyestimated at 1:100,000 in high- and upper-middle-income countries,(70) this translates into an upperbound for the prevalence of iVDPV excretors in thosecountries of 140 (i.e., 1.4 billion people × 1/100,000 ×0.01). Estimating the number of PIDs in developingcountries remains a challenge,(70,92) but we expectmuch smaller numbers (despite larger and youngerpopulations in developing countries) because of theshorter survival of individuals with PIDs. AlthoughHIV currently represents the most prevalent form ofimmunodeficiency, particularly in developing coun-tries, no known iVDPV excretors exist among HIV-
infected persons and the risk of prolonged excretionappears low.(28,71,122)
3.2. Calculation of the Rates of iVDPV-RelatedOutbreaks
The small Poisson rate for the iVDPV risk ap-proximates the probability of an outbreak due to aniVDPV in a year per 100 million people and equals theprobability of the presence of (at least) one iVDPVexcretor times the conditional probability of an out-break in one year given the presence of an iVDPVexcretor.
We assume that the prevalence equals the proba-bility of at least one iVDPV excretor (mathematicallyjustified given the very low prevalence of iVDPV ex-cretors per 100 million people). We base our estimatesof the prevalence of prolonged and chronic excretorson the data in Table III. We estimate the prevalenceas the product of the incidence of first OPV infec-tions, which we define as the annual number of suc-cessful vaccinations and secondary immunizations offully susceptible persons, the rates of iVDPV excre-tors per first infection and the mean duration of ex-cretion beyond the first six months after the last OPVinfection. With steady-state routine OPV immuniza-tion, the prevalence per 100 million people as a func-tion of income level equals:
PreviVDPV = b × (dprolonged × rprolonged
+ dchronic × rchronic),
where
b = the income-level-dependent averagebirth rate,
rprolonged = the rate of prolonged iVDPVs excretorsas a function of income level,
dprolonged = the mean duration of excretion of pro-longed excretors beyond the first sixmonths after the associated OPV infec-tion, in years and as a function of incomelevel,
rchronic = the rate of chronic iVDPVs excretors asa function of income level, and
dchronic = the mean duration of excretion of chronicexcretors beyond the first six months af-ter the associated OPV infection, in yearsand as a function of income level.
These formulas assume that in the presenceof routine OPV immunization and absence ofwild poliovirus transmission the entire birth cohort
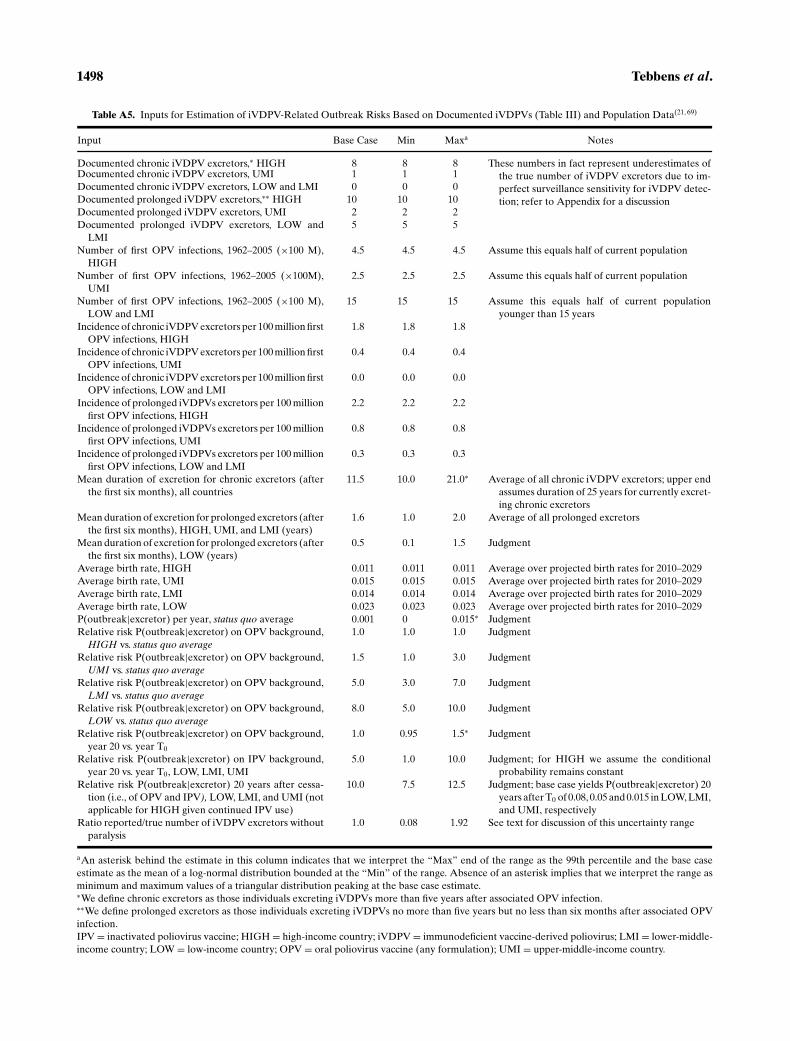
1498 Tebbens et al.
Table A5. Inputs for Estimation of iVDPV-Related Outbreak Risks Based on Documented iVDPVs (Table III) and Population Data(21,69)
Input Base Case Min Maxa Notes
Documented chronic iVDPV excretors,∗ HIGH 8 8 8 These numbers in fact represent underestimates of
the true number of iVDPV excretors due to im-
perfect surveillance sensitivity for iVDPV detec-
tion; refer to Appendix for a discussion
Documented chronic iVDPV excretors, UMI 1 1 1
Documented chronic iVDPV excretors, LOW and LMI 0 0 0
Documented prolonged iVDPV excretors,∗∗ HIGH 10 10 10
Documented prolonged iVDPV excretors, UMI 2 2 2
Documented prolonged iVDPV excretors, LOW and
LMI
5 5 5
Number of first OPV infections, 1962–2005 (×100 M),
HIGH
4.5 4.5 4.5 Assume this equals half of current population
Number of first OPV infections, 1962–2005 (×100M),
UMI
2.5 2.5 2.5 Assume this equals half of current population
Number of first OPV infections, 1962–2005 (×100 M),
LOW and LMI
15 15 15 Assume this equals half of current population
younger than 15 years
Incidence of chronic iVDPV excretors per 100 million first
OPV infections, HIGH
1.8 1.8 1.8
Incidence of chronic iVDPV excretors per 100 million first
OPV infections, UMI
0.4 0.4 0.4
Incidence of chronic iVDPV excretors per 100 million first
OPV infections, LOW and LMI
0.0 0.0 0.0
Incidence of prolonged iVDPVs excretors per 100 million
first OPV infections, HIGH
2.2 2.2 2.2
Incidence of prolonged iVDPVs excretors per 100 million
first OPV infections, UMI
0.8 0.8 0.8
Incidence of prolonged iVDPVs excretors per 100 million
first OPV infections, LOW and LMI
0.3 0.3 0.3
Mean duration of excretion for chronic excretors (after
the first six months), all countries
11.5 10.0 21.0∗ Average of all chronic iVDPV excretors; upper end
assumes duration of 25 years for currently excret-
ing chronic excretors
Mean duration of excretion for prolonged excretors (after
the first six months), HIGH, UMI, and LMI (years)
1.6 1.0 2.0 Average of all prolonged excretors
Mean duration of excretion for prolonged excretors (after
the first six months), LOW (years)
0.5 0.1 1.5 Judgment
Average birth rate, HIGH 0.011 0.011 0.011 Average over projected birth rates for 2010–2029
Average birth rate, UMI 0.015 0.015 0.015 Average over projected birth rates for 2010–2029
Average birth rate, LMI 0.014 0.014 0.014 Average over projected birth rates for 2010–2029
Average birth rate, LOW 0.023 0.023 0.023 Average over projected birth rates for 2010–2029
P(outbreak|excretor) per year, status quo average 0.001 0 0.015∗ Judgment
Relative risk P(outbreak|excretor) on OPV background,
HIGH vs. status quo average1.0 1.0 1.0 Judgment
Relative risk P(outbreak|excretor) on OPV background,
UMI vs. status quo average1.5 1.0 3.0 Judgment
Relative risk P(outbreak|excretor) on OPV background,
LMI vs. status quo average5.0 3.0 7.0 Judgment
Relative risk P(outbreak|excretor) on OPV background,
LOW vs. status quo average8.0 5.0 10.0 Judgment
Relative risk P(outbreak|excretor) on OPV background,
year 20 vs. year T0
1.0 0.95 1.5∗ Judgment
Relative risk P(outbreak|excretor) on IPV background,
year 20 vs. year T0, LOW, LMI, UMI
5.0 1.0 10.0 Judgment; for HIGH we assume the conditional
probability remains constant
Relative risk P(outbreak|excretor) 20 years after cessa-
tion (i.e., of OPV and IPV), LOW, LMI, and UMI (not
applicable for HIGH given continued IPV use)
10.0 7.5 12.5 Judgment; base case yields P(outbreak|excretor) 20
years after T0 of 0.08, 0.05 and 0.015 in LOW, LMI,
and UMI, respectively
Ratio reported/true number of iVDPV excretors without
paralysis
1.0 0.08 1.92 See text for discussion of this uncertainty range
aAn asterisk behind the estimate in this column indicates that we interpret the “Max” end of the range as the 99th percentile and the base case
estimate as the mean of a log-normal distribution bounded at the “Min” of the range. Absence of an asterisk implies that we interpret the range as
minimum and maximum values of a triangular distribution peaking at the base case estimate.∗We define chronic excretors as those individuals excreting iVDPVs more than five years after associated OPV infection.∗∗We define prolonged excretors as those individuals excreting iVDPVs no more than five years but no less than six months after associated OPV
infection.
IPV = inactivated poliovirus vaccine; HIGH = high-income country; iVDPV = immunodeficient vaccine-derived poliovirus; LMI = lower-middle-
income country; LOW = low-income country; OPV = oral poliovirus vaccine (any formulation); UMI = upper-middle-income country.

Risks of Paralytic Disease from Poliovirus 1499
eventually acquires an OPV infection due to vacci-nation or secondary OPV spread, regardless of in-come level or immunization coverage. In reality, lessthan 100% may seroconvert, especially in low-incomecountries that stop SIAs. Thus, if SIAs continue, thenthe prevalence of iVDPV excretors may in reality in-crease. However, we assume that this increased riskcancels out against the better population immunitywith SIAs and we do not model the difference in riskfor a scenario of OPV with or without SIAs.
Table A5 displays our best estimates of the inputsin the above formula. We obtain the value of the ratesof iVDPV excretors (rprolonged and rchronic) by divid-ing the number of documented iVDPV excretors bythe total number of OPV recipients or people immu-nized secondarily prior to receiving IPV or contract-ing a wild poliovirus infection during approximately40 years of widespread OPV use. For high- and upper-middle-income countries we roughly estimate this at450 and 250 million people, respectively, representinghalf of the current population in those countries.(20,21)
For low- and lower-middle-income countries, we es-timate this at 1.5 billion people, corresponding to thecurrent number of people aged less than 15 years,given that widespread OPV use started approximately15 years ago in these countries. Thus, using the num-bers of iVDPVs from Table IV, we estimate rprolonged =10/4.5 ∼ 2.2 and rchronic = 8/4.5 ∼1.8 excretors per100 million first OPV infections in high-income coun-tries, rprolonged = 2/2.5 ∼ 0.8 and rchronic = 1/2.5 ∼0.4 in upper-middle-income countries, and rprolonged =5/15 ∼ 0.3 and rchronic = 0 in low- and lower-middle-income countries. In the absence of documented pro-longed excretors in low-income countries, we arti-ficially set their average duration of excretion at0.5 year to reflect the shorter survival of persons withPIDs in those countries. For the other income levels,we assume dprolongeed = 1.6 years and dchronic = 11.5years based on the durations in Table III.
The prevalence formula results in estimates forPreviVDPV of 0.005, 0.009, 0.116, and 0.272 per 100 mil-lion people for low-, lower-middle-, upper-middle-,and high-income countries, respectively, using aver-age birth rates in 2001 (which inversely correlatewith income).(20,21) Multiplying by the total popula-tions (year 2001) in each income level in multiples of100 million, this translates into aggregate status quoprevalence of iVDPV excretors of 0.12, 0.20, 0.58, and2.51 for low-, lower-middle-, upper-middle-, and high-income countries, respectively.
In a scenario involving OPV cessation, we as-sume the prevalence follows an exponential decay
at a rate of 1 over the average duration of excretionper year (i.e., initial rate × Exp(−y/d), where y = theyear after cessation and d = the average duration ofexcretion).
Estimation of the conditional probability of anoutbreak given the presence of an iVDPV excretor asa function of time and scenario remains problematic.A theoretical, deterministic condition prescribes thatthe initial net reproductive number (Rn, defined as theaverage number of secondary infections that an infec-tious person causes) must exceed 1 for a single virusintroduction to cause an outbreak (i.e., if each new in-fection leads to only <1 new infections on average theoutbreak will die out, but if each leads to>1 new infec-tions on average the outbreak can take off). Given theproportion of susceptibles (s) in a population and thebasic reproductive number (R0, defined as the averagenumber of secondary infections that an initial infec-tion causes in a entirely susceptible population), thenet reproductive number satisfies the equation Rn =R0/s.(121) If we assume that R0 behaves as a randomvariable, then we can estimate the theoretical proba-bility of an outbreak per secondary iVDPV infectionas a function of s as follows:
P(outbreak in income level i | 1 virus introduction)
= 1 − Pi (R0 ≤ 1/s),
where Pi = the income-level-specific probability dis-tribution for R0. Unfortunately, this probability de-pends heavily on the choice of the probability distri-bution. For example, if the median value of R0 fallsfar from the threshold of 1/s (e.g., a median R0 of 9 orless in a population where s = 10%), the spread in theprobability distribution of R0 dominates the result-ing conditional outbreak probability. Estimating riskratios with different values of s based on this theoret-ical threshold remains challenging given substantialvariability and uncertainty in R0.
With a median R0 > 10 and s > 10%, valuesnot uncommon for wild polioviruses in low-incomesettings,(123,124) the outbreak probability exceeds 0.5regardless of the variance of R0. The lack of ob-served iVDPV-related outbreaks despite the theo-retically high probability in those settings may re-flect the absence of iVDPV excretors due to thelow survival rate of people with PIDs in develop-ing countries. In addition, we remain uncertain aboutthe R0 for iVDPVs. Consequently, it remains difficultto find a functional relationship between populationimmunity and the conditional probability of iVDPV-related outbreaks given the presence of an iVDPVexcretor.
1500 Tebbens et al.
The only data basis for estimating the probabilityof outbreaks given the presence of an iVDPV excretorremains the fact that none of the iVDPV excretors todate led to any outbreak of additional paralytic cases(although two very recent events in Minnesota andSpain demonstrated the capacity of iVDPV virusesto circulate).(38,48) The sum of all duration estimatesin Table III suggests 131 person-years of iVDPVs ex-cretion (i.e., not including the first six months of virusexcretion). This translates into a 95% confidence in-terval upper bound for the probability of an iVDPVoutbreak in any year where an iVDPV excretor existsof 0.023 (based on the assumption that this proba-bility follows a Bernoulli distribution).(22,125) Thus, areasonable estimate of the average probability of aniVDPV outbreak during a year in the presence of aniVDPV excretor in the context of an OPV backgroundand a developed country should not exceed the upperbound.
We estimate the annual probability of iVDPVoutbreaks given the presence of an iVDPV excretorduring the status quo of 0.001 (characterizing the un-certainty with a log-normal distribution with mean at0.001 and 99th percentile at 0.015) in the context oflimited information, although multiplication by therelative risk for the income level implies a maximumrisk with continued OPV of 0.008 in low-income coun-tries. We assume that iVDPV excretors effectively im-munize their close contacts prior to excreting highlydiverged viruses, and this reduces the risk that iVDPVexcretors initiate outbreaks. Furthermore, we assumethat iVDPV excretors typically lack pharyngeal ex-cretion and survive only in relatively good hygienesettings with limited fecal-oral spread, and conse-quently the conditional probability of outbreaks giveniVDPV excretion remains lower than this probabilityfor wild virus introductions. Table A5 also providesestimates for the relative risk 20 years after T0 com-pared to T0, and we use simple linear interpolation toexpress this probability as a function of time althoughwe recognize the limited evidence and significant un-certainties. In the event of OPV cessation, we assumea relative risk after 20 years compared to T0 such thatthe probability of an outbreak given iVDPV excre-tion equals 0.08 after 20 years in low-income countriesstopping polio vaccinations altogether (Table A5).
To obtain the time-dependent Poisson rates wemultiply the prevalence of iVDPV excretors by theannual probability of an outbreak given a singleiVDPV excretor such that the annual rate of oc-currence of iVDPV-related outbreaks per 100 mil-lion people in low-, lower-middle-, and upper-middle-
income countries equals:
λiVDPV = [(rr20 − 1) × y/20 + 1] × Poutbreak|iVDPV
× rrp|income × b × {rprolonged × dprolonged
× Exp[−y × (1 − 1OPV)/dprolonged] + rchronic
× dchronic × Exp[−y × (1 − 1OPV)/dchronic]},where
1OPV = 1 for policies involving routine OPVuse and 0 otherwise,
Poutbreak|iVDPV = the baseline yearly probability of anoutbreak given the presence of a sin-gle excretor,
rrp|income = the relative risk of Poutbreak|iVDPV fora given income level compared tothe baseline probability,
rr20 = the relative risk 20 years after T0 asa function of the routine immuniza-tion policy (i.e., OPV, IPV, or stop)and income level, and
y = the year after T0.
Consistent with our assumption that high-incomecountries switched to IPV in 1998 (on average) and as-suming rrincome = rrp|income = 1, the formula for the rateof occurrence of iVDPV outbreaks in high-incomecountries equals:
λiVDPV = Poutbreak|iVDPV × rrp|income
× b × {rprolonged × dprolonged
× Exp[(y + T0 − 1998)/dprolonged]
+ rchronic × dchronic
× Exp[−(y + T0 − 1998)/dchronic]}.
3.3. Uncertainty about the True Numberof iVDPVs
While our base case analysis accounts only forthose iVDPV excretors detected to date, impor-tant uncertainty exists regarding the true number ofiVDPV excretors. In this subsection, we address theuncertainty about the number of iVDPV excretors(without distinguishing chronic and prolonged excre-tors) and present an estimate for the true number ofiVDPVs based on very limited prior knowledge us-ing Bayes’ theorem.(126) As future research regardingiVDPVs becomes available, this approach allows up-dating the estimates to reflect the reduced uncertainty.Table III reveals that individuals with PIDs bothwith and without paralysis can become iVDPV ex-cretors. Systematic clinical surveillance (i.e., AFP or

Risks of Paralytic Disease from Poliovirus 1501
passive poliomyelitis surveillance) can detect iVDPVexcretors who developed paralysis through analysis ofviruses and follow-up of paralytic patients with PIDs.Although clinical surveillance probably does not de-tect paralytic iVDPV excretors with 100% sensitivity,the primary uncertainty remains the true number ofiVDPV excretors without paralysis. Limited screen-ing of persons with PIDs exists to detect any iVDPVexcretors without paralysis, and consequently we donot know how many people with PIDs commonly getinvestigated for long-term poliovirus excretion.
We use Bayesian updating(126) to combine ouruncertainty about the investigated number of per-sons with PIDs and the results of prior studies thatprovided a denominator (i.e., 384 persons with im-munoglobulin G deficiencies)(70,72) to obtain a distri-bution for the true number of iVDPV excretors. Wefocus on upper-middle and high-income countries be-cause of the greater survival of PIDs in those coun-tries. We define θ as the probability that a person witha PID currently excretes an iVDPV. We rely on es-timates of M = 4 iVDPV excretors without paralysisthat we know currently excrete (Table III; includes en-vironmental isolates) and estimates of the prevalenceof individuals with PIDs (excluding immunoglobu-lin A deficiencies) of roughly 1 per 100,000 in de-veloped countries,(70) or 14,000 in upper-middle andhigh-income countries, to get the prior distributionfor θ . Thus, we know that the number of investigatedpersons with PIDs must lie between 4 and 14,000,and lacking further knowledge we assume equal like-lihood for values within that range (i.e., prior distribu-tion for θ ∼ Uniform(k1,k2), with k1 = M/14,000 andk2 = 1, or an expected value of approximately 0.5).We use a binomial(n, θ) distribution to represent thenumber of iVDPVs (y) in a sample of size n given θ .Using Bayes theorem, we derive the following poste-rior distribution for θ given the observation of y = 0iVDPVs among n persons with PIDs:
P(θ |y = 0, n) = (1 − θ)n × (n + 1)/[(1 − k1)
n+1
−(1 − k2)n+1
].
Using the observation of 0 iVDPV excretorsamong 384 persons with PIDs, we estimate a meanof this distribution of 0.0029. This translates into anestimate for the prevalence of 40 chronic excretorswithout paralysis with a 95th percentile of 112 (com-pared to four chronic excretors where we only includeidentified excretors (i.e., at the base case)), or ratiosof 0.1 and 0.04 reported to actual excretors withoutparalysis, respectively. Assuming that about half of the
iVDPV excretors get paralysis, although our charac-terization includes iVDPV excretors that one may notconsider cases of strong evidence (e.g., environmentalisolates or patients without characterized viruses), wemodel a range of the ratios of reported iVDPV excre-tor to actuals of 0.08 to 1.92, with the best estimateremaining 1.
REFERENCES
1. Sutter, R. W., Kew, O. M., & Cochi, S. L. (2004). Poliovirusvaccine—Live. In S. A. Plotkin & W. A. Orenstein (Eds.),Vaccines, 4th ed. (p. 651–705). Philadelphia: W.B. Saunders.
2. World Health Organization. (2005). Global Polio Eradica-tion Initiative. Available at http://www.polioeradication.org/,accessed September 26, 2005.
3. World Health Organization. (2004). Global Polio Eradica-tion Initiative: Progress 2003. Report No.: WHO/Polio/04.01,Geneva.
4. Sangrujee, N., Duintjer Tebbens, R. J., Caceres, V. M., &Thompson, K. M. (2003). Policy decision options during thefirst 5 years following certification of polio eradication. Med-scape General Medicine, 5(4), 35.
5. World Health Organization. (1998). Report of the Meetingon the Scientific Basis for Stopping Polio Immunization.Report No.: WHO/EPI/GEN/98.12, Geneva: World HealthOrganization.
6. Wood, D. J., Sutter, R. W., & Dowdle, W. R. (2000). Stoppingpoliovirus vaccination after eradication: Issues and chal-lenges. Bulletin of the World Health Organization, 78(3),347–57.
7. Technical Consultative Group of the World Health Orga-nization on the Global Eradication of Poliomyelitis. (2002).Endgame issues for the global polio eradication initiative.Clinical Infectious Diseases, 34, 72–79.
8. Wood, D. J. (2001). The scientific basis for stopping polioimmunisation—Issues and challenges. Developments in Bi-ologicals, 105, 69–72.
9. Cochi, S. L., Sutter, R. W., & Aylward, R. B. (2001). Possibleglobal strategies for stopping polio vaccination and how theycould be harmonized. Developments in Biologicals, 105, 153–158.
10. World Health Organization. (2003). Final report of theWHO informal consultation on identification and manage-ment of vaccine-derived polioviruses. Geneva, September3–5.
11. World Health Organization. (2004). Global Polio Eradica-tion Initiative: Strategic Plan 2004–2008. Geneva.
12. World Health Organization. (2004). Conclusions and rec-ommendations of the Ad Hoc Advisory Committee onPoliomyelitis Eradication, Geneva, 21–22 September 2004.Weekly Epidemiological Record, 79(45), 401–408.
13. Aylward, R. B., & Cochi, S. L. (2004). Framework for eval-uating the risks of paralytic poliomyelitis after global inter-ruption of wild poliovirus transmission. Bulletin of the WorldHealth Organization, 82(1), 40–46.
14. Fine, P. E. M., Sutter, R. W., & Orenstein, W. A. (2001).Stopping a polio outbreak in the post-eradication era. De-velopments in Biologicals, 105, 129–147.
15. Bart, K., Foulds, J., & Patriarca, P. (1996). Global eradicationof poliomyelitis: Benefit-cost analysis. Bulletin of the WorldHealth Organization, 74, 35–45.
16. Kahn, M. M., & Ehreth, J. (2003). Costs and benefits of polioeradication: A long-run global perspective. Vaccine, 21, 702–705.
1502 Tebbens et al.
17. Duintjer Tebbens, R. J., Sangrujee, N., & Thompson, K. M.(2006). The costs of future polio risk management policies.Risk Analysis, 26(6), 1507–1531.
18. Duintjer Tebbens, R. J., Pallansch, M. A., Kew, O. M.,Caceres, V. M., Sutter, R. W., & Thompson, K. M. (2005). Adynamic model of poliomyelitis outbreaks: Learning fromthe past to help inform the future. American Journal of Epi-demiology, 162(4), 358–372.
19. Kew, O. M., Sutter, R. W., de Gourville, E., Dowdle, W. R.,& Pallansch, M. A. (2005). Vaccine-derived polioviruses andthe endgame strategy for global polio eradication. AnnualReview of Microbiology, 59, 587–635.
20. World Bank. (2002). World Bank List of Economies(July 2002). Available at http://www.worldbank.org/data/databytopic/CLASS.XLS, accessed December 2002.
21. UNICEF. (2003). The State of the World’s Children 2003.Available at http://www.unicef.org/sowc03/tables/index.html, accessed July 31, 2003.
22. Ross, S. M. (1997). Introduction to Probability Models, 6thed. San Diego: Academic Press.
23. Alexander, L. N. (2004). Personal communication: VAPPbreakdown and case-by-case characteristics. Atlanta: Na-tional Immunization Program, Centers for Disease Controland Prevention.
24. Alexander, L. N., Seward, J. F., Santibanez, T. A., Pallansch,M. A., Kew, O. M., Prevots, D. R., Strebel, P. M., Cono, J.,Wharton, M., Orenstein, W. A., & Sutter, R. W. (2004). Vac-cine policy changes and epidemiology of poliomyelitis in theUnited States. Journal of the American Medical Association,292(14), 1696–1701.
25. Centers for Disease Control and Prevention. (2000). Po-liomyelitis prevention in the United States. Updated recom-mendations of the Advisory Committee on ImmunizationPractices. Morbidity and Mortality Weekly Report, 49(RR-5), 1–22.
26. Nkowane, B. M., Wassilak, S. G. F., Orenstein, W. A., Bart,K. J., Schonberger, L. B., Hinman, A. R., & Kew, O. M.(1987). Vaccine-associated paralytic poliomyelitis. UnitedStates: 1973 through 1984. Journal of the American Medi-cal Association, 267(10), 1335–1340.
27. Strebel, P. M., Sutter, R. W., Cochi, S. L., Biellik, R. J., Brink,E. W., Kew, O. M., Pallansch, M. A., Orenstein, W. A., &Hinman, A. R. (1992). Epidemiology of poliomyelitis in theUnited States one decade after the last reported case ofindigenous wild virus-associated disease. Clinical InfectiousDiseases, 14, 568–579.
28. Sutter, R. W., & Prevots, D. R. (1994). Vaccine-associatedparalytic poliomyelitis among immunodeficient persons. In-fections in Medicine, 11, 426–438.
29. Prevots, D. R., Sutter, R. W., Strebel, P. M., Weibel, R. E., &Cochi, S. L. (1994). Completeness of reporting for paralyticpoliomyelitis, United States, 1980 through 1991. Archives ofPediatrics and Adolescent Medicine, 148, 479–485.
30. Brink, E. W. (1985). OPV Immunization and Poliovirus An-tibody Prevalence Levels. Atlanta: Division of Immuniza-tion, Center for Prevention Services, Centers for DiseaseControl.
31. Centers for Disease Control and Prevention. (2002). Livebirths, birth rates, and fertility rates, by race: United States,specified years 1940–55 and each year, 1960–2000. NationalVital Statistics Report, 50(5), 27.
32. Chen, R. T., Hausinger, S., Dajani, A. S., Hanfling, M.,Baughman, A. L., Pallansch, M. A., & Patriarca, P. A. (1996).Seroprevalence of antibody against poliovirus in inner-citypreschool children. Journal of the American Medical Asso-ciation, 275(21), 1639–1645.
33. Simpson, D. M., Ezzati-Rice, T. M., & Zell, E. R. (2001).Forty years and four surveys: How does our measuring mea-
sure up? American Journal of Preventive Medicine, 20(Suppl.4), 6–14.
34. Smith, P. Z. (2001). Personal communication: Data from: USCensus Bureau, US immunization survey, national health in-terview survey, national immunization survey and nationalimmunization program. Atlanta: Assessment Branch, Cen-ters for Disease Control and Prevention.
35. Zell, E. R., Dietz, V., Stevenson, J. M., Cochi, S. L., & Bruce,R. H. (1994). Low vaccination levels of US preschool andschool-age children: Retrospective assessments of vaccina-tion coverage, 1991–1992. Journal of the American MedicalAssociation, 271(11), 833–839.
36. Domok, I. (1984). Experiences associated with the use oflive poliovirus vaccine in Hungary, 1959–1982. Reviews ofInfectious Diseases, 6(Suppl. 2), S413–S418.
37. Caceres, V. M., & Sutter, R. W. (2001). Sabin monovalentoral polio vaccines: Review of past experiences and theirpotential use after polio eradication. Clinical Infectious Dis-eases, 33(4), 531–541.
38. World Health Organization. (2005). Poliovirus surveillancereport, January–September 2005. Polio Lab Network Quar-terly Update, 11(4), 3–4.
39. Centers for Disease Control and Prevention. (2004). Labora-tory surveillance for wild and vaccine-derived polioviruses,January 2003–June 2004. Morbidity and Mortality WeeklyReport, 53(42), 990–993.
40. Rousset, D., Rakoto-Andrianarivelo, M., Razafindratsi-mandresy, R., Randriamanalina, B., Guillot, S., Balanant,J., Mauclere, P., & Delpeyroux, F. (2003). Recombinantvaccine-derived poliovirus in Madagascar. Emerging Infec-tious Diseases, 9(7), 885–887.
41. Shimizu, H., Thorley, B., Paladin, F. J., Brussen, K. A., Stam-bos, V., Yuen, L., Utama, A., Tano, Y., Arita, M., Yoshida,H., Yoneyama, T., Benegas, A., Roesel, S., Pallansch, M. A.,Kew, O. M., & Miyamura, T. (2004). Circulation of type 1vaccine-derived poliovirus in the Philippines in 2001. Journalof Virology, 78(24), 13512–13521.
42. Kew, O., Morris-Glasgow, V., Landaverde, M., Burns, C.,Shaw, J., Garib, Z., Andre, J., Blackman, E., Freeman, C.J., Jorba, J., Sutter, R., Tambini, G., Venezel, L., Pedreira,C., Laender, F., Shimizu, H., Yoneyama, T., Miyamura, T.,van Der Avoort, H., Oberste, M. S., Kilpatrick, D., Cochi,S., Pallansch, M., & de Quadros, C. (2002). Outbreak of po-liomyelitis in Hispaniola associated with circulating type 1vaccine-derived poliovirus. Science, 296(5566), 356–359.
43. Yang, C., Naguib, T., Yang, S., Nasr, E., Jorba, J., Ahmed,N., Campagnoli, R., van der Avoort, H., Shimizu, H.,Yoneyama, T., Miyamura, T., Pallansch, M. A., & Kew, O. M.(2003). Circulation of endemic type 2 vaccine-derived po-liovirus in Egypt from 1983 to 1993. Journal of Virology,77(15), 8366–8877.
44. Centers for Disease Control and Prevention. (2003). Labora-tory surveillance for wild and vaccine-derived polioviruses,January 2002–June 2003. Morbidity and Mortality WeeklyReport, 52(38), 913–916.
45. Park, R. E., Yang, C-F, Yang, S.-J, Campagnoli, R. P., Asghar,H., Nategh, R., & Kew, O. M. (2002). Molecular character-ization of divergent Sabin 2-derived isolates from patientswith paralysis. Presented at the 21st Annual Meeting of theAmerican Society for Virology July 18, 2002, Lexington, KY.
46. Georgescu, M.-M, Balanant, J., Macadam, A., Otelea, D.,Combiescu, M., Combiescu, A. A., Crainic, R., & Delpey-roux, F. (1997). Evolution of the Sabin type 1 poliovirus inhumans: Characterization of strains isolated from patientswith vaccine-associated paralytic poliomyelitis. Journal ofVirology, 71(10), 7758–7768.
47. Centers for Disease Control and Prevention. (2002). Labo-ratory surveillance for wild poliovirus and vaccine-derived

Risks of Paralytic Disease from Poliovirus 1503
poliovirus, 2000–2001. Morbidity and Mortality Weekly Re-port, 51(17), 369–371.
48. Centers for Disease Control and Prevention. (2005).Poliovirus infections in four unvaccinated children—Minnesota, August–October 2005. Morbidity and MortalityWeekly Report, 54(Dispatch), 1–3.
49. Chiba, Y., Kobayashi, M., Chosa, T., Yamamoto, T., Endo,K., Shimizu, H., Li, L., Wen-Bo, X., & Zhang, L.-B. (2003).Molecular epidemiology of type 2 vaccine-associated para-lytic poliomyelitis in China. Japanese Journal of InfectiousDiseases, 56, 181–183.
50. Martın, J., Odoom, K., Tuite, G., Dunn, G., Hopewell,N., Cooper, G., Fitzharris, C., Butler, K., Hall, W. W., &Minor, P. D. (2004). Long-term excretion of vaccine-derivedpoliovirus by a healthy child. Journal of Virology, 78(24),13839–13847.
51. Cherkasova, E. A., Korotkova, E. A., Yakovenko, M. L.,Ivanova, O. E., Eremeeva, T. P., Chumakov, K. M., & Agol,V. I. (2002). Long-term circulation of vaccine-derived po-liovirus that causes paralytic disease. Journal of General Vi-rology, 76(23), 6791–6799.
52. Cherkasova, E., Laassri, M., Chizhikov, V., Korotkova, E.,Dragunsky, E., Agol, V. I., & Chumakov, K. (2003). Mi-croarray analysis of evolution of RNA viruses: Evidence ofcirculation of virulent highly divergent vaccine-derived po-lioviruses. Proceedings of the National Academy of Sciencesof the United States of America, 100(16), 9398–9403.
53. Horie, H., Yoshida, H., Matsuura, K., Miyazawa, M., Wak-abayashi, K., Nomoto, A., & Hashizume, S. (2002). Isola-tion of vaccine-derived type 1 polioviruses displaying similarproperties to virulent wild strain Mahoney from sewage inJapan. Journal of Medical Virology, 68(3), 445–451.
54. Yoshida, H., Horie, H., Matsuura, K., Kitamura, T.,Hashizume, S., & Miyamura, T. (2002). Prevalence ofvaccine-derived polioviruses in the environment. Journal ofGeneral Virology, 83(Pt 5), 1107–1111.
55. Martın, J., Ferguson, G. L., Wood, D. J., & Minor, P. D. (2000).The vaccine origin of the 1968 epidemic of type 3 poliomyeli-tis in Poland. Virology, 278, 42–49.
56. Korotkova, E. A., Park, R., Cherkasova, E. A., Lipskaya,G. Y., Chumakov, K. M., Feldman, E. V., Kew, O. M., &Agol, V. I. (2003). Retrospective analysis of a local cessationof vaccination against poliomyelitis: A possible scenario forthe future. Journal of Virology, 77(23), 12460–12465.
57. Pavlov, D. N., Van Zyl, W. B., Kruger, M., Blignaut, L.,Grabow, W. O. K., & Ehlers, M. M. (2006). Poliovirus vac-cine strains detected in stool specimens of immunodeficientchildren in South Africa. Diagnostic Microbiology and In-fectious Diseases, 54(1), 23–30.
58. Pavlov, D. N., Van Zyl, W. B., Van Heerden, J., Grabow, W.O. K., & Ehlers, M. M. (2005). Prevalence of vaccine-derivedpolioviruses in sewage and river water in South Africa. WaterResearch, 39(14), 3309–3319.
59. Kew, O. M., Wright, P. F., Agol, V. I., Delpeyroux, F., Shimizu,H., Nathanson, N., & Pallansch, M. A. (2004). Circulatingvaccine-derived polioviruses: Current state of knowledge.Bulletin of the World Health Organization, 82(1), 16–23.
60. Mas Lago, P. (1999). Eradication of poliomyelitis in Cuba:A historical perspective. Bulletin of the World Health Orga-nization, 77(8), 681–687.
61. Strebel, P. M., Aubert-Combiescu, A., Ion-Nedelcu, N.,Biberi-Moroeanu, S., Combiescu, M., Sutter, R. W., Kew,O. M., Pallansch, M. A., Patriarca, P. A., & Cochi, S. L. (1994).Paralytic poliomyelitis in Romania, 1984–1992. Evidence fora high risk of vaccine-associated disease and reintroductionof wild-virus infection. American Journal of Epidemiology,140, 1111–1124.
62. Mas Lago, P., Gary, H. E., Jr., Perez, L. S., Caceres, V. M.,Olivera, J. B., Puentes, R. P., Corredor, M. B., Jimenez, P.,
Pallansch, M. A., & Gonzalez Cruz, R. (2003). Poliovirus de-tection in wastewater and stools following an immunizationcampaign in Havana, Cuba. International Journal of Epi-demiology, 32, 772–777.
63. Mas Lago, P., Caceres, V. M., Galindo, M. A., Gary, H. E., Jr.,Valcarcel, M., Barrios, J., Sarmienro, L., Avalos, I., Bravo,J. A., Palomera, R., Bello, M., Sutter, R. W., Pallansch,M. A., & de Quadros, C. A. (2001). Persistence of vaccine-derived poliovirus following a mass vaccination campaignin Cuba: Implications for stopping polio vaccination afterglobal eradication. International Journal of Epidemiology,30, 1029–1034.
64. Mas Lago, P., Bravo, J. R., Andrus, J. K., Comellas, M. M.,Galindo, M. A., de Quadros, C. A., & Bell, E. (1994). Lessonfrom Cuba: Mass campaign administration of trivalent oralpoliovirus vaccine and seroprevalence of poliovirus neutral-izing antibodies. Bulletin of the World Health Organization,72(2), 221–225.
65. Onorato, I. M., Modlin, J. F., McBean, M.A., Thoms, M. L.,Losonsky, G. A., & Bernier, R. H. (1991). Mucosal immu-nity induced by enhanced-potency inactivated and oral poliovaccines. Journal of Infectious Diseases, 163, 1–6.
66. Modlin, J. F., Halsey, N. A., Thoms, M. L., Meschievitz, C.K., & Patriarca, P. A. (1997). Humoral and mucosal immu-nity in infants induced by three sequential inactivated po-liovirus vaccine-live attenuated oral poliovirus vaccine im-munization schedules. Baltimore area polio vaccine studygroup. Journal of Infectious Diseases, 175(Suppl. 1), s228–s234.
67. Ghendon, Y. Z., & Sanakoyeva, I. I. (1961). Comparison ofthe resistance of the intestinal tract to poliomyelitis virus(sabin’s strains) in persons after naturally and experimen-tally acquired immunity. Acta Virologica, 5, 265–273.
68. Huang, S. Q., Greening, G., Baker, M., Grimwood, K., He-witt, J., Hulston, D., van Duin, L., Fitzsimons, A., Graham,D., Lennon, D., Shimizu, H., Miyamura, T., & Pallansch,M. A. (2005). Persistence of oral polio vaccine virus after itsremoval from the immunisation schedule in New Zealand.Lancet, 366(9483), 394–396.
69. UN Population Division. (2003). World PopulationProspects Population Database: The 2002 Revision Popu-lation Database. Available at http://esa.un.org/unpp/index.asp?panel=2, accessed July 31, 2003.
70. Halsey, N. A., Pinto, J., Espinosa-Rosales, F., Faure-Fontenla, M., da Silva, E. E., Kahn, A. A., ADB, W., Minor,P. D., Dunn, G., Asturia, E., Hussain, H., Pallansch, M. A., &Kew, O. M. (2004). Search for polio virus carriers among peo-ple with primary immune deficiency diseases in the UnitedStates, Mexico, Brazil and the United Kingdom. Bulletin ofthe World Health Organization, 82(1), 3–8.
71. Khetsuriani, N., Prevots, D. R., Quick, L., Elder, M. E., Pal-lansch, M. A., Kew, O. M., & Sutter, R. W. (2003). Persis-tence of vaccine-derived polioviruses among immunodefi-cient persons with vaccine-associated paralytic poliomyeli-tis. Journal of Infectious Diseases, 188, 1845–1852.
72. Fiore, L., Plebani, A., Buttinelli, G., Fiore, S., Donati, V.,Marturano, J., Soresina, A., Martire, B., Azzari, C., Nigro, G.,Cardinale, F., Trizzino, A., Pignata, C., Alvisi, P., Anastasio,E., Bossi, G., & Ugazio, A. G. (2004). Search for polioviruslong-term excretors among patients affected by agamma-globulinemia. Clinical Immunology, 111(1), 98–102.
73. MacLennan, C., Dunn, G., Huissoon, A. P., Kumararatne,D. S., Martin, J., O’Leary, P., Thompson, R. A., Osman, H.,Wood, P., Minor, P., Wood, D. J., & Pillay, D. (2004). Failureto clear persistent vaccine-derived neurovirulent poliovirusinfection in an immunodeficient man. Lancet, 363(9420),1509–1513.
74. Bellmunt, A., May, G., Zell, R., Pring-Akerblom, P., Verha-gen, W., & Heim, A. (1999). Evolution of poliovirus type
1504 Tebbens et al.
i during 5.5 years of prolonged enteral replication in an im-munodeficient patient. Virology, 265(2), 178–184.
75. Kew, O. M., Sutter, R. W., Nottay, B. K., McDonough, M. J.,Prevots, D. R., Quick, L., & Pallansch, M. A. (1998). Pro-longed replication of a type 1 vaccine-derived poliovirus inan immunodeficient patient. Journal of Clinical Microbiol-ogy, 36(10), 2893–2899.
76. Cernakova, B., Sobotova, Z., Rovny, I., Blahova, S.,Roivainen, M., & Hovi, T. (2005). Isolation of vaccine-derived polioviruses in the Slovak Republic. European Jour-nal of Clinical Microbiology and Infectious Diseases, 24(6),438–439.
77. Blomqvist, S., Savolainen, C., Laine, P., Hirttio, P., Lammin-salo, E., Penttila, E., Joks, S., Roivainen, M., & Hovi, T.(2004). Characterization of a highly evolved vaccine-derivedpoliovirus type 3 isolated from sewage in Estonia. Journal ofVirology, 78(9), 4876–4883.
78. Shulman, L. M., Manor, Y., Handsher, R., Delpeyroux, F.,McDonough, M. J., Halmut, T., Silberstein, T., Alfandari,J., Quay, J., Fisher, T., Robinov, J., Kew, O. M., Crainic, R.,& Mendelson, E. (2000). Molecular and antigenic charac-terization of a highly evolved derivative of the type 2 oralpoliovaccine strain isolated from sewage in Israel. Journalof Clinical Microbiology, 38(10), 3729–3734.
79. Western Pacific Regional Office. (2005). Basic HealthInformation on Poliomyelitis (Revised as of 06 December2005). Available at http://www.wpro.who.int/informationsources/databases/regional statistics/rstat poliomyelitis.htm,accessed January 19, 2006.
80. Tharmaphornpilas, P. (2005). Vaccine-derived poliovirus,Thailand, 2003. Emerging Infectious Diseases, 11(5), 777–778.
81. Yang, C.-F., Chen, H.-Y., Jorba, J., Sun, H.-C., Yang, S.-J.,Lee, H.-C., Huang, Y.-C., Lin, T.-Y., Chen, P.-J., Shimizu, H.,Nishimura, Y., Utama, A., Pallansch, M. A., Miyamura, T.,Kew, O. M., & Yang, J.-Y. (2005). Intratypic recombinationamong lineages of type 1 vaccine-derived poliovirus emerg-ing during chronic infection of an immunodeficient patient.Journal of Virology, 79(20), 12623–12634.
82. Hidalgo, S., Garcia, E. M., Cisterna, D., & Freire, M. C.(2003). Paralytic poliomyelitis caused by a vaccine-derivedpolio virus in an antibody-deficient argentinean child. Pedi-atric Infectious Diseases Journal, 22(6), 570–572.
83. Misbah, S. A., Lawrence, P. A., Kurtz, J. B., & Chapel, H. M.(1991). Prolonged faecal excretion of poliovirus in a nursewith common variable hypogammaglobulinaemia. Postgrad-uate Medical Journal, 67(785), 301–303.
84. Abo, W., Chiba, S., Yamanaka, T., Nakao, T., Hara, M.,& Tagaya, I. (1979). Paralytic poliomyelitis in a childwith agammaglobulinemia. European Journal of Pediatrics,132(1), 11–16.
85. Hara, M., Saito, Y., Komatsu, T., Kodama, H., Abo, W.,Chiba, S., & Nakao, T. (1981). Antigenic analysis of po-lioviruses isolated from a child with agammaglobulinemiaand paralytic poliomyelitis after Sabin vaccine administra-tion. Microbiology and Immunology, 25(9), 905–913.
86. Labadie, K., Pelletier, I., Saulnier, A., Martın, J., Colbere-Garapin, F. (2004). Poliovirus mutants excreted by a chron-ically infected hypogammaglobulinemic patient establishpersistent infections in human intestinal cells. Virology,318(1), 66–78.
87. Martın, J., Dunn, G., Hull, R., Patel, V., & Minor, P. D. (2000).Evolution of the Sabin strain of type 3 poliovirus in an im-munodeficient patient during the entire 637-day period ofvirus excretion. Journal of Virology, 74(7), 3001–3010.
88. MacCallum, F. O. (1971). Hypogammaglobulinaemia in theUnited Kingdom. VII. The role of humoral antibodies inprotection against and recovery from bacterial and virus
infections in hypogammaglobulinaemia. Medical ResearchCouncil Special Report Series, 310, 72–85.
89. Minor, P. D. (2001). Characteristics of poliovirus strains fromlong-term excretors with primary immunodeficiencies. De-velopments in Biologicals, 105, 75–80.
90. Dowdle, W. R., de Gourville, E., Kew, O. M., Pallansch, M.A., & Wood, D. J. (2003). Polio eradication: The OPV para-dox. Reviews in Medical Virology, 13, 277–291.
91. Kew, O. M., Mulders, M. N., Lipskaya, G. Y., da Silva, E.E., & Pallansch, M. A. (1995). Molecular epimdemiology ofpolioviruses. Seminars in Virology, 6, 401–414.
92. Fine, P. E. M., & Carneiro, I. A. M. (1999). Transmissibil-ity and persistence of oral poliovirus vaccine viruses: Im-plications for the global poliomyelitis eradication initiative.American Journal of Epidemiology, 150(10), 1001–1021.
93. Dowdle, W. R., & Birmingham, M. E. (1997). The biologicprinciples of poliovirus eradication. Journal of InfectiousDiseases, 175(Suppl. 1), S286– S292.
94. Dowdle, W. R., Gary, H. E., Sanders, R., & van Loon, A.M. (2002). Can post-eradication laboratory containment ofwild polioviruses be achieved? Bulletin of the World HealthOrganization, 80(4), 311–316.
95. World Health Organization. (2004). WHO Global ActionPlan for Laboratory Containment of Wild Polioviruses, 2nded. Report No.: WHO/V&B/03.11, Geneva: World HealthOrganization.
96. Mulders, M. N., Reimerink, J. H., Koopmans, M. P., vanLoon, A. M., & van der Avoort, H. G. A. M. (1997). Geneticanalysis of wild-type poliovirus importation into the Nether-lands (1979–1995). Journal of Infectious Diseases, 176(3),617–624.
97. Deshpande, J. M., Nadkarni, S. S., & Siddiqui, Z. A. (2003).Detection of MEF-1 laboratory reference strain of po-liovirus type 2 in children with poliomyelitis in India in2002 & 2003. Indian Journal of Medical Research, 118, 217–223.
98. Dowdle, W. R., Wolff, C., Sanders, R., Lambert, S., & Best,M. (2004). Will containment of wild poliovirus in labora-tories and inactivated poliovirus vaccine production sites beeffective for global certification? Bulletin of the World HealthOrganization, 82(1), 59–62.
99. Plotkin, S. A., & Vidor, E. (2004). Poliovirus vaccine—Inactivated. In S. A. Plotkin & W. A. Orenstein (Eds.) Vac-cines, 4th ed. (pp. 625–649). Philadelphia: WB Saunders.
100. Centers for Disease Control and Prevention. (2006). Resur-gence of wild poliovirus type 1 transmission and conse-quences of importation—21 previously polio-free countries,2002–2005. Morbidity and Mortality Weekly Report, 55(6),145–150.
101. Smith, J., Leke, R., Adams, A., & Tangermann, R. H. (2004).Certification of polio eradication: Process and lessonslearned. Bulletin of the World Health Organization, 82(1),24–29.
102. World Health Organization. (2005). Progress towards po-liomyelitis eradication–poliomyelitis outbreak in Sudan,2004. Weekly Epidemiological Record, 80(5), 42–46.
103. Sutter, R. W. (2002). Global burden estimate of vaccine-associated paralytic poliomyelitis (VAPP). Presented at theWHO Informal Consultation on Research Towards Devel-opment of Post-Certification Immunization Policy October31–November 1, 2002. Geneva, Switzerland.
104. John, T. J. (2002). Vaccine-associated paralytic polio in India.Bulletin of the World Health Organization, 80(11), 917.
105. Plotkin, S. A. (2001). Commentary: Cuba libre de poliovirus.International Journal of Epidemiology, 30, 1034.
106. Rumke, H., Oostvogel, P. M., van Steenis, G., & van Loon,A. M. (1995). Poliomyelitis in the Netherlands: A review ofpopulation immunity and exposure between the epidemics
Risks of Paralytic Disease from Poliovirus 1505
in 1978 and 1992. Epidemiology and Infection, 115(2), 289–298.
107. Cooke, R. M. (1991). Experts in Uncertainty: Opinion andSubjective Probability in Science. New York: Oxford Univer-sity Press.
108. Thompson, K. M., & Graham, J. D. (1996). Going beyondthe single number: Using probabilistic risk assessment toimprove risk management. Human and Ecological Risk As-sessment, 2(4), 1008–1034.
109. Thompson, K. M., & Duintjer Tebbens, R. J. (2006). Evalua-tion of response scenarios to potential polio outbreaks usingmathematical models. Risk Analysis, 26(6), 1541–1556.
110. Fine, P. E. M., Oblapenko, G., & Sutter, R. W. (2004). Poliocontrol after certification: Major issues outstanding. Bulletinof the World Health Organization, 82(1), 47–52.
111. Sangrujee, N., Caceres, V. M., & Cochi, S. L. (2004).Cost analysis of post-polio certification immunization poli-cies. Bulletin of the World Health Organization, 82(1), 9–15.
112. Kohler, K. A., Banerjee, K., Gary Hlady, W., Andrus, J.K., & Sutter, R. W. (2002). Vaccine-associated paralytic po-liomyelitis in India during 1999: Decreased risk despite mas-sive use of oral polio vaccine. Bulletin of the World HealthOrganization, 80(3), 210–216.
113. Joce, R., Wood, D., Brown, D., & Begg, N. (1992). Paralyticpoliomyelitis in England and Wales, 1985–91. British MedicalJournal, 305(6845), 69–70.
114. Strebel, P. M., Ion-Nedelcu, N., Baughman, A. L., Sutter,R. W., & Cochi, S. L. (1995). Intramuscular injections within30 days of immunization with oral poliovirus vaccine—A riskfactor for vaccine-associated paralytic poliomyelitis. NewEngland Journal of Medicine, 332, 500–506.
115. Andrus, J. K., Strebel, P. M., de Quadros, C. A., & Olive, J.M. (1995). Risk of vaccine-associated paralytic poliomyeli-tis in Latin America, 1989–91. Bulletin of the World HealthOrganization, 73(1), 33–40.
116. Esteves, K. (1988). Safety of oral poliomyelitis vaccine: Re-sults of a WHO enquiry. Bulletin of the World Health Orga-nization, 66, 739–746.
117. John, T. J. (2004). A developing country perspective onvaccine-associated paralytic poliomyelitis. Bulletin of theWorld Health Organization, 82(1), 53–57.
118. Patriarca, P. A., Wright, P. F., & John, T. J. (1991). Factors af-fecting the immunogenicity of oral poliovirus vaccine in de-veloping countries: Review. Reviews of Infectious Diseases,13, 926–939.
119. Kohler, K. A., Banerjee, K., & Sutter, R. W. (2002). Fur-ther clarity on vaccine-associated paralytic polio in India(letter). Bulletin of the World Health Organization, 80(12),987.
120. Cohen-Abbo, A., Culley, B. S., Reed, G. W., Sannella, E. C.,Mace, R. L., Robertson, S. E., & Wright, P. F. (1994). Serore-sponse to trivalent oral poliovirus vaccine as a function ofdosage interval. Pediatric Infectious Diseases Journal, 14(2),100–106.
121. Fine, P. E. M. (1993). Herd immunity: History, theory, prac-tice. Epidemiologic Reviews, 15(2), 265–302.
122. Hennessey, K. A., Lago, H., Diomande, F., Akoua-Koffi, C.,Caceres, V. M., Pallansch, M. A., Kew, O. M., Nolan, M.,& Zuber, P. L. (2005). Poliovirus vaccine shedding amongpersons with HIV in Abidjan, Cote d’Ivoire. Journal of In-fectious Diseases, 192(12), 2124–2128.
123. Fine, P. E. M., & Carneiro, I. A. M. (1998). Transmissibilityand Persistence of Oral Poliovirus Vaccine Viruses: Implica-tions for the Global Poliomyelitis Eradication Initiative. Lon-don: Infectious Disease Epidemiology Unit, Department ofInfectious and Tropical Diseases, London School of Hygiene.
124. Patriarca, P. A., Sutter, R. W., & Oostvogel, P. M. (1997).Outbreaks of paralytic poliomyelitis, 1976–1995. Journal ofInfectious Diseases, 175(Suppl. 1), S165–S172.
125. Equipe de dynamique des populations bacteriennes. (2004).Binomial Confidence Interval. Laboratoire de Biometrieet Bioligie Evolutive, Universite de Lyon. Available athttp://umr5558-sud-str3.univ-lyon1.fr-bici-, accessed April13, 2004.
126. Gelman, A. B., Carlin, J. B., Stern, H. S., & Rubin, D. B.(2000). Bayesian Data Analysis. Boca Raton, FL: Chapman& Hall/CRC.