Risk Controversies Visualized 1: Internet based Argumentation Maps as Innovative Tool in Governing...
10
1 2008 Berlin Conference on the Human Dimensions of Global Environmental Change. International Conference of the Social-Ecological Research Programme. Gerald Beck, Astrid Engel, Martina Erlemann, Cordula Kropp Risk Controversies Visualized 1 : Internet based Argumentation Maps as Innovative Tool in Governing Social-Ecological Change Real and suspected imperilments like asbestos, climate change, and nanoscale technologies open up complex arenas of political debates. Conceptualised as risks they pose some severe questions to the modern self-conception, to modes of taking responsibility and decision-making and to the way to think about the public, its rights, concerns and needs of information and participation as well (Beck 2007; Beck/ Kropp 2007). They go far beyond limited concepts at hand in classical risk management and, instead, set off complex and fluid landscapes of manufactured uncertainties with up to now unseen risk mobilities. This is why the OECD and Renn et al. (2007) adapted the term of “systemic risks”. Systemic risks cannot be bounded in time, space or social sectors and responsibilities. They just emerge in complex networks of heterogeneous areas and involved rationalities, in an ever expanding context of technical, social, financial and economic opportunities and decisions. At the crossroads between events and developments classified as natural (even though more or less altered by human action), markets (but always embedded), social, political and sciento-technological conditions, both at the domestic and the international level these per se unlimited risk phenomena and perceptions arise in disregard of all societal boundary-making. It is their unlimited scope, their embeddedness in different though interrelated fields and dynamics, their indeterminacy and multi-causal nature, and, most importantly, the irreducible uncertainty which is our point of departure. They are typically characterized by a delay between initial event and hazardous outcome that may go unnoticed for a long time. The clear example for this problem is asbestos or CFC. Systemic risks are obviously „socially constructed“, but moreover they are „produced or manufactured“ in the underlying ways of thinking about them, defining and most important creating them by different activities of connecting and linking humans and non-humans to technologies and to regulatory institutions, to value creation chains, and to narratives as well. This is why complexity and ambiguity is always part of the story, but material transitions and flows not less. 1 The research project „Risk Controversies visualized - The Development of Internet based Argumentation Maps” is funded by the Federal Ministry for Education and Research (BMBF) within the social ecological research (SÖF) programme "Strategies to Cope with Systemic Risks". The project is accomplished by the Munich Institute for Social and Sustainability Research (MPS: G. Beck, A. Engel, C. Kropp) and the Environment Science Center (WZU: C. Böschen, M. Erlemann, S. Meissner, J. Soentgen) at the University of Augsburg in cooperation with the Software and Consulting GmbH (SoUCon: S. Sturm, A. Franck).
Transcript of Risk Controversies Visualized 1: Internet based Argumentation Maps as Innovative Tool in Governing...

1
2008 Berlin Conference on the Human Dimensions of Global Environmental Change.
International Conference of the Social-Ecological Research Programme.
Gerald Beck, Astrid Engel, Martina Erlemann, Cordula Kropp
Risk Controversies Visualized 1: Internet based Argumentation Maps as Innovative
Tool in Governing Social-Ecological Change
Real and suspected imperilments like asbestos, climate change, and nanoscale technologies
open up complex arenas of political debates. Conceptualised as risks they pose some
severe questions to the modern self-conception, to modes of taking responsibility and
decision-making and to the way to think about the public, its rights, concerns and needs of
information and participation as well (Beck 2007; Beck/ Kropp 2007). They go far beyond
limited concepts at hand in classical risk management and, instead, set off complex and fluid
landscapes of manufactured uncertainties with up to now unseen risk mobilities. This is why
the OECD and Renn et al. (2007) adapted the term of “systemic risks”. Systemic risks cannot
be bounded in time, space or social sectors and responsibilities. They just emerge in
complex networks of heterogeneous areas and involved rationalities, in an ever expanding
context of technical, social, financial and economic opportunities and decisions.
At the crossroads between events and developments classified as natural (even though
more or less altered by human action), markets (but always embedded), social, political and
sciento-technological conditions, both at the domestic and the international level these per se
unlimited risk phenomena and perceptions arise in disregard of all societal boundary-making.
It is their unlimited scope, their embeddedness in different though interrelated fields and
dynamics, their indeterminacy and multi-causal nature, and, most importantly, the irreducible
uncertainty which is our point of departure. They are typically characterized by a delay
between initial event and hazardous outcome that may go unnoticed for a long time. The
clear example for this problem is asbestos or CFC. Systemic risks are obviously „socially
constructed“, but moreover they are „produced or manufactured“ in the underlying ways of
thinking about them, defining and most important creating them by different activities of
connecting and linking humans and non-humans to technologies and to regulatory
institutions, to value creation chains, and to narratives as well. This is why complexity and
ambiguity is always part of the story, but material transitions and flows not less.
1 The research project „Risk Controversies visualized - The Development of Internet based Argumentation Maps”
is funded by the Federal Ministry for Education and Research (BMBF) within the social ecological research (SÖF) programme "Strategies to Cope with Systemic Risks". The project is accomplished by the Munich Institute for Social and Sustainability Research (MPS: G. Beck, A. Engel, C. Kropp) and the Environment Science Center (WZU: C. Böschen, M. Erlemann, S. Meissner, J. Soentgen) at the University of Augsburg in cooperation with the Software and Consulting GmbH (SoUCon: S. Sturm, A. Franck).
2
To focus on the inherent challenge asking for new modes of governing knowledge and
governance, these risks are characterized by some main aspects. Firstly, contrary to
damages already in place, they always are uncertain and controversial, one might say as
Joost van Loon (2003) does “virtual”, anticipations of potential future losses and in
consequence they present themselves only via discourses and risk claims as “matters of
concern” (Latour 2004). Secondly as uncertain anticipations they are seen and brought up by
current actors, mediated specially by science and the media. Due to this all risk claim is
situated in risk controversies and existing constellations of evaluation and policy making.
Being part of heterogeneous networks risks enrol existing values, uneven actors,
controversial issues not less than technological artefacts and material constraints. Thereby,
thirdly, knowledge controversies and unqualified ignorance challenge governance and
decision making facing risks with long-term and border-crossing character.
As a result every societal actor and even more every decision maker is confronted with
increased complexity and dynamics of contradictory expertises and media reports. These
challenges call for innovative and more including forms of handling controversial knowledge
claims and reconsidering basics of decision making (Böschen/ Kropp/ Söntgen 2007).
Our development effort in reaction to these challenges is the visualisation of risk
controversies in form of “risk cartographies" (www.risk-cartography.org). It aims at an
integrative and multi-perspective knowledge platform to deal with those systemic risks and to
open up the surrounding discursive arena for civil society and for better regulation. Risk
cartographies can be explored from different perspectives following the individual needs and
concerns of actors.
Let us now choose a typical matter of concern in the contemporary risk society to experiment
the potentials and constraints of the risk cartography in vivo: there is growing concern about
production, use and release of nanoscale particles in industry and everyday life. Although
nanotechnology in most fields is still at an experimental stage, the next years will see a
dramatic increase in the industrial production and use of nanoscale particles. Critics caution
against potential harms to health and environments. There is a large debate about possible
risks for example about nanoscale objects crossing cellborders or the blood-brain barrier.
What happens, when nanoscale materials get into domestic sewage? Are there risks for
employees that produce these materials? They even star in Novels (grey goo). Nano is the
buzzword that stands for innovation. But the lable “risk” is already attached to the concept
“nano”.
Let us have a look to the potential of risk cartographies by following this concern in the now
realised prototype of the tool focussing on Titanium dioxide:
A Tour through the Risk cartography of Titanium dioxide
Let us first have a look on the risk cartography and its core features. We apologize that the
risk cartography is at the moment only available in German. This year we will develop an
international version in English as part of an EU financed project that is coordinated by Bruno
Latour at the Sciences Po in Paris.
3
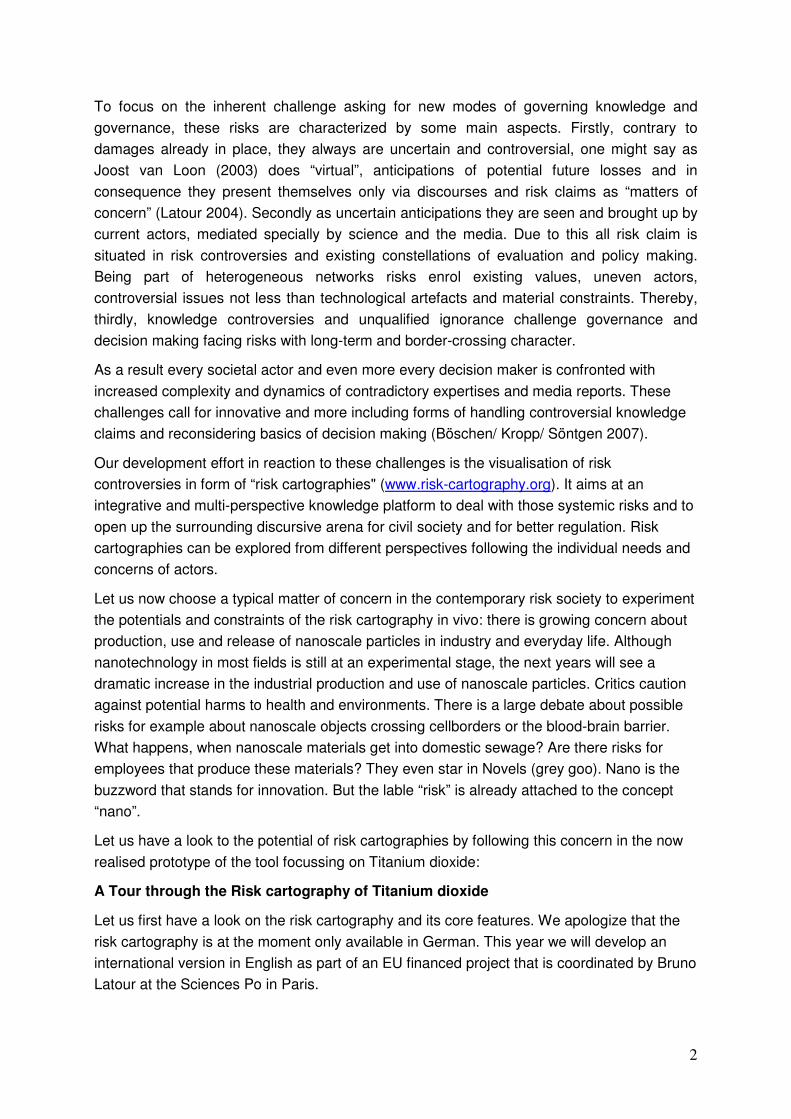
Figure 1
The Risk-Cartography Software has four main features. The first one is the Navigator. You
find it on top of the page. It serves you as orientation tool telling you where you are within the
risk cartography and which paths through the risk cartography you can go from here. At the
moment, the Navigator suggests to choose from the two case studies. We are interested in
the risk debates on nanoparticles now. So we click the corresponding picture.
4
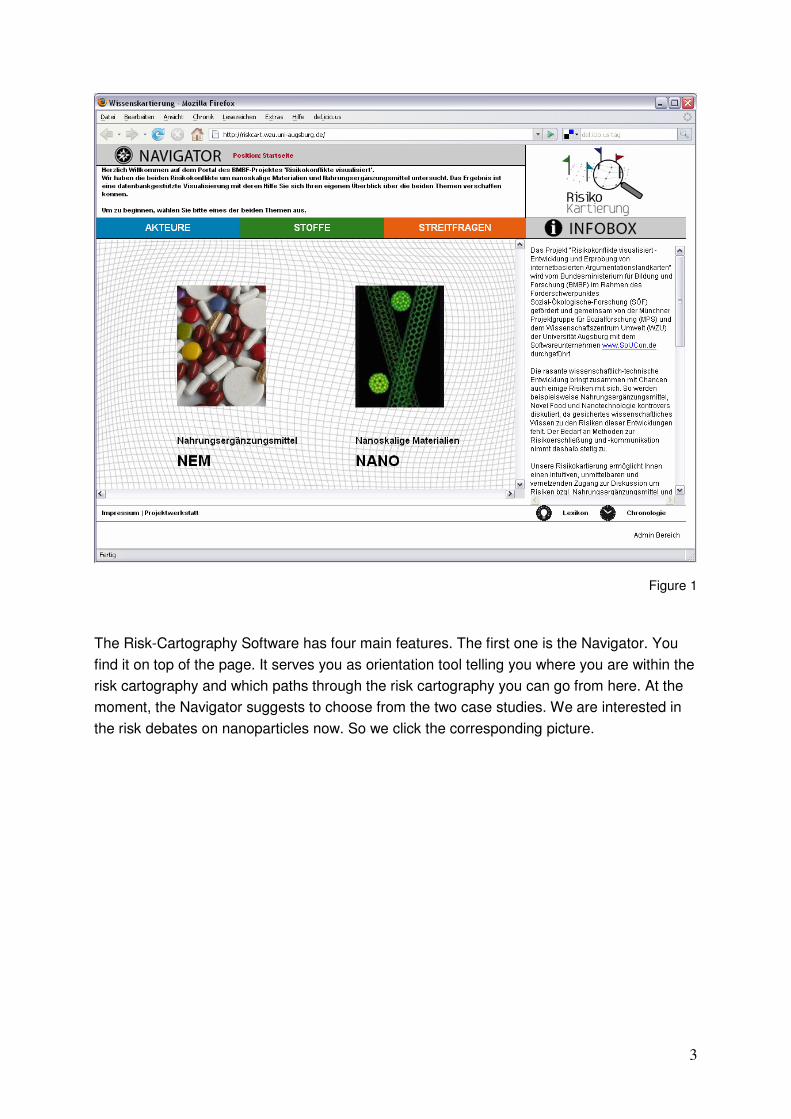
Figure 2
On the right side you have the second feature of the cartography: the Infobox. It provides you
with further information on the risk debate you just have chosen and its central
characteristics. It informs you what this risk discourse is all about and additionally, it offers
some background information about the different, if even divergent, positions in the debate.
Thereby it links information about the enrolled political, social and economic players with
their with their place and function in society and thus with their positions and positionning
interests. For the nanoparticle case we are told that nanoscale particles are seen as
promising and innovative technology, although there are already many products containing
nanoscale particles on the market. But at the same time warnings on risks have been
expressed. The crucial point in the case of nanoparticles is that these days there is still a lack
of sound knowledge about these potential risks. Nevertheless knowledge claims about
possible control, possible effects and arguments for or against the technological
development open up the more or less public deliberation how to integrate nanoparticles in
society and modern life: shaping technology - building society (Bijker/ Law 1994).
Furthermore you get an impression on the main discussion strands in the debate: Although
there are some issues on environmental and health risks being discussed, the main issues at
stake are the risk management and risk policy of nanotechnologies as well as the issue of
the necessity for regulation. Interestingly: participation is this time regarded as the sword to
dissolve the Gordian knot! But the efforts to inform the needed technological citizen, to
endow the "disabled" public (Latour 2005), are still poor.
5
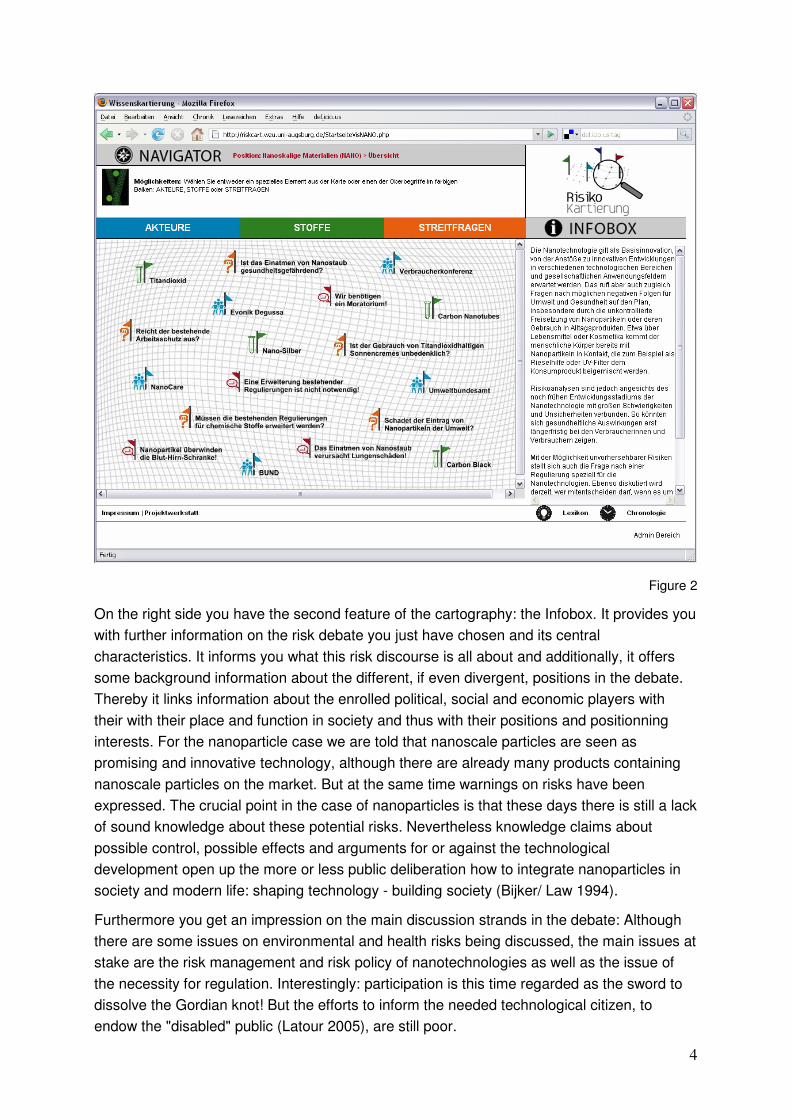
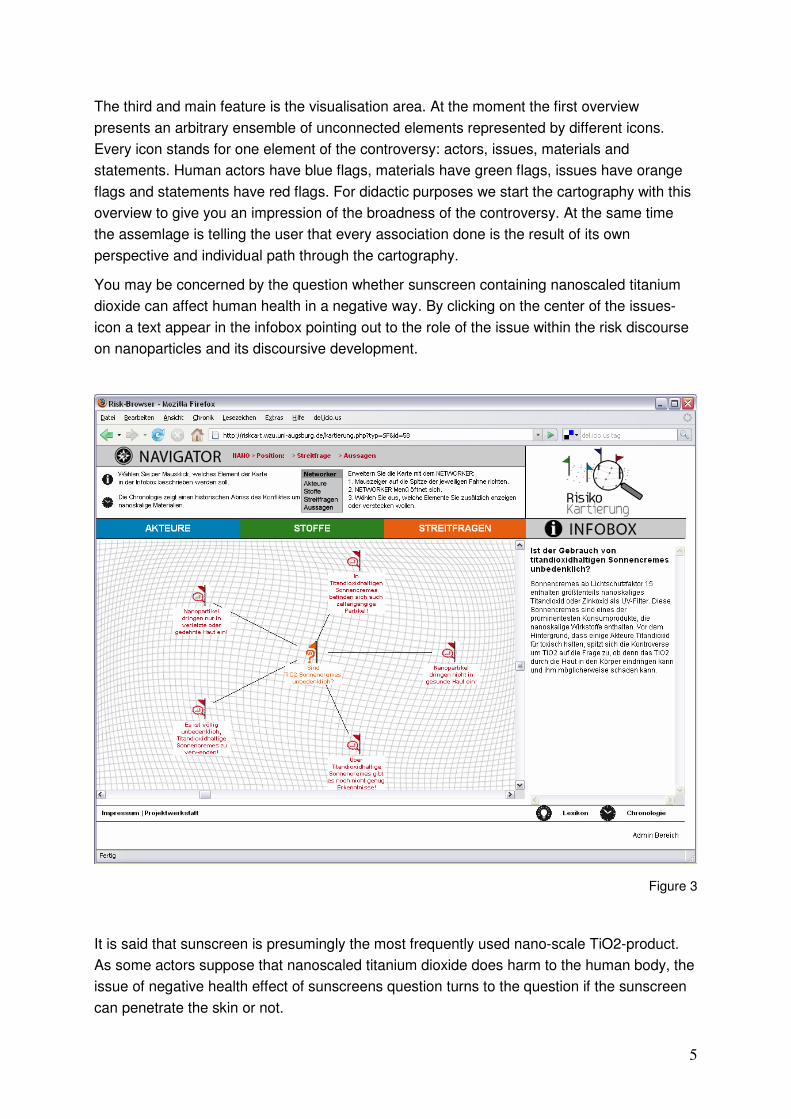
The third and main feature is the visualisation area. At the moment the first overview
presents an arbitrary ensemble of unconnected elements represented by different icons.
Every icon stands for one element of the controversy: actors, issues, materials and
statements. Human actors have blue flags, materials have green flags, issues have orange
flags and statements have red flags. For didactic purposes we start the cartography with this
overview to give you an impression of the broadness of the controversy. At the same time
the assemlage is telling the user that every association done is the result of its own
perspective and individual path through the cartography.
You may be concerned by the question whether sunscreen containing nanoscaled titanium
dioxide can affect human health in a negative way. By clicking on the center of the issues-
icon a text appear in the infobox pointing out to the role of the issue within the risk discourse
on nanoparticles and its discoursive development.
Figure 3
It is said that sunscreen is presumingly the most frequently used nano-scale TiO2-product.
As some actors suppose that nanoscaled titanium dioxide does harm to the human body, the
issue of negative health effect of sunscreens question turns to the question if the sunscreen
can penetrate the skin or not.
6
On the screenshot you can see, that the text in the navigator has changed in this view and
explains your options to move forward. You can continue your “walk” through the cartography
by using the fourth feature and “walking tool” – the networker. It allows you (a) to explore the
actors or speakers that take part in the debate with their statements; (b) to get an overview
about all statements and arguments that were expressed in the debate on this issue; (c) to
learn which nanomaterials are linked to the issue. In the above screenshot we have already
made the choice for you by taking the second one, namely the different statements on the
issue of health effects of TiO2-sunscreen. You can find more about the statements by
clicking on them. Then you will see the original quotations of the statement, their (different)
authors and also in which contexts the statement was uttered. In the visualisation area you
can have a further look on the actor who argues for this statement, again by using the
networker.
Let us have a look on the different claims linked to the issue at stake. It strikes that the
arguments are fairly heterogeneous, concerning the opinion on the danger of TiO2 in
sunscreens and also concerning the rhetorical strategies of the statements. These
statements range from being secure that the use of TiO2-sunscreens is completely harmless
up to warnings that TiO2-nanoaparticles do enter living cells. Interesting here is that the latter
statement was made in connection to the sunscreen-issue albeit the sunscreen-particle can
only do harm to cells after having penetrated the skin and entered the body, which in turn is
the very issue for the first statement at stake, namely if the particle is able to do this.
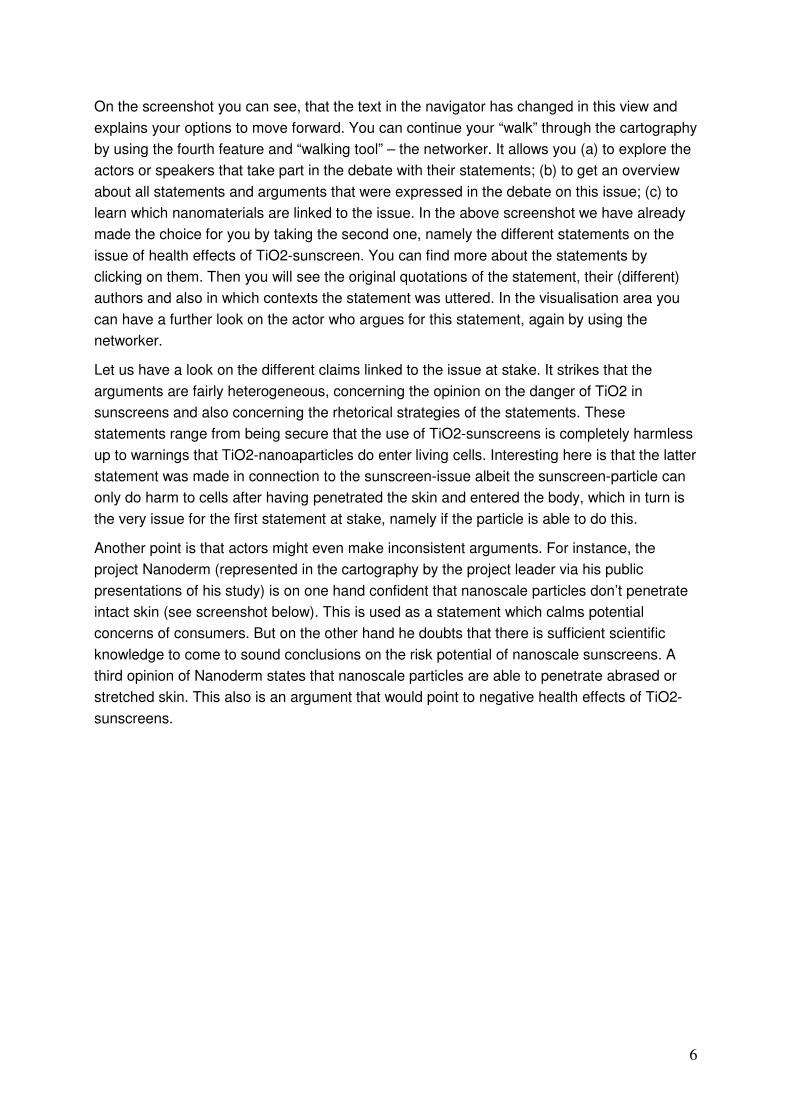
Another point is that actors might even make inconsistent arguments. For instance, the
project Nanoderm (represented in the cartography by the project leader via his public
presentations of his study) is on one hand confident that nanoscale particles don’t penetrate
intact skin (see screenshot below). This is used as a statement which calms potential
concerns of consumers. But on the other hand he doubts that there is sufficient scientific
knowledge to come to sound conclusions on the risk potential of nanoscale sunscreens. A
third opinion of Nanoderm states that nanoscale particles are able to penetrate abrased or
stretched skin. This also is an argument that would point to negative health effects of TiO2-
sunscreens.
7
Figure 4
The other author who made this statement is the company Degussa. Since this statement
shows TiO2-particles as being harmless, it seems not surprising that Degussa who produces
nanoscaled TiO2, refers to this statement of Nanoderm. It fosters their opinion through
knowledge derived from scientific contexts. If you have a click on both other statements of
Nanoderm (not sufficient knowledge for risk assessment; particles penetrate injured skin)
and let show you the actors who said contribute these statements you will not find again
Degussa citing Nanoderm but instead the ETC Group and the Umweltbundesamt
(environmental agency). Both are actors that are far more critical concerning nanoparticles
that Degussa. So the cartography also reveals alliances of opinions and positions within the
discourse and is able to show patterns “who refers to whom?”
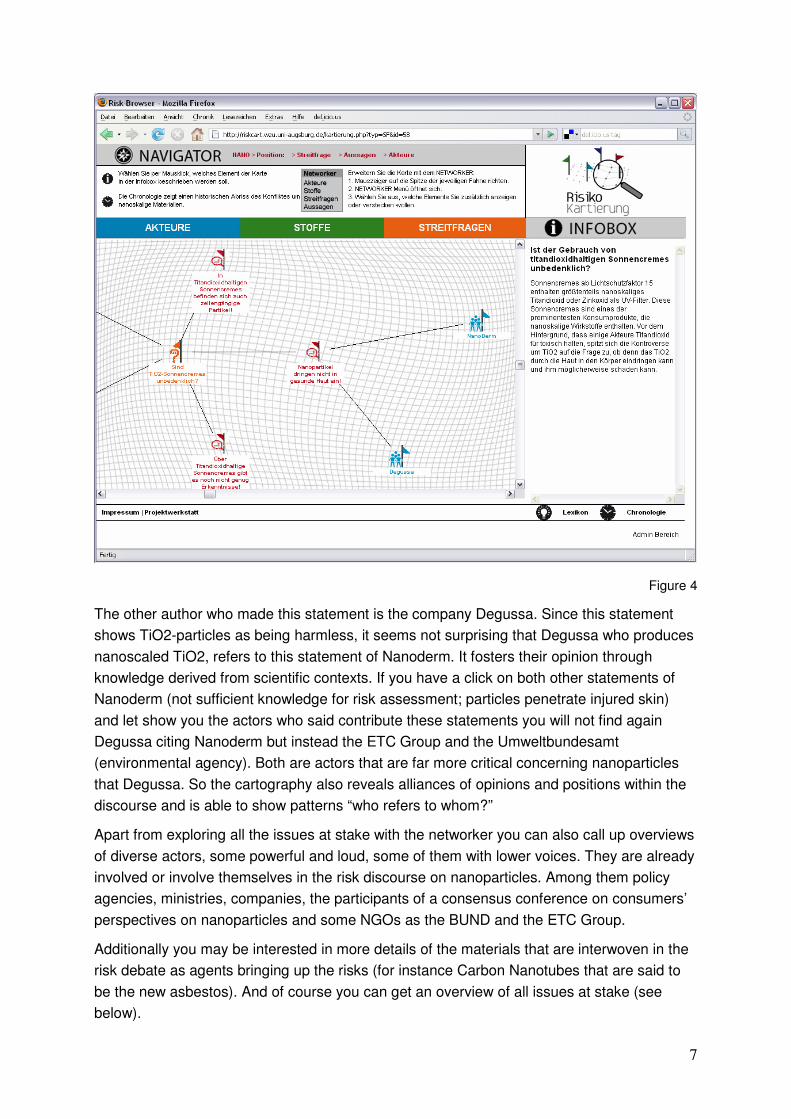
Apart from exploring all the issues at stake with the networker you can also call up overviews
of diverse actors, some powerful and loud, some of them with lower voices. They are already
involved or involve themselves in the risk discourse on nanoparticles. Among them policy
agencies, ministries, companies, the participants of a consensus conference on consumers’
perspectives on nanoparticles and some NGOs as the BUND and the ETC Group.
Additionally you may be interested in more details of the materials that are interwoven in the
risk debate as agents bringing up the risks (for instance Carbon Nanotubes that are said to
be the new asbestos). And of course you can get an overview of all issues at stake (see
below).
8
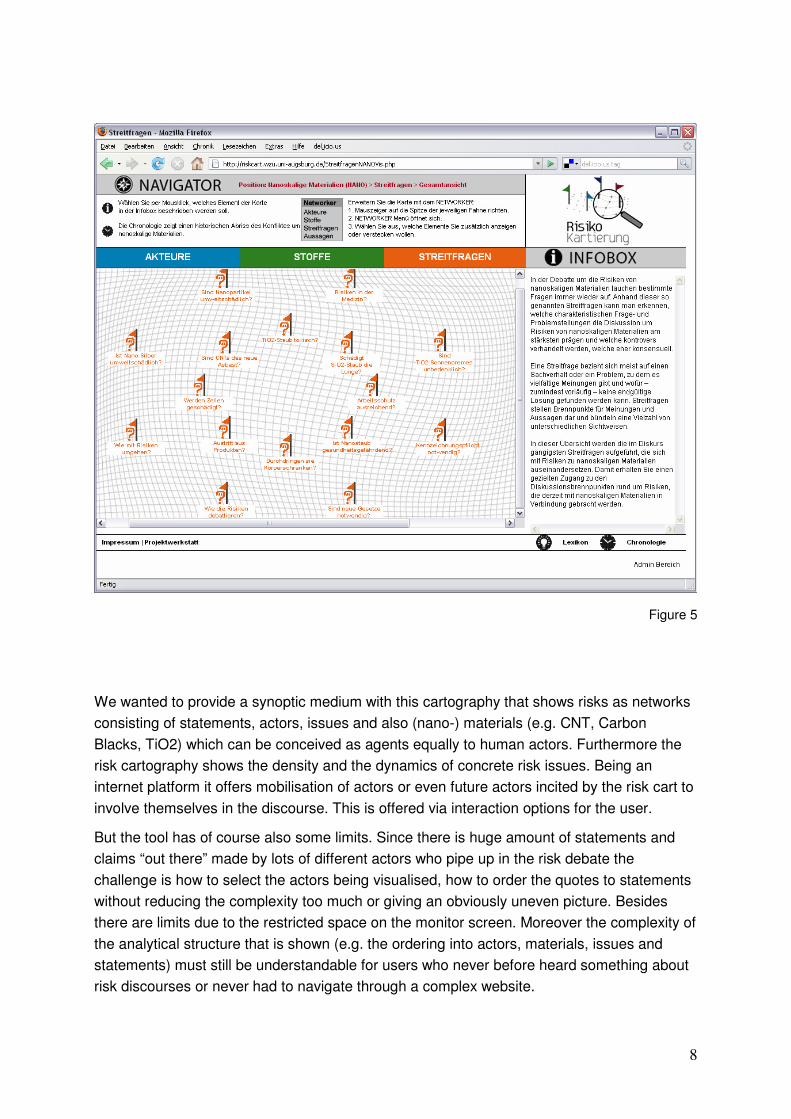
Figure 5
We wanted to provide a synoptic medium with this cartography that shows risks as networks
consisting of statements, actors, issues and also (nano-) materials (e.g. CNT, Carbon
Blacks, TiO2) which can be conceived as agents equally to human actors. Furthermore the
risk cartography shows the density and the dynamics of concrete risk issues. Being an
internet platform it offers mobilisation of actors or even future actors incited by the risk cart to
involve themselves in the discourse. This is offered via interaction options for the user.
But the tool has of course also some limits. Since there is huge amount of statements and
claims “out there” made by lots of different actors who pipe up in the risk debate the
challenge is how to select the actors being visualised, how to order the quotes to statements
without reducing the complexity too much or giving an obviously uneven picture. Besides
there are limits due to the restricted space on the monitor screen. Moreover the complexity of
the analytical structure that is shown (e.g. the ordering into actors, materials, issues and
statements) must still be understandable for users who never before heard something about
risk discourses or never had to navigate through a complex website.
9
The highest possible complexity in order to show the “complete” discourse is to be balanced
with clarity of the visual impression and the synoptic character of the cartography. This
means also a re-ordering of the discourse.
What can risk cartographies contribute to risk governance?
Monographic risk studies and policy reports cannot prevent to organize the controversial
knowledge and the involved statements and interests in a linear way, thereby giving a master
story of the debate. Cartographies on the contrary depart from the heterogeneous elements
of the debate and its linkages and present you the association they are part of. They show at
once the diversity at stake, its situatedness and its dynamic complexity.
Risk cartographies are not afraid to touch the involved social interests and material
constraints but try to give a social and ecological account of the established network now at
risk.
It doesn’t give stabilized evaluations but makes visible ongoing uncertainties and shows
where exactly ignorance is still ruling. By connecting issues to actors and things at risk it
visualizes the hot spots of the debate. Every user can simply see where the controversy is
unstable and where the knots and hubs are.
Risk cartographies supports the evaluation of risk debates and provides anchors for a
strategic risk management.
Finally and most importantly this kind of visualising risk controversies enables different
publics to engage in the debate and to participate in political forming of opinions and decision
making as an informed and reflexive public.
Consequently risk cartographies can be used in every stage of societal handling with risks
and uncertainty: in risk assessment and evaluation, in participative risk management and in
risk communication as well.
10
Bibliography
Beck, U. (2007): Weltrisikogesellschaft. Frankfurt: Suhrkamp.
Beck, U./ Kropp, C. (2007): Environmental Risks and Public Perceptions. In: Pretty, J./ Ball, AS./
Benton, T./ Guivant, J./ Lee, D./ Orr, D./ Pfeffer, M. and H. Ward (Eds): Sage Handbook on
Environment and Society. Los Angeles/ London: Sage. S.601-612.
Bijker, W./ Law, J. (1992): Shaping Technology/Building Society: Studies in Sociotechnical Change.
Cambridge: MIT Press.
Böschen, St./ Kropp, C./ Söntgen, J. (2007): Gesellschaftliche Selbstberatung: Visualisierung von
Risikokonflikten als Chance für Gestaltungsöffentlichkeiten. In: Leggewie, C. (Hrsg.): Von der
Politik- zur Gesellschaftsberatung. Neue Wege öffentlicher Konsultation. Frankfurt am Main:
Campus. S.223-246.
Latour, B. (2004): Why Has Critique Run out of Steam? From Matters of Fact to Matters of Concern.
In: Critical Inquiry Volume 30, Number 2, Winter 2004: 225-248.
Latour, B. (2005): From Realpolitik to Dingpolitik or How to Make Things Public. In: Latour, B./ Weibel,
P. (eds.): Making Things Public: Atmospheres of Democracy. Cambridge: MIT Press.
Loon, van Joost (2003): Risk and Technological Culture: Towards a Sociology of Virulence. London:
Routledge.
Renn, O./ Schweizer, P.-J./ Dreyer, M./ Klinke, A. (2007): Risiko. Über den gesellschaftlichen Umgang
mit Unsicherheit. München: Ökom Verlag.