Richards, Gary E. TITLE The Tennessee Self Concept Scale
39
DOCUMENT RESUME ED 300 391 TM 012 228 AUTHOR Marsh, Herbert W.; Richards, Gary E. TITLE The Tennessee Self Concept Scale: Reliability, Internal Structure, and Construct Validity. PUB DATE 6 Jun 87 NOTE 39p. PUB TYPE Reports - Research/Technical (143) EDRS PRICE MF01/PCO2 Plus Postage. DESCRIPTORS Adults; *Construct Validity; Discriminant Analysis; *Factor Analysis; Foreign Countries; Nultitrait Multimethod Techniques; *Psychometrics; *Self Concept; *Test Reliability IDENTIFIERS Australians; *Confirmatory Factor Analysis; Convergent Validation; Outward Bound; *Tennessee Self Concept Scale ABSTRACT The construct validity of responses to the Tennessee Self Concept Scale (TSCS) was evaluated in two sets of analyses. First, exploratory and confirmatory factor analyses, and an analysis of variance model adapted from multitrait-multimethod (MTMM) research, were used to examine the internal structure of the TSCS responses. Second, MTMM analyses were adapted to examine the convergent and discriminant validity of TSCS responses in relation to responses to the Self Description Questionnaire III and to the multidimensional self-concept ratings inferred by external observers. The subjects were 343 participants (aged from 16 to 37 years) in one of 9 Outward Bound courses offered in 1985 or 1986 at the University of Sydney (Australia). One-third of the subjects were full-time students, and most of the others were employed full-time during the year prior to the course. Across all analyses there was consistent support for TSCS family, social, and physical scales, but less consistent support for other TSCS scales. Eight tables are included and a list of 58 references is appended. (Author/TJH) **************************************************** ***** ************** * Reproductions supplied by EDRS are the best that can be made * * from the original document. * ******************4****************************************************
-
Upload
khangminh22 -
Category
Documents
-
view
1 -
download
0
Transcript of Richards, Gary E. TITLE The Tennessee Self Concept Scale

DOCUMENT RESUME
ED 300 391 TM 012 228
AUTHOR Marsh, Herbert W.; Richards, Gary E.TITLE The Tennessee Self Concept Scale: Reliability,
Internal Structure, and Construct Validity.PUB DATE 6 Jun 87NOTE 39p.
PUB TYPE Reports - Research/Technical (143)
EDRS PRICE MF01/PCO2 Plus Postage.DESCRIPTORS Adults; *Construct Validity; Discriminant Analysis;
*Factor Analysis; Foreign Countries; NultitraitMultimethod Techniques; *Psychometrics; *SelfConcept; *Test Reliability
IDENTIFIERS Australians; *Confirmatory Factor Analysis;Convergent Validation; Outward Bound; *Tennessee SelfConcept Scale
ABSTRACTThe construct validity of responses to the Tennessee
Self Concept Scale (TSCS) was evaluated in two sets of analyses.First, exploratory and confirmatory factor analyses, and an analysisof variance model adapted from multitrait-multimethod (MTMM)research, were used to examine the internal structure of the TSCSresponses. Second, MTMM analyses were adapted to examine theconvergent and discriminant validity of TSCS responses in relation toresponses to the Self Description Questionnaire III and to themultidimensional self-concept ratings inferred by external observers.The subjects were 343 participants (aged from 16 to 37 years) in oneof 9 Outward Bound courses offered in 1985 or 1986 at the Universityof Sydney (Australia). One-third of the subjects were full-timestudents, and most of the others were employed full-time during theyear prior to the course. Across all analyses there was consistentsupport for TSCS family, social, and physical scales, but lessconsistent support for other TSCS scales. Eight tables are includedand a list of 58 references is appended. (Author/TJH)
**************************************************** ***** *************** Reproductions supplied by EDRS are the best that can be made *
* from the original document. *
******************4****************************************************

The Tennessee Self Concept Scale:
Reliability, Internal Structure, and Construct Validity
Herbert W. Marsh, University of Sydney, Australia
Gary E. Richards, Australian Outward Bound School
6 June, 1987
Running Head; Tennesse Self Concept Scale
U.i DEPARTMENT OF EDUCATIONOffice of Educational Research and improvement
EDUCATIONAL RESOURCES INFORMATIONCENTER (ERIC)
111/his document has been reproduced asreCeive0 from the person or organizationcriginating it
0 Miror changes have been mods to improvereproduction queldY
Points of view or opinions stated in this docu-ment do not necessarily represent otticillSERI position or policy
2
"PERMISSION TO REPRODUCE THISMATERIAL HAS BEEN GRANTED BY
WERsor kt1./11.9AsAi
TO THE EDUCATIONAL RESOURCESINFORMATION CENTER (ERIC)
BEST COPY AVAILABLE

The Tennessee Self Concept Scale:
Reliability, Internal Structure, and Construct Validity
ABSTRACT
The construct validity of responses to the Tennessee Self Concept Scale
(TSCS) was evaluated in two sets of analyses. First, exploratory and
confirmatory factor analyses, and an ANOVA model adapted from multitrait-
multimethod (MTMM) research, were used to examine the internal structure of
TSCS responses. Second, MINN analyses were adapted to examine the convergent
and discriminant validity of TSCS responses in relatic, to responses to the
Self Description Questionnaire (SW) III and to the multidimensional self -
concept ratings inferred by external observers. Across all analyses there
was consistent support for the TSCS Family, Social, and Physical scales, but
less consistent support far other TSCS scales. Implications of further
research and for the use of the TSCS were discussed.

Tennessee Self Concept Scale
The Tennessee Self Concept Scale:
Reliability, Internal Structure, and Construct Validity
Historically, self-concept research has emphasized a general or total
self-concept. Although some researchers from the time of William James have
posited self-concept to be multidimensional, there was limited empirical
support for the assumption (Coopersmith, 1967; Marsh & Smith, 1982; Marx &
Winne, 1978; Shavelson, Hubner & Stanton, 1976; Wylie, 1974) prior to the
1980s. Whereas numerous factor analytic studies reported multiple factors,
these factors were typically difficult to interpret, unreplicable, or not
clearly related to the scales that an instrument was intended to measure.
Reviewers were particularly critical of the poor quality of self-concept
instruments (e.g., Wylie, 1974). In dramatic contrast, more recent empirical
research (Byrne, 1984; Byrne & Shavelson, 1986; Dusek & Flaherty, 1981;
Fleming & Courtney, 1984; Harter, 1982; Marsh, Barnes & Hocevar, 1985; Marsh
& Hocevar, 1985; Marsh & Shavelson, 1983; Soares & Soares, 1982) has found
clear support for the multidimensionality of self-concept. The difference is
apparently due to changes in the design of self-concept instruments. Early
instruments tended to consist of a hodge-podge of self-related items and
exploratory factor analysis was used to search for the salient factors.
Current instruments are typically designed to measure a priori factors that
are at least implicitly based on theory, and fpctor analysis is used to
refine and confirm these a priori factors.
The Tennessee Self Concept Scale (TSCS)
The Design of the TSCS.
The Tennessee Self Concept Scale (TSCS; Fitts, 1965), unlike most early
instruments, emphasized the multidimensionality of self and was specifically
designed to measure priori factors. Fitts noted the need for a scale that
was "multidimensional in its description of self-concept" (1965, p. 1) and
developed the TSCS to meet this need. In this respect, the TSCS was a
forerunner of more recently developed instruments.
Fitts used a 5 (external frame of reference; EXT) x 3 (internal fracl
of reference; INT) x 2 (positively vs. negatively worded items; PN) facet
design in the development of the TSCS. The 5 EXT scales -- Physical self,
Moral self, Personal self, Family self, and Social self are like the
traits posited on many subsequent instruments (e.g., Marsh, Barnes &
Hocevar, 1985). In Fitt's schema each of these self-concept traits could be
manifested in relation to three internal frames of reference -- Identity
Tennessee Self Concept Scale 2
(what I am), self -Satisfacticn (how I feel about myself), and Behavior (what
I do or how I act). Identity is the private, internal self-concept, whereas
Behavior As the manifestation of self that is observable to otters. Self -
Satisfaction reflects an actual-ideal discrepancy. Thus Fitts notes that a
parson can have high scores on the Identity and Behavior scales but still
have a low Satisfaction score "because of very high standards and
expectations of himself" (1965, p. 2). The third facet in the design of the
TSCS, PN, provided a control for various response biases although Fitts also
suggested that differences in responses to positively and negatively worded
items may represent psychological conflict (1965, p. 4). Each of the 90 TSCS
items can be classified into one of 3x52115 cells representing all
combinations of the EXT and INT facets, or one of 30 cells if positively and
negatively worded items are considered separately. Whereas a wide variety of
scores have been proposed, Fitts' discussion and most subsequent research
has emphasized the 5 EXT scales, the 3 INT scales, and a total score. The
construct validity of responses to the TSCS in relation to the 3x5 design and
the 3x5x2 design is the focus of the present investigation.
ReY120. 2T tie TEO&
The TSCS continues to be one of the most popular personality
instruments and, perhaps, the most widely used multidimensional self-concept
instrument. Bolton (1976) noted that it ranked 14th in total number of
references for all personality tests during the 1969-71 triennium and was
one of the few tests to increase its rank-order by 30 points or more between
the last two publics' ons of Buros' Personality Tests and Reviews. In the
most recent Mental Measurements Yearbook (Mitchell, 1985, p. xviii), the
TSCS ranked 18th in total number of references compared to all tests, 12th
among personality tests; and 1st among self- concept instruments (followed by
the Piers-Harris Children.' Self Concept Scale and the Coopersmith Self
Esteem Inventories). More than 800 TSCS references are listed in the various
Buros publications, and many more references are contained in a supplement
to the Test Manual. Despite this tremendous popularity, reviews of the TSCS
differ dramatically. In his extensive review of self-concept instruments,
Crandall (1972) rank-ordered instruments in terms of "perceived overall
quality" and selected the TSCS as the best of existing instruments. Bentler's
1972 review of the TSCS indicated that the various content areas are well
conceived" (p. 366) but also noted "the virtually complete absence of
information regarding the internal structure of the scale" (p. 367) that is
surprising for a multidimensional self-concept instrument. In a particularly

Tennessee Self Concept Scale 3
negative review, Wylie (1974) concluded that "no justification can be
offered, either a priori analysis in terms of acceptable methodologicalcriteria or from a survey of empirical results to justify using the scale"(p. 236). Wylie, like Sentler, was critical: of the lack of evidence aboutthe TSCS factor structure and the discriminant validity of its many scores.
Etstgc 1111411111 gf IMO R211220112
Numerous exploratory factor analyses (EFAs) of TSCS responses (e.g.,Bolton, 1976; Boyle & Larson, 1981; Fitzgibbons & Cutler, 1972; Saber, 1984;Sable, La Salle & Cook, 1973; Hoffman & Gallen, 1983; Lang & Vernon, 1977;
Pound, Hansen & Putnam, 1977; Rentz & White, 1967; Raffle, 1981; Tzeng,Maxmy, Fortier & Landis, 1985; Vacchiano & Strauss, 1968; also see Wylie,1914) have been conducted, but are not easily summarized. The findings varysubstantially depending on the number of factors retained and whetter itemor scale scores were analyzed. Many studies are uninterpretable becausescales based on overlapping sets of items that force spurious correlations(i.e., the 5 EXT and 3 INT scores described above) were factor analyzed(e.g., Saber, 1984; Pound, Hansen & Putnam, 1977; Rentz & White, 1967;Rolfe, 1981; also see Wylie, 1974). Across the other studies there wasbetter support for the EXT scales -- particularly the Social, Family, andperhaps the Physical scales -- than the INT scales. Nevertheless, if enoughfactors were retained in analyses of item responses (e.g., Vacchiano &Strauss, 1968; Sable, et al., 1973), or items within a single EXT scale wereanalysed (e.g., Tzeng, et al.), then differentiable subcomponents were foundfor each EXT scale. For example, the Physical scale has componentsreflecting physical health, physical attractiveness, and neatness of
appearance, whereas the Moral scale has components reflecting religion,honesty, and morality. In analyses of item responses, factors reflecting amajority of the items from any one internal scale were unusual, though somefactors reflected primarily the intersection of an EXT and an INT scale. Foranalyses of scale scores, however, support for INT scales -- particularly
the Satisfaction scale -- seemed stronger. In some studies there were
negative-item factors that may represent a method effect or response bias(see Marsh, 1986a, 1987b; Carmines & Zeller, 1979; for discussion of negativeitem factors in self-concept research). In one of the earliest studies,
Vacchiano and Strauss concluded that "the TSCS is a complex measure of self"(p. 326) but found that most of their empirically derived factors reflectedsubcomponents of specific EXT scales. Subsequent research seems to supportthese conclusions.
tit
`1.
Tennessee Self Concept Scale 4
Ibi Mud Ianstiattlgo
The purpose of the prerent investigation is to further examine the
construct validity of responses ;A the TSCS. This was accomplished by
examining the internal structure of responses to the TSCS and by examining
relations between TSCS responses and external constructs. The internal
structure of TSCS responses was examined with three analytic strategies: (a)
exploratory factor analyses (EFA) of item and scale responses; (b)
confirmatory factor analyses (CFA) in which a priori factors corresponding
to the design of the TSCS were postulated; and (c) an ANOVA model adapted
from multitrait-multimethod (MTMM) research to examine the portions of
variance explicable by EXT scales, by INT scales, by positively vs.
negatively worded items, and by various interactions anion, these effects.
The external validity of the TSCS responses was tested with an adaptation of
MTMM analysis. First, TSCS responses were related to responses from the Self
Description Questionnaire (SDQ) III, a self-concept instrument that has a
particularly well defined factor structure. Second, TSCS responses were
related to ratings by external observers.
METHODS
Whitau Pttisla and Emoducps
Subjects were 343 participants in one of 9 Outward Bound courses
offered in 1985 or 1986. The Outward Bound program is a 26-day residential-
program that consists of vigorous outdoor activities that promote both
individual initiative and group cooperation. Participants were between 16
and 37 years of age (Median ag 21), most were unmarried, 3/4 were male, and
they represented a wide range of socioeconomic backgrounds. A majority had
been employed on a full-time basis during the year prior to the course and
about 1/3 had been full-time students. A more detailed description of the
Outward Bound program, its impact on multidimensional self-concepts, and the
type of students who participate in it are presented by Marsh, Richards and
Barnes (1986a, 1986b). As part of a larger research program, participants
completed the TSCS and SIAM on the first day of the course, and were rated
by external observers on the last day of the course.
Ibi DUNE:Mat biannual!
T§G§L Fitts (1965) described the development and use of the TSCS, and
this was briefly summarized earlier. Analyses described here are based on
the 90 TSCS items, half of which are negatively scored, that are responded
to on a 5-point response scale that varies from "completely tr,leu to
"completely false." The additional 10 items from the MMPI lie scale are not
7
Tennessee Self Concept Scale 5
considered here. As recommended-in the Manual (Fitts, 1965), negativelyscored items were reverse scored, and then item responses were summed to formvarious scale scores. Because the TSCS was completed as part of the OutwardBound program, there were nearly no missing responses (less than 1/10 of IX).Far each subject, scale scores were based on the mean of nonmissing
responses. The scale scores to be considered and internal consistencyestimates are described in more detail as part of the analysis (see Table 7).
KIWI. The SDOIII is a 136-item multidimensional self-conceptinstrument that measures 13 dimensions of self-concept. Each of the 13 SDOIII scales is represented by 10 or 12 items, half of which are negativelyworded (see Marsh & O'Niell, 1984, for the wording of the items), andsubjects respond an an eight-point "I-Definitely False" to "8- Definitelytrue" response scale. Previous SDOIII research (e.g., Byrne & Shavelson,1986; Marsh, 1986b, 1986c, 1987c; Marsh, Barnes & Hocevar, 1985; Marsh &Jackson, 1986; Marsh & O'Niell, 1984; Marsh, Richards & Barnes, 1986a,1986b) has shown that the SDOIII responses are reliable, are stable, andhave convergent and discriminant validity with respect to the ratings byexternal observers, to performance on academic achievement measures, and toparticipation in athletics. In this previous research factor analyses, bothEFAs and CFAs, ,lave clearly identified all the 13 factors of self-conceptthat the WWII was designed to measure.
Summary descriptions of the 13 SIAM scaltA are: (a) Math -- I havegood mathematical skills/reasoning ability; (b) Verbal -- I have good verbalskills/reasoning ability; (c) Academic -- I am a good student in most schoolsubjects; (d) Problem Solving -- I am good at problem solving/creativethinking; (e) Physical Ability -- I am good at sports and physicalactivities; (f) Appearance -- I am physically attractive/good looking; (g)
Relations With Same Sex -- I have good interactions/relationships withmembers of the Same Sex; (h) Relations With Opposite Sex -- I have good
interactions/relationships with members of the Opposite Sex; (0 RelationsWith Parents -- I have good interactions/relationships
with my parents; (j)Spirituality/Religion -- ! am a religious/spiritual person; (k) Honesty-- Iam an honest/reliable/trustworthy
person; (l) Emotional Stability -- I am anemotionally stable person; (m) General Self Esteem -- I have self-respect,self-confidence, self-acceptance, positive self-feelings, and a good self-concept.
SDOIII responses were collected as part of the Outward Bound programunder the supervision of Outward Bound staff, and so there were nearly no
8
Tennessee Self Concept Scale 6
missing responses (less than 1/f0 04 1X). For present purposes, each SDOIII
scale score was defined as the mean of nonmissing responses to items in that
scale. An unreported factor analysis of SDOIII responses conducted as part
of the present investigation clearly replicated the findings reported by
Marsh- Richards, and Barnes (1986a, 1986b). Internal consistency estimates
are presented as part of the analyses (see Table 7).
gamma Minim blinkFor most of the Outward Bound program, participants work in small
groups, and activities are specifically designed to foster intense
interaction and cooperation among group members. Hence, by the end of the
26-day residential program, group members had observed each other in a wide
range of experiences. On the last day of the program participants were asked
to complete additional summary instruments describing other members in their
group. For this task, each participant was asked to rate "which of the these
people have got to know you the best throughout your varying experiences at
Outward Bound." On the basis of these ratings group members were chosen
to infer the multidimensional self-concepts of each person in the group,
subject to the constraint that all larticipants served as external observers
for the same number of individuals and each individual was rated by two
external observers. In inferring the multidimensional self concepts, external
observers were told "Judge the statements AS YOU THINK THE PERSON YOU ARE
JUDGING WOULD FILL THEM 1N, if asked to do so. You should base your responses
on everything you know about that person, i.e., what they say, what they do,
the way they think about things in general and think about themselves."
External observers responded to 12 single-item scales designed to
parallel 12 of the 13 SDOIII scales, all but General Esteem, on a 9-point
"very inaccurate" to "very accurate" response scale. The wording of the 12
items is the same as the summary descriptions presented above. Marsh, Barnes
and Hocevar (1985; also see Marsh, 1986b) have previously used these same
scales for this purpose, and found support for their convergent and
discriminant validity in relation to responses to the SDOIII.
External observer ratings were collected as part of the Outward Bound
program, and so there were virtually no missing values. For purposes of the
present investigation, each of the set of 12 external observer ratings was
taker, to be the mean of nonmissing responses across the two external
observers. The external observer ratings were collected for all but twl of
the Outward Bound courses considered in the present investigation, and
resulted in external observer ratings for 280 subjects. Because each scale was
9

Tennessee Self Concept Scale 7
defned by a singlm response, internal consistency estimates of reliabilitycould not be determined. The agreement between responses by two independentexternal observers, however; does constitute a reliability estimate and ispresented as part of the presentation of results (see Table 8).
Ibi Intim/ itcustat gi INg Ett220222Eliagait2CM Dam Sadism
Adopting an exploratory framework, over two hundred EFAs of responsesto the TSCS were conducted. These varied with respect to the number offactors retained (as few as 3 to as many as 20), the type of rotation, andthe level of aggregation. Separate sets of analyses were done on responsesto the 90 TSCS items, the 3x5=15 scales representing all combinations of theINT and EXT facets, and the 3x5x2=30 scales that also separated responses topositively and negatively worded items. Additional EFAs were performed oneach of the 5 sets of 18 items
representing each of the EXT scales. Becauseso many factor analyses were conducted there is a degree of arbitrariness inthe selection of results that are actually presented. An attempt was made toselect solutions that were most interpretable, solutions that were welldefined in that each factor had at least two (and preferably more)substantial loadings, and solutions that corresponded most clearly to apriori factors that the TSCS was designed to measure.
eating* 2f 20 Wm reIR202esz The first results are for EFAs ofresponses t3 the 90 TSCS items. The 9-factor oblique solution (Table 1)provides clear support fel'. three EXT scales -- Family, Social, and Physical.For each of these scales a majority of items (at least 13 of 18 items)designed to define it load positively on the same factor, the items representboth positively and negatively worded items, and the items represent allthree INT scales. Several items from the Personal/Identity cell (e.g., I'm acheerful person) load instead on the Social factor, suggesting that they maybe misclassified.
Insert Table 1 About HereFactor 9 provides some support for the Personal scale, but its
interpretation is more ambiguous: only 8 of 16 items designed to measure thisscale have substantial loadings (none higher than .41), these come primarilyfrom the Behavior scale, and several items from other scales have loadings ashigh or higher than any of the Personal items. Factor 9 seems to reflect alack of
persistence/decisiveness rather than a general Personal self.Moral items contribute substantially to three different factors. Eight
of the 16 Moral items, primarily from the Identity scale, load substantially
10

lennessee Self Concept Scale 8
on factor 6. Because of the strong evaluative component of these items
factor 6 can be interpreted as a "good person" factor. Four of the moral items
define a bipolar religion factor, factor 7, that may cause problems in the
interpretation of TSCS scores. Three Moral (religion) Satisfaction items
(e.g., I ought to go to church more) load positively on factor 8 but the
Identity item "I am a religious person" has a substantial negative loading.
That is, it is respondents who think of themselves as religious persons who
feel more dissatisfied with themselves in relation to religion. Whereas this
pattern may be consistent with Fitts' original ccriceptualization of the
Satisfaction scale, it may be inconsistent with summing across all Moral
items to form a moral scale score. Factor 8 is also a religious or ethical
factor, but it is unidimensional in that all substantial loadings are in the
same direction. (The bipolar religion factor and a separate unidisensional
religion/ethical factor were also reported by Gable, et al., 1973).
Factor 2 can oe interpreted as a weak negative-item factor because all
10 items that define is are negatively worded items. These 10 negatively
worded items represent all 5 EXT scales, but 8 of the 10 items come from the
Satisfaction INT scale. Whereas this factor is clearly distinguishable, it is
not clear whether it is substantively important or a substantively irrelevant
method effect.
Factor 4 rieems to be a weak Satisfaction factor. All 5 items that have
substantial positive loadings come from the Satisfaction scale, though these
represent only 2 of 5 EXT scales. Many other Satisfaction items, however,
have small positive loadings on the factor. In contrast, many of the Identity
and Behavior items have small negative loadings. This pattern appears to be
similar to that observed with the bipolar religion factor.
In summary, factor analyses of the 90 TSCS items provide good support
for only the Physical, Social and Family scales the TSCS. The results
also suggest an effect of negatively worded items that may be a response
bias and potential problems in the interpretation of Satisfaction items.
IbiaY 150121 THE Kam Thirty scales, each the sum of responses to
three items, were formed to represent all possible combinations of the 5 EXT
scales, the 3 INT scales, and the positively and negatively worded items.
Factor analyses of these scales have both advantages and disadvantages
compared to analyses of item responses. Because measured variables are based
on responses to three items, they are more reliable, more generalizable, and
less influenced by idiosyncratic uniqueness in each item. However, the
items used to form each scale must be reasonably homogeneous and derived
11

Tennessee Self Concept Scale 9
factors cannot be readily interpreted with respect to individual item
conte't. Five of the 7 factors (Table 2) are similar to factors based on item
responses,; the Physical, Social and Family factors representing 3 EXT scales,a bipolar Moral factor, and a negative item factor. The other two factorsare defined by both Moral and Personal items, though one is defined primarilyby positively worded items and the other by negatively worded items.
Insert Tables 2 & 3 About Here
Wino 10/ HAIM Fifteen scales, each the sum of responses to cixitems, were formed to present all possible combinations of the 5 EXT and 3INT scales. Three of the 5 factors (Table 3) correspond to the Physical,Social and Family scales that were identified in Tables 1 and 2. Factor 2 islike the Satisfaction factor identified in Table 1. Factor 5 is defined byIdentity and Behavior scales from the Personal and Moral factors. Becauseeach measured variable was the sum of responses to 3 positively and 3negatively worded items, it was, of course, impossible to obtain a negative-item factor.
aberi mare2orted Analyses. Forty-five "item-pair" scales, each the sumof responses to 2 items, were formed by pairing a positively worded andnegatively worded item representing the same INT and the same EXT scale.Thus, each of the 15 cells in Fitts' 3x5 schema was represented by 3 itempairs each consisting of a positively and a negatively worded item. Theselec,:ed factor solution (not shown) had nine factors similar to those inTable 1. They differed in that a negative item factor was not possiblebecause of tne way the scales were formed and one additional factorinterpreted to represent Family Satisfaction was identified.
Additional, unreported EFAs were conducted for each of the S sets of IBitems that define the 5 external scales. Between 2 and 5 interpretable
factors were found for items from each EXT scale: (a) Physical (Fit/healthybody; Neat appearance; Attractiveness; Sickness); (b) Moral (Honest,reliable, trustworthy; Bipolar religion (as in Table 1); Religion/Ethics);(a) Personal (Personal Satisfaction; Calm, easy-going; Negative self-Identity; Self-reliant; Lack of persistence/decisiveness ); (d) Family(Family Satisfaction; Family Identity; Active role; Family dissatisfaction);(e) Social (Social; Social dissatisfaction). Whereas these results indicatethat none of the external scales is clearly unidimensional, they are noteasily summarized. Most of the subcomponents representing each scale aredistinguishable on the basis of specific item contelt. Others reflect theinfluence of specific INT scales -- particularly Satisfaction -- or the
12

Tennessee Self Concept Scale 10
influence of positively and negatively worded items.
Waficadmy bidet ealankas.
In CFA the researcher posits an a priori model and tests its ability to
fit the data. The general approach is to: (a) examine parameter estimates in
rAation to the substantive, a priori model (and also far imprnper2
solutions); (b) evaluate the model in germs of indices of flt such as the X ,
the X /df the Tucker-Leis Index (TLI), and the Bentler-Bnnett Index
(BBI; Bentler is Bonett, 1980; also see Marsh, Balla & McDonald, 1986); (c)
compare the ftt of alternative, a priori models; and, perhaps, (d) test new,
a posteriori models if the a priori models do not perform adequately or if
further clarification of a priori structures is needed. The application of
CFA and its advantages over EFA are well known (e. g., Bentler & Bonett,
1980; Joreskog & !lowborn, 1981; Long, 1983; Marsh is Hocevar, 1983; 1985;
McDonald, 1985; Pedhauzur, 1982) and will not be reviewed hers.
In CFA studies, measured variables are typically posited to be
influenced by just one factor in whc. may be referred to as a single facet
test drlign. In the present investigation, each measure variable is posited
to be influenced by an external frame of reference, an internal fram of
reference, and, perhaps, the positive or negative wording of Aegis. In t'is
respect the TSCS represents a two-facet or even a three-facet test design.
Hence, the present application of CFA is more complicated than typical.
A particularly popular application of CFA to a two facet design i5 the
aiialysis of MTMM data. For MTMM data, the one facet consists of the multiple
traits whereas the second facet consists of the multiple methods. Each
measured variable is posited to represent the influence of one trait and one
method. In MTMM analyses the trait facet is posited to represent validity
whereas method facets are posited to reflect invalidity, but this
interpretational distinction has no effect on the actual analyses. The
application of CFA to the two-facet MTMM design has been reviewed by Wideman
(1985) and Mash (in press; 1987c; Marsh & Hocevar, 1983). These researchers
describe a systematic set of a priori models used to test the Influence of
each of the facets. The general ap-eoach advocated by these researchers and
the CFA models that they summarized are adapted in the present investigation
of responses to the TSCS. Marsh in press; Marsh, Barnes & Hocevar, 1985)
also proposed a three-facet MTMM design in which an additional facet is added
(e.g., traits, methods and occasions).
The TSCS was developed according to a three-facet fully crossed test
design. The three facets are the 5 external frames of reference (EXT), the 3
13
Tennessee Self Concept Scale 11
internal frames frames of reference (INT), and the positive or nzgative
wording of items (PN). In the present analyses each of the 30=5x3x2 cells ofthis 3-facet test design is represented by one scale that is the sum ofresponses to 3 items. The 30x30 matrix of correlations among these scalescores was the basis of the CFAs. Whereas it is possible that parsimoniousmodels reflecting just one of the facets (e.g, a five-factor model
consisting of the EXT scales ar a 3-factor model consisting of the INTscales) cooli adequately describe this data, the results of the EFAs suggestthis to be unlikely.
One plausible model Wit is consistent with the TSCS design (see Table4) posits 10 a priori factors. According to this model, each of the 30measured variables loads an 1 of 5 EXT factors, 1 of 3 INT factors, and 1 of2 PN factors; the remaining 7 factor loadings are fixed to be zero. In orderto maintain the independence of the facets and also in order for the model toconverge to a proper solution, it is necessary for factors representingdifferent fem... to be uncorrelated. That is, correlations among the 5 EXTfactors, among the 3 INT factors, and among the 2 PN factors are freelyestimated, but all other factor correlations are fixed to be zero. Modelslike this one are typically used in the CFA of MTMM data and have beenevaluated extensively in that context (Marsh, in press; 1987c; Wideman,1985).
Insert Tables 4 & 5 About HereA detailed progression at alternative models was posited to test the
ability of each facet, each pair of facets, and all three facets to thedata (Tabie 5). In the first, most parsimonious model (Model 1) a singlefactor that might correspond to total self-concept is posited. One-facetmodels positing only 2 PN factors (Model 2), only 3 INT factors (Model 3),or only 5 EXT factors (Model 4) each do substantially better than Model 1,indicating that Model 1 is inadequate. Model 4 fits the data better thanModels 2 or 3, suggesting that the EXT facet has the greatest influence. Two-facet motels (Models 5, 6 and 7), however, perform better than any of theone-facet models, indicating that the one-facet models are inadequate.Finally, the three-facet model (Model 8) that posits 5 EXT factors, 3 INTfactors, and 2 PN factors provides a substantially better fit than do any ofthe two-facet models.
Several approaches were taken in evaluating Model 8. Guidelines of whatvalue a fit index must attain in order for a model to be judged as providing
2an adequate fit must be interpreted cautiously. Nevertheless, a X /df
14

Tennessee Self Concept Scale 12
ratio of 1.53 for Model 8 -- particularly given the moderately large sample
size -- and a TLI of .93, are typically interpreted to indicate an adequate
fit. Inspection of the modification indices provided by LISREL (see
Joreskog & 80rbom, 1981) provide an estimate of the improvement in fit that
would result in freeing any particular parameter. For the total of 671
parameters fixed to be zero (210 factor loadings, 26 factor correlations,
and 435 uniqueness's correlations), the "largest modification index was 9.1.
Of particular relevance, none of the factor correlations that were fixed to
be zero had a modification index of more than 5. In summary these results,
along with the comparisons with alternative models, indicate that the fit of
Model 8 is adequate.
The inspection of the parameter estimates (Table 4) is important for
evaluating a solution. Factor loadings for 4 of the 5 EXT factors, all but
the Moral factor, are well definud in that all factor loadings are positive
and statistically significant. The factor loadings for the Personal factor,
however, are smaller than those for Physical, Social and Family factors. For
the Moral factor, 3 of 6 factor loadings are nonsignificant. Whereas the
factor loading for the Moral/Identity/positive scale is substantial and
positive, the factor loadings for the two Satisfaction scales are negative.
It should be noted that a similar pattern of factor loadings was observed
for each of the EFAs ( :pie factor labelled bipolar religion in Tables 1-3)
In summary, interpretations of the 5 EXT factors are reasonable and
generally consistent with results based on the EFAs, though the Moral factor
is different from the one proposed by Fitts.
Each of the 3 !NT factors is well defined in that all 10 factor
loadings defining each factor are statistically significant and positive.
Consistent with the Fitts' interpretation of the Satisfaction scale, the
Identity and Behavior factors are more highly correlated with each other
(.83) than with the Satisfaction factor (.61 & .75). The very high
correlations among all three INT factors suggests either a general self-
concept that influences resprnses to all 3 INT scales or a halo effect.
Whatever the explanation, the INT factors -- particularly the Identity and
Behavior factors, are not well differentiated.
The negative item factor is well defined in that all factor loadings
are positive and 14 of 15 are statistically significant. In contrast, only 5
of 15 factor loadings on the positive item factor are significant, and two
of these are negative, This suggests that the positive item factor is weak
and that its interpretation may be ambiguous. One additional model in which

Tennessee Self Concept Scale 13
the positive item factor was eli,:inated was tested in order to further
examine this influence. Whereas the elimination of the positive item factor
led to a modestly (statistically significant) poorer fit, its elimination
had little effect on other parameter estimates.
Ihe eaalleatien ef tht MIll alleYA MAILStanley (1961; also see Kavanagh, Mackinney & Wolins, 1971; Marsh &
Hocevar, 1983) demonstrated that when repeated measurements of subjects are
measured across all levels of two different facets (e.g., the EXT and INTfacets of the TSCS), three orthogonal sources of variance can be estimated.
The main effect due to subjects is a test of haw well the total scores(e.g., total self-concept) differentiate among subjects. If this effect is
nonsignificant or small, then total scores are similar for all subjects. The
two-way interactions betwecl subjects and each facet reflect the extent towhich overall differeltiation between subjects depends on that facet. If an
interaction is small or nonsignificant, then the facet has no discriminantvalidity in that raters are ranked the same for each level of the facet
(e.g., the rank order of individuals is the same for each of the EXT
scales). If an interaction is large, a facet has discriminant validity in
that subjects are differentially ranked depending on the level of the facet
(e.g., subjects are ranked differently for the Physical and Social scales).
The main effects of each facet and their interaction are typically of littleinterest in this analysis, and will be zero if all scales are standardizedto have the same mean and standard deviation. The three-way interaction
(e.g., subjects x EXT x INT) is assumed to represent only random error, andis used to test the statistical significance of the other effects.
Consequently, there is an implicit assumption that differentiation among
subjects does not depend the interaction between the two facets, and this isfrequently cited as an important weakness of this model (e.g., Marsh &
Hocevar, 1983). Stanley (1961) noted, however, that it is possible to expandthe two-facet design so that this third-order interaction can be estimated
independently of the error term.
For purposes of the present investigation the ANOVA model is expanded
to include all three facets of the TSCS design. This provides a test of the
PM factt as well as the INT and EXT facets. Variance can be partitioned into
seven orthogonal sources (see Table 6) in this four factor unreplicated
ANOVA model. The highest order interaction term (subjects x INT x EXT x PN)
is still assumed to represent random error. This expanded model, however,
provides a test of whether differentiation among subjects depends on any of

Tennessee Self Concept Scale 14
the two-way interactions among the three facets. In particular, the subjects
x EXT x INT term that could not be estimated for the two-facet model is
testable in this expanded three-facet model.
Insert Table 6 About Here
In the present investigation, because the df are so large, all sourcesof variance are statistically significant. The variance components (Table 6)provide an indication of the relative size of the effects. The largest
source of non-error variance is due to subjects, suggesting a general self-concept that influences all ratings or, perhaps, a generalized halo effectthat influences the self-report responses. The next largest source is due tothe subjects x EXT interaction, providing support for the discriminant
validity of the EXT scales. Differentiation among subjects also depends onINT and PN facets and, to a smaller extent, the EXT x INT interaction. Theremaining sources of nonerror variation, though statistically significant,are smaller.
he results provide support for the discriminant validity of the EXTand INT facets that were most important in the design of ne TSCS.Differentiation among subjects also depends on whether the TSCS items arepositively or negatively worded, and this may represent the influence of aresponse bias. Differentiation among subjects depends to a lesser extent onthe two-way interactions among the facets -- particularly the EXT x INT
interaction. That is, differentiation among subjects depends not only on theeffects of the INT and EXT facets, but also on particular combinations ofthese facets. This finding may be consistent with the design of the TSCS,but appears to be inconsistent with the scale scores that are typically usedto summarize TSCS responses. The recommended scores represent the marginal
scores in the 3x5 design of EXT and INT facets (e.g., Physical responsesaveraged across the three INT scales and IdeAtity responses averaged acrossthe 5 EXT scales). To the extent that particular combinations of the INT andEXT facets have discriminant validity, however, it may be more appropriate
to report scores for all 3x5=15 combinations of these facets.
Watigui Ittlitto INE 621220S2S tag ElittE01 OnstructsTests of the internal structure of the TSCS responses provide important
evidence about its construct validity. Different analytic procedures, forexample, provide clear support for differentiation among the Physical,
Social, and Family scales of the TSCS. An implicit assumption, of course, isthat the basis of this differentiation is consistent with interpretations ofthe scales. Support for this assumption requires that the TSCS responses be
17

Tennessee Self Concept Scale 15
related to external constructs. The problem of determining appropriate
external criteria is, however, an important obstacle. Self-concept responses
are intended to represent the respondents own self-perceptions whether or not
these are reasonable in relation to objective external criteria or the
observations of external observers. Two frequently used criteria for
validating responses to a self-concept instrument are responses to other
self-concept instruments and the observations of external observers.
Btlitims leasta MO end 6,12Q0222
A frequently used approach to validating responses to one instrument is
to correlate the responses from it to responses from other instruments that
are designed to measure similar constructs. When both instruments are based
on self-report responses by the same person, it may be dubious to interpret
this approach as a test of external validity. Nevertheless, tests of the
consistency of responses across independently constructed instruments do
provide a valuable source of information about the construct validity of
responses to each instrument. Because few self-concept instruments have a
well-defined structure, this approach is usually applied to correlations
between total scores (see Wylie, 1974). To the extent that responses to each
instrument are correlated, then responses are not idiosyi:cratic to either
instrument. A much stronger application of this approach is possible,
however, when twn or more multidimensional self-concept instruments are
designed to measure similar components. Using the logic of MTMM analysis,
scores for matching scales from different instruments should be
substantially correlated, whereas scores between nonmatching scales should
be substantially less correlated. When the intended scales from each
instrument are strictly parallel, or when only matching scales are selected
from different instruments, the data can be analyzed with the traditional
approaches to MTMM data (e.g., Byrne & Shavelson, 1986). Even when the
scales from the different instruments are not strictly parallel, the logic
of MTMM analyses can be adopted (Marsh & SAith, 1982).
TSCS responses are validated against SDOIII responses in the present
investigation, and the SDOIII is particularly well-suited for this purpose.
First, the factor structure for responses to the SDOIII is well-defined as
shown for the data used here and in many previously published factor
analyses. Second, there seems to be a reasonably clear correspondence
between thy TSCS EXT scales and the SDOIII scales: (a) the TSCS Family scale
corresponds to the SDOIII Parents scale; (b) the TSCS Social scale
corresponds to the Same Sex and Opposite Sex scales on the SDOIII (c) the
s

Tennessee Self Concept Scale 16
TSCS Physical scale corresponds to the Physical Ability and Physical
Appearance scales on the SDQIII; (d) the TSCS Moral scale corresponds to the
Honesty/Trustworthiness and the Spiritual/Religion scales on the SDQIII; (e)
the TSCS Personal scale is not so Obviously related to SDQIII scales, but
appears most like General Esteem and, perhaps, Emotional Stability; (f) the
TSCS has no specifically academic self-concept scales corresponding to the
Academic, Math, Verbal, and Problem Solving scales o' the SDQIII, though
some its in the TSCS Personal scale may relate to these academic
components. Whereas several EXT TSCS scales appear to correspond to more
than one SDQIII scale, EFAs of the EXT items suggest that these scales
contain differentiable subcomponents that may correspond more directly to
specific SDQIII scales. Also, Marsh (1987c) has posited higher-order SDQIII
factors in which two or more scales are combined that may correspond more
directly to the TSCS scales.
Correlations between the 5 TSCS EXT scales and the, 13 SDQIII scales are
prevented in Table 7. Correlations between scales posited to be matching
(indicated with asterisks) are like convergent validities in MTMM analyses.
Applying the logic of MTMM analyses these 9 convergent validities should be
substantial and substantially higher than correlations between non-matching
TSCS and SDQIII scales. The median of these 9 correlations, .60, provides
support for convergent validity. Eight of the 9 convergent validities vary.
between .53 to .71, the one exception being the near-zero correlation between
the TSCS Moral and the SDQIII Spiritual/Religion scales. In contrast to these
substantial convergent validities, the median of the remaining 56
correlations is only .30 and just two of these correlations are greater than
.5 (both these involve the SDQIII General Esteem scale which should be
substantially correlated with other areas of self-concept). In general, these
results provide support for both the convergent and discriminant validity of
responses to the TSCS and the SDQIII.
Insert Table 7 About Here
The three smallest convergent validities involve the the TSCS Physical
and Moral scales -- particularly the near-zero correlation between TSCS
Moral and SDQIII Spiritual/Religion scales. A more detailed analysis of the
Identity, Satisfaction, and Behavior components of these TSCS scales,
however, reveals some interesting anomalies. The SDQIII Spiritual/Religion
scale is substantially correlated (.51) with the Moral/Identity scale, not
significantly correlated (.08) with the Moral/Behavior scale, and
significantly matively correlated (-.38) with the Moral/Satisfaction scale.

Tennessee Self Concept Scale 17
This apparently represents the influence of the bipolar religious component
identified in the TSCS Moral responses in earlier factor analyses. In
contrast, the SDQIII Honesty/Trustworthiness scale is most highly correlated
with the Behavior component of the TSCS Moral scale. The SDOIII Physical
ability scale correlates on_y .53 with the TSCS Physical scale. It, however,
correlates .60 with the Physical/Behavior scale and only .39 and .34 with the
Physical/Identity and Physical/Satisfaction scales. in contrast, the SDQIII
Physical Appearance scale correlates .51, .69, and .53 with the Identity,
Satisfaction and Behavior components of the TSCS Physical rcale.
As summarized earlier, EFAs of the TSCE Physical and Moral items
suggested that these scales could be differentiated into distinguishablecomponents: (a) Physical (Fit/healthy body; Neat appearance; Attractiveness;
Sickness); (b) Moral (Honest, reliable, trustworthy; Bipolar religichil
Religion/ethics). The contents of several of these TSCS factors seem to
correspond more closely to SDOIII scales than do the TSCS Physical and :;oral
scales. In order to test this observation, factor scores were derived fromthe factor analyses of the TSCS Physical items and of the TSCS Moral items,
and were related to the SDOIII scales (Table 7). The SDQIII Physical
Ability scale was substantially more highly correlated with the Fit/healthy
body factor score (.66) than with any of the other factor scores or the TSCS
Physical scales (in Table 7). The SDQIII Physical Appearance scale was more
substantially correlated with the Attractiveness factor score (.76) than withother {actor scores or the TSCS scales in Table 7. The SEWN
Spiritual/Religion and the TSCS Bipolar religion factor score were more
highly correlated (.76) than any other pair 04 and SDQIII scores.
Finally, the SDOIII Honesty/trustworthiness scale was more substantially
correlated with the corresponding factor score (.54) than with other factor
scores or the TSCS scales in Table 7. It had been expected that the TSCS
Religion/ethics factor score would be more substantially correlated with theSDQIII Spiritual/Religion scale. It should be noted however, that this factor
was the most poorly defined of the TSCS factors considered in Table 7 (it
had no factor loadings greater than .45 whereas all other factors had at
least three factor loadings between .5 and .80) and was the sec and factor
related to religion extracted from the TSCS Moral items.
In summary, these analyses provide strong support for both the
convergent and discriminant validity of responses to the TSCS and MOM.Further analyses, however, ,-evealed important anomalies in some of the TSCS
scales. For the TSCS Physical and particularly the Moral items, well defined
20

Tennessee Self Concept Scale 18
subcomponents were substantially' more highly correlated with corresponding
WWII scales than were the total scale scores. These additional analyses,
then, provided stronger support for the construct validity of the SDOIII
scales -- particularly the Spiritual/Religion scale -- and also provided
convincing evidence of the multidimensionality of some of the TSCS EXT
scales. These further analyses also suggested, however, that distinctions
between the Identity, Satisfaction, and Behavior subcomponents of some EXT
scales may reflect systematic content differences in the items used to
define the subcomponents instead of, or in addition to, the influence of the
INT frames of reference. For example, the TSCS Physical/Behavior scale was
most highly correlated with the SDOIII Physical Ability scale whereas the TSCS
Physical/Satisfaction scale was most highly correlated with the SDOIII
Physical Appearance scale. As noted earlier, even when the existence of a
priori factors are supported, the interpretation of these factors should be
tested with external constructs.
Ratings ly External Observers.
Multidimensional self-concept ratings were inferred by each of two
external observers for 12 single-item rating scares designed to parallel 12
of the 13 SDOIII scales (all but General Esteem). Thus, the hypothesized
relations between the external observer ratings and the TSCS responses is
the same as posited for the TSCS and SWIM scales except for General
Est(lem. Correlations between the 12 observer rating scales and the 5 TSCS
EXT scales (Table 8) provide only modest support for convergent validity.
The 8 convergent validities range from .05 to .31 (median = .23) and 7 are
statistic4Ily significant. The one nonsignificant convergent validity is the
correlation between the Spiritual/religion scale and the TSCS Moral scale.
Despite these modest convergent validities, there is reasonable support for
the discriminant validity of responses to the TSCS Family, Social, and
Physical scales. Whereas the magnitude of correlations between observer
ratings and TSCS EXT scales is much lower than observed between SDOIII and
TSCS scales, the pattern of results is similar.
Insert Table 8 About Here
The only nonsignificant convergent validity was between
Spiritual/religion observer scale and the T.ICS Moral scale. The Identity
component of the TSCS Moral scale, however, is substantially correlated with
this external observer rating (.29) whereas the TSCS Moral/Satisfaction
scale is negatively correlated with it. Furthermore, the TSCS factor labeled
Bipolar Religion correlates .40 with the Spiritual/religion scale, and
21

Tennessee Self Concept Scale 19
represents the highest correlation between any TSCS scale and observer
ratings. This anomalous pattern is like that observed for the TSCS Moral and
the SDQIII Spiritual/religion scales. The factor scores derived from the TSCS
Physical items also provide modest support for the separation 04 different
physical factors.
The external observer ratings may, perhaps, also provide a basis for
testing the ,alidity of the INT scales. Results from Table 7 suggest that
the WWII scales are more consistently correlated with Identity and, to a
lesser extent, Behavior scales than to Satisfaction scales. Behavior is,
however, the most obvious basis for external observers to form inferred self-concept ratings. Intuitively it would seem that external observer ratings
should be most highly correlated with Behavior ratings and least correlatedwith Satisfaction ratings. Results in Table 8, however, provide no supportfor these expectations. The Behavior scale tends to be less correlated with
observer ratings than the Identity scale and even the Satisfaction scale(except for the Moral responses that were already discussed). Whereas theremay be plausible counter-explanations of these findings, they provide nosupport for the construct validity of the TSCS INT scales.
The observer rating scales were specifically designed to parallel 12 of
the SDQIII scales, and so observer ratings may be more highly correlated withSDQIII responses than TSCS responses. Correlations among the 12 observerrating and corresponding SDQIII scales indicate that the 12 convergentvalidities vary from .17 to .37 (median r = .35), all are statisticallysignificant, and only one (Emotional Stability) is less than .25. With theexception of the Emotional Stability scale, there is also clear support for
discriminant validity. These results provide much stronger support for the
validity of the external observer ratings than did the TSCS responses.
The purpose of the external observer ratings for analyses summarized
here was to validate TSCS and SIAM responses. Whereas this empirical useof observer ratings is legitimate, research on relations between self-
concept and self-concept inferred by significant others has a long and
important theoretical history (e.g., Marsh, Barnes & Hocevar, 1985). Thereare, however, important limitations in the use of external observer ratings.
First, most research has found disappointingly small correlations between
self-report responses and the observations of external observers (e.g.,
Shrauger & Schoeneman, 1979). Second, because the observer ratings were
designed to parallel the SDQIII scales, they may be more relevant as a testof the validity of the SDQIII responses than the TSCS responses that were
22

Tennessee Self Concept Scale 20
the focus of this study. Third, single-item rating scales such as those usedby the external observers are known to have poorer psychometric properties
than the multi-item scales such as the SDOIll and TSCS scales. Results in
Table 8 show that the reliability of the external ratings as inferred from
agreement between the two observers (median as .47) is disappointingly low.
Marsh, Barnes and Hocevar (1985)correlated SDQIII responses with external
observer ratings based on the single -item scales used here and multi-itemscales. Whereas support for convergent and discriminant validity was foundfor observer ratings on single-item scales, better support was found for
observer responses to multi-item scales. Fourth, external observers in the
present investigation only knew the participants within the context of the26-day Outward Bound program. Marsh, Barnes and Hocevar (1985), for example,specifically asked individuals to select the person in the world who knewthem the best, and these individuals were able to infer self-concepts muchmore accurately than the external observers considered here. Hence, the
modest support for the construct validity of ratings by external observersdespite all these limitations -- is surprisingly good.
Summary and Discussion
The TSCS is one of the few self-concept instruments developed prior tothe 1970s that was specifically designed to measure a priori dimensions of
self-concept. Nevertheless, reviewers have been critical of the lack of
empirical information about the TSCS structure and support for the
discriminant validity of its scales. Subsequent research, primarily EFAt of
item or scale responses, has not resolved this problem. The purpose of the
present investigation was to examine further support for the construct
validity of the TSCS.
The internal structure of the TSCS was examined with factor analyses
and analyses adapted from MTMM research. Each of these analyses indicated
the multidimensional nature of the TSCS responses, but empirically derived
factors were sometimes not clearly related to the scales which the TSCS wasintended to measure. There was clear and consistent support for three of theEXT scales -- Physical, Social and Family, but not for the remaining scales.The Moral scale was complicated by the existence of a bipolar religious
component that has been reported in previous research. Personal self appearsto be the least specific of the EXT scales and was not consistently
identified as a differentiable factor.
interpretations of correlations between TSCS responses, SD0111
responses, and the external observer ratings provided support for
23
Tennessee Self Concept Scale 21
interpretations of TSCS's internal structure. Support for convergent anddiscriminant validity was strongest for the TSCS Physical, Social and Familyscales. Only when the TSCS Moral scale was separated into subcomponents wasits relation to MITI and observer responses clarified. The TSCS Personalfactor was most strongly related to the =III General Esteem scale, thoughit is not clear that it was intended to be such a scale.
There was little support for the TSCS INT scales in the presentinvestigation. These scales were not clearly identified in the EFAs, and wereso highly correlated in the CFAs as to be difficult to distinguish. Whereasthis facet does influence TSCS responses, this influence may reflect theidiosyncratic wording of items used to define these males instead of, or inaddition to, the internal frames of reference that they were intended tomeasure. To the extent that these internal frames of reference have aneffect, it seems that this effect is specific to particular EXT scales sothat it may be unjustified to interpret INT scales averaged across the fiveEXT scales.
There was also an influence due to the wording, positive or negative,of TSCS items. It is unclear, however, whether this effect is substantivelyimportant or a substantively
irrelevant method effect. Fitts (1965) suggeststhat differences between positively and (reverse scored) negatively wordeditems reflects psychological conflict in self-perceptions, and proposed avariety of conflict scores based on such discrepancies. Whereas thisoperationalization of conflict is not easily tested, the process is positedto be bipolar. The positive and negative item factors in the CFA of TSCSresponses (Table 4), however, were not significantly correlated. In fact, itwas only the influence of negatively worded items that could be readilyidentified. This suggests that the effect of positively vs. negatively wordeditems represents a response bias that is specific to negatively worded items(also see Marsh, 1987b).
One of the most interesting aspects of the TSCS design, in addition toits clearly articulated emphasis on a multidimensional self-concept, is thetheoretical role of satisfaction. According to Fitts' conceptualization,Satisfaction is like the self-ideal discrepancies posited by otherresearchers. That is, satisfaction is the juxtaposition betweenaccomplishments and the standards that one sets for oneself. Empiricalsupport for discrepancy models of self-concept is generally weak (e.g.,Wylie, 1974; 1979), due in part to methodological problems in the analysis ofoiscrepancy scores, though interest in this approach continues to be strong

Tennessee Self Concept Scale 22
(e.g., Higgins, Klein & Strauman, 1985). Most researchers, however, measureactual-self and idealself
independently, and infer self-satisfaction oresteem from the discrepancies between the two. Measuring satisfactiondirectly, as in the TSCS, may avoid methodological problems in the use ofdifference scores, but it introduces new problems as demonstrated with thebipolar religious factor. Individuals who had religious identities (e.g.,responded more positively to the item "I am a religious person") had lowerself-satisfaction in relation to religion (e.g., responded negatively to theitem 01 am as religious as I want to be"). This distinction is lost,however, when responses are summed across Identity, Satisfaction and Behaviorresponses as in the TSCS EXT scales and the total score. That is, quitedifferent levels of accomplishments and internal standards can lead to thesame level of satisfaction. Whereas it may be more justifiable to sumresponses across the Satisfaction items, the definition of satisfaction inrelation to accomplishments and internal standards probably varies fordifferent areas of self-concept. Furthermore, TSCS Satisfaction scale was nomore highly correlated with the SWIII Esteem scale than were the TSCSBehavior and Identity scales. In summary there appear to be problems with theoperationalization of self-satisfaction in the TSCS that render itsinterpretation as dubious.
Fitts (1965) proposed a 3x5 schema for the design of the TSCS, andrecommended the use of the 8 marginal scores in interpreting responses tothe TSCS. Implicit in this recommendation is the assumption that there is nointeraction between the EXT and INT facets. The identification of EFAfactors that represent a particular combination of EXT and INT items, theresults of the ANOVA model, the interpretation of the bipolar religionfactor, and, perhaps, even Fitts' own interpretation of the Satisfactionscale suggest that this assumption is unwarranted. However, theinterpretation of the 15 scales that represent the cells in this 3x5 schemamay also be unwarranted.
Individually, the reliability of these 15 scales isnot sufficient to justify their practical application. Furthermore, thesubstantial correlations among many of the scales (see Table 3) wouldfurther complicate interpretations of TSCS responses based on them.
The emphasis of the present investigation has been on the examinationof TSCS responses in relation to the subscales that it was designed tomeasure. It is also important, however, to evaluate the TSCS scale inrelation to what it does not measure. Most empirical and theoreticalresearch identifies academic self-concept as an important self-concept
25
Tennessee Self Concept Scale 23
dimension, particularly for school-aged individuals in Western society.
Marsh (Marsh, I986c; Marsh, Byrne & Shavelson, 1907) argue that because Mathand Verbal self-concepts are nearly uncorrelated, at least two dimensions ofacademic self - concept should be included in multi-dimensional instruments.The exclusion of any academic self- concept scale on the TSCS seemsunjustified for an instrument that is to be used by school-aged subjects.
Historically, the TSCS is important because of its popularity, becauseof its emphasis on multiple dimensions of self-concept and, perhaps, becauseof its theoretically provocative design. In the 1960s it may have
represented the best of existing self-concept instruments as suggested inCrandall's 1972 review, particularly if a multidimensional measure wassought, though other reviewers were less favorable. Its continuingpopularity demonstrates its heuristic value. Despite its historicalimportance and heuristic value, however, the TSCS in not a stronginstrument when judged by current test standards. The TSCS was designed toSe multidimensional, but multidimensional statistical procedures wereapparently not used in the original construction/selection of items and theitems have not been refined during the ensuing 30 years. From thisperspective it is hardly surprising that there is weak support for many ofthe scales that the TSCS is designed to measure. Wher/as responses to theTSCS are multidimensional,
clear empirical support was found for only 3 of ;EXT scales and for none of the 3 INT scales in the present investigation,and these findings seem to be consistent with previous research. The three--Facet design of the TSCS was theoretically important, and all three facetsinfluence responses to the TSCS. Neither the nature nor the theoreticalsignificance of the INT and PN facets are well understood, however, and theINT facets seems to introduce unjustified complications into theinterpretation of TSCS responses. Finally, the lack of an academic selfseems unjustified for an instrument to be used with school-aged respondents.
Tennessee Self ConceptScale 24
REFERENCES'Bentler, P. M. & Bonett, D. G. (1980).Significance tests and
goodness of fit
in theanalysis of
covariancestructures.
Plychglogical pglatins, Es, 588-
606.
Bentler, P. (1972).Review of
Tennesse Self Concept Scale. In O. Burns (Ed.),
Mg Winn Ural' eleimmetsyggt222ks. Highland Park, NJ: Gryr in Press,
366-367.
Bolton, B. (1976).Factorial
validity of the Tennessee Self Concept Stage.ellY0912811111 Bizactu ;24. 947-954.Boyle, E. S., &
Larson, P. C. (1981).Factor structure of the
Tennessee Self
Concept Stale for aninstitutionalized disabled
population.egE212tugi end
d2t2r. Daft& EL 575 -582.Byrne, B.
(1984). Thegeneral/academic
self-conceptnomological nEtworks A
review ofconstruct
validation research. Review ofEducgtional
Besegrchs.
427-456.
Byrne, B., &Shavelson, R. J.
(1986). On the structure ofadolescent self-
concept.gd5lilti2021
ESY02122ilks. ZeL 474-481.Campbell, D. T. &Fiske, D. W. (1959).
Convergent anddiscriminant
validation Lly
multitrait-multimethod matrix.esychologial
BulletinL 56s,
81-105.
Carmines, E. G. &Zeller, R. A. (197°).
Reliibility end validityassessments.
Bevtiely Hills, CA: sage.Coopersmith, S. A.
(1967). Theantecedept2 24
s211:e4e2m1 San Francisco:
W. H.Freeman.
Crandall, R. t1973). Themeasurement of
self-esteem and relatedconstructs.
In J. P.Robinson & P. R. Shaver (Eds.),
M2filur2s 24 512cialPsychological
ettiton (RevisedEdition). Ann Arbor, MI:
Institute for SocialResearch.
Dusek, J. 8., &Flaherty, J. F.
(1981). Thedevelopment of
self-conceptduring the
adolescent years. MON ughl 2f the§gci2ty for
Resgarih in
;nagRgygloggpt ifi(4, Serial No. 191).Fitts, W. H. (1965)
NOMA' 18r120011222P S214 C2ncs2t PUlts Los Angeles:
WesternPsychological
Services.Fitzgibbons, D. J., & Cutler,
R. (1972).The factor
structure of theTennessee Self Concept Scale. Jogrnal 24
Clinical Psychfslgays. 2SL1134-186.
Fleming, J. S. & Courtney,B. E. (1984). The
dimensionality of self-esteems II:
Hierarchical facet modelfor revised
measurement scales.Journal, 21
EttlimilitY tad WW1 ElYi-hams. 4¢L 404-421.Saber, L. B. (1984).
Structuraldimensions of aged
self-concept: ATennessee Self Concept study.
Icitishastutail 2i
1211X2221.22U 207-212.

Tennessee Self Concept Scale 25
Gable, R. K., La Salle, A. J., & Cook, K. E. (1973). Dimensionality of self
perception: Tennessee Self Concept Scale. fIrceptual and Motor Skills,, 364.
551-560.
Harter, S. (1982). The Perceived Competence Scale for Children. Child
DIYILMIVAL 11187-97.
Higgins, E. T., Klein, R. & Strauman, T. (1985). Self-concept discrepancy
theory: A psychological model for distinguishing among different
aspects of depression and anxiety. §giitl Gonktign4. 34. 51-76.
Hoffman, R. A., & Gallen, M. I. (1983). The Tennessee Self Concept Scale:
revisit. EInhagflial BUSITils. Ns. 119S-1204.
Joreskog, K. G. (1974). Analyzing psychological data by structural analysis
of covariance matrices. In R. C. Atkinson, D. H. Krantz, R.D. Luce, &
Supper (Eds.), Wat2flagLACY diudgastat2 in mithtmAtial. aust12166Y (Vol.
2, pp. 1-56). San Francisco: W. H. Freeman.
Joreskog, K. G. & Sorbom, D. (1981). LISREL V: Analysis of Linear
gIcKtucil Balitign Ry the nethgg pf Maxkmgm Likelihood Chicago:
International Educational Services.
Kavanagh, M. J., MacKinney, A. C., & Wolins, L. (1975). Issues in managerial
performance: Multitrait-multimethod analyses of ratings. Psychologigal
Valstias. DA 34-49.
Lang, R. J., & Vernon, P. E. (1977). Dimensionality of perceived self:
Tennessee Self Concept Scale. British Journal of Social and Clinical
PsygholpgyL 164, 363-371.
Long, K. S. (1983) Confirmatory factor analysis: A preface to LISREL.
Beverly Hills, CA: Sage.
Marsh, H. W. (1986a). The bias of negatively worded items in rating scales
for young children: A cognitive-developmental phenomena. Developmental
Wit12122Ys. 22A. 37-49.
Marsh, H. W. (1986b). Global self-esteem: Its relation to weighted averages of
specific facets of self-concept and their importance. Journal of
Etamailktx iad EgiskiL ellY021.2%Y1 5L 1224-1236.
Marsh, H. W. (1986c). Verbal and Math self-concepts: An internal/external frame
of reference model. American Edugational Research Journals 234, 129-149.
Marsh, H. W. (1987a). Confirmator. factor analyses of multitrait-multimethod
data: Many problems and a few solutions. (In Review; also see ERIC
Document Reproduction Service No. ED xxx xxx).
Marsh, H. W. (1987b). Jo positively and negatively worded items measure
substantively different components of self-concept?: A construct validityapproach. (In Review).
Marsh, H. W. (1987c). The hierarchical structure of self-concept: An
4 40"41,0114rArOIC41 confirmatory factor analysis._Journal aF
A
28

Tennessee Self Concept Scale 26
gshigitiog tuluE8888L. xxx-xxx.Marsh, H. W. (in press).
Multitrait-multimethod analyses. In J. P. Keeves(Ed.), gdsigatigoal useargb mettgdgiogyL measurement and evaluation: anLaticatimil 11100886. Oxford, Per gamon Press.
Marsh, H. W., Balla, J. R., & McDonald, R. P. (1986).Goodness-of-fit indices
in confirmatory factor analysis: The effect of sample size. (In Review).Marsh, H. W., Barnes, J. & Hocevar, D. (1985). Self-other agreement onmultidimensional self-concept ratings: Factor analysis & multitrait-multimethod analysis. aggral gf Personality and Social Esyghology1360-1377.
Marsh, H. W., Byrne, B. M., & Awn, R. J. (1987). The hierarchicalstructure of academic self-cc.-ept: The Marsh/Shavelson model. (Inreview).
Marsh, H. W., & Hocevar, D. (1983). Confirmatory factor analysis ofmultitrait-multimethod matrices. Journal of EducationalMeasurement) 201 231-248.
Marsh, H. W. & Hocevar, D. (1985). The application of confirmatory factoranalysis to the study of self-concept: First and higher order factorstructures and their invariance across age groups. Psychological
971 562-582.
Marsh, H. W., & O'Niell, R. (1984). Self Description Questionnaire III (SDQIII): The construct validity of multidimensional self-concept ratings bylate-adolescents. Journal of Edugational
Measurement,. 211 153-174.Marsh, H. W., Richards, G., & Barnes, J. (1986a).
Multidimensional self-concepts: A long term followup of the effect of participation in an OutwardBound program. Personality and Social Psychology Buqetin 12, 475-492.
Marsh, H. W., Richards, G., & Barnes, J. (1986b). Multidimensionalself-concepts: The effect of participation in an Outward Boundprogram. agurdal gf Egrigulity and Social Psychology,. 50. 195-204.
Marsh, H. W., & Shavelson, R. J. (1985). Self-concept: Its multifaceted,hierarchical structure. Educational esychologist 20 107-125.
Marsh, H. W. & Smith, I. D. (1981). Multitrait-multimethod analyses of twoself-concept instruments. Joirnal gf educational
gsychology,. 74,. 430-440.Marx, R. W., & Winne, P. H. (1978). Construct interpretations of three self-concept inventories. American gdugational Research journals, 1% 99-108.
McDonald, R. P. (1985). Pastor analysis and relatedmethods. Hillsdale, NJ:
Lawrence Erlbaum.
Pedhauzur, E. J. (1982). tatiat CBQUIllign in behavioral research (2nded.). New York: Holt, Rinehart and Winston.
Pound, R. E., Hansen, J.C., & Putnam, B. A. (1977). An empirical analysis

Tennessee Self Concept Scale 27of the Tennessee Self Concept Scale. Educational andPsychologicalUSISIEMM/L EL 545-551.
Rentz, R. R., & White, W. F.(1967). Factors of self
perception in theTennessee Self Concept Scale. egrgeptgal End Motgr Ski11S1 24s 118.Rolfe, M. W. (1981). The factorialstructure of the Tennessee Self Concept
Scale.Eftgbaggifial Bninik aeL 455-462.
Rosenberg, M. (1979). Gghgeiying the NIL New York: Basic Books.Rushton, J. P., Brainerd, C. J., &Pressley, M. (1983). Behavioraldevelopment and construct
validity: Theprinciple of
aggregation.Hs 18-38.
Shavelson, R. J., Hubner, J. J. & Stanton, G. C. (1976).Validation ofconstruct
interpretations. Balm 2i gjuggli2nal Research, alit 407-441.Soars, L. M., & Soares, A. T. (July,1982). rammum fiDd
ditiCielasticle'mink selkanadl, Paper presented at the 20th Congress of theInternational
Association of Applied Psychology, Edinburgh, Scotland.Stanley, J. C. (1961).
Analysis ofunreplicated three way
classificationswith application to rater bias and trait
independence.PsychometrikEL 26.2.
655-678.
Tzeng, C.C.S., Maxey, W. A., Fotier, R., & Landis, D. (1985). Constructvaliditica of the TennesseeSelf Concept Scale. Educational andElY02.1.22/Eil Messgceeeht. 451 63-78.
Vacchiano, R. B., & Strauss, P. S. (1968). The constructvalidity of theTennessee Self
Concept Scale. Journal of Clinical Psychology,. 241 323-326,Wells, L. E., & Marwell, G. (1976). Self-esteem: Its
conceptualizationand measurement. Beverly Hills,
Calif.: SagePublications.Widaman, K. F. (1985).
Hierarchically nested covariance structure models formultitrait-multimethod data. AppliedPeychologigal
Measurements 91 1-26.Wylie, R. C. (1974). The
self:cohcept: Revised Editign (VolL 1)... A Review ofMIMI:UMW considerations and measuringinstruments. Lincoln:University of
Nebraska Press.Wylie, R. C. (1979). The self-concept (Vol. 1) Lincoln:University of
Nebraska Press.
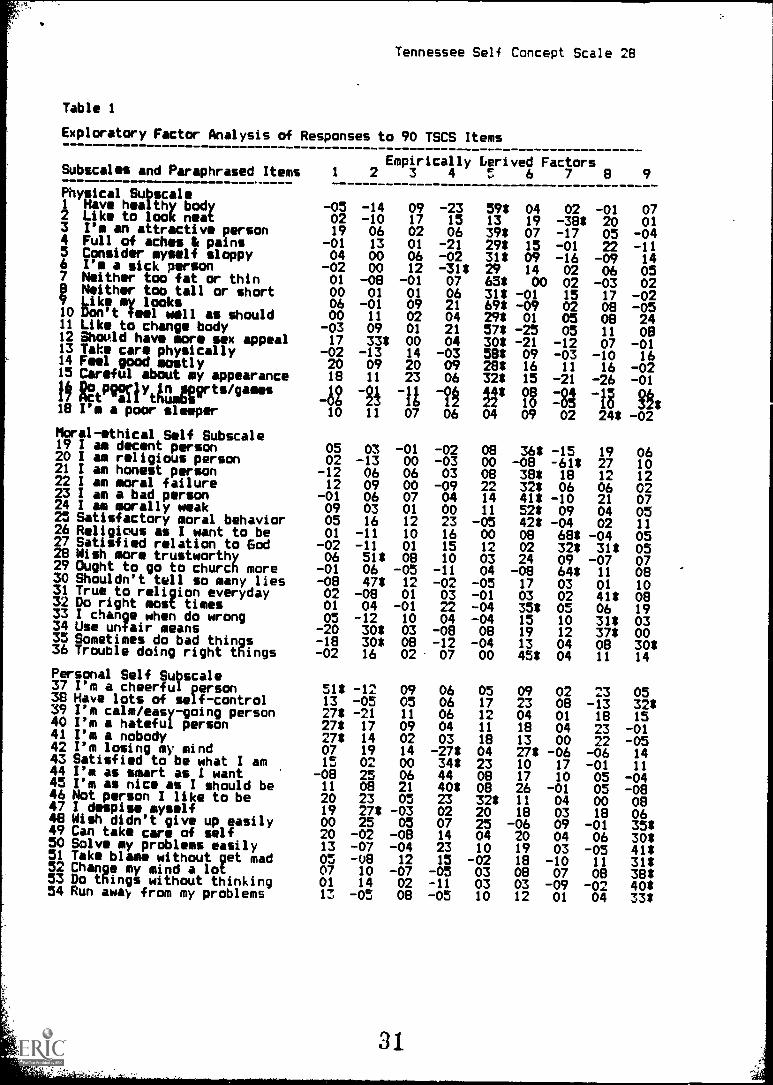
Tennessee Self Concept Scale 28
Table 1
Exploratory Factor Analysis of Responses to 90 TSCS Items
Subscales and Paraphrased It 1 2Empirically Lerived
3 4 5 6Factors
8 9
Physical Subscale1 Have healthy body2 Like to look neat3 I'm an attractive person4 Full of aches & pains5 Consider myself sloppy6 I'm a sick person7 Neither too fat or thin8 Neither too tall or short9 Like my looks10 Don't feel will as should11 Like to change body12 Should have more sex appeal13 Take care physically14 Feel good mostly15 Careful about my appearance
-05 -14 09 -2302 -10 17 1519 06 02 06
-01 13 01 -2104 00 06 -02
-02 00 12 -31*01 -08 -01 0700 01 01 0606 -01 09 2100 11 02 04
-03 09 01 2117 33* 00 04
-02 -13 14 -0320 09 20 0918 11 23 06
59*1339*29*31*2963*31*69*29*57*30*58*28*32*
04 02 -01 0719 -38* 20 0107 -17 05 -0415 -01 22 -1109 -16 -09 1414 02 06 0500 02 -03 02
-01 15 17 -02-09 02 08 -0501 05 08 24
-25 05 11 OS-21 -12 07 -0109 -03 -10 1616 11 16 -0215 -21 -26 -01
19 12tiMillYtACmge9'tsigaimis 42 -3i -II -' 11* 18 =8; la 3*18 I'm a poor sleeper
Moral - ethical Self Subscale19 I am decent person20 I am religious person21 I am honest person22 I am moral failure23 I am a bad person24 I am morally weak25 Satisfactory moral behavior26 Religious as I want to be27 Satisfied relation to God28 Wish more trustworthy29 Ought to go to church more30 Shouldn't tell so many lies31 True to religion everyday32 Do right most times33 I change when do wrong34 Use unfair means35 Sometimes do bad things36 Trouble doing right things
Personal Self Subscale37 I'm a cheerful person38 Have lots of self-control39 I'm calm/easy-going person40 I'm a hateful person41 I'm a nobody42 I'm losing my mind43 Satisfied to be what I am44 I'm as smart as I want45 I'm as nice as I should be46 Not person I like to be47 I despise myself48 Wish didn't give up easily49 Can take care of self50 Solve my problems easily51 Take blame without get mad52 Change my mind a lot53 Do things without thinking54 Run away from my problems
10 11 07 06
05 03 -01 -0202 -13 00 -03
-12 06 06 0312 09 00 -09
-01 06 07 0409 03 01 0005 16 12 2301 -11 10 16
-02 -11 01 1506 51* 08 10
-01 06 -05 -11-08 47* 12 -0202 -08 01 0301 04 -01 2205 -12 10 04
-20 30* 03 -08-18 30* 08 -12-02 16 02 07
51* -12 09 0613 -05 05 0627* -21 11 0627* 17 09 0427* 14 02 0307 19 14 -27*15 02 00 34*
-08 25 06 4411 08 21 40*20 23 05 2319 27* -03 0200 25 05 0720 -02 -08 1413 -07 -04 2305 -OS 12 1507 10 -07 -0501 14 02 -1113 -05 08 -05
04 09 02 24* -02
08 36* -15 19 0600 -08 -61* 27 1008 38* 18 12 1222 32* 06 06 0214 41* -10 21 0711 52* 09 04 05
-05 42* -04 02 1100 08 68* -04 0512 02 32* 31* 0503 24 09 -07 0704 -08 64* 11 08
-05 17 03 01 10-01 03 02 41* 08-04 35: 05 06 19-04 15 10 31* 0308 19 12 37* 00
-04 13 04 08 30*00 45* 04 11 14
05 09 02 23 0517 23 08 -13 32*12 04 01 18 1511 18 04 23 -0118 13 00 22 -0504 27* -06 -06 1423 10 17 -01 1108 17 10 05 -0408 26 -01 05 -0832* 11 04 00 0820 18 03 18 0625 -06 09 -01 35*04 20 04 06 30*10 19 03 -05 41*
-02 18 -10 11 31*03 08 07 08 38*03 03 -09 -02 40*10 12 01 04 33*

Tennessee Self Concept Scale 29
Wily Self Oubstem.. frobily help when
alin trouble 05 12 r7: -18 08 00 04 04 -1136 Important to family/friends 20 08 26* -18 06 19 -05 -03 -0157 Member of happy family -02 -04 75* -01 19 -04 -03 01 -0558 I'm not loved by family 13 14 56* -19 00 00 05 12 -1359 Friends no confidence in me 14 04 17* -17* 15 05 -04 -02 0960 Family doesn't trust me 11 09 59* -16 00 10 05 10 0961 Satisfied family relations -06 03 74* 17 07 -02 -02 -03 0562 Treat parents as I should -05 03 43* 36* 02 -03 03 26 1163 Understand family as should -10 08 49* 42* 07 03 -06 -04 1564 Too sensitive to family -07 11 05 11 09 -08 07 02 48*63 Should trust family more -03 30* 36* 07 06 -13 04 03 22Should love family more -06 34* 27 21 -03 -07 08 10 24play fair family/friends
1,1Do share of work at home
1215
-09-03
33*10
0306
-0706
33*-12
0105
1207
-0427*6 Take interest in family 14 -10 63* 02 01 03 -06 10 0470 Quarrel with family -03 02 37* 01 -03 -08 -05 10 39*71 Give in to parents 17 14 -35* -21 03 -06 08 -07 1272 Don't act as family wants 02 15 54* 07 -15 01 -04 -08 32*
Social Self Subscale73 I'm friendly person 51* -05 03 -07 03 19 -04 10 -0374 I'm popular with women 46* -04 -01 00 17 -02 -08 -12 0975 I'm popular with men 43* -13 07 -03 09 02 -02 -07 1376 I'm mad at whole world 18* 09 13 -15 04 18* 13 00 0577 Not interested in others 26* 02 -02 24 -03 09 -09 07 0378 Hard to be friendly with 58* 10 07 -01 -04 09 08 15 0479 I's as sociable as I want 36* 11 14 29 06 -04 04 -14 -0580 Satisfied with treat others 14 07 15 27 05 31* 05 -19 1381 Please others, not overdone 24 -09 04 06 06 29 11 -08 -0382 Should be more polite 08 57* 08 07 -11 04 09 -08 1183 I'm no good socially 51* 12 03 -12 11 -01 04 13 -1484 Ought get along better 39* 64* 05 20 -07 -09 10 -08 0185 I understand other's view 20 -17 07 10 -14 21 04 38 0986 See good points in all 34* -04 -04 20 -04 -04 -19 18 0687 Get along well with others 52* 02 07 04 00 24 -08 02 0188 Not at ease with others 64* 17 00 -02 -02 -16 -02 O., 1789 I do not forgive easily 22 11 03 02 03 -13 19 33* 0990 Hard to talk to strangers 59* 07 -02 -01 04 -09 -04 14 06
Correlations Among FactorsSocial
100Negative-items 10 100Family22 18 100Satisfaction 04 -05 -10 100Physical32 15 21 06 100Moral (good cerson) 27 10 27 03 25 100Bipolar Moral (religion) -03 10 -01 08 -01 02 100Moral (religion) 13 09 13 00 14 18 01 100Personal (identity/behavior) 24 27 21 07 25 25 02 15 100
Note. The exploratory factor analysis was conduct with SPSS-x (SPSS, 1986)using a Kaiser normalization,
principal factoring, and a oblimin rotation withdelta = O. A total of 26 eigenvalues were greater than 1.0. Within each of the5 subscales of 18 items, the three internal frames of reference (identity,satisfaction, behavior) are represented by the first six, second 6 and thirdsix items. Within each subscale of these sets of 6 items, the first three arepositively scored items and the second three are negatively scored items. Forpresent purposes, negatively scored it
scores always reflect a more positive
factor correlation matrix are based on
derived factors. All coefficients are
* indicates the highest factor loading
greater than .30.
ems have been
self-concept.
a subjective
reversed so that higher
Factor labels used in
interpretation of the
presented without decimal points.
for each item and factor loadings

Tennessee Self Concept Scale..A.)
Table 2
Exploratory Factor Analysis of Responses to 30 TSCS Subscales
Empirically Derived FactorsSubscales
Positively Worded Subscales
1
1 Physical Identity 05 172 Physical Satisfaction -02 -033 Physical Behavior 14 034 Moral Identity 06 62*S Moral Satisfaction -01 -276 Moral Behavior 05 207 Personal Identity 43* 108 Personal Satisfaction 04 -099 Personal Behavior 22 1310 Family Identity 03 0211 Family Satisfaction -16 0912 Family Behavior 17 0713 Social Identity 69* 0014 Social Satisfaction 33* 1015 Social Behavior 56* 19
3 4 5 6 7
05 18 58* 05 -2011 02 67* -05 -0509 24 55* -01 -1801 06 07 10 0752$ 04 01 08 -0346$ 03 -07 17 02
-26 -10 18 02 -0653* 07 19 -14 0538* 07 11 -02 13-12 78$ 07 10 -0129 68* 06 -26 2016 47* 02 -01 00
-03 -04 13 -04 -1127 16 13 20 011Z. 00 -06 02 00
Negatively Worded Subscales
I, Fggini WIllgtion 8i -85 -8 -81 0 -il* Vs18 Physical Behavior 11 -04 00 09 37* 15 2219 Moral Identity 08 03 35* 12 18 45* -1420 Moral Satisfaction -0! -45* 22 04 02 30$ 33*21 Moral Behavior -06 12 14 07 02 37$ 34*22 Personal Identity 28 03 09 17 07 39* 1023 Personal Satisfaction 11 -11 -19 -01 44* 05 35*24 Personal Behavior 13 14 12 02 11 14 34*25 Family Identity 14 -04 09 53* 03 18 0926 Family Satisfaction -07 -06 08 30* 05 -04 58*27 Family Behavior 16 -02 -10 26 -04 05 41*28 Social Identity 60* -14 -05 12 -05 21 -0329 Social Satisfaction 37* -28 01 03 06 04 39$30 Social Behavior 57* 08 -05 -02 08 -04 21Correlations Among FactorsSocial
100Bipolar Moral12 100Moral/Personal 29 00 100Family36 04 29 100Physical43 10 30 37 100Moral/Personal 25 07 10 20 19 100Negative Items 23 08 21 24 21 23 100
Note. The exploratory factor analysis was conduct with SPSS-x (SPSS, 1986)using a Kaiser normalization, principal factoring, and a oblimin rotation withdelta = 0. A total of 7 eigenvalues were greater than 1.0. For presentpurposes, negatively scored items have been reversed so that higher scoresalways reflect a more positive self-concept.
Factor labels used in factorcorrelation matrix are based on a subjective interpretation of the derivedfactors. All coefficients
are presented without decimal points. (See Table 2for wording of the items)
$ indicates the highest factor loading for each item and factor loadingsgreater than .30.

Tennessee Self Concept Scale 31
Table 3
Exploratory Factor Analysis of Responses to 15 TSCS SubscalesSubscales
Empirically Derived Factors
1 Physical2 Physical3 Physical4 Moral5 Moral6 Moral7 Personal8 Personal9 Personal10 Family11 Family12 Family13 Social14 Social15 Social
IdentitySatisfactionBehaviorIdentitySatisfactionBehaviorIdentitySatisfactionBehaviorIdentitySatisfactionBehaviorIdentitySatisfactionBehavior
1 2 3 4 502 -26 67* 10 13
-02 18 73* -01 -0514 02 55* 08 0706 -19 13 -03 71*03 47* 00 17 07-02 17 -05 12 56*40* 06 13 11 33*08 58* 38* 00 1418 8
60437*
11 -111 1
021* 01
-20 25 06 75* 0417 -05 -05 70* 05818 -05 03 05 -04448 39* 08 14 -0760* 04 02 00 15
Correlations Among FactorsSocial
100Satisfaction17 100Physical49 20Family46 38Moral/Personal 46 18
10044 10049 48 100
Witadj. Thr exploratory factor analysis was conduct with SPSS-x (SPSS, 19E6)using a Kaisernormalization, principal factoring, and a oblimin rotation withdelta = O. A total of 5 eigenvalues were greater than 1.0. For present
purposes, negatively scored items have been reversed so that higher scoresalways reflect a more positiveself-concept, and then
corresponding positivelyand negatively worded items were summed to form the 15 subscale scores. Factorlabels used ii factor correlation matrix are based on a subjectiveinterpretation of the derived factors. All coeffli.lents are presented withoutdecimal points. (See Table 2 for wording of the items)
indicates the highest factor loading for each item and factor loadingsgreater than .30.

Tennessee Self Concept Scale 32Table 4
Confirmatory Factor Analysis of Responses to 30 TSCS SubscalesA Priori Factors RepresentingEXT Facet
INT Facet
6 7Iden Sat
8Beh
PN Facet
9 10Pos Neg
Error/
Uniqueness
1TSCS SubscalesPhys
2Mar
3 4Pers Soo
5Fam
Positively Worded Subscales1 Physical Identity 59* 0 0 0 0 36* 0 0 07 0 53*
2 MoralIdentity 0 72* 0 0 0 39* 0 0 36* 0 91*
3 PersonalIdentity 04 FamilyIdentity 0
00
51*0
062*
00
52*48*
00
00
13-12
00
451* *
4
5 Social Identity 06 PhysicalSatisfact 55*
00
00
00
63*0
37*0
041*
00
20*07 0 5748**
7 MoralSatisfact 0 -35* 0 0 0 0 50*
78*
S Personal Satisfact 0 0 22* 0 0 0 63* 0 -10 0 66*
9 Famil'.Satisfact 0 0 0 56* 0 0 61* 0 -10 0 35*
10 Social Satisfact 0 07 0 0 47* 0 51* 0 -21* 0 64*
11 Physical Behavior 65* 0 0 0 0 0 0 50* -16* 0 37*
12 Moral Behavior 0 -01 0 0 0 0 0 53* 17 0 74*
13 Personal Behavior 0 0 32* 0 0 0 0 46* 14 0 66*
14 FamilyBehavior 0 0 0 44* 0 0 0 51* -01 0 58*
15 SocialBehavior 0 0 0 0 44* 0 0 40* 30* 0 64*Negatively Worded Subscales16 PhysicalIdentity 36* 0 0 0 0 40* 0 0 0 24* 64*
17 MoralIdentity 018 PersonalIdentity U
-080
020*
00
00
76*62*
00
00
00
0935*
42*44*
19 FamilyIdentity 0 0 0 48* 0 44* 0 0 0 22* 52*
20 SocialIdentity 0 0 0 0 45* 39* 0 0 0 23* 57*
21 Physical Satisfact 44* 0 0 0 0 0 36* 0 0 33* 63*
22 MoralSatisfact 0 -37* 0 0 0 0 37* 0 0 51* 56*
23 PersonalSatisfact 0 0 49* 0 0 0 53* 0 432 38*
24 FamilySatisfact 0 0 0 36* 0 0 42* 0 u 45* 50*
25 SocialSatisfact 0 0 0 0 41* 0 36* 0 0 52* 48*
26 Physical Behavior 33* 0 0 0 0 0 0 31* 0 33* 69*
27 MoralBehavior 0 09 0 0 0 0 0 46* 0 42* 63*
28 Personal Behavior 0 0 23* 0 0 0 0 40* 0 34* 65*
29 FamilyBehavior 0 0 0 34* 0 0 0 25* 0 38* 67*
30 SocialBehavior 0 0 0 0 50* 0 0 33* 0 25* 59*
Factor Correlationsys1Mar11 1Pers64* -07 1Soc34* 05 36* 1
Fam46* -03 68* 334 1
Iden0 0 0 0 0 1
Sat0 0 0 0 0 62* 1
Beh0 0 0 0 0 83* 75* 1
Pos0 0 0 0 0 0 0 0 1
Nog0 0 0 0 0 0 0 0 08 1
NOtei The confirmatory factor analysis was conduct with LISREL V (Joreskog &Sorbom, 1981). All parameters with values of 0 or 1 were fixed whereas otherparameters were freely estimated. For allparameter estimates
statisticalsignificance was tested with the standard error of the estimate provided byLISREL.
* p < .05.

Tennessee Self Concept Scale 33
Table 5
Goodness of Fit Summaries for Confirmatory Factor Analysis Models Posited toFit Responses to 30 Tennesse Self Concept Scales (N=343]
Model Description X2 df X2/df TLI BBI
0 Null Model 3855 435 8.86 - --
1 1 General factor only 1499 405 3.70 .656 .611
2 2 PN factors only 1377 404 3.41 .694 .6433 3 INT factors only 1360 402 3.38 .697 .647
4 5 Err factors only 1173 395 2.97 .750 .696
5. 2 PN and 3 INT factors 1065 371 2.87 .762 .7246 2 PN and 5 EXT factors 710 364 1.95 .87? .8167 3 INT and 5 EXT factors 713 362 1.97 .877 .815
8 2PN, 3 INT and 5 EXT factors 307 331 1.53 .932 .868
NAL TLI = Tucker-Lewis Index. BBI = Gentler-Bonett Index. PN = facet of
positively or negatively worded items. EXT = facet of physical, social,
moral, family, and personal scales. !NT = facet of identity, satisfaction,
and behavior subscales. The null model posits 30 uncorrelated single-item
factors and is used to calculate the TLI and BBI. Model 1 posits a singlefactor. The remaining models (2 - 8) posit factors represented in PN, EXT,
and INT facets used in the design of the TSCS. Table 4 contains the
parameter estimates for Model 8 and illustrate the definition of all the
factors posited in Models 2 - 8.
PG
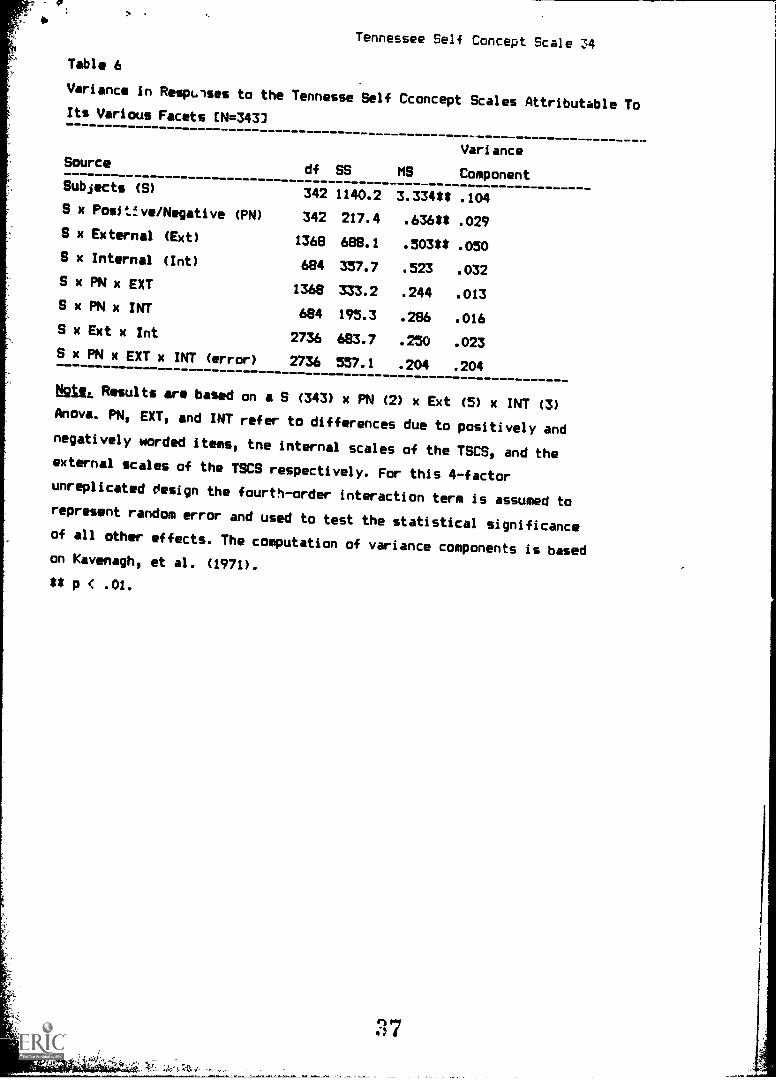
Tennessee Self Concept Scale 34
Table 6
Variance in RespLlses to the Tennesse Self Cconcept Scales Attributable ToIts Various Facets EN=343)
df SS MS
Variance
ComponentSubjects (S) 342 1140.2 3.334** .104S x Posit!ve/Negative
(PN) 342 217.4 .636** .0298 x External (Ext) 1368 688.1 .503** .0508 x Internal (Int) 684 357.7 .523 .032S x PN x EXT
1368 333.2 .244 .0138 x PN x INT
684 195.3 .286 .0168 x Ext x Int 2736 683.7 .250 .0238 x PN x EXT x INT (error) 2736 557.1 .204 .204
Ngt2,, Results are based on a S (343) x PN (2) x Ext (5) x INT (3)Anova. PN, EXT, and INT refer to differences due to positively andnegatively worded items, tne internal scales of the TSCS, and theexternal scales of the TSCS respectively. For this 4-factorunreplicated design the fourth-order interaction term is assumed torepresent random error and used to test the statistical significanceof all other effects. The computation of variance components is basedon Kavenagh, et al. (1971).
** p < .01.
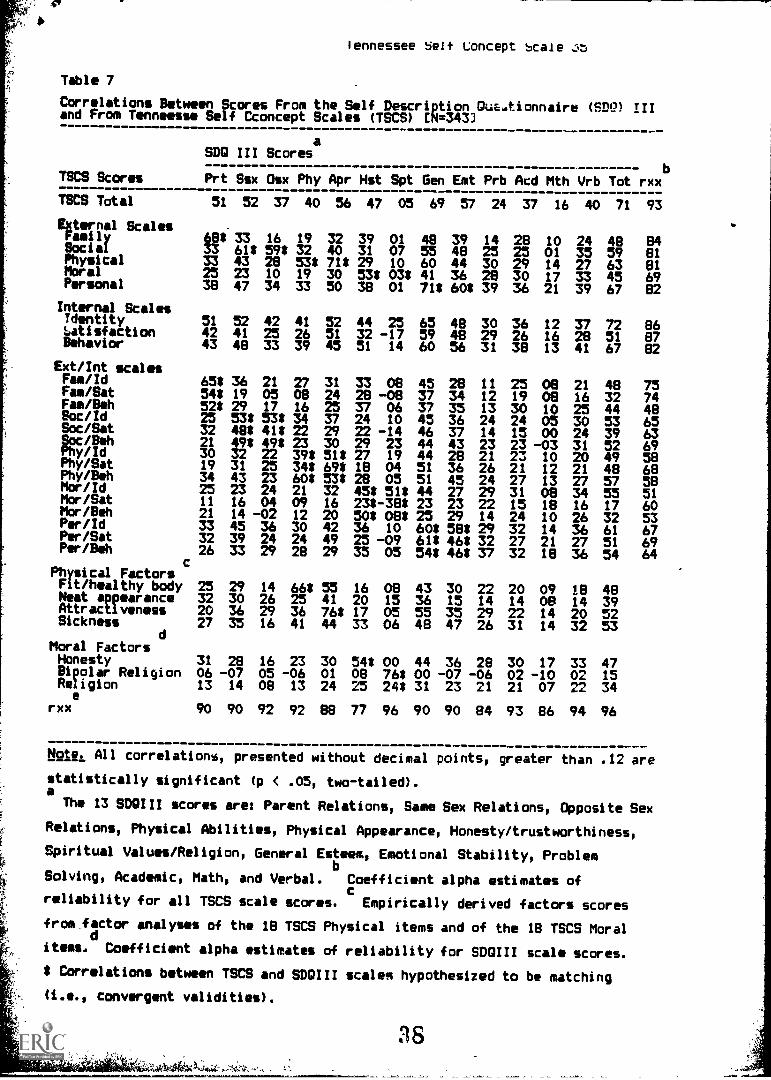
4,
lennessee Self Loncept bcale ..5rJ
Table 7
Correlations Between Scores From the Self Description Ouz.tionnaire (00) IIIand From Tenneesse Self Cconcept Scales (TSCS) CN=343]
TSCS Scores
TSCS Total
External Scales
aSDO III Scores
Prt Ssx Osx Phy Apr Hst Spt Gen Emt Prb Acd Mth Vrb Tot rxx
51 52 37 40 56 47 05 69 57 24 37 16 40 71 93
Family 68* 33 16 19 32 39 01 48 39 14 28 10 24 48 84Social 33 61* 59$ 32 40 31 07 55 48 25 25 01 35 59 81Physical 33 43 28 53* 71* 29 10 60 44 30 29 14 27 63 81Moral 25 23 10 19 30 53* 03* 41 36 28 30 17 33 45 69Personal 38 47 34 33 50 38 01 71* 60* 39 36 21 39 67 82
Internal ScalesIdentity 51 52 42 41 52 44 25 65 48 30 36 12 37 72 86Satisfaction 42 41 25 26 51 32 -17 59 48 29 26 16 28 51 87Behavior 43 48 33 39 45 51 14 60 56 31 38 13 41 67 82
Ext/Int scalesFaa /Id 65* 36 21 27 31 33 08 45 28 11 25 08 21 48 75Fam/Sat 54* 19 05 08 24 28 -08 37 34 12 19 08 16 32 74Fam/Beh 52$ 29 17 16 25 37 06 37 35 13 30 10 25 44 48Soc/Id 25 53* 53* 34 37 24 10 45 36 24 24 05 30 53 65Soc/Sat 32 48* 41* 22 29 22 -14 46 37 14 15 00 24 39 63Soc/Beh 21 49* 49* 23 30 29 23 44 43 23 23 -03 31 52 69Phy/Id 30 32 22 39* 51* 27 19 44 28 21 23 10 20 49 58Phy/Sat 19 31 25 34* 69* 18 04 51 36 26 21 12 21 48 68Phy/Beh 34 43 23 60* 53* 28 05 51 45 24 27 13 27 57 58Mor/Id 25 23 24 21 32 45* 51* 44 27 29 31 08 34 55 51Mor/Sat 11 16 04 09 16 23*-38* 23 23 22 15 18 16 17 60Mor/Beh 21 14 -02 12 20 50$ 08* 25 29 14 24 10 26 32 53Per/Id 33 45 36 30 42 36 10 60* 58* 29 32 14 36 61 67Per/Sat 32 39 24 24 49 25 -09 61* 46* 32 27 21 27 51 69Per/Bah
c26 33 29 28 29 35 05 54* 46* 37 32 18 36 54 64
Physical FactorsFit/healthy body 25 29 14 66* 55 16 08 43 30 22 20 09 18 48Neat appearance 32 30 26 25 41 20 15 36 15 14 14 08 14 39Attractiveness 20 36 29 36 76* 17 05 55 35 29 22 14 20 52Sickness
d27 35 16 41 44 33 06 48 47 26 31 14 32 53
Moral FactorsHonesty 31 28 16 23 30 54* 00 44 36 28 30 17 33 47Bipolar Religion 06 -07 05 -06 01 08 76* 00 -07 -06 02 -10 02 15Religion
erxx
13 14 08 13
90 90 92 92
24
88
25 24*
77 96
31 23 21
90 90 84
21
93
07
86
22
94
34
96
Note:. All correlations, presented without decimal points, greater than .12 are
statistically significant (p < .05, two-tailed).aThe 13 SDOIII scores are: Parent Relations, Same Sex Relations, Opposite Sex
Relations, Physical Abilities, Physical Appearance, Honesty/trustworthiness,
Spiritual Values/Religion, General Esteem, Emotional Stability, Problem
Solving, Academic, Math, and Verbal. Coefficient alpha estimates of
reliability for all TSCS scale scores. Empirically derived factors scores
froeLfactor analyses of the 18 TSCS Physical items and of the 18 TSCS Moral
items. Coefficient alpha estimates of reliability for SDOIII scale scores.
* Correlations between TSCS and SDOIII scales hypothesized to be matching
(i.e., convergent validities).
as

Tennessee Self Concept Scale 36
Table 8
Correlations Between External Observer Ratings and Self-response Ratings tothe Self Description Questionnaire (SW) III and Tennesse Self CconceptScales ('SCS) [N=2807
External Observer Ratings
Prt Ssx Osx Phy Apr Hst Spt Emt Prb Acd Mth Vrb Tot
a
TSCS Total
TSCS ExternalFamilySocialPhysicalMoralPersonal
TSCS InternalIdentitySatisfactionBehavior
18
Scales24*15100712
Scales231213
20
1826*150419
202213
16
0929*080216
201410
20
141331*0118
171817
21
092422*0822
241914
08 07
05 0403 0703 0716* 05*11 05
08 1908 -0909 13
11 19 17 16 26 28
06 12 11 15 21 2106 10 12 05 2S 2507 21 14 15 13 2408 15 18 16 22 1718* 22 16 15 25 28
11 17 15 14 22 3112 21 14 16 25 2307 12 16 16 26 28
39
S scales
i1 it t ! 3 ?I l itagit 31 8 SI A8 -4 6 isFam/BehSoc/Id
10* 16 08 05 03 01 09 00 03 05 09 13 1310 21* 31* 14 26 -04 06 06 10 09 07 18 22Soc/SatSoc/Beh
11 25* 23* 14 20 06 -09 07 10 12 04 21 1915 17* 18* 03 11 05 21 00 05 09 00 22 19Phy/Id 08 08 03 17* 14i 02 14 02 15 09 11 09 17Phy/Sat 06 15 11 26* 21* 04 02 09 20 14 10 20 13Phy/Id Beh 05 06 10 21* 19* 06 09 13 17 16 11 10 19Nor/ 13 01 06 03 13 09* 29* 03 11 09 06 11 18Nor/Sat -02 09 02 00 07 06*-17* 08 14 07 13 15 07Nor/BehPer/Id
05 00 -02 -01 -01 21* 05* 05 07 21 14 19 1315 20 18 09 18 14 11 15* 17 10 07 22 25Per/Sat 09 24 15 14 19 09 -05 16* 21 13 15 22 24Per/Beh 06 06 10 21 19 06 09 13* 17 16 16 18 23TSCS Physical FactorsFit/healthy body 05 02 00 32* 13 -ii -02 03 15 06 08 05 11Neat appearance 15 15 08 14 20 01 14 09 21 14 15 16 24Attractiveness 05 17 13 27 26* 04 03 06 22 15 16 14 24Sickness d09 05 -01 19 04 09 05 06 08 09 08 08 13
TSCS moral FactorsHonesty 08 06 07 07 15 08* 00 07 11 12 14 19 15Bipolar Religion 09 -08 -01 -09 -05 06 40*-07 -05 -01 -05 -05 04Religion 09 01 -01 -01 06 07 19* 05 17 12 07 14 14
SDOIII ScaleslirSeParents 37* 16 15 16 13 10 09 10 07 11 15 13 23
x Peer 08 24 45t 12 32 -03 05 -01 07 04 -01 10 20
Sex Peers 15 26* 26 21 21 06 -01 14 08 24ys Ability 11 11 13 49* 18 -08 -03 19 11 02 08 05 20Phys Appear 07 16 21 30 32* 01 04 06 25 16 16 18 28Honesty /Trust 22 07 03 -04 04 261 14 18 07 22 15 21 21Spiritual/Relig 14 -01 02 -12 -05 14 57*-01 04 06 -01 01 15Emotional Stabil 05 19 16 15 12 11 08 17t 21 13 17 28 26Problem Solving 00 00 09 08 15 -01 01 07 28* 21 24 21 19Academicth
22 11 13 07 17 21 09 12 30 44* 41 37 38Me 11 04 03 10 15 13 01 13 28 27 42* 23 27Verbal 08 04 14 02 17 11 07 07 22 26 21 31* 25General Esteem 13 23 24 24 30 07 14 13 27 20 22 25 35Total Score 24 21 28 24 30 15 21 18 32 31 32 34 45External Rater Agreemehtr12 35 23 39 46 23 06 33 15 24 35 33 28 28rxx 52 38 56 63 37 11 50 27 39 52 50 43 44US* All correlations, presented without decimal points, greater than .12 arestatistically significant (p < .05, two-tailed).
baExterns' observer scales correspond to SDQIII scales (see Table 8). r12 iscareslation between two different external observers wharves rxx is the
Ikl,Ate!!A4thill of the two ratings. 39


![[Jack C. Richards] Curriculum Development in Language](https://static.fdokumen.com/doc/165x107/6313ebc085333559270c7606/jack-c-richards-curriculum-development-in-language.jpg)


