![Synthesis of Rhodium, Iridium, and Palladium Tetranuclear Complexes Directed by 2,6-Dimercaptopyridine. X-ray Crystal Structure of [Rh 4 (μ-PyS 2 ) 2 (cod) 4 ] (cod = 1,5-Cyclooctadiene)](https://static.fdokumen.com/doc/165x107/6337b5bace400ca69809223f/synthesis-of-rhodium-iridium-and-palladium-tetranuclear-complexes-directed-by.jpg)
RHODIUM AND IRON COMPLEXES AND TRANSITION STATES: A ...
251
RHODIUM AND IRON COMPLEXES AND TRANSITION STATES: A COMPUTATIONAL, SPECTROSCOPIC AND ELECTROCHEMICAL STUDY. M.M. CONRADIE
-
Upload
khangminh22 -
Category
Documents
-
view
3 -
download
0
Transcript of RHODIUM AND IRON COMPLEXES AND TRANSITION STATES: A ...

RHODIUM AND IRON COMPLEXES
AND TRANSITION STATES: A COMPUTATIONAL,
SPECTROSCOPIC AND ELECTROCHEMICAL STUDY.
M.M. CONRADIE

RHODIUM AND IRON COMPLEXES
AND TRANSITION STATES: A COMPUTATIONAL,
SPECTROSCOPIC AND ELECTROCHEMICAL STUDY.
A thesis submitted to meet the requirements for the degree of Philosophiae Doctor
in the
Department of Chemistry Faculty of Natural and Agricultural Sciences
at the
University of the Free State
by Marrigje Marianne Conradie
promotor Prof. J. Conradie
March 2010

I will be with you. I will not fail you nor forsake you.
Joshua 1:5
Acknowledgments
My further gratitude hereby expressed to:
Prof. Jeanet Conradie,
my mother and promoter, thank you for your devotion, support and late night discussions.
Mr. Hans Koorts,
my grandfather, who read this thesis for language and grammar editing.
Family and friends,
especially my sister Susan and my friend Liesel, for motivation and support.
Prof. Jannie Swarts and colleagues,
for valuable inputs and discussions.
The Chemistry Department and the University of the Free State,
for available facilities.
Prof. Abhik Gosh and the bioinorganic chemistry group,
for research opportunities and teaching me valuable computational skills.
CTCC and the University of Tromsø,
for available facilities.
The National Research Foundation,
for financial support.

TABLE OF CONTENTS
Table of contents
Chapter 1 Introduction and aim of study ...............................................................................1 1.1 Introduction ...................................................................................................1 1.2 Aim of study ..................................................................................................7
Chapter 2 Survey of literature and fundamental aspects .....................................................9 2.1 Computational chemistry ..............................................................................9 2.1.1 Introduction ........................................................................................9 2.1.2 Basic Quantum Chemistry ...............................................................12 2.1.3 Density Functional Theory (DFT) ...................................................13 2.1.4 Amsterdam Density Functional (ADF) ............................................14 2.1.5 Gaussian03 .......................................................................................15 2.1.6 Exchange-and-correlation (XC) Functional .....................................15 2.1.7 Database ...........................................................................................17 2.2 Fundamental Concepts ................................................................................19 2.2.1 Basic Point Group Theory ................................................................19 2.2.2 Transition Metal Coordination .........................................................23 2.2.3 Crystal Field Theory (CFT) .............................................................25 2.2.4 Molecular Orbital (MO) Theory ......................................................30 2.2.5 Ligand Field Theory (LFT) ..............................................................33 2.2.6 Spin Crossover (SCO) ......................................................................33 2.2.7 Potential Energy Surface (PES) .......................................................35 2.3 Electrochemistry .........................................................................................39 2.3.1 Introduction ......................................................................................39 2.3.2 Cyclic Voltammetry (CV) ................................................................40 2.3.3 Spectroelectrochemistry (SEC) ........................................................45 2.4 Rhodium complexes ....................................................................................47 2.4.1 Square planar Rh(I) and octahedral Rh(III) chemistry ....................47 2.4.2 The Monsanto Process: [Rh(CO)2I2]
– + CH3I ..................................61 2.4.3 [Rh(β-diketonato)(CO)(PPh3)] + CH3I ............................................69 2.4.4 [Rh(acac)(P(OPh)3)2] + CH3I ...........................................................74 2.5 Iron complexes ............................................................................................77 2.5.1 [Fe(β-diketonato)3] ...........................................................................77 2.5.2 [Fe(salen)(CH3)2(COCH3)2(py)2] .....................................................82 2.5.3 [Fe(porphyrin)(Ar)] ..........................................................................85

TABLE OF CONTENTS
Chapter 3 Results and discussion ..........................................................................................95 3.1 Rhodium complexes ....................................................................................95 3.1.1 Introduction ......................................................................................95 3.1.2 [Rh(acac)(CO)(PPh3)] + CH3I .........................................................97 3.1.3 [Rh(β-diketonato)(CO)(PPh3)] + CH3I ..........................................120 3.1.4 [Rh(acac)(P(OPh)3)2] + CH3I .........................................................129 3.1.5 Crystal structure of [Rh(bth)(CO)2] ...............................................144 3.2 Iron complexes ..........................................................................................152 3.2.1 [Fe(β-diketonato)3] .........................................................................152 3.2.2 [Fe(salen)(CH3)2(COCH3)2(py)2] ...................................................168 3.2.3 [Fe(porphyrin)(Ar)] ........................................................................179
Chapter 4 Experimental .......................................................................................................193 4.1 Materials ....................................................................................................193 4.2 Techniques and apparatus .........................................................................193 4.2.1 Melting point (m.p.) determination ................................................193 4.2.2 Analysis ..........................................................................................193 4.2.3 Spectroscopic measurements .........................................................193 4.2.4 Spectrophotometric measurements ................................................194 4.2.5 Electrochemistry ............................................................................194 4.3 Synthesis ...................................................................................................195 4.3.1 β-diketones .....................................................................................195 4.3.2 Rhodium complexes .......................................................................195 4.3.3 [Fe(β-diketonato)3] complexes {1}-{ 10} ......................................195 4.4 Crystallography .........................................................................................202 4.4.1 Structure determination of [Rh(bth)(CO)2] ....................................202 4.5 Computational ...........................................................................................203 4.5.1 Resources .......................................................................................203 4.5.2 Rhodium complexes .......................................................................206 4.5.3 Iron complexes ...............................................................................208
Chapter 5 Concluding remarks and future perspectives ..................................................211 5.1 Concluding remarks ..................................................................................211 5.2 Future perspectives ...................................................................................216

TABLE OF CONTENTS
Appendix A Infrared spectrophotometry (IR) .....................................................................................A-1 Ultraviolet spectrophotometry (UV) ...............................................................................A-6 Mass spectrometry (MS) ...............................................................................................A-11 Cyclic voltammetry (CV) ..............................................................................................A-16
Appendix B Crystallography: supporting information .........................................................................CD
Appendix C Computational: supporting information ..........................................................................CD
Abstract and keywords Opsomming en sleutelwoorde

CHAPTER 1
1
1 Introduction and aim of study
1.1 Introduction.
The formation and breaking of metal-carbon bonds have become an important and versatile tool
in synthetic organic chemistry.1 Transition metal assisted reactions used for the manufacture of
organic compounds on an industrial scale include the oxidation, hydrogenation,
hydroformylation, isomerization and polymerization of alkenes, diene cyclooligomerization and
alcohol carbonylation. Other reactions, such as the asymmetric hydrogenation of prochiral
alkenes, the activation of C-H bonds for hydrogen/deuterium exchange, the reduction of ketones
by hydrosilation and the decarbonylation of aldehydes are also catalyzed by complexes of
transition metals. These reactions have a wide application in laboratory-scale preparations and
some are also used in the manufacture of pharmaceuticals.
The reactions of the types just mentioned, and indeed, a majority of all organic reactions, are
controlled by kinetic rather than thermodynamic factors. The addition of transition metal
complexes that can become intimately involved in the reaction sequence is an effective way of
increasing the reaction rates. The transition metal catalyst lowers the energy of activation of the
reaction by changing the mechanism2 and in some cases it relaxes restrictions imposed by orbital
symmetry control.3
The scope of this thesis focuses mainly on rhodium and iron based catalysts. Below are selected
examples of industrial processes involving rhodium complex or iron complex assisted reactions.
1 (a) H. Alper (Editor), Transition Metal Organometallics in Organic Synthesis, Academic press, New York, 1978,
Vol. 2. (b) D.C. Black, W.R. Jackson, J.M. Swan, In: D.N. Jones (Editor), Comprehensive Organic Chemistry,
Pergamon, Oxford, 1979, Vol. 3, Parts 15 and 16. (c) J.P. Collman, L.S. Hegedus, Principles and Applications of
Organotransition Metal Chemistry, University Science Books, CA, 1980.
2 J.K. Kochi, Organometallic Mechanisms and Catalysis, Academic Press, New York, 1978.
3 (a) J. Halpern, in: I. Wender, P. Pino (Eds.), Organic Synthesis via Metal Carbonyls, Wiley, New York, 1977. (b)
F.D. Mango, Coord. Chem. Rev. 1975 (15) 109-205. (c) R.G. Pearson, Symmetry Rules for Chemical Reactions,
Wiley, New York, 1976.

INTRODUCTION AND AIM OF STUDY
2
Rhodium based catalysts.
During the last 50 years, industrial organic chemistry has been based largely on petroleum
products. Most petrochemical processes use heterogeneous rather than homogeneous catalysts.
This is principally because heterogeneous catalysts are generally more stable at higher
temperatures and are less troublesome to separate from the substrate phase. However, over the
past 30 years, there has been a growing interest in homogeneous catalysts because they often
show higher selectivity and greater catalytic activity and they also provide greater control of
temperature on the catalyst site. For some commercial processes it has been determined that the
advantage of soluble catalysts outweigh the economic problems associated with catalyst
recovery. Examples include the hydroformylation of alkenes and olefins catalyzed by rhodium
phosphine/phosphite complexes and the carbonylation of methanol to acetic acid with
[Rh(CO)2I2]- as the active catalyst.4
Each catalytic cycle is composed of several steps; the hydroformylation of C2H4 by
[HRh(CO)2(PPh3)2] to liberate ethyl aldehyde, C2H5C(O)H, can serve as an example:5
[HRh(CO)2(PPh3)2] + C2H4 [HRh(CO)2(PPh3)(C2H4)] + PPh3 1
[HRh(CO)2(PPh3)(C2H4)] [C2H5Rh(CO)2(PPh3)] 2
[C2H5Rh(CO)2(PPh3)] + PPh3 [C2H5Rh(CO)2(PPh3)2] 3
[C2H5Rh(CO)2(PPh3)2] [C2H5C(O)Rh(CO)(PPh3)2] 4
[C2H5C(O)Rh(CO)(PPh3)2] + H2 [C2H5C(O)Rh(CO)(PPh3)2(H2)] 5
[C2H5C(O)Rh(CO)(PPh3)2(H2)] → [HRh(CO)(PPh3)2] + C2H5C(O)H 6
[HRh(CO)(PPh3)2] + CO [HRh(CO)2(PPh3)2] 7
The above reactions may be classified as ligand addition to the sixteen electron rhodium complex
(reactions 3 and 7), ligand substitution (reaction 1), insertion within the co-ordination sphere
(reactions 2 and 4), oxidative addition (reaction 5) and reductive elimination (reaction 6). During
catalysis, reactions such as 1-7 often occur so rapidly that they may not be individually observed.
Thus, the importance of model complexes to demonstrate and study the individual steps of
4 R.S. Dickson, Homogeneous Catalysis with Compounds of Rhodium and Iridium, D. Reidel Publishing Company,
Dordrecht, 1985, Chapter 1.
5 J.D. Atwood, Coord. Chem. Rev. 1988 (83) 93-114.

CHAPTER 1
3
catalytic reactions is apparent. In South Africa, two world scale hydroformylation plants, one at
Sasolburg and one at Secunda, use rhodium catalysts for the production of alcohols for Sasol.
The rhodium complexes [Rh(acac)(CO)(PPh3)] and [Rh(acac)(P(OPh)3)2] (Hacac =
acetylacetone), in the presence of triphenylphosphine (PPh3) or triphenylphosphite (P(OPh)3)
respectively, are catalyst precursors for the hydroformulation of olefins under mild conditions
(10 atm and 80 °C).6 Hydroformylation of 1,5-hexadiene catalyzed by the
[Rh(acac)(P(OPh)3)2]/P(OPh)3 system leads to the formation of mono- and dialdehydes
4-heptenal, 2-Me-3-hexenal and octane-1,8-dial,2,5-Me2-hexanedial respectively. The reaction
catalyzed by the [Rh(acac)(CO)(PPh3)]/PPh3 system produces, besides dialdehydes,
monoaldehydes with a terminal double bond, namely 6-heptenal and 2-Me-5-hexenal.
Among the most representative examples of an industrial process catalyzed by a rhodium
complex in solution is certainly the rhodium-iodide catalyzed carbonylation of methanol to acetic
acid.7 The original [Rh(CO)2I2]− catalyst, developed at the Monsanto laboratories8 and studied in
detail by Forster and co-workers,9 is largely used for the industrial production of acetic acid with
a selectivity greater than 99%. Acetic acid’s global production in 2005 was about 9 million tons
and the demand grows annually by nearly 5%. More than 60% of this is being produced by the
Monsanto process.10 This process is illustrated in Figure 1.1.
6 (a) A.M. Trzeciak, J.J. Ziólkowski, J. Organomet. Chem. 1994 (464) 107-111. (b) A.M. Trzeciak, J.J. Ziólkowski,
J. Organomet. Chem. 1994 (479) 213-216. (c) A.M. Trzeciak, J.J. Ziólkowski, J. Mol. Catal. 1988 (48) 319-324.
(d) H. Janecko, A.M. Trzeciak, J.J. Ziólkowski, J. Mol. Catal. 1984 (26) 355-361.
7 P.M. Maitlis, A. Haynes, G.J. Sunley, M.J. Howard, J. Chem. Soc., Dalton Trans. 1996 2187-2196.
8 (a) K.K. Robinson, A. Hershman, J.H. Craddock, J.F. Roth, J. Catal. 1972 (27) 389-396. (b) F.E. Paulik, J.F.J.
Roth, Chem. Soc., Chem. Commun. 1968 1578a.
9 (a) D. Forster, J. Am. Chem. Soc. 1976 (98) 846-848. (b) D. Forster, Adv. Oranomet. Chem. 1979 (17) 255-267.
(c) D. Forster, T.C. Singleton, J. Mol. Catal. 1982 (17) 299-314.
10 Annual report, Indian Petrochemicals Corporation Ltd, Baroda, 2005, p68.

INTRODUCTION AND AIM OF STUDY
4
Figure 1.1: The Monsanto process.
The Monsanto process, however, has some drawbacks. The conditions used industrially
(30-60 atm and 150-200 °C)11 have spurred the search for new catalysts which could work in
milder conditions.12,13,14 The rate determining step of the catalytic cycle is the oxidative addition
of methyl iodide (Figure 1.1), therefore a catalyst design should focus on the improvement of this
reaction. The basic idea is that ligands which increase the electron density at the rhodium centre
should promote oxidative addition, and consequently the overall rate of production. For this
purpose, several other rhodium compounds have been synthesized in the last few years and have
been demonstrated to be active catalysts of comparable or better performances than the original
Monsanto catalyst.12,15,16,17 One of the most important classes is based on rhodium complexes
containing simple phosphines,18 biphoshine ligands19 and more recently also mixed bidentate
11 J.F. Roth, J.H. Craddock, A. Hershman, F.E. Paulik, Chem. Technol. 1971 600-605.
12 J.R. Dilworth, J.R. Miller, N. Wheatley, M.J. Baker, J.G. Sunley, J. Chem. Soc., Chem. Commun. 1995 1579-
1581.
13 T. Ghaffar, H. Adams, P.M. Maitlis, A. Haynes, G.J. Sunley, M. Baker, Chem. Commun. 1998 1023-1024.
14 R.W. Wegman, Chem. Abstr. 1986 (105) 78526g.
15 J. Rankin, A.D. Poole, A.C. Benyei, D. Cole-Hamilton, Chem. Commun. 1997 1835-1836.
16 K.V. Katti, B.D. Santarsiero, A.A. Pinkerton, R.G. Cavell, Inorg. Chem. 1993 (32) 5919-5925.
17 M.J. Baker, M.F. Giles, A.G. Orpen, M.J. Taylor, R.J. Watt, J. Chem. Soc., Chem. Commun. 1995 197-198.
18 J. Rankin, A.C. Benyei, A.D. Poole, D.J. Cole-Hamilton, J. Chem. Soc., Dalton Trans. 1999 3771-3782.

CHAPTER 1
5
ligands.14,16,17 Indeed, all these new ligands enhance oxidative addition but as a consequence
they usually retard the subsequent CO migratory insertion because the increased electron density
at the rhodium centre also leads to a stronger Rh-CO bond.
Due to the cost of rhodium (~R600 per gram),20 and the fact that rhodium catalysts can only be
used in reactors made of hastaloy (much more expensive than stainless steel), the development of
rhodium catalysts with a higher activity will be profitable - lower concentration rhodium catalyst
and smaller reactor. In the catalyst design, it is also of economic importance that loss of rhodium
due to decomposition must be minimized.
Effective catalyst design should focus on the acceleration of all steps in the catalytic cycle and
stability over the long term. It is therefore necessary to study each step of a catalytic cycle in
detail and to test the stability of the rhodium catalyst.
Iron based catalysts.
Metal atoms, especially iron, are present at the active catalytic centre in almost a third of all
known enzymes.21 Iron is especially important and occurs in relatively high concentrations in the
human body (5.4 g per 70 kg) of which most of this is involved in the enzyme function.22 This
metal is involved in a number of processes, including binding of substrates to orientate them
properly for the subsequent reaction, mediating oxidation/reduction and electron transport
reactions through reversible changes in the metal oxidation state and electrostatically stabilizing
negative charges.
An important example of industrial processes catalyzed by an iron complex is certainly the
iron-catalyzed cross-coupling reaction (Figure 1.2). The importance of iron-catalyzed
cross-coupling reactions for the formation of carbon-carbon bonds as well as carbon-heteroatom
19 K.G. Moloy, R.W. Wegman, Organometallics 1989 (8) 2883-2892.
20 www.kitco.com
21 I. Diaz-Acosta, J. Baker, J.F. Hinton, P. Pulay, Spectrochimica Acta Part A 2003 (59) 363-377.
22 H. Douglas, Bioorganic Chemistry, Third Edition, Springer, New York, 1996.

INTRODUCTION AND AIM OF STUDY
6
bonds can hardly be overestimated.23 Within a few decades, this methodology evolved into a
routine tool for the preparation of fine chemicals and pharmaceutically active compounds in the
laboratory. On the industrial scale,24 it is widely appreciated in the context of parallel synthesis
and combinatorial chemistry,25 and plays a prominent role in a rapidly growing number of highly
impressive total syntheses of target molecules of utmost complexity.26 As synthetic organic
methods are increasingly concerned with the growing importance of sustainable chemistry,
iron-catalyzed cross-coupling reactions are one of the promising research areas for the
construction of C-C bonds, since iron is inexpensive and more environmentally friendly than the
usual metals used - palladium, cobalt or nickel.27 After the pioneering works of Kochi and
co-workers in the 1970s,27,28 the groups of Cahiez,29 Fürstner,30,31 and Nakamura32 have recently
23 (a) F. Diederich, P.J. Stang (Editors), Metal-catalyzed Cross-coupling Reactions, Wiley-VCH: Weinheim,
Germany, 1998. (b) N. Miyaura (Editor), Cross-Coupling Reactions. A Practical Guide, Topics in Current
Chemistry, Springer: Berlin, 2002, Vol. 219. (c) D.W. Knight, In: B.M. Trost, I. Fleming (Editors),
Comprehensive Organic Synthesis, Pergamon: Oxford, U.K., 1991, Vol. 3, p481. (d) J.J. Li, G.W. Gribble,
(Editors), Palladium in Heterocyclic Chemistry: A Guide for the Synthetic Chemist, Elsevier: Oxford, U.K.,
2000.
24 M. Beller, A. Zapf, W. Mägerlein, Chem. Eng. Technol. 2001 (24) 575-582.
25 K.C. Nicolaou, R. Hanko, W. Hartwig (Editors), Handbook of Combinatorial Chemistry: Drugs, Catalysts,
Materials, Wiley-VCH: Weinheim, Germany, 2002.
26 (a) A. Fürstner, H. Weintritt, J. Am. Chem. Soc. 1998 (120) 2817-2825. (b) A. Fürstner, I. Konetzki, J. Org.
Chem. 1998 (63) 3072-3080. (c) A. Fürstner, J. Grabowski, C.W. Lehmann, J. Org. Chem. 1999 (64) 8275-8280.
(d) A. Fürstner, O.R. Thiel, N. Kindler, B. Bartkowska, J. Org. Chem. 2000 (65) 7990-7995. (e) A. Fürstner, T.
Dierkes, O.R. Thiel, G. Blanda, Chem.-Eur. J. 2001 (7) 5286-5298.
27 (a) C. Bolm, J. Legros, J. Le Paih, L. Zani, Chem. Rev. 2004 (104) 6217-6254. (b) A. Fürstner,R. Martin, Chem.
Lett. 2005 (34) 624-629.
28 (a) M. Tamura, J. K. Kochi, J. Am. Chem. Soc. 1971 (93) 1487-1489. (b) M. Tamura, J.K. Kochi, J. Org. Chem.
1975 (40) 599-606.
29 (a) G. Cahiez, P.Y. Chavant, E. Metais, Tetrahedron Lett. 1992 (33) 5245-5248. (b) G. Cahiez, S. Marquais,
Tetrahedron Lett. 1996 (37) 1773-1776. (c) G. Cahiez, H. Avedissian, Synthesis 1998 1199-1205. (d) C.
Duplais, F. Bures, T. Korn, I. Sapountzis, G. Cahiez, P. Knochel, Angew. Chem. Int. Ed. 2004 (43) 2968-2970.
(e) G. Cahiez, V. Habiak, C. Duplais, A. Moyeux, Angew. Chem. Int. Ed. 2007 (46) 4364-4366.
30 A. Fürstner, A. Leitner, M. Méndez, H. Krause, J. Am. Chem. Soc. 2002 (124) 13856-13863.
31 (a) R. Martin, A. Fürstner, Angew. Chem. Int. Ed. 2004 (43) 3955-3957. (b) A. Fürstner, H. Krause, C.W.
Lehmann, Angew. Chem. Int. Ed. 2006 (45) 440-444. (c) B. Scheiper, M. Bonnekessel, H. Krause, A. Fürstner, J.
Org. Chem. 2004 (69) 3943-3949.
32 M. Nakamura, K. Matsuo, S. Ito, E. Nakamura, J. Am. Chem. Soc. 2004 (126) 3686-3687.

CHAPTER 1
7
extended the scope of iron-catalyzed processes, notably by developing efficient cross-coupling
reactions between aromatic Grignard reagents and alkyl halides.33
R-X'
substrate(organic electrophile)
FeIII -catalystR'-MX+ R-R' MXX'+
coupling partner(nucleophile)
coupling product metal halide
R' = alkyl, aryl, vinyl, allyl, alkynyl, benzyl
R = alkyl, aryl, vinyl, allyl, alkynyl, benzyl, acyl
X, X' = I, Br, Cl
M = Mg, Zn, Cu, Sn, Si, B
Figure 1.2: General iron-catalyzed cross-coupling reaction.
Simple iron salts such as FeCl3, Fe(β-diketonato)3 or the salen complex turned out to be highly
efficient, cheap, toxicologically benign and environmentally friendly pre-catalysts for a host of
cross-coupling reactions of alkyl or aryl Grignard reagents, zincates or organomanganese species
with aryl and heteroaryl chlorides, triflates, and even tosylates.30 Although iron-catalyzed
cross-coupling is not yet nearly as mature as its palladium- or nickel-catalyzed counterparts, this
transformation provides efficient and scalable solutions for many types of C-C-bond
formations.34
1.2 Aim of study.
The following goals were set for the rhodium study:
(i) The determination of the stereochemistry of the reaction products of the oxidative
addition of CH3I to [Rh(acac)(CO)(PPh3)], by means of 1H NMR spectroscopy and DFT
computational methods.
(ii) The determination of the detailed reaction mechanism of the oxidative addition of CH3I to
[Rh(acac)(CO)(PPh3)], by means of DFT computational methods.
33 (a) T. Nagano, T. Hayashi, Org. Lett. 2004 (6) 1297-1299. (b) R.B. Bedford, D.W. Bruce, R.M. Frost, J.W.
Goodby, M. Hird, Chem. Commun. 2004 2822-2823. (c) R.B. Bedford, M. Betham, D.W. Bruce, A.A.
Danopoulos, R.M. Frost, M. Hird, Chem. Commun. 2005 4161-4163. (d) Y. Hayashi, H. Shinokubo, K. Oshima,
Tetrahedron Lett. 1998 (39) 63-66.
34 A. Guérinot, S. Reymond, J. Cossy, Angew. Chem. Int. Ed. 2007 (46) 6521-6524.

INTRODUCTION AND AIM OF STUDY
8
(iii) To investigate the electronic effects of the R1 and R2 side groups of the β-diketonato
ligand, coordinated to the [Rh(β-diketonato)(CO)(PPh3)] complexes, on the DFT
calculated activation energy of the oxidative addition reaction of methyl iodide to the
[Rh(β-diketonato)(CO)(PPh3)] complexes. Different R side groups, with electronic
properties ranging from electron withdrawing (CF3) to electron donating (C4H3S), were
chosen.
(iv) The determination of the stereochemistry of the reaction product and the detailed reaction
mechanism of the oxidative addition of CH3I to [Rh(acac)(P(OPh)3)2], by means of DFT
computational methods.
(v) To investigate the performance of simplified models versus the full experimental model
of the oxidative addition reaction of CH3I to [Rh(acac)(P(OPh)3)2], by means of DFT
computational methods.
The following goals were set for the iron study:
(i) The optimized synthesis of new and known [Fe(β-diketonato)3)] complexes.
(ii) To characterize the synthesized [Fe(β-diketonato)3)] complexes with a variety of
methods, UV spectrophotometry, mass spectroscopy, elemental analysis, melting points,
etc.
(iii) The electrochemical characterization of the [Fe(β-diketonato)3)] complexes using cyclic
voltammetry and spectroelectrochemistry. To evaluate the formal reduction potential
(E0'), as well as the electrochemical and chemical reversibility/irreversibility, of the redox
active iron(III) centre. To determine the effect of the electron donation/withdrawal of the
different R side groups of the β-diketonato ligands on the formal reduction potential (E0').
(iv) To identify the three dimensional geometry of the [Fe(β-diketonato)3)] complexes
utilizing DFT computational methods.
(v) To determine relationships between experimentally determined and DFT calculated
properties, such as the acid dissociation constant (pKa) of the β-diketone coordinated to
the iron complex, the total group electronegativities (χR1 + χR2) of the R1 and R2 side
groups on the β-diketonato ligand, the formal reduction potentials (E0') of the redox active
metal Fe(III)/Fe(II) in [FeIII(β-diketonato)3] and the calculated ionization potentials.
(vi) To test the performance of different functionals in relation to the energetics of different
spin states of transition metal complexes, such as the spin crossover complex
[Fe(salen)(CH3)2(COCH3)2(py)2] and five-coordinate iron(III) porphyrins.

CHAPTER 2
9
2
Survey of literature and fundamental aspects
2.1 Computational chemistry.
2.1.1 Introduction. 1,2,3
Computational chemistry has become a powerful tool for the study of a molecular system prior to
synthesizing the system in the lab. Properties like geometric arrangements, relative energies and
vibration frequencies can be accurately predicted. One of its strengths is the opportunity to study
species, processes and/or conditions that are difficult, dangerous, impossible or too expensive to
study experimentally. Computational chemistry can also be used for a better understanding of
some chemical problems by making it more visual, for instance molecular orbitals.
Originally, computational quantum chemistry suffered from severe limitations with respect to the
size of the molecules. The development of more efficient computers and more elaborate
mathematical tools has overcome parts of this limitation, thus enabling researchers to look at
real- or almost real-sized systems. However, because computational chemistry methods employ
a number of approximations, the results obtained from computational calculations should always
be treated with some degree of caution.
Quantum chemistry is a branch of theoretical chemistry, which applies quantum mechanics and
quantum field theory to address issues and problems in chemistry. A brief introduction to
quantum chemistry is given in section 2.1.2.
1 E Lewars, Computational Chemistry, Introduction to the theory and Applications of Molecular and Quantum
Mechanics, Kluver Academic Publishers, Boston, 2003, p1-7.
2 A. Ghosh, P.R. Taylor, Curr. Opi. Chem. Biol. 2003, 7, 113-124.
3 C. Bo, F. Maseras, Dalton Trans. 2008, 2911-2919.

SURVEY OF LITERATURE AND FUNDAMENTAL ASPECTS
10
The broad classes of computational chemistry are:
• Ab Initio: Ab initio calculations involve a full quantum mechanical calculation from first
principles, based on the Schrödinger equation. It is limited to small systems and the
calculations are very time consuming, but the most accurate that can be performed. Example:
Gaussian03, CCSD(T), CASPT2 etc.
• Density Functional Theory (DFT): DFT is also based on the Schrödinger equation. In
DFT, the many-body electronic wave function is replaced with the electronic density as the
basic quantity. Thus, DFT does not calculate a wave function, but rather derives the electron
distribution (electron density function) direct. Examples: ADF, Q-Chem, Gaussian03,
GAMESS, DALTON, etc.
• Empirical: These calculations are based on a database of experimental observations and
work best at determining molecules of the same class or type as those previously well
characterized. Fast and Cheap. Example: AMBER, OPLS, etc.
• Semi-Empirical: These calculations take advantage of the predictive power of a true
quantum mechanical calculation, but use empirically determined or fit values for parts of the
calculation that are too difficult to perform. It is thus the mixing of theory (Schrödinger
equation) and experiment (empirical means experimental). This plugging of experimental
values into a mathematical procedure to get the best calculated values is called
parameterization. This method is faster than ab initio and more accurate and predictive than
the empirical. The drawback of this method is that the parameters for many systems,
especially larger transition metal complexes, are not available. Example ZINDO, AM1, etc.
• Molecular Mechanics (MM): The term MM refers to the use of Newtonian mechanics to
model molecular systems. Typically, MM models consist of spherical balls (atoms)
connected by springs (bonds). Internal forces experienced in the model structure are
described by using simple mathematical functions (e.g. Hooke's law). If we know what the
normal spring lengths are and how much energy it takes to stretch and bend the springs, we
can calculate the energy of a given collection of balls and springs, i.e. of a given molecule.
Changing the geometry until the lowest energy is found enables one to do a geometrical
optimization. Example: AMBER, Hyperchem.
• Molecular Dynamics (MD): MD simulation numerically solves Newton's equations of
motion on an atomistic or similar model of a molecular system to obtain information about its
time-dependent properties. For example, one can simulate the motion of an enzyme as it
changes shape on binding to a substrate. Example: AMBER.

CHAPTER 2
11
Ab initio means “from the origin” in Latin. The simplest qualitative model is the Hartree-Fock
(HF) approximation, also called the self-consistent field method (SCF). The HF approximation
is a method for the determination of the ground-state wave function and ground-state energy of a
quantum many-body system. Here the N-body wave function can be described by a single Slater
determinant of N spin orbitals. The HF method accounts for a large part of the electron-electron
interaction, including the exchange energy. The exchange interaction is a quantum mechanical
effect which increases or decreases the expectation value of the energy between two or more
identical particles when their wave functions overlap. The single-determinant approximation
does not take into account Coulomb correlation, leading to a total electronic energy different
from the exact solution of the non-relativistic Schrödinger equation within the
Born-Oppenheimer approximation. Therefore the HF limit is always above this exact energy.
The difference in energy is called the correlation energy. Calculating the correlation energy is
very resource-consuming. To account for the correlation energy, several different approaches are
in use of which selected methods are listed in Table 2.1.
Table 2.1: A brief list of electronic structural calculation methods.
Method Class Description Performance HF or SCF ab initio Wave function based
approximation using a single electron configuration.
Modest accuracy for structures and vibrational frequencies, poor for energetics.
MP2 i high-quality ab initio
Improvement on HF using perturbation theory.
Good for structures and frequencies, modest for energetics.
CCSD(T) ii high-quality ab initio
Improvement of HF theory including excited Slater determinants in the wave function.
Excellent structures, frequencies and energetics in case of a single electronic configuration. Is a good initial approximation.
CASSCF iii high-quality ab initio
Wave function approximation using several electron configurations.
Modest to reasonably good accuracy for structures, frequencies and energetics.
CASPT2 iv high-quality ab initio
Improvement of CASSCF theory using second-order perturbation theory.
Good structures and frequencies, good excitation energies, reaction energies of modest accuracy.
DFT not purely ab initio
Density-based methods, taking exchange and correlation parameters into account.
Good structures and frequencies; more variable on energetics; significantly dependent on the functional used (see section 2.1.6).
i Second-order Møller-Plesset perturbation theory. ii Coupled-cluster SD(T).
iii Complete active space SCF. iv Complete active space SCF second-order perturbation theory.

SURVEY OF LITERATURE AND FUNDAMENTAL ASPECTS
12
2.1.2 Basic Quantum Chemistry.4,5,6
Quantum mechanics mathematically describes the behaviour of electrons and thus of chemistry.
In quantum mechanics the state of a system is not described by particle characteristics, but by a
wave function. Therefore, the goal in all quantum chemical methods is to solve (approximate)
the time-independent Schrödinger equation, which describes how the quantum state of a physical
system changes in time. For a single particle, the one dimensional equation can be presented as
follows:
)()()()(
2 2
22
xExxVdx
xd
mψψψ =+− h
This can more generally be written as:
ψψ EH =
where H is the Hamiltonian operator, E the total energy of the state and ψ denotes the molecular
wave function. The wave function ψ is a function of the electron and nuclear positions. As the
name implies, this is the description of an electron as a wave. As such, it can describe the
probability of electrons being in certain locations, but it cannot predict exactly where the
electrons are. The wave function is often called "a probability amplitude" because the square of
the wave function yields probabilities. The Hamiltonian (H) for an N-particle system is generally
given by:
ij
jiparticles
jii
iparticles
i r
mH
<Σ+
∇Σ−=
2
22h
or in atomic units
ij
jiparticles
jii
iparticles
i r
mH
<Σ+
∇Σ−=
2
2
with
2
2
2
2
2
22
iiii zyx ∂
∂+∂∂+
∂∂=∇
4 D.C. Young, Computational Chemistry - A practical Guide for applying techniques to real-world problems,
Wiley-Interscience, New York, 2001, p10-11.
5 W. Koch, M.C. Holthausen, A Chemist's guide to density functional theory, Second Edition, Wiley-VCH,
Weinheim, 2002, p3-6.
6 G.H. Grant, W.G. Richards, Computational Chemistry, Oxford University Press, Oxford, 1995, p5-6.

CHAPTER 2
13
where 2i∇ is the Laplacian operator acting on particle i. mi and qi are the mass and charge of
particle i respectively and r ij is the distance between the particles. Both nuclei and electrons are
particles.
The Hamiltonian operator contains the kinetic (described by the first term) and potential
(described by the second term) energy terms for the whole system. Once the correct wave
function is known, it is in principle possible to extract all information on the system.
Unfortunately, it is only possible to solve the Schrödinger equation exactly for one particle
systems. And because of this, a variety of methods for obtaining approximate solutions have
been developed for multiple electron systems. These methods range from methods having
adjusted parameters (semi-empirical methods) to highly advanced analytical methods based on
different mathematical formalisms (coupled cluster, configuration interaction, many-body
perturbation theory).
2.1.3 Density Functional Theory (DFT).7,8,9,10
The foundation behind DFT is that the energy of a molecule can be determined from the electron
density instead of a wave function. This was first stated by Hoenburg and Kohn. But the
original theorem only applied to the finding of the ground-state electronic energy of a molecule.
A practical application of this theory was developed by Kohn and Sham who formulated a
method similar in structure to the HF method.
In this formalism, Kohn and Sham introduced the concept of a non-interacting reference system
(i.e. a system with non-interacting electrons) described by a set of one-electron orbitals
(KS-orbitals). This made it possible to compute the major part of the kinetic energy to a high
degree of accuracy. The KS-orbitals are used to provide an electron density for further
calculations of the energy, whereas the orbitals in wave function methods (e.g. HF methods) are
7 D.C. Young, Computational Chemistry - A practical Guide for applying techniques to real-world problems,
Wiley-Interscience, New York, 2001, p42-43.
8 C.J. Cramer, Essentials of Computational chemistry - theories and models, Second Edition, Wiley, Chichester,
2004, p249-303.
9 W.J. Hehre, A guide to molecular mechanics and quantum chemical calculations, Wavefunction, Irvine, 2003,
p30-32.
10 U. von Barth, Physica Scripta, 2004, T109, 9-39.

SURVEY OF LITERATURE AND FUNDAMENTAL ASPECTS
14
used to provide the energy direct. Within the Kohn-Sham formalism, the attraction between the
electrons and the nuclei, the Coulomb part of the electron-electron repulsion and the kinetic
energy of non-interaction electrons are calculated exactly. Only the non-classical part of the
electron-electron repulsion (the exchange energy) plus a small part of the kinetic energy are
described by the approximate functionals. In this formalism the usual expression for the DFT
energy is:
EDFT[ρ] = Tni[ρ] + Vne[ρ] + Vee[ρ] + Exc[ρ]
Here Tni symbolizes the exact kinetic energy of a non-interacting system, Vne is the potential
energy generated by the interaction between nuclei and electrons, Vee is the potential energy
generated by the interaction between electrons (the Coulomb energy) and Exc includes exchange
and correlation energies as well as other contributions (such as a small correction to the kinetic
energy) not accounted for in previous terms. The challenge in DFT is to design a functional for
Exc. The usual approach is to handle the large exchange part and the small correlation part
separately. These exchange-and-correlation functional will be discussed in section 2.1.6.
The greatest advantage of DFT compared to ab initio calculations is the low computational cost,
especially for large systems. On the other hand, it is not possible to carry out a systematic
improvement by taking more electron configurations into account, which could be done for ab
initio methods. The only way to improve DFT results is to use better functionals.
2.1.4 Amsterdam Density Functional (ADF).11
ADF12 is a Fortran programme. It performs calculations on atoms and molecules in either gas
phase or in solution. ADF can be used for the study of diverse fields such as molecular
spectroscopy, organic and inorganic chemistry, crystallography and pharmacochemistry. A
separate programme in the ADF package (BAND) is available for the study of periodic systems
such as crystals, surfaces, and polymers. The underlying theory is the Kohn-Sham formalism, as
described in section 2.1.3. This implies a one-electron picture of the many-electron systems, but
yields in principle the exact electron density (and related properties) and the total energy.
11 ADF User's Guide, Release 2007.01, Scientific Computing & Modelling NV, Amsterdam, 2007, p10.
12 G. Te Velde, F.M Bickelhaupt, E.J. Baerends, C.F. Guerra, S.J.A. Van Gisbergen, J.G. Snijders, T. Ziegler, J.
Comput. Chem. 2001 (22) 931-967.

CHAPTER 2
15
2.1.5 Gaussian03.13
Gaussian03 is one of a series of electronic structure programmes. Starting from the basic laws of
quantum mechanics (section 2.1.2), Gaussian predicts the energies, molecular structures and
vibrational frequencies of molecular systems, along with numerous molecular properties derived
from these basic computation types. It can be used to study molecules and reactions under a
wide range of conditions, including both stable species and compounds which are difficult or
impossible to observe experimentally such as short-lived intermediates and transition structures.
2.1.6 Exchange-and-correlation (XC) Functional.8,14
The Density Functional, also called the exchange-and-correlation (XC) functional, may be
divided into four different subgroups:
• Local Density Approximation: LDA implies that the XC functional in each point in space
depends only on the (spin) density at that same point.
• Generalized Gradient Approximation: GGA is an addition to the LDA part, by including
terms that depend on derivatives of the density.
• Hybrid functionals: A hybrid GGA stands for some combination of a standard GGA with a
part of Hartree Fock exchange.
• Meta functionals: A meta-GGA has a GGA part, but also depends on the kinetic energy
density. A meta-hybrid has a GGA part, a part of Hartree-Fock exchange and a part that
depends on the kinetic energy density.
13 Gaussian 03, Revision C.02, M.J. Frisch, G.W. Trucks, H.B. Schlegel, G.E. Scuseria, M.A. Robb, J.R.
Cheeseman, J.A. Montgomery Jr., T. Vreven, K.N. Kudin, J.C. Burant, J.M. Millam, S.S. Iyengar, J. Tomasi, V.
Barone, B. Mennucci, M. Cossi, G. Scalmani, N. Rega, G.A. Petersson, H. Nakatsuji, M. Hada, M. Ehara, K.
Toyota, R. Fukuda, J. Hasegawa, M. Ishida, T. Nakajima, Y. Honda, O. Kitao, H. Nakai, M. Klene, X. Li, J.E.
Knox, H.P. Hratchian, J.B. Cross, V. Bakken, C. Adamo, J. Jaramillo, R. Gomperts, R.E. Stratmann, O. Yazyev,
A.J. Austin, R. Cammi, C. Pomelli, J.W. Ochterski, P.Y. Ayala, K. Morokuma, G.A. Voth, P. Salvador, J.J.
Dannenberg, V.G. Zakrzewski, S. Dapprich, A.D. Daniels, M.C. Strain, O. Farkas, D.K. Malick, A.D. Rabuck,
K. Raghavachari, J.B. Foresman, J.V. Ortiz, Q. Cui, A.G. Baboul, S. Clifford, J. Cioslowski, B.B. Stefanov, G.
Liu, A. Liashenko, P. Piskorz, I. Komaromi, R.L. Martin, D.J. Fox, T. Keith, M.A. Al-Laham, C. Peng, A.
Nanayakkara, M. Challacombe, P.M.W. Gill, B. Johnson, W. Chen, M.W. Wong, C. Gonzalez, J.A. Pople,
Gaussian, Inc., Wallingford CT, 2004.
14 ADF User's Guide, Release 2007.01, Scientific Computing & Modelling NV, Amsterdam, 2007, p66-69.

SURVEY OF LITERATURE AND FUNDAMENTAL ASPECTS
16
The applicable GGA functionals in this study can be divided into three groups with either
exchange correction, correlations correction or both corrections. They are listed below.
For the exchange part, the options are:
• Becke: the gradient correction proposed in 1988 by Becke.15
• PW91x: the exchange correction proposed in 1991 by Perdew-Wang.16
• PBEx: the exchange correction proposed in 1996 by Perdew-Burke-Ernzerhof.17
• OPTX: the OPTX exchange correction proposed in 2001 by Handy-Cohen.18
For the correlation part, the options are:
• Perdew: the correlation term presented in 1986 by Perdew.19
• PBEc: the correlation term presented in 1996 by Perdew-Burke-Ernzerhof.17
• PW91c: the correlation correction of Perdew-Wang (1991).16
• LYP: the Lee-Yang-Parr 1988 correlation correction.20
Some GGA options define the exchange and correlation parts in one stroke. These are:
• BP86: this is equivalent to Becke + Perdew together.
• PW91: this is equivalent to pw91x + pw91c together.
• PBE: this is equivalent to PBEx + PBEc together.
• BLYP: this is equivalent to Becke (exchange) + LYP (correlation).
• OLYP: this is equivalent to OPTX (exchange) + LYP (correlation).
• OPBE: this is equivalent to OPTX (exchange) + PBEc (correlation).21
15 A.D. Becke, Phys. Rev. 1988 (A38) 3098-3100.
16 J.P. Perdew, J.A. Chevary, S.H. Vosko, K.A. Jackson, M.R. Pederson, D.J. Singh, C. Fiolhais, Phys. Rev. B 1992
(46) 6671-6687. Erratum: J.P. Perdew, J.A. Chevary, S.H. Vosko, K.A. Jackson, M.R. Perderson, D.J. Singh, C.
Fiolhais, Phys. Rev. B 1993 (48) 4978.
17 J.P. Perdew, K. Burke, M. Ernzerhof, Phys. Rev. Lett. 1996 (77) 3865-3868; Erratum: J.P. Perdew, K. Burke, M.
Ernzerhof, Phys. Rev. Lett. 1997 (78) 1396.
18 N.C. Handy, A.J. Cohen, Mol. Phys. 2001 (99) 403-412.
19 J.P. Perdew, Phys. Rev. 1986 (B33) 8822-8824; Erratum: J.P. Perdew, Phys. Rev. 1986 (B34) 7406.
20 (a) C. Lee, W. Yang, R.G. Parr, Phys. Rev. B 1988 (37) 785-789. (b) B.G. Johnson, P.M.W. Gill, J.A. Pople, J.
Chem. Phys. 1993 (98) 5612-5626. (c) T.V. Russo, R.L. Martin, P.J. Hay, J. Chem. Phys. 1994 (101) 7729-
7737.
21 M. Swart, A.W. Ehlers, K. Lammertsma, Mol. Phys. 2004 (102) 2467-2474.

CHAPTER 2
17
The applicable hybrid functionals in this study can be described as follows:
• B3LYP: ADF uses VWN5 in the B3LYP functional (20% Hartree-Fock exchange) by
Stephens-Devlin-Chablowski-Frisch.22
• B3LYP*: a modified B3LYP functional (15% Hartree-Fock exchange) by
Reiher-Salomon-Hess.23
The applicable meta functionals in this study can be described as follows:
• TPPS: A meta-GGA functional by Tao-Perdew-Staroverov-Scuseria.24
• TPPSh: A meta-hybrid functional (10% HF exchange) by
Tao-Perdew-Staroverov-Scuseria.24
2.1.7 Database.25,26
The basis functions used by ADF (see section 2.1.4) are commonly known as Slater Type
Orbitals (STOs). This is different from most other DFT programmes, which usually employ
Gaussian Type Orbitals (GTOs), for which many standard basis sets are available in the
literature. The advantage of the STOs is that fewer of them are needed than with GTOs to get a
reasonable description of the molecule. A disadvantage is that not much work has been done to
develop balanced STO basis sets. In a recent study by Mireia Güell and co-workers,27 STOs and
GTO basis sets were evaluated systematically by comparing the spin-state energies of iron
complexes. They found that STO basis sets give consistent and rapidly converging results, while
the convergence (with respect to basis set size) is much slower for the GTO basis sets.
A basis set can roughly be characterized by two factors: its size (single-, double-, triple-zeta; with
or without polarization) and by the level of frozen core approximation. The STO basis sets
provided by ADF are SZ, DZ, DZP, TZP, and TZ2P. The increasing numbers point to an
22 P.J. Stephens, F.J. Devlin, C.F. Chabalowski, M.J. Frisch, J. Phys. Chem. 1994 (98) 11623-11627.
23 M. Reiher, O. Salomon, B.A. Hess, Theor. Chem. Acc. 2001 (107) 48-55.
24 (a) J. Tao, J.P. Perdew, V.N. Staroverov and G.E. Scuseria, Phys. Rev. Lett. 2003 (91) 146401-146404. (b) V.N.
Staroverov, G.E. Scuseria, J. Tao and J.P. Perdew, J. Chem. Phys. 2003 (119) 12129-12137.
25 ADF User's Guide, Release 2007.01, Scientific Computing & Modelling NV, Amsterdam, 2007, p13-15, 77.
26 J. Hill, L. Subramanian, A. Maiti, Molecular Modeling Techniques in Material Sciences, CRC Press, Boca Raton,
2005, p258-259.
27 M. Güell, J.M. Luis, M. Solà, M. Swart, J. Phys. Chem. A 2008 (112) 6384–6391.

SURVEY OF LITERATURE AND FUNDAMENTAL ASPECTS
18
increase in size and quality. It is not possible to give a formally correct short general
classification for each basis set directory. However, generally speaking we can say that SZ is a
single-zeta basis set, DZ is a double zeta basis set, DZP is a double zeta polarized basis, TZP is a
core double zeta, valence triple zeta, polarized basis set, and finally TZ2P is a core double zeta,
valence triple zeta, doubly polarized basis.
For all-electron calculations and for calculations of heavy elements (Actinides), it is necessary to
include relativistic effect. ZORA refers to the Zero Order Regular Approximation. This
formalism requires special basis sets, primarily to include much steeper core-like functions. The
above basis sets are then classified as ZORA/SZ to ZORA/TZ2P. The ZORA/QZ4P basis set for
example can be loosely described as core triple zeta, valence quadruple zeta, with four sets of
polarization functions. The TZ2P+ basis sets for the transition metals Sc to Zn are nearly
identical to TZ2P except for a better description of the d-space (4 d-functions instead of 3). The
ZORA/TZ2P+ basis sets for the lanthanides La to Yb are nearly identical to TZ2P except for a
better description of the f-space (4 f-functions instead of 3). AUG stands for augmented. These
are augmented standard basis sets with some diffuse STOs added, especially meant for
time-dependent-DFT (TDDFT) calculations. They are named ASZ, ADZ, ADZP, ATZP, and
ATZ2P, which means augmented SZ, augmented DZ, augmented DZP, augmented TZP, and
augmented TZ2P, respectively.
Some common GTO basis sets available for other DFT programmes (for example Gaussian03)
are: 3-21G, 6-31G, 6-31G*, 6-311G, 6-311+G**, VDZP, VTZ2D2P, Roos_ANO-aug-dz,
cc-pVTZ and cc-pVQZ. The increasing numbers point to an increase in size and quality. The
notation of the series of Pople basis sets (first five mentioned above) is typically x-yzG. In this
case, x represents the number of primitive Gaussians, consisting of each core atomic orbital basis
function. The y and z indicate that the valence orbitals are composed of two basis functions each,
the first one composed of a linear combination of y primitive Gaussian functions, the other
composed of a linear combination of z primitive Gaussian functions. In addition to these basis
sets, polarization functions are denoted by an asterisk (*). Two asterisks (**) indicate that
polarization functions are also added to light atoms (H and He). Another common addition is the
addition of diffuse functions, denoted by a plus sign (+). Two plus signs (++) indicate that
diffuse functions are also added to light atoms. The more demanding GTO basis sets were
developed by Ahlrichs (VDZP, VTZ2D2P) and Dunning (cc-pVTZ, cc-pVQZ).

CHAPTER 2
19
2.2 Fundamental Concepts.
2.2.1 Basic Point Group Theory.28,29,30,31
The study of symmetry in molecules is an adaptation of the mathematical group theory. The
symmetry of a molecule can be described by listing all the symmetry elements of the molecule
and this allows one to classify the molecule. The symmetry of a molecule can be described by 5
types of symmetry elements.
• Identity ( E).
The identity operation is the operation of doing nothing - every molecule has this element.
Although this element seems a bit insignificant, it is necessary to include the identity in the
description of a molecule's symmetry in order to be able to apply the theory of groups. It is
called unity (German: Einheit) because it is analogous to multiplying by one.
• Rotational axis (Cn).
The rotational axis is an operation where the molecule is rotated 360°/n around an axis, resulting
in a molecule indistinguishable from the original. This is also called an n-fold rotational axis and
abbreviated Cn. A molecule can have more than one rotational axis. The axis with the highest n
is called the principal axis.
• Plane of symmetry (σ).
The plane of symmetry is a plane of reflection through which an exact mirror image of the
original molecule is given and is abbreviated σ. Three types of planes are possible. The first is a
symmetry plane parallel to the principal axis and is called vertical (σv). The second is
perpendicular to the principal axis and is called horizontal (σh). The third is if a vertical
symmetry plane that additionally bisects the angle between two 2-fold rotation axes
perpendicular to the principal axis and is called dihedral (σd).
28 P.H. Walton, Beginning Group Theory for Chemistry, Oxford University Press, Oxford, 1998, p4-75, 137-143.
29 A. Vincent, Molecular symmetry and group theory, Second Edition, John Wiley & Sons, England, 2001, p1-64.
30 ADF User's Guide, Release 2007.01, Scientific Computing & Modelling NV, Amsterdam, 2007, p249-250.
31 W.K. Nicholson, Linear algebra with applications, Third Edition, PWS Publishing Comany, Boston, 1995, p33-
96.

SURVEY OF LITERATURE AND FUNDAMENTAL ASPECTS
20
• Inversion centre (i).
This operation generates inversion through the centre and is abbreviated i. A molecule has a
centre of symmetry when, for any atom in the molecule, an identical atom exists diametrically
opposite this centre and an equal distance from it. It is not necessary that an atom should be at
the centre.
• Rotation-reflection axis (Sn).
The rotation-reflection axis is an axis around which a rotation of 360°/n takes place, followed by
a reflection in a plane perpendicular to it and leaves the molecule unchanged. This is also called
an n-fold improper rotation axis and is abbreviated Sn (n necessarily even).
The 5 symmetry elements are associated with 5 mathematical symmetry operations. By using
these 5 symmetry elements, one can classify a molecule by assigning to it a single point group
symbol. A point group is a set of symmetry operations forming a mathematical group, for which
at least one point remains fixed under all operations of the group. Various methods can be used
for the assignment of the point group symbol, of which a flow chart is most common. Computer
software (for example Chemcaft32) can also be used to automatically assign a point group symbol
to a molecule. There are numerous point groups of which only 22 are most common in
chemistry. Table 2.3 contains a list of these 22 common point groups.
Thus, the point group of a molecule is shorthand for a collection of symmetry operations which
can be carried out on the molecule. The symmetry operations are mathematical representations
that are one of two types: reducible or irreducible. The reducible representations can be seen as
combinations of irreducible representations, whereas the irreducible representations cannot be
further reduced. In chemistry, one is only interested in the irreducible representations since they
can be used to describe the functions which are solutions to the Schrödinger equation (section
2.1.2). This is the mathematical connection between the symmetry of a molecule and the energy
of a molecule. Luckily the irreducible representations for all the point groups have been
calculated beforehand and are summarized in a table called a character table. The word character
is used since the numbers are characteristic of the matrices from which they are derived. Each
set of irreducible representation can be represented by a shorthand symbol which is called the
Mulliken symbol. There is a set of mathematical rules which can be used for the assignment of
32 G.A. Zhurko, D.A. Zhurko, CHEMCRAFT, Version 1.6 (Build 304), 2009.

CHAPTER 2
21
Mulliken symbols, but for chemists these derivations are not of interest. It is thus only important
to understand the character tables. The character tables also capture important information about
the orbitals which form a base for the irreducible representations. This information is
conventionally listed on the right hand side of the character table. The C2v character table is
given in Table 2.2 as an example. Other character tables can be found in references [28] and
[29].
Table 2.2: The C2v character table.
C2v E C2 σv(xz) σv'(yz) A1 1 1 1 1 z x2, y2, z2 A2 1 1 -1 -1 Rz xy B1 1 -1 1 -1 x, Ry xz B2 1 -1 -1 1 y, Rx yz
The above character table can be described as follows:
Point group symbol: C2v
Symmetry operations: E, C2, σv(xz), σv'(yz)
Mulliken symbols: A1, A2, B1, B2
Irreducible representations: 1, -1
Common bases for representations: Rx, Ry, Rz, x2, y2, x, y, z, xy, xz, yz, z2

SURVEY OF LITERATURE AND FUNDAMENTAL ASPECTS
22
Table 2.3: A selection of some common point groups.
Point group Symmetry elements Simple description Mulliken symbol C1 E no symmetry A Ci E, i inversion centre Ag Au Cs E, σh planar A' A'' C∞v E, 2C∞, σv linear σ π δ φ D∞h E, 2C∞, ∞σi, i, 2S∞, ∞C2 linear with inversion centre σg σu πg πu δg δu φg φu C2 E, C2 "open book geometry" A B C2h E, C2, i, σh planar with inversion centre Ag Au Bg Bu C2v E, C2, σv(xz), σv'(yz) angular or see-saw A1 A2 B1 B2 C3v E, 2C2, 3σv trigonal pyramidal A1 A2 E C4v E, 2C4, C2, 2σv, 2σd square pyramidal A1 A2 B1 B2 E D3 E, C3(z), 3C2 triple helix, chiral A1 A2 E D2h E, C2(z), C2(y), C2(x), i,
σ(xy), σ(xz), σ(yz) planar with inversion centre Ag Au B1g B1u B2g B2u
B3g B3u D3h E, 2C3, 3C2, σh, 3σv, 2S3 trigonal planar or
trigonal bipyramidal A1' A1'' A2' A2'' E' E''
D4h E, 2C4, C2, 2C2', 2C2, i, 2S4, σh, 2σv, 2σd
square planar A1g A1u A2g A2u B1g B1u B2g B2u Eg Eu
D5h E, 2C5, 2C52, 5C2, σh,
5σv, 2S5, 2S53
pentagonal A1' A1'' A2' A2'' E1' E1'' E2' E2''
D6h E, 2C6, 2C3, C2, 3C2', 3C2, i, 3S3, 2S6
3, σh, 3σd, 3σv
hexagonal A1g A1u A2g A2u B1g B1u B2g B2u E1g E1u E2g E2u
D2d E, 2S4, C2, 2Ch, 2C2', 2σd 90° twist A1 A2 B1 B2 E D3d E, 2C3, 3C2, i, 2S6, 3σd 60° twist A1g A1u A2g A2u Eg Eu D4d 2S8, 2C4, 2S8
3, C2, 4C2', 4σd
45° twist A1 A2 B1 B2 E1 E2 E3
D5d E, 2C5, 2C52, 5C2, i,
3S103, 2S10, 5σd
36° twist A1g A1u A2g A2u E1g E1u E2g E2u
Td E, 8C3, 3C2, 6S4, 6σd tetrahedral A1 A2 E T1 T2 Oh E, 8C3, 6C2, 6C4, 3C2, i,
6S4, 8S6, 3σh, 6σd octahedral or cubic A1g A1u A2g A2u Eg Eu
T1g T1u T2g T2u

CHAPTER 2
23
2.2.2 Transition Metal Coordination. 33,34
A transition metal is defined35 as an element whose atom has an incomplete d-sub-shell or which
can give rise to cations with an incomplete d-sub-shell. Whereas a transition metal compound is
a structure consisting of a central transition metal atom, coordinated to one or more ligands.
These compounds may be brightly coloured and some are paramagnetic, due to the partially filled
d-shells. The variety of transition metal compounds originate from the diversity of available
oxidation states (for the transition metal) and their ability to form complexes with a wide range
of ligands. This results in a wide range of coordination numbers and geometries. The total
number of other atoms directly linked to the central element is termed the coordination number36
and this can vary from 2 to as many as 16, of which 6 is the most common.
• Coordination number 2 (ML 2).
This coordination number is relatively rare for transition metals, since the two ligands will have
to be oriented 180° apart. The coordination geometry is linear (D∞h).
• Coordination number 3 (ML 3).
The most important 3-coordinate arrangements are trigonal planar (D3h) and trigonal pyramidal
(C3v) in which the three ligands are oriented 120° apart.
33 F.A. Cotton, G. Wilkinson, P.L. Gaus, Basic inorganic chemistry, Third Edition, John Wiley & Sons, New York,
1995, p166-170, 503.
34 F. Mathey, A. Sevin, Molecular Chemistry of the Transition Elements - an introductory course, John Wiley &
Sons, England, 1996, p19-28.
35 Compendium of Chemical Terminology, Internet Edition (http://goldbook.iupac.org), International Union of Pure
and Applied Chemistry (IUPAC), "transition element".
36 Compendium of Chemical Terminology, Internet Edition (http://goldbook.iupac.org), International Union of Pure
and Applied Chemistry (IUPAC), "coordination number".

SURVEY OF LITERATURE AND FUNDAMENTAL ASPECTS
24
• Coordination number 4 (ML 4).
This is a very important coordination number. The best known 4-coordinate arrangements are
square planar (D4h) and tetrahedral (Td). The tetrahedral arrangement is the more common while
the square planar arrangement is found almost exclusively with metal ions having a d8 electronic
configuration.
• Coordination number 5 (ML 5).
This coordination number is less common than four or six, but is still very important. The most
important 5-coordinate arrangements are trigonal bipyramidal (D3h) and square pyramidal (C4v).
For the trigonal bipyramidal, a substitution of one of the axial ligands typically would lower the
symmetry to C3v whereas a substitution of one of the equatorial ligands would lower the
symmetry to C2v. It is interesting to note that these trigonal bipyramidal and square pyramidal
geometries usually differ little in energy and thus the one may become converted into the other
by small changes in bond angles.
• Coordination number 6 (ML 6).
This coordination number is most important of them all, since nearly all cations form
6-coordinated complexes. The octahedron is often distorted, even in cases where all ligands are
chemically the same. There are three principal forms of distortion of an octahedron. The
tetragonal distortion (symmetrical distortion along one C4-axis) gives a D4h symmetry, the

CHAPTER 2
25
rhombic distortion (unsymmetrical distortion along one C4-axis) gives a D2h symmetry and the
trigonal distortion gives a D3d symmetry.
2.2.3 Crystal Field Theory (CFT).37,38,39
There are different approaches to explain the bonding in transition metal complexes. One very
familiar approach is the crystal field theory (CFT). CFT is an electrostatic model that uses the
negative charge on the non-bonding ligand electrons to create an electric field around the
positively charged metal centre. CFT focuses on the energy changes (splitting) of the five
degenerate atomic d-orbitals (Figure 2.1) on the metal centre, when surrounded by the point
charges from the ligands. For alkali metal ions containing a symmetric sphere of charge,
calculations of energies are generally quite successful. However, for transition metal cations that
contain varying numbers of d-electrons in orbitals that are not spherically symmetric, the
situation is quite different. Despite above, CFT still provides a remarkably good qualitative
explanation of many of the transition metal properties. The most common type of metal complex
is octahedral, although tetrahedral and other complex geometries can also be described by CFT.
This splitting is affected by the following factors:
• The nature of the metal ion.
• The metal's oxidation state - a higher oxidation state leads to a larger splitting.
• The arrangement of the ligands around the metal ion.
37 F.A. Cotton, G. Wilkinson, P.L. Gaus, Basic inorganic chemistry, Third Edition, John Wiley & Sons, New York,
1995, p504-544.
38 C.E. Housecroft, A.G. Sharpe, Inorganic Chemistry, Second Edition, Pearson Prentice Hall, Upper Saddle River,
2005, p556-570.
39 G.E. Rodgers, Introduction to coordination, solid state and descriptive inorganic chemistry, McGraw-Hill, New
York, 1994, p54-88.

SURVEY OF LITERATURE AND FUNDAMENTAL ASPECTS
26
• The nature of the ligands surrounding the metal ion - the stronger the effect of the ligands, the
greater the difference between the high and low energy 3d groups.
Figure 2.1: The five atomic d-orbitals on the Cartesian axis. There are two atomic d-orbitals that point direct
along the Cartesian axis: dz2 (which points along the z-axis) and dx2-y2 (which has lobes on both the x- and y-axes).
The other three atomic d-orbitals (dxy, dxz and dyz), have lobes in between the Cartesian axis. A 45° rotation of dxy
along the z-axis results in dx2-y2 and a 90° rotation of dxz along the z-axis results in and dyz.
Octahedral crystal field.
Consider a first row metal cation surrounded by six identical ligands, placed on the Cartesian
axis at the vertices of an octahedron. As mentioned before, each ligand is treated as a negative
point charge and there is an electrostatic attraction between the metal ion and ligands. However,
there is also a repulsive interaction between the electrons in the atomic d-orbitals (Figure 2.1)
and the ligand point charges, due to the repulsion between similar charges. As the distance
between the ligands and the metal ion decreases, the electrons from the ligands will be closer to
the dx2-y2 and dz2 atomic orbitals and further away from the dxy, dxz and dyz atomic orbitals. Thus,
the d-electrons closer to the ligands will have a higher energy than those further away, which
results in the atomic d-orbitals splitting in energy. This means that the dx2-y2 and dz2 atomic
orbitals are destabilized while the dxy, dxz and dyz atomic orbitals are stabilized. From the Oh
character table (section 2.2.1), it can be deduced that the dx2-y2 and dz2 atomic orbitals have an eg

CHAPTER 2
27
symmetry and the dxy, dxz and dyz atomic orbitals possess a t2g symmetry. The energy separation
between them is called ∆oct. To maintain an energy equilibrium, the eg level lies 3/5∆oct above
and the t2g level lies 2/5∆oct below the energy of the unsplit atomic d-orbitals. This pattern of
splitting, in which the algebraic sum of all energy shifts of all atomic orbitals is zero, is said to
"preserve the centre of gravity" of the set of levels and is called the crystal field stabilization
energy (CFSE). The splitting of energy is illustrated in Figure 2.5. The magnitude of ∆oct is
determined by the strength of the crystal field. Factors governing the magnitude are the identity
and oxidation state of the metal ion and the nature of the ligands.
High-spin (HS) and low-spin (LS).
Let us have a look at the effects of different numbers of electrons occupying the atomic d-orbitals
in an octahedral crystal field. For a d1 system, only one state is possible, which is t2g1. For a d4
system, two arrangements are available: the four electrons may occupy the t2g set with the
configuration t2g4 (large ∆oct, Figure 2.2 left) or may singly occupy four atomic d-orbitals with the
configuration t2g3 eg
1 (small ∆oct, Figure 2.2 right). This corresponds to LS (Figure 2.2 left) and
HS (Figure 2.2 right) respectively. The distinction between the LS and HS configurations is
governed by the size of the pairing energy (Ep) versus the crystal field splitting energy (∆). For
the LS configuration, the next question arises - where is the paired electron? Is it
dxy2 dxz
1 dyz1, dxy
1 dxz2 dyz
1 or dxy1 dxz
1 dyz2? The preferred configuration is that with the lowest
energy and depends on where it is energetically preferable to place the fourth electron. Thus for
a d5 system, ten different arrangements (3 LSs, 6 intermediate-spins and 1 HS) are possible
(Figure 2.3). These different arrangements are called alternative spin states and will be used in
this study.
Figure 2.2: Illustration of a LS and HS d4 system in an octahedral environment.

SURVEY OF LITERATURE AND FUNDAMENTAL ASPECTS
28
Figure 2.3: Illustration of alternative spin states (LS, intermediate spin and HS) of a d5 system in an octahedral
environment.
Jahn-Teller distortions.
Octahedral complexes of d9 and high-spin d4 ions are often distorted in such a way that the axial
metal-ligand bonds (along the z-axis) are of different lengths from the remaining four equatorial
metal-ligand bonds (x- and y-axes). This is illustrated in Figure 2.4. For a high-spin d4 ion, one
of the eg atomic orbitals contains one electron while the other is vacant. If the singly occupied
orbital is in the dz2 atomic orbital, most of the electron density in this orbital will be concentrated
between the cation and the two ligands on the z-axis. Thus, there will be a greater electrostatic
repulsion associated with these ligands than with the other four and the complex suffers
elongation (Figure 2.4 left). On the other hand, if the singly occupied orbital is in the dx2-y2
atomic orbital, it would lead to elongation along the x- and y-axes (Figure 2.4 right). A similar
argument applies for a d9 system where the two atomic orbitals in the eg set are singly and doubly
occupied respectively. Distortions of this kind are called Jahn-Teller distortions.

CHAPTER 2
29
Figure 2.4: Jahn-Teller distortions along the z-axis. The Jahn-Teller theorem states that any non-linear molecular
system in a degenerate electronic state will be unstable and will undergo distortion to form a system of lower
symmetry and lower energy, thereby removing the degeneracy.
Tetrahedral crystal field.
Tetrahedral complexes are the second most common type. Here four ligands form a tetrahedron
(Td) around the transition metal ion. This time the negative charges lie between the Cartesian
axis and electrons in the dxy, dyz and dxz atomic orbitals are repelled more than those in the dx2-y2
and dz2 atomic orbitals. Since none of the orbitals points direct at the negative charge, the
separation of the two sets of orbitals is smaller than in an octahedral ligand field. The energy
difference between the two groups is ∆tet with the dx2-y2 and dz2 atomic orbitals (eg) lower in
energy than the dxy, dxz and dyz atomic orbitals (t2g) - the opposite way around to the octahedral
case (Figure 2.5). The ∆tet is significantly less than the ∆oct, for the reason mentioned above and
also since the tetrahedron has fewer ligands which logically exert a weaker ligand field.
Essentially, most tetrahedral complexes are high-spin, since less energy is needed for a t2 to e
transition.
Other crystal fields.
Figure 2.5 shows the crystal field splittings for a variety of coordination geometries with the
relative splittings of the atomic d-orbitals. By using these splitting diagrams, it is possible to
rationalize the magnetic properties of a given complex. However, CFT only applies to simple
complexes.

SURVEY OF LITERATURE AND FUNDAMENTAL ASPECTS
30
Figure 2.5: The crystal field splitting diagrams for some common fields. Splittings are given with respect to∆oct.
2.2.4 Molecular Orbital (MO) Theory. 37,38
Another approach to explain the bonding in transition metal complexes is the molecular orbital
(MO) theory. In MO theory, electrons are not assigned to individual bonds, but are treated as
moving under the influence of the nuclei in the whole molecule. The probable position of the
electrons can be described by an MO wave function which describes the different MOs of a
molecule. MOs can be arranged in energy levels that account for the stability of various
molecules.
Consider an octahedral ML6 complex where the ligands have only σ-orbitals (no π-orbitals)
directed toward the metal ion. The six σ-orbitals are designated σx and σ-x (along the x-axis), σy
and σ-y (along the y-axis) and σz and σ-z (along the z-axis). These six orbitals combine to make
six distinct linear combinations called ligand group orbitals (LGOs). Each LGO has a symmetry
that is correctly oriented to overlap with one of the s-, p- or d-orbitals of the metal. An example
is given in Figure 2.6. This method is called the linear combination of atomic orbitals
approximation and is used in computational chemistry.

CHAPTER 2
31
Figure 2.6: As an example, four LGOs (left) with the correct symmetry to enable it to overlap with the metal dx2-y2
atomic orbital (right). Since they are on the x- and y-axes, they are designated as σx, σ-x, σy and σ-y.
Each such overlap between one of the six LGOs and a metal orbital results in the formation of a
bonding MO and an antibonding MO. If this orbital is of a type in which the electron in the
orbital has a higher probability of being between nuclei than elsewhere, the orbital will be a
bonding orbital and will tend to hold the nuclei together. If the electrons tend to be present in a
molecular orbital in which they spend more time elsewhere than between the nuclei, the orbital
will function as an antibonding orbital and will actually weaken the bond. Figure 2.7 gives an
energy-level diagram that shows the formation of these bonding and antibonding MOs.
MO theory can further be generalized by including π-orbitals. One must differentiate between
two types of ligands: π-donor and π-acceptor ligands. A π-donor ligand donates electrons to the
metal centre in an interaction that involves a filled ligand orbital and an empty metal orbital,
whereas a π-acceptor ligand accepts electrons from the metal centre in an interaction that
involves a filled metal orbital and an empty ligand orbital (Figure 2.8). The ligand group
π-orbitals are filled and lie above (but relatively close to) the ligand group σ-orbitals. The
π-orbitals can overlap with the dxy, dyz and dxz atomic orbitals of the metal and this leads to
bonding (t2g) and antibonding (t2g*) MOs. The positions of these sets of t2g and t2g* orbitals in
the MO energy-level diagram are variable depending on the nature of the ligand π-orbitals.

SURVEY OF LITERATURE AND FUNDAMENTAL ASPECTS
32
Figure 2.7: An approximate MO diagram for the formation of ML6 complexes (where M is a first row metal)
using the LGO approach. The bonding only involves M-L σ-interactions (no π-orbitals).
Figure 2.8: π-Bond formation in a linear L-M-L unit in which the metal and ligand donor atoms lie on the x-axis:
between the metal dxz and the ligand pz orbitals as for a π-donor ligand, for example L = I- (left); and between the
metal dxz and the ligand π*-orbitals as for a π-acceptor ligand, for example L = CO (right).

CHAPTER 2
33
The following important differences between octahedral ML6 complexes containing σ-donor,
π-donor and π-acceptor ligands exist:
• ∆oct decrease in going from a σ-complex to one containing π-donor ligands.
• For a complex with π-donor ligands, increased π-donation stabilizes the t2g level and
destabilizes the t2g*, thus decreasing ∆oct.
• ∆oct values are relatively large for complexes containing π-acceptor ligands and such
complexes are likely to be LS.
• For a complex with π-acceptor ligands, increased π-acceptance stabilizes the t2g level, thus
increasing ∆oct.
2.2.5 Ligand Field Theory (LFT).37,38
Ligand field theory (LFT) is an extension of CFT that assigns certain parameters as variables
rather than taking them as equal to the values found for free ions, thereby taking into account the
potential covalent character of the metal-ligand bond.40 In other words, LFT (like CFT) is
confined to the role of atomic d-orbitals, but (unlike CFT) the LFT approach is not a purely
electrostatic model. It is a freely parameterized model and uses ∆oct along with the Racah
parameters, which are obtained from electronic spectroscopic data. LFT is more powerful than
either CFT or MO theory, but unfortunately it is also more abstract.
2.2.6 Spin Crossover (SCO).41,42
The choice between a low-spin (LS) and a high-spin (HS) configurations for d4 to d7 complexes
is not always unique and a spin crossover (SCO) sometimes occurs. The electronic ground state
of these SCO complexes may be reversibly interchanged under external stimuli such as
temperature, pressure, magnetic field or light irradiation. This type of molecular magnetism is
one of the most spectacular examples of molecular bistability driven by external constraints
leading to molecular switches or memory.
40 Compendium of Chemical Terminology, Internet Edition (http://goldbook.iupac.org), International Union of Pure
and Applied Chemistry (IUPAC), "ligand field".
41 C.E. Housecroft, A.G. Sharpe, Inorganic Chemistry, Second Edition, Pearson Prentice Hall, Upper Saddle River,
2005, p584.
42 P. Gamez, J.S. Costa, M. Quesada, G. Aromí, Dalton Trans. 2009, 7845-7853.

SURVEY OF LITERATURE AND FUNDAMENTAL ASPECTS
34
As mentioned in section 2.2.3, the atomic d-orbitals of an octahedral complex split into the t2g
and eg sets with an energy separation of ∆oct and therefore the complexes can either exist in LS or
HS states. As an example, Figure 2.9 illustrates the possible spin states for iron(II) and iron(III)
complexes. This spin state is influenced by the nature of the ligand field surrounding the metal
centre. In weak fields, HS is the ground state (corresponding to the highest possible spin
multiplicity) and the d-electrons are distributed over the t2g and eg sets. Strong fields again
stabilize the LS state with minimum multiplicity. In this case (Figure 2.9), the t2g set is
completely occupied before electrons are added to the eg set. The energy gap between these
orbitals (∆oct) varies subject to the ligands used to generate the metal coordination compounds. If
the appropriate energy gap is achieved by the application of an external stimulus, the
d-electron(s) transfers from the t2g set to the eg set and the compound passes from one
configuration to the other. This phenomenon is called spin crossover.
Figure 2.9: Schematic representation of the two possible spin states for iron(II) and iron(III) coordination
compounds in an octahedral environment.

CHAPTER 2
35
2.2.7 Potential Energy Surface (PES).43
Introduction.
The potential energy surface (PES)44 is a geometric hypersurface on which the potential energy
of a set of reactants is plotted as they interact, as a function of the coordinates representing the
molecular geometries of the system. Thus, the PES is the connection between molecular
structure and energetics. The hypersurface name comes from the fact that the total energy of an
atom's arrangement can be represented as a curve (coordinate has only one parameter) or
multidimensional surface (coordinate has more than one parameter). The best way to visualize a
two-dimensional PES, where the coordinate has two parameters x and y and is plotted versus the
potential energy, is to think of a topographic map (Figure 2.10). The PES is generally used
within the Born-Oppenheimer approximation to model chemical reactions and interactions in
simple chemical systems.
Figure 2.10: As example, the two-dimensional PES of a simple reaction: reactant → [transition state A] →
product A or reactant → [transition state B] → product B. This PES provides important information about the
mechanism of the reaction.45
43 (a) W.J. Hehre, A guide to molecular mechanics and quantum chemical calculations, Wavefunction, Irvine, 2003,
p1-15. (b) E Lewars, Computational Chemistry, Introduction to the theory and Applications of Molecular and
Quantum Mechanics, Kluver Academic Publishers, Boston, 2003, p9-29. (c) C.J. Cramer, Essentials of
Computational chemistry - theories and models, Second Edition, Wiley, Chichester, 2004, p19-27.
44 Compendium of Chemical Terminology, Internet Edition (http://goldbook.iupac.org), International Union of Pure
and Applied Chemistry (IUPAC), "potential-energy (reaction) surface".
45 www.chem.wayne.edu.

SURVEY OF LITERATURE AND FUNDAMENTAL ASPECTS
36
Simple Example: Cyclohexane.
Let us look at the two-dimensional PES for the ring inversion in cyclohexane, as an elementary
example (Figure 2.11). This PES contains three distinct energy minima - two of lower energy
identified as "chair" and one of higher energy identified as "boat". According to the PES, the
interconversion process occurs in two steps, with the boat structure as an intermediate. The two
transition states (the states corresponding to the highest energy along this reaction coordinate)
leading to this intermediate, adopt structures in which five of the ring carbons lie almost in one
plane. The interconversion of the chair cyclohexane into the boat intermediate via the transition
state, can be viewed as a restricted rotation about one for the ring bonds. Correspondingly, the
interconversion of the boat intermediate into the other chair form can be viewed as rotation
around the opposite ring bond. Overall, two independent "bond rotations", pausing at the high
(but stable) energy boat intermediate, effect conversion of one chair structure into another
equivalent chair. This is an example of motions which all molecules may undergo and the
energy can be given as a function of reaction coordinate. Diagrams like these provide important
information about reactions, e.g. structures, stability, reactivity and selectivity.
Figure 2.11: The PES for the ring inversion in cyclohexane.
Thermodynamics and Kinetics.
The relative stability of reactants and products is indicated on the PES by their relative heights
and is an indication of the thermodynamics of the reaction. The energy of the products in an
exothermic reaction is lower than that of the reactants (Figure 2.12 left). The opposite is true for
an endothermic reaction, where the energy of the products is higher than that of the reactants
(Figure 2.12 right). According to thermodynamics, the amount of products in an exothermic
reaction will be greater than the number of reactants, at infinite time. The actual ratio of
products to reactants can be calculated by the Boltzmann equation:

CHAPTER 2
37
]Tk/)EE(exp[]reactants[
]products[reactantsproducts −−= (Equation 2.1)
where E is the energy of the products and reactants respectively, k is the Boltzmann constant and
T is the temperature (K). Where two or more different products may form in a reaction,
thermodynamics tells us that the products with the lowest energy will form in the greatest
abundance at infinite time, independent of the pathway. This product would be referred to as the
thermodynamic product.
Figure 2.12: The PES for a simple exothermic (left) and endothermic (right) reaction.
The rate at which the reaction occurs depends on the activation energy. This is represented by
the difference in energy between the transition state and the reactants. The rate constant can be
calculated by the Arrhenius equation:
]TR/)EE([expA reactantsstatetransition −−=k (Equation 2.2)
where k is the rate constant, A is the pre-exponential constant (or pre-exponential factor), E is the
energy of the transition state and reactants respectively, R is the gas constant and T is the
temperature (K). The difference between the transition state energy and the reactants energy is
commonly referred to as the activation energy or the energy barrier. Where two or more different
products may form in a reaction, kinetics tells us that the product with the lowest energy barrier
will form the fastest, independent of the lowest energy product. This product would be referred
to as the kinetic product.
Thus, there are two different and independent mechanisms controlling product distributions -
thermodynamic and kinetic (Figure 2.13). This is why some chemical reactions yield one
distribution of products under one set of conditions and an entirely different distribution of
products under a different set of conditions.

SURVEY OF LITERATURE AND FUNDAMENTAL ASPECTS
38
Figure 2.13: A PES illustrating the thermodynamic and kinetic mechanisms controlling product distributions.
Reaction Mechanism.
In practice, chemical reactions generally do not occur in a single step, but rather involve several
distinct steps and one or more intermediates. The overall sequence of the steps is called the
reaction mechanism and can be represented by a PES (Figure 2.14). The step with the highest
energy barrier in the PES will be the rate-limiting step. In terms of thermodynamics, one only
has to focus on the relative energy between the reactants and products. However, to get a better
understanding of the whole reaction mechanism, it is of great importance to look at the kinetics
of the reaction and thus obtaining information about the transition states.
Figure 2.14: A PES of a simple reaction mechanism, involving one reaction intermediate.

CHAPTER 2
39
2.3 Electrochemistry.
2.3.1 Introduction.
Electroanalytical methods in chemistry are a class of techniques which study an analyte by
measuring the potential and/or current in an electrochemical cell containing the analyte. These
methods can be assigned to several categories depending on which aspects of the cell are
controlled and which are measured. The three main categories are:
• Voltammetry: The cell's current is measured while actively altering the cell's potential.
• Potentiometry: The difference in electrode potentials is measured.
• Coulometry: The cell's current is measured over time.
Some of the most sensitive and informative analytical techniques in the chemist's arsenal can be
described by electrochemistry. Methods such as cyclic voltammetry (CV), stripping
voltammetry, differential pulse polarography and chronoamperometry are not only capable of
assaying trace concentrations of an electroactive analyte, but also supply useful information
concerning its chemical and physical properties. Quantities such as oxidation potentials,
diffusion coefficients, electron transfer rates and electron transfer numbers are readily obtained
using electroanalytical methods, whereas it would be more difficult to obtain using other
techniques. Electroanalytical methods can be combined with spectroscopic techniques in situ to
provide information concerning molecular structures and reaction mechanisms of transient
electroactive species. Cyclic voltammetry (CV) is one of the simplest and most popular
electroanalytical methods.46 The effectiveness of this method lies in its ability to probe redox
behaviour of electro-active species over a wide potential range in a relatively short time.
46 P.T. Kissinger , W.R. Heineman, J. Chem. Educ. 1983 (60) 702-706.

SURVEY OF LITERATURE AND FUNDAMENTAL ASPECTS
40
2.3.2 Cyclic Voltammetry (CV).46,47,48,49,50
Basic CV experiment.
Cyclic voltammetry involves the measurement of the resulting current between a working
electrode and an auxiliary electrode, when the potential of the working electrode is oscillated in
an unstirred solution. The potential of the small, static working electrode is controlled relatively
to a reference electrode. Numerous reference electrodes are available, most commonly used is
the saturated calomel electrode (SCE) or a silver/silver chloride electrode (Ag/AgCl). The
controlled potential can be viewed as an excitation signal. This excitation signal causes the
potential of the working electrode to sweep back and forth between the two designated switching
potentials. The experiment starts at an initial potential (Ei) proceeding to a predetermined limit
switching potential (Eλ1), where the direction of the scan is reversed. This signal is a linear
potential scanning with a triangular waveform (Figure 2.15). Although the potential scan is
frequently terminated at the end of the first cycle, it can be continued for any number of cycles
(as indicated by the broken line) - hence the terminology cyclic voltammetry. The scanning rate
is reflected by the slope and vares from microvolts to volts, but is usually between
50 to 1000 mV.s-1.
47 D.H. Evans, K.M. O’Connell, R.A. Peterson, M.J. Kelly, J. Chem. Educ. 1983 (60) 290-293.
48 D.A. Skoog, D.M. West, F.J. Holler, Fundamentals of Analytical Chemistry, Seventh Edition, Saunders College
Publishers, Philadelphia, 1996, p460-496.
49 P.T. Kissinger, W.R. Heineman, Laboratory techniques in electroanalytical Chemistry, Marcel Dekker, Inc., New
York, 1984, p84-94, 469-485.
50 A.J. Bard, L.R. Faulkner, Electrochemical Methods: Fundamentals and Applications, Wiley, New York, 1980,
p213-248.

CHAPTER 2
41
Figure 2.15: Typical potential-time excitation signal for cyclic voltammetry - a triangular potential waveform
with switching potentials at -0.2 and 0.4 V versus SCE.
The resulting voltammogram is given in Figure 2.16. The voltammogram is a display of the
current response (vertical axis) versus the applied potential (horizontal axis). Since the potential
varies linearly with time, the horizontal axis can also be thought of as a time axis. The
differences between the successive scans are important in obtaining and understanding
information about the reaction mechanisms.
Figure 2.16: A voltammogram of 3.0 mmol.dm-3 Fc (ferrocene = [Fe(C5H5)2]) measured in 0.1 mol.dm-3
tetrabutylammonium hexafluorophosphate/acetonitrile at a scan rate of 100 mV.s-1 with a glassy carbon working
electrode (25°C).

SURVEY OF LITERATURE AND FUNDAMENTAL ASPECTS
42
Important parameters of CV.
The most important parameters of cyclic voltammetry are the peak anodic (Epa) and cathodic
(Epc) potentials and the magnitudes of the peak anodic (ipa) and cathodic (ipc) current (indicated in
Figure 2.16). One method of measuring the peak currents (ipa and ipc) involves the extrapolation
of a baseline as shown in Figure 2.16. The establishment of a correct baseline is essential for the
accurate measurement of the peak currents. With this information, the following important
parameters can be calculated:
Current ratio pc
pa
i
i (Equation 2.3)
Difference in peak potentials pcpap EEE −=∆ (Equation 2.4)
Formal reduction potential 2
EEE pcpa0' +
= (Equation 2.5)
One should distinguish between two important processes in electrochemistry: electrochemical
processes (defined in terms of the difference in peak potentials) and chemical processes
(measured in terms of current ratios). For a redox couple to be electrochemically reversible, the
difference in peak potentials (∆Ep) should theoretically be 59 mV at 25°C for a one electron
transfer process. ∆Ep should also be independent of the scan rate. The difference in peak
potentials increases above 59 mV due to slow electron transfer kinetics at the electrode surface as
well as high solvent resistance over potentials. Under the experimental conditions of this study,
a ∆Ep up to 90 mV is considered electrochemically reversible. For the redox couple to be
chemically reversible the ipa and ipc values should be identical, in other words, the current ratio
should be one. This indicates that the electron transfer process is not followed by a chemical
reaction.
The peak current for a chemically reversible system is described by die Randles-Sevcik equation
for the forward sweep of the first cycle:
Randles-Sevcik equation CAD)10687.2( 2
1
2
1
2
35
p υni ×= (Equation 2.6)
where ip is the peak current (A), the constant 2.687 has a unit (C.mol–1.V–1/2), n is the electron
stoichiometry, D is the diffusion coefficient (cm2.s-1), υ is the scan rate (V.s-1), A is the electrode
area (cm2) and C is the concentration (mol.cm-3). Accordingly plots of ipa and ipc versus υ1/2
should be linear with intercepts at the origin.

CHAPTER 2
43
The redox couple is electrochemically quasi-reversible or irreversible when both the oxidation
and reduction processes take place, but there is a slow electron exchange between the electrode
and the redox species in solution. The difference in peak potentials of 90 mV ≤ ∆Ep ≤ 150 mV
indicates quasi-reversible behaviour, while ∆Ep > 150 mV is treated as electrochemically
irreversible. A complete chemically irreversible system is one where only oxidation or reduction
occurs. The electrochemically and chemically reversibility/irreversibility are demonstrated in
Figure 2.17.
Figure 2.17: A schematic representation of the cyclic voltammograms expected for electrochemically reversible,
quasi-reversible and irreversible systems.
Solvent system.
A suitable medium is needed for electrochemical phenomena to occur. The term
"solvent system" is used to describe the medium consisting of both a solvent and a supporting
electrolyte. Important properties that an ideal solvent system should possess are:
• Electrochemical and chemical inertness: The solvent system should not undergo any
electrochemical reactions over a wide range of potentials and it should not react with the
electroactive species or with intermediates or products of the electrode reaction under
investigation.

SURVEY OF LITERATURE AND FUNDAMENTAL ASPECTS
44
• High electrical conductivity: In order to support the passage of an electrical current, the
solvent system should contain a solvent with a low electrical resistance (large dielectric
constant, ε ≥ 10) and a recommendable supporting electrolyte, to increase the conductivity of
the medium.
• Good solvent power: The electroactive substances under investigation must be soluble at
least to the extent of 1 x 10⁻⁴ dm-3 and the electrolyte concentration must be at least 10 times,
but preferably 100 times, that of the electrochemical species under investigation.
There is not one good solvent system suitable for all experiments. However, a commonly used
system for both inorganic salts and organic compounds is CH3CN (acetonitrile) with
tetrabutylammonium hexafluorophosphate (TBAPF6, [NBu4][PF6]) as the supporting electrolyte.
The CH3CN/TBAPF6 system exhibits a wide potential range with positive and negative
decomposition potentials of +3.5 V and -2.9 V respectively versus SCE.49 One disadvantage is
that CH3CN is rather nucleophilic and can act as a coordinating solvent. DCM or THF can be
used when a strictly non-coordinating solvent is required.
New supporting electrolytes and the use of non-traditional solvents have increased options in
electrochemical studies. The use of the non-coordinating (but very expensive) supporting
electrolyte tetrabutylammonium tetrakis(pentafluorophenyl)borate ([NBu4][B(C6F5)4]) improves
electrochemical results compared to results obtained when using the weak coordinating
electrolyte TBAPF6.51 It was shown that with the use of this new electrolyte, electrochemistry
could be conducted in solvents of low dielectric strength and reversible electrochemistry could be
obtrained for compounds that are normally irreversible.52 It was also shown that the peak
separation between two very close oxidation peaks could be better analysed with the use of this
electrolyte.53
Reference electrode.
Prior to the 1980's, nearly all experimental papers specified potentials of a reference electrode
versus normal hydrogen electrode (NHE) or saturated calomel electrode (SCE). However,
IUPAC has since recommend that all electrochemical data be reported versus an internal
51 L. Pospisil, B.T. King, J. Michl, Electrochim. Acta 1998 (44) 103-108.
52 R.J. le Suer, W.E. Geiger, Angew. Chem., Int. Ed. 2000 (39) 248-250.

CHAPTER 2
45
standard.54,55 In organic media, Fc/Fc+ couple (Fc = ferrocene) is a convenient internal standard
(Fc/Fc+ exhibits E0' = 400 mV versus NHE).56 NHE and SCE are used for measurements in
aqueous solutions. However, in many instances electrochemical measurements in water are
impossible due to insolubility or instability. With non-aqueous solvents, an experimental
reference electrode such as Ag/Ag+ (0.01 mol.dm-3 AgNO3 in CH3CN) or Ag/AgCl may be used.
2.3.3 Spectroelectrochemistry (SEC).57,58,59
Spectroelectrochemistry (SEC) combines the two quite different techniques, electrochemistry and
spectroscopy, to study the redox chemistry of inorganic, organic and biological molecules.
Oxidation states are changed electrochemically (in a specially designed electrochemical cell) by
addition or removal of electrons at an electrode. The products of the redox transformation or the
following chemical reactions are then simultaneously monitored in situ by spectroscopic
techniques. Frequently used spectroscopic techniques are ultraviolet (UV, 200-350 nm), visible
(Vis, 350-700 nm), near-infrared (NIR, 700-100 nm) and infrared (IR). Fluorescence, Raman,
Resonance Raman, electronic spin resonance (ESR) and nuclear magnetic resonance (NMR)
spectroscopy can also be used. SEC is a convenient way for obtaining spectra and reduction
potentials and for observing subsequent chemical reactions of electrogenerated species.
Optically transparent electrochemical cells (OTE cells).
An optically transparent electrode, which enables light to be passed through its surface and the
adjacent solution, is most commonly used for performing transmission spectroelectrochemical
experiments. Various OTE cell designs are available depending on the spectroscopic apparatus
used in the experiment. The optically transparent electrode can be:
53 W.J. Moore, Physical Chemistry, Fourth Edition, Longman Group Limited, London, 1972, p333-334.
54 R.R. Gagné, C.A. Koval, G.C. Lisensky, Inorg. Chem. 1980 (19) 2854-2855.
55 G. Gritzner, J. Kủta, Pure & Appl Chem 1984 (56) 461-466.
56 H.M. Koepp, H. Wendt, H. Strehlow, Z. Elektrochem. 1964, (64) 483-491.
57W. Plieth, G.S. Wilson, C. Gutiérrez De La Fe, Pure & Appl. Chem. 1998 (70) 1395-1414.
58 P.T. Kissinger, W.R. Heineman, Laboratory techniques in electroanalytical Chemistry, Marcel Dekker, Inc., New
York, 1984, p63-64, 283-289.
59 A.J. Bard, L.R. Faulkner, Electrochemical Methods: Fundamentals and Applications, Wiley, New York, 1980,
p577-583.

SURVEY OF LITERATURE AND FUNDAMENTAL ASPECTS
46
• A thin metal film on a transparent substrate. The thickness must not exceed 100 nm for the
film to remain transparent, since this can result in a high electrical resistance.
• A glass plate with a thin film of an optically transparent, conducting material. For example,
indiumdoped tin oxide (ITO).
• A gold minigrid between transparent substrates.
• A thicker, free-standing metal mesh.
Ideally, when using OTE cells, the reactant (dissolved in bulk solution) should not absorb
radiation in the wavelength window of the product. If it does, detection of the product may be
difficult if the beam travels through a significant thickness of reactant solution. This is reduced
(if not eliminated) with optically transparent thin layer electrochemical cells (OTTLE cells).
Optically transparent thin layer electrochemical cells (OTTLE cells).
The optically transparent thin layer electrodes consist of a metal (Au, Ag, Ni) micromesh
containing small (10-30 µm) holes, which couples good optical transmission (over 50%) with
good electrical conductivity. Such a minigrid is usually sandwiched between two microscopic
slides, which form a thin-layer cell. The OTTLE is placed in the spectrophotometer so that the
optical beam is passed through the transparent electrode and solution. The working volume of
such a cell is typically 30-100 µl. The OTTLE cell used in this study is displayed in Figure 2.18.
Figure 2.18: The general-purpose OTTLE cell used in this study. The three electrode cell consists out of a Pt
minigrid as working electrode, a Ag/Ag+ wire as reverence electrode and a Pt wire as auxiliary electrode.60
60 www.specac.com, Omni-CellTM System - Data Sheet.

CHAPTER 2
47
2.4 Rhodium complexes.
2.4.1 Square planar Rh(I) and octahedral Rh(III) chemistry.
2.4.1.1 General properties.61,62,63
The chemistry of rhodium(I) is almost entirely one involving π-bonding ligands such as CO, PR3,
RNC, alkenes, cyclopentadienyls and aryls. In a complex, rhodium forms square planar,
tetrahedral, octahedral and five-coordinate species. The latter two are commonly produced by
addition of neutral ligands to the first two. The criteria for relative stability of five- and four-
coordinate species are by no means fully established. Substitution reactions of square species,
which are often rapid, proceed by an associative pathway involving five-coordinate
intermediates. Most of the square planar complexes undergo oxidative addition reactions and
these lead to octahedral rhodium(III) complexes with π-bonding ligands. These Rh(I)-Rh(III)
oxidation changes are important in catalytic cycles.
The rhodium(I) complexes are usually prepared by reduction of similar rhodium(III) complexes
or of halide species such as RhIIICl3.3H2O in the presence of a complexing ligand. Hundreds of
complexes are known and only a few representative examples synthesized from RhIIICl3.3H2O
are shown in Figure 2.19.
61 F.A. Cotton, G. Wilkinson, C.A. Murillo, M. Bochmann, Advanced inorganic chemistry, Sixth edition, John
Wiley & Sons, New York, 1999, p1041-1042.
62 Y.S. Varshavsky, T.G. Cherkosova, N.A. Buzina, L.S. Bresler, J. Organomet. Chem. 1994 (464) 239-245.
63 J. Conradie, T.S. Cameron, M.A.S. Aquino, G.J. Lambrecht, J.C. Swarts, Inorg. Chim. Acta 2005 (358) 2530-
2542.

SURVEY OF LITERATURE AND FUNDAMENTAL ASPECTS
48
Figure 2.19: Preparations and reactions of rhodium(I) and rhodium(III) compounds from RhIIICl3.H2O.
2.4.1.2 Carbonyl (CO) bonding to a metal.64,65,66
The fact that refractory metals, with high heats of atomization (~400 kJ.mol-1), and an inert
molecule like CO are capable of uniting to form stable, molecular compounds is quite surprising,
especially when the CO molecules retain their individuality. Moreover, the Lewis basicity of CO
is negligible. The explanation lies in the multiple nature of the M-CO bond. The bonding is best
explained by a molecular orbital diagram as illustrated in Figure 2.20.
Figure 2.20: The formation of the metal←CO σ-bond using a lone electron pair on the carbon and the formation
of the metal→CO π-backbond. Other orbitals on the CO ligand are omitted for clarity.
64 F.A. Cotton, G. Wilkinson, P.L. Gaus, Basic Inroganic Chemistry, Third edition, John Wiley & Sons, New York,
1995, p649-650.
65 A. Roodt, G.J.J. Steyn, Recent Rs. Devel. Inorganic Chem. 2000 (2) 1-23.
66 S. Franks, F.R. Hartley, J.R. Chipperfield, Inorg. Chem. 1981 (20) 3238-3242.

CHAPTER 2
49
Firstly, there is a dative overlap of the filled carbon σ-orbital. The lone pair electrons of the
carbon are donated to the empty metal dx2-y2-orbital to form a σ-bond. Secondly, there is a dative
overlap of the filled dπ-orbital of the metal with an empty antibonding pπ-orbital of the CO to
form a π-bond. This bonding mechanism is synergic, since the drift of metal electrons into the
CO orbitals will tend to make the CO as a whole negative and, hence, will increase its electron
donating property via the σ-orbital of the carbon. Also, the drift of electrons to the metal in the
σ-bond tends to make the CO positive, thus enhancing the acceptor strength of the π*-orbitals.
Therefore, the effects of σ-bond formation strengthen the π-bonding and vice versa.
The main lines of physical evidence showing the multiple nature of the M-CO bonds are bond
lengths and vibrational spectra. According to the preceding description of the bonding, as the
extent of back-donation from M to CO increases, the M-C bond becomes stronger and the C≡O
bond becomes weaker which results in a lower CO-stretching frequency (νCO). Therefore the
multiple bonding should be evidenced by shorter M-C and longer C-O bonds as compared with
M-C single bonds and C≡O triple bonds respectively and the νCO will decrease as illustrated in
Figure 2.21. Although C-O bond lengths are rather insensitive to bond order, for M-C bonds in
selected compounds there is an appreciable shortening consistent with the π-bonding concept.
Figure 2.21: Tighter bonded C-O bonds (left) have a higher CO-stretching frequency (νCO) than weaker bonded
C-O bonds (right).
Infrared spectra have been widely used in the study of metal carbonyls since the CO-stretching
frequency (νCO) gives a very strong sharp band that is well separated from other vibrational
modes of any other ligands also present. Where the free CO molecule has a νCO = 2143 cm-1, it
has a lower νCO when bonded to a rhodium(I) complex. Although the oxidative addition of CH3I
to rhodium(I) complexes will be discussed in section 2.4.1.4, Figure 2.22 and Figure 2.23
illustrate and explain the CO-stretching frequency (νCO) shifts during the reaction.

SURVEY OF LITERATURE AND FUNDAMENTAL ASPECTS
50
Figure 2.22: CO-stretching frequency (νCO) shifts during oxidative addition reaction of CH3I to a
[Rh(L,L’-BID)(CO)(PPh3)] complex, where L,L’-BID is a monocharged bidentate ligand with donor atoms L and L’
equal to N and S.
Figure 2.23: CO-stretching frequency (νCO) shifts during oxidative addition reaction of CH3I to
trans-[RhCl(CO)(PR3)2] where PR3 = triarylphosphine.
2.4.1.3 Trivalent phosphine (PX3) bonding to a metal.67,68,69,70,71
PX3 compounds can be π-acceptor ligands when X is fairly electronegative (Ph, OR) or very
electronegative (Cl, F). Tertiary phosphines and phosphates are much better Lewis bases than
CO and can form many complexes where π acidity plays little or no role. This is observed with
67 F.A. Cotton, G. Wilkinson, C.A. Murillo, M. Bochmann, Advanced Inorganic Chemistry, Sixth edition, John
Wiley & Sons, New York, 1999, p642.
68 A. Pidcock, In: C.A. McAuliffe (Editor), Transition Metal Complexes of Phosphorus, Arsenic and Antimony
Ligands, Macmillan, London, 1973, Part 1.
69 J. Emsly, D. Hall, The Chemistry of Phosphorus, Harper and Row Publishers, 1976, Chapter 5.
70 C.A. McAuliffe, W. Levason, Phosphine, Arsine and Stibine Complexes of the Transition Elements, Elsevier
Scientific Publishing Company, Amsterdam, 1979, Chapter 3.
71 D.S. Marynick, J. Am. Chem. Soc. 1984 (106) 4064-4065.

CHAPTER 2
51
the phosphine complexes of the early transition metals and with metal atoms of any kind in their
higher oxidation states where the M-P distances show no evidence of significant π-bonding. In
almost any CO-containing molecule, one or more CO groups can be replaced with a PX3 or a
similar ligand. While the occurrence of π-bonding from M to P is a generally acknowledged fact,
the explanation for it entails controversy. The widely credited explanation is the figure that is
shown in Figure 2.24, in which phosphorus specifically employs a pair of its d-orbitals to accept
metal electrons.
Figure 2.24: The backbonding from a filled metal d-orbital to an empty phosphorus 3d-orbital in the PX3 ligand
taking the internuclear axis as the x-axis. An exactly similar overlap occurs in the xy-plane between the dxy-orbitals.
Of course, not all M-P bond properties can be explained by the π-bond model in Figure 2.24.
According to Pidcock68 there are clearly two extremes: firstly, complexes containing the metal in
oxidation states greater than +2 contain predominantly pure σ-bonds with phosphine ligands and
secondly, those in low oxidation states, especially with such ligands as PF3, PCl3 and P(OPh)3
form bonds with phosphines which contain a σ- as well as a π-component. It has been proposed
by Marynick71 (on the basis of quantum mechanical calculations) that phosphorus p-orbitals and
the P-X σ*-orbitals may play a major role in accepting metal dπ electrons, even to the complete
exclusion of the phosphorus dπ-orbitals. Experimental evidence for or against such ideas is
lacking. Figure 2.25 shows the probability that a π-bond will form between phosphorus and the
appropriate ligand.

SURVEY OF LITERATURE AND FUNDAMENTAL ASPECTS
52
Figure 2.25: Dependence of π-bonding on oxidation state of metal and ‘electronegativity’ of the phosphorus
ligands, based on tetracoordinate phosphorus.
2.4.1.4 General oxidative addition in rhodium complexes.
Introduction. 72,73,74,75,76,77
The process of oxidative addition in transition metal chemistry is used to describe the addition of
neutral molecules (X-Y) to transition metal complexes having no more than 16 valence electrons.
Oxidative addition is demonstrated in Figure 2.26, where the forward reaction is oxidative
addition and the reverse reaction is reductive elimination.
72 F. Mathey, A. Sevin, Molecular Chemistry of the Transition Elements - an introductory course, John Wiley &
Sons, England, 1996, p28-50.
73 F.A. Cotton, G. Wilkinson, P.L. Gaus, Basic Inroganic Chemistry, Third edition, John Wiley & Sons, New York,
1995, p704-708.
74 K.F. Purcell, J.C. Kotz, Inorganic Chemistry, W.B. Saunders Company, Philadelphia, 1977, p938-948.
75 J.P. Collman, L.S. Hegedus, Principles and Applications of Organotransition Metal Chemistry, University
Science Books, Mill Valley, California, 1980, p176-258.
76 J.P. Birk, J. Halpern, A.L. Pichard, J. Am. Chem. Soc. 1968 (90) 4491-4492.
77 R. Ugo, Coord. Chem. Rev. 1968 (3) 319-344.

CHAPTER 2
53
Figure 2.26: Oxidative addition of the neutral molecule XY to the transition metal complex LnM(m) with
n = number of ligands (L) bonded to the metal (M) and m = the oxidation state of M before oxidative addition.
These terms merely describe a reaction and have no mechanistic implications. The mechanisms
can be extremely complicated and vary with the nature of the metal-ligand system and the
molecule that is oxidatively added.
For an oxidative addition reaction to proceed, there must be:
• non-bonding electron density on the metal,
• two vacant coordination sites on the complex LnM to allow the formation of two new bonds
to X and Y and
• the oxidation state of the central metal atom has to be two units lower than the most stable
oxidation state of the metal.
Whether the equilibrium in Figure 2.26 lies on the reduced-metal or the oxidized-metal side,
depends most critically on:
• the nature of the metal,
• the nature of the ligands L in the complex,
• the nature of the added molecule XY and of the bonds M-X and M-Y so formed and
• the medium in which the reaction is conducted.
For transition metals, the most common oxidative addition reactions involve complexes of the
metals with d8 and d10 electron configurations, for example Rh(I), Ir(I) and Pt(II). In general, the
oxidative addition to unsaturated square planar, 16 electron, d8 complexes gives saturated
six-coordinate, 18 electron, d6 complexes (Figure 2.27 (a)). Coordinatively saturated
five-coordinate, 18 electron, d8 complexes must lose one of the original ligands in the oxidative
addition of two new ligands to give a saturated six-coordinate, 18 electron, d6 complex as the
final product (Figure 2.27 (b)). Coordinatively saturated d8 compounds are typically less reactive
and usually add only the stronger oxidizing addenda XY. Frequently d10 complexes are
coordinatively unsaturated, being only three or four-coordinate, so addition occurs readily
(example in Figure 2.27 (c)).

SURVEY OF LITERATURE AND FUNDAMENTAL ASPECTS
54
Figure 2.27: Oxidative addition to d8 and d10 complexes. (a) Oxidative addition to unsaturated square planar d8
complex ML4 with metal M and ligands L. (b) Oxidative addition to saturated trigonal bipyramidal d8 complex
(La = an axial ligand, Le = an equatorial ligand). (c) Oxidative addition to coordinatively unsaturated d10 complex.
As explained in section 2.2.7, the final product of an oxidative addition reaction will be the
isomer or mixture of isomers that is thermodynamically the most stable under the reaction
conditions. The nature of the ligands, solvent, temperature, pressure, and the like, will have a
decisive influence on this. The mechanism of oxidative addition determines the initial oxidative
addition product. The nature of the final product, however, does not necessarily give a guide to
the initial product or the mechanism of the addition, since isomerization of the initial product
may occur.

CHAPTER 2
55
Mechanism of oxidative addition reactions.72,73,75,78,79,80,81
Although it is still widely speculated what the intimate mechanism of oxidative addition is, two
general types can be defined: that of one- and that of two-electron oxidative addition. These two
types differ from one another due to the fact that the intermediate of the one-electron mechanism
is paramagnetic and the two-electron mechanism involves a paired electron process. The
one-electron mechanism can be described as a free-radical mechanism while the two-electron
mechanism is dependent on the polarity of the proposed transition state and can be divided into
three subcategories. These main mechanisms are listed below:
a. the free-radical mechanism,
b.i. the three-centred concerted mechanism,
b.ii. the SN2 mechanism and
b.iii. the ionic mechanism.
Pearson81 has pointed out that reactions proceeding with reasonably low activation energies
involve an electron flow between orbitals with the same symmetry properties. For oxidative
addition, electrons must flow from a filled metal orbital into an antibonding X-Y orbital. This
allows the X-Y bond to be broken and new bonds to the metal to be formed. The X-Y
antibonding orbital must overlap in phase with a filled metal orbital, as illustrated in Figure 2.28.
78 J.K. Kochi, Organometallic Mechanism and Catalysis, Academic Press, London, 1978.
79 R.J. Cross, Chem. Soc. Rev. 1985 (14) 197-223.
80 R.S. Dickson, Organometallic Chemistry of Rhodium and Iridium, Academic Press, London, 1983, p70-79.
81 R.G. Pearson, Symmetry Rules for Chemical Reactions, Wiley, New York, 1976, p405-413.

SURVEY OF LITERATURE AND FUNDAMENTAL ASPECTS
56
Figure 2.28: Symmetry-allowed overlap of orbitals for electron transfer in oxidative addition to 16 electron ML4
complexes. Two ligands are above and below the plane of the page. (a) The free-radical mechanism. (b.i.) The
three-centred concerted mechanism. (b.ii.) the SN2 mechanism.
a. The free-radical mechanism.72,81,82,83,84
The free-radical mechanisms, as illustrated in Figure 2.29, are generally observed when the
participating complex is a strong reducing agent and are favoured by the increasing stability of
the radical [LnM-X] ˙ (see Figure 2.28). In certain cases, radical-chain processes are observed.
They are often initiated by O2 or peroxides and can be blocked by inhibitors such as bulky
phenols.
82 J.A. Labinger, A.V. Kramer, J.A. Osborn, J. Am. Chem. Soc. 1973 (95) 7908-7909.
83 M.F. Lappert, P.W. Ledner, J. Chem. Soc., Chem. Commun. 1973 948-949.
84 J.K. Stille, R.W. Fries, J. Am. Chem. Soc. 1974 (96) 1514-1518.

CHAPTER 2
57
Figure 2.29: The free-radical mechanism for oxidative addition.
Free-radical mechanisms are found for organic bromides and iodides reacting with Ir(I) and Pt(0)
complexes. Rh and Pd are less likely to give free-radical reactions. Evidence shows that trans
addition products and racemates of optically active alkyl groups are formed. Although the trans
products are the most probable products, rearrangements lead to cis products and therefore
cannot be ruled out. Non-polar solvents (or the absence of solvents) favour a free-radical
mechanism.
b.i. The three-centred concerted mechanism.72,80
The three-centred concerted mechanism follows the scheme, as illustrated in Figure 2.30.
Figure 2.30: The three-centred concerted mechanism for oxidative addition.
Here, filled dxz- and dxy-orbitals on the metal interact with antibonding orbitals of the substrate
X-Y (Figure 2.28 (b.i)) to produce a cyclic transition state. The product formed by this route will
have a cis-arrangement. As would be expected for a concerted process, the kinetics is of second
order. As with the free-radical mechanism, non-polar solvents (or the absence of solvents)
favour a three-centred concerted mechanism.
b.ii. The SN2 mechanism.72,80
In the SN2 mechanism, the metal complex plays the role of a nucleophile to produce a polar
intermediate, as illustrated in Figure 2.31.
Figure 2.31: The SN2 mechanism for oxidative addition.

SURVEY OF LITERATURE AND FUNDAMENTAL ASPECTS
58
As with the three-centred concerted mechanism, the kinetics is of second order and the activation
entropy (∆S≠) is negative. However, unlike the three-centred concerted mechanism, the product
can have either cis or trans geometry and the reaction is accelerated by polar solvents. The SN2
mechanism seems particularly appropriate to oxidative addition reactions with alkyl and acyl
halides.
b.iii. The ionic mechanism.72
Ionic mechanisms generally require the presence of a strongly dissociated protic acid H-X as a
reagent. This means that a polar solvent is necessary. Two cases have been recognized, as
illustrated in Figure 2.32.
Case 1
Case 2 Figure 2.32: The two variants of the ionic mechanism.
In the more common one (Case 1 in Figure 2.32), the complex is sufficiently basic to protonate,
after which the anion bonds to give the final product. The opposite case, in which the halide ion
attacks first, followed by protonation of the intermediate, is rare. The first route is favoured by
basic ligands and a low oxidation state, the second by electron acceptor ligands and a positive
charge on the metal.
2.4.1.5 General carbonyl insertion and methyl migration in rhodium complexes.
Introduction. 72,85,86,87
An insertion reaction can be defined as the incorporation of an unsaturated two-electron ligand
(A=B) into an M-X σ-bond (X being a one-electron ligand) of a transition metal complex
LnM-X. Of the various classifications of insertion reactions, two are considered here:
85 J.P. Collman, L.S. Hegedus, Principles and Applications of Organotransition Metal Chemistry, University
Science Books, Mill Valley, California, 1980, p259-298.
86 K. Noack, F. Calderazzo, J. Organomet. Chem. 1967 (10) 101-104.
87 Y. Yamamoto, H. Yamazaki, J. Organomet. Chem. 1970 (24) 717-724.

CHAPTER 2
59
(i) Insertion types (1,1) and (1,2) etc. depending on how the addition between M and X to
A=B takes place. Each proceeds through two distinct steps. The first involves incorporating
A=B as a ligand into the metal coordination sphere (LnM-X must have no more than 16 electrons
because the reaction requires a vacant coordination site.) The second step, often called
migratory-insertion, incorporates A=B into the M-X bond. See Figure 2.33.
Figure 2.33: (1,1) and (1,2) insertion reactions of an unsaturated two-electron ligand (A=B) into a M-X σ-bond
(X being a one-electron ligand).
The metal's oxidation state remains unchanged in both the (1,1)- and (1,2)-insertion reactions.
The migration of X to A=B (or A=B to X) requires that these ligands adopt a cis geometry within
the metal sphere. During the migratory-insertion, the number of electrons and the metal
coordination number decrease by two units and one unit respectively. The addition of a
two-electron ligand is often required to stabilize the complex that is produced. Carbon monoxide
(CO) is the ligand that most commonly undergoes (1,1) insertions. Alkenes and alkynes
invariably give (1,2) insertions.
(ii) The insertion processes can also be classified as intramolecular “migratory insertions” or
as intermolecular “nucleophilic additions". The intramolecular “migratory insertions” take place
by the combination of X and A=B, while both are coordinated to the metal (the second step of
both insertion reactions of Figure 2.33). See Figure 2.34 for examples of intra- and
intermolecular insertion reactions. The reaction CH3Mn(CO)5 + 13CO →
CH3COMn(CO)4(13CO) is considered as an intramolecular “migratory insertion” since the
carbonyl insertion took place at a CO group already coordinated to CH3Mn(CO)5 and not at the 13CO group.
Figure 2.34: Example of an intra- and an intermolecular insertion reaction.

SURVEY OF LITERATURE AND FUNDAMENTAL ASPECTS
60
Mechanism of insertion of CO.88,89
Generally speaking, a carbonyl insertion reaction is regarded as known when any one of the
following stoichiometric reactions has been fully characterized:
a. R-M + CO → RCO-M CO insertion into the metal-carbon σ-bond of a
metal complex which may or may not contain
carbonyl groups.
b. R-M(CO) → RCO-M Conversion of a coordinated CO group into an acyl
(or aroyl) group.
c. R-M(CO) + L → RCO-M(L) CO insertion into a metal carbonyl complex
promoted by a Lewis base L.
(L = two-electron ligand, R is an alkyl or related σ-bonded group.)
Carbonyl insertion reactions for square planar complexes may be represented as in Figure 2.35,
where [MR(CO)] is a reactant or an intermediate, R is an alkyl or related σ-bonded group,
L stands for any ligand including CO and M represents a metal together with its ancillary ligands.
Figure 2.35: Carbonyl (CO) insertion reactions for square planar complexes.
The insertion reaction is best considered as an intramolecular alkyl migration to a coordinated
carbon monoxide ligand in a cis-position and the migration probably proceeds through a
three-centred transition state as illustrated in Figure 2.36.
Figure 2.36: Three-centred transition state proposed for carbonyl insertion reaction.
88 F. Calderazzo, Angew. Chem. Int. Ed. Engl. 1977 (16) 299-311.
89 F.A. Cotton, G. Wilkinson, C.A. Murillo, M. Bochmann, Advanced Inorganic Chemistry, Sixth edition, John
Wiley & Sons, New York, 1999, p1208-1212.

CHAPTER 2
61
2.4.2 The Monsanto Process: [Rh(CO)2I 2]– + CH3I.
90,91,92,93,94,95,96,97,98,99,100,101,102
Introduction.
In 1966, the Monsanto Company initiated the development of a rhodium-catalysed process for the
carbonylation of methanol to acetic acid. This process was named the Monsanto process and was
commercialised in 1970. Over the years the Monsanto process was the dominant industrial
process used in the production of millions of tons of acetic acid. Therefore this process has been
studied in detail - both experimentally90,92,93,100,101,102 and theoretically.91,94,95,96,97,98,99 The
typical commercial operating conditions for the Monsanto process are a 30-60 atm pressure and a
150-200°C temperature. These are much milder conditions than the cobalt-catalysed process
(600 atm, 230°C) which used to be used in the production of acetic acid (commercialised in 1960
by BASF).103
Maitlis et al.90 have shown that the Monsanto process can be analyzed as a cyclic series of
separate reactions, as illustrated in Figure 2.37. Analyzing the process in this way gives one
90 P.M. Maitlis, A. Haynes, G.J. Sunley, M.J. Howard, J. Chem. Soc., Dalton Trans. 1996 2187-2196.
91 T.R. Griffin, D.B. Cook, A. Haynes, J.M. Pearson, D. Monti, G.E. Morris, J. Am. Chem. Soc. 1996 (118) 3029-
3030.
92 A. Haynes, B.E. Mann, G.E. Morris, P.M. Maitlis, J. Am. Chem. Soc. 1993 (115) 4093-4100.
93 A. Haynes, B.E. Mann, D.J. Gulliver, G.E. Morris, P.M. Maitlis, J. Am. Chem. Soc. 1991 (113) 8567-8569.
94 M. Feliz, Z. Freixa, P.W.N.M. van Leeuwen, C. Bo, Organometallics 2005 (24) 5718-5723.
95 E.A. Ivanova, V.A. Nasluzov, A.I. Rubaylo, N. Rösch, Chemistry for Sustainable Development 2003 (11) 101-
107.
96 E.A. Ivanova, P. Gisdakis, V.A. Nasluzov, A.I. Rubailo, N. Rösch, Organometallics 2001 (20) 1161-1174.
97 T. Kinnunen, K. Laasonen, J. Mol. Struct. (Theochem) 2001 (542) 273-288.
98 M. Cheong, T. Ziegler, Organometallics 2005 (24) 3053-3058.
99 M. Cheong, R. Schmid, T. Ziegler, Organometallics 2000 (19) 1973-1982.
100 D. Forster, J. Am. Chem. Soc. 1976 (98) 846-848.
101 C.E. Hickey, P.M. Maitlis, J. Chem. Soc., Chem. Commun. 1984 1609-1611.
102 D. Forster, Adv. Oranomet. Chem. 1979 (17) 255-267.
103 R.T. Eby, T.C. Singleton, In: B.E. Leach (Editor), Applied Industrial Catalysis, Academic Press, New York,
1983, Vol. 1, p275-296.

SURVEY OF LITERATURE AND FUNDAMENTAL ASPECTS
62
useful information about each step in the cycle. The catalytic cycle (Figure 2.37) of the
Monsanto process is made up of six separate reactions steps. The first step (reaction of methanol
with HI to give CH3I) and the last step (the reaction of CH3COI with water to give acetic acid
and regenerate HI) are purely organic. The anion [Rh(CO)2I2]– (a) was found to be the initial
catalytically active species. The interaction of (a) with the substrate CH3I results in the
formation of the six-coordinated alkyl complex [Rh(CO)2I2CH3I]– (b). The alkyl complex is
kinetically unstable and the methyl group migrates to the carbonyl group, which results in the
formation of the five-coordinated acyl complex [Rh(CO)(COCH3)I3]– (c). This acyl complex is
then carbonylated to form the six-coordinated [Rh(CO)2(COCH3)I3]– (d), that reductively
eliminates CH3COI and regenerates [Rh(CO)2I2] (a), which starts the whole cycle all over again.
Figure 2.37: The Monsanto process: the catalytic cycle of the carbonylation of methanol to acetic acid.
Detailed kinetic studies have been performed, using spectrophotometric (IR)90,92,93,100 and
spectroscopic (13C NMR)90,92,93 techniques. The reaction rate is first order in both [(a)] and
[CH3I] and is independent of CO pressure. Initially, (b) was not detected. This intermediate was
first detected by Haynes et al.92,93 in neat CH3I solvent using FTIR and FTNMR techniques. The
efficiency of the Monsanto process is largely due to the rapid conversion of (b) into (c), leading
to a low standing concentration of (b) and minimizing side reactions such as methane formation.

CHAPTER 2
63
Computational studies of the kinetics and conformers have also been performed. The main
programmes used were Gaussian91,95,96,97 and ADF.94,98,99 Functionals like BPE,94
BP86,94,95,96,98,99 and B3LYP94,97 were used along with various basis sets. Calculations were
performed in gas phase,95,96,97,99 as well as in solution (methanol,94,98 DCM94,95,96 and CH3I99).
Although the results differ between methods (especially the effect of the different solvents on the
kinetic data), the general findings and conclusions were the same.
During the Monsanto process, different isomers of each complex in the reaction cycle are
possible. The isomers have been investigated both experimentally (IR, 13C NMR and crystal
structure determination) and computationally. All the possible isomers of (a) - (d) are given in
Figure 2.38.
Figure 2.38: Various isomers possible for complexes (a) - (d) in the Monsanto process.

SURVEY OF LITERATURE AND FUNDAMENTAL ASPECTS
64
Oxidative addition.
The first reaction in the catalytic cycle is the oxidative addition of CH3I to the active catalyst (a).
This is the rate-determining step in the cycle and obeys second-order kinetics (first order in [(a)]
and [CH3I]). Experimental studies90,100,101 indicate that the oxidative addition occurs through a
two-step SN2 mechanism, which is consistent with various computational studies.91,94,95,96,97,98
The first step of the SN2 mechanism is the nucleophilic substitution of iodide by the metal
complex (TSab), presumed to proceed with inversion of configuration at the carbon of the methyl
group. The second step is the subsequent coordination of iodide, which completes the addition to
give a six-coordinated alkyl (b) complex. In this CH3I addition, the oxidation state of the metal
centre changes from I to III.
For the initial complex (a), two isomers are possible: cis and trans (Figure 2.38). Various
computational studies95,96,98,99 indicate that the cis-(a) isomer is more stable than the
corresponding trans-(a) isomer by 34-38 kJ.mol-1. This is in agreement with IR and 13C NMR
experimental data93,102 in which the initial catalytically active complex has been characterized as
the cis-(a) isomer.
Three types of transition states between (a) and (b) were considered computationally: two
resulting from trans addition ("linear/back" and "bent") and one resulting from cis addition
("front").94,95,96 The linear/back transition state structure corresponds to an SN2 mechanism,
characterized by a linear Rh-Cmethyl-I arrangement and by an I-Cmethyl-H angle close to 90°. The
methyl hydrogen atoms are located in the equatorial plane of the five-coordinated carbon atom,
resulting in a trigonal bipyramidal arrangement. The bent and front transition state structures
correspond to a side-on approach of the Cmethyl-I bond to the rhodium atom. The bent transition
state structure leads to the same product as the linear/back transition state structure - a neutral
five-coordinated rhodium complex and a free iodide ion. Both the mechanisms of the linear/back
and the bent transition state structures are therefore described as SN2 processes. The front
transition state structure corresponds to a concerted three-centred oxidative addition mechanism,

CHAPTER 2
65
in which the Rh-I and Rh-Cmethyl bonds form simultaneously as I-Cmethyl bond breaks, resulting in
the cis addition of the methyl iodide. The linear/back addition of CH3I to cis-(a) was preferred
125-128 kJ.mol-1 above the bent and front additions of CH3I to the same isomer.94 This clearly
discards the possibility of the bent and front mechanisms and suggests that the linear/back
mechanism is the only possible transition state (TSab) for the oxidative addition of CH3I to the
Monsanto catalyst. The calculated97 ∆G (Gibbs free energy) values for the reaction
cis-(a) → (TSab) are in agreement with the experimental90,92,101 values.
As for the intermediate (b), three isomers are possible: fac,cis, mer,trans and mer,cis
(Figure 2.38). Computational studies96,97,99 could not point out the most stable isomer with a
clear cut of energy. Selected calculated relative energies of the three possible isomers of (b) are
given in Table 2.4.
Table 2.4: The calculated relative energy (kJ.mol-1) of the three possible isomers of (b) in the Monsanto cycle.
reference [96] i reference [97] ii reference [99] iii fac,cis 9 (6) 16 (15) 0 (0)
mer,trans 0 (0) 0 (0) 1 (2) mer,cis 11 (8) 17 (18) 4 (5)
i Solvent DCM, standard basis set. Parenthesis: Solvent DCM, extended basis set. ii Gas phase, including ZPE corrections. Parenthesis: Gas phase, excluding ZPE corrections.
iii Gas phase. Parenthesis: Solvent CH3I.
From the above table it can be seen that all the isomers of (b) exhibit relatively similar energies
(within 18 kJ.mol-1). According to references [96] and [97], the mer,trans-(b) isomer is found to
be the most stable, while reference [99] indicates that the fac,cis-(b) and mer,trans-(b) isomers
are practically equi-energetic. All results agree that the mer,cis-(b) isomer is the least stable.
The higher relative energy of the fac,cis-(b) isomer versus the mer,trans-(b) isomer (as found by
references [96] and [97]) can be explained by the molecular orbitals at the reaction site. The
main interaction in the σ-type bonding in the Rh-Cmethyl bond is due the interaction between the
metal dz2-orbital and the Cmethyl-I σ-orbital. In (a), the dz2-orbital is orthogonal to the plane
formed by the ligands. For the mer,trans-(b) isomer, the CH3 group is located linearly on top of
the metal and the orbitals have a good overlap. For the fac,cis-(b) isomer however, the CH3
group is not located linearly on top of the metal. The CH3 group and the axial-iodide tilt
respectively towards the planar-iodides and the carbonyl groups. This is due to the repulsion of
the axial-iodide by the planar-iodides and results in the elongation of the Rh-Iaxial bond in the

SURVEY OF LITERATURE AND FUNDAMENTAL ASPECTS
66
fac,cis-(b) isomer. This weakens the Rh-Iaxial bond and destabilizes the fac,cis-(b) isomer, as
demonstrated by the relative energies.
The fac,cis-(b) and mer,trans-(b) isomers are the oxidative addition products of trans addition of
CH3I to cis-(a) and trans-(a) respectively. Though, the higher energy of trans-(a) prevents the
reaction of trans-(a) → mer,trans-(b) from occurring. Thus, the formation of fac,cis-(b) after the
addition of CH3I to cis-(a) is preferred. Since the (b) isomers exhibit relatively similar energies
(within 18 kJ.mol-1), it is proposed that intermediate (b) possesses the geometry of fac,cis-(b).
An experimental study90 revealed that according to IR data a cis-dicarbonyl rhodium species was
present (two carbonyl bands with similar intensities), while the 13C NMR data showed that the
two carbonyl ligands were equivalent (one doublet in the rhodium carbonyl region). Therefore,
taking both the IR and the 13C NMR results into account, the fac,cis-(b) isomer is intermediate
(b). This is in agreement with that which was proposed by the theoretical study.
Methyl migration.
The second reaction in the Monsanto process is the 1,1-insertion that goes via an intramolecular
methyl migration to the carbonyl ligand (TSbc). The six-coordinated alkyl (b) complex
automatically converts into a five-coordinated acyl (c) complex. There are four isomers of
complex (c) possible with different groups in the apical position: one with COCH3, one with CO
and two with iodide (Figure 2.38). The acyl (c) complex with the COCH3 group in the apical
position was found to be 37-81 kJ.mol-1 lower in energy than the other three isomers.99 All
computational results95,96,97,99 are in agreement that this isomer is the most stable isomer for
complex (c). This is also the only complex in the Monsanto process of which a crystal structure
was obtained. The COCH3 group of the crystal structure is also in the apical position.104,105
104 G.W. Adams, J.J. Daly, D. Forster, J. Organomet. Chem. 1974 (71) C17-C19.
105 H. Adams, N.A. Bailey, B.E. Mann, C.P. Manuel, C.M. Spencer, A.G. Kent, J. Chem. Soc., Dalton Trans. 1988
489-496.

CHAPTER 2
67
The transition states between (b) and (c) were considered computationally and the activation
parameters were calculated. The 1,1-insertion in fac,cis-(b) was preferred. The
calculated95,96,97,99 ∆G (Gibbs free energy) values for the reaction fac,cis-(b) → (TSbc) are in
agreement with the experimental92 values.
Carbonyl addition.
Upon heating, complex (c) regenerates complex (a),90 therefore indicating the reversibility of
both the oxidative addition and the methyl migration processes. The decomposition of complex
(c) produces CH3I instead of CH3COI, therefore it is important to trap complex (c) by the
addition of CO.
The intake of CO by complex (c) results in the six-coordinated octahedral (d) complex. Three
isomers for complex (d) are possible: fac,cis, mer,trans and mer,cis (Figure 2.38). As for
complex (b), the mer,cis-(d) isomer was found95,96 to be the least stable (Table 2.5). The
mer,trans-(d) and fac,cis-(d) isomers were found to be almost equi-energetic, with the fac,cis-(d)
isomer 5-7 kJ.mol-1 more than the mer,trans-(d) isomer. The slight preference in energy of the
mer,trans-(d) isomer above the fac,cis-(d) isomer can be explained by the more favourable
orientation of the sterically asymmetric CH3CO ligand.96 To distinguish between the isomers
mer,trans-(d) and fac,cis-(d) as the preferred structure of complex (d), one has to look at the next
step, (d) → (a).
Table 2.5: The relative energy (kJ.mol-1) of the three possible isomers of (d).
reference [96] i fac,cis 7 (5)
mer,trans 0 (0) mer,cis 26 (25)
i Solvent DCM, standard basis set. Parenthesis: Solvent DCM, extended basis set.

SURVEY OF LITERATURE AND FUNDAMENTAL ASPECTS
68
Reductive elimination.
This final organometallic step in the catalytic cycle has received less attention. The last
elementary step of the catalytic cycle is the reductive elimination of CH3COI from the octahedral
complex (d). Different routes of (d) → (a) have been considered computationally and the route
of fac,cis-(d) → cis-(a) was found to be the preferable route.95 Therefore it is suggested that
isomer (d) possesses the structure of fac,cis-(d).
Free energy profile.
The free energy profile of the mechanism of the reaction [Rh(CO)2I2]– + CH3I (the Monsanto
process) is given in Table 2.6. From these data it is evident that the (a) → (TSab) oxidative
addition step has the highest free energy barrier (calculated 135-189 kJ.mol-1, experimental 100
kJ.mol-1) and is therefore the rate-determining step of the overall reaction. The barriers for the
(b) → (TSbc) migratory insertion and the (d) → (TSda) reductive elimination steps are much more
modest (calculated 45-77 kJ.mol-1 and 75 kJ.mol-1, respectively). The calculated and
experimental free energies are in the same range.
Table 2.6: The Gibbs free energy (kJ.mol-1) of the reaction [Rh(CO)2I2]– + CH3I. Complexes are
labelled according to Figure 2.37, with TS = transition state.
reference [90] i reference [95] ii reference [96] iii reference [99] iv (a) 0 0 (0) 0 -
(TSab) 100 135 (189) 135 - (b) 14 42 (24) 42 0
(TSbc) 95 89 (69) 116 72 (77) (c) -6 11 (-6) 11 - (d) - 2 (-21) 2 -
(TSda) - 77 (54) 77 - i Experimental at 35 °C in CH2Cl2-CH3I.
ii Solvent DCM. Parenthesis: Gas phase. iii Solvent DCM, extended basis set. iv Solvent CH3I. Parenthesis: Gas phase.

CHAPTER 2
69
2.4.3 [Rh(β-diketonato)(CO)(PPh3)] + CH3I. 62,106,107,108,109,110,111,112,113,114
Introduction.
Rhodium complex compounds are one of the most widely spread industrial homogeneous
catalysts for organic raw material processing. The most classic example is the Monsanto
process, where methanol is converted into acetic acid with the aid of a rhodium catalyst (section
2.4.2). The oxidative addition of methyl iodide to rhodium(I) carbonyl compounds has
significant implications in catalysis, especially when followed by methyl migration to give the
acyl derivatives. The high catalytic reactivity of rhodium complexes is in many respects due to
the nature of the ligands attached to the rhodium. Therefore, in order to achieve a better
understanding of the ways of purposeful alteration of the reactivity of such systems, in detail
studies of the reaction mechanism are of great importance.
The Monstanto process has been studied in detail, both experimentally and theoretically. In
contrast, the same reaction promoted from [Rh(L,L'-BID)(CO)(PPh3)] complexes (where
L,L'-BID is a monoanionic bidentate ligand with donor atoms L and L' or β-diketonato ligands,
Figure 2.39) has mostly been studied experimentally (Table 2.7 and Table 2.8). On the basis of
extensive kinetic studies of these reactions, reaction schemes have been proposed for the
oxidative addition of methyl iodide to [Rh(L,L'-BID)(CO)(PPh3)] complexes. These schemes are
summarized in Figure 2.40.
106 J. Conradie, J.C. Swarts, Organometallics 2009 (28) 1018-1026.
107 M.M. Conradie, J. Conradie, S. Afr. J. Chem. 2008 (61) 102-111.
108 N.F. Stuurman, J. Conradie, J. Organomet. Chem. 2009 (694) 259-268.
109 M.M. Conradie, J. Conradie, Inorg. Chim. Acta 2009 (362) 519-530.
110 M.M. Conradie, J. Conradie, Inorg. Chim. Acta 2008 (361) 208-218.
111 M.M. Conradie, J. Conradie, Inorg. Chim. Acta 2008 (361) 2285-2295.
112 J. Conradie, G.J. Lamprecht, A. Roodt, J.C. Swarts, Polyhedron 2007 (26) 5075-5087.
113 S.S. Basson, J.G. Leipoldt, A. Roodt, J.A. Venter, T.J. van der Walt, Inorg. Chim. Acta 1986 (119) 35-38.
114 S.S. Basson, J.G. Leipoldt, J.T. Nel, Inorg. Chim. Acta 1984 (84) 167-172.

SURVEY OF LITERATURE AND FUNDAMENTAL ASPECTS
70
Figure 2.39: The L,L'-BID ligand is a monoanionic bidentate ligand with donor atoms L and L'. They are easily
complexed to metals like rhodium. An example of an L,L'-BID ligand is a β-diketone (R1COCH2COR2) with donor
atoms O and O. When β-diketones are complexed to a metal like rhodium, they are deprotonated (R1COCHCOR2)–
and noted as β-diketonato. Complexes like these are used in this study.
Figure 2.40: The general reaction scheme for the oxidative addition of methyl iodide to
[Rh(L,L'-BID)(CO)(PPh3)] complexes (L,L'-BID is a monoanionic bidentate ligand with donor atoms L and L' or
β-diketonato ligands, as defined in Table 2.7 and Table 2.8).
The notations "RhIII-alkyl1" and "RhIII-acyl1" in the above figure refer respectively to the first
alkylated [RhIII(L,L'-BID)(CH3)(CO)(PPh3)(I)] and acylated [RhIII(L,L'-BID)(COCH3)(PPh3)(I)]
complexes that are formed. When the last number in the notations change to ‘‘2”, such as in
"RhIII-alkyl2" and "RhIII-acyl2", it shows that after the first alkylated or acylated species had
formed, it converted to a second, different but more stable, alkylated or acylated structural
isomer. Examples of kinetic and structural studies done on [Rh(L,L'-BID)(CO)(PPh3)]
complexes are summarized in Table 2.7 and Table 2.8.

CHAPTER 2
71
Table 2.7: Summary of the kinetic and crystal structures of selected [Rh(L,L'-BID)(CO)(PPh3)] complexes. Atom assignment is as in Figure 2.39.
Rh crystal structure L,L'-BID L L'
Rh kinetic study
Rh(I) Rh(III) Hcacsm methyl(2-cyclohexylamino-1-cyclopentene-1-dithiocarboxylate) N S [65] [65] - Hhacsm methyl(2-amino-1-cyclopentene-1-dithiocarboxylate) N S [65] [115] - Hmacsm methyl(2-methylamino-1-cyclopentene-1-dithiocarboxylate) N S [65] [116] - Hmacsh 2-methylamino-1-cyclopentene-1-dithiocarboxylate N S [65] - - Hstsc salicylaldehydethiosemicarbazose N S [65] [65] [65] Hcupf cupferron O O [117] - [117]
Hdmavk dimethylaminovinylketone O N - [118] [118][119] Hsacac thioacetylacetone O S [120] [121] [122] - Hmnt maleonitriledithiolate S S - - [123]
Na[S2PPh2] Na[S2PPh2] S S - - [124]
Table 2.8: Summary of the kinetic and crystal structures of selected [Rh(β-diketonato)(CO)(PPh3)] complexes. Atom assignment is as in Figure 2.39.
Rh crystal structure β-diketone i R1COCH2COR2
R1 R2 L L' Rh kinetic study Rh(I) Rh(III)
Hacac acetylacetone CH3 CH3 O O [62] [113] [114] [125] - Htfaa trifluoroacetylacetone CF3 CH3 O O [114] - -
Htfdmaa trifluorodimethylacetylacetone CH(CH3)2 CF3 O O [114] [126] - Hptf pivaloyltrifluoroacetone C(CH3)3 CF3 O O - [127] -
Hhfaa hexafluoroacetylacetone CF3 CF3 O O [114] - - Htfhd trifluorohexanedione CH2CH3 CF3 O O - [128] - Hdbm dibenzoylmethane Ph Ph O O - [129] - Htta thenoyltrifluoroacetone CF3 C4H3S O O [110] [130] - Hbth benzoylthenoylacetylacetone Ph C4H3S O O [111] - - Hdtm dithenoylmethane C4H3S C4H3S O O [111] - - Hfctfa ferrocenoyltrifluoroacetone Fc CF3 O O [112] [106] [131] [112] Hfca ferrocenoylacetone Fc CH3 O O [106] - -
Hbfcm benzoylferrocenoylmethane Fc Ph O O [106] - - Hdfcm diferrocenoylmethane Fc Fc O O [106] - - Hba benzoylacetone CH3 Ph O O [108] [132] - Hbap propanylacetophenone CH2CH3 Ph O O [108] - - Hbab buterylacetophenone (CH2)2CH3 Ph O O [108] - - Hbav valerylacetophenone (CH2)3CH3 Ph O O [108] - -
i β-diketone is a type of L,L'-BID ligand, with L,L' = O,O.
115 G.J.J. Steyn, A. Roodt, I. Poletaeva, Y.S. Varshavsky, J. Organomet. Chem. 1997 (536/7) 197-205.
116 G.J.J. Steyn, A. Roodt, J.G. Leipoldt, Inorg. Chem. 1992 (31) 3477-3481.
117 S.S. Basson, J.G. Leipoldt, A. Roodt, J.A. Venter, Inorg. Chim. Acta 1987 (128) 31-37.
118 L.J. Damoense, W. Purcell, A. Roodt, J.G. Leipoldt, Rhodium Ex. 1994 (5) 10-13.
119 L.J. Damoense, W. Purcell, A. Roodt, Rhodium Ex. 1995 (14) 4-9.
120 J.G. Leipoldt, S.S. Basson, L.J. Botha, Inorg. Chim. Acta 1990 (168) 215-220.
121 J.A. Venter, J.G. Leipoldt, R. van Eldik, Inorg. Chem. 1991 (30) 2207-2209.
122L.J. Botha, S.S. Basson, J.G. Leipoldt, Inorg. Chim. Acta 1987 (126) 25-28.
123 C.H. Cheng, B.D. Spivack, R. Eisenberg, J. Am. Chem. Soc. 1977 (99) 3003-3011.
124 J.A. Cabeza, V. Riera, M.A. Villa-Garcia, L. Ouahab, S. Triki, J. Organomet. Chem. 1992 (441) 323-331.
125 J.G. Leipoldt, S.S. Basson, L.D.C. Bok, T.I.A. Gerber, Inorg. Chim. Acta 1987 (26) L35-L37.
126 J.G. Leipoldt, S.S. Basson, J.T. Nel, Inorg. Chim. Acta 1983 (74) 85-88.

SURVEY OF LITERATURE AND FUNDAMENTAL ASPECTS
72
Stereochemistry of the reaction. [127] [128] [129] [130] [131] [132]
The proposed reaction scheme, with specific stereochemistry, for the oxidative addition of
methyl iodide to [Rh(β-diketonato)(CO)(PPh3)] complexes is given in Figure 2.41. The
stereochemistry of the rhodium(I) and rhodium(III) complexes stems from information obtained
from single crystal X-ray crystallography, NMR and DFT computational studies on related
complexes that generally react in the same way as the monocarbonylphosphine rhodium
complexes. The research that concluded the stereochemistry of each rhodium complex is
explained below.
Figure 2.41: The proposed reaction scheme for the oxidative addition of methyl iodide to
[Rh(β-diketonato)(CO)(PPh3)] complexes and the following carbonyl insertion reactions, showing specific
stereochemistry.
For the [Rh(L,L'-BID)(CO)(PPh3)] complexes (where L,L'-BID = N,S-BID = cacsm, hacsm,
macsm and macsh) both the cis and trans addition of methyl iodide is proposed, with the acyl
(containing the COCH3 group in the apical position) as the final product.65
127 J.G. Leipoldt, S.S. Basson, J.H. Potgieter, Inorg. Chim. Acta 1986 (117) L3-L5.
128 E.C. Steynberg, G.J. Lamprecht, J.G. Leipoldt, Inorg. Chim. Acta 1987 (133) 33-37.
129 D. Lamprecht, G.J. Lamprecht, J.M. Botha, K. Umakoshi, Y. Sasaki, Acta Crystallogr., Sect. C: Cryst. Struct.
Commun. 1997 (53) 1403-1405.
130 J.G. Leipoldt, L.D.C. Bok, J.S. van Vollenhoven, A.I. Pieterse, J. Inorg. Nucl. Chem. 1978 (40) 61-63.
131 G.J. Lamprecht, J.C. Swarts, J. Conradie, J.G. Leipoldt, Acta Crystallogr., Sect. C: Cryst. Struct. Commun. 1993
(49) 82-84.

CHAPTER 2
73
• Rhodium(I) isomers.
The rhodium(I) isomers have a square planar arrangement, formed by the β-diketonato ligand and
the CO and PPh3 groups. The geometry of the rhodium(I) isomers was solved by single crystal
X-ray crystallographic structures of [Rh(β-diketonato)(CO)(PPh3)] complexes (Table 2.8). All
these crystals contained one independent molecule in the asymmetric unit, except for
β-diketonato dbm and ba which had two molecules in the asymmetric unit. For the asymmetric
β-diketonato ligands, two isomers were characterized on the NMR62,106,108,110,111,112 The DFT
calculations107,109 are in agreement with the experimental results.
• RhIII -alkyl1 isomers.
The RhIII-alkyl1 isomers have an octahedral arrangement, with the CO and PPh3 groups in the
plane of the β-diketonato ligand and the I and CH3 group in the apical position. This proposed
geometry of the RhIII-alkyl1 isomers is in agreement with the geometries of
[Rh(β-diketonato)(CH3)(CO)(PPh3)(I)]-alkyl1 (where β-diketonato = tta, bth and dtm) which
were obtained by solution-NMR techniques and DFT calculations.109,111 The RhIII-alkyl1 isomers
result from trans addition of CH3I to rhodium(I), i.e. with the CH3 group and the iodide above
and below the square planar plane of the rhodium(I) reactant. The trans addition of CH3I was
also preferred by the Monsanto catalyst (section 2.4.2).
• RhIII -acyl1 isomers.
It is proposed that the RhIII-acyl1 isomers have a square pyramidal arrangement, with the COCH3
and PPh3 groups in the plane of the β-diketonato ligand and the I in the apical position. This
would be the geometry after methyl migration from RhIII-alkyl1. Only a possible geometry of the
RhIII-acyl1 isomers can be proposed, since no corresponding structure or geometry for any related
β-diketonato complex has to date been determined by any technique.
• RhIII -alkyl2 isomers.
The RhIII-alkyl2 isomers have an octahedral arrangement, with the CO and CH3 groups in the
plane of the β-diketonato ligand and the I and PPh group in the apical position. The structure of
one of the RhIII-alkyl2 isomers of [Rh(fctfa)(CH3)(CO)(PPh3)(I)]-alkyl2 was crystallographically
characterized.112 The spectroscopic and spectrophotometric properties of
[Rh(fctfa)(CH3)(CO)(PPh3)(I)]-alkyl2 and [Rh(β-diketonato)(CH3)(CO)(PPh3)(I)]-alkyl2 (where
132 W. Purcell, S.S. Basson, J.G. Leipoldt, A. Roodt, H. Preston, Inorg. Chim. Acta 1995 (234) 153-156.

SURVEY OF LITERATURE AND FUNDAMENTAL ASPECTS
74
β-diketonato = bap, bab and bav) are in agreement with each other. This geometry is also in
agreement with solution-NMR techniques and DFT calculations on
[Rh(β-diketonato)(CH3)(CO)(PPh3)(I)]-alkyl2 (where β-diketonato = tta, bth and dtm).109,110,111
• RhIII -acyl2 isomers.
It is proposed by DFT calculations107,109 that the RhIII-acyl2 isomers have a square pyramidal
arrangement, with the I and PPh3 group in the plane of the β-diketonato ligand and the COCH3
group in the apical position. No [Rh(β-diketonato)(COCH3)(PPh3)(I)]-acyl2 has
crystallographically been characterized, but the crystal structures of related
[Rh(L,L'-BID)(COCH3)(PPh3)(I)]-acyl products (Table 2.7) are in agreement with the proposed
structure where the COCH3 group is in the apical position, indicating that this geometry is
thermodynamically preferred.
2.4.4 [Rh(acac)(P(OPh)3)2] + CH3I.133,134,135
Introduction.
The reaction between methyl iodide and [Rh(L,L'-BID)(P(OPh)3)2] is very similar to the reaction
between methyl iodide and [Rh(CO)2I2]– (Monsanto catalyst, section 2.4.2) and methyl iodide
and [Rh(L,L'-BID)(CO)(PPh3)] complexes (section 2.4.3). In all three the cases, a neutral alkyl
halide is added to a square planar rhodium(I) complex. The main difference between the reaction
with [Rh(L,L'-BID)(P(OPh)3)2] and the other two types of complexes is that this complex
contains no carbonyl group bonded to the rhodium centre. Therefore, no methyl migration is
possible after the oxidative addition of the alkyl halide. Another difference is the electronic and
steric effect on the rate of the reaction of the bulky triphenylphosphite ligands. The oxidative
addition reaction between CH3I and [Rh(L,L'-BID)(P(OPh)3)2] complexes (Table 2.9) has only
been studied experimentally.
133 G.J. van Zyl, G.J. Lamprecht, J.G. Leipoldt, T.W. Swaddle, Inorg. Chim. Acta 1988 (143) 223-227.
134 J.G. Leipoldt, E.C. Steynberg, R. van Eldik, R. Inorg. Chem. 1987 (26) 3068-3070.
135 G.J. van Zyl, G.J. Lamprecht, J.G. Leipoldt, Inorg. Chim. Acta 1987 (129) 35-37.

CHAPTER 2
75
Table 2.9: Summary of the kinetic and crystal structures of selected [Rh(L,L'-BID)(P(OPh)3)2] complexes. Atom assignment is as in Figure 2.39.
Rh crystal structure L,L'-BID L L'
Rh kinetic study
Rh(I) Rh(III) Hbpha benzoylphenylhydroxylamine O O [136] - [137]
Rh crystal structure
β-diketone i R1COCH2COR2
R1 R2 L L' Rh kinetic
study Rh(I) Rh(III)
Hacac acetylacetone CH3 CH3 O O [133] [134] [138] - Htfaa trifluoroacetylacetone CF3 CH3 O O [133] [134] [139] [140] ii Hhfaa hexafluoroacetylacetone CF3 CF3 O O [133] - - Hdbm dibenzoylmethane Ph Ph O O [133] - - Hba benzoylacetone CH3 Ph O O [133] - -
Htfba trifluorobenzoylacetone CF3 Ph O O [133] [141] - i β-diketone is a type of L,L'-BID ligand, with L,L' = O,O.
ii Rhodium(III) product of the reaction: [Rh(tfaa)(P(OPh)3)2] + I2 [135].
General reaction.133
On the basis of kinetic studies of this reaction, a simplified reaction scheme has been proposed
for the oxidative addition of methyl iodide to [Rh(β-diketonato)(P(OPh)3)2] complexes
(Figure 2.42). Experimentally determined large negative values of the volume (∆V≠) and the
entropy (∆S≠) of activation for the oxidative addition reaction of methyl iodide to a series of
[Rh(β-diketonato)(P(OPh)3)2] complexes indicated a mechanism which occurs via a polar
transition state which is consistent with the SN2 mechanism.
Figure 2.42: The general reaction scheme for the oxidative addition of methyl iodide to
[Rh(β-diketonato)(P(OPh)3)2] complexes (β-diketonato ligands defined in Table 2.9).
136 G.J. Lamprecht, J.H. Beetge, S. Afr. J. Chem. 1987 (40) 131-133.
137 G.J. Lamprecht, G.J. Van Zyl, J.G. Leipoldt, Inorg. Chim. Acta 1989 (164) 69-72.
138 J.G. Leipoldt, G.J. Lamprecht, G.J. Van Zyl, Inorg. Chim. Acta 1985 (96) L31-L34.
139 G.J. Van Zyl, G.J. Lamprecht, J.G. Leipoldt, Inorg. Chim. Acta 1985 (102) L1-L4.
140 G.J. Van Zyl, G.J. Lamprecht, J.G. Leipoldt, Inorg. Chim. Acta 1986 (122) 75-79.
141 G.J. Lamprecht, J.G. Leipoldt, G.J. Van Zyl, Inorg. Chim. Acta 1985 (97) 31-35.

SURVEY OF LITERATURE AND FUNDAMENTAL ASPECTS
76
• Rhodium(I).
The rhodium(I) complex has a square planar arrangement, formed by the β-diketonato ligand and
the two P(OPh)3 groups. The geometry of rhodium(I) was solved by single crystal X-ray
crystallographic structures of three [Rh(β-diketonato)(P(OPh)3)2] complexes (Table 2.9). All
these crystals contained two molecules in the asymmetric unit, except for β-diketonato tfba
which had only one molecule in the asymmetric unit. The two molecules in the asymmetric unit
are enantiomers (mirror images) and have virtually the same bond distances and angles around
the rhodium centre. Since the P(OPh)3 groups bonded to the rhodium centre are chemically
symmetrical, only one isomer is possible.
• RhIII -alkyl.
On the grounds of 1H NMR data,133 the structure of the product of the oxidative addition,
[Rh(β-diketonato)(P(OPh)3)2(CH3)(I)], is proposed to adopt an octahedral arrangement with the
two P(OPh)3 groups in the plane of the β-diketonato ligand and the I and CH3 group in the apical
position. This RhIII-alkyl product results from trans addition of CH3I to rhodium(I). Trans
addition was also preferred by [Rh(CO)2I2]– (Monsanto catalyst, section 2.4.2) and
[Rh(β-diketonato)(CO)(PPh3)] complexes (section 2.4.3). No
[Rh(β-diketonato)(P(OPh)3)2(CH3)(I)]-alkyl has crystallographically been characterized, but the
crystal structures of related products, [Rh(bpha)(P(OPh)3)2(CH3)(I)] and [Rh(tfaa)(P(OPh)3)2(I)2]
(Table 2.9) are in agreement with the proposed structure where the added ligands are above and
below the square planar plane, also indicating that this geometry is thermodynamically preferred.

CHAPTER 2
77
2.5 Iron complexes.
2.5.1 [Fe(β-diketonato)3].
Introduction. 142
Metal atoms, especially transition metals, are present at the active catalytic centre in almost a
third of all known enzymes. Iron and zinc are especially important and occur in relatively high
concentration in the human body (5.4 and 2.4 g per 70 kg, respectively) of which most of this is
involved in the enzyme function.143 These metals are involved in a number of processes,
including binding of substrates to orient them properly for subsequent reaction, mediating
oxidation/reduction and electron transport reactions through reversible changes in the metal
oxidation state and electrostatically stabilizing negative charges.
Tris(β-diketonato) metal(III) complexes are particularly accessible species for studying bonding,
ligand coordination and Jahn-Teller distortion in organometallic systems. These 6-coordinated
metal(III) complexes have approximately an octahedral arrangement. Tris(β-diketonato) iron(III)
complexes are often used in iron-catalyzed cross-coupling reactions (Figure 2.43).144,145,146
Organometallic reagents (R'-MX) act as a nucleophile and attack the electrophilic carbon atom of
an organic compound (R-X') to yield a carbon-carbon bond. The iron-catalyzed cross-coupling
reactions need only a short reaction time (typically 5 to 30 min) and are performed at low
temperatures (typically -20 to 0 ˚C). Similar nickel- or palladium-catalyzed cross-coupling
reactions need much longer reaction time (typically 2 to 40 hours) and are performed at elevated
temperatures (typically 40 to 90 ˚C).147 Furthermore, [Fe(β-diketonato)3] catalysts are 100 times
142 I. Diaz-Acosta, J. Baker, J.F. Hinton, P. Pulay, Spectrochimica Acta Part A 2003 (59) 363-377.
143 H. Douglas, Bioorganic Chemistry, Third Edition, Springer, New York, 1996.
144 J.K. Kochi, J. Organomet. Chem. 2002 (653) 11-19.
145 (a) B.D. Sherry, A. Fürstner, Acc. Chem. Res. 2008 (41) 1500–1511. (b) A. Fürstner, A. Leitner, M. Méndez, H.
Krause. J. Am. Chem. Soc. 2002 (124) 13856-13863. (c) B. Scheiper, M. Bonnekessel, H. Krause, A. Fürstner, J.
Org.Chem. 2004 (69) 3943-3949.
146 G. Cahiez, H. Avedissian, Synthesis 1998 1199-1205.
147 F. Diederich, P.J. Stang, Metal-catalyzed Cross-coupling Reactions, Wiley-VCH: Weinheim, Germany, 1998.

SURVEY OF LITERATURE AND FUNDAMENTAL ASPECTS
78
cheaper than [Pd(β-diketonato)2] catalysts, are environment friendly and can easily be stored for
long periods under normal laboratory conditions.
Figure 2.43: General iron-catalyzed cross-coupling reaction.
Synthesis.148,149,150,151
Tris(β-diketonato) iron(III) complexes are being synthesized for almost more than a century.152
In general, three methods are used to synthesize [Fe(β-diketonato)3] complexes (Figure 2.44).
The first method involves the addition of an ethanol solution of the neutralized β-diketone ligand
to an aqueous solution of the iron nitrate or sulphate, buffered with sodium acetate. The product
precipitates to drive the reaction to completion. The second method involves the dissolution of
the β-diketone in aqueous ammonia (if the ligand is water soluble) or a mixture of aqueous
ammonia and ethanol. Aqueous ammonia removes the methane proton from the β-diketone and
forms the ammonium salt. The ammonium salt is then reacted with the iron nitrate or sulphate.
The precipitation of the product drives the reaction to completion. In the third method, the ligand
is added directly to a suspension of the iron chloride in ethanol. In this method, the reaction is
driven by the evaporation of the gaseous hydrogen chloride and the addition of a base is
unnecessary.
148 E.W. Berg, J.T. Truemper, J. Phys. Chem. 1960 (64) 487-490.
149 S. Misumi, M. Aihara, Y. Nonaka, Bull. Chem. Soc. Jpn 1970 (43) 774-778.
150 M.L. Morris, R.W. Moshier, R.E. Sievers, Inorg. Chem. 1963 (2) 411-412.
151 W.O. McSharry, M. Cefola, J. White, Inorg. Chim. Acta 1980 (38) 161-165.
152 G.T. Morgan. H.W. Moss, J. Chem. Soc. 1914 (105) 189-201.

CHAPTER 2
79
Figure 2.44: Methods commonly used to synthesize [Fe(β-diketonato)3] complexes.
Structural properties.
The first tris(β-diketonato) iron(III) complex to be characterized by X-ray crystallography was
[Fe(acac)3] in 1956.153 Since then only a few more crystal structures of [Fe(β-diketonato)3]
complexes were solved. A summary of these structures are given in Table 2.10. The
[Fe(β-diketonato)3] complexes have an octahedral arrangement of the oxygen atoms around the
iron(III) centre. For unsymmetrical β-diketonato ligands of the [Fe(β-diketonato)3] complex, two
isomers are possible: a facial isomer (fac), where the three ligands are symmetrically arranged,
and a meridional isomer (mer) (Figure 2.45). Although the fac isomer is more common in the
crystal structures, the mer isomer was also found.154,155 For [Fe(tfaa)3], both the mer isomer and
the fac isomer crystal structures were found in separate studies.154,156 The Fe-O bond lengths of
the structures are between 1.95-2.00 Å and the inner angles of O-Fe-O are between 85-89˚.
These parameters are more or less constant for the different R groups on the β-diketonato
backbone.
153 R.B. Roof Jr., Acta Crystallogr. 1956 (9) 781-786.
154 I.A. Baidina, P.A. Stabnikov, I.K. Igumenov, S.V. Borisov, Koord. Khim. (Russ. )(Coord. Chem.) 1986 (12)
404-408.
155 H. Soling, Acta Chem. Scand. A 1976 (30) 163-170.
156 I.A. Baidina, P.A. Stabnikov, I.K. Igumenov, S.V. Borisov, Koord. Khim. (Russ.) (Coord. Chem.) 1986 (12)
258-265.

SURVEY OF LITERATURE AND FUNDAMENTAL ASPECTS
80
Fe
O
O
OO OO
R2
R1
R1
R2
R1
R2
Fe
O
O
OO OO
R1
R2
R1
R2
R1
R2
fac-isomer mer-isomer
Figure 2.45: The facial (fac) and meridional (mer) isomers of [Fe(β-diketonato)3] complexes with unsymmetrical
β-diketonato ligands.
Table 2.10: Summary of structural information of selected [Fe(β-diketonato)3] complexes. Groups R1 and R2 assignment is as in Figure 2.45.
β-diketone R1COCH2COR2
R1 R2 Isomer Fe-O / Å (average)
O-Fe-O / ˚ (average)
Ref
Hacac acetylacetone CH3 CH3 -
1.99(1) 2.012
1.99(1) 1.99(1) 1.95(2)
87.4(6) 87.1
87.0(3) 87.4(2) 89(1)
[157] [157] i [158] [159] [153]
Hba benzoylacetone CH3 Ph fac - ii - ii [156] Htba tert-butyl acetoacetate CH3 OC(CH3)3 fac 2.00(5) 87.5(6) [160]
Htfaa trifluoroacetylacetone CH3 CF3 fac mer
- ii 1.99(3)
- ii 87.2(9)
[154] [156]
Hhfaa hexafluoroacetylacetone CF3 CF3 - 2.00(2) 87.0(6) [161] Htta thenoyltrifluoroacetone CF3 C4H3S mer 1.99(2) 87(1) [155] Hptf pivaloyltrifluoroacetone CF3 C(CH3)3 fac 1.99(3) 86.4(3) [162]
Hdbm dibenzoylmethane Ph Ph - 1.99(3) 1.99(2)
86(1) 86.4(9)
[156] [163]
Hdpm dipivaloylmethane C(CH3)3 C(CH3)3 - 2.00(2) 84.8(1) [164] i Computational study.
ii No structural parameters available.
UV/vis absorption.165
Tris(β-diketonato) iron(III) complexes are high-spin d5 systems for which absorption spectra of
ligand field bands are not to be expected. The intensive absorption bands in the wavelength
range 250-700 nm, observed for solutions of [Fe(β-diketonato)3] complexes in the
157 I. Diaz-Acosta, J. Baker, W. Cordes, P. Pulay, J. Phys. Chem. A 2001 (105) 238-244.
158 J. Iball, C.H. Morgan, Acta Cryst. 1967 (23) 239-244.
159 M.-L. Hu, Z.-M. Jin, Q. Miao, L.-P. Fang, Z. Kristallogr. - New Cryst. Struct. 2001 (216) 597-598.
160 U.K. Urs, K. Shalini, S.A. Shivashankarb, T.N. Guru Row, Acta Cryst. 2000 (C56) e448-e449.
161 C.E. Pfluger, P.S. Haradem, Inorg. Chim. Acta 1983 (69) 141-146.
162 I.A. Baidina, N.V. Kurat’eva, P.A. Stabnikov, S.A. Gromilov, J. Struct. Chem. 2007 (48) 494-499.
163 B. Kaitner, B. Kamenar, Cryst. Struct. Commun. 1980 (9) 487-492.
164 I.A. Baidina, P.A. Stabnikov, V.I. Alekseev, I.K. Igumenov, S.V. Borisov, J. Struct. Chem. 1986 (27) 427-434.
165 G. Gumbel, H. Elias, Inorg. Chim. Acta 2003 (342) 97-106.

CHAPTER 2
81
non-coordinating solvent DCM (Table 2.11), are based on ligand excitation and charge transfer
of both the metal to ligand and ligand to metal types.166,167 Modification of the alkyl groups
according to the series [Fe(acac)3] → [Fe(dibm)3] → [Fe(dpm)3] has practically no effect on the
absorption spectra, characterized by absorption bands at approximately 270, 350 and 440 nm.
The introduction of phenyl groups, as in [Fe(ba)3] and [Fe(dbm)3], however, causes a small red
shift of these three characteristic bands. UV/vis data for selected [Fe(β-diketonato)3] complexes
are summarized in Table 2.11.
Table 2.11: UV/vis absorption data (between 250 and 500 nm) for selected [Fe(β-diketonato)3]
complexes in the solvent DCM at 298 K. Groups R1 and R2 assignment is as in Figure 2.45.
β-diketone R1COCH2COR2
R1 R2 λλλλmax / nm Ref
Hacac acetylacetone CH3 CH3 274, 354, 438 [165] Hdibm didimethylacetylacetone CH(CH3)2 CH(CH3)2 270, 356, 438 [165] Hdpm dipivaloylmethane C(CH3)3 C(CH3)3 270, 358, 434 [165] Hba benzoylacetone CH3 Ph 302, 386, 452 [165]
Hdbm dibenzoylmethane Ph Ph 314, 408, 471 [165] Htta thenoyltrifluoroacetone CF3 C4H3S 338, 388, 434 [165]
Cyclic Voltammetry (CV).
Cyclic voltammetry (CV) involves the measurement of the resulting current between a working
electrode and an auxiliary electrode, when the potential of the working electrode is oscillated in
an unstirred solution (section 2.3.2). Endo et al.168 found that [Fe(dbm)3] showed
electrochemically reversible behaviour (∆Ep = 60 mV), whereas those of the other
[Fe(β-diketonato)3] complexes in his study showed electrochemically irreversible behaviour
(∆Ep between 130 and 500 mV). See Figure 2.46 for examples of the cyclic voltammograms.
The data are summarized in Table 2.12.
The [Fe(β-diketonato)3] complexes are of the high-spin (S = 5/2) type. In the reduced form it is
also high-spin (S = 2). The overall electrochemical reaction is: [FeIII(β-diketonato)3] + e-
[FeII(β-diketonato)3]–. The different redox potentials for the series of complexes in Table 2.12
are due to the different electronic densities at the metal centre due to the different substituents on
the β-diketonato ligands.
166 R.L. Lintvedt, L.K. Kernitzky, Inorg. Chem. 1970 (9) 491-494.
167 N.T. Moxon, J.H. Moffett, A.K. Gregson, J. Inorg. Nucl. Chem. 1981 (43) 2695-2702.
168 K. Endo, M. Furukawa, H. Yamatera, H. Sano, Bull. Chem. Soc. Jpn. 1980 (53) 407-410.

SURVEY OF LITERATURE AND FUNDAMENTAL ASPECTS
82
Figure 2.46: Cyclic voltammograms for 5 mM of [Fe(ba)3] (left, electrochemically reversible) and 5 mM of
[Fe(dpm)3] (right, electrochemically irreversible) with 0.1 M TBAP as supporting electrolyte. The scan rate is 100
mV/s and the potential is measured against a saturated Ag/AgCl electrode.168
Table 2.12: Summary CV data of selected [Fe(β-diketonato)3] complexes. Groups R1 and R2 assignment is as in Figure 2.45.
[Fe(β-diketonato)3] β-diketone R1 R2 Epc / V Epa / V ∆Ep / mV E0' / V Ref [Fe(dpm)3] dipivaloylmethane C(CH3)3 C(CH3)3 -1.16 -0.66 500 -0.91 [168] i
[Fe(acac)3] acetylacetone CH3 CH3 -0.68 -0.65
-0.55 -0.59
130 60
-0.62 -0.62
[168] i [169] ii
[Fe(ba)3] benzoylacetone CH3 Ph -0.61 -0.47 140 -0.54 [168] i [Fe(dbm)3] dibenzoylmethane Ph Ph -0.55 -0.49 60 -0.52 [168] iii [Fe(tfaa)3] trifluoroacetylacetone CF3 CH3 0.00 0.19 190 0.10 [168] i [Fe(tfba)3] trifluorobenzoylacetone CF3 Ph 0.07 0.21 140 0.14 [168] i [Fe(tta)3] thenoyltrifluoroacetone CF3 C4H3S 0.06 0.19 130 0.13 [168] i
[Fe(hfaa)3] hexafluoroacetylacetone CF3 CF3 0.50 0.72 220 0.61 [168] i i Solvent DMF, supporting electrolyte TBAP (tetrabutylammonium perchlorate), versus Ag/AgCl (saturated), scan rate 100 mV/s.
ii Solvent DME, supporting electrolyte TEAP (tetraethylammonium perchlorate), versus SCE, scan rate 1000 mV/s. iii Solvent DMF, supporting electrolyte TBAP (tetrabutylammonium perchlorate), versus Ag/AgCl (saturated), scan rate 500 mV/s.
2.5.2 [Fe(salen)(CH3)2(COCH3)2(py)2].
Introduction. 170,171,172
The spin crossover behaviour (section 2.2.6) in iron complexes has been studied extensively to
understand the mechanisms and various factors influencing the phenomenon. The design of new
molecular compounds exhibiting spin crossover (SCO) is one of growing importance in the
research of functional materials, especially for applications in display devices,173 threshold
169 S. Misumi, M. Aihara, Y. Nonaka, Bull. Chem. Soc. Jpn. 1970 (43) 774-778.
170 M.M. Bhadbhade, D. Srinivas, Polyhedron 1998 (17) 2699-2711.
171 J.-Q. Tao, Z.-G. Gu, T.-W. Wang, Q.-F. Yang, J.-L. Zuo, X.-Z. You, Inorg. Chim. Acta 2007 (360) 4125–4132.
172 X. Zhang, Y. Fu, X. Chen, C. Yang, J. Qin, M. Inokuchi, J. Incl. Phenom Macrocycl. Chem. 2007 (59) 217–222.
173 O. Kahn, C.J. Martinez, Science 1998 (279) 44-48.

CHAPTER 2
83
indicators and biomedical imaging.174 The implications of SCO in metalloproteins
(e.g. myoglobin, haemoglobin and cytochromes) are also explored. Factors like substitution,
axial ligands, counterions and solvent of crystallization influence the nature of spin state
crossover.175 Variable temperature X-ray structural studies have revealed that the electron
transfer rate is coupled to intermolecular solid state effects and the onset of dynamic motions of a
solvent molecule in the lattice. The dynamic disorders in the lattice lead to rapid spin
interconversion rates and reversible abrupt transition while static order leads to slow rates and
gradual SCO behaviour.176
SCO is most commonly observed for iron(II) complexes with the nitrogen donor atoms and
represents a transition between the high-spin state (S = 2) to the low-spin state (S = 0), which can
be induced by a variation of temperature, pressure or by light irradiation.177 SCO in salen type
complexes was observed initially by Nishida et al.178 and later Kennedy et al.179 have reported a
detailed study of the influence of uncoordinated anion on the spin state interconversion
dynamics.
In this study, we turn our attention to the salen type complex [Fe(salen)(CH3)2(COCH3)2(py)2],
where py is axial pyridine ligands (Figure 2.47). This complex was first investigated by Jäger et
al.180 Recently, Weber et al.181 preformed a solution NMR study of this iron(II) SCO complex.
174 R.N. Muller, L. Vander Elst, S. Laurent, J. Am. Chem. Soc. 2003 (125) 8405-8407.
175 H. Toftlund, Coord. Chem. Rev. 1989 (94) 67-108.
176 M.D. Timken, C.E. Strouse, S.M. Soltis, S.A. Daverio, D.N. Hendrickson, A.M. Abdel-Mawgoud, S.R. Wilson,
J. Am. Chem. Soc. 1986 (108) 395-402.
177 (a) S. Bonhommeau, G. Molnár, A. Galet, A. Zwick, J.A. Real, J.J. McGarvey, A. Bousseksou, Angew. Chem.,
Int. Ed. 2005 (44) 4069-4073. (b) P. Gütlich, Y. Garcia, H.A. Goodwin, Chem. Soc. Rev. 2000 (29) 419-427.
178 Y. Nishida, S. Oshi, S. Kida, Chem. Lett. 1975 79-80.
179 B.J. Kennedy, A.C. McGrath, K.S. Murray, B.W. Skelton, A.H. White, Inorg. Chem. 1987 (26) 483-495.
180 E.G. Jäger, In: L. Fabbrizzi, A. Poggi (Editors), Chemistry at the Beginning of the Third Millenium, Springer-
Verlag: Heidelberg, Germany, 2000 103-138.
181 B. Weber, F.A. Walker, Inorg. Chem. 2007 (46) 6794-6803.

SURVEY OF LITERATURE AND FUNDAMENTAL ASPECTS
84
Figure 2.47: The salen type complex [Fe(salen)(CH3)2(COCH3)2(py)2] (where py = pyridine) used in this study.
Solution NMR study.181
In the work of Weber et al.181 they introduce a method for analyzing the spin transitions of
iron(II) complexes in solution. Iron(II) is the most important metal centre for SCO complexes.
Most of the investigations on spin-transition complexes are focused on solid-state properties.
However, whereas packing effects are sometimes useful and lead to the desired properties, there
are several other cases where experiments in solution give more detailed answers to open
questions. In solution, packing effects are switched off and a better comparison/study of the
effect of different substituents or the influence of the bridging ligand on the “communication”
between the linked iron centres is possible. Such investigations are important for the
understanding of cooperative interactions in the solid state and therefore for designed syntheses
of new spin-transition compounds.
The magnetic susceptibility of [Fe(salen)(CH3)2(COCH3)2(py)2] was measured in a pyridine-
d5/toluene-d8 mixture (50/50, v/v) with the toluene-CD2H residual methyl proton signal as a
reference on a Varian Unity-300 spectrometer. Magnetic susceptibility is the degree of
magnetization of a material in response to an applied magnetic field. Figure 2.48 shows the plots
of the effective magnetic moment per mole of compound (µeff) as a function of temperature for
[Fe(salen)(CH3)2(COCH3)2(py)2]. For comparison purposes, the results from solid-state
susceptibility measurements are given as well (solid triangles in Figure 2.48). At room
temperature, the complex is in the high-spin (HS) state, with µeff equals to 5.10 µb. Deviations
from the theoretically expected values are due to difficulties in obtaining an accurately weighed
amount of the air-sensitive iron(II) compound. As the temperature is lowered, the magnetic
moment decreases. Significant differences can be found between the behaviour in solution and
that in the solid state. In comparison, a powder sample of [Fe(salen)(CH3)2(COCH3)2(py)2]
shows an abrupt spin transition, whereas the transition curve in solution is gradual, as expected
for a mononuclear complex. The critical temperature T1/2 (with HS mole fraction γHS = 0.5) is
210 K for the pyridine/toluene solution of [Fe(salen)(CH3)2(COCH3)2(py)2]. A significantly

CHAPTER 2
85
lower critical temperature is found for the abrupt spin transition of the powder sample of
[Fe(salen)(CH3)2(COCH3)2(py)2] (177 K). The packing of the molecules in the crystal therefore
influences the thermodynamic parameters of the spin transition.
Figure 2.48: Plot of the effective magnetic moment per mole of compound (µeff) versus temperature (T).
Magnetic property of [Fe(salen)(CH3)2(COCH3)2(py)2], determined in solution (open circles) and in the solid state
(solid triangles).181
2.5.3 [Fe(porphyrin)(Ar)].
Introduction. 182
Porphyrin type molecules (porphyrinoids) consist of a large class of macrocyclic molecules with
a carbon and nitrogen skeleton. Porphyrinoids are called “the colours of life”, since many
porphyrinoids have intense colours and play an important role in nature. They owe their bright
colours to intense absorptions in the near ultraviolet and visible regions. The word porphyrin is
actually derived from the Greek word for purple, porphura. Two well-known porphyrinoids are
the heme cofactor in blood and chlorophyll in plants. The heme cofactor in blood is an
iron-containing porphyrin, where it serves as an O2 and a CO2 carrier. The heme cofactor also
gives the red colour to blood. Chlorophyll is a magnesium chlorin (a reduced porphyrin, Figure
2.50) and is a vital component in photosynthesis as a light-harvesting pigment and is also
182 L.R. Milgrom, The colours of life; Oxford University Press, Oxford, 1997.

SURVEY OF LITERATURE AND FUNDAMENTAL ASPECTS
86
responsible for the green colour of leaves and grass. The main function of porphyrinoids is to
bind to metal atoms that act as centres for significant biochemical events.
The porphyrin skeleton consists of four pyrrole units, linked together by four methine bridges.
This 22 π-electron system has a [18]annulene substructure and like typical aromatic compounds,
unsubstituted porphyrins are planar. The porphyrin structure is given in Figure 2.49 and Figure 2.50
illustrates selected general porphyrinoids.
Figure 2.49: Structure of the free base porphyrin (left) and unsubstituted iron porphyrin (right). Key carbons are
indicated with arrows.
Figure 2.50: Selected general porphyrinoids.

CHAPTER 2
87
Non-planar deformations of porphyrins.
Many biological porphyrin cofactors are observed to be non-planar. This is suspected to play an
important role in biological functions of these compounds.183,184 Non-planar distortion of
substituted porphyrins may be caused by peripheral steric crowding, electronic interactions
involving axial ligands, crystal packing effects, the size of the central ion and specific
metal-ligand orbital interactions. The four common non-planar deformations of porphyrins are
the ruffled (D2d), saddled (D2d), waved (C2h) and domed (C4v)-conformations. They all result in a
lowering of the ideal D4h symmetry of a planar porphyrin (the symmetry is given in parentheses).
The different out-of-plane deformations are illustrated in Figure 2.51.
Figure 2.51: A schematic illustration of the four most common non-planar deformations in porphyrins. Filled
circles represent displacement above the mean porphyrin plane and open circles represent displacement below.182
In the ruffled conformation, the meso-carbons are alternately above and below the mean
porphyrin plane. A small central ion is the primary driving force for this out-of-plane
183 W.R. Scheidt, Y. Lee, J. Struct. Bond. 1987 (64) 1-70.
184 J.A. Shelnutt, Z.Z. Song, J.G. Ma, S.L. Jia, W. Jentzen, C. Medforth, J. Chem. Soc. Rev. 1998 (27) 31-41.

SURVEY OF LITERATURE AND FUNDAMENTAL ASPECTS
88
deformation. Ruffling is often observed together with a metal-pyrrole nitrogen (M-Np) bond
length less than 2.0 Å.185 Additional factors causing the porphyrin macrocycle to ruffle are steric
interactions and electronic effects due to axial ligands and peripheral substituents. The
Cα-N-N-Cα torsion angle is often used to describe the degree of ruffling.
In the saddled out-of-plane deformation geometry, the pyrrole rings are alternately tilted above
and below the mean porphyrin plane. The meso-carbons lie in the mean porphyrin plane. The
principal driving forces for this are short M-NP bonds and peripheral substituents.
In the domed conformation, the metal ion, the pyrrole nitrogens and the α-carbons are above the
mean plane and the β-carbons below the mean plane. This conformation is often observed when
the central metal ion is large and requires large M-NP bonds. Steric interactions with large axial
ligands and other porphyrins in sandwich systems are other driving forces.
Waved porphyrins are quite rare. In this conformation, two opposing pyrrole rings are tilted
above and below the mean porphyrin plane.
Interaction between the metal d-orbitals and the porphyrin HOMOs may affect the ground state
in metalloporphyrins, as mentioned. In planar metalloporphyrins, the metal d-orbitals and the
porphyrin HOMOs are orthogonal and an overlap between them is not allowed. Once the
porphyrin undergoes non-planar distortion, like ruffling and saddling, certain orbital overlaps
become symmetry-allowed (Table 2.13). For instance, ruffling makes the
metal(dxy)-porphyrin(a2u) orbital interaction symmetry-allowed, where the dxy-orbital is the
t2g-type d-orbital in the porphyrin plane.186 Saddling turns on the metal(dx2-y2)-porphyrin(a2u)
orbital interaction, where the dx2-y2-orbital is the eg-type d-orbital in the porphyrin plane.187
Doming results in metal(dz2)-porphyrin(a2u) orbital interaction.
185 J.L. Hoard, Science 1971 (174) 1295-1302.
186 R.-J. Cheng, Y.-K. Wang, P.-Y. Chen, Y.-P. Han, C.-C. Chang, Chem. Com. 2005, 1312-1314.
187 R.-J. Cheng, P.-Y. Chen, Chem. Eur. J. 1999 (5) 1708-1715.

CHAPTER 2
89
Table 2.13: Correlation between the standard D4h irreducible representations and the irreducible representations of some relevant lower-order point groups of macrocyclic ligands. For the D2d
configuration, there are two possible orientations of the ligand HOMOs.188 Possible overlaps are marked in bold for the given conformation.
Orbital Point group
Metal d-orbital D4h
planar D2d
ruffled D2d
saddled C4v
domed D2h
waved Cs
dxy b2g b2 b1 b2 b2g a' dxz eg e e E b3g a'' dyz eg e e E b2g a''
dx2-y2 b1g b1 b2 b1 au a' dz2 a1g a1 a1 a1 ag a'
Ligand HOMOs D4h
planar D2d
ruffled D2d
saddled C4v
domed D2h
waved Cs
a1u a1u b1 b1 a2 au a'' a2u a2u b2 b2 a1 b1u a''
Electronic structure of porphyrins: The four-orbita l model.
Porphyrins have a very characteristic UV/vis spectrum, with strong absorption in the near
ultraviolet region (Soret band) and weaker absorption in the visible region (Q-band) (Figure
2.52). The four-orbital model, developed by Gouterman, gives a theoretical explanation of the
UV-spectra.189,190 According to this model, the two highest occupied molecular orbitals
(HOMOs) and two of the lowest unoccupied molecular orbitals (LUMOs) of a typical
metalloporhyrin are near degenerate. The model also assumes that these four molecular orbitals
(MOs) are energetically well separated from the other MOs. Gouterman's four-orbital model is
still considered as a cornerstone in modern porphyrin chemistry and is highly supported by
modern theoretical calculations.191
188 T. Vangberg, A. Ghosh, J. Am. Chem. Soc. 1999 (121) 12154-12160.
189 M. Gouterman, J. Mol. Spectrosc. 1961 (6) 138-163.
190 M. Gouterman, In: D. Dolphin (Editor), The Porphyrins, Academic Press, New York, 1978, Vol 3, p1-165.
191 A. Ghosh, T. Vangberg, Theor. Chem. Acc. 1997 (97) 143-149.

SURVEY OF LITERATURE AND FUNDAMENTAL ASPECTS
90
Figure 2.52: The electronic absorption spectra of a free-base meso-tetraphenylporphyrin, as an example of the
characteristic UV/vis spectrum of porphyrins. The insert shows a magnified Q band region.190
One-electron transition between the two HOMOs and LUMOs results in two pairs of degenerate
(π,π*) excited states, which account for the Soret band and Q-band absorption seen in the UV/vis
spectrum. The four-orbital model is validated by the gas-phase ultraviolet photoelectron
spectrum.192 The ultraviolet photoelectron spectrum shows that the two lowest ionization
potentials are close to each other and well separated from all other ionization potentials.
DFT(PW91) calculations on the ionization potentials of free base porphyrins reproduced the
experimental ionization potentials accurately.191
The four-orbital model may be used to predict the energy of the two HOMOs relative to each
other. Figure 2.53 sketches the four frontier orbitals of a metalloporphyrin according to the
four-orbital model. Due to different amplitudes at the meso-positions, it is clear that electron
donating or electron withdrawing peripheral substituents at the meso-positions affect the a1u and
the a2u HOMOs differently. With large amplitudes on the meso-carbons, the a2u HOMO will be
stabilized by electron withdrawing meso-substituents and destabilized electron donating
meso-substituents. The a1u HOMO has no amplitude at the meso-positions and is not expected to
be strongly affected by meso-substituents. On the other hand, substituents in β-position should
primarily affect the a1u HOMO.193,194
192 P. Dupuis, R. Roberg, C. Sandorfy, Chem. Phys. Lett. 1980 (75) 434-437.
193 A. Ghosh, In: K.M. Kadish, K.M. Smith, R. Guilard (Editors), The Porphyrin Handbook, Academic, San Diego,
2000, Vol. 7, Chapter 47, p1-38.
194 E. Steene, T. Wondimagegn, A. Ghosh, J. Phys. Chem. B 2001 (105) 11406-11413.

CHAPTER 2
91
Figure 2.53: Schematic visualization of the porphyrin HOMO (below) and LUMO (above).190
Iron porphyrins.
Most of the chemistry of iron is that of iron(II) and iron(III), but iron complexes with the iron in
higher oxidation states are also known in a small number of compounds. High valent iron
complexes have been detected or proposed as reactive intermediates for various iron enzymes
and a number of synthetic models of these enzymes have also been proposed. These models
have been studied in detail and a key point of interest in these studies is whether these species are
oxidized in a metal- or ligand-centred fashion.
Peroxidase compound I intermediates of heme proteins are formally Fe(V) compounds, but the
iron centre itself generally cannot sustain a +5 oxidation state. Hence, these intermediates are
usually described as Fe(IV)-oxo porphyrin radicals.195 For both compound I and II intermediates
and their models, a common feature appears to be that two unpaired electrons are localized on
195 J. Terner, A. Gold, R. Weiss, D. Mandon, A.X. Trautwein, J. Porphyrins Phtalocyanines 2001 (5) 357-364.

SURVEY OF LITERATURE AND FUNDAMENTAL ASPECTS
92
the ferryl group, distributed approximately 1:1 between the iron and the oxygen atoms.196,197 A
recent theoretical finding198 is that the radical in Compound I may not be exclusively localized on
the porphyrin, but is partially delocalized on the axial ligand for relatively strong basic anionic
axial ligands such as imidazolate and thiolate. The active site structure of peroxidase has a
hydrogen bond between the proximal histidine ligand and a conserved aspartate group. This
hydrogen bond has been proposed to impart an imidazolate character to the histidine ligand.199
To model these effects, Deeth200 and Green201 independently reported DFT calculations on both
[Fe(porphyrin)(O)(ImH)]+ and [Fe(porphyrin)(O)(Im)]0 (ImH = Imidazole, Im- = Imidazolate).
The former compound appeared to be a normal fully developed porphyrin radical196,200,201
whereas more than half of the radical spin appeared to be delocalized onto the imidazolate ligand
in the latter compound.200,201 Deeth200 also showed that porphyrin ruffling can result in a
redistribution of the unpaired electron density of [Fe(porphyrin)(O)(ImH)]+, while Vangberg and
Ghosh188 subsequently showed that this redistribution probably results from a
metal(dxy)-porphyrin(a2u) orbital interaction that becomes symmetry allowed in a ruffled
porphyrin (both orbitals transform as b2 in a D2d ruffled porphyrin as shown in Table 2.13).
The radical character of the axial thiolate ligand in a chloroperoxidase compound I (CPO-I) has
been supported by a variety of DFT calculations,202,203,204 although a resonance Raman study by
Hosten et al.205 favours an a1u type radical formulation for CPO-I. With respect to the nature and
strength of the spin coupling between the radical and the S = 1 ferryl group, the different
calculations diverge and both doublet and quartet states have been obtained as ground states for
CPO-I models. CPO-I is unique among Compound I intermediates in having an experimentally
196 H. Kuramochi, L. Noodleman, D.A. Case, J. Am. Chem. Soc. 1997 (119) 11442-11451.
197 A. Ghosh, J. Almlöf, L. Que Jr., J. Phys. Chem. 1994 (98) 5576-5579.
198 J. Antony, M. Grodzicki, A.X. Trautwein, J. Phys. Chem. A, 1997 (101) 2692-2701.
199 M. Gajhede, D.J. Schuller, A. Henriksen, A.T. Smith, T. Poulos, Nat. Struct. Biol. 1997 (4) 1032-1038.
200 R.J. Deeth, J. Am. Chem. Soc. 1999 (121) 6074-6075.
201 M.T. Green, J. Am. Chem. Soc. 2000 (122) 9495-9499.
202 M. Filatov, N. Harris, S. Shaik, J. Chem. Soc. Perkins trans. 1999 (2) 399-410.
203 D.L. Harris, G. Loew, J. Am. Chem. Soc. 1998 (120) 8941-8948.
204 M.T. Green, J. Am. Chem. Soc. 1999 (121) 7939-7940.
205 C.M. Hosten, A.M. Sullivan, V. Palaniappan, M.M. Fitzgerald, J. Terner, J. Biol. Chem. 1994 (269) 13966-
13978.

CHAPTER 2
93
detected doublet ground state,206,207 unlike other compound I species which are quartet.208 For
the model complex [Fe(porphyrin)(O)(SMe)]0 (SMe = methylthiolate) DFT (B3LYP)
calculations by Green204 do reproduce this observation, ascribing the doublet state to an anti-
ferromagnetic coupling involving an Fe(dπ)-S(pπ) orbital overlap.
An Fe(V)-oxo perferryl porphyrin intermediate was reported by Murakami et al.,209 who reported
that it can most likely be described as a [FeV(porphyrin)(O)(OMe)]0 (OMe = methoxide)
complex. DFT (PW91/TZP) calculations indicated that much of the radical spin of
[Fe(porphyrin)(O)(OMe)]0 (S = 3/2) was localized on the methoxy oxygen and thus the iron
centre cannot be regarded as true Fe(V).208 The optimized Fe-O bond distance was found to be
1.68 Å, nearly identical to a distance of 1.69 Å in the optimized geometry of the Compound II
analogue [Fe(porphyrin)(O)(OMe)]– (S = 1), indicating that the electronic character of the ferryl
group may be similar in the two compounds.
Results from DFT (PW91/TZP) calculations on peroxidase Compound II model compounds
[FeIV(porphyrin)(O)] (C4v, S = 1) and [FeIV(porphyrin)(NH)] (C4v, S = 1) reported by Dey and
Ghosh210 yielded optimized Fe-O and Fe-Nimido distances of 1.634 Å and 1.698 Å, respectively.
The optimized Fe-NPor bond distances were reported to be 2.009 Å, the Cα-Cmeso bond distance
1.387 Å and the Cα-Cmeso-Cα bond angle 125.6° for the [FeIV(porphyrin)(O)] complex. In both
compounds the unpaired electron spins are completely localized on the central Fe-oxo/imido
units, the individual spin populations being 1.199 for the Fe in [FeIV(porphyrin)(O)] and 0.775 in
[FeIV(porphyrin)(NH)], 0.826 for the O in [FeIV(porphyrin)(O)] and 1.289 for the Nimido in
[FeIV(porphyrin)(NH)].210 In [FeIV(porphyrin)(py)], where the additional pyridine is an axial
ligand, the optimized Fe-O distance is reported to be 1.652 Å and the corresponding M-Npy bond
length 2.250 Å. There is an expansion of the Fe-O bond length relative to the
[FeIV(porphyrin)(O)] complex. As in [FeIV(porphyrin)(O)], the unpaired electron density is
206 R. Rutter, M. Valentine, M.P. Hendrich, L.P. Hager, P.G. Debrunner, Biochemistry 1983 (22) 4769-4744.
207 R. Rutter, L.P. Hager, H. Dhonau, M.P. Hendrich, M. Valentine, P.G. Debrunner, Biochemistry 1984 (23) 6809-
6816.
208 A. Ghosh, E. Steene, J. Biol. Inorg. Chem. 2001 (6) 739-752.
209 T. Murakami, K. Yamaguchi, Y. Watanabe, I. Morishima, Bull. Chem. Soc. Jpn. 1998 (71) 1343-1353.
210 A. Dey, A. Ghosh, J. Am. Chem. Soc. 2002 (124) 3206-3207.

SURVEY OF LITERATURE AND FUNDAMENTAL ASPECTS
94
completely localized on the ferryl group with the Fe and O spin populations being 1.136 and
0.911 respectively.208
The only examples known to the author of true Fe(V) porphyrins where the d-electron occupancy
can be described as dxy1 dxz
1 dyz1, are the Fe(V) nitrido porphyrin complexes [FeV(OEP)(N)] first
isolated by Wagner and Nakamoto.211,212 Resonance Raman spectral investigations revealed a
band that was assigned to an Fe(V)Nnitrido stretch on the basis of isotope substitution experiments.
To further investigate these complexes, Dey and Ghosh210 have carried out some DFT
(PW91/TZP) calculations giving an optimized Fe-Nnitrido bond distance of 1.722 Å, which is
significantly longer than the optimized Fe-O bond distance in [FeIV(porphyrin)(O)] mentioned
earlier. For [FeV(OEP)(N)], the optimized Fe-NPor bond distances were reported to be 2.008 Å,
the Cα-Cmeso bond distances were 1.378 Å and the Cα-Cmeso-Cα bond angles were 125.6°.210 This
may be interpreted in the following manner: Although the Fe-Nnitrido stretching frequency of
[FeV(OEP)(N)] is higher than the Fe-O stretching frequency of [FeIV(OEP)(O)],213 the former
vibration corresponds to a lower force constant. Dey and Ghosh210 found the three unpaired
electron spins of [FeV(OEP)(N)] to be entirely localized on the Fe-Nnitrido unit and the Fe and the
Nnitrido spin populations were 1.579 and 1.550, respectively.
211 W.D. Wagner, K. Nakamoto, J. Am. Chem. Soc. 1988 (110) 4044-4045.
212 W.D. Wagner, K. Nakamoto, J. Am. Chem. Soc. 1989 (111) 1590-1598.
213 L.M. Proniewcz, K. Bajdor, K. Nakamoto, J. Phys. Chem. 1986 (90) 1760-1766.

CHAPTER 3
95
3 Results and discussion
3.1 Rhodium complexes.
3.1.1 Introduction.
Ever since the formulation of the transition state (TS) theory1 more than a half a century ago,
great effort has been devoted to developing models for characterizing transition states. The
reason for this effort is evident; it is the transition state that governs the height of the reaction
barrier, so any general insight into the nature of the transition state is likely to provide a greater
understanding of those factors that govern chemical reactivity.
The transition state of a reaction step is considered to be the highest energy point on the
minimum two-dimensional potential energy surface (PES), hence, the reaction path. Reactions
are considered to occur via the path of the lowest energy from reactants to products. The
transition state is the point of highest energy on this path. As such it represents a saddle point on
the free energy surface. On the free energy multidimensional surface, it is an energy minimum
with respect to every other variable, except the reaction path.
The mechanism of a reaction is a stepwise description of how reactants are converted to
products. Of course, some reactions occur in a single step. Such reactions are termed
"concerted". More generally, reactions are found to occur in a stepwise fashion. These reactions
may consist of 2, 3 or many more steps. In any stepwise reaction, intermediates must be formed.
By definition an intermediate is any of the species encountered on the reaction path between the
reactants and products which represent a free energy minimum. For examples of the mechanism
of oxidative addition reactions, see section 2.4.1.4 (Chapter 2).
1 (a) H. Eyring, J. Chem. Phys. 1935 (3) 107-115. (b) E. Wigner, Trans. Faraday SOC. 1938 (34) 29-41. (c) S.C.
Tucker, D.G. Truhlar, In: J. Bertran, I.G. Csizmadia (Editors), New Theoretical Concepts for Understanding
Organic Reactions, NATO AS1 Series; Kluwer Academic Publishers: Dordrecht, 1988, Volume C267, p291. (d)
J.T. Hynes, Annu. Rev. Phys. Chem. 1985 (36) 573-597.

RESULTS AND DISCUSSION
96
The rhodium studies in this chapter focus on the oxidative addition reaction of methyl iodide to
square planar rhodium(I) complexes. Two types of rhodium complexes were investigated:
monocarbonyltriphenylphosphine rhodium complexes [Rh(β-diketonato)(CO)(PPh3)] (sections
3.1.2 and 3.1.3) and triphenylphosphite rhodium complexes [Rh(β-diketonato)(P(OPh)3)2]
(section 3.1.4) (where β-diketonato is a monoanionic bidentate ligand with two oxygen donor
atoms (R1COCHCOR2)–).
The reaction, [Rh(β-diketonato)(CO)(PPh3)] + CH3I, consists of many steps with numerous
transition states, intermediate products and reaction products. As representative example,
[Rh(acac)(CO)(PPh3)] (Hacac = acetylacetone) was used to study the complete reaction (section
3.1.2). This study consists of an experimental part and a DFT computational part that
compliment each other. In the experimental part, the reaction products were identified and the
stereochemistry of these products was determined. Only the reactant [Rh(acac)(CO)(PPh3)]2 has
been solved by solid state X-ray crystallography and to date the stereochemistry of all the
reaction products is unknown. The experimental study was done by conducting an in situ NMR
study of the reaction [Rh(acac)(CO)(PPh3)] + CH3I (section 3.1.2.1). Having the reaction
products identified with specific stereochemistry, the multistep reaction mechanism was
investigated by means of an in depth DFT computational study (section 3.1.2.3). Finally, the
oxidative addition reaction was generalized by investigating the first part of this multistep
reaction mechanism for a selected series of [Rh(β-diketonato)(CO)(PPh3)] complexes
(section 3.1.3).
The main difference between the reaction of methyl iodide with [Rh(β-diketonato)(CO)(PPh3)]
complexes and with [Rh(β-diketonato)(P(OPh)3)2] complexes, is that the latter complex contains
no carbonyl group bonded to the rhodium centre. The consequence of this is that the reaction
[Rh(β-diketonato)(P(OPh)3)2] + CH3I is a three step reaction mechanism with only one transition
state, one intermediate product and one reaction product. As representative example,
[Rh(acac)(P(OPh)3)2] was used in the DFT computational study of the reaction mechanism of
this oxidative addition reaction (section 3.1.4). Due to the computational requirement of
optimizing such a big molecular system, simplified models of [Rh(acac)(P(OPh)3)2] were also
2 J.G. Leipoldt, S.S. Basson, L.D.C. Bok, T.I.A. Gerber, Inorg. Chim. Acta 1987 (26) L35-L37.

CHAPTER 3
97
investigated to see whether these models gave the same information regarding the oxidative
addition reaction, whilst saving on computing resources.
The crystal structure of a dicarbonyl square planar [Rh(β-diketonato)(CO)2] complex, a precursor
for the synthesis of [Rh(β-diketonato)(CO)(PPh3)] and [Rh(β-diketonato)(P(OPh)3)2] complexes,
is presented (section 3.1.5) at the end of this rhodium study.
Herewith, the results of the dicarbonyl, monocarbonyltriphenylphosphine and triphenylphosphite
rhodium studies.
3.1.2 [Rh(acac)(CO)(PPh3)] + CH3I.
3.1.2.1 Introduction.
The first experimental study of the oxidative addition of methyl iodide to
[Rh(β-diketonato)(CO)(PPh3)] complexes was reported by Basson et al.3 for β-diketonato = acac,
tfdma, tfaa and hfaa. According to this and follow-up studies,4,5 the oxidative addition of methyl
iodide to [Rh(acac)(CO)(PPh3)] occurs according to the following reaction scheme:
[RhI(acac)(CO)(PPh3)] + CH3I → RhIII-alkyl1 → RhIII-acyl1 → RhIII-alkyl2
The notations "RhIII-alkyl1" and "RhIII-acyl1" above refer respectively to the first alkylated
[RhIII(acac)(CH3)(CO)(PPh3)(I)] and acylated [RhIII(acac)(COCH3)(PPh3)(I)] complexes that are
formed. When the last number in the notation changes to ‘‘2”, as in "RhIII-alkyl2", it shows that
after the first alkylated complex had formed, it converted to a second, different but more stable,
alkylated structural isomer.
Since then, many similar studies have been conducted on a series of
[Rh(β-diketonato)(CO)(PPh3)] complexes, some of which showed another reaction step and the
formation of a second acylated structural isomer, RhIII-acyl2.6,7,8,9 The inclusion of RhIII-acyl2 in
3 S.S. Basson, J.G. Leipoldt, J.T. Nel, Inorg. Chim. Acta 1984 (84) 167-172.
4 S.S. Basson, J.G. Leipoldt, A. Roodt, J.A. Venter, T.J. van der Walt, Inorg. Chim. Acta 1986 (119) 35-38.
5 Y.S. Varshavsky, T.G. Cherkosova, N.A. Buzina, L.S. Bresler, J. Organomet. Chem. 1994 (464) 239-245.
6 J. Conradie, G.J. Lamprecht, A. Roodt, J.C. Swarts, Polyhedron 2007 (26) 5075-5087.
7 J. Conradie, J.C. Swarts, Organometallics 2009 (28) 1018-1026.

RESULTS AND DISCUSSION
98
the reaction scheme leads to the reaction scheme below, with proposed stereochemistry, based on
reaction studies of [Rh(β-diketonato)(CO)(PPh3)] complexes (section 2.4.3, Chapter 2).
Figure 3.1: The proposed reaction scheme of the reaction of methyl iodide with [Rh(β-diketonato)(CO)(PPh3)],
showing specific stereochemistry.
It is of interest to see whether the reaction [Rh(acac)(CO)(PPh3)] + CH3I also gives the
RhIII-acyl2 product and whether the stereochemistry of Figure 3.1 also applies to this reaction.
Since the acac ligand bonded to the rhodium centre is symmetrical, only one isomer in each
reaction step has to be considered and the reaction scheme in Figure 3.1 can be simplified to the
reaction scheme in Figure 3.2. With 1H NMR spectroscopy, the RhIII-alkyl complexes of the
[RhIII(acac)(CH3)(CO)(PPh3)(I)] type and the RhIII-acyl complexes of the
[RhIII(acac)(COCH3)(PPh3)(I)] type can be identified by the resonance signals of the methyl
groups at ~2.0-1.3 ppm and ~3 ppm respectively.5,6,7,8,9,10 Additionally, 1H NOESY spectroscopy
provides valuable information of the stereochemistry of the reaction products, when no crystals
suitable for X-ray analysis have been obtained.
8 M.M. Conradie, J. Conradie, Inorg. Chim. Acta 2008 (361) 2285-2295.
9 N.F. Stuurman, J. Conradie, J. Organomet. Chem. 2009 (694) 259-268.
10 M.M. Conradie, J. Conradie, Inorg. Chim. Acta 2008 (361) 208-218.

CHAPTER 3
99
Figure 3.2: The proposed reaction scheme of the reaction of methyl iodide with [Rh(acac)(CO)(PPh3)], showing
specific stereochemistry. The colour code in this figure will be used throughout this section.
3.1.2.2 Reaction products - NMR study.
Representative 1H NMR spectra of a sample, recorded in situ during the reaction
[Rh(acac)(CO)(PPh3)] + CH3I, are presented in Figure 3.3 and selected spectral parameters are
summarized in Table 3.1 (the region of phenyl protons of the triphenylphosphine ligand (PPh3) is
excluded). The two spectra shown were recorded at 10 minutes and 18 hours respectively after
the reaction has been initiated. Different rhodium complexes (colour coded according to Table
3.1 and Figure 3.2) can be distinguished on the spectra.
Table 3.1: 1H NMR spectral parameters of the reaction of methyl iodide with [Rh(acac)(CO)(PPh3)]. The colour code in this table will be used throughout this section.
δδδδ 1H / ppm Compound
CH (acac) CH3 (acac) i CH3 (acac) ii CH3 (Rh-CH3) CH3 (Rh-COCH3)
Coupling constants
/ Hz iii Rh(I) 5.449 2.108 1.623 - - -
RhIII -alkyl1 5.496 2.089 1.959 1.387 - 2J = 2, 3J = 2 RhIII -acyl1 5.471 2.230 1.662 - 2.966 - RhIII -alkyl2 4.898 1.743 1.735 1.676 - 2J = 2, 3J = 4 RhIII -acyl2 5.523 2.223 1.651 - 2.904 -
i The CH3 side groups of the acac ligand nearest to the O trans to the PPh3 group. ii The CH3 side groups of the acac ligand nearest to the O cis to the PPh3 group.
iii 2J(H-C-Rh) and 3J(H-C-Rh-P) coupling of the methyl protons of the alkyl complexes.

RESULTS AND DISCUSSION
100
Figure 3.3: 1H NMR spectra of the reaction of methyl iodide with [Rh(acac)(CO)(PPh3)]. The two spectra were
recorded at 10 minutes and 18 hours respectively after the reaction had been initiated. The peaks are colour coded
according to the Rh(I) and Rh(III) complexes in Table 3.1 and Figure 3.2.
The signals in the 1H NMR spectra of the reaction [Rh(acac)(CO)(PPh3)] + CH3I (Figure 3.3)
were assigned to the applicable Rh(III) complexes by monitoring the relative increase and
decrease of the peaks as the reaction proceeds and by comparing it with the data obtained by
Varshavsky et al.5 The group of low field signals represents the methine region (5.6-4.8 ppm) of
the methine (CH) protons of the acac ligand. The methine signals of Rh(I), RhIII-alkyl1,
RhIII-acyl1 and RhIII-acyl2 are located at ~5.5 ppm, whereas the methine signal of RhIII-alkyl2 is
shifted to a higher field (4.90 ppm). This shift of the methine proton is due to shielding caused
by the phenyl rings, as was described in a previous oxidation addition study of
[Rh(fctfa)(CO)(PPh3)].11 In the crystal structure6 of [Rh(fctfa)(CH3)(CO)(PPh3)(I)]-alkyl2, the
PPh3 group and the iodide are above and below the plane formed by the fctfa ligand and the other
two groups bonded to the rhodium centre. The positioning of the PPh3 group above the plane as
in [Rh(fctfa)(CH3)(CO)(PPh3)(I)]-alkyl2, implies that as the PPh3 group rotates, a Ph group will
11 M.M. Conradie, J. Conradie, S. Afr. J. Chem. 2008 (61) 102-111.

CHAPTER 3
101
be rotating direct above the methine proton of the β-diketonato ligand. The ring current inside
the phenyl ring shields the methine proton direct below it to a higher field.12 Therefore, the
observed higher field shift of the methine proton of the acac ligand in
[Rh(acac)(CH3)(CO)(PPh3)(I)]-alkyl2 is consistent with the PPh3 group being positioned above
the plane. By the same reasoning, it is expected that the PPh3 group of
[Rh(acac)(COCH3)(PPh3)(I)]-alkyl1 should be positioned in the square planar plane formed by
the acac ligand, since the methine signal at ~5.5 ppm is not shifted to a higher field. These
results are in agreement with the stereochemistry of the complexes proposed in Figure 3.2.
The remaining resonances, namely a number of peaks in the methyl region (3.0-1.3 ppm),
correspond to various protons of the methyl (CH3) groups. Three types of methyl groups are
present: the CH3 side groups of the acac ligand, the CH3 groups bonded direct to the rhodium
atom (as in alkyl complexes) and the CH3 groups bonded to a carbonyl group (as in acyl
complexes). The Rh(I) and Rh(III) complexes present in the reaction mixture have different
stereochemistry around the rhodium centre. The chemical environment, of the two CH3 side
groups of the symmetrical acac ligand bonded to the rhodium centre, is therefore different for
each complex. One should therefore expect to observe five pairs of acac methyl peaks as the
reaction progresses: one pair from the Rh(I) complex and four pairs from the Rh(III) complexes.
The pairs of acac methyl peaks are as follow: 2.11 & 1.62 ppm for Rh(I), 2.09 & 1.96 ppm for
RhIII-alkyl1, 2.23 & 1.66 ppm for RhIII-acyl1, 1.74 & 1.73 ppm for RhIII-alkyl2 and 2.22 & 1.65
ppm for RhIII-acyl2. A shift of ~0.5 ppm exits between the acac methyl pairs of Rh(I), RhIII-acyl1
and RhIII-acyl2. The shift of the RhIII-alkyl1 methyl pairs is smaller (~0.1 ppm), but is still
significant. The RhIII-alkyl2 methyl pairs have a very small shift of 0.008 ppm. According to
this data, all the rhodium complexes except RhIII-alkyl2 must have the PPh3 group oriented in the
plane of the acac ligand (Figure 3.2). In this way, the acac methyl group cis to the PPh3 group is
shielded through space, causing the signal of this group to move to a higher field compared to the
acac methyl group trans to the PPh3 group. For RhIII-alkyl2, the PPh3 group is oriented in the
apical position (Figure 3.2). This results in the shielding of both the acac methyl groups of
RhIII-alkyl2 (as is also the case with this complex's methine peak) causing both signals to move
with almost an equal shift to a higher field.
12 J. Clayden, N. Greeves, S.Warren, P.Wothers, Organic Chemistry, Oxford University Press, Oxford, UK, 2001,
p251.

RESULTS AND DISCUSSION
102
Remaining are the last two types of methyl groups: the CH3 groups bonded direct to the rhodium
atom (as in alkyl complexes) and the CH3 groups bonded to a carbonyl group (as in acyl
complexes).
The COCH3 methyl groups are expected as singlets in the region of ~3 ppm, whereas the Rh-CH3
methyl groups are expected as doublets of doublets in the region of 2.0-1.3 ppm.5,6,7,8,9,10 The
doublet of doublets are expected as a result of the spin-spin coupling of the protons with rhodium
(spin = 1/2; 2J; 1H-13C-103Rh) and phosphorous (spin = 1/2; 3J; 1H-13C-103Rh-31P).13 The singlets
at 2.97 and 2.90 ppm represent the COCH3 methyl groups of RhIII-acyl1 and RhIII-acyl2
respectively. The doublets of doublets at 1.39 and 1.68 ppm represent the Rh-CH3 methyl groups
of RhIII-alkyl1 and RhIII-alkyl2 respectively. It is interesting to note that the coupling constants to
rhodium are similar in both RhIII-alkyl1 and RhIII-alkyl2 (2 Hz), but the values of the coupling
constants to phosphorous are noticeably different (2 and 4 Hz respectively). It was suggested by
Varshavsky et al.5 that the difference in coupling is due to the difference in the relative positions
of the methyl and the phosphine ligands of RhIII-alkyl1 and RhIII-alkyl2. This is in agreement
with the stereochemistry of the complexes proposed in Figure 3.2.
To further investigate the stereochemistry, 1D 1H NOESYs were recorded in situ during the
reaction, to establish the relative dispositions of the ligands in RhIII-alkyl1 and RhIII-alkyl2
(Figure 3.4 and Figure 3.5 respectively). Irradiation of the Rh-CH3 resonance of RhIII-alkyl1 (at
ca 1.4 ppm), resulted in an NOE coupling with the PPh3 groups, the methine proton and the CH3
side groups of the acac ligand (Figure 3.4). This result is only possible if the CH3 group, bonded
to the rhodium centre of RhIII-alkyl1, is above the square planar plane, with the PPh3 group
adjacent to the CH3 group. The NOE coupling with the methine proton rules out the possibility
of the CH3 group being in the square planar plane. From the 1D 1H NOESY spectra it is not
possible to establish whether the CO group or the I is adjacent to the CH3 group, since these
groups do not contain any protons. These results are in agreement with the stereochemistry of
the RhIII-alkyl1 complex proposed in Figure 3.2.
13 C.A. Reilly, H. Thyret, J. Am. Chem. Soc. 1967 (89) 5144-5149.

CHAPTER 3
103
Figure 3.4: 1H NMR (top) and 1D 1H NOESY (bottom) of [RhIII(acac)(CO)(PPh3)(Me)(I)]-alkyl1, pulsing on the
Rh-CH3 resonance at ca 1.4 ppm. Coupling is as illustrated.
Insight into the stereochemistry of RhIII-acyl1, by means of 1D 1H NOESY spectroscopy, is not
possible. Firstly, the conversion of RhIII-acyl1 to RhIII-alkyl2 is very rapid and it is not practical
to perform a NOESY on the timescale of the NMR. Secondly, only the signal of COCH3
(2.97 ppm) and the one CH3 side group of the acac ligand (2.23 ppm) is sufficiently isolated from
the other signals in order to be irradiated independently. Irradiation of these two peaks will result
in no usable data, since only a positive NOE coupling may be used and the absence of a coupling
is regarded as not a positive result. To confirm the stereochemistry of the rhodium complexes by
means of 1D 1H NOESY spectroscopy, a group containing protons is needed in the apical
position. Since the suggested structure of RhIII-acyl1 does not contain such a group, no reliable
insight into the stereochemistry of RhIII-acyl1 can be obtained by means of 1D 1H NOESY
spectroscopy.
Irradiation of the PPh3 resonance of RhIII-alkyl2 (at ca 7.8-7.4 ppm), resulted in an NOE coupling
with the Rh-CH3 groups, the methine proton and the CH3 side groups of the acac ligand
(Figure 3.5). This result is only possible if the PPh3 group is above the square planar plane, with
the CH3 group adjacent to the PPh3 group. The NOE coupling with the methine proton rules out

RESULTS AND DISCUSSION
104
the possibility of the PPh3 group being in the square planar plane. From the 1D 1H NOESY
spectra it is not possible to establish whether the CO group or the I is adjacent to the PPh3 group,
since these groups do not contain any protons. These results are in agreement with the proposed
reaction scheme in Figure 3.2. Irradiation of the Rh-CH3 resonance of RhIII-alkyl2 (at ca
1.68 ppm) resulted in a NOE coupling with the PPh3 groups. This result is consistent with the
Rh-CH3 group being adjacent to the PPh3 group. Irradiation of the methine proton resonance of
RhIII-alkyl2 (at ca 4.9 ppm) resulted in a NOE coupling with the PPh3 groups and the CH3 side
groups of the acac ligand. This result is only possible if the PPh3 group is above the square
planar plane. The combination of the last two results therefore indicated that the Rh-CH3 group
is in the square planar plane. These results are in agreement with the stereochemistry of the
RhIII-alkyl2 complex proposed in Figure 3.2.

CHAPTER 3
105
Figure 3.5: 1H NMR (top) and three 1D 1H NOESYs (bottom) of [RhIII(acac)(CO)(PPh3)(Me)(I)]-alkyl2, pulsing
on the resonances as indicated. Coupling is as illustrated.

RESULTS AND DISCUSSION
106
In conclusion, all 1H NMR and 1D 1H NOESY data presented here are in agreement with the
stereochemistry of the reaction [Rh(acac)(CO)(PPh3)] + CH3I, proposed in Figure 3.2. This
scheme was proposed on the basis of information obtained from the methyl iodide reaction with
similar [Rh(β-diketonato)(CO)(PPh3)] complexes (section 2.4.3, Chapter 2). To summarize the
findings of this NMR study:
• Methyl iodide is oxidatively added to the square planar Rh(I) complex to form an octahedral
RhIII-alkyl1 complex with the CH3 group in the apical position and the PPh3 group in the
plane of the acac ligand. The relative positions of the I and the CO group can not be
determined by 1D 1H NOESY spectroscopy.
• Migration of the CH3 group to the CO group results in a square pyramidal RhIII-acyl1
complex with the PPh3 groups in the plane of the acac ligand. No further reliable insight into
the stereochemistry of RhIII-acyl1 can be obtained by means of 1D 1H NOESY spectroscopy.
• The next product observed in this reaction is an octahedral RhIII-alkyl2 complex with the CH3
group in the plane of the acac ligand and the PPh3 group in the apical position. The relative
positions of the I and the CO group can not be determined by 1D 1H NOESY spectroscopy.
• The final product observed on the NMR is a square pyramidal RhIII-acyl2 complex with the
PPh3 group in the plane of the acac ligand.
Although all these findings are in agreement with the stereochemistry proposed in Figure 3.2,
some uncertainties still remain about the relative position of the I, the CO and the COCH3 groups
in these Rh(III) reaction products. Therefore, before a study of the mechanism of the multistep
reaction [Rh(acac)(CO)(PPh3)] + CH3I can be performed, more research on the stereochemistry
of the reaction products is needed. This was addressed by a DFT computational study of the
relative stability of the possible reaction products, as presented in the first part of section 3.1.2.3.
3.1.2.3 Reaction products and mechanism - DFT computational study.
DFT calculations were carried out on the reaction [Rh(acac)(CO)(PPh3)] + CH3I, using the PW91
functional and the TZP basis set. The solvent used in all the calculations is methanol (ε0 = 32.6).
This DFT computational method was tested and found reliable for [Rh(β-diketonato)(CO)(PPh3)]
complexes in a previous study.14 For the details of the methods and equations used, see section
4.5.2.1 (Chapter 4). The reactants, [Rh(acac)(CO)(PPh3)] and CH3I, are taken as the energy zero
14 M.M. Conradie, J. Conradie, Inorg. Chim. Acta 2009 (362) 519-530.

CHAPTER 3
107
level for all energies and thermodynamic parameters stated. Energies (E) refer to the total
bonding energies (ETBE) in kJ.mol-1.
Reaction products.
Theoretically, the different arrangements of the groups bonded to the rhodium(III) centre after the
oxidative addition of CH3I give rise to a possibility of twelve different octahedral RhIII-alkyl
isomers and six different square pyramidal RhIII-acyl isomers. Since the enantiomers (six
RhIII-alkyl and three RhIII-acyl mirror images) display the same computational and chemical
properties, they can be excluded. This leaves one with the possibility of six RhIII-alkyl isomers
and three RhIII-acyl isomers, as illustrated in Figure 3.6. The possibility of RhIII-acyl isomers
with a trigonal bipyramidal arrangement was also inspected, but resulted in such high relative
energies that they were omitted from this study. The relative energies (∆E) of all the possible
RhIII-alkyl and RhIII-acyl reaction products are given in Figure 3.6.
Figure 3.6: The theoretically possible RhIII-alkyl and RhIII-acyl reaction products in the reaction of methyl iodide
with [Rh(acac)(CO)(PPh3)], excluding enantiomers. The energy (kJ.mol-1) of each complex is given relative to the
reactants.
When comparing the relative energies of the possible RhIII-alkyl complexes in Figure 3.6 with
each other, the lowest energy alkyl isomers are alkyl-i and alkyl-ii. They are more than
21 kJ.mol-1 stable than the other possible RhIII-alkyl complexes and would therefore be the most
probable products in the reaction. Methyl iodide will be added either cis or trans to the square

RESULTS AND DISCUSSION
108
planar Rh(I) complex. Alkyl-ii is the lowest cis addition product, whilst alkyl-i is the lowest
trans addition product. To distinguish whether cis or trans addition occurs, one has to consider
the relative activation energies (∆E≠) of the cis and trans transition states. The trans addition of
methyl iodide in a linear/back manner was found to be more than 114 kJ.mol-1 lower in energy
than a trans addition in a bent manner or a cis addition in a front manner (Figure 3.7). These
transition states will be discussed shortly. Alkyl-i would therefore be the preferred product of the
oxidative addition reaction, which is RhIII-alkyl1 in Figure 3.2. The geometry of alkyl-i is
consistent with the NMR results of the RhIII-alkyl1 complex of this study (section 3.1.2.1).
According to the NMR study, the RhIII-alkyl1 complex has a geometry with the CH3 group in the
apical position and the PPh3 group in the plane of the acac ligand. But the NMR study could not
distinguish between the relative position of the I and the CO group in this RhIII-alkyl1 complex.
According to the computational data, RhIII-alkyl1 has a geometry with the CO group in the plane
of the acac ligand and the I in the apical position (Figure 3.6).
The activation energy (∆E≠) of alkyl-ii to be formed direct from the cis addition of methyl iodide
to rhodium(I) is too high (138 kJ.mol-1). Since alkyl-i and alkyl-ii are equi-energetic, it is
possible that alkyl-ii would form after rearrangement of the groups around the rhodium centre of
alkyl-i (RhIII-alkyl1). The geometry of alkyl-ii is consistent with the NMR results of the
RhIII-alkyl2 complex of this study (section 3.1.2.1). According to the NMR study, the
RhIII-alkyl2 complex has a geometry with the CH3 group in the plane of the acac ligand and the
PPh3 group in the apical position. Based on the calculated relative stability of all the possible
alkyl products (Figure 3.6), alkyl-ii would therefore be RhIII-alkyl2. In the next section, a
detailed DFT computational study of the reaction mechanism leading to RhIII-alkyl2 from
RhIII-alkyl1 will be presented for additional proof of the proposed geometry of RhIII-alkyl2.
The most stable product of the different rhodium(III) complexes in Figure 3.6, with a clear cut of
energy, is Acyl-i. Acyl-i would therefore be the final and most stable product to be formed in the
reaction, which is RhIII-acyl2 in Figure 3.2. The geometry of Acyl-i is also consistent with the
NMR results where it was found that the RhIII-acyl2 complex has a geometry with the PPh3 group
in the plane of the acac ligand. This leaves us with either Acyl-ii or Acyl-iii as RhIII-acyl1.
When comparing the relative energies of the these RhIII-acyl isomers, one can not distinguish
between them on the grounds of their relative energies, since they only differ by 7 kJ.mol-1.

CHAPTER 3
109
Though, NMR results indicate that the PPh3 group of RhIII-acyl1 should be in the plane of the
acac ligand. This rules out Acyl-ii and leaves only Acyl-iii as RhIII-acyl1.
The stereochemistry of the reaction products of the reaction [Rh(acac)(CO)(PPh3)] + CH3I can
now fully be predicted on the grounds of the computational and the experimental (NMR) results.
The geometries of RhIII-alkyl1, RhIII-alkyl2, RhIII-acyl1 and RhIII-acyl2 are as indicated by the
labels in Figure 3.6. Though, a reaction product can only be formed if the activation energy
(∆E≠) is low enough for the reaction to occur. Therefore, a full DFT computational study of the
transition states, the intermediate products and the reaction products is necessary to confirm the
proposed stereochemistry of the different reaction products of the reaction [Rh(acac)(CO)(PPh3)]
+ CH3I. This step by step reaction mechanism is presented next.
Mechanism of the first reaction: Rh(I) + CH3I →→→→ RhIII -alkyl1.
The first step in the reaction is the oxidative addition of methyl iodide to the rhodium(I)
complex. Three types of transition state structures (Figure 3.7) have been reported on the
oxidative addition of methyl iodide to square planar rhodium(I) complexes (especially the
Monsanto catalyst [Rh(CO)2I2]−, section 2.4.2, Chapter 2). Two types of TS structures result
from trans addition ("linear/back" and "bent") and one type of TS structure results from cis
addition ("front"). The linear/back transition state structure corresponds to an SN2 mechanism,
characterized by a linear Rh-CCH3-I arrangement and by an Rh-CCH3-H angle close to 90°. The
methyl hydrogen atoms are located in the equatorial plane of the five-coordinated carbon atom,
resulting in a trigonal bipyramidal arrangement. The bent and front transition state structures
correspond to a side-on approach of the CCH3-I bond to the rhodium atom. The bent transition
state structure leads to the same intermediate product as the linear/back transition state structure -
a cationic five-coordinated rhodium complex and a free iodide ion. The front transition state
structure corresponds to a concerted three-centred oxidative addition mechanism, in which the
Rh-I and Rh-CCH3 bonds are formed simultaneously as I-CCH3 bond breaks, resulting in the cis
addition of the methyl iodide.

RESULTS AND DISCUSSION
110
Figure 3.7: Schematic illustration of a "linear/back", "bent" and "front" transition states of the reaction
[Rh(acac)(CO)(PPh3)] + CH3I. The movement of the applicable atoms in the transition state is indicated with the red
arrows. The activation energies (∆E≠) of the transition states are as indicated (kJ.mol-1).
All three the types of transition states were calculated for the oxidative addition reaction of
methyl iodide to [Rh(acac)(CO)(PPh3)]. The linear/back transition state is favoured with an
activation barrier (∆E≠) of 24 kJ.mol-1, which is 114 kJ.mol-1 less than the other two transition
states. The activation energies and the thermodynamic data of the three types of transition states
are given in Table 3.2. The experimental Gibbs free energy (∆G≠) of the oxidative addition
reaction, [Rh(β-diketonato)(CO)(PPh3)] + CH3I, is in the order of 75-90 kJ.mol-1.7,8,9,10 The
calculated Gibbs free energy of only the linear/back transition state (71 kJ.mol-1) is in agreement
with related experimental values. It is therefore clear that the oxidative addition of methyl iodide
to [Rh(acac)(CO)(PPh3)] occurs via a linear/back type of trans addition to form a cationic
five-coordinated intermediate product (IMab) with a free iodide, as illustrated in Figure 3.8. The
free iodide drifts away in the solvent system and can react with any neighbouring
five-coordinated product. The coordination of an iodide to the cationic five-coordinated
intermediate product proceeds with barrierless energy to an alkyl product with the geometry of
RhIII-alkyl1 (b) in Figure 3.6. The energy needed to rearrange the ligands of the cationic
five-coordinated rhodium intermediate before the coordination of iodide, is too high for the
rearrangement to occur (105 and 130 kJ.mol-1 versus the barrierless coordination of the iodide).
The thermodynamic data of the reactants, the transition state (TSab), the cationic five-coordinated
intermediate product (IMab) and the reaction product RhIII-alkyl1 (b) are given in Table 3.3. The
optimized structures with selected geometrical parameters are given in Figure 3.13 (reactants and
reaction product), Figure 3.14 (intermediate product) and Figure 3.15 (transition state). The
CCH3-I bond length in the free methyl iodide is 2.18 Å. This CCH3-I bond length increases up to
2.61 Å in the transition state (TSab) (Figure 3.8). At this point, the CH3 group is 2.50 Å away
from the rhodium centre and the methyl hydrogen atoms are located in an equatorial plane with a
Rh-CCH3-H angle close to 90°. The CH3 group continues to move closer to the rhodium centre.
The CCH3-Rh distance changes from 2.50 Å to 2.08 Å to 2.11 Å as the reaction progresses

CHAPTER 3
111
(TSab) → (IMab) → (b). In the step (IMab) → (b), the I also coordinates to the rhodium centre
with a final Rh-I bond length of 2.96 Å.
Table 3.2: The PW91/TZP/methanol calculated relative activation energies and the thermodynamic data of the three types of transition states of the oxidative addition reaction [Rh(acac)(CO)(PPh3)] + CH3I. All energy values are given compared to the reactants.
∆E≠≠≠≠
/ kJ.mol-1 ∆H≠≠≠≠ 298K
/ kJ.mol-1 i ∆G≠≠≠≠ 298K
/ kJ.mol-1 ii ∆S≠≠≠≠ 298K
/ J.K-1.mol-1 iii linear/back 24 27 71 -147 bent 141 139 184 -150 front 138 131 181 -167 i Enthalpy, calculated by equation 4.2 (section 4.5.2.1, Chapter 4).
ii Gibbs free energy, calculated by equation 4.3 (section 4.5.2.1, Chapter 4). iii Entropy, calculated from the temperature dependent partition function in ADF at 298.15 K.
Figure 3.8: Reaction mechanism of the oxidative addition of methyl iodide to the square planar rhodium(I)
complex [Rh(acac)(CO)(PPh3)]. The movement of the applicable atoms in the transition state is indicated with the
red arrows.

RESULTS AND DISCUSSION
112
Mechanism of the second reaction: RhIII -alkyl1 →→→→ RhIII -acyl1.
The second reaction in the current study is the intramolecular migration of the CH3 group to the
CO group (Figure 3.9) in the six-coordinated RhIII-alkyl1 (b) to form the five-coordinated
RhIII-acyl1 (c). The optimized structures with selected geometrical parameters are given in
Figure 3.13 (reaction products), Figure 3.14 (intermediate product) and Figure 3.15 (transition
state). The relative energies (∆E) are given in Table 3.3. The axial CH3 group in RhIII-alkyl1 (b)
has a Rh-CCH3 bond length of 2.11 Å. This bond length increases up to 2.31 Å as the CH3 group
moves out of the axial position towards the CO group. At the point of the transition state (TSbc),
the CH3 group is 1.91 Å away from the CO group which is slightly lifted out of the planar plane
formed by the acac ligand. During the (b) → (TSbc) step the Rh-Cco-O angle changed from 175°
to 166° and the CCH3-Rh-CO angle changed from 89° to 53°. The transition state (TSbc) has an
activation barrier of 70 kJ.mol-1. The CH3 group continues to move further away from the
rhodium centre and results in an intermediate product (IMbc) which is 39 kJ.mol-1 lower in energy
than the transition state (TSbc). At this point, the CH3 group formed a 1.53 Å bond with the
CO group and is 2.72 Å away from the centre rhodium with a CCH3-Rh-CO angle of 101°.
Internal rotation by ~180° of the COCH3 group in the intermediate product (IMbc) leads to the
RhIII-alkyl1 (c) reaction product which is 21 kJ.mol-1 lower in energy than the intermediate
product (IMbc). The CCH3-Rh-CO and Rh-Cco-O angles of the RhIII-alkyl1 (c) reaction product
are 21° and 104° respectively and the CCH3-CCO bond length is 1.50 Å. The COCH3 and PPh3
groups lie in the plane formed by the acac ligand and the I is in the apical position.
Figure 3.9: Reaction mechanism of the interconversion of RhIII-alkyl1 to RhIII-acyl1. The movement of the
applicable atoms in the transition state is indicated with the red arrows.

CHAPTER 3
113
Mechanism of the third reaction: RhIII -acyl1 →→→→ RhIII -alkyl2.
The third reaction in the current study is the interconversion of RhIII-acyl1 (c) to RhIII-alkyl2 (d)
(Figure 3.10) which occurs in four distinctive steps. The optimized structures with selected
geometrical parameters are given in Figure 3.13 (reaction products), Figure 3.14 (intermediate
product) and Figure 3.15 (transition states). The relative energies (∆E) are given in Table 3.3.
The PPh3 group in RhIII-acyl1 (c) is in the plane formed by the acac ligand with a PPh3-Rh-I angle
of 94°. The interconversion is initiated by the movement of the PPh3 group towards the apical
position. At the point of the transition state (TScd1), the PPh3-Rh-I angle has increased to 141°.
The frequency animation of the transition state (TScd1) shows a strong movement of the PPh3
group towards the apical position as well as strong movement of the Oacac atom (trans to the PPh3
group) towards the PPh3 group to rapidly decrease the Oacac-Rh-PPh3 angle as the PPh3-Rh-I angle
increases. The PPh3 group continues to move towards the apical position and results in an
intermediate product (IMcd) which is 90 kJ.mol-1 lower in energy than the transition state (TScd1).
The PPh3 group is now in the apical position with the Oacac-Rh-PPh3 and PPh3-Rh-I angles 90°
and 173° respectively. The Rh-Oacac bond length of the Oacac atom (trans to the COCH3 group)
slightly increased from 2.23 Å to 2.24 Å during the (TScd1) → (IMcd) step. The COCH3 group
has rotated by ~90° and lies now flat in the planar plane formed by the acac. The reaction
proceeds with a second transition state (TScd2) by the migration of the CH3 group from the
CO group towards the rhodium centre. The CCH3-CCO distance increases from 1.53 Å to 1.87 Å
to 2.84 Å as the reaction progresses (IMcd) → (TScd2) → (d). The activation barrier of the methyl
migration transition state (TScd2) is 27 kJ.mol-1 and the reaction product RhIII-alkyl2 (d) is
76 kJ.mol-1 lower in energy than the transition state (TScd2). The reaction product RhIII-alkyl2 (d)
has an octahedral arrangement with the CO and CH3 groups in the plane formed by the acac
ligand and the I and PPh3 group in the apical positions. RhIII-alkyl2 was the main product of the
NMR study (Figure 3.3).
Figure 3.10: Reaction mechanism for the interconversion of RhIII-acyl1 to RhIII-alkyl2. The movement of the
applicable atoms in the transition state is indicated with the red arrows.

RESULTS AND DISCUSSION
114
Mechanism of the fourth reaction: RhIII -alkyl2 →→→→ RhIII -acyl2.
The final reaction in the current study is the interconversion of RhIII-alkyl2 (d) to RhIII-acyl2 (e)
(Figure 3.11) which occurs in four distinctive steps. The optimized structures with selected
geometrical parameters are given in Figure 3.13 (reaction products), Figure 3.14 (intermediate
product) and Figure 3.15 (transition states). The relative energies (∆E) are given in Table 3.3.
The first two steps are the same as the backward reaction of RhIII-alkyl2 (d) through the transition
state (TScd2) to the intermediate product (IMcd). This means, (TSde1) = (TScd2) and (IMde) =
(IM cd). The activation barrier of this backward methyl migration transition state (TSde1) is
76 kJ.mol-1 and the intermediate product (IMde) is 27 kJ.mol-1 lower in energy than the transition
state (TSde1). The backward equilibrium was experimentally observed in [Rh(fctfa)(CO)(PPh3)]7
(Hfctfa = ferrocenoyltrifluoroacetone) and the Monsanto catalyst.15 After RhIII-alkyl2 (d) has
interconverted back to (IMde) = (IMcd), the reaction proceeds through transition state (TSde2) to
the final reaction product RhIII-alcyl2 (e). The transition state (TSde2) for the forward reaction to
RhIII-acyl2 (e) is favoured by 76 kJ.mol-1 above the transitions state (TScd1) for the backward
reaction to RhIII-acyl1 (c). The activation barrier of the transition state (TSde2) is 14 kJ.mol-1 and
the reaction product RhIII-acyl2 (e) is 95 kJ.mol-1 lower in energy than the transition state (TSde2).
The Rh-Oacac bond length of the Oacac atom (trans to the COCH3 group) in the intermediate
product (IMde) changes from 2.24 Å to 2.25 Å to 2.07 Å as the reaction progresses
(IM de) → (TSde2) → (e). The acac ligand of the transition state (TSde2) detaches itself from the
rhodium centre on the side trans to the COCH3 group. This is necessary, since the acac ring flips
during the transition state (TSde2) as the I and PPh3 group move closer to each other. The
PPPh3-Rh-I angles change from 173° to 140° to 93° as the reaction progresses (IMde) → (TSde2) →
(e). The acac ligand is again fully bonded in the reaction product RhIII-alcyl2 (e).
Figure 3.11: Reaction mechanism for the interconversion of RhIII-alkyl2 to RhIII-acyl2. The movement of the
applicable atoms in the transition state is indicated with the red arrows.
15 P.M. Maitlis, A. Haynes, G.J. Sunley, M.J. Howard, J. Chem. Soc., Dalton Trans. 1996 2187-2196.

CHAPTER 3
115
Free energy profile.
The free energy profile of the mechanism of the multistep reaction [Rh(acac)(CO)(PPh3)] + CH3I
is given in Figure 3.12 and the thermodynamic data are summarized in Table 3.3. It is therefore
evident that the RhIII-acyl1 (c) → (TScd1) methyl migration reaction has the highest free energy
barrier (∆G≠ = 119 kJ.mol-1) and is therefore the rate-determining step of the overall reaction.
This value is in agreement with the experimental value of ~96 kJ.mol-1 of the RhIII-acyl1 →
RhIII-alkyl2 conversion of [RhIII(β-diketonato)(COCH3)(PPh3)(I)]-acyl1 (with β-diketonato =
fctfa, fca, dfcm and bfcm).6,7 The transition states (TSab), (TSbc) and (TSde1) have all similar free
energy barriers of 65-74 kJ.mol-1. The final reaction product RhIII-acyl2 (e) has an overall
negative free energy value of -20 kJ.mol-1, indicating that the multistep reaction
[Rh(acac)(CO)(PPh3)] + CH3I → RhIII-acyl2 (e) will be spontaneous.
Figure 3.12: The Gibbs free energy of the reactants, transition states, intermediate products and reaction products
during the multistep reaction [Rh(acac)(CO)(PPh3)] + CH3I.
Conclusions.
The linear/back transition state of the oxidative addition of CH3I to the square planar
[Rh(acac)(CO)(PPh3)] complex corresponds to an SN2 nucleophilic attack by the rhodium metal
centre on the methyl iodide. Bent and front types of transition states exist as well, but lie at a
much higher energy level. The multistep reaction [Rh(acac)(CO)(PPh3)] + CH3I consists of
fourteen distinctive steps of which the RhIII-acyl1 (c) → (TScd1) step is the rate-determining step.
The stereochemistry of the reaction products during the reaction is as proposed in Figure 3.2.

RESULTS AND DISCUSSION
116
Tables and graphs.
Table 3.3: The PW91/TZP/methanol calculated relative energies and the thermodynamic data of the transition states, the intermediate products and the reaction products during the reaction [Rh(acac)(CO)(PPh3)] + CH3I. All energy values are given compared to the reactants. Complexes are labelled according to Figures 3.7-3.10, with TS = transition state and IM = intermediate product.
∆E / kJ.mol-1
∆H298K / kJ.mol-1 i
∆G298K / kJ.mol-1 ii
∆S298K / J.K-1.mol-1 iii
(a) Rh(I) 0 0 0 0 (TSab) 24 27 71 -147 (IM ab) 13 -25 26 -168 (b) RhIII-alkyl1 -51 -39 11 -166 (TSbc) 19 23 76 -179 (IM bc) -20 -11 41 -175 (c) RhIII-acyl1 -41 -27 19 -154 (TScd1) 89 91 138 -157 (IM cd) -1 5 61 -189 (TScd2) 26 32 84 -177 (d) RhIII-alkyl2 -50 -38 10 -163 (TSde1) = (TScd2) 26 32 84 -177 (IM de) = (IMcd) -1 5 61 -189 (TSde2) 13 25 76 -169 (c) RhIII-acyl2 -82 -66 -20 -157 i Enthalpy, calculated by equation 4.2 (section 4.5.2.1, Chapter 4).
ii Gibbs free energy, calculated by equation 4.3 (section 4.5.2.1, Chapter 4). iii Entropy, calculated from the temperature dependent partition function in ADF at 298.15 K.

CHAPTER 3
117
Figure 3.13: Optimized structures of the reactants and reaction products during the reaction
[Rh(acac)(CO)(PPh3)] + CH3I. Distances are given in (Å). The colour code of the atoms is as indicated.

RESULTS AND DISCUSSION
118
Figure 3.14: Optimized structures of the intermediate products during the reaction [Rh(acac)(CO)(PPh3)] + CH3I.
Distances are given in (Å). The colour code of the atoms is as indicated.

CHAPTER 3
119
Figure 3.15: Optimized structures of the transition states during the reaction [Rh(acac)(CO)(PPh3)] + CH3I.
Distances are given in (Å). The colour code of the atoms is as indicated.

RESULTS AND DISCUSSION
120
3.1.3 [Rh(β-diketonato)(CO)(PPh3)] + CH3I.
3.1.3.1 Introduction.
Chemistry, like many other sciences finds itself in, is a competitive world. Competition
determines the outcome of catalysts, in other words, whether a given catalyzed reaction is
successful in generating a desired product in good yield, the product is obtained as a mixture or
in very low yield. In general, the outcome of any competition is determined by the relative
activation energies of each competing mechanism. If the reactants are the same for each of the
competing processes, the situation simplifies further: the results of the competition are
determined by the relative free energies of the transition states of each mechanism. Hence, it is
the transition states which actually compete!
Rhodium catalysts are widely used in syntheses, of which the Monsanto catalyst15 is the best
known example. The first (and rate determining) step in this carbonylation reaction is the
oxidative addition of methyl iodide to the active catalyst (section 2.4.2, Chapter 2). To further
investigate the first step of the oxidative addition of methyl iodide to the
monocarbonyltriphenylphosphine rhodium catalysts, a DFT computational study was conducted
for a series of [Rh(β-diketonato)(CO)(PPh3)] complexes to explore the influence of the different
side groups of the β-diketonato ligand on the activation energy (∆E≠) of the transition states of
each complex. The reaction under investigation is:
[RhI(β-diketonato)(CO)(PPh3)] + CH3I → [RhIII(β-diketonato)(CH3)(CO)(PPh3)(I)]
where β-diketonato = tta, bth, dtm and acac (Htta thenoyltrifluoroacetone,
Hbth = benzoylthenoylacetone, Hdtm = dithenoylmethane and Hacac = acetylacetone), as
illustrated in Figure 3.16. The solvent used in all the calculations is chloroform (ε0 = 4.8). The
PW91/TZP computational method was tested and found reliable for
[Rh(β-diketonato)(CO)(PPh3)] complexes in a previous study.14 For further details of the
methods and equations used, see section 4.5.2.1 (Chapter 4). The reactants,
[Rh(β-diketonato)(CO)(PPh3)] and CH3I, are taken as the energy zero level for all energies and
thermodynamic parameters stated. Energies (E) refer to the total bonding energies (ETBE)
in kJ.mol-1.

CHAPTER 3
121
Figure 3.16: Schematic illustration of the [Rh(β-diketonato)(CO)(PPh3)] complexes of this study, where
Htta = thenoyltrifluoroacetone, Hbth = benzoylthenoylacetone, Hdtm = dithenoylmethane and
Hacac = acetylacetone. The labels "A" and "B" refer to the two stereo isomers of tta and bth.
The reaction of methyl iodide with the thenoyl (C4H3S) containing
[Rh(β-diketonato)(CO)(PPh3)] complexes (β-diketonato = tta, bth and dtm, Figure 3.16) proceeds
through the same reaction sequence as with the reaction between methyl iodide and
[Rh(acac)(CO)(PPh3)] (Figure 3.1 and Figure 3.2).8,10,14 Experimental8,10,14 and DFT
computational14 studies are in agreement that the oxidative addition product,
[Rh(RCOCHCO(C4H3S))(COCH3)(PPh3)(I)]-alkyl1 (where R = CF3, Ph and C4H3S), has an
octahedral arrangement with the CO and PPh3 groups in the plane of the β-diketonato ligand and
the I and CH3 group in the apical position (section 2.4.3, Chapter 2). This is the product of trans
addition of CH3I to rhodium(I), as was also found for [Rh(acac)(CO)(PPh3)] (section 3.1.2) and
the Monsanto catalyst.15 One main difference between the complexes of the current study and
[Rh(acac)(CO)(PPh3)], is the introduction of two stereo isomers of [Rh(tta)(CO)(PPh3)] and
[Rh(bth)(CO)(PPh3)] due to the unsymmetrical β-diketone backbone (Figure 3.16). The
transition states of the oxidative addition of methyl iodide to both the stereo isomers therefore
have to be considered. [Rh(dtm)(CO)(PPh3)], like [Rh(acac)(CO)(PPh3)], has a symmetrical
β-diketonato backbone and therefore only has one isomer in each step. This study focuses only
on the first step of the oxidative addition reaction of methyl iodide to the rhodium(I) complex, in
order to compare the thermodynamic parameters of these [Rh(RCOCHCO(C4H3S))(CO)(PPh3)]
complexes with that of [Rh(acac)(CO)(PPh3)] and the Monsanto catalyst. The first three steps of
the oxidative addition reaction [Rh(RCOCHCO(C4H3S))(CO)(PPh3)] + CH3I is illustrated in
Figure 3.17.

RESULTS AND DISCUSSION
122
Figure 3.17: The first three steps of the oxidative addition reaction of methyl iodide with
[Rh(β-diketonato)(CO)(PPh3)] (β-diketonato = tta, bth and dtm), showing specific stereochemistry and both stereo
isomers.
3.1.3.2 Geometries of the transition states (TS).
The linear/back transition states of the reaction in Figure 3.17 were determined by DFT
computational calculations. Table 3.4 summarizes the main geometric parameters of the
calculated transition states of the oxidative addition reaction of methyl iodide to
[Rh(β-diketonato)(CO)(PPh3)] (β-diketonato = tta, bth, dtm and acac) as well as to [Rh(CO)2I2]−
(the Monsanto catalyst). The transition state (TS) structures exhibit similar characteristics. For
the TS [Rh(β-diketonato)(CH3)(CO)(PPh3)]+ complexes, the Rh-Cmethyl bond lengths
(2.39-2.45 Å) are slightly shorter than the I-Cmethyl bond lengths (2.61-2.72 Å). As for the TS
[Rh(CO)2(CH3)I2], the Rh-Cmethyl and the I-Cmethyl bond lengths were found to be of equal length
(2.6 Å).16 The Rh-Cmethyl-I angles are the same for all the complexes (174-176°). The angle at
which the CH3I molecule enters the environment of the Rh centre, represented by the
Cmethine-Rh-Cmethyl-I torsion angle, is unique for each complex. In all the
[Rh(β-diketonato)(CO)(PPh3)] complexes, the angle at which the CH3I molecule approaches the
rhodium centre is tilted slightly away from the PPh3 group (Figure 3.21).
3.1.3.3 Molecular orbitals (MO) of the transition states (TS).
Rhodium(I) is a dxz2 dxz
2 dxy2 dz2
2 dx2-y20 complex of which the HOMO (highest occupied
molecular orbital) exhibits mainly a dz2 character. The main contribution to the Rh-CCH3 bond in
16 M. Feliz, Z. Freixa, P.W.N.M. van Leeuwen, C. Bo, Organometallics 2005 (24) 5718-5723.

CHAPTER 3
123
the TS comes from the overlap of the dz2 HOMO of the rhodium atom with the pz LUMO (lowest
unoccupied molecular orbital) of the methyl carbon. Since the molecular orbitals of the TS
[Rh(β-diketonato)(CH3)(CO)(PPh3)]+ (β-diketonato = tta, bth, dtm and acac) look similar, the
HOMO and LUMO visualizations of [Rh(tta)(CH3)(CO)(PPh3)]+-A are given in Figure 3.18 as
representative example.
Figure 3.18: HOMO (highest occupied molecular orbital) and LUMO (lowest unoccupied molecular orbital)
visualization of the transition state of [Rh(tta)(CO)(CH3)(PPh3)(I)]≠-A, as a representative example of
[Rh(β-diketonato)(CO)(CH3)(PPh3)(I)]≠ (β-diketonato = tta, bth, dtm and acac). Note the dz2-orbital at the rhodium
centre of the HOMO diagram and the pz-orbital at the methyl group of the LUMO diagram. The colour code of the
atoms is as indicated.
3.1.3.4 Energy profile of the reaction.
The calculated relative energies (∆E) of the reactants, TS structures and products are visualized
in Figure 3.19 and the activation energies (∆E≠) are tabulated in Table 3.4. The energy profile of
the [Rh(β-diketonato)(CO)(PPh3)] complexes in this study is similar. The activation energies of
the transition states vary between 27-33 kJ.mol-1 and the formation of the alkyl-products is
39-48 kJ.mol-1 lower in energy relative to the reactants. The relative energies of the reactants,
transition states and the reaction product of the different isomers (A and B) of tta and bth are
within 1 kJ.mol-1 of each other. [Rh(tta)(CO)(PPh3)] has the highest activation barrier
(33 kJ.mol-1) followed by [Rh(bth)(CO)(PPh3)] (28-29 kJ.mol-1), [Rh(acac)(CO)(PPh3)]
(27 kJ.mol-1) and [Rh(dtm)(CO)(PPh3)] (25 kJ.mol-1).

RESULTS AND DISCUSSION
124
Figure 3.19: PW91/TZP/chloroform calculated relative energies (∆E) of the reactants, the transition states and the
alkyl reaction products of the oxidative addition reaction of methyl iodide to [Rh(β-diketonato)(CO)(PPh3)]
(β-diketonato = tta, bth, dtm and acac). The labels "A" and "B" refer to the two stereo isomers of tta and bth, as
illustrated in Figure 3.16. The energy of the reactants is taken as zero.
Whereas the rate of the reaction is theoretically expressed by the activation barrier,
experimentally it is expressed by the kinetic rate constant (k1) (Table 3.4). The larger the value
of k1, the faster the reaction. The linear equation (y = mx + c) defining the relationship between
die theoretical and experimental expression is: k1 = (2.93 x 10⁻³) ∆E≠ + 0.106 (Figure 3.20). The
largest ∆E≠ for tta is in agreement with the fact that the k1 of this reaction is the slowest. The
trend for the [Rh(β-diketonato)(CO)(PPh3)] complexes in this study are as follow:
larger k1 smaller ∆E≠
faster oxidative addition reaction dtm - acac - bth - tta
smaller k1 larger∆E≠
slower oxidative addition reaction
The kinetic rate constant of the Monsanto catalyst15 (0.000068 mol-1.dm3.s-1) is not of the order
of the kinetic rate constants of the [Rh(β-diketonato)(CO)(PPh3)] (β-diketonato = tta, bth, dtm
and acac) complexes (Table 3.4), although the ∆E≠ energies are similar. The linear relationship
expressed in Figure 3.20 is therefore only applicable to [Rh(β-diketonato)(CO)(PPh3)]
complexes.

CHAPTER 3
125
Figure 3.20: A plot of the activation energies (∆E≠) versus the kinetic rate constants (k1) of the reaction
[Rh(β-diketonato)(CO)(PPh3)] (β-diketonato = tta, bth and dtm) + CH3I. The labels "A" and "B" refer to the two
stereo isomers of tta and bth, as illustrated in Figure 3.16.
3.1.3.5 Thermodynamic data.
The thermodynamic data are summarized in Table 3.5. The calculated enthalpy of activation
(∆H≠) is between 26-39 kJ.mol-1 for the [Rh(β-diketonato)(CO)(PPh3)] complexes in this study.
The large negative entropy of activation (∆S≠) (< -131 J.K-1.mol-1) is consistent with an
associative mechanism. The experimental Gibbs free energy (∆G≠) of the oxidative addition
reaction, [Rh(β-diketonato)(CO)(PPh3)] + CH3I, is in the order of 75-90 kJ.mol-1.7,8,9,10 The
calculated Gibbs free energy of 72-84 kJ.mol-1 is in a high agreement with this. The
thermodynamic data of the Monsanto catalyst are similar to that of the
[Rh(β-diketonato)(CO)(PPh3)] complexes in this study.
3.1.3.6 Conclusions.
The oxidative addition of CH3I to the square planar [Rh(β-diketonato)(CO)(PPh3)]
(β-diketonato = tta, bth, dtm and acac) complexes corresponds to an SN2 nucleophilic attack by
the rhodium metal centre on the methyl iodide. The transition states of the complexes in this
study all exhibit similar geometrical and thermodynamical data. The experimental kinetic rate
constants (k1) and the theoretical activation energies (∆E≠) exhibit a linear relationship. This
linear relationship of the [Rh(β-diketonato)(CO)(PPh3)] complexes does not apply to the
Monsanto catalyst. Though, the activation energies (∆E≠) of the [Rh(β-diketonato)(CO)(PPh3)]
complexes in this study are similar to that of the Monsanto catalyst. It is therefore recommended

RESULTS AND DISCUSSION
126
to further investigate the catalytic properties of [Rh(β-diketonato)(CO)(PPh3)] complexes as
promising rhodium based catalysts.
3.1.3.7 Tables and graphs.
Table 3.4: The PW91/TZP/chloroform calculated selected geometrical parameters, TS imaginary frequencies and activation energies (∆E≠) of the transition states of the oxidative addition reaction of methyl iodide to [Rh(β-diketonato)(CO)(PPh3)] (β-diketonato = tta, bth, dtm and acac) and the Monsanto catalyst. Experimental values of the kinetic rate constants (k1) are also listed. The labels "A" and "B" refer to the two stereo isomers of tta and bth, as illustrated in Figure 3.16.
tta-A tta-B bth-A bth-B dtm acac [Rh(CO)2I2(CH3)(I)]−−−− i
Freq / cm-1 222i 247i 257i 266i 239i 260i 323i Intensity -444 -473 -500 -515 -438 -520 -
Rh-Cmethyl / Å 2.387 2.418 2.447 2.454 2.414 2.449 2.592 Cmethyl-I / Å 2.723 2.676 2.606 2.640 2.710 2.654 2.577
Rh-Cmethyl-I / ° 175.7 174.8 176.3 174.0 174.4 175.2 176.7 Cmethine-Rh-Cmethyl-I / ° -9.1 52.1 -7.8 65.0 -12.7 21.1 -
∆∆∆∆E≠≠≠≠ / kJ.mol-1 33 33 28 29 25 27 32 k1 / mol-1.dm3.s-1 0.00171(4) ii 0.0265(6) iii 0.029(1) iii 0.024(3) iv 0.000068 v
i BP86/TZP/methanol, from reference [16]. ii UV spectrophotometry in chloroform, from reference [10].
iii UV spectrophotometry in chloroform, from reference [8]. iv IR spectrophotometry in DCM, from reference [4]. v IR spectrophotometry in neat CH3I, from reference [15].

CHAPTER 3
127
Table 3.5: The PW91/TZP/chloroform calculated thermodynamic data of the reactants, TS and product during the oxidative addition reaction of methyl iodide to [Rh(β-diketonato)(CO)(PPh3)] (β-diketonato = tta, bth, dtm and acac) and the Monsanto catalyst. The labels "A" and "B" refer to the two stereo isomers of tta and bth, as illustrated in Figure 3.16. All energy values are given compared to the reactants. Unbracketed values refer to theoretically determined values (this study); bracketed values refer to experimentally8,10,17 determined values.
∆H298K / kJ.mol-1 i ∆G298K / kJ.mol-1 ii ∆S298K / J.K-1.mol-1 iii [Rh(tta)(CO)(PPh3)]-A + CH3I → [Rh(tta)(CH3)(CO)(PPh3)(I)]-A
Reactants 0 0 0 TS 39 {31.1(5)} 78 {89(1)} -131 {-194(2)} Product -25 21 -156
[Rh(tta)(CO)(PPh3)]-B + CH3I → [Rh(tta)(CH3)(CO)(PPh3)(I)]-B Reactants 0 0 0 TS 37 {31.1(5)} 81 {89(1)} -148 {-194(2)} Product -26 17 -145
[Rh(bth)(CO)(PPh3)]-A + CH3I → [Rh(bth)(CH3)(CO)(PPh3)(I)]-A Reactants 0 0 0 TS 32 {16.8(8)} 82 {82(2)} -167 {-218(3)} Product -34 28 -209
[Rh(bth)(CO)(PPh3)]-B + CH3I → [Rh(bth)(CH3)(CO)(PPh3)(I)]-B Reactants 0 0 0 TS 31 {16.8(8)} 84 {82(2)} -178 {-218(3)} Product -35 24 -197
[Rh(dtm)(CO)(PPh3)] + CH3I → [Rh(dtm)(CH3)(CO)(PPh3)(I)] Reactants 0 0 0 TS 26 {40(6)} 78 {80(3)} -176 {-130(20)} Product -28 26 -180
[Rh(acac)(CO)(PPh3)] + CH3I → [Rh(acac)(CH3)(CO)(PPh3)(I)] Reactants 0 0 0 TS 33 {-} 72 {-} -131 {-} Product -33 12 -150
[Rh(CO)2I2]− + CH3I → [Rh(CO)2I2(CH3)(I)]
− iv Reactants 0 0 0 TS 34 {60} 80 {96} -154 {-120} Product - - - i Enthalpy, calculated by equation 4.2 (section 4.5.2.1, Chapter 4).
ii Gibbs free energy, calculated by equation 4.3 (section 4.5.2.1, Chapter 4). iii Entropy, calculated from the temperature dependent partition function in ADF at 298.15 K. iv BP86/TZP/methanol, from reference [16].
17 T.R. Griffin, D.B. Cook, A. Haynes, J.M. Pearson, D. Monti, G.E. Morris, J. Am. Chem. Soc. 1996 (118) 3029-
3030.

RESULTS AND DISCUSSION
128
Figure 3.21: The PW91/TZP/chloroform calculated transition states of the oxidative addition reaction of methyl
iodide to [Rh(β-diketonato)(CO)(PPh3)] (β-diketonato = tta, bth, dtm and acac). Note the angle at which the CH3I
molecule enters the environment of the Rh centre (represented by the Cmethine-Rh-Cmethyl-I torsion angle indicated by
the dotted black lines). The labels "A" and "B" refer to the two stereo isomers of tta and bth, as illustrated in
Figure 3.16. The colour code of the atoms is as indicated.

CHAPTER 3
129
3.1.4 [Rh(acac)(P(OPh)3)2] + CH3I.
3.1.4.1 Introduction.
The reaction between methyl iodide and [Rh(β-diketonato)(P(OPh)3)2] is very similar to the
reaction between methyl iodide and the [Rh(β-diketonato)(CO)(PPh3)] complexes (section 3.1.2
and 3.1.3). In both cases, a neutral alkyl halide is added to a square planar rhodium(I) complex.
The main difference between the reaction with the [Rh(β-diketonato)(P(OPh)3)2] and the
[Rh(β-diketonato)(CO)(PPh3)] complexes is that the former complex contains no carbonyl group
bonded to the rhodium centre. Therefore, no methyl migration is possible after the oxidative
addition of the alkyl halide. Another difference is the electronic and steric effect on the rate of
the reaction of the bulky triphenylphosphite ligands.
The oxidative addition reaction between CH3I and [Rh(β-diketonato)(P(OPh)3)2] complexes has
only been studied experimentally,18,19 though no solid state X-ray crystal structure has been
solved of the product.20 Since the understanding of the mechanism of the activity of a catalyst
requires an understanding of its structure in all reaction steps, a DFT computational study has
been undertaken of the geometry of the reactant, transition state and possible products of the
oxidative addition reaction of CH3I to [Rh(acac)(P(OPh)3)2] (where Hacac = acetylacetone). Due
to the computational requirement of optimizing such a big molecular system, simplified models
of [Rh(acac)(P(OPh)3)2] were also investigated to see whether these models give the same
information regarding the nature of the transition state and possible reaction products of the
oxidative addition reaction in this study. For the details of the computational methods used, see
section 4.5.2.1 (Chapter 4).
3.1.4.2 General study of [Rh(β-diketonato)(P(OPh)3)2] complexes.
Since DFT computational methods are applied for the first time to [Rh(β-diketonato)(P(OPh)3)2]
complexes, some measure of the reliability of the approach had to be obtained. This was
addressed by comparing the known single crystal X-ray crystallographic structures (Figure 3.22)
18 G.J. van Zyl, G.J. Lamprecht, J.G. Leipoldt, T.W. Swaddle, Inorg. Chim. Acta 1988 (143) 223-227.
19 J.G. Leipoldt, E.C. Steynberg, R. van Eldik, R. Inorg. Chem. 1987 (26) 3068-3070.

RESULTS AND DISCUSSION
130
of [RhI(β-diketonato)(P(OPh)3)2] (β-diketonato = acac,21 tfba,22 tfaa23) and
[RhIII(β-diketonato)(P(OPh)3)2(I)2] (β-diketonato = tfaa24) (Hacac = acetylacetone,
Htfba = trifluorobenzoylacetone and Htfaa = trifluoroacetylacetone) with the theoretically
calculated structure of the same complex.
Figure 3.22: Schematic illustration of the β-diketonatobis(triphenylphosphite)rhodium complexes that have been
solved by X-ray crystallography.
All these β-diketonatobis(triphenylphosphite)rhodium crystals contained two molecules in the
asymmetric unit, except for β-diketonato tfba which had only one molecule in the asymmetric
unit. When comparing the backbones of the two molecules in the asymmetric unit (that is
[Rh(CCOCCOC)(P)2]), a RMSD (root-mean-square distance) a value of 0.03, 0.06 and 0.13 Å is
obtained respectively for [RhI(acac)(P(OPh)3)2], [RhI(tfaa)(P(OPh)3)2] and
[RhIII(tfaa)(P(OPh)3)2(I)2]. Inclusion of the O atoms on the P (that is [Rh(CCOCCOC)(PO3)2]),
gives a RMSD value of 0.04, 0.61 and 0.19 Å respectively. Note that the backbones of the two
molecules in the asymmetric unit are near enantiomers and therefore the mirror symmetry of the
one molecule of each was used for the fitting. The larger RMSD values, when the O atoms on
the P are included, indicate that packing in the solid state may give rise to different orientations
of the OPh groups, whereas in solution these OPh groups can rotate freely. Care should therefore
be taken when optimizing these types of molecules when the geometry is not experimentally
known (no experimental crystal structure), that the global minimum energy geometry is obtained
and not a local minimum structure, due to the orientation of the OPh groups. The relative energy
of the two enantiomeric molecules in the asymmetric unit, optimized with and without
relativistic effects in methanol as solvent, is virtually the same, as would be expected for near
enantiomers (Table 3.6).
20 Cambridge Structural Database (CSD), Version 5.30, August 2008 update.
21 J.G. Leipoldt, G.J. Lamprecht, G.J. Van Zyl, Inorg. Chim. Acta 1985 (96) L31-L34.
22 G.J. Lamprecht, J.G. Leipoldt, G.J. Van Zyl, Inorg. Chim. Acta 1985 (97) 31-35.
23 G.J. Van Zyl, G.J. Lamprecht, J.G. Leipoldt, Inorg. Chim. Acta 1985 (102) L1-L4.
24 G.J. Van Zyl, G.J. Lamprecht, J.G. Leipoldt, Inorg. Chim. Acta 1986 (122) 75-79.

CHAPTER 3
131
The theoretical and experimental geometrical data of the complexes
[RhI(β-diketonato)(P(OPh)3)2] (β-diketonato = acac, tfba, tfaa) and
[RhIII(β-diketonato)(P(OPh)3)2(I)2] (β-diketonato = tfaa) are summarized in Table 3.7 and
comparative information with signed deviations is given in Table 3.8 (atom numbering is as
indicated in Figure 3.24). High agreement between experimental and theoretical structures is
obtained, as reflected by the RMSD values of the calculated data superimposed on the
experimental data of less than 0.11 Å. A key indicator in organometallic compounds is the bond
lengths and angles involving the metal centre. The bonds in the coordination polyhedron of these
four complexes were generally slightly overestimated by the DFT calculations (0.00-0.10 Å for
Rh-O bonds and 0.02-0.10 Å for Rh-P bonds). It is well-known that GGA density functionals
overestimate bonds lengths.25 The angles around the Rh were calculated accurately within 2.9°.
The calculations including relativistic effects gave more precise bond lengths than the calculation
without relativistic effects (Table 3.8). Here it is informative to notice that the Rh-O and Rh-P
bonds (or angles around the Rh) of the optimized geometries of the two enantiomeric molecules
in the asymmetric unit differ by 0.00-0.01 Å (or 0-3°). Since comparisons of experimental
metal-ligand bond lengths with calculated bond lengths below a threshold of 0.02 Å are
considered as meaningless,26 the methods employed in this study give a good account of the
experimental bond lengths of both rhodium(I) and rhodium(III)
β-diketonatobis(triphenylphosphite) complexes.
Oxidative addition of CH3I to [Rh(acac)(P(OPh)3)2] leads to an alkyl product
[Rh(acac)(P(OPh)3)2(CH3)(I)]. Four possible rhodium(III) alkyl isomers are possible: one
(Alkyl-A) if trans addition occurs and three possible isomers (Alkyl-B, Alkyl-C and Alkyl-D) if
cis addition occurs (inserts in Figure 3.23).27 Due to the computational requirement of
25 (a) A.C. Scheiner, J. Baker, J.W. Andzelm, J. Comput. Chem. 1997 (18) 775-795. (b) J.R. Hill, C.M. Freeman, B.
Delley, J. Phys. Chem. A 1999 (103) 3772-3777. (c) F. Furche, J.P. Perdew, J. Chem Phys. 2006 (124) 044103.
26 W.J. Hehre, A guide to molecular mechanics and quantum chemical calculations, Wavefunction, Irvine, 2003,
p153.
27 When optimizing the full experimental model, the influence of the rotating OPh groups must be taken into account
so that the geometry of the global minimum energy structures (in solution) of [Rh(acac)(P(OPh)3)2] and the four
possible alkyl [Rh(acac)(P(OPh)3)2(CH3)(I)] products can be obtained. A conformational search was therefore
performed by calculating the energy of the molecules as a function of the Oacac-Rh-P-O dihedral angle. The
global minimum energy structure was then obtained by re-optimizing the minimum energy structure obtained
from the dihedrally restricted optimizations, without any restraints.

RESULTS AND DISCUSSION
132
optimizing such a big molecular system, two simplified models of [Rh(acac)(P(OPh)3)2], which
are [Rh(acac)(P(OCH3)3)2] and [Rh(acac)(P(OH)3)2], were introduced. The goal is to determine
whether the simplified models give the same information regarding the nature, geometry and
energetics of the transition state (TS) and products of oxidative addition.
3.1.4.3 Energy profile.
The PW91/TZP/methanol optimized relative energies of the rhodium(I) complex
[Rh(acac)(P(OPh)3)2] and the four possible rhodium(III) isomers [Rh(acac)(P(OPh)3)2(CH3)(I)]
of the full experimental model (R = Ph) are displayed in Figure 3.23. These results indicate
(in agreement with experimental observation)18,19,28 that the trans product Alkyl-A is the
product of oxidative addition of CH3I to [Rh(acac)(P(OPh)3)2]. The two simplified
systems, [Rh(acac)(P(OCH3)3)2] and [Rh(acac)(P(OH)3)2] (also displayed in Figure 3.23),
show the same trend regarding the relative energies of the four possible rhodium(III)
reaction products, viz. (most stable) Alkyl-A < Alkyl-D < Alkyl-C < Alkyl-B (least stable).
Inclusion of relativistic effects in the DFT calculations did not change the relative stability
of the four possible [Rh(acac)(P(OR)3)2(CH3)(I)] products of all three models
(R = Ph, CH3 or H). The energetically preferred product of the oxidative addition
reaction of CH3I to [Rh(acac)(P(OPh)3)2] therefore assumes an octahedral geometry, with the
β-diketonato and the two triphenylphosphite groups located in the equatorial plane and the
methyl and iodide ligands in the axial position. The trans addition of CH3I to
[Rh(β-diketonato)(P(OPh)3)2] is also confirmed by the structure determination of a similar
complex, trans-[Rh(benzoylphenylhydroxylamine)(P(OPh)3)2(CH3)(I)].29 Oxidative addition of
I2 to [Rh(tfaa)(P(OPh)3)2(I)2] also gave the trans product (Figure 3.22, right).24 This is also in
agreement with the DFT calculations on the structurally similar
monocarbonyltriphenylphosphine rhodium complexes, [Rh(β-diketonato)(CO)(PPh3)], where the
CH3I oxidative addition resulted in trans addition (section 3.1.3).
28 G.J. van Zyl, G.J. Lamprecht, J.G. Leipoldt, Inorg. Chim. Acta 1987 (129) 35-37.
29 G.J. Lamprecht, G.J. Van Zyl, J.G. Leipoldt, Inorg. Chim. Acta 1989 (164) 69-72.

CHAPTER 3
133
Figure 3.23: PW91/TZP/methanol calculated energies of the reactants [Rh(acac)(P(OR)3)2] + CH3I, the transition
state (TS) and the four possible [Rh(acac)(P(OR)3)2(CH3)(I)]-alkyl reaction products. The energy of the reactants is
taken as zero.
3.1.4.4 Geometry profile.
The PW91/TZP/methanol optimized geometrical data of the full experimental model (R = Ph)
are illustrated in Figure 3.25 and the bond lengths and bond angles around the Rh centre of all
three models (R = Ph, CH3 or H) are given in Table 3.9. Introducing R = CH3 or H instead of Ph,
did not change the bond lengths around the Rh centre significantly - the calculated bond lengths
were similar within 0.05 Å. The bond angles around the Rh centre were within 8.5° (5%) of the
corresponding angle of the three models. It is expected that the bond angles around the Rh centre
will differ as the size of the R group increases from H to CH3 to Ph. The Cmethyl-Rh-I angle of the
full experimental model of Alkyl-A is 169.1° and is in the same order as the Cmethyl-Rh-I angle
(174.2°) of trans-[Rh(benzoylphenylhydroxylamine)(P(OPh)3)2(CH3)(I)]29 and the I-Rh-I angle
(ca. 170°) in [Rh(tfaa)(P(OPh)3)2(I)2].24 The slightly distorted octahedral arrangement in
[Rh(tfaa)(P(OPh)3)2(I)2] is attributed to the steric interaction between the iodide and
triphenylphosphite ligands. The calculated Cmethyl-Rh-I angle of the simplified models of
Alkyl-A, however, increases as the P(OR)3 groups decrease in size - 171.7° and 176.5° for
[Rh(acac)(P(OCH3)3)2(CH3)(I)] and [Rh(acac)(P(OH)3)2(CH3)(I)] respectively.
The deviation of the geometry of the two simplified models can also be evaluated by comparing
the RMSD values of the key bonds of the Rh(CCOCCOC)(P)2 backbone of the optimized
simplified model, fitted on the backbone of the optimized full model (Table 3.9). The RMSD
values of the simplified rhodium(I) models are exceptionally good (0.06 and 0.09 Å

RESULTS AND DISCUSSION
134
respectively). The RMSD values of the simplified rhodium(III) models (between 0.10 and
0.16 Å) are somewhat larger than the rhodium(I) values, as would be expected for the more
complex molecules. Therefore, both simplified models (R = CH3 or H) give a good account of
the key bond lengths around the rhodium centre relative to that of the full experimental model.
3.1.4.5 Transition states.
Figure 3.26 displays the three types of transition state (TS) structures that have been reported for
the oxidative addition of methyl iodide to square planar rhodium(I) complexes (especially the
Monsanto catalyst [Rh(CO)2I2]−, section 2.4.2, Chapter 2). Two results from trans addition
("linear/back" and "bent") and one results from cis addition ("front"). The linear/back transition
state structure corresponds to an SN2 mechanism, characterized by a linear Rh-Cmethyl-I
arrangement and by an Rh-Cmethyl-H angle close to 90°. The methyl hydrogen atoms are located
in the equatorial plane of the five-coordinated carbon atom, resulting in a trigonal bipyramidal
arrangement. The bent and front transition state structures correspond to a side-on approach of
the Cmethyl-I bond to the rhodium atom. The bent transition state structure leads to the same
intermediate product as the linear/back transition state structure - a cationic five-coordinated
rhodium complex and a free iodide ion. Both the mechanisms of the linear/back and the bent
transition state structures are therefore described as SN2 processes. The front transition state
structure corresponds to a concerted three-centred oxidative addition mechanism, in which the
Rh-I and Rh-Cmethyl bonds form simultaneously as I-Cmethyl bond breaks, resulting in the cis
addition of the methyl iodide. Table 3.10 summarizes the main geometric parameters of the TS
structures determined of the simplified models in the study, as well as the calculated geometric
parameters of the Monsanto catalyst [Rh(CO)2I2]−.16
The three types of TS structures exhibit similar characteristics. The I-Cmethyl bond length and the
Rh-Cmethyl bond length of all the [Rh(acac)(P(OH)3)2(CH3)(I)] and
[Rh(acac)(P(OCH3)3)2(CH3)(I)] TS structures, as well as the Monsanto TS structures, are very
similar (2.51-2.85 Å and 2.54-2.78 Å respectively). The Rh-Cmethyl-I angles are between
172.9-176.7° for the linear/back TS structures, 89.2-95.0° for the bent TS structures and 64.3-
65.1° for the front TS structures. The linear/back transition states are favoured by a large margin
of energy (> 90 kJ.mol-1) with activation barriers (∆E≠) of 14-32 kJ.mol-1. The bent and front
transition states were therefore not considered in further investigations. The calculated relative
energies of the reactants, linear/back TS structures and products are summarized in Figure 3.23.

CHAPTER 3
135
The thermodynamic data are summarized in Table 3.11. The calculated enthalpy of activation
(∆H≠) is between 19-37 kJ.mol-1 for the different models. The large negative entropy of
activation (∆S≠) calculated for all models, is consistent with an associative mechanism. The
activation free energy (∆G≠) of the two simplified models (60 kJ.mol-1 for both models) is lower
than that of the full model (75 and 78 kJ.mol-1, with and without relativistic effects).
The DFT optimized reactant complexes, the linear/back TS and the reaction intermediate of the
[Rh(acac)(P(OPh)3)2] + CH3I reaction are visualized in Figure 3.27. The metal centre attacks the
methyl group in a SN2-type fashion, approaching the methyl iodide trans to the leaving iodide
group. During this process the metal-methyl bond is under development, whereas the
methyl-iodide bond is substantially stretched. In the reactant [Rh(acac)(P(OPh)3)2], the large
OPh groups are bent backwards so that the Ph groups are arranged above, below and in the
square planar plane (formed by the acac-ligand, the rhodium atom and the two phosphor atoms).
As the CH3I group approaches the reactant, the "arms" of the OPh groups above the plane
gradually open up to accept the incoming CH3I group to proceed through the TS. The overall
structure of the TS appears to be square pyramidal, with the CH3+ group in the pyramidal
position (Figure 3.27 middle). The optimized distance between the attacking rhodium atom and
CH3+ group at the point of the TS is 2.55, 2.61 and 2.54 Å respectively for R = Ph, CH3 and H.
The carbon-iodide bond distance of the CH3I group increased from 2.18 Å in the reactant to 2.59,
2.51 and 2.55 Å in the products (R = Ph, CH3 and H).
Rhodium(I) is a dxz2 dxz
2 dxy2 dz2
2 dx2-y20 complex of which the HOMO (highest occupied
molecular orbital) exhibits mainly dz2 character. The HOMO of the TS is visualized in Figure
3.27 (middle). The main contribution to the Rh-CCH3 bond in the TS comes from the overlap of
the dz2 HOMO of the rhodium atom with the pz LUMO (lowest unoccupied molecular orbital) of
the methyl carbon.
Following the TS, is the formation of the cationic five-coordinate [Rh(acac)(P(OPh)3)2(CH3)]+
intermediate with the CH3 group in the apical position (Figure 3.27, right) and with the iodide
ion drifting away into the solvent sphere. The product, [Rh(acac)(P(OPh)3)2(CH3)(I)] Alkyl-A, is
octahedral with the methyl and iodide above and below the square planar plane in a trans
arrangement (Figure 3.25, Alkyl-A). Inversion of the configuration at the methyl carbon
occurred and the methyl group is fully bonded to rhodium atom.

RESULTS AND DISCUSSION
136
3.1.4.6 Calculated versus experimental thermodynamic data.
The obtained thermodynamic data (Table 3.11) can be compared with experimental18,19,30 results.
The activation enthalpy (∆H≠) of the oxidative addition of CH3I to [Rh(acac)(P(OPh)3)2] is
experimentally determined as 40(3) kJ.mol-1, which is in the same order as the calculated
activation enthalpy value of 37 and 28 kJ.mol-1 (determined without and with relativistic effects
respectively). The calculated values of the two simplified models are lower, 22 and 19 kJ.mol-1
for [Rh(acac)(P(OCH3)3)2] and [Rh(acac)(P(OH)3)2] respectively. The activation entropy (∆S≠)
of the reaction [Rh(acac)(P(OPh)3)2] + CH3I is experimentally determined as -128(9) J.K-1.mol-1.
This is in agreement with the large negative activation entropy observed as for all models here
and the same as the calculated value of -129 J.K-1.mol-1 for the full model. The activation free
energy (∆G≠) of the reaction [Rh(acac)(P(OPh)3)2] + CH3I is experimentally determined as
78 kJ.mol-1, which is in high agreement with the calculated values of 75 and 78 kJ.mol-1 for the
full model (with and without relativistic effects). The calculated values of the two simplified
models failed to accurately reproduce this value (60 kJ.mol-1 for both [Rh(acac)(P(OCH3)3)2] and
[Rh(acac)(P(OH)3)2]). The agreement between experiment and theory for the individual
components ∆H≠ and ∆S≠ to ∆G≠ = ∆H≠ - T∆S≠ is thus not as good as for ∆G≠ itself. The large
compensating variations in ∆H≠ and ∆S≠, with a modest change in ∆G≠, were also found by
Ziegler and was assigned to solvent effects.31
A reduction in the activation enthalpy associated with the oxidative addition reaction
[Rh(acac)(P(OR)3)2] + CH3I is observed for R = CH3 as compared to Ph. On the basis of
Tolman’s electronic parameter (Table 3.12), P(OCH3)3 is expected to be somewhat more
electron-rich than P(OPh)3.32 Therefore, a nucleophilic attack of the rhodium atom of
[Rh(acac)(P(OCH3)3)2] on the CH3+ group is expected to be easier than that of
[Rh(acac)(P(OPh)3)2]. The higher calculated activation enthalpy of [Rh(acac)(P(OPh)3)2] + CH3I
is therefore as expected on electronic grounds. However, the bulkiness of the P(OPh)3 group
could hinder the attack of the rhodium atom of [Rh(acac)(P(OPh)3)2] on the CH3+ group, also
leading to a higher energy barrier. The high agreement between the computed activation
enthalpy of the full experimental model and the experimentally obtained value demonstrates that
the use of the full P(OPh)3)2 groups are vital for obtaining accurate theoretical values.
30 G.J. van Zyl, G.J. Lamprecht, J.G. Leipoldt, Inorg. Chim. Acta 1987 (129) 35-37.
31 M. Cheong, T. Ziegler, Organometallics 2005 (24) 3053-3058.
32 C.A. Tolman, Chem. Rev. 1977 (77) 313-384.

CHAPTER 3
137
The calculated activation barrier, ∆E≠ = 30 kJ.mol-1, for the trans addition of CH3I to
[Rh(acac)(P(OPh)3)2] in this study is of the same order as the reported DFT values for the
Monsanto system 32 kJ.mol-1 (Table 3.10, BP86) by Feliz,16 but smaller than the value reported
by Laasonen when using the hybrid B3LYP functional (68 kJ.mol-1).33 The calculated
thermodynamic quantities (∆H≠, ∆G≠, ∆S≠, 298 K) of this study compare well with experimental
data of the Monsanto catalyst (60 kJ.mol-1, 96 kJ.mol-1 and 120 J.mol-1 respectively).17
However, since the [Rh(acac)(P(OPh)3)2] complex in this study does not contain a CO group, no
methyl migration (the second step in the Monsanto catalytic cycle) is possible.
3.1.4.7 Conclusions.
Simplified model systems of the oxidative addition reaction [Rh(acac)(P(OPh)3)2] + CH3I, viz.
[Rh(acac)(P(OCH3)3)2] and [Rh(acac)(P(OH)3)2], give a good account of the Rh-L experimental
bond lengths of both rhodium(I) and rhodium(III) β-diketonatobis(triphenylphosphite)
complexes. All models give the same trend concerning the relative stability of the four possible
rhodium(III) reaction products. The main features of the TS, viz. the nucleophilic attack of the
rhodium atom on the CH3+ group and the cleavage of the carbon-iodide bond, are similar for all
three systems. Therefore, in order to save on computational recourses, a simplified model system
can be used to obtain preliminary information of the oxidative addition reaction of CH3I to
[Rh(β-diketonato)(P(OPh)3)2] complexes. However, for the best agreement with experimental
activation parameters, the full experimental system is necessary.
3.1.4.8 Graphs and tables.
Figure 3.24: The core structure of [RhI(β-diketonato)(P(OPh)3)2] (β-diketonato = acac, tfba, tfaa) and
[RhIII(β-diketonato)(P(OPh)3)2(I)2] (β-diketonato = tfaa) indicating the numbering system used in Table 3.6. The
R-groups attached to C2 and C4 are (CH3, CH3) for acac, (Ph, CF3) for tfba and (CF3, CH3) for tfaa.
33 T. Kinnunen, K. Laasonen, J. Mol. Struct. (Theochem) 2001 (542) 273-288.

RESULTS AND DISCUSSION
138
Figure 3.25: The PW91/TZP/methanol calculated minimum energy geometries of the [Rh(acac)(P(OPh)3)2]
complex and the four possible [Rh(acac)(P(OPh)3)2(CH3)(I)]-alkyl reaction products. The H atoms are removed for
clarity (except for the CH3 group bonded to the rhodium). Bond angles (°) and bond lengths (Å) are as indicated.
Only angles in the square planar plane are given.

CHAPTER 3
139
Figure 3.26: Schematic illustration of a "linear/back", "bent" and "front" transition states of the nucleophilic
attack of square planar rhodium(I) on methyl iodide. The Monsanto catalyst [Rh(CO)2I2]− is used as example for the
square planar rhodium(I) complex.
Figure 3.27: The PW91/TZP/methanol optimized structures of the oxidative addition of the reaction
[Rh(acac)(P(OPh)3)2] + CH3I. The H atoms are removed for clarity (except for the methyl group of the CH3I). Left:
The reactant complexes viz. [Rh(acac)(P(OPh)3)2] + CH3I. Middle: The square pyramidal TS, involving the attack
of rhodium atom on the CH3+ group with displacement vector (blue arrow), indicating movement of the CH3
+ group
at the negative frequency (-258.6 cm-1). The HOMO of the TS is superimposed on the TS geometry - note the
dz2-orbital on the rhodium centre. Right: The optimized reaction intermediate [Rh(acac)(P(OPh)3)2(CH3)]+I−.
Table 3.6: The relative energies (kJ.mol-1) of the DFT optimized structures of the two enantiomeric molecules in the asymmetric unit of [RhI(acac)(P(OPh)3)2], [RhI(tfaa)(P(OPh)3)2] and [RhIII(tfaa)(P(OPh)3)2(I)2].
[Rh(acac)(P(OPh)3)2 [Rh(tfaa)(P(OPh)3)2 [Rh(tfaa)(P(OPh)3)2(I) 2 Molecule 1 Molecule 2 Molecule 1 Molecule 2 Molecule 1 Molecule 2
PW91/TZP/methanol i 0.0 1.7 0.0 3.8 0.6 0.0 PW91/TZP/methanol/rel ii 0.0 2.5 0.0 1.7 2.4 0.0
i Geometry optimization was done with the PW91 functional and the TZP basis set in methanol as solvent. ii Geometry optimization under the same conditions as (i), but with inclusion of relativistic effects.

RESULTS AND DISCUSSION
140
Table 3.7: Calculated and experimental bond lengths (Å) and bond angles (°) of [RhI(β-diketonato)(P(OPh)3)2] (β-diketonato = acac, tfba, tfaa) and [RhIII(β-diketonato)(P(OPh)3)2(I)2] (β-diketonato = tfaa). Unbracketed values refer to the solution DFT values, round bracketed values refer to the solution DFT values including relativistic effects (PW91/TZP/methanol) and square bracket values refer to the X-ray crystal data. The atom numbering is as indicated in Figure 3.24.
[Rh(acac)(P(OPh)3)2 i [Rh(tfba)(P(OPh)3)2 [Rh(tfaa)(P(OPh)3)2
i [Rh(tfaa)(P(OPh)3)2(I) 2 i
Molecule 1 Molecule 2 Molecule 1 Molecule 2 Molecule 1 Molecule 2 Bond lengths / Å
C1-C2 1.511 (1.509) [1.510] 1.510 (1.509) [1.548] 1.495 (1.493) [1.480] 1.543 (1.542) [1.500] 1.542 (1.540) [1.492] 1.546 (1.545) [1.517] 1.547 (1.544) [1.472]
C2-C3 1.407 (1.401) [1.406] 1.403 (1.400) [1.392] 1.416 (1.414) [1.407] 1.387 (1.384) [1.363] 1.387 (1.385) [1.367] 1.385 (1.383) [1.372] 1.387 (1.384) [1.450]
C3-C4 1.406 (1.405) [1.401] 1.408 (1.405) [1.401] 1.390 (1.388) [1.377] 1.421 (1.418) [1.386] 1.420 (1.417) [1.434] 1.418 (1.417) [1.428] 1.417 (1.416) [1.284]
C4-C5 1.513 (1.511) [1.519] 1.513 (1.511) [1.528] 1.545 (1.543) [1.512] 1.508 (1.507) [1.539] 1.507 (1.506) [1.548] 1.506 (1.505) [1.607] 1.507 (1.504) [1.535]
C2-O1 1.280 (1.289) [1.286] 1.288 (1.289) [1.271] 1.287 (1.284) [1.269] 1.280 (1.281) [1.240] 1.279 (1.281) [1.269] 1.280 (1.282) [1.226] 1.279 (1.280) [1.237]
C4-O2 1.284 (1.286) [1.279] 1.285 (1.287) [1.264] 1.277 (1.279) [1.285] 1.275 (1.277) [1.281] 1.277 (1.279) [1.254] 1.275 (1.277) [1.246] 1.275 (1.278) [1.286]
O1-Rh 2.098 (2.071) [2.067] 2.094 (2.070) [2.062] 2.101 (2.077) [2.066] 2.117 (2.092) [2.085] 2.117 (2.091) [2.083] 2.133 (2.113) [2.109] 2.135 (2.114) [2.036]
O2-Rh 2.101 (2.075) [2.081] 2.098 (2.074) [2.067] 2.107 (2.080) [2.071] 2.106 (2.080) [2.067] 2.096 (2.070) [2.089] 2.120 (2.101) [2.083] 2.114 (2.095) [2.055]
P1-Rh 2.202 (2.177) [2.142] 2.203 (2.175) [2.148] 2.205 (2.181) [2.150] 2.199 (2.174) [2.136] 2.203 (2.177) [2.137] 2.291 (2.263) [2.190] 2.299 (2.271) [2.221]
P2-Rh 2.200 (2.177) [2.150] 2.202 (2.177) [2.155] 2.206 (2.185) [2.162] 2.197 (2.174) [2.148] 2.209 (2.184) [2.144] 2.287 (2.259) [2.209] 2.286 (2.256) [2.200]
Bond angles / °
C1-C2-C3 118.7 (119.2) [120.5] 119.1 (119.3) [120.4] 120.3 (120.5) [121.0] 117.9 (118.0) [119.2] 118.3 (118.6) [115.9] 117.3 (117.4) [115.2] 117.5 (117.7) [120.5]
C2-C3-C4 127.0 (126.8) [126.9] 127.3 (126.8) [125.6] 125.2 (124.7) [124.7] 125.2 (124.8) [124.3] 125.1 (124.7) [122.1] 126.0 (125.8) [125.4] 125.9 (125.6) [127.0]
C3-C4-C5 117.9 (118.3) [119.2] 118.0 (118.3) [119.1] 117.6 (117.8) [118.5] 117.9 (118.1) [120.2] 118.7 (118.9) [117.6] 117.7 (117.9) [121.5] 118.7 (118.8) [121.0]
O1-C2-C1 114.5 (114.4) [114.4] 114.3 (114.3) [112.5] 115.1 (115.2) [114.9] 111.8 (112.1) [110.5] 111.6 (111.7) [112.6] 111.8 (111.9) [113.4] 111.5 (111.6) [114.9]
O1-C2-C3 126.8 (126.4) [125.1] 126.6 (126.3) [127.0] 124.6 (124.3) [124.0] 130.3 (129.9) [130.3] 130.2 (129.8) [131.5] 130.9 (130.7) [128.8] 130.9 (130.7) [124.4]
O2-C4-C3 126.6 (126.1) [126.0] 126.6 (126.3) [125.7] 130.8 (130.4) [130.0] 125.8 (125.5) [126.0] 125.9 (125.6) [126.1] 126.4 (126.2) [127.0] 126.5 (126.2) [128.1]
O2-C4-C5 115.5 (115.5) [114.8] 115.5 (115.5) [115.2] 111.6 (111.8) [111.4] 116.3 (116.4) [113.8] 115.4 (115.4) [116.2] 115.8 (115.9) [111.3] 114.8 (114.9) [110.7]
O1-Rh-P1 86.9 (86.8) [87.1] 87.1 (87.1) [87.5] 86.4 (86.4) [87.9] 90.2 (89.9) [91.1] 87.2 (86.9) [87.4] 89.6 (89.5) [92.3] 88.7 (88.3) [89.3]
P1-Rh-P2 96.2 (96.4) [94.2] 95.0 (95.3) [93.8] 94.1 (94.4) [93.0] 91.7 (92.1) [90.6] 93.9 (94.3) [92.2] 92.5 (92.5) [91.4] 92.6 (93.0) [91.2]
P2-Rh-O2 87.5 (87.2) [89.9] 88.3 (88.0) [90.3] 90.7 (90.3) [90.8] 88.9 (88.7) [90.1] 89.7 (89.5) [92.4] 87.8 (87.5) [87.1] 88.4 (88.3) [90.0]
O2-Rh-O1 90.2 (90.5) [89.3] 90.5 (90.6) [88.8] 88.9 (89.0) [88.4] 89.3 (89.4) [88.1] 89.4 (89.6) [87.9] 90.2 (90.6) [89.3] 90.2 (90.5) [89.4]
I1-Rh-I2 - - - - - 171.1 (170.6) [172.6] 169.3 (168.9) [169.4] i Contains two molecules per asymmetric unit.

CHAPTER 3
141
Table 3.8: Comparative information of the deviations between the calculated (PW91/TZP/methanol) and the experimental (X-ray crystal) structures. Signed deviations of the bond lengths (Å) and the bond angles (°) around the rhodium centre of [RhI(β-diketonato)(P(OPh)3)2] (β-diketonato = acac, tfba, tfaa) and [RhIII(β-diketonato)(P(OPh)3)2(I)2] (β-diketonato = tfaa) are given. Unbracket values refer to the solution DFT values and round bracket values refer to the solution DFT values including relativistic effects. The atom numbering is as indicated in Figure 3.24.
[Rh(acac)(P(OPh)3)2 i [Rh(tfba)(P(OPh)3)2 [Rh(tfaa)(P(OPh)3)2
i [Rh(tfaa)(P(OPh)3)2(I) 2 i
Molecule 1 Molecule 2 Molecule 1 Molecule 2 Molecule 1 Molecule 2 Bond length deviations ii / Å
O1-Rh -0.03 (0.00) -0.03 (-0.01) -0.04 (-0.01) -0.03 (-0.01) -0.03 (-0.01) -0.02 (0.00) -0.10 (-0.08) O2-Rh -0.02 (0.01) -0.03 (-0.01) -0.04 (-0.01) -0.04 (-0.01) -0.01 (0.02) -0.04 (-0.02) -0.06 (-0.04) P1-Rh -0.06 (-0.04) -0.05 (-0.03) -0.06 (-0.03) -0.06 (-0.04) -0.07 (-0.04) -0.10 (-0.07) -0.08 (-0.05) P2-Rh -0.05 (-0.03) -0.05 (-0.02) -0.04 (-0.02) -0.05 (-0.03) -0.06 (-0.04) -0.08 (-0.05) -0.09 (-0.06)
Bond angle deviations ii / ° O1-Rh-P1 0.2 (0.3) 0.4 (0.4) 1.5 (1.5) 0.9 (1.2) 0.2 (0.5) 2.7 (2.8) 0.6 (1.0) P1-Rh-P2 -2.0 (-2.2) -1.2 (-1.5) -1.1 (-1.4) -1.1 (-1.5) -1.7 (-2.1) -1.1 (-1.1) -1.4 (-1.8) P2-Rh-O2 2.4 (2.7) 2.0 (2.3) 0.1 (0.5) 1.2 (1.4) 2.7 (2.9) -0.7 (-0.4) 1.6 (1.7) O2-Rh-O1 -0.9 (-1.2) -1.7 (-1.8) -0.5 (-0.6) -1.2 (-1.3) -1.5 (-1.7) -0.9 (-1.3) -0.8 (-1.1)
RMSD iii 0.05 (0.05) 0.06 (0.05) 0.05 (0.03) 0.06 (0.05) 0.10 (0.11) 0.10 (0.09) 0.10 (0.09)
i Contains two molecules per asymmetric unit. ii Experimental value - Calculated value (data from Table 3.7).
iii RMSD values, in Å, are root-mean-square atom positional deviations, calculated for the non-hydrogen atoms and excluding the rotational groups (CF3, Ph and OPh).

RESULTS AND DISCUSSION
142
Table 3.9: A comparison between the PW91/TZP/methanol calculated minimum energy geometries of the [Rh(acac)(P(OR)3)2] complex and the four possible [Rh(acac)(P(OR)3)2(CH3)(I)]-alkyl reaction products for R = Ph, CH3 and H. Angles (°), bond lengths (Å) and RMSD values (Å) are as indicated. All models were optimized without relativistic effects, except where indicated. The calculated energies (E, kJ.mol-1) are also listed with the energy of the reactant taken as zero (see Table 3.23).
Ph Ph (incl. rel.) CH3 H Rh-P 2.195 2.171 2.218 2.189 Rh-P' 2.194 2.171 2.217 2.196 Rh-O 2.097 2.071 2.113 2.119 Rh-O' 2.096 2.071 2.111 2.117 O-Rh-O' 89.9 90.0 89.1 90.6 O'-Rh-P' 88.8 88.4 91.0 87.4 P'-Rh-P 92.6 93.1 92.6 93.6 P-Rh-O 88.7 88.5 87.3 87.9 RMSD i - 0.02 0.06 0.09
Rh(
I)
E 0 0 0 0 Rh-P 2.277 2.250 2.270 2.239 Rh-P' 2.271 2.240 2.270 2.244 Rh-O 2.117 2.099 2.127 2.143 Rh-O' 2.105 2.086 2.126 2.136 Rh-I 2.889 2.855 2.943 2.913 Rh-C 2.121 2.110 2.104 2.114 O-Rh-O' 91.2 91.4 90.1 90.6 O'-Rh-P' 88.3 88.3 88.5 85.6 P'-Rh-P 96.5 96.6 93.2 97.8 P-Rh-O 83.8 83.6 87.9 86.0 I-Rh-C 169.1 168.4 171.7 176.5 RMSD i - 0.02 0.12 0.15
Alk
yl-A
E -28 -40 -71 -101 Rh-P 2.348 2.317 2.344 2.312 Rh-P' 2.351 2.321 2.354 2.335 Rh-O 2.187 2.165 2.203 2.190 Rh-O' 2.092 2.075 2.086 2.107 Rh-I 2.739 2.715 2.758 2.740 Rh-C 2.123 2.112 2.112 2.121 O-Rh-O' 91.9 92.5 91.7 91.7 O'-Rh-C 87.3 86.8 86.6 86.7 C-Rh-I 91.7 92.2 92.1 92.2 I-Rh-O 89.1 88.6 89.6 89.5 P-Rh-P' 173.0 173.8 179.7 176.4 RMSD i - 0.02 0.10 0.13
Alk
yl-B
E 21 16 -29 -23 Rh-P 2.511 2.457 2.416 2.460 Rh-P' 2.257 2.229 2.227 2.260 Rh-O 2.121 2.102 2.134 2.133 Rh-O' 2.090 2.073 2.104 2.095 Rh-I 2.757 2.732 2.742 2.761 Rh-C 2.114 2.106 2.131 2.120 O-Rh-O' 91.5 92.0 91.8 91.3 O'-Rh-P' 90.5 90.2 85.2 89.6 P'-Rh-I 89.3 89.7 93.9 93.5 I-Rh-O 88.0 87.5 88.9 85.1 P-Rh-C 167.6 167.6 175.6 172.2 RMSD i - 0.03 0.16 0.16
Alk
yl-C
E 12 2 -33 -48 Rh-P 2.294 2.267 2.277 2.251 Rh-P' 2.261 2.232 2.264 2.236 Rh-O 2.121 2.102 2.134 2.163 Rh-O' 2.179 2.159 2.210 2.205 Rh-I 2.821 2.795 2.847 2.853 Rh-C 2.126 2.112 2.112 2.115 O-Rh-O' 90.1 90.6 88.9 89.2 O'-Rh-P' 93.1 92.5 96.0 85.9 P'-Rh-C 87.7 88.5 88.4 94.5 C-Rh-O 88.9 88.1 86.6 90.4 P-Rh-I 166.6 166.9 174.6 175.1 RMSD i - 0.02 0.12 0.12
Alk
yl-D
E -3 -14 -56 -77 i RMSD values, in Å, are root-mean-square atom positional deviations, calculated by fitting the Rh(CCOCCOC)(P)2 backbones of the
simplified models on the backbone of the full model (R = Ph).

CHAPTER 3
143
Table 3.10: The PW91/TZP/methanol calculated selected geometrical parameters, TS imaginary frequencies and activation energies (∆E≠) of the three possible transition states when methyl iodide is oxidatively added to the selected square planar rhodium(I) complexes.
Freq / cm-1
Intensity Rh-Cmethyl
/ Å Cmethyl-I
/ Å Rh-Cmethyl-I
/ ° I-Cmethyl-H
/ ° ∆∆∆∆E≠≠≠≠
/ kJ.mol-1 [Rh(acac)(P(OH)3)2(CH3)(I)]
linear/back 242i -523 2.541 2.554 172.9 93.2 14 bent 523i -315 2.678 2.845 95.0 78.8, 149.6 155 front 253i -43 2.689 2.617 65.1 83.0, 112.0 106
[Rh(acac)(P(OCH3)3)2(CH3)(I)] linear/back 187i -514 2.608 2.509 175.4 95.5 14
bent 311i -305 2.684 2.862 94.0 70.4, 136.7 148 front 264i -82 2.655 2.522 68.1 86.9, 119.9 161
[Rh(CO)2I2(CH3)(I)] − i linear/back 323i - 2.592 2.577 176.7 91.8 32
bent 386i - 2.775 2.641 89.2 144.2, 81.9 160 front 306i - 2.618 2.721 64.3 124.5, 95.5, 86.7 157
i BP86/TZP/methanol, from reference [16].
Table 3.11: The PW91/TZP/methanol calculated thermodynamic data of the reactants, TS and product during the oxidative addition reaction [Rh(acac)(P(OR)3)2] + CH3I (where R = Ph, CH3 or H). All energy values are given compared to the reactant. Unbracketed values refer to R = Ph, round bracketed values refer to R = Ph (including relativistic effects), square bracketed values refer to R = CH3 and curved bracketed values refer to R = H.
∆E / kJ.mol-1 ∆H298K / kJ.mol-1 i ∆G298K / kJ.mol-1 ii ∆S298K / J.K-1.mol-1 iii Reactants 0 (0) [0] {0} 0 (0) [0] {0} 0 (0) [0] {0} 0 (0) [0] {0} TS 30 (22) [14] {17} 37 (28) [22] {19} 75 (78) [60] {60} -129 (-168) [-125] {-137} Product (Alkyl-A) -28 (-40) [-71] {-101} -16 (-27) [-56] {-95} 27 (18) [-2] {-47} -144 (-151) [-180] {-163} i Enthalpy, calculated by equation 4.2 (section 4.5.2.1, Chapter 4).
ii Gibbs free energy, calculated by equation 4.3 (section 4.5.2.1, Chapter 4). iii Entropy, calculated from the temperature dependent partition function in ADF at 298.15 K.
Table 3.12: Electronic (ν) and steric (cone angle, θ) parameters of P(OR)3, R = Ph or CH3 and computed relative activation enthalpies of oxidative addition reaction [Rh(acac)(P(OR)3)2] + CH3I.
P(OR)3 νννν / cm-1 cone angle / ° ∆H≠≠≠≠ 298K / kJ.mol-1 P(OPh)3 2085 128 37 P(OCH3)3 2080 107 22

RESULTS AND DISCUSSION
144
3.1.5 Crystal structure of [Rh(bth)(CO) 2].
Transition metal complexes with a square planar geometry allow stacking in the solid state and
allow the molecules to interact with another unit. As a consequence, the formation of metal
chains is possible.34,35 Examples of metal chains with strong metal-metal bonds that are
catalytically active in processes, such as the water gas shift reaction and CO2 reduction, are
known.36 16-Electron rhodium(I) complexes are electron deficient and coordinatively
unsaturated, making these systems prone to stacking and allowing the formation of metal-metal
bonds37 and chains with weak metal-metal interactions between the rhodium atoms.38,39 The
34 M. Jakonen, L. Oresmaa, M. Haukka, Crystal Growth & Design, 2007 (7) 2620-2626.
35 (a) J.S. Miller, Extended linear chain compounds, Plenum Press: New York, 1982, Vol. 1–3. (b) J.K. Bera, K.R.
Dunbar, Angew. Chem., Int. Ed. 2002 (23) 4453-4457.
36 (a) K. Tanaka, M. Morimoto, T. Tanaka, Chem. Lett. 1983 901-904. (b) M. Haukka, J. Kiviaho, M. Ahlgrén, T.A.
Pakkanen, Organometallics 1995 (14) 825-833. (c) S. Luukkanen, P. Homanen, M. Haukka, T.A. Pakkanen, A.
Deronzier, S. Chardon-Noblat, D. Zsoldos, R. Ziessel, Appl. Catal. A 1995 (185) 157-164. (d) M. Haukka, T.
Venäläinen, M. Kallinen, T.A. Pakkanen, J. Mol. Catal. A: Chem. 1998 (136) 127-134. (e) M.A. Moreno, M.
Haukka, T. Venäläinen, T.A. Pakkanen, Catal. Lett. 2004 (96) 153-155. (f) H. Ishida, K. Tanaka, T. Tanaka,
Chem. Lett. 1985 (3) 405-406. (g) H. Ishida, K. Tanaka, T. Tanaka, Chem. Lett. 1987 (16) 1035-1038. (h) M.-N.
Collomb-Dunand-Sauthier, A. Deronzier, R. Ziessel, Inorg. Chem. 1994 (33) 2961-2967. (i) S. Chardon-Noblat,
A. Deronzier, F. Hartl, J. van Slageren, T. Mahabiersig, Eur. J. Inorg. Chem. 2001 613-617.
37 (a) S.-S. Chern, G.-H. Lee, S.-M. Peng, Chem. Commun. 1994 1645-1646. (b) G.M. Finniss, E. Candall, C.
Campana, K.R. Dunbar, Angew. Chem., Int. Ed. 1996 (35) 2772-2774. (c) M. Mitsumi, H. Goto, S. Umebayashi,
Y. Ozawa, M. Kobayashi, T. Yokoyama, H. Tanaka, S. Kuroda, K. Toriumi, Angew. Chem., Int. Ed. 2005 (44)
4164-4168.
38 F. Huq, A.C. Skapski, J. Cryst. Mol. Struct. 1974 (4) 411-418.
39 (a) M.J. Decker, D.O.K. Fjeldsted, S.R. Stobart, M.J. Zaworotko, Chem. Commun. 1983 1525-1527. (b) C.
Crotti, S. Cenini, B. Rindone, S. Tollari, F. Demartin, Chem. Commun. 1986 784-786. (c) G.M. Villacorta, S.J.
Lippard, Inorg. Chem. 1988 (27) 144-149. (d) G. Matsubayashi, K. Yokoyama, T. Tanaka, J. Chem. Soc.,
Dalton Trans. 1988 253-256. (e) L.A. Oro, M.T. Pinillos, C. Tejel, M.C. Apreda, C. Foces-Foces, F.H. Cano, J.
Chem. Soc., Dalton Trans. 1988 1927-1933. (f) J. Pursiainen, T. Teppana, S. Rossi, T.A. Pakkanen, Acta Chem.
Scand. 1993 (47) 416-418. (g) F. Ragaini, M. Pizzotti, S. Cenini, A. Abbotto, G.A. Pagain, F. Demartin, J.
Organomet. Chem. 1995 (489) 107-112. (h) A. Elduque, C. Finestra, J.A. Lopéz, F.J. Lahoz, F. Merchan, L.A.
Oro, M.T. Pinillos, Inorg. Chem. 1998 (37) 824-829. (i) F.P. Pruchnik, P. Jakimowicz, Z. Ciunik, Inorg. Chem.
Commun. 2001 (4) 726-729. (j ) N.K. Kiriakidou-Kazemifar, M. Haukka, T.A. Pakkanen, S.P. Tunik, E.
Nordlander, J. Organomet. Chem. 2001 (623) 65-73. (k) M.C. Torralba, M. Cano, J.A. Campo, J.V. Heras, E.
Pinilla, M.R. Torres, J. Organomet. Chem. 2001 (633) 91-104. (l) F.A. Cotton, E.V. Dikarev, M.A. Petrukhina,
J. Organomet. Chem. 2002 (596) 130-135.

CHAPTER 3
145
extended interactions are the result of metal-metal σ-bonding between the square planar
d8 transitional metal complexes. The weak σ-bonding interactions are formed between occupied
dz2-orbitals and unoccupied pz-orbitals.40 The typical distance between two rhodium(I) molecules
in extended metal chains is in the range of 3.25-3.68 Å.38,39 The square planar rhodium(I)
complexes can also form a dinuclear unit, which interacts with another similar dinuclear unit via
weak metal-metal interactions,38,39,41 metal and ligand interactions,42,43 metal and aromatic
π-interactions43 or π-π interactions.34 In these cases, the distance between the metals in the
dinuclear unit varies from 3.23 to almost 4.00 Å.43,44
The results of a single crystal structure determination of [Rh(bth)(CO)2]
(Hbth = benzoylthenoylacetone) are presented. The molecular diagram showing atom labelling
of [Rh(bth)(CO)2] is presented in Figure 3.28. Crystal data of the structure of [Rh(bth)(CO)2] are
summarized in Table 3.15, selected bond lengths, angles and torsion angles can be found in
Table 3.14. The cif file with the complete crystallographic data, is given in Appendix B.
Selected comparative geometric data of the square planar complexes of the type
[Rh(β-diketonato)(CO)2] (β-diketonato = bth, acac,38 tfba45 and fctfa46) are given in Table 3.13.
40 S.T. Trzaska, T.M. Swager, Chem. Mater. 1998 (10) 438-443.
41 (a) V. Schurig, W. Pille, W. Winter, Angew. Chem., Int. Ed. 1983 (22) 327-328. (b) A.F. Heyduk, D.J. Krodel,
E.E. Meyer, D.G. Nocera, Inorg. Chem. 2002 (41) 634-636.
42 J.F. Berry, F.A. Cotton, P. Huang, C.A. Murillo, X. Wang, Dalton Trans. 2005 3713-3715.
43 (a) R.J. Doendes, Inorg. Chem. 1978 (17) 1315-1318. (b) P.W. de Haeven, V.L. Goedken, Inorg. Chem. 1979
(18) 827-831. (c) Y. Yamamoto, Y. Wakatsuki, H. Yamazaki, Organometallics 1983 (2) 1604-1607. (d) F.A.
Cotton, K.-B. Shiu, ReV. Chem. Miner. 1986 (23) 14-19. (e) W.S. Sheldrick, P. Bell, Inorg. Chim. Acta 1987
(137) 181-188. (f) W.S. Sheldrick, B. Gunther, Inorg. Chim. Acta 1988 (151) 237-241. (g) E. Corradi, N.
Masciocchi, G. Palyi, R. Ugo, A. Vizi-Orosz, C. Zucchi, A. Sironi, J. Chem. Soc., Dalton Trans. 1997 4651-
4655. (h) A. Elduque, Y. Garces, F.J. Lahoz, J.A. Lopéz, L.A. Oro, T. Pinillos, C. Tejel, Inorg. Chem. Commun.
1999 (2) 414-418. (i) T. Mochida, R. Torigoe, T. Koinuma, C. Asano, T. Satou, K. Koike, T. Nikaido, Eur. J.
Inorg. Chem. 2006 558-565.
44 F.H. Allen, Acta Crystallogr., Sect. B 2002 (58) 380-388.
45 J.G. Leipoldt, L.D.C. Bok, S.S. Basson, J.S. van Vollenhoven, T.I.A. Gerber, Inorg. Chim. Acta 1977 (25) L63-
L64.
46 J. Conradie, T.S. Cameron, M.A.S. Aquino, G.J. Lambrecht, J.C. Swarts, Inorg. Chim. Acta 2005 (358) 2530-
2542.

RESULTS AND DISCUSSION
146
Figure 3.28: Molecular diagram of [Rh(bth)(CO)2] (Hbth = benzoylthenoylacetone) showing atom numbering.
Table 3.13: Selected geometric and crystallographic data of square planar complexes [Rh(β-diketonato)(CO)2] (β-diketonato = bth, acac,38 tfba45 and fctfa46) with R1 and R2 groups as indicated.
β-diketone R1COCH2COR2
R1 R2 Rh-O / Å
Rh-O' / Å
Rh-C / Å
Rh-C’ / Å
O-Rh-O' / °
C-Rh-C’ / °
Space group
Hbth benzoylthenoylacetylacetone Ph C4H3S 2.028(6) 2.041(5) 1.866(9) 1.846(9) 90.4(2) 88.1(3) P212121 Hacac acetylacetone CH3 CH3 2.040(4) 2.044(4) 1.831(7) 1.831(7) 90.8(2) 88.9(3) Pī Htfba trifluorobenzoylacetone CF3 Ph 2.02(2) 2.02(2) 1.79(3) 1.82(3) 89.8(7) 87(1) Pbca Hfctfa ferrocenoyltrifluoroacetone Fc CF3 2.016(9) 2.049(8) 1.84(1) 1.83(2) 90.2(3) 89.1(6) C2/c
The [Rh(bth)(CO)2] molecules pack in the P212121 space group with Z = 4. The Rh(I) atom has a
square planar coordination sphere. The [Rh(bth)(CO)2] molecule as a whole is non-planar. The
thenoyl (C4H3S) and benzoyl (Ph) groups bonded to the β-diketone backbone are both rotated out
of the plane formed by the rest of the molecule by 2° and 15° respectively. This might possibly
be due to packing effects (Figure 3.29) as different interactions of the two groups are observed
with neighbouring molecules. Although both the groups are aromatic, the angle of the benzoyl
which is larger than the angle of the thenoyl, implies that the conjugation between the pseudo
aromatic β-diketonato ring and the thenoyl is stronger. The bonds around the rhodium centre of
the [Rh(bth)(CO)2] molecule were in the same range as the other [Rh(β-diketonato)(CO)2]
molecules (Table 3.13).
The packing diagrams of the [Rh(β-diketonato)(CO)2] molecules are given in Figure 3.29. The
[Rh(bth)(CO)2] molecules stack in an infinite chain of rhodium atoms along the a-axis with a
Rh···Rh distance of 3.250 Å. Neighbouring units are oriented with an angle of 180° in the
opposite direction due to an inversion symmetry operation (Figure 3.30). The rhodium atoms

CHAPTER 3
147
that form the core of a column are stacked in a zigzag fashion with an angle between Rh···Rh
vectors of 167.38°. The distance between Rh atoms in [Rh(bth)(CO)2] is therefore too long to be
considered as a true metal-metal bond, but indicates clearly that interactions between metal
atoms exist. In the examples presented in the literature, the distance between the two Rh(I)
centres is typically within a range of 3.25-3.68 Å34,38,39 in the stacked Rh(I) chains that have no
covalent metal-metal bonds and contain meaningful weak metal-metal interactions. Similar
Rh···Rh interactions were observed for the other [Rh(β-diketonato)(CO)2] molecules
(β-diketonato = acac, tfba and fctfa), as illustrated in Figure 3.29.
The [Rh(acac)(CO)2] molecules consist of weak dimeric units with a Rh···Rh distance of
3.253 Å. These dimers are stacked along the a-axis in a linear fashion, with a distance of
3.271 Å between the dimers. The neighbouring atoms in a dimeric unit are oriented with an
angle of 180° in the opposite direction due to an inversion symmetry operation. A stereoview of
this stacking arrangement is given in Figure 3.30. The rhodium atoms that form the core of a
column are not perfectly aligned on top of one another with an angle between Rh···Rh vectors of
175.28°.
The [Rh(tfba)(CO)2] molecules stack in infinite arrays along the c-axis, with a Rh····Rh distance
of 3.537 Å between the molecules. Different from [Rh(bth)(CO)2] and [Rh(acac)(CO)2],
neighbouring [Rh(tfba)(CO)2] molecules are staggered with an O-Rh···Rh-O torsion angle of
~115° between them (Figure 3.30). The orientation of the neighbouring molecules is
antieclipsed. That is, the ligands are oriented in opposite directions. The angle between Rh···Rh
vectors forming the core of a column is 170.0°. The benzoyl (Ph) group bonded to the
β-diketonato backbone in [Rh(tfba)(CO)2] is rotated out of the plane formed by the rest of the
molecule by 22°, slightly more than the 15° rotation of the benzoyl in [Rh(bth)(CO)2].
The [Rh(fctfa)(CO)2] molecules form weak dimeric units with a Rh···Rh distances of 3.346. Like
[Rh(tfba)(CO)2], the two units of a [Rh(fctfa)(CO)2] dimer are staggered with a an O-Rh···Rh-O
torsion angle of ~96° between them (Figure 3.30) and the orientation of the neighbouring
molecules is antieclipsed. The dimeric units are further supported by π-π interactions that exist
between the neighbouring cyclopentadienyl rings of the ferrocenyl (Fc) groups. The
cyclopentadienyl rings are displaced from each other, in a slipped or offset alignment47 with a
47 C. Janiak, J. Chem. Soc., Dalton Trans. 2000 3885-3896.

RESULTS AND DISCUSSION
148
centroid-centroid separation of 3.585 Å. One main difference between the [Rh(fctfa)(CO)2] and
the other three [Rh(β-diketonato)(CO)2] complexes discussed here is that the dimeric units do not
stack with the rhodium as a central axis. The dimeric units additionally rotates a further 180° so
that the rhodium centre of the one pair stacks on the β-diketonato backbone of the adjacent pair.
Such an arrangement allows Rh-π interactions between the Rh of one dimeric unit and the
cyclopentadienyl ring of another unit. The Rh-centroid separation is 3.599 Å. The stacking is
illustrated by the blue spheres in Figure 3.29.
Figure 3.29: Packing diagrams of the [Rh(β-diketonato)(CO)2] molecules (β-diketonato = bth, acac, tfba and
fctfa). Note the different types of stacking, accentuated by the blue spheres around the rhodium centre.

CHAPTER 3
149
Figure 3.30: Two closest interacting [Rh(β-diketonato)(CO)2] molecules (β-diketonato = bth, acac, tfba and
fctfa), viewed perpendicularly to the coordination plane. Note the orientation between the two molecules.

RESULTS AND DISCUSSION
150
Table 3.14: Selected bond lengths (Å), bond angles (°) and torsion angles (°) of [Rh(bth)(CO)2]. Geometric parameters involving hydrogen atoms are omitted from this table. Atom numbering is as indicated in Figure 3.28.
Bond lengths / Å Rh1-C14 1.846 (9) C1-C4B 1.485 (16) C12-C13 1.383 (12) Rh1-C15 1.866 (9) C2-C3 1.391 (11) S1A-C7A 1.684 (10) Rh1-O1 2.028 (6) C3-C8 1.496 (12) S1A-C4A 1.714 (11) Rh1-O2 2.041 (5) C4B-C5B 1.438 (17) C5A-C4A 1.421 (17) O1-C3 1.265 (10) C4B-S1B 1.728 (17) C5A-C6A 1.431 (17) O2-C1 1.250 (9) C8-C9 1.397 (12) C6A-C7A 1.359 (13) O3-C14 1.140 (9) C8-C13 1.438 (13) S1B-C7B 1.695 (19) O4-C15 1.128 (10) C9-C10 1.360 (12) C5B-C6B 1.415 (18) C1-C2 1.401 (10) C10-C11 1.373 (14) C6B-C7B 1.325 (18) C1-C4A 1.483 (10) C11-C12 1.366 (14)
Bond angles / ° C14-Rh1-C15 88.1 (3) C3-C2-C1 126.5 (7) C12-C13-C8 118.2 (8) C14-Rh1-O1 177.5 (3) O1-C3-C2 125.3 (8) O3-C14-Rh1 178.2 (7) C15-Rh1-O1 90.4 (3) O1-C3-C8 114.8 (7) O4-C15-Rh1 178.7 (8) C14-Rh1-O2 91.2 (3) C2-C3-C8 119.8 (7) C7A-S1A-C4A 91.9 (5) C15-Rh1-O2 177.6 (4) C5B-C4B-C1 133.3 (16) C4A-C5A-C6A 110.0 (14) O1-Rh1-O2 90.4 (2) C5B-C4B-S1B 113.3 (12) C7A-C6A-C5A 112.7 (11) C3-O1-Rh1 126.1 (6) C1-C4B-S1B 113.4 (13) C6A-C7A-S1A 113.8 (8) C1-O2-Rh1 125.3 (5) C9-C8-C13 118.1 (8) C7B-S1B-C4B 90.4 (11) O2-C1-C2 126.3 (7) C9-C8-C3 124.3 (8) C6B-C5B-C4B 106.2 (15) O2-C1-C4A 116.5 (8) C13-C8-C3 117.6 (7) C7B-C6B-C5B 117.1 (19) C2-C1-C4A 117.2 (8) C10-C9-C8 120.7 (9) C6B-C7B-S1B 113.0 (18) O2-C1-C4B 106.6 (10) C9-C10-C11 121.7 (9) C5A-C4A-C1 133.2 (12) C2-C1-C4B 126.9 (11) C12-C11-C10 118.9 (9) C5A-C4A-S1A 111.6 (9) C4A-C1-C4B 11.2 (10) C11-C12-C13 122.4 (9) C1-C4A-S1A 115.2 (8)
Torsion angles / ° C14-Rh1-O1-C3 -133 (7) C2-C1-C4B-S1B -21 (3) C4A-C5A-C6A-C7A -0.4 (15) C15-Rh1-O1-C3 175.0 (8) C4A-C1-C4B-S1B 11 (7) C5A-C6A-C7A-S1A -0.6 (14) O2-Rh1-O1-C3 -2.7 (8) O1-C3-C8-C9 154.6 (9) C4A-S1A-C7A-C6A 1.1 (11) C14-Rh1-O2-C1 179.8 (7) C2-C3-C8-C9 -28.7 (14) C5B-C4B-S1B-C7B 0 (3) C15-Rh1-O2-C1 -109 (7) O1-C3-C8-C13 -27.1 (11) C1-C4B-S1B-C7B 178 (3) O1-Rh1-O2-C1 1.7 (7) C2-C3-C8-C13 149.5 (10) C1-C4B-C5B-C6B -179 (4) Rh1-O2-C1-C2 -0.1 (13) C13-C8-C9-C10 0.9 (13) S1B-C4B-C5B-C6B -1.0 (17) Rh1-O2-C1-C4A -179.1 (7) C3-C8-C9-C10 179.1 (8) C4B-C5B-C6B-C7B 1 (2) Rh1-O2-C1-C4B 175.3 (16) C8-C9-C10-C11 0.4 (14) C5B-C6B-C7B-S1B -1 (4) O2-C1-C2-C3 -1.4 (17) C9-C10-C11-C12 -1.5 (15) C4B-S1B-C7B-C6B 0 (3) C4A-C1-C2-C3 177.5 (10) C10-C11-C12-C13 1.4 (16) C6A-C5A-C4A-C1 -179.5 (13) C4B-C1-C2-C3 -176 (2) C11-C12-C13-C8 -0.1 (15) C6A-C5A-C4A-S1A 1.2 (14) Rh1-O1-C3-C2 2.3 (14) C9-C8-C13-C12 -1.0 (13) O2-C1-C4A-C5A 172.4 (13) Rh1-O1-C3-C8 178.7 (6) C3-C8-C13-C12 -179.4 (8) C2-C1-C4A-C5A -6.6 (17) C1-C2-C3-O1 0.2 (18) C15-Rh1-C14-O3 22 (27) C4B-C1-C4A-C5A -159 (10) C1-C2-C3-C8 -176.0 (8) O1-Rh1-C14-O3 -31 (32) O2-C1-C4A-S1A -8.2 (13) O2-C1-C4B-C5B -19 (4) O2-Rh1-C14-O3 -160 (27) C2-C1-C4A-S1A 172.7 (8) C2-C1-C4B-C5B 157 (2) C14-Rh1-C15-O4 -171 (41) C4B-C1-C4A-S1A 21 (9) C4A-C1-C4B-C5B -172 (12) O1-Rh1-C15-O4 7 (41) C7A-S1A-C4A-C5A -1.3 (11) O2-C1-C4B-S1B 163.8 (17) O2-Rh1-C15-O4 118 (39) C7A-S1A-C4A-C1 179.2 (9)

CHAPTER 3
151
Table 3.15: Crystal data and structure refinement of [Rh(bth(CO)2].
Empirical formula C15H9O4RhS Theta range for data collection
3.5-40.5°
Formula weight 388.19 g mol-1 Index ranges 8<=h<=8
15<=k<=15 26<=l<=26
Temperature 100(2) K Reflections collected 25770
Wavelength 0.71073 Å Independent reflections 3596
[Rint = 0.152]
Crystal system Orthorhombic Theta maximum 28.5°
Space group P212121 Absorption correction multi-scan
Unit cell dimensions
a = 6.4610(9) Å b = 11.4245(18) Å c = 19.557(3) Å
α = 90° β = 90° γ = 90°
Max. and min. transmission 0.937 and 0.620
Volume 1443.57 Å3 Refinement method Full-matrix
least-squares on F2
Z 4 Data / restraints /
parameters 3596 / 26 / 185
Density (calculated) 1.786 Mg m-3 Goodness-of-fit on F2 1.06
Absorption coefficient (µµµµ) 1.34 mm-1 Final R indices [I>2sigma(I)]
R1 = 0.074
F(000) 768 R indices (all data) R1 = 0.0979
wR2 = 0.1948
Crystal size 0.40 x 0.09 x 0.05 mm3 Largest diff.
peak and hole 3.46 and -1.60 e.Å-3
- - Absolute structure
parameter 0.46(10)

RESULTS AND DISCUSSION
152
3.2 Iron complexes.
3.2.1 [Fe(β-diketonato)3].
3.2.1.1 Synthesis.
Two new [Fe(β-diketonato)3] complexes (β-diketonato = bth {3} and dtm {4}) and eight known
[Fe(β-diketonato)3] complexes (β-diketonato = acac {1}, ba {2}, dbm {5}, tfaa {6}, tffu {7}, tfba
{8}, tta {9} and hfaa {10}) were synthesized by a general adapted method.48,49,50 The general
method is given in Figure 3.31.
Figure 3.31: General method to synthesize [Fe(β-diketonato)3] complexes.
The method involves buffering the aqueous metal solution of Fe(NO3)3 with sodium acetate. The
result of this reaction, 2 Fe(NO3)3 + 4 CH3COONa, is a paddle wheel complex [Fe2(CH3COO)4]
(Figure 3.32). Bridging occurs since the CH3COO− ligand forms a four membered ring with a
bite angle of ~68°. Since a bite angle of ~90° (as with a six membered ring) is necessary for
overlap with the d-orbitals of the iron centre (as with the final product), a paddle wheel complex
forms. This keeps the iron soluble in water without reacting with the water itself.
48 E.W. Berg, J.T. Truemper, J. Phys. Chem. 1960 (64) 487-490.
49 K. Endo, M. Furukawa, H. Yamatera, H Sano, Bull. Chem. Soc. Jpn 1980 (53) 407-410.
50 G.S. Hammond, D.C. Nonhebel, C.S. Wu, Inorg. Chem. 1963 (2) 73-76.

CHAPTER 3
153
Figure 3.32: The paddle wheel complex [Fe2(CH3COO)4].
For complexes {2}, {3}, {8} and {9}, the aqueous buffered metal solution was used as is. For
complexes {1}, {4}, {5}, {6}, {7} and {10}, ethanol was added additionally to the aqueous
buffered metal solution to make a 1:1 H2O:EtOH solution. This was done for the purpose of the
next step for one of the following two reasons: the β-diketone is already a liquid and was
therefore not dissolved in ethanol or the β-diketone is insoluble in pure water. The next step
therefore is to add the β-diketone to the buffered metal solution. For {2}, {3}, {8} and {9}, the
β-diketones were first dissolved in ethanol and then added to the buffered solution. For {1}, {6},
{7} and {10}, the β-diketones were added direct with a syringe, since they are liquid at room
temperature. For {4} and {5}, the β-diketones were first dissolved in DCM and then added to
the 1:1 H2O:EtOH solution. The resulting solution in all the cases was stirred well for
30 minutes and was left overnight in a fume hood. The precipitate was collected the next day by
filtration and thorough washing with water. The complexes were confirmed by mass
spectroscopy and elemental analysis (section 4.3.3, Chapter 4). Since the complexes are
paramagnetic, no 1H NMR characterization was possible. A comparison table with the different
characteristics of the different [Fe(β-diketonato)3] complexes is given in Table 3.16.
In general, good yields (71-96%) were obtained, except for {4} and {10} which had yields of
39% and 51% respectively. The poor yield for {4} is due to solubility problems of the
β-diketone. DCM was the only solvent that reasonably could dissolve the β-diketone and still
could mix with the buffered metal solution. The poor yield for {10} is probably due to the fact
that the β-diketone is extremely volatile at room temperature.
The complexes had all red-like colours, varying from light orange to black. This is due to the
crystal field splitting exhibited by the high spin octahedral complexes, which will be discussed in
section 3.2.1.4. The melting points of the known complexes were in the same range as the
reported values,48,51,52,53,54,55,56 except for {8} which was found to melt much earlier than the
reported value. Since the elemental analysis of this compound was within 99% accurate for

RESULTS AND DISCUSSION
154
carbon, it is assumed that the compound is clean. The melting point was determined three times
and is therefore accepted to be 58.4-60.1 °C and not 128-129 °C, as reported by Berg et al.48 in
1960.
Table 3.16: Characteristic data and results of the synthesis of [Fe(β-diketonato)3] complexes.
[Fe(β-diketonato)3] Yield Colour λλλλmax / nm i
(εεεεmax / mol-1.dm3.cm-1) M.p.
acac {1} acetylacetone 73% red 270 (25842) 180.0-182.0 °C
(reported: 179 °C,48 180 °C51)
ba {2} benzoylacetone 84% red-orange 298 (40256) 218.5-220.3 °C
(reported: 222-224 °C48) bth {3} benzoylthenoylacetylacetone 85% red-brown 361 (30956) 220.0-222.0 °C dtm {4} dithenoylmethane 39% black 260 (35301) 63.7-66.4 °C
dbm {5} dibenzoylmethane 71% dark red 336 (48608) 264.0-265.2 °C
(reported: 261 °C,52 257 °C53)
tfaa {6} trifluoroacetylacetone 91% red-brown 271 (48996) 113.5-116.1 °C
(reported: 115 °C 48,54)
tffu {7} trifluorofuroylacetone 92% dark red 333 (53476) 205.0-208.0 °C
(reported: 201-208 °C48)
tfba {8} trifluorobenzoylacetone 96% orange 304 (30788) 58.4-60.1 °C
(reported: 128-129 °C48)
tta {9} thenoyltrifluoroacetone 78% dark red 333 (48461) 158.0-161.0 °C
(reported: 159-160 °C,48 162.5 °C55)
hfaa {10} hexafluoroacetylacetone 51% light orange - ii 56.0-58.0 °C
(reported: 55 °C56)
i In CH3CN solution. ii Insoluble in CH3CN.
3.2.1.2 Cyclic Voltammetry (CV).
In this section, the electrochemistry of [FeIII(β-diketonato)3] (β-diketonato = acac {1}, ba {2}, bth
{3}, dtm {4}, dbm {5}, tfaa {6}, tffu {7}, tfba {8} , tta {9} and hfaa {10}, Table 3.18) is
described. The only redox active centre in the complexes studied was the iron centre. The
oxidation state of iron changes reversibly between Fe(III) and Fe(II). The overall electrochemical
reaction is: [FeIII(β-diketonato)3] + e- [FeII(β-diketonato)3]–. The different redox potentials of
the [FeIII(β-diketonato)3] series are due to the different electronic densities at the metal centre due
to the different substituents on the β-diketonato ligands. The details of the methods used are
given in section 4.2.5 (Chapter 4).
51 M.-L. Hu, Z.-M. Jin, Q. Miao, L.-P. Fang, Z. Kristallogr. - New Cryst. Struct. 2001 (216) 597-598.
52 B. Kaitner, B. Kamenar, Cryst. Struct. Commun. 1980 (9) 487-492.
53 I.A. Baidina, P.A. Stabnikov, I.K. Igumenov, S.V. Borisov, Koord. Khim. (Russ.) (Coord.Chem.) 1986 (12) 258-
265.
54 I.A. Baidina, P.A. Stabnikov, I.K. Igumenov, S.V. Borisov, Koord. Khim. (Russ. )(Coord. Chem.) 1986 (12) 404-
408.
55 H. Soling, Acta Chem. Scand. A 1976 (30) 163-170.
56 C.E. Pfluger, P.S. Haradem, Inorg. Chim. Acta 1983 (69) 141-146.

CHAPTER 3
155
The electrochemical data of [Fe(acac)3] {1} (at varying scan rates) are summarized in Table 3.17
and the cyclic voltammograms are shown in Figure 3.33. One iron-related reduction half
reaction in the cathodic sweep (the peaks pointing downward) and one oxidation half reaction in
the anodic sweep (the peaks pointing upward) were observed. The [Fe(acac)3] {1} complex
shows reversible electrochemical behaviour at the slower scan rates (∆Ep < 90 mV). However, at
a higher scan rate of 1000 mV.s-1, the difference in peak potentials increased to 109 mV. A slow
increase of ∆Ep with scan rate is consistent with electrode adsorption. The current ratios
(ipa/ipc ≈ 1) indicate that this redox reaction is chemically reversible.
Table 3.17: Electrochemical datai of [Fe(acac)3] {1}.
Scan Rate / mV.s-1 Epa / V Epc / V ∆∆∆∆Ep / V E0' / V ipa / µµµµA ipc / µµµµA ipa/ipc 50 -1.002 -1.076 0.074 -1.039 10.56 10.75 0.98 100 -1.002 -1.074 0.072 -1.038 14.66 14.72 1.00 150 -1.000 -1.077 0.077 -1.038 17.58 18.51 0.95 200 -0.997 -1.078 0.081 -1.037 20.25 20.50 0.99 250 -0.997 -1.078 0.081 -1.037 22.73 22.92 0.99 300 -0.993 -1.081 0.088 -1.037 24.47 25.03 0.98 1000 -0.983 -1.092 0.109 -1.037 42.42 43.35 0.98
i Solvent CH3CN, supporting electrolyte TBAPF6 ([NBu4][PF6]), versus Fc/Fc+, scan rate as indicated.
-60
-50
-40
-30
-20
-10
0
10
20
30
40
50
-1.6 -1.4 -1.2 -1.0 -0.8 -0.6
E / mV vs Fc/Fc+
i / µµ µµ
A
i a
i c
Figure 3.33: Cyclic voltammograms (versus Fc/Fc+) of 1 mmol.dm-3 [Fe(acac)3] {1} at scan rates 50, 100, 150,
200, 250, 300 and 1000 mV.s-1. Scans initiated in the direction of the arrow. Measured in 100 mmol.dm-3
TBAPF6/CH3CN on a glassy carbon working electrode at 25 °C.

RESULTS AND DISCUSSION
156
Selected electrochemical data of all the [FeIII(β-diketonato)3] complexes in this study are
summarized in Table 3.18 and the comparative cyclic voltammograms are shown in Figure 3.34.
The complete cyclic voltammograms of the [FeIII(β-diketonato)3] complexes in this study, along
with the tables with the complete electrochemical data, are given in Appendix A. Complexes
{2} - {10} show electrochemistry similar to that of [Fe(acac)3] {1}, producing electrochemically
and chemically reversible behaviour, except for [Fe(tfaa)3] {6}. The [Fe(tfaa)3] {6} complex
shows quasi-reversible electrochemical behaviour (88 mV < ∆Ep < 147 mV). A quasi-reversible
redox couple indicates that both the oxidation and reduction processes still take place, but there
is a slow electron exchange between the electrode and the redox species in solution. [Fe(hfaa)3]
{10} is insoluble in CH3CN. A sufficient amount was, however, dissolved in DCM to perform
an electrochemical analysis. The results of {1} - {9} in TBAPF6/CH3CN and {10} in
TBAPF6/DCM are much better than in TBAP/DMF, reported by Endo et. al.49 In our study, all
the [FeIII(β-diketonato)3] complexes (except {6}) show reversible electrochemical behaviour
(62 mV < ∆Ep < 72 mV at 100 mV.s-1). Endo et. al.49 found that [Fe(dbm)3] {5} showed
electrochemically reversible behaviour (∆Ep = 60 mV at 500 mV.s-1), whereas those of the other
[FeIII(β-diketonato)3] complexes in his study (Table 2.10, section 2.5.1, Chapter 2) showed
electrochemically irreversible behaviour (130 < ∆Ep < 500 mV). The formal reduction potentials
(E0', versus saturated Ag/AgCl), had the same sequence as in the table below.

CHAPTER 3
157
-20
30
80
130
180
230
-1.3 -1.1 -0.9 -0.7 -0.5 -0.3 -0.1 0.1 0.3 0.5
E / mV vs Fc/Fc+
i / µµ µµ
A
i a
i c
acac
ba
bth
dtm
dbm
tfaa
tffu
tfba
tta
hfaa
Figure 3.34: Comparative cyclic voltammograms (versus Fc/Fc+) of 1 mmol.dm-3 of the indicated
[FeIII (β-diketonato)3] complexes at a scan rate of 100 mV.s-1. Scans initiated in the direction of the arrow. The
β-diketonato ligands in the red, green and blue groups contain respectively none, one and two CF3 side groups.

RESULTS AND DISCUSSION
158
Table 3.18: Acid dissociation constant (pKa), total group electronegativities on the Gordy scale (χR1 + χR2) and selected electrochemical data of the [FeIII(β-diketonato)3] complexes.
β-diketone (R1COCH2COR2) [FeIII(β-diketonato)3] R1 R2 pKa χχχχR1 + χχχχR2 ∆∆∆∆Ep / mV E0' / V
acac {1} acetylacetone CH3 CH3 8.95 57 4.68 58 72 i -1.038 i
ba {2} benzoylacetone CH3 Ph 8.70 57 4.55 58,60 63 i -0.971 i bth {3} benzoylthenoylacetylacetone Ph C4H3S 9.01 59 4.31 60,59 62 i -0.881 i dtm {4} dithenoylmethane C4H3S C4H3S 8.89 59 4.20 59 70 i -0.844 i dbm {5} dibenzoylmethane Ph Ph 9.35 57 4.42 60 68 i -0.921 i tfaa {6} trifluoroacetylacetone CF3 CH3 6.30 57 5.35 60,58 88 i -0.377 i tffu {7} trifluorofuroylacetone CF3 C4H3O 6.48 iii 5.13 iii 67 i -0.347 i tfba {8} trifluorobenzoylacetone CF3 Ph 6.30 57 5.22 60 64 i -0.351 i tta {9} thenoyltrifluoroacetone CF3 C4H3S 6.50 59 5.11 60,59 70 i -0.355 i
hfaa {10} hexafluoroacetylacetone CF3 CF3 4.35 61 6.02 60 70 ii 0.202 ii i Solvent CH3CN, supporting electrolyte TBAPF6 ([NBu4][PF6]), versus Fc/Fc+, scan rate 100 mV.s-1.
ii Solvent DCM, supporting electrolyte TBAPF6 ([NBu4][PF6]), versus Fc/Fc+, scan rate 100 mV.s-1. iii This study, calculated from the relationships in Figure 3.35.
According to Figure 3.34, the [FeIII(β-diketonato)3] complexes in this study can be divided into
three distinctive groups. The red group: containing [FeIII(β-diketonato)3] complexes where the
β-diketonato ligand has no CF3 side groups. The green group: containing [FeIII(β-diketonato)3]
complexes where the β-diketonato ligand has one CF3 side group. The blue group: containing a
[FeIII(β-diketonato)3] complex where the β-diketonato ligand has two CF3 side groups. The CF3
group has a higher group electronegativity than the other groups (CF3 = 3.01,60 CH3 = 2.34,58 Ph
= 2.21,60 C4H3O = 2.1262 and C4H3S = 2.10 59). Therefore, an increase in the number of CF3
groups results in an increase of the total group electronegativity (χR1 + χR2) of the β-diketonato
ligands bonded to the iron centre. In general, as the total group electronegativity increases, the
formal reduction potential (E0') also increases (Table 3.18). This is expected since the more
electron-withdrawing the R group becomes, the more electron density is removed from the
β-diketonato backbone, making the iron centre relatively more positive and more difficult to
reduce.
Parameters that are related to the electron density of the metal centre of [FeIII(β-diketonato)3],
such as the acid dissociation constant (pKa) of the uncoordinated β-diketone, the total group
57 J. Starý, The Solvent Extraction of Metal Chelates, MacMillan Company, New York, 1964, Appendix.
58 R.E. Kagarise, J. Am. Chem. Soc. 1955 (77) 1377-1379.
59 M.M. Conradie, A.J. Muller, J. Conradie, S. Afr. J. Chem. 2008 (61) 13-21.
60 W.C. du Plessis, T.G. Vosloo, J.C. Swarts, J. Chem. Soc. Dalton Trans. 1998 2507-2514.
61 M. Ellinger, H. Duschner, K. Starke, J. Inorg. Nucl. Chem. 1978 (40) 1063-1067.
62 This study, calculated from the relationships in Figure 3.35.

CHAPTER 3
159
electronegativities (χR1 + χR2) of the R1 and R2 side groups on the β-diketonato ligand and the
formal reduction potentials (E0') of the redox active metal Fe(III)/Fe(II) in [FeIII(β-diketonato)3],
are also included in Table 3.18. The relationships of the formal reduction potential (E0') with pKa
and χR1 + χR2 are shown graphically in Figure 3.35.
The correlation of the formal reduction potentials shows the following trends:
E0' versus pKa: Shows that the E0' increases linearly with a decreasing pKa. The iron centre is
relatively more electron-deficient (with smaller pKa) and consequently more energy is needed to
reduce [FeIII(β-diketonato)3].
E0' versus χχχχR1 + χχχχR2: Three separate trends were found for the red, green and blue groups, where
the β-diketonato ligands contain respectively none, one and two CF3 side groups. In general, the
E0' increases for the three groups as the number of CF3 groups increase. The trend within a
group, however, shows an opposite behaviour. The E0' decreases slightly linearly with the
increase in total group electronegativities.
The linear equations (y = mx + c) in Figure 3.35, defining the relationships between E0' and the
parameters above are: pKa = (-4.164) E0' + 5.033
χR1 + χR2 = (-2.483) E0' + 2.120 (red group, R1 and R2 ≠ CF3)
χR1 + χR2 = (-6.990) E0' + 2.703 (green group, R1 or R2 = CF3)
χR1 + χR2 = 6.020 (blue group, R1 = R2 = CF3)
This allows one to determine the acid dissociation constant (pKa) of the uncoordinated
β-diketone and the total group electronegativities (χR1 + χR2) of the R1 and R2 side groups, when
the formal reduction potential (E0') is known. These newly found relationships were used on
[Fe(tffu)3] {7}, where neither the acid dissociation constant of Htffu nor the group
electronegativity of furyl (C4H3O) was known. Using the experimental value of -0.347 V for the
E0' of [Fe(tffu)3] {7}, the pKa of Htffu was calculated as 6.48 and the χC4H3O of furyl was
calculated as 2.12.

RESULTS AND DISCUSSION
160
R2 = 0.964
4
5
6
7
8
9
10
-1.2 -0.7 -0.2 0.3
E0' / V
p Ka
{10}
{8}{6}
{9}
{1}{2}
{5}
{3}
{4}
R2 = 0.992
R2 = 0.864
4.0
4.5
5.0
5.5
6.0
6.5
-1.2 -0.7 -0.2 0.3
E0' / Vχχ χχ R
1 +
χχ χχR
2
{10}
{8}{6}
{9}
{1}{2}{5}
{3}{4}
Figure 3.35: The correlation of the formal reduction potentials (E0') of [FeIII(β-diketonato)3] complexes with the
acid dissociation constants (pKa) of the uncoordinated β-diketones (R1COCH2COR2) and the total group
electronegativities (χR1 + χR2) of the R1 and R2 side groups. The β-diketonato ligands in the red, green and blue
groups contain respectively none, one and two CF3 side groups.
From the DFT computational study (section 3.2.1.4), it is clear that both the facial (fac) and
meridional (mer) isomers exist in appreciable quantities for the [FeIII(β-diketonato)3] complexes
with unsymmetrical β-diketonato ligands. However, it was impossible to distinguish between the
two stereo isomers electrochemically. This entirely expected result indicates that molecular
geometry does not significantly influence the potential required to oxidise the iron centre, but
bond delocalisation does transmit electron donating or electron withdrawing effects of molecular
fragments to and from the iron centre.
3.2.1.3 Spectroelectrochemistry (SEC).
To further investigate the electrochemical properties of the [FeIII(β-diketonato)3] complexes
(β-diketonato = acac {1}, ba {2}, bth {3}, dtm {4}, dbm {5}, tfaa {6}, tffu {7}, tfba {8} and tta
{9}), a spectroelectrochemical study was conducted. Spectroelectrochemistry (SEC) combines
the two quite different techniques, electrochemistry and spectroscopy, to study the influence of
the redox chemistry of the [FeIII(β-diketonato)3] complexes on their UV/vis absorption spectra.

CHAPTER 3
161
The oxidation state is changed electrochemically (in an OTTLE cell) by the addition of an
electron. The product of the redox transformation is then simultaneously monitored in situ by
UV/vis spectroscopy (200-600 nm). The details of the methods used are given in section 4.2.5
(Chapter 4).
From the cyclic voltammetry study (section 3.2.1.2), we already know that [FeIII(β-diketonato)3]
complexes undergo a single one-electron iron-related reduction reaction. This reaction is
electrochemically and chemically reversible. The voltammograms are given in Figure 3.34 and
Appendix A and the electrochemical data are summarized in Table 3.18.
Iron(III) complexes have strong absorption bands in the near ultraviolet region. Iron(III)
porphyrins have a typical Soret63 band at ~400nm,64,65,66,67 whereas tris(β-diketonato) iron(III)
complexes have a strong absorption band at ~300nm.68 The intensity of the bands change as the
iron(III) complexes are reduced or oxidized.64,65,66,67 The spectral changes obtained during the
Fe(III)/Fe(II) reduction of complexes {1} - {9} are presented graphically in Figure 3.36. The
study was conducted in CH3CN and since [Fe(hfaa)3] {10} is insoluble in CH3CN, it is excluded
from this study.
63 J.L. Soret, Comptes Rendus 1883 (97) 1269-1273.
64 K.M. Kadish, E. van Caemelbecke, E. Gueletti, S. Fukuzumi, K. Miyamoto, T. Suenobu, A. Tabard, R. Guilard,
Inorg. Chem. 1998 (37) 1759-1766.
65 P.W Crawford, M.D. Ryan, Inorg. Chem. 1991 (179) 25-33.
66 K.M. Kadish, E. van Caemelbecke, F. D’Souza, C.J. Medforth, K.M. Smith, A. Tabard, R. Guilard, Inorg. Chem.
1995 (34) 2984-2989.
67 D. Lancon, P. Cocolios, R. Guilard, K.M. Kadish, Inorg. Chem. 1984 (106) 4472-4478.
68 G. Gumbel, H. Elias, Inorg. Chim. Acta 2003 (342) 97-106.

RESULTS AND DISCUSSION
162
Figure 3.36: UV/vis thin-layer spectral changes during the one-electron Fe(III)/Fe(II) reduction of
[FeIII(β-diketonato)3] complexes {1} - {9}, measured in TBAPF6/CH3CN in an OTTLE cell at 25 °C. First scans are
marked blue and the peak increase/decrease is as indicated by the arrows.
Similar spectra for [Fe(acac)3] {1} and [Fe(tfaa)3] {6} were observed. The β-diketonato ligands
acac and tfaa have respectively CH3/CH3 and CH3/CF3 side groups. Changing the one side group
from CH3 to CF3 had very little effect on the spectral absorption of these two complexes. This is
also the case with [Fe(ba)3] {2} and [Fe(tfba)3] {8}, which also have very similar spectra. The
β-diketonato ligands ba and tfba have respectively Ph/CH3 and Ph/CF3 side groups. Introduction
of one Ph or two Ph side groups successively causes a red shift of ~30 nm:

CHAPTER 3
163
[Fe(acac)3] {1} (270 nm) → [Fe(ba)3] {2} (298 nm) → [Fe(dbm)3] {5} (336 nm)
[Fe(tfaa)3] {6} (271 nm) → [Fe(tfba)3] {8} (304 nm) → [Fe(dbm)3] {5} (336 nm)
The spectral changes during the reduction of [Fe(acac)3] {1} and [Fe(tfaa)3] {6}, as well as of
[Fe(ba)3] {2} and [Fe(tfba)3] {8}, were very similar. Changing the one side group from CH3 to
CF3 not only had very little effect on the spectral absorption of the [FeIII(β-diketonato)3]
complexes, but also on the [FeII(β-diketonato)3]– complexes.
The other complexes, all containing one or two aromatic side groups, had unique spectra and
spectral changes and no further trends were observed. Each complex is discussed in detail in the
following paragraphs.
[Fe(acac)3] {1}: This complex has a strong band at 270 nm, two smaller bands at 235 and 355
nm and a shoulder at 440 nm. Upon reduction of the complex, the 235, 270 and 440 nm bands
decrease in intensity and the 355 nm band increases. The 235 and 335 nm bands also have a red
shift of 5 and 25 nm respectively. Additionally, a new shoulder appears at 320 nm. Two
isobestic points are visible at 295 and 390 nm. These spectral changes are similar to that of
Fe(tfaa)3] {6}.
[Fe(ba)3] {2}: This complex has a strong band at 298 nm and a smaller band at 250 nm. Upon
reduction of the complex, the 298 and 250 nm bands respectively decrease and increase in
intensity. One isobestic point is visible at 265 nm. These spectral changes are similar to that of
Fe(tfba)3] {8}.
[Fe(bth)3] {3}: This complex has a strong band at 361 nm, a smaller band at 245 nm and a
shoulder at 275 nm. Upon reduction of the complex, the 361 nm band decreases in intensity.
The 245 nm band initially slightly decreases with a red shift of 10 nm and then strongly increases
at 255 nm. The shoulder at 275 nm increases with a red shift of 25 nm. One isobestic point is
visible at ~300 nm.
[Fe(dtm)3] {4}: This complex has a band at 260 nm and four shoulders at 295, 350, 375 and 445
nm. Upon reduction of the complex, the 350, 375 and 445 nm shoulders decrease in intensity
and the 260 nm band with the 295 nm shoulder increases in intensity. One isobestic point is
visible at 320 nm.

RESULTS AND DISCUSSION
164
[Fe(dbm)3] {5}: This complex has a strong band at 336 nm, a smaller band at 251 nm and a
shoulder at 415 nm. Upon reduction of the complex, the 336 nm band decreases in intensity and
the shoulder at 415 nm disappears completely. The 251 nm band increases in intensity with a
slight blue shift of 3 nm. One isobestic point is visible at 270 nm.
[Fe(tfaa)3] {6}: This complex has a strong band at 271 nm, two smaller bands at 235 and 360
nm and a shoulder at 450 nm. Upon reduction of the complex, the 235, 271 and 450 nm bands
decrease in intensity and the 360 nm band increases. The 235 and 271 nm bands also both have a
red shift of 4 nm. Additionally, a new shoulder appears at 315 nm. Two isobestic points are
visible at 290 and 390 nm. These spectral changes are similar to that of Fe(acac)3] {1}.
[Fe(tffu)3] {7}: This complex has a strong band at 333 nm, two smaller bands at 230 and 385
nm and a shoulder at ~520 nm. Upon reduction of the complex, the 333, 385 and ~520 nm bands
disappear completely. A new strong band at 295 nm and a shoulder at 350 nm appear. The 230
nm band increases with a red shift of 5 nm. Two isobestic points are visible at 230 and 300 nm.
[Fe(tfba)3] {8}: This complex has a strong band at 304 nm and a shoulder at 259 nm. Upon
reduction of the complex, the 304 and 259 nm bands respectively decrease and increase in
intensity. Two isobestic points are visible at 230 and 275 nm. These spectral changes are similar
to that of Fe(ba)3] {2}.
[Fe(tta)3] {9}: This complex has a strong band at 333 nm, a smaller band at 270 nm and a
shoulder at 385 nm. Upon reduction of the complex, the 333 nm band decreases in intensity to
form a band at 320 nm with a shoulder at 350 nm. The shoulder at 385 nm also decreases in
intensity. The band at 270 nm slightly increases in intensity and a new shoulder at 230 nm
appears. Two isobestic points are visible at 225 and 300 nm.
3.2.1.4 DFT computational study.
In this DFT computational study, we investigate the electrochemical behaviour of the redox
reaction: [FeIII(β-diketonato)3] + e- [FeII(β-diketonato)3]– (β-diketonato = acac {1}, ba {2},
bth {3}, dtm {4}, dbm {5}, tfaa {6}, tffu {7}, tfba {8}, tta {9} and hfaa {10}, Table 3.18).
Tris(β-diketonato) iron(III) complexes are stable molecules with the metal in a high spin state

CHAPTER 3
165
(S = 5/2).69,70 In the reduced form, [FeII(β-diketonato)3]–, it is also high-spin (S = 2). These
complexes can have either a D3 (complexes with symmetrical β-diketone ligand), C3 (complexes
with unsymmetrical β-diketone ligand, arranged in such a way that they have a 3-fold rotational
axis) or C1 (complexes with unsymmetrical β-diketone ligand, arranged in such a way that they
have no symmetry operation) symmetry. The details of the computational methods used are
given in section 4.5.3.1 (Chapter 4).
To validate the DFT computational method, the S = 1/2, 3/2 and 5/2 states of [Fe(acac)3] were
optimized with a variety of functionals (PW91, OLYP, B3LYP and B3LYP*), to see which
functional can correctly predict the S = 5/2 state. The relative energies are given in Table 3.19.
To further validate the DFT computational method, the bond lengths and bond angles of
[Fe(acac)3] (S = 5/2) were compared to known experimental70,71 and calculated70 data (Table
3.20). OLYP, B3LYP and B3LYP* successfully predict a sextet ground state with the other
states approximately 90 kJ.mol-1 higher in energy (Table 3.19). PW91, however, incorrectly
predicts a doublet state with the sextet state 30 kJ.mol-1 higher in energy. The functional OLYP
was therefore used in further calculations. The OLYP optimization of [Fe(acac)3] (S = 5/2) with
D3, C2 and C1 symmetry constraint gave virtually the same energies. The OLYP geometries are
in close agreement with known experimental and calculated data (Table 3.20). The calculated
bond lengths are slightly longer than those obtained from X-ray crystallography, but it is
well-known that GGA density functionals overestimate bonds lengths.25
Table 3.19: Relative energies (kJ.mol-1) of the different spin states (default occupations) of [Fe(acac)3], optimized under a D3 symmetry constraint with a selection of functionals.
Spin PW91 OLYP B3LYP B3LYP* 1/2 -30 61 132 89 3/2 30 76 135 109 5/2 0 0 0 0
69 F.A. Cotton, G. Wilkinson, Advanced inorganic chemistry, Second edition, John Wiley & Sons, New York, 1966,
p875.
70 I. Diaz-Acosta, J. Baker, W. Cordes, P. Pulay, J. Phys. Chem. A 2001 (105) 238-244.
71 J. Iball, C.H. Morgan, Acta Cryst. 1967 (23) 239-244.

RESULTS AND DISCUSSION
166
Table 3.20: Selected experimental and calculated geometrical parameters of [Fe(acac)3] (S = 5/2), optimized under a D3 symmetry.
Properties OLYP B3LYP70 i Crystal70 Crystal71 Fe-O(Å) 2.064 2.011 1.992(21) 1.992(6) O-C (Å) 1.276 1.275 1.262(4) 1.258(12) C-C (Å) 1.408 1.405 1.382(5) 1.377(19)
C-CH3 (Å) 1.517 1.512 1.504(5) 1.530(21) O-Fe-O (°) 85.9 87.1 87.43(9) 87.1(3) Fe-O-C (°) 129.8 129.8 129.12(20) 129.3(6) O-C-C (°) 125.1 124.9 124.5(3) 125.0(15) C-C-C (°) 124.3 123.5 124.8(3) 124.8(8)
i PQS parallel ab initio programme, B3LYP functional, 6-31G* basis set and D3 symmetry.
The coordination of the metal in tris(β-diketonato) iron(III) complexes with a symmetrical
β-diketone ligand ({1}, {4}, {5} and {10}) is approximately of octahedral D3 symmetry. Figure
3.37 shows a qualitative diagram of the d-orbital energies of the metal ion and the effect on the
relative energies upon distortion of the ligand field (section 2.2.3, Chapter 2). The
symmetry-breaking distortion is zero at the middle, corresponding to octahedral symmetry.
Distortion towards D3 ligand symmetry splits the degenerate t2g-orbitals into a and e components.
Qualitatively, a positive D3 distortion corresponds to the flattening of the octahedron and a
negative distortion corresponds to an increase of its height. Depending on the sign of the D3
distortion, either the a or the e component is lower in energy. Complexes {1}, {4}, {5} and {10}
all show negative distortion as depicted in Figure 3.37 9 (left), with the lowest d-orbital having a
symmetry. Therefore, when [Fe(β-diketonato)3] with D3 symmetry is reduced to become
[Fe(β-diketonato)3]–, the lower a component of the d-orbital will gain an electron. Gaining only
one electron is not allowed for the e component, since the e component has to be doubly
occupied.
Figure 3.37: Alteration of octahedral orbital energies (Oh) under D3 distortion.
For tris(β-diketonato) iron(III) complexes with a unsymmetrical β-diketone ligand ({2}, {3}, {6},
{7}, {8} and {9}), two stereo isomers are possible: a facial isomer (fac), where the three ligands
are symmetrically arranged, and a meridional isomer (mer) (Figure 3.38). The ratios of the

CHAPTER 3
167
isomers were calculated with the Boltzmann equation (Equation 2.1, Chapter 2) and are tabulated
in Table 3.21. The population of the fac and mer isomers were used in calculating the effective
ionization potential (IP) of the complex.
Fe
O
O
OO OO
R2
R1
R1
R2
R1
R2
Fe
O
O
OO OO
R1
R2
R1
R2
R1
R2
fac-isomer mer-isomer
Figure 3.38: The facial (fac) and meridional (mer) isomers of [Fe(β-diketonato)3] complexes with unsymmetrical
β-diketonato ligands.
Table 3.21: The calculated fac and mer isomer distribution of [Fe(β-diketonato)3] and [Fe(β-diketonato)3]
–. The ionization potential of the redox reaction is also given.
[Fe(β-diketonato)3] [Fe(β-diketonato)3]–
% fac Efac / kJ.mol-1 % mer Emer / kJ.mol-1 % fac Efac / kJ.mol-1 % mer Emer / kJ.mol-1
Ionization potential / kJ.mol-1
acac {1} 100.0 -24433 - - 100.0 -24593 - - 160 ba {2} 45.8 -38849 54.2 -38849 44.3 -39037 55.7 -39037 188 bth {3} 88.6 -47158 11.4 -47153 73.3 -47367 26.7 -47365 209 dtm {4} 100.0 -41049 - - 100.0 -41259 - - 210 dbm {5} 100.0 -53259 - - 100.0 -53475 - - 216 tfaa {6} 65.4 -24637 34.6 -24636 65.9 -24896 34.1 -24894 259 tffu {7} 64.5 -33680 35.5 -33679 42.3 -33943 57.7 -33944 264 tfba {8} 45.8 -39059 54.2 -39059 70.5 -39330 29.5 -39328 270 tta {9} 32.5 -32949 67.5 -32951 42.6 -33223 57.4 -33224 273
hfaa {10} 100.0 -24806 - - 100.0 -25165 - - 360
The ionization potential (IP) of the [FeIII(β-diketonato)3] complexes, calculated according to
[FeIII(β-diketonato)3] + e- [FeII(β-diketonato)3]– + IP
as the amount of energy required to add an electron to [FeIII(β-diketonato)3] to form
[FeII(β-diketonato)3]–, is also tabulated in Table 3.21. The forward reaction is the reduction
reaction and the backward reaction is the oxidation reaction. The formal reduction potentials
(E0') of the redox active metal Fe(III)/Fe(II) in [FeIII(β-diketonato)3], are included in Table 3.18
(section 3.2.1.2). The relationship between the calculated ionization potential (IP) and E0' is
shown graphically in Figure 3.39.
The correlation of the calculated ionization potentials shows that IP increases with increasing
(less negative) formal reduction potential. A larger E0' implies that more energy is needed to
reduce [FeIII(β-diketonato)3]. In other words, more energy is needed to add an electron to

RESULTS AND DISCUSSION
168
[FeIII(β-diketonato)3] and thus a larger IP. The linear equation (y = mx + c) defining this
relationship is: E0' = (6.933 x 10⁻³) IP + 2.258. This allows one to determine the formal reduction
potentials (E0') of [FeIII(β-diketonato)3] complexes when the calculated IP is known.
R2 = 0.957
-1.2
-1.0
-0.8
-0.6
-0.4
-0.2
0.0
0.2
0.4
150 200 250 300 350
Ionization Potential / kJ.mol-1
E0' /
V
{10}
{8}
{6} {9}
{1}
{2}
{5}{3}
{4}
{7}
Figure 3.39: A plot of the ionization potentials versus the formal reduction potentials (E0') of the redox reaction
[FeIII(β-diketonato)3] + e- [FeII(β-diketonato)3]– + IP for the [FeIII(β-diketonato)3] {1} - {10}.
3.2.2 [Fe(salen)(CH3)2(COCH3)2(py)2].
3.2.2.1 Introduction.
For researchers involved in DFT calculations on open-shell transition metal complexes,
including many important bioinorganic systems, a lasting question stays the choice of the
exchange-correlation functional.72,73,74 Unfortunately, there have been only a few comparative
studies of different functionals in relation to the energetics of low-lying spin states of transition
72 A. Ghosh, P.R. Taylor, Curr. Opin. Chem. Biol. 2003 (91) 113-124.
73 J.N. Harvey, Struct. Bonding 2004 (112) 151-183.
74 A. Ghosh, J. Biol. Inorg. Chem. 2006 (11) 712-724.

CHAPTER 3
169
metal complexes.75,76,77 Nevertheless, the limited amount of data suggests that, whereas the
“classic” pure functionals such as BLYP,78,79 PW91,80 and BP8679,81 favour somewhat unduly
spincoupled, covalent descriptions, hybrid functionals such as B3LYP82 err in the other direction.
To correct for the latter tendency, the amount of Hartree-Fock exchange in B3LYP has been
reduced from the standard 20% to 15%. The resulting B3LYP*83 functional has been found to
yield improved results in certain cases. These stereotypes of the different functionals were
further confirmed in a recent study of first-row transition metal β-diketiminato (nacnac) imido
complexes, where the classic pure functionals led to unduly low-multiplicity spin states, whereas
the hybrid functionals B3LYP and O3LYP84 resulted in unduly high-multiplicity ground states.85
75 Selected studies comparing the performance of different functionals vis-à-vis transition metal spin state
energetics: (a) M. Swart, A.R. Groenhof, A.W. Ehlers, K. Lammertsma, J. Phys. Chem. A 2004 (108) 5479-
5483. (b) R.J. Deeth, N. Fey, J. Comp. Chem. 2004 (25) 1840-1848. (c) A.R. Groenhof, M. Swart, A.W. Ehlers,
K. Lammertsma, J. Phys. Chem. A 2005 (109) 3411-3417. (d) L.M.L. Daku, A. Vargas, A. Hauser, A. Fouqueau,
M.E. Casida, ChemPhysChem 2005 (6) 1393-1410. (e) G. Ganzenmuller, N. Berkaine, A. Fouqueau, M.E.
Casida, M. Reiher, J. Chem. Phys. 2005 (122) 234321-234332. (f) F. De Angelis, N. Jin, R. Car, J.T. Groves,
Inorg. Chem. 2006 (45) 4268-4276. (g) A. Vargas, M. Zerara, E. Krausz, A. Hauser, L.M.L. Daku, J. Chem.
Theory Comput. 2006 (2) 1342-1359. (h) C.Y. Rong, S.X. Lian, D.L. Yin, B. Shen, A.G. Zhong, L. Bartolotti,
S.B. Liu, J. Chem. Phys. 2006 (125) 174102-174108. (i) N. Strickland, J.N. Harvey, J. Phys. Chem. B 2007
(111) 841-852.
76 J. Conradie, A. Ghosh, J. Phys. Chem. B 2007 (111) 12621-12624.
77 M. Swart, A.W. Ehlers, K. Lammertsma, Mol. Phys. 2004 (102) 2467-2474.
78 (a) C. Lee, W. Yang, R.G. Parr, Phys. Rev. B 1988 (37) 785-789. (b) B.G. Johnson, P.M.W. Gill, J.A. Pople, J.
Chem. Phys. 1993 (98) 5612-5626. (c) T.V. Russo, R.L. Martin, P.J. Hay, J. Chem. Phys. 1994 (101) 7729-
7737.
79 A.D. Becke, Phys. Rev. 1988 (A38) 3098-3100.
80 J.P. Perdew, J.A. Chevary, S.H. Vosko, K.A. Jackson, M.R. Pederson, D.J. Singh, C. Fiolhais, Phys. Rev. B 1992
(46) 6671-6687. Erratum: J.P. Perdew, J.A. Chevary, S.H. Vosko, K.A. Jackson, M.R. Perderson, D.J. Singh, C.
Fiolhais, Phys. Rev. B 1993 (48) 4978.
81 J.P. Perdew, Phys. Rev. 1986 (B33) 8822-8824; Erratum: J.P. Perdew, Phys. Rev. 1986 (B34) 7406.
82 P.J. Stephens, F.J. Devlin, C.F. Chabalowski, M.J. Frisch, J. Phys. Chem. 1994 (98) 11623-11627.
83 M. Reiher, O. Salomon, B.A. Hess, Theor. Chem. Acc. 2001 (107) 48-55.
84 A.J. Cohen, N.C. Handy, Mol. Phys. 2001 (99) 607-615.
85 J. Conradie, A. Ghosh, J. Chem. Theory Comput. 2007 (3) 689-702.

RESULTS AND DISCUSSION
170
Interestingly, the OLYP78,86 and OPBE77,86 pure functionals, based on the new OPTX86 exchange
functional, yielded the correct ground states for all of the complexes examined, notably S = 0 for
CoIII(nacnac)(NR) and S = 3/2 for FeIII(nacnac)(NR). This finding led us to speculate, though on
the basis of a limited amount of data, that exchange-correlation functionals based on the
OPTX-based exchange functional may be among the best from the point of view of transition
metal spin state energetics.85 To further test this proposal, DFT calculations were carried out
with different functionals on the spin crossover complex [Fe(salen)(CH3)2(COCH3)2(py)2]. The
question to be addressed in this study is: which functional best reproduces accurate geometry and
equi-energetic S = 0 (high spin, HS) and 2 (low spin, LS) states of this complex?
All DFT calculations in this study have been performed on two different conformations of
[Fe(salen)(CH3)2(COCH3)2(py)2] with the pyridine groups oriented either vertically or dihedrally
relative to the symmetry plane through the salen ligand, as illustrated in Figure 3.40. Both
conformations gave very similar results throughout the study. Since the conformation with the
vertical pyridines is energetically preferred, only results of this conformation will be given. For
the details of the computational methods used, see section 4.5.3.2 (Chapter 4).
86 N.C. Handy, A.J. Cohen, Mol. Phys. 2001 (99) 403-412.

CHAPTER 3
171
Figure 3.40: PW91 optimized geometries (C2v symmetry constraint) of two different conformations of
[Fe(salen)(CH3)2(COCH3)2(py)2] - pyridine groups oriented vertically or dihedrally. The conformation with the
vertical pyridines is energetically preferred. The distances (Å, black), the angles (°, red) and the colour code of the
atoms are as indicated.
3.2.2.2 Geometry profile of default occupations.
The S = 0, 1 and 2 states of [Fe(salen)(CH3)2(COCH3)2(py)2], with default occupation, were
optimized with a selection of functionals (PW91, BP86, BLYP, PBE, OLYP, OPBE and
B3LYP). The bond lengths and bond angles around the Fe(II) centre, a key indicator of the
structure in organometallic complexes, are tabulated in Table 3.22. Focussing on the Fe-Npy
bond length, one would expect a longer bond length for high spin complexes compared to low
spin complexes.87 The Fe-Npy bond lengths of all the singlet states are more or less the same for
all the studied functionals, varying between 1.970 and 2.043 Å. Though, the Fe-Npy bond lengths
of the quintet state vary between 2.265 and 2.498 Å. According to the high spin octahedral
crystal structure of [Fe(py)6]2+,88 Fe-Npy bond lengths should be in the range of 2.22-2.29 Å.
Therefore, only the PW91 functional (2.298 Å for TZP basis set and 2.265 Å for 6-311G** basis
set) is able to produce a good geometry of the high spin [Fe(salen)(CH3)2(COCH3)2(py)2]
complex. BP86, PBE89 and B3LYP slightly overestimated the Fe-Npy bond length with very
similar geometries (2.307, 2.308 and 2.312 respectively). OLYP, which is known to be one of
87 M.B. Darkhovskii, I.V. Pletnev, A.L. Tchougréeff, J. Comp. Chem. 2003 (24) 1703-1719.
88 R.J. Doedens, L.F. Dahl, J. Am. Chem. Soc. 1966 (88) 4847-4855.
89 J.P. Perdew, K. Burke, M. Ernzerhof, Phys. Rev. Lett. 1996 (77) 3865-3868; Erratum: J.P. Perdew, K. Burke, M.
Ernzerhof, Phys. Rev. Lett. 1997 (78) 1396.

RESULTS AND DISCUSSION
172
the best functionals for transition metal systems,75,85 performed the worst geometry optimization
of all with an Fe-Npy bond length of 2.498 Å, indicating that the pyridine groups have basically
fallen off.
3.2.2.3 Energy profile of default occupations.
For spin crossover to be possible, the relative energies of the different spin states of
[Fe(salen)(CH3)2(COCH3)2(py)2] have to be within 30 kJ.mol-1 (0.3 eV) of each other. The
relative energies of the S = 0, 1 and 2 states of [Fe(salen)(CH3)2(COCH3)2(py)2], with default
occupation and a selection of functionals, are tabulated in Table 3.22. The energy profile,
compared to the geometry profile, shows a completely opposite performance by the functionals.
OLYP, OPBE and B3LYP performed the best with an energy range of 5, 14 and 23 kJ.mol-1
respectively. The other studied functionals, including PW91 (energy range of 103 kJ.mol-1 for
TZP basis set and 115 kJ.mol-1 for 6-311G** basis set), produced an unacceptable energy profile.
Therefore, the functional with the best geometry profile, PW91, gave the worst energy profile
and the functional with the best energy profile, OLYP, gave the worst geometry profile. In this
light, a linear transit was performed on the S = 2 state of [Fe(salen)(CH3)2(COCH3)2(py)2], with
OLYP, to see whether the geometry of a specific functional has a large influence on its energy
profile. The stepwise changing of the Fe-Npy bond length of 2.50-2.30 Å resulted in a stepwise
energy increase of only 8 kJ.mol-1. Therefore, the precise geometry does not have a large
influence on the energy profile of a specific functional. Therefore one can conduct single-point
calculations on the PW91 geometry, with different functionals, to obtain an accurate energy
profile with a good geometry profile.
3.2.2.4 Energy profile of alternative occupations.
Single-point OLYP, B3LYP and B3LYP* calculations were carried out for the PW91 optimized
geometries of S = 0, 1 and 2. Subsequently, alternative occupations of the triplet and quintet
states were also calculated. The energy profiles of these calculations are tabulated in Table 3.23.
As mentioned before, for spin crossover to be possible, the different spin states of
[Fe(salen)(CH3)2(COCH3)2(py)2] have to be equi-energetic, especially the low spin S = 0 and the
high spin S = 2.90 B3LYP exhibits the best energy profile with all quintet states (5B2, 5A2 and
90 B. Weber, F.A. Walker, Inorg. Chem. 2007 (46) 6794-6803.

CHAPTER 3
173
5A1) within the energy range of the singlet state (1A1). PW91 once again exhibits the worst
energy profile, with no high spin states in the range of the low spin state.
3.2.2.5 Spin density profile.
Figure 3.41 presents a comparison of the PW91, OLYP, B3LYP and B3LYP* spin density
profiles of S = 2 [Fe(salen)(CH3)2(COCH3)2(py)2]. Contrary to that which was found for similar
salen complexes (S = 1/2),76 the different functionals exhibit a qualitatively similar electron
description for both S = 1 (as example: Figure 3.42, top row, left) and S = 2 (Figure 3.41). For all
functionals, the S = 2 iron centre carries approximately 3.7 of majority electron spin and the N of
the pyridine carries approximately 0.03. The O and N in the salen ligand carries approximately
0.06-0.08 majority electron spin.
Figure 3.42 represents the B3LYP spin density profiles of [Fe(salen)(CH3)2(COCH3)2(py)2] for
all the triplet and quintet states. The Mullikan spin density around the iron centre, of each triplet
and quintet state, is a combination of mainly the singly occupied d-orbitals (SOMO). For
instance, the Mullikan spin density of the triplet state 1: 3A2 (Figure 3.42, top row, left) consists
of 48.4% dxz and 46.0% dz2 d-orbital character, as illustrated by the form of the majority spin
density in cyan. In the same way, the triplet state 3A1 (Figure 3.42, top row, middle) consists of
47.7% dx2-y2 and 49.1% dz2 d-orbital character. This pattern is repeated for the other triplet states.
The quintet states are mostly a fine mesh of four of the five d-orbitals, resulting in an almost
round shape of Mullikan spin density around the iron centre (Figure 3.42, bottom row).
3.2.2.6 Conclusions.
The pure functional PW91 gives a good geometry optimization of both the low and high spin
states of the spin crossover complex [Fe(salen)(CH3)2(COCH3)2(py)2]. The pure functionals
OLYP, OPBE, BLYP, PBE and BP86 and the hybrid functional B3LYP only succeeded in giving
a good geometry optimization of the low spin complex. For the high spin geometry, OLYP
performed the worst. Though, an opposite performance by functionals was obtained for the
spin-state energetics. OLYP, B3LYP and B3LYP* provided the best spin-state energetics for
spin crossover with similar spin density profiles. So, to answer the question stated in the
beginning: which functional best reproduces accurate geometry and equi-energetic S = 0 (high
spin, HS) and 2 (low spin, LS) states of this complex? Although OLYP is known to be one of
the best functionals for transition metal systems,75,85 it failed to perform for the spin crossover

RESULTS AND DISCUSSION
174
complex [Fe(salen)(CH3)2(COCH3)2(py)2]. Failures like these inspire researchers to constantly
improve old functionals and hence developing new ones.91
3.2.2.7 Tables and graphs.
Table 3.22: Relative energies (kJ.mol-1) of the different spin states of [Fe(salen)(CH3)2(COCH3)2(py)2] (pyridine groups vertically oriented), optimized under a C2v symmetry constraint. Calculated bond lengths (Å) and bond angles (°) around the Fe(II) centre are also tabulated.
Basis Set STO-TZP 6-311G** Functional PW91 BP86 BLYP PBE OLYP OPBE PW91 B3LYP
State Properties E (kJ.mol-1) 0 0 0 0 0 0 0 0 Fe-Npy (Å) 1.990 1.994 2.034 1.994 2.043 2.002 1.970 2.036 Fe-Ns (Å) 1.896 1.899 1.924 1.897 1.897 1.874 1.890 1.925 Fe-Os (Å) 1.942 1.945 1.968 1.945 1.963 1.946 1.930 1.958
Npy-Fe-Npy (°) 174.1 173.3 173.0 173.7 173.5 172.2 173.8 172.9 Ns-Fe-Ns (°) 85.2 85.1 85.0 85.2 85.7 85.5 85.7 85.1 Ns-Fe-Os (°) 93.7 93.5 92.9 93.6 92.7 92.7 93.5 92.2
1A1
Os-Fe-Os (°) 87.4 87.9 89.2 87.5 88.9 89.0 87.2 90.5 E (kJ.mol-1) 75 70 52 71 1 14 83 23 Fe-Npy (Å) 2.383 2.401 2.476 2.406 2.847 3.481 2.345 2.427 Fe-Ns (Å) 1.894 1.896 1.915 1.894 1.889 1.862 1.887 1.919 Fe-Os (Å) 1.931 1.931 1.948 1.933 1.934 1.905 1.918 1.941
Npy-Fe-Npy (°) 171.0 170.9 171.2 169.2 167.6 160.4 170.8 170.8 Ns-Fe-Ns (°) 85.0 85.0 85.1 85.1 85.4 85.6 85.6 85.1 Ns-Fe-Os (°) 93.8 93.7 93.3 93.8 93.2 93.8 93.7 92.5
1: 3A2
Os-Fe-Os (°) 87.4 87.5 88.3 87.4 88.3 86.8 87.0 90.0 E (kJ.mol-1) 103 95 77 95 -5 8 115 -2 Fe-Npy (Å) 2.298 2.307 2.365 2.308 2.498 2.494 2.265 2.312 Fe-Ns (Å) 2.083 2.088 2.108 2.086 2.093 2.068 2.070 2.106 Fe-Os (Å) 2.001 2.001 2.013 2.006 2.013 2.001 1.991 2.021
Npy-Fe-Npy (°) 172.1 171.9 171.9 170.0 168.7 168.9 170.9 169.8 Ns-Fe-Ns (°) 79.3 79.2 79.3 79.2 79.2 79.3 80.2 79.5 Ns-Fe-Os (°) 87.5 87.3 86.9 87.3 86.7 87.1 87.4 86.1
5B2
Os-Fe-Os (°) 105.8 106.2 106.8 106.2 107.5 106.5 105.0 108.3
91 E.J. Baerends, O.V. Gritsenko, J. Chem. Phys. 2005 (123) 62202-62218.

CHAPTER 3
175
Table 3.23: Relative energies (kJ.mol-1) of the different spin states of [Fe(salen)(CH3)2(COCH3)2(py)2] (pyridine groups vertically oriented), optimized under a C2v symmetry constraint with PW91. Single-point OLYP, B3LYP and B3LYP* calculations were carried out on the PW91 optimized geometries. Note alternative occupations.
State Occupation Configuration PW91 OLYP B3LYP B3LYP* 1A1 A1 = 40//40
A2 = 11//11 B1 = 27//27 B2 = 22//22
dz20 dxy
0 dx2-y2
2 dxz2 dyz
2 0 0 0 0
1: 3A2 A1 = 41//40
A2 = 11//10 B1 = 27//27 B2 = 22//22
dz21 dxy
0 dx2-y2
2 dxz1 dyz
2 75 14 10 25
3A1 A1 = 41//39
A2 = 11//11 B1 = 27//27 B2 = 22//22
dz21 dxy
0 dx2-y2
1 dxz2 dyz
2 102 44 i 56 68
1: 3B2 A1 = 41//40
A2 = 11//11 B1 = 27//27 B2 = 22//21
dz21 dxy
0 dx2-y2
2 dxz2 dyz
1 128 i 68 i 45 65
2: 3B2 A1 = 40//40
A2 = 11//10 B1 = 28//27 B2 = 22//22
dz20 dxy
1 dx2-y2
2 dxz1 dyz
2 174 i 156 i 137 152
3B1 A1 = 40//39
A2 = 11//11 B1 = 28//27 B2 = 22//22
dz20 dxy
1 dx2-y2
1 dxz2 dyz
2 112 79 62 77
2: 3A2 A1 = 40//40
A2 = 11//11 B1 = 28//27 B2 = 22//21
dz20 dxy
1 dx2-y2
2 dxz2 dyz
1 189 i 155 i 137 149
5B2 A1 = 41//39
A2 = 11//10 B1 = 28//27 B2 = 22//22
dz21 dxy
1 dx2-y2
1 dxz1 dyz
2 189 2 -19 12
5A2 A1 = 41//39
A2 = 11//11 B1 = 28//27 B2 = 22//21
dz21 dxy
1 dx2-y2
1 dxz2 dyz
1 135 34 10 42
5A1 A1 = 41//40
A2 = 11//10 B1 = 28//27 B2 = 22//21
dz21 dxy
1 dx2-y2
2 dxz1 dyz
1 166 i 63 i 18 54
i Non Aufbau.

RESULTS AND DISCUSSION
176
Figure 3.41: Spin density profiles of S = 2 [Fe(salen)(CH3)2(COCH3)2(py)2] (pyridine groups vertically oriented)
of the different functionals on the PW91 optimized geometry. Majority and minority spin densities shown in cyan
and magenta, respectively. The spin (magenta), the charge (green) and the colour code of atoms are as indicated.

CHAPTER 3
177
Figure 3.42: B3LYP spin density profiles of [Fe(salen)(CH3)2(COCH3)2(py)2] (pyridine groups vertically
oriented) for alternative occupations of S = 1 and 2 on the PW91 optimized geometry. Majority and minority spin
densities shown in cyan and magenta, respectively. The occupation and the colour code of the atoms are as
indicated.

RESULTS AND DISCUSSION
178

CHAPTER 3
179
3.2.3 [Fe(porphyrin)(Ar)].
3.2.3.1 Introduction.
One of the triumphs of modern density functional theory (DFT) is that it provides good to
excellent results on open-shell transition metal systems at a fraction of the cost of high-quality
multiconfigurational ab initio methods.72,74,92 A key imperfection in this otherwise encouraging
picture, however, is that DFT often does not do a particularly good job of describing the
spin-state energetics of transition metal complexes. The problem is particularly acute for iron
complexes and iron porphyrins appear to be some of the worst offenders in this regard.93,94 This
problem came to light in the course of a combined DFT and ab initio study of the chloroiron(III)
porphyrin, [FeIII(porphyrin)(Cl)], which is essentially an S = 5/2 system. The then popular pure
functional PW91, however, predicted an S = 3/2 ground state. In contrast, ab initio CASPT2
calculations on [FeIII(porphyrin)(Cl)] and CCSD(T) calculations on a small model complex
yielded the expected S = 5/2 ground state by a clear margin of energy.93 Since that time,
experience with other transition metal systems have been gained, but the five-coordinate iron(III)
porphyrins with a variety of currently popular exchange-correlation functionals have not been
revisited.95 This is therefore the aim of this study, to focus on an intriguing series of remarkable
aryliron(III) porphyrins, [FeIII(porphyrin)(Ar)], reported by Kadish et al. in 1995.96 Such species
are also of significant biological interest: aryliron-porphyrins have been implicated as reactive
92 (a) For an introduction to DFT as applied to transition metal systems, see: F. Neese, J. Biol. Inorg. Chem. 2006
(11) 702-711. (b) For a biochemically oriented review, see: L. Noodleman, T. Lovell, W.-H. Han, J. Li, F. Himo,
Chem. Rev. 2004 (104) 459-508. (c) J.N. Harvey, Struct. Bonding 2004 (112) 151-183.
93 (a) A. Ghosh, T. Vangberg, E. Gonzalez, P.R. Taylor, J. Porph. Phth. 2001 (5) 345-356. (b) A. Ghosh, B.J.
Persson, P.R. Taylor, J. Biol. Inorg. Chem. 2003 (8) 507-511.
94 (a) A. Ghosh, P.R. Taylor, J. Chem. Theory Comput. 2005 (1) 597-600. (b) M. Radon, K. Pierloot, J. Phys.
Chem. A 2008 (112) 11824-11832. (c) B.O. Roos, V. Veryazov, J. Conradie, P.R. Taylor, A. Ghosh, J. Phys.
Chem. B 2008 (112) 14099-14102.
95 Notable, recent theoretical studies on five-coordinate iron porphyrins, see: (a) N. Strickland, J.N. Harvey, J. Phys.
Chem. B 2007 (111) 841-852. (b) D.A. Scherlis, M. Cococcioni, P. Sit, N. Marzari, J. Phys. Chem. B 2007 (111)
7834-7391. (c) P. Rydberg, L. Olsen, J. Phys. Chem. A 2009 (113) 11949-11953.
96 K.M. Kadish, E. van Caemelbecke, E. Gueletti, S. Fukuzumi, K. Miyamoto, T. Suenobu, A. Tabard, R. Guilard,
Inorg. Chem. 1998 (37) 1759-1766.

RESULTS AND DISCUSSION
180
intermediates in the metabolism of arylhydrazines by cytochromes P45097 and their reactivity
patterns provide significant insights into the active site topologies of membrane-bound P450s
whose crystal structures remain to be solved.98,99
Ferrous and ferric hemes exhibit a wide variety of electronic structures and spin states.100,101 A
useful rule of thumb, however, is that five-coordinate iron porphyrins are generally high spin,
whereas six-coordinate ones are generally low spin. There are some exceptions to this
generalization,102,103 even though it applies quite broadly. Aryliron(III) porphyrins are
particularly interesting in this regard because the spin state of the complex depends on the
substitution pattern of the aryl group. All known [FeIII(porphyrin)(Ph)] complexes are low spin,
whereas all known [FeIII(porphyrin)(C6F5)] and [FeIII(porphyrin)(C6F4H)] derivatives are high
spin. For the trifluorophenyl derivatives, the spin state energies appear to be exceedingly finely
balanced: FeIII(OEP)(2,4,6-C6F3H2) is S = 5/2, but FeIII(OEP)(3,4,5-C6F3H2) is S = 1/2.96 How
well do different DFT functionals capture this remarkable spin state diversity? Briefly put, some
functionals do not do well, whereas others do not do badly...
97 P.R. Ortiz de Montellano, In: P.R. Ortiz de Montellano (Editor), Cytochrome P450, Kluwer, New York, 2005,
Chapter 7, p247-322.
98 Key references to the original literature on P450-hydrazine interactions, see: (a) R. Raag, B.S. Swanson, T.L.
Poulos, P.R. Ortiz de Montellano, Biochemistry 1990 (29) 8119-8126. (b) K.L. Kunze, P.R. Ortiz de
Montellano, J. Am. Chem. Soc. 1983 (105) 1380-1381. (c) D. Ringe, G.A. Petsko, D.E. Kerr, P.R. Ortiz de
Montellano, Biochemistry 1984 (23) 2-4.
99 For relevant synthetic model studies, see: (a) P. Battioni, J.P. Mahy, G. Gillet, D. Mansuy, J. Am. Chem. Soc.
1983 (105) 1380-1381. (b) D. Lancon, P. Cocolios, R. Guilard, K.M. Kadish, J. Am. Chem. Soc. 1984 (106)
4472-4478. (c) R. Guilard, B. Boisselier-Cocolios, A. Tabard, P. Cocolios, B. Simonet, K.M. Kadish, Inorg.
Chem. 1985 (24) 2509-2520.
100 F.A. Walker, In: K.M. Kadish, K.M. Smith, R. Guilard (Editors), The Porphyrin Handbook, Academic, San
Diego, 2000, Chapter 36, p81-183.
101 (a) M. Nakamura, Coord. Chem. Rev. 2006 (250) 2271-2294. (b) A. Ikezaki, Y. Ohgo, M. Nakamura, Coord.
Chem. Rev. 2009 (253) 2056-2069.
102 Nakamura has recently reported a route to intermediate-spin iron(III) porphyrins: T. Sakai, Y. Ohgo, T. Ikeue,
M. Takahashi, M. Takeda, M. Nakamura, J. Am. Chem. Soc. 2003 (125) 13028-13029.
103 The N-nitrito ligand gives rise to (highly reactive) low spin iron(III) porphyrin intermediates: J. Conradie, A.
Ghosh, Inorg. Chem. 2006 (45) 4902-4909.

CHAPTER 3
181
DFT calculations in this study have been performed on [FeIII(porphyrin)(Ar)] complexes
(Ar = aryl = Cl, Ph, C6F5, 3,4,5-C6F3H2 and 2,4,6-C6F3H2) (Figure 3.43 and Figure 3.44). For the
details of the computational methods used, see section 4.5.3.3 (Chapter 4). A number of classic
pure functionals were used (PW91,80 BLYP,78,79 BP8679,81 and TPSS104). However, because the
results obtained with these functionals were all in near-perfect mutual agreement, only the PW91
results are shown for all the complexes studied, as representative of the older pure functionals.
The newer pure functionals (OLYP78,86 and OPBE77,86), based on the improved OPTX exchange
functional, were also examined, as were the hybrid functionals (B3LYP82 and B3LYP*83) which
contain 20 and 15% Hartree-Fock exchange respectively. The OPBE results will not be
presented, since they are nearly identical to those obtained with OLYP. Finally, the hybrid
meta-GGA functional TPSSh104 (which contains 10% Hartree-Fock exchange) was aslo
examined.
Figure 3.43: Chemical structure of [FeIII(porphyrin)(Ar)], the porphyrin used in this study.
Figure 3.44: [FeIII(porphyrin)(Ar)] complexes studied in this work.
104 (a) J. Tao, J.P. Perdew, V.N. Staroverov and G.E. Scuseria, Phys. Rev. Lett. 2003 (91) 146401-146404. (b) V.N.
Staroverov, G.E. Scuseria, J. Tao and J.P. Perdew, J. Chem. Phys. 2003 (119) 12129-12137.

RESULTS AND DISCUSSION
182
3.2.3.2 Geometry profile.
The [FeIII(porphyrin)(Ar)] (Ar = aryl = Cl, Ph, C6F5, 3,4,5-C6F3H2 and 2,4,6-C6F3H2) complexes
were optimized with a selection of functionals. The bond lengths around the Fe(III) centre, a key
indicator of the structure in organometallic complexes, of the low spin (S = 1/2) and high spin
(S = 5/2) complexes (with default occupation) are tabulated in Table 3.24. All the functionals
give satisfactory results for the geometries of the different spin states. Focussing on the Fe-Npor
bond length, one would expect that the bond length becomes longer as the spin state increases
from S = 1/2 to 5/2.87 Consequently the porphyrin becomes more dome deformed (section 2.5.3,
figure 2.5.1, Chapter 2), with the iron centre shifted out of the plane (Figure 3.45). The Fe-Npor
bond lengths of the doublet state are more or less the same for all the studied functionals, varying
between 1.97-2.00 Å (difference of 0.03 Å). This is also the case for the Fe-Npor bond lengths of
the quintet state, where the enlonged bond lengths vary between 2.09-2.13 Å (difference of
0.04 Å). The axial bond lengths, Fe-Ar, differ from each other in as the aryl substituents change,
but are virtually the same for all functionals used (difference of 0.04 Å). This axial bond length
also becomes longer as the spin state increases from S = 1/2 to 5/2 (Table 3.24, Figure 3.45).
3.2.3.3 Energy profile.
Tables 3.24-3.28 present the calculated spin-state energetics of the above five complexes, with
the S = 5/2 state as the energy zero level in each case. The shapes of the d-type frontier orbitals
are very similar throughout and are shown, along with their irreducible representations, for the
high spin state of [FeIII(porphyrin)(Ph)] in Figure 3.46. The following are the results obtained of
these molecules.
[FeIII(porphyrin)(Cl)]: As found in an earlier study,93 PW91 predicts a 4A1 state for
[FeIII(porphyrin)(Cl)], with the expected 6A1 state approximately 36 kJ.mol-1 higher in energy
(see Table 3.25). Interestingly, both OLYP and B3LYP successfully predict a sextet ground
state, although the 4A1 state is just over 10 kJ.mol-1 higher in energy with both functionals. With
B3LYP*, the 6A1 and 4A1 states are equi-energetic and TPSSh incorrectly favours the 4A1 state as
the ground state. However, although OLYP, B3LYP and B3LYP* are clearly better than PW91
(and other classic pure functionals), they still significantly underestimate the sextet-quartet
splitting relative to both CASPT2 and CCSD(T), which indicate that it is around 70 kJ.mol-1.

CHAPTER 3
183
[FeIII(porphyrin)(Ph)]:96 For [FeIII(porphyrin)(Ph)], Table 3.26 presents full results from all the
functionals examined. All functionals successfully predict an S = 1/2 ground state for this
complex, as expected on the basis of experimental results. Moreover, all the functionals agree
among themselves in yielding a 2B2 ground state, with a 2B1 state only 2-6 kJ.mol-1 higher in
energy. These two states correspond to the dx2-y22 dxz
2 dyz1 and dx2-y2
2 dxz1 dyz
2 configurations
respectively. The 2A1 state with the dx2-y21 dxz
2 dyz2 configuration is somewhat higher in energy,
23-40 kJ.mol-1 relative to the ground state, depending on the functional.
OLYP, OPBE, B3LYP and B3LYP* are in remarkable agreement vis-à-vis the energy of the
sextet state, which is found to be 26-49 kJ.mol-1 higher, relative to the ground state. In the
absence of other results to the contrary, one is inclined to regard a doublet-sextet splitting in the
order of ~50 kJ.mol-1 as representative of reality for this complex. These results, however, need
to be taken with a pinch of salt, given the apparently poor performance of all the functionals for
[FeIII(porphyrin)(Cl)]. With the classic pure functionals, which tend to unduly pair up electrons,
the sextet energy is much higher, > 100 kJ.mol-1 relative to the ground state.
[FeIII(porphyrin)(C6F5)]:96 The fact that [FeIII(OEP)(C6F5)] is an S = 5/2 complex, suggests that
[FeIII(porphyrin)(C6F5)] should also be a high spin complex. As shown in Table 3.27, only
OLYP appears to be consistent with this expectation - it predicts a sextet ground state with the 2B2 state 12 kJ.mol-1 higher in energy. With B3LYP, the two states are almost exactly
equi-energetic, whereas with B3LYP*, the 2B2 state appears to be favoured by close to
15 kJ.mol-1. TPSSh performs distinctly differently (worse), favoring the 2B2 state by 34 kJ.mol-1,
relative to the sextet state. With PW91, the sextet state is nearly 74 kJ.mol-1 above the 2B2 state
and similarly poor results are obtained with other pure functionals. Interestingly, all the
functionals predict a low-lying quartet state - 4A2, of which the electronic configuration may be
described as dx2-y22 dxz
1 dyz1 dz2
1, where the double occupancy of the dx2-y2 orbital may be ascribed
to a π-backbonding interaction with the C6F5 group.
[FeIII(porphyrin)(3,4,5-C6F3H2)] and [FeIII(porphyrin)(2,4,6-C6F3H2)]:96 As mentioned above,
these two regioisomeric complexes are expected to be low spin and high spin, respectively. The
spin state energetics of these two complexes would appear to present a stringent test of the
performance of any functional. However, as in the case of [FeIII(porphyrin)(Ph)], all the
functionals examined appear to correctly indicate a low spin (2B2) ground state for

RESULTS AND DISCUSSION
184
[FeIII(porphyrin)(3,4,5-C6F3H2)] (Table 3.28). The energy of the sextet state is 24-29 kJ.mol-1
with OLYP, TPSSh and B3LYP, 46 kJ.mol-1 with B3LYP* and > 100 kJ.mol-1 with PW91, all
relative to the ground state. The fact that OLYP, B3LYP and B3LYP* are in reasonably good
agreement suggests that the sextet-doublet splitting obtained with these functionals should be
reasonably good.
With [FeIII(porphyrin)(2,4,6-C6F3H2)] (Table 3.29), as with [FeIII(porphyrin)(C6F5)], the lowest
doublet and sextet states seem to be very finely balanced indeed. Once again, only OLYP
appears to indicate a sextet ground state by a reasonable margin of energy, approximately
8 kJ.mol-1. B3LYP appears to predict either a doublet or a sextet state. B3LYP* favors a
doublet ground state, with the sextet state nearly 18 kJ.mol-1 higher, as does TPSSh with the
sextet state 44 kJ.mol-1 above the doublet ground state. Once again, PW91 is the worst, placing
the sextet some 79 kJ.mol-1 above the doublet ground state.
3.2.3.4 Spin density.
Figure 3.47 presents spin density plots of the lowest-energy low spin (2B2) and high spin (6A1)
states of the complexes studied. Note that the axial aryl groups carry little spin density. This
implies, as does a detailed examination of the valence molecular orbitals, that there is little
π-interaction between the aryl π-systems and the iron dπ-orbitals. The aryl groups are therefore
reasonably viewed as relatively pure, strong σ-donating ligands. Studies of spin state energetics
as a function of the Fe-C distance (details not shown) indicate that the high-spin state of
[FeIII(porphyrin)(2,4,6-C6F3H2)] (as opposed to the low-spin state of its 3,4,5- regioisomer) owes
more to the steric requirements of the 2,6-fluoro substituents than to the slightly weaker s-donor
ability of the 2,4,6-C6F3H2 ligand. Thus, note from Figure 3.45 that for a given spin state, the
axial Fe-C bond is roughly 0.03 Å longer for the 2,6-fluorinated complexes relative to their
2,6-unfluorinated counterparts. It is a relatively small difference but it apparently suffices to tip
the delicately poised spin-state energies in favor of a high-spin state for the 2,6-fluorinated
complexes.
3.2.3.5 Conclusions.
A series of closely related complexes such as the aryliron porphyrins, which exhibit different
spin states, provide a powerful calibration of the performance of DFT functionals vis-à-vis the
issue of transition metal spin state energetics.93,94,95 These approaches provide an attractive

CHAPTER 3
185
alternative to the much more demanding strategy of calibrating DFT-derived spin-state energetics
against high-level ab initio methods such as CASPT2 and CCSD(T).105
Which functionals perform best for the complexes examined here? The newer pure functional
(OLYP or OPBE) appears to have performed best, closely followed by B3LYP. Both OLYP and
B3LYP appear to have performed distinctly better than B3LYP*, which is somewhat of a
surprise, given that B3LYP* usually performs significantly better than B3LYP. Somewhat
surprisingly, OLYP, B3LYP and B3LYP* have all performed better than the hybrid functional
TPSSh. Classic pure functionals such as PW91 are clearly the worst, as far as spin state
energetics is concerned.73,74 Unfortunately, the reasons as to why one functional performs better
than another are not easy to fathom, given the empirical manner in which most functionals are
designed. The preponderance of evidence, however, suggests that the OPTX exchange
functional, which provides the exchange part of OLYP and OPBE, is a particularly good one.
3.2.3.6 Graphs and tables.
Figure 3.45: OLYP optimized geometries of the lowest-energy low spin (2B2, top) and high spin (6A1, bottom)
states of the [FeIII(porphyrin)(Ar)] complexes (Ar = aryl = Cl, Ph, C6F5, 3,4,5-C6F3H2 and 2,4,6-C6F3H2). Distances
(Å) and angles (°) are indicated in black and red, respectively.
105 Selected DFT/ab initio comparisons for transition metal systems: (a) K.P. Jensen, J. Phys. Chem. B 2005 (109)
10505-10512. (b) A. Ghosh, E. Gonzalez, E. Tangen, B.O. Roos, J. Phys. Chem. A 2008 (112) 12792-12798. (c)
M. Swart, J. Chem. Theory Comput. 2008 (4) 2057-2066. (d) T. Takatani, J.S. Sears, C.D. Sherrill, J. Phys.
Chem. A 2009 (113) 9231-9236.

RESULTS AND DISCUSSION
186
Figure 3.46: The shapes of the d-type frontier orbitals, along with their irreducible representations, of the high
spin state 6A1 of [FeIII(porphyrin)(Ph)], optimized with OLYP.
Figure 3.47: OLYP spin density profiles of the lowest-energy low spin (2B2, top) and high spin (6A1, bottom)
states of the [FeIII(porphyrin)(Ar)] complexes (Ar = aryl = Cl, Ph, C6F5, 3,4,5-C6F3H2 and 2,4,6-C6F3H2). Majority
and minority spin densities shown in cyan and magenta, respectively.

CHAPTER 3
187
Table 3.24: Calculated bond lengths (Å) around the Fe(III) centre of the S = 1/2 and 5/2 states (default occupations) of the [FeIII(porphyrin)(Ar)] complexes (Ar = aryl = Cl, Ph, C6F5, 3,4,5-C6F3H2 and 2,4,6-C6F3H2), optimized under a C2v symmetry constraint.
Basis Set STO-TZP 6-311G** Functional PW91 i OLYP ii B3LYP
[FeIII (porphyrin)(Cl)] Fe-Npor (Å) 1.987 2.004 1.999 2B2 Fe-Cl (Å) 2.156 2.168 2.200
Fe-Npor (Å) 2.099 2.117 2.088 6A1 iii
Fe-Cl (Å) 2.194 2.211 2.232 [FeIII (porphyrin)(Ph)]
Fe-Npor (Å) 1.985 2.000 2.003 2B2 Fe-Ph (Å) 1.939 1.949 1.956
Fe-Npor (Å) 2.105 2.128 2.099 6A1 Fe-Ph (Å) 2.044 2.067 2.071
[FeIII (porphyrin)(C 6F5)] Fe-Npor (Å) 1.972 1.981 1.989 2B2 Fe-CAr (Å) 1.951 1.961 1.975 Fe-Npor (Å) 2.098 2.115 2.091 6A1 Fe-CAr (Å) 2.079 2.109 2.103
[FeIII (porphyrin)(3,4,5-C6F3H2)] Fe-Npor (Å) 1.985 1.997 2.001 2B2 Fe-CAr (Å) 1.931 1.931 1.947 Fe-Npor (Å) 2.102 2.116 2.094 6A1 Fe-CAr (Å) 2.050 2.061 2.077
[FeIII (porphyrin)(2,4,6-C6F3H2)] Fe-Npor (Å) 1.974 1.984 1.990 2B2 Fe-CAr (Å) 1.947 1.958 1.967 Fe-Npor (Å) 2.105 2.120 2.096 6A1 Fe-CAr (Å) 2.066 2.094 2.089
i As representation of classic pure functionals. BLYP and BP86 results are in near-perfect mutual agreement. ii As representation of newer pure functionals. OPBE results are in near-perfect mutual agreement.
iii C4v symmetry constraint.

RESULTS AND DISCUSSION
188
Table 3.25: Spin-state energetics (kJ.mol-1) of [FeIII(porphyrin)(Cl)] with the 6A1 state as the energy zero level. All-electron occupancies (α/β) as well as individual d-orbital occupancies are indicated.
State Occupation dx2-y2 dxz dyz dz2 dxy PW91 i OLYP ii TPSSh B3LYP B3LYP* 2B2 A1: 34//34
A2: 18//18 B1: 25//25 B2: 25//24
2 2 1 0 0 -11 65 18 61 43
2B1 A1: 34//34 A2: 18//18 B1: 25//24 B2: 25//25
2 1 2 0 0 -10 65 19 63 44
2A1 A1: 34//33 A2: 18//18 B1: 25//25 B2: 25//25
1 2 2 0 0 34 iii 107 iii 72 107 89
4A1 iv A1: 25//24
A2: 7//7 B1: 10//10 B2: 11//11 E: 50//48
2 1 1 1 0 -36 13 -11 10 -2
6A1 iv A1: 25//24
A2: 7//7 B1: 10//9 B2: 12//11 E: 50//48
1 1 1 1 1 0 0 0 0 0
i As representation of classic pure functionals. BLYP, BP86 and TPSS results are in near-perfect mutual agreement. ii As representation of newer pure functionals. OPBE results are in near-perfect mutual agreement.
iii Non Aufbau. iv C4v symmetry constraint.

CHAPTER 3
189
Table 3.26: Spin-state energetics (kJ.mol-1) of [FeIII(porphyrin)(Ph)] with the 6A1 state as the energy zero level. All-electron occupancies (α/β) as well as individual d-orbital occupancies are indicated.
State Occupation dx2-y2 dxz dyz dz2 dxy PW91 TPSS BLYP BP86 OLYP OPBE TPSSh B3LYP B3LYP* 2B2 A1: 40//40
A2: 19//19 B1: 30//30 B2: 25//24
2 2 1 0 0 -115 -111 -103 -107 -31 -33 -64 -26 -49
2B1 A1: 40//40 A2: 19//19 B1: 30//29 B2: 25//25
2 1 2 0 0 -111 -107 -99 -104 -27 -31 -60 -20 -44
2A1 A1: 40//39 A2: 19//19 B1: 30//30 B2: 25//25
1 2 2 0 0 -85 i -70 -69 i -77 i -3 i -10 i -24 14 -10
4A2 A1: 41//40 A2: 19//19 B1: 30//29 B2: 25//24
2 1 1 1 0 -30 i -29 -29 i -26 i 23 i 27 i -6 14 2
4B1 A1: 40//39 A2: 20//19 B1: 30//30 B2: 25//24
1 2 1 0 1 -15 -9 -10 -12 21 22 12 24 15
4B1 A1: 40//40 A2: 20//19 B1: 30//29 B2: 25//24
2 1 1 0 1 -5 i -4 -2 i -2 i 34 i 37 i 17 31 22
4B2 A1: 41//39 A2: 19//19 B1: 30//30 B2: 25//24
1 2 1 1 0 25 i 31 30 i 30 i 78 i 78 i 59 86 71
4B2 A1: 40//39 A2: 20//19 B1: 30//29 B2: 25//25
1 1 2 0 1 -16 -9 -10 -13 20 20 12 26 17
4B1 A1: 41//39 A2: 19//19 B1: 30//29 B2: 25//25
1 1 2 1 0 24 i 26 29 i 28 i 76 i 75 i 59 84 69
6A1 A1: 41//39 A2: 20//19 B1: 30//29 B2: 25//24
1 1 1 1 1 0 i 0 0 i 0 i 0 0 0 0 0
i Non Aufbau.
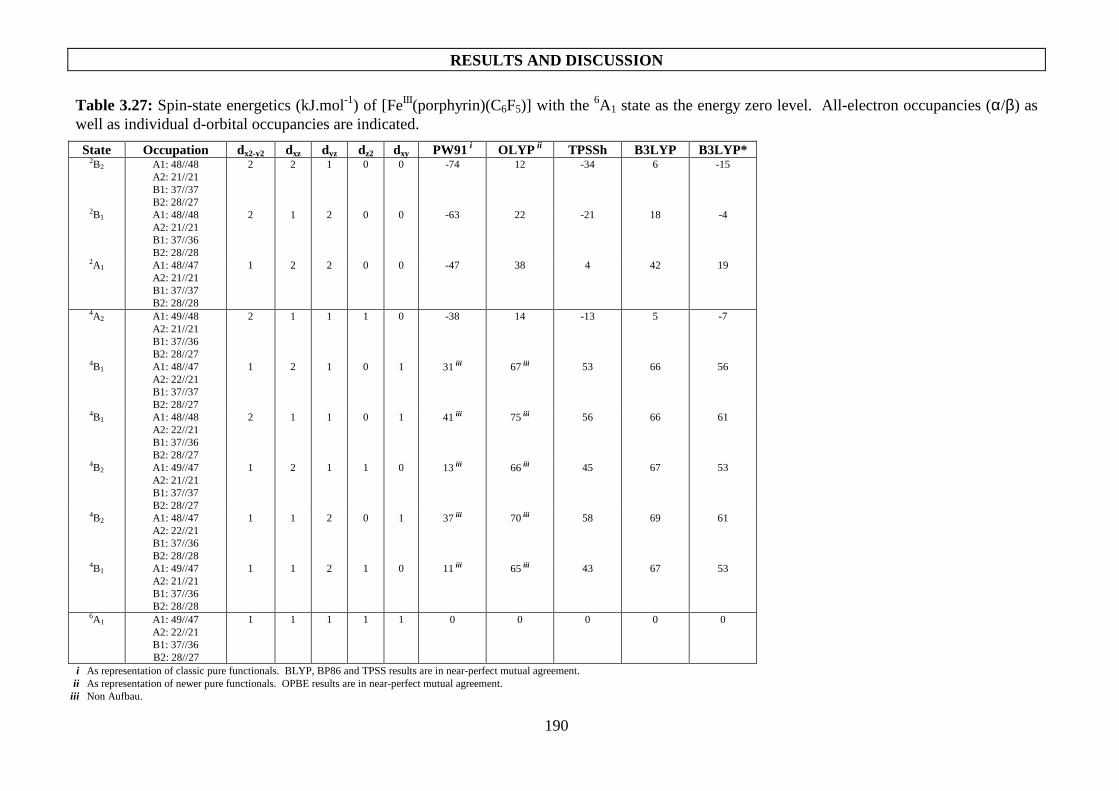
RESULTS AND DISCUSSION
190
Table 3.27: Spin-state energetics (kJ.mol-1) of [FeIII(porphyrin)(C6F5)] with the 6A1 state as the energy zero level. All-electron occupancies (α/β) as well as individual d-orbital occupancies are indicated.
State Occupation dx2-y2 dxz dyz dz2 dxy PW91 i OLYP ii TPSSh B3LYP B3LYP* 2B2 A1: 48//48
A2: 21//21 B1: 37//37 B2: 28//27
2 2 1 0 0 -74 12 -34 6 -15
2B1 A1: 48//48 A2: 21//21 B1: 37//36 B2: 28//28
2 1 2 0 0 -63 22 -21 18 -4
2A1 A1: 48//47 A2: 21//21 B1: 37//37 B2: 28//28
1 2 2 0 0 -47 38 4 42 19
4A2 A1: 49//48 A2: 21//21 B1: 37//36 B2: 28//27
2 1 1 1 0 -38 14 -13 5 -7
4B1 A1: 48//47 A2: 22//21 B1: 37//37 B2: 28//27
1 2 1 0 1 31 iii 67 iii 53 66 56
4B1 A1: 48//48 A2: 22//21 B1: 37//36 B2: 28//27
2 1 1 0 1 41 iii 75 iii 56 66 61
4B2 A1: 49//47 A2: 21//21 B1: 37//37 B2: 28//27
1 2 1 1 0 13 iii 66 iii 45 67 53
4B2 A1: 48//47 A2: 22//21 B1: 37//36 B2: 28//28
1 1 2 0 1 37 iii 70 iii 58 69 61
4B1 A1: 49//47 A2: 21//21 B1: 37//36 B2: 28//28
1 1 2 1 0 11 iii 65 iii 43 67 53
6A1 A1: 49//47 A2: 22//21 B1: 37//36 B2: 28//27
1 1 1 1 1 0 0 0 0 0
i As representation of classic pure functionals. BLYP, BP86 and TPSS results are in near-perfect mutual agreement. ii As representation of newer pure functionals. OPBE results are in near-perfect mutual agreement.
iii Non Aufbau.

CHAPTER 3
191
Table 3.28: Spin-state energetics (kJ.mol-1) of [FeIII(porphyrin)(3,4,5-C6F3H2)] with the 6A1 state as the energy zero level. All-electron occupancies (α/β) as well as individual d-orbital occupancies are indicated.
State Occupation dx2-y2 dxz dyz dz2 dxy PW91 i OLYP ii TPSSh B3LYP B3LYP* 2B2 A1: 45//45
A2: 20//20 B1: 34//34 B2: 27//26
2 2 1 0 0 -109 -25 -29 -24 -46
2B1 A1: 45//45 A2: 20//20 B1: 34//33 B2: 27//27
2 1 2 0 0 -106 -22 -25 -19 -41
2A1 A1: 45//44 A2: 20//20 B1: 34//34 B2: 27//27
1 2 2 0 0 -80 iii 1 iii 8 14 -10
4A2 A1: 46//45 A2: 20//20 B1: 34//33 B2: 27//26
2 1 1 1 0 -35 iii 18 23 9 -3
4B1 A1: 45//44 A2: 21//20 B1: 34//34 B2: 27//26
1 2 1 0 1 -7 30 52 32 22
4B1 A1: 45//45 A2: 21//20 B1: 34//33 B2: 27//26
2 1 1 0 1 4 iii 44 iii 59 41 32
4B2 A1: 46//44 A2: 20//20 B1: 34//34 B2: 27//26
1 2 1 1 0 20 iii 72 iii 88 79 64
4B2 A1: 45//44 A2: 21//20 B1: 34//33 B2: 27//27
1 1 2 0 1 -6 30 53 33 24
4B1 A1: 46//44 A2: 20//20 B1: 34//33 B2: 27//27
1 1 2 1 0 18 iii 71 iii 84 78 62
6A1 A1: 46//44 A2: 21//20 B1: 34//33 B2: 27//26
1 1 1 1 1 0 0 0 0 0
i As representation of classic pure functionals. BLYP, BP86 and TPSS results are in near-perfect mutual agreement. ii As representation of newer pure functionals. OPBE results are in near-perfect mutual agreement.
iii Non Aufbau.

RESULTS AND DISCUSSION
192
Table 3.29: Spin-state energetics (kJ.mol-1) of [FeIII(porphyrin)(2,4,6-C6F3H2)] with the 6A1 state as the energy zero level. All-electron occupancies (α/β) as well as individual d-orbital occupancies are indicated.
State Occupation dx2-y2 dxz dyz dz2 dxy PW91 i OLYP ii TPSSh B3LYP B3LYP* 2B2 A1: 45//45
A2: 20//20 B1: 34//34 B2: 27//26
2 2 1 0 0 -79 8 -44 4 -18
2B1 A1: 45//45 A2: 20//20 B1: 34//33 B2: 27//27
2 1 2 0 0 -65 20 -30 17 -5
2A1 A1: 45//44 A2: 20//20 B1: 34//34 B2: 27//27
1 2 2 0 0 -49 36 iii -4 42 19
4A2 A1: 46//45 A2: 20//20 B1: 34//33 B2: 27//26
2 1 1 1 0 -34 19 iii -19 10 -3
4B1 A1: 45//44 A2: 21//20 B1: 34//34 B2: 27//26
1 2 1 0 1 26 62 iii 39 60 52
4B1 A1: 45//45 A2: 21//20 B1: 34//33 B2: 27//26
2 1 1 0 1 35 iii 70 iii 44 63 58
4B2 A1: 46//44 A2: 20//20 B1: 34//34 B2: 27//26
1 2 1 1 0 18 iii 71 iii 41 74 60
4B2 A1: 45//44 A2: 21//20 B1: 34//33 B2: 27//27
1 1 2 0 1 33 67 iii 46 67 58
4B1 A1: 46//44 A2: 20//20 B1: 34//33 B2: 27//27
1 1 2 1 0 18 iii 71 41 76 61
6A1 A1: 46//44 A2: 21//20 B1: 34//33 B2: 27//26
1 1 1 1 1 0 0 0 0 0
i As representation of classic pure functionals. BLYP, BP86 and TPSS results are in near-perfect mutual agreement. ii As representation of newer pure functionals. OPBE results are in near-perfect mutual agreement.
iii Non Aufbau.

CHAPTER 4
193
4 Experimental
4.1 Materials.
Reagents were obtained from Merck and Sigma-Aldrich. Solid reagents employed in
preparations were used direct without further purification. Liquid reactants and solvents were
distilled prior to use. Doubly distilled H2O was used. Organic solvents were dried and distilled
before use.
4.2 Techniques and apparatus.
4.2.1 Melting point (m.p.) determination.
Melting points (m.p.) were determined with an Olympus BX51 system microscope assembled on
top of a Linkam THMS600 stage and connected to a Linkam TMS94 temperature programmer.
4.2.2 Analysis.
Elemental analysis was performed by Canadian Microanalytical Service Ltd, Canada. Mass
spectroscopy was performed by Dr. Charlene Marais, University of the Free State, South Africa.
Crystal determination was performed by Dr. Jan-André Gertenbach, University of Stellenbosch,
South Africa.
4.2.3 Spectroscopic measurements.
NMR measurements at 298 K were recorded on a Bruker Advance II 600 NMR spectrometer
[1H (600.130 MHz)]. The chemical shifts were reported relative to SiMe4 (0.00 ppm) for the 1H
spectra. Positive values indicate downfield shift and negative values correspond to upfield shifts.
Spectral processing was done by means of TOPSPIN.1
1 TOPSPIN - Bruker NMR Software, Version 1.3, 2005.

EXPERIMENTAL
194
MALDI-TOF-MS (matrix assisted laser desorption/ionization time-of-flight mass spectrometry)
spectra were collected by a Bruker Microflex LRF20 in the negative and positive reflection mode
(independently) with the minimum laser power required to observe signals.
4.2.4 Spectrophotometric measurements.
IR spectra were recorded on a Bruker Tensor 27 infrared spectrophotometer fitted with a Pike
MIRacle single bounce and a diamond ATR. Both solid and liquid samples were recorded by
placing a small amount of the pure material on the diamond of the ATR.
UV/vis spectra were recorded on a Varian Cary 50 Conc ultra-violet/visible spectrophotometer.
CH3CN was used as solvent for spectroelectrochemical (SEC) measurements.
Spectral processing was done with Microsoft Office Excel 2003.
4.2.5 Electrochemistry.
Cyclic voltammetric (CV) and spectroelectrochemical (SEC) measurements were done on a
BAS100B Electrochemical Analyzer linked to a personal computer utilizing the BAS100W
Version 2.3 software. Measurements were done at 293 K and the temperature was kept constant
within 0.5 K. Successive experiments under the same experimental conditions showed that all
formal reduction and oxidation potentials were reproducible within 5 mV. Data processing was
done with Microsoft Office Excel 2003.
Cyclic voltammetric (CV) measurements were performed on 1 mmol.dm-3 solutions of the
complex dissolved in CH3CN as solvent containing 100 mmol.dm-3 tetrabutylammonium
hexafluorophosphate (TBAPF6, [NBu4][PF6]) as supporting electrolyte. Measurements were
conducted under a blanket of purified Argon. A three-electrode cell, consisting of a Pt auxiliary
electrode, a glassy carbon (surface area 0.0707 cm2) working electrode and a Ag/Ag+
(10 mmol.dm-3 AgNO3 in CH3CN) reference electrode2 mounted on a Luggin capillary, was
used.3,4 The working electrode was polished with 3 µm followed by 1 µm Diapat diamond paste
2 D.T. Sawyer, J.L. Roberts Jr, Experimental electrochemistry for chemists, Wiley, New York, 1974, p54.
3 D.H. Evans, K.M. O'Connell, R.A. Peterson, M.J. Kelly, J. Chem. Educ. 1983 (60) 290-293.
4 G.A. Mabbott, J. Chem. Educ. 1983 (60) 697-702.

CHAPTER 4
195
on an abrasive cloth (in a figure of 8 motions), rinsed with EtOH, H2O and CH3CN and dried
before each experiments. Scan rates were between 50 and 1000 mV.s-1. All cited potentials are
referenced against the Fc/Fc+ couple as suggested by IUPAC.5
Spectroelectrochemical (SEC) measurements were performed on 0.3 mmol.dm-3 solutions of the
complex dissolved in CH3CN as solvent containing 200 mmol.dm-3 tetra-n-butylammonium
hexafluorophoshate as supporting electrolyte. An optically transparent thin layer electrochemical
(OTTLE) Omni cell system fitted with NaCl liquid Omni windows, connected to a Cary 50 Conc
ultra-violet/visible spectrophotometer, was used. The scan rate was set at 500 µV.s-1. Spectra
were collected every 5 minutes between 200-600 nm.
4.3 Synthesis.
4.3.1 β-diketones.
The β-diketones dithenoylmethane (Hdtm) and benzoylthenoylacetone (Hbth) were synthesized
according to published methods.6 All other β-diketones in this study were obtained from Merck
and Sigma-Aldrich.
4.3.2 Rhodium complexes.
All Rhodium complexes used in this study were synthesized according to published methods.7,8
4.3.3 [Fe(β-diketonato)3] complexes {1}-{10}.
[Fe(β-diketonato)3] complexes {2}, {3}, {8} and {9} were prepared by the following adapted
procedure:9
5 G. Gritzner, J. Kuta, Pure Appl. Chem. 1984 (56) 461-466.
6 M.M. Conradie, A.J. Muller, J. Conradie, S. Afr. J. Chem. 2008 (61) 13-21.
7 M.M. Conradie, J. Conradie, Inorg. Chim. Acta 2008 (361) 2285–2295.
8 S.S. Basson, J.G. Leipoldt, J.T. Nel, Inorg. Chim. Acta 1984 (84) 167-172.

EXPERIMENTAL
196
A metal solution of 0.15 mmol Fe(NO3)3.9H2O (dissolved in 10 ml H2O) was buffered with
0.45 mmol CH3COONa.3H2O (dissolved in 10 ml H2O). To this buffered metal solution, an
0.53 mmol β-diketone solution (dissolved in 10 ml EtOH) was added. The resulting solution was
stirred well for 30 minutes and was left overnight in a fume hood. The precipitate was collected
by filtration and washing with H2O.
[Fe(β-diketonato)3] complexes {1}, {6}, {7} and {10} were prepared by the following adapted
procedure:9
A metal solution of 0.15 mmol Fe(NO3)3.9H2O was buffered with 0.45 mmol CH3COONa.3H2O
(dissolved in minimal H2O). To this, EtOH was added to make a 1:1 H2O:EtOH solution. With
the aid of a syringe, liquid 0.53 mmol β-diketone was added. The resulting solution was stirred
well (with a lid on) for 30 minutes and was left overnight in a fume hood (without lid). The
precipitate was collected by filtration and washing with H2O.
[Fe(β-diketonato)3] complexes {4} and {5} were prepared by the following adapted procedure:9
A metal solution of 0.15 mmol Fe(NO3)3.9H2O was buffered with 0.45 mmol CH3COONa.3H2O
(dissolved in minimal H2O). To this, EtOH was added to make a 1:1 H2O:EtOH solution. An
0.53 mmol β-diketone solution (dissolved in 10 ml DCM) was added to the above. The resulting
solution was stirred well for 30 minutes and was left overnight in a fume hood. The precipitate
was collected by filtration and washing with H2O.
9 (a) E.W. Berg, J.T. Truemper, J. Phys. Chem. 1960 (64) 487-490 (b) K. Endo, M. Furukawa, H. Yamatera, H
Sano, Bull. Chem. Soc. Jpn 1980 (53) 407-410 (c) G.S. Hammond, D.C. Nonhebel, C.S. Wu, Inorg. Chem. 1963
(2) 73-76.

CHAPTER 4
197
4.3.3.1 Tris(acetylacetonato-κκκκ2O,O’)iron(III) [Fe(acac) 3] {1}.
{1}
Yield 73%. Colour: red. M.p. 180.0-182.0 °C (reported: 179 °C,10 180 °C11). UV: λmax 270 nm,
εmax 25842 mol-1.dm3.cm-1 (CH3CN). MS Calcd. ([M]–, positive mode): m/z 352.2. Found: m/z
351.9. Anal. Calcd. for FeC15H21O6: C, 51.01; H, 5.99. Found: C, 50.42; H, 5.91.
4.3.3.2 Tris(benzoylacetonato-κκκκ2O,O’)iron(III) [Fe(ba) 3] {2}.
{2}
Yield 84%. Colour: red-orange. M.p. 218.5-220.3 °C (reported: 222-224 °C10). UV: λmax
298 nm, εmax 40256 mol-1.dm3.cm-1 (CH3CN). MS Calcd. ([M], positive mode): m/z 539.4.
Found: m/z 539.1. Anal. Calcd. for FeC30H27O6: C, 66.80; H, 5.05. Found: C, 66.46; H, 5.10.
10 E.W. Berg, J.T. Truemper, J. Phys. Chem. 1960 (64) 487-490.
11 M.-L. Hu, Z.-M. Jin, Q. Miao, L.-P. Fang, Z. Kristallogr. - New Cryst. Struct. 2001 (216) 597-598.

EXPERIMENTAL
198
4.3.3.3 Tris(benzoylthenoylacetonato-κκκκ2O,O’)iron(III) [Fe(bth) 3] {3}.
{3}
Yield 85%. Colour: red-brown. M.p. 220.0-222.0 °C. UV: λmax 361 nm, εmax 30956
mol-1.dm3.cm-1 (CH3CN). MS Calcd. ([M], positive mode): m/z 743.7. Found: m/z 743.2. Anal.
Calcd. for FeC39H27S3O6: C, 62.99; H, 3.66. Found: C, 61.44; H, 3.71.
4.3.3.4 Tris(dithenoylmethanato-κκκκ2O,O’)iron(III) [Fe(dtm) 3] {4}.
{4}
Yield 39%. Colour: black. M.p. 63.7-66.4 °C. UV: λmax 260 nm, εmax 35301 mol-1.dm3.cm-1
(CH3CN). This complex could not be ionized for an MS analysis. Anal. Calcd. for
FeC33H21S6O6: C, 52.03; H, 2.78. Found: C, 51.27; H, 2.71.

CHAPTER 4
199
4.3.3.5 Tris(dibenzoylmethanato-κκκκ2O,O’)iron(III) [Fe(dbm) 3] {5}.
{5}
Yield 71%. Colour: dark red. M.p. 264.0-265.2 °C (reported: 261 °C,12 257 °C13). UV: λmax
336 nm, εmax 48608 mol-1.dm3.cm-1 (CH3CN). MS Calcd. ([M], positive mode): m/z 725.6.
Found: m/z 725.3. Anal. Calcd. for FeC45H33O6: C, 74.49; H, 4.58. Found: C, 75.29; H, 4.51.
4.3.3.6 Tris(trifluoroacetylacetonato-κκκκ2O,O’)iron(III) [Fe(tfaa) 3] {6}.
{6}
Yield 91%. Colour: red-brown. M.p. 113.5-116.1 °C (reported: 115 °C10,14). UV: λmax 271 nm,
εmax 48996 mol-1.dm3.cm-1 (CH3CN). MS Calcd. ([M]–, negative mode): m/z 514.1. Found: m/z
513.5. Anal. Calcd. for FeC15H12O6F9: C, 34.98; H, 2.35. Found: C, 34.48; H, 2.30.
12 B. Kaitner, B. Kamenar, Cryst. Struct. Commun. 1980 (9) 487-492.
13 I.A. Baidina, P.A. Stabnikov, I.K. Igumenov, S.V. Borisov, Koord. Khim. (Russ.) (Coord.Chem.) 1986 (12) 258-
265.
14 I.A. Baidina, P.A. Stabnikov, I.K. Igumenov, S.V. Borisov, Koord. Khim. (Russ. )(Coord. Chem.) 1986 (12) 404-
408.

EXPERIMENTAL
200
4.3.3.7 Tris(trifluorofuroylacetonato- κκκκ2O,O’)iron(III) [Fe(tffu) 3] {7}.
{7}
Yield 92%. Colour: dark red. M.p. 205.0-208.0 °C (reported: 201-208 °C10). UV: λmax 333 nm,
εmax 53476 mol-1.dm3.cm-1 (CH3CN). MS Calcd. ([M], positive mode): m/z 671.2. Found:
m/z 671.1. Anal. Calcd. for FeC24H12O9F9: C, 42.95; H, 1.80. Found: C, 42.91; H, 1.83.
4.3.3.8 Tris(trifluorobenzoylacetonato-κκκκ2O,O’)iron(III) [Fe(tfba) 3] {8}.
{8}
Yield 96%. Colour: orange. M.p. 58.4-60.1 °C (reported: 128-129 °C10). UV: λmax 304 nm, εmax
30788 mol-1.dm3.cm-1 (CH3CN). MS Calcd. ([M], negative mode): m/z 701.3. Found: m/z
701.1. Anal. Calcd. for FeC30H18O6F9: C, 51.38; H, 2.59. Found: C, 50.66; H, 2.53.

CHAPTER 4
201
4.3.3.9 Tris(thenoyltrifluoroacetonato-κκκκ2O,O’)iron(III) [Fe(tta) 3] {9}.
{9}
Yield 78%. Colour: dark red. M.p. 158.0-161.0 °C (reported: 159-160 °C,10 162.5 °C15). UV:
λmax 333 nm, εmax 48461 mol-1.dm3.cm-1 (CH3CN). MS Calcd. ([M], negative mode): m/z 719.4.
Found: m/z 718.9. Anal. Calcd. for FeC24H12S3O6F9: C, 40.07; H, 1.68. Found: C, 39.51; H,
1.70.
4.3.3.10 Tris(hexafluoroacetylacetonato-κκκκ2O,O’)iron(III) [Fe(hfaa) 3] {10}.
{10}
Yield 51%. Colour: light orange. M.p. 56.0-58.0 °C (reported: 55 °C16). MS Calcd. ([M],
negative mode): m/z 677.0. Found: m/z 676.8. Anal. Calcd. for FeC15H3O6F18: C, 26.61; H,
0.45. Found: C, 26.17; H, 0.51.
15 H. Soling, Acta Chem. Scand. A 1976 (30) 163-170.
16 C.E. Pfluger, P.S. Haradem, Inorg. Chim. Acta 1983 (69) 141-146.

EXPERIMENTAL
202
4.4 Crystallography.
4.4.1 Structure determination of [Rh(bth)(CO)2].
Crystals of [Rh(bth)(CO)2] (Hbth = benzoylthenoylacetone) were obtained by recrystallization
from acetone and water. The red crystal was mounted on a glass fibre and used for the X-ray
crystallographic analysis. The X-ray intensity data were measured on a Bruker X8 Apex II 4K
Kappa CCD diffractometer area detector system equipped with a graphite monochromator and a
Mo Kα fine-focus sealed tube (λ = 0.71073 Å) operated at 1.5 kW power (50 kV, 30 mA). The
detector was placed at a distance of 3.75 cm from the crystal. The crystal temperature during the
data collection was kept constant at 100(2) K using an Oxford 700 series cryostream cooler.
The initial unit cell and data collection was achieved by the Apex2 software17 utilizing
COSMO18 for optimum collection of more than a hemisphere of reciprocal space. A total of
1778 frames were collected with a scan width of 0.5° in φ and ω and an exposure time of 40
s.frame-1. The frames were integrated using a narrow-frame integration algorithm and reduced
with the Bruker SAINT-Plus19 and XPREP19 software packages respectively. The integration of
the data using a monoclinic cell yielded a total of 25770 reflections to a maximum θ angle of
28.5°, of which 3596 were independent with a Rint = 0.1523. Analysis of the data showed no
significant decay during the data collection. Data were corrected for absorption effects using the
multi-scan technique SADABS20 with minimum and maximum transmission coefficients of
0.620 and 0.937 respectively.
The structure was solved by the direct methods package SHELXS21 and refined using the X-Seed
software package22 incorporating SHELXL.21 The final anisotropic full-matrix least-squares
refinement on F2 with 235 variables converged at R1 = 0.0842 for the observed data and
wR2 = 0.1948 for all data. The GOF was 1.002. The largest peak on the final difference electron
17 Apex2., Bruker AXS Inc., Madison, Wisconsin, USA, Version 1.0-27, 2005.
18 COSMO, Bruker AXS Inc., Madison, Wisconsin, USA, Version 1.48, 2003.
19 SAINT-Plus, Bruker AXS Inc., Madison, Wisconsin, USA, Version 7.68a (including XPREP), 2009.
20 SADABS, Bruker AXS Inc., Madison, Wisconsin, USA, Version 2008/1, 2009.
21 G.M. Sheldrick, Acta Cryst. 2008 (A64) 112-122.
22 J.L. Atwood, L.J. Barbour, Cryst. Growth Des. 2003 (3) 3-8.

CHAPTER 4
203
density synthesis was 3.11 e.Å-3 at 0.5 Å from Rh1 and the deepest hole -1.621.576 e.Å-3 at
0.77 Å from Rh1.
The aromatic H atoms were placed in geometrically idealized positions (C–H = 0.95 Å) and
constrained to ride on their parent atoms with Uiso(H) = 1.2Ueq(C). Non-hydrogen atoms were
refined with anisotropic displacement parameters. Atomic scattering factors were taken from the
International Tables for Crystallography Volume C.23 The molecular plot was drawn using the
X-Seed programme.22
4.5 Computational.
4.5.1 Resources.
4.5.1.1 Computational Facilities.24
The Norwegian Metacenter for Computational Science (Notur) project provides the national
infrastructure for computational science in Norway. The project provides computational
resources and services to individuals or groups involved in education and research at Norwegian
universities and colleges, operational forecasting and research at the Meteorological Institute and
to institutes and industries that collaborate with the project. The university partners of the Notur
consortium operate a number of High Performance Computing (HPC) facilities. Some
characteristics of all the available facilities are given in Table 4.1.
Each of the facilities consists of a computer resource (a number of compute nodes each with a
number of processors and internal shared-memory, plus an interconnect that connects the nodes),
a central storage resource that is accessible to all the nodes, and a secondary storage resource for
back-up (and in few cases also for archiving). All facilities use variants of the UNIX operating
system (Linux, AIX, etc.).
23 International Tables for Crystallography, Kluwer Academic Publishers, Dordrecht, The Netherlands, Vol. C,
p1002.
24 www.notur.no.

EXPERIMENTAL
204
Table 4.1: Some characteristics of all the available facilities at the Notur consortium.
System Type No. of Nodes
No. of cores
CPU type Theoretical total peak
Total memory
Total disk capacity
Hexagon Cray XT4 MPP i 1388 2 776 Opteron 12214 Gflop 6064 GB 288 TB Njord IBM p575+ distributed SMP 62 992 Power5+ 7500 Gflop 1984 GB 70 TB Stallo HP BL 460c cluster 704 5 632 Xeon 2 60 000 Gflop 12 064 GB 128 TB
Titan Dell 1425
Sun X2200 cluster
180 448
360 1872
Xeon Opteron
2304 Gflop 9539 Gflop
720 GB 7620 GB
28 TB + 12 TB GPFS 336 TB + 120 TB GPFS
i MPP = Massively Parallel Processor.
For the research of the projects in this thesis, the facility Stallo was used. This was made
possible through collaboration between Prof. J. Conradie at the University of the Free State
(UFS)25 and the Centre for Theoretical and Computational Chemistry (CTCC).26 The key
numbers of the facility Stallo are given in Table 4.2.
Table 4.2: Key numbers about the facility Stallo, a Linux cluster.
Aggregated Per node Peak performance 60 Teraflop/s 85.12 Gigaflop/s No. of Nodes 704 x HP BL460c blade servers 1 x HP BL460c blade server No. of CPUs / No. of Cores 1408 / 5632 2 / 8
Processors 1408 x 2.66 GHz Intel Xeon X5355 Quad Core
2 x 2.66 GHz Intel Xeon X5355 Quad Core
Total memory 12 TB 16 GB (50 nodes with 32 GB) Internal storage 84.5 TB 120 GB Centralized storage 128 TB 128 TB Interconnect Gigabit Ethernet + Infiniband i Gigabit Ethernet + Infiniband i Compute racks 11 Infrastructure racks 2 Storage racks 4 Dimensions (w x d x h) 15 m x 1.3 m x 2 m Weight 16 tons i All nodes in the cluster are connected with Gigabit Ethernet and 384 nodes are also connected with Infiniband.
4.5.1.2 Scaling of ADF 2007.27
Geometry optimization calculations were performed on a caffeine molecule (24 atoms, closed
shell, BP86/DZP) and a ring-substituted iron-porphyrin with axial ligands (125 atoms, open
shell, D2d symmetry, PW91/TZP) with the ADF 2007 programme on Stallo. Tests were made on
1, 2, 4, 8, 16, 24, 30, 40, 60, 80 and 100 processors and repeated twice.
25 www.ufs.ac.za.
26 www.ctcc.no.
27 Performed by Dr. Espen Tangen, University of Trømso, Trømso, Norway, 2008.

CHAPTER 4
205
In general, ADF 2007 appears to be very stable, though somewhat memory-demanding. Energies
varied slightly, but showed satisfactory reliability when running on 40 processors or less. In the
initial tests, default values for the convergence criteria and the numerical integration were used.
This proved to be a rather poor test for ADF 2007, since the results were unreliable. It is
therefore recommended to use a tighter convergence geometry criterion, in other words a tighter
SCF convergence and a higher integration accuracy. A general rule of thumb: by increasing the
default integration by one, one should also decrease both the grad in the geometry cycle and the
SCF convergence by an order of magnitude. The default value for the SCF iterations (50) was
also found to be too low for jobs to work realistically. It is therefore recommended to use a value
of at least 200 as a standard number and it can be increased up to 3000.
Results are summarized in Table 4.3 and Table 4.4. The speed-up is calculated by dividing the
real-time for the job on one processor by the real-time for the job on the given amount of
processors. Therefore, the higher the value for speed-up, the better. The scale factor is the
reported real time, multiplied by the number of processors and then divided by the reported
real-time for the job on one processor. This number should ideally be as close to 1 as possible.
Time-Save is the time-difference between the reported real-time and the shortest time reported.
Table 4.3: Scaling results of the small molecule (caffeine, 24 atoms). Best performance is indicated in bold.
No. of processors Real Speed-up Scale-factor Time-Save 1 0:49:45 1.00 1.00 0:23:59 2 0:40:57 1.21 1.65 0:15:11 4 0:25:46 1.93 2.07 0:00:00 8 0:32:43 1.52 5.26 0:06:57 16 0:46:04 1.08 14.82 0:20:18 24 0:53:30 0.93 25.81 0:27:44 30 0:57:28 0.87 34.66 0:31:42 40 1:02:11 0.80 50.00 0:36:25 60 1:15:14 0.66 90.73 0:49:28 80 1:17:34 0.64 124.73 0:51:48 100 1:22:25 0.60 165.66 0:56:39

EXPERIMENTAL
206
Table 4.4: Scaling results of the large molecule (iron-porphyrin, 125 atoms). Best performance is indicated in bold.
No. of processors Real Speed-up Scale-factor Time-Save 1 23:28:51 1.00 1.00 20:11:57 2 10:41:01 2.20 0.91 7:24:07 4 8:15:08 2.85 1.41 4:58:14 8 5:17:12 4.44 1.80 2:00:18 16 3:38:51 6.44 2.49 0:21:57 24 3:25:40 6.85 3.50 0:08:46 30 3:37:15 6.48 4.63 0:20:21 40 3:21:25 6.99 5.72 0:04:31 60 4:57:38 4.73 12.68 1:40:44 80 4:24:42 5.32 15.03 1:07:48 100 3:16:54 7.16 13.98 0:00:00
From the above results, it is recommended to use 4 to 8 processors (1/2 to 1 node) for small jobs
and 40 processors (5 nodes) for large jobs. Exceeding these recommended amounts of
processors only increase the wall time consumption.
4.5.2 Rhodium complexes.
4.5.2.1 [Rh(β-diketonato)(CO)(PPh3)] and [Rh(acac)(P(OR)3)2].
DFT calculations were carried out on [Rh(β-diketonato)(CO)(PPh3)] (β-diketone = Hacac, Htta,
Hbth or Hdtm) and [Rh(acac)(P(OR)3)2] complexes using the ADF (Amsterdam Density
Functional) 2007 programme28 with the GGA (Generalized Gradient Approximation) functional
PW91.29 The TZP (Triple ζ polarized) basis set, with a fine mesh for numerical integration, a
spin-restricted formalism and a full geometry optimization with tight convergence criteria, was
used for minimum energy and transition state (TS) searches. Approximate structures of the TS
have been determined with linear transit (LT) scans, with a constraint optimization along a
chosen reaction coordinate, to sketch an approximate path over the TS between reactants and
products. Throughout, all calculations have been performed with no symmetry constraint (C1)
and all structures have been calculated as singlet states.
28 G. Te Velde, F.M Bickelhaupt, E.J. Baerends, C.F. Guerra, S.J.A. Van Gisbergen, J.G. Snijders, T. Ziegler, J.
Comput. Chem. 2001 (22) 931-967.
29 J.P. Perdew, J.A. Chevary, S.H. Vosko, K.A. Jackson, M.R. Pederson, D.J. Singh, C. Fiolhais, Phys. Rev. B 1992
(46) 6671-6687. Erratum: J.P. Perdew, J.A. Chevary, S.H. Vosko, K.A. Jackson, M.R. Perderson, D.J. Singh, C.
Fiolhais, Phys. Rev. B 1993 (48) 4978.

CHAPTER 4
207
Numerical frequency analyses,30,31 where the frequencies are computed numerically by
differentiation of energy gradients in slightly displaced geometries, have been performed to
verify the TS geometries. A TS has one imaginary frequency.
Zero point energy and thermal corrections (vibrational, rotational and translational) were made in
the calculation of the thermodynamic parameters. The enthalpy (H) and Gibbs free energy (G)
were calculated from
U = ETBE + EZPE + EIE (Equation 4.1)
H = U + RT (gas phase) or H = U (solution) (Equation 4.2)
G = H - TS (Equation 4.3)
where U is the total energy, ETBE is total bonding energy, EZPE is zero point energy, EIE is internal
energy, R is the gas constant, T is temperature and S is entropy. The entropy (S) was calculated
from the temperature dependent partition function in ADF at 298.15 K. The computed results
assume an ideal gas.
Solvent effects were taken into account for all optimized structures reported here. The COSMO
(Conductor like Screening Model) model of solvation32,33,34 was used as implemented in ADF.35
The COSMO model is a dielectric model in which the solute molecule is embedded in a
molecule-shaped cavity surrounded by a dielectric medium with a given dielectric constant (ε0).
The type of cavity used is Esurf36 and the solvent used is methanol (ε0 = 32.6) and chloroform
(ε0 = 4.8). Where applicable, scalar relativistic effects were used with the ZORA37,38,39,40,41
(Zero Order Regular Approximation) formalism.
30 L. Fan, T. Ziegler, J. Chem. Phys. 1992 (96) 9005-9012.
31 L. Fan, T. Ziegler, J. Amer. Chem. Soc. 1992 (114) 10890-10897.
32 A. Klamt, G. Schüürmann, J. Chem. Soc., Perkin Trans. 2 1993 799-805.
33 A. Klamt, J. Phys. Chem. 1995 (99) 2224-2235.
34 A. Klamt, V. Jones, J. Chem. Phys. 1996 (105) 9972-9981.
35 C.C. Pye, T. Ziegler, Theor. Chem. Acc. 1999 (101) 396-408.
36 J.L. Pascual-Ahuir, E. Silla, I. Tuñon, J. Comput. Chem. 1994 (15) 1127-1138.
37 E. van Lenthe, A.E. Ehlers, E.J. Baerends, J. Chem. Phys. 1999 (110) 8943-8953.
38 E. van Lenthe, E.J. Baerends, J.G. Snijders, J. Chem. Phys. 1993 (99) 4597-4610.
39 E. van Lenthe, E.J. Baerends, J.G. Snijders, J. Chem. Phys. 1994 (101) 9783-9792.
40 E. van Lenthe, J.G. Snijders, E.J. Baerends, J. Chem. Phys. 1996 (105) 6505-6516.
41 E. van Lenthe, R. van Leeuwen, E.J. Baerends, J.G. Snijders, Int. J. Quantum Chem. 1996 (57) 281-293.

EXPERIMENTAL
208
The accuracy of the computational approach was evaluated by comparing the root-mean-square
distances (RMSDs) as calculated by the "RMS Compare Structures" utility in ChemCraft.42 The
RMSD values were calculated for the best three-dimensional superposition of optimized
molecular structures on experimental crystal structures, using only the non-hydrogen atoms and
the non-rotational groups of the molecule.
4.5.3 Iron complexes.
4.5.3.1 [Fe(β-diketonato)3].
DFT calculations were carried out on [Fe(β-diketonato)3] (β-diketone = Hacac, Hba, Hdtm, Hbth,
Hdbm, Htfaa, Htffu, Htfba, Htta or Hhfaa) complexes using the ADF 2007 programme28 with the
GGA functional OLYP.43,44 The TZP basis set, with a fine mesh for numerical integration and a
full geometry optimization with tight convergence criteria, was used. Initial calculations on
[Fe(acac)3] were performed with a D3 symmetry constraint and a selection of spin states (S = 1/2,
3/2 and 5/2). Final calculations on all [Fe(β-diketonato)3] and [Fe(β-diketonato)3]− complexes
have been performed with a D3 (complexes with symmetrical β-diketone ligand), C3 (complexes
with unsymmetrical β-diketone ligand, arranged in such a way that they have a 3-fold rotational
axis) or C1 (complexes with unsymmetrical β-diketone ligand, arranged in such a way that they
have no symmetry operation) symmetry constraint. Both [Fe(β-diketonato)3] (S = 5/2) and
[Fe(β-diketonato)3]-1 (S = 2) complexes were calculated, with the expected spin states in
parentheses.
42 G.A. Zhurko, D.A. Zhurko, CHEMCRAFT, Version 1.6 (Build 304), 2009.
43 N.C. Handy, A.J. Cohen, Mol. Phys. 2001 (99) 403-412.
44 (a) C. Lee, W. Yang, R.G. Parr, Phys. Rev. B 1988 (37) 785-789. (b) B.G. Johnson, P.M.W. Gill, J.A. Pople, J.
Chem. Phys. 1993 (98) 5612-5626. (c) T.V. Russo, R.L. Martin, P.J. Hay, J. Chem. Phys. 1994 (101) 7729-
7737.

CHAPTER 4
209
4.5.3.2 [Fe(salen)(CH3)2(COCH3)2(py)2].
DFT calculations were carried out on two different conformations of the
Fe(salen)(CH3)2(COCH3)2(py)2 complex using the ADF 2007 programme28 with a selection of
GGA functionals, namely PW91,29 BLYP,44,45 BP86,45,46 PBE,47 OLYP43,44 and OPBE.43,48 The
TZP basis set, with a fine mesh for numerical integration and a full geometry optimization with
tight convergence criteria, was used. DFT and hybrid DFT calculations were also carried out
using the Gaussian 03 programme49. These calculations were performed with tight convergence
criteria using the PW9129 and B3LYP50 functionals and the 6-311G**51 basis set. Subsequently,
single-point OLYP,43,44 B3LYP50 and B3LYP*52 calculations were performed on the PW9129
geometries with the ADF 2007 programme28 using the TZP basis set and alternative occupations.
Throughout, all ADF calculations have been performed with a C2v symmetry constraint and both
conformations have been calculated as singlet, triplet and quintet states for a variety of
low-energy d-electron configurations, which were manually worked out. The xy symmetry plane
45 A.D. Becke, Phys. Rev. 1988 (A38) 3098-3100.
46 J.P. Perdew, Phys. Rev. 1986 (B33) 8822-8824; Erratum: J.P. Perdew, Phys. Rev. 1986 (B34) 7406.
47 J.P. Perdew, K. Burke, M. Ernzerhof, Phys. Rev. Lett. 1996 (77) 3865-3868; Erratum: J.P. Perdew, K. Burke, M.
Ernzerhof, Phys. Rev. Lett. 1997 (78) 1396.
48 M. Swart, A.W. Ehlers, K. Lammertsma, Mol. Phys. 2004 (102) 2467-2474.
49 Gaussian 03, Revision C.02, M.J. Frisch, G.W. Trucks, H.B. Schlegel, G.E. Scuseria, M.A. Robb, J.R.
Cheeseman, J.A. Montgomery Jr., T. Vreven, K.N. Kudin, J.C. Burant, J.M. Millam, S.S. Iyengar, J. Tomasi, V.
Barone, B. Mennucci, M. Cossi, G. Scalmani, N. Rega, G.A. Petersson, H. Nakatsuji, M. Hada, M. Ehara, K.
Toyota, R. Fukuda, J. Hasegawa, M. Ishida, T. Nakajima, Y. Honda, O. Kitao, H. Nakai, M. Klene, X. Li, J.E.
Knox, H.P. Hratchian, J.B. Cross, V. Bakken, C. Adamo, J. Jaramillo, R. Gomperts, R.E. Stratmann, O. Yazyev,
A.J. Austin, R. Cammi, C. Pomelli, J.W. Ochterski, P.Y. Ayala, K. Morokuma, G.A. Voth, P. Salvador, J.J.
Dannenberg, V.G. Zakrzewski, S. Dapprich, A.D. Daniels, M.C. Strain, O. Farkas, D.K. Malick, A.D. Rabuck,
K. Raghavachari, J.B. Foresman, J.V. Ortiz, Q. Cui, A.G. Baboul, S. Clifford, J. Cioslowski, B.B. Stefanov, G.
Liu, A. Liashenko, P. Piskorz, I. Komaromi, R.L. Martin, D.J. Fox, T. Keith, M.A. Al-Laham, C. Peng, A.
Nanayakkara, M. Challacombe, P.M.W. Gill, B. Johnson, W. Chen, M.W. Wong, C. Gonzalez, J.A. Pople,
Gaussian, Inc., Wallingford CT, 2004.
50 P.J. Stephens, F.J. Devlin, C.F. Chabalowski, M.J. Frisch, J. Phys. Chem. 1994 (98) 11623-11627.
51 (a) R.C. Binning Jr., L.A. Curtiss, J. Comp. Chem. 1990 (11) 1206-1216. (b) L.A. Curtiss, M.P. McGrath, J.-P.
Blaudeau, N.E. Davis, R.C. Binning Jr., L. Radom, J. Chem. Phys. 1995 (103) 6104-6113. (c) M.P. McGrath, L.
Radom, J. Chem. Phys. 1991 (94) 511-516.
52 M. Reiher, O. Salomon, B.A. Hess, Theor. Chem. Acc. 2001 (107) 48-55.

EXPERIMENTAL
210
is defined to be in the plane of the salen ligand with the y-axis as the 2-fold rotational axis. The
z-axis is defined to point upwards towards the pyridine ligand.
4.5.3.3 [Fe(porphyrin)(Ar)].
DFT calculations were carried out on [Fe(porphyrin)(Ar)] complexes (Ar = aryl = Cl, Ph, C6F5,
3,4,5-C6F3H2 and 2,4,6-C6F3H2) using the ADF 2007 programme28 with a selection of GGA,
meta-GGA and meta-hybrid functionals, namely PW91,29 BLYP,44,45 BP86,45,46 OLYP,43,44
OPBE,43,48 TPPS53 and TPPSh.53 Subsequently, single-point B3LYP50 and B3LYP*52 hybrid
calculations were performed on the OLYP43,44 geometries. The TZP basis set, with a fine mesh
for numerical integration and a full geometry optimization with tight convergence criteria, was
used. Hybrid DFT calculations were also carried out using the Gaussian 03 programme49. These
calculations were performed with tight convergence criteria using the B3LYP50 functional and
the 6-311G**51 basis set. Throughout, all ADF calculations have been performed with a C2v
symmetry constraint (unless else indicated) and all structures have been calculated as doublet,
quartet and sextet states for a variety of low-energy d-electron configurations, which were
manually worked out.
53 (a) J. Tao, J.P. Perdew, V.N. Staroverov and G.E. Scuseria, Phys. Rev. Lett. 2003 (91) 146401-146404. (b) V.N.
Staroverov, G.E. Scuseria, J. Tao and J.P. Perdew, J. Chem. Phys. 2003 (119) 12129-12137.

CHAPTER 5
211
5
Concluding remarks and future perspectives
5.1 Concluding remarks.
Rhodium complexes.
The oxidative addition reaction of methyl iodide to square planar rhodium(I) complexes has been
studied. Two types of rhodium complexes were investigated: monocarbonyltriphenylphosphine
rhodium complexes [Rh(β-diketonato)(CO)(PPh3)] and triphenylphosphite rhodium complexes
[Rh(β-diketonato)(P(OPh)3)2] (where β-diketonato is a monoanionic bidentate ligand with two
oxygen donor atoms (R1COCHCOR2)–).
The reaction, [Rh(β-diketonato)(CO)(PPh3)] + CH3I (β-diketonato = acac, tta, bth and dtm),
consists of many steps with numerous transition states, intermediate products and reaction
products. Experimental studies indicate that the reaction occurs according to the following
reaction scheme:
[RhI(β-diketonato)(CO)(PPh3)] + CH3I → RhIII -alkyl1 → RhIII -acyl1 → RhIII -alkyl2 → RhIII -acyl2
[Rh(acac)(CO)(PPh3)] (Hacac = acetylacetone) was used to study the stereochemistry of the
reaction products and the complete reaction mechanism. An in situ 1H NMR experimental study
revealed the following information about the stereochemistry of the reaction products:
RhIII-alkyl1 has an octahedral geometry around the rhodium centre with the CH3 group in the
apical position and the PPh3 group in the plane of the acac ligand, RhIII-acyl1 has a square
pyramidal geometry around the rhodium centre with the PPh3 groups in the plane of the acac
ligand, RhIII-alkyl2 has an octahedral geometry around the rhodium centre with the PPh3 group in
the apical position and the CH3 group in the plane of the acac ligand and RhIII-acyl2 has a square
pyramidal geometry around the rhodium centre with the PPh3 group in the plane of the acac
ligand. A DFT computational study on the relative stability of the possible reaction products is
in agreement with these findings of the 1H NMR experimental study. The DFT computational
study gave additional insight into the relative positions of the I and the CO group in each of the
above reaction products. On the grounds of the 1H NMR experimental study and the DFT

CONCLUDING REMARKS AND FUTURE PERSPECTIVES
212
computational study, a general reaction scheme with specific stereochemistry for the reaction
[Rh(β-diketonato)(CO)(PPh3)] + CH3I could be constructed (Figure 5.1). For
[Rh(β-diketonato)(CO)(PPh3)] complexes with symmetrical β-diketonato ligands, only one
isomer in the reaction scheme has to be considered.
Figure 5.1: The proposed reaction scheme of the reaction of methyl iodide with [Rh(β-diketonato)(CO)(PPh3)],
showing specific stereochemistry.
A DFT computational study of the multistep reaction mechanism of the reaction
[Rh(acac)(CO)(PPh3)] + CH3I was conducted. The DFT computational study revealed that the
oxidative addition of methyl iodide to the square planar rhodium(I) complex corresponds to an
SN2 nucleophilic attack by the rhodium metal centre on the methyl iodide and that the multistep
reaction mechanism consists of fourteen distinctive steps with the RhIII-acyl1 → RhIII-alkyl2 step
as the rate-determining step. The multistep reaction mechanism is given in Figure 5.2.
Figure 5.2: The multistep reaction mechanism of the reaction [Rh(acac)(CO)(PPh3)] + CH3I.

CHAPTER 5
213
The oxidative addition reaction was generalized by investigating the first part of this multistep
reaction mechanism with DFT computational methods for a selected series of
[Rh(β-diketonato)(CO)(PPh3)] complexes. The oxidative addition of CH3I to the square planar
[Rh(β-diketonato)(CO)(PPh3)] (β-diketonato = acac, tta, bth and dtm) complexes corresponds to
an SN2 nucleophilic attack by the rhodium metal centre on the methyl iodide. The transition
states of these complexes all exhibit similar geometrical and thermodynamical data. The
experimental kinetic rate constants (k1) and the theoretical activation energies (∆E≠) exhibited a
linear relationship due to the different electronic effect of the R1 and R2 side groups of the
β-diketonato ligands coordinated to the [Rh(β-diketonato)(CO)(PPh3)] complexes. The
[Rh(β-diketonato)(CO)(PPh3)] complexes showed rapid oxidative addition compared to the
Monsanto catalyst and it is recommended to further investigate these complexes as promising
rhodium based catalysts.
Finally, a DFT computational study of the oxidative addition of methyl iodide to the bulky
[Rh(acac)(P(OPh)3)2] was performed. Due to the computational requirement of optimizing such
a big molecular system, simplified models, viz. [Rh(acac)(P(OCH3)3)2] and [Rh(acac)(P(OH)3)2],
were also investigated. The models have similar geometrical features and energy profiles of the
reactants, transition state and possible reaction products. Methyl iodide is added trans to the
square planar rhodium(I) complex with [Rh(acac)(P(OR)3)2(CH3)(I)]-alkyl (R = Ph, CH3, H) as
the product. The [Rh(acac)(P(OR)3)2(CH3)(I)]-alkyl product has an octahedral geometry around
the rhodium centre with the I and CH3 group in the apical position and the P(OR)3 groups in the
plane of the acac ligand. The main features of the transition state, viz. the nucleophilic attack of
the rhodium atom on the CH3+ group and the cleavage of the carbon-iodide bond, were also
similar for all the models. Though, only the full model gave thermodynamic data about the
oxidative addition reaction in agreement with experimental data. Therefore, in order to save on
computational recourses, simplified models can be used to obtain preliminary information on the
geometrical features and the energy profile of the oxidative addition reaction
[Rh(β-diketonato)(P(OPh)3)2] + CH3I. But in order to compare thermodynamic results with the
experimental data, the full model is needed.

CONCLUDING REMARKS AND FUTURE PERSPECTIVES
214
Iron complexes.
A series of [FeIII(β-diketonato)3] (β-diketonato = acac, ba, bth, dtm, dbm, tfaa, tffu, tfba, tta and
hfaa) complexes were studied by experimental and computational methods. Two new and eight
known [Fe(β-diketonato)3)] complexes were successfully synthesized. The DFT computational
study indicated that these complexes can occur as two isomers, the facial (fac) and meridional
(mer) isomers. These complexes were all characterized with UV/vis spectrophotometry, mass
spectroscopy, elemental analysis and by their melting points.
The [Fe(β-diketonato)3)] complexes were further electrochemically characterized by using cyclic
voltammetry and spectroelectrochemistry. Cyclic voltammetric studies on the
[Fe(β-diketonato)3)] complexes were performed in the weakly coordinating CH3CN/TBAPF6
medium. The only redox active centre in the complexes studied was the iron centre. The overall
electrochemical reaction can be expressed as:
[FeIII(β-diketonato)3] + e- [FeII(β-diketonato)3]–
The redox process was found to be electrochemically and chemically reversible at a scan rate of
100 mV.s-1. The different redox potentials of the [FeIII(β-diketonato)3] series are due to the
different electronic densities at the metal centre which are due to the different substituents on the
β-diketonato ligands. The formal reduction potential (E0') of the redox active metal Fe(III)/Fe(II)
in the [FeIII(β-diketonato)3] complexes was correlated to parameters related to electron density on
the iron centre, such as the acid dissociation constant (pKa) of the uncoordinated β-diketone
(R1COCH2COR2), the total group electronegativities (χR1 + χR2) of the R1 and R2 side groups on
the β-diketonato ligand (R1COCHCOR2)– and the calculated ionization potentials of the
[FeIII(β-diketonato)3] complexes. The linear equations (y = mx + c) defining these relationships
can be expressed as:
pKa = (-4.164) E0' + 5.033
χR1 + χR2 = (-2.483) E0' + 2.120 (R1 and R2 ≠ CF3)
χR1 + χR2 = (-6.990) E0' + 2.703 (R1 or R2 = CF3)
E0' = (6.933 x 10⁻³) IP + 2.258
This allows one to predict the electronegativities of the R1 and R2 side groups, the acid
dissociation constant of the uncoordinated β-diketone and the formal reduction potential of the
[FeIII(β-diketonato)3] complexes, if the calculated ionization potentials are known.
Electrochemical and spectroscopic techniques were combined in a spectroelectrochemistry study
of the [FeIII(β-diketonato)3] complexes. The influence of the reduction reactions on the UV/vis

CHAPTER 5
215
absorption spectra was monitored. The intensity of the bands in the near ultraviolet region
(200-600 nm) changed as the iron(III) complexes were reduced. Complexes without aromatic
side groups had similar absorption spectra and spectral changes during the reduction reaction.
Introduction of one Ph or two Ph side groups successively caused a red shift of ~30 nm on the
maximum absorbance band of the iron(III) complexes. Inclusion of aromatic groups such as
C4H3S or C4H3O resulted in different spectra.
In the final two studies, the performance of different DFT functionals, in relation to the
energetics of different spin states of iron complexes, was tested. The spin crossover complex
[Fe(salen)(CH3)2(COCH3)2(py)2] and low/high spin five-coordinate iron(III) porphyrins were
used to conduct this research.
For the spin crossover complex [Fe(salen)(CH3)2(COCH3)2(py)2], no single functional could
accurately reproduce the geometry of both the low and high spin states as well as provide an
energy profile with equi-energetic low and high spin states. The functional PW91 gave a good
geometry optimization of both the low and high spin states, whereas the functionals BP86,
BLYP, PBE, OLYP, OPBE and B3LYP only succeeded in giving a good geometry optimization
of the low spin complex. For the high spin geometry, OLYP and OPBE performed the worst.
An opposite performance by functionals was obtained for the spin-state energetics. OLYP,
OPBE and B3LYP provided the best spin-state energetics for spin crossover, whereas the
functionals PW91, BP86, BLYP and PBE could not reproduce equi-energetic low and high spin
states. Although OLYP is known to be one of the best functionals for transition metal systems, it
failed to perform for the spin crossover complex [Fe(salen)(CH3)2(COCH3)2(py)2]. Failures like
these inspire researchers to constantly improve old functionals and hence to develop new ones.
A series of closely related five-coordinate iron(III) porphyrins, [FeIII(porphyrin)(Ar)] (Ar = aryl =
Cl, Ph, C6F5, 3,4,5-C6F3H2 and 2,4,6-C6F3H2), was also used to test the performance of different
DFT functionals. These complexes are an excellent calibration tool, since even though they are
closely related, they exhibit different spin states. The newer pure functionals (OLYP and OPBE)
performed the best in predicting the applicable spin states of the porphyrin complexes, closely
followed by B3LYP. Both OLYP and B3LYP appeared to have performed distinctly better than
B3LYP*, which was somewhat of a surprise, given that B3LYP* usually performs significantly
better than B3LYP. The classic pure functionals (such as PW91) performed the worst, as far as
spin state energetics were concerned.

CONCLUDING REMARKS AND FUTURE PERSPECTIVES
216
5.2 Future perspectives.
The rhodium studies can be extended as follow:
(i) DFT calculation of the oxidative addition reaction [Rh(β-diketonato)(CO)(PPh3)] + CH3I
for a series of β-diketonato ligands and compare data to known experimental values.
(ii) Investigate whether the proposed mechanism of the reaction [Rh(acac)(CO)(PPh3)] +
CH3I also applies to [Rh(β-diketonato)(CO)(PPh3)] complexes with an unsymmetrical
β-diketone backbone, using DFT calculations.
(iii) Determination of the molecular structures of rhodium(III) reaction products, using X-ray
crystallography
(iv) Electrochemical characterization of the [Rh(β-diketonato)(CO)(PPh3)] complexes using
cyclic voltammetry and spectroelectrochemistry. Evaluation of the peak anodic potential
(Epa), as well as the electrochemical and chemical reversibility/irreversibility, of the redox
active rhodium(I) centre. Determination whether these Rh(I) complexes are oxidized to
Rh(II) or Rh(III), using bulk electrolysis. Determination of the effect of the electron
donation/withdrawal of the different R side groups of the β-diketonato ligands on the
peak anodic potential (Epa).
(v) Determination of the relationships between experimentally determined and DFT
calculated properties, such as the acid dissociation constant (pKa) of the β-diketone
coordinated to the rhodium complex, the total group electronegativities (χR1 + χR2) of the
R1 and R2 side groups on the β-diketonato ligand, the peak anodic potential (Epa) of the
redox active metal Rh(I)/Rh(II) or Rh(I)/Rh(III) in [Rh(β-diketonato)(CO)(PPh3)] and the
calculated ionization potentials.
The iron studies can be extended as follow:
(i) Synthesize a series of tris(β-diketonato) metal complexes (where metal = Cr, Mn, Co, Ni
and Cu) to explore electrochemical trends of metals in the same row in the periodic table.
(ii) Calculate the ionization potential of a series of tris(β-diketonato) metal complexes (where
metal = Cr, Mn, Co, Ni and Cu) and compare with experimental data.
(iii) Synthesize a series of tris(β-diketonato) metal complexes (where metal = Ru and Os) to
explore electrochemical trends of metals in the same group in the periodic table.
(iv) Calculate the ionization potential of a series of tris(β-diketonato) metal complexes (where
metal = Ru and Os) and compare with experimental data.

APPENDIX A
A-1
A Appendix
A.1 Infrared spectrophotometry (IR).
600110016002100260031003600
Wavenumber / cm-1
Abs
orba
nce
Figure A.1: Infrared spectrum of powder [Fe(acac)3] {1}.
600110016002100260031003600
Wavenumber / cm-1
Abs
orba
nce
Figure A.2: Infrared spectrum of powder [Fe(ba)3] {2}.

APPENDIX A
A-2
600110016002100260031003600
Wavenumber / cm-1
Abs
orba
nce
Figure A.3: Infrared spectrum of powder [Fe(bth)3] {3}.
600110016002100260031003600
Wavenumber / cm-1
Abs
orba
nce
Figure A.4: Infrared spectrum of powder [Fe(dtm)3] {4}.

APPENDIX A
A-3
600110016002100260031003600
Wavenumber / cm-1
Abs
orba
nce
Figure A.5: Infrared spectrum of powder [Fe(dbm)3] {5}.
600110016002100260031003600
Wavenumber / cm-1
Abs
orba
nce
Figure A.6: Infrared spectrum of powder [Fe(tfaa)3] {6}.

APPENDIX A
A-4
600110016002100260031003600
Wavenumber / cm-1
Abs
orba
nce
Figure A.7: Infrared spectrum of powder [Fe(tffu)3] {7}.
600110016002100260031003600Wavenumber / cm-1
Abs
orba
nce
Figure A.8: Infrared spectrum of powder [Fe(tfba)3] {8}.

APPENDIX A
A-5
600110016002100260031003600
Wavenumber / cm-1
Abs
orba
nce
Figure A.9: Infrared spectrum of powder [Fe(tta)3] {9}.
600110016002100260031003600
Wavenumber / cm-1
Abs
orba
nce
Figure A.10: Infrared spectrum of powder [Fe(hfaa)3] {10}.

APPENDIX A
A-6
A.2 Ultraviolet spectrophotometry (UV).
200 250 300 350 400 450 500 550 600
Wavelength / nm
Abs
orba
nce
Figure A.11: Ultraviolet spectrum of [Fe(acac)3] {1}, measured in CH3CN at 25 °C.
200 250 300 350 400 450 500 550 600
Wavelength / nm
Abs
orba
nce
Figure A.12: Ultraviolet spectrum of [Fe(ba)3] {2}, measured in CH3CN at 25 °C.

APPENDIX A
A-7
200 250 300 350 400 450 500 550 600
Wavelength / nm
Abs
orba
nce
Figure A.13: Ultraviolet spectrum of [Fe(bth)3] {3}, measured in CH3CN at 25 °C.
200 250 300 350 400 450 500 550 600
Wavelength / nm
Abs
orba
nce
Figure A.14: Ultraviolet spectrum of [Fe(dtm)3] {4}, measured in CH3CN at 25 °C.

APPENDIX A
A-8
200 250 300 350 400 450 500 550 600
Wavelength / nm
Abs
orba
nce
Figure A.15: Ultraviolet spectrum of [Fe(dbm)3] {5}, measured in CH3CN at 25 °C.
200 250 300 350 400 450 500 550 600
Wavelength / nm
Abs
orba
nce
Figure A.16: Ultraviolet spectrum of [Fe(tfaa)3] {6}, measured in CH3CN at 25 °C.

APPENDIX A
A-9
200 250 300 350 400 450 500 550 600
Wavelength / nm
Abs
orba
nce
Figure A.17: Ultraviolet spectrum of [Fe(tffu)3] {7}, measured in CH3CN at 25 °C.
200 250 300 350 400 450 500 550 600
Wavelength / nm
Abs
orba
nce
Figure A.18: Ultraviolet spectrum of [Fe(tfba)3] {8}, measured in CH3CN at 25 °C.

APPENDIX A
A-10
200 250 300 350 400 450 500 550 600
Wavelength / nm
Abs
orba
nce
Figure A.19: Ultraviolet spectrum of [Fe(tta)3] {9}, measured in CH3CN at 25 °C.

APPENDIX A
A-11
A.3 Mass spectrometry (MS).
Figure A.20: MALDI mass spectrum of [Fe(acac)3]– {1} in the positive reflection mode. Calculated in red.
Figure A.21: MALDI mass spectrum of [Fe(ba)3] {2} in the positive reflection mode. Calculated in red.
345.837
0
200
400
600
800
1000
Intens. [a.u.]
344 346 348 350 352 354 356 358 360 m/z
351.906
539.122
0
2000
4000
6000
Intens. [a.u.]
541.121
537.120 542.123
0
200
400
600
800
1000 Intens. [a.u.]
527.5 530.0 532.5 535.0 537.5 540.0 542.5 545.0 547.5 550.0 m/z

APPENDIX A
A-12
Figure A.22: MALDI mass spectrum of [Fe(bth)3] {3} in the positive reflection mode. Calculated in red.
Figure A.23: MALDI mass spectrum of [Fe(dbm)3] {5} in the positive reflection mode. Calculated in red.
743.226
766.228
0
1000
2000
3000
Intens. [a.u.]
720 725 730 735 740 745 750 755 760 765 m/z
725.306
0.0
0.5
1.0
1.5
2.0
2.5 5 x10 Intens. [a.u.]
0
200
400
600
800
1000 Intens. [a.u.]
716 718 720 722 724 726 728 730 732 m/z

APPENDIX A
A-13
Figure A.24: MALDI mass spectrum of [Fe(tfaa)3]– {6} in the negative reflection mode. Calculated in red.
Figure A.25: MALDI mass spectrum of [Fe(tffu)3] {7} in the positive reflection mode. Calculated in red.
671.112
0.00
0.25
0.50
0.75
1.00
1.25
1.50
5 x10 Intens. [a.u.]
670.968
668.973
672.973
673.976
0
200
400
600
800
1000 Intens. [a.u.]
665 670 675 680 685 690 m/z
513.484
0
1000
2000
3000
4000 Intens. [a.u.]
511.988
515.988
516.990
0
200
400
600
800
1000 Intens. [a.u.]
507.5 510.0 512.5 515.0 517.5 520.0 522.5 525.0 527.5 m/z

APPENDIX A
A-14
Figure A.26: MALDI mass spectrum of [Fe(tfba)3] {8} in the negative reflection mode. Calculated in red.
Figure A.27: MALDI mass spectrum of [Fe(tta)3] {9} in the negative reflection mode. Calculated in red.
701.062
0
1
2
3
5 x10 Intens. [a.u.]
703.036
699.035 704.039
0
200
400
600
800
1000 Intens. [a.u.]
695.0 697.5 700.0 702.5 705.0 707.5 710.0 712.5 715.0 m/z
718.900
0
1
2
3
4
5 x10 Intens. [a.u.]
722.897
723.898
0
200
400
600
800
1000 Intens. [a.u.]
670 680 690 700 710 720 730 m/z

APPENDIX A
A-15
Figure A.28: MALDI mass spectrum of [Fe(hfaa)3] {10} in the negative reflection mode. Calculated in red.
0
50
100
150
200
250 Intens. [a.u.]
674.903
678.903
679.906
0
200
400
600
800
1000 Intens. [a.u.]
667.5 670.0 672.5 675.0 677.5 680.0 682.5 685.0 687.5 m/z

APPENDIX A
A-16
A.4 Cyclic voltammetry (CV).
Table A.1: Electrochemical data of [Fe(acac)3] {1}. Solvent CH3CN, supporting electrolyte TBAPF6 ([NBu4][PF6]), versus Fc/Fc+, scan rate as indicated.
Scan Rate Epa / V Epc / V ∆∆∆∆Ep / V E0' / V ipa / µµµµA ipc / µµµµA ipa/ipc 50 -1.002 -1.076 0.074 -1.039 10.56 10.75 0.98 100 -1.002 -1.074 0.072 -1.038 14.66 14.72 1.00 150 -1.000 -1.077 0.077 -1.038 17.58 18.51 0.95 200 -0.997 -1.078 0.081 -1.037 20.25 20.50 0.99 250 -0.997 -1.078 0.081 -1.037 22.73 22.92 0.99 300 -0.993 -1.081 0.088 -1.037 24.47 25.03 0.98 1000 -0.983 -1.092 0.109 -1.037 42.42 43.35 0.98
-50
-40
-30
-20
-10
0
10
20
30
40
-1.6 -1.4 -1.2 -1.0 -0.8 -0.6
E / mV vs Fc/Fc+
i / µµ µµ
A
i a
i c
Figure A.29: Cyclic voltammograms (versus Fc/Fc+) of 1 mmol.dm-3 [Fe(acac)3] {1} at scan rates 50, 100, 150,
200, 250, 300 and 1000 mV.s-1. Scans initiated in the direction of the arrow. Measured in 100 mmol.dm-3
TBAPF6/CH3CN on a glassy carbon working electrode at 25 °C.

APPENDIX A
A-17
Table A.2: Electrochemical data of [Fe(ba)3] {2}. Solvent CH3CN, supporting electrolyte TBAPF6 ([NBu4][PF6]), versus Fc/Fc+, scan rate as indicated.
Scan Rate Epa / V Epc / V ∆∆∆∆Ep / V E0' / V ipa / µµµµA ipc / µµµµA ipa/ipc 50 -0.938 -1.004 0.066 -0.971 7.14 7.22 0.99 100 -0.940 -1.003 0.063 -0.971 10.43 10.65 0.98 150 -0.939 -1.003 0.064 -0.971 12.55 12.55 1.00 200 -0.937 -1.003 0.066 -0.970 14.16 14.60 0.97 250 -0.936 -1.006 0.070 -0.971 16.02 16.69 0.96 300 -0.934 -1.005 0.071 -0.969 17.45 17.81 0.98 1000 -0.932 -1.008 0.076 -0.970 30.81 31.12 0.99
-40
-30
-20
-10
0
10
20
30
-1.3 -1.2 -1.1 -1.0 -0.9 -0.8 -0.7 -0.6
E / mV vs Fc/Fc+
i / µµ µµ
A
i a
i c
Figure A.30: Cyclic voltammograms (versus Fc/Fc+) of 1 mmol.dm-3 [Fe(ba)3] {2} at scan rates 50, 100, 150,
200, 250, 300 and 1000 mV.s-1. Scans initiated in the direction of the arrow. Measured in 100 mmol.dm-3
TBAPF6/CH3CN on a glassy carbon working electrode at 25 °C.

APPENDIX A
A-18
Table A.3: Electrochemical data of [Fe(bth)3] {3}. Solvent CH3CN, supporting electrolyte TBAPF6 ([NBu4][PF6]), versus Fc/Fc+, scan rate as indicated.
Scan Rate Epa / V Epc / V ∆∆∆∆Ep / V E0' / V ipa / µµµµA ipc / µµµµA ipa/ipc 50 -0.848 -0.913 0.065 -0.881 0.58 0.60 0.97 100 -0.850 -0.912 0.062 -0.881 0.78 0.78 1.00 150 -0.847 -0.914 0.067 -0.881 1.17 1.18 0.99 200 -0.848 -0.913 0.065 -0.881 1.38 1.39 0.99 250 -0.846 -0.915 0.069 -0.881 1.47 1.50 0.98 300 -0.847 -0.913 0.066 -0.880 1.71 1.74 0.98 1000 -0.843 -0.920 0.077 -0.882 2.47 2.54 0.97
-50
-40
-30
-20
-10
0
10
20
30
40
-1.3 -1.2 -1.1 -1.0 -0.9 -0.8 -0.7 -0.6
E / mV vs Fc/Fc+
i / µµ µµ
A
i a
i c
Figure A.31: Cyclic voltammograms (versus Fc/Fc+) of 1 mmol.dm-3 [Fe(bth)3] {3} at scan rates 50, 100, 150,
200, 250, 300 and 1000 mV.s-1. Scans initiated in the direction of the arrow. Measured in 100 mmol.dm-3
TBAPF6/CH3CN on a glassy carbon working electrode at 25 °C.

APPENDIX A
A-19
Table A.4: Electrochemical data of [Fe(dtm)3] {4}. Solvent CH3CN, supporting electrolyte TBAPF6 ([NBu4][PF6]), versus Fc/Fc+, scan rate as indicated.
Scan Rate Epa / V Epc / V ∆∆∆∆E / V E0' / V ipa / µµµµA ipc / µµµµA ipa/ipc 50 -0.805 -0.882 0.077 -0.843 5.90 6.04 0.98 100 -0.809 -0.879 0.070 -0.844 7.90 7.98 0.99 150 -0.808 -0.880 0.072 -0.844 8.60 8.87 0.97 200 -0.807 -0.879 0.072 -0.843 9.29 9.29 1.00 250 -0.806 -0.880 0.074 -0.843 10.10 10.41 0.97 300 -0.807 -0.879 0.072 -0.843 18.81 19.19 0.98 1000 -0.806 -0.884 0.078 -0.845 23.53 24.01 0.98
-60
-50
-40
-30
-20
-10
0
10
20
30
-1.2 -1.1 -1.0 -0.9 -0.8 -0.7 -0.6 -0.5
E / mV vs Fc/Fc+
i / µµ µµ
A
i a
i c
Figure A.32: Cyclic voltammograms (versus Fc/Fc+) of 1 mmol.dm-3 [Fe(dtm)3] {4} at scan rates 50, 100, 150,
200, 250, 300 and 1000 mV.s-1. Scans initiated in the direction of the arrow. Measured in 100 mmol.dm-3
TBAPF6/CH3CN on a glassy carbon working electrode at 25 °C.

APPENDIX A
A-20
Table A.5: Electrochemical data of [Fe(dbm)3] {5}. Solvent CH3CN, supporting electrolyte TBAPF6 ([NBu4][PF6]), versus Fc/Fc+, scan rate as indicated.
Scan Rate Epa / V Epc / V ∆∆∆∆Ep / V E0' / V ipa / µµµµA ipc / µµµµA ipa/ipc 50 -0.886 -0.954 0.068 -0.920 4.14 4.27 0.97 100 -0.887 -0.955 0.068 -0.921 7.39 7.54 0.98 150 -0.888 -0.951 0.063 -0.920 8.88 9.16 0.97 200 -0.886 -0.954 0.068 -0.920 9.99 10.09 0.99 250 -0.884 -0.953 0.069 -0.919 11.26 11.26 1.00 300 -0.885 -0.953 0.068 -0.919 12.30 12.43 0.99 1000 -0.883 -0.954 0.071 -0.919 23.17 23.65 0.98
-50
-40
-30
-20
-10
0
10
20
30
40
-1.2 -1.1 -1.0 -0.9 -0.8 -0.7 -0.6
E / mV vs Fc/Fc+
i / µµ µµ
A
i a
i c
Figure A.33: Cyclic voltammograms (versus Fc/Fc+) of 1 mmol.dm-3 [Fe(dbm)3] {5} at scan rates 50, 100, 150,
200, 250, 300 and 1000 mV.s-1. Scans initiated in the direction of the arrow. Measured in 100 mmol.dm-3
TBAPF6/CH3CN on a glassy carbon working electrode at 25 °C.

APPENDIX A
A-21
Table A.6: Electrochemical data of [Fe(tfaa)3] {6}. Solvent CH3CN, supporting electrolyte TBAPF6 ([NBu4][PF6]), versus Fc/Fc+, scan rate as indicated.
Scan Rate Epa / V Epc / V ∆∆∆∆Ep / V E0' / V ipa / µµµµA ipc / µµµµA ipa/ipc 50 -0.330 -0.426 0.096 -0.378 3.18 3.21 0.99 100 -0.333 -0.421 0.088 -0.377 5.64 5.75 0.98 150 -0.331 -0.426 0.095 -0.379 9.88 10.08 0.98 200 -0.326 -0.427 0.101 -0.377 11.40 11.52 0.99 250 -0.323 -0.431 0.108 -0.377 13.79 13.93 0.99 300 -0.324 -0.432 0.108 -0.378 17.04 17.04 1.00 1000 -0.304 -0.451 0.147 -0.378 26.45 27.27 0.97
-50
-40
-30
-20
-10
0
10
20
30
40
-0.65 -0.60 -0.55 -0.50 -0.45 -0.40 -0.35 -0.30 -0.25 -0.20
E / mV vs Fc/Fc+
i / µµ µµ
A
i a
i c
Figure A.34: Cyclic voltammograms (versus Fc/Fc+) of 1 mmol.dm-3 [Fe(tfaa)3] {6} at scan rates 50, 100, 150,
200, 250, 300 and 1000 mV.s-1. Scans initiated in the direction of the arrow. Measured in 100 mmol.dm-3
TBAPF6/CH3CN on a glassy carbon working electrode at 25 °C.
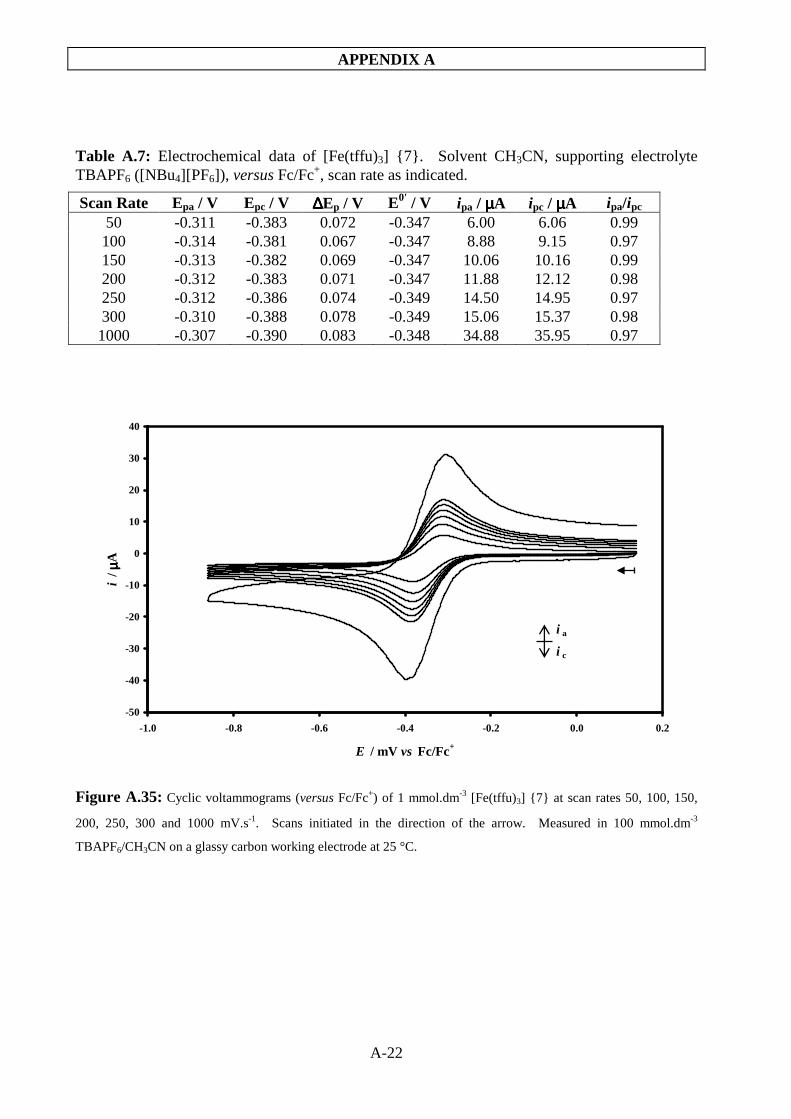
APPENDIX A
A-22
Table A.7: Electrochemical data of [Fe(tffu)3] {7}. Solvent CH3CN, supporting electrolyte TBAPF6 ([NBu4][PF6]), versus Fc/Fc+, scan rate as indicated.
Scan Rate Epa / V Epc / V ∆∆∆∆Ep / V E0' / V ipa / µµµµA ipc / µµµµA ipa/ipc 50 -0.311 -0.383 0.072 -0.347 6.00 6.06 0.99 100 -0.314 -0.381 0.067 -0.347 8.88 9.15 0.97 150 -0.313 -0.382 0.069 -0.347 10.06 10.16 0.99 200 -0.312 -0.383 0.071 -0.347 11.88 12.12 0.98 250 -0.312 -0.386 0.074 -0.349 14.50 14.95 0.97 300 -0.310 -0.388 0.078 -0.349 15.06 15.37 0.98 1000 -0.307 -0.390 0.083 -0.348 34.88 35.95 0.97
-50
-40
-30
-20
-10
0
10
20
30
40
-1.0 -0.8 -0.6 -0.4 -0.2 0.0 0.2
E / mV vs Fc/Fc+
i / µµ µµ
A
i a
i c
Figure A.35: Cyclic voltammograms (versus Fc/Fc+) of 1 mmol.dm-3 [Fe(tffu)3] {7} at scan rates 50, 100, 150,
200, 250, 300 and 1000 mV.s-1. Scans initiated in the direction of the arrow. Measured in 100 mmol.dm-3
TBAPF6/CH3CN on a glassy carbon working electrode at 25 °C.

APPENDIX A
A-23
Table A.8: Electrochemical data of [Fe(tfba)3] {8}. Solvent CH3CN, supporting electrolyte TBAPF6 ([NBu4][PF6]), versus Fc/Fc+, scan rate as indicated.
Scan Rate Epa / V Epc / V ∆∆∆∆Ep / V E0' / V ipa / µµµµA ipc / µµµµA ipa/ipc 50 -0.317 -0.386 0.069 -0.352 10.58 10.80 0.98 100 -0.319 -0.383 0.064 -0.351 15.39 15.86 0.97 150 -0.318 -0.385 0.067 -0.352 17.09 17.44 0.98 200 -0.319 -0.387 0.068 -0.353 21.26 21.70 0.98 250 -0.317 -0.386 0.069 -0.352 26.80 27.07 0.99 300 -0.315 -0.387 0.072 -0.351 28.74 29.03 0.99 1000 -0.314 -0.390 0.076 -0.352 28.88 29.78 0.97
-40
-30
-20
-10
0
10
20
30
-0.9 -0.8 -0.7 -0.6 -0.5 -0.4 -0.3 -0.2 -0.1 0.0 0.1
E / mV vs Fc/Fc+
i / µµ µµ
A
i a
i c
Figure A.36: Cyclic voltammograms (versus Fc/Fc+) of 1 mmol.dm-3 [Fe(tfba)3] {8} at scan rates 50, 100, 150,
200, 250, 300 and 1000 mV.s-1. Scans initiated in the direction of the arrow. Measured in 100 mmol.dm-3
TBAPF6/CH3CN on a glassy carbon working electrode at 25 °C.

APPENDIX A
A-24
Table A.9: Electrochemical data of [Fe(tta)3] {9}. Solvent CH3CN, supporting electrolyte TBAPF6 ([NBu4][PF6]), versus Fc/Fc+, scan rate as indicated.
Scan Rate Epa / V Epc / V ∆∆∆∆Ep / V E0' / V ipa / µµµµA ipc / µµµµA ipa/ipc 50 -0.319 -0.394 0.075 -0.356 4.64 4.68 0.99 100 -0.320 -0.390 0.070 -0.355 6.71 6.71 1.00 150 -0.319 -0.389 0.070 -0.354 9.13 9.22 0.99 200 -0.319 -0.393 0.074 -0.356 9.66 9.76 0.99 250 -0.317 -0.394 0.077 -0.355 11.59 11.83 0.98 300 -0.316 -0.392 0.076 -0.354 12.17 12.17 1.00 1000 -0.311 -0.400 0.089 -0.355 23.62 23.86 0.99
-40
-30
-20
-10
0
10
20
30
-0.7 -0.6 -0.5 -0.4 -0.3 -0.2 -0.1 0.0
E / mV vs Fc/Fc+
i / µµ µµ
A
i a
i c
Figure A.37: Cyclic voltammograms (versus Fc/Fc+) of 1 mmol.dm-3 [Fe(tta)3] {9} at scan rates 50, 100, 150,
200, 250, 300 and 1000 mV.s-1. Scans initiated in the direction of the arrow. Measured in 100 mmol.dm-3
TBAPF6/CH3CN on a glassy carbon working electrode at 25 °C.

APPENDIX A
A-25
Table A.10: Electrochemical data of [Fe(hfaa)3] {10}. Solvent DCM, supporting electrolyte TBAPF6 ([NBu4][PF6]), versus Fc/Fc+, scan rate as indicated.
Scan Rate Epa / V Epc / V ∆∆∆∆Ep / V E0' / V ipa / µµµµA ipc / µµµµA ipa/ipc 50 0.238 0.168 0.070 0.203 2.07 2.14 0.97 100 0.237 0.167 0.070 0.202 4.34 4.39 0.99 150 0.238 0.164 0.074 0.201 5.37 5.42 0.99 200 0.240 0.163 0.077 0.201 6.40 6.53 0.98 250 0.244 0.159 0.085 0.201 7.01 7.08 0.99 300 0.244 0.159 0.085 0.201 7.91 8.15 0.97 1000 0.260 0.145 0.115 0.202 13.64 14.21 0.96
-25
-20
-15
-10
-5
0
5
10
15
20
25
30
-0.3 -0.2 -0.1 0.0 0.1 0.2 0.3 0.4 0.5 0.6 0.7
E / mV vs Fc/Fc+
i / µµ µµ
A
i a
i c
Figure A.38: Cyclic voltammograms (versus Fc/Fc+) of 1 mmol.dm-3 [Fe(hfaa)3] {10} at scan rates 50, 100, 150,
200, 250, 300 and 1000 mV.s-1. Scans initiated in the direction of the arrow. Measured in 100 mmol.dm-3
TBAPF6/DCM on a glassy carbon working electrode at 25 °C.

Abstract
Fundamental properties of rhodium and iron catalyst have been researched in this study, by
means of experimental and DFT computational techniques. Two types of rhodium complexes
were studied: monocarbonyltriphenylphosphine rhodium complexes
[Rh(β-diketonato)(CO)(PPh3)] and triphenylphosphite rhodium complexes
[Rh(β-diketonato)(P(OPh)3)2] (where β-diketonato is a monoanionic bidentate ligand with two
oxygen donor atoms (R1COCHCOR2)–). The oxidative addition reaction of methyl iodide to
both of these square planar rhodium(I) complexes has been studied. Three types of iron
complexes were studied: tris(β-diketonato) iron(III) complexes [Fe(β-diketonato)3], a salen
complex [Fe(salen)(CH3)2(COCH3)2(py)2] and porphyrin complexes [FeIII(porphyrin)(Ar)].
The reaction, [Rh(β-diketonato)(CO)(PPh3)] + CH3I (β-diketonato = acac, tta, bth and dtm),
consists of many steps with numerous transition states, intermediate products and reaction
products. On the grounds of an in situ 1H NMR experimental study and a DFT computational
study, a general reaction scheme with specific stereochemistry for the reaction
[Rh(β-diketonato)(CO)(PPh3)] + CH3I was constructed. The first step in the reaction, the
oxidative addition of methyl iodide to the square planar rhodium(I) complex, was
computationally studied for the series of [Rh(β-diketonato)(CO)(PPh3)] (β-diketonato = acac, tta,
bth and dtm) complexes. The transition state of the oxidative addition reaction corresponds to an
SN2 nucleophilic attack by the rhodium metal centre on the methyl iodide. The experimental
kinetic rate constants (k1) and the theoretical activation energies (∆E≠) exhibited a linear
relationship. A DFT computational study of the multistep reaction mechanism of the reaction
[Rh(acac)(CO)(PPh3)] + CH3I revealed that the reaction mechanism consists of fourteen
distinctive steps with the formation of a second alkyl complex [Rh(acac)(CH3)(CO)(PPh3)(I)] as
the rate-determining step.
A DFT computational study of the reaction [Rh(acac)(P(OPh)3)2] + CH3I was conducted.
Simplified models, viz. [Rh(acac)(P(OCH3)3)2] and [Rh(acac)(P(OH)3)2], were also investigated.
The various models have similar geometrical features and energy profiles of the reactants,

ABSTRACT
transition state and possible reaction products, but only the full model gave thermodynamic
results in agreement with experimental data.
A series of [FeIII(β-diketonato)3] (β-diketonato = acac, ba, bth, dtm, dbm, tfaa, tffu, tfba, tta and
hfaa) complexes was synthesized and characterized with the aid of UV/vis spectrophotometry,
mass spectroscopy, elemental analysis and by melting point measurements. A DFT
computational study indicated that these complexes can occur as two isomers, the facial (fac) and
meridional (mer) isomers. The [Fe(β-diketonato)3)] complexes were further electrochemically
characterized by using cyclic voltammetry and spectroelectrochemistry. The redox process,
[FeIII(β-diketonato)3] + e- [FeII(β-diketonato)3]–, was found to be electrochemically and
chemically reversible at a scan rate of 100 mV.s-1. The formal reduction potential of the redox
active metal Fe(III)/Fe(II) in the [FeIII(β-diketonato)3] complexes was correlated to parameters
related to electron density of the iron centre, such as the acid dissociation constant of the
uncoordinated β-diketone (R1COCH2COR2), the total group electronegativities of the R1 and R2
side groups on the β-diketonato ligand (R1COCHCOR2)– and the calculated ionization potentials
of the [FeIII(β-diketonato)3] complexes. Electrochemical and spectroscopic techniques were
combined in a spectroelectrochemistry study of the [FeIII(β-diketonato)3] complexes. The
influence of the reduction reactions on the UV/vis absorption spectra was monitored. The
intensity of the bands in the near ultraviolet region (200-600 nm) changed as the iron(III)
complexes were reduced.
The performance of different DFT functionals in relation to the energetics of different spin states
of iron complexes was tested. The spin crossover complex [Fe(salen)(CH3)2(COCH3)2(py)2] and
the low/high spin complexes [FeIII(porphyrin)(Ar)] (Ar = aryl = Cl, Ph, C6F5, 3,4,5-C6F3H2 and
2,4,6-C6F3H2) were used to conduct this research. For the spin crossover complex
[Fe(salen)(CH3)2(COCH3)2(py)2], no single functional in the study could accurately reproduce
the geometry of both the low and high spin states as well as provide an energy profile with
equi-energetic low and high spin states. For the low/high spin complexes [FeIII(porphyrin)(Ar)],
the newer pure functionals (OLYP and OPBE) performed the best in predicting the applicable
spin states, closely followed by B3LYP.
Keywords rhodium, iron, β-diketonato, salen, porphyrin, oxidative addition, spin crossover, DFT, NMR, CV, SEC

Samevatting
Fundamentele eienskappe van rodium en yster katalisators is met behulp van eksperimentele en
kwantum-berekeningschemiese tegnieke ondersoek. Twee tipes rodium komplekse is ondersoek:
monokarbonieltrifenielfosfien rodium komplekse [Rh(β-diketonato)(CO)(PPh3)] en
trifenielfosfiet rodium komplekse [Rh(β-diketonato)(P(OPh)3)2] (waar β-diketonato 'n
monoanioniesebidentate ligande is met twee elektron skenkende suurstof atome
(R1COCHCOR2)–). 'n Studie van die oksidatiewe addisie-reaksie van metieljodied tot
vierkantige planêre rodium(I) komplekse is uitgevoer. Drie tipes yster komplekse is ondersoek:
tris(β-diketonato) yster(III) komplekse [Fe(β-diketonato)3], 'n salen kompleks
[Fe(salen)(CH3)2(COCH3)2(py)2] en 'n porfirien kompleks [FeIII(porphyrin)(Ar)].
Die reaksie, [Rh(β-diketonato)(CO)(PPh3)] + CH3I (β-diketonato = acac, tta, bth en dtm), bestaan
uit baie stappe met veelvuldige oorgangstoestande, intermediêreprodukte en reaksieprodukte. Op
grond van 'n in situ 1H NMR eksperimentele studie en 'n kwantum-berekeningschemiese studie is
'n algemene reaksie skema met spesifieke stereochemie vir die reaksie
[Rh(β-diketonato)(CO)(PPh3)] + CH3I saamgestel. Die eerste stap van die reaksie, die
oksidatiewe addisie van metieljodied tot die vierkantige planêre rodium(I) komplekse
[Rh(β-diketonato)(CO)(PPh3)] (β-diketonato = acac, tta, bth en dtm), is in die
kwantum-berekeningschemiese studie in diepte ondersoek. Die oorgangstoestand van die
oksidatiewe addisie-reaksie toon 'n SN2 nukleofieliese aanval deur die sentrale rodium atoom op
die metieljodied molekuul. Die eksperimentele kinetiese tempokonstante (k1) en die teoretiese
aktiveringsenergie (∆E≠) toon 'n lineêre verwantskap. 'n Kwantum-berekeningschemiese studie
van die stappe van die reaksie-meganisme van die reaksie [Rh(acac)(CO)(PPh3)] + CH3I het
getoon dat die reaksie-meganisme uit veertien afsonderlike stappe bestaan met die vorming van
'n tweede alkiel kompleks [Rh(acac)(CH3)(CO)(PPh3)(I)] as die tempobepalende stap.
'n Kwantum-berekeningschemiese studie van die reaksie [Rh(acac)(P(OPh)3)2] + CH3I is ook
uitgevoer. Twee vereenvoudigde modelle, naamlik [Rh(acac)(P(OCH3)3)2] en
[Rh(acac)(P(OH)3)2], is ook ondersoek. Die verskillende modelle het soortgelyke geometriese
kenmerke en energieprofiele van die reaktante, oorgangstoestande en moontlike reaksieprodukte

SAMEVATTING
getoon, maar slegs die vol model kon termodinamiese resultate in ooreenstemming met
eksperimentele data weergee.
'n Reeks [FeIII(β-diketonato)3] (β-diketonato = acac, ba, bth, dtm, dbm, tfaa, tffu, tfba, tta en hfaa)
komplekse is gesintetiseer en gekarakteriseer met behulp van UV/vis spektrofotometrie, massa
spektroskopie, element analise en smeltpunt metings. 'n Kwantum-berekeningschemiese studie
het aangedui dat hierdie komplekse as twee isomere voorkom, die fac- en mer-isomere. Die
[FeIII(β-diketonato)3] komplekse is verder gekarakteriseer deur 'n elektrochemiese studie met
behulp van sikliese voltammetrie en spektro-elektrochemie. Daar is bevind dat die redoksproses,
[FeIII(β-diketonato)3] + e- [FeII(β-diketonato)3]–, elektrochemies en chemies omkeerbaar is
teen 'n skandeertempo van 100 mV.s-1. Korrelasies is gevind tussen die formele reduksie
potensiaal van die redoksaktiewe metaal Fe(III)/Fe(II) in die [FeIII(β-diketonato)3] komplekse en
parameters wat betrekking het op die elektrondigtheid van die sentrale yster, soos byvoorbeeld
die suurdissosiasie konstante van die ongekoördineerde β-diketone (R1COCH2COR2), die totale
groepelektronegatiwiteite van die R1 en R2 groepe van die β-diketonato ligande
(R1COCHCOR2)– en die berekende ioniseringspotensiaal van die [FeIII(β-diketonato)3]
komplekse. Elektrochemiese en spektroskopiese tegnieke is gekombineer in 'n
spektro-elektrochemiese studie van die [FeIII(β-diketonato)3] komplekse. Die invloed van die
reduksiereaksies op die absorbansiespektra van die komplekse is met behulp van UV/vis
spektrofotometrie gemonitor. Die intensiteit van die absorbansiebande in die naby ultraviolet
area (200-600 nm) het verander soos die Fe(III) komplekse gereduseer is.
Verskillende moduleringsdigtheidsfunksionale is geevalueer met betrekking tot die energieë van
verskillende spintoestande van yster komplekse. Die spinoorkruisingskompleks
[Fe(salen)(CH3)2(COCH3)2(py)2] en die lae of hoë spin komplekse [FeIII(porphyrin)(Ar)]
(Ar = aryl = Cl, Ph, C6F5, 3,4,5-C6F3H2 en 2,4,6-C6F3H2) is in die toetsing gebruik. Nie 'n enkele
moduleringsdigtheidsfunksionaal kon die geometrieë sowel as die gelyke energievlakke van die
lae en hoë spin komplekse van [FeIII(porphyrin)(Ar)] akkuraat voorspel nie. Vir die lae of hoë
spin komplekse [FeIII(porphyrin)(Ar)] het die moduleringsdigtheidsfunksionale OLYP en OPBE,
gevolg deur B3LYP, goed gepresteer deur die toepaslike spintoestande akkuraat te voorspel.
Sleutelwoorde rodium, yster, β-diketonato, salen, porfirien, oksidatiewe addisie, spinoorkruising, DFT, KMR, SV, SEC