Revisiting the particle size distribution of soils: comparison of different methods and sample...
11
European Journal of Soil Science, December 2010, 61, 854–864 doi: 10.1111/j.1365-2389.2010.01298.x Revisiting the particle-size distribution of soils: comparison of different methods and sample pre-treatments N. Vdovi´ c a , J. Obho D aˇ s b & K. Pikelj c a Department for Marine and Environmental Research, Ru d er Boˇ skovi´ c Institute, Bijeniˇ cka 54, 10000 Zagreb, Croatia, b Department of Experimental Physics, Ru d er Boˇ skovi´ c Institute, Bijeniˇ cka 54, 10000 Zagreb, Croatia and c Department of Geology and Palaeontology, Faculty of Science, University of Zagreb, Horvatovac 102 a, 10000 Zagreb, Croatia Summary The choice of analytical method and sample pretreatment has significant consequences for the shape of particle- size distribution (PSD) frequency curves, and therefore for the evaluation of soil textural parameters. Here, the comparison of several granulometric methods based on different physical principles is presented: wet sieving (WS), based on gravity and the mechanical force of water, was combined with pipette (PP) sedimenta- tion/settling velocity, Micromeritics SediGraph (MS) sedimentation/x-ray attenuation and Coulter Counter (CC) electroresistance particle counting. The Malvern Mastersizer (MM), an instrument based on laser diffraction, was used without WS. Twelve typical temperate-region soil types were chosen for this study on the basis of their mineral composition, organic matter content, conductivity and magnetic susceptibility. The modalities of PSD frequency curves obtained by different methods were compared. The results showed considerably larger clay- fraction contents determined with the sedimentation techniques, PP and MS, than that obtained by CC or MM. Statistical correlation and regression models were used to compare the fractions of clay, silt and sand obtained with different methods. Linear correlations were found in almost all cases, except those comparing clay fractions obtained by CC with those obtained by MM, PP and MS methods. These correlations were non-linear. The observed difference was attributed to the presence of aggregates and/or magnetic properties of soil particles. However, more data are needed to verify this hypothesis. The implications of sample pre-treatment with dispersant and hydrogen peroxide (H 2 O 2 ) were evaluated by the MS and CC techniques and observed by the scanning electron microscope. H 2 O 2 was found to be an efficient disaggregating agent. The use of dispersant resulted in the increased amount of the clay fraction measured by the MS method. Introduction Information on soil texture is fundamental for many soil studies, especially for those involving soil chemical and mineral com- position (Murashkina et al., 2007), soil C content (Zhang et al., 2005), sorption characteristics (Gawlik et al., 1999), tillage char- acteristics (Basic et al., 2001), plant growth (Lipiec et al., 2007), erosion (Warrington et al., 2009), desertification (Su et al., 2004) and influence of soil characteristics on mine-detection techniques (Obho daˇ s et al., 2005; Obho daˇ s, 2007). Precise and comparable information on soil texture is of great importance for these studies. It is well known that the choice of granulometric method and sam- ple pre-treatment has consequences for particle size distribution Correspondence: N. Vdovi´ c. E-mail: [email protected] Received 17 February 2010; revised version accepted 15 August 2010 (PSD) and hence for soil texture characterization. The differences between granulometric methods have been investigated (Syvitski et al., 1991; Wu et al., 1993; Kn¨ osche et al., 1997; Konert & Vanderberghe, 1997; Beuselinck et al., 1998; Eshel et al., 2004; Dur et al., 2004; Filgueira et al., 2006; McCave et al., 2006; Goossens, 2008), but attention has rarely been paid to the modal- ity of PSD frequency curves. The modality in frequency curves reflects different patterns of pedogenesis and has to be carefully observed prior to choosing a model for PSD interpretation. Bimodality of PSDs is quite common and indicates two phys- ical processes involved in soil formation, weathering of primary rocks resulting in sand and silt fractions (primary soil miner- als) and weathering of sand and silt soil fractions resulting in clay fractions (secondary soil minerals). Assuming soil bimodal- ity, Shiozawa & Campbell (1991) developed a Gaussian bimodal model for describing PSD of various soils. Condappa et al. (2008) © 2010 The Authors 854 Journal compilation © 2010 British Society of Soil Science
Transcript of Revisiting the particle size distribution of soils: comparison of different methods and sample...
European Journal of Soil Science, December 2010, 61, 854–864 doi: 10.1111/j.1365-2389.2010.01298.x
Revisiting the particle-size distribution of soils:comparison of different methods and samplepre-treatments
N . V d o v i ca , J . O b h o D a sb & K . P i k e l jc
aDepartment for Marine and Environmental Research, Ruder Boskovic Institute, Bijenicka 54, 10000 Zagreb, Croatia, bDepartmentof Experimental Physics, Ruder Boskovic Institute, Bijenicka 54, 10000 Zagreb, Croatia and cDepartment of Geology and Palaeontology,Faculty of Science, University of Zagreb, Horvatovac 102 a, 10000 Zagreb, Croatia
Summary
The choice of analytical method and sample pretreatment has significant consequences for the shape of particle-size distribution (PSD) frequency curves, and therefore for the evaluation of soil textural parameters. Here,the comparison of several granulometric methods based on different physical principles is presented: wetsieving (WS), based on gravity and the mechanical force of water, was combined with pipette (PP) sedimenta-tion/settling velocity, Micromeritics SediGraph (MS) sedimentation/x-ray attenuation and Coulter Counter (CC)electroresistance particle counting. The Malvern Mastersizer (MM), an instrument based on laser diffraction,was used without WS. Twelve typical temperate-region soil types were chosen for this study on the basis of theirmineral composition, organic matter content, conductivity and magnetic susceptibility. The modalities of PSDfrequency curves obtained by different methods were compared. The results showed considerably larger clay-fraction contents determined with the sedimentation techniques, PP and MS, than that obtained by CC or MM.Statistical correlation and regression models were used to compare the fractions of clay, silt and sand obtainedwith different methods. Linear correlations were found in almost all cases, except those comparing clayfractions obtained by CC with those obtained by MM, PP and MS methods. These correlations were non-linear.The observed difference was attributed to the presence of aggregates and/or magnetic properties of soilparticles. However, more data are needed to verify this hypothesis. The implications of sample pre-treatmentwith dispersant and hydrogen peroxide (H2O2) were evaluated by the MS and CC techniques and observedby the scanning electron microscope. H2O2 was found to be an efficient disaggregating agent. The use ofdispersant resulted in the increased amount of the clay fraction measured by the MS method.
Introduction
Information on soil texture is fundamental for many soil studies,especially for those involving soil chemical and mineral com-position (Murashkina et al., 2007), soil C content (Zhang et al.,2005), sorption characteristics (Gawlik et al., 1999), tillage char-acteristics (Basic et al., 2001), plant growth (Lipiec et al., 2007),erosion (Warrington et al., 2009), desertification (Su et al., 2004)and influence of soil characteristics on mine-detection techniques(Obhodas et al., 2005; Obhodas, 2007). Precise and comparableinformation on soil texture is of great importance for these studies.It is well known that the choice of granulometric method and sam-ple pre-treatment has consequences for particle size distribution
Correspondence: N. Vdovic. E-mail: [email protected]
Received 17 February 2010; revised version accepted 15 August 2010
(PSD) and hence for soil texture characterization. The differencesbetween granulometric methods have been investigated (Syvitskiet al., 1991; Wu et al., 1993; Knosche et al., 1997; Konert &Vanderberghe, 1997; Beuselinck et al., 1998; Eshel et al., 2004;Dur et al., 2004; Filgueira et al., 2006; McCave et al., 2006;Goossens, 2008), but attention has rarely been paid to the modal-ity of PSD frequency curves. The modality in frequency curvesreflects different patterns of pedogenesis and has to be carefullyobserved prior to choosing a model for PSD interpretation.
Bimodality of PSDs is quite common and indicates two phys-ical processes involved in soil formation, weathering of primaryrocks resulting in sand and silt fractions (primary soil miner-als) and weathering of sand and silt soil fractions resulting inclay fractions (secondary soil minerals). Assuming soil bimodal-ity, Shiozawa & Campbell (1991) developed a Gaussian bimodalmodel for describing PSD of various soils. Condappa et al. (2008)
© 2010 The Authors854 Journal compilation © 2010 British Society of Soil Science
Revisiting the particle size distribution of soils 855
have shown that processes of pedogenesis in tropical and subtrop-ical regions favour the generation of soils with bimodal PSDs.However, those of soils from temperate regions often exhibitmultimodality (Pieri et al., 2006), indicating more complex pedo-genesis. In addition, joining segments of the PSD obtained fromtechniques exploiting different particle properties to cover the nec-essary size spectrum adds a complication to quantitative analysis.
Some studies dealing with PSD interpretation involve descrip-tion of soil texture using fractals (Comegna et al., 1998; Filgueiraet al., 2006; Prosperini & Perugini, 2008). A fractal modelis appropriate only to the distribution arising from a singlesoil-forming process, which involves only the particles that frac-ture as the consequence of a stress concentration on their surface.Fractal models most often can not provide adequate descriptionsof the entire PSD size spectrum. Some authors use fractals onlyto describe the fine fraction in PSD spectra (Millan et al., 2003;Filgueira et al., 2006), whereas application to the entire PSDs maylead to fractal exponents >3 (Tyler & Wheatcraft, 1989), whichhave no physical meaning.
Soil magnetism and soil conductivity are often not determined.The need for these types of information has arisen in relationto soil properties that adversely affect detection of landmines.Magnetic properties of some soils severley affect metal detectorsensing, preventing their use for landmine clearance. Frequency-dependent magnetic susceptibility (KLF - KHF ) indicates the‘magnetic viscosity’ of the soil particle which affects the sensingof the electrical instrument. Tite & Linington (1975) and Hannam& Dearing (2008) found that Terra Rossa soils overlying limestonebeds can have large frequency-dependent magnetic susceptibilitycaused by the presence of ferro-minerals in the clay fraction. Mag-netic susceptibility of the soil may be caused by a subgroup in theclay fraction containing ferromagnetic particles of size 0.5–1 μmthat contain only one magnetic domain, having as a consequencehigher magnetic susceptibility when compared with larger parti-cles. For this reason, haematite and goethite, minerals typicallypresent in Terra Rossa soils, exhibit a pronounced magnetic vis-cosity regardless of the fact that the magnetic characteristics ofthese minerals are weak and usually do not contribute to soil mag-netism. The magnetic susceptibility effects on PSD needs to beresolved.
In addition to the effects introduced by the methods, the prepa-ration of samples is an important factor that contributes to mea-surement reliability (Matthews, 1991; Chappell, 1998). Commonpreparations for determination of PSDs include removal of organicmatter, carbonates and/or iron oxides, ultrasonication and addi-tion of a dispersant (McManus, 1988). However, it is not alwaysadvisable to use all of these. The choice should correspond tothe aim of the investigation and type of material to be analysed(Matthews, 1991).
The present study examines the reliability of several methods(and combinations thereof) for PSD determination, exploiting var-ious particle properties of a variety of temperate soils, subjectedto selected pretreatments, and examines their variability.
Materials and methods
Sample determination and preparation
Twelve soil samples were chosen to represent typical soils fromtemperate regions. These were selected from a number of sam-ples collected from cleared landmine sites in previous studies(Obhodas et al., 2005; Obhodas, 2007). All samples were driedat 105◦C and sieved through a 2000-μm ASTM sieve to elimi-nate gravel and large organic debris. A portion of each samplewas homogenized in an agate mortar. The mineralogical com-position of homogenized samples was analysed with a Philips‘X’Pert’ vertical x-ray goniometer (PANalytical, B.V., Almelo,the Netherlands). The determination of carbonate minerals wasperformed by acid digestion, (ONORM L 1084, 1999) and theorganic matter (OM) content was determined as weight loss onignition. Soil conductivity was measured in a stirred water suspen-sion made of 1 g of soil in 200 ml of deionized water (conductivity1.9 ± 1.2 μS cm−1) using a YSI 5563 sensor (YSI Ltd., Fleet,UK). The soil volumetric magnetic susceptibility was measuredwith a Bartington MS2 B-Coil susceptibility meter (BartingtonInstruments, Witney, UK) at the frequencies of KLF = 458 Hz andKHF = 4580 Hz, which provided an indication of the volumetricfrequency-dependent magnetic susceptibility (KLF − KHF ).
Grain-size analyses
The soil samples were suspended in deionised water, ultra-sonicated for five minutes and then analysed by pipette (PP),Micromeritics SediGraph 5100 (MS) (Micromeritics InstrumentCorporation, Norcross, GA, USA) and Coulter Counter TA II (CC)(Coulter Electronics, Hialeah, FL, USA) in combination with wetsieving, and by the Malvern Mastersizer 2000 (MM) (MalvernInstruments, Malvern, UK). Texture classes of the soil samples,determined from the resulting PSDs, were categorized accordingto the German soil texture classification system (Bormann, 2007).A short description of each of these methods is given below.
Pipette method. Ten grams of soil sample suspended in 1 litreof deionised water were passed through a set of American Soci-ety for Testing and Materials (A.S.T.M.) sieves (1000 – 32 μm).The transmitted suspension was then poured into a 1-litre gradu-ated cylinder and allowed to settle. Successive aliquots of 10 cm3
were extracted from the suspension at the time intervals calculatedfor a specific particle diameter (according to Stokes’ law), driedand weighed. The PSD of particles <32 μm was calculated on amass basis.
Micromeritics SediGraph. Ten grams of dry sample weresuspended in water, sieved (1000 – 63 μm sieves) and thetransmitted suspension was allowed to settle. Granulometricdistribution of particles in the suspension was determined bymeasuring the X-ray attenuation during sedimentation in theinstrument’s cell. The PSD of this portion of the sample (<63 μm)
© 2010 The AuthorsJournal compilation © 2010 British Society of Soil Science, European Journal of Soil Science, 61, 854–864
856 N. Vdovic et al.
was determined, on a mass basis, from the X-ray attenuationduring sedimentation.
Coulter Counter. Samples were wet-sieved as described for thepipette method. An aliquot of the transmitted suspension waswithdrawn and mixed with 0.15 m NaCl solution (conductiv-ity = 15659.6 μS cm−1). The suspension was drawn through atube of 70-μm aperture. Two electrodes placed either side of thetube aperture provide a direct current electrical field. As a particlepasses through the measurement tube, it changes the resistancebetween the electrodes. This produces a short voltage pulse ofa magnitude proportional to the particle volume. The detectablesize-range for this aperture was 1–32 μm, and below this sizethe PSD function was graphically extrapolated by the operator.The segment of the PSD obtained from sieving (>32 μm) wasthen joined to the segment from the CC expressed on a volumebasis.
Malvern Mastersizer. One gram of dry sample was suspendedin 50 cm3 of redistilled water. Approximately 5–10 cm3 of thatsuspension was placed in a dispersion unit containing 800 mlof tap water. The intensity of scattered light from the laser,scattered at different angles from the different particles, wasmeasured with a series of detectors. Particle size was calcu-lated on a volume basis using the Mie theory and proprietarysoftware. A refractive index of 1.53 was used as a modelparameter.
Sample disaggregation and dispersion procedures
Four suspensions of selected samples were prepared as: (i) originalsample suspended in deionised water (10 g dm−3), (ii) originalsample suspended in 0.1% solution of dispersant (sodium hexam-etaphosphate), (iii) sample treated with 15% H2O2 solution, and
(iv) sample treated with H2O2, and then suspended in 0.1% dis-persant solution. The PSDs were measured by the MS and CCmethods. Subsequently, suspensions were allowed to settle andafter six days 10-ml aliquots were withdrawn from the top ofeach suspension. Sample aliquots were air-dried on the glass tiles,coated with graphite, and inspected at 20 kV by a TS 5136 MMscanning electron microscope (SEM; Tescan, Cranberry Township,PA, USA).
Mathematical methods
Median (d50), average particle sizes (APD), Pearson product-moment correlation coefficients (r) used with the 0.95 confidencelevel, coefficients of determination (R2)and probability of error(p) were calculated from the PSDs. The fractions of sand, silt andclay obtained from the various methods were correlated pair-wisefor the 12 samples. The resulting parameters a and b are the slopeand the intercept of the linear regression equations (Y = aX + b),while c and d are the parameters of the logarithmic regressionequations (Y = (c)logX + d). For the 0.95 confidence level, astatistically significant correlation corresponds to r ≥ 0.576 (forN = 12 and N-2 degrees of freedom). APD was calculatedaccording to the model:
x =n∑
i
wixi/100, (1)
where wi is a fraction of xi in percentages, and xi is an averageparticle diameter of ith size.
Results and discussion
Soil characteristics
Table 1 shows the characteristics of the 12 samples, obtainedby the XRD analysis. Samples were composed mainly of
Table 1 Mineral constituents, the proportion (weight) of calcite (%) and organic matter (% LOI), soil type, dry density of soil samples (g cm−3), soilconductivity (mS cm−1), volumetric magnetic susceptibility at low frequency - KLF (SI × 10−), at high frequency - KHF (SI × 10−5) and volumetricfrequency-dependent magnetic susceptibility (KLF - KHF )
Sample ID Q Chl Il / M F Ca Ka S H / G CaCO3 OM Soil type Dry soil density Conductivity KLF KHF KLF - KHF
1-Baranja + + + — + + + — 1.3 9.4 Gleysol 1.14 32.0 25.5 24.5 1.02-Ðurdevac + + + + + — — — 1.4 1.1 Luvisol 1.53 5.7 51.6 50.8 0.83-Osijek + + + + — + — — 0.8 4.9 Gleysol 1.32 23.3 75.1 66.0 9.14-Turanj + + + + — + — + 0.4 9.2 Gleysol 1.32 23.7 31.3 29.8 0.85-IRB + + + + — + — — 0.4 12.0 Gleysol 1.29 12.0 70.4 65.3 5.16-Cerovac + + + + + — — — 5.8 3.7 Vertisol 1.03 56.3 19.1 17.1 2.17-Rogoznica + + + + + + + + 2.7 9.1 Terra Rossa 1.14 23.3 538.5 505.8 49.08-Sabunike + — + + + — — — 55.0 3.0 Anthroposol 1.42 24.3 23.3 21.2 2.19-P. Mika + + + + + — — + 10.9 9.4 Terra Rossa 1.03 18.7 264.3 237.1 27.2
10-Zemunik + + + + + + + — 20.9 7.6 Anthroposol 0.95 31.3 39.0 35.4 3.611-Bokanjac + + + + + + + — 18.4 4.2 Anthroposol 1.29 29.7 19.1 17.4 1.712-Oklaj + + + + + — — — 25.0 12.0 Terra Rossa 1.09 38.0 117.2 105.5 11.7
Q = quartz; Chl = chlorite; Il / M = illite/muscovite; F = feldspars; Ca = calcite; Ka = kaolinite; S = smectite; H / G = haematite/goethite.
© 2010 The AuthorsJournal compilation © 2010 British Society of Soil Science, European Journal of Soil Science, 61, 854–864
Revisiting the particle size distribution of soils 857
quartz, chlorite, K-feldspars, mica and clay minerals. A sub-stantial amount of calcite was detected in samples 6–12.The quantitative analysis of carbonate minerals using theacid-digestion method was consistent with the XRD analy-sis. Samples 1–5 contained 0.4–1.4%, samples 6 and 7 con-tained less than 10%, and samples 8–12 contained 10–55%of carbonates (CaCO3). The organic matter content (OM)ranged from 1.1 to 12.0% (by weight). The conductivityvaried between 5.7 and 56.3 μS cm−1 and the frequency-dependent magnetic susceptibility between 0.8 and 49.0 ×10⁻⁵ (SI units).
Soil texture
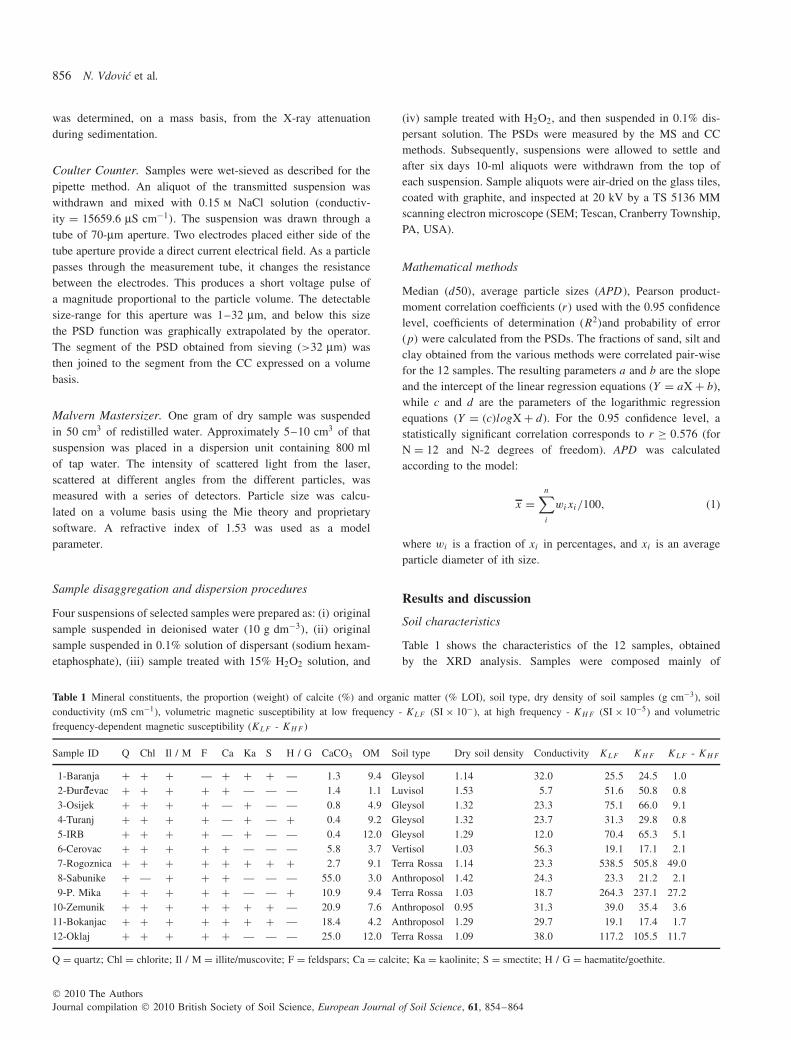
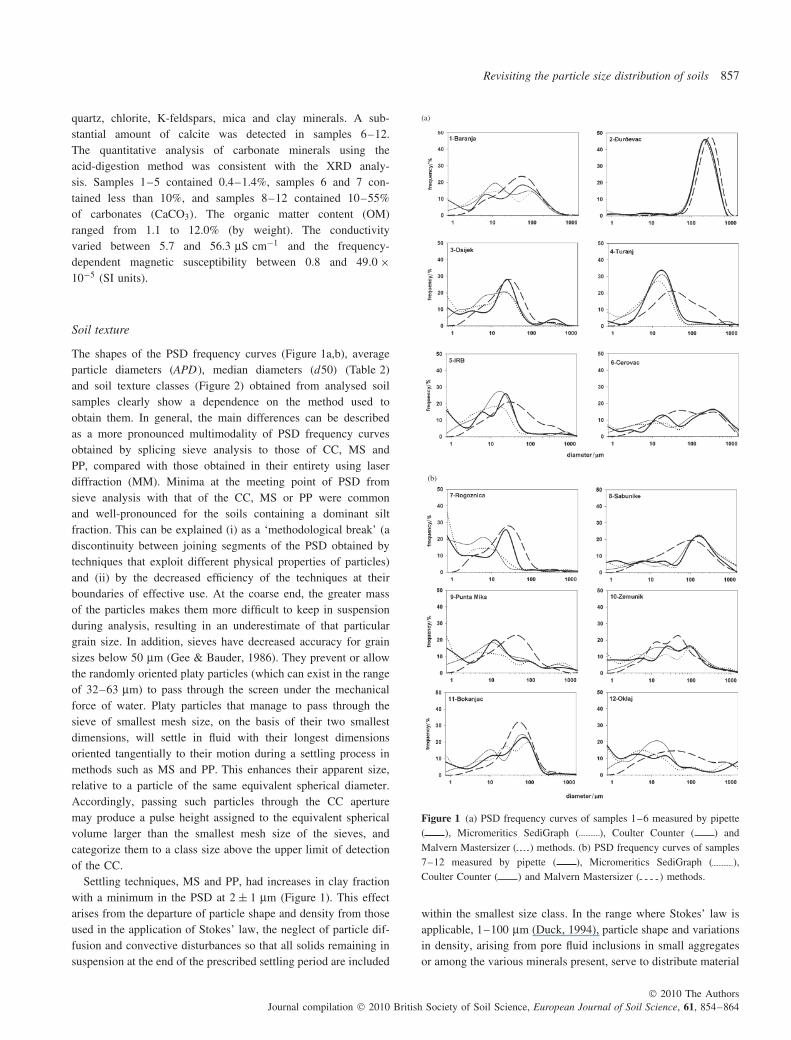
The shapes of the PSD frequency curves (Figure 1a,b), averageparticle diameters (APD), median diameters (d50) (Table 2)and soil texture classes (Figure 2) obtained from analysed soilsamples clearly show a dependence on the method used toobtain them. In general, the main differences can be describedas a more pronounced multimodality of PSD frequency curvesobtained by splicing sieve analysis to those of CC, MS andPP, compared with those obtained in their entirety using laserdiffraction (MM). Minima at the meeting point of PSD fromsieve analysis with that of the CC, MS or PP were commonand well-pronounced for the soils containing a dominant siltfraction. This can be explained (i) as a ‘methodological break’ (adiscontinuity between joining segments of the PSD obtained bytechniques that exploit different physical properties of particles)and (ii) by the decreased efficiency of the techniques at theirboundaries of effective use. At the coarse end, the greater massof the particles makes them more difficult to keep in suspensionduring analysis, resulting in an underestimate of that particulargrain size. In addition, sieves have decreased accuracy for grainsizes below 50 μm (Gee & Bauder, 1986). They prevent or allowthe randomly oriented platy particles (which can exist in the rangeof 32–63 μm) to pass through the screen under the mechanicalforce of water. Platy particles that manage to pass through thesieve of smallest mesh size, on the basis of their two smallestdimensions, will settle in fluid with their longest dimensionsoriented tangentially to their motion during a settling process inmethods such as MS and PP. This enhances their apparent size,relative to a particle of the same equivalent spherical diameter.Accordingly, passing such particles through the CC aperturemay produce a pulse height assigned to the equivalent sphericalvolume larger than the smallest mesh size of the sieves, andcategorize them to a class size above the upper limit of detectionof the CC.
Settling techniques, MS and PP, had increases in clay fractionwith a minimum in the PSD at 2 ± 1 μm (Figure 1). This effectarises from the departure of particle shape and density from thoseused in the application of Stokes’ law, the neglect of particle dif-fusion and convective disturbances so that all solids remaining insuspension at the end of the prescribed settling period are included
(a)
(b)
Figure 1 (a) PSD frequency curves of samples 1–6 measured by pipette( ), Micromeritics SediGraph ( ), Coulter Counter ( ) andMalvern Mastersizer ( ) methods. (b) PSD frequency curves of samples7–12 measured by pipette ( ), Micromeritics SediGraph ( ),Coulter Counter ( ) and Malvern Mastersizer ( ) methods.
within the smallest size class. In the range where Stokes’ law isapplicable, 1–100 μm (Duck, 1994), particle shape and variationsin density, arising from pore fluid inclusions in small aggregatesor among the various minerals present, serve to distribute material
© 2010 The AuthorsJournal compilation © 2010 British Society of Soil Science, European Journal of Soil Science, 61, 854–864
858 N. Vdovic et al.
Table 2 Average particle-size diameter (APD) and median diameter (d50)
for measured soil samples obtained by pipette (PP), Coulter Counter(CC), Micromeritcs SediGraph (MS) and Malvern Mastersizer (MM)methods
APD / μm d50 / μm
PP CC MS MM PP CC MS MM
1-Baranja 59.2 56.2 49.0 68.0 25.4 16.7 11.8 37.22-Ðurdevac 235 229 228 300 217.6 203.1 204.5 267.93-Osijek 39.5 26.8 25.6 38.3 16.4 10.0 8.1 19.94-Turanj 43.5 43.8 39.1 80.6 15.8 12.7 10.3 32.45-IRB 43.6 44.8 39.4 87.7 10.6 12.3 6.5 29.26-Cerovac 241 204 231 175 87.2 82.5 86.6 71.87-Rogoznica 31.6 16.6 22.2 34.5 6.4 2.9 2.2 17.98-Sabunike 152 232 235 136 87.2 115.0 120.7 64.39-Punta Mika 81.0 96.2 80.6 57.7 9.6 11.4 6.6 28.6
10-Zemunik 73.8 93.4 91.4 78.3 22.1 26.1 18.8 29.211-Bokanjac 79.3 66.0 50.8 70.4 32.4 33.5 22.1 42.112-Oklaj 176 136 161 187 7.0 12.7 6.4 40.7
into size classes close to that defined by the selected implemen-tation of Stokes’ law.
Implementation of Stokes’ law (Equation 2) requires a solidsdensity that is unlikely to represent all the materials in the sample
and serves to define the size axis of that part of the PSD:
v = (ρp − ρf )g d2
18μ, (2)
where v is the settling velocity, ρp is the particle density, ρf isthe fluid density, g is the acceleration due to the gravity, d is theparticle diameter and μ is the dynamic viscosity of the fluid.
Another reason is that a solids density of 2.65 g cm−3 is oftenused with Stokes’ law in its application to soils and sediments,but according to Clifton et al. (1999) particle density may varyin a sample from 1.66 to 2.99 g cm−3. Recently, Virto et al.(2008) have shown that the silt fraction found in silty temper-ate soils actually consists of un-complexed, non-occluded lightorganic matter, non-occluded primary silt-size minerals and sta-ble silt-size aggregates with densities between 1.6 and 2.5 g cm−3.In addition, aggregates often contain a significant pore volume,which decreases their density and prolongs settling time (Tre-week & Morgan, 1977) in relation to a solid particle of the samedimensions.
If we assume a range of particle densities as 1.6 < ρp <
2.65 g cm−3, fluid density of ρf = 1.0 g cm−3 and dynamic fluidviscosity of μ = 0.01 g cm−1 s−1, Stokes’ law (Equation 2) forparticles of 30 μm in diameter will give settling velocities from
Figure 2 Texture classes of measured soil samples obtained by four granulometric methods presented in texture triangles. Texture classes are: Ss = puresand, Sl = loamy sand, St = clayey sand, Su = silty sand, Ls = sandy loam, Lts = clayey sandy loam, Ts = sandy clay, Us = sandy silt, Ut = clayeysilt, Lt = clayey loam, Su = silty sand, Sl = loamy sand, Slu = loamy silty sand, Uu = pure silt, Uls = loamy sandy silt, Lu = silty loam, Tu=siltyclay, Tl = loamy clay, Tt = pure clay, 2 = slightly, 3 = medium, 4 = highly.
© 2010 The AuthorsJournal compilation © 2010 British Society of Soil Science, European Journal of Soil Science, 61, 854–864
Revisiting the particle size distribution of soils 859
0.0294 cm s−1 to 0.0785 cm s−1. Hence, the 30-μm particles,having ρ = 1.6 g cm−3, need 5.67 minutes to settle to the depthof 10 cm, while 2.65 g cm−3 particles need 2.12 minutes. Theporosity and irregular shape of aggregates will additionaly pro-long their settling time. Therefore, the minima in PSD frequencycurves obtained by settling techniques can reflect the presenceof low-density particles and irregular, heterogeneous aggregatesreported in fractions of smaller dimensions. The more pronouncedmultimodality of PSD frequency curves obtained by settling tech-niques, caused most probably by irregular shape and heteroge-neous densities of particles and aggregates, can be observed inFigure 1(a,b).
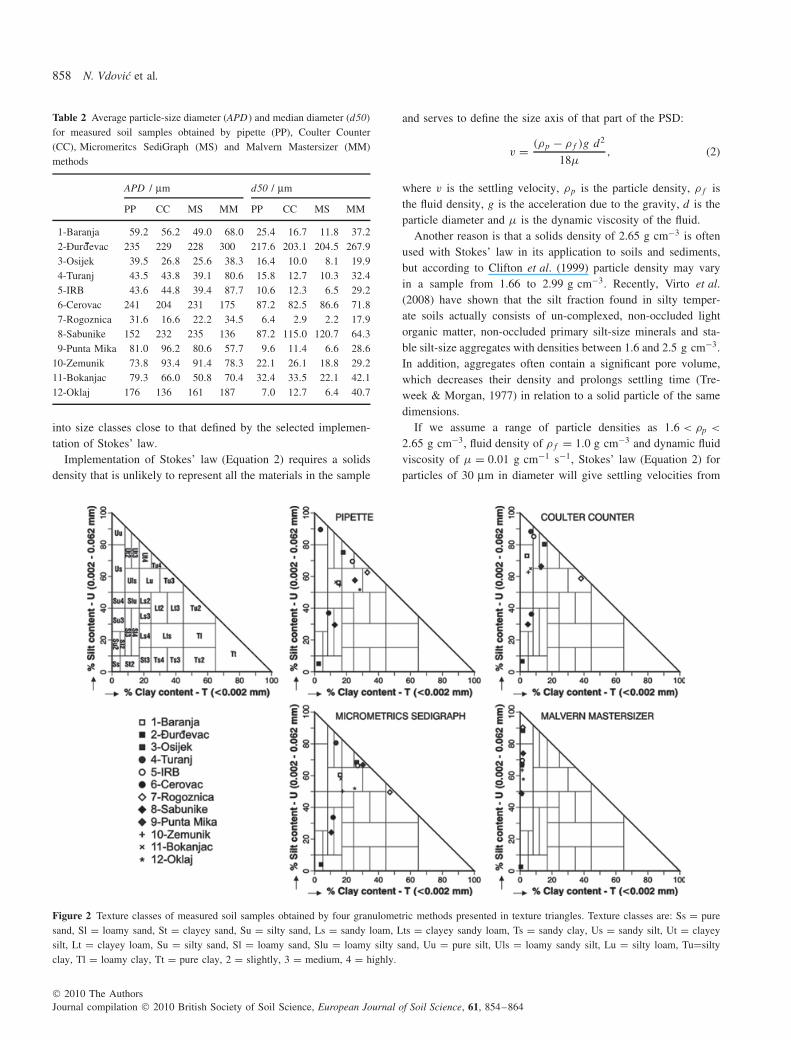
In contrast to settling techniques, the CC technique mayunderestimate the clay fraction content. The weak electrolytesolution used in this technique can promote aggregation ofclay particles in spite of ultrasonic dispersion pretreatment andcontinuous stirring during the measurement. In addition, anyparticles much smaller than approximately 5% of the aperturediameter may pass undetected because the instrument sensitivitydecreases rapidly below this size. The combination of the PSDfrom CC with that from sieve analysis involves joining a sizescale based on an equivalent spherical diameter with that of amesh size provided directly by the sieves. The usual practice ofjoining of these two segments does not include conversion ofCC-derived volume percentage (% Vol) to mass percentage (%Mass) or vice versa because a representative solid density is used.
Such practice gives equivalent volume and mass PS distributions,although a distribution of densities with size will produce somedistortions from this equivalence (Figure 3).
The volume and the mass percentages are related as:
% V ol = ρ(soil)
ρ(s.particle)% Mass, (3)
where ρ (soil) represents the average soil density and ρ (s. parti-cle) is the density of a certain size fraction; the conversion ofCC data to a mass basis (or vice versa) requires selection ofan appropriate solids density for a given fraction, which deter-mines the relative amplitude of this segment of the overall PSD.If the range of densities reported by Virto et al. (2008) is used,2.65 g cm−3 for clay and 1.6 < ρ < 2.65 g cm−3 for silt, then theshape of the PSD curve will be modified accordingly. The assump-tion of greater particle density in the silt fraction will influencethe shape of the PSD frequency curve in the region closer to thesand fraction, whereas the assumption of lower particle densitywill influence the region closer to the clay fraction.
In comparison with the other techniques, the MM techniqueconsiderably underestimates the clay and fine silt fractions andshifts the distribution towards larger sizes. Such shifting wasalso observed by other authors (Konert & Vandenberghe, 1997;Eshel et al., 2004; McCave et al., 2006; Pieri et al., 2006), whoattributed the underestimate of the fine fraction to the liability of
Figure 3 Recalculation of results (Vol % in Mass %) obtained by CC with respect to different particle densities for (a) soil 1, (b) soil 3, (c) soil 4 and(d) soil 5.
© 2010 The AuthorsJournal compilation © 2010 British Society of Soil Science, European Journal of Soil Science, 61, 854–864
860 N. Vdovic et al.
the laser technique to interpret the platy particles as spheres. Theyalso considered the influence of different optical model applica-tions (Mie and Fraunhofer theories) and measurement parameters,such as the selection of absorbance and relative refractive index inthe Mie theory. However, there was agreement that the shape orsphericity of the particles is of prime importance in measuring thegrain size by the laser technique. In addition, in a continuous flowof particles, the projected cross-sectional area of a non-sphericalparticle averaged over all the particle’s possible orientations rel-ative to the direction of the beam is larger than that of a spherewith an equal volume (Jonasz, 1991).
The shift toward larger sizes by the MM technique is exempli-fied by samples 4, 5, 7, 9 and 12 (Figure 1). The common char-acteristic of these samples is their large OM content, which wasa possible cause of aggregation. Because no sieving was applied,we can assume that this could be the additional reason why thetwo-step techniques show a greater content of fine fractions. Theshaking and the mechanical force of water applied during sievingcould break the aggregates more efficiently than ultrasonicationalone, enhancing the contribution of the fractions <32/63 μm.
The parameters of linear regression analyses of the sand, siltand clay fractions obtained by the various techniques (Table 3)suggest a reasonably good fit, with correlation coefficients (r) of> 0.76, which suggests a good statistical significance.
However, these results differ from those obtained by others(Konert & Vandenberghe, 1997; Eshel et al., 2004; Pieri et al.,2006). We confirm, as these authors have observed, that uni-versally applicable mathematical relationships between the PSDfrequency curves, or fractions thereof, obtained by the variousmethods, cannot be established. Such relationships are influencedstrongly by sample pretreatment techniques, the instrument typeand measurement parameters. Should the need arise to compare,or merge, soil texture databases comprising PSDs from thesevarious techniques then suitable mathematical relationships forinter-conversion between these are desirable.
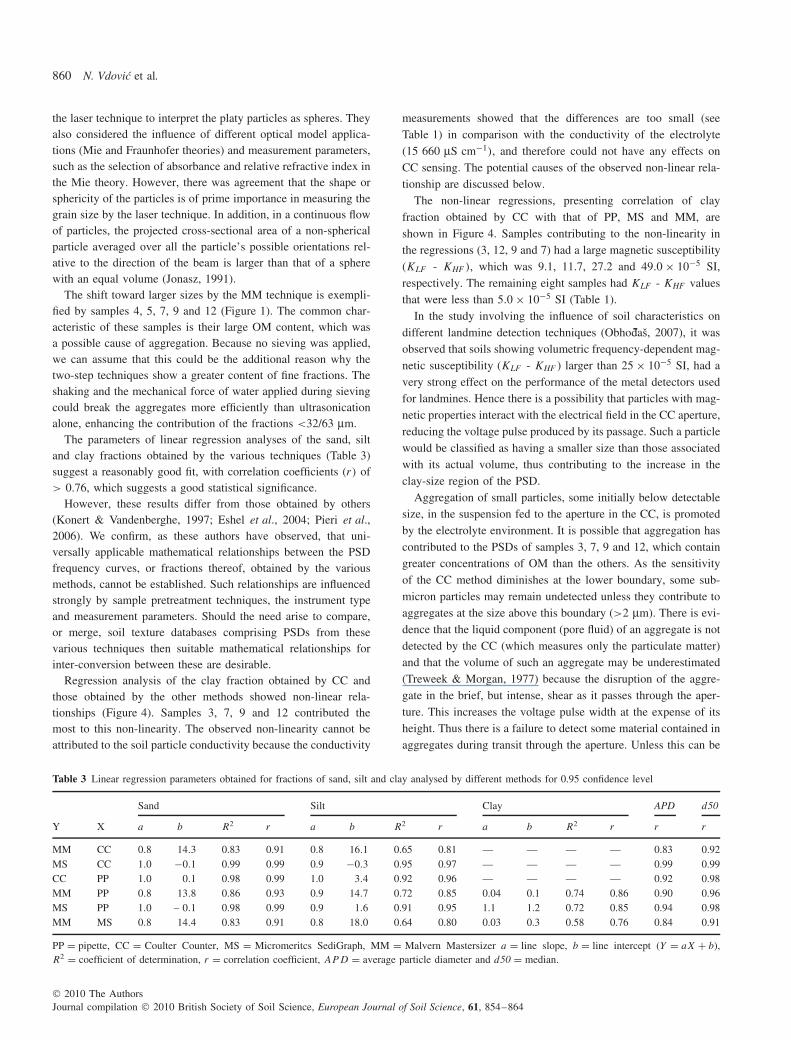
Regression analysis of the clay fraction obtained by CC andthose obtained by the other methods showed non-linear rela-tionships (Figure 4). Samples 3, 7, 9 and 12 contributed themost to this non-linearity. The observed non-linearity cannot beattributed to the soil particle conductivity because the conductivity
measurements showed that the differences are too small (seeTable 1) in comparison with the conductivity of the electrolyte(15 660 μS cm−1), and therefore could not have any effects onCC sensing. The potential causes of the observed non-linear rela-tionship are discussed below.
The non-linear regressions, presenting correlation of clayfraction obtained by CC with that of PP, MS and MM, areshown in Figure 4. Samples contributing to the non-linearity inthe regressions (3, 12, 9 and 7) had a large magnetic susceptibility(KLF - KHF ), which was 9.1, 11.7, 27.2 and 49.0 × 10⁻⁵ SI,respectively. The remaining eight samples had KLF - KHF valuesthat were less than 5.0 × 10⁻⁵ SI (Table 1).
In the study involving the influence of soil characteristics ondifferent landmine detection techniques (Obhodas, 2007), it wasobserved that soils showing volumetric frequency-dependent mag-netic susceptibility (KLF - KHF ) larger than 25 × 10−5 SI, had avery strong effect on the performance of the metal detectors usedfor landmines. Hence there is a possibility that particles with mag-netic properties interact with the electrical field in the CC aperture,reducing the voltage pulse produced by its passage. Such a particlewould be classified as having a smaller size than those associatedwith its actual volume, thus contributing to the increase in theclay-size region of the PSD.
Aggregation of small particles, some initially below detectablesize, in the suspension fed to the aperture in the CC, is promotedby the electrolyte environment. It is possible that aggregation hascontributed to the PSDs of samples 3, 7, 9 and 12, which containgreater concentrations of OM than the others. As the sensitivityof the CC method diminishes at the lower boundary, some sub-micron particles may remain undetected unless they contribute toaggregates at the size above this boundary (>2 μm). There is evi-dence that the liquid component (pore fluid) of an aggregate is notdetected by the CC (which measures only the particulate matter)and that the volume of such an aggregate may be underestimated(Treweek & Morgan, 1977) because the disruption of the aggre-gate in the brief, but intense, shear as it passes through the aper-ture. This increases the voltage pulse width at the expense of itsheight. Thus there is a failure to detect some material contained inaggregates during transit through the aperture. Unless this can be
Table 3 Linear regression parameters obtained for fractions of sand, silt and clay analysed by different methods for 0.95 confidence level
Sand Silt Clay APD d50
Y X a b R2 r a b R2 r a b R2 r r r
MM CC 0.8 14.3 0.83 0.91 0.8 16.1 0.65 0.81 — — — — 0.83 0.92MS CC 1.0 −0.1 0.99 0.99 0.9 −0.3 0.95 0.97 — — — — 0.99 0.99CC PP 1.0 0.1 0.98 0.99 1.0 3.4 0.92 0.96 — — — — 0.92 0.98MM PP 0.8 13.8 0.86 0.93 0.9 14.7 0.72 0.85 0.04 0.1 0.74 0.86 0.90 0.96MS PP 1.0 – 0.1 0.98 0.99 0.9 1.6 0.91 0.95 1.1 1.2 0.72 0.85 0.94 0.98MM MS 0.8 14.4 0.83 0.91 0.8 18.0 0.64 0.80 0.03 0.3 0.58 0.76 0.84 0.91
PP = pipette, CC = Coulter Counter, MS = Micromeritcs SediGraph, MM = Malvern Mastersizer a = line slope, b = line intercept (Y = aX + b),R2 = coefficient of determination, r = correlation coefficient, APD = average particle diameter and d50 = median.
© 2010 The AuthorsJournal compilation © 2010 British Society of Soil Science, European Journal of Soil Science, 61, 854–864
Revisiting the particle size distribution of soils 861
Figure 4 Correlations of clay fractions obtained by CC and the other threemethods.
quantified, distortion of the CC PSD and its proportion in relationto that of the corresponding sieve range PSD remains uncertain.
Aggregation does not appear to account for the observed depar-ture from the linear trend line. The possibility of aggregatesforming could also be expected for other samples containing largeamounts of OM (for example samples 1 and 4) but those samplesdid not contribute to the observed non-linearity. The soil parti-cle magnetism and aggregation do not exclude each other. Cur-rently we do not have enough evidence in favour of any of theseexplanations.
Effects of sample pre-treatment
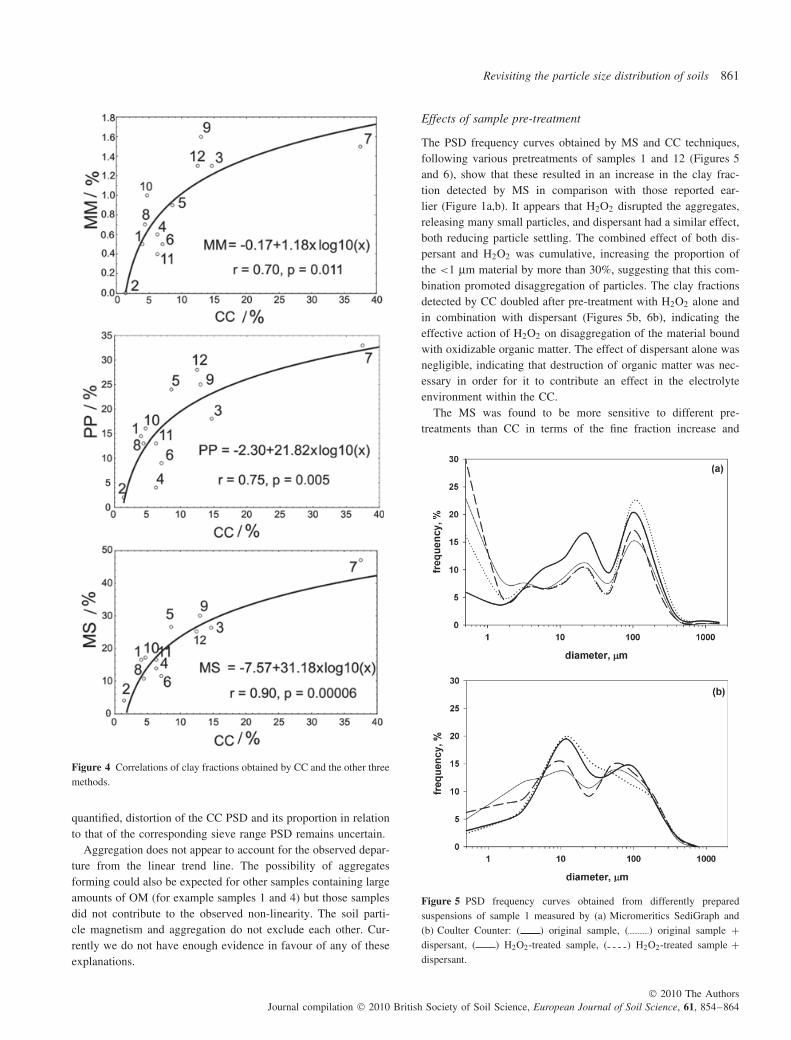
The PSD frequency curves obtained by MS and CC techniques,following various pretreatments of samples 1 and 12 (Figures 5and 6), show that these resulted in an increase in the clay frac-tion detected by MS in comparison with those reported ear-lier (Figure 1a,b). It appears that H2O2 disrupted the aggregates,releasing many small particles, and dispersant had a similar effect,both reducing particle settling. The combined effect of both dis-persant and H2O2 was cumulative, increasing the proportion ofthe <1 μm material by more than 30%, suggesting that this com-bination promoted disaggregation of particles. The clay fractionsdetected by CC doubled after pre-treatment with H2O2 alone andin combination with dispersant (Figures 5b, 6b), indicating theeffective action of H2O2 on disaggregation of the material boundwith oxidizable organic matter. The effect of dispersant alone wasnegligible, indicating that destruction of organic matter was nec-essary in order for it to contribute an effect in the electrolyteenvironment within the CC.
The MS was found to be more sensitive to different pre-treatments than CC in terms of the fine fraction increase and
Figure 5 PSD frequency curves obtained from differently preparedsuspensions of sample 1 measured by (a) Micromeritics SediGraph and(b) Coulter Counter: ( ) original sample, ( ) original sample +dispersant, ( ) H2O2-treated sample, ( ) H2O2-treated sample +dispersant.
© 2010 The AuthorsJournal compilation © 2010 British Society of Soil Science, European Journal of Soil Science, 61, 854–864
862 N. Vdovic et al.
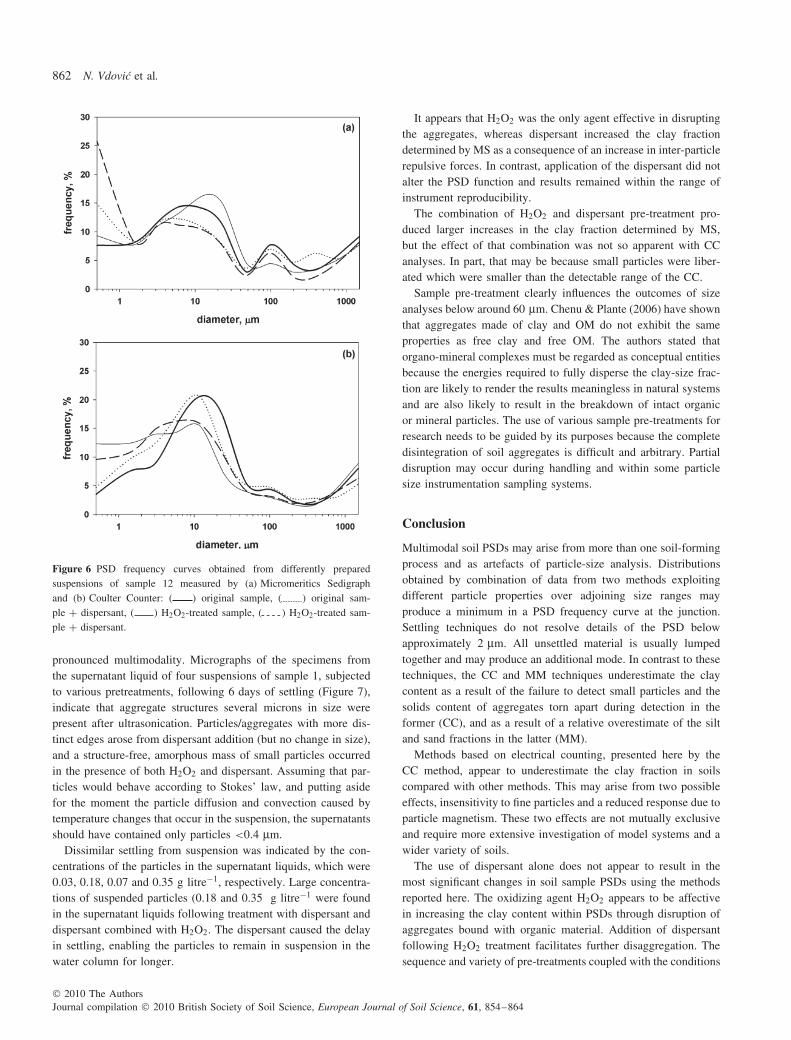
Figure 6 PSD frequency curves obtained from differently preparedsuspensions of sample 12 measured by (a) Micromeritics Sedigraphand (b) Coulter Counter: ( ) original sample, ( ) original sam-ple + dispersant, ( ) H2O2-treated sample, ( ) H2O2-treated sam-ple + dispersant.
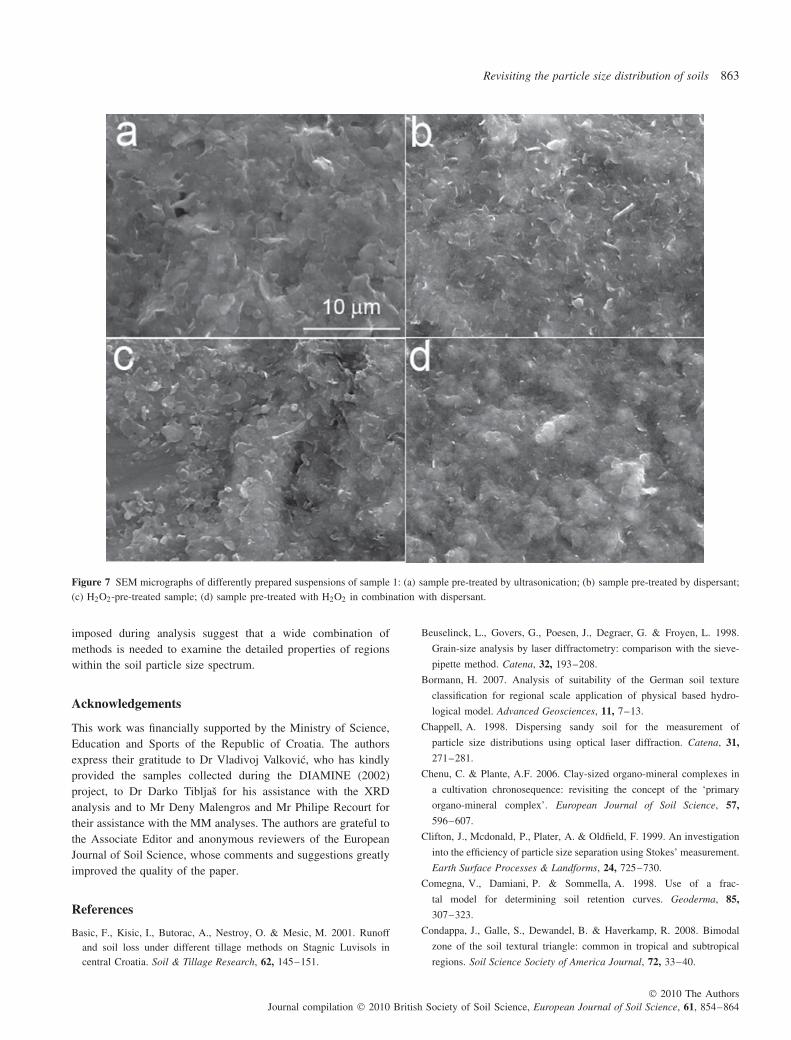
pronounced multimodality. Micrographs of the specimens fromthe supernatant liquid of four suspensions of sample 1, subjectedto various pretreatments, following 6 days of settling (Figure 7),indicate that aggregate structures several microns in size werepresent after ultrasonication. Particles/aggregates with more dis-tinct edges arose from dispersant addition (but no change in size),and a structure-free, amorphous mass of small particles occurredin the presence of both H2O2 and dispersant. Assuming that par-ticles would behave according to Stokes’ law, and putting asidefor the moment the particle diffusion and convection caused bytemperature changes that occur in the suspension, the supernatantsshould have contained only particles <0.4 μm.
Dissimilar settling from suspension was indicated by the con-centrations of the particles in the supernatant liquids, which were0.03, 0.18, 0.07 and 0.35 g litre−1, respectively. Large concentra-tions of suspended particles (0.18 and 0.35 g litre−1 were foundin the supernatant liquids following treatment with dispersant anddispersant combined with H2O2. The dispersant caused the delayin settling, enabling the particles to remain in suspension in thewater column for longer.
It appears that H2O2 was the only agent effective in disruptingthe aggregates, whereas dispersant increased the clay fractiondetermined by MS as a consequence of an increase in inter-particlerepulsive forces. In contrast, application of the dispersant did notalter the PSD function and results remained within the range ofinstrument reproducibility.
The combination of H2O2 and dispersant pre-treatment pro-duced larger increases in the clay fraction determined by MS,but the effect of that combination was not so apparent with CCanalyses. In part, that may be because small particles were liber-ated which were smaller than the detectable range of the CC.
Sample pre-treatment clearly influences the outcomes of sizeanalyses below around 60 μm. Chenu & Plante (2006) have shownthat aggregates made of clay and OM do not exhibit the sameproperties as free clay and free OM. The authors stated thatorgano-mineral complexes must be regarded as conceptual entitiesbecause the energies required to fully disperse the clay-size frac-tion are likely to render the results meaningless in natural systemsand are also likely to result in the breakdown of intact organicor mineral particles. The use of various sample pre-treatments forresearch needs to be guided by its purposes because the completedisintegration of soil aggregates is difficult and arbitrary. Partialdisruption may occur during handling and within some particlesize instrumentation sampling systems.
Conclusion
Multimodal soil PSDs may arise from more than one soil-formingprocess and as artefacts of particle-size analysis. Distributionsobtained by combination of data from two methods exploitingdifferent particle properties over adjoining size ranges mayproduce a minimum in a PSD frequency curve at the junction.Settling techniques do not resolve details of the PSD belowapproximately 2 μm. All unsettled material is usually lumpedtogether and may produce an additional mode. In contrast to thesetechniques, the CC and MM techniques underestimate the claycontent as a result of the failure to detect small particles and thesolids content of aggregates torn apart during detection in theformer (CC), and as a result of a relative overestimate of the siltand sand fractions in the latter (MM).
Methods based on electrical counting, presented here by theCC method, appear to underestimate the clay fraction in soilscompared with other methods. This may arise from two possibleeffects, insensitivity to fine particles and a reduced response due toparticle magnetism. These two effects are not mutually exclusiveand require more extensive investigation of model systems and awider variety of soils.
The use of dispersant alone does not appear to result in themost significant changes in soil sample PSDs using the methodsreported here. The oxidizing agent H2O2 appears to be affectivein increasing the clay content within PSDs through disruption ofaggregates bound with organic material. Addition of dispersantfollowing H2O2 treatment facilitates further disaggregation. Thesequence and variety of pre-treatments coupled with the conditions
© 2010 The AuthorsJournal compilation © 2010 British Society of Soil Science, European Journal of Soil Science, 61, 854–864
Revisiting the particle size distribution of soils 863
Figure 7 SEM micrographs of differently prepared suspensions of sample 1: (a) sample pre-treated by ultrasonication; (b) sample pre-treated by dispersant;(c) H2O2-pre-treated sample; (d) sample pre-treated with H2O2 in combination with dispersant.
imposed during analysis suggest that a wide combination ofmethods is needed to examine the detailed properties of regionswithin the soil particle size spectrum.
Acknowledgements
This work was financially supported by the Ministry of Science,Education and Sports of the Republic of Croatia. The authorsexpress their gratitude to Dr Vladivoj Valkovic, who has kindlyprovided the samples collected during the DIAMINE (2002)project, to Dr Darko Tibljas for his assistance with the XRDanalysis and to Mr Deny Malengros and Mr Philipe Recourt fortheir assistance with the MM analyses. The authors are grateful tothe Associate Editor and anonymous reviewers of the EuropeanJournal of Soil Science, whose comments and suggestions greatlyimproved the quality of the paper.
References
Basic, F., Kisic, I., Butorac, A., Nestroy, O. & Mesic, M. 2001. Runoffand soil loss under different tillage methods on Stagnic Luvisols incentral Croatia. Soil & Tillage Research, 62, 145–151.
Beuselinck, L., Govers, G., Poesen, J., Degraer, G. & Froyen, L. 1998.
Grain-size analysis by laser diffractometry: comparison with the sieve-
pipette method. Catena, 32, 193–208.
Bormann, H. 2007. Analysis of suitability of the German soil texture
classification for regional scale application of physical based hydro-
logical model. Advanced Geosciences, 11, 7–13.
Chappell, A. 1998. Dispersing sandy soil for the measurement of
particle size distributions using optical laser diffraction. Catena, 31,
271–281.
Chenu, C. & Plante, A.F. 2006. Clay-sized organo-mineral complexes in
a cultivation chronosequence: revisiting the concept of the ‘primary
organo-mineral complex’. European Journal of Soil Science, 57,
596–607.
Clifton, J., Mcdonald, P., Plater, A. & Oldfield, F. 1999. An investigation
into the efficiency of particle size separation using Stokes’ measurement.
Earth Surface Processes & Landforms, 24, 725–730.
Comegna, V., Damiani, P. & Sommella, A. 1998. Use of a frac-
tal model for determining soil retention curves. Geoderma, 85,
307–323.
Condappa, J., Galle, S., Dewandel, B. & Haverkamp, R. 2008. Bimodal
zone of the soil textural triangle: common in tropical and subtropical
regions. Soil Science Society of America Journal, 72, 33–40.
© 2010 The AuthorsJournal compilation © 2010 British Society of Soil Science, European Journal of Soil Science, 61, 854–864
864 N. Vdovic et al.
Duck, R.W. 1994. Application of the Qda-Md method of environmentaldiscrimination to particle size analyses of fine sediments by pipette andsedigraph methods: a comparative study. Earth Surface Processes &Landforms, 19, 525–529.
Dur, J.C., Elsass, F., Chaplain, V. & Tessier, D. 2004. The relationshipbetween particle-size distribution by laser granulometry and imageanalysis by transmission electron microscopy in a soil clay fraction.European Journal of Soil Science, 55, 265–270.
Eshel, G., Levy, G.J., Mingelgrin, U. & Singer, M.J. 2004. Criticalevaluation of the use of laser diffraction for particle-size dis-tribution analysis. Soil Science Society of America Journal, 68,736–743.
Filgueira, R.R., Fournier, L.L., Cerisola, C.I., Gelati, P. & Garcia, M.G.2006. Particle-size distribution in soils: a critical study of the fractalmodel validation. Geoderma, 134, 327–334.
Gawlik, B.M., Bo, F., Kettrup, A. & Muntau, H. 1999. Characterizationof a second generation of European reference soils for sorption studiesin the framework of chemical testing – Part I: chemical composition andpedological properties. Science of the Total Environment, 229, 99–107.
Gee, G.W. & Bauder, J.W. 1986. Particle-size analysis. In: Methods ofSoil Analysis: Part 1, 2nd edn (ed. A. Klute), pp. 383–411. ASA &SSSA, Madison, WI.
Goossens, D. 2008. Techniques to measure grain-size distribution of loamysediments: a comparative study of ten instruments for wet analysis.Sedimentology, 55, 65–96.
Hannam, J.A. & Dearing, J.A. 2008. Mapping soil magnetic properties inBosnia and Herzegovina for landmine clearance operations. Earth &
Planetary Science Letters, 274, 285–294.Jonasz, M. 1991. Size, shape, composition and structure of microparticles
from light scattering. In: Principles, Methods and Applications of
Particle Size Analysis (ed. J.P.M. Syvitski), pp. 143–162. CambridgeUniversity Press, New York.
Knosche, C., Friedrich, H. & Stintz, M. 1997. Determination of particlesize distribution and electrokinetic properties with the acustosizerin comparison with other methods. Particle & Particle SystemsCharacterization, 14, 175–180.
Konert, M. & Vandenberghe, J. 1997. Comparison of laser grainsize analysis with pipette and sieve analysis: a solution for theunderestimation of the clay fraction. Sedimentology, 44, 523–535.
Lipiec, J., Walczak, R., Witkowska-Walczak, B., Nosalewicz, A.,Słowinska-Jurkiewicz, A. & Sławinski, C. 2007. The effect of aggre-gate size on water retention and pore structure of two silt loam soils ofdifferent genesis. Soil & Tillage Research, 97, 239–246.
Matthews, M.D. 1991. The effect of pretreatment on size analysis. In:Principles, Methods and Applications of Particle Size Analysis (ed.J.P.M. Syvitski), p. 368. Cambridge University Press, Cambridge, MA.
McCave, I.N., Hall, I.R. & Bianchi, G.G. 2006. Laser vs. settling velocitydifferences in silt grain-size measurements: estimation of paleo currentvigour. Sedimentology, 53, 919–928.
McManus, J. 1988. Grain size determination and interpretation. In:Techniques in Sedimentology (ed. M. Tucker), pp. 35–44. BlackwellScientific Publications, Oxford.
Millan, H., Gonzalez-Posada, M., Aguilar, M., Dominguez, J. &Cespedes, L. 2003. On the fractal scaling of soil data. Particle-sizedistributions. Geoderma, 117, 117–128.
Murashkina, M.A., Southard, R.J. & Pettygrove, G.S. 2007. Silt and finesand fractions dominate K fixation in soils derived from graniticalluvium of the San Joaquin Valley, California. Geoderma, 141,283–293.
Obhodas, J. 2007. Space-time variations of soil properties and influence
on landmine detection performance potential . PhD thesis, University ofZagreb, Faculty of Science, Zagreb.
Obhodas, J., Vdovic, N. & Valkovic, V. 2005. Dynamics of soilparameters relevant for humanitarian demining. Nuclear Instruments &Methods in Physics Research B, 241, 759–764.
ONORM L 1084 1999. Determination of Carbonate. Austrian StandardsInstitute, Vienna.
Pieri, L., Bittelli, M. & Rossi Pisa, P. 2006. Laser diffraction, transmissionelectron microscopy and image analysis to evaluate a bimodalGaussian model for particle size distribution in soils. Geoderma, 135,118–132.
Prosperini, N. & Perugini, D. 2008. Particle size distribution of some soilsfrom the Umbria region (Italy): fractal analysis and numerical modeling.Geoderma, 145, 185–195.
Shiozawa, S. & Campbell, G.S. 1991. On the calculation of mean particlediameter and standard deviation from sand, silt and clay fractions. Soil
Science, 152, 427–431.Su, Y.Z., Zhao, H.L., Zhao, W.Z. & Zhang, T.H. 2004. Fractal features
of soil particle size distribution and the implication for indicatingdesertification. Geoderma, 122, 43–49.
Syvitski, J.P.M., LeBlanc, K.W.G. & Asprey, K. 1991. Interlabora-tory, interinstrument calibration experiment. In: Principles, Meth-
ods and Applications of Particle Size Analysis (ed. J.P.M. Syvitski),pp. 174–193. Cambridge University Press, Cambridge, MA.
Tite, M. & Linington, R.E. 1975. Effect of climate on the magneticsusceptibility of soils. Nature, 256, 565–566.
Tyler, S.W. & Wheatcraft, S.W. 1989. Application of fractal mathematicsto soil water retention estimation. Soil Science Society of America
Journal, 53, 987–996.Treweek, G.P. & Morgan, J.J. 1977. Size distribution of flocculated
particles: application of electronic particle counters. Environmental
Science & Technology, 11, 707–714.Virto, I., Barre, P. & Chenu, C. 2008. Microaggregation and organic
matter storage at the silt/size scale. Geoderma, 146, 326–335.Warrington, D.N., Mamedov, A.I., Bhardwaj, A.K. & Levy, G.J. 2009.
Primary particle size distribution of eroded material affected by degreeof aggregate slaking and seal development. European Journal of Soil
Science, 60, 84–93.Wu, Q., Borkovec, M. & Sticher, H. 1993. On particle-size distributions
in soils. Soil Science Society of America Journal, 57, 883–890.Zhang, J.H., Liu, S.Z. & Zhong, X.H. 2005. Distribution of soil organic
carbon and phosphorus on an eroded hillslope of the rangeland in thenorthern Tibet Plateau, China. European Journal of Soil Science, 57,365–371.
© 2010 The AuthorsJournal compilation © 2010 British Society of Soil Science, European Journal of Soil Science, 61, 854–864