Revised: 30 August 2007 Prepared by Douglas Hedley for the ...
43
Revised: 30 August 2007 Prepared by Douglas Hedley for the Department of Agriculture, Government of Prince Edward Island Report to the Government of Prince Edward Island, Department of Agriculture, Policy and Regulatory Division Regarding the Impacts of Possible Government Decisions About the Cattle Abattoir in the Province Prepared by Douglas Hedley 30 August 2007
-
Upload
khangminh22 -
Category
Documents
-
view
0 -
download
0
Transcript of Revised: 30 August 2007 Prepared by Douglas Hedley for the ...
Revised: 30 August 2007
Prepared by Douglas Hedley for the Department of Agriculture, Government of Prince Edward Island
Report to the Government of Prince Edward Island,
Department of Agriculture, Policy and Regulatory Division
Regarding the Impacts of Possible Government Decisions
About the Cattle Abattoir in the Province
Prepared by
Douglas Hedley
30 August 2007
Revised: 30 August 2007
Prepared by Douglas Hedley for the Department of Agriculture, Government of Prince Edward Island
2
Table of Contents
BACKGROUND AND FOCUS OF THE REPORT ..................................................... 4 ISSUE ................................................................................................................................. 4 OUTLINE OF THE REPORT ........................................................................................ 5 OVERVIEW OF THE PEI AGRICULTURE AND FOOD SECTOR ....................... 5
The PEI Economy ......................................................................................................... 5 Population ...................................................................................................................... 5 Employment................................................................................................................... 6 Food Manufacturing ..................................................................................................... 6 Farms and Farm Cash Receipts .................................................................................. 6
THE CATTLE INDUSTRY............................................................................................. 8 The Atlantic Beef Products Plant ................................................................................ 8 Beef Pricing.................................................................................................................... 9 Plant Throughput.......................................................................................................... 9 Labour and Management of the Plant ...................................................................... 10 Rendering..................................................................................................................... 10 Other Beef Packers in Maritime Canada ................................................................. 11 Beef Production ........................................................................................................... 11 Cattle Markets and Pricing........................................................................................ 13
PROVINCE-WIDE ISSUES .......................................................................................... 14 Environment ................................................................................................................ 15 Cost of Employment Creation in PEI ....................................................................... 16 Tax Revenue ................................................................................................................ 16 Potato Waste Supply................................................................................................... 17 North American Beef Markets .................................................................................. 17 Transfer Pricing Problems......................................................................................... 18 Scale Economies .......................................................................................................... 18
IMPLICATIONS AND CONSEQUENCES OF PLANT CLOSURE ....................... 19 Issue Definition............................................................................................................ 19 Impacts of Closure of the Beef Plant......................................................................... 20
At farm level for the beef plant:................................................................................ 22 At government level for the beef plant: .................................................................... 23 At economy level: ..................................................................................................... 23
Impacts for Government Withdrawal from the Beef Plant; Plant Continues
Operations ................................................................................................................... 23 At farm level: ............................................................................................................ 24 At government level:................................................................................................. 24 At economy level: ..................................................................................................... 25 Other issues for consideration:.................................................................................. 25
CONCLUSIONS ............................................................................................................. 26 OPTIONS FOR THE PEI GOVERNMENT ............................................................... 26
The Beef Plant ............................................................................................................. 27 ANCILLARY OBSERVATIONS ................................................................................. 28
Revised: 30 August 2007
Prepared by Douglas Hedley for the Department of Agriculture, Government of Prince Edward Island
3
Charts
Chart 1: Canadian Cow Slaughter, 2000 to 2007.
Tables Table 1: Farm Cash Receipts: Prince Edward Island, 1998 to 2006 Table 2: Farm Cash Receipts: Nova Scotia, 1998 to 2006 Table 3: Farm Cash Receipts: New Brunswick, 1998 to 2006 Table 4: Farm Cash Receipts, Maritimes, 1998 to 2006 Table 5: Farm Cash Receipts, Canada, 1998 to 2006 Table 6: Percent of Total Maritime Farm Cash Receipts by Product, 2006 Table 7: Per Capita Disappearance and Consumption of Beef and Pork, 1998 to 2002,
Canada Table 8: Estimated Disposition of Cattle in Maritime Canada Table 9: Cattle Inventories in Maritime Provinces (‘000 head) Table 10: Coarse Grains Imports for PEI, NS, NB
Revised: 30 August 2007
Prepared by Douglas Hedley for the Department of Agriculture, Government of Prince Edward Island
4
Report to the Government of Prince Edward Island,
Department of Agriculture, Policy and Regulatory Division
Regarding the Impacts of Possible Government Decisions
About the Cattle Abattoir in the Province
BACKGROUND AND FOCUS OF THE REPORT
The Government of Prince Edward Island has invested considerable funding in the cattle abattoir over the past several months, to assure that the cattle producers of the province have the opportunity to market cattle within the province. As well, with the opening of the beef plant, PEI has encouraged producers in adjacent provinces to use these facilities for their own producers. The only alternative to the plant for PEI producers is to ship cattle as far as the Cargill-Better Beef facility in Guelph, Ontario. While the Billette and Levinoff facilities in St. Lois-Gonzaque and Montreal, owned by UPA, provide a closer facility for cattle, the Levinoff plant is a cull cow plant,1 and the Billette facility does not have the capacity to take on all of the cattle from PEI. The PEI beef abattoir continues to struggle financially, and has been unable to reach the management targets in terms of financial sustainability expected of them. The value of the Canadian dollar, the recent rise in feed grain prices, and labour and management turnover, has affected their performance. This abattoir is not alone in facing these problems. Almost all beef abattoirs in Canada are facing difficulty, particularly recent start-up plants.2 Current expectations are that the beef plant will need substantial governmental support to continue operations in its current form over the next several months and possibly years, because of the financial difficulties now facing almost all abattoirs, and the need for continuing improvements in equipment, labour skills and management at the plants, and marketing arrangements and market development for products from the plant. In June, the Government of PEI gave the beef plant 90 days to put forward strategic and operating plans for continued operations. The PEI Cabinet wishes to make decisions regarding the continuation of assistance to the plant by mid-September 2007. ISSUE
The basic issue faced by the Government of Prince Edward Island is whether the government should continue assistance to the plant to assure continued operations, or whether to terminate assistance, with the likely result that the plant will close indefinitely.
1 The Levinoff plant has indicated willingness to kill finished cattle. 2 Rancher’s Beef, a plant with 800 head per day capacity closed its doors on 18 August 2007 after only 14 months in operation. As well, a new beef plant at Arkansas City, Kansas, was shut down recently and subsequently re-opened under new ownership.
Revised: 30 August 2007
Prepared by Douglas Hedley for the Department of Agriculture, Government of Prince Edward Island
5
The issue to be addressed in this study is to examine the impacts and implications of terminating assistance to the plant, primarily in Prince Edward Island, but also more generally in Nova Scotia and New Brunswick. OUTLINE OF THE REPORT
The report begins with considerable background information on the agriculture and food sectors in PEI and their relationships to these industries in the Maritimes and Canada, as well as putting this information into the context of the overall economy. The cattle sector is explored next to provide greater detail on the industry and the markets in Canada and the US, of which it are a part. Following this, wider issues in the PEI economy and society are outlined which may be useful in the expected Cabinet deliberations in September. The implications for PEI stemming from the closure of the beef abattoir are examined in the following section. The final section reports on the major conclusions and options facing the PEI government. The PEI Cabinet has requested that the two polar alternatives, continuation of the abattoirs or closure be explored. However, there are likely options going beyond these two alternatives with respect to transition, alternative arrangements and opportunities which may need to be explored within the beef sector, as well as in related agricultural production alternatives. OVERVIEW OF THE PEI AGRICULTURE AND FOOD SECTOR
The PEI Economy
The PEI provincial economy represents 0.30 percent of the total Canadian economy, the smallest share of the national economy compared to the shares of the other provinces. Its share remains above that of only the Yukon and Nunavut, with the Northwest Territories’ share rising above that of PEI since 2003. The growth rate in the Canadian economy averaged 2.7 percent over the period 2002 to 2006, with PEI at 2.11 percent, equal to that of Newfoundland and Labrador, and above that of the other two Maritime provinces. In comparison to all provinces west of Atlantic Canada, only Quebec’s growth rate was lower than that of PEI. Population
PEI has a population of 138,500 (2006) representing 0.42 percent of the Canadian total. It is by far the smallest in population for any province in Canada. For Atlantic Canada, the population share of the Canadian total is 7.15 percent and for Maritime Canada 5.59 percent. PEI still has a positive population growth although very modest at about 0.3 percent annually. For all other provinces in Atlantic Canada, population level is stagnant (NS and NB) or declining (NL). The relevance of these numbers comes from the size of the local market for beef products in the region. That is, there is no growth in demand for
Revised: 30 August 2007
Prepared by Douglas Hedley for the Department of Agriculture, Government of Prince Edward Island
6
beef and pork within Maritime Canada. Markets outside the region are critical to
growth for both industries unless the plants can displace current suppliers in
Maritime Canada. Employment
The employed labour force in PEI is the smallest of any province in Canada, representing only 0.45 percent of the Canadian total (2001 Census). For Atlantic Canada, PEI represents 6.5 percent of the labour force. Participation rates in the work force for PEI and Canada are almost identical at 68.2 and 67.6 percent respectively (June 2007). The unemployment rate in PEI is 10.2 percent compared to 6.1 percent for Canada as a whole, 8.1 percent for Nova Scotia and 6.8 percent in New Brunswick. There are few significant differences in education level in the population over 15 years of age compared to Canada and other provinces in Atlantic Canada. PEI has neither an advantage nor a
disadvantage in labour force skills compared to the Canadian average. Food Manufacturing
Manufacturing shipments in PEI for 2006 stood at $1,349.4 billion, the smallest level in the ten provinces. However, 62.8 percent ($847.9 million) of these shipments came from food establishments, giving PEI by far the largest share of manufacturing shipments from food establishments of any province in Canada. Nonetheless, PEI is the second smallest in total value of food establishment shipments among the provinces. Only Newfoundland and Labrador was smaller with $729.9 million. In Atlantic Canada, 19.4 percent of all manufacturing shipments come from food establishments, and 18.2 percent of shipments in Maritime Canada. In comparison, only 11.5 percent of manufacturing shipments were from food establishments Canada-wide. The implication is that any significant
reduction in food shipments or capacity for food shipments will hit PEI harder than
the other Maritime provinces, and harder than any other area of Canada. Farms and Farm Cash Receipts
Farm cash receipts in PEI were $379.8 million in 2006, about one percent of farm receipts in Canada. However, the share of agriculture in the PEI economy is the highest of any province in Canada, stemming in large measure from the facts that a very high proportion of the non-urban land area is arable, little heavy industry or international level service industries exist on the island, and mineral resources are scarce. PEI has held this share of farm cash receipts on average for at least 15 years. Similarly, Atlantic Canada has held about 3.6 to 3.8 percent of farm cash receipts for many years. The implication
is that agriculture in PEI and Atlantic Canada more generally is not lagging behind
nor is it ahead of the growth rate in the agricultural sector across Canada. (Tables 1-5) In the farming sector, PEI lost 7.9 percent of its farms from 2001 to 2006, declining from 1845 to 1700 farms. Of the total farms in 2001, 46.7 percent were engaged in dairy, beef cattle and hog production whereas in 2006, only 39.6 percent of farms were classified as
Revised: 30 August 2007
Prepared by Douglas Hedley for the Department of Agriculture, Government of Prince Edward Island
7
these same types of operations. Potato farms at 19 percent and hay farms at 6 percent made up another quarter of all PEI farms. Interestingly, some of the largest declines in the number of farms occurred in dairy, beef and hog operations. This is the same as in
the rest of Canada as operations become larger, somewhat more specialized, and
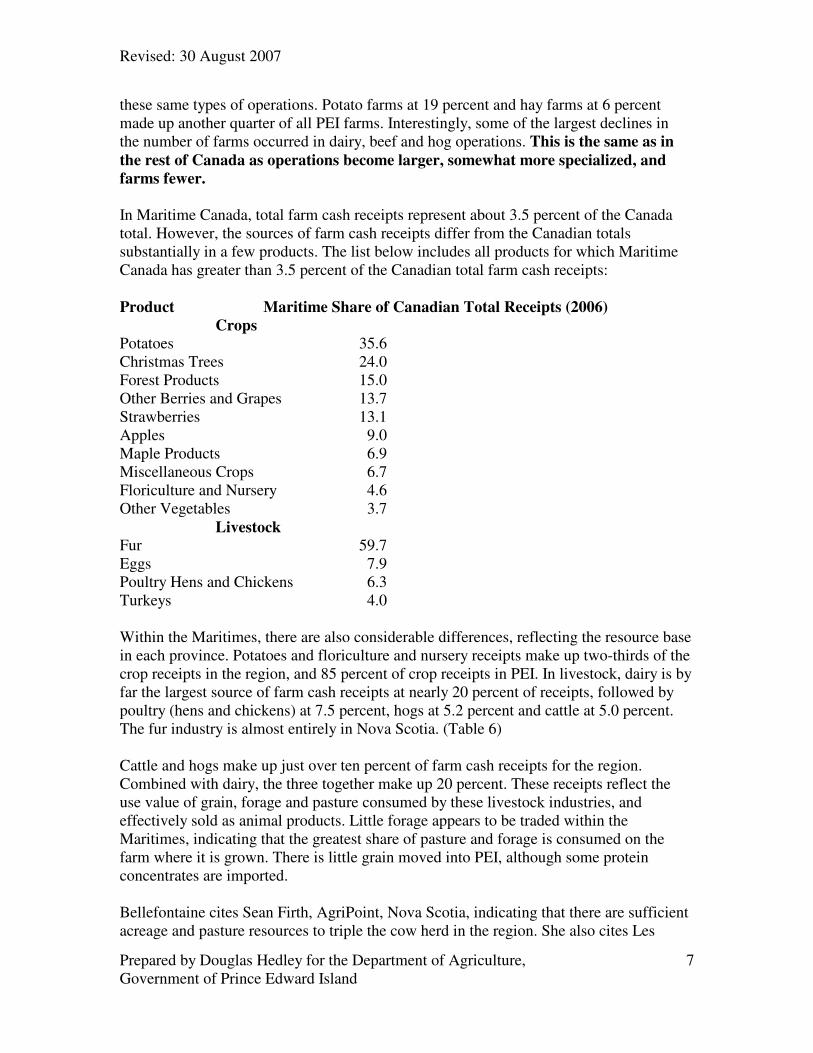
farms fewer. In Maritime Canada, total farm cash receipts represent about 3.5 percent of the Canada total. However, the sources of farm cash receipts differ from the Canadian totals substantially in a few products. The list below includes all products for which Maritime Canada has greater than 3.5 percent of the Canadian total farm cash receipts: Product Maritime Share of Canadian Total Receipts (2006)
Crops
Potatoes 35.6 Christmas Trees 24.0 Forest Products 15.0 Other Berries and Grapes 13.7 Strawberries 13.1 Apples 9.0 Maple Products 6.9 Miscellaneous Crops 6.7 Floriculture and Nursery 4.6 Other Vegetables 3.7 Livestock
Fur 59.7 Eggs 7.9 Poultry Hens and Chickens 6.3 Turkeys 4.0 Within the Maritimes, there are also considerable differences, reflecting the resource base in each province. Potatoes and floriculture and nursery receipts make up two-thirds of the crop receipts in the region, and 85 percent of crop receipts in PEI. In livestock, dairy is by far the largest source of farm cash receipts at nearly 20 percent of receipts, followed by poultry (hens and chickens) at 7.5 percent, hogs at 5.2 percent and cattle at 5.0 percent. The fur industry is almost entirely in Nova Scotia. (Table 6) Cattle and hogs make up just over ten percent of farm cash receipts for the region. Combined with dairy, the three together make up 20 percent. These receipts reflect the use value of grain, forage and pasture consumed by these livestock industries, and effectively sold as animal products. Little forage appears to be traded within the Maritimes, indicating that the greatest share of pasture and forage is consumed on the farm where it is grown. There is little grain moved into PEI, although some protein concentrates are imported. Bellefontaine cites Sean Firth, AgriPoint, Nova Scotia, indicating that there are sufficient acreage and pasture resources to triple the cow herd in the region. She also cites Les
Revised: 30 August 2007
Prepared by Douglas Hedley for the Department of Agriculture, Government of Prince Edward Island
8
Halliday of PEI Department of Agriculture, who indicates that there is the capacity to finish an additional 10,000 head of beef in PEI. The conclusion is that area and feed
resources are not a restriction on the number of cattle produced in the region.
THE CATTLE INDUSTRY The Atlantic Beef Products Plant
The Atlantic Beef Products (ABP) plant in Prince Edward Island is the only commercial beef packing plant east of Montreal. It opened for business in January 2005 with an estimated capacity of 500 animals per week, or 25,000 annually (single shift, five days per week, 50 weeks per year). It is federally inspected and has recently obtained export accreditation movement of product to the USA. The plant has the capability to kill and cut to boxed beef level, without any further processing capability. Boxed beef from the plant is moving primarily into Atlantic Coop outlets throughout Atlantic Canada as well as Loblaws distribution. In both cases, the cutting beyond primals is carried out by buyers, not at the plant. The ABP is a corporation with three equity investors, providing the initial basis for plant construction. The first investor was the Atlantic Beef Products Cooperative, a farmer-owned cooperative, which raised money through the sale of hooks in the plant at $60 each, with an initial sale of about 19,000 hooks.3 Of these, about 80 percent of the hooks were purchased by farmers in PEI and the balance in Nova Scotia and New Brunswick. Within the cooperative, about 25 percent of the buyers of hooks were from Nova Scotia and New Brunswick. The Atlantic Beef Products Cooperative holds 50 percent equity in ABP. To fully fund the initial equity investment by the Cooperative, the PEI government loaned $440,000 to the Cooperative until additional hooks could be sold. With more recent sales of hooks, the total number of hooks sold has reached about 22,500. The second investor was Atlantic Coop which provided $500,000 in equity financing, taking a 15 percent equity position in ABP. The third investor was the PEI government, providing $1 million in equity financing, taking a 35 percent equity position. The PEI government has an outstanding loan to the Atlantic Beef Producers Cooperative, Ltd., to provide working capital for operating requirements. The initial loan of $1,500,000 has been reduced to $1,190,447.63 on 31 July 2007. The repayment arrangement involves a $20 per head check-off from the producer for each animal processed in the plant, with proceeds from the check-off paid monthly to the PEI Lending Agency. The interest rate on this loan is prime plus 2.75 percent. The plant was constructed under a lease-to-own arrangement with the contractor, based on an initial construction cost of about $15 million. The arrangement with the contractor was that the value of the construction would be paid off in 20 years, with annual
3 One hook entitles the owner to have one animal per year harvested in the plant.
Revised: 30 August 2007
Prepared by Douglas Hedley for the Department of Agriculture, Government of Prince Edward Island
9
payments of $1.3 million. The PEI government guaranteed the payments to the contractor for the 20 year payoff schedule. Beef Pricing
During the development of the beef plant, the farmer cooperative as an equity investor held negotiations with the other investors including the PEI government to establish the pricing mechanism for beef at the plant. The agreement was that all beef would be priced on a dressed weight basis at $7/cwt less than the Ontario price, with the Ontario price heavily dependent on the posted price at the Cargill-Better Beef facility in Guelph, as well as prices at other plants and markets in Ontario. This discount was regarded as a fair representation of the historic difference in price between PEI and Ontario markets. The discount broadly covers three costs in the movement of live cattle from PEI to Ontario. The first is the transport cost of the live animals. At the time of the agreement, fuel and related transport costs were considerably below current costs and while there has been discussion of altering this component to reflect current costs, no changes have been made. The second component is the shrinkage in live animals from the PEI base to Ontario. Shrinkage in live animals is normally in the range of 1 to 1.5 percent of dressed weight for the PEI to Ontario movement. The third component is the increased percentage of “dark cutters” due to the stress in transport to Ontario. The percentage of dark cutters can be as high as 6 percent of animals moved from PEI to Ontario, with the associated discount in the dressed price. In comparison, the PEI plant has experienced a dark cutting rate of about 0.5 percent of animals. As a consequence, the additional 5.5 percent of dark cutters for movement to Ontario adds to the discount between the PEI and Ontario markets. The discount in Ontario for dark cutters is on the order of $0.25 per pound carcass weight, currently about 15 percent below normal prices. This adds about one percent to the discount on carcass value between Maritime and Ontario markets for finished cattle. The plant is selling beef primals at a discount to Ontario beef primals of about 4-5 cents per pound. The result is that the discount on live cattle going into the plant is less than the full cost of movement to Ontario, and product sale is at a discount to Ontario prices, leaving a margin of about 3 cents per pound carcass weight.4 In a fully functional market, the discount for animals going into the plant ought to be about 10-11 cents per pound dressed weight, and the selling price would be expected to be above Ontario prices by about 4-5 cents, that is, an import basis. The result is that the plant is taking a margin of about 3 cents compared to an expected margin of about 15 cents per pound dressed. Plant Throughput
The ABP plant takes in about 80 to 90 percent of its kill as finished cattle, about 80 percent of which come from feedlots in PEI. The balance of the kill is cull animals, with
4 This discount appears to reflect both lower visual quality of the product as well as the lack of aggressive marketing by the plant.
Revised: 30 August 2007
Prepared by Douglas Hedley for the Department of Agriculture, Government of Prince Edward Island
10
about three-quarters as dairy animals and the remainder from the beef breeding herd. While only about 20 percent of the finished animals come from Nova Scotia and New Brunswick feedlots, a much higher percentage of cull animals come from these two provinces. Cull animals are processed on Thursdays and some Fridays as necessary, with Monday to Wednesday limited to finished animals. The dressed carcass weights for finished cattle at the plant average about 810 pounds for steers and 760 pounds for heifers in the past few months. These weights are slightly below the average carcass weights and have wider variation in weight and quality than in the rest of Canada. The breeding herd in Maritime Canada is considerably less uniform than in Ontario and western Canada herds, and hormones are not used for finished cattle. The result is a wider spread in weights of primal cuts. Other outputs from the plant include the trimmed fat and lean for ground beef and prepared meats, offals and drop credits. The plant has been able to begin establishing a brand for its beef products in Atlantic Canada. With limited antibiotic use and no hormone use in the region, the beef is marketed as “natural”. However, with the use of pesticides in potatoes, part of a three year crop rotation, particularly in PEI but also in Nova Scotia and New Brunswick, it is likely impossible to achieve “organic” status for beef products. Labour and Management of the Plant
The plant employs about 90 staff, including labour and management. All employees have been local hire, beginning with limited skills for either the kill line or the fabrication room. A major effort starting at the inception of the plant to train workers was put in place and skills have improved considerably. Turnover of labour has been higher than related employment in PEI but substantially below the experience of other major beef plants in Canada. Rendering
The plant is not equipped to do any rendering. In the past, all rendering materials are moved to the Rothsay (Maple Leaf) plant in Truro, Nova Scotia. However, Rothsay is not equipped to handle specified risk materials (SRMs). It has declared that it will be an SRM-free facility following the 12 July 2007 federal regulation deadline on SRMs, although it has indicated that it would consider opening a separate dedicated line for such materials. Because of the recent regulations on SRMs, particularly for cattle over thirty months of age (OTM), arrangements have been made to ship SRMs to Quebec for disposal. All three provinces are examining potential ways of handling SRMs from both the PEI facility and the many provincially inspected establishments. In New Brunswick, an incinerator is being built at Fredericton to handle all of the SRM from establishments within the province, based on federal and provincial assistance. In Nova Scotia, both burial and incineration are banned, and options are being explored for composting and
Revised: 30 August 2007
Prepared by Douglas Hedley for the Department of Agriculture, Government of Prince Edward Island
11
containment although operationally, this option is still several months away. In PEI, arrangements have been made to move SRM material to Quebec for handling until alternatives are developed in the province. Other Beef Packers in Maritime Canada
In the report “Profile of the Maritime Beef Industry”5, the number of provincially inspected plants is given as:
• Prince Edward Island 9
• New Brunswick 32
• Nova Scotia 20 In the Atlantic Beef magazine article on SRMs, Summer 2007 issue,6 an industry spokesperson indicated that there were about 27 provincially inspected plants in New Brunswick. Slaughter numbers for these local plants are maintained only in Nova Scotia and Prince Edward Island. Bellefontaine indicates that 12,661 head were slaughtered in these two provinces by these establishments in 2006; on average these plants were killing about 8-9 head per week. As well, Bellefontaine indicates that about 5,000 head are killed annually in New Brunswick facilities, suggesting that the total kill among the provincially inspected plants appears to be on the order of 17,000 to 18,000 head annually. Beef Production
It is impossible to consider beef production in PEI without consideration of the beef and dairy production industry in Maritime Canada as a whole. There are several reasons for this. First, any review of the cattle inventory numbers indicates that PEI is finishing far more cattle than are born in PEI. Second, PEI has an ample grain supply whereas neither New Brunswick nor Nova Scotia has the local feed supplies to finish cattle born within their provinces. Third, the Supply and Disposition tables of Statistics Canada for cattle are quite unrealistic. For example, the calf crop in PEI in most years is larger than the mature cow inventory. Another example is that inter-provincial movement of cattle into PEI is far less than would be required to sustain current levels of slaughter in PEI when combined with PEI-born calves finished to slaughter weights. The conclusion is that Nova Scotia and New Brunswick have considerable herds of both beef and dairy cattle, and that aside from replacement animals held back on farms, cull animals moving into Quebec and Ontario, and dairy calf movement for veal or veal feeding to Quebec, few animals are finished within these two provinces. This is consistent with the general conclusion in cattle feeding that cattle are moved to feed rather than feed to the animals. A supply and disposition table for the Maritime area can be reconstructed with some simple assumptions about likely movements. In Table 14, the inventories of cattle on
5 Ronda Bellefontaine, March 2007. “Profile of the Maritime Beef Industry” 6 David Lindsay, 2007. “SRM: A Major Pain in the Ganglia”. DvL Publishing Inc. Atlantic Beef. (Summer 2007 edition.)
Revised: 30 August 2007
Prepared by Douglas Hedley for the Department of Agriculture, Government of Prince Edward Island
12
farms in each of the three provinces and the region are shown for 1 January 2007. Starting from inventories as a reasonably accurate measure of animal numbers, the subsequent calf crops, replacements, culls and finished animals can be estimated with the following assumptions:
• Annual surviving calf crop is 95 percent of the mature cow (dairy and beef) inventory
• The cull rate on mature animals is 15 percent per year
• The share of calves held back for replacement animals has been quite stable over a number of years, and hence the replacement level is held at the number for the 1 January 2007 inventory level
• The dairy calves moved to Quebec for veal is 50 percent of the annual surviving dairy calves
• The share of cull animals leaving the Maritime provinces is 80 percent
• Slaughter of finished animals in provincially inspected plants is 17,500 head. While any of these assumptions can be challenged, the resulting estimates mimic the finished cattle slaughter and cull slaughter in the PEI plant. As noted earlier, about 10 to 20 percent of the kill in PEI is mature animals; in this estimation the cull animal kill is 15.5 percent. The total available kill level for PEI reflects the throughput at the ABP facility. It should be noted that by starting with the cattle inventory for 1 January 2007, the finished cattle shown in the table would not be slaughtered until sometime during 2008. The upper part of the table shows the actual inventory recorded for 1 January 2007. The lower part of the table is an attempt to estimate the disposition of the animals from this inventory in each of the provinces. For PEI, with the feeding capacity and the ABP plant in PEI, the table indicates that no feeder cattle leave PEI (net basis). The feeder cattle leaving Nova Scotia and New Brunswick for Ontario and Quebec are assumed to be 15 percent of the available animals in New Brunswick and Nova Scotia and are allocated to the two provinces as a share of the provincial beef cows in these two provinces. The results indicate that feeder calves are entering PEI throughout the year, being finished to slaughter weight in PEI and slaughtered there. As well, some animals are moving west to Ontario and Quebec as feeders or finished animals. The auction information in Bellefontaine clearly indicates that the destination for some auctioned feeder cattle is Ontario and Quebec.7 Some animals will be fed in the other two provinces until local feed supplies are exhausted, and moved to PEI as short-keep feedlot animals (heavy stockers). In other cases, feed supply will allow feeding to finish and these animals are subsequently slaughtered in local plants or moved to PEI for slaughter. This is consistent with the fact that some of the hooks were purchased by producers in Nova Scotia and New Brunswick in the establishment of the plant. However, the proportion of
7 Bellefontaine indicates that for the Maritime Feeder Cattle Market auctions in the period 8 April 2006 to 10 March 2007, 1243 head moved to Ontario and Quebec from total sales of 4580. As well, 65 percent of these animals moved to PEI.
Revised: 30 August 2007
Prepared by Douglas Hedley for the Department of Agriculture, Government of Prince Edward Island
13
hooks sold to Nova Scotia and New Brunswick is far lower than the proportion of cattle coming from these two provinces. The share of hooks in Nova Scotia and New Brunswick likely represents the share of animals moved to PEI for immediate slaughter. The cause is that most animals move to PEI prior to finished weight and are no longer owned by producers in these two provinces at the time of slaughter. The closure of the beef plant in PEI would affect all three provinces quite dramatically. The beef cow levels in each province indicate that Nova Scotia and New Brunswick have higher numbers than PEI, with the provincial shares of 22, 44 and 34 percent respectively for PEI, Nova Scotia and New Brunswick. Nova Scotia and New Brunswick producers would be faced with the choice of selling feeder cattle into Ontario feedlots or moving them to PEI for finishing because of the available feed supply. PEI producers would be faced with the choice of selling finished animals into Ontario plants or selling the animals as feeders/stockers. As indicated later, the pressure on feeder to finished margins indicates that moving feeder cattle out of PEI may be the preferred option. Cattle Markets and Pricing
To lay the ground work for this section, the relationship among cattle prices by weights and ages is reviewed. The rationale is that this review will provide the basis for examining current market conditions as well as understanding implications of possible plant closure. Consider the following example of the relationship among prices of feeder and finished cattle. Suppose the current price of finished cattle, say $100/cwt live at 1000 pounds, reflects the expected value of the animal when finished at a future date. Suppose also that the average “all-in cost” of adding one pound of gain to the feeder animal starting at 500 pounds is 80 cents, or $80/cwt. Then the maximum price that a feedlot can pay for the feeder animal is $120/cwt. If the “all-in cost” of gain rises, the lower will be the price per pound of the feeder animal. Conversely, if the “all-in cost of gain” falls, the higher will be the maximum feeder price that the feedlot can pay, for any given price for finished cattle. As well, as an animal on feed gains in weight, each additional pound costs more. So the expectation is that the heavier that the feeder/stocker is at the time it moves from grass to feedlot, the lower will be the price per pound of the feeder/stocker. Another result of this example is that so long as the all-in cost of adding one more pound of gain is lower than the finished cattle price, then the feedlot will continue to feed the animal to a heavier weight until either the animal has sufficient finish for slaughter or the cost of an additional pound of gain equals or exceeds the finished cattle price. Because the price of feed is slightly higher in Maritime Canada than in Alberta, and finished cattle prices in Maritime Canada are at a discount to Ontario and Alberta prices, one would expect that cattle would be finished to lighter weights in the region than is typically found in western Canada and Ontario. This is consistent with the lighter carcass weights in found in the ABP plant. Carcass weights in Canada were on average above 850 pounds for steers and nearly 800 pounds for heifers in the first three months of 2007 for an average of about 825 pounds, compared to average carcass weights in the APB plant of 810 pounds for steers.
Revised: 30 August 2007
Prepared by Douglas Hedley for the Department of Agriculture, Government of Prince Edward Island
14
Throughout North America, cattle markets are adjusting to the changes caused by the discovery of BSE in May 2003 in Canada and subsequently in the USA, and as well to the sharp increases in feed costs since spring 2006. In Canada, herd levels increased dramatically in 2003-2005 as cull animal prices fell, peaking in 2005 with an additional 500,000 cows in the breeding herd compared to 2003. Cull slaughter more recently indicates that the market is now absorbing these animals, with higher than usual cull slaughter levels in the USA and Canada. (Chart 3). Over half of the increase in herd numbers gained in the period 2003 to 2005 have now left the national beef cow herd. The rise in the price of corn generated from the surging ethanol demand has also caused some sell down in the beef herd. Similarly, finished cattle in Canada were slowed considerably in moving to slaughter after May 2003 because of the lack of capacity for kill in Canada and the inability to export product to the USA for a period of time. The lower supplies in the USA, without imports from Canada, shortened the feeding period for cattle, moving cattle forward in the market, and denying them for later kill. The US continues to move cattle more swiftly to market than in the past, because of the poor pasture conditions throughout the western prairies in 2005 and 2006. Nonetheless, carcass weights are expected to start to rise again this fall. However, the feed prices can be expected to hold slaughter weights below the levels in previous years. The reason is that the heavier the animal, the more costly is a pound of gain in finished cattle. The result is that the weight at which it becomes unprofitable to add a pound of gain has decreased compared to the weights indicated by previous price levels for feed and cattle. As well, more calves been moving to the veal market than earlier, because of the concern for the effects of the increased feed prices.8 In general, the outlook in the beef sector is for continued adjustment in cattle numbers, feeding times and weights in the months ahead as the impacts of BSE dissipate over time and feeding systems adapt to considerably higher feed prices, now expected to continue for some years. Packers are facing substantially reduced margins across North America throughout this evolution in the market. Based on population estimates and average Canadian per capita consumption of beef, Maritime Canada is producing and slaughtering far less beef than required to feed the Maritime population. From very rough estimates,9 only about one-sixth of the beef consumption in Maritime Canada comes from the PEI plant. As a result, retail prices for beef should reflect an “import basis” compared to Ontario prices, that is, higher than Ontario prices by the amount of transportation and handling costs to Maritime Canada. This compares at farm level with pricing at “export basis” since slaughter facilities will not accommodate all beef raised in the Maritimes. (Table 12) PROVINCE-WIDE ISSUES
8 See USDA-ERS, 2007. Livestock, Dairy and Poultry Outlook. May 21, 2007. Available at: http://www.ers.usda.gov/Publications/LDP/2007/05May/ldpm155.pdf 9 Calculated as Maritime population multiplied by disappearance per capita of beef at carcass weight, compared to a kill of 24,000 head of beef yielding 810 lbs per carcass.
Revised: 30 August 2007
Prepared by Douglas Hedley for the Department of Agriculture, Government of Prince Edward Island
15
Prince Edward Island faces general economic and social issues which need to be addressed in the considerations regarding future support to the beef plant. Environment
First, environmental quality is a critical aspect of the economic and political climate for the province. The Island is a major tourist destination for North America and other countries, e.g., Japan. In maintaining the image of a pristine environment to encourage tourism, the contribution of agriculture to environmental problems has been an issue for some years. The heavy use of chemical fertilizer and pesticides in potato production has raised concerns with water course run-off and associated fish kills. The livestock industry generates considerable manure which is currently used as organic fertilizer for grains and potatoes. Any reduction in livestock populations would increase chemical fertilizer use to replace the lost organic fertilizer. Equally, a loss of livestock populations from plant closures could cause an increase in potato production, where grasslands may be converted to annual arable land, in turn increasing the use of pesticides and chemical fertilizer. Potatoes need to be grown in rotation with other crops, normally grains, to limit disease and pests affecting the potato crop. That is, a great deal of grain in PEI is grown in rotation with potatoes, which utilize both chemical fertilizers and pesticides, making it very difficult to generate organic grain production for use in producing organically grown livestock. Only a very small fraction of potato production in PEI is currently organic, not large enough to generate interest in shifting the livestock feeding industry to move significantly to organically grown meats. This interaction among potato, grain and livestock production sharply limits options for alternative land use. It also forces consideration of the wider social, political and economic agenda in PEI when decisions are made regarding the future of the beef plant. This problem is most severe in PEI, compared to Nova Scotia and New Brunswick. Tourism in PEI is island-wide, covering all areas of the province, both for “drive through” vacationers as well as longer term summer homes. The tourist attraction of PEI is in part founded on the benign, pastoral landscape throughout the island. That is, the vulnerability of PEI in tourism is widespread. While New Brunswick also faces substantial environmental interaction between livestock and potatoes/grain production in selected regions of the province, these regions in New Brunswick are not as closely aligned with tourist destinations in the province as in the PEI case. The major tourism industry in PEI, most affected by both environmental image and environmental reality, would be less of a concern for New Brunswick. With only a small potato production industry in Nova Scotia, this is likely much less of a concern than in PEI or New Brunswick. Breaking the connection between potatoes, grain, forage and livestock, along with the tourism industry, is likely a long term endeavour and politically difficult in PEI. To do so would likely require identification and segregation of land use for the potatoes-grain
Revised: 30 August 2007
Prepared by Douglas Hedley for the Department of Agriculture, Government of Prince Edward Island
16
rotation from land for organic potato, grain and forage production, allowing a portion of the livestock industries to produce organic meats for sale in the high end Maritime market, Eastern Canada and Boston-New York corridor. It could become an attractive tourism selling point as well as moving at least part of the beef products to command premium prices. Some potato production is already organic, although this part of the industry is too small to generate enough feed grain to encourage a shift to organic beef production so far. Shifting to organic livestock production more rapidly would likely require imports of organic feed grain for a period of time to create an efficient organic value chain in any of the livestock industries. Nonetheless, it is unclear if there is any price-cost advantage in shifting to organic beef since far less than half the beef carcass could be successfully sold as organic. Offals, drop credits, and low quality cuts have no value advantage in being organic.10 Cost of Employment Creation in PEI
A second general issue is the relative cost of creating employment in PEI. The PEI government has invested considerable resources in the beef plant in the province, in part to efficiently sustain an industry, as well as because of the linkage to the potato and grain sectors described above. The issue is whether the governmental costs of supporting the beef plant creates as much employment and wages for the PEI economy as investments in other sectors of the economy. The most appropriate measure for this would be the marginal cost of job creation (or one dollar of wages for full time continuous employment) in PEI, expressed as governmental and private sector investments. No publicly available statistics have been found for this measure. Tax Revenue
A third issue deals with the impact on the tax base in PEI. From the study by MRSB Consulting Services (June 2006),11 some rough measures can be found for the beef industry, considering that the input-output multipliers for beef and hogs are roughly the same. Based on the hog study, for each $1 million decline in direct sales from primary hog production, provincial taxes will decline by $3523 and municipal taxes by $575. For the entire value chain, each $1 million of added value (primary production, processing, breeding stock, research and services, and related non-swine farm sales) reduces provincial taxes by $18,914 and municipal taxes by $2685. In general, these same estimates for hogs are used to approximate the impacts of changes to the beef value chain.
10 While it may be difficult to successfully establish an organic beef industry, there is little doubt that
organic livestock production can be highly successful. Boehlje and Gray report on a case study of a large scale organic dairy operation, indicating that the corn produced and fed to dairy cattle within the operation returns US$7/bu. See Allan W. Gray and Michael D. Boehlje, 2007. “Drivers of Change in U.S. Agriculture: Implications for Future Policy”. Principal Paper for the Joint AAEA/CAES Meetings in Portland, Oregon, July 2007. 11 MSRB Consulting Services, June 2006. Economic Impacts of Hog Production in Prince Edward Island. Prepared for the Prince Edward Island Department of Agriculture, Fisheries and Aquaculture.
Revised: 30 August 2007
Prepared by Douglas Hedley for the Department of Agriculture, Government of Prince Edward Island
17
For beef, the combined value added of a single beef animal raised and processed in PEI is roughly $1300 to $1500. Hence the provincial tax revenue loss is about $23 to $27 per head not produced. This estimate includes the direct effect of the fed animal as well as the indirect impacts through the feed and other input supply and the processing. Considering that a feeder animal of 500 pounds represents about $475-$500 in market value based on July 2007 prices, this is considerably less than half of the value added of a finished animal processed in PEI. As a result, the difference in provincial tax revenue between a finished, processed animal in PEI and a feeder animal leaving PEI is on the order of $16 per animal, i.e., two-thirds of the tax revenue per animal. These are very rudimentary estimates applying the input-output ratios from the hog study to the beef industry and apportioning the effects on tax revenues based on estimated value added differences. If feeder animals are fed to heavier weights, based on the abundance of pasture and hay in PEI, the tax impact is expected to be lower. This assumes that tax incidence is equal across all segments of the industry. If farmers are taxed less than other parts of the industry, these estimates of tax revenue loss are low. Potato Waste Supply
Cavendish has indicated that it is planning to invest in a digester for steam peel and culls from the potato processing plant. At present, steam peels and culls are sold by Cavendish to beef feedlots as a feed supplement, representing both an efficient use of the potato waste and a low cost energy component in beef feedlot rations. Removing some or all of the steam peel and culls of the Cavendish potato plant from the beef feeding system will increase grain requirements and costs for beef feedlots. North American Beef Markets
Virtually all beef plants are going through considerable difficulty as the North American and international markets adjust to very different input and product conditions compared to those of the previous two decades. New start-up beef plants have been hit the hardest in this adjustment process. The continuing BSE fall-out (SRM regulations, for example), continue to affect the beef industry. The strong grain and soybean prices from biofuel demand are also forcing re-adjustment. New and different meat competitors are emerging around the world. Differentiated products in beef are only now starting to gain consumer attraction beyond the highly localized, individual carcass level. The result is that there is considerable turmoil ahead in this market as it adjusts to very different market conditions. The importance for the PEI government then is the speed of withdrawal from the “lender of last resort” position for the beef plant. This position of “lender of last resort” is now deeply ingrained in the fabric of the livestock sector, forcing government to step into the breach rather than putting pressure on the industries to adapt and adjust to market conditions. Abrupt and early withdrawal, particularly without a political and social consensus to do so, may cause more harm to the beef industry than a phased withdrawal. However, with a phased withdrawal, costs to the PEI government rise rapidly, and time may erode the political consensus for withdrawal and cause re-entry of government into these markets.
Revised: 30 August 2007
Prepared by Douglas Hedley for the Department of Agriculture, Government of Prince Edward Island
18
Transfer Pricing Problems
One of the great difficulties for governmental involvement in private firms which have multi-plant, multi-site operations, is the opportunity for transfer pricing problems within the firm. So long as the PEI government can be regarded as the “lender of last resort” for a single plant by the multi-plant firm, then the firm will use internal pricing arrangements for services used by the plant and product sources to assure minimal or negative returns, shifting profits to elsewhere in the firm, and seeking further governmental assistance for continued plant operations. Accounting measures which may be set by government as a precondition for its involvement in a plant are insufficient to eliminate the possibility of this transfer pricing problem. A simple example would be a multi-plant firm with three market segments: high price premium, modest price premium and commodity (no price premium). By assigning the supply of mostly commodity (no premium) product to the plant with access to government largesse, minimal or negative profit can always result in the plant, while the higher premium/margin products are supplied by or assigned to the other plants within the firm. Scale Economies
Finally, beef processing for commodity product is a very large scale industry. Even the largest beef plants in Canada are considered mid-sized in the North American market. With very high continuous throughput, the large plants can provide continuous flows of product for retail shelves across a range of products in large volume, preferred by the retail chains. The disappearance of the beef plant would have no measurable effect
on the North American market volumes or prices. It is difficult to propose realistic circumstances within which the beef plant in PEI could survive in a commodity product market. It cannot produce enough output for continuous flow of highly uniform products for the large scale standard retail systems.12 The only markets in which the plant can survive are the specialty high end markets commanding a premium price, such as natural, organic, ethnic, image or “food experience” markets.13 Establishing such markets is difficult and time consuming for a single location plant. However, for firms with established markets and value chains through to consumers, the plant could be an attractive purchase. The unattractive part is the time it takes to achieve a continuous supply of quality product from the plant to meet the product characteristics required for these markets, starting at input level (grain, forage, protein supplement),
12 The only time that the large retailers can be expected to buy commodity beef from the plant is when product is not moving rapidly through the plant to wholesalers, and coolers are backing up with product. The retailers, acting opportunistically, will offer to clean out the backlog, usually at a discount, but they will rarely rely on longer term supply arrangements with these plants. 13 “Food experience” markets are those outlets which cater to customers looking for specific product characteristics such as environmental quality in production or processing, knowledge of source of the product, educational and experiential quality through such outlets as very high end restaurants or farmers’ markets. Another example at retail is Whole Foods, relying on high quality and “shopping experience” for premium pricing strategies.
Revised: 30 August 2007
Prepared by Douglas Hedley for the Department of Agriculture, Government of Prince Edward Island
19
through production and processing systems.14 It points to the need for significant increases in technical skills within the plant, substantial investment in high quality marketing skills on a sustained basis; and much greater experience in overall managerial capability in the plant. IMPLICATIONS AND CONSEQUENCES OF PLANT CLOSURE
Issue Definition
There are two quite separable issues involved in the discussion of plant closure. The first concerns the direct consequences to the beef industry as well as to the PEI government and economy if the plant closes. The second question is about the role of and process for the PEI government in removing itself from future liability for the plant, whether or not the plant closes as a result of the governmental withdrawal. In addressing the second question first, the issue faced by the PEI government is the extent to which the beef plant can expect to rely on governmental funding to stay in business. That is, it is not a decision by government on whether or not the plant actually closes, but the timing and process for removing the PEI government from current and future financial, managerial or liability involvement in the beef plant. Removing the PEI government from responsibility for maintaining operations of the plant will be exceedingly difficult politically and socially, and avoiding the re-entry into financial support for the beef plant will be even more difficult. Until and unless a clear political and social consensus can be reached with producers and plant owners for no further governmental involvement, there will not be the pressure on the private sector for aggressive market based evolution toward long term sustainable decisions in production and processing for the full value chain. Finally, the PEI government has made considerable investments, as equity, loans and loan guarantees in the beef plant. An issue for consideration in the decision to withdraw future support for the plants is whether different investments in PEI agriculture and food processing can be made which serve to strengthen the long run financial viability of the plant. Examples of this would include programs for rapid transition to natural products in potatoes, grain, oilseeds, forages, and beef; beef herd improvement to obtain more uniform products coming to market, including full animal traceability in the value chain; image development (branding) for PEI/Maritime products; combining tourism and agro-tourism with image development so that tourists carry away the desire to accept and search for PEI product when they return home.15
14 In discussions with industry and other governments, the consensus is that the visual quality of the product currently offered by ABP is noticeably below the quality of commodity meat cuts in the retail meat case, and that it is not well presented in many cases. 15 While substantial increases in organic production of beef may appear interesting, two factors suggest that organic beef production may offer little gain. First is the difficulty in moving potatoes into organic in sufficient quantity to allow organic grains to be produced. The second factor is that generally less than 40 percent of the cuts from a beef carcass could gain a price premium for organic, not enough to offset the additional cost of achieving organic status.
Revised: 30 August 2007
Prepared by Douglas Hedley for the Department of Agriculture, Government of Prince Edward Island
20
To pursue this vision for PEI agriculture and food, a clear set of objectives and criteria would need to be established with industry and society:
• No equity investments, lending or loan guarantees in agriculture and food production or processing by the PEI government.
• An agriculture based on premium markets, leveraging the positive, pastoral, and touristic image PEI already enjoys.16
• Programs designed to sharply accelerate the transition to full value chain traceability from inputs to consumer.
• Programs to rapidly shift to production processes to meet niche market requirements; e.g., greater uniformity in beef herds; health and quality criteria.
• Rapid emergence of traceable natural production across an increasing portion of the crop and livestock production.
• Recognize the reality that full organic production is both unlikely and uneconomic, particularly for parts of the potato industry; and recognize that a clear and transparent separation and traceability must be maintained between organic and non-organic production processes, if premium niche markets are to be achieved and sustained.
The PEI beef plant relies on cattle from Nova Scotia and New Brunswick to maintain throughput at optimal levels. Simply, the beef (and dairy) herd alone in PEI will not sustain the plant. If one starts from the premise that the plant could be profitable with a significant share of its product going to premium price markets and that this share could be fully obtained in PEI, then cattle from Nova Scotia and New Brunswick would not carry any premium and would be priced on the standard discount from Ontario markets. If Nova Scotia and/or New Brunswick wished to participate in the premium markets, or there was not an adequate supply in PEI for the premium markets, then it would be in the interest of the other provincial governments to pursue overall policy directions parallel to those suggested for PEI. Impacts of Closure of the Beef Plant
Regarding the first question on the beef plant closure, assuming the closure is permanent, several immediate and longer term consequences for each of the industries are relatively clear.17 The process of achieving plant closure involves the refusal of any further loans by the PEI government to the plant, forcing bankruptcy within one to two months. Thereafter, no one is willing to purchase and operate the facility. On the surface, the beef plant closure will return PEI to the status in place before the opening of the plant in January 2005. However, because of the changes in the feeding, feed cost, transport and
16 “Buy local” campaigns may offer some price advantage at retail on a Maritime-wide basis. However, for the high end, large premium markets, the PEI and Maritime consumer base is too small to influence these markets. The high premium markets lie in Ontario and Quebec and more importantly in the Boston-Washington region, where image development could have its greatest impact. 17 The PEI government cannot enforce the permanent closure of the plant. So long as there is some positive value to the use of the assets of the plant by another party, the private sector will continue to process beef. The issue is whether there is a positive price of the assets that can be found in the private sector.
Revised: 30 August 2007
Prepared by Douglas Hedley for the Department of Agriculture, Government of Prince Edward Island
21
handling costs, and packing margins since that time, it is unlikely to fully reflect the earlier situation. Cattle receipts in PEI for 2005 and 2006 were stable but they remain below the levels experienced before the plant opening and below the pre-BSE period. This downward trend in receipts for cattle will resume with plant closure. To describe in detail the adjustments likely to occur in the PEI beef industry, I start with the assumption that the feeder cattle markets are in spatial equilibrium now. PEI is importing feeder cattle from Nova Scotia and New Brunswick so PEI is on a “PEI import basis”. New Brunswick is exporting feeders to Quebec and Ontario now, so prices in New Brunswick for quality feeder animals in at least part of the province represent an export basis to the west. The Nova Scotia producer of quality feeder animals has a choice between exporting to the west or to PEI. Clearly, with Nova Scotia animals going to PEI, prices are higher in that market than for shipments west. However, it would take only a small drop in feeder prices in PEI to make westbound shipments from Nova Scotia and PEI more attractive, since feeder prices in New Brunswick are already on an export basis. In talking with the beef industry, Ontario and Quebec buyers of feeder cattle in New Brunswick are buying the higher quality, uniform lots, at truckload level. The greater variability in Maritime feeder cattle quality suggests some discount from the prices paid for feeder cattle moving out of New Brunswick as a realistic price for feeders moving out of PEI and Nova Scotia. The implication is that crossbred dairy-beef feeder cattle will have a higher discount than beef-only feeders. This will place downward pressure on the value of these animals and likely result in movement of dairy-beef crosses to shift toward the veal market. For the finished beef animals, the current discount from Ontario prices is fixed and considerably lower than current markets suggest. For example, when the arrangement on the price differential between Ontario and PEI was negotiated, Brent Crude at Montreal was $312.59 per cubic meter (2 July 2004) and $509.77 per cubic meter three years later, a rise of 63 percent. 18 This will clearly impact freight rates between PEI and Ontario. As a result, a market-based difference (basis) between PEI and Ontario prices for finished animals is in the order of $0.10 to $0.12 per pound carcass. For the feedlot finisher, the most important variable is the feeding margin, that is, the difference between the purchase price of the feeder and the selling price for the finished animal. If the change in PEI-Ontario basis in fed cattle is the same as the decrease in feeder prices on a per pound basis, the feeding margin will shrink. Another way to look at this, is to estimate the impact of the increase in basis on the maximum price for feeder cattle that a PEI feedlot operator can pay. A drop of 4-5 percent in finished cattle prices in PEI would result in a decline of at least 10 percent in the maximum price PEI feedlots could pay for feeders. Ontario and Quebec buyers are unlikely to discount feeder cattle by this amount with the result that they can pay more for feeder animals than PEI feedlot operators and still make a profit.
18 These data are taken from Natural Resources Canada, crude oil prices (on-line).
Revised: 30 August 2007
Prepared by Douglas Hedley for the Department of Agriculture, Government of Prince Edward Island
22
With ample supplies of pasture and forage in PEI, the result will be some stagnation of pasture and forage land prices although the resource will continue to be used for cow calf herds, since there is no alternative use. With lower feeding margins, the feedlot operators will be squeezed and slowly leave the business. Many feedlot operators in PEI will continue feeding cattle, particularly if the feedlot facility is without debt. However, there will be few new entrants to the business and those who are debt free will likely remain in business to the end of the farm life cycle. Those with debt will leave the business more rapidly. The effect of market psychology of closing the beef plant will cause many industry participants to immediately and substantially re-think their farm operations. Certainly banks with loans outstanding in this industry will be seeking revision of farm financial plans and lending levels. The result is that there will be some immediate departures from the industry followed by an erosion in the feeding industry over time. If one uses a long term supply elasticity of 2 (percentage change in quantity produced divided by the percentage change in price), then a 4 to 6 percent drop in feeding margin would result in a decline of 8 to 12 percent of fed cattle in the two years following the plant closure. With limited entry and farm life cycle effects, the erosion will continue over time. One can only guess at the extent of decline over five to ten years. With the forecast of variability/volatility in markets, margins and processing, the erosion could be as much as 50 percent over several years. At farm level for the beef plant:
• Loss of equity by farmers who have bought hooks in the plant through the cooperative; the cooperative will likely fail.
• Change in the basis between PEI farm gate prices for finished cattle and Ontario prices, increasing the basis from $0.07/lb. cw to the $0.10 to $0.12/lb. cw.
• Continuing decline in finished beef production within PEI. This decline can be expected to be initially abrupt, probably on the order of 8 to 12 percent in the first two years, with continuing erosion over time.
• More cattle leaving the Maritimes as feeder/stocker cattle, moving to Quebec and Ontario.
• Shift from finished cattle production to feeder cattle production.19
• Lower asset values on farms as the beef finishing facilities have very limited or alternative use. The only possibility may be for some of the finishing operations to shift to dry dairy cow and replacement dairy heifer facilities.
• Limited effect on the PEI dairy industry; cull cows would still leave the province; dairy steers and heifers for meat would be discounted, and forced to move into Quebec and Ontario as veal calves or lower quality feeder animals.
• Fewer acres of forage corn (corn silage) grown, likely shifted to other feed grains.
19 With the current basis between PEI and Ontario/Quebec prices for feeder cattle fully reflected in market prices, and an increased basis expected in the finished cattle market, it becomes more profitable to sell feeder cattle than finished cattle. That is, Ontario/Quebec buyers can pay more for the feeder animals than PEI farmers can pay and still make a profit.
Revised: 30 August 2007
Prepared by Douglas Hedley for the Department of Agriculture, Government of Prince Edward Island
23
At government level for the beef plant:
• Loss of the equity position in the beef plant, roughly $1 million.
• Continued responsibility for the outstanding payments for plant construction, estimated at $1.3 million annually for another 17-18 years, either as an annual payment or a negotiated cash settlement (present value) with the plant builder.
• Loss of the remaining balance on the operating loan provided in 2007, currently $1.2 million.
• Losses on any loans made to farmers or farm organizations where bankruptcy or financial restructuring is required because of plant closure.
• Decline in provincial tax revenues of about $19,000 for every $1 million decline in value added in the beef industry. With loss of all processing value added, a shift to cow-calf operations and lower finished cattle production, the value added in the industry will likely halve; that is, provincial taxes decline about $420,000.
• Decline of about $2700 in municipal tax revenues for every $1 million decline in value added in the beef industry. With loss of all processing value added, a shift to cow-calf operations and lower finished cattle production, the value added in the industry will likely halve; that is, municipal taxes decline about $60,000.
• No provision for SRM disposal would be required in the province.
• BRM payments may increase for two to three years as the adjustments take place. No estimate can be made of this increase since farmers will adjust their operations in both beef and other farm operations to regain gross and net income (margin) levels. As well, the CAIS program cannot separate the individual commodity effect on a dynamic basis. The shifts in production and lower incomes on farms would not necessarily increase BRM costs proportionately with lower incomes, since some of this change will be offset by the farm structure adjustments in the program.
• The risk of policy and program changes which increase BRM payments is far greater than the impact of changes brought about by plant closure.
At economy level:
• Direct employment loss of 90 jobs; indirect losses of another 200 to 250 jobs in related service and feed manufacturing.20
• Gross provincial product declines of between 1.5 and 2.5 times the decline in total value added in the beef industry.
• Some decline in the feed manufacturing sector; based on half the number of finished cattle produced, with half the ration from grain and soy concentrates (or cooked whole beans), and the balance from corn silage, about 35-40,000 tonnes of prepared feed.21
Impacts for Government Withdrawal from the Beef Plant; Plant Continues
Operations
20 Based on the employment multiplier from the MSRB Consulting Services, op.cit. 21 Estimated at 50 percent of beef finishing ration provided by corn silage, the other half from prepared feed; with 7.5 pounds of feed per pound of gain, and 400 pounds of gain per animal attributable to the finishing ration.
Revised: 30 August 2007
Prepared by Douglas Hedley for the Department of Agriculture, Government of Prince Edward Island
24
If the beef plant continues to operate, outside of any PEI government involvement, the consequences are quite different. In effect, this would involve the sale of the beef plant, elimination of PEI government equity and lending, and allowing continued private sector plant operations. At farm level:
• Lower prices for finished cattle, probably at close to a market basis below Ontario/Quebec prices, on the order of $0.10 to $0.12/lb. cw., a 4 to 5 percent fall in revenues for finished beef. This lowers feeder cattle prices by at least 10 percent within a closed PEI market. However, Ontario and Quebec finishers will not discount PEI cattle to this extent, forcing feeder cattle prices higher (than the 10 percent discount) and squeezing the feeding margin for feedlots in PEI. The only mitigating factor in the squeeze on feeding margins would be higher prices from traceable finished beef going into premium niche markets, assuming some of the premium is transmitted to producer level.22
• Greater discount on dairy steers and heifers for feeder/stocker prices as well as finished beef, shifting some of these animals into the veal trade.
• Modest decline in finished beef production over time as the growing squeeze on feedlots takes effect more rapidly than the premium beef markets can be established.
• Loss of equity by farmers who have bought hooks in the plant through the cooperative; the cooperative will likely fail, approximately $1.5 million.
At government level:
• The PEI government can likely recover a small part of the loan guarantee currently outstanding on the plant. An early or forced sale may recover up to 10 percent of the outstanding liability; a more careful sale over time may recover up to 20 percent of the liability.23 The timing of sale would need to be balanced against any liability for operating losses until the sale is made (unless the plant closes immediately and later purchased for continued operation). The most appropriate buyer is likely an existing firm with strong, well established marketing capacity for premium niche markets in both Canada and the USA. The major beef packers would not be expected to come forward as buyers since their primary interest lies in commodity beef.
• Loss of the equity position in the beef plant, roughly $1 million.
• Loss of the remaining balance on the operating loan provided in 2007, currently $1.2 million.
• Losses on any loans made to farmers or farm organizations where bankruptcy or financial restructuring is required because of plant sale.
22 A fully private sector packer will not pass much of the niche market premium for beef through to farm level. Only the portion required to prevent cattle from leaving the island for finishing in Ontario and Quebec will be passed through to producers. 23 These estimates can only be guesses. In private conversations with industry people, few suggest that the plant can be sold easily, or at recovery levels above 10 or 15 percent of the outstanding liability. That is, the real value of the facility is likely bare real estate value.
Revised: 30 August 2007
Prepared by Douglas Hedley for the Department of Agriculture, Government of Prince Edward Island
25
• Negligible change in tax revenues.
• Negligible changes in BRM payments.
• Investment in SRM facilities would still be required. At economy level:
• Modest declines in employment initially, with potential for re-employment to current levels over time.
• No significant change in gross provincial product. Other issues for consideration:
• Any continued operation of the beef plant will require decisions regarding the disposal of SRMs. The only long run solution currently available involves the movement of these materials to Quebec disposal sites. The proposed facility in New Brunswick is not likely to have adequate capacity for SRMs from PEI.
• A significant decline in beef feedlot finishing in PEI may leave surplus feed grains in the province. This is more likely if both hog and beef plants close. To the extent that PEI feed grain prices are not on an export basis already, feed grain prices in PEI will decline to a full export basis. With grain and soybeans integral to potato production, the net revenues from the potato-grain/oilseed rotation will diminish. PEI grain exports would offset feed grains imported into the Maritimes.
• A final consideration in changes to the beef plant financing is the land use mix in PEI. There is considerable pasture and forage production in PEI, serving in part the dairy industry and in part the beef cow calf operations. With potential declines in beef production, alternative uses for forage and pasture may be required. The only livestock enterprise other than beef and dairy which uses forage and pasture is the sheep industry. While the sheep and lamb meat and wool industry has been declining in North America, the dairy sheep industry has been growing rapidly, albeit from a very tiny base. New England, Wisconsin and Southern Ontario and Quebec appear to be the regions well advanced in sheep milk and sheep milk products. These niche products command considerable premiums for cheese and yogurt. The government and industry in PEI may wish to explore such alternatives which would be consistent with a quality premium price for image based products.24
24 The US National Academy of Sciences is currently exploring the sheep industry at the request of the US Congress. The study report is expected to be released in 2008; no information from the study can be released prior to its publication. The author of this report on the PEI beef plant is a member of the study team for the National Academy of Sciences. For information on the dairy sheep industry, see the following websites: www.ewenity.com www.ontariodairysheep.org www.sheepdairying.com/breeds.htm www.cias.wisc.edu/archives/2005/05/19/dairy_sheep_enterprise_budget/index.php
Revised: 30 August 2007
Prepared by Douglas Hedley for the Department of Agriculture, Government of Prince Edward Island
26
CONCLUSIONS
1. Without the beef plant, the farm cash receipts for cattle will continue to erode
toward half of the current level because of the expected squeeze on feeding margins. PEI will become a supplier of discount feeder cattle to Eastern Canada.
2. Nova Scotia will be more deeply affected by the closure of the beef plant than
will New Brunswick. Nova Scotia will join PEI in shifting toward feeder cattle production for Ontario and Quebec, rather than finishing cattle. That is, cattle move to feed where the feed is nearest to the slaughter facility.
3. The PEI government will forfeit the value of all outstanding loans, equity
investment and loan guarantees to the beef plant if it closes, as well as loans to other partners in the beef plant, and stands to recoup very little from the beef facility if a buyer is found.
4. The losses in provincial tax revenues are expected to be lower than the additional
costs to the PEI government to permanently sustain operations of the beef plant. 5. Organic production of beef is likely impossible (except in the very long run) and
may not offer any gains to the beef plant. Organic premiums relate to less than half of the carcass weight; drop credits, offals, and lower quality cuts such as brisket, flank and shoulder have no organic premium.
6. Natural and image product characteristics coupled with “buy local” may offer
opportunity for the beef plant. However, it will take at least three to five years to establish these markets, unless an existing firm has already developed these markets and operates/uses the PEI plant as a source of product. There would still be a lag in achieving product quality for these markets, and sustained premiums while a PEI or Maritime brand is established.
7. Because of the actual and (more importantly) the perceived magnitude of the
economic, political and social impacts of the plant closing, there will be continuous pressure on the PEI government to re-invest or lend to re-open and sustain the plants. To avoid re-entry politically, the PEI government may need to consider a concerted effort to engage all parts of civil society in establishing a new consensus on the long term future of agriculture and its role within the social and economic fabric of PEI.
OPTIONS FOR THE PEI GOVERNMENT
The PEI Cabinet has requested that the two polar alternatives, continuation of the abattoirs or closure of one or both, be explored. However, there are likely options going beyond these two alternatives with respect to transition, alternative arrangements and opportunities which may need to be explored within the beef sector, as well as in related agricultural production alternatives.
Revised: 30 August 2007
Prepared by Douglas Hedley for the Department of Agriculture, Government of Prince Edward Island
27
Regardless of the options selected by the PEI government in dealing with the beef plant, a major consultation will be needed with civil society and all stakeholders on the future directions for all of the agriculture and food sector, the role of the PEI government, and the wider implications for the economy of PEI including tourism and job creation. Additionally, if a course of action leads to continued plant operations, new or revamped programs may be needed to assist the industry to achieve the consensus reached through consultation. For the beef plant, agreement with the governments of New Brunswick and Nova Scotia on shared costs may be possible. A possible starting point would be the share of hooks owned by producers in each of these provinces. However, this does not account for the feeder cattle moving into PEI from these two provinces. There are no publicly available data on the origins of finished cattle, by the province of birth of the animals. Another starting point could be the additional costs imposed on the Nova Scotia beef industry and the tax loses in the province stemming from a shift to mostly feeder cattle production for Quebec and Ontario feedlots. No estimate of these costs has been made in this report.
The Beef Plant
Option I
The minimum conditions for plant survival include:
• Write off the balance on the government’s liability of payments in the lease to own arrangement.
o This lowers the expenses of the plant by $1.3 million annually.
• In return for writing off the balance, break the agreement with the other owners on the basis discount for cattle purchased by the plant; allow the basis to be set by the plant at market levels, sufficient to keep cattle from being moved to Quebec or Ontario.
o For every penny added to the basis discount, the plant saves $200,000 annually. Increasing the basis discount to $0.10 per pound carcass weight lowers plant cost by $600,000 annually.
• Write off the balance remaining on the current operating loan of $1.2 million o This removes future liabilities of $1.2 million by the plant.
• Immediately make provision for low cost SRM disposal in PEI.
• Indicate that the PEI government will no longer provide operating loans to the plant. Use legislation if necessary to deny eligibility for future support.
• Forfeit the equity ownership in the plant.
• Urge the plant management to find immediately a highly qualified plant manager and a highly qualified market development manager, each with a minimum of ten years experience at these levels.
• Urge the plant management to operate a mandatory training program for all staff on the kill line and cutting rooms until product quality equals or exceeds commodity beef at wholesale/retail level.
Revised: 30 August 2007
Prepared by Douglas Hedley for the Department of Agriculture, Government of Prince Edward Island
28
Total cost savings to the plant are roughly $2 million annually. Increase in receipts should come with higher quality product and market development in premium based pricing. Option II
Sell the plant as soon as possible to an existing firm with well developed management, market value chains and meat distribution. This includes obtaining plant management, skills training and marketing capability brought in by the buyer.
• The initial costs to the PEI government remain roughly the same as Option I.
• Additional costs could include added lending to the plant until a buyer is found. In the event of sale, these added operating loans would need to be written off by the government.
• Indicate that the plant will not receive any operating loans or other grants after the plant is sold. Use legislation if necessary to deny eligibility of future support.
• Immediately make provision for low cost SRM disposal in PEI. The transfer pricing potential remains, so long as there is any possibility of the PEI government restarting support for the plant. Option III
Force bankruptcy of the plant, close the plant and sell the real estate.
• Costs to the PEI government will approximate Option II.
• No action on SRM disposal needed. Option IV
Continue lending to the plant for operating losses until premium price market development, skills development and plant management improves sufficiently to make the plant financially sustainable.
• This is an open-ended offer with all of the costs to the PEI government in Option I, plus any additional amount annually in non-recoverable operating loans which are greater than the value of the lost loan guarantee while the plant achieves some financial independence, a period of five or more years. In Option I, the loan guarantee is considered lost, amounting to a grant of $1.3 million annually. Since losses at the beef plant are larger than this amount in the first half of 2007 alone, additional unrecoverable loans would be required for a number of years.
• This option will ease the pressure on the plant to achieve financial sustainability and increase the period to reach profitability.
ANCILLARY OBSERVATIONS
The beef plant faces very great difficulty in reaching financial viability. These observations go beyond the scope requested in the study. Nonetheless, having examined the impact of plant closure, a great deal more information than is reported
Revised: 30 August 2007
Prepared by Douglas Hedley for the Department of Agriculture, Government of Prince Edward Island
29
in the study has been generated. These observations are included here for information only.
• Competing in a commodity market in a volatile period with current plant size and single-site operations is very problematic.
• Losses can be expected for at least three to five years before market development enables continuous, stable access to premium market prices for premium products.
• Product quality at wholesale/retail is below that of commodity product; major skills improvement for visually enhanced product is time consuming.
• Managerial and marketing skills are far below the levels required to move the plant to a sustainable financial basis.
• The purchase price basis for cattle is fixed by agreement below current market levels; pricing cannot adjust to market conditions. For every penny the fixed basis is lower than market level, the plant loses about $200,000 annually.
• Current arrangements for SRM disposal are costly.
• Future loss of potato waste for beef feedlots will increase finishing costs for beef.
More generally:
• Because of the established pattern of support by the PEI government for the hog and beef plants as lender of last resort, there is insufficient market pressure on the plant to adjust rapidly and forcefully to changes in markets, prices and opportunities.
• If the beef plant is sold to an existing firm with well established premium markets, the transfer pricing problem will limit sustainable profits in the beef plant so long as the PEI government remains involved as an actual or potential lender.
• The beef markets in North America are going through quite painful adjustments at production and processing levels. These adjustments will take some time, and will generate greater variability in pricing and returns (higher risk) at all levels in these markets. Bio-fuels and grain pricing, competition in North America and abroad, exchange rate adjustments and the like are the causes.
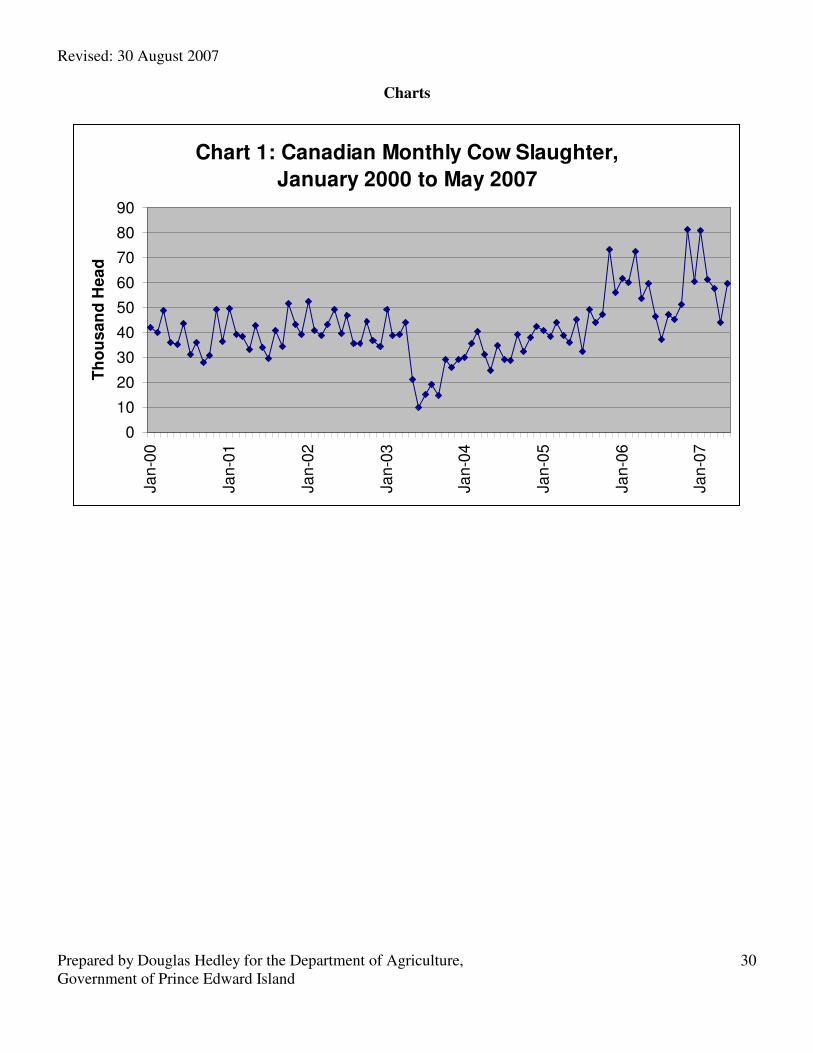
Revised: 30 August 2007
Prepared by Douglas Hedley for the Department of Agriculture, Government of Prince Edward Island
30
Charts
Chart 1: Canadian Monthly Cow Slaughter,
January 2000 to May 2007
0
10
20
30
40
50
60
70
80
90
Ja
n-0
0
Ja
n-0
1
Ja
n-0
2
Ja
n-0
3
Ja
n-0
4
Ja
n-0
5
Ja
n-0
6
Ja
n-0
7
Th
ou
sa
nd
He
ad
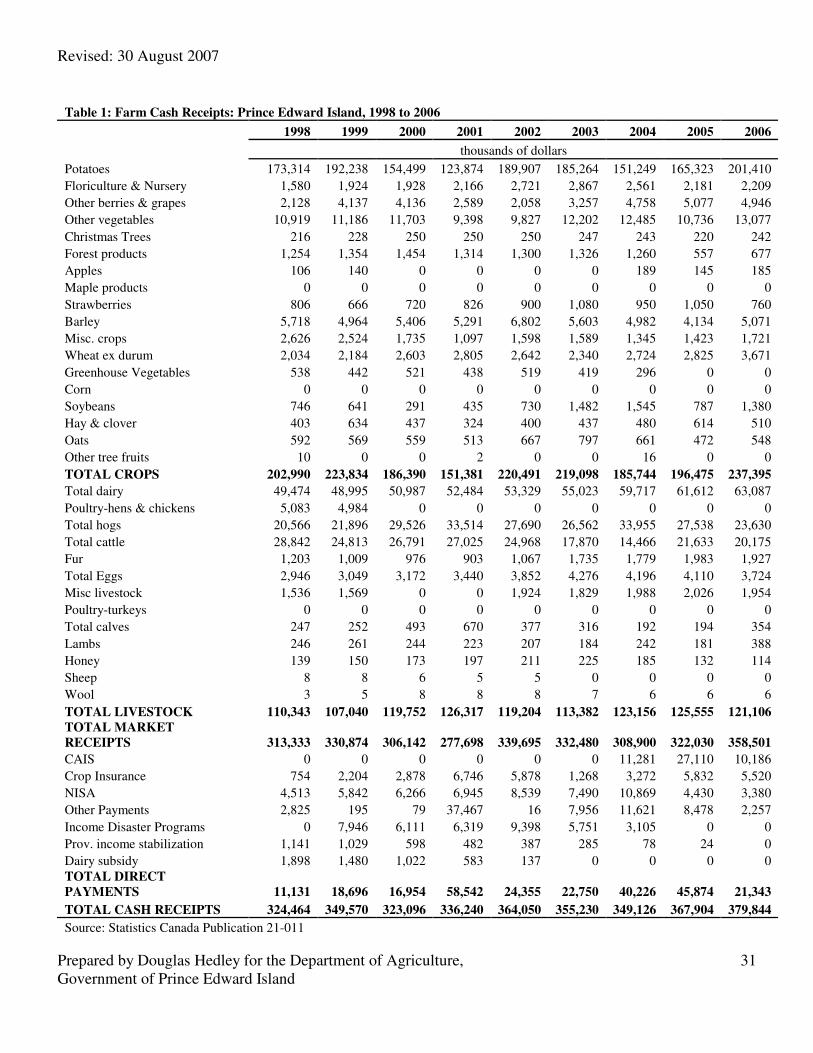
Revised: 30 August 2007
Prepared by Douglas Hedley for the Department of Agriculture, Government of Prince Edward Island
31
Table 1: Farm Cash Receipts: Prince Edward Island, 1998 to 2006
1998 1999 2000 2001 2002 2003 2004 2005 2006
thousands of dollars
Potatoes 173,314 192,238 154,499 123,874 189,907 185,264 151,249 165,323 201,410
Floriculture & Nursery 1,580 1,924 1,928 2,166 2,721 2,867 2,561 2,181 2,209
Other berries & grapes 2,128 4,137 4,136 2,589 2,058 3,257 4,758 5,077 4,946
Other vegetables 10,919 11,186 11,703 9,398 9,827 12,202 12,485 10,736 13,077
Christmas Trees 216 228 250 250 250 247 243 220 242
Forest products 1,254 1,354 1,454 1,314 1,300 1,326 1,260 557 677
Apples 106 140 0 0 0 0 189 145 185
Maple products 0 0 0 0 0 0 0 0 0
Strawberries 806 666 720 826 900 1,080 950 1,050 760
Barley 5,718 4,964 5,406 5,291 6,802 5,603 4,982 4,134 5,071
Misc. crops 2,626 2,524 1,735 1,097 1,598 1,589 1,345 1,423 1,721
Wheat ex durum 2,034 2,184 2,603 2,805 2,642 2,340 2,724 2,825 3,671
Greenhouse Vegetables 538 442 521 438 519 419 296 0 0
Corn 0 0 0 0 0 0 0 0 0
Soybeans 746 641 291 435 730 1,482 1,545 787 1,380
Hay & clover 403 634 437 324 400 437 480 614 510
Oats 592 569 559 513 667 797 661 472 548
Other tree fruits 10 0 0 2 0 0 16 0 0
TOTAL CROPS 202,990 223,834 186,390 151,381 220,491 219,098 185,744 196,475 237,395
Total dairy 49,474 48,995 50,987 52,484 53,329 55,023 59,717 61,612 63,087
Poultry-hens & chickens 5,083 4,984 0 0 0 0 0 0 0
Total hogs 20,566 21,896 29,526 33,514 27,690 26,562 33,955 27,538 23,630
Total cattle 28,842 24,813 26,791 27,025 24,968 17,870 14,466 21,633 20,175
Fur 1,203 1,009 976 903 1,067 1,735 1,779 1,983 1,927
Total Eggs 2,946 3,049 3,172 3,440 3,852 4,276 4,196 4,110 3,724
Misc livestock 1,536 1,569 0 0 1,924 1,829 1,988 2,026 1,954
Poultry-turkeys 0 0 0 0 0 0 0 0 0
Total calves 247 252 493 670 377 316 192 194 354
Lambs 246 261 244 223 207 184 242 181 388
Honey 139 150 173 197 211 225 185 132 114
Sheep 8 8 6 5 5 0 0 0 0
Wool 3 5 8 8 8 7 6 6 6
TOTAL LIVESTOCK 110,343 107,040 119,752 126,317 119,204 113,382 123,156 125,555 121,106
TOTAL MARKET
RECEIPTS 313,333 330,874 306,142 277,698 339,695 332,480 308,900 322,030 358,501
CAIS 0 0 0 0 0 0 11,281 27,110 10,186
Crop Insurance 754 2,204 2,878 6,746 5,878 1,268 3,272 5,832 5,520
NISA 4,513 5,842 6,266 6,945 8,539 7,490 10,869 4,430 3,380
Other Payments 2,825 195 79 37,467 16 7,956 11,621 8,478 2,257
Income Disaster Programs 0 7,946 6,111 6,319 9,398 5,751 3,105 0 0
Prov. income stabilization 1,141 1,029 598 482 387 285 78 24 0
Dairy subsidy 1,898 1,480 1,022 583 137 0 0 0 0 TOTAL DIRECT
PAYMENTS 11,131 18,696 16,954 58,542 24,355 22,750 40,226 45,874 21,343
TOTAL CASH RECEIPTS 324,464 349,570 323,096 336,240 364,050 355,230 349,126 367,904 379,844
Source: Statistics Canada Publication 21-011
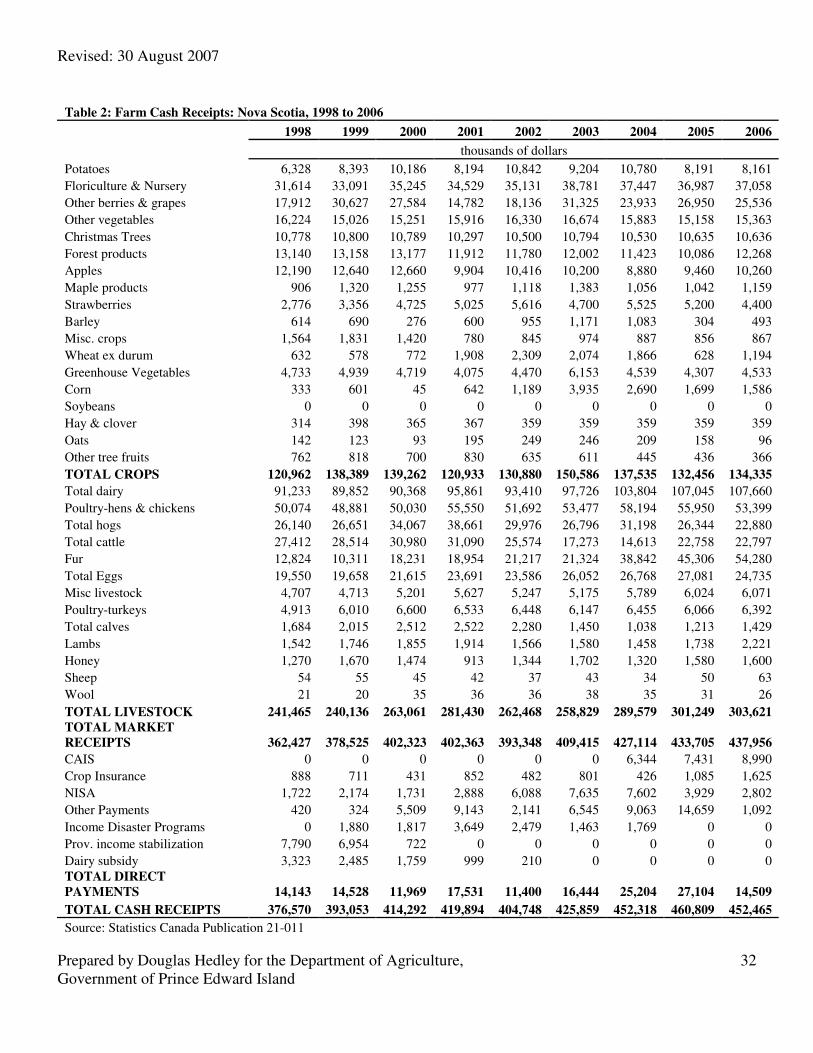
Revised: 30 August 2007
Prepared by Douglas Hedley for the Department of Agriculture, Government of Prince Edward Island
32
Table 2: Farm Cash Receipts: Nova Scotia, 1998 to 2006
1998 1999 2000 2001 2002 2003 2004 2005 2006
thousands of dollars
Potatoes 6,328 8,393 10,186 8,194 10,842 9,204 10,780 8,191 8,161
Floriculture & Nursery 31,614 33,091 35,245 34,529 35,131 38,781 37,447 36,987 37,058
Other berries & grapes 17,912 30,627 27,584 14,782 18,136 31,325 23,933 26,950 25,536
Other vegetables 16,224 15,026 15,251 15,916 16,330 16,674 15,883 15,158 15,363
Christmas Trees 10,778 10,800 10,789 10,297 10,500 10,794 10,530 10,635 10,636
Forest products 13,140 13,158 13,177 11,912 11,780 12,002 11,423 10,086 12,268
Apples 12,190 12,640 12,660 9,904 10,416 10,200 8,880 9,460 10,260
Maple products 906 1,320 1,255 977 1,118 1,383 1,056 1,042 1,159
Strawberries 2,776 3,356 4,725 5,025 5,616 4,700 5,525 5,200 4,400
Barley 614 690 276 600 955 1,171 1,083 304 493
Misc. crops 1,564 1,831 1,420 780 845 974 887 856 867
Wheat ex durum 632 578 772 1,908 2,309 2,074 1,866 628 1,194
Greenhouse Vegetables 4,733 4,939 4,719 4,075 4,470 6,153 4,539 4,307 4,533
Corn 333 601 45 642 1,189 3,935 2,690 1,699 1,586
Soybeans 0 0 0 0 0 0 0 0 0
Hay & clover 314 398 365 367 359 359 359 359 359
Oats 142 123 93 195 249 246 209 158 96
Other tree fruits 762 818 700 830 635 611 445 436 366
TOTAL CROPS 120,962 138,389 139,262 120,933 130,880 150,586 137,535 132,456 134,335
Total dairy 91,233 89,852 90,368 95,861 93,410 97,726 103,804 107,045 107,660
Poultry-hens & chickens 50,074 48,881 50,030 55,550 51,692 53,477 58,194 55,950 53,399
Total hogs 26,140 26,651 34,067 38,661 29,976 26,796 31,198 26,344 22,880
Total cattle 27,412 28,514 30,980 31,090 25,574 17,273 14,613 22,758 22,797
Fur 12,824 10,311 18,231 18,954 21,217 21,324 38,842 45,306 54,280
Total Eggs 19,550 19,658 21,615 23,691 23,586 26,052 26,768 27,081 24,735
Misc livestock 4,707 4,713 5,201 5,627 5,247 5,175 5,789 6,024 6,071
Poultry-turkeys 4,913 6,010 6,600 6,533 6,448 6,147 6,455 6,066 6,392
Total calves 1,684 2,015 2,512 2,522 2,280 1,450 1,038 1,213 1,429
Lambs 1,542 1,746 1,855 1,914 1,566 1,580 1,458 1,738 2,221
Honey 1,270 1,670 1,474 913 1,344 1,702 1,320 1,580 1,600
Sheep 54 55 45 42 37 43 34 50 63
Wool 21 20 35 36 36 38 35 31 26
TOTAL LIVESTOCK 241,465 240,136 263,061 281,430 262,468 258,829 289,579 301,249 303,621
TOTAL MARKET
RECEIPTS 362,427 378,525 402,323 402,363 393,348 409,415 427,114 433,705 437,956
CAIS 0 0 0 0 0 0 6,344 7,431 8,990
Crop Insurance 888 711 431 852 482 801 426 1,085 1,625
NISA 1,722 2,174 1,731 2,888 6,088 7,635 7,602 3,929 2,802
Other Payments 420 324 5,509 9,143 2,141 6,545 9,063 14,659 1,092
Income Disaster Programs 0 1,880 1,817 3,649 2,479 1,463 1,769 0 0
Prov. income stabilization 7,790 6,954 722 0 0 0 0 0 0
Dairy subsidy 3,323 2,485 1,759 999 210 0 0 0 0 TOTAL DIRECT
PAYMENTS 14,143 14,528 11,969 17,531 11,400 16,444 25,204 27,104 14,509
TOTAL CASH RECEIPTS 376,570 393,053 414,292 419,894 404,748 425,859 452,318 460,809 452,465
Source: Statistics Canada Publication 21-011
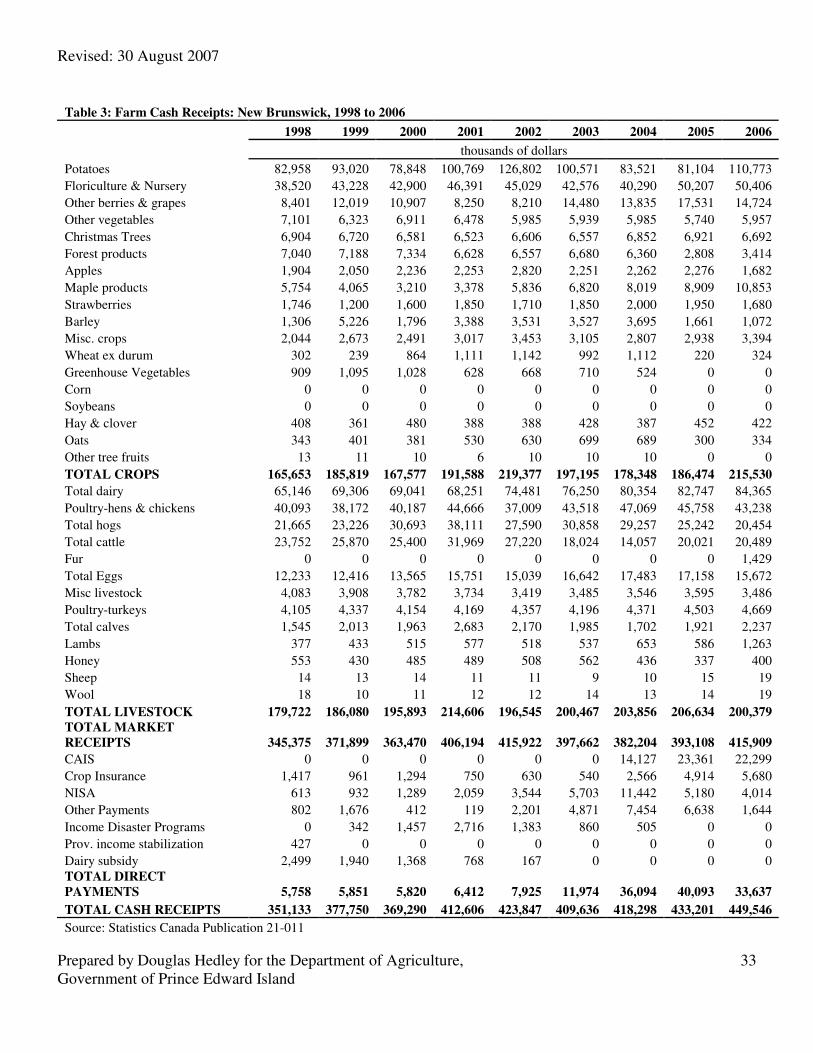
Revised: 30 August 2007
Prepared by Douglas Hedley for the Department of Agriculture, Government of Prince Edward Island
33
Table 3: Farm Cash Receipts: New Brunswick, 1998 to 2006
1998 1999 2000 2001 2002 2003 2004 2005 2006
thousands of dollars
Potatoes 82,958 93,020 78,848 100,769 126,802 100,571 83,521 81,104 110,773
Floriculture & Nursery 38,520 43,228 42,900 46,391 45,029 42,576 40,290 50,207 50,406
Other berries & grapes 8,401 12,019 10,907 8,250 8,210 14,480 13,835 17,531 14,724
Other vegetables 7,101 6,323 6,911 6,478 5,985 5,939 5,985 5,740 5,957
Christmas Trees 6,904 6,720 6,581 6,523 6,606 6,557 6,852 6,921 6,692
Forest products 7,040 7,188 7,334 6,628 6,557 6,680 6,360 2,808 3,414
Apples 1,904 2,050 2,236 2,253 2,820 2,251 2,262 2,276 1,682
Maple products 5,754 4,065 3,210 3,378 5,836 6,820 8,019 8,909 10,853
Strawberries 1,746 1,200 1,600 1,850 1,710 1,850 2,000 1,950 1,680
Barley 1,306 5,226 1,796 3,388 3,531 3,527 3,695 1,661 1,072
Misc. crops 2,044 2,673 2,491 3,017 3,453 3,105 2,807 2,938 3,394
Wheat ex durum 302 239 864 1,111 1,142 992 1,112 220 324
Greenhouse Vegetables 909 1,095 1,028 628 668 710 524 0 0
Corn 0 0 0 0 0 0 0 0 0
Soybeans 0 0 0 0 0 0 0 0 0
Hay & clover 408 361 480 388 388 428 387 452 422
Oats 343 401 381 530 630 699 689 300 334
Other tree fruits 13 11 10 6 10 10 10 0 0
TOTAL CROPS 165,653 185,819 167,577 191,588 219,377 197,195 178,348 186,474 215,530
Total dairy 65,146 69,306 69,041 68,251 74,481 76,250 80,354 82,747 84,365
Poultry-hens & chickens 40,093 38,172 40,187 44,666 37,009 43,518 47,069 45,758 43,238
Total hogs 21,665 23,226 30,693 38,111 27,590 30,858 29,257 25,242 20,454
Total cattle 23,752 25,870 25,400 31,969 27,220 18,024 14,057 20,021 20,489
Fur 0 0 0 0 0 0 0 0 1,429
Total Eggs 12,233 12,416 13,565 15,751 15,039 16,642 17,483 17,158 15,672
Misc livestock 4,083 3,908 3,782 3,734 3,419 3,485 3,546 3,595 3,486
Poultry-turkeys 4,105 4,337 4,154 4,169 4,357 4,196 4,371 4,503 4,669
Total calves 1,545 2,013 1,963 2,683 2,170 1,985 1,702 1,921 2,237
Lambs 377 433 515 577 518 537 653 586 1,263
Honey 553 430 485 489 508 562 436 337 400
Sheep 14 13 14 11 11 9 10 15 19
Wool 18 10 11 12 12 14 13 14 19
TOTAL LIVESTOCK 179,722 186,080 195,893 214,606 196,545 200,467 203,856 206,634 200,379
TOTAL MARKET
RECEIPTS 345,375 371,899 363,470 406,194 415,922 397,662 382,204 393,108 415,909
CAIS 0 0 0 0 0 0 14,127 23,361 22,299
Crop Insurance 1,417 961 1,294 750 630 540 2,566 4,914 5,680
NISA 613 932 1,289 2,059 3,544 5,703 11,442 5,180 4,014
Other Payments 802 1,676 412 119 2,201 4,871 7,454 6,638 1,644
Income Disaster Programs 0 342 1,457 2,716 1,383 860 505 0 0
Prov. income stabilization 427 0 0 0 0 0 0 0 0
Dairy subsidy 2,499 1,940 1,368 768 167 0 0 0 0 TOTAL DIRECT
PAYMENTS 5,758 5,851 5,820 6,412 7,925 11,974 36,094 40,093 33,637
TOTAL CASH RECEIPTS 351,133 377,750 369,290 412,606 423,847 409,636 418,298 433,201 449,546
Source: Statistics Canada Publication 21-011
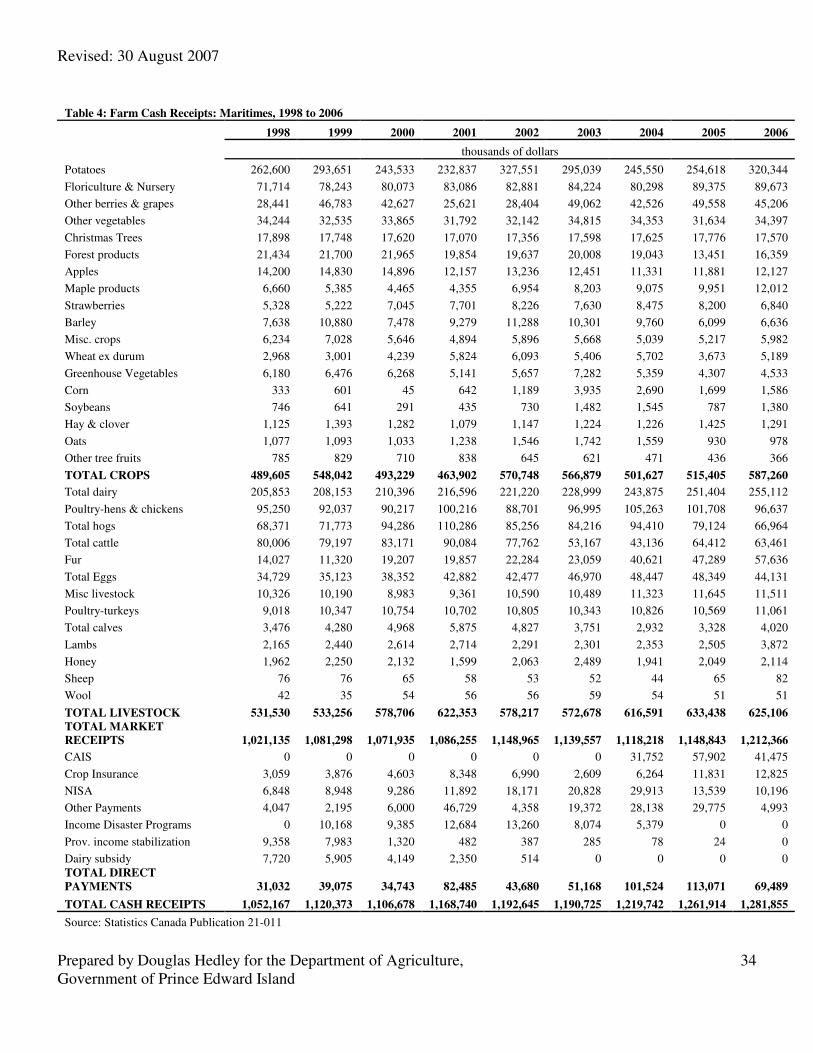
Revised: 30 August 2007
Prepared by Douglas Hedley for the Department of Agriculture, Government of Prince Edward Island
34
Table 4: Farm Cash Receipts: Maritimes, 1998 to 2006
1998 1999 2000 2001 2002 2003 2004 2005 2006
thousands of dollars
Potatoes 262,600 293,651 243,533 232,837 327,551 295,039 245,550 254,618 320,344
Floriculture & Nursery 71,714 78,243 80,073 83,086 82,881 84,224 80,298 89,375 89,673
Other berries & grapes 28,441 46,783 42,627 25,621 28,404 49,062 42,526 49,558 45,206
Other vegetables 34,244 32,535 33,865 31,792 32,142 34,815 34,353 31,634 34,397
Christmas Trees 17,898 17,748 17,620 17,070 17,356 17,598 17,625 17,776 17,570
Forest products 21,434 21,700 21,965 19,854 19,637 20,008 19,043 13,451 16,359
Apples 14,200 14,830 14,896 12,157 13,236 12,451 11,331 11,881 12,127
Maple products 6,660 5,385 4,465 4,355 6,954 8,203 9,075 9,951 12,012
Strawberries 5,328 5,222 7,045 7,701 8,226 7,630 8,475 8,200 6,840
Barley 7,638 10,880 7,478 9,279 11,288 10,301 9,760 6,099 6,636
Misc. crops 6,234 7,028 5,646 4,894 5,896 5,668 5,039 5,217 5,982
Wheat ex durum 2,968 3,001 4,239 5,824 6,093 5,406 5,702 3,673 5,189
Greenhouse Vegetables 6,180 6,476 6,268 5,141 5,657 7,282 5,359 4,307 4,533
Corn 333 601 45 642 1,189 3,935 2,690 1,699 1,586
Soybeans 746 641 291 435 730 1,482 1,545 787 1,380
Hay & clover 1,125 1,393 1,282 1,079 1,147 1,224 1,226 1,425 1,291
Oats 1,077 1,093 1,033 1,238 1,546 1,742 1,559 930 978
Other tree fruits 785 829 710 838 645 621 471 436 366
TOTAL CROPS 489,605 548,042 493,229 463,902 570,748 566,879 501,627 515,405 587,260
Total dairy 205,853 208,153 210,396 216,596 221,220 228,999 243,875 251,404 255,112
Poultry-hens & chickens 95,250 92,037 90,217 100,216 88,701 96,995 105,263 101,708 96,637
Total hogs 68,371 71,773 94,286 110,286 85,256 84,216 94,410 79,124 66,964
Total cattle 80,006 79,197 83,171 90,084 77,762 53,167 43,136 64,412 63,461
Fur 14,027 11,320 19,207 19,857 22,284 23,059 40,621 47,289 57,636
Total Eggs 34,729 35,123 38,352 42,882 42,477 46,970 48,447 48,349 44,131
Misc livestock 10,326 10,190 8,983 9,361 10,590 10,489 11,323 11,645 11,511
Poultry-turkeys 9,018 10,347 10,754 10,702 10,805 10,343 10,826 10,569 11,061
Total calves 3,476 4,280 4,968 5,875 4,827 3,751 2,932 3,328 4,020
Lambs 2,165 2,440 2,614 2,714 2,291 2,301 2,353 2,505 3,872
Honey 1,962 2,250 2,132 1,599 2,063 2,489 1,941 2,049 2,114
Sheep 76 76 65 58 53 52 44 65 82
Wool 42 35 54 56 56 59 54 51 51
TOTAL LIVESTOCK 531,530 533,256 578,706 622,353 578,217 572,678 616,591 633,438 625,106
TOTAL MARKET
RECEIPTS 1,021,135 1,081,298 1,071,935 1,086,255 1,148,965 1,139,557 1,118,218 1,148,843 1,212,366
CAIS 0 0 0 0 0 0 31,752 57,902 41,475
Crop Insurance 3,059 3,876 4,603 8,348 6,990 2,609 6,264 11,831 12,825
NISA 6,848 8,948 9,286 11,892 18,171 20,828 29,913 13,539 10,196
Other Payments 4,047 2,195 6,000 46,729 4,358 19,372 28,138 29,775 4,993
Income Disaster Programs 0 10,168 9,385 12,684 13,260 8,074 5,379 0 0
Prov. income stabilization 9,358 7,983 1,320 482 387 285 78 24 0
Dairy subsidy 7,720 5,905 4,149 2,350 514 0 0 0 0 TOTAL DIRECT
PAYMENTS 31,032 39,075 34,743 82,485 43,680 51,168 101,524 113,071 69,489
TOTAL CASH RECEIPTS 1,052,167 1,120,373 1,106,678 1,168,740 1,192,645 1,190,725 1,219,742 1,261,914 1,281,855
Source: Statistics Canada Publication 21-011
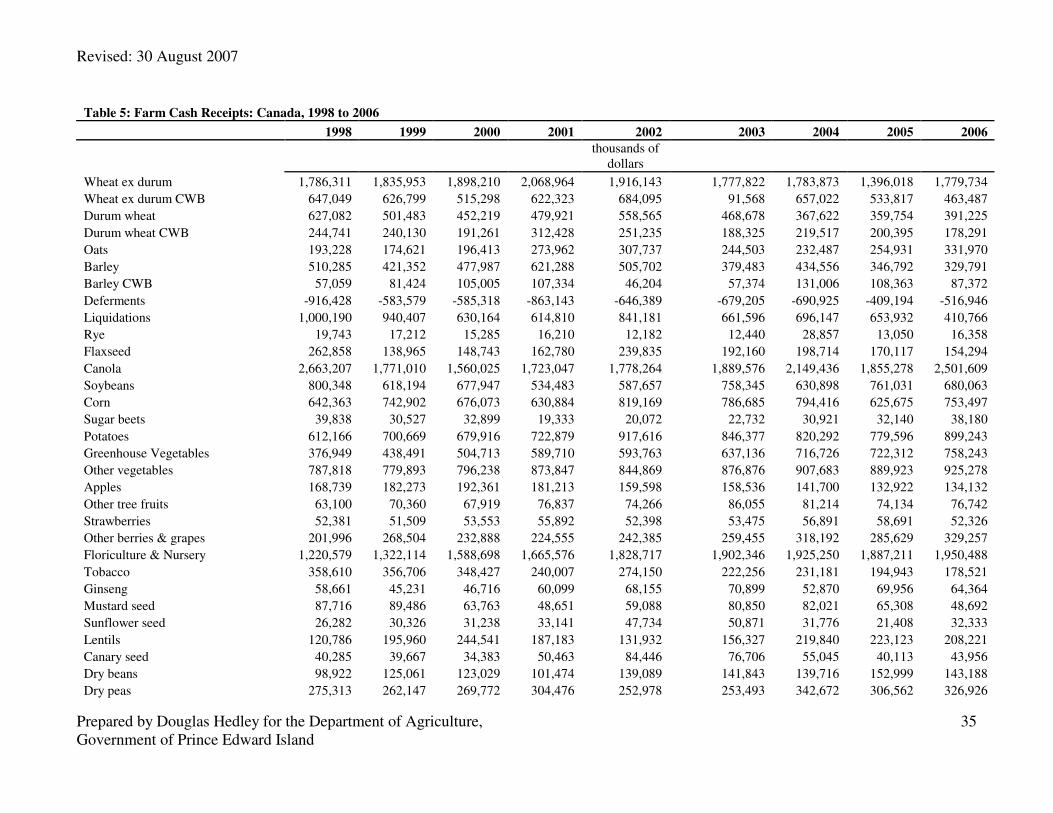
Revised: 30 August 2007
Prepared by Douglas Hedley for the Department of Agriculture, Government of Prince Edward Island
35
Table 5: Farm Cash Receipts: Canada, 1998 to 2006
1998 1999 2000 2001 2002 2003 2004 2005 2006
thousands of
dollars
Wheat ex durum 1,786,311 1,835,953 1,898,210 2,068,964 1,916,143 1,777,822 1,783,873 1,396,018 1,779,734
Wheat ex durum CWB 647,049 626,799 515,298 622,323 684,095 91,568 657,022 533,817 463,487
Durum wheat 627,082 501,483 452,219 479,921 558,565 468,678 367,622 359,754 391,225
Durum wheat CWB 244,741 240,130 191,261 312,428 251,235 188,325 219,517 200,395 178,291
Oats 193,228 174,621 196,413 273,962 307,737 244,503 232,487 254,931 331,970
Barley 510,285 421,352 477,987 621,288 505,702 379,483 434,556 346,792 329,791
Barley CWB 57,059 81,424 105,005 107,334 46,204 57,374 131,006 108,363 87,372
Deferments -916,428 -583,579 -585,318 -863,143 -646,389 -679,205 -690,925 -409,194 -516,946
Liquidations 1,000,190 940,407 630,164 614,810 841,181 661,596 696,147 653,932 410,766
Rye 19,743 17,212 15,285 16,210 12,182 12,440 28,857 13,050 16,358
Flaxseed 262,858 138,965 148,743 162,780 239,835 192,160 198,714 170,117 154,294
Canola 2,663,207 1,771,010 1,560,025 1,723,047 1,778,264 1,889,576 2,149,436 1,855,278 2,501,609
Soybeans 800,348 618,194 677,947 534,483 587,657 758,345 630,898 761,031 680,063
Corn 642,363 742,902 676,073 630,884 819,169 786,685 794,416 625,675 753,497
Sugar beets 39,838 30,527 32,899 19,333 20,072 22,732 30,921 32,140 38,180
Potatoes 612,166 700,669 679,916 722,879 917,616 846,377 820,292 779,596 899,243
Greenhouse Vegetables 376,949 438,491 504,713 589,710 593,763 637,136 716,726 722,312 758,243
Other vegetables 787,818 779,893 796,238 873,847 844,869 876,876 907,683 889,923 925,278
Apples 168,739 182,273 192,361 181,213 159,598 158,536 141,700 132,922 134,132
Other tree fruits 63,100 70,360 67,919 76,837 74,266 86,055 81,214 74,134 76,742
Strawberries 52,381 51,509 53,553 55,892 52,398 53,475 56,891 58,691 52,326
Other berries & grapes 201,996 268,504 232,888 224,555 242,385 259,455 318,192 285,629 329,257
Floriculture & Nursery 1,220,579 1,322,114 1,588,698 1,665,576 1,828,717 1,902,346 1,925,250 1,887,211 1,950,488
Tobacco 358,610 356,706 348,427 240,007 274,150 222,256 231,181 194,943 178,521
Ginseng 58,661 45,231 46,716 60,099 68,155 70,899 52,870 69,956 64,364
Mustard seed 87,716 89,486 63,763 48,651 59,088 80,850 82,021 65,308 48,692
Sunflower seed 26,282 30,326 31,238 33,141 47,734 50,871 31,776 21,408 32,333
Lentils 120,786 195,960 244,541 187,183 131,932 156,327 219,840 223,123 208,221
Canary seed 40,285 39,667 34,383 50,463 84,446 76,706 55,045 40,113 43,956
Dry beans 98,922 125,061 123,029 101,474 139,089 141,843 139,716 152,999 143,188
Dry peas 275,313 262,147 269,772 304,476 252,978 253,493 342,672 306,562 326,926
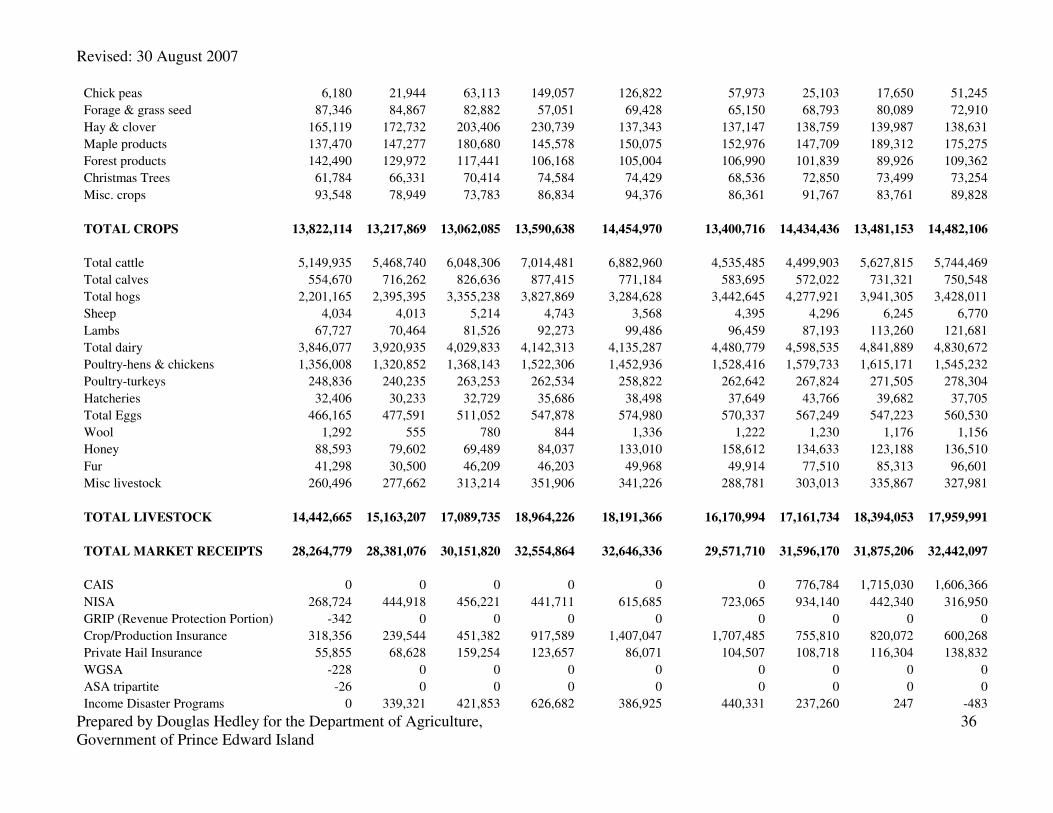
Revised: 30 August 2007
Prepared by Douglas Hedley for the Department of Agriculture, Government of Prince Edward Island
36
Chick peas 6,180 21,944 63,113 149,057 126,822 57,973 25,103 17,650 51,245
Forage & grass seed 87,346 84,867 82,882 57,051 69,428 65,150 68,793 80,089 72,910
Hay & clover 165,119 172,732 203,406 230,739 137,343 137,147 138,759 139,987 138,631
Maple products 137,470 147,277 180,680 145,578 150,075 152,976 147,709 189,312 175,275
Forest products 142,490 129,972 117,441 106,168 105,004 106,990 101,839 89,926 109,362
Christmas Trees 61,784 66,331 70,414 74,584 74,429 68,536 72,850 73,499 73,254
Misc. crops 93,548 78,949 73,783 86,834 94,376 86,361 91,767 83,761 89,828
TOTAL CROPS 13,822,114 13,217,869 13,062,085 13,590,638 14,454,970 13,400,716 14,434,436 13,481,153 14,482,106
Total cattle 5,149,935 5,468,740 6,048,306 7,014,481 6,882,960 4,535,485 4,499,903 5,627,815 5,744,469
Total calves 554,670 716,262 826,636 877,415 771,184 583,695 572,022 731,321 750,548
Total hogs 2,201,165 2,395,395 3,355,238 3,827,869 3,284,628 3,442,645 4,277,921 3,941,305 3,428,011
Sheep 4,034 4,013 5,214 4,743 3,568 4,395 4,296 6,245 6,770
Lambs 67,727 70,464 81,526 92,273 99,486 96,459 87,193 113,260 121,681
Total dairy 3,846,077 3,920,935 4,029,833 4,142,313 4,135,287 4,480,779 4,598,535 4,841,889 4,830,672
Poultry-hens & chickens 1,356,008 1,320,852 1,368,143 1,522,306 1,452,936 1,528,416 1,579,733 1,615,171 1,545,232
Poultry-turkeys 248,836 240,235 263,253 262,534 258,822 262,642 267,824 271,505 278,304
Hatcheries 32,406 30,233 32,729 35,686 38,498 37,649 43,766 39,682 37,705
Total Eggs 466,165 477,591 511,052 547,878 574,980 570,337 567,249 547,223 560,530
Wool 1,292 555 780 844 1,336 1,222 1,230 1,176 1,156
Honey 88,593 79,602 69,489 84,037 133,010 158,612 134,633 123,188 136,510
Fur 41,298 30,500 46,209 46,203 49,968 49,914 77,510 85,313 96,601
Misc livestock 260,496 277,662 313,214 351,906 341,226 288,781 303,013 335,867 327,981
TOTAL LIVESTOCK 14,442,665 15,163,207 17,089,735 18,964,226 18,191,366 16,170,994 17,161,734 18,394,053 17,959,991
TOTAL MARKET RECEIPTS 28,264,779 28,381,076 30,151,820 32,554,864 32,646,336 29,571,710 31,596,170 31,875,206 32,442,097
CAIS 0 0 0 0 0 0 776,784 1,715,030 1,606,366
NISA 268,724 444,918 456,221 441,711 615,685 723,065 934,140 442,340 316,950
GRIP (Revenue Protection Portion) -342 0 0 0 0 0 0 0 0
Crop/Production Insurance 318,356 239,544 451,382 917,589 1,407,047 1,707,485 755,810 820,072 600,268
Private Hail Insurance 55,855 68,628 159,254 123,657 86,071 104,507 108,718 116,304 138,832
WGSA -228 0 0 0 0 0 0 0 0
ASA tripartite -26 0 0 0 0 0 0 0 0
Income Disaster Programs 0 339,321 421,853 626,682 386,925 440,331 237,260 247 -483
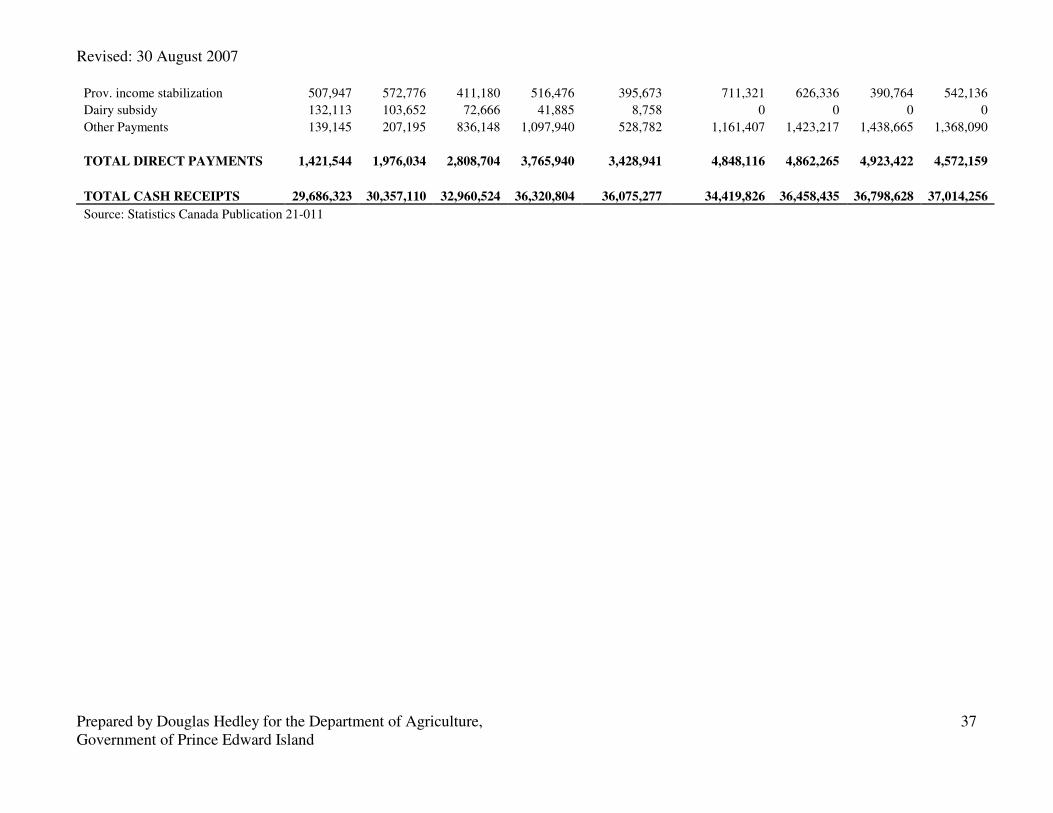
Revised: 30 August 2007
Prepared by Douglas Hedley for the Department of Agriculture, Government of Prince Edward Island
37
Prov. income stabilization 507,947 572,776 411,180 516,476 395,673 711,321 626,336 390,764 542,136
Dairy subsidy 132,113 103,652 72,666 41,885 8,758 0 0 0 0
Other Payments 139,145 207,195 836,148 1,097,940 528,782 1,161,407 1,423,217 1,438,665 1,368,090
TOTAL DIRECT PAYMENTS 1,421,544 1,976,034 2,808,704 3,765,940 3,428,941 4,848,116 4,862,265 4,923,422 4,572,159
TOTAL CASH RECEIPTS 29,686,323 30,357,110 32,960,524 36,320,804 36,075,277 34,419,826 36,458,435 36,798,628 37,014,256
Source: Statistics Canada Publication 21-011
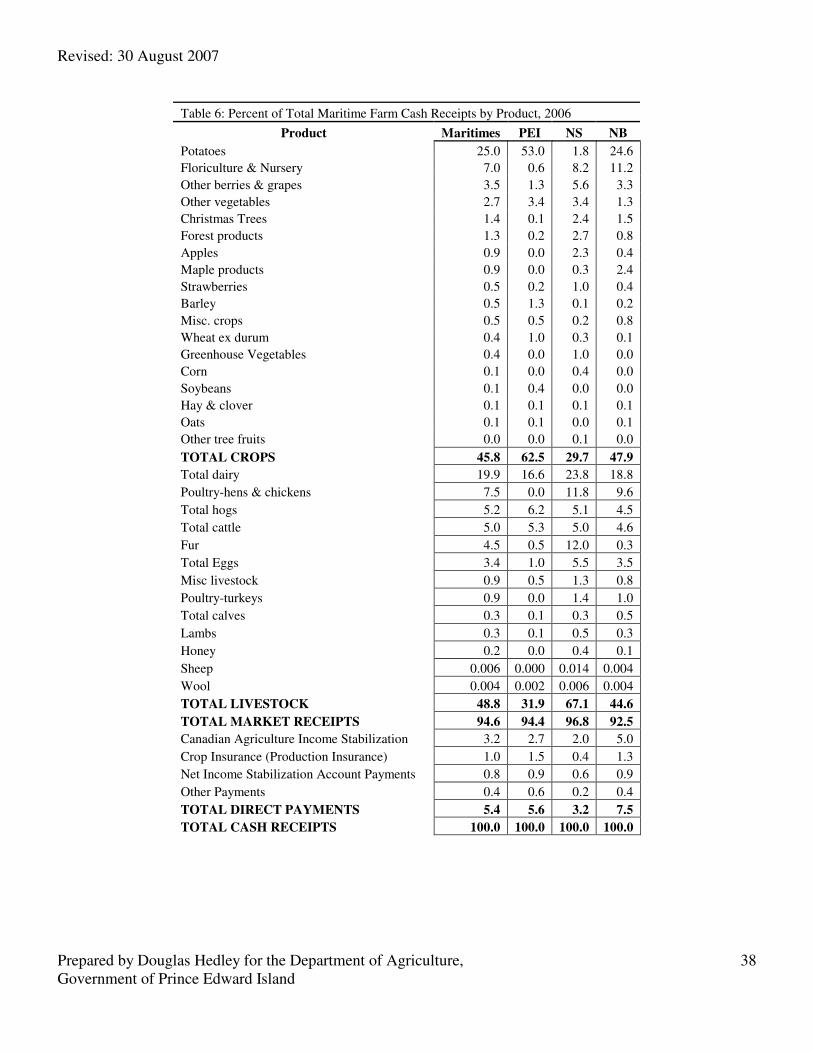
Revised: 30 August 2007
Prepared by Douglas Hedley for the Department of Agriculture, Government of Prince Edward Island
38
Table 6: Percent of Total Maritime Farm Cash Receipts by Product, 2006
Product Maritimes PEI NS NB
Potatoes 25.0 53.0 1.8 24.6
Floriculture & Nursery 7.0 0.6 8.2 11.2
Other berries & grapes 3.5 1.3 5.6 3.3
Other vegetables 2.7 3.4 3.4 1.3
Christmas Trees 1.4 0.1 2.4 1.5
Forest products 1.3 0.2 2.7 0.8
Apples 0.9 0.0 2.3 0.4
Maple products 0.9 0.0 0.3 2.4
Strawberries 0.5 0.2 1.0 0.4
Barley 0.5 1.3 0.1 0.2
Misc. crops 0.5 0.5 0.2 0.8
Wheat ex durum 0.4 1.0 0.3 0.1
Greenhouse Vegetables 0.4 0.0 1.0 0.0
Corn 0.1 0.0 0.4 0.0
Soybeans 0.1 0.4 0.0 0.0
Hay & clover 0.1 0.1 0.1 0.1
Oats 0.1 0.1 0.0 0.1
Other tree fruits 0.0 0.0 0.1 0.0
TOTAL CROPS 45.8 62.5 29.7 47.9
Total dairy 19.9 16.6 23.8 18.8
Poultry-hens & chickens 7.5 0.0 11.8 9.6
Total hogs 5.2 6.2 5.1 4.5
Total cattle 5.0 5.3 5.0 4.6
Fur 4.5 0.5 12.0 0.3
Total Eggs 3.4 1.0 5.5 3.5
Misc livestock 0.9 0.5 1.3 0.8
Poultry-turkeys 0.9 0.0 1.4 1.0
Total calves 0.3 0.1 0.3 0.5
Lambs 0.3 0.1 0.5 0.3
Honey 0.2 0.0 0.4 0.1
Sheep 0.006 0.000 0.014 0.004
Wool 0.004 0.002 0.006 0.004
TOTAL LIVESTOCK 48.8 31.9 67.1 44.6
TOTAL MARKET RECEIPTS 94.6 94.4 96.8 92.5
Canadian Agriculture Income Stabilization 3.2 2.7 2.0 5.0
Crop Insurance (Production Insurance) 1.0 1.5 0.4 1.3
Net Income Stabilization Account Payments 0.8 0.9 0.6 0.9
Other Payments 0.4 0.6 0.2 0.4
TOTAL DIRECT PAYMENTS 5.4 5.6 3.2 7.5
TOTAL CASH RECEIPTS 100.0 100.0 100.0 100.0
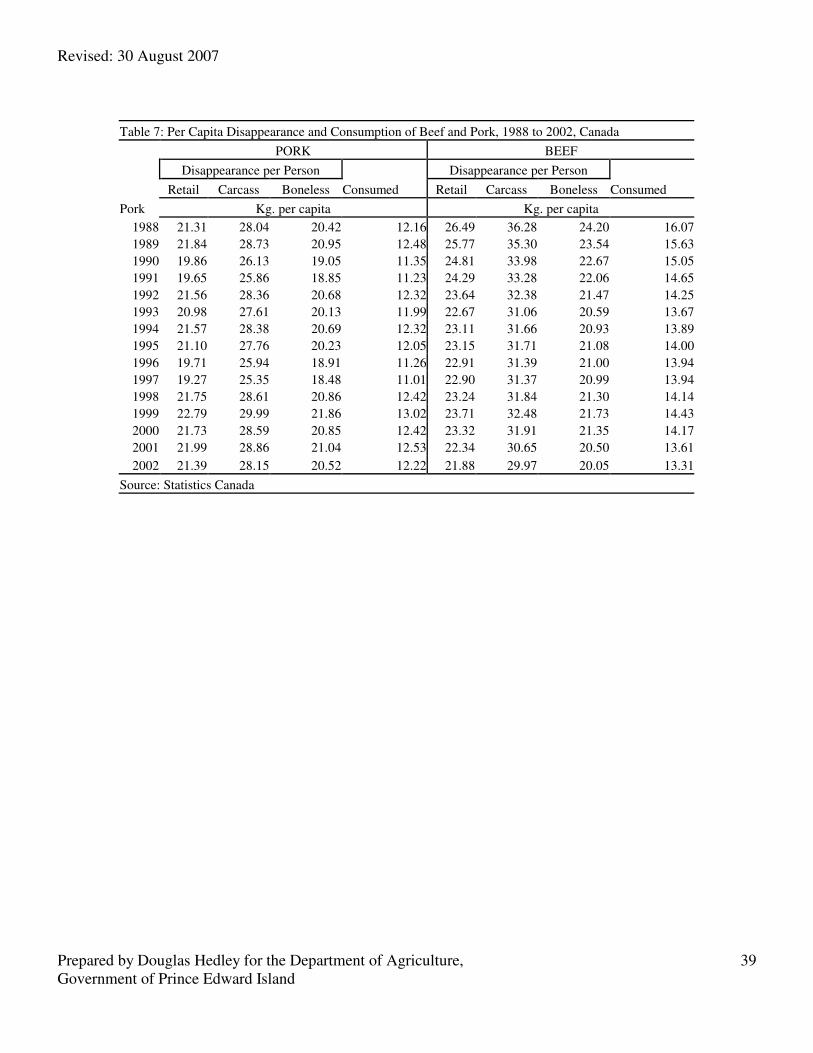
Revised: 30 August 2007
Prepared by Douglas Hedley for the Department of Agriculture, Government of Prince Edward Island
39
Table 7: Per Capita Disappearance and Consumption of Beef and Pork, 1988 to 2002, Canada
PORK BEEF
Disappearance per Person Disappearance per Person
Retail Carcass Boneless Consumed Retail Carcass Boneless Consumed
Pork Kg. per capita Kg. per capita
1988 21.31 28.04 20.42 12.16 26.49 36.28 24.20 16.07
1989 21.84 28.73 20.95 12.48 25.77 35.30 23.54 15.63
1990 19.86 26.13 19.05 11.35 24.81 33.98 22.67 15.05
1991 19.65 25.86 18.85 11.23 24.29 33.28 22.06 14.65
1992 21.56 28.36 20.68 12.32 23.64 32.38 21.47 14.25
1993 20.98 27.61 20.13 11.99 22.67 31.06 20.59 13.67
1994 21.57 28.38 20.69 12.32 23.11 31.66 20.93 13.89
1995 21.10 27.76 20.23 12.05 23.15 31.71 21.08 14.00
1996 19.71 25.94 18.91 11.26 22.91 31.39 21.00 13.94
1997 19.27 25.35 18.48 11.01 22.90 31.37 20.99 13.94
1998 21.75 28.61 20.86 12.42 23.24 31.84 21.30 14.14
1999 22.79 29.99 21.86 13.02 23.71 32.48 21.73 14.43
2000 21.73 28.59 20.85 12.42 23.32 31.91 21.35 14.17
2001 21.99 28.86 21.04 12.53 22.34 30.65 20.50 13.61
2002 21.39 28.15 20.52 12.22 21.88 29.97 20.05 13.31
Source: Statistics Canada
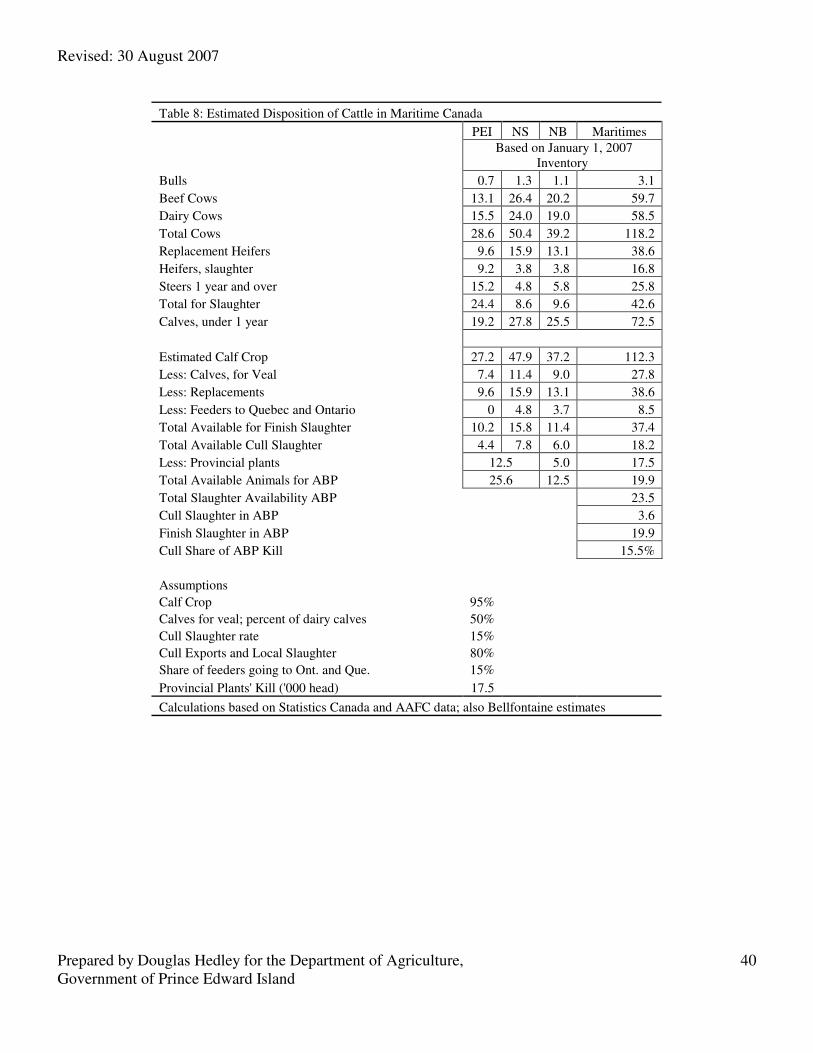
Revised: 30 August 2007
Prepared by Douglas Hedley for the Department of Agriculture, Government of Prince Edward Island
40
Table 8: Estimated Disposition of Cattle in Maritime Canada
PEI NS NB Maritimes
Based on January 1, 2007
Inventory
Bulls 0.7 1.3 1.1 3.1
Beef Cows 13.1 26.4 20.2 59.7
Dairy Cows 15.5 24.0 19.0 58.5
Total Cows 28.6 50.4 39.2 118.2
Replacement Heifers 9.6 15.9 13.1 38.6
Heifers, slaughter 9.2 3.8 3.8 16.8
Steers 1 year and over 15.2 4.8 5.8 25.8
Total for Slaughter 24.4 8.6 9.6 42.6
Calves, under 1 year 19.2 27.8 25.5 72.5
Estimated Calf Crop 27.2 47.9 37.2 112.3
Less: Calves, for Veal 7.4 11.4 9.0 27.8
Less: Replacements 9.6 15.9 13.1 38.6
Less: Feeders to Quebec and Ontario 0 4.8 3.7 8.5
Total Available for Finish Slaughter 10.2 15.8 11.4 37.4
Total Available Cull Slaughter 4.4 7.8 6.0 18.2
Less: Provincial plants 12.5 5.0 17.5
Total Available Animals for ABP 25.6 12.5 19.9
Total Slaughter Availability ABP 23.5
Cull Slaughter in ABP 3.6
Finish Slaughter in ABP 19.9
Cull Share of ABP Kill 15.5%
Assumptions
Calf Crop 95%
Calves for veal; percent of dairy calves 50%
Cull Slaughter rate 15%
Cull Exports and Local Slaughter 80%
Share of feeders going to Ont. and Que. 15%
Provincial Plants' Kill ('000 head) 17.5
Calculations based on Statistics Canada and AAFC data; also Bellfontaine estimates
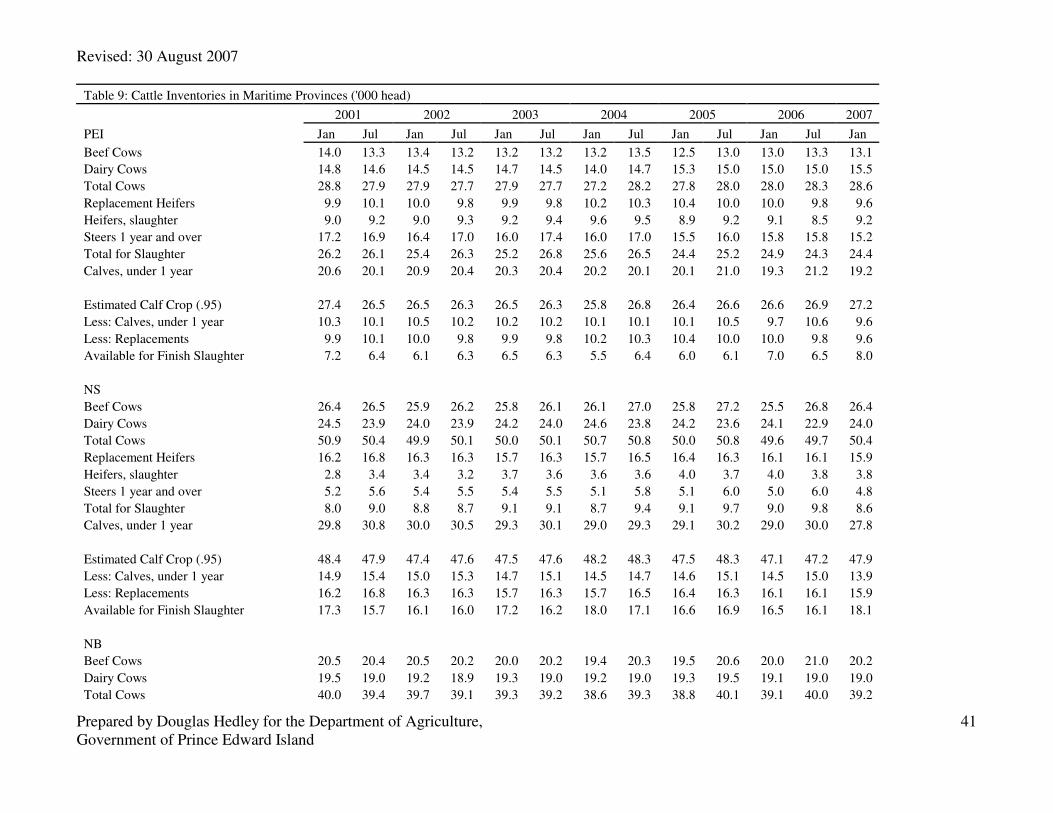
Revised: 30 August 2007
Prepared by Douglas Hedley for the Department of Agriculture, Government of Prince Edward Island
41
Table 9: Cattle Inventories in Maritime Provinces ('000 head)
2001 2002 2003 2004 2005 2006 2007
PEI Jan Jul Jan Jul Jan Jul Jan Jul Jan Jul Jan Jul Jan
Beef Cows 14.0 13.3 13.4 13.2 13.2 13.2 13.2 13.5 12.5 13.0 13.0 13.3 13.1
Dairy Cows 14.8 14.6 14.5 14.5 14.7 14.5 14.0 14.7 15.3 15.0 15.0 15.0 15.5
Total Cows 28.8 27.9 27.9 27.7 27.9 27.7 27.2 28.2 27.8 28.0 28.0 28.3 28.6
Replacement Heifers 9.9 10.1 10.0 9.8 9.9 9.8 10.2 10.3 10.4 10.0 10.0 9.8 9.6
Heifers, slaughter 9.0 9.2 9.0 9.3 9.2 9.4 9.6 9.5 8.9 9.2 9.1 8.5 9.2
Steers 1 year and over 17.2 16.9 16.4 17.0 16.0 17.4 16.0 17.0 15.5 16.0 15.8 15.8 15.2
Total for Slaughter 26.2 26.1 25.4 26.3 25.2 26.8 25.6 26.5 24.4 25.2 24.9 24.3 24.4
Calves, under 1 year 20.6 20.1 20.9 20.4 20.3 20.4 20.2 20.1 20.1 21.0 19.3 21.2 19.2
Estimated Calf Crop (.95) 27.4 26.5 26.5 26.3 26.5 26.3 25.8 26.8 26.4 26.6 26.6 26.9 27.2
Less: Calves, under 1 year 10.3 10.1 10.5 10.2 10.2 10.2 10.1 10.1 10.1 10.5 9.7 10.6 9.6
Less: Replacements 9.9 10.1 10.0 9.8 9.9 9.8 10.2 10.3 10.4 10.0 10.0 9.8 9.6
Available for Finish Slaughter 7.2 6.4 6.1 6.3 6.5 6.3 5.5 6.4 6.0 6.1 7.0 6.5 8.0
NS
Beef Cows 26.4 26.5 25.9 26.2 25.8 26.1 26.1 27.0 25.8 27.2 25.5 26.8 26.4
Dairy Cows 24.5 23.9 24.0 23.9 24.2 24.0 24.6 23.8 24.2 23.6 24.1 22.9 24.0
Total Cows 50.9 50.4 49.9 50.1 50.0 50.1 50.7 50.8 50.0 50.8 49.6 49.7 50.4
Replacement Heifers 16.2 16.8 16.3 16.3 15.7 16.3 15.7 16.5 16.4 16.3 16.1 16.1 15.9
Heifers, slaughter 2.8 3.4 3.4 3.2 3.7 3.6 3.6 3.6 4.0 3.7 4.0 3.8 3.8
Steers 1 year and over 5.2 5.6 5.4 5.5 5.4 5.5 5.1 5.8 5.1 6.0 5.0 6.0 4.8
Total for Slaughter 8.0 9.0 8.8 8.7 9.1 9.1 8.7 9.4 9.1 9.7 9.0 9.8 8.6
Calves, under 1 year 29.8 30.8 30.0 30.5 29.3 30.1 29.0 29.3 29.1 30.2 29.0 30.0 27.8
Estimated Calf Crop (.95) 48.4 47.9 47.4 47.6 47.5 47.6 48.2 48.3 47.5 48.3 47.1 47.2 47.9
Less: Calves, under 1 year 14.9 15.4 15.0 15.3 14.7 15.1 14.5 14.7 14.6 15.1 14.5 15.0 13.9
Less: Replacements 16.2 16.8 16.3 16.3 15.7 16.3 15.7 16.5 16.4 16.3 16.1 16.1 15.9
Available for Finish Slaughter 17.3 15.7 16.1 16.0 17.2 16.2 18.0 17.1 16.6 16.9 16.5 16.1 18.1
NB
Beef Cows 20.5 20.4 20.5 20.2 20.0 20.2 19.4 20.3 19.5 20.6 20.0 21.0 20.2
Dairy Cows 19.5 19.0 19.2 18.9 19.3 19.0 19.2 19.0 19.3 19.5 19.1 19.0 19.0
Total Cows 40.0 39.4 39.7 39.1 39.3 39.2 38.6 39.3 38.8 40.1 39.1 40.0 39.2
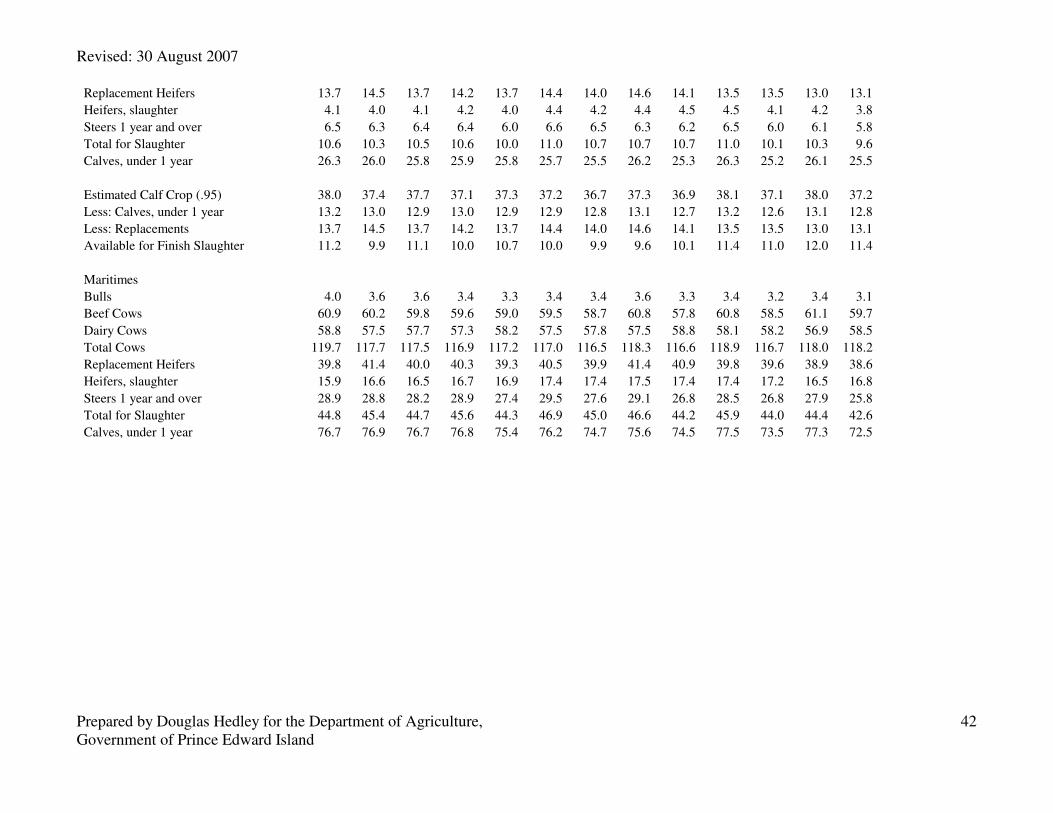
Revised: 30 August 2007
Prepared by Douglas Hedley for the Department of Agriculture, Government of Prince Edward Island
42
Replacement Heifers 13.7 14.5 13.7 14.2 13.7 14.4 14.0 14.6 14.1 13.5 13.5 13.0 13.1
Heifers, slaughter 4.1 4.0 4.1 4.2 4.0 4.4 4.2 4.4 4.5 4.5 4.1 4.2 3.8
Steers 1 year and over 6.5 6.3 6.4 6.4 6.0 6.6 6.5 6.3 6.2 6.5 6.0 6.1 5.8
Total for Slaughter 10.6 10.3 10.5 10.6 10.0 11.0 10.7 10.7 10.7 11.0 10.1 10.3 9.6
Calves, under 1 year 26.3 26.0 25.8 25.9 25.8 25.7 25.5 26.2 25.3 26.3 25.2 26.1 25.5
Estimated Calf Crop (.95) 38.0 37.4 37.7 37.1 37.3 37.2 36.7 37.3 36.9 38.1 37.1 38.0 37.2
Less: Calves, under 1 year 13.2 13.0 12.9 13.0 12.9 12.9 12.8 13.1 12.7 13.2 12.6 13.1 12.8
Less: Replacements 13.7 14.5 13.7 14.2 13.7 14.4 14.0 14.6 14.1 13.5 13.5 13.0 13.1
Available for Finish Slaughter 11.2 9.9 11.1 10.0 10.7 10.0 9.9 9.6 10.1 11.4 11.0 12.0 11.4
Maritimes
Bulls 4.0 3.6 3.6 3.4 3.3 3.4 3.4 3.6 3.3 3.4 3.2 3.4 3.1
Beef Cows 60.9 60.2 59.8 59.6 59.0 59.5 58.7 60.8 57.8 60.8 58.5 61.1 59.7
Dairy Cows 58.8 57.5 57.7 57.3 58.2 57.5 57.8 57.5 58.8 58.1 58.2 56.9 58.5
Total Cows 119.7 117.7 117.5 116.9 117.2 117.0 116.5 118.3 116.6 118.9 116.7 118.0 118.2
Replacement Heifers 39.8 41.4 40.0 40.3 39.3 40.5 39.9 41.4 40.9 39.8 39.6 38.9 38.6
Heifers, slaughter 15.9 16.6 16.5 16.7 16.9 17.4 17.4 17.5 17.4 17.4 17.2 16.5 16.8
Steers 1 year and over 28.9 28.8 28.2 28.9 27.4 29.5 27.6 29.1 26.8 28.5 26.8 27.9 25.8
Total for Slaughter 44.8 45.4 44.7 45.6 44.3 46.9 45.0 46.6 44.2 45.9 44.0 44.4 42.6
Calves, under 1 year 76.7 76.9 76.7 76.8 75.4 76.2 74.7 75.6 74.5 77.5 73.5 77.3 72.5
Revised: 30 August 2007
Prepared by Douglas Hedley for the Department of Agriculture, Government of Prince Edward Island
43
Table 10: Coarse Grain Imports for PEI, NS, NB
Corn Barley Oats
tonnes
2000-01 23870 24988 7118
2001-02 57394 20830 12241
2002-03 8472 16168 13628
2003-04 33765 10914 17749
2004-05 19215 12847 20620
2005-06 13334 5530 20412
2006-07* 30044 2657 6771
*: Up to May 2007.
Source: AAFC