Chapter 9, Non-functional Requirements Organizational Requirements Engineering
Upload
khangminh22Category
view
3download
0
Report for:
North West Leicestershire
District Council
Review of Housing
Requirements
(2011-31)
Final Report – April 2016


Nor t h W es t Le ices tersh i re Dis t r i c t Counc i l – Rev iew o f Hous ing Requi rements (2011-31)
Contents
1. Introduction ................................................................................................................. 1
2. Updating the SHMA to take Account of EMGRFI ..................................................... 9
3. Trend-based Demographic Projections .................................................................. 15
4. Economic-led Housing Requirements .................................................................... 39
5. Market Signals and Affordable Housing Need ....................................................... 55
6. Impact of EMGRFI on Other Areas .......................................................................... 77
7. Conclusions – Overall Housing Requirements ...................................................... 85


Nor t h W es t Le ices tersh i re Dis t r i c t Counc i l – Rev iew o f Hous ing Requi rements (2011-31)
Page 1
1. Introduction
Introduction
1.1 This document undertakes a review of housing needs and requirements in the North West
Leicestershire (NWL) District for the period 2011 to 2031 (to align with the emerging Local Plan) to
inform the consideration of what housing requirement to use in the Local Plan. The analysis
undertaken does not supersede the 2014 Strategic Housing Market Assessment (SHMA) but has
been developed to ascertain whether there is any local evidence which suggests that the housing
need identified in the SHMA should be adjusted (specifically in relation to NWL) when translating into
a housing requirement. In particular, this focuses on economic growth issues, recognising that the
SHMA itself highlighted, but did not take account of a range of local policies (including the East
Midlands Gateway Rail Freight Interchange (EMGRFI) which will have a particular impact on NWL).
1.2 All efforts have been made in this report not use the terms ‘housing need’ and ‘housing requirement’
interchangeably. For clarity, the term ‘housing need’ is used in this report to define the need for
housing as set against a range of demographic trend-based projections and baseline economic
forecasts; whilst the term ‘housing requirement’ is used when discussing any additional housing that
might be required as a result of above baseline increases in the number of jobs in the District
(specifically in relation to EMGRFI).
1.3 The analysis fulfils the key requirements of a SHMA as set out in the National Planning Policy
Framework (NPPF) and Planning Practice Guidance (PPG) on Housing and Economic Development
Needs Assessment.
1.4 The document is a partial update to the 2014 SHMA, completed for the Council and the other local
authorities in the Leicester & Leicestershire Housing Market Area (L&L HMA) in July 2014. In
particular, the study considers up-to-date information not available at the time the SHMA was
prepared; including that from ONS mid-year population estimates, the 2011 Census, 2012-based
ONS subnational population projections (SNPP), economic forecasts and CLG household
projections (particularly the 2012-based version). Crucially, this report seeks to assess the potential
impact on housing requirements of additional jobs expected to be created as a result of the EMGRFI.
1.5 The report studies the need/requirement for housing and the impact of EMGRFI in two ways (as
described below):
• As an update to the 2014 SHMA – this part of the analysis takes the data used in the SHMA and all
related assumptions (e.g. about employment and household formation rates) to model an uplift to
housing requirements to take account of the impact of EMGRFI. This can therefore be seen to be
consistent with the current SHMA – a report which has been accepted as providing a robust
assessment of the need for housing across the L&L HMA (see Charnwood Local Plan inspector’s
report).
Nor t h W es t Le ices tersh i re Dis t r i c t Counc i l – Rev iew o f Hous ing Requi rements (2011-31)
Page 2
• As a full update to take account of new data – this analysis recognises that since the 2014 SHMA
was undertaken a number of new sources of information have become available. To ensure that the
analysis is up-to-date a full reappraisal of this data has therefore been undertaken – this includes
consideration of demographic data (e.g. population trends, migration and household formation rates)
and economic forecasts. This updated analysis only focusses on NWL.
1.6 The need to update the assessment to reflect the EMGRFI can also be seen from a recent
inspector’s report in the District (January 2016 – Appeal Ref: APP/G2435/W/15/3005052; Land
South of Greenhill Road, Coalville). This says in paragraph 26 ‘… it is clear that the SHMA is out of
date and should be recalculated to take account of the latest economic projections… the Council
does not have a robust position on what its housing requirement should be and thus the Council
cannot demonstrate (on that basis) that it has a 5-year housing supply’.
1.7 This document does not constitute a full SHMA although key requirements of an SHMA are fully
reviewed and updated. This is with particular regard to analysis of housing need and requirements
using up-to-date demographic and economic data. The study is specific to NWL and does not
consider needs across the wider L&L HMA. A similar exercise (the Housing and Economic
Development Needs Assessment (HEDNA)) is expected to be undertaken during 2016 to look at
wider HMA needs. This report does however review the current HMA-wide SHMA.
Policy Background
National Planning Policy Framework
1.8 The Government published its National Planning Policy Framework (NPPF) in March 2012. The
NPPF sets out that the purpose of planning is to help achieve sustainable development. It
establishes a presumption in favour of sustainable development (para 14) which should be seen as a
golden thread running through both plan-making and decision making. It sets out that for plan
making this means:
• Local planning authorities should positive seek opportunities to meet the development needs of their
area;
• Local Plans should meet objectively assessed needs, with sufficient flexibility to respond to rapid
change, unless:
- any adverse impacts of doing so would significantly and demonstrably outweigh the benefits,
when assessed against the policies in this Framework as a whole; or
- specific policies in the Framework indicate development should be restricted.

Nor t h W es t Le ices tersh i re Dis t r i c t Counc i l – Rev iew o f Hous ing Requi rements (2011-31)
Page 3
1.9 Core planning principles which should underpin both plan-making and decision-making are set out in
Paragraph 17. The third principle is relevant to determining housing provision, and provides that
planning should:
“Proactively drive and support sustainable economic development to deliver the homes, business
and industrial units, infrastructure and thriving local places that the country meets. Every effort
should be made objectively to identify and then meet the housing, business and other development
needs of an area, and respond positively to wider opportunities for growth. Plans should take
account of market signals, such as land prices and housing affordability, and set out a clear strategy
for allocating sufficient land which is suitable for development in their area, taking account of the
needs of residential and business communities.”
1.10 Paragraph 47 explains that the Government’s ambition is to significantly boost the supply of housing.
To do so LPAs should:
“Use their evidence base to ensure that their Local Plan meets the full, objectively assessed needs
for market and affordable housing in the housing market area, as far as is consistent with policies in
the Framework, including identifying key sites which are critical to the delivery of the housing
strategy over the plan period.”
1.11 This is reaffirmed in Paragraph 50 which provides that local planning authorities should plan for a
mix of housing based on current and future demographic trends, market trends and the needs of
different groups in the community.
1.12 A Local Plan is required to set out the strategic priorities for the area, including the homes and jobs
needed. In paragraph 158 the Framework provides that:
“Local Plans should be based on adequate, up-to-date and relevant evidence about the economic,
social and environmental characteristics and prospects of the area. Local planning authorities should
ensure that their assessment of and strategies for housing, employment and other uses are
integrated and take full account of relevant market and economic signals.”
1.13 Paragraph 159 explains that a Strategic Housing Market Assessment (SHMA) should form the key
part of the evidence base for policies for housing provision. The Strategic Housing Market
Assessment should assess full housing needs, working with neighbouring authorities where housing
market areas cross administrative boundaries. The scope of the SHMA is defined as follows:
“The Strategic Housing Market Assessment should identify the scale and mix of housing and the
range of tenures that the local population is likely to need over the plan period which:
• meets household and population projections, taking account of migration and demographic change;
• addresses the need for all types of housing, including affordable housing and the needs of different
groups in the community;
• caters for housing demand and the scale of housing supply necessary to meet this demand.”

Nor t h W es t Le ices tersh i re Dis t r i c t Counc i l – Rev iew o f Hous ing Requi rements (2011-31)
Page 4
National Planning Policy Guidance – Housing and Economic Development Needs Assessments
1.14 New guidance was issued by Government in March 2014 (“PPG”) as part of its review of planning
practice guidance. This includes advice on ‘Housing and Economic Development Needs
Assessments’ and is maintained online and updated periodically. The Guidance is relevant to this
report in that it provides clarity on how key elements of the NPPF should be interpreted, including the
approach to deriving an objective assessment of the need for housing.
1.15 The PPG defines “need” as referring to:
“…the scale and mix of housing and the range of tenures that is likely to be needed in the housing
market area over the plan period – and should cater for the housing demand of the area and identify
the scale of housing supply necessary to meet this need.”
1.16 The PPG sets out that the assessment of need should be realistic in taking account of the particular
nature of that area, and should be based on future scenarios that could be reasonably expected to
occur. It should not take account of supply-side factors or development constraints, although the
PPG confirms that such factors will need to be taken into consideration ‘when bringing evidence
bases together to identify specific policies within development plans’.
1.17 The PPG outlines that whilst estimating future need is not an exact science and that there is no one
methodological approach or dataset which will provide a definitive assessment of need, the starting
point for establishing the need for housing should be the latest population and household projections
published by the Department for Communities and Local Government (CLG).
1.18 It sets out that there may be instances where these national projections require adjustment to take
account of factors affecting local demography or household formation rates, in particular where there
is evidence that household formation rates are or have been constrained by supply. It suggests that
proportional adjustments should be made where the market signals point to supply being
constrained relative to long-term trends or other areas in order to improve affordability.
1.19 With regard to economic evidence, the PPG indicates that job growth and economic forecasts should
be considered. It sets out that:
“Where the supply of working age population that is economically active (labour force supply) is less
than the projected job growth, this could result in unsustainable commuting patterns (depending on
public transport accessibility or other sustainable options such as walking or cycling) and could
reduce the resilience of local businesses. In such circumstances, plan makers will need to consider
how the location of new housing or infrastructure development could help address these problems.”
1.20 It cautions against reducing migration assumptions based on economic evidence unless this
approach is agreed with other local planning authorities under the duty to cooperate.

Nor t h W es t Le ices tersh i re Dis t r i c t Counc i l – Rev iew o f Hous ing Requi rements (2011-31)
Page 5
1.21 The PPG effectively describes a process whereby the latest population and household projections
are a starting point; and a number of “tests” then need to be considered to examine whether it is
appropriate to consider an adjustment to housing provision. These tests are:
• Is there evidence that the official population projections need adjustment due to specific local
evidence about migration and population growth?
• Is there evidence that household formation rates in the projections have been constrained?
• What do economic forecasts say about job growth? Is there evidence that a different spatial
distribution of housing would be needed to support this?
• Do market signals point to a need to increase housing supply?
• How do the demographic projections ‘sit’ with the affordable housing needs evidence, and should an
increase in housing supply be considered to support delivery of affordable housing?
Planning Advisory Service (PAS) – Technical Advice Note
1.22 In June 2014 PAS published a Technical Advice Note ‘Objectively Assessed Need and Housing
Targets’. This advice was subsequently updated in July 2015 (Second edition). The advice has no
official status but has been developed based on existing good practice and the recommendations of
Planning Inspectors. Where relevant, key parts of the PAS Advice Note have been quoted within this
report – this is particularly in relation to affordable housing need.
Housing and Planning Bill
1.23 In October 2015, the government published the Housing and Planning Bill 2015-16. This set out a
number of government initiatives which are likely to directly influence the supply and demand for
housing and affordable housing.
1.24 The detail of the Bill is not yet available and is not expected until April 2016 at the earliest. However,
in its current version (December 2015) the Bill will introduce a statutory requirement for local
authorities to promote the supply of starter homes in England. Starter homes are defined as:
• a new dwelling;
• which is available for purchase by qualifying first-time buyers only;
o First Time Buyer, Under 40,
• is to be sold at a discount of at least 20% of the market value;
• is to be sold for less than the price cap;
o £250,000 outside London, and
• Is subject to any restrictions on sale or letting specified in regulations made by the Secretary of
State.
1.25 Starter homes will also fall under the definition of an affordable home. The impact on this on the
supply of affordable homes has not yet been determined but could trigger a targeted update of
affordable housing calculation once a greater understanding is achieved. This issue is not addressed
in this report (which is predominantly looking at overall housing needs/requirements) but is an issue
which will need consideration in the forthcoming HEDNA.

Nor t h W es t Le ices tersh i re Dis t r i c t Counc i l – Rev iew o f Hous ing Requi rements (2011-31)
Page 6
1.26 There have also been a number of other initiatives which may impact on the supply and demand for
general and affordable homes, although the full impact is yet to be understood. These include:
• A requirement for social rents to be reduced by 1% for four years from April 2016. The likely
impact of this will be to reduce income for both the local authorities (which have housing stock) and
housing associations. This in turn may reduce the LA or RP reinvestment funding and may
subsequently reduce the development of new affordable homes.
• The extension of the Right to Buy to Registered Providers’ tenants. Although not enforceable
this could reduce affordable housing stock and reduce thus the number of re-lets. Research by
Joseph Rowntree Foundation predicts that nationally 8.3% of housing association tenants will be
eligible for and could afford the RTB, and that 71% of those will purchase their home over the first
five years.
• Local authorities to sell high value social housing stock as it becomes vacant. Whilst the detail
of this has yet to be confirmed this is will reduce the number of available properties which are
available for re-lets each year. Higher value areas will be impacted most although it may provide
additional funding for smaller affordable properties.
• Increasing rent to market rates for social housing tenants earning over £30,000. This “pay to
stay” initiative will ensure those who can afford to pay market rates will do so. However, it may mean
that people are more likely to exercise their right to buy thus reducing the stock level of affordable
housing.
• Capping social housing rents at Local Housing Allowance. For some Registered Providers this
will limit their income to a multiple of the Local Housing Allowance. In the long term this may
influence the type of homes they build with more smaller homes being likely. The proposal will see
any single claimants under 35 only being eligible for the LHA Shared Accommodation Rate which at
present is much lower than the LHA for one bedroom flats. This could result in reduced demand for
RP properties with a shift toward the Private Rented Sector (PRS).
• The introduction of 3% higher stamp duty on buy to let properties and second homes. This
may result in a reduction in the number of Buy-to-let landlords; both through sales of their existing
properties and new landlords seeing the sector it as unviable. The Bank of England expressed their
concerns that the proliferation of Buy-to-let landlords could result in a housing crash if they flood the
market with their unwanted property. While the introduction of the new rules may not result in a flood
of sales it may well reduce the supply of PRS properties.

Nor t h W es t Le ices tersh i re Dis t r i c t Counc i l – Rev iew o f Hous ing Requi rements (2011-31)
Page 7
Leicester & Leicestershire Strategic Housing Market Assessment (2014)
1.27 The Strategic Housing Market Assessment (SHMA) was prepared as required by the NPPF and
PPG for the relevant Housing Market Area (HMA) covering Leicester and Leicestershire. It adopted
the approach recommended in the PPG (on housing and economic development needs
assessments) – starting with the latest official demographic projections and official data, and then
considering whether there is a case to adjust the assessment of housing to take account of evidence
from market signals (to support improved affordability), of the need for affordable housing or
trends/forecasts for employment growth. All of this information was brought together to provide a
view about the Objectively Assessed Need for Housing (OAN) across the HMA and for individual
local authorities.
1.28 The SHMA assessed housing need across the HMA. The starting point was a need for 66,700
homes between 2011 and 2031 based on extending the 2011-based Household Projections to 2031
(3,335 dwellings per annum). An upwards adjustment was made to this to reflect the latest
population data, increasing the need by 3% to 68,800 homes (3,440 per annum). Taking account of
market signals, the assessed need was adjusted upwards further to 75,500 homes (3,775 per
annum) by remodelling household formation rates based on a midpoint between those in the 2008-
and 2011-based CLG Household Projections. This formed the basis of the lower end of the OAN
range defined.
1.29 The upper end of the range took account of Experian 2013 econometric forecasts, which the
modelling indicated would require provision of 77,100 homes across the HMA (3,855 dwellings per
annum). Incorporating further upwards adjustments to enhance affordable housing delivery and
improve the affordability of market housing in parts of the HMA, the upper end of the range was set
higher still at 84,300 homes (4,215 per annum) over the 2011-31 period.
1.30 A consistent approach was used in the SHMA to derive figures for individual local authorities on a
‘policy off’ basis. This resulted in a need for 285 – 350 homes per year in North West Leicestershire.
The following section provides more information about the outputs of the SHMA in terms of housing
need in NWL.

Nor t h W es t Le ices tersh i re Dis t r i c t Counc i l – Rev iew o f Hous ing Requi rements (2011-31)
Page 8
Summary – Introduction
The National Planning Policy Framework (NPPF) sets out that Local Plans should seek to meet
objectively-assessed development needs in their areas where feasible and should plan to deliver a mix of
housing based on current and future demographic trends, market trends and the needs of different groups
within the community.
The NPPF provides greater policy freedoms regarding development densities, levels of brownfield
development and site size thresholds for affordable housing. In determining affordable housing policies,
account though needs to be taken of wider policies in the Plan including sustainability standards,
infrastructure policies, its relationship to CIL and wider economic viability.
National Planning Policy Guidance (PPG) provides some clarity about how parts of the NPPF should be
interpreted. This is particularly in relation to calculating Objectively Assessed Needs for housing, although
guidance is also provided around affordable housing needs, market signals, housing market area
definitions and the needs of specific groups in the population.
Development needs should be met at a housing market area level with a ‘duty to cooperate’ with adjoining
local authorities where it is clear that cross-boundary linkages exist. The 2014 SHMA studied needs
across the HMA and concluded a need for up to 4,215 dwellings per annum in the period 2011-31
(including up to 350 in NWL).
This report is structured around the key requirements of the PPG and is split into a number of sections
which build up an understanding of need in NWL. The sections that follow are:
• Trend-based Demographic Projections
• Economic-led Housing Requirements
• Market Signals and Affordable Housing Need
• Conclusions – Overall Housing Requirements

Nor t h W es t Le ices tersh i re Dis t r i c t Counc i l – Rev iew o f Hous ing Requi rements (2011-31)
Page 9
2. Updating the SHMA to take Account of EMGRFI
Introduction
2.1 The first piece of analysis takes the modelling and assumptions underpinning the 2014 SHMA and
seeks to study the impact of the EMGRFI in terms of the potential growth in the number of jobs in the
District and the number of these likely to be filled by people who will live in the area. It is considered
that the potential increase in the number of residents in employment (over and above a baseline
position) will drive a requirement for more housing to be delivered given that not all of the new jobs
can realistically be expected to be filled by people commuting in from other areas.
2.2 The analysis below begins by summarising some of the key outputs in the SHMA (for NWL) before
moving on to consider job growth and changes to the resident workforce as a result of EMGRFI. The
analysis concludes by looking at the potential uplift to the housing requirements as a result of
increased job growth.
Key Outputs from the SHMA
2.3 The table below shows the key outputs from the SHMA in terms of the estimated housing need
under a range of scenarios. Overall the scenarios showed a range of need from 252 to 478 dwellings
per annum and the report ultimately concluded, when considering all of the evidence in the round,
that the OAN for NWL was for 350 dwellings per annum. This figure was higher than the range of
demographic based projections developed but below outputs from projections linked to economic
growth. The scenarios modelled are briefly described below:
• Start point projection – this used information from the 2011-based SNPP and CLG household
projections and extended the information to 2031 (noting that the 2011-based projections only
provided data up to 2021)
• Updated demographic projection – this took the start point projections described above and
updated key population data (e.g. about migration) to take account of more recent published data
• Reduced household formation constraint – this used the updated demographic projection but
recognised that there was some suppression of household formation within the 2011-based CLG
household projections. Household formation was therefore partially returned to the rates seen in the
earlier 2008-based projections
• Housing need to meet economic forecasts (NWL) – this projection took forecast job growth from
Experian and projected what level of housing delivery might be needed if there were to be sufficient
growth in the resident workforce. This projection used the job growth forecast data specifically for
NWL.
• Housing need to meet economic forecasts (HMA) – a similar projection to the one above;
however, in this case job growth was spread evenly across each of the local authorities in the HMA

Nor t h W es t Le ices tersh i re Dis t r i c t Counc i l – Rev iew o f Hous ing Requi rements (2011-31)
Page 10
Figure 2.1: Scenario Outputs from the SHMA – North West Leicestershire
Scenario SHMA source Housing need
(per annum)
Housing need
(2011-31)
Start point projection Table 10 290 5,805
Updated demographic projection Table 16 252 5,041
Reduced household formation constraint Table 18 284 5,672
Housing need to meet economic forecasts (NWL) Table 21 478 9,555
Housing need to meet economic forecasts (HMA) Table 23 372 7,442
Overall need for housing (upper end of range) Table 84 350 7,000
Source: 2014 SHMA
2.4 As noted previously, the outputs of the SHMA have been accepted as robust through the Local Plan
Examination process (in Charnwood) and indeed the figure of 350 dwellings per annum for NWL has
been accepted at a Section 78 inquiry in NWL (Lower Packington Road, Ref: 2217036). It is however
recognised that this figure does not take account of the potential impact of the EMGRFI. The figure
of 350 dwellings per annum does however provide a reasonable start point against which any uplift
for EMGRFI can be assessed.
East Midlands Gateway Rail Freight Interchange
2.5 East Midlands Gateway is a proposed Strategic Rail Freight Interchange (EMGRFI) which will
accommodate new distribution and storage buildings. The project will include a rail freight terminal
and will have direct connections into the National Freight Network. It is to be built on farmland
between the village of Castle Donington, East Midlands Airport and the M1. It is being promoted by
Roxhill (Kegworth) Limited and was approved on the 16th January 2016.
2.6 This is a substantial proposal which is expected to generate significant job growth in the NWL area.
Indeed, the Environmental Statement for the East Midlands Gateway SRFI (July 2014) estimates the
creation of 7,317 jobs once fully operational. The table below show the number of jobs by type and
whether or not these are full- or part-time.
Figure 2.2: Projected Direct Employment by Job Type
Job type
Approximate
number of
jobs
Full-time Part-time
Warehouse staff 3,120 2,746 374
Drivers 759 668 91
Admin Staff 897 789 108
Managerial Staff 644 567 77
IT, engineering, sales, customer services 1,852 1,630 222
Rail terminal staff 45 45 0
TOTAL 7,317 6,445 872
Source: EMG SRFI Environmental Statement (Table 4.8)

Nor t h W es t Le ices tersh i re Dis t r i c t Counc i l – Rev iew o f Hous ing Requi rements (2011-31)
Page 11
2.7 In terms of modelling what level of additional housing might be required it would be possible just to
take the figure of 7,317. However, the reality is likely to be more complex than this with a number of
issues needing to be considered:
• Displacement – the extent to which people may move between different companies and sectors and
therefore not provide any additional jobs (for example a self-employed person might take up a job at
EMGRFI or someone might move from an existing business and not be replaced. In such
circumstances there would be no additional ‘job’ created);
• Additionality – the extent to which the EMGRFI will further increase jobs, such as through supply
chains or as a result of new workers spending money in the local area, this could see new
businesses started or existing businesses providing additional employment.
2.8 The Environmental Statement referred to above has considered both of these points and concluded
(in Table 4.9) that the site would provide an additional 6,881 full-time equivalent (FTE) jobs and that
the total net additional effect would be 6,688 FTEs. The calculations in the Environmental Statement
are based on best estimates and it is difficult to say for certain how robust these assumptions are;
however, on the basis of the figures above it would be reasonable to conclude that the number of
FTE jobs created will be broadly similar to the net additional effect in terms of FTE.
2.9 It would therefore be reasonable to also assume that the number of jobs (both full- and part-time) will
be similar to the net additional effect in terms of jobs. Hence it is assumed that the number of jobs
expected (7,317) will be in addition to the jobs (and growth in the resident workforce) implicit within
the SHMA housing need projections – it should be noted that the SHMA (as is typical in analysis of
this nature) focuses on the number of jobs rather than a FTE.
2.10 The analysis therefore proceeds on the basis that the Council should be looking at planning for
7,317 jobs over and above the numbers in the SHMA projections. It is assumed that these jobs will
be created in the period to 2031, to be consistent with the SHMA demographic modelling and the
Council’s emerging Local Plan.
Converting Additional Jobs into Growth in the Resident Workforce
2.11 It would be possible to model the impact of additional jobs on a fairly standard basis (which would for
example take account of current commuting patterns); however, such an approach would not be
consistent with the EMGRFI clearly being a particular ‘shock’ in terms of job growth which would be
expected to draw in labour from a range of areas and not just NWL.
2.12 For example, using a standard commuting ratio would not be appropriate given that in looking at the
impact of the site the analysis is only looking at where the new workers are coming from (and not the
net flow between locations). If all areas with commuting links to NWL were also proposing something
of the scale of EMGRFI then there would be merit in looking at a two-way movement; however, this
is not the case.

Nor t h W es t Le ices tersh i re Dis t r i c t Counc i l – Rev iew o f Hous ing Requi rements (2011-31)
Page 12
2.13 Therefore, to consider how many additional residents in employment might be expected, the analysis
has looked solely at the locations from which people travel to work in NWL. Analysis of commuting
patterns in the table below shows that (as of the 2011 Census) there were 53,975 people working in
the District, included within this are 26,699 people who commute in. Therefore, the proportion of
local jobs taken up by in-commuters can be calculated as 49.5%. This figure is potentially higher
given that the number of people working in the District includes those working from home and with
no fixed workplace.
Figure 2.3: Commuting patterns NWL (2011)
NWL
Live and work in LA/HMA 18,880
Home workers 5,069
No fixed workplace 3,327
Out-commute 19,246
In-commute 26,699
Total working in LA/HMA 53,975
Total living in LA/HMA (and working) 46,522
% of local workers commuting into District 49.5%
Source: 2011 Census
2.14 If this ratio (0.495) remained the same then it would be expected that 3,619 of the jobs would be
filled by people commuting from other areas (with 3,698 being filled by residents of the District).
2.15 Clearly an assumption that a substantial proportion of the new jobs would be taken up by in-
commuters does potentially have an impact on levels of population growth (and housing
requirements) in other areas which will need to be considered as part of duty-to-cooperate
discussions. However, it is clear (given current commuting patterns) that it would be unrealistic to
expect more than about half of the additional jobs to be undertaken by people resident in the District.
An assessment of the potential impact in housing terms on other locations can be found in Section 6
of this report.
2.16 On this point it is notable that Roxhill themselves (as part of the Socio-Economic Aspects report –
para 4.9.23) only expect some 20% of employees at EMGRFI to seek to move to the area (and this
is based on an ‘area of influence’ which covers a broad area and not just NWL). Hence the
assumptions made in this report look more likely to over- rather than under-estimate the required
growth in the resident workforce.
2.17 As well as commuting patterns the analysis also considers that a number of people may have more
than one job (double jobbing). This can be calculated as the number of people working in the local
authority divided by the number of jobs. Data from the Annual Population Survey (available on the
NOMIS website) suggests that around 3.3% of workers have a second job (data averaged from data
for the 2004-14 period to recognise relatively high error margins associated with data for individual
years). This gives a double jobbing ratio of 0.967 (i.e. the number of jobs can be discounted by 3.3%
to estimate the required change in the workforce).

Nor t h W es t Le ices tersh i re Dis t r i c t Counc i l – Rev iew o f Hous ing Requi rements (2011-31)
Page 13
2.18 Given that the EMGRFI is expected to provide a notable number of part-time jobs (about 12% of the
total) it is considered appropriate to apply an allowance for double jobbing. On the basis of 3,698
jobs being taken up by people resident in the District and applying a 0.967 adjustment for double
jobbing, it is estimated that to meet an additional 7,317 jobs there would be a further increase in the
resident working population of some 3,576 people from 2011 to 2031.
2.19 It should be noted that whilst this ‘double jobbing’ estimate has been based on data for the whole of
NWL (and is not specific to EMGRFI and the type of jobs expected to be created) it is only a small
adjustment. Any different and reasonable view of double jobbing in relation to EMGRFI would not
substantially impact on estimates of the required workforce and how this works through into
estimates of housing requirements.
Modelling EMGRFI as an uplift to the SHMA
2.20 To model the impact of the EMGRFI the analysis has worked out the growth in the number of
residents in employment for the range of scenarios described above and then modelled what
additional population growth (and worked through to household growth and housing requirements)
would be needed if the number of residents in employment were to increase by 3,576. There are a
number of assumptions in the SHMA which are worthy of discussion and these are shown below:
• Employment rates – the SHMA methodology set employment rates (by age and sex) to be consistent
with figures from the 2011 Census (the employment rate being calculated as the number of people
working divided by the total population in any specific age/sex cohort). Moving forward from 2011 it
was assumed that rates would change at half of the level seen in the previous (2001-11) decade –
again based on Census data. This approach was highlighted in the Lower Packington Road appeal
decision as being ‘conservative’ (para 41). In this context, the word ‘conservative’ was used to
suggest that changes (particularly increases) in employment rates in the SHMA could reasonably
have been projected to be higher; this would have the impact of reducing the population growth
required to meet job growth forecasts and hence reduce the level of housing need.
• Household formation rates – these are based on taking a midpoint between the rates of change in
the 2011-based and 2008-based CLG household projections. This approach was described by the
inspector to the Charnwood Local Plan Examination as being ‘pragmatic and justified’ (para 32).
2.21 The reason for highlighting these aspects of the SHMA analysis is that the full updating of
information (carried out in the sections to follow) looks again at these issues. With regard to
employment rates, it is considered that an approach which takes more direct account of changes to
state pension age to be more robust. Regarding, household formation rates, it is the case that CLG
have now published a new set (of 2012-based) figures; clearly these should be considered in any
updating of information. However, for the purposes of looking at the impact of EMGRFI as an
addition to the SHMA analysis, it is considered that the broad methodology in the SHMA remains
sound (and is supported by a number of inspectors).

Nor t h W es t Le ices tersh i re Dis t r i c t Counc i l – Rev iew o f Hous ing Requi rements (2011-31)
Page 14
2.22 The table below shows the range of scenarios (plus the OAN) from the SHMA and the uplift to
housing provision that would be required if the resident workforce were to increase by a further 3,576
people in the 2011-31 period. The analysis shows that around an additional 120 dwellings per
annum would be required (approaching 2,500 across the whole plan period). Focussing on the uplift
to the SHMA OAN conclusion, the analysis shows a requirement for 472 dwellings per annum – this
is 9,440 homes in total over the 2011-31 period.
Figure 2.4: Scenario Outputs from the SHMA – North West Leicestershire
Scenario
Housing need
(per annum) –
SHMA
Housing
requirement
(per annum) –
SHMA+EMGRFI
Potential uplift
(per annum)
Start point projection 290 410 +120
Updated demographic projection 252 372 +120
Reduced household formation constraint 284 406 +122
Housing need to meet economic forecasts (NWL) 478 600 +122
Housing need to meet economic forecasts (HMA) 372 495 +123
Overall need for housing (upper end of range) 350 472 +122
Source: 2014 SHMA and additional data modelling
Summary – Updating the SHMA to take Account of EMGRFI
The 2014 SHMA looked at a range of demographic and economic based projections and concluded that
the objectively assessed need for housing in NWL was somewhere in the range of 285-350 dwellings per
annum (with a main focus being on a figure at the top end of this range). This conclusion was not only
based on data for NWL but also took account of the need and distribution across the whole HMA.
The SHMA analysis did not however take any account of the likely future job growth as a result of the
EMGRFI (estimated to be around 7,300 additional jobs in NWL). Using the SHMA data and methodology
an analysis has been undertaken which seeks to show what sort of level of uplift on the housing need
might be appropriate if EMGRFI is included within the figures. Taking account of the locations from which
people might be expected to commute (along with an adjustment for double jobbing) is was estimated that
a further 3,600 resident workers would be required to fulfil this level of additional employment.
The analysis identified that this level of additional job growth would be likely to require an increase in
provision of about 120 dwellings per annum to meet housing requirements. On the basis of an OAN of 350
dwellings per annum it is therefore suggested that SHMA+EMGRFI housing requirement assessment
would be for provision of about 472 dwellings per annum in the 2011-31 period.

Nor t h W es t Le ices tersh i re Dis t r i c t Counc i l – Rev iew o f Hous ing Requi rements (2011-31)
Page 15
3. Trend-based Demographic Projections
Introduction
3.1 In this section consideration is given to demographic evidence of housing need and trend-based
projections. Such projections are critical to the SHMA process and this is emphasised in the NPPF
(para 158) which states that local planning authorities should prepare a SHMA to identify the scale of
housing which ‘meets household and population projection, taking account of migration and
demographic change’.
3.2 The importance of such projections can also be seen in the PPG which states [2a-015] that
‘household projections published by [CLG] should provide the starting point estimate of overall
housing need’. The CLG projections are directly linked to ONS subnational population projections
(SNPP). Further emphasis is put on the CLG projections in 2a-017 where it is noted that ‘the
household projections… are statistically robust and are based on nationally consistent assumptions’.
3.3 However, the PPG also identifies [2a-014] that ‘establishing future need for housing is not an exact
science. No single approach will provide a definitive answer’ and in 2a-017 notes that ‘plan makers
may consider sensitivity testing, specific to their local circumstances’ – this is particularly related to
evidence that there have been particular events which may have impacted on migration or the profile
of the local population. Furthermore, the PPG notes [2a-016] that ‘where possible, local needs
assessments should be informed by the latest available data’ – this is relevant in this area due to
new population estimates having been published since the release of the last SNPP.
3.4 For information, the 2014 SHMA had access to a 2011-based set of SNPP and associated CLG
household projections; 2012-based mid-year population estimates (MYE) from ONS has also been
published. At the time of writing this report, a 2012-based set of population and household
projections were available along with MYE for 2013 and 2014. Since the SHMA was written it is
therefore clear that a significant amount of new data is available that can be used in analysis.
3.5 The PAS technical advice note provides some additional detail about sensitivity testing and in
particular advises (para 6.24) that using a longer (10- to 15-year) past trend analysis should provide
a more robust projection than the SNPP (which uses data from the previous 5-6 years). The PAS
technical advice note also highlights the issue of Unattributable Population Change (UPC) – UPC is
an adjustment made by ONS for discrepancies between Census data and annual monitoring. PAS
states (para 6.35) that ‘plan makers may take a view that the UPC, or part of it, should be included in
the base period as past migration’.

Nor t h W es t Le ices tersh i re Dis t r i c t Counc i l – Rev iew o f Hous ing Requi rements (2011-31)
Page 16
3.6 On the basis of the wording in both the PPG and the PAS technical advice note a number of
observations can be made which are relevant to the assessment of trend-based demographic
projections:
• CLG household projections (which link to ONS population projections) are robust and should be
used as the ‘start point’ for assessing housing need
• These projections can be sensitivity tested where there is evidence of changes over time (e.g. short-
term changes to migration patterns) or where UPC may be related to recorded migration levels
• Up-to-date information should be used where possible and this will include later releases of ONS
mid-year population estimates (MYE)
3.7 Although guidance does not talk about either increasing or decreasing need as a result of
sensitivities, it would seem logical that assessment could go in either direction. This is on the basis
of a ‘common sense’ approach whereby any suggested increase in migration in one area will come
with a commensurate decrease in other locations. It is also recognised that levels of population
growth for individual local authorities (nationally) will need to sum to the total level of growth
projected nationally (through ONS national population projections). This latter point is slightly
complicated by a new set of national projections (published in October 2015 (2014-based)) which
suggest population growth (2014-37) to be 6% higher than in the previous (2012-based) version. As
yet there are no new (2014-based) SNPP – these being due to be published at the end of May 2016.
3.8 In considering whether or not projections can be increased or decreased from ONS figures some
general trends should also be understood. In particular, it has been evident since about 2008 (the
start of recession) that population growth has been relatively strong in many urban areas – this looks
to be driven by a reduced trend of out-migration from such locations (which is likely to be linked to
factors such as mortgage finance constraints). This has meant that more rural locations have
typically seen lower levels of population growth than previously. These trends have not been
observed universally across different types of locations but can give an insight into whether or not it
is reasonable to move away from official projections.
3.9 In understanding what a reasonable projection is a number of factors can be considered. In
particular, this would include overlaying past and projected population growth (to see if there is a
correlation) and also to compare past and projected levels of migration – this needs to recognise that
migration may well be expected to change over time as the age structure of the population changes.
3.10 Overall, it is clear that developing the most reasonable and realistic projections for housing need is
far from straightforward and will involve a degree of professional judgement. The need for judgment
can clearly be seen in a recent High Court case in Kings Lynn (CO/914/2015) where it is noted that
‘this is a statistical exercise involving a range of relevant data for which there is no one set
methodology, but which will involve elements of judgment about trends and the interpretation and
application of the empirical material available’.

Nor t h W es t Le ices tersh i re Dis t r i c t Counc i l – Rev iew o f Hous ing Requi rements (2011-31)
Page 17
Demographic Profile of NWL
3.11 The analysis below looks at the population profile in NWL, including past levels of population
change, the components of this change (e.g. births, deaths and migration) and the age structure.
Where relevant, comparisons are made with other areas (the Leicester & Leicestershire (L&L)
Housing Market Area (HMA), the East Midlands region and England). The analysis uses 2014 as a
base date, due to this being the date for which the most recent information was available at the time
of writing (from ONS mid-year population estimates).
Overall population level and changes
3.12 The population of NWL in 2014 is estimated to be 95,900, this is an increase of 10,200 people since
2001 – an 11.9% increase over the 13-year period. This level of population growth is slightly below
that seen across the L&L HMA but above equivalent figures for both the East Midlands (10.7%) and
England (9.8%).
Figure 3.1: Population Growth (2001-14)
Area Population
2001
Population
2014
Change in
Population % change
NWL 85,678 95,882 10,204 11.9%
L&L HMA 893,036 1,005,558 112,522 12.6%
East Midlands 4,189,622 4,637,413 447,791 10.7%
England 49,449,746 54,316,618 4,866,872 9.8%
Source: ONS (mid-year population estimates)
3.13 Analysis can also be provided to consider longer-term trends in population growth with data being
available back to 1981. The data shows variations in population change over time in all areas with
stronger growth being seen in the period from about 2001. NWL saw weaker population growth than
across the HMA or region until the late 1990s but since 2001 has seen a similar level of
proportionate growth. Across the whole period studied, the level of population growth has been
broadly similar in each of NWL, the HMA and the East Midlands; this level of growth is somewhat
stronger than has been observed nationally.

Nor t h W es t Le ices tersh i re Dis t r i c t Counc i l – Rev iew o f Hous ing Requi rements (2011-31)
Page 18
Figure 3.2: Indexed population growth (1981-2014)
Source: ONS (mid-year population estimates)
Components of past population change
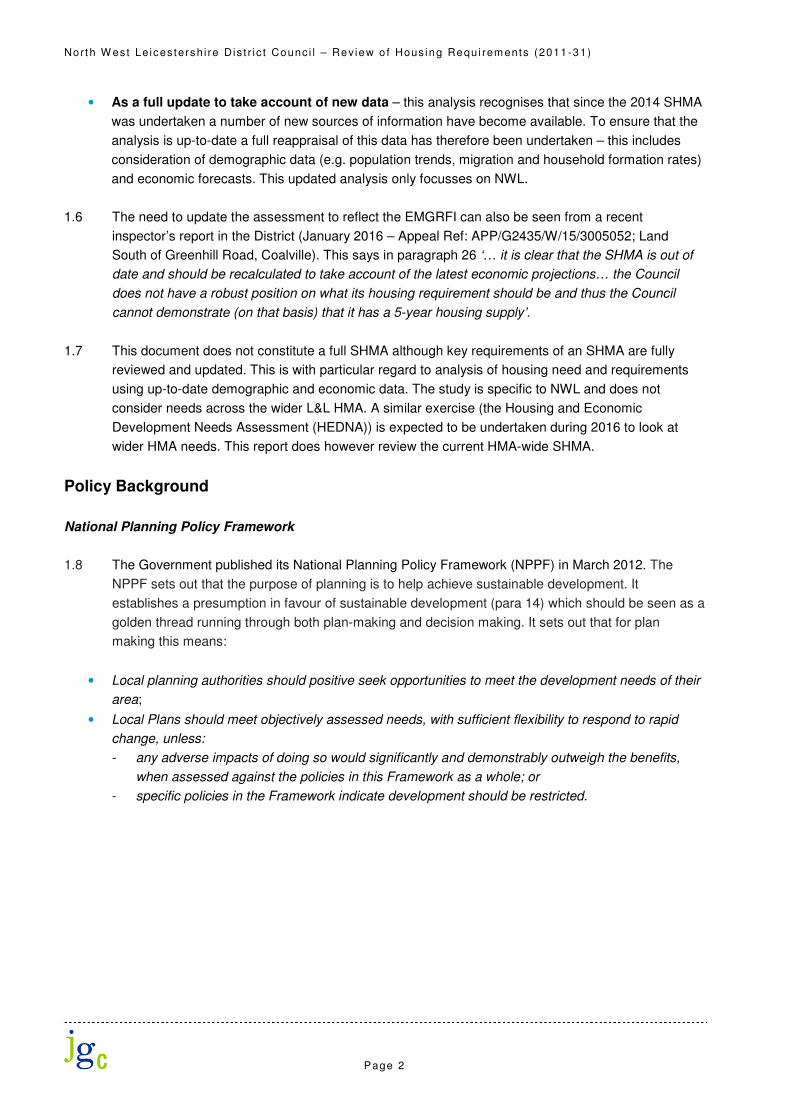
3.14 The figure and table below consider the drivers of population change in the NWL area from 2001 to
2014 (2001 being the base date from which detailed figures are available). Population change is
largely driven by net migration although there is also a positive level of natural change (births minus
deaths). Within ONS data there is also a small other changes category (mainly related to armed
forces and prison populations) and an unattributable population change (UPC) – this is an
adjustment made by ONS to mid-year population estimates where Census data has suggested that
population growth had either been over- or under-estimated in the inter-Census years. Because UPC
links back to Census data a figure is only provided for 2001 to 2011.
3.15 The figure shows that net migration has been the key driver of population change (and in particular
internal migration (i.e. moves from one part of the country to another)) – over the 2001-14 period net
migration averaged 495 people per annum out of an average population growth of 785. About 85%
of this migration was internal net migration and the remaining 15% a net movement of people from
abroad. The average level of natural change over this period was 155 per annum (i.e. 155 more
births than deaths). Other changes averaged just 3 people per annum (negative figure).
3.16 The data also shows a small (but not insignificant) level of UPC. The UPC (for 2001-11) is an
average of 138 per annum (positive and when averaged for the whole 2001-14 period) and would
suggest that ONS may have previously under-estimated migration and population growth in the NWL
area – this could potentially have some impact on forward projections.
95
100
105
110
115
120
125
1981 1983 1985 1987 1989 1991 1993 1995 1997 1999 2001 2003 2005 2007 2009 2011 2013
Indexed population growth (1981=100)
NWL L&L HMA East Midlands England
Nor t h W es t Le ices tersh i re Dis t r i c t Counc i l – Rev iew o f Hous ing Requi rements (2011-31)
Page 19
Figure 3.3: Components of population change, mid-2001 to mid-2014 – NWL
Source: ONS
Figure 3.4: Components of population change, mid-2001 to mid-2014 – NWL
Year Natural
change
Net internal
migration
Net
international
migration
Other
changes
Other
(unattributable)
Total
change
2001/2 97 962 -60 -6 171 1,164
2002/3 97 720 -31 -4 170 952
2003/4 175 711 -4 1 168 1,051
2004/5 103 502 9 -13 177 778
2005/6 150 240 214 -3 182 783
2006/7 176 575 156 -12 175 1,070
2007/8 217 290 113 3 184 807
2008/9 190 -28 95 -2 190 445
2009/10 205 36 14 -3 185 437
2010/11 175 34 101 1 194 505
2011/12 193 61 91 3 0 348
2012/13 142 549 100 5 0 796
2013/14 95 832 149 -8 0 1,068
Source: ONS
-200
0
200
400
600
800
1,000
1,200
1,400
2001/2
2002/3
2003/4
2004/5
2005/6
2006/7
2007/8
2008/9
2009/10
2010/11
2011/12
2012/13
2013/14
Natural change Net internal migration Net international migration
Other changes Unattributable population change Total change
Nor t h W es t Le ices tersh i re Dis t r i c t Counc i l – Rev iew o f Hous ing Requi rements (2011-31)
Page 20
Age Profile and Past Changes
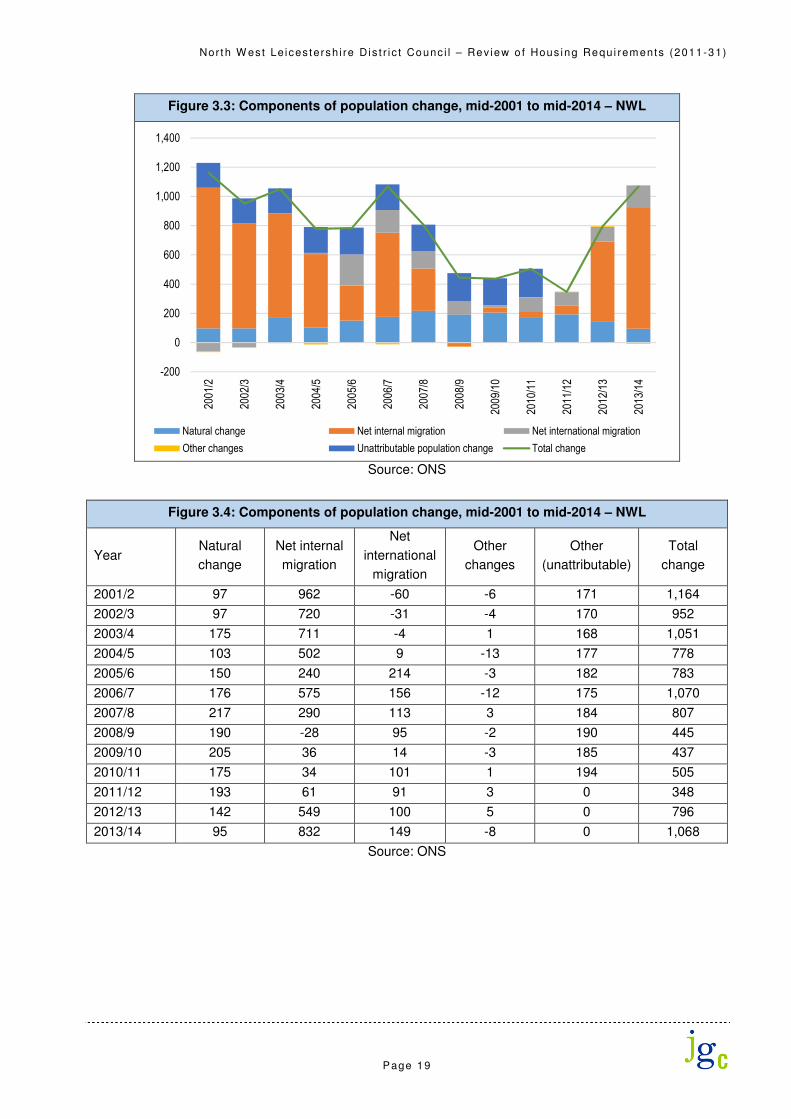
3.17 When compared with other areas, NWL has a relatively old population structure with 25% of the
population aged 60 and over (compared with 22% across the HMA, 24% in the East Midlands and
23% nationally). The proportion of people aged under 30 is relatively low (34% in NWL, compared
with 39% in the HMA and 37% regionally and nationally). The age profile of the population of NWL
more closely resembles that seen regionally than the HMA position (although the latter is influenced
by the inclusion of Leicester and the impact students have on the population profile).
Figure 3.5: Population Age Profile (2014)
Source: ONS 2014 mid-year population estimates
3.18 The table below shows how the age structure of the population has changed over the 2001 to 2014
period. The data shows the most significant growth to have been in the 60-74 age group, with this
group also showing the highest proportionate increase. Increases have also been seen in the 15-29
and 45-59 age groups (the latter increasing by 2,800 people). The population aged 75 and over has
increased by around 1,200 people; a 19% increase. The analysis also indicates a decline in the
population aged 30-44 and a modest increase in the number of children (population aged Under 15).
Figure 3.6: Change in Age Structure (2001-2014) – NWL
Age group 2001 2014 Change % change
Under 15 15,863 16,532 669 4.2%
15-29 13,839 15,782 1,943 14.0%
30-44 19,772 18,157 -1,615 -8.2%
45-59 18,182 21,003 2,821 15.5%
60-74 11,544 16,685 5,141 44.5%
75 and over 6,478 7,723 1,245 19.2%
Total 85,678 95,882 10,204 11.9%
Source: ONS 2014 mid-year population estimates
17.8%
17.3%
17.8%
17.2%
19.4%
19.3%
21.0%
16.5%
19.9%
18.6%
19.0%
18.9%
19.9%
20.6%
19.8%
21.9%
14.9%
16.1%
14.7%
17.4%
8.1%
8.3%
7.7%
8.1%
0% 10% 20% 30% 40% 50% 60% 70% 80% 90% 100%
England
East Midlands
L&L HMA
NWL
Under 15 15-29 30-44 45-59 60-74 75 and over

Nor t h W es t Le ices tersh i re Dis t r i c t Counc i l – Rev iew o f Hous ing Requi rements (2011-31)
Page 21
3.19 The same analysis has been carried out for a range of comparator areas (in the table below). The
data identifies that population profile changes in NWL are broadly similar to that seen in other areas
– the main differences look to be stronger growth in the 60-74 age group and a higher decrease in
the population aged 30-44.
Figure 3.7: Change in Age Structure (2001-2014)
Age group NWL L&L HMA East Midlands England
Under 15 4.2% 5.5% 2.0% 4.2%
15-29 14.0% 19.5% 17.0% 12.9%
30-44 -8.2% -4.8% -8.0% -4.0%
45-59 15.5% 17.0% 16.0% 16.0%
60-74 44.5% 31.1% 31.8% 24.1%
75 and over 19.2% 23.0% 21.0% 17.5%
Total 11.9% 12.6% 10.7% 9.8%
Source: Mid-Year Population Estimates
Demographic Evidence of Housing Need – Start Point
3.20 The PPG [2a-015] states that ‘household projections published by the Department for Communities
and Local Government should provide the starting point estimate of overall housing need. The
household projections are produced by applying projected household representative rates to the
population projections published by the Office for National Statistics. Projected household
representative rates are based on trends observed in Census and Labour Force Survey data’.
3.21 The most up-to-date projections are the 2012-based CLG household projections published in
February 2015 (i.e. post-dating the 2014 SHMA). These projections were underpinned by ONS
(2012-based) subnational population projections (SNPP) – published in May 2014. In December
2015, CLG published a new set of ‘Stage 2’ projections which looked at household types – these
projections did not alter estimates of household growth although some age specific estimates were
changed; this is discussed later in this section.
3.22 The table below sets out levels of household growth expected by the CLG household projections in
the 2011-31 period (noting that whilst the projections are 2012-based, information is provided back
to 1991). Data is also provided for the L&L HMA, the East Midlands and England for comparative
purposes. Across the whole NWL area, the CLG household projections show household growth of
about 5,100 – this is a 13% increase; below equivalent figures for both the East Midlands (17%) and
England (19%), the level of growth is also below that projected across the HMA (at 17%).

Nor t h W es t Le ices tersh i re Dis t r i c t Counc i l – Rev iew o f Hous ing Requi rements (2011-31)
Page 22
Figure 3.8: Household change 2011 to 2031 (2012-based CLG household
projections
Area Households
2011
Households
2031
Change in
households % change
NWL 39,230 44,297 5,067 12.9%
L&L HMA 390,865 459,055 68,190 17.4%
East Midlands 1,897,445 2,220,059 322,614 17.0%
England 22,103,878 26,406,679 4,302,801 19.5%
Source: CLG household projections (2012-based)
3.23 Whilst the 2012-based data is the latest ‘official’ population projection and therefore forms the start
point for analysis in line with the PPG, it is worth testing the assumptions underpinning the projection
to see if it broadly reasonable in the local context – this involves considering both the population
projections (the SNPP from ONS) and also the way CLG have converted this data into households.
The analysis below initially considers the validity of the population projections and their consistency
with past trends, before moving on to consider past trend data in more detail, and also data released
since the population projections were published (in particular, ONS has subsequently published new
mid-year population estimates for 2013 and 2014).
2012-based Subnational Population Projections (SNPP)
3.24 The latest SNPP were published by ONS on the 29th May 2014. They replace the 2010- and 2011-
based projections. Subnational population projections provide estimates of the future population of
local authorities, assuming a continuation of recent local trends in fertility, mortality and migration
which are constrained to the assumptions made for the 2012-based national population projections.
The new SNPP are largely based on trends in the 2007-12 period (2006-12 for international
migration trends). The SNPP are only population projections and do not contain headship rates
(which are needed to convert into household estimates).
3.25 They are not forecasts and do not attempt to predict the impact that future government or local
policies, changing economic circumstances or other factors might have on demographic behaviour.
The primary purpose of the subnational projections is to provide an estimate of the future size and
age structure of the population of local authorities in England. These are used as a common
framework for informing local-level policy and planning in a number of different fields as they are
produced in a consistent way.
Overall Population Growth
3.26 The table below shows projected population growth from 2011 to 2031 in each of NWL and a range
of comparator areas. The figures for different areas are all taken from the most recent projections; in
the case of data for England, this uses information from the 2014-based national population
projections, whereas for other areas the data is taken from the 2012-based SNPP. The data shows
that the population of the NWL area is projected to grow by around 8,600 people; this is a 9%
increase – slightly below that projected across the HMA and East Midlands (10%) and also below
the figure for England as a whole (12%).

Nor t h W es t Le ices tersh i re Dis t r i c t Counc i l – Rev iew o f Hous ing Requi rements (2011-31)
Page 23
3.27 Since the 2012-based SNPP was published there have been two releases of mid-year population
estimates (MYE) from ONS (for mid-2013 and mid-2014). It is the case in NWL that both of the MYE
show stronger levels of population growth than was projected in the SNPP (this finding is the same
as observed across the whole L&L HMA). It is possible in the demographic modelling to overwrite
the projected figures for 2013 and 2014 for those in the MYE and then project forward from 2014. In
doing this the analysis assumes the same birth and death rates as in the 2012-based SNPP and the
same levels of migration (in absolute number terms). Once updated the projection shows a higher
level of population growth, and one which is slightly higher than seen across the HMA and region,
but still below the national projected change (10,200 people – 11%).
Figure 3.9: Projected population growth (2011-2031) – 2012-based SNPP (and 2014-based national
population projections)
Area Population
2011
Population
2031
Change in
population % change
NWL (2012-based) 93,670 102,271 8,601 9.2%
NWL (2012-based (as updated)) 93,670 103,850 10,180 10.9%
L&L HMA 1,005,600 1,102,800 97,200 9.7%
East Midlands 4,637,400 5,099,500 462,100 10.0%
England 54,316,600 60,853,000 6,536,400 12.0%
Source: ONS and demographic projections
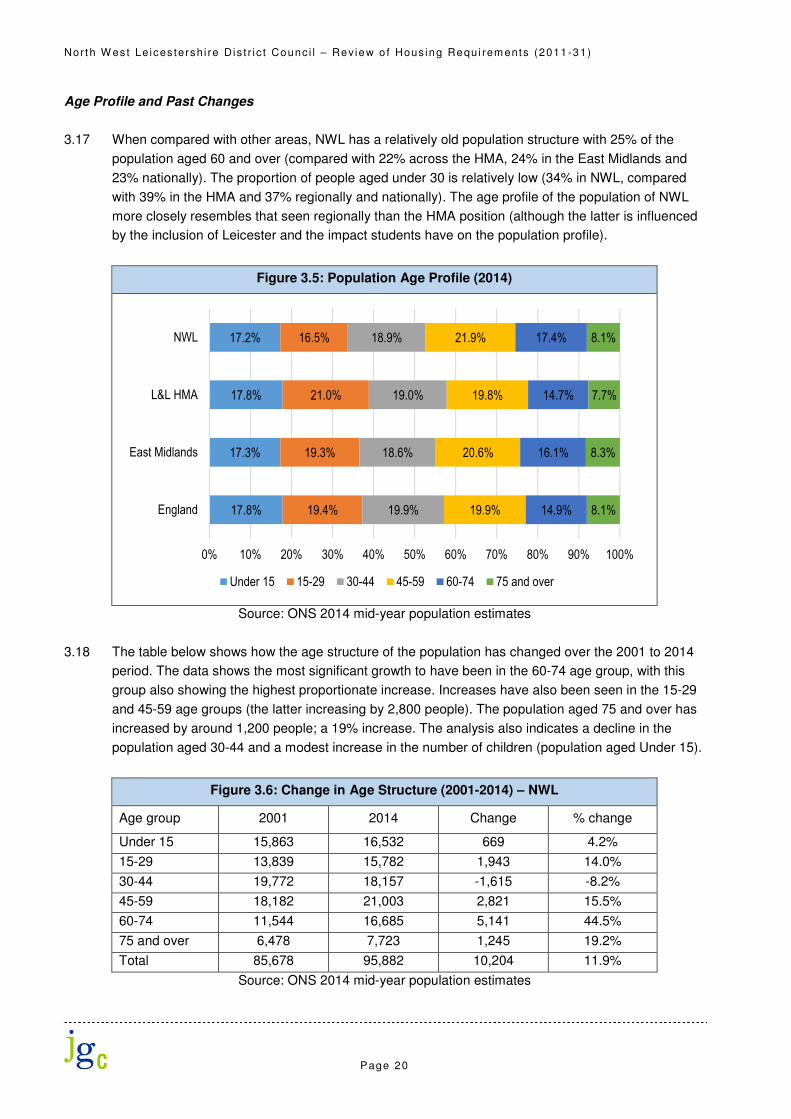
3.28 The figure below shows past and projected population growth in the period 2001 to 2031. The data
also plots a linear trend line for the last five years for which data is available (2009-14) and also a
longer-term period from 2001 to 2014 – this being the longest period for which reasonable data
about the components of population change (e.g. migration) is available. The projection is based on
the SNPP but takes account of more up-to-date MYE figures.
3.29 The data shows that the population is projected to grow at a rate which below both long- and short-
term trends although more closely matching the short-term figures. This is an important finding given
that ONS typically consider short-term trends when developing the SNPP (looking at the last 5-years
for internal migration and the last 6-years for international migration).
Nor t h W es t Le ices tersh i re Dis t r i c t Counc i l – Rev iew o f Hous ing Requi rements (2011-31)
Page 24
Figure 3.10: Past and projected population growth – 2012-based SNPP (as updated)
– NWL
Source: ONS and demographic projections
Components of population change
3.30 The figure below brings together data about migration (both past trends and the future projection)
along with information about natural change. This shows that natural change is expected to
decrease over time (a reduction in the excess of births over deaths). Expected levels of migration
show the opposite pattern – generally increasing over time. When compared with the past trends in
migration, the projected figures look to be slightly on the low side. For the whole of the projection
period (2014-31) the average level of migration is expected to be around 321 people (net) per
annum – this figure is lower than the level seen in short-term past trends (393 per annum over the
past 5-years) and an average figure of 495 if the longer-term (2001 to 2014) figures are used.
3.31 The figure of 321 (net migration) per annum is however somewhat higher than would be suggested
by the period feeding into the 2012-based SNPP (2007-12 data for internal migration and 2006-12
for international) – this would be an average of 174 people (net) per annum. On that basis the
migration figures in the SNPP do not look unduly low.
80,000
85,000
90,000
95,000
100,000
105,000
110,000
2001
2003
2005
2007
2009
2011
2013
2015
2017
2019
2021
2023
2025
2027
2029
2031
Population
Trend (2001-14) Trend (2009-14) 2012-based (as updated)
Linear (Trend (2001-14)) Linear (Trend (2009-14))
Nor t h W es t Le ices tersh i re Dis t r i c t Counc i l – Rev iew o f Hous ing Requi rements (2011-31)
Page 25
Figure 3.11: Components of population change, mid-2001 to mid-2031 (summary
chart) – NWL
Source: ONS and demographic projections
Alternative Demographic Scenarios
3.32 The SNPP looks to be a sound projection with regard migration and population growth in NWL
(noting that the projected level of migration is above that which might be suggested by the past trend
data being used; i.e. from 2006/7 to 2012). However, it is noted across the District that levels of
migration and population growth have been variable over time and that the period which fed into the
SNPP can be characterised as one where migration levels were quite low. On this basis it would be
reasonable to consider alternative (sensitivity) scenarios – such an approach is set out in para 2a-
017 of the PPG which states ‘plan makers may consider sensitivity testing, specific to their local
circumstances, based on alternative assumptions in relation to the underlying demographic
projections…’.
3.33 There are a number of issues and alternatives which can be investigated. Firstly, it should be noted
that the SNPP are 2012-based; with publication of new population data for 2013 and 2014 it is now
possible to see if there have been any notable shifts in short-term migration patterns and hence use
the more recent data to establish if the next SNPP (a 2014-based version expected to be published
in May 2016) will differ substantially from that in the 2012-based version. Secondly, account can be
taken of longer-term migration trends (noting that earlier analysis has suggested a lower level of
migration in the recent past than over the longer-term (back to 2001 for example). Finally, earlier
analysis did highlight some concerns in relation to the ‘unattributable’ component of population
change within ONS population data for the 2001-11 period and it is possible to test alternative
scenarios taking account of this component of change.
97 97 175
103
150
176
217
190
205
175
193
142
95
902
689
707
511
454
731
403
67 50 135
152
649
981
195
195
202
202
201
197
190
182
172
157
143
125
105
85 64 41 22
254
273
280
286
299
332
336
323
306
324
323
327
335
355
361
365
374
0
200
400
600
800
1,000
1,200
2001/2
2002/3
2003/4
2004/5
2005/6
2006/7
2007/8
2008/9
2009/10
2010/11
2011/12
2012/13
2013/14
2014/15
2015/16
2016/17
2017/18
2018/19
2019/20
2020/21
2021/22
2022/23
2023/24
2024/25
2025/26
2026/27
2027/28
2028/29
2029/30
2030/31
Natural change (past) Net migration (past) Natural change (projection) Net migration (projection)

Nor t h W es t Le ices tersh i re Dis t r i c t Counc i l – Rev iew o f Hous ing Requi rements (2011-31)
Page 26
3.34 The analysis below therefore considers three potential sensitivities to the figures. These can be
described as:
• Implications of 2013 and 2014 mid-year population data
• Implications of long-term migration trends
• Implications of Unattributable Population Change (UPC) and long-term migration trends
Implications of 2013 and 2014 mid-year population data
3.35 In seeking to understand how population projections might change as a result of more recent ONS
data, it is important to understand how the projections work. The SNPP is not a simple roll forward of
past migration numbers but also takes account of the age structure and how this will change over
time – this has an impact on estimated future migration (which can go up as well as down).
Additionally, international migration is linked back to the ONS national projections which use a
longer-term time series for analysis (believed to date back to 1994). It also needs to be noted that
when looking at past trends at a local level, ONS conventionally uses data from the past five years
for internal/domestic migration and a period of six years when considering international migration
trends.
3.36 The table below therefore shows average levels of migration in the periods which fed into the 2012-
based SNPP and also that are expected to feed into the 2014-based SNPP. The analysis considers
the difference between these periods to determine if the next set of SNPP are likely to show a higher
or lower level of population growth. The analysis looks at internal and international migration
separately.
3.37 The data shows across the District that migration has been stronger in the period to 2014 than the
equivalent period to 2012 – overall, net migration is shown to be around 220 people per annum
higher (entirely driven by an increase in net internal migration with international migration being
largely unchanged). The increase in net migration is likely to some degree to be linked to increased
housebuilding over the past couple of years.
Figure 3.12: Past trends in internal and international migration –
data feeding into subnational population projections
Internal net migration International net
migration
2006/7 156
2007/8 290 113
2008/9 -28 95
2009/10 36 14
2010/11 34 101
2011/12 61 91
2012/13 549 100
2013/14 832 149
2012-SNPP 79 95
2014-SNPP 302 92
Difference 224 -3
Source: ONS

Nor t h W es t Le ices tersh i re Dis t r i c t Counc i l – Rev iew o f Hous ing Requi rements (2011-31)
Page 27
3.38 To model an alternative scenario, the levels of migration underpinning the 2012-based SNPP have
been adjusted to reflect the difference between figures for the different periods shown in the table
above. For example, the modelling assumes a level of internal migration that is 224 people higher for
each year of the projection post-2014 (data to 2014 being fixed by reference to the ONS mid-year
population estimates).
Implications of long-term migration levels
3.39 Previous analysis has identified that levels of population growth have been variable over time and
this is at least in part due to a variable level of recorded migration. Analysis has therefore given
consideration to migration trends over the longer-term (taken to be the 2001-14 period for the
purposes of this analysis). A consideration of longer-term trends is suggested as an alternative
scenario in the PAS technical advice note where trends over a 10-15-year period are suggested as a
possible alternative way to look at demographic change – the analysis in this report uses a 13-year
reference period.
3.40 The scenario developed takes the average level of migration seen over the 2001-14 period and
treats this as ‘fixed‘ within the projection. Arguably this approach is less robust than within the SNPP
(where migration levels vary year on year depending on the age structure) – however, it is not
possible from the data available to realistically develop a ‘dynamic’ projection. In any case, part of
the purpose of looking at long-term trends is to provide a more ‘stable’ baseline of information for the
purposes of modelling.
3.41 The table below provides a similar analysis to that above but with data going back to 2001. The level
of net migration over this period is shown to be an internal net in-migration of 422 people per annum
and net international in-migration of 73 people each year.
Figure 3.13: Past trends in internal and international migration and
long-term average
Internal net migration International net
migration
2001/2 962 -60
2002/3 720 -31
2003/4 711 -4
2004/5 502 9
2005/6 240 214
2006/7 575 156
2007/8 290 113
2008/9 -28 95
2009/10 36 14
2010/11 34 101
2011/12 61 91
2012/13 549 100
2013/14 832 149
Average (2001-14) 422 73
Source: ONS

Nor t h W es t Le ices tersh i re Dis t r i c t Counc i l – Rev iew o f Hous ing Requi rements (2011-31)
Page 28
Combining long-term migration and UPC
3.42 As noted earlier there is a modest level of Unattributable Population Change (UPC) in the ONS data
for 2001-11 in NWL. In this instance UPC is positive, this suggests that the components of change
feeding into the SNPP may under-estimate migration and population growth. Whilst making an
adjustment for UPC could be an alternative scenario it is not considered, on its own, to be a robust
alternative to the SNPP. The main reasons for this are that it is unclear if UPC is related to migration
and more importantly, due to changes in the methods used by ONS to measure migration it is most
probable that any errors are focussed on earlier periods (notably 2001-6) and therefore a UPC
adjustment for more recent data would not be appropriate. On this basis, whilst it is not considered
that UPC should be included on its own as a projection to take forward into the modelling of
objectively assessed need it is considered that there is merit in looking at UPC when also
considering long-term trends.
3.43 The reason for this is due (as noted above) to the fact that any errors due to UPC are likely to impact
more strongly on some of the early years of past trends (notably 2001-6). This is because post-2006,
ONS has improved its collection of migration data. Therefore, if a projection is using data from the
2001-6 period (as it does when looking at long-term migration trends) then it is reasonable to also
include an adjustment for UPC – i.e. some of the older long-term data is more likely to be affected by
UPC issues.
3.44 Hence the final sensitivity projection takes the outputs from the long-term migration scenario and
makes a further additional adjustment for UPC (based on the years in which this arises). For the
purposes of analysis, it has been assumed that UPC is equally split between international and
internal migration – this assumption is considered to be reasonable given that generally it is thought
that UPC is more closely associated with international migration, but, in NWL international migration
is a relatively small component of population change. In reality this assumption will not substantially
impact on the figures given that the overall level of migration is the same regardless of which group it
is placed in – there would however be some differences due to differing age/sex profiles of migrants
in each of the international and internal migrant groups.
3.45 The table below therefore set out the assumptions modelled. Across the District, when compared
with the long-term migration scenario it can be seen that net migration is assumed to be slightly
higher – an overall net in-migration of about 633 people per annum (compared with 495 for long-term
migration trends).

Nor t h W es t Le ices tersh i re Dis t r i c t Counc i l – Rev iew o f Hous ing Requi rements (2011-31)
Page 29
Figure 3.14: Past trends in internal and international migration (with
a UPC adjustment) and long-term average
Internal net migration International net
migration
2001/2 1,048 26
2002/3 805 54
2003/4 795 80
2004/5 591 98
2005/6 331 305
2006/7 663 244
2007/8 382 205
2008/9 67 190
2009/10 129 107
2010/11 131 198
2011/12 61 91
2012/13 549 100
2013/14 832 149
Average (2001-14) 491 142
Source: ONS
Outputs from different demographic projections
3.46 The table below shows the estimated level of population growth in the SNPP and the alternative
projections developed. Across the whole NWL area the SNPP shows population growth (2011-31) of
9.2% - this figure increases when more recent population and migration data is included in the
modelling (due to 2012-14 having shown relatively high population change). Scenarios taking
account of both long-term migration trends and UPC also show higher levels of population growth.
Figure 3.15: Projected population growth (2011-2031) – alternative scenarios – NWL
Population
2011
Population
2031
Change in
population % change
2012-based SNPP 93,670 102,271 8,601 9.2%
2012-based SNPP (as updated) 93,670 103,850 10,180 10.9%
2014-based (estimated) 93,670 108,154 14,484 15.5%
Long-term migration 93,670 107,290 13,620 14.5%
Long-term migration/UPC 93,670 110,012 16,342 17.4%
Source: Demographic projections
3.47 Overall, whilst there is merit in looking at alternative scenarios for demographic change, it is not
considered that any of these is definitively better or more robust than another. It is however noted
that all of the alternative scenarios are higher than is suggested by the SNPP (unadjusted) and
therefore the evidence all points in an upwards direction when compared with the most recent official
projections.

Nor t h W es t Le ices tersh i re Dis t r i c t Counc i l – Rev iew o f Hous ing Requi rements (2011-31)
Page 30
3.48 Standing back from the various analysis, it is considered that something in the range between long-
term migration trends and long-term migration trends with a UPC adjustment is probably a
reasonable view about future demographic change. This recognises that the reference period
feeding into the 2012-based SNPP is one where migration levels were below more typical trends; it
also recognises that there may have been some underestimation of migration in the 2001-11 period
(but this this is not definitively known). Combining the levels of population growth from these two
projections would suggest population growth of about 16%, a figure similar to (but slightly higher
than) the attempt to estimate what the next round of SNPP might project.
Age Structure Changes
3.49 With growth in the population will also come age structure changes. The tables below summarise the
findings for key (15-year) age groups under the 2012-based SNPP and also with long-term migration
trends and a UPC adjustment (which shows the highest level of population growth of the projections
developed).
3.50 Focussing on the SNPP, the data shows that largest growth will be in people aged 60 and over; it is
estimated that there will be 34,200 people aged 60 and over in 2031 – this is an increase of 11,200
from 2011, representing growth of 49%. The population aged 75 and over is projected to increase by
an even greater proportion, 90%. Looking at the other end of the age spectrum the data shows that
there is projected to be little change in the population aged under 30 along with declines in the
number of people aged 30-44 and 45-59.
3.51 With a higher level of population growth (as in with the scenario linked to long-term migration
changes and UPC) there is still a notable ageing of the population (albeit this is consistent with
expectations regionally and nationally). However, it is notable that younger age groups see
somewhat higher growth than when linked to the SNPP – in particular, the 15-29 and 30-44 age
groups see growth of 8% and 6% respectively, compared with population decline when using the
SNPP. Older age groups (60-74 and 75+) see higher growth with the higher projection, but
differences are less marked than for other age groups – the population aged 75 and over accounts
for 76% of the population change under the SNPP, but only 42% with higher migration assumptions.
Figure 3.16: Population change 2011 to 2031 by fifteen-year age bands (2012-based
SNPP) – NWL
Age group Population
2011
Population
2031
Change in
population
% change from
2011
Under 15 16,536 16,655 119 0.7%
15-29 15,116 15,085 -31 -0.2%
30-44 19,128 17,989 -1,139 -6.0%
45-59 19,918 18,368 -1,550 -7.8%
60-74 15,679 20,324 4,645 29.6%
75+ 7,293 13,850 6,557 89.9%
Total 93,670 102,271 8,601 9.2%
Source: ONS and demographic projections
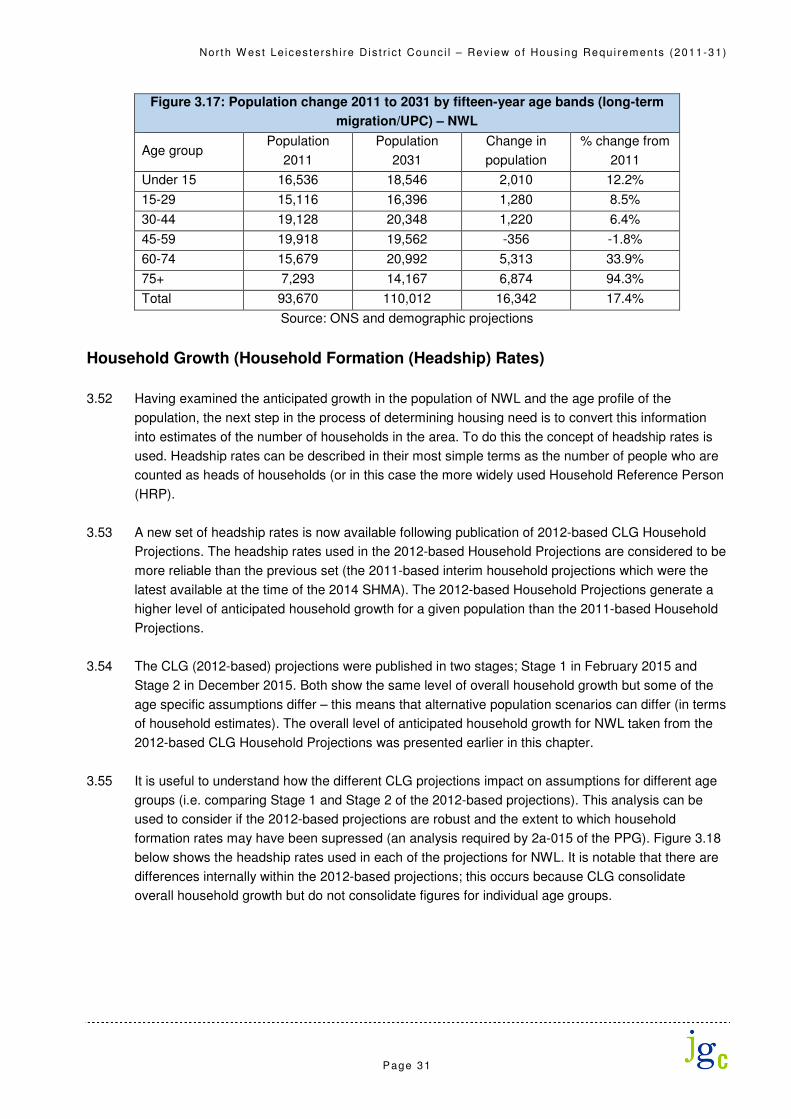
Nor t h W es t Le ices tersh i re Dis t r i c t Counc i l – Rev iew o f Hous ing Requi rements (2011-31)
Page 31
Figure 3.17: Population change 2011 to 2031 by fifteen-year age bands (long-term
migration/UPC) – NWL
Age group Population
2011
Population
2031
Change in
population
% change from
2011
Under 15 16,536 18,546 2,010 12.2%
15-29 15,116 16,396 1,280 8.5%
30-44 19,128 20,348 1,220 6.4%
45-59 19,918 19,562 -356 -1.8%
60-74 15,679 20,992 5,313 33.9%
75+ 7,293 14,167 6,874 94.3%
Total 93,670 110,012 16,342 17.4%
Source: ONS and demographic projections
Household Growth (Household Formation (Headship) Rates)
3.52 Having examined the anticipated growth in the population of NWL and the age profile of the
population, the next step in the process of determining housing need is to convert this information
into estimates of the number of households in the area. To do this the concept of headship rates is
used. Headship rates can be described in their most simple terms as the number of people who are
counted as heads of households (or in this case the more widely used Household Reference Person
(HRP).
3.53 A new set of headship rates is now available following publication of 2012-based CLG Household
Projections. The headship rates used in the 2012-based Household Projections are considered to be
more reliable than the previous set (the 2011-based interim household projections which were the
latest available at the time of the 2014 SHMA). The 2012-based Household Projections generate a
higher level of anticipated household growth for a given population than the 2011-based Household
Projections.
3.54 The CLG (2012-based) projections were published in two stages; Stage 1 in February 2015 and
Stage 2 in December 2015. Both show the same level of overall household growth but some of the
age specific assumptions differ – this means that alternative population scenarios can differ (in terms
of household estimates). The overall level of anticipated household growth for NWL taken from the
2012-based CLG Household Projections was presented earlier in this chapter.
3.55 It is useful to understand how the different CLG projections impact on assumptions for different age
groups (i.e. comparing Stage 1 and Stage 2 of the 2012-based projections). This analysis can be
used to consider if the 2012-based projections are robust and the extent to which household
formation rates may have been supressed (an analysis required by 2a-015 of the PPG). Figure 3.18
below shows the headship rates used in each of the projections for NWL. It is notable that there are
differences internally within the 2012-based projections; this occurs because CLG consolidate
overall household growth but do not consolidate figures for individual age groups.
Nor t h W es t Le ices tersh i re Dis t r i c t Counc i l – Rev iew o f Hous ing Requi rements (2011-31)
Page 32
3.56 Arguably the most notable difference is in the 45-54 age group (where the Stage 1 projections go
down over time compared with Stage 2 showing a notable increase). There are also relatively
substantial differences between Stage 1 and Stage 2 figures for the 25-34, 35-44, 65-74 and 85 and
over age groups. It is also notable that the 25-34 shows a continuing reduction in headship rates
regardless of the analysis being studied.
3.57 It is difficult to say which of Stage 1 or Stage 2 are the most reliable to take forward into
demographic modelling and given the differences between the two sets of figures a pragmatic
approach has been taken to initially use the mid-point between Stage 1 and Stage 2 figures (this is
also shown on the chart below).
3.58 In focussing on this mid-point position, it is considered that these are generally sound and do not
indicate any degree of supressed household formation (either in the past or built into the future
projections). The only exception to this is the 25-34 age group where the data shows a notable
decrease in the headship rate from 2001 to 2011 – this would suggest that there may have been
some degree of suppression of household formation in this period (although this is not clear cut as
the headship rates can also be influenced by other factors such as international migration and
growth in BME communities). Moving forward from 2011 the projections are expecting some further
decrease in the headship rate; this suggests that there may be some additional suppression being
built into the projections.
3.59 In looking at suppression amongst the 25-34 age group it is also useful to look at the 35-44 age
group (noting that, for example, people aged 25-34 in 2011 will be aged 35-44 by 2021). The 35-44
age group shows little change in headship rates in the past and continuing in the future (albeit with
some year-on-year variation). On this basis there is no significant evidence of suppression in this
age group either in the past or projected forward. This analysis therefore suggests that the extent to
which there is a suppression in the 25-34 age group, it is expected that this will not remain as a
supressed household formation – the analysis would suggest that all of the households who might
be expected to form will do so, it’s just that some of this formation might be delayed (i.e. households
who might historically been expected to form when aged 25-34 will now form when aged 35-44).
Overall, therefore levels of household growth will over a period of time (e.g. to 2031) fully reflect the
needs of the local population with no suppression being evident in the long-term.

Nor t h W es t Le ices tersh i re Dis t r i c t Counc i l – Rev iew o f Hous ing Requi rements (2011-31)
Page 33
Figure 3.18: Projected household formation rates by age of head of household – NWL
15-24 25-34
35-44 45-54
55-64 65-74
75-84 85 and over
Source: Derived from CLG data
0
0.05
0.1
0.15
0.2
1991
1993
1995
1997
1999
2001
2003
2005
2007
2009
2011
2013
2015
2017
2019
2021
2023
2025
2027
2029
2031
Stage 1
Stage 2
Midpoint
0.3
0.35
0.4
0.45
0.5
1991
1993
1995
1997
1999
2001
2003
2005
2007
2009
2011
2013
2015
2017
2019
2021
2023
2025
2027
2029
2031
Stage 1
Stage 2
Midpoint
0.45
0.5
0.55
0.6
0.65
1991
1993
1995
1997
1999
2001
2003
2005
2007
2009
2011
2013
2015
2017
2019
2021
2023
2025
2027
2029
2031
Stage 1
Stage 2
Midpoint
0.45
0.5
0.55
0.6
0.65
1991
1993
1995
1997
1999
2001
2003
2005
2007
2009
2011
2013
2015
2017
2019
2021
2023
2025
2027
2029
2031
Stage 1
Stage 2
Midpoint
0.45
0.5
0.55
0.6
0.65
1991
1993
1995
1997
1999
2001
2003
2005
2007
2009
2011
2013
2015
2017
2019
2021
2023
2025
2027
2029
2031
Stage 1
Stage 2
Midpoint
0.5
0.55
0.6
0.65
0.7
1991
1993
1995
1997
1999
2001
2003
2005
2007
2009
2011
2013
2015
2017
2019
2021
2023
2025
2027
2029
2031
Stage 1
Stage 2
Midpoint
0.65
0.7
0.75
0.8
0.85
1991
1993
1995
1997
1999
2001
2003
2005
2007
2009
2011
2013
2015
2017
2019
2021
2023
2025
2027
2029
2031
Stage 1
Stage 2
Midpoint
0.7
0.75
0.8
0.85
0.9
1991
1993
1995
1997
1999
2001
2003
2005
2007
2009
2011
2013
2015
2017
2019
2021
2023
2025
2027
2029
2031
Stage 1
Stage 2
Midpoint
Nor t h W es t Le ices tersh i re Dis t r i c t Counc i l – Rev iew o f Hous ing Requi rements (2011-31)
Page 34
Housing Need (linked to 2012-based headship rates)
3.60 The table below brings together outputs in terms of household growth and housing need using the
2012-based headship rates and the full range of population growth scenarios developed. To convert
households into dwellings the data includes an uplift to take account of vacant homes. Analysis of
2011 Census data about unoccupied household spaces (Table: QS417EW) suggests a vacancy rate
of 3.4% which has been used in analysis. It is assumed that such a level of vacant homes will allow
for movement within the housing stock and includes an allowance for second homes.
3.61 The analysis shows an overall housing need for 262 dwellings per annum across the NWL area
when using the 2012-based SNPP as the underlying population projection. This figure also
represents the ‘start point’ as defined in the PPG. This figure increases for all of the alternative
scenario and with long-term migration and a UPC adjustment (the highest of the population
projections developed) there is a need for 406 dwellings per annum to be provided. Taking a mid-
point between long-term migration and long-term migration with a UPC adjustment would give a
need for about 380 dwellings per annum.
Figure 3.19: Projected housing need – range of demographic based scenarios and 2012-based
headship rates – NWL
Households
2011
Households
2031
Change in
households Per annum
Dwellings
(per
annum)
2012-based SNPP 39,232 44,294 5,062 253 262
2012-based SNPP (as updated) 39,232 44,862 5,630 282 291
2014-based (estimated) 39,232 46,387 7,155 358 370
Long-term migration 39,232 46,078 6,846 342 354
Long-term migration/UPC 39,232 47,078 7,846 392 406
Source: Demographic projections
Alternative methods for looking at headship rates
3.62 Although it is considered that the 2012-based headship rates are sound, it is worthwhile looking at
potential alternative ways of looking at the interpretation of these rates. A number of methods have
been considered in the past and many of these put weight on the use of the 2008-based CLG
projection headship rates. The sort of methods used include:
• Blended headship – where the rates are comprised of a combination of the 2012- and 2008-based
rates. In some cases, this ‘blending’ is only carried out for specific age groups (generally with the aim
of increasing the apparent housing need); an approach which is not considered to be robust as it is
clear that patterns of formation vary across different age bands and any analysis should be viewed
for the population as a whole.
• Full-return to trend – a second approach is to return all household formation rates back to those
observed in the 2008-based projections. This is also not considered to be a robust approach given
that the 2008-based figures were prepared at a point in time at which interest rates had been at a
historical low point for some time; coupled with availability of a range of mortgage deals (including
100% mortgages) which in a historical context would be seen as somewhat exceptional.

Nor t h W es t Le ices tersh i re Dis t r i c t Counc i l – Rev iew o f Hous ing Requi rements (2011-31)
Page 35
3.63 Overall, it is not considered that there is any merit in using the 2008-based rates in the analysis
(whether as a partial or full adjustment). Not taking account of these historic figures has some
considerable support from academic analysts with Alan Holmans for example noting that part of the
shift away from 2008-based household formation rates relates to international migration and different
household structures within new migrant communities. He identifies that this “will not be reversed.”
3.64 More recent research by Ludi Simpson and Neil McDonald has also considered these issues and is
clear that it is not appropriate to revert to the 2008-based household representative rates, setting
out: “it is no longer sensible to appeal to previous household projections including the 2008-based
set as if they were evidence of an underlying trend in household formation. They were produced at a
time when household formation had already changed, starting before the economic downturn of the
mid-to-late 2000s, and are in themselves only evidence of the optimism of that period.”
3.65 The PAS technical advice note also supports this position, noting that ‘The CLG 2008 HRRs are no
longer helpful because they are based on very old evidence, and anyway may not reflect the true
long-term trend’.
3.66 There is however merit in considering if changes to the formation rates of the 25-34 age group could
be brought forward to enable access to housing at the sort of ages seen typically in the past. As can
be seen from the analysis above, there has been a notable decrease in the formation rates of the
population aged 25-34 since about 2001 and this downward trend is projected to continue (at least
when looking at the CLG Stage 2 projections).
3.67 A sensitivity analysis has therefore been run which considers and seeks to quantify the uplift of
housing required in order to return the household formation rates of the 25-34 age group back to
2001 levels (i.e. before the rate started to decrease) by 2031 (the end of the projection period). If
achieved, the effect would be to reduce the proportions of shared households and persons within
this age group living with parents.
3.68 This sensitivity in effect seeks to consider a scenario in which affordability and access to housing for
younger households improves, and quantifies what level of housing provision might be required to
facilitate this, all other factors being equal.
3.69 In reality, other factors such as real growth in disposable income (allowing people to save), the
availability of and access to mortgage finance, interest rates and economic confidence will all
influence trends in household formation. There is a complex set of factors at play, and it is difficult to
predict how these factors might interact in the future and the impact on household formation rates (in
the absence of any supply-side constraints). Furthermore, as noted above, part of the changes in
household formation rates for this age group may have been due to international migration.
3.70 Such as approach is however considered to be consistent with the PPG which says in 2a-015 that
‘the household projection-based estimate of housing need may require adjustment to reflect factors
affecting local demography and household formation rates which are not captured in past trends. For
example, formation rates may have been suppressed historically by under-supply and worsening
affordability of housing’.

Nor t h W es t Le ices tersh i re Dis t r i c t Counc i l – Rev iew o f Hous ing Requi rements (2011-31)
Page 36
3.71 The figure below shows how the household formation rates of the 25-34 age group are projected to
change with this scenario. The assumed increase is quite substantial and takes the rate back to 0.47
by 2031 (which is some way above the rate projected in both the Stage 1 (0.43) and Stage 2 (0.38)
projections.
Figure 3.20: Increasing household formation rates of population
aged 25-34
Source: Derived from CLG data
3.72 The analysis with this uplift shows an overall housing need for 296 dwellings per annum across the
NWL area when using the 2012-based SNPP as the underlying population projection. This figure
increases for all of the alternative scenario and with long-term migration and a UPC adjustment (the
highest of the population projections developed) there is a need for 444 dwellings per annum to be
provided. This adjustment to household formation rates therefore increases the need by between 9%
and 13% depending on the scenario studied – this is a substantial uplift.
3.73 Taking a mid-point between long-term migration and long-term migration with a UPC adjustment
would give a need for about 417 dwellings per annum and on the basis of analysis carried out would
represent a reasonable level of demographically-based need for NWL.
Figure 3.21: Projected housing need – range of demographic based scenarios and 2012-based
headship rates (with uplift for 25-34 age group) – NWL
Households
2011
Households
2031
Change in
households Per annum
Dwellings
(per
annum)
2012-based SNPP 39,232 44,948 5,716 286 296
2012-based SNPP (as updated) 39,232 45,528 6,296 315 326
2014-based (estimated) 39,232 47,103 7,871 394 407
Long-term migration 39,232 46,782 7,550 378 390
Long-term migration/UPC 39,232 47,818 8,586 429 444
Source: Demographic projections
0.35
0.4
0.45
0.5
1991
1993
1995
1997
1999
2001
2003
2005
2007
2009
2011
2013
2015
2017
2019
2021
2023
2025
2027
2029
2031
Stage 1Stage 2MidpointUplift

Nor t h W es t Le ices tersh i re Dis t r i c t Counc i l – Rev iew o f Hous ing Requi rements (2011-31)
Page 37
Summary – Trend based Demographic Projections
The start point for assessing housing need in line with the PPG is the most recent official household
projections; these are the 2012-based CLG projections which suggest a need for around 262 dwellings per
annum to be provided (2011-31). These projections were underpinned by the most recent ONS
subnational population projections (SNPP – also 2012-based).
Analysis of past trends in migration indicate that the reference period used in the 2012-based projections
(largely the 2007-12 period) was one which saw low levels of migration in comparison with other periods
(both before 2007 and since 2012). It was therefore concluded that the SNPP might be projecting a
relatively low level of population growth and alternative scenarios were developed based on both long-
term and more recent migration trends.
Whilst none of the alternative scenarios could definitively be described as the most robust it is viewed that
the strongest consideration should be given to projections linked to long-term migration trends (either with
or without an additional adjustment for Unattributable Population change (UPC)). Overall, these
projections suggested a need for around 380 dwellings per annum (2011-31).
When looking at the data about headship rates underpinning the 2012-based CLG household projections it
was observed that the 25-34 age group looked to have seen some suppression of household formation in
the past (and that this trend was projected to continue into the future). The picture was however not
entirely clear with Stage 1 and Stage 2 of the CLG projections showing a different pattern.
Given the difference between Stage 1 and Stage 2 figures a pragmatic approach was taken to model data
on a midpoint between the two. Further analysis was carried out to model the returning of headship rates
amongst the 25-34 population back to the levels seen in 2001 (which is the date at which they are shown
to have started to drop). This increased the need by between 9% and 13% depending on the scenario
chosen. Taking a mid-point between long-term migration and long-term migration with a UPC adjustment
would give a need for about 417 dwellings per annum and on the basis of analysis carried out would
represent a reasonable level of demographically-based need for NWL

Nor t h W es t Le ices tersh i re Dis t r i c t Counc i l – Rev iew o f Hous ing Requi rements (2011-31)
Page 38

Nor t h W es t Le ices tersh i re Dis t r i c t Counc i l – Rev iew o f Hous ing Requi rements (2011-31)
Page 39
4. Economic-led Housing Requirements
Introduction
4.1 Planning Practice Guidance sets out that consideration should be given to future economic
performance in drawing conclusions on the overall need for housing. Where the evidence suggests
that higher migration might be needed than seen in past trends in order to support economic growth,
consideration should be given to adjusting the spatial distribution of housing. Specifically, the
Guidance outlines that:
‘Plan makers should make an assessment of the likely growth in job numbers based on past trends
and/or economic forecasts as appropriate and also having regard to the growth of the working age
population’
And that:
‘Where the supply of working age population that is economically active (labour force supply) is less
than the projected job growth, this could result in unsustainable commuting patterns (depending on
public transport accessibility or other sustainable options such as walking or cycling) and could
reduce the resilience of local businesses. In such circumstances, plan makers will need to consider
how the location of new housing or infrastructure development could help address these problems’
4.2 This section seeks to understand what level of population growth might be required to support the
required growth in the resident workforce under a range of trend-based (policy-off) economic
forecasts. It then builds on this analysis to specifically look at the additional implications of proposed
job growth in relation to the East Midlands Gateway Rail Freight Interchange.
Economic Forecasts
4.3 A range of economic forecasts have been accessed which look at the number of additional jobs that
might be created in the District based on a ‘business as usual’ approach. The forecasts all work
slightly differently but essentially consider how the national and regional economy might perform
before considering the local situation. At the local level these forecasts consider past job growth as
well as an understanding of how different sectors have performed; this is used to predict what might
happen in the future.
4.4 Economic forecasts need to be treated with some degree of caution; they often show widely different
outputs depending on the time of the forecast and the forecasting house. Additionally, they can be
influenced by past trend ‘shocks’ (e.g. where an area has seen strong growth in the past, it is
generally assumed that this will continue in the future; in reality it may be that high past trends are
influenced by individual schemes that are not likely to be repeated).

Nor t h W es t Le ices tersh i re Dis t r i c t Counc i l – Rev iew o f Hous ing Requi rements (2011-31)
Page 40
4.5 A total of five forecasts have been accessed for analysis: the first is an Experian forecast from 2013,
which is the forecast used to underpin analysis in the 2014 SHMA; the second is a forecast
produced by PACEC as part of the 2013 Employment Land Study; the final three have been taken
from a recent proof of evidence submitted to the Council by Gladman (January 2016 – Appeal Ref:
APP/G2435/W/15/3005052; Land South of Greenhill Road, Coalville) – although it is not stated it is
assumed that all of these forecasts were produced in 2015. These final three forecasts cover all of
the main three forecasting houses active in providing such information at a local authority level.
4.6 The table below shows the estimated number of jobs forecast to be provided on average each year
in the 2011-31 period. The data is contrasted with similar figures for the whole L&L HMA. Figures are
also provided for the percentage annual growth this represents from the number of jobs in 2011, with
the 2011 baseline being taken from the PACEC analysis (in the absence of this being readily
available from other sources).
4.7 The analysis shows a range of job growth in NWL from 340 to 596 per annum and from 2,046 to
3,374 across the L&L HMA – these are both quote wide ranges and do help to emphasise the
difficultly in pinning down a robust view about future job growth. It is however notable in all cases
that the forecast level of job growth in NWL is higher (in proportionate terms) than is seen for the
whole HMA.
Figure 4.1: Job growth per annum (2011-31) – a range of economic forecasts
NWL L&L HMA
Additional jobs
per annum
% per annum
increase from
2011
Additional jobs
per annum
% per annum
increase from
2011
Experian (2013) – SHMA 515 0.9% 2,680 0.6%
PACEC (2013) 475 0.8% 3,230 0.7%
Experian (2015) 596 1.1% 3,374 0.7%
Cambridge Econometrics (2015) 340 0.6% 2,329 0.5%
Oxford Economics (2015) 430 0.8% 2,046 0.4%
Average 471 0.8% 2,732 0.6%
Source: 2014 SHMA, PACEC ELR, Gladman proof of evidence (2015)
4.8 For the purposes of this assessment however, the focus is on the figures for NWL. Later in this
section, an estimate of the likely housing requirement linked to each of the forecasts is provided. It is
however worth briefly considering which is likely to be the most robust. When looking at the average
of all the forecasts (for NWL) it is clear that the PACEC figures are most closely aligned and on that
basis it is concluded that it is this forecast which should be given the greatest weight. Although the
PACEC forecast dates from 2013, it is not substantially different from the range of other forecasts
accessed.

Nor t h W es t Le ices tersh i re Dis t r i c t Counc i l – Rev iew o f Hous ing Requi rements (2011-31)
Page 41
4.9 Whilst this is just a view based on looking at the range of forecasts, it is noted that the Council
themselves are continuing to use the PACEC information within the emerging Local Plan (although
this is in part due to the absence of another source that contains data for all local authorities in the
HMA). Additionally, the inspector in the case referred to above supports the use of PACEC, noting in
paragraph 25 that ‘PACEC is a robust economic forecast, which should inform the FOAN; that the
FOAN must include an allowance for EMG on top of PACEC’. The impact of EMG is considered later
in this section, with initial analysis looking at the need associated with baseline forecasts (as shown
in the table above).
Linking Job Growth and Changes to Resident Labour Force
4.10 The analysis above has set out a range of potential scenarios for changes in the number of jobs in
the District. However, for the purposes of analysis linked to demographic data it is necessary to
convert this into estimates of the required change to the economically active population. The number
of jobs and resident workers required to support these jobs will differ depending on two main factors:
• Commuting patterns – where an area sees more people out-commute for work than in-commute it
may be the case that a higher level of increase in the economically active population would be
required to provide a sufficient workforce for a given number of jobs (and vice versa where there is
net in-commuting);
• Double jobbing – some people hold down more than one job and therefore the number of workers
required will be slightly lower than the number of jobs.
Commuting patterns
4.11 Commuting patterns in relation to EMGRFI were discussed in Section 2; however, when looking at
baseline forecasts a different approach is used (which recognises both in- and out-commuting). The
table below shows summary data about commuting to and from the District and the HMA (for
comparative purposes) from the 2011 Census. Overall the data shows that NWL sees a notable level
of net in-commuting for work with the number of people resident in the District who are working being
about 86% of the total number who work in the area. This number is shown as the commuting ratio
in the final row of the table and is calculated as the number of people living in an area (and working)
divided by the number of people working in the area (regardless of where they live). Across the
HMA, the analysis suggests that commuting is broadly in balance.
Figure 4.2: Commuting patterns in NWL and the L&L HMA (2011)
NWL L&L HMA
Live and work in LA/HMA 18,880 326,133
Home workers 5,069 45,789
No fixed workplace 3,327 31,180
Out-commute 19,246 61,323
In-commute 26,699 64,110
Total working in LA/HMA 53,975 467,212
Total living in LA/HMA (and working) 46,522 464,425
Commuting ratio 0.86 0.99
Source: 2011 Census

Nor t h W es t Le ices tersh i re Dis t r i c t Counc i l – Rev iew o f Hous ing Requi rements (2011-31)
Page 42
4.12 In translating the commuting pattern data into growth in the labour-force for the District it is assumed
that the commuting ratio remains at the same level as shown by the 2011 Census (i.e. assumes that
the growth in the number of residents who are economically active will need to be 14% lower than
the increase in the number of jobs).
Double jobbing
4.13 Double jobbing was also discussed in Section 2 where analysis of Annual Population Survey data
showed that around 3.3% of workers have a second job. This gave a double jobbing ratio of 0.967
(i.e. the number of jobs can be discounted by 3.3% to estimate the required change in the
workforce).
Labour-force growth
4.14 To work out the change in the resident workforce required to match the forecast number of jobs, the
commuting ratio is multiplied by the amount of double jobbing (to give an adjustment factor) and in
turn multiply this by the number of jobs – this is shown in the table below. Overall, the range of
forecasts expect an increase of between 340 and 596 jobs per annum across the District; if
commuting patterns and levels of double jobbing remain the same then this would require a slightly
lower level of growth in the resident workforce (of about 283-497 people per annum). Looking at the
PACEC forecast the estimated workforce change is just under 400 per annum, giving a total change
of about 7,900 over the full 2011-31 period.
4.15 To be clear on the calculations in the table below; the commuting ratio is 0.86 (i.e. there are 0.86
residents in employment for every 1 person who works in the District) and the double jobbing figure
is 0.967 (i.e. 100 jobs would need 96.7 workers). The adjustment factor applied is therefore 0.83
(0.86 × 0.967) – so for every additional job in the District there would need to be 0.83 additional
residents who are working. The figures below may not exactly match this calculation due to
rounding.
Figure 4.3: Jobs growth and change in resident workforce
Forecast Additional jobs
(pa)
Change in
resident
workforce (pa)
Change in
resident
workforce
(2011-31)
Experian (2013) – SHMA 515 429 8,585
PACEC (2013) 475 396 7,918
Experian (2015) 596 497 9,935
Cambridge Econometrics (2015) 340 283 5,667
Oxford Economics (2015) 430 358 7,168
Source: Range of economic forecasts, NOMIS and 2011 Census

Nor t h W es t Le ices tersh i re Dis t r i c t Counc i l – Rev iew o f Hous ing Requi rements (2011-31)
Page 43
Linking resident workforce change to demographic projections
4.16 Having estimated the likely required change to the workforce under a range of scenarios the next
stage is to estimate how much growth is implied by demographic projections (and hence if levels of
population growth would need to change so that a sufficient workforce is available). This is a very
thorny issue with no set methodology and a range of different methods and views being used. It is
considered, having studied this for many years is that it is impossible to robustly project how
economic activity or employment rates will change in the future and hence such an approach is not
sufficiently rigorous when looking at the link between jobs and housing.
4.17 For example, all of the main forecasting houses (Experian, Oxford Economics and Cambridge
Econometrics) use population data as an input to their forecasts and each will estimate different
levels of job growth. Inherently, each of the forecasting houses are therefore suggesting that
whatever level of job growth they expect, this will be met by the population (and the population as it
is projected to change). Given the different levels of job growth it is therefore implicit that there will
be an assumption about how employment rates are likely to change, and this assumption will be
different depending on the forecasting house. There could also be changes such as double jobbing
within the modelling although this is difficult to determine.
4.18 Whilst it is possible to estimate what the implied employment rates are, this is difficult to do with any
confidence at a smaller area level (such as a local authority) and attempts to estimate these have at
times been criticised by planning inspectors (particularly where modelling attempts to look at
individual age and sex groups) – one example can be seen in an appeal in Farnsfield (Newark &
Sherwood – APP/B3030/W/15/3006252).
4.19 Some consultancies (both for public and private sector clients) have looked for other sources of
employment or economic activity rate data; the most commonly used being a set of figures published
by the Office for Budget Responsibility (OBR). These however are at a national level and are not
robustly applicable to smaller areas. Perhaps more significantly, the level of job growth (growth in
residents in employment) estimated by OBR is significantly lower than from any of the main
forecasting houses (a growth in residents in employment of about 2,500,000 from 2014-35 compared
with a figure in excess of 4,000,000 in the most recent Experian forecast for the United Kingdom).
This means that the OBR employment/activity rate figures cannot realistically be used when testing
job growth levels from forecasts, as they relate to a completely different set of national assumptions.
4.20 One final set of rate data that is utilised is that published by Kent County Council (KCC) in November
2014. This is specific to Kent and so not applicable in other areas, however, more importantly many
of the rates used in the model draw from a 2006 ONS publication (about projecting economic activity
rates); this publication can (by 2014) be seen to have been substantially wrong for all age groups
where a reasonable comparison can be made with more up-to-date information.
4.21 Hence, there is no clear and agreed set of figures which can be used to estimate how economic
activity rates might change in the future. At best, any rates will be informed guesswork and at worse
they can simply be unrealistic when set against the forecasts being used (either being too positive of
too negative).

Nor t h W es t Le ices tersh i re Dis t r i c t Counc i l – Rev iew o f Hous ing Requi rements (2011-31)
Page 44
4.22 For these reasons this report has sought to look at changes to economic activity rates using as much
data as possible for which there is relative certainty, whilst some level of assumption is required, the
method used is designed to limit the amount of speculation and therefore provide some certainly that
the outputs properly reflect what might be expected to happen. The method used considers two key
groups of the population:
• The population of working age who are economically active;
• The population who have reached retirement age who are economically active.
4.23 Below is a discussion of these two groups and how the number of economically active people is
projected to change. When modelling data against job-growth forecasts it is assumed that the
increase in the number of residents in employment would need to be matched by the increase in the
number of people who are economically active.
4.24 In reality this assumption over-estimate the need for housing; if for example unemployment were to
fall then an additional workforce is provided from the current population without the need for
additional population growth (or housing). In NWL there is some evidence of this with data from the
Annual Population Survey showing a decrease in the number of unemployed residents of about 200
from 2011 to 2014 (a decrease from 5.3% to 5.0%). This is not factored into the analysis which
essentially assumes that unemployment will be at the same level in 2031 as it was in 2011.
Working-age population
4.25 The first part of the analysis looks at the working-age population. Such an analysis is uncontentious,
with working age being fixed by Central Government through the setting of pensionable age (most
recently in the Pensions Act of 2014). The use of working-age is also consistent with wording in the
PPG [2a-018] which states that:
‘plan makers should make an assessment of the likely change in job numbers based on past trends
and/or economic forecasts as appropriate and also having regard to growth of the working age
population in the housing market area’ [emphasis added]
4.26 Estimating the working age population and how this will change over time is not as straightforward
as it has been in the past where conventionally the working age population has been defined as the
population aged 16-64 (and previously 16-64 for males and 16-59 for females). The situation
currently is one where there are incremental changes to pensionable age for both sexes which
means that gradually people will be able to draw a state pension later in life.
4.27 The tables below are taken from supporting information from the 2014-based national population
projections from ONS and show for both males and females the proportion of an age group who are
considered to be of pensionable age. For example, the first table shows in 2019 that an estimated
60% of males aged 65 will be of pensionable age and in 2020 about 10% will have reached that
threshold. The data is cut off from 2027 and age 66 as there are currently no future proposals for
changes to pensionable age until 2044 (which is some way beyond the date of projections
developed in this report).
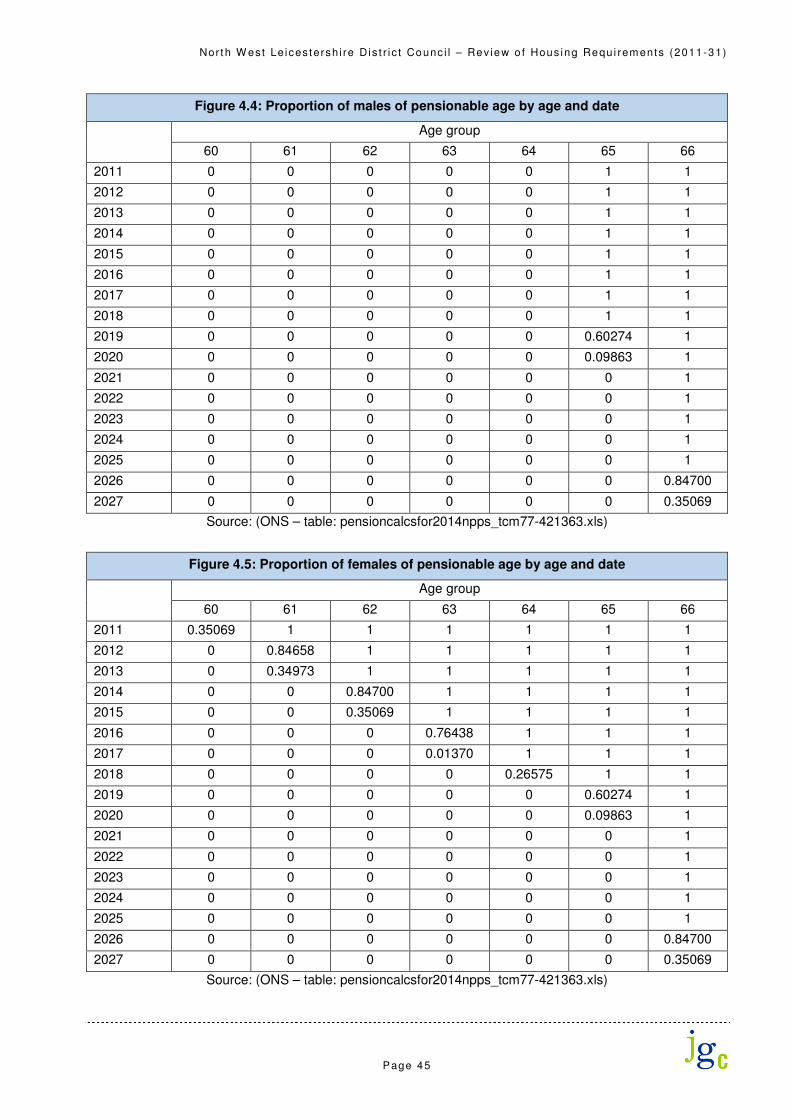
Nor t h W es t Le ices tersh i re Dis t r i c t Counc i l – Rev iew o f Hous ing Requi rements (2011-31)
Page 45
Figure 4.4: Proportion of males of pensionable age by age and date
Age group
60 61 62 63 64 65 66
2011 0 0 0 0 0 1 1
2012 0 0 0 0 0 1 1
2013 0 0 0 0 0 1 1
2014 0 0 0 0 0 1 1
2015 0 0 0 0 0 1 1
2016 0 0 0 0 0 1 1
2017 0 0 0 0 0 1 1
2018 0 0 0 0 0 1 1
2019 0 0 0 0 0 0.60274 1
2020 0 0 0 0 0 0.09863 1
2021 0 0 0 0 0 0 1
2022 0 0 0 0 0 0 1
2023 0 0 0 0 0 0 1
2024 0 0 0 0 0 0 1
2025 0 0 0 0 0 0 1
2026 0 0 0 0 0 0 0.84700
2027 0 0 0 0 0 0 0.35069
Source: (ONS – table: pensioncalcsfor2014npps_tcm77-421363.xls)
Figure 4.5: Proportion of females of pensionable age by age and date
Age group
60 61 62 63 64 65 66
2011 0.35069 1 1 1 1 1 1
2012 0 0.84658 1 1 1 1 1
2013 0 0.34973 1 1 1 1 1
2014 0 0 0.84700 1 1 1 1
2015 0 0 0.35069 1 1 1 1
2016 0 0 0 0.76438 1 1 1
2017 0 0 0 0.01370 1 1 1
2018 0 0 0 0 0.26575 1 1
2019 0 0 0 0 0 0.60274 1
2020 0 0 0 0 0 0.09863 1
2021 0 0 0 0 0 0 1
2022 0 0 0 0 0 0 1
2023 0 0 0 0 0 0 1
2024 0 0 0 0 0 0 1
2025 0 0 0 0 0 0 1
2026 0 0 0 0 0 0 0.84700
2027 0 0 0 0 0 0 0.35069
Source: (ONS – table: pensioncalcsfor2014npps_tcm77-421363.xls)
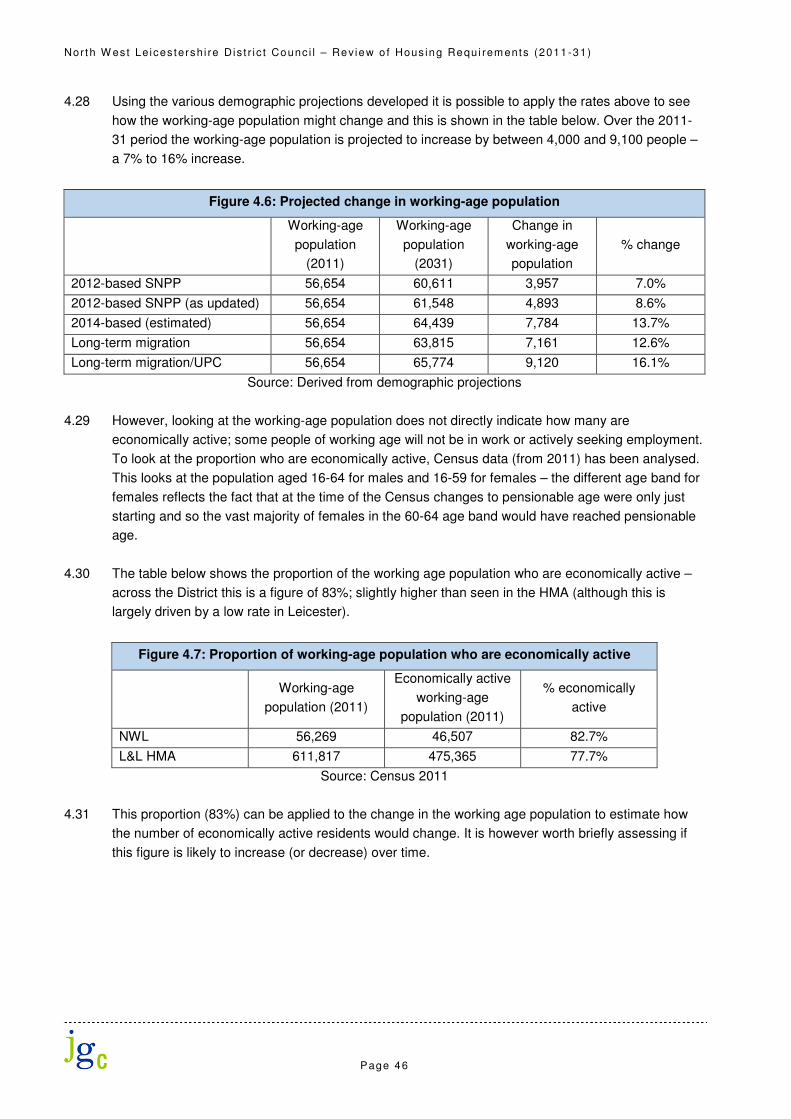
Nor t h W es t Le ices tersh i re Dis t r i c t Counc i l – Rev iew o f Hous ing Requi rements (2011-31)
Page 46
4.28 Using the various demographic projections developed it is possible to apply the rates above to see
how the working-age population might change and this is shown in the table below. Over the 2011-
31 period the working-age population is projected to increase by between 4,000 and 9,100 people –
a 7% to 16% increase.
Figure 4.6: Projected change in working-age population
Working-age
population
(2011)
Working-age
population
(2031)
Change in
working-age
population
% change
2012-based SNPP 56,654 60,611 3,957 7.0%
2012-based SNPP (as updated) 56,654 61,548 4,893 8.6%
2014-based (estimated) 56,654 64,439 7,784 13.7%
Long-term migration 56,654 63,815 7,161 12.6%
Long-term migration/UPC 56,654 65,774 9,120 16.1%
Source: Derived from demographic projections
4.29 However, looking at the working-age population does not directly indicate how many are
economically active; some people of working age will not be in work or actively seeking employment.
To look at the proportion who are economically active, Census data (from 2011) has been analysed.
This looks at the population aged 16-64 for males and 16-59 for females – the different age band for
females reflects the fact that at the time of the Census changes to pensionable age were only just
starting and so the vast majority of females in the 60-64 age band would have reached pensionable
age.
4.30 The table below shows the proportion of the working age population who are economically active –
across the District this is a figure of 83%; slightly higher than seen in the HMA (although this is
largely driven by a low rate in Leicester).
Figure 4.7: Proportion of working-age population who are economically active
Working-age
population (2011)
Economically active
working-age
population (2011)
% economically
active
NWL 56,269 46,507 82.7%
L&L HMA 611,817 475,365 77.7%
Source: Census 2011
4.31 This proportion (83%) can be applied to the change in the working age population to estimate how
the number of economically active residents would change. It is however worth briefly assessing if
this figure is likely to increase (or decrease) over time.
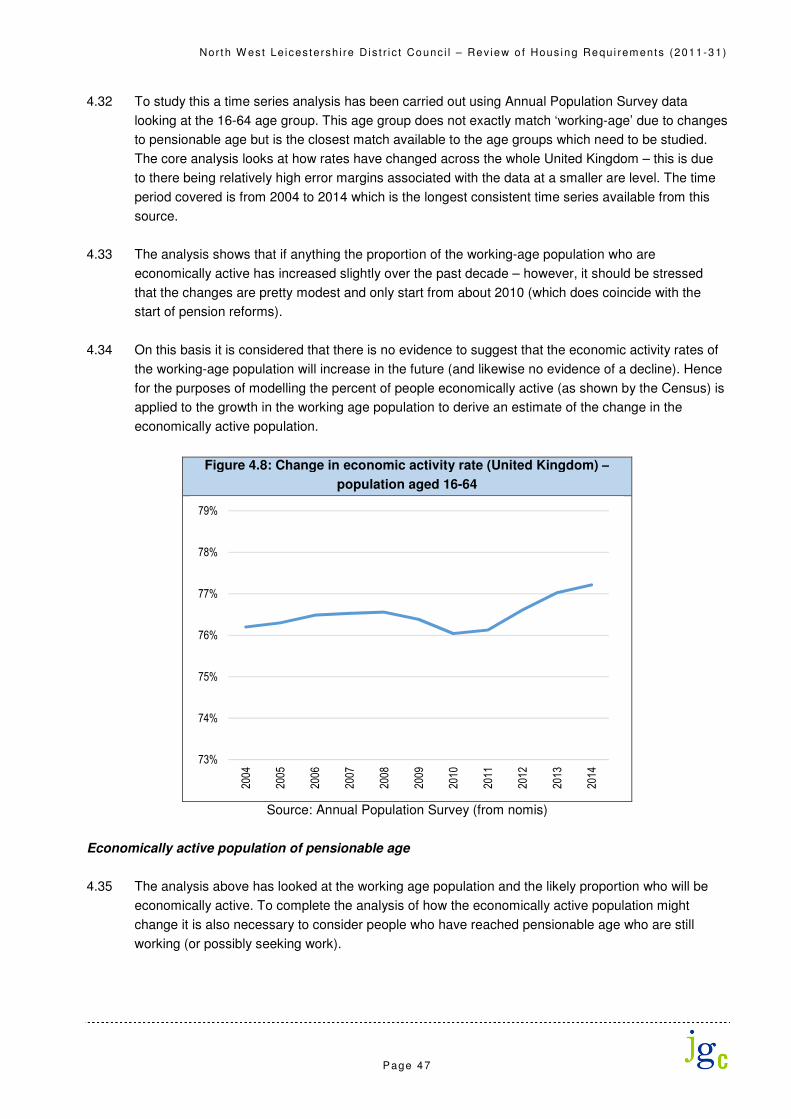
Nor t h W es t Le ices tersh i re Dis t r i c t Counc i l – Rev iew o f Hous ing Requi rements (2011-31)
Page 47
4.32 To study this a time series analysis has been carried out using Annual Population Survey data
looking at the 16-64 age group. This age group does not exactly match ‘working-age’ due to changes
to pensionable age but is the closest match available to the age groups which need to be studied.
The core analysis looks at how rates have changed across the whole United Kingdom – this is due
to there being relatively high error margins associated with the data at a smaller are level. The time
period covered is from 2004 to 2014 which is the longest consistent time series available from this
source.
4.33 The analysis shows that if anything the proportion of the working-age population who are
economically active has increased slightly over the past decade – however, it should be stressed
that the changes are pretty modest and only start from about 2010 (which does coincide with the
start of pension reforms).
4.34 On this basis it is considered that there is no evidence to suggest that the economic activity rates of
the working-age population will increase in the future (and likewise no evidence of a decline). Hence
for the purposes of modelling the percent of people economically active (as shown by the Census) is
applied to the growth in the working age population to derive an estimate of the change in the
economically active population.
Figure 4.8: Change in economic activity rate (United Kingdom) –
population aged 16-64
Source: Annual Population Survey (from nomis)
Economically active population of pensionable age
4.35 The analysis above has looked at the working age population and the likely proportion who will be
economically active. To complete the analysis of how the economically active population might
change it is also necessary to consider people who have reached pensionable age who are still
working (or possibly seeking work).
73%
74%
75%
76%
77%
78%
79%
2004
2005
2006
2007
2008
2009
2010
2011
2012
2013
2014

Nor t h W es t Le ices tersh i re Dis t r i c t Counc i l – Rev iew o f Hous ing Requi rements (2011-31)
Page 48
4.36 A similar process has been undertaken and this begins by considering the pensionable age
population and how this will change in the future; the table below shows that the number of people of
pensionable age is projected to increase by between 4,500 and 5,100 (depending on the projection
being run). There is less variation than when looking at the working-age population, this is because
the demographic scenarios consider increases to migration, and migration tends to be more strongly
concentrated amongst working-age people (and their children).
Figure 4.9: Projected change in pensionable-age population
Pensionable-
age population
(2011)
Pensionable-
age population
(2031)
Change in
pensionable-
age population
% change
2012-based SNPP 19,357 23,860 4,503 23.3%
2012-based SNPP (as updated) 19,357 23,995 4,638 24.0%
2014-based (estimated) 19,357 24,358 5,001 25.8%
Long-term migration 19,357 24,298 4,941 25.5%
Long-term migration/UPC 19,357 24,459 5,102 26.4%
Source: Derived from demographic projections
4.37 Again, the change in the number of people of pensionable age does not directly show how many are
economically active. To look at the proportion who are economically active, Census data (from 2011)
has again been utilised. This looks at the population aged 65+ for males and 60+ for females –
consistent with the analysis undertaken for the working-age population.
4.38 The table below shows the proportion of the pensionable age population who are economically
active – across the District this is a figure of 14%; the same as can be observed for the HMA.
Figure 4.10: Proportion of pensionable-age population who are economically active
Pensionable-age
population (2011)
Economically active
pensionable-age
population (2011)
% economically
active
NWL 19,522 2,727 14.0%
L&L HMA 181,851 25,586 14.1%
Source: Census 2011
4.39 Again, this proportion could be applied to the change in the pensionable age population to estimate
how the number of economically active residents would change. It is however again worth assessing
if this figure is likely to increase (or decrease) over time.
4.40 To study this a time series analysis has again been carried out using Annual Population Survey data
looking at the 65+ age group. This age group does not exactly match ‘pensionable-age’ but is the
closest match available from this source. The core analysis looks at how rates have changed across
the whole United Kingdom – this again is due to there being relatively high error margins associated
with the data at a smaller are level. The time period covered is from 2004 to 2014 which is the
longest consistent time series available from this source.

Nor t h W es t Le ices tersh i re Dis t r i c t Counc i l – Rev iew o f Hous ing Requi rements (2011-31)
Page 49
4.41 The analysis shows that the proportion of the pensionable-age population who are economically
active has increased notably over the past decade (increasing from about 6% in 2004 to 10% in
2014) – this would suggest that further potential increase in activity rates of the older population
might reasonably be expected. It is difficult to know by how much the economic activity rate of this
cohort of the population might change in the future and the analysis takes the pragmatic view that
further increases will be at half of the rate seen in the 2004-14 decade (this is a 0.2% increase per
annum).
4.42 Whilst there is no precedent in the use of a ‘half’ increase, it is arguably a reasonable assumption for
modelling given that the data clearly shows an upward trend with no evidence of this slowing down.
However, it is noted that such a trend could not continue indefinitely on a linear pattern (to do so
would mean that eventually everyone aged 65+ would be assumed to be economically active (which
is not realistic)). Additionally, the use of a ‘half’ recognises that much of the ageing of the population
is in older age groups (e.g. those aged 85+) where activity rates are likely to be very low; that said
an ageing of the population will also be underpinning the APS analysis.
Figure 4.11: Change in economic activity rate (United Kingdom) –
population aged 65+
Source: Annual Population Survey (from nomis)
4.43 Hence, on the basis of the analysis and discussion above the following economic activity rates have
been applied to the pensionable age population in each of 2011 and 2031.
Figure 4.12: Estimated economic activity rates 2011 and 2031 –
population on pensionable age
% economically active
(2011)
% economically active
(2031)
NWL 14.0% 18.0%
Source: Census 2011
5%
6%
7%
8%
9%
10%
11%
2004
2005
2006
2007
2008
2009
2010
2011
2012
2013
2014

Nor t h W es t Le ices tersh i re Dis t r i c t Counc i l – Rev iew o f Hous ing Requi rements (2011-31)
Page 50
What is the change to the economically-active population?
4.44 Having run through an analysis of the two groups from which economically active people will arise
(those of working age and those who have reached pensionable age) it is possible to estimate the
overall change in the number of economically active people in the District. This is set out in the table
below and uses the proportions of each group who are economically active (and changes as
appropriate) applied to the relevant population.
4.45 The analysis shows that linked to the 2012-based SNPP there would be an increase in the
economically active population of about 4,900 people. This figure is lower than the growth in the
resident workforce suggested as being required by even the lowest of the economic forecasts
(5,700). The highest of the demographic projections (linked to long-term migration and a UPC
adjustment) would provide sufficient workforce for all of the economic forecasts apart from the
highest of the Experian figures (which required a change in the resident workforce of 9,900 people).
Figure 4.13: Estimated change to the economically active population (2011-31)
Change in
working-age
economically
active
Change in
pensionable
age
economically
active
Total change in
economically
active
Per annum
change
2012-based SNPP 3,271 1,583 4,854 243
2012-based SNPP (as updated) 4,044 1,608 5,652 283
2014-based (estimated) 6,434 1,673 8,107 405
Long-term migration 5,919 1,662 7,581 379
Long-term migration/UPC 7,538 1,691 9,229 461
Source: Derived from demographic projections
Housing Need linked to job-growth forecasts
4.46 Given that the level of growth in the economically active population is typically (but not universally)
lower than required to meet job growth forecasts it is necessary to consider an uplift to the
population such that the economically active population also increases. Within the modelling,
migration assumptions have been changed so that across the District the increase in the
economically active population matches the increase in the resident workforce required.
4.47 The changes to migration have been applied on a proportionate basis; the methodology assumes
that the age/sex profile of both in- and out-migrants is the same as underpins the SNPP with
adjustments being consistently applied to both internal (domestic) and international migration.
Adjustments are made to both in- and out-migration (e.g. if in-migration is increase by 1% then out-
migration is reduced by 1%).
4.48 Once the level of economically active population matches the job growth forecast the population
(and its age structure) is modelled against CLG headship rates (with an uplift for the 25-34 age
group) to see what level of housing provision that might imply.
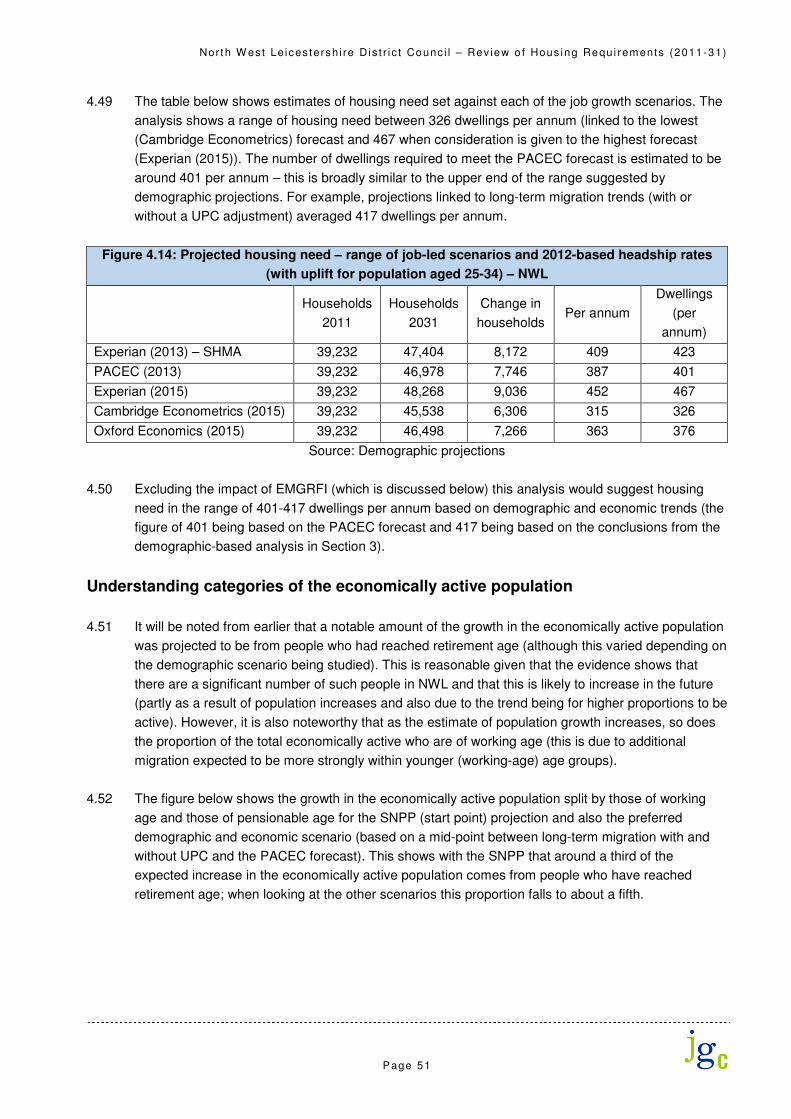
Nor t h W es t Le ices tersh i re Dis t r i c t Counc i l – Rev iew o f Hous ing Requi rements (2011-31)
Page 51
4.49 The table below shows estimates of housing need set against each of the job growth scenarios. The
analysis shows a range of housing need between 326 dwellings per annum (linked to the lowest
(Cambridge Econometrics) forecast and 467 when consideration is given to the highest forecast
(Experian (2015)). The number of dwellings required to meet the PACEC forecast is estimated to be
around 401 per annum – this is broadly similar to the upper end of the range suggested by
demographic projections. For example, projections linked to long-term migration trends (with or
without a UPC adjustment) averaged 417 dwellings per annum.
Figure 4.14: Projected housing need – range of job-led scenarios and 2012-based headship rates
(with uplift for population aged 25-34) – NWL
Households
2011
Households
2031
Change in
households Per annum
Dwellings
(per
annum)
Experian (2013) – SHMA 39,232 47,404 8,172 409 423
PACEC (2013) 39,232 46,978 7,746 387 401
Experian (2015) 39,232 48,268 9,036 452 467
Cambridge Econometrics (2015) 39,232 45,538 6,306 315 326
Oxford Economics (2015) 39,232 46,498 7,266 363 376
Source: Demographic projections
4.50 Excluding the impact of EMGRFI (which is discussed below) this analysis would suggest housing
need in the range of 401-417 dwellings per annum based on demographic and economic trends (the
figure of 401 being based on the PACEC forecast and 417 being based on the conclusions from the
demographic-based analysis in Section 3).
Understanding categories of the economically active population
4.51 It will be noted from earlier that a notable amount of the growth in the economically active population
was projected to be from people who had reached retirement age (although this varied depending on
the demographic scenario being studied). This is reasonable given that the evidence shows that
there are a significant number of such people in NWL and that this is likely to increase in the future
(partly as a result of population increases and also due to the trend being for higher proportions to be
active). However, it is also noteworthy that as the estimate of population growth increases, so does
the proportion of the total economically active who are of working age (this is due to additional
migration expected to be more strongly within younger (working-age) age groups).
4.52 The figure below shows the growth in the economically active population split by those of working
age and those of pensionable age for the SNPP (start point) projection and also the preferred
demographic and economic scenario (based on a mid-point between long-term migration with and
without UPC and the PACEC forecast). This shows with the SNPP that around a third of the
expected increase in the economically active population comes from people who have reached
retirement age; when looking at the other scenarios this proportion falls to about a fifth.

Nor t h W es t Le ices tersh i re Dis t r i c t Counc i l – Rev iew o f Hous ing Requi rements (2011-31)
Page 52
Figure 4.15: Projected change to economically active population by broad
population cohort and scenario (per annum average)
Source: Demographic projections
4.53 Generally, the higher level of population growth therefore leads to a younger age structure. However,
when considering the higher growth scenarios, it should be borne in mind that these are implying an
increase in migration – this migration would be expected to come from other areas which in turn
would see lower population growth. Hence there are clearly cross boundary issues related to the
higher (jobs-led) scenarios which will need to be considered as part of duty-to-cooperate
discussions. This will also be an issue to be dealt with in the forthcoming HEDNA.
Impact of East Midlands Gateway Rail Freight Interchange
4.54 Section 2 of this report provided some information about the East Midlands Gateway Strategic Rail
Freight Interchange (EMGRFI). The analysis noted a forecast increase in jobs of about 7,300 and
furthermore (once account was taken of commuting and double jobbing) that there would be an
increase in the resident workforce of about 3,600 people. This increase was modelled in Section 2
on the basis of the assumptions used in the SHMA. Below a similar analysis has been undertaken in
relation to the methodology in this report (i.e. to link to changes within the working- and pensionable-
age populations).
4.55 For the purposes of the modelling the additional change to the resident workforce (3,576) has been
added to the baseline forecasts to estimate the required change to the number of economically
active residents in the period to 2031 – this is shown in the table below. Overall, the analysis
suggests a need for the number of economically active residence (the resident workforce) to
increase by between 9,200 and 13,500 people – the figure when viewed as an uplift to PACEC is
about 11,500.
164
336313
79 84 83
0
50
100
150
200
250
300
350
400
SNPP Preferred demographic PACEC
Growth in economically-active population
Working-age Pensionable-age

Nor t h W es t Le ices tersh i re Dis t r i c t Counc i l – Rev iew o f Hous ing Requi rements (2011-31)
Page 53
Figure 4.16: Jobs growth and change in resident workforce
Forecast
Change in
resident
workforce
(2011-31) –
baseline
Change in
resident
workforce
(2011-31) –
EMG
Total change in
resident
workforce
(2011-31)
Experian (2013) – SHMA 8,585 3,576 12,161
PACEC (2013) 7,918 3,576 11,494
Experian (2015) 9,935 3,576 13,511
Cambridge Econometrics (2015) 5,667 3,576 9,243
Oxford Economics (2015) 7,168 3,576 10,744
Source: Range of economic forecasts, EMGRFI, NOMIS and 2011 Census
4.56 The modelling of these adjusted scenarios to include EMGRFI through to estimates of housing
requirements can be seen in the table below. This shows a range of dwellings required of between
444 and 586 per annum. A figure of 519 per annum can be seen when set against the PACEC
forecast. It is considered that this figure (519) is the best estimate of the requirement for housing
once the additional job growth at EMGRFI is factored in to the calculations – this figure sits in the
middle of the range of outputs from the modelling.
Figure 4.17: Projected housing requirements – range of job-led scenarios plus EMGRFI uplift and
2012-based headship rates (with uplift for population aged 25-34) – NWL
Households
2011
Households
2031
Change in
households Per annum
Dwellings
(per
annum)
Experian (2013) – SHMA 39,232 49,692 10,460 523 541
PACEC (2013) 39,232 49,265 10,033 502 519
Experian (2015) 39,232 50,556 11,324 566 586
Cambridge Econometrics (2015) 39,232 47,825 8,593 430 444
Oxford Economics (2015) 39,232 48,786 9,554 478 494
Source: Demographic projections
4.57 The uplift to the assessed need of including EMGRFI is around 120 dwellings per annum. This is
based on the modelling which looks at understanding the changes to both the working and
pensionable age population (along with an estimate of the proportion who will be economically
active). This uplift is virtually identical to that shown in Section 2 of this report (which was based on a
slightly different method as used in the SHMA). The analysis taken as a whole is however clear – the
EMGRFI will require about 120 additional dwellings per annum over and above whatever baseline
position is taken by the Council.

Nor t h W es t Le ices tersh i re Dis t r i c t Counc i l – Rev iew o f Hous ing Requi rements (2011-31)
Page 54
Summary – Economic-led Housing Requirements
Analysis has sought to estimate the likely level of housing needed to be delivered if the resident workforce
is to increase sufficiently to meet a range of job-growth forecasts. Job growth forecasts range from 340 to
596 additional jobs per annum (across the District) – taking account of commuting patterns and double
jobbing, the resident workforce would need to increase by 5,700 to 9,900 people over the 2011-31 period.
A key difficulty in matching job-growth to population growth (and ultimately housing need/requirements) is
what assumptions to make about how employment or economic activity rates might change in the future. A
range of potential sources are available to undertake this step, but none can be considered as robust
given the wide range of assumptions (either implicit or explicit assumptions).
The approach in this report is to draw on known data about changes to the working-age population (and
the proportion who will be economically active) along with changes to the pensionable age population
(again who are economically active). Such an approach reduces the number of assumptions needing to be
made.
In running the modelling, it is estimated that to meet the job growth forecasts there will need to be
provision of between 326 and 467 dwellings per annum across the District. The figure when set against
the PACEC forecast (which is in the middle of the range) is for 401 dwellings per annum; consistent with
the sort of figures coming out of the demographic modelling.
An uplift to these figures was provided to take account of the impact of an additional 7,317 jobs at East
Midlands Gateway. Taking account of the locations from which people might be expected to commute
(along with an adjustment for double jobbing) is was estimated that a further 3,576 economically active
residents would be required to fulfil this level of additional employment.
The housing requirement when set against the uplifted forecast is for between 444 and 586 dwellings per
annum, with the figure linked to PACEC being for 519 dwellings per annum. This latter figure is considered
to be the best estimate of the requirement for housing taking account of East Midlands Gateway.

Nor t h W es t Le ices tersh i re Dis t r i c t Counc i l – Rev iew o f Hous ing Requi rements (2011-31)
Page 55
5. Market Signals and Affordable Housing Need
Introduction
5.1 The PPG [2a-019 and 2a-020] sets out that housing numbers suggested by household projections
should be adjusted if necessary to reflect appropriate market signals, as well as other market
indicators of the balance between demand for and supply of dwellings. It indicates that prices or
rents rising faster than the national/local average may indicate particular market undersupply relative
to demand. It identifies a number of relevant market signals.
• Land Prices – where price premiums indicate a shortage of land in a locality;
• House Prices and Rents – where longer-term changes in prices may indicate a supply-demand
imbalance;
• Affordability – using the ratio of lower quartile house prices to lower quartile incomes to assess
relative affordability of market housing;
• Rates of Development – through comparison of rates of permissions and completions relative to
planned numbers over a meaningful period;
• Overcrowding – whereby long-term increases in overcrowded, concealed and sharing households,
homelessness and numbers in temporary accommodation should be considered.
5.2 The focus is on considering indicators relating to price and quantity. Guidance states these issues
should be assessed by comparing long-term trends in the housing market area, similar
demographic/economic areas, and nationally. For the purposes of analysis, the situation in NWL is
compared with all areas having a boundary with the District as well as wider areas. Additionally,
account has been taken of ONS (2011) area classifications which identifies ‘most similar’ local
authorities. Interestingly, the three most similar areas to NWL are also adjoining authorities and
these are marked with an asterisk (*) in the list below which shows the full range of areas against
which the market signals in NWL are compared:
• South Derbyshire*
• Erewash
• Rushcliffe
• Charnwood
• Hinckley & Bosworth*
• North Warwickshire*
• Lichfield
• Leicester
• Leicestershire (excluding Leicester)
• East Midlands
• England (or England & Wales)

Nor t h W es t Le ices tersh i re Dis t r i c t Counc i l – Rev iew o f Hous ing Requi rements (2011-31)
Page 56
Land Prices
5.3 The table below provides an estimate of the per hectare land value for residential sites with planning
permission for a range of areas. The data is taken from a 2015 CLG publication and is estimated as
of the 1st January 2014. The analysis shows that land values sit somewhere in the bottom/middle of
the range when compared with adjoining areas; land values are however substantially below those
seen nationally (even when excluding London). Overall the analysis does not point towards a
particular shortage of development land within the District.
Figure 5.1: Post permission residential land value estimates, per hectare (as of 1st
January 2014)
Estimated value of a typical residential site
North West Leicestershire £1,160,000
South Derbyshire £485,000
Erewash £790,000
Rushcliffe £1,450,000
Charnwood £1,180,000
Hinckley & Bosworth £1,550,000
North Warwickshire £1,435,000
Lichfield £2,825,000
Leicester £2,060,000
England (including London) £6,017,000
England (excluding London) £1,958,000
Source: CLG Land value estimates for policy appraisal (February 2015)
House Prices
5.4 A range of sources can be used to look at house prices and how these have changed over time
(including directly from Land Registry and analysis from ONS/CLG). Unfortunately, different sources
cover different geographies and are not calculated in the same way (for example ONS data on
‘House Price Statistics for Small Areas’ are not consistent with Land Registry House Price Index
(HPI) data).
5.5 The table below shows average (median) sale prices for different dwelling types and overall in the
year to September 2015. The analysis shows that whilst house prices are higher than in some
adjoining areas, they are quite low in a national context. The average sale price in the period
covered was £170,000; this is slightly lower than the County average and some 15% lower than the
equivalent figure for England & Wales.
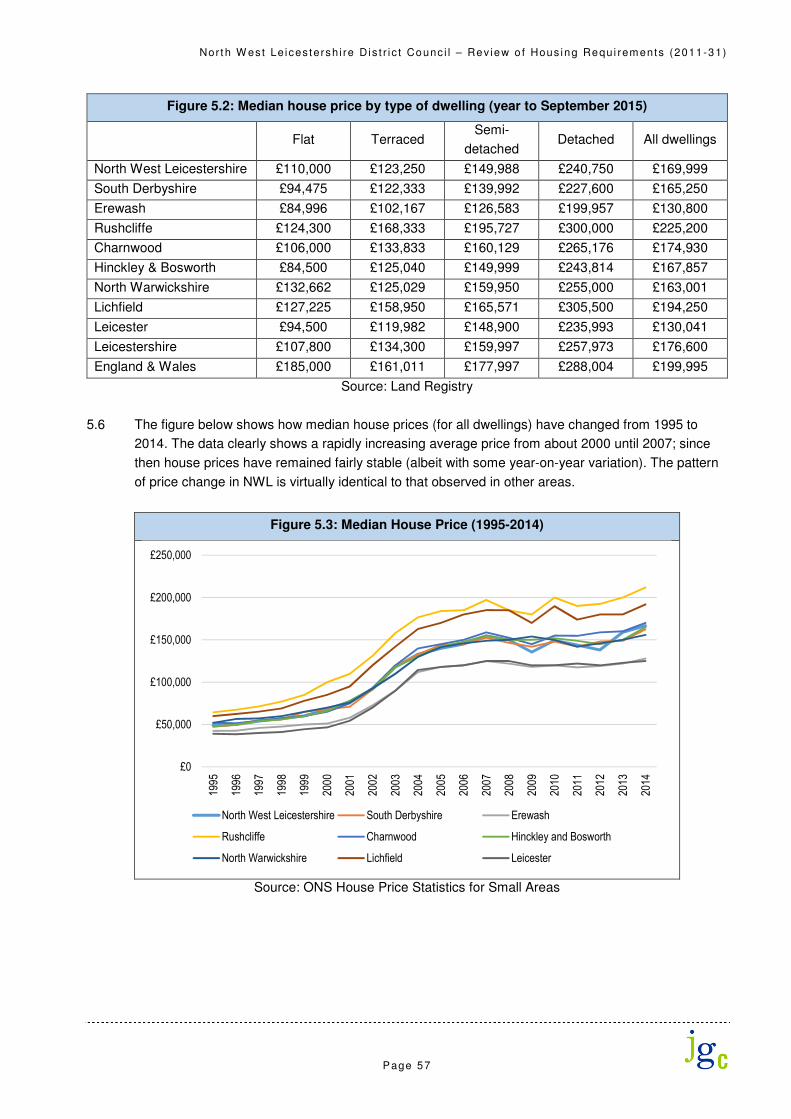
Nor t h W es t Le ices tersh i re Dis t r i c t Counc i l – Rev iew o f Hous ing Requi rements (2011-31)
Page 57
Figure 5.2: Median house price by type of dwelling (year to September 2015)
Flat Terraced Semi-
detached Detached All dwellings
North West Leicestershire £110,000 £123,250 £149,988 £240,750 £169,999
South Derbyshire £94,475 £122,333 £139,992 £227,600 £165,250
Erewash £84,996 £102,167 £126,583 £199,957 £130,800
Rushcliffe £124,300 £168,333 £195,727 £300,000 £225,200
Charnwood £106,000 £133,833 £160,129 £265,176 £174,930
Hinckley & Bosworth £84,500 £125,040 £149,999 £243,814 £167,857
North Warwickshire £132,662 £125,029 £159,950 £255,000 £163,001
Lichfield £127,225 £158,950 £165,571 £305,500 £194,250
Leicester £94,500 £119,982 £148,900 £235,993 £130,041
Leicestershire £107,800 £134,300 £159,997 £257,973 £176,600
England & Wales £185,000 £161,011 £177,997 £288,004 £199,995
Source: Land Registry
5.6 The figure below shows how median house prices (for all dwellings) have changed from 1995 to
2014. The data clearly shows a rapidly increasing average price from about 2000 until 2007; since
then house prices have remained fairly stable (albeit with some year-on-year variation). The pattern
of price change in NWL is virtually identical to that observed in other areas.
Figure 5.3: Median House Price (1995-2014)
Source: ONS House Price Statistics for Small Areas
£0
£50,000
£100,000
£150,000
£200,000
£250,000
1995
1996
1997
1998
1999
2000
2001
2002
2003
2004
2005
2006
2007
2008
2009
2010
2011
2012
2013
2014
North West Leicestershire South Derbyshire Erewash
Rushcliffe Charnwood Hinckley and Bosworth
North Warwickshire Lichfield Leicester

Nor t h W es t Le ices tersh i re Dis t r i c t Counc i l – Rev iew o f Hous ing Requi rements (2011-31)
Page 58
5.7 The table below summarises some of the data from above by looking at house price change from
1995 to 2014 in terms of both the percentage increase and the actual increase. The analysis shows
in proportionate terms than NWL has one of the highest increases in prices (at 241%) although the
actual increase (of about £118,000) is lower than seen in a number of areas. Overall, as with the
chart above the data does not suggest and substantial differences in NWL when compared with
other locations.
Figure 5.4: Median House Price Change (1995-2014)
Median price
(1995)
Median price
(2014) % change
Actual
change
North West Leicestershire £49,000 £166,850 241% £117,850
South Derbyshire £47,500 £162,500 242% £115,000
Erewash £42,375 £128,000 202% £85,625
Rushcliffe £64,500 £212,000 229% £147,500
Charnwood £51,950 £170,000 227% £118,050
Hinckley and Bosworth £47,550 £165,000 247% £117,450
North Warwickshire £52,000 £156,000 200% £104,000
Lichfield £59,950 £192,000 220% £132,050
Leicester £39,000 £125,000 221% £86,000
Source: ONS House Price Statistics for Small Areas
5.8 The final analysis of house price change looks at Land Registry HPI data for the County, region and
England & Wales (data from this source if not available for non-Unitary local authorities). The
analysis shows that house prices in Leicestershire are consistently above the regional average but
below national figures. The analysis also shows that the gap between Leicestershire and England &
Wales has been growing (higher increases in prices nationally than across the County) whilst the
difference in prices between the county and the region has remained broadly constant. This
suggests (at least at the County level) that pressures seen on the housing market are less
pronounced than seen nationally.

Nor t h W es t Le ices tersh i re Dis t r i c t Counc i l – Rev iew o f Hous ing Requi rements (2011-31)
Page 59
Figure 5.5: Average House Price (1995-2015) – County, Regional, National
Source: Land Registry House Price Index
Private rental trends
5.9 The figure below shows rental trends. The ONS Monthly Private Rental Index indicates that across
the region, rental values have grown fairly modestly when compared with the national average.
Since 2011 they have increased by around 7% compared with 11% across England – however,
removing London from the England figure does show a similar level of increase in rents across the
region. The level of growth in rents (particularly when inflation over this period is considered); does
not point to a substantial supply-demand imbalance in the rental sector.
Figure 5.6: Index of Rental Trends
Source: ONS Monthly Private Rental Index
£0
£20,000
£40,000
£60,000
£80,000
£100,000
£120,000
£140,000
£160,000
£180,000
£200,000
Jan-95
Oct-95
Jul-96
Apr-97
Jan-98
Oct-98
Jul-99
Apr-00
Jan-01
Oct-01
Jul-02
Apr-03
Jan-04
Oct-04
Jul-05
Apr-06
Jan-07
Oct-07
Jul-08
Apr-09
Jan-10
Oct-10
Jul-11
Apr-12
Jan-13
Oct-13
Jul-14
Apr-15
Leicestershire East Midland England & Wales
85
90
95
100
105
110
115
2005
2006
2007
2008
2009
2010
2011
2012
2013
2014
2015
Private Rental Index (January 2011=100)
East Midlands England England (excluding London)

Nor t h W es t Le ices tersh i re Dis t r i c t Counc i l – Rev iew o f Hous ing Requi rements (2011-31)
Page 60
5.10 Turning to consider rental values at a more local level, the figure below draws on published data
from the Valuation Office Agency (VOA). This shows that NWL has relatively high private rent levels
in a regional context and also arguably at a more local level. When compared with the national
position, it is however clear that rent levels are relatively low.
Figure 5.7: Rental Values (Per Calendar Month) – All Properties – year to September 2015
No. Rentals Average Lower
quartile Median
Upper
quartile
North West Leicestershire 536 £617 £475 £550 £675
South Derbyshire 469 £586 £475 £550 £625
Erewash 299 £512 £425 £475 £575
Rushcliffe 1,013 £619 £425 £550 £695
Charnwood 1,221 £538 £400 £500 £595
Hinckley and Bosworth 845 £555 £450 £525 £625
North Warwickshire 419 £590 £495 £550 £650
Lichfield 590 £667 £507 £600 £735
Leicester 3,587 £496 £345 £475 £595
Leicestershire 4,430 £591 £460 £550 £650
East Midlands 51,292 £555 £430 £525 £625
England 486,403 £788 £494 £625 £850
Source: VOA
5.11 Rental values are influenced by property size. The figure below provides a comparison of rental
levels for 2-bed properties across a range of areas (a 2-bedroom home has been used given that in
many areas this size represents the access point to the market; in addition, nationally (and also in
NWL) it is this size of stock that sees the most lettings annually). In NWL this data points to similar
rent levels to the region (generally slightly lower) and again confirms low rents in a national context.
Figure 5.8: Rental Values (Per Calendar Month) – two bedroom properties – year to September
2014
No. Rentals Average Lower
quartile Median
Upper
quartile
North West Leicestershire 208 £513 £450 £500 £550
South Derbyshire 205 £510 £465 £499 £550
Erewash 140 £497 £440 £475 £535
Rushcliffe 322 £576 £525 £575 £600
Charnwood 443 £526 £475 £525 £550
Hinckley and Bosworth 388 £521 £475 £500 £550
North Warwickshire 167 £553 £495 £550 £595
Lichfield 237 £596 £525 £585 £650
Leicester 1,277 £513 £350 £525 £590
Leicestershire 1,741 £535 £490 £525 £575
East Midlands 19,798 £527 £455 £525 £575
England 198,449 £727 £495 £595 £795
Source: VOA

Nor t h W es t Le ices tersh i re Dis t r i c t Counc i l – Rev iew o f Hous ing Requi rements (2011-31)
Page 61
5.12 The data above can also be used along with historic data to see how rent levels have changed. The
table below shows rents for the year to September 2011 (the oldest date for which this information is
available for a comparable 12-month period). Data for a two-bedroom property is used so that any
changes in the profile of lettings does not unduly impact on the figures and a comparison is made for
the median rent in each case (it should however be noted that changes to dwelling types (e.g.
detached, terraced) could have some influence on the figures). The data shows in comparison with
national data that private sector rents in NWL have increased at a slower rate (1% over the 4-years
compared with 8%). The rate of change in the District is lower than observed in any of the
comparator areas.
Figure 5.9: Changes to Rental Values (Per Calendar Month) – two bedroom
properties – 2011 to 2015 (median figures)
Year to
September 2011
Year to
September 2015 % change
North West Leicestershire £495 £500 1%
South Derbyshire £475 £499 5%
Erewash £450 £475 6%
Rushcliffe £550 £575 5%
Charnwood £495 £525 6%
Hinckley and Bosworth £485 £500 3%
North Warwickshire £500 £550 10%
Lichfield £575 £585 2%
Leicester £500 £525 5%
Leicestershire £495 £525 6%
East Midlands £475 £525 11%
England £550 £595 8%
Source: VOA
5.13 Overall, the rental data, as with the price and sales data does not provide any strong evidence of
significant market pressures in the District relative to other areas (costs are relatively low and have
not grown significantly in the past).
Affordability of Market Housing
5.14 Lower quartile price to income ratios are identified by Government as a measure of the affordability
of housing. They consider the affordability of entry-level market housing to younger prospective
buyers. The figure below compares performance on this measure within NWL with key neighbouring
authorities, the County and England more widely. Affordability trends using this measure have
tracked the trajectory seen in other areas.

Nor t h W es t Le ices tersh i re Dis t r i c t Counc i l – Rev iew o f Hous ing Requi rements (2011-31)
Page 62
Figure 5.10: Lower Quartile Price to Income Ratio
Source: DCLG Table 576
5.15 The table below studies this information for 1997 and 2013. It can be seen that the price:income ratio
in NWL is virtually identical to that for England in terms of both its level and the change seen over
the 16-year period studied. The increase in the ratio (of 2.9) over the period studied is higher than in
a number of neighbouring areas although it is a lower increase than seen across the County. As an
absolute measure (in 2013) the price:income ratio in NWL was lower than across Leicestershire,
indicating that housing is relatively affordable. There is little doubt however that affordability (at least
on this measure) has worsened over time (albeit improving since about 2007).
Figure 5.11: Lower Quartile Price to Income Ratio (1997 and 2013)
Price:income ratio
(1997)
Price:income ratio
(2013)
Change 1997-
2013
North West Leicestershire 3.53 6.43 2.90
South Derbyshire 3.00 5.79 2.79
Erewash 3.03 5.29 2.26
Rushcliffe 4.30 8.58 4.28
Charnwood 3.31 6.31 2.99
Hinckley & Bosworth 3.92 6.29 2.37
North Warwickshire 3.97 6.37 2.40
Lichfield 4.44 7.13 2.69
Leicester 2.65 5.29 2.64
Leicestershire 3.58 6.76 3.18
England 3.57 6.45 2.89
Source: DCLG Table 576
0
1
2
3
4
5
6
7
8
9
10
1997 1998 1999 2000 2001 2002 2003 2004 2005 2006 2007 2008 2009 2010 2011 2012 2013
North West Leicestershire South Derbyshire Erewash
Rushcliffe Charnwood Hinckley & Bosworth
North Warwickshire Lichfield Leicester
Leicestershire England

Nor t h W es t Le ices tersh i re Dis t r i c t Counc i l – Rev iew o f Hous ing Requi rements (2011-31)
Page 63
Rates of Development
5.16 Completions over time can be benchmarked using the Council’s monitoring data with housing
delivery measured against targets in the East Midlands Plan and previously the Structure Plan. The
East Midlands Plan was only in force from its adoption in 2009 to 2013 and so get a meaningful
period, data has been provided back to 2001.
5.17 The analysis clearly identifies a shortfall in provision in the past, although this has only occurred
since 2008. Overall, the analysis identifies a shortfall in provision of 1,125 dwellings by 2013 (and
this figure would be higher if the Regional Plan were used for benchmarking from 2006). There has
however been a notable uplift in provision over the last two years, with an average of 553
completions per annum in the 2013-15 period.
Figure 5.12: Completions compared with Structure Plan and East Midlands Regional Plan targets
Year Completions Cumulative
completions Target
Cumulative
target Balance Source of target
2001/2 493 493 368 368 125 Structure Plan
2002/3 395 888 368 736 152 Structure Plan
2003/4 315 1,203 368 1,104 99 Structure Plan
2004/5 306 1,509 368 1,472 37 Structure Plan
2005/6 410 1,919 368 1,840 79 Structure Plan
2006/7 336 2,255 368 2,208 47 Structure Plan
2007/8 353 2,608 368 2,576 32 Structure Plan
2008/9 237 2,845 368 2,944 -99 Structure Plan
2009/10 228 3,073 510 3,454 -381 Regional Plan
2010/11 186 3,259 510 3,964 -705 Regional Plan
2011/12 234 3,493 510 4,474 -981 Regional Plan
2012/13 366 3,859 510 4,984 -1,125 Regional Plan
2013/14 431 4,290 n/a - - -
2014/15 675 4,965 n/a - - -
Source: Annual Monitoring Reports
Overcrowding and Houses in Multiple Occupation
5.18 The final market signal highlighted in guidance is overcrowding where it is noted that an ‘increase in
the number of such households may be a signal to consider increasing planned housing numbers’.
The analysis below firstly looks at levels of overcrowding in NWL compared with other areas (based
on the bedroom standard) before moving on to consider how overcrowding has changed over time
(in this case using the room standard as historical bedroom standard data is not available from the
Census source used).
5.19 The figure below shows in 2011 that some 1.9% of households in NWL were overcrowded. This is
below the average for many of the other areas studied and is less than half the level observed
nationally.

Nor t h W es t Le ices tersh i re Dis t r i c t Counc i l – Rev iew o f Hous ing Requi rements (2011-31)
Page 64
Figure 5.13: Overcrowding (2011) – bedroom standard
Overcrowded (no.) Overcrowded (%)
North West Leicestershire 746 1.9%
South Derbyshire 684 1.8%
Erewash 1,067 2.2%
Rushcliffe 755 1.6%
Charnwood 1,671 2.5%
Hinckley & Bosworth 787 1.7%
North Warwickshire 650 2.5%
Lichfield 976 2.4%
Leicester 12,052 9.8%
Leicestershire 5,417 2.0%
East Midlands 59,298 3.1%
England 1,024,473 4.6%
Source: Census (2011)
5.20 The figure below shows overcrowding (as measured through the room standard) in 2001 and 2011.
The data confirms that levels of overcrowding in NWL are lower than in many other locations and
that the increase has also been quite moderate.
Figure 5.14: Changes in overcrowding (2001-2011) – room standard
2001 2011 Change
North West Leicestershire 2.8% 2.9% 0.2%
South Derbyshire 2.5% 3.2% 0.8%
Erewash 3.2% 3.7% 0.5%
Rushcliffe 3.1% 3.1% 0.0%
Charnwood 4.5% 5.0% 0.5%
Hinckley & Bosworth 3.2% 3.2% 0.0%
North Warwickshire 3.3% 3.6% 0.3%
Lichfield 3.0% 3.6% 0.5%
Leicester 10.6% 15.2% 4.6%
Leicestershire 3.4% 3.7% 0.3%
East Midlands 4.5% 5.5% 1.1%
England 7.1% 8.7% 1.6%
Source: Census (2001 and 2011)
5.21 As well as studying overcrowding the table below looks at the number of Houses in Multiple
Occupation (HMOs). For the purposes of this analysis, data has been taken from the Census about
the number of households in the ‘Other’ household composition category – this category is largely
made up of multi-adult households where residents are unrelated. This therefore provides an
indication of the number of sharing households.
5.22 The table below shows that the proportion of households sharing accommodation is generally below
that seen in other areas with the increase also being quite modest in comparison with other locations
(the increase in overcrowding has been less than half of that seen regionally or nationally).

Nor t h W es t Le ices tersh i re Dis t r i c t Counc i l – Rev iew o f Hous ing Requi rements (2011-31)
Page 65
Figure 5.15: Changes in sharing households (2001-2011)
2001 2011 Change
North West Leicestershire 2.1% 2.5% 0.4%
South Derbyshire 1.9% 2.6% 0.7%
Erewash 2.2% 2.6% 0.4%
Rushcliffe 2.9% 3.1% 0.1%
Charnwood 2.6% 3.3% 0.7%
Hinckley & Bosworth 2.2% 2.5% 0.3%
North Warwickshire 2.5% 2.7% 0.3%
Lichfield 2.2% 2.7% 0.5%
Leicester 4.3% 6.2% 1.9%
Leicestershire 2.3% 2.8% 0.5%
East Midlands 2.7% 3.5% 0.8%
England 3.7% 4.5% 0.8%
Source: Census (2001 and 2011)
5.23 A final analysis looks at the number of concealed families in the District and other areas. The
Census definition of a concealed family is ‘A concealed family is one living in a multi-family
household in addition to the primary family, such as a young couple living with parents’. NWL, like
other areas has seen some increase in the number of concealed families over time – the increase
has been higher than seen in other locations although the level of concealed households in 2011 is
below that seen both regionally and nationally (and indeed slightly below the figure for
Leicestershire).
Figure 5.16: Concealed families (2001-2011)
2001 2011 Change % change
Concealed
as % of all
households
(2011)
North West Leicestershire 185 334 149 81% 0.9%
South Derbyshire 190 335 145 76% 0.9%
Erewash 232 347 115 50% 0.7%
Rushcliffe 218 336 118 54% 0.7%
Charnwood 459 740 281 61% 1.1%
Hinckley & Bosworth 267 358 91 34% 0.8%
North Warwickshire 198 292 94 47% 1.1%
Lichfield 241 400 159 66% 1.0%
Leicester 2,084 3,734 1,650 79% 3.0%
Leicestershire 1,745 2,801 1,056 61% 1.0%
East Midlands 11,708 20,403 8,695 74% 1.1%
England 161,254 275,954 114,700 71% 1.3%
Source: Census (2001 and 2011)

Nor t h W es t Le ices tersh i re Dis t r i c t Counc i l – Rev iew o f Hous ing Requi rements (2011-31)
Page 66
5.24 Overall, the analysis of overcrowding, HMOs and concealed families does not point to a particular
imbalance in the District. However, it is recognised that all of the measures show a worsening over
time.
Conclusions on market signals
5.25 Drawing together the individual market signals above allows a picture of the current housing market
in NWL to be built, and how the area sits in comparison with local, regional and national data. Below
a brief summary of the key market signals (as set out in the PPG) is provided.
Land Prices – the evidence does not point to any supply/demand imbalance. Residential land
values are generally low (particularly in comparison with national data) and so there is no evidence
of a particular pressure.
House prices – house prices in the District are generally average in comparison with other ‘local’
areas but are low national context. Over the long-term there has been a notable increase in prices,
although this is consistent with that seen in other locations.
Rent levels – in a local context, NWL has relatively average private sector rents. Rent levels are
however some way below the national comparative position. Further analysis indicates that the
growth in rents has been less pronounced than in other areas and overall the evidence does not
point to any supply/demand imbalance.
Affordability – the affordability of housing (measured using a price:income ratio) shows a significant
deterioration from 1997 to about 2005. Over the past decade, this measure does however suggest
an improvement in the ratio in NWL; additionally, the ratio sits somewhere in the middle of that in
other ‘local’ areas and in line with the national position. Overall, it is considered that this measure
indicates some supply/demand imbalance when looked at over the period back to 1997.
Rates of development – when compared with plan targets, NWL under-supplied new housing. As a
market signal this arguably provides some basis for uplifting housing numbers from the ‘start point’
identified in the PPG.
Overcrowding – levels of overcrowding, HMOs and concealed families in NWL are relatively low
when compared with other areas. All of these indicators did however rise over the 2001-11 decade.
Overall, it is considered that this provides some limited evidence of a need to consider an uplift in
housing numbers.

Nor t h W es t Le ices tersh i re Dis t r i c t Counc i l – Rev iew o f Hous ing Requi rements (2011-31)
Page 67
5.26 Overall the analysis of market signals points towards some affordability pressures although the
analysis suggests this is pretty modest when compared with other locations. The PPG sets out [2a-
020] that:
“In areas where an upward adjustment [to the assessment of housing need] is required, plan makers
should set this adjustment at a level that is reasonable. The more significant the affordability
constraints (as reflected in rising prices and rents, and worsening affordability ratio) and the stronger
other indicators of high demand (e.g. the differential between land prices), the larger the
improvement in affordability needed and, therefore, the larger the additional supply response should
be.”
5.27 The Guidance does not however set out how such an adjustment should be quantified. It simply sets
out that it should be ‘reasonable.’ Indeed, inspectors at various Local Plan Inquiries have taken a
range of different views, even when faced with similar evidence.
5.28 Probably the most cited inspectors reports where market signals have been considered are in
Eastleigh and Uttlesford, where different inspectors suggested that the local authorities should
consider increasing housing need by 10% as a result of the evidence. Key quotes from these reports
are provided below.
Eastleigh (February 2015) – ‘It is very difficult to judge the appropriate scale of such an uplift. I
consider a cautious approach is reasonable bearing in mind that any practical benefit is likely to be
very limited because Eastleigh is only part of a much larger HMA. Exploration of an uplift of, say,
10% would be compatible with the “modest” pressure of market signals recognised in the SHMA
itself’
Uttlesford (December 2014) – ‘I conclude that it would be reasonable and proportionate, in
Uttlesford’s circumstances, to make an upward adjustment to the OAN, thereby increasing provision
with a view to relieving some of the pressures. In my view it would be appropriate to examine an
overall increase of around 10%...’
5.29 To be balanced it should however be noted that there are a number of inspectors who have not
suggested any need for an uplift due to market signals and these would include:
Mendip (October 2014) – ‘these findings indicate that trends in Mendip sit fairly comfortably
alongside county, regional and national trends and do not, therefore, justify an upward adjustment of
the housing numbers that came out of the housing projection’
Crawley (May 2015) – ‘I am not convinced that the market signals uplift is justified by the evidence,
for the various indicators reveal a situation in Crawley which is not as severe as in other North West
Sussex authorities, and one that has not worsened in recent years’ (this is an interesting case given
that the Council themselves had suggested an uplift for market signals)
Stratford-on-Avon (March 2015) – ‘On balance I conclude, despite the SHMA’s finding that there is a
case for an uplift, that an upward adjustment in housing numbers has not been justified in terms of
market signals in the District’.

Nor t h W es t Le ices tersh i re Dis t r i c t Counc i l – Rev iew o f Hous ing Requi rements (2011-31)
Page 68
Cornwall (June 2015) – ‘National guidance is that a worsening trend in any relevant market signal
should result in an uplift. But for the reasons given below I do not consider that I should require such
an uplift to be made for Cornwall at this time’ (this one is also interesting given that it was the same
inspector as Eastleigh)
5.30 To consider this issue in NWL, it is worthwhile returning to the requirements of the PPG. Para 2a-
019 states that the ‘housing need number suggested by household projections (the starting point)
should be adjusted to reflect appropriate market signals’ [emphasis added]. It is clear from this that
any uplift should be considered in relationship to the ‘starting point’ estimate of housing need. In
NWL the start point (as informed by CLG household projections) is for 262 dwellings per annum. If
the Council were to set the need at a level consistent with demographic and economic projections
(401-417 dwellings per annum) then the uplift would be up to 59%; if the Council planned for 519
dwellings per annum (as suggested once EMG is included) the uplift is nearly 100%. These are
considered to be significant uplifts and therefore it is difficult to suggest on the basis of the market
signals evidence than any additional uplift is required. It should also be noted that the housing need
figures already include an uplift for apparent suppression in the 25-34 population age group.
Affordable Housing Need
5.31 This report has not revisited the need for affordable housing and draws on information from the 2014
SHMA to provide an indication of the need. The table below has been adapted from information in
Tables 40 and 45 of the SHMA to look at the affordable housing need over the 2011-31 period. This
shows an annual need for 212 affordable homes (4,240 over the 20-year period).
Figure 5.17: Estimated Level of Affordable Housing Need (2011-31)
Per annum 20-years
Current need 17 340
Newly forming households 327 6,540
Existing households falling into need 190 3,800
Total Gross Need 534 10,680
Supply 322 6,440
Net Affordable Need 212 4,240
Source: Derived from 2014 SHMA
5.32 In considering the level of affordable housing need, it is worth reflecting on the wording of the PPG,
which says in 2a-029 that an ‘increase in the total housing figures included in the local plan should
be considered where it could help deliver the required number of affordable homes’ [emphasis
added]. This consideration is reflected on below.
Relating Affordable Housing Need and OAN – legal judgments and guidance
5.33 The analysis above clearly indicates a need for affordable housing across the District. However, the
link between affordable need and the OAN is complex and has been subject to a number of recent
High Court decisions. The Planning Advisory Service’s Technical Advice Note on Objectively-
Assessed Need and Housing Targets (2nd Edition, July 2015) also deals with this issue. Below are
summarised some of the key judgements and guidance in Chronological Order.

Nor t h W es t Le ices tersh i re Dis t r i c t Counc i l – Rev iew o f Hous ing Requi rements (2011-31)
Page 69
Satnam Millennium Limited v Warrington Borough Council (February 2015)
5.34 In this case, a challenge to the adoption of the Warrington Local Plan Core Strategy succeeded,
resulting in the quashing of the Plan’s housing provision policies. With regard to affordable housing
the judge found that the assessment of full, objectively assessed needs for housing had not taken
account of the (substantial) need for affordable housing.
5.35 In paragraph 43 of the judgement it is concluded that ‘the Local Plan should then meet the OAN for
affordable housing, subject only to the constraints referred to in the NPPF, paragraphs 14 and 47’.
This quote has been taken by some parties to imply that the need for affordable housing (as shown
in modelling such as within the section) needs to be met in full – for example, if the affordable need
is 200 per annum and delivery is likely to be 20% then an OAN for 1,000 homes would be
appropriate.
5.36 It is not clear if this is exactly what the judge in this case had in mind. What is clear that such an
approach in many areas would be impractical as it would require huge increases to have any
significant impact.
Oadby and Wigston v Bloor Homes (July 2015)
5.37 In this case, a challenge by Oadby & Wigston Borough Council to the granting of planning
permission through a Section 78 inquiry was dismissed.
5.38 The key issue in front of the Judge was whether or not the original inspector’s adoption of a figure of
147 dwellings per annum as the full objectively assessed need for housing (FOAN) was sound. In
essence the Council’s position was that the need was in the range of 80-100 dwellings per annum
and that this was a policy-off figure based on the most up-to-date population and household
projections. The appellant suggested a need in the range of 147-161 based on long-term migration
trends and the needs of the local economy (in terms of matching job growth and housing need).
5.39 The Judge’s initial conclusion was that he considered the SHMA position (of 80-100 dwellings per
annum) to be policy-on. He based this on a recognition that other analysis in the SHMA had
indicated a need for 173 dpa to meet economic growth and a slightly lower figure (of 160 per annum)
as the affordable housing need.
5.40 The uncertainty in this decision is whether or not the FOAN must include all of the affordable housing
need. Some of the wording of the judgment would suggest that this was the case with Judge
Hickinbottom stating that the assessment of need ‘becomes policy on as soon as the Council takes a
course of not providing sufficient affordable housing to satisfy the FOAN’. This however is
inconsistent with the more recent judgement in Kings Lynn (below) and also contrasts with the
approach recommended in the PAS Technical Advice Note.

Nor t h W es t Le ices tersh i re Dis t r i c t Counc i l – Rev iew o f Hous ing Requi rements (2011-31)
Page 70
Planning Advisory Service – Technical Advice note (July 2015)
5.41 At about the same time as the Oadby & Wigston judgement, the Planning Advisory Service (PAS)
published the second edition of their technical advice note on Objectively Assessed Need and
Housing Targets – this replaced/updated a version from June 2014.
5.42 The consideration of affordable housing need and its relationship to overall housing need is covered
in some detail within Section 9 of the document. PAS set out a suggested approach for looking at the
relationship between OAN and affordable housing (which is broadly in line with the approach in this
report) before going on to consider their own view about the relationship.
5.43 They initially suggest that affordable housing is “a policy consideration” that bears on housing targets
rather than OAN and note that they are not comparable because they relate to different meanings of
the term “need.” They also highlight that the OAN relates to new dwellings whereas much of the
affordable need relates to existing households, who, when moving, would free up dwellings to be
occupied by other households.
5.44 PAS conclude that there is no arithmetical way of combining the OAN (calculated through
demographic projections) and the affordable need before concluding that the affordable need cannot
be a component part of the OAN. PAS do however note that their views ‘may be’ contradicted by the
Satnam judgement referred to above.
Kings Lynn v Elm Park Holdings (July 2015)
5.45 The final case of reference is Kings Lynn and West Norfolk Council vs. SSCLG and Elm Park
Holdings. The case involved the Council’s challenge to an inspector’s granting of permission for 40
dwellings in a village. Although much of the case was about the approach to take with regards to
vacant and second homes, the issue of affordable housing was also a key part of the final judgment.
5.46 Focussing on affordable housing, Justice Dove considered the "ingredients" involved in making a
FOAN and noted that the FOAN is the product of the Strategic Housing Market Assessment (SHMA)
required by paragraph 159 of the NPPF. It is noted that the SHMA must identify the scale and mix of
housing to meet household and population projections, taking account of migration and demographic
change, and then address the need for all housing types, including affordable homes.

Nor t h W es t Le ices tersh i re Dis t r i c t Counc i l – Rev iew o f Hous ing Requi rements (2011-31)
Page 71
5.47 He continued by noting that the scale and mix of housing is ‘a statistical exercise involving a range of
relevant data for which there is no one set methodology, but which will involve elements of
judgement’. Crucially, in paragraph 35 of the judgment he says that the ‘Framework makes clear that
these needs [affordable housing needs] should be addressed in determining the FOAN, but neither
the Framework nor the PPG suggest that they have to be met in full when determining that FOAN.
This is no doubt because in practice very often the calculation of unmet affordable housing need will
produce a figure which the planning authority has little or no prospect of delivering in practice’. This
is an important point, given the previous judgements in Satnam and Oadby & Wigston. And indeed in
relation to Oadby and Wigston he notes that ‘Insofar as Hickinbottom J in the case of Oadby and
Wigston Borough Council v Secretary of State [2015] EWHC 1879 might be taken in paragraph 34(ii)
of his judgment to be suggesting that in determining the FOAN, the total need for affordable housing
must be met in full by its inclusion in the FOAN I would respectfully disagree. Such a suggestion is
not warranted by the Framework or the PPG’.
5.48 Therefore, this most recent judgement is clear that an assessment of affordable housing need
should be carried out, but that the level of affordable need shown by analysis does not have to be
met in full within the assessment of the FOAN.
5.49 The approach in Kings Lynn is also similar to that taken by the inspector (Simon Emerson) to the
Cornwall Local Plan. His preliminary findings in June 2015 noted in paragraph 3.20 that ‘National
guidance requires consideration of an uplift; it does not automatically require a mechanistic increase
in the overall housing requirement to achieve all affordable housing needs based on the proportions
required from market sites.’
Relating Affordable Housing Need and Housing Need/Requirements
5.50 The analysis above indicates a clear need for affordable housing in the District. Using a baseline
(start point) demographic need (for all tenures) linked to the 2012-based SNPP and household
projections (a need for 262 dwellings per annum) the analysis is suggesting that some 81% of the
need is for affordable housing. This percentage drops to about 50% with the preferred demographic
and economic-based assessments, and further still (to 41%) when including an uplift for EMGRFI.
These figures are however calculated in different ways and are not strictly comparable.
Figure 5.18: Affordable Need as % of Housing Need/Requirement Projections
Demographic-
based Need/
Requirement
Affordable
Housing Need
Affordable as
% of
Demographic-
based Need/
Requirement
Start point (2012-based projections) 262 212 81%
Preferred demographic scenario 417 212 51%
Preferred economic baseline 401 212 53%
Preferred economic baseline + EMG 519 212 41%

Nor t h W es t Le ices tersh i re Dis t r i c t Counc i l – Rev iew o f Hous ing Requi rements (2011-31)
Page 72
5.51 The Planning Practice Guidance sets out how it expects the affordable housing need to be
considered as part of the plan-making process. It outlines in Paragraph 029 that:
“The total affordable housing need should be considered in the context of its likely delivery as a
proportion of mixed market and affordable housing developments, given the probable percentage of
affordable housing to be delivered by market housing led developments. An increase in the total
housing figures included in the local plan should be considered where it could help deliver the
required number of affordable homes.”
5.52 The likely delivery of affordable housing on mixed market housing-led developments will be
influenced both by affordable housing policies (themselves influenced by development viability
evidence), the mix of homes which are delivered and the viability of individual development
schemes. Some schemes will not be able to viably deliver policy-compliant levels of affordable
housing.
5.53 This study has not considered residential development viability, but it is noted that the emerging local
plan sets targets of 20%-30% depending on location (at thresholds of 11+ or 15+ dwellings).
Evidence from Annual Monitoring Reports suggests that about 16% of dwellings were delivered as
affordable housing in the 2004-13 period.
5.54 It should be borne in mind that besides delivery of affordable housing on mixed-tenure development
schemes, there are a number of other mechanisms which deliver affordable housing. These include:
• National Affordable Housing Programme – this (adminsted by the HCA) provides fuding to support
Registered Providers in delivering new housing including on sites owned by RPs;
• Building Council Homes – following reform of the HRA funding system, Councils can bring forward
affordable housing themselves.
• Empty Homes Programmes – where local authorities can bring properties back into use as
affordable housing. These are existing properties, and thus represent a change in tenure within the
current housing stock;
• Rural Exception Site Development – where the empasis is on delivering affordable housing to meet
local needs.
5.55 Funding for specialist forms of affordable housing, such as extra care provision, may also be
available from other sources; whilst other niche agents, such as Community Land Trusts, may
deliver new affordable housing. Net changes in affordable housing stock may also be influenced by
estate regeneration schemes, as well as potentially by factors such as the planned extension of the
Right to Buy to housing association properties. Affordable housing can be met by changes in the
ownership of existing housing stock, not just by new-build development.

Nor t h W es t Le ices tersh i re Dis t r i c t Counc i l – Rev iew o f Hous ing Requi rements (2011-31)
Page 73
5.56 In interpreting the relationship between affordable need and total housing provision, it is important to
understand the basis of the affordable housing needs model. As the Planning Practice Guidance
sets out, the calculation of affordable need involves “adding together the current unmet housing
need and the projected future housing need and then subtracting this from the current supply of
affordable stock.” The affordable housing need does therefore not represent an assessment of what
proportion of additional households might require affordable housing. Instead the model considers:
• What need can be expected to arise from both existing and newly-forming household who require
financial support to access suitable housing;
• This is then compared with the projected supply of affordable housing expected to arise from the
turnover of existing stock.
5.57 The affordable housing model thus includes supply-side factors. The net affordable need figures
derived are influenced by the current stock of affordable housing and turnover of this. This has been
influenced by past policies and investment decisions (at both the national and local levels). Funding
mechanisms for affordable housing have influenced past delivery, which in turn influence the
affordable need today.
5.58 Given that there has been little change in affordable housing stock over the last 15 years, the Private
Rented Sector has in effect taken on an increasing role in providing housing for households who
require financial support in meeting their housing needs, supported by Local Housing Allowance.
5.59 Whilst the Private Rented Sector (PRS) does not fall within the definition of “affordable housing,” it
has evidently been playing a role in meeting the needs of households who require financial support
in meeting their housing need. Government recognises this, and indeed legislated through the 2011
Localism Act to allow Councils to discharge their “homelessness duty” through providing an offer of a
suitable property in the PRS.
5.60 It is also worth reflecting on the NPPF (Annex 2) definition of affordable housing. This says:
‘Affordable housing: Social rented, affordable rented and intermediate housing, provided to eligible
households whose needs are not met by the market’ [emphasis added]. Clearly where a household
is able to access suitable housing in the private rented sector (with or without Housing Benefit) it is
the case that these needs are being met by the market (as within the NPPF definition). This does not
mean that such households do not have a ‘need’ but it reflects the solutions potentially available. As
such the role played by the private rented sector should be recognised – it is evidently part of the
functioning of housing markets.
5.61 Data from the Department of Work and Pensions (DWP) has been used to look at the number of
LHA supported private rented homes. As of August 2015 it is estimated that there were around 1,300
benefit claimants in the Private Rented Sector.
5.62 From English Housing Survey it is estimated that the proportion of households within the private
sector who are “new lettings” each year (i.e. stripping out the effect of households moving from one
private rented property to another) is around 13% (nationally). Applying this to the number of LHA
claimants in the Private Rented Sector gives an estimate of around 160-170 private sector lettings
per annum to new LHA claimants in the District. This serves to illustrate that there is some flexibility
within the wider housing market.

Nor t h W es t Le ices tersh i re Dis t r i c t Counc i l – Rev iew o f Hous ing Requi rements (2011-31)
Page 74
5.63 However, national planning policy does not specifically seek to meet the needs identified through the
Basic Needs Assessment Model through the Private Rented Sector. Government’s benefit caps may
reduce the contribution which this sector plays in providing a housing supply which meets the needs
of households identified in the affordable housing needs model herein. In particular future growth in
households living within the PRS and claiming LHA cannot be guaranteed.
5.64 Secondly, and perhaps more critically, it is important to recognise that the model includes needs
arising from both new households and existing households. Part of the needs included are from
households who might require an additional home, such as:
• Newly-forming households;
• Those in temporary accommodation;
• Concealed households; and
• Homeless households.
5.65 But the figures also include needs arising from households who will require a different form of home,
but who – by moving to another property – would release an existing property for another household.
These households do not necessarily generate a need for more dwellings overall (subject to there
being housing within the existing dwelling stock that is sufficient to meet their housing requirements).
They include households who need to move as they are:
• Overcrowded;
• Coming to the end of a tenancy;
• Living in unsuitable housing; and
• Cannot afford to remain in their current home.
5.66 Such households do not necessarily generate a net need for additional homes, as by moving they
would release a home for other households. On this basis, these elements of the affordable housing
need are not directly relevant to considering overall housing need and housing targets (which are
typically measured in terms of net dwellings). In considering the overall need for housing, only those
who are concealed or homeless would be likely to result in an additional need for housing. Numbers
of newly-forming households in the modelling are established specifically from the demographic
projections.

Nor t h W es t Le ices tersh i re Dis t r i c t Counc i l – Rev iew o f Hous ing Requi rements (2011-31)
Page 75
Summary – Market Signals and Affordable Housing
The extent to which the demographic ‘starting point’ for identifying the need for housing (i.e. the CLG’s
household projections) needs to be boosted to address market signals is necessarily an area of
judgement. The PPG is clear that the more significant the affordability constraints and the stronger other
indicators of high demand, the larger the improvement in affordability needed and therefore the larger the
additional supply response should be.
Overall the analysis of market signals points to modest affordability pressures in the District, although it is
recognised that house prices and the affordability ratio have increased over the longer-term, along with
increases in the number of overcrowded and concealed households. None of these indicators can
however be considered as any worse than seen in other locations. The analysis does also identify a
historic under-delivery of housing (against planned targets).
In terms of the PPG, any uplift for market signals is from the start point projections; in NWL the start point
(as informed by CLG household projections) is for 262 dwellings per annum. If the Council were to set the
need at a level consistent with demographic and economic projections (401-417 dwellings per annum)
then the uplift would be up to 59%; if the Council planned for 519 dwellings per annum (as suggested once
EMG is included) the uplift is nearly 100%. These are considered to be significant uplifts and therefore it is
difficult to suggest on the basis of the market signals evidence that any further additional uplift is required.
It should also be noted that the housing need/requirement figures already include an uplift for apparent
suppression in the 25-34 population age group.
A reworking of the affordable housing needs assessment in the 2014 SHMA suggests a net deficit of 212
affordable homes per annum in the 2011-31 period. There is thus a requirement for new affordable
housing in the District and the Council is justified in seeking to secure additional affordable housing.
The identified affordable housing need represents 41%-81% of the need arising through the demographic
projections. However, in considering this relationship, it is important to bear in mind that the affordable
housing needs model includes existing households who require a different size or tenure of
accommodation rather than new accommodation per se. Furthermore, many households secure suitable
housing within the Private Rented Sector, supported by housing benefit. On this basis, the analysis does
not suggest that there is any strong evidence of a need to consider additional housing over and above that
suggested by demographic and economic-based projections to help meet the affordable need.

Nor t h W es t Le ices tersh i re Dis t r i c t Counc i l – Rev iew o f Hous ing Requi rements (2011-31)
Page 76

Nor t h W es t Le ices tersh i re Dis t r i c t Counc i l – Rev iew o f Hous ing Requi rements (2011-31)
Page 77
6. Impact of EMGRFI on Other Areas
Introduction
6.1 The analysis in this report identifies of an expected 7,317 additional jobs at EMGRFI that some
3,698 would potentially be filled by workers who will be resident in the District – this being based on
an analysis of commuting patterns for the whole of the District. This implies that some 3,619 jobs
would be filled by people commuting in from other areas.
6.2 It is therefore of use to consider the locations from which people might be expected to travel to the
site for work and the potential implications for additional homes in each of these locations.
Commuting Patterns to NWL and EMGRFI
6.3 The table below shows the locations of residence of people who work in NWL but live outside the
Borough. All local authorities are included where the number of workers is in excess of 200 (the
choice of 200 is arbitrary but has been used to limit the number of areas to a manageable number –
recognising that areas with lower levels of commuting will not have particularly strong links with
NWL). The table also shows the implied number of additional workers who might be expected to
come from different areas if commuting patterns were to remain the same (as in 2011). The analysis
identifies particularly strong links with South Derbyshire, Charnwood and Derby and relatively weak
links with some parts of Leicestershire (including Melton and Oadby & Wigston).

Nor t h W es t Le ices tersh i re Dis t r i c t Counc i l – Rev iew o f Hous ing Requi rements (2011-31)
Page 78
Figure 6.1: Commuting patterns to NWL and implied number working at EMGRFI
Commute from… Number
commuting % of commuters
Implied number
working at
EMGRFI
Amber Valley 405 1.5% 55
Ashfield 252 0.9% 34
Blaby 747 2.8% 101
Broxtowe 683 2.6% 93
Charnwood 3,263 12.2% 442
Derby 2,616 9.8% 355
Erewash 1,891 7.1% 256
Gedling 283 1.1% 38
Harborough 293 1.1% 40
Hinckley & Bosworth 1,870 7.0% 253
Leicester 1,620 6.1% 220
Melton 274 1.0% 37
Nottingham 1,016 3.8% 138
Oadby & Wigston 262 1.0% 36
Rushcliffe 766 2.9% 104
South Derbyshire 3,995 15.0% 542
Rest of East Midlands 1,075 4.0% 146
Birmingham 359 1.3% 49
East Staffordshire 940 3.5% 127
Lichfield 209 0.8% 28
North Warwickshire 273 1.0% 37
Nuneaton and Bedworth 221 0.8% 30
Tamworth 338 1.3% 46
Rest of West Midlands 1,147 4.3% 155
Elsewhere 1,901 7.1% 258
TOTAL 26,699 100.0% 3,619
Source: 2011 Census (and as calculated)
6.4 To some extent this is a slightly false analysis of where people might be drawn from to work at
EMGRFI; this is because the proposed development is at the very North of the District (between
Kegworth and Castle Donington) and is therefore more likely to draw a workforce from those areas
immediately adjacent to the site rather than from local authorities to the South.

Nor t h W es t Le ices tersh i re Dis t r i c t Counc i l – Rev iew o f Hous ing Requi rements (2011-31)
Page 79
6.5 Hence a further analysis has been carried out to look at the locations from which workers commute
to the broad area in which EMGRFI is to be located. From Census data it is possible to look at Mid-
Layer Super Output (MSOA) areas with the EMGRFI site broadly corresponding with areas 001 and
002 (these two areas cover Kegworth and Castle Donington). The table below shows the current
residence of people commuting to the relevant MSOAs; in this case any inflow of in excess of 50 has
been included in the table (again an arbitrary cut-off, but chosen to limit the number of areas to a
manageable number – recognising that areas with lower levels of commuting will not have
particularly strong links with the relevant MSOAs. The lower figure of 50 used in this analysis (as
opposed to a cut-off of 200 when looking at District-wide analysis) reflects a lower number of
workers in the two relevant MSOAs when compared with the numbers commuting in across the
whole District)).
Figure 6.2: Commuting patterns to NWL and implied number working at EMGRFI
(based on workers in relevant MSOA)
Commute from… Number
commuting % of commuters
Implied number
working at
EMGRFI
Amber Valley 318 2.8% 100
Ashfield 195 1.7% 61
Blaby 105 0.9% 33
Bolsover 66 0.6% 21
Broxtowe 553 4.8% 174
Charnwood 1,192 10.3% 374
Chesterfield 52 0.5% 16
Derby 2,021 17.5% 634
Derbyshire Dales 66 0.6% 21
Erewash 1,673 14.5% 525
Gedling 199 1.7% 62
Harborough 56 0.5% 18
Hinckley & Bosworth 153 1.3% 48
Leicester 194 1.7% 61
Mansfield 98 0.9% 31
Melton 81 0.7% 25
Newark & Sherwood 72 0.6% 23
North East Derbyshire 63 0.5% 20
Nottingham 837 7.3% 263
Rushcliffe 571 5.0% 179
South Derbyshire 1,028 8.9% 323
Rest of East Midlands 230 2.0% 72
Birmingham 66 0.6% 21
East Staffordshire 234 2.0% 73
Tamworth 63 0.5% 20
Rest of West Midlands 455 3.9% 143
Elsewhere 888 7.7% 279
TOTAL 11,529 100.0% 3,619
Source: 2011 Census (and as calculated)

Nor t h W es t Le ices tersh i re Dis t r i c t Counc i l – Rev iew o f Hous ing Requi rements (2011-31)
Page 80
6.6 The number of areas highlighted by this analysis is similar to the analysis based on the whole of
NWL although some of the areas are different. The following areas appear in both lists and are
therefore worthy of consideration in terms of the likely influence of EMGRFI:
• Amber Valley • Erewash • Nottingham
• Ashfield • Gedling • Rushcliffe
• Blaby • Harborough • South Derbyshire
• Broxtowe • Hinckley & Bosworth • Birmingham
• Charnwood • Leicester • East Staffordshire
• Derby • Melton • Tamworth
6.7 The analysis proceeds by considering the number of jobs at EMGRFI likely to be taken up by people
resident in each of the main other local authority areas. To provide a broad indication an average
has been taken from the two analyses above (i.e. based on the whole of NWL and with a secondary
focus on MSOAs). Whilst taking an average is arbitrary it does reflect a) the location of EMGRFI and
b) that the influence of such a major level of job creation could well be wider than is seen in current
(localised) commuting patterns.
6.8 The table below shows the number of additional workers assumed to be resident in each of the
areas identified. In total, 2,962 (82%) of workers from outside of NWL are assumed to live in one of
these areas. Whilst this leaves some 657 workers, the number of locations in which they are
expected to live are too numerous to realistically undertake a modelling process (and in any case, for
any individual area the impact in housing terms is likely to be quite limited).
6.9 The table shows that the main areas from which workers might be expected to be drawn are Derby
(494 workers), South Derbyshire (432), Charnwood (408) and Erewash (391).

Nor t h W es t Le ices tersh i re Dis t r i c t Counc i l – Rev iew o f Hous ing Requi rements (2011-31)
Page 81
Figure 6.3: Estimated number of EMGRFI workers’ resident in each local authority
Based on LA
commuting
Based on MSOA
commuting Average
Amber Valley 55 100 77
Ashfield 34 61 48
Blaby 101 33 67
Broxtowe 93 174 133
Charnwood 442 374 408
Derby 355 634 494
Erewash 256 525 391
Gedling 38 62 50
Harborough 40 18 29
Hinckley & Bosworth 253 48 151
Leicester 220 61 140
Melton 37 25 31
Nottingham 138 263 200
Rushcliffe 104 179 142
South Derbyshire 542 323 432
Birmingham 49 21 35
East Staffordshire 127 73 100
Tamworth 46 20 33
TOTAL 2,929 2,994 2,962
Other areas 690 625 657
TOTAL 3,619 3,619 3,619
Source: Derived from 2011 Census (and as calculated)
Housing Requirement Impact of EMGRFI in Other Areas
6.10 To model the impact of the EMGRFI on other areas a similar process has been undertaken as for
the modelling for NWL in this report. All data used is specific to the local authority being analysed
and a broad summary is provided below:
1. Set up a demographic model populated by data from the 2012-based SNPP (and including MYE
data for 2013 and 2014);
2. Apply headship rates from the 2012-based CLG household projections with an uplift to the 25-34 age
group;
3. Apply vacancy rate from the 2011 Census to establish housing need/requirement;
4. Apply economic activity rates from the 2011 Census (split by those of working and pensionable-age);
5. Estimate number of people who are economically active;
6. Estimate proportion of people with more than one job (double jobbing) and hence the uplift to this
population required to meet the resident workforce figures (as shown in the table above);
7. Iterate the model to increase the resident workforce (as required); and
8. Establish the uplift to housing requirement implied by this uplift (for the 2011-31 period and also
expressed annually)

Nor t h W es t Le ices tersh i re Dis t r i c t Counc i l – Rev iew o f Hous ing Requi rements (2011-31)
Page 82
6.11 The outputs of the modelling are shown in the table below. This identifies a potential uplift to housing
requirements of 2,008 dwellings over the 2011-31 period in those areas identified as being likely to
have some connection with EMGRFI. A further 446 dwellings are estimated as required in other
areas (this has been estimated on the basis of the relationship between the number of people
commuting from a wider area and the number of homes estimated as being required within the ‘area
of influence’ – calculated as 657/2,962 × 2,008).
6.12 Annually the figures represent a requirement for 123 dwellings per annum in areas outside NWL to
provide a workforce for the EMGRFI; this is particularly focussed in Derby, South Derbyshire,
Erewash and Charnwood.
Figure 6.4: Estimated Housing Requirement Arising due to EMGRFI
2011-31 Per annum
Amber Valley 51 3
Ashfield 34 2
Blaby 41 2
Broxtowe 87 4
Charnwood 258 13
Derby 349 17
Erewash 263 13
Gedling 34 2
Harborough 18 1
Hinckley & Bosworth 97 5
Leicester 102 5
Melton 19 1
Nottingham 172 9
Rushcliffe 89 4
South Derbyshire 276 14
Birmingham 27 1
East Staffordshire 69 3
Tamworth 22 1
TOTAL 2,008 100
Other areas (estimated) 446 22
TOTAL 2,453 123
Source: Demographic modelling

Nor t h W es t Le ices tersh i re Dis t r i c t Counc i l – Rev iew o f Hous ing Requi rements (2011-31)
Page 83
Summary – Impact of EMGRFI on Other Areas
With EMGRFI expected to generate in excess of 7,000 additional jobs in NWL, it is clear that only a
proportion of the workforce would be expected to be resident in NWL (and therefore requiring housing in
the local authority area). An analysis has been carried out to establish those areas (outside of NWL) from
which people might commute and the potential additional housing requirements in these locations.
A total of 18 local authority areas were identified as potentially having an ‘influence’ on the EMGRFI site –
these being the areas which on the basis of current (2011) commuting patterns provide a workforce to
both NWL and also the general location where EMGRFI is to be sited. The key areas were identified as
Derby, South Derbyshire, Erewash and Charnwood.
A demographic modelling process was undertaken in each of the 18 areas using the same broad
assumptions as that carried out for NWL (e.g. in terms of household formation and economic activity
rates). This estimated that the EMGRFI would generate a requirement for around 2,450 homes to be
provided in other locations for the EMGRFI workforce (in the 2011-31 period). Around half of this
requirement (47%) was identified as being in the four key areas; including an estimated requirement for
349 homes in Derby, 276 in South Derbyshire, 263 in Erewash and 258 in Charnwood.

Nor t h W es t Le ices tersh i re Dis t r i c t Counc i l – Rev iew o f Hous ing Requi rements (2011-31)
Page 84

Nor t h W es t Le ices tersh i re Dis t r i c t Counc i l – Rev iew o f Hous ing Requi rements (2011-31)
Page 85
7. Conclusions – Overall Housing Requirements
Introduction
7.1 As can be seen from the information above there has been a significant amount of work undertaken
to understand the objectively assessed need for NWL; this includes looking at demographic trends,
economic needs, market signals and affordable housing. The analysis in this report has considered
the evidence and analysis in the 2014 SHMA as well as a full updating to take account of more up-
to-date information. This final section brings together the evidence to form a view about the objective
level of need for NWL and housing requirements taking account of EMGRFI.
7.2 The analysis starts by considering the requirements of the NPPF and PPG (on housing and
economic development needs assessments). The Guidance effectively describes a process whereby
the latest population and household projections are a starting point and that these can be scrutinised
on the basis of more recent evidence.
7.3 A number of “tests” then need to be considered to examine whether it is appropriate to consider an
adjustment to housing provision. These are:
• Is there evidence that the official population projections need adjustment due to specific local
evidence about migration and population growth?
• Is there evidence that household formation rates in the projections have been constrained?
• What do economic forecasts say about job growth? Is there evidence that a different spatial
distribution of housing would be needed to support this?
• Do market signals point to a need to increase housing supply?
• How do the demographic projections ‘sit’ with the affordable housing needs evidence, and should an
increase in housing supply be considered to support delivery of affordable housing?
The Starting Point
7.4 The analysis started with consideration of the 2012-based CLG household projections. Over the
2011-31 period (consistent with the emerging Local Plan) this projection shows household growth of
253 per annum – including an allowance for vacant homes (based on 2011 Census data) it is
concluded that the ‘start point’ need for housing is for 262 dwellings per annum. This figure is slightly
lower than the ‘start point’ projections in the 2014 SHMA (for 290 dwellings per annum) although the
SHMA did also identify a lower figure (of 252 dwellings per annum) once more up-to-date
demographic data available at that time was taken into account.
Test 1: Is there evidence that the official population projections need adjustment
due to specific local evidence about migration and population growth?
7.5 Analysis of underlying demographic trends and up-to-date information about migration and
population growth was undertaken which suggested that the reference period feeding into the
household projections (and the associated population projections) was one in which migration and
population growth was quite modest (lower than had been seen earlier in the period back to 2001
and also since 2012).

Nor t h W es t Le ices tersh i re Dis t r i c t Counc i l – Rev iew o f Hous ing Requi rements (2011-31)
Page 86
7.6 Alternative scenarios were therefore developed to look at both longer-term trends and also more
recent information. These scenarios all suggested a potentially higher need for housing than set out
in the CLG projections and it was concluded on the basis of the evidence available that a figure of
about 380 dwelling per annum was a reasonable level of demographic based need.
7.7 The 2014 SHMA did not consider long-term trends and focussed on the data feeding into, and
outputs of the 2011-based ‘interim’ population and household projections. Given a fairly low level of
migration in the 2011/12 period (which was the only new data available at the time of the SHMA) the
adjustments made to demographic projections were in a slight downwards direction.
Test 2: Is there evidence that household formation rates in the projections have
been constrained?
7.8 The analysis studied the detail behind the CLG household projections and this did suggest that there
had been some suppression of household formation over the decade to 2011, and that this was
projected to continue in the future. The evidence was not clear-cut with different releases of the CLG
household projections showing different future ‘trends’ for different age groups.
7.9 The clearest trend was a reduction in the household formation rates of the population aged 25-34
and analysis was carried out to look at the level of housing need if the rates of this group were to
return to the levels seen in 2001 (which is the date from which the decrease (and potential
suppression)) began. On the basis of the preferred demographic scenario (which took a mid-point
between a projection based on long-term migration trends and long-term migration trends with a
further adjustment for Unattributable Population change (UPC)) it was concluded that the
demographic need for housing is of the order of 417 dwelling per annum (2011-31).
7.10 The approach of including an uplift for household formation rates amongst the 25-34 population was
then applied consistently across of other projections (e.g. those linked to job growth).
7.11 In the 2014 SHMA an uplift was applied to data (from the 2011-based CLG household projections) to
take account of supressed household formation; this was based on consideration of 2008-based
data (information which is no longer thought to be of much assistance in the analysis of housing
need). This uplift increased the demographic based need in NWL by about 13%, a similar uplift to
that being suggested when using more up-to-date household projections (albeit it should be
recognised that there are notable differences between the 2012- and 2011-based projections).
Test 3: What do economic forecasts say about job growth? Is there evidence that a
different spatial distribution of housing would be needed to support this?
7.12 A key part of the analysis was to consider what level of housing might be required to support a
growing resident workforce; this was in terms of meeting both trend-based job growth and also the
impact of additional jobs expected at the East Midlands Gateway Rail Freight Interchange.

Nor t h W es t Le ices tersh i re Dis t r i c t Counc i l – Rev iew o f Hous ing Requi rements (2011-31)
Page 87
7.13 A range of baseline forecast were accessed and it was concluded that the most robust to use in
analysis was that provided by PACEC – this suggested an increase in jobs across the District of
about 9,500 over the 2011-31 period. The EMGRFI is expected to provide a further 7,317 jobs and it
has been assumed that these will be in addition to those from the baseline forecast (although in
reality it is possible that the net effect is either higher or lower due to displacement and additionality).
7.14 When looking at the baseline forecast, adjustments were made based on current (2011) commuting
patterns and the extent to which people have more than one job (double jobbing). On this basis it
was estimated that the resident workforce would need to grow by about 7,900 people for there to be
sufficient labour for 9,500 additional jobs. This level of labour-force growth was modelled by taking
account of changes to both the working-age and pensionable-age population who are economically
active. Undertaking this modelling suggested a housing need of about 416 dwellings per annum.
7.15 In the 2014 SHMA, two economic based projections were carried out and these suggested a need
for between 372 and 478 dwellings per annum. The lower of the figures was considered as most
robust given that it was based on economic growth across the whole L&L HMA (and recognising that
economic forecasts at a smaller area level (such as individual Districts) are likely to be less reliable
than those across a wider area). Taking account of both demographic projections and economic
forecasts the SHMA concluded a need for 350 dwellings per annum (this figure being at the top end
of the range developed).
7.16 The approach taken to an additional uplift for EMGRFI was slightly different, and predominantly
focussed on where people who work in NWL live. Based on Census data is was estimated that
around half of jobs in the District are taken up by people who live elsewhere and this factor was
applied to the 7,317 jobs to work out the required growth in the resident workforce (along with a
small adjustment for double jobbing). It was estimated that the District could expect an additional
3,600 economically active residents as a result of EMGRFI.
7.17 Taken together, the baseline and EMG forecasts would lead to a projected growth in the resident
workforce of about 11,500 people. This was modelled through the demographic analysis which
showed a requirement for 519 dwellings per annum to be provided in the 2011-31 period.
7.18 Undertaking a similar analysis on the basis of the assumptions underpinning the 2014 SHMA, it was
estimated that the impact of EMG would be to increase housing requirement by about 120 dwellings
per annum. With an OAN of 350 in the SHMA, this analysis therefore concluded that had EMGRFI
been factored into the SHMA then a requirement of around 472 dwellings per annum would have
been suggested. This could potentially increase to about 495 dwellings per annum if the preferred
economic-based forecast were used.
Test 4: Do market signals point to a need to increase housing supply?
7.19 Overall, the analysis of market signals points to modest affordability pressures in the District;
although it is recognised that house prices and the affordability ratio have increased over the longer-
term, along with increases in the number of overcrowded and concealed households. None of these
indicators can however be considered as any worse than seen in other locations. The analysis does
also identify a historic under-delivery of housing (against planned targets).

Nor t h W es t Le ices tersh i re Dis t r i c t Counc i l – Rev iew o f Hous ing Requi rements (2011-31)
Page 88
7.20 In terms of the PPG, any uplift for market signals is from the start point projections; in NWL the start
point (as informed by CLG household projections) is for 262 dwellings per annum. If the Council
were to set the need at a level consistent with demographic and economic projections (401-417
dwellings per annum) then the uplift would be up to 59%; if the Council planned for 519 dwellings per
annum (as suggested once EMG is included) the uplift is nearly 100%. These are considered to be
significant uplifts and therefore it is difficult to suggest on the basis of the market signals evidence
than any additional uplift is required. It should also be noted that the housing need/requirement
figures already include an uplift for apparent suppression in the 25-34 population age group.
7.21 The 2014 SHMA also considered market signals and did not highlight these as being particularly
strong in NWL.
Test 5: How do the demographic projections ‘sit’ with the affordable housing needs
evidence, and should housing supply be increased to meet affordable needs?
7.22 The analysis of affordable housing need identifies a significant requirement for affordable housing.
However, in considering this relationship, it is important to bear in mind that the affordable housing
needs model includes existing households who require a different size or tenure of accommodation
rather than new accommodation per se. Furthermore, many households secure suitable housing
within the Private Rented Sector, supported by housing benefit. On this basis, the analysis does not
suggest that there is any strong evidence of a need to consider additional housing over and above
that suggested by demographic projections to help meet the affordable need.
7.23 The 2014 SHMA did highlight affordable housing need as being a factor in considering the OAN. For
this reason, (as well as a recognition of potential job growth) a range of need from 285 to 350
dwellings per annum was identified – the upper end being the level used as the OAN by the Council
prior to consideration of the impact of EMGRFI.
Overall Conclusions on Housing Requirements
7.24 The analysis of housing need carried out in line with the NPPF and PPG suggests a start point need
for housing of around 262 dwellings per annum, this figure increases to 380 per annum based on
recent and longer-term demographic trends. The figure is increased further (to 417 dwellings per
annum) once account is taken of constrained household formation.
7.25 The baseline economic forecasts confirm this as a reasonable level of provision (suggesting a need
for around 401 dwellings per annum) although including development at EMGRFI increases the
requirement to 519 dwellings per annum. Given that the EMGRFI has now been granted
development consent, it would be prudent for the Council to plan for this higher figure. It is therefore
concluded that the housing requirement, taking account of all the factors discussed in the report is
for 520 dwellings per annum (2011-31) – this is 10,400 homes over the emerging plan period.
7.26 The reanalysis of SHMA data suggests a slightly lower housing requirement with the inclusion of
EMGRFI (for 472 dwellings per annum when EMG is considered as an uplift to the SHMA housing
need position (of a need for 350 dwellings per annum)).
Nor t h W es t Le ices tersh i re Dis t r i c t Counc i l – Rev iew o f Hous ing Requi rements (2011-31)
Page 89
7.27 Given the range of new data available and analysed in this report, it is considered that the higher of
the figures calculated should be used to inform housing targets and the 5-year housing land supply
position moving forward (i.e. a requirement for about 520 dwellings per annum). Given that this is
only about 10% higher than an equivalent figure if SHMA data is used it is also concluded that the
SHMA (when taken as a whole across the L&L HMA) remains sound, although housing need figures
will be reviewed as part of the ongoing HEDNA process which is expected to be completed by the
end of 2016.
7.28 Additional analysis identified a requirement for around 2,450 homes to be provided outside of NWL
(this analysis being based on an understanding of the likely residential location of people who would
commute to work at the site). Around half of this requirement was concentrated in four areas (Derby,
South Derbyshire, Erewash and Charnwood).
7.29 To summarise, the analysis which updated the SHMA to take account of EMGRFI and also the
analysis which updated all elements of the projections both show that the impact of EMGRFI would
be to increase the housing requirements by around 120 dwellings per annum. Hence this report
concludes an overall requirement for between 472 (SHMA based) and 519 (updated position)
dwellings per annum in the 2011-31 period in NWL. There are additional requirements likely to be
generated outside the local authority boundary which will need to be considered as part of duty-to-
cooperate discussions.
Copyright © 2022 FDOKUMEN