Retrieval of surface roughness parameters of bare soil from the radar satellite data
8
Retrieval of surface roughness parameters of bare soil from the radar satellite data L. Vulfson c, d , A. Genis a, d, * , D.G. Blumberg a , M. Sprintsin a, b , A. Kotlyar c , V. Freilikher c , J. Ben-Asher a, b, d a Department of Geography and Environmental Development, Ben Gurion University of the Negev, Beer-Sheva, Israel b Jacob Blaustein Institute for Desert Research, Ben Gurion University of the Negev, Beer-Sheva, Israel c Department of Physics, Bar-Ilan University, Tel-Aviv, Israel d Katif Research Center for the Development of Coastal Deserts, Israel article info Article history: Received 1 March 2010 Received in revised form 1 July 2012 Accepted 20 July 2012 Available online 30 August 2012 Keywords: Arid ecosystem Soil surface Soil water content Synthetic aperture radar abstract The objective of this study was to develop a method to determine root mean square (RMS) height h of the surface roughness using single-channel data from the European remote-sensing satellite-2 (ERS-2) synthetic aperture radar (SAR) for known soil texture and water content. Accordingly, a new equation for the determination of h was obtained, which required combining two models: a semi-empirical model of vertically co-polarized mode backscattering coefficient s 0 vv for bare soil; a semi-empirical model for the real part of dielectric constant ε and the empirical equation deriving the roughness correlation length l from h. The equation allowed calculating h for ERS-2 SAR data on natural bare smooth flat sandy and loessy areas of the Negev desert (Israel) for the dry, wet and artificially wetted conditions. It was found that the roughness of soil was typically small (h < 0.5 cm) and remained constant throughout the whole annual wetting cycle. Corresponding formulas were developed and applied for the determination of absolute and relative errors of retrieved h. It was shown that the relative error in retrieving of h was almost independent of its value. The values of h obtained from ERS-2 SAR data showed acceptable correlation with the ground measurements. Ó 2012 Elsevier Ltd. All rights reserved. 1. Introduction Soil surface roughness is determined by a statistical term RMS (root mean square) height h. Soils with h 1 cm are typical for arid environments. It is an important feature controlling how the rain- fall distributes among runoff, evapotranspiration and infiltration. In turn, the rainfall allocation determines surface water content and energy balance; governs the partitioning between latent and sensible heat; it influences the agricultural potential of dryland (Carmi and Berliner, 2008; Sud et al., 1988). The surface roughness affects considerably processes of aeolian erosion and deposition, which frequently leads to desertification in arid environments. Sand transport rates vary among soil surfaces with different roughness, because the threshold friction velocity required to move sand particles also varies with roughness. A key parameter necessary for modeling these processes is the aero- dynamic roughness length z 0 . This is an aerodynamic parameter which equals the height above the surface at which the profile of wind speed drops to 0. The value of z 0 is a function of the surface roughness and can be estimated as proportional to h 2 /l (Blumberg and Greeley, 1993; Rees and Arnold, 2007). In most cases h is the main parameter used in radar backscat- tering models for retrieving the soil moisture content, which is highly important for the climate modeling and desertification prediction at the regional and local levels (Blumberg and Freilikher, 2001; Sud and Walker, 1990). The roughness is highly variable both temporally and spatially due to soil heterogeneity, topography, land cover, rainfall non- uniformity and agricultural activity (Meade et al., 1999). At the same time, in contrast to the agricultural fields, surface roughness of natural arid ecosystems, where the precipitation is scarce, does not change significantly with time (Álvarez-Mozos et al., 2006; Moran et al., 2000; Thoma et al., 2006; Verhoest et al., 1998, 2008; Walker et al., 2004). Moreover, according to Carmi and Berliner (2008), rainfall has no effect on the roughness when h < 0.7 cm. Ground evaluation of h is a time and labor consuming process. At the same time, active microwave remote sensing technique allows monitoring of soil surface roughness and water content, due to a high sensitivity of the backscattering coefficient s 0 to these parameters. In addition, this technique has all-weather capability which allows monitoring at night and under cloudy conditions. Unlike optical sensors, the Synthetic Aperture Radar (SAR) generates a signal which is independent of external illumination * Corresponding author. Department of Geography and Environmental Devel- opment, Ben-Gurion University of the Negev, P.O. Box 653, 84105 Beer-Sheva, Israel. Tel.: þ972 54 752 0672; fax: þ972 8 991 7019. E-mail address: [email protected] (A. Genis). Contents lists available at SciVerse ScienceDirect Journal of Arid Environments journal homepage: www.elsevier.com/locate/jaridenv 0140-1963/$ e see front matter Ó 2012 Elsevier Ltd. All rights reserved. http://dx.doi.org/10.1016/j.jaridenv.2012.07.006 Journal of Arid Environments 87 (2012) 77e84
Transcript of Retrieval of surface roughness parameters of bare soil from the radar satellite data

at SciVerse ScienceDirect
Journal of Arid Environments 87 (2012) 77e84
Contents lists available
Journal of Arid Environments
journal homepage: www.elsevier .com/locate/ jar idenv
Retrieval of surface roughness parameters of bare soil from the radar satellite data
L. Vulfson c,d, A. Genis a,d,*, D.G. Blumberg a, M. Sprintsin a,b, A. Kotlyar c, V. Freilikher c, J. Ben-Asher a,b,d
aDepartment of Geography and Environmental Development, Ben Gurion University of the Negev, Beer-Sheva, Israelb Jacob Blaustein Institute for Desert Research, Ben Gurion University of the Negev, Beer-Sheva, IsraelcDepartment of Physics, Bar-Ilan University, Tel-Aviv, IsraeldKatif Research Center for the Development of Coastal Deserts, Israel
a r t i c l e i n f o
Article history:Received 1 March 2010Received in revised form1 July 2012Accepted 20 July 2012Available online 30 August 2012
Keywords:Arid ecosystemSoil surfaceSoil water contentSynthetic aperture radar
* Corresponding author. Department of Geographopment, Ben-Gurion University of the Negev, P.O. BoxTel.: þ972 54 752 0672; fax: þ972 8 991 7019.
E-mail address: [email protected] (A. Genis).
0140-1963/$ e see front matter � 2012 Elsevier Ltd.http://dx.doi.org/10.1016/j.jaridenv.2012.07.006
a b s t r a c t
The objective of this study was to develop a method to determine root mean square (RMS) height h of thesurface roughness using single-channel data from the European remote-sensing satellite-2 (ERS-2)synthetic aperture radar (SAR) for known soil texture and water content. Accordingly, a new equation forthe determination of h was obtained, which required combining two models: a semi-empirical model ofvertically co-polarized mode backscattering coefficient s0vv for bare soil; a semi-empirical model for thereal part of dielectric constant ε and the empirical equation deriving the roughness correlation length lfrom h. The equation allowed calculating h for ERS-2 SAR data on natural bare smooth flat sandy andloessy areas of the Negev desert (Israel) for the dry, wet and artificially wetted conditions. It was foundthat the roughness of soil was typically small (h < 0.5 cm) and remained constant throughout the wholeannual wetting cycle. Corresponding formulas were developed and applied for the determination ofabsolute and relative errors of retrieved h. It was shown that the relative error in retrieving of h wasalmost independent of its value. The values of h obtained from ERS-2 SAR data showed acceptablecorrelation with the ground measurements.
� 2012 Elsevier Ltd. All rights reserved.
1. Introduction
Soil surface roughness is determined by a statistical term RMS(root mean square) height h. Soils with h � 1 cm are typical for aridenvironments. It is an important feature controlling how the rain-fall distributes among runoff, evapotranspiration and infiltration. Inturn, the rainfall allocation determines surface water content andenergy balance; governs the partitioning between latent andsensible heat; it influences the agricultural potential of dryland(Carmi and Berliner, 2008; Sud et al., 1988).
The surface roughness affects considerably processes of aeolianerosion and deposition, which frequently leads to desertification inarid environments. Sand transport rates vary among soil surfaceswith different roughness, because the threshold friction velocityrequired to move sand particles also varies with roughness. A keyparameter necessary for modeling these processes is the aero-dynamic roughness length z0. This is an aerodynamic parameterwhich equals the height above the surface at which the profile ofwind speed drops to 0. The value of z0 is a function of the surface
y and Environmental Devel-653, 84105 Beer-Sheva, Israel.
All rights reserved.
roughness and can be estimated as proportional to h2/l (Blumbergand Greeley, 1993; Rees and Arnold, 2007).
In most cases h is the main parameter used in radar backscat-tering models for retrieving the soil moisture content, which ishighly important for the climate modeling and desertificationprediction at the regional and local levels (Blumberg and Freilikher,2001; Sud and Walker, 1990).
The roughness is highly variable both temporally and spatiallydue to soil heterogeneity, topography, land cover, rainfall non-uniformity and agricultural activity (Meade et al., 1999). At thesame time, in contrast to the agricultural fields, surface roughnessof natural arid ecosystems, where the precipitation is scarce, doesnot change significantly with time (Álvarez-Mozos et al., 2006;Moran et al., 2000; Thoma et al., 2006; Verhoest et al., 1998, 2008;Walker et al., 2004). Moreover, according to Carmi and Berliner(2008), rainfall has no effect on the roughness when h < 0.7 cm.
Ground evaluation of h is a time and labor consuming process.At the same time, active microwave remote sensing techniqueallows monitoring of soil surface roughness and water content, dueto a high sensitivity of the backscattering coefficient s0 to theseparameters. In addition, this technique has all-weather capabilitywhich allows monitoring at night and under cloudy conditions.
Unlike optical sensors, the Synthetic Aperture Radar (SAR)generates a signal which is independent of external illumination
L. Vulfson et al. / Journal of Arid Environments 87 (2012) 77e8478
sources. In comparison to real aperture radars, the SAR increasessynthetically the antenna’s size or the aperture in order to increasethe spatial resolution.
As soil surface water content q affects the returned signaldepending on the dielectric properties of the soil, the large contrastbetween the real part of dielectric constant (ε) of water (73e83)and dry soil (3e8) makes this feasible (Ulaby et al., 1986;Verhoest et al., 2008; Walker et al., 2004).
Soil roughness determines the type of reflected radiation. Asa very smooth surface reflects all the incident radiation in thespecular direction, a very rough surface diffuses the incident wavein all directions. Most of the natural surfaces both reflect anddiffuse the incident radiation in proportions varying according tothe roughness and local incidence angle (Fung et al., 1992; Ulabyet al., 1986; Ulaby and Dobson, 1989; Verhoest et al., 2008).
Various empirical, semi-empirical and theoretical models havebeen developed to relate s0 to: 1) soil surface parameters such asroughness (RMS height h and correlation length l) and q; 2) radarparameters such as wavelength l, polarization and incident angle w.Inversely, these models can be used to calculate the roughnessparameters, mainly h (Fung and Chen, 2004; Verhoest et al., 2008;Walker et al., 2004). Some studies on surface roughness by remotesensing are based on a single solution using soil water contentparameters fromdirectgroundmeasurements.Otherstudiesarebasedon time series solutionswhich follow the changes ofs0 and assumenomodification of target variables such as soil texture and roughness(Blumberg et al., 2006; Blyth, 1997; Moran et al., 2000; Walker et al.,2004). Yet other methods are based on multiple imaging in polariza-tion,wavelengthor the incident angledomains inorder to separate therelative contribution of roughness and dielectric properties into thebackscattering (Baghdadi et al., 2006, 2007, 2008; Bindlish and Barros,2000; Blumberg and Freilikher, 2001; Blumberg et al., 2006; Duboiset al.,1995;Ohetal.,1992,1994;Verhoestet al., 2008;Zribi et al., 2005).
Generally, studies on environmental changes require time seriesdata on roughness and soil moisture. However, there is often a severelack of data reflecting these changes in arid regions. At the same time,archive ERS remote data have been collected from 1991. These datahave thepotential tofill thevoid in theavailablehistoricalgrounddata.
At the same time even in a case of flat surface, the estimation ofh using single-channel ERS SAR data requires the concurrentmeasurements of q. In the present study, in order to determine thesoil roughness for known q, a new semi-empirical equation wasdeveloped using a combination of the semi-empirical model of Ohet al. (1994) for s0vv, the semi-empirical model of Peplinski et al.(1995) for ε and the empirical equation of Baghdadi et al. (2004),which derives l as a function of h. This equation was used not onlyfor the retrieval of h, but also for the analyses of errors in itsdetermination (see Section 2.)
The measured soil surface water content q was used for theevaluation of h. To validate the output, we compared h determinedby a ground automated laser system with the roughness heightdetermined by the remote method.
2. Modeling
The first part (2.1) of this section is devoted to a detaileddescription of the new semi-empirical model for the retrieval of hfrom the remote sensing data (for the known q and soil texture),including the methods of its deriving and application. In the secondpart (2.2) using this model there were obtained equations for thecalculation of errors of h retrieval as a function of errors in thedetermination of s0vv and q. The a priori estimation of the errors of hretrieval allowed to optimize the methods of field experiments inorder to retrieve the values of h and their ground verification(Section 3).
2.1. The semi-empirical equation for h retrieval
The developed semi-empirical equation for h retrieval wasbased on:
� The semi-empirical backscattering model of Oh et al. (1994),which was elaborated using the existing theoretical backscat-tering models (Ulaby et al., 1986) in conjunctionwith extensiveexperimental data. The model calculates s0vv as a function of h(cm), l (cm),ε, l (cm) and w (degree). The range of validity is0.1< h< 5.0 cm, 2.0< l< 20.0 cm; 3< l< 30 cm; 10� < w< 70�
(see Appendix 1).� Peplinski’s et al. (1995) semi-empirical model. Thissoilewatereair dielectric mixing model is one of the mostwidely used for the determination of ε as a function of q. It hasvalidity for 1 < l < 30 cm and accounts for the most importantfactors including observation frequency (Hz), soil texture (inweight parts) and temperature T (�C).
� The empirical equation of Baghdadi et al. (2004), developed forcalibration of theoretical Integral EquationModel (IEM) of Fung(1994) with the reference to ERS-2 SAR data, was also foundsuitable for the semi-empirical backscattering model calibra-tion used in this study. According to Baghdadi et al. (2004), inthe conditions under consideration, the correlation length l asa function of h can be written as power-type relationship:
l ¼ 4$hx; (1)
where x and 4 are the fitted constants (x ¼ 0.8814, 4 ¼ 15.22 cm),obtained for an independent set of ground measured (h) andremote sensing data (s0vv) to ensure better agreement between themodeled and experimental s0vv values.
In the model of Oh et al. ε was expressed through q (in vol. %)using Peplinski’s et al. model. The described two models andEquation (1) were used for calculation of h as a function of s0vv (indB) under known values of q (1e30 vol. %), w (19.5�e26.5�), l(5.65 cm), T (10e30 �C) for both sandy and loessy soils. Althoughthe general formula is rather cumbersome (see Appendix), itsnumerical analysis showed, that in the considered range of h (from0.1 to 1.0 cm), the dependence of the retrieved values of h on themeasured s0vv could be fitted with high precision (coefficients ofdetermination, r2 � 0.999 and residual mean square error,s2h < 0.0001 cm2) by the function:
h ¼ ebðqÞðs0vvþcðqÞÞ; (2)
where b (dB�1) and c (dB) are the fitted polynomial and logarithmicfunctions of q (in the range from 1 to 30%) correspondingly:
b ¼ aþ a1qþ a2q2 (3)
c ¼ klnqþ m (4)
Equations (2)e(4) were used for retrieval h the data on svv in theERS-2 SAR images as follows. First, for known values of q (based onground measurements) the values of b and c were determined forthe typical test sites with Equations (3) and (4). Then, the obtainedvalues of b and cwere used for determination of hwith Equation (2).
Corresponding parametric values for the functions b (q) and c (q)under w ¼ 23� and T ¼ 20 �C for two soil types are presented inTable 1:
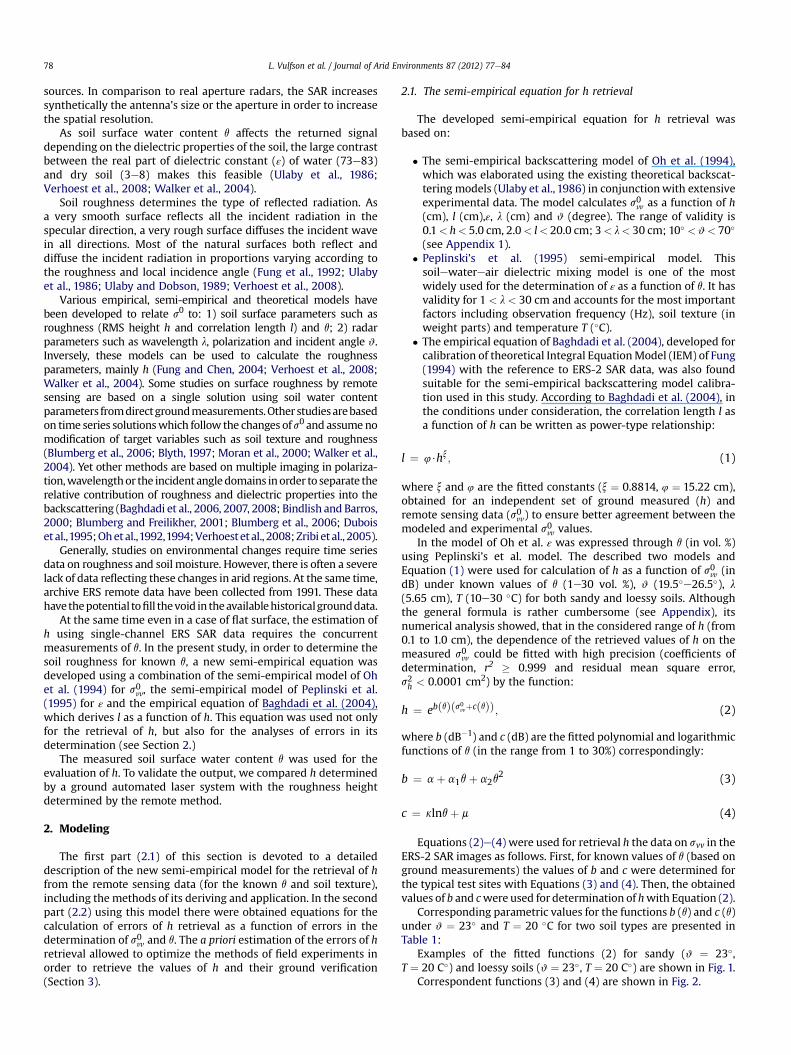
Examples of the fitted functions (2) for sandy (w ¼ 23�,T ¼ 20 C�) and loessy soils (w ¼ 23�, T ¼ 20 C�) are shown in Fig. 1.
Correspondent functions (3) and (4) are shown in Fig. 2.
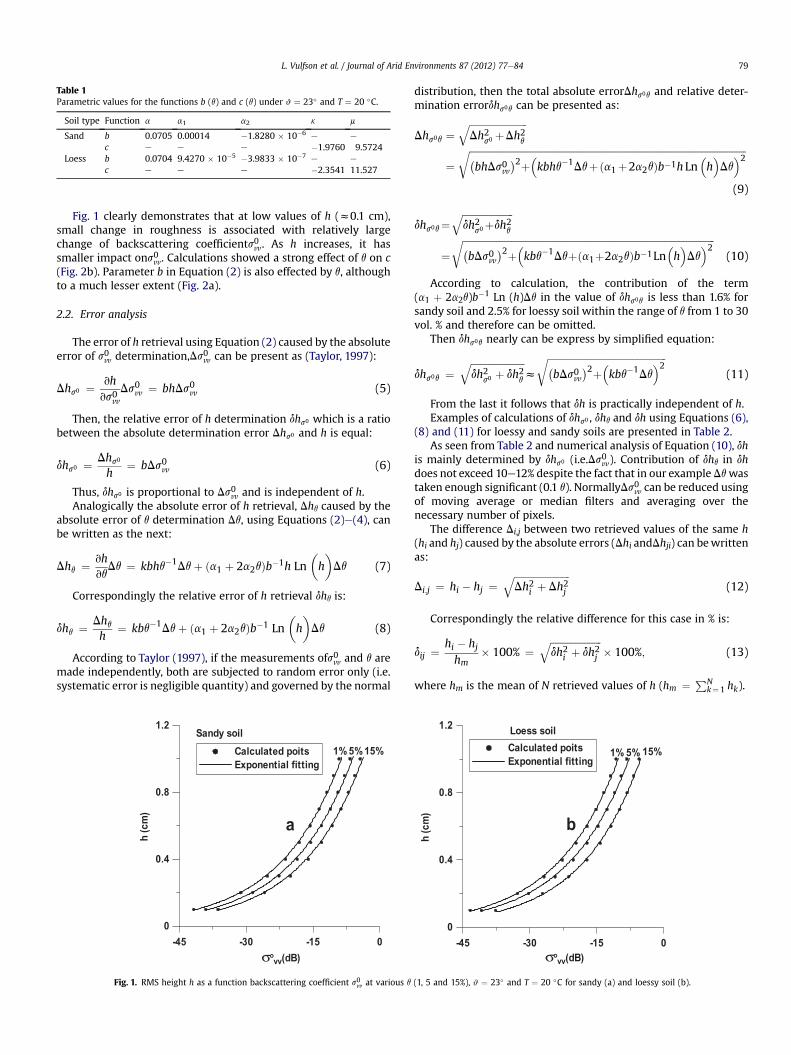
Table 1Parametric values for the functions b (q) and c (q) under w ¼ 23� and T ¼ 20 �C.
Soil type Function a a1 a2 k m
Sand b 0.0705 0.00014 �1.8280 � 10�6 e e
c e e e �1.9760 9.5724Loess b 0.0704 9.4270 � 10�5 �3.9833 � 10�7 e e
c e e e �2.3541 11.527
L. Vulfson et al. / Journal of Arid Environments 87 (2012) 77e84 79
Fig. 1 clearly demonstrates that at low values of h (z0.1 cm),small change in roughness is associated with relatively largechange of backscattering coefficients0vv. As h increases, it hassmaller impact ons0vv. Calculations showed a strong effect of q on c(Fig. 2b). Parameter b in Equation (2) is also effected by q, althoughto a much lesser extent (Fig. 2a).
2.2. Error analysis
The error of h retrieval using Equation (2) caused by the absoluteerror of s0vv determination,Ds0vv can be present as (Taylor, 1997):
Dhs0 ¼ vhvs0vv
Ds0vv ¼ bhDs0vv (5)
Then, the relative error of h determination dhs0 which is a ratiobetween the absolute determination error Dhs0 and h is equal:
dhs0 ¼ Dhs0
h¼ bDs0vv (6)
Thus, dhs0 is proportional to Ds0vv and is independent of h.Analogically the absolute error of h retrieval, Dhq caused by the
absolute error of q determination Dq, using Equations (2)e(4), canbe written as the next:
Dhq ¼ vhvq
Dq ¼ kbhq�1Dqþ ða1 þ 2a2qÞb�1h Ln�h�Dq (7)
Correspondingly the relative error of h retrieval dhq is:
dhq ¼ Dhqh
¼ kbq�1Dqþ ða1 þ 2a2qÞb�1 Ln�h�Dq (8)
According to Taylor (1997), if the measurements ofs0vv and q aremade independently, both are subjected to random error only (i.e.systematic error is negligible quantity) and governed by the normal
-45 -30 -15 0
σo
vv(dB)
0
0.4
0.8
1.2
h (
cm
)
Calculated poits
Exponential fitting
Sandy soil
1% 5% 15%
a
Fig. 1. RMS height h as a function backscattering coefficient s0vv at various q
distribution, then the total absolute errorDhs0q and relative deter-mination errordhs0q can be presented as:
Dhs0q ¼ffiffiffiffiffiffiffiffiffiffiffiffiffiffiffiffiffiffiffiffiffiffiffiffiDh2s0 þDh2
q
q
¼ffiffiffiffiffiffiffiffiffiffiffiffiffiffiffiffiffiffiffiffiffiffiffiffiffiffiffiffiffiffiffiffiffiffiffiffiffiffiffiffiffiffiffiffiffiffiffiffiffiffiffiffiffiffiffiffiffiffiffiffiffiffiffiffiffiffiffiffiffiffiffiffiffiffiffiffiffiffiffiffiffiffiffiffiffiffiffiffiffiffiffiffiffiffiffiffiffiffiffiffiffiffiffiffiffiffiffiffiffiffiffiffiffiffi�bhDs0vv
�2þ�kbhq�1Dqþða1þ2a2qÞb�1h Ln�h�Dq�2r(9)
dhs0q¼ffiffiffiffiffiffiffiffiffiffiffiffiffiffiffiffiffiffiffiffiffidh2s0þdh2
q
q
¼ffiffiffiffiffiffiffiffiffiffiffiffiffiffiffiffiffiffiffiffiffiffiffiffiffiffiffiffiffiffiffiffiffiffiffiffiffiffiffiffiffiffiffiffiffiffiffiffiffiffiffiffiffiffiffiffiffiffiffiffiffiffiffiffiffiffiffiffiffiffiffiffiffiffiffiffiffiffiffiffiffiffiffiffiffiffiffiffiffiffiffiffiffiffiffiffiffiffiffiffiffiffiffiffi�bDs0vv
�2þ�kbq�1Dqþða1þ2a2qÞb�1Ln�h�Dq�2r
(10)
According to calculation, the contribution of the term(a1 þ 2a2q)b�1 Ln (h)Dq in the value of dhs0q is less than 1.6% forsandy soil and 2.5% for loessy soil within the range of q from 1 to 30vol. % and therefore can be omitted.
Then dhs0q nearly can be express by simplified equation:
dhs0q ¼ffiffiffiffiffiffiffiffiffiffiffiffiffiffiffiffiffiffiffiffiffiffidh2s0 þ dh2
q
qz
ffiffiffiffiffiffiffiffiffiffiffiffiffiffiffiffiffiffiffiffiffiffiffiffiffiffiffiffiffiffiffiffiffiffiffiffiffiffiffiffiffiffiffiffiffiffiffiffiffi�bDs0vv
�2þ�kbq�1Dq�2r
(11)
From the last it follows that dh is practically independent of h.Examples of calculations of dhs0 , dhq and dh using Equations (6),
(8) and (11) for loessy and sandy soils are presented in Table 2.As seen from Table 2 and numerical analysis of Equation (10), dh
is mainly determined by dhs0 (i.e.Ds0vv). Contribution of dhq in dhdoes not exceed 10e12% despite the fact that in our exampleDqwastaken enough significant (0.1 q). NormallyDs0vv can be reduced usingof moving average or median filters and averaging over thenecessary number of pixels.
The difference Di,j between two retrieved values of the same h(hi and hj) caused by the absolute errors (Dhi andDhji) can bewrittenas:
Di;j ¼ hi � hj ¼ffiffiffiffiffiffiffiffiffiffiffiffiffiffiffiffiffiffiffiffiffiffiffiDh2i þ Dh2j
q(12)
Correspondingly the relative difference for this case in % is:
dij ¼hi � hjhm
� 100% ¼ffiffiffiffiffiffiffiffiffiffiffiffiffiffiffiffiffiffiffiffiffidh2i þ dh2j
q� 100%; (13)
where hm is the mean of N retrieved values of h (hm ¼ PNk¼1 hk).
-45 -30 -15 0
σo
vv(dB)
0
0.4
0.8
1.2
h (
cm
)
Calculated poits
Exponential fitting
Loess soil
1% 5% 15%
b
(1, 5 and 15%), w ¼ 23� and T ¼ 20 �C for sandy (a) and loessy soil (b).

0 10 20 30
θ (% vol.)
0.07
0.071
0.072
0.073
0.074
b (
dB
-1)
Calculated points,sandy soil
Calculated points,loess soil
Polynomial fitting
a
0 10 20 30
θ (% vol.)
2
4
6
8
10
12
c (
dB
)
b
Fig. 2. a) Coefficient b as a function of q, b) Coefficient c as a function of q for sandy and loess soils. w ¼ 23� , T ¼ 20 �C.
L. Vulfson et al. / Journal of Arid Environments 87 (2012) 77e8480
3. Materials and methods
3.1. Study area
The study area included the Besor basin spanning much of theNorthern Negev desert from East to West. For part of the study wefocused on the smaller Secher stream catchment located within theBesor. The study was focused on three years (1997, 1998 and 2000)with annual rainfall (mainly from December to March) amounts of100 mme140 mm. The average soil temperature to the depth of1e2 cm varied between 15 and 30 �C. Most of the year, the soil-water content was very low (1e2% for sand and 2e3% loess) andinsufficient for plant growth. Generally, during the rainy season q
reaches as high as 30% in the loess and 20% in the sand.Four visually homogenous plane bare test sites of 10,000 m2
area (8 � 8 ERS SAR pixels) were selected within the Besor basin,including: two sandy sites (#2-1 and #2-2, farms Zeelim andRevivim), two loessy sites (#2-3 and #2-4, both within the WadiMashash farm) along the Nahal Secher Stream and also one aban-doned artificially wetted plane sandy field near Zeelim. Texture and
0.44 0.48 0.52
hr (cm)
0.4
0.44
0.48
0.52
hm(c
m)
hm
= 1.004 * hr - 0.015
R2
= 0.69
Fig. 3. Comparison of h retrieved from filtered values of s0vv derived from the remotedata surveyed on 22.08.97 under qs ¼ 2.3% and the ground measured h over 64 pixelson the loessy site # 2-4 on 17.12.00.
bulk density of the soils within the above sites are presented inTable 3.
3.2. ERS-2 SAR data
For this project three ERS-2 archival SAR images were madeavailable by the European Space Agency. The images were providedin precision image (PRI) format with the pixel spacing of 12.5 m.The ERS SAR sensor operated at C-band (5.65 cm) vertically co-polarized (VV) mode with the image center incidence angle of23� (reference incident angle). The same orbit was repeated every35 days. However, over the region of interest there is an overlap ofascending (SoutheNorth) and descending (NortheSouth) sceneswithin 12.5 h. In this study descending scenes obtained at 10:00a.m. LST (Local Standard Time) on 22.08.1997, 25.12.1998 and24.03.2000 were used. All images were geometrically transformedto the UTM (Universal Transverse Mercator) grid by usingGeographic Control Points. The research sites were identified usingGPS (Global Positioning System) data collected during the field-work and extracted from the whole scene. Within each site, thebackscatter coefficients for each pixel were calculated and cor-rected for variation in the incident angle using the equations of Lauret al. (2004).
The local incidence angle w for each individual pixel wascalculated using the geometry of the SAR and topographic infor-mation from a digital elevation model using the expression pre-sented by Robinson (1966). For the case of plane horizontal surfacew equals the zenith angle of the SAR.
The s0vv data obtained over the four test sites were filtered by5� 5 pixels median filter so as to reduce speckle noise. The averagevalues ofs0vv calculated in decibel (dB) for each test site over 64pixels (with the absolute error, Ds0vv less than 0.4 dB at the confi-dence level of 95%) are presented in Table 4.
The s0vv data obtained along two adjacent profiles within theartificially moisturized sandy field near Zeelim farm and filtered bya 5-pixel one-dimensional average filter to reduce speckle noise arepresented in Fig. 4.
Table 2Results of calculations of the relative errors dhs0 , dhq, dh.
Soiltype
Ds0vv(dB)
q
(vol. %)b(dB�1)
kb Dq(vol. %)
dhs0 dhq dh
Loess �0.5 2.3% 0.0706 �0.166 �0.20 �0.035 �0.017 �0.039Sand �0.5 1.0% 0.0708 �0.140 �0.10 �0.035 �0.014 �0.038

Table 3The texture and bulk density of the soils in the research sites.
Texture Clay (%) Silt (%) Sand (%) Bulk density (kg/m3)
Sand 4 8 88 1670Loess 15 30 55 1460
0 8 16 24 32
Distance (pixels)
0.1
0.2
0.3
h (
cm
)
6.0
12.0
18.0
θ(%
vo
l.)
-32
-27
-22
σ0
(d
B)
Retrieved h values (profile-1)
Retrieved h values (profile-2)
Filtered data (profile-1)
Filtered data (profile-2)
Graund maesured values
Linear fitting
σσ
θ
Fig. 4. Variation of filtered s0vv values derived from the remote data surveyed on25.12.98, qmeasured by TDR and retrieved h values along two adjoining profiles withinthe abandoned artificially moisturized sandy field near Zeelim farm.
L. Vulfson et al. / Journal of Arid Environments 87 (2012) 77e84 81
3.3. Determination of soil water content
The SAR observation depth, i.e. thickness of the top soil layerinfluencing backscattering signal, normally equals to about 0.2 l
(Verhoest et al., 2008; Walker et al., 2004). Therefore, since thewavelength of ERS-2 SAR is 5.65 cm, water content was determinedat the depth of 1e2 cm.
Soil water content was directly measured by using the followingtwo groundmethods: 1) Gravimetric method, i.e. weighing the wetsoil samples, drying them at 105 �C in an oven for 24 h and then re-weighing them; 2) Time Domain Reflectometry (TDR) with 5-cmprobes, allowing in situ measurements.
According to our own long-term measurements supported byfindings of Agam and Berliner (2004), q is uniformly lowwithin thedry period (typically from June to October). In particular, during thisperiod at the time of the satellite survey (10:00 a.m. LST) themean q
values of the top 1-cm soil layer calculated for each test site over 64measurements (one per pixel) was found generally constant (1 vol.% for sand and 2.3 vol. % for loess) from day to day. Suchphenomenon typical for the dry period allows avoiding laboriousground measurements of q necessary for h retrieval.
In 1998, after the end of the dry period and up to late Decemberthere was no rainfall. Therefore, during this period qwas uniformlysmall but still greater than during the dry period due to increasedair humidity and decreased insolation and evaporation. At the timeof survey in 1998 the mean q was found equal 1.7 vol. % for sandysites, 3.7% for loessy sites and from 8 to13 vol. % for the artificiallywetted sandy field, as shown in Fig. 4. InMarch 2000, mean q valuesat the time of survey for the four sites were determined as follows:14.7 vol. % for sandy site #2-1, 3.2% for sandy site #2-2, 5.7 vol. % forloessy site #2-3 and 13.1% for loessy site #2-4. According to thestatistical analysis, the relative errors (dq ¼ Dq/q) of the above meanq were within the range of �0.1 at the confidence level of 95%.
3.4. Determination of roughness
For discrete one-dimensional surface roughness profiles con-sisting of N points with surface height zi, the RMS height h can becalculated as (Verhoest et al., 2008):
h ¼ffiffiffiffiffiffiffiffiffiffiffiffiffiffiffiffiffiffiffiffiffiffiffiffiffiffiffiffiffiffiffiffiffiffiffiffiffi1N
"XNi¼1
z2i � Nz2#vuut ; (14)
where:
z ¼ 1N
XNi¼1
zi (15)
Table 4The mean values ofs0vv (dB) obtained over the four test sites reduced to w ¼ 23� .
Site Date:
22.08.97s0vv (dB)
25.12.98s0vv (dB)
24.03.00s0vv (dB)
Sandy site 2-1 �23.34 �22.34 �17.58Sandy site 2-2 �22.35 �21.77 �20.55Loessy site 2-3 �21.12 �20.08 �19.68Loessy site 2-4 �20.62 �19.86 �16.18
The correlation length l describes the horizontal distance overwhich the surface profile is auto correlated with a value larger than1/e (y0.368). The normalized autocorrelation function for thedisplacement x ¼ jDx, and the spatial resolution of the profile Dxcan be presented as:
r�x�
¼PN�j
i¼1 ziziþjPNi¼1 z
2i
(16)
For the correlation length l of a surface profile:
rðlÞ ¼ 1=e (17)
The autocorrelation function was fitted using an exponential(rðxÞ ¼ expð�x=lÞ) or Gaussian (rðxÞ ¼ expð�x2=l2Þ) function.
Direct ground field measurements of surface roughness weretaken using an automated laser system. The system (BGU GSS1800)utilizes a laser source which illuminates a 60-cm-long line on thesoil surface. As the device turns, a CCD (Charge Coupled Device)camera captures the laser reflection off the surface. An onboardprocessor and encoders determine the offset of the laser beam andgenerate a digital file with the values of elevation at the resolutionof 0.01 cm in height, and spacing of 0.5 cm. The captured area isa circle of 1.2 m in diameter with an enclosed square of0.84 m � 0.84 m. Using this method, the three-dimensional surfaceroughness was measured. The data were then reduced to the RMSheight h and the correlation length l (Blumberg and Freilikher,2001). As an isotropic surface is independent of azimuth, h couldbe calculated in one dimension (Ulaby and Dobson, 1989; Ulabyet al., 1982). The ground measurements of roughness were con-ducted on December 17e20, 2000. On each test site 64measurements (one per pixel) were made and the average valuesof h and l for each site were calculated.
Retrieving of h for a given soil type was carried out usingEquations (2)e(4) for known data on s0vv, w, q and T. Consecutively,the values of l were calculated according to Equation (1) usingretrieved values of h. The retrieval of mean values of h for two sandyand two loessy sites was conducted using the mean values of s0vvobtained for the dry and wet periods (Table 4) and the knownvalues of q (see Section 3.3).

0 10 20 30 40
Number of pixels
0.14
0.16
0.18
0.2
0.22
0.24
h (
cm
) c
um
ula
tiv
e m
ea
n
profile-1
profile-2
average of profile-1 and 2
Fig. 5. Cumulative mean h retrieved from the filtereds0vv values derived from theremote data surveyed on 25.12.98 and ground measured q using TDR for profile-1,profile-2 and the average of profile-1 and 2.
0.46
0.48
e m
ean
of h
(cm
)
L. Vulfson et al. / Journal of Arid Environments 87 (2012) 77e8482
4. Results and discussion
Mean values of h and l retrieved and measured for each sandyand loessy site are presented in Table 5.
The maximum difference between retrieved and measuredvalues of h was less than 0.017 cm (4.1%) for sandy sites and lessthan 0.025 cm (5.6%) for loessy sites. The maximum differencebetween values retrieved at various dates was less than 0.014 cm(3.5%) for sandy sites and less than 0.020 cm (4.4%) for loessy sites.The close results for the last case were also obtained by calculationwith use formulas (10) and (13) namely 4.0% for sandy sites and4.6% for loessy sites. Such small differences confirm both correct-ness of the proposed approach and stability of h throughout thetime. The difference in h retrieved at various dates allowed calcu-lating their definition error. If d is the difference, then, according toEquation (13), the definition error is dh ¼ d/2. For example, atd ¼ 3.5% dh was 2.5% and at d ¼ 4.4% dh was 3.1%.
The difference between calculated and measured l was foundmuch greater (up to 40%).
The main cause of such a great error is low accuracy of themethod for the determination of l (Verhoest et al., 2008). Theaccuracy of this method depends not only on the measurementprecision of surface heights, but also on the spatial resolution of theroute profile (Dx) and a choice of the autocorrelation function.
The values of h retrieved from s0vv noise filtered by a 5 � 5-pixelmedian filter (surveying date 22.08.97; qs ¼ 2.3%) was comparedwith the ground measured h over 64 pixels on loessy site # 2-4(measuring date 17.12.00). The resulting linear relationship isshown in Fig. 3.
Relatively good correlation (R2 of 0.69, slope of 1.004, interceptof 0.015) between retrieved and measured values of h (Fig. 3)supports acceptability of the proposed methodology of h retrieval.
Fig. 4 presents: 1) Variations of s0vv filtered by a 5-pixel one-dimensional average filter derived from the remote data surveyedon 25.12.98 along two adjacent profiles within the artificiallymoisturized abandoned sandy field near Zeelim farm; 2) Variationof the groundmeasured q at the time of the survey common for thetwo profiles; 3) Variations of h retrieved using the above s0vv and q.
The correlation between retrieved h for the two profiles wasfound very low (R2 z 0.01), while the average values of h for theprofile-1 (0.205 cm) and the profile-2 (0.193 cm) were very close.This shows that the distribution of h along profiles is representedby a random field which is statistically homogeneous. Cumulatedmean values for the profile-1, profile-2 and the average of the twowere calculated in order to determine the number of pixelsrequired for obtaining the representative mean value of h fora given visually homogeneous field (Fig. 5).
As can be seen from Fig. 5, the variation of cumulated averagevalues decreased after the number of pixels reached 22 for eachsandy profile. After this point the average cumulative mean differsfrom its final value (calculated for 62 pixels) by less than 0.001 cm,which should not be confused with the standard error of the mean(which in this case is 0.006 cm (3.0%) at the confidence level of 95%).Close results were obtained in the two loessy and two sandy sites.
Table 5Mean values of h (cm) and l (cm) over the four research sites.
Site Retrieved22.08.97
Retrieved25.12.98
Retrieved24.03.00
Measured17-20.12.00
h(cm)
l(cm)
h(cm)
l(cm)
h(cm)
l(cm)
h(cm)
l(cm)
Sandy, # 2-1 0.390 6.6 0.390 6.6 0.404 6.8 0.406 6.7Sandy, # 2-2 0.396 6.7 0.384 6.5 0.385 6.6 0.387 4.6Loessy, # 2-3 0.441 7.4 0.440 7.4 0.419 7.1 0.444 8.7Loessy, # 2-4 0.457 7.6 0.446 7.5 0.464 7.7 0.447 8.4
In Fig. 6 are presented the cumulatedmean values of h, retrievedin the loessy site # 2-4 using both filtered and untreated s0vv valueswhich derived from the remote data surveyed on 22.08.97, andqs¼ 2.3%. Here the variations of the cumulatedmean of h decreasedafter the number of pixels reached 60, at which point h stabilized at0.461 � 0.0003 cm for filtered and at 0.459 � 0.0004 cm foruntreated values ofs0vv. Thus, the conclusion is that obtaining of thereliable mean values of h for given visually homogenous soilsurfaces requires the retrieval of the average values of h froma certain number of pixels. The necessary number of pixels dependson required precision of determination of h. In our case approxi-mately 60 pixels were required in order to obtain the mean h withthe standard error of the mean of 0.005 (1.1%) for filtered data and0.01 (2.2%) for untreated data at the confidence level of 95%.
According to Equation (2), the sensitivity of s0vv to the variationof h is inversely proportional to hðvs0vv=vh ¼ 1=bhÞ. In the case ofsmall roughness this means that even a small error in retrieval of hleads to a considerable error in retrieval of q. For example,according to our calculations, relative error dh ¼ 2.5% leads to the
0 16 32 48 64
Pixels number
0.42
0.44
Cum
ulat
iv With use raw data With use filtered datavvσ
vvσ
Fig. 6. Cumulative mean h retrieved using the raw and filtereds0vv values derived fromthe remote data surveyed on 22.08.97 under qs ¼ 2.3% on the loessy site # 2-4.

L. Vulfson et al. / Journal of Arid Environments 87 (2012) 77e84 83
relative error of q retrieval dqh¼ 16% for sand, and dh¼ 0.031% leadsto dqh ¼ 17% for loess. This justifies such high precision for theretrieval of h, which is necessary for the subsequent retrieval of q.Considering stability of h in time under arid conditions, it isappropriate to determine h during the dry period when q is knownand only a minimum number of control measurements are needed.Subsequently, the retrieved values of h can be used for the retrievalof q during the wet period.
5. Conclusion
In this study, a method was presented which allows retrievingparameters of small surface roughness by using the archive single-channel ERS-2 SAR images. It is shown that in the range of h from0.1 to 1.0 cm, the dependence of the retrieved values of h on themeasured s0vv could be fitted with a high precision by an expo-nential function. Error analysis of the proposed algorithm has beencarried out. It has been shown in particular that the relativedetermination error of h did not depend on its value.
Analysis of daily variations of surface q during the dry periodconfirmed that q remained generally constant (1 � 0.1% for sandand 2.3 � 0.2% for loess) at the time of the satellite survey. Thisphenomenon, which is characteristic for the arid conditions of thestudied area, eliminates the need in laborious measurements of qfor the retrieval of h.
The values of h retrieved during both dry and wet periodsshowed a fairly good agreement with the ground measured valuesfrom both sandy and loessy test sites. This corroborates the validityof the proposed method and its assumption about stability of h intime.
As was determined in the current research, some several tens ofpixels are required in order to obtain a representativemean value ofh for the visually homogeneous sandy and loessy sites. Theproposedmethod is applicable not only for the Negev desert but formany other arid regions of the world as well. In addition, themethod is based on the models suitable for a wide spectrum ofsoils: from coarse sand to heavy loams, which allows to assume itsrelevance for these types of soil as well.
Acknowledgments
This work was supported by the Israel’s Ministry of Science andTechnology grant 3-4766 to the Katif Research Center for theDevelopment of Coastal Deserts. The study was partially supportedby a grant from the Israel’s Ministry of Science, the Bundesminis-terium für Bildung und Forschung (BMBF), by State and Federalfunds allocated under GLOWA project. In addition, a number ofimages were made available by the European Space Agency grantfor provision of archival images.
Appendix
The semi-empirical backscattering model of Oh et al. (1994) canbe presented as:
s0vv ¼13:5exp�� 1:4ðk0hÞ0:2
�p�0:5Ghðk0hÞ2ðcoswÞ3:25�0:05k0l
� exp�� ð2k0hcoswÞ0:6
�W
(A.1)
where:W is the roughness spectrum corresponding to a quadraticexponential correlation function (Oh et al., 1994), which is the bestfor describing roughness of natural surfaces:
W ¼ ðk0lÞ2 1� 0:71
1� 3ð2:6k0lsinwÞ2� �!
(A.2)
1þ ð2:6k0lsinwÞ2 1þ ð2:6k0lsinwÞ22
p0:5 ¼ 1� ð2w=pÞ0:314=G0expð�k0hÞ (A.3)
G0 ¼1� ffiffiffi
ε
p1þ ffiffiffi
ε
p2
(A.4)
Gh ¼cosw�
ffiffiffiffiffiffiffiffiffiffiffiffiffiffiffiffiffiffiffiffiε� sin2
wp
coswþffiffiffiffiffiffiffiffiffiffiffiffiffiffiffiffiffiffiffiffiε� sin2
wp
2
(A.5)
where:k0¼ 2p/l is free spacewave number;l¼ 5.65 cm is free spacewavelength;G0 is Fresnal reflectivityat nadir;Gh is Fresnal horizontalreflectivity;s0vv (dB) equals 10logs
0vv;h and l are in cm;w is in rad.
References
Agam, N., Berliner, P.R., 2004. Diurnal water content changes in the bare soil ofa coastal desert. Journal of Hydrometeorology 5, 922e933.
Álvarez-Mozos, J., Casalí, J., Gonzalez-Audícana, M., Verhoest, N.E.C., 2006. Assess-ment of the operational applicability of RADARSAT-1 data for surface soilmoisture estimation. IEEE Transactions on Geoscience and Remote Sensing 44,913e924.
Baghdadi, N., Aubert, M., Cerdan, O., Franchistéguy, L., Viel, C., Martin, E., Zribi, M.,Desprats, J.F., 2007. Operational mapping of soil moisture using syntheticaperture radar data: application to the Touch basin (France). Sensors 7,2458e2483.
Baghdadi, N., Cerdan, O., Zribi, M., Véronique Auzet, V., Frédéric Darboux, F., Hajj, M.,Kheir, R.B., 2008. Operational performance of current synthetic aperture radarsensors in mapping soil surface characteristics in agricultural environments:application to hydrological and erosion modeling. Hydrological Processes 22,9e20.
Baghdadi, N., Gherboudj, I., Zribi, M., Sahebi, M., King, C., Bonn, F., 2004. Semi-empirical calibration of the IEM backscattering model using radar images andmoisture and roughness field measurements. International Journal of RemoteSensing 25, 3593e3623.
Baghdadi, N., Holah, N., Zribi, M., 2006. Soil moisture estimation using multi-incidence and multi-polarization ASAR SAR data. International Journal ofRemote Sensing 27 (10), 1907e1920.
Bindlish, R., Barros, A.P., 2000. Multifrequency soil moisture inversion from SARmeasurements with the use of IEM. Remote Sensing of Environment 71, 67e88.
Blumberg, D.G., Freilikher, V., 2001. Soil water-content and roughness retrievalusing ERS-2 SAR data in the Negev Desert, Israel. Journal of Arid Environments49, 449e464.
Blumberg, D.G., Greeley, R., 1993. Field studies of aerodynamic roughness length.Journal of Arid Environment 25, 39e48.
Blumberg, D.G., Ronen, G., Ben-Asher, J., Freilikher, V., Vulfson, L., Kotlyar, A., 2006.Utilizing a P-band scatterometer to assess soil water saturation percent ofa bare sandy soil. Journal of Hydrology 318, 374e378.
Blyth, K., 1997. An assessment of the capabilities of the ERS satellites’ activemicrowave instruments for monitoring soil moisture change. Hydrology andEarth System Sciences 1, 159e174.
Carmi, G., Berliner, P., 2008. The effect of soil crust on the generation of runoff onsmall plots in an arid environment. Catena 74, 37e42.
Dubois, P.C., van Zyl, J., Engman, T., 1995. Measuring soil moisture with imagineradars. IEEE Transactions on Geoscience and Remote Sensing 33, 915e926.
Fung, A.K., 1994. Microwave Scattering and Emission Models and Their Applica-tions. Artech House, London.
Fung, A.K., Chen, K.S., 2004. An update of the IEM surface backscattering model.IEEE Geoscience and Remote Sensing Letters 1, 75e77.
Fung, A.K., Li, Z., Chen, K.S., 1992. Backscattering from a random rough dielectricsurface. IEEE Transactions on Geoscience and Remote Sensing 30, 356e369.
Laur, H., Bally, P., Meadows, P., Sánchez, J., Schäettler, B., Lopinto, E., Esteban, D.,2004. ERS SAR Calibration: Derivation of the Backscattering Coefficient s0 inESA ERS SAR PRI Products. European Space Agency. ES-TN-RS-PM-HL09, 2/5f,3e5.
Meade, N.G., Hinzman, L.D., Kane, D.L., 1999. Spatial estimation of soil moistureusing synthetic aperture radar in Alaska. Advances in Space Research 24,935e940.
Moran, M.S., Hymer, D.C., Qi, J., Sano, E.E., 2000. Soil moisture evaluation usingmulti-temporal synthetic aperture radar (SAR) in semiarid rangeland. Agricul-tural and Forest Meteorology 105, 69e80.
Oh, Y., Sarabandi, K., Ulaby, F.T., 1992. An empirical model and an inversion tech-nique for radar scattering from bare soil surfaces. IEEE Transactions on Geo-science and Remote Sensing 30, 370e381.

L. Vulfson et al. / Journal of Arid Environments 87 (2012) 77e8484
Oh, Y., Sarabandi, K., Ulaby, F.T., 1994. An inversion algorithm for retrieving soilmoisture and surface roughness from polarimetric radar observation. In:Proceedings, International Geoscience and Remote Sensing Symposium(IGARSS), Pasadena, pp. 1582e1584.
Peplinski, N.R., Ulaby, F.T., Dobson, M.C., 1995. Dielectric properties of soils in the0.3e1.3 GHz range. IEEE Transactions on Geoscience and Remote Sensing 33,803e807.
Rees, W.G., Arnold, N.S., 2007. Scale-dependent roughness of a glacier surface:implications for radar backscatter and aerodynamic roughness modeling.Journal of Glaciology 52, 214e222.
Robinson, N., 1966. Solar Radiation. Elsevier, Amsterdam.Sud, Y.C., Shukla, J., Mintz, Y., 1988. Influence of land surface-roughness on atmo-
spheric circulation and precipitation e a sensitivity study with a generalcirculation model. Journal of Applied Meteorology 27, 1036e1054.
Sud, Y.C., Walker, G.K., 1990. A Review of Recent Research on Improvement ofPhysical Parameterization in the GLA GCM. NASA Goddard Space Flight Center.Technical Memorandum 10771.
Taylor, J.R., 1997. An Introduction to Error Analysis: The Study of Uncertainties inPhysical Measurements. University Science Books, Sausalito, CA.
Thoma, D.P., Moran, M.S., Bryant, R., Rahman, M., Holifield Collins, C.D., Skirvin, S.,Sano, E.E., Slocum, K., 2006. Comparison of four models to determine surface
soil moisture from C-band radar imagery in a sparsely vegetated semiaridlandscape. Water Resources Research 42, 1e12.
Ulaby, F.T., Dobson, M.C., 1989. Handbook of Radar Scattering Statistics for Terrain.Artech House, Norwood.
Ulaby, F.T., Moore, R.K., Fung, A.K., 1982. Microwave Remote Sensing: Active andPassive. In: Radar Remote Sensing and Surface Scattering and Emission Theory,vol. II. Addison-Wesley, MA.
Ulaby, F.T., Moore, R.K., Fung, A.K., 1986. Microwave Remote Sensing: Active andPassive. In: From Theory to Applications, vol. III. Artech House, Boston, London.
Verhoest, N.E.C., Lievens, H., Wagner, W., Álvarez-Mozos, J., Moran, M.S., Mattia, F.,2008. On the soil roughness parameterization problem in soil moisture retrievalof bare surfaces from synthetic aperture radar. Sensors 8, 4213e4248.
Verhoest, N.E.C., Troch, P.A., Paniconi, C., De Troch, F.P., 1998. Mapping basin scalevariable source areas from multitemporal remotely sensed observations of soilmoisture behavior. Water Resources Research 34, 3235e3244.
Walker, J.P., Paul, R., Houser, P.R., Garry, R., Willgoose, G.R., 2004. Active microwaveremote sensing for soil moisture measurement: a field evaluation using ERS-2.Hydrological Processes 18, 1975e1997.
Zribi, M., Baghdadi, N., Holah, N., Fafin, O., 2005. New methodology for soil surfacemoisture estimation and its application to ENVISAT-ASAR multi-incidence datainversion. Remote Sensing of Environment 96, 485e496.