Results of the Predictors of Response to CRT (PROSPECT) Trial
10
Results of the Predictors of Response to CRT (PROSPECT) Trial Eugene S. Chung, MD; Angel R. Leon, MD; Luigi Tavazzi, MD; Jing-Ping Sun, MD; Petros Nihoyannopoulos, MD; John Merlino, MD; William T. Abraham, MD; Stefano Ghio, MD; Christophe Leclercq, MD; Jeroen J. Bax, MD; Cheuk-Man Yu, MD, FRCP; John Gorcsan III, MD; Martin St John Sutton, FRCP; Johan De Sutter, MD, PhD; Jaime Murillo, MD Background—Data from single-center studies suggest that echocardiographic parameters of mechanical dyssynchrony may improve patient selection for cardiac resynchronization therapy (CRT). In a prospective, multicenter setting, the Predictors of Response to CRT (PROSPECT) study tested the performance of these parameters to predict CRT response. Methods and Results—Fifty-three centers in Europe, Hong Kong, and the United States enrolled 498 patients with standard CRT indications (New York Heart Association class III or IV heart failure, left ventricular ejection fraction 35%, QRS 130 ms, stable medical regimen). Twelve echocardiographic parameters of dyssynchrony, based on both conventional and tissue Doppler– based methods, were evaluated after site training in acquisition methods and blinded core laboratory analysis. Indicators of positive CRT response were improved clinical composite score and 15% reduction in left ventricular end-systolic volume at 6 months. Clinical composite score was improved in 69% of 426 patients, whereas left ventricular end-systolic volume decreased 15% in 56% of 286 patients with paired data. The ability of the 12 echocardiographic parameters to predict clinical composite score response varied widely, with sensitivity ranging from 6% to 74% and specificity ranging from 35% to 91%; for predicting left ventricular end-systolic volume response, sensitivity ranged from 9% to 77% and specificity from 31% to 93%. For all the parameters, the area under the receiver-operating characteristics curve for positive clinical or volume response to CRT was 0.62. There was large variability in the analysis of the dyssynchrony parameters. Conclusion—Given the modest sensitivity and specificity in this multicenter setting despite training and central analysis, no single echocardiographic measure of dyssynchrony may be recommended to improve patient selection for CRT beyond current guidelines. Efforts aimed at reducing variability arising from technical and interpretative factors may improve the predictive power of these echocardiographic parameters in a broad clinical setting. (Circulation. 2008;117: 2608-2616.) Key Words: dyssynchrony echocardiography echocardiography, Doppler heart failure pacemakers I n patients with New York Heart Association (NYHA) class III and ambulatory class IV systolic heart failure and electrocardiographic evidence of ventricular dyssynchrony, cardiac resynchronization therapy (CRT) improves quality of life and functional status (eg, NYHA class, exercise capaci- ty), 1 reduces heart failure–related hospitalizations, 2 and pro- longs survival. 3 Thus, there is a strong clinical mandate for the use of CRT in eligible patients that is supported by national and international practice guidelines. 4–6 Although most treated patients show a benefit from CRT, some patients have been considered nonresponders in clinical trials using a variety of measures of clinical responsive- ness. 1,7,8 In the Multicenter InSync Randomized Clinical Evaluation (MIRACLE), 34% of patients did not demonstrate an improvement in a heart failure clinical composite score (CCS) that combined all-cause mortality, heart failure hospi- talization, NYHA class, and patient global assessment into an outcome measure. 1,9 Continuing medical education (CME) credit is available for this article. Go to http://cme.ahajournals.org to take the quiz. Received October 24, 2007; accepted February 27, 2008. From the Lindner Clinical Trial Center, The Ohio Heart and Vascular Center, and The Christ Hospital, Cincinnati, Ohio (E.S.C.); Emory University–Crawford Long Hospital, Atlanta, Ga (A.R.L., J.-P.S., J.M.); Ospedale Policlinico San Matteo, Pavia, Italy (L.T., S.G.); Imperial College London and Hammersmith Hospital, London, UK (P.N.); Ohio State University Heart Center, Columbus (W.T.A.); University Hospital, Rennes, France (C.L.); Leiden University Medical Center, Leiden, the Netherlands (J.J.B.); Prince of Wales Hospital, Hong Kong, China (C.-M.Y.); University of Pittsburgh, Pittsburgh, Pa (J.G.); University of Pennsylvania Medical Center, Philadelphia (M.S.J.S.); University Hospital Gent, Gent, Belgium (J.D.S.); and Sentara Norfolk General Hospital, Norfolk, Va (J.M.). The online Data Supplement, which consists of an Appendix, can be found with this article at http://circ.ahajournals.org/cgi/content/full/ CIRCULATIONAHA.107.743120/DC1. Clinical trial registration information—URL: http://www.clinicaltrials.gov. Unique identifier: NCT00253357. Correspondence to Eugene Chung, The Christ Hospital, Ohio Heart and Vascular Center, and the Lindner Clinical Trial Center, Cincinnati, OH 45219. E-mail [email protected] © 2008 American Heart Association, Inc. Circulation is available at http://circ.ahajournals.org DOI: 10.1161/CIRCULATIONAHA.107.743120 2608 Heart Failure by guest on August 16, 2015 http://circ.ahajournals.org/ Downloaded from
-
Upload
independent -
Category
Documents
-
view
4 -
download
0
Transcript of Results of the Predictors of Response to CRT (PROSPECT) Trial

Results of the Predictors of Response to CRT(PROSPECT) Trial
Eugene S. Chung, MD; Angel R. Leon, MD; Luigi Tavazzi, MD; Jing-Ping Sun, MD;Petros Nihoyannopoulos, MD; John Merlino, MD; William T. Abraham, MD; Stefano Ghio, MD;
Christophe Leclercq, MD; Jeroen J. Bax, MD; Cheuk-Man Yu, MD, FRCP; John Gorcsan III, MD;Martin St John Sutton, FRCP; Johan De Sutter, MD, PhD; Jaime Murillo, MD
Background—Data from single-center studies suggest that echocardiographic parameters of mechanical dyssynchronymay improve patient selection for cardiac resynchronization therapy (CRT). In a prospective, multicenter setting, thePredictors of Response to CRT (PROSPECT) study tested the performance of these parameters to predict CRT response.
Methods and Results—Fifty-three centers in Europe, Hong Kong, and the United States enrolled 498 patients with standardCRT indications (New York Heart Association class III or IV heart failure, left ventricular ejection fraction �35%, QRS�130 ms, stable medical regimen). Twelve echocardiographic parameters of dyssynchrony, based on both conventionaland tissue Doppler–based methods, were evaluated after site training in acquisition methods and blinded core laboratoryanalysis. Indicators of positive CRT response were improved clinical composite score and �15% reduction in leftventricular end-systolic volume at 6 months. Clinical composite score was improved in 69% of 426 patients, whereasleft ventricular end-systolic volume decreased �15% in 56% of 286 patients with paired data. The ability of the 12echocardiographic parameters to predict clinical composite score response varied widely, with sensitivity ranging from6% to 74% and specificity ranging from 35% to 91%; for predicting left ventricular end-systolic volume response,sensitivity ranged from 9% to 77% and specificity from 31% to 93%. For all the parameters, the area under thereceiver-operating characteristics curve for positive clinical or volume response to CRT was �0.62. There was largevariability in the analysis of the dyssynchrony parameters.
Conclusion—Given the modest sensitivity and specificity in this multicenter setting despite training and central analysis,no single echocardiographic measure of dyssynchrony may be recommended to improve patient selection for CRTbeyond current guidelines. Efforts aimed at reducing variability arising from technical and interpretative factors mayimprove the predictive power of these echocardiographic parameters in a broad clinical setting. (Circulation. 2008;117:2608-2616.)
Key Words: dyssynchrony � echocardiography � echocardiography, Doppler � heart failure � pacemakers
In patients with New York Heart Association (NYHA) classIII and ambulatory class IV systolic heart failure and
electrocardiographic evidence of ventricular dyssynchrony,cardiac resynchronization therapy (CRT) improves quality oflife and functional status (eg, NYHA class, exercise capaci-ty),1 reduces heart failure–related hospitalizations,2 and pro-longs survival.3 Thus, there is a strong clinical mandate forthe use of CRT in eligible patients that is supported bynational and international practice guidelines.4–6 Although
most treated patients show a benefit from CRT, somepatients have been considered nonresponders in clinicaltrials using a variety of measures of clinical responsive-ness.1,7,8 In the Multicenter InSync Randomized ClinicalEvaluation (MIRACLE), 34% of patients did not demonstratean improvement in a heart failure clinical composite score(CCS) that combined all-cause mortality, heart failure hospi-talization, NYHA class, and patient global assessment into anoutcome measure.1,9
Continuing medical education (CME) credit is available for this article. Go to http://cme.ahajournals.org to take the quiz.Received October 24, 2007; accepted February 27, 2008.From the Lindner Clinical Trial Center, The Ohio Heart and Vascular Center, and The Christ Hospital, Cincinnati, Ohio (E.S.C.); Emory
University–Crawford Long Hospital, Atlanta, Ga (A.R.L., J.-P.S., J.M.); Ospedale Policlinico San Matteo, Pavia, Italy (L.T., S.G.); Imperial CollegeLondon and Hammersmith Hospital, London, UK (P.N.); Ohio State University Heart Center, Columbus (W.T.A.); University Hospital, Rennes, France(C.L.); Leiden University Medical Center, Leiden, the Netherlands (J.J.B.); Prince of Wales Hospital, Hong Kong, China (C.-M.Y.); University ofPittsburgh, Pittsburgh, Pa (J.G.); University of Pennsylvania Medical Center, Philadelphia (M.S.J.S.); University Hospital Gent, Gent, Belgium (J.D.S.);and Sentara Norfolk General Hospital, Norfolk, Va (J.M.).
The online Data Supplement, which consists of an Appendix, can be found with this article at http://circ.ahajournals.org/cgi/content/full/CIRCULATIONAHA.107.743120/DC1.
Clinical trial registration information—URL: http://www.clinicaltrials.gov. Unique identifier: NCT00253357.Correspondence to Eugene Chung, The Christ Hospital, Ohio Heart and Vascular Center, and the Lindner Clinical Trial Center, Cincinnati, OH 45219.
E-mail [email protected]© 2008 American Heart Association, Inc.
Circulation is available at http://circ.ahajournals.org DOI: 10.1161/CIRCULATIONAHA.107.743120
2608
Heart Failure
by guest on August 16, 2015http://circ.ahajournals.org/Downloaded from
Editorial p 2573Clinical Perspective p 2616
Recently, several echocardiographic measures of mechan-ical dyssynchrony have identified responders to CRT beforedevice implantation. Ventricular dyssynchrony has been mea-sured with traditional echocardiographic techniques,10 tissueDoppler imaging (TDI), and other methods.11–18 A few ofthese parameters have demonstrated the ability to distinguishCRT responders from nonresponders with a high degree ofaccuracy in multiple small single-center studies. To date,however, no multicenter study has examined the potential ofechocardiography to assist in determining patients most likelyto respond to CRT. Here, we present the results of Predictorsof Response to CRT (PROSPECT), a prospective, multi-center, nonrandomized study designed to evaluate selected,predefined baseline echocardiographic parameters for theirability to predict clinical and echocardiographic responseto CRT.
MethodsA detailed description of the rationale and methods for PROSPECThas been published previously.19 The patient population and studyprotocol are described below.
Study PopulationPatients with heart failure symptoms referred for CRT according tothe current guidelines for the treatment of chronic heart failure were
evaluated for enrollment. Patients were included according to thefollowing criteria: left ventricular ejection fraction (LVEF) �35% asassessed by the investigator, NYHA functional status III or IV, andQRS duration �130 ms. Medical therapy, unless contraindicated,was to include an angiotensin-converting enzyme inhibitor or angio-tensin receptor blocker for at least 1 month before enrollment and a�-blocker started at least 3 months before and unchanged for at least1 month before enrollment. Patients were enrolled across 53 centersin the United States, Europe, and Hong Kong between March 2004and December 2005. All centers collected data at preimplant baselineassessment; at the time of implantation; immediately after implan-tation; at 1, 3, and 6 months after implantation; and every 6 monthsuntil study closure. Any Medtronic market–released CRT devicewith or without implantable cardioverter-defibrillator (ICD) func-tionality could be used in the study.
Echocardiographic Measures ofVentricular DyssynchronyThe PROSPECT Steering Committee selected 12 echocardiographicparameters identified from published and unpublished literature aspossible predictors of a positive response to CRT.10,11,13–18 Details ofeach parameter are presented in Table 1.
Echocardiography Core LaboratoriesThe recording of a baseline echocardiogram was performed according tostudy protocol and sent to either a US or European core laboratory. Thecore laboratories used echocardiographic equipment from 1 of 3manufacturers: General Electric (GE, Milwaukee, Wis), Philips (An-dover, Mass), and Siemens (Malvern, Pa). Echocardiogram data ob-tained on GE machines (37%) were analyzed with GE Echopac softwareon a standalone workstation V4.0.4 or a GE Vivid 7 ultrasound system
Table 1. Summary of Echocardiographic Predictors of Response to CRT
Echocardiographic Predictor Description of Method Echocardiography Method Cutoff
SPWMD10 Septal-posterior wall motion delay; M mode measured by parasternalshort-axis view
M mode �130 ms
IVMD14 Interventricular mechanical delay defined as the difference betweenleft and right ventricular preejection intervals
Pulsed Doppler �40 ms
LVFT/RR14 Left ventricular filling time (LVFT) in relation to cardiac cycle length(RR) as measured by transmitral Doppler echo expressed
as percentage
Pulsed Doppler �40%
LPEI14 Left ventricular preejection interval defined as the time intervalbetween the beginning of QRS and beginning of left ventricular
ejection by Doppler
Pulsed Doppler �140 ms
LLWC14 Intraventricular dyssynchrony left lateral wall contraction defined asthe presence of overlap between the end of lateral wall contraction(via M mode) and onset of LV filling (by Doppler echocardiography)
M mode and pulsed Doppler Any overlap
Ts-(lateral-septal)15 Delay between time to peak systolic velocity in ejection phase atbasal septal and basal lateral segments
TDI �60 ms
Ts-SD11,13 SD of time from QRS to peak systolic velocity in ejection phase for12 left ventricular segments (6 basal and 6 middle)
TDI �32 ms
PVD16 Peak velocity difference derived from subtracting the maximal fromthe minimal difference of time to peak velocity (excluding velocities
occurring during isovolumic contraction time) for 6 segments atbasal level
TDI �110 ms
DLC17,18 Delayed longitudinal contraction measured in the 6 basal leftventricular segments with a systolic contraction component in early
diastole by TDI and confirmed with strain rate imaging
TDI�SRI �2 basal segments
Ts-peak displacement Maximum difference of time to peak systolic displacementfor 4 segments
TDI �Median
Ts-peak (basal) Maximum difference of time to peak systolic velocity for 6 segmentsat basal level
TDI �Median
Ts-onset (basal) Maximum difference of time to onset of systolic velocity for 6segments at basal level
TDI �Median
Chung et al Echocardiographic Predictors of Response to CRT 2609
by guest on August 16, 2015http://circ.ahajournals.org/Downloaded from
running version 3.2.6. Data obtained on Philips (50%) used Sonos 5500,7500, or IE33, and TDI data were analyzed beginning with PhilipsQLAB version 2.0 and progressively updated throughout the study toversion 4.1. TDI data on Siemens (12%) were analyzed with TomtecResearch Arena software version 1.0. In addition, 6 baseline echocar-diograms (1%) were obtained with Aloka ProSound 5500.
The US core laboratory in Atlanta, Ga (Emory University–Crawford Long Hospital), processed all studies from the UnitedStates and Hong Kong. For studies from Europe, the core laboratoryin Pavia, Italy (Policlinico San Matteo), analyzed all standard2-dimensional measurements and TDI analysis of studies recordedon machines from GE. The core laboratory in London, UK (Ham-mersmith Hospital), performed TDI analysis of echocardiogramsrecorded on machines manufactured by Philips and Siemens.
Training and Quality ControlAt all centers, training on the echocardiogram protocol, data acqui-sition, and storage was completed by means of a written manual andvideo presentation. In addition, each center was required to obtainaccreditation from the echocardiography core laboratory in its regionby providing high-quality images before enrolling any study sub-jects. Furthermore, any subsequent studies judged to be of insuffi-cient quality by the core laboratory were censored and not includedin the analysis.
A team of echocardiologists (see the Appendix in the online DataSupplement) assisted in the creation and review of an echocardio-graphic measurement manual that was followed by the core labora-tories to ensure consistent measurement of images. This documentwas reviewed and approved by the PROSPECT Steering Committee,which was made up of heart failure specialists, echocardiologists,and electrophysiologists (see the Appendix). In addition, an inde-pendent echocardiographic review committee (see the Appendix)reviewed the core laboratory data and predictor calculations beforestatistical analysis. The echocardiographic review committee pro-vided support and expert review during visits to each of the corelaboratories.
Repeatability and Reproducibility of MeasurementsVariability was evaluated with measurements selected to representthe major echocardiographic methodology categories: 2-dimensionalstudy, M-mode, pulsed Doppler, and TDI based. Intraoperatorvariability was assessed within each core laboratory with 10 baselinerecordings. Measurement of each echocardiographic recording wasconducted 3 times (on days 1, 2, and 7). For each patient, leftventricular end-systolic volume (LVESV; study end point), septal-posterior wall motion delay (SPWMD), the SD of time to peaksystolic velocity of 12 segments of the left ventricular wall at thebasal and medial levels (Ts-SD; used for power calculations), leftventricular preejection interval (measured in MIRACLE and MIR-ACLE ICD), and maximal time to peak systolic velocity differenceof 6 segments at the basal level (Ts-peak) were measured.
Interobserver variability was measured between core laboratorieswith the same echocardiographic parameters (LVESV, SPWMD,Ts-SD, left ventricular preejection interval, Ts-peak). For this as-sessment, a total of 12 recordings were exchanged by the US andItalian core laboratories; the US and UK core laboratories exchanged20 echocardiograms.
Definition of Response to CRTResponse to CRT was evaluated through the use of 2 separatelyanalyzed primary outcomes at 6 months: heart failure CCS andrelative change in LVESV. The CCS describes patients regardless ofvital status at 6 months and includes both objective and subjectivemeasures of clinical status. A patient’s CCS was classified as one ofthe following: worsened (the patient died or was hospitalized for orassociated with worsening heart failure, demonstrated worsening inNYHA class at last observation carried forward, had moderate ormarked worsening of patient global assessment score at last obser-vation carried forward, or permanently discontinued CRT because ofor associated with worsening heart failure), improved (the patient
had not worsened as defined above and demonstrated improvementin NYHA class at last observation carried forward or had moderateor marked improvement in patient global assessment score at lastobservation carried forward), or unchanged (the patient was neitherimproved nor worsened).9 An independent end point committee (seethe Appendix) adjudicated all hospitalizations and CRT discontinu-ations for heart failure relatedness. A positive response to CRT wasdefined in the case of CCS as a designation of “improved” and withLVESV as a reduction of �15% at 6 months compared with baseline(paired LVESV measurements). A reduction in LVESV of �15%has been used in previous trials10,11 and was used in this study as anobjective measure of cardiac function.
Statistical MethodsPrespecified cutoff values for each echocardiographic measure weredetermined from both published and unpublished data, and eachparameter was tested against the response outcomes (CCS andLVESV). When predictive cutoff values did not appear in theliterature, the cutoff was defined as the median value (Table 1). Theproportions of patients with a positive response to CRT above andbelow the specified cutoff values were compared by Fisher’s exacttest. No adjustment for conducting multiple statistical tests wasmade. Receiver-operating characteristics curves were generated, andareas under the curve are reported as a measure of the ability topredict positive response at any cutoff value.
For the analysis of intraobserver and interoperator echocardio-graphic variability, we calculated an adjusted coefficient of variation(CV), defined as the ratio of the SD and the mean of absolutereadings for each echocardiographic parameter. Agreement ofbinary echocardiographic predictors was assessed with Cohen’s �coefficients.
Finally, to further characterize the relationship between echocar-diographic measures and the 2 primary outcomes, retrospectiveanalyses of the following subgroups were performed: core laborato-ry–measured LVEF �35%, left ventricular end-diastolic diameter�65 mm, and ischemic and nonischemic origin of heart failure.
The authors had full access to and take full responsibility for theintegrity of the data. All authors have read and agree to themanuscript as written.
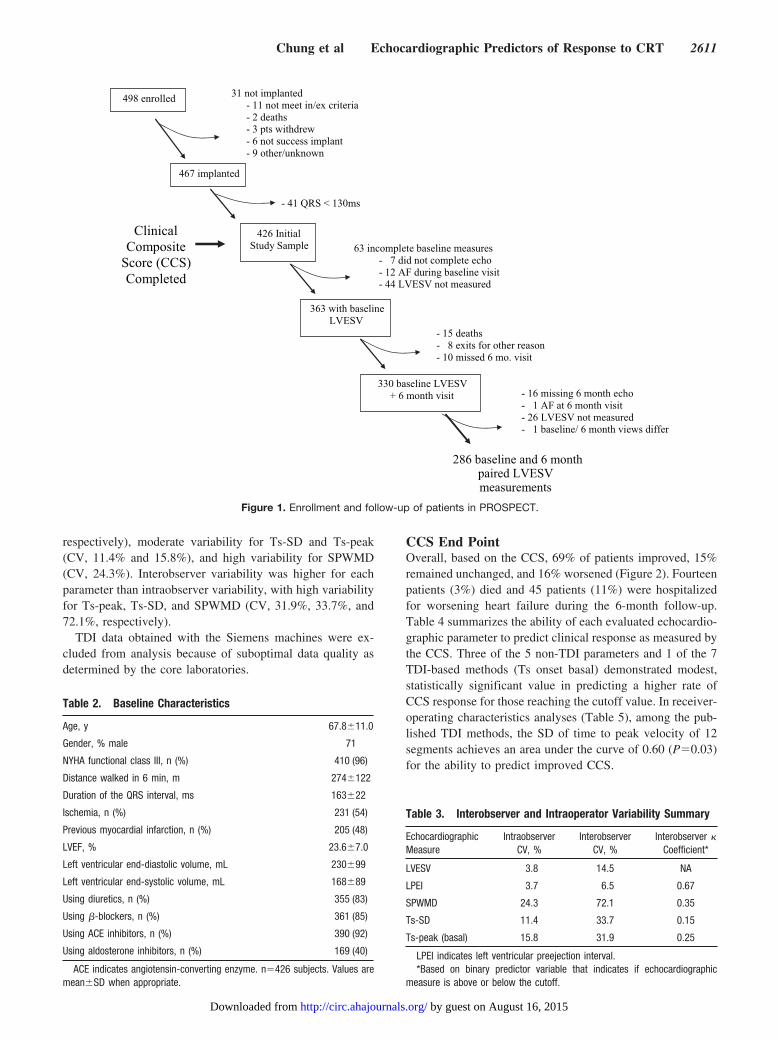
ResultsPatient CharacteristicsOverall, 498 patients were enrolled in PROSPECT, and after31 early exits, 467 patients were successfully implanted withCRT devices. After exclusion of 41 patients in a narrow QRSsubstudy (�130 ms), the 426 remaining patients formed thefinal study group of the present report. The disposition ofsubjects is presented in Figure 1. A total of 227 patients wereenrolled in the United States, 194 in Europe, and 5 in HongKong. Baseline characteristics are shown in Table 2. Ingeneral, most patients were male (71%); 54% had ischemicorigin of heart failure; and the use of evidence-based heartfailure medications at baseline was high, as required. Com-pared with patients enrolled in the United States, Europeanpatients had more nonischemic origin of underlying cardio-myopathy (63% versus 44%; P�0.0001) and, from corelaboratory measurements, lower LVEF (25.5�6.2% versus32.9�11.5%; P�0.0001) and larger LVESV (206.6�91.9versus 132.5�69.5 mL; P�0.0001).
Echocardiographic DataVariability analyses of echocardiographic measures areshown in Table 3. Intraobserver reproducibility was similar inthe 3 core laboratories, with low variability for LVESV andleft ventricular preejection interval (CV, 3.8% and 3.7%,
2610 Circulation May 20, 2008
by guest on August 16, 2015http://circ.ahajournals.org/Downloaded from
respectively), moderate variability for Ts-SD and Ts-peak(CV, 11.4% and 15.8%), and high variability for SPWMD(CV, 24.3%). Interobserver variability was higher for eachparameter than intraobserver variability, with high variabilityfor Ts-peak, Ts-SD, and SPWMD (CV, 31.9%, 33.7%, and72.1%, respectively).
TDI data obtained with the Siemens machines were ex-cluded from analysis because of suboptimal data quality asdetermined by the core laboratories.
CCS End PointOverall, based on the CCS, 69% of patients improved, 15%remained unchanged, and 16% worsened (Figure 2). Fourteenpatients (3%) died and 45 patients (11%) were hospitalizedfor worsening heart failure during the 6-month follow-up.Table 4 summarizes the ability of each evaluated echocardio-graphic parameter to predict clinical response as measured bythe CCS. Three of the 5 non-TDI parameters and 1 of the 7TDI-based methods (Ts onset basal) demonstrated modest,statistically significant value in predicting a higher rate ofCCS response for those reaching the cutoff value. In receiver-operating characteristics analyses (Table 5), among the pub-lished TDI methods, the SD of time to peak velocity of 12segments achieves an area under the curve of 0.60 (P�0.03)for the ability to predict improved CCS.
498 enrolled 31 not implanted- 11 not meet in/ex criteria- 2 deaths- 3 pts withdrew- 6 not success implant- 9 other/unknown
467 implanted
- 41 QRS < 130ms
426 Initial Study Sample 63 incomplete baseline measures
- 7 did not complete echo- 12 AF during baseline visit- 44 LVESV not measured
363 with baseline LVESV
- 15 deaths- 8 exits for other reason- 10 missed 6 mo. visit
330 baseline LVESV+ 6 month visit - 16 missing 6 month echo
- 1 AF at 6 month visit- 26 LVESV not measured- 1 baseline/ 6 month views differ
286 baseline and 6 month paired LVESV measurements
Clinical Composite
Score (CCS) Completed
Figure 1. Enrollment and follow-up of patients in PROSPECT.
Table 2. Baseline Characteristics
Age, y 67.8�11.0
Gender, % male 71
NYHA functional class III, n (%) 410 (96)
Distance walked in 6 min, m 274�122
Duration of the QRS interval, ms 163�22
Ischemia, n (%) 231 (54)
Previous myocardial infarction, n (%) 205 (48)
LVEF, % 23.6�7.0
Left ventricular end-diastolic volume, mL 230�99
Left ventricular end-systolic volume, mL 168�89
Using diuretics, n (%) 355 (83)
Using �-blockers, n (%) 361 (85)
Using ACE inhibitors, n (%) 390 (92)
Using aldosterone inhibitors, n (%) 169 (40)
ACE indicates angiotensin-converting enzyme. n�426 subjects. Values aremean�SD when appropriate.
Table 3. Interobserver and Intraoperator Variability Summary
EchocardiographicMeasure
IntraobserverCV, %
InterobserverCV, %
Interobserver �Coefficient*
LVESV 3.8 14.5 NA
LPEI 3.7 6.5 0.67
SPWMD 24.3 72.1 0.35
Ts-SD 11.4 33.7 0.15
Ts-peak (basal) 15.8 31.9 0.25
LPEI indicates left ventricular preejection interval.*Based on binary predictor variable that indicates if echocardiographic
measure is above or below the cutoff.
Chung et al Echocardiographic Predictors of Response to CRT 2611
by guest on August 16, 2015http://circ.ahajournals.org/Downloaded from
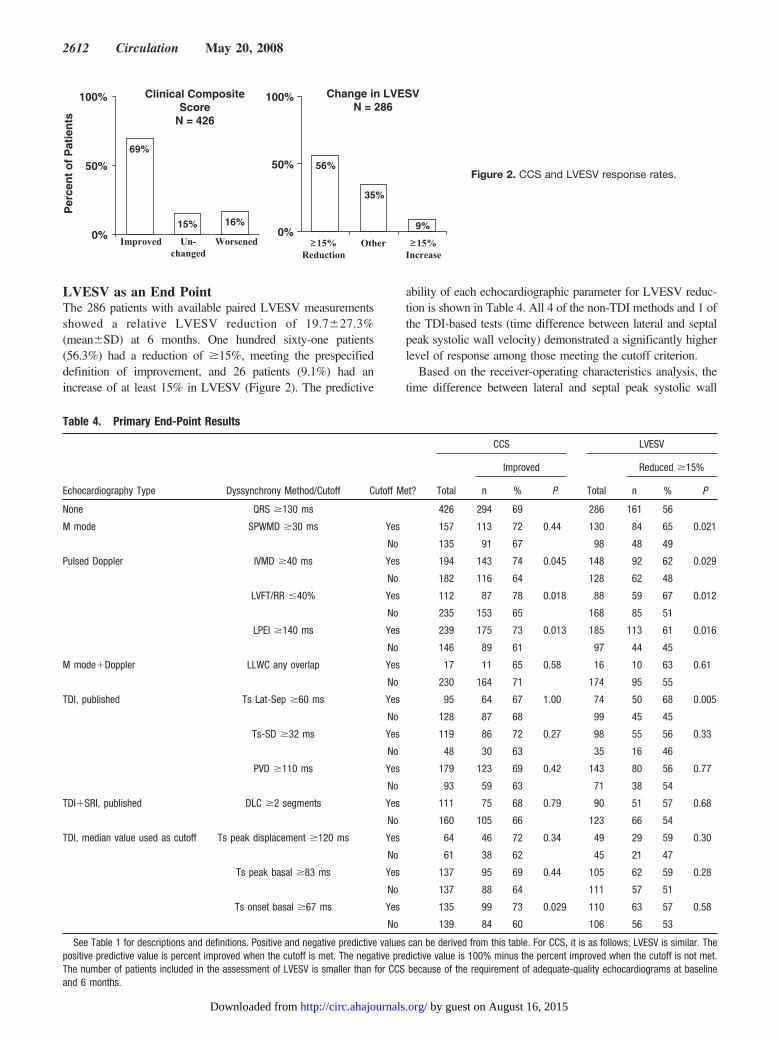
LVESV as an End PointThe 286 patients with available paired LVESV measurementsshowed a relative LVESV reduction of 19.7�27.3%(mean�SD) at 6 months. One hundred sixty-one patients(56.3%) had a reduction of �15%, meeting the prespecifieddefinition of improvement, and 26 patients (9.1%) had anincrease of at least 15% in LVESV (Figure 2). The predictive
ability of each echocardiographic parameter for LVESV reduc-tion is shown in Table 4. All 4 of the non-TDI methods and 1 ofthe TDI-based tests (time difference between lateral and septalpeak systolic wall velocity) demonstrated a significantly higherlevel of response among those meeting the cutoff criterion.
Based on the receiver-operating characteristics analysis, thetime difference between lateral and septal peak systolic wall
≥15%Reduction
≥15%Increase
Other
Clinical CompositeScore
N = 426
Change in LVESVN = 286
Per
cen
t o
f P
atie
nts
Improved Un-changed
Worsened
69%
15% 16%0%
50%
100%
56%
35%
9%0%
50%
100%
Figure 2. CCS and LVESV response rates.
Table 4. Primary End-Point Results
Echocardiography Type Dyssynchrony Method/Cutoff Cutoff Met?
CCS LVESV
Total
Improved
Total
Reduced �15%
n % P n % P
None QRS �130 ms 426 294 69 286 161 56
M mode SPWMD �30 ms Yes 157 113 72 0.44 130 84 65 0.021
No 135 91 67 98 48 49
Pulsed Doppler IVMD �40 ms Yes 194 143 74 0.045 148 92 62 0.029
No 182 116 64 128 62 48
LVFT/RR �40% Yes 112 87 78 0.018 88 59 67 0.012
No 235 153 65 168 85 51
LPEI �140 ms Yes 239 175 73 0.013 185 113 61 0.016
No 146 89 61 97 44 45
M mode�Doppler LLWC any overlap Yes 17 11 65 0.58 16 10 63 0.61
No 230 164 71 174 95 55
TDI, published Ts Lat-Sep �60 ms Yes 95 64 67 1.00 74 50 68 0.005
No 128 87 68 99 45 45
Ts-SD �32 ms Yes 119 86 72 0.27 98 55 56 0.33
No 48 30 63 35 16 46
PVD �110 ms Yes 179 123 69 0.42 143 80 56 0.77
No 93 59 63 71 38 54
TDI�SRI, published DLC �2 segments Yes 111 75 68 0.79 90 51 57 0.68
No 160 105 66 123 66 54
TDI, median value used as cutoff Ts peak displacement �120 ms Yes 64 46 72 0.34 49 29 59 0.30
No 61 38 62 45 21 47
Ts peak basal �83 ms Yes 137 95 69 0.44 105 62 59 0.28
No 137 88 64 111 57 51
Ts onset basal �67 ms Yes 135 99 73 0.029 110 63 57 0.58
No 139 84 60 106 56 53
See Table 1 for descriptions and definitions. Positive and negative predictive values can be derived from this table. For CCS, it is as follows; LVESV is similar. Thepositive predictive value is percent improved when the cutoff is met. The negative predictive value is 100% minus the percent improved when the cutoff is not met.The number of patients included in the assessment of LVESV is smaller than for CCS because of the requirement of adequate-quality echocardiograms at baselineand 6 months.
2612 Circulation May 20, 2008
by guest on August 16, 2015http://circ.ahajournals.org/Downloaded from
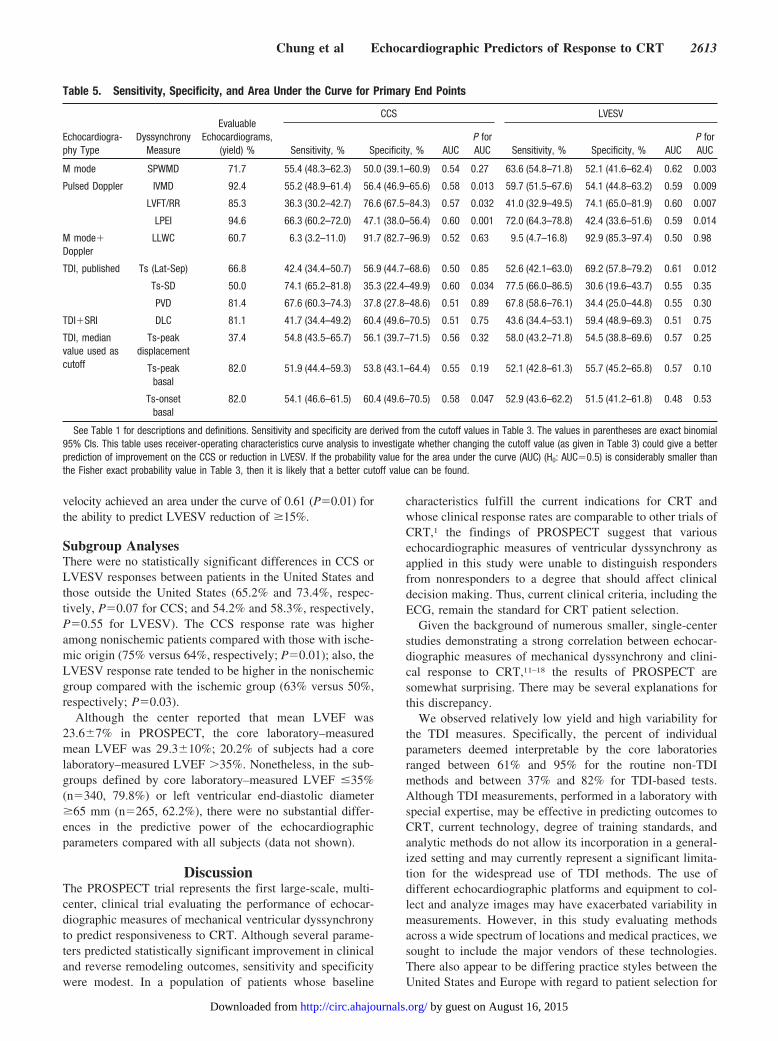
velocity achieved an area under the curve of 0.61 (P�0.01) forthe ability to predict LVESV reduction of �15%.
Subgroup AnalysesThere were no statistically significant differences in CCS orLVESV responses between patients in the United States andthose outside the United States (65.2% and 73.4%, respec-tively, P�0.07 for CCS; and 54.2% and 58.3%, respectively,P�0.55 for LVESV). The CCS response rate was higheramong nonischemic patients compared with those with ische-mic origin (75% versus 64%, respectively; P�0.01); also, theLVESV response rate tended to be higher in the nonischemicgroup compared with the ischemic group (63% versus 50%,respectively; P�0.03).
Although the center reported that mean LVEF was23.6�7% in PROSPECT, the core laboratory–measuredmean LVEF was 29.3�10%; 20.2% of subjects had a corelaboratory–measured LVEF �35%. Nonetheless, in the sub-groups defined by core laboratory–measured LVEF �35%(n�340, 79.8%) or left ventricular end-diastolic diameter�65 mm (n�265, 62.2%), there were no substantial differ-ences in the predictive power of the echocardiographicparameters compared with all subjects (data not shown).
DiscussionThe PROSPECT trial represents the first large-scale, multi-center, clinical trial evaluating the performance of echocar-diographic measures of mechanical ventricular dyssynchronyto predict responsiveness to CRT. Although several parame-ters predicted statistically significant improvement in clinicaland reverse remodeling outcomes, sensitivity and specificitywere modest. In a population of patients whose baseline
characteristics fulfill the current indications for CRT andwhose clinical response rates are comparable to other trials ofCRT,1 the findings of PROSPECT suggest that variousechocardiographic measures of ventricular dyssynchrony asapplied in this study were unable to distinguish respondersfrom nonresponders to a degree that should affect clinicaldecision making. Thus, current clinical criteria, including theECG, remain the standard for CRT patient selection.
Given the background of numerous smaller, single-centerstudies demonstrating a strong correlation between echocar-diographic measures of mechanical dyssynchrony and clini-cal response to CRT,11–18 the results of PROSPECT aresomewhat surprising. There may be several explanations forthis discrepancy.
We observed relatively low yield and high variability forthe TDI measures. Specifically, the percent of individualparameters deemed interpretable by the core laboratoriesranged between 61% and 95% for the routine non-TDImethods and between 37% and 82% for TDI-based tests.Although TDI measurements, performed in a laboratory withspecial expertise, may be effective in predicting outcomes toCRT, current technology, degree of training standards, andanalytic methods do not allow its incorporation in a general-ized setting and may currently represent a significant limita-tion for the widespread use of TDI methods. The use ofdifferent echocardiographic platforms and equipment to col-lect and analyze images may have exacerbated variability inmeasurements. However, in this study evaluating methodsacross a wide spectrum of locations and medical practices, wesought to include the major vendors of these technologies.There also appear to be differing practice styles between theUnited States and Europe with regard to patient selection for
Table 5. Sensitivity, Specificity, and Area Under the Curve for Primary End Points
Echocardiogra-phy Type
DyssynchronyMeasure
EvaluableEchocardiograms,
(yield) %
CCS LVESV
Sensitivity, % Specificity, % AUCP forAUC Sensitivity, % Specificity, % AUC
P forAUC
M mode SPWMD 71.7 55.4 (48.3–62.3) 50.0 (39.1–60.9) 0.54 0.27 63.6 (54.8–71.8) 52.1 (41.6–62.4) 0.62 0.003
Pulsed Doppler IVMD 92.4 55.2 (48.9–61.4) 56.4 (46.9–65.6) 0.58 0.013 59.7 (51.5–67.6) 54.1 (44.8–63.2) 0.59 0.009
LVFT/RR 85.3 36.3 (30.2–42.7) 76.6 (67.5–84.3) 0.57 0.032 41.0 (32.9–49.5) 74.1 (65.0–81.9) 0.60 0.007
LPEI 94.6 66.3 (60.2–72.0) 47.1 (38.0–56.4) 0.60 0.001 72.0 (64.3–78.8) 42.4 (33.6–51.6) 0.59 0.014
M mode�Doppler
LLWC 60.7 6.3 (3.2–11.0) 91.7 (82.7–96.9) 0.52 0.63 9.5 (4.7–16.8) 92.9 (85.3–97.4) 0.50 0.98
TDI, published Ts (Lat-Sep) 66.8 42.4 (34.4–50.7) 56.9 (44.7–68.6) 0.50 0.85 52.6 (42.1–63.0) 69.2 (57.8–79.2) 0.61 0.012
Ts-SD 50.0 74.1 (65.2–81.8) 35.3 (22.4–49.9) 0.60 0.034 77.5 (66.0–86.5) 30.6 (19.6–43.7) 0.55 0.35
PVD 81.4 67.6 (60.3–74.3) 37.8 (27.8–48.6) 0.51 0.89 67.8 (58.6–76.1) 34.4 (25.0–44.8) 0.55 0.30
TDI�SRI DLC 81.1 41.7 (34.4–49.2) 60.4 (49.6–70.5) 0.51 0.75 43.6 (34.4–53.1) 59.4 (48.9–69.3) 0.51 0.75
TDI, medianvalue used ascutoff
Ts-peakdisplacement
37.4 54.8 (43.5–65.7) 56.1 (39.7–71.5) 0.56 0.32 58.0 (43.2–71.8) 54.5 (38.8–69.6) 0.57 0.25
Ts-peakbasal
82.0 51.9 (44.4–59.3) 53.8 (43.1–64.4) 0.55 0.19 52.1 (42.8–61.3) 55.7 (45.2–65.8) 0.57 0.10
Ts-onsetbasal
82.0 54.1 (46.6–61.5) 60.4 (49.6–70.5) 0.58 0.047 52.9 (43.6–62.2) 51.5 (41.2–61.8) 0.48 0.53
See Table 1 for descriptions and definitions. Sensitivity and specificity are derived from the cutoff values in Table 3. The values in parentheses are exact binomial95% CIs. This table uses receiver-operating characteristics curve analysis to investigate whether changing the cutoff value (as given in Table 3) could give a betterprediction of improvement on the CCS or reduction in LVESV. If the probability value for the area under the curve (AUC) (H0: AUC�0.5) is considerably smaller thanthe Fisher exact probability value in Table 3, then it is likely that a better cutoff value can be found.
Chung et al Echocardiographic Predictors of Response to CRT 2613
by guest on August 16, 2015http://circ.ahajournals.org/Downloaded from

CRT, with a tendency toward use of CRT earlier in thedisease process in the United States, which may have addedto the variability in patient selection characteristics. Note,however, that distance walked in 6 minutes was 246 m onaverage in US patients versus 308 m in European patients. Italso has been suggested that longitudinal dyssynchrony maybe subject to higher variability and may correlate less wellwith ventricular functional recovery after CRT than2-dimensional strain techniques that evaluate radial dyssyn-chrony.20 Other potentially interesting methods for furtherstudy are novel echocardiographic techniques, including2-dimensional strain imaging (speckle tracking approach),21
3-dimensional echocardiography,22 anatomic M-mode imag-ing,23 and magnetic resonance imaging.24
Were the cutoff points for the echocardiographic measure-ments appropriately selected? The values selected for PROS-PECT, although based on published reports when available,were developed in observational single-center studies andmay need to be refined when the methodology is translated tothe larger community. Do the end points reflect clinicallyrelevant outcomes, and are they robust enough to be accu-rately predicted by echocardiographic methods? The 2 pri-mary end points were selected to measure clinically relevantoutcomes in heart failure patients with a validated tool (CCS)and to assess cardiac structural response (reverse remodel-ing). The CCS has been used in heart failure clinical trialswith success1,7 and consists of easily measured components(survival, hospitalization, NYHA class, patient global assess-ment) with stringent criteria for improved status. Nonethe-less, given that patients enrolled in clinical trials generallyimprove even in the absence of therapy, it is possible thatCCS changes may not be due to events that bear anyrelationship to echocardiographic measures. Therefore, ameasure of cardiac structural change also was incorporated.The reverse remodeling end point (LVESV reduction �15%)has been used more specifically in studies evaluating echo-cardiographic predictors,10,11 and there was general consensusamong the steering committee that 15% reduction in LVESVwas a robust and clinically relevant outcome measure. Theideal end point to assess response to CRT is currently unclear,and it has been noted that a discrepancy exists betweenclinical and echocardiographic responses (a reduction inLVESV), with a greater rate of clinical response comparedwith echocardiographic response.25
The PROSPECT patient population may be somewhatdifferent from those studied for the published echocardio-graphic parameters, partly accounting for the discrepancywith previously reported results. Indeed, as measured by thecore laboratory, 20.2% had LVEF �35% and 37.8% had leftventricular end-diastolic diameter �65 mm, suggesting thatperhaps the severity of illness in PROSPECT, a studyconducted in the course of clinical practice, was not congru-ent with previously studied patients in the setting of clinicaltrials. Nonetheless, the average 6-minute walk distance inPROSPECT was 274�122 m compared with 298�92 m inMIRACLE1 and 243�122 m in MIRACLE ICD.7 Morespecifically, in 2 TDI methodology studies,11,15 baseline6-minute walk distances were �248 and 320 m, respectively.Furthermore, extensive subgroup analyses looking at those
with the lowest LVEF, greatest left ventricular diameter, andischemic or nonischemic origin do not demonstrate substan-tial difference in the predictive ability of the echocardio-graphic parameters. Still, additional studies focusing onpatients with LVEF �35% and left ventricular end-diastolicdiameter �65 mm should be performed.
It is possible that mechanisms other than attenuation ofsystolic dyssynchrony per se underlie the benefits seen withCRT. Chronically, the existence of an abnormally highregional wall stress such as with an infarcted zone may leadto progressive left ventricular dilation.26 Prinzen and col-leagues27 have shown that ventricular pacing significantlyreduces wall stress and workload by causing the region nearthe pacing site to contract early in the cycle against a lowerventricular pressure and at a reduced preload. Therefore, thepreexcited region does less external work and develops lessstress; in a chronic setting, this phenomenon may havefavorable effects on the failing heart.
Finally, determining the patients most likely to respondbefore CRT requires an assessment of factors other thanechocardiography-measured dyssynchrony. For example,limited venous anatomy may introduce a mismatch betweenleft ventricular lead position and latest activation site28 that islikely to lead to a variation of CRT response that is unrelatedto echocardiographic parameters. In a multicenter setting, thisfactor is even more difficult to control. In addition, extensiveleft ventricular scar tissue attenuates clinical and structuralresponse rates to CRT despite the presence of cardiacdyssynchrony and could be a potential confounder of resultsin ischemic patients.29 Therefore, integration of cardiac dys-synchrony and magnetic resonance imaging evaluation forthe presence, location, and size of the scar in patients withischemic cardiomyopathy may be a useful modality in patientselection for CRT.30,31 In this regard, the interplay betweenheart failure origin, end-point selection, and echocardio-graphic parameters should be noted in future study design.
The major limitation of this study is the observational,nonrandomized design. The main purpose of this study was toassess predictive abilities of the echocardiographic parame-ters, not to test whether the use of these parameters has aclinical impact. If echocardiographic parameters can beidentified in a multicenter setting that improve significantlyon the current implantation criteria, further randomized stud-ies testing such parameters would be warranted. The rela-tively high levels of both interobserver and intraobservervariability noted in this multicenter study impair our ability toconclusively assess the potential predictive capabilities of theechocardiographic parameters in an ideal setting. Therefore,the introduction of variability in image acquisition andanalysis currently represents a major limitation to translatingexpert, single-center experience to widespread use.
ConclusionsDespite promising preliminary data from prior single-centerstudies, echocardiographic measures of dyssynchrony aimedat improving patient selection criteria for CRT do not appearto have a clinically relevant impact on improving responserates when studied in a multicenter setting such as PROS-PECT. Thus, at present, the echocardiographic parameters
2614 Circulation May 20, 2008
by guest on August 16, 2015http://circ.ahajournals.org/Downloaded from
assessing dyssynchrony do not have enough predictive valueto be recommended as selection criteria for CRT beyondcurrent indications.
Source of FundingMedtronic Inc provided funding for this study and manufactured theCRT system used in this research.
DisclosuresDrs Abraham, Bax, Chung, Gorcsan, Nihoyannopoulos, St. JohnSutton, Tavazzi, and Yu have served as consultants to and receivedresearch grants from Medtronic. Drs De Sutter, Ghio, Leclercq,Leon, Murillo, Nihoyannopoulos and Sun have received honorariafrom or consulted for Medtronic.
References1. Abraham WT, Fisher WG, Smith AL, Delurgio DB, Leon AR, Loh E,
Kocovic DZ, Packer M, Clavell AL, Hayes DL, Ellestad M, Trupp RJ,Underwood J, Pickering F, Truex C, McAtee P, Messenger J, forMIRACLE Study Group, Multicenter InSync Randomized Clinical Eval-uation. Cardiac resynchronization in chronic heart failure. N Engl J Med.2002;346:1845–1853.
2. Bristow MR, Saxon LA, Boehmer J, Krueger S, Kass DA, De Marco T,Carson P, DiCarlo L, DeMets D, White BG, DeVries DW, Feldman AM,for the COMPANION Investigators. Cardiac-resynchronization therapywith or without an implantable defibrillator in advanced chronic heartfailure. N Engl J Med. 2004;350:2140–2150.
3. Cleland JG, Daubert JC, Erdmann E, Freemantle N, Gras D, Kappen-berger L, Tavazzi L, for the Cardiac Resynchronization-Heart Failure(CARE-HF) Study Investigators. The effect of cardiac resynchronizationon morbidity and mortality in heart failure. N Engl J Med. 2005;352:1539–1549.
4. Hunt SA, Abraham WT, Chin MH, Feldman AM, Francis GS, GaniatsTG, Jessup M, Konstam MA, Mancini DM, Michl K, Oates JA, RahkoPS, Silver MA, Stevenson LW, Yancy CW, Antman EM, Smith SC Jr,Adams CD, Anderson JL, Faxon DP, Fuster V, Halperin JL, Hiratzka LF,Jacobs AK, Nishimura R, Ornato JP, Page RL, Riegel B, for the AmericanCollege of Cardiology, American Heart Association Task Force onPractice Guidelines, American College of Chest Physicians, InternationalSociety for Heart and Lung Transplantation, Heart Rhythm Society.ACC/AHA 2005 guideline update for the diagnosis and management ofchronic heart failure in the adult: a report of the American College ofCardiology/American Heart Association Task Force on PracticeGuidelines (Writing Committee to Update the 2001 Guidelines for theEvaluation and Management of Heart Failure). Circulation. 2005;112:e154–e235.
5. Swedberg K, Cleland J, Swedberg K, Cleland J, Dargie H, Drexler H,Follath F, Komajda M, Tavazzi L, Smiseth OA, Gavazzi A, Haverich A,Hoes A, Jaarsma T, Korewicki J, Lévy S, Linde C, Lopez-Sendon JL,Nieminen MS, Piérard L, Remme WJ, for the Task Force for theDiagnosis and Treatment of Chronic Heart Failure of the EuropeanSociety of Cardiology. Guidelines for the diagnosis and treatment ofchronic heart failure: executive summary (update 2005). Eur Heart J.2005;26:1115–1140.
6. Heart Failure Society of America. Executive summary: HFSA 2006comprehensive heart failure practice guideline. J Card Fail. 2006;12:10–38.
7. Young JB, Abraham WT, Smith AL, Leon AR, Lieberman R, Wilkoff B,Canby RC, Schroeder JS, Liem LB, Hall S, Wheelan K, for the Multi-center InSync ICD Randomized Clinical Evaluation (MIRACLE ICD)Trial Investigators. Combined cardiac resynchronization and implantablecardioversion defibrillation in advanced chronic heart failure: theMIRACLE ICD Trial. JAMA. 2003;289:2685–2694.
8. Saxon LA, Boehmer JP, Hummel J, Kacet S, De Marco T, Naccarelli G,Daoud E, for the VIGOR CHF and VENTAK CHF Investigators. Biven-tricular pacing patients with congestive heart failure: two prospectiverandomized trials. Am J Cardiol. 1999;83:120D–123D.
9. Packer M. Proposal for a new clinical end point to evaluate the efficacyof drugs and devices in the treatment of chronic heart failure. J Card Fail.2001;7:176–182.
10. Pitzalis MV, Iacoviello M, Romito R, Massari F, Rizzon B, Luzzi G,Guida P, Andriani A, Mastropasqua F, Rizzon P. Cardiac resynchroni-
zation therapy tailored by echocardiographic evaluation of ventricularasynchrony. J Am Coll Cardiol. 2002;40:1615–1622.
11. Yu CM, Fung WH, Lin H, Zhang Q, Sanderson JE, Lau CP. Predictors ofleft ventricular reverse remodeling after cardiac resynchronizationtherapy for heart failure secondary to idiopathic dilated or ischemiccardiomyopathy. Am J Cardiol. 2003;91:684–688.
12. Bax JJ, Bleeker GB, Marwick TH, Molhoek SG, Boersma E, Steendijk P,van der Wall EE, Schalij MJ. Left ventricular dyssynchrony predictsresponse and prognosis after cardiac resynchronization therapy. J Am CollCardiol. 2004;44:1834–1840.
13. Yu CM, Fung JW, Zhang Q, Chan CK, Chan YS, Lin H, Kum LC, KongSL, Zhang Y, Sanderson JE. Tissue Doppler imaging is superior to strainrate imaging and postsystolic shortening on the prediction of reverseremodeling in both ischemic and nonischemic heart failure after cardiacresynchronization therapy. Circulation. 2004;110:66–73.
14. Cazeau S, Bordachar P, Jauvert G, Lazarus A, Alonso C, Vandrell MC,Mugica J, Ritter P. Echocardiographic modeling of cardiac dyssynchronybefore and during multisite stimulation: a prospective study; Pacing ClinElectrophysiol. 2003;26(pt II):137–143.
15. Bax JJ, Marwick TH, Molhoek SG, Bleeker GB, van Erven L, BoersmaE, Steendijk P, van der Wall EE, Schalij MJ. Left ventricular dyssyn-chrony predicts benefit of cardiac resynchronization therapy in patientswith end-stage heart failure before pacemaker implantation.Am J Cardiol. 2003;92:1238–1240.
16. Notabartolo D, Merlino JD, Smith AL, DeLurgio DB, Vera FV, EasleyKA, Martin RP, Leon AR. Usefulness of the peak velocity difference bytissue Doppler imaging technique as an effective predictor of response tocardiac resynchronization therapy. Am J Cardiol. 2004;94:817–820.
17. Søgaard P, Egeblad H, Pedersen AK, Kim WY, Kristensen BO, HansenPS, Mortensen PT. Sequential versus simultaneous biventricular resyn-chronization for severe heart failure: evaluation by tissue Dopplerimaging. Circulation. 2002;106:2078–2084.
18. Søgaard P, Egeblad H, Kim WY, Jensen HK, Pedersen AK, KristensenBO, Mortensen PT. Tissue Doppler imaging predicts improved systolicperformance and reversed left ventricular remodeling during long-termcardiac resynchronization therapy. J Am Coll Cardiol. 2002;40:723–730.
19. Yu CM, Abraham WT, Bax J, Chung E, Fedewa M, Ghio S, Leclercq C,Leon AR, Merlino J, Nihoyannopoulos P, Notabartolo D, Sun JP, TavazziL, for the PROSPECT Investigators. Predictors of Response to CardiacResynchronization Therapy (PROSPECT): study design. Am Heart J.2005;149:600–605.
20. Helm RH, Leclercq C, Faris OP, Ozturk C, McVeigh E, Lardo AC,Kass DA. Cardiac dyssynchrony analysis using circumferential versuslongitudinal strain: implications for assessing cardiac resynchroni-zation. Circulation. 2005;31:111:2760 –2767.
21. Suffoletto MS, Dohi K, Cannesson M, Saba S, Gorcsan J 3rd. Novelspeckle-tracking radial strain from routine black-and-white echocardio-graphic images to quantify dyssynchrony and predict response to cardiacresynchronization therapy. Circulation. 2006;113:960–968.
22. van Dijk J, Knaapen P, Russel IK, Hendriks T, Allaart CP, de Cock CC,Kamp O. Mechanical dyssynchrony by 3D echo correlates with acutehaemodynamic response to biventricular pacing in heart failure patients.Europace. 2008;10:63–68.
23. Mastouri R, Mahenthiran J, Kamalesh M, Gradus-Pizlo I, Feigenbaum H,Sawada SG. Prediction of ischemic events by anatomic M-mode strainrate stress echocardiography. J Am Soc Echocardiogr. 2008:21:299–306.
24. Westenberg JJ, Lamb HJ, van der Geest RJ, Bleeker GB, Holman ER,Schalij MJ, de Roos A, van der Wall EE, Reiber JH, Bax JJ. Assessmentof left ventricular dyssynchrony in patients with conduction delay andidiopathic dilated cardiomyopathy: head-to-head comparison betweentissue Doppler imaging and velocity-encoded magnetic resonanceimaging. J Am Coll Cardiol. 2006;47:2042–2048.
25. Bleeker GB, Bax JJ, Fung JW, van der Wall EE, Zhang Q, Schalij MJ,Chan JY, Yu CM. Clinical versus echocardiographic parameters to assessresponse to cardiac resynchronization therapy. Am J Cardiol. 2006;97:260–263.
26. Aikawa Y, Rohde L, Plehn J, Greaves SC, Menapace F, Arnold MO,Rouleau JL, Pfeffer MA, Lee RT, Solomon SD. Regional wall stresspredicts ventricular remodeling after anteroseptal myocardial infarction inthe Healing and Early Afterload Reducing Trial (HEART): an echocar-diography-based structural analysis. Am Heart J. 2001;141:234–242.
27. Prinzen FW, Hunter WC, Wyman BT, McVeigh ER. Mapping of regionalmyocardial strain and work during ventricular pacing: experimental studyusing magnetic resonance imaging tagging. J Am Coll Cardiol. 1999;33:1735–1742.
Chung et al Echocardiographic Predictors of Response to CRT 2615
by guest on August 16, 2015http://circ.ahajournals.org/Downloaded from
28. Van de Veire NR, Schuijf JD, De Sutter J, Devos D, Bleeker GB, de RoosA, van der Wall EE, Schalij MJ, Bax JJ. Non-invasive visualization of thecardiac venous system in coronary artery disease patients using 64-slicecomputed tomography. J Am Coll Cardiol. 2006;48:1832–1838.
29. Bleeker GB, Kaandorp TA, Lamb HJ, Boersma E, Steendijk P, de RoosA, van der Wall EE, Schalij MJ, Bax JJ. Effect of posterolateral scartissue on clinical and echocardiographic improvement after cardiac resyn-chronization therapy. Circulation. 2006;113:969–976.
30. Ypendburg C, Roes SD, Bleeker GB, Kaandorp TA, de Roos A, SchalijMJ, van der Wall EE, Bax JJ. Effect of total scar burden on contrast-enhanced magnetic resonance imaging on response to cardiac resynchro-nization therapy. Am J Cardiol. 2007;99:567–560.
31. Chalil S, Stegemann B, Muhyaldeen SA, Khadjooi K, Foley PW,Smith RE, Leyva F. Effect of posterolateral left ventricular scar onmortality and morbidity following cardiac resynchronization therapy.Pacing Clin Electrophysiol. 2007;10:1201–1209.
CLINICAL PERSPECTIVECardiac resynchronization has revolutionized the care of a substantial portion of patients with advanced heart failure; forthose with appropriate indications, cardiac resynchronization therapy appears to improve clinical status in �70% of thosetreated. Although this degree of response is very encouraging, numerous echocardiographic techniques, based largely ontissue Doppler measurements, have been developed to better distinguish responders from nonresponders. Ideally, the abilityto accurately predict likelihood of response will enhance the quality and substance of the physician-patient conversationbefore treatment. These methods attempt to detect mechanical dyssynchrony more accurately than with the QRS under theassumption that correction of dyssynchrony is the main mechanism of action with cardiac resynchronization therapy.However, there had not been a large multicenter study to evaluate these methods prospectively. In 426 patients, Predictorsof Response to CRT (PROSPECT) studied 12 echocardiographic methods for their ability to predict response and showedthat in the multicenter setting, they lacked sensitivity and specificity to affect clinical decisions. We therefore recommendthat these methods not be used routinely in evaluating a patient for cardiac resynchronization therapy. Other methods areunder investigation (eg, strain measurements, 3-dimensional imaging, scar location) that may be able to distinguishresponders from nonresponders with more accuracy. However, before they can be recommended for general use, theirapplicability should be tested in a multicenter setting.
Go to http://cme.ahajournals.org to take the CME quiz for this article.
2616 Circulation May 20, 2008
by guest on August 16, 2015http://circ.ahajournals.org/Downloaded from
Yu, John Gorcsan III, Martin St John Sutton, Johan De Sutter and Jaime MurilloMerlino, William T. Abraham, Stefano Ghio, Christophe Leclercq, Jeroen J. Bax, Cheuk-Man
Eugene S. Chung, Angel R. Leon, Luigi Tavazzi, Jing-Ping Sun, Petros Nihoyannopoulos, JohnResults of the Predictors of Response to CRT (PROSPECT) Trial
Print ISSN: 0009-7322. Online ISSN: 1524-4539 Copyright © 2008 American Heart Association, Inc. All rights reserved.
is published by the American Heart Association, 7272 Greenville Avenue, Dallas, TX 75231Circulation doi: 10.1161/CIRCULATIONAHA.107.743120
2008;117:2608-2616; originally published online May 5, 2008;Circulation.
http://circ.ahajournals.org/content/117/20/2608World Wide Web at:
The online version of this article, along with updated information and services, is located on the
http://circ.ahajournals.org/content/suppl/2008/05/06/CIRCULATIONAHA.107.743120.DC1.htmlData Supplement (unedited) at:
http://circ.ahajournals.org//subscriptions/
is online at: Circulation Information about subscribing to Subscriptions:
http://www.lww.com/reprints Information about reprints can be found online at: Reprints:
document. Permissions and Rights Question and Answer this process is available in the
click Request Permissions in the middle column of the Web page under Services. Further information aboutOffice. Once the online version of the published article for which permission is being requested is located,
can be obtained via RightsLink, a service of the Copyright Clearance Center, not the EditorialCirculationin Requests for permissions to reproduce figures, tables, or portions of articles originally publishedPermissions:
by guest on August 16, 2015http://circ.ahajournals.org/Downloaded from