Results of the first performance tests * of the CMS electromagnetic calorimeter
14
Available on CMS information server CMS NOTE 2005/020 October 19, 2005 Results of the first performance tests of the CMS electromagnetic calorimeter The CMS Electromagnetic Calorimeter Group P. Adzic c , R. Alemany-Fernandez m , C. B. Almeida m, n , N. M. Almeida m , G. Anagnostou b , M. G. Anfreville k , I. Anicin c , Z. Antunovic ad , A. Asimidis l , E. Auffray j , S. Baccaro ab, ac , D. Barney j , L. M. Barone ac , P. Barrillon o , A. Bartoloni ac , S. Beauceron k , F. Beaudette j , K. W. Bell h , R. Benetta j , M. J. Bercher y , B. Betev ak , R. Beuselinck o , A. Bhardwaj g , C. Biino ag , S. Bimbot y , P. Bloch j , S. Blyth f , M. Bonesini q , P. Bordalo m , A. Bornheim z , J. M. Bourotte y, j , D. Britton o , R. M. Brown h , R. Bruneliere ah, j , P. Busson y , T. Camporesi j , N. Cartiglia ag , F. Cavallari ac , D. Chamont y , P. Chang af , Y. H. Chang f , C. Charlot y , E. A. Chen f , R. Chipaux k , D. J. Cockerill h , C. Collard y , C. Combaret ah , S. Costantini ac , J. C. Da Silva m , I. Dafinei ac , G. Daskalakis j , G. Davatz ak , A. De Min q , K. Deiters ai , M. Dejardin k , R. Della Negra ah , P. Depasse ah , J. Descamp k , G. Dewhirst o , S. Dhawan w , M. Diemoz ac , G. Dissertori ak , M. Dittmar ak , L. Djambazov ak , L. Dobrzynski y , S. Drndarevic c , M. Dupanloup ah , M. Dzelalija ad , J. Ehlers ak , H. El Mamouni ah , A. Elliott-Peisert j , I. Evangelou l , B. Fabbro k , J. L. Faure k , J. Fay ah , F. Ferri q , P. S. Flower h , G. Franzoni q , W. Funk j , A. Gaillac y , C. Gargiulo ac , S. Gascon Shotkin ah , Y. Geerebaert y , F. X. Gentit k , A. Ghezzi q , J. Gilly y , A. S. Giolo-Nicollerat ak , A. Givernaud k , S. Gninenko t , A. Go f , N. Godinovic ae , N. Golubev t , R. Gomez-Reino j , P. Govoni q , J. Grahl r , P. Gras k , J. Greenhalgh h , J. P. Guillaud a , M. Haguenauer y , G. Hamel De Montechenault k , M. Hansen j , H. F. Heath e , J. A. Hill h , P. R. Hobson p , D. Holmes e , A. G. Holzner ak , G. W. Hou af , B. Ille ah , Q. Ingram ai , A. Jain m , P. Janot j , P. Jarry k , M. A. Karar y , S. K. Kataria v , V. Katchanov aa , B. W. Kennedy h , K. Kloukinas j , B. Koblitz y , P. Kokkas l , M. Korjik s , N. Krasnikov t , D. Krpic c , A. Kyriakis b , M. Lebeau j , P. Lecomte ak , P. Lecoq j , M. C. Lemaire k , M. Lethuillier ah , W. Lin f , A. L. Lintern h , A. Lister ak , E. Locci k , A. B. Lodge h , E. Longo ac , D. Loukas b , W. Lustermann ak , C. Lynch e , C. K. Mackay e , D. Maletic c , I. Mandjavidze k , N. Manthos l , A. Markou b , H. Mathez ah , V. Matveev t , G. Maurelli ah , E. Menichetti ag , P. Meridiani ac , P. Milenovic c , G. Milleret y , P. Mine y , M. Montecchi ab, ac , M. Mur k , Y. Musienko d, s , A. Nardulli ak , J. Nash j, o , H. Neal w , P. Nedelec a , P. Negri q , F. Nessi-Tedaldi ak , H. B. Newman z , A. Nikitenko o , M. M. Obertino ag, r , R. A. Ofierzynski ak , G. C. Organtini ac , P. Paganini y , M. Paganoni q , I. Papadopoulos l , R. Paramatti j, ac , N. Pastrone ag , F. Pauss ak , P. Poilleux y , I. Puljak ae , A. Pullia q , J. Puzovic c , S. Ragazzi q , S. Ramos m , J. Rander k , O. Ravat ah , M. Raymond o , P. A. Razis x , N. Redaelli q , N. Regnault y , D. Renker ai , S. Reucroft d , J. M. Reymond k , M. Reynaud ah , S. Reynaud j , T. Romanteau y , F. Rondeaux k , A. Rosowsky k , C. Rovelli q , R. Rusack r , S. V. Rusakov u , M. J. Ryan o , H. Rykaczewski ak , T. Sakhelashvili ai, * , R. Salerno q , M. Santos m, n , D. Schinzel j , C. Seez o , I. Semeniouk y , P. Sempere Roldan j , O. Sharif p , P. Sharp j , C. Shepherd-Themistocleous h , S. Shevchenko z , R. K. Shivpuri g , G. Sidiropoulos l , D. Sillou a , A. Singovski r , Y Sirois y , A.M. Sirunyan aj , B. Smith h , V. J. Smith e , M. Sproston h , H. Suter ak , J. Swain d , T. Tabarelli De Fatis q , M. Takahashi o , R. J. Tapper e , A. Tcheremoukhine i , I. Teixeira m, n , J. P. Teixeira m, n , O. Teller j , F. A. Triantis l , S. Troshin aa , N. Tyurin aa , S. Udriot ak , K. Ueno af , A. Uzunian aa , I. Van Vulpen j , J. Varela m, j , N. Vaz Cardoso m , P. Verrecchia k , P. Vichoudis l, j , G. Viertel ak , T. Virdee o, j , M. Wang af , J. H. Williams h , I. Yaselli p , N. Zamiatin i , S. Zelepoukine aa , M. Zeller w , L. Y. Zhang z , K. Zhu z and R. Y. Zhu z
Transcript of Results of the first performance tests * of the CMS electromagnetic calorimeter
Available on CMS information server CMS NOTE 2005/020
October 19, 2005
Results of the first performance tests of the CMS electromagnetic calorimeter The CMS Electromagnetic Calorimeter Group
P. Adzic c, R. Alemany-Fernandez m, C. B. Almeida m, n, N. M. Almeida m, G. Anagnostou b, M. G. Anfreville k,
I. Anicin c, Z. Antunovic ad, A. Asimidis l, E. Auffray j, S. Baccaro ab, ac, D. Barney j, L. M. Barone ac, P. Barrillon o, A. Bartoloni ac, S. Beauceron k, F. Beaudette j, K. W. Bell h, R. Benetta j, M. J. Bercher y,
B. Betev ak, R. Beuselinck o, A. Bhardwaj g, C. Biino ag, S. Bimbot y, P. Bloch j, S. Blyth f, M. Bonesini q, P. Bordalo m, A. Bornheim z, J. M. Bourotte y, j, D. Britton o, R. M. Brown h, R. Bruneliere ah, j, P. Busson y,
T. Camporesi j, N. Cartiglia ag, F. Cavallari ac, D. Chamont y, P. Chang af, Y. H. Chang f, C. Charlot y, E. A. Chen f, R. Chipaux k, D. J. Cockerill h, C. Collard y, C. Combaret ah, S. Costantini ac, J. C. Da Silva m,
I. Dafinei ac, G. Daskalakis j, G. Davatz ak, A. De Min q, K. Deiters ai, M. Dejardin k, R. Della Negra ah, P. Depasse ah, J. Descamp k, G. Dewhirst o, S. Dhawan w, M. Diemoz ac, G. Dissertori ak, M. Dittmar ak,
L. Djambazov ak, L. Dobrzynski y, S. Drndarevic c, M. Dupanloup ah, M. Dzelalija ad, J. Ehlers ak, H. El Mamouni ah, A. Elliott-Peisert j, I. Evangelou l, B. Fabbro k, J. L. Faure k, J. Fay ah, F. Ferri q,
P. S. Flower h, G. Franzoni q, W. Funk j, A. Gaillac y, C. Gargiulo ac, S. Gascon Shotkin ah, Y. Geerebaert y, F. X. Gentit k, A. Ghezzi q, J. Gilly y, A. S. Giolo-Nicollerat ak, A. Givernaud k, S. Gninenko t, A. Go f,
N. Godinovic ae, N. Golubev t, R. Gomez-Reino j, P. Govoni q, J. Grahl r, P. Gras k, J. Greenhalgh h, J. P. Guillaud a, M. Haguenauer y, G. Hamel De Montechenault k, M. Hansen j, H. F. Heath e, J. A. Hill h, P. R. Hobson p, D. Holmes e, A. G. Holzner ak, G. W. Hou af, B. Ille ah, Q. Ingram ai, A. Jain m, P. Janot j, P. Jarry k, M. A. Karar y, S. K. Kataria v, V. Katchanov aa, B. W. Kennedy h, K. Kloukinas j, B. Koblitz y, P. Kokkas l, M. Korjik s, N. Krasnikov t, D. Krpic c, A. Kyriakis b, M. Lebeau j, P. Lecomte ak, P. Lecoq j,
M. C. Lemaire k, M. Lethuillier ah, W. Lin f, A. L. Lintern h, A. Lister ak, E. Locci k, A. B. Lodge h, E. Longo ac, D. Loukas b, W. Lustermann ak, C. Lynch e, C. K. Mackay e, D. Maletic c, I. Mandjavidze k, N. Manthos l, A. Markou b, H. Mathez ah, V. Matveev t, G. Maurelli ah, E. Menichetti ag, P. Meridiani ac, P. Milenovic c,
G. Milleret y, P. Mine y, M. Montecchi ab, ac, M. Mur k, Y. Musienko d, s, A. Nardulli ak, J. Nash j, o, H. Neal w, P. Nedelec a, P. Negri q, F. Nessi-Tedaldi ak, H. B. Newman z, A. Nikitenko o, M. M. Obertino ag, r,
R. A. Ofierzynski ak, G. C. Organtini ac, P. Paganini y, M. Paganoni q, I. Papadopoulos l, R. Paramatti j, ac, N. Pastrone ag, F. Pauss ak, P. Poilleux y, I. Puljak ae, A. Pullia q, J. Puzovic c, S. Ragazzi q, S. Ramos m,
J. Rander k, O. Ravat ah, M. Raymond o, P. A. Razis x, N. Redaelli q, N. Regnault y, D. Renker ai, S. Reucroft d, J. M. Reymond k, M. Reynaud ah, S. Reynaud j, T. Romanteau y, F. Rondeaux k, A. Rosowsky k, C. Rovelli q,
R. Rusack r, S. V. Rusakov u, M. J. Ryan o, H. Rykaczewski ak, T. Sakhelashvili ai, *, R. Salerno q, M. Santos m, n, D. Schinzel j, C. Seez o, I. Semeniouk y, P. Sempere Roldan j, O. Sharif p, P. Sharp j,
C. Shepherd-Themistocleous h, S. Shevchenko z, R. K. Shivpuri g, G. Sidiropoulos l, D. Sillou a, A. Singovski r, Y Sirois y, A.M. Sirunyan aj, B. Smith h, V. J. Smith e, M. Sproston h, H. Suter ak, J. Swain d,
T. Tabarelli De Fatis q, M. Takahashi o, R. J. Tapper e, A. Tcheremoukhine i, I. Teixeira m, n, J. P. Teixeira m, n, O. Teller j, F. A. Triantis l, S. Troshin aa, N. Tyurin aa, S. Udriot ak, K. Ueno af, A. Uzunian aa, I. Van Vulpen j,
J. Varela m, j, N. Vaz Cardoso m, P. Verrecchia k, P. Vichoudis l, j, G. Viertel ak, T. Virdee o, j, M. Wang af, J. H. Williams h, I. Yaselli p, N. Zamiatin i, S. Zelepoukine aa, M. Zeller w, L. Y. Zhang z, K. Zhu z and R. Y. Zhu z
2
a Laboratoire d’Annecy-le-Vieux de Physique des Particules, 74941 Annecy-le-Vieux, France
b Institute of Nuclear Physics “Demokritos”, 153 10 Attiki, Greece c “Vinca” Institute of Nuclear Sciences and Faculty of Physics of University of Belgrade,
11000 Belgrade, Serbia and Montenegro d Northeastern University, Boston MA 02115-5096, USA e Bristol University, Bristol BS8 1TL, United Kingdom f National Central University, Chung-Li, Taiwan, ROC
g Delhi University, Delhi 110 007, India h CCLRC, Rutherford Appleton Laboratory, Didcot OX11 0QX, United Kingdom i Joint Institute for Nuclear Research, 141980 Dubna (Moscow Region), Russia
j European Organization for Nuclear Research, CERN, 1211 Geneva 23, Switzerland k Centre d’Etudes Nucleaires de Saclay, 91191 Gif-sur-Yvette Cedex, France
l University of Ioannina, 451 10 Ioannina, Greece m Laboratório de Instrumentação e Física Experimental de Partículas, 1000-149 Lisboa, Portugal
n Instituto de Engenharia de Sistemas e Computadores, 1000-029 Lisboa, Portugal o Imperial College, London SW7 2BZ, United Kingdom
p Brunel University, Middlesex UB8 3PH, United Kingdom q Università degli Studi Milano-Bicocca and INFN-Sezione di Milano, 20126 Milano, Italy
r Minnesota University, Minneapolis MN 55455, USA s Research Institute for Nuclear Problems, Byelorussian State University, 220050 Minsk, Byelorussia
t Institute for Nuclear Research, Russian Academy of Sciences, 117312 Moscow, Russia u Lebedev Physical Institute, Russian Academy of Sciences, 117924 Moscow, Russia
v Bhabha Atomic Research Centre, Mumbai 400 085, India w Yale University, New Haven CT 06520-8121, USA
x Cyprus University, 1678 Nicosia, Cyprus y Laboratoire Leprince-Ringuet, Ecole Polytechnique, 91128 Palaiseau Cedex, France
z California Institute of Technology, Charles C. Lauritsen Laboratory, Pasadena CA91125, USA aa State Research Center, 142284 Protvino (Moscow Region), Russia
ab ENEA - CR Casaccia, 00060 S. Maria di Galeria, Roma, Italy ac Università “La Sapienza”, Dipartimento di Fisica and INFN-Sezione di Roma, 00185 Roma, Italy
ad Split University, PMF, 21000 Split, Croatia ae Technical University of Split, FESB, 21000 Split, Croatia
af National Taiwan University, 106 Taipei, Taiwan ROC ag Università di Torino, Dipartimento di Fisica and INFN-Sezione di Torino, 10125 Torino, Italy
ah Institut de Physique Nucléaire, IN2P3-CNRSand Université C. Bernard Lyon I, 69622 Villeurbanne, France ai Paul Scherrer Institut, 5232 Villigen, Switzerland
aj Yerevan Physics Institute, 375036 Yerevan 36, Armenia ak Eidgenössische Technische Hochschule, ETH, 8093 Zürich, Switzerland
* On leave from High Energy Physics Institute, Tblisi, Georgia
Abstract Performance tests of some aspects of the CMS ECAL were carried out on modules of the “barrel” sub-system in 2002 and 2003. A brief test with high energy electron beams was made in late 2003 to validate prototypes of the new Very Front End electronics. The final versions of the monitoring and cooling systems, and of the high and low voltage regulation were used in these tests. The results are consistent with the performance targets including those for noise and overall energy resolution, required to fulfil the physics programme of CMS at the LHC.
Corresponding author: Egidio Longo e-mail: [email protected]
3
1. Introduction The Compact Muon Solenoid (CMS) [1] detector is a general purpose detector to be installed at the 14 TeV proton-proton collider, LHC, under construction at CERN and due to start operation in 2007. The Electromagnetic Calorimeter (ECAL) [2] of the detector is a hermetic homogeneous calorimeter made of 61,200 lead tungstate (PbWO4) crystals mounted in the central “barrel” part, closed by 7,324 crystals in each of the two end-caps. Avalanche photodiodes (APDs) are used as photodetectors in the barrel and vacuum phototriodes in the end-caps. The use of high density PbWO4 crystals [3] has allowed the design of a calorimeter which is fast, has fine granularity and is radiation resistant, all important characteristics in the LHC environment. One of the driving criteria in the design was the capability to detect the decay to two photons of the postulated Higgs boson. This capability is enhanced by the superior energy resolution provided by a homogeneous crystal calorimeter. The intrinsic performance of components of the calorimeter has been demonstrated in previous publications [4]. One of the key requirements, needed to be able to realise the potential excellent energy resolution in operation, is stability of the calibration and inter-calibration over extended periods of time. The temperature of the crystals needs to be maintained constant to high precision. The variation of the crystal transparency under irradiation must be tracked with precision monitoring and corrected for. In addition, the gains of the APDs used in the barrel part are strongly sensitive to both temperature and bias voltage, placing further constraints on thermal stability and power supply regulation. With the construction of final elements of the barrel calorimeter underway, it became possible to verify the performance of these system aspects of the calorimeter. This paper reports on tests of these aspects carried out in 2002 and 2003. In recent years a major redesign of the electronics system architecture was made to reduce the number of optical links and hence the cost and complexity of the overall system. This required the generation of trigger primitives to be moved from the off-detector to the on-detector electronics, which was made possible by designing on-detector ASICS using the recently developed 0.25 µm IBM CMOS technology. This paper reports on a high energy electron beam test made in late 2003 to validate prototypes of the new electronics. The noise level and the ability to reconstruct the signal amplitude from the digitised time-samples of the pulses were tested, and the impact of the overall electronics performance on energy resolution was determined. The light yield of each crystal is measured in the laboratory before being installed in the calorimeter. The variations in the yield can be used to predict differences in response of the individual channels in the calorimeter. Results are presented on the extent to which this can be used to inter-calibrate their response before the start of the experiment. In November 2004, tests of a supermodule fully equipped with the final electronics in an electron beam confirmed the stability and performance reported here; these results will be presented in detail in a future publication.
2. The CMS barrel electromagnetic calorimeter The crystals in the barrel part of the calorimeter have a tapered shape, slightly varying along the polar angle with respect to the beam axis. The front face dimensions are approximately 2.2×2.2 cm2, and the crystal length of 23 cm corresponds to 25.8 radiation lengths. To avoid cracks aligned with particle trajectories, the axes of the crystals are tilted by 3º in both polar and azimuthal angles with respect to the direction of the nominal interaction point. The crystals are grouped into 5×2 matrices, held in a glass fibre alveolar submodule, of which 40 or 50 are then mounted into a module. The modules are held by an aluminium grid, which supports their weight from the rear.
4
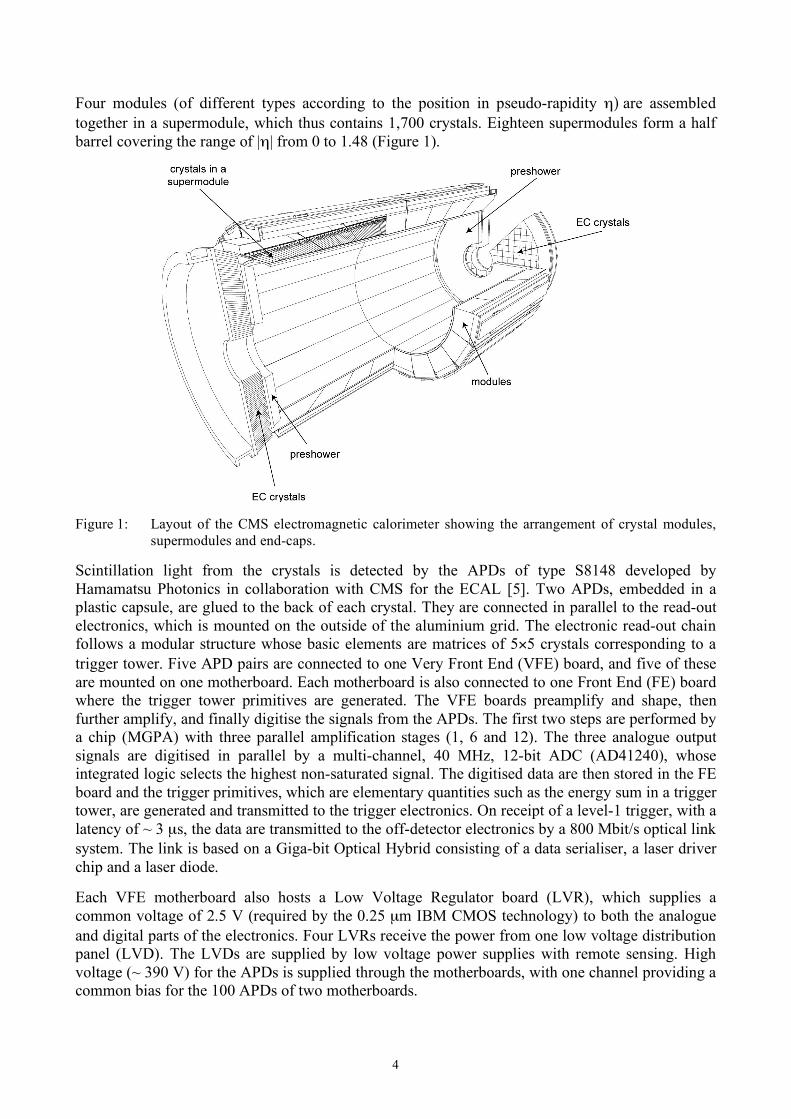
Four modules (of different types according to the position in pseudo-rapidity η) are assembled together in a supermodule, which thus contains 1,700 crystals. Eighteen supermodules form a half barrel covering the range of |η| from 0 to 1.48 (Figure 1).
Figure 1: Layout of the CMS electromagnetic calorimeter showing the arrangement of crystal modules,
supermodules and end-caps. Scintillation light from the crystals is detected by the APDs of type S8148 developed by Hamamatsu Photonics in collaboration with CMS for the ECAL [5]. Two APDs, embedded in a plastic capsule, are glued to the back of each crystal. They are connected in parallel to the read-out electronics, which is mounted on the outside of the aluminium grid. The electronic read-out chain follows a modular structure whose basic elements are matrices of 5×5 crystals corresponding to a trigger tower. Five APD pairs are connected to one Very Front End (VFE) board, and five of these are mounted on one motherboard. Each motherboard is also connected to one Front End (FE) board where the trigger tower primitives are generated. The VFE boards preamplify and shape, then further amplify, and finally digitise the signals from the APDs. The first two steps are performed by a chip (MGPA) with three parallel amplification stages (1, 6 and 12). The three analogue output signals are digitised in parallel by a multi-channel, 40 MHz, 12-bit ADC (AD41240), whose integrated logic selects the highest non-saturated signal. The digitised data are then stored in the FE board and the trigger primitives, which are elementary quantities such as the energy sum in a trigger tower, are generated and transmitted to the trigger electronics. On receipt of a level-1 trigger, with a latency of ~ 3 µs, the data are transmitted to the off-detector electronics by a 800 Mbit/s optical link system. The link is based on a Giga-bit Optical Hybrid consisting of a data serialiser, a laser driver chip and a laser diode. Each VFE motherboard also hosts a Low Voltage Regulator board (LVR), which supplies a common voltage of 2.5 V (required by the 0.25 µm IBM CMOS technology) to both the analogue and digital parts of the electronics. Four LVRs receive the power from one low voltage distribution panel (LVD). The LVDs are supplied by low voltage power supplies with remote sensing. High voltage (~ 390 V) for the APDs is supplied through the motherboards, with one channel providing a common bias for the 100 APDs of two motherboards.
5
3. Experimental set-up In the summer of 2002 and 2003, several parts of the barrel system were tested in the H4 test beam facility at CERN, consisting of a secondary beam line capable to supply electron beams with a narrow momentum bite and high rates (> 2000 electrons per burst) between 20 and 250 GeV/c. Modules or supermodules were mounted on a rotating table, allowing the beam to be directed into the centre of the front face of each crystal. In 2002, a module of type 2, designated M0’, was installed, with 100 crystals fully equipped with the previous version of the electronics [6]. In 2003, a supermodule, designated SM0, was installed on the table with 100 crystals read out. Following this a second supermodule, SM1, was put in place with 50 channels equipped with prototypes of the new on-detector electronics. Other tests were performed on modules and supermodules during the assembly procedure, during the same two years.
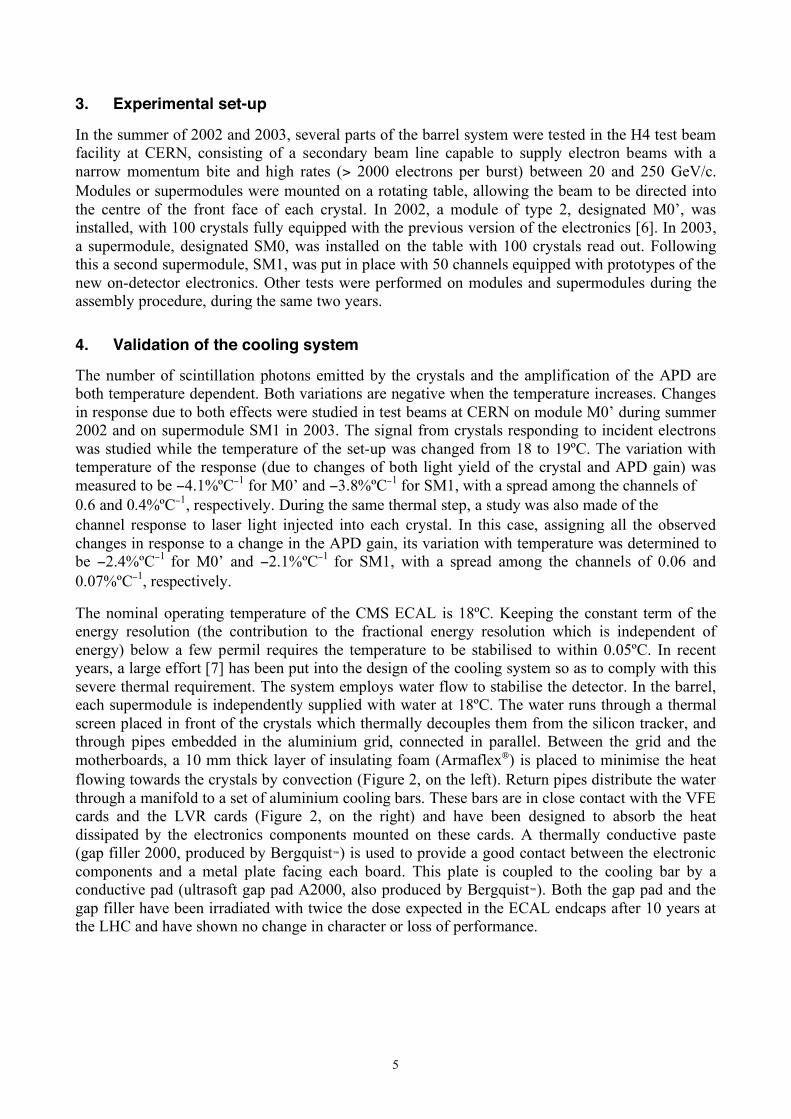
4. Validation of the cooling system The number of scintillation photons emitted by the crystals and the amplification of the APD are both temperature dependent. Both variations are negative when the temperature increases. Changes in response due to both effects were studied in test beams at CERN on module M0’ during summer 2002 and on supermodule SM1 in 2003. The signal from crystals responding to incident electrons was studied while the temperature of the set-up was changed from 18 to 19ºC. The variation with temperature of the response (due to changes of both light yield of the crystal and APD gain) was measured to be −4.1%ºC−1 for M0’ and −3.8%ºC−1 for SM1, with a spread among the channels of 0.6 and 0.4%ºC−1, respectively. During the same thermal step, a study was also made of the channel response to laser light injected into each crystal. In this case, assigning all the observed changes in response to a change in the APD gain, its variation with temperature was determined to be −2.4%ºC−1 for M0’ and −2.1%ºC−1 for SM1, with a spread among the channels of 0.06 and 0.07%ºC−1, respectively. The nominal operating temperature of the CMS ECAL is 18ºC. Keeping the constant term of the energy resolution (the contribution to the fractional energy resolution which is independent of energy) below a few permil requires the temperature to be stabilised to within 0.05ºC. In recent years, a large effort [7] has been put into the design of the cooling system so as to comply with this severe thermal requirement. The system employs water flow to stabilise the detector. In the barrel, each supermodule is independently supplied with water at 18ºC. The water runs through a thermal screen placed in front of the crystals which thermally decouples them from the silicon tracker, and through pipes embedded in the aluminium grid, connected in parallel. Between the grid and the motherboards, a 10 mm thick layer of insulating foam (Armaflex) is placed to minimise the heat flowing towards the crystals by convection (Figure 2, on the left). Return pipes distribute the water through a manifold to a set of aluminium cooling bars. These bars are in close contact with the VFE cards and the LVR cards (Figure 2, on the right) and have been designed to absorb the heat dissipated by the electronics components mounted on these cards. A thermally conductive paste (gap filler 2000, produced by Bergquist™) is used to provide a good contact between the electronic components and a metal plate facing each board. This plate is coupled to the cooling bar by a conductive pad (ultrasoft gap pad A2000, also produced by Bergquist™). Both the gap pad and the gap filler have been irradiated with twice the dose expected in the ECAL endcaps after 10 years at the LHC and have shown no change in character or loss of performance.
6
Figure 2: ECAL cooling scheme. On the left, the layer of insulating foam is shown on top of the grid.
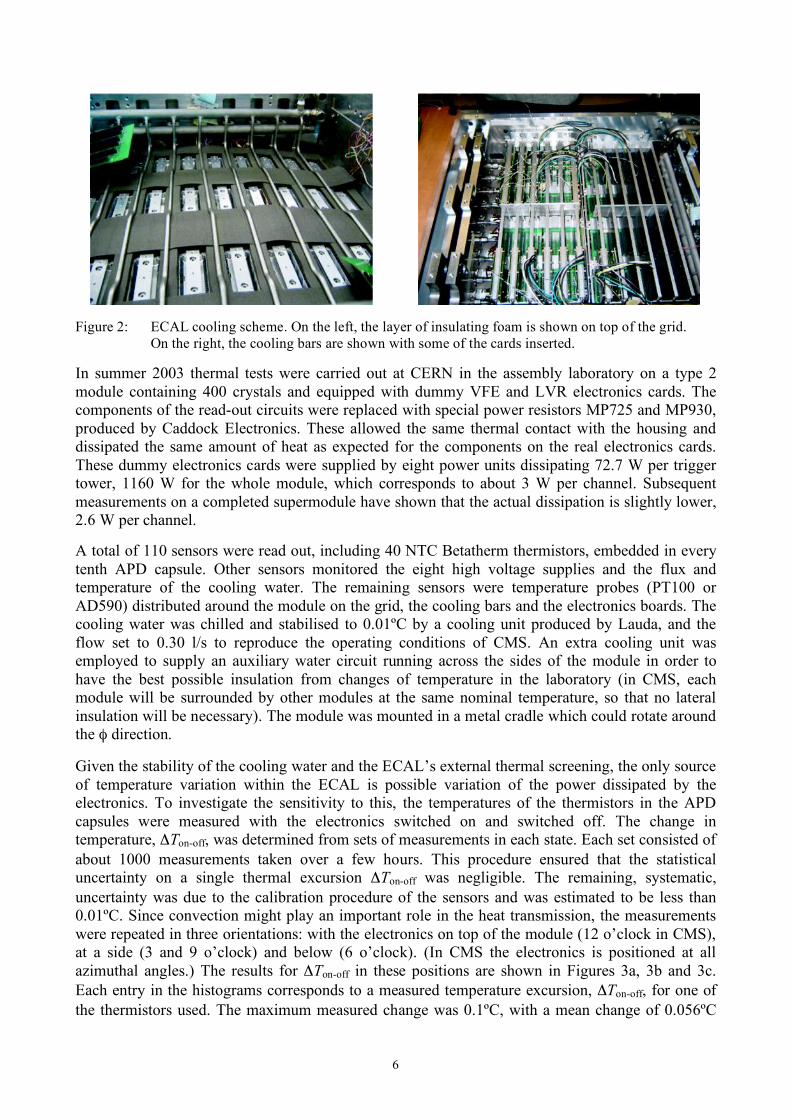
On the right, the cooling bars are shown with some of the cards inserted. In summer 2003 thermal tests were carried out at CERN in the assembly laboratory on a type 2 module containing 400 crystals and equipped with dummy VFE and LVR electronics cards. The components of the read-out circuits were replaced with special power resistors MP725 and MP930, produced by Caddock Electronics. These allowed the same thermal contact with the housing and dissipated the same amount of heat as expected for the components on the real electronics cards. These dummy electronics cards were supplied by eight power units dissipating 72.7 W per trigger tower, 1160 W for the whole module, which corresponds to about 3 W per channel. Subsequent measurements on a completed supermodule have shown that the actual dissipation is slightly lower, 2.6 W per channel. A total of 110 sensors were read out, including 40 NTC Betatherm thermistors, embedded in every tenth APD capsule. Other sensors monitored the eight high voltage supplies and the flux and temperature of the cooling water. The remaining sensors were temperature probes (PT100 or AD590) distributed around the module on the grid, the cooling bars and the electronics boards. The cooling water was chilled and stabilised to 0.01ºC by a cooling unit produced by Lauda, and the flow set to 0.30 l/s to reproduce the operating conditions of CMS. An extra cooling unit was employed to supply an auxiliary water circuit running across the sides of the module in order to have the best possible insulation from changes of temperature in the laboratory (in CMS, each module will be surrounded by other modules at the same nominal temperature, so that no lateral insulation will be necessary). The module was mounted in a metal cradle which could rotate around the φ direction. Given the stability of the cooling water and the ECAL’s external thermal screening, the only source of temperature variation within the ECAL is possible variation of the power dissipated by the electronics. To investigate the sensitivity to this, the temperatures of the thermistors in the APD capsules were measured with the electronics switched on and switched off. The change in temperature, ΔTon-off, was determined from sets of measurements in each state. Each set consisted of about 1000 measurements taken over a few hours. This procedure ensured that the statistical uncertainty on a single thermal excursion ΔTon-off was negligible. The remaining, systematic, uncertainty was due to the calibration procedure of the sensors and was estimated to be less than 0.01ºC. Since convection might play an important role in the heat transmission, the measurements were repeated in three orientations: with the electronics on top of the module (12 o’clock in CMS), at a side (3 and 9 o’clock) and below (6 o’clock). (In CMS the electronics is positioned at all azimuthal angles.) The results for ΔTon-off in these positions are shown in Figures 3a, 3b and 3c. Each entry in the histograms corresponds to a measured temperature excursion, ΔTon-off, for one of the thermistors used. The maximum measured change was 0.1ºC, with a mean change of 0.056ºC
7
for the worst position (6 o’clock, where the APDs are above the electronics). However, the electronics will remain switched on during the experiment with little variation in power dissipation and so the temperature variations should be much smaller than these values. Therefore the contribution to the constant term of the energy resolution due to thermal fluctuations will be negligible, even without temperature corrections.
Figure 3: a) Distribution of ΔTon-off with the module at 12 o’clock; the mean value is 0.022ºC.
b) The same with the module at 3 o’clock; the mean value is 0.044ºC. c) The same with the module at 6 o’clock; the mean value is 0.056ºC.
5. HV stability The APDs are silicon avalanche photodiodes, which are operated with an internal amplification, M, of 50. Since the gain has a strong dependence on the bias voltage (1/M dM/dV ≈ 3.2%/V at M=50), the APDs require a bias voltage supply system with a stability of few tens of mV (including long term stability, regulation, noise and ripple, and reproducibility) in order to give a negligible contribution to the constant term of the energy resolution. For this reason a special HV system has been developed for the CMS ECAL in collaboration with the CAEN company. It is made of a control crate (SY1527) hosting several boards (A1520E). Each board has nine channels and each channel supplies 50 crystals (100 APDs, grouped to have the same bias voltage requirement). Each channel can give a bias voltage from 0 to 500 V with a maximum current of 15 mA. Laboratory measurements [8] have shown that the stability is better than 20 mV.
8
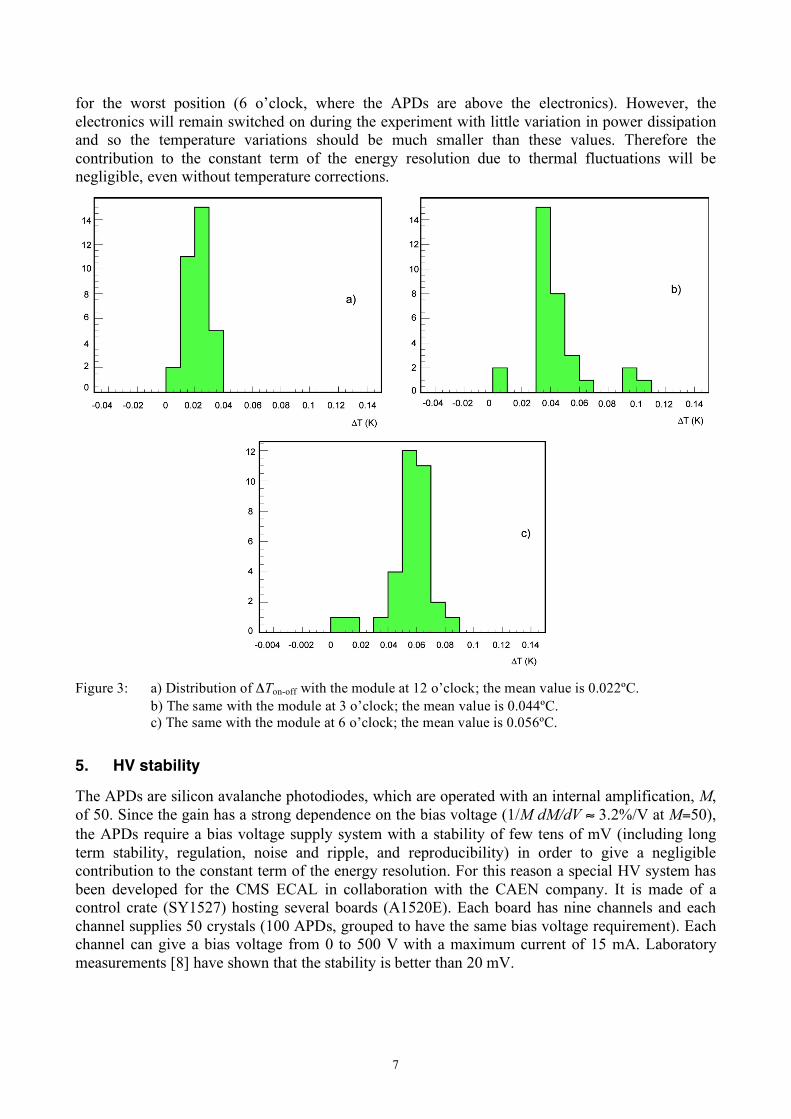
A prototype of this system was tested in the summer of 2002, with 200 APDs supplied by two HV channels. The HV crate was connected to the module via a cable of 120 m, as it will be after installation in the experiment. The HV system was controlled and continuously monitored using a Labview program and the CAEN OPC server to access the crate. The program allowed the setting of HV values, and the monitoring of the voltage and the current for each channel. The stability of the crystals was monitored with the laser system described in the next section. The APD bias voltage was permanently monitored by a sense wire close to the load. Figure 4 shows the stability of this voltage, as monitored by the HV crate for the two channels over several days. Calibration measurements performed in the laboratory show that the fluctuations measured over the sense wires correspond to a dispersion of the voltage at the load of less than ± 20 mV, as required by the specifications.
Figure 4: Stability of the high voltage monitored by the sense wire for two channels.
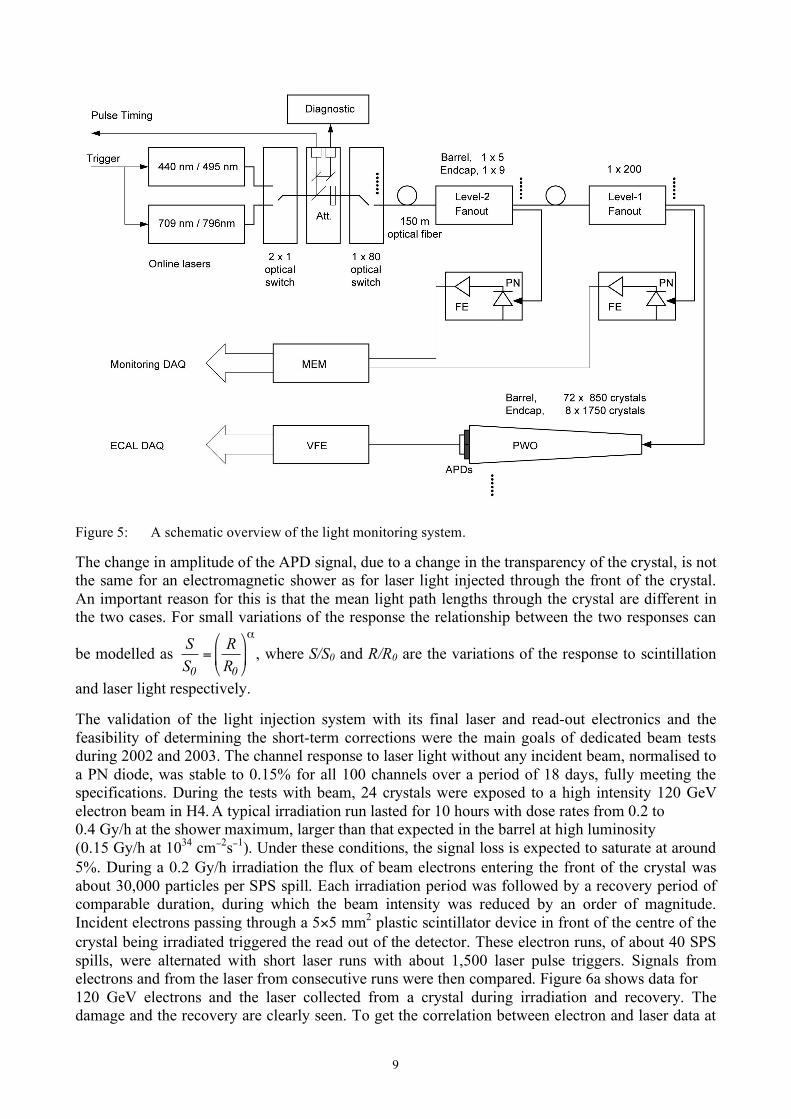
6. Crystal transparency monitoring Variations in the light transmission of the crystals are expected at the LHC due to radiation damage and recovery. The damage has been shown [9] to be the creation of colour centres, which then partly disappear due to self annealing. In the high luminosity regime, the response of the barrel crystals is expected to drop by a few percent in the first few hours of operation with colliding beams. Due to the competition between damage and recovery the light loss then saturates at a level that depends on the dose rate. Frequent optical transmission measurements of all the ECAL crystals are thus required in order to obtain short-term corrections to the calorimeter response. An optical monitoring system has been developed consisting of a laser source and an optical fibre distribution system. The system is described in detail elsewhere [10] and a schematic overview is shown in Figure 5. The final system consists of two lasers operating at four different wavelengths (440, 495, 706 and 796 nm) but in these tests only the blue (440 nm) laser was used, whose wavelength is close to the scintillation emission peak of the crystals. This laser light is distributed through optical fibres and injected simultaneously into 850 crystals (half a supermodule). PN diodes measure the amplitude of the laser pulses as received by groups of 200 crystals, and provide a normalisation of the magnitude of the injected light pulse. The system, including PN diodes and fibres, has been shown to be radiation hard for doses up to those expected for 10 years of high luminosity LHC running [10].
9
Figure 5: A schematic overview of the light monitoring system. The change in amplitude of the APD signal, due to a change in the transparency of the crystal, is not the same for an electromagnetic shower as for laser light injected through the front of the crystal. An important reason for this is that the mean light path lengths through the crystal are different in the two cases. For small variations of the response the relationship between the two responses can
be modelled as
!
S
S0
=R
R0
"
# $
%
& '
(
, where S/S0 and R/R0 are the variations of the response to scintillation
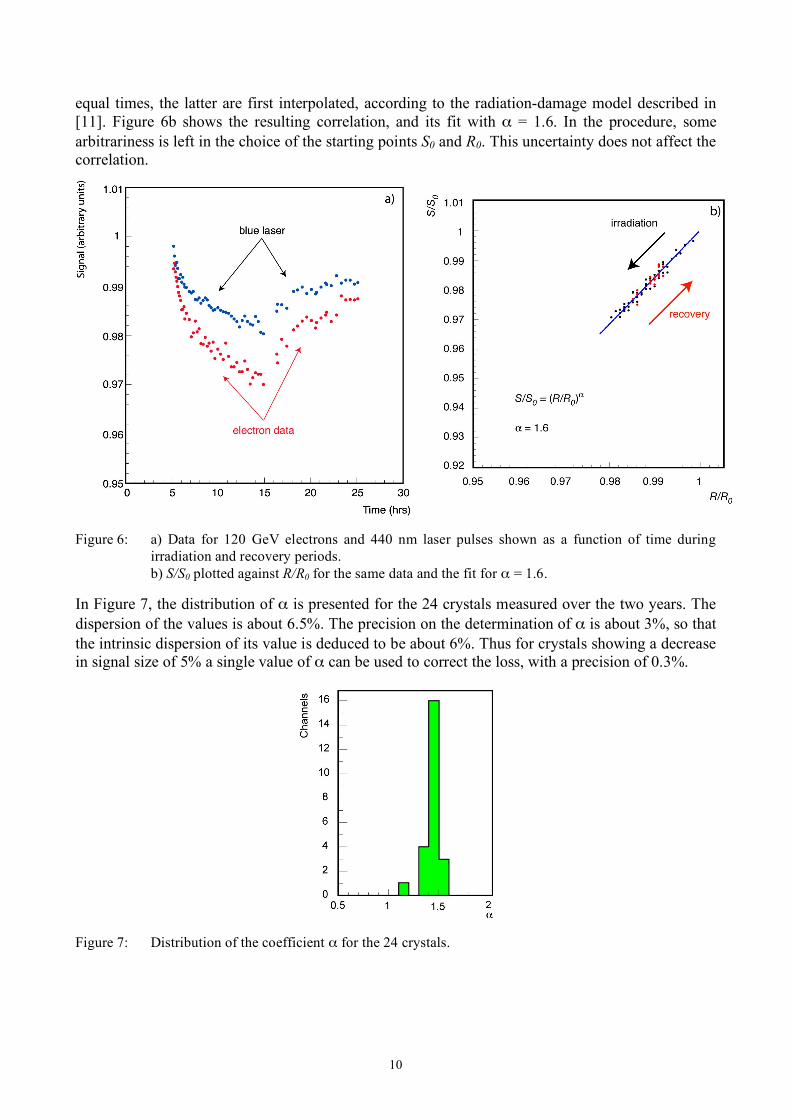
and laser light respectively. The validation of the light injection system with its final laser and read-out electronics and the feasibility of determining the short-term corrections were the main goals of dedicated beam tests during 2002 and 2003. The channel response to laser light without any incident beam, normalised to a PN diode, was stable to 0.15% for all 100 channels over a period of 18 days, fully meeting the specifications. During the tests with beam, 24 crystals were exposed to a high intensity 120 GeV electron beam in H4. A typical irradiation run lasted for 10 hours with dose rates from 0.2 to 0.4 Gy/h at the shower maximum, larger than that expected in the barrel at high luminosity (0.15 Gy/h at 1034 cm−2s−1). Under these conditions, the signal loss is expected to saturate at around 5%. During a 0.2 Gy/h irradiation the flux of beam electrons entering the front of the crystal was about 30,000 particles per SPS spill. Each irradiation period was followed by a recovery period of comparable duration, during which the beam intensity was reduced by an order of magnitude. Incident electrons passing through a 5×5 mm2 plastic scintillator device in front of the centre of the crystal being irradiated triggered the read out of the detector. These electron runs, of about 40 SPS spills, were alternated with short laser runs with about 1,500 laser pulse triggers. Signals from electrons and from the laser from consecutive runs were then compared. Figure 6a shows data for 120 GeV electrons and the laser collected from a crystal during irradiation and recovery. The damage and the recovery are clearly seen. To get the correlation between electron and laser data at
10
equal times, the latter are first interpolated, according to the radiation-damage model described in [11]. Figure 6b shows the resulting correlation, and its fit with α = 1.6. In the procedure, some arbitrariness is left in the choice of the starting points S0 and R0. This uncertainty does not affect the correlation.
Figure 6: a) Data for 120 GeV electrons and 440 nm laser pulses shown as a function of time during
irradiation and recovery periods. b) S/S0 plotted against R/R0 for the same data and the fit for α = 1.6.
In Figure 7, the distribution of α is presented for the 24 crystals measured over the two years. The dispersion of the values is about 6.5%. The precision on the determination of α is about 3%, so that the intrinsic dispersion of its value is deduced to be about 6%. Thus for crystals showing a decrease in signal size of 5% a single value of α can be used to correct the loss, with a precision of 0.3%.
Figure 7: Distribution of the coefficient α for the 24 crystals.
11
7 Very Front End electronics performance For the last two weeks of available beam time in 2003, the 50 crystals of two trigger towers of supermodule SM1 were equipped with prototypes of the new VFE electronics. After amplification, the signal, shaped to peak after about 50 ns, is sampled and digitised at 40 MHz. For each trigger the consecutive digitisations within a defined time frame (250 ns) were read out. In order to obtain the amplitude of a digitised pulse, the samples within the time frame were weighted and summed as
!
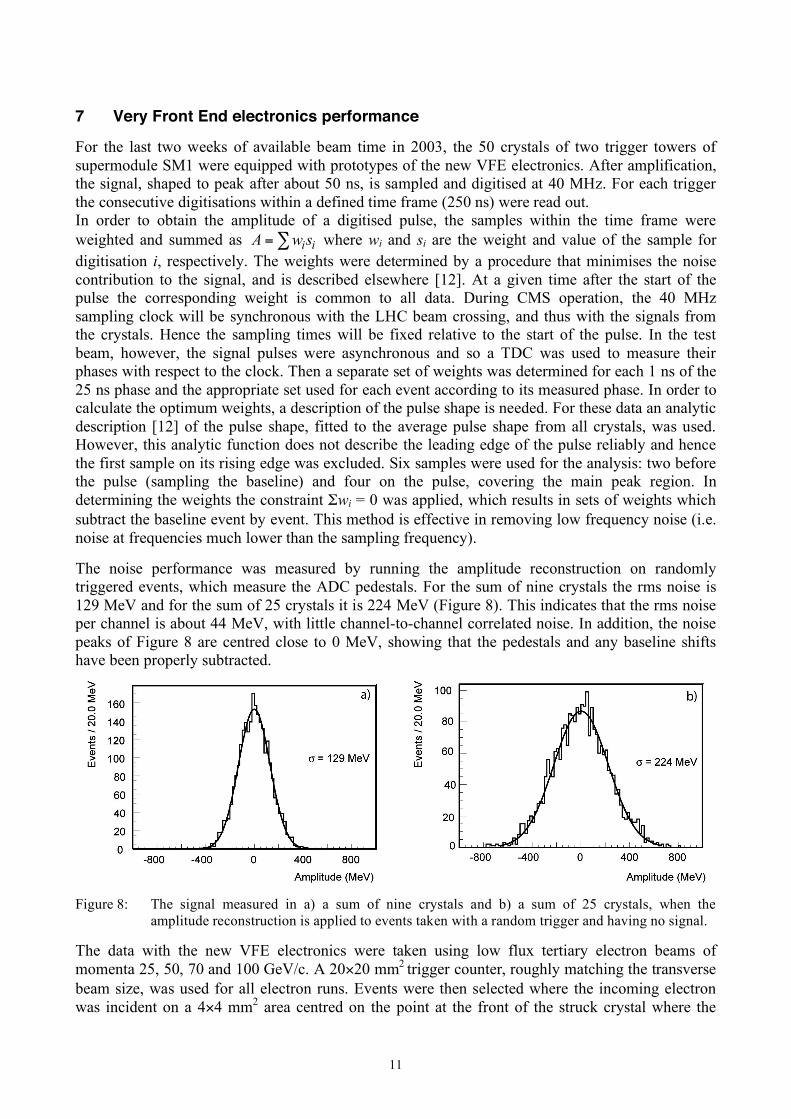
A = wi" si where wi and si are the weight and value of the sample for digitisation i, respectively. The weights were determined by a procedure that minimises the noise contribution to the signal, and is described elsewhere [12]. At a given time after the start of the pulse the corresponding weight is common to all data. During CMS operation, the 40 MHz sampling clock will be synchronous with the LHC beam crossing, and thus with the signals from the crystals. Hence the sampling times will be fixed relative to the start of the pulse. In the test beam, however, the signal pulses were asynchronous and so a TDC was used to measure their phases with respect to the clock. Then a separate set of weights was determined for each 1 ns of the 25 ns phase and the appropriate set used for each event according to its measured phase. In order to calculate the optimum weights, a description of the pulse shape is needed. For these data an analytic description [12] of the pulse shape, fitted to the average pulse shape from all crystals, was used. However, this analytic function does not describe the leading edge of the pulse reliably and hence the first sample on its rising edge was excluded. Six samples were used for the analysis: two before the pulse (sampling the baseline) and four on the pulse, covering the main peak region. In determining the weights the constraint Σwi = 0 was applied, which results in sets of weights which subtract the baseline event by event. This method is effective in removing low frequency noise (i.e. noise at frequencies much lower than the sampling frequency). The noise performance was measured by running the amplitude reconstruction on randomly triggered events, which measure the ADC pedestals. For the sum of nine crystals the rms noise is 129 MeV and for the sum of 25 crystals it is 224 MeV (Figure 8). This indicates that the rms noise per channel is about 44 MeV, with little channel-to-channel correlated noise. In addition, the noise peaks of Figure 8 are centred close to 0 MeV, showing that the pedestals and any baseline shifts have been properly subtracted.
Figure 8: The signal measured in a) a sum of nine crystals and b) a sum of 25 crystals, when the
amplitude reconstruction is applied to events taken with a random trigger and having no signal. The data with the new VFE electronics were taken using low flux tertiary electron beams of momenta 25, 50, 70 and 100 GeV/c. A 20×20 mm2
trigger counter, roughly matching the transverse beam size, was used for all electron runs. Events were then selected where the incoming electron was incident on a 4×4 mm2 area centred on the point at the front of the struck crystal where the
12
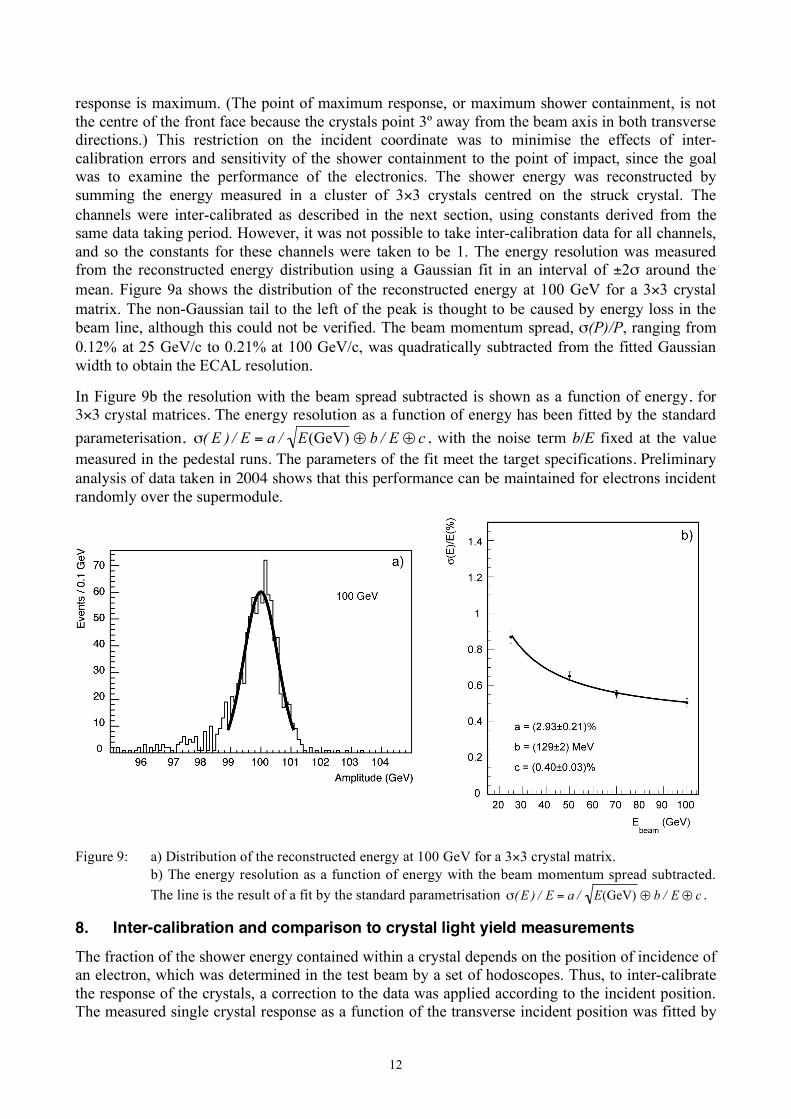
response is maximum. (The point of maximum response, or maximum shower containment, is not the centre of the front face because the crystals point 3º away from the beam axis in both transverse directions.) This restriction on the incident coordinate was to minimise the effects of inter-calibration errors and sensitivity of the shower containment to the point of impact, since the goal was to examine the performance of the electronics. The shower energy was reconstructed by summing the energy measured in a cluster of 3×3 crystals centred on the struck crystal. The channels were inter-calibrated as described in the next section, using constants derived from the same data taking period. However, it was not possible to take inter-calibration data for all channels, and so the constants for these channels were taken to be 1. The energy resolution was measured from the reconstructed energy distribution using a Gaussian fit in an interval of ±2σ around the mean. Figure 9a shows the distribution of the reconstructed energy at 100 GeV for a 3×3 crystal matrix. The non-Gaussian tail to the left of the peak is thought to be caused by energy loss in the beam line, although this could not be verified. The beam momentum spread, σ(P)/P, ranging from 0.12% at 25 GeV/c to 0.21% at 100 GeV/c, was quadratically subtracted from the fitted Gaussian width to obtain the ECAL resolution.
In Figure 9b the resolution with the beam spread subtracted is shown as a function of energy, for 3×3 crystal matrices. The energy resolution as a function of energy has been fitted by the standard parameterisation,
!
"( E ) / E = a / E(GeV) # b / E # c , with the noise term b/E fixed at the value measured in the pedestal runs. The parameters of the fit meet the target specifications. Preliminary analysis of data taken in 2004 shows that this performance can be maintained for electrons incident randomly over the supermodule.
Figure 9: a) Distribution of the reconstructed energy at 100 GeV for a 3×3 crystal matrix.
b) The energy resolution as a function of energy with the beam momentum spread subtracted. The line is the result of a fit by the standard parametrisation
!
"( E ) / E = a / E(GeV) # b / E # c .
8. Inter-calibration and comparison to crystal light yield measurements The fraction of the shower energy contained within a crystal depends on the position of incidence of an electron, which was determined in the test beam by a set of hodoscopes. Thus, to inter-calibrate the response of the crystals, a correction to the data was applied according to the incident position. The measured single crystal response as a function of the transverse incident position was fitted by
13
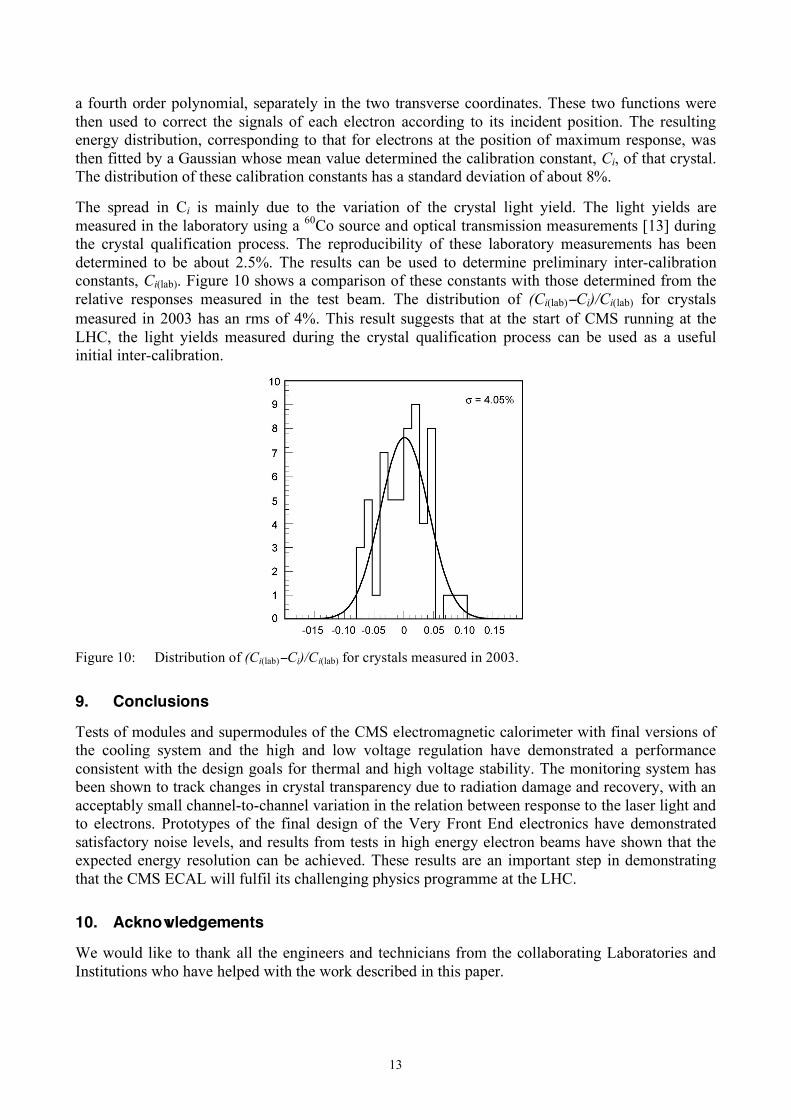
a fourth order polynomial, separately in the two transverse coordinates. These two functions were then used to correct the signals of each electron according to its incident position. The resulting energy distribution, corresponding to that for electrons at the position of maximum response, was then fitted by a Gaussian whose mean value determined the calibration constant, Ci, of that crystal. The distribution of these calibration constants has a standard deviation of about 8%. The spread in Ci is mainly due to the variation of the crystal light yield. The light yields are measured in the laboratory using a 60Co source and optical transmission measurements [13] during the crystal qualification process. The reproducibility of these laboratory measurements has been determined to be about 2.5%. The results can be used to determine preliminary inter-calibration constants, Ci(lab). Figure 10 shows a comparison of these constants with those determined from the relative responses measured in the test beam. The distribution of (Ci(lab)−Ci)/Ci(lab) for crystals measured in 2003 has an rms of 4%. This result suggests that at the start of CMS running at the LHC, the light yields measured during the crystal qualification process can be used as a useful initial inter-calibration.
Figure 10: Distribution of (Ci(lab)−Ci)/Ci(lab) for crystals measured in 2003.
9. Conclusions Tests of modules and supermodules of the CMS electromagnetic calorimeter with final versions of the cooling system and the high and low voltage regulation have demonstrated a performance consistent with the design goals for thermal and high voltage stability. The monitoring system has been shown to track changes in crystal transparency due to radiation damage and recovery, with an acceptably small channel-to-channel variation in the relation between response to the laser light and to electrons. Prototypes of the final design of the Very Front End electronics have demonstrated satisfactory noise levels, and results from tests in high energy electron beams have shown that the expected energy resolution can be achieved. These results are an important step in demonstrating that the CMS ECAL will fulfil its challenging physics programme at the LHC.
10. Acknowledgements We would like to thank all the engineers and technicians from the collaborating Laboratories and Institutions who have helped with the work described in this paper.
14
References [1] CMS Collaboration, “The Compact Muon Solenoid Technical Proposal”, CERN/LHCC 94-38
(1994). [2] CMS Collaboration, “The Electromagnetic Calorimeter Technical Design Report”
CERN/LHCC 97-33 (1977). [3] A.A. Annenkov, P. Lecoq and M.V. Korzhik, “Lead Tungstate scintillation material”,
Nucl. Instr. and Meth. A490 (2002) 30. [4] E. Auffray et al., “Beam tests of lead tungstate crystal matrices and a silicon strip preshower
detector for the CMS electromagnetic calorimeter”, Nucl. Instr. and Meth. A412 (1998) 223. G. Alexeev et al., “Studies of lead tungstate crystal matrices in high energy beams for the
CMS electromagnetic calorimeter at the LHC”, Nucl. Instr. and Meth. A385 (1997) 425. J. P. Peigneux et al., “Results from tests on matrices of lead tungstate crystals using high
energy beams”, Nucl. Instr. and Meth. A378 (1996) 410. [5] Z. Antunovic et al., “Radiation hard avalanche photodiodes for the CMS detector”, Nucl.
Instr. and Meth. A537 (2005) 379, and references therein. [6] J. P. Walder et al., “Custom integrated Front-End circuit for CMS Electromagnetic
Calorimeter”, IEEE Trans. on Nucl. Sc., vol. 48 n. 6 (2001). [7] I. Baillon et al.,”Design and performance of the cooling system for the electromagnetic
calorimeter of CMS”, to be published on the Proceedings of 2004 IEEE Instrumentation and Measurement Technology Conference, Como, Italy, May 18-20, 2004, CMS CR-2004/030.
[8] A. Bartoloni, “The power supply system for the CMS-ECAL APDs”, Proceedings of 7th
Workshop on Electronics for LHC Experiments LEB 2001, Stockholm, Sweden, 10-14 Sept. 2001, CERN-2001-005 (2001), 358.
[9] E. Auffray et al., “Improvement of several properties of lead tungstate crystals with different
doping ions”, Nucl. Instr. and Meth. A402 (1998) 75, and references therein. [10] R.Y. Zhu, “ Calibration and monitoring for crystal calorimetry”, Nucl. Instr. and Meth. A537
(2005) 344. [11] P. Bonamy et al., “The ECAL calibration: use of the light monitoring system”, CMS Note
1998/013. [12] P. Paganini et al., “Pulse amplitude reconstruction in the CMS ECAL using the weights
method”, CMS Note 2004/025. [13] F. Cavallari et al., “A proposal for intercalibration of ECAL crystals using laboratory
measurements”, CMS Note in preparation.