Restricted movement by mottled sculpin (pisces: cottidae) in a southern Appalachian stream
15
Restricted movement by mottled sculpin (pisces: cottidae) in a southern Appalachian stream J. TODD PETTY AND GARY D. GROSSMAN D.B. Warnell School of Forest Resources, University of Georgia, Athens, GA, U.S.A. SUMMARY 1. We used direct observation and mark-recapture techniques to quantify movements by mottled sculpins (Cottus bairdi) in a 1 km segment of Shope Fork in western North Carolina. Our objectives were to: (i) quantify the overall rate of sculpin movement, (ii) assess variation in movement among years, individuals, and sculpin size classes, (iii) relate movement to variation in stream flow and population size structure, and (iv) quantify relationships between movement and individual growth rates. 2. Movements were very restricted: median and mean movement distances for all sculpin size classes over a 45 day period were 1.3 and 4.4 m respectively. Nevertheless, there was a high degree of intrapopulation and temporal variation in sculpin movement. Movement of juveniles increased with discharge and with the density of large adults. Movement by small and large adults was not influenced by stream flow, but large adults where more mobile when their own density was high. Finally, there were differences in the growth rates of mobile and sedentary sculpins. Mobile juveniles grew faster than sedentary individuals under conditions of low flow and high density of large adults, whereas adults exhibited the opposite pattern. 3. Our results support the hypothesis that juvenile movement and growth is influenced by both intraspecific interactions with adults and stream flow. In contrast, adult movement appears to be influenced by competitive interactions among residents for suitable space. The relationship between movement and growth may provide a negative feedback mechanism regulating mottled sculpin populations in this system. Keywords: flow variability, growth, restricted movement, size-dependent interactions, stream fish Introduction Animal movement is a key mechanism underlying a host of ecological processes, including habitat selec- tion (Brown, 1988; Hughes, 1998), population dynam- ics (Kareiva, 1990), predator-prey interactions (Stewart-Oaten & Murdoch, 1990), and community structure (Tilman, 1994). This is particularly true for stream fishes, which inhabit spatially and temporally complex environments (Hildrew & Giller, 1994). Stream fishes require access to a wide array of habitat types for feeding and reproduction, and also access to refuges from predators and environmental extremes (Schlosser, 1995). Depending on the spatial arrange- ment of habitat patches in the landscape, fishes may be required to move long distances to find scarce or critical resources. Consequently, movement controls a variety of ecological patterns in stream fishes, such as longitudinal size patterns (Hughes & Reynolds, 1994; Hughes, 1998), source-sink dynamics (Schlosser, 1998), colonisation of newly available habitats (Taylor, 1997; Lonzarich, Warren & Lonzarich, 1998), and fish assemblage structure (Osborne & Wiley, 1992; Snodgrass & Meffe, 1998). Because of its importance to stream fish ecology, researchers have produced a substantial body of work on fish movement (see Gowan et al., 1994; Matthews, 1998; Rodrı ´guez, 2002 for reviews). Generally, these Correspondence: J. Todd Petty, Division of Forestry, West Virginia University, Morgantown, WV 26506, U.S.A. E-mail: [email protected] Freshwater Biology (2004) 49, 631–645 Ó 2004 Blackwell Publishing Ltd 631
Transcript of Restricted movement by mottled sculpin (pisces: cottidae) in a southern Appalachian stream

Restricted movement by mottled sculpin (pisces: cottidae)in a southern Appalachian stream
J . TODD PETTY AND GARY D. GROSSMAN
D.B. Warnell School of Forest Resources, University of Georgia, Athens, GA, U.S.A.
SUMMARY
1. We used direct observation and mark-recapture techniques to quantify movements by
mottled sculpins (Cottus bairdi) in a 1 km segment of Shope Fork in western North
Carolina. Our objectives were to: (i) quantify the overall rate of sculpin movement, (ii)
assess variation in movement among years, individuals, and sculpin size classes, (iii) relate
movement to variation in stream flow and population size structure, and (iv) quantify
relationships between movement and individual growth rates.
2. Movements were very restricted: median and mean movement distances for all sculpin
size classes over a 45 day period were 1.3 and 4.4 m respectively. Nevertheless, there was a
high degree of intrapopulation and temporal variation in sculpin movement. Movement of
juveniles increased with discharge and with the density of large adults. Movement by
small and large adults was not influenced by stream flow, but large adults where more
mobile when their own density was high. Finally, there were differences in the growth
rates of mobile and sedentary sculpins. Mobile juveniles grew faster than sedentary
individuals under conditions of low flow and high density of large adults, whereas adults
exhibited the opposite pattern.
3. Our results support the hypothesis that juvenile movement and growth is influenced by
both intraspecific interactions with adults and stream flow. In contrast, adult movement
appears to be influenced by competitive interactions among residents for suitable space.
The relationship between movement and growth may provide a negative feedback
mechanism regulating mottled sculpin populations in this system.
Keywords: flow variability, growth, restricted movement, size-dependent interactions, stream fish
Introduction
Animal movement is a key mechanism underlying a
host of ecological processes, including habitat selec-
tion (Brown, 1988; Hughes, 1998), population dynam-
ics (Kareiva, 1990), predator-prey interactions
(Stewart-Oaten & Murdoch, 1990), and community
structure (Tilman, 1994). This is particularly true for
stream fishes, which inhabit spatially and temporally
complex environments (Hildrew & Giller, 1994).
Stream fishes require access to a wide array of habitat
types for feeding and reproduction, and also access to
refuges from predators and environmental extremes
(Schlosser, 1995). Depending on the spatial arrange-
ment of habitat patches in the landscape, fishes may
be required to move long distances to find scarce or
critical resources. Consequently, movement controls a
variety of ecological patterns in stream fishes, such as
longitudinal size patterns (Hughes & Reynolds, 1994;
Hughes, 1998), source-sink dynamics (Schlosser,
1998), colonisation of newly available habitats (Taylor,
1997; Lonzarich, Warren & Lonzarich, 1998), and
fish assemblage structure (Osborne & Wiley, 1992;
Snodgrass & Meffe, 1998).
Because of its importance to stream fish ecology,
researchers have produced a substantial body of work
on fish movement (see Gowan et al., 1994; Matthews,
1998; Rodrıguez, 2002 for reviews). Generally, these
Correspondence: J. Todd Petty, Division of Forestry,
West Virginia University, Morgantown, WV 26506, U.S.A.
E-mail: [email protected]
Freshwater Biology (2004) 49, 631–645
� 2004 Blackwell Publishing Ltd 631

studies have focused on fish movement rates along
stream corridors and simply addressed whether fishes
are sedentary or mobile (Gowan et al., 1994; Fausch &
Young, 1995). The traditional view of stream fish
movement, referred to by Gowan et al. (1994) as the
‘Restricted Movement Paradigm’ (henceforth RMP),
maintains that adult fishes are sedentary, often
spending their entire lives within the same channel
unit or stream reach (Gerking, 1953). Subsequent field
studies of fish movement tended to support the view
of restricted movement by fishes, with the exception
of highly migratory species.
More recent findings indicate that the simplistic
view that all stream fishes are sedentary is incorrect
(Gowan et al., 1994; Skalski & Gilliam, 2000; Gilliam
& Fraser, 2001; Rodrıguez, 2002). In fact, Gowan
et al. (1994) argued that stream salmonids are
mobile, rather than sedentary, and that support for
the RMP was largely the result of flawed study
designs and misinterpretation of data by previous
authors. Subsequent analyses of salmonid movement
data by Rodrıguez (2002) tempered this view
slightly, but also clearly affirmed a high degree of
variability in the range of movements exhibited by
stream salmonids. Researchers also continue to
discover that fish movement behaviour is affected
by a variety of factors including: species, time of
year, fish age/size, and local environmental condi-
tions (Matthews, 1998).
Despite recent advances in the study of fish move-
ments, two important information gaps remain. First,
we know very little about the mobility of non-game
fishes, especially benthic species. Besides some nota-
ble exceptions (Hill & Grossman, 1987a; Freeman,
1995; Matheney & Rabeni, 1995; Lonzarich, Lonzarich
& Warren, 2000; Skalski & Gilliam, 2000; Gilliam &
Fraser, 2001), most data on stream fish movements are
based on studies of salmonids or centrarchids (Todd
& Rabeni, 1989; Gatz & Adams, 1994; Gowan et al.,
1994; Rodrıguez, 2002). This is unfortunate given that
cyprinids and benthic species dominate fish assem-
blages in most north temperate streams (Lee, Gilbert
& et al., 1980). Furthermore, these species possess life-
history requirements that are very different from most
trout species (Jenkins & Burkhead, 1994). Conse-
quently, it is difficult to infer general patterns and
causes of movement by stream fish communities
solely from information on stream-dwelling salmo-
nids.
Secondly, the underlying mechanisms that cause
animals to move are poorly understood (Turchin,
1998). Potential determinants of fish movement in
streams include variation in stream flow and tem-
perature, changes in habitat quality and the distribu-
tion of habitat patches, and seasonal changes in
habitat requirements. Additional ecological determi-
nants include intra- and inter-specific interactions,
such as competition and predation (Nakano, 1995;
Gilliam & Fraser, 2001). Despite this extensive list of
potential mechanisms, researchers have largely ig-
nored questions regarding the causes and conse-
quences of movement by stream fishes.
To address gaps in our understanding of stream
fish movement, we conducted a long-term descriptive
study of mottled sculpin (Cottus bairdi, Girard).
Sculpins are widely distributed across North America
and frequently dominate stream fish assemblages in
both abundance and biomass (see references in
Grossman, McDaniel & Ratajczak, 2002). In the Cow-
eeta Creek basin of western North Carolina, sculpins
are sit-and-wait predators that select microhabitats
comprised of coarse substrata and feed primarily on
benthic macroinvertebrates (Stouder, 1990; Petty &
Grossman, 1996; Grossman & Ratajczak, 1998). They
can live to age 7, grow slowly, and have low fecundity
(maximum fecundity <250 eggs) (Grossman et al.,
2002).
Recent studies in the Coweeta Creek drainage
indicate that sculpin populations are influenced by
three factors. First, Petty & Grossman (1996) found
that sculpin distributions are controlled by the patchy
distribution of suitable habitat and food. Adults are
able to identify patches of high invertebrate density
and select microhabitats that maximise their access to
food (Petty & Grossman, 1996). Secondly, a 12-year
study of sculpin populations established that tempor-
al variation in population density and age structure is
primarily influenced by density-dependent interac-
tions between adults and juveniles (G. D. Grossman
et al., unpublished data), with flow variation playing a
secondary role. Finally, size-dependent interactions
among residents may influence the distribution and
habitat use of small adult and juvenile sculpins
(Freeman & Stouder, 1989). Freeman & Stouder
(1989) found that large adults (i.e. sculpins >65 mm)
caused small individuals to shift from deeper, cen-
trally located microhabitats to shallow water along the
stream margin. The authors attribute this response to
632 J.T. Petty and G.D. Grossman
� 2004 Blackwell Publishing Ltd, Freshwater Biology, 49, 631–645

the ability of large dominant adults to exclude small
individuals from high quality patches. The manner in
which each of these factors influences movement is
currently unknown.
To ascertain how abiotic and biotic factors may
affect sculpin movement and to determine the rele-
vance of the RMP to this population, we addressed
four objectives. First, we quantified the extent and rate
of movement by sculpins in a 1-km section of Shope
Fork. Secondly, we examined intrapopulation vari-
ation (among individuals and size classes) in sculpin
movement. Thirdly, we quantified temporal variation
in sculpin movement and compared this variation to
hydrologic conditions and population size structure.
Fourthly, we described the relationship between
movement behaviour and individual fitness (i.e.
growth rate) of sculpins under different conditions
of stream flow and population structure.
Methods
The study site and sampling regime
Shope Fork is a fourth order tributary of Coweeta
Creek, which is located on the USDA Coweeta
Hydrologic Laboratory in western North Carolina,
U.S.A. Shope Fork is a relatively undisturbed, cold-
water stream (maximum summer temperature
<20 �C), and is representative of many small streams
in this region. The stream lies within a mixed
hardwood-conifer forest with an understory of rho-
dodendron (Rhododendron maximum L.), mountain
laurel (Kalmia latifolia L.) and dogwood (Cornus florida
L.). At its mouth, Shope Fork is just under 700 m in
altitude, drains a 2185 ha catchment, and has a long-
term, annual mean discharge of 0.23 m3 s)1. Typical
of small, Appalachian streams, the lower Shope Fork
fish assemblage includes just four species: mottled
sculpin, rainbow trout (Oncorhynchus mykiss Wal-
baum), longnose dace (Rhinichthys cataractae Valenci-
ennes), and rosyside dace (Clinostomus funduloides
Girard).
We observed fish while snorkeling and used mark-
recapture techniques to quantify sculpin movements
and estimate demographic parameters. We used the
‘Robust’ mark-recapture sampling design of Pollock
et al. (1990), which consisted of sampling at both
primary and secondary time scales. A primary sample
was a single seasonal sample taken in a single year.
We completed four primary samples [spring/early
summer (early June), mid summer (late July), late
summer (early September), and autumn (late Octo-
ber)] in each of 3 years (1994–96). Secondary samples
consisted of four separate sampling passes made over
a 7–10 day period within each primary sample, which
yielded a total of 16 sampling passes made each year.
Passes made within each season were separated by 1–
2 days, and each seasonal sample was separated by
approximately 45 days. We assumed that the popula-
tion was closed within primary samples and open
between them (Pollock et al., 1990).
Intensive sampling of sculpin populations was
confined to a central 200 m core of the 1-km site on
Shope Fork. Each time a sampling pass was
conducted, we observed sculpins within the 200 m
core (i.e. four passes per season within the core).
We also sampled two 400 m ‘buffer zones’ located
immediately up- and downstream of the study core
at the end of each season (i.e. one pass per season
within the buffer zones). Buffer zones were sampled
to capture marked individuals that may have
moved out of the core site. Our study design
ensured that we were able to characterise small
and large-scale movements.
However, the unbalanced nature of our sampling
design inserts an unfortunate bias into our analyses of
movement. Specifically, we were more likely to
observe short movements than long movements,
because sampling within the core area was four times
more frequent than sampling in the buffer zones.
Nevertheless, we do not believe that this sampling
discrepancy affects our overall findings for two
reasons. First, over 75% of the sculpins originally
marked in our study were recaptured and, of these
recaptures, <2% occurred outside of the core (see
Results). Secondly, of the individuals captured out-
side of the core, none was further than 50 m from the
core border (see Results). These findings suggest that
both our sampling area and design were adequate for
the detection of potential large-scale movements by
this species.
Field observations
We began each sampling pass by entering the 200 m
core site at a randomly determined location and
snorkeling slowly upstream. Regardless of where we
entered, we covered the entire 200 m core area in a
Stream fish movement 633
� 2004 Blackwell Publishing Ltd, Freshwater Biology, 49, 631–645
single day. On the fourth pass of each season, we
covered the entire 1 km site. This final pass usually
took 2–3 days to complete. When we located a sculpin
we immediately captured it with a dip net and
marked its focal position with a painted lead weight.
At the time of first capture, individuals were lightly
anaesthetised with MS222 and marked with acrylic
paints injected subcutaneously (Hill & Grossman,
1987b). Use of four colours (blue, green, red and
yellow) and six body locations (four along the anal fin
and one at the base of each pectoral fin) ensured that
each individual could be uniquely marked. An in-
stream, double marking study, using fin clips and
acrylic paints, indicated that mark retention by
juveniles and adults was extremely high (i.e. >90%)
for up to 16 months and did not differ significantly
among size classes (J. T. Petty & G. D. Grossman,
unpublished data). Newly marked and recaptured
individuals were weighed with an electronic balance
(±0.05 g) and measured (standard length, ±1 mm),
allowed to revive in fresh water, and returned to their
exact location of capture. After snorkeling the entire
200 m core site, we triangulated the exact location
(±5 cm) of each captured individual via a mapped
network of permanent transect posts positioned along
the stream margin.
Because we were interested in examining size-
dependent variation in sculpin behaviour, we used
length measurements to classify captured individu-
als into one of three size classes: juveniles
(SL £ 48 mm), small adults (48 < SL < 65 mm), and
large adults (‡65 mm). Demographic studies of
sculpins in the Coweeta Creek drainage demonstrate
that juveniles can be clearly separated from adults
on the basis of standard length (Petty, 1998).
However, there is considerable overlap in the body
size of adult sculpins of different ages (Grossman
et al., 2002). Nonetheless, our previous studies have
shown that size affects a variety of ecological
characteristics of sculpins (Grossman & Freeman,
1987; Grossman & Ratajczak, 1998; Grossman et al.,
2002) and consequently warrants consideration in
this study.
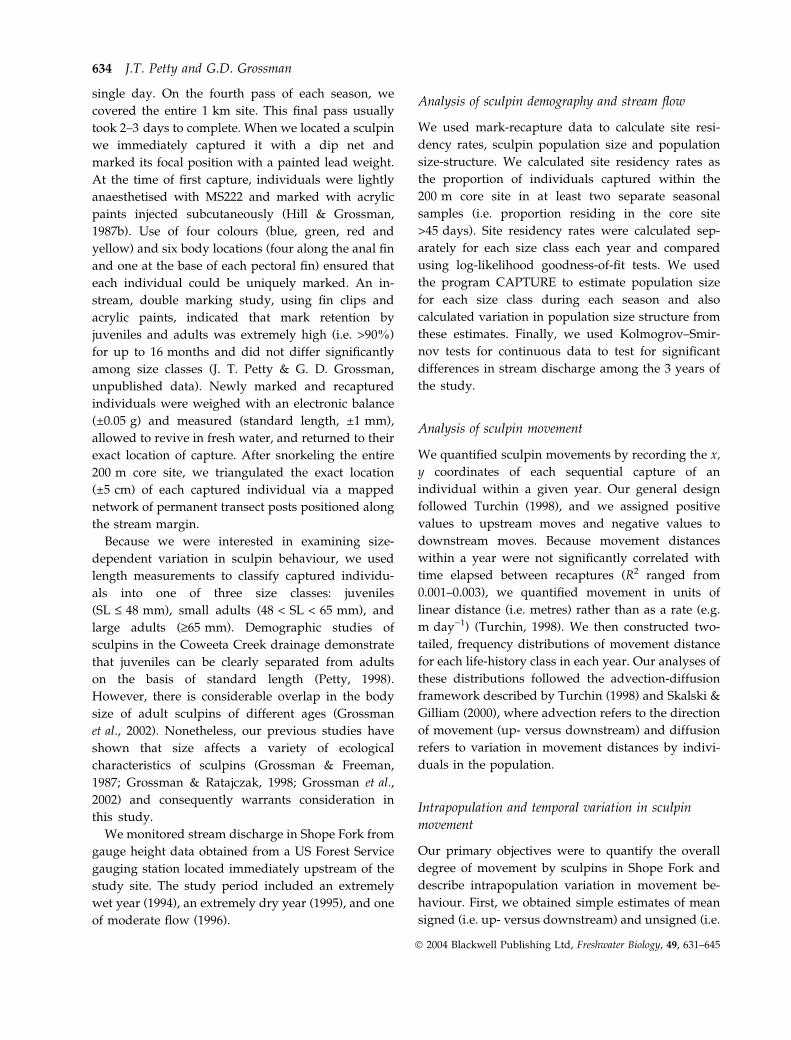
We monitored stream discharge in Shope Fork from
gauge height data obtained from a US Forest Service
gauging station located immediately upstream of the
study site. The study period included an extremely
wet year (1994), an extremely dry year (1995), and one
of moderate flow (1996).
Analysis of sculpin demography and stream flow
We used mark-recapture data to calculate site resi-
dency rates, sculpin population size and population
size-structure. We calculated site residency rates as
the proportion of individuals captured within the
200 m core site in at least two separate seasonal
samples (i.e. proportion residing in the core site
>45 days). Site residency rates were calculated sep-
arately for each size class each year and compared
using log-likelihood goodness-of-fit tests. We used
the program CAPTURE to estimate population size
for each size class during each season and also
calculated variation in population size structure from
these estimates. Finally, we used Kolmogrov–Smir-
nov tests for continuous data to test for significant
differences in stream discharge among the 3 years of
the study.
Analysis of sculpin movement
We quantified sculpin movements by recording the x,
y coordinates of each sequential capture of an
individual within a given year. Our general design
followed Turchin (1998), and we assigned positive
values to upstream moves and negative values to
downstream moves. Because movement distances
within a year were not significantly correlated with
time elapsed between recaptures (R2 ranged from
0.001–0.003), we quantified movement in units of
linear distance (i.e. metres) rather than as a rate (e.g.
m day)1) (Turchin, 1998). We then constructed two-
tailed, frequency distributions of movement distance
for each life-history class in each year. Our analyses of
these distributions followed the advection-diffusion
framework described by Turchin (1998) and Skalski &
Gilliam (2000), where advection refers to the direction
of movement (up- versus downstream) and diffusion
refers to variation in movement distances by indivi-
duals in the population.
Intrapopulation and temporal variation in sculpin
movement
Our primary objectives were to quantify the overall
degree of movement by sculpins in Shope Fork and
describe intrapopulation variation in movement be-
haviour. First, we obtained simple estimates of mean
signed (i.e. up- versus downstream) and unsigned (i.e.
634 J.T. Petty and G.D. Grossman
� 2004 Blackwell Publishing Ltd, Freshwater Biology, 49, 631–645

ignoring direction) movement distance, standard
deviation of signed movement distance, and kurtosis
of signed movement distance. We then used t-tests to
determine if mean signed movement differed sig-
nificantly from zero (i.e. to detect preferential up- or
downstream movement). We also tested for normality
of movement distributions using D‘Agostino’s test
and estimated kurtosis for each size class each year
(Turchin, 1998). These comparisons were made to
assess the degree of leptokurtosis (sensu Skalski &
Gilliam, 2000) in movement distributions both within
and among years. Skalski & Gilliam (2000) showed
that leptokurtosis of movement distributions provides
a good indicator of individual level variation in
movement behaviour (i.e. mobile versus sedentary
individuals).
We also examined differences in the movement
behaviour of sculpin size classes and differences
within these classes over time. First, we used
Variance-Ratio tests to compare the standard devia-
tion of movement distributions among sculpin size
classes. The same procedure was used to compare
the variance in movement among years within each
size class. These comparisons determined whether
the amount of population diffusion differed among
size classes or within size classes from year to year.
Secondly, we tested for differences in movement
distance among size classes and years by conducting
ANOVAANOVAs on mean squared movement data (Gilliam
& Fraser, 2001). We normalised these data with log-
transformations of squared data. Finally, Kolmogrov–
Smirnov tests were used to compare cumulative
frequency distributions of sculpin movement data.
We made pair-wise comparisons between size classes
within years and between years within size classes.
These analyses examined whether the degree of
sculpin movement differed among sculpin size clas-
ses or among years within a size class. After these
tests were completed, we used simple regression to
relate temporal changes in movement to changes in
stream flow conditions and population size structure.
For these analyses, we used size class-specific meas-
ures of diffusion (i.e. standard deviation of unsigned
movement) as the independent variable. Because
sample sizes were low for this analysis (n ¼ 3 years),
our intent was simply to identify general relation-
ships between movement and environmental condi-
tions.
Movement and growth
The final objective of our study was to determine the
fitness consequences of movement for individual
sculpins and the degree to which this varied from
year to year. For this analysis, we compared the mean
annual growth rate of relatively mobile (‘movers’) and
relatively sedentary (‘stayers’) sculpin for each study
year. Growth was quantified as the average net
change in fish mass (grams) from one season to the
next and then converted to a rate (45 g day)1, where
45 days was the typical length of time between
seasonal samples). We identified movers as individ-
uals that moved more than 2 m between captures in
subsequent seasons and stayers as individuals that
moved <2 m between seasonal captures. Previous
analyses of sculpin behaviour indicate that move-
ments <2 m represent restricted movements by
sculpins within discrete areas (i.e. ‘patch use’),
whereas movements greater than 2 m generally
represent directed movements by sculpins away from
one area to another (i.e. ‘patch abandonment’) (Petty,
1998).
We used two-way ANOVAANOVAs to test the hypothesis
that mean annual growth rate (response variable) was
related to movement (main effect 1) and year (main
effect 2). Growth for movers and stayers was calcu-
lated separately for each season and then pooled
across seasons within a year to ensure sufficient
sample sizes. Growth data were normally distributed.
We conducted statistical analyses on each size class
separately to control for ontogenetic differences in
individual growth rates and because no large adults
could be identified as movers in 1994.
Results
Annual variation in flow
Flow conditions in Shope Fork varied annually (Fig. 1).
The study period included years of: (i) above average
flow-1994 (mean daily flow ¼ 0.305 m3 s)1), (ii) aver-
age flow-1996 (mean daily flow ¼ 0.246 m3 s)1),
and (iii) below average flow-1995 (mean daily flow ¼0.177 m3 s)1). The long-term annual (n ¼ 55 years)
mean daily flow for Shope Fork is 0.243 m3 s)1.
Kolmogrov–Smirnov tests indicated that flows differed
significantly in each year of the study (1994 versus
Stream fish movement 635
� 2004 Blackwell Publishing Ltd, Freshwater Biology, 49, 631–645

1995: D ¼ 0.53, n ¼ 214, P < .001; 1994 versus 1996:
D ¼ 0.28, n ¼ 214, P < .001; 1995 versus 1996:
D ¼ 0.36, n ¼ 214, P < .001). The critical difference
in flow characteristics among years was the high
frequency (>90%) of flows less than the long-term
annual mean discharge (0.23 m3 s)1) in 1995 (Fig. 1).
Residency and population size
Between late spring 1994 and autumn 1996 we
marked and released a total of 604 individuals within
the core 200-m area. We recaptured 477 individuals
(79%) at least once within the 1-km site, and these
specimens were used in movement analyses. Initial
analysis of mark-recapture data indicated: (i) that
sculpin capture probabilities did not vary among size
classes (v2 ¼ 0.74, d.f. ¼ 2, P > 0.5) or among years
(v2 ¼ 2.21, d.f. ¼ 2, P > 0.1); and 2) that we observed
50–65% of the sculpin population inhabiting the study
site each season. Furthermore, during extensive
sampling outside of the 200 m core site we captured
only 12 emigrants, all of which were collected within
50 m of the up- or downstream borders of the core
site.
Residency varied among size classes and juvenile
residency rate was significantly lower than small
and large adult residency rates in 1995 (G ¼ 18.01,
d.f. ¼ 2, P < .05) and 1996 (G ¼ 28.48, d.f. ¼ 2,
P < .05) but not in 1994 (G ¼ 2.83, d.f. ¼ 2, P > .05)
(Table 1). Furthermore, juvenile residency varied
significantly among the 3 years of the study
(G ¼ 6.57, d.f. ¼ 2, P < .05), ranging from 55% in
1994 to 28% in 1996 (Table 1). In contrast, residency
rates did not vary significantly among years for
either small (G ¼ 3.37, d.f. ¼ 2, P > .05) or large
adults (G ¼ 1.05, d.f. ¼ 2, P > .05) or between these
two size classes. The residency rate of large adults
was consistently high, ranging from 73–83% of the
population (Table 1). The residency rate of small
adults, although slightly lower than large adults
(range from 65–78%), also was relatively high and
constant (Table 1). Despite the wide variability in
juvenile residency, the rate for the entire sculpin
population remained constant from year to year at
65% (Table 1).
0.0
0.2
0.4
0.6
0.8
1.0
0 0.1 0.2 0.3 0.4 0.5 0.6 0.7 0.8 0.9 1
Discharge (m3 s–1)
Cum
ulat
ive
freq
uenc
y 1994
1995
1996
Fig. 1 Yearly variation in stream flow of Shope Fork illustrating
3 years of variable flow conditions (1994: wet year, 1995: dry
year, 1996: average year). Analysis was based on mean daily
flows from 1 April to 31 October of each year.
Table 1 Summary of mottled sculpin
captures in a 200-m segment of Shope
Fork over a 3-year sampling period. The
total number of individual sculpins of
each size class captured each year is pre-
sented. Residency rate is the proportion of
the population captured in at least two
seasons within a year. Size classes with a
different superscript letter had signifi-
cantly (alpha value ¼ 0.05) different resi-
dency rates within that year. We used the
Bonferroni criterion to correct for multiple
comparisons. Average population size is
the average of four separate seasonal
estimates of population size each year
Year/size
class
Total no.
captured
Residency
rate
Average population
size (±95% CI)
1994
Juveniles 39 0.55a 37 (13)
Small adults 143 0.65a 99 (22)
Large adults 18 0.73a 19 (5)
All ages 200 0.65 156 (38)
1995
Juveniles 52 0.46a 46 (15)
Small adults 132 0.78b 114 (24)
Large adults 24 0.78b 28 (8)
All ages 208 0.65 189 (40)
1996
Juveniles 44 0.28a 37 (13)
Small adults 113 0.75b 90 (22)
Large adults 39 0.83b 51 (13)
All ages 196 0.65 178 (44)
636 J.T. Petty and G.D. Grossman
� 2004 Blackwell Publishing Ltd, Freshwater Biology, 49, 631–645

Mean annual population size was relatively con-
stant during the study, and population size structure
was relatively constant from 1994 to 1995 (Table 1;
Fig. 2a). Small adults dominated the population and
juveniles slightly outnumbered large adults in 1994
and 1995. However, the number of large adults
inhabiting the study site increased significantly from
an average of 19 and 28 individuals in 1994 and 1995,
respectively, to 51 individuals in 1996 (Table 1;
Fig. 2a). A concomitant shift in population size struc-
ture also was observed in 1996 with a significant
increase in the percent composition of large adults in
the population (Fig. 2b).
Sculpin movement
During our study, sculpins did not exhibit trends
towards up- or downstream movement. Mean signed
movement did not differ significantly from zero for
any size class in any year (each case P > 0.25)
(Table 2; Fig. 3). Our analyses also indicated an
overall low rate of movement within Shope Fork
(Table 2; Fig. 3). The distance moved by individual
sculpins over a 45 day period ranged from 0.1 to
165 m. Mean unsigned movement distance ranged
from 1.0 m (large adults in 1994) to 8.4 m (juveniles
in 1996). Median unsigned movement distance
ranged from 0.78 m (large adults in 1994) to 1.79 m
(large adults in 1996) (Table 2).
0
20
40
60
80
100
120
140
160
Sp ES LS Au Sp ES LS Au Sp ES LS Au
Scu
lpin
abu
ndan
ce
Juveniles
Small adults
Large adults
0.0
0.2
0.4
0.6
0.8
1.0
1994 1995 1996
Mea
n pr
opor
tion
Juveniles Small adults Large adults
1994 1996 1995
(a)
(b)
Fig. 2 Temporal variation in a mottled sculpin population
inhabiting a 200-m section of Shope Fork: (a) size (±95% CI) of
each age class, (b) proportional contribution of each age class to
the total population. Sp, spring; ES, early summer; LS, late
summer; Au, autumn.
Table 2 Summary statistics of mottled sculpin movement in a 1 km segment of Shope Fork. Signed movement refers to statistics
related to up- and downstream movements. Unsigned movement statistics are based on the absolute value of movement distance.
Units for mean signed and unsigned movement and median unsigned movement are meters. Please see Table 3 for a summary of the
results of pair-wise statistical comparisons of these values
Signed movement Unsigned movement
N Mean Kurtosis SD Mean (SE) Median
1994
Juveniles 25 1.57 5.6 11.9 5.8 (2.1) 1.11
Small adults 50 0.67 12.3 14.5 5.8 (1.9) 1.13
Large adults 20 0.04 0.03 1.2 1.0 (1.4) 0.78
1995
Juveniles 29 )0.54 4.5 3.6 2.2 (0.5) 1.28
Small adults 86 1.38 37.9 11.9 4.0 (1.2) 1.08
Large adults 38 )0.08 0.9 2.0 1.6 (0.2) 1.14
1996
Juveniles 19 0.62 4.1 16.3 8.4 (3.2) 1.45
Small adults 92 1.25 21.1 13.9 6.0 (1.3) 1.54
Large adults 58 )0.94 20.7 7.6 3.5 (0.9) 1.79
Stream fish movement 637
� 2004 Blackwell Publishing Ltd, Freshwater Biology, 49, 631–645

Intrapopulation and temporal variability in movement
Leptokurtosis was a general feature of sculpin move-
ment distributions (Table 2; Fig. 3). The degree of
kurtosis was most extreme for small adults, ranging
from 12.3 in 1994 (wet year) to 37.9 in 1995 (dry year),
suggesting a high level of inter-individual variability
in the movement behaviours of small adults. Kurtosis
also was consistently evident in the movement distri-
butions of juvenile sculpins ranging from 4.1 to 5.6
(Table 2). In contrast, the movement distribution of
large adults generally did not exhibit kurtosis. Kur-
tosis was not present in the distribution of movements
by large adults in 1994 and 1995 (0.03 and 0.9,
respectively). In 1996, however, kurtosis for large
adults increased dramatically to 20.7, indicating an
increase in the level of inter-individual variability in
behaviour of large adults (Table 2).
In virtually every case, size class and year signi-
ficantly affected the movement of sculpins (Tables 2
and 3; Fig. 4). First, the movement behaviour of
small adults was consistent across years, regardless
of flow and population size structure (Tables 2 and 3;
Figs. 3 & 4). Small adults consistently exhibited both
high diffusion (SD of signed movement ranged from
11.9 to 14.5) and high movement distances (mean
unsigned movement ranged from 4.0 to 6.0 m)
(Tables 2 and 3). Secondly, juvenile movement was
similar to that of small adults in 1994 (wet year) and
1996 (average flow), but not in 1995 (dry year)
(Tables 2 and 3; Figs. 3 & 4). Juvenile movement
increased significantly with flow [SD of movement
distance ¼ 35.0 (mean annual discharge) + 2.4,
n ¼ 3, R2 ¼ 0.39, P < .01) and the percentage of large
adults in the population [SD of movement dis-
tance ¼ 0.41 (% large adults) + 2.6, n ¼ 3,
1994n = 25
n = 50
n = 20 n = 38 n = 58
n = 86
–36 –24 –12 0 12 24 3601234567
1995n = 29
–36 –24 –12 0 12 24 36
1996n = 19
–36 –24 –12 0 12 24 36
Juveniles
1994
–36 –24 –12 0 12 24 360
4
8
12
16
20
Small adults
1995
–36 –24 –12 0 12 24 36
1996n = 92
–36 –24 –12 0 12 24 36
1994
–36 –24 –12 0 12 24 360
2
4
6
8
101995
–36 –24 –12 0 12 24 36
1996
–36 –24 –12 0 12 24 36
Large adults
Displacement (m)
Fre
quen
cy
Fig. 3 Frequency distributions of movement distance by juvenile, small adult and large adult mottled sculpins residing in Shope Fork.
Data from 1994 (a wet year), 1995 (a dry year), and 1996 (a year of average flow) are presented. Please refer to Tables 2 and 3 for
a summary of statistics associated with each movement distribution.
638 J.T. Petty and G.D. Grossman
� 2004 Blackwell Publishing Ltd, Freshwater Biology, 49, 631–645

R2 ¼ 0.50, P < .01). Finally, large adults exhibited
extremely low movement rates in 1994 and 1995
(mean movement ¼ 1.0 and 1.6 m, respectively).
However, overall movement (mean move-
ment ¼ 3.5 m) and diffusion (SD of movement ¼ 7.6)
7.6) for large adults increased significantly in 1996
(Tables 2 and 3; Figs. 3 & 4). Consequently, we
observed a significant relationship between large
adult movement and the percent of large adults in
the population (SD of movement distance ¼ 0.28 (%
large adults) + 1.3, n ¼ 3, R2 ¼ 0.92, P < 0.05).
Movement and growth
We observed significant interactive effects of move-
ment and year (flow) on growth of juveniles, small
adults and large adults (Table 4; Fig. 5). In addition,
effects differed between juveniles and adults but not
between large and small adults. Specifically: (i)
regardless of size class, growth rate was significantly
lower during 1995 (dry year) than in 1994 (wet year)
and 1996 (average flow) (Table 4; Fig. 5), (ii) the
growth rate of juvenile movers did not differ from
that of juvenile stayers in 1994 but was significantly
higher than stayers in 1995 and 1996 (Table 4;
Fig. 5), and (iii) the growth rate of large and small
adult movers and stayers was equal in 1994 and
1996. In 1995, however, the growth of small and
large adult stayers was significantly faster than that
of adult movers (Table 4; Fig. 5). Interestingly,
growth versus movement patterns for adults (i.e.
growth of movers < stayers) was opposite to the
pattern for juveniles (i.e. growth of movers >
stayers) (Fig. 5).
Table 3 Results of pair-wise comparisons of various measures of mottled sculpin movement among size classes and among years.
The Variance-Ratio test compares the standard deviation of mean signed displacement (i.e. rate of population diffusion), A N O V AA N O V A
compares mean unsigned displacement and represents a test of overall differences among life history classes rather than pair-wise
differences, and Kolmogrov–Smirnov (K–S) compares cumulative frequency distributions of unsigned displacement
Variance-Ratio test A N O V AA N O V A K–S
F d.f F d.f. D d.f.
Movement among size classes
1994
J versus SA 1.5 49,24 2.31 92 0.5 5,25
J versus LA 101.2*** 24,19 na na 9.25* 5,25
SA versus LA 151.8*** 49,19 na na 6.25** 5,50
1995
J versus SA 11.1*** 85,28 0.36 150 2.0 5,29
J versus LA 3.17 28,37 na na 2.0 5,29
SA versus LA 35.1*** 85,37 na na 4.0 5,86
1996
J versus SA 1.4 18,91 0.81 166 4.0 5,19
J versus LA 4.6*** 18,57 na na 9.0** 5,19
SA versus LA 3.4*** 91,57 na na 4.0 5,93
Movement among years
Juveniles
94 versus 95 11.0*** 24,28 2.19 70 5.0 5,25
94 versus 96 1.89 18,24 na na 4.0 5,25
95 versus 96 20.7*** 18,28 na na 7.2* 5,29
Small adults
94 versus 95 1.5 49,85 1.31 225 2.0 5,50
94 versus 96 0.9 49,91 na na 5.0 5,50
95 versus 96 1.4 91,85 na na 2.0 5,86
Large adults
94 versus 95 2.9 37,19 5.86* 166 3.0 5,19
94 versus 96 41.5*** 57,19 na na 8.5** 5,19
95 versus 96 14.3*** 57,37 na na 7.0* 5,38
*P < 0.05; **P < 0.01; ***P < 0.001.
J, juveniles; SA, small adults; LA, large adults; na, not applicable.
Stream fish movement 639
� 2004 Blackwell Publishing Ltd, Freshwater Biology, 49, 631–645

Discussion
Sculpin display restricted movement
Between 1994 and 1996, movement by sculpins in
Shope Fork was very restricted. Most individuals in
the population moved less than 3 m over a 45 day
period (0.07 m day)1). Median movement distance
(pooled data) over a 45 day period was only 1.3 m,
whereas, mean movement distance over the same
period was 4.4 m. Gowan et al. (1994) argue that the
poor designs of most movement studies of stream
fishes produce underestimates of movement rates.
Because our data were based on fish captured by hand
rather than through electrofishing or seining, our
estimates probably are closer to the true mobility of
0.0
0.2
0.4
0.6
0.8
1.0
0.0
0.2
0.4
0.6
0.8
1.0
Cum
ulat
ive
freq
uenc
y
JuvenilesSmall adults
Large adults
0.0
0.2
0.4
0.6
0.8
1.0
0 4 8 12 16 20 24 28 32 36 40 44
Movement rate (m 45 day –1)
1994
1995
1996
Fig. 4 Cumulative frequency distributions of mottled sculpin
movement distances in Shope Fork. Distributions for juveniles,
small adults, and large adults from each year are presented.
Table 4 Results of two-way A N O V AA N O V A comparisons of individual
sculpin growth rates. Analyses were run separately on juveniles,
small adults and large adults. Move class refers to individual
sculpin categorised as either ‘movers’ or ‘stayers’ based on
movement distance
Size class/treatment d.f. F P
Juveniles
Year 2 6.96 0.02
Move class 1 4.64 0.04
Year · move class 2 12.95 0.003
Small adults
Year 2 19.94 0.001
Move class 1 2.47 ns
Year · move class 2 7.98 0.03
Large adults
Year 1 4.38 0.05
Move class 1 2.86 ns
Year · move class 1 4.64 0.04
–1
–0.5
0
0.5
1
1.5
2
Juvenile movers
Juvenile stayers
–1
–0.5
0
0.5
1
1.5
2
1994 1995 1996
Gro
wth
(g
45 d
ay–1
)G
row
th (
g 45
day
–1)
Sm adult moversSm adult stayersLg adult moversLg adult stayers
(a)
(b)
Fig. 5 Mean (±SE) individual growth rate (45 g day)1) of relat-
ively mobile (i.e. movers) and sedentary (i.e. stayers) juvenile (a)
and adult (b) mottled sculpin. Missing data for large adult
movers in 1994 is the result of a failure to identify any large
adults that could be classified as movers in that year.
640 J.T. Petty and G.D. Grossman
� 2004 Blackwell Publishing Ltd, Freshwater Biology, 49, 631–645

sculpins than results obtained through more disrup-
tive sampling techniques. Furthermore, our high
recapture rates (60–80% seasonally) of sculpins are
indicative of a population experiencing low turnover
and low rates of movement (Gowan et al., 1994;
Rodrıguez, 2002). Hence, in concert with Rodrıguez
(2002), we suggest that it is premature to proclaim the
restricted movement paradigm dead, and that it is
also inappropriate to assume that stream fishes
necessarily move substantial distances. Clearly, more
detailed movement studies of non-salmonid stream
fishes are needed.
Sculpins in Shope Fork displayed one of the lowest
movement rates recorded for stream fishes. In a meta-
analysis of salmonid movement studies, Rodrıguez
(2002) found that median movement distance ranged
from 2.1 to 8300 m, with an average distance of 28 m.
In comparison with the few non-salmonid fishes
studied, sculpin movement was also low, although a
minority of these studies was capable of measuring
movement at spatial scales smaller than the channel
unit (Hill & Grossman, 1987b; Todd & Rabeni, 1989;
Gatz & Adams, 1994; Freeman, 1995; Matheney &
Rabeni, 1995; Lonzarich et al., 2000; Skalski & Gilliam,
2000; Gilliam & Fraser, 2001). Todd & Rabeni (1989)
concluded that smallmouth bass, Micropterus dolomieu
(Lacepede), exhibited restricted movements in an
Ozark stream, but individual movements in their
system ranged from 120 to 980 m day)1 depending on
water temperature. Similarly, Matheney & Rabeni
(1995) found that movements of northern hog suckers,
Hypentilium nigricans (Lesueur), ranged from 276–
425 m day)1, and Lonzarich et al. (2000) calculated
movements by central stonerollers, Campostoma
anomolum (Rafinesque), of 10–30 m 3 day)1. In each
case, movement rates were one to two orders of
magnitude greater than our estimates of sculpin
movement, even for the few benthic fishes studied
(Freeman, 1995; Matheney & Rabeni, 1995; Lonzarich
et al., 2000).
A potential reason for low movement rates by
sculpin is that they are poor swimmers, who have
ready access to refuge, food and reproductive habitats
in Shope Fork (Grossman, Ratajczak & Crawford,
1995; Petty, 1998; Fiumera et al., 2002). Sculpins lack a
gas bladder and tend to move by hopping across the
bottom rather than swimming. In addition, unlike
many stream fishes, sculpins do not have to move
long distances from an area used for foraging to one
used for reproduction or refuge. For example, most of
the adult males observed in Shope Fork moved <10 m
over the course of 3 years, a period that included
multiple movements from foraging and over-winter-
ing habitats to microhabitats used for reproduction
(Petty, 1998).
The low mobility of sculpins also may have been
affected by high population density. In most years,
sculpin density averages one to two individuals per
linear metre of stream (Freeman et al., 1988; G. D.
Grossman et al., unpublished data), and Petty (1998)
has shown that significant intraspecific interactions
occur over patches occupied by sculpins. These
factors may make it difficult for a sculpin to increase
its fitness by moving, once it occupies an acceptable
patch. A similar situation may affect Rivulus hartii
(Boulenger) populations in Trinidad streams (Gilliam
& Fraser, 2001). This killifish occurs at very high
population densities and exhibits low movement rates
similar to those observed for sculpins (e.g. mean
movement approximately 5.4 m, median movement
approximately 3.0 m over approximately 60 days,
Gilliam & Fraser, 2001). Additional studies of benthic
fish are needed before general statements about the
relative mobility of these species can be made.
Intrapopulation variation in sculpin movement
Despite the generally sedentary behaviour of sculpins,
different size classes displayed different mobility. For
example, small adults displayed a higher degree of
leptokurtosis in movement distributions than did
juveniles. Large adults did not exhibit kurtosis in 2
of the 3 years sampled. Skalski & Gilliam (2000) also
observed a high level of leptokurtosis in movement
distributions of bluehead chubs (Nocomis leptocephalus
Girard) inhabiting a North Carolina (U.S.A.) Pied-
mont stream. Through a combined field study and
modelling approach, these authors concluded that
leptokurtotic distributions were the result of pool-
ing the movement data of two subpopulations, a
relatively ‘static’ and a relatively ‘mobile’ popula-
tion, each of which exhibits a normally distribu-
ted movement pattern when considered separately.
By inadvertently pooling the normal distributions of
two populations with different levels of disper-
sion, a single strongly leptokurtic distribution obtains.
Consequently, Skalski & Gilliam (2000) concluded
that leptokurtosis is an indication of significant
Stream fish movement 641
� 2004 Blackwell Publishing Ltd, Freshwater Biology, 49, 631–645

intrapopulation variability in movement rates; large
differences in the movement rates of distinct subpop-
ulations produces high levels of leptokurtosis in the
movement distributions. Fraser, Skalski & Gilliam
(2001) went on to provide experimental and field
evidence of this phenomenon for R. hartii in Trinida-
dian streams.
Following the logic of previous investigators
(Skalski & Gilliam, 2000; Fraser et al., 2001; Rodrıguez,
2002), the high level of leptokurtosis in movement
distributions of sculpins suggests a high level of
variation among individuals within each size class.
Furthermore, because leptokurtosis was highest for
small adults, it would appear that the highest degree
of individual variation exists within this size class.
However, behavioural observations of sculpins sug-
gest that leptokurtosis of movement distribution may
be the result of temporal variation in the movement
behaviours of the same individual, rather than con-
sistent variation among individuals. Analyses of the
two dimensional movement patterns of adults indi-
cate that the movement distributions of individuals
are dominated by short (i.e. <2 m) moves within
small, discrete areas (i.e. <1 m2) separated by occa-
sional long moves (often >10 m) (Petty, 1998). The
combination of frequent, short-distance moves with
occasional, long-distance moves produces a strongly
leptokurtic movement distribution. This obtains
although most of the individuals within the small
adult size class are behaving in exactly the same way.
Movement behaviours of large adults also conform to
this pattern. Hence, leptokurtosis in the movement
distributions of adults can be explained by temporal
variability as well as inter-individual variability in
movement behaviour.
Nevertheless, this explanation cannot explain lep-
tokurtosis in movement distributions of juveniles. In
contrast to adults, individual juveniles did not exhibit
the consistent combination of frequent short moves
and the occasional long move (Petty, 1998). Rather,
juvenile sculpins tend to be either predominantly
‘mobile’ or ‘sedentary,’ much like the Rivulus studied
by Fraser et al. (2001). Consequently, it is likely that the
leptokurtotic movement distributions of juvenile scul-
pins are the result of consistent variability among
individuals (sensu Skalski & Gilliam, 2000), rather than
temporal variation in individual behaviours.
The possibility that leptokurtic movement distri-
butions are produced by temporal differences in
movement behaviour within individuals, rather than
by overall inter-individual differences, has important
implications. The distinction between movers and
stayers within a fish population has a long history in
fish ecology (Gerking, 1953; Matthews, 1998), and
has always involved presumed inherent differences
in the behaviour of specific individuals. In contrast, it
appears that the current suite of local environmental
conditions determines whether an adult sculpin will
be either a mover or a stayer. Hence, movement
tendency is not a fixed trait in this species, but rather
one that depends on the specific setting of the
individual. We believe future studies of fish move-
ment should focus on establishing whether a partic-
ular population is comprised of mobile and
sedentary subpopulations or whether individuals
switch between mobile or sedentary behaviour.
Sculpin movement, growth and flow
Although our study lasted only 3 years, variation in
sculpin movement and growth among years and
size classes yielded insights into the factors causing
sculpin to move or remain sedentary. Juvenile
mobility increased with increasing stream flow and
increasing density of large adults. In addition, we
found that mobile juveniles grew faster than seden-
tary ones, regardless of year. Our results for juvenile
sculpins also support the findings of Skalski &
Gilliam (2000) for bluehead chub. Small, sedentary
bluehead chub grew slower than more mobile
individuals. Consistent with this study, our findings
suggest that the movement and growth of juvenile
sculpins may be simultaneously influenced by
intraspecific interactions with large adults and
stream flow conditions. Juvenile movers may repre-
sent ‘bold’ individuals (sensu Fraser et al., 2001) that
are able to move around, garner scarce resources
and grow fast. In contrast, juvenile stayers may
represent ‘shy’ individuals that are trapped by
larger conspecifics and suffer reduced growth, a
condition exacerbated by periods of low stream flow
(e.g. 1995). Experiments in which the density of
large adults and stream flow are manipulated are
needed to understand more fully the interactive
effects of intraspecific interactions and flow condi-
tions on juvenile sculpins.
The mobility of small and large adults differed
significantly from those of juveniles. Movement by
642 J.T. Petty and G.D. Grossman
� 2004 Blackwell Publishing Ltd, Freshwater Biology, 49, 631–645

large and small adults was unaffected by stream flow.
We also found no evidence that movement by small
adults was influenced by population size structure.
The mobility of large adults, however, tended to
increase with their increasing density. We also found
that mobile adults grew slower than sedentary adults,
a pattern that was opposite of that observed for
juveniles. Considering the behaviour of small and
large adults together suggests that competitive inter-
actions between adults may have a stronger effect on
adult movement than flow conditions.
It is interesting that we observed differences in
growth rate between adult movers and stayers only
during the low flow year. At low flow, three primary
factors could potentially affect sculpin movement and
growth: (i) increased physiological stress because of
increased temperature, (ii) a reduction in wetted area,
and (iii) concentration of benthic macroinvertebrates
because of decreased habitat. Increased temperature
during periods of low flow undoubtedly influences
sculpin growth, although, this probably affects mov-
ers and stayers equally. In fact, we observed an
overall reduction in adult growth in 1995 regardless of
mobility. It is more likely that growth differences
between adult movers and stayers during low stream
flow conditions are caused by a reduction in wetted
area and the increased congregation of insects. Indi-
viduals in profitable, high-prey patches remain sed-
entary and grow quickly. Because of reduced habitat
availability, however, movers may have difficulty
finding alternative space and suffer reduced growth
as a consequence.
In conclusion, the influence of stream flow and
population size structure on sculpin movement and
growth has important consequences for population
regulation and dynamics. When the density of large
adults is low, juveniles should be relatively mobile
and grow quickly. Similarly, adults should grow
quickly and not move. In combination, the growth
and movement patterns of juveniles and adults would
facilitate rapid population growth when adult density
is low. In contrast, when adult population density is
high, individual growth rates should decline in
response to changes in the movement behaviours of
juveniles and adults (i.e. reduced movement by
juveniles and increased movement by adults) and
result in a reduced population growth rate. Conse-
quently, changes in sculpin mobility and growth with
changes in population size and structure may provide
an important negative feedback mechanism regula-
ting sculpin populations.
Acknowledgments
We thank Andrew Sutherland, Bobbi Valentine, and
Lee Shuff for their help with field collections. We also
thank Robert Ratajczak for his assistance both in the
field and laboratory. In addition, we gratefully
acknowledge the years of guidance, logistical support,
and access to the site provided by B. Kloeppel, W.
Swank, L. Swift, B. Cunningham and the staff of the
U.S. Forest Service Coweeta Hydrologic Laboratory.
Earlier versions of this manuscript were greatly
improved by reviews from one anonymous reviewer.
Financial Support for this project was provided by
grants from the U.S. Department of Agriculture
McIntire-Stennis program (GEO-0047-MS), the Na-
tional Science Foundation (BSR-9011661), The Daniel
B. Warnell School of Forest Resources, and the
University of Georgia.
References
Brown J.S. (1988) Patch use as an indicator of habitat
preference, predation risk, and competition. Behavioral
Ecology and Sociobiology, 22, 37–47.
Fausch K.D. & Young M.K. (1995) Evolutionary signifi-
cant units and movement of resident stream fishes: a
cautionary tale. American Fisheries Society Symposium,
17, 360–370.
Fiumera A.C., Porter B.A., Grossman G.D. & Avise J.C.
(2002) Intensive genetic assessment of the mating
system and reproductive success in a semi-closed
population of the mottled sculpin, Cottus bairdi.
Molecular Ecology, 11, 2367–2377.
Fraser D.F., Skalski G.T. & Gilliam J.F. (2001) Explaining
leptokurtic movement distributions: intrapopulation
variation in boldness and exploration. American Nat-
uralist, 158, 124–135
Freeman M.C. (1995) Movements by two small fishes in a
large stream. Copeia, 1995, 361–367.
Freeman M.C. & Stouder D.J. (1989) Intraspecific interac-
tions influence size specific depth distribution in Cottus
bairdi. Environmental Biology of Fishes, 24, 231–236.
Freeman M.C., Crawford M.K., Barrett J.C., Facey D.E.,
Flood M.G., Hill J., Stouder D.J. & Grossman G.D.
(1988) Fish assemblage stability in a southern Appa-
lachian stream. Canadian Journal of Fisheries and Aquatic
Sciences, 45, 1949–1958.
Stream fish movement 643
� 2004 Blackwell Publishing Ltd, Freshwater Biology, 49, 631–645

Gatz, A.J. Jr. & Adams S.M. (1994) Patterns of movement
of centrarchids in two warmwater streams in eastern
Tennessee. Ecology of Freshwater Fish, 3, 35–48.
Gerking S.D. (1953) Evidence for the concepts of home
range and territory in stream fishes. Ecology, 34, 347–
365.
Gilliam J.F. & Fraser D.F. (2001) Movement in corridors:
enhancement by predation threat, disturbance, and
habitat structure. Ecology, 82, 258–273.
Gowan C., Young M.K., Fausch K.D. & Riley S.C. (1994)
Restricted movement in resident stream salmonids: a
paradigm lost? Canadian Journal of Fisheries and Aquatic
Sciences, 51, 2626–2637.
Grossman G.D. & Freeman M.C. (1987) Microhabitat use
in a stream fish assemblage. Journal of Zoology, 212,
151–176.
Grossman G.D. & Ratajczak R.E. (1998) Long-term
patterns of microhabitat use by fishes in a southern
Appalachian stream (1983–1992): effects of hydrologic
period, season, and fish length. Ecology of Freshwater
Fish, 7, 108–131.
Grossman G.D., Ratajczak R. Jr. & Crawford M.C. (1995)
Do rock bass (Ambloplites rupestris) induce microhabitat
shifts in mottled sculpin (Cottus bairdi). Copeia, 1995,
343–353.
Grossman G.D., McDaniel K.M. & Ratajczak R.E. (2002)
Demographic characteristics of female sculpin (Cottus
bairdi) in the Coweeta Creek drainage, North
Carolina (U.S.A.). Environmental Biology of Fish, 63,
299–308.
Hildrew A.G. & Giller P.S. (1994) Patchiness, species
interactions and disturbance in the stream benthos. In:
Aquatic Ecology: Scale, Pattern, Process (Eds P.S. Giller,
A.G. Hildrew & D.G. Raffaelli ). pp. 21–62. Blackwell
Publications, Oxford.
Hill J. & Grossman G.D. (1987a) Home range estimates
for three North American stream fishes. Copeia, 1987,
376–380.
Hill J. & Grossman G.D. (1987b) Effects of subcutaneous
marking on stream fishes. Copeia, 1987, 492–495.
Hughes N.F. (1998) A model of habitat selection by drift-
feeding stream salmonids at different scales. Ecology,
79, 281–294.
Hughes N.F. & Reynolds J.B. (1994) Why do Arctic
grayling (Thymallus arcticus) get bigger as you go
upstream? Canadian Journal of Fisheries and Aquatic
Sciences, 51, 2154–2163.
Jenkins R.E. & Burkhead N.M. (1994) Freshwater Fishes of
Virginia. American Fisheries Society, Bethesda, MD.
Kareiva P. (1990) Population dynamics in spatially
complex environments: theory and data. Philosophical
Transactions of the Royal Society of London, 330, 5368–
5387.
Lee D.S., Gilbert C.R. et al. (1980) Atlas of North American
Freshwater Fishes. North Carolina State Museum of
Natural History, Raleigh, NC.
Lonzarich D.G., Warren M.L. Jr. & Lonzarich M.R. (1998)
Effects of habitat isolation on the recovery of fish
assemblages in experimentally defaunated stream
pools in Arkansas. Canadian Journal of Fisheries and
Aquatic Sciences, 55, 2141–2149.
Lonzarich, D.G., Lonzarich M.R. & Warren M.L. Jr. (2000)
Effects of riffle length on the short-term movement of
fishes among stream pools. Canadian Journal of Fisheries
and Aquatic Sciences, 57, 1508–1514.
Matheney M.P. IV & Rabeni C.F. (1995) Patterns of
movement and habitat use by northern hog suckers in
an Ozark stream. Transactions of the American Fisheries
Society, 124, 886–897.
Matthews W.J. (1998) Patterns in Freshwater Fish Ecology.
pp. 757.Chapman and Hall, New York, NY.
Nakano S. (1995) Individual differences in resource
use, growth and emigration under the influence of a
dominance hierarchy in fluvial red-spotted masu
salmon in a natural habitat. Animal Ecology, 64, 75–
84.
Osborne L.L. & Wiley M.J. (1992) Influence of tributary
spatial position on the structure of warmwater fish
communities. Canadian Journal of Fisheries and Aquatic
Sciences, 49, 671–681.
Petty J.T. (1998) Mottled Sculpin in a Dynamic Landscape:
Linking Environmental Heterogeneity, Individual Behav-
iors, and Population Regulation in a Southern Appalachian
Stream. PhD dissertation. University of Georgia.
Petty J.T. & Grossman G.D. (1996) Patch selection by
sculpin (Pisces: Cottidae) in a southern Appalachian
stream. Freshwater Biology, 35, 261–276.
Pollock K.H., Nichols J.D., Brownie C. & Hines J.E. (1990)
Statistical inference for capture-recapture experiments.
Wildlife Monographs, 107, 1–97.
Rodrıguez M.A. (2002) Restricted movement in stream
fish: the paradigm is incomplete, not lost. Ecology, 83,
1–13.
Schlosser I.J. (1995) Critical landscape attributes that
influence fish population dynamics in headwater
streams. Hydrobiologia, 303, 71–81.
Schlosser I.J. (1998) Fish recruitment, dispersal, and
trophic interactions in a heterogeous lotic environ-
ment. Oecologia, 113, 260–268.
Skalski G.T. & Gilliam J.F. (2000) Modeling diffusive
spread in a heterogeneous population: a movement
study with stream fish. Ecology, 81, 1685–1700.
Snodgrass J.W. & Meffe G.K. (1998) Influence of beavers
on stream fish assemblages: effects of pond age and
watershed position. Ecology, 79, 928–942.
644 J.T. Petty and G.D. Grossman
� 2004 Blackwell Publishing Ltd, Freshwater Biology, 49, 631–645

Stewart-Oaten A. & Murdoch W.W. (1990) Temporal
consequences of spatial density dependence. Journal of
Animal Ecology, 59, 1027–1045.
Stouder D.J. (1990) Dietary Fluctuation in Stream Fishes and
the Effects of Benthic Species Interactions. PhD disserta-
tion. University of Georgia, GA.
Taylor C.M. (1997) Fish species richness and incidence
patterns in isolated and connected stream pools: effects
of pool volume and spatial position. Oecologia, 110,
560–566.
Tilman D. (1994) Competition and biodiversity in spa-
tially structured habitats. Ecology, 75, 2–16.
Todd B.L. & Rabeni C.F. (1989) Movement and habitat
use by stream-dwelling smallmouth bass. Transactions
of the American Fisheries Society, 118, 229–242.
Turchin P. (1998) Quantitative Analysis of Movement.
Sinauer Associates, Inc., Sunderland, MA.
(Manuscript accepted 1 March 2004)
Stream fish movement 645
� 2004 Blackwell Publishing Ltd, Freshwater Biology, 49, 631–645