RESTRICT OR SHARE THE USE OF THE INTERACTIVE WHITEBOARD? THE CONSEQUENCES ON THE PERCEPTION, THE...
14
1 Reference DUROISIN, N., TEMPERMAN, G., DE LIEVRE, B. (2015). RESTRICT OR SHARE THE USE OF THE INTERACTIVE WHITEBOARD? THE CONSEQUENCES ON THE PERCEPTION, THE LEARNING PROCESSES AND THE PERFORMANCE OF STUDENTS WHITHIN A LEARNING SEQUENCE ON DYNAMIC GEOMETRY, TOJET, 14(2), 144-154. RESTRICT OR SHARE THE USE OF THE INTERACTIVE WHITEBOARD? THE CONSEQUENCES ON THE PERCEPTION, THE LEARNING PROCESSES AND THE PERFORMANCE OF STUDENTS WHITHIN A LEARNING SEQUENCE ON DYNAMIC GEOMETRY Natacha Duroisin*, Gaëtan Temperman**, Bruno De Lièvre** *Research Fellow F. R. S. - FNRS Service of Methodology and Formation/University of Mons 18, Place du Parc B-7000 Mons [email protected] **Service of general pedagogy and educational Media/University of Mons 18, Place du Parc B-7000 Mons [email protected] [email protected] Abstract The aim of this study is to analyse the impact of the shared use of the interactive whiteboard (IWB) on the perceptions, learning processes and performance of learners. It was carried out with lower secondary school students within the context of a class on dynamic geometry. The work is based on a set of indicators and the results were obtained from quantitative data, which was collected through a written questionnaire, and from qualitative data, which was collected through encoded video recordings. These results show that sharing the use of the interactive whiteboard has an impact on the perceptions of learners in terms of the usability and usefulness of the tool, that it encourages interactions between the students and that it seems to have a positive effect on the efficiency of the learning sequence itself. Interactive whiteboard, shared use, teaching/learning process, interactions, perception of the learners.
Transcript of RESTRICT OR SHARE THE USE OF THE INTERACTIVE WHITEBOARD? THE CONSEQUENCES ON THE PERCEPTION, THE...
1
Reference DUROISIN, N., TEMPERMAN, G., DE LIEVRE, B. (2015). RESTRICT OR SHARE THE USE OF
THE INTERACTIVE WHITEBOARD? THE CONSEQUENCES ON THE PERCEPTION, THE LEARNING
PROCESSES AND THE PERFORMANCE OF STUDENTS WHITHIN A LEARNING SEQUENCE ON
DYNAMIC GEOMETRY, TOJET, 14(2), 144-154.
RESTRICT OR SHARE THE USE OF THE INTERACTIVE WHITEBOARD? THE
CONSEQUENCES ON THE PERCEPTION, THE LEARNING PROCESSES AND THE
PERFORMANCE OF STUDENTS WHITHIN A LEARNING SEQUENCE ON DYNAMIC
GEOMETRY
Natacha Duroisin*, Gaëtan Temperman**, Bruno De Lièvre**
*Research Fellow F. R. S. - FNRS
Service of Methodology and Formation/University of Mons
18, Place du Parc
B-7000 Mons
**Service of general pedagogy and educational Media/University of Mons
18, Place du Parc
B-7000 Mons
Abstract
The aim of this study is to analyse the impact of the shared use of the interactive whiteboard (IWB)
on the perceptions, learning processes and performance of learners. It was carried out with lower
secondary school students within the context of a class on dynamic geometry. The work is based on
a set of indicators and the results were obtained from quantitative data, which was collected
through a written questionnaire, and from qualitative data, which was collected through encoded
video recordings. These results show that sharing the use of the interactive whiteboard has an
impact on the perceptions of learners in terms of the usability and usefulness of the tool, that it
encourages interactions between the students and that it seems to have a positive effect on the
efficiency of the learning sequence itself.
Interactive whiteboard, shared use, teaching/learning process, interactions, perception of the
learners.
1. TOWARDS ‘THOUGHTFUL USE’ OF THE INTERACTIVE WHITEBOARD
For over twenty years, many researchers have been studying the use of information and
communication technology (ICT) in schools. Several authors (Depover et al., 2007; Karsenti et al.,
2002) show that simply using technology does not guarantee its educational effectiveness, while
others, including Poyet (2009), indicate that contexts and teaching situations are the key factors for
the effectiveness of ICT in teaching practices. Having already been used in companies for many
years, interactive whiteboard (IWB) usage has been increasing for several years in classrooms in
England, Australia and Mexico. In 2011, in Europe and North America, IWB was one of the most
popular technological supports for teaching and learning in different disciplines. Governments,
understanding the value of using such tools in the classroom, have already accepted integrating this
technology into educational settings. Recently, studies both confirming and refuting the potential
impacts of the tool have been conducted, and the results are far from unanimous.
Studies (Miller & al., 2002; Jeunier et al., 2005; Kennewell & Beauchamp, 2007; Lee, 2010 ;
Tataroglu & Erduran, 2010; Bidaki & Mobasheri, 2013) show that the use of IWB by students led
to both a higher degree of motivation and level of participation, others (Levy, 2002; Wall, Higgins
& Smith, 2005; Merrett & Edwards, 2005; Glover et al., 2007; Karsenti, Collin & Dumouchel,
2012) maintain that the motivational effects fade away quickly and are more related to the novelty
effect of the tool. Others (Slay et al., 2008) highlight that the originality of the support may be a
source of motivation but educational value must be more important to perpetuate its effects.
Concerning the quality of learning, here again the results are not unequivocal. Glover and al. (2001)
and Becta (2003) indicate that this support does not induce differences in overall performance while
others (Somekh et al., 2007) observed an improvement in students’ performances.
Few studies to date relate the impact of the ways of using the IWB from an experimental point of
view. This study was conducted in an attempt to provide some possible answers to this problematic
situation. The effects of a ‘shared usage’ of the interactive whiteboard with learners in comparison
with a ‘restricted use’ for the teacher are analysed. The objective is to evaluate the impacts of the
use and usability of the tool on the progress of the students, the teaching / learning process and the
perceptions of learners. The independent variable considered in this study distinguishes between the
use of the IWB being strictly reserved for the teacher in one group and the sharing of the material
between the students and the teacher in a second group of learners. Given that the teaching and
learning is based on a pedagogical script that integrates the IWB differently, differences on several
levels are to be expected.
On the level of the students’ perceptions, it can be assumed that the shared use of the support
will have a motivational effect in comparison to the teacher only use. It is also expected that the
types of privileged interactions during the course will depend on the mode of use of the media.
Finally, the hypothesis that the performance between students of the two groups formed will differ
will also be considered. In other words, the aim of this study is to identify and compare, in a
specific context and with specific mathematical content, the most appropriate conditions for getting
the maximum value out of the interactive whiteboard, from a pedagogical point of view.

2. EXPERIMENTAL CONTEXT
This study was conducted at a technical college, as part of a mathematics course which is taught
five hours per week to students of the second year of secondary school (about 13-year-old students).
A teaching sequence was given to students over five hours. It consisted of a script and three
different activities with the IWB. The material chosen for the sequence focused on the axes and
centres of symmetry. For the simulation exercise, students were put in pairs and had to form two
piles of playing cards. Without instructions or advice, it was expected that students would
distinguish the difference between the cards with or without an axis or a centre of symmetry. As
mentioned previously, three activities were proposed: the first consisted of asking students to make
a line, to complete a representation of letters using orthogonal symmetry, to find the letters in the
alphabet having an axis and/or a centre of symmetry and to determine whether the logos presented
had one or more axes and a centre of symmetry. The second activity required the students to
identify the axes and the centres of symmetry of known geometric figures and then infer proposed
rules that can be taken from the case presented. The third activity involved two tasks where students
are asked to identify the axes and centre of symmetry of regular polygons. Apart from the
differences in the experimental design of the methodology (handling or non-handling of the tool by
the student), the course was the same in each class.
3. DISTINCTION BETWEEN THE TWO WAYS OF USING THE
INTERACTIVE WHITEBOARD
The aim was to observe the differences in the learning/teaching process and the in performance due
to the experimental process itself. Therefore, the teacher had to carefully follow the instructions of
the developed pattern. Only differences regarding the methodology were planned. The two groups
were formed on the basis of Warren’s statement (2002) according to which two ways of using the
IWB were mainly implemented by the teachers. The first group (experimental group) consisted of
two classes (N=24) of learners who used the interactive tool repeatedly during the lesson (this is
called ‘shared use of the IWB’ with the learners). ‘Shared use’ of the interactive tool means that all
the learners use the interactive whiteboard on a voluntary basis or after being asked by the teacher.
Different activities were given to the learners (construction of figures, removal of objects, etc.) in
order to confront them with the different possibilities of the IWB. These activities were mainly
taken from the book Actimath (Bams et al., 2014). The teacher and the students used the manual,
which the teacher had digitised in order to make it readable on the IWB. The related CD-Rom was
used as a correction tool. While the learner used the IWB, the teacher and the other students were
available for confirmation and/or to offer some assistance. There were no restrictions on another
volunteer going up to the IWB depending on requests from the others. During the five hours of the
experiment each learner used the interactive tool an average of ten times with an average total
duration of eighteen minutes. The second group (control group) consisted of one class (N=11) that
attended the same course using the same tool. The only difference was that only the teacher used
the whiteboard (this is referred to as ‘exclusive use of the IWB’ by the teacher).
In order to maintain the ecological validity of this study, it was decided to keep the composition of
the three classes and to form two different quasi-experimental groups.

4. TEST PATTERN AND METHODOLOGY
Based on the work of Beauchamp & Parkinson (2005) and Cohen (2007), the main hypothesis for
this study is that sharing the use of the IWB between the teacher and the students can favourably
impact both the perception of the learners and the teaching and learning processes that are
implemented during the learning sequence. In other words, this study analyses the impacts of a
‘shared use’ of the interactive whiteboard on the motivation of the students, on the preferred means
of interaction and on performance. A pattern to observe the use of the tool within a real learning
context was set up in order to confirm or invalidate the hypotheses. It is based on a quasi-
experimental plan which is structured in three successive stages (Table 1). A pre-test was carried
out in which the learners were required to perform 8 exercises about axes and centres of symmetry
without any precise information about the purpose of the experiment. For the first two sub-
exercises, they had to complete the construction of geometrical figures by using orthogonal
symmetry. During the second activity, the learners were shown two road signs. The students
indicated if there were one or more symmetrical axes with or without a centre while specifying how
many. For the next activity, the students were given two kinds of figures (with secant and parallel
segments) on which they had to draw the axis or axes, and in some cases the symmetrical centre.
For the last activity, the students had to move shapes and/or segments in a way that the given line(s)
corresponded to the symmetrical axis or axes. For each of the sub-exercises a grade was given in
terms of raw score. These grades were added up so that a relative gain in performance could be
calculated. After that, the teacher gave a five-hour learning sequence based on a pattern with a
precise methodology to apply. Finally, all the students performed a ‘post-test’ using the same
protocol applied during the ‘pre-test’. The whole experiment was filmed.
1. Pre-test
- 8 exercises about axes and centres of symmetry (4 exercises consisting of two sub-exercises) - On IWB - video camera - same protocol
2. Learning script
- a learning sequence for five hours (based on a pattern with a precise methodology about axes and centres of symmetry (5 hours) - Using book « Actimath » (mathematics book) - Same methodological development in both experimental groups - video camera
3. Post-test
- 8 exercises about axes and centres of symmetry (4 exercises consisting of two sub-exercises) - On IWB - video camera - same protocol
Table 1 Test pattern
Concerning the analysis of the process, all the social activity of students was encoded based on a
video recording of the full lesson. Six indicators were considered: number of questions asked per
student, number of answers given, number of remarks, number of interactions between the students
in the class, number of interactions between a student in the class and a student at the IWB, and
number of times each student raised their hand. The aim of this content analysis was to recognise
these events for each student, irrespective of length, and then to record this information in a
database.

5. DEPENDENT VARIABLES AND RESEARCH HYPOTHESES
The aim of this study is to analyse the impact of the independent variable, shared or restricted use,
on three dependent variables: the perceptions, the processes and the performance (variables). Table
2 presents the distinction between these variables, the indicators associated with these variables and
the different ways of collecting the data.
Variables Indicators Sources of the observation
Perception-
Usability of the tool
Learning
Controllability
Clarity
Flexibility
Skilfulness
Usability
Adaptation and translation of the
opinion survey of Davis (1989)
Usefulness of the tool
Helps to understand the material
Helps to improve the quality of the work
Questionnaire concerning the
usefulness of the tool
Motivation Admitted motivation Questionnaire on the motivation of
the students
Process-
Social interactions of
the students
Average number of questions asked per student
Average number of answers given per student
Average number of remarks made per student
Average number of interactions between the
students
Average number of times hand raised per student
Average number of interactions of the students
with the person at the IWB
Observations made in class
recorded with a video camera
Performance-
Progress of the
students
Scores in terms of relative gains per student Analysis of the “pre-test” data
Analysis of the “post-test” data
Table 2 Dependent variables, indicators and sources of the observation
5.1. Hypothesis 1 – The usability and usefulness of the IWB gives the students a better
grasp of the taught lesson and allows them to improve their learning
The first research hypothesis (H1) is about the perceptions of the learners according to two
complementary dimensions. For this the learners had to be asked about the usability of the tool.
Therefore, the translated version of Davis’s survey was used (1989)1. Six criteria were selected in
order to evaluate the usability of the tool: the Learning, the Controllability, the Clarity, the
Flexibility, the Skilfulness, and the Usability. Each student had to choose an answer from a seven-
point Likert scale (Strongly disagree – Disagree – Disagree somewhat – Undecided – Agree
somewhat – Agree – Strongly agree). Learners were also asked about the usefulness of the tool for
teaching/learning.
1 The questionnaire, which was administered at the end of training, also included two items to assess the students'
motivation in relation to their learning.

5.2. Hypothesis 2 – Sharing the use of the IWB gives more motivation to the students in
comparison with an exclusive use of the tool by the teacher
All the students participating in the experiment were invited to evaluate several statements about
their motivation level in order to confirm or invalidate this second hypothesis (H2).
5.3. Hypothesis 3 – Sharing the use of the IWB had an impact on the learning processes
that were implemented during the learning sequence.
The variable called ‘social interactions of the learners’ was taken into account to test this third
hypothesis (H3). The learning sequences were recorded and different indicators were selected to
code all the interactions of the class (Bouchard & Mangenot, 2001) in order to observe the learning
dynamic that had occurred during the courses. Based on the work of Sinclair & Coulthard (1992),
each of the noted actions were classified into specific categories (questions asked by a student,
answers given by a student, remarks by student, interactions between learners, times students raised
their hands, open questions to the students, closed questions to the students, open questions to a
student, closed questions to a student, given answers, remarks to the students and remarks to a
student). Then, the video recordings and analyses made it possible to precisely encode the different
interactions observed during the courses. In order to more easily compare the interactions between
the groups, the results are presented in terms of average numbers.
5.4. Hypothesis 4 – Sharing the use of the IWB influences the homogeneity of the students
in terms of performance.
The fourth research hypothesis (H4) is based on the theoretical model of Mayer (2010) according to
which the quality of learning, including the use of technological material, increases as the student
activity increases. The aim of the hypothesis is to find how an interaction method impacts on the
progress made by the learners and to evaluate the homogeneity of the performance of the learners.
The relative gains in their performance was calculated in order to assess the progress of the learners
and to compare the performance of each group in the same way. These calculations were made
using the formula described by D’Hainaut2 (1975) which made it possible to have a comparison
between the student’s ‘actual attainment’ and what was calculated to be the ‘best possible’
attainment. So, the results of the ‘pre-test’ and ‘post-test’ meant that performance could be
measured in terms of relative gains. These tests were carried out with all of the learners on an
interactive support in order to evaluate them on a tool identical to that used for the lesson
(Devauchelle, 2008). As previously mentioned, the analysis procedure of the performance, by
means of ‘pre-test’ and ‘post-test’, consisted of an evaluation of four activities each made of two
similar sub-exercises.
2 The formula to calculate the relative gains is (Result post-test – Result pre-test) / (Maximum result – result pre-test) x 100.
6. ANALYSIS OF THE RESULTS
6.1. Analysis of the results concerning the usability and usefulness of the tool (H1)
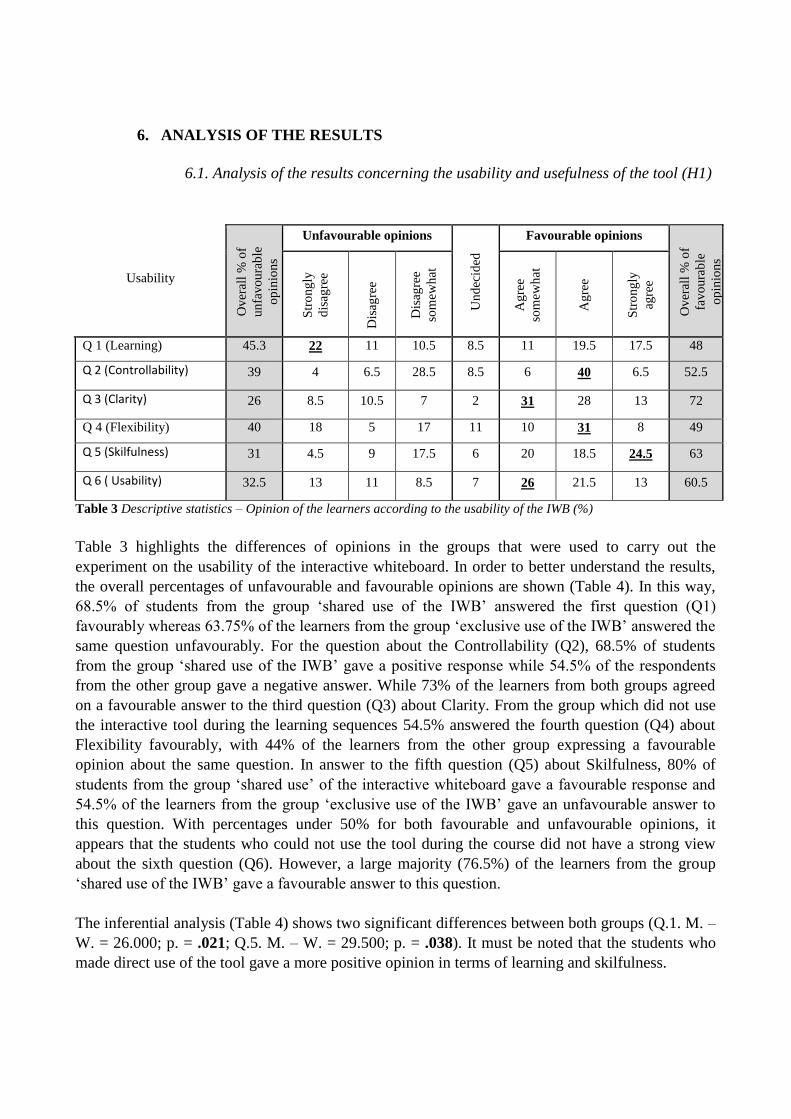
Table 3 Descriptive statistics – Opinion of the learners according to the usability of the IWB (%)
Table 3 highlights the differences of opinions in the groups that were used to carry out the
experiment on the usability of the interactive whiteboard. In order to better understand the results,
the overall percentages of unfavourable and favourable opinions are shown (Table 4). In this way,
68.5% of students from the group ‘shared use of the IWB’ answered the first question (Q1)
favourably whereas 63.75% of the learners from the group ‘exclusive use of the IWB’ answered the
same question unfavourably. For the question about the Controllability (Q2), 68.5% of students
from the group ‘shared use of the IWB’ gave a positive response while 54.5% of the respondents
from the other group gave a negative answer. While 73% of the learners from both groups agreed
on a favourable answer to the third question (Q3) about Clarity. From the group which did not use
the interactive tool during the learning sequences 54.5% answered the fourth question (Q4) about
Flexibility favourably, with 44% of the learners from the other group expressing a favourable
opinion about the same question. In answer to the fifth question (Q5) about Skilfulness, 80% of
students from the group ‘shared use’ of the interactive whiteboard gave a favourable response and
54.5% of the learners from the group ‘exclusive use of the IWB’ gave an unfavourable answer to
this question. With percentages under 50% for both favourable and unfavourable opinions, it
appears that the students who could not use the tool during the course did not have a strong view
about the sixth question (Q6). However, a large majority (76.5%) of the learners from the group
‘shared use of the IWB’ gave a favourable answer to this question.
The inferential analysis (Table 4) shows two significant differences between both groups (Q.1. M. –
W. = 26.000; p. = .021; Q.5. M. – W. = 29.500; p. = .038). It must be noted that the students who
made direct use of the tool gave a more positive opinion in terms of learning and skilfulness.
Usability
Ov
eral
l %
of
un
favo
ura
ble
op
inio
ns
Unfavourable opinions
Un
dec
ided
Favourable opinions
Ov
eral
l %
of
fav
ou
rab
le
op
inio
ns
Str
on
gly
dis
agre
e
Dis
agre
e
Dis
agre
e
som
ewh
at
Ag
ree
som
ewh
at
Ag
ree
Str
on
gly
agre
e
Q 1 (Learning) 45.3 22 11 10.5 8.5 11 19.5 17.5 48
Q 2 (Controllability) 39 4 6.5 28.5 8.5 6 40 6.5 52.5
Q 3 (Clarity) 26 8.5 10.5 7 2 31 28 13 72
Q 4 (Flexibility) 40 18 5 17 11 10 31 8 49
Q 5 (Skilfulness) 31 4.5 9 17.5 6 20 18.5 24.5 63
Q 6 ( Usability) 32.5 13 11 8.5 7 26 21.5 13 60.5

Table 4 Descriptive and inferential statistics – Opinion of the learners according to the usability of the IWB (%)
Concerning the usefulness of the interactive tool (Table 5), all the opinions of the students were
favourable regardless the group. In fact, all the learners who did not use the tool gave a positive
opinion and said that the interactive whiteboard helps to understand the academic content being
taught. Moreover, when the percentages of favourable opinions are added together, the findings
show that 92% of the learners from the group ‘shared use of the IWB’ agree with them. In the same
way, it can be noted that 96% of the members from the group ‘exclusive use of the IWB’ gave a
favourable answer to the proposition about improving the quality of work according to the use of
the tool compared with more than 72% of students that used the tool during the learning sequence.
Table 5 Descriptive statistic – Opinion of the learners according to the usefulness of the IWB (%)
Usability
Unfavourable opinions
Un
dec
ided
Favourable opinions
M. – W. p.
Str
on
gly
dis
agre
e
Dis
agre
e
Dis
agre
e
som
ewh
at
Ag
ree
som
ewh
at
Ag
ree
Str
on
gly
agre
e
Q. 1.
exclusive use of
the IWB 36.5 18.25 9 9 18.25 0 9
26.000 .021 shared use of the
IWB 7.5 4 11.5 8.5 4 38.5 26
Q. 2.
exclusive use of
the IWB 0 9 45.5 9 0 36.5 0 33.500 .070
shared use of the
IWB 7.5 4 11.5 8.5 12 43.5 13
Q. 3.
exclusive use of
the IWB 9 9 9 0 36.5 27.5 9 57.000 .812
shared use of the
IWB 8.5 12 4.5 4 25 29 17
Q. 4.
exclusive use of
the IWB 18.25 0 18.25 9 9 36.5 9 52.500 .591
shared use of the
IWB 17.5 10.5 15.5 12.5 11 26 7
Q. 5.
exclusive use of
the IWB 9 18 27.5 0 27.5
0 18
29.500 .038 shared use of the
IWB 0 0 7.5 12.5 12.5 36.5 31
Q. 6.
exclusive use of
the IWB 18.25 18.25 9 9 36.5 9 0 32.500 .060
shared use of the
IWB 7.5 4 7.5 4.5 15.5 34.5 26.5
Usefulness
Gro
up
s
Unfavourable opinions
Un
dec
ided
Favourable opinions
Ov
eral
l %
of
fav
ou
rab
le
op
inio
ns
Str
on
gly
dis
agre
e
Dis
agre
e
Dis
agre
e
som
ewh
at
Ag
ree
som
ewh
at
Ag
ree
Str
on
gly
agre
e
Item
1 Do you think that the
IWB helps you to
better understand
academic content?
exclusive
use of the IWB
0 0 0 0 18 45.5 36.5 100
shared use
of the IWB 0 0 4 4 12 39 41 92
Item
2
Using the IWB would
improve the quality of
your work.
exclusive
use of the
IWB 9 0 0 18.25 9 18.25 45.5 72.75
shared use of the IWB
0 0 0 4 36.5 38 21.5 96

There is no significant difference of opinions among the groups (Item 1: M. – W. = 130.500; p. =
.954; Item 2: Mann-Whitney3 (M. – W.) = 131.000; p. = .970) concerning the inferential statistic.
Having used the tool or not does not seem to influence the perceptions of the students as far as the
usefulness of the tool is concerned. In fact, regardless of the way of using it, it appears that the
interactive tool helps to have a better idea of the material and improves the quality of the work
being done.
6.2. Analysis of the results on the motivation of the learners (H2)
Two items of the questionnaire, provided at the end of the educational sequence, were about the
motivation of the learners (Table 6). The first item shows that sharing the use of the tool influences
the level of motivation of the learners. So, while 73% of the members from the group ‘exclusive use
of the IWB’ brought up the fact that their motivation did not change when the teacher used the
interactive whiteboard on their own, 54% of the learners from the other group recognised that their
motivation decreased significantly in the same situation (p=.018). The students who shared the use
of the tool expressed that they felt that the situation was less relevant if the interactive whiteboard
was used in a traditional way. For the second item, the views converge as far as the shared use of
the interactive whiteboard between the learners and the teacher (p=.784) is concerned. In fact, the
majority of the students in both groups said that their motivation for attending the course increased
in such a teaching and learning context. For this item, 45% of learners from the group ‘exclusive
use of the IWB’ said that their motivation decreased in such conditions while 25% of students from
the group “shared use of the IWB” said that this did not influence their motivation.
Way of
using
More
motivated
Less
motivated
It does not
change your
motivation
M. – W. p.
Item
1 When your teacher teaches
mathematics while using the
interactive whiteboard on its
own, you are…
Exclusive
use of the
IWB
9 18 73
70.500 .018 Shared use of
the IWB 21 54 25
Item
2 When your teacher teaches
mathematics while using the
interactive whiteboard and
you are invited to use it ,
you are…
Exclusive
use of the
IWB
54 45 0
125.500 .784 Shared use of
the IWB 71 4 25
Table 6 Descriptive and inferential statistics – Motivation of the learners
6.3 Analysis of the results about the learning processes (H3)
Figure 1 shows the average amount of social interaction, for a learner, according to both
experimental groups. There are noticeable differences between the averages of both groups
regarding the targeted social interactions. On the whole, the results are in favour of the group
‘shared use of the IWB’. The group of learners that did not share the use of the tool got a higher
average (x= 37.27; σ = 25.09) in comparison with the other group (x= 36.21; σ = 24.83) but for
only one variable, the ‘average number (x) of answers per student’. In other words, it appears that
the group sharing the use of the interactive whiteboard exchanged and shared more information
than the group that could not use the tool during the courses.
3 Mann-Whitney is a non-parametric test to compare two independent samples of small size.

Figure 1 Descriptive statistics – learning process characterised by the average number of social interactions which
were noted during the learning sequences
Thanks to the learning process analysis, it appears that the students who shared the use of the
interactive whiteboard interacted more in comparison with students who could not use the tool
directly. This statement has been statistically confirmed. There are indeed very significant
differences in terms of average numbers (x) between both groups consisting of the targeted
interaction types for the majority. Therefore, the students using the interactive tool asked the
teacher more questions than the learners from the group ‘exclusive use of the IWB’ (t= -2.189; p. =
.018). This result is an interesting indicator which suggests that students using the tool actively are
more interested in, and motivated by, participating in the lesson. This statement is in line with the
observations of other studies (Jeunier et al., 2005; Leroy, 2007) since they say that the use of the
IWB by students increases their motivation and, therefore, their participation. Moreover, the
learners who could share the use of the tool interacted more with each other than those for whom
the use of the interactive whiteboard was limited to the teacher (t= -3,438 ; p. = .001). Thanks to the
analysis of this learning process, therefore, it appears that the method which consists of sharing the
use of the tool is an interesting lever to stimulate a learning activity based on the IWB. As noted in
Cohen (2007) and Beauchamp & Parkinson, (2005), this study found that an educational mediation
of the teacher between the whiteboard and the students encouraged collective work between the
students and developed the contribution of others in the group. As well as the interactions between
each other, students from the group ‘shared use of the IWB’ did not hesitate to help the learners
using the tool and to interact with them (t= -5.272; p. = .000). The high significance of the
difference between the groups, for this indicator, is due to the experimental plan and lies in the fact
that only the students from the group ‘shared use’ had the possibility to develop these kind of
interactions. The observations showed that the interactions mainly concerned the techniques for
using the IWB to be able to cognitively perform the proposed exercises in the second phase.

6.4 Analysis of the results about the progress of the learners (H4)
From Table 7, a difference in the limit of the significance between the averages of both groups in
terms of relative gains is observed.
modes of use
of the IWB Pre-test Post-test relative gains
average CV
t= -0.45
p = .482
average CV
t= -1.69
p = .050
average CV
t= -1.60
p = .059
exclusive
use of the
IWB
11.09 .43 15.82 .18 44.00 79.11
shared use
of the IWB 11.17 .40 17.23 .11 61.88 46.26
Table 7 Descriptive and inferential statistics – Progression of the learners
The learners sharing the use of the interactive whiteboard made more progress in the mastery of the
skills up to 61.88% in comparison to the other group which was not allowed to use the tool and of
which the average is 44.00%. If considering the dispersion of the results while observing the
degrees of heterogeneity (CV) of the pre-test and post-test, there was a positive effect of the
educational sequence on the homogeneity of the results whatever the way the IWB was used. If
considering the difference between the modes of use, it is noted that the results of the learners for
the post-test with the condition ‘shared use’ are more homogeneous (CV= .11) than those with the
condition ‘exclusive use’ (CV= .18). In terms of intrinsic efficiency, a more participative
educational management of the IWB leads to benefits both on the progress of the students and the
level of heterogeneity of a group.
7. DISCUSSIONS, CONCLUSIONS AND PERSPECTIVES
The results achieved at the end of this study help to understand, to a certain extent, the lack of
potential benefits from the contribution of the interactive whiteboard in recent meta-analyses
(Karsenti, Collin & Dumouchel, 2012).
This study shows that a ‘shared use’ of the IWB has an impact on the learning and teaching process.
The observations made in a similar context, in accordance with the premise ‘all things being equal’,
gives the opportunity to see that sharing the use of the interactive whiteboard influences the
quantity and types of favoured interactions. In this teaching situation, there were more social
interactions in the classroom in comparison with an exclusive use of the board by the teacher.
Furthermore, the teacher acted more individually when they shared the use of the tool with the
students. This means that the teacher could observe the work of the students in real-time and had
more possibilities to better regulate the learning process while advising the students and guiding
them to perform the exercises. Several studies (Wood & Ashfield, 2008 ; Jeunier et al., 2005;
BECTA, 2003) argue that the potential of the tool lays the groundwork for educational methods in
greater accordance with the needs of the learners. However, it could be considered that the
condition for an educational use of the tool, more than the tool itself, leads to a more differentiated
teaching (Duroisin et al., 2011). The analysis of the declared level of motivation and the perceived
usability corroborates this observation at the process level.
With regards to the educational efficiency of the mode of use of the IWB, the progress of the
students is greater when they have the opportunity to share the use of the IWB and this can be
explained by their greater commitment to the activity. Although this difference in terms of progress

does not appear to be as significant on a statistical level, this analysis also shows a greater
homogeneity of performance for those learners. It appears that sharing the use of the interactive tool
considerably lightens the dispersion of the averages of all the learners from the group. This result is
interesting insofar as it shows that different educational use of the IWB can have a positive effect
on the level of heterogeneity of a group, which is often difficult for the teacher to achieve. Being
exposed to content is therefore not enough to learn. It has to be backed up by a real thought in terms
of tasks given to the students in order to facilitate the development of the targeted skills. This idea is
perfectly coherent with the model of Mayer (2010) according to which the human factor is a key-
variable to get a positive impact from the technology supporting learning if pertinent choices are
made in terms of educational implementation.
At the end of this experiment and in light of the results presented, it can be considered that a well
thought out, shared use of the interactive whiteboard has to be favoured if the learners participate
actively and if the teacher is capable of mobilising the interactive potential of the tool. As this study
has shown, giving the teacher exclusive of the tool has limited effects. However, as previously
suggested, the perfect solution does not exist. The quality of the use of the tool and the given lesson
essentially depends on the underlying thought process. Last but not least, it should be noted that
other dependent variables could also be taken into account. Additional measures which could be
taken into consideration for further studies are things such as efficiency, the differences in the
general performance and the precision between the productions made on paper or on an interactive
whiteboard, the use of traces and the number of multimediatised resources used. This could help to
better understand the learning dynamics around the interactive whiteboard. In terms of perspectives,
it is important to further investigate the modes of participation of the students within a learning
sequence including the use of the IWB. From the information available it seems that not many
empirical investigations have evaluated interactivity on the whole, when the students have the
opportunity to participate with the direct help of communication tools. These tools could be
handheld voting devices or digital tablets which are equipped with specific software in order to
manage the information flow between the teacher and the students.
8. ACKNOWLEDGEMENTS
Natacha Duroisin benefited from a F. R. S. - FNRS doctoral grant (Belgium). This work was
supported by the F. R. S. - FNRS under Grant 5046941.
9. REFERENCES
Bams, M., Chevalier, M., Colin, M., Dewaele, P., Huin, F. Want, A. (2014). Actimath. Van In,
Belgique.
Beauchamp, G. & Parkinson, J. (2005). Beyond the ‘wow’ Factor: Developing Interactivity with the
Interactive Whiteboard. School Science Review, 86, 97-103.
Bidakia, M. Z. & Mobasheri, N. (2013). Teachers’ Views of the Effects of the Interactive White
Board (IWB) on Teaching. Procedia - Social and Behavioral Sciences, Vol. 83, p. 140–144.
Bouchard, R. & Mangenot, F. (2001). Interactivité, interactions et multimédia, ENS Editions, Lyon.
British Educational Communications and Technology Agency - BECTA (2005). What the Research
Says about Interactive Whiteboards.
http://web.archive.org/web/20061208064641/http://www.becta.org.uk/page_documents/research
/wtrs_whiteboards.pdf Accessed 14 September 2013.
Cohen, Y. (2007). Un tableau qui favorise et valorise les échanges. Médialog, 62.
Dale, E. (1969). Audiovisual Methods in Teaching. A Holt-Dryden Book, New York.

Depover, Ch., Karsenti, Th. & Komis, V. (2007). Enseigner avec les technologies : favoriser les
apprentissages. Presses Universitaire du Québec, Québec.
D’Hainaut, L. (1975). Concepts et méthodes de la statistique. Labor, Bruxelles.
Duroisin, N., Temperman, G. & De Lievre, B. (2011). Effets de deux modalités d’usage du tableau
blanc interactif sur la dynamique d’apprentissage et la progression des apprenants, EIAH,
Université de Mons, Mons.
Glover, D., & Miller, D. (2001). Running with Technology: The Pedagogic Impact of the Large-
scale Introduction of Interactive Whiteboards in one Secondary School. Journal of Information
technology for Teacher Education, 10, 257–276.
Glover, D., Miller, D., Averis, D., & Door, V. (2007). The evolution of an effective pedagogy for
teachers using the interactive whiteboard in mathematics and modern languages: An empirical
analysis from the secondary sector. Learning, Media & Technology, 32(1), 5–20.
Hennessy, S. (2013). Using the Interactive Whiteboards to Support Dialogue in the Whole Class
Context. In Leask, M. & Pachler, N. Learning to Teach Using ICT in the Secondary School. A
Companion to School Experience. Routledge.
Jeunier, B., Morcillo-Bareille, A. & Camps, J. F. (2005). Expertise relative aux usages du tableau
blanc interactif en école primaire. Institut Universitaire de Formation des Maîtres. PrimTICE.
Karsenti, Th., Peraya, D. & Viens, J. (2002). Formation des enseignants à l’intégration pédagogique
des TIC : Esquisse historique des fondements, des recherches et des pratiques, Revue des
sciences de l’éducation, 28, 2.
Karsenti, T., Collin, S. & Dumouchel, G. (2012). L’envers du tableau : ce que disent les recherches
de l’impact des TBI sur la réussite scolaire, AQEP, 25 (2), p.30-32.
Kennewell, S & Beauchamp, G. (2007). Features of interactive whiteboards. Learning, Media and
Technology, 32(3), p. 227-241.
Lee, M. (2010). Interactive Whiteboards and Schooling: the Context. Technology, Pedagogy and
Education, Volume 19, Issue 2, p. 133-141.
Leroy, M. (2007). Du vidéoprojecteur au TBI ; Les TICE au service du collectif. TICE Infos, 21,
Académie de Nancy-Metz.
Levy, P. (2002). Interactive Whiteboards in Learning and teaching in two Sheffield schools: A
developmental study. Department of Information Studies, University of Sheffield.
http://dis.shef.ac.uk/eirg/projects/wboards.htm. Accessed 19 novembre 2013
López, O. (2010). The Digital Learning Classroom: Improving English Language Learners’
academic success in mathematics and reading using interactive whiteboard technology.
Computers & Education, Volume 54, Issue 4, p. 901–915.
Macedo-Rouet, M. Que dit la recherche?, Agence des usages TICE, 2006. http://www.agence-
usages-tice.education.fr/template.asp?page=10. Accessed 7 novembre 2013.
Mayer, R E. (2010), “Learning with technology”, in Hanna Dumont, David Istance and Francisco
Benavides (eds.), The Nature of Learning: Using Research to Inspire Practice, OECD
Publishing.
Merrett, S. & Edwards, J. (2005). Enhancing mathematical thinking with an interactive whiteboard.
Micromath, 21(3), 9–12.
Poyet, F. (2009). Impact des TIC dans l'enseignement : une alternative pour l'individualisation ?,
Dossier d'actualité n° 41, Lyon : INRP.

Sinclair, J. & Coulthard, M. (1992). Toward an Analysis of Discourse. Advances in Spoken
Discourse Analysis. Routledge, London.
Slay, H., Siebo¨rger, I. & Hodgkinson-Williams, C. (2008). Interactive whiteboards: Real beauty or
just ‘‘lipstick”? Computers & Education, Vol. 51, p. 1321–1341.
Somekh, B., Haldane, M., Jones, K. (2007). Evaluation of the Primary Schools Whiteboard
Expansion Project. Report to the Department for Children, Schools and Families. Manchester
Metropolitan University.
Torff, B., Tirottaa, R. (2009). Interactive whiteboards produce small gains in elementary students’
self-reported motivation in mathematics. Computers & Education, 54, 379-383.
Vygotsky, L. S. (1978). Mind in Society: The Development of Higher Psychological Processes.
Cambridge, MA : Harvard University Press.
Wall, K., Higgins, S. & Smith, H. (2005). ‘The Visual Helps me Understand the Complicated
Things’: Pupil Views of Teaching and Learning With Interactive Whiteboards. British Journal of
Educational Technology, 36 (5), 851-867.
Warren, C. (2002). Interactive Whiteboards: an approach to an effective methodology.
http://www.virtuallearning.org.uk/whiteboards/An_approach_to_an_effective_methodology.pdf
Accessed 5 janvier 2012.
Wood, R. & Ashfield, J. (2008). The Use of the Interactive Whiteboard for Creative Teaching
and Learning in Literacy and Mathematics: a Case Study. British Journal of Educational
Technology, 39 (1), 84-96.