“Resonantly induced refractive index changes in Yb-doped fibers: the origin, properties and...
26
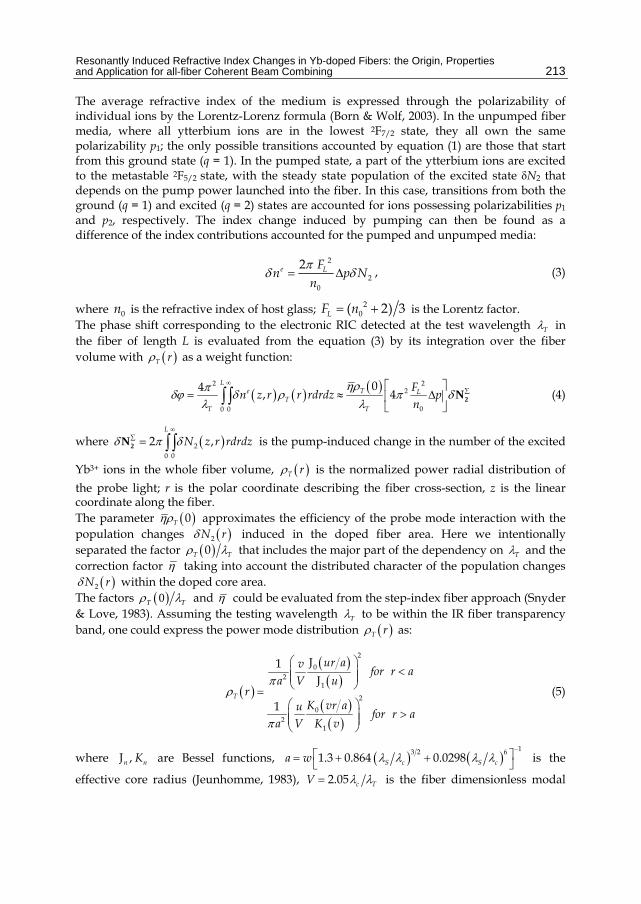
11 Resonantly Induced Refractive Index Changes in Yb-doped Fibers: the Origin, Properties and Application for all-fiber Coherent Beam Combining Andrei A. Fotiadi 1,3 , Oleg L. Antipov 2 and Patrice Mégret 1 1 Université de Mons, 2 Institute of Applied Physics RAS, 3 Ioffe Physico-Technical Institute RAS, 1 Belgium 2,3 Russian Federation 1. Introduction For years, solid-state lasers have replaced traditional systems in numerous laser applications. Now, fiber lasers bring the ultimate in solid-state reliability and operating convenience to applications in materials processing, telecom, sensing, and medicine and so on. Various configurations of continuous wave (cw), mode-locked, Q-switched, or single- frequency lasers have been reported, offering a large variety in performance characteristics. Ytterbium-doped silica fiber lasers operating near 1 μm as well as erbium fibers at 1.5 μm have been among the most successful fiber lasers creating a great impact on many areas of technology. Current progresses in fiber lasers are associated with further scaling of the output power. In particular, such power scaling could be achieved through coherent combining of the beams delivered by a number of regular fiber sources. In this perspective, apart from the use of active fibers as a gain media, it has appeared that the unique and rather special properties of Yb-doped fibers discussed in this Chapter have still to be exploited in novel high-brightness all-fiber laser systems. The Chapter is dedicated to the effect of refractive index changes taking place in standard commercial Yb-doped optical fibers under diode pumping, and also to applications of this effect for coherent combining of fiber lasers. Being associated with changes of population of different ion states, the effect of refractive index changes (RIC) is essentially a side effect of the population inversion mechanism that is responsible for light amplification in lasers. The electronic and thermal RIC mechanisms, which are important both for laser crystals and glasses, are intensively investigated for several years. Correct understanding of these phenomena is vital for Yb-doped fiber lasers and amplifiers, whose performance characteristics rely on physical processes in the active medium. The Chapter includes remarkable amount of original experimental studies, theoretical modeling and demonstration of advanced fiber configurations. The structure of the Chapter is logical and easy to follow. Part 2 contains judicially selected background material to
-
Upload
independent -
Category
Documents
-
view
3 -
download
0
Transcript of “Resonantly induced refractive index changes in Yb-doped fibers: the origin, properties and...
11
Resonantly Induced Refractive Index Changes in Yb-doped Fibers: the Origin, Properties
and Application for all-fiber Coherent Beam Combining
Andrei A. Fotiadi1,3, Oleg L. Antipov2 and Patrice Mégret1 1Université de Mons,
2Institute of Applied Physics RAS, 3Ioffe Physico-Technical Institute RAS,
1Belgium 2,3Russian Federation
1. Introduction For years, solid-state lasers have replaced traditional systems in numerous laser applications. Now, fiber lasers bring the ultimate in solid-state reliability and operating convenience to applications in materials processing, telecom, sensing, and medicine and so on. Various configurations of continuous wave (cw), mode-locked, Q-switched, or single-frequency lasers have been reported, offering a large variety in performance characteristics. Ytterbium-doped silica fiber lasers operating near 1 µm as well as erbium fibers at 1.5 µm have been among the most successful fiber lasers creating a great impact on many areas of technology. Current progresses in fiber lasers are associated with further scaling of the output power. In particular, such power scaling could be achieved through coherent combining of the beams delivered by a number of regular fiber sources. In this perspective, apart from the use of active fibers as a gain media, it has appeared that the unique and rather special properties of Yb-doped fibers discussed in this Chapter have still to be exploited in novel high-brightness all-fiber laser systems. The Chapter is dedicated to the effect of refractive index changes taking place in standard commercial Yb-doped optical fibers under diode pumping, and also to applications of this effect for coherent combining of fiber lasers. Being associated with changes of population of different ion states, the effect of refractive index changes (RIC) is essentially a side effect of the population inversion mechanism that is responsible for light amplification in lasers. The electronic and thermal RIC mechanisms, which are important both for laser crystals and glasses, are intensively investigated for several years. Correct understanding of these phenomena is vital for Yb-doped fiber lasers and amplifiers, whose performance characteristics rely on physical processes in the active medium. The Chapter includes remarkable amount of original experimental studies, theoretical modeling and demonstration of advanced fiber configurations. The structure of the Chapter is logical and easy to follow. Part 2 contains judicially selected background material to

Frontiers in Guided Wave Optics and Optoelectronics
210
enable those who are not expert in the field to appreciate the subject of the research. We give a clear physical insight into the electronic and thermal RIC mechanisms, and present important estimations helping the reader to clearly understand the scientific context, motivation and aims of this work. The main body of the work is centered around two experimental studies (Fotiadi et al., 2008c; Fotiadi et al., 2009c), reproduced in parts 3 and 4. Part 3 is dedicated to the fundamental properties of the Yb-doped fibers sensitive to the diode pumping at 980 nm. In this part we show our original RIC experiments performed with different samples of aluminum-silicate fibers and report on the dynamical characteristics of the RIC effect measured in the spectral range 1460 - 1620 nm. Detailed analysis of these experimental data has brought us to the conclusion that the process is predetermining by the electronic RIC mechanism that can be quantitatively described by a two-level population inversion model with the polarizability difference (PD) of the Yb-ion in the excited and ground states as the only material model parameter determined from the experimental data. The absolute PD value measured in the experiment is found to be independent on the testing wavelength and the fiber specification parameters, i.e. the cross-section profile, the size, the length and the Yb-ion concentration. Our results ensure a predominant contribution to the RIC effect from far-resonance UV electronic transitions rather than near-resonant IR transitions. Part 4 of the Chapter focuses on potential applications of the RIC effect in advanced fiber laser systems implemented through our original concept of all-fiber coherent beam combining. The concept employs Yb-doped fibers as optically controllable phase shifters to be conjugated with Er-doped fiber amplifiers operating at ~1.55 µm. The coherent combining of 500-mW Er-doped amplifiers successfully demonstrated in our experiment confirms the validity of the concept. The performance characteristics of the multichannel fiber laser system associated with the proposed power scaling method are also under discussion.
2. RICs in Yb-doped optical fibers: the origins and fundamentals In this part we summarize fundamentals of the electronic and thermal mechanisms of the refractive index changes (RIC) in single-mode ytterbium-doped optical fibers induced by optical pulses at 980 nm and we report the general equations describing RIC evolution. In particular, the electronic RIC dynamics is shown to follow the dynamics of the population of the excited/unexcited ion states with a factor proportional to their polarizability difference (PD). The thermal contribution to the RICs induced in standard Yb-doped fibers is shown to be negligible under condition of all-fiber low-power experiments discussed in the Chapter.
2.1 Electronic and thermal RIC mechanisms caused by nonlinear pump absorption Ytterbium-doped silicate glass fibers are widely used for high-power, high-beam-quality laser sources due to their impressing gain efficiency, single transverse mode quality, relaxed thermal management problems, and overall robustness to environmental disturbances. Resulting from the confined mode structure and typically long propagation distances, nonlinear phenomena such as stimulated Brillouin scattering, stimulated Raman scattering, optical Kerr effect, inter-mode four-wave mixing, soliton and supercontinuum generation are observed in fiber lasers at relatively low power due to the high field intensity in the fiber

Resonantly Induced Refractive Index Changes in Yb-doped Fibers: the Origin, Properties and Application for all-fiber Coherent Beam Combining
211
core (Agrawal, 1989). In particular, the optical Kerr effect can cause refractive index changes (RIC) leading to self-focusing, self trapping, self phase modulation, and soliton formation in the fiber cavity. It has been shown, however, that power-dependent RICs other than the optical Kerr effect can take place in ytterbium-doped fibers (Arkwright et al., 1996). These specific phenomena are attributed to the population inversion mechanism that is also responsible for optically induced light amplification and saturating absorption in the active fiber media (Digonnet et al., 1997). The propagation of an optical beam through the absorbing (or amplifying) fiber media induces changes in the refractive index, which could cause self- and cross- phase modulation, light-induced gratings, spectral hole-burning effects, i.e. effects contributing dynamical behavior of the fiber lasers. In the particular case of Yb-doped optical fibers, one could account for thermal and non-thermal RIC effects driven by the population inversion mechanism in an indirect and direct manner, respectively. The thermal RIC effects are caused by pump thermalization of the absorbed energy into heat. The electronic RICs are explained by the polarizability difference (PD) between the excited and ground states. We have to distinguish the electronic RIC effect from the regular Kerr nonlinearity that does not relay on the population inversion. In many experiments, it is not straightforward to separate electronic and thermal contributions to refractive index change because they usually have similar response times. In the next sections of this part, we present an analytical treatment and then rough estimations in order to evaluate the RIC signal and determinate the fractions of the electronic and thermal contributions to this signal in the experiments discussed further in the Chapter.
2.2 Fundamentals of electronic RICs in Yb-doped fibers Silica glass, the most common material for the production of fibers, is a good host for Yb-ions. The spectroscopy of the Yb-ion is simple compared to other rare-earth ions (figure 1) (Paschotta et al., 1997). For amplification in optical spectrum range, only two level manifolds are important: the ground-state manifold (2F7/2) and the excited-state manifold (2F5/2). They consist of four and three sublevels, respectively. The transitions between sublevels are smoothed by strong homogeneous and inhomogeneous broadening. As a result, ytterbium fibers are able to provide an optical gain over the very broad wavelength range from 975 to 1200 nm with a range of possible pump wavelengths from 860 nm to 1064 nm. In the spectrum range outside these resonances, ytterbium fibers are optically transparent and are the subject to pure RIC effect measurements. The electronic-population RIC contribution is owned to the polarizability difference (PD) between the excited and ground states (Born & Wolf, 2003). The electronic polarizability is defined as the ratio of the dipole moment induced in an ion to the electric field that produces this dipole moment. The polarizability of the Yb-ion on some electron level q at the given testing optical frequency Tν is determined by the probabilities of all possible transitions from this level to other levels i q≠ and is expressed as the following:
2 22
2 2 2 2 2
( )( )
4 ( ) ( )qi qi T
q Ti qi T T qi
fepm
ν νν
π ν ν ν ν−
=− + Δ∑ (1)
where e and m are the electron charge and mass; fqi is the oscillator force of the transition between levels q and i; qiν and qiνΔ are the resonance frequency and the linewidth.

Frontiers in Guided Wave Optics and Optoelectronics
212
4
12
3
5d
4f
E, cm-1
0
~1000
~700
Charge-transfer band
~5000
2F5/2
2F7/2 1
2
(a) (b) Fig. 1. The atomic manifold level system (a) (Antipov et al., 2003) and emission and absorption cross section of ytterbium in silica host (b) (Paschotta et al., 1997). 1, 2 and 1, 2, 3,4 indicate the levels for two- and four- level laser models, respectively.
Remaining in the frame of the two level laser approximation, we have to use only 1( )p ν and 2( )p ν , i.e. the Yb-ion polarizabilities in the ground (2F7/2) and excited (2F5/2) states, respectively. According to equation (1), the dominating contributions to these polarizabilities are expected from the transitions, whose resonant frequencies are closer to the testing frequency 1 2,I I Tν ν ν≈ and/or from the non-resonance transitions with the strongest oscillator forces. In Yb-doped materials, the well-allowed UV transitions to the 5d-electron shell and the charge-transfer transition are characterized by the oscillator forces that are several orders of magnitude higher than the forces of optical transitions inside the 4f-electron shell. In IR spectrum band, the polarizability difference 2 1( )p p pνΔ = − is expressed from equation (1) as a sum of contributions from the near-resonance transitions (between the ground and excited states) and non-resonance UV transitions. Far from optical resonances, i.e. within Yb-doped fiber IR transparency band ( 1.2T mλ μ> ), the PD could be represented by two major terms with different dependencies on the testing wavelength Tλ :
2 2 2
2 2 2 2 2 2
1( ) 14 1
R UT
R T T T
ep A o B oc m
λ λλπ λ λ λ λ
⎧ ⎫⎡ ⎤ ⎡ ⎤⎛ ⎞ ⎛ ⎞⎪ ⎪Δ ≈ + + +⎢ ⎥ ⎢ ⎥⎨ ⎬⎜ ⎟ ⎜ ⎟−⎢ ⎥ ⎢ ⎥⎝ ⎠ ⎝ ⎠⎪ ⎪⎣ ⎦ ⎣ ⎦⎩ ⎭
(2)
where 2 22 2 1 1I I I I
I RA f fλ λ
∈
≡ −∑ ; ( )2 22 2 1 1U U U UB f fλ λ≡ − ; ~ 1R mλ μ is a typical wavelength of the
resonance transitions, 1Uf , 1Uλ , 2Uf , 2Uλ are oscillation forces and wavelengths of well-allowed charge-transfer transitions to the 5d-electron shell from the ground and excited state, respectively. The free space wavelengths 1Uλ , 2Uλ are located in the UV spectrum band around ~ 0.1U mλ μ and obviously 1 2U Uλ λ≠ . So, the origin of non-resonance contribution to the PD (the second term, ~ B ) is the difference in the probabilities of the transitions at the testing wavelength Tλ from the ground and excited states to the 5d- electron shell or the charge-transfer transition.
Resonantly Induced Refractive Index Changes in Yb-doped Fibers: the Origin, Properties and Application for all-fiber Coherent Beam Combining
213
The average refractive index of the medium is expressed through the polarizability of individual ions by the Lorentz-Lorenz formula (Born & Wolf, 2003). In the unpumped fiber media, where all ytterbium ions are in the lowest 2F7/2 state, they all own the same polarizability p1; the only possible transitions accounted by equation (1) are those that start from this ground state (q = 1). In the pumped state, a part of the ytterbium ions are excited to the metastable 2F5/2 state, with the steady state population of the excited state N2 that depends on the pump power launched into the fiber. In this case, transitions from both the ground (q = 1) and excited (q = 2) states are accounted for ions possessing polarizabilities p1 and p2, respectively. The index change induced by pumping can then be found as a difference of the index contributions accounted for the pumped and unpumped media:
2
20
2e LFn p N
nπ
δ δ= Δ , (3)
where 0n is the refractive index of host glass; 20( 2) 3LF n= + is the Lorentz factor.
The phase shift corresponding to the electronic RIC detected at the test wavelength Tλ in the fiber of length L is evaluated from the equation (3) by its integration over the fiber volume with ( )T rρ as a weight function:
( ) ( ) ( )2 22
00 0
04 , 4L
Te LT
T T
Fn z r r rdrdz pn
ηρπδϕ δ ρ π δλ λ
∞∑⎡ ⎤
= ≈ Δ⎢ ⎥⎣ ⎦
∫ ∫ 2N (4)
where ( )20 0
2 ,L
N z r rdrdzδ π δ∞
∑ = ∫ ∫2N is the pump-induced change in the number of the excited
Yb3+ ions in the whole fiber volume, ( )T rρ is the normalized power radial distribution of the probe light; r is the polar coordinate describing the fiber cross-section, z is the linear coordinate along the fiber. The parameter ( )0Tηρ approximates the efficiency of the probe mode interaction with the population changes ( )2N rδ induced in the doped fiber area. Here we intentionally separated the factor ( )0T Tρ λ that includes the major part of the dependency on Tλ and the correction factor η taking into account the distributed character of the population changes
( )2N rδ within the doped core area. The factors ( )0T Tρ λ and η could be evaluated from the step-index fiber approach (Snyder & Love, 1983). Assuming the testing wavelength Tλ to be within the IR fiber transparency band, one could express the power mode distribution ( )T rρ as:
( )
( )( )
( )( )
2
02
1
2
02
1
J1J
1T
ur av for r aa V u
rK vr au for r a
a V K v
πρ
π
⎛ ⎞<⎜ ⎟⎜ ⎟
⎝ ⎠=⎛ ⎞
>⎜ ⎟⎜ ⎟⎝ ⎠
(5)
where J ,n nK are Bessel functions, ( ) ( )13 2 61.3 0.864 0.0298S c S ca w λ λ λ λ
−⎡ ⎤= + +⎣ ⎦ is the
effective core radius (Jeunhomme, 1983), 2.05 c TV λ λ= is the fiber dimensionless modal

Frontiers in Guided Wave Optics and Optoelectronics
214
parameter, w is the modal field diameter at 1.06S mλ μ≈ , and cλ is the fiber cut-off
wavelength, ( )Tu λ and ( ) ( )22T Tv V uλ λ= − are the modal phase parameters that are a
solution of the characteristic equation ( ) ( ) ( ) ( )0 1 0 1J K K Jv u v u v u= .
0
5
10
0.0 0.5 1.0 1.5 2.00.0
0.5
1.0
1.5
Delta Uniform Gauss
Yb-
ion
dist
ribut
ion
πa2 n Y
b(r)
980 nm 1060 nm 1550 nm
Mod
e po
wer
dis
tribu
tion
πa2 ρ T(r
)
Radius r/a1100 1200 1300 1400 1500 1600 1700
0.00.20.40.60.81.01.21.4
η for delta nYb(r)η for uniform nYb(r)
πa2ρT(0)
Cor
rect
ion
fact
ors
Test wavelength, nm
η for Gaussian nYb(r)0
5
10
0.0 0.5 1.0 1.5 2.00.0
0.5
1.0
1.5
Delta Uniform Gauss
Yb-
ion
dist
ribut
ion
πa2 n Y
b(r)
980 nm 1060 nm 1550 nm
Mod
e po
wer
dis
tribu
tion
πa2 ρ T(r
)
Radius r/a1100 1200 1300 1400 1500 1600 1700
0.00.20.40.60.81.01.21.4
η for delta nYb(r)η for uniform nYb(r)
πa2ρT(0)
Cor
rect
ion
fact
ors
Test wavelength, nm
η for Gaussian nYb(r)
(a) (b)
Fig. 2. The normalized mode power distributions at different wavelengths in comparison with examples of Yb-ion distributions: delta-like ( ) ( ) 2
Ybn r r aδ π= , uniform ( ) 21Ybn r aπ= and Gaussian ( ) ( )2 24exp 2Ybn r r a aπ⎡ ⎤== −⎣ ⎦ (a). The coefficient ( )0Tρ (equations (5)) and correction factors η (equation (6)) calculated for different Yb-ion distributions.
Figure 2 explains the dependencies of the parameter ( )0Tηρ on the testing wavelength λT and on the Yb-ion distribution within the fiber core. One can see from figure 2 (a) that the longer testing wavelength λT corresponds to the wider distribution ( )T rρ providing the smaller overlap between the signal power and the doped fiber core area. As a result the parameter ( )0Tρ (figure 2 (b)) decreases with the testing wavelength. As far as all changes
( )2N rδ are assumed to occur close to the fiber axis, the factor 1η → . However, the wider Yb-ion distribution ( )N r decreases the overlap between the signal power and the doped fiber core area (figure 2(a)) resulting in 1η < . The factor η could be estimated from equation (4) to lie within two bounds:
( ) ( ) ( )( ) ( ) ( )
( ) ( )0
0
0
0Yb P T
Yb T T
Yb P
n r r r rdrn r r rdr
n r r rdr
ρ ρρ ρ η
ρ
∞
∞
∞< <∫
∫∫
(6)
where ( )P rρ is the normalized mode radial power distribution at the pump wavelength Pλ
and ( ) ( ) ( )0
2Ybn r N r N r rdrπ∞
= ∫ is the normalized distribution of Yb-ions over the fiber core.
The typical values of the correction factor calculated for uniform and Gaussian distributions of the Yb-ion dopands are 0.7η ≈ and 0.85η ≈ , respectively. The factors η determined from inequalities (6) perform a typical error of ~10% (figure 2(b)).

Resonantly Induced Refractive Index Changes in Yb-doped Fibers: the Origin, Properties and Application for all-fiber Coherent Beam Combining
215
Equation (4) predicts that the phase shift is proportional to the pump-induced change in the whole number of the excited ions in the fiber. Therefore, the dynamics of both of them is governed by similar rate equations:
in out ASE
P S sp
d P P Pdt h h
δ δν ν τ
Σ Σ−= − −2 2N N (7)
Sin out ASE
P sp
d K P P Pdtδϕ λ δϕ
λ τ⎡ ⎤
= − − −⎢ ⎥⎣ ⎦
(8)
where ( )2 204 0L T P TK F p n hcπ ηρ λ λ= Δ , h is the Plank constant, Pν , Sν are the average
frequencies of the pump and the amplified spontaneous emission (ASE) (or lasing), inP , outP are the input and output (residual) powers at Pν , ASEP is the emitted power at ν S and
an ideal quantum efficiency for the Yb-doped fiber is assumed. The validity of the equation (8) has been confirmed in the experiment to be discussed in part 3 of the Chapter.
2.3 Fundamentals of thermally induced RICs in Yb-doped fibers The described electronic RIC is not the only mechanism responsible for the induced phase shift in Yb-doped fibers and governed by the population inversion. The thermalization of the pump power leading to temperature rise may result in thermally-induced index changes in the fiber media. Moreover, thermal expansions of the fiber core along its length and its radius may cause phase modulation. However, one could show that the transverse expansion of the single-mode fiber core gives a small contribution to the thermally-induced phase shift in comparison with the volume RIC and core longitudinal expansion. The refractive index change due to temperature rise Tδ is expressed as
302 'T T
phn nn T n n C TT T
δ δ δ α δ⎡ ⎤∂ ∂⎛ ⎞ ⎛ ⎞= + = +⎜ ⎟ ⎜ ⎟⎢ ⎥∂ ∂⎝ ⎠ ⎝ ⎠⎣ ⎦ (9)
where n T∂ ∂ is the thermal RIC coefficient, phnδ accounts for the photoelastic effect, 'C denotes a photoelastic constant averaged over polarizations, and Tα is the thermal longitudinal expansion coefficient. In the simplest approximation of four-level fiber amplifier (see figure 1(a)), the thermal load is achieved through radiation-less transitions only. The corresponding heat equation expresses the evolution of the temperature ( ), ,T r z t within the fiber:
( )43 4 43 21 2 21
1
p p
T T h N w h N wt C C
κ ν νρ ρ
∂− Δ = +
∂ (10)
where κ and ρ are the thermal conductivity and density of the host glass; PC is the thermal capacity, 4N is the population of the upper pump level “ 4 ” (the Stark-depleted sub-level of the (2F5/2) state) of the Yb3+-ions; 43v , 43w are the frequency and rate of the transition from the pump level “ 4 ” to the upper laser level “ 3 ”; 2N is the population of the lower laser level “ 2 ” (the depleted sub-level of the (2F7/2) ground state); 21v and 21w are the frequency and rate of the transition from the low laser level “ 2 ” to the ground state “ 1 ”.
Frontiers in Guided Wave Optics and Optoelectronics
216
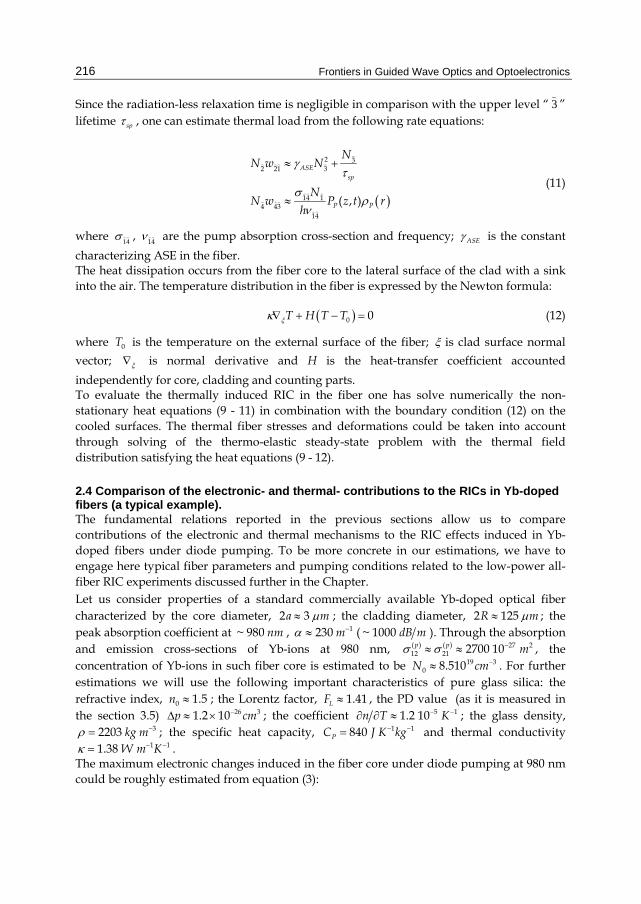
Since the radiation-less relaxation time is negligible in comparison with the upper level “ 3 ” lifetime spτ , one can estimate thermal load from the following rate equations:
( )
2 32 21 3
14 14 43
14
( , )
ASEsp
P P
NN w N
NN w P z t r
h
γτ
σρ
ν
≈ +
≈ (11)
where 14σ , 14ν are the pump absorption cross-section and frequency; ASEγ is the constant characterizing ASE in the fiber. The heat dissipation occurs from the fiber core to the lateral surface of the clad with a sink into the air. The temperature distribution in the fiber is expressed by the Newton formula:
( )0 0T H T Tξκ∇ + − = (12)
where 0T is the temperature on the external surface of the fiber; ξ is clad surface normal vector; ξ∇ is normal derivative and H is the heat-transfer coefficient accounted independently for core, cladding and counting parts. To evaluate the thermally induced RIC in the fiber one has solve numerically the non-stationary heat equations (9 - 11) in combination with the boundary condition (12) on the cooled surfaces. The thermal fiber stresses and deformations could be taken into account through solving of the thermo-elastic steady-state problem with the thermal field distribution satisfying the heat equations (9 - 12).
2.4 Comparison of the electronic- and thermal- contributions to the RICs in Yb-doped fibers (a typical example). The fundamental relations reported in the previous sections allow us to compare contributions of the electronic and thermal mechanisms to the RIC effects induced in Yb-doped fibers under diode pumping. To be more concrete in our estimations, we have to engage here typical fiber parameters and pumping conditions related to the low-power all-fiber RIC experiments discussed further in the Chapter. Let us consider properties of a standard commercially available Yb-doped optical fiber characterized by the core diameter, 2 3a mμ≈ ; the cladding diameter, 2 125R mμ≈ ; the peak absorption coefficient at ~ 980 nm , 1230 mα −≈ ( ~ 1000 dB m ). Through the absorption and emission cross-sections of Yb-ions at 980 nm, ( ) ( ) 27 2
12 21 2700 10p p mσ σ −≈ ≈ , the concentration of Yb-ions in such fiber core is estimated to be 19 3
0 8.510N cm−≈ . For further estimations we will use the following important characteristics of pure glass silica: the refractive index, 0 1.5n ≈ ; the Lorentz factor, 1.41LF ≈ , the PD value (as it is measured in the section 3.5) 26 31.2 10p cm−Δ ≈ × ; the coefficient 5 11.2 10n T K− −∂ ∂ ≈ ; the glass density,
32203 kg mρ −= ; the specific heat capacity, 1 1840PC J K kg− −= and thermal conductivity 1 11.38 W m Kκ − −= .
The maximum electronic changes induced in the fiber core under diode pumping at 980 nm could be roughly estimated from equation (3):
Resonantly Induced Refractive Index Changes in Yb-doped Fibers: the Origin, Properties and Application for all-fiber Coherent Beam Combining
217
2
60
0
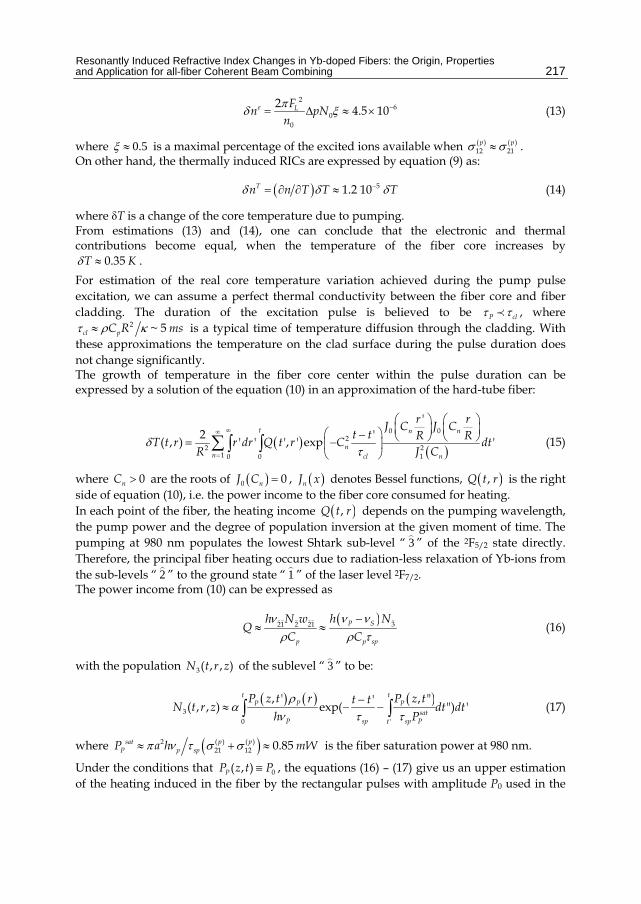
2 4.5 10e LFn pNnπδ ξ −= Δ ≈ × (13)
where 0.5ξ ≈ is a maximal percentage of the excited ions available when ( ) ( )12 21
p pσ σ≈ . On other hand, the thermally induced RICs are expressed by equation (9) as:
( ) 51.2 10Tn n T T Tδ δ δ−= ∂ ∂ ≈ (14)
where T is a change of the core temperature due to pumping. From estimations (13) and (14), one can conclude that the electronic and thermal contributions become equal, when the temperature of the fiber core increases by
0.35T Kδ ≈ . For estimation of the real core temperature variation achieved during the pump pulse excitation, we can assume a perfect thermal conductivity between the fiber core and fiber cladding. The duration of the excitation pulse is believed to be P clτ τ≺ , where
2 ~ 5cl pC R msτ ρ κ≈ is a typical time of temperature diffusion through the cladding. With these approximations the temperature on the clad surface during the pulse duration does not change significantly. The growth of temperature in the fiber core center within the pulse duration can be expressed by a solution of the equation (10) in an approximation of the hard-tube fiber:
( ) ( )0 0
22 2
1 10 0
'2 '( , ) ' ' ', ' exp '
t n n
nn cl n
r rJ C J Ct t R RT t r r dr Q t r C dt
R J Cδ
τ
∞∞
=
⎛ ⎞ ⎛ ⎞⎜ ⎟ ⎜ ⎟⎛ ⎞− ⎝ ⎠ ⎝ ⎠= −⎜ ⎟
⎝ ⎠∑∫ ∫ (15)
where 0nC > are the roots of ( )0 0nJ C = , ( )nJ x denotes Bessel functions, ( ),Q t r is the right side of equation (10), i.e. the power income to the fiber core consumed for heating. In each point of the fiber, the heating income ( ),Q t r depends on the pumping wavelength, the pump power and the degree of population inversion at the given moment of time. The pumping at 980 nm populates the lowest Shtark sub-level “ 3 ” of the 2F5/2 state directly. Therefore, the principal fiber heating occurs due to radiation-less relaxation of Yb-ions from the sub-levels “ 2 ” to the ground state “ 1 ” of the laser level 2F7/2. The power income from (10) can be expressed as
( ) 321 2 21 P S
p p sp
h Nh N wQ
C Cν νν
ρ ρ τ−
≈ ≈ (16)
with the population 3( , , )N t r z of the sublevel “ 3 ” to be:
( ) ( ) ( )3
0 '
, ' , "'( , , ) exp( ") 't t
P P Psat
P sp sp Pt
P z t r P z tt tN t r z dt dth P
ρα
ν τ τ−
≈ − −∫ ∫ (17)
where ( )( ) ( )221 12 0.85p psat
P p spP a h mWπ ν τ σ σ≈ + ≈ is the fiber saturation power at 980 nm.
Under the conditions that 0( , )PP z t P≡ , the equations (16) – (17) give us an upper estimation of the heating induced in the fiber by the rectangular pulses with amplitude P0 used in the

Frontiers in Guided Wave Optics and Optoelectronics
218
experiment. Taking into account that 0sat
PP P>> , the quantity Q averaged over the fiber core cross-section and the pulse duration is estimated to be:
( )2
satp p s
p p
PQ
a Cν ν
απ ρ ν
−≈ (18)
The upper estimation of the temperature deviation T in the fiber core centre achieved for the pump pulse excitation Pτ is derived from (15) by setting ( ', ')Q t r Q≡ and then formally assuming Pt τ= → ∞ :
( )2
2 2 ln 1 ln 0.012
sat p sst cl
p
Pa R RT T Q KR a a
α ν νδ τ
πκν
−⎛ ⎞⎛ ⎞ ⎛ ⎞< Δ ≈ + ≈ ≈⎜ ⎟⎜ ⎟ ⎜ ⎟⎝ ⎠ ⎝ ⎠⎝ ⎠
(19)
One can see from (19) that T is at least of one order of magnitude lower than the core temperature increase expected for the case of equal contributions of thermal and electronic mechanisms. Following the same procedure we could estimate from equations (3) and (15) – (19) the ratio between the electronic and thermal RIC contributions during the excitation:
( ) ( )
2
20
2 1 352ln 1
espL
T
P S
pn Fn n a R n T h
a
τ κπ
ν ν
ΔΔ> ≈
Δ ⎛ ⎞⎛ ⎞ + ∂ ∂ −⎜ ⎟⎜ ⎟⎝ ⎠⎝ ⎠
(20)
Just after the end of the pulse excitation the heating of the fiber core continues, since the sublevel “ 3 ” is still populated. In accordance with equation (3), relaxation of the population from the sublevel “ 3 ” occurs exponentially with a decay time 0.85sp msτ ≈ , so the quantity Q has to relax in the same manner. The exponential relaxation of the heating source Q causes similar relaxation of the fiber core temperature, because thermalization of the heating in the fiber core area occurs for the time 2 ~ 3cor pC a sτ ρ κ μ≈ much smaller then the relaxation time ( cor spτ τ<< ). As a result, the exponential RIC relaxation after pulse excitation is contributed by two synchronized components of the electronic and thermal RICs, e
relnΔ and T
relnΔ , respectively. The ratio between them is estimated from expressions (15)-(17) as:
( )
( )( )2
0 22
3.5 10/ ( )
eL sprel
Trel p s p cor
F n pnn n T h C
π τ
ν ν ρ τ
ΔΔ≈ ≈ ×
Δ ∂ ∂ − (21)
In conclusion, the estimations (20 - 21) ensure us that the RIC effects measured in our experiment is almost of pure electronic nature. These experiments are under consideration in the next part of the Chapter.
2.5 Conclusion to the part 2 Summarizing this part, we have presented theoretical analysis of the electronic and thermal RIC effects taking place in Yb-doped optical fibers. We have clarified their joined population inversion nature and explained the principal difference between the two mechanisms. We derived key equations of the dynamical effects that will be fruitfully employed in the next sections for detailed analysis of numerous experimental observations. Importantly, the

Resonantly Induced Refractive Index Changes in Yb-doped Fibers: the Origin, Properties and Application for all-fiber Coherent Beam Combining
219
thermal contribution to the RICs observed in Yb-doped fibers is shown to be negligible under condition of the all-fiber low-power experiments considered below.
3. Pump-induced refractive index changes in Yb-doped optical fibers In this part, we experimentally characterize the RICs induced by optical pulses at 980 nm in single-mode ytterbium-doped optical fibers and report details of the effect observation (Fotiadi et al., 2007, 2008b, 2008c). The RIC dynamics is shown to agree with the two level laser model discussed early in section 2.2. The only material model parameter, the absolute PD value, is measured in the spectral range of 1460-1620 nm for different fiber samples and is found to be independent on the fiber geometry and on the ion concentration. The PD dispersion profile highlights a predominant far-resonance UV rather than near-resonant IR transitions contribution to the RIC.
MasterLaser
Yb-doped fiberunder test
50/50coupler
1450-1620 nm~10m of
coherence balanced
fiber
50/50coupler
Pump980 nm
Photodetector
WDMcoupler
WDMcoupler
1450-1620 nmOutput
0 2000 4000 6000 8000 10000
0.0
0.5
1.0
Cur
rent
, a.u
.
T im e, μsec
Electricalgenerator
Oscillo-scopeSync
Fig. 3. Experimental setup for testing of the Yb-doped fiber samples.
3.1 Introduction to the part 3 The electronic RICs in pumped rare-earth-doped optical fibers is associated with changes of population of the ion states with different polarizabilities (Digonnet et al., 1997). This effect, which is important both for laser crystals and glasses, has been intensively investigated during the last decade. The nature of the polarizability difference (PD) in rare-earth ions is also widely discussed. Some authors believe that the main contribution to the PD expressed by equation (2) comes from the first term responsible for near-resonance IR transitions (Desurvire, 1994; Bochove, 2004; Barmenkov et al., 2004; Garsia et al, 2005). An alternative model suggests the predominant contribution from the second term responsible for strong UV transitions located far from the resonance (Digonnet et al., 1997), similar to those observed in laser crystals (Antipov et al., 2003, 2006; Margerie et al., 2006; Messias et al., 2007). Correct understanding of these electronic phenomena in Yb-doped fibers (Arkwright et al., 1998) is very important for numerous fiber applications. The pump-induced RICs could significantly affect the fiber laser behavior. The enhanced nonlinear phase shift could be employed for coherent beam combining discussed in the Chapter, optical switching (Wu et al., 1995), all-fiber adaptive interferometry (Stepanov et al., 2007). In the following paragraphs, we discuss our original RIC observations in commercial single-mode Yb-doped optical fibers pumped at ~980 nm by a laser diode. The experiment is
Frontiers in Guided Wave Optics and Optoelectronics
220
(a)
(b)
performed in a Mach-Zehnder interferometer configuration operating in IR spectrum band far from the absorption and emission Yb3+ ion resonances. The main objectives are to explore the RIC dynamics and to measure the values of the PD in standard Yb-doped fibers in spectral range 1460 - 1620 nm.
3.2 Experimental setup The experimental setup is shown in figure 3. The Yb-doped fibers under investigation are introduced in one arm of the all-fiber spliced Mach-Zehnder interferometer. The tested fibers are pumped to the core from a standard laser diode operating at 980 nmPλ ≈ with the power up to ~145 mW. The CW-radiation of diode laser “Tunics” with a coherence length ~10 m is used as the test wave. The passed test signal is detected at the interferometer output by a fast photodiode. The test wavelength λT is tunable within the range from 1460 to 1620 nm.
0 2000 4000 6000 8000 10000
0.0
0.5
1.0
Cur
rent
, a.u
.
Time, μsec
~980 nm
0 2000 4000 6000 8000 10000
-1.0
-0.5
0.0
0.5
1.0
Vol
tage
, a.u
.
Time, μsec
1450 –1620 nm
0 2000 4000 6000 8000 10000
0
1
2
3
4
Pha
se d
iffer
ence
, Δφ/
π
Time, μsec
( )tδϕ
Umin
Umax
0 2000 4000 6000 8000 10000
0.0
0.5
1.0
Cur
rent
, a.u
.
Time, μsec
~980 nm
0 2000 4000 6000 8000 10000
0.0
0.5
1.0
Cur
rent
, a.u
.
Time, μsec
~980 nm
0 2000 4000 6000 8000 10000
-1.0
-0.5
0.0
0.5
1.0
Vol
tage
, a.u
.
Time, μsec
1450 –1620 nm
0 2000 4000 6000 8000 10000
0
1
2
3
4
Pha
se d
iffer
ence
, Δφ/
π
Time, μsec
( )tδϕ
0 2000 4000 6000 8000 10000
0
1
2
3
4
Pha
se d
iffer
ence
, Δφ/
π
Time, μsec
( )tδϕ
0 2000 4000 6000 8000 10000
0
1
2
3
4
Pha
se d
iffer
ence
, Δφ/
π
Time, μsec
( )tδϕ
0 2000 4000 6000 8000 10000
0
1
2
3
4
Pha
se d
iffer
ence
, Δφ/
π
Time, μsec
( )tδϕ
Umin
Umax
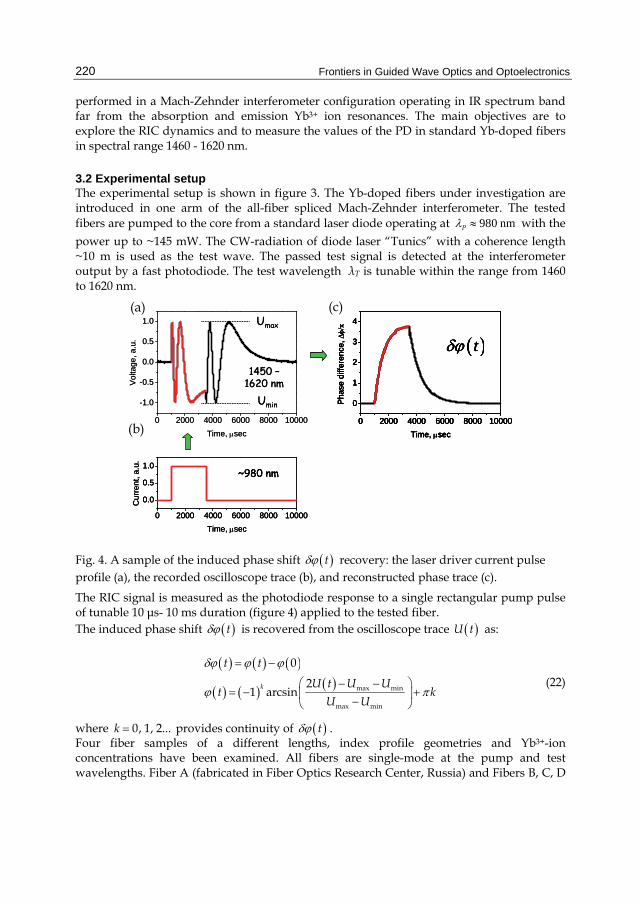
Fig. 4. A sample of the induced phase shift ( )tδϕ recovery: the laser driver current pulse profile (a), the recorded oscilloscope trace (b), and reconstructed phase trace (c).
The RIC signal is measured as the photodiode response to a single rectangular pump pulse of tunable 10 μs- 10 ms duration (figure 4) applied to the tested fiber. The induced phase shift ( )tδϕ is recovered from the oscilloscope trace ( )U t as:
( ) ( ) ( )
( ) ( ) ( ) max min
max min
0
21 arcsink
t t
U t U Ut k
U U
δϕ ϕ ϕ
ϕ π
= −
⎛ − − ⎞= − +⎜ ⎟
−⎝ ⎠
(22)
where 0, 1, 2...k = provides continuity of ( )tδϕ . Four fiber samples of a different lengths, index profile geometries and Yb3+-ion concentrations have been examined. All fibers are single-mode at the pump and test wavelengths. Fiber A (fabricated in Fiber Optics Research Center, Russia) and Fibers B, C, D
(c)

Resonantly Induced Refractive Index Changes in Yb-doped Fibers: the Origin, Properties and Application for all-fiber Coherent Beam Combining
221
(a) (c)
(Yb-198, -118, -103, of CorActive, Canada) have rectangular and circular cladding profiles, respectively, with the cladding side/diameter ~ 125 mμ . All fibers are aluminum silicate with a Gaussian distribution of Yb3+-ion concentration in the core. The fiber parameters are shown in Table 1. Parameter Fiber A Fiber B Fiber C Fiber D Peak absorption at 980 nm ( Pα ), dB m ~ 900 ~ 1073 ~ 245 ~ 35 Mode-field diameter at Sλ ( w ), mμ ~ 4.5 ~ 3.6 ~ 4.5 ~ 3.6 Cut-off wavelength ( cλ ), nm ~ 810 ~ 870 ~ 680 ~ 816 Equivalent core radius ( a ), mμ ~ 1.6 ~ 1.4 ~ 1.3 ~ 1.3 Coefficient K at 1550 nm, -1 -1rad ms mW ~ 0.043π ~ 0.056π ~ 0.067π ~ 0.067π
Table 1. Specifications of Yb-doped single-mode fibers tested during the experiment.
0 2 4 6 8 10
0
1
2
3
4
Pha
se s
hift,
π ra
d
Time, ms0 2 4 6
0
1
Nor
mal
ized
pha
se s
hift
Time, ms
( ) ~ exp
sp
ttδϕτ
⎛ ⎞−⎜ ⎟⎜ ⎟
⎝ ⎠
( ) ~ exp
sp
ttδϕτ
⎛ ⎞−⎜ ⎟⎜ ⎟
⎝ ⎠
0 2 4 6
0
1
Nor
miliz
ed p
hase
shi
ft
Time, ms0 2 4 6 8 10
0
1
2
3
4
Pha
se s
hift,
π ra
d
Time, ms
Pump amplitude:2 -145 mW
Pulse duration:~2 ms
Pump amplitude:~145 mW
Pulse duration:0.02 -2.5 ms
0 2 4 6 8 10
0
1
2
3
4
Pha
se s
hift,
π ra
d
Time, ms0 2 4 6
0
1
Nor
mal
ized
pha
se s
hift
Time, ms
( ) ~ exp
sp
ttδϕτ
⎛ ⎞−⎜ ⎟⎜ ⎟
⎝ ⎠
( ) ~ exp
sp
ttδϕτ
⎛ ⎞−⎜ ⎟⎜ ⎟
⎝ ⎠
0 2 4 6
0
1
Nor
miliz
ed p
hase
shi
ft
Time, ms0 2 4 6 8 10
0
1
2
3
4
Pha
se s
hift,
π ra
d
Time, ms
0 2 4 6 8 10
0
1
2
3
4
Pha
se s
hift,
π ra
d
Time, ms0 2 4 6
0
1
Nor
mal
ized
pha
se s
hift
Time, ms
( ) ~ exp
sp
ttδϕτ
⎛ ⎞−⎜ ⎟⎜ ⎟
⎝ ⎠
( ) ~ exp
sp
ttδϕτ
⎛ ⎞−⎜ ⎟⎜ ⎟
⎝ ⎠
0 2 4 6
0
1
Nor
miliz
ed p
hase
shi
ft
Time, ms0 2 4 6 8 10
0
1
2
3
4
Pha
se s
hift,
π ra
d
Time, ms
Pump amplitude:2 -145 mW
Pulse duration:~2 ms
Pump amplitude:~145 mW
Pulse duration:0.02 -2.5 ms
Fig. 5. Phase shifts induced in Fiber A by pulses of different pulse duration (a) and pulse amplitude (b). Only relaxing parts of the same curves normalized to the maximal values are shown in the delayed scale (c, d). The test wavelength is ~1550 nm, the fiber length is ~2m.
3.3 Relaxation of the phase shift after pump pulse excitation The recorded phase shifts up to ~ 4π shown in figure 5 highlight strong RIC effect induced in Fiber A by pump pulses of different amplitudes and durations. In every cases, the effect exhibits smooth saturation at some steady-state level. The saturation depends on the pulse amplitude and on the pulse duration (figure 5(a, b), respectively), or more precisely, on the pulse energy. Decaying parts of the phase traces describe relaxation of the refractive index after the end of the pulse excitation. They are perfectly fitted by an exponential decay function ( ) ( )~ exp spt tϕ τ− with the relaxation time constant equal to the Yb-ion excited
(b) (d)
Frontiers in Guided Wave Optics and Optoelectronics
222
state life-time μs850spτ ≈ , almost the same for all fiber samples. All normalized curves shown in figure 5 (c, d) in the delayed time scale are similar, although they relate to different pumping conditions. Such relaxation behavior corresponds to the electronic mechanism of RIC predicted by equation (8) explained in section 2.2. No other features that might be attributed to the thermally induced RICs have been observed in the experiment.
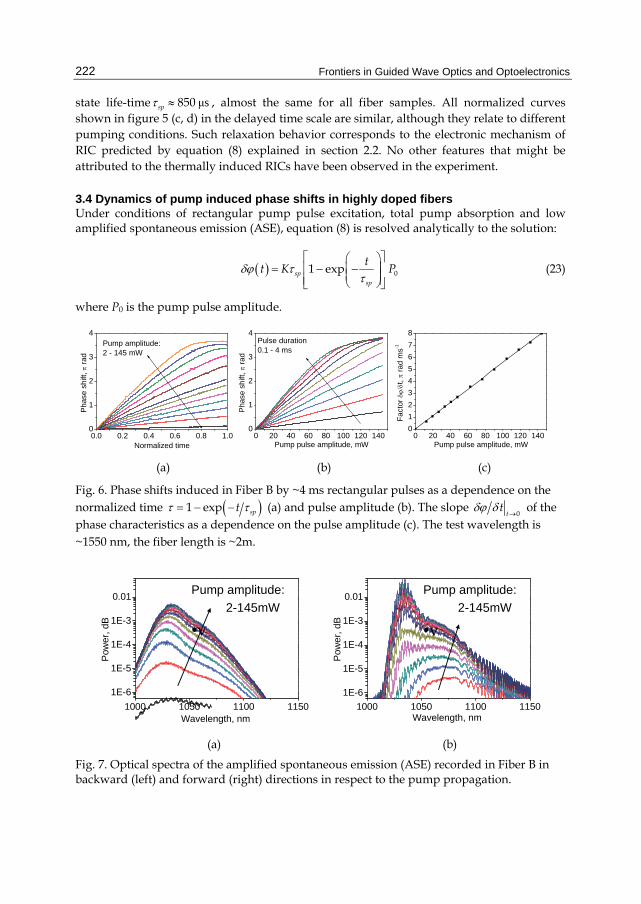
3.4 Dynamics of pump induced phase shifts in highly doped fibers Under conditions of rectangular pump pulse excitation, total pump absorption and low amplified spontaneous emission (ASE), equation (8) is resolved analytically to the solution:
( ) 01 expspsp
tt K Pδϕ ττ
⎡ ⎤⎛ ⎞⎢ ⎥= − −⎜ ⎟⎜ ⎟⎢ ⎥⎝ ⎠⎣ ⎦
(23)
where P0 is the pump pulse amplitude.
0.0 0.2 0.4 0.6 0.8 1.00
1
2
3
4
Phas
e sh
ift, π
rad
Normalized time
Pump amplitude:2 - 145 mW
0 20 40 60 80 100 120 1400
1
2
3
4
Phas
e sh
ift, π
rad
Pump pulse amplitude, mW
Pulse duration0.1 - 4 ms
0 20 40 60 80 100 120 140012345678
Fact
or δ
ϕ/δt
, π ra
d m
s-1
Pump pulse amplitude, mW
(a) (b) (c)
Fig. 6. Phase shifts induced in Fiber B by ~4 ms rectangular pulses as a dependence on the normalized time ( )1 exp sptτ τ= − − (a) and pulse amplitude (b). The slope
0ttδϕ δ
→ of the
phase characteristics as a dependence on the pulse amplitude (c). The test wavelength is ~1550 nm, the fiber length is ~2m.
1000 1050 1100 11501E-6
1E-5
1E-4
1E-3
0.01
Pow
er, d
B
Wavelength, nm1000 1050 1100 1150
1E-6
1E-5
1E-4
1E-3
0.01
Pow
er, d
B
Wavelength, nm
Pump amplitude: 2-145mW
•v
Pump amplitude: 2-145mW
•v
(a) (b)
Fig. 7. Optical spectra of the amplified spontaneous emission (ASE) recorded in Fiber B in backward (left) and forward (right) directions in respect to the pump propagation.

Resonantly Induced Refractive Index Changes in Yb-doped Fibers: the Origin, Properties and Application for all-fiber Coherent Beam Combining
223
In highly doped fiber samples A, B and C, the pump power is completely absorbed by the fiber length. At low pump pulse energies, the experimental traces shown in figure 6 perfectly reproduce the predictions of equation (23). One can verify the exponential character of the phase growth to its steady-state level (figure 6(a)), and the linear dependence on the pump pulse amplitude (figure 6(b)). As the pass gain and ASE level remain low, the slopes
0ttδϕ δ
→ can be measured for different pulse amplitudes (figure
6(c)). Their linear fit gives us the factor -1 -1rad ms mW0.056K π= that is the only unknown material parameter in equation (8).
0 2 4 6 8 10
0
20
40
60
80
Pow
er, m
W
Time, ms
F+B F B
0 2 4 6 8 10
0
20
40
60
80
Res
tore
d po
wer
, mW
Time, ms
backward
total
forward
0 2 4 6 8 10
0
20
40
60
80
Pow
er, m
W
Time, ms
F+B F B
0 2 4 6 8 10
0
20
40
60
80
Res
tore
d po
wer
, mW
Time, ms
backward
total
forward
(a) (b) Fig. 8. The recorded (left) and reconstructed from equation (24) (right) ASE powers.
At higher excitation levels, an error between the recorded traces and the formula (23) appears and increases as the ASE power increases. The spectra of the optical emission at both fiber ends explain the ASE to be the reason of the saturation of the monotonic growth of the phase shift at high pump energies (figure 7). In general case of all available pulse energies, the phase trace dynamics is driven by the differential equation (8) of the two-level RIC model (section 2.2). To validate the model at high pump power levels, the output powers from both fiber ends have been recorded during the pulse excitation simultaneously with recording of the test signal. Due to absorption saturation and re-absorption processes, the ASE pulse recorded in the forward direction is slightly delayed in respect to the backward ASE pulse thus causing a specific break in the leading edge of the total power (figure 8(a)). We should compare the recorded trace of the total ASE power with the prediction of the equation (8) allowing reconstruction of the ASE power from the recorded phase traces though a simple mathematical procedure:
( ) ( ) ( )1ASE in
sp
d t tP t P K
dtδϕ δϕ
τ−
⎡ ⎤≈ − +⎢ ⎥
⎢ ⎥⎣ ⎦ (24)
From figure 8, one can see that the reconstructed ASE profile is in a good quantitative agreement with the recorded total ASE power trace. Surprisingly, the model is able to reproduce the specific break of the original ASE pulse. This result proves our electronic RIC model to be eligible for whole range of the pulse energies used in the experiment.

Frontiers in Guided Wave Optics and Optoelectronics
224
3.5 Evaluation of the polarizability difference (PD) Factor K in equations (23, 24) is the only model parameter relating the induced phase shift and the pump pulse parameters at a given test wavelength. Phase dynamics observed in two different sample lengths of Fiber C shows the factor K to be independent on the fiber length (figure 9(a)). Reduction in the fiber length causes reduction of the saturation energy, but does not affect the slope in phase changes at low pump pulse energies. At the same experimental conditions, the phase shift dependencies observed with different fiber samples reveal different slopes and other distinct features (figure 9(b)). The Fiber D with lowest Yb-ion concentration exhibits lower saturation power than others fibers, but the slope in this fiber is nearly the same as the slope relating to Fiber C and is larger than the slope relating to Fiber B and Fiber A. Approximation by equation (23) gives different factors K for different fibers presented in Table 1. However, the mutual ratios of the factors are in good agreement with our RIC model that predicts the factor K independent on Yb-ion concentration and inversely proportional to the square of the fiber core radius a . The measured factors K allow us to estimate the polarizability difference at 1550 nm which proves to be the same for all tested fibers. Evaluation of ( )0Tηρ for a step-index fiber and Gaussian Yb-ion
distribution with radius equal to a ( )0.85η ≈ presented in figure 2 gives 3cm26
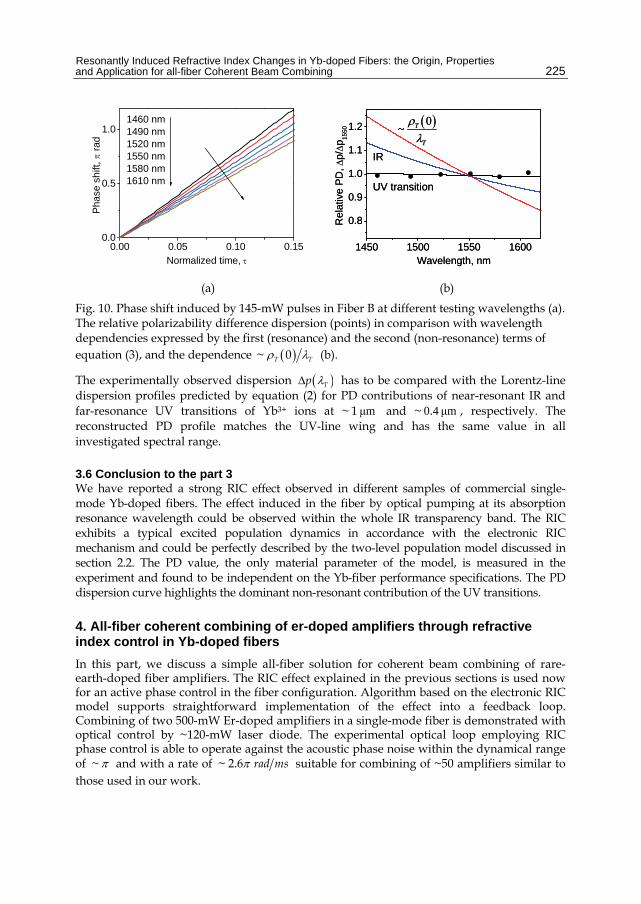
1550 1.2 10p −Δ ≈ × . We expect ~20% error in this value due to uncertainty of the doped area size. Notice that the expression for K given in (Fotiadi et al., 2008c) contains an unfortunate error causing overestimation of the PD value reported therein. To measure the PD dispersion in the spectral range of 1450-1620 nm, Fiber B was additionally characterized at different testing wavelengths λT. The phase traces shown in figure 10(a) highlight significant differences in the phase slopes δϕ δτ referenced to different λT. Qualitatively similar results have been reported earlier for the two-core Yb-doped fibers (Arkwright et al., 1998). However, in our case the measured dispersion of the factor ( )TK λ is found to be coincide with the dependence ( )~ 0T Tρ λ as it is expressed from the step-index approach (figure 10(b)). As far as the polarizability difference (PD)
( )Tp λΔ is directly proportional to ( ) ( )1~ 0T T TK λ ρ λ− , the strong wavelength dependencies of ( )TK λ and ( )~ 0T Tρ λ are compensating each other, providing the PD to be nearly independent on the test wavelength in the measured spectrum range.
0.00 0.05 0.10 0.150.0
0.5
1.0 Fibers 1-4
4
3 2
Phas
e sh
ift, π
rad
Normalized time, τ
1
0.00 0.05 0.10 0.150.0
0.5
1.0
~20 cm
Phas
e sh
ift, π
rad
Normalized time, τ
Fiber 3
~2 m
Fiber CFiber length ~2 m
~20 cm
Fibers A-D
A
D
C B
0.00 0.05 0.10 0.150.0
0.5
1.0 Fibers 1-4
4
3 2
Phas
e sh
ift, π
rad
Normalized time, τ
1
0.00 0.05 0.10 0.150.0
0.5
1.0
~20 cm
Phas
e sh
ift, π
rad
Normalized time, τ
Fiber 3
~2 m
Fiber CFiber length ~2 m
~20 cm
0.00 0.05 0.10 0.150.0
0.5
1.0
~20 cm
Phas
e sh
ift, π
rad
Normalized time, τ
Fiber 3
~2 m
Fiber CFiber length ~2 m
~20 cm
Fibers A-D
A
D
C B
(a) (b)
Fig. 9. Phase shift induced by 145-mW pulses in different fiber samples: in the same fiber of different lengths (a) and different fibers of ~2m length.
Resonantly Induced Refractive Index Changes in Yb-doped Fibers: the Origin, Properties and Application for all-fiber Coherent Beam Combining
225
0.00 0.05 0.10 0.150.0
0.5
1.0
Ph
ase
shift
, π ra
d
Normalized time, τ
1460 nm1490 nm1520 nm1550 nm1580 nm1610 nm
1450 1500 1550 1600
0.8
0.9
1.0
1.1
1.2
Rel
ativ
e PD
, Δp/
Δp15
50
Wavelength, nm
UV transition
IR
( )0~ T
T
ρλ
1450 1500 1550 1600
0.8
0.9
1.0
1.1
1.2
Rel
ativ
e PD
, Δp/
Δp15
50
Wavelength, nm
UV transition
IR
( )0~ T
T
ρλ
(a) (b)
Fig. 10. Phase shift induced by 145-mW pulses in Fiber B at different testing wavelengths (a). The relative polarizability difference dispersion (points) in comparison with wavelength dependencies expressed by the first (resonance) and the second (non-resonance) terms of equation (3), and the dependence ( )~ 0T Tρ λ (b).
The experimentally observed dispersion ( )Tp λΔ has to be compared with the Lorentz-line dispersion profiles predicted by equation (2) for PD contributions of near-resonant IR and far-resonance UV transitions of Yb3+ ions at ~ μm1 and ~ 0.4 μm , respectively. The reconstructed PD profile matches the UV-line wing and has the same value in all investigated spectral range.
3.6 Conclusion to the part 3 We have reported a strong RIC effect observed in different samples of commercial single-mode Yb-doped fibers. The effect induced in the fiber by optical pumping at its absorption resonance wavelength could be observed within the whole IR transparency band. The RIC exhibits a typical excited population dynamics in accordance with the electronic RIC mechanism and could be perfectly described by the two-level population model discussed in section 2.2. The PD value, the only material parameter of the model, is measured in the experiment and found to be independent on the Yb-fiber performance specifications. The PD dispersion curve highlights the dominant non-resonant contribution of the UV transitions.
4. All-fiber coherent combining of er-doped amplifiers through refractive index control in Yb-doped fibers In this part, we discuss a simple all-fiber solution for coherent beam combining of rare-earth-doped fiber amplifiers. The RIC effect explained in the previous sections is used now for an active phase control in the fiber configuration. Algorithm based on the electronic RIC model supports straightforward implementation of the effect into a feedback loop. Combining of two 500-mW Er-doped amplifiers in a single-mode fiber is demonstrated with optical control by ~120-mW laser diode. The experimental optical loop employing RIC phase control is able to operate against the acoustic phase noise within the dynamical range of ~ π and with a rate of ~ 2.6 rad msπ suitable for combining of ~50 amplifiers similar to those used in our work.
Frontiers in Guided Wave Optics and Optoelectronics
226
4.1 Introduction Being the most low-threshold nonlinear phenomena in optical fibers, Stimulated Brillouin scattering (SBS) reduces power levels available with CW narrow-band fiber sources, in particular leading to the self-pulsing and other laser instabilities (Fotiadi et al., 1998, 2002, 2004, 2006). A way to overcome this limitation is to use coherent combining of single-mode amplifiers each operating below the SBS threshold. The idea of this method is to split a single highly coherent beam into many beams which are then amplified by a parallel array of similar power amplifiers and finally recombined to a high power diffraction limited beam without significant broadening of the initial spectrum (Fan, 2005).
MasterLaser
Optical amplifiers, Yb-dopedfibers
Pump~980 nm
NxNcoupler
NxNcoupler
Single-modeoutput
Photodetectors
highlycoherent
1.15S mλ μ
Sλ
~ Sλ
MasterLaser
Optical amplifiers, Yb-dopedfibers
Pump~980 nm
NxNcoupler
NxNcoupler
Single-modeoutput
Photodetectors
highlycoherent
1.15S mλ μ
Sλ
~ Sλ
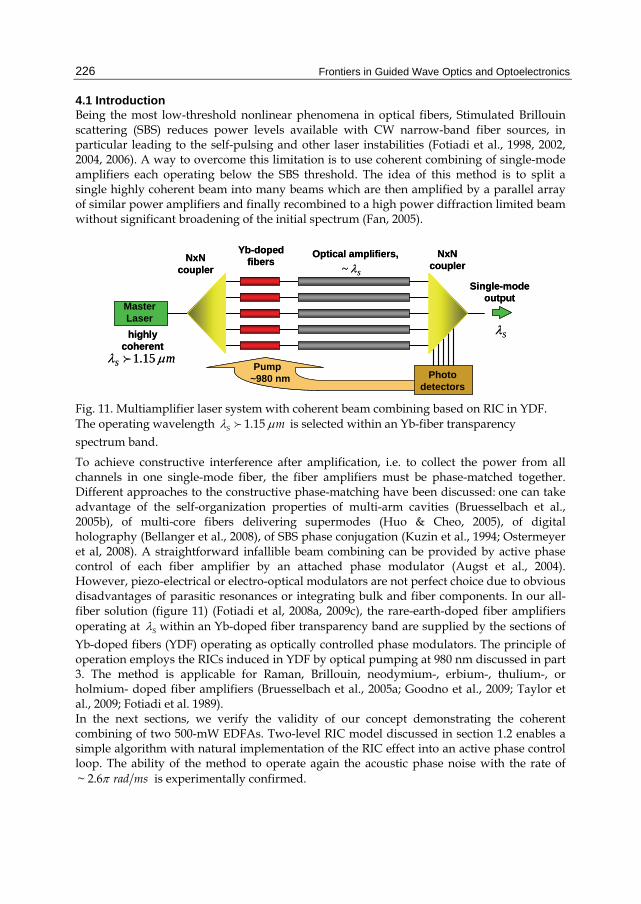
Fig. 11. Multiamplifier laser system with coherent beam combining based on RIC in YDF. The operating wavelength 1.15S mλ μ is selected within an Yb-fiber transparency spectrum band. To achieve constructive interference after amplification, i.e. to collect the power from all channels in one single-mode fiber, the fiber amplifiers must be phase-matched together. Different approaches to the constructive phase-matching have been discussed: one can take advantage of the self-organization properties of multi-arm cavities (Bruesselbach et al., 2005b), of multi-core fibers delivering supermodes (Huo & Cheo, 2005), of digital holography (Bellanger et al., 2008), of SBS phase conjugation (Kuzin et al., 1994; Ostermeyer et al, 2008). A straightforward infallible beam combining can be provided by active phase control of each fiber amplifier by an attached phase modulator (Augst et al., 2004). However, piezo-electrical or electro-optical modulators are not perfect choice due to obvious disadvantages of parasitic resonances or integrating bulk and fiber components. In our all-fiber solution (figure 11) (Fotiadi et al, 2008a, 2009c), the rare-earth-doped fiber amplifiers operating at Sλ within an Yb-doped fiber transparency band are supplied by the sections of Yb-doped fibers (YDF) operating as optically controlled phase modulators. The principle of operation employs the RICs induced in YDF by optical pumping at 980 nm discussed in part 3. The method is applicable for Raman, Brillouin, neodymium-, erbium-, thulium-, or holmium- doped fiber amplifiers (Bruesselbach et al., 2005a; Goodno et al., 2009; Taylor et al., 2009; Fotiadi et al. 1989). In the next sections, we verify the validity of our concept demonstrating the coherent combining of two 500-mW EDFAs. Two-level RIC model discussed in section 1.2 enables a simple algorithm with natural implementation of the RIC effect into an active phase control loop. The ability of the method to operate again the acoustic phase noise with the rate of ~ 2.6 rad msπ is experimentally confirmed.

Resonantly Induced Refractive Index Changes in Yb-doped Fibers: the Origin, Properties and Application for all-fiber Coherent Beam Combining
227
4.2 Experimental setup The experimental setup (figure 12) is not so different from the setup used in the previous part, except the two amplifiers introduced into the interferometer. A master laser diode in combination with a 15-dBm preamplifier delivers single mode radiation at 1.55 µm with a coherence length of ~10 m. The first fiber coupler splits the laser emission into two arms, which are then amplified by two single mode EDFAs specified with 500-mW output. No spectral broadening of the amplified radiation has been observed at such power level. The EDFAs are supplied by thermo-electric controllers used for low-frequency phase noise elimination.
~1.55 µm
Photodetector
MasterLaser
50/50coupler
50/50coupler
Yb-dopedfiber
balancedfiber
Pump980 nm WDM
coupler
15dBEr-doped
preamplifier
~500 mWEr-dopedamplifier
~500 mWEr-dopedamplifier
~45m~45m Channel 1
Channel 2
~1.55 µm
High powerOutput
Electrical feedback loop
~1.55 µm
Photodetector
MasterLaser
50/50coupler
50/50couplerMaster
Laser
50/50coupler
50/50coupler
Yb-dopedfiber
Yb-dopedfiber
balancedfiber
balancedfiber
Pump980 nm WDM
coupler
Pump980 nm WDM
coupler
Pump980 nm WDM
coupler
15dBEr-doped
preamplifier
~500 mWEr-dopedamplifier
~500 mWEr-dopedamplifier
~45m~45m Channel 1
Channel 2
~1.55 µm
High powerOutput
Electrical feedback loop
Fig. 12. Experimental setup used for demonstration of all-fiber coherent combining.
0 100 200 300 400 5000
20
40
60
80
100
120
Pum
p po
wer
, mW
Time, μs
0 100 200 300 400 500
2.3
2.4
2.5
2.6
Phas
e sh
ift, π
rad
Time, μs
radπ
~45mW
( )1 1Pϕ φ=
( )2 2Pϕ φ=
( )Pφ
( )1 1Pϕ φ=
( )2 2Pϕ φ=
1P
2P
(a) (b)
(c)
~ 2.6 radms
π
avP
0 20 40 60 80 100 1200
1
2
3
4
Stea
dy-s
tate
pha
se s
hift,
π ra
d
Pump power level, mW
0 100 200 300 400 5000
20
40
60
80
100
120
Pum
p po
wer
, mW
Time, μs
0 100 200 300 400 500
2.3
2.4
2.5
2.6
Phas
e sh
ift, π
rad
Time, μs
radπ radπ
~45mW
( )1 1Pϕ φ=
( )2 2Pϕ φ=
( )Pφ
( )1 1Pϕ φ=
( )2 2Pϕ φ=
1P
2P
(a) (b)
(c)
~ 2.6 radms
π
avP
0 20 40 60 80 100 1200
1
2
3
4
Stea
dy-s
tate
pha
se s
hift,
π ra
d
Pump power level, mW
Fig. 13. Experimental steady-state (a) and dynamical (b) phase characteristics. Phase response (b) on a double jump of the diode power (c): positive (black) and inverted (red).
Frontiers in Guided Wave Optics and Optoelectronics
228
For fast phase adjustment, one of the arms is supplied by a 2-m length of YDF directly spliced with the amplifier. The YDF has an independent input for 120-mW laser diode operating at 980 nm. The use of the highly doped Fiber B (see, Table 1) ensures maximal RIC effect due to total absorption of the pump radiation inside the fiber. Since the RIC is directly proportional to the population density of the excited Yb-ions (see equation (3)), the phase shift induced in the fiber is determined by the laser diode power that could be used to maintain a constructive phase-matched coupling of two intense laser arms in a single-mode fiber (Channel 1). The power emitted through the Channel 2 is used for operation of the feedback loop discussed in next paragraphs. The relationship between the Channel 2 power and phase mismatching is regulated by equation (22).
4.3 Operation algorithm The phase control operation algorithm is based on the steady-state and dynamical characteristics of the electronic RIC discussed in the previous part. The steady-state characteristic ( )Pϕ φ= (figure 13(a)) is evaluated as the phase response to Heaviside step pulses of different amplitude P. One could tune the phase in the range up to ~ 3.75 radπ by a simple adjustment of the laser diode power. Commonly, the phase switching from
( )1 1Pϕ φ= to ( )2 2Pϕ φ= is provided by switching the diode power from 1P to 2P , but this procedure requires several milliseconds to proceed. Fast dynamical switching is possible within a part of the range covered by the steady-state curve ( )Pϕ φ= , for an example, within the range of ~ radπ marked in figure 13(a). In the general case of total pump absorption and negligible spontaneous emission, we can extend equation (23) to all linear part of the steady-state curve, so the phase response ( )tϕΔ on a single positive or negative jump of the diode power PΔ is expressed as:
( ) 1 expspsp
tt K Pϕ ττ
⎡ ⎤⎛ ⎞⎢ ⎥Δ = − − Δ⎜ ⎟⎜ ⎟⎢ ⎥⎝ ⎠⎣ ⎦
(25)
where 1 10.056K rad ms mWπ − −≈ at 1.55T mλ μ≈ (see Fiber B in Table 1). In accordance with equation (25) a fast phase tuning (figure 13(b, c)) from ( )1 1Pϕ φ= to
( )2 2Pϕ φ= is achieved through two consecutive switchings of the diode power, first, from the level 1P to a level 1 0P P+ Δ and then to the level 2P , where 0PΔ is the power jump (positive or negative) available with the laser diode within the used tuning range. The switching time of such dynamical phase change is equal to the time τ between two opposite jumps of the diode power and is expressed for small phase steps as ( )2 1 0 spK Pτ ϕ ϕ τ= − Δ << . The higher 0PΔ , the faster phase tuning is. However, higher 0PΔ is available within smaller tuning ranges. For tuning range of ~ radπ 0PΔ is limited by ~45mW that corresponds to an adjustment rate ~ 2.6 rad msπ . The mission committed to the feedback loop circuit (figure 14) is to support the maximal power level emitted at 1.55μm through the Channel 1 (see figure 12). Therefore, the power emitted through the Channel 2 has to be kept as low as possible. This power recorded by the photodetector is used in the feedback circuit driven by 2.86-MHz acquisition card (National Instruments, NI PCI-6251). The period of data acquisition 25 sτ μ= is synchronized with by the card analogue output (alone or in combination with a standard pulse generator) that forces the laser driver to emit 50 μs -period meander signal with an amplitude

Resonantly Induced Refractive Index Changes in Yb-doped Fibers: the Origin, Properties and Application for all-fiber Coherent Beam Combining
229
Photodetector
Pump980 nm
Laserdriver
Signalgenerator
PCErrorsignal
AcquisitionCard (NI)
Power, 980nmInduced
phase shiftPower, 1550 nm
60avP mW≈
( )MEANDERP t
( )ERRORP t
( )av avPϕ φ≈
( )SAW TOOTH tϕ −
PhaseNoise
( )ERROR tϕ( )NOISE tϕ
+
+
+
+
+Photo
detectorPump
980 nm
Laserdriver
Signalgenerator
PCErrorsignal
AcquisitionCard (NI)
Power, 980nmInduced
phase shiftPower, 1550 nm
60avP mW≈
( )MEANDERP t
( )ERRORP t
( )av avPϕ φ≈
( )SAW TOOTH tϕ −
PhaseNoise
( )ERROR tϕ( )NOISE tϕ
+
+
+
+
+
Fig. 14. The principal scheme of the electrical feedback loop operation.
0.0 0.2 0.4 0.6 0.8 1.0-10
-5
0
5
10
Pha
se d
evia
tion,
10-2
π ra
d
Time, ms
0.0
0.5
1.0
1.5
2.0
Pow
er (C
hann
el 2
), %
0
20
40
60
80
100
120
Pum
p po
wer
, mW
(a) (c)
(b) (d)
0.0 0.2 0.4 0.6 0.8 1.0
Time, ms
0.0 0.2 0.4 0.6 0.8 1.0
-10
-5
0
5
10
Pha
se d
evia
tion,
10-2
π ra
d
Time, ms
0.0
0.5
1.0
1.5
2.0
Pow
er (C
hann
el 2
), %
0
20
40
60
80
100
120
Pum
p po
wer
, mW
(a) (c)
(b) (d)
0.0 0.2 0.4 0.6 0.8 1.0
Time, ms
Fig. 15. Simulated feedback loop operation for cases of compensated (a, b) and uncompensated (c, d) phase noise: (a, c) laser diode (grey) and Channel 2 (black) powers; (b, d) the reconstructed phase deviation (grey) and reconstructed error signal (black);
60avP mW≈ .
0 45P mWΔ = ± and a controllable DC level avP within the range of 45-75 mW (figure 15(a)). The modulated diode power induces a fast sawtooth modulation of the phase with a DC level of ( )av avPϕ φ= and the excursion of 0 0 0.06K P radϕ τ πΔ = Δ ≈ (figure 15(b)). Such phase modulation leads to ~100% amplitude modulation of the power in Channel 2 (figure 15(c, d)), while the modulation of the high power radiation in Channel 1 is negligible (~1%). The signal acquired by the photodetector is the result of the superposition between the phase noise and the periodic phase modulation. In the case of right phase matching (when the phase noise is completely compensated), this signal is a perfect sawtooth signal, because the peaks associated with the positive and negative phase changes are of the same amplitude (figure 15(a)). In contrast, the presence of uncompensated noise causes the signal peaks to spread in two series. Importantly, the phase mismatching NOISEϕ is directly
Frontiers in Guided Wave Optics and Optoelectronics
230
proportional to the difference between neighboring peaks (figure 15(c)). The error signal, produced by a PC from the acquired data, controls the phase avϕ through the control of the laser diode current: to compensate the phase mismatching, it produces a smooth correction
av ERROR NOISEP P Kδ ϕ τ→ − = − to avP (figure 14).
4.4 Experimental results The phase control algorithm described in the previous section has been applied to the experimental setup (figure 12) demonstrating reliable operation against the phase noise.
0 5 10 15 20
-1.0
-0.5
0.0
0.5
1.0
Pha
se d
evia
tion,
π ra
d
Time, s0 20 40 60 80 100
0.25
0.30
0.35
0.40
Time, ms
(a) (b)
0 5 10 15 20
-1.0
-0.5
0.0
0.5
1.0
Pha
se d
evia
tion,
π ra
d
Time, s0 20 40 60 80 100
0.25
0.30
0.35
0.40
Time, ms
(a) (b)
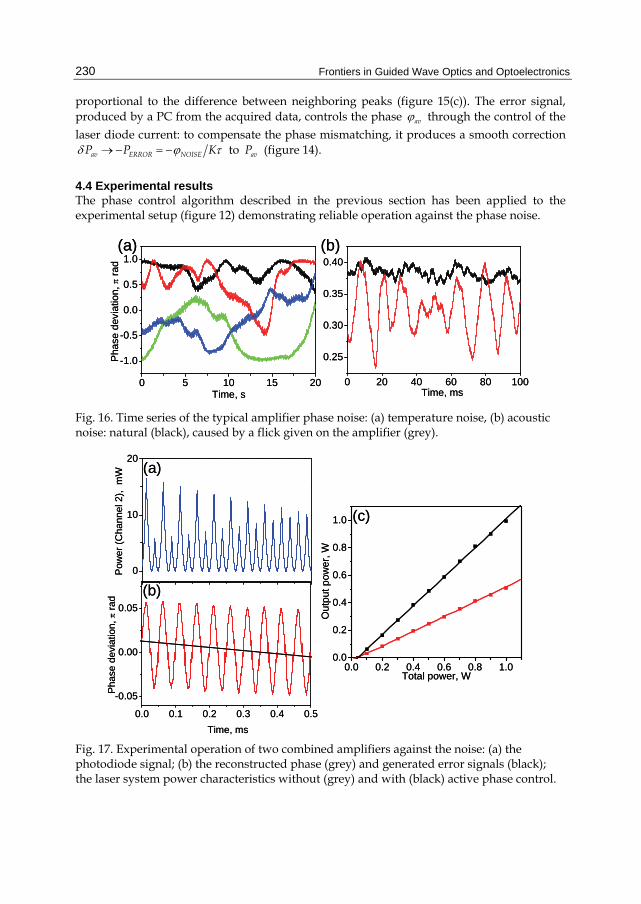
Fig. 16. Time series of the typical amplifier phase noise: (a) temperature noise, (b) acoustic noise: natural (black), caused by a flick given on the amplifier (grey).
0
10
20
Pow
er (C
hann
el 2
), m
W
0.0 0.1 0.2 0.3 0.4 0.5
-0.05
0.00
0.05
Time, ms
Phas
e de
viat
ion,
π ra
d
0.0 0.2 0.4 0.6 0.8 1.00.0
0.2
0.4
0.6
0.8
1.0
Out
put p
ower
, W
Total power, W
(a)
(b)
(c)
0
10
20
Pow
er (C
hann
el 2
), m
W
0.0 0.1 0.2 0.3 0.4 0.5
-0.05
0.00
0.05
Time, ms
Phas
e de
viat
ion,
π ra
d
0.0 0.2 0.4 0.6 0.8 1.00.0
0.2
0.4
0.6
0.8
1.0
Out
put p
ower
, W
Total power, W
(a)
(b)
(c)
Fig. 17. Experimental operation of two combined amplifiers against the noise: (a) the photodiode signal; (b) the reconstructed phase (grey) and generated error signals (black); the laser system power characteristics without (grey) and with (black) active phase control.

Resonantly Induced Refractive Index Changes in Yb-doped Fibers: the Origin, Properties and Application for all-fiber Coherent Beam Combining
231
Figure 16 presents the operation of the laser configuration without an active feedback. The phase traces have been recorded for a steady-state condition that is achieved after both amplifiers have reached thermal equilibrium (after 2-3 minutes of their operation with a power of 500 mW). Two classes of traces highlight phase fluctuations, associated with thermal variations (figure 16 (a)) and environmental acoustic vibrations (figure 16 (b)). These two kinds of noise contribute to different time domains and show different scales of the phase excursion that have to be compensated. Thermally induced phase noise is large fluctuations with amplitude up to several ~π rad attained for several seconds. For compensation of these fluctuations, no advanced fast technique is needed: the ordinary thermo-controllers connected with the feedback loop provide perfect suppression of low-frequency thermal noise. In contrast, acoustic phase noise associated mainly with mechanical resonances – noisy equipment, cooling fans, etc. – dominates with excursion rates of ~1ms and much smaller excursion amplitude, ~0.01π rad. This should be considered as a minimum requirement for servo loop bandwidth since these measurements were taken in a quiet laboratory setting. Noisier environments would require a commensurate reduction of the feedback loop time, but we have checked that even a flick given on the amplifier causes a phase deviation with the amplitude no larger than ~0.02π rad attending with a rate of ~0.02π rad/ms. These observations give target parameters for the active phase control to be employed for compensation of the environmental acoustic noise in the system comprising two fiber amplifiers. Note, that a typical phase rate value to be compensated is more than 100 times lower than the capability of the proposed technique as just estimated. However, as the number of parallel amplifiers increases, the phase compensation rates have to be increased proportionally. The algorithm could be applied to the multi-amplifier system through time-division multiplexing. The coherent combining of two 500-mW Er-doped amplifiers resulting in ~1 W power decoupled through the single-mode fiber output has been successfully demonstrated. Typical Channel 2 power and phase traces (figure 17(a, b)) exhibit the features similar to that shown in figure 15(c, d). The absolute power variations are about 10 – 20 mW, i.e. ~1 – 2 % of the total power emitted by two amplifiers. One can see how, during the given time series, the initial phase mismatch caused by a flick given on the amplifier is compensating due to operation of the feedback loop: the peaks initially separated in two series join together highlighting constructive interference achieved in Channel 1. The power characteristics of the combined system (figure 17(c)) give clear evidence that more than 95% of the radiation generated in two fiber amplifiers is efficiently decoupled through the single mode output.
4.5 Conclusion to the part 4 In conclusion, the reported result gives us the basis of the work towards development of the multichannel system shown in figure 11. The method is proved to operate against the noise with a rate of ~2.6π rad/ms that potentially serves combining of ~50-100 amplifiers with noise properties like those shown in figure 16. It opens the potential to produce high-power narrow-band radiation through the complete near-infrared employing the YDF phase control in combination with variety of rare-earth-doped and Raman fiber amplifiers, in particular, based on large-mode-area fibers. Attractive features of these sources are their compactness, reliability, all-fiber integrated format.
5. Conclusions and recent progress In this Chapter refractive index changes (RICs) induced in Yb-doped optical fibers by resonance pumping is considered as a side effect of the population inversion mechanism

Frontiers in Guided Wave Optics and Optoelectronics
232
that generally manages operation of the fiber lasers and amplifiers. The fundamentals of the RIC phenomena and details of the effect dynamics are explained in terms of the two-level laser model. The effect is experimentally quantified for commercial aluminium silicate fibers demonstrating that the RIC dynamics follows the change of the population of the excited/unexcited ion states with a factor proportional to their polarizability difference (PD). The PD, the only material parameter used by the model, is measured for a number of fiber samples and found to be independent on the fiber geometry, the ion concentration and the tested wavelength in the range 1460 - 1620 nm. Continuation of this work is investigations of fibers with different matrixes of activators. In particular, our recent study of phosphate silicate Yb-doped fibers (Fotiadi et al., 2009a) highlighted their PD value to be not so different from the reported for aluminium silicate fibers, despite the Yb-ion life times in these fibers defer almost in two times. Deep understanding of these electronic phenomena in Yb-doped fibers is very important for numerous fiber applications. In this Chapter, we propose a simple solution for coherent beam combining of rare-earth-doped fiber amplifiers. The RIC effect is employed for an active phase control in all fiber spliced configuration. A simple algorithm is developed on the based of the electronic RIC model allows straightforward implementation of the effect into a feedback loop. Combining of two 500-mW Er-doped amplifiers in a single-mode fiber is demonstrated with optical control by ~120-mW laser diode. The experimental optical loop is able to operate against the acoustic phase noise within the range of π rad and with a rate of ~2.6π rad/ms suitable for combining ~50 amplifiers similar to those used in our work. Recently we demonstrated that two wavelengths scheme improves the dynamical range and the response time of the phase control loop (Fotiadi et al., 2009b). Instead using the 980 nm laser diode alone, we proposed to use it in combination with a 1060nm laser. The use of both diodes gives a two times dynamical range or increases in several times the response of the phase control loop.
6. Acknowledgements This research was supported by the Interuniversity Attraction Pole program VI/10 of the Belgian Science Policy and program “Scientific and Research-Educational Cadres for Innovation Russia” of Russian Federal Agency on Science and Innovation (contract 02.740.11.5093).
7. References Agrawal, G. P. (1989). Nonlinear Fiber Optics, Academic, Boston, Mass.. Antipov, O. L.; Eremeykin, O. N.; Savikin, A. P.; Vorob’ev, V. A.; Bredikhin, D. V. &
Kuznetsov, M. S. (2003). Electronic Changes of Refractive Index in Intensively Pumped Nd:YAG Laser Crystals, IEEE J. Quantum Electron., vol. 39, pp. 910-918.
Antipov, O. L.; Bredikhin, D. V. ; Eremeykin, O.N.; Savikin, A. P. ; Ivakin, E.V. & Sukhadolau, A.V. (2006). Electronic mechanism of refractive index changes in intensively pumped Yb:YAG laser crystals, Opt. Lett., vol. 31, pp.763-765.
Arkwright, J. W.; Elango, P.; Atkins, G. R.; Whitbread, T. & Digonnet, M. J. F. (1998). Experimental and Theoretical Analysis of the Resonant Nonlinearity in Ytterbium-Doped Fiber, J. Lightwave Technol., vol. 16, pp. 798-806.
Arkwright, J. W.; Elango, P.; Whitbread, T. W. & Atkins, G. R. (1996). Nonlinear phase changes at 1310 nm and 1545 nm observed far from resonance in diode pumped ytterbium doped fiber. IEEE Photon. Technol. Lett., vol. 8, pp. 408-410.

Resonantly Induced Refractive Index Changes in Yb-doped Fibers: the Origin, Properties and Application for all-fiber Coherent Beam Combining
233
Augst, S. J.; Fan, T. Y. & Sanchez, A. (2004). Coherent beam combining and phase noise measurements of Yb fiber amplifiers, Opt. Lett., vol. 29, pp. 474-476.
Barmenkov, Yu. O.; Kir’yanov, A. V. & Andres M. V. (2004). Resonant and thermal changes of refractive index in a heavily doped erbium fiber pumped at wavelength 980 nm, Appl. Phys. Lett., vol. 85, pp.2466-2468.
Bellanger, C.; Brignon, A.; Colineau, J. & Huignard, J. P. (2008). Coherent fiber combining by digital holography, Opt. Lett., vol.33, pp.293-295.
Bochove, E. (2004). Nonlinear refractive index of rare-earth-doped fiber laser, Opt. Lett., vol.29, pp.2414-2416.
Born, M. & Wolf, E. (2003). Principles of Optics. University Press, Cambridge. Bruesselbach, H.; Wang, Sh.; Minden, M.; Jones, D.C. & Mangir, M. (2005a). Power-scalable
phase-compensating fiber-array transceiver for laser communications through the atmosphere, J. Opt. Soc. Am. B, vol. 22, pp. 347-353.
Bruesselbach, H.; Jones, D. C.; Mangir, M. S.; Minden, M. & Rogers, J. L. (2005b). Self-organized coherence in fiber laser arrays, Opt. Lett., vol. 30, pp.1339-1341.
Desurvire, E. (1994). Erbium-doped fiber amplifiers: Principles and Applications, Willey, NY. Digonnet, M. J. F.; Sadowski, R. W.; Shaw, H. J. & Pantell, R. H. (1997). Resonantly
Enhanced Nonlinearity in Doped Fibers for Low-Power All-Optical Switching: A Review. Opt. Fiber Technol. Vol. 3, pp. 44-64.
Fan, T.Y. (2005). Laser Beam Combining for High-Power, High-Radiance Sources, IEEE J. Sel. Top. Quantum Electron., vol. 11, pp. 567-577.
Feng, Y.; Taylor, L. & Calia, D.B. (2009). 25 W Raman-fiber-amplifier-based 589 nm laser for laser guide star, Opt. Express, vol. 17, pp. 19021-19026.
Fotiadi, A. A.; Kuzin, E. A.; Petrov, M. P. & Ganichev. A. A. (1989). Amplitude-frequency characteristic of an optical-fiber stimulated Brillouin amplifier with pronounced pump depletion. Sov.Tech.Phys.Lett., vol.15, pp.434-436.
Fotiadi, A. A. & Kiyan, R. V. (1998). Cooperative stimulated Brillouin and Rayleigh backscattering process in optical fiber. Opt. Lett., vol. 23, pp.1805-1807.
Fotiadi, A. A.; Kiyan, R; Deparis, O.; Mégret, P. & Blondel, M. (2002). Statistical properties of stimulated Brillouin scattering in singlemode optical fibers above threshold, Opt. Lett., vol.27, pp.83-85.
Fotiadi, A. A.; Mégret, P.; Blondel, M. (2004). Dynamics of self-Q-switched fiber laser with Rayleigh – stimulated Brillouin scattering ring mirror, Opt. Lett., vol.29, pp. 1078-1080.
Fotiadi, A. A. & Mégret, P. (2006). “Self-Q-switched Er-Brillouin fiber source with extra-cavity generation of a Raman supercontinuum in a dispersion shifted fiber”, Opt.Lett., vol. 31, pp.1621-1623.
Fotiadi, A. A.; Antipov, O. L. & Mégret, P. (2007). Dynamics of pump/signal-induced index change in Yb-doped fiber amplifier, Conference Digest: CLEO-Europe’2007, IEEE, CJ3-4-THU.
Fotiadi, A. A.; Zakharov, N. G.; Antipov, O. L. & Mégret, P. (2008a). All-Fiber Coherent Combining of Er-Doped Fiber Amplifiers by Active Resonantly Induced Refractive Index Control in Yb-Doped Fiber, in Conference on Lasers and Electro-Optics/Quantum Electronics and Laser Science Conference, OSA Technical Digest (CD) (Optical Society of America, San Jose, CA, USA, 2008), CWB2.
Fotiadi, A. A.; Antipov, O. L. & Mégret, P. (2008b). Pump/Signal Induced Refractive Index Changes in Yb-Doped Fiber Amplifier: The Origin and Properties, in Conference on Lasers and Electro-Optics/Quantum Electronics and Laser Science Conference and

Frontiers in Guided Wave Optics and Optoelectronics
234
Photonic Applications Systems Technologies, OSA Technical Digest (CD) (Optical Society of America, San Jose, CA, USA, 2008), CFR3.
Fotiadi, A. A.; Antipov, O. L. & Mégret, P. (2008c). Dynamics of pump-induced refractive index changes in single-mode Yb-doped optical fibers, Opt. Express, vol.16, pp. 12658-12663.
Fotiadi, A. A.; Antipov, O. L.; Bufetov, I. A.; Dianov, E. M. & Mégret, P. (2009a). Comparative Study of Pump-Induced Refractive Index Changes in Aluminum and Phosphate Silicate Yb-Doped Fibers, in Conference on Lasers and Electro-Optics/Quantum Electronics and Laser Science Conference, OSA Technical Digest (CD) (Optical Society of America, 2009), JWA9.
Fotiadi, A. A.; Antipov, O. L. & Mégret, P. (2009b). All-fiber Coherent Combining of Er-doped Amplifiers via Refractive Index Control in Yb-doped Fibers by Two-wavelengths Optical Signal, Conference Digest: CLEO-Europe’2009, IEEE, CJ3-2-WED.
Fotiadi, A. A.; Zakharov, N. G.; Antipov, O. L. & Mégret, P. (2009c). All-fiber Coherent Combining of Er-doped Amplifiers through Refractive Index Control in Yb-doped Fibers, Opt.Lett., vol. 34, in press.
Garsia, H.; Johnson, A. M.; Oguama, F. A. & Trivedi, S. (2005). Pump-induced nonlinear refractive index change in erbium and ytterbium-doped fibers: theory and experiment, Opt. Lett., vol. 30, pp.1261-1263.
Goodno, G. D.; Book, L. D. & Rothenberg, J. E. (2009) Low-phase-noise, single-frequency, single-mode 608 W thulium fiber amplifier, Opt. Lett., vol. 34, pp.1204-1206.
Huo, Y. & Cheo, P. K. (2005). Analysis of transverse mode competition and selection in multicore fiber lasers, J. Opt. Soc. Am. B, vol. 22, pp. 2345-2349.
Jeunhomme, L. (1983). Single-Mode Fiber Optics, Marcel Dekker, New. York. Kuzin, E. A.; Petrov, M. P. & Fotiadi, A. A. (1994). Phase conjugation by SMBS in optical
fibers. In: Optical phase conjugation, ed. by M.Gower, D.Proch. Springer-Verlag, pp.74-96.
Margerie, J.; Moncorgé, R. & Nagtegaele, P. (2006). Spectroscopic investigation of the refractive index variations in the Nd:YAG laser crystal, Phys. Rev. B, vol.74, pp.235108-10.
Messias, D.N.; Catunda, T.; Myers, J.D. & Myers, M.J. (2007). Nonlinear electronic line shape determination in Yb3+-doped phosphate glass, Opt. Lett., vol. 32, pp.665-667.
Ostermeyer, M.; Kong, et al. (2008). Trends in stimulated Brillouin scattering and optical phase conjugation, Laser and particle beams, vol. 26, pp. 297-362.
Paschotta R., Nilsson J.; Tropper, A. C.; & Hanna, D. C. (1997). Ytterbium-Doped Fiber Amplifiers, IEEE J. Sel. Top. Quantum Electron., vol. 33, pp. 1049-1056.
Snyder, W. & Love, J. D. (1983). Optical waveguide theory, Chapman and Hall, London. Stepanov, S. I.; Fotiadi, A. A.; Mégret, P. (2007). Effective recording of dynamic phase
gratings in Yb-doped fibers with saturable absorption at 1064nm, Opt. Express, vol. 15, pp.8832-8837.
Taylor, L.; Feng, Y. & Calia, D. B. (2009). High power narrowband 589nm frequency doubled fibre laser source, Opt. Express, vol. 17, pp. 14687-14693.
Wu, B.; Chu, P. L. & Arkwright, J. W. (1995). Ytterbium-doped silica slab waveguide with large nonlinearity, IEEE Photon. Technol. Lett., vol. 7, pp. 1450-1452.