Resolving Implicit References in Instructional Texts - ACL ...

Microsc. Microanal. 20, 1100–1110, 2014doi:10.1017/S1431927614012872
© MICROSCOPY SOCIETYOF AMERICA 2014
Resolving the Morphology of Niobium CarbonitrideNano-Precipitates in Steel Using Atom ProbeTomographyAndrew J. Breen,1,2 Kelvin Y. Xie,3 Michael P. Moody,4 Baptiste Gault,4 Hung-Wei Yen,1,2
Christopher C. Wong,5 Julie M. Cairney,1,2,* and Simon P. Ringer1,2
1School of Aerospace, Mechanical and Mechatronic Engineering, The University of Sydney, NSW 2006, Australia2The Australian Centre for Microscopy and Microanalysis, The University of Sydney, NSW 2006, Australia3School of Mechanical Engineering, Johns Hopkins University, Baltimore, MD 21218-2682, USA4Department of Materials, University of Oxford, Parks Road, OX13PH, Oxford, UK5Department of Psychology, The University of Sydney, NSW 2006, Australia
Abstract: Atom probe is a powerful technique for studying the composition of nano-precipitates, but theirmorphology within the reconstructed data is distorted due to the so-called local magnification effect. A newtechnique has been developed to mitigate this limitation by characterizing the distribution of the surroundingmatrix atoms, rather than those contained within the nano-precipitates themselves. A comprehensive chemicalanalysis enables further information on size and chemistry to be obtained. The method enables new insightinto the morphology and chemistry of niobium carbonitride nano-precipitates within ferrite for a series ofNb-microalloyed ultra-thin cast strip steels. The results are supported by complementary high-resolutiontransmission electron microscopy.
Key words: HSLA steel, atom probe tomography, niobium, precipitation, clustering, local magnification effects
INTRODUCTION
Nano-precipitates are transition nanostructures that formduring the early stages of tempering or aging heat treatmentswithin supersaturated metallic solid solutions. They are some-times referred to as Guinier–Preston or GP zones, after whomthey were discovered (Guinier, 1938; Preston, 1938), particularlyin relation to aluminum alloys. Physically, they are extremelysmall solute rich platelets (several nm in length) that are largelycoherent with the parent matrix and lie along the most energe-tically favorable crystallographic plane families. The formationof nano-precipitates has a profound influence on themechanicalproperties of the alloys in which they form. The formation ofniobium carbonitride Nb(C, N) nano-precipitates in steel, forinstance, can substantially increase the yield strength byimpeding themovement of dislocations (Deschamps et al., 2011;Xie et al., 2012). It is therefore not surprising that the pre-cipitation of Nb(C, N) has attracted significant research interestover the last several decades in an effort to design and develophigh performance niobium-alloyed low-carbon steels (Hansenet al., 1980; Hua et al. 1997; DeArdo et al., 2001; Shanmugamet al., 2006). The study of this important process was the moti-vation behind developing the analysis technique presented inthis manuscript.
Many different theoretical studies have been undertakento elucidate the mechanisms of Nb(C, N) precipitation.
Recent thermodynamic and kinetic models have been pro-posed to understand nucleation, growth, and coarsening(Fujita et al., 2004; Perez et al., 2007; Hin et al., 2008;Hutchinson et al., 2008), and to facilitate prediction of par-ticle size distribution, number density, and volume fractionfor different aging conditions. However, precisely modellingthe nucleation pathways of metastable nano-precipitates inmulticomponent alloys is particularly difficult due to themulti-dimensionality of the systems being modelled.
Experimental analysis of Nb(C, N) nano-precipitates istherefore crucial to understanding the nucleation mechan-isms and the structure–property relationships. Nb(C, N)morphology, orientation, and crystallography have primarilybeen observed by means of high-resolution transmissionelectron microscopy (HRTEM) and field ion microscopy(Maruyama et al., 1998; Danoix et al., 2012). Specifically,HRTEM images have shown that the formation of Nb(C, N)in ferrite begins with fully coherent clusters in mono-atomicdisks perpendicular to the elastically soft ⟨001⟩ferrite directionsof the body centered cubic lattice (Perez et al., 2007).After longer aging times, the coherent nano-precipitatesgrow to become semi-coherent carbonitride platelets, whichhave a face centered cubic B1 crystal structure, exhibiting theBaker–Nutting orientation relationship of [100]Nb(C, N)//[110]ferrite and [001]Nb(C,N)//[001]ferrite, evidenced fromtransmission electronmicroscopy diffraction (Courtois et al.,2006). Further information such as the chemical composi-tion has been attained using electron energy dispersivespectroscopy (Courtois et al., 2006; Perez et al., 2007).*Corresponding author. [email protected]
Received March 16, 2014; accepted June 26, 2014
Atom probe tomography (APT) has also been success-fully applied to the study of nano-precipitates such as thosefound in Al-Cu alloys (Hono et al., 1986; Araullo-Peterset al., 2014) and ss Nb(C, N) in ferrous alloys (Deschampset al., 2011; Xie et al., 2012; Shrestha et al., 2013). APT is a3D microscopy technique capable of reconstructing andidentifying millions of individual atoms with sub-nanometerspatial resolution, and is a powerful means for studyingprecipitation reactions in alloys (Gault et al., 2012c). How-ever, a well-known limitation of APT is the local magnifi-cation effect, which causes inaccuracies in the measuredpositions of atoms originating from clusters and precipitatesin multi-component material systems (Miller & Hether-ington, 1991; Vurpillot et al., 2000; De Geuser et al., 2007).The origins of local magnification lie in the relative strengthsof the electric field required to field evaporate differenttypes of atomic elements from the surface of the specimen.Relatively high-field species, such as Nb, C, and N surroundedby Fe, are preferentially retained leading to a change in shape ofthe tip surface that perturbs the trajectories of the ions in theseregions. Due to limitations caused by the local magnificationeffect, studies on Nb(C, N) have predominantly focused onextracting chemical information or cluster size distributions,and have not been shown to successfully restore morphology in3D. However, from all the aforementioned microanalysistechniques, APT presents a uniquely powerful opportunity tocombine chemical information with 3D morphological infor-mation for the study of nano-precipitates.
This manuscript proposes a new method for analyzingthe chemistry, size, and morphology of individual nano-precipitates in 3D using APT. It was found that the localmagnification effect that distorts the trajectories of ionsoriginating from the nano-precipitate does not appear to be assevere for the surrounding ions originating from the matrix.Close inspection of APT reconstructions of Nb-microalloyedHSLA steels revealed lower density regions of matrix atomscorresponding to the position of Nb(C, N) nano-precipitates.These density voids often have a more realistic morphologythan the reconstructed ions originating from the nano-precipitates themselves. With the use of atom probe crystal-lography techniques (Moody et al., 2011; Araullo-Peters et al.,2012; Gault et al., 2012b) it is also possible to determine thecrystallographic orientation of the tip and hence determine theorientation of the nano-precipitates relative to the ferritematrix. Combining this with a detailed chemical analysis of theclustered ions originating from the nano-precipitates enablesthe size and chemistry to also be predicted.
MATERIALS AND EXPERIMENTAL METHODS
Different-aged conditions of a Nb-microalloyed (0.084 wt%Nb) ultra-thin strip cast steels produced from the CASTRIP®process were selected for APT analysis (Sosinsky et al., 2008;Xie et al., 2011; Shrestha et al., 2013) as an interesting casestudy for testing the developed analysis method. WithCASTRIP®, thin sheets of steel (~1–2 mm) can be directlycast from molten steel after only one stage of hot rolling.
A finish rolling temperature of 879°C and a coiling tempera-ture of 567°C were used. The chemical composition of thesteel is shown in Table 1.
The steel then underwent a series of simple agingheat treatments in a barium chloride salt bath followed bywater quenching. Xie et al. (2012) reported a remarkableage hardening response, achieving a peak increase in yieldstrength from 475 to 640MPa with no appreciable loss ofductility, for the aging time of 4 min at 700°C. Further agingshowed a decrease in yield strength, with a final recordedstrength of 600MPa after 40 min. Atomic scale microscopyrevealed that the strengthening effect was associated with theformation of Nb(C, N) clusters and nano-precipitates.
Three different aging conditions were then selected forAPT analysis, 240 h at 525°C, 4 min at 700°C and 40 min at700°C, so that an initial comparison of Nb(C, N) precipita-tion evolution was possible. Since the aging temperatureswere below the calculated Ae1 temperature for this steel, asshown in Figure 1a, the observed Nb(C, N) precipitationoccurred within ferrite. A magnified region of the curve,Figure 1b, reveals that while Nb(C, N) carbonitrides canform at high temperature, most niobium solute is conservedfor the later aging treatments within ferrite.
Specimens were prepared for APT using the standard2-stage electropolishing technique. Data were collected usinga Cameca LEAP 3000 X (CAMECA Instruments, Inc.,Madison, WI). The lowest possible specimen temperature of~20 K was used along with a pulse fraction of ~20%, that hadpreviously been observed to provide good quality data for thesetypes of steels (Yao et al., 2011). The collected data sets weresubsequently reconstructed using IVAS® and calibrated usingthe protocol described by Gault et al. (2009).
HRTEM was also used to confirm the validity of theatom probe results. Electropolished thin films were preparedusing standard techniques and were imaged using a JEOLJEM 3000F operated at 300 kV.
A ROBUST METHOD FOR OBSERVINGINDIVIDUAL NANO-PRECIPITATEMORPHOLOGY IN 3DThe procedure for observing nano-precipitate morphologyin 3D is outlined in the sections below. A 3D density map ofthe matrix atoms is used to clearly highlight the morphologyof the nano-precipitates while the clustered ions aroundthe nano-precipitate region are analyzed for informationon size and chemistry. Finally, virtual atom models of thenano-precipitates based on the observed chemistry, size, andmorphology within the reconstruction are created.
Table 1. Nb-Microalloyed CASTRIP® Chemical Composition.
Comp. Nb C N Cr Ni Cu Mn Si Fe
wt% 0.084 0.031 0.007 0.37 0.03 0.05 0.83 0.2 Bal.at% 0.050 0.14 0.028 0.40 0.028 0.044 0.84 0.4 Bal.
APT of individual Niobium Carbonitride Nano-Precipitates 1101

USING 3D DENSITY MAPS TO HIGHLIGHTTHE LOWER DENSITY REGIONS OF THENANO-PRECIPITATES
3D density maps of the matrix atoms were created using thecommercially available image and visualization software(IVAS®) for the LEAP®. It follows that nano-precipitatesshould show as lower density voids within the reconstruc-tion. To highlight the presence of these features, a very smallvoxel size and delocalization (Hellman et al., 2003) is appliedwhen implementing the grid-based density distribution map.Cubic voxels with extents of 0.14 nm, combined with a 1 nmdelocalization, were used in this study.
To facilitate clearer observation of the habit planes of thenano-precipitates, the reconstructions were rotated so thatthe x, y, and z-axis aligned with the ⟨001⟩ferrite directions.Details of the method used for determining the crystalorientation of atom probe reconstructions can be foundelsewhere (Moody et al., 2009; Araullo-Peters et al., 2012).If a thin slice from within the density map is isolated,nano-precipitate morphology becomes apparent and is oftenmuch clearer than a density distribution of the ions origi-nating from the nano-precipitate. The nano-precipitateswere observed to have a tri-axial ellipsoid or platelet geo-metry. Throughout the manuscript the two larger axes willbe termed the length and width, while the shortest axis willbe termed the thickness.
DETERMINING THE SIZE AND CHEMISTRY OFTHE NANO-PRECIPITATES
Information on the size and chemistry of individual nano-precipitates can be found by closely examining the clusteredions surrounding the lower density regions. Each massspectrum was ranged as consistently as possible; Figure 2 isan example of a ranged mass spectrum used in this study.Importantly, the chemical analyses undertaken here havesought to account for the effects of key experimental
limitations of APT that can significantly affect quantitativemeasurement, including peak overlaps in the mass spectrum,molecular ion detection, and imperfect detection efficiencyof ions. These issues and the necessary assumptions thatwere taken are addressed later in the discussion.
A sub volume of the reconstruction around each nano-precipitate of interest was then created and the numbers ofclustered Nb, C, and N atoms were counted. The inclusion ofincorrectly ranged ions, due to background noise, is assumedto be negligible. This is because background noise israndomly distributed throughout the reconstruction andonly small concentrations of Nb, C, and N are present withinthe steel. Therefore any clustered ions are likely to haveoriginated from the nano-precipitate.
Finally, the effects of detection efficiency are considered.It is noted that the detection efficiency is a stochasticprocess and that the true number of atoms within a singlenano-precipitate cannot be known for certain. A binomialprobability distribution can be used to model the likelihoodthat a certain number of atoms were originally present in a
Figure 1. a: The equilibrium phase fraction (in weight fraction) with respect to temperature, calculated usingThermo-Calc with the TCFE7 database. b: Magnified region of (a) for <5 × 10⁻³ wt%.
Figure 2. An example mass spectrum of the CASTRIP® steelsample aged 240 h at 525°C. Ions containing C, N, and Nb, whichconstitute the nano-precipitates are highlighted in red (see onlineversion for colour).
1102 Andrew J. Breen et al.
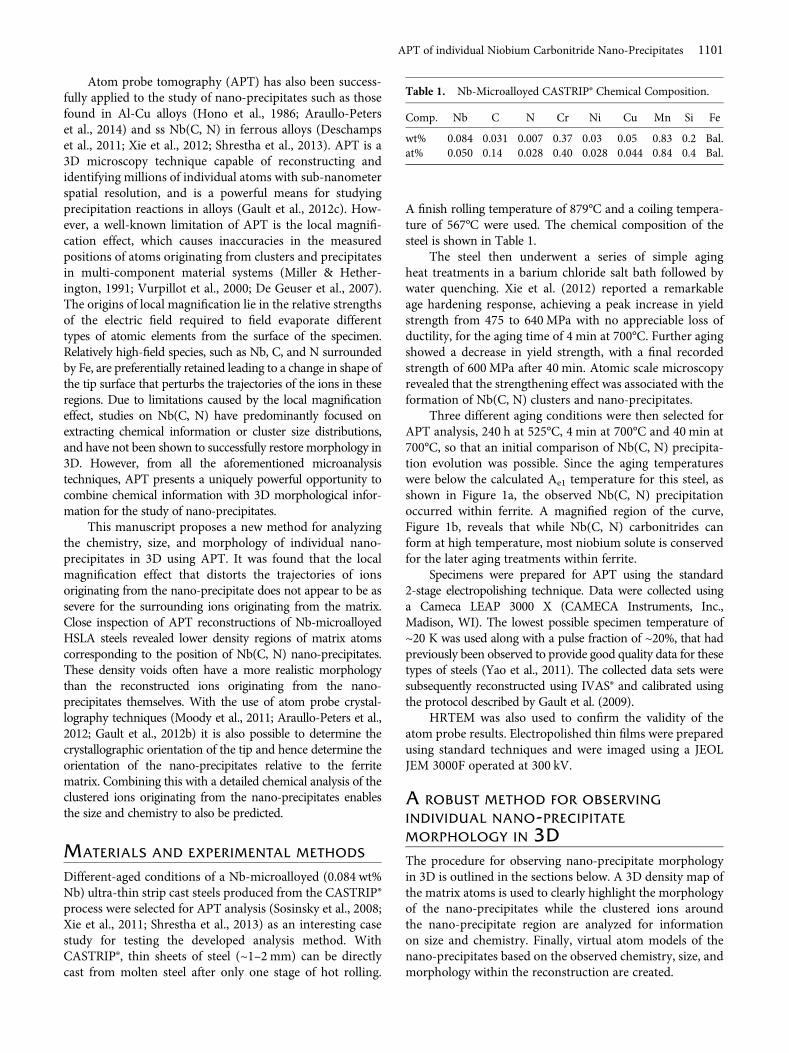
nano-precipitate (Stephenson et al., 2011). The mean (andmaximum probability) of this distribution can be calculatedfrom the detected number of atoms divided by the detectorefficiency. The standard deviation can be calculated from thesquare root of the variance and has been used in this study asthe confidence interval when quoting the number of atomspredicted. The detector efficiency of the Cameca LEAP3000 X used to collect the APT data were measured in aprevious study as εdetector = 0.57 (Moody et al., 2011).
MODELLING NANO-PRECIPITATES BASED ONMEASURED SIZE, SHAPE, AND CHEMISTRY
While the 3D density maps provided a clear method ofobserving the general shape and orientation of the plateletsrelative to the ferrite matrix, it was difficult to accuratelymeasure the dimensions. This is because the size is depen-dent on the selected voxel size, delocalization, and color mapproperties. Choosing specific limits to take measurementsfrom are therefore arbitrary. Instead, the approximatedimensions were measured directly from the density void ofthe originally reconstructed Fe atoms and compared withthose observed in HRTEM micrographs.
Figure 3 shows a nano-precipitate observed within anAPT reconstruction and another observed from a HRTEMmicrograph for the 4 min at 700°C aging condition. Onewould expect nano-precipitates from the same aging condi-tion to have very similar dimensions, and indeed goodagreement is seen between the observed lengths (~3.6 nmin APT reconstruction, ~ 4 nm in HRTEM micrograph).However, the thickness is much larger within the lowerdensity region of the atom probe reconstruction (~1 nm)compared with the monolayer observed in the HRTEMmicrograph ({001}ferrite plane spacing ~ 0.14 nm), due totrajectory aberrations caused by the local magnificationeffect. The severity also appeared to change depending on theorientation of the platelets relative to the detector. The closerthe nano-precipitates were to being tangential to the analysisdirection, the clearer the platelet morphology.
Virtual atom models of the nano-precipitates, based onthe measured dimensions and chemistry, were then created.The calculated maximum probability of actual atoms fromthe detected nano-precipitates was used in the models.The length and width were made equal to that measuredfrom the atom probe reconstruction. If all the atoms couldnot fit onto a single {001}ferrite atomic layer; additional layerswere added to the zone. By doing this, the issue of localmagnification affecting the thickness measurement wasmitigated. Further modelling details were similar to thatdescribed by Danoix et al. (2012):
∙ Nb was assumed to substitute for all Fe atoms in plateletsoccupying the {001}ferrite habit planes.
∙ N and C occupied the octahedral sites at the center of4 in-plane {001}ferrite Nb atoms.
It was not possible to unequivocally determine whichoctahedral sites the C and N atoms fill due to severity of the
local magnification effect. For sub-stoichiometric con-centrations of C and N, it was arbitrarily chosen to filloctahedral sites from the center. Due to the large atomic sizeof Nb compared with Fe, some distortion of the ferrite latticewould also be expected, but for simplicity, this has not beenadapted in the provided models.
RESULTS
The observed nano-precipitate morphology and virtual atommaps derived from the method described above are presentedin the following sections for the 240 h at 525°C, 4min at 700°C,and 40min at 700°C aging conditions. HRTEM images are alsoused to confirm the observations made with APT.
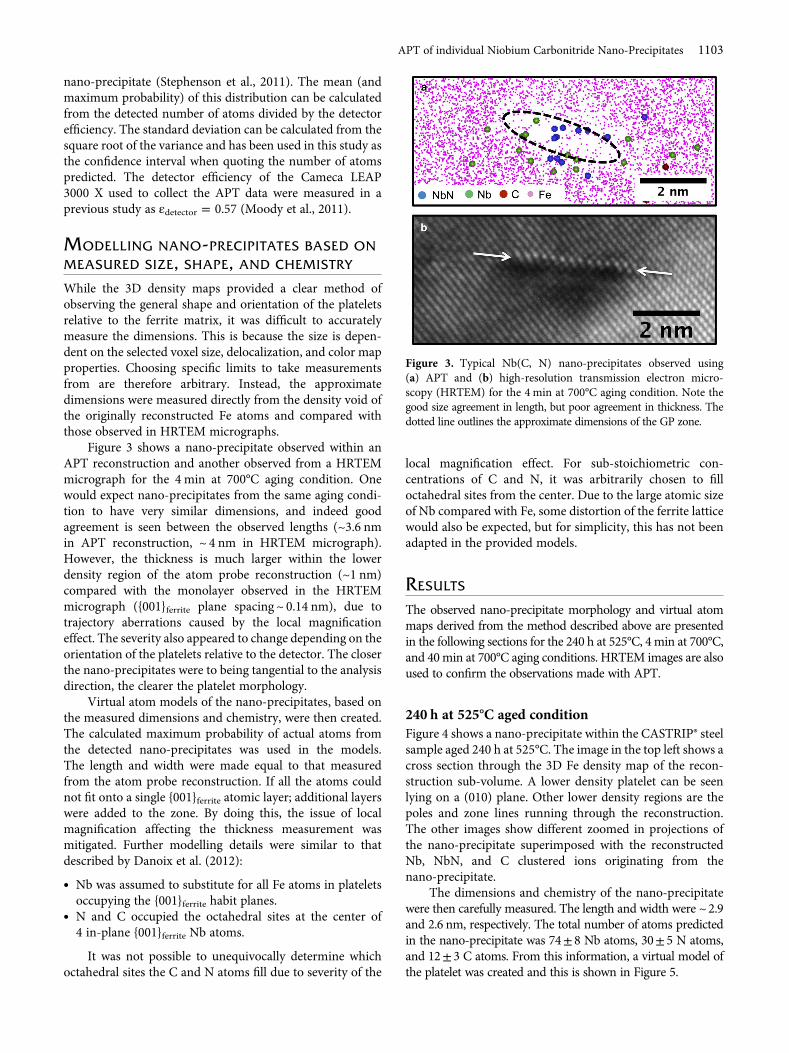
240 h at 525°C aged conditionFigure 4 shows a nano-precipitate within the CASTRIP® steelsample aged 240 h at 525°C. The image in the top left shows across section through the 3D Fe density map of the recon-struction sub-volume. A lower density platelet can be seenlying on a (010) plane. Other lower density regions are thepoles and zone lines running through the reconstruction.The other images show different zoomed in projections ofthe nano-precipitate superimposed with the reconstructedNb, NbN, and C clustered ions originating from thenano-precipitate.
The dimensions and chemistry of the nano-precipitatewere then carefully measured. The length and width were ~2.9and 2.6 nm, respectively. The total number of atoms predictedin the nano-precipitate was 74± 8 Nb atoms, 30± 5 N atoms,and 12± 3 C atoms. From this information, a virtual model ofthe platelet was created and this is shown in Figure 5.
Figure 3. Typical Nb(C, N) nano-precipitates observed using(a) APT and (b) high-resolution transmission electron micro-scopy (HRTEM) for the 4 min at 700°C aging condition. Note thegood size agreement in length, but poor agreement in thickness. Thedotted line outlines the approximate dimensions of the GP zone.
APT of individual Niobium Carbonitride Nano-Precipitates 1103

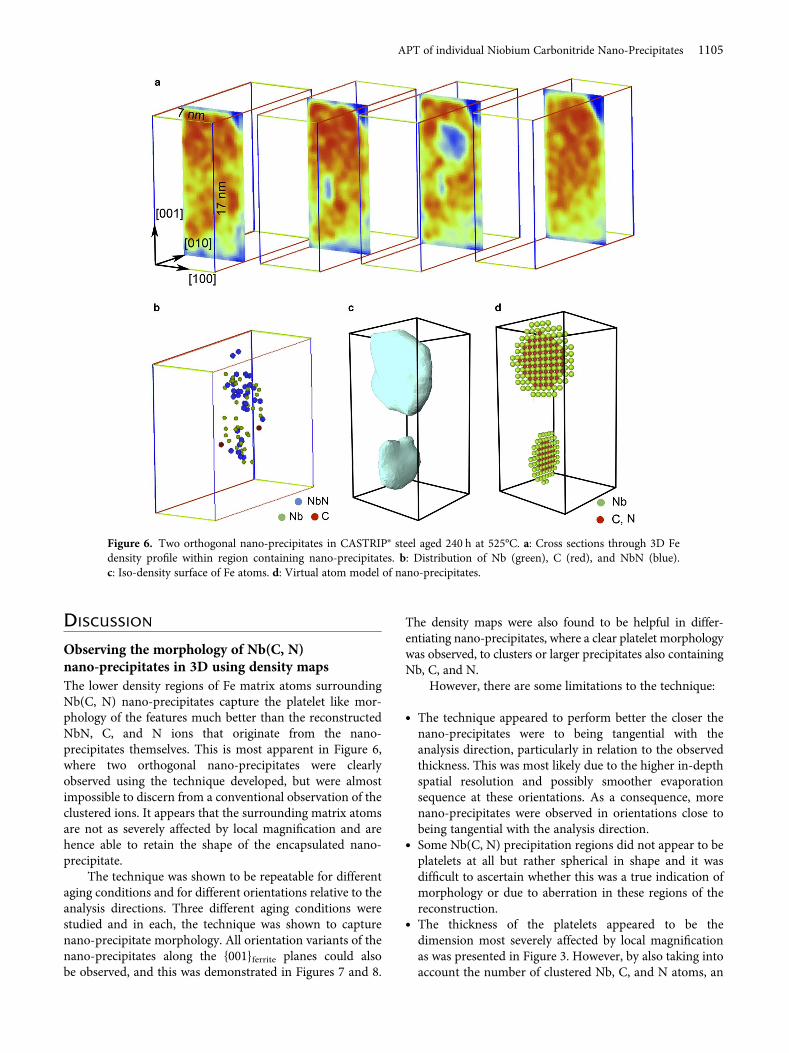
Other nano-precipitates lying on different variants ofthe {001}ferrite planes were also seen within the reconstruction.Two orthogonal platelets lying in very close proximity toeach other are shown in Figure 6a. The presence of twoseparate and orthogonal nano-precipitates is not obvious
from the distribution of NbN, Nb, and N alone (Fig. 6b). Aniso-density surface of Fe atoms in Figure 6c also clearlyshows the morphology and relative orthogonal positioningof the nano-precipitates. Finally, an atom model of eachnano-precipitate is shown in Figure 6d. The top nano-precipitate was predicted to contain 107± 9 Nb, 47± 6 N,and 9± 3 C atoms, respectively, whereas the bottom nano-precipitate was smaller with 74± 8 Nb, 26± 5 N, and 4± 2 Catoms. Based on the observed size along with the numberof clustered ions detected, the platelets have been modelledas 1 atomic layer thick and ~ 3.4 and 2.9 nm in diameter,respectively.
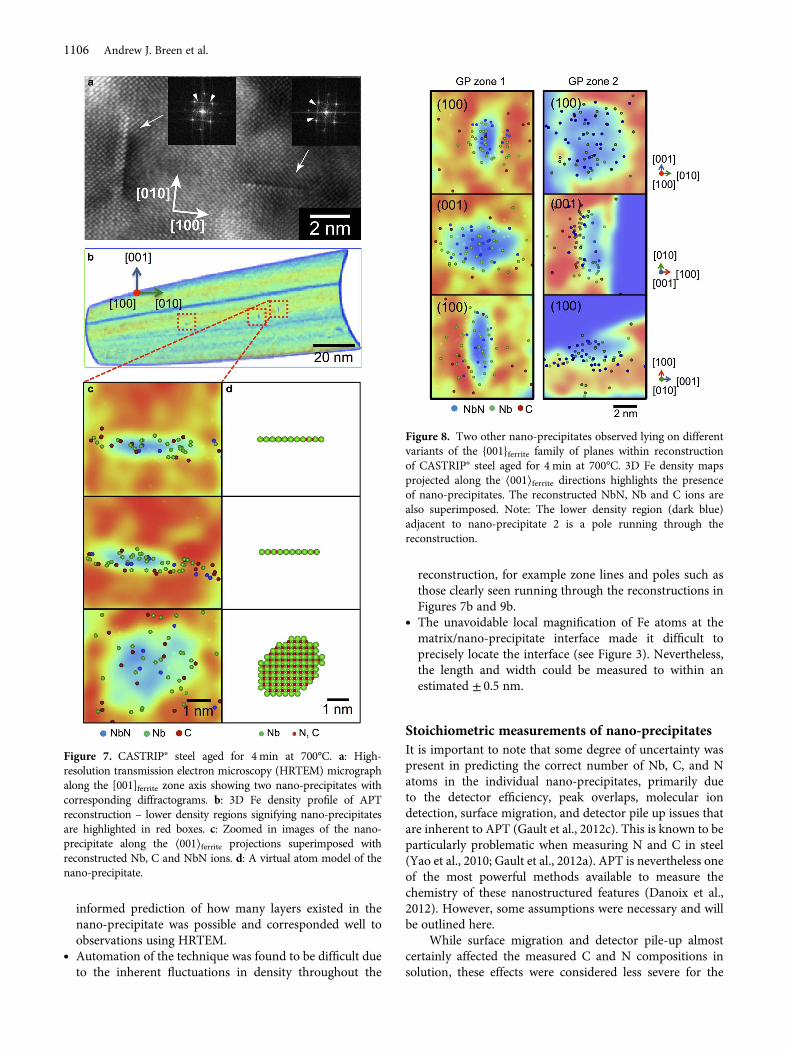
4min at 700°C aged conditionFigure 7 demonstrates the results achieved for the 4 min at700°C aged condition corresponding to the peak hardnessdetermined in the study by Xie et al. ( 2012). This time,HRTEM was used to confirm the size and geometry of thenano-precipitates (Fig. 7a). The strikes in the diffractograms,processed by the fast Fourier transformation (FFT), confirmthe ultra-thin structure of the nano-precipitate and thecoherency with the ferrite matrix. Figure 7b and 7c showcasethe atom probe results of the same steel. The plateletmorphology is clearly captured by the density void of Fematrix atoms within the reconstruction. The length andwidth of the platelet were found to be ~3.2 and 1.9 nm,respectively. The nano-precipitate was found to contain93± 8 Nb atoms, 16± 4 N atoms, and 53± 6 C atoms.Taking this information into account, a virtual atom modelof a monolayer nano-precipitate was created (Fig. 7d).
Other nano-precipitates lying on different variants ofthe {001}ferrite planes were also observed within this recon-struction. Figure 8 shows projections of 3D Fe density mapsof two other nano-precipitates lying on the (001)ferrite and(100)ferrite planes. The measured number of atoms for eachnano-precipitate was also calculated and is given in Table 3.
40min at 700°C aged conditionThe characterization method was then applied to the speci-men aged for 40 min at 700°C. The HRTEM image andcorresponding diffractograms using the FFT, Figure 9a,indicate the presence of multilayer nano-precipitates withinthe sample. Careful inspection of the diffractograms revealedthe Baker–Nutting orientation relationship and the latticemismatch between the nano-precipitate and ferrite matrix.Nano-precipitates were again observed within the APTreconstruction using the method developed, Figure 9b, 9c,and were consistent in size to those observed using HRTEM.The length and width of the selected nano-precipitate were~2.6 and 2.8 nm, respectively and was estimated to contain155± 11 Nb, 50± 6 N, and 102± 9 C atoms. Combining thisinformation suggests that the nano-precipitate is two layersthick. The nano-precipitate is still considered to be under thecritical size of coherency loss with the ferrite matrix and avirtual atom model is provided in Figure 9d.
Figure 4. Nb(N, C) nano-precipitate within APT reconstructionof CASTRIP® steel aged 240 h at 525°C. Top left: Fe 3D densitymap cross-section of reconstruction sub-volume showing nano-precipitate. Center: Zoomed in region of nano-precipitate in 3Ddensity map, clearly showing the platelet morphology; top right,bottom left and bottom right: projections along the ⟨001⟩ferritedirections. The clustered Nb, NbN and C ions have also beensuperimposed with the profiles of the nano-precipitate.
Figure 5. a: Probability distributions for the number of atomsoriginally in the nano-precipitate shown in Figure 4 based ondetected number of atoms and detector efficiency. The verticalblue lines, from left to right, represent the number of C, N andNb atoms originally detected. The pink area under each distribu-tion represents the estimated number of each element originallyin the nano-precipitate within one standard deviation. The meanand confidence values to the nearest integer are given in the topright-hand corner. b: Virtual atom model of Nb(C, N) nano-precipitate based on measured dimensions of density void andthe estimated mean number of atoms originally in the nano-precipitate.
1104 Andrew J. Breen et al.
DISCUSSION
Observing the morphology of Nb(C, N)nano-precipitates in 3D using density mapsThe lower density regions of Fe matrix atoms surroundingNb(C, N) nano-precipitates capture the platelet like mor-phology of the features much better than the reconstructedNbN, C, and N ions that originate from the nano-precipitates themselves. This is most apparent in Figure 6,where two orthogonal nano-precipitates were clearlyobserved using the technique developed, but were almostimpossible to discern from a conventional observation of theclustered ions. It appears that the surrounding matrix atomsare not as severely affected by local magnification and arehence able to retain the shape of the encapsulated nano-precipitate.
The technique was shown to be repeatable for differentaging conditions and for different orientations relative to theanalysis directions. Three different aging conditions werestudied and in each, the technique was shown to capturenano-precipitate morphology. All orientation variants of thenano-precipitates along the {001}ferrite planes could alsobe observed, and this was demonstrated in Figures 7 and 8.
The density maps were also found to be helpful in differ-entiating nano-precipitates, where a clear platelet morphologywas observed, to clusters or larger precipitates also containingNb, C, and N.
However, there are some limitations to the technique:
∙ The technique appeared to perform better the closer thenano-precipitates were to being tangential with theanalysis direction, particularly in relation to the observedthickness. This was most likely due to the higher in-depthspatial resolution and possibly smoother evaporationsequence at these orientations. As a consequence, morenano-precipitates were observed in orientations close tobeing tangential with the analysis direction.
∙ Some Nb(C, N) precipitation regions did not appear to beplatelets at all but rather spherical in shape and it wasdifficult to ascertain whether this was a true indication ofmorphology or due to aberration in these regions of thereconstruction.
∙ The thickness of the platelets appeared to be thedimension most severely affected by local magnificationas was presented in Figure 3. However, by also taking intoaccount the number of clustered Nb, C, and N atoms, an
Figure 6. Two orthogonal nano-precipitates in CASTRIP® steel aged 240 h at 525°C. a: Cross sections through 3D Fedensity profile within region containing nano-precipitates. b: Distribution of Nb (green), C (red), and NbN (blue).c: Iso-density surface of Fe atoms. d: Virtual atom model of nano-precipitates.
APT of individual Niobium Carbonitride Nano-Precipitates 1105
informed prediction of how many layers existed in thenano-precipitate was possible and corresponded well toobservations using HRTEM.
∙ Automation of the technique was found to be difficult dueto the inherent fluctuations in density throughout the
reconstruction, for example zone lines and poles such asthose clearly seen running through the reconstructions inFigures 7b and 9b.
∙ The unavoidable local magnification of Fe atoms at thematrix/nano-precipitate interface made it difficult toprecisely locate the interface (see Figure 3). Nevertheless,the length and width could be measured to within anestimated ± 0.5 nm.
Stoichiometric measurements of nano-precipitatesIt is important to note that some degree of uncertainty waspresent in predicting the correct number of Nb, C, and Natoms in the individual nano-precipitates, primarily dueto the detector efficiency, peak overlaps, molecular iondetection, surface migration, and detector pile up issues thatare inherent to APT (Gault et al., 2012c). This is known to beparticularly problematic when measuring N and C in steel(Yao et al., 2010; Gault et al., 2012a). APT is nevertheless oneof the most powerful methods available to measure thechemistry of these nanostructured features (Danoix et al.,2012). However, some assumptions were necessary and willbe outlined here.
While surface migration and detector pile-up almostcertainly affected the measured C and N compositions insolution, these effects were considered less severe for the
Figure 7. CASTRIP® steel aged for 4min at 700°C. a: High-resolution transmission electron microscopy (HRTEM) micrographalong the [001]ferrite zone axis showing two nano-precipitates withcorresponding diffractograms. b: 3D Fe density profile of APTreconstruction – lower density regions signifying nano-precipitatesare highlighted in red boxes. c: Zoomed in images of the nano-precipitate along the ⟨001⟩ferrite projections superimposed withreconstructed Nb, C and NbN ions. d: A virtual atom model of thenano-precipitate.
Figure 8. Two other nano-precipitates observed lying on differentvariants of the {001}ferrite family of planes within reconstructionof CASTRIP® steel aged for 4 min at 700°C. 3D Fe density mapsprojected along the ⟨001⟩ferrite directions highlights the presenceof nano-precipitates. The reconstructed NbN, Nb and C ions arealso superimposed. Note: The lower density region (dark blue)adjacent to nano-precipitate 2 is a pole running through thereconstruction.
1106 Andrew J. Breen et al.

C and N held within the nano-precipitates. This is becauseC and N are strongly bonded to the Nb and are therefore lesslikely to migrate large distances over the surface of the tip tohigher electric field regions, as appears to be the case whenexposed within the ferrite matrix regions (Gault et al., 2012a).One would expect that if this assumption were valid, bulkcompositional measurements would be more accurate atlonger-aged conditions when more of the C and N weretrapped within the nano-precipitates and indeed this is whatwas observed (see Table 2).
Another significant assumption was that N totally eva-porated as 93Nb14N3+ . No other clear N peaks were observedwithin the mass spectrum (see Fig. 2). It was possible thatsome N within the nano-precipitates had evaporated as14N1+ and this overlaps with 28Si2 + . Peak deconvolution wasnot practical in this case due to the low concentration of Nrelative to Si. Instead, the distribution of Si was observedcarefully in the reconstruction. One would expect that ifsome N were contained within this peak, clustering would beobserved around the nano-precipitate regions, but this was notthe case. The compositional measurements of N were also quiteclose to the nominal composition for the longest aging condi-tion shown in Table 2, further suggesting that almost all Nevaporated as 93Nb14N3+ within the nano-precipitates.
C was also difficult to measure due to the peak overlaps ofdifferent isotopes and charge states. 12C2+, 12C3
2+, 12C+/12C22+ ,
12C21+/12C4
2+ peaks were identified. Assumptions based on themeasurements described by Sha et al. (1992) were used todeconvolve the peak overlaps. For the peak at 12C+/12C2
2 +
(i.e. 12 u/e), 95% of ions were assumed to be the 12C+ specieswhile the other 5% were 12C2
2 + . The close agreement betweenthe nominal composition and bulk composition calculationfor C at the 40 min at 700°C aging condition, where most ofthe C and N are trapped in the nano-precipitates, is also astrong indication that the ranging is correct and most of theC is accounted for.
Nb was the easiest element to measure. The measuredbulk compositions in each dataset closely matched thenominal composition, strongly suggesting that almost allNb had been ranged correctly. It therefore seems a validassumption that Nb was totally accounted for by the93Nb14N3+ , 93Nb4+ , and 93Nb14N3+ peaks.
Finally, the detector efficiency had to be taken intoaccount when predicting the number of atoms that wereoriginally in the nano-precipitates. It was assumed that the
Figure 9. Steel aged for 40 min at 700°C. a: High-resolutiontransmission electron microscopy (HRTEM) micrograph alongthe [001]ferrite zone axis showing two nano-precipitates with cor-responding fast Fourier transformation (FFT) diffractograminserts. b: 3D Fe density profile of APT reconstruction – lowerdensity regions signifying nano-precipitates are highlighted in theboxes. c: Zoomed in projections along ⟨001⟩ of a nano-precipitatesuperimposed with reconstructed Nb, C and NbN ions. d: Atommodel of the nano-precipitate based on measured size and chemistry.
Table 2. Comparing the Bulk Composition Measurements of C,N and Nb to the Nominal Composition.
Dataset C (at%) N (at%) Nb (at%)
Nominal composition 0.140 0.028 0.050240 h @ 525°C 0.063 0.018 0.0514 min @ 700°C 0.053 0.012 0.05640 min @ 700°C 0.142 0.021 0.049
Bulk atomic compositions were calculated on IVAS® using backgroundcorrection and decomposition of molecular ions.
APT of individual Niobium Carbonitride Nano-Precipitates 1107

chance of detecting an evaporated ion was the same for allatomic species and equal to the detection efficiency of ~57%for the straight flight path CAMECA® LEAP® 3000X used inthis study. For reflectron fitted instruments, the detectionefficiency, and hence the chance of detecting an evaporatedion, would be even less at 35–45% (Mottura et al., 2010).
Unfortunately, the precise number of atoms in indivi-dual nano-precipitates cannot be known. Instead, the mostlikely number of atoms based on binomial probability dis-tributions, such as that shown in Figure 5, was used to pre-dict the number of atoms. Since the detected number ofatoms in the nano-precipitates can sometimes be particularlysmall, this is a potential source of error. It is worth notingthat cluster identification algorithms (Miller & Kenik, 2004;Stephenson et al., 2007; Ceguerra et al., 2010) can providebetter statistics for comparing distributions of differentcluster chemistries, but in this study, the chemistry of indi-vidual nano-precipitates was required. With intended futureimprovements to the detector efficiency (Miller et al., 2012;Kelly et al., 2013), the counting method presented shouldimprove in accuracy. Table 3 is a summary of the measuredchemistry for some individual nano-precipitates usedthroughout the manuscript.
Atom models of nano-precipitatesBy combining the morphological information from thedensity maps with the size and chemistry information of theclustered ions, it was proposed that virtual atomic models ofthe nano-precipitates could be created. The models providesome practical advantages to studying the formation of Nb(C, N) nano-precipitates including:
∙ A way to quickly visualize the approximate morphology(including number of layers) and stoichiometry of Nb(C,N) precipitates that would otherwise be difficult to observefrom the raw atom probe reconstructions.
∙ A means of more easily comparing the relative orientationand size of neighboring nano-precipitates such as thoseshown in Figure 6.
From a bigger picture perspective, the models couldpotentially be used as a nexus between APT data and compu-tational materials sciencemodelling for the purposes of studyingNb(C, N) nano-precipitate formation in steels. Combiningtheory and experiment is increasingly recognized as a necessarystep for the complex modelling of nanostructured materials(Billinge & Levin, 2007). Density functional theory, for example,requires lattice-based model inputs to calculate material prop-erties and are also very computationally expensive. The modelsprovide a way to input crystal structures and narrow down thedifferent structural combinations that need to be tested.
Of course, as with any model, the approach presentedhere does have limitations that must be considered in anysubsequent analysis. The individual interstitial positioning ofC and N could not be determined from the atom probereconstructions and due to the severity of the local magnifi-cation effect and the limited detector efficiency the precisenumber of total atoms also cannot be determined. In realitysignificant lattice strain would also be present, but this can beapproximated by lattice relaxation in subsequent computa-tional materials science modelling. Overall, the models createdcorresponded well in size and shape to the nano-precipitatesobserved in the HRTEM images (see Figs. 7 and 9).
Insight into the early stages of Nb(C, N) precipitateformation in ferriteThe focus of the present manuscript was the development ofan APT microanalysis technique to characterize Nb(C, N)nano-precipitate morphology in steel and mitigate someof the issues relating to local magnification. The resultsprovide some interesting initial insights into the early stagesof Nb(C, N) precipitation that highlight the usefulness ofthe technique developed and will be briefly described. Theresults suggest an increase in nano-precipitate size from 4 to40 min at the 700°C aging condition. This is not particularlysurprising in itself, but importantly, it shows that the methoddeveloped is able to pick up subtle differences in nano-precipitate morphology and size at different aging conditions
Table 3. Predicted Numbers of Atoms from Individual Nb(C, N) Nano-PrecipitatesWithin One Standard Deviation Confidence Interval atDifferent Aging Conditions.
Aging condition No. Nb N C Figure
240 h @ 525°C 1 74± 8 30± 5 12± 3 4, 52 107± 9 47± 6 9± 3 63 74± 8 26± 5 4± 2 6Average 85± 8 34± 5 8± 3
4 min @ 700°C 1 93± 8 16± 4 53± 6 72 144± 10 62± 7 46± 6 8 (left)3 72± 7 30± 5 11± 3 8 (right)Average 103± 8 36± 5 37± 5
40 min @ 700°C 1 155± 11 50± 6 102± 9 9c2 134± 10 32± 5 92± 9 9b (right box)3 67± 7 11± 3 53± 6 9b (right box)Average 118± 9 31± 5 82± 8
All values are to the nearest integer.
1108 Andrew J. Breen et al.

for the purposes of tracking the early stages of Nb(C, N)precipitate formation.
The nano-precipitates also appeared to evolve frombeing predominantly monolayers at 4 min to double layers at40 min. The change in nano-precipitate morphology corre-lated to a decrease in tensile strength from 640 to 600MPa asreported by Xie et al. (2012). This further suggests that afine dispersion of monolayer Nb(C, N) nano-precipitatesis a more effective strengthening mechanism than larger pre-cipitates. It is also worth mentioning that the size of the nano-precipitates observed in the 240 h at 525°C aging conditionwere very similar to that observed for the 4min at 700°C con-dition. This gives some indication to the effect the aging tem-perature has on the rate of precipitation growth and coarsening.
The results on chemistry summarized in Table 3 are alsointeresting regarding precipitation behavior of Nb(C, N). Itappears that the stoichiometry changes at different stagesand evolution of Nb(C, N) precipitation. For the 240 h at525°C and 4 min at 700°C aging conditions, (C +N)/Nbwas consistently <1, that is the nano-precipitates weresub stoichiometric. For the 40 min at 700°C, the nano-precipitates observed were much closer to being stoichio-metric. A possible reason for this is that at the longer-agedconditions, less Nb is available to be precipitated out ofsolution enabling C and N to diffuse relatively faster into thezones. The fact that the steel being studied has significantlymore C and N than Nb is also likely to contribute to thiseffect. Perez et al. (2007) also reported observing sub-stoichiometric niobium carbo-nitrides that maintained asimilar chemistry over longer aging times, but this was for amodel steel where the C and N contents were approximatelyhalf of the Nb content. Also, the total number of atoms andthe C/N ratio vary significantly, even for nano-precipitateswithin the same reconstruction. These variations are difficultto model using precipitation kinetics software and thusemphasize the need for experimental chemical character-ization at the early stages of Nb(C, N) precipitation.
CONCLUSION
A novel technique has been developed to characterize mor-phology, crystallographic orientation, size and chemistry ofindividual Nb(C, N) nano-precipitates in steel using APT.The morphology of the nano-precipitates was determinedfrom Fe atomic-density distribution maps. This differs fromthe more conventional analysis that focuses on the spatialdistribution of the actual constituent atoms of the nano-precipitates, the locations of which are detrimentally affectedby the local magnification effect. A detailed chemical analysiswas also used to predict size and chemistry. This informationwas then combined to create atomistic models of individualnano-precipitates; the results of which correlated wellwith HRTEM micrographs. The approach was used tocharacterize Nb(C, N) nano-precipitates at three differentaging conditions of a Nb-microalloyed strip cast steel, and isexpected to be amenable for studying nano-precipitates inother systems. The atomistic models created offer an exciting
opportunity to bridge the gap between experimental APTdata and computational materials science.
ACKNOWLEGMENTS
The authors acknowledge scientific and technical input fromthe Australian Microscopy & Microanalysis Research Facilitynode at The University of Sydney. The authors are also gratefulto the Australian Research Council and BlueScope Steel forproving funding support and research materials.
REFERENCESARAULLO-PETERS, V., GAULT, B., GEUSER, F.d., DESCHAMPS, A. &
CAIRNEY, J.M. (2014). Microstructural evolution during ageing ofAl–Cu–Li–x alloys. Acta Materialia 66, 199–208.
ARAULLO-PETERS, V.J., GAULT, B., SHRESTHA, S.L., YAO, L., MOODY, M.P.,RINGER, S.P. & CAIRNEY, J.M. (2012). Atom probe crystallography:Atomic-scale 3-D orientation mapping. Scripta Materialia 66(11),907–910.
BILLINGE, S.J.L. & LEVIN, I. (2007). The problem with determiningatomic structure at the nanoscale. Science 316(5824), 561–565.
CEGUERRA, A.V., MOODY, M.P., STEPHENSON, L.T., MARCEAU, R.K.W.& RINGER, S.P. (2010). A three-dimensional Markov fieldapproach for the analysis of atomic clustering in atomprobe data. Philosophical Magazine 90(12), 1657–1683.
COURTOIS, E., EPICIER, T. & SCOTT, C. (2006). EELS study of niobiumcarbo-nitride nano-precipitates in ferrite.Micron 37(5), 492–502.
DANOIX, F., EPICIER, T., VURPILLOT, F. & BLAVETTE, D. (2012). Atomic-scale imaging and analysis of single layer GP zones in amodel steel. Journal of Materials Science 47(3), 1567–1571.
DE GEUSER, F., LEFEBVRE, W., DANOIX, F., VURPILLOT, F., FORBORD, B. &BLAVETTE, D. (2007). An improved reconstruction procedure forthe correction of local magnification effects in three-dimensionalatom-probe. Surface and Interface Analysis 39(2–3), 268–272.
DEARDO, A.J. (2001). Fundamental Metallurgy of Niobium in Steel.Niobium Science and Technology: Proceedings of the Niobium2001 International Symposium, TMS, 427–500.
DESCHAMPS, A., DANOIX, F., DE GEUSER, F., EPICIER, T., LEITNER, H. &PEREZ, M. (2011). Low temperature precipitation kinetics ofniobiumnitride platelets in Fe.Materials Letters 65(14), 2265–2268.
FUJITA, N., BHADESHIA, H.K.D.H. & KIKUCHI, M. (2004). Precipitationsequence in niobium-alloyed ferritic stainless steel. Modellingand Simulation in Materials Science and Engineering 12(2), 273.
GAULT, B., DANOIX, F., HOUMMADA, K., MANGELINCK, D. & LEITNER, H.(2012a). Impact of directional walk on atom probe microanalysis.Ultramicroscopy 113, 182–191.
GAULT, B., MOODY, M.P., CAIRNEY, J.M. & RINGER, S.P. (2012b). Atomprobe crystallography. Materials Today 15(9), 378–386.
GAULT, B., MOODY, M.P., CAIRNEY, J.M. & RINGER, S.P. (2012c). AtomProbe Microscopy. New York: Springer.
GAULT, B., MOODY, M.P., DE GEUSER, F., TSAFNAT, G., LA FONTAINE, A.,STEPHENSON, L.T., HALEY, D. & RINGER, S.P. (2009). Advances inthe calibration of atom probe tomographic reconstruction.Journal of Applied Physics 105(3), 448–457.
GUINIER, A. (1938). Structure of age-hardened aluminium-copperalloys. Nature 142, 569–570.
HANSEN, S.S., VANDERSANDE, J.B. & COHEN, M. (1980). Niobiumcarbonitride precipitation and austenite recrystallization inhot-rolled microalloyed steels. Metallurgical Transactions A –Physical Metallurgy and Materials Science 11(3), 387–402.
APT of individual Niobium Carbonitride Nano-Precipitates 1109
HELLMAN, O.C., DU RIVAGE, J.B. & SEIDMAN, D.N. (2003). Efficientsampling for three-dimensional atom probe microscopy data.Ultramicroscopy 95(1–4), 199–205.
HIN, C., BRECHET, Y., MAUGIS, P. & SOISSON, F. (2008). Kinetics ofheterogeneous dislocation precipitation of NbC in alpha-iron.Acta Materialia 56(19), 5535–5543.
HONO, K., HASHIZUME, T., HASEGAWA, Y., HIRANO, K. & SAKURAI, T.(1986). A study of multilayer Gp zones in an Al-1.7at-percent cualloy by atom-probe fim. Scripta Metallurgica 20(4), 487–492.
HUA, M., GARCIA, C.I. & DEARDO, A.J. (1997). Precipitation behaviorin ultra-low-carbon steels containing titanium and niobium.Metallurgical and Materials Transactions A – PhysicalMetallurgy and Materials Science 28(9), 1769–1780.
HUTCHINSON, C.R., ZUROB, H.S., SINCLAIR, C.W. & BRECHET, Y.J.M.(2008). The comparative effectiveness of Nb solute and NbCprecipitates at impeding grain-boundary motion in Nb steels.Scripta Materialia 59(6), 635–637.
KELLY, T.F., MILLER, M.K., RAJAN, K. & RINGER, S.P. (2013). Atomic-scale tomography: A 2020 Vision.Microscopy andMicroanalysis19(3), 652–664.
MARUYAMA, N., UEMORI, R. & SUGIYAMA, M. (1998). The role ofniobium in the retardation of the early stage of austeniterecovery in hot-deformed steels. Materials Science andEngineering A – Structural Materials Properties Microstructureand Processing 250(1), 2–7.
MILLER, M.K. & HETHERINGTON, M.G. (1991). Local magnificationeffects in the atom probe. Surface Science 246(1–3), 442–449.
MILLER, M.K., KELLY, T.F., RAJAN, K. & RINGER, S.P. (2012). The futureof atom probe tomography. Materials Today 15(4), 158–165.
MILLER, M.K. & KENIK, E.A. (2004). Atom probe tomography: Atechnique for nanoscale characterization. Microscopy andMicroanalysis 10(3), 336–341.
MOODY, M.P., GAULT, B., STEPHENSON, L.T., HALEY, D. & RINGER, S.P.(2009). Qualification of the tomographic reconstruction in atomprobe by advanced spatial distribution map techniques.Ultramicroscopy 109(7), 815–824.
MOODY, M.P., GAULT, B., STEPHENSON, L.T., MARCEAU, R.K.W.,POWLES, R.C., CEGUERRA, A.V., BREEN, A.J. & RINGER, S.P. (2011).Lattice rectification in atom probe tomography: Toward true three-dimensional atomic microscopy. Microscopy and Microanalysis17(2), 226–239.
MOTTURA, A., WARNKEN, N., MILLER, M.K., FINNIS, M.W. & REED, R.C.(2010). Atom probe tomography analysis of the distribution ofrhenium in nickel alloys. Acta Materialia 58(3), 931–942.
PEREZ, M., COURTOIS, E., ACEVEDO, D., EPICIER, T. & MAUGIS, P.(2007). Precipitation of niobium carbonitrides in ferrite:Chemical composition measurements and thermodynamicmodelling. Philosophical Magazine Letters 87(9), 645–656.
PRESTON, G.D. (1938). The diffraction of X-rays by an age-hardeningalloy of aluminium and copper. The structure of anintermediate phase. Philosophical Magazine 26(178), 855–871.
SHA, W., CHANG, L., SMITH, G.D.W., LIU, C. & MITTEMEIJER, E.J.(1992). Some aspects of atom-probe analysis of Fe-C and Fe-NSystems. Surface Science 266(1–3), 416–423.
SHANMUGAM, S., MISRA, R.D.K., HARTMANN, J. & JANSTO, S.G. (2006).Microstructure of high strength niobium-containing pipelinesteel.Materials Science and Engineering A – Structural MaterialsProperties Microstructure and Processing 441(1–2), 215–229.
SHRESTHA, S.L., XIE, K.Y., ZHU, C., RINGER, S.P., KILLMORE, C.,CARPENTER, K., KAUL, H., WILLIAMS, J.G. & CAIRNEY, J.M. (2013).Cluster strengthening of Nb-microalloyed ultra-thin cast stripsteels produced by the CASTRIP® process.Materials Science andEngineering: A 568, 88–95.
SOSINSKY, D.J., CAMPBELL, P., MAHAPATRA, R., BLEJDE, W. & FISHER, F.(2008). The CASTRIP(A (R)) process – recent developments atNucor steel’s commercial strip casting plant. Metallurgist52(11–12), 691–699.
STEPHENSON, L.T., MOODY, M.P., GAULT, B. & RINGER, S.P. (2011).Estimating the physical cluster-size distribution within materialsusing atom-probe. Microscopy Research and Technique 74(9),799–803.
STEPHENSON, L.T., MOODY, M.P., LIDDICOAT, P.V. & RINGER, S.P.(2007). New techniques for the analysis of fine-scaled clusteringphenomena within atom probe tomography (APT) data.Microscopy and Microanalysis 13(6), 448–463.
VURPILLOT, F., BOSTEL, A. & BLAVETTE, D. (2000). Trajectory overlapsand local magnification in three-dimensional atom probe.Applied Physics Letters 76(21), 3127–3129.
XIE, K.Y., YAO, L., ZHU, C., CAIRNEY, J.M., KILLMORE, C.R., BARBARO, F.J., WILLIAMS, J.G. & RINGER, S.P. (2011). Effect of Nbmicroalloyingand hot rolling on microstructure and properties of ultrathincast strip steels produced by the CASTRIP(A (R)) process.Metallurgical and Materials Transactions A – Physical Metallurgyand Materials Science 42A(8), 2199–2206.
XIE, K.Y., ZHENG, T.X., CAIRNEY, J.M., KAUL, H., WILLIAMS, J.G.,BARBARO, F.J., KILLMORE, C.R. & RINGER, S.P. (2012).Strengthening from Nb-rich clusters in a Nb-microalloyed steel.Scripta Materialia 66(9), 710–713.
YAO, L., CAIRNEY, J.M., ZHU, C. & RINGER, S.P. (2011). Optimisationof specimen temperature and pulse fraction in atom probemicroscopy experiments on a microalloyed steel. Ultramicroscopy111(6), 648–651.
YAO, L., GAULT, B., CAIRNEY, J.M. & RINGER, S.P. (2010). On themultiplicity of field evaporation events in atom probe: A newdimension to the analysis of mass spectra. PhilosophicalMagazine Letters 90(2), 121–129.
1110 Andrew J. Breen et al.
Copyright © 2022 FDOKUMEN