Resistance Tests of a Systematic Series of U.S. Coast Guard ...
66
Carderock Division, Naval Surface Warfare Center West Bethesda, Maryland 2081 7-5700 NSWCCD-50-TR-2005/063 December 2005 Hydromechanics Department Report Resistance Tests of a Systematic Series of U.S. Coast Guard Planing Hulls by Bryson J. Metcalf Lisa Faul Elissa Bumiller Jonathan Slutsky -o 40 knAPOE O ULCRLAS;DSRBTO NIIE U z 17
-
Upload
khangminh22 -
Category
Documents
-
view
2 -
download
0
Transcript of Resistance Tests of a Systematic Series of U.S. Coast Guard ...

Carderock Division, Naval Surface Warfare Center
West Bethesda, Maryland 2081 7-5700
NSWCCD-50-TR-2005/063 December 2005Hydromechanics Department Report
Resistance Tests of a Systematic Series of U.S.Coast Guard Planing HullsbyBryson J. MetcalfLisa FaulElissa BumillerJonathan Slutsky
-o
40
knAPOE O ULCRLAS;DSRBTO NIIE
U
z
17
REPORT DOCUMENTATION PAGE 0Form ApprovedI OMB No. 0704-0188
Public reporting burden for this collection of Information is estimated to average 1 hour per response, including the time for reviewing instructions, searching existing data sources, gath-ering and maintaining the date needed, and completing and reviewing the collection of information. Send comments regarding this burden estimate or any other aspect of this collection of infornmtion,Inctuding suggestions for reducing this burden to Wasinglon Headquarters Services, Directorate for Information. Operations and Reports. 1215 Jefferson Davis Highway, Suite 1204, Artlngton, VA222024302, and to the Office of Mengemaent and Budget, Paperwork Reduction Project (0704-0188). Washington, DC 20503.
1. AGENCY USE ONLY (Leave blank) 2. REPORT DATE 3. REPORT TYPE AND DATES COVERED
I December 2005 Final4. TITLE AND SUBTITLE 5. FUNDING NUMBERS
RESISTANCE TESTS OF A SYSTEMATIC SERIES OF USCG PLANING- HULLS 04-1-5200-158
6. AUTHOR(S)
.. Bryson J. Metcalf, Lisa Faul, Elissa Bumiller, Jonathan Slutsky
7. PERFORMING ORGANIZATION NAME(S) AND ADDRESS(ES) 8. PERFORMING ORGANIZATION
NSWCCD Code 5200 REPORT NUMBER
9500 MacArthur Blvd. NSWCCD-50-TR-2005/063West Bethesda, MD 20817-5700
9. SPONSORING / MONITORING AGENCY NAME(S) AND ADDRESS(ES) 10. SPONSORING / MONITORING
United States Coast Guard Engineering and Logistics Center AGENCY REPORT NUMBER
Propulsion Systems Acquisition Branch- Code 046, M/S 26, Bldg. 312401 Hawkins Point RoadBaltimore, MD 21226-5000
11. SUPPLIMENTARY NOTES
12a. DISTRIBUTION / AVAILABILITY STATEMENT 12b. DISTRIBUTION CODE
Approved for Public Release; Distribution Unlimited.
13. ABSTRACT (Maximum 200 words)
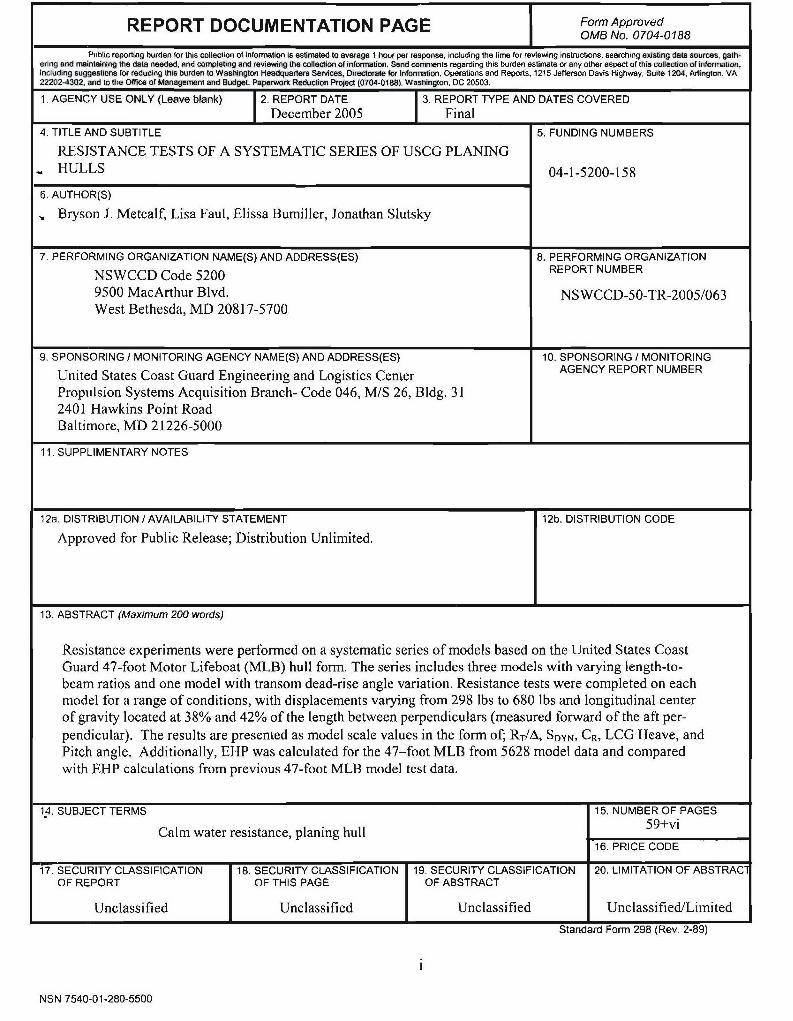
Resistance experiments were performed on a systematic series of models based on the United States CoastGuard 47-foot Motor Lifeboat (MLB) hull form. The series includes three models with varying length-to-beam ratios and one model with transom dead-rise angle variation. Resistance tests were completed on eachmodel for a range of conditions, with displacements varying from 298 lbs to 680 lbs and longitudinal centerof gravity located at 38% and 42% of the length between perpendiculars (measured forward of the aft per-pendicular). The results are presented as model scale values in the form of; RT/A, SDYN, CR, LCG Heave, andPitch angle. Additionally, EHP was calculated for the 47-foot MLB from 5628 model data and comparedwith EHP calculations from previous 47-foot MLB model test data.
14. SUBJECT TERMS 15. NUMBER OF PAGES
Calm water resistance, planing hull 59+vi
16. PRICE CODE
17. SECURITY CLASSIFICATION 18. SECURITY CLASSIFICATION 19. SECURITY CLASSIFICATION 20. LIMITATION OF ABSTRACOF REPORT OF THIS PAGE OF ABSTRACT
Unclassified Unclassified Unclassified Unclassified/Limited
Standard Form 298 (Rev. 2-89)
NSN 7540-01-280-5500

THIS PAGE IS INTENTIONALLY LEFT BLANK
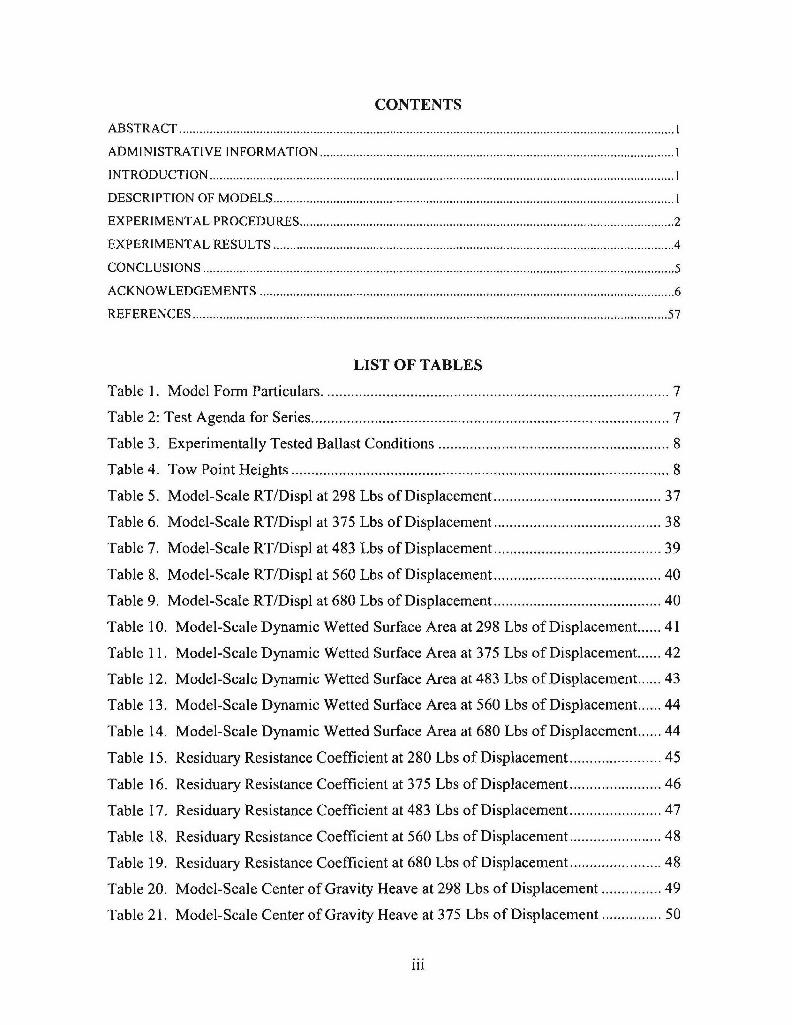
CONTENTS
ABSTRACT .................................................................
ADM INISTRATIVE INFORMATION...............................................I
INTRODUCTION .............................................................. 1
DESCRIPTION OF MODELS.....................................................1
EXPERIMENTAL PROCEDURES ................................................. 2
EXPERIMENTAL RESULTS .......................................................................... 4
C O N C L U S IO N S ............................................................................................................................................. 5
ACKNOWLEDGEMENTS ....................................................... 6
RE F E R E N C E S .............................................................................................................................................. 5 7
LIST OF TABLES
Table 1. M odel Form Particulars .................................................................................... 7
Table 2: Test A genda for Series ....................................................................................... 7
Table 3. Experimentally Tested Ballast Conditions ...................................................... 8
Table 4. Tow Point H eights ........................................................................................... 8
Table 5. Model-Scale RT/Displ at 298 Lbs of Displacement ...................................... 37
Table 6. Model-Scale RT/Displ at 375 Lbs of Displacement ...................................... 38
Table 7. Model-Scale RT/Displ at 483 Lbs of Displacement ...................................... 39
Table 8. Model-Scale RT/Displ at 560 Lbs of Displacement ...................................... 40
Table 9. Model-Scale RT/Displ at 680 Lbs of Displacement ...................................... 40
Table 10. Model-Scale Dynamic Wetted Surface Area at 298 Lbs of Displacement ...... 41
Table 11. Model-Scale Dynamic Wetted Surface Area at 375 Lbs of Displacement ...... 42
Table 12. Model-Scale Dynamic Wetted Surface Area at 483 Lbs of Displacement ...... 43
Table 13. Model-Scale Dynamic Wetted Surface Area at 560 Lbs of Displacement ...... 44
Table 14. Model-Scale Dynamic Wetted Surface Area at 680 Lbs of Displacement ...... 44
Table 15. Residuary Resistance Coefficient at 280 Lbs of Displacement ................... 45
Table 16. Residuary Resistance Coefficient at 375 Lbs of Displacement ................... 46
Table 17. Residuary Resistance Coefficient at 483 Lbs of Displacement ................... 47
Table 18. Residuary Resistance Coefficient at 560 Lbs of Displacement ................... 48
Table 19. Residuary Resistance Coefficient at 680 Lbs of Displacement ................... 48
Table 20. Model-Scale Center of Gravity Heave at 298 Lbs of Displacement ........... 49
Table 21. Model-Scale Center of Gravity Heave at 375 Lbs of Displacement ........... 50
iii

Table 22. Model-Scale Center of Gravity Heave at 483 Lbs of Displacement ........... 51
Table 23. Model-Scale Center of Gravity Heave at 560 Lbs of Displacement ........... 52
Table 24. Model-Scale Center of Gravity Heave at 680 Lbs of Displacement ........... 52
Table 25. Pitch Angle at 298 Lbs of Displacement ................................................... 53
Table 26. Pitch Angle at 375 Lbs of Displacement ................................................... 54
Table 27. Pitch Angle at 483 Lbs of Displacement ................................................... 55
Table 28. Pitch Angle at 560 Lbs of Displacement .................................................... 56
Table 29. Pitch Angle at 680 Lbs of Displacement ................................................... 56
LIST OF FIGURES
Figure 1. Series Hullforms Body-Plan Views ............................................................... 9
Figure 2. Series Hullform s Profile-Views ................................................................... 10
Figure 3. M odel 5628 Dry and at 2981bs, 43%, 25.47 Knots .......................................... 11
Figure 4. Model 5629 Dry and at 2981bs, 43%, 25.47 Knots .......................................... 11
Figure 5. Model 5630 Dry and at 2981bs, 43%, 25.47 Knots .......................................... 11
Figure 6. Model 5631 Dry and at 2981bs, 43%, 25.47 Knots ...................................... II
Figure 7. Block Gauge and Gymbal Assembly .......................................................... 12
Figure 8. Dynamic Wetted Surface Area of Model 5631 ............................................ 12
Figure 9. EHP for Full Scale 47 ft MLB at 38% LCG ................................................. 13
Figure 10. EHP for Full Scale 47 ft MLB at 42% LCG .............................................. 13
Figure 11. L/B & on Resistance for 298Lbs at 38% LCG .......................... .................... 14
Figure 12. L/B & Deadrise Influence on Resistance for 298Lbs at 42% LCG ........... 14
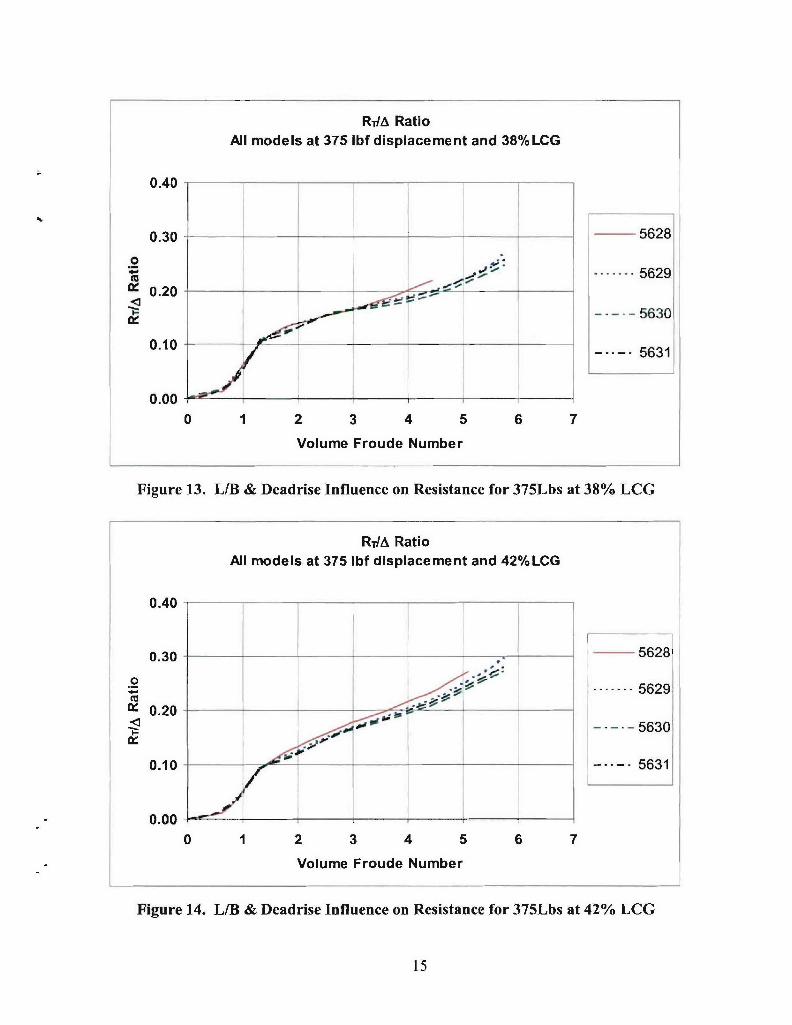
Figure 13. L/B & Deadrise Influence on Resistance for 375Lbs at 38% LCG ....... 15
Figure 14. L/B & Deadrise Influence on Resistance for 375Lbs at 42% LCG ........... 15
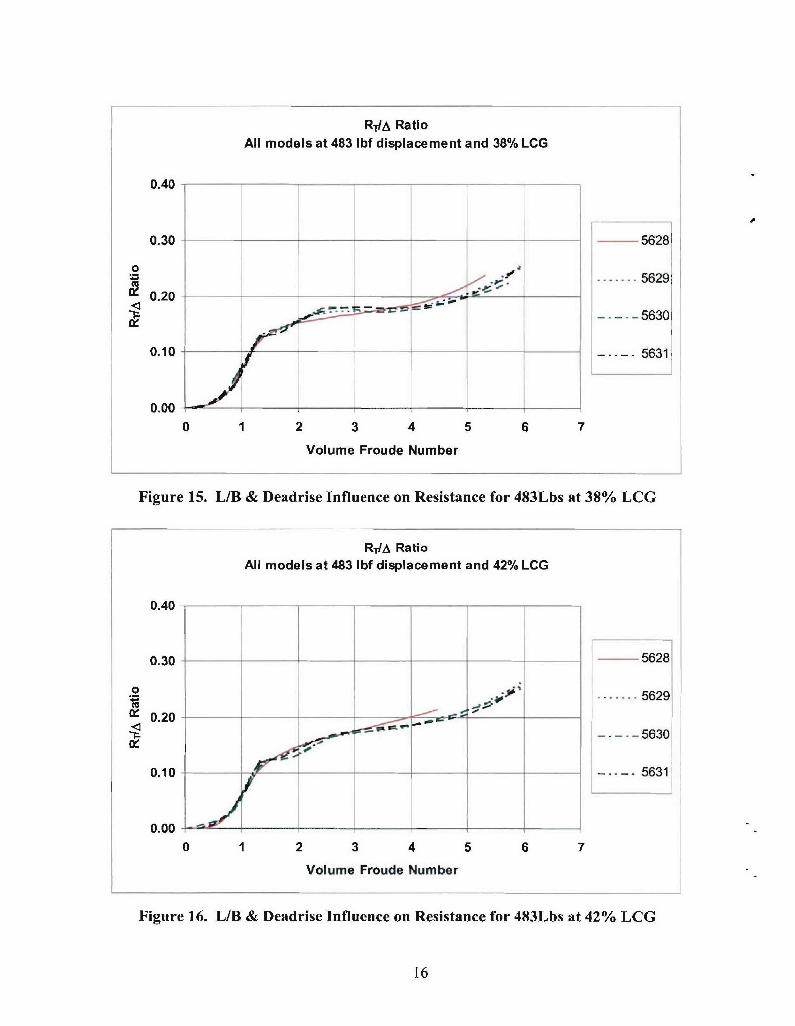
Figure 15. L/B & Deadrise Influence on Resistance for 483Lbs at 38% LCG ........... 16
Figure 16. L/B & Deadrise Influence on Resistance for 483Lbs at 42% LCG ........... 16
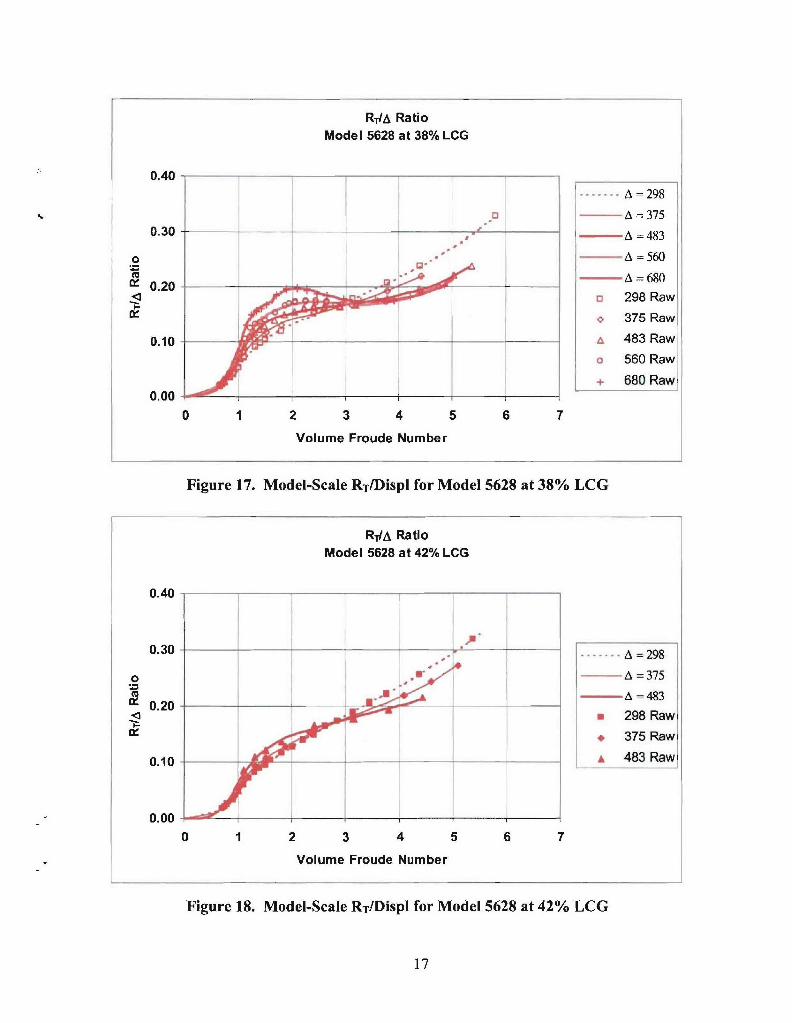
Figure 17. Model-Scale RT/Displ for Model 5628 at 38% LCG ................................. 17
Figure 18. Model-Scale RT/Displ for Model 5628 at 42% LCG ................................. 17
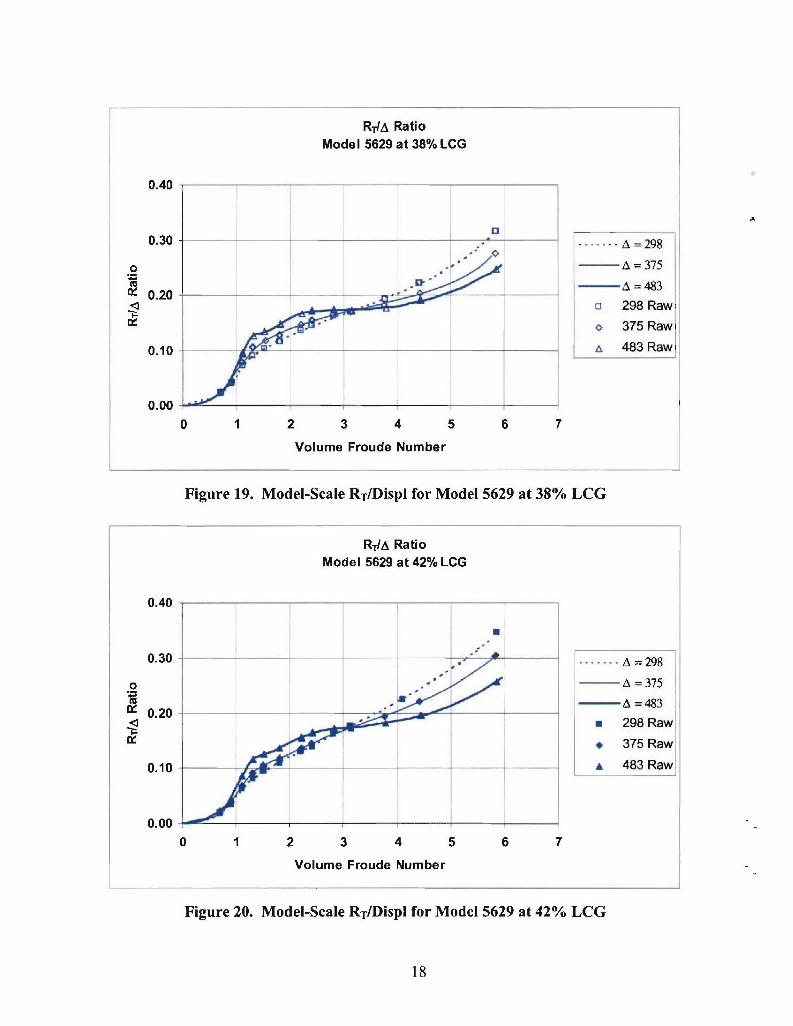
Figure 19. Model-Scale RT/Displ for Model 5629 at 38% LCG ................................. 18
Figure 20. Model-Scale RT/Displ for Model 5629 at 42% LCG ................................. 18
Figure 21. Model-Scale RTiDispl for Model 5630 at 38% LCG ................................. 19
Figure 22. Model-Scale RT/Displ for Model 5630 at 42% LCG ................................ 19
Figure 23. Model-Scale RT/Displ for Model 5631 at 38% LCG ................................ 20
iv
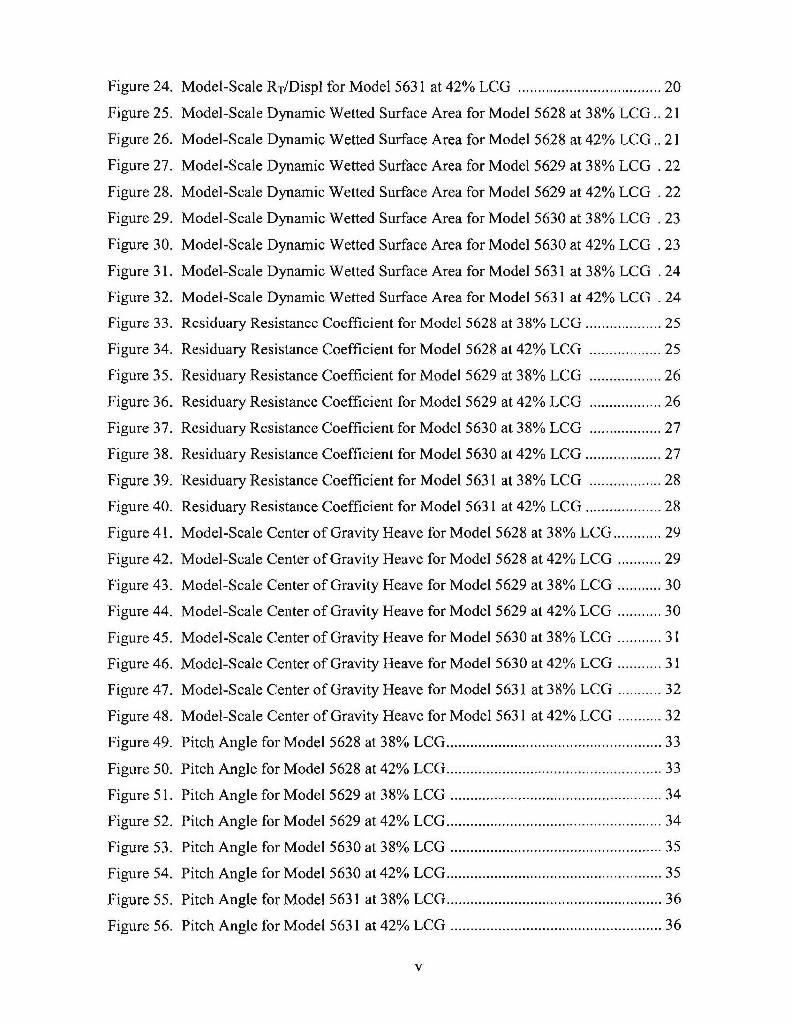
Figure 24. Model-Scale RT/Displ for Model 5631 at 42% LCG ................................ 20
Figure 25. Model-Scale Dynamic Wetted Surface Area for Model 5628 at 38% LCG.. 21
Figure 26. Model-Scale Dynamic Wetted Surface Area for Model 5628 at 42% LCG.. 21
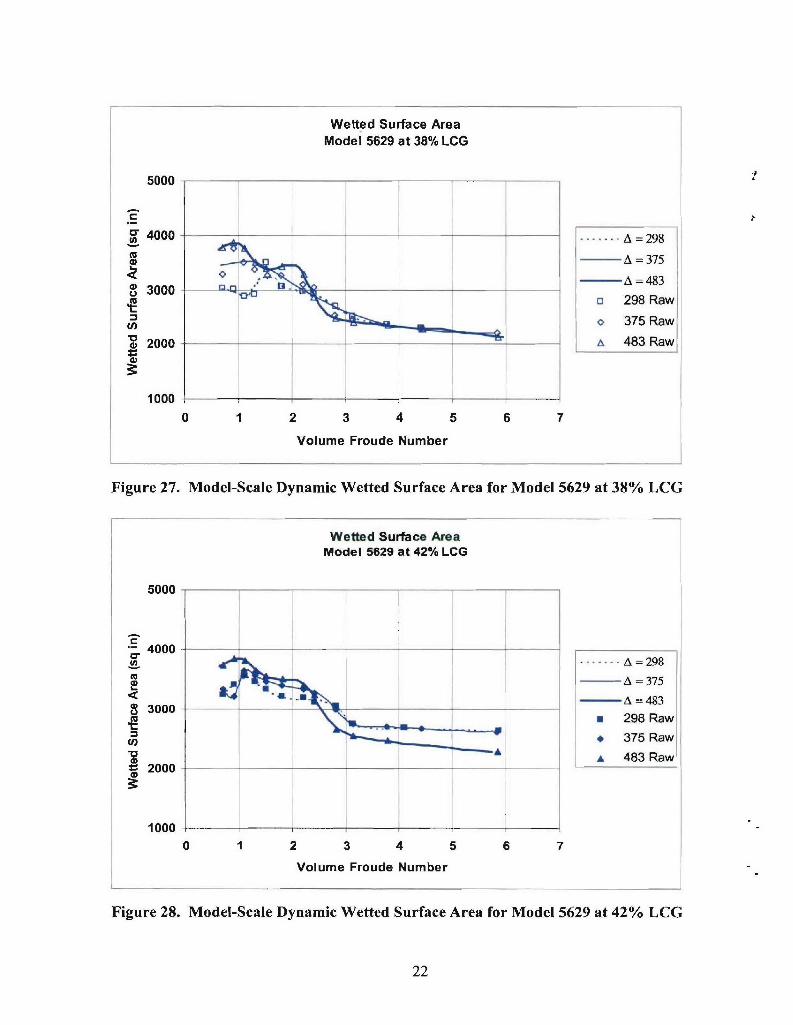
Figure 27. Model-Scale Dynamic Wetted Surface Area for Model 5629 at 38% LCG .22
Figure 28. Model-Scale Dynamic Wetted Surface Area for Model 5629 at 42% LCG .22
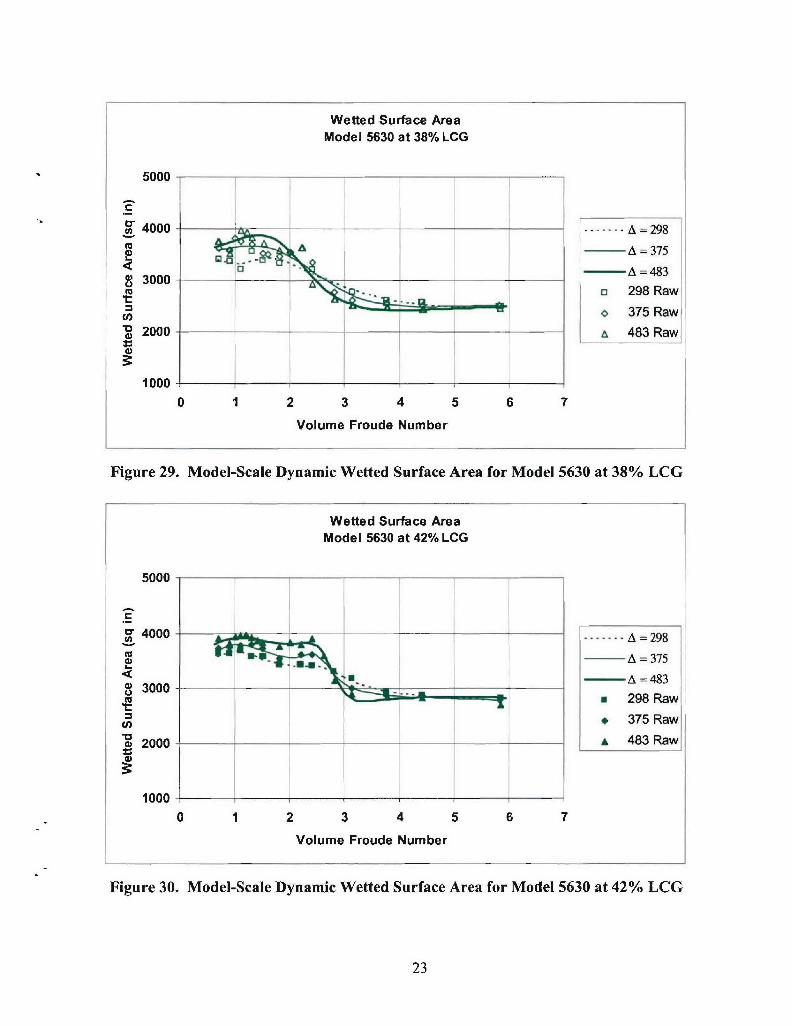
Figure 29. Model-Scale Dynamic Wetted Surface Area for Model 5630 at 38% LCG .23
Figure 30. Model-Scale Dynamic Wetted Surface Area for Model 5630 at 42% LCG .23
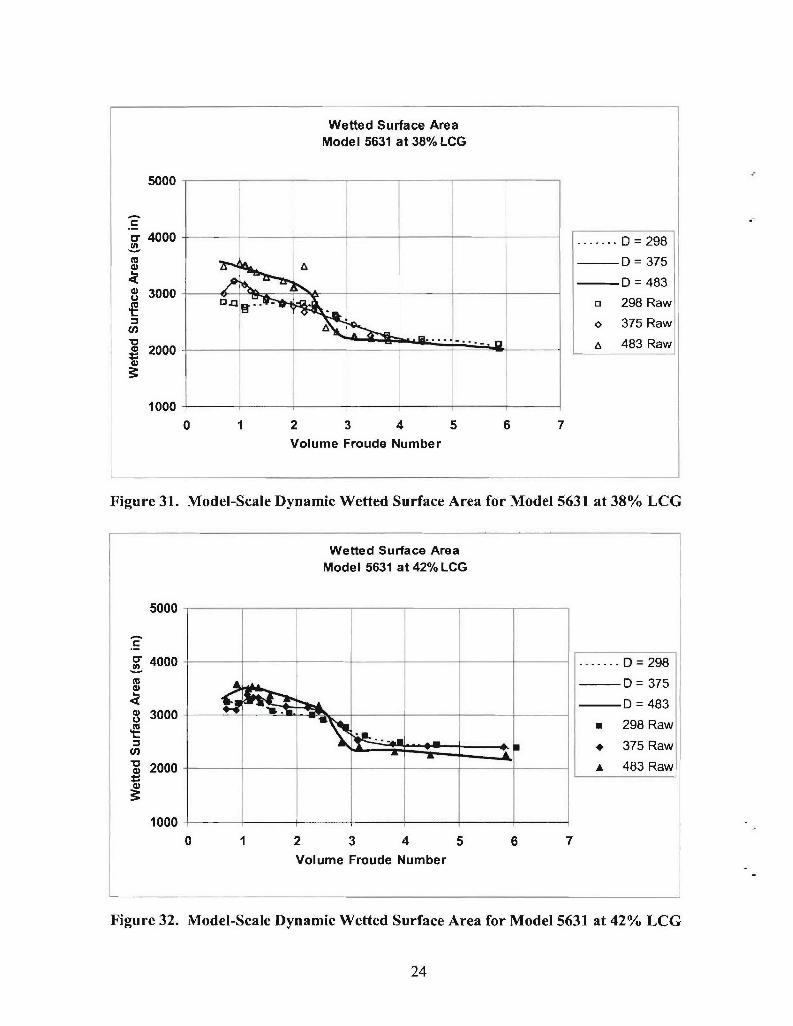
Figure 31. Model-Scale Dynamic Wetted Surface Area for Model 5631 at 38% LCG .24
Figure 32. Model-Scale Dynamic Wetted Surface Area for Model 5631 at 42% LCG .24
Figure 33. Residuary Resistance Coefficient for Model 5628 at 38% LCG ............... 25
Figure 34. Residuary Resistance Coefficient for Model 5628 at 42% LCG ......... 25
Figure 35. Residuary Resistance Coefficient for Model 5629 at 38% LCG .............. 26
Figure 36. Residuary Resistance Coefficient for Model 5629 at 42% LCG ......... 26
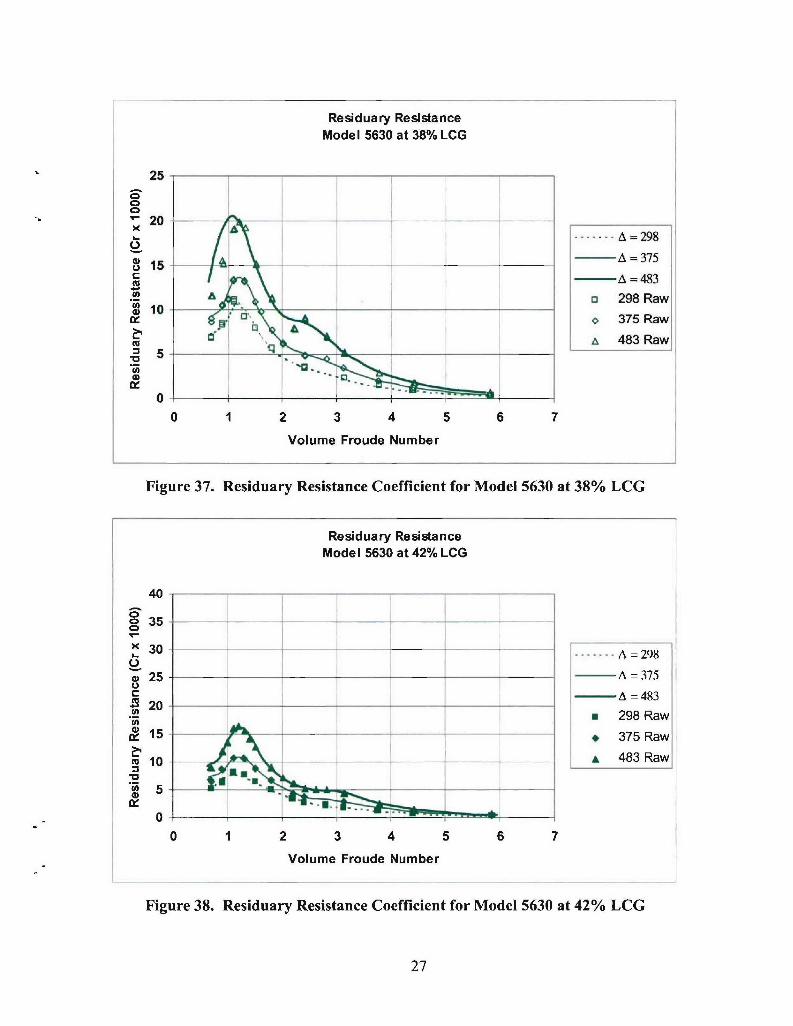
Figure 37. Residuary Resistance Coefficient for Model 5630 at 38% LCG .............. 27
Figure 38. Residuary Resistance Coefficient for Model 5630 at 42% LCG ............... 27
Figure 39. Residuary Resistance Coefficient for Model 5631 at 38% LCG ......... 28
Figure 40. Residuary Resistance Coefficient for Model 5631 at 42% LCG .............. 28
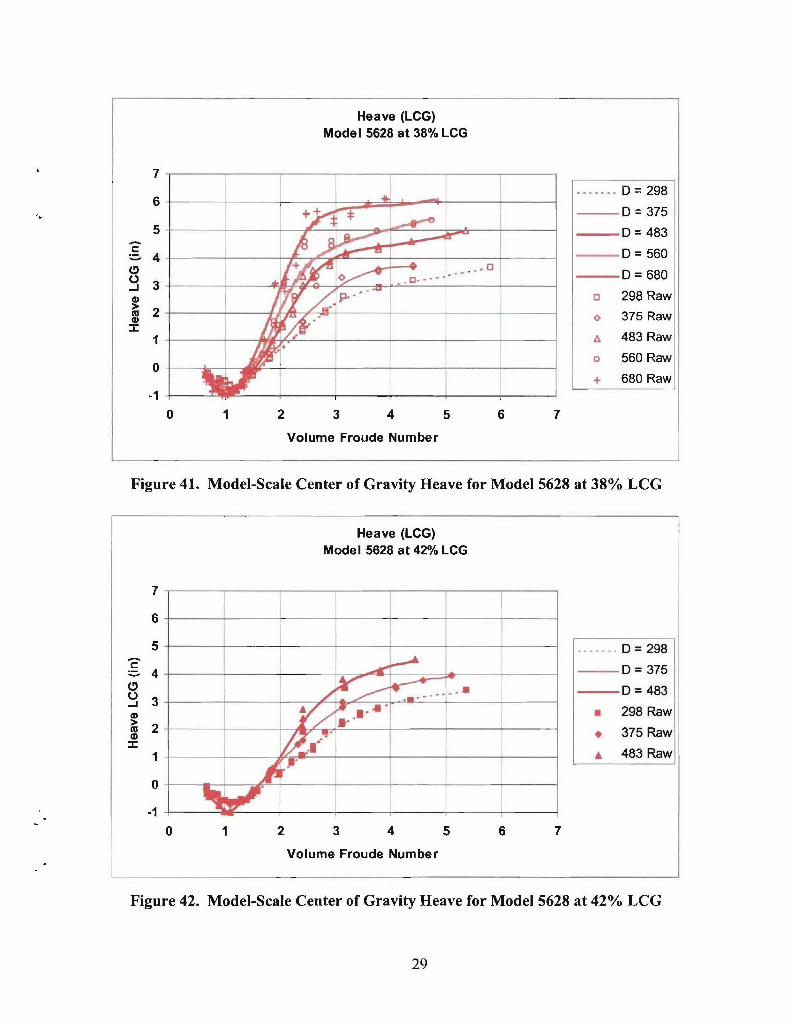
Figure 41. Model-Scale Center of Gravity Heave for Model 5628 at 38% LCG ...... 29
Figure 42. Model-Scale Center of Gravity Heave for Model 5628 at 42% LCG ..... 29
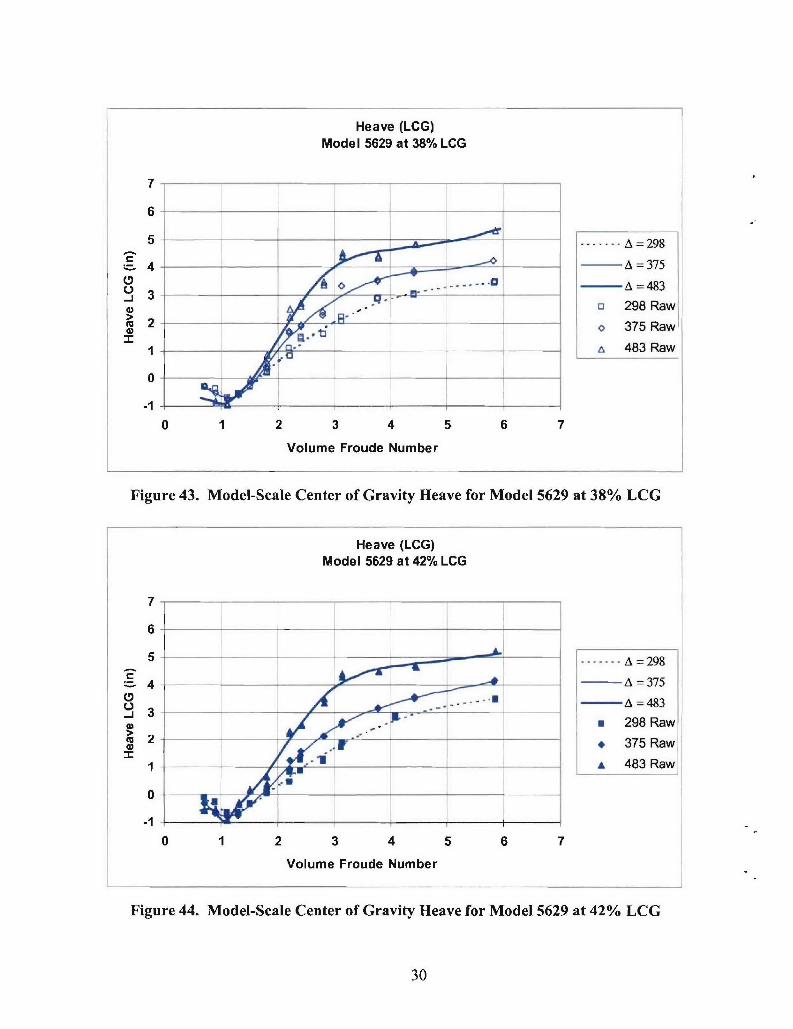
Figure 43. Model-Scale Center of Gravity Heave for Model 5629 at 38% LCG ........... 30
Figure 44. Model-Scale Center of Gravity Heave for Model 5629 at 42% LCG ..... 30
Figure 45. Model-Scale Center of Gravity Heave for Model 5630 at 38% LCG ........... 31
Figure 46. Model-Scale Center of Gravity Heave for Model 5630 at 42% LCG ........... 31
Figure 47. Model-Scale Center of Gravity Heave for Model 5631 at 38% LCG ........... 32
Figure 48. Model-Scale Center of Gravity Heave for Model 5631 at 42% LCG ........... 32
Figure 49. Pitch Angle for Model 5628 at 38% LCG ................................................. 33
Figure 50. Pitch Angle for Model 5628 at 42% LCG ................................................. 33
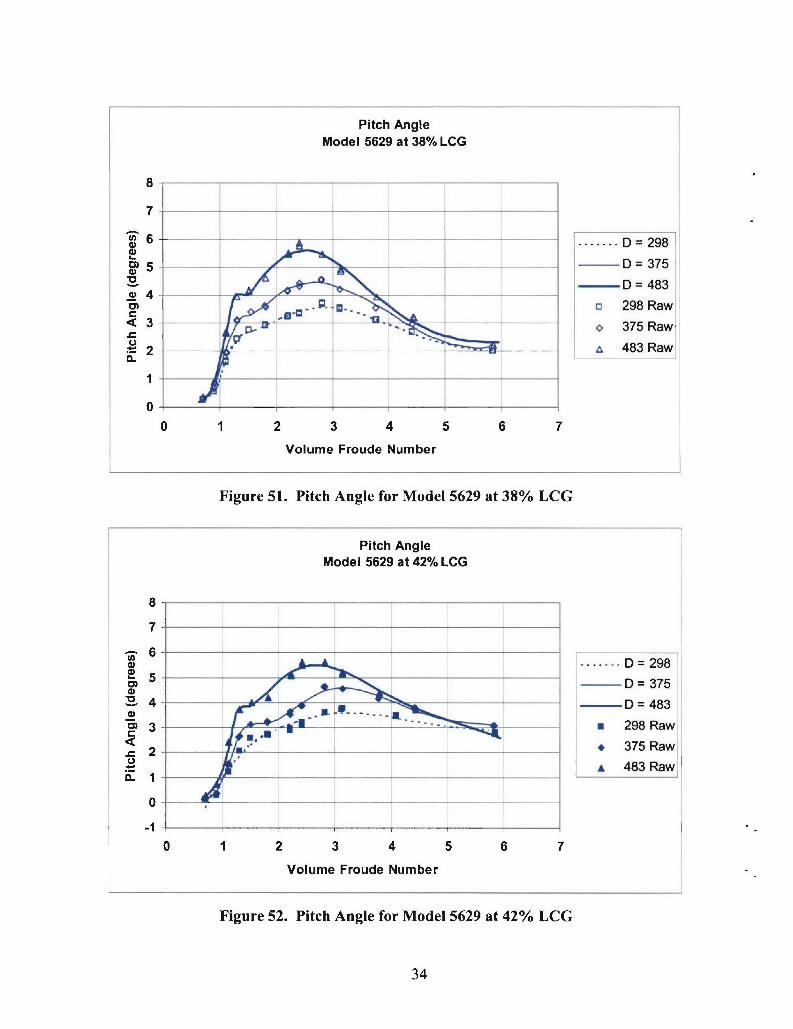
Figure 51. Pitch Angle for Model 5629 at 38% LCG ................................................ 34
Figure 52. Pitch Angle for Model 5629 at 42% LCG ................................................. 34
Figure 53. Pitch Angle for Model 5630 at 38% LCG ................................................ 35
Figure 54. Pitch Angle for Model 5630 at 42% LCG .................................................. 35
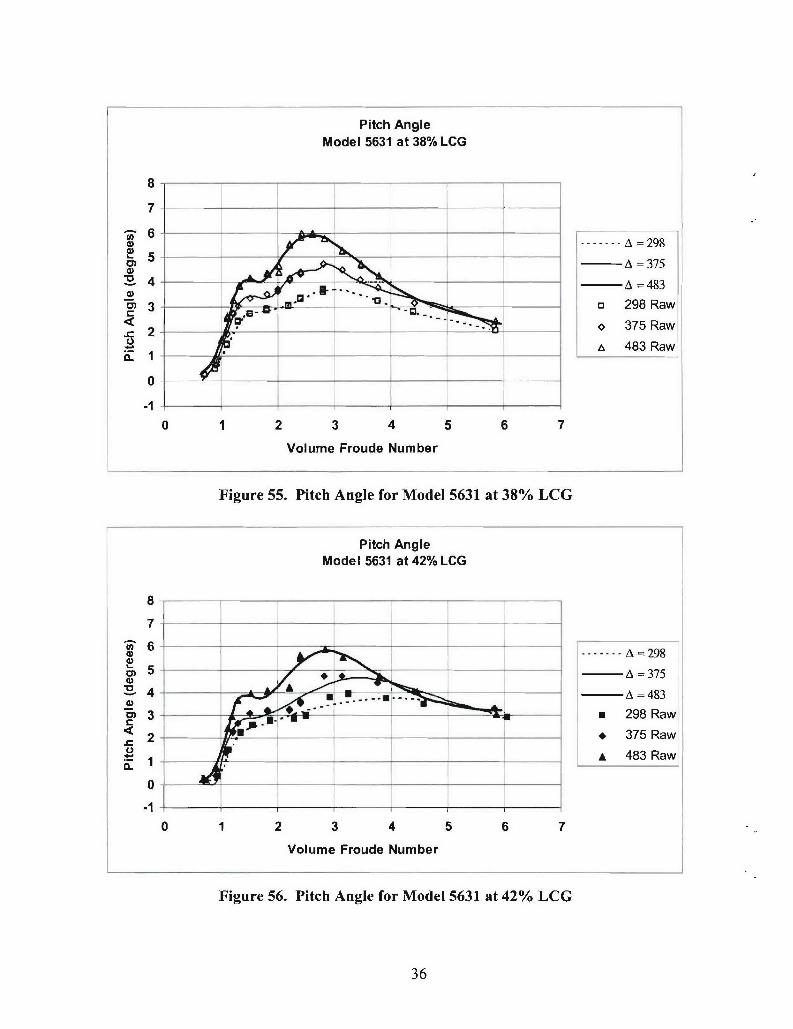
Figure 55. Pitch Angle for Model 5631 at 38% LCG .................................................. 36
Figure 56. Pitch Angle for Model 5631 at 42% LCG ................................................. 36
v
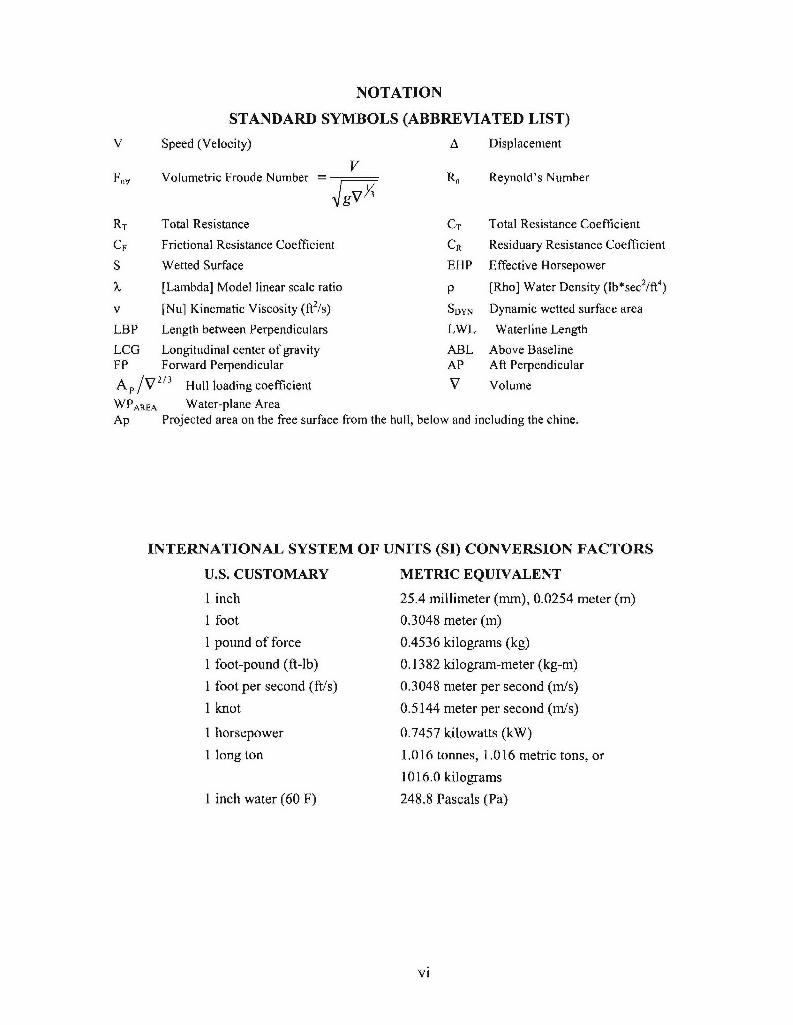
NOTATION
STANDARD SYMBOLS (ABBREVIATED LIST)
V Speed (Velocity) A Displacement
VFý, Volumetric Froude Number R, Reynold's Number/gV
RT Total Resistance CT Total Resistance Coefficient
CF Frictional Resistance Coefficient CR Residuary Resistance Coefficient
S Wetted Surface EHP Effective Horsepower
% [Lambda] Model linear scale ratio p (Rho] Water Density (lb*sec 2/ft4)
v [Nu] Kinematic Viscosity (ft2/s) SDyN Dynamic wetted surface area
LBP Length between Perpendiculars LWL Waterline Length
LCG Longitudinal center of gravity ABL Above BaselineFP Forward Perpendicular AP Aft Perpendicular
A /V 2/3 Hull loading coefficient V Volume
WPAREA Water-plane AreaAp Projected area on the free surface from the hull, below and including the chine.
INTERNATIONAL SYSTEM OF UNITS (SI) CONVERSION FACTORS
U.S. CUSTOMARY METRIC EQUIVALENT
1 inch 25.4 millimeter (mm), 0.0254 meter (m)
1 foot 0.3048 meter (m)
1 pound of force 0.4536 kilograms (kg)
1 foot-pound (ft-lb) 0.1382 kilogram-meter (kg-m)
1 foot per second (ft/s) 0.3048 meter per second (m/s)
1 knot 0.5144 meter per second (m/s)
1 horsepower 0.7457 kilowatts (kW)
1 long ton 1.016 tonnes, 1.016 metric tons, or
1016.0 kilograms
1 inch water (60 F) 248.8 Pascals (Pa)
vi
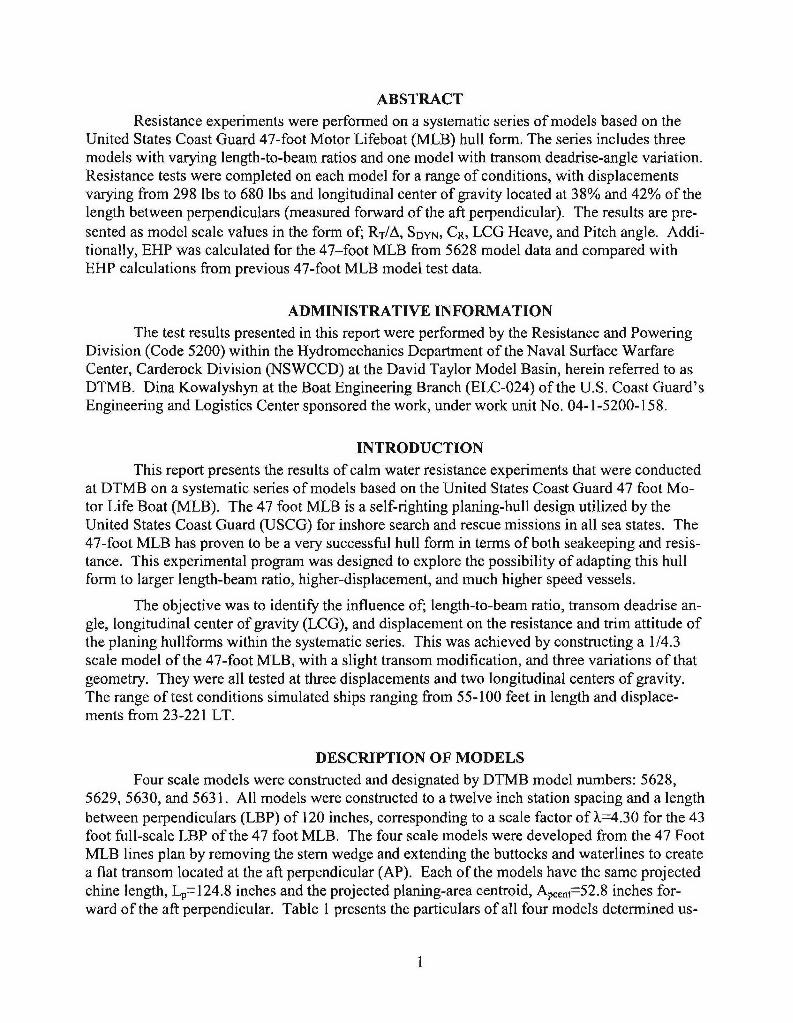
ABSTRACTResistance experiments were performed on a systematic series of models based on the
United States Coast Guard 47-foot Motor Lifeboat (MLB) hull form. The series includes threemodels with varying length-to-beam ratios and one model with transom deadrise-angle variation.Resistance tests were completed on each model for a range of conditions, with displacementsvarying from 298 lbs to 680 lbs and longitudinal center of gravity located at 38% and 42% of thelength between perpendiculars (measured forward of the aft perpendicular). The results are pre-sented as model scale values in the form of; RT/A, SDYN, CR, LCG Heave, and Pitch angle. Addi-tionally, EHP was calculated for the 47-foot MLB from 5628 model data and compared withEHP calculations from previous 47-foot MLB model test data.
ADMINISTRATIVE INFORMATIONThe test results presented in this report were performed by the Resistance and Powering
Division (Code 5200) within the Hydromechanics Department of the Naval Surface WarfareCenter, Carderock Division (NSWCCD) at the David Taylor Model Basin, herein referred to asDTMB. Dina Kowalyshyn at the Boat Engineering Branch (ELC-024) of the U.S. Coast Guard'sEngineering and Logistics Center sponsored the work, under work unit No. 04-1-5200-158.
INTRODUCTION
This report presents the results of calm water resistance experiments that were conductedat DTMB on a systematic series of models based on the United States Coast Guard 47 foot Mo-tor Life Boat (MLB). The 47 foot MLB is a self-righting planing-hull design utilized by theUnited States Coast Guard (USCG) for inshore search and rescue missions in all sea states. The47-foot MLB has proven to be a very successful hull form in terms of both seakeeping and resis-tance. This experimental program was designed to explore the possibility of adapting this hullform to larger length-beam ratio, higher-displacement, and much higher speed vessels.
The objective was to identify the influence of; length-to-beam ratio, transom deadrise an-gle, longitudinal center of gravity (LCG), and displacement on the resistance and trim attitude ofthe planing hullforms within the systematic series. This was achieved by constructing a 1/4.3scale model of the 47-foot MLB, with a slight transom modification, and three variations of thatgeometry. They were all tested at three displacements and two longitudinal centers of gravity.The range of test conditions simulated ships ranging from 55-100 feet in length and displace-ments from 23-221 LT.
DESCRIPTION OF MODELSFour scale models were constructed and designated by DTMB model numbers: 5628,
5629, 5630, and 5631. All models were constructed to a twelve inch station spacing and a lengthbetween perpendiculars (LBP) of 120 inches, corresponding to a scale factor of X=4.30 for the 43foot full-scale LBP of the 47 foot MLB. The four scale models were developed from the 47 FootMLB lines plan by removing the stem wedge and extending the buttocks and waterlines to createa flat transom located at the aft perpendicular (AP). Each of the models have the same projectedchine length, Lp=124.8 inches and the projected planing-area centroid, Apcent-52.8 inches for-ward of the aft perpendicular. Table 1 presents the particulars of all four models determined us-
I
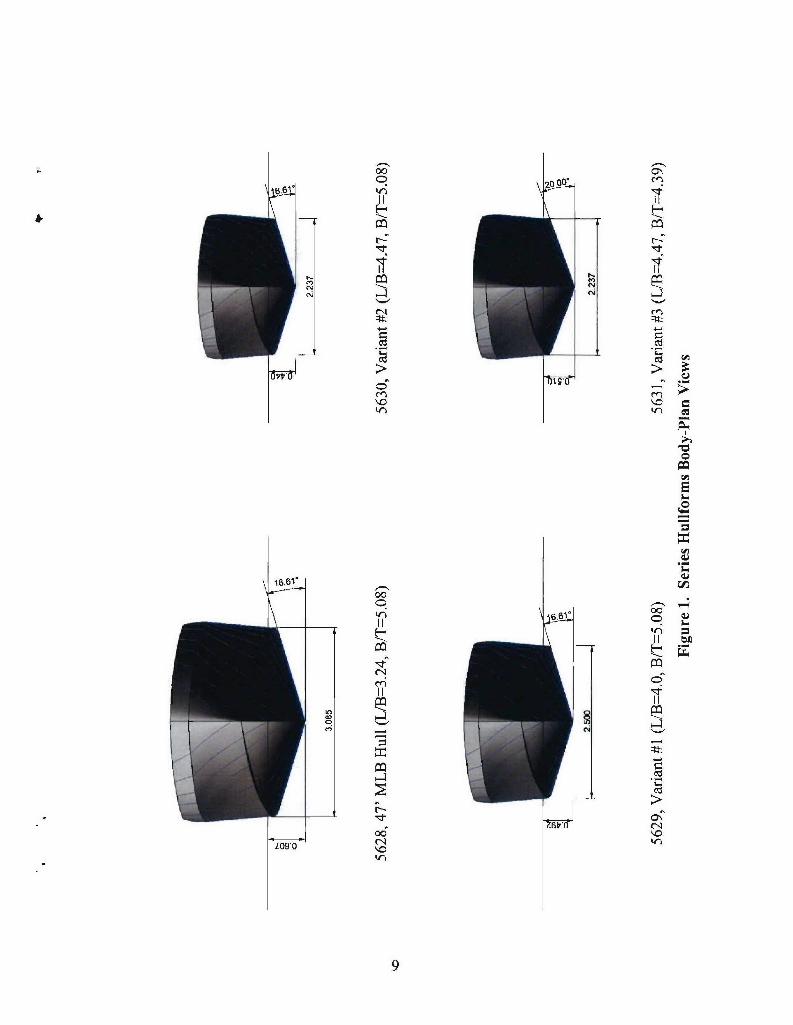
ing the design waterline from the 47-foot MLB drawings. In Table 1 the beam is listed as themaximum width at the waterline, the deadrise angle is taken at the transom, the volume excludesthe spray rails, and the projected planning area includes the surfaces below the outer chine (ex-cluding the spray rail). The hullforms body plans and profiles appear in Figures 1 and 2.
Model 5628 is the parent model of this series, as shown in Figure 3. This model is sub-stantially the same as the full scale 47 foot MLB hull with the following differences: model 5628has a flat transom rather than the rounded transom of the full scale ship, and it does not have thestern wedge found on the actual 47 foot MLB hull. It has a length-to-beam ratio of 3.24 and abeam-to-draft ratio of 3.67.
Model 5629 is considered Variant #1 of the series, as shown in Figure 4. The model wasdesigned to obtain a length-to-beam ratio of 4.0 by scaling the body plan with a constant (0.810),while maintaining the length between perpendiculars, this will be referred to as a yz-scaling inthe remainder of the document.
Model 5630 is considered Variant #2 of the series, as shown in Figure 5. The model wasalso designed by a direct yz-scaling (0.725) of the parent hull. The scale factor was obtained bythe minimum beam corresponding to the limit of intact stability of this geometry, resulting in alength-to-beam ratio of 4.47.
Model 5631 is considered Variant #3 of the series, as shown in Figure 6. The model is avariation of Variant #2 in which the hull below the chine was stretched in the z-direction to ob-tain a transom deadrise of 20 degrees while maintaining the Variant #2 hull shape above and in-cluding the chine. Each station line below the chine was scaled independently (1.1-1.22) toachieve a smooth hull form connecting the chine to the flat keel (lowered 0.07036').
Models 5628-5630 were constructed by MAPC from transverse sections of numericallycut (NC) low-density urethane foam. The sections were assembled on a flat table and coveredwith fiberglass cloth, painted and marked with stations and waterlines. Internal structural mem-bers were constructed from ¼ inch plywood.
Model 563 lwas constructed by Don Trumpy from model-scale station lines provided byMAPC. This model was strip planked and finished with fiberglass.
EXPERIMENTAL PROCEDURES
All the resistance experiments reported herein were conducted on Carriage 3 in the high-speed basin, which has a cross sectional area of 21 feet wide by 16 feet deep. During these ex-periments the models were free to pitch, heave, and roll, but were restrained in surge, sway andyaw. The test agenda and the static, at rest conditions of the models are presented in Table 2 and3 respectively.
The longitudinal position of the tow point was set by experimental design at 38 and 42percent of the LBP forward of the aft perpendicular. The models were attached to the light heavestaff mounted to the east end of carriage III. Two two-inch block gauges were used to measuredrag (calibrated to + 200 lbf) and side force (calibrated to ± 20 lbf). Running trim was measuredwith string potentiometers at the LCG and the stern of each model. A "grasshopper" wasmounted at approximately station 8 in each model to restrain the model in yaw and provide ayaw-zeroing adjustment capability, while two tethers extended from the bow forward and out-ward for safety purposes to prevent excessive yaw and/or break away from the carriage. The
2

tethers were ¼/4 inch nylon rope attached with enough slack such that they would not interferewith the model running trim or influence the drag measurements.
Due to the small size and the internal structure of the models, the existing instrumentstack could not be mounted to the hull in its standard configuration. A new mount for the exist-ing two-inch gimbal was designed and built to lower the tow points to the desired levels and al-low for easy longitudinal adjustment, Figure 7. The tow point heights, listed in Table 4, weredetermined from the height (above the keel) of the shaft thrust bearing on the full scale MLB.This height was obtained from the 47-foot MLB lines plans supplied by ELC-024. For eachvariant hullform the height was scaled according to the appropriate yz-scale ratio.
The ballast conditions of the models were given by model displacement and LCG sup-plied by the ELC-024. To obtain the proper ballast conditions the longitudinal centers of gravitywere first determined for the unballasted, rigged models. This was achieved by hanging eachmodel from the 38% LCG such that it was free to pivot about this transverse axis. Trim weightswere added to level the model in pitch, which allowed the model's longitudinal center of gravityto be calculated by a simple balancing of moments. Given each of the model's longitudinal cen-ters of gravity, the desired displacement and center of gravity for each test configuration was ob-tained through the precise placement of ballast weights. The achieved ballast conditions arelisted in Table 3.
The models were tested over a range of model speeds corresponding to ship speeds of 10through 55 knots. Data were collected at 100 Hz in ten-second spots, with two or more spotstaken per speed. The number of spots collected per pass varied with the number and magnitudeof speeds being run. Additionally, at each speed, the wave profile was observed at 4 locations onthe model and documented. This was documented to determine the dynamic (at speed) wettedsurface area of the model. These locations pertained to the keel-water intersection, the foremostlocation of the intersection between the chine and the spray-sheet, the chine reattachment point(the location where the chine no longer sheds water from the hullform above the chine), and theheight of the water on station 10 (side of the model at the transom). Figure 8 shows these meas-urements for Model 5631 at 10.87 knots and 375 lbs of displacement at the 38% LCG. The solidline represents a generalized wave profile from the four observed locations on the model. Thesurface of the model was discretized into thousands of triangular panels in order to determine thewetted surface areas. The three colors on figure 8 represent panels, which were fully, partially,and non-wetted. The dynamic wetted surface area is then the total of the fully and V2 the partiallywetted panels.
The deep transoms of the models, especially at high displacements and speeds, generatedlarge divergent wave systems. With the removal of the wave-dampening troughs in the high-speed basin, the only dampers in the basin were a single line of swimming lane markers. Underthese conditions, coherent packets of waves could be seen moving up and down the basin asmuch as ten minutes after a run. To damp the waves in the basin more quickly, additional lanemarkers were placed at the east end of the basin and the large horizontal wave suppressor platewas mounted to the carriage. The plate was lowered to the water surface when backing up be-tween runs. This significantly reduced the persistence of the wave systems resulting in calmertank conditions at the start of each run.
3

EXPERIMENTAL RESULTSAll of the data presented in this report, shown in Tables 5-29 and Figures 11-56, are
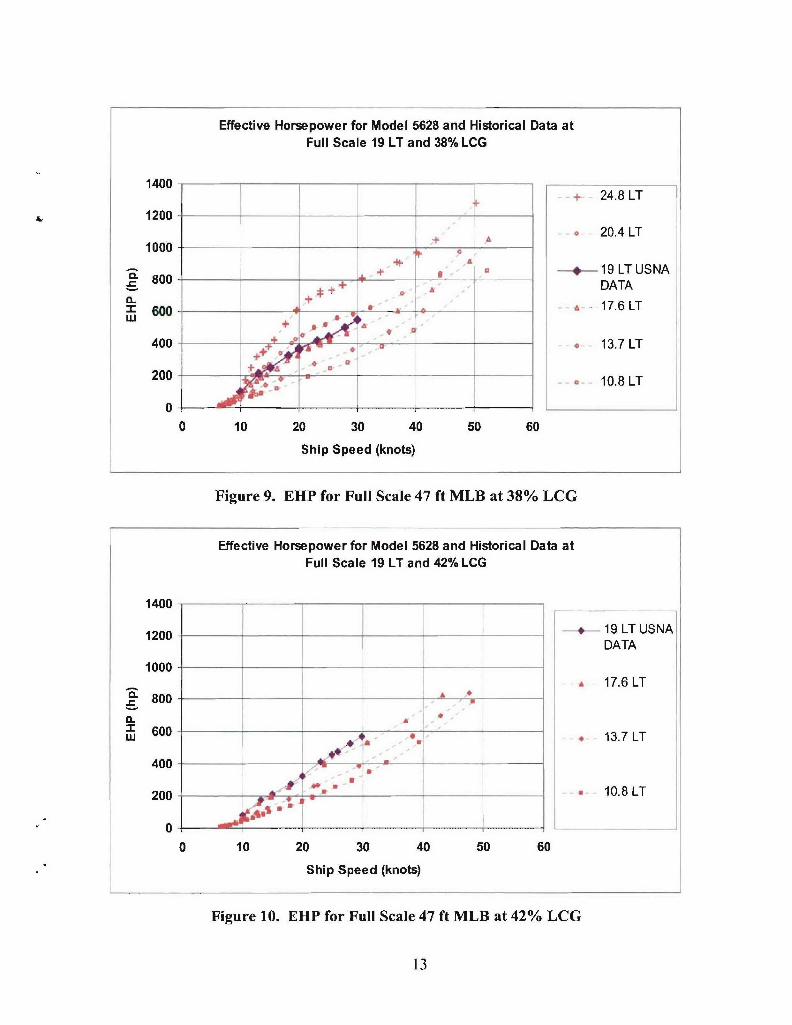
model scale values. Figures 9 and 10 are the 47-foot MLB extrapolation to full scale. The re-sults of the resistance experiments' analysis are presented in the form of, RT/A, SDYN, CR, LCGHeave, and Pitch angle. Additionally, EHP data were calculated for the 5628 model data tocompare with EHP calculations from previous 47-foot MLB model test data published in [1] col-lected at the United States Naval Academy (USNA), Division of Engineering and Weapons.
The EHP comparison plots with [1] are presented in Figures 9 and 10. The EHP datawere calculated identically using a correlation allowance of zero, the ITTC 1957 correlation lineand assuming the full scale vessel is operating in smooth, deep salt water with a uniform stan-dard temperature of 590 Fahrenheit (15' Celsius). The only differences between the currentmodel geometry and that in [1] were the scale ratios and that Model 5628 had a flat transom andno stem wedge. The only appendages on both models as tested were simple spray rails. By vis-ual inspection it is evident that the current data fits reasonably well with the USNA data, bearingin mind that the displacement conditions are not identical. This comparison gives good assur-ance that the current data are reasonable.
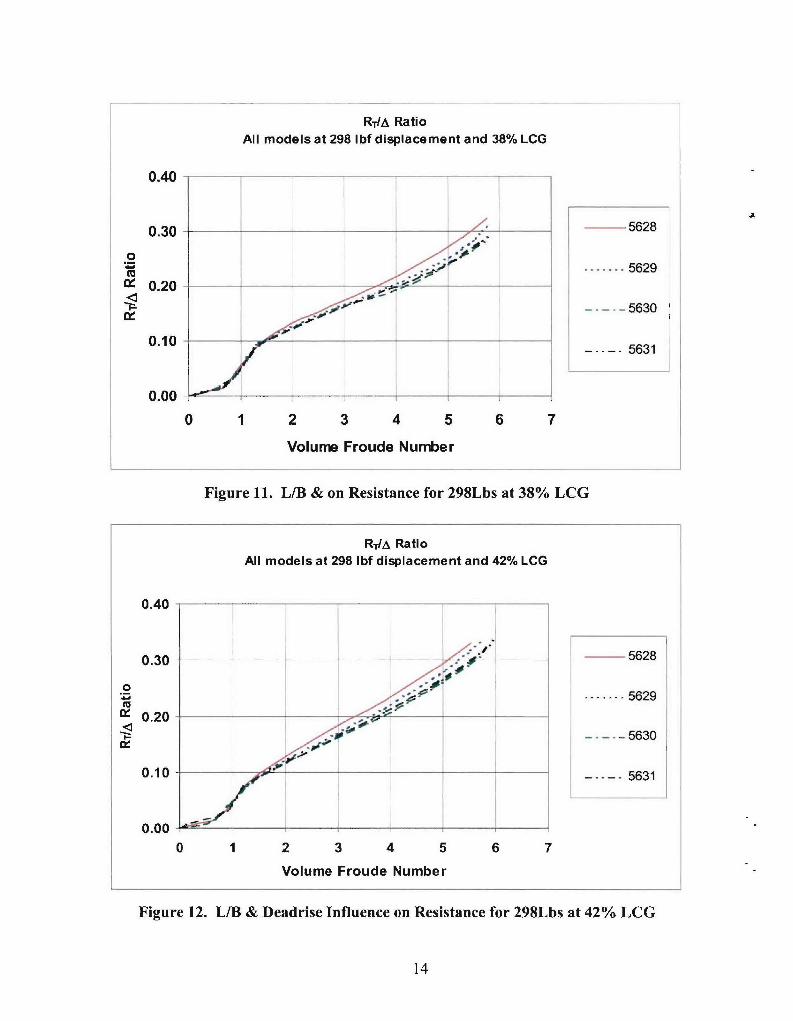
The influences of L/B and deadrise angle on RT/A, are presented in Figures 11 through16. The data is plotted for all of the models at a given displacement and LCG location. Throughclose inspection of the figures and data, four key points are worth noting. The resistance perpound of displacement is influenced approximately equally by the L/B ratio and LCG locationand their influences are more substantial at higher speed. The resistance per pound of displace-ment is clearly ordered in terms of L/B ratio. At nearly all speeds, higher length-beam ratios re-sult in reduced RT/A. Shifting the LCG forward tends to flatten the curve causing the RT/A toincrease in the high-speed region and decrease in the low-speed region thus reducing the benefitof planning. The effect of an increased deadrise angle is noticeable however slight. It tends toreduce the benefit of a slender hull.
Figures 17 through 24 present the RT/A for each model individually at a single LCG, re-vealing the impact of change in displacement. For a given L/B ratio, the displacement has alarge impact on the RT/A. The data exhibit an inflection point where the curves change fromconcave downward to concave upward for all of the hullforms. At approximately this speed allthe curves cross over each other. The inflection point of the curves occurs between 11 and 14knots model speed. At speeds below the inflection point the Rr/A is larger for heavy displace-ments. Above the inflection point the inverse is true. This means that at speeds higher than theinflection-point the hullforms, with regard to resistance, become more efficient as the displace-ment increases. Another trend exists in which, for increases in length-beam ratio the point ofinflection moves slightly to the right, occurring at higher speed.
The dynamic wetted surface areas from the experimental measurements shown in Figures25 through 32, exhibit a noticeable trend. Looking at each hullform individually it can be seenthat the dynamic wetted surface area for all displacements converge to the same value at higherspeeds. It is very clear that for a particular hullform and LCG location the dynamic wetted sur-face area reaches approximately a constant, once planing. For these hullfonns the constant isachieved at approximately Fnv =3.6. For greater displacements it can be seen that a larger reduc-tion occurs in dynamic wetted surface area as a result of planing.
4
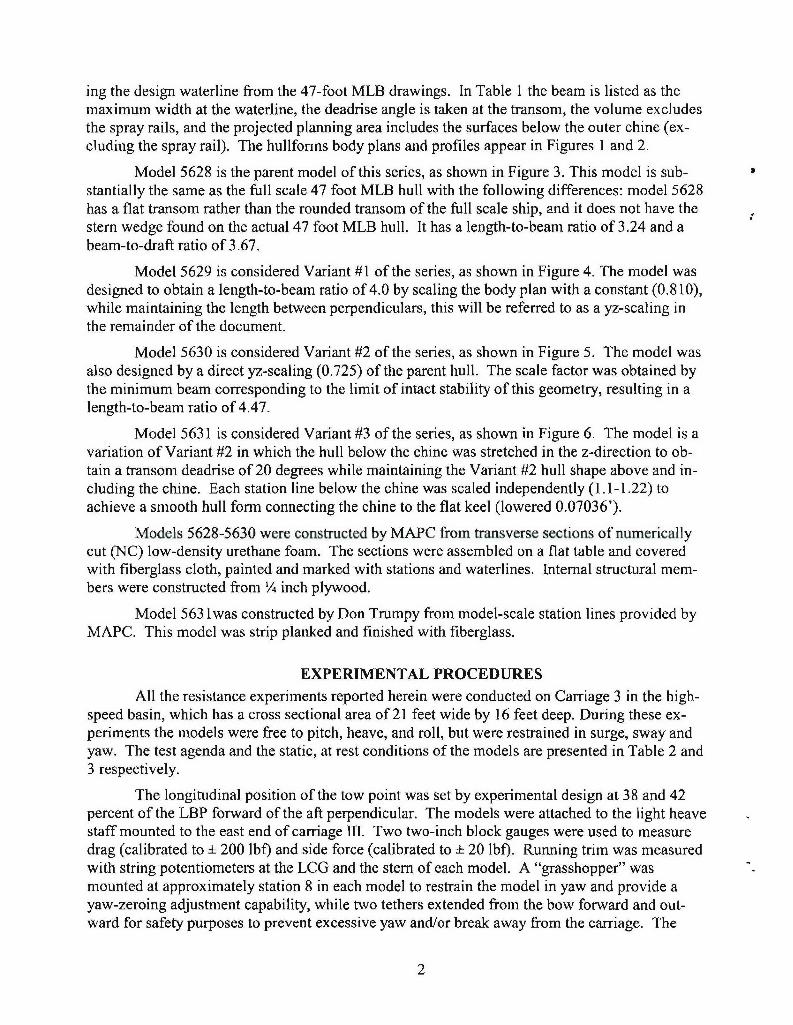
The residuary drag coefficients (CR) presented in Figures 33 through 40 follow expectedtrends with regard to displacement. However, no coherent trends can be established with regardto L/B ratio. There does exist however, noticeable and expected effects due to the change indeadrise angle and the LCG location. The curves have the typical peak occurring at a volumetricFroude number slightly greater than 1.0 and arranged in ascending order according to increasingdisplacement. The forward LCG location results in a decreased CR curve while the increaseddeadrise angle acts to increase the CR curve.
The curves in Figures 41 through 48 represent the CG heave of the models. The curvesare S shaped. The initial response as speed increases from very low speed is to sink slightly, be-fore steadily increasing from low to medium speed, prior to leveling out once planing isachieved. They are in ascending order with regard to increasing displacement. At first thoughtthis may seem incorrect, however the effect of planing is to elevate the hullform out of the wateruntil the hullform above the chines is dry. Interestingly, in order to achieve the planing conditionat the same speed noted previously (Fnv -3.6), the rate of heave gets larger with increased dis-placement. This results in a greater amount of heave when planing for the heavier displacementcondition. The figures also show that the amount of CG heave is relatively insensitive to the L/Bratio variation, although an increase in deadrise angle does indicate a higher amount of CGheave.
The pitch angle measurements are shown in Figures 49 through 56. Two humps appearin the curves, which occur very nearly the same speed as the two humps in the CR curves, espe-cially with the higher two L/B ratios. The curves of pitch angle are well ordered with regard tothe displacements. The largest and smallest maximum-pitch angles occur for high and low dis-placements, respectively. The maximum-pitch angle can also be seen to occur shortly prior tothe maximum CG heave, which becomes approximately constant when the hullform is on plane.The pitch angle is also responsive to the LCG location. A forward LCG location will minimallyreduce the amount of pitch for a given displacement. Additionally, the maximum pitch angleoccurs at a higher speed when the LCG is forward and also when the L/B ratio is larger.
CONCLUSIONS
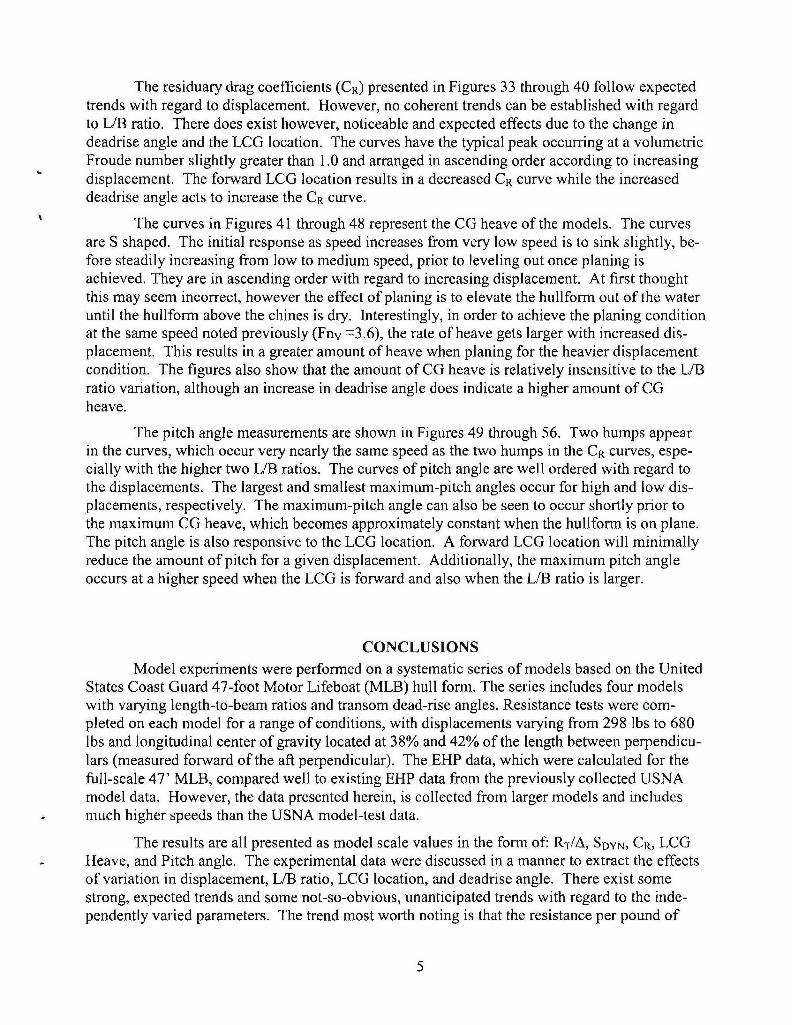
Model experiments were performed on a systematic series of models based on the UnitedStates Coast Guard 47-foot Motor Lifeboat (MLB) hull form. The series includes four modelswith varying length-to-beam ratios and transom dead-rise angles. Resistance tests were com-pleted on each model for a range of conditions, with displacements varying from 298 lbs to 680lbs and longitudinal center of gravity located at 38% and 42% of the length between perpendicu-lars (measured forward of the aft perpendicular). The EHP data, which were calculated for thefull-scale 47' MLB, compared well to existing EHP data from the previously collected USNAmodel data. However, the data presented herein, is collected from larger models and includesmuch higher speeds than the USNA model-test data.
The results are all presented as model scale values in the form of: RT/A, SDYN, CR, LCGHeave, and Pitch angle. The experimental data were discussed in a manner to extract the effectsof variation in displacement, L/B ratio, LCG location, and deadrise angle. There exist somestrong, expected trends and some not-so-obvious, unanticipated trends with regard to the inde-pendently varied parameters. The trend most worth noting is that the resistance per pound of
5

displacement is more favorable for high displacement at high speed and low displacement at lowspeed. Likewise, the effect of LCG location on the resistance per pound of displacement alsoreveals a favorable result with aft LCG location at higher speeds and forward LCG location atlower speeds. There exists a common, small, speed range (11-14 VMK) in which this inflectiontakes place for all independent variables. This speed is where the aft LCG location and heavierdisplacements become more favorable considering resistance per pound of displacement. Addi-tionally, the dynamic wetted-surface-area data revealed an interesting trend with regard to high-speed and the variation of displacement. The dynamic wetted surface area of a particular hull-form and LCG location for all of the displacements, converge to the same value once the hull-form is planing. It can also be seen that, for the same hullform, a forward LCG location will in-crease the dynamic wetted-surface-area to which all the displacements converge.
The results in this report are presented as model scale values due to the conceptual natureof the program. It must be noted that the curves of resistance per pound of displacement will beaffected when scaled to some notional full-scale vessel. However, the trends will not vary, butmay become less obvious. The effect of expanding to full-scale will result in a flatter curve,where the low speed hump becomes less pronounced and less curvature exists at high speed.
ACKNOWLEDGEMENTS
The United States Coast Guard Technical Point of Contact was Dina Kowalyshyn. Theauthor would like to extend a special thanks to the following NSWCCD employees for their con-tributions and support towards this project: Dennis Mullinix (5200) for calibration and installa-tion of the Data Acquisition System (DAS) electronics and the staff of the Facilities EngineeringDivision, Code 5100 for reworking the exterior of all 4 models to provide a consistent surfacefinish with very short notice. Without all of your efforts the test could not have been success-fully completed.
6
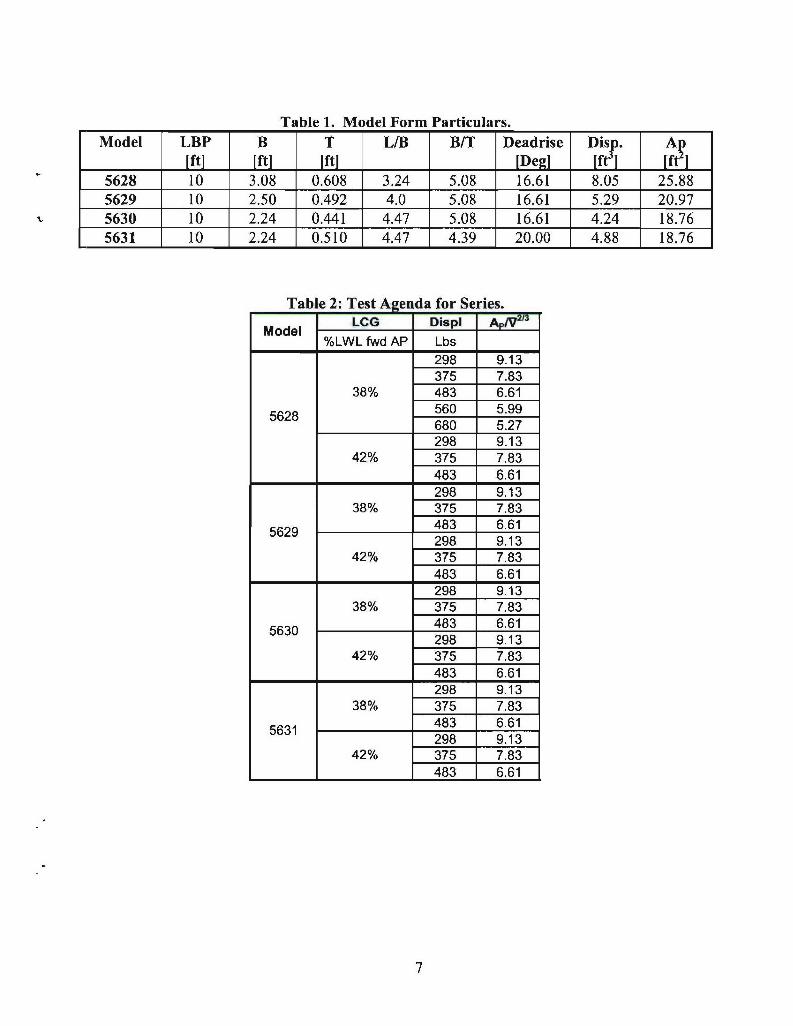
Table 1. Model Form Particulars.
Model LBP B T L/B B/T Deadrise Disp. ApIN Ift] Itt] IN [Deg] [ft ,
5628 10 3.08 0.608 3.24 5.08 16.61 8.05 25.885629 10 2.50 0.492 4.0 5.08 16.61 5.29 20.975630 10 2.24 0.441 4.47 5.08 16.61 4.24 18.765631 10 2.24 0.510 4.47 4.39 20.00 4.88 18.76
Table 2: Test Agenda for Series.Model LCG Dispi
%LWL fwd AP Lbs298 9.13375 7.83
38% 483 6.61
5628 560 5.99680 5.27298 9.13
42% 375 7.83483 6.61
298 9.1338% 375 7.83
483 6.61298 9.13
42% 375 7.83483 6.61298 9.13
38% 375 7.83
5630 483 6.61298 9.13
42% 375 7.83483 6.61298 9.13
38% 375 7.83483 6.61298 9.13
42% 375 7.83483 6.61
7

Table 3. Experi entally Tested Ballast Conditions
Model LCG Dispi ApV 2 3" TAp TFP TRIM WPAREA S[%LWL fwd AP] [Lbs] [in] [in] [in] [in-] [Fin'
38.08% 297.76 9.13 5.406 5.710 -0.304 2950 322837.97% 375.69 7.83 6.000 6.556 -0.556 3211 355838.00% 483.68 6.62 7.000 7.312 -0.312 3391 386738.00% 560.16 5.99 7.750 7.750 0.000 3475 40525n6r837.90% 679.94 5.26 9.000 8.243 0.757 3565 430542.12% 297.76 9.13 4.750 6.742 -1.992 2948 325142.04% 375.69 7.83 5.350 7.553 -2.203 3280 363242.01% 484.19 6.61 6.000 8.767 -2.767 3497 397937.99% 298.28 7.40 5.593 5.557 0.035 2700 302237.98% 375.85 6.35 6.400 6.274 0.126 2820 3296
5629 38.00% 484.18 5.36 7.650 7.301 0.349 2924 358341.98% 298.24 7.40 4.905 6.577 -1.672 2777 313142.03% 376.16 6.34 6.030 6.812 -0.782 2855 333442.06% 484.18 5.36 7.030 7.883 -0.853 2969 363838.03% 297.77 6.62 5.750 5.518 0.232 2515 293538.01% 375.46 5.68 6.900 5.888 1.012 2590 3153
5630 38.01% 483.78 4.79 8.250 6.696 1.554 2682 345542.00% 297.77 6.62 5.000 6.587 -1.587 2584 301042.02% 375.46 5.68 5.750 7.489 -1.739 2674 325342.00% 483.78 4.79 7.000 8.410 -1.410 2764 355638.01% 298.92 6.62 6.438 5.478 0.960 2439 287038.01% 375.34 5.68 7.500 6.011 1.489 2537 3108
5631 38.00% 483.59 4.79 8.750 7.006 1.744 2645 342742.00% 298.88 6.62 5.519 6.831 -1.313 2526 296442.00% 375.27 5.68 6.206 7.855 -1.649 2634 322242.01% 483.59 4.79 8.000 8.069 -0.069 2692 3486
Table 4. Tow Point Heights
Model Number 5628 5629 5630 5631
Tow Point ABL [in] 6.06 4.91 4.39 5.05
8
00
jB.6 Owl.
II'IT
cla
73 i.9
o6~
LOTO 1n

47' MLB Hull Profile
Variant #1 Hull Profile
Variant #2 Hull Profile
Variant #3 Hull Profile
Figure 2. Series Hullforms Profile-Views
10
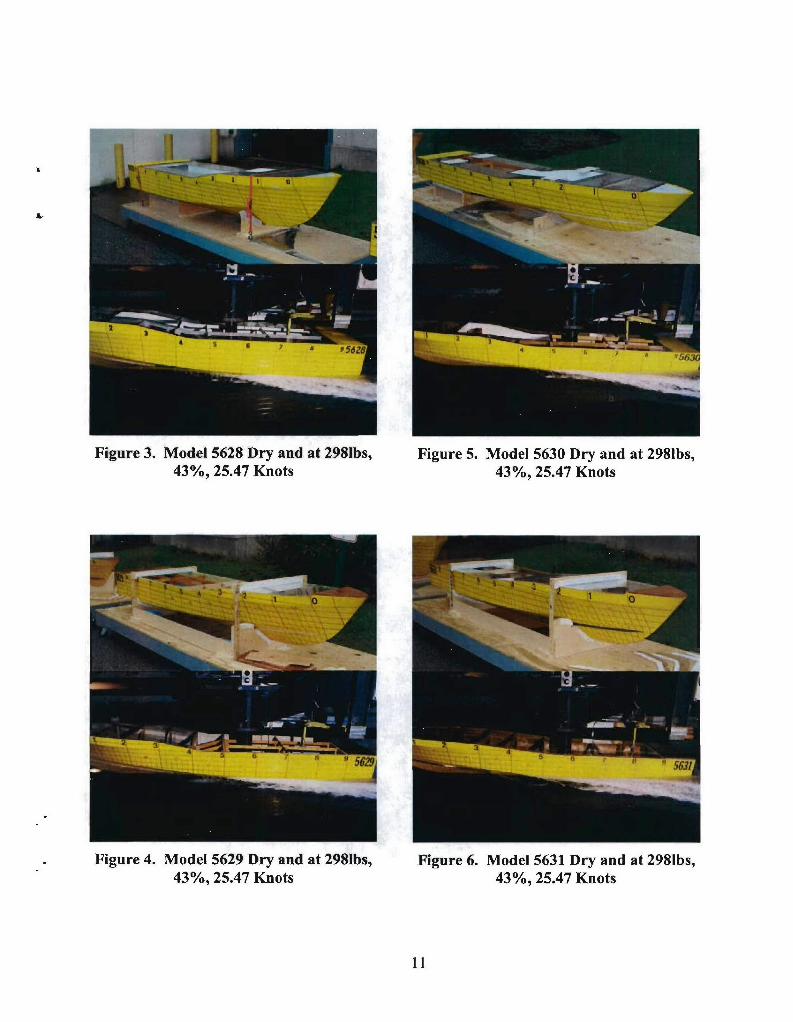
Figure 3. Model 5628 Dry and at 2981bs, Figure 5. Model 5630 Dry and at 2981bs,43%, 25.47 Knots 43%, 25.47 Knots
Figure 4. Model 5629 Dry and at 2981bs, Figure 6. Model 5631 Dry and at 2981bs,43%, 25.47 Knots 43%, 25.47 Knots
11
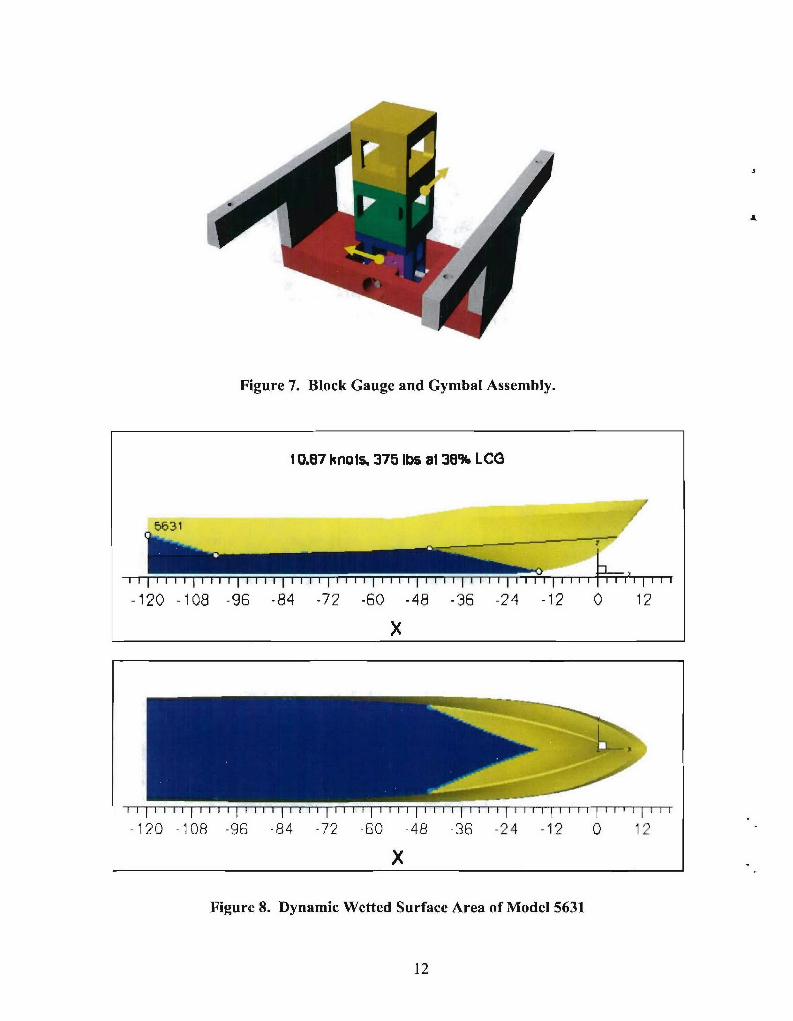
Figure 7. Block Gauge and Gymbal Assembly.
10.87 knols. 375 Ibs al 38% LCG
-120 -108 -96 -84 -72 -60 -48 -36 -24 -12 0 12
-120 -108 -96 -84 -72 -60 -48 -36 -24 -12 0 12
x
Figure 8. Dynamic Wetted Surface Area of Model 5631
12
Effective Horsepower for Model 5628 and Historical Data at
Full Scale 19 LT and 38% LCG
1400
_
+ 24.8 LT
1200 -20.4 LT
1000 ........ +
+__ 4a-.19 LT USNAS800 ',. 1DATA
600 - -17.6 LT
400 0
400 + 137 LT
2 10.8 LT
0 , _
0 10 20 30 40 50 60
Ship Speed (knots)
Figure 9. EHP for Full Scale 47 ft MLB at 38% LCG
Effective Horsepower for Model 5628 and Historical Data atFull Scale 19 LT and 42% LCG
1400
1200 - 19 LT USNADATA
1000 T
17.6 LT
. 800 -- °a.I
uz 600600 -, el * 13.7 LT
400 -t -
200 10.8 LT
0 1
0 10 20 30 40 50 60
Ship Speed (knots)
Figure 10. EHP for Full Scale 47 ft MLB at 42% LCG
13
RT/A RatioAll models at 298 lbf displacement and 38% LCG
0.40
0.30 - 5628
---- -------- 5629n 0.20-
-- -.-.-. 5630
0.10 ..... 5631
0.00
0 1 2 3 4 5 6 7
Volume Froude Number
Figure 11. L/B & on Resistance for 298Lbs at 38% LCG
R-T/A RatioAll models at 298 Ibf displacement and 42% LCG
0.40
0.30 :5628o. 02 0 ........- 5629
S0.20- --.-.-- 5630
0.10 - -". . . 5631
0.00
0 1 2 3 4 5 6 7
Volume Froude Number
Figure 12. L/B & Deadrise Influence on Resistance for 298Lbs at 42% LCG
14
RT/A RatioAll models at 375 lbf displacement and 38%LCG
0.40
0.30 5628,
0 "
---- 5629n 0.20 - S..... 5630
0.10 ..... 5631
0.00 ,0 1 2 3 4 5 6 7
Volume Froude Number
Figure 13. L/B & Deadrise Influence on Resistance for 375Lbs at 38% LCG
Rt/A RatioAll models at 375 lbf displacement and 42%LCG
0.40
0.30 - 5628'
.2 / ..-....... 5629t 0.20 "
<t- ----- 5630Q
0.10 .... 5631
0.00..0 1 2 3 4 5 6 7
Volume Froude Number
Figure 14. L/B & Deadrise Influence on Resistance for 375Lbs at 42% LCG
15
RT/A RatioAll models at 483 lbf displacement and 38% LCG
0.40 -
0.30 - 5628
• ...... 5629, 0.20
" - -- ". 56301
0.10 . 5631
0.000 1 2 3 4 5 6 7
Volume Froude Number
Figure 15. L/B & Deadrise Influence on Resistance for 483Lbs at 38% LCG
RT/A Ratio
All models at 483 lbf displacement and 42% LCG
0.40 -
0.30 ____ ___ __ _ ____56280.30 -
".2 ....... 5629r,0.20
-.--.- 5630
0.10 ---- 5631
0.000 1 2 3 4 5 6 7
Volume Froude Number
Figure 16. L/B & Deadrise Influence on Resistance for 483Lbs at 42% LCG
16
RT/A Ratio
Model 5628 at 38% LCG
0.40....... A = 298
A = 375
0.30 - A =483
. - A =560S0.20 -0.20 - A = 680
i 298 Raw
0 375 Raw
0.10 z 483 Raw
o 560 Raw
+ 680 Raw0.00.
0 1 2 3 4 5 6 7
Volume Froude Number
Figure 17. Model-Scale RT/Displ for Model 5628 at 38% LCG
RT/A RatioModel 5628 at 42% LCG
0.40
0.30 -= ...... A 298
Or A =375"M - A =483n 0.20 -
a 298 Raw
, 375 Raw
0.10 A 483 Raw
0.00 '0 1 2 3 4 5 6 7
Volume Froude Number
Figure 18. Model-Scale RT/Displ for Model 5628 at 42% LCG
17
RT/A RatioModel 5629 at 38% LCG
0.40
0.30 - A=298
.O A = 375
-0A = 483'~0.20
. 298 Raw
S375 Raw
0.10 A 483 Raw
0.00 -
0 1 2 3 4 5 6 7
Volume Froude Number
Figure 19. Model-Scale RT/Displ for Model 5629 at 38% LCG
RTIA RatioModel 5629 at 42% LCG
0.40
0.30 ....... A =298
. A =375M= A=483, 0.20 -
. 298 Raw
, 375 Raw
0.10 A 483 Raw
0.000 1 2 3 4 5 6 7
Volume Froude Number
Figure 20. Model-Scale RT/Displ for Model 5629 at 42% LCG
18

RT/A Ratio
Model 5630 at 38% LCG
0.40
0.30 - ....... A = 298
SA = 375
0".20 -A = 483
. 298 Raw0 375 Raw
0.10 __ 483 Raw1
0.00
0 1 2 3 4 5 6 7
Volume Froude Number
Figure 21. Model-Scale RT/Displ for Model 5630 at 38% LCG
RT/A RatioModel 5630 at 42% LCG
0.40
l
0.30 ........ A - 298
.o A = 375(.- A =483
S0.20a 298 Raw
. 375 Raw
0.10 A 483 RawI[
0. 00 ,,:
0 1 2 3 4 5 6 7
Volume Froude Number
Figure 22. Model-Scale RT/Displ for Model 5630 at 42% LCG
19

RT/A RatioModel 5631 at 38% LCG
0.40
0.30 -. ...... A = 298
o A = 375U- - A = 483
', 0.20o 298 Raw
o 375 Raw
0.10 A 483 Raw
0.00
0 1 2 3 4 5 6 7
Volume Froude Number
Figure 23. Model-Scale RT/DispI for Model 5631 at 38% LCG
R.T/A RatioModel 5631 at 42% LCG
0.40
U
0 .3 0 . . . . . . . A = 2 9 80.30 .=29
o A = 375
-A = 483t 0.20 E 298 Raw
. 375 Raw
0.10 - A 483 Raw
0.000 1 2 3 4 5 6 7
Volume Froude Number
Figure 24. Model-Scale RT/Displ for Model 5631 at 42% LCG
20

Wetted Surface AreaModel 5628 at 38% LCG
5000 D=9
D___ 375
cr 4000 -0D483
O13 560
a_ D___ 680S3000 13 298 Raw~
c~375 Rawi
~2000~ 483 Rawl
0 560 RawI
100 _________________ ___ ____ + 680ORaw
0 1 2 3 4 5 6 7Volume Froude Number
Figure 25. Model-Scale Dynamic Wetted Surface Area for Model 5628 at 38% LCG
Wetted Surface AreaModel 5628 at 42% LCG
5000
A
cr 4000 -D =298Y
1_ 3= 483N 298 Raw'
* 375 Raw
~2000 - 483 Raw
10000 1 2 3 4 5 6 7
Volume Froude Number
Figure 26. Model-Scale Dynamic Wetted Surface Area for Model 5628 at 42% LCG
21
Wetted Surface AreaModel 5629 at 38% LCG
5000
S4000 . =298p • A 375
< o & 483
40' 3000 3 _O
w o 298 Raw
U) o 375 Raw
A2000 483 Raw
1000 i0 1 2 3 4 5 6 7
Volume Froude Number
Figure 27. Model-Scale Dynamic Wetted Surface Area for Model 5629 at 38% LCG
Wetted Surface AreaModel 5629 at 42% LCG
5000
o- 4000 (........ A= 298
-A =375
3000 - A =483 S3000 1
* 298 Raw
* 375 Raw"20 A 483 Raw2000
10000 1 2 3 4 5 6 7
Volume Froude Number
Figure 28. Model-Scale Dynamic Wetted Surface Area for Model 5629 at 42% LCG
22
Wetted Surface AreaModel 5630 at 38% LCG
5000
r 4000 ....... A = 298(• A =375
< d A =4830 30001a 300298 Raw
" )' o 375 Raw
S2000 - 483 Raw
1000 1
0 1 2 3 4 5 6 7
Volume Froude Number
Figure 29. Model-Scale Dynamic Wetted Surface Area for Model 5630 at 38% LCG
Wetted Surface AreaModel 5630 at 42% LCG
5000
r 4000 A.......A = 298
A = 375
-E - A =483S3000
v 298 Raw
". 375 Raw
2000 -A 483 Raw
1000 ... I
0 1 2 3 4 5 6 7
Volume Froude Number
Figure 30. Model-Scale Dynamic Wetted Surface Area for Model 5630 at 42% LCG
23
Wetted Surface AreaModel 5631 at 38% LCG
5000 -
rr 4000----..-. D=298
-- D = 375
S• D = 483U 3000
, 298 Raw
"o 375 Raw
2000 7 483 RawV
10000 1 2 3 4 5 6 7
Volume Froude Number
Figure 31. Model-Scale Dynamic Wetted Surface Area for Model 5631 at 38% LCG
Wetted Surface AreaModel 5631 at 42% LCG
5000 -
g 4000 ....... D 298
M___D =375<_ D =483S3000 -•Fu•S30 298 Raw
Si . 375 RawS2000 - 77 A 483 RawJ
1000
0 1 2 3 4 5 6 7Volume Froude Number
Figure 32. Model-Scale Dynamic Wetted Surface Area for Model 5631 at 42% LCG
24

Residuary ResistanceModel 5628 at 38% LCG
40... ...... D = 298
CD35- • -'- -- D = 375x 30
3 0D = 483S25-
,- 25 "D= 560
S20D = 680
S15 o 298 Raw
., 10 o 375 Raw
-2 a 483 Raw"U) 5 - .
0 560 Raw
0 1 2 3 4 5 6 7 + 680Raw
Volume Froude Number
Figure 33. Residuary Resistance Coefficient for Model 5628 at 38% LCG
Residuary ResistanceMode 1 5628 at 42% LCG
40
§35
x 30 .. D = 298C-)
S25 D= 375
O 2D = 48320a 298 Raw
O15 375 Raw
10 & 483 Raw
5-
0 1 2 3 4 5 6 7
Volume Froude Number
Figure 34. Residuary Resistance Coefficient for Model 5628 at 42% LCG
25

Residuary ResistanceModel 5629 at 38% LCG
40
o35
x 30 A =298
25 - - A = 375oWXA = 483
U) . 298 Raw
S15 o 375 Raw
M 10- IA 483 Raw,
'*i 5-3(,
0 2 3 4 5 6 7
Volume Froude Number
Figure 35. Residuary Resistance Coefficient for Model 5629 at 38% LCG
Residuary ResistanceModel 5629 at 42% LCG
40
o35. ...... A = 298 S30-
25 A =375UC~ = -483 S20 -=•
"2•- 2 * 298 RawU)
*15 . 375 Raw
M 10 A 483 Raw
0 1 2 3 4 5 6 7Volume Froude Number
Figure 36. Residuary Resistance Coefficient for Model 5629 at 42% LCG
26
Residuary ResistanceModel 5630 at 38% LCG
25-
20 ,0
--- ....... A =298
15 /A 375
-A =4832 A] 298 Raw,1 o 375 Raw
a 483 Raw
00 1 2 3 4 5 6 7
Volume Froude Number
Figure 37. Residuary Resistance Coefficient for Model 5630 at 38% LCG
Residuary ResistanceModel 5630 at 42% LCG
40 O
o35 -
x 30,x 30- ....... A =298C.)
25 -_ _ _ _ _ _ _ _ _ _ _ _ A =375S205
"N20 . 298 Raw
g•15 -' 375 Raw
10 - A 483 Raw
5-5
-U.00 1 2 3 4 5 6 7
Volume Froude Number
Figure 38. Residuary Resistance Coefficient for Model 5630 at 42% LCG
27

Residuary ResistanceModel 5631 at 38% LCG
40
035
x 30 = D 298_ _"_D =375
o25 _"D = 483S20'2 o 298 Raw
,15- 375 Raw
- 10 [a 483 Raw
M 10.~5
0 i:
0 1 2 3 4 5 6 7Volume Froude Number
Figure 39. Residuary Resistance Coefficient for Model 5631 at 38% LCG
Residuary ResistanceModel 5631 at 42% LCG
40
g35
S30 -.... D =298 1L-)
, 25 - D = 375C- 0=483S20
•2 *0 298 Raw
S 15 . 375 Raw
Cu 10 • 483 Raw _ '
"0 5
0 1 2 3 4 5 6 7
Volume Froude Number
Figure 40. Residuary Resistance Coefficient for Model 5631 at 42% LCG
28
Heave (LCG)Model 5628 at 38% LCG
7-. ...... D= 298
6++, - D = 375
5 -D= 483
"4 - D = 5600+ - D = 680_j 3'
-3 298 RawM 2 375 Raw
a , 483 Raw
o 560 Raw0 + 680 Raw
0 1 2 3 4 5 6 7
Volume Froude Number
Figure 41. Model-Scale Center of Gravity Heave for Model 5628 at 38% LCG
Heave (LCG)Model 5628 at 42% LCG
7
6
5 ...... D =298•4 _A00- - D =375
0a D =483_. 3 - ......
a, .. u 298 RawM 2 375 Raw
1 - A 483 Raw
0-
-1 -
0 1 2 3 4 5 6 7
Volume Froude Number
Figure 42. Model-Scale Center of Gravity Heave for Model 5628 at 42% LCG
29
Heave (LCG)Model 5629 at 38% LCG
7
6
5 ...... A =298""4- -A 375
SA... .. - = 483o 3 298 Raw
m 2 o 375 Raw
a 483 Raw
0
-1
0 1 2 3 4 5 6 7
Volume Froude Number
Figure 43. Model-Scale Center of Gravity Heave for Model 5629 at 38% LCG
Heave (LCG)Model 5629 at 42% LCG
7
6
5 - ----- A = 298F A=375
-- -A=483
SE 298 Raw
~ 2 375 Raw
1 - A 483 Raw0 , !
-1
0 1 2 3 4 5 6 7Volume Froude Number
Figure 44. Model-Scale Center of Gravity Heave for Model 5629 at 42% LCG
30

Heave (LCG)Model 5630 at 38% LCG
7
6
5 j,.._ ....... A =298
=-4 . - 375
..... A = 483
)- a 298 Raw.- 375 Raw
1 • 483 Raw
0
0 1 2 3 4 5 6 7
Volume Froude Number
Figure 45. Model-Scale Center of Gravity Heave for Model 5630 at 38% LCG
Heave (LCG)Model 5630 at 42% LCG
7
6 - _
5. A =298" 4-_____'-_ _ A = 375
'D - A=483
m 298 Raw•> 24"1Wr 2 375 Raw
1�_�_ _� A 483 Raw
-1 _____
0 1 2 3 4 5 6 7
Volume Froude Number
Figure 46. Model-Scale Center of Gravity Heave for Model 5630 at 42% LCG
31

Heave (LCG)Model 5631 at 38% LCG
7
6
4- A 3753 .. A =483
_j 3- 0 298 Raw2- 0 375 Raw
1 /WO Q, 483 Raw
0 -
-1
0 1 2 3 4 5 6 7
Volume Froude Number
Figure 47. Model-Scale Center of Gravity Heave for Model 5631 at 38% LCG
Heave (LCG)
Model 5631 at 42% LCG
6
5 A= 298C= 4 ___- A =375
4-.-CD - A = 483
m 298 Raw. 375 Raw
A 483 Raw
0-
0 1 2 3 4 5 6 7
Volume Froude Number
Figure 48. Model-Scale Center of Gravity Heave for Model 5631 at 42% LCG
32

Pitch AngleModel 5628 at 38% LCG
8
7________--_ _-------_. .... A=2986 -A = 375-A =483
- - A = 560
J3 -A = 680"o 3 o 298 RawC - - ...... C,<_ _ __,_o 375 Raw2--
._ __._1_ _ _ _ _ _,_a 483 Raw
0 I 0 560 Raw0+ 680 Raw
O 1 2 3 4 5 6 7
Volume Froude Number
Figure 49. Pitch Angle for Model 5628 at 38% LCG
Pitch AngleModel 5628 at 42% LCG
8
7
S6....... = . . ........D=298
0 5 ___- D = 375
4- D = 483CD _,_-_ ______--___298 Raw
,--_<_2_ __ __ ___ 375 Raw
____ _ _ _ _483 Raw
0-1
0 1 2 3 4 5 6 7
Volume Froude Number
Figure 50. Pitch Angle for Model 5628 at 42% LCG
33
Pitch AngleModel 5629 at 38% LCG
8
7
6- ...... D 2987cm 5- D =375
2.-.- D- 483S_. . 298 Raw
<3 o 375 Raw
2 "- 483 Raw0.
E
00 1 2 3 4 5 6 7
Volume Froude Number
Figure 51. Pitch Angle for Model 5629 at 38% LCG
Pitch AngleModel 5629 at 42% LCG
8
7
....... D =298
D =375S4 - D 483
3-3 . 298 RawC
."375 RawS' A 483 Raw
0
0 1 2 3 4 5 6 7
Volume Froude Number
Figure 52. Pitch Angle for Model 5629 at 42% LCG
34

Pitch AngleModel 5630 at 38% LCG
8
7
6...... D= 2985 5
o 375 Raw
-A 483 Raw
0
0 1 2 3 4 5 6 7
Volume Froude Number
Figure 53. Pitch Angle for Model 5630 at 38% LCG
Pitch AngleModel 5630 at 42% LCG
8
7 -____
6... ....... A = 298
D 5 -- A = 375/ A A= 483
04- - u 298 Raw
3 - 375 Raw
t' 2-, A 483 Raw
0
0 1 2 3 4 5 6 7
Volume Froude Number
Figure 54. Pitch Angle for Model 5630 at 42% LCG
35
Pitch AngleModel 5631 at 38% LCG
8
7
------------------------------ A =298' 5 -A = 375
4 !-A = 483
0 3 a- 298 Raw
o 375 Raw
S483 Raw
0 1
0 1 2 3 4 5 6 7
Volume Froude Number
Figure 55. Pitch Angle for Model 5631 at 38% LCG
Pitch AngleModel 5631 at 42% LCG
8
7
------------------------------- A =298O5 -A =375S 4 A ...... __A=483
"t- 3 -- --. U E-l- . 2 9 8 R a w
v2 375 Raw
A 483 Raw
L 0
0 1 2 3 4 5 6 7
Volume Froude Number
Figure 56. Pitch Angle for Model 5631 at 42% LCG
36

Table 5. Model-Scale RT/Displ at 298 Lbs of Displacement
Test # 8 5 22 25 10 13 16 19Model # 5628 5628 5629 5629 5630 5630 5631 5631
A = 298 298 298 298 298 298 298 298LCG 38% 42% 38% 42% 38% 42% 38% 42%
Vm RT/A RT/A RT/A RT/A RT/A RT/A RT/A RT/A(knots) Lbs/Lbs Lbs/Lbs Lbs/Lbs Lbs/Lbs Lbs/Lbs Lbs/Lbs Lbs/Lbs Lbs/Lbs
0 0.0000 0.0000 0.0000 0.0000 0.0000 0.0000 0.0000 0.00001 0.0039 0.0052 0.0066 0.0027 0.0063 0.0028 0.0054 0.0106
2 0.0099 0.0098 0.0123 0.0069 0.0127 0.0070 0.0102 0.01763 0.0169 0.0172 0.0205 0.0167 0.0210 0.0170 0.0176 0.0199
4 0.0461 0.0368 0.0446 0.0388 0.0394 0.0390 0.0405 0.0342
5 0.0727 0.0663 0.0763 0.0661 0.0735 0.0638 0.0721 0.0680
6 0.0945 0.0883 0.0959 0.0861 0.0957 0.0828 0.0922 0.08487 0.1111 0.1034 0.1087 0.1004 0.1063 0.0972 0.1053 0,0968
8 0.1240 0.1167 0.1194 0.1125 0.1155 0.1094 0.1162 0.10809 0.1349 0.1302 0.1292 0.1239 0.1257 0.1206 0.1262 0.1191
10 0.1447 0.1441 0.1387 0.1352 0.1366 0.1311 0.1358 0.130211 0.1542 0.1576 0.1478 0.1463 0.1473 0.1414 0.1450 0.141312 0.1635 0.1702 0.1567 0.1575 0.1569 0.1515 0.1539 0.1524
13 0.1729 0.1819 0.1654 0.1687 0.1647 0.1616 0.1625 0.1636
14 0.1824 0.1933 0.1740 0.1800 0.1708 0.1717 0.1708 0.174715 0.1921 0.2048 0.1825 0.1915 0.1762 0.1820 0.1791 0.186016 0.2022 0.2166 0.1912 0.2033 0.1820 0.1924 0.1873 0.197217 0.2127 0.2290 0.2000 0.2153 0.1890 0.2032 0.1956 0.2086
18 0.2237 0.2418 0.2093 0.2278 0.1974 0.2142 0.2041 0.220119 0.2353 0.2553 0.2190 0.2408 0.2071 0.2258 0.2131 0.231820 0.2476 0.2692 0.2296 0.2544 0.2179 0.2378 0.2226 0.243821 0.2607 0.2837 0.2412 0.2687 0.2296 0.2505 012329 0.2562
22 0.2747 0.2986 0.2541 0.2838 0.2420 0.2639 0.2444 0.2691
23 0.2898 0,3142 0.2688 0.3000 0.2550 0.2781 0.2573 0.282924 0.3062 0.3302 0.2860 0.3174 0.2684 0.2934 0.2721 0.297925 0.3239 0.3064 0.3362 0.2822 0.3097 0.2894 0.314926 0.33532728
37
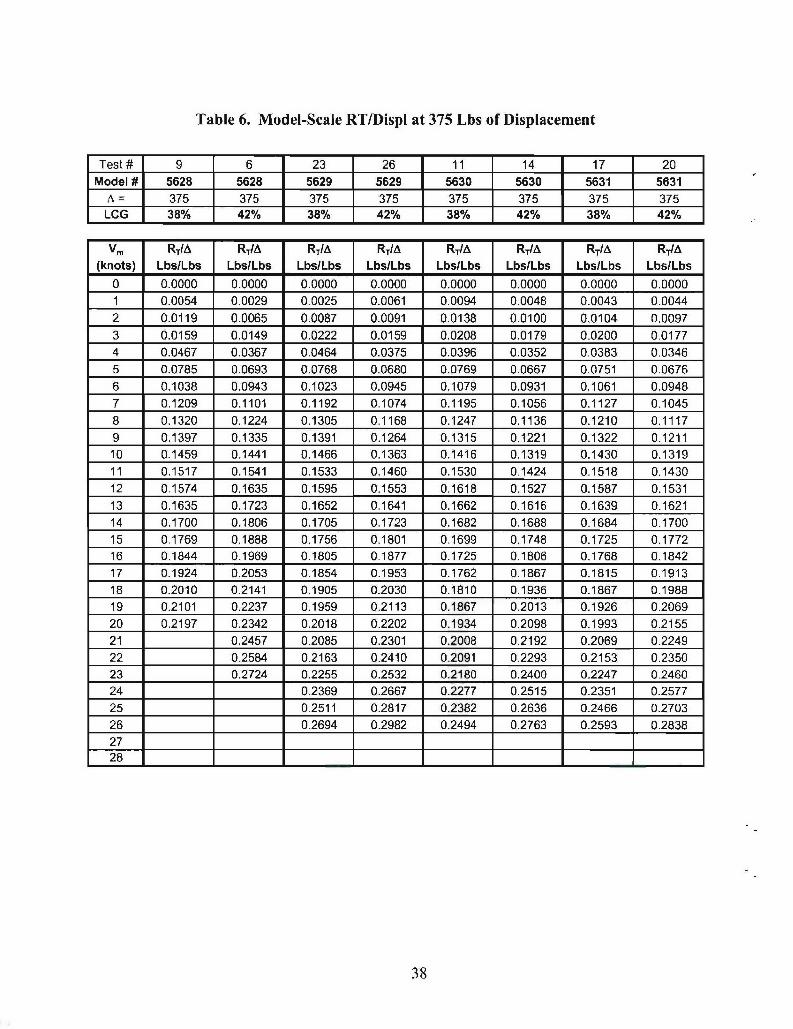
Table 6. Model-Scale RT/Displ at 375 Lbs of Displacement
Test # 9 6 23 26 11 14 17 20Model # 5628 5628 5629 5629 5630 5630 5631 5631
A = 375 375 375 375 375 375 375 375LCG 38% 42% 38% 42% 38% 42% 38% 42%
Vm RTIA RT/A RT/A RT/A RT/A RT/A RT/A RT/A(knots) Lbs/Lbs Lbs/Lbs Lbs/Lbs Lbs/Lbs Lbs/Lbs Lbs/Lbs Lbs/Lbs Lbs/Lbs
0 0.0000 0.0000 0.0000 0.0000 0.0000 0.0000 0.0000 0.0000
1 0.0054 0.0029 0.0025 0.0061 0.0094 0.0048 0.0043 0.00442 0.0119 0.0065 0.0087 0.0091 0.0138 0.0100 0.0104 0.0097
3 0.0159 0.0149 0.0222 0.0159 0.0208 0.0179 0.0200 0.0177
4 0.0467 0.0367 0.0464 0.0375 0.0396 0.0352 0.0383 0.03465 0.0785 0.0693 0.0768 0.0680 0.0769 0.0667 0.0751 0.0676
6 0.1038 0.0943 0.1023 0.0945 0.1079 0.0931 0.1061 0.09487 0.1209 0.1101 0.1192 0.1074 0.1195 0.1056 0.1127 0.10458 0.1320 0.1224 0.1305 0.1168 0.1247 0.1136 0.1210 0.1117
9 0.1397 0.1335 0.1391 0.1264 0.1315 0.1221 0.1322 0.121110 0.1459 0.1441 0.1466 0.1363 0.1416 0.1319 0.1430 0.1319
11 0.1517 0.1541 0.1533 0.1460 0.1530 0.1424 0.1518 0.143012 0.1574 0.1635 0.1595 0.1553 0.1618 0.1527 0.1587 0.1531
13 0.1635 0.1723 0.1652 0.1641 0.1662 0.1616 0.1639 0.162114 0.1700 0.1806 0.1705 0.1723 0.1682 0.1688 0.1684 0.170015 0.1769 0.1888 0.1756 0.1801 0.1699 0.1748 0.1725 0.177216 0.1844 0.1969 0.1805 0.1877 0.1725 0.1806 0.1768 0.1842
17 0.1924 0.2053 0.1854 0.1953 0.1762 0.1867 0.1815 0.191318 0.2010 0.2141 0.1905 0.2030 0.1810 0.1936 0.1867 0.1988
19 0.2101 0.2237 0.1959 0.2113 0.1867 0.2013 0.1926 0.206920 0.2197 0.2342 0.2018 0.2202 0.1934 0.2098 0.1993 0.215521 0.2457 0.2085 0.2301 0.2008 0.2192 0.2069 0.224922 0.2584 0.2163 0.2410 0.2091 0.2293 0.2153 0.2350
23 0.2724 0.2255 0.2532 0.2180 0.2400 0.2247 0.246024 0.2369 0.2667 0.2277 0.2515 0.2351 0.2577
25 0.2511 0.2817 0.2382 0.2636 0.2466 0.270326 0.2694 0.2982 0.2494 0.2763 0.2593 0.2838
2728
38

Table 7. Model-Scale RT/Displ at 483 Lbs of Displacement
Test # 2 7 24 27 12 15 18 21Model # 5628 5628 5629 5629 5630 5630 5631 5631
A= 483 483 483 483 483 483 483 483LCG 38% 42% 38% 42% 38% 42% 38% 42%
Vm RT/A RT/A RT/A RT/A RT/A RT/A RT/A RT/A(knots) Lbs/Lbs Lbs/Lbs Lbs/Lbs Lbs/Lbs Lbs/Lbs Lbs/Lbs Lbs/Lbs Lbs/Lbs
0 0.0000 0.0000 0.0000 0.0000 0.0000 0.0000 0.0000 0.00001 0.0022 0.0000 0.0023 0.0022 0.0009 0.0062 0.0039 0.00062 0.0060 0.0010 0.0076 0.0072 0.0064 0.0099 0.0096 0.00483 0.0156 0.0121 0.0186 0.0176 0.0214 0.0170 0.0191 0.01554 0.0408 0.0376 0.0405 0.0381 0.0505 0.0344 0.0375 0.03725 0.0808 0.0714 0.0820 0.0756 0.0887 0.0691 0.0775 0.07446 0.1142 0.1005 0.1235 0.1134 0.1208 0.1065 0.1216 0.11397 0.1332 0.1205 0.1317 0.1240 0.1381 0.1223 0.1308 0.12518 0.1435 0.1340 0.1410 0.1313 0.1452 0.1250 0.1372 0.12889 0.1499 0.1437 0.1535 0.1421 0.1504 0.1291 0.1487 0.138510 0.1545 0.1512 0.1633 0.1525 0.1603 0.1394 0.1610 0.150111 0.1581 0.1575 0.1692 0.1605 0.1742 0.1527 0.1710 0.160012 0.1613 0.1633 0.1720 0.1660 0.1816 0.1636 0.1773 0.167413 0.1643 0.1687 0.1732 0.1696 0.1804 0.1699 0.1803 0.172614 0.1672 0.1739 0.1736 0.1722 0.1768 0.1730 0.1810 0.176215 0.1702 0.1791 0.1740 0.1744 0.1741 0.1750 0.1806 0.178816 0.1734 0.1843 0.1748 0.1767 0.1729 0.1770 0.1799 0.180817 0.1770 0.1896 0.1761 0.1792 0.1731 0.1795 0.1795 0.182818 0.1810 0.1952 0.1782 0.1822 0.1745 0.1827 0.1798 0.184819 0.1855 0.2009 0.1810 0.1858 0.1769 0.1866 0.1809 0.187220 0.1908 0.2068 0.1847 0.1902 0.1802 0.1912 0.1831 0.190021 0.1970 0.2131 0.1893 0.1953 0.1843 0.1966 0.1865 0.193622 0.2042 0.1948 0.2013 0.1891 0.2025 0.1910 0.1980
23 0.2129 0.2013 0.2083 0.1947 0.2092 0.1969 0.2034
24 0.2234 0.2090 0.2164 0.2009 0.2165 0.2042 0.210025 0.2362 0.2178 0.2257 0.2078 0.2244 0.2131 0.2182
26 0.2281 0.2364 0.2154 0.2331 0.2238 0.228427 0.2400 0.2487 0.2238 0.2424 0.2365 0.241128 0.2538 0.2628 0.2525 0.2517 0.2572
39

Table 8. Model-Scale RT/Displ at 560 Table 9. Model-Scale RT/Displ at 680Lbs of Displacement Lbs of Displacement
Test # J 3 Test # 4Model # 5628 Model # 5628
A = 560 A = 680LCG 38% LCG 38%
Vm RT/A Vm RT/A(knots) Lbs/Lbs (knots) Lbs/Lbs
0 0.0000 0 0.00001 0.0014 1 0.00112 0.0068 2 0.00503 0.0200 3 0.01514 0.0452 4 0.03885 0.0812 5 0.08616 0.1171 6 0.14047 0.1418 7 0.16178 0.1555 8 0-17399 0.1639 9 0.188410 0.1697 10 0.196411 0.1728 11 0.196412 0.1733 12 0.191913 0.1721 13 0.186314 0.1703 14 0.181315 0.1689 15 0.177416 0.1684 16 0.175017 0.1691 17 0.173818 0.1710 18 0.174019 0.1743 19 0.175420 0.1791 20 0.178021 0.1856 21 0.181622 0.1939 22 0.186523 0.2045 23 0.192424 24 0.199725 25
26 2627 2728 28
40

Table 10. Model-Scale Dynamic Wetted Surface Area at 298 Lbs of Displacement
Test # 8 5 22 25 10 13 16 19Model # 5628 5628 5629 5629 5630 5630 5631 5631
A = 298 298 298 298 298 298 298 298LCG 38% 42% 0 38% 42% 38% 42% 38% 42%
Vm SDYN SOYN SDYN SDYN SDYN SDYN SDYN SDYN(knots) in2 in2 in2 in2 in2 in2 in2 in2
0
123 3454.1 4370.4 3026.5 3240.0 3410.4 3575.3 2834.3 3257.34 3441.2 3926.3 2968.3 3423.3 3338.7 3666.5 2791.5 3234.75 3644.1 3333.5 2900.1 3558.4 3318.2 3658.3 2791.5 3235.36 3763.9 3309.6 3199.4 3418.5 3403.1 3589.8 2815.7 3208.27 3724.3 3432.1 3242.4 3269.0 3441.4 3508.1 2844.5 3065.78 3605.2 3538.7 3062.2 3193.5 3400.2 3444.1 2860.5 3037.99 3459.7 3590.6 3002.0 3164.2 3309.7 3413.4 2851.3 3015.910 3313.8 3583.7 2956.1 3161.2 3198.4 3415.3 2811.1 2975.411 3179.0 3530.2 2874.0 3159.1 3084.5 3412.3 2741.0 2908.912 3059.0 3447.3 2731.3 3077.0 2977.5 3342.2 2648.1 2818.513 2953.7 3350.3 2584.3 2859.1 2881.9 3221.2 2543.6 2719.214 2862.0 3249.5 2484.3 2712.2 2798.9 3110.9 2439.9 2630.715 2782.0 3151.1 2423.2 2675.1 2728.5 3030.3 2348.6 2563.416 2712.0 3058.2 2381.5 2671.9 2669.8 2973.4 2277.4 2517.217 2650.6 2972.1 2348.3 2673.9 2621.4 2932.2 2229.7 2486.518 2596.2 2893.0 2318.7 2674.5 2582.3 2901.0 2203.6 2465.619 2547.9 2820.6 2290.9 2672.7 2551.3 2876.7 2193.0 2450.7
20 2504.8 2754.4 2669.0 2527.3 2857.0 2189.6 2439.2
21 2465.9 2693.8 2663.7 2509.5 2840.8 2184.9 2429.422 2430.9 2638.2 2657.3 2497.2 2827.1 2172.9 2420.6
23 2399.0 2587.1 2649.9 2489.5 2815.3 2152.2 2412.4
24 2369.9 2641.8 2486.2 2805.1 2127.0 2404.3
25 2343.3 2633.2 2486.6 2796.2 2107.2 2396.4
26 2388.52728
41
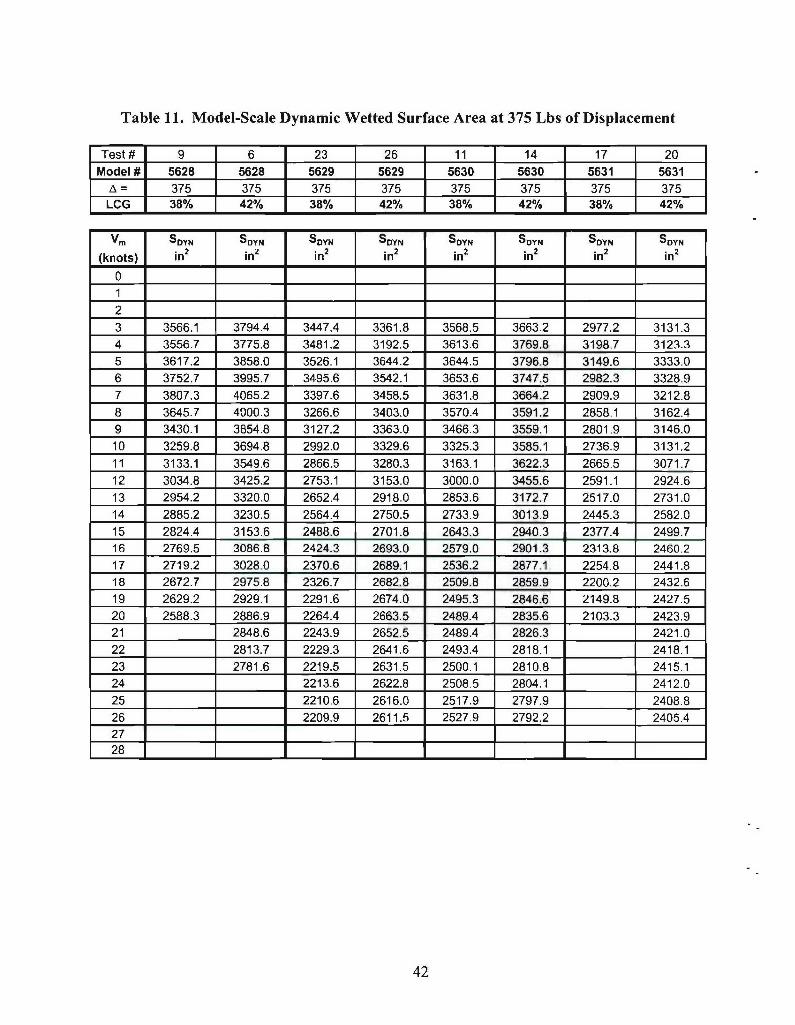
Table 11. Model-Scale Dynamic Wetted Surface Area at 375 Lbs of Displacement
Test # 9 6 23 26 11 14 17 20Model # 5628 5628 5629 5629 5630 5630 5631 5631
A = 375 375 375 375 375 375 375 375LCG 38% 42% 38% 42% 38% 42% 38% 42%
Vm SDYN SDYN SDYN SDYN SDYN SDYN SDYN SDYN
(knots) in' inl in2 in2 in= in2 in= in'012
3 3566.1 3794.4 3447.4 3361.8 3568.5 3663.2 2977.2 3131.34 3556.7 3775.8 3481.2 3192.5 3613.6 3769.8 3198.7 3123.35 3617.2 3858.0 3526.1 3644.2 3644.5 3796.8 3149.6 3333.06 3752.7 3995.7 3495.6 3542.1 3653.6 3747.5 2982.3 3328.97 3807.3 4065.2 3397.6 3458.5 3631.8 3664,2 2909.9 3212.88 3645.7 4000.3 3266.6 3403.0 3570.4 3591.2 2858.1 3162.4
9 3430.1 3854.8 3127.2 3363.0 3466.3 3559.1 2801.9 3146.0
10 3259.8 3694.8 2992.0 3329.6 3325.3 3585.1 2736.9 3131.211 3133.1 3549.6 2866.5 3280.3 3163.1 3622.3 2665.5 3071.712 3034.8 3425.2 2753.1 3153.0 3000.0 3455.6 2591.1 2924.6
13 2954.2 3320.0 2652.4 2918.0 2853.6 3172.7 2517.0 2731.014 2885.2 3230.5 2564.4 2750.5 2733.9 3013.9 2445.3 2582.015 2824.4 3153.6 2488.6 2701.8 2643.3 2940.3 2377.4 2499.716 2769.5 3086.8 2424,3 269310 2579.0 2901.3 2313,8 2460.2
17 2719.2 3028,0 2370.6 2689.1 2536.2 2877.1 2254.8 2441.818 2672.7 2975.8 2326.7 2682.8 2509.8 2859.9 2200.2 2432ý619 2629.2 2929.1 2291.6 2674.0 2495.3 2846.6 2149.8 2427.5
20 2588.3 2886.9 2264.4 2663.5 2489.4 2835.6 2103.3 2423.921 2848.6 2243.9 2652.5 2489.4 2826.3 2421.0
22 2813.7 2229.3 2641.6 2493.4 2818.1 2418.123 2781.6 2219.5 2631.5 2500.1 2810.8 2415.124 2213.6 2622.8 2508.5 2804.1 2412.0
25 2210.6 2616.0 2517.9 2797.9 2408.826 112209.9 2611.5 2527.9 2792.2 2405.42728
42
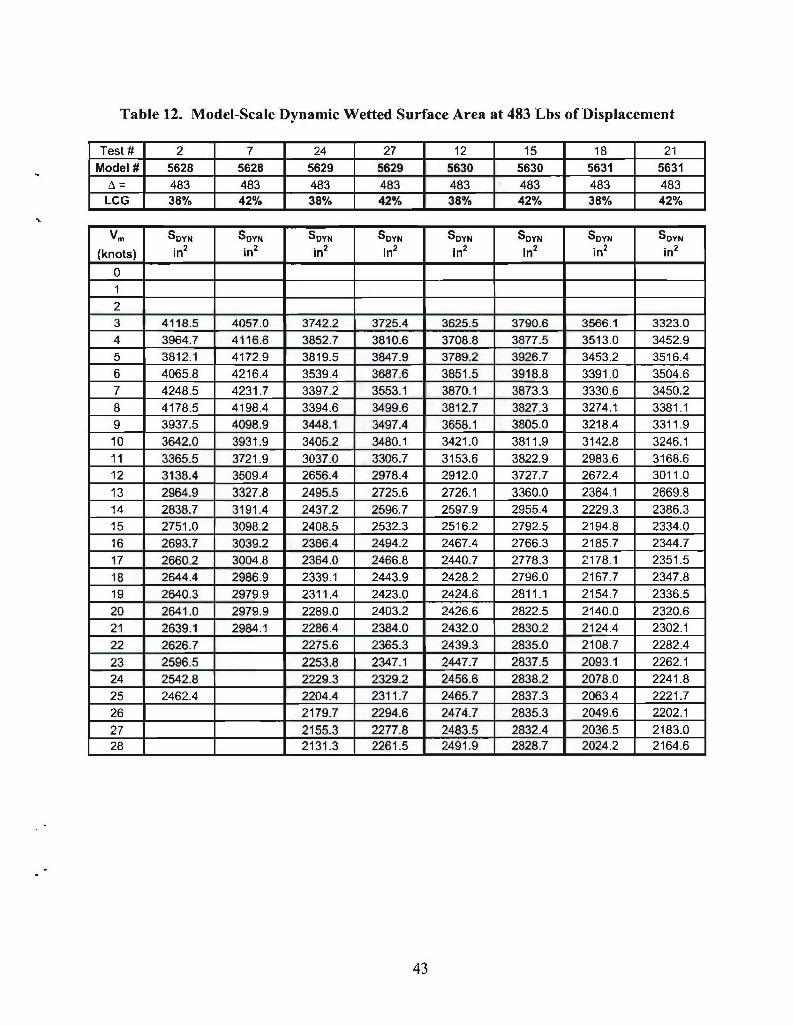
Table 12. Model-Scale Dynamic Wetted Surface Area at 483 Lbs of Displacement
Test # 2 7 24 27 12 15 18 21Model # 5628 5628 5629 5629 I 5630 5630 5631 5631
A = 483 483 483 483 483 483 483 483LCG 38% 42% 38% 42% 38% 42% 38% 42%
Vm SDYN SDYN SDYN SDYN SDYN SDYN SDYN SDYN
(knots) in2 in2 in2 In2 in2 in2 in2 in2
0123 4118.5 4057.0 3742,2 3725.4 3625.5 3790.6 3566.1 3323.04 3964.7 4116.6 3852.7 3810.6 3708.8 3877.5 3513.0 3452.95 3812.1 4172.9 3819.5 3847.9 378,9.2 3926.7 3453.2 3516.4
6 4065.8 4216.4 3539.4 3687.6 3851.5 3918.8 3391.0 3504.67 4248.5 4231.7 3397.2 3553.1 3870.1 3873.3 3330.6 3450.28 4178.5 4198.4 3394.6 3499.6 3812.7 3827.3 3274.1 3381.1
9 3937.5 4098.9 3448.1 3497.4 3658.1 3805.0 3218.4 3311.910 3642.0 3931.9 3405.2 3480.1 3421.0 3811.9 3142.8 3246.111 3365.5 3721.9 3037.0 3306.7 3153.6 3822.9 2983.6 3168.6
12 3138.4 3509.4 2656.4 2978.4 2912.0 3727.7 2672.4 3011.013 2964.9 3327.8 2495.5 2725.6 2726.1 3360.0 2364.1 2669.8
14 2838.7 3191.4 2437.2 2596,7 2597.9 2955.4 2229.3 2386.315 2751.0 3098.2 2408.5 2532.3 2516.2 2792.5 2194.8 2334.0
16 2693.7 3039.2 2386.4 2494.2 2467.4 2766.3 2185.7 2344.7
17 2660.2 3004.8 2364.0 2466.8 2440.7 2778.3 2178.1 2351.518 2644.4 29866.9 2339.1 2443.9 2428.2 2796.0 2167.7 2347.8
19 2640.3 2979.9 2311.4 2423 .0 2424.6 2811.1 2154.7 2336.520 2641.0 2979.9 2289.0 2403.2 2426.6 2822.5 2140.0 2320.621 2639.1 29864.1 2286.4 2384.0 2432.0 2830.2 2124.4 2302.122: 2626.7 2275.6 2365,3 2439.3 2835-0 2108.7 2282.4
23 2596.5 2253.8 2347.1 2447.7 2837.5 2093.1 2262.124 2542.8 2229.3 2329.2 2456.6 2838.2 2078.0 2241.8
25 2462.4 2204.4 2311.7 2465.7 2837.3 2063.4 2221.726 12179.7 12294.6 2474.7 2835.3 2049.6 2202.1
27 2155.3 2277.. 2483.5 2832.4 2036.5 2183.028 2131.3 2261.5 2491.9 2828.7 2024.2 2164.6
43

Table 13. Model-Scale Dynamic Wetted Table 14. Model-Scale Dynamic Wetted
Surface Area at 560 Lbs of Displacement Surface Area at 680 Lbs of Displacement
Test # 3 Test # J 4
Model # 5628 Model # 5628A = 560A = 680____ 560 1O 8
LCG 38% LCG 38%
Vm SDYNVm SDVN .2
(knots) in2 (knots) in
0 0
1 1
2 2
3 4161.0 3 4912.8
4 4187.3 4 4854.4
5 4195.0 5 4754.4
6 4171.2 6 4610.5
7 4106.5 7 4424.8
8 3996.9 8 4199.7
9 3844.9 9 3923.0
10 3659.6 10 3556.7
11 3455.6 11 3184.2
12 3250.6 12 2992.7
13 3062.9 13 2904.3
14 2908.6 14 2843.3
15 2799.0 15 2796.5
16 2739.8 16 2762.8
17 2731.3 17 2741.0
18 2769.7 18 2729.3
19 2846.7 19 2725.820 2944.9 20 2728.6
21 3020.9 21 2736.0
22 2966.1 22 2746.7
23 2528.1 23 2759.8
24 24 2774.4
25 25
26 26
27 27
28 28 ------- --
44
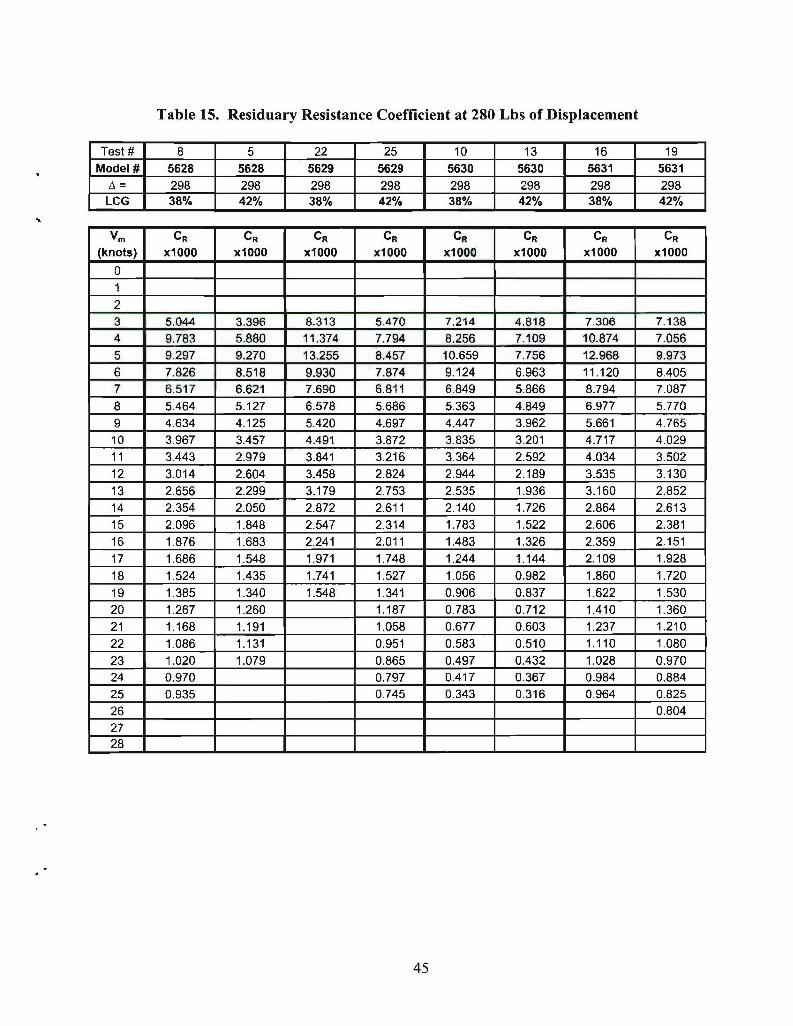
Table 15. Residuary Resistance Coefficient at 280 Lbs of Displacement
Test # 8 5 22 25 10 13 16 19Model # 5628 5628 5629 5629 5630 5630 5631 5631
A = 298 298 298 298 298 298 298 298LCG 38% 42% 38% 42% 38% 42% 38% 42%
Vm CR CR CR CR CR CR CR CR
(knots) xl000 xl000 xl000 xl000 xl000 xl000 xl000 xl000012
3 5.044 3.396 8.313 5.470 7.214 4.818 7.3G6 7.1384 9.783 5.880 11.374 7.794 8.256 7.109 10.874 7.056
5 9.297 9.270 13.255 8.457 10.659 7.756 12.968 9.9736 7,826 8.518 9.930 7.874 9.124 6.963 11.120 8.4057 6.517 6.621 7.690 6.811 6.849 5.866 8.794 7.087
8 5.464 5.127 6.578 5.686 5.363 4.849 6.977 5.770
9 4.634 4.125 5.420 4.697 4.447 3.962 5.661 4.76510 3.967 3.457 4.491 3.872 3.835 3.201 4.717 4.029
11 3,443 2.979 3.841 3.216 3.364 2.592 4.034 3.50212 3.014 2.604 3.458 2.824 2.944 2.189 3.535 3.13013 2.656 2.299 3.179 2.753 2.535 1.936 3.160 2.85214 2.354 2.050 2.872 2.611 2.140 1.726 2.864 2.61315 2.096 1.848 2.547 2.314 1.783 1.522 2.606 2. 38116 1.876 1.683 2.241 2.011 1.483 1.326 2.359 2.15117 1.686 1.548 1.971 1.748 1.244 1.144 2.109 1.928
18 1 .524 1.435 1.741 1.527 1.056 0.982 1.860 1.72019 1.385 1.340 1.548 1.341 0.906 0.837 1.622 1.53020 1.267 1.260 1.187 0. 783 0.712 1.410 1. 36021 1.168 1.191 1.058 0.677 0.603 1.237 1.210
22 1 1.086 1.131 0.951 0.583 0.510 1.110 1.08023 1.020 1.079 0.865 0.497 0.432 1.028 0.97024 0.970 0.797 0.417 0.367 0.984 0.88425 0.935 0.745 0.343 0.316 0.964 0.82526 0.804
2728
45

Table 16. Residuary Resistance Coefficient at 375 Lbs of Displacement
Test # 9 6 23 26 11 14 17 20Model # 5628 5628 5629 5629 5630 5630 5631 5631
A = 375 375 375 375 375 375 375 375LCG 38% 42% 38% 42% 38% 42% 38% 42%
Vm CR CR CR CR CR CR CR CR
(knots) xl000 xl000 xl000 xl000 xl000 xl000 xl000 xl000
0
12
3 6.258 5.134 10.618 6.865 9.256 7.227 11.244 8.9024 12.829 8.658 13.065 11.134 10.176 8.193 11.411 10.306
5 13.873 10.950 13.944 11.503 13.402 10.656 15.554 12.7726 12.007 9.815 12,899 11.498 13.044 10.511 16.320 12.4767 9.719 7.880 11.067 9.470 10.197 8.576 12.521 10.060
8 8.163 6.472 9.327 7.621 7.794 6.802 10.055 7,931
9 6.979 5.533 7.909 6.260 6.321 5.468 8.557 6.48110 5.932 4.837 6.780 5.231 5.520 4.421 7,419 5.47811 5.023 4.261 5.866 4.456 5.038 3.617 6.433 4.792
12 4.268 3.756 5.111 3.983 4.565 3.291 5.562 4.40613 3.655 3.307 4.473 3.827 4M001 3.209 4.807 4.18914 3.160 2.908 3.926 3.596 3.418 2.929 4.167 3.914
15 2.757 2.557 3,450 3,164 2.889 2534 3.631 3.53116 2.424 2.253 3.032 2.718 2.436 2.143 3.187 3.112
17 2.151 1.991 2.663 2.333 2.054 1.802 2.822 2.71618 1,929 1.769 2.337 2.013 1.731 1.517 2.522 2.36819 1.741 1.583 2.050 1.750 1.458 1.282 2.277 2.07120 1.575 1.430 1.799 1.534 1.226 1.089 2.077 1.822
21 1.306 1.583 1.359 1.027 0.929 1.613
22 1.208 1.403 1.217 0.858 0.795 1.439
23 1.134 1.258 1.103 0.712 0.683 1.29424 1.152 1.014 0.588 0.588 1.17425 1.089 0.944 0.482 0.506 1.074
26 1.079 0.890 0.391 0.436 0.9922728
46

Table 17. Residuary Resistance Coefficient at 483 Lbs of Displacement
Test # 2 7 24 27 12 15 18 21Model # 5628 5628 5629 5629 5630 5630 5631 5631
A _483 483 483 483 483 483 483 483LCG 38% 42% 38% 42% 38% 42% 38% 42%
Vm CR CR CR CR CR CR CR CR
(knots) xl000 xl000 xl000 xl000 xl000 xl000 xl000 xl0000123 7.223 4.974 10.502 9.805 13.162 9.179 11.570 9.6904 12.980 11.184 13.336 12.548 18.216 10.743 13.600 13.7465 18.263 14.166 18.553 16.723 20.510 14.650 19,518 18.2526 16.648 13.681 21.407 18.522 18.943 16.028 22.093 19.7497 13.176 11.721 16.989 15.025 15.419 13.324 17.255 15.7278 10.642 9.695 13.476 11.895 12.118 10.004 13.614 12.1299 8.993 8.074 11.018 9.810 9.946 7.749 11.537 10.19710 7.850 6.894 9.277 8.251 8.986 6.449 10.105 8.87711 6.971 6.050 8.804 7.344 8.701 5.596 9.139 7.76412 6.207 5.403 8.551 7.010 8.123 4.963 8.831 6.99313 5.501 4.845 7.588 6.558 7.094 4.831 8.617 6.92614 4.839 4.321 6.426 5.829 5.997 4.854 7.712 6.80215 4.222 3.818 5.389 5.040 5.020 4.377 6.512 5.91216 3.655 3.340 4.536 4.323 4.195 3.682 5.421 4.949
17 3.143 2.898 3.851 3.709 3.508 3.041 4.526 4.159
18 2.687 2.497 3.306 3.198 2.940 2.510 3.812 3.52819 2.291 2.140 2.875 2.775 2.467 2.081 3.244 3.02120 1.957 1,825 /2.515 2.428 2.074 1.734 2.794 2.61121 1.689 1 .548 2.183 2.145 1.745 1.450 2.437 2.277
22 1-490 1.927 1.914 1.470 1.217 2.157 2.00723 1.365 1.741 1.728 1.239 1.024 1.940 1.79124 1.318 1.602 1.581 1.047 0.864 1.775 1.624
25 1.358 1.501 1.468 0.887 0.729 1.656 1.501
26 1.432 1.387 0.755 0.617 1.579 1.421
27 11 1.394 1 1.334 0.646 1 0.523 1.539 1.38528 1.385 0.445 1.535 1.9
47
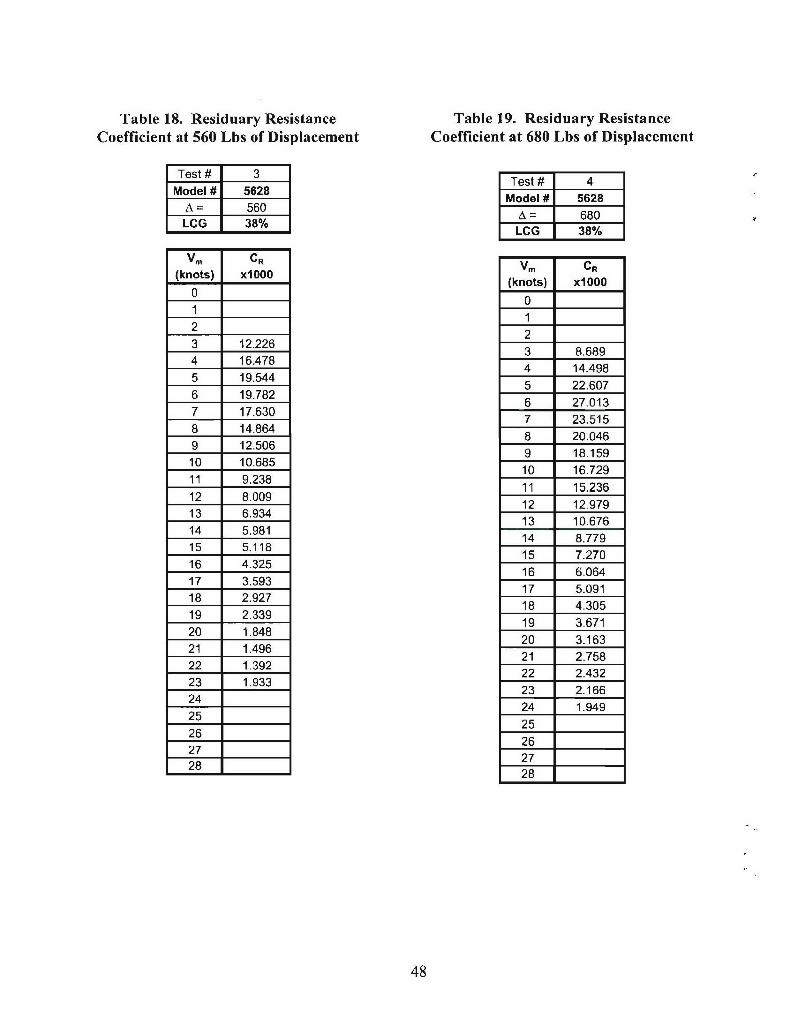
Table 18. Residuary Resistance Table 19. Residuary ResistanceCoefficient at 560 Lbs of Displacement Coefficient at 680 Lbs of Displacement
Test # _ 3 Test # 4Model # 5628 Model # 5628
A = 560 A = 680LCG 38% LCG 38%
Vm CR Vm CR
(knots) xl000 (knots) xl000
0 01 12 2
3 12.226 3 8.6894 16.478 4 14.4985 19.544 5 22.607
6 19.782 6 27.0137 17.630 7 23.515
8 14.864 8 20.0469 12.506 9 18.15910 10.685 10 16.729
11 9.238 11 15.23612 8.009 12 12.979
13 6.934 13 10.676
14 5.98114 8.779
15 5.118 15 7.270
16 4.325 16 6.06417 3.593 17 5.09118 2.927 18 4.30519 2.339 19 3.67120 1.848 20 3.163
21 1.496 21 2.75822 1.392 22 2.432
23 1.933 23 2.16624 24 1.94925 ____ 25 _____
26 26
27 27
28 2728
48

Table 20. Model-Scale Center of Gravity Heave at 298 Lbs of Displacement
Test # 8 5 22 25 10 13 16 19Model # 5628 5628 5629 5629 5630 5630 5631 5631
A J 298 298 298 298 298 298 298 298LCG 38% 42% 38% 42% 38% 42% 38% 42%
Vm CG Heave CG Heave CG Heave CG Heave CG Heave CG Heave CG Heave CG Heave(knots) In in in in in in in In
012
3 -0.152 -0.113 -0.326 -0.062 -0.164 -0.217 -0.189 -0.2844 -0.444 -0.475 -0.428 -0.382 -0.444 -0.502 -0.435 -0.356
5 -0.599 -0.647 -0.715 -0M642 -0.616 -0.647 -0.702 -0.746
6 -0.460 -0.553 -0.504 -0.530 -0.484 -0.579 -0.541 -0.5837 -0.054 -0.203 -0.102 -0.232 -0.073 -0.299 -0.131 -0.2748 0.410 0.193 0.322 0.101 0.195 0.110 0.180 0.0799 0.809 0.530 0.727 0.442 0.360 0.536 0.454 0.43710 1.182 0.888 1.102 0.779 0.732 0.874 0.785 0.78011 1.586 1.275 1.441 1.102 1.249 1.018 1.204 1.09912 1.991 1.654 1.746 1.406 1.736 1.192 1.667 1.39213 2.330 1.996 2.017 1.689 2.121 1.608 2.090 1.660
14 2.581 2.289 2.256 1.948 2.409 1.944 2.416 1.90315 2.759 2.533 2.467 2.185 2.623 2.188 2.640 2.12516 2.890 2.732 2.650 2.398 2.786 2.377 2.790 2.327
17 2.992 2.892 2.810 2.589 2.914 2.534 2.896 2.51218 3.079 3.021 2.947 2.759 3.020 2.668 2.980 2.68219 3.158 3.123 3.064 2.909 3.110 2.787 3.056 2.839
20 3.234 3.205 3.163 3.042 3.189 2.895 3.131 2.98421 3.310 3.271 3.246 3.158 3.262 2.995 3.209 3.118
22 3.389 3.323 3.314 3.259 3.331 3.089 3.294 3.24323 3.471 3.364 3.369 3.346 3.397 3.178 3.385 3.35924 3.558 3.411 3.422 3.461 3.265 3.485 3.467
25 3.650 3.443 3.488 3.524 3.349 3.592 3.569
26 3.664
2728
49

Table 21. Model-Scale Center of Gravity Heave at 375 Lbs of Displacement
Test# 9 6 23 26 11 14 17 20
Model # 5628 5628 5629 5629 5630 5630 5631 5631
A = 375 375 375 375 375 375 375 375LCG 38% 42% 38% 42% 38% 42% 38% 42%
Vm CGHeave CGHeave CGHeave CGHeave CGHeave CGHeave CGHeave CGHeave(knots) in in In in in in in in
01
23 -0.2269 -0.3269 -0,2681 -0.1931 -0.1408 -0.4034 -0.2356 -0.3513
4 -0.6080 -0.5233 -0.5357 -0.6445 -0.4828 -0.5556 -0.5644 -0.5895
5 -0.6718 -0.7009 -0.6954 -0.7775 -0.6887 -0.6831 -0.7074 -0.6978
6 -0.4849 -0.5253 -0.6005 -0.6390 -0.6075 -0.7161 -0.6035 -0.67307 -0.1220 -0.1691 -0.1985 -0.3125 -0.2119 -0.5381 -0.2508 -0.5079
8 0.3467 0.2865 0.3898 0.1268 0.2728 -0.0657 0.2853 -0.20839 0.8623 0.7819 0.9945 0.6137 0.6250 0.5444 0.9011 0.201310 1.3802 1.2720 1.5249 1.0965 0.9156 0.9240 1.4664 0.6803
11 1.8693 1.7268 1.9675 1.5416 1.3435 1.0516 1.6762 1.182912 2.3100 2.1308 2.3387 1.9325 1.9252 1.3850 1.9018 1.6689
13 2.6914 2.4786 2.6573 2.2657 2.5089 1.9815 2.5481 2.110714 3.0089 2.7719 2.9354 2.5454 2.9791 2.5068 2.9952 2.4940
15 3.2622 3.0159 3.1774 2.7792 3.3142 2.8506 3.3147 2.815416 3.4534 3.2171 3.3824 2.9756 3.5397 3.0611 3.5565 3.0784
17 3.5864 3.3821 3.5479 3.1422 3.6882 3.1967 3.7450 3.2896
18 3.6656 3.5170 3.6730 3.2859 3.7858 3.2949 3.8942 3.457219 3.6959 3.6272 3.7613 3.4122 3.8513 3.3775 4.0137 3.588620 3.6821 3.7171 3.8210 3.5257 3.8973 3.4565 4.1100 3.6909
21 3.7905 3.8632 3.6298 3.9329 3.5392 4.1881 3.769922 3.8504 3.9001 3.7273 3.9653 3.6301 4.2515 3.8302
23 3.8992 3.9427 3.8206 4.0011 3.7326 4.3027 3.8759
24 3.9998 3.9113 4.0487 3.8492 4.3434 3.909825 4.0786 4.0010 4.1219 3.9826 4.3742 3.934626 4.1847 4.0908 4.2515 4.1355 4.3939 3.9520
2728
50
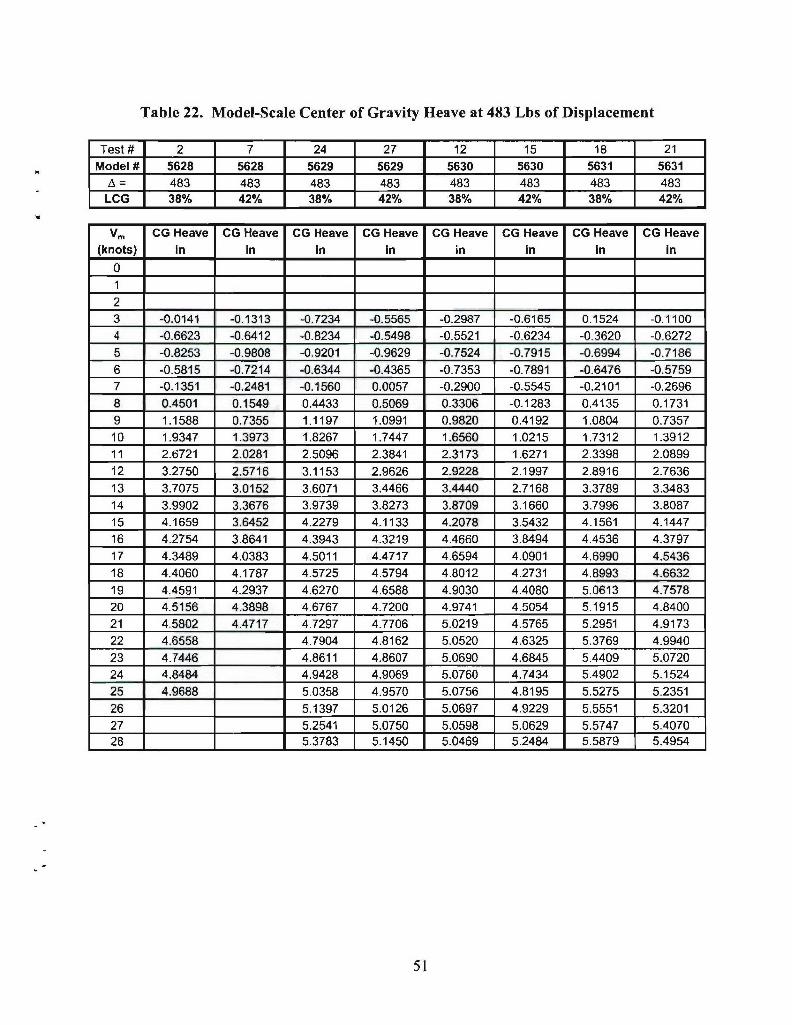
Table 22. Model-Scale Center of Gravity Heave at 483 Lbs of Displacement
Test # 2 7 24 27 12 15 18 21Model # 5628 5628 5629 5629 5630 5630 5631 5631
A = 483 483 483 483 483 483 483 483LCG 38% 42% 38% 42% 38% 42% 38% 42%
Vm CG Heave CG Heave CG Heave CG Heave CG Heave CG Heave CG Heave CG Heave(knots) in in in in in in In in
0123 -0.0141 -0.1313 -0.7234 -0.5565 -0.2987 -0.6165 0.1524 -0.11004 -0.6623 -0.6412 -0.8234 -0.5498 -0.5521 -0.6234 -0.3620 -0.62725 -0.8253 -0.9808 -0.9201 -0.9629 -0,752.4 -0.7915 -0.6994 -0.71866 -0.5815 -0.7214 -0-6344 -0.4365 -0.7353 -0.7891 -0.6476 -0.57597 -0.1351 -0.2481 -0.1560 0.0057 -0.2900 -0.5545 -0.2101 -0.26968 0.4501 0.1549 0.4433 0.5069 0.3306 -0.1283 0.4135 0.1731
9 1.1588 0.7355 1.1197 1.0991 0.9820 0.4192 1.0804 0.735710 1.9347 1.3973 1.8267 1.7447 1.6560 1.0215 1.7312 1.391211 2.6721 2.0281 2.5096 2.3841 2.3173 1.6271 2.3398 2.089912 3.2750 2.5716 3.1153 2.9626 2.922a 2.1997 2.8916 2.7636
13 3.7075 3.0152 3.6071 3.4466 3.4440 2.7168 3.3789 3.348314 3.9902 3.3676 3.9739 3.8273 3.8709 3.1660 3.7996 31808715 4.1659 3.6452 4.2279 4.1133 4.2078 3.5432 4.1561 4.1447
16 4.2754 3.8641 4.3943 4.3219 4.4660 3.8494 4.4536 4.379717 4.3489 4.0383 4.5011 4.4717 4.6594 4.0901 4.6990 4.5436
18 4.4060 4.1787 4.5725 4.5794 4.8012 4.2731 4.8993 4.663219 4.4591 4.2937 4.6270 4.6588 4.9030 4.4080 5.0613 4.757820 4.5156 4.3898 4.6767 4.7200 4.9741 4.5054 5.1915 4.8400
21 4.5802 4.4717 4.7297 4.7706 5.0219 4.5765 5.2951 4.917322 4.6558 4.7904 4.8162 5.0520 4.6325 5.3769 4.9940
23 4.7446 4.8611 4.8607 5.0690 4.6845 5.4409 5.072024 4.84B4 4.9428 4.9069 5.0760 4.7434 5.4902 5.1524
25 4.9688 5.0358 4.9570 5.0756 4.8195 5.5275 5.235126 5.1397 5.0126 5M097 4.9229 5.5551 5.320127 5.2541 5.0750 5.0598 5.0629 5.5747 5.407028 5.3783 5.1450 15.0469 5.2484 5.5879 5.4954
51

Table 23. Model-Scale Center of Gravity Table 24. Model-Scale Center of GravityHeave at 560 Lbs of Displacement Heave at 680 Lbs of Displacement
Test # j 3 Test # 4
Model # 5628 Model # 5628A = 560 A = 680LCG 38% LCG 38%
VMr CG Heave VM CG Heave(knots) in (knots) in
0 0
1 1
2 2
3 0.0481 3 -0.21144 -0.6728 4 -0.72975 -0.8129 5 -0.9862
6 -0.5965 6 -0.7827
7 -0.1555 7 -0.1301
8 0.5362 8 0.76029 1.4568 9 1.764910 2.4057 10 2.8746
11 3.1686 11 3.9367
12 3.6958 12 4.7381
13 4.0465 13 5.2412
14 4.2901 14 5.528715 4.4736 15 5.687316 4.6238 16 5.774617 4.7553 17 5.824318 4.8756 18 5.8558
19 4.9889 19 5.880320 5.0974 20 5.9052
21 5.2023 21 5.9359
22 5.3042 22 5.977023 5.4036 23 6.0337
24 24 6.1126
25 2526 26
27 2728 28
52

Table 25. Pitch Angle at 298 Lbs of Displacement
Test # 8 5 22 25 10 13 16 19Model # 5628 5628 5629 5629 5630 5630 5631 5631
A = 298 298 298 298 298 298 298 298LCG 38% 42% 38% 42% 38% 42% 38% 42%
Vm Trm Trim Trim Trim Trim Trim Trim Trim(knots) Deg Deg Deg Deg Deg Deg Deg Deg
0123 0.316 0.139 0.212 -0.189 0.207 0.208 0.115 0.2944 0.590 0.300 0.620 0.648 0.609 0.467 0.642 0.2345 2.012 1.594 1.901 1.412 1.785 1.355 1.703 1.5116 2.710 2.414 2.585 2.067 2.627 2.319 2.587 2.3137 3.036 2.772 2.756 2.503 2.856 2.674 2.793 2.535
8 3.351 3.059 2.950 2.799 2.950 2.707 2.862 2.7089 3.548 3.216 3.165 3.044 2.980 2.746 3.002 2.896
10 3.659 3.350 3.355 3.250 3.234 2.847 3.211 3.08311 13.762 3.490 3.492 3.411 3.584 3.032 13.447 3.25612 3.838 3.609 3.563 3.523 3.814 3.538 3.642 3.40613 3.829 3.689 3.563 3.587 3.863 3.964 3.726 3.53014 3.725 3.726 3.499 3.606 3.774 3.958 3.677 3.62715 3.559 3.725 3.381 3.585 3.606 3.860 3.532 3.69716 13,370 3.692 3.223 3.534 3.407 3.771 13.341 3.74217 3.183 3.637 3.041 3.461 3.205 3.696 3.146 3.76318 3.013 3.566 2.853 3.375 3.017 3.627 2.966 3.76019 2.868 3.487 2.672 3.284 2.847 3.558 2.809 3.73520 2.749 3.401 2.507 3.196 2.696 3.486 2.675 3.68721 12.656 3.314 2,365 3.116 2.562 3.408 2.558 3.61722 2.589 3.227 2.248 13.048 2.439 3.322 2.451 13.52623 2.547 3.141 2.155 2.994 2.324 3.226 2.347 3.41324 2.527 2.086 2.955 2.208 3.118 2.236 3.27825 2.529 2.035 2.929 2.085 2.997 2.103 3.12126 2.9392728 4
53

Table 26. Pitch Angle at 375 Lbs of Displacement
Test # 9 6 23 26 11 14 17 20Model # 5628 5628 5629 5629 5630 5630 5631 5631
A = 375 375 375 375 375 375 375 375LCG 38% 42% 38% 42% 38% 42% 38% 42%
V. Trim Trim Trim Trim Trim Trim Trim Trim(knots) Deg Deg Deg Deg Deg Deg Deg Deg
0
1
2
3 0.444 -0.087 0.230 0.096 0.007 0.082 0.064 0.3664 0.475 0.322 0.615 0.370 0.693 0.426 0.723 0.0265 2.559 1.705 2.066 1.512 1.958 1.479 1.996 1.8486 3.387 2.844 3.125 2.797 3.204 2.827 3.186 2.7427 3.529 3.150 3.290 3.132 3.465 3.064 3.450 2.870
8 3.954 3.504 3.564 3.144 3.476 3.058 3.368 2.9889 4.425 3.861 3.932 3,334 3.758 3.224 3.626 3.21410 4.741 4.142 4.234 3.662 4.152 3.516 4.190 3.518
11 4.811 4.322 4.409 4.013 4.513 3.854 4.444 3.84612 4.663 4.408 4.461 4.305 4.719 4.177 4.508 4.14513 4.400 4.421 4.412 4.498 4.709 4.444 4.727 4.38314 4.125 4.381 4.287 4.577 4.529 4.627 4.502 4.543
15 3.893 4.309 4.107 4.550 4.268 4.713 4.180 4.62116 3.715 4.216 3.889 4.438 3.989 4.699 3.912 4.623
17 3.578 4.113 3.644 4.270 3.725 4.596 3.715 4.56218 3.462 4.004 3.382 4.072 3.486 4.423 3.564 4.451
19 3.350 3.895 3.116 3.871 3.273 4.209 3.439 4.30420 3.230 3.785 2.858 3.682 3.083 3.981 3.323 4.13321 3.676 2.623 3.517 2.910 3.763 3.204 3.95022 3.565 2.422 3.380 2.751 3.572 3.073 3.765
23 3.447 2.268 3.273 2.599 3.417 2.922 3.584
24 2.165 3.196 2.449 3.299 2.744 3.415
25 2.121 3.146 2.296 3.215 2.527 3.26226 2.136 3.121 2.137 3.161 2.258 3.1262728
54
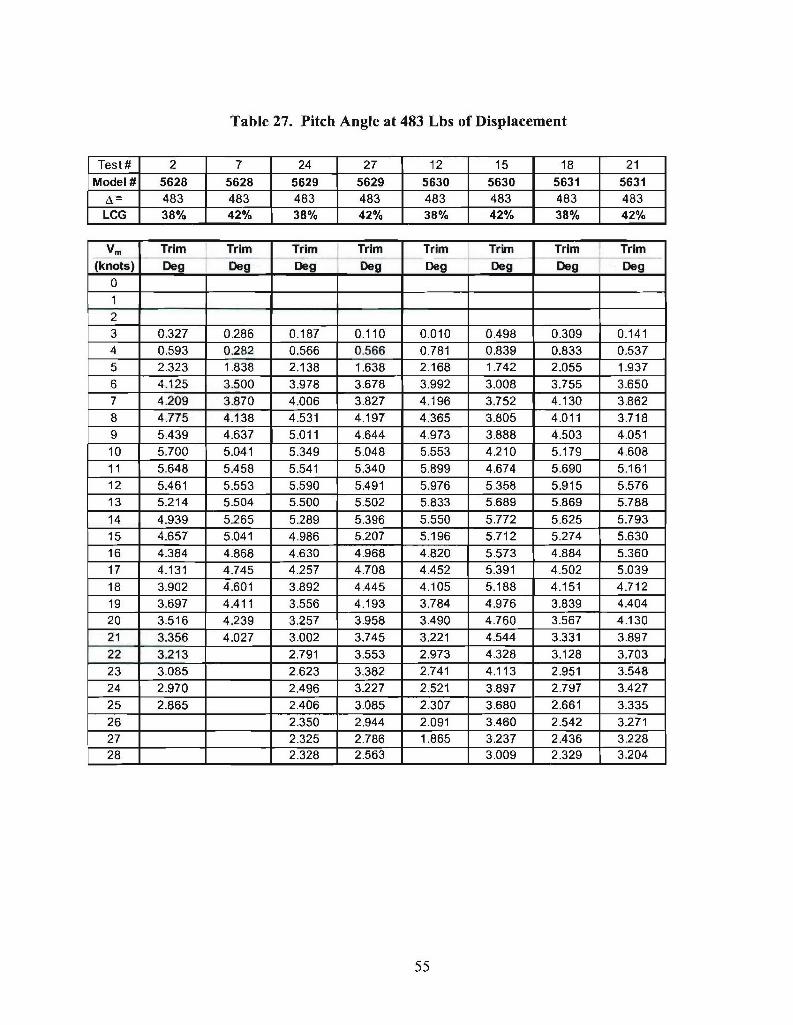
Table 27. Pitch Angle at 483 Lbs of Displacement
Test# 2 7 24 27 12 15 18 21Model # 5628 5628 5629 5629 5630 5630 5631 5631
A = 483 483 483 483 483 483 483 483LCG 38% 42% 38% 42% 38% 42% 38% 42%
Vm Trim Trim Trim Trim Trim Trim Trim Trim
(knots) DDg Dog Deg Deg Deg Dog Dog Doeg
0123 0.327 0.286 0.187 0.110 0.010 0.498 0.309 0.1414 0.593 0.282 0.566 0.566 0.781 0.839 0.833 0.5375 2.323 1.838 2.138 1.638 2.168 1.742 2.055 1.937
6 4.125 3.500 3.978 3.678 3.992 3.008 3.755 3.6507 4.209 3.870 4.006 3.827 4.196 3.752 4.130 3.8628 4.775 4.138 4.531 4.197 4.365 3.805 4.011 3.718
9 5.439 4.637 5.011 4.644 4.973 3.888 4.503 4.05110 5.700 5.041 5.349 5.048 5.553 4.210 5.179 4.60811 5.648 5.458 5.541 5.340 5.899 4.674 5.690 5.161
12 5.461 5.553 5.590 5.491 5.976 5.358 5.915 5.576
13 5.214 5-504 5.500 5.502 5.833 5.689 5.869 5.788
14 4.939 5.265 5.289 5.396 5.550 5.772 5.625 5.79315 4.657 5.041 4.986 5.207 5.196 5.712 5.274 5.63016 4.384 4.868 4.630 4.968 4.820 5.573 4.884 5.36017 4.131 4.745 4.257 4.708 4A452 5.391 4.502 5.03918 3.902 4.601 3.892 4.445 4.105 5.188 4.151 4.712
19 3.697 4.411 3.556 4.193 3.784 4.976 3.839 4.40420 3.516 4.239 3.257 3.958 3.490 4.760 3.567 4.13021 3.356 4.027 3.002 3.745 3.221 4.544 3.331 3.89722 3.213 2.791 3.553 2.973 4.328 3.128 3.70323 3-085 2.623 3,382 2.741 4.113 2.951 3.54824 2.970 2.496 3.227 2.521 3.897 2.797 3.42725 2.865 2.406 3.085 2.307 3.680 2.661 3.335
26 2.350 2.944 2.091 3.460 2.542 3.27127 2.325 2.786 1.865 3.237 2.436 3.22828 2.328 2.563 3.009 2.329 3.204
55

Table 28. Pitch Angle at 560 Lbs of Table 29. Pitch Angle at 680 Lbs ofDisplacement Displacement
Test # 3 Test # 4Model # 5628 Model # 5628
A_= 560 A_= 680LCG 38% LCG 38%
Vm Trim Vm Trim(knots) Deg (knots) Deg
0 0.000 01 0,000 12 0.000 2
3 0.195 3 -0.011
4 0.762 4 0.8335 2.464 5 2.586
6 4,643 6 5.0777 4.695 7 5.7748 5.624 8 6.702
9 6.279 9 7.39710 6&590 10 7.648
11 6.561 11 7.60512 6.278 12 7.29813 5.874 13 6.81014 5.445 14 6.262
15 5.043 15 5-73816 4.686 16 5.271
17 4.378 17 4.871
18 4.118 18 4.53219 3.898 19 4.24720 3.713 20 4.00821 3.558 21 3.80822 3.428 22 3.639
23 3.320 23 3.49624 24 3.37325 2526 2627 2728 28
56

REFERENCES
[1] Zseleczky, John, "Effective Horsepower Model Tests of the U.S. Coast Guard 47'Motor Lifeboat (MLB)", United States Naval Academy, Division of Engineeringand Weapons, Annapolis, 1988.
57

THIS PAGE IS INTENTIONALLY LEFT BLANK
58

DISTRIBUTION
Number Total
of Copies Office Individual Copies
5 United States Coast Guard
Engineering and Logistics Center 5
Code 046
DTIC 6
1 3442 (Library) 7
5010 (w/o enclosure)
4 5060 Walden 11
2 5200 5200 Office Files 13
3 5200 Metcalf, Day, Karafiath 16