Residents’ understanding of the role of green infrastructure for climate change adaptation in...
53
Residents’ understanding of the role of green infrastructure for climate change adaptation in Hangzhou, China Jason A. BYRNE 1 *, Alex Y LO 2 and YANG Jianjun 3 1.* Correspondence author : Dr. Jason BYRNE, Associate Professor, School of Environment and Urban Research Program, Room 3.06, Building G 31, Griffith University QLD 4222, AUSTRALIA. Ph. : +61+(07)+ 5552-7723 Fax: +61+(07)+ 5552-8244; email: [email protected] 2. Dr Alex LO, Assistant Professor, The Kadoorie Institute, The University of Hong Kong, Hong Kong, China. Email: [email protected] 3. Professor YANG Jianjun, Department of Regional and Urban Planning, Zhejiang University, Hangzhou, People’s Republic of China. Email: [email protected] *Complete Title Page
Transcript of Residents’ understanding of the role of green infrastructure for climate change adaptation in...
Residents’ understanding of the role of green infrastructure for climate change adaptation
in Hangzhou, China
Jason A. BYRNE1*, Alex Y LO
2 and YANG Jianjun
3
1.* Correspondence author: Dr. Jason BYRNE, Associate Professor, School of Environment
and Urban Research Program, Room 3.06, Building G 31, Griffith University QLD 4222,
AUSTRALIA. Ph. : +61+(07)+ 5552-7723 Fax: +61+(07)+ 5552-8244; email:
2. Dr Alex LO, Assistant Professor, The Kadoorie Institute, The University of Hong Kong,
Hong Kong, China. Email: [email protected]
3. Professor YANG Jianjun, Department of Regional and Urban Planning, Zhejiang
University, Hangzhou, People’s Republic of China. Email: [email protected]
*Complete Title Page

Research highlights
Urban green-space use impacts green infrastructure efficacy for climate response
Green-space users may support tree planting for climate adaptation
Tree planting support appears related to user’s age and perceived economic impacts
Intensity and frequency of recreational use may not predict urban greening support
*Highlights (for review)

1
1. Introduction 1
The concept of „green infrastructure‟ is rapidly gaining traction in urban planning and 2
environmental management, evidenced by a burgeoning literature on the topic, and by increasing 3
policy uptake. This is especially evident in the potential use of green infrastructure for climate 4
change adaptation. Land use planners, environmental managers and policy makers are 5
increasingly responding to the failure of the international community to reach consensus over 6
strategies for climate change mitigation by directing their efforts towards adaptation initiatives, 7
such as urban greening (Brown, 2011; Bulkeley, 2013; Mees & Driessen, 2011; Emmanuel and 8
Loconsole, 2015; Klemm et al., 2015). Much recent planning and urban design research has 9
investigated how best to adapt urban environments to expected climate change impacts, 10
including better understanding the barriers and enablers to adaptive responses (e.g. Castán Broto 11
& Bulkeley, 2012; Matthews et al., 2015). Using „green infrastructure‟ for climate adaptation 12
such as green walls, green roofs, urban trees and designed wetlands (Byrne & Yang, 2009; Gill 13
et al., 2007; Abreu-Harbich et al., 2015; Jim, 2015), is increasingly justified by the manifold 14
benefits that such interventions purportedly confer upon urban residents (Byrne & Yang, 2009; 15
Jim, 2011; Lo & Jim, 2012; Roy et al. 2012). While the idea is tantalizing, we presently lack 16
detailed research on the efficacy of green infrastructure for climate change adaptation, especially 17
its acceptability to urban residents and to users of urban green-spaces. 18
19
Green infrastructure is believed to possess considerable potential to adapt cities to some 20
emerging climate change impacts such as heat-island impacts, increased flooding, higher wind 21
speeds and more episodic rainfall, especially in higher-density cities where larger green-spaces 22
may be scarce (Brown et al., 2015; Demuzere et al., 2014). Essentially this ecological 23
*Manuscript (with references and tables)Click here to view linked References

2
modernization response deploys biotechnology and „soft‟ engineered biological spaces to 24
ameliorate some urban problems including heat, air pollution, and storm-water runoff (Byrne et 25
al., 2009; Howes et al., 2010). This paper reports the results of research investigating citizens‟ 26
dispositions towards the use of tree-planting in parks and public green-spaces as a potential 27
climate change adaptation response in Hangzhou, China. Hangzhou is a useful case study 28
because it is a rapidly growing, high-density city with limited green-space in the urban core. 29
Brown et al., (2015) note that many rapidly growing cities globally are in temperate and warm 30
climate regions where heat impacts will manifest strongly; insights from Hangzhou can inform 31
planning in those cities. 32
33
We ask the following three research questions: (1) Does the knowledge of Hangzhou 34
residents about climate change, their perception of climate risks, and their understanding of 35
potential adaptive responses, shape their disposition towards the use of green infrastructure (tree-36
planting) as a climate adaptation intervention?; (2) Do residents‟ patterns of green-space use 37
affect their level of acceptance of increasing vegetation density to combat climate change 38
impacts?; (3) Do the socio-demographic characteristics of green-space users play a role in their 39
knowledge about climate change and their attitudes towards using green infrastructure as a 40
climate change adaptive response? The answers to these questions are import because they can 41
inform planners‟ understanding of how best to communicate the climate adaptive benefits of 42
urban trees (as a form of green infrastructure) to the general public. Answers can shed light on an 43
understudied aspect of green infrastructure, and thus address an important knowledge gap. 44
45
2. Background 46
3
Green infrastructure is a term that has been broadly defined in the literature to refer to: “either 47
investment in green-space or as infrastructure with a sustainable objective” (Mell, 2012: 2). 48
While some authors have tended to conflate green infrastructure with green-space generally (e.g. 49
Vandermeulen et al., 2011), the two terms refer to different ideas and should not be used 50
interchangeably. Nor should green infrastructure be thought of as regular infrastructure (e.g. light 51
rail) with „green‟ benefits. It is useful to briefly review the definition of green infrastructure here, 52
for the purpose of conceptual clarity. 53
54
2.1. Definition of key terms 55
This paper discusses climate change adaptation and in some places climate change mitigation. 56
Mitigation refers to actions to slow, reduce or reverse anthropogenic impacts on the atmosphere, 57
such as reducing carbon dioxide and methane emissions from power stations, switching to 58
alternative energy or energy efficient appliances, promoting public transport use, or planting very 59
large forests to act as carbon sinks (Castán Broto and Bulkeley, 2012). We are not talking about 60
mitigation in this paper, nor do we argue for macro-climatic mitigation functions of urban trees 61
and green infrastructure. We also use the term adaptation. Adaptation refers to actions taken to 62
adjust human settlements (and behaviors) to the anticipated impacts of climate change. If climate 63
change is expected to increase temperatures, raise sea levels or cause flooding of low-lying land 64
during extreme storm events, then adaptive responses include actions such as using insulation in 65
buildings (or green roofs), relocating populations away from floodplains, increasing the height of 66
river levees, or raising the height of buildings above projected flood levels, and using sea walls 67
to reduce coastal erosion (Byrne et al., 2009). 68
69

4
What we are referring to when we talk about green infrastructure are highly modified or 70
engineered „intentional landscapes‟, not those which are characterized by vegetated natural 71
remnants or left-over spaces occupied by spontaneous vegetation. Roe and Mell (2013) stress 72
that what sets green infrastructure apart from regular green-space is an emphasis on human 73
modification and recognition of the ecosystem services (e.g. water purification, heat reduction) 74
provided by these intentionally designed spaces (see also Lovell & Taylor, 2013). The key idea 75
behind green infrastructure is that it is purposeful, intentional, designed, and deployed primarily 76
for widespread public use and benefit (Beer, 2010), and in this way, it functions like other forms 77
of infrastructure (e.g. highways, power transmission lines, telecommunication cables or airports). 78
To paraphrase Mell et al. (2013: 297) it might best be thought of as: “the biological resources in 79
urban areas that are human modified and primarily serve an overt [socio]ecological function”. 80
81
Green-infrastructure is thus comprised of: “parks, public green-space, allotments, green 82
corridors, street trees, urban forests, roof and vertical greening” among other interventions 83
(Cameron et al., 2012: 129). While the term green infrastructure excludes naturally occurring 84
green-spaces such as forest remnants, it encompasses other green and blue spaces such as 85
community gardens, constructed wetlands, green roofs, green walls and greened alleyways, 86
because these spaces are human-modified landscapes, which have been specifically designed and 87
used for social and economic benefits. Green infrastructure is not standard infrastructure that is 88
given a green wash or green spin for its purported sustainability benefits (e.g. wind-farms, co-89
generation plants, or genetically modified agriculture), but it can refer to the application of 90
biotechnology to existing infrastructure, such as ecologically restored storm-water infrastructure 91
(Hostetler et al., 2011). 92

5
93
Green infrastructure will typically be publicly or communally owned. Moreover, it 94
usually takes the form of a network of spaces, such as parks or greenways, rather than solitary 95
and/or fully private spaces, such as backyard gardens (Mell et al., 2013). Green infrastructure 96
may include corporately or communally-owned spaces such as power transmission corridors, 97
easements, alleyways and even parking lots, but only if these have been actively (re)designed to 98
include extensive vegetation and are intended to meet multi-purpose objectives such as 99
recreation, habitat provision, storm-water attenuation and/or carbon sequestration (Gaffin, et al., 100
2012; Lovell and Taylor, 2013; Newell et al., 2013). 101
102
We recognize that this conception of green infrastructure challenges some established 103
definitions, which include what might be called „natural‟ areas. Our intent is not to perpetuate a 104
schism about human-nature duality, we recognize that cities are social and ecological entities 105
(Byrne, 2011), and we see green infrastructure as a socio-natural assemblage. Two reasons 106
inform our alternative perspective. First, we wish to address the ambiguous and sometimes 107
misleading claims made by some commentators about the extent of ecosystem service benefits 108
derived from green infrastructure, based on the inclusion of large forest tracts, broad open spaces 109
and remnant vegetation in their definitions. Second, and more importantly, there is a very real 110
risk that characterizing all urban greenery as „green infrastructure‟ will undermine the 111
conservation and environmental protection value of lesser disturbed remnant sites, large tracts of 112
open space, or sites less exposed to anthropogenic impacts, such as urban protected areas. They 113
will become devalued because they can be subsumed into a philosophy that the biosphere is 114

6
available for human appropriation. Such protected areas and reserves can then easily be coopted 115
as just another type of „infrastructure‟ for human use. This is not an outcome we endorse. 116
117
We also note that there is little variation in Chinese and Western conceptions of green 118
infrastructure, possibly because the Chinese literature on green infrastructure has yet to develop. 119
Much of the existing discussion in Chinese journals simply follows international trends, and 120
Chinese scholars are yet to generate and apply a „domestic‟ definition. Chinese studies are 121
currently limited to trying to introduce, explain and test existing definitions from the 122
international literature, and Chinese scholars are yet to evolve locally specific conceptualizations 123
(Zhang, 2004; Zhang 2009). 124
125
2.2. Why use green infrastructure for climate adaptation? 126
The idea of using green infrastructure for climate change adaptation is relatively recent (Byrne & 127
Yang, 2009; Gill et al., 2007). Planners often regard green infrastructure favorably because it can 128
be seen as a useful tool in a „no regrets‟ approach to climate adaptation (Heltberg et al., 2009; 129
Mees & Driessen, 2011; Roe & Mell, 2013). Employing green infrastructure can foster a wide 130
range of ecological, social and economic benefits (e.g. improving mental health, increasing 131
physical activity or reducing energy consumption), irrespective of how fast and to what extent 132
climate change impacts manifest in different urban environments (Austin, 2014; Demezure et al., 133
2014; Wright, 2011). 134
135
7
Green infrastructure may be attractive to planners because it can be less politically 136
contentious than other climate change adaptive responses, and may have broader public appeal 137
(Matthews et al., 2015). Fewer people would likely contest a city-wide street tree program 138
compared to relocating populations away from floodplains, increasing the height of levees, 139
compulsory retrofitting of buildings with insulation or double-glazing, or increased rates or 140
morbidity and mortality from heat-stress (Vollmer at al., 2015). Moreover, improved aesthetics, 141
increased property values, modulated ambient temperatures and reduced storm-water runoff 142
associated with citywide greening have been found to engender widespread citizen support 143
(Jones et al., 2013). However, we acknowledge that tree-planting can be contentious in some 144
cities where proponents may encounter property developer or citizen resistance (Kirkpatrick et 145
al., 2012, 2013; Young and McPherson, 2013), and the ecosystem disservices of some tree 146
species may be harmful to health and property, potentially limiting public support (Roy et al., 147
2012). 148
149
Urban trees are the form of green infrastructure that has received considerable attention 150
as a potential climate change adaptation strategy – via planting out existing green-spaces, adding 151
new street trees, retrofitting „grey-spaces‟, and boosting the overall area of urban forests. 152
Researchers have been attracted to quantifying the benefits of urban trees that are directly related 153
to climate change adaptation. These include: cooling heat islands, reducing electricity 154
consumption, lowering storm-water runoff and lowering mortality and morbidity associated with 155
heat waves (Bowler et al., 2010; Roy et al., 2012). 156
157

8
Studies have found that built environments could be retrofitted through urban greening to 158
potentially increase tree cover by up to 5% and thus reduce diurnal temperatures by as much as 159
2.3°C (Hall et al., 2012; see also Hamada & Ohta, 2010). Modeling has demonstrated that 160
densely greening parking lots could reduce ambient temperatures by up to 7°C at the site (Onishi 161
et al., 2010) and that green walls and roofs may cool some urban areas by up to 8°C (Alexandri 162
& Jones, 2008). Studies have also reported that green areas as small as 0.24 ha may reduce 163
temperatures by as much as 6.9°C (Oliveira et al., 2011). Moreover, such green infrastructure 164
strategies may be economically and socially viable, even in developing countries (Kitha & Lyth, 165
2011), and across a wide range of climatic zones (Alexandri & Jones, 2008; Brown et al., 2015). 166
These findings have important implications for climate change adaptation. As Akbari et al. 167
(2001: 295) have noted: “electricity demand in cities increases by 2-4% for each 1°C increase in 168
temperature”; urban greening therefore has the potential to save more than $10 billion annually 169
in energy use. 170
171
And the benefits of green infrastructure are not limited to economic gains. Several recent 172
studies have also reported that well-vegetated green-spaces can provide a refuge during times of 173
intense heat, contributing to citizen health and wellbeing, and potentially to reducing morbidity 174
and mortality (Brown et al., 2015; Kravchenko et al., 2013; Xu et al., 2013). Because increases 175
in mortality of up to 3% are associated with every 1°C increase in temperature, successfully 176
retrofitting green infrastructure to lower urban temperatures will be critically important to 177
address the heat impacts associated with climate variability in those cities that will experience 178
rising temperatures due to climate change (Brown et al., 2015; Kravchenko et al., 2013). 179
180

9
Unfortunately the socio-cultural dimensions of green infrastructure planning have tended 181
to receive much less attention than biophysical considerations (Byrne & Yang, 2009; Young & 182
McPherson, 2013). We know considerably less about citizen attitudes towards urban greening for 183
climate change adaptation, and about their potential concerns with ecosystem disservices 184
associated with afforestation. A key question for us is whether green-space users would be 185
prepared to accept an increase in vegetation density (potentially reducing areas available for 186
active recreation) as a trade-off for cooler built environments and other climate-adaptive benefits 187
of urban trees. European researchers suggest they might (Bjerke et al., 2006) and assert that even 188
small green-spaces may foster stress relief and mental restoration (Nordh et al., 2009). But we 189
know comparatively little about Asian cities – where residential densities are very high, heat 190
island impacts are magnified, larger areas of green-space are scarce, and populations are 191
burgeoning. 192
193
We believe that important questions include: how do urban residents feel about using 194
green infrastructure for climate change adaptation? Are they willing to accept more tree-planting 195
in parks and open spaces to help adapt to climate change impacts? Do they understand the 196
benefits that urban trees confer upon built environments? Do they have concerns about the costs 197
(ecosystem disservices) of urban trees? And does this shape residents‟ beliefs about the efficacy 198
of urban trees as a climate adaptive response for built environments? The answers to these 199
questions are not clearly identifiable in the green infrastructure literature, as research on this 200
topic is nascent (e.g. Mell et al., 2013). We now turn our attention to probing these issues. 201
202
3. Methods 203
10
The specific hypothesis underpinning our research is: „how Hangzhou residents perceive the 204
contributions of urban trees for climate change adaptation will be related to: (i) how they 205
understand climate change (which is broadly defined in terms of awareness, concern, expectation 206
of impacts), and their perceived self-efficacy in managing impacts; (ii) their perceptions of tree 207
services and disservices, (iii), their patterns of green-space use; and (iv) their socio-demographic 208
characteristics‟. 209
3.1. Case study: Hangzhou, China 210
Hangzhou is one of China‟s oldest inhabited settlements (Altenburger & Chu, 2010) (see figure 211
1). It is also one of China‟s faster growing cities, with annual population growth rates of around 212
100,000 per annum. Residential densities in the core districts of this metropolis of about 6 213
million people range between 16,000 and 19,000 persons per km2
(Spiekermann et al., 2013). 214
Rapid urbanization is profoundly impacting the city‟s environmental quality (Spiekermann et al., 215
2013). Unfettered property development has devoured much of the city‟s outlying agricultural 216
land, and the city is often blanketed in air pollution (Wu et al., 2012). The city‟s annual average 217
temperatures are now the second-hottest in China, reflecting a loss in urban green-space (Shen et 218
al., 2013). But Hangzhou has begun to embrace a range of innovative efforts to restore lost 219
green-space (Dao, 2011; Wu et al., 2012). Such efforts are earning this city a national reputation 220
for green leadership (Delman, 2014). 221
222
<INSERT FIGURE 1 AROUND HERE> 223
224
3.1.1. Green-space in Hangzhou 225

11
According to the City Government‟s website, Hangzhou has 166.5 km2 of green -space (about 226
40% of the city area). Moreover, almost two thirds of the municipal area is devoted to green and 227
open space. In 2012, the amount of urban green-space increased by 14.4 million m2; the 2013, 228
the target was for an additional 13 million m2 of green-space. The official ratio of green-space is 229
about 15m2 per capita, and some commentators suggest that over 90% of the city‟s population 230
has easy access to some form of green-space (Sang et al,, 2013). The city has also embarked 231
upon large-scale urban reforestation. 232
233
However, official statistics mask the paradoxical nature of green-space in Hangzhou. 234
Although much of the city‟s official green-space actually lies within the municipal boundary, it 235
is not within the urban area. This is because large areas of undeveloped land are included in the 236
city‟s administrative jurisdiction, though they are mostly rural in character. Further, many of 237
Hangzhou‟s urban green-spaces are actually quite small and contain few facilities, especially 238
those in the urban core (Wolch et al., 2014). Although they are aesthetically pleasing, many are 239
ill-suited to active recreation. Indeed, most parks in Hangzhou are what Western scholars would 240
call elaborately landscaped „pleasure gardens‟ (Cheng et al., 2009), intended mainly for passive 241
recreation (e.g. promenading, sitting, relaxing, fishing, kite flying, dancing, practicing 242
calligraphy, and people-watching (Cheng et al., 2006). Many of these spaces also have extensive 243
paved surfaces to accommodate high volumes of use (see figure 3), making them hot in the 244
summer months, and less able to infiltrate storm-water. Those green-spaces that are conducive to 245
active recreation are highly valued. 246
247
<INSERT FIGURE 2 AROUND HERE> 248
12
249
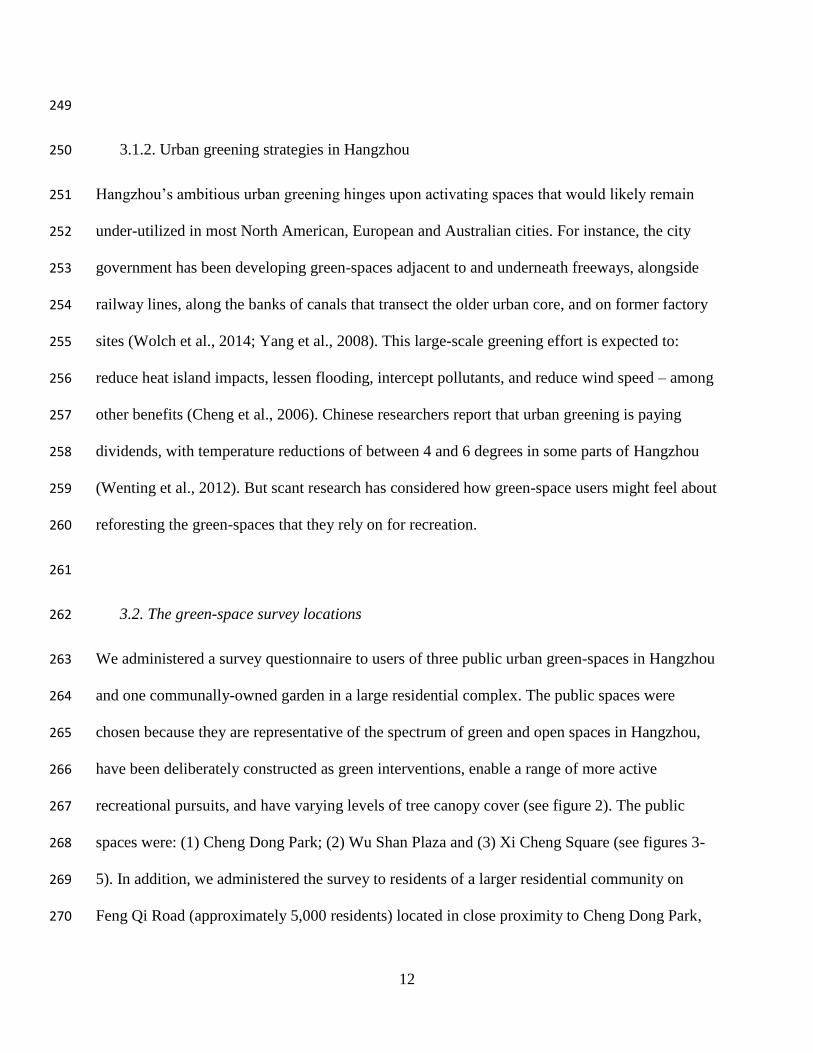
3.1.2. Urban greening strategies in Hangzhou 250
Hangzhou‟s ambitious urban greening hinges upon activating spaces that would likely remain 251
under-utilized in most North American, European and Australian cities. For instance, the city 252
government has been developing green-spaces adjacent to and underneath freeways, alongside 253
railway lines, along the banks of canals that transect the older urban core, and on former factory 254
sites (Wolch et al., 2014; Yang et al., 2008). This large-scale greening effort is expected to: 255
reduce heat island impacts, lessen flooding, intercept pollutants, and reduce wind speed – among 256
other benefits (Cheng et al., 2006). Chinese researchers report that urban greening is paying 257
dividends, with temperature reductions of between 4 and 6 degrees in some parts of Hangzhou 258
(Wenting et al., 2012). But scant research has considered how green-space users might feel about 259
reforesting the green-spaces that they rely on for recreation. 260
261
3.2. The green-space survey locations 262
We administered a survey questionnaire to users of three public urban green-spaces in Hangzhou 263
and one communally-owned garden in a large residential complex. The public spaces were 264
chosen because they are representative of the spectrum of green and open spaces in Hangzhou, 265
have been deliberately constructed as green interventions, enable a range of more active 266
recreational pursuits, and have varying levels of tree canopy cover (see figure 2). The public 267
spaces were: (1) Cheng Dong Park; (2) Wu Shan Plaza and (3) Xi Cheng Square (see figures 3-268
5). In addition, we administered the survey to residents of a larger residential community on 269
Feng Qi Road (approximately 5,000 residents) located in close proximity to Cheng Dong Park, 270
13
and within the city‟s urban core. This community has access to its own internal communally-271
owned, park-like garden, which is increasingly common in newer residential developments. The 272
communal green-space is about 0.66 ha in area. Residents use the garden for daily walks, 273
supervising small children at play, for informal exercise (Tai Chi and dancing) and for walking 274
their dogs. They tend to use nearby Cheng Dong Park for more active recreation, for family 275
gatherings, as well as for finding a space for quiet reflection and mental restoration. 276
277
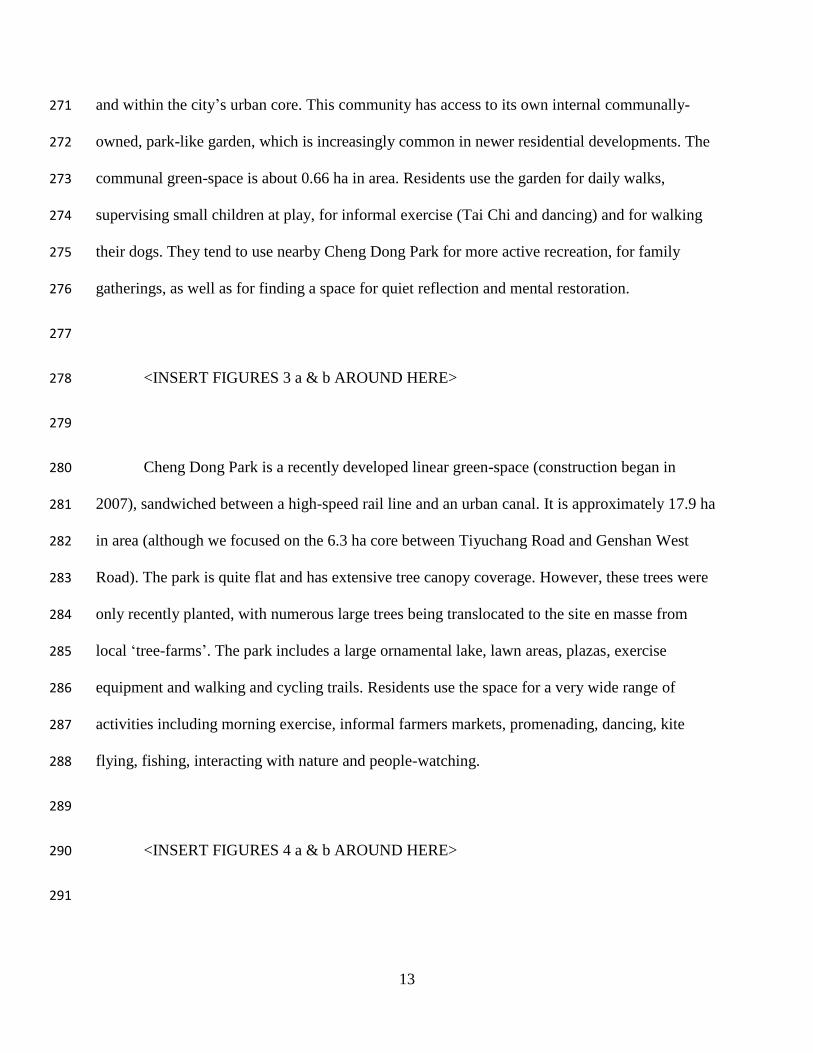
<INSERT FIGURES 3 a & b AROUND HERE> 278
279
Cheng Dong Park is a recently developed linear green-space (construction began in 280
2007), sandwiched between a high-speed rail line and an urban canal. It is approximately 17.9 ha 281
in area (although we focused on the 6.3 ha core between Tiyuchang Road and Genshan West 282
Road). The park is quite flat and has extensive tree canopy coverage. However, these trees were 283
only recently planted, with numerous large trees being translocated to the site en masse from 284
local „tree-farms‟. The park includes a large ornamental lake, lawn areas, plazas, exercise 285
equipment and walking and cycling trails. Residents use the space for a very wide range of 286
activities including morning exercise, informal farmers markets, promenading, dancing, kite 287
flying, fishing, interacting with nature and people-watching. 288
289
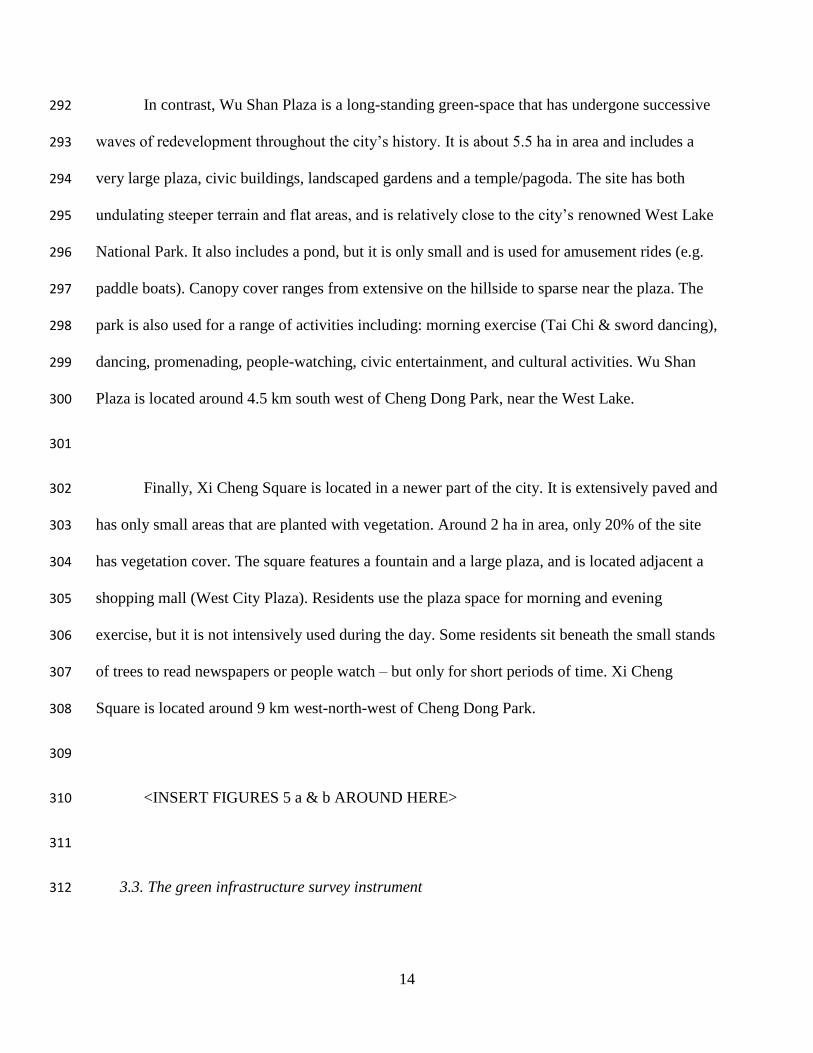
<INSERT FIGURES 4 a & b AROUND HERE> 290
291
14
In contrast, Wu Shan Plaza is a long-standing green-space that has undergone successive 292
waves of redevelopment throughout the city‟s history. It is about 5.5 ha in area and includes a 293
very large plaza, civic buildings, landscaped gardens and a temple/pagoda. The site has both 294
undulating steeper terrain and flat areas, and is relatively close to the city‟s renowned West Lake 295
National Park. It also includes a pond, but it is only small and is used for amusement rides (e.g. 296
paddle boats). Canopy cover ranges from extensive on the hillside to sparse near the plaza. The 297
park is also used for a range of activities including: morning exercise (Tai Chi & sword dancing), 298
dancing, promenading, people-watching, civic entertainment, and cultural activities. Wu Shan 299
Plaza is located around 4.5 km south west of Cheng Dong Park, near the West Lake. 300
301
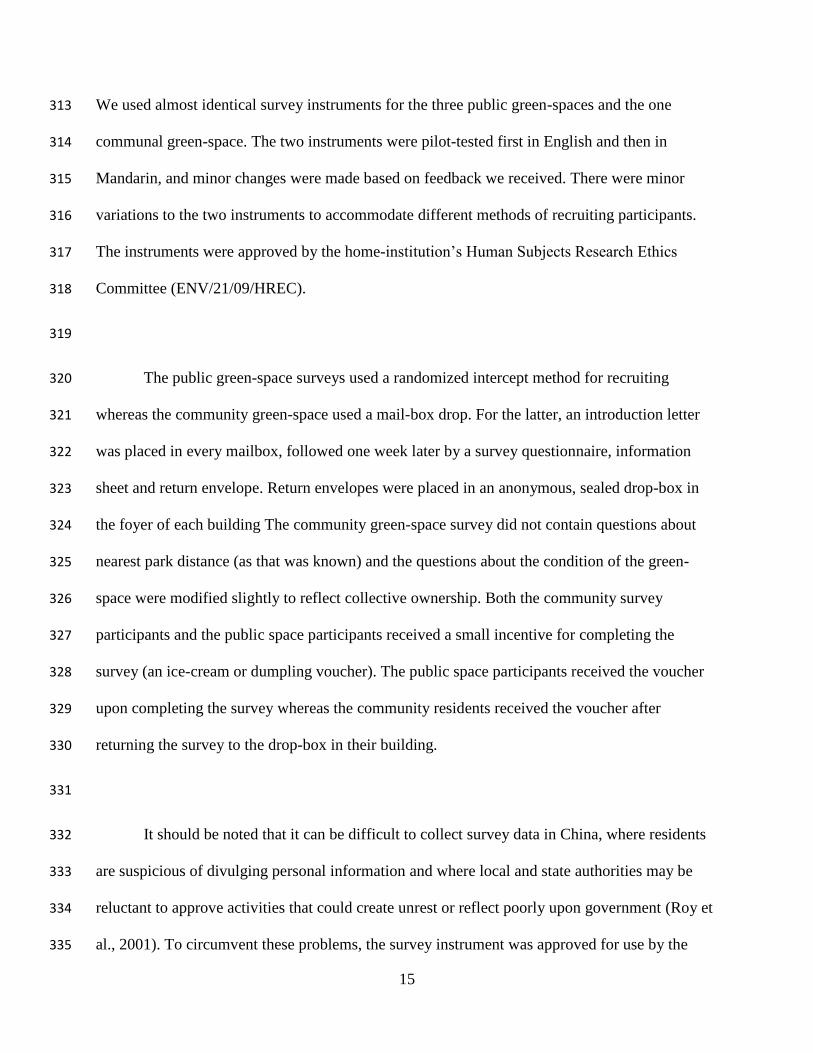
Finally, Xi Cheng Square is located in a newer part of the city. It is extensively paved and 302
has only small areas that are planted with vegetation. Around 2 ha in area, only 20% of the site 303
has vegetation cover. The square features a fountain and a large plaza, and is located adjacent a 304
shopping mall (West City Plaza). Residents use the plaza space for morning and evening 305
exercise, but it is not intensively used during the day. Some residents sit beneath the small stands 306
of trees to read newspapers or people watch – but only for short periods of time. Xi Cheng 307
Square is located around 9 km west-north-west of Cheng Dong Park. 308
309
<INSERT FIGURES 5 a & b AROUND HERE> 310
311
3.3. The green infrastructure survey instrument 312
15
We used almost identical survey instruments for the three public green-spaces and the one 313
communal green-space. The two instruments were pilot-tested first in English and then in 314
Mandarin, and minor changes were made based on feedback we received. There were minor 315
variations to the two instruments to accommodate different methods of recruiting participants. 316
The instruments were approved by the home-institution‟s Human Subjects Research Ethics 317
Committee (ENV/21/09/HREC). 318
319
The public green-space surveys used a randomized intercept method for recruiting 320
whereas the community green-space used a mail-box drop. For the latter, an introduction letter 321
was placed in every mailbox, followed one week later by a survey questionnaire, information 322
sheet and return envelope. Return envelopes were placed in an anonymous, sealed drop-box in 323
the foyer of each building The community green-space survey did not contain questions about 324
nearest park distance (as that was known) and the questions about the condition of the green-325
space were modified slightly to reflect collective ownership. Both the community survey 326
participants and the public space participants received a small incentive for completing the 327
survey (an ice-cream or dumpling voucher). The public space participants received the voucher 328
upon completing the survey whereas the community residents received the voucher after 329
returning the survey to the drop-box in their building. 330
331
It should be noted that it can be difficult to collect survey data in China, where residents 332
are suspicious of divulging personal information and where local and state authorities may be 333
reluctant to approve activities that could create unrest or reflect poorly upon government (Roy et 334
al., 2001). To circumvent these problems, the survey instrument was approved for use by the 335
16
residential management committee of the apartment complex and permission was sought from 336
city authorities in the parks and urban planning departments. Survey administrators were 337
subsequently provided with an official letter of permission from the Chinese research partner, 338
authorizing the collection of survey data in public spaces. 339
340
The survey instrument consisted of 52 questions, which were divided into six different 341
sections. The first section asked respondents about their knowledge of climate change and 342
whether they knew of any climate-change related impacts that would affect Hangzhou. The 343
second section asked respondents if they thought that measures could be taken to adapt to the 344
identified impacts; it specifically focused on the acceptability (or otherwise) of tree-planting as 345
an adaptive strategy. This section asked respondents about perceived tree benefits (ecosystem 346
services) and tree costs (ecosystem disservices). The tree benefits included response options such 347
as cooling temperatures, improved esthetics and reducing flooding whereas the tree costs 348
included options such as damaging sidewalks, reducing sunlight, attracting pests, and increasing 349
crime. The third section asked respondents about how they used the green-space (activities, 350
duration, travel patterns etc.). The fourth section asked respondents about their level of 351
agreement with a series of Likert scale questions, modeled on Dunlap‟s (2008) NEP, designed to 352
elicit respondents‟ environmental values. The fifth section assessed respondents‟ attitudes 353
towards other park users, barriers to access and experiences of conflict in the green-space. The 354
final section of the survey collected socio-demographic information about the users (age, sex, 355
income, home-ownership, education and household composition). Copies of the instrument are 356
available upon request. 357
358

17
The survey questions were specifically designed to test some of the assertions of Byrne 359
and Yang (2009), who suggested that a range of potential factors, which are linked to residents‟ 360
perceptions and patterns of recreation, are likely to impact the utility of green-space (and by 361
implication green infrastructure), as a climate change adaptive response. Specifically, they 362
asserted that these are likely to include: concerns about vegetation density and personal safety; 363
the potential loss of space available for active recreation (and perhaps increased user conflict); 364
increased potential of human-wildlife conflict; increased likelihood of hard infrastructure 365
damage (e.g. trees uplifting sidewalks); and potential loss of sunlight. Measures on the 366
questionnaires specifically assessed these issues. 367
368
Surveying occurred during the course of two weeks during late summer and early autumn, 369
as prior research has demonstrated that this is when most people visit and use parks in Hangzhou 370
(Chen at al, 2009; Zhang et al., 2013). A team of trained student volunteers from Zhejiang 371
University randomly intercepted park users between 6 am and 9 pm during weekdays and 372
weekends. They were instructed to collect surveys from people 15 years of age and older and to 373
randomize their intercepts to remove potential bias by approaching every 5th
person, irrespective 374
of sex, activity-type, appearance etc. The survey took respondents approximately 15 minutes to 375
complete and was accompanied by a detailed information sheet. Informed consent was provided 376
by completing and returning the questionnaires, in accordance with the home institution‟s ethics 377
approval. A total of 152 surveys were completed among the three parks and a further 137 378
surveys for the communal garden in the apartment complex, resulting in a total sample size of 379
289 green-space users (hereafter termed respondents). The survey was administered in Mandarin. 380
It managed to achieve an overall response rate of 23% due to inherent difficulties in recruiting 381

18
survey participants in China. For example, public opinion surveys are still comparatively new for 382
residents, and potential respondents have concerns about divulging personal information (Roy et 383
al., 2001). As such, we do not claim demographic representativeness of the sample, but focus on 384
ascertaining the relationships between selected attitudinal and socioeconomic variables. 385
386
4. Analysis 387
Green infrastructure users‟ responses to selected survey questions helped create a series of 388
variables to be used in the subsequent regression analysis, described below. 389
4.1. Dependent variable 390
Specifying the dependent variable involved combining five survey items concerning residents‟ 391
perception of the benefits of urban trees for adapting cities to climate change. Each of these 392
items described a specific function of urban trees and requested the respondent to indicate 393
whether or not they considered it as an important benefit of planting trees. These functions are 394
either directly or indirectly related to climate change. For instance, urban trees can lessen the 395
impacts of adverse weather events, such as high urban temperatures, heavy rains, and strong 396
winds (in China this is sometimes accompanied by dust storms). In addition, collectively 397
managed urban green-spaces, in the form of communal gardens, can provide an alternative 398
source of food and enhance food security in the event that weather extremes impact food supply. 399
The five survey items captured these functions, namely, reducing air temperature, reducing 400
floodwater runoff, providing food, etc. They were combined to create a composite variable to 401
represent the perceived benefits of urban trees. 402
403
19
4.2. Independent variables 404
The independent variables comprised a battery of survey items that solicited climate change 405
belief. These included two binary questions concerning whether or not the respondent had heard 406
of climate change and worried about it, which denote Awareness and Concern respectively and 407
are entered as individual items in the analysis. Several follow-up questions then probed 408
respondents‟ expectation as to what kind of climate change impacts would affect the city they 409
were living in (i.e. Hangzhou). These questions were grouped into two composite variables, i.e. 410
Weather Changes and Economic Disruptions. The former included five items that described 411
expected impacts of climate change on weather, such as temperature rises, flooding, storms, etc. 412
The latter had six items describing adverse economic consequences, such as increasing the 413
demand for food and electricity, slowing down economic growth, and damaging infrastructure. 414
The two composite variables indicate two different ways in which climate change impacts can be 415
understood, i.e. as an environmental stressor or an economic threat, which are logically related 416
but have different cognitive implications. 417
418
Respondents were also requested to express their Confidence in the capacity of human 419
beings to manage climate change impacts. A binary question gauged their view as to whether or 420
not human action can stop climate change from impacting cities. Respondents were then 421
presented a list of energy-related household practices and invited to nominate which ones could 422
help effectively lessen climate change impacts on the city of Hangzhou. Available options 423
described different ways of managing emissions (e.g. driving less often, installing solar hot water 424
heater, using less electricity, using alternative energy, using fans instead of air-conditioners, etc.). 425
20
There were seven items, and they formed a composite variable representing Effective Mitigation 426
Actions, indicating the sense of efficacy in responding to climate change. 427
428
Five questions at the end of the questionnaire gauged the socio-economic information of 429
respondents, including age (continuous scale), sex, education (university holder or not), tenure 430
(owned the house/unit currently living in or renting), and children (have children under 18 living 431
at home). Home ownership is used as a proxy for household wealth since a high proportion 432
(20%) of respondents refused to provide information on household incomes. These items were 433
used as independent variables in the regression analysis to ascertain socio-economic effects on 434
the perception of urban trees. 435
436
Bivariate correlation and linear regression analyses were conducted using a standard 437
statistical package (SPSS) to address the proposed hypothesis. We used climate change belief 438
and socio-economic variables as independent variables to predict the perceived contributions of 439
urban trees in reducing climate change impacts (the dependent variable). We identified their 440
relationships in terms of statistical significance. Results are presented in the next section. 441
442
It is appropriate here to acknowledge a limitation of our analysis. In question 8 (Q8) of 443
the survey the instrument, respondents were explicitly informed of tree disservices and were 444
asked to respond to questions about these disservices. Few respondents reported problems with 445
trees. We ran the regression with tree costs (ecosystem disservices) items (i.e. Q8), but we had a 446
very low R square (2%), meaning our model had limited utility. This is due to limited variations 447

21
among respondents to that question. Most respondents identified few 'yes/agree' responses to 448
potential disservices (<5%). The majority of responses were thus identical ( i.e. '0'). With limited 449
variation, we were unable to obtain meaningful regression results. This is not an error; it simply 450
reflects the fact that most respondents did not identify negative tree impacts. Due to limited 451
variations, it is statistically not meaningful to present these regression results. 452
453
5. Results 454
5.1. Descriptive statistics 455
The analysis combined the two datasets collected from the survey sites, namely, Cheng Dong 456
Park, Wu Shan Plaza and Xichen Square with the communal green-space. This produced a total 457
of 289 observations. Table 1 describes the socio-economic characteristics of the respondents. 458
The average respondent was in their middle age, around 44 years old. The youngest respondent 459
was 15 and the oldest one was 82 (the ethics approval limited the survey to children 15 years and 460
older, due to concerns about difficulties in parental consent and the cognitive capacity of 461
younger children to understand survey constructs). The sample was equally split between the two 462
sexes: 50.5% were female and 49.5% were male. Just over half of them (53.3%) completed a 463
university degree. Furthermore, many respondents declared ownership of the house or unit in 464
which they resided (75.8%). Nearly one-third (31.5%) reported that they had children under 18 465
years of age living at home. 466
467
<INSERT TABLE 1 AROUND HERE> 468
469

22
Table 2 displays the descriptive statistics used in the regression analysis. The Perceived 470
Benefits variable yielded an average value of 3.31 and an alpha value of .69, which means that 471
this composite item achieved internal consistency. Most of the Hangzhou green-space users (60-472
80%) we surveyed recognized the various adaptive benefits of urban trees, although trees as an 473
alternative source of food did not attract considerable attention (just 25% of respondents). 474
475
The Awareness and Concern variables recorded relatively high values, indicating that 476
most respondents were aware of and concerned about climate change. The Weather Changes 477
variable yielded an average value of 2.45, with a modest degree of variation between its 478
constituent items. Most of the respondents (>50%) believed that climate change impacts will 479
materialize in the form of hotter weather and more flooding events, but thought less likely (< 480
30%) to occur would be more rain (frequency) and heavier rain (intensity). This variable 481
produced a marginally acceptable alpha value of .64. On the other impact variable, (i.e. 482
Economic Disruptions), more than half of the respondents (50-70%) articulated climate change 483
impacts in terms of crop damage and increasing demand for goods, while less than 30% of them 484
selected damage to infrastructure and the economy. Still, this variable generated a satisfactory 485
alpha value of .78. 486
487
<INSERT TABLE 2 AROUND HERE> 488
489
The Confidence variable recorded 182 positive observations, or 63% of the sample. This 490
suggests a modest degree of optimism in the ability of human beings to manage climate change 491

23
impacts. Most respondents (64-81%) suggested that they could manage climate change impacts 492
by using less energy or using non-renewable energy (e.g. by harvesting solar heat), with one 493
exception; „using fans instead of air-conditioners‟ only attracted 46% positive responses. This 494
variable, labeled as Effective Actions, had a satisfactory alpha value of .74. 495
496
The Park Use variable combined a number of recreational pursuits of park visitors. 497
Respondents indicated the types of active and passive recreational activities they engaged in 498
when visiting the green-spaces. To facilitate response, we provided a list of 19 common 499
recreational activities for selection, including walking, riding bicycles, dancing, Tai Chi, etc. 500
This variable had an alpha value of .68. 501
502
<INSERT TABLE 3 AROUND HERE> 503
504
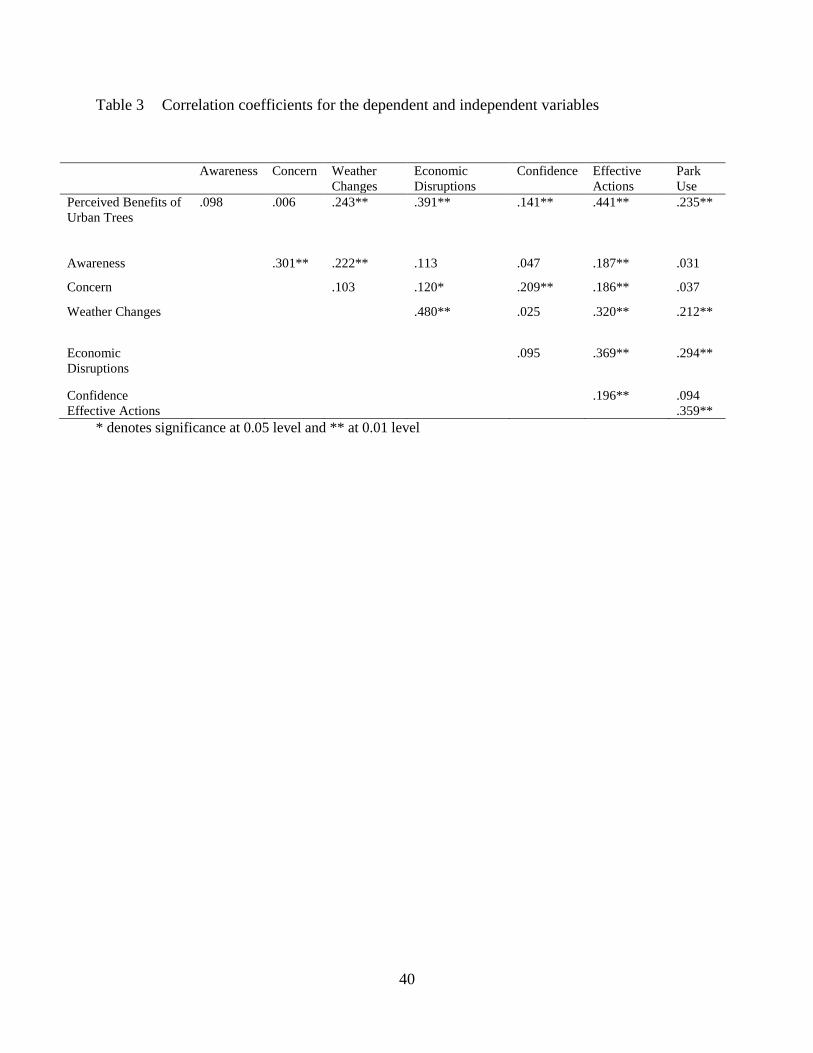
5.2. Correlated and regression analyses 505
Bivariate correlation coefficients of the model variables are listed in Table 3. The Perceived 506
Benefits variable was positively related to all other variables, except Awareness and Concern. 507
There are strong associations between some of the independent variables. This begs the question 508
whether collinearity exists between predictors. We further examined these relationships through 509
a regression analysis. 510
511
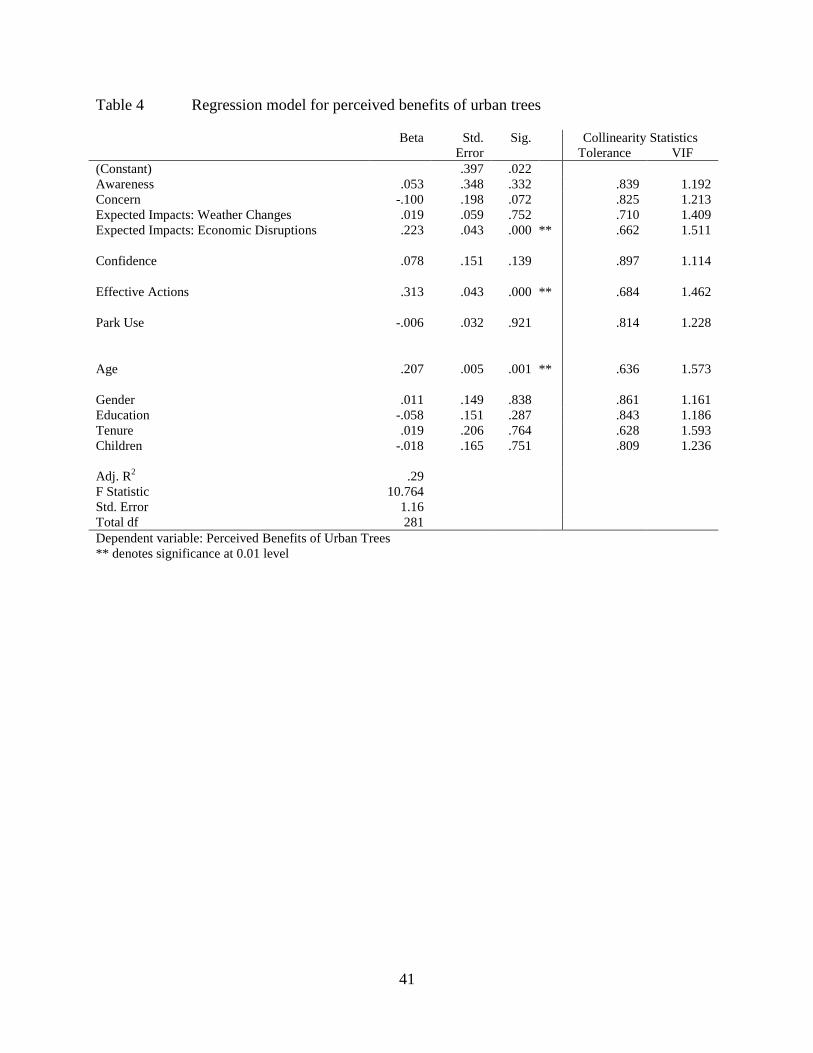
Table 4 shows a regression model using the listed dependent and independent variables. 512
Only three of the tested variables achieved statistical significance in the model, and they 513

24
accounted for 30% of variance in the dependent variable. The Tolerance and VIF values were 514
acceptable and cleared away concerns about collinearity. Tolerance values indicate the percent of 515
variance in the predictor that cannot be accounted for by the other predictors. Small values mean 516
that a predictor is redundant - anything less than .10 may merit further investigation. The VIF 517
stands for variance inflation factor. As a rule of thumb, a variable with a VIF value greater than 518
10 may merit further investigation. The model estimates suggest that Perceived Benefits of 519
Urban Trees demonstrated no observable relationship with Awareness and Concern. This means 520
that those individuals who are aware of, and concerned about, climate change are no more likely 521
to recognize the related adaptive functions of urban trees. 522
523
Expectations about climate change impacts generated mixed results. The Weather 524
Changes variable lost significance when other factors were controlled for, whereas Economic 525
Disruptions predicted Perceived Benefits and were statistically significant at 1% level. The 526
positive sign suggests that the selected functions of urban trees were more likely to attract 527
attention if the respondent expected that climate change would lead to adverse economic 528
consequences. Pragmatic (economic) considerations concerning climate change impacts are 529
associated with perceived benefits of urban trees. 530
531
<INSERT TABLE 4 AROUND HERE> 532
533
Confidence was not related to perception of urban tree benefits when other factors were 534
controlled for, but Effective Actions sustained a highly significant positive relationship with the 535

25
dependent variable. This indicates that those respondents who nominated a greater number of 536
possible actions to mitigate climate change impacts tended to recognize the functions of urban 537
trees. Belief in the collective efficacy in tackling the problem is associated with perceived 538
contributions of urban trees. 539
540
Park Use was positively associated with Perceived Benefits. Regression results however, 541
did not suggest a significant relationship between these two variables. This means that 542
recreational use of the green-spaces was unlikely to be a predictor of the tendency for 543
recognizing the benefits of urban trees when other factors were included in the analysis. 544
545
Socio-economic variables managed to produce significant observations. Sex, Education, 546
Tenure, and Dependent Children failed to predict the dependent variable. Yet, Age was a key 547
predictor with a positive effect, i.e. the older the individual, the more likely they were to 548
appreciate the role of urban trees in adapting cities to climate change. 549
550
551
6. Discussion and Conclusions 552
In recent years there has been growing concern among planners about the impacts of climate 553
change on cities. Attention has turned to how best to adapt built environments to expected 554
impacts such as heat waves, intense storms, increased wind speeds and flooding. Green 555
infrastructure, including parks, green-spaces, green roofs and urban trees is increasingly being 556
recognized for the adaptive benefits that it can confer on cities, including cooling, reducing 557

26
storm-water runoff, and potentially food production (Maes et al., 2014). But the perceptions, 558
attitudes, and values of green-space users towards green-infrastructure interventions are not well 559
understood – including the perceived issues associated with urban trees (Faehnle et al., 2014). 560
This is a potential problem if urban green-spaces are targeted for reforestation as an adaptive 561
response, without an adequate understanding of the potential for citizen concern and resistance 562
(Young and McPherson, 2013) 563
564
We undertook research in Hangzhou, China – a rapidly growing city with high densities 565
in the urban core. It is a useful case study because other cities in Asia, Canada and Australia are 566
also growing rapidly, increasing in density and are expected to be strongly impacted by climate 567
change (Brown et al., 2015; Mazhar et al., 2015). Many lessons learned from Hangzhou could be 568
applied to those cities. The results of our research show that green-space users in Hangzhou, 569
China are more likely to recognize a wider range of climate-adaptive benefits of tree-planting if 570
they believe that climate change will create adverse economic impacts on their city (pragmatic, 571
utilitarian motivation). Results also suggest that green-space users in Hangzhou tend to 572
appreciate those benefits if they feel that they can manage climate change impacts by altering 573
their consumption practices (a sense of collective efficacy). These findings could inform how 574
planners frame the problem of climate change and the potential adaptive responses they advocate. 575
Importantly, communicating the adaptive benefits of urban trees in Hangzhou should emphasize 576
their potential to lessen economic impacts stemming from climate change. 577
578
These results are important because they suggest that emphasizing the deleterious 579
impacts of climate change on cities (other than economic impacts), will not be as conducive to 580

27
fostering residents‟ acceptance of adaptive responses as would stressing the benefits of self-581
efficacy. In other words, planners and environmental managers may want to focus their attention 582
on the positive message that individuals can make a difference in adapting their cities to climate 583
change, and that green-infrastructure, such as tree planting, is a good place to begin. Cities that 584
have already embarked on massive tree-planting programs to combat future climate change 585
impacts will likely find supportive allies in green-space users. But targeting green-spaces for 586
more intensive tree planting could be problematic. 587
588
One surprising result of our research was that recreationists in Hangzhou did not appear 589
to oppose using trees for climate adaptation, and recognized the many benefits that trees confer 590
upon built environments. This is promising because it suggests that planners may be able to 591
increase tree densities in existing green-spaces in Hangzhou, without facing a backlash from 592
recreationists. But this may not be the case for cities outside China. A telling aspect of green-593
spaces in Chinese cities is that there are few large spaces dedicated to active recreation. It is rare 594
to see playing fields, basketball courts, skate parks or other larger and more intensive 595
recreational spaces that characterize cities in North America, Australia and Europe (Dong & 596
Chick, 2012). It is also rare to see children‟s playgrounds in parks and green-spaces in most 597
Chinese cities. Further research is therefore required in cities outside China to ascertain if green-598
space users would be as favorably disposed to using trees to adapt to climate change as they are 599
in Hangzhou. It is too early to tell if the large scale greening that is occurring in Chinese cities 600
like Hangzhou could also be successful in Western countries, although Young and McPherson 601
(2013) have found evidence that tree large scale tree planting can be problematic in some cities 602
28
in the United States, and Kirkpatrick et al. (2013) have found related issues in some Australian 603
cities. 604
605
An age-effect is also present in our results. Older green-space users in Hangzhou were 606
more likely to recognize the adaptive benefits of urban trees. There could be several reasons for 607
this finding. In China, older people seem more likely to use green-spaces because they have 608
more leisure time. They may also be more likely to remember the time before large-scale 609
urbanization, when Chinese cities were greener and cooler. And they may also have stronger 610
affinities for nature, having grown up in more naturalistic settings. Further research will need to 611
test these potential explanations. 612
613
Our results do suggest that age-based communication strategies might work well in the 614
Chinese context; many elderly do regular morning exercises in public parks. This finding is 615
encouraging because there is often a tendency to write-off the opinions of older people about 616
climate change, since they are likely to die before the worst impacts manifest, and in some places 617
have been shown to be more skeptical about climate change (Whitmarsh, 2011). Perhaps we 618
should not be so hasty in discounting the role of older people in adaptation. Planners should 619
remember that older people often have more time for child-care. In China, it is grandparents, not 620
parents, who tend to take primary responsibility for child-rearing, as parents are often working 621
very long hours (Goh & Kuczynski, 2010). Our results suggest that if planners in China target 622
climate change adaptation messages to older people, there could be a pay-off, where their 623
knowledge and values are transmitted to the next generation, paving the way for greater 624
acceptance of green-infrastructure as an adaptive response. There could be similar benefits 625

29
outside China, especially in cultures where older people are valued for their contributions to 626
society, but further research is needed, to test these postulates. 627
628
6.1 Potential limitation of this study 629
It is worth noting some potential limitations of this study. We did not obtain a representative 630
sample of Hangzhou residents, due to the inherent difficulties of securing socio-demographic 631
census data in China – making sampling problematic (Goodkind and West, 2002). Unlike 632
Western cities, demographic data is not available in fine detail for Chinese cities because it is 633
aggregated to a very broad scale, making generalization of survey findings challenging, if not 634
impossible. In this paper we have also focused on climate change adaptation, not mitigation. We 635
recognize that more research is required to test the efficacy of green infrastructure for mitigation, 636
but that was outside the scope of this study. We also acknowledge that some adaptive responses 637
may prove mal-adaptive in the longer term. For example, large scale afforestation could lower 638
groundwater, might damage grey infrastructure (e.g. sidewalks), could increase fire hazards, and 639
may increase the incidence of asthma if inappropriate species were chosen (Demuzere et al., 640
2014; Roy et al., 2012). And we acknowledge that outside China, tree planting for climate 641
change adaptation could prove to be contentious due to maintenance costs, or because trees 642
might increase greenhouse gas emissions if planting and maintenance are highly mechanized (or 643
through composting green waste). In China, where labor is cheap, and mature trees are 644
translocated en-masse from local tree farms, the benefits (and costs) are quickly apparent. 645
Outside China, where small trees are often planted, it may take decades for the trees to mature 646
and for the full suite of benefits (and costs) to manifest. However, these limitations also suggest 647
three useful directions for further research. 648

30
649
6.2 Directions for further research 650
First, more research is required to understand the „macroclimate‟ contributions of green 651
infrastructure, for both adaptation and mitigation. We know little about this topic. Can 652
metropolitan-scale green infrastructure interventions aggregate to contribute to regional, national 653
or even global climate change response outcomes? For example, it is highly improbable that 654
even the most ambitious urban greening programs could lessen the chances of sea-level rise or 655
reduce flooding from high-intensity storm events in the absence of aggressive international 656
action for emissions abatement. So what are the aggregate benefits (and costs) of green 657
infrastructure at larger scales? More research is required to explore the cumulative benefits (and 658
costs) of urban greening as a climate change response. 659
660
Second, it must be acknowledged that urban trees are just one component of green 661
infrastructure. What are the synergistic effects of other forms of greening, and would residents 662
have similar dispositions towards green roofs, green walls or constructed wetlands as we have 663
found in this study – both in China and elsewhere? And how might residents‟ attitudes change 664
when comparing new, small tree plantings with the more mature plantings we examined in this 665
study? Would residents perceive the same type and scale of benefits and/or costs? Do the esthetic 666
characteristics of species matter? 667
668
Last, more research is required to assess the potential mal-adaptive impacts of large-scale 669
urban greening – on greenhouse gas emissions, on residents‟ health, on ecosystems and 670

31
ultimately on urban policy and land use decision-making. While we have not been able to 671
address these complex issues in this paper, our findings suggest that there is nonetheless 672
considerable potential to use green infrastructure for climate change adaptation, and that 673
residents may be favorably disposed towards green infrastructure if they feel they can take action 674
themselves to lessen climate change, and if they can recognize the economic benefits of green 675
infrastructure. This study is just a first step towards engaging with the socio-cultural dimensions 676
of green infrastructure for climate change adaptation. Our encouraging findings suggest it is a 677
research agenda warranting further investigation. 678

32
References
Abreu-Harbich, L. V., Labaki, L. C., Matzarakis, A. (2015) Effect of tree planting design and
tree species on human thermal comfort in the tropics, Landscape and Urban Planning this
volume/issue.
Akbari, H., Pomerantz, M., & Taha, H. (2001). Cool surfaces and shade trees to reduce energy
use and improve air quality in urban areas. Solar Energy, 70(3), 295-310.
Alexandri, E. & Jones, P. (2008). Temperature decreases in an urban canyon due to green walls
and green roofs in diverse climates. Building and Environment, 43(4), 480-493.
Altenburger, E., & Chu, G. (2010). Hangzhou: Heaven on Earth. Focus on Geography, 49(2), 7-
13.
Austin, G., (2014), Green Infrastructure for Landscape Planning: Integrating Human and
Natural Systems, Routledge, London, pp. 266.
Beer, A. R. (2010). Greenspaces, green structure, and green infrastructure planning. In J.
Aitkenhead-Peterson & A. Volder (Eds.), Urban Ecosystem Ecology (pp. 431-448).
Madison, WI: American Society of Agronomy, Crop Science Society of America and Soil
Science Society of America.
Bjerke, T., Østdahl, T., Thrane, C., & Strumse, E. (2006). Vegetation density of urban parks and
perceived appropriateness for recreation. Urban Forestry & Urban Greening, 5(1), 35-44.
Bowler, D. E., Buyung-Ali, L., Knight, T. M., & Pullin, A. S. (2010). Urban greening to cool
towns and cities: A systematic review of the empirical evidence. Landscape and Urban
Planning, 97(3), 147-155.
Brown, R. D. (2011). Ameliorating the effects of climate change: modifying microclimates
through design. Landscape and Urban Planning, 100(4), 372-374.
Brown, R., Vanos, J.K., Kenny, N.A., and Lenzholzer, S. (2015). Designing urban parks that
ameliorate the effects of climate change. Landscape and Urban Planning, this
volume/issue.
Bulkeley, H. (2013). Cities and Climate Change. Milton Park, Abingdon, Oxon: Routledge.
Byrne, J. A., Gleeson, B., Howes, M., & Steele, W. (2009). The limits of ecological
modernization as an adaptive strategy. In S. Davoudi, J. Crawford & A. Mehmood (Eds.),
Planning for Climate Change: Strategies for Mitigation and Adaptation for Spatial
Planners (pp. 136-154). London: Earthscan.
Byrne, J. A., & Yang, J. (2009). Can urban greenspace combat climate change? Towards a
subtropical cities research agenda. Australian Planner, 46(4), 36-43.
Byrne, J. (2011). The human relationship with nature: rights of animals and plants in the urban
context. In I. Douglas, D. Goode, M.C. Houck & R. Wand (Eds.), The Routledge
Handbook of Urban Ecology (pp. 63-73). New York: Routledge.
Cameron, R. W. F, Blanuša, T., Taylor, J. E, Salisbury, A., Halstead, A. J, Henricot, B., &
Thompson, K. (2012). The domestic garden - its contribution to urban green
infrastructure. Urban Forestry & Urban Greening, 11(2), 129-137.
Castán Broto, V., & Bulkeley, H. (2012). A survey of urban climate change experiments in 100
cities. Global Environmental Change, 23(1), 92-102.
33
Chen, B., Adimo, O.A., & Bao, Z. (2009). Assessment of aesthetic quality and multiple functions
of urban green space from the users‟ perspective: The case of Hangzhou Flower Garden,
China. Landscape and Urban Planning, 93(1), 76-82.
Chen, B., Bao, Z., & Zhu, Z. (2006). Assessing the willingness of the public to pay to conserve
urban green space: the Hangzhou City, China, case. Journal of Environmental Health,
69(5), 26.
Dao, Q-T. (2011). The expanded utilizations of urban waterfront green spaces-three cases in
Hangzhou. Paper presented at 2nd
. International Conference on Multimedia Technology
(ICMT), 26-28 July, 2011, Hangzhou, China,
http://ieeexplore.ieee.org/xpl/articleDetails.jsp?arnumber=6002752, accessed 5/11/13.
Delman, J., 2014, Climate change politics and Hangzhou's 'green city making', In P. O. Berg and
E. Björner, (eds.), Branding Chinese Mega-Cities: Policies, Practices and Positioning
Edward Elgar, Cheltenham, PA, pp. 249-261.
Demuzere, M., Orru, K., Heidrich, O., Olazabal, E., Geneletti, D., Orru, H., Bhave, A., Mittal,
N., Feliu, E., Faehnle, M., (2014), Mitigating and adapting to climate change: multi-
functional and multi-scale assessment of green urban infrastructure, Journal of
Environmental Management, 146:107-115.
Dong, E., & Chick, G. (2012). Leisure constraints in six Chinese cities. Leisure Sciences, 34(5),
417-435.
Dunlap, R. E. (2008). The new environmental paradigm scale: From marginality to worldwide
use. The Journal of Environmental Education, 40(1), 3-18.
Emmanuel, R., Loconsole, A. (2015) Green infrastructure as an adaptation approach to tackle
urban overheating in the Glasgow Clyde Valley Region, Landscape and Urban Planning
this volume/issue.
Faehnle, M., Bäcklund, P., Tyrväinen, L., Niemelä, J., Yli-Pelkonen, V., (2014), How can
residents' experiences inform planning of urban green infrastructure? Case Finland,
Landscape and Urban Planning, 130,171-183.
Gaffin, S. R., Rosenzweig, C., & Kong, A. Y. Y. (2012). Adapting to climate change through
urban green infrastructure. Nature Climate Change, 2(10), 704-704.
Gill, S. E., Handley, J. F., Ennos, A. R., & Pauleit, S. (2007). Adapting cities for climate change:
the role of the green infrastructure. Built Environment, 33(1), 115-133.
Goh, E. C. L, & Kuczynski, L. (2010). 'Only children' and their coalition of parents: considering
grandparents and parents as joint caregivers in urban Xiamen, China. Asian Journal of
Social Psychology, 13(4), 221-231.
Goodkind, D., West, L. A., (2002), China's floating population: definitions, data and recent
findings, Urban Studies, 39(12), 2237-2250.
Hall, J. M., Handley, J. F., & Ennos, A. R. (2012). The potential of tree planting to climate-proof
high density residential areas in Manchester, UK. Landscape and Urban Planning,
104(3), 410-417.
Hamada, S., & Ohta, T. (2010). Seasonal variations in the cooling effect of urban green areas on
surrounding urban areas. Urban Forestry & Urban Greening, 9(1), 15-24.
Heltberg, R., Siegel, P. B., & Jorgensen, S. L. (2009). Addressing human vulnerability to climate
change: toward a 'no-regrets' approach. Global Environmental Change, 19(1), 89-99.
34
Hostetler, M., Allen, W., & Meurk, C. (2011). Conserving urban biodiversity? Creating green
infrastructure is only the first step. Landscape and Urban Planning, 100(4), 369-371.
Howes, M., McKenzie, M., Gleeson, B., Gray, R., Byrne, J., & Daniels, P. (2010). Adapting
ecological modernization to the Australian context. Journal of Integrative Environmental
Sciences, 7(1), 5-21.
Jim, C.Y. (2011). Holistic research agenda for sustainable management and conservation of
urban woodlands. Landscape and Urban Planning, 100(4), 375-379.
Jim, C. Y. (2015) Assessing climate-adaptation effect of extensive tropical green roofs in cities,
Landscape and Urban Planning this volume/issue.
Jones, R., Emmet, D., Kimberly L, & Bradford, J. (2013). The value of trees: Factors influencing
homeowner support for protecting local urban trees. Environment and Behavior, 45(5),
650-676.
Kirkpatrick, J., Davison, A., Daniels, G., (2012), Resident attitudes towards trees influence the
planting and removal of different types of trees in eastern Australian cities, Landscape
and Urban Planning, 107(2):147-158.
Kirkpatrick, J. B., Davison, A., Harwood, A., (2013), How tree professionals perceive trees and
conflicts about trees in Australia's urban forest, Landscape and Urban Planning, 119:124-
130.
Kitha, J., & Lyth, A. (2011). Urban wildscapes and green spaces in Mombasa and their potential
contribution to climate change adaptation and mitigation. Environment and Urbanization,
23(1), 251-265.
Klemm, W., Heusinkveld, B. G., Lenzholzer, S., Van Hove, B. (2015) Street greenery and its
physical and psychological impact on outdoor thermal comfort, Landscape and Urban
Planning this volume/issue.
Kravchenko, J., Abernethy, A. P., Fawzy, M., & Lyerly, H. K. (2013). Minimization of heatwave
morbidity and mortality. American Journal of Preventive Medicine, 44(3), 274-282.
Lo, A. Y.H., & Jim, C.Y. (2012). Citizen attitude and expectation towards greenspace provision
in compact urban milieu. Land Use Policy, 29(3), 577-586.
Lovell, S. T., & Taylor, J. R. (2013). Supplying urban ecosystem services through
multifunctional green infrastructure in the United States. Landscape Ecology, 28, 1447-
1463.
Maes, J., Barbosa, A., Baranzelli, C., Zulian, G., e Silva, F. B., Vandecasteele, I., Hiederer, R.,
Liquete, C., Paracchini, M. L., Mubareka, S., (2014), More green infrastructure is
required to maintain ecosystem services under current trends in land-use change in
Europe, Landscape Ecology, DOI: 10.1007/s10980-014-0083-2, 1-18.
Matthews, T., Lo, A. and Byrne, J., (2015). Reconceptualizing green infrastructure for climate
change adaptation: barriers to adoption and drivers for uptake by spatial planners,
Landscape and Urban Planning, this volume/issue.
Mazhar, N., Brown, R., Kenny, N., Lenzholzer, S. (2015) Thermal comfort of outdoor spaces in
Lahore Pakistan: Lessons for bioclimatic urban design in the context of global climate
change, Landscape and Urban Planning this volume/issue.
Mees, H-L P., & Driessen, P. P. J. (2011). Adaptation to climate change in urban areas: climate-
greening London, Rotterdam, and Toronto. Climate Law, 2(2), 251-280.

35
Mell, I. C. (2012). Can you tell a green field from a cold steel rail? Examining the "green" of
green infrastructure development. Local Environment, 18(2), 152-166.
Mell, I. C., Henneberry, J., Hehl-Lange, S., & Keskin, B. (2013). Promoting urban greening:
valuing the development of green infrastructure investments in the urban core of
Manchester, UK. Urban Forestry & Urban Greening, 12(3), 296-306.
Newell, J. P., Seymour, M., Yee, T., Renteria, J., Longcore, T., Wolch, J. R., & Shishkovsky, A.
(2013). Green Alley Programs: Planning for a sustainable urban infrastructure? Cities, 31,
144-155.
Nordh, H., Hartig, T., Hagerhall, C.M., & Fry, G. (2009). Components of small urban parks that
predict the possibility for restoration. Urban Forestry & Urban Greening, 8(4), 225-235.
Norton, B. A., Coutts, A. M., Livesley, S. J., Harris, R. J., Hunter, A. M., Williams, N. S. G.,
(2015) Planning for cooler cities: A framework to prioritise green infrastructure to
mitigate high temperatures in urban landscapes, Landscape and Urban Planning 134:127-
138.
Oliveira, S., Andrade, H., & Vaz, T. The cooling effect of green spaces as a contribution to the
mitigation of urban heat: A case study in Lisbon. Building and Environment, 46(11),
2186-2194.
Onishi, A., Cao, X., Ito, T., Shi, F., & Imura, H. (2010). Evaluating the potential for urban heat-
island mitigation by greening parking lots. Urban Forestry & Urban Greening, 9(4), 323-
332.
Roe, M., & Mell, I. (2013). Negotiating value and priorities: evaluating the demands of green
infrastructure development. Journal of Environmental Planning and Management, 56(5),
650-673.
Roy, A., Walters, P. G. P., & Luk, S. T. K. (2001). Chinese puzzles and paradoxes: Conducting
business research in China. Journal of Business Research, 52(2), 203-210.
Roy, S., Byrne, J., & Pickering, C. (2012). A systematic quantitative review of urban tree
benefits, costs, and assessment methods across cities in different climatic zones. Urban
Forestry & Urban Greening, 11, 351-363.
Sang Lijie, S. Y., Zhu, W., & Su, F. (2013). Accessibility of urban green spaces in Hangzhou
City. Progress in Geography (CN), 32(6), 950-957.
Shen, T., Chow, D. H. C, & Darkwa, J. (2013). Simulating the influence of microclimatic design
on mitigating the Urban Heat Island effect in the Hangzhou Metropolitan Area of China.
International Journal of Low-Carbon Technologies. doi: 10.1093/ijlct/ctt050
Spiekermann, M., He, Y., Yang, J., Burkhardt, I., Yan, F., Yi, X., & Pauleit, S. (2013).
Hangzhou: fast urbanization and high population growth. In K. Nilsson, S. Pauliet, S.
Bell, C. Aalbers & T. Sick Neilsen (Eds.), Peri-urban Futures: Scenarios and Models for
Land Use Change in Europe (pp. 307-337). Dordrecht: Springer.
Vandermeulen, V., Verspecht, A., Vermeire, B., Van Huylenbroeck, G., & Gellynck, X. (2011).
The use of economic valuation to create public support for green infrastructure
investments in urban areas. Landscape and Urban Planning, 103(2), 198-206.
Vollmer, D., Prescott, M.F., Padawangi, R., Girot, C. and Grêt-Regamey, A. (2015).
Understanding the value of urban riparian corridors: considerations in planning for
36
cultural services along an Indonesian river. Landscape and Urban Planning, this
volume/issue.
Wenting, W., Yi, R., & Hengyu, Z. (2012). Investigation on temperature dropping effect of
urban green space in summer in Hangzhou. Energy Procedia, 14, 217-222.
Whitmarsh, L. (2011). Scepticism and uncertainty about climate change: dimensions,
determinants and change over time. Global Environmental Change, 21(2), 690-700.
Wolch, J. R., Byrne, J., Newell, J. P., (2014), Urban green space, public health, and
environmental justice: The challenge of making cities 'just green enough', Landscape and
Urban Planning 125, 234-244.
Wright, H. (2011). Understanding green infrastructure: the development of a contested concept
in England. Local Environment, 16(10), 1003-1019.
Wu, K-Y., Ye, X-Y., Qi, Z-F., & Zhang, H. (2012). Impacts of land use/land cover change and
socioeconomic development on regional ecosystem services: the case of fast-growing
Hangzhou Metropolitan Area, China. Cities, 31, 276-284.
Wu, W. T., Zhao, H. Y., Ren, Y., Tian, M. M., & Shen, D. (2012). Investigation on shading
effect of urban green space in summer in Hangzhou. Advanced Materials Research, 424,
916-919.
Xu, Y., Dadvand, P., Barrera-Gómez, J., Sartini, C., Marí-Dell'Olmo, M., Borrell, C., Basagaña,
X. (2013). Differences on the effect of heat waves on mortality by sociodemographic and
urban landscape characteristics. Journal of Epidemiology and Community Health, 67(6),
519-525.
Yang, W., Chang, J., Xu, B., Peng, C., & Ge, Y. (2008). Ecosystem service value assessment for
constructed wetlands: A case study in Hangzhou, China. Ecological Economics, 68(1),
116-125.
Young, R. F., & McPherson, E. G. (2013). Governing metropolitan green infrastructure in the
United States. Landscape and Urban Planning, 109(1), 67-75.
Zhang, Q. M., (2004), Green infrastructure, Land and Resources Information (CN) 7:35-38.
Zhang, J.-S., (2009), Green infrastructure: a systematic solution to urban space and
environmental issues, Modern Urban Research (CN) 11:81-86.
Zhang, H., Chen, B., Sun, Z., Bao, Z., (2013), Landscape perception and recreation needs in
urban green space in Fuyang, Hangzhou, China, Urban Forestry & Urban Greening,
12(1):44-52.

37
LIST OF TABLES
Table 1 - Socio-demographic characteristics of respondents
Table 2 - Descriptive statistics for model variables
Table 3 - Correlation coefficients for the dependent and independent variables
Table 4 - Regression model for perceived benefits of urban trees

38
Table 1 Socio-demographic characteristics of respondents (n = 289)
Age
Average 44.1 years
Range 15 - 82 years
Sex
Female 50.5%
Male 49.5%
Education
University degree holders 53.3%
Non-degree holders 46.7%
Tenure
Owned the house / unit currently occupied 75.8%
Renting 24.2%
Children
Have children under 18 years 31.5%
Otherwise 68.5%

39
Table 2 Descriptive statistics for model variables (n = 289)
Item Observed
range
Mean S.D. Alpha
Dependent variable
Perceived Benefits of Urban Trees 0-5 3.31 1.39 .69
Independent variables
Awareness (heard of climate change) 0-1 .95 .22 -
Concern (worry about climate change) 0-1 .82 .38 -
Expected climate change impacts
Weather Changes 0-5 2.45 1.39 .64
Economic Disruptions 0-6 2.88 1.96 .78
Confidence (people can stop climate change impacts) 0-1 .63 .48 -
Effective Actions 0-7 4.83 1.96 .74
Park Use 0-13 3.58 2.42 .68
Park Visit Frequency (times / month) 1-60 14.05 11.67 -
40
Table 3 Correlation coefficients for the dependent and independent variables
Awareness Concern Weather
Changes
Economic
Disruptions
Confidence Effective
Actions
Park
Use
Perceived Benefits of
Urban Trees
.098 .006 .243** .391** .141** .441** .235**
Awareness .301** .222** .113 .047 .187** .031
Concern .103 .120* .209** .186** .037
Weather Changes .480** .025 .320** .212**
Economic
Disruptions
.095 .369** .294**
Confidence .196** .094
Effective Actions .359**
* denotes significance at 0.05 level and ** at 0.01 level
41
Table 4 Regression model for perceived benefits of urban trees
Beta Std.
Error
Sig. Collinearity Statistics
Tolerance VIF
(Constant) .397 .022
Awareness .053 .348 .332 .839 1.192
Concern -.100 .198 .072 .825 1.213
Expected Impacts: Weather Changes .019 .059 .752 .710 1.409
Expected Impacts: Economic Disruptions .223 .043 .000 ** .662 1.511
Confidence .078 .151 .139 .897 1.114
Effective Actions .313 .043 .000 ** .684 1.462
Park Use -.006 .032 .921 .814 1.228
Age .207 .005 .001 ** .636 1.573
Gender .011 .149 .838 .861 1.161
Education -.058 .151 .287 .843 1.186
Tenure .019 .206 .764 .628 1.593
Children -.018 .165 .751 .809 1.236
Adj. R2 .29
F Statistic 10.764
Std. Error 1.16
Total df 281
Dependent variable: Perceived Benefits of Urban Trees
** denotes significance at 0.01 level

42
LIST OF FIGURES
Figure 1 - Hangzhou location map
Figure 2 - Location of the surveyed green-spaces in Hangzhou
Figure 3 - Xi Cheng Square (a) Looking west towards the mall and (b) Looking north towards
adjoining residential communities
Figure 4 - Wu Shan Plaza (a) Dancing near civic buildings & (b) Tai Chi near the pagoda (both
photographs looking south towards the City God Pagoda)
Figure 5 - Cheng Dong Park (a) Entry from elevated road (looking north-west towards North
Ring Road and canal) and (b) Walking trail (looking north, adjacent the railway line)

Figure 1Click here to download high resolution image
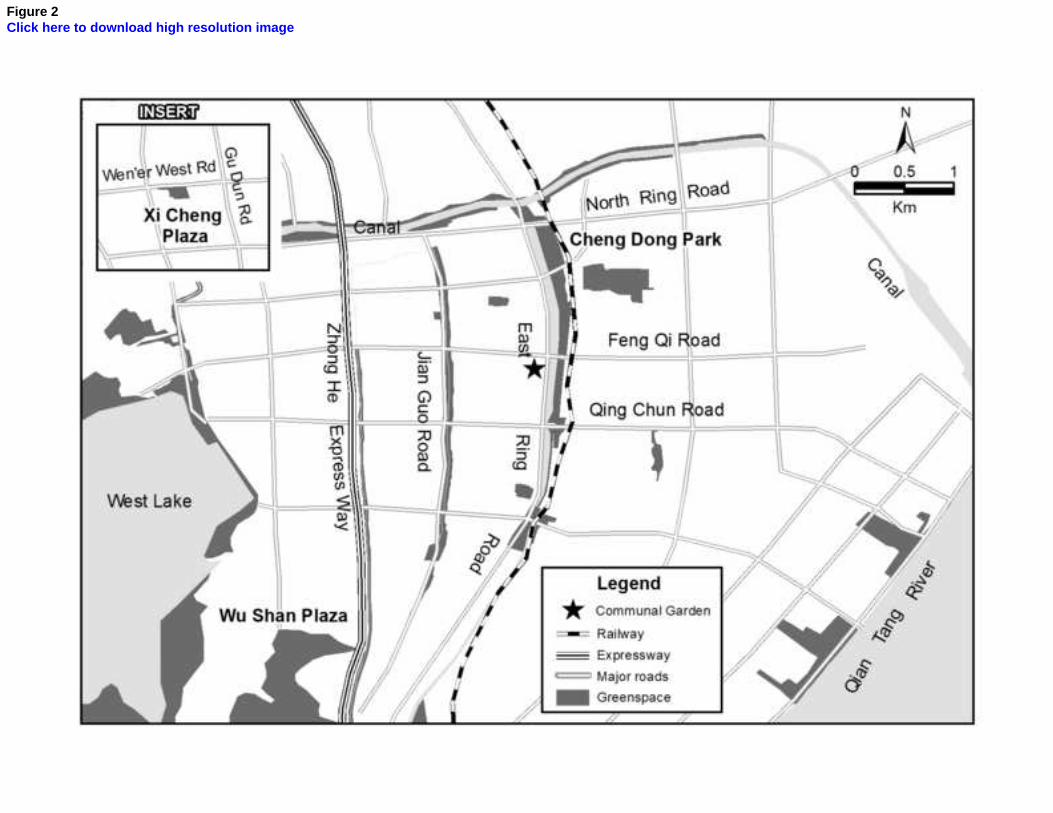
Figure 2Click here to download high resolution image

Figure 3aClick here to download high resolution image
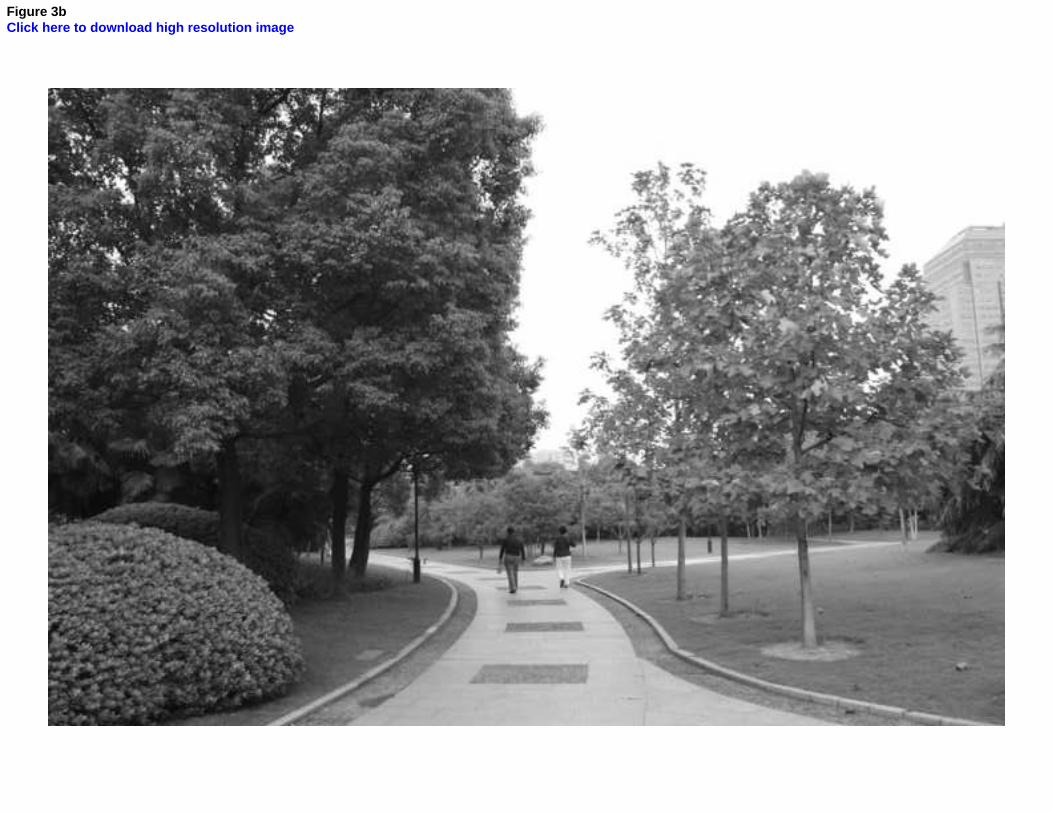
Figure 3bClick here to download high resolution image
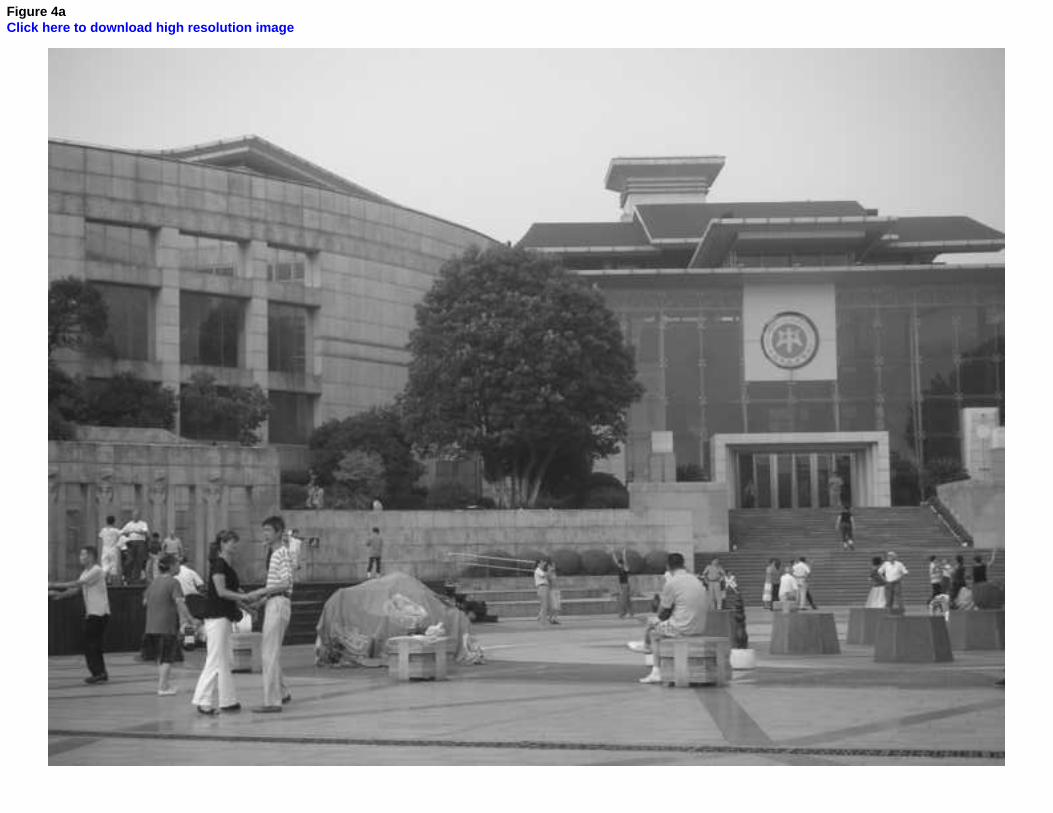
Figure 4aClick here to download high resolution image
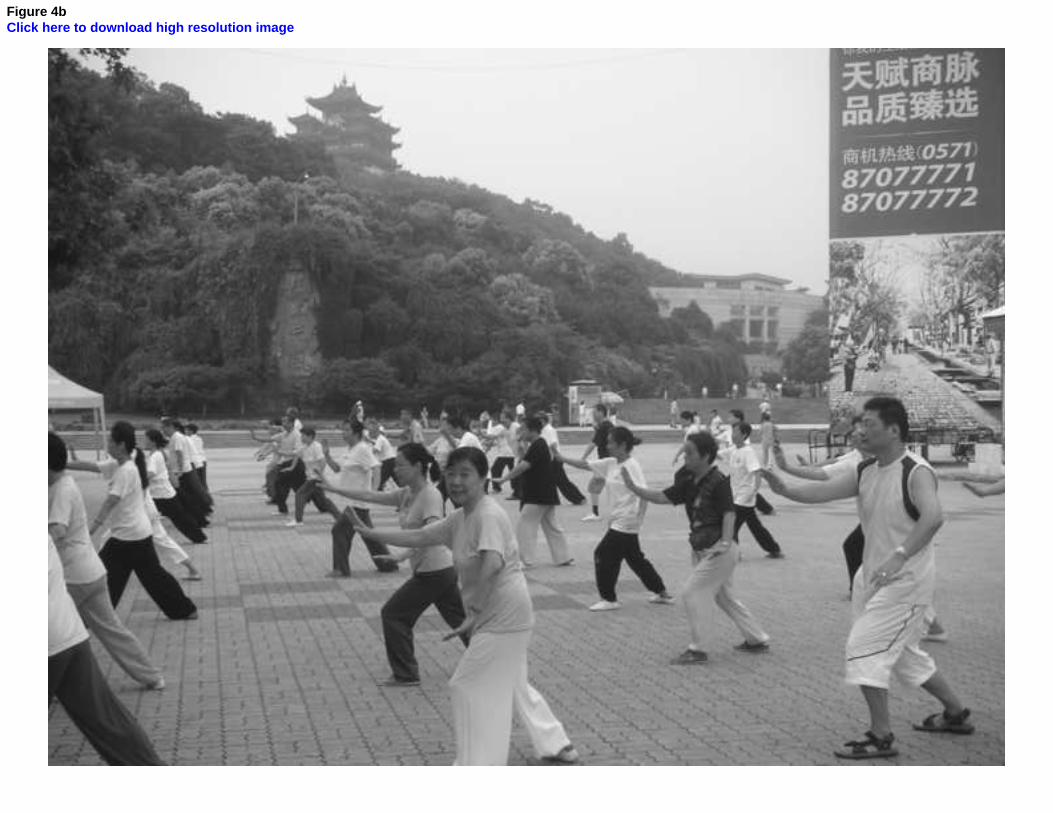
Figure 4bClick here to download high resolution image

Figure 5bClick here to download high resolution image

Figure 5aClick here to download high resolution image

Acknowledgements
We would like to thank the anonymous reviewers for their assistance with this paper. Their
suggestions and feedback have greatly improved the paper. We would also like to thank Griffith
University and Zhejiang University for funding this research, and Zhejiang University for
generously providing office space for the first author during his research leave. Thanks are also
due to Daniela Guitart (Griffith University) for her assistance in cleaning the data for analysis,
and to Hong Yi Dan, Jiang Yan, Zhang Bin, and Zheng Wen Wen (Zhejiang University) for their
assistance in collecting the park user data and helping to identify suitable green-spaces for the
research. We also thank Mrs Huang Juying for assisting us in providing the participation
vouchers for survey respondents and for acting as an intermediary in securing the permission of
the community managers for undertaking the survey in Feng Qi Gardens. Finally we owe a debt
of gratitude to Dr Christina Qi Li, spatial analyst with the Gold Coast City Council, for
generously giving up her own free time to prepare the maps for this paper. All errors and
omissions remain those of the authors.
Acknowledgments