Residential Solar Water Heater Adoption Behaviour - MDPI
26
energies Review Residential Solar Water Heater Adoption Behaviour: A Review of Economic and Technical Predictors and Their Correlation with the Adoption Decision Sara Ghaboulian Zare 1 , Reza Hafezi 2 , Mohammad Alipour 3,4, * , Reza Parsaei Tabar 5 and Rodney A. Stewart 3,4 Citation: Ghaboulian Zare, S.; Hafezi, R.; Alipour, M.; Parsaei Tabar, R.; Stewart, R.A. Residential Solar Water Heater Adoption Behaviour: A Review of Economic and Technical Predictors and Their Correlation with the Adoption Decision. Energies 2021, 14, 6630. https://doi.org/10.3390/ en14206630 Academic Editor: Antonio Rosato Received: 3 August 2021 Accepted: 8 October 2021 Published: 14 October 2021 Publisher’s Note: MDPI stays neutral with regard to jurisdictional claims in published maps and institutional affil- iations. Copyright: © 2021 by the authors. Licensee MDPI, Basel, Switzerland. This article is an open access article distributed under the terms and conditions of the Creative Commons Attribution (CC BY) license (https:// creativecommons.org/licenses/by/ 4.0/). 1 Industrial Engineering Department, Sadjad University, Mashhad 91886, Iran; [email protected] 2 Science and Technology Futures Studies, National Research Institute for Science Policy, Tehran 1435894461, Iran; [email protected] 3 School of Engineering and Built Environment, Griffith University, Southport, QLD 4222, Australia; r.stewart@griffith.edu.au 4 Cities Research Institute, Griffith University, Southport, QLD 4222, Australia 5 Faculty of Administrative Sciences and Economics, Ferdowsi University, Mashhad 91779, Iran; [email protected] * Correspondence: mohammad.alipour@griffithuni.edu.au; Tel.: +61-40-435-2223 Abstract: The successful deployment of the solar water heater (SWH) in the residential sector relies on the household’s bounded rational decision-makers to accept this system. The decision is shaped by a wide spectrum of predictors that form heterogeneous behaviour. Over the past years, research has employed a wide range of these predictors to understand their role in the decision and predict the behaviour and diffusion rate of SWHs. This review primarily identifies economic and technical predictors of 100 quantitative and qualitative studies on the residential SWH adoption decision. For the identified predictors, their characteristics and popularity are explored in a structured and coherent framework. The review further investigates the correlation between the identified predictors and the adoption decision from 97 of the 100 initially reviewed studies. The outcome of the research revealed 123 (56 economic and 67 technical) predictors that were classified into seven categories. ‘Financial incentives’ and ‘perceived attitude towards government policies’ are among the most popular economic predictors, whereas ‘house type’ and ‘knowledge of SWH’ were the most frequent technical factors in the research. Analysing the correlation between 99 predictors and the decision also unfolded that certain attitudinal attributes have a stronger influence on the residential SWH take-up than some common factors (e.g., electricity cost, technical variables). Keywords: solar water heater; adoption behaviour; household; predictors; technology innovation 1. Introduction Promising renewable energy (RE) systems have ushered in a transition towards a green, low-carbon, and climate-resilient society. Among the available RE systems, solar water heaters (SWHs) are a well-established technology that has been developed world- wide in response to energy poverty, pollution, and climate change [1,2]. The production of hot water using an SWH is one of the most prominent uses of solar energy, where thermal energy from solar radiation is converted into heat for use in various water heating applications [3]. Over the past three decades, environmentally friendly SWH systems have become increasingly affordable, technically reliable, and in many areas, are now on the threshold of mass-market uptake. As the technology has been embraced in both developed as well as remote and off-grid areas, governments worldwide have vested interests in the installation and use of domestic SWHs. Despite the wide range of policies in place, the uptake of home SWHs has remained low in many areas. Efforts to promote these systems in the residential sector through finan- Energies 2021, 14, 6630. https://doi.org/10.3390/en14206630 https://www.mdpi.com/journal/energies
-
Upload
khangminh22 -
Category
Documents
-
view
1 -
download
0
Transcript of Residential Solar Water Heater Adoption Behaviour - MDPI

energies
Review
Residential Solar Water Heater Adoption Behaviour: A Reviewof Economic and Technical Predictors and Their Correlationwith the Adoption Decision
Sara Ghaboulian Zare 1 , Reza Hafezi 2 , Mohammad Alipour 3,4,* , Reza Parsaei Tabar 5
and Rodney A. Stewart 3,4
�����������������
Citation: Ghaboulian Zare, S.;
Hafezi, R.; Alipour, M.; Parsaei Tabar,
R.; Stewart, R.A. Residential Solar
Water Heater Adoption Behaviour: A
Review of Economic and Technical
Predictors and Their Correlation with
the Adoption Decision. Energies 2021,
14, 6630. https://doi.org/10.3390/
en14206630
Academic Editor: Antonio Rosato
Received: 3 August 2021
Accepted: 8 October 2021
Published: 14 October 2021
Publisher’s Note: MDPI stays neutral
with regard to jurisdictional claims in
published maps and institutional affil-
iations.
Copyright: © 2021 by the authors.
Licensee MDPI, Basel, Switzerland.
This article is an open access article
distributed under the terms and
conditions of the Creative Commons
Attribution (CC BY) license (https://
creativecommons.org/licenses/by/
4.0/).
1 Industrial Engineering Department, Sadjad University, Mashhad 91886, Iran; [email protected] Science and Technology Futures Studies, National Research Institute for Science Policy,
Tehran 1435894461, Iran; [email protected] School of Engineering and Built Environment, Griffith University, Southport, QLD 4222, Australia;
[email protected] Cities Research Institute, Griffith University, Southport, QLD 4222, Australia5 Faculty of Administrative Sciences and Economics, Ferdowsi University, Mashhad 91779, Iran;
[email protected]* Correspondence: [email protected]; Tel.: +61-40-435-2223
Abstract: The successful deployment of the solar water heater (SWH) in the residential sector relieson the household’s bounded rational decision-makers to accept this system. The decision is shapedby a wide spectrum of predictors that form heterogeneous behaviour. Over the past years, researchhas employed a wide range of these predictors to understand their role in the decision and predictthe behaviour and diffusion rate of SWHs. This review primarily identifies economic and technicalpredictors of 100 quantitative and qualitative studies on the residential SWH adoption decision.For the identified predictors, their characteristics and popularity are explored in a structured andcoherent framework. The review further investigates the correlation between the identified predictorsand the adoption decision from 97 of the 100 initially reviewed studies. The outcome of the researchrevealed 123 (56 economic and 67 technical) predictors that were classified into seven categories.‘Financial incentives’ and ‘perceived attitude towards government policies’ are among the mostpopular economic predictors, whereas ‘house type’ and ‘knowledge of SWH’ were the most frequenttechnical factors in the research. Analysing the correlation between 99 predictors and the decisionalso unfolded that certain attitudinal attributes have a stronger influence on the residential SWHtake-up than some common factors (e.g., electricity cost, technical variables).
Keywords: solar water heater; adoption behaviour; household; predictors; technology innovation
1. Introduction
Promising renewable energy (RE) systems have ushered in a transition towards agreen, low-carbon, and climate-resilient society. Among the available RE systems, solarwater heaters (SWHs) are a well-established technology that has been developed world-wide in response to energy poverty, pollution, and climate change [1,2]. The productionof hot water using an SWH is one of the most prominent uses of solar energy, wherethermal energy from solar radiation is converted into heat for use in various water heatingapplications [3]. Over the past three decades, environmentally friendly SWH systems havebecome increasingly affordable, technically reliable, and in many areas, are now on thethreshold of mass-market uptake. As the technology has been embraced in both developedas well as remote and off-grid areas, governments worldwide have vested interests in theinstallation and use of domestic SWHs.
Despite the wide range of policies in place, the uptake of home SWHs has remainedlow in many areas. Efforts to promote these systems in the residential sector through finan-
Energies 2021, 14, 6630. https://doi.org/10.3390/en14206630 https://www.mdpi.com/journal/energies
Energies 2021, 14, 6630 2 of 26
cial support and the triggering of environmental values have thus far led to inconsistentand contradictory implications. Beyond the incentives and managerial interventions areheterogeneous households, who are the final and main decision-makers in the uptakedecision-making process [4,5]. Their adoption decision behaviour determines the extentto which any assertive deployment policies translate into success [6]. The central roleof household behaviour towards the adoption of SWHs has attracted the attention of re-searchers. Accordingly, studies have investigated various dimensions of the heterogeneous,heuristic behaviour of households and predicted their diffusion rate of the innovation forlong-term policies. A wide range of predictors (in this study, variables, characteristics,factors, parameters, indicators, and determinants interchangeably refer to the ‘predictors’of residential SWH system adoption) has been proposed in retroactive and futuristic studiesfor testing and analysing the awareness, motivation, interests, attitude, tendency, will-ingness, intention, and adoption decision regarding the uptake of SWHs in the hope ofachieving more tangible insight. These predictors span a range of environmental, social,demographic, psychological, and personal values, but also—and more crucially—financialand technical angles. The overriding composition of economic and technological predictorshas largely dominated studies on residential SWH acceptance [7–11]. Economic factorsdetermine the final price of the systems as well as the decision-makers’ purchasing power,indicating to what extent they can afford the system. Technical indicators, either directly orindirectly, profoundly influence economic dimensions, system efficiency, and performance.
Although end-user’s perspectives on the adoption of SWH systems have been wellestablished, no coherent framework has been developed for critically understanding thepivotal component of this research—namely, the predictors. While research on the pre-dictors of SWH adoption is scarce, numerous studies have recognised the behaviouralfactors related to sport [12], information technology [13], solar photovoltaic (SPV) [11],medical [14,15], and technology-based products [16]. To address this gap, this study pri-marily sought to identify the determinants of home SWH uptake decisions with a focuson economic and technical parameters. The gleaned factors were classified in a coherentscheme and their utilisation was described; then, the popular and overlooked factors wereexamined closely by estimating their frequency of use. Another main objective of thisstudy was to investigate the correlation between the identified predictors (independentvariables) and adoption decision (dependent variable) to determine the significance levelof the predictors on the decision. To achieve these objectives, quantitative and qualitativestudies were systematically reviewed that (1) investigated the adoption and pre-adoptionprospects of residential consumers towards SWH usage; (2) predicted the acceptance ratesfor medium to long periods; or (3) explained consumer behaviour by distinguishing thepredictors’ effects on adoption.
The remainder of this review is organised as follows: Section 2 describes the methodsused to collect, derive, and analyse the data. The outcome of the study is presented intwo sections: Section 3 reports the economic and technical predictors of SWH adoption be-haviour alongside their popularity in the literature; and Section 4 examines the correlationbetween the identified predictors and the adoption decision. Discussion and conclusionsof the study are finally provided in Section 5.
2. Method
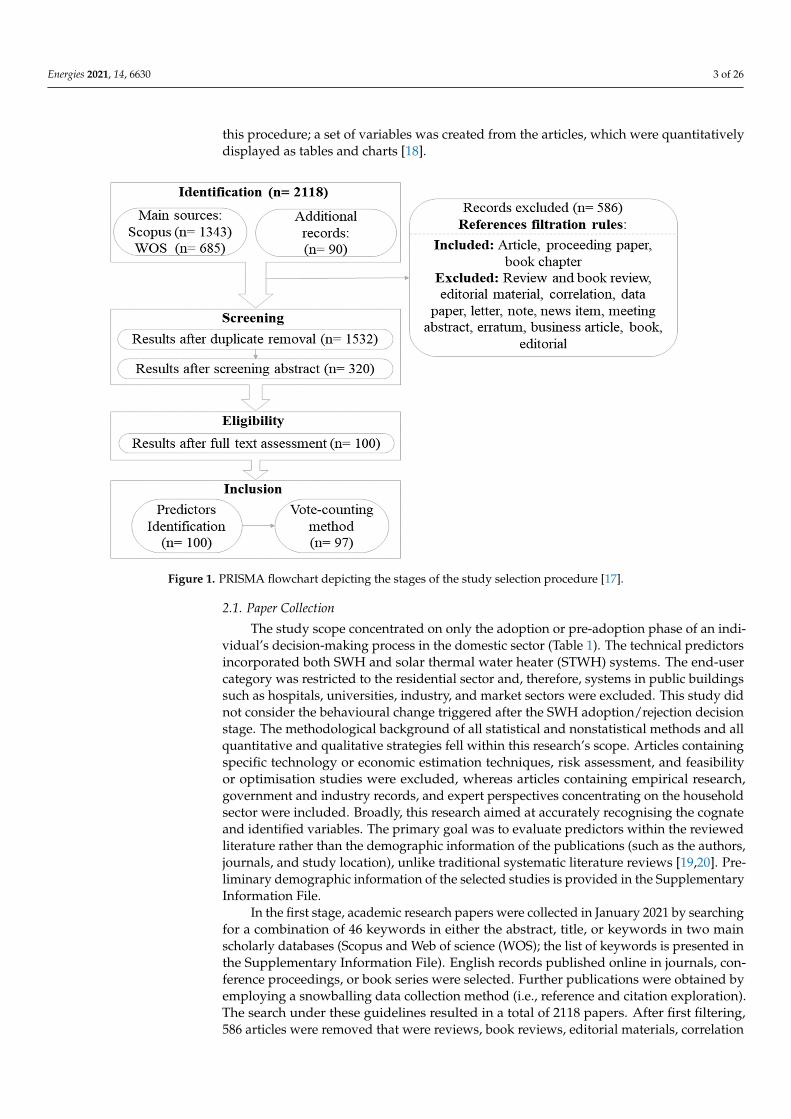
This systematic quantitative literature review was performed under the PreferredReporting Items for Systematic Reviews and Meta-Analyses (PRISMA) framework [17](Figure 1). The PRISMA framework enabled relevant articles to be derived from among thevarious RE studies that exist in the literature, and further facilitated the quantitative glean-ing of the factors discussed in the selected research. This review applied a comprehensiveand simply reproducible systematic exploration rule. This type of review is systematicbecause the methods used to survey the literature and select the most relevant papers areexplicit and reproducible. This means that following the method’s steps will lead to similarconclusions. Qualitative, quantitative, and empirical research can be evaluated using
Energies 2021, 14, 6630 3 of 26
this procedure; a set of variables was created from the articles, which were quantitativelydisplayed as tables and charts [18].
Energies 2021, 14, x FOR PEER REVIEW 3 of 31
systematic because the methods used to survey the literature and select the most relevant papers are explicit and reproducible. This means that following the method’s steps will lead to similar conclusions. Qualitative, quantitative, and empirical research can be evaluated using this procedure; a set of variables was created from the articles, which were quantitatively displayed as tables and charts [18].
Figure 1. PRISMA flowchart depicting the stages of the study selection procedure [17].
2.1. Paper Collection The study scope concentrated on only the adoption or pre-adoption phase of an in-
dividual’s decision-making process in the domestic sector (Table 1). The technical pre-dictors incorporated both SWH and solar thermal water heater (STWH) systems. The end-user category was restricted to the residential sector and, therefore, systems in public buildings such as hospitals, universities, industry, and market sectors were excluded. This study did not consider the behavioural change triggered after the SWH adop-tion/rejection decision stage. The methodological background of all statistical and non-statistical methods and all quantitative and qualitative strategies fell within this re-search’s scope. Articles containing specific technology or economic estimation tech-niques, risk assessment, and feasibility or optimisation studies were excluded, whereas articles containing empirical research, government and industry records, and expert perspectives concentrating on the household sector were included. Broadly, this research aimed at accurately recognising the cognate and identified variables. The primary goal was to evaluate predictors within the reviewed literature rather than the demographic information of the publications (such as the authors, journals, and study location), unlike traditional systematic literature reviews [19,20]. Preliminary demographic information of the selected studies is provided in the Supplementary Information File.
Figure 1. PRISMA flowchart depicting the stages of the study selection procedure [17].
2.1. Paper Collection
The study scope concentrated on only the adoption or pre-adoption phase of an indi-vidual’s decision-making process in the domestic sector (Table 1). The technical predictorsincorporated both SWH and solar thermal water heater (STWH) systems. The end-usercategory was restricted to the residential sector and, therefore, systems in public buildingssuch as hospitals, universities, industry, and market sectors were excluded. This study didnot consider the behavioural change triggered after the SWH adoption/rejection decisionstage. The methodological background of all statistical and nonstatistical methods and allquantitative and qualitative strategies fell within this research’s scope. Articles containingspecific technology or economic estimation techniques, risk assessment, and feasibilityor optimisation studies were excluded, whereas articles containing empirical research,government and industry records, and expert perspectives concentrating on the householdsector were included. Broadly, this research aimed at accurately recognising the cognateand identified variables. The primary goal was to evaluate predictors within the reviewedliterature rather than the demographic information of the publications (such as the authors,journals, and study location), unlike traditional systematic literature reviews [19,20]. Pre-liminary demographic information of the selected studies is provided in the SupplementaryInformation File.
In the first stage, academic research papers were collected in January 2021 by searchingfor a combination of 46 keywords in either the abstract, title, or keywords in two mainscholarly databases (Scopus and Web of science (WOS); the list of keywords is presented inthe Supplementary Information File). English records published online in journals, con-ference proceedings, or book series were selected. Further publications were obtained byemploying a snowballing data collection method (i.e., reference and citation exploration).The search under these guidelines resulted in a total of 2118 papers. After first filtering,586 articles were removed that were reviews, book reviews, editorial materials, correlation
Energies 2021, 14, 6630 4 of 26
studies, data papers, letters, notes, news items, meeting abstracts, errata, business articles,books, or editorials. Next, the articles’ information was downloaded to the EndNote X9software package; duplicate articles were deleted, leaving 1532 papers. Articles were thenreviewed to remove those that did not have full-text access or only the title, abstract, andkeywords of the article were in English. A four-step method was employed to facilitatescreening and eligibility assessments (details of the method are provided in the Supple-mentary Information File). The initially identified studies were evaluated by their title,keywords, abstract, and full text. The use of this method within the PRISMA frameworklargely minimised the exclusion of any relevant articles. Screening the titles and abstractsof articles and excluding irrelevant articles resulted in 320 articles. Full-text analysis ofthe remaining records led to the final 100 articles that were subjected to data extraction,synthesis, and vote-counting quantitative analysis.
Table 1. Scope of the research.
Scope Inclusion
Technology contextIncluded Solar water heater and solar thermal water heater systems
Excluded Solar photovoltaics, solar cookers, solar-powered lanterns, and passive solar
End-user typeIncluded Residential sector
Excluded Public utility, industry, and market
BehaviourIncluded Adoption and pre-adoption: Adoption, intention, willingness to adopt, attitude,
motives, awareness, knowledge, and tendency towards SWH or STWH adoption
Excluded Behaviour after the adoption stage: satisfaction level and efficiency level
2.2. Data Extraction and Synthesis
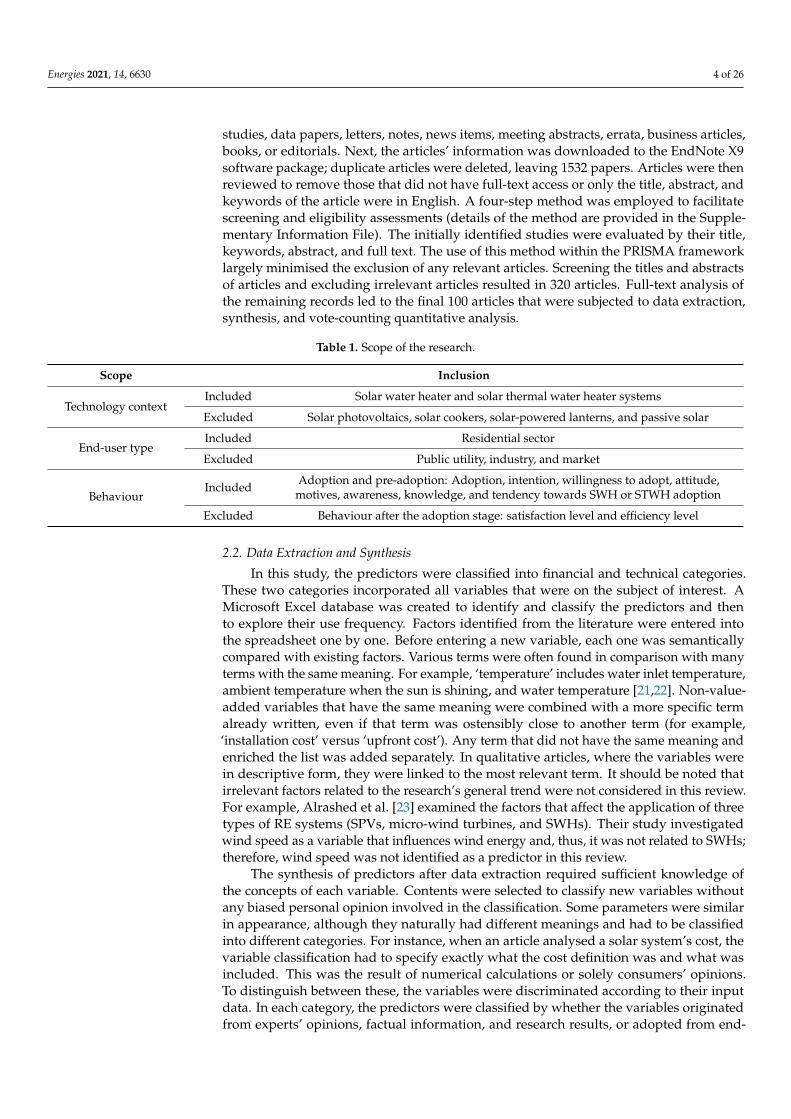
In this study, the predictors were classified into financial and technical categories.These two categories incorporated all variables that were on the subject of interest. AMicrosoft Excel database was created to identify and classify the predictors and thento explore their use frequency. Factors identified from the literature were entered intothe spreadsheet one by one. Before entering a new variable, each one was semanticallycompared with existing factors. Various terms were often found in comparison with manyterms with the same meaning. For example, ‘temperature’ includes water inlet temperature,ambient temperature when the sun is shining, and water temperature [21,22]. Non-value-added variables that have the same meaning were combined with a more specific termalready written, even if that term was ostensibly close to another term (for example,‘installation cost’ versus ‘upfront cost’). Any term that did not have the same meaning andenriched the list was added separately. In qualitative articles, where the variables werein descriptive form, they were linked to the most relevant term. It should be noted thatirrelevant factors related to the research’s general trend were not considered in this review.For example, Alrashed et al. [23] examined the factors that affect the application of threetypes of RE systems (SPVs, micro-wind turbines, and SWHs). Their study investigatedwind speed as a variable that influences wind energy and, thus, it was not related to SWHs;therefore, wind speed was not identified as a predictor in this review.
The synthesis of predictors after data extraction required sufficient knowledge ofthe concepts of each variable. Contents were selected to classify new variables withoutany biased personal opinion involved in the classification. Some parameters were similarin appearance, although they naturally had different meanings and had to be classifiedinto different categories. For instance, when an article analysed a solar system’s cost, thevariable classification had to specify exactly what the cost definition was and what wasincluded. This was the result of numerical calculations or solely consumers’ opinions.To distinguish between these, the variables were discriminated according to their inputdata. In each category, the predictors were classified by whether the variables originatedfrom experts’ opinions, factual information, and research results, or adopted from end-

Energies 2021, 14, 6630 5 of 26
users’ judgements, opinions, and obtained information (Figure 2). Each leading group wassubdivided into two sections based on the source of input data: perceived attitudes towardsfinancial and technical features and financial and technical knowledge of SWH adoption.The second category’s determinants were shaped by experts’ or stakeholders’ viewpoints oractual data carried from research or assessments. The perceived orientation determinantswere raised from households’ characteristics, beliefs, and information towards housesor SWH technology features. Broadly speaking, the categorisation was an evolutionaryapproach, which means that by identifying new predictors, the best general appropriateterm was chosen to replace the previous one.
Energies 2021, 14, x FOR PEER REVIEW 5 of 31
biased personal opinion involved in the classification. Some parameters were similar in appearance, although they naturally had different meanings and had to be classified into different categories. For instance, when an article analysed a solar system’s cost, the variable classification had to specify exactly what the cost definition was and what was included. This was the result of numerical calculations or solely consumers’ opinions. To distinguish between these, the variables were discriminated according to their input da-ta. In each category, the predictors were classified by whether the variables originated from experts’ opinions, factual information, and research results, or adopted from end-users’ judgements, opinions, and obtained information (Figure 2). Each leading group was subdivided into two sections based on the source of input data: perceived at-titudes towards financial and technical features and financial and technical knowledge of SWH adoption. The second category’s determinants were shaped by experts’ or stake-holders’ viewpoints or actual data carried from research or assessments. The perceived orientation determinants were raised from households’ characteristics, beliefs, and in-formation towards houses or SWH technology features. Broadly speaking, the categori-sation was an evolutionary approach, which means that by identifying new predictors, the best general appropriate term was chosen to replace the previous one.
Figure 2. Distinction between the financial and technical predictors in both categories based on their input data.
2.3. Frequency of Use The estimation of frequency of use and the recognition of factors were directed
simultaneously. Once classified, a predictor was considered ‘1’ in its corresponding cell. A subcategory with more than one variable was calculated using the number of iterations of the variables. For example, ‘government financial incentives’ contained various types of government policies, such as governmental grants, financial incentives, subsidies for purchase, subsidies for installation, legislation, solar RE credits, Renewable Portfolio Standard rate, and reduction of return of investment (RoI) by feed-in tariffs (FiTs). All of these were merged into only two predictors, and their repetitions exhibited all related incentives.
Figure 2. Distinction between the financial and technical predictors in both categories based on their input data.
2.3. Frequency of Use
The estimation of frequency of use and the recognition of factors were directed si-multaneously. Once classified, a predictor was considered ‘1’ in its corresponding cell. Asubcategory with more than one variable was calculated using the number of iterations ofthe variables. For example, ‘government financial incentives’ contained various types ofgovernment policies, such as governmental grants, financial incentives, subsidies for pur-chase, subsidies for installation, legislation, solar RE credits, Renewable Portfolio Standardrate, and reduction of return of investment (RoI) by feed-in tariffs (FiTs). All of these weremerged into only two predictors, and their repetitions exhibited all related incentives.
2.4. Vote-Counting Method
Widely regarded as one of the most common quantitative techniques used in re-search reviews, the vote-counting procedure describes studies’ results for synthesisingall outcomes correlated to each article [24,25]. This method provided insight into whichindependent variables were most/least correlated with the behaviour variables and theirlevel of importance in the uptake decision. Ninety-seven quantitative and qualitativearticles with either empirical or statistical data were selected to create a database for thevote-counting technique. The quantitative studies included a linear regression approachthat analysed the statistical relationship (significance at 0.1%, 0.5%, 1%, and 5%) betweenindependent and dependent parameters. However, variables in quantitative studies with

Energies 2021, 14, 6630 6 of 26
surveys and descriptive statistical methods were translated into the most similar terms andwere voted in a similar manner to qualitative studies (i.e., interviews). In qualitative studieswith narrative data, the votes were limited to the variables discussed by the authors.
The vote-counting technique elicited four potential coding results from the level ofthe impact of the identified variables (as independent variables) on the adoption decisionin the reviewed papers (Table 2): (non)significant positive and (non)significant negativerelationships. In the quantitative studies, variables were evaluated based on the valueof β and p and fell into one of the four codes. The parameters in the qualitative studieswere categorised based on the level of arguments and inferences. All dependent andindependent predictors incorporated in the vote-counting method were specified in thisprocess in a spreadsheet and then summed over studies to detect the overall trends of(non)significance of variables. When the relationships between variables were analysedin the reverse direction (e.g., lack of knowledge), their codes were also reversed to retainconsistency.
Table 2. Assessment of votes based on described coding.
CodeInterpretation
Quantitative Studies Qualitative Studies
−2: Significant negative connections Negative β and p value ≤ 0.05 Strongly argued−1: Negative connections Negative β and p value ≥ 0.05 Limited knowledge, no consensus+1: Positive connections Positive β and p value ≥ 0.05 Limited knowledge, no consensus
+2: Significant positive connections Positive β and p value ≤ 0.05 Strongly argued
As an example of assigning codes to predictors in qualitative research, Balezentiset al. [26] stated that the “energy efficiency of installations is important for 67% of respon-dents”; thus, ‘perceived efficiency’ was coded as +2. Furthermore, Li et al. [27] quantita-tively tested nine hypotheses to examine people’s willingness to adopt solar systems. Theirstudy applied linear regression to investigate the impact of the independent variables onwillingness. They found that switching cost had a significant negative relationship withwillingness (β = −0.465, p = 0.044); therefore, ‘switching cost’ was coded as −2.
3. Predictors of Solar Hot Water Adoption Behaviour
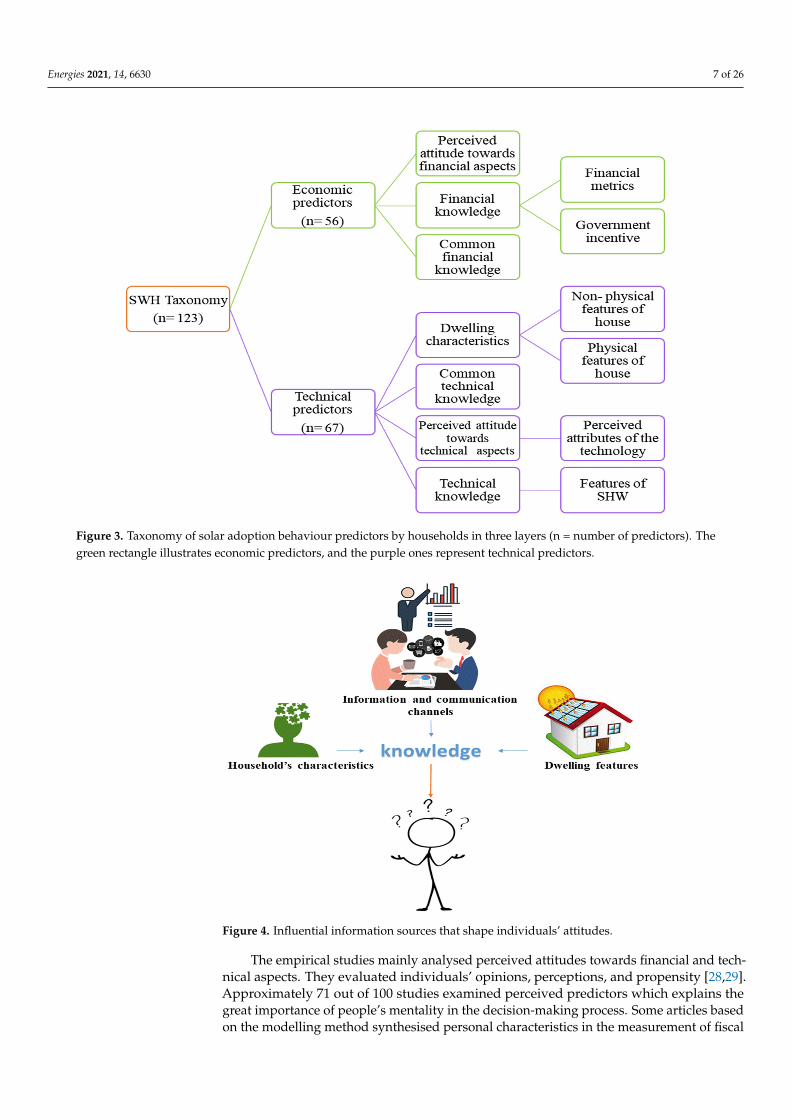
The review of 100 research studies led to the identification of 123 techno-economicpredictors of residential SWH adoption behaviour. These predictors evaluated households’attitude towards SWH, RE, and solar technologies as well as their diffusion rates, inten-tion, acceptance, willingness, and technology choice. Studies’ specific variables relied ontheir research purpose, and on average, seven predictors were evaluated in each article.Economic and technical determinants varied in detail; some referred to general indicators,whereas others described the indicators in as much detail as possible. To purchase an SWHsystem, consumers deal with two underlying types of predictors, namely financial andtechnical, acquired through two sets of factors. Economic and technological variables wereclassified into seven main categories and six subcategories (Figure 3). Figure 3 demon-strates sequences of concepts and the interconnection of layers. This customised taxonomywas achieved on the basis of behavioural theories and contextual factors, and the variableswere categorised into perceived knowledge and actual knowledge. In terms of frequencyof use, the technical and financial classifications occurred 421 and 402 times, respectively.Although the economic category had 11 variables fewer than the other category, its fre-quency of use was just 19 less than the technical category, demonstrating the importanceof economic predictors. Part of perceived knowledge comes from official and unofficial(interpersonal) data flows, such as experts, acquaintances, or mass media, which conveythe message that ultimately shapes the individual’s attitude (e.g., the perceived suitabilityof a house; Figure 4). In reality, when the uptake of SWHs is estimated, the individual’smindset is as vital as statistical data and scientific research. This is because the final decisionis based on the household’s cognition, not on raw input data.
Energies 2021, 14, 6630 7 of 26
Energies 2021, 14, x FOR PEER REVIEW 7 of 31
technological variables were classified into seven main categories and six subcategories (Figure 3). Figure 3 demonstrates sequences of concepts and the interconnection of layers. This customised taxonomy was achieved on the basis of behavioural theories and con-textual factors, and the variables were categorised into perceived knowledge and actual knowledge. In terms of frequency of use, the technical and financial classifications oc-curred 421 and 402 times, respectively. Although the economic category had 11 variables fewer than the other category, its frequency of use was just 19 less than the technical category, demonstrating the importance of economic predictors. Part of perceived knowledge comes from official and unofficial (interpersonal) data flows, such as experts, acquaintances, or mass media, which convey the message that ultimately shapes the in-dividual’s attitude (e.g., the perceived suitability of a house; Figure 4). In reality, when the uptake of SWHs is estimated, the individual’s mindset is as vital as statistical data and scientific research. This is because the final decision is based on the household’s cognition, not on raw input data.
Figure 3. Taxonomy of solar adoption behaviour predictors by households in three layers (n = number of predictors). The green rectangle illustrates economic predictors, and the purple ones represent technical predictors.
Figure 3. Taxonomy of solar adoption behaviour predictors by households in three layers (n = number of predictors). Thegreen rectangle illustrates economic predictors, and the purple ones represent technical predictors.
Energies 2021, 14, x FOR PEER REVIEW 8 of 31
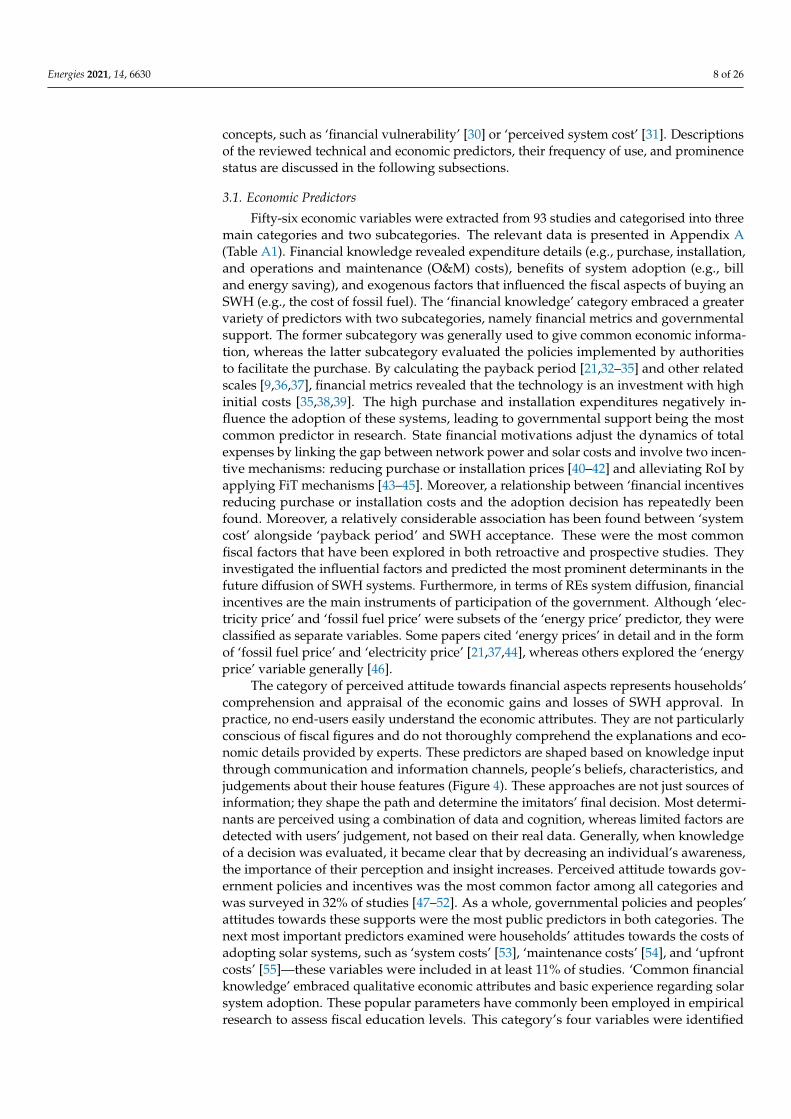
Figure 4. Influential information sources that shape individuals’ attitudes.
The empirical studies mainly analysed perceived attitudes towards financial and technical aspects. They evaluated individuals’ opinions, perceptions, and propensity [28,29]. Approximately 71 out of 100 studies examined perceived predictors which ex-plains the great importance of people’s mentality in the decision-making process. Some articles based on the modelling method synthesised personal characteristics in the measurement of fiscal concepts, such as ‘financial vulnerability’ [30] or ‘perceived system cost’ [31]. Descriptions of the reviewed technical and economic predictors, their fre-quency of use, and prominence status are discussed in the following subsections.
3.1. Economic Predictors Fifty-six economic variables were extracted from 93 studies and categorised into
three main categories and two subcategories. The relevant data is presented in Appendix A (Table A1). Financial knowledge revealed expenditure details (e.g., purchase, installa-tion, and operations and maintenance (O&M) costs), benefits of system adoption (e.g., bill and energy saving), and exogenous factors that influenced the fiscal aspects of buying an SWH (e.g., the cost of fossil fuel). The ‘financial knowledge’ category embraced a greater variety of predictors with two subcategories, namely financial metrics and gov-ernmental support. The former subcategory was generally used to give common eco-nomic information, whereas the latter subcategory evaluated the policies implemented by authorities to facilitate the purchase. By calculating the payback period [21,32–35] and other related scales [9,36,37], financial metrics revealed that the technology is an invest-ment with high initial costs [35,38,39]. The high purchase and installation expenditures negatively influence the adoption of these systems, leading to governmental support being the most common predictor in research. State financial motivations adjust the dy-namics of total expenses by linking the gap between network power and solar costs and involve two incentive mechanisms: reducing purchase or installation prices [40–42] and alleviating RoI by applying FiT mechanisms [43–45]. Moreover, a relationship between ‘financial incentives reducing purchase or installation costs and the adoption decision has repeatedly been found. Moreover, a relatively considerable association has been found between ‘system cost’ alongside ‘payback period’ and SWH acceptance. These were the most common fiscal factors that have been explored in both retroactive and prospective studies. They investigated the influential factors and predicted the most
Figure 4. Influential information sources that shape individuals’ attitudes.
The empirical studies mainly analysed perceived attitudes towards financial and tech-nical aspects. They evaluated individuals’ opinions, perceptions, and propensity [28,29].Approximately 71 out of 100 studies examined perceived predictors which explains thegreat importance of people’s mentality in the decision-making process. Some articles basedon the modelling method synthesised personal characteristics in the measurement of fiscal
Energies 2021, 14, 6630 8 of 26
concepts, such as ‘financial vulnerability’ [30] or ‘perceived system cost’ [31]. Descriptionsof the reviewed technical and economic predictors, their frequency of use, and prominencestatus are discussed in the following subsections.
3.1. Economic Predictors
Fifty-six economic variables were extracted from 93 studies and categorised into threemain categories and two subcategories. The relevant data is presented in Appendix A(Table A1). Financial knowledge revealed expenditure details (e.g., purchase, installation,and operations and maintenance (O&M) costs), benefits of system adoption (e.g., billand energy saving), and exogenous factors that influenced the fiscal aspects of buying anSWH (e.g., the cost of fossil fuel). The ‘financial knowledge’ category embraced a greatervariety of predictors with two subcategories, namely financial metrics and governmentalsupport. The former subcategory was generally used to give common economic informa-tion, whereas the latter subcategory evaluated the policies implemented by authoritiesto facilitate the purchase. By calculating the payback period [21,32–35] and other relatedscales [9,36,37], financial metrics revealed that the technology is an investment with highinitial costs [35,38,39]. The high purchase and installation expenditures negatively in-fluence the adoption of these systems, leading to governmental support being the mostcommon predictor in research. State financial motivations adjust the dynamics of totalexpenses by linking the gap between network power and solar costs and involve two incen-tive mechanisms: reducing purchase or installation prices [40–42] and alleviating RoI byapplying FiT mechanisms [43–45]. Moreover, a relationship between ‘financial incentivesreducing purchase or installation costs and the adoption decision has repeatedly beenfound. Moreover, a relatively considerable association has been found between ‘systemcost’ alongside ‘payback period’ and SWH acceptance. These were the most commonfiscal factors that have been explored in both retroactive and prospective studies. Theyinvestigated the influential factors and predicted the most prominent determinants in thefuture diffusion of SWH systems. Furthermore, in terms of REs system diffusion, financialincentives are the main instruments of participation of the government. Although ‘elec-tricity price’ and ‘fossil fuel price’ were subsets of the ‘energy price’ predictor, they wereclassified as separate variables. Some papers cited ‘energy prices’ in detail and in the formof ‘fossil fuel price’ and ‘electricity price’ [21,37,44], whereas others explored the ‘energyprice’ variable generally [46].
The category of perceived attitude towards financial aspects represents households’comprehension and appraisal of the economic gains and losses of SWH approval. Inpractice, no end-users easily understand the economic attributes. They are not particularlyconscious of fiscal figures and do not thoroughly comprehend the explanations and eco-nomic details provided by experts. These predictors are shaped based on knowledge inputthrough communication and information channels, people’s beliefs, characteristics, andjudgements about their house features (Figure 4). These approaches are not just sources ofinformation; they shape the path and determine the imitators’ final decision. Most determi-nants are perceived using a combination of data and cognition, whereas limited factors aredetected with users’ judgement, not based on their real data. Generally, when knowledgeof a decision was evaluated, it became clear that by decreasing an individual’s awareness,the importance of their perception and insight increases. Perceived attitude towards gov-ernment policies and incentives was the most common factor among all categories andwas surveyed in 32% of studies [47–52]. As a whole, governmental policies and peoples’attitudes towards these supports were the most public predictors in both categories. Thenext most important predictors examined were households’ attitudes towards the costs ofadopting solar systems, such as ‘system costs’ [53], ‘maintenance costs’ [54], and ‘upfrontcosts’ [55]—these variables were included in at least 11% of studies. ‘Common financialknowledge’ embraced qualitative economic attributes and basic experience regarding solarsystem adoption. These popular parameters have commonly been employed in empiricalresearch to assess fiscal education levels. This category’s four variables were identified
Energies 2021, 14, 6630 9 of 26
only eight times, with ‘awareness of financial metrics used for calculating investment’mentioned three times as the primary predictor.
3.2. Technical Predictors
A total of 94 studies were reviewed to extract 67 technical predictors, which were splitover the following four groups: technical knowledge, perceived attitude towards technicalaspects, dwelling characteristics, and common technical knowledge. The relevant datais accessible in Appendix A in Table A2. Perceived technical attitude expounded on theresidential beliefs about the system and technical market issues. These approaches wereimpenetrable experiences formed based on individuals’ viewpoints and the hermeneu-tics of the received knowledge combined with individual features and beliefs, similar toperceived financial attitudes (Figure 4). Its larger subcategory, ‘perceived features of thetechnology’, uncovered people’s beliefs regarding solar technology, not statistical dataand real characteristics. Some variables such as ‘perceived ease of use’ were instinctivelyunderstood by the end-user [56], whereas some others were appreciated by gaining knowl-edge and cognition. ‘Perceived attitudes towards technical aspects’ identified in 56 of thereviewed papers assessed 26 predictors with a frequency of use of approximately 17%. Theknowledge and beliefs of decision-makers affected the levels of financial and technical atti-tudes; for example, the reasons for accepting SWHs provided by a specialist differed fromthose of an ordinary citizen with limited knowledge. The main predictor of this categoryfor households was ‘lack of knowledge’, which occurred in 14 studies. It covered obtainingtrustworthy and reliable information for accepting and using the system correctly [57].
The next significant category of adoption decisions for residential SWHs was ‘dwellingcharacteristics’. This category involved both the physical and nonphysical details of thebuilding. The physical attributes of a dwelling refer to the interior and exterior features ofthe building, such as roof type and number of rooms. The nonphysical factors measuresolar radiation and some general traits such as house ownership. ‘House type’ was studiedin approximately 30% of research and refers to the type of residential accommodation:detached, semi-detached, apartment, farm, or single story [58]. ‘Geographical location’and ‘solar radiation’ were occasionally indicated in 22 and 15 studies, respectively, andwere established among the first ranked factors after ‘house type’ in this category. Ahouse’s position is critical because it determines the amount of sunlight absorbed bysolar panels. If the house is located in a low-sunlight area, the system’s efficiency andits distribution decrease. The determination of ‘geographical location’ has mostly beenused for Southeast Asian countries [21,34,59–61], which have a high level of solar radiation,whereas it has been used sparsely for the UK [62,63], Australia [64], and Ireland [65].Even within a country, the amount of solar absorption may vary based on ‘geographicallocation’; therefore, these two parameters were considered the most important indicatorsin most articles [44]. The technical characteristics of SWHs promoted the recognitionof mechanical properties and the efficiency of technology through 10 predictors and 7%of repetitions. These predictors were parts of fiscal assessments for obtaining financialmetrics in some econometric and prediction studies (commonly through ‘system size’ and‘efficiency of SWH’ [37,44]). However, compared with financial factors, fewer studiesused technical variables for statistical calculation. The predictor of ‘solar collector’, themain component of the system, was analysed in 9% of the studies. The predictors of‘SWH lifespan’ and ‘capacity’, the next most popular technical factors, were investigatedin fewer than 10 studies [34,46]. ‘Common technical knowledge’ covered the technicalqualitative traits and usual necessary expertise regarding adoption behaviour. Theseprevailing predictors were generally adopted in the empirical research to evaluate technicalknowledge levels. Eight factors in this category were used in 35 studies and identified62 times, with ‘awareness of SWHs’ indicated 21 times as the leading predictor [66,67].

Energies 2021, 14, 6630 10 of 26
4. Correlation of Predictors with the Adoption Decision
A total of 399 votes were conducted and synthesised from two vote-counting exercises,namely economic and technical categories. Although both categories had the same size, theadoption decision was more significantly associated with economic predictors (Figure 5),and 57% of votes were recorded in this category. It contained more significant negative(61%) and positive votes (59%) than the technical category. It was observed that the technicalcategory, despite having more subcategories, had fewer votes in all subcategories. Technicalknowledge only had 12 significant votes, whereas perceived technical aspects had themost significantly negative votes (28 articles) in this category, and ‘dwelling characteristic’variables were examined in 34 studies as significant positive predictors. Broadly speaking,all categories included more positive votes than negative, except the ‘perceived attitudetowards technical aspects’ group (45 negative votes against 28 positive ones). The votinganalysis focused on the most measured predictors to present a broad overview of thecollected results. Predictors with one vote were excluded from the following calculation,and the full outcomes of vote-counting results for both categories are illustrated in theSupplementary Information File.
Energies 2021, 14, x FOR PEER REVIEW 11 of 31
Figure 5. Overall vote-counting results of the main categories.
4.1. Significance of Economic Predictors The analysis of 50 economic variables considered 228 votes in three categories with
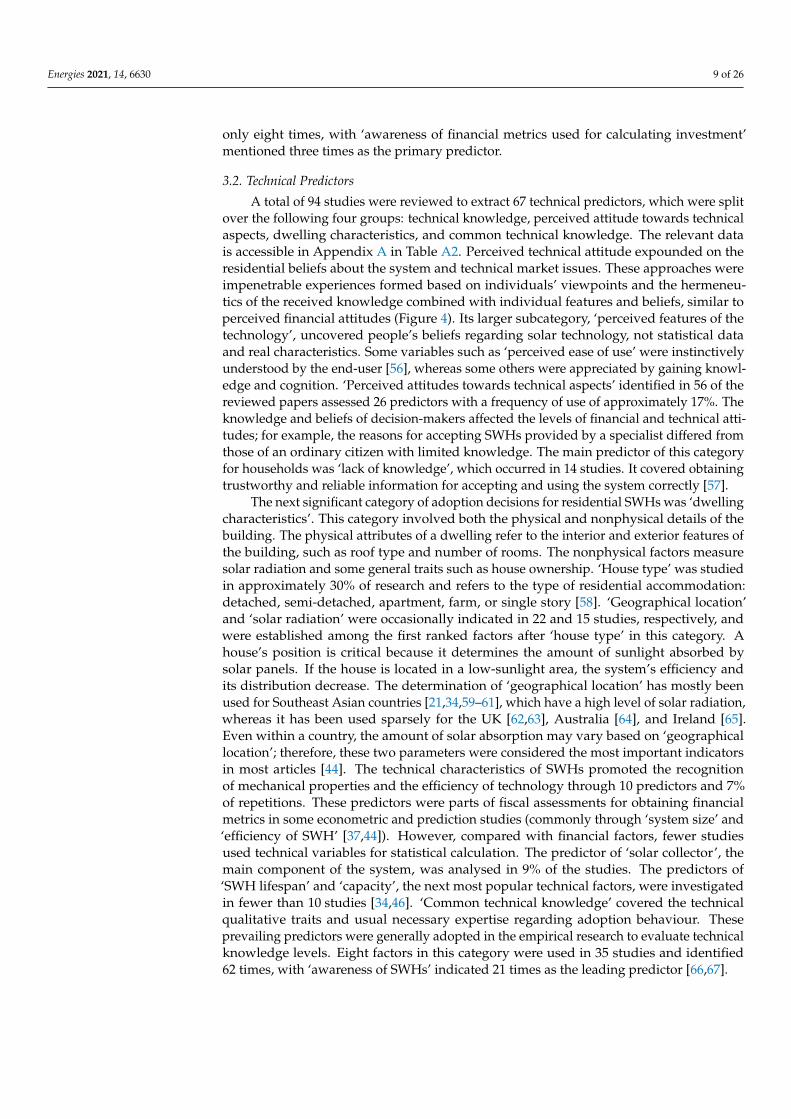
almost identical weights in two larger subgroups (Figure 6). The vote-counting results illustrated that government policies had a statistically significant association with resi-dential system adoption. Moreover, 25% of the economic votes were allocated to both perceived and real government support, of which 23% confirmed the positive effects of these predictors, and only 2% recorded the negative impact. ‘Perceived attitude of gov-ernment policies’ was analysed in fewer studies compared with ‘government incentives’ (24 < 34) and had more negative votes (5 > 1). Furthermore, 97% of the ‘government in-centives’ subcategory had a positive correlation with solar system adoption. A study conducted in Karnataka, India, concluded that the 6–10% property tax rebate for SWH users was high. This tax decreased the willingness to accept the system, and should be reduced [52]. This study was the only negative vote in the governmental support sub-category; therefore, it must be seen whether it was in fact high or limited to that specific country and individuals’ perception. Perceived costs in the form of ‘installation costs’ and ‘upfront costs’ were significantly negatively correlated with adoption at 100%, whereas actual costs and the price of the system had a negative association in more than 83% of related studies. Kumar et al. stated that ‘perceived cost’ positively influenced customers’ purchase intention to buy an SWH, and their positive correlation was con-firmed by collecting data from 695 respondents in North India [66]. However, other studies that reviewed cost predictors found a negative correlation with adoption behav-iour.
Figure 5. Overall vote-counting results of the main categories.
4.1. Significance of Economic Predictors
The analysis of 50 economic variables considered 228 votes in three categories withalmost identical weights in two larger subgroups (Figure 6). The vote-counting results il-lustrated that government policies had a statistically significant association with residentialsystem adoption. Moreover, 25% of the economic votes were allocated to both perceivedand real government support, of which 23% confirmed the positive effects of these predic-tors, and only 2% recorded the negative impact. ‘Perceived attitude of government policies’was analysed in fewer studies compared with ‘government incentives’ (24 < 34) and hadmore negative votes (5 > 1). Furthermore, 97% of the ‘government incentives’ subcategoryhad a positive correlation with solar system adoption. A study conducted in Karnataka,India, concluded that the 6–10% property tax rebate for SWH users was high. This tax

Energies 2021, 14, 6630 11 of 26
decreased the willingness to accept the system, and should be reduced [52]. This study wasthe only negative vote in the governmental support subcategory; therefore, it must be seenwhether it was in fact high or limited to that specific country and individuals’ perception.Perceived costs in the form of ‘installation costs’ and ‘upfront costs’ were significantlynegatively correlated with adoption at 100%, whereas actual costs and the price of thesystem had a negative association in more than 83% of related studies. Kumar et al. statedthat ‘perceived cost’ positively influenced customers’ purchase intention to buy an SWH,and their positive correlation was confirmed by collecting data from 695 respondents inNorth India [66]. However, other studies that reviewed cost predictors found a negativecorrelation with adoption behaviour.
In the economic attributes category, although installation, system, and upfront costshad a lower correlation with the decision, ‘energy cost’ was significantly and negativelycorrelated in all studies that included it. Various reasons existed for this negative cor-relation. For instance, government fuel subsidies and the cheap cost of energy suppliesreduced energy demand for RE systems such as SWHs [67,68]. Therefore, ‘energy cost’had a significantly negative relationship with the adoption of solar systems. However,‘energy saving’ and ‘bill saving’ in both categories were known to be significant positivemotivations for households by all studies that considered them. ‘Profitability’, ‘financialmotivation’, and ‘increasing home values’ had significantly positive associations withacceptance behaviour in less than 50% of studies. Generally, cost-related variables werenegatively correlated with residential adoption, less in actual financial attributes thanperceived economic variables. The smallest category, ‘common financial knowledge’, had aminor correlation with system adoption. The ‘knowledge of incentives’ was identified as asignificant factor in only two papers.
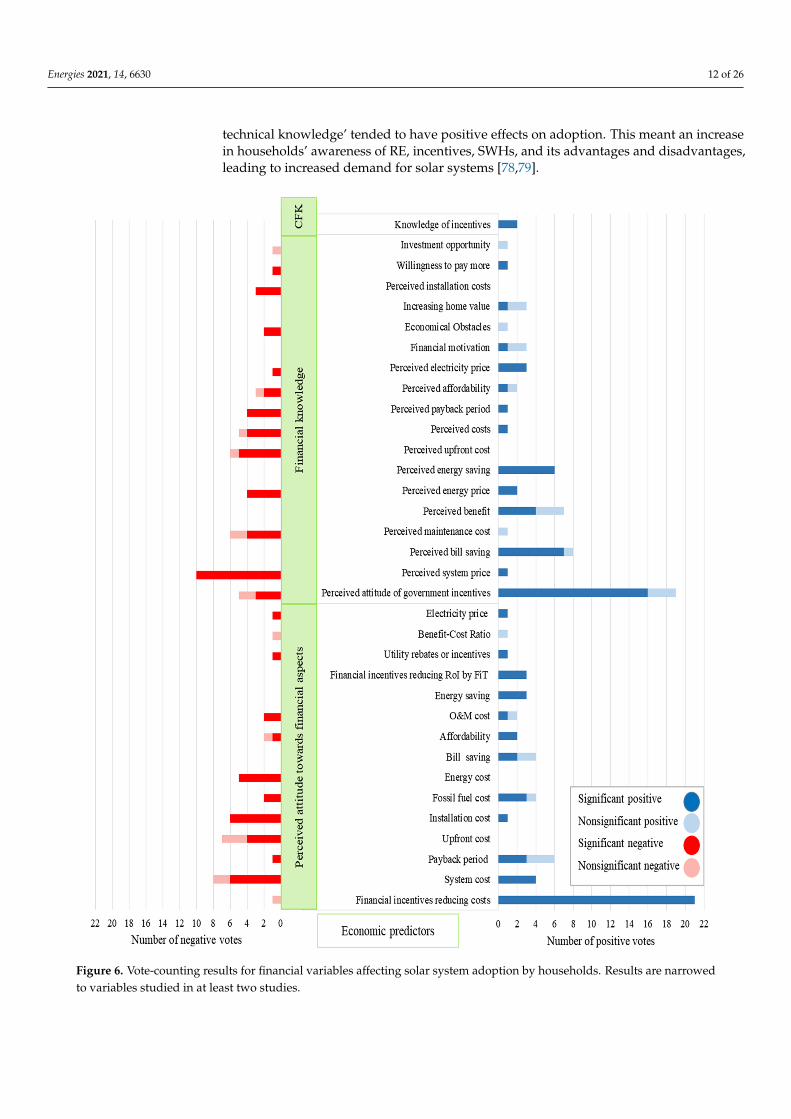
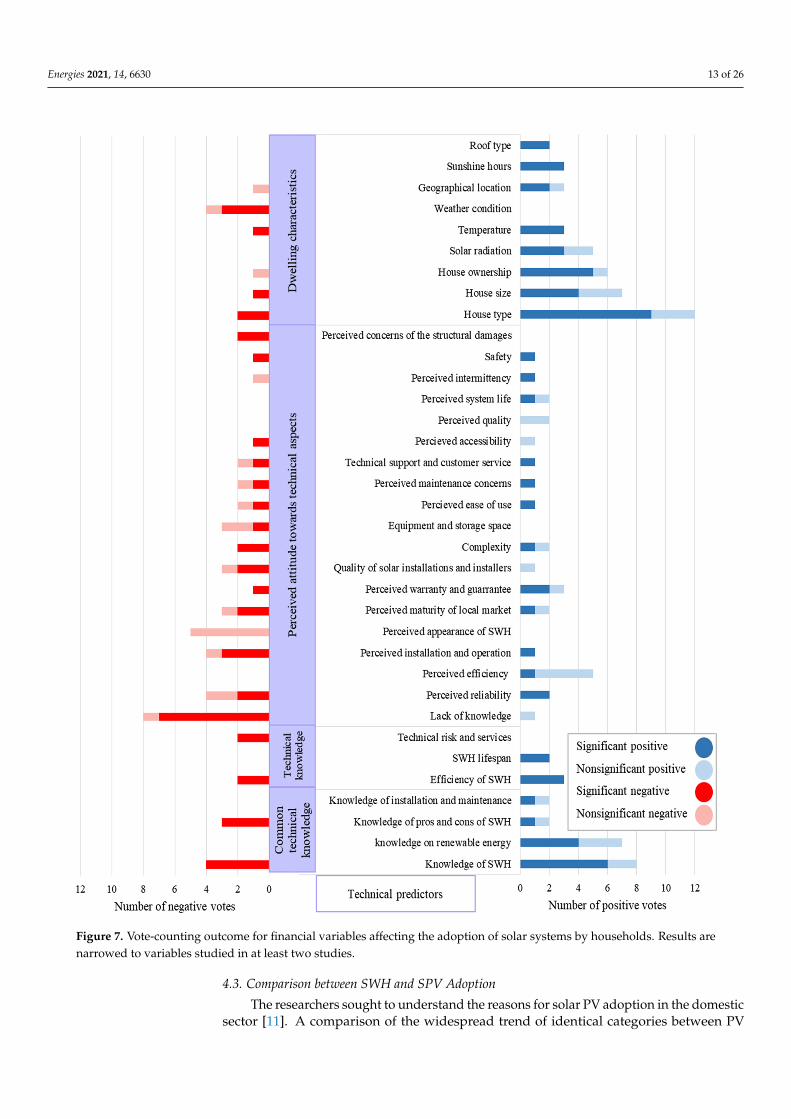
4.2. Technical Predictors
The vote-counting exercise resulted in 171 technical votes in four separate groups(Figure 7). The largest group that included 73 votes was ‘perceived attitude towards tech-nical aspects’, while ‘technical knowledge’ was the least significant category with only12 votes. Predictors within the ‘perceived technical attitudes’ subcategory recorded ap-proximately 43% of the technical votes. They were significantly connected to the adoptionof SWHs. Although ‘perceived appearance’, ‘structural damage of SWHs’, and ‘equipmentand storage space’ were negatively associated [23,58,63,66,69,70], ‘perceived efficiency’,‘perceived quality’, and ‘perceived system life’ had absolute positive relationships [54,56,71]with system adoption. Perceived technology votes were significantly negative in more than60% of measurements. The most prevalent factor was ‘lack of knowledge’, which was anal-ysed in nine studies and regarded as a significantly negative vote in seven studies [72,73].The vote-counting results were indecisive for ‘safety’ and ‘complexity’ [8,74].
The parameters of the ‘dwelling characteristic’ category (with 57 votes) had the highestpositive correlation with solar adoption. All predictors’ positive influences exceeded theiradverse effects, except for the ‘weather condition’ variable, which had a significant butnegative relationship, demonstrating their importance in the formation of solar adoptionbehaviour. For example, ‘climatic conditions’ (e.g., typhoon effect) were considered themajor negative factors influencing the popularisation of SWHs in Taiwan [75]. ‘House type’was the most potent factor in technical categories. It comprises all types of house suchas detached, semi-detached, apartment, villa, and farms, and in some cases, it includesbuilding materials [53,76]. In fact, ‘house type’ is an influential factor in the possibility ofsystem installation. The ‘technical knowledge’ category was the smallest with only 12 votes.It discussed the level of effectiveness of professional technology predictors. For example,Mukwada et al. [77] stated that some residents prefer water pipes to be installed outsidetheir houses instead of running along the interior walls because it could possibly causedampness in the event of leakage, even though this could expose the water to a greaterchance of freezing during winter. Moreover, the system’s efficiency could be reduced dueto the freezing of pipes or the lack of sunlight. Three-quarters of concepts under ‘common
Energies 2021, 14, 6630 12 of 26
technical knowledge’ tended to have positive effects on adoption. This meant an increasein households’ awareness of RE, incentives, SWHs, and its advantages and disadvantages,leading to increased demand for solar systems [78,79].
Energies 2021, 14, x FOR PEER REVIEW 12 of 31
Figure 6. Vote-counting results for financial variables affecting solar system adoption by households. Results are nar-rowed to variables studied in at least two studies.
In the economic attributes category, although installation, system, and upfront costs had a lower correlation with the decision, ‘energy cost’ was significantly and negatively correlated in all studies that included it. Various reasons existed for this negative corre-lation. For instance, government fuel subsidies and the cheap cost of energy supplies
Figure 6. Vote-counting results for financial variables affecting solar system adoption by households. Results are narrowedto variables studied in at least two studies.
Energies 2021, 14, 6630 13 of 26Energies 2021, 14, x FOR PEER REVIEW 14 of 31
Figure 7. Vote-counting outcome for financial variables affecting the adoption of solar systems by households. Results are narrowed to variables studied in at least two studies.
Figure 7. Vote-counting outcome for financial variables affecting the adoption of solar systems by households. Results arenarrowed to variables studied in at least two studies.
4.3. Comparison between SWH and SPV Adoption
The researchers sought to understand the reasons for solar PV adoption in the domesticsector [11]. A comparison of the widespread trend of identical categories between PV
Energies 2021, 14, 6630 14 of 26
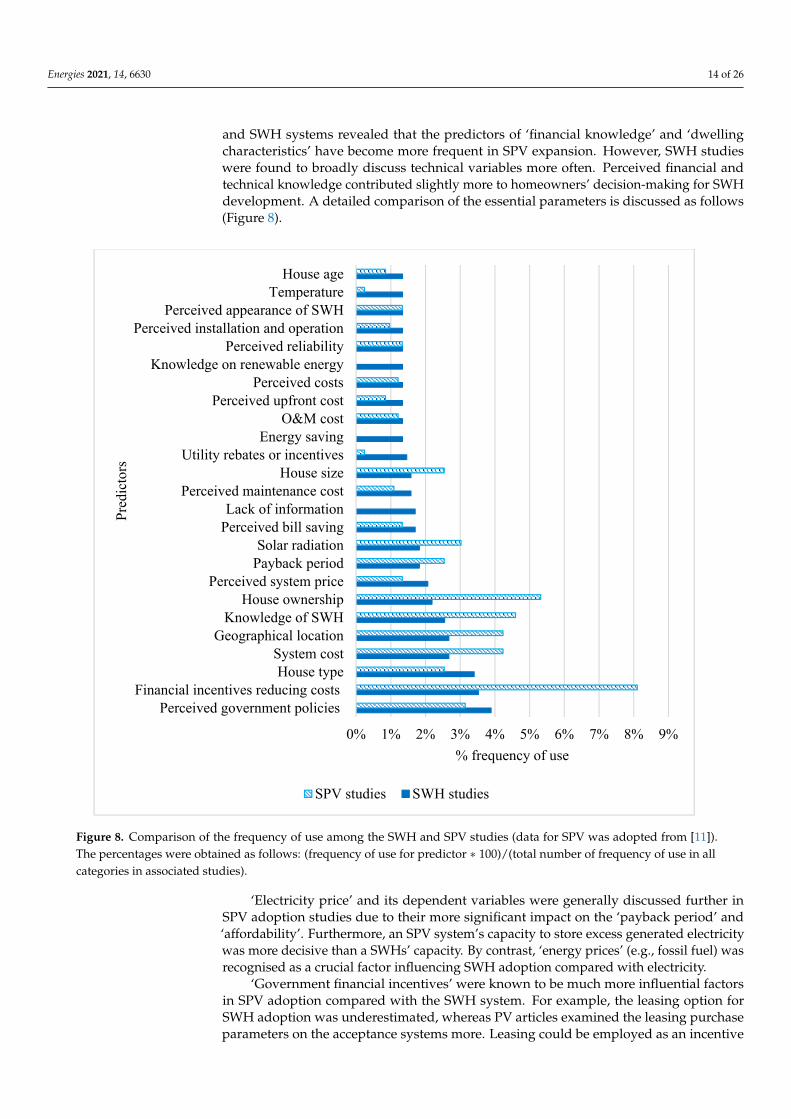
and SWH systems revealed that the predictors of ‘financial knowledge’ and ‘dwellingcharacteristics’ have become more frequent in SPV expansion. However, SWH studieswere found to broadly discuss technical variables more often. Perceived financial andtechnical knowledge contributed slightly more to homeowners’ decision-making for SWHdevelopment. A detailed comparison of the essential parameters is discussed as follows(Figure 8).
Energies 2021, 14, x FOR PEER REVIEW 16 of 31
Figure 8. Comparison of the frequency of use among the SWH and SPV studies (data for SPV was adopted from [11]). The percentages were obtained as follows: (frequency of use for predictor * 100)/(total number of frequency of use in all cat-egories in associated studies).
‘Electricity price’ and its dependent variables were generally discussed further in SPV adoption studies due to their more significant impact on the ‘payback period’ and ‘affordability’. Furthermore, an SPV system’s capacity to store excess generated electric-ity was more decisive than a SWHs’ capacity. By contrast, ‘energy prices’ (e.g., fossil fuel) was recognised as a crucial factor influencing SWH adoption compared with electricity.
‘Government financial incentives’ were known to be much more influential factors in SPV adoption compared with the SWH system. For example, the leasing option for SWH adoption was underestimated, whereas PV articles examined the leasing purchase parameters on the acceptance systems more. Leasing could be employed as an incentive in SWH development. Conversely, ‘utility rebates or incentives’ were discussed in only two SPV articles, although it is a famous concept in the development of SWH systems. The ‘warranty and guarantee’ concept was also missed in SPV analyses, whereas it was reviewed in seven SWH articles. One main reason for the low popularity of SWHs among households was demonstrated to be their ‘lack of information’, an indicator that was largely overlooked in SPV studies [11]. Increasing ‘public awareness’ of these systems’ positive aspects can serve as a starting point for their expansion.
0% 1% 2% 3% 4% 5% 6% 7% 8% 9%
Perceived government policiesFinancial incentives reducing costs
House typeSystem cost
Geographical locationKnowledge of SWH
House ownershipPerceived system price
Payback periodSolar radiation
Perceived bill savingLack of information
Perceived maintenance costHouse size
Utility rebates or incentivesEnergy saving
O&M costPerceived upfront cost
Perceived costsKnowledge on renewable energy
Perceived reliabilityPerceived installation and operation
Perceived appearance of SWHTemperature
House age
% frequency of use
Pred
icto
rs
SPV studies SWH studies
Figure 8. Comparison of the frequency of use among the SWH and SPV studies (data for SPV was adopted from [11]).The percentages were obtained as follows: (frequency of use for predictor ∗ 100)/(total number of frequency of use in allcategories in associated studies).
‘Electricity price’ and its dependent variables were generally discussed further inSPV adoption studies due to their more significant impact on the ‘payback period’ and‘affordability’. Furthermore, an SPV system’s capacity to store excess generated electricitywas more decisive than a SWHs’ capacity. By contrast, ‘energy prices’ (e.g., fossil fuel) wasrecognised as a crucial factor influencing SWH adoption compared with electricity.
‘Government financial incentives’ were known to be much more influential factorsin SPV adoption compared with the SWH system. For example, the leasing option forSWH adoption was underestimated, whereas PV articles examined the leasing purchaseparameters on the acceptance systems more. Leasing could be employed as an incentive
Energies 2021, 14, 6630 15 of 26
in SWH development. Conversely, ‘utility rebates or incentives’ were discussed in onlytwo SPV articles, although it is a famous concept in the development of SWH systems.The ‘warranty and guarantee’ concept was also missed in SPV analyses, whereas it wasreviewed in seven SWH articles. One main reason for the low popularity of SWHs amonghouseholds was demonstrated to be their ‘lack of information’, an indicator that was largelyoverlooked in SPV studies [11]. Increasing ‘public awareness’ of these systems’ positiveaspects can serve as a starting point for their expansion.
5. Discussion and Concluding Remarks
This study reviewed 100 articles on the technical and economic predictors that con-tribute to the residential adoption of SWHs. The original studies concentrated on theparticular features of individuals’ decisions and sought to discover the reasons for thehouseholds’ actions and forecast future behaviours. The results revealed 123 predictorsalongside their nature and origin. The findings further revealed the popularity of thesefactors and determined how and where they are often employed. This study introduceda comprehensive taxonomy customised for SWH adoption in the domestic sector for theidentified predictors. The predictors in this taxonomy were divided into two main dimen-sions, seven categories, and six subcategories. A comparison of variables’ frequency ofuse was also performed at the various taxonomy levels. The secondary objective was todifferentiate the correlations between the 99 identified predictors and the adoption decisionvariables. The analysis stages helped to identify and evaluate the significance of the variouspredictors, which was the main study goal regarding the adoption of SWH technology.
5.1. Economic Predictors Versus Technical Predictors
Although numerous studies have classified household behaviour variables that concerninformation technology [13], technology-based products [16], sport [12], and medicine [14,15],only a few publications have considered both internal and external variables of adoptionbehaviour in the field of SPV technology [11]; furthermore, no studies have estimated bothendogenous and exogenous concepts of the household decision in the adoption of SWHin residential sector. Although the article scope is limited to SWH and solar thermal, theframework is broadly appropriate to all solar and energy-efficiency technologies, and theidentified predictors can be applied to all consumer behaviours in the residential sector.While some technical factors change, most economic factors remain valuable in otherresidential technologies. In this vein, the significant predictors identified in this article cangive authors a good insight to identify technical and economic determinants of householdsin future studies. All of these parameters can be used as a starting point for future research.
By discriminating between the types of information input in the formation of the resi-dential buyers’ beliefs, the classification highlighted the importance of various influencesand roles of accurate data and personal opinions. It also attempted to present a holisticinsight into the whole picture of possible predictors and, in turn, more efficient determinantchoices. The identified predictors comprised analysed concepts and unknown areas yetto be discovered. This comprehensive and synthesised review of appropriate predictorswill make future studies more efficient and help policymakers decide on a broader vision.Although some parameters were similar in appearance, they could have different meaningsin terms of concept. An accurate perception of a variable’s concept had a great impacton its correct classification. As each of the predictors could enrich the list, they were notmerged to emphasise common terms.
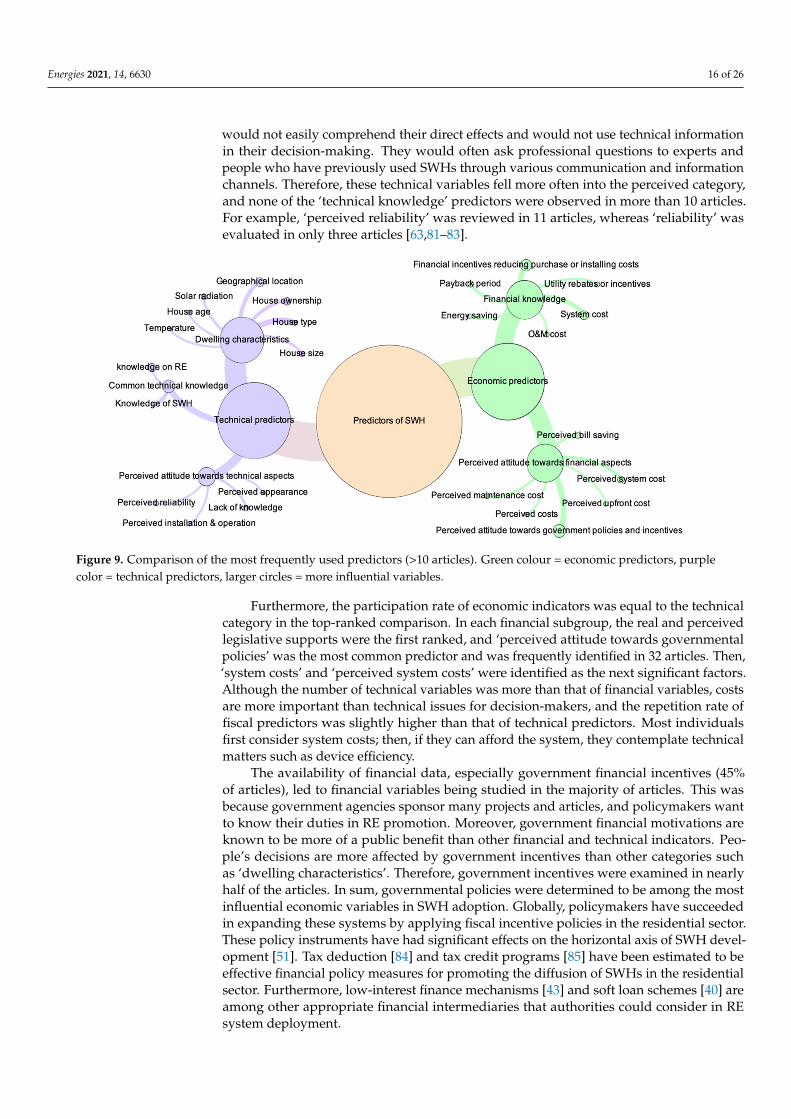
Investigations of the top-ranked determinants can be employed for the comparisonof two main categories (Figure 9); 50% of top-ranked indicators were located in the tech-nical group, and the house characteristic subset included seven concepts. ‘House type’and ‘geographical location’ were among the top five of all predictors. They illustratethe importance of house features in the decision-making process [28,49,80]. By contrast,‘common technical knowledge’ and ‘perceived attitudes towards technical aspects’ wereless common. Because ‘technical knowledge’ predictors are specialised, most individuals
Energies 2021, 14, 6630 16 of 26
would not easily comprehend their direct effects and would not use technical informationin their decision-making. They would often ask professional questions to experts andpeople who have previously used SWHs through various communication and informationchannels. Therefore, these technical variables fell more often into the perceived category,and none of the ‘technical knowledge’ predictors were observed in more than 10 articles.For example, ‘perceived reliability’ was reviewed in 11 articles, whereas ‘reliability’ wasevaluated in only three articles [63,81–83].
Energies 2021, 14, x FOR PEER REVIEW 18 of 31
10 articles. For example, ‘perceived reliability’ was reviewed in 11 articles, whereas ‘re-liability’ was evaluated in only three articles [63,81–83].
Figure 9. Comparison of the most frequently used predictors (>10 articles). Green colour = economic predictors, purple color = technical predictors, larger circles = more influential variables.
Furthermore, the participation rate of economic indicators was equal to the technical category in the top-ranked comparison. In each financial subgroup, the real and per-ceived legislative supports were the first ranked, and ‘perceived attitude towards gov-ernmental policies’ was the most common predictor and was frequently identified in 32 articles. Then, ‘system costs’ and ‘perceived system costs’ were identified as the next significant factors. Although the number of technical variables was more than that of fi-nancial variables, costs are more important than technical issues for decision-makers, and the repetition rate of fiscal predictors was slightly higher than that of technical predictors. Most individuals first consider system costs; then, if they can afford the system, they contemplate technical matters such as device efficiency.
The availability of financial data, especially government financial incentives (45% of articles), led to financial variables being studied in the majority of articles. This was be-cause government agencies sponsor many projects and articles, and policymakers want to know their duties in RE promotion. Moreover, government financial motivations are known to be more of a public benefit than other financial and technical indicators. Peo-ple’s decisions are more affected by government incentives than other categories such as ‘dwelling characteristics’. Therefore, government incentives were examined in nearly half of the articles. In sum, governmental policies were determined to be among the most influential economic variables in SWH adoption. Globally, policymakers have succeeded in expanding these systems by applying fiscal incentive policies in the residential sector. These policy instruments have had significant effects on the horizontal axis of SWH de-velopment [51]. Tax deduction [84] and tax credit programs [85] have been estimated to be effective financial policy measures for promoting the diffusion of SWHs in the resi-dential sector. Furthermore, low-interest finance mechanisms [43] and soft loan schemes [40] are among other appropriate financial intermediaries that authorities could consider in RE system deployment.
In addition, the findings revealed that the most significant predictors were exam-ined in the majority of studies. We found that approximately 60% of negative votes were allocated to perceived categories. This illustrates individuals’ negative beliefs regarding solar systems and their financial dimensions, although statistical and specialised calcu-lations revealed more positive aspects of SWHs and their reliability and affordability. As
Figure 9. Comparison of the most frequently used predictors (>10 articles). Green colour = economic predictors, purplecolor = technical predictors, larger circles = more influential variables.
Furthermore, the participation rate of economic indicators was equal to the technicalcategory in the top-ranked comparison. In each financial subgroup, the real and perceivedlegislative supports were the first ranked, and ‘perceived attitude towards governmentalpolicies’ was the most common predictor and was frequently identified in 32 articles. Then,‘system costs’ and ‘perceived system costs’ were identified as the next significant factors.Although the number of technical variables was more than that of financial variables, costsare more important than technical issues for decision-makers, and the repetition rate offiscal predictors was slightly higher than that of technical predictors. Most individualsfirst consider system costs; then, if they can afford the system, they contemplate technicalmatters such as device efficiency.
The availability of financial data, especially government financial incentives (45%of articles), led to financial variables being studied in the majority of articles. This wasbecause government agencies sponsor many projects and articles, and policymakers wantto know their duties in RE promotion. Moreover, government financial motivations areknown to be more of a public benefit than other financial and technical indicators. Peo-ple’s decisions are more affected by government incentives than other categories suchas ‘dwelling characteristics’. Therefore, government incentives were examined in nearlyhalf of the articles. In sum, governmental policies were determined to be among the mostinfluential economic variables in SWH adoption. Globally, policymakers have succeededin expanding these systems by applying fiscal incentive policies in the residential sector.These policy instruments have had significant effects on the horizontal axis of SWH devel-opment [51]. Tax deduction [84] and tax credit programs [85] have been estimated to beeffective financial policy measures for promoting the diffusion of SWHs in the residentialsector. Furthermore, low-interest finance mechanisms [43] and soft loan schemes [40] areamong other appropriate financial intermediaries that authorities could consider in REsystem deployment.

Energies 2021, 14, 6630 17 of 26
In addition, the findings revealed that the most significant predictors were examinedin the majority of studies. We found that approximately 60% of negative votes were allo-cated to perceived categories. This illustrates individuals’ negative beliefs regarding solarsystems and their financial dimensions, although statistical and specialised calculationsrevealed more positive aspects of SWHs and their reliability and affordability. As scepti-cism about solar systems reduces the likelihood of adoption [67], increasing consumers’knowledge through effective policy interventions can encourage uptake (Figure 4). Thepredictors of government support had the most significant and positive impact, whereasperceived government variables with more negative votes were considered in fewer studies.Intention to go for SWH is driven by the perceived attitudes towards the governmentalpolicies. Therefore, a higher level of knowledge is required to be injected from both formaland interpersonal communication channels.
5.2. Limitations and Future Research Recommendations
A number of observations can be drawn about the limitations of the study. Oneconcern is that the collected information was not specific to one country, and multiple termswere used to express the same concept according to different cultures. The same words notbeing used in different articles made the data collection more challenging, which was amajor limitation. Furthermore, the frequency of use of the variables, subcategories, andgroups indicated their popularity and capacity. Although the method used to determinethe degree of repetition of influential predictors is proximate, the overall trend should betreated cautiously because some predictors were merged. Another limitation was thatsome predictors were correlated with others. As mentioned previously, many parametersintroduced one concept (e.g., solar radiation) but had various manifestations. These werelisted precisely because in some articles they were mentioned generally, whereas in others,they were stated in detail [76,86].
Although residential SWH installation dates back more than five decades, approx-imately 50% of studies have been conducted during the past six years. This expandingenthusiasm should be maintained and disseminated. Behavioural studies that thoroughlyconsider parameters and models lead to an improved grasp of household behaviour. Thisreview did not distinguish between the parameters of mature and immature markets inindustrial and non-industrial countries. Future studies may consider the distinction ofpredictor type, their roles, and importance in the decision-making procedure based ontheir market and country conditions. Furthermore, determinants from retroactive andprospective studies were contemplated as the same factors in this study. Future studiesneed to examine the differences among applied predictors’ selection and characteristicsin each study type. Moreover, the theoretical frameworks’ diversity and quality in thereviewed studies were largely limited. Future studies can apply this framework andmethodology to the adoption of other innovations to specify the most important conceptsand draw an entire picture of all RE technologies. In addition, this article did not addressthe dynamic connections between the economic and technical predictors to measure howthey transform over time, as well as which parameters handle more shifts. The perceptionof behaviour becomes complex when the financial and technical characteristics of SWHsare incorporated into behavioural and social tendencies. Therefore, while current researchhas developed economic and technology predictors, future research could focus on socialand individual predictors.

Energies 2021, 14, 6630 18 of 26
Supplementary Materials: The following are available online at https://www.mdpi.com/article/10.3390/en14206630/s1, the searched keywords, four-phase assessment approach, temporal distributionof published research, list of reviewed papers, and full details of vote counting can be found in theSupplementary Information File.
Author Contributions: Conceptualization, S.G.Z. and M.A.; methodology, S.G.Z. and M.A.; software,S.G.Z. and R.P.T.; validation, S.G.Z., R.H., M.A. and R.A.S.; formal analysis, S.GH., R.H. and M.A.;investigation, M.A. and R.A.S.; resources, S.G.Z. and R.P.T.; data curation, S.G.Z. and M.A.; writing—original draft preparation, S.G.Z., R.H., M.A. and R.P.T.; writing—review and editing, R.H., M.A. andR.A.S.; visualization, S.G.Z., R.H. and R.P.T.; supervision, R.A.S.; project administration, S.G.Z. andM.A. All authors have read and agreed to the published version of the manuscript.
Funding: This research received no external funding.
Institutional Review Board Statement: Not applicable.
Informed Consent Statement: Not applicable.
Conflicts of Interest: The authors declare no conflict of interest.

Energies 2021, 14, 6630 19 of 26
Appendix A
Table A1. Financial characteristics of household adoption of solar systems. The green colour of the numbers in front of each predictor indicates their use frequency. Darker colour = morecommon in studies.
Cat
egor
ies
# Predictor Description
Freq
uenc
yof
Use
Fina
ncia
lkno
wle
dge
1 Financial incentives reducing purchase or installing costs Government support policies such as: governmental grants, financial incentives, legislation, and solar renewableenergy credit subsidy for installation. 29
2 System cost It refers to the SWH price. 223 Payback period The time required to recoup an investment. 154 Utility rebates or incentives It refers to: discount rate, and rebate support. 125 Energy saving The energy saved from an SWH system use per house. 116 O&M cost Yearly operational expenses and life cycle cost. 117 Bill saving It refers to: not paying a high bill, energy cost-saving, and reduce bills. 108 Loan It refers to: capital debt loan, low-interest finance mechanisms, and debt interest rates. 99 Upfront cost The initial cost for SWH adoption. 910 Installation cost The costs for installing the system. 811 Electricity price It refers to two facets: (1) the current grid electricity price, (2) the recent increase in price in some countries. 712 Energy price It refers to: energy bill, energy escalation rate. 713 Fossil fuel price It refers to: yearly inflation on fossil fuel cost, unsubsidised fuel price, and low price for oil and gas. 714 Internal rate of return (IRR) A discount rate that makes the NPV of the project equal to zero. 715 Net present value (NPV) Difference between present values of cash inflows and outflows over the system life. 616 Affordability It refers to: financially affordable, financial viability, and the household has saved money. 617 Financial incentives reducing RoI by FiT Any income on the implementation of the system. 518 Economic benefit The financial revenues of installing a system for homeowners. 519 Benefit-Cost Ratio Ratio to identify the relationship between discounted benefits and costs of the project. 420 Cash flow It is based on the sum of income and expenses. 321 Permissions and insurance It refers to: permitting fees, institutional and regulatory. 322 Installation date Time of adoption. 223 System cost per Watt The price per Watt of energy of a solar panel system. 2
24 Energy rationing A goal of 20% reduction in electricity consumption was established, and heavy fines were applied when this goalwas not achieved. 1
25 Switching cost The prices for replacement with the old systems. 126 Breakeven percentage Estimated breakeven values. 127 Financial support The financial aids from the government or installer companies. 128 Adoption type People prefer to adopt systems by leasing or buying. 1
Total 205

Energies 2021, 14, 6630 20 of 26
Table A1. Cont.
Cat
egor
ies
# Predictor Description
Freq
uenc
yof
Use
Perc
eive
dat
titu
deto
war
dsfin
anci
alas
pect
s
29 Perceived attitude towards government policies and incentives Attitude toward all incentives offered by the government such as FiT, government commitment,government support, and all other financial incentives. 32
30 Perceived system cost People’s estimations for the SWH. 17
31 Perceived bill saving Households’ beliefs about: save or earn money from lower fuel bills and government incentives, themonetary benefit to end-users, and lower electricity bill. 14
32 Perceived maintenance cost Approximate resources (cost) required for usage and maintenance. 1333 Perceived upfront cost Individuals believe in the initial cost of SWH adoption. 1134 Perceived costs The SWH costs such as O&M, purchase cost, perceived high cost, and cost barrier. 1135 Perceived energy price People’s beliefs towards the total costs of energy. 1036 Perceived payback period Households’ viewpoint in the field of the required time to recoup an investment. 937 Perceived affordability It refers to: good financial investment, financial viability, and economically feasible. 938 Perceived financial benefit Individuals’ approach in the profitability of SWH installing. 739 Investment opportunity End-users think that SWH is an economic investment or not. 740 Financial motivation Financial motives offered by utility companies, government, or installer. 641 Perceived electricity price Concern over future electricity price. 642 Perceived fossil fuel price Expectations on fuel prices. 643 Increasing home value Perceived value of owner-occupied homes. 644 Economic obstacles It refers to: economic obstacles, or not enough funds. 445 Perceived switching cost It refers to: replacement for old systems, ability to relocate or change. 446 Perceived installation cost Individuals’ approach towards the costs of installing system process. 4
47 Obtaining best possible price Individuals assume that the SWH price is more reasonable than electricity and fuel, and by buying it,they get the best energy supply cost. 3
48 Perceived fossil fuel consumption A household belief that the usage of limited natural resources is reduced by adopting an SWH system. 349 Willingness to pay more Willingness to pay an additional cost for SWH. 250 Financial vulnerability Status of economic uncertainty or a position to the exposure of financial risk. 251 Attitude toward marketing factors Attitudes towards the utility and installer companies. 252 Perceived income Perceived financial situation of the household, and sufficient income to finance the installation. 1
Total 189
Com
mon
finan
cial
know
ledg
e
53 Knowledge of financial metrics used for calculating investment It refers to: investment-relevant knowledge, a range of financial data for the solar water heater. 354 Knowledge of Security of investment Households know the risk and security of investment. 2
55 Knowledge of incentives Decision-makers are aware of the incentives, availability of funds to pay upfront, and subsidy offeredby the government. 2
56 Knowledge of net-billing To understand the economic benefits that could be obtained by the adoption of SWH or awarenessabout the cost of current fuel. 1
Total 8
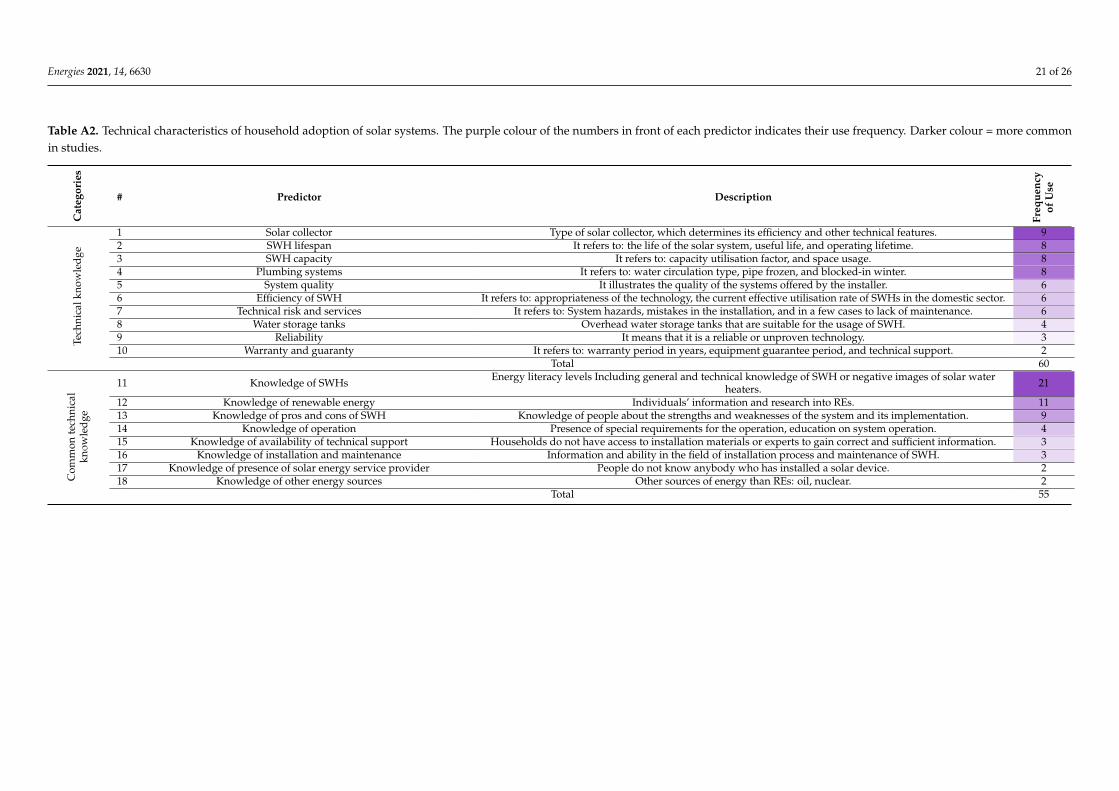
Energies 2021, 14, 6630 21 of 26
Table A2. Technical characteristics of household adoption of solar systems. The purple colour of the numbers in front of each predictor indicates their use frequency. Darker colour = more commonin studies.
Cat
egor
ies
# Predictor Description
Freq
uenc
yof
Use
Tech
nica
lkno
wle
dge
1 Solar collector Type of solar collector, which determines its efficiency and other technical features. 92 SWH lifespan It refers to: the life of the solar system, useful life, and operating lifetime. 83 SWH capacity It refers to: capacity utilisation factor, and space usage. 84 Plumbing systems It refers to: water circulation type, pipe frozen, and blocked-in winter. 85 System quality It illustrates the quality of the systems offered by the installer. 66 Efficiency of SWH It refers to: appropriateness of the technology, the current effective utilisation rate of SWHs in the domestic sector. 67 Technical risk and services It refers to: System hazards, mistakes in the installation, and in a few cases to lack of maintenance. 68 Water storage tanks Overhead water storage tanks that are suitable for the usage of SWH. 49 Reliability It means that it is a reliable or unproven technology. 310 Warranty and guaranty It refers to: warranty period in years, equipment guarantee period, and technical support. 2
Total 60
Com
mon
tech
nica
lkn
owle
dge
11 Knowledge of SWHs Energy literacy levels Including general and technical knowledge of SWH or negative images of solar waterheaters. 21
12 Knowledge of renewable energy Individuals’ information and research into REs. 1113 Knowledge of pros and cons of SWH Knowledge of people about the strengths and weaknesses of the system and its implementation. 914 Knowledge of operation Presence of special requirements for the operation, education on system operation. 415 Knowledge of availability of technical support Households do not have access to installation materials or experts to gain correct and sufficient information. 316 Knowledge of installation and maintenance Information and ability in the field of installation process and maintenance of SWH. 317 Knowledge of presence of solar energy service provider People do not know anybody who has installed a solar device. 218 Knowledge of other energy sources Other sources of energy than REs: oil, nuclear. 2
Total 55

Energies 2021, 14, 6630 22 of 26
Table A2. Cont.
Cat
egor
ies
# Predictor Description
Freq
uenc
yof
Use
Perc
eive
dat
titu
deto
war
dste
chni
cala
spec
ts
19 Lack of information It means that peoples do not have correct and reliable information. 1420 Perceived reliability Consumers think that SWH is functionality and technologically reliable. 1121 Perceived installation and operation Users’ ability towards installation and usage of SWH. 1122 Perceived appearance of SWH Opinions of households about the aesthetics of the device and its equipment. 1123 Quality of solar installations and installers Peoples believe that they have access to installation materials or expert human resources. 10
24 Complexity Complexity is the degree to which an innovation is perceived as relatively difficult to understand and to use. Thecomplexity of innovation, as perceived by members of a social system, is negatively related to its rate of adoption. 8
25 Perceived efficiency It refers to: awareness and understanding of energy efficiency, and the energy efficiency of SWH. 726 Perceived quality Domestic sector’s opinion related to the quality control, quality of utilities provided, and water quality. 727 Perceived ease of use Complexity of SWH system utilisation. 6
28 Perceived maturity of local market It refers to: availability of local installers or dealers, the problems of limited commercial systems, reputation of thecompany, and imperfect competition with conventional technologies. 6
29 Perceived Equipment and storage space The space required to install the system in people’s opinion. 530 Perceived warranty and guaranty People’s beliefs and information about the warranty and guarantee of the system 5
31 Technical support and customer service Attitude towards the quality or importance of the technical support and service offered by the municipality orinstaller to facilitate the technical conditions after-sale service. 5
32 Perceived Accessibility It refers to: unstable water supply or access to water. This is how easy it is to access energy-efficient devices,which would be crucial for maintenance inspections, repairs, etc. 4
33 Perceived intermittency Energy is not available when users need it. 434 Perceived maintenance concerns Users worry about how to maintain the device. 435 Perceived system life System lifetime. 3
36 Safety Individuals believe that solar and SWH are safe energy sources in different weather conditions or the field ofhealth implications. 3
37 Brand image Public opinion towards the company’s manufacturing and installing the system. 338 Perceived durability It is a durable system. 239 Structural damages The high weight of the device and the water pipes leaking damage the building structure. 2
40 Perceived solar radiation received Households’ evaluation towards the attracted solar radiation based on their house location and surroundingconditions. 2
41 Technology obsolete Some people think that the technology will become obsolete too quickly as difficulty in purchasing. 242 Ease of purchase Purchase with interest-free instalments. 1
43 Perceived suitability of house People believe their house is suitable for installing an SWH based on climate conditions and home location (notshaded by trees, chimneys, other buildings). 1
44 Perceived complexity of information Failure to fully understand the techno-economic information provided by the installer or the government. 1Total 138
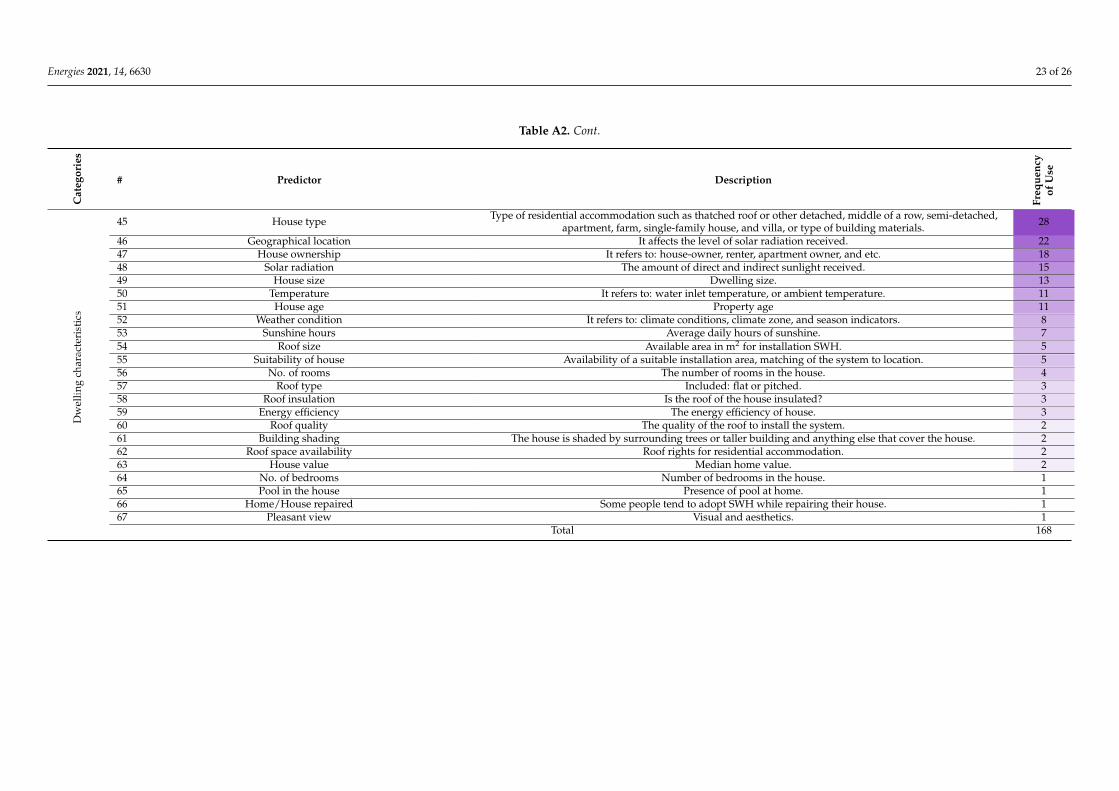
Energies 2021, 14, 6630 23 of 26
Table A2. Cont.
Cat
egor
ies
# Predictor Description
Freq
uenc
yof
Use
Dw
ellin
gch
arac
teri
stic
s
45 House type Type of residential accommodation such as thatched roof or other detached, middle of a row, semi-detached,apartment, farm, single-family house, and villa, or type of building materials. 28
46 Geographical location It affects the level of solar radiation received. 2247 House ownership It refers to: house-owner, renter, apartment owner, and etc. 1848 Solar radiation The amount of direct and indirect sunlight received. 1549 House size Dwelling size. 1350 Temperature It refers to: water inlet temperature, or ambient temperature. 1151 House age Property age 1152 Weather condition It refers to: climate conditions, climate zone, and season indicators. 853 Sunshine hours Average daily hours of sunshine. 754 Roof size Available area in m2 for installation SWH. 555 Suitability of house Availability of a suitable installation area, matching of the system to location. 556 No. of rooms The number of rooms in the house. 457 Roof type Included: flat or pitched. 358 Roof insulation Is the roof of the house insulated? 359 Energy efficiency The energy efficiency of house. 360 Roof quality The quality of the roof to install the system. 261 Building shading The house is shaded by surrounding trees or taller building and anything else that cover the house. 262 Roof space availability Roof rights for residential accommodation. 263 House value Median home value. 264 No. of bedrooms Number of bedrooms in the house. 165 Pool in the house Presence of pool at home. 166 Home/House repaired Some people tend to adopt SWH while repairing their house. 167 Pleasant view Visual and aesthetics. 1
Total 168

Energies 2021, 14, 6630 24 of 26
References1. Hafezi, R.; Alipour, M. Renewable Energy Sources: Traditional and Modern Age Technologies. In Affordable and Clean Energy;
Leal Filho, W., Azul, A.M., Brandli, L., Lange Salvia, A., Wall, T., Eds.; Springer International Publishing: Cham, Switzerland,2020; pp. 1–15. [CrossRef]
2. Hafezi, R.; Alipour, M. Sustainable Energy Management. In Affordable and Clean Energy; Leal Filho, W., Azul, A.M., Brandli, L.,Lange Salvia, A., Wall, T., Eds.; Springer International Publishing: Cham, Switzerland, 2020; pp. 1–13. [CrossRef]
3. Veeraboina, P.; Ratnam, G.Y. Analysis of the opportunities and challenges of solar water heating system (SWHS) in India:Estimates from the energy audit surveys & review. Renew. Sustain. Energy Rev. 2012, 16, 668–676. [CrossRef]
4. Alipour, M.; Salim, H.; Stewart, R.A.; Sahin, O. Residential solar photovoltaic adoption behaviour: End-to-end review of theories,methods and approaches. Renew. Energy 2021. [CrossRef]
5. Alipour, M.; Hafezi, R.; Papageorgiou, E.; Hafezi, M.; Alipour, M. Characteristics and scenarios of solar energy development inIran: Fuzzy cognitive map-based approach. Renew. Sustain. Energy Rev. 2019, 116, 109410. [CrossRef]
6. Alipour, M.; Stewart, R.A.; Sahin, O. Beyond the Diffusion of Residential Solar Photovoltaic Systems at Scale: Allegorising theBattery Energy Storage Adoption Behaviour. Energies 2021, 14, 5015. [CrossRef]
7. Wang, X.; Xiong, Y.; Yang, R.; Yu, P. Social Psychological Predictors of Adoption Intention for Solar Water Heaters in Rural China.Soc. Behav. Personal. 2019, 47, 1–13. [CrossRef]
8. Naidoo, A. The socio-economic impacts of solar water heaters compared across two communities: A case study of Cato Manor.Renew. Sustain. Energy Rev. 2020, 119, 109525. [CrossRef]
9. Cruz, T.; Schaeffer, R.; Lucena, A.F.P.; Melo, S.; Dutra, R. Solar water heating technical-economic potential in the household sectorin Brazil. Renew. Energy 2020, 146, 1618–1639. [CrossRef]
10. Ntanos, S.; Kyriakopoulos, G.; Chalikias, M.; Arabatzis, G.; Skordoulis, M. Public Perceptions and Willingness to Pay forRenewable Energy: A Case Study from Greece. Sustainability 2018, 10, 687. [CrossRef]
11. Alipour, M.; Salim, H.; Stewart, R.A.; Sahin, O. Predictors, taxonomy of predictors, and correlations of predictors with the decisionbehaviour of residential solar photovoltaics adoption: A review. Renew. Sustain. Energy Rev. 2020, 123, 109749. [CrossRef]
12. Blank, C.; Kopp, M.; Niedermeier, M.; Schnitzer, M.; Schobersberger, W. Predictors of doping intentions, susceptibility, andbehaviour of elite athletes: A meta-analytic review. SpringerPlus 2016, 5, 1–14. [CrossRef] [PubMed]
13. Jeyaraj, A.; Rottman, J.W.; Lacity, M.C. A Review of the Predictors, Linkages, and Biases in IT Innovation Adoption Research. J.Inf. Technol. 2006, 21, 1–23. [CrossRef]
14. Varabyova, Y.; Blankart, C.R.; Greer, A.L.; Schreyögg, J. The determinants of medical technology adoption in different decisionalsystems: A systematic literature review. Health Policy 2017, 121, 230–242. [CrossRef] [PubMed]
15. Turner, C.; O’Gorman, B.; Nair, A.; O’Kearney, R. Moderators and predictors of response to cognitive behaviour therapy forpediatric obsessive-compulsive disorder: A systematic review. Psychiatry Res. 2018, 261, 50–60. [CrossRef] [PubMed]
16. Satapathy, S.; Sangle, S.; Unnikrishnan, S. Determinants of technology-based product adoption by consumers. World Rev. Sci.Technol. Sustain. Dev. 2018, 14, 85–99. [CrossRef]
17. Moher, D.; Liberati, A.; Tetzlaff, J.; Altman, D.G. Preferred Reporting Items for Systematic Reviews and Meta-Analyses: ThePRISMA Statement. Ann. Intern. Med. 2009, 151, 264–269. [CrossRef]
18. Pickering, C.; Grignon, J.; Steven, R.; Guitart, D.; Byrne, J. Publishing not perishing: How research students transition from noviceto knowledgeable using systematic quantitative literature reviews. Stud. High. Educ. 2015, 40, 1756–1769. [CrossRef]
19. Cheng, M.; Edwards, D.; Darcy, S.; Redfern, K. A Tri-Method Approach to a Review of Adventure Tourism Literature: BibliometricAnalysis, Content Analysis, and a Quantitative Systematic Literature Review. J. Hosp. Tour. Res. 2016, 42, 997–1020. [CrossRef]
20. Phan, T.D.; Smart, J.C.R.; Capon, S.J.; Hadwen, W.L.; Sahin, O. Applications of Bayesian belief networks in water resourcemanagement: A systematic review. Environ. Model. Softw. 2016, 85, 98–111. [CrossRef]
21. Rout, A.; Sahoo, S.; Thomas, S.; Varghese, S. Development of Customized Formulae for Feasibility and Break-Even Analysis ofDomestic Solar Water Heater. Int. J. Renew. Energy Res. 2017, 7, 386–398.
22. Yuan, X.; Zuo, J.; Ma, C. Social acceptance of solar energy technologies in China—End users’ perspective. Energy Policy 2011, 39,1031–1036. [CrossRef]
23. Alrashed, F.; Asif, M. An Exploratory of Residents’ Views Towards Applying Renewable Energy Systems in Saudi Dwellings.Energy Procedia 2015, 75, 1341–1347. [CrossRef]
24. Bushman, B.; Wang, M.C. Vote-counting procedures in meta-analysis. Handb. Res. Synth. 1994, 236, 193–213.25. Kahiya, E.T. Five decades of research on export barriers: Review and future directions. Int. Bus. Rev. 2018, 27, 1172–1188.
[CrossRef]26. Balezentis, T.; Streimikiene, D.; Mikalauskas, I.; Shen, Z. Towards carbon free economy and electricity: The puzzle of energy costs,
sustainability and security based on willingness to pay. Energy 2021, 214, 119081. [CrossRef]27. Li, X.; Li, H.; Wang, X. Farmers’ willingness to convert traditional houses to solar houses in rural areas: A survey of 465
households in Chongqing, China. Energy Policy 2013, 63, 882–886. [CrossRef]28. Matsumoto, S. Household Income Structure and Electrical Appliance Ownership: Evidence from Japanese National Household
Survey. Int. J. Energy Econ. Policy 2016, 6, 14–19.

Energies 2021, 14, 6630 25 of 26
29. Refalo, P.; Mulè Stagno, L.; Farrugia, R.N.; Yousif, C.; Sant, T.; Jakkel, N.; Zammit, A.; Portelli, J. The ‘Reduce and Save’ Project:An Island-Wide Resource Management Awareness Initiative. In Mediterranean Green Buildings & Renewable Energy; Springer:Cham, Switzerland, 2017; pp. 811–820.
30. Moglia, M.; Podkalicka, A.; James, M. An Agent-Based Model of Residential Energy Efficiency Adoption. J. Artif. Soc. Soc. Simul.2018, 21, 3. [CrossRef]
31. Jeong, G. Assessment of government support for the household adoption of micro-generation systems in Korea. Energy Policy2013, 62, 573–581. [CrossRef]
32. Yamaguchi, Y.; Akai, K.; Shen, J.; Fujimura, N.; Shimoda, Y.; Saijo, T. Prediction of photovoltaic and solar water heater diffusionand evaluation of promotion policies on the basis of consumers’ choices. Appl. Energy 2013, 102, 1148–1159. [CrossRef]
33. Salgado-Conrado, L.; Lopez-Montelongo, A. Barriers and solutions of solar water heaters in Mexican household. Sol. Energy 2019,188, 831–838. [CrossRef]
34. Yaqoot, M.; Diwan, P.; Kandpal, T. Financial attractiveness of decentralized renewable energy systems—A case of the centralHimalayan state of Uttarakhand in India. Renew. Energy 2017, 101, 973–991. [CrossRef]
35. Özdemir, E.D.; Marathe, S.D.; Tomaschek, J.; Dobbins, A.; Eltrop, L. Economic and environmental analysis of solar water heaterutilisation in Gauteng Province, South Africa. J. Energy South. Afr. 2012, 23, 2–19. [CrossRef]
36. Cesta, J.R.; Decker, P.G. Speeding solar energy commercialization: A Delphi research of marketplace factors. J. Bus. Res. 1978, 6,311–328. [CrossRef]
37. Lugaric, L.; Skrlec, D.; Krajcar, S. Household Solar Water Heating System Investment Modelling and Risk Analysis. In Proceedingsof the EUROCON 2007—The International Conference on “Computer as a Tool”, Warsaw, Poland, 9–12 September 2007;pp. 841–848.
38. Chang, K.; Lee, T.; Chung, K. Solar water heaters in Taiwan. Renew. Energy 2006, 31, 1299–1308. [CrossRef]39. Chang, K.-C.; Lin, W.-M.; Ross, G.; Chung, K.-M. Dissemination of solar water heaters in South Africa. J. Energy South. Afr. 2011,
22, 2–7. [CrossRef]40. Yaqoot, M.; Kandpal, T. Potential of Renewable Energy System Utilization at Decentralized Level in the State of Uttarakhand in
India. Int. J. Ambient Energy 2018, 41, 1–27. [CrossRef]41. Lin, W.-M.; Chang, K.-C.; Chung, K.-M. The Impact of Subsidy Programs for Solar Thermal Applications: A Case Study for a
Remote Island. Energies 2019, 12, 3944. [CrossRef]42. Su, W.; Liu, M.; Zeng, S.; Štreimikiene, D.; Baležentis, T.; Ališauskaite-Šeškiene, I. Valuating renewable microgeneration
technologies in Lithuanian households: A study on willingness to pay. J. Clean. Prod. 2018, 191, 318–329. [CrossRef]43. Saunders, R.W.; Gross, R.J.K.; Wade, J. Can premium tariffs for micro-generation and small scale renewable heat help the fuel
poor, and if so, how? Case studies of innovative finance for community energy schemes in the UK. Energy Policy 2012, 42, 78–88.[CrossRef]
44. Stevanovic, S.; Pucar, M. Financial measures Serbia should offer for solar water heating systems. Energy Build. 2012, 54, 519–526.[CrossRef]
45. Simpson, G.; Clifton, J. The emperor and the cowboys: The role of government policy and industry in the adoption of domesticsolar microgeneration systems. Energy Policy 2015, 81, 141–151. [CrossRef]
46. Absemetov, A.; Mukushev, M.; Yerubayev, A.; Zhumanalina, Z.; Rojas-Solórzano, L. Effectiveness and Prospects of Implementinga Solar Water Heating System in Astana, Kazakhstan. In The Role of Exergy in Energy and the Environment; Springer: Cham,Switzerland, 2018; pp. 603–615. [CrossRef]
47. Elmustapha, H.; Hoppe, T.; Bressers, H. Consumer renewable energy technology adoption decision-making; comparing modelson perceived attributes and attitudinal constructs in the case of solar water heaters in Lebanon. J. Clean. Prod. 2018, 172, 347–357.[CrossRef]
48. Reddy, S.; Painuly, J.P. Diffusion of renewable energy technologies—Barriers and stakeholders’ perspectives. Renew. Energy 2004,29, 1431–1447. [CrossRef]
49. Aydin, E.; Eichholtz, P.; Yönder, E. The economics of residential solar water heaters in emerging economies: The case of Turkey.Energy Econ. 2018, 75, 285–299. [CrossRef]
50. Chen, C.-f.; Xu, X.; Frey, S. Who wants solar water heaters and alternative fuel vehicles? Assessing social–psychological predictorsof adoption intention and policy support in China. Energy Res. Soc. Sci. 2016, 15, 1–11. [CrossRef]
51. Jridi, O.; Aguir Bargaoui, S.; Nouri, F.Z. Household preferences for energy saving measures: Approach of discrete choice models.Energy Build. 2015, 103, 38–47. [CrossRef]
52. Sakri, S.G.; Jayaramaiah, G.V. Study of consumer’s willingness to use solar water heaters in DSM program. In Proceedings of the2013 IEEE 7th International Power Engineering and Optimization Conference (PEOCO), Langkawi, Malaysia, 3–4 June 2013;pp. 478–482.
53. Saleh, A.; Haris, A.; Ahmad, N. Towards a UTAUT-based model for the intention to use solar water heaters by Libyan households.Int. J. Energy Econ. Policy 2014, 4, 26–31.
54. van Blommestein, K.; Daim, T. Residential Energy Efficient Device Adoption in South Africa. Sustain. Energy Technol. Assess. 2013,1, 13–27. [CrossRef]
55. Labay, D.G.; Kinnear, T.C. Exploring the Consumer Decision Process in the Adoption of Solar Energy Systems. J. Consum. Res.1981, 8, 271–278. [CrossRef]
Energies 2021, 14, 6630 26 of 26
56. Michelsen, C.C.; Madlener, R. Motivational factors influencing the homeowners’ decisions between residential heating systems:An empirical analysis for Germany. Energy Policy 2013, 57, 221–233. [CrossRef]
57. Baskaran, R.; Managi, S.; Bendig, M. A public perspective on the adoption of microgeneration technologies in New Zealand: Amultivariate probit approach. Energy Policy 2013, 58, 177–188. [CrossRef]
58. Willis, K.; Scarpa, R.; Gilroy, R.; Hamza, N. Renewable energy adoption in an ageing population: Heterogeneity in preferences formicro-generation technology adoption. Energy Policy 2011, 39, 6021–6029. [CrossRef]
59. Chang, K.-C.; Lin, W.-M.; Chung, K.-M. A lesson learned from the long-term subsidy program for solar water heaters in Taiwan.Sustain. Cities Soc. 2018, 41, 810–815. [CrossRef]
60. Ma, B.; Song, G.; Smardon, R.C.; Chen, J. Diffusion of solar water heaters in regional China: Economic feasibility and policyeffectiveness evaluation. Energy Policy 2014, 72, 23–34. [CrossRef]
61. Lim, S.; Huh, S.-Y.; Shin, J.; Lee, J.; Lee, Y.-G. Enhancing public acceptance of renewable heat obligation policies in South Korea:Consumer preferences and policy implications. Energy Econ. 2019, 81, 1167–1177. [CrossRef]
62. Balcombe, P.; Rigby, D.; Azapagic, A. Investigating the importance of motivations and barriers related to microgeneration uptakein the UK. Appl. Energy 2014, 130, 403–418. [CrossRef]
63. Caird, S.; Roy, R. Adoption and Use of Household Microgeneration Heat Technologies. Low Carbon Econ. 2010, 1, 61–70. [CrossRef]64. Higgins, A.; Foliente, G. Evaluating intervention options to achieve environmental benefits in the residential sector. Sustain. Sci.
2013, 8, 25–36. [CrossRef]65. Claudy, M.C.; Michelsen, C.; O’Driscoll, A.; Mullen, M.R. Consumer awareness in the adoption of microgeneration technologies:
An empirical investigation in the Republic of Ireland. Renew. Sustain. Energy Rev. 2010, 14, 2154–2160. [CrossRef]66. Kumar, V.; Syan Amanjot, S.; Kaur, K. A structural equation modeling analysis of factors driving customer purchase intention
towards solar water heater. Smart Sustain. Built Environ. 2020. ahead-of-print. [CrossRef]67. Yuasa, K.; Yata, M. Installation of Residential Energy Systems: Local Conditions and Residents′ Willingness. J. Asian Archit. Build.
Eng. 2016, 15, 127–132. [CrossRef]68. Urmee, T.; Walker, E.; Bahri, P.A.; Baverstock, G.; Rezvani, S.; Saman, W. Solar water heaters uptake in Australia—Issues and
barriers. Sustain. Energy Technol. Assess. 2018, 30, 11–23. [CrossRef]69. Faiers, A.; Neame, C. Consumer attitudes towards domestic solar power systems. Energy Policy 2006, 34, 1797–1806. [CrossRef]70. Caird, S.; Roy, R.; Herring, H. Improving the energy performance of UK households: Results from surveys of consumer adoption
and use of low- and zero carbon technologies. Energy Effic. 2008, 1, 149. [CrossRef]71. Sidiras, D.K.; Koukios, E.G. Solar systems diffusion in local markets. Energy Policy 2004, 32, 2007–2018. [CrossRef]72. Bergman, N. Why is renewable heat in the UK underperforming? A socio-technical perspective. Proc. Inst. Mech. Eng. Part A J.
Power Energy 2013, 227, 124–131. [CrossRef]73. Sharifi, M.; Khazaei Pool, J.; Jalilvand, M.R.; Tabaeeian, R.A.; Ghanbarpour Jooybari, M. Forecasting of advertising effectiveness
for renewable energy technologies: A neural network analysis. Technol. Forecast. Soc. Chang. 2019, 143, 154–161. [CrossRef]74. Foster, J. Solar Water Heating in Queensland: The Roles of Innovation Attributes, Attitudes and Information in the Adoption
Process. Prometheus 1993, 11, 219–233. [CrossRef]75. Wang, X.; Guan, Z.; Wu, F. Solar energy adoption in rural China: A sequential decision approach. J. Clean. Prod. 2017, 168,
1312–1318. [CrossRef]76. Mukwada, G.; Chingombe, W.; Taru, P. Why Social Acceptance in South African Solar Water Heater Projects Should Shape
National Energy Policy: The Case of Bluegumbosch. Mediterr. J. Soc. Sci. 2014, 5, 635. [CrossRef]77. Zografakis, N.; Sifaki, E.; Pagalou, M.; Nikitaki, G.; Psarakis, V.; Tsagarakis, K.P. Assessment of public acceptance and willingness
to pay for renewable energy sources in Crete. Renew. Sustain. Energy Rev. 2010, 14, 1088–1095. [CrossRef]78. Liu, W.; Wang, C.; Mol, A.P.J. Rural public acceptance of renewable energy deployment: The case of Shandong in China. Appl.
Energy 2013, 102, 1187–1196. [CrossRef]79. Karytsas, S.; Vardopoulos, I.; Theodoropoulou, E. Factors Affecting Sustainable Market Acceptance of Residential Microgeneration
Technologies. A Two Time Period Comparative Analysis. Energies 2019, 12, 3298. [CrossRef]80. Kanyarusoke, K. Problems of engineering entrepreneurship in Africa: A design optimization example in solar thermal engineering.
Eng. Sci. Technol. Int. J. 2020, 23, 345–356. [CrossRef]81. Amer, M.; Daim, T.U. Selection of renewable energy technologies for a developing county: A case of Pakistan. Energy Sustain.
Dev. 2011, 15, 420–435. [CrossRef]82. Hast, A.; Alimohammadisagvand, B.; Syri, S. Consumer attitudes towards renewable energy in China—The case of Shanghai.
Sustain. Cities Soc. 2015, 17, 69–79. [CrossRef]83. Sardianou, E.; Genoudi, P. Which factors affect the willingness of consumers to adopt renewable energies? Renew. Energy 2013, 57,
1–4. [CrossRef]84. Nasirov, S.; Carredano, N.; Agostini, C.A.; Silva, C. Public perception and adoption of Solar Water Heating systems in Chile: The
role of supply side income tax credits. Renew. Sustain. Energy Rev. 2021, 135, 110389. [CrossRef]85. Chang, K.-C.; Lee, T.-S.; Lin, W.-M.; Chung, K.-M. Outlook for solar water heaters in Taiwan. Energy Policy 2008, 36, 66–72.
[CrossRef]86. Uken, E. Policy Pitfalls of SWH. Energy Procedia 2012, 30, 1432–1434. [CrossRef]