RESIDENTIAL MOBILITY OF HOUSEHOLDS IN THE REDUCTION STAGE IN THE NETHERLANDS
15
Hooimeijer, P., Dieleman, F.M., & Dam, van, J. (1988). Residential mobility of households in the reduction stage in The Netherlands. TESG, 79(5), 306-319.
-
Upload
independent -
Category
Documents
-
view
0 -
download
0
Transcript of RESIDENTIAL MOBILITY OF HOUSEHOLDS IN THE REDUCTION STAGE IN THE NETHERLANDS

Hooimeijer, P., Dieleman, F.M., & Dam, van, J. (1988). Residential mobility of households in the reduction stage in The Netherlands. TESG, 79(5), 306-319.
IM
RESIDENTIAL MOBILITY OF HOUSEHOLDS IN THE REDUCTIONSTAGE IN THE NETHERLANDS
by
P. HOOIMEIJER*, F. M. DIELEMAN* & J. VAN DAM*
Utrecht, The Netherlands
IntroductionBy the year 2000, more than half of the totalnumber of households in the Netherlands areexpected to be in the `reduction stage' of theirlife cycle. In a previous study we tried to esti-mate the number of households in the reduc-tion stage more precisely, using methods offamily demography and population projec-tions published by the Central Bureau ofStatistics (Hooimeijer & Dieleman 1986). Inthe present study we have defined the reductionstage as the period of the life cycle ranging fromthe moment the first child leaves the parentalhome (in the Netherlands, when the mother is47 years of age, on the average) until the mo-ment the last member of the household leavesthe market for independent housing or dies. Ifno major changes occur in the age at whichchildren leave the parental home or in old-agemortality in the next decade, the number of
,households in the reduction stage can be ex-pected to grow by about 400,000 between 1985and 2000. The large population cohorts bornin the decades after the Second World War arenow beginning to enter the reduction stage ofthe life cycle and will be responsible for the ex-pected growth in the coming twelve years.
In previous publications we estimated someof the effects of the ageing of the populationon the housing market (Hooimeijer et al. 1986,1987). We demonstrated that mobility andhousing choice of households in the reduction
* Department of Geography, University of Utrecht, P.O.Box 80.115, 3508 TC Utrecht, The Netherlands.
Received March, 1988; revised July, 1988
stage differ markedly from the behaviour ofhouseholds in the earlier stages of the life cycleand that the process of filtering in the housingmarket will change substantially with the age-ing of the Dutch population.
For younger households the demand for ex-tra space - which accompanies the growth ofthe family and the growth in income - isknown to be a major force behind the processof housing adjustment (Clark et al. 1986). Forhouseholds in the reduction stage the need forextra space will be less important or even non-existent because the number of householdmembers decreases. Often the income has alsoreached a more or less stable level by the ageof 50. So (growth in) income will probably alsobe less important as a factor in residential mo-bility at the moment the household reaches thereduction stage of the life cycle. These maywell be the major elements explaining the lowmobility rate of households in the reductionstage. If the reduction stage is subdivided intothe child-launching, empty-nest and widow-hood phases, the mobility is especially low inthe phase of child-launching. At this time, theextra space created by the reduction in house-hold size is not a major reason to make an ad-justment move to smaller housing. Probablymany households in the child-launching andempty-nest phases want to retain this extraspace as a guestroom for children, grandchil-dren and friends. Nor does the more or lessstable income necessitate a move to smaller,less expensive housing in these phases of thereduction stage.
There seems to be a state of equilibrium be-tween demand for housing space and quality
306 Tijdschrift voor Econ. en Soc. Geografie 79 (1988) Nr. 5
and characteristics of the dwelling one oc-cupies, particularly in the phase of child-launching. This equilibrium slowly seems toturn into disequilibrium in the later phases ofthe reduction stage (cf. Hooimeijer & Diele-man 1986). The mobility rate remains low inlater phases of the reduction stage but ishigher in comparison to the child-launchingphase. Households that do move tend tochoose smaller dwellings; an excess of spaceseems cumbersome at an older age when phys-ical capacities decrease and the household isreduced in many instances to one person (cf.Hooimeijer et al. 1986). But the factors in-fluencing the propensity of older householdsto move should be investigated more systemat-ically to substantiate this line of reasoning.
The patterns of housing choice expressed bythose households in the reduction stage that domove also tend to differ from the choice pat-terns of households in the earlier stages of thelife cycle and seem to depend on other factors.In general, choice patterns are strongly in-fluenced by previous tenure, especially in con-trolled housing markets such as those in theNetherlands and Sweden. Households livingin the public sector have greater access to otherhousing in that sector than do householdsfrom the private rental and owner-occupiedsectors (Deurloo et al. 1987). It is interestingto note that, like in North America and Brit-ain, income is still a major determinant ofdwelling choice in the Netherlands, despite thehighly regulated structure of the housing mar-ket in this country (Kendig 1984, Clark 1986).Young, growing households move more fromrental and multi-family housing towardssingle-family and home-ownership housingthan vice versa, and income clearly acts as aconstraint on this general pattern (Deurloo etal. 1987). But older households show a differ-ent choice pattern. They seem to have a greaterpreference for rental housing, and the role ofincome as a constraint on or determinant ofchoice may therefore be less important (Hooi-meijer et al. 1987).
Although recent studies have considerably ex-tended our knowledge of migration and mo-bility of older households (cf. Golant 1984,Barink & Hooimeijer 1988), the links betweenthe characteristics and housing situation ofthese households, the propensity to move, andthe nature of their housing choice are not yetwell understood. This study is designed to ex-plicate some of these, relationships more sys-
tematically.Can the propensity to move of householdsin the reduction stage be related systemati-cally to the housing situation and charac-teristics of these households?
- How do tenure, income, life cycle, and otherfactors influence the housing choice ofhouseholds in the reduction stage that makean adjustment move? Is the housing choiceof households in the reduction stage drivenby other factors than those implicated in thehousing choice of younger households?
Research design and dataThe data file that formed the basis of earlierand related investigations (Hooimeijer et al.1986, Deurloo 1987) was also used here. Thedata of the National Housing Needs Survey1981 (wso81) are derived from a one-percentsample of all households in the Netherlands in1981, carried out under the auspices of theCentral Bureau of Statistics (css). This dataset contains information on the (changes in)the housing situation in individual householdsin the period 1978-1981 and on householdcharacteristics at the time of the interview,which took place at the end of this period.From this file we sub-sampled the 22,500households in the reduction stage. There aremany definitions of the concept of householdlife cycle, differentiating two to 24 stages in thetotal span of adult life (Duvall 1977). If onlytwo stages are distinguished, the reductionstage is the period from the moment the firstchild leaves the parental home until the mo-ment the household dissolves, which can hap-pen when the last partner dies, moves in withone of the children, or is admitted to an insti-tution. This lengthy reduction stage can bedifferentiated into child-launching, empty-nest and widowhood phases (Abu-Lughod &Foley 1960). The concept of family life cyclehas encountered severe criticism over the lastdecade, (Trost 1977, Stapleton 1980). It hasbeen pointed out that, due to rising divorcerates and the increased tendency to remain sin-gle or childless, a large number of householdsdo not fit into these categories. Although ithas been established that less than 5% of thewomen aged 45 or over in the Netherlandshave never been married and that more than85% have had at least one child (Hooimeijer& Linde 1987), rendering the traditional lifecycle concept less obsolete than might havebeen expected, we have nevertheless chosen avery flexible definition of our research popu-
Tijdschrift voor Econ. en Soc. Geografie 79 (1988) Nr. 5 307
-
lation. Hence households in the reductionstage areoperationally defined as those house-holds having a female head of 47 years or old-er. The cut-off point of 47 years is based onthe average age of the mother when the firstchild leaves the parental home (Hooimeijer etal. 1986). The female was designated head ofthe household in our definition, because theage of children is more closely related to theage of the mother than to the age of the father.Within this broad definition of the reductionstage, we allowed for three to six householdpositions and a classification into four-year oreight-year intervals (Table 1).
Residential mobility has been defined asmoves between independent dwellings withinthe confines of a housing market area, whichin turn is defined as the area within which peo-ple can relocate without loss of social and cul-tural contacts or necessitating a change inworkplace. In the wao81, Dutch municipali-ties are classified into 51 housing market areas(cf. Deurloo 1987). This definition of mobilitycovers more than 80% of all moves made byhouseholds in the reduction stage, as Table 2shows. The reason for the small share of long-distance migration among this group is therelative absence of retirement migration in theNetherlands (Vergoossen & Warnes 1987). Un-like countries such as the United States orGreat Britain, the Netherlands does not haveregions which are particularly attractive forthe retired.
Eight different types of dwelling were dis-tinguished to define housing choice (Table 3).The typology is based on earlier research(Hooimeijer & Dieleman 1986) which revealedtenure class, type of structure and size of thedwelling to be the most important dimensionsof housing choice among households in thereduction stage. Other characteristics ofdwellings, like price or rent, partly coincidewith these dimensions. The option move/nomove and the choice of one of the eight typesof dwellings are used as the dependent varia-bles in the analyses reported in this article.
The initial choice set of independent varia-bles refers to three different sets of factors in-fluencing mobility and choice (Table 1).- The first group comprises household
characteristics such as household composi-tion, age of the head, income and participa-tion in the labour force.
- The second group encompasses relevant at-tributes of the present or prior dwelling suchas tenure class, size, type, period of con-
struction and number of persons per room.- The third group pertains to the spatial con-
text within which the move is made, indicat-ing variations in the supply of dwellings andthe composition of the housing stock. Thisspatial context has a noticeable influence onboth mobility rates and choice patterns ingeneral (cf. Deurloo 1987). At the regionallevel a distinction has been made betweenthe Randstad and the rest of the Nether-lands, because supply of housing and com-position of the stock vary most markedlybetween these two parts of the country. Themobility also varies with the degree of ur-banization of the housing market, a localaspect of housing market context. The sizeof the municipality by number of inhabi-tants was used as an indicator for urbaniza-tion.The categorisation of each of the indepen-
dent variables (Table 1) has been made asdetailed as the original data set would allow.Age and income form an exception; for thesevariables, the categorisation ,has been simpli-fied to make the analyses more manageablewith the techniques we:used.
Techniques of analysisIn the analysis of residential mobility andhousing choice it is often necessary to rely ondata sets such as wso81 which contain manycategorical independent and/or dependentvariables. Logit analysis is often an appropri-ate tool to model the relationship betweensuch variables (Wrigley 1985). But given a dataset with a large number of variables which maybe supposed to have a relationship with mobil-ity and choice, direct application of logit anal-ysis to the data is often problematic or impos-sible, especially if the variables have a largenumber of categories. A cross tabulation ofthe variables in 'Fable 1, for example, wouldyield so many cells that zeros or small numbersof observations would occur in many cells.The estimates of parameters of a logit modelfor such a table would be unreliable and themany parameters of the model would escapemeaningful interpretation.
In such situations a thorough pre-processingof the data prior to logit analysis is necessary,as many researches have argued (e.g. Higgins& Koch 1977, Green 1978, Magidson 1982).The pre-processing involves selection of themost relevant independent variables from alarger set and simplification of the categorisa-tion of these variables. A two- or three-stage
308 Tijdschrift voor Econ. en Soc. Geografie 79 (1988) Nr. 5
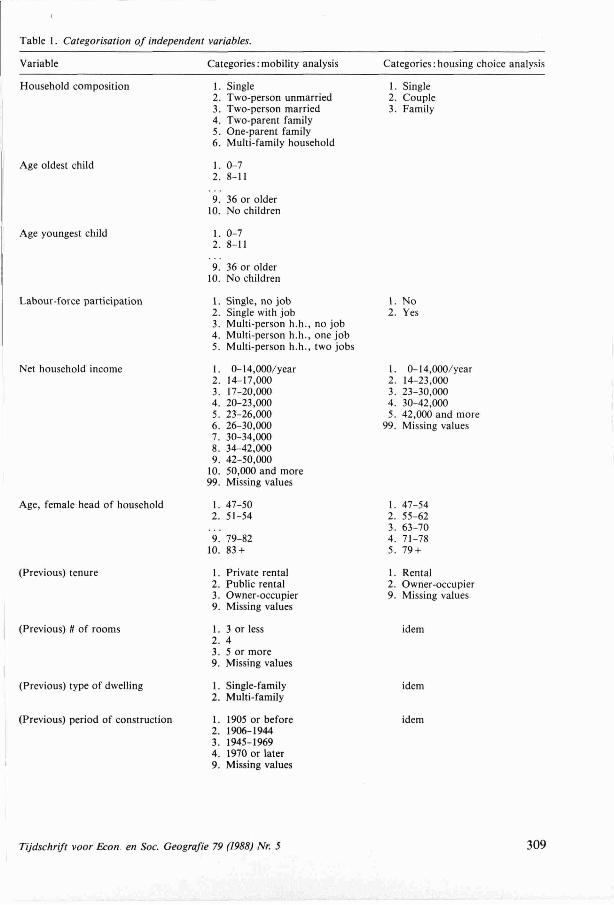
Table 1. Categorisation of independent variables.
Variable Categories: mobility analysis Categories: housing choice analysis
Household composition 1. Single 1. Single
2. Two-person unmarried 2. Couple3. Two-person married 3. Family4. Two-parent family5. One-parent family6. Multi-family household
Age oldest child 1. 0-7
2. 8-11
9. 36 or older
10. No children
Age youngest child 1. 0-7
2. 8-11
9. 36 or older
10. No children
Labour-force participation 1. Single, no job2. Single with job3. Multi-person h.h., no job4. Multi-person h.h., one job
1. No2. Yes
5. Multi-person h.h., two jobs
Net household income 1. 0-14,000/year 1. 0-14,000/year
2. 14-17,000 2. 14-23,000
3. 17-20,000 3. 23-30,000
4. 20-23,000 4. 30-42,000
5. 23-26,000 5. 42,000 and more6. 26-30,000 99. Missing values7. 30-34,000
8. 34-42,000
9. 42-50,000
10. 50,000 and more99. Missing values
Age, female head of household 1. 47-50 1. 47-542. 51-54 2. 55-62
3. 63-70
9. 79-82 4. 71-78
10. 83+ 5. 79+
(Previous) tenure 1. Private rental2. Public rental3. Owner-occupier9. Missing values
1. Rental2. Owner-occupier9. Missing values
(Previous) # of rooms 1. 3 or less idem2. 4
3. 5 or more
9. Missing values
(Previous) type of dwelling 4. Single-family2. Multi-family
idem
(Previous) period of construction 1. 1905 or before idem2. 1906-1944
3. 1945-1969
4. 1970 or later
9. Missing values
309Tijdschrift voor Econ. en Soc. Geografie 79 (1988) Nr. 5

Table 1. (Continued).
Variable Categories: mobility analysis Categories: housing choice analysis
# Rooms per person 1. 0 -0.24 -0.24
2. 0.25-0.49 2.
3. 0.50-0.74 3.
4. 0.75-0.99 4. or more
5. 1.00-1.24
6. 1.25-1.49
7. 1.50 or more
Size municipality 1. <5,000 inhabitants 10,0002. 5-10,000 2.
3. 10-20,000 3.
4. 20-50,000 4.
5. 50-100,000 5. or more
6. 100,000 or more
Location housing market 1. Randstad2. Rest of the Netherlands
modelling strategy, employing different tech-niques, was proposed recently by Clark et al.(1988). We used (some of) the techniques theyrecommended. We summarize the characteris-tics and purpose of the techniques here brie-fly ; readers should refer to Deurloo (1987) andClark et al. (1988) for a more detailed discus-sion.
Two techniques were used here for pre-
processing the data, viz. Proportional Reduc-tion of Uncertainty (PRU) and - to a lesser ex-tent - Chi-square Automatic Interaction De-tection (CHAIN) (Teachman 1980, Kass 1980).Given the dependent variable (move/no moveor housing choice), the PRU criterion selectsthe independent variables that are most rele-vant in a sequential mariner. The variablewhich explains most of the distribution of the
Table 2. Mobility of households in the reduction stage, 1978-1981.
Household type Non-movers (o)
Single 88.0Couple 88.1Family 90.8
Total 89.1
Source: wao81.
Movers within housingmarket area (o)
10.29.77.9
9.2
Table 3. The housing typology in 1981 (number x 1000).
Type of dwelling
Rental, multi-family, 3 rooms or lessRental, multi-family, 4 rooms or moreRental, single-family, 3 rooms or lessRental, single-family, 4 roomsRental, single-family, 5 rooms or moreOwner-occupier, 3 rooms or lessOwner-occupier, 4 roomsOwner-occupier, 5 rooms or more
Total
Source: wBo81.
Movers across housing Totalmarket areas (%)
1.8. 100.02.2 100.0
1.3 100.0
1.7 100.0
Number Percentage
776,7 15.8
602,5 12.2
247,0 5.0
710,1 14.4
527,0 10.7
273,4 5.5
735,5 14.9
1053,9 21.3
4926,2 100.0
310 Tijdschrift voor Econ. en Soc. Geografie 79 (1988) Nr. 5
observations over the categories of the depen-dent variable is chosen first ; categorisation issimplified using the same PRU criterion, whichis based on the change in entropy in the depen-dent variable. Variables are added until norelevant additional variables can be includedor until the data are exhausted. The analyseswith the PRu criterion are reported most exten-sively in this article because it is a more ap-propriate method of pre-processing thanCHAID if one uses un-nested logit models as wehave done here (Clark et al. 1988).
CHAID has the same purpose as the PRumethod and also employs a forward stepwiseprocedure, though with a different theoreticalunderpinning than PRu. CHAID stems from theautomatic interaction detection of Sonquist &Morgan (1964). The major difference betweenCHAID and the PRu criterion is that CHAID per-mits the nesting of independent variableswithin categories of other independent varia-bles. Both methods yield a selection of in-dependent variables that are usually notstrongly interrelated : in addition, they gener-ally allow a simplification of the categorisa-tion of variables without important loss of in-formation. In this article, CHAID is only usedto verify if the selection of independent varia-bles and the simplification of categories is nottoo dependent on the PRU procedure. Theresults of CHAID are therefore not reported ex-tensively.
The simplified cross tabulations resultingfrom pre-processing can often be successfullyanalysed with logit models. Clark et al. (1988)point out that it is sometimes practical to usea simplified form of logit modelling known asMultivariate Nominal Scale Analysis (MNA, Cf.Andrews & Messenger 1973) or ANalysis OfTAbles (ANOTA, Keller & Verbeek 1984).MNA/ANOTA makes the restricting assumptionthat an additive model adequately representsthe data. This assumption facilitates the com-putation and interpretation dramatically, ascompared to logit analysis. The results of theanalysis with ANOTA indeed allow straightfor-ward interpretation and are comparable to theresults of a multiple regression analysis. It isespecially useful to apply this technique if thedependent variable and (some of) the indepen-dent variables have more than two categories.We will use this technique in our analysis ofhousing choice.
Because the techniques are adequatelydescribed and illustrated in the literature andbecause the results are easy to understand,
these brief remarks will suffice here. We willgive further explanation when necessary alongwith the presentation of the results.
The propensity to moveThe relationship between the dependent varia-ble, move/no move, in the period 1978-1981 forhouseholds in the reduction stage, and the in-dependent variables that characterize thesehouseholds and their housing conditions wasfirst analysed with the PRu criterion. Table 4,step la, shows all the independent variablesthat have an effect on move/no move at theone-percent significance level. All the PRuvalues are low because the overall mobility rateof the research population is only 9.3% overthe four years.
Tenure class is the best predictor of thepropensity to move. Households in the reduc-tion stage that own their house are less likelyto move than renters. The quality of the dwell-ing (indicated by the period of construction)and the characteristics of the housing marketalso have a strong effect on the propensity tomove; the older the house and the larger themunicipality, the more likely one is to move.The number of rooms per person is also relat-ed to mobility. Older households tend to moveaway from excess space; the more rooms perperson they have, the more likely they are tomove. These relationships are logical andcomply with the general literature on mobility(Clark et al. 1986). But it is striking that ageof the head of household and other indicatorsof the life cycle stage are relatively unimpor-tant as predictors of mobility. In analysing thepropensity to move of the total number ofhouseholds in the Netherlands, we found thatage is always overwhelmingly the most impor-tant predictor of move/no move (Deurloo1987).
In the stepwise procedure using the PRucriterion to select important independent vari-ables from a wider set, the variable with thehighest value is selected in the first step (ten-ure, in this case). The criterion indicates thatthe categorisation of previous tenure can besimplified without significant loss of informa-tion; mobility does not differ much betweenrenters in the private (1) or public (2) sectorsand therefore these categories are joined instep lb. Step la leads to the cross tabulationof move/no move by tenure. In step 2a, all theother independent variables are considered foraddition to this two-by-two table. Only fourpredictors have PRu values that are significant
T jdschrifl voor Econ. en Soc. Geografie 79 (1988) Nr. 5 311

Table 4. Steps in the selection procedure using the PRU criterion (dependent variable: move/no move).
Independent variable
Step la Previous tenure (1, 2, 3)Previous period of constructionMunicipality size# of rooms per personPrevious type of dwellingHousehold compositionLabour-force participationAge oldest childAge head of householdAge youngest childNet incomeLocation of housing marketPrevious # of rooms
Step lb Previous tenure (1 +2, 3)
Step 2a Prev. ten. * previous period of construction (1, 2, 3, 4)Prev. ten.. # rooms per personPrev. ten. * household compositionPrev. ten. * age head of household
PRU
0.00652
0.005410.00529
0.00449
0.00420
0.00409
0.00314
0.00285
0.00218
0.00167
0.00143
0.00040
0.00037
0.00612
0.01403
0.01223
0.01113
0.01096
Step 2b Prev. ten. * previous period of construction (1 + 2, 3, 4) 0.01375Prev. ten. * previous period of construction (I+2, 3+4) 0.01331
Step 3a Prev. ten.. prev. period constr. * age head of hshld. (1, 2, 3, 4, 5, 6, 7, 8, 9, 10) 0.02117Prev. ten. * prev. period constr. * # rooms per person
Step 3b Prev.. ten. * prev. period constr. * age head of hshld. (1 +2+3+4, 5+6+7+8, 9, 10) 0.01917Prev. ten. * prev. period constr. * age head of hshld. (1+2+3+4+5+6+7+8, 9, 10) 0.01817Prev. ten. * prev. period constr. * age head of hshld. (1 +2+3+4, 5+6+7+8, 9+ 10) 0.01747
at the one-percent level. The effect of size ofmunicipality, apparent in step 1, plays no fur-ther role because tenure varies strongly be-tween municipalities of different sizes. Theaddition of this variable to the table, therefore,does not help to distinguish further betweenmove/no move. The age of the dwelling andcharacteristics of the households remain im-portant predictors of the propensity to moveafter the effect of tenure has been accountedfor. Period of construction is added to thecross tabulation in step 2a and can be reducedto a distinction between pre- and postwarhousing in step 2b. In step 3 only the age ofthe head of household and the number ofrooms per person lead to a significant increasein the explained variation of mobility. Age isselected and reduced to three categories in step3b, viz. 47-62 years, 63-78 years and 79 yearsand older. None of the other variables couldbe successfully added to the, by now, four-dimensional cross tabulation in step 4.
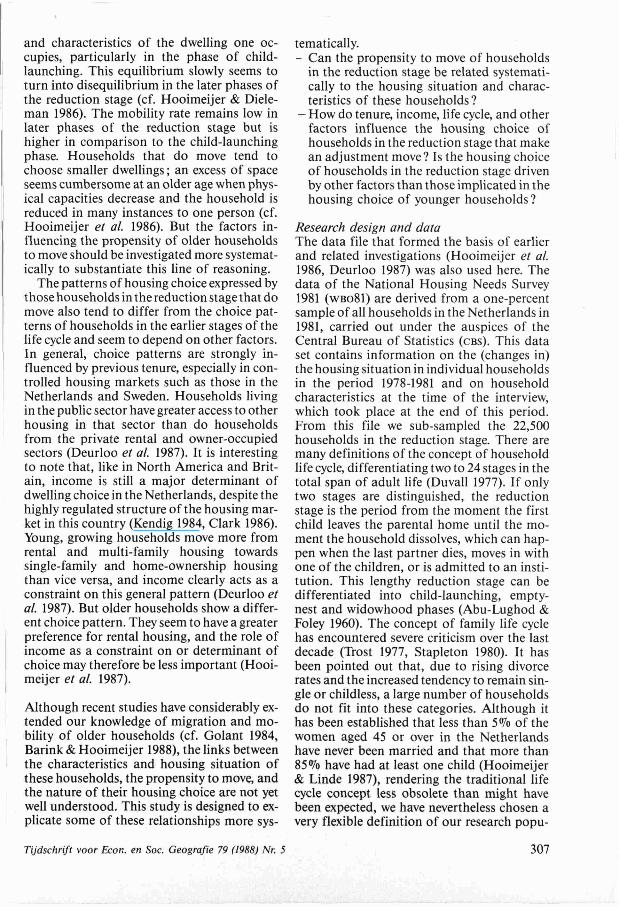
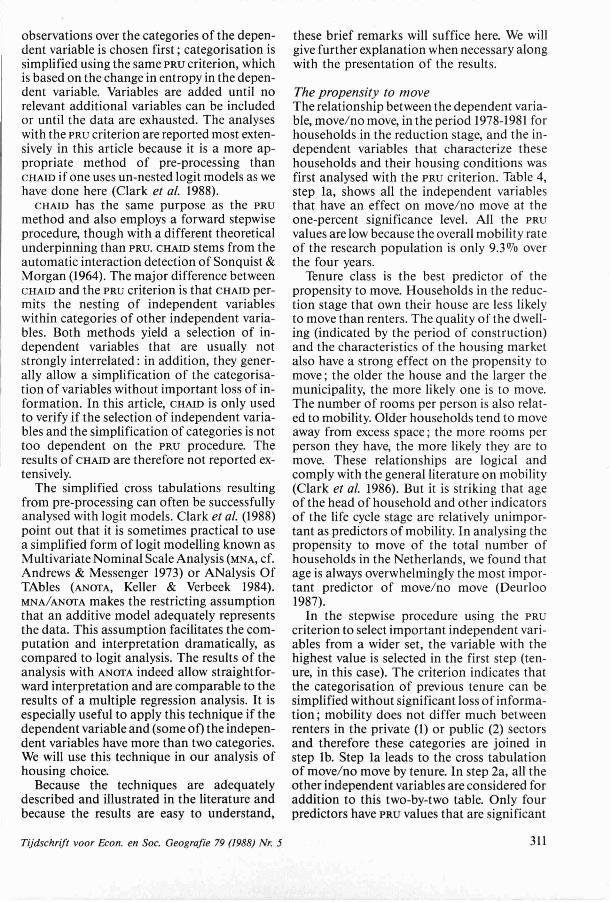
The cross tabulation of mobility by tenureand period of construction of the (previous)dwelling and by age of the head of the house-hold is presented graphically in Figure 1. This
figure shows that the propensity to movevaries considerably and fairly systematicallyover the categories of the three predictors thathave been chosen with the PRU criterion. Theeffects of tenure and period of construction ofthe (previous) dwelling on the mobility rateshow up very clearly. In the rental sector andin older housing the propensity to move is rela-tively high. Age has a fairly regular effect onthe propensity to move within the categoriesof the other two independent variables. Thevery old move least, and those b3 to 78 yearsold move more frequently, although of coursethe mobility rate of all households in thereduction stage is low in comparison withyoung, growing households. The somewhathigher mobility rate between the ages of 63and 78 is probably related to changes that arelikely to occur in the situation of the house-hold in that period of the life cycle, like deathof one of the partners, retirement and relatedchanges like a decrease in income and a declinein health. But tenure and quality of housingare more important than age as predictors ofmobility of the older households, a fact hardlyencountered in the literature.
112 Tijdschrift voor Econ. en Soc. Geografie 79 (1988) Nr. 5
0.01944

rentfbefore 1945 ownerlbefore 1945X161- 16r
o14E
12
10
3 age
014E
rent/after 1945 owner/after 194516r 16
1 OE 14
12
10
0
6
4
2
01 1-.: 1 P
1 2 3 age
1 = 47-62 years2 = 63-78 years3 = 79 years and older
E14
12
10
8
6
4
2
02 3 age
Source: WBO 81.
Fig. 1. Percentage of households that moved, 1978-1981,by tenure and period of construction of (previous) dwell-ing and by age of head of household.
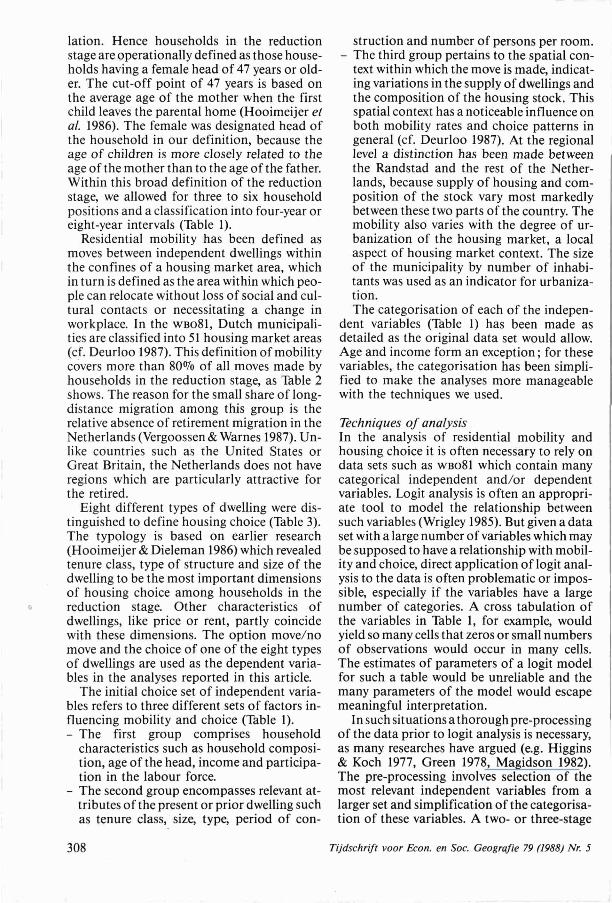
The pre-processing of the same data withCHAID substantiates the findings of PRU (Fig.2). Tenure is again the most important deter-minant of the decision to move/not moveamong households in the reduction stage. Butfor homeowners, household composition isindicated as the second most important in-dependent variable. Families with children inthe reduction stage show a lower propensity tomove in this sector than other households.Quality of housing (period of construction)enters the model as a third variable in this ten-ure class, but remains in second place in therental sector. Therefore, household composi-tion is added to the set of independent varia-bles that were chosen in the PRU procedure andentered into the more formal logit analysis ofmobility and factors influencing mobility,which is described in the next section.
The analysis with PRU and CHAly help toselect the most important factors that in-fluence move/no move from a much wider setof independent variables that are related tomobility. Still, it can be useful to proceed withmore formal modelling to determine how in-teraction effects between independent varia-bles affect mobility and to simplify the modelsby deleting unimportant effects from themodels. Table 5 shows the results of a standardlogit analysis (Wrigley 1985) between mobilityand the four independent variables that wererevealed to be important by the pre-processinganalyses with PRU and CHAID, viz. Tenure, Peri-od of construction, Age and Household com-position.
Starting with the saturated model, includ-ing all interaction effects, a backward hierar-chical selection procedure was used to elimi-nate those effects that are not significant at theone-percent level. The interaction effects ofthe independent variables on mobility that in-clude period of construction (P) can all be re-moved from the model, until only the main ef-fect of this variable on mobility remains.Partitioning of the likelihood-ratio shows thata satisfactory model can be constructed whichincludes the main effect of period of construc-tion and the second-order integration effect oftenure, age and household composition. Instep 7, the term A*P can still be removed; thelikelihood-ratio value is 29.35 after this stepout of a maximum of 272.93, so almost 90%of the total variation is explained by this par-simonious model. The model has only 13parameters (age of the head of household hadthree categories, all other variables have twocategories).
The results of the logit analysis seem to indi-cate that quality of housing has an indepen-dent effect on the propensity to move ofhouseholds in the reduction stage. Low qualityof housing leads to a higher mobility rate,regardless of the other factors influencing mo-bility. Age, household composition, and ten-ure show interaction effects on the propensityto move.
Housing choiceIn this section we analyse the housing choiceof households that moved in the period 1978-1981. Of course many households in the reduc-tion stage did not move during this period, andtherefore the number of observations issmaller than in the analysis of mobility in theprevious section. The number of categories of
Tijdschrift voor Econ. en Soc. Geografie 79 (1988) Nr. 5 313
x
8
6
4
2
0
?
n
age
1
1 2
u
10
1

Category numbers
Number of households!
Mobility (%)
r9 Before 1945
64
,0
12 Rent
13339
10,9
(Previous) period construction
4,4 8,2 7,5J J 13,3
/Rooms er arson (Previous) type of dwelling_12
1885
16,6
11,0 '
No child.
2486 1268 2604 2100 1560
After 1945
10,.7
39 Owner
19199
7,1
Household composition
1235
5476
8,6
(Previous) period construction
192
2854
10.4
(Prevlous)Arroomsr
69n 567 89n 1 22
+ 16' year18-27
34
8375
9,0
Single 2
1
family 3907 family
No 3 or less 4Year + 28'
Fig. 2. dendogram of percentage of households that moved.
the independent variables we used is nowsmaller, because categories with only a few ob-servations were added to larger categories (seeTable 1). Housing choice (Table 3) is the depen-dent variable, but the set of independent varia-bles is the same as in the analysis of mobilitydescribed above.
The exploratory procedure with the PRU
34
2622
46
3723
5,0
After 1946
Two parent familiesfamily h.h,
criterion shows a strong effect of householdcomposition on choice (Table 6). Tenure ofprevious dwelling, age of the head of house-hold, and municipality size are also stronglyrelated to choice. It is interesting to note therelatively small effect of income on choice. Forall the households in the Netherlands, incomeis by far the most important determinant of
Table 5. Complete backward logit regression of move/no move, with age head of household (A), household composi-tion (H), period of construction (P), and tenure (T).
Step number df Term removed
01 2 A*H*P*T2 1 H*P*T3 2 A*P*T4 1 P*T5 2 A*H*P6 1 H*P7 2 A*P8 2 A*H*T9 2 A*T
10 2 A*HI1 1 H*T12 2 'A
13 1-' H14 1 T15 1 P
0,0.0,49 9345 0.5.1,24
2906
L1,9
Age 1't hild
L
Goodness of fit Improvement
cxrsquare P-value cxt-square P-value
.000 1.000
.687 .709 .687 .709
1.652 .648 .965 .32614.327 .014 12.675 .002
15.528 .017 1.210 .273
27.524 .001 11.996 .002
27.683 .001 .159 .690
29.350 .002 1.667 .434
46.303 .000 16.953 .000
49.560 .000 3.257 .196
56.704 .000 7.144 .028
72.737 .000 16.034 .000
97.348 .000 24.611 .000
121.195 .000 23.847 .000
206.256 .000 85.061 .000
272.930 .000 66.674 .000
314 Tijdschrift voor Econ. en Soc. Geografie 79 (1988) Nr. 5
1
4468
7,5
22538
9,3
- I(Previous) tenure
A e lest child
one-perenl
families
ore 45
6,7
Non Nmlliea+

Table 6. Steps in the selection procedure using the PRu criterion (dependent variable: housing choice).
Step la
Independent variable
Household composition (1, 2, 3)Previous tenureAge head of householdMunicipality sizeNet incomePrevious # of rooms# rooms per personLocation of housing marketPrevious type of dwellingLabour-force participation
PRU
0.1050
0.0737
0.0671
0.0578
0.0467
0.0402
0.0395
0.0364
0.0347
0.0096
Step lb
Step 2a Hshld. comp.. previous tenureHshld. comp. * municipality sizeHshld. comp.: net income
0.1793
0.1709
0.1544
Step 2b
Step 3a Hshld. comp. * prev. ten. * municipality sizeHshld. comp.. prev. ten. * net income
Step 3b
dwelling choice (Deurloo et al. 1987). But forolder households, income seems to play onlya minor role, and housing choice is influencedmore by the composition of the household.
In step la we selected the composition of thehousehold as the first variable for cross tabu-lation with housing choice. The categorisationof this variable could not be simplified with-out significantly reducing the PRU value in steplb. Tenure of the previous dwelling, munici-pality size, and income also determine choiceafter the effect of household composition hasbeen accounted for (Table 6). Previous tenureand municipality size are selected in steps 2and 3 of the PRU procedure. The categorisa-tion of these variables cannot be simplifiedfurther. Income has only a slightly lower PRuvalue than municipality size in step 3, but itcannot be added in a subsequent step 4 (thedata are then exhausted and too many emptycells occur). The results of the PRu pre-processing are corroborated by a CHAIR analy-sis we also performed on the same data. Theinterpretation of these results follows in thenext paragraph, where the choice patterns ofhouseholds over the categories of the indepen-dent variables are described in greater detail.
To construct a more formal model of the hous-ing choice of older households, we decided touse the additive ANOTA model (see the sectionon techniques). We could have used a mul-
0.2434
0.2419
tinomial logit analysis as well. But with somany categories of dependent and indepen-dent variables, a multinomial logit analysissoon becomes counter-productive, becausethe analysis is complicated and the results aredifficult to interpret. In our experience, the as-sumption that an additive model can be usedto represent the data makes it a good alterna-tive strategy to logit modelling (see Clark et al.1988). In the ANorA method, which uses thisassumption, estimated coefficients show theeffect of being in a particular category of anindependent variable on the likelihood ofselecting a particular category of the depen-dent variable. The coefficients are correctedfor the influence of other independent varia-bles and can therefore be treated as partialregression coefficients, as in multiple regres-sion of interval- and ratio-scale variables. Fora detailed description, see Deurloo et al.(1987).
The three independent variables selected inthe analysis with the PRU criterion were subse-quently entered into the ANorA procedure. Thecross tabulation of these three variables withhousing choice shows that first-time buyersare virtually non-existent among householdsin the reduction stage of the life cycle. Nearlyevery household with a previous dwelling inthe rental sector remains in that sector of thehousing market. The table also shows that ten-ure and size of municipality are closely inter-
Tijdschrift voor Econ. en Soc. Geografie 79 (1988) Nr. 5 315

related, as we noted already in the analysis ofmove/no move (Table 4). These circumstanceslead to empty cells in the table, and the inter-relationship between tenure and municipalityclearly violates the assumptions Of ANOTA. TheANOTA analysis was therefore carried outseparately for (former) owners and renters.
The results of the analysis are shown in Ta-ble 7. The coefficients are simple to interpret.They can be added to or subtracted from theaverage to elucidate the influence on choice ofbeing in a particular category of an indepen-dent variable. For instance, of the elderlyhouseholds that owned their former dwellingand (now) live in a settlement with less than20,000 inhabitants, 73.6% (48.0+19.7+5.9)moved into single-family owner-occupierhousing. Among the owner-occupiers who livealone and moved within or into a city of over100,000 inhabitants, 40.8% (16.1+17.1+7.6)chose a small apartment in a multi-familystructure. This percentage rises to 73.7(38.4+23.4+11.9) in cases where they rentedtheir former dwelling and (now) occupy ahouse in a city of over 100,000 inhabitants.These figures illustrate that tenure, householdcomposition, and size of the municipalityhave a strong impact on the housing choice ofolder households that move.
On the whole, the patterns of choicedemonstrated by households in different cate-gories of the independent variables are fairly
Table 7. ANOTA coefficients for housing choice by (previous) tenure, household composition and municipality size.
Ownership
Type of dwelling Average Household composition
Rent, single, small 10.9 8 0.8Rent, multi, small 16.1 17.1 0.2Rent, single, large 10.1 -5.1 -0.9Rent, multi, large 4.5 -2.9 1.0Owner, single 48.0 -29.2 0.8Owner, multi 10.5 9.3 -2.0
Single Couple Family
Rental
Municipality size (x 1000)
20 or less 20-50 50-100 100 or more
13.3 1.2 -2.4 -7.4-8.5 -4.0 1.0 7.6
1.2 1.6 -1.6 -0.4-2.6 -2.9 1.1 2.8
5.9 8.5 0.5 - 10.7
-9.3 -4.4 1.3 8.2
Type of dwelling Average Household composition Municipality size (x 1000)
-8.4- 12.4
4.4
1.0
19.7
-4.5
Single Couple Family
Rent, single, small 16.0Rent, multi, small 38.4Rent, single, large 21.7Rent, multi, large 14.5Owner, single 7.5Owner, multi 1.8
5.4 2.3
23.4 2.9
- 15.7 -2.8-9.0 -1,1-4.5 -0.7
0.4 -0.7
-8.2-27.6
19.4
10.6
5.4
0.4
obvious and easy to interpret. Renters remainin rental accommodation; no more than 20%of the renters move to owner-occupation. Thesmaller the household, the more it tends tomove into a small dwelling or into multi-family housing. The larger the municipality, interms of inhabitants, the more renters moveinto multi-family housing. Owners move intorental accommodation more often thanrenters buy a house. Especially single personsmove away from owner-occupation housing(70%). Families tend to remain in the owner-occupied sector. Former owner-occupiers aremore likely to choose large, single-familydwellings if they move into the rental sectorthan movers who were already in this sector.Apparently they are used to more space andtherefore move into more spacious accommo-dation. The choice for single- or multi-familyhousing is determined to a large extent by thesize of the municipality households move in(to). The larger the municipality, the morehouseholds (have to) move into the multi-family housing that forms a considerable partof the housing stock in cities.
ConclusionsThe most important conclusion of thisresearch is that socio-economic variables donot play a major role in the short-distancerelocation behaviour of households in thereduction stage in the Netherlands. Neither in-
20 or less 20-50 50-100 100 or more
11.6 0.7 3.8 -7.3- 16.8 -8.0 2.0 11.9
12.7 6.1 - 1.8 -8.5- 10.8 - 1.5 -0.7 6.0
5.0 3.6 -3.2 -3.0- 1.1 -0.3 -0.1 0.7
316 Tijdschrift voor Econ. en Soc. Geografie 79(1988) Nr. 5
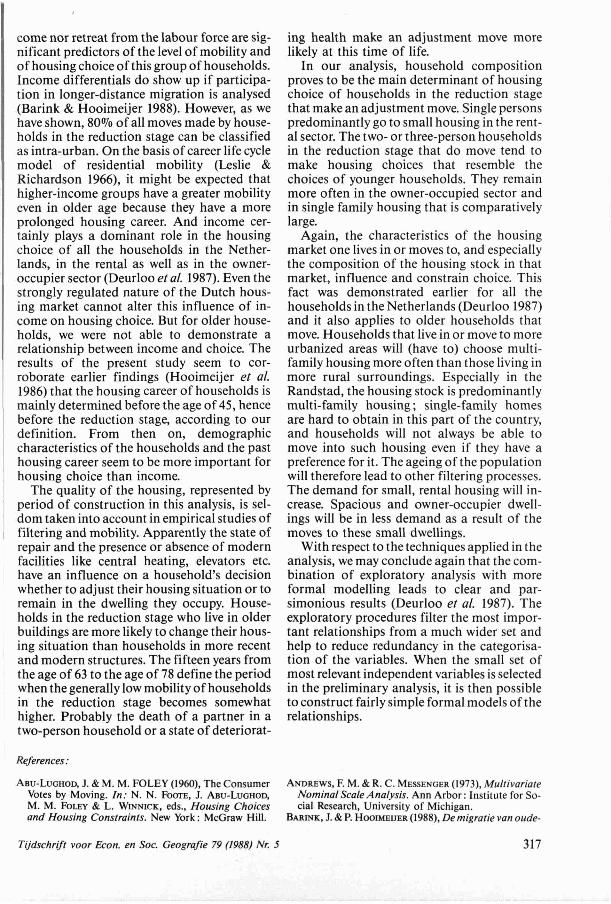
come nor retreat from the labour force are sig-nificant predictors of the level of mobility andof housing choice of this group of households.Income differentials do show up if participa-tion in longer-distance migration is analysed(Barink & Hooimeijer 1988). However, as wehave shown, 80016 of all moves made by house-holds in the reduction stage can be classifiedas intra-urban. On the basis of career life cyclemodel of residential mobility (Leslie &Richardson 1966), it might be expected thathigher-income groups have a greater mobilityeven in older age because they have a moreprolonged housing career. And income cer-tainly plays a dominant role in the housingchoice of all the households in the Nether-lands, in the rental as well as in the owner-occupier sector (Deurloo et al. 1987). Even thestrongly regulated nature of the Dutch hous-ing market cannot alter this influence of in-come on housing choice. But for older house-holds, we were not able to demonstrate arelationship between income and choice. Theresults of the present study seem to cor-roborate earlier findings (Hooimeijer et al.1986) that the housing career of households ismainly determined before the age of 45, hencebefore the reduction stage, according to ourdefinition. From then on, demographiccharacteristics of the households and the pasthousing career seem to be more important forhousing choice than income.
The quality of the housing, represented byperiod of construction in this analysis, is sel-dom taken into account in empirical studies offiltering and mobility. Apparently the state ofrepair and the presence or absence of modernfacilities like central heating, elevators etc.have an influence on a household's decisionwhether to adjust their housing situation or toremain in the dwelling they occupy. House-holds in the reduction stage who live in olderbuildings are more likely to change their hous-ing situation than households in more recentand modern structures. The fifteen years fromthe age of 63 to the age of 78 define the periodwhen the generally low mobility of householdsin the reduction stage becomes somewhathigher. Probably the death of a partner in atwo-person household or a state of deteriorat-
ing health make an adjustment move morelikely at this time of life.
In our analysis, household compositionproves to be the main determinant of housingchoice of households in the reduction stagethat make an adjustment move. Single personspredominantly go to small housing in the rent-al sector. The two- or three-person householdsin the reduction stage that do move tend tomake housing choices that resemble thechoices of younger households. They remainmore often in the owner-occupied sector andin single family housing that is comparativelylarge.
Again, the characteristics of the housingmarket one lives in or moves to, and especiallythe composition of the housing stock in thatmarket, influence and constrain choice. Thisfact was demonstrated earlier for all thehouseholds in the Netherlands (Deurloo 1987)and it also applies to older households thatmove. Households that live in or move to moreurbanized areas will (have to) choose multi-family housing more often than those living inmore rural surroundings. Especially in theRandstad, the housing stock is predominantlymulti-family housing; single-family homesare hard to obtain in this part of the country,and households will not always be able tomove into such housing even if they have apreference for it. The ageing of the populationwill therefore lead to other filtering processes.The demand for small, rental housing will in-crease. Spacious and owner-occupier dwell-ings will be in less demand as a result of themoves to these small dwellings.
With respect to the techniques applied in theanalysis, we may conclude again that the com-bination of exploratory analysis with moreformal modelling leads to clear and par-simonious results (Deurloo et al. 1987). Theexploratory procedures filter the most impor-tant relationships from a much wider set andhelp to reduce redundancy in the categorisa-tion of the variables. When the small set ofmost relevant independent variables is selectedin the preliminary analysis, it is then possibleto construct fairly simple formal models of therelationships.
References:
Asu-LUGHOD, J. & M. M. FOLEY (1960), The ConsumerVotes by Moving. In: N. N. FoorE, J. Asu-LUGHOD,M. M. FOLEY & L. WINNICK, eds., Housing Choicesand Housing Constraints. New York: McGraw Hill.
ANDREWS, F. M. & R. C. MESSENGER (1973), MultivariateNominal Scale Analysis. Ann Arbor: Institute for So-cial Research, University of Michigan.
BARINK, J. & P. HOOIMEIIER (1988), De migratie van oude-
Tijdschrift voor Econ, en Soc. Geografie 79 (1988) Nr. 5 317

ren in de tijd. Stedelijke Netwerken, Werkstukken 4.Zoetermeer : Ministerie van Onderwijs en Wetenschap-pen.
CLARK, W. A. V. (1986), Modeling Mobility: TheoreticalContributions Versus Policy Relevancy. Tijdschriftvoor Economische en Sociale Geografie 77, pp.358-367.
CLARK, W. A. V., M. C. DEURLOO & F. M. DIELEMAN(1986), Residential Mobility in Dutch Housing Mar-kets. Environment and Planning A 18, pp. 763-788.
CLARK, W. A. V., M. C. DEURLOO & F. M. DIELEMAN(1988), Modeling Strategies for Categorical Data: Ex-amples from Housing and Tenure Choice. Geographi-cal Analysis 20, pp. 197-217.
DEURLOO, M. C. (1987), A Multivariate Analysis ofResidential Mobility. Amsterdam: Instituut voor So-ciale Geografie, Universiteit van Amsterdam.
DEURLOO, M. C., F. M. DIELEMAN & W. A. V. CLARK(1987), Tenure Choice in the Dutch Housing Market.Environment and Planning A 19, pp. 763-781.
DUVALL, E. (1977), Family Development. Philadelphia:Lippincott.
GOLANT, S. M. (1984), The Geographical Literature ofAgeing and Old Age: An Introduction. Urban Geogra-phy 5, pp. 262-272.
GREEN, (1978), An AID/Logit Procedure for AnalyzingLarge Multiway Contigency Tables. Journal of Market-ing Research 15, pp. 132-136.
HIGGINS, J. W. & G. G. KOCH (1977), Variable Selectionand Generalized Chi-square Analysis of CategoricalData Applied to a Large Cross-sectional OccupationalHealth Survey. International Statistical Review 45, pp.51-62.
HOOIMEIJER, P. & F. M. DIELEMAN (1986), Huishoudensin de reductiefase en woonruimteverdeling. 's-Gravenhage: Ministerie van Volkshuisvesting, Ruim-telijke Ordening en Milieubeheer.
HOOIMEIJER, P. & M. A. J. LINDE (1987), DemographicChange, Household Evolution and Housing Needs.Utrecht: Department of Geography, University ofUtrecht.
HOOIMEUER, P., W. A. V. CLARK & F. M. DIELEMAN (1986),
Households in the Reduction Stage: Implications forthe Netherlands Housing Market. Housing Studies 1,pp. 195-209.
HOOIMEUER, P., E M. DIELEMAN & J. VAN DAM (1987),Huishoudens in de reductiefase op de woningmarkt,Analyse van gedrag en vooruitblik naar het jaar 2000.Tijdschrift voor Gerontologie en Geriatrie 18, pp.233-239.
KASS, G. V. (1980), An Exploratory Technique for Inves-tigating Large Quantities of Categorical Data. AppliedStatistics 29, pp. 119-127.
KELLER, W. J. & A. VERBEEK (1984), ANOTA: Analysis ofTables. Kwantitatieve Methoden 15, pp. 1-16.
KENDIG, H. L. (1984), Housing Careers, Life Cycle andResidential Mobility: Implications for the HousingMarket. Urban Studies 21, pp. 271-283.
LESLIE, G. R. & A. H. RICHARDSON (1966), Life Cycle,Career Pattern and the Decision to Move. AmericanSociological Review 26, pp. 147-159.
MAGIDSON, J. (1982), Some Common Pitfalls in CausalAnalysis of Categorical Data. Journal of MarketingResearch 19, pp. 461-471.
SONQUIST, J. A. & J. N. MORGAN (1964), The Detectionof Interaction Effects. Ann Arbor: University ofMichigan.
STAPLETON, C. (1980), Reformulation of the Family LifeCycle Concept. Environment and Planning A 12, pp.1103-1118.
TEACHMAN, J. D. (1980), Analysis of Population Diversity,Measures of Qualitative Variation. SociologicalMethods and Research 8, pp. 341-362.
TROST, F. (1977), The Family Life Cycle: A ProblematicConcept. In: E. CUISINIER, ed., The Family Life Cyclein European Societies, pp. 467-482. The Hague/Paris :Mouton.
VERGOOSSEN, Tls. W. M. & A. M. WARNES (1987), Mobilityof the Elderly. Paper presented at Conference on Com-parative Population Geography of the United Kingdomand of the Netherlands, Oxford.
WRIGLEY, N. (1985), Categorical Data Analysis for Ge-ographers and Environmental Scientists. London:Longman.
318 Tijdschrift voor Econ. en Soc. Geografie 79 (1988) Nr. 5
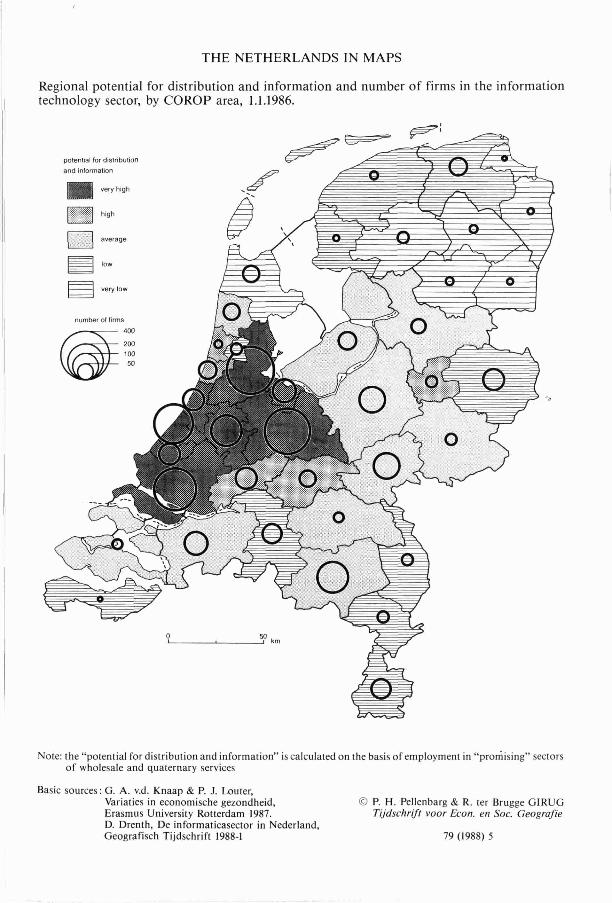
THE NETHERLANDS IN MAPS
Regional potential for distribution and information and number of firms in the informationtechnology sector, by COROP area, 1.1.1986.
potential for distribution
and information
low
very low
0 50km
Note: the "potential for distribution and information" is calculated on the basis of employment in "promising" sectorsof wholesale and quaternary services
Basic sources: G. A. v.d. Knaap & P. J. Louter,Variaties in economische gezondheid, © P. H. Pellenbarg & R. ter Brugge GIRUGErasmus University Rotterdam 1987. Tijdschrift voor Econ. en Soc. GeografieD. Drenth, De inform aticasector in Nederland,Geografisch Tijdschrift 1988-1 79 (1988) 5