Research paper
7
Journal of Petroleum and Gas Exploration Research (ISSN 2276-6510) Vol. 2(10) pp. 181-187, November, 2012 Available online http://www.interesjournals.org/JPGER Copyright © 2012 International Research Journals Full Length Research Paper Petrophysical analysis of well logs for reservoir evaluation: A case study of ‘Laja’ Oil Field, Niger Delta *J.O. Amigun, B. Olisa and O.O. Fadeyi Department of Applied Geophysics, Federal University of Technology, Akure, Nigeria Accepted November 23, 2012 This study presents the log analysis results of a suite of geophysical logs comprising gamma ray (GR), resistivity (LLD), neutron (PHIN) and density (PHID) logs from six wells in ‘Laja’ Field located in the Niger delta. The analysis was carried out to evaluate the field’s hydrocarbon prospect i.e. identify hydrocarbon bearing reservoir(s) and study reservoir properties based on log data from the six wells. Eleven zones of interest (sand bodies) were delineated and correlated across this field. Six of these sands were further identified as potential hydrocarbon reservoirs. The computed petrophysical parameters for the reservoir layers have porosity, φ range of 13% – 38% and hydrocarbon saturation, S h range of 0.16% to 22.2%. The analysis indicates that reservoirs (sands) are encountered at depth range of 4350m to 7650m with relative permeability to oil ranging from 314.0 to 18521.8md. These results on the whole suggest that the reservoir sand units of ‘Laja’ Field contain significant accumulations of hydrocarbon Keywords: Petrophysical parameters, hydrocarbon prospect, reservoir, log analysis, Niger Delta. INTRODUCTION “LAJA” Oil Field is an onshore field located within latitude 5.3 0 and 5.4 0 N and longitude 6.0 0 and 6.2 0 E in the Niger Delta (Figure 1). The general purpose of well log analysis is to convert the raw log data into estimated quantities of oil, gas and water in a formation (Asquith and Krygowski, 2004). In this study, the objectives of using the gamma ray (GR), resistivity, neutron (PHIN) and density (PHID) logs includes the determination of lithologic units, differentiating between hydrocarbon bearing and non- hydrocarbon bearing zone(s) within identify reservoir(s), definition of reservoir geometry by means of well to well correlation and determination of the petrophysical parameters value of zones of interest (reservoirs) in the field such as porosity, permeability, gross thicknesses, water saturation and hydrocarbon saturation. Geology of the Area The Niger Delta which covers an area of about 7500 km 2 *Corresponding Author E-mail: [email protected] is a large acute delta extending between longitude 3 0 and 9 0 E and latitudes 4 0 and 6 0' N (Doust and Omatsola, 1990). Its stratigraphy has been described in detail by Short and Stauble (1967) and Kulke (1995), of which they recognized three lithostratigraphic units i.e. the Benin, Agbada and Akata Formations. The Benin Formation is the uppermost and the youngest rock stratigraphic unit, while the Agbada Formation is a paralic sequence that is characterized by the alternation of sand bodies and shale layers. The Agbada Formation is also associated with synsedimentary growth faulting and as well contains the bulk of the known oil accumulation in the Niger Delta. The Akata Formation is the lowest unit with evidence of some hydrocarbon and is under compacted in much of the delta (Figure 2). The growth faults in the Niger Delta according to Weber (1987) are considered to be the major migration conduit and leading factor controlling the hydrocarbon distribution pattern in the Niger Delta. Log Analysis The initial step in this log analysis is to identify the zones
-
Upload
tu-cottbus -
Category
Documents
-
view
0 -
download
0
Transcript of Research paper

Journal of Petroleum and Gas Exploration Research (ISSN 2276-6510) Vol. 2(10) pp. 181-187, November, 2012 Available online http://www.interesjournals.org/JPGER Copyright © 2012 International Research Journals
Full Length Research Paper
Petrophysical analysis of well logs for reservoir evaluation: A case study of ‘Laja’ Oil Field, Niger Delta
*J.O. Amigun, B. Olisa and O.O. Fadeyi
Department of Applied Geophysics, Federal University of Technology, Akure, Nigeria
Accepted November 23, 2012
This study presents the log analysis results of a suite of geophysical logs comprising gamma ray (GR), resistivity (LLD), neutron (PHIN) and density (PHID) logs from six wells in ‘Laja’ Field located in the Niger delta. The analysis was carried out to evaluate the field’s hydrocarbon prospect i.e. identify hydrocarbon bearing reservoir(s) and study reservoir properties based on log data from the six wells. Eleven zones of interest (sand bodies) were delineated and correlated across this field. Six of these sands were further identified as potential hydrocarbon reservoirs. The computed petrophysical
parameters for the reservoir layers have porosity, φφφφ range of 13% – 38% and hydrocarbon saturation, Sh range of 0.16% to 22.2%. The analysis indicates that reservoirs (sands) are encountered at depth range of 4350m to 7650m with relative permeability to oil ranging from 314.0 to 18521.8md. These results on the whole suggest that the reservoir sand units of ‘Laja’ Field contain significant accumulations of hydrocarbon Keywords: Petrophysical parameters, hydrocarbon prospect, reservoir, log analysis, Niger Delta.
INTRODUCTION “LAJA” Oil Field is an onshore field located within latitude 5.3
0 and 5.4
0N and longitude 6.0
0 and 6.2
0E in the Niger
Delta (Figure 1). The general purpose of well log analysis is to convert the raw log data into estimated quantities of oil, gas and water in a formation (Asquith and Krygowski, 2004). In this study, the objectives of using the gamma ray (GR), resistivity, neutron (PHIN) and density (PHID) logs includes the determination of lithologic units, differentiating between hydrocarbon bearing and non-hydrocarbon bearing zone(s) within identify reservoir(s), definition of reservoir geometry by means of well to well correlation and determination of the petrophysical parameters value of zones of interest (reservoirs) in the field such as porosity, permeability, gross thicknesses, water saturation and hydrocarbon saturation. Geology of the Area The Niger Delta which covers an area of about 7500 km
2
*Corresponding Author E-mail: [email protected]
is a large acute delta extending between longitude 30 and
90E and latitudes 4
0 and 6
0' N (Doust and Omatsola,
1990). Its stratigraphy has been described in detail by Short and Stauble (1967) and Kulke (1995), of which they recognized three lithostratigraphic units i.e. the Benin, Agbada and Akata Formations.
The Benin Formation is the uppermost and the youngest rock stratigraphic unit, while the Agbada Formation is a paralic sequence that is characterized by the alternation of sand bodies and shale layers. The Agbada Formation is also associated with synsedimentary growth faulting and as well contains the bulk of the known oil accumulation in the Niger Delta. The Akata Formation is the lowest unit with evidence of some hydrocarbon and is under compacted in much of the delta (Figure 2).
The growth faults in the Niger Delta according to Weber (1987) are considered to be the major migration conduit and leading factor controlling the hydrocarbon distribution pattern in the Niger Delta. Log Analysis The initial step in this log analysis is to identify the zones

182 J. Pet. Gas Explor. Res.
Figure 1. The Map of Niger delta showing location of Laja field and insert is the Base map Indicating Well Locations.
Figure 2. Geological Cross section showing Stratigraphic units of the Niger Delta (After
Michele et al., 1999).
of interest i.e. clean sand with hydrocarbon. Gamma ray (GR) log which measures natural radioactivity in formations (track 1 in Figure 3), was used in the
identification of sand/shale lithology in the study area. The deep laterolog (LLD) represented in track-2 (Figure 3) in combination with the GR log were used to differen-

Amigun et al. 183
Figure 3. Lithologic Correlation Panel of Hydrocarbon Bearing Reservoir of “LAJA” field, Niger Delta.
tiate between hydrocarbon and non-hydrocarbon bearing zones. Consequently, the zones of interest for the petrophysical interpretation were defined in terms of clean zones with hydrocarbon saturation (low GR and high resistivity).
The formation density and neutron logs were used for the differentiation of the various fluid types. The gas zones are interpreted from crossover of the porosity logs i.e. formation density and neutron logs, oil zones are based on high resistivity values and water zones corresponds to very low resistivities.
The next step is shale volume estimation; shale volume (Vsh) was calculated using the Dresser Atlas, 1979 formula in equation (1) which uses values from the gamma ray (GR) in equation (2) Vsh = 0.083
(2(3.7 x IGR) -1.0 (1)
(2)
In equation (2), IGR is the gamma ray index, GRlog is the picked log value while GR minimum and GR
maximum indicate values picked in the sand and shale base lines respectively.
Porosity, φD was determined (Dresser Atlas, 1979) by substituting the bulk density readings obtained from the formation density log within each reservoir into the equation (3)
And where , and are matrix density, formation
bulk density and fluid density respectively. To calculate water saturation, Sw the method used in
this study requires a water resistivity Rw value at formation temperature calculated from the porosity and resistivity logs within clean water zone, using the Ro method given by the following equation:
Rw is the water resistivity at formation temperature, φ
and Ro are the total porosity and deep resistivity values in the water zone respectively. Tortuosity factor is represented as “a” and m is the cementation exponent,

184 J. Pet. Gas Explor. Res.
Table 1. Summary of Results from Log Analysis in well 1 in ‘Laja’ Field.
SAND TOP BASE GROSS NET N/G GRlog IGR VSH
(m) (m) (m) (m) (%) (API) (%)
A 4560 4980 420 336 80 66.54 0.38 11.55
B 5090 5210 120 104.4 87 52.91 0.28 14.56
C 5290 5310 20 15.6 78 72.11 0.42 20.37
D 5392 5439 47 30.08 64 91.3 0.57 46.01
E 5516 5798 282 174.84 62 76.16 0.45 16.34
F 5888 5935 47 34.31 73 83.78 0.51 16.4
G 6020 6272 252 201.6 80 68.7 0.4 18.41
H 6600 6812 212 173.84 82 55.03 0.3 9.28
I 6855 7140 285 250.8 88 75.78 0.45 14.47
J 7490 7560 70 57.4 82 89.2 0.55 20.59
SAND Øe F Sw Sh Swirr BVW K OMI
(%) (%) (%) (%) (md)
A 25.75 11.39 97.98 2.02 7.55 0.26 4525.96 0.9838
B 26.69 10.89 99.44 0.56 7.38 0.27 5226.05 0.9955
C 30.43 8.16 98.71 1.29 6.39 0.31 13183.63 0.9897
D 19.41 18 99.62 0.38 9.49 0.21 1046.28 0.997
E 29.09 8.82 100 0 6.64 0.3 10257.03 1
F 23.96 12.5 99.24 0.76 7.91 0.25 3360.54 0.9939
G 23.26 13.78 99.71 0.29 8.3 0.24 2459.22 0.9976
H 24.36 12.97 71.88 28.12 8.05 0.18 2988.27 0.7587
I 16.98 24.5 99.86 0.14 11.07 0.18 390.11 0.9989
J 17.08 22.95 99.69 0.31 10.71 0.19 481.2 0.9975
usually 2 for sands (Asquith and Krygowski, 2004). In the water zone, saturation should be equal to 1, as water resistivity Rw at formation temperature is equal to Rwa
Water saturation, Sw can then be calculated using Archie’s method, given by:
where n is the saturation exponent and Rwa is water resistivity in the zone of interest, calculated in the same manner as RW at formation temperature (Archie, 1942).
Hydrocarbon Saturation, Sh is the percentage of pore volume in a formation occupied by hydrocarbons. It can be determined by subtracting the value obtained for water saturation from 100% i.e. Sh = (100 – SW) % (6) Permeability, K of each identified reservoir is calculated using equation (7)
where Swir is the irreducible water saturation (Tixier, 1949)
The productivity of each delineated reservoir rock at the zone of interest are estimated by evaluating results of their calculated petrophysical parameters using equation (1) – (7).
Lithologic correlation of equivalent strata across the six wells was done using the gamma ray log. Equally, identified potential hydrocarbon reservoirs in the various wells were correlated using the gamma ray and resistivity logs to know their lateral and vertical extent. Their results are presented as correlation panels in Figure 3. RESULTS AND INTERPRETATION The litho-stratigraphic correlation is a visual process which provides knowledge of the general stratigraphy of an area (Amigun, 1998). Figure 3 shows a composition of alternating sand and shale layers delineated in ‘Laja’ Field. Eleven sand bodies were correlated across this field and were marked sand A, B, C, D, E, F, G, H, I, J and K. The shale layers are observed to increase with depth along with a corresponding decrease in sand layers. This pattern in the Niger delta indicates a transition from Benin to Agbada Formation. From the analysis, specifically the resistivity logs, six hydrocarbon bearing reservoir zones namely; A, C, E, F, H and J were identified across all the wells encountered at depths ranging from 4350m to 7650m. Sand H in Figure 3 is hydrocarbon bearing, occurring at depth 6600m and 6590m in well 1 and 3 respectively. This reservoir is wet in well 2 i.e. containing only water and its hydrocarbon
Amigun et al. 185
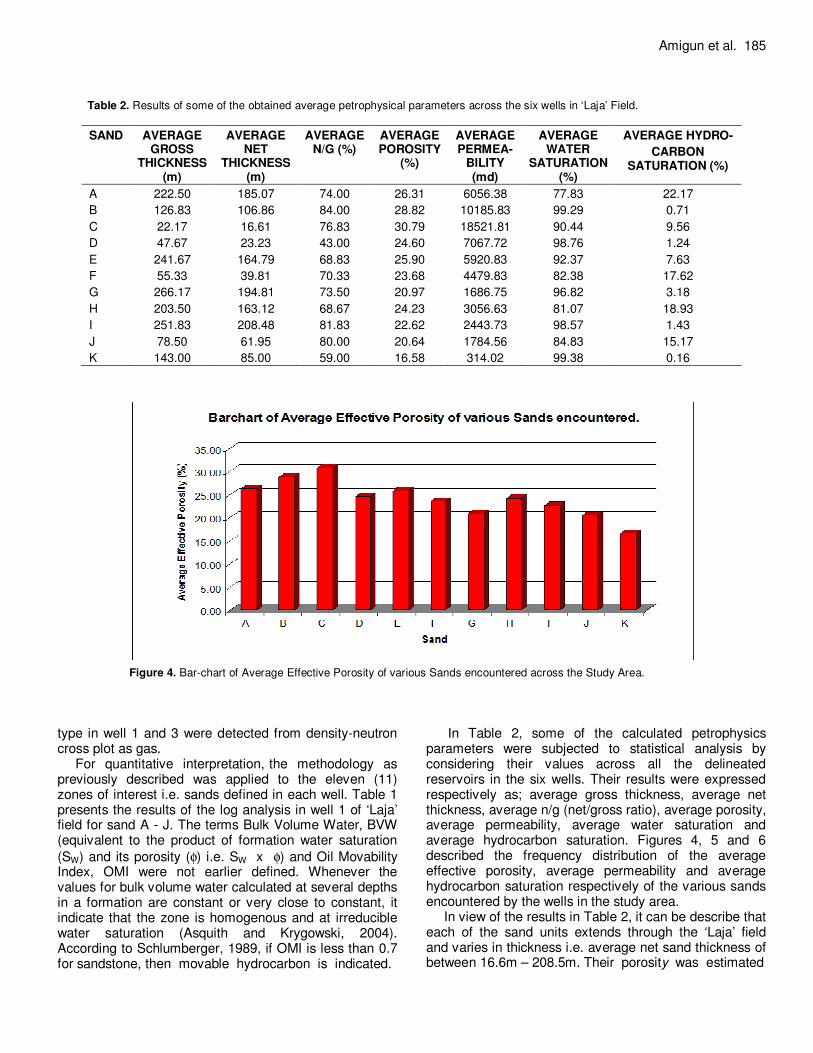
Table 2. Results of some of the obtained average petrophysical parameters across the six wells in ‘Laja’ Field.
Figure 4. Bar-chart of Average Effective Porosity of various Sands encountered across the Study Area.
type in well 1 and 3 were detected from density-neutron cross plot as gas.
For quantitative interpretation, the methodology as previously described was applied to the eleven (11) zones of interest i.e. sands defined in each well. Table 1 presents the results of the log analysis in well 1 of ‘Laja’ field for sand A - J. The terms Bulk Volume Water, BVW (equivalent to the product of formation water saturation
(SW) and its porosity (φ) i.e. SW x φ) and Oil Movability Index, OMI were not earlier defined. Whenever the values for bulk volume water calculated at several depths in a formation are constant or very close to constant, it indicate that the zone is homogenous and at irreducible water saturation (Asquith and Krygowski, 2004). According to Schlumberger, 1989, if OMI is less than 0.7 for sandstone, then movable hydrocarbon is indicated.
In Table 2, some of the calculated petrophysics parameters were subjected to statistical analysis by considering their values across all the delineated reservoirs in the six wells. Their results were expressed respectively as; average gross thickness, average net thickness, average n/g (net/gross ratio), average porosity, average permeability, average water saturation and average hydrocarbon saturation. Figures 4, 5 and 6 described the frequency distribution of the average effective porosity, average permeability and average hydrocarbon saturation respectively of the various sands encountered by the wells in the study area.
In view of the results in Table 2, it can be describe that each of the sand units extends through the ‘Laja’ field and varies in thickness i.e. average net sand thickness of between 16.6m – 208.5m. Their porosity was estimated
SAND AVERAGE GROSS
THICKNESS (m)
AVERAGE NET
THICKNESS (m)
AVERAGE N/G (%)
AVERAGE POROSITY
(%)
AVERAGE PERMEA-
BILITY (md)
AVERAGE WATER
SATURATION (%)
AVERAGE HYDRO-
CARBON SATURATION (%)
A 222.50 185.07 74.00 26.31 6056.38 77.83 22.17
B 126.83 106.86 84.00 28.82 10185.83 99.29 0.71
C 22.17 16.61 76.83 30.79 18521.81 90.44 9.56
D 47.67 23.23 43.00 24.60 7067.72 98.76 1.24
E 241.67 164.79 68.83 25.90 5920.83 92.37 7.63
F 55.33 39.81 70.33 23.68 4479.83 82.38 17.62
G 266.17 194.81 73.50 20.97 1686.75 96.82 3.18
H 203.50 163.12 68.67 24.23 3056.63 81.07 18.93
I 251.83 208.48 81.83 22.62 2443.73 98.57 1.43
J 78.50 61.95 80.00 20.64 1784.56 84.83 15.17
K 143.00 85.00 59.00 16.58 314.02 99.38 0.16

186 J. Pet. Gas Explor. Res.
Figure 5. Bar-chart of Average Permeability of various Sands encountered across the Study Area.
Figure 6. Bar-chart of Average Hydrocarbon Saturation of various Sands encountered across the Study Area.
from density log (RHOB) using porosity formula with shale correction by Dresser Atlas (1979) and these values were found to be high in almost all interpreted zones, ranging from 13% to 38% (see Figure 4). In the assessment of a well's productivity, the permeability of sand unit (reservoir rock) is an important parameter i.e. productivity is related to the mathematical product of permeability, k, and thickness, h of that unit. In Figure 5, the sand units’ permeability range was from 314.0 to 18521.8md with sand units C having the highest value. The hydrocarbon bearing sand units in ‘Laja’ field possess hydrocarbon saturation, Sh ranging from 0.16%
to 22.2% (Figure 6). The movability of hydrocarbons in each reservoir was determined and considered satisfactory for the production of hydrocarbon. CONCLUSIONS The log analysis performed in this study shows that the reservoir sand units of ‘Laja’ field contain significant accumulations of hydrocarbon. The delineated zones of interest (eleven in number) have an average net sand thickness of between 16.6m – 208.5m, average effective

porosity in the range of 0.013 to 0.38 and hydrocarbon saturation, Sh ranging from 0.002 to 0.22 which are favorable indicators for commercial hydrocarbon accumulation.
Further calibration of the log analysis parameters with core and production data is necessary to verify the calculated values, as the permeabilities for some of the reservoir sand units are extremely high. ACKNOWLEDGEMENTS We would like to thank Department of Petroleum Resource (DPR), a subsidiary of Nigerian National Petroleum Corporation (NNPC) for providing the dataset and Seismic Micro – Technology, Inc; USA for the use of donated software (Kingdom SuiteTM) to the department of Applied Geophysics, Federal University of Technology, Akure. REFRENCES Amigun JO (1998). Interpretation of Seismic Reflection Data over
Okpoko oil Field, Niger Delta; (unpublished M.Sc thesis) Obafemi Awolowo University, Ile-Ife.
Amigun et al. 187 Archie GE (1942). The Electrical Resistivity as an Aid in Determining
Some Reservoir Characteristics. J. Petrol. Technol., 5:54-62 Asquith G, Krygowski D (2004). Basic Well Log Analysis: AAPG
Methods in Exploration Series. (16) Doust H, Omatsola O (1990). Niger Delta: In Divergent and Passive
margin Basin (Edwards J.D. Santoyrossi P.A. Eds.) American Association of Petroleum Geologists. Memoir 48:191-248.
Dresser Atlas (1979). Log interpretation charts: Houston Dresser Industries, Inc. 107
Kulke H (1995). Nigeria, in, (Kulke, H, ed) Regional Petroleum Geology of the World. Part II: Africa, America, Australia and Antarctica: Berlin, Gebrüder Borntraeger, p. 143-172.
Michele LWT, Ronald RC, Michael EB (1999). The Niger Delta Petroleum System: Niger Delta Province. Open – File Report 99 – 50 – H. USGS.
of Petroleum Geologists. Bulletin, 51:761-779. Schlumberger (1989). Principle and application of log interpretation.
Schlumberger Education services, Houston. Short KC, Stauble AJ (1967). Outline of geology of Niger Delta,
American Association Tixier MP (1949). Evaluation of Permeability from Electric Log
Resistivity Gradients. Oil and Gas J.,8:75-90. Weber KJ (1987). Hydrocarbon Distribution Pattern in Nigeria growth
fault structures controlled by structural style and stratigraphy. J. Petrol. Sci. Engine.. Elsevier Science Publishers B.V. Amsterdam, 1-12.