RESEARCH INTO ENTREPRENEUR IDENTIFICATION AND ...
27
RESEARCH INTO ENTREPRENEUR IDENTIFICATION AND DEVELOPMENT An In-House Review And Critique of Findings Frank R- Denton Employment and Enterprise Development Division Office of Rural and Institutional Development Bureau For Science and Technology March 1988
-
Upload
khangminh22 -
Category
Documents
-
view
1 -
download
0
Transcript of RESEARCH INTO ENTREPRENEUR IDENTIFICATION AND ...

RESEARCH INTO ENTREPRENEUR IDENTIFICATION AND DEVELOPMENT
An In-House Review
And
Critique of Findings
Frank R-Denton
Employment and Enterprise Development Division Office of Rural and Institutional Development
Bureau For Science and Technology
March 1988
EXECUTIVE SUMMARY
The Research or Entrepreneur Identification and Development Project started 3 years ago as an ambitious effort to show that an individuals performance in starting and developing a business could be partially predicted from a knowledge of certain personal characteristics The basic point of departure for the research was the assumption that certain entrepreneurial caracteristics could be determined from interviews conducted with individuals who are in business and in turn that it would be possible to demonstrate which entrepreneurial characteristics were more common among the relatively successful businesspersons
Once the characteristics of the successful businesspersons were known (a causal relationship was to be assumed) it would be possile to use them to pre-select promising business managers Alternashytively a knowledge of the characteristics of superior business m-nagers could be used in developing training programs designed to enhance management performance
McBer and Company with long experience in entrepreneur definition and development was s(iected as contractor for the research phase (to determine the characteristics associated with superior business performance) McBers work is now completed Management Systems International was selected for the training program development and testing their work is still on-going This report covers only the work of McBer
The research was undertaken in three countries to identify through personal interviews the characshyteristics which differentiated superior from average experienced businesspersons The research was to be in two phases and was to ultimately involve several hundred businesspersons
Phase I was completed but problems were encountered in the process Initial findings were not very encouraging In a review after Phase I the original scope of the project was shown to be too ambitious given time and resources available There were also judged to be needs for strengthshyening data collection and analytic processes in order to develop useful findings from Phase IL
After the mid-project review the number of countries for research in Phase fl was reduced to two and recommendations were made for certain steps to improve data collection and analysis
In April1987 the contractor McBer prcvided its final report on the project In summary McBers conchusions are
1 There is a moderate degree of consistency in the results of these in the several countries] The following [personal] competencies average g-oups of entrepreneurs in more than one study
studies differen
[Phase tiated
I and mccesfL
Phase id
II
Sees and Acts on Opportunities Corcern for High Quality of Work Commitment to Work Contract Systematic Planning Self Confidence (p236)
2 Once again caution is needed in interpreting the results because of the differences among the studies In addition the competencies differentiating the groups MM [underlining mine] depending on the statistical analysis used (p235)
3 he first three of these [see 1 above] as well as some competencies that were significant in only one study (Initiative Persistence Effciency Orientation) are clearly related to the concept of Acievement M ivation that has served as the basis of many entreprercurship training programs (p 236)
4 [However] Not all of the competencies differentiating the successful from average groups were clearly related to achievement or task orientation (p236)
5 Someone for whom these themes [the assumed Achievement Motivation themes] are important may be likely to develop compencies lRke Information Seeking Concern for High quality of Work and Commitment t Vork Contract (p 236)
6 Variabes bLws d on personal background and demographic information generally failed to difshyferentiate the svcwessful from the average groups of entrepreneurs (p234)
AID Commentt-The McBer conclusions infer that their analysis demonstrates general support for the initial working assumption that higher Achievement Motivation will be demonstrated by the superior bushtssperson It is Lhe view of the project office SampTRD in AJD that this conclusion is not suppoted by the analysis and that no such inference should be made The relationships cited above are not consistent a fact that is noted by McBer They exist in some of the studies and not in others Within a stud) the ielationships are shown to exist with some statistical analysis tools and not with others Not full explained by the centractor is the fact that although statistical signirficance is often obtained tk pragmatic ability to separate the superior from the average businessipersons using these findings is quite weak
Moreover the assumption (see 5 above) that High Quality Wirk and Work Contract Commitment My reflect characteristics of persons with high Achievement Motivation is precisely that merely a statement of possibility Thus SampTRD tends to feel that the work as reported on by McBer simply does not offer a firm basis for concluding that Achievement Motivation characterizes those persons who are classed as superior performers in this researrh
Given the money spent on collecting the intei-ew data and the potential importance any conshyclusions as to the sources of busino-ss success would have for development plai in AICD conshycluded that 3 more careful and thorough analysis of the data should be made It was decided to conduct an ir-depth analysis of these data using in-house resources
The conclusions from this in-house effort areshy
a The data are not as useful as it was hoped would be the case There ma well be a large error or nuise component in these data-certain evid-nce supports such t conusioiL Tl =Y case ther is
1-2 uzied abblY to ampaMcally prdamp-t iwdcaled busminess pformance fairn a bwwltge of thf peronal characteistics of the biu4eampVpmns bufveiewed dur the cogmse of this prcject
b Either because there is no real relationship or becmise the aisrror comporent ma43 r nal relationship the data set does not support the iniWai working ky1-thesis of he pogiect That is the data do not show a consistent and meaningful relationship between the Achieaele Motivation orientationof these bsi spersons andtheirindicatedbiinr prfoimance
ii
c The one pattern that seems to be suggested rather consistently but not overly strongly bythese data is that persons who know their business thoroughly and make it a consciou~s policy tokeep that knowledge up-to-date are somewhat more likely to have good business performance It isprobably worthwhile to consider this a subject for further research by those interested in the field of business management
d A second possible positive relationship is that those businessesons with good managementinformationmorntoring patterns may be eAected to be more successful The relationship found isnot strong but isnonetheless of sufficient consistency to suggest the utility of further research
e At this time it has not been proven that personality traits may be used as criteria in predictinga persons likelihood of success in starting and managing an enterprise On the contrary ourinterpretation of the evidence generated from this study suggests that many differem types of persons can be successful Consequently tis study offem no support for the proposition thaitraining people so as to enhance certain personality traits will lead to improvement In their busishyness management performance It has also to be said that this study offers little support forconcluding that personality variables clearly have no role in determining business success
il
ACKNOWLEDGEMENT
Pegg Persch of the Univen- Frsconsin Graduate School of Business did much of the statistical work reported on in this document Her extensive involvement at the project was extremety important in itsfnal development
MAIN REPORT
IV
BACKGROUND
The Research on Entrepreneur Identification and Development Project started 3 years ago as an ambitious effort to show that an individuals performance in starting and developing a business could be partially predicted from a knowledge of certain personal characteristics The basic point of departure for the research was the assumption that certain entrepreneurial characteristics could be determined from interviews conducted with individuals who are in business and in turn that it would be possible to demonstrate which entrepreneurial characteristics were more common among the relatively successful businesspersons
Once the characteristics of the successful businesspersons were determined (a causal relationship was to be assumed) it would be possible to use them to pre-select promising business managersAlternatively a knowledge of the characteristics of superior business managers could be used in developing training programs designed to enhance management performance
McBer and Company with long experience in entrepreneur definition and development was selected as contractor for the research phase (to determine the characteristics associated with superiorbusiness performance) McBers work is now completed Management Systems International was selected for the training program development and testing their work is still on-going This report covers only the work of McBer
The research was undertaken in three countries to identify through personal interviews the characshy
ambitious given time and
teristics which differentiated superior from average experienced businesspersons The research was to be in two phases and was to ultimately involve several hundred businesspersons
Phase I was completed but problems were encountered in the very encouraging In a review after Phase L the original scope
process Initial of the project
findings were not was shown to be
too resources available There were also judged to be needs for strengshythening data collection and analytic processes in order to develop useful findings from Phase IL After the mid-project review the number of countries for research in Phase II was reduced to two
and recommendations were made for certain steps to improve data collection and analysis
In April1987 the contractor McBer provided its final report on the project
Resuts obtained from this work were rather disappointing Ouestions continue to exist about the quality of the data generated There is still the feeling that the analysis of the data was not as careful as might be For these reasons SampTRDEED has undertaken a thorough in-house analysis of the best subset of the data collected during the project This report summarizes the contractors findings and gives the findings from the in-house analysis
2
L THE CONTRACTORS CONCLUSIONS 1
A primary objective in the entrepreneur project was to determine if there were certain personalattributes (Personal Entrepreneurial Characteristics or PECs) that differentiated superior from average businesspersons About 25 Personal Entrepreneurial Competencies (PECs) were developed and investigated by the contractor2 The characteristics ranged from those which can be thought of as generalized personality-related concepts such as high initiative aggressiveness and so forth to those of a somewhat more business-specific or acquirable nature such as concern with high quality product systematic planning and information seeking
The basic structure of the research was quite straightforward It involved 1) the selection of samples of experienced businesspersons in three countries 2) the categorization of those businessshypersons into superior and not superior categories 3) the determination of the degree to which the subjects demonstrated the Personal Entrepreneurial Characteristics (PECs) and 4) finally the detershymination of differences in PEC patterns between the two sets of businesspersons in order to demonstrate the competencies that characterized the superior set of businesspersons
The project was to involve a rigorous empirical examination of a moderately large cross-national sample of businesspersons It was to have a widespread impact for private sector development activities The final product was to be a set of PECs which characterized superior busincsspersons and which did not occur with similar frequency among the personal characteristics of those in the not-superior set of businesspersons This information was to be the basis for development of either or both training programs for budding entrepreneurs or screening devices to select those with more business management potential
A certain degree of confusion arose in the project due to the breadth and undifferentiated nature of the concepts used in developing a typology of individuals There was arguably insufficient attention given to the rigorous definition of the initial typology However the contractor set about conducting this research in Ecuador India and Malawi The research was conducted in two phases In Phase I a number of businesspersons were selected from each country and categorized as to business capability These businesspersons were interviewed On the basis of the interviews their PECs were determined At the end of Phase I an analysis of the relationship between the PEC scores and rated business capability was conducted across the three countries This analysis was to
IThese conclusions are taken from McBer and Company The Ideification and Assessment of Cometendes and other Personal Charucteristics of nrcprnw3 in Developig Counies Final Report ALD project 936-5314 April 1987
2The underlying theory behind the development of the characteristics assumed to be relevant in entrepreneurial or business management performance derives from the early work by David Mclelland on achievement motivation and from McBers continued development of these concepts For a more thorough discussion see
David C McClelland Achievement Motivation can be Develope4 Harvard Business Review Nov-Dec 1965
David C Mclelland and Winter DG Motivating Economic Achievement Free Press New York 1965
3
be the basis for refining the theory improving the interview process and for suggesting possible shortcomings in the rcsearch)
The results from Phase I were not encouraging The data from Ecuador ultimately were judged tobe not usable The Malawi data seemed more internally consistent bvut produced no usable evidence as to what differentiated better businesspersons The India data appeared to be of better qualityalthough the relationships between measures of business capability and personal characteristics were weak and not always consistent Nonetheless there was some promise shown in the data collected on Indian businesspersons
Consideration was given to stopping the project at the end of Phase L However it was decided to go ahead with Phase II in India and Malawi In this Phase sets of 92 experienced businesspersons were selected for observation in each country Half of the 92 were to be persons rated as havingsuperior business capacity and half to be from among businesspersons who were not rated as possessing superior capacity Also for Phase U the set of PECs was reduced to a core fifteen Lengthy interviews were conducted with each of the businesspersons to determine the extent to which they exhibited the fifteen characteristics judged to be critical in determining business capacity In Phase 13 more attention was also given to ascertaining background characteristics Such indicators as education family wealth social class and so forth were observed for each respondent involved in the sample
An analysis (for Phase II data) of the relationships between the PECs and rated business perforshymance completed the contractors work on this part of the project For the data from Malawi thisanalysis showed that there were no relationships of any consequence between the PECs and inshydicated business performance As a result the Malawi data have been largely ignored in developingsuch final conclusions as are made from the project
The contractor then with the project offices concurrence concentrated on the Phase 11 data from India The contractor concluded from its analysis that there were sgnificant and meaningfulrelationships between the PECs and rated or demonstrated business capacity
1 Variables based on personal background and demographic information generally failed to difshyferentiate the successful from the average groups of entrepreneurs (p234)
2 In contrast to the personal variables competencieoften differentiated successful from averagegroups (p234)
3 There is a moderate degree of consistency in the results of these sradies [Phase I and Phase II in the several countries] the following [personal] competencies differentiated successful and average groups of entrepreneurs in more than one study
Sees and Acts on Opportunities Concern for High Quality of Work Commitment to Work Contract Systematic Planning Self Confidence (p236)
4 The first three of these [see 3 above] as well as some competencies that were significant in
3See McBer amp Co Ehrepreneur and Small Enteprise Development Second Annual Report March 25 1986
4
only one study (Initiative Persistence Efficiency Orientation) are dearly related to the concept of Achievement Motivation that has served as the basis of many entrepreneurship training programs(p236)
5 Someone for whom these themes [the assumed Achievement Motivation themes] are importantmay be likely to develop competencies like Information Seeking Concern for High Quality of Work and Commitment to Work Contract (p 236)
McBer does add a cautionary note
6 Once again caution is needed in interpreting the results because of the differences among the studies In addition the competencies differentiating the groups Xy [underlining mine4 depending on the statistical analysis [technique] used (p235)
However the contractors final report seems ultimately to accept the conclusion that the causa relationship of Achievement Motivation related PECs to Business Performance has been demonstratshyed
Many of the competencies that discriminated successful from average groups of entrepreneurs are more like personality traits than skills Examples of trait-like competencies include PersistenceConcern for High Quality of Work Self Confidence and Commitment to Work Contract These competencies probably show considerable stability over time and may not be easy to denzlop or train If these competencies are critical to entrepreneurial success it may be easier to select people who already possess these competencies than to try to develop the competencies through training (p242)
On reviewing the contractors final report SampTRD was not satisfied that meaningful relationshipshad been demonstrated nor that the relationships which did appear to eist as weak as they were were not best explained as reflecting possible biases in the data
Because of the importance of the research questions regarding characteristics of superior businessshypersons and because of the amount of money invested in collecting data it was decided to conduct a thorough in-house review of the India Phase II data This report documents that review and gives our in-house conclusions as to what may be said to be demonstrated by these data A full set of McBer reports is available for those interested
5
IL Samprs ANALYSIS
DIFFERENTIATING PECS
Theoretical Reasoning As noted earlier SampT felt that the PECs were rather inhomogeneous in nature It was decided that the selected Personal Entrepreneurial Competencies measures could be usefully thought of as falling into three basic classes-1) indicators of personal characteristics which are close to personality and therefore not readily changed 2) business management styleindicators that represent behavioral tendeacies that are more readily adopted or dropped when recognized as useful or not useful and 3) business skill indices which are related tc dearlylearned attributes These differences are important because at one end a PEC migbt represent a characteristic that could be learned in training programs while at the other end a PEC could be a rather unalterable trait Knowledge of such unalterable traits could only be of practical inuse developing a screening tool Thus the different implications even if shown to be valid as predictors
PECs carry significantly different operational
A cy
number of variables exist in these classes Because of the non-homogeneity indicators aod because of the different operational implications (learnable
among thc competenshyattributes at one end
versus difficult-to-change basic personality factors at the other) SampT felt it important to treat the PECs by sub-group
Groun) A This group contains the PECs seen as akin to basic personality Such indicators used by the contractor are Aggressive type High Initiative and so forth
Group B This includes PECs usefully viewed as related to btsiness management style These inshydicators are judged to be in-between basic personality and consciously learned behavior havingcharacteristics of both Indicators here include the McBer competencies of Concern with HighQuality Work Monitoring of Business Orientation Toward Efficiency and so forth These seem to represent indices of how the respondent chooses to run his or her business While perhaps partlyrelated to personality these indicators may also be developed as habit of business behavior
Group CThese are business skill indicators One or two of the McBer indicators of competency can be usefully thought of as business-skill related these are attributes that are prcdo-minantly acshyquired either through training or from long experience In particular Systematic Planning is thought to be skill related This class of competency indicators is judged to be least related to personality
To determine empirically the degree to which these clusters actually exist in the data a correlation matrix and a factor matrix were computed using the observed values on these fifteen variables for the 92 businesspersons It was hoped that by using the factor analysis that it would be pomble to reduce the number of variables from 15 to some lesser number-hopefully one for each of the three groups discussed above
Empirical Results Both the correlation matrix and factor analysis matrix (appendix A) show that one strong duster and one weak cluster exist in these data The strong Cluster can be interpreted as representing business management style We have called it modem management style The PECs
6
contained in the duster are4
PriMa (strongly related)
Concern with High Quality (HIQUAL)Sees and Acts on Opportunities (SEEACr) Problem Solving Approach (PROSOLV) Monitoring of Business (MONITOR) Efficiency Orientation (EFFIC) Self Confidence (CONFID)
Seonda (weakly related)
Initiative (IN) Commitment to Contracts (COMMIT)
The average of the intercorrelations for the six primary competencies in the cluster is 061 while the minimum correlation is 052 This indicates a moderately strongly interdependent cluster The titles of the competencies are not totally descriptive But if one delves into the detailed definitions most of these competencies seem to be indicating in the first instance a tendency to run a tightship in the modem business school sense of the phrase It is only Self-Confidence which appears to represent a significantly different concept Empirically the analysis then shows there is goodevidence of a duster of learned business behavior indices which account for much of the variance in the competency observations A single central underlying pattern of careful and thoughtfulbusiness management seems to be manifested in these conceptually similar indicators of behavior
For this work it is accepted that such a cluster representing management style exists No one of the competencies measured seems to be more central to this duster than does any other Thus it was decided to create a composite indicator of the central tendency wung factor analysis A principal component factor was extracted from the six primary members of the duster and a composite indicator created by computing factor scores
The factor loadings on this composite indicator areLoading
High Quality 084 Self Confidence 086 Sees and Acts 082 Problem Solving 083 Monitoring 079 Efficiency 078
As can be seen the factor effectively representing the
loadings are tendency if
very high indicating if you will the composite measure is sich exists This composite will be used as one of the
primary independent variables in the attempt to predict business management performance from a
4 See McBers final report for more information on the operational and theoretical meaning of the 15 competencies
5 The factor loadings are equal to the correlations between the original variables and the created composite
7
knowledge of the managers personal characteristics
The secondary competency duster was than the also for(factor) much looser first It accounted a rather small portion of the variance in the competency data matrix Thus it is conceptually less powerful as an index to represent basic patterns in the competency matrix The duster is howevercomposed of competencies which seem most appropriately referred to as personality indicators Thus it does conform to the initial expectation (theory) that there would be such a clustering of PECs
Because of the lower correlations between the variables in this duster there was a reluctance to treat only a single composite variable as was done with modern management style Instead fromthese several variables the following composite and raw measures are used as indicators of pershysonality type
a Aggressive Personality-This is derived from a principal component factor fit to the four variables of Persistence Assertiveness Persuasiveness and Use of Influence Strategies The fit is only moderately good empirically but the composite is robust in a theoretical sense
b The two most prominent original personality indicators from this duster Assertiveness and Persistence are also included as independent variables Their inclusion reflects the centrality ofthese two variables in the original concept of entrepreneurial pei-sonality type and the relativelyweak correlations between the members of the duster
The third expected duster that of busiAess skills did not show-up in the factor anpjysis results This probably happened because of the limited number of measures related to skills that were included among the 15 final PECS Therefore a limited portion of the data variance is accounted forby skills performance Thus there is no siitable measure of this conceptual category for use in the final analysis
However two other vaiiables are included in the final set of independent variables chosen to reuresent the competency set Information Seeking is included because it is an empirically robust measure there few scores and because McBers analysis it was best predicshyare zero in the single tor of their measure of business performance Initiative is inciuded because of our perception of its centrality to the original concepts of the entrepreneurial personality type
Thus the fifteen competency indicators are reduced to a set of six measures Two of the three classes expected to be found are represented Group A is represented by the Management Stylecomposite and by Information Seeking Group B by the Personality composite and the three separate personality measures
These variables some as original data and others as composite estimates will form the set of trial predictors for our examination of the correlates of business management performance
BACKGROUND CHARACTERISTICS
As noted the basic objective of the project was to ascertain the degree to which business manageshyment performance related to PEs Background characteristics however were also believed to be potentially important in real and perceived business performance and several background indicators were thus included in the analysis
1 to determine if there was any evidence indicating that the panels selection of superior and average businesspersons might been by perceptions the andhave biased their of social economic
8
backgrounds of those businesspersons
2 to determine the extent to which notwithstanding PECs individuals from higher economic and social classes appeared to do better in business
McBer obtained data on a moderately wide array of background characteristics As with the comshypetency data it was decided to use correlation and factor analysis to determine the patterns of relationships among these background indicators Ultimately the hope was to reduce the number of background descriptors to a minimum It was expected that perhaps two dusters of backgrounddata would exist-one representing social classprestige and the other family wealth
The following background indices were included in the analysis
Overall caste (CAST) High caste (HICAST) Business caste (BUSCAST) Years of education (EDUC) Source of start-up financing for the business-self or bank (FINANCE)No of relatives in professions and government (RELAT)No of rooms in familys home (ROOMS) No of languages spoken (LANG) Received technical training (TRAIN) Fathers occupation (OCCUP) Stated reasons for starting a business (BUSMOTIV) Years in business (EXPER)
The caste variables used here require some explanation More than 30 different castes were represhysented by the 92 respondents available for this analysis Based on consultation with a colleague of Indian extraction three caste indicators were formulated from these thirty A general indicator of caste rank was created in which Brahmins received a score of four members of a business caste a three landowning caste a 2 and so-called scheduled castes a L Uncertain as to how accurate this ranking was two other indices were included One was business caste and the other landowning or high caste each was scored as a 01 measure
The factor matrix resulting from the analyses of these data is shown in Appendix B As seems typical of these data the demonstrated empirical patterns were weak at best There was in this case very little correlation between the various indicators of background This seems at variance with common wisdom
It is counter-intuitive to find that there is so little correlation between indicators such as fathers occupation number of rooms in the family home years of education family as source of business financing and so forth all of rhich seemingly would relate to basic wealth and status of the family This recurring absence of relationships which coinentional wisdom indicates should be present tends to suggest that the data are of rather poor quality They must consequently be treated with care
Testing for Panel Bias-It was thought that the poibility for bias in the panels selections of superior entrepreneurs was significant The most likely bias was judged that of the panels tendingto favor higher socal class It may be that tie judges would find that they were more empatheticwith and knew better persons from backgrounds similar to their own A goal in the use of the background data was to find a generalized measure of social class and to use it to determine if there was evidence of bias in panel classification
9
It was not possibic however to generate a single satisfying indicator of social class Instead based on the empirical relationships found in the correlation matrices and the factor analyses six sepashyrate indicators of social background were constructed for these individuals These are
Family as Source of Initial Financing for Business Years ofSchooling Number of Relatives in Professions and Government Business Caste Overall Caste A Composite Index of Background
All six were used in the analysis of busines performance
With the development of the best stummary measures of personal competencies and of backgroundindices developed from detailed exploration of the interdependencies in the raw data the next step was to define a suitable weasure or set of measures of business performance
BUSINESS PERFORMANCE
The panel selection process used by the contractor for determining who were the superior businessshypersons was one that was essentially unobservable as to its rationale6 It was a process inherentlysubject to bias a bias neither rcadily observable nor controlled for Maus SampT attempted to develop measures of business performance which were derived from sources other than the panelrankings These other measures could be combined with panel ranking or treated in opposition if the results so justified
During the interview each of the respondents was asked for certain information about hisherbusiness The information requested included business sales and profits for each of the three yearsbefore the interview and the sales zald profits in the second year of the business In addition each was asked how well hisher busirvss was doing now compared to two earlier benchmark years A matrix of data on these items was subjected to correlation and factor analyses The factor matrix is attached as Appendix C
Once again a great scatteration was present in the data The panel ratings did not correlate strongly with the objective (sales profits etc) indicators of business performance Thus the businessperson rated as superior by the panels did not in general have a business with higherreported sales with higher profits or with a higher ratio of profits to sales Moreover the rorrelashytion of high sales with high nominal profits was weak and itwas almost zero with high rates of profits
The highest correlation was between the panels judgments and the respondents own judgmientsabout how well their business had done in the most recent year Why it is that the judgmental items correlate more strongly than do the objective indicators is a puzzle
However because of the scatteration there was again a felt need to include a number of indicators of business performance The diversity of patterns that these data showed with respect to indicated
6McBers explanation as to how the panel ranking is done is not totally clear Pages 16 and 17
of the Final Report by McBer provide the best explanation available
10
performance meant that no one measure could represent the variations present The number six reappeared This came about empirically not with pre-intetion The six measures of business performance chosen for the final analysis are
Panel Rating Composite of Self Rating and Panel Rating Composite of Profits and Panel Rating Profit Rate Recent Business Growth Business Size
The low correlation between the various business performance indicators particalarly between rate of profits and panel rating remained disturbing If a panel selection bias etisled as was thoughtpossible then perhaps this bias was masking what was plausibly a true reltionship-that superiorbusineaspersors would tend to generate a higher rate of profits It did iot = that including the six different indicators itself would be sufficient How was one to determine wich of the measures was superior in the event of determination of confliciing relationships 9
It was decided to assemble reduced data sets The reduced sets would be formed by excluding those persons who were coded as inconsistent Inconsistent here was defined as having high rates of profits and a low panel rating or vice-versa If panel bias was creating the inconsistency in the performance data then some of that inconsistency might be excluded by dropping the cases in which objective performance and panel judgement were in conflict
The rate of profit variable was a coatinuum so the question was raised where did inconsistency lie along the scale A mild test resulted in the throwing out of 3 inconsistent cases and a verystringent test resulted in the discarding of two-thi ds of the cases Particularly the latter case created a data set in which panel judgement and objective indications of rate of profit were substantially consistent in indicatir g superior and aveage performers
The correlation and factor analyses were repeated for the two reduced data sets containing the more consistent subjects It was found tit reducing the sample set from 90 observations to 59 more consistent and then to 24 most consient had virtually no impact on the basic structure of the data
Correlation matrices and fctor analyses were done for each of three data sets--90 59 and 24 observations There was remarkably little variation in either tLhr correlation matrix or the factor matrix In the correlation matrix pairwise correlatio-ns seldom deviateo by more than 003 froi one data set to another The factor structures that were found emained unchanged across an thiree data sets
Factor Structures for the 90 59 and 24 Observation Cases The controlling case is the 90 observashytion set This set contained data for all respondents excluding the two individuals for whom missing values predominated As noted in this set of data there was an unexpected degree of independenc- among the variables used to represent business performance Essentially five separatefactors were derived with a structure tiat indicated remarkably ttle overlap between the factors The five factois are
1 Sales-A size or quantity of sales factor in which sales in previous year two years earlier and three years earlier were the predominant variables
2 Profits-A profits factor in which profits in the pre us year two years earlier and three years
11
earlier were the predominant variablus
3 Profit Rate-A rate of profits factor in which the ratio of profits to sales in the previous year two years earlier and three ars earlier were the predominant variables
4 Growth-A rate of change in business factor in which variables computed by subtracting earlier sales from recent sales and earlier profits from recent profits were the predominant variables
5 Ratig-And finally a rated performance factor in which the panel judgment dominated but in whichi self-perceptions of ones business doing better also loaded
For the 59 observation case the character of the factor matrix was essentially the same as the 90 observation case The one change of corsequence undoubtedly occurred because of the nature of the test used to discard subjects Those persons who showed an inconsistency between heir record of profit and panel rating were removed firom the data set This of course increased the correlation between panel rating and the rate of profits It also coincidentally increased the correlation between panel rating and the self rating (how well is business doing now compared to earlier years)
The results for the very stringently defined data set of 24 observations are essentially the same as for the other two sets Only the relationships between panel rating and self rating and rate of profits are further enhanced
The primary loadings for the principal factors for the three cases are given below Only loadings above 04 are listed
Factor Loading by Case
90obs 52obs 2Aampb
Variables Factor One-Sales
Sales Last Yr 092 093 094 Sales 2 Yrs Ago 096 097 099 Sales 3 Yrs Ago 097 097 099
Factor Two-Profits
Profs Last Yr 073 072 073 Profs 2 Yrs Ago 090 091 089 Profs 3 Yrs Ago 093 092 092
Factor Three-Profits Rate
PS Last Year 070 065 081 PS 2 Yrs Ago 090 086 093 PS 3 Yrs Ago 047 048 037 Rec Bus Impr - - 055
12
Factor Four-Growth
Profs Yr 1 - Yr 3 095 094 096 Profs Yrlamp2 - Yr 3 094 093 094 Sales Yr I - Yr 3 069 072 074 Sales Yr 1amp2- Yr 3 067 070 078 Profs Yr 1 057 057 055 ProfsYr I - Yr 2 040 038 033
Factor Five-Rating
Panel Rating 091 090 090 Bus Impr last yr - 057 054 Bus Impr ovr 3 yrs - 033 035
As seen the factor structures are for practical purposes identical There is a distinct tendency for amount of sales amount of profits the rate of profits the rate of business growth and the selfshyand panel-ratings to be unrelated to one another across the three data sets a remarkably consisshytent overall patrnm The single exception is that when the 24 observation data set is analyzed the self-rating variables tend to load on the profit rate factor The change is not great and not of obvious theoretical significance It has consequently been ignored
It is hard not to conclude from these empirical findings that the data have a large noise comshyponent for surely in some real sense these various measures of business performance must be correlated with one another It is particularly disturbing to find that absolute sales and absolute profits do not correlate more strongly Surely a large business is going to make absolutely more profits on the average Perhaps the consistency in the patterns is that of random noise
However given the scatteration there seemed little choice but to adopt a wide variety of measures of business performance leaving open the question of which measure truly represents the concepshytual factor of business management capability
Six indicators of business performance were chosen for the analyses undertaken to determine the degree to which indicated performance could be predicted from a knowledge of personal charactershyistics and background indicators of the respondents
Some of the discussion below is differentiated for the three data sets but as the above analysis suggests the relationships or lack thereof in large measure remain constant across all data sets
At this point in the analysis the data have been sifted and boiled down Two sets of independentvariables have been assembled-one representing PECs and one representing background A third set of dependent indicators have been assembled to represent business management performance
The final step is to perform the analysis which was defined by the project purpose-that of detershymining a set of PECs which will discriminate superior from average businesspersons This final step is that of ascertaining
While controlling for possile biases are there PECs which becan employed to discriminate the superior from the not superior subjects in these data sets
13
PREDICTING BUSINESS PERFORMANCE
Three principal statistical techniques were employed to determine the extent to which business performance could be predicted from a knowledge of personal characteristics and personal backshyground Correlation and factor analysis were employed to examine the overall patterns in the matrix constructed from the 18 final variables Based on the empirical observations and on pre-projecttheory as to expected relationships multiple regression was used to deteimine the extent to which values on the business performance indicators could be predicted using the independent variables representing the businesspersons measured cornpetencies and background characteristics The backshyground measures and the reduced data sets are employed primarily to test for and to attempt to control possible bias
The factor analysis suggestd that only four of the performance variables (pnel rating profit rategrowth and size) could possibly be meaningful The remaining analsis used only Jhese four which eased the interpretation exiercise somewhat
Correlations The following table contains the inter-correlations between these four measures of business performance and between the independent variables developed in the earlier analyses Onlyindependent variables which have at least one correlation with ime of the factors of 025 or more are listed in this table
Performance measures
Independent Variables
Panel Rdfi]g
Profit RateGrowh Size
Personality Initiative Persistence Personaltype
012 0344 028
025 018 027
020 017 020
006 010 005
Manage Style Infoseeking 04800 0330 037 034 Managestyle 020 0290 0470 0330
Background Relat in Govt -006 -003 -015 -029
Significant at 005 Significant at 001
Among the personality variables only Persistence relates in a significant manner to any of the performance measures Persistence shows a correlation of 034 (10 percent of variance) with Panel Rating However Persistence relates significantly only to Panel Rating Information Seeking and Management Style on the other hand relate to most of the performance variables particularly to the objective measures of growth and size However even for these variables the correlations are rather low indicating only a marginally meaningful relationship in any predictive sense
The correlation matrix smggests that there is limited capability for empirically predicting business performance from a knowledge of scores on the personal competency or the background variables Multiple regression was nonetheless employed to determine if a combination of variables would enhance the predictive power Each business performance measure is examined separately
14
Panel Rating To test for possible rater bias regression equations were run for the 24 59 and 90 cases data sets A modest predictive ability exists within each of these data sets Together threevariables all individually showing near statitical significance give an equation with a multiple r2 03 Thus all things being equpal perhaps 30 percent of the variance in the panels ratings ofbusinesspersons can be predicted from a knowledge of certain background and personal competencyindicators for that person The regression equation and the significance of coefficients is as follows
Rating - -039 + 012 CAST + 015 INFOSEEK + 009 PERSTY(PE
there is bias
2 (007)
o032 (00003) (003)
The numbers in parenthesis indicate the statistical significance of the pairwiseinformation seeking indicator shows a very significant relationship The other significant at approximately the 005 level (the traditional cutoff point for significance)
relationships The two variables are
How should this indicated relationship be interpreted As noted earlier there is a concern that in the panels ratings The expected biases would be for higher panel ratings for those
of higher caste or with aggressive personality type or for those with greater wealth The aboveequation consistent with certain expected biases thus might be explained as caused by panel biasOf course the indicated relationships could as well be present because such a real relationshipexists This point will be examined again later in the analysic
There was no essential difference in explanatory power for the 59 and 24 observation data setsindicating that the relationship is not strengthened by discarding inconsistent cases It had been thought that if errors were in part the reason for the weak relationships the discarding processaimed at defining one potential error could strengthen the correlations Such did not prove to be the case
Rate of Profits The objective measure (objective in that it is not a panel rating but is at least conceptually based on a measure of one aspect of actual performance) chosen as the most relevant indicator of business performance is that of Rate of Profits Other things being equal good busishynesspersons should show amp higher rate of profits than businessperson who are less capable Havingprofit rate data for a tuee year period gives some hope of averaging out random fluctuations in profits Thus when undertaking the analysis it was hoped that the Rate of Profits variable would provid a definitive indcx of performance
Unfortunately within these data there is little ability to use the independent variables to predictbusiness performance when performance is defined in terms of Rate of Profits The highest multiple r2 obtained with any combination of the independent variables was only 020 The equation giventhe 020 level hwcolved three variables only one of which (Information Seeking) approached signshyificance at 005 (0057)
Profit Rate - -35 + 006 INFOSEEK +004 PERSTYPE +003 MGTSTYL (030)
r 020 (0057) (021)
Moreover even this weak predictive potential could only be reached for the 59 observations case where as already noted some inconsistent cases were discarded employing profit rate as an inconshysistency indicator The consistency criteria used for the discarding tended to reinforce the correlashytion between Rate of Profit and Panel Rating creating a probable bias itself Thus the safest
15
observation to make is that ther are no personal descriptors which are usefd in preictingBusinessPerformanceifstatedRate of Profiisis chosen as the indicatorofpeyfvmuance
Growth Growth as measured here must be treated cautiousy as an indicator of business perforshymance There were only two years of growth measures and it is felt that this is not a long enoughtime period to allow an adequate indication of business growth even if the data were error-free The Growth indicator used here is most probably a weak but marginally useful indicator of busishyness performance
Accepting these limits as in the panel rating it is found that there is a modest empirical ability topredict Growth from the competency and background measures An r2 of about 025 is obtainedwhen employing Business Caste Management Style Information Seeking and composite PersonalityType as the independent variables However only Management Style and Information Seeking amongthese variables are significant at the 005 level It cannot be said conclusively that there is nopredictive power At the same time relationships are so weak as to have no operational meanshyingfulness either for screening or training program development
Growth - -55 +22 BUSCAST +18 MGTSTYL + 15 INFOSEEK +012 PERSTYPE (023) (0004) (002) (086)
Size The final measure employed as an indicator of business management success is that of size ofthe firm managed Again this may not be a highly valid index of business performance since in the short to medium term Size may be more influenced by access to capital tian by managementcapability Size is therefore probably related rather strongly to initial or family wealth for these individually-owned businesses Nonetheless one would expect that better managers are going tohave businesses that have grown relatively larger over the years and that therefore some relationshyship to management skill should also exist
Empirically there is only a limited ability to predict business Size from PEC and background inshydicators Multiple r2 s of 023 to 025 can be obtained The only variable which is significantlyrelated in these equations is the old standby of Information Seeking To some extent membershipin one of the traditional business castes tends to relate to business size this may be an access to capital effect
Size - 122 - 25 RELAT +10 INFOSEEK - 53 CAST + 52 MGTSTYL (006) (001) (040) (017)
Predicting Management Performance A Summary Overall the results are not very enlightening Nodear and credible pattern emerges that would permit one to say this is what characterizes better business managers That is with the measures of business performance used there is very little evidence of meaningful relationships between measured performance and the competency indicators and background vanables
Panel Rating of business performance (the indicator used by the contractor) is moderately related to the competency indicator of Persistence But this relationship may plausibly reflect a bias amongpanel members where panels tend to assign high rank to known to have athose persons personalshyity trait that is widely accepted by conventional wisdom as entrepreneurial It cannot be said from the evidence available that the indicated relationship reflects either reality or bias In any case the discriminant or predictive power isweak
For the other measures of management performance developed for the SampT review Persistence
16
provides no predictive power Thus even this relationship is not of operational meaningfulness
Among the objective measures of business performance-Profits Growth and Size-there is a weakalthough rather consistent indication that a general management style of knowing your business knowing your profession knowing your competitors may be associated with superior performanceThis relationship is strong enough to indicate that further research might be justified To this analyst there is however not sufficient robustness in the indicated relationships to jusify their use in an operationalprogram at this time
CONCLUSIONS AS TO DATA AND PATTERNS
After an unusually exhaustive analysis a degree of uncertainty prevails as to conclusions The data have been analyzed seemingly with all avenues explored not once but twice or thrice Whatever is there in terms of relationships must have been discovered in this process Nonetheless the empirishycal relationships remain weakly specified Moreover the patterns such as they are are generally not absolutely consistent
The verifiable absence of a relationship between the personality type variables and the indicators of business performance would itself be of great interest But plausible high levels of errors or noise in the data may cause real relationships to be significantly attenuated in tiis empiricalsample Thus the relationships are too weak to be accepted as valid but the plausibility of high error input which could attenuate a stronger real relationship is not to be ignored
The result is a quandary There seem to be at least three possible alternative conclusions which can be drawn from these data The alternatives are presented below with the authors thoughts as to the relative merits of the explanations
Conclusion 1-The data are filled with errors and therefore do not provide a reasonable mapping of real world relationships Because of the erron (noise) little if anything can be concluded about the true relationships between the variables
There is direct evidence of error in Ecuador The Malawi data appear devoid of pattern much as would be the case if there were random data collection Empirically there is a case for an unacshyceptable level of errors
Moreover there is great intrinsic risk in attempting to have agents collect complex data in remote third world countries without having the project principals involved in a hands-on-manner during data collection Thus deductively one might expect the data to be rather filled with errors
The analytic findings from the India data set also tend to be consistent with a high error rate For example the Panel Ratings of superior businesspersons do not correlate very well with the objecshytive indications of business performance such as Rate of Profit Rate of Growth and so forth There seems to be little pattern in the background data and such indicators of family wealth as exist in the data do not relate to size of business Even within the set of data generated from the respondents statements about how their businesses were doing and how much sale and profits they were making there is no satisfying set of relationships Prior experience intuition and theory all suggest certain of these variables should be related
Conclusion 2-Personality variables are not usefti predictors of business performance because the personality-oricnted competency measures which are repesented the data do not relate consisshyn tently io the various measures of businessperformance for the respondents
17
Using the criterion of statistical significance there is a positive relationship between the compositemeasure- of Personality Type and the indicator of Panel Rating This is as project theory predictsThe Personality variable does not however show a significant relationship to the other measures ofbusiness success such as Rate of Profits Growth Sales and so forth Moreover although there is asignificant relationship to Panel Rating in a statistical sense in the practical or predictive sensethis relationship is not meaningful That is those who score high on the Personality indicators areonly rated marginally better on performance as business persons than are those who score low on the Personality indicators
It is fair to say the theory is not well supported by these data But the discovery of a weakrelationship in data in which there is possible presence of a high rate of errors effectivelyprevents one from concluding that the data contradict the theory of high achievement personality types doing better
It is the authors judgement that there is an extensive error component in the data But it is alsosuggested that the data can be used in a very limited and cautious way to give indications ofpositive relationships The data probably cannot be considered as providing a valid basis for indicashyting the lack of relationships The error component is large enough so that real relationships ofmodest significance might well be masked Thus with care the data may be usable for indicating a positive relationship which may justify further research
Conclusion 3-Businesssuccess relatesmeaningftuly to managenustyle
Throughout all the analyses done within AID and by McBer there is only one personal variable thatconsistently relates to almost all the various measures of business performance InformationSeeking is a characteristic that is in almost every case associated with indicators of greaterbusiness success It is however largely a moderate and nev-s a strong relationship In addition thecomposite measure of business style-derived from Commitment to Contract Quality ControlPlanning and so forth-also relates moderately to the business success indicators especially to Rate of Profits
The relationships are significant statistically but provides modest ability to separate those with better business track records from those with less success
This third conc sion might be cautiously accepted It is not one which is justified as operationallyacceptable but one which issufficiently supported to justy further research
SOME FINAL WORDS
1 In the context of the types of businesspersons interviewed in India-experienced medium andsmall industrialists-these data suggest that personaliy type is not likey to be very important in success For the moment it therefore seems difficult to justify having operational programs based on an assumption that certain entrepreneurial types are more Likely to succeed in business or thatentrepreneurial training is going to be important in business management success
2 The ctent to which systematic and thorough bnowledge of ones business and commuinent toquality work is important in success is worth further nvestigation These data if error is assumed to account for a certain degree of dispersion could support moderately strongly that such a management style is meaningfully associated with greater success at least in India
3 On procedural grounds research into questions with this degree of complexity requires much greater rigor than was applied in this project-both in design and in implementation
18
APPENDIX A
COMPETENCIES
1 Correlation Matrix
Variable Number
1INIT 1 10
2 3 4 5 6 7 8 9 10 11 12 13 14 15
2SEEACT 44 10 3PERSIST -- -- 10 4INFOSEEK - -- - 10 5HIQUAL 26 50 10 6COMMIT -- -- 37 10 7EFFIC 25 41 42 -- 10 8PIAN -- -- -- -- 10 9PROSOLV 54 58 46 -- 43 -- 10 10CONFID 11ASSERT 12PERSUAS 13INFUJEN 14MONITOR 15E IPLYEE
38 -- 38 26
57 -- 47
44
37 45 --
--
60 --
50
32
45 --
31 --
43 --
39
28
--
26 --
--
43 --
48
10 --
55 ----
10 32 26 --
10 45 --
10 - 10
10
--
-- --
--
----
-- --
--
2 Factor Matrix--Varimax Rotation
Factor Loadings
1INIT 2SEEACT 3PERSIST 4 INFOSEEK 5HIQUAL 6COHMIT 7EFFIC 8PIAN 9PROSOLV 10CONFID IIASSERT 12PERSUAS 13INFUEN 14bullMONITOR 15E PLYEE
1 066 078
067
067 --
080 068
067 --
2
--
083
--
--
--
066 068 069 --
3 --
088
051
-shy
4 5
-- -shy-083 --
091
-- --041
--
063 -shy
APPENDIX B
BACKGROUND DATA
I Factor Matrix-Varimax Rotation
1HICAST 2BUSCAST 3CAST 4EDUC 5BANKFIN 6REIAT 7 ROOMS 8LANG 9TRAIN 10MOTIV-ERN EXPER 12OCCUP 13MOTIV-OPT
1 080 -- 093 --
-----
---- ----
2
---
-067
058
Factor Loadings3 4 - -
066 -- -041 -
-- 076 049
057
5
059 ---
-shy
054 -shy
6 -049
091 -shy
-shy
-shy
APPENDIX C
BUSINESS PERFOMANCE MEASURES
1 Factor Matrix-Varimax Rotation
Factors Loadings
1PANEL RATE 2SALE PAST YR
1 - 091
2
3 4 5 059
3PROF PAST YR - 071 - 059 -4SALE 2 YR AGO 098 - -5PROF 2 YR AGO - 088 6SALE 3 YR AGO 093 -
7PROF 3 YR AGO - 092 - - -8 SELFRATE-NOW - -9SELFRATE-3YR - -10PRFRATE PST YR - - 074 - -11SALE YR1-YR3 065 - - 067 -12PROF YRI-YR3 - - - 095 -14SALE YR1+YR2 096 - - - -15PROF YR1+YR3 - 083 - 041 -16SALE INCRESE 061 - - 057 -17PROF INCRESE - - - 092 -18SALE 3 YRS 096 - - - -19PROF 3 YRS - 089 - - -20PROFRATE 2 YRS - - 091 - -21PROFRATE 3 YRS - - 095 - -
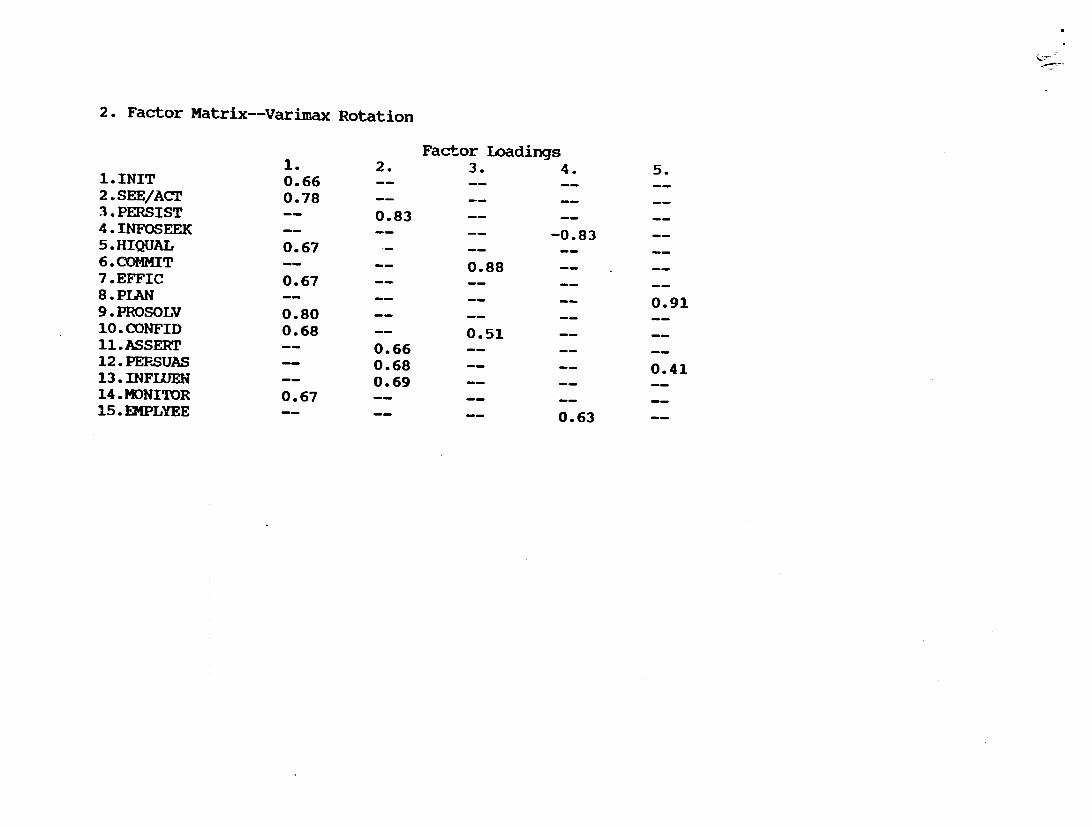
--
-- --
--
----
-- --
--
2 Factor Matrix--Varimax Rotation
Factor Loadings
1INIT 2SEEACT 3PERSIST 4 INFOSEEK 5HIQUAL 6COHMIT 7EFFIC 8PIAN 9PROSOLV 10CONFID IIASSERT 12PERSUAS 13INFUEN 14bullMONITOR 15E PLYEE
1 066 078
067
067 --
080 068
067 --
2
--
083
--
--
--
066 068 069 --
3 --
088
051
-shy
4 5
-- -shy-083 --
091
-- --041
--
063 -shy
APPENDIX B
BACKGROUND DATA
I Factor Matrix-Varimax Rotation
1HICAST 2BUSCAST 3CAST 4EDUC 5BANKFIN 6REIAT 7 ROOMS 8LANG 9TRAIN 10MOTIV-ERN EXPER 12OCCUP 13MOTIV-OPT
1 080 -- 093 --
-----
---- ----
2
---
-067
058
Factor Loadings3 4 - -
066 -- -041 -
-- 076 049
057
5
059 ---
-shy
054 -shy
6 -049
091 -shy
-shy
-shy
APPENDIX C
BUSINESS PERFOMANCE MEASURES
1 Factor Matrix-Varimax Rotation
Factors Loadings
1PANEL RATE 2SALE PAST YR
1 - 091
2
3 4 5 059
3PROF PAST YR - 071 - 059 -4SALE 2 YR AGO 098 - -5PROF 2 YR AGO - 088 6SALE 3 YR AGO 093 -
7PROF 3 YR AGO - 092 - - -8 SELFRATE-NOW - -9SELFRATE-3YR - -10PRFRATE PST YR - - 074 - -11SALE YR1-YR3 065 - - 067 -12PROF YRI-YR3 - - - 095 -14SALE YR1+YR2 096 - - - -15PROF YR1+YR3 - 083 - 041 -16SALE INCRESE 061 - - 057 -17PROF INCRESE - - - 092 -18SALE 3 YRS 096 - - - -19PROF 3 YRS - 089 - - -20PROFRATE 2 YRS - - 091 - -21PROFRATE 3 YRS - - 095 - -
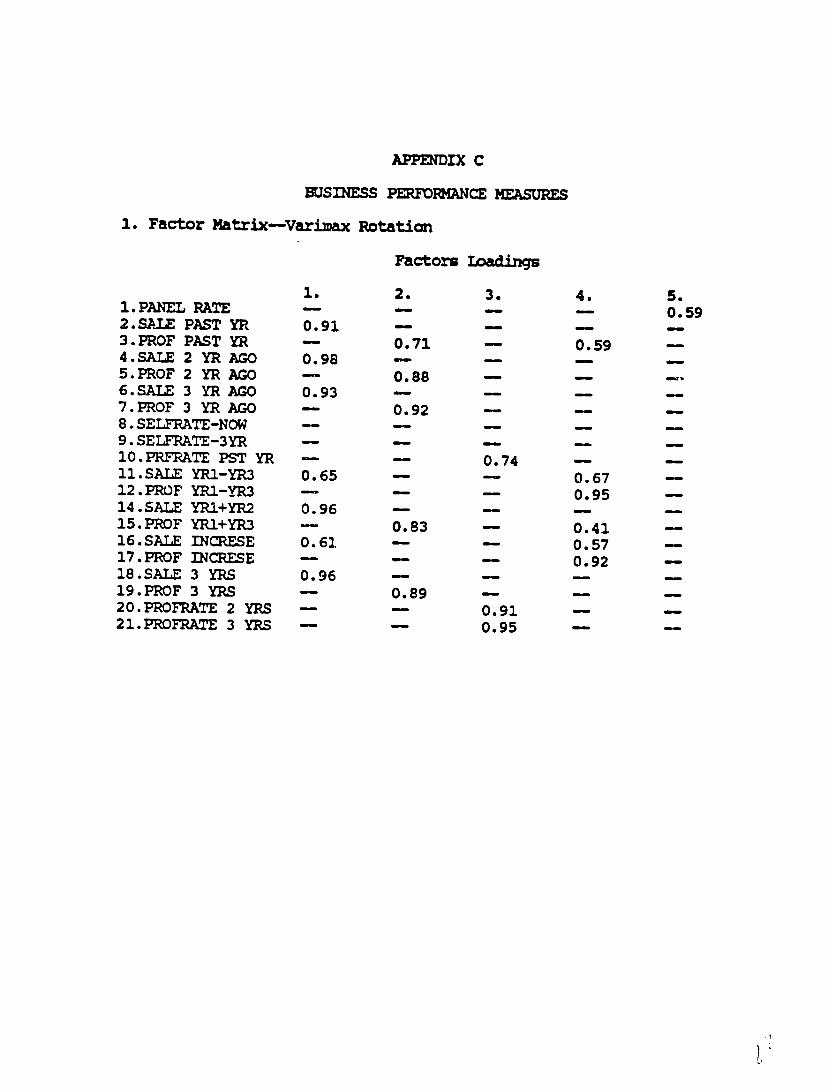