
Research Brief - National Institute For Health Care Reform
19
Research Brief State leaders interested in reforming their health care systems face a dilemma. Every state’s health care system is utterly dependent on funding flows from federal health pro- grams and subsidies in the federal tax system, but federal programs, in some cases, run counter to state political cultures and priorities. Section 1332 of the 2010 Affordable Care Act (ACA) offers an alternate reform path by allowing states to request federal waivers of many key ACA provisions. But a state’s alternate plan must achieve the same or better health coverage and affordability for state residents and be budget-neutral for the federal government. The ACA also allows states to develop so-called coordinated waivers com- bining a Section 1332 waiver, a Medicaid waiver and a Medicare waiver. The coordinat- ed-waiver option opens new doors for states to fundamentally rearrange state and federal government roles in regulating and financing health care. Some states might use a coordinated waiver to establish a single-payer system of tax- financed universal coverage. A key stumbling block would be the high tax rate required to fund a single-payer plan, particularly if it offers more comprehensive coverage than today’s norms. Other states might pursue a more-targeted coordinated waiver to replace the ACA’s health insurance marketplaces and Medicaid for children and nondisabled adults with income-related vouchers to buy private health insurance. In some states, pro- jected funding levels for Medicaid and the marketplaces would be sufficient to support a broad-based voucher program. In other states, a voucher-based approach would face challenges in meeting the ACA Section 1332 coverage and affordability standards. States pursuing a voucher approach could potentially tap into additional federal funding if they agreed to implement the ACA Medicaid expansion as a base for the waiver. In general, states developing either a single-payer approach or a voucher approach would face an easier path if their waiver plans include substantial and effective cost-control components. Health Reform 2.0: Alternate State Waiver Paths Under the Affordable Care Act BY CHAPIN WHITE AND VIRGINIA KOTZIAS A D V A N C I N G H E A L T H P O L I C Y R E S E A R C H NUMBER 19 • SEPTEMBER 2015 About the Institute. The National Institute for Health Care Reform (NIHCR) contracted with the Center for Studying Health System Change (HSC) between 2009 and 2013 to conduct health poli- cy research and analyses to improve the organi- zation, financing and delivery of health care in the United States. As a result of the subsequent merger of Mathematica Policy Research (MPR) and HSC, MPR assumed the contract to complete NIHCR projects. NIHCR Research Director: Paul B. Ginsburg c/o Mathematica Policy Research 1100 1st Street, NE, 12th Floor Washington, DC 20002-4221 ACA 1332 Waivers: Side Door to Innovation? The Affordable Care Act delegates sev- eral key roles to states, including defin- ing the essential health benefits package, implementing an expanded Medicaid program and establishing health insur- ance marketplaces. So-called Blue states have embraced these roles enthusiastically, although with mixed success. 1 Red states have taken a more winding path, mostly rejecting and attempting to undermine the ACA—but in some cases, reshaping the law more to their liking. 2 The history of Medicaid, the joint federal-state health program for low- income people, offers guidance about what to expect with state ACA implementation. Medicaid was first signed into federal law in 1965, and federal matching funds were available for states beginning in January 1966. 3 About half the states—mostly in the South and West, which today would be characterized as Red states—initially delayed and resisted Medicaid because of philosophical and political objections. The lure of generous federal funding eventually prevailed, however, and all states partici- pate today. Moreover, mainstream conser- vative proposals today accept Medicaid’s existence and instead emphasize increased state flexibility to administer the program. 4 It’s likely the ACA may follow a similar path into the mainstream over the com- ing years. And, as the ACA become less
-
Upload
khangminh22 -
Category
Documents
-
view
1 -
download
0
Transcript of Research Brief - National Institute For Health Care Reform

Research Brief
State leaders interested in reforming their health care systems face a dilemma. Every state’s health care system is utterly dependent on funding flows from federal health pro-grams and subsidies in the federal tax system, but federal programs, in some cases, run counter to state political cultures and priorities. Section 1332 of the 2010 Affordable Care Act (ACA) offers an alternate reform path by allowing states to request federal waivers of many key ACA provisions. But a state’s alternate plan must achieve the same or better health coverage and affordability for state residents and be budget-neutral for the federal government. The ACA also allows states to develop so-called coordinated waivers com-bining a Section 1332 waiver, a Medicaid waiver and a Medicare waiver. The coordinat-ed-waiver option opens new doors for states to fundamentally rearrange state and federal government roles in regulating and financing health care.
Some states might use a coordinated waiver to establish a single-payer system of tax-financed universal coverage. A key stumbling block would be the high tax rate required to fund a single-payer plan, particularly if it offers more comprehensive coverage than today’s norms. Other states might pursue a more-targeted coordinated waiver to replace the ACA’s health insurance marketplaces and Medicaid for children and nondisabled adults with income-related vouchers to buy private health insurance. In some states, pro-jected funding levels for Medicaid and the marketplaces would be sufficient to support a broad-based voucher program. In other states, a voucher-based approach would face challenges in meeting the ACA Section 1332 coverage and affordability standards. States pursuing a voucher approach could potentially tap into additional federal funding if they agreed to implement the ACA Medicaid expansion as a base for the waiver. In general, states developing either a single-payer approach or a voucher approach would face an easier path if their waiver plans include substantial and effective cost-control components.
Health Reform 2.0: Alternate State Waiver Paths Under the Affordable Care ActBY CHAPIN WHITE AND VIRGINIA KOTZIAS
A D V A N C I N G H E A L T H P O L I C Y R E S E A R C H
NUMBER 19 • SEPTEMBER 2015
About the Institute. The National Institute for Health Care Reform (NIHCR) contracted with the Center for Studying Health System Change (HSC) between 2009 and 2013 to conduct health poli-cy research and analyses to improve the organi-zation, financing and delivery of health care in the United States. As a result of the subsequent merger of Mathematica Policy Research (MPR) and HSC, MPR assumed the contract to complete NIHCR projects.
NIHCR Research Director: Paul B. Ginsburg c/o Mathematica Policy Research 1100 1st Street, NE, 12th Floor Washington, DC 20002-4221
ACA 1332 Waivers: Side Door to Innovation?The Affordable Care Act delegates sev-eral key roles to states, including defin-ing the essential health benefits package, implementing an expanded Medicaid program and establishing health insur-ance marketplaces. So-called Blue states have embraced these roles enthusiastically, although with mixed success.1 Red states have taken a more winding path, mostly rejecting and attempting to undermine the ACA—but in some cases, reshaping the law more to their liking.2
The history of Medicaid, the joint federal-state health program for low-income people, offers guidance about what to expect with state ACA implementation. Medicaid was first signed into federal law in 1965, and federal matching funds were available for states beginning in January 1966.3 About half the states—mostly in the South and West, which today would be characterized as Red states—initially delayed and resisted Medicaid because of philosophical and political objections. The lure of generous federal funding eventually prevailed, however, and all states partici-pate today. Moreover, mainstream conser-vative proposals today accept Medicaid’s existence and instead emphasize increased state flexibility to administer the program.4 It’s likely the ACA may follow a similar path into the mainstream over the com-ing years. And, as the ACA become less
Data Source
This Research Brief relies on several different data sources, including projections of Medicare and Medicaid spending from the Congressional Budget Office, historical state-lev-el health care spending and historical and projected national health care spending from the Office of the Actuary in the Centers for Medicare & Medicaid Services, historical and pro-jected population data from the U.S. Census Bureau, and other sources. For a more detailed explanation of data sources and methods, see the Technical Appendix.
2
About the Authors
Chapin White, Ph.D., is a senior policy researcher at the RAND Corporation. He for-merly was a senior researcher at the Center for Studying Health System Change. Virginia Kotzias, M.P.P., is a project associate at the RAND Corporation.
polarizing over time, state leaders likely will begin to focus on tailoring the ACA to their own circumstances and values.
The ACA opens several paths for state innovation through the Section 1332 waiv-er option. The provision was championed by Democratic U.S. Sen. Ron Wyden of Oregon and has been dubbed the “Wyden waiver,”5 though other senators provided key support, including Bernie Sanders of Vermont, Barbara Boxer of California and Mary Landrieu of Louisiana. Sen. Wyden, in promoting the waiver concept, rejected “one-size-fits-all” health reform, believing that Oregon could “come up with innova-tive solutions that the Federal government has never had the flexibility or will to implement.”6 Under Section 1332, states can opt out of or modify one or more of the following key ACA provisions begin-ning in 2017:
• the individual coverage mandate and related penalties;
• the employer coverage mandate and related penalties;
• creation of health insurance market-places;
• restrictions on premiums and benefit design in the nongroup and small-group insurance markets;
• advance premium tax credits, or subsi-dies; and
• cost-sharing reductions for low-income people.7
The ACA specifies that these provi-sions can be waived only if the state has an alternate way to cover at least as many people, provide benefits that are at least as comprehensive with the same or lower cost sharing, and without adding to the federal deficit. Section 1332 also lays out a process for states to submit a “coordinated waiver” that combines a 1332 waiver with one or more other waivers relating to Medicaid, the state Children’s Health Insurance Program (CHIP) or Medicare.
To illustrate the range of potential 1332 coordinated waivers, this analysis explores two far-reaching but very different approaches. The first coordinated-waiver approach would automatically enroll almost all state residents in a universal coverage plan financed by a federal lump-sum payment to the state and a new state payroll tax. The second coordinated-waiver approach would replace marketplace subsi-dies and the Medicaid and CHIP programs for children and nondisabled adults with a uniform voucher for all low- and mod-erate-income people to purchase a private health plan.
The goal is not to endorse either approach but rather to explore why states might pursue waivers, to quantify the level of federal and state funding potentially available to support states, and to identify what states would have to do to meet waiver requirements. Additionally, states that pursue a 1332 coordinated waiver would have to spell out many design details only hinted at here, or glossed over entirely, and they would face a new and untested federal approval process.
This analysis focuses on 2017 because it is the first year states could implement a waiver. The general approach is to use projected national spending totals from the Congressional Budget Office (CBO) and allocate the national totals to individual states using a variety of state-level data sources (see Data Source and Technical Appendix). Spending and financing lev-els for the nation as a whole are reported, as well as separately for each of the five most populous states—California, Florida, Illinois, New York and Texas. While impor-tant in their own right, the five states also reflect a range of political cultures and health care systems.
The analysis focuses only on spending for “medical care,” defined to include hos-pital care, physician and other professional services for physical and mental health care, prescription drugs, imaging, and laboratory services. The analysis excludes spending on care provided in nursing facilities or homes for the developmentally disabled, dental care, and over-the-counter drugs.
State Motivations for a 1332 WaiverState policy makers could use 1332 coor-dinated waivers to move their health care systems in many different directions, depending on their perceptions of problems with the current system. Those perceived problems generally fall into three areas:
National Institute for Health Care Reform Research Brief No. 19 • September 2015
3
→
which disincentivizes, or “distorts,” indi-vidual decisions about whether to work and how much to work.11,12 According to CBO estimates, for a single parent enrolled in a marketplace plan, the phase out of premium and cost-sharing subsi-dies increases marginal tax rates by 10 to 18 percentage points. The employer penalties in the ACA also have so-called
cliffs—discrete cut points—based on employees’ hours worked per week and firm size. These cliffs can distort firms’ hiring and staffing choices. The clearest example of a cliff-driven distortion is employers following the “29er” strategy, meaning that they limit their employees’ weekly hours to 29 to avoid being subject to the ACA employer coverage mandate penalty.13
In addition to labor-market distor-tions, the ACA expands the “beggar-thy-neighbor” system of health care financing. Employers, states and local governments have a range of options available that could slow health care spending growth and increase the effi-ciency of the health care system. But the rewards for implementing these changes are blunted, or reversed entirely, under the current system of financing health care. For example, a municipal-ity that prevents overbuilding of health care facilities will end up losing federal inflows from Medicare and Medicaid.14 And, employers that reduce spending on
health care for their employees give up the value of the tax exclusion for employ-er-sponsored insurance. States also face strong financial incentives to increase the flow of funds through their Medicaid program to draw down larger federal matching payments.15 For the most part, the ACA leaves each of these rewards for inefficiency in place and adds a new
one: marketplace premium subsidies are based on local premiums, and, as a result, states that manage to reduce marketplace premiums will reduce federal funding inflows for marketplace subsidies.
Current Federal Funding Flows for Health CareSection 1332 coordinated waivers would entail some reorganization of the roles of the federal and state governments in financing and regulating health care.16 To understand the potential for 1332 coordi-nated waivers, the first step is to identify and quantify the major existing flows of health care funding. States considering a 1332 waiver also would have to take these flows into account in designing a waiver plan and meeting the requirement for fed-eral budget-neutrality.
Historically, the federal government has funded medical services through four major channels (see Figure 1):
• Medicare, the federal health program for the elderly and disabled ($603 billion in
• Too much income redistribution and regulation. The ACA was designed to build a health insurance system where nearly everyone is enrolled in a relatively comprehensive and affordable health plan.8 To accomplish this vision, the ACA imposed significant new regulations on nongroup and small-group insurers (e.g. plans must cover essential health benefits, insurers must offer guaranteed issue without medical underwriting); on individuals (e.g. tax penalties for remain-ing uninsured); and on large employers (e.g. tax penalties for not offering cover-age). Making coverage affordable also entailed expanding Medicaid eligibility and offering significant new premium and cost-sharing subsidies for low- and moderate-income people to buy private coverage in the marketplaces. Some view these requirements as overly restrictive and the premium subsidies as overly redistributive.
• Too little progress toward universal access to health care. The ACA adds new enrollees and federal subsidies to the cur-rent system of private health insurance and private, often for-profit providers. This puts the burden of enrolling in and paying for a health plan on individu-als and endorses a competitive dynamic where willingness and ability to pay play key roles in determining who gets care. Some view this approach as deepening the reliance of the health care system on the market and falling short of the prom-ise of universal access to needed care.
• Too distortionary and too little reward for efficiency. Under the ACA, eligibil-ity for Medicaid and premium subsidies phase out at higher incomes, and, as a result, individuals whose income rises will lose some or all of their health care subsidies.9,10 This subsidy phase-out increases what economists refer to as the effective marginal tax rate on labor,
National Institute for Health Care Reform Research Brief No. 19 • September 2015
Employers, states and local governments have a range of options
available that could slow health care spending growth and increase
the efficiency of the health care system. But the rewards for implement-
ing these changes are blunted, or reversed entirely, under the current
system of financing health care.

4
10%
eral funds through the Medicaid program, and the ACA creates two new federal flows of funds for health care that may be central to a 1332 waiver proposal:
• premium and cost-sharing subsidies for individuals enrolled in qualified health plans through health insurance market-places ($95 billion in projected federal outlays in 2017);
• individual mandate penalties, which will be paid to the federal government by certain uninsured individuals ($4 billion in projected federal revenues in 2017),
projected federal outlays in 2017);
• Medicaid, the joint state-federal health program for the poor ($312 billion in projected federal outlays for medical ser-vices in 2017);
• health coverage for current and former federal employees and veterans, through the Veterans Health Administration, Department of Defense and the Federal Employees Health Benefit Program (VHA/DoD/FEHBP) ($166 billion in projected federal outlays in 2017); and
• the tax exclusion of employer-sponsored
health benefits ($268 billion in projected tax expenditures in 2017). Employer health benefits receive two types of favor-able tax treatment: They are excluded from workers’ taxable compensation, and they are treated as a deductible business expense for the employer. This tax treat-ment creates a tax expenditure, meaning that it reduces federal tax revenues,17 which represents an indirect federal subsidy of employer-sponsored health benefits.
The ACA has increased the flow of fed-
National Institute for Health Care Reform Research Brief No. 19 • September 2015
Figure 1Flow of Funds for Health Care Financing in a State
State Residents
Health Insurance Marketplace
Employers
State Government
Employer-Sponsored Health Plans
Retiree Health Plans
Nongroup Health Plans
Medicaid
Medicare
VHA/DoD/FEHBP
Health Care Providers
Income/Payroll Taxes
ACA Mandate Penalties
ESI Tax ExclusionFederal Government
Deficit FinancingResidents of Other States
Notes: The six key federal flows that are relevant to 1332 coordinated waivers are highlighted as dashed heavy lines (i.e. Medicare, Medicaid, VHA (Veterans Health Administration)/DoD (Department of Defense)/FEHBP (Federal Employee Health Benefits program), marketplace and cost-sharing subsidies, the ESI (employer-sponsored insurance) tax exclusion, and the ACA man-date penalties). Heavy dashed lines are quantified in Tables 1 and 2.
Source: Authors’ analysis
5
National Institute for Health Care Reform Research Brief No. 19 • September 2015
and employer mandate penalties, which will be paid to the federal government by certain large employers that do not offer an affordable health plan to their workers ($12 billion in projected federal revenues in 2017).
Several other ACA provisions increase federal revenues—for example, the addi-tional Medicare Hospital Insurance tax and the excise, or Cadillac, tax on high-premi-um employer-sponsored health plans, but these revenues are not obviously within the scope of a 1332 coordinated waiver and so are not quantified in this analysis.18
Three facts are worth noting regarding federal health care funding flows under the current system:
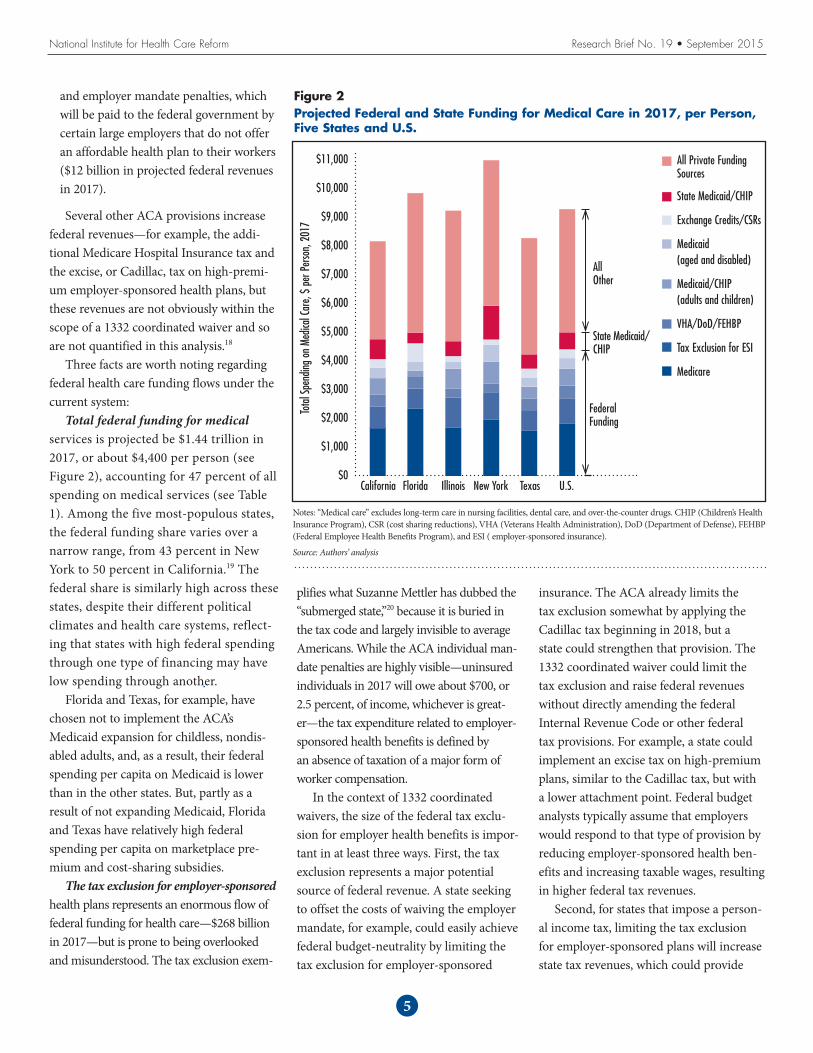
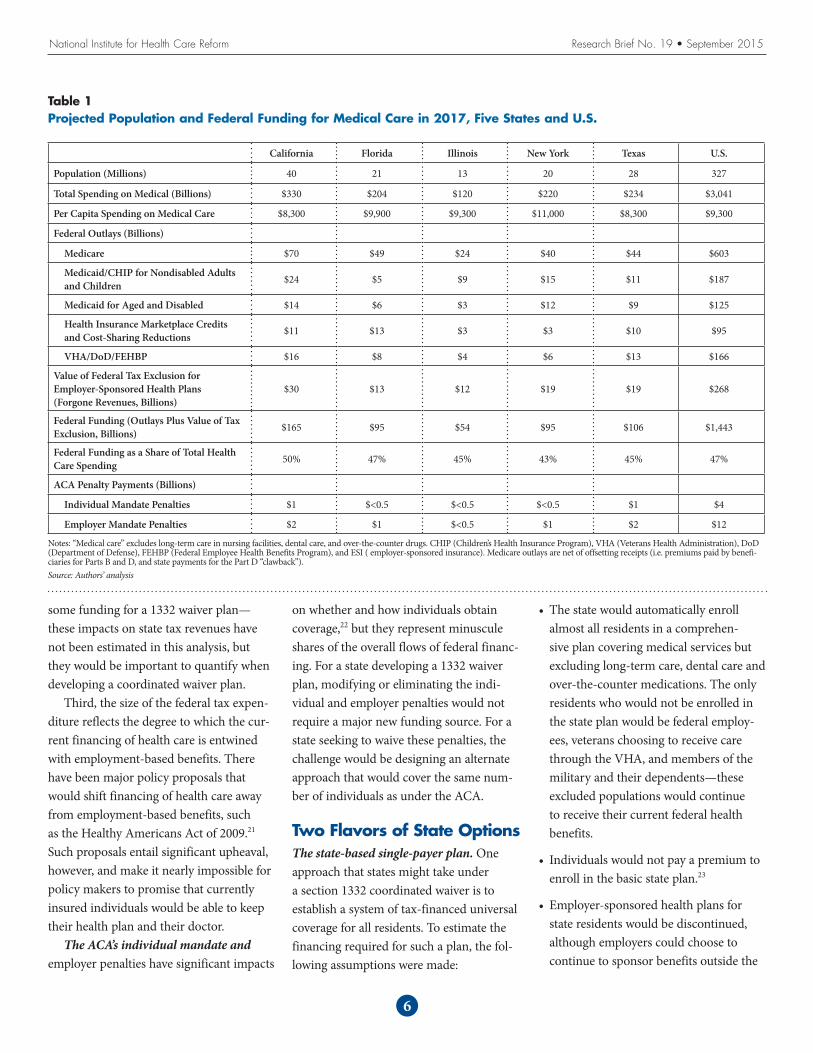
Total federal funding for medical services is projected be $1.44 trillion in 2017, or about $4,400 per person (see Figure 2), accounting for 47 percent of all spending on medical services (see Table 1). Among the five most-populous states, the federal funding share varies over a narrow range, from 43 percent in New York to 50 percent in California.19 The federal share is similarly high across these states, despite their different political climates and health care systems, reflect-ing that states with high federal spending through one type of financing may have low spending through another.
Florida and Texas, for example, have chosen not to implement the ACA’s Medicaid expansion for childless, nondis-abled adults, and, as a result, their federal spending per capita on Medicaid is lower than in the other states. But, partly as a result of not expanding Medicaid, Florida and Texas have relatively high federal spending per capita on marketplace pre-mium and cost-sharing subsidies.
The tax exclusion for employer-sponsored health plans represents an enormous flow of federal funding for health care—$268 billion in 2017—but is prone to being overlooked and misunderstood. The tax exclusion exem-
Figure 2Projected Federal and State Funding for Medical Care in 2017, per Person, Five States and U.S.
Notes: “Medical care” excludes long-term care in nursing facilities, dental care, and over-the-counter drugs. CHIP (Children’s Health Insurance Program), CSR (cost sharing reductions), VHA (Veterans Health Administration), DoD (Department of Defense), FEHBP (Federal Employee Health Benefits Program), and ESI ( employer-sponsored insurance).
Source: Authors’ analysis
All Private Funding Sources
State Medicaid/CHIP
Exchange Credits/CSRs
Medicaid (aged and disabled)
Medicaid/CHIP (adults and children)
VHA/DoD/FEHBP
Tax Exclusion for ESI
Medicare
$11,000
$10,000
$9,000
$8,000
$7,000
$6,000
$5,000
$4,000
$3,000
$2,000
$1,000
$0
Tota
l Spe
nding
on
Medic
al Ca
re, $
per
Per
son,
201
7
California TexasNew YorkIllinoisFlorida U.S.
All Other
State Medicaid/ CHIP
Federal Funding
plifies what Suzanne Mettler has dubbed the “submerged state,”20 because it is buried in the tax code and largely invisible to average Americans. While the ACA individual man-date penalties are highly visible—uninsured individuals in 2017 will owe about $700, or 2.5 percent, of income, whichever is great-er—the tax expenditure related to employer-sponsored health benefits is defined by an absence of taxation of a major form of worker compensation.
In the context of 1332 coordinated waivers, the size of the federal tax exclu-sion for employer health benefits is impor-tant in at least three ways. First, the tax exclusion represents a major potential source of federal revenue. A state seeking to offset the costs of waiving the employer mandate, for example, could easily achieve federal budget-neutrality by limiting the tax exclusion for employer-sponsored
insurance. The ACA already limits the tax exclusion somewhat by applying the Cadillac tax beginning in 2018, but a state could strengthen that provision. The 1332 coordinated waiver could limit the tax exclusion and raise federal revenues without directly amending the federal Internal Revenue Code or other federal tax provisions. For example, a state could implement an excise tax on high-premium plans, similar to the Cadillac tax, but with a lower attachment point. Federal budget analysts typically assume that employers would respond to that type of provision by reducing employer-sponsored health ben-efits and increasing taxable wages, resulting in higher federal tax revenues.
Second, for states that impose a person-al income tax, limiting the tax exclusion for employer-sponsored plans will increase state tax revenues, which could provide
6
some funding for a 1332 waiver plan—these impacts on state tax revenues have not been estimated in this analysis, but they would be important to quantify when developing a coordinated waiver plan.
Third, the size of the federal tax expen-diture reflects the degree to which the cur-rent financing of health care is entwined with employment-based benefits. There have been major policy proposals that would shift financing of health care away from employment-based benefits, such as the Healthy Americans Act of 2009.21 Such proposals entail significant upheaval, however, and make it nearly impossible for policy makers to promise that currently insured individuals would be able to keep their health plan and their doctor.
The ACA’s individual mandate and employer penalties have significant impacts
on whether and how individuals obtain coverage,22 but they represent minuscule shares of the overall flows of federal financ-ing. For a state developing a 1332 waiver plan, modifying or eliminating the indi-vidual and employer penalties would not require a major new funding source. For a state seeking to waive these penalties, the challenge would be designing an alternate approach that would cover the same num-ber of individuals as under the ACA.
Two Flavors of State OptionsThe state-based single-payer plan. One approach that states might take under a section 1332 coordinated waiver is to establish a system of tax-financed universal coverage for all residents. To estimate the financing required for such a plan, the fol-lowing assumptions were made:
• The state would automatically enroll almost all residents in a comprehen-sive plan covering medical services but excluding long-term care, dental care and over-the-counter medications. The only residents who would not be enrolled in the state plan would be federal employ-ees, veterans choosing to receive care through the VHA, and members of the military and their dependents—these excluded populations would continue to receive their current federal health benefits.
• Individuals would not pay a premium to enroll in the basic state plan.23
• Employer-sponsored health plans for state residents would be discontinued, although employers could choose to continue to sponsor benefits outside the
Table 1Projected Population and Federal Funding for Medical Care in 2017, Five States and U.S.
California Florida Illinois New York Texas U.S.
Population (Millions) 40 21 13 20 28 327
Total Spending on Medical (Billions) $330 $204 $120 $220 $234 $3,041
Per Capita Spending on Medical Care $8,300 $9,900 $9,300 $11,000 $8,300 $9,300
Federal Outlays (Billions)
Medicare $70 $49 $24 $40 $44 $603
Medicaid/CHIP for Nondisabled Adults and Children $24 $5 $9 $15 $11 $187
Medicaid for Aged and Disabled $14 $6 $3 $12 $9 $125
Health Insurance Marketplace Credits and Cost-Sharing Reductions $11 $13 $3 $3 $10 $95
VHA/DoD/FEHBP $16 $8 $4 $6 $13 $166
Value of Federal Tax Exclusion for Employer-Sponsored Health Plans (Forgone Revenues, Billions)
$30 $13 $12 $19 $19 $268
Federal Funding (Outlays Plus Value of Tax Exclusion, Billions) $165 $95 $54 $95 $106 $1,443
Federal Funding as a Share of Total Health Care Spending 50% 47% 45% 43% 45% 47%
ACA Penalty Payments (Billions)
Individual Mandate Penalties $1 $<0.5 $<0.5 $<0.5 $1 $4
Employer Mandate Penalties $2 $1 $<0.5 $1 $2 $12
Notes: “Medical care” excludes long-term care in nursing facilities, dental care, and over-the-counter drugs. CHIP (Children’s Health Insurance Program), VHA (Veterans Health Administration), DoD (Department of Defense), FEHBP (Federal Employee Health Benefits Program), and ESI ( employer-sponsored insurance). Medicare outlays are net of offsetting receipts (i.e. premiums paid by benefi-ciaries for Parts B and D, and state payments for the Part D “clawback”).Source: Authors’ analysis
National Institute for Health Care Reform Research Brief No. 19 • September 2015
7
scope of the state plan, such as dental care and long-term care insurance.
• The state plan would enroll individuals of all ages, including Medicare beneficiaries, the uninsured and the disabled.
• Individual and employer mandates and penalties would be waived in the state.
• The federal government would provide lump-sum financing to the state equal to what the federal government would have spent in that state under the cur-rent system for Medicare and Medicaid (excluding long-term care) and mar-ketplace subsidies, plus the value of the tax expenditure for employer-sponsored health plans.
• Federal lump-sum financing would be reduced by an amount equal to the lost federal revenues from waiving the indi-vidual and employer penalties.
• To finance the plan, the state would use its existing spending on Medicaid and CHIP and also impose a new payroll tax on state residents (and possibly employ-ers) to cover the difference between state plan costs and the lump-sum federal funding.
• The state would provide low-income individuals with an expanded scope of benefits, including services such as non-emergency transportation, consistent with each state’s current Medicaid benefit package.24
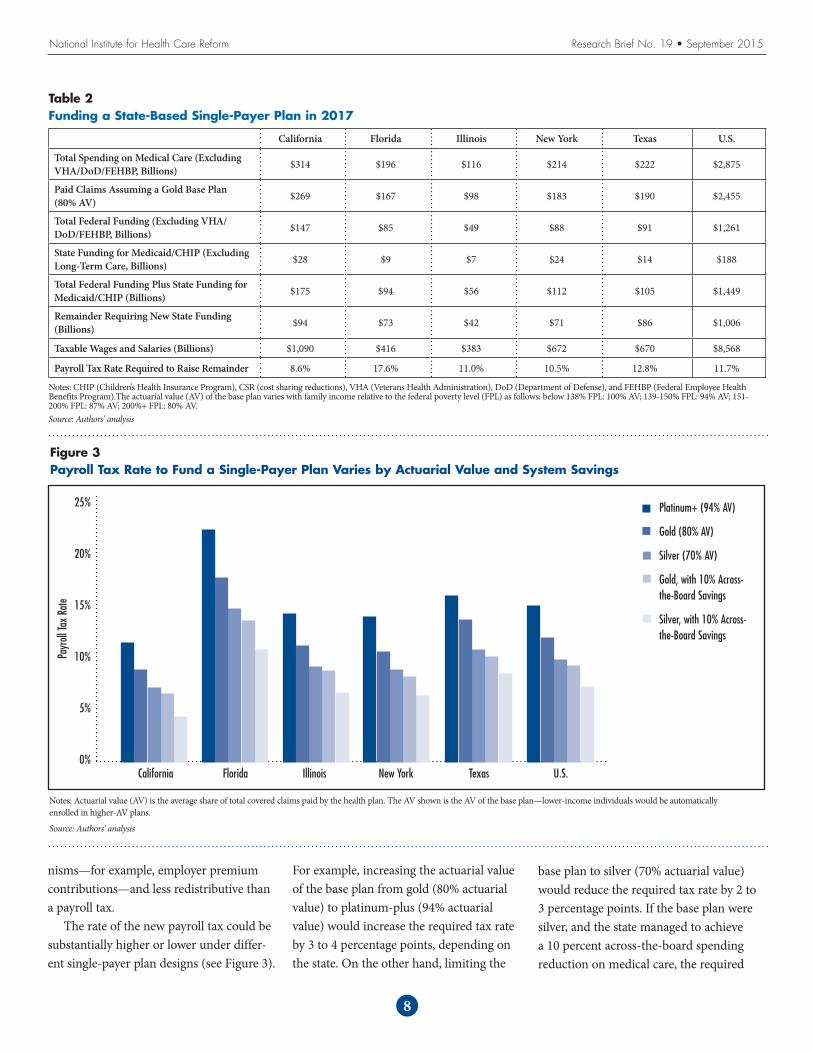
For two key features of the state plan—actuarial value of the basic plan, or the average share of covered medical services paid for by the plan, and whether there is any reduction in total medical spending—the analysis includes a base-case scenario and alternative scenarios. (See Table 2 for an illustration of fund-ing for the base-case scenario and Figure 3 for a summary of the payroll tax rate required to finance the base-case and alternative scenarios.)
In the base-case scenario, the state plan would have an actuarial value of 80 percent, which is equivalent to a gold plan in the current marketplaces and roughly equal to the actuarial value of the Medicare benefit. Alternative scenarios include a platinum-plus basic plan with an actuarial value of 94 percent and a silver basic plan with an actuarial value of 70 percent.25 Under all of the scenarios, the
actuarial value of the plan was assumed to be boosted for lower-income people, con-sistent with ACA marketplace cost-sharing subsidies and Medicaid cost-sharing limitations, and so the differences would only affect middle- and higher-income people.26
In the base-case scenario, total spend-ing on medical care would be the same as under the current system. The base-case scenario can be thought of as assuming no change in administrative costs, no change in the quantity of medical services provided and no change in the average rates paid to providers. In the alternative scenarios, total medical care spending would be reduced by 10 percent across the board. This analysis does not specify the mechanism to achieve the reduction and instead focuses only on the implications for funding the single-payer plan.27
There are many, many additional details that any state considering such an approach would have to work through. These include whether and how to enroll noncitizen legal residents and undocumented immigrants;
whether to operate a single state-run plan or a marketplace with competing private plans or some hybrid; and whether and how to offer supplemental coverage, or “buy-ups,” to achieve actuarial values above the basic plan (i.e. 80% in the base-case scenario).
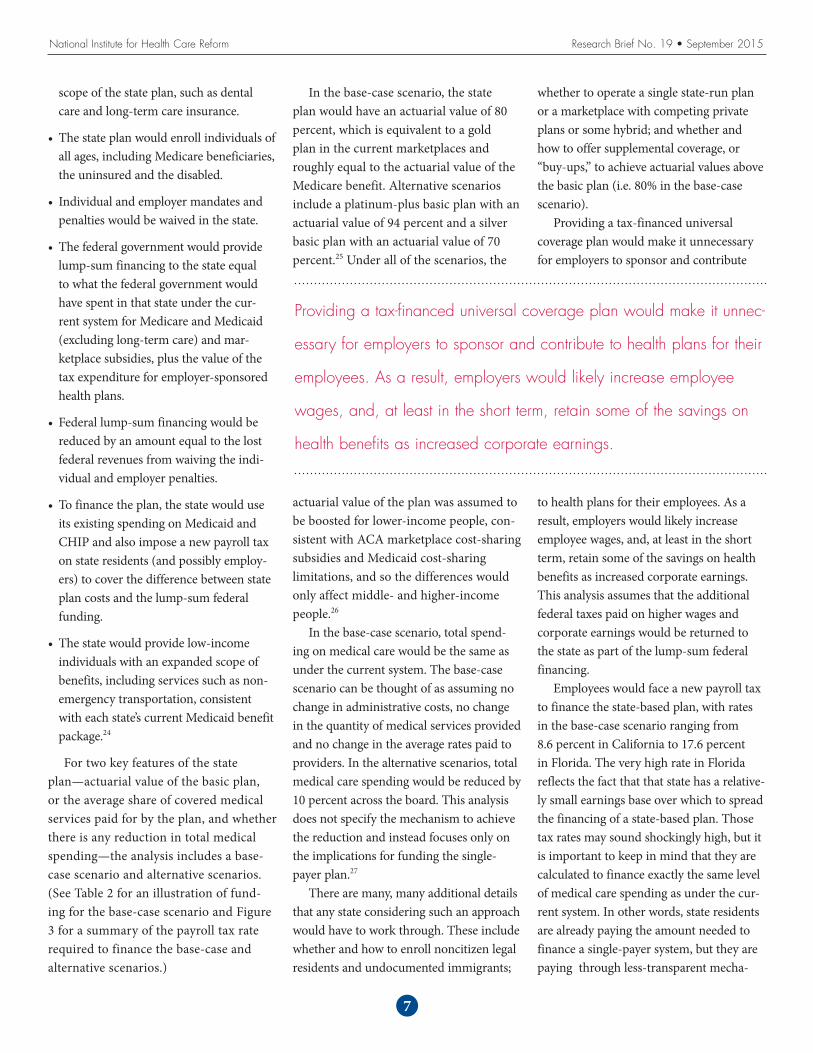
Providing a tax-financed universal coverage plan would make it unnecessary for employers to sponsor and contribute
to health plans for their employees. As a result, employers would likely increase employee wages, and, at least in the short term, retain some of the savings on health benefits as increased corporate earnings. This analysis assumes that the additional federal taxes paid on higher wages and corporate earnings would be returned to the state as part of the lump-sum federal financing.
Employees would face a new payroll tax to finance the state-based plan, with rates in the base-case scenario ranging from 8.6 percent in California to 17.6 percent in Florida. The very high rate in Florida reflects the fact that that state has a relative-ly small earnings base over which to spread the financing of a state-based plan. Those tax rates may sound shockingly high, but it is important to keep in mind that they are calculated to finance exactly the same level of medical care spending as under the cur-rent system. In other words, state residents are already paying the amount needed to finance a single-payer system, but they are paying through less-transparent mecha-
National Institute for Health Care Reform Research Brief No. 19 • September 2015
Providing a tax-financed universal coverage plan would make it unnec-
essary for employers to sponsor and contribute to health plans for their
employees. As a result, employers would likely increase employee
wages, and, at least in the short term, retain some of the savings on
health benefits as increased corporate earnings.
nisms—for example, employer premium contributions—and less redistributive than a payroll tax.
The rate of the new payroll tax could be substantially higher or lower under differ-ent single-payer plan designs (see Figure 3).
For example, increasing the actuarial value of the base plan from gold (80% actuarial value) to platinum-plus (94% actuarial value) would increase the required tax rate by 3 to 4 percentage points, depending on the state. On the other hand, limiting the
base plan to silver (70% actuarial value) would reduce the required tax rate by 2 to 3 percentage points. If the base plan were silver, and the state managed to achieve a 10 percent across-the-board spending reduction on medical care, the required
8
National Institute for Health Care Reform Research Brief No. 19 • September 2015
Figure 3Payroll Tax Rate to Fund a Single-Payer Plan Varies by Actuarial Value and System Savings
Notes: Actuarial value (AV) is the average share of total covered claims paid by the health plan. The AV shown is the AV of the base plan—lower-income individuals would be automatically enrolled in higher-AV plans.
Source: Authors’ analysis
Platinum+ (94% AV)
Gold (80% AV)
Silver (70% AV)
Gold, with 10% Across-the-Board Savings
Silver, with 10% Across-the-Board Savings
25%
20%
15%
10%
5%
0%California TexasNew YorkIllinoisFlorida U.S.
Payr
oll Ta
x Ra
te
Table 2Funding a State-Based Single-Payer Plan in 2017
California Florida Illinois New York Texas U.S.
Total Spending on Medical Care (Excluding VHA/DoD/FEHBP, Billions) $314 $196 $116 $214 $222 $2,875
Paid Claims Assuming a Gold Base Plan (80% AV) $269 $167 $98 $183 $190 $2,455
Total Federal Funding (Excluding VHA/DoD/FEHBP, Billions) $147 $85 $49 $88 $91 $1,261
State Funding for Medicaid/CHIP (Excluding Long-Term Care, Billions) $28 $9 $7 $24 $14 $188
Total Federal Funding Plus State Funding for Medicaid/CHIP (Billions) $175 $94 $56 $112 $105 $1,449
Remainder Requiring New State Funding (Billions) $94 $73 $42 $71 $86 $1,006
Taxable Wages and Salaries (Billions) $1,090 $416 $383 $672 $670 $8,568
Payroll Tax Rate Required to Raise Remainder 8.6% 17.6% 11.0% 10.5% 12.8% 11.7%
Notes: CHIP (Children’s Health Insurance Program), CSR (cost sharing reductions), VHA (Veterans Health Administration), DoD (Department of Defense), and FEHBP (Federal Employee Health Benefits Program).The actuarial value (AV) of the base plan varies with family income relative to the federal poverty level (FPL) as follows: below 138% FPL: 100% AV; 139-150% FPL: 94% AV; 151-200% FPL: 87% AV; 200%+ FPL: 80% AV. Source: Authors’ analysis
National Institute for Health Care Reform Research Brief No. 19 • September 2015
9
payroll tax rate would be reduced by 4 to 7 percentage points.
One important question regarding the single-payer plan is whether the payroll tax would be levied just on employees, or just on employers, or on both. This analysis assumes the payroll tax would be levied solely on employees. This differs from the Medicare Hospital Insurance tax, which is levied equally on employees and employers. It also differs from the Vermont single-payer financing plan, which would have combined a premium tax on individuals with a payroll tax levied on employers. There are advantages and disadvantages to levying the tax only on employees. The advantage is that it eliminates entirely the tax advantage for health care spending, which addresses the tax incentives for inef-ficiency and is consistent with including the full value of the federal tax exclusion in the federal lump-sum funding to the state.28 The disadvantage is that it would be more disruptive than a payroll tax applied both to employers and employees
The state-based voucher plan. A very different state-based approach would be to combine and convert marketplace premium subsidies and Medicaid funding for children and nondisabled adults into a unified vouch-er program for low-income individuals and families. One of the rationales for this approach would be to lessen the institutional barriers separating Medicaid and private coverage and the distortionary tax provisions designed to encourage employer-sponsored coverage. The vouchers, therefore, could be applied equally to the purchase of a non-group health plan or an employer-sponsored plan, and the employer mandate would be eliminated. To estimate the available funding for such an approach, the following assump-tions were made:
• Each state would maintain its existing Medicaid program for the aged and dis-abled, and the Medicare program would
continue as is, along with existing federal health programs for veterans, federal employees, and members of the military or their dependents.
• For children and nondisabled adults, the Medicaid program would be converted into a voucher program for the purchase of private health insurance.
• Federal funding for Medicaid and CHIP for children and nondisabled adults, along with funding for marketplace pre-mium and cost-sharing subsidies, would fund the voucher program.
• Low-income people would be auto-enrolled in a private nongroup health plan, with the voucher amount credited toward the premium.
• Individuals could switch to a competing nongroup health plan or an employer-sponsored plan and apply the voucher to the cost of the plan.
• Voucher-eligible individuals who enroll in an employer-sponsored health plan could apply the voucher amount to employer and employee premium contri-butions.
• Voucher amounts in excess of premiums would be automatically credited to a dedicated health care savings account.
• The employer mandate would be elimi-nated.
• Vouchers would only be available to U.S. citizens.
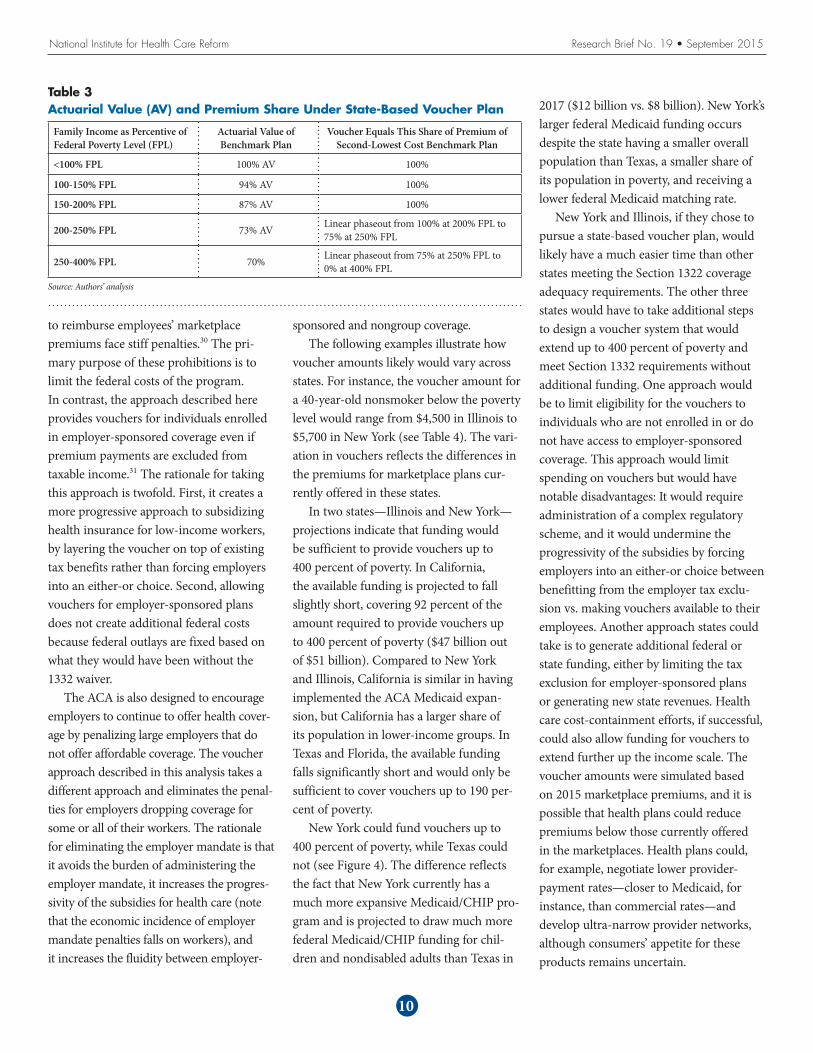
• The voucher amount would be set based on the individual’s family income and would be set equal to a sliding-scale pro-portion of the premium of a benchmark plan (see Table 3).
• The premiums for benchmark plans in each state were projected based on the premiums for the second-lowest cost marketplace silver plan in 2015. Marketplace premiums were assumed to grow from 2015 to 2017 at a 4 percent
annual rate and were adjusted based on the age and sex of the projected popula-tion receiving the vouchers.
• In some states, the available federal and state funding is not adequate to provide vouchers for the entire population below 400 percent of the federal poverty level. For the purposes of modeling vouch-ers in these states, an income cutoff was identified up to which vouchers could be offered with the available funding.29
It is important to note that the voucher approach described in this analysis differs in key ways from the approach taken in the ACA. Under the ACA, individuals are pre-vented from receiving a premium tax credit and at the same time also benefiting from the tax exclusion for employer-sponsored coverage (so-called “double dipping,” see Internal Revenue Code 36B(c)), and firms that attempt to use pre-tax contributions
A very different state-based approach would be to combine and con-
vert marketplace premium subsidies and Medicaid funding for children
and nondisabled adults into a unified voucher program for low-income
individuals and families.
National Institute for Health Care Reform Research Brief No. 19 • September 2015
to reimburse employees’ marketplace premiums face stiff penalties.30 The pri-mary purpose of these prohibitions is to limit the federal costs of the program. In contrast, the approach described here provides vouchers for individuals enrolled in employer-sponsored coverage even if premium payments are excluded from taxable income.31 The rationale for taking this approach is twofold. First, it creates a more progressive approach to subsidizing health insurance for low-income workers, by layering the voucher on top of existing tax benefits rather than forcing employers into an either-or choice. Second, allowing vouchers for employer-sponsored plans does not create additional federal costs because federal outlays are fixed based on what they would have been without the 1332 waiver.
The ACA is also designed to encourage employers to continue to offer health cover-age by penalizing large employers that do not offer affordable coverage. The voucher approach described in this analysis takes a different approach and eliminates the penal-ties for employers dropping coverage for some or all of their workers. The rationale for eliminating the employer mandate is that it avoids the burden of administering the employer mandate, it increases the progres-sivity of the subsidies for health care (note that the economic incidence of employer mandate penalties falls on workers), and it increases the fluidity between employer-
sponsored and nongroup coverage.The following examples illustrate how
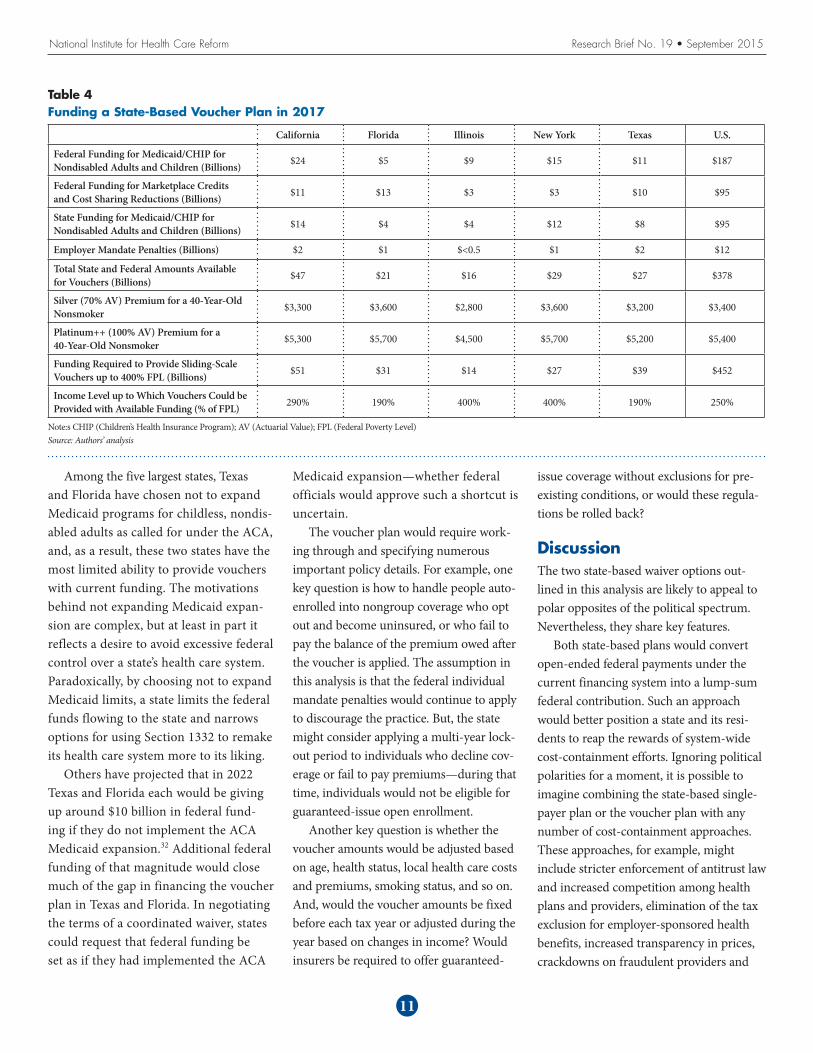
voucher amounts likely would vary across states. For instance, the voucher amount for a 40-year-old nonsmoker below the poverty level would range from $4,500 in Illinois to $5,700 in New York (see Table 4). The vari-ation in vouchers reflects the differences in the premiums for marketplace plans cur-rently offered in these states.
In two states—Illinois and New York—projections indicate that funding would be sufficient to provide vouchers up to 400 percent of poverty. In California, the available funding is projected to fall slightly short, covering 92 percent of the amount required to provide vouchers up to 400 percent of poverty ($47 billion out of $51 billion). Compared to New York and Illinois, California is similar in having implemented the ACA Medicaid expan-sion, but California has a larger share of its population in lower-income groups. In Texas and Florida, the available funding falls significantly short and would only be sufficient to cover vouchers up to 190 per-cent of poverty.
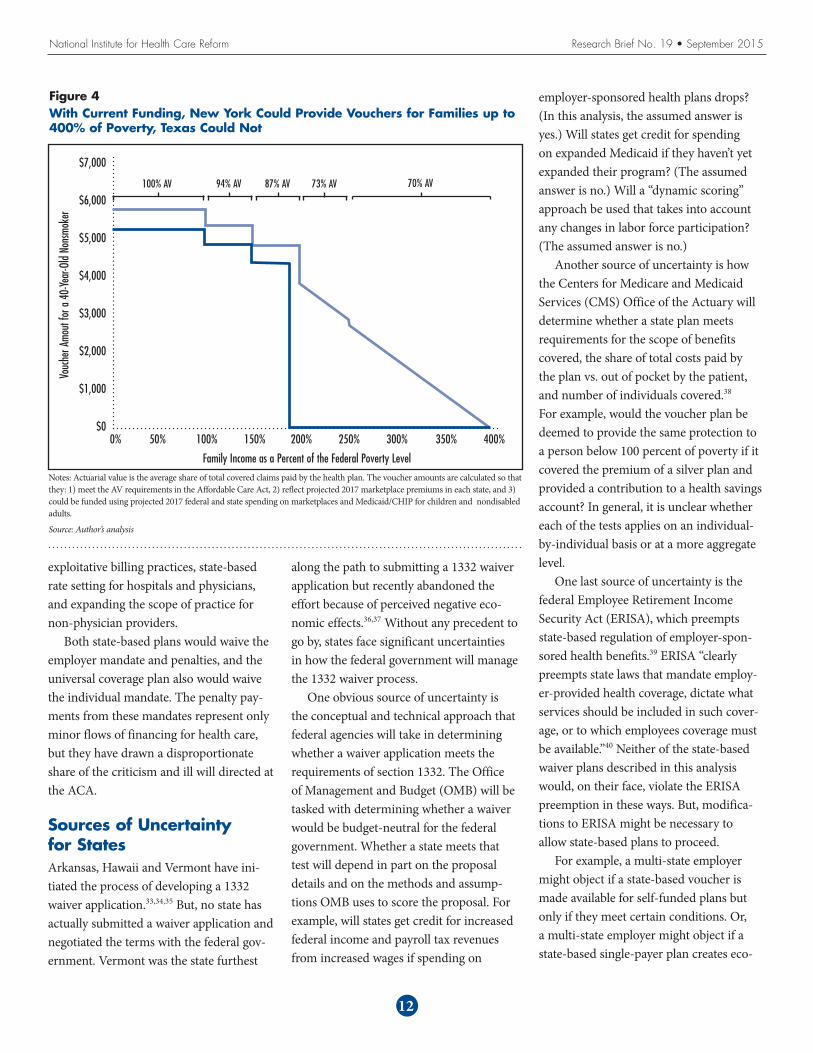
New York could fund vouchers up to 400 percent of poverty, while Texas could not (see Figure 4). The difference reflects the fact that New York currently has a much more expansive Medicaid/CHIP pro-gram and is projected to draw much more federal Medicaid/CHIP funding for chil-dren and nondisabled adults than Texas in
10
Table 3Actuarial Value (AV) and Premium Share Under State-Based Voucher Plan
Family Income as Percentive of Federal Poverty Level (FPL)
Actuarial Value of Benchmark Plan
Voucher Equals This Share of Premium of Second-Lowest Cost Benchmark Plan
<100% FPL 100% AV 100%
100-150% FPL 94% AV 100%
150-200% FPL 87% AV 100%
200-250% FPL 73% AV Linear phaseout from 100% at 200% FPL to 75% at 250% FPL
250-400% FPL 70% Linear phaseout from 75% at 250% FPL to 0% at 400% FPL
Source: Authors’ analysis
2017 ($12 billion vs. $8 billion). New York’s larger federal Medicaid funding occurs despite the state having a smaller overall population than Texas, a smaller share of its population in poverty, and receiving a lower federal Medicaid matching rate.
New York and Illinois, if they chose to pursue a state-based voucher plan, would likely have a much easier time than other states meeting the Section 1322 coverage adequacy requirements. The other three states would have to take additional steps to design a voucher system that would extend up to 400 percent of poverty and meet Section 1332 requirements without additional funding. One approach would be to limit eligibility for the vouchers to individuals who are not enrolled in or do not have access to employer-sponsored coverage. This approach would limit spending on vouchers but would have notable disadvantages: It would require administration of a complex regulatory scheme, and it would undermine the progressivity of the subsidies by forcing employers into an either-or choice between benefitting from the employer tax exclu-sion vs. making vouchers available to their employees. Another approach states could take is to generate additional federal or state funding, either by limiting the tax exclusion for employer-sponsored plans or generating new state revenues. Health care cost-containment efforts, if successful, could also allow funding for vouchers to extend further up the income scale. The voucher amounts were simulated based on 2015 marketplace premiums, and it is possible that health plans could reduce premiums below those currently offered in the marketplaces. Health plans could, for example, negotiate lower provider-payment rates—closer to Medicaid, for instance, than commercial rates—and develop ultra-narrow provider networks, although consumers’ appetite for these products remains uncertain.
National Institute for Health Care Reform Research Brief No. 19 • September 2015
Among the five largest states, Texas and Florida have chosen not to expand Medicaid programs for childless, nondis-abled adults as called for under the ACA, and, as a result, these two states have the most limited ability to provide vouchers with current funding. The motivations behind not expanding Medicaid expan-sion are complex, but at least in part it reflects a desire to avoid excessive federal control over a state’s health care system. Paradoxically, by choosing not to expand Medicaid limits, a state limits the federal funds flowing to the state and narrows options for using Section 1332 to remake its health care system more to its liking.
Others have projected that in 2022 Texas and Florida each would be giving up around $10 billion in federal fund-ing if they do not implement the ACA Medicaid expansion.32 Additional federal funding of that magnitude would close much of the gap in financing the voucher plan in Texas and Florida. In negotiating the terms of a coordinated waiver, states could request that federal funding be set as if they had implemented the ACA
Medicaid expansion—whether federal officials would approve such a shortcut is uncertain.
The voucher plan would require work-ing through and specifying numerous important policy details. For example, one key question is how to handle people auto-enrolled into nongroup coverage who opt out and become uninsured, or who fail to pay the balance of the premium owed after the voucher is applied. The assumption in this analysis is that the federal individual mandate penalties would continue to apply to discourage the practice. But, the state might consider applying a multi-year lock-out period to individuals who decline cov-erage or fail to pay premiums—during that time, individuals would not be eligible for guaranteed-issue open enrollment.
Another key question is whether the voucher amounts would be adjusted based on age, health status, local health care costs and premiums, smoking status, and so on. And, would the voucher amounts be fixed before each tax year or adjusted during the year based on changes in income? Would insurers be required to offer guaranteed-
issue coverage without exclusions for pre-existing conditions, or would these regula-tions be rolled back?
DiscussionThe two state-based waiver options out-lined in this analysis are likely to appeal to polar opposites of the political spectrum. Nevertheless, they share key features.
Both state-based plans would convert open-ended federal payments under the current financing system into a lump-sum federal contribution. Such an approach would better position a state and its resi-dents to reap the rewards of system-wide cost-containment efforts. Ignoring political polarities for a moment, it is possible to imagine combining the state-based single-payer plan or the voucher plan with any number of cost-containment approaches. These approaches, for example, might include stricter enforcement of antitrust law and increased competition among health plans and providers, elimination of the tax exclusion for employer-sponsored health benefits, increased transparency in prices, crackdowns on fraudulent providers and
11
Table 4Funding a State-Based Voucher Plan in 2017
California Florida Illinois New York Texas U.S.
Federal Funding for Medicaid/CHIP for Nondisabled Adults and Children (Billions) $24 $5 $9 $15 $11 $187
Federal Funding for Marketplace Credits and Cost Sharing Reductions (Billions) $11 $13 $3 $3 $10 $95
State Funding for Medicaid/CHIP for Nondisabled Adults and Children (Billions) $14 $4 $4 $12 $8 $95
Employer Mandate Penalties (Billions) $2 $1 $<0.5 $1 $2 $12
Total State and Federal Amounts Available for Vouchers (Billions) $47 $21 $16 $29 $27 $378
Silver (70% AV) Premium for a 40-Year-Old Nonsmoker $3,300 $3,600 $2,800 $3,600 $3,200 $3,400
Platinum++ (100% AV) Premium for a 40-Year-Old Nonsmoker $5,300 $5,700 $4,500 $5,700 $5,200 $5,400
Funding Required to Provide Sliding-Scale Vouchers up to 400% FPL (Billions) $51 $31 $14 $27 $39 $452
Income Level up to Which Vouchers Could be Provided with Available Funding (% of FPL) 290% 190% 400% 400% 190% 250%
Note:s CHIP (Children’s Health Insurance Program); AV (Actuarial Value); FPL (Federal Poverty Level)Source: Authors’ analysis
National Institute for Health Care Reform Research Brief No. 19 • September 2015
exploitative billing practices, state-based rate setting for hospitals and physicians, and expanding the scope of practice for non-physician providers.
Both state-based plans would waive the employer mandate and penalties, and the universal coverage plan also would waive the individual mandate. The penalty pay-ments from these mandates represent only minor flows of financing for health care, but they have drawn a disproportionate share of the criticism and ill will directed at the ACA.
Sources of Uncertainty for StatesArkansas, Hawaii and Vermont have ini-tiated the process of developing a 1332 waiver application.33,34,35 But, no state has actually submitted a waiver application and negotiated the terms with the federal gov-ernment. Vermont was the state furthest
along the path to submitting a 1332 waiver application but recently abandoned the effort because of perceived negative eco-nomic effects.36,37 Without any precedent to go by, states face significant uncertainties in how the federal government will manage the 1332 waiver process.
One obvious source of uncertainty is the conceptual and technical approach that federal agencies will take in determining whether a waiver application meets the requirements of section 1332. The Office of Management and Budget (OMB) will be tasked with determining whether a waiver would be budget-neutral for the federal government. Whether a state meets that test will depend in part on the proposal details and on the methods and assump-tions OMB uses to score the proposal. For example, will states get credit for increased federal income and payroll tax revenues from increased wages if spending on
12
Figure 4With Current Funding, New York Could Provide Vouchers for Families up to 400% of Poverty, Texas Could Not
Family Income as a Percent of the Federal Poverty Level
$7,000
$6,000
$5,000
$4,000
$3,000
$2,000
$1,000
$0
Vouc
her A
mout
for a
40-
Year
-Old
Nons
moke
r
0% 50% 100% 150% 200% 250% 300% 350% 400%
100% AV 94% AV 87% AV 73% AV 70% AV
Notes: Actuarial value is the average share of total covered claims paid by the health plan. The voucher amounts are calculated so that they: 1) meet the AV requirements in the Affordable Care Act, 2) reflect projected 2017 marketplace premiums in each state, and 3) could be funded using projected 2017 federal and state spending on marketplaces and Medicaid/CHIP for children and nondisabled adults.
Source: Author’s analysis
employer-sponsored health plans drops? (In this analysis, the assumed answer is yes.) Will states get credit for spending on expanded Medicaid if they haven’t yet expanded their program? (The assumed answer is no.) Will a “dynamic scoring” approach be used that takes into account any changes in labor force participation? (The assumed answer is no.)
Another source of uncertainty is how the Centers for Medicare and Medicaid Services (CMS) Office of the Actuary will determine whether a state plan meets requirements for the scope of benefits covered, the share of total costs paid by the plan vs. out of pocket by the patient, and number of individuals covered.38 For example, would the voucher plan be deemed to provide the same protection to a person below 100 percent of poverty if it covered the premium of a silver plan and provided a contribution to a health savings account? In general, it is unclear whether each of the tests applies on an individual-by-individual basis or at a more aggregate level.
One last source of uncertainty is the federal Employee Retirement Income Security Act (ERISA), which preempts state-based regulation of employer-spon-sored health benefits.39 ERISA “clearly preempts state laws that mandate employ-er-provided health coverage, dictate what services should be included in such cover-age, or to which employees coverage must be available.”40 Neither of the state-based waiver plans described in this analysis would, on their face, violate the ERISA preemption in these ways. But, modifica-tions to ERISA might be necessary to allow state-based plans to proceed.
For example, a multi-state employer might object if a state-based voucher is made available for self-funded plans but only if they meet certain conditions. Or, a multi-state employer might object if a state-based single-payer plan creates eco-
National Institute for Health Care Reform Research Brief No. 19 • September 2015
nomic incentives that more or less compel the employer to drop its employee health benefits for residents of one state. The path that would provide the most certainty to states would be for Congress to pass leg-islation delineating a “safety zone” within which 1332 waiver plans could not be chal-lenged under ERISA. The administration, in reviewing and approving a 1332 waiver plan, could also offer a legal rationale for the plan being consistent with ERISA. The most uncertain path through the ERISA minefield would be for a state to propose and implement a 1332 waiver plan, and then deal with ERISA-based court chal-lenges as they arise.
Notes1. Johnson, Jenna, and Mary Pat Flaherty,
“As Md. Rebuilds Its Health Insurance Exchange, Lots of Pressure and Little Room for Missteps,” The Washington Post (May 3, 2014). http://www.washingtonpost.com/local/md-politics/as-md-rebuilds-its-health-insurance-exchange-lots-of-pressure-and-little-room-for-missteps/2014/05/03/4ba5c12c-d214-11e3-937f-d3026234b51c_story.html.
2. Arkansas Center for Health Improvement, PPACA Section 1332: Waiver for State Innovation (2015). http://www.achi.net/Docs/280/.
3. Kaiser Commission on Medicaid and the Uninsured, A Historical Review of How States Have Responded to the Availability of Federal Funds for Health Coverage (August 2012). https://kai-serfamilyfoundation.files.wordpress.com/2013/01/8349.pdf.
4. U.S. Senators Richard Burr, Orrin Hatch and Fred Upton, The Patient Choice, Affordability, Responsibility, and Empowerment Act (2015). http://www.burr.senate.gov/public/_files/FINAL%20Patient%20CARE%20Act%20Plan.pdf.
5. McDonough, J. E., “Wyden’s Waiver: State Innovation on Steroids,” Journal of
Health Politics, Policy and Law, Vol. 39, No. 5 (2014). http://jhppl.dukejournals.org/content/39/5/1099.full.pdf.
6. Wyden, Ron, Letter to Bruce Goldberg, MD (Aug. 24, 2010). http://www.wyden.senate.gov/download/?id=f07c39f4-0633-4505-870c-5f8a582694c1&download=1.
7. U.S. Department of Health and Human Services (HHS), “Application, Review, and Reporting Process for Waivers for State Innovation,” Federal Register, Vol. 77, No. 38 (Feb. 27, 2012). http://www.gpo.gov/fdsys/pkg/FR-2012-02-27/pdf/2012-4395.pdf.
8. Note that “nearly everyone” does not include undocumented immigrants and only includes legal residents who have met residency requirements. For a discussion of the ACA and provisions relating to immigrants, see Kenney, Genevieve M., and Michael Huntress, The Affordable Care Act: Coverage Implications and Issues for Immigrant Families, HHS, Office of the Assistant Secretary for Planning and Evaluation (April 2012). http://aspe.hhs.gov/hsp/11/ImmigrantAccess/Coverage/ib.shtml.
9. For a narrative account, see Goodnough, Abby, “Under Health Care Act, Many Tax Filers Are Discovering Costly Complications,” The New York Times (March 21, 2015). http://www.nytimes.com/2015/03/22/us/affordable-care-act-insurance-tax-penalty.html.
10. The ACA, as written by Congress, required that states expand Medicaid eligibility to 138 percent of the federal poverty level (FPL) and made exchange subsidies available for individuals above that point. But, as a result of the 2012 U.S. Supreme Court decision, the Medicaid expansion was made optional for states. In states that have not expanded Medicaid, a cliff exists at 100 percent FPL—individuals with incomes below that point are ineligible for exchange subsidies. The result of that cliff is to encourage workers to increase
their incomes to become eligible for the exchange subsidies.
11. Congressional Budget Office, Effective Marginal Tax Rates for Low- and Moderate-Income Workers (November 2012). http://www.cbo.gov/sites/default/files/11-15-2012-MarginalTaxRates.pdf.
12. Mulligan, Casey B., Average Marginal Labor Income Tax Rates under the Affordable Care Act, National Bureau of Economic Research, Working Paper No. 19365 (August 2013). http://www.nber.org/papers/w19365.
13. Dettling, Aaron L., So, You’re Thinking About Running the 29er Strategy, Balch and Bingham, LLC (June 17, 2013). http://www.acareview.com/2013/06/so-youre-thinking-about-running-the-29er-strategy.
14. White, Chapin, and Paul B. Ginsburg, Working at Cross Purposes: Health Care Expansions May Jumpstart Local Economies but Fuel Nation’s Fiscal Woes, Center for Studying Health System Change, Washington, D.C. (August 2011). http://hschange.org/CONTENT/1228/.
15. U.S. Government Accountability Office, Medicaid Financing: States’ Increased Reliance on Funds from Health Care Providers and Local Governments Warrants Improved CMS Data Collection (July 2014). http://www.gao.gov/assets/670/665077.pdf.
16. The flows of funds among households, the federal government and state gov-ernments are extraordinarily complex. For a detailed discussion of these flows in one small state, see Eibner, Christine, et al., The Economic Incidence of Health Care Spending in Vermont, RAND Health (January 2015). http://www.leg.state.vt.us/Jfo/healthcare/Health%20Reform%20Oversight%20Committee/2015_01_06/2015_01_06_RAND_Economic%20Incidence%20of%20Health%20Care%20Spending%20in%20VT.pdf.
13
17. Joint Committee on Taxation, Estimates of Federal Tax Expenditures for Fiscal Years 2012-2017 (Feb. 1, 2013).
18. The ACA increases the Medicare Hospital Insurance tax, establishes the new “Cadillac” tax on high-premium employer-sponsored plans beginning in 2018, and establishes new fees on health insurance plans and prescrip-tion drug and device manufacturers. For details, see Congressional Research Service, Health-Related Revenue Provisions in the Patient Protection and Affordable Care Act (PPACA) (May 3, 2010). https://www.asaecenter.org/files/FileDownloads/PublicPolicy/crs%20health%20related%20provisions.pdf.
19. The federal funding share calculated (47%) is much higher than the federal government’s share of national health expenditures projected for 2017 by the Centers for Medicare & Medicaid Services (CMS) (29%). That difference in federal funding shares is due to two key differences in methodology. First, CMS’ calculation of federal spending only includes Medicare outlays from general revenues and treats Medicare outlays that are funded by payroll taxes as spending by households and employers. Second, CMS’ calculation does not take into account the value of the federal tax exclusion for employer-sponsored health plans. CMS’ calcu-lations also include a broader set of spending (national health expenditures, rather than spending on medical care), although that difference does not nec-essarily significantly affect the federal government’s share. CMS projects that total national health expenditures will equal $3.6 trillion in 2017 and that the federal government will sponsor $1.0 trillion of that amount (29%). See Table 16, CMS, NHE Projections 2013-2023 – Tables (2014). http://www.cms.gov/Research-Statistics-Data-and-Systems/Statistics-Trends-and-Reports/NationalHealthExpendData/Downloads/Proj2013tables.zip.
20. Mettler, Suzanne, The Submerged State: How Invisible Government Policies Undermine American Democracy, University of Chicago Press, Chicago, Ill. (2011). http://www.amazon.com/The-Submerged-State-Invisible-Government/dp/0226521656.
21. U.S. Congress, Healthy Americans Act (Feb. 5, 2009). https://www.congress.gov/bill/111th-congress/senate-bill/391.
22. Auerbach, David, et al., “Will Health Insurance Mandates Increase Coverage?: Synthesizing Perspectives From Health, Tax, And Behavioral Economics,” National Tax Journal, Vol. 63, No. 4, Part 1 (December 2010).
23. An alternative approach to financing the single-payer plan would include premium payments by state resi-dents, similar to Medicare, which is financed with revenues from taxes on wage income plus premiums paid by enrollees. Requiring premium pay-ments for a single-payer plan would be similar to imposing a head tax on state residents, which would reduce the tax progressivity of the financing of the plan. Requiring premium payments raises several policy questions, among them: 1) how large would premium revenues be compared to payroll-tax revenues? 2) would premiums be col-lected through the tax system and, if so, how would premiums be collected from non-filers? 3) would nonpayment of premiums result in individuals being dropped from the single-payer plan? 4) would premiums be adjusted for age, income or health status, and, if so, how? Those policy questions are clearly answerable, but they make the model-ing too complex for the scope of the current study.
24. In all states, the Medicaid Early and Periodic Screening, Diagnosis and Treatment (EPSDT) program provides some benefits beyond the essential health benefits package, including dental care for children under age 21. Other additional Medicaid benefits
include non-emergency medical trans-portation. See Baumrucker, Evelyne, and Bernadette Fernandez, Comparing Medicaid and Exchanges: Benefits and Costs for Individuals and Families, Congressional Research Service (June 26, 2013). http://www.law.umaryland.edu/marshall/crsreports/crsdocuments/R42978_06262013.pdf.
25. Vermont’s proposed single-payer plan would have provided an actuarial value of 94 percent. For details, see Shumlin, Peter, Green Mountain Care: A Comprehensive Model for Building Vermont’s Universal Health Care System, State of Vermont (Dec. 30, 2014). http://hcr.vermont.gov/sites/hcr/files/2014/GMCReport2014/GMC%20FINAL%20REPORT%20123014.pdf.
26. A base plan with 70 percent actuarial value would entail significantly higher cost sharing relative to the current Medicare benefit package and relative to typical employer-sponsored plans. That gap in actuarial values could result in the coordinated waiver failing to meet the requirements in the ACA and would undoubtedly raise objections among current enrollees in more-gen-erous plans.
27. For examples of the policy options that a state might consider to reduce overall medical spending, see Eibner, Christine, et al., Controlling Health Care Spending in Massachusetts: An Analysis of Options, RAND (August 2009). http://www.mass.gov/eohhs/docs/dhcfp/r/pubs/09/control-health-care-spending-rand-08-07-09.pdf.
28. To see that the tax advantage is elimi-nated entirely under the employee-only approach, suppose the residents of a state are considering whether to increase the generosity of the state-based plan and increase the payroll tax accordingly to cover the additional spending. Under the employee-only approach, increasing health spending and the payroll tax would not reduce taxable income or generate any savings
14

National Institute for Health Care Reform Research Brief No. 19 • September 2015
for state residents in federal income tax payments or corporate tax payments. Suppose, instead, that the payroll tax is split evenly between the employer and employee. If total compensation is assumed to remain, then increasing the payroll tax rate would result in a reduction in taxable compensation to the employee, which, in turn, generates savings for state residents in federal income tax payments.
29. Setting an income limit for vouchers below 400 percent of the federal pov-erty level simplifies the modeling of the voucher approach but would likely not be acceptable to the federal govern-ment under the terms of a coordinated waiver.
30. See Internal Revenue Service, Employer Health Care Arrangements (April 16, 2015). http://www.irs.gov/Affordable-Care-Act/Employer-Health-Care-Arrangements.
31. There is a precedent, in the Medicare Part D prescription drug benefit, for providing two forms of subsidies for the same health care spending. When originally enacted in the Medicare Modernization Act of 2003, Part D provided substantial subsidies to employers who provided prescription drug benefits to their retirees and, at the same time, allowed employers to deduct total spending on retiree drug benefits (including the subsidies) for purposes of corporate income taxes. Additionally, the value of retiree drug benefits was excluded from retiree income. Under the ACA, employers continue to receive Part D subsidies, but they are no longer permitted to deduct the Part D subsidies from their corporate income.
32. Glied, Sherry, and Stephanie Ma, How States Stand to Gain or Lose Federal Funds by Opting In or Out of the Medicaid Expansion, Commonwealth Fund (December 2013). http://www.commonwealthfund.org/~/media/Files/Publications/Issue%20Brief/2013/
Dec/1718_Glied_how_states_stand_gain_lose_Medicaid_expansion_ib_v2.pdf.
33. State of Hawaii, State Innovation Waiver; State Innovation Waiver Task Force; Appropriation (2014). http://www.capitol.hawaii.gov/session2014/bills/HB2581_CD1_.pdf
34. Public Consulting Group, Section 1332 Waivers and the Future of Arkansas Healthcare Innovation, Arkansas Health Insurance Marketplace Board and Legislative Oversight Committee (Dec. 19, 2014). http://posting.arktimes.com/media/pdf/pcg_1332_waiver_report_for_ahm_jan2_2015.pdf.
35. Ollove, Michael, “Vermont Tries to Go Beyond Obamacare,” Governing (Aug. 11, 2014). http://www.governing.com/news/headlines/vermont-tries-to-go-beyond-obamacare.html.
36. McArdle, Megan, “If Single Payer Can’t Work in Vermont...” BloombergView (Dec.23, 2014). http://www.bloom-bergview.com/articles/2014-12-23/vermonts-lessons-for-fans-of-singlepayer-health-care.
37. Shumlin, Peter, Gov. Shumlin Details Health Care Financing Report to Business and Consumer Advisory Councils (2014). http://governor.ver-mont.gov/node/2163.
38. From Section 1332(b): “(1) IN GENERAL.—The Secretary may grant a request for a waiver under subsection (a)(1) only if the Secretary determines that the State plan—(A) will provide coverage that is at least as comprehen-sive as the coverage defined in section 1302(b) and offered through Exchanges established under this title as certified by Office of the Actuary of the Centers for Medicare & Medicaid Services based on sufficient data from the State and from comparable States about their experience with programs created by this Act and the provisions of this Act that would be waived; (B) will provide coverage and cost sharing protections
against excessive out-of-pocket spend-ing that are at least as affordable as the provisions of this title would provide; (C) will provide coverage to at least a comparable number of its residents as the provisions of this title would provide; and (D) will not increase the Federal deficit.”
39. Congressional Research Service, Regulation of Health Benefits Under ERISA: An Outline (Oct. 20, 2008).
40. Monahan, Amy, Pay or Play Laws, ERISA Preemption, and Potential Lessons from Massachusetts, University of Missouri-Columbia School of Law Legal Studies, Research Paper (2007).
15
National Institute for Health Care Reform Research Brief No. 19 • September 2015
HEALTH REFORM 2.0: ALTERNATIVE STATE WAIVER PATHS UNDER THE AFFORDABLE CARE ACT
TECHNICAL APPENDIX
This Research Brief combines several dif-ferent data sources, including projections of Medicare and Medicaid spending from the Congressional Budget Office,1 historical state-level health care spending and his-torical and projected national health care spending from the Office of the Actuary in the Centers for Medicare & Medicaid Services,2 historical and projected popula-tion data from the U.S. Census Bureau,3 and other sources.
Scope of Health Care Spending Included in the Analysis. The analysis only includes spending on “medical care,” which we define as national health expenditures minus spending on dental services, nursing care facilities and continuing care retire-ment communities, other non-durable medical products (mainly over-the-counter medications), government public health activities, and research.4 The analysis includes the 50 states plus the District of Columbia, and excludes Puerto Rico and other U.S. territories.
Methods. The general method for pro-jecting state-level population and health care spending involves three steps:
1. project a national amount for calendar year 2017,
2. create an initial set of projected state-spe-cific amounts for calendar year 2017, and
3. create an adjusted set of state-specific amounts that are adjusted proportion-ally so that they sum to exactly equal the national control totals calculated in step 1.Although only results from the five
most-populous states are presented, this general method requires projecting state-specific amounts for all 50 states plus the District of Columbia.
Population. National projections from the U.S. Census Bureau were used to estimate the total U.S. resident popula-tion in 2017, for all ages (327 million), and separately for the nonelderly 64 and younger (276 million) and 65 and older (51 million).5 To project the population in each state in 2017, state-level population estimates by single year of age from the U.S. Census Bureau were used to measure each state’s population in July 2010 and in July 2012 separately for the nonelderly and elderly.6 Annual state-level growth rates from 2010 to 2012 were then used to project separate state-level nonelderly and elderly populations. State-level population projections were then adjusted to match the national control totals in 2017 sepa-rately for the nonelderly and elderly.
To project the population in each state in 2017 in different income groups, esti-mates were used from the Kaiser Family Foundation (KFF) based on the March 2014 Current Population Survey of the share of each state’s population in different income categories in 2013.7 KFF reports the share of each state’s population under 100 percent of the federal poverty level (FPL), the share between 100-199 per-cent FPL, and the share between 200-399 percent. To project each state’s popula-tion under 100 percent FPL in 2017, the share under 100 percent FPL in 2013 was multiplied by the projected state popula-tion in 2017. The populations in each state between 100-199 percent FPL and between 200-399 percent FPL were pro-jected similarly. It was assumed that the population in each state was distributed uniformly within the 100-199 percent FPL income group and within the 200-399 income FPL income group.
Spending on Medical Care. To project spending on medical care in each state in 2017, national total spending on medi-cal care in 2017 was first estimated, using projections of national health expendi-tures (NHE) in 2017 from the Centers for Medicare and Medicaid Services (CMS) Office of the Actuary.8 Spending on medi-cal care in 2017 ($3041 billion) is defined as NHE ($3579 billion) minus the following categories: “Dental Services” ($135 billion), “Nursing Care Facilities and Continuing Care Retirement Communities” ($191 billion), “Other Non-Durable Medical Products” (mainly over-the-counter medicines, $69 billion), “Government Public Health Activities” ($93 billion), and “Research” ($50 billion).
To project total spending on medi-cal care in each state in 2017, state health expenditures (SHE) from the CMS Office of the Actuary were used.9 The SHE include historical spending on medical care by state of residence from 1991 through 2009 (the latest year for which data are available). To measure historical spend-ing on medical care in each state in 2009, total spending on personal health care was used minus the following spending cat-egories: “Dental Services,” “Nursing Home Care,” and “Other Health, Residential, and Personal Care.” An initial projection of spending on medical care in each state in 2017 was generated by multiplying the historical spending in 2009 by two factors: the ratio of the projected state population in 2017 over the historical state population in 2009, and the accumulated projected growth in per-person spending from 2009 to 2017. The accumulated growth in per-person spending is based on the historical annual growth in spending per capita in
16
National Institute for Health Care Reform Research Brief No. 19 • September 2015
each state from 1991-2009.10 Projected spending in each state was then adjusted proportionally so that the sum of the state projections equals the projected national total in 2017.
To project federal outlays for Medicare in each state in 2017, CBO April 2014 Medicare baseline projections were con-verted from federal fiscal year to calendar year.11 Projected national Medicare spend-ing equals projected mandatory outlays for benefits and administration (including the effects of sequestration) plus discretionary outlays for administration minus offsetting receipts. (Offsetting receipts include pre-mium payments by beneficiaries for Parts B and D, state “clawback” payments for part D, and amounts paid to providers and sub-sequently recovered.)
An initial projection of Medicare spend-ing in each state was calculated by multiply-ing total state-level Medicare spending in 2009 from the SHE by two factors. The first factor is the ratio of the number Medicare beneficiaries in 2017 over the number of Medicare beneficiaries in 2009, and the second factor is the accumulated projected growth in per-beneficiary Medicare spend-ing from 2009 to 2017. The projected num-ber of Medicare beneficiaries in each state in 2017 equals the sum of the projected number of elderly Medicare beneficiaries (age 65 and older) plus the projected num-ber of nonelderly Medicare beneficiaries (under age 65 who qualify on the basis of disability or end-stage renal disease). The projected number of elderly beneficiaries in 2017 equals the number of elderly Medicare beneficiaries in 2012 multiplied by the ratio of the elderly population in 2017 over the elderly population in 2012. The projected number of nonelderly beneficiaries equals the share of the nonelderly population enrolled in Medicare in 2012 multiplied by the projected nonelderly population in 2017. The projected number of Medicare beneficiaries was then adjusted propor-tionally to equal the national control total,
which equals the intermediate estimate of enrollment in Medicare Parts A or B in 2017 from the 2014 Medicare Trustees report (59.025 million).12 To project the accumulated projected growth in per-ben-eficiary Medicare spending from 2009 to 2017, CMS state-level Medicare geographic variation files were used to measure growth in spending per fee-for-service beneficiary from 2009 to 2012.13,14 The growth in spending per beneficiary from 2012 to 2017 was extrapolated using the historical state-level growth in Medicare spending per fee-for-service beneficiary from 2008 to 2012, Projected Medicare spending in each state was proportionately adjusted to equal the national control total.
To project Medicaid spending in each state, data reported on KFF’s State Health Facts were used to measure total historical Medicaid spending in each state in 2012.15 Additional data from KFF State Health Facts were used to allocate historical Medicaid spending to aged and disabled enrollees vs. nondisabled adults and chil-dren16 and to allocate Medicaid spending to acute care, long-term care, and dispropor-tionate share hospital (DSH) payments.17 Historical federal medical assistance percentages data from the Department of Health and Human Services (HHS) were used to allocate Medicaid spending to each state vs. the federal government.18 States planning to expand Medicaid under the ACA19 were identified, and Urban Institute estimates of the number of newly Medicaid eligibles in each state under the ACA were used.20 CBO data were used to project federal spending on Medicaid for different eligibility categories21 and the projected federal costs of the ACA Medicaid expan-sion.22 These various data sources were combined to project state-level Medicaid spending in calendar 2017, separately by eligibility category (nondisabled adults made newly eligible under the ACA, other nondisabled adults, children, and the aged and disabled), type of service (long-term
care, acute care, and DSH), and federal vs. state payment. In each case, the state-level projected spending amounts were adjusted to equal the national control totals.
To project marketplace premium subsidies and cost-sharing reductions in each state, CBO projections were used to calculate the national total amount in cal-endar 201723 and then the 2017 national total was allocated proportionally to states based on their 2015 marketplace enroll-ment as reported by HHS.24 To project federal health care spending through the Veterans Health Administration (VHA), the Department of Defense (DoD), and the Federal Employee Health Benefits Program (FEHBP), projections of 2017 total national spending were used from the 2015 budget from the Office of Management and Budget (OMB).25 The national total was allocated proportionally to each state based on the number of federal employees (civilian plus military) in each state in 2013 as reported by the National Priorities Project.26
To project the federal tax expenditure for employer-sponsored health plans, the Joint Committee on Taxation (JCT) projec-tion for the “exclusion of employer contri-butions for health care, health insurance premiums, and long-term care insurance premiums” for calendar 2017 ($164 billion) was used as a starting point.27 That amount only reflects tax expenditures under the federal income tax system. Based on pub-lished estimates of the tax expenditures under the federal income tax system and the federal payroll tax system,28 an estimate of the ratio of federal income plus payroll tax expenditures for employer-sponsored health benefits to federal income tax expen-ditures for employer-sponsored health benefits was generated ($227 billion in 2012 divided by $139 billion in 2012 equals 1.64). The federal total from JCT was then multiplied by that ratio to project the total national tax expenditure in 2017 ($268 bil-lion). The national total value of the tax expenditure was allocated to each state
17

National Institute for Health Care Reform Research Brief No. 19 • September 2015
based on each state’s share of total premi-ums for employer-sponsored health insur-ance in 2012, based on the product of the number of enrollees in each state29 and the average single premium in 2012.30
Total projected individual mandate penalty payments and employer mandate penalty payments for calendar 2017 were calculated from CBO projections.31 Those national totals were allocated to states pro-portionally based on KFF’s estimate of the number of uninsured in each state in 2014.32
To project taxable wages and salaries in each state in 2017, CBO projections of the total tax base for wages and salaries in calendar 2017 ($8568 billion) were used,33 then the wages and salaries were allocated proportionally to each state based on its share of the national total of 2011 Medicare Part A (HI) taxable earnings.34
To project exchange premiums in 2017, the monthly premium in each state for the second-lowest cost silver plan for a 40-year-old nonsmoker, as reported by KFF, was used.35 These monthly premiums were converted to annual amounts and escalated from 2015 to 2017 (assuming a 4% annual growth rate). The silver premium for a 40-year-old was then converted to silver premiums for individuals in different age bands (under 21, 21 to 34, 35 to 44, 45 to 54 and 55 to 64). Those relative premiums were obtained by comparing premiums quoted on healthcare.gov. Silver premiums were converted to Platinum++ (100% actu-arial value (AV)) by multiplying by 1.6, to Platinum+ (94% AV) by multiplying by 1.48, to Gold+ (87% AV) by multiplying by 1.34, to Silver+ (73% AV) by multiplying by 1.06. (These ratios were based on observed relationships among actuarial values and premiums for Silver, Gold, and Platinum plans quoted on healthcare.gov.)
To project the voucher-eligible popula-tion in each state, the U.S. Census Bureau’s CPS Table Creator was used to create a customized tabulation of the average popu-lation from 2011-2013 in each state for
each combination of age band and poverty group (below 100% FPL, 100-150% FPL, 150-200% FPL, 200-250% FPL, 250-300% FPL, 300-400% FPL).36 These population totals were calculated not broken out by nativity and for non-citizens. The num-ber of citizens equals the total minus the number of non-citizens. The 2011-2013 average populations in each age-income cell were grown to 2017 using each state’s projected overall population growth. The projected amount required to fund vouch-ers in a state equals the sum-product of the 2017 population in each age-band*income group, the plan actuarial value adjustment, and the income phase-out adjustment. For states with available funding that was not adequate to cover vouchers up to 200 per-cent FPL, the income cutoff was estimated as 200 percent * (available funding / fund-ing required to cover vouchers up to 200% FPL). For states with available funding sufficient to cover the population up to 200 percent FPL but not up to 400 percent FPL, the income cutoff was estimated as 200 per-cent + (400% - 200%) * (1 – sqrt(1 – (avail-able funding - funding required to cover vouchers up to 200%) / funding required to cover vouchers for 200-400%)).
Notes1. Congressional Budget Office (CBO),
Congressional Budget Office’s April 2014 Medicare Baseline (2014). http://www.cbo.gov/sites/default/files/cbofiles/attachments/44205-2014-04-Medicare.pdf
2. Centers for Medicare & Medicaid Services (CMS), NHE Projections 2013-2023 - Tables (2014). http://www.cms.gov/Research-Statistics-Data-and-Systems/Statistics-Trends-and-Reports/NationalHealthExpendData/Downloads/Proj2013tables.zip.
3. U.S. Census Bureau, Table 1. Projected Population by Single Year of Age, Sex, Race, and Hispanic Origin for the United States: 2014 to 2060 (2014). http://www.census.gov/population/projections/files/downloadables/NP2014_D1.csv.
4. CMS, National Health Expenditure Accounts: Methodology Paper, 2013, Definitions, Sources, and Methods (2013). http://www.cms.gov/Research-Statistics-Data-and-Systems/Statistics-Trends-and-Reports/NationalHealthExpendData/Downloads/DSM-13.pdf.
5. U.S. Census Bureau, Table 1. Projected Population by Single Year of Age, Sex, Race, and Hispanic Origin for the United States: 2014 to 2060 (2014). http://www.census.gov/population/projections/files/downloadables/NP2014_D1.csv.
6. U.S. Census Bureau, Downloadable Dataset: Annual Estimates of the Civilian Population by Single Year of Age and Sex for the United States and States: April 1, 2010 to July 1, 2013 (2014). http://www.census.gov/popest/data/state/asrh/2013/files/SC-EST2013-AGESEX-CIV.csv.
7. Kaiser Family Foundation (KFF), State Health Facts: Distribution of Total Population by Federal Poverty Level, 2013 (2015). http://kff.org/other/state-indicator/distribution-by-fpl/#.
8. CMS, NHE Projections 2013-2023 - Tables (2014). http://www.cms.gov/Research-Statistics-Data-and-Systems/Statistics-Trends-and-Reports/NationalHealthExpendData/Downloads/Proj2013tables.zip.
9. CMS, Health Expenditures by State of Residence, 1991-2009 (2013). http://www.cms.gov/Research-Statistics-Data-and-Systems/Statistics-Trends-and-Reports/NationalHealthExpendData/Downloads/resident-state-estimates.zip.
10. For each state, the annual historical growth in spending on medical care per capita from 1991-2009 was measured, g. The initial pro-jection of spending per capita in each state in 2017 equals the level of spending in 2009 multiplied by (1+g)^(2017-2009). That ini-tial spending projection is then adjusted to match the national control total in 2017.
11. Projected spending in calendar year 2017 equals 0.75 multiplied by projected spend-ing in federal fiscal year 2017 plus 0.25 multiplied by projected spending in federal fiscal year 2018.
18
National Institute for Health Care Reform Research Brief No. 19 • September 2015
A D V A N C I N G H E A L T H P O L I C Y R E S E A R C H
12. Medicare Trustees, 2014 Annual Report Of The Boards Of Trustees Of The Federal Hospital Insurance And Federal Supplementary Medical Insurance Trust Funds (July 28, 2014). http://www.cms.gov/Research-Statistics-Data-and-Systems/Statistics-Trends-and-Reports/ReportsTrustFunds/Downloads/TR2014.pdf.
13. CMS, Medicare Geographic Variation, State Table - Beneficiaries under 65 (February 2015). http://www.cms.gov/Research-Statistics-Data-and-Systems/Statistics-Trends-and-Reports/Medicare-Geographic-Variation/Downloads/State_Table_Under_65.zip.
14. CMS, Medicare Geographic Variation, State Table - Beneficiaries 65 and Older (February 2015). http://www.cms.gov/Research-Statistics-Data-and-Systems/Statistics-Trends-and-Reports/Medicare-Geographic-Variation/Downloads/State_Table_65_and_over.zip.
15. KFF, Total Medicaid Spending, FY 2013, State Health Facts (2015). http://kff.org/medicaid/state-indicator/total-medicaid-spending/#.
16. KFF, State Health Facts: Medicaid Spending by Enrollment Group (FY2011) (2015). http://kff.org/medicaid/state-indi-cator/medicaid-spending-by-enrollment-group/#.
17. KFF, Distribution of Medicaid Spending by Service, FY 2012 (2015). http://kff.org/medicaid/state-indicator/distribution-of-medicaid-spending-by-service/.
18. U.S. Department of Health and Human Services (HHS), “Federal Financial Participation in State Assistance Expenditures; Federal Matching Shares for Medicaid, the Children’s Health Insurance Program, and Aid to Needy Aged, Blind, or Disabled Persons for FY 2012,” Federal Register, Vol. 75, No. 217 (Nov. 10, 2010). http://aspe.hhs.gov/health/fmap12.shtml.
19. KFF, Status of State Action on the Medicaid Expansion Decision, State Health Facts (Dec.17, 2014). http://kff.org/health-reform/state-indicator/state-activity-around-expanding-medicaid-under-the-affordable-care-act/.
20. Kenney, Genevieve M., et al., Opting in to the Medicaid Expansion under the ACA: Who Are the Uninsured Adults Who Could Gain Health Insurance Coverage, Urban Institute (2012). http://www.urban.org/pub-lications/412630.html.
21. CBO, Detail of Spending and Enrollment for Medicaid for CBO’s April 2014 Baseline (April 2014). http://www.cbo.gov/sites/default/files/cbofiles/attachments/44204-2014-04-Medicaid.pdf.
22. CBO, Updated Estimates of the Effects of the Insurance Coverage Provisions of the Affordable Care Act, April 2014 (April 2014). http://www.cbo.gov/sites/default/files/cbofiles/attachments/45231-ACA_Estimates.pdf.
23. Ibid.
24. HHS, Office of the Assistant Secretary for Planning and Evaluation, Health Insurance Marketplaces 2015 Open Enrollment Period: March Enrollment Report (March 10, 2015). http://aspe.hhs.gov/health/reports/2015/MarketPlaceEnrollment/Mar2015/ib_2015mar_enrollment.pdf.
25. Office of Management and Budget, Fiscal Year 2015 Historical Tables, Budget of the U.S. Government (2014). http://www.white-house.gov/sites/default/files/omb/budget/fy2015/assets/hist.pdf (Table 16.1).
26. Sweger, Becky, et al., State Smart: Federal Funds in 50 States, National Priorities Project (Nov. 24, 2014). https://media.nationalpriorities.org/uploads/publications/npp_state_smart_federal_funds_in_50_states.pdf.
27. Joint Committee on Taxation, Estimates of Federal Tax Expenditures For Fiscal Years 2014-2018 (Aug. 5, 2014). https://www.jct.gov/publications.html?func=startdown&id=4663.
28. Miller, G. Edward, and Thomas M. Selden, “Tax Subsidies for Employer-Sponsored Health Insurance: Updated Microsimulation Estimates and Sensitivity to Alternative Incidence Assumptions,” Health Services Research, Vol. 48, No. 2, part 2 (April 2013).
29. State Health Access Data Assistance Center, State-Level Trends in Employer-Sponsored
Health Insurance, University of Minnesota (April, 2013). http://www.shadac.org/files/shadac/publications/ESI_Report_2013.pdf.
30. KFF, Average Single Premium per Enrolled Employee For Employer-Based Health Insurance (2014). http://kff.org/other/state-indicator/single-coverage/.
31. CBO, Updated Estimates of the Effects of the Insurance Coverage Provisions of the Affordable Care Act, April 2014 (April, 2014). http://www.cbo.gov/sites/default/files/cbofiles/attachments/45231-ACA_Estimates.pdf.
32. KFF, How Will the Uninsured Fare Under the Affordable Care Act? (April 2014). https://kaiserfamilyfoundation.files.word-press.com/2014/04/8531-how-will-the-uninsured-fare-under-the-aca.pdf.
33. CBO, An Update to the Budget and Economic Outlook: 2014 to 2024 (August 2014). http://www.cbo.gov/sites/default/files/cbofiles/attachments/45653-Outlook-Update_2014_Aug.pdf.
34. See Table 4 in Social Security Administration, Earnings and Employment Data for Workers Covered Under Social Security and Medicare, by State and County, 2011 (May 2014). http://www.socialsecurity.gov/policy/docs/statcomps/eedata_sc/2011/.
35. KFF, State Health Facts: Monthly Silver Premiums for a 40 Year Old Non-Smoker Making $30,000/Year (2015. http://kff.org/other/state-indicator/monthly-silver-premiums-for-a-40-year-old-non-smoker-making-30000year-2014-2015/#.
36. U.S. Census Bureau, Current Population Survey (CPS), CPS Table Creator (2015). http://www.census.gov/cps/data/cpstablec-reator.html.