Reseach Paper4
21
Hitotsubashi University Repository Title Household-level Recovery after Floods in a Developing Country: Further Evidence from Khyber Pakhtunkhwa, Pakistan Author(s) Kurosaki, Takashi; Khan, Humayun; Shah, Mir Kalan; Tahir, Muhammad Citation Issue Date 2012-04 Type Technical Report Text Version publisher URL http://hdl.handle.net/10086/22958 Right
-
Upload
independent -
Category
Documents
-
view
3 -
download
0
Transcript of Reseach Paper4

Hitotsubashi University Repository
Title
Household-level Recovery after Floods in a
Developing Country: Further Evidence from Khyber
Pakhtunkhwa, Pakistan
Author(s)Kurosaki, Takashi; Khan, Humayun; Shah, Mir Kalan;
Tahir, Muhammad
Citation
Issue Date 2012-04
Type Technical Report
Text Version publisher
URL http://hdl.handle.net/10086/22958
Right

PRIMCED Discussion Paper Series, No. 27
Household-level Recovery after Floods in a Developing Country: Further Evidence from Khyber
Pakhtunkhwa, Pakistan
Takashi Kurosaki, Humayun Khan, Mir Kalan Shah, and
Muhammad Tahir
April 2012
Research Project PRIMCED Institute of Economic Research
Hitotsubashi University 2-1 Naka, Kunitatchi Tokyo, 186-8601 Japan
http://www.ier.hit-u.ac.jp/primced/e-index.html

Household-level Recovery after Floods in a Developing Country:
Further Evidence from Khyber Pakhtunkhwa, Pakistan
April 2012
Takashi Kurosaki, Humayun Khan, Mir Kalan Shah, and Muhammad Tahir
Abstract:
Based on a second survey of villages and households one year after a pilot survey, we analyze
the household-level recovery process from damage due to floods in Pakistan in 2010. With
regard to initial recovery from flood damage, we find that households who had initially fewer
assets and were hit by greater flood damage had more difficulty in recovering. After one year,
the overall recovery had improved, but there remained substantial variation across households
regarding the extent of recovery. Initially rich households were associated with faster recovery
than other households at the time of the second survey, but the speed of recovery declined
during the most recent year. The overall pattern appears to indicate that the village economy was
turning towards the initial regime, where the income distribution was characterized by a large
mass of households whose welfare and asset levels were around the income poverty line and a
small middle class of households whose asset levels were sufficiently high to ensure a welfare
level above the poverty line.
JEL classification codes: O12, D12, D91.
Keywords: natural disaster, recovery, resilience, Pakistan.
Takashi Kurosaki is the corresponding author (Institute of Economic Research, Hitotsubashi University, 2-1 Naka, Kunitachi, Tokyo 186-8603, Japan. Phone: +81-42-580-8363; Fax: +81-42-580-8333; E-mail: [email protected]). Humayun Khan ([email protected]), Mir Kalan Shah ([email protected]), and Muhammad Tahir ([email protected]) are all associated with the Institute of Development Studies, Khyber Pakhtunkhwa Agricultural University, Peshawar, Pakistan. Funding from a JSPS Grant-in-Aid for Scientific Research-S (22223003) is gratefully acknowledged.
1

1. Introduction
Households throughout the world face a wide variety of risks arising from natural
disasters, such as floods, droughts, and earthquakes. Households in low-income developing
countries are particularly vulnerable, since their initial welfare levels are already close to the
poverty line, institutional arrangements used to cope with disasters are lacking, and early
warning systems are absent. Furthermore, the number of natural disasters reported appears to be
increasing globally—from fewer than 100 per year in the mid-1970s to approximately 400 per
year during the 2000s, according to the emergency events database (EM-DAT).1 Nevertheless,
economics literature on the impact of natural disasters is scarce (Sawada, 2007), and economics
literature on disaster relief is still nascent (Morris and Wodon, 2003; Takasaki, 2011).
To fill these literature gaps, we conducted a pilot survey in December 2010–February
2011, to analyze the impact of floods that hit Pakistan in July–August 2010 (Kurosaki et al.,
2011; Kurosaki and Khan, 2011). The floods were indeed unprecedented in Pakistan, and they
had affected about two-thirds of Pakistan’s districts. The pilot survey was conducted in Khyber
Pakhtunkhwa,2 which was most severely hit by the floods. From the pilot survey, we found that
(1) there were both between-village and within-village variations in flood damage, (2) different
types of damages were not highly correlated, (3) the aid distribution across villages appeared to
be well-targeted toward severely affected villages, (4) the aid allocation within villages was
targeted toward households with greater house damage, but not toward households with greater
damage to land, crop, or other assets, (5) aid recipients did not show higher or lower recovery
than non-recipients, especially in terms of house damage, and (6) households that had initially
fewer assets and were afflicted by greater flood damage had more difficulty in recovery
(Kurosaki et al., 2011; Kurosaki and Khan, 2011).
Since the recovery process is dynamic in nature, a single “snapshot” survey after a
disaster cannot provide detailed information on it. For this reason, we conducted a second
survey of villages and households covered in the pilot survey, one year later. By combining data
from these two surveys, we can obtain rich information on household-level recovery, both
immediately after the floods and in subsequent years. Utilizing the panel nature of the
post-disaster dataset, this paper reports preliminary results regarding recovery dynamics. This
type of analysis is lacking in the literature on South Asian economies; given this scarcity, the
evidence shown in this paper is expected to shed light on the issue of natural disasters and the
recovery process, despite the small sample size involved.
The rest of this paper is organized as follows. After this introductory section, Section 2
briefly describes the study area and survey design. Section 3 summarizes village- and
1 Available on http://www.emdat.be/natural-disasters-trends (accessed on October 25, 2011). 2 Khyber Pakhtunkhwa is one of the four provinces that comprise Pakistan. The province was formerly known as the North-West Frontier Province (NWFP).
2

household-level changes that occurred between the two surveys. Section 4 provides the results
of the regression analysis with respect to the level of recovery. Section 5 contains a summary
and concluding remarks.
2. The 2011/12 Resurvey
2.1. Study area and the 2010/11 survey
In July–August 2010, heavy torrential rains and flash floods severely affected human
lives, livestock, infrastructure, crops, and livelihoods all over Pakistan. The province of Khyber
Pakhtunkhwa was affected most; the main reason for this was the fact that the province was
affected directly by rains, and that no flood warning had been issued in most of the province
when flash floods hit, as it occurred during the night time.
To tackle the aftermath and the inherent difficulties therein, relief activities were
quickly organized by international and domestic nongovernment organizations (NGOs) and
government agencies. The Pakistani government also initiated its Watan card program, in order
to help the flood-affected population reconstruct damaged houses. Under the program,
flood-affected families were registered by the government authority and were issued automated
teller machine (ATM) cards that were keyed to accounts to which a total of Rs. 100,000 was to
be paid in five equal installments. These cards were distributed in December 2010, and the first
installment payment was released between December 2010 and April 2011. In July–October
2011, the government issued Watan cards to areas to which an initial allotment had not been
assigned. The second installment was delayed in most of Pakistan, due to the government’s
failure to secure the related budgetary funding. Due to the intensity of the damage, these aid
inflows did not appear to be sufficient.
To assess the vulnerability and resilience of rural economies against this unexpected
natural disaster, we conducted a pilot survey of village economies in the Peshawar District of
Khyber Pakhtunkhwa, Pakistan, in the 2010/11 fiscal year. The pilot survey covered 10 sample
villages and 100 sample households (i.e., 10 from each sample village). The sample villages
were chosen in a way similar to that in which the authors surveyed villages in the same district
in 1996/97 and 1999/2000 (Kurosaki and Hussain, 1999; Kurosaki and Khan, 2001). We chose
villages with different characteristics in terms of economic development, but with similar
characteristics in terms of ethnicity and culture, in order to elicit the dynamic implications of
economic development from a cross-section. Of the three villages surveyed in the previous
panel surveys, two villages (Tarnab and Damane Hindko) were successfully resurveyed in the
pilot survey. One village (Yousuf Khel) was not covered for security reasons. Eight villages
were added to the survey; each of them satisfied the above inclusion criterion, as well as an
additional criterion: sample villages must present various levels of damage due to the flooding.
3
The actual survey for the first round was carried out between December 2010 and
February 2011. We successfully surveyed 10 villages, each of which had different levels of
flood damage to its houses and infrastructure. In the survey, village-level information was
collected from knowledgeable villagers,3 via a structured questionnaire. From each of these 10
sample villages, 10 sample households were chosen for the household survey; they did not
strictly constitute a random sample, as they were chosen to represent, as comprehensively as
possible, the various levels of flood damage the village had sustained. A structured
questionnaire for households was used in the survey. Kurosaki et al. (2011) provide greater
detail about the first survey and its background.
2.2. The 2011/12 resurvey
In order to collect information on changes since the first round of the pilot survey, we
conducted a second survey approximately 12 months after the first round, between December
2011 and January 2012. The second survey successfully covered all 10 sample villages and 100
sample households (i.e., 10 from each sample village) in Peshawar, Pakistan. Table 1 shows the
list of the 10 villages surveyed; in that second survey, a structured questionnaire was used,
whose focus was on the changes that had occurred since the first survey with regard to
household demography, labor force, physical assets, monetary assets, aid receipt, and so on.
Table 2 summarizes the household-level data obtained from the two rounds of surveys.
Since the sampling probability differs from village to village (Kurosaki et al., 2011), we report
unweighted statistics as well as weighted statistics that were adjusted for the different sampling
probabilities. As shown in the table, the average age of the household head was 47 and his/her
education level was 6.9 years of schooling. The average education level is higher than the
national average for the same age cohort by approximately one year, which appears to indicate
the prevalence in the study area of the idea of education investment as being key to poverty
reduction (Kurosaki and Khan, 2006).
The average land-holding before the floods was 3.7 acres (unweighted) or 2.7 acres
(weighted). These figures are smaller than the national average but similar to the average
land-holding size in Peshawar District. The average land asset value is Rs. 4.6 million (mean) or
Rs. 1.0 million (median).4 Regarding land distribution, the average figure may be misleading,
since as much as 42% of the sample households did not own any land. Owing to this skewed
distribution, the median land-holding size was equal to or less than 1.0 acre. Livestock is
another physical asset of importance in the study area. About 58% of the sample households
3 In each village, a group comprising two to five villagers who knew the village well was interviewed for the survey. Such knowledgeable villagers included social workers appointed by the government, union councilors, traditional village leaders such as members of the Jirga or village Malik, and Islamic leaders. 4 “Rs.” stands for Pakistani rupee; at the time of the first survey, US$1.00 = Rs. 86.
4

owned large livestock animals, such as cattle and buffalo; 78% of them owned some kind of
livestock animals, including goats and poultry. Livestock assets are thus more equally
distributed than land assets; nonetheless, their distribution is not completely egalitarian,
resulting in a huge difference between its mean (Rs. 74,000) and median (Rs. 34,000)
(unweighted statistics). The distribution of core physical assets (houses, land, and large
livestock animals) is thus characterized by a large mass of households that each holds a small lot
of assets, and a small pool of middle-class households whose asset levels are comparatively and
distinctively higher. This pre-flood distribution is similar to that seen in the panel data of
1996/97–1999/2000 (Kurosaki and Hussain, 1999; Kurosaki and Khan, 2001), where the
welfare levels of the former group were at around the income poverty line, while those of the
latter group were above the poverty line.
The last section of Table 2 summarizes information on aid receipt. Slightly less than
one-half of the sample households received emergency aid from NGOs, emergency aid from the
government, and Watan cards, while the total receipt in terms of money equivalent was only
4–5% of the estimated value of the average damage due to the 2010 floods. Therefore, the aid
receipt on average was not large relative to the flood damage sustained. Nevertheless, for those
households whose initial wealth level was not high and which had suffered a substantial loss to
houses, the percentage was much higher, that is, compensating for 20–30% of the flood
damages.
As the key variable in this paper, we collected variables on the level of recovery,
taking one of the 11 percentage-point categories, from 0 (no recovery) to 100 (complete
recovery). Although figures are based on subjective assessments, they correspond well to the
changes in asset values reported by households. The recovery rates at the ends of 2010 and 2011
are summarized in Table 3. At the end of 2010, the recovery rates were higher for crops than
houses, land, and livestock; at the end of 2011, the recovery rates were improved with respect to
all kinds of damage. The average overall recovery rate was just below 90%, compared to less
than 70% one year previous. Especially with regard to crops and livestock, the recovery was
quick, and the average was close to 100%. On the other hand, the recovery rates from land and
house damage were not very high. A substantial portion of the sample households reported that
their recovery rates in land and houses were less than 50% at the end of 2011.
3. Changes during the One-Year Period
This section summarizes the village- and household-level changes that our survey
team found to have occurred between the two surveys. Wherever corresponding data were
collected in the second survey, quantitative evidence is also provided in the section.
5

3.1. Borrowing and lending
To cope with disaster and emergency situations, self-coping through borrowing is an
important strategy throughout the world. With regard to borrowing and lending, institutional
sources are rarely used in this area; only two instances of institutional-source borrowing were
reported during the second survey, and they were for social and business purposes.
Institutional-source borrowing was avoided by respondents in the sample villages, because of
the interest charged on these loans—a practice prohibited by Islamic law and which is contrary
to the people’s social norms. Other factors responsible for this response could be the lengthy
and difficult procedures involved, a lack of collateral, and the illiteracy of some of the affected
households.
Informal credit sources were often used in the study area. Borrowing from friends and
relatives is common, and this indicates strong social connections among the people. Reported
borrowings from this source occur without any interest payments, without any need for
collateral, and with no fixed duration for repayment. These loans are based totally on faith and
on relationships that prevail in the study area. A total of 47 instances of informal borrowings
were reported by the respondents. Informal borrowings were most frequently found in Damane
Hindko village, where every respondent reported borrowing more than once during the reported
period. These informal borrowings helped households replenish their livestock; the sample
households in Damane Hindko suffered from the largest livestock losses due to the 2010 floods.
These informal credit transactions thus played the most important role in helping affected
households rehabilitate their livelihoods and reconstruct their asset bases.
3.2. Availability of outside aid
Outside aid can be classified as rehabilitation and relief aid. Aid for pure emergency
relief was seen only during the first several months of the period between the two surveys.
Government departments independently and in collaboration with different
international organizations (e.g., WFP, UN, Care, and USAID) provided relief aid to the
flood-affected areas, in the forms of food, medication, agricultural inputs, business support, and
payment for the compensation of standing crops. Food aid, for example, continued in the most
heavily affected areas for those in need, until March 2011. NGOs also played an active role in
providing relief activities, like the supply of food, clothes, utensils, etc. during the reported
period. The role of NGOs in providing such aid was limited, due mainly to breakdowns in law
and order and to a general lack of funds.
Some NGOs provided services for distributing government aid, while international
organizations devised from their own sources aid-distribution programs. Noteworthy here is a
program run by the Sarhad Rural Development Programme (SRDP). Under the program, people
6
mostly with agriculture backgrounds were contacted and hired as labor to rehabilitate public
properties (e.g., clearance of irrigation channels and drains). The participants were paid in kind
with food and clothes. The program was praised by the people of the localities, on the basis that
the aid was provided with honor and not as a work-free “handout.”
The Watan card program was a basic tool of government rehabilitation programs. In
the province of Khyber Pakhtunkhwa, the second installment payment was released fully in the
worst affected districts of Charsadda and Nowshera and partially in other districts (i.e., only in
the worst affected Union Councils in these districts). Only in the villages of Jala Bela and Mian
Gujar did respondents report the receipt of the second installment. Due to the delays in Watan
payment, most of the people perceived the program as having failed to meet its basic objective.
To facilitate rehabilitation, several NGOs and local business communities provided
affected people with raw materials for house reconstruction. Such aid, in most cases, was
allocated based on merit and need. However, in one instance in Mian Gujar, we saw that
reconstruction material had been provided to a few households in excess of the genuine need
pertaining to house damage; this instance provides anecdotal evidence of nepotism and
favoritism. In general, rehabilitation aid funded by international sources was limited and
suspended earlier than had been planned as a part of the war against terrorism.
3.3. Rehabilitation of rural infrastructure
At the time of the second survey, it was found that various government departments in
charge of the electricity supply, telephone, post office, etc. had rehabilitated their damaged
infrastructure soon after the flood. Other departments had also launched programs to rehabilitate
the damaged infrastructure within their respective domains, which were mostly incomplete and
delayed due to funding unavailability. Where damages were extensive and impinged upon the
livelihood of the people, special cells were established to report and reconstruct the damaged
infrastructure. In this regard, the creation of Flood Damages Directorates in the Irrigation and
Construction & Works Department (a department otherwise meant to oversee the construction
of roads and bridges) by the government of Khyber Pakhtunkhwa can be considered important.
The directorates were established to ensure speedy and coordinated reconstruction and
rehabilitation.
The sample households reported that some work had been done by the irrigation
department in their villages, even as roads remained damaged, save for a partial repair of a link
road to Jala Bela village. These actions may reflect the government’s priorities that it considers
irrigation rehabilitation more important to rural livelihood than the reconstruction of roads. In
the road sector, funds were mostly spent to rectify washed-out roads and bridges and roads of
national and regional importance.
7

3.4. Changes in demography and labor force
The village data shows that the number of households residing in the village increased
during the previous year, mostly because of an increase in population and the split of
households into nuclear families. The household data shows that the average household size
increased by 0.35 persons (unweighted) or by 0.41 persons (weighted) during the previous year
(Table 2). Most of this increase was attributable to new births—another indicator of recovery.
The average number of working household members increased by 0.23 persons during
the previous year. Most of the new jobs were in the private sector, dominated by low-paying,
daily-wage labor. This indicates that after the floods, the demand for such jobs increased as a
result of reconstruction activities. The increase in the working population may have been a
result of the pressure to generate more income to reconstruct houses and other properties. The
overall composition of sectors for these working members remained the same as before: the
largest labor absorber was primary industry.
4. Correlates of the Recovery Process
4.1. Empirical strategy
Descriptions in the previous sections show that at the time of the second survey, most
of the affected households were in the process of recovering from flood damage. The main
source of recovery funding was their own sources, supplemented by informal borrowing. Other
sources—like aid receipt from the government and NGOs—were limited during the
rehabilitation phase, although the receipt of relief helped flood victims consolidate savings for
reconstruction.
In this section, we attempt to quantify the above summary situations, using
household-level econometrics. Since our sample is not strictly a random one, the level of the
explanatory variables may contain measurement error—especially at the village level. For this
reason, we focus on within-village variation and address the question: what type of households
achieved more recovery than others in the same village?
To address this question, we regress the explanatory variable of the extent of recovery
(reported in Table 3) on the following explanatory variables. First, the list of explanatory
variables includes village fixed effects, to control for unobservable factors that affected the
recovery process at the village level. Second, the list includes a vector of variables that
characterize asset positions before the floods: human capital indicators, such as household size
(quantity of human capital); the household head’s education (quality of human capital in the
modern context); and the household head’s village leader dummy (quality of human capital in
the traditional context). The list also includes physical capital indicators, such as the number of
8

housing buildings, the value of land, and the value of livestock owned by each household before
the floods. See Table 4 of Kurosaki et al. (2011) for summary statistics of these variables. Third,
to capture the impact of flood damage on subsequent recovery, we include a vector of asset
amounts damaged by the floods. Since some of the household-level variation in flood damage is
endogenous, we follow the approach of Kurosaki et al. (2011) and use the fitted residuals from
regression models where observed levels of flood damage are regressed on village fixed effects
and the household asset variables mentioned above. The regression results associated with the
calculated residuals are reported in Table 10 of Kurosaki et al. (2011). The fitted residuals
contain the component of variation in flood damage not explained by village fixed effects and
households’ initial assets. Therefore, coefficients on the fitted residuals can be interpreted as the
recovery response to asset amounts damaged by the floods, after controlling for the flood
damage endogenously determined by households’ initial assets.
In addition to these basic variables, we also attempted a specification with the fitted
residuals for aid receipt, based on Table 17 of Kurosaki et al. (2011). All four aid-receipt
variables have insignificant coefficients, probably due to the mixing of the recovery-promoting
effect of aid and the selection effect for aid toward households that inherently have more
difficulty with recovery. For this reason, this paper reports regression results without using aid
receipts as explanatory variables.
4.2. Correlates of household-level recovery
The regression results are reported in three tables that correspond to different
dependent variables. Those in Table 4 correspond to the specification using the recovery level at
the end of 2010 as the dependent variable5; those in Table 5 show the results one year later (i.e.,
the recovery level at the end of 2011); and those in Table 6 correspond to the specification using
the change in recovery from the end of 2010 to the end of 2011 as the dependent variable.
Regarding initial recovery, Table 4 shows that household size has positive and
significant coefficients with regard to overall and land recovery; the education of the household
head was found to have a positive effect on the overall recovery; the village leader dummy had
a positive coefficient, which is statistically significant (though the significance level was low);
and the initial livestock assets contributed to the livestock recovery, which is commonsense,
because it is easier for households with a larger initial volume of livestock to compensate for the
loss of one animal than for households with smaller volumes. Looking at flood damage, most of
the flood damage variables have negative coefficients, as expected; two of them—that is, house
damage on house recovery and crop damage on recovery in 2010/11 rabi cropping—were
statistically significant. The regression results in Table 4 thus confirm that households with
5 The table is extracted from Table 22 of Kurosaki et al. (2011).
9
initially fewer assets and those hit by more extensive flood damage were slower to recover.
One year later, had this pattern changed? To address this question, we replaced the
dependent variable in Table 4 with a similar variable that corresponded to one year later. The
results are reported in Table 5. Since the recovery rates approached 100% in the cases of crops
and livestock (so that the variation in the dependent variable is minimal), we estimated the
model excluding these categories. A pattern similar to that seen in Table 4 (i.e., pre-flood human
capital assets have positive coefficients and flood damage has negative coefficients) is still
observed one year later, but with lower levels of statistical significance. One difference is in the
impact of the initial house asset: it now has a significantly negative coefficient, indicating that
those households with more housing buildings before the floods were slower to recover than
other households. Even after controlling for the extent of house damages, households with more
houses had difficulties in recovering quickly, because they needed to spread their limited
resources across more houses. The coefficient was also negative at the end of 2010, but was
statistically insignificant. However, those households with more houses are richer than other
households. Therefore, their relatively late recovery may not be a serious concern, from a policy
perspective. The positive impact of modern (education) and traditional (Jirga leader) human
capital on recovery remains statistically significant for the house recovery, but became
insignificant for overall recovery.
To cleanly identify changes that occurred in the previous year, Table 6 reports the
regression results based on the first difference of recovery levels, between the two surveys. This
specification has an advantage that household fixed effects on the recovery level are controlled
perfectly. A disadvantage is that the sample size becomes smaller, because we need to exclude
those households whose recovery rate was already at 100% at the end of 2010. For such
households, the change in recovery rate cannot be defined in a meaningful way; more
specifically, we do not report regression results for land recovery, because the sample size is as
small as 11. The results in Table 6 show that pre-flood asset variables now have negative
coefficients, and some of them are statistically significant. For example, the recovery rate of
households whose head is a traditional leader was slowed by 11 percentage points in the
previous year.
4.3. Interpretations of results
Does the recovery process characterized by the regression results indicate a recovery
to the initial regime of the village economy, or a transition to a new regime with a different
distribution of welfare levels and assets?6 The coefficients on the initial asset variables in
6 This question is motivated by the ecology literature on resilience. For instance, Gunderson and Pritchard (2002) define “engineering resiliency” as the quickness in time required for a system to recover
10

Tables 4 and 5 indicate the tendency for initially rich households to recover quickly. If this
effect dominates, inequality in physical assets should be exacerbated as a result of turbulence
due to the floods.
On the other hand, the coefficients on these variables in Table 6 indicate the tendency
for the recovery rate of initially rich households to slow down. Furthermore, those households
with initially more assets tended to suffer greater damage from floods, and those greater
damages make recovery more difficult. In addition, the aid allocation was targeted towards
those with lower initial assets, although weakly (Kurosaki et al., 2011). These tendencies work
in the direction of reducing inequality in physical assets.
From the regression results alone, it is difficult to judge which effect dominates.
However, it appears to be safe to conclude that a drastic change in inequality in physical assets
cannot be expected to be an ultimate result of the 2010 floods. At the same time, we cannot
deny the possibility that the 2010 floods may have destroyed human and social capital or
changed the way human and physical assets translate into household well-being by way of
institutional changes. In other words, to address the question above, we should consider a
composite asset (called the “livelihood asset” below), which aggregates the vector of various
types of human capital, social capital, and physical assets that contribute to household
well-being (Carter and Barrett, 2006).
As far as the field observations indicate, however, we find no clear evidence that the
2010 floods destroyed human or social capital or changed the way in which human and physical
assets translate into household well-being. Then, our tentative conclusion is that although
damage stemming from the 2010 floods was massive, the resulting turbulence did not result in a
transition to a new regime with a completely different distribution of welfare levels and
livelihood assets; instead, the rural economy seems to be recovering to the initial regime.
To support this argument, our analysis using the 1996–99 household panel data from
two villages included in the current datasets indicates the existence of two stable equilibrium
levels of livelihood assets, one of which corresponds to an income level around the poverty line
and the other of which corresponds to a middle-class income level, far beyond the poverty line.7
In the pilot survey, the pre-flood asset distribution among sample households was consistent
with this characterization.8 It is not surprising, then, to observe that a small turbulence in the
to the initial regime after turbulence, and “ecological resiliency” as the threshold turbulence above which the system transitions to a new regime.7 We estimated a nonparametric regression of the livelihood asset in 1999/2000 on the livelihood asset in 1996/97, using the methodology of Adato et al. (2006). The preliminary result shows an S-curve with two stable equilibriums, the lower of which corresponds to the poverty trap defined by Carter and Barrett (2006). Preliminary results are available on request. 8 Unfortunately, due to the lack of necessary information on household income/consumption and returns on various types of assets (including human and social capital), we cannot estimate a similar nonparametric regression of the livelihood asset by using data from the two rounds of post-flood pilot
11

distribution of physical assets was not able to change the long-term distribution of the livelihood
asset.
5. Conclusion
This paper analyzed the household-level process of recovering from damage due to
floods in Pakistan in 2010, based on a second survey of villages and households one year after a
pilot survey had been conducted. With regard to the initial recovery from flood damage, we
found that households who had initially fewer assets and faced more extensive flood damage
had greater difficulty in recovering. We further found that after one year, overall recovery had
been improved, but that there remained substantial variation across households regarding the
extent of recovery. The initially rich households tended to recover more quickly than other
households at the time of the second survey, but the speed of recovery had significantly declined
during the previous year.
The overall pattern appears to indicate that the village economy was gradually
recovering towards the initial regime, where the income distribution was characterized by a
large mass of households whose welfare and asset levels were around the income poverty line,
together with a small grouping of middle-class households whose asset levels were sufficiently
high to ensure them of a welfare level above the poverty line. This conclusion applies to the
long-run and overall description of the village economy in the study area. It does not imply that
there were no individual households that suffered a sustained deterioration in their welfare
levels. There is an important role for public policies in supporting such households in the
aftermath of the devastating floods.
Because of the small sample size and the non-representative nature of the household
dataset—as well as the limited information on returns on various types of assets therein—our
conclusion is tentative and preliminary. We cannot claim the general applicability of our
findings, either. The provision of further support for this paper’s findings and interpretations
thereof is left to future research.
surveys.
12

References Adato, M., M.R. Carter, and J. May (2006), “Exploring Poverty Traps and Social Exclusion in
South Africa Using Qualitative and Quantitative Data,” Journal of Development Studies, 42(2): 226–247.
Carter, M.R. and C. Barrett (2006), “The Economics of Poverty Traps and Persistent Poverty: An Asset-Based Approach,” Journal of Development Studies, 42(2): 178–199.
Gunderson, L.H. and L. Pritchard Jr. (eds.) (2002), Resilience and the Behavior of Large-Scale Systems, Washington D.C.: Island Press.
Kurosaki, T. and A. Hussain (1999), “Poverty, Risk, and Human Capital in the Rural North-West Frontier Province, Pakistan,” IER Discussion Paper Series B No. 24, March 1999, Hitotsubashi University.
Kurosaki, T. and H. Khan (2001), “Human Capital and Elimination of Rural Poverty: A Case Study of the North-West Frontier Province, Pakistan,” IER Discussion Paper Series B No. 25, January 2001, Hitotsubashi University.
----- (2006), “Human Capital, Productivity, and Stratification in Rural Pakistan,” Review of Development Economics, 10(1): 116–134.
----- (2011), “Floods, Relief Aid, and Household Resilience in Rural Pakistan: Findings from a Pilot Survey in Khyber Pakhtunkhwa,” The Review of Agrarian Studies, 1(2) (web version accessed on 26 Jan 2012).
Kurosaki, T., Humayun Khan, Mir Kalan Shah, and Muhammad Tahir (2011), “Natural Disasters, Relief Aid, and Household Vulnerability in Pakistan: Evidence from a Pilot Survey in Khyber Pakhtunkhwa,” PRIMCED Discussion Paper No. 12, August 2011, Hitotsubashi University.
Morris, S.S. and Q. Wodon (2003), “The Allocation of Natural Disaster Relief Funds: Hurricane Mitch in Honduras,” World Development 31(7): 1279–1289.
Sawada, Y. (2007), “The Impact of Natural and Manmade Disasters on Household Welfare,” Agricultural Economics 37(s1): 59–73.
Takasaki, Y. (2011), “Targeting Cyclone Relief within the Village: Kinship, Sharing, and Capture,” Economic Development and Cultural Change 59(2): 387–416.
13

Table 1: Characteristics of the sample villages and their flood damage during the floods 2010
Characteristics before the floods Reported damage caused by the floods: Irrigation ratio Number of Infrastructure
Total acres (1000) House damagesVillage name (%) households (1000) damages 1 Tarnab 4.0 100 2.0 Partly affected Minor damages 2 Masma 0.7 94 0.1 Partly affected Minor damages 3 Urmar Miana 3.0 50 1.2 Partly affected Minor damages 4 Mera Kachori 10.0 10 3.5 Partly affected Minor damages 5 Damane Hindko 6.0 58 1.5 Partly affected Minor damages 6 Shahi Bala 5.0 64 0.3 Partly affected Minor damages 7 Jala Bela 1.2 92 0.5 Heavily affected Major damages 8 Mian Gujar 4.5 78 3.5 Heavily affected Major damages 9 Budhni 3.5 86 4.5 Partly affected Minor damages
10 Dag 1.6 75 0.3 Minor damages Minor damages
Source: Two rounds of pilot survey data (same for the following tables).
14

Table 2: Characteristics of the sample households, Khyber Pakhtunkhwa, Pakistan
NOB with Unweighted statistics Weighted statisticspositive
Variable Survey(1) values Mean (Std.Dev.) Median Mean (Std.Dev.) Median Minimum Maximum 1. Characteristics of household heads at the end of 2010
Age 1 100 46.8 (13.9) 46.5 47.5 (14.4) 47.0 20 80 Years of formal schooling 1 62 6.88 (6.03) 8.00 6.93 (6.17) 10.00 0 16
2. The number of household members End of 2010 1 100 9.45 (5.01) 9.00 9.47 (4.19) 9.00 2 38 Change during 2011 2 37 0.35 (0.98) 0.00 0.41 (1.00) 0.00 -2 3 End of 2011 2 100 9.80 (5.38) 9.00 9.88 (4.55) 9.00 2 41
3. Land and livestock assets before the 2010 floods Land ownership (acres) 1 58 3.74 (7.26) 1.00 2.70 (5.83) 0.25 0 40 Value of land owned (Rs.1,000) 1 58 4553.0 (9196.5) 1025.0 4327.3 (10521.1) 690.0 0 60000
Number of large animals(2) owned 1 58 1.41 (2.01) 1.00 1.53 (2.27) 1.00 0 12
Value of all livestock animals(2) owned (Rs.1,000) 1 78 73.9 (150.0) 34.3 71.6 (140.5) 35.5 0 1250 4. Damage due to the 2010 floods (Rs.1,000)
House buildings 1 87 139.1 (139.8) 127.6 137.4 (124.1) 135.3 0 650 Agricultural land 1 19 57.5 (235.7) 0.0 33.6 (140.8) 0.0 0 2000 Standing crops 1 75 417.1 (1035.3) 67.5 342.9 (941.3) 75.0 0 5250 Livestock 1 28 9.4 (23.1) 0.0 7.2 (21.0) 0.0 0 100 Others 1 7 17.9 (108.9) 0.0 14.1 (100.7) 0.0 0 1000 Total 1 99 641.0 (1188.5) 250.0 535.1 (989.4) 250.0 0 6770
5. Amount of aid received including the imputed value of in-kind transfers (Rs.1,000) Emergency aid from NGOs, 2010 1 46 6.1 (8.6) 0.0 7.2 (9.0) 5.0 0 40 Emergency aid from the government, 2010 1 43 5.3 (7.1) 0.0 4.2 (6.3) 0.0 0 30 Reconstruction aid from NGOs, 2011 2 7 2.6 (12.2) 0.0 4.8 (16.7) 0.0 0 100 Reconstruction aid from the government, 2011 2 4 0.7 (5.1) 0.0 0.4 (1.8) 0.0 0 50 Income transfer through Watan cards 2 42 9.8 (12.6) 0.0 12.7 (14.4) 0.0 0 40
Notes: The number of observations (NOB) is 100 (10 from each village reported in Table 1). "Weighted statistics" use the inverse of sampling probability as the weights. (1) Survey 1 corresponds to the first round (fiscal year 2010/11) and Survey 2 corresponds to the second round (fiscal year 2011/12). (2) "Large animals" include buffalo, cattle, horse, and mule. "All livestock animals" in addition include goat, sheep, and chicken.
15

Table 3: The extent of recovery from the 2010 floods
NOB with positive Frequency distribution of the recovery extent(1) Unweighted statistics Weighted statistics
Type of recovery Assessment period
flood
damage(1) 0-9% 10-
19% 20-
29% 30-
39% 40-
49% 50-
59% 60-
69% 70-
79% 80-
89% 90-
99% 100%
Mean (Std.Dev.) Mean (Std.Dev.) Overall End of 2010 99 3 2 0 3 3 24 4 12 21 6 21 69.0 (25.3) 68.8 (25.5)
House buildings Agricultural land
End of 2011 End of 2010 End of 2011 End of 2010 End of 2011
99 87 87 19 19
0 3 0 5 2
0 0 0 0 0
1 1 3 1 0
1 14
3 2 1
3 3 1 0 0
4 31
8 2 1
3 1 3 0 2
10 10
3 0 0
8 2
12 1 4
17 0 6 0 0
52 22 48
8 9
87.3 60.1 83.8 55.8 74.7
(18.8) (27.8) (23.3) (43.8) (33.4)
86.3 57.4 84.6 59.9 74.1
(19.8) (28.9) (22.9) (43.6) (33.7)
Crops(2) Rabi 2010/11 Kharif 2011
75 75
5 1
0 0
0 0
1 0
1 0
6 2
1 2
4 1
2 0
2 0
53 69
84.9 96.0
(28.8) (15.2)
88.1 97.0
(26.8) (13.5)
Rabi 2011/12 75 0 0 0 0 0 0 1 0 4 0 70 98.4 (6.4) 99.5 (3.4) Livestock End of 2010 28 14 0 0 0 0 1 0 1 1 0 11 46.4 (48.5) 50.5 (48.1)
End of 2011 28 0 0 0 0 0 0 0 0 0 0 28 100.0 n.a. 100.0 n.a.
Notes: (1) The recovery extent is a concept applicable only to those households with positive flood damage. Therefore, the sum of frequency distribution is the same as the number reported in the first column.
(2) Kharif is a monsoon season whose harvest comes on September-December (major crops: maize, rice, etc.) and Rabi is a dry season whose harvest comes in March-June (major crops: wheat).
16
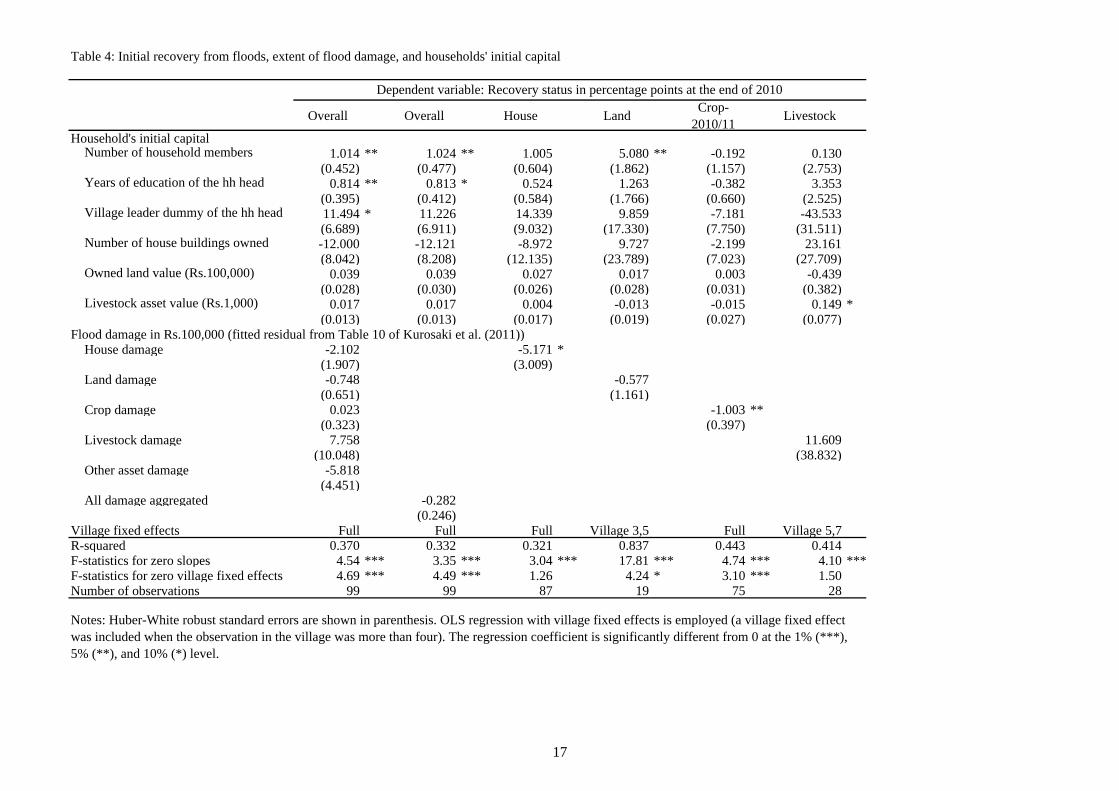
Table 4: Initial recovery from floods, extent of flood damage, and households' initial capital
Dependent variable: Recovery status in percentage points at the end of 2010 Crop-
Overall Overall House Land Livestock2010/11
Household's initial capital Number of household members 1.014 ** 1.024 ** 1.005 5.080 ** -0.192 0.130
(0.452) (0.477) (0.604) (1.862) (1.157) (2.753) Years of education of the hh head 0.814 ** 0.813 * 0.524 1.263 -0.382 3.353
(0.395) (0.412) (0.584) (1.766) (0.660) (2.525) Village leader dummy of the hh head 11.494 * 11.226 14.339 9.859 -7.181 -43.533
(6.689) (6.911) (9.032) (17.330) (7.750) (31.511) Number of house buildings owned -12.000 -12.121 -8.972 9.727 -2.199 23.161
(8.042) (8.208) (12.135) (23.789) (7.023) (27.709) Owned land value (Rs.100,000) 0.039 0.039 0.027 0.017 0.003 -0.439
(0.028) (0.030) (0.026) (0.028) (0.031) (0.382) Livestock asset value (Rs.1,000) 0.017 0.017 0.004 -0.013 -0.015 0.149 *
(0.013) (0.013) (0.017) (0.019) (0.027) (0.077) Flood damage in Rs.100,000 (fitted residual from Table 10 of Kurosaki et al. (2011))
House damage -2.102 -5.171 * (1.907) (3.009)
Land damage -0.748 -0.577 (0.651) (1.161)
Crop damage 0.023 -1.003 ** (0.323) (0.397)
Livestock damage 7.758 11.609 (10.048) (38.832)
Other asset damage -5.818 (4.451)
All damage aggregated -0.282 (0.246)
Village fixed effects Full Full Full Village 3,5 Full Village 5,7 R-squared 0.370 0.332 0.321 0.837 0.443 0.414 F-statistics for zero slopes 4.54 *** 3.35 *** 3.04 *** 17.81 *** 4.74 *** 4.10 *** F-statistics for zero village fixed effects 4.69 *** 4.49 *** 1.26 4.24 * 3.10 *** 1.50 Number of observations 99 99 87 19 75 28
Notes: Huber-White robust standard errors are shown in parenthesis. OLS regression with village fixed effects is employed (a village fixed effect was included when the observation in the village was more than four). The regression coefficient is significantly different from 0 at the 1% (***), 5% (**), and 10% (*) level.
17

Table 5: Recovery a year after from floods, extent of flood damage, and households' initial capital
Dependent variable: Recovery status in percentage points at the end of 2011
Overall Overall House Land Household's initial capital
Number of household members 0.087 0.096 -0.046 3.153 (0.182) (0.185) (0.319) (2.407)
Years of education of the hh head 0.271 0.270 0.626 * 0.568 (0.205) (0.223) (0.368) (2.477)
Village leader dummy of the hh head -1.525 -1.784 14.750 ** -2.847 (4.039) (4.187) (5.835) (22.336)
Number of house buildings owned -9.089 ** -9.206 ** -0.318 12.638 (3.587) (3.709) (9.771) (30.189)
Owned land value (Rs.100,000) -0.006 -0.006 0.008 0.088 (0.008) (0.012) (0.015) (0.058)
Livestock asset value (Rs.1,000) -0.003 -0.003 0.000 0.027 (0.004) (0.005) (0.008) (0.033)
Flood damage in Rs.100,000 (fitted residual from Table 10 of Kurosaki et al. (2011)) House damage -1.724 ** -2.935
(0.863) (1.852) Land damage -1.060 ** 0.873
(0.524) (1.758) Crop damage 0.066
(0.117) Livestock damage 3.941
(3.734) Other asset damage -0.600
(1.712) All damage aggregated -0.202 **
(0.084) Village fixed effects Full Full Full Village 3,5 R-squared 0.729 0.704 0.414 0.362 F-statistics for zero slopes 9.81 *** 11.18 *** 5.16 *** 0.69 F-statistics for zero village fixed effects 12.01 *** 13.54 *** 4.07 *** 0.34 Number of observations 99 99 87 19
Notes: See Table 4.
18

Table 6: Changes in recovery from floods, extent of flood damage, and households' initial capital
Dependent variable: Changes in recovery status in percentage points from the end of 2010 to the end of 2011
Overall Overall House Household's initial capital
Number of household members -0.279 -0.249 -0.319 (0.321) (0.365) (0.622)
Years of education of the hh head 0.102 0.032 0.357 (0.290) (0.277) (0.379)
Village leader dummy of the hh head -2.157 -2.549 -10.981 * (4.664) (4.641) (6.459)
Number of house buildings owned -3.859 -3.118 1.612 (8.130) (7.340) (7.539)
Owned land value (Rs.100,000) -0.037 *** -0.032 ** -0.012 (0.012) (0.012) (0.017)
Livestock asset value (Rs.1,000) -0.018 *** -0.015 * -0.015 (0.006) (0.008) (0.012)
Flood damage in Rs.100,000 (fitted residual from Table 10 of Kurosaki et al. (2011)) House damage 1.651 -3.045
(1.285) (3.573) Land damage -0.709 **
(0.348) Crop damage -0.121
(0.160) Livestock damage 2.441
(6.305) Other asset damage 6.232 **
(2.643) All damage aggregated -0.049
(0.148) Village fixed effects Full Full Full R-squared 0.341 0.266 0.204 F-statistics for zero slopes 5.17 *** 2.69 *** 0.98 F-statistics for zero village fixed effects 3.21 *** 2.58 ** 1.16 Number of observations 78 78 65
Notes: See Table 4. In this regression, the subsample whose recovery extent was below 100% in the end of 2010 is used.
19