Republic of the Marshall Islands ICHNS - Food Systems ...
194
Page|i Republic of the Marshall Islands Integrated Child Health and Nutrition Survey 2017 Monitoring the situation of children and women Republic of the Marshall Islands ICHNS
-
Upload
khangminh22 -
Category
Documents
-
view
0 -
download
0
Transcript of Republic of the Marshall Islands ICHNS - Food Systems ...

P a g e | i
Republic of the Marshall Islands
Integrated Child Health and Nutrition Survey 2017
Monitoring the situation of children and women
Republic of the Marshall Islands ICHNS

P a g e | ii
Republic of the Marshall Islands
Integrated Child Nutrition and Health Survey
2017
Final Report
November, 2017

P a g e | iii
The Republic of the Marshall Islands Integrated Child Health and Nutrition Survey was carried out in 2017 by the RMI Ministry of Health and Human Services (MoHHS) in collaboration with the RMI Economic, Policy Planning and Statistics Office (EPPSO). Technical and financial support was provided by the United Nations Children’s Fund (UNICEF).
The Republic of the Marshall Islands (RMI) Integrated Child Health and Nutrition Survey 2017 (ICHNS 2017) is based on the international standardized Multiple Indicator Survey (MICS) household survey programme developed and supported by UNICEF. MICS surveys measure key indicators that allow countries to generate data for use in policies and programmes, and to monitor progress towards the Millennium Development Goals (MDGs) and other internationally agreed upon commitments for children and women.
As part of the global effort to further develop national capacities to generate and analyse high quality and disaggregated data, the RMI ICHNS 2017 allows for global comparison to MICS and DHS surveys implemented by other countries in the region. The ICHNS 2017 is primarily intended for use in RMI to develop national frameworks to monitor progress towards the SDGs and establish baselines, strategic planning and investments based on the robust data collected.
Suggested citation: Republic of the Marshall Islands Ministry of Health and Human Services, RMI Economic, Policy Planning and Statistics Office and UNICEF. 2017. Republic of the Marshall Islands Integrated Child Health and Nutrition Survey 2017, Final Report. Majuro, Republic of the Marshall Islands: Republic of the Marshall Islands Ministry of Health and Human Services, RMI Economic, Policy Planning and Statistics Office

P a g e | iv
Preface

P a g e | v
Summary Table of Findings1
Key survey indicators with correlation to Multiple Indicator Cluster Surveys (MICS) and Sustainable Development Goal (SDG) indicators, ICHNS, 2017
REPUBLIC OF THE MARSHALL ISLANDS ICHNS AT A GLANCE
Survey implementation Sample frame RMI National Census 2011
Updated for 2017 projections Questionnaires Households with children under 5
Caregivers (age 15‐49) Children under 5
Interviewer training February, March 2017 Fieldwork April, May, June 2017
Survey sample
Households with children under 5 ‐ Sampled ‐ Occupied ‐ Interviewed ‐ Response rate (Percent)
600581581
100.0
Children under 5‐ Eligible ‐ Mothers/caregivers interviewed ‐ Response rate (Percent)
881881
100.0
Caregivers with children under 5 ‐ Eligible for interviews ‐ Interviewed ‐ Response rate (Percent)
70469899.1
Survey population for households with children under 5 Average household size 9.02 Percentage of population living in
‐ Urban areas ‐ Rural areas
Wealth index quintile ‐ Poorest ‐ Second ‐ Middle ‐ Fourth ‐ Richest
Household food security 2 ‐ Food secure ‐ Mildly food insecure ‐ Moderately food insecure ‐ Severely food insecure
80.419.6
20.120.120.020.219.6
59.87.113.419.7
Education of household head ‐ None ‐ Primary ‐ Secondary ‐ Higher
Ethnicity ‐ Marshallese ‐ Other
Religion ‐ Assembly of God ‐ Protestant ‐ Catholic ‐ Other
5.820.148.525.6
98.51.5
16.051.47.6
25.0
Housing characteristics Household personal assets Percentage of households with
‐ Electricity (SDG 7.1.1) ‐ Finished floor ‐ Finished roofing ‐ Finished walls
72.290.195.548.4
Percentage of households that own ‐ A television ‐ A refrigerator ‐ Agricultural land ‐ Farm animals/livestock
48.439.69.026.2
Mean number of persons per room used for sleeping
2.47 Percentage of households that have
‐ Mobile phone ‐ Car or truck ‐ Internet connection
62.018.221.5
1 See Appendix E for a detailed description of MICS indicators 2 Household food security measured by the Household Food Insecurity Access Scale for all households with a child under 2 years of age.

P a g e | vi
NUTRITION
Nutrition status children under 5 years 3 MICS Indicator
Indicator Description Value
2.1a 2.1b
Underweight prevalence (a) Moderate and severe (b) Severe
Percentage of children under age 5 who fall below (a) minus two standard deviations (moderate and severe) (b) minus three standard deviations (severe) of the median weight for age of the WHO standard
11.72.7
2.2a 2.2b
SDG 2.2.1 Stunting prevalence (a) Moderate and severe (b) Severe
Percentage of children under age 5 who fall below (a) minus two standard deviations (moderate and severe) (b) minus three standard deviations (severe) of the median height for age of the WHO standard
35.310.2
2.3a 2.3b
SDG 2.2.2 Wasting prevalence (a) Moderate and severe (b) Severe
Percentage of children under age 5 who fall below (a) minus two standard deviations (moderate and severe) (b) minus three standard deviations (severe) of the median weight for height of the WHO standard
3.61.1
2.4 SDG 2.2.2 Overweight prevalence Percentage of children under age 5 who are above two standard deviations of the median weight for height of the WHO standard
3.8
Breastfeeding and infant feeding MICS Indicator Indicator Description Value2.5 Children ever
breastfed Percentage of women with a live birth in the last 2 years who breastfed their last live‐born child at any time
87.4
2.6 Early initiation of breastfeeding
Percentage of women with a live birth in the last 2 years who put their last newborn to the breast within one hour of birth
60.8
2.7 Exclusive breastfeeding under 6 months
Percentage of infants under 6 months of age who are exclusively breastfed4
42.3
2.8 Predominant breastfeeding under 6 months
Percentage of infants under 6 months of age who received breast milk as the predominant source of nourishment 5 during the previous day
50.9
2.9 Continued breastfeeding at 1 year
Percentage of children age 12‐15 months who received breast milk during the previous day
40.5
2.10 Continued breastfeeding at 2 years
Percentage of children age 20‐23 months who received breast milk during the previous day
34.2
2.12 Age‐appropriate breastfeeding
Percentage of children age 0‐23 months appropriately fed 6 during the previous day
39.8
2.13 Introduction of solid, semi‐solid or soft foods
Percentage of infants age 6‐8 months who received solid, semi‐solid or soft foods during the previous day
64.2
2.14 Milk feeding frequency for non‐breastfed children
Percentage of non‐breastfed children age 6‐23 months who received at least 2 milk feedings during the previous day
39.4
2.15 Minimum meal frequency
Percentage of children age 6‐23 months who received solid, semi‐solid and soft foods (plus milk feeds for non‐breastfed children) the minimum number of times or more 7 during the previous day
60.8
3 Weight and height/length measurements were successfully completed for 99.9 and 99.5 percent of children under age 5, respectively 4 Infants receiving breast milk, and not receiving any other fluids or foods, with the exception of ORS, vitamins, mineral supplements and medicines 5 Infants receiving breast milk as the predominant source of nourishment during the previous day with water based drinks and fruit juice allowed but no milk, infant formula or solid, semi-solid or soft foods. 6 Children 0-5 months of age receive exclusive breastfeeding during the previous day and children 6-23 months of age receive breastmilk as well as solid, semi-solid or soft foods in the previous day. 7 Proportion of breastfed and non‐breastfed children 6‐23 months of age who received solid, semi‐solid, or soft foods or milk feeds for non‐breastfed children the minimum number of times or more.

P a g e | vii
Breastfeeding and infant feeding MICS Indicator Indicator Description Value2.16 Minimum dietary
diversity Percentage of children age 6–23 months who received foods from 4 or more food groups vii during the previous day 8
42.5
2.17a 2.17b
Minimum acceptable diet
(a) Percentage of breastfed children age 6–23 months who had at least the minimum dietary diversity and the minimum meal frequency during the previous day (b) Percentage of non‐breastfed children age 6–23 months who received at least 2 milk feedings and had at least the minimum dietary diversity not including milk feeds and the minimum meal frequency during the previous day (c) Total minimum acceptable diet for all children 6‐23 months
26.0
33.0
29.6
2.18 Bottle feeding Percentage of children age 0‐23 months who were fed with a bottle during the previous day
29.7
Child feeding practices Indicator Description ValueConsumption of nutrient rich foods
Percentage of children 6‐59 months of age who consumed in the previous 24 hours: (a) Iron rich foods
a. 6‐11m b. 12‐23m c. 24‐59m
(b) Dark green leafy vegetables a. 6‐11m b. 12‐23m c. 24‐59m
(c) Vitamin A rich fruits and vegetables a. 6‐11m b. 12‐23m c. 24‐59m
(d) Fortified baby cereal a. 6‐11m b. 12‐23m
c. 24‐59m
67.0 79.7 88.3
7.3 16.8 15.6
29.3 45.9 50.6
28.4 6.7 5.7
Consumption of low nutrient density foods
Percentage of children 6‐59 months of age who consumed in the previous 24 hours: (a) Fats and oils
a. 6‐11m b. 12‐23m c. 24‐59m
(b) Sweet foods a. 6‐11m b. 12‐23m c. 24‐59m
(c) Sugar‐sweetened beverages a. 6‐11m b. 12‐23m c. 24‐59m
(d) Tea or coffee a. 6‐11m b. 12‐23m c. 24‐59m
(e) Any low nutrient density food a. 6‐11m b. 12‐23m
c. 24‐59m
13.3 18.3 29.9
19.1 32.6 64.8
19.1 32.6 56.5
8.5 28.5 36.1
34.9 61.2 82.8
8 The indicator is based on consumption of any amount of food from at least 4 out of the 7 following food groups: 1) grains, roots and tubers, 2) legumes and nuts, 3) dairy products (milk, yogurt, cheese), 4) flesh foods (meat, fish, poultry and liver/organ meats), 5) eggs, 6) vitamin‐A rich fruits and vegetables, and 7) other fruits and vegetables

P a g e | viii
Child birthweight MICS Indicator Indicator Description Value2.20 Low‐birthweight infants Percentage of most recent live births in the last 2 years
weighing below 2,500 grams at birth 11.6
‐‐‐ High‐birthweight infants Percentage of most recent live births in the last 2 years weighing 4,000 grams or more at birth
4.8
2.21 Infants weighed at birth Percentage of most recent live births in the last 2 years who were weighed at birth
89.9
Nutrition status mothers 15‐49 years Indicator Description ValueUnderweight prevalence Percentage of non‐pregnant mothers with a BMI < 18.5 (kg/m2) 9 1.8
Overweight prevalence (a) Overweight (b) Obese
Percentage of non‐pregnant mothers with a BMI 9
(a) BMI > 25 kg/m2 (overweight and obese) (b) BMI >30 kg/m2
72.745.1
Short stature prevalence (a) Short stature (b) Borderline short
stature
Percentage of mothers with a height 10
(a) Less than 145 cm (b) Less than 150 cm
4.426.1
Dietary quality of caregivers 15‐49 years Indicator Description ValueWomen’s Minimum Dietary Diversity
Percentage of caregivers 15‐49 years of age who consumed at least 5 out of 10 food groups 11 in the previous 24 hours 27.2
Consumption of nutrient rich foods
Percentage of caregivers 15‐49 years of age who consumed in the previous 24 hours: (a) Iron rich foods (b) Dark green leafy vegetables (c) Vitamin A rich fruits and vegetables
75.314.836.2
Consumption of low nutrient density foods
Percentage of caregivers 15‐49 years of age who consumed in the previous 24 hours: (a) Fats and oils (b) Savoury and fried snacks (c) Sweet foods (d) Sugar‐sweetened beverages (e) Any low nutrient density food
23.625.746.841.063.5
CHILD HEALTH
Receipt micronutrient supplementation and deworming Indicator Description ValueCoverage of vitamin A supplementation
Percentage of children age 6‐59 months who received vitamin A supplementation in the previous 6 months
54.4
Coverage of iron supplementation
Percentage of children age 0‐59 months who received iron supplementation in the previous 7 days
11.3
Coverage of deworming Percentage of children age 12‐59 months who received deworming in the previous 6 months
32.1
9 WHO classification for non-pregnant adults 18 years of age and older and applies to caregivers 15-49 years of age with a child under 5 years of age 10 Short stature measured in caregivers 15-49 years of age with a child under 5 years of age as height < 145cm and borderline short stature as height <150 cm 11 Women minimum dietary diversity based on consumption of caregivers with a child under 5 years of any amount of food from at least 5 out of the 10 following food groups: 1) grains, white roots and tubers, and plantain, 2) pulses (beans, peas and lentils), 3) Nuts and seeds, 4) dairy, 5) meat, poultry and fish, 6) eggs, 7) dark green leafy vegetables, 8) other vitamin A rich fruits and vegetables, 9) other vegetables, 10) other fruits

P a g e | ix
Care of the Child MICS Indicator Indicator Description Value‐‐‐ Children with diarrhoea Percentage of children under age 5 with diarrhoea in the
last 2 weeks 9.3
3.10 Care‐seeking for diarrhoea Percentage of children under age 5 with diarrhoea in the last 2 weeks for whom advice or treatment was sought from a health facility or provider
47.1
3.11 Diarrhoea treatment with oral rehydration salts (ORS) and zinc
Percentage of children under age 5 with diarrhoea in the last 2 weeks who received ORS and zinc
7.5
‐‐‐ Children with ARI symptoms
Percentage of children under age 5 with ARI symptoms in the last 2 weeks
2.9
‐‐‐ Children with fever Percentage of children under age 5 with fever in the last 2 weeks
11.5
Solid fuel use MICS Indicator Indicator Description Value
3.15 Use of solid fuels for cooking
Percentage of household members in households that use solid fuels (coconut husks, wood) as the primary source of domestic energy to cook
12.5
WATER AND SANITATION
Water and sanitation MICS Indicator Indicator Description Value4.1 SDG 6.1.1 Use of improved drinking
water sources Percentage of household members using improved sources of drinking water
100.0
4.2 Water treatment Percentage of household members in households who use an appropriate treatment method
58.8
4.3 Use of improved sanitation Percentage of household members using improved sanitation facilities which are not shared
86.3
4.4 Safe disposal of child’s faeces
Percentage of children age 0‐2 years whose last stools were disposed of safely
6.0
4.5 SDG 6.2.1 Place for handwashing Percentage of households with a specific place for hand washing where water and soap or other cleansing agent are present
91.7
4.6 Availability of soap or other cleansing agent
Percentage of households with soap or other cleansing agent
98.8
REPRODUCTIVE HEALTH
Maternal and newborn health MICS Indicator Indicator Description Value5.5a 5.5b
Antenatal care coverage Percentage of women age 15‐49 years with a live birth in the last 2 years who were attended during their last pregnancy that led to a live birth (a) at least once by skilled health personnel (b) at least four times by any provider
92.767.8
5.7 SDG 3.1.2 Skilled attendant at delivery
Percentage of women age 15‐49 years with a live birth in the last 2 years who were attended by skilled health personnel during their most recent live birth
92.4

P a g e | x
Maternal and newborn health MICS Indicator Indicator Description Value5.8 Institutional deliveries Percentage of women age 15‐49 years with a live birth in
the last 2 years whose most recent live birth was delivered in a health facility
92.1
5.9 Caesarean section Percentage of women age 15‐49 years whose most recent live birth in the last 2 years was delivered by caesarean section
9.7
‐‐‐ Iron folate supplementation coverage
Percentage of women age 15‐49 years with a live birth in the last 2 years who received any iron folate tablets during their last pregnancy that led to a live birth
67.4
‐‐‐ Adequate iron folate supplementation
Percentage of women age 15‐49 years with a live birth in the last 2 years who consumed 90 or more iron folate tablets during their last pregnancy that led to a live birth
25.7
‐‐‐ Deworming tablet coverage
Percentage of women age 15‐49 years with a live birth in the last 2 years who received a deworming tablet during their last pregnancy that led to a live birth
13.1
CHILD DEVELOPMENT
Child development MICS Indicator Indicator Description Value6.1 Attendance to early
childhood education Percentage of children age 36‐59 months who are attending an early childhood education programme
5.2
6.2 Support for learning Percentage of children age 36‐59 months with whom an adult has engaged in four or more activities to promote learning and school readiness in the last 3 days
72.3
6.3 Father’s support for learning
Percentage of children age 36‐59 months whose biological father has engaged in four or more activities to promote learning and school readiness in the last 3 days
1.6
6.4 Mother’s support for learning
Percentage of children age 36‐59 months whose biological mother has engaged in four or more activities to promote learning and school readiness in the last 3 days
59.3
6.5 Availability of children’s books
Percentage of children under age 5 who have three or more children’s books
18.5
6.6 Availability of playthings Percentage of children under age 5 who play with two or more types of playthings
70.9
6.7 Inadequate care Percentage of children under age 5 left alone or in the care of another child younger than 10 years of age for more than one hour at least once in the last week
9.1
6.8 SDG 4.2.1 Early child development index
Percentage of children age 36‐59 months who are developmentally on track in at least three of the following four domains: literacy‐numeracy, physical, social‐emotional, and learning
78.9
CHILD PROTECTION
Birth registration MICS Indicator
Indicator Description Value
8.1 SDG 16.9.1 Birth registration Percentage of children under age 5 whose births are reported registered
83.8
P a g e | xi
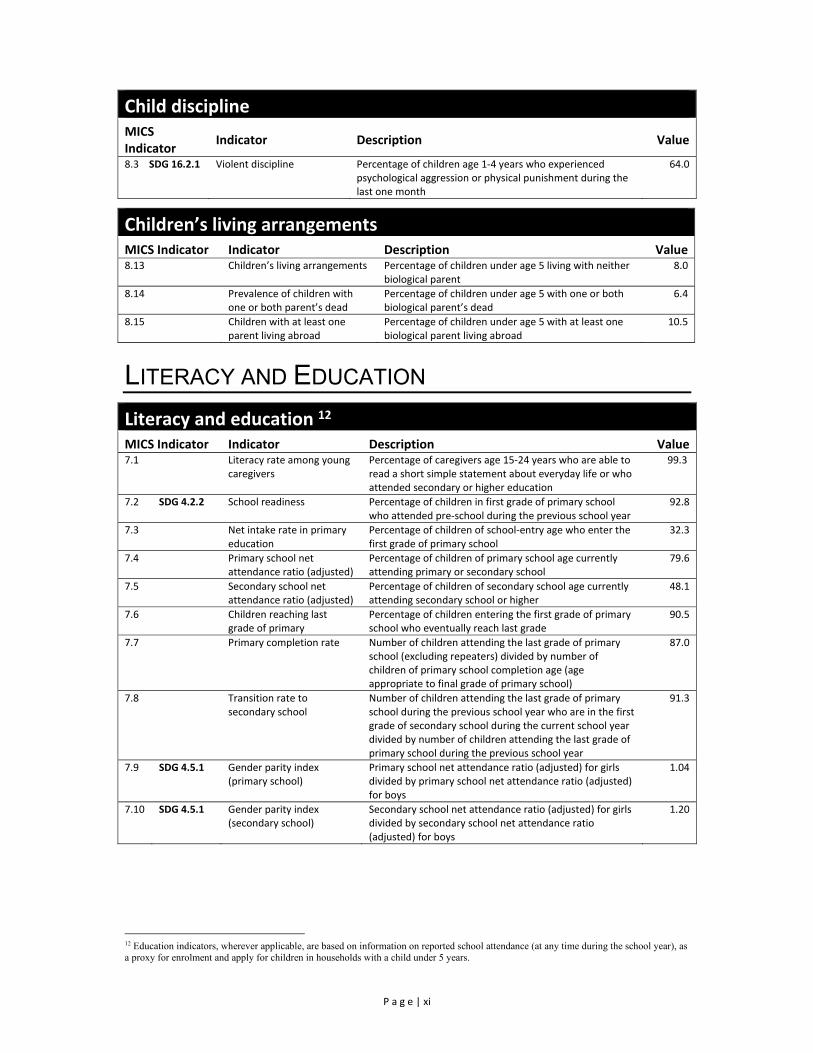
Child discipline MICS Indicator
Indicator Description Value
8.3 SDG 16.2.1 Violent discipline Percentage of children age 1‐4 years who experienced psychological aggression or physical punishment during the last one month
64.0
Children’s living arrangements MICS Indicator Indicator Description Value8.13 Children’s living arrangements Percentage of children under age 5 living with neither
biological parent 8.0
8.14 Prevalence of children with one or both parent’s dead
Percentage of children under age 5 with one or both biological parent’s dead
6.4
8.15 Children with at least one parent living abroad
Percentage of children under age 5 with at least one biological parent living abroad
10.5
LITERACY AND EDUCATION
Literacy and education 12
MICS Indicator Indicator Description Value7.1 Literacy rate among young
caregivers Percentage of caregivers age 15‐24 years who are able to read a short simple statement about everyday life or who attended secondary or higher education
99.3
7.2 SDG 4.2.2 School readiness Percentage of children in first grade of primary school who attended pre‐school during the previous school year
92.8
7.3 Net intake rate in primary education
Percentage of children of school‐entry age who enter the first grade of primary school
32.3
7.4 Primary school net attendance ratio (adjusted)
Percentage of children of primary school age currently attending primary or secondary school
79.6
7.5 Secondary school net attendance ratio (adjusted)
Percentage of children of secondary school age currently attending secondary school or higher
48.1
7.6 Children reaching last grade of primary
Percentage of children entering the first grade of primary school who eventually reach last grade
90.5
7.7 Primary completion rate Number of children attending the last grade of primary school (excluding repeaters) divided by number of children of primary school completion age (age appropriate to final grade of primary school)
87.0
7.8 Transition rate to secondary school
Number of children attending the last grade of primary school during the previous school year who are in the first grade of secondary school during the current school year divided by number of children attending the last grade of primary school during the previous school year
91.3
7.9 SDG 4.5.1 Gender parity index (primary school)
Primary school net attendance ratio (adjusted) for girls divided by primary school net attendance ratio (adjusted) for boys
1.04
7.10 SDG 4.5.1 Gender parity index (secondary school)
Secondary school net attendance ratio (adjusted) for girls divided by secondary school net attendance ratio (adjusted) for boys
1.20
12 Education indicators, wherever applicable, are based on information on reported school attendance (at any time during the school year), as a proxy for enrolment and apply for children in households with a child under 5 years.

P a g e | xii
Table of Contents
Preface ................................................................................................................................................................iv
Summary Table of Findings ................................................................................................................................. v
Republic of the Marshall Islands ICHNS at a Glance ........................................................................................ v
Nutrition ......................................................................................................................................................... vi
Child Health .................................................................................................................................................. viii
Water and Sanitation ...................................................................................................................................... ix
Reproductive Health ....................................................................................................................................... ix
Child Development .......................................................................................................................................... x
Child Protection .............................................................................................................................................. x
Literacy and Education .................................................................................................................................... xi
Table of Contents ............................................................................................................................................... xii
List of Tables ...................................................................................................................................................... xv
List of Figures ................................................................................................................................................... xvii
List of Abbreviations ....................................................................................................................................... xviii
Acknowledgements ........................................................................................................................................... xix
Executive Summary ............................................................................................................................................ xx
I. Introduction ............................................................................................................................................... 1
Background ..................................................................................................................................................... 1
Survey Justification and Rationale ................................................................................................................... 3
Survey Objectives ............................................................................................................................................ 5
II. Sample and Survey Methodology ............................................................................................................... 7
Sample Design ................................................................................................................................................ 7
Questionnaires ................................................................................................................................................ 7
Survey Teams .................................................................................................................................................. 8
Survey Instruments ......................................................................................................................................... 8
Training .......................................................................................................................................................... 9
Fieldwork ...................................................................................................................................................... 10
Data Processing ............................................................................................................................................ 11
Data Analysis ................................................................................................................................................ 11
Methodological Limitations .......................................................................................................................... 13
Archiving and Dissemination ......................................................................................................................... 13
III. Sample Coverage and the Characteristics of Households and Respondents ............................................. 14
Sample Coverage .......................................................................................................................................... 14

P a g e | xiii
Characteristics of Households ....................................................................................................................... 15
Characteristics of Caregivers Respondents 15‐49 Years of Age and Children Under‐5 ................................... 16
Housing Characteristics, Asset Ownership, and Wealth Quintiles .................................................................. 19
Household Food Security Status .................................................................................................................... 21
IV. Nutrition ................................................................................................................................................... 25
Low Birth Weight .......................................................................................................................................... 25
Nutrition Status ............................................................................................................................................ 27
Breastfeeding and Infant and Young Child Feeding ....................................................................................... 32
Caregiver Nutrition Status ............................................................................................................................. 45
V. Child Health .............................................................................................................................................. 49
Care of Illness ................................................................................................................................................ 49
Diarrhoea ...................................................................................................................................................... 51
Solid Fuel Use ................................................................................................................................................ 54
VI. Water and Sanitation ........................................................................................................................... 58
Use of Improved Water Sources .................................................................................................................... 58
Use of Improved Sanitation ........................................................................................................................... 63
Handwashing ................................................................................................................................................ 70
VII. Reproductive Health ............................................................................................................................ 73
Antenatal Care .............................................................................................................................................. 73
Assistance at Delivery ................................................................................................................................... 78
Place of Delivery ........................................................................................................................................... 80
Receipt of Micronutrient Supplementation and Deworming ......................................................................... 81
VIII. Early Childhood Development .............................................................................................................. 82
Early Childhood Care and Education ............................................................................................................. 82
Quality of Care .............................................................................................................................................. 83
Developmental Status of Children ................................................................................................................. 89
Child Functioning .......................................................................................................................................... 91
IX. Literacy and Education ............................................................................................................................. 93
Literacy Among Young Caregivers ................................................................................................................. 93
School Readiness ........................................................................................................................................... 94
Primary and Secondary School Participation ................................................................................................. 95
X. Child Protection ...................................................................................................................................... 106
Birth Registration ........................................................................................................................................ 106
Child Discipline ............................................................................................................................................ 108
Children’s Living Arrangements ................................................................................................................... 112
Conclusions and Recommendations ................................................................................................................ 116
P a g e | xiv
Appendices ..................................................................................................................................................... 121
Appendix A. Sample Design ................................................................................................................... 121
Appendix B. List of Personnel Involved in the Survey ............................................................................. 127
Appendix C. Estimates of Sampling Errors ............................................................................................. 129
Appendix D. Data Quality Tables ........................................................................................................... 132
Appendix E. RMI ICHNS, 2017 Indicators: Numerators and Denominators ............................................ 133
Appendix F. RMI ICHNS, 2017 Questionnaires ....................................................................................... 138

P a g e | xv
List of Tables
Table SS.1: Methods for classification of key household, dietary quality, and anthropometric
indicators ...................................................................................................................................... 12
Table HH.1: Results of household, caregivers and under‐5 interviews ................................................ 14
Table HH.3: Household composition .................................................................................................... 15
Table HH.4: Caregiver's background characteristics ............................................................................. 17
Table HH.5: Under‐5's background characteristics ............................................................................... 18
Table HH.6: Housing characteristics ..................................................................................................... 19
Table HH.7: Household and personal assets ......................................................................................... 20
Table HH.8: Wealth quintiles ................................................................................................................ 21
Table HH.9a: Food security by HFIAS category .................................................................................... 23
Table HH.9b: Percent distribution of household by HFIAS category .................................................... 24
Table NU.1: Low birth weight and high birth weight infants ................................................................ 26
Table NU.2a: Nutritional status of children: weight‐for‐age ................................................................ 29
Table NU.2b: Nutritional status of children: height‐for‐age ................................................................. 30
Table NU.2c: Nutritional status of children: weight‐for‐height ............................................................ 31
Table NU.3: Initial breastfeeding .......................................................................................................... 34
Table NU.4: Breastfeeding .................................................................................................................... 37
Table NU.6: Age‐appropriate breastfeeding ......................................................................................... 38
Table NU.7: Introduction of solid, semi‐solid, or soft foods ................................................................. 39
Table NU.8: Infant and young child feeding (IYCF) practices ................................................................ 40
Table NU.9: Bottle feeding .................................................................................................................... 41
Table NU.11: Consumption of nutrient‐rich and low‐nutrient‐density food groups (0‐23m) .............. 43
Table NU.11b: Consumption of nutrient rich and low‐nutrient‐density food groups (24‐59m) .......... 44
Table NU.12: Nutrition status of caregivers with a child under 5......................................................... 45
Table NU.13: Caregivers aged 15‐49 years nutrition status ................................................................. 46
Table NU.14: Caregiver's short stature ................................................................................................. 47
Table NU.15: Caregiver's dietary diversity ............................................................................................ 48
Table CH.4: Reported disease episodes ................................................................................................ 50
Table CH.5: Care‐seeking during diarrhoea .......................................................................................... 52
Table CH.6: Feeding practices during diarrhoea ................................................................................... 53
Table CH.7: Oral rehydration solutions, recommended homemade fluids, and zinc ........................... 54
Table CH.12: Solid fuel use .................................................................................................................... 55
Table CH.13: Solid fuel use by place of cooking .................................................................................... 56
Table CH.14: Children's receipt micronutrient supplementation and deworming .............................. 57
Table WS.1: Use of improved water sources ........................................................................................ 59
Table WS.2: Household water treatment ............................................................................................. 61
Table WS.3: Time to source of drinking water ...................................................................................... 62

P a g e | xvi
Table WS.4: Person collecting water .................................................................................................... 63
Table WS.5: Types of sanitation facilities ............................................................................................. 64
Table WS.6: Use and sharing of sanitation facilities ............................................................................. 66
Table WS.7: Drinking water and sanitation ladders ............................................................................. 68
Table WS.8: Disposal of child's faeces .................................................................................................. 69
Table WS.9: Water and soap at place for handwashing ....................................................................... 71
Table WS.10: Availability of soap or other cleansing agent .................................................................. 72
Table RH.7: Antenatal care coverage .................................................................................................... 74
Table RH.8: Number of antenatal care visits and timing of first visit ................................................... 76
Table RH.10: Assistance during delivery and caesarean section .......................................................... 79
Table RH.11: Place of delivery .............................................................................................................. 80
Table RH.12: Receipt of micronutrient supplementation and deworming during pregnancy ............. 81
Table CD.1: Early childhood education ................................................................................................. 82
Table CD.2: Support for learning .......................................................................................................... 84
Table CD.3: Learning materials ............................................................................................................. 87
Table CD.4: Inadequate care ................................................................................................................. 88
Table CD.5: Early child development index .......................................................................................... 90
Table CF.1: Child functioning for children aged 2‐4 .............................................................................. 91
Table CF.2: Use of assistive devices for children aged 2‐4 ................................................................... 92
Table ED.1: Literacy (young caregivers) ................................................................................................ 93
Table ED.2: School readiness ................................................................................................................ 94
Table ED.3: Primary school entry .......................................................................................................... 95
Table ED.6: Children reaching last grade of primary school ............................................................... 102
Table ED.7: Primary school completion and transition to secondary school ..................................... 103
Table ED.8: Education gender parity .................................................................................................. 104
Table ED.9: Out of school gender parity ............................................................................................. 105
Table CP.1: Birth registration .............................................................................................................. 107
Table CP.5: Child discipline ................................................................................................................. 109
Table CP.6: Attitudes toward physical punishment ............................................................................ 111
Table CP.14: Children's living arrangements and orphanhood .......................................................... 113
Table CP.15: Children with parents living abroad ............................................................................... 115
Table SD.1: Allocation of Sample Clusters (Primary Sampling Units) to Sampling Strata................... 122
Table SD.2: Calculated sample weights for households, caregivers and children .............................. 126
Table SE.1: Indicators selected for sampling error calculations ......................................................... 130
Table SE.2: Sampling errors: Total sample .......................................................................................... 131
Table DQ.15: Heaping in anthropometric measurements .................................................................. 132

P a g e | xvii
List of Figures
Figure 1: Short‐ and long‐term consequences of child malnutrition ...................................................... 4
Figure NU.1: Underweight, stunted, wasted and overweight children under age 5 ............................ 32
Figure NU.2: Initiation of breastfeeding ............................................................................................... 35
Figure NU.3: Infant feeding patterns by age......................................................................................... 36
Figure WS.1: Percent distribution of household members by source of drinking water ..................... 60
Figure WS.2: Percent distribution of household members by use of sanitation facilities ................... 65
Figure WS.3: Use of improved drinking water sources and improved sanitation facilities .................. 67
Figure RH.1: Receipt of ANC services and place of delivery ................................................................. 73
Figure RH.3: Person assisting at delivery .............................................................................................. 78
Figure ED.1: Education indicators by sex ............................................................................................ 105
Figure CP.1: Children under‐5 whose births are registered................................................................ 108
Figure CP.2: Child disciplining methods, children age 12‐59 months of age ...................................... 110
Figure DQ.2: Weight and height/length measurements by digits reported for the decimal points .. 132

P a g e | xviii
List of Abbreviations ARI Acute Respiratory Infection BMI Body Mass Index EBF Exclusive Breastfeeding EPPSO Economic Policy, Planning and Statistics Office FAO Food and Agriculture Organization GPI Gender Parity Index HAZ Height for Age Z‐score HFIAS Household Food Insecurity Access Scale ICHNS Integrated Child Health and Nutrition Survey IYCF Infant and Young Child Feeding LBW Low Birth Weight MAD Minimum Acceptable Diet MDD Minimum Dietary Diversity MFF Minimum Feeding Frequency MDG Millennium Development Goals MICS Multiple Indicator Cluster Survey MICS6 Sixth global round of Multiple Indicator Clusters Surveys programme MoHHS Ministry of Health and Human Services NAR Net Attendance Rate NSO National Statistics Office ORT Oral Rehydration Treatment PBF Predominant Breastfeeding ppm Parts Per Million PPS Probability Proportionate to Size PSU Primary Sampling Unit RMI Republic of the Marshall Islands SDGs Sustainable Development Goals SPSS Statistical Package for Social Sciences TWG Technical Working Group UNDP United Nations Development Programme UNFPA United Nations Population Fund UNICEF United Nations Children’s Fund USAID U.S. Agency for International Development WASH Water, Sanitation and Hygiene WAZ Weight for Age Z‐score WMDD Women’s Minimum Dietary Diversity WFFC World Fit for Children WHZ Weight for Height Z‐score WHO World Health Organization

P a g e | xix
Acknowledgements
The Republic of the Marshall Islands Integrated Child Health and Nutrition Survey, 2017 (RMI ICHNS, 2017), was conducted from April to June 2017. The survey findings provide important information on the nutrition status of children in RMI and it is anticipated that they will provide invaluable information for stakeholders as they embark on programming for the health, nutrition and the well being of mothers and children. The survey will be an important source of information to monitor the progress towards achieving the Sustainable Development Goals (SDGs) for children. The Survey Steering Committee and Technical Working Group gave exemplary guidance and managed this complex survey. The invaluable contributions of the following institutions are acknowledged:
Ministry of Health and Human Services
Economic Policy, Planning and Statistics Office
The Republic of the Marshall Islands Integrated Child Health and Nutrition Survey, 2017 and the corresponding analysis in this report are the result of joint efforts by a number of individuals, institutions and organisations. The survey was conducted jointly by the Government of RMI and the United Nations Children’s Fund (UNICEF) with technical expertise from UNICEF in the areas of survey methodology, data collection tools, training, fieldwork and data analysis. The survey was made possible through the financial and technical support from the MoHHS, EPPSO, UNICEF, Government of New Zealand, Government of Canada and Government of Italy. Diligent work by the data enumerators who worked long hours and still maintained their energy, enthusiasm and morale throughout the survey period in spite of having to stay away from their families for weeks at a time due to unpredictable flight schedule is appreciated. Finally, the survey data collection was possible because of the nearly six hundred households across RMI who generously gave their time to make the survey a reality.

P a g e | xx
Executive Summary
The RMI Integrated Child Health and Nutrition Survey (RMI ICHNS 2017) was conducted from April to
June 2017 by the Ministry of Health and Human Services (MoHHS) and the Economic, Policy Planning
and Statistics Office (EPPSO). Technical and financial support for the survey was mainly provided by
the United Nationals Children’s Fund (UNICEF) Pacific Country Office in Fiji. The RMI ICHNS 2017
provides valuable information and the latest evidence on the situation of children and their mothers
in RMI, updating information from previous surveys. The survey presents data from an equity
perspective by indicating disparities by sex, area, education, household wealth and other
characteristics. The RMI ICHNS 2017 is based on a sample of 581 households with children under 5
that were interviewed and provides a comprehensive picture of children and their caregivers at the
national, urban and rural level in RMI.
Nutritional Status and Breastfeeding
Nearly 90 percent of children under 5 years of age in the survey were weighed at birth. Overall, 11.6
percent were reported to weigh less than 2,500 grams at birth and 4.8 percent were reported to
weight 4,000 grams or higher at birth. Among children whose mothers had short stature the
prevalence of low birth weight was 25.3 percent.
The prevalence of moderate or severe underweight among children under 5 in RMI is reported at
11.7 percent which is classified as a medium public health concern by the WHO. The prevalence of
moderate or severe underweight was highest in children who were born low birth weight at 23.1
percent and in children whose mothers had short stature at 23.6 percent.
Over one in three children in RMI is moderately or severely stunted with stunting classified as a high
public health concern by the WHO. The prevalence of stunting increased with child age with
critically high levels of stunting in children 12‐35 months of age with over 40 percent of children
stunted. Children under 5 in the poorest households in RMI were more likely to be moderately or
severely stunted than children from other wealth index quintiles although prevalence of stunting
was 20 percent in even the wealthiest households.
Moderate or severe wasting among children under 5 in RMI was 3.6 percent which is classified as
acceptable by the WHO. There was little variation in wasting by household wealth or age of the
child, however wasting surpassed 10 percent in children whose mothers were short stature.
Prevalence of overweight in children under 5 years was low at 3.8 percent in RMI. Urban children
were more likely to be overweight compared to rural children, however prevalence was still low at
4.3 percent.
A high percentage (87.4 percent) of newborns in RMI were breastfed at some point after birth.
However, only 60.8 percent started breastfeeding at the correct time (i.e., within one hour of birth).
A total of 42.3 percent of infants aged 0‐5 months are exclusively breastfed and 50.9 percent of
infants 0‐5 months are predominantly breastfed. Some 34.2 percent of children in RMI continue to
receive breastfeeding at 2 years old. The timely introduction of solid, semi‐solid or soft foods is poor
in RMI with only 64.2 percent of children 6‐8 months receiving these foods in the previous day.
Among children 6‐23 months of age, 42.5 percent of children received minimum dietary diversity
P a g e | xxi
and 60.8 percent of children received minimum meal frequency. Less than a third of children (29.6
percent) received a minimum acceptable diet adequate in both dietary quality and quantity.
Maternal Nutrition Status
Three out of four caregivers with a child under 5 in RMI are overweight with nearly one in two
caregivers are obese. Percentage of overweight and obesity increased with caregiver age with
nearly all women 40‐49 years of age (93.3 percent) overweight or obese. There was no association
between overweight and obesity and household wealth with caregivers in the poorest households as
likely to be overweight as caregivers in the wealthiest households. Over one in four caregivers had
borderline short stature with a height less than 150cm.
Dietary practices for caregivers with a child under 5 was poor in RMI with only 27.4 percent of
women meeting minimum dietary diversity. Minimum dietary diversity was positively associated
with household wealth, however only 43.4 percent of the wealthiest mothers consumed a diet
which met minimum dietary diversity. While consumption of iron rich foods was good (75.3 percent)
only 14.8 percent of caregivers consumed dark green leafy vegetables and 36.2 percent of caregivers
consumed vitamin A rich fruits and vegetables. However, consumption of nutrient poor and high
calorie foods such as cakes, cookies, sugar sweetened beverages and fried snacks was high with 63.5
percent of caregivers consuming at least one of these foods in the last 24 hours.
Child Health
In RMI, 9.3 percent of children under 5 had diarrhoea in the last 2 weeks with 47.1 percent of these
children receiving medical care or advice from a health facility or provider. While care seeking for
diarrhoea was nearly 50 percent, only 28.4 percent of children under 5 who had diarrhoea received
ORS or any recommended homemade fluid and 7.5 percent received ORS and zinc. Percentage of
children who had symptoms of ARI was 2.9 percent while 11.5 percent of children had an episode of
fever in the previous 2 weeks to the survey.
All children 6‐59 months of age should receive high dose vitamin A supplementation (VAS) twice
yearly. In RMI, 54.4 percent of children 6‐59 months received high dose VAS with higher coverage
among female children compared to males. Coverage of deworming was lower than VAS in RMI with
32.1 percent of children 12‐59 months of age receiving deworming in the previous 6 months. The
highest coverage of both VAS and deworming in RMI was among the richest households. Only 11.3
percent of children received any form of iron supplementation in the previous 7 days with higher
coverage in urban areas.
Water and Sanitation
The RMI ICHNS 2017 showed that in households with a child under 5, 100 percent of the population
has access to improved sources of drinking water. The majority of households used rainwater
collection (67.6 percent) for drinking water while 18.1 percent used bottled water. While all
households used improved sources of drinking water, 58.8 percent of households used an additional
water treatment method to purify their drinking water. Household assess to improved sanitation
facilities was 86.3 percent with 8.3 percent of households using open defecation. In rural areas, over
a third of households used open defecation with the highest percentage in the poorest households.

P a g e | xxii
The percentage of households who adequately disposed of children’s stools was low at 6.0 percent.
A majority of households (68.1 percent) threw the child stools in the garbage which is considered an
unsafe method of disposal.
Nearly all households (91.7 percent) in RMI had a specific place for handwashing with water and
soap or other cleansing agent present. For the poorest households, this indicator was lower, at 81.0
percent.
Reproductive Health
Among mothers who had a live birth in the last two years, 92.7 percent received antenatal care from
skilled personnel at least once during their pregnancy. In one out of three cases, antenatal care was
provided by a medical doctor. A total of 67.8 percent of mothers who had a live birth during the last
two years, had four or more antenatal care visits during their last pregnancy and 43.7 percent of
mothers had their first antenatal care visit during the first trimester. However, only 31.1 percent of
mothers who were not married received their first antenatal care visit during the first trimester.
A total of 92.4 percent of deliveries were attended by a skilled personnel and 9.7 percent were by C‐
section. Mothers in rural areas were less likely to have a delivery by a skilled attendant (66.2
percent) as well as mothers in the poorest households (73.0 percent). The majority of births were
delivered in a public hospital (83.0 percent) with only 3.7 percent of births delivered at home. Two
out of five of the poorest mothers gave birth in an outer island health centre or dispensary.
Early Childhood Development
In RMI, only 5.2 percent of children 36‐59 months attended an organized early childhood education
programme, however public school provided kindergarten is only offered with children entering at 5
or 6 years of age. Provision of organized early childhood education is available through private
schools with children starting at 4 or 5 years of age. It is notable that the richest households had the
highest percentage of children attending ECD (11.1 percent). In addition to poor attendance in early
childhood education programmes for children 3 to 4 years of age, adult engagement with the child in
activities that promote learning or school readiness was sub‐optimal. A total of 72.3 percent of
children were engaged by adult household members in four or more learning activities while only
59.3 percent of children were engaged by their mother in four or more learning activities. Only 1.6
percent of fathers have engagement with their children in activities that promote learning or school
readiness. A total of 70.9 percent of children had access to two or more playthings and nearly one in
five children lived in a household with 3 or more children’s books. Some 9.1 percent of children aged
under 5 were left with inadequate care during the week preceding the survey.
Among children aged 36‐59 months, 78.9 percent were developmentally on track. There were no
differences in the percentage of children developmentally on track by household wealth status,
caregiver’s education level, or urban and rural area.
Literacy and Education
In RMI, 99.3 percent of young caregivers aged 15‐24 years and with a child under 5 years were
literate. In terms of school readiness, the percentage of children attending Grade 1 who were
attending kindergarten the previous year is 92.8 percent. Overall, 32.3 percent of primary school
entry age children who live in a household with a child under 5 enter primary school Grade 1. In RMI,

P a g e | xxiii
children are considered primary school entry age at 6 years, however many children start school
later at 7 or 8 years. The net attendance ratio at primary level (adjusted) was 79.6 percent, with 8.7
percent of primary school age attending preschool and 10.0 percent not attending school or
preschool. The net attendance ratio at primary level (adjusted) was higher for female children (83.2
percent) compared to boy children (76.5 percent). The net attendance ratio (adjusted) at secondary
level was lower at 48.1 percent with 29.8 percent of children of secondary school age attending
primary school and 22.6 percent of children out of school.
A total of 90.5 percent of children entering Grade 1 eventually reach Grade 8. Completion of primary
school and transition into secondary school was similar with 87.0 percent of children completing
primary school and 91.3 percent of children transitioning to secondary school. In RMI, there was
gender parity at the primary level, however, at the secondary level there are 1.20 secondary school
age girls attending secondary school for every secondary school age boy attending secondary school.
Child Protection
In RMI, 83.8 percent of children under 5 years of age had their birth registered with civil authorities.
Children in rural areas were less likely to have their birth registered (69.2 percent) as well as children
from the poorest households (77.0 percent) and richest households (76.6 percent). The use of
violent discipline methods was high in RMI, with 61.6 percent of children 1‐4 years having faced any
violent discipline method during the one month preceding the survey. Caregiver education level was
inversely associated with use of any violent discipline method. Similarly, 69.1 percent of respondents
felt that physical punishment should be used to discipline children. This indicator also showed an
inverse association with the respondent’s education level.
In total, 8.0 percent of children under 5 lived with neither biological parent with the highest
prevalence among older children 36‐59 months. Overall, 6.4 percent of children in RMI had one or
both parents dead and 10.5 percent of children had at least one parent living abroad.
Conclusion
The RMI ICHNS 2017 Final Report presents a “report card” on RMI’s nutrition situation for young
children and their caregivers, highlighting the specific nutrition concerns where attention is required.
Analysis of the ICHNS 2017 data reveals that malnutrition is high in RMI, with stunting in children
and overweight in caregivers identified as national public health concerns. Additionally, while
micronutrient status was not measured in the survey, poor dietary quality of both children and their
caregivers indicates that prevalence of micronutrient deficiencies is high and universal.
While the historic reduction in morbidity and improved well‐being in RMI are a victory, the
potential increases in productivity and intellectual capacity due to reduction of malnutrition in
children and their caregivers are substantial additional benefits not to be overlooked. These
health improvements can ultimately reverse a cycle of dependence and can fuel a cycle of
increased productivity, economic development and prosperity.
P a g e | 1
I. Introduction
Background
This report is based on the Republic of the Marshall Islands Integrated Child Health and Nutrition
Survey (ICHNS), conducted in 2017 by the RMI Ministry of Health and Human Services (MoHHS) in
collaboration with the RMI Economic, Policy Planning and Statistics Office (EPPSO). Technical and
financial support was provided by the United Nations Children’s Fund (UNICEF). The survey provides
statistically sound and internationally comparable data essential for developing evidence‐based
policies and programmes, and for monitoring progress toward national goals and global
commitments. Among these global commitments are those emanating from the World Fit for
Children Declaration and Plan of Action, the Education for All Declaration and the Sustainable
Development Goals (SDGs).
A Commitment to Action: National and International Reporting Responsibilities
The governments that signed the Millennium Declaration and the World Fit for Children Declaration and Plan of Action also committed themselves to monitoring progress towards the goals and objectives they contained: “We will monitor regularly at the national level and, where appropriate, at the regional level and assess progress towards the goals and targets of the present Plan of Action at the national, regional and global levels. Accordingly, we will strengthen our national statistical capacity to collect, analyse and disaggregate data, including by sex, age and other relevant factors that may lead to disparities, and support a wide range of child‐focused research. We will enhance international cooperation to support statistical capacity‐building efforts and build community capacity for monitoring, assessment and planning.” (A World Fit for Children, paragraph 60) “…We will conduct periodic reviews at the national and subnational levels of progress in order to address obstacles more effectively and accelerate actions.…” (A World Fit for Children, paragraph 61) The Plan of Action of the World Fit for Children (paragraph 61) also calls for the specific involvement of UNICEF in the preparation of periodic progress reports: “… As the world’s lead agency for children, the United Nations Children’s Fund is requested to continue to prepare and disseminate, in close collaboration with Governments, relevant funds, programmes and the specialized agencies of the United Nations system, and all other relevant actors, as appropriate, information on the progress made in the implementation of the Declaration and the Plan of Action.” Similarly, the Millennium Declaration (paragraph 31) calls for periodic reporting on progress: “…We request the General Assembly to review on a regular basis the progress made in implementing the provisions of this Declaration, and ask the Secretary‐General to issue periodic reports for consideration by the General Assembly and as a basis for further action.”
The Republic of the Marshall Islands (RMI) is located in the Central Pacific Ocean and covers an area
of 181 square kilometres comprising 29 scattered and remote atolls. There are 1,225 islands and
islets in RMI and most are not more than 10 feet in elevation above sea level. RMI is spread across
750,000 square miles of ocean with total land area of 181 square kilometres and some 370 km of
coastline. RMI has a unique geography which is a challenge to the delivery of basic health services.
Transportation, electricity and communication are also limited because of the isolated nature of the
islands. The projected population as of 2017 in RMI is approximately 55,000 with the majority of the

P a g e | 2
population living in the urban (73 percent) areas of Majuro and Kwajalein. The 27 percent of the
population living in rural areas is dispersed amongst the outer atolls and islands.
RMI was traditionally dependent on fishing and subsistence agriculture, however, with increasing
urbanization, the highly urbanized Marshallese depend on financial transfers from abroad and
imports to meet national demand. The potential of the natural environment to sustain the
population has been diminished due to contamination with radioactive wastes.
Climate change is a concern for RMI, which is extremely vulnerable to rising sea levels and subject to
frequent droughts and cyclones. Recently RMI was affected by long periods of drought due to El
Nino. The prolonged situation affected both agricultural production and household food security
with resultant impact on health, nutrition, water, sanitation and education status of the population.
Water scarcity, attributed to frequent drought, is an influencing factor to hygiene practices including
hand washing and unhealthy household environments. Malnutrition in children is largely attributed
to unhealthy household environments (poor sanitation, lack of clean water, prevalence of infectious
diseases) as well as the prevalence of inadequate care and feeding practices (poor breastfeeding
support, poor complementary feeding practices, inadequate dietary intake, household food
insecurity), poverty, and the globalization of the food system and aggressive marketing of unhealthy
food. These factors are negatively impacted during emergencies such as drought and cyclones with
young children highly susceptible to deteriorating nutrition status.
There is limited data available on the nutrition status of young children and their mothers for RMI.
The available data indicates that nearly 18 percent of infants are born with low birthweight and that
exclusive breastfeeding is low at 31 percent of children under 6 months13. Micronutrient deficiencies
are widely prevalent with nearly 30 percent of children under 5 years of age anaemic and 13 percent
of preschool children deficient in vitamin A. While 1 out of 4 (24 percent) women of reproductive
age are anaemic14, anaemia is highest amongst pregnant women with nearly 2 out of 5 pregnant
women anaemic (38 percent). There is no available data on child anthropometric status in RMI as
previous surveys did not collect child height and weight which are required to determine the
national prevalence of stunting, underweight, wasting and overweight. In adults, the prevalence of
both overweight and obesity is a serious public health concern with 79 percent of women
overweight and 49 percent of women obese13.
This ICHNS 2017 report presents key findings from the analysis of the ICHNS 2017 which was
conducted in RMI in 2017. It assesses the current nutrition status in RMI of both children under 5
years of age and their caregivers and identifies nutrition status shortfalls with the goal of informing
policy and programmatic action. Key features of the ICHNS 2017 survey include the availability of
area level data on relevant nutrition indicators and the inclusion of data of household food security,
maternal nutrition status, and maternal dietary quality which have previously never been collected
in RMI. The ICHNS 2017 survey quantifies the prevalence of the nutrition conditions that are of
greatest concern to the vulnerable populations of infants and young children and their caregivers. As
RMI is experiencing a double burden of malnutrition with high prevalence of both under‐ and over‐
nutrition, the survey analysis report examines nationally‐based and area‐based indicators relevant to
the country’s current nutrition transition. The area level data are useful for identifying target areas
requiring additional programming, training, and resources.
13 Global Nutrition Report, 2015. 14 Marshall Islands Food and Nutrition Profile (2014). EU, FAO, WFP, WHO and UNICEF.

P a g e | 3
A well‐nourished population is vital to a country’s social and economic progress; however, RMI faces
serious public health challenges from malnutrition. This Integrated Child Health and Nutrition Survey
2017 (ICHNS 2017) report aims to inspire and inform a political commitment to investment in
nutrition programmes, to deliver effective and affordable interventions to women and children and
to advance RMI’s sustainable development agenda. The ICHNS 2017 results will be critically
important for final SDG reporting, and are expected to form part of the baseline data.
Survey Justification and Rationale
The Republic of the Marshall Islands implemented a DHS in 2007 and a National Census in 2011,
however these surveys did not measure the prevalence of malnutrition, infant and young child
feeding practices and their influencing variables in young children at the national and sub‐national
level. Therefore, findings from the ICHNS 2017 form the baseline for key nutrition indicators in the
country, at both the national and sub‐national level, which together with any future Demographic
Health Surveys/ Multiple Indicator Cluster Surveys conducted in RMI, can provide evidence on
progress towards achieving the Sustainable Development Goals.
The ICHNS 2017 is the most comprehensive nutrition assessment ever conducted in The Republic of
the Marshall Islands. The ICHNS 2017 provides statistically representative prevalence of key
parameters for urban and rural areas in RMI and may be used to fill the existing data gaps and
provide more robust updated data for policy makers and program managers. The principle survey
design collected data on the current nutrition status of children under 5 years of age and their
caregivers and the key determinants of optimal nutrition status in the country at the national and at
the urban and rural level. As described in Figure 1, the survey will identify the critical influencing
factors associated with malnutrition of children in the country.

P a g e | 4
F i gure 1 : Shor t ‐ and l ong ‐ te rm consequences of ch i ld malnut r i t ion as a component of the Ch i ld Malnut r i t ion Conceptua l Framework 15
The ICHNS 2017 is the first survey to assess in RMI both wealth and household food security status
of households with under 5‐year old children through the FAO and USAID Household Food Insecurity
Access Scale measurement guide. The addition of household food security status allows for
comparative assessment of nutrition status by target population group in relation to the socio‐
economic and food security status of the households they live. The survey is also the first in RMI to
assess the dietary diversity of caregivers of children under 5 years of age through the FAO and USAID
Women’s Minimum Dietary Diversity indicator. Dietary diversity assessment of caregivers 15‐49
years of age provides information on dietary quality and potential rationale for common types of
micronutrient deficiencies in RMI women.
A key strength of the survey is the measurement of immediate causes, underlying causes, basic
causes and consequences of child nutrition status which allow for a full understanding of which
factors place children at risk for malnutrition. The survey contributes important data on the nutrition
status of both children under 5 years of age and their mothers which was unavailable prior to the
ICHNS 2017. The area‐level data collected for all nutrition indicators is useful for identifying under‐
performing areas where additional planning, training, and resources may be required for targeted
support.
15 Basic, underlying and immediate causes are included in this figure, as well as outcomes of malnutrition. Figure adapted by ASEAN, UNICEF and WHO for publication in ASEAN/UNICEF/WHO (2016) Regional Report on Nutrition Security in ASEAN, Volume 2, from the 1997 UNICEF Conceptual Framework of Malnutrition.

P a g e | 5
Survey Objectives
The objective of the ICHNS 2017 is to assess the current nutrition status and influencing variables to
nutrition status in under 5 children and their mothers in the Republic of the Marshall Islands.
The survey:
1. Examines the prevalence and identify the key determinants of stunting, underweight,
overweight and wasting in young children and examines the prevalence of overweight,
underweight and short stature in caregivers of young children.
2. Establishes the current status of early child development, child functioning and child
discipline practices in urban and rural children.
The RMI ICHNS 2017 will enable stakeholders in RMI to more effectively plan, manage and monitor
existing nutrition programs and determine where programmatic revision may be needed to address
gaps and barriers to effective coverage.
The 2017 ICHNS has as its primary objectives:
To provide up‐to‐date information for assessing the situation of children and their caregivers in
RMI;
To generate data for the critical assessment of the progress made in various areas, and to put
additional efforts in those areas that require more attention;
To furnish data needed for monitoring progress toward goals established in the Millennium
Declaration, Sustainable Development Goals and other internationally agreed upon goals, as a
basis for future action;
To collect disaggregated data for the identification of disparities, to allow for evidence based
policy‐making aimed at social inclusion of the most vulnerable;
To contribute to the generation of baseline data for the post‐2015 agenda;
To validate data from other sources and the results of focused interventions.
The specific objectives and key metrics of the survey are outlined below with representativeness at
the national and the urban and rural area level. The specific objectives have been organized in
accordance with the determinant framework for optimal nutrition status presented in Figure 1.
Objectives for assessing nutrition status (overall program outcomes)
Determine the prevalence of malnutrition in children 0‐59 months of age (stratified at
national, urban and rural level) and caregivers of children 0‐59 months of age.
Objectives for assessing the immediate determinants of nutrition status
Determine the prevalence of core IYCF practices, including the following indicators stratified
at the national and urban/rural location level:
‐ Exclusive breastfeeding and predominant breastfeeding for infants 0‐5 months of age

P a g e | 6
‐ Early initiation of breastfeeding for infants 0‐23 months of age
‐ Minimum dietary diversity for children 6‐23 months of age
‐ Minimum meal frequency for children 6‐23 months of age
‐ Minimum acceptable diet for children 6‐23 months of age
‐ Consumption of iron rich foods
‐ Consumption of vitamin A rich foods
‐ Consumption of low nutrient density foods
‐ Bottle‐feeding for children 0‐23 months of age.
Determine the quality of maternal diets at the national and urban/rural location level
‐ Women’s minimum dietary diversity for all caregivers 15‐49 years
‐ Consumption of iron rich foods
‐ Consumption of vitamin A rich foods
‐ Consumption of low nutrient density foods
Determine the prevalence of low birthweight for children 0‐59 months of age.
Determine the health status of children 0‐59 months of age as measured by fever, diarrhoea
and Acute Respiratory Infection (ARI).
Determine the coverage of the following nutrition interventions implemented at scale at the
national and urban and rural areas:
‐ Receipt of vitamin A supplementation for children 6‐59 months of age.
‐ Receipt of iron supplementation or other vitamin/mineral supplementation for children
0‐59 months of age.
‐ Receipt of deworming tablets for children 12‐59 months of age.
‐ Receipt and utilization of iron folic acid supplementation through ANC or health centres
for mothers of children 0‐23 months of age.
Objectives for assessing the underlying determinants of nutrition status
Determine household food insecurity for households with children under 2 years of age
Determine access to improved sanitation, water sources and improved hygiene practices.
Determine quality of ANC care practices
Objectives for assessing child functioning for children 2‐4 years of age
Assess functional difficulties for seeing, hearing, mobility, communication/comprehension,
learning, relationships and playing.
Objectives for assessing child protection for children 0‐59 months of age
Determine the prevalence of birth registration for children 0‐59 months of age
Assess child disciplining methods for children 1‐5 years of age
Determine children’s living arrangements and orphanhood for children 0‐59 months of age

P a g e | 7
II. Sample and Survey Methodology
Sample Design
The sample for the Integrated Child Health and Nutrition Survey 2017 (ICHNS 2017) was designed to
provide estimates for a large number of indicators on the situation of children and their caregivers at
the national level and for urban and rural areas. The Republic of Marshall Islands (RMI) 2011 Census
with 2017 projections was used as the sampling frame with identification of the primary sampling
units (clusters) stratified for urban and rural areas selected systematically with probability
proportional to size. In each selected cluster, a household listing was carried out to identify
households with children under 5 years of age. In the 50 selected clusters, 12 households in each
cluster for a total of 600 households were randomly sampled as the secondary sampling unit. During
household listing exercises, several clusters had less than 12 households with children under 5 years
of age necessitating a reduction in the total sample size to 581 households. The sample was
stratified by urban and rural areas, and is not self‐weighting. For reporting national level results,
sample weights are used. A more detailed description of the sample design can be found in
Appendix A: Sample Design.
Questionnaires
The survey used quantitative data collection methods with three sets of questionnaires used in the
survey: 1) a household questionnaire which was used to collect basic demographic information on all
de jure household members (usual residents), the household, and the dwelling; 2) a questionnaire
for individual mothers or caregivers of children under 5 years of age administered in each household
to all caregivers aged 15‐49 years; and 3) an under‐5 questionnaire, administered to mothers or
caregivers for all children under 5 living in the household.
The following modules are included in the 2017 RMI ICHNS:
Household Questionnaire:
o Household Information Panel o List of Household Members o Education [5+] o Household Characteristics
o Water and Sanitation o Hand washing
Questionnaire for Individual Women:
o Woman’s Information Panel o Woman’s Background o Marriage/Union o Fertility/Birth History
o Maternal and Newborn Health o Women’s Minimum Dietary Diversity o Household Food Insecurity Access Scale o Anthropometric Measurement
Questionnaire for Children Under 5:
o Under‐Five Child Information Panelo Under‐Five’s Background o Birth Registration o Early Childhood Development o Child Discipline [1‐4]
o Child Functioning [2‐4] o Breastfeeding and Dietary Intake o Child Health o Anthropometry
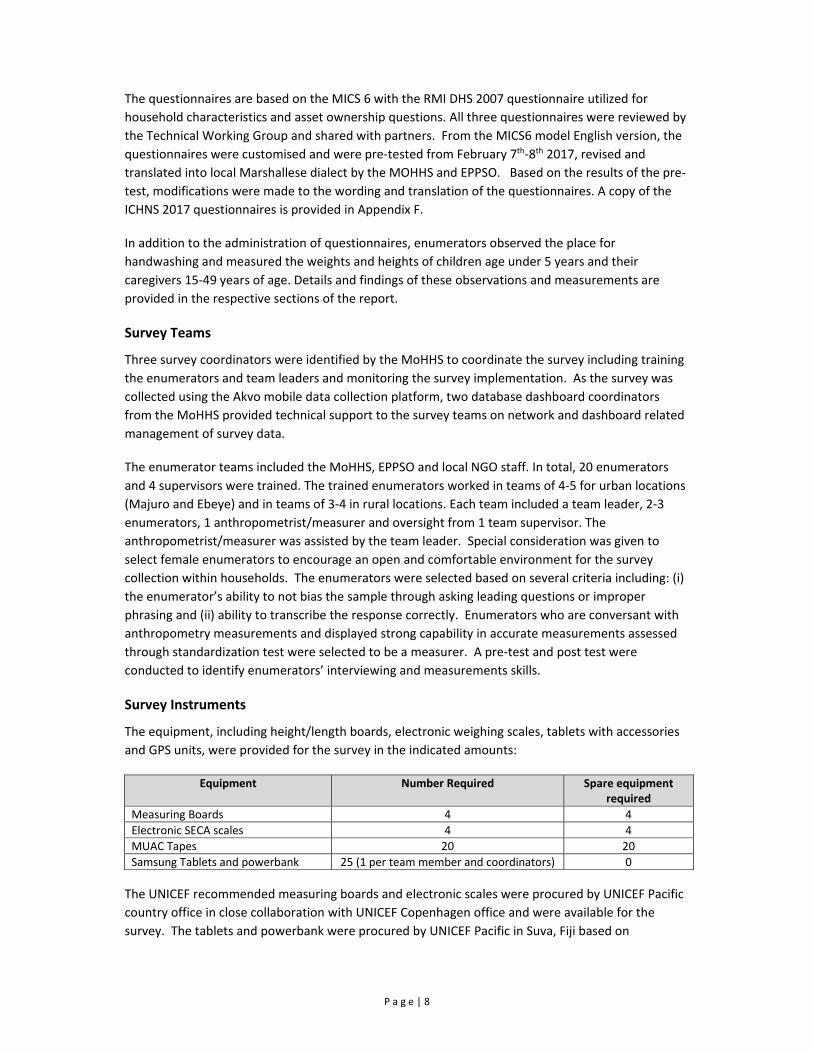
P a g e | 8
The questionnaires are based on the MICS 6 with the RMI DHS 2007 questionnaire utilized for
household characteristics and asset ownership questions. All three questionnaires were reviewed by
the Technical Working Group and shared with partners. From the MICS6 model English version, the
questionnaires were customised and were pre‐tested from February 7th‐8th 2017, revised and
translated into local Marshallese dialect by the MOHHS and EPPSO. Based on the results of the pre‐
test, modifications were made to the wording and translation of the questionnaires. A copy of the
ICHNS 2017 questionnaires is provided in Appendix F.
In addition to the administration of questionnaires, enumerators observed the place for
handwashing and measured the weights and heights of children age under 5 years and their
caregivers 15‐49 years of age. Details and findings of these observations and measurements are
provided in the respective sections of the report.
Survey Teams
Three survey coordinators were identified by the MoHHS to coordinate the survey including training
the enumerators and team leaders and monitoring the survey implementation. As the survey was
collected using the Akvo mobile data collection platform, two database dashboard coordinators
from the MoHHS provided technical support to the survey teams on network and dashboard related
management of survey data.
The enumerator teams included the MoHHS, EPPSO and local NGO staff. In total, 20 enumerators
and 4 supervisors were trained. The trained enumerators worked in teams of 4‐5 for urban locations
(Majuro and Ebeye) and in teams of 3‐4 in rural locations. Each team included a team leader, 2‐3
enumerators, 1 anthropometrist/measurer and oversight from 1 team supervisor. The
anthropometrist/measurer was assisted by the team leader. Special consideration was given to
select female enumerators to encourage an open and comfortable environment for the survey
collection within households. The enumerators were selected based on several criteria including: (i)
the enumerator’s ability to not bias the sample through asking leading questions or improper
phrasing and (ii) ability to transcribe the response correctly. Enumerators who are conversant with
anthropometry measurements and displayed strong capability in accurate measurements assessed
through standardization test were selected to be a measurer. A pre‐test and post test were
conducted to identify enumerators’ interviewing and measurements skills.
Survey Instruments
The equipment, including height/length boards, electronic weighing scales, tablets with accessories
and GPS units, were provided for the survey in the indicated amounts:
Equipment Number Required Spare equipment required
Measuring Boards 4 4
Electronic SECA scales 4 4
MUAC Tapes 20 20
Samsung Tablets and powerbank 25 (1 per team member and coordinators) 0
The UNICEF recommended measuring boards and electronic scales were procured by UNICEF Pacific
country office in close collaboration with UNICEF Copenhagen office and were available for the
survey. The tablets and powerbank were procured by UNICEF Pacific in Suva, Fiji based on

P a g e | 9
specifications provided by Akvo which has been contracted to conduct the training of the survey
team on how to use tablets for the survey.
Teams were allocated spare electronic scales and measuring boards to facilitate continuous and
smooth data collection. USB flash drives were provided for back‐up of survey data from smart
phones and tablets in case of delays in instant transfer of data due to network connectivity issues
especially in remote clusters.
Training
Training for the RMI ICHNS 2017 was conducted in three stages: (i) household listing (ii) Akvo
training for the use of tablets in survey data collection and (iii) the collection of the three
questionnaires and implementation of anthropometric measurements.
Training for household listing was conducted with survey teams in collaboration with the EPPSO
during a half‐day orientation. During the training, EPPSO provided cluster maps and the 2011 Census
household listing. Instructions were provided on how to conduct the location and cluster mapping
and household listing. Following the orientation, the survey teams practiced the implementation of
the household listing in selected clusters in Majuro between the February 22nd‐25th. The EPPSO
supervised the household listing to ensure accuracy and completeness of the household listing in the
selected clusters.
Akvo, a non‐profit organization, provided technical support to set up digital format of the survey
questionnaires for mobile data collection and reporting as well as follow‐up support for collection of
the digital versions of the questionnaires. A 5‐day Akvo training of trainers was conducted from
February 13th to 17th. Three supervisors, 2 MoH database managers and 2 UNICEF technical staff
were trained on the use of the Akvo dashboard and on the basic concepts of how to train
enumerators to use the digitalized version of the questionnaires and the process of transmitting
completed questionnaires to the survey coordinators on a timely basis for daily quality assurance
checks. A pilot study was conducted to review the ease of use of the programmed questionnaire
and to make any necessary revisions if required.
The main training of the enumerators and team leaders was conducted from February 27th to March
7th 2017. The training included 5 days in‐class training that incorporates review of the survey
questionnaires, anthropometric training for measurers and Akvo training to the enumerators for the
use of digital questionnaires. The UNICEF technical staff, survey coordinators and the MoHHS
database managers conducted the training of the enumerators on the use of digital tablets for
interviews. The 5‐day training was immediately followed by 3 days fieldwork practice, with each
survey team covering a total of 12 households. During the 3‐day fieldwork practice, survey teams
practiced household listing and selection of households as per the protocol.
The general format for the training included an overview of the survey concepts, followed by a
question‐by ‐question walk‐through of the module by a trainer. The enumerators were trained on
the overall survey, and given an explanation of each question within the survey, as well as how to
ask each question. The participants were engaged by reading questions out loud to ensure that the
interviewers ask questions as they are written. The training also included tests for the enumerators,
demonstration interviews, mock interviews and group interview practice sessions. In addition to
classroom training, field practice sessions were provided to gain hands‐on experience in conducting

P a g e | 10
interviews and handling fieldwork logistics. The field training was conducted in a convenient, local
village that has not been selected as a cluster for the actual survey. The teams practiced conducting
household listing, selection of households, approach household heads and caregivers on the purpose
of the survey, conduct interviews, use digital questionnaires and take anthropometric
measurements of children and mothers. The teams were monitored by supervisors and any errors in
household selection, interview techniques, data entry and measurements were corrected. The data
from the field training were reviewed and analysed for data quality with feedback sessions
conducted afterwards with pre‐ and post‐tests.
Fieldwork
The main fieldwork was conducted from April 3rd until June 23rd, 2017 with all survey teams starting
data collection in urban areas. A total of 4 teams comprising of 5 members each (total 20
enumerators) were deployed to 18 clusters in Majuro; while 2 teams of 4 members each were
deployed to 7 clusters in Ebeye. For the outer islands, the team composition varied with teams of 3
to 4 team members. The rationale for increasing the number of teams (and reduction of team
members) in the outer islands were for two reasons: (i) due to flight connectivity (which was
generally once a week), the teams stayed in each cluster in the outer island for more than a week
and hence had more time to complete the survey; this allowed more time for the teams to complete
the household listing and conducting the survey, and (ii) to facilitate completion of the overall survey
within a reasonable time period.
Under the overall supervision of the three survey coordinators, the team leaders were responsible
for the mapping, household listing, quality data collection, editing and transmission of
questionnaires to the respective coordinators. Each team leader liaised directly with the community
leader in each of the enumeration areas to facilitate the team’s work. Additionally, the survey
coordinator maintained close contact and regular communication with the teams through phone
and radio communication. The survey teams and supervisors were provided allowances for airtime
to ensure communication to facilitate prompt corrective measures to deal with challenges as they
arise in the field.
The survey coordinators provided support to their respective teams and were accountable for all
data collection activities. Fieldwork supervision was coordinated by three senior survey
coordinators from the MoHHS’s and three senior EPPSO supervisors with support from the UNICEF
technical team. The supervisors monitored the mapping, household listing and selection, interview
techniques, digital data entry and measurements and provided corrective actions. The survey
coordinators and UNICEF technical team also conducted random monitoring visits to observe the
household listing, survey data collection and provided on‐the‐job feedback on data collection and
recording. The survey coordinators and the UNICEF Nutrition Consultant based in Majuro reviewed
all data entry prior to syncing the digital data online. Any observed errors in data collection were
reviewed with the teams for corrective action.
Particular care was taken in the allocation of teams for remote outer islands where there was no
communication access. Experienced team leaders who were familiar with the area and the
communities were assigned to guide the teams. Having EPPSO and MOHHS staff as part of the team
members was helpful as the staff were familiar with the communities.

P a g e | 11
Selected communities were informed about the survey through various communication channels.
Messages were disseminated through radio, newspaper and SMS messages. Local chiefs and
landlords were informed by the survey coordinators about the teams’ visit to the clusters and to
request their support by accompanying the teams for the mapping, household listing and data
collection. The selected households were contacted by the team leaders to make an appointment
with the household head and caregiver for the data collection.
Data Processing
Digital questionnaires from Akvo were used for data collection with paper based forms used as
reference and back up. The digital format questionnaire had built‐in quality checks including double
entry and skip questions built into the system. The Akvo digital questionnaires did not allow for any
questions to be left unanswered with error messages appearing at the end of each questionnaire
indicating which questions are left unanswered. The geolocation information in the programme
allowed for identifying the location of the selected household and the cluster. Additionally, the
programme allowed for photo capture and obtaining consent from the households. The data
gathered from questionnaires were submitted by the teams on daily basis and the information was
instantly available on the Akvo web‐based dashboard for review by the UNICEF Nutrition Consultant
based in Majuro and the UNICEF EAPRO Nutrition Consultant based in Bangkok. The web‐based
dashboard allowed for real time data quality monitoring and follow‐up with the teams for correction
of errors and clarification as needed. During survey implementation, external data quality checks on
oncoming data was conducted by the UNICEF EAPRO Nutrition Consultant to implement plausibility
checks for key socio‐demographic indicators and anthropometric indicators.
Once final forms for each survey questionnaire were prepared, data were exported to SPSS version
22 and additional data cleaning and quality assurance were performed by the UNICEF EAPRO
Nutrition Consultant based in the Regional Office, Bangkok. The data cleaning process involved
producing a set of (unweighted) frequency distributions for every variable in each data file which
were checked for unusual values, those outside the range of most responses (outliers), and
implausible answers to respective questions. Seemingly incorrect values were checked against
original paper questionnaires. To generate national prevalence estimates for all indicators, weights
were generated for household, children 0‐59 months, and caregivers 15‐49 years of age. Weighting
estimates were applied for the development of all national estimates in the NNS V and are
presented by cluster in Appendix A: Sample Design.
Data Analysis
Survey data were analysed using SPSS version 22 with the complex survey module and the analysis
was conducted in three stages. The first stage involved calculation of composite variables, using the
standardized MICS 5 protocol16 and the calculation and integration of sample weights. During this
stage, coefficient of variation was calculated for all variables and confirmatory checks of recodes,
transformations, and calculations were conducted. The second stage of analysis involved conducting
descriptive analyses for all key survey indicators, including calculating proportions to derive
prevalence estimates and calculating means and medians for continuous measurements. National
prevalence estimates were calculated using a weighted analysis to account for the unequal
probability of cluster selection in the two strata. Weighted percentages as well as unweighted
counts are presented in the results tables.
16 http://mics.unicef.org/tools?round=mics5#data-processing.

P a g e | 12
In the third stage, bivariate analyses (chi‐square, t‐test) were performed to determine relationships
between key dependent variables and influencing independent variables. The statistical precision of
all estimates was assessed using 95 percent confidence limits that accounted for the complex
stratified cluster sampling design. Table SS.1 presents the methodology used for the determination
and classification of key socio‐demographic and anthropometric indicators measured in the target
populations.
Table SS.1: Methods for classification of key household, dietary quality, and anthropometric indicators, ICHNS, 2017
Indicator Classification method
Household wealth quintile index The RMI DHS 2007 questionnaire for household characteristics and asset ownership was used to update MICS syntax for the calculation of wealth index quintiles
Household Food Insecurity Access Scale17
USAID FANTA HFIAS methodology used to calculate and categorize household food security status
Mothers’ minimum dietary diversity score18
USAID FANTA and FAO Women’s Minimum Dietary Diversity (W‐MDD) methodology used to calculate mothers’ dietary diversity score and percentage with minimum dietary diversity. W‐MDD also used to assess consumption of specific food groups including consumption of iron‐rich foods, vitamin A‐rich foods, sugar‐sweetened drinks, sugary and fried foods.
IYCF Indicators19 UNICEF and WHO standardized indicators
Child 0‐59 months anthropometry20
Calculated using WHO Child Growth Standards and ANTHRO calculator with following cut‐offs:
Wasting: < -2 SD WHZ Stunting: < -2 SD HAZ Underweight: < -2 SD WAZ Overweight: > +2 SD WHZ
Mothers’ anthropometry21 BMI calculated [weight (kg) / height (m)2] with following cut‐offs:
Underweight: < 18.5 kg/m2
Normal weight: 18.5-24.9 kg/m2 Overweight: 25.0-29.9 kg/m2 Obese: ≥ 30.0 kg/m2
Women’s short stature: height < 145 cm Women’s borderline short stature: height < 150 cm
All analysis was performed with IBM SPSS Statistics version 22 using complex samples analysis.
Sampling weights were applied for each dataset to take into consideration unequal probabilities of
selection resulting from sample design and non‐ response.
17 Coates J, Swindale A, Bilinsky P. Household Food Insecurity Access Scale (HFIAS) for Measurement of Household Food Access: Indicator Guide (v. 3). Washington, DC: FANTA/AED, 2007. 18 FAO and FHI 360. Minimum Dietary Diversity for Women: A Guide for Measurement. Rome: FAO, 2016. 19 Infant and young child feeding: Model chapter for textbooks for medical students and allied health professionals: Indicators for assessing infant and young child feeding practices. Geneva: World Health Organization, 2009. 20 WHO Multicentre Growth Reference Study Group. WHO Child Growth Standards: Length/height-for-age, weight-for-age, weight- for-length, weight-for-height and body mass index-for-age: Methods and development. Geneva: World Health Organization, 2006. 21 WHO. Global database on body mass index. Geneva: World Health Organization, 2000

P a g e | 13
Methodological Limitations
Limitations of the ICHNS 2017 are common to other large cross‐sectional surveys. A key limitation is
not being able to infer causality from observed associations between dependent and influencing
variables. Survey data were only collected during the end of spring and beginning of summer (April
to June, 2016) so no seasonal variations could be identified. In addition, in Majuro the household
listing was conducted a month prior to the survey implementation and several of the selected
households became empty or had moved within the time period. The households were replaced
from the list of five reserved households in the original sampling plan. Absent or empty households
were not an issue in Ebeye and the outer islands as the data collection was conducted immediately
after the household listing. There were instances when the data entered to the tablets did not sync
properly with the Akvo system. Where the tablets did not properly sync, the missing entries were
managed by updating the tablet interphase and to provide a backup mobile data collection, hard
copy questionnaires were additionally collected for Ebeye and outer islands. Data from the hard
copy questionnaires were then inputted to the tablets immediately after return to Majuro.
Archiving and Dissemination
Steps were taken to ensure anonymity of all data in the datasets from the survey. The MoH will be
the sole responsible focal agency of the data collected (hard and soft copies), cleaned and
anonymised data. UNICEF will hold an anonymised copy of the dataset. The MOH will make the
anonymised survey dataset available to responsible researchers as per government approved
requests.
The MoHHS disseminated the survey findings with relevant sectors and partners through a
dissemination meeting planned in mid‐November 2017.

P a g e | 14
III. Sample Coverage and the Characteristics of Households and Respondents
Sample Coverage
During household listing exercises, several clusters had less than 12 households with children under
5 years of age necessitating a reduction in the total sample size from 600 to 581 households. Of
these, 581 were successfully interviewed for a household response rate of 100 percent.
In the interviewed households, 704 women caregivers (age 15‐49 years) with a child under 5 years
were identified. Of these, 596 mothers and 102 caregivers were interviewed in the survey for a total
of 698, yielding a response rate of 99.1 percent within the interviewed households. There were 881
children under age 5 listed in the household questionnaires. Questionnaires were completed for 881
of these children, which corresponds to a response rate of 100 percent within interviewed
households.
Overall response rates of 99.1 and 100 percent are calculated for the individual interviews of women
and under‐5s, respectively (Table HH.1).
Table HH.1: Results of household, caregivers and under-5 interviews
Number of households, caregivers and children under 5 by interview results, and household, caregivers and under-5's response rates, RMI ICHNS, 2017
Total
Area
Urban Rural
Households a
Sampled 600 300 300
Occupied 581 299 282
Interviewed 581 299 282
Household response rate 100.0 100.0 100.0
Caregivers of children under 5 b
Eligible 704 379 325
Interviewed 698 376 322
Women's response rate 99.1 99.2 99.1
Women's overall response rate 99.1 99.2 99.1
Children under 5 c
Eligible 881 490 391
Caregivers interviewed 881 490 391
Under-5's response rate 100.0 100.0 100.0
Under-5's overall response rate 100.0 100.0 100.0
a In the 50 selected clusters, 12 households in each cluster for a total of 600 households were to be randomly sampled. During household listing exercises, several clusters had less than 12 households with children under 5 years of age necessitating a reduction in the total sample size to 581 households.
b 596 mothers and 102 caregivers were interviewed in the survey for a total of 698.
c All eligible children 0-59 months of age in selected households participated in the survey, with several caregivers not completing components of the survey questionnaire. Specific population counts are included in the children's tables.
Response rates were very high. The response rate for households in both rural and urban areas was
100 percent. The response rate for eligible women was 99.1 percent: 99.1 percent in rural areas and
99.2 percent in urban areas. For children under 5 years of age, the response rate was 100 percent.

P a g e | 15
Characteristics of Households
Tables HH.3, HH.4 and HH.5 provide basic information on the households, caregiver’s aged 15‐49
and children under‐5. Both unweighted and weighted numbers are presented. Such information is
essential for the interpretation of findings presented later in the report and provide background
information on the representativeness of the survey sample. The remaining tables in this report are
presented only with unweighted numbers.
Table HH.3 provides basic background information on the households, including the sex of the
household head, area, number of household members, education of household head, religion and
ethnicity22 of the household head. These background characteristics are used in subsequent tables in
this report; the figures in the table are also intended to show the numbers of observations by major
categories of analysis in the report.
Table HH.3: Household composition
Percent and frequency distribution of households by selected characteristics, RMI ICHNS, 2017
Weighted percent
Standard Error
95 percent CI Number of households
Lower Upper Weighted Unweighted
Total 100.0 581 581
Sex of household head
Male 73.6 2.2 69.0 77.7 427 431
Female 26.4 2.2 22.3 31.0 154 150
Area
Urban 80.4 1.4 77.6 83.0 467 299
Rural 19.6 1.4 17.0 22.4 114 282
Number of household members
1-4 22.8 2.0 19.1 27.0 133 164
5-10 49.7 2.5 44.7 54.7 289 293
11+ 27.5 2.4 23.1 32.3 160 124
Education of household head
None 5.8 1.1 4.0 8.2 33 43
Primary 20.1 1.9 16.6 24.2 117 145
Secondary 48.5 2.6 43.5 53.5 282 273
Higher 25.6 2.3 21.4 30.4 149 120
Ethnicity
Marshallese 98.5 0.6 96.7 99.3 572 574 Other 1.5 0.6 0.7 3.3 9 7
Religion
Assembly of God 16.0 1.8 12.7 20.0 93 92 Protestant 51.3 2.5 46.3 56.3 298 324
Catholic 7.6 1.3 5.4 10.5 44 43 Other 25.0 2.2 20.9 29.7 145 122
Head of household age
Under 20 years 0.0 0.0 0.0 0.0 0 0 20-29 years 6.6 1.2 4.6 9.3 38 47 30-39 years 20.4 2.0 16.8 24.6 119 137 40-49 years 23.7 2.1 19.8 28.2 138 138 50 or older 47.7 2.6 42.7 52.7 277 248
Don't know 1.6 0.6 0.7 3.5 9 11
Mean household size 9.02 0.2 581 581
22 This was determined by asking for the religion, native language and ethnic group of the head of household.

P a g e | 16
The weighted and unweighted total number of households are equal, since sample weights were
normalized.23 The table also shows the weighted mean household size estimated by the survey.
Table HH.3 shows that almost 3 in 4 (73.6 percent) households are male‐headed and over 3 in 4
(77.2 percent) have five or more household members. Overall mean household size is 9.02
members. In total, 74.1 percent of the household heads have attained secondary education or
above.
Characteristics of Caregivers Respondents 15‐49 Years of Age and Children Under‐5
Tables HH.4 and HH.5 provide information on the background characteristics of caregivers 15‐49
years of age and of children under age 5. In both tables, the total numbers of weighted and
unweighted observations are equal, since sample weights have been normalized (standardized).23 In
addition to providing useful information on the background characteristics of women and children
under age 5, the tables are also intended to show the numbers of observations in each background
category. These categories are used in the subsequent tabulations of this report.
Table HH.4 provides background characteristics of caregiver respondents aged 15‐49 years. The
table includes information on the distribution of women according to area, age, education24, wealth
index quintiles25, religion of the household head, maternal marital status, motherhood status, parity,
residence in current household, and previous place of residence.
Table HH.4 shows that an estimated 21.5 percent of mothers are currently married. Age distribution
of the women shows that almost half (45.7 percent) of caregivers interviewed are 20‐29 years old.
Only a small percentage (1.0 percent) of the caregivers interviewed had no education and 80.7
percent of the women interviewed had secondary education or higher. The distribution of the
women interviewed by wealth quintiles shows that 20.7 percent are from the poorest households
and 17.8 percent are from the richest quintile.
23 Sample weights are presented in Appendix A. Sample Design 24 Throughout this report, unless otherwise stated, “education” refers to highest educational level ever attended by the respondent when it is used as a background variable. 25 The wealth index is a composite indicator of wealth. To construct the wealth index, principal components analysis is performed by using information on the ownership of consumer goods, dwelling characteristics, water and sanitation, and other characteristics that are related to the household’s wealth, to generate weights (factor scores) for each of the items used. First, initial factor scores are calculated for the total sample. Then, separate factor scores are calculated for households in urban and rural areas. Finally, the urban and rural factor scores are regressed on the initial factor scores to obtain the combined, final factor scores for the total sample. This is carried out to minimize the urban bias in the wealth index values. Each household in the total sample is then assigned a wealth score based on the assets owned by that household and on the final factor scores obtained as described above. The survey household population is then ranked according to the wealth score of the household they are living in, and is finally divided into 5 equal parts (quintiles) from lowest (poorest) to highest (richest). In the RMI ICHNS, 2017, see Household Questionnaire in Appendix F, questions HC8 and HC9 for the assets used in these calculations. The wealth index is assumed to capture the underlying long-term wealth through information on the household assets, and is intended to produce a ranking of households by wealth, from poorest to richest. The wealth index does not provide information on absolute poverty, current income or expenditure levels. The wealth scores calculated are applicable for only the particular data set they are based on. Further information on the construction of the wealth index can be found in Filmer, D and Pritchett, L. 2001. Estimating wealth effects without expenditure data – or tears: An application to educational enrolments in states of India. Demography 38(1): 115-132; Rutstein, SO and Johnson, K. 2004. The DHS Wealth Index. DHS Comparative Reports No. 6; and Rutstein, SO. 2008. The DHS Wealth Index: Approaches for Rural and Urban Areas. DHS Working Papers No. 60.

P a g e | 17
Table HH.4: Caregiver's background characteristics
Percent and frequency distribution of caregivers by selected background characteristics, RMI ICHNS, 2017
Weighted percent Number of women
Weighted Unweighted
Total 100.0 698 698
Area
Urban 81.9 572 376 Rural 18.1 126 322
Caregiver Age
Under 20 4.0 28 26
20-29 45.7 318 317
30-39 36.8 256 247
40-49 10.5 73 83
50 and older 3.0 21 23
Caregiver's education
None 1.0 7 8
Primary 18.3 127 143
Secondary 60.0 419 425
Higher 20.7 145 122
Wealth index quintile
Poorest 20.7 144 302 Second 21.4 149 116 Middle 22.3 156 109 Fourth 17.8 125 91 Richest 17.8 124 80
Religion
Assembly of God 17.5 122 114
Protestant 48.7 340 378
Catholic 7.8 54 54
Other 26.0 181 152
Maternal Married Status 1
Never married/in union 41.1 248 234
Currently married 21.5 130 134
Separated/Divorced/Widowed 3.5 21 21
Cohabitating 33.8 204 207
Relationship with under-5 child
Mother 86.5 604 596
Caregiver 13.5 94 102
Parity 1 31.5 190 178 2 26.5 160 164 3 19.4 117 114 4 12 72 72 5 5.2 31 38 6 + 5.5 32 30
Residence in current household
0-4 years 19.2 134 126 5-9 years 19.9 139 123 10 or more years 60.8 425 449
Previous place of residence
Different atoll/island 13.2 92 104
Same atoll, different island 15.5 108 90
Same atoll, different islet 1.6 11 13
Overseas 2.0 14 12
Same Islet, Same Zone, Same Atoll 67.7 472 479 1. For maternal married status, never married/in union was defined as the mother never married or not currently
cohabitating with a partner while cohabitating was defined as the mother currently cohabiting with a partner regardless if the partner was the child’s father.

P a g e | 18
Background characteristics of children under 5 are presented in Table HH.5. These include the
distribution of children by several attributes: sex, area, age in months, respondent type, maternal
age at birth, caregiver’s education, wealth index quintile, religion, maternal married status, and
father presence in household.
Table HH.5: Under-5's background characteristics
Percent and frequency distribution of children under 5 years of age by selected characteristics, RMI ICHNS, 2017
Weighted percent
Number of under-5 children
Weighted Unweighted
Total 100.0 881 881
Sex
Male 51.7 456 455
Female 48.7 425 426
Area
Urban 83.5 736 490
Rural 16.5 145 391
Age
0-5 months 8.5 75 80
6-11 months 12.7 112 111
12-23 months 18.8 166 171
24-35 months 18.6 164 169
36-59 months 41.4 365 350
Respondent to the under-5 questionnaire
Mother 85.9 757 752
Other caregiver 14.1 124 129
Maternal Age at Birth Less than 20 years 15.2 117 112
20-34 years 73.4 565 559
35-49 years 11.4 87 92
Caregiver's education
None 1.5 13 12
Primary 18.8 164 181
Secondary 59.3 519 529
Higher 20.5 180 155
Wealth index quintile
Poorest 19.4 171 370
Second 22.5 198 152
Middle 23.1 204 144
Fourth 16.6 146 108
Richest 18.4 162 107
Religion
Assembly of God 16.3 143 133
Protestant 49.7 438 485
Catholic 8.0 70 68
Other 26.1 230 195
Maternal Married Status
Not married 43.8 350 333
Currently married 21.7 173 175
Cohabitating 34.6 276 281
Father in Household
Yes 72.1 635 623
No 27.9 246 258

P a g e | 19
Table HH.5 shows that 83.5 percent of children under 5 surveyed are from urban areas compared to
16.5 percent from rural areas. In 85.9 percent of cases, the respondent to the under‐5 questionnaire
was the natural mother and 1.5 percent of respondents had no education. A total of 35.0 percent of
the children were from the two richest quintiles compared to 41.9 percent from two poorest
quintiles. Over 7 out of 10 (72.1 percent) children lived in the same household as his or her father.
Housing Characteristics, Asset Ownership, and Wealth Quintiles
Tables HH.6, HH.7 and HH.8 provide further details on household level characteristics. HH.6 presents
characteristics of housing, disaggregated by area, distributed by whether the dwelling has electricity,
the main materials of the flooring, roof, and exterior walls, as well as the number of rooms used for
sleeping.
Table HH.6 shows that 72.2 percent of all households have electricity with 81.7 percent of urban and
1 of 3 rural households having electricity. While a difference was found in household flooring with
91.4 percent of urban households with finished flooring compared to 84.6 percent of rural
households, prevalence of finished roofing was the same in urban households (95.5 percent) as in
rural households (95.4 percent).
Table HH.6: Housing characteristics
Percent distribution of households by selected characteristics, RMI ICHNS, 2017
Total
Area Unweighted
Number P-value Urban Rural
Electricity
Yes 72.2 81.7 33.3 333 ***
No 27.8 18.3 66.7 248
Flooring
Natural floor 1.9 1.5 3.5 12 --
Rudimentary floor 8.1 7.1 11.9 58
Finished floor 90.1 91.4 84.6 511
Roof
Natural roofing 0.7 0 3.4 11 ***
Rudimentary roofing 3.8 4.5 1.2 15
Finished roofing 95.5 95.5 95.4 555
Exterior walls
Natural walls 0.6 0.4 1.6 6 --
Rudimentary walls 51 49.5 57.1 311
Finished walls 48.4 50.1 41.3 264
Rooms used for sleeping
1 22 17.8 39.1 169 ***
2 32.6 32.9 31.6 184
3 or more 45.4 49.3 29.3 228
Number of households 581 299 282 581
Mean number of persons per room used for sleeping
2.47 2.58 2.01 581
* P<0.05, ** P<0.01, *** P<0.001

P a g e | 20
In Table HH.7 households are distributed according to ownership of assets by households and by
individual household members. This also includes ownership of dwelling.
Overall, 8.6 percent of households at the national level own a non‐mobile telephone. Prevalence of a
mobile phone in urban households was 70.7 percent compared to 26.1 percent in rural households
and prevalence of internet connection in the home in urban households was 26.7 percent compared
to 0.0 percent in rural households. In urban areas, 21.9 percent of households owned a car or truck
compared to 3.0 percent in rural areas. Prevalence of dwelling ownership was 54.9 percent for rural
households compared to 13.9 percent for urban households.
Table HH.7: Household and personal assets
Percentage of households by ownership of selected household and personal assets, and percent distribution by ownership of dwelling, RMI ICHNS, 2017
Total
Area
P-value Urban Rural
Percentage of households that own a Radio 39.4 36.9 49.6 **
Television 48.4 55.6 18.5 ***
Non-mobile telephone 8.6 10.5 0.7 ***
Refrigerator 39.6 44.8 18.2 ***
Percentage of households that own
Agricultural land 9.0 4.9 25.8 ***
Farm animals/Livestock 26.2 16.1 67.8 ***
Percentage of households where at least one member owns or has a
Fishing gear 44.3 37.6 72.1 ***
Solar panel 11.1 1.3 51.3 *** Deep freezer 36.5 40.6 19.6 *** Communication antennae 5.1 4.4 8.2 -- Electric generator 1.2 0.6 3.8 ** CB radio 3.8 2.0 11.0 *** Video/DVD player 34 33.6 35.7 --
Washing Machine 38.9 43 21.8 --
Internet Connection 21.5 26.7 0.0 *** Sewing Machine 4.4 4.3 4.8 -- Electric Stove 9.0 8.8 10.0 --
Cassette Tape Player 10.6 10.8 9.7 -- Laptop 11.5 12.8 6.2 * Microwave 9.8 11.2 4.3 **
Walkie Talkie 0.9 0.3 3.7 **
Watch 79.4 85 56.7 ***
Mobile Telephone 62.0 70.7 26.1 *** Bicycle 43.9 39.5 61.8 *** Motorcycle/Scooter 2.4 1.9 4.0 -- Animal draw cart 2.4 0.6 9.9 *** Car/truck 18.2 21.9 3.0 ***
Boat with motor 8.1 7.3 11.5 --
Sailing Canoe 4.9 1.2 20.1 ***
Paddle Canoe 4.9 1.4 19.1 ***
Ownership of dwelling
Owned by a household member 21.9 13.9 54.9 *** Not owned 78.1 86.1 45.1 --
Number of households 581 299 282
* P<0.05, ** P<0.01, *** P<0.001

P a g e | 21
Table HH.8 shows how the household populations in areas are distributed according to household
wealth quintiles. Table HH.8 shows that 24.2 percent of the household population in urban areas
falls into the richest category compared to 0.0 percent in rural areas. Of households with household
head having no education, 75.0 percent fell into the poorest 2 wealth index quintiles, while only 12.5
percent fell into the top two quintiles. Of households with a household head with education higher
than secondary, 9.4 percent fell into the bottom wealth index quintile and 35.8 percent fell into the
top quintile.
Table HH.8: Wealth quintiles
Percent distribution of the household population by wealth index quintile, selected characteristics, RMI ICHNS, 2017
Wealth index quintile
Total
Number of household members
P-value Poorest Second Middle Fourth Richest
Total 20.1 20.1 20.0 20.2 19.6 100.0 4758 --
Sex of household head
Male 21.3 21.3 18.4 19.9 19.1 100.0 3448 1310
--
Female 18.0 16.0 24.0 22.0 20.0 100.0
Area
Urban 4.7 23.5 23.5 24.2 24.2 100.0 2760 ***
Rural 85.7 5.7 5.7 2.9 0.0 100.0 1998
Number of household members
1-5 27.7 18.5 15.4 20.0 18.5 100.0 691 **
6-10 18.4 21.8 21.8 20.7 17.2 100.0 2265
11+ 11.4 20.0 22.9 20.0 25.7 100.0 1802
Education of household head
None 25.0 50.0 12.5 12.5 0.0 100.0 350 ***
Primary 30.3 21.2 24.2 12.1 12.1 100.0 1142
Secondary 22.2 23.3 18.9 22.2 13.3 100.0 2275
Higher 9.4 9.4 22.6 22.6 35.8 100.0 991
Religion
Assembly of God 18.5 29.6 14.8 22.2 14.8 100.0 15.7 *
Protestant 25.0 17.7 15.6 22.9 18.8 100.0 56.2
Catholic 5.9 11.8 17.6 23.5 41.2 100.0 6.9
Other 15.2 23.9 32.6 13.0 15.2 100.0 21.3
* P<0.05, ** P<0.01, *** P<0.001
Wealth index quintiles are constructed by using data on housing characteristics, household and personal assets, and on water and sanitation via principal components analysis.
Household Food Security Status
Food security is “the condition in which all people at all times have physical, social, and economic
access to sufficient, safe, and nutritious food that meets their dietary needs and food preferences
for an active and healthy life”26. Food security requires sufficient supply of food, physical and
economic access to food, and proper utilization of food through safe preparation methods, equitable
food consumption in the household, and good health status to properly absorb nutrients from food
to meet physiological requirements27. In order for a household to be food secure, all members of the
household must not only have sufficient quantity of food to meet their caloric requirements, but
26 FAO. 2002. The State of Food Insecurity in the World 2001. 27 https://publichealthreviews.biomedcentral.com/articles/10.1186/s40985-017-0056-5

P a g e | 22
also the types of food they prefer to consume. Multiple political, economic, social, cultural, and
environmental factors affect food security, with seasonal food shortages common during the “lean”
season when harvest crops are depleted and desirable foods like fruits, vegetables, meat, and dairy
products are not readily available. The lack of food security, due to inadequate access to sufficient
calories and to a variety of nutrient‐dense foods, is a leading cause of global malnutrition.
There are various factors affecting household food security that vary by area and season. Standard
indicators have been developed to assess household food security across countries and within
countries. The most commonly used measure is the Household Food Insecurity Access Scale
(HFIAS)28 which is used to assess prevalence of household food insecurity based on a household’s
access to sufficient quantity of food and the types of foods household members prefer to consume.
The HFIAS is a particularly useful measure for identifying vulnerable households for targeted
interventions and for assessing changes in prevalence of household food insecurity over time.
The HFIAS questions (Table HH.9a) are grouped based on anxiety or uncertainty about household
food supply and the household’s access to sufficient quality and quantity of food for all households
with a child under 2 years of age. The physical consequences or behaviours taken by household
members to adapt to a lack of food quality and quantity, such as eating non‐preferred foods or
having smaller meals, are also examined.
In RMI, the majority of households with children under two years, 59.8 percent, were food secure
while 40.2 percent of households had some level of food insecurity. Households with mild food
insecurity (7.1 percent) have anxiety or worry about not having enough food to eat and may resort
to eating non‐preferred foods, however do not have to restrict their intake of food. Moderate food
insecurity is classified in households by food restriction with a family member needing to eat smaller
meals or eat fewer meals due to food insecurity. In RMI, 13.4 percent of households had moderate
food insecurity. Severe food insecurity occurred in 19.7 percent of households where the household
did not have any food in the house, a family member went to bed hungry at night or a family
member went a whole day and night without eating due to food insecurity.
28 Coates, Jennifer, Anne Swindale and Paula Bilinsky. 2007. Household Food Insecurity Access Scale (HFIAS) for Measurement of Household Food Access: Indicator Guide (v. 3). Washington, D.C.: FHI 360/FANTA.
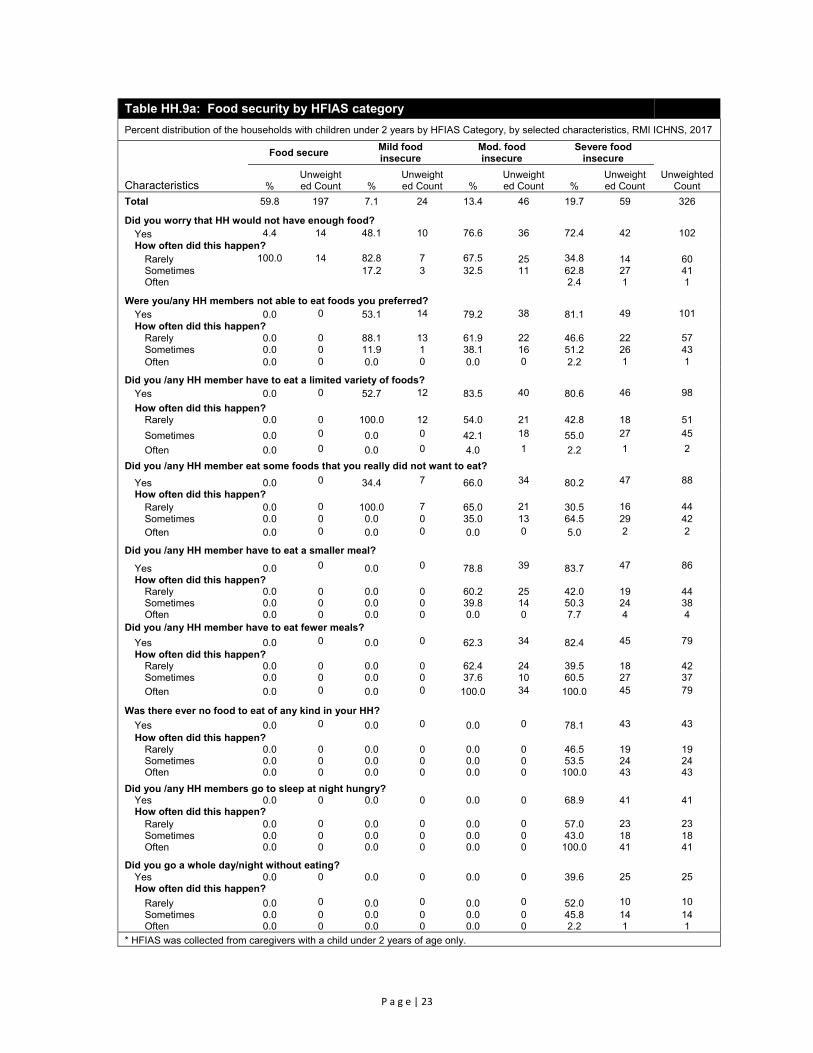
P a g e | 23
Table HH.9a: Food security by HFIAS category
Percent distribution of the households with children under 2 years by HFIAS Category, by selected characteristics, RMI ICHNS, 2017
Characteristics
Food secure Mild food insecure
Mod. food insecure
Severe food insecure
Unweighted Count %
Unweighted Count %
Unweighted Count %
Unweighted Count %
Unweighted Count
Total 59.8 197 7.1 24 13.4 46 19.7 59 326
Did you worry that HH would not have enough food? Yes 4.4 14 48.1 10 76.6 36 72.4 42 102 How often did this happen?
Rarely 100.0 14 82.8 7 67.5 25 34.8 14 60 Sometimes 17.2 3 32.5 11 62.8 27 41 Often 2.4 1 1
Were you/any HH members not able to eat foods you preferred? Yes 0.0 0 53.1 14 79.2 38 81.1 49 101 How often did this happen?
Rarely 0.0 0 88.1 13 61.9 22 46.6 22 57 Sometimes 0.0 0 11.9 1 38.1 16 51.2 26 43 Often 0.0 0 0.0 0 0.0 0 2.2 1 1
Did you /any HH member have to eat a limited variety of foods? Yes 0.0 0 52.7 12 83.5 40 80.6 46 98
How often did this happen? Rarely 0.0 0 100.0 12 54.0 21 42.8 18 51
Sometimes 0.0 0 0.0 0 42.1 18 55.0 27 45
Often 0.0 0 0.0 0 4.0 1 2.2 1 2
Did you /any HH member eat some foods that you really did not want to eat?
Yes 0.0 0 34.4 7 66.0 34 80.2 47 88
How often did this happen? Rarely 0.0 0 100.0 7 65.0 21 30.5 16 44 Sometimes 0.0 0 0.0 0 35.0 13 64.5 29 42 Often 0.0 0 0.0 0 0.0 0 5.0 2 2
Did you /any HH member have to eat a smaller meal?
Yes 0.0 0 0.0 0 78.8 39 83.7 47 86
How often did this happen? Rarely 0.0 0 0.0 0 60.2 25 42.0 19 44 Sometimes 0.0 0 0.0 0 39.8 14 50.3 24 38 Often 0.0 0 0.0 0 0.0 0 7.7 4 4
Did you /any HH member have to eat fewer meals?
Yes 0.0 0 0.0 0 62.3 34 82.4 45 79 How often did this happen?
Rarely 0.0 0 0.0 0 62.4 24 39.5 18 42 Sometimes 0.0 0 0.0 0 37.6 10 60.5 27 37
Often 0.0 0 0.0 0 100.0 34 100.0 45 79
Was there ever no food to eat of any kind in your HH?
Yes 0.0 0 0.0 0 0.0 0 78.1 43 43 How often did this happen?
Rarely 0.0 0 0.0 0 0.0 0 46.5 19 19 Sometimes 0.0 0 0.0 0 0.0 0 53.5 24 24 Often 0.0 0 0.0 0 0.0 0 100.0 43 43
Did you /any HH members go to sleep at night hungry? Yes 0.0 0 0.0 0 0.0 0 68.9 41 41 How often did this happen?
Rarely 0.0 0 0.0 0 0.0 0 57.0 23 23 Sometimes 0.0 0 0.0 0 0.0 0 43.0 18 18 Often 0.0 0 0.0 0 0.0 0 100.0 41 41
Did you go a whole day/night without eating? Yes 0.0 0 0.0 0 0.0 0 39.6 25 25 How often did this happen?
Rarely 0.0 0 0.0 0 0.0 0 52.0 10 10 Sometimes 0.0 0 0.0 0 0.0 0 45.8 14 14 Often 0.0 0 0.0 0 0.0 0 2.2 1 1
* HFIAS was collected from caregivers with a child under 2 years of age only.

P a g e | 24
Table HH.9b presents the distribution of sampled households with a child under 2 years of age
according to their food security status as measured by the Household Food Insecurity Access Scale.
Overall, 40.2 percent of households were food insecure with mild, moderate or severe food
insecurity. There were no differences between urban and rural areas however there was a strong
association between food insecurity and household wealth. Poor households had the highest
prevalence of food insecurity with 51.3 percent of the poorest households and 61.1 percent of the
second poorest household’s having food insecurity. Households where open defecation was
practiced also had higher prevalence of food insecurity with 54.4 percent of household food insecure
compared to 38.3 percent of households with improved sanitation.
Table HH.9b: Percent distribution of household by HFIAS category
Percent distribution of the households with a child under 2 years by HFIAS category, by selected characteristics, RMI ICHNS, 2017
Characteristics Household
number
Food secure Food insecure
P-value Percent
95% CI Unweighted
Count Percent
95% CI Unweighted
Count Lower Upper Lower Upper
Total 326 59.8 53.3 66.1 197 40.2 33.9 46.7 129 --
Area
Urban 180 59.9 52.2 67.2 107 40.1 32.8 47.8 73 --
Rural 146 59.6 51.1 67.6 90 40.4 32.4 48.9 56
Wealth index quintile
Poorest 139 48.7 38.7 58.9 79 51.3 41.1 61.3 60 ***
Second 53 38.9 25.8 53.8 22 61.1 46.2 74.2 31
Middle 56 64.1 49.3 76.6 38 -- -- --
18
Fourth 43 72.9 56.9 84.6 31 -- -- --
12
Richest 35 78.9 62.3 89.4 27 -- -- --
8
Gender of Household Head
Male 234 62.1 54.2 69.3 149 37.9 30.7 45.8 85 --
Female 92 54.3 42.4 65.7 48 45.7 34.3 57.6 44
Number of household members
5 or less 63 64.2 49.2 76.9 38 35.8 23.1 50.8 25 --
6-10 164 54.2 44.7 63.5 96 45.8 36.5 55.3 68
11 or more 99 64.7 53.7 74.3 63 35.3 25.7 46.3 36
Improved Sanitation Facility
Improved 253 61.7 54.5 68.5 162 38.3 31.5 45.5 91 *
Open Defecation 73 45.6 32.3 59.5 35 54.4 40.5 67.7 38
* P<0.05, ** P<0.01, *** P<0.001
P a g e | 25
IV. Nutrition
Low Birth Weight
Weight at birth is a good indicator not only of a mother's health and nutritional status but also the
newborn's chances for survival, growth, long‐term health and psychosocial development. Low birth
weight (defined as less than 2,500 grams) carries a range of grave health risks for children. Babies
who were undernourished in the womb face a greatly increased risk of dying during their early days,
months and years. Those who survive may have impaired immune function and increased risk of
disease; they are likely to remain undernourished, with reduced muscle strength, throughout their
lives, and suffer a higher incidence of diabetes and heart disease in later life. Children born with low
birth weight also risk a lower IQ and cognitive disabilities, affecting their performance in school and
their job opportunities as adults.
In the developing world, low birth weight stems primarily from the mother's poor health and
nutrition. Three factors have most impact: the mother's poor nutritional status before conception,
short stature (due mostly to undernutrition and infections during her childhood), and poor nutrition
during pregnancy. Inadequate weight gain during pregnancy is particularly important since it
accounts for a large proportion of foetal growth retardation. Moreover, diseases such as diarrhoea
and malaria, which are common in many developing countries, can significantly impair foetal growth
if the mother becomes infected while pregnant. Additional causes of low birth weight are cigarette
smoking during pregnancy and becoming pregnant at an early age as young mothers who give birth
when their own bodies have not finished growing have a higher risk of bearing low birth weight
babies.
Babies born with high birth weight (≥ 4000g) are at increased risk for complications during delivery
and negative health outcomes in childhood and later life. High birth weight is primarily due to excess
maternal weight gain and or pre‐existing or gestational diabetes in the mother. Genetics also plays a
role as babies born to overweight or obese mothers are more likely to be large. Babies born over
4000g at birth are at higher risk for hypoglycaemia during the neonatal period and are more likely to
be overweight or obese in childhood and adolescence.
Overall, 89.9 percent of children in RMI were weighed at birth and 11.6 percent of infants are
estimated to weigh less than 2,500 grams at birth while 4.8 percent of infants weighed 4,000 grams
or higher at birth (Table NU.1). Maternal short stature was associated with low birth weight with
25.3 percent of babies born to mothers under 145cm born low birthweight compared to 14.9
percent for mothers 145‐149cm, 10.9 percent for mothers 150‐159cm, and 0.5 percent for mothers
taller than or equal to 160cm. Mothers with primary only education were more likely to have a low
birthweight child (15.1 percent) compared to mothers with secondary (10.3 percent) or higher (8.9
percent) education. Having the father in household was associated with high birth weight at 5.9
percent versus 1.6 percent high birth weight for children not living in the same household as their
father.

P a g e | 26
Table NU.1: Low birth weight and high birth weight infants a
Percentage of last live-born children 0-59 months of age that are estimated to have weighed below 2,500 grams, weighed exactly 2,500 grams or weighed 4,000 grams or higher at birth and percentage of live births weighed at birth, by selected characteristics, RMI ICHNS, 2017
Percentage of live births
Below 2,500 grams1 At 2,500 grams 4,000 grams or higher Number of children b
Weighed at birth2 Number of children Percent Lower Upper P-value Percent Lower Upper P-value Percent Lower Upper P-value Percent P-value
Total 11.6 9.1 14.7 -- 0.9 0.4 2.3 -- 4.8 3.3 6.9 -- 685 89.9 -- 881
Child gender Male 11.1 8.0 15.3 -- 0.9 0.2 3.3 -- 5.0 3.0 8.0 -- 364 91.0 -- 455 Female 12.2 8.5 17.1 1.0 0.3 3.3 4.6 2.7 7.8 321 88.7 426
Area Urban 11.3 8.6 14.8 -- 0.9 0.3 2.5 -- 5.0 3.4 7.3 -- 450 94.6 *** 490 Rural 13.8 9.8 19.2 1.0 0.2 4.1 3.3 1.6 6.7 235 65.9 391
Caregiver's education
None -- -- -- *** -- -- -- -- -- -- -- -- 11 98.0 ** 12
Primary 15.1 8.8 24.7 1.5 0.3 6.4 5.8 2.4 13.2 112 82.0 181
Secondary 10.3 7.3 14.2 0.7 0.2 2.5 3.9 2.4 6.4 428 91.6 529
Higher 8.9 5.0 15.6 1.3 0.2 8.5 7.0 3.6 13.0 133 92.6 155
Wealth index quintile
Poorest 13.3 8.1 21.0 -- 0.8 0.2 3.2 -- 4.2 1.8 9.6 -- 217 69.8 *** 370
Second 16.3 11.0 23.5 1.6 0.4 6.1 3.5 1.4 8.3 146 99.7 152 Middle 7.8 3.9 15.2 0.7 0.1 5.0 6.2 3.2 11.8 126 90.4 144 Fourth 9.4 4.8 17.9 1.6 0.2 10.3 4.6 1.8 11.2 99 95.6 108 Richest 10.5 5.5 19.0 0.0 0.0 0.0 5.6 2.6 11.6 97 93.5 107
Father in Household Yes 12.2 9.2 15.9 -- 0.9 0.3 2.7 -- 5.9 4.0 8.6 * 502 91.3 * 623 No 10.0 6.2 15.8 1.2 0.3 4.6 1.6 0.5 4.8 183 86.3 258
Maternal Short Stature
<145cm 25.3 12.3 44.9 ** 3.7 0.5 25.1 -- 3.7 0.5 22.4 -- 32 91 -- 43
145-149cm 14.9 9.6 22.5 5.8 2.9 5.2 5.8 2.9 11.4 168 89.1 229
150-159cm 10.9 7.9 14.8 4 2.4 2.8 4 2.4 6.4 432 90.3 538
≥160cm 0.5 0.1 3.8 9.6 9.6 0 9.6 3.7 22.7 51 90.2 65
* P<0.05, ** P<0.01, *** P<0.001
1 MICS indicator 2.20- Low birth weight infants below 2,500grams
2 MICS indicator 2.21 - Infants weighed at birth a The percentage of births weighing below 2,500 grams, exactly 2,500 grams and above 4,000 grams is estimated from the mother’s recall of the child’s weight or the information on the health card if the child was weighed at birth. b 33 children were weighted at birth but the caregiver did not know the weight. These children were excluded from the birth weight assessments.

P a g e | 27
Nutrition Status
Children’s nutritional status is a reflection of their overall health. When children have access to an
adequate food supply, are not exposed to repeated illness, and are well cared for, they reach their
growth potential and are considered well nourished.
Undernutrition is associated with more than half of all child deaths worldwide. Undernourished
children are more likely to die from common childhood ailments, and for those who survive, have
recurring sicknesses and faltering growth. Three‐quarters of children who die from causes related to
malnutrition were only mildly or moderately malnourished – showing no outward sign of their
vulnerability. The Sustainable Development Goal target is to end all forms of malnutrition by 2030
and by 2025 to reduce by 40 percent the number of children under 5 who are stunted and reduce
the prevalence of children who are wasted to less than 5 percent. A reduction in the prevalence of
malnutrition will also assist in the goal to reduce child mortality.
In a well‐nourished population, there is a reference distribution of height and weight for children
under age 5. Under‐nourishment in a population can be gauged by comparing children to a
reference population. The reference population used in this report is based on the WHO growth
standards29. Each of the three nutritional status indicators – weight‐for‐age, height‐for‐age, and
weight‐for‐height ‐ can be expressed in standard deviation units (z‐scores) from the median of the
reference population.
Weight‐for‐age is a measure of both acute and chronic malnutrition. Children whose weight‐for‐age
is more than two standard deviations below the median of the reference population are considered
moderately or severely underweight while those whose weight‐for‐age is more than three standard
deviations below the median are classified as severely underweight.
Height‐for‐age is a measure of linear growth. Children whose height‐for‐age is more than two
standard deviations below the median of the reference population are considered short for their age
and are classified as moderately or severely stunted. Those whose height‐for‐age is more than three
standard deviations below the median are classified as severely stunted. Stunting is a reflection of
chronic malnutrition as a result of failure to receive adequate nutrition over a long period and
recurrent or chronic illness.
Weight‐for‐height can be used to assess wasting and overweight status. Children whose weight‐for‐
height is more than two standard deviations below the median of the reference population are
classified as moderately or severely wasted, while those who fall more than three standard
deviations below the median are classified as severely wasted. Wasting is usually the result of a
recent nutritional deficiency. The indicator of wasting may exhibit significant seasonal shifts
associated with changes in the availability of food or disease prevalence.
Children whose weight‐for‐height is more than two standard deviations above the median reference
population are classified as moderately or severely overweight.
29 http://www.who.int/childgrowth/standards/technical_report

P a g e | 28
In the RMI Integrated Child Health and Nutrition Survey 2017 (ICHNS 2017), weights and heights of
all children under 5 years of age were measured using the anthropometric equipment
recommended30 by UNICEF. Findings in this section are based on the results of these measurements.
Tables NU.2a, NU.2b, and NU.2c show percentages of children classified into each of the above
described categories, based on the anthropometric measurements that were taken during fieldwork.
Additionally, the table includes mean z‐scores for all three anthropometric indicators.
Children whose measurements are outside a plausible range are excluded from Tables NU.2a,
NU.2b, and NU.2c. Children are excluded from one or more of the anthropometric indicators when
their weights and heights have not been measured, whichever applicable. For example, if a child has
been weighed but his/her height has not been measured, the child is included in underweight
calculations, but not in the calculations for stunting and wasting. As shown in Table DQ.15 in
Appendix D, there was a higher prevalence of 0 and 5 which indicates that rounding occurred but
within the acceptable range for data quality.
The prevalence of moderate or severe underweight among children under 5 in RMI is reported at
11.7 percent which is classified as a medium public health concern by the WHO (Table NU.2a).
Underweight was associated with child age, the youngest children 0‐5 months of age having the
lowest prevalence at 1.3 percent and the oldest children having the highest prevalence at 15.3
percent. Underweight was also associated with maternal nutrition status with obese mothers having
the lowest prevalence of underweight (8.5 percent) compared to mothers with normal nutrition
status (16.0 percent). Prevalence of underweight was associated with maternal marital status, with
lower prevalence in children of currently married mothers (5.1 percent) compared to children whose
mothers were not married (16.8 percent) or cohabitating (9.6 percent). While not significant, the
prevalence of moderate or severe underweight was highest in children who were born low birth
weight at 23.1 percent and in children whose mothers had short stature at 23.6 percent.
Over one in three children in RMI is moderately or severely stunted or too short for their age with
stunting classified as a high public health concern by the WHO (Table NU.2b). The prevalence of
stunting increased with child age with critically high levels of stunting in children 18‐35 months of
age with over 40 percent of children stunted (Figure NU.1). Stunting was associated with child age
with children 0‐5 months having the lowest prevalence and dramatically increasing between 6 to 23
months of age to 42.8 percent for children 12‐23 months of age after which prevalence plateaued.
Stunting was closely associated with wealth index quintile with children under 5 in the poorest
households in RMI having critically higher levels of moderate or severe stunting (44.5 percent)
compared to children from richer wealth index quintiles. However, in even the wealthiest
households, prevalence of stunting was elevated at 20 percent.
Moderate or severe wasting among children under 5 in RMI was 3.6 percent which is classified as
acceptable by the WHO (Table NU.2c). There was little variation in wasting by household wealth or
age of the child, however wasting surpassed 10 percent in children whose mothers were short
stature (height <145cm) and was 6.7 percent in children whose mothers were 145‐149cm tall.
Prevalence of overweight in children under 5 years was low at 3.8 percent in RMI. Urban children
were more likely to be overweight compared to rural children with 4.3 percent of urban children
overweight compared to 1.3 percent of rural children.
30 See MICS Supply Procurement Instructions: http://www.childinfo.org/mics5_planning.html

P a g e | 29
Table NU.2a: Nutritional status of children: weight-for-age
Percentage of children under age 5 by nutritional status according to anthropometric indices: weight for age, by selected characteristics, RMI ICHNS, 2017
Weight for age
Number of children
under age 5
Underweight (-2 SD)1 Severe Underweight (-3 SD)2 Mean Z-Score (SD)
95% CI P-value
95% CI P-value % Lower Upper % Lower Upper
Total 11.7 9.3 14.5 -- 2.7 1.6 4.5 -- -0.73 863 Child Age
0-5m 1.3 0.4 4.2 * 1.0 0.2 4.0 -- -0.34 80 6-11m 11.5 6.1 20.7 2.8 0.7 10.6 -0.60 105
12-23m 8.2 4.5 14.5 2.7 0.9 8.2 -0.37 169
24-35m 12.1 7.2 19.6 3.3 1.3 8.5 -0.77 167
36-59m 15.3 11.2 20.7 2.8 1.2 6.3 -0.99 342
Child gender
Male 13.5 10.0 18.0 -- 3.0 1.4 5.9 -- -0.8 445
Female 9.7 6.8 13.5 2.5 1.2 4.9 -0.65 418
Area
Urban 11.6 8.9 15.1 -- 2.7 1.5 4.9 -- -0.7 474
Rural 11.8 8.8 15.6 2.6 1.3 5.0 -0.87 389
Caregiver's education
None -- -- -- * -- -- -- -- -- 12
Primary 13.5 8.3 21.3 2.0 0.5 7.9 -0.87 180
Secondary 13.1 9.9 17.2 3.2 1.8 5.8 -0.79 515
Higher 4.1 1.9 8.7 0.8 0.1 5.6 -0.35 152
Wealth index quintile
Poorest 11.7 8.5 15.9 -- 3.0 1.5 5.9 -- -0.92 365
Second 19.2 13.1 27.2 4.0 1.6 9.6 -0.92 150
Middle 9.1 5.2 15.6 2.4 0.7 7.8 -0.72 142
Fourth 10.3 5.4 18.7 2.1 0.5 8.2 -0.64 104
Richest 6.6 2.7 15.3 1.6 0.2 10.7 -0.38 102
Maternal Nutrition Status
Underweight -- -- -- ** -- -- -- -- -- 12
Normal 16.0 10.5 23.6 2.7 0.8 8.2 -0.98 205
Overweight 13.2 8.5 19.9 4.7 2.3 9.4 -0.89 213
Obese 8.5 5.5 13.0 0.9 0.3 3.1 -0.54 301
Maternal Married Status
Not married 16.8 12.3 22.6 ** 2.8 1.3 6.2 -- -0.9 323 Currently married 5.1 2.6 10.1 0.5 0.1 2.1 -0.41 169
Cohabitating 9.6 6.2 14.6 3.5 1.6 7.6 -0.73 279
Child Birthweight
Low Birthweight 23.1 14.2 35.2 ** 4.8 1.4 15.1 -- -1.11 80
Normal 10.6 8.0 14.1 2.3 1.2 4.4 -0.7 555
High Birthweight 0.0 0.0 0.0 0.0 0.0 0.0 0.23 32
Maternal Short Stature
<145cm 23.6 11.1 43.2 ** 0 0 0 -- -1.26 42
145-149cm 17.7 12.5 24.5 4.7 2.2 9.9 -0.91 226
150-159cm 9.5 6.8 13.2 2.1 1 4.3 -0.69 524
>160cm 3.1 0.8 11.1 0 0 0 -0.11 65 * P<0.05, ** P<0.01, *** P<0.001 1 MICS indicator 2.1a - Underweight prevalence (moderate and severe)
2 MICS indicator 2.1b - Underweight prevalence (severe)
The percent ‘below -2 standard deviations’ includes those who fall below -3 standard deviations from the median.

P a g e | 30
Table NU.2b: Nutritional status of children: height-for-age
Percentage of children under age 5 by nutritional status according to anthropometric indices: height for age, by selected characteristics, RMI ICHNS, 2017 Height for age
Number of children
under age 5
Stunted (-2 SD)1 Severe Stunted (-3 SD)2 Mean Z-Score (SD)
95% CI P-value
95% CI P-value % Lower Upper % Lower Upper
Total 35.3 31.5 39.5 -- 10.2 8 12.8 -1.49 871
Child Age
0-5m 13.3 6.7 24.6 *** 4.5 1.3 14.7 -- -0.64 80 6-11m 20.9 13.0 31.8 7.6 3.3 16.7 -1.07 110 12-23m 42.8 34.0 52.0 12.6 7.5 20.4 -1.47 170
24-35m 43.7 34.8 53.0 12.1 7.4 19.1 -1.67 166
36-59m 37.2 31.2 43.5 10.2 7.2 14.4 -1.73 345
Child gender Male 39.7 34.3 45.3 * 10.7 7.7 14.7 -- -1.66 451 Female 30.6 25.6 36.2 9.6 6.9 13.4 -1.31 420
Area Urban 34.6 30.2 39.2 -- 9.6 7.1 12.7 -- -1.47 486 Rural 39.1 34.2 44.2 13.3 10.2 17.3 -1.62 385
Caregiver's education
None -- -- -- ** -- -- -- ** -2.06 12 Primary 41.3 32.7 50.5 17.7 11.6 26.0 -1.78 181 Secondary 37.8 32.9 43.0 9.4 6.9 12.7 -1.53 520 Higher 20.9 14.5 29.0 3.8 1.6 8.9 -1.07 154
Wealth index quintile
Poorest 44.5 38.0 51.2 ** 14.4 10.3 19.8 * -1.74 364
Second 42.0 33.8 50.7 13.5 8.7 20.5 -1.7 151
Middle 37.4 29.2 46.4 11.0 6.5 18.0 -1.54 143
Fourth 29.4 20.7 39.9 8.5 4.1 16.8 -1.33 107
Richest 20.0 12.9 29.7 2.1 0.5 7.9 -1.05 106
Religion
Assembly of God 33.6 24.7 43.9 ** 9.0 4.6 16.8 -- -1.44 129
Protestant 39.6 34.1 45.3 12.9 9.5 17.1 -1.66 479
Catholic 10.2 4.8 20.4 3.1 0.9 9.9 -0.65 68
Other 35.9 28.7 43.7 8.0 4.8 13.0 -1.47 195
Maternal Nutrition Status
Underweight -- -- -- -- -- -- -- -- -- 12 Normal 43.0 34.8 51.6 9.7 5.7 16.2 -1.68 204 Overweight 38.0 30.6 46.0 13.0 8.8 18.9 -1.64 215 Obese 32.3 26.2 38.9 8.5 5.4 13.2 -1.36 306
Maternal Married Status
Not married 41.1 34.8 47.6 * 12.6 8.9 17.5 -- -1.65 327 Currently married 26.4 19.3 34.8 6.5 3.3 12.3 -1.12 173 Cohabitating 35.0 28.5 42.0 8.9 5.7 13.8 -1.54 279
Child Birthweight
Low Birthweight 51.8 39.2 64.2 * 24.1 15.1 36.2 *** -2.07 81 Normal 33.1 28.7 37.9 8.0 5.8 11.1 -1.42 561 High Birthweight 26.4 13.2 46.0 4.9 1.1 19.6 -0.98 34
Maternal Short Stature <145cm 44.2 28 61.7 ** 22 10.4 40.7 * -1.87 42 145-149cm 43.1 35.4 51.1 13.5 9 19.7 -1.73 226
150-159cm 34.4 29.6 39.5 8.8 6.3 12.1 -1.47 532 >160cm 14.6 7.4 26.7 4.5 1.6 11.9 -0.71 65
* P<0.05, ** P<0.01, *** P<0.001
1 MICS indicator 2.2a and SDG Indicator-2.2.1- Stunting prevalence (moderate and severe) 2 MICS indicator 2.2b - Stunting prevalence (severe)
The percent ‘below -2 standard deviations’ includes those who fall below -3 standard deviations from the median.

P a g e | 31
Table NU.2c: Nutritional status of children: weight-for-height
Percentage of children under age 5 by nutritional status according to anthropometric indices: weight for height, by selected characteristics, RMI ICHNS, 2017
Weight for height Number
of children under age 5
Wasted (-2 SD)1 Severe Wasted (-3 SD)2
Overweight Mean Z-
Score (SD) %
95% CI P-value %
95% CI P-value %
95% CI P-value Lower Upper Lower Upper Lower Upper
Total 3.6 2.4 5.6 -- 1.1 0.5 2.6 -- 3.8 2.5 5.8 -- 0.19 858
Child Age
0-5m 4.7 1.7 12.6 -- 1.9 0.4 9.0 -- 6.0 1.7 19.5 * 0.18 79
6-11m 5.7 2.5 12.5 1.0 0.2 3.9 2.7 0.8 9.1 0.09 105
12-23m 3.6 1.3 9.7 0.0 0.0 0.0 8.8 4.6 16.0 0.46 169
24-35m 4.2 1.8 9.7 1.7 0.4 6.6 3.9 1.5 9.5 0.2 165
36-59m 2.5 0.9 6.5 1.3 0.3 5.1 1.3 0.5 3.7 0.09 340
Mother's age at birth
< 20 years 0.8 0.2 3.2 -- 0.5 0.1 3.4 -- 5.9 2.2 15.0 -- 0.37 111
20-34 years 4.6 2.9 7.2 1.3 0.5 3.3 3.4 1.9 5.8 0.16 541
35-49 years 3.5 0.6 18.1 0.0 0.0 0.0 1.7 0.3 8.1 -0.08 90
Child gender
Male 4.8 2.8 8.2 -- 0.9 0.2 3.5 -- 4.8 2.8 7.9 -- 0.19 443 Female 2.4 1.2 4.7 1.4 0.5 3.7 2.8 1.4 5.6 0.18 415
Area
Urban 3.6 2.2 6.0 -- 1.2 0.5 3.0 -- 4.3 2.8 6.7 ** 0.21 473 Rural 3.6 2.1 6.2 0.9 0.3 2.9 1.3 0.6 2.8 0.08 385
Caregiver's education
None -- -- -- -- -- -- -- -- -- -- -- -- -- 12 Primary 3.0 1.2 7.7 0.0 0.0 0.0 1.9 0.5 7.2 0.19 180 Secondary 4.3 2.5 7.2 1.3 0.5 3.3 4.7 2.8 7.7 0.14 511 Higher 1.6 0.5 5.0 0.8 0.1 5.6 3.6 1.4 8.5 0.35 151
Wealth index quintile
Poorest 3.2 1.8 5.6 -- 0.8 0.2 2.6 -- 0.9 0.4 2.3 -- 0.12 362 Second 7.4 3.8 14.1 1.2 0.3 4.8 2.6 1.0 6.4 0.09 149 Middle 1.7 0.4 6.7 1.0 0.1 7.0 5.7 2.7 11.6 0.27 141 Fourth 3.0 0.9 8.9 1.0 0.1 7.1 2.6 0.6 10.5 0.16 104 Richest 2.5 0.6 10.0 1.6 0.2 10.7 7.0 3.3 14.0 0.3 102
Maternal Nutrition Status
Underweight 12.3 2.6 42.2 -- 0.0 0.0 0.0 -- 0.0 0.0 0.0 -- -0.71 12 Normal 5.0 2.4 10.3 1.0 0.2 4.5 3.0 1.1 7.9 -0.05 203 Overweight 5.8 2.8 11.8 2.2 0.6 7.2 3.6 1.5 8.3 0.15 212 Obese 1.5 0.6 3.8 0.4 0.1 2.6 3.4 1.6 7.0 0.32 299
Father in Household
Yes 4.1 2.5 6.6 -- 1.2 0.5 3.0 -- 3.1 1.8 5.2 -- 0.17 603 No 3.1 1.3 7.6 1.2 0.2 6.3 4.7 2.1 10.2 0.12 218
Child Birthweight
Low Birthweight 4.8 1.7 12.5 -- 1.5 0.2 9.8 -- 3.7 0.9 14.3 -- 0.11 81 Normal 3.8 2.2 6.3 0.9 0.3 2.7 3.9 2.3 6.4 0.16 561 High Birthweight 0.0 0.0 0.0 0.0 0.0 0.0 14.5 5.5 33.0 1.04 34
Maternal Short Stature
<145cm 10.6 3.5 28.1 ** 1.7 0.2 11.1 ** 0 0 0 -- -0.27 42 145-149cm 6.7 3.5 12.2 3.2 1.1 8.6 4.7 2.1 10 0.17 224 150-159cm 2.2 1.1 4.5 0.1 0 0.6 4.2 2.5 6.9 0.21 521 >160cm 0 0 0 0 0 0 0.4 0.1 2.7 0.41 67
* P<0.05, ** P<0.01, *** P<0.001 1 MICS indicator 2.3a and SDG indicator 2.2.2 - Wasting prevalence (moderate and severe)2 MICS indicator 2.3b - Wasting prevalence (severe) 7 MICS indicator 2.4 and SDG indicator 2.2.2 - Overweight prevalence
The percent ‘below -2 standard deviations’ includes those who fall below -3 standard deviations from the median.
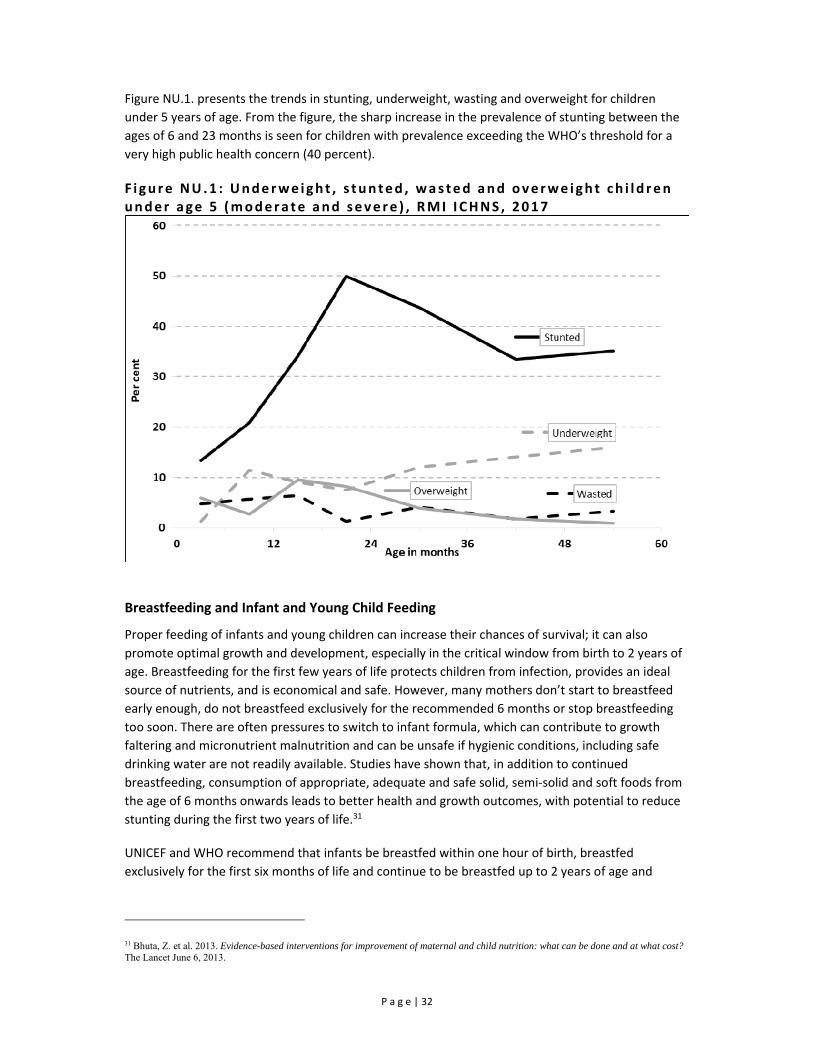
P a g e | 32
Figure NU.1. presents the trends in stunting, underweight, wasting and overweight for children
under 5 years of age. From the figure, the sharp increase in the prevalence of stunting between the
ages of 6 and 23 months is seen for children with prevalence exceeding the WHO’s threshold for a
very high public health concern (40 percent).
F i gure NU.1 : Underwe ight , s tunted , wasted and overwe igh t ch i ld ren under age 5 (modera te and seve re ) , RMI I CHNS , 2017
Breastfeeding and Infant and Young Child Feeding
Proper feeding of infants and young children can increase their chances of survival; it can also
promote optimal growth and development, especially in the critical window from birth to 2 years of
age. Breastfeeding for the first few years of life protects children from infection, provides an ideal
source of nutrients, and is economical and safe. However, many mothers don’t start to breastfeed
early enough, do not breastfeed exclusively for the recommended 6 months or stop breastfeeding
too soon. There are often pressures to switch to infant formula, which can contribute to growth
faltering and micronutrient malnutrition and can be unsafe if hygienic conditions, including safe
drinking water are not readily available. Studies have shown that, in addition to continued
breastfeeding, consumption of appropriate, adequate and safe solid, semi‐solid and soft foods from
the age of 6 months onwards leads to better health and growth outcomes, with potential to reduce
stunting during the first two years of life.31
UNICEF and WHO recommend that infants be breastfed within one hour of birth, breastfed
exclusively for the first six months of life and continue to be breastfed up to 2 years of age and
31 Bhuta, Z. et al. 2013. Evidence-based interventions for improvement of maternal and child nutrition: what can be done and at what cost? The Lancet June 6, 2013.
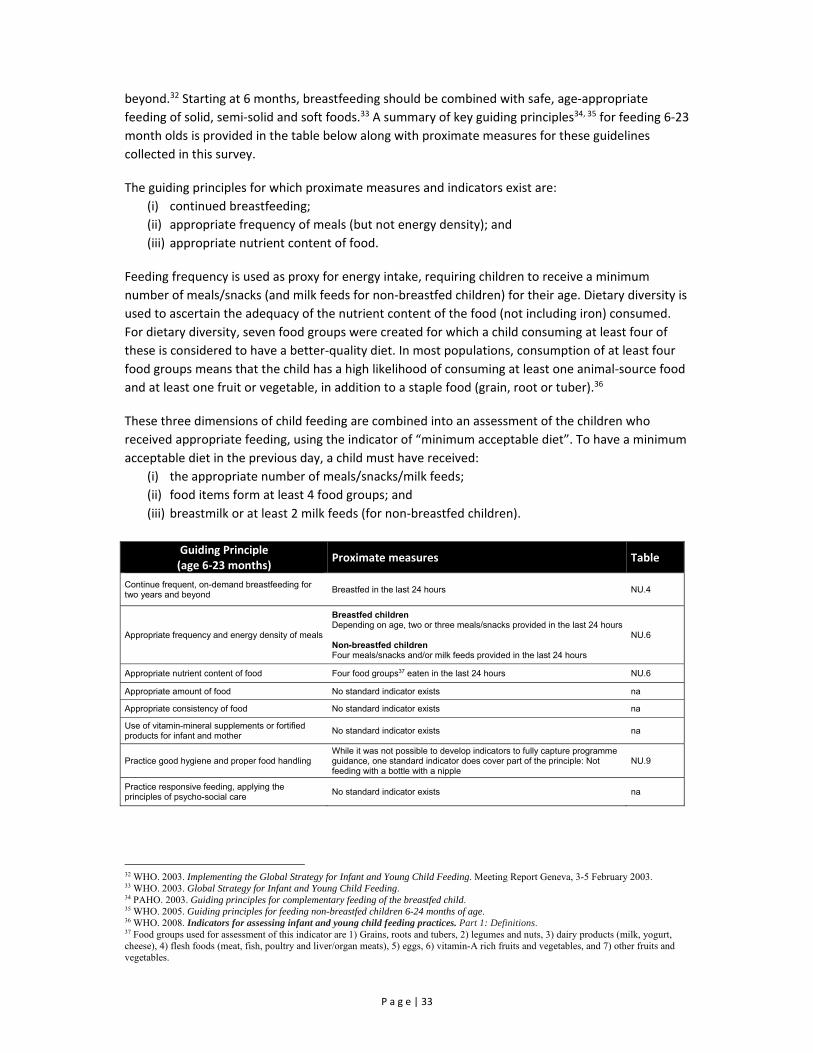
P a g e | 33
beyond.32 Starting at 6 months, breastfeeding should be combined with safe, age‐appropriate
feeding of solid, semi‐solid and soft foods.33 A summary of key guiding principles34, 35 for feeding 6‐23
month olds is provided in the table below along with proximate measures for these guidelines
collected in this survey.
The guiding principles for which proximate measures and indicators exist are:
(i) continued breastfeeding;
(ii) appropriate frequency of meals (but not energy density); and
(iii) appropriate nutrient content of food.
Feeding frequency is used as proxy for energy intake, requiring children to receive a minimum
number of meals/snacks (and milk feeds for non‐breastfed children) for their age. Dietary diversity is
used to ascertain the adequacy of the nutrient content of the food (not including iron) consumed.
For dietary diversity, seven food groups were created for which a child consuming at least four of
these is considered to have a better‐quality diet. In most populations, consumption of at least four
food groups means that the child has a high likelihood of consuming at least one animal‐source food
and at least one fruit or vegetable, in addition to a staple food (grain, root or tuber).36
These three dimensions of child feeding are combined into an assessment of the children who
received appropriate feeding, using the indicator of “minimum acceptable diet”. To have a minimum
acceptable diet in the previous day, a child must have received:
(i) the appropriate number of meals/snacks/milk feeds;
(ii) food items form at least 4 food groups; and
(iii) breastmilk or at least 2 milk feeds (for non‐breastfed children).
Guiding Principle (age 6‐23 months)
Proximate measures Table
Continue frequent, on-demand breastfeeding for two years and beyond
Breastfed in the last 24 hours NU.4
Appropriate frequency and energy density of meals
Breastfed children Depending on age, two or three meals/snacks provided in the last 24 hours Non-breastfed children Four meals/snacks and/or milk feeds provided in the last 24 hours
NU.6
Appropriate nutrient content of food Four food groups37 eaten in the last 24 hours NU.6
Appropriate amount of food No standard indicator exists na
Appropriate consistency of food No standard indicator exists na
Use of vitamin-mineral supplements or fortified products for infant and mother
No standard indicator exists na
Practice good hygiene and proper food handling While it was not possible to develop indicators to fully capture programme guidance, one standard indicator does cover part of the principle: Not feeding with a bottle with a nipple
NU.9
Practice responsive feeding, applying the principles of psycho-social care
No standard indicator exists na
32 WHO. 2003. Implementing the Global Strategy for Infant and Young Child Feeding. Meeting Report Geneva, 3-5 February 2003. 33 WHO. 2003. Global Strategy for Infant and Young Child Feeding. 34 PAHO. 2003. Guiding principles for complementary feeding of the breastfed child. 35 WHO. 2005. Guiding principles for feeding non-breastfed children 6-24 months of age. 36 WHO. 2008. Indicators for assessing infant and young child feeding practices. Part 1: Definitions. 37 Food groups used for assessment of this indicator are 1) Grains, roots and tubers, 2) legumes and nuts, 3) dairy products (milk, yogurt, cheese), 4) flesh foods (meat, fish, poultry and liver/organ meats), 5) eggs, 6) vitamin-A rich fruits and vegetables, and 7) other fruits and vegetables.

P a g e | 34
Table NU.3: Initial breastfeeding Percentage of last live-born children in the last two years who were ever breastfed, breastfed within one hour of birth, and within one day of birth, and percentage who received a pre-lacteal feed, by selected characteristics, RMI ICHNS, 2017
Percentage who were ever breastfed1
Percentage who were first breastfed: Number of last live-
born children in the last two
years a
Percentage who received a pre-lacteal feed
Number of last live-
born children in the last two
years a
Within one hour of birth2 Within one day of birth
Percent Lower Upper P-
value Percent Lower Upper P-
value Percent Lower Upper P-
value Percent Lower Upper P-
value Total 87.4 82.1 91.3 -- 60.8 54.5 66.8 -- 64.5 58.1 70.3 -- 355 24.4 18.8 31.1 -- 273
Child gender Male 88.6 81.3 93.3 -- 58.3 49.7 66.5 -- 62.1 53.4 70.1 -- 195 24.2 16.9 33.4 -- 149
Female 86.0 77.4 91.7 63.9 54.4 72.3 67.3 57.9 75.5 160 24.8 16.7 35.1 124 Area
Urban 86.9 80.5 91.4 -- 61.0 53.4 68.1 -- 64.0 56.4 70.9 -- 188 24.3 17.8 32.2 -- 149 Rural 89.8 83.9 93.7 60.2 52.3 67.6 66.7 59.0 73.7 167 25.2 18.0 33.9 124
Wealth index quintile
Poorest 83.1 71.2 90.7 -- 56.3 46.1 66.1 -- 60.3 49.9 69.9 -- 161 23.8 16.0 33.9 -- 117 Second 88.7 73.1 95.8 60.8 45.0 74.6 68.6 52.5 81.2 48 25.8 14.2 42.2 41
Middle 93.9 82.1 98.1 74.0 60.5 84.0 74.6 61.1 84.6 59 27.2 15.8 42.6 48
Fourth 89.9 74.3 96.5 54.8 38.3 70.3 57.3 40.6 72.5 42 24.8 11.6 45.4 33 Richest 80.6 64.4 90.5 54.7 39.2 69.3 59.0 43.2 73.0 45 19.8 9.0 37.9 34
Maternal Married Status
Not married 86.0 76.3 92.2 * 66.3 56.0 75.2 -- 70.9 60.7 79.4 -- 140 28.6 19.9 39.3 -- 120 Currently married 82.3 66.9 91.5 60.1 45.5 73.0 65.9 51.1 78.2 64 21.3 11.2 36.8 53 Cohabitating 96.2 88.9 98.7 67.4 56.3 76.8 69.1 58.0 78.4 119 21.6 13.2 33.3 99
Father in Household Yes 90.3 84.1 94.2 * 64.9 57.5 71.6 * 68.2 60.8 74.7 * 255 26.1 19.7 33.8 -- 211 No 79.0 67.0 87.5 48.8 36.8 61.0 53.5 41.2 65.4 100 17.9 8.7 33.4 62
Assistance at delivery Skilled attendant 93.3 87.2 96.6 -- 81.3 74.2 86.8 -- 86.0 79.1 90.9 -- 220 24.5 18.5 31.6 -- 225 Traditional birth
attendant 85.5 56.9 96.3 77.5 54.5 90.9 83.9 56.9 95.3 45 18.2 9.1 33.0 45
Delivered in Health Facility Yes 92.9 86.8 96.3 -- 81.0 74.0 86.5 -- 85.6 78.7 90.5 -- 237 23.8 18.0 30.8 -- 242 No 90.1 54.6 98.6 80.3 52.0 93.9 88.5 56.4 97.9 28 25.6 10.4 50.4 28
* P<0.05, ** P<0.01, *** P<0.001 1 MICS indicator 2.5 - Children ever breastfed 2 MICS indicator 2.6 - Early initiation of breastfeeding a A total of 362 children 0-23 months of age were included in the survey, however 7 children are excluded due to missing the infant and young child feeding component of the questionnaire and 89 children are missing from the prelacteal feeding questions.

P a g e | 35
Table NU.3 is based on mothers’ reports of what their last live‐born child, born in the last two years,
was fed in the first few days of life. It indicates the proportion who were ever breastfed, those who
were first breastfed within one hour and one day of birth, and those who received a pre‐lacteal
feed.38 Although a very important step in management of lactation and establishment of a physical
and emotional relationship between the baby and the mother, only 60.8 percent of babies are
breastfed for the first time within one hour of birth and only 64.5 percent of newborns in RMI start
breastfeeding within one day of birth. Initial breastfeeding practices did not differ by area or
household wealth, however children with their fathers in the household had higher prevalence of
ever breastfed, breastfed within one hour, and breastfed within one day. The findings are presented
in Figure NU.2 by area and presence of the father in the household.
F i gure NU.2 : I n i t i a t ion of breas t feed ing , RMI I CHNS , 2017
The set of Infant and Young Child Feeding indicators reported in tables NU.4 through NU.8 and
Figure NU.3 are based on the mother’s report of consumption of food and fluids during the day or
night prior to being interviewed. Data are subject to a number of limitations, some related to the
respondent’s ability to provide a full report on the child’s liquid and food intake due to recall errors
as well as lack of knowledge in cases where the child was fed by other individuals.
Figure NU.3 shows the detailed pattern of breastfeeding by the child’s age in months. Even at 0‐3
months, almost half (46.4 percent) of children are receiving liquids or foods other than breast milk,
with other milk or formula being of highest prevalence. At age 4‐5 months, only 1 in 3 children (33.3
percent) is exclusively breastfed. By the time a child is 6‐7 month of age, 44.4 percent are no longer
breastfed.
38 Prelacteal feed refers to the provision any liquid or food, other than breastmilk, to a newborn during the period when breastmilk flow is generally being established (estimated here as the first 3 days of life).

P a g e | 36
F i gure NU.3 : I n fant feed ing pat te rns by age , RMI I CHNS , 2017
In Table NU.4, breastfeeding status is presented for both Exclusively breastfed and Predominantly
breastfed; referring to infants age less than 6 months who are breastfed, distinguished by the former
only allowing vitamins, mineral supplements, and medicine and the latter allowing also plain water
and non‐milk liquids. The table also shows continued breastfeeding of children at 12‐15 and 20‐23
months of age.
An estimated 42.3 percent of children under 6 months old are exclusively breastfed and 50.9 percent
are predominantly breastfed. By age 12‐15 months, 40.5 percent of children are breastfed and by
age 20‐23 months, 34.2 percent are breastfed.
Given the small sample size of the survey there was limited power to detect significant difference by
key characteristics for breastfeeding indicators. Prevalence of continued breastfeeding at age 12‐15
months was found to be higher in female children (49.6 percent) compared to their male
counterparts (29.9 percent) however this difference was not statistically significant.

P a g e | 37
Table NU.4: Breastfeeding
Percentage of living children according to breastfeeding status at selected age groups, by selected characteristics, RMI ICHNS, 2017
Children age 0-5 months
Children age 12-15 months Children age 20-23 months
Percent exclusively breastfed1
Percent predominantly breastfed2 Number
of children
a
Percent breastfed (Continued breastfeeding at 1 year)3 Number
of children
b
Percent breastfed (Continued breastfeeding at 2 years)4 Number
of children
c Percent Lower Upper Percent Lower Upper Percent Lower Upper Percent Lower Upper
Total 42.3 29.4 56.5 50.9 37.2 64.4 75 40.5 26.6 56.1 56 34.2 21.5 49.6 62
Child gender
Male 41.4 25.2 59.8 54.8 36.6 71.8 42 29.9 13.9 53.0 26 22.7 11.2 40.6 38
Female 43.7 24.4 65.2 45.0 25.5 66.2 33 49.6 29.5 69.8 30 -- -- -- 24
Area
Urban 39.6 24.1 57.5 49.2 32.5 66.1 35 38.4 22.9 56.6 32 36.0 20.6 55.0 30
Rural 51.6 35.9 67.0 56.4 40.4 71.2 40 -- -- -- 24 27.6 15.0 45.0 32 1 MICS indicator 2.7 - Exclusive breastfeeding under 6 months
2 MICS indicator 2.8 - Predominant breastfeeding under 6 months
3 MICS indicator 2.9 - Continued breastfeeding at 1 year
4 MICS indicator 2.10 - Continued breastfeeding at 2 years
Children exclusively breastfed: Children currently breastfeeding and no other liquid or food given with the exception of ORS and medicines.
Children predominantly breastfed: Children currently breastfeeding who are either exclusively breastfed or receiving plain water and non-milk liquids only with no animal milk or formula provided.
Titles of indicators on continued breastfeeding at 1 and 2 years reflect approximations of the age ranges covered.
a There were a total of 80 children 0-5 months of age in the survey, however 5 children did not have complete breastfeeding and feeding information.
b There were a total of 57 children 12-15 months of age however 1 child did not have complete breastfeeding and feeding information.
c There were 62 children 20-23 months of age with all children having complete breastfeeding and feeding information

P a g e | 38
The age‐appropriateness of breastfeeding of children under 24 months of age is provided in Table
NU.6. Different criteria of feeding are used depending on the age of the child. For infants aged 0‐5
months, exclusive breastfeeding is considered age‐appropriate feeding, while children aged 6‐23
months are considered to be appropriately fed if they are receiving breast milk and solid, semi‐solid
or soft food. In RMI, 42.3 percent of children 0‐5 are exclusively breastfed and only 39.2 percent of
children aged 6‐23 months are being appropriately breastfed and given solid, semi‐solid or soft
foods. A total of 39.8 percent of children aged 0‐23 months are being appropriately breastfed. While
there were no significant differences in the age‐appropriate breastfeeding indictors and selected
characteristics, there was a trend for higher appropriate breastfeeding of children 6‐23 months and
0‐23 months in rural areas compared to urban. Additionally, girls received higher appropriate
breastfeeding at both 6‐23 months and 0‐23 months of age compared to boys. Similarly, children age
0‐23 months living in households from the three poorer wealth quintiles (35.9 percent, 54.4 percent,
42.7 percent) are more likely to be appropriately breastfed and given solid, semi‐solid or soft foods
than the two richest wealth index quintiles (29.6 percent, 31.2 percent).
Table NU.6: Age-appropriate breastfeeding
Percentage of children age 0-23 months who were appropriately breastfed during the previous day, by selected characteristics, RMI ICHNS, 2017
Children age 0-5 months Children age 6-23 months Children age 0-23 months
Percent exclusively breastfed1
Number of children a
Percent currently breastfeeding and receiving
solid, semi-solid or soft foods
Number of
children b
Percent appropriately
breastfed2
Number of
children c
Total 42.3 75 39.2 280 39.8 355
Child gender
Male 41.4 42 36.6 153 37.6 195
Female 43.7 33 42.2 127 42.5 160
Area
Urban 39.6 35 38.3 153 38.5 188
Rural 51.6 40 43.7 127 45.6 167
Wealth index quintile
Poorest 42.6 39 35.9 122 37.5 161
Second -- 8 54.4 40 51.9 48
Middle -- 10 42.7 49 43.8 59
Fourth -- 8 29.6 34 27.8 42
Richest -- 10 31.2 35 37.1 45
1 MICS indicator 2.7 - Exclusive breastfeeding under 6 months
2 MICS indicator 2.12 - Age-appropriate breastfeeding
Children appropriately breastfed includes children age 0-5 months who are exclusively breastfed (see table NU.4) and children age 6-23 months who are currently breastfed and receiving any solid, semi-solid or soft foods.
a There were a total of 80 children 0-5 months of age in the survey, however 5 children did not have complete breastfeeding and feeding information. b There were a total of 282 children 6-23 months of age however 2 children did not have complete breastfeeding and feeding information.
c There were 362 children 0-23 months of age with 7 children not having complete breastfeeding and feeding information.

P a g e | 39
Overall, 64.2 percent of infants 6‐8 months old received solid, semi‐solid or soft foods at least once
during the previous day (Table NU.7). Prevalence was 59.6 percent among currently breastfeeding
infants and higher among infants currently not breastfeeding however the sample size was too small
to display prevalence. All indicators for introduction of solid, semi‐solid, or soft foods were higher in
rural areas compared to urban areas however due to low sample size cannot be displayed.
Table NU.7: Introduction of solid, semi-solid, or soft foods
Percentage of infants age 6-8 months who received solid, semi-solid, or soft foods during the previous day, by selected characteristics, RMI ICHNS, 2017
Currently breastfeeding
Currently not breastfeeding All
Percent receiving
solid, semi-solid or soft
foods
Number of children
age 6-8 months
Percent receiving
solid, semi-solid or soft
foods
Number of children age 6-8 months
Percent receiving
solid, semi-solid or soft
foods1 P-value
Number of
children age 6-8 months a
Total 59.6 35 -- 13 64.2 -- 48
Sex
Male -- 20 -- 8 73.1 -- 28
Female -- 15 -- 5 -- 20
Area
Urban -- 20 -- 10 60.5 -- 30
Rural -- 15 -- 3 -- 18
* P<0.05, ** P<0.01, *** P<0.001
1 MICS indicator 2.13 - Introduction of solid, semi-solid or soft foods
a There was a total of 49 children 6-8 months of age in the survey with 48 children having complete data
Table NU.8 shows that overall, about 6 out of 10 children aged 6‐23 months (60.8 percent) were
receiving solid, semi‐solid or soft foods the minimum number of times. The proportion of children
receiving the minimum dietary diversity, or foods from at least four food groups, was lower (42.5
percent) than that for minimum meal frequency (60.8 percent), indicating the need to focus on
improving diet quality and nutrient intake among this vulnerable group. A higher proportion of older
(12‐23 month) children (49.3 percent) achieved minimum dietary diversity compared to younger (6‐
11 month) children (32.4 percent). The overall assessment using the indicator of minimum
acceptable diet revealed that only 29.6 percent were benefitting from a diet sufficient in both
diversity and frequency.
At 25.1 percent, children in the 6‐11 month age group are less likely to receive a minimum
acceptable diet compared to children in the 12‐23 months age group at 32.6 percent. Prevalence of
minimum dietary diversity in children 6‐23 months was higher in urban areas (45.0 percent) than in
rural areas (29.9 percent). Maternal dietary diversity was strongly associated with child dietary
diversity, with 68.8 percent of children meeting minimum dietary diversity if their mothers also ate a
diverse diet compared to 32.6 percent of children whose mothers did not consume a diverse diet.

P a g e | 40
Table NU.8: Infant and young child feeding (IYCF) practices
Percentage of children age 6-23 months who received appropriate liquids and solid, semi-solid, or soft foods the minimum number of times or more during the previous day, by breastfeeding status, by selected characteristics, RMI ICHNS, 2017
Currently breastfeeding
Currently not breastfeeding
All
Percent of children who received: Number
of children age 6-
23 months
Percent of children who received: Number
of children age 6-
23 months
Percent of children who received: Number of
children age 6-23 months a
Minimum dietary
diversity
Minimum meal
frequency
Minimum acceptable
diet1
Minimum dietary
diversity
Minimum meal
frequency
Minimum acceptable
diet2
At least 2
milk feeds3
Minimum dietary diversity4
Minimum meal frequency5
Minimum acceptable diet
Percent P-
value Percent P-
value Percent P-
value
Total 34.9 64.5 26.0 144 49.8 57.2 33.0 39.4 134 42.5 -- 60.8 -- 29.6 -- 278
Child Age 6-11m 30.0 61.8 26.5 80 37.9 62.0 21.8 59.7 29 32.4 * 61.9 -- 25.1 -- 109 12-23m 41.5 68.0 25.4 64 53.6 55.7 36.5 33.0 105 49.3 60.0 32.6 169
Child gender Male 42.7 65.2 31.4 72 43.4 59.1 31.9 42.9 79 43.1 -- 61.9 -- 31.7 -- 151 Female 27.3 63.7 20.9 72 58.8 54.5 34.5 34.6 55 41.8 59.5 27.1 127
Area Urban 36.9 63.7 26.6 81 52.9 59.8 34.9 42.0 72 45.0 * 61.7 30.8 153 Rural 25.1 68.2 23.2 63 34.6 44.3 23.6 26.4 62 29.9 56.1 23.4 125
Caregiver's education None -- -- -- 2 -- -- -- -- 2 -- -- -- -- -- * 4 Primary 26.2 63.0 26.2 26 24.2 43.3 1.0 25.5 29 25.1 52.2 12.4 55 Secondary 39.3 60.8 25.4 93 49.9 55.2 34.8 44.0 76 44.3 58.2 29.8 169 Higher 28.2 75.4 28.2 23 70.4 74.2 53.2 41.0 27 52.2 74.7 42.5 50
Wealth index quintile Poorest 26.8 66.2 25.0 57 36.2 28.7 17.2 16.6 63 32.5 -- 43.6 -- 20.3 -- 120 Second 41.3 77.9 33.6 30 23.5 46.6 23.5 46.2 10 36.2 69.0 30.7 40 Middle 37.6 57.8 23.9 25 50.5 54.1 25.6 33.9 24 43.9 56.0 24.7 49 Fourth 24.3 65.6 24.3 17 52.8 79.5 42.8 74.1 17 40.6 73.5 34.9 34
Richest 38.4 46.9 18.2 15 75.4 78.3 55.3 36.6 20 61.0 66.0 40.8 35
Maternal Minimum Dietary Diversity Yes 66.9 56.6 48.1 24 70.6 74.2 52.8 64.1 23 68.8 *** 65.8 -- 50.6 ** 47 No 22.2 68.4 18.3 102 42.9 55.8 26.6 64.3 94 32.6 62.0 22.5 196
* P<0.05, ** P<0.01, *** P<0.001 1 MICS indicator 2.17a - Minimum acceptable diet (breastfed) 2 MICS indicator 2.17b - Minimum acceptable diet (non-breastfed) 3 MICS indicator 2.14 - Milk feeding frequency for non-breastfed children 4 MICS indicator 2.16 - Minimum dietary diversity 5 MICS indicator 2.15 - Minimum meal frequency a A total of 282 children 6-23 months of age where included in the survey, however 4 children did not include consumption of foods in the previous 24 hours.

P a g e | 41
The continued practice of bottle‐feeding is a concern because of possible contamination due to
unsafe water and lack of hygiene in preparation. Table NU.9 shows prevalence of bottle‐feeding in
RMI. Overall, 29.7 percent of children under 24 months of age are fed using a bottle with a nipple.
There was no difference in bottle feeding by age of the child with 33.0 percent of infants under 6
months of age bottlefed. Children born to mothers with parity of 4 or more (10.1 percent) had lower
prevalence of being fed using a bottle with a nipple than with parity of one (30.6 percent) and 2‐3
children (35.5 percent). Prevalence of being fed using a bottle with a nipple was highest among
children with unmarried mothers (33.8 percent) compared to cohabitating mothers (27.9 percent)
and currently married mothers (14.5 percent).
Table NU.9: Bottle feeding
Percentage of children age 0-23 months who were fed with a bottle with a nipple during the previous day, by selected characteristics, RMI ICHNS, 2017
Percentage of children age 0-23 months fed with a
bottle with a nipple1 P-value Number of children age 0-23 months
Total 29.7 -- 355
Child Age
0-5m 33.0 -- 75
6-11m 34.5 110
12-23m 25.2 170
Child gender
Male 31.7 -- 195
Female 27.3 160
Area
Urban 31.1 -- 188
Rural 23.6 167
Caregiver's education
None -- -- 5
Primary 18.5 66
Secondary 31.4 217
Higher 33.4 67
Wealth index quintile
Poorest 20.9 -- 161
Second 23.7 48
Middle 33.1 59
Fourth 44.3 42
Richest 27.9 45
Maternal Parity
1 30.6 ** 94
2-3 35.5 147
4 or more 10.1 70
Maternal Married Status
Not married 33.8 * 140
Currently married 14.5 64
Cohabitating 27.9 119
* P<0.05, ** P<0.01, *** P<0.001
1 MICS indicator 2.18 - Bottle feeding

P a g e | 42
Children’s consumption of nutrient rich and low nutrient density foods was measured in the RMI
ICHNS 2017 to determine changing consumption patterns for children under 5 years and is
presented for children 0‐23 months in table NU.11a and for children 24‐59 months in table NU.11b.
In Table NU.11a consumption of nutrient rich and low nutrient density food groups is presented for
children 0‐23 months. A third of infants under 6 months received infant formula (33.1 percent) and
15.8 percent received animal milk in the previous 24 hours. Children 6‐23 months of age continued
to receive infant formula or other “growing up milk” with 1 in 5 children 12‐23 months of age
receiving formula. The provision of tea or coffee was high with 28.5 percent of children 12‐23
months of age receiving either tea or coffee which can inhibit iron absorption and lead to iron
deficiency.
In children under 2 years of age, the consumption of iron rich foods was high with 67.0 percent of
children 6‐11 months and 79.7 percent of children 12‐23 months receiving iron rich foods in the
form of fish, poultry, meat or organ meats. However, consumption of vitamin A rich fruits and
vegetables and dark green leafy vegetables was poor. Provision of fortified baby cereal was highest
for children 6‐11 months with over 1 in 4 children receiving fortified baby cereal as a complementary
food. Children were more likely to receive nutrient rich foods if their mother had a minimally
diverse diet indicating the link between what the mother eats and what she feeds her child.
Consumption of low nutrient density foods was high for young children under 2 years. In children 12‐
23 months of age, nearly 1 in 2 received a sugary food such as cakes, cookies, pies or candy in the
previous 24 hours. A third of children 12‐23 months received a sugar sweetened beverage.
Consumption of low nutrient density foods such as sugar sweetened beverages and sugary foods as
well as nutrient rich foods like fortified baby cereals and dark green leafy vegetables was highest in
urban areas. Additionally, consumption of infant formula was nearly double in urban areas (28.9
percent) compared to rural areas (16.2 percent).
In Table NU.11b consumption of nutrient rich and nutrient poor food groups is presented for
children 24‐59 months. After two years of age, children consume less complementary foods and
more frequently partake in meals prepared for the household. In RMI, older children, 2‐4 years of
age, consume less infant formula and milk than younger children but increased their consumption of
juice and tea or coffee with over a third of children 36‐59 months consuming tea or coffee in the
previous 24 hours. Consumption of iron rich foods is high with 88.3 percent of children consuming
fish, poultry, meat or organ meats however consumption of vitamin A rich fruits and vegetables and
dark green leafy vegetables remained low. There was a marked increase in consumption of low
nutrient density foods in children 2‐4 years of age compared to children under 2 years of age with
64.8 percent of older children consuming sugary foods and 56.5 percent of children consuming sugar
sweetened beverages.
Similar to children under 2 years of age, consumption of low nutrient density and nutrient rich foods
was highest in urban areas. Additionally, maternal dietary diversity was strongly correlated with
child consumption of nutrient rich foods with 81.4 percent of children consuming vitamin A rich
fruits and vegetables and 45.4 percent of children consuming dark green leafy vegetables if their
mother had minimum dietary diversity.

P a g e | 43
Table NU.11: Consumption of nutrient-rich and low-nutrient-density food groups (0-23m)
Percentage of children age 0-23 months who were fed liquids, nutrient poor foods and nutrient rich foods during the previous day, by selected characteristics, RMI ICHNS, 2017
Receipt of Liquids Receipt of Low Nutrient Density Foods Receipt of Nutrient Rich Foods
Number of children 0-23 monthsk
Breastmilk Infant
Formulaa Milk b Tea or Coffee
Sugar Sweetened Beverages d Sugary Foodse Oils, fats f
Iron rich foods g
Fortified Baby Cereal h
Vitamin A rich fruits and
vegetables i
Dark green leafy
vegetables j
% P-value % P-
value % P-value % P-
value % P-value % P-
value % P-value % P-
value % P-value % P-
value % P-value
Total 55.6 -- 26.6 -- 20.5 -- 17.9 -- 22.9 -- 31.6 -- 13.7 -- 63.7 -- 14.9 -- 32.9 -- 10.4 -- 355
Child Age
0-5m 81.3 *** 33.1 -- 15.8 -- 7.7 *** 5.4 * 7.3 *** 3.2 ** 19.2 *** 12.8 *** 7.3 *** 0.0 ** 75 6-11m 69.9 31.3 24.1 8.5 19.1 26.7 13.3 67.0 28.4 29.3 7.3 110 12-23m 35.5 20.8 20.0 28.5 32.6 44.8 18.3 79.7 6.7 45.9 16.8 170
Child gender
Male 52.6 -- 28.8 -- 19.9 -- 18.5 -- 25.2 -- 31.8 -- 10.8 -- 59.7 -- 14.0 -- 32.7 -- 11.4 -- 195 Female 59.4 23.9 21.2 17.3 20.1 31.5 17.2 68.6 16.0 33.2 9.3 160
Area
Urban 54.8 -- 28.9 ** 22.2 * 16.0 * 24.6 * 35.1 *** 14.6 -- 65.1 -- 16.4 * 32.6 -- 12.0 ** 188 Rural 59.5 16.2 12.5 26.5 15.2 15.7 9.4 57.4 8.0 34.7 3.2 167
Wealth index quintile
Poorest 50.0 -- 15.3 * 12.4 -- 26.7 * 20.5 -- 21.9 -- 9.2 ** 54.5 -- 10.5 -- 39.5 -- 5.5 -- 161 Second 75.0 21.2 20.5 27.8 24.7 35.4 3.8 60.5 10.4 33.5 10.3 48 Middle 55.7 23.0 20.5 11.0 30.6 38.7 25.4 67.5 10.5 25.4 6.7 59 Fourth 50.0 39.5 19.2 19.3 19.0 25.7 8.5 71.7 27.8 25.8 10.4 42
Richest 49.2 37.8 31.2 6.0 17.6 35.8 18.0 65.3 18.1 41.3 21.4 45
Women's MDD Final
No 56.5 -- 28.6 -- 23.2 -- 17.7 -- 22.7 -- 29.5 -- 13.0 -- 61.3 -- 17.6 -- 21.6 *** 2.7 *** 252 Yes 53.7 33.8 20.2 22.5 31.6 41.0 17.9 72.2 10.5 59.3 30.5 60
* P<0.05, ** P<0.01, *** P<0.001
a Infant formula, such as Similac, Bonna, Bonamil, Morinaga BF, Enfamil b Milk from animals, such as fresh, tinned, or powdered milk (not sweetened condensed milk)
d Sugar sweetened beverages such as carbonated soft drinks
e Any sugary foods such as chocolates, sweets, candies, pastries, cakes or biscuits (including condensed milk and ice cream)
f Any oil, fats, or butter, or foods made with any of these including cream and sour cream. g Red meat, pork and poultry, seafood, beans, dark green leafy vegetables, such as spinach, dried fruit, such as raisins and apricots, iron-fortified cereals, breads and pastas, peas
h Any baby food, such as commercially fortified baby food, e.g. Cerelac, Gerber, Hero or Nestum
i Sweet potatoes, carrots, dark green leafy vegetables, winter squashes, lettuce, dried prunes, dried apricots, dried peaches, cantaloupe, bell peppers, mango, papaya
j Collard, spinach, mustard and dandelion green, kale k There were 362 children 0-23 months of age with 7 children not having complete breastfeeding and feeding information.

P a g e | 44
Table NU.11b: Consumption of nutrient rich and low-nutrient-density food groups (24-59m) Percentage of children age 24-59 months who were fed liquids, nutrient poor foods and nutrient rich foods during the previous day, by selected characteristics, RMI ICHNS, 2017
Receipt of Liquids Receipt of Low Nutrient Density Foods Receipt of Nutrient Rich Foods Number
of children 24-59
months k
Breastmilk Infant
Formula a Milk b Juice c Tea or Coffee
Sugar Sweetened Beverages d
Sugary Foods e Oils, fats f
Iron rich foods g
Fortified Baby Cereal
h
Vitamin A rich fruits
and vegetables i
Dark green leafy
vegetables j
% P-value % P-value % P-
value % P-value % P-
value % P-value % P-
value % P-value % P-
value % P-value % P-
value % P-value
Total 18.1 -- 10.0 -- 16.1 -- 57.1 -- 36.1 -- 56.5 -- 64.8 -- 29.9 -- 88.3 -- 5.7 -- 50.6 -- 15.6 -- 516
Child Age 24-35m 32.5 *** 11.8 -- 16.1 -- 58.7 -- 32.7 -- 54.4 -- 62.9 -- 29.0 -- 90.6 -- 9.2 -- 51.6 -- 13.6 -- 166
36-59m 11.8 9.2 16.1 56.4 37.6 57.3 65.6 30.2 87.3 4.2 50.1 16.5 350
Child gender
Male 19.0 -- 11.3 -- 13.2 -- 61.5 -- 44.4 ** 61.1 -- 66.7 -- 30.8 -- 87.8 -- 6.5 -- 55.6 -- 16.7 -- 257
Female 17.2 8.6 19.1 52.7 27.7 51.8 62.8 28.9 88.8 4.9 45.4 14.6 259
Area
Urban 18.4 -- 11.3 *** 17.6 ** 58.7 * 35.3 -- 60.1 *** 69.6 *** 32.7 *** 87.9 -- 6.6 ** 50.2 -- 18.4 *** 292
Rural 16.6 3.1 8.2 48.8 40.4 37.2 38.9 14.8 90.4 0.8 52.4 1.2 224
Wealth index quintile
Poorest 12.8 -- 7.8 -- 12.2 -- 45.2 * 44.4 -- 47.5 -- 40.3 *** 14.3 * 86.5 -- 5.3 -- 46.2 -- 1.1 *** 209
Second 19.4 9.4 11.9 55.2 35.0 66.0 68.5 27.9 88.0 7.2 43.6 13.4 98
Middle 20.4 9.1 14.4 50.9 30.6 49.4 68.2 39.7 87.9 7.9 47.2 12.7 83
Fourth 21.3 8.2 20.5 72.1 38.1 65.4 68.2 33.9 91.5 6.1 53.7 19.4 64
Richest 16.1 15.2 23.8 65.7 34.2 53.5 76.7 32.4 88.2 1.2 65.2 33.1 62
Women's MDD Final No 12.7 -- 17.2 -- 14.0 -- 51.9 * 29.4 * 46.4 ** 57.3 -- 17.9 * 81.5 ** 4.9 -- 35.8 *** 0.3 *** 97 Yes 28.4 22.8 22.4 74.6 53.6 75.8 75.9 38.9 100.0 13.6 81.4 45.4 43
* P<0.05, ** P<0.01, *** P<0.001 a Infant formula, such as Similac, Bonna, Bonamil, Morinaga BF, Enfamil b Milk from animals, such as fresh, tinned, or powdered milk (not sweetened condensed milk)
c Juice or juice drinks
d Sugar sweetened beverages such as carbonated soft drinks
e Any sugary foods such as chocolates, sweets, candies, pastries, cakes or biscuits (including condensed milk and ice cream)
f Any oil, fats, or butter, or foods made with any of these including cream and sour cream. g Red meat, pork and poultry, seafood, beans, dark green leafy vegetables, such as spinach, dried fruit, such as raisins and apricots, iron-fortified cereals, breads and pastas, peas
h Any baby food, such as commercially fortified baby food, e.g. Cerelac, Gerber, Hero or Nestum
i Sweet potatoes, carrots, dark green leafy vegetables, winter squashes, lettuce, dried prunes, dried apricots, dried peaches, cantaloupe, bell peppers, mango, papaya
j Collard, spinach, mustard and dandelion green, kale k There were a total of 519 children 24-59 months of age with 3 children having incomplete dietary records.

P a g e | 45
Caregiver Nutrition Status
Table NU.12 presents a summary of the nutritional status and dietary quality of sampled mothers
and caregivers with a child under 5 years in the ICHNS 2017.
Table NU.12: Nutrition status of caregivers with a child under 5
Percent distribution of the nutrition status of caregivers, by selected characteristics, RMI ICHNS, 2017
Percent Lower 95% CI Upper 95% CI Unweighted
Nutrition status 673
Underweight 1.8 0.9 3.5
Overweight 72.7 68.4 76.5
Obese 45.1 40.6 49.7
Height Categories
Under 145cm 4.4 3.0 6.3 37
145-149cm 21.7 18.2 25.7 151
150-159cm 64.4 60.0 68.6 424
160 and taller 9.5 7.2 12.6 61
Minimum Dietary Diversity 1 27.2 21.7 33.6 324
Mean number of food groups 3.58 324
Consumption nutrient rich foods
Iron rich foods 75.3 68.9 80.7
Dark Green leafy vegetables 14.8 10.6 20.1
Vitamin A rich fruits and vegetables 36.2 30.1 42.7
Other Vegetables 14.5 10.5 19.8
Other Fruits 34.3 28.3 40.9
Consumption low nutrient density foods
Fats and oils 23.6 18.3 29.8
Savory and fried snacks 25.7 20.2 32.2
Sweet foods 46.8 40.3 53.4
Sugar sweetened beverages 41.0 34.8 47.6
Total any low nutrient density foods 63.5 57.0 69.6 1. Minimum dietary diversity for women and consumption of nutrient rich and low nutrient density foods was measured only in
caregivers with a child under 2 years.
As shown in Table NU.13, caregivers aged 15‐49 years had very high prevalence of overweight and
obesity. Three out of four mothers in RMI are overweight with nearly one in two mothers obese.
Percentage of overweight and obesity increased with maternal age with nearly all women 40‐49
years of age (93.3 percent) overweight or obese. Prevalence of overweight and obesity was high for
even the youngest caregivers with 39.6 percent of women under 20 years overweight and 15.7
percent obese. There was no association between overweight and obesity and household wealth
with mothers in the poorest households as likely to be overweight as mothers in the wealthiest
households.

P a g e | 46
Table NU.13: Caregivers aged 15-49 years nutrition status
Percent distribution of nutrition status of caregivers aged 15-49 years, by selected characteristics, RMI ICHNS, 2017
Underweight Overweight Obese Mean BMI
Unweighted % P-
value % P-
value % P-
value % P-
value
Total 1.8 72.7 45.1 29.5 673
Caregiver's Age
Under 20 0.0 *** 39.6 *** 15.7 *** 24.3 *** 25
20-29 2.1 62.9 31.5 27.7 317
30-39 1.9 82.3 60.0 31.8 246
40-49 0.7 93.3 62.3 32.4 83
Area
Urban 1.9 73.1 45.6 29.6 -- 365 Rural 1.5 70.8 42.9 29.0 308
Caregiver's Education None -- -- * -- -- -- 7 Primary 1.3 65.4 42.5 28.7 131 Secondary 1.4 70.7 43.8 29.2 414 Higher 3.4 83.7 49.8 31.0 121
Wealth index quintile
Poorest 1.4 73.5 45.6 29.1 -- 289 Second 2.1 64.4 37.2 28.2 114
Middle 0.7 75.8 53.7 30.3 104 Fourth 1.1 71.6 41.1 29.5 89 Richest 4.1 78.9 47.6 30.8 77
Household Food Security Food Secure 3.0 * 65.4 30.8 28.0 -- 129 Food Insecure 0.5 74.4 41.5 29.3 191
Maternal Parity 1 3.2 62.5 ** 39.8 *** 28.5 *** 176 2-3 0.9 72.2 36.8 29.0 278 4 or more 0.0 83.5 63.0 31.9 140
Married Status Never Married 1.4 67.0 * 35.5 ** 28.6 ** 233 Currently Married 1.7 83.6 59.6 31.7 134 Divorced/Separated/Widowed 5.9 55.4 37.0 26.1 21
Cohabitating 0.9 71.8 44.2 29.6 206
Minimum Dietary Diversity Yes 0.6 * 71.0 35.8 28.8 -- 256 No 4.0 70.1 41.3 29.0 69
* P<0.05, ** P<0.01, *** P<0.001
While prevalence of short stature (height < 145cm) was relatively low at 4.4 percent in caregivers,
over one in four mothers had borderline short stature or short stature with a height less than
150cm. Short stature in women is indicative of earlier growth restriction during childhood with a
short stature woman usually stunted as a child. While not significant, there was a general trend of
decreasing short stature in caregivers with increasing household wealth. A total of 30.4 percent of
caregivers in the poorest households were under 150 cm compared to 16.2 percent of caregivers in
the richest households.

P a g e | 47
Table NU.14: Caregiver's short stature
Percent distribution of short status of caregivers aged 15-49 years, by selected characteristics, RMI ICHNS, 2017
Under 145cm
145-150cm
150-159cm
160cm and taller Unweighted P-value
Total 4.4 21.7 64.4 9.6 671
Caregiver's Age
Under 20 3.7 19.4 76.9 0.0 25 --
20-29 5.3 24.1 60.5 10.0 317 30-39 3.1 19.6 67.7 9.6 246 40-49 4.3 19.7 65.0 11.0 83
Area Urban 3.7 21.3 64.9 10.1 364 -- Rural 7.3 23.6 62.1 7.1 307
Caregiver's Education
None -- -- -- -- 7 -- Primary 7.9 23.0 64.6 4.7 130 Secondary 4.3 23.2 62.5 10.0 413 Higher 1.2 16.7 69.3 12.8 121
Wealth index quintile Poorest 7.3 23.1 63.9 5.9 288 -- Second 6.1 26.1 58.8 9.0 114 Middle 5.1 19.7 69.7 5.2 103 Fourth 2.3 22.6 59.7 15.4 89 Richest 0 16.2 69.9 14.0 77
Religion Assembly of God 6.5 21.7 66.8 4.7 108 ** Protestant 4.3 26.7 61.1 7.9 368 Catholic 5.3 17.4 52.6 24.1 49 Other 2.4 13.3 72.5 11.8 146
Maternal Married Status Never Married 5.2 22.5 64.9 7.3 233 ** Currently Married 1.6 14.5 68.2 15.7 134
Divorced/Separated/Widowed -- -- -- -- 21 Cohabitating 4.3 27.2 62.6 5.9 206
* P<0.05, ** P<0.01, *** P<0.001
Dietary practices for caregivers with a child under 2 years was poor in RMI with only 27.4 percent of
caregivers meeting minimum dietary diversity (Table NU.15). Minimum dietary diversity was
positively associated with household wealth, however only 43.4 percent of the wealthiest mothers
consumed a diet which met minimum dietary diversity. Additionally, while minimum dietary
diversity was higher in urban areas with 31.6 percent compared to only 8.1 percent of women in
rural areas, the majority of all caregivers in RMI consumed poor quality diets.
While consumption of iron rich foods was high in RMI (75.3 percent), however only 14.8 percent of
caregivers consumed dark green leafy vegetables and 36.2 percent of mothers consumed vitamin A
rich fruits and vegetables. In contrast to poor consumption of nutrient rich foods, consumption of
low nutrient and high calorie foods such as cakes, cookies, sugar sweetened beverages and fried
snacks was high with 63.5 percent of caregivers consuming at least one of these foods in the last 24
hours. There were little differences in the consumption of high calorie, low nutrient foods by
household wealth, urban or rural areas or other maternal characteristics with consumption high for
all caregivers.

P a g e | 48
Table NU.15: Caregiver's dietary diversity
Percent distribution of dietary diversity of caregivers aged 15-49 years, by selected characteristics, RMI ICHNS, 2017
Minimum Dietary
Diversity P-
value
Mean number of Food Groups
Nutrient rich food groups Low nutrient density food groups
Iron Rich
Foods
Dark Green leafy
vegetables
Vitamin A rich fruits
and vegetables
Fats and oils
Savoury and fried
snacks Sweet foods
Sugar sweetened beverages
Total Any Low
Nutrient Foods Unweighted P-value
Total 27.4
3.58 75.3 14.8 36.2 23.6 25.7 46.8 41.0 63.5 324 --
Caregiver's Age
Under 20 -- *** -- -- -- -- -- -- -- -- -- 19 --
20-29 25.3 3.50 72.5 15.2 38.5 19.1 25.4 46.9 41.1 63.6 182
30-39 31.9 3.66 78.6 17.3 32.3 30.7 25.3 48.0 42.6 63.4 93
40-49 23.3 3.94 84.7 13.8 31.7 26.2 32.2 51.3 39.7 64.6 30
Area
Urban 31.6 *** 3.80 74.6 17.3 37.6 25.6 28.1 51.4 42.4 65.1 177 -- Rural 8.1 2.54 78.4 3.1 29.5 14.5 14.8 25.6 34.6 56.1 147
Caregiver's Education
None -- -- -- -- -- -- -- -- -- -- 2 -- Primary 20.1 3.24 81.6 5.7 30.2 27.4 30.3 44.9 30.7 61.6 56 Secondary 27.7 3.57 72.7 16.0 35.5 21.8 24.7 49.2 44.4 64.0 209 Higher 31.1 3.81 77.5 16.7 41.8 25.7 24.5 40.6 39.2 62.7 57
Wealth index quintile
Poorest 17.9 2.83 76.4 5.0 36.0 12.6 14.6 26.3 33.8 53.2 140 -- Second 28.0 3.78 76.0 21.2 39.0 17.9 31.1 53.6 44.0 68.0 52 Middle 25.1 3.65 79.4 13.7 27.1 36.3 33.8 58.8 53.7 73.1 56 Fourth 26.8 3.57 68.0 18.6 35.3 21.4 24.1 37.0 27.1 54.0 42 Richest 43.4 4.17 75.2 16.2 48.2 28.0 22.6 57.3 43.3 67.5 34
Household Food Security
Food Insecure 23.5 3.75 72.4 13.1 32.5 16.9 18.6 42.5 42.0 63.2 128 --
Food Secure 30.2 3.35 77.5 16.1 38.9 28.5 30.5 49.9 40.4 63.8 191
Caregiver's Nutrition Status
Underweight -- -- -- -- -- -- -- -- -- -- 5 *
Normal 25.6 3.52 77.7 13.9 39.3 14.5 24.9 48.5 32.2 61.2 99 Overweight 23.7 3.35 70.0 11.5 32.9 23.1 26.4 44.0 37.4 61.9 100 Obese 29.5 3.75 77.4 19.2 34.2 31.9 25.9 46.2 49.6 65.3 119
* P<0.05, ** P<0.01, *** P<0.001

P a g e | 49
V. Child Health
Care of Illness
A key strategy for accelerating progress toward SDG 3 is to tackle the diseases that are the leading killers
of children under 5. Diarrhoea and pneumonia are two such diseases. The Global Action Plan for the
Prevention and Control of Pneumonia and Diarrhoea (GAPPD) aims to end preventable pneumonia and
diarrhoea death by reducing mortality from pneumonia to 3 deaths per 1000 live births and mortality
from diarrhoea to 1 death per 1000 live births by 2025.
Table CH.4 presents the percentage of children under 5 years of age who were reported to have had an
episode of diarrhoea, symptoms of acute respiratory infection (ARI), or fever during the 2 weeks
preceding the survey. These results are not measures of true prevalence, and should not be used as
such, but rather the period‐prevalence of those illnesses over a two‐week time window.
The definition of a case of diarrhoea or fever, in this survey, was the mother’s (or caregiver’s) report that
the child had such symptoms over the specified period; no other evidence was sought beside the
opinion of the mother. A child was considered to have had an episode of ARI if the mother or caregiver
reported that the child had, over the specified period, an illness with a cough with rapid or difficult
breathing, and whose symptoms were perceived to be due to a problem in the chest or both a problem
in the chest and a blocked nose. While this approach is reasonable in the context of the ICHNS survey,
these basically simple case definitions must be kept in mind when interpreting the results, as well as the
potential for reporting and recall biases. Further, diarrhoea, fever and ARI are not only seasonal but are
also characterized by the often‐rapid spread of localized outbreaks from one area to another at different
points in time. The timing of the survey and the location of the teams might thus considerably affect the
results, which must consequently be interpreted with caution. For these reasons, although the period‐
prevalence over a two‐week time window is reported, these data should not be used to assess the
epidemiological characteristics of these diseases but rather to obtain denominators for the indicators
related to use of health services and treatment.
Overall, 9.3 percent of children under 5 years of age were reported to have had diarrhoea in the two
weeks preceding the survey, 2.9 percent symptoms of ARI, and 11.5 percent an episode of fever (Table
CH.4). Children’s age was associated with both diarrhoea and ARI with ARI highest in children 6‐11
months of age (8.7 percent) and diarrhoea highest in children 12‐35 months of age. Mother’s age was
associated with symptoms or ARI with 0.4 percent in children of mothers less than 20 years old, 1.8
percent in mothers 20‐34 years old and 5.9 percent in mothers 35‐49 years old at the time of the child’s
birth. There was no significant difference in prevalence of fever and selected characteristics.

P a g e | 50
Table CH.4: Reported disease episodes
Percentage of children age 0-59 months for whom the mother/caregiver reported an episode of diarrhoea, symptoms of acute respiratory infection (ARI), and/or fever in the last two weeks, by selected characteristics, RMI ICHNS, 2017
Percentage of children who in the last two weeks had: Number of
children age 0-59
months
An episode of diarrhoea Symptoms of ARI a An episode of fever
Percentage P-value Percentage P-value Percentage P-value
Total 9.3 -- 2.9 -- 11.5 -- 874
Child Age
0-5m 2.6 ** 1.1 ** 9.6 -- 77
6-11m 7.6 8.7 14.7 108
12-23m 13.7 3.1 16.1 170
24-35m 16.8 1.6 8.9 169
36-59m 5.8 1.9 10.0 350
Mother's age at birth
Less than 20 years 13.6 -- 0.4 * 12.5 -- 112
20-34 years 8.8 1.8 10.2 552
35-49 years 11.9 5.9 10.5 92
Child gender
Male 9.5 -- 3.2 -- 10.7 -- 450
Female 9.1 2.5 12.3 424
Area
Urban 9.1 -- 2.8 -- 12.0 -- 484
Rural 10.4 3.0 9.0 390
Caregiver's education
None -- -- -- -- -- -- 12
Primary 11.9 4.0 12.0 180
Secondary 8.5 1.8 9.6 525
Higher 10.1 4.5 16.6 153
Wealth index quintile
Poorest 8.5 -- 1.7 -- 9.5 -- 369
Second 8.2 2.3 14.2 149
Middle 10.5 5.3 11.8 143
Fourth 10.2 4.0 10.4 106
Richest 9.2 0.7 10.9 107
Maternal Married Status
Not married 11.0 -- 3.0 -- 13.4 -- 330
Currently married 5.7 1.5 10.5 173
Cohabitating 10.2 2.0 8.4 279
Father in Household
Yes 9.6 -- 2.8 -- 10.8 -- 617
No 8.4 3.1 13.3 257
* P<0.05, ** P<0.01, *** P<0.001 a Suspected ARI: Children with symptoms of ARI are those who had an illness with a cough, accompanied by a rapid or difficult breathing and whose symptoms were due to a problem in the chest, or both a problem in the chest and a blocked nose.

P a g e | 51
Diarrhoea
Diarrhoea is a leading cause of death among children under 5 worldwide. Most diarrhoea‐related deaths
in children are due to dehydration from loss of large quantities of water and electrolytes from the body
in liquid stools. Management of diarrhoea – either through oral rehydration salts (ORS) or a
recommended home fluid (RHF) – can prevent many of these deaths. In addition, provision of zinc
supplements has been shown to reduce the duration and severity of the illness as well as the risk of
future episodes within the next two or three months. Preventing dehydration and malnutrition by
increasing fluid intake and continuing to feed the child are also important strategies for managing
diarrhoea.
In the RMI ICHNS, 2017, mothers or caregivers were asked whether their child under age 5 had an
episode of diarrhoea in the two weeks prior to the survey. In cases where mothers reported that the
child had diarrhoea, a series of questions were asked about the treatment of the illness, including what
the child had been given to drink and eat during the episode and whether this was more or less than
what was usually given to the child.
The overall period‐prevalence of diarrhoea in children under 5 years of age is 9.3 percent (Table CH.4)
and ranged from 9.1 percent in urban areas to 10.4 percent in rural areas. The highest period‐
prevalence is seen among children age 12‐35 months which corresponds to the period of time where
children increase their consumption of complementary foods and have increased mobility.
Table CH.5 shows the percentage of children with diarrhoea in the two weeks preceding the survey for
whom advice or treatment was sought and where. Overall, a health facility or provider was seen in 47.1
percent of cases, predominantly in the public sector (36.2 percent). For boys (49.9 percent) and girls
(50.4 percent) the prevalence of “No advice or treatment sought” was about the same at 50 percent.

P a g e | 52
Table CH.5: Care-seeking during diarrhoea
Percentage of children age 0-59 months with diarrhoea in the last two weeks for whom advice or treatment was sought, by source of advice or treatment, by selected characteristics, RMI ICHNS, 2017
Percentage of children with diarrhoea for whom: Number of children age 0-59 months
with diarrhoea in the last two
weeks
Advice or treatment was sought from:
No advice or treatment
was sought
Health facilities or providers
Other source
A health facility or
provider 1, bPublic Private
Community health
provider a
Total 36.2 0.0 10.9 2.8 47.1 50.2 86
Child gender
Male 35.7 0.0 9.1 5.3 44.8 49.9 44
Female 36.7 0.0 12.8 0.0 49.6 50.4 42
Area
Urban 43.9 0.0 0.0 2.9 43.9 53.2 45
Rural 2.7 0.0 58.4 2.1 61.1 36.8 41
Caregiver's education
None 28.5 0.0 17.7 0.0 46.2 53.8 25
Primary 36.4 0.0 7.6 5.1 43.9 50.9 44
Secondary -- -- -- -- -- -- 17
Higher 36.2 0.0 10.9 2.8 47.1 50.2 86
Maternal Married Status
Not married 34.6 0.0 8.9 0.8 43.5 55.6 40
Currently married -- -- -- -- -- -- 9
Cohabitating 31.9 0.0 10.2 1.1 42.0 56.8 29
Father in Household
Yes 36.0 0.0 9.4 3.7 45.4 50.9 60
No 36.8 0.0 15.2 0.0 52.0 48.0 26 1 MICS indicator 3.10 - Care-seeking for diarrhoea a Community health provider includes both public (Community health worker and Mobile/Outreach clinic) and private (Mobile clinic) health facilities b Includes all public and private health facilities and providers, but excludes private pharmacy
The denominator for this table is number of children with diarrhoea during the last two weeks.
Table CH.6 provides statistics on drinking and feeding practices during diarrhoea. One fifth (20.0
percent) of children under 5 years of age with diarrhoea were given more to drink than usual while 76.2
percent were given the same or less. About 54.3 percent were given somewhat less, same or more, but
45.3 percent were given much less or nothing to drink. Almost one third (29.9 percent) of children under
5 years of age with diarrhoea were given more to eat than usual while 62.3 percent were given the same
or less. About 65.5 percent were given somewhat less, same or more (continued feeding), but 33.4
percent were given much less or nothing to eat.

P a g e | 53
Table CH.6: Feeding practices during diarrhoea
Percent distribution of children age 0-59 months with diarrhoea in the last two weeks by amount of liquids and food given during episode of diarrhoea, by selected characteristics, RMI ICHNS, 2017
Drinking practices during diarrhoea
Eating practices during diarrhoea Number of children age 0-59 months with diarrhoea in the last two weeks
Child was given to drink:
Total
Child was given to eat:
Total Much less
Somewhat less More
Nothing Missing/DK
Much less
Somewhat less More Nothing Missing/DK
Total 41.9 34.3 20.0 3.4 0.4 100.0 26.7 35.6 29.9 6.7 1.1 100.0 86
Child gender
Male 35.1 34.0 25.0 5.9 0.0 100.0 24.3 26.4 37.9 9.3 2.1 100.0 44
Female 49.6 34.6 14.3 0.7 0.8 100.0 29.3 45.9 21.0 3.7 0.0 100.0 42
Area
Urban 43.7 33.5 19.0 3.8 0.0 100.0 28.7 33.4 31.4 6.6 0.0 100.0 45
Rural 34.4 37.7 24.0 1.7 2.1 100.0 17.9 45.5 23.5 7.2 5.9 100.0 41
Caregiver's education
None 38.9 38.2 21.2 0.0 1.7 100.0 5.1 53.9 38.1 0.0 2.9 100.0 25
Primary 50.6 29.3 13.9 6.3 0.0 100.0 37.9 31.1 25.7 4.6 0.7 100.0 44
Secondary -- -- -- -- -- -- -- -- -- -- -- -- 17
Higher 41.9 34.3 20.0 3.4 0.4 100.0 26.7 35.6 29.9 6.7 1.1 100.0 86
Maternal Married Status
Not married 43.1 35.2 13.6 7.3 0.8 100.0 25.3 32.0 33.9 8.8 0.0 100.0 40
Currently married -- -- -- -- -- -- -- -- -- -- -- -- 9
Cohabitating 36.5 35.3 28.3 0.0 0.0 100.0 26.3 40.1 25.0 7.5 1.1 100.0 29
Father in Household
Yes 40.9 34.6 19.4 4.6 0.5 100.0 32.2 34.1 26.9 5.3 1.5 100.0 60
No 45.0 33.4 21.6 0.0 0.0 100.0 10.6 40.0 38.7 10.7 0.0 100.0 26
The denominator for this table is number of children with diarrhoea during the last two weeks.

P a g e | 54
Table CH.7 shows the percentage of children receiving ORS, and recommended homemade fluids
during the episode of diarrhoea. Since children may have been given more than one type of liquid,
the percentages do not necessarily add up to 100. About 28.4 percent received ORS or health
personnel recommended homemade fluid. A total of 24.0 percent of children were given any type of
ORS and 14.3 percent received recommended homemade fluid. Children 0‐23 months with an
episode of diarrhoea in the last two weeks were twice as likely to receive ORS or recommended
homemade fluid (40.7 percent) compared to children 24‐59 months of age (20.2 percent).
Table CH.7: Oral rehydration solutions, recommended homemade fluids, and zinc
Percentage of children age 0-59 months with diarrhoea in the last two weeks, and treatment with oral rehydration salts (ORS), recommended homemade fluids, and zinc, by selected characteristics, RMI ICHNS, 2017
Percentage of children with diarrhoea who received:
Number of children age 0-59 months with diarrhoea in the last two weeks
Oral rehydration salts (ORS)
ORS or any
recommended homemade
fluid
Zinc
Fluid from
packet
Pre-packaged
fluid Any ORS
Any recommended
homemade fluid
Any zinc
ORS and zinc1
Total 18.9 16.9 24.0 14.3 28.4 10.5 7.5 86
Child Age
0-23 34.0 28.8 37.2 23.0 40.7 18.8 17.5 31
24-59 8.8 9.0 15.1 8.5 20.2 4.9 0.9 55
Child gender
Male 18.6 11.1 23.8 14.4 27.8 8.4 3.8 44
Female 19.3 23.5 24.2 14.2 29.0 12.8 11.7 42
Area
Urban 20.8 16.1 23.5 14.5 26.9 9.8 8.1 45
Rural 10.7 20.3 26.3 13.6 35.0 13.2 4.9 41
Caregiver's education
None 17.2 9.4 25.0 8.4 31.7 4.3 0.0 25
Primary 23.8 24.5 27.1 17.7 32.3 16.5 13.9 44
Secondary -- -- -- -- -- -- -- 17
Higher 18.9 16.9 24.0 14.3 28.4 10.5 7.5 86
Maternal Married Status
Not married 10.9 10.9 17.9 8.6 19.9 3.1 1.9 40
Currently married -- -- -- -- -- -- -- 9
Cohabitating 11.6 9.6 15.2 14.2 19.3 4.9 0.0 29
Father in Household
Yes 17.3 18.8 22.1 16.9 26.7 13.5 9.6 60
No 23.7 11.3 29.6 6.7 33.2 1.5 1.5 26 1 MICS indicator 3.11 - Diarrhoea treatment with oral rehydration salts (ORS) and zinc
Solid Fuel Use
More than 3 billion people around the world rely on solid fuels for their basic energy needs,
including cooking and heating. Solid fuels include biomass fuels, such as wood, charcoal, crops or
other agricultural waste, dung, shrubs and straw, and coal. Cooking and heating with solid fuels
leads to high levels of indoor smoke which contains a complex mix of health‐damaging pollutants.
The main problem with the use of solid fuels is their incomplete combustion, which produces toxic
elements such as carbon monoxide, polyaromatic hydrocarbons, and sulphur dioxide (SO2), among
others. Use of solid fuels increases the risks of incurring acute respiratory illness, pneumonia,
chronic obstructive lung disease, cancer, and possibly tuberculosis, asthma, or cataracts, and may

P a g e | 55
contribute to low birth weight of babies born to pregnant women exposed to smoke. The primary
indicator for monitoring use of solid fuels is the proportion of the population using solid fuels as the
primary source of domestic energy for cooking, shown in Table CH.12.
Overall, 12.4 percent of the household population in RMI uses solid fuels for cooking, consisting
mainly of coconut husks and shells (10.6 percent). Use of solid fuels for cooking is very low in urban
areas (2.8 percent), but very high in rural areas, where they are used by almost two thirds of
household members (65.0 percent). Household wealth and the educational level of the household
head are also important indicators for solid fuel use. The findings show that use of solid fuel ranges
from 54.4 percent of household members in the poorest wealth index quintile to 9.8 percent in the
second quintile, 0.0 in the third, 1.7 in the fourth and 0.0 in the richest quintile. The educational
level of the household head is also inversely related to the percentage of the household population
using solid fuel for cooking with 26.6 percent of household members with their household head
having no education and 21.5 percent having primary education only compared to 10.8 percent and
5.5 percent for secondary and higher, respectively.
Table CH.12: Solid fuel use Percent distribution of household members according to type of cooking fuel mainly used by the household, and percentage of household members living in households using solid fuels for cooking, by selected characteristics, RMI ICHNS, 2017
Percentage of household members in households mainly using:
P-value
Number of
household members Electricity
Liquefied Petroleum
Gas (LPG)
Solar energy
Total
Solid fuels for cooking1 Wood
Coconut husks/shells
Total 11.8 75.4 0.4 1.9 10.6 100.0 12.4 -- 4758
Sex of household head
Male 10.7 75.9 0.5 1.6 11.4 100.0 13.0 -- 3448 Female 14.6 74.1 0.1 2.7 8.5 100.0 11.1 1310
Area
Urban 11.8 85.3 0.1 1.1 1.7 100.0 2.8 *** 2760 Rural 11.9 21.1 1.9 5.9 59.1 100.0 65.0 1998
Number of household members 1-5 8.9 67.1 1.9 2.4 19.8 100.0 22.1 -- 691 5-10 11.1 73.2 0.4 2.3 13.0 100.0 15.2 2265 11+ 13.1 79.3 0.0 1.4 6.2 100.0 7.6 1802
Education of household head None 10.4 62.5 0.5 5.7 20.9 100.0 26.6 *** 350 Primary 7.1 70.1 1.2 4.6 16.9 100.0 21.5 1142 Secondary 9.7 79.3 0.2 1.2 9.7 100.0 10.8 2275 Higher 19.8 74.7 0.0 0.3 5.2 100.0 5.5 991
Wealth index quintile
Poorest 4.0 40.3 1.3 5.0 49.4 100.0 54.4 *** 1884
Second 9.3 80.6 0.2 4.3 5.5 100.0 9.8 850 Middle 3.5 96.2 0.3 0.0 0.0 100.0 0.0 774 Fourth 14.1 84.2 0.0 0.0 1.7 100.0 1.7 634 Richest 29.2 70.8 0.0 0.0 0.0 100.0 0.0 616
* P<0.05, ** P<0.01, *** P<0.001
1 MICS indicator 3.15 - Use of solid fuels for cooking
Households that use solid fuels for cooking (wood, coconut husks) as the main type of fuel used for cooking. Denominators are obtained by weighting the number of households by the number of household members.

P a g e | 56
Solid fuel use by place of cooking is depicted in Table CH.13. The presence and extent of indoor
pollution are dependent on cooking practices, places used for cooking, as well as types of fuel used.
According to the RMI ICHNS, 2017, only 0.4 percent of household members living in households
using solid fuels for cooking cook food in a separate room that is used as a kitchen. The majority of
household members live in households where food is cooked in a separate building (34.1 percent) or
outdoors (65.5 percent). Nearly all urban households cook food outdoors (96.3 percent) compared
to 58.2 percent of households in rural areas.
Table CH.13: Solid fuel use by place of cooking
Percent distribution of household members in households using solid fuels by place of cooking, by selected characteristics, RMI ICHNS, 2017
Place of cooking
P-value
Number of household
members in households
using solid fuels for cooking
In the house in a separate room used as
kitchen In a separate
building Outdoors Total
Total 0.4 34.1 65.5 100.0 -- 1449
Sex of household head
Male 0.6 39.9 59.5 100.0 * 1128
Female 0.0 16.5 83.5 100.0 321
Area
Urban 0.0 3.7 96.3 100.0 ** 108
Rural 0.5 41.3 58.2 100.0 1341
Number of household members
1-5 2.2 36.4 61.4 100.0 -- 301 6-10 0.0 42.0 58.0 100.0 818 11+ 0.0 17.5 82.5 100.0 330 Education of household head
None 0.0 24.9 75.1 100.0 -- 150
Primary 0.0 38.6 61.4 100.0 486 Secondary 0.0 28.1 71.9 100.0 640 Higher 3.8 53.7 42.5 100.0 173 Wealth index quintile
Poorest 0.5 40.8 58.7 100.0 -- 1330
Second 0.0 8.1 91.9 100.0 106
Middle 0.0 0.0 0.0 100.0 0
Fourth 0.0 0.0 100.0 100.0 13
Richest 0.0 0.0 0.0 100.0 0
* P<0.05, ** P<0.01, *** P<0.001
Denominators are obtained by weighting the number of households using solid fuels for cooking by the number of household members.
Children's receipt of micronutrient supplementation and deworming is depicted in Table CH.14.
Overall, 54.4 percent of children age 6‐59 months received high dose vitamin A supplement in the
last 6 months, 11.3 percent of children 0‐59 months received iron supplementation during the past 7
days, and 32.1 percent of children 12‐59 months received deworming in the previous 6 months. Of
children aged 12‐23 months 20.3 percent received deworming in the previous 6 months compared
to 30.2 percent of children 24‐35 months and 38.2 percent of children 36‐49 months. There were no
significant differences between child age and receipt of vitamin A supplementation or iron
supplementation. Of children living in urban areas, 12.9 percent received iron supplementation
during the past 7 days compared to 3.5 percent of children in rural areas. Children with low
birthweight (12.0 percent) and normal birthweight (11.1 percent) received iron supplementation

P a g e | 57
during the past 7 days at a lower prevalence than children with high birth weight (27.9 percent). For
vitamin A supplementation and deworming, coverage was highest among the richest households
(68.0 percent and 39.8 percent respectfully).
Table CH.14: Children's receipt micronutrient supplementation and deworming
Percent distribution of children age 6-59 months by receipt of high dose vitamin A supplement in the last 6 months, receipt of iron supplementation in the previous 7 days for children 0-59 months of age and receipt of deworming in the previous 6 months for children 12-59 months of age, by selected characteristics, RMI ICHNS, 2017
Percentage of children who received vitamin A
during the last 6 months
Percentage of children who received iron supplementation
during the past 7 days
Percentage of children who received deworming
in the previous 6 months
% P-
value
Number of children age 6-59 months % P-value
Number of children age 0-59 months % P-value
Number of children age 12-59
months
Total 54.4 -- 797 11.3 -- 874 32.1 -- 689
Child Age
0-5m 6.9 -- 77
6-11m 50.2 -- 108 14.6 108
12-23m 52.1 170 8.5 170 20.3 *** 170
24-35m 56.1 169 11.2 169 30.2 169
36-59m 56.0 350 12.5 350 38.2 350
Child gender Male 49.8 * 408 12.7 -- 450 29.6 -- 353 Female 59.3 389 9.9 424 34.7 336
Area
Urban 55.6 -- 447 12.9 *** 484 31.6 -- 385 Rural 48.4 350 3.5 390 34.2 304
Wealth index quintile
Poorest 55.2 ** 330 7.3 -- 369 30.5 * 286
Second 42.9 139 13.4 149 21.2 122
Middle 58.7 133 15.0 143 37.6 111
Fourth 48.4 98 11.1 106 32.6 84
Richest 68.0 97 8.6 107 39.8 86
Religion
Assembly of God 56.8 -- 122 9.6 * 132 40.0 -- 107
Protestant 54.2 442 9.7 484 34.4 379
Catholic 53.3 58 23.8 65 23.4 51
Other 53.8 175 11.9 193 24.9 152
Maternal Nutrition Status
Underweight -- *** 11 0.0 -- 12 -- -- 8
Normal 44.2 177 9.0 205 27.6 150
Overweight 51.5 196 11.1 216 34.4 167
Obese 63.8 285 12.9 307 34.5 251
Maternal Married Status
Not married 56.4 -- 299 19.2 *** 330 28.7 -- 246
Currently married 59.3 158 7.7 173 35.6 142
Cohabitating 51.3 250 3.8 279 33.7 221
Child Birthweight
Low Birthweight 55.8 -- 79 12.0 * 82 31.6 -- 67 Normal 55.5 512 11.1 564 31.8 440 High Birthweight 77.1 31 27.9 34 41.6 26
* P<0.05, ** P<0.01, *** P<0.001

P a g e | 58
VI. Water and Sanitation
Safe drinking water is a basic necessity for good health. Unsafe drinking water can be a significant
determinant of diseases such as cholera, typhoid, and schistosomiasis. Drinking water can also be
contaminated with chemical and physical contaminants with harmful effects on human health. In
addition to preventing disease, improved access to drinking water may be particularly important for
women and children, especially in rural areas, who bear the primary responsibility for carrying
water, often for long distances.39
Inadequate disposal of human excreta and personal hygiene are associated with a range of diseases
including diarrhoeal diseases and polio and are important determinants of stunting. Improved
sanitation can reduce diarrhoeal disease by more than a third40, and can substantially lessen the
adverse health impacts of other disorders among millions of children in many countries.
SDG targets 6.1 and 6.2 focus on achieving universal and equitable access to safe and affordable
drinking water for all and achieving access to adequate and equitable sanitation and hygiene for all
and end open defecation by 2030.
For more details on water and sanitation and to access some reference documents, please visit
data.unicef.org41 or the website of the WHO/UNICEF Joint Monitoring Programme for Water Supply
and Sanitation42.
Use of Improved Water Sources
The distribution of the population in households with a child under 5 by main source of drinking
water is shown in Table WS.1. The population using improved sources of drinking water are those
using any of the following types of supply: piped water (into dwelling, compound, yard or plot, to
neighbour, public tap/standpipe), tube well/borehole, protected well, protected spring, and
rainwater collection. Bottled water is considered as an improved water source only if the household
is using an improved water source for handwashing and cooking.
39 WHO/UNICEF. 2012. Progress on Drinking water and Sanitation: 2012 update. 40 Cairncross, S et al. 2010. Water, sanitation and hygiene for the prevention of diarrhoea. International Journal of Epidemiology 39: i193- i205. 41 http://data.unicef.org/water-sanitation 42 http:// www.wssinfo.org

P a g e | 59
Table WS.1: Use of improved water sources
Percent distribution of household population according to main source of drinking water and percentage of household population using improved drinking water sources, by selected characteristics, RMI ICHNS, 2017
Main source of drinking water
Total
Percentage using
improved sources of drinking water1
Number of household members
Improved sources
Unimproved sources
Piped water
Tube-well/ bore-hole
Pro-tected well
Rain-water
collection Bottled water a
Unpro-tected well
Tanker truck
Bottled water a Other
Into dwelling
Into yard/plot
To neigh-bour
Public tap/
stand-pipe
Total 4.0 5.1 0.9 3.8 0.0 0.5 67.6 18.1 0.0 0.0 0.0 0.0 100.0 100.0 4758
Sex of household head Male 4.5 5.3 0.6 2.8 0.1 0.6 69.6 16.4 0.0 0.0 0.0 0.0 100.0 100.0 3448
Female 2.6 4.4 1.8 6.2 0.0 0.3 62.5 22.3 0.0 0.0 0.0 0.0 100.0 100.0 1310
Area
Urban 4.4 5.3 1.1 3.4 0.0 0.2 64.5 21.1 0.0 0.0 0.0 0.0 100.0 100.0 2760
Rural 1.8 3.9 0.2 5.7 0.3 2.2 84.7 1.3 0.0 0.0 0.0 0.0 100.0 100.0 1998
Number of household members
1-5 5.0 3.4 0.3 5.0 0.0 2.1 63.3 20.8 0.0 0.0 0.0 0.0 100.0 100.0 691
5-10 3.9 4.4 0.0 5.0 0.1 0.5 70.6 15.5 0.0 0.0 0.0 0.0 100.0 100.0 2265
11+ 3.8 6.1 2.0 2.3 0.0 0.2 65.9 19.8 0.0 0.0 0.0 0.0 100.0 100.0 1802
Education of household head
None 26.2 3.0 0.0 0.0 0.0 2.7 66.3 1.7 0.0 0.0 0.0 0.0 100.0 100.0 350
Primary 0.2 5.9 4.7 4.4 0.0 0.5 70.7 13.6 0.0 0.0 0.0 0.0 100.0 100.0 1142
Secondary 2.4 2.7 0.1 4.5 0.0 0.2 71.6 18.6 0.0 0.0 0.0 0.0 100.0 100.0 2275
Higher 4.7 9.5 0.0 2.8 0.2 0.7 57.9 24.2 0.0 0.0 0.0 0.0 100.0 100.0 991
Wealth index quintile
Poorest 1.5 3.3 0.2 6.1 0.2 1.1 85.5 2.2 0.0 0.0 0.0 0.0 100.0 100.0 1884
Second 3.8 3.7 2.3 1.0 0.0 0.0 78.8 10.4 0.0 0.0 0.0 0.0 100.0 100.0 850
Middle 5.0 1.1 0.0 6.6 0.0 0.4 71.0 15.9 0.0 0.0 0.0 0.0 100.0 100.0 774
Fourth 2.8 2.5 2.3 3.8 0.0 0.3 68.4 19.8 0.0 0.0 0.0 0.0 100.0 100.0 634
Richest 6.3 15.2 0.0 1.5 0.0 0.9 33.9 42.4 0.0 0.0 0.0 0.0 100.0 100.0 616 1 MICS indicator 4.1; MDG indicator 7.8 - Use of improved drinking water sources a Households using bottled water as the main source of drinking water are classified into improved or unimproved drinking water users according to the water source used for other purposes such as cooking and handwashing. Denominators are obtained by weighting the number of households by the total number of household members.

P a g e | 60
Overall, 100 percent of the population uses an improved source of drinking water, primarily via
bottled water and rain water collection. The source of drinking water for the population varies
strongly by area (Table WS.1). In rural areas, the primary source of drinking water is rain water at
84.7 percent prevalence. The predominant sources in urban areas is rain water (64.5 percent) and
bottled water (21.1 percent). The use of bottled water and rain water collection as sources of
drinking water for the population vary strongly by wealth index quintile. The use of rain water
collection is most prevalent in the poorest wealth index quintile (85.5 percent) and progressively less
prevalent in richer quintiles. The use of bottled water is most prevalent in the richest wealth index
quintile (42.4 percent) and progressively less prevalent in poorer quintiles. Use of protected wells
were more prevalent in rural areas (2.2 percent) compared to urban areas (0.2 percent) as was use
of public tap/standpipe with 5.7 percent prevalence in rural areas compared to 3.4 percent
prevalence in urban areas. In urban areas, the prevalences of piped water into dwelling and into
yard/plot were higher in urban areas (4.4 and 5.3 percent) compared to rural areas (1.8 and 3.9
percent).
Figure WS.1. presents an overview of the percent distribution of household members in RMI by
source of drinking water.
F i gure WS.1 : Percent d i s t r ibu t ion of househo ld members by source of dr ink ing water , RMI I CHNS , 2017
Use of household water treatment is presented in Table WS.2. Households were asked about ways
they may be treating water at home to make it safer to drink. Boiling water, adding bleach or
chlorine, using a water filter, and using solar disinfection are considered as effective treatment of
drinking water. Table WS.2 shows water treatment by all household members and the percentage of
those living in households using improved water sources and also using appropriate water treatment
methods.

P a g e | 61
There was universal use of improved water in RMI, however 58.8 percent of the population used an
addition method to treat drinking water. Boiling water is the most common method (42.1 percent)
used for water treatment followed by adding bleach (7.3 percent), using a water filter (4.8 percent)
and straining water through a cloth (4.6 percent).
Variations were observed in the use of water treatment methods between rural and urban areas. In
urban areas, 7.3 percent of the household population used a water filter for water treatment while
only 3.8 percent do so in rural areas. Adding bleach as a method of water treatment is more
prevalent in rural areas (16.5 percent) than urban areas (9.0 percent) and prevalence of using no
water treatment method was higher in urban areas (40.0 percent) than in rural areas (32.4 percent).
Table WS.2: Household water treatmentPercentage of household population by drinking water treatment method used in the household, and for household members living in households where an unimproved drinking water source is used, the percentage who are using an appropriate treatment method, by selected characteristics, RMI ICHNS, 2017
Water treatment method used in the household
Number of household member
Any household
water treatment method
Percentage of household members in household using
unimproved drinking water sources and
using an appropriate water treatment
method
Number of household
members in households
using unimproved
drinking water source None Boil
Add bleach/ chlorine
Strain through a cloth
Use water filter
Total 41.2 42.1 7.3 4.6 4.8 4758 58.8 0.0 0
Sex of household head
Male 41.2 42.1 7.3 4.6 4.8 431 58.8 0.0 0
Female 32.6 36.0 17.4 2.4 11.7 150 67.4 0.0 0
Area
Urban 40.0 39.7 9.0 4.1 7.3 299 60.0 0.0 0
Rural 32.4 43.7 16.5 3.6 3.8 282 67.6 0.0 0
Number of household members
1-5 31.4 46.7 8.0 5.9 8.0 164 68.6 0.0 0
5-10 37.8 44.5 10.5 2.8 4.4 293 62.2 0.0 0
11+ 41.4 35.0 10.3 4.7 8.5 124 58.6 0.0 0
Education of household head
None 37.1 44.1 9.3 7.8 1.7 43 62.9 0.0 0
Primary 30.1 45.2 8.4 7.3 9.1 145 69.9 0.0 0
Secondary 39.7 40.2 8.8 4.4 6.9 273 60.3 0.0 0
Higher 43.9 36.1 14.2 0.0 5.8 120 56.1 0.0 0
Wealth index quintile
Poorest 44.9 33.7 12.7 5.0 3.7 265 55.1 0.0 0
Second 39.9 39.4 10.5 7.7 2.5 98 60.1 0.0 0
Middle 24.5 57.0 10.2 4.5 3.8 82 75.5 0.0 0
Fourth 45.3 36.8 11.5 2.2 4.2 72 54.7 0.0 0
Richest 42.1 32.0 6.1 0.0 19.8 64 57.9 0.0 0
1 MICS indicator 4.2 - Water treatment
Drinking water is considered appropriately treated if one the following methods of treatment is used: boiling; adding bleach or chlorine; using a water filter; or using solar disinfection.
Note that all households used improved sources of drinking water so the total percentage of household members in the household using an unimproved drinking water source and using an appropriate water treatment method is zero.
Denominators are obtained by weighting the number of households by the number of household members.
The amount of time it takes to obtain water is presented in Table WS.3 and the person who usually
collects the water in Table WS.4. Note that for Table WS.3, household members using water on
premises are also shown in this table and for others, the results refer to one roundtrip from home to
drinking water source. Information on the number of trips made in one day was not collected.

P a g e | 62
Table WS.3 shows that for 82.7 percent of the household population, the drinking water source is on
premises. The availability of water on premises is associated with greater use, better family hygiene
and better health outcomes. For a water collection round trip of 30 minutes or more it has been
observed that households carry progressively less water and are likely to compromise on the
minimal basic drinking water needs of the household. For 11.2 percent of the population, it takes the
household 30 minutes or more to get to the water source and bring water. In urban areas, 12.5
percent of household members were found to spend 30 minutes or more collecting water compared
to 4.5 percent in rural areas which is attributed to higher use of bottled water in urban areas.
Household members in the richest wealth index quintile have the highest prevalence of 30 or more
minutes time to their water source at 26.8 percent compared to 4.2 percent, 5.3 percent, 9.1
percent, and 11.3 percent for the less wealthy quintiles.
Table WS.3: Time to source of drinking water
Percent distribution of household population according to time to go to source of drinking water, get water and return, for users of improved drinking water sources, by selected characteristics, RMI ICHNS, 2017
Time to source of drinking water
Users of improved drinking water sources
Total
Number of
household members
Water on premises
Less than 30 minutes
30 minutes or more Missing/DK
P-value
Total 82.7 4.5 11.2 1.5 100.0 -- 4758
Sex of household head
Male 82.1 4.9 12.0 1.0 100.0 -- 3448
Female 84.4 3.5 9.2 2.9 100.0 1310
Area
Urban 81.6 4.4 12.5 1.6 100.0 -- 2760
Rural 89.1 5.2 4.5 1.2 100.0 1998
Number of household members
1-5 82.5 6.8 8.8 1.9 100.0 -- 691
5-10 86.6 3.6 9.5 0.2 100.0 2265
11+ 79.2 4.8 13.4 2.6 100.0 1802
Education of household head
None 86.4 13.6 0.0 0.0 100.0 * 350
Primary 84.2 3.0 7.8 5.0 100.0 1142
Secondary 79.7 6.2 13.6 0.5 100.0 2275
Higher 86.7 0.3 11.8 1.1 100.0 991
Wealth index quintile
Poorest 80.1 14.8 4.2 1.0 100.0 *** 1884
Second 87.2 5.3 5.3 2.3 100.0 850
Middle 89.9 0.4 9.1 0.6 100.0 774
Fourth 83.7 2.7 11.3 2.3 100.0 634
Richest 71.4 0.3 26.8 1.5 100.0 616
* P<0.05, ** P<0.01, *** P<0.001
Only responses for users of improved drinking water are included as 100 percent of households used improved water. Water on premises: water in dwelling or water in own plot or yard. Water not on premises is based on water elsewhere than in dwelling or own plot or yard. Time to water source is based on responses to how long does it take to go there, get water and come back in minutes. Denominators are obtained by weighting the number of households by the number of household members.

P a g e | 63
Table WS.4 shows that for the majority of households (82.9 percent) an adult man usually collects
drinking water when the source is not on premises. Adult women collect water in 2.4 percent of
cases while, for the rest of the households, male (9.1 percent) or female (0.2 percent) children under
age 15 usually collect the water. The prevalence of men retrieving the water is higher in rural areas
(91.1 percent) than in urban areas (82.1 percent).
Table WS.4: Person collecting water
Percentage of households without drinking water on premises, and percent distribution of households without drinking water on premises according to the person usually collecting drinking water used in the household, by selected characteristics, RMI ICHNS, 2017
Percentage of households
without drinking water on premises
Number of households
Person usually collecting drinking water Number of households
without drinking water on premises
Adult woman
Adult man
Female child under age 15
Male child under age 15
Missing/Don't Know Total
Total 17.3 581 2.4 82.9 0.2 9.1 5.5 100.0 78
Area
Urban 18.4 299 2.1 82.1 0.0 10.0 5.8 100.0 44
Rural 10.9 282 5.4 91.1 1.7 0.0 1.8 100.0 34
Use of Improved Sanitation
An improved sanitation facility is defined as one that hygienically separates human excreta from
human contact. Improved sanitation facilities for excreta disposal include flush or pour flush to a
piped sewer system, septic tank, or pit latrine; ventilated improved pit latrine, pit latrine with slab,
and use of a composting toilet. The data on the use of improved sanitation facilities in RMI are
provided in Table WS.5.
Nearly one out of ten household members in RMI (8.3 percent) practices open defecation with no
sanitation facility (Table WS.5). The table indicates that practice of open defecation is strongly
correlated with wealth and is profoundly different between urban (3.5 percent) and rural (34.7
percent) areas. In rural areas, the population primarily uses septic tanks (56.7 percent) or simply
have no facilities (34.7 percent). In contrast, the most common facilities in urban areas are flush
toilets with connection to a piped sewer system (50.0 percent) or septic tank (45.3 percent).

P a g e | 64
Table WS.5: Types of sanitation facilities
Percent distribution of household population according to type of toilet facility used by the household, by selected characteristics, RMI ICHNS, 2017
Type of toilet facility used by household
Open defecation (no facility, bush, field) Total
Number of
household members
Improved sanitation facility
Flush/Pour flush to:
Pit latrine with slab
Piped sewer system
Septic tank
Pit latrine
Unknown place/not sure/DK where
Total 42.7 47.0 0.6 0.4 0.9 8.3 100.0 4758
Sex of household head
Male 41.6 48.0 0.5 0.6 1.2 8.0 100.0 3448
Female 45.5 44.7 0.8 0.0 0.2 8.9 100.0 1310
Area
Urban 50.0 45.3 0.1 0.4 0.7 3.5 100.0 2760
Rural 3.0 56.7 2.9 0.7 2.0 34.7 100.0 1998
Number of household members
1-5 28.6 44.4 1.3 1.0 3.8 20.9 100.0 691
5-10 41.7 45.3 0.8 0.8 1.2 10.2 100.0 2265
11+ 47.0 49.3 0.2 0.0 0.0 3.6 100.0 1802
Education of household head
None 30.0 36.2 1.0 1.9 7.7 23.1 100.0 350 Primary 28.1 54.6 2.2 0.0 1.2 13.9 100.0 1142 Secondary 48.1 43.8 0.2 0.7 0.4 6.9 100.0 2275 Higher 46.3 50.1 0.0 0.0 0.2 3.3 100.0 991
Ethnicity
Marshallese 42.2 47.4 0.6 0.5 0.9 8.4 100.0 4712 Other 87.9 12.1 0.0 0.0 0.0 0.0 100.0 46
Religion
Assembly of God 45.4 48.0 0.4 0.0 1.0 5.2 100.0 746
Protestant 39.7 49.5 0.8 0.5 0.7 8.7 100.0 2672 Catholic 58.1 38.1 0.0 0.0 0.0 3.8 100.0 328 Other 43.2 43.5 0.3 0.7 1.6 10.7 100.0 1012
Head of household age
Under 20 years 0.0 0.0 0.0 0.0 0.0 0.0 0.0 0
20-29 years 35.0 50.3 2.6 0.0 0.0 12.1 100.0 261
30-39 years 43.9 39.0 1.2 0.7 0.9 14.4 100.0 920 40-49 years 39.0 50.6 0.3 1.3 0.9 7.9 100.0 1080 50 or older 44.6 47.6 0.3 0.1 1.1 6.3 100.0 2398 Don't know 40.1 52.3 0.0 0.0 0.0 7.6 100.0 99
Wealth index quintile Poorest 21.6 39.5 2.4 1.8 1.7 33.0 100.0 1884 Second 50.2 38.6 0.5 0.5 2.8 7.3 100.0 850 Middle 45.7 52.9 0.0 0.0 0.0 1.4 100.0 774 Fourth 49.9 48.3 0.0 0.0 0.0 1.8 100.0 634 Richest 44.2 55.8 0.0 0.0 0.0 0.0 100.0 616
Improved sanitation facilities are: Flush/Pour flush toilet to piped sewer system, septic tank, pit latrine, or to unknown place, and pit latrine with slab.
There were no forms of unimproved pit latrines or other forms of toilet in use in RMI with all unimproved sanitation facilities attributed to open defecation.
Denominators are obtained by weighting the number of households by the number of household members.

P a g e | 65
Figure WS.2 presents the distribution of the survey population by use and sharing of sanitation
facilities.
F i gure WS.2 : Percent d i s t r ibu t ion of househo ld members by use of
san i ta t ion f a c i l i t i e s , RMI I CHNS , 2017
The SDGs and the WHO / UNICEF Joint Monitoring Programme (JMP) for Water Supply and
Sanitation classify otherwise acceptable sanitation facilities which are public or shared between two
or more households as unimproved. Therefore, “use of improved sanitation” is used both in the
context of this report and as an SDG indicator to refer to improved sanitation facilities, which are not
public or shared. Data on the use of improved sanitation are presented in Tables WS.6 and WS.7.
As shown in Table WS.6, 91.7 percent of the household population is using an improved sanitation
facility. Only 5.5 percent of households use an improved toilet facility that is public or shared with
other households. Rural households are slightly more likely than urban households to use a shared
toilet facility of an improved type (6.9 percent and 5.2 percent respectively). Use of non‐shared
improved sanitation facilities and use of open defecation was correlated to wealth index quintile and
education. Open defecation was practiced by 23.1 percent of household members with no education
and 33.0 percent of the poorest households, while 92.3 percent of household members whose
household head had higher education and 100 percent of the wealthiest households used improved
sanitation facilities that were not shared.

P a g e | 66
Table WS.6: Use and sharing of sanitation facilities
Percent distribution of household population by use of private and public sanitation facilities and use of shared facilities, by users of improved sanitation facilities, by selected characteristics, RMI ICHNS, 2017
Users of improved sanitation facilities Open
defecation (no facility, bush, field) Total P-value
Number of household members
Not shared1
Public facility
Shared by 5 households
or less More than 5 households
Total 86.3 0.0 4.1 1.4 8.3 100.0 -- 4758
Sex of household head
Male 85.4 0.0 4.9 1.6 8.0 100.0 -- 3448 Female 88.5 0.0 1.8 0.8 8.9 100.0 1310
Area
Urban 91.3 0.0 3.8 1.4 3.5 100.0 *** 2760
Rural 58.4 0.0 5.4 1.5 34.7 100.0 1998
Number of household members
1-5 73.9 0.0 3.4 1.8 20.9 100.0 ** 691
5-10 84.1 0.0 3.9 1.8 10.2 100.0 2265 11+ 91.2 0.0 4.4 0.9 3.6 100.0 1802
Education of household head
None 63.6 0.0 10.2 3.2 23.1 100.0 * 350
Primary 80.6 0.0 4.6 0.8 13.9 100.0 1142
Secondary 88.0 0.0 3.3 1.8 6.9 100.0 2275
Higher 92.3 0.0 3.6 0.7 3.3 100.0 991
Ethnicity
Marshallese 86.5 0.0 4.1 1.0 8.4 100.0 *** 4712
Other 63.7 0.0 0.0 36.3 0.0 100.0 46
Wealth index quintile
Poorest 62.4 0.0 3.5 1.1 33.0 100.0 *** 1884
Second 81.1 0.0 8.2 3.4 7.3 100.0 850
Middle 93.7 0.0 4.3 0.6 1.4 100.0 774
Fourth 92.8 0.0 3.6 1.8 1.8 100.0 634
Richest 100.0 0.0 0.0 0.0 0.0 100.0 616
* P<0.05, ** P<0.01, *** P<0.001 1 MICS indicator 4.3; MDG indicator 7.9 - Use of improved sanitation
Denominators are obtained by weighting the number of households by the number of household members.
The distribution of users of between types of improved and unimproved sanitation facilities are as shown in Table WS.5.
Having access to both an improved drinking water source and an improved sanitation facility brings
the largest public health benefits to a household.43 In its 2008 report44, the JMP developed a new
way of presenting the access figures, by disaggregating and refining the data on drinking‐water and
sanitation and reflecting them in "ladder" format. This ladder allows a disaggregated analysis of
trends in a three‐rung ladder for drinking‐water and a four‐rung ladder for sanitation. For sanitation,
this gives an understanding of the proportion of population with no sanitation facilities at all – who
revert to open defecation, of those reliant on technologies defined by JMP as "unimproved," of
those sharing sanitation facilities of otherwise acceptable technology, and those using "improved"
sanitation facilities.
43 Wolf, J et al. 2014. Systematic review: Assessing the impact of drinking water and sanitation on diarrhoeal disease in low- and middle-income settings: systematic review and meta-regression. Tropical Medicine and International Health 2014. 44 WHO/UNICEF JMP. 2008. MDG assessment report. http://www.wssinfo.org/fileadmin/user_upload/resources/1251794333-JMP_08_en.pdf

P a g e | 67
Table WS.7 presents the percentages of household population by these drinking water and
sanitation ladders. The table also shows the percentage of household members using both improved
sources of drinking water45 and an improved sanitary means of excreta disposal. In RMI the
prevalence of household members using improved drinking water sources and improved sanitation
facilities is 86.3 percent. Members in households in urban areas, with greater number of members,
with household head with higher education level, and in higher wealth index quintiles are more
likely to use an improved drinking water source and improved sanitation facilities compared to their
counterparts. These results are presented by urban and rural areas in Figure WS.3.
F i gure WS.3 : Use of improved dr ink ing wate r sources and improved san i ta t ion f a c i l i t i e s by househo ld members , RMI I CHNS , 2017
Disposal of faeces of children 0‐2 years of age is presented in Table WS.8. Safe disposal of a child’s
faeces is disposing of the stool, by the child using a toilet or by rinsing the stool into a toilet or
latrine. Putting disposable diapers with solid waste, a very common practice throughout the world
has thus far been classified as an inadequate means of disposal of child faeces for concerns about
poor disposal of solid waste itself. This classification is currently under review.
In only 6.0 percent of cases, child faeces were disposed of safely the last time the child passed stool.
Prevalence of disposal of children’s faeces into the garbage was 68.1 percent. Child age was closely
associated with safe disposal of stools with children 12‐23 months old (12.0 percent) having higher
prevalence than children 6‐11 months (1.0 percent) and 0‐5 months of age (0.0 percent).
45 Those indicating bottled water as the main source of drinking water are distributed according to the water source used
for other purposes such as cooking and handwashing.

P a g e | 68
Table WS.7: Drinking water and sanitation ladders
Percentage of household population by drinking water and sanitation ladders, by selected characteristics, RMI ICHNS, 2017
Percentage of household population using:
Number of household members
Improved drinking water1, a
Unimproved drinking water Total
Improved sanitation2
Unimproved sanitation
Total
Improved drinking water
sources and improved sanitation
Piped into dwelling,
plot or yard Other
improved
Shared improved facilities
Unimproved facilities
Open defecation P-value
Total 10.0 90.0 0.0 100.0 86.3 5.5 0.0 8.3 100.0 86.3 -- 4758
Sex of household head
Male 10.5 89.5 0 100.0 85.4 6.6 0.0 8.0 100.0 85.4 -- 3448 Female 8.7 91.3 0 100.0 88.5 2.6 0.0 8.9 100.0 88.5 1310
Area
Urban 10.7 89.3 0 100.0 91.3 5.2 0.0 3.5 100.0 91.3 *** 2760
Rural 5.8 94.2 0 100.0 58.4 6.9 0.0 34.7 100.0 58.4 1998
Number of household members
1-5 8.7 91.3 0 100.0 73.9 5.2 0.0 20.9 100.0 73.9 *** 691 5-10 8.4 91.6 0 100.0 84.1 5.7 0.0 10.2 100.0 84.1 2265 11+ 11.8 88.2 0 100.0 91.2 5.2 0.0 3.6 100.0 91.2 1802
Education of household head
None 29.2 70.8 0 100.0 63.6 13.4 0.0 23.1 100.0 63.6 *** 350 Primary 10.8 89.2 0 100.0 80.6 5.4 0.0 14.0 100.0 80.6 1142 Secondary 5.2 94.8 0 100.0 88.0 5.1 0.0 6.9 100.0 88.0 2275 Higher 14.2 85.8 0 100.0 92.4 4.3 0.0 3.3 100.0 92.3 991
Wealth index quintile
Poorest 4.9 95.1 0 100.0 62.4 4.6 0.0 33.0 100.0 62.4 *** 1884 Second 9.7 90.3 0 100.0 81.1 11.6 0.0 7.3 100.0 81.1 850 Middle 6.1 93.9 0 100.0 93.7 4.9 0.0 1.4 100.0 93.7 774 Fourth 7.6 92.4 0 100.0 92.8 5.4 0.0 1.8 100.0 92.8 634 Richest 21.4 78.6 0 100.0 100.0 0.0 0.0 0.0 100.0 100.0 616
* P<0.05, ** P<0.01, *** P<0.001 1 MICS indicator 4.1; SDG indicator 6.1.1 Proportion of population using safely managed drinking water services 2 MICS indicator 4.3; SDG indicator 6.2.1 Proportion of population using safely managed sanitation services a Those indicating bottled water as the main source of drinking water are distributed according to the water source used for other purposes such as cooking and handwashing.
Denominators are obtained by weighting the number of households by the total number of household members.

P a g e | 69
Table WS.8: Disposal of child's faeces
Percent distribution of children age 0-2 years according to place of disposal of child's faeces, and the percentage of children age 0-2 years whose stools were disposed of safely the last time the child passed stools, by selected characteristics, RMI ICHNS, 2017
Place of disposal of child's faeces Percentage of children whose last stools were disposed of
safely1 P-
value
Number of
children age 0-2 years
Child used toilet/latrine
Put/rinsed into toilet or latrine
Put/rinsed into drain or ditch
Thrown into
garbage Buried
Left in the
open
Thrown in the ocean Other Missing/DK Total
Total 4.5 1.5 0.2 68.1 8.6 0.8 4.0 8.6 3.7 100.0 6.0 -- 362
Child Age
0-5m 0.0 0.0 0.8 71.3 7.2 0.0 2.2 10.2 8.4 100.0 0.0 *** 80
6-11m 0.0 1.0 0.0 71.2 9.5 1.0 3.3 9.3 4.7 100.0 1.0 111
12-23m 9.5 2.5 0.2 64.6 8.6 1.1 5.3 7.3 0.9 100.0 12.0 171
Mother's age at birth
Less than 20 years 0.0 0.0 0.0 79.7 9.3 0.0 3.6 2.6 4.8 100.0 0.0 -- 40
20-34 years 3.8 1.8 0.2 65.2 8.1 1.3 4.9 9.9 4.8 100.0 5.6 234
35-49 years 12.9 2.7 0.0 70.5 9.9 0.0 1.2 2.8 0.0 100.0 15.5 41
Child gender
Male 3.7 2.8 0.1 69.7 8.6 1.0 2.3 6.5 5.3 100.0 6.4 -- 197
Female 5.4 0.0 0.3 66.3 8.5 0.6 6.0 11.1 1.8 100.0 5.4 165
Area
Urban 4.8 1.8 0.0 73.3 4.6 0.0 2.6 8.5 4.4 100.0 6.6 -- 195
Rural 2.9 0.0 1.3 43.8 27.2 4.7 10.5 9.0 0.5 100.0 2.9 167
Wealth index quintile
Poorest 2.4 0.0 1.1 58.0 21.5 3.9 8.6 4.1 0.4 100.0 2.4 -- 161
Second 0.0 0.0 0.0 79.4 7.7 0.0 5.7 0.0 7.1 100.0 0.0 52
Middle 3.0 6.2 0.0 76.0 4.5 0.0 3.2 2.9 4.2 100.0 9.2 60
Fourth 9.3 0.0 0.0 68.2 8.2 0.0 1.8 8.6 3.9 100.0 9.3 44
Richest 8.7 0.0 0.0 57.6 0.0 0.0 0.0 30.4 3.2 100.0 8.7 45
* P<0.05, ** P<0.01, *** P<0.001 1 MICS indicator 4.4 - Safe disposal of child’s faeces

P a g e | 70
Handwashing
Handwashing with water and soap is the most cost‐effective health intervention to reduce both the
incidence of diarrhoea and pneumonia in children under 546. It is most effective when done using
water and soap after visiting a toilet or cleaning a child, before eating or handling food and, before
feeding a child. Monitoring correct handwashing behaviour at these critical times is challenging. A
reliable alternative to observations or self‐reported behaviour is assessing the likelihood that correct
handwashing behaviour takes place by asking if a household has a specific place where people wash
their hands and, if yes, observing whether water and soap (or other local cleansing materials) are
available at this place47.
In RMI, 97.7 percent of the households with a specific place for handwashing was observed while 2.3
percent of households could not indicate a specific place where household members usually wash
their hands (Table WS.9). Prevalence was 91.7 percent for “Households with a specific place for
handwashing where water and soap or other cleansing agent are present”. This same indicator was
associated with wealth index quintile, having higher prevalence in wealthier households.
As shown in Table WS.10, 1.2 percent of households did not have any soap or other cleansing agent
in the household. In the remaining 98.8 percent of households, either the soap or other cleansing
agent was observed or shown to the interviewer (Table WS.10). The percentage of households with
soap or other cleansing agent anywhere in the dwelling was lower with lower levels of education of
the household head. Rural areas had about the same percentage of households (99.5 percent) with
soap or other cleansing agent anywhere in the dwelling as households in urban areas (98.6 percent).
46 Cairncross, S and Valdmanis, V. 2006. Water supply, sanitation and hygiene promotion Chapter 41 in Disease Control Priorities in Developing Countries. 2nd Edition, Edt. Jameson et al. The World Bank. 47 Ram, P et al. editors. 2008. Use of a novel method to detect reactivity to structured observation for measurement of
handwashing behavior. American Society of Tropical Medicine and Hygiene.

P a g e | 71
Table WS.9: Water and soap at place for handwashing
Percentage of households where place for handwashing was observed, percentage with no specific place for handwashing, and percent distribution of households by availability of water and soap at specific place for handwashing, by selected characteristics, RMI ICHNS, 2017
Percentage of households:
Number of house-
holds
Place for handwashing observed
No specific place for
hand-washing in
the dwelling, yard, or plot Total
Percent-age of house-holds with a specific place
for hand-washing where water and soap
or other cleansing agent
are present1 P-
value
Number of house-holds where place for hand-washing was observed or with no specific place for hand-washing in the
dwelling, yard, or plot
Where place for handwashing was observed
With no specific place
for hand-washing in
the dwelling, yard, or plot
Water is available and:
Water is not available and:
Soap present
No soap:
Soap present
No soap:
Fixed facility
in dwelling
Fixed facility in yard or plot
Bucket/Jug/ Kettle for hand-washing
Ash, mud, or
sand present
No other cleansing
agent present
Ash, mud, or
sand present
No other cleansing
agent present
Total 32.2 31.3 34.2 2.3 581 84.7 7.0 0.9 3.8 1.3 0.0 2.3 100.0 91.7 -- 581
Sex of household head
Male 30.4 31.1 35.6 2.9 431 83.7 6.8 1.2 4.0 1.4 0.0 2.9 100.0 90.5 -- 431
Female 37.1 31.9 30.3 0.6 150 87.5 7.6 0.0 3.5 0.9 0.0 0.6 100.0 95.0 150
Area
Urban 36.5 34.5 27.2 1.8 299 85.8 6.4 1.1 3.5 1.4 0.0 1.8 100.0 92.2 -- 299
Rural 14.3 18.3 63.1 4.3 282 80.2 9.4 0.0 5.0 1.0 0.0 4.3 100.0 89.7 282
Number of household members
1-5 39.1 25.8 32.7 2.4 164 79.9 8.3 1.3 7.2 0.8 0.0 2.4 100.0 88.2 -- 164
5-10 25.9 34.7 38.0 1.5 293 86.7 8.3 0.0 3.1 0.5 0.0 1.5 100.0 95.0 293
11+ 37.7 30.0 28.6 3.6 124 85.2 3.5 2.1 2.4 3.2 0.0 3.6 100.0 88.7 124
Education of household head
None 30.0 37.8 31.2 1.0 43 81.6 6.9 5.0 5.5 0.0 0.0 1.0 100.0 88.4 -- 43
Primary 22.6 37.0 39.5 0.9 145 83.6 5.8 2.9 6.4 0.5 0.0 0.9 100.0 89.4 145
Secondary 29.9 31.4 35.7 3.0 273 82.4 8.5 0.0 3.7 2.5 0.0 3.0 100.0 90.9 273
Higher 44.4 25.3 28.0 2.3 120 90.7 5.2 0.0 1.8 0.0 0.0 2.3 100.0 95.9 120
Wealth index quintile Poorest 7.6 21.2 68.3 2.9 265 74.3 6.8 1.3 10.7 4.0 0.0 2.9 100.0 81.0 *** 265 Second 20.2 42.6 35.9 1.3 98 81.2 8.9 2.5 4.2 1.9 0.0 1.3 100.0 90.1 98
Middle 34.7 29.3 32.7 3.3 82 90.0 4.3 0.0 2.5 0.0 0.0 3.3 100.0 94.3 82
Fourth 38.4 40.9 18.4 2.3 72 92.1 5.6 0.0 0.0 0.0 0.0 2.3 100.0 97.7 72 Richest 69.4 22.5 6.5 1.5 64 89.1 9.4 0.0 0.0 0.0 0.0 1.5 100.0 98.5 64
* P<0.05, ** P<0.01, *** P<0.001 1 MICS indicator 4.5 - Place for handwashing
Only households where the place for handwashing was observed by the interviewer and households with no specific place for handwashing are included in the denominator of the indicator. Households with water at place for handwashing and soap or other cleansing agent at place for handwashing are included in the numerator.

P a g e | 72
Table WS.10: Availability of soap or other cleansing agent
Percent distribution of households by availability of soap or other cleansing agent in the dwelling, by selected characteristics, RMI ICHNS, 2017
Place for handwashing observed Place for handwashing not observed
Total
Percentage of households with soap or
other cleansing agent
anywhere in the dwelling1
Number of households
Soap or other cleansing
agent observed
Soap or other cleansing agent not observed at place for handwashing
Soap or other cleansing
agent shown
No soap or other cleansing
agent in household
Not able/Does not want to
show soap or other cleansing
agent
Soap or other cleansing
agent shown
No soap or other cleansing
agent in household
Not able/Does not want to
show soap or other cleansing
agent
Total 86.5 10.4 0.9 0.0 1.9 0.4 0.0 100.0 98.8 581
Sex of household head
Male 84.4 11.5 1.2 0.0 2.4 0.5 0.0 100.0 98.3 431
Female 92.2 7.2 0.0 0.0 0.6 0.0 0.0 100.0 100.0 150
Area
Urban 88.0 9.2 1.1 0.0 1.5 0.3 0.0 100.0 98.6 299 Rural 80.4 15.3 0.0 0.0 3.8 0.5 0.0 100.0 99.5 282
Number of household members
1-5 83.5 12.8 1.3 0.0 2.0 0.4 0.0 100.0 98.3 164 5-10 88.4 10.2 0.0 0.0 1.5 0.0 0.0 100.0 100.0 293 11+ 85.6 8.7 2.1 0.0 2.7 1.0 0.0 100.0 96.9 124
Education of household head
None 64.0 30.0 5.0 0.0 1.0 0.0 0.0 100.0 95.0 43
Primary 85.0 11.3 2.9 0.0 0.9 0.0 0.0 100.0 97.1 145
Secondary 86.1 10.9 0.0 0.0 2.5 0.6 0.0 100.0 99.4 273
Higher 93.5 4.1 0.0 0.0 2.0 0.4 0.0 100.0 99.6 120
Wealth index quintile
Poorest 69.3 26.5 1.3 0.0 2.5 0.4 0.0 100.0 98.2 265
Second 78.6 17.5 2.5 0.0 1.3 0.0 0.0 100.0 97.5 98
Middle 95.1 1.6 0.0 0.0 3.3 0.0 0.0 100.0 100.0 82
Fourth 96.5 1.2 0.0 0.0 2.3 0.0 0.0 100.0 100.0 72
Richest 98.5 0.0 0.0 0.0 0.0 1.5 0.0 100.0 98.5 64 1 MICS indicator 4.6 - Availability of soap or other cleansing agent
Households with soap anywhere in the dwelling are those where soap was observed by the interviewer at the place for handwashing and those households where soap was not observed at the place for handwashing but soap was shown to the interviewer.
Soap includes bar soap, powder, liquid or paste detergent and liquid soap; other cleansing agents include ash.

P a g e | 73
VII. Reproductive Health
Antenatal Care
The antenatal period presents important opportunities for reaching pregnant women with a number
of interventions that may be vital to their health and well‐being and that of their infants. Better
understanding of foetal growth and development and its relationship to the mother's health has
resulted in increased attention to the potential of antenatal care as an intervention to improve both
maternal and newborn health. For example, antenatal care can be used to inform women and
families about risks and symptoms in pregnancy and about the risks of labour and delivery, and
therefore it may provide the route for ensuring that pregnant women do, in practice, deliver with
the assistance of a skilled health care provider. Antenatal visits also provide an opportunity to supply
information on birth spacing, which is recognized as an important factor in improving infant survival.
Tetanus immunization during pregnancy can be life‐saving for both the mother and the infant. The
prevention and treatment of malaria among pregnant women, management of anaemia during
pregnancy and treatment of sexually transmitted infections (STIs) can significantly improve foetal
outcomes and improve maternal health. Adverse outcomes such as low birth weight can be reduced
through a combination of interventions to improve women's nutritional status and prevent
infections (e.g., malaria and STIs) during pregnancy. More recently, the potential of the antenatal
care as an entry point for HIV prevention and care, in particular for the prevention of HIV
transmission from mother to child, has led to renewed interest in access to and use of antenatal
services.
WHO previously recommended a minimum of 4 antenatal visits, however based on a review of the
effectiveness of different models of antenatal care the WHO updated its guidance for a minimum of
8 antenatal visits. It is of crucial importance for pregnant women to start attending antenatal care
visits as early in pregnancy as possible in order to prevent and detect pregnancy conditions that
could affect both the woman and her baby. Antenatal care should continue throughout the entire
pregnancy.
Antenatal care coverage indicators (at least one visit with a skilled provider and 4 or more visits with
any providers) are used to track progress toward the Millennium Development Goal 5 of improving
maternal health. Figure RH.1. presents an overview of key reproductive health indicators in RMI.
F i gure RH.1 : Rece ip t of ANC se rv i ces and p lace of de l i ve ry , RMI I CHNS 2017

P a g e | 74
The type of personnel providing antenatal care to women aged 15‐49 years who gave birth in the
two preceding years is presented in Table RH.7.
Table RH.7: Antenatal care coverage a
Percent distribution of mothers age 15-49 years with a live birth in the last two years by antenatal care provider during the pregnancy for the last birth, by selected characteristics, RMI ICHNS, 2017
Provider of antenatal care b
No antenatal
care Total Any skilled provider 1,c
Number of women
with a live birth in the
last two years
P-value
Medical doctor
Nurse/ Midwife
Health Assistant
Traditional birth
attendant Local
Healer
Total 36.6 46.8 9.3 1.2 1.7 4.4 100.0 92.7 270
Mother's age at birth
Less than 20 years 29.3 49.0 9.6 6.9 1.1 4.1 100.0 87.9 32 --
20-34 years 37.5 48.4 8.2 0.6 1.0 4.3 100.0 94.1 200
35-49 years 40.0 32.8 15.6 0.0 5.8 5.8 100.0 88.5 35
Area
Urban 37.2 50.7 4.9 0.9 1.9 4.5 100.0 92.7 147 --
Rural 34.0 27.9 30.9 2.4 0.7 4.2 100.0 92.7 123
Mother's education
None -- -- -- -- -- -- -- -- 3 **
Primary 32.6 50.1 12.2 1.3 0.7 3.0 100.0 95.0 47
Secondary 41.1 44.3 11.2 0.3 0.0 3.1 100.0 96.6 167
Higher 29.2 49.7 2.3 3.3 6.6 8.9 100.0 81.2 53
Wealth index quintile
Poorest 31.6 40.0 22.9 2.0 0.0 3.5 100.0 94.5 116 --
Second 42.9 44.5 3.8 0.0 0.0 8.8 100.0 91.2 41
Middle 37.2 48.9 10.4 3.0 0.5 0.0 100.0 96.5 48
Fourth 52.9 41.5 0.7 0.0 4.8 0.0 100.0 95.2 32
Richest 20.6 58.4 5.7 0.0 4.2 11.1 100.0 84.7 33
Maternal Nutrition Status
Underweight -- -- -- -- -- -- -- -- 6 **
Normal 41.4 47.1 9.4 0.3 0.4 1.3 100.0 98.0 88
Overweight 33.6 42.3 8.8 2.6 2.6 10.1 100.0 84.7 80
Obese 38.4 47.6 9.9 0.9 2.3 1.0 100.0 95.9 91
Maternal Parity
1 31.8 54.1 5.2 2.5 0.4 6.0 100.0 91.1 82 --
2-3 38.6 43.3 11.3 0.2 3.6 3.0 100.0 93.2 121
4 or more 41.4 43.2 11.7 0.9 0.0 2.7 100.0 96.3 57
Maternal Married Status
Not married 30.4 56.2 10.6 0.5 0.3 2.1 100.0 97.1 119 --
Currently married 35.4 40.9 12.0 0.0 3.5 8.2 100.0 88.3 52
Cohabitating 44.8 39.4 6.1 2.8 2.2 4.8 100.0 90.3 98
Father in Household
Yes 36.6 44.8 10.3 1.4 2.1 4.8 100.0 91.7 209 --
No 36.5 54.8 5.2 0.5 0.0 3.0 100.0 96.5 61
* P<0.05, ** P<0.01, *** P<0.001 1 MICS indicator 5.5a a 53 caregivers did not participate as they were not the mother and 39 mothers did not complete the ANC section of the questionnaire. b Only the most qualified provider is considered in cases where more than one provider was reported. c Skilled providers include Medical doctor and Nurse/Midwife.

P a g e | 75
The results show that a relatively small percentage of women (4.4 percent) do not receive antenatal
care. In RMI, the majority of antenatal care is provided by either medical doctors (36.6 percent) or
nurse/midwife (46.8 percent). Of mothers with a live birth in the last two years, over half (50.7
percent) in urban areas were provided antenatal care by a nurse/midwife compared to 27.9 percent
in rural areas. Interestingly, the highest prevalence of no antenatal care was in mothers with higher
education (8.9 percent) compared to about 3.0 percent for those with less educational attainment.
Table RH.8 shows the number of antenatal care visits during the latest pregnancy that took place
within the two years preceding the survey, regardless of provider, by selected characteristics. A total
of 67.8 percent of mothers received antenatal care at least four times and 29.9 percent received
antenatal care 8 times or more. While not significant, there was higher prevalence of mothers
having 4 or more ANC visits in urban areas (70.1 percent) than in rural areas (56.5 percent).
Table RH.8 also provides information about the timing of the first antenatal care visit. Overall, 43.7
percent of women with a live birth in the last two years had their first antenatal care visit during the
first trimester of their last pregnancy, with a median of 3.7 months of pregnancy at the first visit
among those who received antenatal care. Prevalence of first antenatal visit during the first
trimester was not significantly different by area with 41.6 percent in the rural areas compared to
44.2 percent in urban areas.

P a g e | 76
Table RH.8: Number of antenatal care visits and timing of first visit a
Percent distribution of mothers age 15-49 years with a live birth in the last two years, by selected characteristics, RMI ICHNS, 2017
Percent distribution of women who had: Percent distribution of women by number of months pregnant
at the time of first antenatal care visit
Number of women with a live birth in the last two years
Median months pregnant at first ANC visit
Number of women with a live birth in the last two years who had at least one
No antenatal
care visits
1 visit 2 visits 3 visits
4 or more visits1
DK/ Missing Total
8 or more visits 2
P-value
No antenatal
care visits
First trimester
4-5 months
6-7 months
8+ months
DK/ Missing Total
P-value
Total 4.4 1.8 4.7 6.5 67.8 14.7 100.0 29.9 -- 4.4 43.7 30.9 11.5 3.9 5.6 100.0 -- 270 3.7 258
Mother's age at birth (Years)
Less than 20 4.1 1.1 0.0 13.2 71.2 10.4 100.0 33.8 -- 4.1 23.6 49.9 18.5 0.0 3.9 100.0 -- 32 4.4 31
20-34 4.3 1.1 5.6 6.8 66.7 15.6 100.0 30.3 4.3 44.1 29.1 11.0 5.2 6.4 100.0 200 3.8 191
35-49 5.8 7.0 4.0 0.0 69.3 14.0 100.0 26.2 5.8 57.2 24.9 8.9 0.0 3.2 100.0 35 2.8 33
Area
Urban 4.5 1.6 4.1 6.1 70.1 13.6 100.0 30.9 -- 4.5 44.2 32.1 10.1 4.3 4.9 100.0 -- 147 3.7 140
Rural 4.2 3.1 7.6 8.8 56.5 19.8 100.0 25.3 4.2 41.6 25.1 18.2 2.1 8.9 100.0 123 3.9 118
Mother's education
None -- -- -- -- -- -- -- -- -- -- -- -- -- -- -- -- -- 3 4.9 3
Primary 3.0 0.0 5.4 9.3 54.0 28.4 100.0 24.9 3.0 40.4 33.9 12.4 0.0 10.4 100.0 47 3.6 46
Secondary 3.1 0.6 5.4 7.3 74.2 9.4 100.0 32.3 3.1 45.6 30.6 13.0 3.8 3.9 100.0 167 3.8 162
Higher 8.9 6.2 2.5 3.0 60.3 19.1 100.0 27.5 8.9 42.8 27.9 6.7 6.9 6.9 100.0 53 3.5 48
Wealth index quintile
Poorest 3.5 2.6 11.0 9.8 56.2 17.0 100.0 24.1 -- 3.5 39.1 33.1 13.0 4.6 6.8 100.0 -- 116 4.1 112
Second 8.8 0.0 5.4 4.8 62.8 18.3 100.0 23.8 8.8 50.0 22.3 7.7 5.6 5.6 100.0 41 3.5 37
Middle 0.0 2.1 5.5 9.1 66.8 16.5 100.0 24.6 0.0 29.4 39.8 17.1 5.4 8.2 100.0 48 4.3 48
Fourth 0.0 4.8 0.0 4.9 79.0 11.2 100.0 37.3 0.0 50.2 37.1 12.7 0.0 0.0 100.0 32 3.4 32
Richest 11.1 0.0 0.0 2.5 77.6 8.9 100.0 43.7 11.1 56.7 19.3 4.8 2.6 5.6 100.0 33 3.0 29
Maternal Nutrition Status
Underweight -- -- -- -- -- -- -- -- -- -- -- -- -- -- -- -- ** 6 5.2 4
Normal 1.3 2.1 4.2 10.4 68.3 13.6 100.0 39.1 1.3 38.5 35.3 13.9 7.0 4.0 100.0 88 4.1 87
Overweight 10.1 3.1 5.2 6.9 66.1 8.6 100.0 26.0 10.1 38.2 36.3 12.3 2.0 1.1 100.0 80 3.8 72
Obese 1.0 0.7 4.7 3.3 70.5 19.8 100.0 26.3 1.0 53.3 25.0 7.5 1.7 11.5 100.0 91 3.2 90
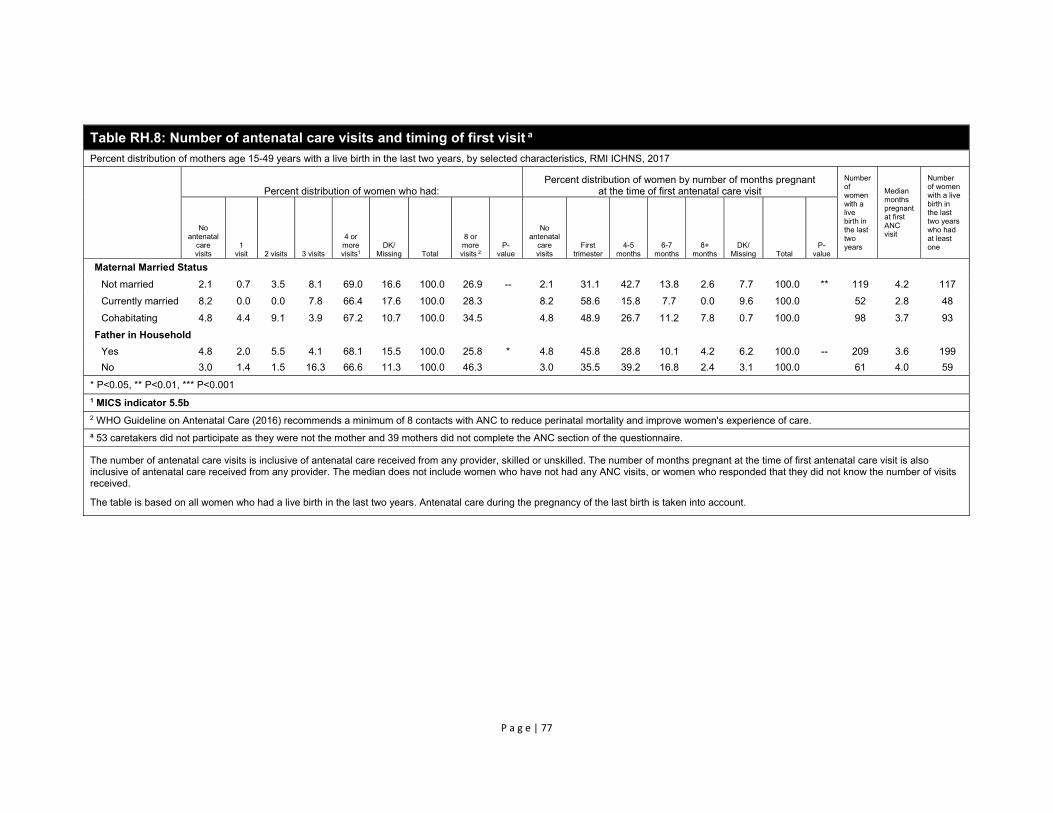
P a g e | 77
Table RH.8: Number of antenatal care visits and timing of first visit a
Percent distribution of mothers age 15-49 years with a live birth in the last two years, by selected characteristics, RMI ICHNS, 2017
Percent distribution of women who had: Percent distribution of women by number of months pregnant
at the time of first antenatal care visit
Number of women with a live birth in the last two years
Median months pregnant at first ANC visit
Number of women with a live birth in the last two years who had at least one
No antenatal
care visits
1 visit 2 visits 3 visits
4 or more visits1
DK/ Missing Total
8 or more visits 2
P-value
No antenatal
care visits
First trimester
4-5 months
6-7 months
8+ months
DK/ Missing Total
P-value
Maternal Married Status
Not married 2.1 0.7 3.5 8.1 69.0 16.6 100.0 26.9 -- 2.1 31.1 42.7 13.8 2.6 7.7 100.0 ** 119 4.2 117
Currently married 8.2 0.0 0.0 7.8 66.4 17.6 100.0 28.3 8.2 58.6 15.8 7.7 0.0 9.6 100.0 52 2.8 48
Cohabitating 4.8 4.4 9.1 3.9 67.2 10.7 100.0 34.5 4.8 48.9 26.7 11.2 7.8 0.7 100.0 98 3.7 93
Father in Household
Yes 4.8 2.0 5.5 4.1 68.1 15.5 100.0 25.8 * 4.8 45.8 28.8 10.1 4.2 6.2 100.0 -- 209 3.6 199
No 3.0 1.4 1.5 16.3 66.6 11.3 100.0 46.3 3.0 35.5 39.2 16.8 2.4 3.1 100.0 61 4.0 59
* P<0.05, ** P<0.01, *** P<0.001
1 MICS indicator 5.5b
2 WHO Guideline on Antenatal Care (2016) recommends a minimum of 8 contacts with ANC to reduce perinatal mortality and improve women's experience of care. a 53 caretakers did not participate as they were not the mother and 39 mothers did not complete the ANC section of the questionnaire.
The number of antenatal care visits is inclusive of antenatal care received from any provider, skilled or unskilled. The number of months pregnant at the time of first antenatal care visit is also inclusive of antenatal care received from any provider. The median does not include women who have not had any ANC visits, or women who responded that they did not know the number of visits received.
The table is based on all women who had a live birth in the last two years. Antenatal care during the pregnancy of the last birth is taken into account.

P a g e | 78
Assistance at Delivery
About three quarters of all maternal deaths occur due to direct obstetric causes.48 The single most
critical intervention for safe motherhood is to ensure that a competent health worker with
midwifery skills is present at every birth, and in case of emergency that transport is available to a
referral facility for obstetric care. The skilled attendant at delivery indicator is used to track progress
toward the Sustainable Development Goal 3 of improving maternal health.
The ICHNS 2017 included a number of questions to assess the proportion of births attended by a
skilled attendant. A skilled attendant includes a doctor, nurse, or midwife.
Overall, almost 1 in 10 (9.7 percent) of women who delivered in the last two years had a C‐section
and an estimated 92.4 percent of deliveries occurring in the two years preceding the survey were
assisted by skilled personnel (Table RH.10). A total of 60.7 percent of births in the two years
preceding the ICHNS 2017 were delivered with the assistance of a medical doctor. A nurse or a
midwife assisted with the delivery of 31.7 percent of births. In rural areas, the percentage of births
assisted by a doctor is 34.1 percent compared to 66.2 percent in urban areas. Wealth index quintile
shows a positive association with deliveries assisted by skilled attendant with 73.0 percent of
deliveries in the poorest quintile compared to 90.2 percent in the second, 99.5 percent in the third
and 100 percent in the 2 richest quintiles. Figure RH.3. presents and overview of person assisting at
delivery for the national level in RMI.
F i gure RH.3 : Per son ass i s t ing a t de l i ve ry , RMI I CHNS , 2017
48 Say, L et al. 2014. Global causes of maternal death: a WHO systematic analysis. The Lancet Global Health 2(6): e323-33. DOI: 10.1016/S2214-109X(14)70227-X

P a g e | 79
Table RH.10: Assistance during delivery and caesarean section a Percent distribution of mothers age 15-49 years with a live birth in the last two years by person providing assistance at delivery, and percentage of births delivered by C-section, by selected characteristics, RMI ICHNS, 2017
Person assisting at delivery
No attendant Total
Delivery assisted by any skilled attendant1,b P-value
Percent delivered
by C-section 2 P-value
Number of women who had a live birth in the
last two years Medical doctor
Nurse/ Midwife
Auxiliary midwife
Traditional birth
attendant Local
Healer Relative/Friend Other
Total 60.7 31.7 4.2 1.2 0.8 0.0 0.6 0.8 100.0 92.4 -- 9.7 -- 270
Area Urban 66.2 31.7 0.0 0.5 0.0 0.0 0.7 0.9 100.0 97.8 *** 10.3 -- 147 Rural 34.1 32.0 24.7 4.7 4.4 0.0 0.0 0.0 100.0 66.2 6.8 123
Mother's education None -- -- -- -- -- -- -- -- -- -- -- -- -- 3 Primary 49.0 40.2 8.0 0.6 2.2 0.0 0.0 0.0 100.0 89.2 3.5 47 Secondary 70.0 22.5 3.8 1.9 0.5 0.0 0.0 1.3 100.0 92.5 11.7 167 Higher 44.7 50.2 2.1 0.0 0.5 0.0 2.5 0.0 100.0 94.9 7.4 53
Wealth index quintile
Poorest 44.9 28.1 20.5 3.4 3.1 0.0 0.0 0.0 100.0 73.0 *** 10.1 -- 116
Second 62.2 28.0 0.0 2.7 0.0 0.0 3.1 4.1 100.0 90.2 14.4 41 Middle 68.1 31.4 0.0 0.0 0.5 0.0 0.0 0.0 100.0 99.5 5.9 48 Fourth 69.6 30.4 0.0 0.0 0.0 0.0 0.0 0.0 100.0 100.0 5.5 32 Richest 58.7 41.3 0.0 0.0 0.0 0.0 0.0 0.0 100.0 100.0 13.4 33
Maternal Nutrition Status
Underweight -- -- -- -- -- -- -- -- -- -- * -- -- 6
Normal 74.3 17.5 4.3 2.7 1.2 0.0 0.0 0.0 100.0 91.8 12.1 88
Overweight 53.9 34.1 5.2 0.9 1.2 0.0 2.0 2.6 100.0 88.0 6.8 80
Obese 58.6 38.2 3.0 0.3 0.0 0.0 0.0 0.0 100.0 96.8 11.1 91
Father in Household
Yes 59.3 33.1 4.4 1.1 0.4 0.0 0.7 1.0 100.0 92.4 -- 9.8 -- 209
No 66.5 26.2 3.4 1.9 2.0 0.0 0.0 0.0 100.0 92.7 9.3 61
* P<0.05, ** P<0.01, *** P<0.001
1 MICS indicator 5.7; SDG indicator 3.1.2 – Proportion of births attended by skilled health personnel 2 MICS indicator 5.9 - Caesarean section
a 53 caregivers did not participate as they were not the mother and 39 mothers did not complete the ANC section of the questionnaire. b Skilled attendants include Medical doctor and Nurse/Midwife.

P a g e | 80
Place of Delivery
Increasing the proportion of births that are delivered in health facilities is an important factor in
reducing the health risks to both the mother and the baby. Proper medical attention and hygienic
conditions during delivery can reduce the risks of complications and infection that can cause
morbidity and mortality to either the mother or the baby. Table RH.11 presents the percent
distribution of women age 15‐49 who had a live birth in the two years preceding the survey by place
of delivery, and the percentage of births delivered in a health facility, according to background
characteristics.
Table RH.11: Place of delivery a
Percent distribution of mothers age 15-49 years with a live birth in the last two years by place of delivery of their last birth, by selected characteristics, RMI ICHNS, 2017
Place of delivery
Total
Delivered in health facility1
P-value
Number of women
with a live birth in the
last two years
Hospital Outer Island Health Center/
Dispensary Home Other Public sector
Private sector
Total 83.0 0.0 9.1 3.7 4.1 100.0 92.1 -- 270
Area
Urban 92.0 0.0 0.9 2.2 4.9 100.0 93.0 -- 147
Rural 39.1 0.0 49.0 11.3 0.6 100.0 88.1 123
Mother's education
None -- -- -- -- -- -- -- -- 3
Primary 85.5 0.0 12.5 2.0 0.0 100.0 98.0 47
Secondary 83.3 0.0 8.5 4.3 3.9 100.0 91.8 167
Higher 81.4 0.0 7.3 3.7 7.6 100.0 88.7 53
Wealth index quintile
Poorest 50.8 0.0 39.8 8.9 0.5 100.0 90.6 ** 116
Second 89.1 0.0 1.0 9.8 0.0 100.0 90.2 41
Middle 100.0 0.0 0.0 0.0 0.0 100.0 100.0 48
Fourth 100.0 0.0 0.0 0.0 0.0 100.0 100.0 32
Richest 73.9 0.0 4.2 0.0 21.9 100.0 78.1 33
Maternal Parity
1 85.5 0.0 5.9 5.6 3.0 100.0 91.4 -- 82
2-3 81.5 0.0 12.1 1.5 4.9 100.0 93.6 121
4 or more 84.9 0.0 6.8 5.9 2.4 100.0 91.7 57
Maternal Married Status
Not married 85.7 0.0 10.1 2.5 1.7 100.0 95.9 ** 119
Currently married 75.1 0.0 6.7 5.9 12.4 100.0 81.8 52
Cohabitating 84.7 0.0 9.6 3.9 1.9 100.0 94.3 98
Father in Household
Yes 82.5 0.0 8.8 3.6 5.2 100.0 91.3 -- 209
No 85.1 0.0 10.6 4.4 0.0 100.0 95.6 61
* P<0.05, ** P<0.01, *** P<0.001 1 MICS indicator 5.8 - Institutional deliveries a 53 caregivers did not participate as they were not the mother and 39 mothers did not complete the ANC section of the questionnaire.

P a g e | 81
A total of 92.1 percent of births in RMI are delivered in a health facility; 83.0 percent of deliveries
occur in public sector facilities (Table RH.11). Relatively few births (3.7 percent) take place at home.
Prevalence of delivery in a health facility was much lower for women in the richest wealth index
quintile at 78.1 percent compared to the other quintiles which ranged from 90.6 and 90.2 percent
for the two poorest quintiles to 100 percent for the middle and fourth quintiles. Prevalence of
delivery in a health facility was also associated with maternal marital status, married mothers
delivering their children in health facilities at a lower prevalence (81.8 percent) compared to
unmarried (95.9 percent) or cohabitating (94.3 percent) mothers.
Receipt of Micronutrient Supplementation and Deworming
Pregnant women should receive daily iron folate supplementation throughout their pregnancy with
a minimum of 90 iron folate tablets recommended to reduce maternal anaemia. Table RH.12 shows
the coverage of prenatal supplementation in RMI with pregnant women receiving iron tablets, iron
folate tablets, and multi‐micronutrient tablets and 67.4 percent of pregnant women receiving any
type of iron folic acid tablets. However, only a quarter of pregnant women received 90 or more iron
folic acid tablets indicating that pregnant women are not receiving adequate iron supplementation
to prevent anaemia during pregnancy. Few pregnant women received deworming during pregnancy
(13.1 percent) with more women receiving deworming in urban areas (14.4 percent) compared to
rural areas (7.2 percent).
Table RH.12: Receipt of micronutrient supplementation and deworming during pregnancy
Percent distribution of mothers age 15-49 years with a live birth in the last two years who took micronutrient supplementation or deworming during their pregnancy, by selected characteristics, RMI ICHNS, 2017
Received
iron tablets Received iron folate tablets
Received multi-
micronutrient tablets
Received any iron folic acid tablets
Consumed 90 iron folate
tablets or more
Received deworming
tablet Unweighted
Count
Total 33.5 31.9 49.0 67.4 25.7 13.1 317
Mother's age at birth
Less than 20 years 41.7 24.8 48.2 60.1 14.0 8.2 39
20-34 years 34.6 34.6 46.7 67.1 26.3 15.3 234
35-49 years 21.8 20.2 61.0 73.7 33.8 6.0 41
Area
Urban 33.7 33.1 47.8 66.8 26.0 14.4 174 Rural 32.3 26.1 55.2 70.4 24.4 7.2 143
Wealth index quintile
Poorest 33.8 23.7 52.4 66.7 19.3 10.6 139 Second 33.7 19.4 41.5 55.1 23.8 18.5 48 Middle 30.2 31.4 48.5 68.6 27.2 11.8 55 Fourth 23.9 37.1 51.6 71.6 29.9 10.6 38
Richest 47.0 51.7 51.7 76.0 29.6 14.7 37
Maternal Married Status
Not married 39.8 30.2 43.8 62.6 22.8 12.6 137
Currently married 32.9 30.9 61.6 72.5 23.1 11.8 64
Cohabitating 26.6 34.4 47.2 69.6 31.0 14.7 115
Father in Household Yes 32.9 33.1 50.4 69.4 28.9 14.2 247
No 35.6 27.3 43.5 59.2 13.2 9.0 70
a 275 mothers and 42 caregivers responded to receipt of micronutrient supplementation with caregivers responding for the mother. 11 caregivers and 34 mothers did not complete the micronutrient supplementation section of the questionnaire.

P a g e | 82
VIII. Early Childhood Development
Early Childhood Care and Education
Readiness of children for primary school can be improved through attendance to early childhood
education programmes or through pre‐school attendance. Early childhood education programmes
include programmes for children that have organised learning components as opposed to baby‐
sitting and day‐care which do not typically have organised education and learning.
In RMI, there is no provision of public pre‐school or pre‐kindergarten. Kindergarten starts at 5 years
of age through public schools and private schools offer pre‐school for children 4‐5 years of age. The
lack of public availability organized early childhood education programmes for children 3‐4 years of
age is reflected in the findings of the ICHNS 2017 with only 5.2 percent of children aged 36‐59
months attending an organized early childhood education programme (Table CD.1). Enrollent in
kindergarten, which starts from the age of 5, is accounted for in Table ED2.
While not significant, a trend in increased attendance in early childhood education by socio‐
economic status is seen with prevalence in the richest wealth index quintile at 11.1 percent while
the poorer quintiles range between 1.8 and 6.5 percent. Caregiver’s higher level of education was
associated with higher prevalence of the child’s attendance; 12.6 percent of children with a
caregiver who had higher education attended early childhood education compared to 2.1 percent
for secondary level and 4.4 percent for primary level.
Table CD.1: Early childhood education a Percentage of children age 36-59 months who are attending an organized early childhood education programme, by selected characteristics, RMI ICHNS, 2017
Percentage of children age 36-59 months attending early childhood education1
Number of children age 36-59 months P-value
Total 5.2 350 --
Sex Male 5.2 178 -- Female 5.3 172
Area Urban 4.9 203 -- Rural 6.9 147
Age of child 36-47 months 3.0 169 -- 48-59 months 7.2 181
Caregiver's education None -- 5 * Primary 4.4 81 Secondary 2.1 199
Higher 12.6 61
Wealth index quintile
Poorest 4.4 138 -- Second 1.8 66 Middle 3.1 58 Fourth 6.5 40 Richest 11.1 48
Maternal Married Status Not married 3.9 121 -- Currently married 7.8 79 Cohabitating 3.8 101
* P<0.05, ** P<0.01, *** P<0.001 1 MICS indicator 6.1 - Attendance to early childhood educationa Early childhood education is measured for children 36-59 months of age while kindergarten in RMI is usually provided from 5 years

P a g e | 83
of age.
Quality of Care
It is well recognized that a period of rapid brain development occurs in the first 3‐4 years of life, and
the quality of home care is a major determinant of the child’s development during this period. 49 In
this context, engagement of adults in activities with children, presence of books in the home for the
child, and the conditions of care are important indicators of quality of home care. As set out in A
World Fit for Children, “children should be physically healthy, mentally alert, emotionally secure,
socially competent and ready to learn.”50
Information on a number of activities that support early learning was collected in the survey. These
included the involvement of adults with children in the following activities: reading books or looking
at picture books, telling stories, singing songs, taking children outside the home, compound or yard,
playing with children, and spending time with children naming, counting, or drawing things.
For 72.3 percent of children aged 36‐59 months, an adult household member engaged in four or
more activities that promote learning and school readiness during the three days preceding the
survey (Table CD.2). The mean number of activities that adults engaged in with children was 4.2. The
table also indicates that the father’s involvement in such activities was limited. The father’s
involvement in four or more activities was 1.6 percent, far lower than the level of the mother’s
involvement (59.3 percent).
Mother’s level of education was associated with engagement in four or more activities with mothers
with primary level education involved at a prevalence of 37.6 percent compared to 61.4 percent for
those with secondary level education and 74.6 percent for those with higher education. Prevalence
was also much higher for married mothers at 79.3 percent compared to 52.5 percent for
cohabitating mothers and mothers who were never married, widowed or divorced (53.9 percent).
49 Grantham‐McGregor, S et al. 2007. Developmental Potential in the First 5 Years for Children in Developing Countries. The
Lancet 369: 60–70 50 UNICEF. 2002. A World Fit For Children adopted by the UN General Assembly at the 27th Special Session, 10 May 2002:
2.
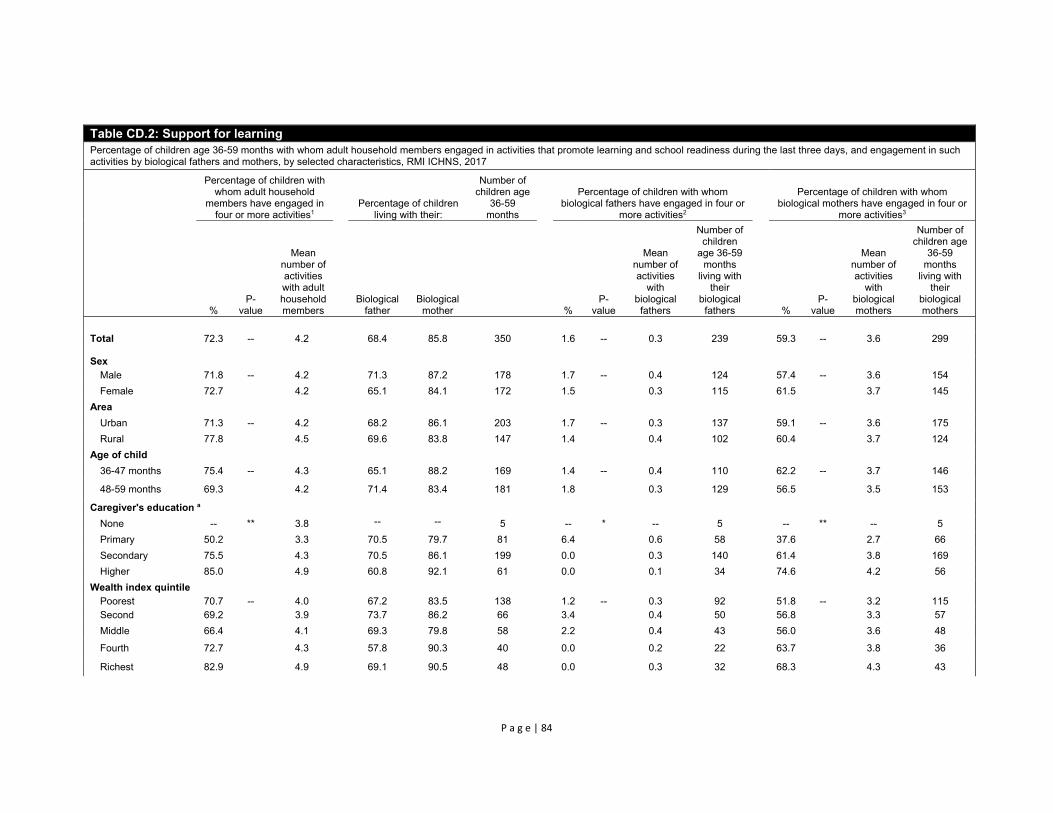
P a g e | 84
Table CD.2: Support for learning Percentage of children age 36-59 months with whom adult household members engaged in activities that promote learning and school readiness during the last three days, and engagement in such activities by biological fathers and mothers, by selected characteristics, RMI ICHNS, 2017
Percentage of children with whom adult household
members have engaged in four or more activities1
Percentage of children living with their:
Number of children age
36-59 months
Percentage of children with whom biological fathers have engaged in four or
more activities2
Percentage of children with whom biological mothers have engaged in four or
more activities3
% P-
value
Mean number of activities with adult household members
Biological father
Biological mother
% P-
value
Mean number of activities
with biological
fathers
Number of children
age 36-59 months
living with their
biological fathers
% P-
value
Mean number of activities
with biological mothers
Number of children age
36-59 months
living with their
biological mothers
Total 72.3 -- 4.2 68.4 85.8 350 1.6 -- 0.3 239 59.3 -- 3.6 299
Sex Male 71.8 -- 4.2 71.3 87.2 178 1.7 -- 0.4 124 57.4 -- 3.6 154
Female 72.7 4.2 65.1 84.1 172 1.5 0.3 115 61.5 3.7 145
Area
Urban 71.3 -- 4.2 68.2 86.1 203 1.7 -- 0.3 137 59.1 -- 3.6 175
Rural 77.8 4.5 69.6 83.8 147 1.4 0.4 102 60.4 3.7 124
Age of child
36-47 months 75.4 -- 4.3 65.1 88.2 169 1.4 -- 0.4 110 62.2 -- 3.7 146
48-59 months 69.3
4.2 71.4 83.4 181 1.8 0.3 129 56.5 3.5 153
Caregiver's education a
None -- ** 3.8 -- -- 5 -- * -- 5 -- ** -- 5
Primary 50.2 3.3 70.5 79.7 81 6.4 0.6 58 37.6 2.7 66
Secondary 75.5 4.3 70.5 86.1 199 0.0 0.3 140 61.4 3.8 169
Higher 85.0 4.9 60.8 92.1 61 0.0 0.1 34 74.6 4.2 56
Wealth index quintile Poorest 70.7 -- 4.0 67.2 83.5 138 1.2 -- 0.3 92 51.8 -- 3.2 115 Second 69.2 3.9 73.7 86.2 66 3.4 0.4 50 56.8 3.3 57
Middle 66.4 4.1 69.3 79.8 58 2.2 0.4 43 56.0 3.6 48
Fourth 72.7 4.3 57.8 90.3 40 0.0 0.2 22 63.7 3.8 36
Richest 82.9
4.9 69.1 90.5 48 0.0 0.3 32 68.3 4.3 43

P a g e | 85
Table CD.2: Support for learning Percentage of children age 36-59 months with whom adult household members engaged in activities that promote learning and school readiness during the last three days, and engagement in such activities by biological fathers and mothers, by selected characteristics, RMI ICHNS, 2017
Percentage of children with whom adult household
members have engaged in four or more activities1
Percentage of children living with their:
Number of children age
36-59 months
Percentage of children with whom biological fathers have engaged in four or
more activities2
Percentage of children with whom biological mothers have engaged in four or
more activities3
% P-
value
Mean number of activities with adult household members
Biological father
Biological mother
% P-
value
Mean number of activities
with biological
fathers
Number of children
age 36-59 months
living with their
biological fathers
% P-
value
Mean number of activities
with biological mothers
Number of children age
36-59 months
living with their
biological mothers
Mother's age at birth
Less than 20 years 56.8 * 3.8 56.4 100.0 47 0.0 -- 0.4 28 42.2 * 3.2 47
20-34 years 75.1 4.3 80.0 100.0 211 0.3 0.3 168 64.2 3.8 211
35-49 years 54.7 3.7 83.1 100.0 37 0.0 0.1 31 52.8 3.3 37
Maternal Marital Status
Not Married 62.9 ** 3.9 56.4 99.1 121 0.0 -- 0.2 65 53.9 ** 3.4 120 Married 89 5.0 95.0 100.0 79 0.0 0.2 75 79.3 4.6 79 Cohabitating 65 3.9 90.3 98.0 101 0.6 0.4 91 52.5 3.3 100
Father Lives in Household
Staying Elsewhere 81.2 * 4.7 0.0 63.8 111 0.0 -- 0.0 0 63.3 -- 4.0 69
Living in Household 68.1 4.0 100.0 95.9 239 1.6 0.3 239 58.1 3.5 230
* P<0.05, ** P<0.01, *** P<0.001
1 MICS indicator 6.2 - Support for learning
2 MICS Indicator 6.3 - Father’s support for learning
3 MICS Indicator 6.4 - Mother’s support for learning a The background characteristic "Caregiver's education" refers to the education level of the respondent to the Questionnaire for Children Under Five, and covers both mothers and primary caregivers, who are interviewed when the mother is not listed in the same household. Since indicator 6.4 reports on the biological mother's support for learning, this background characteristic refers to only the educational levels of biological mothers when calculated for the indicator in question.
MICS Indicator 6.2 is calculated as: Engagement of household members age 15 or over in four or more activities.
Both indicator 6.2 and the mean number of activities in which household members engage with the child are calculated irrespective of the number of household members and whether mother or father are living in the household.
For father's and mother's engagement (indicators 6.3 and 6.4), the denominator is confined to those children actually living with their father and mother, respectively.
The maximum number of activities is 6, as asked in the under-5 questionnaire. The activities include: (A) Reading books to or looking at picture books with the child, (B) Telling stories to the child, (C) Singing songs to or with the child, including lullabies, (D) Taking the child outside the home, compound, yard, or enclosure, (E) Playing with the child, and (F) Naming, counting, or drawing things to or with the child.

P a g e | 86
Exposure to books in early years not only provides the child with greater understanding of the
nature of print, but may also give the child opportunities to see others reading, such as older siblings
doing school work. Presence of books is important for later school performance. The
mothers/caregivers of all children under 5 were asked about number of children’s books or picture
books they have for the child, and the types of playthings that are available at home.
In RMI, fewer than one in five (18.5 percent) children aged 0‐59 months live in households where at
least three children’s books are present for the child (Table CD.3). The proportion of children with 10
or more books declines to 3.5 percent. A much higher percentage of urban children (20.8 percent)
have access to three or more children’s books than those living in rural households (6.8 percent).
The presence of children’s books is also positively correlated with the child’s age: in the homes of
22.9 percent of children aged 24‐59 months, there are three or more children’s books, while the
figure is 11.9 percent for children aged 0‐23 months.
The mother’s education and household wealth status are positively correlated with the percentage
of children who have three or more children’s books at home. Children with caregivers with primary
level education have 3 or more books in the home (13.1 percent) compared to 16.0 percent with
caregivers with secondary level education and 32.5 percent with caregivers with higher education.
Children in the richest wealth quintile are well over ten times more likely (44.0 percent) to have
three or more children’s books compared to children in poorest wealth quintile (3.2 percent). There
is higher prevalence of 3 or more books in the home for children of mothers who are married (28.5
percent) than for those with mothers who are not married (12.3 percent) and those who are
cohabitating (19.4 percent).
Table CD.3 also shows that 70.9 percent of children aged 0‐59 months had two or more kinds of
playthings to play with in their homes. Playthings included in the questionnaires were homemade
toys (such as dolls and cars or other toys made at home), toys that came from a store and household
objects (such as pots and bowls) or objects and materials found outside the home (such as sticks,
rocks, animal shells or leaves). A total of 69.0 percent of children play with toys that come from a
store, 66.4 percent of children play with homemade toys or objects found outside and 68.1 percent
of children play with homemade toys.

P a g e | 87
Table CD.3: Learning materials
Percentage of children under age 5 by numbers of children's books present in the household, and by playthings that child plays with, by selected characteristics, RMI ICHNS, 2017
Percentage of children living in households that have for the child: Percentage of children who play with:
Number of children
under age 5
3 or more children's
books1 P-value
10 or more children's
books
Home-made toys
Toys from a shop/ manu-
factured toys
House-hold objects/ objects found
outside
Two or more
types of play-
things2 P-
value
Total 18.5 -- 3.5 68.1 69.0 66.4 70.9 -- 881
Sex
Male 15.6 -- 1.5 63.8 63.8 64.6 65.8 ** 455
Female 21.6 5.6 72.6 74.5 68.4 76.3 426
Area
Urban 20.8 *** 4.0 68.5 73.5 65.4 71.8 -- 490
Rural 6.8 0.9 65.9 46.1 71.5 66.1 391
Age of child
0-23m 11.9 *** 1.3 53.9 53.8 46.4 52.3 *** 362
24-59m 22.9 5.0 77.5 79.1 79.8 83.2 519
Caregiver's education
None -- *** -- -- -- -- -- -- 12
Primary 13.1 0.0 64.5 61.9 71.5 68.3 181
Secondary 16.0 2.6 66.7 66.8 64.8 68.8 529
Higher 32.5 9.6 75.0 81.4 64.7 78.0 155
Wealth index quintile
Poorest 3.2 *** 0.0 63.7 42.3 68.8 61.3 * 370
Second 7.8 1.3 72.5 67.9 70.5 72.9 152
Middle 23.6 1.8 61.9 74.5 63.7 67.0 144
Fourth 15.7 6.3 66.5 79.0 62.2 72.5 108
Richest 44.0 9.5 76.3 82.5 66.2 81.9 107
Maternal Married Status
Not married 12.3 ** 2.0 60.6 63.2 59.2 63.9 * 333
Currently married 28.5 4.2 75.3 74.9 66.7 75.3 175
Cohabitating 19.4 2.8 71.5 71.0 73.8 74.5 281
Father in Household
Yes 18.7 -- 3.2 68.4 66.8 65.0 68.9 -- 623
No 17.9 4.2 67.3 74.6 70.1 75.8 258
* P<0.05, ** P<0.01, *** P<0.001 1 MICS indicator 6.5 - Availability of children’s books 2 MICS indicator 6.6 - Availability of playthings
Leaving children alone or in the presence of other young children is known to increase the risk of
injuries.51 In the ICHNS 2017, two questions were asked to find out whether children age 0‐59
months were left alone during the week preceding the interview, and whether children were left in
the care of other children under 10 years of age.
Table CD.4 shows that 4.9 percent of children aged 0‐59 months were left in the care of another
child younger than 10 years of age for more than an hour in the past week, while 9.1 percent were
left alone during the week preceding the interview. Combining the two care indicators, it is
51 Grossman, DC. 2000. The History of Injury Control and the Epidemiology of Child and Adolescent Injuries. The Future of
Children, 10(1): 23‐52.
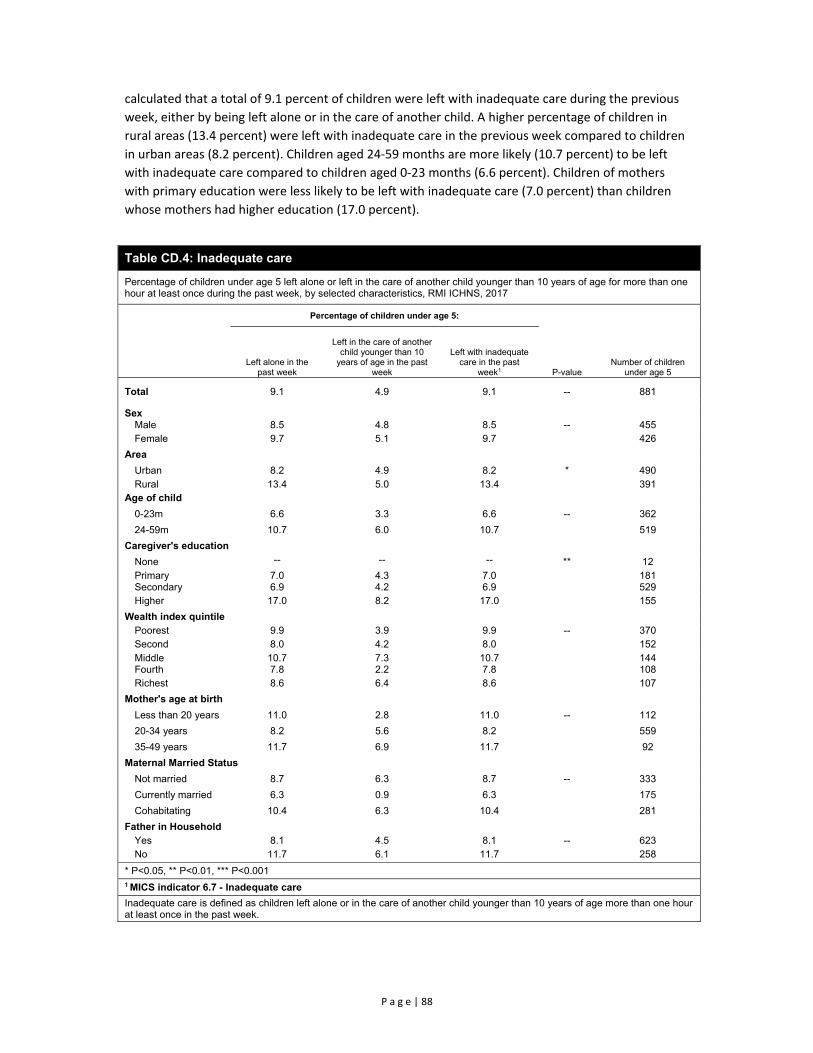
P a g e | 88
calculated that a total of 9.1 percent of children were left with inadequate care during the previous
week, either by being left alone or in the care of another child. A higher percentage of children in
rural areas (13.4 percent) were left with inadequate care in the previous week compared to children
in urban areas (8.2 percent). Children aged 24‐59 months are more likely (10.7 percent) to be left
with inadequate care compared to children aged 0‐23 months (6.6 percent). Children of mothers
with primary education were less likely to be left with inadequate care (7.0 percent) than children
whose mothers had higher education (17.0 percent).
Table CD.4: Inadequate care
Percentage of children under age 5 left alone or left in the care of another child younger than 10 years of age for more than one hour at least once during the past week, by selected characteristics, RMI ICHNS, 2017
Percentage of children under age 5:
P-value Number of children
under age 5 Left alone in the
past week
Left in the care of another child younger than 10
years of age in the past week
Left with inadequate care in the past
week1
Total 9.1 4.9 9.1 -- 881
Sex Male 8.5 4.8 8.5 -- 455 Female 9.7 5.1 9.7 426
Area
Urban 8.2 4.9 8.2 * 490 Rural 13.4 5.0 13.4 391
Age of child
0-23m 6.6 3.3 6.6 -- 362
24-59m 10.7 6.0 10.7 519
Caregiver's education
None -- -- -- ** 12 Primary 7.0 4.3 7.0 181 Secondary 6.9 4.2 6.9 529 Higher 17.0 8.2 17.0 155
Wealth index quintile Poorest 9.9 3.9 9.9 -- 370 Second 8.0 4.2 8.0 152 Middle 10.7 7.3 10.7 144 Fourth 7.8 2.2 7.8 108 Richest 8.6 6.4 8.6 107
Mother's age at birth
Less than 20 years 11.0 2.8 11.0 -- 112
20-34 years 8.2 5.6 8.2 559
35-49 years 11.7 6.9 11.7 92
Maternal Married Status
Not married 8.7 6.3 8.7 -- 333
Currently married 6.3 0.9 6.3 175
Cohabitating 10.4 6.3 10.4 281
Father in Household Yes 8.1 4.5 8.1 -- 623 No 11.7 6.1 11.7 258
* P<0.05, ** P<0.01, *** P<0.001
1 MICS indicator 6.7 - Inadequate care
Inadequate care is defined as children left alone or in the care of another child younger than 10 years of age more than one hour at least once in the past week.

P a g e | 89
Developmental Status of Children
Early childhood development is defined as an orderly, predictable process along a continuous path,
in which a child learns to handle more complicated levels of moving, thinking, speaking, feeling and
relating to others. Physical growth, literacy and numeracy skills, socio‐emotional development and
readiness to learn are vital domains of a child’s overall development, which is a basis for overall
human development. 52
A 10‐item module was used to calculate the Early Child Development Index (ECDI). The primary
purpose of the ECDI is to inform public policy regarding the developmental status of children in RMI.
The index is based on selected milestones that children are expected to achieve by ages 3 and 4. The
10 items are used to determine if children are developmentally on track in four domains:
Literacy‐numeracy: Children are identified as being developmentally on track based on
whether they can identify/name at least ten letters of the alphabet, whether they can read
at least four simple, popular words, and whether they know the name and recognize the
symbols of all numbers from 1 to 10. If at least two of these are true, then the child is
considered developmentally on track.
Physical: If the child can pick up a small object with two fingers, like a stick or a rock from the
ground and/or the mother/caregiver does not indicate that the child is sometimes too sick
to play, then the child is regarded as being developmentally on track in the physical domain.
Social‐emotional: Children are considered to be developmentally on track if two of the
following are true: If the child gets along well with other children, if the child does not kick,
bite, or hit other children and if the child does not get distracted easily.
Learning: If the child follows simple directions on how to do something correctly and/or
when given something to do, is able to do it independently, then the child is considered to
be developmentally on track in this domain.
ECDI is then calculated as the percentage of children who are developmentally on track in at least
three of these four domains.
The results are presented in Table CD.5.
In RMI, 78.9 percent of children aged 36‐59 months are developmentally on track. As expected, the
ECDI is higher (85.9 percent) in the older age group (48‐59 months) than among those aged 36‐47
months (71.3 percent) since children acquire more skills with age.
The analysis of four domains of child development shows that 92.8 percent of children are on track
in the physical domain, but much less on track in social‐emotional (72.4 percent) and literacy‐
numeracy (55.4 percent) domains and slightly less in learning (87.6 percent) domains. In each
individual domain except physical the higher score is associated with older children.
52 Shonkoff, J and Phillips, D (eds). 2000. From neurons to neighborhoods: the science of early childhood development. Committee on Integrating the Science of Early Childhood Development, National Research Council, 2000.

P a g e | 90
Table CD.5: Early child development index
Percentage of children age 36-59 months who are developmentally on track in literacy-numeracy, physical, social-emotional, and learning domains, and the early child development index score, by selected characteristics, RMI ICHNS, 2017
Percentage of children age 36-59 months who are developmentally on track for indicated domains
Early child development index score1 Number of
children age 36-59
months Literacy-
numeracy Physical Social-
Emotional Learning Percentage P-value
Total 55.4 92.8 72.4 87.6 78.9 -- 350
Sex
Male 57.3 95.0 69.5 87.7 79.6 -- 178 Female 53.2 90.4 75.6 87.6 78.2 172
Area
Urban 55.5 92.4 71.8 86.7 77.8 -- 203 Rural 54.5 95.4 75.5 92.8 85.3 147
Age of child
36-47 months 47.0 92.8 68.1 84.0 71.3 ** 169 48-59 months 63.1 92.9 76.3 90.9 85.9 181
Caregiver's education
None -- -- -- -- -- -- 5 Primary 39.2 87.7 64.2 75.6 67.5 81 Secondary 56.5 92.4 71.6 88.1 80.0 199 Higher 71.8 98.4 79.5 97.8 85.5 61
Wealth index quintile
Poorest 48.5 94.8 73.4 89.3 83.6 -- 138 Second 41.4 90.6 69.5 83.4 67.2 66 Middle 61.6 92.9 70.1 83.7 81.4 58 Fourth 54.4 88.5 77.3 95.5 84.6 40 Richest 70.9 96.4 73.9 90.1 81.8 48
Religion
Assembly of God 44.9 86.5 74.8 86.9 78.3 -- 55 Protestant 56.6 93.9 74.9 90.2 81.3 195 Catholic 46.9 96.6 65.7 85.8 72.7 27 Other 62.6 93.9 67.8 83.6 76.5 73
Mother's age at birth
Less than 20 years 42.7 86.1 71.3 80.3 69.8 -- 47 20-34 years 59.2 94.4 70.7 88.8 81.3 211 35-49 years 62.4 89.8 74.5 98.0 83.4 37
Maternal Parity
1 62.5 98.0 84.2 80.3 75.0 -- 48 2-3 56.0 90.3 69.5 87.0 79.5 147 4 or more 54.6 90.3 62.3 91.3 77.5 91
* P<0.05, ** P<0.01, *** P<0.001 1 MICS indicator 6.8 - Early child development index
Children 36-59 months of age were assessed for developmentally on track in four domains: Literacy-numeracy: Developmentally on track if at least two of the following are true: Can identify/name at least ten letters of the alphabet, Can read at least four simple, popular words, Knows the name and recognizes the symbol of all numbers from 1 to 10. Physical: Developmentally on track if one or both of the following is true: Can pick up a small object with two fingers, like a stick or a rock from the ground, Is not sometimes too sick to play. Social-emotional: Developmentally on track if at least two of the following are true: Gets along well with other children, Does not kick, bite, or hit other children, Does not get distracted easily. Learning: Developmentally on track if one or both of the following is true: Follows simple directions on how to do something correctly, When given something to do, is able to do it independently. MICS indicator 6.8 is calculated as the percentage of children who are developmentally on track in at least three of the four component domains (literacy-numeracy, physical, social-emotional, and learning).

P a g e | 91
Child Functioning
Table CF.1 provides an assessment of children 2‐4 years of age with a functional difficulty in one of
the eight domains: seeing, hearing, walking, finer motor, communication, learning, playing and
controlling behaviour. A child was determined to have a functional difficulty if they had a lot of
difficulty or cannot do an activity at all or answered a lot more for controlling behaviour. Prevalence
of functional difficulty was low among children with 3.7 percent of children having at least one
functional difficulty in any one domain. A higher percentage of children 49‐59 months of age had at
least one functional difficulty (6.9 percent) than children 24‐35 months (3.1 percent) or 36‐47
months (1.5 percent).
Table CF.1: Child functioning for children aged 2-4
Percentage of children aged 2-4 years with functional difficulty in at least one domain, by selected characteristics, RMI ICHNS, 2017
Percentage of children aged 2-4 years who have functional difficulty for the indicated domains
Percentage of children with
functional difficulty in at
least one domain
Number of children aged 2-4 years
Se
ein
g
Hea
ring
Wa
lking
Fine
motor
Co
mm
unica
tion
Lea
rning
Pla
ying
Con
trollin
g be
havio
ur
Total 0.1 0.3 1.1 0.2 1.5 0.3 0.9 0.5 3.7 519
Sex
Male 0.0 0.4 0.7 0.1 1.1 0.4 0.0 0.7 2.2 258
Female 0.2 0.2 1.5 0.3 1.8 0.3 1.7 0.2 5.3 261
Area Urban 0.0 0.3 1.1 0.0 1.5 0.3 0.9 0.3 3.5 295
Rural 0.6 0.5 0.8 1.2 1.5 0.8 0.8 1.6 5.1 224
Age 24-35m 0.0 0.0 0.0 0.2 0.2 0.0 2.4 0.3 3.1 169
36-47m 0.0 0.2 0.1 0.1 0.9 0.1 0.1 0.4 1.5 184
48-59m 0.3 0.7 3.2 0.2 3.4 0.9 0.2 0.7 6.9 166
Caregiver's education
No Education -- -- -- -- -- -- -- -- -- 7
Primary 0.0 0.0 2.0 0.0 2.5 0.0 0.0 0.4 4.9 112
Secondary 0.2 0.1 1.2 0.3 0.9 0.2 1.5 0.3 3.9 310
Higher 0.0 1.1 0.0 0.0 2.4 1.1 0.0 1.1 2.4 86
Wealth index quintile
Poorest 0.5 0.4 0.7 1.0 2.1 0.7 0.7 1.4 5.3 209
Second 0.0 0.0 0.0 0.0 0.0 0.0 0.0 0.0 0.0 100
Middle 0.0 0.0 3.2 0.0 1.5 0.0 2.0 0.0 6.8 84
Fourth 0.0 1.3 0.0 0.0 3.1 1.3 1.8 1.3 4.9 64
Richest 0.0 0.0 1.2 0.0 1.3 0.0 0.0 0.0 2.5 62
Functional difficulty is defined as follows: For children aged 2-4, the definition includes "a lot of difficulty" and "cannot do at all" for all questions, and "a lot more" for the question on controlling behaviour.
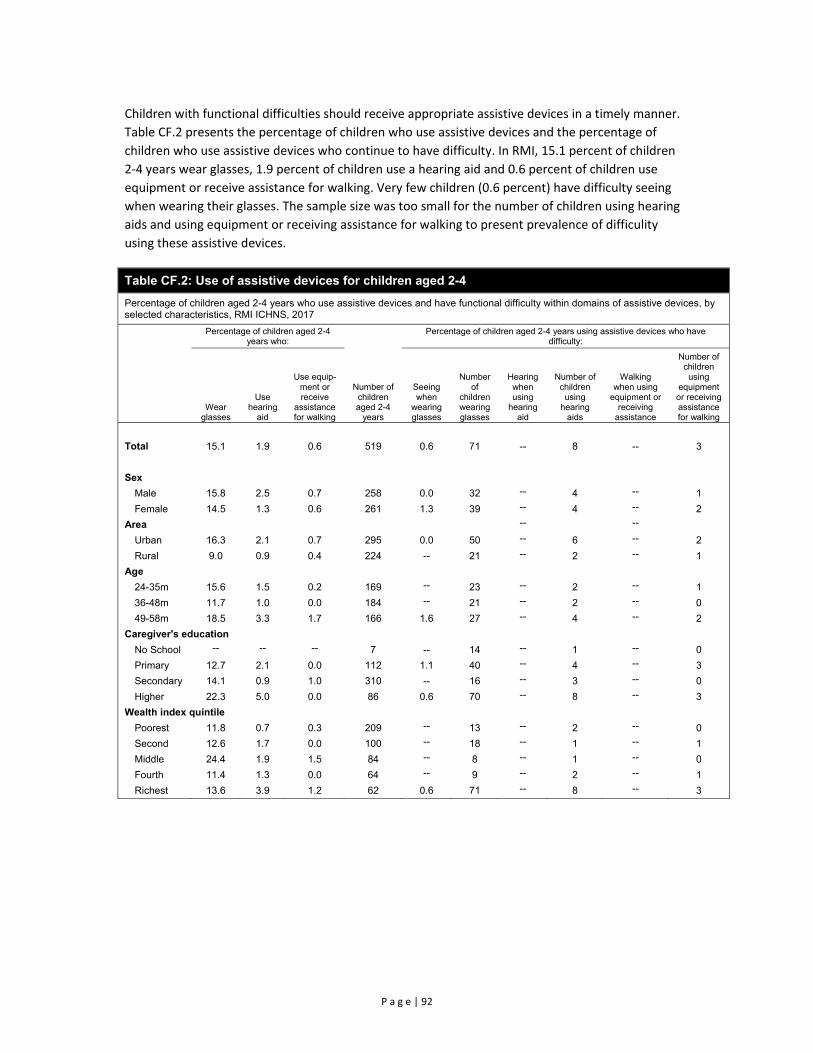
P a g e | 92
Children with functional difficulties should receive appropriate assistive devices in a timely manner.
Table CF.2 presents the percentage of children who use assistive devices and the percentage of
children who use assistive devices who continue to have difficulty. In RMI, 15.1 percent of children
2‐4 years wear glasses, 1.9 percent of children use a hearing aid and 0.6 percent of children use
equipment or receive assistance for walking. Very few children (0.6 percent) have difficulty seeing
when wearing their glasses. The sample size was too small for the number of children using hearing
aids and using equipment or receiving assistance for walking to present prevalence of difficulity
using these assistive devices.
Table CF.2: Use of assistive devices for children aged 2-4
Percentage of children aged 2-4 years who use assistive devices and have functional difficulty within domains of assistive devices, by selected characteristics, RMI ICHNS, 2017
Percentage of children aged 2-4 years who:
Number of children aged 2-4
years
Percentage of children aged 2-4 years using assistive devices who have difficulty:
Wear glasses
Use hearing
aid
Use equip-ment or receive
assistance for walking
Seeing when
wearing glasses
Number of
children wearing glasses
Hearing when using
hearing aid
Number of children using
hearing aids
Walking when using
equipment or receiving
assistance
Number of children using
equipment or receiving assistance for walking
Total 15.1 1.9 0.6 519 0.6 71 -- 8 -- 3
Sex
Male 15.8 2.5 0.7 258 0.0 32 -- 4 -- 1
Female 14.5 1.3 0.6 261 1.3 39 -- 4 -- 2
Area -- -- Urban 16.3 2.1 0.7 295 0.0 50 -- 6 -- 2
Rural 9.0 0.9 0.4 224 -- 21 -- 2 -- 1
Age
24-35m 15.6 1.5 0.2 169 -- 23 -- 2 -- 1
36-48m 11.7 1.0 0.0 184 -- 21 -- 2 -- 0
49-58m 18.5 3.3 1.7 166 1.6 27 -- 4 -- 2
Caregiver's education
No School -- -- -- 7 -- 14 -- 1 -- 0
Primary 12.7 2.1 0.0 112 1.1 40 -- 4 -- 3
Secondary 14.1 0.9 1.0 310 -- 16 -- 3 -- 0
Higher 22.3 5.0 0.0 86 0.6 70 -- 8 -- 3
Wealth index quintile
Poorest 11.8 0.7 0.3 209 -- 13 -- 2 -- 0
Second 12.6 1.7 0.0 100 -- 18 -- 1 -- 1
Middle 24.4 1.9 1.5 84 -- 8 -- 1 -- 0
Fourth 11.4 1.3 0.0 64 -- 9 -- 2 -- 1
Richest 13.6 3.9 1.2 62 0.6 71 -- 8 -- 3

P a g e | 93
IX. Literacy and Education
Literacy Among Young Caregivers
The Youth Literacy Rate reflects the outcomes of primary education over the previous 10 years or so.
As a measure of the effectiveness of the primary education system, it is often seen as a proxy
measure of social progress and economic achievement. In RMI ICHNS 2017, since only a mother’s
questionnaire was administered, the results are based only on female caregivers aged 15‐24 years
with a child under 5. Literacy is assessed on the ability of the respondent to read a short simple
statement or based on school attendance.
The literacy rate is presented in Table ED.1. Table ED.1 indicates that 99.3 percent of young
caregivers in RMI are literate and that literacy status varies slightly by area, education and age of the
woman. In urban areas 99.1 percent of caregivers were literate compare to 100 percent of
caregivers in rural areas.
Table ED.1: Literacy (young caregivers)
Percentage of women age 15-24 years who are literate, by selected characteristics, RMI ICHNS, 2017
Percentage
literate1 Cannot read at all
Number of women age 15-24
years P-value
Total 99.3 0.7 164 --
Area
Urban 99.1 0.9 94 --
Rural 100.0 0.0 70
Education
None 93.8 6.2 16 *
Primary 100.0 0.0 116
Secondary 100.0 0.0 32
Higher 99.3 0.7 164
Age
15-19 95.1 4.9 25 *
20-24 100.0 0.0 139
Wealth index quintile
Poorest 100.0 0.0 65 --
Second 96.9 3.1 32
Middle 100.0 0.0 34
Fourth 100.0 0.0 17
Richest 100.0 0.0 16
Religion
Assembly of God 96.2 3.8 26 --
Protestant 100.0 0.0 85
Catholic 100.0 0.0 16
Other 100.0 0.0 37
* P<0.05, ** P<0.01, *** P<0.001
1 MICS indicator 7.1
Percentage of women age 15-24 years who are able to read a short simple statement about everyday life or who attended secondary or higher education are classified as literate.

P a g e | 94
School Readiness
Attendance to pre‐school education is important for the readiness of children to school. Table ED.2
shows the proportion of children in the first grade of primary school (regardless of age) who
attended kindergarten the previous year53. As only households with a child under 5 were included in
the RMI ICHNS 2017, all indicators for education apply to children who live in a household with a
child under 5 years only.
Overall, 92.8 percent of children who are currently attending the first grade of primary school
attended kindergarten the previous year. The proportion among males is lower (87.6 percent) than
females (97.5 percent) and higher in urban areas (94.3 percent) compared to 86.6 percent among
children living in rural areas. The analysis takes into account all children attending first grade,
regardless of their age. It is notable that the majority of children were older than 6 years, the entry
age for first grade. High previous attendance of first graders in kindergarten, but low attendance of
children in ECD services for children 3‐4 years of age, indicate that children do universally attend
kindergarten but enrol at a later age.
Table ED.2: School readiness
Percentage of children attending first grade of primary school who attended kindergarten the previous year, by selected characteristics, RMI ICHNS, 2017
Percentage of children attending first grade
who attended kindergarten in previous
year1
Number of children attending first grade
of primary school P-value
Total 92.8 101 --
Sex
Male 87.6 55 *
Female 97.5 46
Area
Urban 94.3 50 --
Rural 86.6 51
Child Age
5 -- 3 **
6 100.0 34
7 95.0 45
8+ -- 19
* P<0.05, ** P<0.01, *** P<0.001 1 MICS indicator 7.2 - School readiness; SDG indictor 4.2.2
The numerator includes children for whom: Currently attend primary school, grade 1 and attended preschool or ECD the previous year. The denominator is the number of children attending first grade of primary school regardless of age.
53 The computation of the indicator does not exclude repeaters, and therefore is inclusive of both children who are attending primary school for the first time, as well as those who were in the first grade of primary school the previous school year and are repeating. Children repeating may have attended pre‐school prior to the school year during which they attended the first grade of primary school for the first time; these children are not captured in the numerator of the indicator

P a g e | 95
Primary and Secondary School Participation
Universal access to basic education and the completion of pre‐primary and primary education by the
world’s children is one of the Sustainable Development Goals. Education is a vital prerequisite for
combating poverty, empowering women, protecting children from hazardous and exploitative
labour and sexual exploitation, promoting human rights and democracy, protecting the
environment, and influencing population growth.
Of children who are of primary school entry age (age 6) in RMI, 32.3 percent are attending the first
grade of primary school (Table ED.3). Differentials are present by sex and urban‐rural areas.
Prevalence of boys’ timely participation is 27.7 percent compared to 37.6 percent for girls. Children’s
participation to primary school is timelier in rural areas (41.5 percent) than in urban areas (30.9
percent).
Table ED.3: Primary school entry
Percentage of children of primary school entry age (6 years) entering grade 1 (net intake rate), by selected characteristics, RMI ICHNS, 2017
Percentage of children of primary school entry age
entering grade 11
Number of children of primary school
entry age P-value
Total 32.3 123 --
Sex
Male 27.7 67 --
Female 37.6 56
Area
Urban 30.9 77 --
Rural 41.5 46 1 MICS indicator 7.3 - Net intake rate in primary education
The denominator is the number of children who were of primary school entry age (6-years) at the beginning of the current (or the most recent) school year. This is established by rejuvenating children to the first month of the current (or most recent) school year by using information on the date of birth, if available, and information on when the current (or most recent) school year began. If the date of birth is not available, then a full year is subtracted from the current age of the child at the time of survey, if the interview took place more than 6 months after the school year started. If the latter is less than six months and the date of birth is not available, the current age is assumed to be the same as the age at the beginning of the school year.
The numerator includes those children in the denominator for whom attend either first or second grade. Grade 2 of primary school is accepted to take early starters into account.
Table ED.4 provides the percentage of children of primary school age 6 to 13 years who are
attending primary or secondary school54 and those who are out of school. The majority of children of
primary school age are attending school (79.6 percent). However, 18.7 percent of the children are
out of school, though primarily due to a very low attendance rate (34.4 percent) for children age 6,
who appear to be starting late in school, as seen by a relatively high percentage attending pre‐
school. A total of 10 percent of children of primary school age were not attending preschool, primary
or secondary school with higher prevalence in urban areas (11.4 percent) compared to 3.8 percent in
rural areas.
54 Ratios presented in this table are "adjusted" since they include not only primary school attendance, but also secondary school attendance in the numerator.
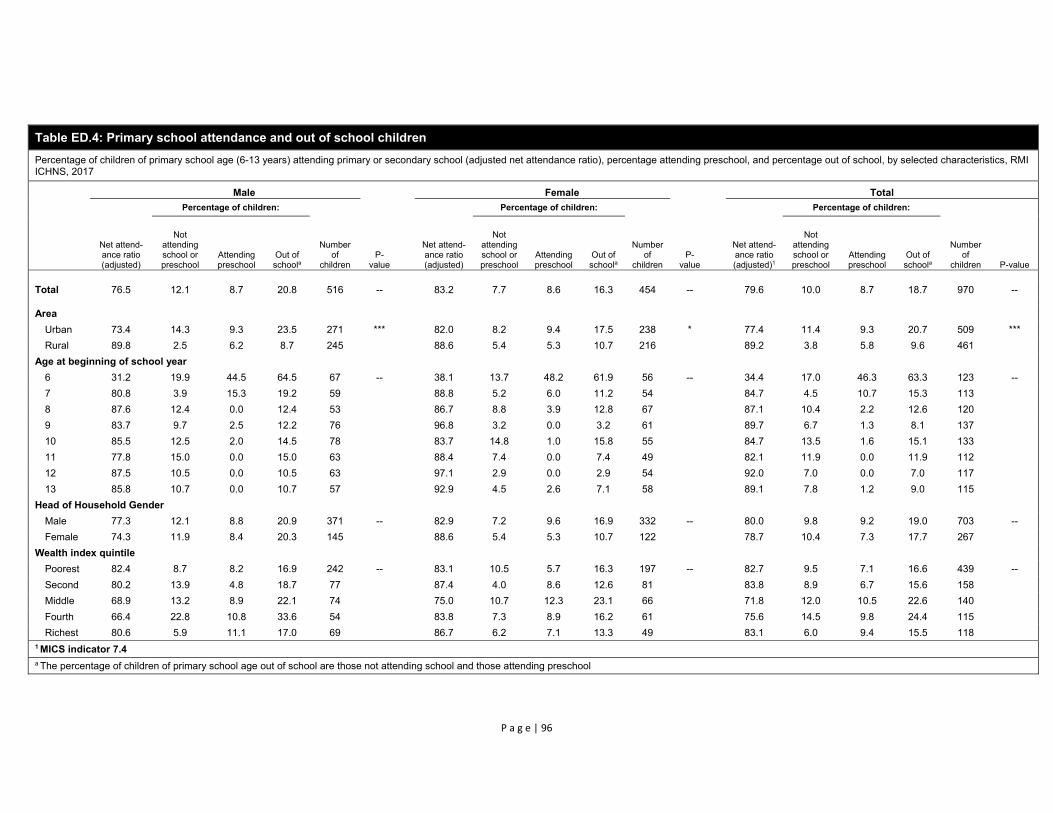
P a g e | 96
Table ED.4: Primary school attendance and out of school children
Percentage of children of primary school age (6-13 years) attending primary or secondary school (adjusted net attendance ratio), percentage attending preschool, and percentage out of school, by selected characteristics, RMI ICHNS, 2017
Male Female Total
Net attend-ance ratio (adjusted)
Percentage of children:
Number of
children P-
value
Net attend-ance ratio (adjusted)
Percentage of children:
Number of
children P-
value
Net attend-ance ratio (adjusted)1
Percentage of children:
Number of
children P-value
Not attending school or preschool
Attending preschool
Out of schoola
Not attending school or preschool
Attending preschool
Out of schoola
Not attending school or preschool
Attending preschool
Out of schoola
Total 76.5 12.1 8.7 20.8 516 -- 83.2 7.7 8.6 16.3 454 -- 79.6 10.0 8.7 18.7 970 --
Area
Urban 73.4 14.3 9.3 23.5 271 *** 82.0 8.2 9.4 17.5 238 * 77.4 11.4 9.3 20.7 509 ***
Rural 89.8 2.5 6.2 8.7 245 88.6 5.4 5.3 10.7 216 89.2 3.8 5.8 9.6 461
Age at beginning of school year
6 31.2 19.9 44.5 64.5 67 -- 38.1 13.7 48.2 61.9 56 -- 34.4 17.0 46.3 63.3 123 --
7 80.8 3.9 15.3 19.2 59 88.8 5.2 6.0 11.2 54 84.7 4.5 10.7 15.3 113
8 87.6 12.4 0.0 12.4 53 86.7 8.8 3.9 12.8 67 87.1 10.4 2.2 12.6 120
9 83.7 9.7 2.5 12.2 76 96.8 3.2 0.0 3.2 61 89.7 6.7 1.3 8.1 137
10 85.5 12.5 2.0 14.5 78 83.7 14.8 1.0 15.8 55 84.7 13.5 1.6 15.1 133
11 77.8 15.0 0.0 15.0 63 88.4 7.4 0.0 7.4 49 82.1 11.9 0.0 11.9 112
12 87.5 10.5 0.0 10.5 63 97.1 2.9 0.0 2.9 54 92.0 7.0 0.0 7.0 117
13 85.8 10.7 0.0 10.7 57 92.9 4.5 2.6 7.1 58 89.1 7.8 1.2 9.0 115
Head of Household Gender
Male 77.3 12.1 8.8 20.9 371 -- 82.9 7.2 9.6 16.9 332 -- 80.0 9.8 9.2 19.0 703 --
Female 74.3 11.9 8.4 20.3 145 88.6 5.4 5.3 10.7 122 78.7 10.4 7.3 17.7 267
Wealth index quintile
Poorest 82.4 8.7 8.2 16.9 242 -- 83.1 10.5 5.7 16.3 197 -- 82.7 9.5 7.1 16.6 439 --
Second 80.2 13.9 4.8 18.7 77 87.4 4.0 8.6 12.6 81 83.8 8.9 6.7 15.6 158
Middle 68.9 13.2 8.9 22.1 74 75.0 10.7 12.3 23.1 66 71.8 12.0 10.5 22.6 140
Fourth 66.4 22.8 10.8 33.6 54 83.8 7.3 8.9 16.2 61 75.6 14.5 9.8 24.4 115
Richest 80.6 5.9 11.1 17.0 69 86.7 6.2 7.1 13.3 49 83.1 6.0 9.4 15.5 118 1 MICS indicator 7.4 a The percentage of children of primary school age out of school are those not attending school and those attending preschool

P a g e | 97
The adjusted primary school net attendance ratio (NAR) is the percentage of children of primary school age (as of the beginning of school year) who are attending primary or secondary school. Children of primary school age at the beginning of the school year currently attending primary or secondary school are included in the numerator (attendance to secondary school is included to take into account early starters). Children that did not attend school in the current school year, but have already completed primary school are also included in the numerator. All children of primary school age (at the beginning of the school year) are included in the denominator.
Ratios presented in this table are termed "adjusted" since they include not only primary school attendance, but also secondary school attendance in the numerator.
The percentage of children: i) Not attending school are those who did not attend school or preschool in the current school year and have not completed primary school (ED5=2 and ED4<>last grade of primary school). ii) Attending preschool are those who in the current school year have been attending preschool school (ED6A=0). iii) Out of school children are the sum of i) and ii).
Children for whom it is not known whether they are attending school (ED5>2), for whom level of current attendance is not known (ED6A>3), or those who are likely misclassified as attending level(s) above secondary education (ED6A>2) are not considered out of school. This group should consist of very few cases (missing and inconsistent values). Therefore, the results in the NAR and Out of School columns do not necessarily sum to 100.
The age at the beginning of the school year is estimated by rejuvenating children to the first month of the (current or most recent) school year by using information on the date of birth (HL5), if available, and information on when the current (or most recent) school year began. If the date of birth is not available, then a full year is subtracted from the current age of the child at the time of survey (HL6), if the interview took place more than 6 months after the school year started. If the latter is less than six months and the date of birth is not available, the current age is assumed to be the same as the age at the beginning of the school year.
The table is based on a 6-year primary school system, for ages 6 to 11. This should be adapted in accordance with the country-specific primary school ages as indicated by ISCED.

P a g e | 98
The secondary school net attendance ratio is presented in Table ED.555. Attendance is less than for
primary school with only about half (48.1 percent) of the children attending school. Of the remaining
half, most are attending primary school, but almost one out four children (22.6 percent) of
secondary school age are completely out of school.
Age shows a strong positive correlation with being out of school. 17.9 percent of 14‐year‐old
children and 17.1 percent of 15 years old children are out of school. This dramatically increases to
25.8 percent for children aged 16 and 29.4 percent for children aged 17. Attendance is higher in
households with a male head of household (52.3 percent) compared to female (34.5 percent).
Almost one of three children of secondary school age in the poorest households (32.7 percent) are
out of school compared to 1 in 7 (14.0 percent) in the richest households.
Table ED.5 reflects the findings of Table ED.4 with late enrolment a contributing factor to low
enrolment in both primary and secondary school. For children aged 14 years, only 18.8 percent were
enrolled in secondary school or higher while the majority (65.5 percent) were attending primary
school. High attendance of secondary school age children in primary school was also seen in older
children with 1 in 4 children 15 years of age and 1 in 5 children 16 years of age attending primary
school.
55 Ratios presented in this table are "adjusted" since they include not only secondary school attendance, but also attendance to higher levels in the numerator.

P a g e | 99
Table ED.5: Secondary school attendance and out of school children
Percentage of children of secondary school age (14-17 years) attending secondary school or higher (adjusted net attendance ratio), percentage attending primary school, and percentage out of school, by selected characteristics, RMI ICHNS, 2017
Male Female Total
Net attend-ance ratio (adjusted)
Percentage of children:
Number of
children P-
value
Net attend-ance ratio (adjusted)
Percentage of children:
Number of
children P-
value
Net attend-ance ratio (adjusted)1
Percentage of children:
Number of
children P-
value
Attending primary school
Out of schoola
Attending primary school
Out of schoola
Attending primary school
Out of schoola
Total 46.7 32.3 20.9 168 -- 49.8 26.6 24.7 141 -- 48.1 29.8 22.6 309 --
Area
Urban 48.3 30.6 21.2 95 -- 49.2 26.3 25.8 89 -- 48.7 28.6 23.3 184 --
Rural 38.7 41.5 19.8 73 53.8 28.3 17.9 52 44.9 36.0 19.0 125
Age at beginning of school year
14 7.3 79.5 13.3 48 -- 30.6 51.1 22.6 40 -- 18.8 65.5 17.9 88 --
15 58.6 27.1 14.3 45 51.0 28.4 20.6 34 55.2 27.7 17.1 79
16 55.1 17.6 27.3 29 54.2 21.3 24.5 36 54.6 19.5 25.8 65
17 59.8 12.5 27.7 46 67.4 0.0 32.6 31 62.5 8.0 29.4 77
Head of Household Gender
Male 50.1 33.1 16.8 131 * 55.3 23.2 23.2 102 -- 52.3 28.9 19.5 233 *
Female 32.6 29.2 38.2 37 36.0 35.4 28.6 39 34.5 32.6 33.0 76
Wealth index quintile
Poorest 28.1 38.2 33.7 64 -- 37.4 31.2 31.4 51 -- 32.1 35.2 32.7 115 --
Second 59.1 26.3 14.6 37 57.2 21.3 26.5 28 58.3 24.2 19.6 65
Middle 39.4 39.4 21.2 28 47.8 18.5 33.8 20 42.9 30.7 26.4 48
Fourth 46.3 28.5 25.2 19 52.0 28.9 19.2 21 49.3 28.7 22.0 40
Richest 56.1 30.1 13.8 20 51.9 33.9 14.2 21 54.1 31.9 14.0 41 1 MICS indicator 7.5 - Secondary school net attendance ratio (adjusted) a The percentage of children of secondary school age out of school are those who are not attending primary, secondary, or higher education

P a g e | 100
The adjusted secondary school net attendance ratio (NAR) is the percentage of children of secondary school age (as of the beginning of the current or most recent school year) who are attending secondary school or higher (higher levels are included to take early starters into account). Children of secondary school age currently attending secondary school or higher are included in the numerator. Children that did not attend school in the current school year, but have already completed secondary school are also included in the numerator. All children of secondary school age at the beginning of the school year are included in the denominator.
Ratios presented in this table are termed "adjusted" since they include not only secondary school attendance, but also attendance to higher levels of education.
The percentage of children of secondary school age who are attending primary school should be used to complete the analysis for secondary school age children, including the adjusted secondary school net attendance ratio and the percentage of children of secondary school age out of school.
The percentage of children out of school are those who are not attending secondary school or higher, those who are not attending primary school, and those who have not already completed secondary school.
The age at the beginning of the school year is estimated by rejuvenating children to the first month of the (current or most recent) school year by using information on the date of birth, if available, and information on when the current (or most recent) school year began. If the date of birth is not available, then a full year is subtracted from the current age of the child at the time of survey, if the interview took place more than 6 months after the school year started. If the latter is less than six months and the date of birth is not available, the current age is assumed to be the same as the age at the beginning of the school year.

P a g e | 101
The percentage of children entering first grade who eventually reach the last grade of primary school
is presented in Table ED.6. Of all children starting grade one, the majority (90.5 percent) will
eventually reach grade 8. The survey included only questions on school attendance in the current
and previous year. Thus, the indicator is calculated synthetically by computing the cumulative
probability of survival from the first to the last grade of primary school, as opposed to calculating the
indicator for a real cohort which would need to be followed from the time a cohort of children
entered primary school, up to the time they reached the last grade of primary school. Repeaters are
excluded from the calculation of the indicator, because it is not known whether they will eventually
graduate. As an example, the probability that a child will move from the first grade to the second
grade is computed by dividing the number of children who moved from the first grade to the second
grade (during the two consecutive school years covered by the survey) by the number of children
who have moved from the first to the second grade plus the number of children who were in the
first grade the previous school year, but dropped out. Both the numerator and denominator exclude
children who repeated during the two school years under consideration.
The percentage of children reaching the last grade of primary school is quite high across all
background characteristics. Boys (87.3 percent) are less likely to reach primary grade 8 than girls
(94.6 percent) and children in urban areas (87.1 percent) are less likely to reach primary grade 8
than children in rural areas (93.3 percent).
The primary school completion rate and transition rate to secondary education are presented in
Table ED.7. The primary completion rate is the ratio of the total number of students, regardless of
age, entering the last grade of primary school for the first time, to the number of children of the
primary graduation age at the beginning of the current (or most recent) school year.
Table ED.7 shows that the primary school completion rate is 87.0 percent and 91.3 percent of the
children who were attending the last grade of primary school in the previous school year were found
to be attending the first grade of secondary school in the school year of the survey. The table also
provides “effective” transition rate which takes account of the presence of repeaters in the final
grade of primary school. This indicator better reflects situations in which pupils repeat the last grade
of primary education but eventually make the transition to the secondary level. The simple transition
rate tends to underestimate pupils’ progression to secondary school as it assumes that the repeaters
never reach secondary school. The table shows that in total 92.7 percent of the children in the last
grade of primary school are expected to move on to secondary school.
The primary school completion rate for boys is 101.8 percent compared to 72.4 percent for girls. The
primary completion rate is higher in rural areas at 101.9 percent compared to urban areas at 74.2
percent.

P a g e | 102
Table ED.6: Children reaching last grade of primary school
Percentage of children entering first grade of primary school who eventually reach the last grade of primary school (Survival rate to last grade of primary school), by selected characteristics, RMI ICHNS, 2017
Percent attending
grade 1 last school year who are in grade 2
this school year
Percent attending grade 2 last
school year who are attending grade 3 this school year
Percent attending grade 3 last
school year who are attending grade 4 this school year
Percent attending grade 4 last
school year who are attending grade 5 this school year
Percent attending grade 5 last
school year who are attending grade 6 this school year
Percent attending grade 6 last
school year who are attending grade 7 this school year
Percent attending grade 7 last
school year who are attending grade 8 this school year
Percent who reach grade 8 of those
who enter grade 11
Total 99.1 97.6 99.2 98.5 100.0 97.8 97.9 90.5
Sex
Male 98.3 98.5 98.5 97.4 100.0 97.5 96.4 87.3
Female 100.0 96.5 100.0 100.0 100.0 98.1 100.0 94.6
Area
Urban 98.4 94.8 98.4 97.1 100.0 100.0 97.8 87.1
Rural 100.0 100.0 100.0 100.0 100.0 95.2 98.0 93.3 1 MICS indicator 7.6
Children reaching the last grade of primary, also known as the survival rate to the last grade of primary school, is defined as the percentage of children attending the first grade of primary school who would be expected to reach the last grade of primary school, if current rates of transition from one grade of primary school to the next were applicable. Since the survey collects information on the attendance of children to primary school only for two school years (the current school year and the previous school year), it is not possible to follow a real cohort of children entering primary school and reaching (or dropping out before they do so) the last grade of primary school. Therefore, calculations are carried out on the basis of a hypothetical cohort that is assumed to experience transition rates during the previous and current school years. To calculate the first probability above, the number of children who were attending the first grade of primary school during the previous school year and moved on to the second grade of primary school in the current year are divided by the number of children who were in the first grade last year and graduated to second grade or dropped out of school. In short, this is the percentage of children who successfully moved from grade 1 to grade 2. Children who are repeating the first grade do not enter the calculation because it is not known whether they will eventually graduate. The calculation of the other probabilities is similar: the number who graduated from one grade to another divided by the number who graduated or dropped out of that grade. All probabilities are then multiplied together to obtain the cumulative probability of reaching the last grade among those who enter first grade.

P a g e | 103
Table ED.7: Primary school completion and transition to secondary school
Primary school completion rates and transition and effective transition rates to secondary school, by selected characteristics, RMI ICHNS, 2017
Primary school
completion rate1
Number of children of primary school completion age
Transition rate to secondary school2
Number of children who were in the last grade of primary school the
previous year
Effective transition rate to secondary
school
Number of children who were in the last grade of
primary school the previous year and are
not repeating that grade in the current school year
Total 87.0 115 91.3 69 92.7 68
Sex
Male 101.8 57 87.5 32 87.5 32
Female 72.4 58 94.6 37 97.2 36
Area
Urban 74.2 62 85.7 42 87.8 41
Rural 101.9 53 100.0 27 100.0 27 1 MICS indicator 7.7 - Primary completion rate 2 MICS indicator 7.8 - Transition rate to secondary school
The primary completion rate is the ratio of the total number of students, regardless of age, entering the last grade of primary school for the first time, to the number of children of the primary graduation age at the beginning of the current (or most recent) school year, calculated as: Primary completion rate = 100 * (number of children attending the last grade of primary school - repeaters) / (number of children of primary school completion age at the beginning of the school year). Repeaters are those in the last grade of primary in both the current and previous school year. The denominator are children whose age at the beginning of the school year is equal to the age corresponding to the last grade of primary school. The transition rate to secondary education is the percentage of children who were in the last grade of primary school during the previous school year and who are attending the first grade of secondary school in the current (or most recent) school year, calculated as: Transition rate to secondary education = 100 * (number of children in the first grade of secondary school who were in the last grade of primary school the previous year) / (number of children in the last grade of primary school the previous year). The effective transition rate is similar to the transition rate, except that the denominator also excludes repeaters. The calculation is: 100 * (number of children in the first grade of secondary school who were in the last grade of primary school the previous year) / (number of children in the last grade of primary school the previous year who are not repeating the last grade of primary school in the current year).

P a g e | 104
The ratio of girls to boys attending primary and secondary education is provided in Table ED.8. These
ratios are better known as the Gender Parity Index (GPI). Notice that the ratios included here are
obtained from net attendance ratios rather than gross attendance ratios. The latter provide an
erroneous description of the GPI mainly because, in most cases, the majority of over‐age children
attending primary education tend to be boys. When reporting the net attendance ratio (NAR), data from
Tables ED.4 and ED.5 should be used for primary and secondary school attendance respectfully while
Table ED.8 provides a measure of the gender parity index (GPI) for primary ad secondary school.
The table shows that gender parity for primary school is at 1.04, indicating little difference in the
attendance of girls and boys to primary school. However, the indicator increases to 1.20 for secondary
education indicting a disadvantage among boys. The disadvantage of boys in secondary school is
particularly pronounced in rural areas (1.49).
Table ED.8: Education gender parity
Ratio of adjusted net attendance ratios of girls to boys, in primary and secondary school, by selected characteristics, RMI ICHNS, 2017
Primary school Secondary school
Primary school
adjusted net attendance ratio (NAR),
girls
Primary school
adjusted net attendance ratio (NAR),
boys
Gender parity index (GPI) for primary
school adjusted
NAR1
Secondary school
adjusted net attendance ratio (NAR),
girls
Secondary school
adjusted net attendance ratio (NAR),
boys
Gender parity index (GPI)
for secondary school
adjusted NAR2
Total 85.2 81.7 1.04 49.3 41.1 1.20
Area
Urban 81.9 74.2 1.10 48.3 46.3 1.04
Rural 88.9 89.9 0.99 50.9 34.3 1.49 1 MICS indicator 7.9; 2 MICS indicator 7.10;
The gender parity index (GPI) is the ratio of female to male adjusted net attendance ratios (primary or secondary). The primary and secondary adjusted net attendance ratios are presented in more detail in tables ED.4 and ED.5.
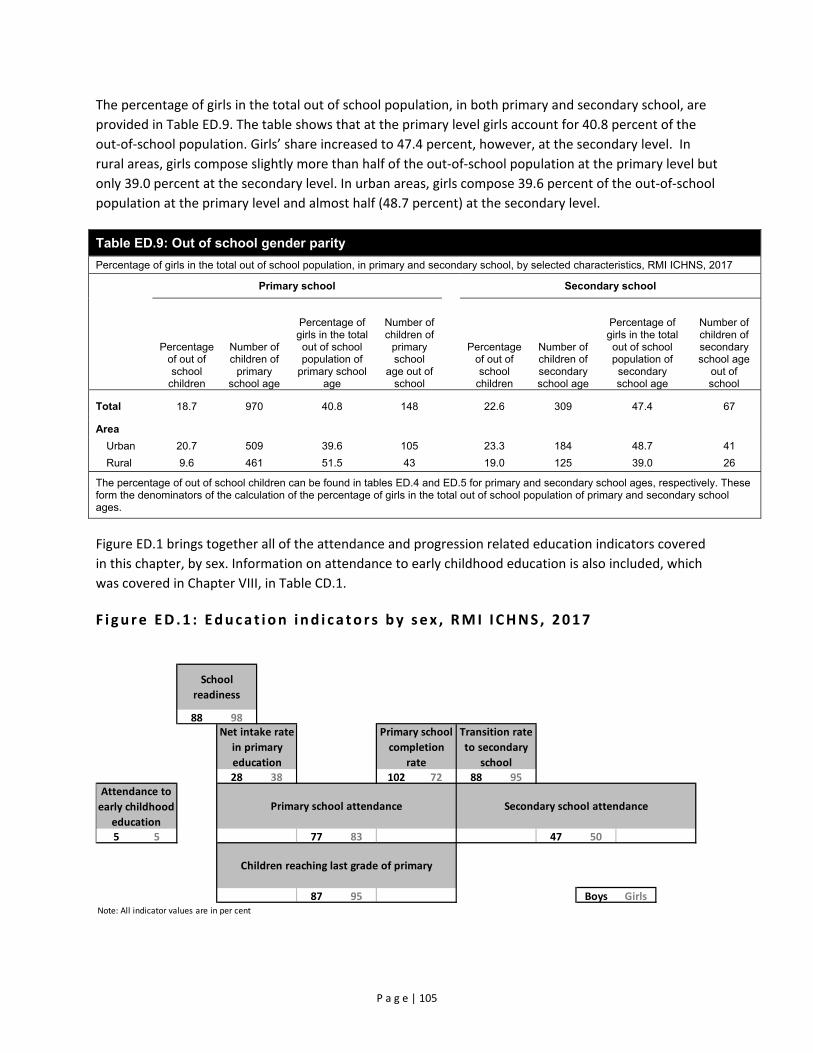
P a g e | 105
The percentage of girls in the total out of school population, in both primary and secondary school, are
provided in Table ED.9. The table shows that at the primary level girls account for 40.8 percent of the
out‐of‐school population. Girls’ share increased to 47.4 percent, however, at the secondary level. In
rural areas, girls compose slightly more than half of the out‐of‐school population at the primary level but
only 39.0 percent at the secondary level. In urban areas, girls compose 39.6 percent of the out‐of‐school
population at the primary level and almost half (48.7 percent) at the secondary level.
Table ED.9: Out of school gender parity
Percentage of girls in the total out of school population, in primary and secondary school, by selected characteristics, RMI ICHNS, 2017
Primary school Secondary school
Percentage of out of school
children
Number of children of
primary school age
Percentage of girls in the total out of school population of
primary school age
Number of children of
primary school
age out of school
Percentage of out of school
children
Number of children of secondary school age
Percentage of girls in the total out of school population of
secondary school age
Number of children of secondary school age
out of school
Total 18.7 970 40.8 148 22.6 309 47.4 67
Area
Urban 20.7 509 39.6 105 23.3 184 48.7 41
Rural 9.6 461 51.5 43 19.0 125 39.0 26
The percentage of out of school children can be found in tables ED.4 and ED.5 for primary and secondary school ages, respectively. These form the denominators of the calculation of the percentage of girls in the total out of school population of primary and secondary school ages.
Figure ED.1 brings together all of the attendance and progression related education indicators covered
in this chapter, by sex. Information on attendance to early childhood education is also included, which
was covered in Chapter VIII, in Table CD.1.
F i gure ED .1 : Educa t ion i nd i ca to r s by sex , RMI I CHNS , 2017
88 98
28 38 102 72 88 95
5 5 77 83 47 50
87 95 Boys GirlsNote: All indicator values are in per cent
Children reaching last grade of primary
Net intake rate
in primary
education
Primary school
completion
rate
Transition rate
to secondary
school
Attendance to
early childhood
education
Primary school attendance Secondary school attendance
School
readiness

P a g e | 106
X. Child Protection
Birth Registration
Having a name and nationality is every child’s right, enshrined in the Convention on the Rights of the
Child (CRC) and other international treaties. Yet the births of around one in four children under the age
of five worldwide have never been recorded.56 This lack of formal recognition by the State usually means
that a child is unable to obtain a birth certificate. As a result, he or she may be denied health care or
education. Later in life, the lack of official identification documents can mean that a child may enter into
marriage or the labour market, or be conscripted into the armed forces, before the legal age. In
adulthood, birth certificates may be required to obtain social assistance or a job in the formal sector, to
buy or prove the right to inherit property, to vote and to obtain a passport. Registering children at birth
is the first step in securing their recognition before the law, safeguarding their rights, and ensuring that
any violation of these rights does not go unnoticed.57
The lack of adequate knowledge of how to register a child can present another major obstacle to the
fulfilment of a child’s right to identity. In RMI, however, data show that 62.5 percent of mothers of
unregistered children reported that they know how to register a birth, which points to the existence of
other major barriers to birth registration.
Table CP.1 reveals that the births of 83.8 percent of children under 5 in RMI have been registered.
Overall, birth certificates were seen by enumerators for only 47.1 percent of children. The percentage of
certificates observed was lower in rural areas (31.1 percent) compared to urban areas (50.2 percent).
Prevalence of birth registration was higher in urban areas with 86.6 percent registered compared to 69.2
percent in rural areas. The prevalence was also much higher for children whose delivery was assisted by
a skilled attendant (81.3 percent) compared to those assisted by a traditional birth attendant (57.5
percent). Prevalence of registration was statistically associated with wealth with lowest registration in
the poorest (77.0 percent) and richest (76.6 percent) wealth index quintiles compared to the middle
three quintiles which ranged from 91.9 percent in the second poorest quintile to 86.0 percent in the
middle to 85.5 percent in the fourth quintile.
These findings are also presented in Figure CP.1.
56 UNICEF. 2014. The State of the World’s Children 2015. UNICEF. 57 UNICEF. 2013. Every Child’s Birth Right: Inequities and trends in birth registration. UNICEF.

P a g e | 107
Table CP.1: Birth registration
Percentage of children under age 5 by whether birth is registered and percentage of children not registered whose mothers/caregivers know how to register birth, by selected characteristics, RMI ICHNS, 2017
Children under age 5 whose birth is registered with civil authorities
Number of
children under age 5
Children under age 5 whose birth is not registered
Has birth certificate
No birth certificate
Total registered1 Percent of
children whose mother/caregiver
knows how to register birth
Number of children
under age 5 without birth registrationSeen
Not seen Percent
P-value
Total 47.1 32.3 4.4 83.8 -- 881 62.5 185
Child Age
0-5m 41.1 24.3 9.5 74.9 -- 80 56.2 25
6-11m 56.8 22.3 4.2 83.3 111 68.3 27
12-23m 51.6 27.6 1.8 81.0 171 70.0 35
24-35m 46.7 32.6 4.9 84.2 169 58.7 38
36-59m 43.5 39.0 4.3 86.8 350 59.6 60
Child gender
Male 46.5 33.3 5.3 85.1 -- 455 67.2 96
Female 47.7 31.2 3.4 82.3 426 58.2 89
Area
Urban 50.2 32.2 4.2 86.6 *** 490 66.8 66
Rural 31.1 32.8 5.4 69.2 391 52.9 119
Caregiver's education
None -- -- -- -- ** 12 -- 2
Primary 36.3 31.2 6.9 74.3 181 37.9 50 Secondary 52.8 30.4 4.5 87.6 529 63.2 101Higher 39.2 40.9 1.3 81.4 155 95.9 30
Wealth index quintile
Poorest 37.7 35.4 3.9 77.0 ** 370 48.7 103
Second 59.5 28.5 3.9 91.9 152 -- 17
Middle 55.9 26.4 3.7 86.0 144 46.0 25 Fourth 39.7 39.0 6.7 85.5 108 -- 15Richest 37.4 34.9 4.2 76.6 107 91.2 25
Maternal Married Status
Not married 58.2 27.9 2.9 88.9 * 333 53.1 46
Currently married 44.6 31.4 6.2 82.3 175 77.4 40
Cohabitating 37.4 37.2 5.2 79.7 281 60.3 74
Father in Household
Yes 50.5 30.5 4.2 85.2 -- 623 63.3 124
No 38.2 36.9 4.9 80.0 258 60.8 61
Assistance at delivery
Skilled attendant 52.7 23.5 5.1 81.3 ** 225 67.5 47
Traditional birth attendant 24.5 24.7 8.4 57.5 45 -- 23
* P<0.05, ** P<0.01, *** P<0.001 1 MICS indicator 8.1 - Birth registration
Children age 0-59 months whose birth is registered includes: - children whose birth certificate was seen by the interviewer, - children reported to have a birth certificate that was not seen by the interviewer, and - children who do not have a birth certificate but are reported to have been registered with civil authorities. The denominator for children whose mothers/caregiver know how to register birth includes children who are not registered as well as children whose registration status is unknown.

P a g e | 108
F i gure CP .1 : Ch i ld ren under ‐5 whose b i r ths are reg i s te red , RMI I CHNS , 2017
Child Discipline
Teaching children self‐control and acceptable behaviour is an integral part of child discipline in all
cultures. Positive parenting practices involve providing guidance on how to handle emotions or conflicts
in manners that encourage judgment and responsibility and preserve children's self‐esteem, physical
and psychological integrity and dignity. Too often however, children are raised through the use of
punitive methods that rely on the use of physical force or verbal intimidation to obtain desired
behaviours. Studies have found that exposing children to violent discipline have harmful consequences,
which range from immediate impacts to long‐term harm that children carry forward into adult life58,59,60.
Violence hampers children’s development, learning abilities and school performance; it inhibits positive
relationships, provokes low self‐esteem, emotional distress and depression; and, at times, it leads to risk
taking and self‐harm.
In the survey, respondents to the household questionnaire were asked a series of questions on the
methods adults in the household used to discipline a selected child during the past month.Error! Bookmark not
defined. In RMI, 64.0 percent of children aged 1‐4 years were subjected to at least one form of
psychological or physical punishment by household members during the past month.
For the most part, households employ a combination of violent disciplinary practices, reflecting
caregivers’ motivation to control children’s behaviour by any means possible. While 30.6 percent of
children experienced psychological aggression, about 61.6 percent experienced physical punishment.
58 Straus, MA and Paschall MJ. 2009. Corporal Punishment by Mothers and Development of Children’s Cognitive Ability: A longitudinal study of two nationally representative age cohorts. Journal of Aggression, Maltreatment & Trauma 18(5): 459-83. 59 Erickson, MF and Egeland, B. 1987. A Developmental View of the Psychological Consequences of Maltreatment. School Psychology Review 16: 156-68. 60 Schneider, MW et al. 2005. Do Allegations of Emotional Maltreatment Predict Developmental Outcomes Beyond that of Other Forms of Maltreatment?. Child Abuse & Neglect 29(5): 513–32.

P a g e | 109
The most severe forms of physical punishment (hitting the child on the head, ears or face or hitting the
child hard and repeatedly) are overall less common; 7.6 percent of children were subjected to severe
physical punishment.
Boys were subjected to physical discipline (61.9 percent) at almost exactly the same prevalence as girls
(61.4 percent). There was also no significant difference in the use of any violent discipline methods
between urban (62.9 percent) and rural areas (69.7 percent). Prevalence of any violent discipline
method was higher in older children with children aged 35‐49 months at 70.0 percent compared to
children 24‐35 months at 62.3 percent and children 12‐23 months at 52.4 percent. Mother’s marital
status was associated with violent discipline methods with children of mothers who were currently
married (53.7 percent) having much lower prevalence than those who were not married (63.7 percent)
or cohabitating (72.4 percent).
Table CP.5: Child discipline Percentage of children age 1-4 years by child disciplining methods experienced during the last one month, by selected characteristics, RMI ICHNS, 2017
Percentage of children age 1-4 years who experienced: Number of children age 1-4years
Only non-violent
discipline Psychological
aggression
Physical punishment Any violent discipline method1
Any Severe Percentage P-value
Total 26.6 30.6 61.6 7.6 64.0 -- 690
Child Age
12-23m 29.6 16.6 50.1 2.0 52.4 *** 171
24-35m 28.1 25.8 60.3 8.2 62.3 169
36-59m 24.6 39.0 67.5 9.8 70.0 350
Child gender
Male 28.2 32.8 61.9 10.2 63.9 -- 354
Female 25.0 28.2 61.4 4.7 64.1 336
Area
Urban 27.3 29.8 60.6 7.7 62.9 -- 386 Rural 22.9 34.2 67.2 6.9 69.7 304
Caregiver's education
None -- -- -- -- -- ** 11
Primary 17.5 32.2 75.2 8.2 76.7 143
Secondary 32.3 32.9 57.7 8.9 60.6 412
Higher 20.3 22.9 63.1 3.3 65.0 120
Wealth index quintile
Poorest 24.9 40.3 65.2 9.7 69.5 -- 286
Second 27.5 35.6 58.5 9.5 61.1 123
Middle 20.5 22.5 71.8 5.2 72.5 111
Fourth 31.5 31.5 58.1 5.7 59.3 84
Richest 30.4 23.2 52.9 7.2 55.9 86
Maternal Married Status
Not married 28.5 35.3 60.3 11.3 63.7 * 246
Currently married 28.6 16.5 52.1 1.3 53.7 143
Cohabitating 21.1 33.5 70.9 8.2 72.4 221
Father in Household
Yes 26.4 29.8 61.6 7.2 63.7 -- 487
No 27.3 32.6 61.8 8.5 64.8 203

P a g e | 110
Table CP.5: Child discipline * P<0.05, ** P<0.01, *** P<0.001
1 MICS indicator 8.3 - Violent discipline
Columns of the table refer to the following: (B) Only non-violent discipline: Took away privileges, forbade something the child liked or did not allow the child to leave the house, or explained why the child's behaviour was wrong only. (C) Psychological aggression: Shouted, yelled at or screamed at the child or called the child dumb, lazy or another similar name. (D) Any physical punishment: Shook the child or Spanked, hit or slapped the child on the bottom with bare hand or Hit the child on the bottom or elsewhere on the body with something like a belt, hairbrush, stick or other hard object or Hit or slapped the child on the face, head or ears or Hit or slapped the child on the hand, arm or leg or Beat the child up, that is hit him/her over and over as hard as one could. (E) Severe physical punishment: Hit or slapped the child on the face, head or ears or beat the child up, that is hit him/her over and over as hard as one could. (F) Any violent discipline method: Shook the child; Shouted, yelled at or screened at the child; Spanked, hit or slapped the child with bare hand; Hit the child on the bottom or elsewhere on the body with something like a belt, hairbrush, stick or other hard object; Called the child dumb, lazy or another similar name; Hit or slapped the child on the face, head or ears; Hit or slapped the child on the hand, arm or leg; or Beat the child up, that is hit him/her over and over as hard as one could. Child disciplining methods in this table should be considered as lower bounds of the actual discipline methods used by the household members, since children who may have been separated from the household members (e.g. at boarding school) during the past month are considered not to have been subjected to any disciplining method.
Figure CP.2. summarizes child disciplining methods for children 12‐59 months of age in RMI. In total,
64.0 percent of children were subjected to physical punishment and/or psychological aggression as a
method of discipline while only 26.6 percent of children received only non‐violent discipline.
Concerningly, 7.6 percent of children 1‐4 years of age were subjected to severe physical punishment
where they were hit or slapped on the face, head or ears or hit repeatedly as hard as the adult could.
F i gure CP .2 : Ch i ld d i s c ip l i n ing methods , ch i ld ren age 12 ‐59 months of age , RMI I CHNS , 2017

P a g e | 111
Violent methods are common forms of discipline in RMI, Table CP.6 reveals that the majority of
caregivers (69.1 percent) believe that physical punishment is a necessary part of child‐rearing. Overall,
respondents with low educational attainment are more likely to find physical punishment as necessary
in disciplining children. Additionally, associated with higher prevalence of belief in the necessity of
physical punishment were greater child age, wealth of the household, maternal status of not married or
cohabitating, and a mother who does not engage in 4 or more activities with the child. Mothers who did
not engage in 4 or more activities with their child had higher belief that physical punishment is a
necessary part of child‐rearing (83.5 percent) compared to mothers who engaged in 4 or more activities
(65.2 percent).
Table CP.6: Attitudes toward physical punishment
Percentage of respondents to the child discipline module who believe that physical punishment is needed to bring up, raise, or educate a child properly, by selected characteristics, RMI ICHNS, 2017
Respondent believes that a child needs to be physically
punished
Number of respondents to the child discipline modulePercent P-value
Total 69.1 -- 690
Child Age
12-23m 59.4 *** 171 24-35m 69.3 16936-59m 73.4 350
Child gender Male 72.3 -- 354 Female 65.7 336
Area Urban 69.8 -- 386 Rural 65.3 304
Caregiver's education
None -- ** 11 Primary 78.5 143Secondary 70.3 412Higher 59.6 120
Wealth index quintile
Poorest 69.3 * 286 Second 70.7 123Middle 79.8 111Fourth 58.3 84 Richest 63.3 86
Maternal Married Status
Not married 68.9 * 246 Currently married 57.2 143Cohabitating 74.9 221
Mother Engages in 4 or more activities with child Yes 65.2 ** 179 No 83.5 120
Father in Household
Yes 65.5 -- 203 No 70.5 487
* P<0.05, ** P<0.01, *** P<0.001

P a g e | 112
Children’s Living Arrangements
The CRC recognizes that “the child, for the full and harmonious development of his or her personality,
should grow up in a family environment, in an atmosphere of happiness, love and understanding”.
Millions of children around the world grow up with without the care of their parents for several reasons,
including due to the premature death of the parents or their migration for work. In most cases, these
children are cared for by members of their extended families, while in others, children may be living in
households other than their own, as live‐in domestic workers for instance. Understanding the children’s
living arrangements, including the composition of the households where they live and the relationships
with their primary caregivers, is key to design targeted interventions aimed at promoting child’s care
and wellbeing.
Table CP.14 presents information on the living arrangements and orphanhood status of children under
age 18. A total of 70.5 percent of children age 0‐4 years in RMI live with both their parents, 19.9 percent
live with mothers only and 1.6 percent live with fathers only. A total of 7.2 percent of children live with
neither of their biological parents while both of them are alive while 14.5 percent live with mothers only
while the biological father is alive.
Few children have lost one or both parents. A total of 5.9 percent of children have only their mother
alive and 0.5 percent of children have only their father alive. Table CP.14 shows that the percentage of
children living with neither biological parents is the highest (11.5 percent) in the oldest child age group
(36‐59 months). Table CP.14 also shows that the percentage of children living with one or both parents
dead is highest in children whose mother is less than 20 years of age (14.3 percent).

P a g e | 113
Table CP.14: Children's living arrangements and orphanhood
Percent distribution of children age 0-4 years according to living arrangements, percentage of children age 0-4 years not living with a biological parent and percentage of children who have one or both parents dead, by selected characteristics, RMI ICHNS, 2017
Living with both
parents
Living with neither biological parent
Living with mother only
Living with father only
Total
Living with neither biological parent1
One or both parents dead 2
Number of
children age 0-5 years
Only father alive
Only mother alive
Both alive
Both dead
Father alive
Father dead
Mother alive
Mother dead %
P-value %
P-value
Total 70.5 0.3 0.5 7.2 0.0 14.5 5.4 1.4 0.2 100.0 8.0 -- 6.4 -- 881
Child Age
0-5m 68.2 0.0 0.0 0.8 0.0 20.8 10.3 0.0 0.0 100.0 0.8 * 10.3 -- 80 6-11m 72.7 0.0 0.0 5.0 0.0 11.6 9.1 1.5 0.0 100.0 5.0 9.1 111 12-23m 77.2 0.0 0.4 6.7 0.0 9.9 4.4 1.4 0.0 100.0 7.1 4.9 171 24-35m 73.7 0.0 1.0 5.5 0.0 16.9 2.7 0.3 0.0 100.0 6.5 3.7 169 36-59m 65.9 0.6 0.6 10.1 0.1 15.2 5.0 2.0 0.4 100.0 11.5 6.7 350
Mother's age at birth
Less than 20 years 53.9 0.0 0.0 0.0 0.0 0.0 31.8 14.3 0.0 100.0 0.0 -- 14.3 ** 112
20-34 years 81.4 0.0 0.0 0.0 0.0 0.0 13.9 4.7 0.0 100.0 0.0 4.7 559 35-49 years 90.6 0.0 0.0 0.0 0.0 0.0 8.1 1.3 0.0 100.0 0.0 1.3 92
Child gender Male 72.2 0.1 0.8 6.0 0.1 15.6 3.5 1.8 0.0 100.0 6.9 -- 4.4 * 455 Female 68.7 0.4 0.3 8.4 0.0 13.4 7.5 0.9 0.4 100.0 9.1 8.6 426
Area Urban 71.0 0.2 0.4 6.7 0.0 14.3 5.9 1.4 0.2 100.0 7.3 * 6.6 -- 490 Rural 68.3 0.7 1.1 9.4 0.3 15.9 3.1 0.9 0.3 100.0 11.5 5.5 391
Wealth index quintile Poorest 69.6 0.2 1.0 10.1 0.2 14.3 3.9 0.5 0.3 100.0 11.5 -- 5.6 -- 370 Second 71.3 0.0 1.5 5.7 0.0 11.5 7.2 2.3 0.6 100.0 7.2 9.2 152 Middle 70.4 0.3 0.0 5.9 0.0 12.2 8.6 2.6 0.0 100.0 6.1 8.8 144 Fourth 66.8 0.9 0.0 8.2 0.0 22.9 1.2 0.0 0.0 100.0 9.1 2.1 108 Richest 74.0 0.0 0.0 6.6 0.0 13.9 4.8 0.7 0.0 100.0 6.6 4.8 107
Maternal Parity 1 63.4 0.0 0.0 0.0 0.0 22.7 13.9 0.0 0.0 100.0 0.0 -- 13.9 *** 182 2-3 80.1 0.0 0.0 0.0 0.0 16.1 3.9 0.0 0.0 100.0 0.0 3.9 384 4 or more 88.0 0.0 0.0 0.0 0.0 8.6 2.4 1.1 0.0 100.0 0.0 2.4 191
* P<0.05, ** P<0.01, *** P<0.001 1 MICS indicator 8.13 - Children’s living arrangements 2 MICS indicator 8.14 - Prevalence of children with one or both parents dead
MICS definition for children who are not living with at least one biological parent includes either because the parents live elsewhere or because the parents are dead The denominator in this table is children age 0-4 years in the list of household members.

P a g e | 114
The RMI Integrated Child Health and Nutrition Survey 2017 (ICHNS 2017) included a simple measure of
one particular aspect of migration related to what is termed ‘children left behind’, i.e. for whom one or
both parents have moved abroad. While the body of literature is growing, the long‐term effects of the
benefits of remittances versus the potential adverse psycho‐social effects are not yet conclusive, as
there is somewhat conflicting evidence regarding the impacts on children.
Besides presenting simple prevalence rates, the results of the ICHNS 2017 presented in Table CP.15 will
greatly help fill the data gap on the topic of migration.
More than one in ten children (10.5 percent) age 0‐4 has one or both parents living abroad; 7.4 percent
with only the father living abroad, 0.9 with only the mother living abroad, and 2.2 percent with both
parents living abroad.
There are non‐significant differences between groups of children, as the percentage of at least one
parent living abroad is higher in urban areas (11.0 percent) than rural areas (8.0 percent) and among
children with caregivers who have higher education (14.0 percent). Prevalence of at least one parent
living abroad was significantly associated with child age, at 14.0 percent of children 35‐49 months, 12.2
percent of children 24‐35 months, 7.0 percent of children 12‐23 months and 1.9 percent of children 6‐11
months but then higher again for children age 0‐5 at 10.0 percent.

with parents living abroad
age 0-4 years by residence of parents in another country, by selected characteristics, RMI ICHNS, 2017
Percent distribution of children age 0-4 years: Percentage of children age 0-4 years with at least one
parent living abroad¹ Number of children
age 0-4 years
With at least one parent living abroad With neither parent living
abroad Total y mother broad
Only father abroad
Both mother and father abroad Percent P-value
0.9 7.4 2.2 89.5 100.0 10.5 -- 881
0.0 9.6 0.4 90.0 100.0 10.0 * 80
0.0 1.5 0.4 98.1 100.0 1.9 111
0.0 3.9 3.0 93.0 100.0 7.0 171
0.2 9.3 2.7 87.8 100.0 12.2 169
2.0 9.5 2.5 86.0 100.0 14.0 350
1.4 7.3 1.0 90.3 100.0 9.7 -- 455 0.3 7.5 3.4 88.7 100.0 11.3 426
0.9 8.1 1.9 89.0 100.0 11.0 -- 490 0.6 4.0 3.5 92.0 100.0 8.0 391
-- -- -- -- -- -- -- 12
3.4 5.1 0.5 91.1 100.0 8.9 181
0.4 6.9 2.5 90.3 100.0 9.7 529
0.0 10.7 3.3 86.0 100.0 14.0 155
0.5 6.9 2.7 90.0 100.0 10.0 -- 370 2.0 6.2 3.5 88.3 100.0 11.7 152
0.6 6.9 0.8 91.6 100.0 8.4 144
1.1 12.5 1.8 84.7 100.0 15.3 108
0.0 5.4 2.3 92.3 100.0 7.7 107
0.0 9.1 0.0 90.9 100.0 9.1 -- 182 0.0 8.6 0.0 91.4 100.0 8.6 384 0.0 5.1 0.0 94.9 100.0 5.1 191
with at least one parent living abroad

CONCLUSIONS AND RECOMMENDATIONS
The Republic of the Marshall Islands is classified as an upper middle‐income country with high literacy rates, steadily
declining child mortality and maternal mortality rates and major improvements in infrastructure development with
improved quality of housing, water and sanitation in the past 30 years. Despite this progress, the results of the
ICHNS 2017 indicate that widespread nutrition challenges remain. The burgeoning double burden of malnutrition,
manifested in a high prevalence of stunting in children under 5 years of age, high and widespread household food
insecurity and a critically high prevalence of overweight and obesity in women, adversely impacts individual and
family well‐being at the community level, poses exorbitant economic costs on the health system, and negatively
impacts the country’s long‐term development.
Prevalence of stunting in children under 5 years of age is classed as a high public health concern with
prevalence of stunting in children 12‐35 months of age critically high.
The ICHNS 2017 revealed that stunting is a high public health concern in RMI with 35 percent of children under 5
years of age stunted and 10 percent of children severely stunted. The prevalence of stunting was significantly
associated with age and gender of the child with highest prevalence in children 12‐35 months of age and boys having
significantly higher prevalence of stunting (40 percent) compared to girls (31 percent, P<0.01). There was no
significant difference in the prevalence of stunting by area with similar prevalence for both urban and rural areas.
Child stunting is attributed to multivariate factors with the prevalence of child stunting in RMI associated with socio‐
economic status as well as maternal characteristics, child feeding practices, and child care practices.
Children from the poorest two wealth index quintiles had over twice the prevalence of stunting (44.5 percent, 42.0
percent) compared to the wealthiest children (20.0 percent, P<0.01). However, in even the wealthiest children, the
prevalence of stunting surpasses the WHO’s classification for a public health concern. Access to improved sanitation
was associated with child stunting in RMI. While all households had access to improved drinking water in the survey,
only 86.3 percent of households used improved sanitation facilities that were not shared, with 8.3 percent of
households practicing open defecation. Use of unimproved sanitation facilities was associated with higher
prevalence of stunting (45.1 percent) compared to children whose households used improved sanitation facilities
(34.2 percent, P<0.05).
Maternal indicators such as maternal education achievement, married status, and short stature were strongly
associated with child stunting. Prevalence of child stunting was inversely associated with caregiver education with
highest prevalence of stunting among children whose caregivers had primary education only (41.3 percent) or
secondary education only (37.8 percent) compared to children whose mothers obtained higher education (20.9
percent, P<0.01). Children of mothers who were currently married had lower prevalence of stunting (26.4 percent)
compared to children whose mothers were not married (41.1 percent) or cohabitating with their partner (35.0
percent, P<0.05).
Maternal short stature was high in RMI with 26.1 percent of mothers less than 150cm tall. Short stature in the
mother impacts the infant’s growth and development in utero through intrauterine growth restriction and
contributes directly to low birthweight and early stunting in infants. In RMI, children whose mothers were less than
150cm tall had significantly higher prevalence of stunting (45.3 percent) compared to children whose mothers were
150‐159cm (35.8 percent) or 160cm and taller (12.1 percent, P<0.01). Children who were born with low birthweight,
representing 11.6 percent of all children, also had significantly higher prevalence of stunting (51.8 percent)
compared to children with normal birthweight (33.1 percent) or high birthweight (26.4 percent, P<0.01).
Inadequate child feeding and care practices were associated with child stunting in RMI. Consumption of high calorie,
low nutrient density foods was high among all children under 5 years of age, with consumption of sugar‐sweetened
beverages associated with higher prevalence of stunting (40.5 percent) compared to children who did not consume
these foods (31.8 percent, P<0.05). Consumption of any junk foods, including sugar‐sweetened beverages, sugary

foods such as cakes, cookies and candy, and fried, fatty foods was also associated with higher prevalence of stunting
(39.3 percent) compared to children who did not consume these foods (27.7 percent, P<0.01).
Poor child care and development practices were also associated with higher prevalence of stunting. Children who
had 10 or more books at home had dramatically lower prevalence of stunting (6.7 percent) compared to children
with 3 or more books (30.3 percent) or less than 3 books (37.5 percent, P<0.01). Children who were not stunted had
higher father engagement in school readiness activities compared to children who were stunted (P<0.01) although
there was no difference in maternal engagement or caregiver engagement between stunted and non‐stunted
children. Physical punishment was associated with child stunting with children who were severely punished having
dramatically higher prevalence of stunting (66.8 percent) compared to children who were not severely punished
(37.8 percent, P<0.01).
In RMI, high prevalence of stunting in children under 5 years of age is associated with maternal nutrition status,
infant and young children feeding practices and care, development practices, and a multitude of influencing
variables from the environment. The low prevalence of both underweight and wasting in children indicates that
children receive sufficient calories in their diets, with stunting likely attributed to poor maternal nutrition during
pregnancy, a presence of micronutrient deficiencies throughout infancy and young childhood, and poor child care
and development practices.
Poor infant and young child feeing practices place children at risk of malnutrition in RMI.
While 87 percent of children ever receive breastmilk in RMI only 61 percent are put to the breast within one hour of
birth and only 42 percent receive exclusive breastfeeding for the first six months of life indicating that the majority
of infants in RMI do not receive optimum nutrition and immunity benefits from breast milk. The prevalence of
continued breastfeeding in RMI was found to decrease gradually with child age with 41 percent of children receiving
any breastmilk at 1 year of age and 34 percent of children receiving any breastmilk at 2 years of age.
Complementary feeding practices were poor in RMI with only 64 percent of infants 6‐8 months of age receiving
timely introduction of solid, semi‐solid or soft foods during the previous day and poor dietary diversity and feeding
frequency of children 6 to 23 months of age. Only 43 percent of children received minimum dietary diversity with
foods from 4 or more foods groups in the previous day while only 61 percent of children received the minimum
number of meals or snacks in the previous day. For breastfed children, only a quarter (26 percent) had a minimal
acceptable diet while a third of non‐breastfed children (33 percent) were provided a minimal acceptable diet.
Poor dietary diversity in children was attributed to low consumption of micronutrient‐rich fruits and vegetables.
While a large majority of children consumed iron rich foods with good consumption of meat and fish, only 13
percent of children 6‐23 months and 16 percent of children 24‐59 months consumed dark green leafy vegetables.
Only a third of children 6‐23 months (33 percent) and 51 percent of children 24‐59 months of age received vitamin A
rich fruits and vegetables. Notably, consumption of tea or coffee was high for young children with 1 in 5 (21 percent)
children 6‐23 months of age and over a third (36 percent) of children 24‐59 months of age consuming tea or coffee.
Tea and coffee inhibit the absorption of iron and zinc from the diet and can lead to anaemia in young children.
While consumption of nutrient rich foods was poor, young children had high consumption of low nutrient density
foods with 51 percent of children 6‐23 months and 83 percent of children 24‐59 months of age consuming at least
one junk food in the previous day. Consumption of sugar‐sweetened beverages and sweet foods such as cakes,
cookies, and candies was high with 65 percent of children 24‐59 month consuming a sweet food and 57 percent of
children 24‐59 months of age consuming a sugar‐sweetened beverage in the previous day.
Child feeding practices were significantly associated with area, wealth index quintiles, maternal education
achievement, maternal nutrition status and maternal dietary diversity. Maternal overweight was associated with a
lower prevalence of minimum acceptable diet for children compared to children whose mothers were of normal
weight (28 percent vs 43 percent, P<0.001). Additionally, maternal education was strongly associated with child

feeding practices, with consumption of not only nutrient‐rich foods increasing with maternal education but low
nutrient density foods as well. Children whose mothers obtained a higher education level had the highest prevalence
of minimum acceptable diet (42.5 percent) and high consumption of sugary foods (64.6 percent). Consumption of
both nutritious foods and low nutrient density foods was significantly higher in urban areas compared to rural areas
with urban children having higher consumption of green leafy vegetables and minimum dietary diversity as well as
significantly higher consumption of sugar‐sweetened drinks, sweet foods, and fried and fatty foods.
In RMI, less than half of infants are exclusively breastfed and receive water, milk, juice and complementary foods at
an early age. These foods have lower nutrition value than breastmilk and can quickly lead to the development of
micronutrient deficiencies, stunting and wasting. Children who receive poor infant and young child feeding practices
are placed at further risk of micronutrient deficiencies and stunting. When complementary foods are introduced to
children in RMI, they tend to be micronutrient poor with few fruits and vegetables provided to the child. While few
children received dark green leafy vegetables or vitamin A rich fruits and vegetables, over half of children aged 6‐23
months received sweet foods such as cakes, cookies or candy, sugar‐sweetened beverages or other low nutrient
density food in the previous day. Consumption of nutrient poor but calorie rich foods places children at risk of
overweight and obesity while providing little nutrition value, worsening micronutrient deficiencies and stunting.
Prevalence of overweight in caregivers of children under 5 years of age is a critical public health concern
for RMI with women consuming diets poor in nutrient rich fruits and vegetables but rich in junk foods.
The prevalence of overweight and obesity among mothers with children under 5 years of age in RMI has reached
epidemic proportions and is a major public health challenge facing the country. Nearly three in four caregivers in
RMI is overweight (73 percent) with 45 percent of caregivers obese. There was no association between prevalence of
overweight and wealth index quintile or area, however maternal age, marital state and education were all strongly
associated with overweight. Prevalence of overweight increased with maternal education achievement with 85
percent of caregivers with higher education overweight compared to 64 percent of caregivers with primary only
education (P<0.01). Caregiver overweight also increased significantly with maternal age with 33 percent of
caregivers under age 20 overweight compared to 94 percent of caregivers 40‐49 years of age (P<0.001). Married
women had the highest prevalence of overweight (83.4 percent) compared to never married women (67.6 percent)
and cohabitating women (72.2 percent, P<0.05).
While prevalence of borderline short stature (height < 150cm) was high in caregivers (26 percent) there was no
significant association between short stature and demographic or socio‐economic factors in RMI. There was a
general trend for short stature to be highest among the poorest women with primary level only or no education who
lived in food insecure households and in rural areas.
Caregivers had very poor minimum dietary diversity (27 percent) indicating that women do not consume sufficient
diets to prevent micronutrient deficiencies. There were stark differences in minimum dietary diversity by area with
31 percent of caregivers in urban areas and only 8 percent of caregivers in rural areas meeting minimum dietary
diversity (P<0.01). Wealthier caregivers had higher dietary diversity (42 percent) compared to the poorest caregivers
(18 percent). Similar to the findings in children, caregivers in urban areas consumed more nutritious foods such as
dark green leafy vegetables, vitamin A rich vegetables, other fruits and vegetables but they also consumed more junk
foods such as sweet foods and fried savoury snacks. Consumption of fruits and vegetables was very poor among
caregivers in rural areas with only 3 percent consuming dark green leafy vegetables, 13 percent consuming vitamin A
rich vegetables, 4 percent consuming other vegetables and 19 percent consuming other fruits. Consumption of
meat, fish and starches was high in caregivers in both urban and rural areas.
There is a strong correlation between minimum dietary diversity in caregivers and minimum acceptable diet in their
children. Of children with caregivers with minimum dietary diversity, 51 percent of children received a minimal
acceptable diet, compared to 23 percent of children with caregivers whose diets did not meet minimum dietary
diversity. The association was also present for specific food groups with 61 percent of children receiving vitamin A
rich foods if their caregivers consumed vitamin A rich foods compared to only 25 percent of children whose

caregivers did not consume vitamin A rich foods (P<0.05). Consumption of low nutrient density foods was correlated
between caregivers and their children as well, with higher consumption of sugary foods in children whose caregivers
consumed sugary foods (60 percent) compared to children whose caregivers did not consume sugary foods (28
percent, P<0.05).
In RMI, caregivers with children under 5 years of age have a critically high prevalence of overweight and obesity with
poor dietary practices a major contributing factor to overweight. The prevalence of overweight is nearly universal in
RMI, with high prevalence regardless of area, age, wealth index quintile, or education level. Dietary practices are
poor for the majority of caregivers, however dietary diversity is lowest in rural areas where mothers have very poor
consumption of vegetables and fruits. Consumption of low nutrient density foods is substantial in caregivers in both
urban and rural areas, however consumption is higher in urban areas. There was a strong association between
maternal and child diet on their dietary diversity, consumption of nutrient rich foods and dietary quality. Maternal
dietary choices frame the foods young children are fed. Meeting the standard of dietary diversity in both the mother
and the child is necessary to prevent micronutrient deficiencies and stunting.
Receipt of targeted nutrition interventions to prevent micronutrient deficiency is poor among children
and pregnant women.
RMI implements several targeted nutrition interventions to prevent micronutrient deficiencies in young children and
pregnant women. Twice‐yearly vitamin A supplementation is an essential intervention for children 6‐59 months of
age to reduce child mortality and morbidity as well as vitamin A deficiency. While WHO recommends coverage
should be higher than 70 percent, coverage in RMI was 54 percent with coverage lower in rural areas, poorer
households and male children. Complementary to the distribution of vitamin A supplementation, all children 12‐59
months of age should receive deworming twice per year at the same time as VAS. In RMI, only 32 percent of children
received deworming in the past 6 months.
Poor receipt and compliance with iron folic acid supplementation guidance for pregnant women can lead to
maternal anaemia with reduced physical and cognitive growth in the infant during gestation and increased risk of
maternal death during childbirth. Per WHO recommendations, all pregnant women should receive daily
supplementation with iron and folic acid, with women consuming at least 90 iron folic acid supplements during their
pregnancy. Of mothers in RMI with a child under 2 years of age, only 67 percent received iron folate
supplementation during their last pregnancy and only 26 percent received 90 or more iron folate tablets.
Pregnant women and young children have high nutrient requirements to meet their rapid growth needs. Receipt of
vitamin A supplementation and deworming for children and iron folic acid supplementation for pregnant women
prevents against deficiency and can have long‐term benefits for cognitive and physical development in children. As
previous surveys indicate that both vitamin A deficiency and anaemia are public health concerns in RMI, coverage of
essential programmes such as vitamin A supplementation and deworming to children and iron folic acid
supplementation to pregnant women needs to be strengthened in order to prevent deficiencies in these targeted
population groups.
Poverty reduction strategies are an integral component to reduce malnutrition in RMI with a focus on
rural areas.
Despite the high prevalence of overweight and obesity among mothers in RMI, the ICHNS 2017 revealed that food
insecurity is a major problem in the country, 40 percent of households with a child under 2 years of age experienced
some level of food insecurity and 1 in 5 households (20 percent) had severe food insecurity. The ICHNS 2017
revealed marked socio‐economic disparities in food security status, with 51 percent of the poorest households
having some level of food insecurity and 28 percent of the poorest households severely food insecure.
The term food security involves all household members so the findings of the ICHNS 2017 leave unclear which
household members are disproportionately affected by food insecurity in RMI. Further understanding is needed in

order to target programmes to ensure adequate diets are available and accessible to the most vulnerable
individuals.
Dietary approaches are key to address high prevalence of malnutrition in RMI, however nutrition‐sensitive
approaches are necessary to reduce prevalence of inflammation, infection and disease in children which contributes
to stunting and micronutrient deficiencies. Universal access to improved sanitation facilities is required to reduce
repeated infections and is recommended as an essential part of RMI’s comprehensive nutrition strategy.
While access to improved sources of drinking water was universal in RMI, only 86.3 percent of households with a
child under 5 used improved sanitation with 8.3 percent of all households practicing open defecation. Use of poor
sanitation or no facility was highest in rural areas with over 1 in 3 households (34.7 percent) practicing open
defecation and only 58.4 percent of rural households having access to improved sanitation. There were marked
differences in the practice of open defecation and household wealth with 72.8 percent of all households we
practiced open defecation falling under the poorest wealth index quintile. There was a significant association
between child stunting and practice of open defecation in RMI. The prevalence of stunting was 45.1 percent in
households where open defecation was practiced compared to 34.2 percent in households with toilet facilities
(P<0.05).
Nearly all households had a specific place for handwashing where water and soap or other cleansing agent were
present (91.7 percent), however only a third of households (32.2 percent) had a fixed handwashing facility in the
dwelling. The majority of households had a fixed handwashing facility in the yard or plot (31.3 percent) or used a
bucket or a kettle for handwashing (34.2 percent). There was an association between the type of handwashing
facility in a household and child stunting with the lowest prevalence of stunting in households with a fixed
handwashing facility in the dwelling (28.2 percent) compared to households who used a bucket or kettle for
handwashing (39.6 percent, P<0.05).
Ensuring universal access to food security, improved sanitation and hygiene through poverty reduction strategies is a
critical nutrition‐sensitive component for reducing the burden of malnutrition in RMI.
Summary
The ICHNS 2017 Final Report presents a “report card” on RMI’s nutrition situation, highlighting the specific
nutrition concerns where attention is required. Analysis of the ICHNS 2017 data reveals that malnutrition is high
in RMI, with stunting in children and overweight in mothers identified as national public health concerns.
Additionally, while micronutrient status was not measured in the survey, poor dietary quality of both children
and their mothers indicates that prevalence of micronutrient deficiencies is high and universal.
While the historic reduction in morbidity and improved well‐being in RMI are a victory, the potential increases
in productivity and intellectual capacity due to reduction of malnutrition in children and their mothers are
substantial additional benefits not to be overlooked. It is easy to imagine the positive effect a child can have on
a household when he or she grows up to his or her full productive capability. When we extrapolate that to a
town, to an area and to the national scale we can start to imagine how increases in health and well‐being and
improvements in intellectual capacity at the population level can multiply recursively through increased
creativity, motivation and drive. These health improvements can ultimately reverse a cycle of dependence and
can fuel a cycle of increased productivity, economic development and prosperity.
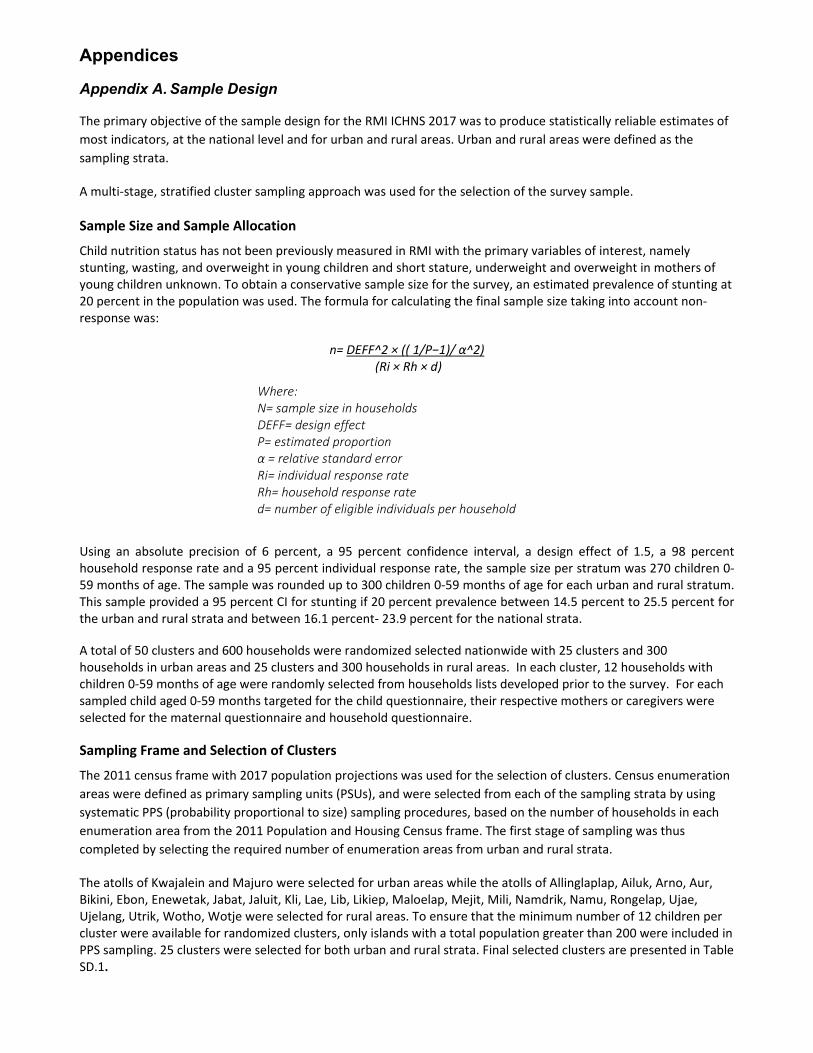
Appendices
Appendix A. Sample Design
The primary objective of the sample design for the RMI ICHNS 2017 was to produce statistically reliable estimates of
most indicators, at the national level and for urban and rural areas. Urban and rural areas were defined as the
sampling strata.
A multi‐stage, stratified cluster sampling approach was used for the selection of the survey sample.
Sample Size and Sample Allocation
Child nutrition status has not been previously measured in RMI with the primary variables of interest, namely stunting, wasting, and overweight in young children and short stature, underweight and overweight in mothers of young children unknown. To obtain a conservative sample size for the survey, an estimated prevalence of stunting at 20 percent in the population was used. The formula for calculating the final sample size taking into account non‐response was:
n= DEFF^2 × (( 1/P−1)/ α^2) (Ri × Rh × d)
Using an absolute precision of 6 percent, a 95 percent confidence interval, a design effect of 1.5, a 98 percent household response rate and a 95 percent individual response rate, the sample size per stratum was 270 children 0‐59 months of age. The sample was rounded up to 300 children 0‐59 months of age for each urban and rural stratum. This sample provided a 95 percent CI for stunting if 20 percent prevalence between 14.5 percent to 25.5 percent for the urban and rural strata and between 16.1 percent‐ 23.9 percent for the national strata.
A total of 50 clusters and 600 households were randomized selected nationwide with 25 clusters and 300 households in urban areas and 25 clusters and 300 households in rural areas. In each cluster, 12 households with children 0‐59 months of age were randomly selected from households lists developed prior to the survey. For each sampled child aged 0‐59 months targeted for the child questionnaire, their respective mothers or caregivers were selected for the maternal questionnaire and household questionnaire.
Sampling Frame and Selection of Clusters
The 2011 census frame with 2017 population projections was used for the selection of clusters. Census enumeration
areas were defined as primary sampling units (PSUs), and were selected from each of the sampling strata by using
systematic PPS (probability proportional to size) sampling procedures, based on the number of households in each
enumeration area from the 2011 Population and Housing Census frame. The first stage of sampling was thus
completed by selecting the required number of enumeration areas from urban and rural strata.
The atolls of Kwajalein and Majuro were selected for urban areas while the atolls of Allinglaplap, Ailuk, Arno, Aur, Bikini, Ebon, Enewetak, Jabat, Jaluit, Kli, Lae, Lib, Likiep, Maloelap, Mejit, Mili, Namdrik, Namu, Rongelap, Ujae, Ujelang, Utrik, Wotho, Wotje were selected for rural areas. To ensure that the minimum number of 12 children per cluster were available for randomized clusters, only islands with a total population greater than 200 were included in PPS sampling. 25 clusters were selected for both urban and rural strata. Final selected clusters are presented in Table SD.1.
Where: N= sample size in households DEFF= design effect P= estimated proportion α = relative standard error Ri= individual response rate Rh= household response rate d= number of eligible individuals per household

Table SD.1: Allocation of Sample Clusters (Primary Sampling Units) to Sampling Strata
Population (2017 Estimates) Number of Clusters
Total Urban Rural Total Urban Rural
Total 55,236 40,736 14,500 50 25 25
Name of Atoll Name of Island Projected Population
2017 Number of
Urban Clusters Number of
Rural Clusters
Kwajalein
Ebeye Zone 1 2438 2
Ebeye Zone 2 2132 1
Ebeye Zone 3 1525 1
Ebeye Zone 4 2008 1
Ebeye Zone 5 1888 2
Majuro
Rita 1 1757 1
Rita 2 2174 2
Jenrok 2311 1
Downtown 1341 1
Uliga 1033 1
Small Island 1508 1
Delap 2 1288 1
Delap 3 1882 1
Delap 4 1924 2
Jable/Long Island 542 1
Long Island 1284 1
Rairok 1236 1
Ajeltake 1374 1
Ajeltake/Woja 945 1
Laura 2 982 1
Ejit 267 1
Ailinglaplap
Jeh 293 1
Woja 503 1
Bouj 229 1
Airok 274 1
Ailuk Ailuk 310 1
Arno Ulien 201 1
Aur Tabal 233 1
Ebon Toka 222 1
Enewetak Enewetak 690 2
Jaluit Jabwor 931 2
Jaluit 288 1
Kili Kili 569 2
Lae Lae 344 1
Mejit Mejit 362 1
Mili Mili 239 1
Namdrik Namdrik 528 2
Namu Majkin 315 1
Ujae Ujae 378 1
Utrik Utrik 452 1
Wotje Wotje 751 2

Large enumeration areas that contained more than one cluster were segmented. Enumeration areas that were subdivided into smaller segments include Rita 2 and Delap 4 in Majuro, Ebeye zone 1 and Ebeye Zone 5 in Kwajalein; Kili, Jabwor, Enewetak, Namdrik and Wotje in the outer islands.
The enumeration areas were segmented based on well‐defined landmarks and taking into consideration that the segments were roughly of equal size, if feasible.
Listing Activities
Since the sampling frame (the 2011 census) was not up‐to‐date, a new listing of households was conducted in all the
sample enumeration areas prior to the selection of households. For this purpose, listing teams were formed who
visited all of the selected enumeration areas and listed all households with a child under 5 years of age in the
enumeration areas.
The main objective of the household listing operation was to create a complete and updated list of households for all selected clusters, so that the sampled households can represent the total population. This list then served as a sampling frame for the final selection of households during the second stage of sampling.
One‐day orientation including piloting was provided to the enumerators on how to conduct the mapping and household listing. A total of 20 enumerators were trained to do the household listing. The household listing was conducted by teams of 3 enumerators. Two enumerators were responsible for the numbering and tagging of households; and the third member was responsible for collecting household details including name of the head of the household, total number of family members and number of children under‐5. The exercise was undertaken with guidance and overall supervision from EPPSO and survey supervisors and in collaboration with the closest health centre staff and village chiefs.
During the household listing operation, each selected cluster was visited to update the household listing. The
following steps were undertaken:
Review and update the existing map of the cluster. Specifically, the teams update the new and old structures
and possible hidden structures
Record on the listing forms description of every structure together with details of the household and
presence of children under‐5 in the households
Maps of the selected clusters prepared by the EPPSO for the 2011 RMI Census were used as a reference for the household listing operations. The cluster maps were reviewed to examine key landmarks and boundaries. Online google earth (https://www.google.com/earth/) images for each selected cluster were examined with the census maps to verify boundaries, landmarks, abolished structures and new structures. Hard copies of the google maps were printed and were cross checked and validated by the EPPSO technical team. The validated maps for each cluster were printed and distributed to each team. Electronic versions of the cluster maps were also provided to the teams.
Information from the household listing was collected using digital tablets which included GPS coordinates of each household in the cluster. The collected data were synced online and maps were created using the CartoDB online application (https://carto.com/). CartoDB is an online interphase that generates GPS collected information into an online map. The maps generated were cross‐checked with the original cluster maps by EPPSO for accuracy.
Selection of Households
In the selected enumerator areas (clusters) listed in Table SD.1, a complete list of all occupied residential households was obtained by the survey enumerators from the household listing activity. All private households within the selected village or enumeration area (EA) was listed and recorded along with the contact information of the head of the household, number of children under‐5 and total number of household members. Households that did not have children under‐5 years were excluded and only households with children under‐5 were included in the listing. This listing was used for random selection of households with children under‐5 from selected enumeration areas.
Two separate approaches were undertaken for the household listing in selected urban and rural clusters:

a) Household listing was implemented by survey teams in advance of the survey for the 18 selected clusters in Majuro
b) Household listing was conducted immediately prior to the survey data collection for the remaining 7 clusters m in Ebeye and in the 25 outer rural atolls. For the selected clusters in Ebeye and outer islands, the household listing was conducted by the survey enumerators in collaboration with the health staff from the closest health centres on these islands.
From the total updated household list, 12 households with children under‐5 were randomly selected using the systematic random selection procedure. All occupied residential households with a child 0‐59 months of age were numbered sequentially beginning with 1 and continuing to the total number of households in the cluster. A sampling interval was calculated by dividing the total number of applicable households by 12 and a random number was generated through www.random.org using 1 as the starting number and the total number of households as the maximum. The first household generated was selected as the random number with additional 11 households selected by adding the sampling intervals to the generated random number until all 12 households were selected. In some clusters, where there were less than 12 households with U5 children the teams were instructed to interview all the households with child under 5.
Several challenges were faced with the household listing and household selection activities. In a few clusters specifically in Majuro, it was found that some of the selected households did not have children under‐5 and hence had to be excluded. This was because at the time of the household listing, the caregivers had provided the incorrect age of the child. As there was a time lapse from the time of household listing to actual survey implementation, a few households had moved away permanently either to another location within Majuro or to another island or had moved to another country. A series of home visits and phone call follow‐ups were made to ascertain that the households had moved. For those households that had moved permanently, reserve household was randomly selected as replacement. This was not an issue for Ebeye and outer islands.
Calculation of Sample Weights
The RMI ICHNS 2017 sample is not self‐weighting. Essentially, by allocating equal numbers of households to urban
and rural areas, different sampling fractions were used in each area since the sizes of the areas varied. For this
reason, sample weights were calculated and these were used in the subsequent analyses of the survey data.
The major component of the weight is the reciprocal of the sampling fraction employed in selecting the number of
sample households in that particular sampling stratum (h) and PSU (i):
hihi f
W1
The term fhi, the sampling fraction for the i‐th sample PSU in the h‐th stratum, is the product of probabilities of
selection at every stage in each sampling stratum:
hihihihi pppf 321
where pshi is the probability of selection of the sampling unit at stage s for the i‐th sample PSU in the h‐th sampling
stratum. Based on the sample design, these probabilities were calculated as follows:
p1hi = h
hih
M
Mn ,
nh = number of sample PSUs selected in stratum h
Mhi = number of households in the 2010 Census frame for the i‐th sample PSU in stratum h
Mh = total number of households in the 2010 Census frame for stratum h
p2hi = proportion of the PSU listed the i‐th sample PSU stratum h (in the case of PSUs that were segmented);
for non‐segmented PSUs, p2hi = 1

p3hi = hiM '
20
M'hi = number of households listed in the i‐th sample PSU in stratum h
Since the number of households in each enumeration area (PSU) from the 2011 Census frame with updated 2017
population projections used for the first stage selection and the updated number of households in the enumeration
area from the listing are generally different, individual overall probabilities of selection for households in each
sample enumeration area (cluster) were calculated.
A final component in the calculation of sample weights takes into account the level of non‐response for the
household and individual interviews. The adjustment for household non‐response in each stratum is equal to:
hRR
1
where RRh is the response rate for the sample households in stratum h, defined as the proportion of the number of
interviewed households in stratum h out of the number of selected households found to be occupied during the
fieldwork in stratum h.
Similarly, adjustment for non‐response at the individual level (caregivers and under‐5 children) for each stratum is
equal to:
hRR
1
where RRh is the response rate for the individual questionnaires in stratum h, defined as the proportion of eligible
individuals (caregivers and under‐5 children) in the sample households in stratum h who were successfully
interviewed.
After the completion of fieldwork, response rates were calculated for each sampling stratum. These were used to
adjust the sample weights calculated for each cluster. Response rates in the RMI ICHNS 2017 are shown in Table
HH.1 in this report.
The non‐response adjustment factors for the individual caregiver and under‐5 questionnaires were applied to the
adjusted household weights. Numbers of eligible caregivers and under‐5 children were obtained from the roster of
household members in the Household Questionnaire for households where interviews were completed.
The design weights for the households were calculated by multiplying the inverse of the probabilities of selection by
the non‐response adjustment factor for each enumeration area. These weights were then standardized (or
normalized), one purpose of which is to make the weighted sum of the interviewed sample units equal to the total
sample size at the national level. Normalization is achieved by dividing the full sample weights (adjusted for
nonresponse) by the average of these weights across all households at the national level. This is performed by
multiplying the sample weights by a constant factor equal to the unweighted number of households at the national
level divided by the weighted total number of households (using the full sample weights adjusted for nonresponse).
A similar standardization procedure was followed in obtaining standardized weights for the individual caregiver and
under‐5 questionnaires.
Sample weights were appended to all data sets and analyses were performed by weighting households, women, or
under‐5s with these sample weights.

Table SD.2: Calculated sample weights for households, caregivers and children
Cluster Normalized Household
Weight Normalized Caregiver
Weight Normalized Child
Weight 1 1.496992 1.450944 1.430566 2 1.496992 1.450944 1.430566 3 2.618778 2.538224 2.502575 4 1.872197 1.814607 1.789122 5 2.465633 2.389790 2.356226 6 1.159435 1.123770 1.107987 7 1.159435 1.123770 1.107987 8 2.158067 2.091684 2.062308 9 1.334913 1.293851 1.275679
10 1.334913 1.293851 1.275679 11 2.838286 2.750979 2.712343 12 1.646308 1.595667 1.573256 13 1.268566 1.229544 1.212276 14 1.851777 1.794816 1.769609 15 1.581221 1.532583 1.511058 16 2.311212 2.240119 2.208657 17 1.18113 1.144798 1.128720 18 1.18113 1.144798 1.128720 19 0.66618 0.645689 0.636620 20 1.577393 1.528872 1.507399 21 1.517411 1.470735 1.450079 22 1.687146 1.635249 1.612283 23 1.160073 1.124389 1.108597 24 1.206016 1.168919 1.152502 25 0.327985 0.317896 0.313432 26 0.359816 0.348748 0.328587 27 0.617684 0.598684 0.564075 28 0.280766 0.272129 0.256398 29 0.336919 0.326555 0.307677 30 0.38031 0.368611 0.347302 31 0.246308 0.238732 0.224931 32 0.285888 0.277094 0.261075 33 0.273108 0.264708 0.249405 34 0.423701 0.410668 0.386927 35 0.423701 0.410668 0.386927 36 0.571741 0.554154 0.522119 37 0.571741 0.554154 0.522119 38 0.35351 0.342635 0.322828 39 0.349681 0.338925 0.319332 40 0.349681 0.338925 0.319332 41 0.422425 0.409431 0.385762 42 0.44412 0.430459 0.405575 43 0.293528 0.284499 0.268052 44 0.324157 0.314186 0.296023 45 0.324157 0.314186 0.296023 46 0.386691 0.374796 0.353130 47 0.46454 0.450250 0.424222 48 0.55515 0.538074 0.506968 49 0.461349 0.447158 0.421308 50 0.461349 0.447158 0.421308

Appendix B. List of Personnel Involved in the Survey
Technical Working Group
Mailynn Konelius Deputy Secretary of Health
Francyne Wase‐Jacklick Assistant Secretary Office of Health Planning, Policy and Statistics
Daisy Pedro Immunization Program Manager
Frederick de Brum Director of EPPSO
Herokko Neamon Public Health Chief Nurse
Charles Lomae Vaccine, Storage and Handling Nurse Supervisor
Caroline Johnny MCH, Family Planning and Reproductive Health Coordinator
John Henry EPPSO Senior Statistician
Carolynn Neamon Statistics Specialist
Joseline Melang Statistics Specialist
Survey Consultants
Pete John Biscarra UNICEF RMI Consultant
Jessica Blankenship UNICEF EAPRO Consultant
Survey Coordinators
Herokko Neamon Public Health Chief Nurse
Charles Lomae Vaccine, Storage and Handling Nurse Supervisor
Caroline Johnny MCH, Family Planning and Reproductive Health Coordinator
Survey Enumerators
Jacqueline Mojilong MOH Nurse
Rosebella Jennet MOH Nurse
Shellyann Mejbon MOH Nurse
Deanechson Kaious MOH Nurse
Kacy Lucky MOH Nurse
George Beio Ebeye, Hospital Vital Statistics Specialist
Jimberline Nashion Enumerator
Ngiel Rang Enumerator
Brandon Johnson Enumerator
Joseph Allen Enumerator
Fiora Lomae Enumerator
Carlmai Melong Enumerator
Janen Torelik Enumerator
Jelmira Jatios Enumerator
Dennis Kanes Enumerator
Hanamo Luke Lakior Enumerator
Scottie Jason Enumerator
Rafael Capelle Enumerator
Benty Jirokele Enumerator
Wanna Jejon Enumerator
Neilani Kenja Enumerator

Household Listing Enumerators
Kacy Lucky MOH Nurse
Jimberline Nashion Enumerator
Ngiel Rang Enumerator
Brandon Johnson Enumerator
Joseph Allen Enumerator
Fiora Lomae Enumerator
Carlmai Melong Enumerator
Janen Torelik Enumerator
Jelmira Jatios Enumerator
Dennis Kanes Enumerator
Hanamo Luke Lakior Enumerator
Scottie Jason Enumerator
Rafael Capelle Enumerator
Benty Jirokele Enumerator
Wanna Jejon Enumerator
Neilani Kenja Enumerator
Kela Santein Enumerator
Kimberlynn Kalles Enumerator
Eslin Matthew Enumerator
Neti Louis Enumerator

Appendix C. Estimates of Sampling Errors
The sample of respondents selected in the RMI Integrated Child Health and Nutrition Survey (RMI ICHNS 2017) is
only one of the samples that could have been selected from the same population, using the same design and size.
Each of these samples would yield results that differ somewhat from the results of the actual sample selected.
Sampling errors are a measure of the variability between the estimates from all possible samples. The extent of
variability is not known exactly, but can be estimated statistically from the survey data.
The following sampling error measures are presented in this appendix for each of the selected indicators:
Standard error (se): Standard error is the square root of the variance of the estimate. For survey indicators that
are means, proportions or ratios, the Taylor series linearization method is used for the estimation of standard
errors. For more complex statistics, such as fertility and mortality rates, the Jackknife repeated replication
method is used for standard error estimation.
Coefficient of variation (se/r) is the ratio of the standard error to the value (r) of the indicator, and is a measure
of the relative sampling error.
Design effect (deff) is the ratio of the actual variance of an indicator, under the sampling method used in the
survey, to the variance calculated under the assumption of simple random sampling based on the same sample
size. The square root of the design effect (deft) is used to show the efficiency of the sample design in relation to
the precision. A deft value of 1.0 indicates that the sample design of the survey is as efficient as a simple random
sample for a particular indicator, while a deft value above 1.0 indicates an increase in the standard error due to
the use of a more complex sample design.
Confidence limits are calculated to show the interval which contains the true value of the indicator for the
population, with a specified level of confidence. For ICHNS 2017 results 95 percent confidence intervals are
used, which is the standard for this type of survey. The concept of the 95 percent confidence interval can be
understood in this way: if many repeated samples of identical size and design were taken and the confidence
interval computed for each sample, then 95 percent of these intervals would contain the true value of the
indicator.
For the calculation of sampling errors from ICHNS 2017 data, SPSS Version 22 Complex Samples module was used.
The results are shown in the tables that follow. In addition to the sampling error measures described above, the
tables also include weighted and unweighted counts of denominators for each indicator. Given the use of
normalized weights, by comparing the weighted and unweighted counts it is possible to determine whether a
particular domain has been under‐sampled or over‐sampled compared to the average sampling rate. If the weighted
count is smaller than the unweighted count, this means that the particular domain had been over‐sampled. As
explained later in the footnote of Table SE.1, there is an exception in the case of indicators 4.1 and 4.3, for which the
unweighted count represents the number of sample households, and the weighted counts reflect the total
population.
Sampling errors are calculated for indicators of primary interest, for the national level and for urban and rural areas.
Of the selected indicators, 4 are based on household members, 6 are based on caregivers, and 18 are based on
children under 5. Table SE.1 shows the list of indicators for which sampling errors are calculated, including the base
population (denominator) for each indicator. Tables SE.2 shows the calculated sampling errors for selected domains.

Table SE.1: Indicators selected for sampling error calculations
List of indicators selected for sampling error calculations, and base populations (denominators) for each indicator, RMI ICHNS, 2017a
MICS5 Indicator Base Population
Household members
4.1 Use of improved drinking water sources All household members
4.3 Use of improved sanitation All household members
7.4 Primary school net attendance ratio (adjusted) Children of primary school age
-- Household food security All households with a child under 2 years of age
Caregivers
5.5a Antenatal care coverage (1+ times, skilled provider)
Mothers of children under 5 years,15-49 years, and a live birth in the last 2 years
5.5b Antenatal care coverage (4+ times, any provider) Mothers of children under 5 years,15-49 years, and a live birth in the last 2 years
5.7 Skilled attendant at delivery Mothers of children under 5 years,15-49 years, and a live birth in the last 2 years
-- Overweight (BMI>25kg/m2) Caregivers age 15-49 years
-- Short stature <150cm Caregivers age 15-49 years
-- Caregiver minimum dietary diversity Caregivers age 15-49 years
Under-5s
2.1a Underweight prevalence (moderate and severe) Children under age 5 years
2.1b Underweight prevalence (severe) Children under age 5 years
2.2a Stunting prevalence (moderate and severe) Children under age 5 years
2.2b Stunting prevalence (severe) Children under age 5 years
2.3a Wasting prevalence (moderate and severe) Children under age 5 years
2.3b Wasting prevalence (severe) Children under age 5 years
2.4 Overweight prevalence Children under age 5 years
2.2 Low birth weight Children under age 5 years
2.6 Early initiation of breastfeeding Children under age 2 years
2.7 Exclusive breastfeeding under 6 months Children under age 6 months
2.15 Minimum feeding frequency Children age 6-23 months
2.16 Minimum dietary diversity Children age 6-23 months
6.1 Attendance in early childhood education Children age 36-59 months
6.2 Adult support for learning Children age 36-59 months
6.7 Left in inadequate care in the past week Children under age 5 years
6.8 Early child development index score Children age 36-59 months
8.1 Birth registration Children under age 5 years
8.3 Violent discipline Children age 1-5 years

Table SE.2: Sampling errors: Total sample
Standard errors, coefficients of variation, design effects (deff), square root of design effects (deff), and confidence intervals for selected indicators, RMI ICHNS, 2017a
MICS5 Indicator Indicator Name
Value (r)
Standard error (se)
Coefficient of variation
(se/r)
Design effect (deff)
Square root of design effect (deff)
Weighted count
Unweighted count
Confidence limits Lower bound r-2se
Upper bound r+2se
Household members
4.1 Use of improved drinking water sources
1 0 0
5239 581 1 1
4.3 Use of improved sanitation 0.863 0.016 0.019 1.295 1.138 5239 581 0.831 0.895
7.4 Primary school net attendance ratio (adjusted)
0.796 0.016 0.021 1.617 1.272 986 970 0.764 0.828
-- Household Food Security 0.599 0.033 0.055 1.448 1.203 329 326 0.534 0.663
Caregivers
5.5a Antenatal care coverage (1+ times, skilled provider)
0.927 0.02 0.021 3.365 1.834 264 270 0.889 0.965
5.5b Antenatal care coverage (4+ times, any provider)
0.795 0.032 0.041 1.624 1.274 226 224 0.731 0.859
5.7 Skilled attendant at delivery 0.924 0.014 0.015 1.411 1.188 264 270 0.897 0.952
-- Overweight (BMI>25kg/m2) 0.727 0.021 0.028 1.444 1.202 674 673 0.686 0.767 -- Short stature <150cm 0.261 0.02 0.077 1.408 1.186 672 671 0.686 0.767
-- Caregiver minimum dietary diversity
0.274 0.031 0.112 1.52 1.233 324 324 0.214 0.335
Under-5s
2.1a Underweight prevalence (moderate and severe)
0.117 0.014 0.116 1.543 1.242 846 863 0.089 0.144
2.1b Underweight prevalence (severe)
0.027 0.006 0.234 1.313 1.146 846 863 0.014 0.04
2.2a Stunting prevalence (moderate and severe)
0.353 0.021 0.06 1.713 1.309 873 871 0.31 0.396
2.2b Stunting prevalence (severe) 0.102 0.015 0.148 2.163 1.471 873 871 0.072 0.132
2.3a Wasting prevalence (moderate and severe)
0.036 0.007 0.182 1.071 1.035 844 858 0.023 0.05
2.3b Wasting prevalence (severe) 0.011 0.004 0.37 1.361 1.167 844 858 0.003 0.02
2.4 Overweight prevalence 0.038 0.009 0.232 1.82 1.349 844 858 0.02 0.056
2.2 Low birth weight 0.116 0.018 0.154 2.118 1.455 760 685 0.08 0.152
2.6 Early initiation of breastfeeding
0.608 0.031 0.051 1.423 1.193 342 355 0.546 0.67
2.7 Exclusive breastfeeding under 6 months
0.423 0.07 0.166 1.492 1.222 67 75 0.281 0.565
2.15 Minimum feeding frequency 0.608 0.047 0.077 2.525 1.589 274 278 0.514 0.701
2.16 Minimum dietary diversity 0.425 0.045 0.106 2.309 1.519 274 278 0.334 0.516
6.1 Attendance in early childhood education
0.052 0.011 0.211 0.856 0.925 365 350 0.03 0.074
6.2 Adult support for learning 0.723 0.037 0.052 2.448 1.564 365 350 0.647 0.798
6.7 Left in inadequate care in the past week
0.091 0.018 0.195 3.327 1.824 881 881 0.055 0.126
6.8 Early child development index score
0.789 0.027 0.035 1.57 1.253 365 350 0.734 0.844
8.1 Birth registration 0.838 0.025 0.03 4.089 2.022 881 881 0.787 0.888
8.3 Violent discipline 0.64 3.036 0.052 3.373 1.837 694 690 0.573 0.708

Appendix D. Data Quality Tables
Table DQ.15: Heaping in anthropometric measurements
Distribution of weight and height/length measurements by digits reported for the
decimal points, RMI ICHNS 2017
Total Weight Height or Length
Digits Number Percent Number Percent0 82 9.3 136 15.4
1 74 8.4 87 9.9
2 82 9.3 102 11.6
3 86 9.8 81 9.2
4 77 8.8 94 10.6
5 102 11.6 123 14
6 92 10.4 84 9.6
7 96 10.9 72 8.2
8 94 10.7 33 3.8
9 96 10.9 66 7.5
0 or 5 184 20.9 259 29.4
F igure DQ.2 : Weight and he igh t/ leng th measurements by d ig i t s repor ted fo r the dec ima l po in t s , RMI I CHNS , 2017

Appendix E. RMI ICHNS, 2017 Indicators: Numerators and Denominators
MICS INDICATOR MODULE 61 NUMERATOR DENOMINATOR
SDG INDICATOR
REFERENCE 62
NUTRITION
2.1a 2.1b
Underweight prevalence
AN
Number of children under age 5 who fall below
(a) minus two standard deviations (moderate and severe) (b) minus three standard deviations (severe)
of the median weight for age of the WHO standard
Total number of children under age 5
2.2a 2.2b
Stunting prevalence
AN
Number of children under age 5 who fall below
(a) minus two standard deviations (moderate and severe) (b) minus three standard deviations (severe)
of the median height for age of the WHO standard
Total number of children under age 5
SDG 2.2.1
2.3a 2.3b
Wasting prevalence
AN
Number of children under age 5 who fall below
(a) minus two standard deviations (moderate and severe) (b) minus three standard deviations (severe)
of the median weight for height of the WHO standard
Total number of children under age 5
SDG 2.2.2
2.4 Overweight prevalence
AN
Number of children under age 5 who are above two standard deviations of the median weight for height of the WHO standard
Total number of children under age 5
SDG 2.2.2
2.5 Children ever breastfed
MN Number of women with a live birth in the last 2 years who breastfed their last live-born child at any time
Total number of women with a live birth in the last 2 years
2.6 Early initiation of breastfeeding
MN Number of women with a live birth in the last 2 years who put their last newborn to the breast within one hour of birth
Total number of women with a live birth in the last 2 years
2.7 Exclusive breastfeeding under 6 months
BD Number of infants under 6 months of age who are exclusively breastfed
Total number of infants under 6 months of age
2.8 Predominant breastfeeding under 6 months
BD
Number of infants under 6 months of age who received breast milk as the predominant source of nourishment during the previous day
Total number of infants under 6 months of age
2.9 Continued breastfeeding at 1 year
BD Number of children age 12-15 months who received breast milk during the previous day
Total number of children age 12-15 months
61 Some indicators are constructed by using questions in several modules in the ICHNS 2017 questionnaires. In such cases, only the module(s) which contains most of the necessary information is indicated. 62 Sustainable Development Goals (MDG) indicators, effective 1 January 2016 - https://unstats.un.org/sdgs/indicators/indicators-list/, accessed 31 October 2017

MICS INDICATOR MODULE 61 NUMERATOR DENOMINATOR
SDG INDICATOR
REFERENCE 62
2.10 Continued breastfeeding at 2 years
BD Number of children age 20-23 months who received breast milk during the previous day
Total number of children age 20-23 months
2.12 Age-appropriate breastfeeding
BD Number of children age 0-23 months appropriately fed during the previous day
Total number of children age 0-23 months
2.13 Introduction of solid, semi-solid or soft foods
BD Number of infants age 6-8 months who received solid, semi- solid or soft foods during the previous day
Total number of infants age 6-8 months
2.14
Milk feeding frequency for non-breastfed children
BD Number of non-breastfed children age 6-23 months who received at least 2 milk feedings during the previous day
Total number of non-breastfed children age 6-23 months
2.15 Minimum meal frequency
BD
Number of children age 6-23 months who received solid, semi-solid and soft foods (plus milk feeds for non-breastfed children) the minimum number of times or more during the previous day
Total number of children age 6-23 months
2.16 Minimum dietary diversity
BD Number of children age 6-23 months who received foods from 4 or more food groups during the previous day
Total number of children age 6–23 months
2.17a 2.17b
Minimum acceptable diet
BD
(a) Number of breastfed children age 6-23 months who had at least the minimum dietary diversity and the minimum meal frequency during the previous day
(b) Number of non-breastfed children age 6-23 months who received at least 2 milk feedings and had at least the minimum dietary diversity not including milk feeds and the minimum meal frequency during the previous day
(a) Number of breastfed children age 6–23 months (b) Number of non-breastfed children age 6–23 months
2.18 Bottle feeding BD Number of children age 0-23 months who were fed with a bottle during the previous day
Total number of children age 0-23 months
2.20 Low birth weight infants
MN Number of live births in the last 5 years weighing below 2,500 grams at birth
Total number of children under age 5
2.21 Infants weighed at birth
MN Number of most recent live births in the last 5 years who were weighed at birth
Total number of most recent live births in the last 5 years
CHILD HEALTH
3.10 Care-seeking for diarrhoea
CA
Number of children under age 5 with diarrhoea in the last 2 weeks for whom advice or treatment was sought from a health facility or provider
Total number of children under age 5 with diarrhoea in the last 2 weeks
3.S11
Diarrhoea treatment with oral rehydration salts (ORS)
CA Number of children under age 5 with diarrhoea in the last 2 weeks who received ORS
Total number of children under age 5 with diarrhoea in the last 2 weeks
3.15 Use of solid fuels for cooking
HC
Number of household members in households that use solid fuels as the primary source of domestic energy to cook
Total number of household members

MICS INDICATOR MODULE 61 NUMERATOR DENOMINATOR
SDG INDICATOR
REFERENCE 62
WATER AND SANITATION
4.1 Use of improved drinking water sources
WS Number of household members using improved sources of drinking water
Total number of household members
4.2 Water treatment WS
Number of household members in households using unimproved drinking water who use an appropriate treatment method
Total number of household members
4.3 Use of improved sanitation
WS Number of household members using improved sanitation facilities which are not shared
Total number of household members
4.4 Safe disposal of child’s faeces
CA Number of children age 0-2 years whose last stools were disposed of safely
Total number of children age 0-2 years
4.5 Place for handwashing
HW Number of households with a specific place for handwashing where water and soap or other cleansing agent are present
Total number of households
4.6 Availability of soap or other cleansing agent
HW Number of households with soap or other cleansing agent
Total number of households
REPRODUCTIVE HEALTH
5.5a 5.5b
Antenatal care coverage
MN
Number of women age 15-49 years with a live birth in the last 2 years who were attended during their last pregnancy that led to a live birth (a) at least once by skilled health
personnel (b) at least four times by any provider
Total number of women age 15-49 years with a live birth in the last 2 years
5.7 Skilled attendant at delivery
MN
Number of women age 15-49 years with a live birth in the last 2 years who were attended by skilled health personnel during their most recent live birth
Total number of women age 15-49 years with a live birth in the last 2 years
5.8 Institutional deliveries
MN
Number of women age 15-49 years with a live birth in the last 2 years whose most recent live birth was delivered in a health facility
Total number of women age 15-49 years with a live birth in the last 2 years
5.9 Caesarean section
MN Number of women age 15-49 years whose most recent live birth in the last 2 years was delivered by caesarean section
Total number of women age 15-49 years with a live birth in the last 2 years

MICS INDICATOR MODULE 61 NUMERATOR DENOMINATOR
SDG INDICATOR
REFERENCE 62
CHILD DEVELOPMENT
6.1 Attendance in early childhood education
EC Number of children age 36-59 months who are attending an early childhood education programme
Total number of children age 36-59 months
6.2 Support for learning
EC
Number of children age 36-59 months with whom an adult has engaged in four or more activities to promote learning and school readiness in the last 3 days
Total number of children age 36-59 months
6.3 Father’s support for learning
EC
Number of children age 36-59 months whose biological father has engaged in four or more activities to promote learning and school readiness in the last 3 days
Total number of children age 36-59 months
6.4 Mother’s support for learning
EC
Number of children age 36-59 months whose biological mother has engaged in four or more activities to promote learning and school readiness in the last 3 days
Total number of children age 36-59 months
6.5 Availability of children’s books
EC Number of children under age 5 who have three or more children’s books
Total number of children under age 5
6.6 Availability of playthings
EC Number of children under age 5 who play with two or more types of playthings
Total number of children under age 5
6.7 Inadequate care EC
Number of children under age 5 left alone or in the care of another child younger than 10 years of age for more than one hour at least once in the last week
Total number of children under age 5
6.8 Early child development index
EC
Number of children age 36-59 months who are developmentally on track in at least three of the following four domains: literacy-numeracy, physical, social-emotional, and learning
Total number of children age 36-59 months
SDG 4.2.1
LITERACY AND EDUCATION
7.1 Literacy rate among young caregivers
WB
Number of caregivers age 15-24 years who are able to read a short simple statement about everyday life or who attended secondary or higher education
Total number of caregivers age 15-24 years
7.2 School readiness ED Number of children in first grade of primary school who attended preschool during the previous year
Total number of children attending the first grade of primary school
SDG 4.2.2
7.3 Net intake rate in primary education
ED Number of children of school-entry age who enter the first grade of primary school
Total number of children of school-entry age
7.4 Primary school net attendance ratio (adjusted)
ED Number of children of primary school age currently attending primary or secondary school
Total number of children of primary school age

MICS INDICATOR MODULE 61 NUMERATOR DENOMINATOR
SDG INDICATOR
REFERENCE 62
7.5
Secondary school net attendance ratio (adjusted)
ED Number of children of secondary school age currently attending secondary school or higher
Total number of children of secondary school age
7.6 Children reaching last grade of primary
ED Proportion of children entering the first grade of primary school who eventually reach last grade
7.7 Primary completion rate
ED Number of children attending the last grade of primary school (excluding repeaters)
Total number of children of primary school completion age (age appropriate to final grade of primary school)
7.8 Transition rate to secondary school
ED
Number of children attending the last grade of primary school during the previous school year who are in the first grade of secondary school during the current school year
Total number of children attending the last grade of primary school during the previous school year
7.9 Gender parity index (primary school)
ED Primary school net attendance ratio (adjusted) for girls
Primary school net attendance ratio (adjusted) for boys
SDG. 4.5.1
7.10 Gender parity index (secondary school)
ED Secondary school net attendance ratio (adjusted) for girls
Secondary school net attendance ratio (adjusted) for boys
SDG. 4.5.1
CHILD PROTECTION
8.1 Birth registration BR Number of children under age 5 whose births are reported registered
Total number of children under age 5
SDG 16.9.1
8.3 Violent discipline CD
Number of children age 1-4 years who experienced psychological aggression or physical punishment during the last one month
Total number of children age 1-4 years
8.13 Children’s living arrangements
HL Number of children age 0-4 years living with neither biological parent
Total number of children age 0-4 years
8.14
Prevalence of children with one or both parent’s dead
HL Number of children age 0-4 years with one or both biological parent’s dead
Total number of children age 0-4 years
8.15 Children with at least one parent living abroad
HL Number of children 0-4 years with at least one biological parent living abroad
Total number of children age 0-4 years

Appendix F. RMI ICHNS, 2017 Questionnaires
HOUSEHOLD QUESTIONNAIRE Republic of Marshall Islands Integrated Child Health and Nutrition Survey 2017
MODULE HH: HOUSEHOLD INFORMATION PANEL HH
HH1. Cluster number: ___ ___ ___ HH2. Household number: ___ ___
HH3. Interviewer’s name and number: HH4. Team Leader’s name and number:
Name _________________________ ___ ___ Name__________________________ ___ ___
HH5. Day / Month / Year of interview: ___ ___ /___ ___ / 2 0 1 ___
HH7. NAME OF ATOL/ISLAND (ETAN AELON EO AM/(etan bukon eo a)
HH6. Area: Urban ............................................................................................. 1 Rural .............................................................................................. 2
HH8. Name of Zone/Village
We are from THE MINISTRY OF HEALTH AND THE NATIONAL STATISTICS OFFICE RMI. We are conducting a survey about the situation of children, families and households. I would like to talk to you about these subjects. The interview will take about 30 minutes and you can stop the interview at any time. All the information we obtain will remain strictly confidential and anonymous. May I start now?
Iakwe eta in (etam). Team in ej itok jen Jikin Ejmuur eo, im Office eo an jikin Bonbon eo. Komij kommane juon jerbal in ekkatak ikkijen ejmuur ko an ajiri ro,
bamle ko, im barenwot jikin jokwe ko ilo Majuro, Ebeye, im Outer Islands. Imaron ke konono ak kajitok kajitok kein ibbam emaron bok 20 jima minit aetokan ak jabrewot ien komaron kabojrak io. Aolep melele kein konaj litok renaj bed ilo aer nojak im enaj an wot rejerbal rein. Kejro maron ke wonmanlok im jinoe?
AET/Yes, permission is given ETAL NAN (Go to HH18 to record the time and then begin the interview). JAB/No, permission is not given ETAL NAN (Circle 04 in HH9. Discuss this result with your supervisor).
HH9. Result of household interview: Completed/Ededelok .................................................................................................................................................................................................... 01 No household member or no competent respondent at home at time of visit/Ejelok ro remaron uak mweo ............................................................... 02 Entire household absent for extended period of time/Ri-mweo eto aer jako ilo juon tore aetok ................................................................................. 03 Refused/Rejab konaan remakoko ............................................................................................................................................................................... 04 Dwelling vacant / Address not a dwelling/Ejelok kobban ak ejab juon jikin joke ........................................................................................................ 05 Dwelling destroyed/Mweo emoj an jorran.................................................................................................................................................................... 06 Dwelling not found/Mweo kojab maron loe .................................................................................................................................................................. 07 Other (specify)wawein ko jet _____________________________________________________________________________________________ 96
After the household questionnaire has been completed, fill in the following information: Ne emoj an dredrelok aolep kajitok kein ilo form in, kanne melele kein ilal:
HH11. Total number of household members: Woran aolep armij ro rej joke mwin: ____ _____
HH17. Field editor’s name and number: Name____________________________ ____ _____
HH14. Number of children under age 5: Woran ajiri ro lalin 5 yio ____ _____
HH18. Main data entry clerk’s name and number: Name____________________________ ____ _____
HH15. Number of under 5 questionnaires completed ____ _____ Woran form edredrelok an ro ilalin 5 yio
HH16. Number of maternal questionnaires for children under 5 completed: Woran form ko an ro jinen ajiri ro ilalin 5 yio. ____ _____
HH19. Record the time Hour(s) ____ _____ Minute(s) ____ _____

MODULE HL: LIST OF HOUSEHOLD MEMBERS HLFIRST, PLEASE TELL ME THE NAME OF EACH PERSON WHO USUALLY LIVES HERE, STARTING WITH THE HEAD OF THE HOUSEHOLD. MOKTA, KOMARON KE JOUJ IM LETOK ETAN AOLEP RO EKKA AER JOKE MWIN, JINO JEN EO EJ
JEBAN MWIN. LIST THE HEAD OF THE HOUSEHOLD IN LINE 01. LIST ALL HOUSEHOLD MEMBERS (HL2), THEIR RELATIONSHIP TO THE HOUSEHOLD HEAD (HL3), AND THEIR SEX (HL4)
Then ask: ARE THERE ANY OTHERS WHO LIVE HERE, EVEN IF THEY ARE NOT AT HOME NOW? EBAR LON KE ARMIJ REJ JOKE MWIN IM KOMELOKLOK IN LETOK ETAER AK REJAKO ILO TOREIN? If yes, complete listing for questions HL2-HL4. Then, ask questions starting with HL5 for each person at a time. Use an additional questionnaire if all rows in the List of Household Members have been used.
For children age 0-4
For children age 0-17 years For
Children age 0-4
HL1. Line no.
HL2.
Name
HL3. WHAT IS
THE
RELATION-SHIP OF
(name) TO
THE HEAD
OF HOUSE-HOLD? TA
KADKAD IN
(ET EO) NAN
EO EJ
JEBAN
MWIN)
HL4. IS (name) MALE OR
FEMALE? EJ JUON
MAAN KE
KORA 1 Male 2 Female
HL5. WHAT IS (name)’S
DATE OF BIRTH? TA IEN LOTAK EO AN (ET
EO)?
HL6. HOW OLD IS
(name)? JETE AN (ET
EO) YIO? Record in completed years. If age is 95 or above, record ‘95’.
HL6A. DID
(name) STAY HERE
LAST
NIGHT? (ET EO) EKAR KE KIKI MWEIN BON AK BED IE?) 1 Yes 2 No
HL7B. Circle line no. if 0-4. Doululi line no eo, ne ajiri eo ej 0-4.
HL11. IS
(name)’S
NATURAL
MOTHER
ALIVE? JINEN (ET
EO) EJ
MOUR WOT
KE? 1 Yes 2 No
HL12. DOES
(name)’S
NATURAL
MOTHER
LIVE IN
THIS HOUSE- HOLD?JINE
N EJ KE
JOKWE
MWIN?
If “Yes”, record line no. of mother and go to HL13. If “No”, record 00.
HL12A. WHERE
DOES
(name)’S
NATURAL
MOTHER
LIVE? IA EO
JINEN (ET
EO) EJ
JOKE IE? 1 In another household in this country/Bar ilo juon em ilo ene in?
2 Institution in this country
3 Abroad/likin majol
8 DK/jab jela
HL13. IS (name)’S NATURAL FATHER ALIVE?JEM
EN (ET EO) EJ MOUR
WOT KE? 1 Yes 2No
HL15 8DK
HL15
HL14. DOES
(name)’S
NATURAL
FATHER LIVE
IN THIS HOUSE- HOLD? JEMEN (ETEO) EJ KE
JOKWE
MWIN?
If “Yes”, record line no. of father and go to HL15. If “No”, record 00.Ne uak eo ej AET, je line nomba ne an im etal wot nan HL 15
HL14A. WHERE
DOES
(name)’S
NATURAL
FATHER
LIVE?IA
EO
JEMEN
(ET EO) EJ JOKWE
IE? 1 In another household in this country.ilo bar joun em
2 Institution in this country
3 Abroad/likin Majol
8 DK
HL15. Record line no. of mother from HL12 if indicated/ If HL12 is blank or ‘00’ ask: WHO IS THE PRIMARY
CAREGIVER OF
(name)?WON EJ BOK
EDDOIN IM LALE (ET
EO)? 98 DK
9998 DK
Line Name Relation*
M F Month Year Age Y N 0-4 Y N DK Mother Y N DK Father Mother
01 0 1 1 2 __ __ __ __ __ __ __ __ 1 2 01 1 2 8 ___ ___ 1 2 3 8 1 2 8 ___ ___ 1 2 3 8 ___ ___
02 ___ ___ 1 2 __ __ __ __ __ __ __ __ 1 2 02 1 2 8 ___ ___ 1 2 3 8 1 2 8 ___ ___ 1 2 3 8 ___ ___
03 ___ ___ 1 2 __ __ __ __ __ __ __ __ 1 2 03 1 2 8 ___ ___ 1 2 3 8 1 2 8 ___ ___ 1 2 3 8 ___ ___
04 ___ ___ 1 2 __ __ __ __ __ __ __ __ 1 2 04 1 2 8 ___ ___ 1 2 3 8 1 2 8 ___ ___ 1 2 3 8 ___ ___
05 ___ ___ 1 2 __ __ __ __ __ __ __ __ 1 2 05 1 2 8 ___ ___ 1 2 3 8 1 2 8 ___ ___ 1 2 3 8 ___ ___

06 ___ ___ 1 2 __ __ __ __ __ __ __ __ 1 2 06 1 2 8 ___ ___ 1 2 3 8 1 2 8 ___ ___ 1 2 3 8 ___ ___
07 ___ ___ 1 2 __ __ __ __ __ __ __ __ 1 2 07 1 2 8 ___ ___ 1 2 3 8 1 2 8 ___ ___ 1 2 3 8 ___ ___
08 ___ ___ 1 2 __ __ __ __ __ __ __ __ 1 2 08 1 2 8 ___ ___ 1 2 3 8 1 2 8 ___ ___ 1 2 3 8 ___ ___
09 ___ ___ 1 2 __ __ __ __ __ __ __ __ 1 2 09 1 2 8 ___ ___ 1 2 3 8 1 2 8 ___ ___ 1 2 3 8 ___ ___
10 ___ ___ 1 2 __ __ __ __ __ __ __ __ 1 2 10 1 2 8 ___ ___ 1 2 3 8 1 2 8 ___ ___ 1 2 3 8 ___ ___
11 ___ ___ 1 2 __ __ __ __ __ __ __ __ 1 2 11 1 2 8 ___ ___ 1 2 3 8 1 2 8 ___ ___ 1 2 3 8 ___ ___
12 ___ ___ 1 2 __ __ __ __ __ __ __ __ 1 2 12 1 2 8 ___ ___ 1 2 3 8 1 2 8 ___ ___ 1 2 3 8 ___ ___
13 ___ ___ 1 2 __ __ __ __ __ __ __ __ 1 2 13 1 2 8 ___ ___ 1 2 3 8 1 2 8 ___ ___ 1 2 3 8 ___ ___
14
___ ___ 1 2 __ __ __ __ __ __ __ __ 1 2 14 1 2 8 ___ ___ 1 2 3 8 1 2 8 ___ ___ 1 2 3 8 ___ ___
15 ___ ___ 1 2 __ __ __ __ __ __ __ __ 1 2 15 1 2 8 ___ ___ 1 2 3 8 1 2 8 ___ ___ 1 2 3 8 ___ ___
Tick here if additional questionnaire used
Probe for additional household members. Probe especially for any infants or small children not listed, and others who may not be members of the family (such as servants, friends) but who usually live in the household. Insert names of additional members in the household list and complete form accordingly. Bar etale im lukun lale elane ebar lon ajiri ej jokwe ilo mweo ak ejjab lukun nejin armij ro mwin. Elane ewor bar je etaer ilo laajrak in etan armij ro ilo mweo..
Now for each woman age 15-49 years, write her name and line number and other identifying information in the information panel of a separate Individual Women’s Questionnaire. For each man age 15-49 years, write his name and line number and other identifying information in the information panel of a separate Individual Man’s Questionnaire. For each child under age 5, write his/her name and line number AND the line number of his/her mother or caregiver in the information panel of a separate Under-5 Questionnaire. You should now have a separate questionnaire for each eligible woman, each eligible man, and each child under five in the household.Elane ewor maan ak kora ilo mweo dettaer ej 15 yio lok nan 49 yio, ekwe je
etaer ilo laajrak in kajitok ko an emaan im kora jimor. Ajiri ro ilalin 5 yio je etaer im nomba ko aer ilo laajrak in kajitok ko an ajiri wot.
* Codes for HL3: Relationship to head of household:
01 Head 02 Spouse / Partner 03 Son / Daughter
04 Son-In-Law / Daughter-In-Law 05 Grandchild 06 Parent
07 Parent-In-Law 08 Brother / Sister 09 Brother-In-Law / Sister-In-Law
10 Uncle / Aunt 11 Niece / Nephew 12 Other relative
13 Adopted / Foster/ Stepchild
14 Servant (Live-in)
96 Other (Not related) 98 DK

MODULE ED: EDUCATION ED
For household members
age 5 and above For household members age 5-24 years
ED1. Line
number
ED2. Name and age
Copy from HL2 and HL6.
Lali et ko ilo kajitok ko ilo HL2 im HL6
ED3. HAS
(name) EVER
ATTENDED
SCHOOL OR
PRE-SCHOOL?( ET EO) ENANIN KE
KAR JINO
JIKUUL? 1 Yes 2 NO
NextLine
ED4A. WHAT IS THE
HIGHEST LEVEL
OF SCHOOL
(name) HAS
ATTENDED? TA LABEL IN
JIKUUL EO ILON
TATA EAR BED
IE? Level: 0 Preschool 1 Elementary 2 High School 3. Vocational 3 Higher 8 DK If level=0, skip to ED5.
ED4B. WHAT IS THE
HIGHEST GRADE
(name) COMPLETED AT
THIS LEVEL? KLAAJ TA EO
ILON TATA EAR
KAMOJE IE? Grade: 98 DK If the first grade at this level is not completed, enter “00”. Elanne kilaaj eo jinoin ear jab drederlok likit “00”.
ED5. DURING THE
CURRENT
SCHOOL
YEAR, THAT IS
2016-2017, DID (name) ATTEND
SCHOOL OR
PRESCHOOL
AT ANY
TIME?(ILO YIO
IN JIKUUL IN
(16-17) (ET
EO) EJ KE BED
ILO JIKUUL AK
KAMINENE? 1 Yes 2 No
ED7
ED6. DURING THIS/THAT SCHOOL
YEAR, WHICH LEVEL AND GRADE
IS/WAS (name) ATTENDING? ( ILO YIO IN JIKUUL IN (ET EO ) EJ/EKAR KE BED ILO JIKUUL?
ED7. DURING THE
PREVIOUS
SCHOOL YEAR, THAT IS 2015-2016, DID
(name) ATTEND
SCHOOL OR
PRESCHOOL AT
ANY TIME? (EJJA ILO YIO IN JIKUUL IN 2015-
16, ELON IEN EKAR
BED ILO JIKUUL AK KAMINENE? 1 Yes 2 No
Next Line8 DK
Next Line
ED8. DURING THAT PREVIOUS SCHOOL
YEAR, WHICH LEVEL AND GRADE
DID (name) ATTEND? ILO YIO IN
JIKUUL EO LOK, LABEL IM KILAAJ
JETE EKAR DRELONE? Level: 0 Preschool 1 Elementary 2 High School 3. Vocational 3 Higher 8 DK If level=0, skip to ED7.
Grade: 98 DK If the first grade at this level is not completed, enter “00” Elanne kilaaj eo jinoin ear jab drederlok likit “00”.
Level: 0 Preschool 1 Elementary 2 High School 3. Vocational 3 Higher 8 DK If level=0, go to next line.
Grade/Kilaaj:
98 DK If the first grade at this level is not completed, enter “00”.
Elanne kilaaj
jinoin ear jab
drederlok likit “00”.
Line Name Age Yes No Level Grade Yes No Level Grade Yes No DK Level Grade 01 ___ ___ 1 2 0 1 2 3 8 ___ ___ 1 2 0 1 2 3 8 ___ ___ 1 2 8 0 1 2 3 8 ___ ___ 02 ___ ___ 1 2 0 1 2 3 8 ___ ___ 1 2 0 1 2 3 8 ___ ___ 1 2 8 0 1 2 3 8 ___ ___ 03 ___ ___ 1 2 0 1 2 3 8 ___ ___ 1 2 0 1 2 3 8 ___ ___ 1 2 8 0 1 2 3 8 ___ ___ 04 ___ ___ 1 2 0 1 2 3 8 ___ ___ 1 2 0 1 2 3 8 ___ ___ 1 2 8 0 1 2 3 8 ___ ___ 05 ___ ___ 1 2 0 1 2 3 8 ___ ___ 1 2 0 1 2 3 8 ___ ___ 1 2 8 0 1 2 3 8 ___ ___ 06 ___ ___ 1 2 0 1 2 3 8 ___ ___ 1 2 0 1 2 3 8 ___ ___ 1 2 8 0 1 2 3 8 ___ ___ 07 ___ ___ 1 2 0 1 2 3 8 ___ ___ 1 2 0 1 2 3 8 ___ ___ 1 2 8 0 1 2 3 8 ___ ___ 08 ___ ___ 1 2 0 1 2 3 8 ___ ___ 1 2 0 1 2 3 8 ___ ___ 1 2 8 0 1 2 3 8 ___ ___ 09 ___ ___ 1 2 0 1 2 3 8 ___ ___ 1 2 0 1 2 3 8 ___ ___ 1 2 8 0 1 2 3 8 ___ ___ 10 ___ ___ 1 2 0 1 2 3 8 ___ ___ 1 2 0 1 2 3 8 ___ ___ 1 2 8 0 1 2 3 8 ___ ___ 11 ___ ___ 1 2 0 1 2 3 8 ___ ___ 1 2 0 1 2 3 8 ___ ___ 1 2 8 0 1 2 3 8 ___ ___ 12 ___ ___ 1 2 0 1 2 3 8 ___ ___ 1 2 0 1 2 3 8 ___ ___ 1 2 8 0 1 2 3 8 ___ ___
13 ___ ___ 1 2 0 1 2 3 8 ___ ___ 1 2 0 1 2 3 8 ___ ___ 1 2 8 0 1 2 3 8 ___ ___
14 ___ ___ 1 2 0 1 2 3 8 ___ ___ 1 2 0 1 2 3 8 ___ ___ 1 2 8 0 1 2 3 8 ___ ___
15 ___ ___ 1 2 0 1 2 3 8 ___ ___ 1 2 0 1 2 3 8 ___ ___ 1 2 8 0 1 2 3 8 ___ ___

HOUSEHOLD CHARACTERISTICS HC
HC1A. WHAT IS THE RELIGION OF THE HEAD OF THIS HOUSEHOLD? (KABUN TA EO AN EO EJ JEBAN MWIN?)
CATHOLIC 1 PROTESTANT 2 BAHAI FAITH 3 SDA 4 MORMONS 5 MUSLIM 6 ASSEMBLY OF GOD 7 BAPTIST 8 JEHOVAHS WITNESS 9 PENTECOSTAL 10 OTHER RELIGION (SPECIFY) 11 ________________________ NO RELIGION 98
HC1B. WHAT IS THE MOTHER TONGUE/NATIVE LANGUAGE OF THE HEAD OF THIS HOUSEHOLD? (TA LUKUN KAJIN EO AN EO EJ JEBAN MWIN?)
MARSHALESE 1
ENGLISH 2
OTHER LANGUAGE (SPECIFY) 6
______________________
HC1C. TO WHAT ETHNIC GROUP DOES THE HEAD OF THIS HOUSEHOLD BELONG? AELON TA EO AN EO EJ JEBAN MWIN?
MARSHALESE……………1 FILIPINO 2 JAPANESE 3 INDIAN 4 KOREAN 5 CAUCASIAN 6 FIJI 7 TONGA 8 SOMOA 9 NAURU 10 KIRIBATI 11 OTHER ETHNIC GROUP (SPECIFY
__________________
HC2. HOW MANY ROOMS IN THIS HOUSEHOLD ARE USED FOR SLEEPING? (JETE ROOM KOJERBALE NAN KIKI?)
NUMBER OF ROOMS
(WORAN ROOM ) __ __
HC3. MAIN MATERIAL OF THE DWELLING FLOOR. BEDBED IN MWIN EJ KOMMAN JEN TA. RECORD OBSERVATION/JE TA EO KWOJ LOE.
NATURAL FLOOR
EARTH / SAND 11
RUDIMENTARY FLOOR
WOOD PLANKS 21 WOOD PLANKS WITH VINYL CARPET 22
FINISHED FLOOR
PARQUET OR POLISHED WOOD 31
VINYL OR ASPHALT STRIPS 32
CERAMIC TILES 33
CEMENT 34
CARPET 35
CEMENT TILES 36
OTHER (SPECIFY) 96
HC4. MAIN MATERIAL OF THE ROOF.BORWAJ EO AN MWEO EJ KOMAN JEN TA?
RECORD OBSERVATION. LALE IM JE UAK KO.
NATURAL ROOFING
NO ROOF/EJELOK AN BORWAJ 11
HATCH / PALM LEAF/AJ AK KIMEJ 12
RUDIMENTARY ROOFING
CANVAS/TARPOULINE/KOBBA 21
WOOD PLANKS/ALAL 23

CARDBOARD/BOK KO REKIJNENE 24
FINISHED ROOFING
METAL / TIN/KIN TIIN KO 31
WOOD/KIN RE AK PLEWUUT 32
CALAMINE / CEMENT FIBRE 33
CERAMIC TILES/TAEL DREKA 34
CEMENT/JIMEEN WOT 35
ROOFING SHINGLES/
KOMMAN JEN BEDKAT AK BOK KO 36
OTHER (SPECIFY)/KAIN KO JET 96
HC5. MAIN MATERIAL OF THE EXTERIOR WALLS. DEBIN MWEO EJ KOMMAN JEN
TA?
RECORD OBSERVATION. LALE IM JE UAAK KO
NATURAL WALLS/ALAL IM PLEWUUT
NO WALLS/EJELOK TURIN 11
PANDANUS LEAF / PALM / TRUNKS 12
DIRT/AJ AK KIMEJ IN NI KO 13
RUDIMENTARY WALLS
PLYWOOD/PLAWUUT 21
CARDBOARD/BOK KO REBIN 22
REUSED WOOD/ALAL KO JET 23
CANVAS/TARPOULINE/KOBBA 24
MASONITE/TAEL KO RERABOLBOL 25
DRY WALL/KOMAN JEN PLAWUUT KO JET EINWOT GYPSIUM
26
FINISHED WALLS
CEMENT/JIMEEN WOT 31
STONE WITH LIME / CEMENTJIMEEN IBBEN DREKA
32
BRICKS/BIROK 33
CEMENT BLOCKS/BIROK KO JET 34
WOOD PLANKS / SHINGLES/RA KO 36
OTHER (SPECIFY)/KO JET96
HC6. WHAT TYPE OF FUEL DOES YOUR HOUSEHOLD MAINLY USE FOR COOKING?
TA EO KOM EJ KÕJERBAL ÑAN KÕMAT?
ELECTRICITY/JAROM 01
PROPANE GAS)KAAN KIJEEK KO EINWOT PROPANE
02
SOLAR ENERGY/KAJUR IN AL 03
KEROSENE/KARIJIN 05
CHARCOAL/MELLE 07
WOOD/MOTTAN ALAL KO 08
COCONUT HUSKS/SHELLS/LAT IM BWEO 09
NO FOOD COOKED IN HOUSEHOLD/JAB KOMAT ILO MWEO
95
OTHER (SPECIFY)/KO JET 96
01HC8
02HC8
03HC8
95HC8
HC7. IN THIS HOUSEHOLD, IS FOOD COOKED ON AN OPEN FIRE, AN OPEN STOVE
OR A CLOSED STOVE
LO MWIN, KOMIJ KÕMAT LAL KE, KÕMAT ILO STOVE KOEJELOK CHIMNEY AK JIKIN
KADRIWÕJLOK BAAT KO KE,(EINWÕT STOVE KEROSENE) KE, ILO STOVE KO EWÕR
AER CHIMNEY AK COVER?
If ‘In the house’, probe: IS IT DONE IN A SEPARATE ROOM USED AS A KITCHEN?
EJENOLOK KE JIKIN KOMAT EO ILO MWEO?
OPEN FIRE/KIJEEK LAL 1
OPEN STOVE/JITOOP 3
CLOSED STOVE WITH CHIMNEY
JITOOP NE ELON KEIN KADIOJ LOK BAAT 4
OTHER (SPECIFY) /KO JET 6
1 HC8
3 HC8
4 HC7B
6-> HC7B
HC7B. DOES THIS (FIRE/STOVE) HAVE A CHIMNEY, A HOOD OR NEITHER OF CHIMNEY ……………………………………1

THESE?
EWÕR KE AN STOVE IN CHIMNEY AK JIKIN KADRIWÕJLOK BAAT KO?
HOOD…………………………………………2
NEITHER………………………………………3
HC8. IS THE COOKING USUALLY DONE IN THE HOUSE, IN A SEPARATE BUILDING,
OR OUTDOORS?
EKKÃ AN RI-MWIN KÕMAT ILOAN MWIN KE AK ILO JUON JIKIN EO EJJENOLOK KE
AK ILO NABÕJ?
IN THE HOUSE/ILO MWEO …………………………………1
IN A SEPARATE
BUILDING/EJENOLOK………………………2
OUTDOORS/NABOJ………………………..3
OTHER (SPECIFY)/JOKO JET 6
2 HC9
3 HC9
HC8A. DO YOU HAVE A SEPARATE ROOM WHICH IS USED AS A
KITCHEN?EJJENOLOK KE JKIN KOMAT EO?
YES/AET………………………………………1
NO/JAB………………………………… ……2
HC8B. DOES ANY MEMBER OF THIS HOUSEHOLD OWN:
EWÕR KE IAN RI-MWIN EWÕR MEN KEIN IBBEIR:
A WATCH? WATCH?
A BICYCLE? BAAJKLE
A MOTORCYCLE OR MOTOR SCOOTER? OTOBAI?
A FISHING GEAR? KEIN EÑOD KO?
A CAR, TRUCK, OR VAN? WAAN ETTÕR?
A BOAT WITH MOTOR? LOON IBBEN ENGINE?
A SAILING CANOE? TIPÑOL?
A PADDLING CANOE? KÕRKÕR?
A REAR-CART? DRIAKA?
AGRICULTURAL/FARM EQUIPMENT?
KEIN JERBAL KO ILO JIKIN KALLIP AK ATKE KILEP KO?
YES/AET 1
NO/JAB 2
A WATCH?/WAJ
A BICYCLE?/BAAJIKOL
A MOTORCYCLE OR MOTOR SCOOTER?/OTOBAI
A FISHING GEAR?/KEIN EONOD
A CAR, TRUCK, OR VAN?/WAAN ETTOR?
A BOAT WITH MOTOR?LOON IPPEN INJIN LOK?
A SAILING CANOE?/TIPNOL?
A PADDLING CANOE?/KORKOR?
A REAR-CART?DIEKA
AGRICULTURAL/FARM EQUIPMENT?/KEIN JERBAL ILO JIKIN KALLIP
MENIN EDEK?
HC9. DOES ANY MEMBER OF YOUR HOUSEHOLD OWN:
EWÕR KE MEN KEIN IMWIN IM REJ EMMÕN WÕT AER JERBAL:
ELECTRICITY?
A COMMUNICATION ANTENNA?
A TABLE?
A CHAIR?
A SOFA?
A BED?
A CUPBOARD OR CABINET?
A RADIO?RADIO NAN RONJAKE
A CB OR VHF RADIO?KEIN KENAAN
A CD/CASSETTE PLAYER?KEIN RONJAKE AL KO
A VIDEO OR DVD PLAYER? KEIN ALOOJ PIJA
A TELEVISION? TIBI IN ALOOJ
A MOBILE TELEPHONE? TEINWA/TELPOON KO KWOJ ITIITAK KAKI
LANDLINE TELEPHONE?TELPOON KO MOKO
A WALKIE TALKIE? KEIN KENAAN KKO JET
A REFRIGERATOR? ICE BOX
A DEEP FREEZER? ICE BOX KEIN KAKOJKOJ
A GAS OR ELECTRIC STOVE? JITOOP JAROM
A DESK/LAPTOP COMPUTER? COMPUTER
AN INTERNET CONNECTION? INTERNOT NAN TOBAR IJOKO RETOLOK IMEJATOTO
A WASHING MACHINE? INJIN IN KWALOKWOL NUKNUK
A SEWING MACHINE? MEJIN IN KEKE
A MICROWAVE OVEN? OBUN/JITOOP
A DRYER? KEIN KOMERE NUKNUK
YES 1
NO 2
ELECTRICITY?/JAROM 1 2
A COMMUNICATION ANTENNA? 1 2
A TABLE? 1 2
A CHAIR? 1 2
A SOFA? 1 2
A BED? 1 2
A CUPBOARD OR CABINET? 1 2
A RADIO? 1 2
A CB OR VHF RADIO? 1 2
A CD/CASSETTE PLAYER? 1 2
A VIDEO OR DVD PLAYER? 1 2
A TELEVISION? 1 2
A MOBILE TELEPHONE? 1 2
LANDLINE TELEPHONE? 1 2
A WALKIE TALKIE? 1 2
A REFRIGERATOR? 1 2
A DEEP FREEZER? 1 2
A GAS OR ELECTRIC STOVE? 1 2
A DESK/LAPTOP COMPUTER? 1 2
AN INTERNET CONNECTION? 1 2
A WASHING MACHINE? 1 2
A SEWING MACHINE? 1 2
A MICROWAVE OVEN? 1 2

SOLAR PANEL/EQUIPMENT? KEIN KEJERBAL KAJOOR JEN AL
AN ELECTRIC GENERATOR? INJIN JAROM JIDIK KO
A DRYER? 1 2
SOLAR PANEL/EQUIPMENT? 1 2
AN ELECTRIC GENERATOR? 1 2
HC11. DOES ANY MEMBER OF THIS HOUSEHOLD OWN:
EWÕR KE IAN RI-MWIN EWÕR JIKIN:
RESIDENTIAL LAND? JIKIN AN JOKWE MAKE
AGRICULTURAL LAND? JIKIN AN KALLIP MENIN EDDEK
COMMERCIAL LAND? JIKIN AN KOMAN/WIAKAKE
YES 1
NO 2
RESIDENTIAL LAND? 1 2 AGRICULTURAL LAND? 1 2 COMMERCIAL LAND? 1 2
HC13. DOES THIS HOUSEHOLD OWN ANY LIVESTOCK, HERDS, OTHER FARM
ANIMALS, OR POULTRY?
EWÕR KE NEJIN RI-MWIN MENIN MOUR KO EINWÕT BAO AK PIG?
YES 1
NO 2
2HC15
HC14. HOW MANY OF THE FOLLOWING ANIMALS DOES THIS HOUSEHOLD HAVE?
JETE UAN MENIN MOUR KEIN EWÕR NEJIMI?
[A] DUCKS?/DAK [B] CHICKENS?BAO [C] PIGS?PIIK [D] GOATS?KOAT
[E] OTHER DOMESTICATED LIVESTOCK?(SPECIFCY)
MENIN MOUR KO JET
IF NONE, RECORD “00”/NE EJELOK UAAK, LIKIT “00”. IF 95 OR MORE, RECORD
“95”./NE 95 LONLOK, LIKIT “95” IF UNKNOWN, RECORD “98”.NE KOJAJE,
LIKIT “98”.
DUCKS ___ ___ CHICKENS ___ ___ PIGS ___ ___ GOATS __ ___ OTHER __ __ _____________________
HC15. DOES ANY MEMBER OF THIS HOUSEHOLD HAVE A BANK ACCOUNT?
EWÕR KE IAN RI-MWIN EWÕR AN ACCOUNT ILO BANK KO?
YES 1
NO 2
MODULE WS: WATER AND SANITATION
WS1. WHAT IS THE MAIN SOURCE OF DRINKING WATER FOR MEMBERS OF YOUR
HOUSEHOLD?
RIMWIN REJ IDRAK JEN IA?
PIPED WATER
11WS6
12WS6
13WS6
14WS3
21WS3
PIPED INTO DWELLING……………………...11
PIPED INTO COMPOUND, YARD OR PLOT…...12
PIPED TO NEIGHBOUR…..…………………..13
PUBLIC TAP / STANDPIPE………..………….14
TUBE WELL, BOREHOLE………..…………..21

DUG WELL 31WS3
32WS3
51WS3
61WS3
96WS3
.PROTECTED WELL 31
.UNPROTECTED WELL 32
.RAINWATER COLLECTION 51
.TANKER-TRUCK 61
BOTTLED WATER 91
OTHER (SPECIFY) 96
WS2. WHAT IS THE MAIN SOURCE OF WATER USED BY YOUR HOUSEHOLD FOR
OTHER PURPOSES SUCH AS COOKING AND HANDWASHING?
IA EO EKKÃ AN RI-MWIN EBBÕK AER DREN IN KÕMMANE JERBAL KO IMWIN
EINWÕT KÕMAAT AK KWALKWÕL?
PIPED WATER PIPED INTO DWELLING PIPE LOK NAN LOAN MWEO 11 PIPED INTO COMPOUND, YARD OR PLOT 12 PIPED TO NEIGHBOUR 13 PUBLIC TAP / STANDPIPE 14 TUBE WELL, BOREHOLE 21 DUG WELL PROTECTED WELL 31
UNPROTECTED WELL 32 RAINWATER COLLECTION 51 TANKER-TRUCK 61 OTHER (SPECIFY) 96
11WS6
12WS6
13WS6
WS3. WHERE IS THAT WATER SOURCE LOCATED?
IA EO JIKIN EBBÕK DREN IN EJ BED IE?
IN OWN DWELLING/MWEO 1
IN OWN YARD / PLOT/NABOJ IN MOKO 2
ELSEWHERE/IJOKO JET 3
1WS6
2WS6
WS4. HOW LONG DOES IT TAKE TO GO THERE, GET WATER, AND COME BACK?
EWI AITOKEN ETAL NAN JIKIN EBBÕK DEN EO IM ROLTOK?
NUMBER OF MINUTES (JETE MINUTES ) ____ __
DK/JAJE 998
WS5. WHO USUALLY GOES TO THIS SOURCE TO COLLECT THE WATER FOR YOUR
HOUSEHOLD?
WÕN EO EKKÃ AN ETAL IM BÕKTOK DREN ÑAN RI-MWIN?
PROBE:
IS THIS PERSON UNDER AGE 15? DETTAN EDIK JEN 15 YIO?
WHAT SEX? LEDRIK AK LADRIK?
ADULT WOMAN/KORA RO (AGE 15+ YEARS) 1
ADULT MAN/ EMAAN RO (AGE 15+ YEARS) 2
FEMALE CHILD/ LEDIK RO LALIN 5 YIO(UNDER 15) 3
MALE CHILD/LADIK RO LALIN 5 YIO (UNDER 15) 4
DK/JAJE 8
WS6. DO YOU DO ANYTHING TO THE WATER TO MAKE IT SAFER TO DRINK?
ELON KE WÃWEIN EO KWÕJ KÕMMANE NAN DREN EO BWE EN ERREO ÑAN IDAAK?
YES/ELON 1
NO/EJELOK 2
DK/JAB JELA 8
2WS8
8WS8
WS7. WHAT DO YOU USUALLY DO TO MAKE THE WATER SAFER TO DRINK?
TA EO EKKÃ AM KÕMMANE ÑAN KÕKMANMANLOK DREN EO BWE EN ERREO NAN
IDAAK?
PROBE: ANYTHING ELSE? EBAR KE WÕR?
RECORD ALL ITEMS MENTIONED. JE AOLEPEN UAAK KO.
BOIL/KOMATE A
ADD BLEACH / CHLORINE/
KEREIKI KIN JERAJKO B
STRAIN IT THROUGH A CLOTH/LIKLIKI KIN NUKNUK
C
USE WATER FILTER/KOJERBAL KEIN LIKLIK DREN KO (CERAMIC,
SAND, COMPOSITE, ETC.)
D
SOLAR DISINFECTION/KOJEEKE E
LET IT STAND AND SETTLE/LIKITI IM KOTTAR AN JOK ETTON KO IE
F
OTHER (SPECIFY)/EBAR KE WOR X
DK/EJELOK Z

WS8. WHAT KIND OF TOILET FACILITY DO MEMBERS OF YOUR HOUSEHOLD
USUALLY USE?
KAIN IMÕN BWIDREJ RÕT RI-MWIN REJ KÕJERBALE?
IF “FLUSH” OR “POUR FLUSH”, PROBE:
WHERE DOES IT FLUSH TO? EJ TOORLOK NAN IA?
IF NOT POSSIBLE TO DETERMINE, ASK PERMISSION TO OBSERVE THE FACILITY.
LALE ELANE EJAB ALIKAR.
FLUSH / POUR FLUSH
FLUSH TO PIPED SEWER SYSTEM/FLUSH 11
FLUSH TO SEPTIC TANK/ 12
FLUSH TO PIT (LATRINE)KOJERBAL RON KO AK EM LAL KO
13
FLUSH TO SOMEWHERE ELSE/KOTOOR NAN IJOKO JET
14
PIT LATRINE/RON KO KOJERBAL NAN KEBOJAK
CLOSED PIT/JIKIN KEBOJAK KO ELON RON
ILAL 21
BUCKET/KOJERBAL BAKOJ 41
NO FACILITY, BUSH, FIELD/KOJERBAL MELAAJ KO KIN AN EJELOK
JIKIN 95
OTHER (SPECIFY)IJOKO JET 96
95SI1
WS9. DO YOU SHARE THIS FACILITY WITH OTHERS WHO ARE NOT MEMBERS OF
YOUR HOUSEHOLD?
KOMIJ KOJERBALE IMÕN BWIDREJ IN IBBEN MOKO JET?
YES / AET 1
NO/ JAB 2
2SI1.
WS10. HOW MANY HOUSEHOLDS IN TOTAL USE THIS TOILET FACILITY, INCLUDING
YOUR OWN HOUSEHOLD? JETE EM EJ BAR KOJERBALE MWON BWIDREJ IN?
NUMBER OF HOUSEHOLDS/JETE ORAN RI-MWIN (IF LESS THAN 10)
(EIET LOK UWAN JEN 10 ARMIJ)
TEN OR MORE HOUSEHOLDS 10
(ELON LOK UWAN JEN 10 ARMIJ)
DK/JAJE 98

HANDWASHING HW
HW1. We would like to learn about where members of this household wash their hands.
Can you please show me where members of your household most often wash their hands? Imaron k jela ia ak tuia armij in mwin rej kwale pâer ie. Komaron ke jouj im kwalok ia ekka aer kwal pâer ie Record result and observation. Je aolep uaak ko
OBSERVED FIXED FACILITY OBSERVED (SINK / TAP) IN DWELLING/ILOAN MWEO ....................................................... 1 IN YARD /PLOT/NABOJ IN MOKO ............................................... 2 MOBILE OBJECT OBSERVED (BUCKET / JUG / KETTLE)/BAKOJ/TAB ...................................... 3 NOT OBSERVED NO HANDWASHING PLACE IN DWELLING / YARD / PLOT/EJELOK JIKIN ILO TURIN MWEO ........................ 4 NO PERMISSION TO SEE/EJELOK MELIM NAN LALE ................. 5 OTHER REASON (specify)UN KO JET ______________________ 6
4HW5 5HW4 6HW5
HW2. Observe presence of water at the place for handwashing. Verify by checking the tap/pump, or basin, bucket, water container or similar objects for presence of water. Etale elane ewor dren ilo jikin kwalkol pâ eo.
WATER IS AVAILABLE/ELON DREN ............................................... 1 WATER IS NOT AVAILABLE/EJELOK DREN .................................. 2
HW3. Is soap or detergent or ash/mud/sand present at the place for handwashing? Elon ke soap ilo jikin kwalkol pâ mweo?
YES, PRESENT/AET, EWOR ........................................................... 1 NO, NOT PRESENT/EJELOK ........................................................... 2
1HW7 2HW5
HW4. Where do you or other members of your household most often wash your hands? IA NE EKKA AM AK AN RIMWIN KWOLE BWEIER IE?
FIXED FACILITY (SINK / TAP) IN DWELLING/ILOAN MWEO ....................................................... 1 IN YARD / PLOT/NABOJIN MWEO ............................................... 2 MOBILE OBJECT (BUCKET / JUG / KETTLE)KOJERBAL BAKOJ/TAB .................. 3 NO HANDWASHING PLACE IN DWELLING / YARD / PLOT/EJELOK JIKIN ILOAN/NABOJ IN
MWEO ........................................................................................... 4 OTHER (specify)JOKO JET _______________________________ 6
HW5. Do you have any soap or detergent or ash/mud/sand in your house for washing hands? Elon ke soap ak men ko jet ilo jikin kwalkol pâ eo?
YES/ELON ........................................................................................ 1 NO/EJELOK ...................................................................................... 2
2End
HW6. Can you please show it to me? Komaron ke jouj im kwaloke?
YES, SHOWN/ KWALOK .................................................................. 1 NO, NOT SHOWN/JAB KWALOK .................................................... 2
2End
HW7. Record your observation. Circle all that apply.doululi uaak ko
BAR OR LIQUID SOAP/JOOP BIN ................................................... A DETERGENT (POWDER / LIQUID / PASTE) ................................... B ASH / MUD / SAND/JOOP DREN .................................................... C
HH20. THANK THE RESPONDENT FOR HIS/HER COOPERATION AND ASK IF THE RESPONDENT HAS ANY ADDITIONAL QUESTIONS FROM THE ENUMERATOR. AFTER YOU
HAVE ANSWERED ANY QUESTIONS FROM THE RESPONDENT, CHECK THE LIST OF HOUSEHOLD MEMBERS: LELOK KAMOLOL NAN ARMIJ EO IMWEO IM LALE ALENE
EWOR AN JABDEWOT KAJITOK IKIJIEN JERBAL IN.
A SEPARATE QUESTIONNAIRE FOR EACH MOTHER WITH A CHILD UNDER 5 YEARS OF AGE HAS BEEN ISSUED FOR EACH MOTHER IN THE LIST OF HOUSEHOLD
MEMBERS (HL15)
A SEPARATE QUESTIONNAIRE FOR EACH CHILDREN UNDER FIVE HAS BEEN ISSUED FOR EACH CHILD UNDER AGE 5 YEARS IN THE LIST OF HOUSEHOLD MEMBERS
(HL7B).
RETURN TO THE COVER PAGE AND MAKE SURE THAT THE RESULT OF THE HOUSEHOLD INTERVIEW (HH9), THE NAME AND LINE NUMBER OF THE RESPONDENT TO
THE HOUSEHOLD QUESTIONNAIRE (HH10), AND THE NUMBER OF ELIGIBLE UNDER-5S (HH14) ARE ENTERED.
ETALE BAR JUON ALEN ELANE EJIMWE AM KAR KANNE UAAK KO ILO LAAJRAK IN KAJITOK KO ILO HOUSEHOLD LIST EO.
MAKE ARRANGEMENTS FOR THE ADMINISTRATION OF THE REMAINING QUESTIONNAIRE(S) IN THIS HOUSEHOLD.

QUESTIONNAIRE FOR CHILDREN UNDER FIVE Republic of the Marshall Islands Integrated Child Health and Nutrition Survey 2017
UNDER‐FIVE CHILD INFORMATION PANEL
UF1. Cluster number: ___ ___ UF2. Household number:
UF3. Child’s name and line number: NAME _____________________________________________________ ___
UF4. Mother’s / Caregiver’s name and line number: NAME ____________________________________________________
UF5. Interviewer’s name and number: NAME _________________________________________________ ___ ___
UF6. Team leader name and number: NAME _________________________________________________ ___
UF7. Day / Month / Year of interview: ___ ___ /___ ___ / 2 0 1 ___
UF8. Record the time: HOURS : MINUTES
__ __ : __ __
UF9. Check completed questionnaires in this household: Have you or another
member of your team interviewed this respondent for another questionnaire? YES, INTERVIEWED ALREADY ...........................NO, FIRST INTERVIEW ........................................
1UF10B 2UF10A
UF10A. Hello, my name is (your name). We are from the Ministry of Health and National Statistical Office, RMI. We are conducting a survey about the situation of children, families and households. I would like to talk to you about (child’s name from UF3)’s health and well-being. This interview will take about number minutes. All the information we obtain will remain strictly confidential and anonymous. If you wish not to answer a question or wish to stop the interview, please let me know. May I start now?
Iakwe eta in (etam). Team in ej itok jen Jikin Ejmuur eo, im Office eo an jikin Bonbon eo. Komij kommane juon jerbal in ekkatak ikkijen ejmuur ko an ajiri ro, bamle ko im jikin jolwe ko barenwot ilo Majuro, Ebeye, im Outer Island ko. Ewor jet kajitok ko ikonaan naaj konono ibbam kaki kon ejmuur ne an (Etan ajiri eo). Emaron bok 5 minit. Aolep melele kein renaaj jet koi m jenaaj lukkun tiljok kaki bwe ren noojak jen ro jet. Botaab ne elon kajiotk ko im kojjab konaan naaj uwaaki, jouj im ba. Kojro maron ke jinoe kio?
UF10B. Now I would like to talk to you about (child’s name from UF3)’s health and well-being in more detail. This interview will take about number minutes. Again, all the information we obtain will remain strictly confidential and anonymous. If you wish not to answer a question or wish to stop the interview, please let me know. May I start now?
Inaaj wonmaanlok im jino konono kein kon wewen ejmuur ne an
(etan ajiri eo jen UF3). Emaron bok jet minit ko, im ikonaan bar kakemejmej yuk ke melele kein renaaj kanuuj in tiljok im nojak jen ro jet. Ne elon kajitok ko im kojjab konaan uwaaki, jouj im ba. Kojro maron ke jinoe?
YES, PERMISSION IS GIVEN .................................................................................NO, PERMISSION IS NOT GIVEN ..........................................................................
1UNDER FIVE’S BACKGROUND Module 2UF17
UF17. Result of interview for children under 5 Codes refer to mother/caregiver. Discuss any result not completed with Supervisor.
COMPLETED ..................................................................................................NOT AT HOME ...............................................................................................REFUSED .......................................................................................................PARTLY COMPLETED ...................................................................................INCAPACITATED (specify) ____________________________________________________ OTHER (specify) _______________________________________________

Module UB: UNDER-FIVE’S BACKGROUND UB4. CHECK THE RESPONDENT’S LINE NUMBER (UF4) AND THE
RESPONDENT TO THE HOUSEHOLD QUESTIONNAIRE (HH15): Lale line nomba eo an eo ej Uak (UF4)im eo ilo household
questionnaire eo (HH15)
RESPONDENT IS THE SAME, UF4=HL15 ........ 1ELANE EJJELOK OKTAK ILO UWAAK EO ,UF4=HL15 KONAAJ
LIKIT NOMBA JUON (1) RESPONDENT IS NOT THE SAME, UF4≠HH15 ....................... ..2ELANE EINJUON UWAAK KO ILO UF4 IM HH15 LIKIT NOMBA RUO (2)
UB1. On what day, month and year was (name) born? Raan ta, allon ta, im iio ta (etan ajir) ear lotak ie? Probe: What is (his/her) birthday? Ta ien lotak eo an? If the mother/caregiver knows the exact date of birth, also record
the day; otherwise, circle ‘98’ for day. Elane jinen ajiri eo ak armij eo ej bok eddoin ejela ien lotak eo an, je raan eo; ne enjuon duoluōli 98.
Month and year must be recorded. Allon im yio ej aikuij wor.
DATE OF BIRTH DAY/RAAN EO .................................................................. __ __ DK DAY/IJAJE RAAN EO ....................................................... 98 MONTH /ALLON ................................................................ __ __ YEAR/IIO ................................................................. 2 0 1 __
UB2. How old is (name)? Jete an (et eo) yio? Probe: How old was (name) at (his/her) last birthday? Jet an (et eo) iio ilo kar ien kemem eo an eliktata? Record age in completed years. Likit yio in lotak eo an. Record ‘0’ if less than 1 year. Likit “0” elane edik jen juon iio. If responses to UB1 and UB2 are inconsistent, probe further and
correct. Ne uwak eo ilo UB1 and UB2 rejab jonan wot juon, bar lukkun
etale im komman kajimwe.
AGE (IN COMPLETED YEARS) ................................................. __DETTAN ILO JEJJOT IN IIO EO AN
UB3. How old were you when (name) was born? Jet am yio ilo tore eo (et eo) ekar lotak? (if adopted mother) Jete an jinen (etan ajiri) eo iio ilo ien eo ekar kiotake?
AGE (IN COMPLETED YEARS) ____________________ DETTAN ILO JEJJOT IN IIO EO AN
UB4. Was (name) weighed at birth? (ET EO) ear ke boun elkin an lotak?
YES/AET ......................................................................................... NO/JAAB ......................................................................................... 2
DK/EJJAB JELA ........................................................................... 8
2GO TO
MODULE BR ELANE UWAAK
EO EJ RUO
(2) ETAL
WOT NAN
MODULE BR 8GO TO
MODULE BR
UB5. How much did (name) weigh? Kar jete an boun (ET EO)? IF A HEALTH CARD IS AVAILABLE, RECORD WEIGHT FROM CARD. NE ELON AN AJIRI EO YELLOW CARD, RECORD E BOUN EO ILO YELLOW CARD
EO.
FROM CARD ..................................................... 1 (KG) __ . __ __ __JONAN EDDO EO JEN CARD EO 1 (KG)
FROM RECALL ................................................. 2 (KG) __ . __ __ __ILO AN ANTOONE JONAN EDDO EO LIKIT 2 (KG)
DK/EJJAB JELA ................................................................... 99998
MODULE BR: BIRTH REGISTRATION

BR1. DOES (name) HAVE A BIRTH CERTIFICATE? ELON KE AN (ET EO) PEPA IN LOTAK?
If yes, ask: Ne elon, kajitok e: MAY I SEE IT? IMARON K LALE?
Yes, seen/aet, kwoj loe ............................................................ 1 Yes, not seen/aet kojjab loe ..................................................... 2 No/jaab .................................................................................... 3 DK/ejjab jela .................................................................................... 8
1Go to Module ECD 1 etal nan Module ECD 2Go to Module ECD 2 etal nan module ECD
BR2. HAS (name)’S BIRTH BEEN REGISTERED WITH the civil authorities? Emoj ke an delon ak rejejtor iien lotak eo an (et eo) ilo jikin
rejejtor ko?
Yes/aet ................................................................................... 1 No/jaab .................................................................................... 2 DK/Ejjab jela ................................................................................... 8
1Go to Module ECD 1 etal nan Module ECD
BR3. DO YOU KNOW HOW TO REGISTER (name)’S BIRTH? KOJELA KE KILEN KOMMAN AN (ETAN AJIRI EO) PEPA IN LOTAK?
Yes/aet .................................................................................... 1 No/jaab .................................................................................... 2
EC. EARLY CHILD DEVELOPMENT
EC1. HOW MANY CHILDREN’S BOOKS OR PICTURE BOOKS DO YOU
HAVE FOR (name)? Ewor jete an (et eo) book ko an ajiri ak book ko elon pija ie?
None/ejjelok .......................................................................... 00 Number of children’s books oran book ko an ajiri ............................................................ 0 __ Ten or more books / elon lok jen 10 book ............................................................... 10
EC2. I AM INTERESTED IN LEARNING ABOUT THE THINGS THAT
(name) PLAYS WITH WHEN HE/SHE IS AT HOME. IMARON KE
BAR JELA TA KO (ET EO) EJ IKKURE KAKI ILO MWEO. DOES HE/SHE PLAY WITH: EJ KE IKKURE KON MEN KEIN:
[A] HOMEMADE TOYS (SUCH AS DOLLS, CARS, OR OTHER
TOYS MADE AT HOME)? KEIN IKKURE KO KOMMAN ILO
MWEO.?
[B] TOYS FROM A SHOP OR MANUFACTURED TOYS? KEIN
IKKURE KO JEN MON WIA KO?
[C] HOUSEHOLD OBJECTS (SUCH AS BOWLS OR POTS) OR
OBJECTS FOUND OUTSIDE (SUCH AS STICKS, ROCKS, ANIMAL SHELLS OR LEAVES)? MEN KO IMWEO EINWOT
(BOOL KO, IM AINBOT), MEN KO IBELAKIN MWEO
EINWOT ALAL KO, DEKA KO, MENIN MOUR KO, AK
BŌLŌK KO)?
If the respondent says “YES” to the categories above, then probe to learn specifically what the child plays with to ascertain the response. Elane uwaak ko rej “aet” nan aolep men kein ilon, innem bar lukkun etale nan am jela ta eo ekka an ajiri eo ikkure kake, nan kommane juon uwaak eo ejejjot.
Y N DK Homemade toys/ ........................................................ 1 2 8 Kein ikkure ko jej kommani imoko Toys from a shop ........................................................ 1 2 8 Kein ikkure ko jen imon wia ko Household objects or outside objects ...................................................... 1 2 8 men ko ilo mweo im ko ibelakin mweo
EC3. SOMETIMES ADULTS TAKING CARE OF CHILDREN HAVE TO
LEAVE THE HOUSE TO GO SHOPPING, WASH CLOTHES, OR FOR
OTHER REASONS AND HAVE TO LEAVE YOUNG CHILDREN. JETE IEN RO REJ LALE AJIRI RO REJ KOMAKE KI ER IM ETAL
NAN JIKIN WIA KO,JIKIN KWALKOL KO, IM JIKIN KO JET. ON HOW MANY DAYS IN THE PAST WEEK WAS (name): ELON
KE RAN ILO WEEK KO REJ JEMLOK (ET EO) EO EAR KE: [A] LEFT ALONE FOR MORE THAN AN HOUR? MAKE IAAN AETOK LOK JEN 1 AWA?
[B] LEFT IN THE CARE OF ANOTHER CHILD, THAT IS, SOMEONE LESS THAN 10 YEARS OLD, FOR MORE THAN
AN HOUR? BED IPPEN BAR JUON AJIRI EO EDRIK YIO EO AN JEN 10
YIO DRETTAN ELAPLOK JEN 1 AWA? If ‘none’ enter’ 0’. If ‘don’t know’ enter’8’. Elane ejjelok likit ‘0’. Elane ejaje likit ‘8’
Number of days left alone for more than an hour/ ................................................................ __ Oran raan in an make iaan aetoklok jen 1 awa Number of days left with other child for more than an hour .................................................... __ oran raan in an juon bar ajiri lale elaplok 1 awa

EC4. Check AG2: Age of child. Dettan ak iio eo an ajiri eo – iio ke ak allon? Child age 0, 1 or 2 Go to Module CD./ajiri eo 0, 1 or 2 etal nan Module CD Child age 3 or 4 Continue with EC5./ ajiri eo 3 ak 4 etal nan ECS
EC5. Has (name) ever attended any early childhood education programme, such as kindergarden, headstart programme for children 3-4 years of age, or the ministry of educations WUTMI Parents as Teachers (PAT) programme? (Et eo) enanin ke kar bad ilo school ak program in katakin ko an ajiri jiddik ro einwot, kindergarten, headstart, ak program eo an PAT (Parents as Teachers) eo im ej bad ilo WUTMI?
YES/AET ...................................................................................... 1NO/JAAB ................................................................................. 2
2EC7 2 etal nan EC7
EC6. Does (he/she) currently attend early childhood education programmes, such as kindergarden, headstart programme for children 3-4 years of age, or the ministry of educations WUTMI Parents as Teachers (PAT) programme? (et eo) ej ke bad ilo school ak programme in katakin ko an ajiri jidik ro, einwot, kindergarten, headstart, ak program eo an PAT (Parents as Teachers) eo im ej bad ilo WUTMI?
YES/AET ...................................................................................... 1NO/JAAB ................................................................................. 2
EC7. IN THE PAST 3 DAYS, DID YOU OR ANY HOUSEHOLD MEMBER
AGE 15 OR OVER ENGAGE IN ANY OF THE FOLLOWING
ACTIVITIES WITH (name): ILO RAAN KO JILU REJ MOOTLOK, KWE AK BAR RO JET IMWEO IM
15 AER IIO AK RITTOLOK, RENANIN KE KAR KOMMANI WEWEN
KEIN IBBEN (ET EO) If yes, ask: WHO ENGAGED IN THIS ACTIVITY WITH (name)? ELANE AET, KAJITOK:WON EO EKAR KOMMANI WEWEN KEIN
IBBEN (ET EO)? Circle all that apply./Doluli aolep wewen ko ekar
kommani ibben (et eo)
Mother Father Other No one
[A] READ BOOKS TO OR LOOKED AT PICTURE BOOKS WITH (name)? RIIT BOOK KO ILO AERRO JIMOR
(ET EO ) KALIMJEK PIJA KO ILO BOOK EO
Read books Riit book
A B X Y
[B] TOLD STORIES TO (name)? INON AK BWEBWENATO
NANE
Told stories/ bwebwenato nane
A B X Y
[C] SANG SONGS TO (name) OR WITH (name), INCLUDING LULLABIES? AL IN AJIRI KO NAN (ET EO) AK
AL IBBEN (ET EO).
Sang songs Al al ko
A B X Y
[D] TOOK (name) OUTSIDE THE HOME, COMPOUND, YARD OR ENCLOSURE?/ BOK (ET EO) NAN
NAMOJEN MWEO AK IJOKO JET IBELAAKIN MWEO.
Took outside Boke nan ijoko naboj
A B X Y
[E] PLAYED WITH (name)? IKKURE IBBEN (ET EO) Played with/ikkure ibben
A B X Y
[F] NAMED, COUNTED, OR DREW THINGS TO OR WITH (name)? KONONO KON ET KO , BONBON,
JOTOJOTTAK MEN KO NANE AK KOMMANI MEN KEIN IBBEN (ET
EO)
Named/counted/konono kon et ko an bonbon ko
A B X Y
EC8. I WOULD LIKE TO ASK YOU SOME QUESTIONS ABOUT THE
HEALTH AND DEVELOPMENT OF (name). CHILDREN DO NOT
ALL DEVELOP AND LEARN AT THE SAME RATE. FOR EXAMPLE, SOME WALK EARLIER THAN OTHERS. THESE QUESTIONS ARE
RELATED TO SEVERAL ASPECTS OF (name)’S DEVELOPMENT. KIO INAAJ KAJITOK IKKIJEN EJMUUR IM AN (ET EO) AN
EDDOKLOK. AOLEP AJIRI RO EJJAB JOKKIN WOT JUON AER
EDDEKLOK IM AER EKATAK, NAN WAANJONAK, JET REMARON
MOKAJ AER ETETAL JEN JET. KAJITOK KEIN REJ KWALOK
JOKJOK AK WEWEN AN (ET EO ) EDDEKLOK. CAN (name) IDENTIFY OR NAME AT LEAST TEN LETTERS OF
THE ALPHABET? (ET EO) EMARON KE KWALOK IM BA ETAN 10 LETA KO.
Yes/yes .................................................................................... 1 No/jaab .................................................................................... 2 DK/ijaje .................................................................................... 8
EC9. CAN (name) READ AT LEAST FOUR SIMPLE, POPULAR
WORDS? Yes/aet .................................................................................... 1 No/jaab .................................................................................... 2

(ET EO) EAMRON KE RIIT EMEN (4) NAAN JIDDIK KO IM EKKA
AD KOJERBALI. DK/ijaje .................................................................................... 8
EC10. DOES (name) KNOW THE NAME AND RECOGNIZE THE
SYMBOL OF ALL NUMBERS FROM 1 TO 10? (ET EO) EJELA KE ETAN IM EJELA KE KAJJEN AOLEP NOMBA KO
JEN 1 NAN 10?
Yes/aet .................................................................................... 1 No/jaab .................................................................................... 2 DK/ijaje ................................................................................... 8
EC11. CAN (name) PICK UP A SMALL OBJECT WITH TWO FINGERS, LIKE A STICK OR A ROCK FROM THE GROUND?
(ET EO) EMARON KE KOTAKI MEN EO REDDIK KON RUO ADDI
KO, EINWOT ALAL AK DEKA KO JEN LAL.
Yes/aet .................................................................................... 1 No/jaab .................................................................................... 2 DK/ijaje .................................................................................... 8
EC12. IS (name) SOMETIMES TOO SICK TO PLAY? ELON KE JET IEN KO (ET EO) ELUKKUN NANINMIJ NAN
IKKURE?
Yes/aet .................................................................................... 1 No/jaab .................................................................................... 2 DK/ijaje .................................................................................... 8
EC13. DOES (name) FOLLOW SIMPLE DIRECTIONS ON HOW TO DO
SOMETHING CORRECTLY? (ET EO) EJ KE JIMWE AN KOMMANI IM LOOR WEWEN KOMELEL
KO LILOK NANE.
Yes/aet/ ................................................................................... 1 No/jaab .................................................................................... 2 DK/ijaje .................................................................................... 8
EC14. WHEN GIVEN SOMETHING TO DO, IS (name) ABLE TO DO IT
INDEPENDENTLY? (ET EO) EJ KA MAKE KOMMANI MEN KO LILOK BWE EN
KOMMANI?
Yes/aet .................................................................................... 1 No/jaab .................................................................................... 2 DK/ijaje .................................................................................... 8
EC15. DOES (name) GET ALONG WELL WITH OTHER CHILDREN? (ET EO) EJ KE KOBALOK IBBEN AJIRI RO JET.
Yes/aet .................................................................................... 1 No/jaab .................................................................................... 2 DK/ijaje .................................................................................... 8
EC16. DOES (name) KICK, BITE, OR HIT OTHER CHILDREN OR
ADULTS? (ET EO ) EJ KE KOMMANI MEN KEIN, KICK, IKKIJ, AK DENLOKE
AJIRI IM RITTO RO JIMOR?
Yes/aet .................................................................................... 1 No/jaab .................................................................................... 2 DK/ijaje ................................................................................... 8
EC17. DOES (name) GET DISTRACTED EASILY? EBIDODO KE AN (ET EO) ILBOK AK BOK KOLMENLOJEN EO
AN.
Yes/aet .................................................................................... 1 No/jaab .................................................................................... 2 DK/ijaje .................................................................................... 8
MODULE CD: CHILD DISCIPLINE / KAJE KO NAN AJIRI EO
UCD1. Check UB2: Child’s age? Lale UB2: IIO EO AN AJIR EO?
AGE 0 ....................................................................................... 1 AGE 1, 2, 3 OR 4 ..................................................................... 2
1Go to Module UCF.
UCD2. Adults use certain ways to teach children the right behavior or to address a behavior problem. I will read various methods that are used. Please tell me if you or any other adult in your household has used this method with (name) in the past month.
Ro reritto rej kommani jet wewen ko nan katakin im kaje ajiro ro nan aer ukot mwil ko rejjab jimwe im ajiri eo ej kommani. Inaaj riiti waj wewen ko jej kojerbali. Elane kwe ak ro bar imweo rekar kojerbali wewen kein ilo allon eo lok nan (et eo)
[A] Took away privileges, forbade something
(name) liked or did not allow (him/her) to leave the house./ kabojerak an (et eo) kommani men ko ekonaan ak jab kotlok an (et eo) diwoj jen imweo.
[B] Explained why (name)’s behavior was
wrong./ komeleleiki wewen an (et eo) jab eman milin. [C] Shook (him/her)./ Idikdiki [D] Shouted, yelled at or screamed at (him/her)./Lamoj
nane ak burone. [E] Gave (him/her) something else to do./ Lelok jet men
nan an kommani.
YES NO TOOK AWAY PRIVILEGES ............................................. 1 2 BOKE KONAAN AJ JIMWE KO AN EXPLAINED WRONG BEHAVIOR .................................................................. 1 2 KOMLELEKI KON MANIT EO EJAB JIMWE SHOOK HIM/HER .......................................................... 1 2 IDIKDIKI SHOUTED, YELLED, SCREAMED ............................................................... 1 2 LAMOJ AK BURONE GAVE SOMETHING ELSE TO DO ........................................................................ 1 2 LELOK JET MEN NAN AN KOMMANI

[F] Spanked, hit or slapped (him/her) on the bottom with bare hand./ dente, ak jebtake kabin.
[G] Hit (him/her) on the bottom or elsewhere on the
body with something like a belt, hairbrush, stick or other hard object./ denloke kabin ak ijoko jet enbwinin kon kańor, koom buraj, alal ak men ko im reben ak kijnene
[H] Called (him/her) dumb, lazy or another
name like that./ Kabbwebweiki, ba nane ke eleje im jeronlok bar jet men eierlok wot.
[I] Hit or slapped (him/her) on the face, head or
ears. Dente ak jebtake turin mejen, boran ak lojelňin [J] Hit or slapped (him/her) on the hand, arm, or leg.
Dente ak jebtake ion pein ak neen [K] BEAT (HIM/HER) UP, THAT IS HIT HIM/HER OVER AND OVER AS
HARD AS ONE COULD. DENTE AK MANE ELAP JEN JONAN
SPANKED, HIT, SLAPPED ON BOTTOM WITH BARE HAND ..................................... 1 2 DENETE, JEBTAKE KABIN. HIT WITH BELT, HAIRBRUSH, STICK OR OTHER HARD OBJECT ...................................................................... 1 2 DENETE KON KANOR, BIRAJ IN BAR, ALAL AK MEN KO
REBEN AK REKIJNENE CALLED DUMB, LAZY OR ANOTHER NAME ....................................................... 1 2 HIT / SLAPPED ON THE FACE, HEAD OR EARS ......................................................... 1 2 DENETE, JEBTAKE MEJEN, BORAN IM LOJILININ HIT / SLAPPED ON HAND, ARM OR LEG ............................................................. 1 2 DENTE, JEBTAKE IION PEIN, PEIN AK NEEN. BEAT UP, HIT OVER AND OVER AS HARD AS ONE COULD ....................................... 1 2 DENTE ELON ALLEN AK MANE ELAP JAN JONAN
UCD3. DO YOU BELIEVE THAT IN ORDER TO BRING UP, RAISE, OR
EDUCATE A CHILD PROPERLY, THE CHILD NEEDS TO BE
PHYSICALLY PUNISHED? KOJ TOMAK K, ILO AN JUON AJIRI
WONLONTAK,RITTOLOK KON KATAK KO REJEJOT IM JIMWE, AJIRI EO EJ AIKUIJ KAJE?
YES/AET ................................................................................. 1 NO/JAAB ................................................................................. 2 DK / NO OPINION ................................................................... 8 IJAJE/ EJJELOK UWAAK
UCF. Child Functioning
UCF1. Check UB2: Child’s age? AGE 0 OR 1 ..........................................................................................AGE 2, 3 OR 4 ......................................................................................
1 Go to Module BD
UCF4. I would like to ask you some questions about difficulties your child may have.
Imaron ke kajitok jet kajitok ko ikijen aban ko ippen ajiri eo.
Does (name) wear glasses? (et eo) ej ke kojerbal mej bilo ko?
YES/AET ..............................................................................................NO/JAAB ...............................................................................................
UCF5. Does (name) use a hearing aid? (et eo) ej ke kojerbale kein jiban ronjake ko?
YES/AET ...............................................................................................NO/JAAB ...............................................................................................
UCF6. Does (name) use any equipment or receive assistance for walking?
(et eo) ej ke kojerbale men ko nan jibane etetal.
YES/AET ...............................................................................................NO/JAAB ...............................................................................................
UCF7. In the following questions, I will ask you to answer by selecting one of four possible answers. For each question, would you say that (name) has: 1) no difficulty, 2) some difficulty, 3) a lot of difficulty, or 4) that (he/she) cannot at all.
Ilo kajitok kein kio, imaron ke kajitok waj ippam bwe kon uaki ilo am kalet juon ian uak kein. 1) Ejelok aban, 2) ewor jidik aban, 3) elap an lon aban, 4) ejab maron nan jidik.
Repeat the categories during the individual questions
whenever the respondent does not use an answer category:
Remember the four possible answers: Would you say that (name) has: 1) no difficulty, 2) some difficulty, 3) a lot of difficulty, or 4) that (he/she) cannot at all?
UCF8. Check UCF4: Child wears glasses? Lale UCF4: Ajiri eo ej ke kojerbal mejen riit ko?
YES/AET, UCF4=1 ................................................................................NO/JAB, UCF4=2 ..................................................................................
1UCF7A 2UCF7B

UCF8A. When wearing (his/her) glasses, does (name) have difficulty seeing? Ne ej kojerbal mej ko, (et eo) emman ke an reimaanlok ak kojerbale?
NO DIFFICULTY/EJELOK ABAN .........................................................SOME DIFFICULTY/JIDIK ABAN .........................................................A LOT OF DIFFICULTY/ELAP AN ABAN .............................................CANNOT SEE AT ALL/EJJAB LOLOKIJEN KAKE..............................
UCF9. Check UCF3: Child uses a hearing aid? Ej ke kojerbal kein jiban ronjake ko?
YES/AET, UCF3=1 ...............................................................................NO/JAB, UCF3=2 .................................................................................
1UCF9A 2UCF9B
UCF9A. When using (his/her) hearing aid(s), does (name) have difficulty hearing sounds like peoples’ voices or music? Ilo an kojerba lkein ronjake eo, ( et eo) emman ke an ron ainikien armij ak al ko?
NO DIFFICULTY/EJELOK ABAN .........................................................SOME DIFFICULTY/JIDIK ABAN .........................................................A LOT OF DIFFICULTY/ELAP AN ABAN .............................................CANNOT HEAR AT ALL/EJAB MARON RONJAKE ............................
UCF10. Check UCF4: Child uses equipment or receives assistance for walking?Ajiri eo ej kojerbal ke kein jiban etetal im makutktu ko?
YES/AET, UCF4=1 ...............................................................................NO/JAB, UCF4=2 .................................................................................
1UCF10A 2UCF11
UCF10A. Without (his/her) equipment or assistance, does (name) have difficulty walking? Ewor ke aban ilo an emakutkut ak etetal ilo an jab kojerbal kein jiban etetal kein?
SOME DIFFICULTY/JIDIK ABAN .........................................................A LOT OF DIFFICULTY/ELAP AN ABAN .............................................CANNOT WALK AT ALL/EJAB MARON NAN JIDIK ............................
UCF10B. With (his/her) equipment or assistance, does (name) have difficulty walking? ( Ilo an kojerbal kein jiban etetal kein, ewor ke an ban ilo an emakutkut?
NO DIFFICULT/EJELOK ABAN ...........................................................SOME DIFFICULTY/EWOR AN ABAN .................................................A LOT OF DIFFICULTY/EBIN AN EMAKUTKUT ................................CANNOT WALK AT ALL/EBAN EMAKUTKUT .....................................
1UCF12 2UCF12 3UCF12 4UCF12
UCF11. Compared with children of the same age, does (name) have difficulty walking? Keidi ippen ajiri ro jet jonan yio ko aer wot juon, ( et eo) ewor kea ban ilo an emakutkut?
NO DIFFICULTY/EJELOK AN ABAN ...................................................SOME DIFFICULTY/EWOR ABAN .......................................................A LOT OF DIFFICULTY/EBIN AN EMAKUTKUT .................................CANNOT WALK AT ALL/EJAJE EMAKUTKUT ....................................
UCF12. Compared with children of the same age, does (name) have difficulty picking up small objects with (his/her) hand? Keidi nan ajiri ro jet jonan dettaer wot juon, elon ke an (et eo) aban ak ebin ke an jibwe im kotaki jen lal jet men ko redrik kin pein?
NO DIFFICULTY/EJELOK ABAN .........................................................SOME DIFFICULTY/EWOR ABAN .......................................................A LOT OF DIFFICULTY/ELAP AN BIN/ABAN ......................................CANNOT PICK UP AT ALL/EBAN JIBWE/KOTAKE ............................
UCF13. Does (name) have difficulty understanding you? (Et eo) ej melele ke kin ta eo kwoj ba nane ilo am konono?
NO DIFFICULTY/JEJELOK ABAN .......................................................SOME DIFFICULTY/JIDIK ABAN .........................................................A LOT OF DIFFICULTY/ELAP AN ABAN .............................................CANNOT UNDERSTAND AT ALL/EJAB MELELE ...............................
UCF14. When (name) speaks, do you have difficulty understanding (him/her)? Ne (et eo) ej konono, emelele ke am ronjake ta eo ej ba?
NO DIFFICULTY/EJELOK ABAN .........................................................SOME DIFFICULTY/JIDIK ABAN .........................................................A LOT OF DIFFICULTY/ELAP AN ABAN .............................................CANNOT BE UNDERSTOOD AT ALL/EJJAB MELELE ........................
UCF15. Compared with children of the same age, does (name) have difficulty learning things? Keidi ippen ajiri ro dettan wot e, (et eo) ebin ke an ekatak jet kol ak men kaal?
NO DIFFICULTY/EJELOK ABAN .........................................................SOME DIFFICULTY/WOR JIDIK ABAN ...............................................A LOT OF DIFFICULTY/ELAP AN LON ABAN ....................................CANNOT LEARN THINGS AT ALL/EJAB MARON ..............................
UCF16. Compared with children of the same age, does (name) have difficulty playing? Keidi ippen ajiri ro dettan wot e, (et eo) ewor ke aban ilo an ikure?
NO DIFFICULTY/EJELOK ABAN .........................................................SOME DIFFICULTY/EBWE AN ABAN AN IKURE ...............................A LOT OF DIFFICULTY/EBIN AN IKURRE ..........................................CANNOT PLAY AT ALL/EJAJE KUKKURE .........................................

UCF17. The next question has five different options for answers. I am going to read these to you after the question. Kajitok in tok juon ewor 5 kilen am naj uake im naj kwaloki mojin wot riiti waj kajitok in.
Compared with children of the same age, how much
does (name) kick, bite or hit other children or adults? Keidi ippen ajiri jet dettaer wot juon, ewi jonan an (et eo) irre einwot juuji, kuji, ak denloke ajiri ro jet ak ritto ro?
Would you say: not at all, less, the same, more or a lot
more?
NOT AT ALL/EJJAB NAN JIDIK ...........................................................LESS/EDRIKLOK ..................................................................................THE SAME/JONAN EO WOT ...............................................................MORE/ELAPLOK AN IRRE ..................................................................A LOT MORE/ELUKUN TAR JEN JONAN AN IRRE ...........................
MODULE BD: BREASTFEEDING AND DIETARY INTAKE
BD2. Has (name) ever been breastfed? (Et eo) enanin ke kar ninnin ippam?
YES/AET .................................................................................................NO/JAB ................................................................................................... DK/JAB JELA/EJELOK UAAK ...............................................................
2BD4 8BD4
BD3. Is (name) still being breastfed? Kwõj kaninnin wõt ke (ET EO) ilo ittum?
YES/AET .................................................................................................NO/JAB ................................................................................................... DK/JAB JELA AK EJELOK UAAK .........................................................
2BD4 8BD4
BD3A. How many times did you breastfeed last night between sunset and sunrise Jete allen am kar kaninin ajiri eo ibbam jen jota tok nan ke ejibon? If unknown, record ‘99’. Ne ejab alikar uaak eo je nomba
kein “99”
NUMBER OF NIGHTTIME FEEDINGS JETE ALEN AM KANINNIN ILO JUON BON
BD3B. How many times did you breastfeed yesterday during the daylight hours? Jete allen am kar kaninnini ajiri eo ibbam inne jen ke ej jibon nan ke ej bon ? If unknown, record ‘99’. Ne uaak eo ejjab alikkar likit nomba kein “99”
NUMBER OF DAYLIGHT FEEDINGS Jete alen am kaninnin ilo juon raan likio
BD4. Yesterday, during the day or night, did (name) drink anything from a bottle with a nipple?
(ET EO) ear ke idaak jabrewõt jen bato eo ewõr boran ilo raan eo
inne ak jotenin inne?
YES/AET .................................................................................................NO/AET ................................................................................................... DK/EJAJE UAAK EO ..............................................................................
BD5. Did (name) drink Oral Rehydration Salts, ORS, yesterday, during the day or night?
(Et eo) ekar ke idraak ORS (ak uno eo nan bobrae an jab mora enbwinid ilo ien ad bidodo) in bon ke ak ilo raan
YES/AET .................................................................................................NO/JAB ................................................................................................... DK/EJAJE UAAK EO ..............................................................................
BD6. Did (name) drink or eat vitamin or mineral supplements or any medicines yesterday, during the day or night? (Et eo) ekar ke idaak uno einwot vitamin, mineral, ak uno ko jet inn eke bon?
YES/AET .................................................................................................NO/JAB ................................................................................................... DK/EJAJE UAAK EO ..............................................................................

BD7. Now I would like to ask you about all other liquids that (name) may have had yesterday during the day or the night. Ij kio iten kajitok ippam kain dren rot ko (et eo) ear ilimi ak idraak aolepen inne kab bon.
Please include liquids consumed outside of your home. Ekoba ne
ear idaak ijoko jet ijelokin mweo. Did (name) drink (name of item) yesterday during the day or the night: (Et eo) ekar ke idaak ( etan dren eo) inne ke bon.
YES NO DK
[A] Plain water? Aeboj wot? PLAIN WATER 1 2 8
[B] Juice or juice drinks? Dren in leen wojke ko? JUICE OR JUICE DRINKS 1 2 8
[C] Clear broth/clear soup? Drenin soup ? CLEAR BROTH 1 2 8
[D] Infant formula, such as Similac, Bonna, Bonamil, Morinaga BF, Enfamil. Milk ko nimen ninnin einwot Enfamil, morinaga, similac im ko jet?
INFANT FORMULA 1
2 BD7[E]
8 BD7[E]
[D1] How many times did (name) drink infant formula? Jete alen an (et eo) idraak milk ko nimen ninnin?
If 7 or more times, record ‘7’. Jimjoun ak lonlok, je “7” If unknown, record ‘8’. Ne ejab alikar, je “8”
NUMBER OF TIMES DRANK INFANT FORMULA ..............................................................................JETE ALEN AN AJIRI EO IDRAAK MILK KO NIMEN NINNIN
[E] Milk from animals, such as fresh, tinned, or powdered milk? (Not sweetened condensed milk)
Milk kuwat ak milk bouta ak milk dren ko jet?
MILK 1
2 BD7[F]
8 BD7[F]
[E1] How many times did (name) drink milk? Jete alen an (et eo) eo idraak milk?
If 7 or more times, record ‘7’. Jimmjuon ak lonlok, je nomba “7”
If unknown, record ‘8’. Ne ejab alikar, je “8”
NUMBER OF TIMES DRANK MILK ..................................................................................................... _JETE ALEN AN KAR IDAAK MILK
[F] Tea or Coffee? Tea ak Kobe?
TEA OR COFFEE/TEA IM KOBE?
1
2
8
[G] Sugar sweetened beverages such as carbonated soft drinks? Ak dren ko jet retinal einwot cola?
SUGAR SWEETENED BEVERAGES 1 2 8 DREN KO JET MME RETONAL
[X] Any other liquids? Bar kain dren ko jet?
OTHER LIQUIDS/DREN KO JET 1 2
BD8 8
BD8
[X1] Record all other liquids mentioned. Bar je kain dren ko jet.
(Specify)/kalikar dren rot _____________________________________
BD8. Now I would like to ask you about everything that (name) ate yesterday during the day or the night. Please include foods consumed outside of your home.
- Think about when (name) woke up yesterday. Did (he/she) eat anything at that time? If ‘Yes’ ask: Please tell me everything (name) ate at that time. Probe: Anything else? Record answers using the food groups below. - What did (name) do after that? Did (he/she) eat anything at that time? Repeat this string of questions, recording in the food groups, until the respondent tells you that the child went to sleep until the next morning. Imaron ke bar kajitõk ñe ebar wõr kain moña ko (ET EO) ear buki inne, jen jiboñ ñan boñ. Komaron ke kobaik mona ko ear buki moko jet. -Ke ekar rujtok inne ekar ke mona ien ne? Ne “aet”, komaron ke letok ta ear mona?. Bar lale: ebar lon k? Je aolep uak ilo group in mona kein ilal. Ta eo (et eo) ear komane elikin? Ekar k bar mona ien ne? Elije kajitok kane im je uak ko ilo group in mona kane, nan ne jenen eba waj k ajiri eo ekiki.
For each food group not mentioned after completing the above ask: Just to make sure, did (name) eat (food group items) yesterday
during the day or the night. (Et eo) ekar ek mona (mona kein) inne ak bon?
YES NO DK
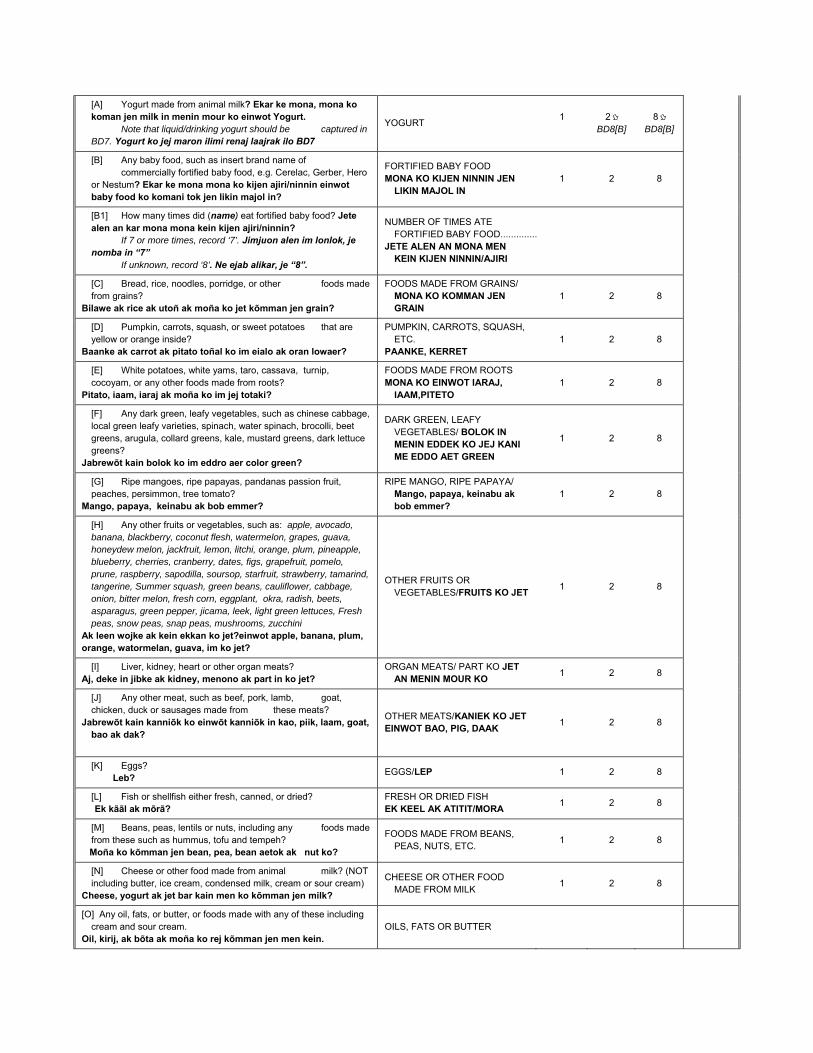
[A] Yogurt made from animal milk? Ekar ke mona, mona ko koman jen milk in menin mour ko einwot Yogurt.
Note that liquid/drinking yogurt should be captured in BD7. Yogurt ko jej maron ilimi renaj laajrak ilo BD7
YOGURT 1
2 BD8[B]
8 BD8[B]
[B] Any baby food, such as insert brand name of commercially fortified baby food, e.g. Cerelac, Gerber, Hero or Nestum? Ekar ke mona mona ko kijen ajiri/ninnin einwot baby food ko komani tok jen likin majol in?
FORTIFIED BABY FOOD MONA KO KIJEN NINNIN JEN
LIKIN MAJOL IN 1 2 8
[B1] How many times did (name) eat fortified baby food? Jete alen an kar mona mona kein kijen ajiri/ninnin?
If 7 or more times, record ‘7’. Jimjuon alen im lonlok, je nomba in “7”
If unknown, record ‘8’. Ne ejab alikar, je “8”.
NUMBER OF TIMES ATE FORTIFIED BABY FOOD ..............JETE ALEN AN MONA MEN
KEIN KIJEN NINNIN/AJIRI
[C] Bread, rice, noodles, porridge, or other foods made from grains?
Bilawe ak rice ak utoñ ak moña ko jet kõmman jen grain?
FOODS MADE FROM GRAINS/ MONA KO KOMMAN JEN GRAIN
1 2 8
[D] Pumpkin, carrots, squash, or sweet potatoes that are yellow or orange inside?
Baanke ak carrot ak pitato toñal ko im eialo ak oran lowaer?
PUMPKIN, CARROTS, SQUASH, ETC.
PAANKE, KERRET 1 2 8
[E] White potatoes, white yams, taro, cassava, turnip, cocoyam, or any other foods made from roots?
Pitato, iaam, iaraj ak moña ko im jej totaki?
FOODS MADE FROM ROOTS MONA KO EINWOT IARAJ,
IAAM,PITETO 1 2 8
[F] Any dark green, leafy vegetables, such as chinese cabbage, local green leafy varieties, spinach, water spinach, brocolli, beet greens, arugula, collard greens, kale, mustard greens, dark lettuce greens?
Jabrewõt kain bolok ko im eddro aer color green?
DARK GREEN, LEAFY VEGETABLES/ BOLOK IN MENIN EDDEK KO JEJ KANI ME EDDO AET GREEN
1 2 8
[G] Ripe mangoes, ripe papayas, pandanas passion fruit, peaches, persimmon, tree tomato?
Mango, papaya, keinabu ak bob emmer?
RIPE MANGO, RIPE PAPAYA/ Mango, papaya, keinabu ak bob emmer?
1 2 8
[H] Any other fruits or vegetables, such as: apple, avocado, banana, blackberry, coconut flesh, watermelon, grapes, guava, honeydew melon, jackfruit, lemon, litchi, orange, plum, pineapple, blueberry, cherries, cranberry, dates, figs, grapefruit, pomelo, prune, raspberry, sapodilla, soursop, starfruit, strawberry, tamarind, tangerine, Summer squash, green beans, cauliflower, cabbage, onion, bitter melon, fresh corn, eggplant, okra, radish, beets, asparagus, green pepper, jicama, leek, light green lettuces, Fresh peas, snow peas, snap peas, mushrooms, zucchini
Ak leen wojke ak kein ekkan ko jet?einwot apple, banana, plum, orange, watormelan, guava, im ko jet?
OTHER FRUITS OR VEGETABLES/FRUITS KO JET
1 2 8
[I] Liver, kidney, heart or other organ meats? Aj, deke in jibke ak kidney, menono ak part in ko jet?
ORGAN MEATS/ PART KO JET AN MENIN MOUR KO
1 2 8
[J] Any other meat, such as beef, pork, lamb, goat, chicken, duck or sausages made from these meats?
Jabrewõt kain kanniõk ko einwõt kanniõk in kao, piik, laam, goat, bao ak dak?
OTHER MEATS/KANIEK KO JET EINWOT BAO, PIG, DAAK
1 2 8
[K] Eggs? Leb?
EGGS/LEP 1 2 8
[L] Fish or shellfish either fresh, canned, or dried? Ek kããl ak mõrã?
FRESH OR DRIED FISH EK KEEL AK ATITIT/MORA
1 2 8
[M] Beans, peas, lentils or nuts, including any foods made from these such as hummus, tofu and tempeh?
Moña ko kõmman jen bean, pea, bean aetok ak nut ko?
FOODS MADE FROM BEANS, PEAS, NUTS, ETC.
1 2 8
[N] Cheese or other food made from animal milk? (NOT including butter, ice cream, condensed milk, cream or sour cream)
Cheese, yogurt ak jet bar kain men ko kõmman jen milk?
CHEESE OR OTHER FOOD MADE FROM MILK
1 2 8
[O] Any oil, fats, or butter, or foods made with any of these including cream and sour cream.
Oil, kirij, ak bõta ak moña ko rej kõmman jen men kein. OILS, FATS OR BUTTER

[P] Any sugary foods such as chocolates, sweets, candies, pastries, cakes or biscuits? (Including condensed milk and ice cream). Mona ko jet retinal einwot chocolate, cakes, cookies, ice kuriim im ko jet?
SUGARY FOODS/ MONA KO RETONAL
[X] Other solid, semi-solid, or soft food? Mona ko jet rebidodo im ko jet rej jab kanuij in bin nan kani.
OTHER SOLID, SEMI-SOLID, OR SOFT FOOD
1
2 BD9
8 BD9
[X1] Record all other solid, semi-solid, or soft food that do not fit food groups above.
Moña ko jet im remaroñ eppen ak ko rejjab lukun pen?
(Specify)lukun kalikare ______________________________________
BD9. How many times did (name) eat any solid, semi-solid or soft foods yesterday during the day or night?
Ewõr jete katõn an (ET EO JEN 542) kar moña moña ko reppen, rejjab lukun eppen, ak ko rebiroro ilo aolepen raan eo inne jen jibuñ ñan jota
NUMBER OF TIMES/JETE ALEN .......................................................... _ DK/EJAB JELA UAAK EO ......................................................................
BD10. WHAT DO YOU THINK ABOUT HAND WASHING WITH SOAP? KOLAK BAJ
LALE EMMAN KE AM KARREOIKI PEID KIN DREN IM SOAP? (CAREGIVER)
Good/Emman .......................................................................... 1 Not good/Ejab emman ............................................................ 2 DK/Ejab jela…………………………………….3
BD11. AT WHAT TIMES DO YOU NORMALLY WASH YOUR HANDS WITH SOAP?
NEET EKKA AM KWALE PEUM KIN SOAP? (CIRCLE THE RESPONSES SPOKEN) DOULULI UAAK EO
Yes/Aet No/Jab Before eating/mokta jen mona 1 2 After using the toilet/mojen koherbal mon kepojak eo
1 2
Every time / regularly/aolep ien 1 2 Before cooking food/mokta jen koman mona
1 2
When I have diarrhea/ne ij naninmij in ilok loje
1 2
After working/mojin jerbal 1 2 When my hands look dirty/ne peiu ej etoon
1 2
After handling animals/elkin jebjeb menin mour ko
1 2
Don’t know/ejaje 1 2 Other (specify) /ebar wor ke……………………….
Module CH. Child Health
CH1. DID (NAME) RECEIVE A VITAMIN A DOSE WITHIN THE LAST SIX MONTHS? (ET EO) EAR KE EBBÕK UNOKAN VITAMIN A ILO 6 ALLON KO REJ JEMLOKLOK? Show common types of ampules / capsules / syrups ( kwalok jekjekin uno kein)
Yes/Aet .................................................................................... 1 No/Jab ..................................................................................... 2 DK/Jab jela .............................................................................. 8
CH2. IN THE LAST SEVEN DAYS, DID (NAME) TAKE IRON PILLS, OR IRON SYRUP
(LIKE THIS/ANY OF THESE)? ILO RAAN KO 7 KO REJ JEMLOK, (ET EO) EAR KE EBBÕK IRON PILL AK SYRUP
EINWÕT KEIN WALOK IJIN? Show common types of ampules / capsules / syrups/kwalok jekjekin uno kein
Yes/Aet .................................................................................... 1 No/Jab ..................................................................................... 2 DK/jab jela ............................................................................... 8
CH3. HAS (NAME) TAKEN ANY DRUG FOR INTESTINAL WORMS (DEWORMING) IN
THE LAST SIX MONTHS? (ET EO) EAR KE IDAAK UNOKAN MAJ KO ILO LOJE ILO ALLOÑ KO 6 REJ JEMLOK? SHOW COMMON TYPES OF PILLS
Yes/Aet .................................................................................... 1 No/Jab ..................................................................................... 2 DK/Jab jela .............................................................................. 8
CH4. In the last two weeks, has (name) had diarrhoea? (ET EO) ENAÑIN KE BIRORO AK ILOK LOJEN ILO WEEK KO RUO REJ JEMLOK?
YES/AET .................................................................................... 1NO/JAB ...................................................................................... 2 DK/JAB JELA ........................................................................... 8
2CH10 8CH10
CH5. I would like to know how much (name) was given to drink during the diarrhoea. This includes breastmilk, Oral Rehydration Salts, ORS and other liquids given with medicine.
During the time (name) had diarrhoea, was (he/she) given less than
usual to drink, about the same amount, or more than usual? If ‘less’, probe: Was (he/she) given much less than usual to drink, or somewhat less?
MUCH LESS/EJAB LAP ............................................................ 1SOMEWHAT LESS/EDIK .......................................................... 2ABOUT THE SAME/EBWE ........................................................ 3MORE/ELAPLOK ....................................................................... 4NOTHING TO DRINK/EJELOK .................................................. 5 DK/JAB JELA ........................................................................... 8

Imaron k jela ewi jonan am lelok den in draak nan (etan) ilo ien an ilok loje. Einwot ilo kaninin ak ORS ak dren ko ewor uno ie? Ilo ien eo ear ilok lojen, edrik an draak jen mokta ke, eja jonan eo wot ke, ak elaplok jen mokta?
Ne “edrik” bar etale; Edriklok an draak dren jen mokta, ak enwot
edriklok.
CH6. During the time (name) had diarrhoea, was (he/she) given less than usual to eat, about the same amount, more than usual, or nothing to eat?
If ‘less’, probe: Was (he/she) given much less than usual to eat or somewhat less? Ilo ien eo (ET EO) ear ilok lojen ak biroro, ewi joñan kar lelok kijen:
eddiklok jen joñan eo ekkã am kijoñ naajdiki ke, ejja joñan eo ekkã am kijoñ naajdiki ke, elaplok jen joñan eo ekkã am kijoñ naajdiki ke, ejelok moña en lelok nañe?
ELAÑE EDDIKLOK, ETALE: Elap an dik jen joñan eo ekkã am naajdiki
ke, ebwe an dik?
MUCH LESS/EDIK ..................................................................... 1SOMEWHAT LESS/JIDIK .......................................................... 2ABOUT THE SAME/EBWE ........................................................ 3MORE/ELAPLOK ....................................................................... 4STOPPED FOOD/DRIKE MONA ............................................... 5NEVER GAVE FOOD/EAR JAB MONA ..................................... 7 DK/JAB JELA ........................................................................... 8
CH7. Did you seek any advice or treatment for the diarrhoea from any source?
EWÕR KE JIKIN EN KWAR KABBOK JIBAÑ AK UNOKAN BIRORO IE?
YES/AET .................................................................................... 1NO/JAB ...................................................................................... 2 DK/JAB JELA ........................................................................... 8
2CH9 8CH9
CH8. Where did you seek advice or treatment? Probe: Anywhere else? Ia eo kwar kabbok jibañ ak uno ie? Ebar ke wõr jikin? Circle all providers mentioned, but do not prompt with any suggestions.
Doululi uaak eo Probe to identify each type of provider. If unable to determine if public or private sector, write the name of the
place and then temporarily record ‘X’ until you learn the appropriate category for the response. Elane ejab alikar etan jikin ak ia eo, ekwe je etan ijo ak bujon eo
_____________________________________________________ (Name of place) Etan jikin eo
GOV'T MEDICAL FACILITY MAJURO HOSPITAL.. A EBEYE HOSPITAL B OUTER ISLAND HEALTH CENTER/ DISPENSARY C MOBILE CLINIC D PRIVATE MEDICAL FACILITY . . . E SHOP F LOCAL HEALER G OTHER _________________________ X (SPECIFY)
CH9. During the time (name) had diarrhoea, was (he/she) given: Ewõr ke ian dren ak uno kein elããjrak ijin ilal kar lelok ñan ajiri eo ilo
tõre eo ear jino an ilok lojen ak biroro [A] A fluid made from a special packet called insert local name
for ORS packet solution? Uno bouta ilo package im kwõj iiõke ibben dren ñan jibañ bõbrae an
mõrã enbwinin (ORS)? [B] A pre-packaged ORS fluid called insert local name for pre-
packaged ORS fluid? Uno dren eo im edredrelok iiõke ñan bõbrae an mõrã enbwinin
(einwõt electro-lite, ORS)? [C] A government recommended homemade fluid? Iiõk ko im letok jen Kien eo im komaroñ kõmmane imweo im ej jibañ
bõbrae an mõrã enbwinnin? [D] Zinc supplementation?
Y N DK
FLUID FROM ORS PACKET ....................................... 1 2 8 PRE-PACKAGED ORS FLUID ..................................... 1 2 8 GOVERNMENT RECOMMENDED HOMEMADE FLUID1 2 8 ZINC ........................................................................... 1 2 8
CH10. At any time in the last two weeks, has (name) been ill with a fever?
YES/AET ...................................................................................... NO/JAB ........................................................................................ 2

(ET EO) EAR KE NAÑINMEJ KIN FEVER ILO JABREWÕT IEN ILOAN WEEK KO RUO
REJ JEMLOK? DK/JAB JELA ............................................................................. 8
CH11. At any time in the last two weeks, has (name) had an illness with a cough? (ET EO) EAR KE NAÑINMEJ IN POKPOK ILO JABREWÕT IEN ILOAN WEEK KO RUO
REJ JEMLOK?
YES/AET ...................................................................................... NO/JAB ........................................................................................ 2 DK/JAB JELA ............................................................................. 8
CH12. At any time in the last two weeks, has (name) had fast, short, rapid breaths or difficulty breathing? ILO IEN AN (ET EO) EAR BÕK NAÑINMEJ IN POKPOK, EMAKIJKIJ IM KADU JETÑAK
IN AN MENONO KE, E BON AN MENONO KE?
YES/AET ...................................................................................... NO/JAB ........................................................................................ 2 DK/JAB JELA ............................................................................. 8
2CH14 8CH14
CH13. Was the fast or difficult breathing due to a problem in the chest or a blocked or runny nose? ILO AN EMAKIJKIJJ IM KADU JETÑAK IN AN MENONO, EJ ITOK JEN PROBLEM IN OB
KE JEN AN BON IM TOR BOTIN?
PROBLEM IN CHEST ONLY/JORREN ILO UPON ...................... BLOCKED OR RUNNY NOSE ONLY/EBON AK IUR BOTIN ....... 2 BOTH/AOLEP MEN KEIN ............................................................ 3 OTHER (SPECIFY)/KO JET .................................................... 6 DK/JAB JELA ............................................................................. 8
CH14. THE LAST TIME (NAME) PASSED STOOLS, WHAT WAS DONE TO DISPOSE OF
THE STOOLS? ELIKTATA IN AN KAR KEPOJAK (BIJOK)EWI WAWEIN AM KAR JOLOK BWIDREJ EO
AN?
CHILD USED TOILET / LATRINE/MON KEPOJAK EO ............ 0PUT / RINSED INTO TOILET OR LATRINE/JAUNI ILO MON KEPOJAK EO ...................... 02PUT / RINSED INTO DRAIN OR DITCH .................................... 03THROWN INTO GARBAGE (SOLID WASTE)JOLOK ILO NIEN KOPEJ KO ..................... 04BURIED/KALBINI ....................................................................... 05LEFT IN THE OPEN/KOJERBAL IJOKO REJERWAWA ......... 06PUT/RINSED IN THE OCEAN…………………..97 OTHER (SPECIFY)/WEWEIN KO JET .................................. 96 DK/JAB JELA.......................................................................... 98
ANTHROPOMETRY MODULE INFORMATION PANEL
AN1. Cluster number: ___ ___ ___ AN2. Household number: __
AN3. Child’s name and line number: NAME/ETAM ____________________________________________ ___ ___
AN4. Child’s age from UB2: AGE/YIO (IN COMPLETED YEARS) ...............................................................
AN5. Mother’s / Caregiver’s name and line number: Etan jinen/rikokajiriri eo NAME/ETAM ______________________________________________ ___ ___
AN6. Interviewer’s name and number: NAME/ETAM ____________________________________________ ___ __
ANTHROPOMETRY
AN7. Measurer’s name and number: NAME
AN8. Child Weight Eddo in ajiri eo Record the result as read out by the Measurer: Je jona eddo eo Read the record back to the Measurer and also ensure that he/she verifies
your record.
KILOGRAMS (KG)/EDDO IN ....................................... CHILD NOT PRESENT/EJAKO AJIRI EO ..................CHILD REFUSED/MAKOKO IN PAUN .......................RESPONDENT REFUSED ......................................... OTHER (specify) _____________________________
99.3AN13 99.4AN10 99.5AN10 99.6AN10
AN9. Was the child undressed to the minimum?Ajiri eo ekar ke utikik nuknuk ko an ilo ien an paun?
YES/AET .....................................................................NO, THE CHILD COULD NOT BE UNDRESSED TO THE MINIMUM/JAB
KONAAN .................................................................
AN10. Check AN4: Child’s age? Dettan ajiri eo?
AGE/YIO 0 OR 1 .........................................................AGE/YIO 2, 3 OR 4 .....................................................
1AN11A 2AN11B

AN11A. Child Height/Length. Aetokan ajiri eo? The child is less than 2 years old and should be measured lying down. Record
the result as read out by the Measurer: Jone aetokan ilo an babu elane ajiri eo edik jen 2 yio dettan Read the record back to the Measurer and also ensure that he/she verifies
your record.Kwalok jonan aetokan ajiri eo nan rijeje eoim bwe en bar kamole aetokan
AN11B. The child is at least 2 years old and should be measured standing up.
Record the result as read out by the Measurer: Ajiri eo en jutak ilo am jone aetokan elane 2 an yio im lonlok
Read the record back to the Measurer and also ensure that he/she verifies
your record. Kwalok jonan aetokan ajiri eo bwe rijeje eo en jeiki im kamole
LENGTH / HEIGHT (CM) ...................................... __ CHILD REFUSED .......................................................RESPONDENT REFUSED ......................................... OTHER (specify) _____________________________
999.4AN13 999.5AN13 999.6AN13
AN12. How was the child actually measured? Lying down or standing up? Ewi wewein an kar ajiri eo jonok? Babu ke jutak?
LYING DOWN/BABU ..................................................STANDING UP/JUTAK ...............................................
AN13. Child MUAC Record the result as read out by the Measurer: Read the record back to the Measurer and also ensure that he/she verifies
your record. Kwalok jonan bwe rijeje eo ej jeiki ilo an rijonjon eo lale im kamole
MUAC (MILLIMETERS) ___ ___ ___ . ___ CHILD NOT PRESENT/EJAKO ..................................CHILD REFUSED/EMAKOKO ....................................RESPONDENT REFUSED/JINEN EJAB KONAN ...... OTHER (specify) .........................................................
999.3AN13 999.4AN10 999.5AN10 999.6AN10
AN14. Access the child for bilateral oedema. Etale im lale ebboj ke enbwinin ajiri eo.
Does the child have bilateral oedema? Ebboj ke enbwinin ajiri eo?
YES/AET ..................................................................... NO/JAB .......................................................................
AN15. Today’s date: Day/raan / Month/allon / Year/yio: ___ ___ /___ ___ / 2 0 1 ___
AN16. Is there another child under age 5 in the household who has not yet been measured? Ebar work e ajiri imwin yio eo an edik jen 5 yio ak ejanin jone aetokan?
YES/AET ..................................................................... NO/JAB ......................................................................
1Next Child
AN17. Thank the respondent for his/her cooperation and inform your Supervisor that the Measurer and you have completed all the measurements in this household. Lelok kamolol nan armij eo im kenanik jupervijor eo am ke emoj an dedelok jerbal on jonok eo
UF11. Record the time. Je awa eo HOURS AND MINUTES ........................................ __ __ : __
UF16. Check columns HL10 and HL20 in LIST OF HOUSEHOLD MEMBERS, HOUSEHOLD QUESTIONNAIRE: Is the respondent the mother or caregiver of
another child age 0-4 living in this household? Armij eo kwar kajitikini ilo mweo ejjinen ajiri eo ke ta rikokajiriri eo Yes/Aet Go to UF17 on the UNDER-FIVE INFORMATION PANEL and circle ‘01’. Then go to the next QUESTIONNAIRE FOR CHILDREN UNDER
FIVE to be administered to the same respondent. No/jab Go to UF17 on the UNDER-FIVE INFORMATION PANEL and circle ‘01’. Then end the interview with this respondent by thanking her/him for
her/his cooperation. Check to see if there are other questionnaires to be administered in this household.
QUESTIONNAIRE FOR MOTHERS OF CHILDREN 0-59 MONTHS OF AGE Republic of the Marshall Islands National Nutrition Survey 2017
WOMAN’S INFORMATION PANEL WM
WM1. Cluster number: ___ ___ WM2. Household number: ___

WM3. Woman’s name and line number: ( NAME ___________________________________________________ ___
WM4. Team Leader’s name and number: NAME _______________________________________________ ___ ___
WM5. Interviewer’s name and number: NAME _______________________________________________ ___ ___
WM6. Day / Month / Year of interview: (raan/allon/iio) ___ ___ /___ ___ / _2_ _0_ _1_
WM7. Record the time:
HOURS : MINUTES
__ __ : __ __
WM8. Check completed questionnaires in this household: Have you or another member of your team interviewed this respondent for another questionnaire?
YES, INTERVIEWED ALREADY ...............................NO, FIRST INTERVIEW ............................................
1WM9B 2WM9A
WM9A. Hello, my name is (your name). We are from National Statistical Office. We are conducting a survey about the situation of children, families and households. I would like to talk to you about your health and other topics. This interview usually takes about number minutes. We are also interviewing mothers about their children. All the information we obtain will remain strictly confidential and anonymous. If you wish not to answer a question or wish to stop the interview, please let me know. May I start now?
WM9B. Now I would like to talk to you about your health and other topics in more detail. This interview will take about number minutes. Again, all the information we obtain will remain strictly confidential and anonymous. If you wish not to answer a question or wish to stop the interview, please let me know. May I start now?
YES, PERMISSION IS GIVEN ..........................................................................NO, PERMISSION IS NOT GIVEN ...................................................................
1WOMAN’S BACKGROUND Module 2WM17
WM17. Result of woman’s interview. Discuss any result not completed with Supervisor.
COMPLETED ...............................................................................................NOT AT HOME .............................................................................................REFUSED .....................................................................................................PARTLY COMPLETED ................................................................................. INCAPACITATED (specify) ______________________________________ OTHER (specify) ______________________________________________
MODULE WB: WOMAN’S BACKGROUND (KADKADIN KORA EO)
WB1. HOW LONG HAVE YOU BEEN LIVING CONTINUOUSLY IN (NAME
OF CURRENT PLACE OF RESIDENCE)? EWI AETOKAN AM KAR JOKWE AK BED? JE ETAN JIKIN
EO:(_______________) IF LESS THAN ONE YEAR, RECORD ‘00’ YEARS. NE EDRIK JEN JUON
YIO, LIKIT “00”
YEARS(YIO)…………………………………
ALWAYS…………………………………………95 ( AOLEP IEN) VISITOR…………………………………………96 ( RI-LOTOK)
95 WB3 96 WB3
WB2.JUST BEFORE YOU MOVED HERE, IN WHAT ISLAND/ATOLL AND
ISLET DID YOU USUALLY RESIDE? MOKTA JEN AM KAR JOKWE
IJIN, IA EO EKKA AM KAR JOKWE AK BED IE?
WRITE THE NAME OF THE ATOLL/ISLANDS AND ISLET. ( JE ETAN
ENE AK AETO EO) (SPECIFY) _____________
DIFFERENT ATOLL/ISLAND ………………
SAME ATOLL, DIFFERENT ZONE ………..94 SAME ATOLL, DIFFERENT ISLET………...95 OVERSEAS ………………………………….96
WB3. IN WHAT MONTH AND YEAR WERE YOU BORN? ALLOÑ IM YIO TA
EO KWAR LOTAK IE?
MONTH . . . . . . . . . . . . . . . . . DON'T KNOW MONTH . . . . . . . . . . . 98
YEAR . . . . . . . . . . . DON'T KNOW YEAR . . . . . . . . . . . 9998
WB4. HOW OLD WERE YOU AT YOUR LAST BIRTHDAY? JETE AM
YIO ILO KAR BIRTHDAY EO ELIKTATA?
AGE IN COMPLETED YEARS
WB. HAVE YOU EVER ATTENDED SCHOOL? KONAÑIN KE KAR BED ILO JIKUUL?
YES (AET) . . . . . . . . . . . . . . . . . . . . . . . . . . . 1 NO (JAB) . . . . . . . . . . . . . . . . . . . . . . . . . . .2

WB5. WHAT IS THE HIGHEST LEVEL OF SCHOOL YOU ATTENDED: ELEMENTARY, SECONDARY, OR HIGHER?
TA LEBAL EO ILONTATA KWAR BED IE, ELMENTORE, SECONDORE, AK LABEL KO ILONLOK?
ELEMENTARY . . . . . . . . . . . . … . . . . . . 01 HIGH SCHOOL . . . . . . . . . . . . . . . …... . 02 VOCATIONAL . . . . . . . . . . . . . . . . . . …. 03 SOME COLLEGE . . . . . . . . . . . . . …… . 04 ASSOCIATE DEGREE . . . . . . . . . . . .. . 05 BACHELOR'S DEGREE . . . . . . . . . . ... 06 MASTER'S DEGREE . . . . . . . . . . . . …..07 PROFESSIONAL DEGREE . . . . . . ….. 08 DOCTORATE DEGREE . . . . . . . . . ……09. DON'T KNOW . . . . . . . . . . . . . . . . . ….. 98
WB6. WHAT IS THE HIGHEST (GRADE/YEAR) YOU COMPLETED AT
THAT LEVEL? TA LABEL EO ILONTATA(KILAAJ/YIO) KWAR
KAMOJE?
GRADE/YEAR (CLASS JETE IM YIO TA) . . . . . . .
WB7. CHECK WB5 FOR HIGHEST LEVEL OF SCHOOL ATTENDANCE. LALE WB5 IM LALE LABEL IN JIKUUL EO ILONTATA EAR BED IE.
ELEMENTARY………..…………………………….1 HIGH SCHOOL OR HIGHER……..………………….2
1WB8 2MA1
WB8. NOW I WOULD LIKE YOU TO READ THIS SENTENCE TO ME. KIO
KOMARON K RITI TOK NAAN KEIN. SHOW SENTENCE ON THE CARD TO THE RESPONDENT.IF
RESPONDENT CANNOT READ WHOLE SENTENCE, PROBE: CAN YOU
READ PART OF THE SENTENCE TO ME? KOMAROÑ KE RIITI TOK JET AK JIDIK IN WÕT NAAN KEIN?
CANNOT READ AT ALL ( EJAB MARON RIIT) 1 ABLE TO READ ONLY PARTS OF SENTENCE (MARON RIITI WOT JET IAN JEJE KEIN) 2 ABLE TO READ WHOLE SENTENCE ( MARON RIITI AOLPEN JEJE KEIN) 3
NO SENTENCE IN REQUIRED LANGUAGE
(SPECIFY) 5 BLIND/VISUALLY IMPAIRED ( EBILO IM EJJAB EMMAN AN
RIIT)………………………………… .6
TH
WB9 HAVE YOU EVEN PARTICIPATED IN A LITERACY PROGRAM OR
ANY OTHER PROGRAM THAT INVOLVES LEARNING TO READ OR
WRITE (NOT INCLUDING ELEMENTARY SCHOOL)? KONAÑIN KE KAR BÕK KONAM AK BED ILO PIROKIRAAM ÑAN BUKOT
JELALOKJEN AK PROKIRAAM KO JET IM REJ KATAKIN KILEN RIIT
IM JEJE JIMOR (IJELOKIN ELEMENTARY JIKUUL)?
YES (AET) . . . . . . . . . . . . . . . . . . . . . . . . . . . 1 NO (JAAB) . . . . . . . . . . . . . . . . . . . . . . . . . . . 2
MODULE MA. MARITAL STATUS
MA1. WHAT IS YOUR MARITAL STATUS? KONANIN KE MARE? JEBEL? EMOUR KE LEO IPPAM?
NEVER MARRIED– 1 COMMON/CURRENTLY MARRIED – 2
SEPARATED – 3 DIVORCED – 4 WIDOWED – 5
COHABITATING – 6
1MA3 5MA7
MA2. HOW OLD IS YOUR (HUSBAND/PARTNER)? JETE AN LEO BELELE/MÕTTAM YIO? PROBE: HOW OLD WAS YOUR (HUSBAND/PARTNER) ON HIS
LAST BIRTHDAY?
AGE IN YEARS (DRETTAN) __ __
DK 98
MA3. IS THE FATHER OF YOUR CHILD LIVING WITH YOU NOW OR IS HE
STAYING ELSEWHERE? JEMEN AJIRI NE NEJIM EJ KE JOKWE
IPPAM KIO KE BAR JUON JIKIN?
LIVING WITH HER (JOKWE IPPEN) – 1 STAYING ELSEWHERE( EJAB JOKWE IPPEN) – 2
1MA6 2MA4
MA4. IF HE LIVES ELSEWHERE, WHERE DOES THE FATHER OF THE
CHILD RESIDE? NE EJAB JOKWE IPPAM, EJ JOKWE ITU IA?
ABROAD( LIKIN MAJOL) – 1 ON ANOTHER ATOLL( AELON KO JET)– 2
IN SAME ATOLL BUT DIFFERENT TOWN(ENIIN WOT?)– 3 IN HOMETOWN(MOKO MON)– 4
OTHER (SPECIFY:______________________) – 88
MA5. WHY DO YOU LIVE SEPARATELY FROM THE FATHER OF THE
CHLID? ETKE EJENOLOK JIKIN AMIRO JOKE JEN JEMAN?
WORK OPPORTUNITIY – 1 EDUCATION OPPORTUNITY – 2
SEPARATED/DIVORCED/NEVER MARRIED– 3 OTHER (SPECIFY:____________________) – 88
MA6. RECORD THE FATHER’S NAME AND LINE NUMBER FROM THE
HOUSEHOLD QUESTIONNAIRE.(JE ETAN JEMEN JEN HOUSEHOLD
FORM NE) IF FATHER DOES NOT LIVE IN HOUSEHOLD, RECORD ‘00’. NE JEMAN
EJAB JOKE MWIN LIKIT ‘”0”
NAME(ETAN) __________________________
LINE NUMBER( NOMBA IN ID) __ __

MA7. IN WHAT MONTH AND YEAR DID YOU ENTER THE UNION WITH
YOUR (HUSBAND/PARTNER)? ALLON IM YIO TA EO KWAR JINO AM JOKWE AK BED IM JOKWE IBBEN
LEO PELEEM KEIN KAJOUN?
DATE OF (FIRST) MARRIAGE MONTH __ __
DK MONTH 98 YEAR __ __ __ __
DK YEAR 9998
Module CM. Fertility/Birth History
CM1. Now I would like to ask about all the births you have had during your life. How many children have you given birth to?
Kiõ imaron k kajitõkin yok kin jet kajitõk ko ikijen aolep
ajiri ro nejim. Jej kenono kin aolep ajiri ro me lukkun nejim im jab ajiri ro kwar kakaajririki er.
This module and the birth history should only include
children born alive. Any stillbirths should not be included in response to any question. ( kajitok wot ikijien ajiri ro remour im ejab ro emoj aer jako ak mij)
Number of live births _____________________________ ( Jete nejim ajiri emour?)
CM2. Are you pregnant now? Kwõj bõroro ak nañinmej ke kiiõ?
YES NO
UNSURE
1CM3
2MN1
3MN1
CM3. How many weeks or months pregnant are you? Jete am alloñ kiiõ? RECORD NUMBER OF COMPLETED WEEKS OR MONTHS
Only.
Weeks (wiik)………………………………
MONTHS (allon) . . . . . . . . . . . . . . . . .
Module MN. Maternal and Newborn Health
This module is to be completed for each child under 2 years of age. Mothers with more than one child under 2 years of age should be asked to complete a separate module for each child. Check the household list (HL5 and HL6) for all children under 2 years of age in the household. The child’s date of birth should be after (month), 2015. If the child is born on the same month as today in 2015, they should be included in this module.
MN1. Do you have a child/children under 2 years of age? Elon ke nejim ajiri yio eo an ele ilalin 2?
Copy name and child’s number from the household list. Je
etan kab nomba eo an ajiri eo jen list in eo ilo Household form eo)
YES ...............................................................................................NO .................................................................................................
Name _______________________________________________
Child’s number _________________________
1MN2. 2Check
against HL5 and HL6 in the Household Questionnaire. If child is older than 23 months, proceed to Module AN1.
MN1a. Is (name) an adopted child? YES ...............................................................................................NO .................................................................................................
1MN14
MN2. Did you see anyone for antenatal care during your pregnancy with (name)?
Ewõr ke en kwar lolok ak takto ippen ke kwar buroro kin
________________ (etan ajiri eo)?
YES ...............................................................................................NO .................................................................................................
2MN7
MN3. Whom did you see? Probe: Anyone else? Wõn eo kwar lolok ak takto ippen? Ebar ke wõr? PROBE FOR THE TYPE OF PERSON SEEN AND CIRCLE ALL ANSWERS
GIVEN.( KAJITIKINI WON IM TITLE ROT EO AN ARMIJ EO EAR TAKTO
IPPEN)
HEALTH PROFESSIONAL DOCTOR( TAKTO) .................................................................... NURSE / MIDWIFE .................................................................... HEALTH ASSITANCE/PERSONNEL .........................................
OTHER PERSON TRADITIONAL BIRTH ATTENDANT( RIKEMOUR IN
AELON KEIN RO) ...................................................................... LOCAL HEALER ........................................................................
OTHER (specify) ______________________________________

MN4. Where did you receive prenatal care for this pregnancy Ia eo kwar takto in kurae ie ilo ien eo kwar bõroro ? Anywhere else? ebar ke wor? Probe to identify types of sources and circle the appropriate
codes. Kajitokini elane ekar takto ijoko jet ijelokin hospital eo.
If unable to determine if facility is public or private, write the
name of the place. Je etan ijo ear takto ie)
YOUR HOME( MWEO) . . . A OTHER HOME ( MON BAR JET ARMIJ). . . B
GOV'T MEDICAL FACILITY MAJURO HOSPITAL C
EBEYE HOSPITAL D OUTER ISLAND HEALTH CENTER/
DISPENSARY E PRIVATE . . . . . F
OTHER _________________________ X
(SPECIFY)
MN5. How many weeks or months pregnant were you when you first received antenatal care for this pregnancy?
Jete am alloñ ke kwar jino takto in kurae ke kwar Bororo? Record the answer as stated by respondent. (Je uaak eo einwot an kora eo ba)
WEEKS (WIIK) ..............................................................................
MONTHS ( ALLON) .......................................................................
DK( EJAB JELA) .......................................................................... 9
MN6. How many times did you receive antenatal care during this pregnancy?
Jete allen am takto in kurae ke kwar Bororo ak ilo kar ien
bõroro in? Probe to identify the number of times antenatal care was
received. If a range is given, record the minimum number of times antenatal care received. En lukun alikar jete katton an kar takto in kurae
NUMBER OF TIMES( JETE ALEN) .......................................... __
DK(EJAB KEMEMEJ) ....................................................................
MN7. During this pregnancy, were you given or did you buy any vitamin or mineral tablets or syrup? Ilo am kar Bororo takto ro rar lewaj ke kwar wia nimom uno in vitamin, minerals ak uno ko naetaer OON?
SHOW TABLETS/SYRUP( kwaloki bwe rijerbal ro ren lali)
YES(aet) . . . . . . . . . . . . . 1 NO(jab) . . . . . . . . . . . . . 2
DON'T KNOW(ejaje) . . . . . 8
1MN8 2MN10 8MN10
MN8. If yes, what type of vitamin or mineral tablets or syrup did you take? Tick all that apply. ( Ne ear wor nimom uno, kain rot ian uno kein ijin?
Iron – 1 Iron/folic acid tablet – 2
Folic acids – 3 Mixed vitamin/mineral with iron – 5
Other (specify:______________) – 88
MN9. During the whole pregnancy, for how many days did you take the tablets or syrup? (Ilo aolepen tõre in bõroro eo, jete raan in am kar bõk uno kein?) IF ANSWER IS NOT NUMERIC, PROBE FOR APPROXIMATE NUMBER OF DAYS.( Elane ejab alikar innem je oran raan in an kar idaak uno kein)
days Don’t know / not answered – 77
MN10. DURING THIS PREGNANCY, DID YOU TAKE ANY DRUG FOR
INTESTINAL WORMS? (ILO TÕRE IN BÕRORO IN, EWÕR KE UNO IN MAJ EN KWAR IDAAK?)
YES . . . . . . . . . . . . . 1 NO . . . . . . . . . . . . . 2
DON'T KNOW . . . . . 8

MN11. Who assisted with the delivery of (name)? Wõn eo ear jibañ keotake (ET EO)? Probe: Anyone else? Ebar ke wõr? Ta kadkadin armij eo ear jiban kolotak eok. Probe for the type of person assisting and circle all answers
given.
HEALTH PROFESSIONAL DOCTOR ................................................................................... NURSE / MIDWIFE .................................................................... HEALTH ASSITANT/PERSONNEL ...........................................OTHER PERSON TRADITIONAL BIRTH ATTENDANT ......................................... LOCAL HEALER ........................................................................
OTHER (specify) ______________________________________NO ONE ........................................................................................
MN12. Where did you give birth to (name________)? Ia eo im kwar keotake (ET EO) ie? Probe to identify the type of place. If unable to determine whether public or private, write the
name of the place and then temporarily record ‘96’ until you learn the appropriate category for the response.( Je etan jikin eo kwar kolotak ie )
__________________________________________________
Etan jikin eo (Name of place)
YOUR HOME . . . A OTHER HOME . . . B
GOV'T MEDICAL FACILITY MAJURO HOSPITAL.. C
EBEYE HOSPITAL D OUTER ISLAND HEALTH CENTER/
DISPENSARY E PRIVATE . . . . . F
OTHER _________________________ X
(SPECIFY)
MN13. Was (name) delivered by caesarean section? Rar ke mwijiti lojem im kwalok ninnin eo nejim? (Et
eo____________)?
YES ...............................................................................................NO .................................................................................................
MN14. Was (name) weighed at birth? (Et eo________) ear ke boun elkin an lotak?
YES ...............................................................................................NO .................................................................................................
DK .................................................................................................
2MN15 8MN15
MN15. How much did (name) weigh? Ewi joñan eddro eo an (Et eo__________) If a card is available, record weight from card. ( lale eddo eo
an ajiri eo ilo yellow card eo an)
FROM CARD ( LALE YELLOW CARD) ............. 1 (KG) __ . __ __
FROM RECALL ................................................. 2 (KG) __ . __ __
DK ........................................................................................... 999
MN16. Did you ever breastfeed (name)? Konañin ke kar kaninnini (Et eo___________)?
YES ...............................................................................................NO .................................................................................................
2MN18.
MN17. How long after birth did you first put (name) to the breast?
Ewi toan jen ien lotak eo im kwar jino am kaninnin (ET EO) ilo ittum? If less than 1 hour, record ‘00’ hours.( dik jen 1 awa) If less than 24 hours, record hours. ( iloan 24 awa) Otherwise, record days. ( ne ejab ekwe jete raan innem ejino
ninnin)
IMMEDIATELY ............................................................................ 0
HOURS ................................................................................ 1 __
DAYS ................................................................................... 2 __
DK / DON’T REMEMBER ............................................................ 9
MN18. In the first three days after delivery, was (name) given anything to drink other than breast milk?
Ilo raan ko jilu elkin an lotak, ekar ke idak milk ak dren ko jet ijelokin milk in ittumt ñan (ET EO___________)?
YES ...............................................................................................NO .................................................................................................
1MN19 2AN1

MN19. In the first three days after delivery, what was (name) given to drink?
Dren rõt eo (ET EO) ear idaak ilo raan ko jilu imaan elkin an kar lotak?
Probe: Anything else? Ebar ke wõr? ‘Not given anything to drink’ is not a valid response and response category Y cannot be circled. ( jab doululi uaak eo elane ninnin eo ejelok men en ear idaak ilo raan ko jilu imaan elkin an kar lotak)
MILK (OTHER THAN BREAST MILK) ........................................... ( MILK KO JET IJELOKIN DRENIN ITTUM) PLAIN WATER .............................................................................. (AEBOJ SUGAR OR GLUCOSE WATER ................................................... ( DEN KO RETONAL) GRIPE WATER .............................................................................SUGAR-SALT-WATER SOLUTION...............................................FRUIT JUICE ................................................................................INFANT FORMULA .......................................................................TEA / INFUSIONS / TRADITIONAL HERBAL PREPARATIONS ...HONEY..........................................................................................PRESCRIBED MEDICINE .............................................................
OTHER (specify) ______________________________________
NOT GIVEN ANYTHING TO DRINK ..............................................
Modulde DD. Maternal Minimum Dietary DIversity
Yesterday during the day or at night, did you eat or drink:
Code
Food Category Consumed
DD1 Any foods made from grains, like: Porridge, bread, rice, pasta/noodles or other foods made from grains ( kwar ke mona inne ak bon mona kein einwot jokkop in rice, pilawe, rice, ramen ak mona jet nan kokajuur enbwinid)
___ yes (1) ___ no (0)
DD2 Any vegetables or roots that are orange- coloured inside, like: Pumpkin, carrots, squash or sweet potatoes that are yellow or orange inside ( kwar ke mona men kein inne ak bon einwot paanke, carrot, potato tonal ako ko jet elap an yellow ak orange kilier)
___ yes (1) ___ no (0)
DD3
Any white roots and tubers or plantains, such as: White potatoes, white yams, turnip, manioc/cassava/yucca, cocoyam, taro or any other foods made from white-fleshed roots or tubers, or plantains( kwar ke mon men kein jota ak bon einwot iaaraj, potato ne emouj loan yam, cassava ako mona kane einlok wot iaraj?
___ yes (1) ___ no (0)
DD4
Any dark green leafy vegetables, such as: Chinese cabbage, local green leafy varieties, spinach, water spinach, Broccoli, Beet greens, Arugula, collard greens, Kale, Mustard greens, or dark lettuce( kwar ke mona men kein einwot broccoli, bulokin cabbage ako ko jet elap an maroro bolok ko bolokier?
___ yes (1) ___ no (0)
DD5
Any fruits that are dark yellow or orange inside, like: Ripe mango, ripe papaya, apricots, cantaloupe, passion fruit, peaches, persimmon, tree tomato( kwar ke mona men kein einwot mango emmed, papaya, cantaloupe, peaches ko remmed im kalo)
___ yes (1) ___ no (0)
DD6
Any other fruits: Apple, avocado, banana, blackberry, coconut flesh, watermelon, grapes, guava, honeydew melon, jackfruit, lemon, litchi, orange, plum, pineapple, blueberry, cherries, cranberry, dates, figs, grapefruit, pomelo, prune, raspberry, sapodilla, soursop, starfruit, strawberry, tamarind, tangerine ( kwar ke bareinwot mona men kein einwot apple, banana, lemon, lime, pineapples, strawberry, em fruits ko jet)
___ yes (1) ___ no (0)
DD7
Any other vegetables: Summer squash, green beans, cauliflower, cabbage, onion, bitter melon, fresh corn, eggplant, okra, radish, beets, asparagus, green pepper, jicama, leek, light green lettuces, Fresh peas, snow peas, snap peas, mushrooms, zucchini( kwar ke mona vegetables kein einwot squash, green beans, cauliflower, cabbage, onion, radish, im ko einlok wot kein?,
___ yes (1) ___ no (0)
DD8
Any meat made from animal organs, such as: Liver, kidney, heart or other organ meats or blood-based foods, including from wild game( kwar mona ke kaniek ko komman jen part ko an menin mour ko einwot aj, deka in jibke ko menono k, ako part ko jet)
___ yes (1) ___ no (0)
DD9
Any meat: Beef, pork, lamb, goat, rabbit, wild game meat, chicken, duck, other birds( Kwar mone men kein inne ak jota einwot kaniek in beef, pork, lamp ak sheep kobao, dak ak bao ko jet)
___ yes (1) ___ no (0)

DD10
Any eggs ( kwar ke mona men kein inne ak boneinwot lep ak men ko jet walok jen bao) Eggs from poultry or any other bird
___ yes (1) ___ no (0)
DD11
Any fish or seafood, whether fresh or dried (kwar ke mona men kein einwot eek ako mona ko jet walok jen lojet, remoaron mora ak tutu)
Fresh, frozen, canned or dried fish, shellfish or seafood
___ yes (1) ___ no (0)
DD12
Any beans or peas or lentils such as: (kwar ke mona men kein inne ak jota einwot beans, peas, ako ko eierlok wot) Mature beans or peas (fresh or dried seed), lentils or bean/ pea products, including hummus, tofu and tempeh
___ yes (1) ___ no (0)
DD13
Any nuts or seeds, like: ( kwar ke mona men kein einwot peanut, ako nut ko jet eierlok wot) Any tree nut, groundnut/peanut, or certain seeds or nut/seed “butters” or pastes
___ yes (1) ___ no (0)
DD14
Any milk or milk products, such as: Fresh milk, reconstituted powdered milk, evaporated milk or ultra high temperature (boxed) milk, cheese, yoghurt or other milk products, but NOT including butter, ice cream, condensed milk, cream or sour cream( kwar ke idaak den kein inne ak jota einwot carnation milk, fresh milk, mona cheese, yogurt ako ko jet komman jen milk)
___ yes (1) ___ no (0)
DD15 Any insects or other small protein foods, including: Insects, insect larvae/grubs, insect eggs and land and sea snails( kwar ke nemak ak mona men kein inne tok nan bon einwot lipen lon ko, kinal ko, snail ako keo jet eierlok wot kein)
___ yes (1) ___ no (0)
DD16 Any red palm oil ( kwar ke mona kain en emoj komman im kere kin red palm oil inne tok nan bon?)
___ yes (1) ___ no (0)
DD17
Any oils and fats Oil, fats or butter added to food or used for cooking, including extracted oils from nuts, fruits and seeds, and all animal fat( kwar ke mona kain mona rot ne emoj kere kin butter ako oil kan rej komat mona kaki inne tok nan bon)
___ yes (1) ___ no (0)
DD18
Any savoury and fried snacks, such as: Crisps and chips, fried dough,puffs, samosas, corn tortilla chips, cassava chips, other fried snacks( kwar ke mon kain en an chip kane einwot potato chip, ma chip em kain kan jet eierlok wot)
___ yes (1) ___ no (0)
DD19
Any sweets, such as: Sugary foods, such as chocolates, candies, sweetened condensed milk, cookies/sweet biscuits and cakes, sweet pastries or ice cream (kwar ke mona men rot en etonal einwot ice cream, chocolate, candies, cookies ak ko jet eierlok wot)
___ yes (1) ___ no (0)
DD20
Any sugar-sweetened beverages, like: Sweetened fruit juices and “juice drinks”, soft drinks/fizzy drinks, chocolate drinks, malt drinks, yoghurt drinks, sweet tea or coffee with sugar( Elon ke dren tonal kwar idraak inne tok nan bon einwot cola, juice chocolate milkcoffee im dren ko jet retonal)
___ yes (1) ___ no (0)
DD21
Any condiments and seasonings, such as: Ingredients used in small quantities for flavour, such as chilies, spices, herbs, fish powder, tomato paste, flavour cubes or seeds (Elon ke mona rot en raar kereiki kin kein kere mona einwot chillies, tomato paste, spices ak kere ko rebwil inne tok nan bon)
___ yes (1) ___ no (0)
DD22
Any other beverages Tea or coffee if not sweetened, clear broth, all types of alcohol.( Elon ke bar jet kain dren kwar idaak jen inne tok nan bon einwot arkool, (aolep kain arkool) tea ak coffeeim ko jet)
___ yes (1) ___ no (0)
Household Food Insecurity Access Scale
1. IN THE PAST FOUR WEEKS, DID YOU WORRY THAT YOUR HOUSEHOLD
WOULD NOT HAVE ENOUGH FOOD? ( IUMIN WIIK KO EMEN REJ
MOOTLOK, EWOR KE AM KAR EKKOL KE EMARON KAR ETAL IM JABWE
MONA ILO MWEO)
0 = No (skip to Q2) 1=Yes
1a. How often did this happen?
( Ewi ikutkut in an walok jekjek in ilo mweo)
1 = Rarely (once or twice in the past four weeks)
2 = Sometimes (three to ten times in the past four weeks)
3 = Often (more than ten times in the past four weeks)

2. In the past four weeks, were you or any household member not able to eat the kinds of foods you preferred because of a lack of resources? ( Iumin wiik ko emen rej mootlok, ewor ke iami ilo mwiin ekar jab maron mona men ko rekonaan kani kin an jabwe ak ejelok kein bukitok ak wiakitok)
0 = No (skip to Q3) 1=Yes
2a. How often did this happen?
( Ewi ikutkut in an walok wewein in)
1 = Rarely (once or twice in the past four weeks) (Ejeja-1 ak 2 alen iumin 4 wiik) 2 = Sometimes (three to ten times in the past four weeks) (Jet ien-3-10 alen iiumin 4 wiik)
3 = Often (more than ten times in the past four weeks) ( ekutkut- elon lok jen 10 alen iumin 4 wiik)
3. In the past four weeks, did you or any household member have to eat a limited variety of foods due to a lack of resources? ( Iumin wiik ko emen rej mootlok kwe ako ro jet imwiin kar ke mona im ajeej bwe aolep ren bwe im wor kijeer kin an dik mon aim aban tok)
0 = No (skip to Q4) 1 = Yes
3a. How often did this happen? (Ewi emakijkij an walok wewein in)
1 = Rarely (once or twice in the past four weeks)
( Ejeja an walok, einwot 1 ak 2 kattok ilo 4 wiik)
2 = Sometimes (three to ten times in the past four weeks) ( Jet ien—3 lok nan 10 alen ilo wiik ko emen)
3 = Often (more than ten times in the past four weeks) ( Ekutkut—10 katto iumin 4 wiik ko remootlok)
4. In the past four weeks, did you or any household member have to eat some foods that you really did not want to eat because of a lack of resources to obtain other types of food? (Elon ke mona en kwe ak ro jet ilo mweo kom ar mona jet men ko komij jab konaan kani ak kin an ilem aban tok iumin wiik kko emen remoot lok)
0 = No (skip to Q5) 1 = Yes
4a. How often did this happen?
( Ewi emakijkij in an walok wewein in)
1 = Rarely (once or twice in the past four weeks) ( Ejeja, 1 ak 2 alen ilo wiik ko 4 rej bedolok) 2 = Sometimes (three to ten times in the past four weeks) (Jet ien- 3—10 alen ilo wiik ko 4 rej mootlok)
3 = Often (more than ten times in the past four weeks) ( Emakijkij- elon lok jen 10 alen ilo wiik ko 4 rej mootlok)
5. In the past four weeks, did you or any household member have to eat a smaller meal than you felt you needed because there was not enough food? ( Ewor ke ien kwe ak ro jet ilo mweo komij mona edik jen jonan kinke ejabwe im di kilo wiik ko emen rej mootlok)
0 = No (skip to Q6) 1 = Yes
5a. How often did this happen?
( Ewi emakijkij in an walok jekjek in)
1 = Rarely (once or twice in the past four weeks) ( Ejeja, 1 ak 2 alen ilo wiik ko 4 rej bedolok) 2 = Sometimes (three to ten times in the past four weeks) (Jet ien- 3—10 alen ilo wiik ko 4 rej mootlok)
3 = Often (more than ten times in the past four weeks) ( Emakijkij- elon lok jen 10 alen ilo wiik ko 4 rej mootlok)
6. In the past four weeks, did you or any other household member have to eat fewer meals in a day because there was not enough food? ( Ewor ke ien iumin wiik ko emen imaanlok kwe ak ro jet ilo mweo kom kar mona 1 ak 2 katton wot ilo 1 raan kin wot an ilem jabe mona)
0 = No (skip to Q7) 1 = Yes

6a. How often did this happen?
( Ewi emakijkij in an walok jekjek in)
1 = Rarely (once or twice in the past four weeks) ( Ejeja, 1 ak 2 alen ilo wiik ko 4 rej bedolok) 2 = Sometimes (three to ten times in the past four weeks) (Jet ien- 3—10 alen ilo wiik ko 4 rej mootlok)
3 = Often (more than ten times in the past four weeks) ( Emakijkij- elon lok jen 10 alen ilo wiik ko 4 rej mootlok)
7. In the past four weeks, was there ever no food to eat of any kind in your household because of lack of resources to get food? ( Ilo wiik ko emen imaanlok, ekar ke ilem ejelok mona mwin kin wot an ilem ejelok kein kapok ak wia mona)
0 = No (skip to Q8) 1 = Yes
7a. How often did this happen?
( Ewi emakijkij in an walok jekjek in)
1 = Rarely (once or twice in the past four weeks) ( Ejeja, 1 ak 2 alen ilo wiik ko 4 rej bedolok) 2 = Sometimes (three to ten times in the past four weeks) (Jet ien- 3—10 alen ilo wiik ko 4 rej mootlok)
3 = Often (more than ten times in the past four weeks) ( Emakijkij- elon lok jen 10 alen ilo wiik ko 4 rej mootlok)
8. In the past four weeks, did you or any household member go to sleep at night hungry because there was not enough food? (Iumin wiik ko emen imaanlok, elon iami imwiin ekar kiki ak ejab mat kin wot an jabwe mona nan aolep)
0 = No (skip to Q9) 1 = Yes
8a. How often did this happen?
( Ewi ikutkut in an walok jekjek in)
1 = Rarely (once or twice in the past four weeks) ( Ejeja, 1 ak 2 alen ilo wiik ko 4 rej bedolok) 2 = Sometimes (three to ten times in the past four weeks) (Jet ien- 3—10 alen ilo wiik ko 4 rej mootlok)3 = Often (more than ten times in the past four weeks) ( Emakijkij- elon lok jen 10 alen ilo wiik ko 4 rej mootlok)
9. In the past four weeks, did you or any household member go a whole day and night without eating anything because there was not enough food? (Elon ke ien kwe ak ro jet imweo komij jab mona ilo likieo in juon raan im juon bon kin wot an jab bwe mona imweo, ilo wiik ko 4 imaanlok)
0 = No (questionnaire is finished) 1 = Yes
9a. How often did this happen? ( Ewi ikutkut in an walok jekjek in)
1 = Rarely (once or twice in the past four weeks) ( Ejeja, 1 ak 2 alen ilo wiik ko 4 rej bedolok) 2 = Sometimes (three to ten times in the past four weeks) (Jet ien- 3—10 alen ilo wiik ko 4 rej mootlok)3 = Often (more than ten times in the past four weeks) ) ( Emakijkij- elon lok jen 10 alen ilo wiik ko 4 rej mootlok)
Module AN: Mother’s Anthropometric Measurements
AN1 Weight ( Eddo in) Kg
AN2 Height ( Aetokan) Cm
AN3 Were there any difficulties (body defects) measuring height or weight? ( Elon ke jabdewot aban ak mojno ilo enbwin ilo am pouni im jone aetokan)
Yes – 1 No – 2
WM16. Check columns HL7B and HL15 in LIST OF HOUSEHOLD MEMBERS, HOUSEHOLD QUESTIONNAIRE: Is the respondent the mother or caregiver of any child age 0-4 living in this household?( Etale elane kora eo kwoj kajitikini ej jinen ak juon eo ej lale
kajiririki juon ajiri eo me dettan ej 0—4 yio) Yes Go to WM17 in WOMAN’S INFORMATION PANEL and circle ‘01’. Then go to the QUESTIONNAIRE FOR CHILDREN UNDER FIVE for that child and start the interview with this respondent.