Report_09112020_0.pdf - Telecom Regulatory Authority of India
159
Telecom Regulatory Authority of India The Indian Telecom Services Performance Indicators April – June, 2020 New Delhi, India 9 th November, 2020 Mahanagar Doorsanchar Bhawan, Jawahar Lal Nehru Marg, New Delhi-110002 Tel: +91-11- 23221856, Fax: +91-11- 23236650 Website: www.trai.gov.in
-
Upload
khangminh22 -
Category
Documents
-
view
0 -
download
0
Transcript of Report_09112020_0.pdf - Telecom Regulatory Authority of India
Telecom Regulatory Authority of India
The Indian Telecom Services Performance Indicators
April – June, 2020
New Delhi, India
9th November, 2020
Mahanagar Doorsanchar Bhawan, Jawahar Lal Nehru Marg, New Delhi-110002
Tel: +91-11- 23221856, Fax: +91-11- 23236650 Website: www.trai.gov.in

Disclaimer
The Information and Statistics contained in this report are derived from
variety of sources, but are mainly reliant on data obtained from Service
Providers. This report does not constitute any commercial or other
advice. No warranty, representation or undertaking of any kind,
expressed or implied, is given in relation to the information and statistics
contained in this report.

Table of Contents
Snapshot ......................................................................................................... i
Trends at a Glance .......................................................................................... xi
Introduction ................................................................................................. xiii
Chapter 1 : Subscription Data .......................................................................... 1
Section A : Access Services - An Overview ........................................................ 2
Section B : Wireless Services .......................................................................... 13
Section C : Wireline Services .......................................................................... 23
Section D : Internet Services .......................................................................... 34
Section E : Other Value Added Services - PMRTS & VSAT …………………….....46
Chapter 2 : Revenue and Usage of Wireless Services ....................................... 49
Chapter 3 : Financial Data of Telecom Services Sector ................................... 59
Chapter 4 : Quality of Service (QoS) ............................................................... 64
Section A: Quality of Service Performance of Wireless Service Providers .......... 65
Section B: Quality of Service Performance of Wireline Service Providers .......... 73
Section C: Quality of Service Performance of Broadband Service Providers ..... 81
Chapter 5 : Performance of Cable TV, DTH and Radio Broadcasting Services.. 85
Annexures ..................................................................................................... 94
Annexure 1.1: Wireless Subscriber Base ......................................................... 95
Annexure 1.2: Wireline Subscriber Base ......................................................... 96
Annexure 1.3: Service Area and Operator-wise details of PCOs ....................... 97
Annexure 1.4: Service Provider-wise details of Village Public Telephones ........ 99
Annexure 1.5: Internet Service Provider(ISP)-wise Internet Subscriber base….101
Annexure 1.6: List of Service Providers which reported IP Telephony Minutes.111
Annexure 1.7: Service Area-wise PMRTS subscriber Base ............................ .112
Annexure 2.1: Revenue & Usage of Wireless Services – License Service Area wise
Statistics ............................................................................... 113
Annexure 4.1: Performance of QoS Parameters for Cellular Mobile Services .. 114
Annexure 4.2: Performance of QoS Parameters for Basic (Wire-line) Services..116
Annexure 4.3: Performance of QoS Parameters for Wireline Broadband
Services ................................................................................. 119
Annexure 5.1: MRP of pay channels, offered by broadcasters to subscribers as
reported to TRAI… ................................................................. 122
Annexure 5.2: List of Major MSOs / HITS Operators ..................................... 135
Annexure 5.3: List of Pay DTH Operators ..................................................... 135
Annexure 5.4: List of existing 104 cities with operational FM Radio Stations in
India ..................................................................................... 135
Index of Tables & Charts ..................................................................... 142

i
Snapshot
(Data as on Q.E. 30th June, 2020)
Telecom Subscribers (Wireless+Wireline)
Total Subscribers 1,160.52 Million
% change over the previous quarter -1.48%
Urban Subscribers 636.83 Million
Rural Subscribers 523.69 Million
Market share of Private Operators 88.55%
Market share of PSU Operators 11.45%
Tele-density 85.85
Urban Tele-density 137.35
Rural Tele-density 58.96
Wireless Subscribers
Total Wireless Subscribers 1,140.71 Million
% change over the previous quarter -1.47%
Urban Subscribers 619.11 Million
Rural Subscribers 521.60 Million
Market share of Private Operators 89.33%
Market share of PSU Operators 10.67%
Tele-density 84.38
Urban Tele-density 133.53
Rural Tele-density 58.72
Total Wireless Data Usage during the quarter 25,979 million GB
Number of Public Mobile Radio Trunk Services (PMRTS) 64,838
Number of Very Small Aperture Terminals (VSAT) 2,95,571
Wireline Subscribers
Total Wireline Subscribers 19.81 Million
% change over the previous quarter -2.02%
Urban Subscribers 17.72 Million
Rural Subscribers 2.09 Million
Market share of PSU Operators 56.84%
Market share of Private Operators 43.16%
Tele-density 1.47
Rural Tele-density 0.24
Urban Tele-density 3.82
No. of Village Public Telephones (VPT) 68,406
No. of Public Call Office (PCO) 1,61,937

ii
Telecom Financial Data
Gross Revenue (GR) during the quarter `66,858 Crore
% change in GR over the previous quarter -1%
Adjusted Gross Revenue (AGR) during the quarter `44,128 Crore
% change in AGR over the previous quarter -1.81%
Share of Public sector undertakings in Access AGR 7.22%
Monthly Average Revenue Per User (ARPU) for Access Services `98.01
Internet/Broadband Subscribers
Total Internet Subscribers 749.07 Million
% change over previous quarter 0.79%
Narrowband subscribers 50.84 Million
Broadband subscribers
698.23 Million
Wired Internet Subscribers 23.05 Million
Wireless Internet Subscribers 726.01 Million
Urban Internet Subscribers 455.98 Million
Rural Internet Subscribers 293.09 Million
M Total Internet Subscribers per 100 population 55.41
Urban Internet Subscribers per 100 population 98.35
Rural Internet Subscribers per 100 population 33
Broadcasting & Cable Services
Number of private satellite TV channels permitted by the Ministry of I&B for uplinking only/downlinking only/both uplinking and downlinking
909
Number of Pay TV Channels as reported by broadcasters 332
Number of private FM Radio Stations (excluding All India Radio) 367
Number of total active subscribers with pay DTH operators
70.58 Million
Number of Operational Community Radio Stations 300
Number of pay DTH Operators 4
Revenue & Usage Parameters
Monthly ARPU of Wireless Service `90.12
Minutes of Usage (MOU) per subscriber per month - Wireless Service 744 Minutes
Total Outgoing Minutes of Usage for Internet Telephony 124.07 Million
Wireless Data Usage Average Wireless Data Usage per wireless data subscriber per month
12.15 GB
Average revenue realization per subscriber per GB wireless data during the quarter
10.55
_______________________________________________________________
* For ARPU explanation please refer to footnote on Page 52

iii
Executive Summary
1. The number of telephone subscribers in India decreased from
1,177.97 million at the end of Mar-20 to 1,160.52 million at the
end of Jun-20, registering a decline rate of 1.48% over the previous
quarter. This reflects Year-On-Year (Y-O-Y) decline rate of 2.20%
over the same quarter of the last year. The overall Tele-density in
India also decreased from 87.37 as in QE Mar-20 to 85.85 as in
QE Jun-20.
Trends in Telephone subscribers and Tele-density in India
2. Telephone subscribers in Urban areas decreased from 656.46
million at the end of Mar-20 to 636.83 million at the end of Jun-20
and Urban Tele-density also declined from 142.31 to 137.35
during the same period.
3. Rural telephone subscribers increased from 521.51 million at the
end of Mar-20 to 523.69 million at the end of Jun-20 and Rural

iv
Tele-density also increased from 58.79 to 58.96 during the same
period.
4. Out of the total subscription, the share of Rural subscription
increased from 44.27% at the end of Mar-20 to 45.13% at the end
of Jun-20.
Composition of Telephone Subscribers
5. With a net decrease of 17.04 million subscribers during the
quarter, the total wireless subscriber base decreased from
1,157.75 million at the end of Mar-20 to 1,140.71 million at the
end of Jun-20, registering a decline rate of 1.47% over the previous
quarter. Wireless subscriptions declined on Y-O-Y basis at the rate
of 2.12% during the year.
6. Wireless Tele-density declined from 85.87 at the end of Mar-20 to
84.38 at the end of Jun-20 with quarterly decline rate of 1.73%.

v
7. Wireline subscribers decreased from 20.22 million at the end of
Mar-20 to 19.81 million at the end of Jun-20 with a quarterly
decline rate of 2.02% and on a Y-O-Y basis, wireline subscriptions
also declined by 6.42% in QE Jun-20.
8. Wireline Tele-density decreased from 1.50 at the end of Mar-20 to
1.47 at the end of Jun-20.
9. Total number of Internet1 subscribers increased from 743.19
million at the end of Mar-20 to 749.07 million at the end of
Jun-20, registering a quarterly growth rate of 0.79%. Out of
749.07 million internet subscribers, number of Wired Internet
subscribers are 23.06 million and number of Wireless Internet
subscribers are 726.01 million.
Composition of internet subscription
1 Internet: Interconnected global networks that use the internet protocol.

vi
10. The Internet subscriber base is comprised of Broadband2 Internet
subscriber base of 698.23 million and Narrowband3 Internet
subscriber base of 50.84 million.
11. The broadband Internet subscriber base increased by 1.57% from
687.44 million at the end of Mar-20 to 698.23 million at the end of
Jun-20. However, the narrowband Internet subscriber base
declined by 8.81% from 55.75 million at the end of Mar-20 to
50.84 million at the end of Jun-20.
12. Monthly Average Revenue per User (ARPU)4 for wireless service
decreased by 1.50%, from `91.49 in QE Mar-20 to `90.12 in
QE Jun-20. On Y-O-Y basis, monthly ARPU for wireless service
increased by 21.30% in this quarter.
13. Prepaid ARPU per month for QE Jun-20 remained same i.e. `84 as
it was QE Mar-20 however for Postpaid ARPU per month decreased
from `244 in QE Mar-20 to `224 in QE Jun-20.
14. On an all India average, the overall Minutes of Usage (MOU)5 per
subscriber per month for wireless service decreased by 0.80% from
750 in QE Mar-20 to 744 in QE Jun-20.
15. Prepaid MOU per subscriber per month decreased from 757 in QE
Mar-20 to 748 in QE Jun-20. However, Postpaid MOU per
subscriber per month increased from 611 in QE Mar-20 to 648 in
QE Jun-20.
2 Broadband: Internet access with a minimum capacity of greater or equal 512 Kbit/s in one or both directions. 3 Narrowband: Internet access with a capacity of less than 512 Kbit/s in one or both directions.
(Source-ITU)
4 ARPU per month is calculated by dividing net subscribers’ revenue by average number of subscribers. 5 MOU per subscriber per month is calculated by dividing total minutes of usage (incoming & outgoing) by
average number of subscribers.

vii
16. Gross Revenue6 (GR) and Adjusted Gross Revenue7 (AGR) of
Telecom Service Sector for the Q.E. Jun-20 has been `66,858
Crore and `44,128 Crore respectively. GR and AGR decreased by
1% and 1.81% respectively in Q.E. Jun-20 as compared to
previous quarter.
17. The Y-O-Y growth in GR and AGR in Q.E. Jun-20 over the same
quarter in last year has been 8.65% and 12.79% respectively.
18. Pass-through8 charges increased from `22,593 Crore in QE Mar-20
to `22,730 Crore in QE Jun-20 with quarterly growth rate of
0.60%. The Y-O-Y growth rate of 1.42% has been recorded in
pass-through charges for QE Jun-20.
19. The License Fee9 decreased from `3,604 Crore for the QE Mar-20
to `3,526 Crore for the QE Jun-20. The quarterly and the Y-O-Y
growth rates of license fee are -2.16% and 12.57% respectively in
this quarter.
6 Gross Revenue is inclusive of installation charges, late fees, sale proceeds of handsets (or any other
terminal equipment etc.), revenue on account of interest, dividend, value added services, supplementary
services, access or interconnection charges, roaming charges, revenue from permissible sharing of
infrastructure and any other miscellaneous revenue, without any set-off for related item of expense etc. 7 Adjusted Gross Revenue: The following shall be excluded from the Gross Revenue to arrive at the AGR:
I. PSTN related call charges (Access Charges) actually paid to other eligible/entitled
telecommunication service providers within India;
II. Roaming revenues actually passed on to other eligible/entitled telecommunication service providers;
and
III. Service Tax on provision of service and Sales Tax actually paid to the Government if gross revenue
had included as component of Sales Tax and Service Tax
8 Pass through charges means the charges excluded from gross revenue to arrive at adjusted gross revenue
for the purpose of levying licence fee.
9 License Fee means a fee payable by Licensee at prescribed intervals and rates for the period of the
Licence.

viii
Service-wise composition of Adjusted Gross Revenue
20. Access services contributed 77.79% of the total Adjusted Gross
Revenue of telecom services. In Access services, Gross Revenue
(GR), Adjusted Gross Revenue (AGR), License Fee and Spectrum
Usage Charges (SUC)10 decreased by 0.15%, 0.49%, 0.83% and
3.83% respectively in QE Jun-20. However, Pass Through Charges
increased quarterly by 0.63% during the same period.
21. Monthly Average Revenue per User (ARPU) for Access Services
based on AGR, increased from `97.64 in QE Mar-20 to `98.01 in
QE Jun-20.
10 Spectrum Usage Charge is payable by the licensees providing mobile access services, as a percentage of
their Adjusted Gross Revenue (AGR).
(Source – DoT License Agreement)

ix
22. The performance of wireline service providers in terms of QoS during
the quarter vis-à-vis that in the previous quarter is given below: -
23. The performance of Cellular Mobile service providers in terms of Quality
of Service (QoS) during the quarter vis-à-vis that in the previous quarter
is given as below: -
Parameters showing improvement in QoS
Parameters showing deterioration in QoS
• “Fault repair”
Fault incidences
No. of faults per
100 subs/month)
• “Fault repair” % Fault repaired by next
working day (for urban areas)
• “Mean time to Repair” (MTTR)
• “Metering and Billing” Metering and
billing credibility - post-paid,
• “Response time to the customer for assistance” - Accessibility of call centre/ customer
care
- %age of calls answered by the
operators (voice to voice) within 90
seconds
• “Termination / closure of service”- Time taken for refund of deposits after
closures
Parameters showing improvement in QoS
Parameters showing deterioration in QoS
• Network QoS DCR Spatial Distribution Measure [Network_
QSD (90,90)]
• Metering and billing credibility - post paid
• Accessibility of call centre/ customer care
• %age of calls answered by the operators (voice to voice) within 90 sec
• Time taken for refund of deposits after closures

x
24. A total number of 909 private satellite TV channels have been
permitted by the Ministry of Information and Broadcasting (MIB)
for uplinking only/downlinking only/both uplinking and
downlinking, as on 30th June, 2020.
25. As per the reporting done by broadcasters in pursuance of the
Tariff Order (Broadcasting & Cable), dated 3rd March 2017, as
amended, there are 332 pay channels as on 30th June 2020, which
include 235 SD (standard definition) pay TV channels and 97 HD
(high definition) Pay TV channels.
26. Since its introduction in the year 2003, DTH (direct-to-home)
service has displayed a phenomenal growth. During
QE 30th June 2020, there were 4 pay DTH service providers in the
country.
27. Pay DTH has attained total active subscriber base of around
70.58 million in QE 30th June 2020. This is in addition the
subscribers of DTH Free Dish (free DTH services of Doordarshan).
28. Apart from the radio stations operated by All India Radio – the
public broadcaster, as on 30th June 2020, there are 367
operational private FM Radio stations in 105 cities with operational
31 Private FM Radio broadcasters as compared to 368 private FM
Radio Stations in 105 cities with operational 32 FM Radio
broadcasters in the previous quarter.
29. The reported advertisement revenue during the quarter ending
30th June 2020 in respect of 366 private FM Radio stations is
`98.41 crore as against `400.64 crore in respect of 367 private FM
Radio stations for the previous quarter.
30. As per data received from MIB, as on 30th June 2020, 300
Community Radio Stations are operational in the country.

xi
Trends at a Glance
A. Access Service (Wireline + Wireless)
QE Jun 2019
QE Sep 2019
QE Dec 2019
QE Mar 2020
QE Jun 2020
%age change
over Jun-2019
%age change
over Sept-2019
%age change
over Dec-2019
%age change
over Mar-2020
(12
months) (9
months) (6
months) (3
months)
1) Subscriber Base (in million)
Wireline 21.17 21.49 21.00 20.22 19.81 -6.42% -7.82% -5.68% -2.02%
Wireless 1165.46 1173.75 1151.44 1157.75 1140.71 -2.12% -2.82% -0.93% -1.47%
Total 1186.63 1195.24 1172.44 1177.97 1160.52 -2.20% -2.91% -1.02% -1.48%
Rural 511.05 517.29 509.99 521.51 523.69 2.47% 1.24% 2.68% 0.42%
Urban 675.58 677.95 662.45 656.46 636.83 -5.74% -6.07% -3.87% -2.99%
2) Tele-density
Wireline 1.61 1.63 1.59 1.50 1.47 -8.84% -9.97% -7.83% -2.27%
Wireless 88.50 88.90 86.98 85.87 84.38 -4.66% -5.08% -2.99% -1.73%
Total 90.11 90.52 88.57 87.37 85.85 -4.73% -5.17% -3.08% -1.74%
Rural 56.99 57.59 56.67 58.79 58.96 3.45% 2.38% 4.04% 0.28%
Urban 160.78 160.63 156.26 142.31 137.35 -14.57% -14.49% -12.10% -3.48%
3) Service Provider wise Subscribers Base (in Million) (wireless+wireline)
Bharti Airtel
324.65 329.88 331.61 332.21 320.94 -1.14% -2.71% -3.22% -3.39%
Vodafone Idea
383.77 372.86 333.01 319.62 305.56 -20.38% -18.05% -8.24% -4.40%
Reliance Jio
331.26 356.08 371.07 388.61 398.70 20.36% 11.97% 7.45% 2.60%
BSNL 126.86 127.19 127.70 128.60 126.48 -0.30% -0.55% -0.95% -1.64%
MTNL 6.63 6.57 6.50 6.45 6.44 -2.84% -2.02% -0.90% -0.21%
Tata Tele. 12.56 1.82 1.79 1.77 1.73 -86.26% -5.05% -3.51% -2.52%
Reliance Com.
0.68 0.63 0.57 0.52 0.48 -30.04% -23.92% -16.23% -8.52%
Quadrant 0.22 0.21 0.20 0.18 0.18 -19.19% -15.34% -10.53% -2.87%
Total 1186.63 1195.24 1172.44 1177.97 1160.52 -2.20% -2.91% -1.02% -1.48%

xii
B. Internet Services
QE Jun 2019
QE Sep 2019
QE Dec 2019
QE Mar 2020
QE Jun 2020
%age change
over Jun-2019
%age change
over Sept-2019
%age change
over Dec-2019
%age change
over Mar-2020
(12
months) (9
months) (6
months) (3
months)
1) Subscriber's Base (in million)
A. Wired Internet Subscribers
21.67 22.26 22.39 22.42 23.06 6.43% 3.60% 3.00% 2.87%
B. Wireless
Internet Subscribers
643.64 665.37 696.36 720.78 726.01 12.80% 9.11% 4.26% 0.73 %
i. Mobile Wireless
(Mobile & Dongle) 643.09 664.79 695.74 720.17 725.38 12.80% 9.11% 4.26% 0.72%
ii. Fixed Wireless (Wi-Fi, Wi-Max, Point-to-Point Radio & VSAT)
0.55 0.58 0.62 0.61 0.63 14.44% 9.16% 2.75% 3.69%
Total Internet Subscribers
665.31 687.62 718.74 743.19 749.07 12.59% 8.94% 4.22% 0.79%
2) No. of Internet Subs per 100 Population
50.52 52.08 54.29 55.12 55.41 9.68% 6.40% 2.06% 0.53%
C. Usage and Revenue for Wireless Services
Traffic (MOU) (minutes of uses/ subscriber/month)
701 691 712 750 744 6.13% 7.74% 4.49% -0.80%
ARPU (Rs./sub/ month)
74 74 79 91 90 21.30% 21.16% 14.58% -1.50%
D. Telecom Financial Data
QE Jun 2019
QE Sep 2019
QE Dec 2019
QE Mar 2020
QE Jun 2020
%age change
over Jun-2019
%age change
over Sept-2019
%age change
over Dec-2019
%age change
over Mar-2020
(12
months)
(9
months)
(6
months)
(3
months)
1. Telecom Sector
i) Gross Revenue
(` in Crores) 61535 59992 63764 67534 66858 8.65% 11.44% 4.85% -1.00%
ii) Adjusted Gross Revenue (` in Crores)
39124 37338 40877 44940 44128 12.79% 18.18% 7.95% -1.81%
2. Access Services
Adjusted Gross
Revenue (` in
Crores)
28650 27921 30323 34496 34328 19.82% 22.95% 13.21% -0.49%
ARPU per month (AGR/ Average subscribers/3)
80.66 78.17 85.07 97.64 98.01 21.51% 25.39% 15.21% 0.38%

xiii
Introduction
This Report presents the Key Parameters and growth trends for the
Telecom Services in India for the quarter ending 30th June, 2020. It
provides a broad perspective on the Telecom Services to serve as a
reference document for various stakeholders, research agencies and
analysts. Chapter-1 depicts the growth pattern, in terms of Subscriber
base and Tele-density of Wireline, Wireless, Internet and Value Added
Services (VAS) as well as Wireless Data Usage. Chapter-2 covers the key
revenue and usage parameters. Chapter-3 gives the financial and
accounting data. Chapter-4 covers performance of various telecom
service providers in terms of QoS. The information relating to Cable TV,
DTH & Radio Broadcast services is provided in Chapter-5.
2. The Report has been prepared based on the information furnished
by the Service Providers. It is also available on TRAI’s website
(www.trai.gov.in under the link http://www.trai.gov.in/release-
publication/reports/performance-indicators-reports). Any suggestion or
any clarification pertaining to this report, Pr. Advisor (F&EA), TRAI may
be contacted on Tel. +91-11-23221856, Fax. +91-11-23235249 and
e-mail: [email protected].

1
Chapter 1 :
Subscription Data
----------------------------------------------------------------------------------------------------------------
• In this report, Tele-density figures are derived from the subscriber data
provided by the operators and the population projection of the country are
taken from the Population Projections for India and States (2011-36), Report of
the Technical Group on Population Projections, National Commission on
Population, Ministry of Health & Family Welfare.” (Based on Census of India 2011).

2
Section A : Access Service - An Overview
1.1 The number of telephone subscribers in India decreased from
1,177.97 million at the end of Mar-20 to 1,160.52 million at the end
of Jun-20, registering a decline rate of 1.48% over the previous
quarter. This reflects year-on-year (Y-O-Y) growth rate of -2.20%
over the same quarter of last year. The overall Tele-density in India
also decreased from 87.37 as on 31st March, 2020 to 85.85 as on
30th June, 2020 with quarterly decline rate of 1.74%.
Chart 1.1: Trends in Telephone Subscribers and Tele-density in India
Table1.1: Subscriber Base & Tele-density - Rural & Urban
Quarter
ending
Subscriber Base (million) Tele-density
Rural Urban Rural Urban
Jun-19 511.05 675.58 56.99 160.78
Sep-19 517.29 677.95 57.59 160.63
Dec-19 509.99 662.45 56.67 156.26
Mar-20 521.51 656.46 58.79 142.31
Jun-20 523.69 636.83 58.96 137.35

3
1.2 Telephone subscription in Urban areas decreased from 656.46
million at the end of Mar-20 to 636.83 million at the end of Jun-
20 and Urban Tele-density also declined from 142.31 to 137.35 at
the end of the quarter.
1.3 Rural telephone subscription increased from 521.51 million at the
end of Mar-20 to 523.69 million at the end of Jun-20 and Rural
Tele-density also increased from 58.79 to 58.96 at the end of the
quarter.
1.4 The Y-O-Y growth rates of Urban and Rural telephone
subscriptions from Jun-19 to Jun-20 are -5.74% and 2.47%
respectively. The Y-O-Y growth rates of Urban and Rural Tele-
density from Jun-19 to Jun-20 are -14.57% and 3.45%
respectively.
Chart 1.2: Market Share - Rural & Urban Subscribers
1.5 Share of subscriptions of rural areas in the total telephone
subscriptions increased from 44.27% at the end of Mar-20 to
45.13% at the end of Jun-20.

4
Chart 1.3: Composition of Access subscription - Wireline & Wireless
1.6 Share of wireline subscription in total telephone subscription
decreased from 1.72% at the end of Mar-20 to 1.71% at the end of
Jun-20.
Chart 1.4: Composition of Rural-Urban Telephone Subscription
at the end of the quarter

5
Table 1.2: Service Area wise Access (Wireless+Wireline) Subscriber base
Service Area Subscribers (million)
Mar-20 Jun-20 Net
Additions Rate of Growth
Andhra Pradesh 89.17 87.66 -1.51 -1.69%
Assam 23.72 23.60 -0.12 -0.49%
Bihar 84.90 83.85 -1.05 -1.24%
Delhi 56.67 55.22 -1.44 -2.54%
Gujarat 68.93 67.20 -1.74 -2.52%
Haryana 27.94 27.55 -0.39 -1.41%
Himachal Pradesh 10.89 10.83 -0.06 -0.54%
Jammu & Kashmir 12.00 11.93 -0.07 -0.55%
Karnataka 69.78 68.81 -0.97 -1.39%
Kerala 44.99 45.09 0.10 0.21%
Madhya Pradesh 75.90 75.19 -0.72 -0.95%
Maharashtra 94.15 92.59 -1.56 -1.65%
Mumbai 40.90 39.53 -1.37 -3.35%
North East 12.12 11.97 -0.15 -1.20%
Orissa 33.54 33.18 -0.37 -1.09%
Punjab 39.87 39.20 -0.67 -1.68%
Rajasthan 66.02 64.84 -1.18 -1.79%
T.N. (incl. Chennai) 83.99 80.59 -3.41 -4.05%
U.P.(E) 97.16 98.27 1.11 1.14%
U.P.(W) 63.69 62.40 -1.29 -2.02%
Kolkata 26.39 26.01 -0.37 -1.42%
West Bengal 55.25 55.01 -0.24 -0.44%
All India 1,177.97 1,160.52 -17.45 -1.48%
1.7 All service areas showed decline in their subscriber base except
Kerala and UP (E) during the quarter ending Jun-20. UP (E)
service area showed maximum growth of 1.14% and Tamil Nadu
service area showed maximum decline rate of 4.05% during the
quarter.

6
Table 1.3: Service Area wise Rural-Urban Subscribers at QE Jun-20
Service Area
Number of Subscribers (in million)
Total Rural Urban % of Rural Subscribers
Andhra Pradesh 87.66 43.95 43.71 50.14%
Assam 23.60 13.90 9.70 58.89%
Bihar 83.85 55.86 27.99 66.62%
Delhi 55.22 2.46 52.76 4.46%
Gujarat 67.20 26.84 40.36 39.94%
Haryana 27.55 12.52 15.03 45.44%
Himachal Pradesh 10.83 7.35 3.48 67.89%
Jammu & Kashmir 11.93 5.72 6.21 47.91%
Karnataka 68.81 26.89 41.92 39.07%
Kerala 45.09 21.07 24.02 46.73%
Madhya Pradesh 75.19 34.41 40.77 45.77%
Maharashtra 92.59 43.54 49.05 47.02%
Mumbai 39.53 1.79 37.74 4.54%
North East 11.97 5.94 6.04 49.58%
Orissa 33.18 22.11 11.07 66.64%
Punjab 39.20 13.53 25.67 34.51%
Rajasthan 64.84 35.08 29.76 54.10%
T.N. (incl. Chennai) 80.59 23.81 56.77 29.55%
U.P.(E) 98.27 61.19 37.08 62.27%
U.P.(W) 62.40 29.40 33.00 47.11%
Kolkata 26.01 1.89 24.13 7.26%
West Bengal 55.01 34.44 20.57 62.61%
All India 1,160.52 523.69 636.83 45.13%
1.8 Only eight service areas have more than 50% share of rural
subscribers in their total number of subscribers. Himachal Pradesh
service area has maximum share of rural subscribers (67.89%) in its
total telephone subscribers.

7
Chart 1.5: Trend of Net Addition/decline in Telephone Subscription
1.9 The net decrease in telephone subscription is 17.45 million during
QE Jun-20 as compared to the net addition of 5.52 million
subscribers during QE Mar-20.
Table 1.4 : Service Area wise Tele-density
Service Area/ States
As on 31st March, 2020 As on 30th June, 2020
Rural Tele-
density
Urban
Tele-
density
Total Tele-
density
Rural
Tele-
density
Urban
Tele-
density
Total Tele-
density
Andhra Pradesh
79.13 129.80 99.06 80.57 122.77 97.24
Assam 47.16 186.45 68.34 47.13 183.00 67.83
Bihar 41.68 117.38 53.25 41.22 114.20 52.40
Delhi - - 280.18 - - 271.78
Gujarat 73.30 126.17 98.53 73.31 120.12 95.71
Haryana 73.64 128.95 95.97 72.04 126.95 94.29
Himachal Pradesh
111.07 473.05 148.13 111.27 461.06 147.10
J&K 60.14 154.23 88.15 59.77 152.74 87.52
Karnataka 75.54 144.36 105.14 71.10 146.16 103.47

8
Service Area/ States
As on 31st March, 2020 As on 30th June, 2020
Rural Tele-
density
Urban
Tele-
density
Total Tele-
density
Rural
Tele-
density
Urban
Tele-
density
Total Tele-
density
Kerala 190.84 98.54 127.13 195.46 97.41 127.23
Madhya Pradesh 42.43 131.54 67.40 42.34 128.56 66.54
Maharashtra (incl. Mumbai)*
70.42 148.83 108.09 69.77 104.04 105.51
North East 57.72 122.51 79.07 57.76 118.69 77.93
Orissa 62.37 139.24 76.46 61.69 137.11 75.55
Punjab 76.50 194.68 127.33 75.77 189.83 124.94
Rajasthan 61.63 148.00 84.26 60.50 144.31 82.49
Tamil Nadu (incl. Chennai)
70.83 141.73 108.21 64.98 138.25 103.70
Uttar Pradesh (incl. UPE & UPW)*
46.29 132.86 67.17 49.72 120.73 66.88
West Bengal (incl. Kolkata)*
57.43 128.50 82.77 57.24 126.51 82.01
All India 58.79 142.31 87.37 58.96 137.35 85.85
* Population data/projections are available state-wise only.
Notes:- 1. Tele-density figures are derived from the subscriber data provided by the operators and the
population projections, for Urban and Rural areas, of the country are taken from Report of the technical group on population projections published by National Commission on
Population, Ministry of Health & Family Welfare (Based on Census of India 2011). 2. Delhi Service area, apart from the State of Delhi, includes wireless subscribers of the areas
served by the local exchanges of Ghaziabad & Noida (in UP) and Gurgaon & Faridabad (in Haryana).
3. Data/information for Andhra Pradesh includes Telengana, Madhya Pradesh includes
Chhatishgarh, Bihar includes Jharkhand, Maharashtra includes Goa, Uttar Pradesh
includes Uttarakhand, West Bengal includes Sikkim and North-East includes Arunachal
Pradesh, Manipur, Meghalaya, Mizoram, Nagaland & Tripura states.
1.10 Kerala service area has the highest Rural Tele-density of 195.44
followed by Himachal Pradesh service area of 111.27. Bihar service
area has the lowest Rural Tele-density of 41.22 followed by Madhya
Pradesh service area with rural tele-density of 42.34 in QE Jun-20.

9
Table 1.5 : State/UT wise subscriber base (wireline+wireless)
Sl.
No. States/UT
Total Telephone Subscription (million)
Total Rural Urban
1 Andhra Pradesh 45.80 25.90 19.89
2 Arunachal Pradesh 1.30 0.76 0.54
3 Assam 23.60 13.90 9.70
4 Bihar 61.83 43.74 18.08
5 Chhattisgarh 20.01 9.70 10.31
6 Goa 2.84 1.10 1.74
7 Gujarat 66.46 26.61 39.85
8 Haryana 33.26 12.57 20.68
9 Himachal Pradesh 10.83 7.35 3.48
10 Jharkhand 22.02 12.11 9.91
11 Karnataka 68.81 26.89 41.92
12 Kerala 45.00 21.03 23.97
13 Madhya Pradesh 55.18 24.71 30.47
14 Maharashtra Incl. Mumbai 129.28 44.24 85.05
15 Manipur 2.31 0.96 1.36
16 Meghalaya 2.31 1.31 1.00
17 Mizoram 1.34 0.54 0.80
18 Nagaland 1.62 0.84 0.79
19 Odisha 33.18 22.11 11.07
20 Punjab 37.39 13.48 23.90
21 Rajasthan 64.84 35.08 29.76
22 Sikkim 0.67 0.38 0.29
23 Tamil Nadu (incl. Chennai) 79.41 23.49 55.92
24 Telangana 41.87 18.05 23.82
25 Tripura 3.09 1.54 1.55
26 Uttar Pradesh (UPE + UPW) 155.39 84.11 71.28
27 Uttarakhand 12.93 6.50 6.43
28 West Bengal Incl. Kolkata 79.98 35.78 44.20
Union Territories
1 Andaman & Nicobar Islands 0.37 0.17 0.20
2 Chandigarh 1.80 0.04 1.76
3
Dadra and Nagar Haveli and
Daman and Diu 0.73 0.23 0.50
4 Delhi 41.88 2.40 39.48
5 Jammu & Kashmir 11.48 5.55 5.93
6 Ladakh 0.45 0.17 0.28
7 Lakshdweep 0.09 0.04 0.049
8 Puduchery 1.17 0.33 0.85
Total 1160.52 523.69 636.83

10
Table 1.6 : State/UT wise total Tele-density
Sl.No. State/UT Total Tele-density
Total Rural Urban
1 Andhra Pradesh 87.07 128.31 238.31
2 Arunachal Pradesh 85.41 66.26 142.79
3 Assam 67.83 47.13 183.00
4 Bihar 50.72 40.81 122.96
5 Chhattisgarh 68.43 45.00 134.20
6 Goa 182.90 261.15 153.84
7 Gujarat 96.09 73.14 121.54
8 Haryana 113.84 72.35 174.72
9 Himachal Pradesh 147.10 - -
10 Jharkhand 57.77 42.79 101.05
11 Karnataka 103.47 71.10 146.16
12 Kerala 127.23 195.14 97.47
13 Madhya Pradesh 65.88 41.38 126.75
14 Maharashtra Incl. Mumbai 104.53 68.53 143.85
15 Manipur 73.60 44.52 136.23
16 Meghalaya 70.78 50.58 148.96
17 Mizoram 110.66 97.10 122.04
18 Nagaland 74.57 66.30 86.01
19 Odisha 75.55 61.69 137.11
20 Punjab 123.88 75.54 193.85
21 Rajasthan 82.49 60.50 144.31
22 Sikkim 100.21 99.76 100.79
23 Tamil Nadu (incl. Chennai) 104.26 64.92 139.86
24 Telangana 111.48 88.92 138.01
25 Tripura 76.27 59.64 105.53
26 Uttar Pradesh (UPE +UPW) 67.88 48.12 131.70
27 Uttarakhand 114.30 87.89 164.11
28 West Bengal Incl. Kolkata 81.85 56.92 126.78
Union Territories
1 Andaman & Nicobar Islands 92.05 74.84 115.27
2 Chandigarh 150.52 - -
3 Dadra and Nagar Haveli and Daman and Diu
70.53 99.36 62.45
4 Delhi 206.10 - -
5 Jammu & Kashmir 86.08 59.29 149.01
6 Ladakh 153.20 81.52 325.18
7 Lakshdweep 130.51 - -
8 Puduchery 75.82 69.70 78.46
Total 85.85 58.96 137.35
11
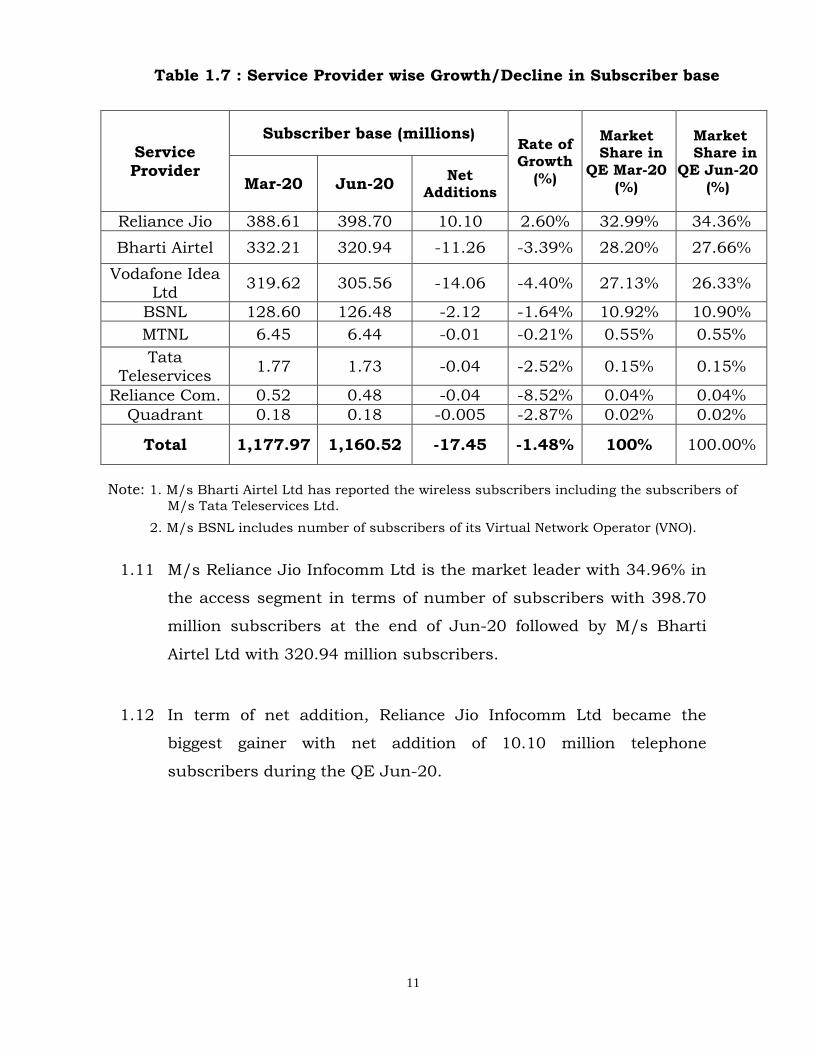
Table 1.7 : Service Provider wise Growth/Decline in Subscriber base
Service Provider
Subscriber base (millions) Rate of Growth
(%)
Market Share in QE Mar-20
(%)
Market Share in QE Jun-20
(%) Mar-20 Jun-20 Net
Additions
Reliance Jio 388.61 398.70 10.10 2.60% 32.99% 34.36%
Bharti Airtel 332.21 320.94 -11.26 -3.39% 28.20% 27.66%
Vodafone Idea Ltd
319.62 305.56 -14.06 -4.40% 27.13% 26.33%
BSNL 128.60 126.48 -2.12 -1.64% 10.92% 10.90%
MTNL 6.45 6.44 -0.01 -0.21% 0.55% 0.55%
Tata Teleservices
1.77 1.73 -0.04 -2.52% 0.15% 0.15%
Reliance Com. 0.52 0.48 -0.04 -8.52% 0.04% 0.04%
Quadrant 0.18 0.18 -0.005 -2.87% 0.02% 0.02%
Total 1,177.97 1,160.52 -17.45 -1.48% 100% 100.00%
Note: 1. M/s Bharti Airtel Ltd has reported the wireless subscribers including the subscribers of
M/s Tata Teleservices Ltd.
2. M/s BSNL includes number of subscribers of its Virtual Network Operator (VNO).
1.11 M/s Reliance Jio Infocomm Ltd is the market leader with 34.96% in
the access segment in terms of number of subscribers with 398.70
million subscribers at the end of Jun-20 followed by M/s Bharti
Airtel Ltd with 320.94 million subscribers.
1.12 In term of net addition, Reliance Jio Infocomm Ltd became the
biggest gainer with net addition of 10.10 million telephone
subscribers during the QE Jun-20.

12
Table 1.8 : Market Share of the service providers in total rural subscriber base
Service Provider No. of Total Subscribers (in millions)
No. of Rural Subscribers (in millions)
Percentage of Rural
subscribers
Market share of Rural
subscribers (%)
Vodafone Idea Ltd
305.56 166.02 54.33% 31.70
Bharti Airtel 320.94 151.09 47.08% 28.85
Reliance Jio 398.70 166.35 41.72% 31.77
BSNL 126.48 40.10 31.70% 7.66
Quadrant 0.18 0.03 19.56% 0.01
Tata Teleservices 1.73 0.04 2.56% 0.01
MTNL 6.44 0.05 0.71% 0.01
Reliance Com. 0.48 0.001 0.17% 0.0002
Total 1,160.52 523.69 45.13% 100
1.13 M/s Vodafone Idea Ltd is the telecom service provider with highest
proportion of rural telephone subscribers of 54.33% followed by
Bharti Airtel of 47.08% to their total telephone subscribers at the
end of Jun-20.

13
Section B : Wireless Service
Table 1.9: List of Cellular Mobile (GSM, LTE & CDMA) Service Providers
currently providing service [As on 30th June, 2020]
Sl.No. Service Provider Licensed Service Areas
1 Reliance Jio Infocom Ltd All India
2 Bharti Airtel Ltd All India
3 Vodafone Idea Ltd All India
4 BSNL All India (except Delhi & Mumbai)
5 MTNL Delhi & Mumbai
6 Reliance Communications Ltd / Reliance Telecom Ltd
All India (except Assam & NE) /
Kolkata, MP, WB, HP, Bihar, Odisha, Assam & NE
Source : DoT website
UL Access Services Licensees Virtual Network Operators (VNOs)
who are providing services as on 30th June, 2020
1 Surftelecom Pvt. Ltd (Formerly
Plintron India Pvt. Ltd. All India
2 AdPay Mobile Payment India
Pvt. Ltd Tamil Nadu including
Chennai
Source : As reported by telecom service providers
1.14 Number of total Wireless subscribers decreased from 1,157.75
million at the end of Mar-20 to 1,140.71 million at the end of Jun-
20, thereby showing a quarterly decline rate of 1.47%. During the
quarter, net decline of 17.04 million wireless subscribers has been
recorded.
1.15 The total wireless subscriber base recorded a Y-O-Y negative growth
rate of 2.12% in QE Jun-20 over the same quarter in the previous
year.

14
1.16 Wireless Teledensity in the country decreased from 85.87 at the end
of Mar-20 to 84.38 at the end of Jun-20.
Chart 1.6: Wireless Subscriber Base and Teledensity
Table 1.10: Wireless Subscriber Base & Tele-density - Rural & Urban
Quarter ending Subscriber Base (million) Tele-density
Rural Urban Rural Urban
Jun-19 508.19 657.27 56.68 156.42
Sep-19 514.56 659.18 57.28 156.18
Dec-19 507.46 643.97 56.39 151.90
Mar-20 519.27 638.48 58.54 138.41
Jun-20 521.60 619.11 58.72 133.53
1.17 Number of Rural Wireless subscribers increased from 519.27 million
at the end of Mar-20 to 521.60 million at the end of Jun-20,
however, the number of urban wireless subscribers decreased from
638.48 million to 619.11 million during the quarter. Quarterly

15
growth rates of Rural and Urban wireless subscriptions are 0.45%
and -3.03% respectively during QE Jun-20.
1.18 The share of rural wireless subscription increased from 44.85% to
45.73% in total wireless subscription in this quarter.
Chart 1.7: Wireless Market Share - Rural & Urban
Table 1.11: Growth in Wireless Subscriber base
Service Provider
Subscriber Base (millions) Rate of Growth
(%)
Market Share
Mar-20 (%)
Market Share
Jun-20 (%) Mar-20 Jun-20 Net
Additions
Reliance Jio 387.52 397.25 9.73 2.51 33.47 34.82
Bharti Airtel 327.81 316.67 -11.14 -3.40 28.31 27.76
Vodafone Idea
Ltd 319.17 305.10 -14.06 -4.41 27.57 26.75
BSNL 119.87 118.31 -1.56 -1.30 10.35 10.37
MTNL 3.36 3.35 -0.01 -0.16 0.29 0.29
Reliance Com. 0.02 0.02 0.00 -2.30 0.002 0.002
Total 1,157.75 1,140.71 -17.04 -1.47 100 100

16
1.19 M/s RJIL Limited is the market leader with a wireless subscriber
base of 397.25 million which translates into market share of
34.82% w.r.t total wireless subscriber base. M/s Bharti Airtel Ltd. is
at 2nd position with a total subscriber base of 316.67 million and
market share of 27.76%. M/s RJIL has reported the net additions of
9.73 Million.
1.20 In terms of net additions during QE Jun-20, except M/s RJIL
Limited all service providers have showed negative growth in their
wireless subscribers.
Table 1.12: Service Area wise Wireless Subscriber base
Service Area Subscriber base (in million)
Mar-20 Jun-20 Net
Additions Rate of
change (%)
Andhra Pradesh 87.86 86.35 -1.50 -1.71
Assam 23.60 23.49 -0.12 -0.49
Bihar 84.72 83.67 -1.05 -1.24
Delhi 53.40 52.03 -1.36 -2.55
Gujarat 67.93 66.24 -1.70 -2.50
Haryana 27.67 27.26 -0.42 -1.51
Himachal Pradesh 10.79 10.74 -0.05 -0.50
Jammu & Kashmir 11.86 11.79 -0.07 -0.60
Karnataka 67.63 66.68 -0.95 -1.40
Kerala 43.43 43.59 0.16 0.36
Madhya Pradesh 75.23 74.56 -0.67 -0.89
Maharashtra 92.80 91.28 -1.51 -1.63
Mumbai 37.83 36.47 -1.36 -3.60
North East 12.02 11.88 -0.15 -1.21
Orissa 33.33 32.97 -0.36 -1.08
Punjab 39.17 38.52 -0.65 -1.66
Rajasthan 65.53 64.37 -1.16 -1.77
T.N. (incl. Chennai) 81.98 78.63 -3.35 -4.09
U.P.(E) 96.76 97.94 1.18 1.22
U.P.(W) 63.38 62.08 -1.31 -2.06
Kolkata 25.73 25.36 -0.38 -1.46
West Bengal 55.07 54.81 -0.27 -0.48
All India 1,157.75 1,140.71 -17.04 -1.47

17
Table 1.13: Service Area wise Wireless Rural-Urban Subscriber base
Service Area Subscriber base (in million)
Total Rural Urban % of Rural Subscribers
Andhra Pradesh 86.35 43.82 42.54 50.74
Assam 23.49 13.88 9.60 59.11
Bihar 83.67 55.84 27.83 66.74
Delhi 52.03 2.46 49.57 4.73
Gujarat 66.24 26.76 39.48 40.40
Haryana 27.26 12.47 14.78 45.76
Himachal Pradesh 10.74 7.30 3.44 68.00
Jammu & Kashmir 11.79 5.70 6.08 48.39
Karnataka 66.68 26.80 39.88 40.19
Kerala 43.59 20.21 23.38 46.37
Madhya Pradesh 74.56 34.39 40.18 46.12
Maharashtra 91.28 43.36 47.92 47.50
Mumbai 36.47 1.79 34.67 4.92
North East 11.88 5.92 5.95 49.88
Orissa 32.97 22.07 10.90 66.94
Punjab 38.52 13.40 25.12 34.79
Rajasthan 64.37 35.05 29.33 54.44
T.N. (incl. Chennai) 78.63 23.57 55.06 29.97
U.P.(E) 97.94 61.16 36.78 62.45
U.P.(W) 62.08 29.38 32.70 47.32
Kolkata 25.36 1.89 23.47 7.44
West Bengal 54.81 34.37 20.44 62.71
All India 1,140.71 521.60 619.11 45.73
1.21 Detailed table on service provider wise subscriber base in each
service area is at Annexure-1.1.

18
Table 1.14 : Service Area wise Wireless Tele-density
Service Area
As on 31st March, 2020 As on 30th June, 2020
Rural Tele-density
Urban Tele-density
Total Tele-density
Rural Tele-density
Urban Tele-density
Total Tele-density
A.P. 78.86 126.49 97.59 80.32 119.47 95.78
Assam 47.11 184.65 68.02 47.07 181.18 67.51
Bihar 41.66 116.74 53.14 41.21 113.55 52.29
Delhi - - 264.02 - - 256.09
Gujarat 73.05 123.44 97.10 73.09 117.50 94.34
Haryana 73.39 127.08 95.07 71.79 124.88 93.30
H.P. 110.26 467.11 146.79 110.49 455.43 145.83
J&K 60.00 151.23 87.16 59.65 149.55 86.49
Karnataka 75.27 137.18 101.90 70.87 139.04 100.28
Kerala 182.64 95.84 122.72 187.51 94.81 123.01
M.P. 42.39 129.52 66.81 42.31 126.67 65.99
Maharashtra
(incl. Mumbai)* 70.12 141.79 104.55 69.50 137.08 102.02
North East 57.58 120.87 78.43 57.63 117.05 77.30
Orissa 62.25 137.14 75.98 61.58 135.06 75.09
Punjab 75.77 190.45 125.10 75.08 185.73 122.78
Rajasthan 61.55 145.84 83.63 60.44 142.20 81.89
Tamil Nadu (incl. Chennai)
70.12 137.44 105.62 64.31 134.07 101.17
Uttar Pradesh (incl. UPE&UPW)*
46.25 131.75 66.87 49.69 119.69 66.60
West Bengal (incl. Kolkata)*
57.32 126.33 81.92 57.13 124.29 81.15
All India 58.54 138.41 85.87 58.72 133.53 84.38
* Population data/projections are available state-wise only.
Notes: 1. Tele-density figures are derived from the subscriber data provided by the operators and the
population projections, for Urban and Rural areas, of the country are taken from the Report of the technical group on population projections published by National Commission on
Population, Ministry of Health & Family Welfare (Based on Census of India 2011). 2. Delhi Service area, apart from the State of Delhi, includes wireless subscribers of the areas
served by the local exchanges of Ghaziabad & Noida (in UP) and Gurgaon & Faridabad (in Haryana).
3. Data/information for Andhra Pradesh includes Telengana, Madhya Pradesh includes
Chhatishgarh, Bihar includes Jharkhand, Maharashtra includes Goa, Uttar Pradesh
includes Uttarakhand, West Bengal includes Sikkim and North-East includes Arunachal
Pradesh, Manipur, Meghalaya, Mizoram, Nagaland & Tripura states.

19
Table 1.15 : State/UT wise Wireless Subscriber Base
Sl. No.
States/UT Wireless Subscribers (in million)
Total Rural Urban
1 Andhra Pradesh 45.08 25.80 19.28
2 Arunachal Pradesh 1.28 0.75 0.53
3 Assam 23.49 13.88 9.60
4 Bihar 61.74 43.73 18.01
5 Chhattisgarh 19.88 9.69 10.19
6 Goa 2.75 1.07 1.68
7 Gujarat 65.51 26.53 38.98
8 Haryana 32.94 12.53 20.42
9 Himachal Pradesh 10.74 7.30 3.44
10 Jharkhand 21.93 12.11 9.83
11 Karnataka 66.68 26.80 39.88
12 Kerala 43.51 20.17 23.33
13 Madhya Pradesh 54.69 24.70 29.99
14 Maharashtra 125.00 44.08 80.91
15 Manipur 2.29 0.95 1.34
16 Meghalaya 2.29 1.31 0.98
17 Mizoram 1.33 0.53 0.79
18 Nagaland 1.62 0.84 0.78
19 Odisha 32.97 22.07 10.90
20 Punjab 36.88 13.36 23.52
21 Rajasthan 64.37 35.05 29.33
22 Sikkim 0.67 0.38 0.29
23 Tamil Nadu 77.50 23.25 54.25
24 Telangana 41.27 18.02 23.25
25 Tripura 3.07 1.54 1.53
26 Uttar Pradesh 154.80 84.06 70.74
27 Uttarakhand 12.85 6.49 6.36
28 West Bengal 79.15 35.71 43.43
Union Territories
1 Andaman & Nicobar Islands 0.35 0.17 0.19
2 Chandigarh 1.63 0.04 1.59
3 Dadra and Nagar Haveli and
Daman and Diu 0.73 0.23 0.50
4 Delhi 38.73 2.40 36.33
5 Jammu & Kashmir 11.34 5.54 5.80
6 Ladakh 0.45 0.17 0.28
7 Lakshdweep 0.08 0.04 0.05
8 Puduchery 1.13 0.32 0.81
Total 1140.71 521.60 619.11
20
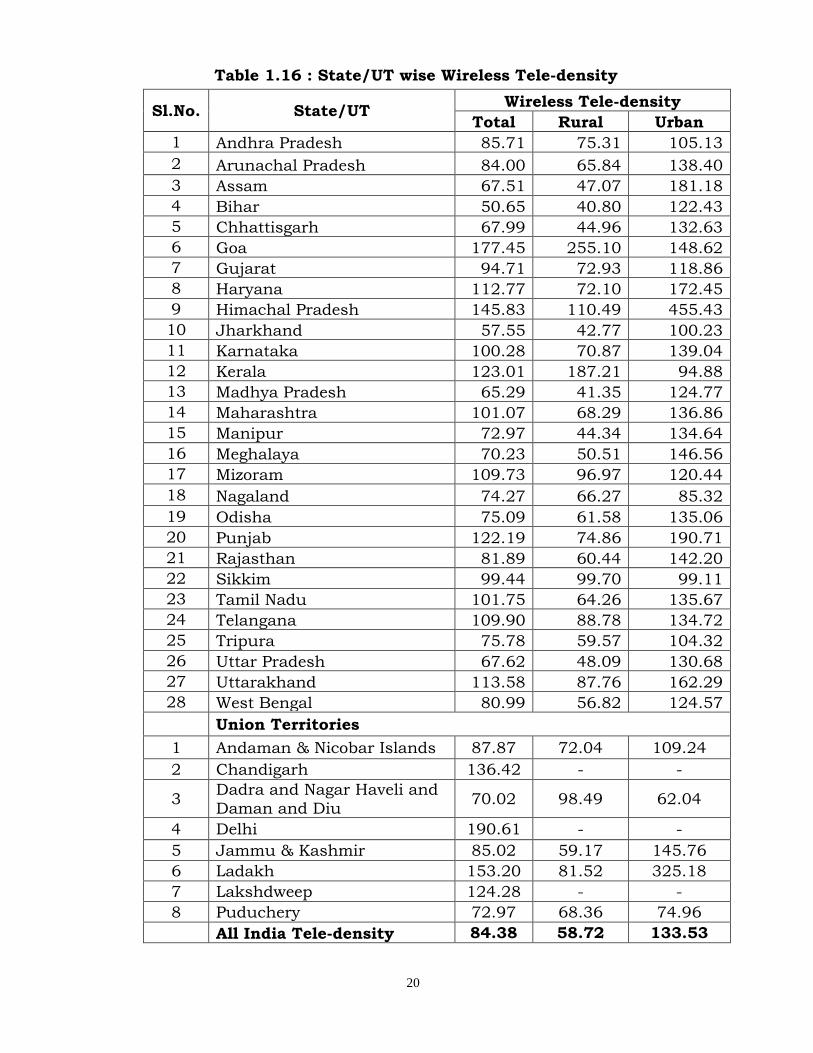
Table 1.16 : State/UT wise Wireless Tele-density
Sl.No. State/UT Wireless Tele-density
Total Rural Urban
1 Andhra Pradesh 85.71 75.31 105.13
2 Arunachal Pradesh 84.00 65.84 138.40
3 Assam 67.51 47.07 181.18
4 Bihar 50.65 40.80 122.43
5 Chhattisgarh 67.99 44.96 132.63
6 Goa 177.45 255.10 148.62
7 Gujarat 94.71 72.93 118.86
8 Haryana 112.77 72.10 172.45
9 Himachal Pradesh 145.83 110.49 455.43
10 Jharkhand 57.55 42.77 100.23
11 Karnataka 100.28 70.87 139.04
12 Kerala 123.01 187.21 94.88
13 Madhya Pradesh 65.29 41.35 124.77
14 Maharashtra 101.07 68.29 136.86
15 Manipur 72.97 44.34 134.64
16 Meghalaya 70.23 50.51 146.56
17 Mizoram 109.73 96.97 120.44
18 Nagaland 74.27 66.27 85.32
19 Odisha 75.09 61.58 135.06
20 Punjab 122.19 74.86 190.71
21 Rajasthan 81.89 60.44 142.20
22 Sikkim 99.44 99.70 99.11
23 Tamil Nadu 101.75 64.26 135.67
24 Telangana 109.90 88.78 134.72
25 Tripura 75.78 59.57 104.32
26 Uttar Pradesh 67.62 48.09 130.68
27 Uttarakhand 113.58 87.76 162.29
28 West Bengal 80.99 56.82 124.57
Union Territories
1 Andaman & Nicobar Islands 87.87 72.04 109.24
2 Chandigarh 136.42 - -
3 Dadra and Nagar Haveli and
Daman and Diu 70.02 98.49 62.04
4 Delhi 190.61 - -
5 Jammu & Kashmir 85.02 59.17 145.76
6 Ladakh 153.20 81.52 325.18
7 Lakshdweep 124.28 - -
8 Puduchery 72.97 68.36 74.96
All India Tele-density 84.38 58.72 133.53

21
Table 1.17 : Rural Wireless Subscriber base and Market Share as on 30.06.2020
Service Provider
Total number of wireless
Subscribers (in millions)
Rural Subscribers
(in millions)
% of Rural subscribers
in total
Market Share of
Rural Subscribers
(%)
Reliance Jio 397.25 166.35 41.88 31.89
Bharti Airtel* 316.67 151.09 47.71 28.97
Vodafone Idea Ltd
305.10 166.02 54.41 31.83
BSNL 118.31 38.09 32.20 7.30
MTNL 3.35 0.05 1.36 0.01
Reliance Com. 0.02 0.00 0.00 0.00
Total 1,140.71 521.60 45.73 100
Note: 1. M/s Reliance Com. has not reported number of its rural wireless subscribers and
hence its rural wireless subscription has been taken as NIL.
2. M/s Bharti Airtel Ltd has reported the wireless subscribers including the
subscribers of M/s Tata Teleservices Ltd for QE June, 2020.
Wireless Data Usage
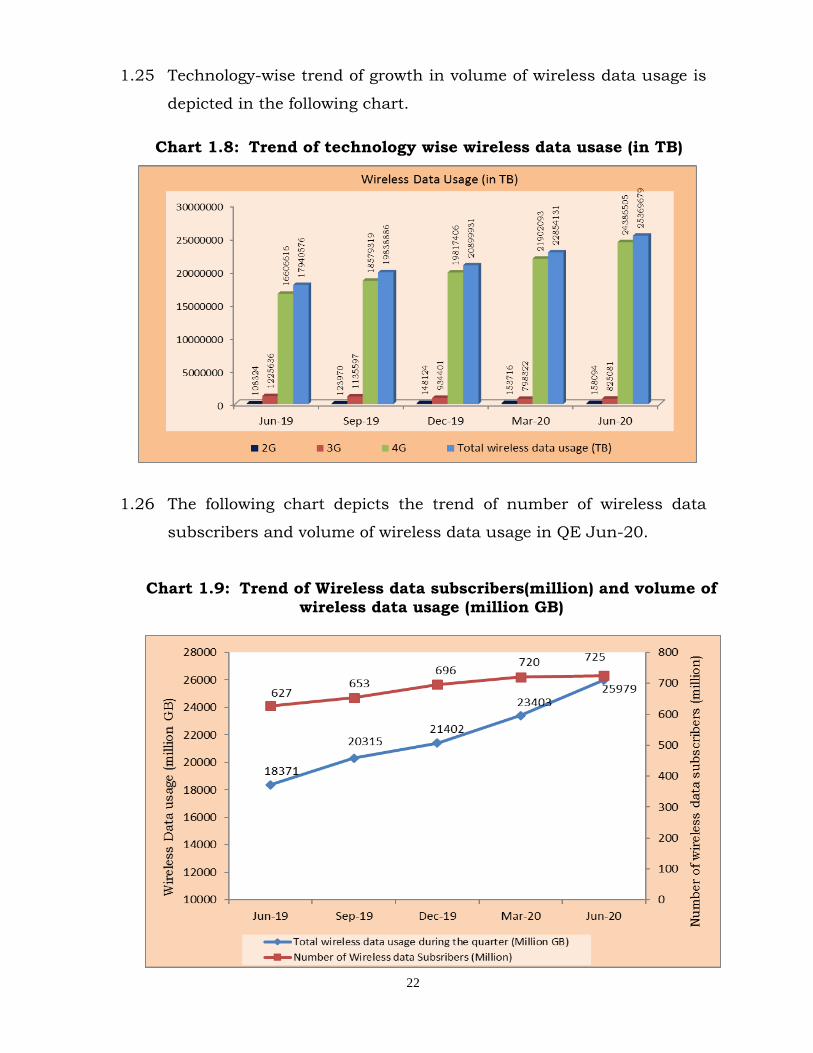
1.22 Volume of total wireless data usage increased from 22,854,131 TB
during Q.E. Mar-20 to 25,369,679 TB during Q.E. Jun-20 with
quarterly growth rate of 11.01%. Out of total data wireless usage,
2G data usage was 158,094 TB, 3G data usage was 825,081 TB and
4G data usage was 24,386,505 TB during the quarter.
1.23 Total number of wireless data subscribers increased from 720.18
million at the end of Mar-20 to 725.40 million at the end of Jun-20.
1.24 The contribution of 2G, 3G and 4G data usage in total volume of
wireless data usage are about 0.62%, 3.25% and 96.12%
respectively during the QE Jun-20.
22
1.25 Technology-wise trend of growth in volume of wireless data usage is
depicted in the following chart.
Chart 1.8: Trend of technology wise wireless data usase (in TB)
1.26 The following chart depicts the trend of number of wireless data
subscribers and volume of wireless data usage in QE Jun-20.
Chart 1.9: Trend of Wireless data subscribers(million) and volume of
wireless data usage (million GB)

23
Section C : Wireline Service
Table 1.18 : Service Providers providing Wireline Service
[As on 30th June, 2020]
Sl.
No. Name of the
Service Provider Area of Operation
1 Bharti Airtel Ltd
Telangana, Delhi, Gujarat, Haryana, Karnataka, Kerala, Kolkata,
Madhya Pradesh (excluding Chhattisgarh), Chhattisgarh,
Maharashtra (excluding Mumbai), Mumbai, Punjab, Rajasthan,
Tamilnadu (excluding Chennai), Chennai, UP-East and UP-
West(excluding Uttarakhand).
2 BSNL All India except Delhi & Mumbai 3 MTNL Delhi & Mumbai
4 Quadrant
Televentures Ltd. Punjab
5 Reliance
Communications
Ltd.
Andhra Pradesh (excluding Telangana), Telangana, Bihar
(Excluding Jharkhand), Jharkhand, Delhi, Gujarat, Haryana,
Himachal Pradesh, Karnataka, Kerala, Kolkata, Madhya Pradesh
(excluding Chhattisgarh), Chhattisgarh, Maharashtra (Excluding
Mumbai & Goa) Goa, Mumbai, Orissa, Punjab, Rajasthan,
Tamilnadu (excluding Chennai), Chennai, UP-East, UP-West
(Excluding Uttarakhand), Uttarakhand and West Bengal (Excluding
Andaman & Nicobar and Sikkim)
6
Tata Teleservices
(Maharashtra) Ltd. Maharashtra & Goa, Mumbai
Tata Teleservices
Ltd.
Andhra Pradesh (Excluding Telangana), Telangana, Bihar
(Excluding Jharkhand), Jharkhand, Delhi, Gujarat, Haryana,
Himachal Pradesh, Karnataka, Kerala, Kolkata, Maharashtra
(excluding Mumbai & Goa), Goa, Mumbai Madhya Pradesh
(Excluding Chhattisgarh), Chhattisgarh, Orissa, Punjab,
Rajasthan, Tamilnadu (Excluding Chennai), Chennai, UP-East, UP-
West (Excluding Uttarakhand), Uttarakhand and West Bengal
(Excluding Andaman & Nicobar and Sikkim)
7 Vodafone Idea Ltd
Andhra Pradesh (Excluding Telangana), Telangana, Assam, Bihar
(Excluding Jharkhand), Jharkhand, Delhi, Gujarat, Haryana,
Himachal Pradesh, Karnataka, Kerala, Kolkata, Madhya Pradesh
(Excluding Chhattisgarh), Chhattisgarh, Maharashtra (Excluding
Mumbai & Goa), Goa, Mumbai Meghalaya, Orissa, Punjab,
Rajasthan, Tamilnadu (Excluding Chennai), UP-East, UP-West
(Excluding Uttarakhand), Uttarakhand and West Bengal (Excluding
Andaman & Nicobar and Sikkim)

24
8 Reliance Jio
Andhra Pradesh (Excluding Telangana), Telangana, Assam, Bihar
(Excluding Jharkhand), Jharkhand, Delhi, Gujarat, Haryana,
Himachal Pradesh, Jammu & Kashmir, Karnataka, Kerala,
Kolkata, Madhya Pradesh (Excluding Chhattisgarh), Chhattisgarh,
Maharashtra (Excluding Mumbai), Mumbai, Manipur, Meghalaya,
Mizoram, Nagaland, Orissa, Punjab, Rajasthan, Tamilnadu
(Excluding Chennai), Chennai, UP-East, UP-West (Excluding
Uttarakhand), Uttarakhand and West Bengal (Excluding Andaman
& Nicobar and Sikkim)
1.27 Total number of Wireline subscribers decreased from 20.22 million
at the end of Mar-20 to 19.81 million at the end of Jun-20 with
quarterly decline rate of 2.02%. Overall Wireline Teledensity also
decreased from 1.50 at the end of Mar-20 to 1.47 at the end of Jun-
20.
1.28 Urban wireline subscriber base declined by 1.40%, from 17.97
million at the end of Mar-20 to 17.72 million at the end of Jun-20.
Rural wireline subscription also declined by 6.94%, from 2.24
million to 2.09 million during the same period.
Chart 1.10: Wireline Subscriber Base and Tele-density

25
Table 1.19 : Wireline Subscriber Base & Tele-density - Rural & Urban
Quarter ending Subscriber Base (million)
Tele-density (%)
Rural Urban Rural Urban
Jun-19 2.85 18.31 0.32 4.36
Sep-19 2.72 18.77 0.30 4.45
Dec-19 2.53 18.47 0.28 4.36
Mar-20 2.24 17.97 0.25 3.90
Jun-20 2.09 17.72 0.24 3.82
Table 1.20 : Service Provider wise Subscriber base (Rural - Urban) – As on 30.06.2020
Service Provider
Subscriber Base (million)
Percentage of Rural
subscribers
Share of Rural
subscription Rural Urban Total
BSNL 2.00 6.17 8.18 24.51% 96.00%
Bharti 0.00 4.27 4.27 -- 0.00%
MTNL 0.00 3.09 3.09 -- 0.00%
Tata Tele. 0.04 1.68 1.73 2.56% 2.11%
Reliance Com.
0.001 0.46 0.46 0.18% 0.04%
Quadrant 0.03 0.14 0.18 19.56% 1.66%
Vodafone Idea
0.00 0.46 0.46 -- 0.00%
Reliance Jio 0.004 1.45 1.46 0.28% 0.19%
Total 2.09 17.72 19.81 10.54% 100.00%
1.29 Detailed table on service provider wise subscriber base in each
service area is at Annexure-1.2.

26
Chart 1.11: Composition of Wireline Subscriber base - Rural & Urban
1.30 Market Share of Rural wireline subscription declined from 11.09% in
QE Mar-20 to 10.54% in QE Jun-20.
Table 1.21 : Service Provider wise growth in Wireline Subscriber base
Service Provider
Subscriber Base (million) Rate of change
(%)
Market share-
Mar-20(%)
Market share-
Jun-20(%) Mar-20 Jun-20 Net
Addition
BSNL 8.73 8.18 -0.552 -6.33 43.16 41.27
Bharti 4.39 4.27 -0.120 -2.74 21.73 21.57
MTNL 3.09 3.09 -0.008 -0.25 15.30 15.58
Tata Tele. 1.77 1.73 -0.045 -2.52 8.76 8.71
Reliance Com 0.51 0.46 -0.044 -8.74 2.50 2.33
Quadrant 0.18 0.18 -0.005 -2.87 0.90 0.89
Vodafone 0.46 0.46 0.002 0.42 2.26 2.31
Reliance Jio 1.09 1.46 0.365 33.43 5.39 7.35
Total 20.22 19.81 -0.41 -2.02 100 100

27
Table 1.22: Service Area wise Wireline Subscriber base & Net Additions (in million)
Service Area Mar-20 Jun-20 Net Additions
Rate of Change (%)
Andhra Pradesh 1.32 1.31 -0.005 -0.36
Assam 0.11 0.11 0.001 1.02
Bihar 0.18 0.18 0.001 0.76
Delhi 3.27 3.19 -0.080 -2.43
Gujarat 1.00 0.96 -0.042 -4.24
Haryana 0.26 0.29 0.025 9.40
Himachal Pradesh 0.10 0.09 -0.005 -4.91
Jammu & Kashmir 0.13 0.14 0.006 4.61
Karnataka 2.15 2.13 -0.022 -1.02
Kerala 1.56 1.50 -0.062 -3.97
Madhya Pradesh 0.67 0.62 -0.048 -7.22
Maharashtra 1.35 1.31 -0.043 -3.20
Mumbai 3.07 3.06 -0.010 -0.34
North East 0.10 0.10 -0.001 -0.95
Orissa 0.21 0.20 -0.007 -3.10
Punjab 0.70 0.68 -0.021 -2.97
Rajasthan 0.49 0.47 -0.017 -3.49
T.N. (incl. Chennai) 2.01 1.96 -0.052 -2.60
U.P.(E) 0.40 0.33 -0.069 -17.19
U.P.(W) 0.31 0.33 0.017 5.53
Kolkata 0.65 0.66 0.001 0.16
West Bengal 0.17 0.20 0.025 14.11
All India 20.22 19.81 -0.408 -2.02
1.31 West Bengal service area showed maximum growth of 14.11% and
UP(E) service area showed maximum decline of 17.19% in their
wireline subscriber base during the quarter ending Jun-20.

28
Table 1.23: Service Area wise Wireline Rural-Urban Subscriber Base (in million)
Service Area Total
Subscribers
Rural
Subscribers
Urban
Subscribers
% of Rural
Subscribers
Andhra Pradesh 1.31 0.14 1.18 10.37%
Assam 0.11 0.02 0.10 14.09%
Bihar 0.18 0.02 0.16 11.38%
Delhi 3.19 0.00 3.19 0.00%
Gujarat 0.96 0.08 0.88 8.14%
Haryana 0.29 0.04 0.24 15.35%
Himachal Pradesh 0.09 0.05 0.04 54.61%
Jammu & Kashmir 0.14 0.01 0.13 8.03%
Karnataka 2.13 0.08 2.04 3.99%
Kerala 1.50 0.86 0.64 57.24%
Madhya Pradesh 0.62 0.02 0.60 3.64%
Maharashtra 1.31 0.18 1.13 13.65%
Mumbai 3.06 0.00 3.06 0.00%
North East 0.10 0.01 0.08 13.77%
Orissa 0.20 0.04 0.17 18.89%
Punjab 0.68 0.12 0.55 18.13%
Rajasthan 0.47 0.04 0.43 7.82%
T.N. (incl. Chennai) 1.96 0.25 1.71 12.56%
U.P.(E) 0.33 0.03 0.30 10.45%
U.P.(W) 0.33 0.02 0.30 7.62%
Kolkata 0.66 0.00 0.66 0.11%
West Bengal 0.20 0.07 0.13 34.91%
All India 19.81 2.09 17.72 10.54%
1.32 Kerala service area has the maximum share (57.24%) of rural
wireline subscriber in its total wireline subscriber base at the end of
Jun-20.
29
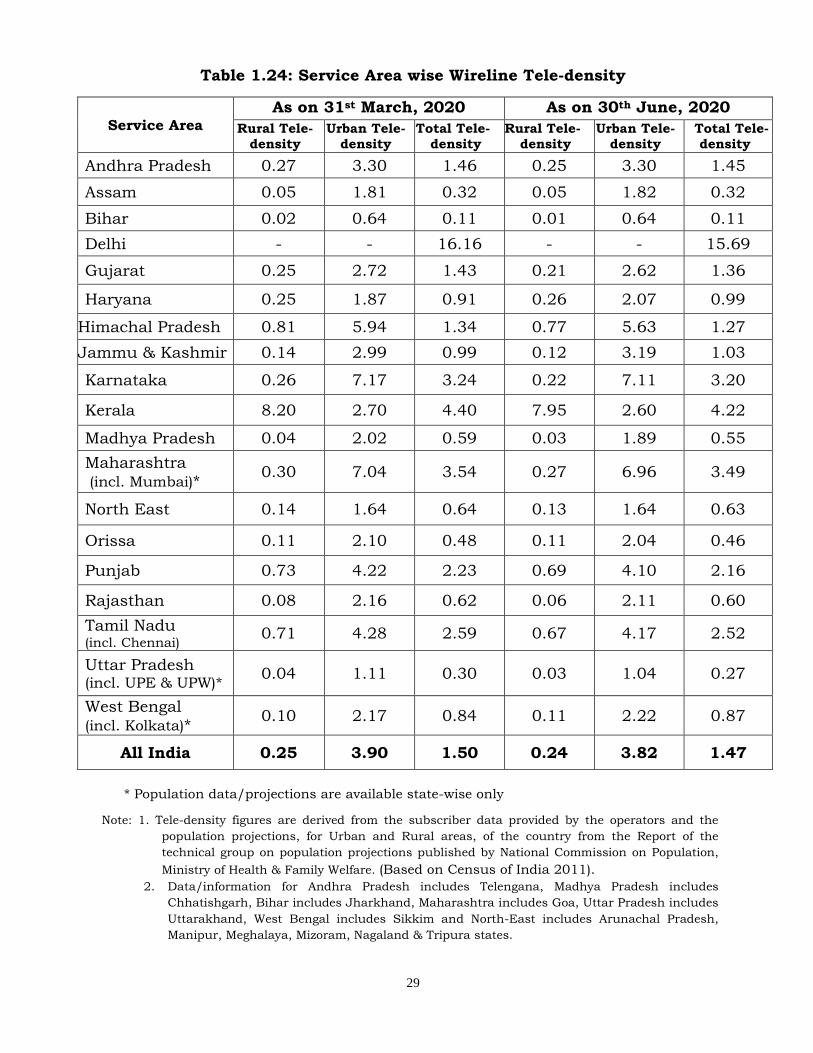
Table 1.24: Service Area wise Wireline Tele-density
Service Area
As on 31st March, 2020 As on 30th June, 2020
Rural Tele-density
Urban Tele-density
Total Tele-density
Rural Tele-density
Urban Tele-density
Total Tele-density
Andhra Pradesh 0.27 3.30 1.46 0.25 3.30 1.45
Assam 0.05 1.81 0.32 0.05 1.82 0.32
Bihar 0.02 0.64 0.11 0.01 0.64 0.11
Delhi - - 16.16 - - 15.69
Gujarat 0.25 2.72 1.43 0.21 2.62 1.36
Haryana 0.25 1.87 0.91 0.26 2.07 0.99
Himachal Pradesh 0.81 5.94 1.34 0.77 5.63 1.27
Jammu & Kashmir 0.14 2.99 0.99 0.12 3.19 1.03
Karnataka 0.26 7.17 3.24 0.22 7.11 3.20
Kerala 8.20 2.70 4.40 7.95 2.60 4.22
Madhya Pradesh 0.04 2.02 0.59 0.03 1.89 0.55
Maharashtra (incl. Mumbai)*
0.30 7.04 3.54 0.27 6.96 3.49
North East 0.14 1.64 0.64 0.13 1.64 0.63
Orissa 0.11 2.10 0.48 0.11 2.04 0.46
Punjab 0.73 4.22 2.23 0.69 4.10 2.16
Rajasthan 0.08 2.16 0.62 0.06 2.11 0.60
Tamil Nadu
(incl. Chennai) 0.71 4.28 2.59 0.67 4.17 2.52
Uttar Pradesh (incl. UPE & UPW)*
0.04 1.11 0.30 0.03 1.04 0.27
West Bengal (incl. Kolkata)*
0.10 2.17 0.84 0.11 2.22 0.87
All India 0.25 3.90 1.50 0.24 3.82 1.47
* Population data/projections are available state-wise only
Note: 1. Tele-density figures are derived from the subscriber data provided by the operators and the
population projections, for Urban and Rural areas, of the country from the Report of the
technical group on population projections published by National Commission on Population,
Ministry of Health & Family Welfare. (Based on Census of India 2011).
2. Data/information for Andhra Pradesh includes Telengana, Madhya Pradesh includes
Chhatishgarh, Bihar includes Jharkhand, Maharashtra includes Goa, Uttar Pradesh includes
Uttarakhand, West Bengal includes Sikkim and North-East includes Arunachal Pradesh,
Manipur, Meghalaya, Mizoram, Nagaland & Tripura states.

30
Table 1.25: State/UT wise Wireline Subscriber base
Sl.No. States/UT Wireline Subscribers (in million)
Total Rural Urban
1 Andhra Pradesh 0.72 0.11 0.61
2 Arunachal Pradesh 0.02 0.00 0.02
3 Assam 0.11 0.02 0.10
4 Bihar 0.09 0.01 0.08
5 Chhattisgarh 0.13 0.01 0.12
6 Goa 0.08 0.03 0.06
7 Gujarat 0.95 0.08 0.88
8 Haryana 0.31 0.04 0.27
9 Himachal Pradesh 0.09 0.05 0.04
10 Jharkhand 0.09 0.01 0.08
11 Karnataka 2.13 0.08 2.04
12 Kerala 1.49 0.85 0.64
13 Madhya Pradesh 0.49 0.01 0.48
14 Maharashtra Incl. Mumbai 4.29 0.15 4.13
15 Manipur 0.02 0.00 0.02
16 Meghalaya 0.02 0.002 0.02
17 Mizoram 0.01 0.001 0.01
18 Nagaland 0.01 0.000 0.01
19 Odisha 0.20 0.04 0.17
20 Punjab 0.51 0.12 0.39
21 Rajasthan 0.47 0.04 0.43
22 Sikkim 0.01 0.00 0.00
23 Tamil Nadu (incl. Chennai) 1.92 0.24 1.68
24 Telangana 0.60 0.03 0.57
25 Tripura 0.02 0.00 0.02
26 Uttar Pradesh (UPE+UPW) 0.60 0.05 0.55
27 Uttarakhand 0.08 0.01 0.07
28 West Bengal Incl. Kolkata 0.83 0.06 0.77
Union Territories
1 Andaman & Nicobar Islands 0.02 0.01 0.01
2 Chandigarh 0.17 0.001 0.17
3 Dadra and Nagar Haveli and Daman and Diu
0.005 0.002 0.003
4 Delhi 3.15 0.00 3.15
5 Jammu & Kashmir 0.14 0.01 0.13
6 Ladakh 0.00 0.00 0.00
7 Lakshdweep 0.004 0.002 0.003
8 Puduchery 0.04 0.01 0.04
Total 19.81 2.09 17.72

31
Table 1.26: State/UT wise Wireline Tele-density
Sl.No. State/UT Wireline Tele-density
Total Rural Urban
1 Andhra Pradesh 2.49 0.40 6.41
2 Arunachal Pradesh 1.41 0.41 4.40
3 Assam 0.32 0.05 1.82
4 Bihar 0.07 0.01 0.52
5 Chhattisgarh 0.44 0.04 1.57
6 Goa 5.45 6.05 5.22
7 Gujarat 1.38 0.21 2.67
8 Haryana 1.07 0.26 2.27
9 Himachal Pradesh 1.27 0.77 5.63
10 Jharkhand 0.23 0.02 0.82
11 Karnataka 3.20 0.22 7.11
12 Kerala 4.22 7.93 2.59
13 Madhya Pradesh 0.59 0.02 1.99
14 Maharashtra Incl. Mumbai 3.47 0.24 6.99
15 Manipur 0.62 0.18 1.58
16 Meghalaya 0.55 0.07 2.40
17 Mizoram 0.93 0.13 1.60
18 Nagaland 0.31 0.03 0.69
19 Odisha 0.46 0.11 2.04
20 Punjab 1.69 0.68 3.14
21 Rajasthan 0.60 0.06 2.11
22 Sikkim 0.77 0.06 1.68
23 Tamil Nadu (incl. Chennai) 2.52 0.66 4.19
24 Telengana 1.59 0.14 3.29
25 Tripura 0.49 0.07 1.22
26 Uttar Pradesh (UPE + UPW) 0.26 0.03 1.01
27 Uttarakhand 0.71 0.13 1.82
28 West Bengal incl. Kolkata 0.85 0.10 2.21
Union Territories
1 Andaman & Nicobar Islands 4.17 2.80 6.03
2 Chandigarh 14.10 33.80 14.03
3
Dadra and Nagar Haveli and
Daman and Diu 0.51 0.86 0.41
4 Delhi 15.49 0.00 15.60
5 Jammu & Kashmir 0.53 0.06 1.63
6 Ladakh 0.00 0.00 0.00
7 Lakshdweep 6.23 63.64 3.89
8 Puduchery 2.85 1.34 3.50
Total 1.47 0.24 3.82

32
Public Call Offices (PCO)
1.33 Total number of PCOs in the country declined from *1,77,525 at the
end of Mar-20 to 1,61,937 at the end of Jun-20. Detailed table of
service provider wise PCOs is available at Annexure -1.3.
Chart 1.12: Trend of Number of PCOs
1.34 Number of PCOs continued shows declining trend over the year.
It has recorded a overall quarterly decline rate of 8.78% and the
year-on-year Y-O-Y decline rate of 29.09% at the QE Jun-20.
Table 1.27 : Rate of change & Market share of PCOs
Service Provider
Mar-20 Jun-20 Rate of
change (%)
Market share
(%)
(Jun-20)
BSNL *1,05,003 9,6521 -8.08 59.60
MTNL 62,464 56,399 -9.71 34.83
Bharti 9,355 8,347 -10.77 5.15
Quadrant 703 670 -4.69 0.41
Total 1,77,525 1,61,937 -8.78 100
*BSNL revised the PCO subscriber figure of Telangana for Dec 2019 (0 to 4097) & March 2020 (0 to 4234)

33
Village Public Telephones (VPTs)
1.35 There are 5,93,731 inhabited villages in India as per census 2001.
During the Q.E. Jun-20, there are 68,406 villages having Village
Public Telephones (VPTs).
1.36 Number of VPTs increased from 67,762 at the end of Mar-20 to
68,406 at the end of Jun-20 with quarterly growth rate of 0.95%. It
shows yearly declining rate of 34.52% in QE Jun-20 over same
quarter in previous year.
1.37 As per the information received in TRAI, at the end of Jun-20, only
M/s BSNL was providing VPT in the country. Service area wise
detailed table of VPT is available at Annexure -1.4.
Chart 1.13: Trend of number of VPTs

34
Section D: Internet Service
1.38 This section summarizes information submitted by internet service
providers for the quarter ending Jun-20. Part-I consists of
information of Internet service (narrowband+broadband), Part-II
consists of broadband service and Part-III covers narrowband
service.
Part-I : Internet Service (broadband + narrowband)
1.39 As per reports received from 358 operators as compared to 360
operators in last quarter, total number of internet subscribers
increased from 743.19 million at the end of Mar-20 to 749.07 million
at the end of Jun-20 with quarterly growth rate of 0.79%. Out of
total 749.07 million internet subscribers, 698.23 million were
broadband subscribers and 50.84 million were narrowband
subscribers.
1.40 Wired Internet subscribers increased from 22.42 million at the end
of Mar-20 to 23.06 million at the end of Jun-20 with quarterly
growth rate of 2.86%. Wireless Internet subscribers increased from
720.78 million at the end of Mar-20 to 726.01 million at the end of
Jun-20 with quarterly growth rate of 0.73%.
1.41 The number of Broadband subscribers increased from 687.44
million at the end of Mar-20 to 698.23 million at the end of Jun-20
with quarterly growth rate of 1.57%. However, the number of
Narrowband subscribers declined from 55.75 million at the end of
Mar-20 to 50.84 million at the end of Jun-20 with quarterly decline
rate of 8.81%.

35
Table 1.28: Trend of Internet subscriber base
Segment
Mode of Access
Total
Subscribers (in million)
Wired
Subscribers (in million)
Wireless Subscribers (in million)
Fixed Wireless (Wi-Fi, Wi-Max,
Radio & VSAT)
Mobile
Wireless (Phone + Dongle)
Total
Wireless
Mar-20 Jun-20 Mar-20 Jun-20 Mar-20 Jun-20 Mar-20 Jun-20 Mar-20 Jun-20
Broadband 19.18 19.82 0.61 0.63 667.66 677.79 668.27 678.41 687.44 698.23
Narrowband 3.24 3.24 0.01 0.008 52.51 47.59 52.51 47.60 55.75 50.84
Total 22.41 23.06 0.61 0.63 720.17 725.38 720.78 726.01 743.19 749.07
1.42 The following charts present the composition of Internet Subscribers
by mode of access and composition of Broadband & Narrowband
subscription as on 30th June, 2020.
Chart 1.14: Composition of Internet subscription
1.43 Out of total internet subscribers, 96.84% subscribers are using
Mobile devices for access of internet service. Wired internet
subscribers are only 3.08% in total internet subscribers at the end
of Jun-20.

36
Chart 1.15 : Composition of Broadband & Narrowband subscription
1.44 Out of total internet subscribers, 93.21% subscribers are using
broadband for access of internet.
1.45 Share of private internet service providers in total internet
subscriber base, increased from 95.68% at QE Mar-20 to 95.93% at
QE Jun-20. The following charts present the composition of market
share of PSUs and Private Internet service providers.
Chart 1.16 : Market share of PSUs and Private Internet Service
Providers

37
1.46 The urban/rural break up of internet subscribers are as per the
following table: -
Table 1.29: Break up of Rural-Urban internet subscriber base (in millions)
Telecom Service
Area
Narrowband Broadband Total
(June 2020)
Total
(March 2020)
Rural Urban Rural Urban Rural Urban Rural Urban
Andhra Pradesh 1.830 1.620 24.217 31.484 26.047 33.103 25.509 33.143
Assam 0.607 0.329 7.960 5.567 8.567 5.896 8.313 5.934
Bihar 3.045 1.149 28.634 16.761 31.679 17.910 30.533 17.862
Delhi 0.164 2.655 0.619 37.175 0.783 39.830 0.755 40.242
Gujarat 0.869 1.099 13.088 30.434 13.957 31.533 13.671 31.645
Haryana 0.409 0.495 6.504 9.924 6.914 10.419 6.811 10.368
Himachal Pradesh 0.174 0.140 3.729 2.041 3.903 2.180 3.793 2.207
Jammu & Kashmir 0.318 0.161 3.040 4.009 3.358 4.170 3.445 4.234
Karnataka 1.521 1.611 15.121 27.860 16.642 29.471 17.013 28.820
Kerala 0.711 0.947 10.477 15.316 11.188 16.263 10.754 15.793
Kolkata 0.059 1.150 1.416 14.902 1.474 16.052 1.418 15.987
Madhya Pradesh 1.963 1.736 18.397 27.892 20.360 29.628 19.746 28.971
Maharashtra 2.048 2.170 23.807 36.076 25.855 38.247 25.164 37.848
Mumbai 0.064 1.810 1.660 25.936 1.724 27.746 1.533 28.768
North East 0.279 0.209 3.831 3.722 4.110 3.931 3.973 3.996
Orissa 1.121 0.356 11.633 6.591 12.754 6.947 12.365 6.915
Punjab 0.569 0.864 7.992 17.033 8.561 17.897 8.432 17.698
Rajasthan 1.601 1.287 18.660 20.735 20.261 22.023 20.022 22.482
Tamil Nadu 1.414 2.286 12.383 34.959 13.797 37.245 13.819 37.819
UP (East) 3.374 1.337 26.405 24.107 29.779 25.445 28.915 25.681
UP (West) 1.301 1.263 13.136 22.131 14.436 23.394 13.341 24.458
West Bengal 1.856 0.868 15.087 15.780 16.942 16.648 16.647 16.353
Grand Total 25.296 25.544 267.795 430.435 293.092 455.979 285.969 457.225
50.840 698.231 749.071 743.194

38
Table 1.30: Internet Subscriber Base and Market Share of top 10 Service Providers
S.No ISP No. of Subscribers (In million)
Share (%)
1 Reliance Jio Infocomm Ltd 398.31 53.17
2 Bharti Airtel Ltd. 176.42 23.55
3 Vodafone Idea Limited 135.67 18.11
4 Bharat Sanchar Nigam Ltd. 29.31 3.91
5 Atria Convergence Technologies Pvt. Ltd.
1.68 0.22
6 Hathway Cable & Datacom Pvt. Ltd. 0.99 0.13
7 Mahanagar Telephone Nigam Ltd. 0.98 0.13
8 You Broadband India Pvt. Ltd. 0.82 0.11
9 GTPL Broadband Pvt. Ltd. 0.41 0.05
10 Excitel Broadband Private Limited 0.39 0.05
Total of Top 10 ISPs 744.97 99.45
Others 4.10 0.55
Grand Total 749.07 100
1.47 Reliance Jio holds the top position with 53.17% of market share of
internet subscribers followed by Bharti Airtel Ltd with 23.55% at the
QE Jun-20. M/s Vodafone Idea Ltd held the third position in respect
of internet subscriber base with market share of 18.11%.
1.48 Out of total 358 internet service providers, top 10 Service Providers
together hold 99.45% of total internet subscriber base at the
QE Jun-20. Detailed table of number of internet subscriber base
(broadband and narrowband) of all the service providers is available
at Annexure-1.5.

39
1.49 The following chart depicts the internet subscriber base of top ten
Internet Service Providers (ISPs) in the QE Jun-20.
Chart 1.17 : Subscriber base of top ten ISPs
1.50 Out of total 23.06 million wired internet subscribers, BSNL holds
48.10% market share with 11.09 million subscribers, followed by
Bharti with 2.47 million subscribers.
Chart 1.18 : Composition of Wired Internet subscribers

40
1.51 In wireless internet segment, Reliance Jio holds 54.72% market
share with 397.25 million subscribers followed by Bharti Airtel Ltd
with 23.96% of wireless internet subscribers at the QE Jun-20.
Chart 1.19 : Composition of Wireless Internet subscription
Chart 1.20 : Technology trend for Wireless Internet Access

41
Chart 1.21: Technology trend for Wired Internet Access
1.52 Top five service areas in terms of internet subscriptions (wired+
wireless) are Maharashtra (64.10 million), Andhra Pradesh including
Telengana (59.15 million), U.P.(East) (55.22 million) Tamil Nadu
including Chennai (51.04 million) and Madhya Pradesh including
Chhatishgarh (49.99 million).
Table 1.31 : Service Area wise number of Internet Subscribers per
100 population at the end of Jun-20
Service Area
Internet Subscribers (in million)
No. of Internet subscribers per 100 population
Rural Urban Total Rural Urban Total
Andhra Pradesh 26.05 33.10 59.15 47.75 92.97 65.61
Assam 8.57 5.90 14.46 29.05 111.21 41.57
Bihar 31.68 17.91 49.59 23.38 73.07 30.99
Delhi 0.78 39.83 40.61 528.15 197.47 199.88
Gujarat 13.96 31.53 45.49 38.13 93.85 64.79
Haryana 6.91 10.42 17.33 39.79 88.01 59.33
Himachal Pradesh 3.90 2.18 6.08 59.06 289.06 82.63
Jammu & Kashmir 3.36 4.17 7.53 35.12 102.50 55.23
Karnataka 16.64 29.47 46.11 44.01 102.75 69.35

42
Service Area
Internet Subscribers (in million)
No. of Internet subscribers
per 100 population
Rural Urban Total Rural Urban Total
Kerala 11.19 16.26 27.45 103.79 65.96 77.47
Madhya Pradesh 20.36 29.63 49.99 25.05 93.41 44.24
Maharashtra 25.86 38.25 64.10 42.44 109.53 74.72
Mumbai 1.72 27.75 29.47
North East 4.11 3.93 8.04 39.99 77.30 52.34
Orissa 12.75 6.95 19.70 35.59 86.07 44.87
Punjab 8.56 17.90 26.46 47.96 132.32 84.32
Rajasthan 20.26 22.02 42.28 34.94 106.79 53.79
Tamil Nadu 13.80 37.25 51.04 37.65 90.69 65.68
UP (East) 29.78 25.44 55.22 24.47 84.14 38.73
UP (West) 14.44 23.39 37.83
Kolkata 1.47 16.05 17.53 29.02 92.56 51.74
West Bengal 16.94 16.65 33.59
Total 293.09 455.98 749.07 33.00 98.35 55.41
* Population data/projections are available state-wise only.
Notes: 1. No. of total internet subscribers per 100 population is derived from the subscriber data
provided by the operators and the population projections of the country from the Report of
the technical group on population projections published by National Commission on
Population, Ministry of Health & Family Welfare. (Based on Census of India 2011)
2. Data/information for Andhra Pradesh includes Telengana, Madhya Pradesh includes
Chhatishgarh, Bihar includes Jharkhand, Maharashtra includes Goa, Uttar Pradesh
includes Uttarakhand, West Bengal includes Sikkim and North-East includes Arunachal
Pradesh, Manipur, Meghalaya, Mizoram, Nagaland & Tripura states.
ISP Connectivity
1.53 The International Internet bandwidth owned by various service
providers is reported to be 18,242 Gbps during the quarter ending
June-20 as compare to 16,041 Gbps during the previous quarter.

43
Internet Telephony
1.54 As per the reports received from 15 service providers, providing
Internet Telephony services, the total outgoing minutes of usage for
internet telephony decreased from 181.34 million minutes at the end
of Mar-20 to 124.07 million minutes at the end of Jun-20. List of
Internet Telephony Service providers is available at Annexure-1.6.
Chart 1.22 : Trends in MOU for Internet Telephony
Part-II : Broadband Service (Download Speed >=512 Kbps)
1.55 The total number of broadband subscribers increased from 687.44
million at the end of Mar-20 to 698.23 million at the end of Jun-20.
Out of which number of wired broadband subscribers are 19.82
million and wireless broadband subscribers are 678.41 million.
1.56 Top five broadband (wired+wireless) service providers in term of
subscribers are Reliance Jio (398.31 million), Bharti Airtel (151.30
million), Vodafone Idea Ltd (116.45 million), BSNL (23 million) and
Atria Convergence (1.68 million).

44
1.57 In wired broadband segment, BSNL holds 39.84% market share with
7.90 million subscribers followed by Bharti with 2.47 million
subscribers in QE Jun-20.
1.58 In wireless broadband segment, Reliance Jio holds 58.56% market
share with 397.25 million subscribers followed by Bharti Airtel Ltd
(21.94%) with 148.83 million subscribers in QE Jun-20.
1.59 Top five service areas in respect of broadband subscriptions at Q.E.
Jun-20 are Maharashtra (59.88 million), Andhra Pradesh including
Telengana (55.70 million), U.P.-East (50.51 million), Tamil Nadu
including Chennai (47.34 million) and Madhya Pradesh (46.29
million).
Chart 1.23 : Composition of Broadband subscription –
Technology wise
1.60 Mobile Device Users (dongle+phone) constitute 97.07% of total
broadband subscribers at the end of Jun-20.

45
Part-III : Narrowband Service (Download Speed <512 Kbps)
1.61 Total number of narrowband subscribers declined from 55.75
million at the end of Mar-20 to 50.84 million at the end of Jun-20
with the quarterly decline rate of 8.81%. Out of 50.84 million
narrowband subscribers, Wired Narrowband subscribers are 3.24
million and Wireless Narrowband subscribers are 47.60 million.
1.62 The top five narrowband (wired+wireless) service providers in term of
subscriber base are Bharti Airtel (25.11 million), Vodafone Idea Ltd
(19.22 million), BSNL (6.31 million), MTNL (0.15 million) and You
Broadband (0.02 million) at the end of Jun-20.
1.63 In wired narrowband segment, BSNL holds 98.61% market share
with 3.20 million subscribers followed by You Broadband India Pvt
Ltd with 0.02 million subscribers.
1.64 In wireless narrowband segment, Bharti Airtel holds 52.76% market
share with 25.11 million subscribers followed by Vodafone Idea Ltd
with 19.22 million subscribers.
Chart 1.24 : Composition of Narrowband subscription – Technology wise

46
Section E : Other Value Added Services - PMRTS & VSAT
Public Mobile Radio Trunk Services (PMRTS)
1.65 The subscriber base of PMRTS decreased from 66,576 at the end of
Mar-20 to 64,833 at the end of Jun-20 with quarterly decline rate of
2.61%.
Table 1.32 : PMRTS Subscriber base - Service Provider wise
Sl. No
Name of the Service Provider
Subscriber
Base as on 31.03.2020
Subscriber
Base as on 30.06.2020
Net Addition
% Growth in
subscribers in QE Jun-20
1
Arya Omnitalk Radio
Trunking Services Pvt. Ltd.
56396 54515 -1881 -3.34
4 Procall Ltd. 3249 3297 48 1.48
2 Quick Call 2098 2087 -11 -0.52
3 Inative Networks Pvt Ltd 1820 1820 0 0.00
5 Smartalk Pvt Ltd 1193 1360 167 14.00
6 Bhilwara Telenet Services Pvt Ltd
868 883 15 1.73
7 Wiwanet Solutions Pvt Ltd
457 460 3 0.66
8 Airtalk Solutions & Services Pvt Ltd
495 416 -79 -15.96
Total 66576 64838 -1738 -2.61
1.66 Detailed table on Service Area wise subscriber base of PMRTS as on
30th June, 2020 is available at Annexure-1.7.

47
Chart 1.25 : Number of PMRTS subscribers & Rate of Growth (%)
Very Small Aperture Terminal (VSAT)
1.67 The total number of VSAT subscribers decreased from 3,00,686 at
the end of Mar-20 to 2,95,571 at the end of Jun-20. Net decrease
during the quarter has been 5,115 at the declining rate of 1.70%.
Chart 1.26 : Number of VSAT Subscribers & Rate of Growth (%)

48
Table 1.33 : VSAT Service Providers currently providing service & their subscriber base
Sr. No
Name of Service Providers
Subscriber base at the
Quarter ending Net Addition
%age
Growth
Market Share (%) Jun-20
Mar-20 Jun-20
1 Hughes
Communications Ltd. 1,21,221 1,22,087 866 0.71 41.31
2 Bharti Airtel Limited 80,094 78,898 -1,196 -1.49 26.69
3 Tatanet Services 70,207 71,134 927 1.32 24.07
4 HCL Comnet 15,065 10,888 -4,177 -27.73 3.68
5 BSNL 11,468 9,939 -1,529 -13.33 3.36
6 Infotel Satcom 2,581 2,575 -6 -0.23 0.87
7 Cloudcast Digital Ltd (eartwhile Planetcast
Media Services Ltd)
50 50 0 0.00 0.02
Total 3,00,686 2,95,571 -5,115 -1.70 100
1.68 Hughes Communication Limited continues to be the market leader
with 41.31% share in VSAT with subscriber base of 1,22,087
followed by Bharti Airtel Ltd with 78,898 at the end of Jun-20.
1.69 In term of net addition, M/s Tatanet Services added maximum
number of VSAT subscribers (927 subscribers) during the
QE Jun-20. Bharti Airtel Limited, HCL Comnet, BSNL and Infotel
Satcom have lost VSAT subscribers during the quarter.

49
Chapter 2 :
Revenue and Usage
Wireless Services
------------------------------------------------------------------------------------------------------------ • For all the parameters, Metros indicate data for Delhi, Mumbai & Kolkata. Data
for Chennai service area has been included in Circle A, as part of TN.
• ARPU arrived after adjusting interconnect usage charges and roaming settlement
charges.
• The data contained in this section covers the licensees, who have been providing
service during the entire period from 1st April, 2020 to 30th June, 2020 in the
various service areas.

50
Table 2.1: Key Indicators – Wireless Services
2.1 The following chart presents % break-up of outgoing minutes from
Home Service Area (HSA) in the QE Jun-20.
Chart 2.1: Break-up of Outgoing minutes from Home Service Area (HSA)
Parameter Jun-20 Mar-20 Jun-19 QoQ %age
change
YoY %age
change
Share of Prepaid (%) 95.48% 95.35% 95.65% 0.14% -0.18%
Incoming MOU per subscriber per month
372.62 376.07 348.88 -0.92% 6.80%
Outgoing MOU per subscriber per month
371.16 373.86 352.12 -0.72% 5.41%
No. of Outgoing SMS per subscriber per month
15.30 17.26 17.07 -11.36% -10.37%
Average Revenue Per User
(ARPU) per month (`) 90.12 91.49 74.30 -1.50% 21.29%

51
2.2 The following chart presents pre-paid subscribers as a % of total
subscribers as on the last day of the respective quarters for various
categories of circles.
Chart 2.2: Proportion of prepaid subscribers
Note: Based on subscriber figures as on the last day of the quarter.
2.3 The market share of pre-paid segment has increased from 95.35% at
the end of QE March-20 to 95.48% at the end of QE June-20.
2.4 The ARPU per month (all India blended) decreased from Rs.91.49 in
QE March-20 to Rs.90.12 in QE Jun-20 with quarterly decline rate
of 1.50%. Year-on-Year basis, ARPU per month increased by 21.30%
in this quarter.
2.5 The ARPU per month for pre-paid segment is Rs.84 and ARPU per
month for postpaid segment is Rs.224 in QE Jun-20.
2.6 The following table presents the ARPU per month for various
categories of circles and various platforms for payment viz. post-paid
and pre-paid.
Table 2.2: Monthly ARPU – Wireless Services in QE Jun-20

52
Circle Category ARPU per month (in `)
Post-paid Pre-paid Blended
Circle A 264 95 103
Circle B 236 82 85
Circle C 178 84 88
Metros 192 47 69
All India 224 84 90.12
All private SPs 226 90 96.19
BSNL/MTNL 188 36 39.56
2.7 The following table presents the composition of ARPU per month for
QE Jun-20.
Table 2.3: Composition of ARPU per month - Wireless Services
S. No.
Item
Revenue (excl. service tax) per subscriber per month (in `)
Share of total revenue from subscribers
1 Usage from Home Service Area
1.1. Rental Revenue 0.91 0.9%
1.2. Revenue from calls 17.16 16.6%
1.3. Revenue from SMS 0.80 0.8%
1.4. Revenue from data usage 79.58 77.0%
1.5. Revenue from other VAS 1.32 1.3%
1.6. Other revenue 3.12 3.0%
2 Usage outside Home Service Area
2.1. Revenue from out-roamers 0.49 0.5%
3 Total revenue from subscribers (1+2) 103.38 100%
4 Net inter-operator settlement charges receivable *
-13.26
5 Net Revenue (ARPU) per month (3+4) 90.12
* includes Interconnect Usages Charges and roaming settlement charges # Starting from QE March-20 the TSPs started bifurcating rental revenue amongst revenue from calls and data usage There is a difference in ARPU calculated by TRAI and the figures published by TSPs in their financial statements. This is because each TSP has a different methodology to calculate the ARPU. For example, one of the TSPs calculated ARPU by dividing the service revenue by the average number of subscribers during the quarter. Another TSP calculated ARPU by dividing operating revenue as given in the P&L account for the quarter by the average subscriber base for the current and previous quarters. Further, TRAI calculates Average Revenue Per User (ARPU) per month as Quarterly Revenue adjusted for interconnect usage charges and roaming settlement charges divided by average subscribers during the quarter for its own regulatory analysis. Therefore, the different methods result in a TRAI ARPU figure being less than what a TSP would declare in its quarterly financial results or presents to investors/Credit rating agencies.

53
2.8 From the above table, it may be seen that the net inter-operator
settlement charges payable (Rs.13.26) accounts for 12.83% of the
total revenue from subscribers in the Q.E. Jun-2020.
2.9 On an all India average, the overall MOU per subscriber per month
decreased by 0.80% from 750 in Q.E. Mar-20 to 744 in Q.E. Jun-20.
2.10 The following table presents the total MOU (usage from, and outside,
the home service area) per subscriber per month for various
categories of circles and various platforms for payment.
Table 2.4: MOU per subscriber per month - QE Jun-20
Circle
category
MOU per subscriber per month
Post-paid Pre-paid Blended
Outg
oin
g
MO
U
Incom
ing
MO
U
Tota
l
MO
U
Outg
oin
g
MO
U
Incom
ing
MO
U
Tota
l
MO
U
Outg
oin
g
MO
U
Incom
ing
MO
U
Tota
l M
OU
Circle A 360 314 674 335 326 661 336 326 662
Circle B 344 313 657 362 375 738 362 374 736
Circle C 380 385 765 435 469 905 433 466 899
Metro 315 254 569 453 409 862 432 386 817
All India 345 304 648 372 376 748 371 373 744
Note: MOU indicates total usage i.e. usage from and outside HSA
2.11 The overall ratio of incoming MOUs and outgoing MOUs for the Q.E.
June-20 is 50.1: 49.9.
2.12 Average number of Outgoing SMS per subscriber per month is 15 in
QE Jun-20. The following table presents the outgoing SMS usage
(usage from and outside, the home service area) per subscriber per

54
month for various categories of circles and various categories of
subscribers viz. post-paid and pre-paid during Q.E. June - 20.
Table 2.5: No. of Outgoing SMS per subscriber per month during QE Jun-20
Circle
category
Outgoing SMS per subscriber per month
Post-paid Pre-paid Blended
Circle A 30 17 17
Circle B 29 13 13
Circle C 19 18 18
Metro 16 13 13
All India 24 15 15
Note: No. of Outgoing SMS indicate total usage i.e. usage from and outside HSA
Chart 2.3 : Minutes of Usage by Out-roamers as a % of Total
Minutes of Usage during Q.E. June-2020
Minutes of usage from HSA
91.34%
Minutes of usage by
outroamers (outside HSA)
8.66%
Chart 2.4: Outgoing SMS Usage by Out-roamers as a % of Total
No. of Outgoing SMS Usage during Q.E. June-2020

55
Outgoing SMS usage from HSA 93.26%
Outgoing SMS usage by outroamers
(outside HSA) 6.74%
2.13 The following table presents the percentage break-up of outgoing
minutes of usage from home service area between various categories
of termination networks in the Q.E. June-20.
Table 2.6: %Break-up of Outgoing minutes from Home Service Area (HSA)
Circle Category
% Intra-circle to wireline
% Intra-circle to
own wireless
% Intra-circle to
other wireless
% Inter-circle to wireline
% Inter-circle to
own wireless
% Inter-circle to
other wireless
% ILD
Circle A 1.05% 39.15% 45.29% 0.29% 6.37% 7.82% 0.04%
Circle B 0.52% 38.65% 41.50% 0.15% 8.37% 10.79% 0.02%
Circle C 0.29% 41.98% 35.44% 0.16% 10.74% 11.38% 0.01%
Metros 1.05% 27.25% 33.97% 0.31% 15.75% 21.61% 0.07%
All India 0.70% 38.20% 40.83% 0.21% 8.94% 11.09% 0.03%
2.14 The following chart presents the percentage of subscribers who
availed roaming services (out-roamers) during the QE Jun-20.
Chart 2.5: % subscribers availed roaming services during the QE Jun-20

56
2.15 The usage pattern of out-roamers i.e. usage from outside the home
service area shows that incoming minutes accounts for 45.21% of
the total minutes of usage by out-roamers in QE June-20 as
against 44.54% in the March-20 quarter. The chart given below
presents the break-up of minutes of usage of out-roamers.
Chart 2.6: % Break-up of minutes of usage of out-roamers
(usage from outside the Home Service Area)

57
2.16 The tariff plans are of bundled nature and the trade-off is generally
between monthly fixed charges and variable (call) charges.
Therefore, average revenue per outgoing minute of usage from
Home Service Area (HSA) as defined below would be a realistic
indicator of average tariff levels.
8. Average Revenue per Outgoing Minute of usage from HSA
Rental revenue + Revenue from Calls
=
No. of outgoing minutes from HAS
Table 2.7: Average revenue per outgoing minute from HSA in
QE Jun-20
(In Rs. per minute)
Circle Category Postpaid Prepaid Blended
Circle A 0.14 0.05 0.06
Circle B 0.14 0.05 0.05
Circle C 0.10 0.05 0.05
Metros 0.11 0.04 0.05
All India 0.13 0.05 0.05
2.17 All India average revenue per outgoing minute has decreased from
Re. 0.06 in the QE Mar-20 to Re. 0.05 in Q.E. June-20.

58
Table 2.8: Trends of Key Parameters - Wireless Services
2.18 Service Area wise statistics are available at Annexure-2.1.
Parameter Jun-19 Sep-19 Dec-19 Mar-20 Jun-20
1. ARPU (` Per month) 74 74 79 91 90
2. Average revenue Realization per subscriber per GB wireless
data (in `)
7.70 6.99 8.45 11.23 10.55
3. MOU per subscriber per month
702 691 712 750 744
4. Outgoing MOU per subscriber per month
4.1 Local (Intra-circle) 261 254 265 276 282
4.2 NLD (inter-circle) 91 92 92 98 90
4.3 ILD 0.15 0.16 0.11 0.10 0.09
5. Average no. of Outgoing SMS per subscriber per
month
17 18 18 17 15
6. Average revenue per outgoing minute from HSA (in `)
0.13 0.13 0.11 0.06 0.05

59
Chapter 3 :
Financial Data of Telecom Service
Sector

60
Table 3.1: Gross Revenue (GR), Adjusted Gross Revenue (AGR), License Fee (LF) & Spectrum Charges
Particulars QE Jun-19
(` in Crore)
QE Mar-20
(` in Crore)
QE Jun-20
(` in Crore)
Q-O-Q % Change
Y-O-Y % Change
Gross Revenue (GR)
61,534 67,534 66,858 -1.00 8.65
Adjusted Gross Revenue (AGR)
39,123 44,940 44,128 -1.81 12.79
Pass Through Charges (GR-AGR)
22,410 22,593 22,730 0.60 1.42
License Fee 3,132 3,604 3,526 -2.16 12.57
Spectrum Usage Charges
1,121 1,424 1,369 -3.84 22.12
3.1 Gross Revenue (GR) and Adjusted Gross Revenue (AGR) quarterly
declined by 1% and 1.81% respectively in QE Jun-20. However, GR
and AGR yearly increased by 8.65% and 12.79% respectively in
QE Jun-20.
3.2 Pass through charges quarterly increased by 0.60% and yearly
increased by 1.42% in the QE Jun-20.
3.3 Pass-through charges as a percentage of Gross Revenue are 34% in
QE Jun-20 as against 33.45% in the previous quarter.
Table 3.2: Service-wise Gross Revenue, Adjusted Gross Revenue, License Fee and Spectrum Charges for QE Jun-20
(in ` Crore)
Service GR AGR LF Spectrum
Usage Charges
Access Providers
49,490.78 34,328.19 2,746.42 1,365.21
NLD 9,977.06 7,720.29 617.62 -
ILD 3,335.83 1,576.10 126.08 -
Others 4,053.94 503.54 35.95 4.03
Total 66,857.61 44,128.11 3,526.07 1,369.24

61
Chart 3.1: Composition of Adjusted Gross Revenue
3.4 Access services contributed 77.79% of the total Adjusted Gross
Revenue of telecom services. In Access services, Gross Revenue (GR),
Adjusted Gross Revenue (AGR), License Fee and Spectrum Usage
Charges (SUC)‡‡‡ decreased by 0.15%, 0.49%, 0.83% and 3.83%
respectively in QE Jun-20. However, Pass Through Charges
quarterly increased by 0.63% during the same period.
3.5 Monthly Average Revenue per User (ARPU) for Access Services
based on AGR increased from 97.64 in QE Mar-20 to 98.01 in
QE Jun-20. Trend of ARPU per month for Access Services is
depicted in the following chart 3.2.
‡‡‡ Spectrum Usage Charge is payable by the licensees providing mobile access services, as a percentage of
their Adjusted Gross Revenue (AGR).
(Source – DoT License Agreement)

62
Chart 3.2: Trend in ARPU per month for Access Services
Table 3.3: Access Services - Service Provider wise Adjusted
Gross Revenue (in ` Crore)
Service Provider QE Jun-20 QE Mar-20 % Change
Reliance Jio 15259.91 13428.07 13.64
Bharti Airtel 10088.46 9737.00 3.61
Vodafone Idea 5865.36 7866.60 -25.44
BSNL 2140.40 2274.32 -5.89
Tata Tele. 540.84 664.18 -18.57
MTNL 337.04 453.89 -25.74
Reliance Com. 96.27 69.58 38.36
Quadrant -0.06 0.06 -205.72
V-Con Mobile & Infra Pvt. Ltd.
-0.02 2.17 -101.12
Grand Total
(Access) 34328.19 34495.87 -0.49%
3.6 Public Sector Undertakings' share in the Access AGR of telecom
services is 7.22% in the QE Jun-20.

63
Table 3.4: Category-wise share in Adjusted Gross Revenue (AGR) of Access Services
Category AGR of Access Services for QE Jun-20 (in crore)
%age share of AGR
Metro 3345.8 9.75
A 13310.12 38.77
B 12780.38 37.23
C 4891.9 14.25
Total 34328.19 100
Notes :
1. Source: Figures are un-audited and as submitted by the TSPs. 2. A copy of quarterly Statement(s) of Revenue and Licence Fee and Spectrum Charges filed with
the licensor(DoT) is submitted by Telecom Service Providers to TRAI in reference to TRAI’s Order No.14-11/2009-FA, dated 9th August, 2010.
3. The figures have been re-grouped wherever considered necessary for analysis purpose. 4. Percentage of contribution of Five TSPs of Public Sector (BSNL, MTNL, Rail Tel, Power Grid, Oil
India and Bharat Broadband) to AGR in NLD Service and two TSPs of Public Sector (BSNL/MTNL) in Access Services and BSNL in ILD Services.
5. For all the parameters metros indicate data for Delhi, Mumbai and Kolkata. Data for Chennai Service Area has been included as part of Tamil Nadu
6. M/s. V-Con Mobile & Infra Pvt. Ltd has started reporting GR/AGR with effect from Oct- Dec.,2019 onwards.

64
Chapter 4 : Quality of Service (QoS)

65
Section A: Quality of Service Performance of Wireless Service Providers
Table 4.1: QoS Summary - Wireless Service
Summary of Performance of Service providers comparative to the previous quarter against identified parameters
S.No. Parameters Benchmark
Performance in respect of UASL/CMTS Licensees for the Parameters and Benchmarks
For Quarter Ending
March, 2020
For Quarter Ending
June, 2020
Out Of
110 (Nos.)
Out Of 110 (%)
Out Of 110
(Nos.)
Out Of 110 (%)
I. Network Related Parameters
1 Network Availability
(i) BS Accumulated down-time (not available for service) (%age)
≤ 2% 0 0% 0 0%
(ii) Worst affected BSs due to down-time (%age)
≤ 2% 0 0% 0 0%
2 Connection Establishment (Accessibility)
(i)
Call Set-up Success Rate and Session Establishment Success Rate for Circuit Switched Voice or VoLTE as applicable(within licensee's own network)
≥ 95% 0 0% 0 0%
(ii) SDCCH/ Paging Channel Congestion/ RRC Congestion (%age)
≤ 1% 0 0% 0 0%
(iii) TCH, RAB and E-RAB Congestion (%age)
≤ 2% 2 1.82% 2 1.82%
3 Connection Maintenance (Retain ability)
(i) Network QoS DCR Spatial Distribution Measure [Network_ QSD(90,90)]
≤ 2% 7 6.36% 5 4.55%
(ii) Network QoS DCR Temporal Distribution Measure [Network_ QTD(97,90)]
≤ 3% 7 6.36% 7 6.36%
4
Connections with good voice quality, Circuit Switched Voice Quality and VoLTE quality
≥ 95% 0 0% 0 0%

66
5
Point of Interconnection (POI) Congestion (No. of POIs not meeting the benchmark) (Averaged over a period of quarter)
≤ 0.5% 0 0% 0 0%
6 Down Link (DL) Packet Drop Rate or DL-PDR
≤ 2% 0 0% 0 0%
7 Up Link (UL) Packet Drop Rate or UL-PDR
≤ 2% 0 0% 0 0%
II. Customer Service Quality Parameters
6 Metering and Billing/
(i) Metering and billing credibility - post paid
≤ 0.1% 1 0.91% 0
0%
(ii) Metering and billing credibility - pre paid
≤ 0.1% 0 0% 0 0%
(iii) Resolution of billing/ charging/validity complaints
98% within 4 weeks
1 0.91% 1 0.91%
Resolution of billing/charging/validity complaints
100% within 6 weeks
1
0.91% 1 0.91%
(iv)
Period of applying credit/ waiver/ adjustment to customer’s account from the date of resolution of complaints
within 1 week of
resolution of
complaint
1 0.91% 1 0.91%
7 Response time to the customer for assistance
(i) Accessibility of call centre/ customer care
≥ 95% 1 0.91% 3 2.73%
(ii) %age of calls answered by the operators (voice to voice) within 90 seconds
≥ 95% 23
20.91% 84 76.36%
8 Termination / closure of service
(i) %age requests for Termination / Closure of service complied within 7 days
100% within 7
days
1
0.91%
1 0.91%
(ii) Time taken for refund of deposits after closures
100% within 60
days 11 10.00% 66 60.00%
4.1 The performance has improved in this quarter as compared to the
previous quarter in respect of the following parameters: -
a. Network QoS DCR Spatial Distribution Measure [Network_ QSD
(90,90)]
b. Metering and billing credibility - post paid

67
4.2 The performance has deteriorated in this quarter as compared to the
previous quarter in respect of the following parameters: -
a. Accessibility of call centre/ customer care
b. %age of calls answered by the operators (voice to voice) within
90 sec
c. Time taken for refund of deposits after closures
Table 4.2: Parameter wise Analysis of Non-compliance of QoS
Benchmarks for Wireless Service Providers
Parameter Benchmark Service Provider
Service Area Performance
TCH, RAB and E-RAB Congestion
(%age) ≤ 2%
VIL-Brand Idea
Uttar Pradesh (West)
2.25
VIL-Brand Vodafone
Uttar Pradesh (West)
2.25
Network QoS DCR Spatial Distribution Measure [Network_
QSD(90,90)]
≤ 2%
BSNL West Bengal 8.57
VIL-Brand Idea
Himachal Pradesh
2.56
Jammu & Kashmir
2.44
VIL-Brand Vodafone
Himachal Pradesh
2.56
Jammu & Kashmir
2.44
Network QoS DCR Temporal
Distribution Measure [Network_
QTD(97,90)]
≤ 3%
BSNL West Bengal 10.71
VIL-Brand Idea
Himachal Pradesh
4.13
Jammu & Kashmir
4.00
Uttar Pradesh (West)
3.06
VIL-Brand Vodafone
Himachal Pradesh
4.13
Jammu & Kashmir
4.00
Uttar Pradesh (West)
3.06
Resolution of billing/charging
complaints
98% within 4 weeks
VIL-Brand Idea
Delhi 97.56
100% within 6 weeks
VIL-Brand Vodafone
Gujarat 99.98

68
Parameter Benchmark Service Provider
Service Area Performance
Period of applying credit/ waiver/ adjustment to
customer’s account from the date of
resolution of complaints
within 1 week of
resolution of
complaint
VIL-Brand Vodafone
Gujarat 99.94
Accessibility of call centre/ customer
care ≥ 95%
VIL-Brand Idea
Gujarat 94.00
BSNL Karnataka 94.00
BSNL Kerala 94.00
Percentage of calls answered by the
operators (voice to voice) within 90
seconds
≥ 95%
Airtel
Andhra Pradesh 80.00
Assam 90.00
Bihar 92.00
Delhi 89.00
Gujarat 88.00
Haryana 88.00
Himachal Pradesh
89.00
Jammu & Kashmir
81.00
Karnataka 85.00
Kerala 81.00
Kolkata 91.00
Madhya Pradesh 91.00
Maharashtra 90.00
Mumbai 89.00
North East 86.00
Odisha 90.00
Punjab 88.00
Rajasthan 92.00
Tamil Nadu 62.00
Uttar Pradesh (East)
91.00
Uttar Pradesh
(West) 91.00
West Bengal 85.00
BSNL
Karnataka 67.39
Kerala 39.00
Punjab 55.23
Tamil Nadu 58.81
Uttar Pradesh (East)
43.04
Uttar Pradesh (West)
45.52

69
Parameter Benchmark Service Provider
Service Area Performance
Percentage of calls answered by the
operators (voice to voice) within 90
seconds
≥ 95%
RJIL
Andhra Pradesh 89.96
Bihar 90.19
Delhi 90.30
Gujarat 94.31
Kolkata 92.26
Madhya Pradesh 90.43
Mumbai 91.38
Odisha 93.89
Punjab 93.26
Rajasthan 90.13
Tamil Nadu 94.08
Uttar Pradesh (East)
90.32
Uttar Pradesh (West)
89.49
West Bengal 90.18
VIL-Brand Idea
Andhra Pradesh 92.12
Assam 66.78
Bihar 59.84
Delhi 68.07
Gujarat 81.16
Haryana 89.60
Himachal Pradesh
70.95
Jammu & Kashmir
82.94
Kerala 90.73
Kolkata 83.03
Madhya Pradesh 83.37
Maharashtra 89.71
Mumbai 94.18
North East 68.07
Odisha 58.90
Punjab 87.49
Rajasthan 79.25
Uttar Pradesh (East)
85.11
Uttar Pradesh (West)
88.03
West Bengal 86.64
VIL-Brand Vodafone
Andhra Pradesh 94.87
Assam 59.16
Bihar 81.42

70
Parameter Benchmark Service Provider
Service Area Performance
Percentage of calls answered by the
operators (voice to voice) within 90
seconds
≥ 95%
VIL-Brand Vodafone
Delhi 48.21
Gujarat 44.66
Haryana 76.95
Himachal Pradesh
90.43
Jammu & Kashmir
80.66
Karnataka 93.69
Kerala 87.39
Kolkata 50.06
Madhya Pradesh 83.29
Maharashtra 83.21
Mumbai 86.74
North East 59.00
Odisha 73.06
Punjab 87.99
Rajasthan 46.31
Tamil Nadu 75.72
Uttar Pradesh (East)
68.78
Uttar Pradesh (West)
84.68
West Bengal 53.77
%age requests for Termination /
Closure of service complied within 7
days
100% within 7
days
VIL-Brand Idea
Uttar Pradesh (West)
99.88
Time taken for refund of deposits after closures
100% within 60
days
Airtel
Andhra Pradesh 88.00
Assam 59.00
Bihar 70.00
Delhi 89.00
Gujarat 89.00
Haryana 79.00
Himachal Pradesh
76.00
Jammu & Kashmir
88.00
Karnataka 79.00
Kerala 64.00
Kolkata 91.00
Madhya Pradesh 81.00
Maharashtra 87.00
Mumbai 89.00

71
Parameter Benchmark Service Provider
Service Area Performance
Time taken for refund of deposits
after closures
100% within 60 days
Airtel
North East 50.00
Odisha 90.00
Punjab 85.00
Rajasthan 82.00
Tamil Nadu 77.00
Uttar Pradesh (East)
77.00
Uttar Pradesh (West)
86.00
West Bengal 89.00
VIL-Brand Idea
Andhra Pradesh 37.56
Assam 61.80
Bihar 17.29
Delhi 0.00
Gujarat 92.36
Haryana 63.05
Himachal Pradesh
76.63
Jammu & Kashmir
3.13
Karnataka 39.35
Kerala 42.86
Kolkata 21.17
Madhya Pradesh 39.47
Maharashtra 70.87
Mumbai 0.13
North East 37.50
Odisha 76.13
Punjab 50.47
Rajasthan 0.00
Tamil Nadu 27.17
Uttar Pradesh (East)
30.43
Uttar Pradesh
(West) 26.71
West Bengal 15.22
VIL-Brand Vodafone
Andhra Pradesh 34.93
Assam 63.45
Bihar 42.06
Delhi 0.43
Gujarat 49.31
Haryana 65.68
Himachal Pradesh
66.23

72
Parameter Benchmark Service Provider
Service Area Performance
Time taken for refund of deposits
after closures
100% within 60 days
VIL-Brand Vodafone
Jammu & Kashmir
8.69
Karnataka 51.53
Kerala 66.95
Kolkata 41.39
Madhya Pradesh 40.43
Maharashtra 0.00
Mumbai 21.53
North East 46.95
Odisha 55.92
Punjab 61.26
Rajasthan 12.25
Tamil Nadu 34.24
Uttar Pradesh (East)
21.15
Uttar Pradesh (West)
25.86
West Bengal 42.49
4.3 The detailed table on Service Provider wise performance of QoS
parameters for Wireless Services is available at Annexure-4.1.

73
Section B: Quality of Service Performance of Wireline
Service Providers
Table 4.3: QoS Summary - Wireline Service Summary of Performance of service providers against identified parameters
S. No.
Parameters Benchmark No of license areas where operators not meeting the benchmarks
March, 2020 June, 2020
Out of 104 In Nos.
Out of 104 In %age
Out of 98 In Nos.
Out of 98 In %age
(i)
“Fault repair” Fault incidences No. of faults per 100 subs/month)
≤ 7 1 0.96% 0 0.00%
(ii)
% Fault repaired by next working day (for urban areas)
≥ 85% 2 1.92% 10 10.20%
% Fault repaired within 5 days (for urban areas) ≥100% 2 1.92% 2 2.04%
(iii)
% Fault repaired by next working day (for rural and hilly areas)
≥ 75% 0 0.00% 0 0.00%
% Fault repaired within 7 days (for rural and hilly areas)
≥100% 0 0.00% 0 0.00%
(iv) “Mean time to Repair” (MTTR) ≤10Hs 3 2.88% 10 10.20%
(v)
“Point of Interconnection” (POI) Congestion (No. of PoIs not meeting benchmark)
≤ 0.5% 0 0.00% 0 0.00%
(vi)
“Metering and Billing” Metering and billing credibility - post-paid
≤ 0.1% 0 0.00% 1 1.02%
Metering and Billing
credibility -pre-paid ≤ 0.1% 0 0.00% 0 0.00%
(vii)
Resolution of billing/charging /Credit & validity complaints
98% within 4 weeks
0 0.00% 0 0.00%
Resolution of billing/charging / Credit & validity complaints
100% within 6 weeks
0 0.00% 0 0.00%

74
(viii)
Period of applying credit /waiver/adjustment to customer's
1 week of resolution
of complaint
0 0.00% 0 0.00%
(ix)
“Response time to the customer for assistance” Accessibility of call centre/ customer care
≥ 95% 10 9.62% 13 13.27%
%age of calls answered by the operators (voice to voice) within 90 seconds
≥ 95% 26 25.00% 30 30.61%
(x)
“Termination / closure of service”-
%age of request for Termination / closure of service complied within 7 days
100% within 7
days 1 0.96% 1 1.02%
(xi) Time taken for refund of deposits after closures
100% within 60
days 2 1.92% 13 13.27%
NOTE: Most of the SPs have not reported for the parameter “Metering and billing credibility - pre paid” due to not providing pre-paid service in Basic (Wire line) service.
4.4 The performance has improved in this quarter as compared to the
previous quarter in respect of the following parameters: -
❖ “Fault repair” Fault incidences No. of faults per 100 subs/month)
4.5 The performance has deteriorated in this quarter as compared to the
previous quarter in respect of the following parameters: -
❖ “Fault repair” % Fault repaired by next working day (for urban areas)
❖ “Mean time to Repair” (MTTR)
❖ “Metering and Billing” Metering and billing credibility - post-paid,
❖ “Response time to the customer for assistance” - Accessibility of call centre/ customer care,
- %age of calls answered by the operators (voice to voice) within 90
seconds
❖ “Termination/closure of service”- Time taken for refund of deposits after closures

75
Table 4.4: Parameter wise Analysis of Non-compliance of QoS Benchmarks for Wireline Service Providers
Parameters Benchmarks Service Provider
Service areas
Parameters not met
% of faults repaired by next working day
For urban areas by next working day:
≥85% MTNL Delhi 66.80%
% of faults repaired by next working day
For urban areas by next working day:
≥85% MTNL Mumbai 46.70%
% of faults repaired by next working day
For urban areas by next working day:
85% TTSL
Andhra Pradesh
82.51
% of faults repaired by next working day
For urban areas by next working day:
85% TTSL Delhi 73.21%
% of faults repaired by next working day
For urban areas by next working day:
85% TTSL Gujarat 77.72%
% of faults repaired by next working day
For urban areas by next working day:
85% TTSL Karnataka 73.44%
% of faults repaired by next working day
For urban areas by next working day:
85% TTSL Maharashtra 73.24%
% of faults repaired by next working day
For urban areas by next working day:
85% TTSL Mumbai 53.80%
% of faults repaired by next working day
For urban areas by next working day:
85% TTSL Tamilnadu 50.00%
% of faults repaired by next working day
For urban areas by next working day:
85% TTSL West Bengal 84.62%
% of faults repaired within 5 days
For urban areas: ≥ 100%
MTNL Delhi 88.49%
% of faults repaired within 5 days
For urban areas: ≥ 100%
MTNL Mumbai 69.20%
Mean Time to Repair (MTTR)
≤ 10 Hrs MTNL Delhi 17.03
Mean Time to Repair (MTTR)
≤ 10 Hrs MTNL Mumbai 45.44
Mean Time to Repair (MTTR)
≤ 10 Hrs TTSL Andhra Pradesh
12.69
Mean Time to Repair (MTTR)
≤ 10 Hrs TTSL Delhi 17.27
Mean Time to Repair (MTTR)
≤ 10 Hrs TTSL Gujarat 13.35

76
Parameters Benchmarks Service Provider
Service areas
Parameters not met
Mean Time to Repair (MTTR)
≤ 10 Hrs TTSL Karnataka 17.42
Mean Time to Repair (MTTR)
≤ 10 Hrs TTSL Maharashtra 16.42
Mean Time to Repair (MTTR)
≤ 10 Hrs TTSL Mumbai 27.90
Mean Time to Repair (MTTR)
≤ 10 Hrs TTSL Tamilnadu 32.33
Mean Time to Repair (MTTR)
≤ 10 Hrs TTSL West Bengal 12.50
Metering and Billing
credibility - post paid ≤0.1% BSNL Haryana 0.33%
Accessibility of call centre/ customer care
≥95% BSNL Andhra Pradesh
80.29%
Accessibility of call centre/ customer care
≥95% BSNL Assam 85.76%
Accessibility of call centre/ customer care
≥95% BSNL Bihar 86.90%
Accessibility of call centre/ customer care
≥95% BSNL Gujarat 17.98%
Accessibility of call centre/ customer care
≥95% BSNL Kerala 85.75%
Accessibility of call centre/ customer care
≥95% BSNL Kolkata 64.33%
Accessibility of call centre/ customer care
≥95% BSNL Karnataka 72.15%
Accessibility of call centre/ customer care
≥95% BSNL Maharashtra 18.88%
Accessibility of call centre/ customer care
≥95% BSNL Madhya Pradesh
7.05%
Accessibility of call centre/ customer care
≥95% BSNL North East 77.50%
Accessibility of call centre/ customer care
≥95% BSNL Odisha 78.26%
Accessibility of call centre/ customer care
≥95% BSNL Tamilnadu 69.50%
Accessibility of call centre/ customer care
≥95% BSNL West Bengal 71.51%
Percentage of calls answered by the operators (voice to voice) within 90 seconds
≥95% Airtel Andhra Pradesh
52.00%

77
Parameters Benchmarks Service Provider
Service areas
Parameters not met
Percentage of calls answered by the
operators (voice to voice) within 90
seconds
≥95% Airtel Delhi 56.00%
Percentage of calls answered by the
operators (voice to voice) within 90
seconds
≥95% Airtel Gujarat 54.00%
Percentage of calls answered by the
operators (voice to
voice) within 90 seconds
≥95% Airtel Haryana 59.00%
Percentage of calls answered by the
operators (voice to voice) within 90
seconds
≥95% Airtel Kerala 54.00%
Percentage of calls answered by the
operators (voice to voice) within 90
seconds
≥95% Airtel Kolkata 46.00%
Percentage of calls answered by the
operators (voice to voice) within 90
seconds
≥95% Airtel Karnataka
63.00%
Percentage of calls answered by the
operators (voice to voice) within 90
seconds
≥95% Airtel Maharashtra 53.00%
Percentage of calls answered by the
operators (voice to
voice) within 90 seconds
≥95% Airtel Madhya Pradesh
56.00%
Percentage of calls answered by the
operators (voice to voice) within 90
seconds
≥95% Airtel Mumbai 56.00%
Percentage of calls answered by the
operators (voice to voice) within 90
seconds
≥95% Airtel Punjab 57.00%
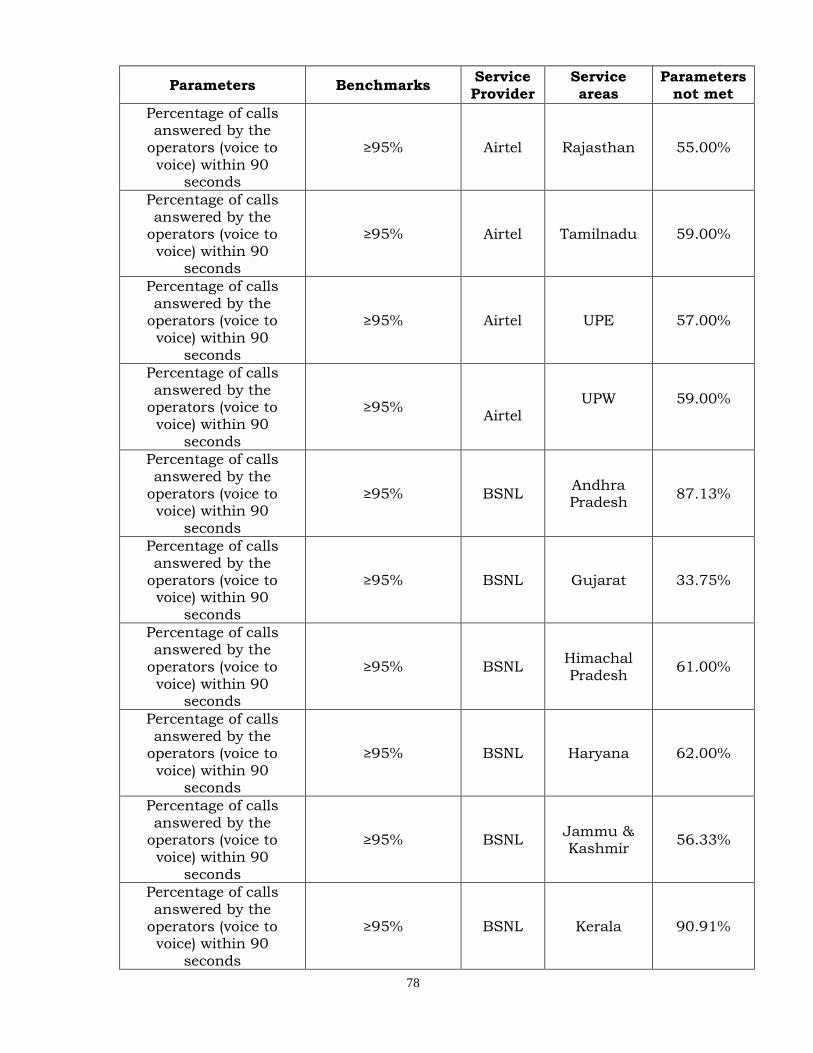
78
Parameters Benchmarks Service Provider
Service areas
Parameters not met
Percentage of calls answered by the
operators (voice to voice) within 90
seconds
≥95% Airtel Rajasthan 55.00%
Percentage of calls answered by the
operators (voice to voice) within 90
seconds
≥95% Airtel Tamilnadu 59.00%
Percentage of calls answered by the
operators (voice to
voice) within 90 seconds
≥95% Airtel UPE 57.00%
Percentage of calls answered by the
operators (voice to voice) within 90
seconds
≥95%
Airtel UPW
59.00%
Percentage of calls answered by the
operators (voice to voice) within 90
seconds
≥95% BSNL Andhra Pradesh
87.13%
Percentage of calls answered by the
operators (voice to voice) within 90
seconds
≥95% BSNL Gujarat 33.75%
Percentage of calls answered by the
operators (voice to voice) within 90
seconds
≥95% BSNL Himachal Pradesh
61.00%
Percentage of calls answered by the
operators (voice to
voice) within 90 seconds
≥95% BSNL Haryana 62.00%
Percentage of calls answered by the
operators (voice to voice) within 90
seconds
≥95% BSNL Jammu & Kashmir
56.33%
Percentage of calls answered by the
operators (voice to voice) within 90
seconds
≥95% BSNL Kerala 90.91%

79
Parameters Benchmarks Service Provider
Service areas
Parameters not met
Percentage of calls answered by the
operators (voice to voice) within 90
seconds
≥95% BSNL Karnataka 79.86%
Percentage of calls answered by the
operators (voice to voice) within 90
seconds
≥95% BSNL Maharashtra 53.79%
Percentage of calls answered by the
operators (voice to
voice) within 90 seconds
≥95% BSNL Madhya Pradesh
2.42%
Percentage of calls answered by the
operators (voice to voice) within 90
seconds
≥95% BSNL Punjab 60.00%
Percentage of calls answered by the
operators (voice to voice) within 90
seconds
≥95% BSNL Rajasthan 60.33%
Percentage of calls answered by the
operators (voice to voice) within 90
seconds
≥95% BSNL Tamilnadu 64.44%
Percentage of calls answered by the
operators (voice to voice) within 90
seconds
≥95% BSNL UPE 62.33%
Percentage of calls answered by the
operators (voice to
voice) within 90 seconds
≥95% BSNL UPW 60.67%
Percentage of calls answered by the
operators (voice to voice) within 90
seconds
≥95% MTNL Mumbai 80.81%
%age requests for Termination / Closure
of service complied within 7 days
100% within 7 days
MTNL
Mumbai 89.11%

80
Parameters Benchmarks Service Provider
Service areas
Parameters not met
Time taken for refund of deposits after
closures
100% within 60 days
Bharti Airtel
Andhra Pradesh
89.00%
Time taken for refund of deposits after
closures
100% within 60 days
Bharti Airtel
Delhi
79.00%
Time taken for refund of deposits after
closures
100% within 60 days
Bharti Airtel
Haryana
82.00%
Time taken for refund of deposits after
closures
100% within 60 days
Bharti Airtel
Kerala
83.00%
Time taken for refund of deposits after
closures
100% within 60 days
Bharti Airtel
Kolkata
94.00%
Time taken for refund of deposits after
closures
100% within 60 days
Bharti Airtel
Karnataka
84.00%
Time taken for refund of deposits after
closures
100% within 60 days
Bharti Airtel
Madhya Pradesh
87.00%
Time taken for refund of deposits after
closures
100% within 60 days
Bharti Airtel
Punjab
81.00%
Time taken for refund of deposits after
closures
100% within 60 days
Bharti Airtel
Rajasthan
95.00%
Time taken for refund of deposits after
closures
100% within 60 days
Bharti Airtel
Tamilnadu
77.00%
Time taken for refund of deposits after
closures
100% within 60 days
Bharti Airtel
UPE
80.00%
Time taken for refund of deposits after
closures
100% within 60 days
Bharti Airtel
UPW
83.00%
Time taken for refund of deposits after
closures
100% within 60 days
MTNL Mumbai 13.55%
4.6 Detailed table containing QoS parameters for all the Wireline Service
Providers is given in Annexure-4.2.

81
Section C : Quality of Service Performance of Broadband (wireline) Service
4.7 There are 305 Internet Service Providers (ISPs) providing broadband
(wireline) service at the end of June, 2020. Out of these 305 ISPs,
57 Service Providers are having broadband subscriber base more
than 10,000 and market share of these 57 SPs is 98.33% of total
broadband subscriber base. This report covers performance of 53
broadband Service Providers vis-à-vis the QoS benchmarks
prescribed by TRAI, for the QE June, 2020. One service provider
namely M/s Tachyon Communications Pvt. Ltd. (New entrant) and
M/s IKF Technologies Ltd., M/s K NET Solutions Pvt. Ltd., and
M/s RI Networks Pvt Ltd has not submitted their Performance
Monitoring Report (PMR) in this quarter.
Table 4.5 : Summary of Performance of Broadband Service Providers against identified parameters
S. No.
Parameters Benchmark
Quarter Ending Quarter Ending
March, 2020 June, 2020
Out of 111
Out of 111
Out
of 107
Out of 107
1 Service Provisioning 100% in =<15
working days
1.2 %age of connections provided within 15
days of registration of demand
100% 6 5.61% 4 3.74%
2 Faults Repair
2.2 % of faults repaired by next working day (>90%)
>90% 4 3.74% 7 6.54%
2.3 % of faults repaired within 3 working day
=>99% 4 3.74% 9 8.41%
3 Billing Performance
3.3 %age of bills disputed <2% 0 0.00% 0 0.00%

82
3.4 %age of billing complaints resolved within 4 weeks
100% within
4 weeks 0 0.00% 0 0.00%
3.5 %age of cases to whom refund of
deposits is made within 60 days of
closures
100% within 60 days
1 0.93% 7 6.54%
4 Response Time to the Customer for assistance
4.2 %age of calls answered by operator (Voice to voice) within
60 sec
>60% 1 0.93% 20 18.69%
4.3 %age of calls
answered by operator (Voice to voice) within
90 sec
>80% 4 3.74% 22 20.56%
5 Bandwidth utilisation/ throughput
5.2 No. of Intra network
links having Bandwidth utilisation >90% during peak
hours (TCBH)
0 0 0.00% 0 0.00%
5.4 No. of Upstream links
for International connectivity having
bandwidth utilisation >90% during peak hours (TCBH)
0 0 0.00% 0 0.00%
5.7 % International bandwidth utilization
during peak hours (TCBH) (Enclose MRTG) <90%
<90% 0 0.00% 1 0.93%
5.8 Broadband Connection Speed
available (download) from ISP node to user
>80% 0 0.00% 0 0.00%
6 Service availability /uptime (for all users) in %age
6.3 Service availability
/uptime (for all users) in %age
>98% 0 0.00% 0 0.00%
7 Packet loss (for wired broadband access) in %age
<1% 0 0.00% 0 0.00%

83
8 Network latency (for wired broadband access)
8.1 User reference point
at POP/ISP Gateway node to IGSP/NIXI
<120 ms 0 0.00% 0 0.00%
8.2 User reference point at ISP Gateway node to International
nearest NAP port abroad (terrestrial)
<350 ms 0 0.00% 0 0.00%
8.3 User reference point at ISP Gateway node to International
nearest NAP port abroad (satellite)
<800 ms 0 0.00% 0 0.00%
Table 4.6: Parameter-wise Analysis of non-compliance of QoS benchmarks for Broadband Service Providers
Sl. No.
Parameters Bench-mark
Name of the Service Provider not meeting the Benchmark
1 Service Provisioning
1.2
%age of connections provided within 15
days of registration of demand
100%
MTNL - Delhi & Mum (83.75%)
Airnet Cable - Maharashtra (1.00%) GTPL - All India (99.70%) You Broadband - All India (80.23.%)
2 Faults Repair
2.2
% of faults repaired
by next working day (>90%)
>90%
MTNL - Delhi & Mum (63.71%),
Intech - Mah. (85.22%), Mumbai (87.04%) Tata (TTSL) - All India (except MH) (68.27%)
Tata (TTML) - Mah. & Mumbai (48.00%), Yashash – Karnataka (81.00%), You Broadband - All India (82.99%)
2.3 % of faults repaired within 3 working day
=>99%
MTNL - Delhi & Mumbai (78.11%), Atria - All India (98.43%) GTPL - All India (97.11%
Intech - Mah. (96.52%), Mumbai (97.65%) Tata (TTSL) - All India (except MH) (89.12%),
TATA(TTML) - Mah. & Mumbai. (73.50%) Yashash - Karnataka (90.00%), You Broadband - All India (98.86%)

84
Sl. No.
Parameters Bench-mark
Name of the Service Provider not meeting the Benchmark
3 Billing Performance
3.5
%age of cases to whom refund of deposits is made
within 60 days of closures
100%
MTNL - Delhi & Mum (53.69%) Airtel - DL (90.00%), GUJ (78.00%), HR(81.00%), MP(76.00%),TN (79.00%),UPW
(67.00%)
4 Response Time to the Customer for assistance
4.2 %age of calls
answered by operator (Voice to voice) within 60 sec
>60%
Atria Convergence - All India (27.00%)
Bharti Airtel - AP (50.00%),DL (44.00%), GJ(49.00%), HR (47.00%), KAR (54.00%), KR(43.00%), KOL (43.00%), J&K (50.00%),
MP(46.00%), MH (48.00%), MUM (49.00%), PB(56.00%), RJ (58.00%), TN (56.00%),
UPE(49.00%),UPW (47.00%), DEN - All India (48.01%), Yashash - Karnataka (55.51%),
You Broadband - All India (38.16%)
4.3 %age of calls
answered by operator (Voice to voice) within 90 sec
>80% BSNL - All India (63.91%)
Atria Convergence - All India (30.00%), Bharti Airtel - AP (57.00%),DL (53.00%),GJ (56.00%),HR (54.00%),KAR (61.00%),KR
(49.00%),KOL (51.00%),J&K (58.00%),MP (54.00%),MH (55.00%),MUM (57.00%),PB
(62.00%),RJ (64.00%),TN (62.00%),UPE (57.00%),UPW (55.00%), DEN - All India (52.52%)
Tata Sky - All India (77.62%), Yashash - Karnataka (76.29%), You Broadband - All India (45.30%)
5 Bandwidth utilisation/ throughput
5.7
% International
bandwidth utilization during peak hours (TCBH)
(Enclose MRTG) <90%
<90% Yashash - Karnataka (92.61%)
4.8 Detailed table containing QoS parameters for all the Broadband
Service Providers is given in Annexure-4.3.

85
Chapter 5 : Performance of Cable
TV, DTH and Radio Broadcasting Services

86
Table 5.1: Key Parameters - Broadcasting & Cable TV Services
S.No Parameter QE Mar-20 QE Jun-20
1
Number of Private satellite TV channels
permitted by the Ministry of Information and Broadcasting (MIB) for uplinking only/ downlinking only/both uplinking
and downlinking
926 909
2 Number of Pay TV Channels as reported
by broadcasters 333 332
3 Number of FM Radio Stations (excluding All India Radio)
368 367
4 Number of pay DTH Operators 4 4
5 Number of Operational Community Radio Stations
290 300
A. Satellite TV Channels
5.1 A total of 909 private satellite TV channels have been permitted by
the Ministry of Information and Broadcasting (MIB) for uplinking
only/downlinking only/both uplinking and downloading, as on
30th June, 2020. The quarter-wise figures of the total number of TV
channels is depicted in below chart: -
Chart 5.1: Quarterly growth in number of Satellite TV channels (FTA & Pay) registered with Ministry of I&B

87
B. Pay TV Channels
5.2 Telecom Regulatory Authority of India (TRAI), in March, 2017,
notified the new regulatory framework for Broadcasting and Cable
services. The framework comprises of Tariff Order 2017,
Interconnection Regulations 2017 and Quality of Service &
Consumer Protection Regulations 2017. The framework was duly
notified vide press release no.71/2018 dated 3rd July 2018 with
revised timelines for implementation. All the timelines prescribed in
the above-mentioned framework commenced from 3rd July 2018. The
new regulatory framework has come into effect on 29th December
2018.
5.3 As per the Telecommunication (Broadcasting and Cable) Services
(Eighth) (Addressable Systems) Tariff Order, 2017 dated 3rd March
2017 as amended, every broadcaster has to offer all its channels on
a-la-carte basis to all distributors of television channels and declare
maximum retail price, per month, payable by a subscriber for each
of its pay channel offered on a-la-carte basis. Further, it is also
permissible for a broadcaster to offer its pay channels in the form of
bouquet and declare the maximum retail price, per month, of such
bouquet payable by a subscriber.
5.4 As per the reporting done by broadcasters in pursuance of the Tariff
Order dated 3rd March 2017, as amended, there are 332 pay TV
channels, as on 30th June 2020, which includes 235 SD pay TV
channels and 97 HD Pay TV channels. A list of pay TV channels
offered by broadcasters to subscribers as reported to TRAI is
attached as Annexure-5.1.

88
Chart 5.2 : Quarterly growth in number of satellite Pay TV channels in India
C. Cable TV Sector
5.5 The country has achieved 100% digitization of Cable TV network.
This is a stupendous achievement making India as the only large
country where 100% digital cable has been achieved through
mandatory regulations.
5.6 As on 30th June 2020, there are 1666 MSOs registered with MIB.
Further, as per the data reported by MSOs/HITS operators, there
are 12 MSOs & 1 HITS operator who have subscriber base greater
than one million. M/s e-Infrastructure and Entertainment India
Private Limited (MSO) has shut down of all MSO operation/
business. A list of Major MSOs/HITS Operators is attached as
Annexure 5.2. Details of the total active subscriber base of these 12
MSOs and 1 HITS operator are given in following table 5.2.

89
Table 5.2: Subscriber base of major MSOs/HITS operators at the end of June, 2020 (More than one million subscribers)
Sl. No.
Name of the operator
Total Active Subscriber Base (includes subscribers who have been inactive or temporarily suspended for not more than
last 90 days)
1. Siti Networks 88,78,164
2. GTPL Hathway 77,09,349
3. Hathway Digital 53,23,752
4. Den Networks 52,39,009
5. Tamil Nadu Arasu Cable TV 30,49,817
6. Kerala Communicators Cable Ltd (KCCL)
29,19,533
7. TCCL 27,06,317
8. Fastway Transmissions Pvt Ltd 23,83,629
9. IndusInd Media and Communication Ltd (HITS)
21,65,400
10. KAL Cables 19,40,255
11. VK Digital 15,82,489
12. IndusInd Media and Communication Ltd
(CATV)
12,13,182
13. Asianet Digital Network 12,12,099
D. Direct-to-Home (DTH) Sector
5.7 Since its introduction in the year 2003, Indian DTH service has
displayed a phenomenal growth. During the quarter ending 30th
June, 2020, there were 4 pay DTH service providers in India.
5.8 Pay DTH has attained Total active subscriber base of around
70.58 million. This is in addition to the subscribers of the DD Free
Dish (free DTH services of Doordarshan). The total active subscriber
base has increased from 70.26 million in March 2020 to 70.58
million in June 2020.

90
5.9 It is important to note that previously (upto March 2019) the
subscription figure of total active subscribers included inactive and
temporarily suspended subscribers for not more than last 120 days.
However as per new regulatory framework of Broadcasting and Cable
TV Services, the total active subscribers are counted including only
those subscribers which are inactive/ temporarily suspended for not
more than last 90 days. This point has been duly clarified by the
Authority in the Press Release no. 86/ 2019 dated 8th October, 2019
(https://main.trai.gov.in/sites/default/files/PR_No.86of2019.pdf)
5.10 Quarterly growth in the DTH sector in terms of the total active
subscriber base and market share of DTH operators in terms of
percentage of total active subscribers during the quarter ending
30th June 2020 is depicted in the following charts: -
Chart 5.3 : Quarterly growth in total Active subscribers (in million) of
pay DTH Sector

91
Chart 5.4 : Market share of DTH Operators
Source : As reported by DTH service providers
E. FM Radio Services
5.12 Apart from the radio stations operated by All India Radio – the
public broadcaster, as on 30th June 2020, there are 367
operational private FM Radio stations in 105 cities with operational
31 Private FM Radio broadcasters as compared to 368 private FM
Radio Stations in 105 cities with operational 32 FM Radio
broadcasters in the previous quarter. During the quarter end 30th
June 2020, M/s Muthoot Broadcasting Private Limited has ceased
the operation of its single FM Radio station at Chennai. A list of 105
existing cities with operational private FM radio channels in India,
as on 30th June, 2020 is placed at Annexure 5.4. The following
chart 5.5 depicts the quarterly growth in private FM Radio stations.

92
Chart 5.5 : Quarterly growth in private FM Radio stations
5.13 The reported advertisement revenue during the quarter ending
30th June 2020 in respect of 366 private FM Radio stations is
` 98.41 crore as against ` 400.64 crore in respect of 367 private
FM Radio stations for the previous quarter i.e 31st March 2020.
One FM Radio Broadcaster, M/s Gwalior Firm Private Limited,
operating in the city of Guwahati, has not submitted the
advertisement revenue.
Chart 5.6: Quarterly growth in FM Radio Advertisement Revenue
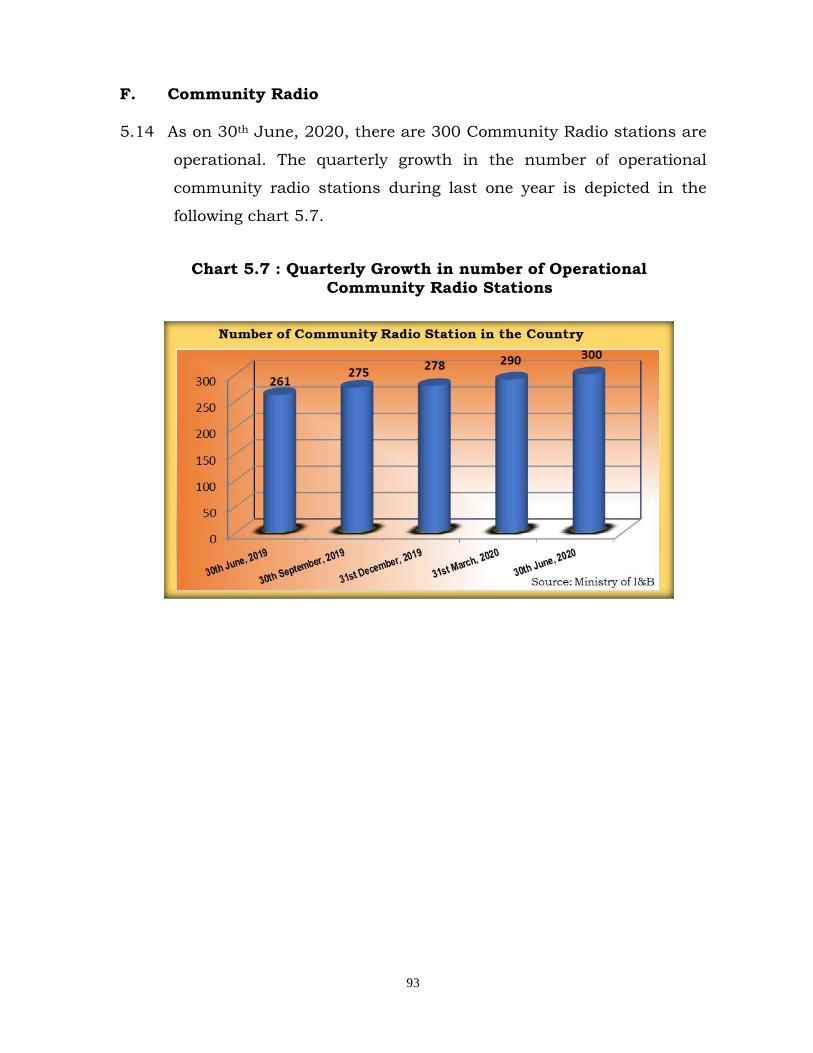
93
F. Community Radio
5.14 As on 30th June, 2020, there are 300 Community Radio stations are
operational. The quarterly growth in the number of operational
community radio stations during last one year is depicted in the
following chart 5.7.
Chart 5.7 : Quarterly Growth in number of Operational
Community Radio Stations

94
Annexures

95
Annexure 1.1: Wireless Subscriber Base
Mar-20 Jun-20 Mar-20 Jun-20 Mar-20 Jun-20 Mar-20 Jun-20 Mar-20 Jun-20 Mar-20 Jun-20 Mar-20 Jun-20 Net Additions
Andhra Pradesh 18117771 16948499 29,359,105 28513977 2215 2175 9,880,476 9855027 30496220 31033822 87,855,787 86,353,500 -1502287
Assam 4183200 3892299 8,353,872 8285759 0 0 2,790,779 2843947 8275824 8465436 23,603,675 23,487,441 -116234
Bihar 14591200 13652772 34,977,894 33693996 381 360 5,628,326 5701746 29526256 30622243 84,724,057 83,671,117 -1052940
Delhi 17332519 16417191 15,622,321 15048030 1789 1751 0 2,181,486 2179026 18259352 18388992 53,397,467 52,034,990 -1362477
Gujarat 27072381 25892692 10,993,217 9920925 605 612 6,111,290 6106266 23755633 24316715 67,933,126 66,237,210 -1695916
Haryana 8785711 8361858 4,537,398 4498706 136 130 5,003,797 5013844 9347510 9381819 27,674,552 27,256,357 -418195
Himachal Pradesh 850315 788330 3,328,098 3211925 104 103 2,991,601 2997445 3620570 3739380 10,790,688 10,737,183 -53505
Jammu & Kashmir 610483 588643 5,928,411 5720475 0 0 1,257,282 1259303 4064862 4220936 11,861,038 11,789,357 -71681
Karnataka 11268724 10825486 28,721,892 27876260 1540 1601 7,318,035 7274657 20318123 20702665 67,628,314 66,680,669 -947645
Kerala 17962231 17575190 5,609,440 5622201 634 690 10,944,293 10949638 8915611 9441962 43,432,209 43,589,681 157472
Madhya Pradesh 23,870,180 23058064 14,476,869 13315433 750 728 6,368,950 6376004 30517136 31814555 75,233,885 74,564,784 -669101
Maharashtra 38,126,290 35920408 16,099,766 15598186 1050 912 7,051,528 7022942 31518967 32741143 92,797,601 91,283,591 -1514010
Mumbai 12,712,857 11937699 9,921,502 9205994 2397 2318 0 1,178,701 1175694 14013751 14147321 37,829,208 36,469,026 -1360182
North East 1,721,989 1625330 5,232,246 5086549 0 0 1,422,503 1402201 3645578 3763129 12,022,316 11,877,209 -145107
Orissa 3,159,284 2851806 11,428,399 10770115 364 379 6,227,956 6354332 12515137 12995977 33,331,140 32,972,609 -358531
Punjab 9,328,394 8838348 10,288,523 9926586 316 307 5,779,360 5817451 13777111 13940730 39,173,704 38,523,422 -650282
Rajasthan 13,598,361 12928571 21,115,780 20458171 368 385 6,271,217 6312472 24547174 24671680 65,532,900 64,371,279 -1161621
Tamil Nadu (incl. Chennai) 20,335,566 19408811 25,220,269 24498103 3135 3132 12,696,544 10689186 23724399 24027784 81,979,913 78,627,016 -3352897
UP(E) 25,719,403 26206694 30,968,581 30874068 866 687 11,693,544 11717082 28376042 29138887 96,758,436 97,937,418 1178982
UP(W) 23,633,309 22054123 13,933,712 13934826 301 283 5,964,689 6036679 19849305 20050305 63,381,316 62,076,216 -1305100
Kolkata 7368356 7013690 6244080 5836094 36 33 2096657 2169503 10024019 10338362 25,733,148 25,357,682 -375466
West Bengal 18820090 18317372 15,451,606 14775105 809 801 2,373,296 2409240 18428223 19305561 55,074,024 54,808,079 -265945
Total 319,168,614 305,103,876 327,812,981 316,671,484 17,796 17,387 119,872,123 118,308,965 3,360,187 3,354,720 387,516,803 397,249,404 1,157,748,504 1,140,705,836 -17042668
TotalBSNL MTNL Reliance Jio Service Area
Vodafone IdeaBharti Airtel
(including Tata Teleservices)Reliance Com.

96
Annexure 1.2: Wireline Subscriber Base
Service Area
Mar-20 Jun-20 Mar-20 Jun-20 Mar-20 Jun-20 Mar-20 Jun-20 Mar-20 Jun-20 Mar-20 Jun-20 Mar-20 Jun-20 Mar-20 Jun-20 Mar-20 Jun-20
Andhra Pradesh 213913 217071 29286 26517 166571 161986 754108 710649 51345 51915 100686 142988 1,315,909 1,311,126 -4,783
Assam 95015 91870 3450 3450 12875 17159 111,340 112,479 1,139
Bihar 2056 1937 8402 8124 146322 140696 1980 1830 17614 25121 176,374 177,708 1,334
Delhi 1491730 1416973 67232 62940 147802 144233 1395358 1391811 - - 78115 75335 87626 97012 3,267,863 3,188,304 -79,559
Gujarat 99478 101627 9725 8597 85404 82095 643726 579193 32052 32022 130278 154695 1,000,663 958,229 -42,434
Haryana 22600 24810 1526 1314 38096 38349 175363 174789 360 360 26290 49461 264,235 289,083 24,848
Himachal
Pradesh1117 953 1933 1820 94579 89491 60 30 795 1352 98,484 93,646 -4,838
Jammu &
Kashmir4325 0 0 0 120470 111452 0 0 14337 25251 134,807 141,028 6,221
Karnataka 778931 776627 97249 92714 272504 267925 863720 823344 82947 80357 51624 84124 2,146,975 2,125,091 -21,884
Kerala 62520 60252 10242 9487 19648 19377 1445592 1379954 5670 6090 14857 21465 1,558,529 1,496,625 -61,904
Madhya Pradesh 240632 234566 4692 4368 13334 12452 358417 303347 2310 2130 50033 64190 669,418 621,053 -48,365
Maharashtra 113704 116173 35947 30889 257716 249175 877812 838078 29723 29223 36781 44952 1,351,683 1,308,490 -43,193
Mumbai 398083 373704 137505 119526 538886 524705 1698442 1694184 0 85887 86886 213724 263091 3,072,527 3,062,096 -10,431
North East 90954 86189 270 270 6265 10107 97,489 96,566 -923
Orissa 1651 1590 8697 8747 185731 174878 5760 6060 8160 12219 209,999 203,494 -6,505
Punjab 139989 133009 9444 9023 182269 177039 12314 11773 314234 294817 3030 3180 37031 48715 698,311 677,556 -20,755
Rajasthan 58468 57600 12659 11802 11599 11303 356233 328940 9960 11780 39655 50095 488,574 471,520 -17,054
Tamil Nadu
(incl. Chennai)547423 531136 45557 41223 122719 120655 1165205 1102690 32545 36755 99310 128014 2,012,759 1,960,473 -52,286
U.P.(E) 63353 63375 2745 2701 8308 7575 277783 193146 13330 13900 36200 51960 401,719 332,657 -69,062
U.P.(W) 25940 28135 2118 2040 4820 4662 209990 186171 5550 5460 62279 101403 310,697 327,871 17,174
Kolkata 135817 133050 33239 32293 48882 48127 389392 382620 11480 10700 36,071 49137 654,881 655,927 1,046
West Bengal 1615 1509 2473 2372 162457 182698 120 120 8186 12831 174,851 199,530 24,679
Total 4,392,581 4,272,433 505,605 461,423 182,269 177,039 1,770,108 1,725,455 3,093,800 3,085,995 8,727,103 8,175,012 455,944 457,853 1,090,677 1,455,342 20,218,087 19,810,552 -407,535
Reliance JioNet
Additions
Vodafone Idea TotalMTNL BSNLBharti Airtel Reliance Com. Quadrant Tata Tele.

97
Annexure 1.3: Service Area and Service Provider-wise details of PCOs
Name of Telecom Service Area
Service Provider Number of PCOs as on 31.03.2020
Number of PCOs as on 30.06.2020
Net PCO increase/ decrease
as on 30.06.2020
Percentage Growth/ Decline as on
30.06.2020
Andhra Pradesh (Excluding Telangana)
Bharat Sanchar Nigam Limited 4,677 4,359 -318 -6.80%
Bharti Airtel 185 0 -185 -100.00%
Telangana Bharat Sanchar Nigam Limited *4,234 4,833 599 14.15%
Bharti Airtel 0 181 181 100.00%
Assam Bharat Sanchar Nigam Limited 1,173 957 -216 -18.41%
Bihar (Excluding Jharkhand)
Bharat Sanchar Nigam Limited 822 654 -168 -20.44%
Jharkhand Bharat Sanchar Nigam Limited 2,440 2,415 -25 -1.02%
Delhi Bharti Airtel 330 330 0 0.00%
MTNL 45,602 39,537 -6,065 -13.30%
Gujarat Bharat Sanchar Nigam Limited 5,612 5,012 -600 -10.69%
Bharti Airtel 14 14 0 0.00%
Haryana Bharat Sanchar Nigam Limited 732 535 -197 -26.91%
Bharti Airtel 137 135 -2 -1.46%
Himachal Pradesh Bharat Sanchar Nigam Limited 719 641 -78 -10.85%
Jammu & Kashmir Bharat Sanchar Nigam Limited 840 478 -362 -43.10%
Karnataka Bharat Sanchar Nigam Limited 11,019 10,838 -181 -1.64%
Bharti Airtel 2,978 2,848 -130 -4.37%
Kerala Bharat Sanchar Nigam Limited 11,635 11,596 -39 -0.34%
Bharti Airtel 395 392 -3 -0.76%
Kolkata Bharat Sanchar Nigam Limited 2,078 2,061 -17 -0.82%
Bharti Airtel 39 36 -3 -7.69%
Madhya Pradesh (Excluding
Chhatisgarh)
Bharat Sanchar Nigam Limited 8,062 7,113 -949 -11.77%
Bharti Airtel 1,305 1,210 -95 -7.28%
Chhatisgarh Bharat Sanchar Nigam Limited 894 335 -559 -62.53%
Maharashtra (Excluding Mumbai
& Goa)
Bharat Sanchar Nigam Limited 10,235 8,065 -2,170 -21.20%
Bharti Airtel 1 0 -1 100.00%
Mumbai Bharti Airtel 50 50 0 0.00%
MTNL 16,862 16,862 0 0.00%
Goa Bharat Sanchar Nigam Limited 589 174 -415 -70.46%
Arunachal Pradesh Bharat Sanchar Nigam Limited 908 1,045 137 15.09%
Manipur Bharat Sanchar Nigam Limited 772 772 0 0.00%
Meghalaya Bharat Sanchar Nigam Limited 255 255 0 0.00%
Mizoram Bharat Sanchar Nigam Limited 113 109 -4 -3.54%
Nagaland Bharat Sanchar Nigam Limited 0 0 0 -

98
Annexure 1.3 (contd.)
Name of Telecom Service Area
Service Provider Number of PCOs as on 31.03.2020
Number of PCOs as on 30.06.2020
Net PCO increase/ decrease
as on 30.06.2020
Percentage Growth/ Decline as on
30.06.2020
Tripura Bharat Sanchar Nigam Limited 478 477 -1 -0.21%
Orissa Bharat Sanchar Nigam Limited 1,230 1,211 -19 -1.54%
Punjab
Bharat Sanchar Nigam Limited 1,400 1,309 -91 -6.50%
Bharti Airtel 8 4 -4 -50.00%
Quadrant 703 670 -33 -4.69%
Rajasthan Bharat Sanchar Nigam Limited 1,637 1,378 -259 -15.82%
Bharti Airtel 209 209 0 0.00%
Tamil Nadu (Excluding Chennai)
Bharat Sanchar Nigam Limited 17,519 16,417 -1,102 -6.29%
Bharti Airtel 3,631 2,868 -763 -21.01%
Chennai Bharat Sanchar Nigam Limited 6,841 6,841 0 0.00%
Uttar Pradesh East Bharat Sanchar Nigam Limited 5,073 4,052 -1,021 -20.13%
Bharti Airtel 73 70 -3 -4.11%
Uttar Pradesh West (Excluding
Uttarakhand) Bharat Sanchar Nigam Limited 1,307 1,323 16 1.22%
Uttarakhand Bharat Sanchar Nigam Limited 451 397 -54 -11.97%
West Bengal (Excluding
Andaman & Nicobar and
Sikkim)
Bharat Sanchar Nigam Limited 1,219 830 -389 -31.91%
Andaman & Nicobar
Bharat Sanchar Nigam Limited 39 39 0 0.00%
Sikkim Bharat Sanchar Nigam Limited 0 0 0 0.00%
Total 1,77,525 1,61,937 -15,588 -8.78%
Total (In Lakhs) 1.78 1.62 -0.16 -8.78%
* BSNL revised the PCO subscriber figure of Telangana for March 2020 (0 to 4234).

99
Annexure 1.4: Service Area and Service Provider wise details of Village Public Telephones (VPTs)
S.No Name of
Telecom Service Area
Service Provider
Number of VPTs as on 31.03.2020
Number of VPTs as on 30.06.2020
Net VPTs increase/ decrease
as on 30.06.2020
1 Andhra Pradesh (Excluding Telangana)
Bharat Sanchar Nigam Limited
2,052 2,052 0
2 Telangana Bharat Sanchar Nigam Limited
0 844 844
3 Assam Bharat Sanchar Nigam Limited
105 105 0
4 Bihar (Excluding Jharkhand)
Bharat Sanchar Nigam Limited
5,893 5,893 0
5 Jharkhand Bharat Sanchar Nigam Limited
221 221 0
6 Gujarat Bharat Sanchar Nigam Limited
5,278 5,278 0
7 Haryana Bharat Sanchar Nigam Limited
462 462 0
8 Himachal Pradesh
Bharat Sanchar Nigam Limited
1,875 1,875 0
9 Jammu & Kashmir
Bharat Sanchar Nigam Limited
810 810 0
10 Karnataka Bharat Sanchar Nigam Limited
3,656 3,656 0
11 Kerala Bharat Sanchar Nigam Limited
331 331 0
12 Kolkata Bharat Sanchar Nigam Limited
130 130 0
13 Madhya Pradesh (Excluding Chhatisgarh)
Bharat Sanchar Nigam Limited
9,907 9,907 0
14 Chhatisgarh Bharat Sanchar Nigam Limited
193 193 0
15 Maharashtra (Excluding Mumbai & Goa)
Bharat Sanchar Nigam Limited
7,615 7,615 0
16 Goa Bharat Sanchar Nigam Limited
231 231 0
17 Arunachal Pradesh
Bharat Sanchar Nigam Limited
623 623 0
18 Manipur Bharat Sanchar Nigam Limited
93 93 0
19 Meghalaya Bharat Sanchar Nigam Limited
207 207 0

100
Annexure 1.4 (contd.)
S.No Name of Telecom Service Area
Service Provider
Number of VPTs as on 31.03.2020
Number of VPTs as on 30.06.2020
Net VPTs increase/ decrease
as on 30.06.2020
20 Mizoram Bharat Sanchar Nigam Limited
12 12 0
21 Nagaland Bharat Sanchar Nigam Limited
25 25 0
22 Tripura Bharat Sanchar Nigam Limited
222 22 -200
23 Orissa Bharat Sanchar Nigam Limited
1,554 1,554 0
24 Punjab Bharat Sanchar Nigam Limited
4,493 4,493 0
25 Rajasthan Bharat Sanchar Nigam Limited
0 0 0
26 Tamil Nadu (Excluding Chennai)
Bharat Sanchar Nigam Limited
5,478 5,478 0
27 Uttar Pradesh East
Bharat Sanchar Nigam Limited
568 568 0
28 Uttar Pradesh West (Excluding Uttarakhand)
Bharat Sanchar Nigam Limited
1,637 1,637 0
29 Uttarakhand Bharat Sanchar Nigam Limited
2,121 2,121 0
30
West Bengal (Excluding Andaman & Nicobar and Sikkim)
Bharat Sanchar Nigam Limited
11,557 11,557 0
31 Andaman & Nicobar
Bharat Sanchar Nigam Limited
93 93 0
32 Sikkim Bharat Sanchar Nigam Limited
320 320 0
Total 67,762 68,406 644 Total (In Lakh) 0.68 0.68 0.01

101
Annexure 1.5 : Internet Service Provider(ISP) wise Internet Subscriber base as on 30.06.2020
S.No. Name of the Service Provider: Narrowband Broadband Total
1 Reliance Jio Infocomm Ltd 0 398311560 398,311,560
2 Bharti Airtel Ltd./ Bharti Hexacom Ltd. 25111862 151303479 176,415,341
3 Vodafone Idea Limited 19217746 116451254 135,669,000
4 Bharat Sanchar Nigam Ltd. 6308787 22998602 29,307,389
5 Atria Convergence Technologies Pvt. Ltd. 0 1675141 1,675,141
6 Hathway Cable & Datacom Pvt. Ltd. 0 993765 993,765
7 Mahanagar Telephone Nigam Ltd. 148315 827774 976,089
8 You Broadband India Pvt. Ltd. 14653 801976 816,629
9 GTPL Broadband Pvt. Ltd. 0 409775 409,775
10 Excitel Broadband Private Limited 0 392605 392,605
11 Planet E-Shop Holdings India Ltd. 0 317053 317,053
12 Tikona Infinet Pvt Ltd 0 294914 294,914
13 Alliance Broadband Services Pvt. Ltd. 0 242954 242,954
14 D-Vois Broadband Private Limited 0 231923 231,923
15 Asianet Satellite Communications Ltd. 0 226212 226,212
16 INTECH ONLINE PVT LTD 0 219425 219,425
17 Netplus Broadband Services Pvt. Ltd 0 213749 213,749
18 Quadrant Televentures Ltd.(HFCL Infotel
Ltd.) 94 201119 201,213
19 Joister Infoserve Pvt. Ltd. 0 194134 194,134
20 RailTel Corporation of India Ltd. 0 170373 170,373
21 Indinet Service Pvt Ltd 0 124734 124,734
22 DEN Broadband Private Limited 0 114287 114,287
23 Tata Sky Broadband Private Limited 0 85950 85,950
24 ANI network Pvt Ltd 0 66210 66,210
25 Five Network Solution (India) Ltd. 0 63842 63,842
26 Wish Net Pvt. Ltd. 0 61847 61,847
27 Nextra Teleservices Pvt. Ltd. 0 59460 59,460
28 Honesty Net Solutions (I) Pvt Ltd 60 48981 49,041
29 Fusionnet Web Services Pvt. Ltd. 0 45899 45,899
30 Tata Teleservices Limited 283 69048 69,331
31 Airlink Communications Pvt. Ltd 0 40090 40,090
32 AIRNET CABLE AND DATACOM PVT
LTD 0 37655 37,655
33 Limras Eronet Broadband Service Pvt
Ltd 5482 29550 35,032
34 K Net Solutions Pvt. Ltd. 0 34318 34,318
35 Shyam Spectra Private Limited 0 33119 33,119
36 Wan and Lan Internet Pvt. Ltd. 0 32413 32,413
37 Ishan Netsol Pvt Ltd 0 31363 31,363
38 Digital Satellite Connect Pvt. Ltd. 0 28206 28,206

102
S.No. Name of the Service Provider: Narrowband Broadband Total
39 SITI Broadband Services Pvt. Ltd. 0 26452 26,452
40 Vasai Cable Pvt. Ltd. 0 25409 25,409
41 MICROSCAN COMPUTERS PVT LTD 8416 15430 23,846
42 ESTO BROADBAND Pvt. Ltd. 0 23509 23,509
43 DNA Infotel Pvt Ltd 0 22943 22,943
44 Ortel Communication Ltd. 0 20448 20,448
45 Sikka Broadband(P) Ltd. 0 19050 19,050
46 Rajesh Digital & Data Com Pvt. Ltd. 18 18745 18,763
47 City Online Services Ltd 0 18228 18,228
48 Digital Network associates Pvt. Ltd 0 16925 16,925
49 IKF Technologies Ltd 0 15852 15,852
50 World Phone Internet Services Pvt Ltd 0 15824 15,824
51 CSC e-Governance Services India Ltd. 0 15352 15,352
52 Quest Consultancy Pvt. Ltd. 0 14991 14,991
53 Meghbela Cable & Broadband Servies (P)
Ltd 0 14618 14,618
54 Tata Communications Limited 153 13484 13,637
55 RI Networks Pvt Ltd 0 12570 12,570
56 Sai Prasad Internet Services Pvt. Ltd. 0 12467 12,467
57 Tachyon Communications Pvt. Ltd. 0 12146 12,146
58 Yashash Cable Network Pvt Ltd 0 11992 11,992
59 Shree Omkar Infocom Pvt. Ltd. 0 10292 10,292
60 Pioneerelabs 351 9643 9,994
61 United Telecoms Ltd. 0 9889 9,889
62 Intermedia Cable Communication Pvt
Ltd 0 9838 9,838
63 North East Dataa Network Pvt Ltd. 0 9613 9,613
64 Readylink Internet Services Pvt Ltd 0 9101 9,101
65 Geocity Network Solutions Pvt. Ltd. 0 9072 9,072
66 Net 9 Online Hathway Private Limited 0 8593 8,593
67 WOW SOLUTIONS & SYSTEM PVT LTD 0 8214 8,214
68 DL GTPL BROADBAND PVT LTD 0 8094 8,094
69 Veloxr Telecom Pvt. Ltd. (Shree Balaji
Infoway Pvt Ltd.) 0 7702 7,702
70 Cityzone Infonet Pvt. Ltd 0 7674 7,674
71 Jetway Broadband India Pvt.Ltd. 0 7641 7,641
72 Limerick Technologies Pvt Ltd 0 7627 7,627
73 Swiftmail Communications Ltd. 2579 5044 7,623
74 FOXTEL TELECOMMUNICATIONS PVT
LTD 7325 0 7,325
75 Reliance Communications Limited 192 7062 7,254
76 SSCN PVT LTD 0 7015 7,015
77 Apna Telelink Ltd. 0 6702 6,702
78 Spiderlink Networks Pvt. Ltd. 0 6561 6,561

103
S.No. Name of the Service Provider: Narrowband Broadband Total
79 Kappa Internet Services Pvt Ltd. 0 6541 6,541
80 Angel Air Network Solutions Private
Limited 0 5509 5,509
81 Broadband Pacenet (I) Pvt. Ltd. 0 5323 5,323
82 Multicraft Digital Technologies Private
Limited 0 4865 4,865
83 Swiftnet Broadband Pvt Ltd 0 4795 4,795
84 IAXN Telecom Pvt. Ltd. 0 4766 4,766
85 Siliguri Internet & Cable TV Pvt. Ltd. 0 4742 4,742
86 Sifi Online Pvt. Ltd. 0 4692 4,692
87 Mukand Infotel Pvt. Ltd. 4355 0 4,355
88 Multinet (Udaipur) Pvt. Ltd. 0 4334 4,334
89 SUPER SONIC BROADBAND PVT LTD 0 4089 4,089
90 SONALI INTERNET SERVICES PVT LTD 0 4042 4,042
91 LM Energy and Software Pvt. Ltd. 0 4032 4,032
92 Blazenet Ltd. 0 4017 4,017
93 Bittel Telecom Pvt.Ltd 0 4015 4,015
94 Shine Communications Pvt. Ltd. 0 3983 3,983
95 GBPS Networks Pvt. Ltd. 0 3871 3,871
96 Five Net Service Provider Pvt. Ltd. 0 3848 3,848
97 Pink Broadband Services Pvt. Ltd. 1890 1890 3,780
98 CHANNEL III INTERNET PVT LTD 0 3671 3,671
99 Juweriyah Networks Pvt Ltd 0 3517 3,517
100 Vision Smartlink Networking Pvt. Ltd. 0 3481 3,481
101 WSNS Pvt. Ltd. 0 3402 3,402
102 Rainbow Internet teleservices Pvt Ltd 16 3184 3,200
103 Star Broadband Services (I) Pvt Ltd 0 3076 3,076
104 GETWAY BROADBAND PVT LTD 0 3056 3,056
105 Spacenet Internet Services Pvt Ltd 0 2932 2,932
106 Airgenie Communications Pvt. Ltd. 0 2877 2,877
107 CANDOR INFOSOLUTION PVT LTD 2836 0 2,836
108 VRD Web Services Private Limited 0 2782 2,782
109 S.S.Netcom Pvt Ltd 0 2704 2,704
110 TGN NETWOKS PVT LTD 0 2679 2,679
111 Chandra Net Pvt. Limited 0 2435 2,435
112 TRANSMEDIA TECHNOLOGIES (AP) PVT
LTD 0 2427 2,427
113 NISS INTERNET SERVICES PVT. LTD. 0 2392 2,392
114 Blu Ultraband Internet Services Private
Limited 0 2234 2,234
115 INET FIBER INDIA PVT LTD 0 2156 2,156
116 Jetspot Networks Pvt. Ltd. 0 2098 2,098
117 SMARTLINK SOLUTIONS PVT. LTD. 0 1965 1,965
118 Symbois Creations Pvt. Ltd. 0 1847 1,847

104
S.No. Name of the Service Provider: Narrowband Broadband Total
119 Speed Online.net Pvt. Ltd. 0 1812 1,812
120 Capture Network Systems Pvt. Ltd. 288 1517 1,805
121 Southern Online Bio Technologies Ltd. 0 1799 1,799
122 F/X Wireless Technology Services Pvt.
Ltd. 0 1705 1,705
123 Assistive networks & technologie Pvt Ltd 0 1701 1,701
124 Elyzium Technologies Pvt. Ltd. 0 1675 1,675
125 Smart Net India Pvt Ltd 0 1671 1,671
126 Ultranet Infotech Solution Private
Limited 0 1600 1,600
127 Nettlinx Ltd. 0 1591 1,591
128 Radinet Info Solutions Pvt Ltd 0 1581 1,581
129 DNS SKYLINK PVT. LTD. 0 1580 1,580
130 Touch Net India Pvt. Ltd. 0 1570 1,570
131 Datawave IT solutions Pvt. Ltd. 775 775 1,550
132 delDSL Internet Pvt Ltd 0 1521 1,521
133 Sphier Infotech Pvt. Ltd. 0 1515 1,515
134 GALAXYNET CONNECTIONS PVT LTD 0 1497 1,497
135 Fiberzone Communications Pvt. Ltd. 0 1471 1,471
136 Deenet Services Pvt Ltd 0 1447 1,447
137 Netfirre Communications Pvt. Ltd. 0 1408 1,408
138 Bakcom Networks India Pvt Ltd 0 1398 1,398
139 GIGACAST NETWORK PVT LTD 0 1360 1,360
140 Click4Net Internet Services Private
Limited 0 1340 1,340
141 Skylink Fibernet Pvt. Ltd. 0 1307 1,307
142 SCUD COMMUNICATION PVT LTD 0 1303 1,303
143 Wnet Telecom Private Limited 0 1283 1,283
144 MAKS COMMUNICATIONS PVT.LTD. 0 1248 1,248
145 Hughes Communications India Ltd. 119 1096 1,215
146 Zoram Business Enterprise Private
Limited 0 1200 1,200
147 Aerocast Networks Pvt Ltd. 0 1162 1,162
148 DA Smartzone Pvt Ltd 0 1158 1,158
149 STN Infotech Pvt. Ltd 0 1151 1,151
150 SS FIBER NET OPTICAL
COMMUNICATION PVT. LTD 0 1124 1,124
151 HARDWORK CABLE & INTERNET
SERVICES PVT LTD 0 1109 1,109
152 Craze IT Solutions Pvt Ltd 0 1100 1,100
153 CJ Online Pvt. Ltd. 0 1082 1,082
154 Karunay lnternet Private Limited 0 1080 1,080
155 Aeroway Networks Pvt Ltd. 0 1063 1,063
156 Rajesh Patel Net Services Pvt. Ltd. 11 991 1,002
157 NGC Broadband Pvt. Ltd. 0 997 997

105
S.No. Name of the Service Provider: Narrowband Broadband Total
158 Correl IT Services Pvt. Ltd. 0 975 975
159 AHM Digital Network Pvt Ltd 0 970 970
160 ACN Fiber Pvt. Ltd. 0 949 949
161 Grace Teleinfra Pvt Ltd 0 927 927
162 Packenet Solutions Pvt. Ltd. 0 923 923
163 FASTNET COMMUNICATION PVT LTD 225 694 919
164 Sanchit Infocom Pvt Ltd 0 909 909
165 HOSTAXIS NETWORKS PVT LTD 0 890 890
166 Ficus Telecom Pvt. Ltd. 0 873 873
167 Japra Tele Link Pvt. Ltd. 0 869 869
168 Amar Broadband Private Limited 0 863 863
169 SKY ONLINE TECHNOSYSTEM PVT LTD 0 863 863
170 Telosy Telecom Pvt. Ltd. 0 863 863
171 JBN Online Private Limited. 0 857 857
172 DREAMLINK TECHNOLOGIES PVT LTD 0 848 848
173 ADRI INFOCOM PVT. LTD. 0 845 845
174 NetMagic Solutions(P) Ltd. 0 833 833
175 Touchnet Broadband Services Pvt Ltd 0 804 804
176 Light Air Transmission Pvt. Ltd. 396 396 792
177 Ani Broadband Service Pvt. Ltd. 0 763 763
178 SVD DIGITAL NETWORKS PVT LTD 0 758 758
179 Spirenet Digital Communication Pvt Ltd 0 752 752
180 Darer Internet Services Pvt. Ltd. 0 718 718
181 CLOUDNET COMMUNICATIONS PVT
LTD 0 714 714
182 Unitel Media Pvt Ltd 0 707 707
183 SEFARO NETWORKS PRIVATE LTD 0 700 700
184 Acegen Broadband Pvt. Ltd 0 683 683
185 HPS DIGITAL BROADBAND PVT LTD 0 672 672
186 Primenet Global Ltd. 0 668 668
187 Rida Communication Pvt. Ltd. 0 657 657
188 iAIRONET COMMUNICATION PVT LTD 0 631 631
189 Speedmaxx Digital Networks Pvt Ltd 0 628 628
190 Wi-Link Network Pvt. Ltd 0 614 614
191 NETVISION AWADH NETWORKS PVT
LTD 137 474 611
192 WEBRIDERS INTERNET PVT LTD 0 594 594
193 Reticule Infotech Pvt. Ltd. 0 580 580
194 Alphanet Broadband Pvt Ltd 0 571 571
195 DATAMAX TECHNOLOGY PVT LTD 63 504 567
196 Daksh Broadband Services Pvt Ltd 0 555 555
197 Alegra Communication Pvt Ltd 0 552 552
198 Digital2Virtual ISP Pvt. Ltd. 0 549 549

106
S.No. Name of the Service Provider: Narrowband Broadband Total
199 Panav Network and Communications Private Limited
0 548 548
200 VIVA Communications Pvt Ltd 0 542 542
201 SOUTHNET BROADBAND PVT LTD 0 540 540
202 Shree Manoranjan Broadband Pvt Ltd 0 538 538
203 Power Grid Corporation of India Ltd. 0 530 530
204 VARESHA AIR WORLD NETWORKS PVT
LTD 20 509 529
205 Data Ingenious Global Ltd 4 508 512
206 ELECON INFOTMATION TECHNOLOGY
LTD 0 484 484
207 Sify Technologies Ltd. 251 227 478
208 HELM CONSULTANTS PVT LTD 467 0 467
209 Amityhua Electronics Pvt. Ltd. 0 460 460
210 Oasis Cable Pvt Ltd. 0 445 445
211 Tamana Winet Pvt. Ltd. 0 436 436
212 REVOLUTION BROADBAND PVT LTD 0 429 429
213 Quick Link Broadband And Services Pvt.
Ltd 0 424 424
214 Lotus Broadband Pvt Ltd 0 419 419
215 Oistel Telecom Pvt. Ltd. 203 203 406
216 Spider Broadband and Cable Pvt Ltd 0 404 404
217 Pulse Telesystems Pvt. Ltd. 0 401 401
218 STN Communication & Advertising Pvt
Ltd. 0 401 401
219 CNS INFOTEL SERVICES PVT LTD 0 392 392
220 MORADABAD INTERNET DERVICES
PVT LTD 0 384 384
221 Nandini Broadband Pvt Ltd 0 382 382
222 SmartLink Broadband Services 0 376 376
223 Bhiwani Communications Pvt. Ltd. 0 375 375
224 Gorakhpur Net Services Pvt. Ltd. 0 375 375
225 WINDSOR INTERNET PVT LTD 0 374 374
226 Citylink Broadband Services Pvt. Ltd. 0 360 360
227 Bass Networks Pvt Ltd 0 352 352
228 BASS JOKERNET PRIVATE LIMITED 0 345 345
229 Sysnet Broadband Services Pvt. Ltd. 0 340 340
230 Sai Akshay Internet Services Pvt Ltd. 0 332 332
231 CATLA IT&ENGG. CO. PVT LTD. 0 327 327
232 Twincity Communication Private Limited 0 325 325
233 Gleam Worldwide Services Pvt. Ltd. 0 309 309
234 SHEEN TELECOM CONSULTANTS PVT
LTD 0 292 292
235 WAVETREE NETWORKS PVT LTD 0 291 291
236 Dhanam Internet Services India Pvt. Ltd. 0 289 289

107
S.No. Name of the Service Provider: Narrowband Broadband Total
237 ALWAR ONLINE PVT LTD 0 283 283
238 Antariksh Broadband & Wireless
Solutions Pvt Ltd 280 0 280
239 Goodwill Smartlink Pvt. Ltd. 0 277 277
240 Sense Connect IT Pvt. Ltd. 0 267 267
241 PANCHSHEEL BROADBAND
SERVICES'S PVT LTD. 0 260 260
242 Singh Internet Services Pvt. Ltd. 0 260 260
243 Cityline Networks Pvt Ltd 0 251 251
244 Faiconet Internet Pvt Ltd 0 245 245
245 VISPUTES INTERNET PRIVATE LIMITED 0 245 245
246 Airmesh Communications Limited 0 241 241
247 AUSPICE INFRATAL PVT LTD 0 232 232
248 Gazillio Technologies Pvt. Ltd. 0 232 232
249 Allied IT Infrastructures & Services Pvt.
Ltd. 0 231 231
250 NEXTGEN COMPUSOFT PVT LTD 0 231 231
251 Khetan Cable Network (P) Ltd 0 228 228
252 Shineplus Networks Pvt Ltd 0 225 225
253 VMO BROADBAND PVT LTD 225 0 225
254 ANUSHREE DIGITAL NETWORK PVT
LTD 0 222 222
255 ACEBROWSE PVT LTD 0 219 219
256 Smart Wi5 Pvt. Ltd. 0 218 218
257 CIT SOLUTIONS PVT. LTD. 0 217 217
258 Suncity Broadband Pvt Ltd. 0 215 215
259 Srinagar Technology Consultants Ltd 213 0 213
260 Wi5 Internet Services P Limited 0 212 212
261 CERALINK COMMUNICATION PVT LTD 0 210 210
262 Imperium Digital Network Pvt. Ltd. 0 209 209
263 Microsense Pvt. Ltd. 0 209 209
264 Saibaba Broadband Pvt. Ltd. 0 206 206
265 JB Jain Broadband Solutions Private
Limited. 0 200 200
266 Fastx Broadband Private Limited 0 199 199
267 PROLINE DATATECH SERCIVCES PVT
LTD 0 193 193
268 Netrexo Communications Pvt. Ltd. 0 191 191
269 Barani Data Solutions Private Limited 190 0 190
270 Development Logics Solutions Pvt Ltd 0 186 186
271 Kataria Net Solutions Pvt. Ltd. 0 183 183
272 Satpar Infotech Pvt Ltd 0 183 183
273 Verizon Communications India Pvt. Ltd. 0 178 178
274 Optisky Fiber Pvt Ltd 0 168 168
275 AIRMAX INTERNET PVT LTD 160 0 160

108
S.No. Name of the Service Provider: Narrowband Broadband Total
276 Nanjil Internet Services Pvt. Ltd. 0 158 158
277 PMG NETWORKD PVT LTD 0 154 154
278 Achiever Communication and Services
Pvt. Ltd. 0 139 139
279 Global India Tele Infra Pvt. Ltd. 36 100 136
280 Texes Connect Private Limited 112 24 136
281 NR DATA SERVICE PVT LTD 0 135 135
282 AT&T Global Network Services India
Private Limited 0 134 134
283 Shri Vinayagaa Internet Pvt Ltd 0 131 131
284 MLC INTERNET PVT LTD 0 126 126
285 Sri Ram Broadband Services Pvt. Ltd. 0 126 126
286 Mediatesh Communication Pvt. Ltd. 0 125 125
287 Micronova Network Solutions Ltd 4 116 120
288 ROYAL WIRELESS SERVICES PVT LTD 0 120 120
289 V NET NETWORKS PVT. LTD 0 118 118
290 Shri Ram Braoadband Services Pvt Ltd 0 112 112
291 White Stallion Networks Pvt. Ltd. 0 112 112
292 Malang Solutions Pvt. Ltd. 0 107 107
293 Pronoc Technologies Pvt. Ltd. 0 107 107
294 Omkar Net Services Pvt. Ltd. 0 99 99
295 SATH TECHNOLOGIES PVT LTD 0 99 99
296 Veer Point Pvt. Ltd. 0 99 99
297 Shreepad Communication Pvt. Ltd. 0 98 98
298 DRONAGIRI INFOTECH PVT LTD 0 95 95
299 Cheetah Networks Pvt Ltd 0 94 94
300 ERNET India 49 42 91
301 INFINITY WIRELESS SERVICES PVT.
LTD. 0 89 89
302 AirFiber IT Solutions Pvt. Ltd 0 87 87
303 Invensys Networks pvt ltd 0 87 87
304 KKM Broadband Internet Pvt Ltd 0 87 87
305 Airtechzone Services India Pvt Ltd 85 0 85
306 ARP INFONET PVT. LTD. 0 84 84
307 Vidarbha Wi-Fi & Network Services Pvt.
Ltd. 84 0 84
308 Dream Plus Multi Services Pvt. Ltd. 0 82 82
309 Classic Internet and Cable Services Pvt Ltd
81 0 81
310 M-TEL Networks (P) Ltd 0 80 80
311 NETWIRE INTERNET SOLUTIONS PVT. LTD.
0 79 79
312 Zoram Infonet Pvt Ltd 0 75 75
313 Mtel Networks Pvt. Ltd. 0 73 73
314 TRIPLE LINK PVT LTD 0 73 73

109
S.No. Name of the Service Provider: Narrowband Broadband Total
315 S A INTERNET SOLUTION PVT LTD 0 72 72
316 Hipath Netcom Services Pvt. Ltd. 0 71 71
317 BSL Technologies Pvt. Ltd. 0 66 66
318 Wireline Solution(India) Pvt. Ltd. 0 65 65
319 Infiber Broadnet Pvt. Ltd. 0 56 56
320 QBC Infotech Pvt. Ltd. 0 53 53
321 City Broadband Pvt. Ltd. 0 52 52
322 Divine Broadband Services Pvt Ltd 0 45 45
323 Edge Telecommunications Pvt. Ltd. 0 42 42
324 GURU NETCOMM PVT LTD 0 41 41
325 Sun Boardband and Data Services Pvt
Ltd 0 39 39
326 Mesh Infranet Pvt Ltd 0 36 36
327 Navariya Satellite Services Pvt.Ltd. 33 0 33
328 Dreamnet Pvt.Ltd. 0 30 30
329 Sanyog Networks Pvt Ltd 0 29 29
330 Orange Business Services India Network
Pvt. Ltd. 0 28 28
331 Prompt Infracom Pvt Ltd 0 28 28
332 WE INTERNET LIMITED 0 27 27
333 West Bengal Electronics Industry
Development Corp. Ltd. 0 25 25
334 Angrow Netcomm Pvt. Ltd. 24 0 24
335 JAI MATA DI TELECTRONIX PVT LTD 0 23 23
336 Pacific Internet India Pvt. Ltd. 0 23 23
337 SKYNETZONE WIFI SERVICES PVT LTD 0 20 20
338 FASTHOOK NETWORKS PVT LTD 0 18 18
339 Tatanet Services Ltd 0 18 18
340 Hienet Internet Services Pvt Ltd 0 16 16
341 Kartik Network Pvt. Ltd. 0 16 16
342 Microtel Internet Network Pvt ltd 0 15 15
343 Adya Tech One Services Pvt Ltd 0 13 13
344 Airlink Broadband Pvt Ltd 0 12 12
345 Marutham Networks Pvt. Ltd. 0 12 12
346 UBERCORE DATA LABS PVT LTD 0 12 12
347 Clear Beam Communication Pvt Ltd 10 0 10
348 A TO Z INFOLINK PVT.LTD. 0 9 9
349 Rajdhani Telecom Pvt. Ltd. 2 6 8
350 Essel Shyam Communications Limited 0 7 7
351 Financial Technologies Communications Ltd.
0 7 7
352 Critel Technologies Pvt. Ltd. 0 5 5
353 Mastek Infosystems OPC Pvt. Ltd. 0 5 5
354 Cloudcast Digital Ltd 0 4 4

110
S.No. Name of the Service Provider: Narrowband Broadband Total
355 INSTANET TECHNOLOGIES PRIVATE LIMITED
0 4 4
356 ABT Ltd. 3 0 3
357 Aristo Telenet Pvt Ltd 0 3 3
358 Sabse Internet Services Provider Pvt Ltd 0 2 2 Total 50839963 698230938 749,070,901 Total (in million) 50.840 698.231 749.071

111
Annexure 1.6: List of Service Providers which reported IP Telephony
Minutes for Q.E. Jun-20
S. No. Name of Service Providers reported IP Telephony
Minutes as on 30th June 2020
1 Alliance Broadband Services Pvt. Ltd.
2 Asianet Satellite Communications Ltd.
3 Blazenet Ltd.
4 City Online Services Ltd.
5 Citycom Networks Pvt. Ltd.
6 delDSL Internet Pvt Ltd
7 Novanet Ltd.
8 Pulse Telesystems Pvt. Ltd.
9 Sify Technologies Ltd.
10 Tata Communications Limited
11 Trikon Electronics Pvt. Ltd.
12 VIVA Communications Pvt. Ltd.
13 World Phone Internet Services Pvt. Ltd.
14 You Broadband & Cable India Pvt. Ltd.
15 Warmconnect Internet Services Pvt. Ltd.

112
Annexure 1.7: Service Area wise PMRTS subscriber Base
31.03.2020 30.06.2020
Arya Omnitalk Radio Trunking
Services Pvt.Ltd.2,771 2,736
QuickCall 932 975
VisakhapatnamArya Omnitalk Radio Trunking
Services Pvt.Ltd.4,477
VishakhapatnamArya Omnitalk Radio Trunking
Services Pvt.Ltd.4,658
8,361 8,188
Arya Omnitalk Radio Trunking
Services Pvt.Ltd.8,442 7,972
Procall Ltd. 2,923 2,942
11,365 10,914
AhmedabadArya Omnitalk Radio Trunking
Services Pvt.Ltd.1,226 1,134
BharuchArya Omnitalk Radio Trunking
Services Pvt.Ltd.1,491 1,503
DahejArya Omnitalk Radio Trunking
Services Pvt.Ltd.1,005 1,005
Jamnagar Inative Networks Pvt. Ltd. 360 360
Kutch Inative Networks Pvt. Ltd. 205 205
SuratArya Omnitalk Radio Trunking
Services Pvt.Ltd.1,750 1,658
Surat Inative Networks Pvt. Ltd. 895 895
VadodaraArya Omnitalk Radio Trunking
Services Pvt.Ltd.1,750 1,678
Vadodara Inative Networks Pvt. Ltd. 360 360
9,042 8,798
Arya Omnitalk Radio Trunking
Services Pvt.Ltd.7,444 7,266
QuickCall 642 604
8,086 7,870
ErnakulamArya Omnitalk Radio Trunking
Services Pvt.Ltd.976 989
Kerala Wiwanet Solutions Pvt. Ltd 457 460
1433 1,449
6 Kolkata KolkataArya Omnitalk Radio Trunking
Services Pvt.Ltd.2,326 2,236
7Madhya
PradeshIndore
Arya Omnitalk Radio Trunking
Services Pvt.Ltd.1,643 1,475
Arya Omnitalk Radio Trunking
Services Pvt.Ltd.2,277 2,173
Smartalk Pvt Ltd. 525 605
6,771 2,778
Airtalk Solutions & Services Pvt.
Ltd.495 416
Arya Omnitalk Radio Trunking
Services Pvt.Ltd.9,647 9,277
Bhilwara Telenet Services Pvt.Ltd. 868 883
Smartalk Pvt Ltd. 668 755
11678 11,331
Arya Omnitalk Radio Trunking
Services Pvt.Ltd.884 863
Procall Ltd. 326 355
1210 1,218
Arya Omnitalk Radio Trunking
Services Pvt.Ltd.8,106 8,073
QuickCall 524 508
8,630 8,581
66,576 64,838 Grand Total
10 RajasthanJaipur
Total
11 Tamil NaduChennai
Total
8 MaharashtraPune
Total
9 MumbaiMumbai
Total
4 KarnatakaBangalore
Total
5 Kerala
Total
2 DelhiDelhi
Total
3 Gujarat
Total
S.No.
DOT
Licensed
Service Area
Area Served Service Provider
Subscriber Base
1Andhra
Pradesh
Hyderabad
Total

113
Annexure 2.1: Wireless Revenue Service - Service Area wise Statistics for QE June, 2020
Key parameters for service areas of category-A
Service Area % of pre-paid in total subscribers
ARPU
(` per month)
Total usage (from & outside HSA) per subscriber per month
Outgoing SMS
Outgoing MOU
Incoming MOU
Total MOU
AP 95.94 107 18 341 341 682
Gujarat 95.89 91 15 332 294 627
Karnataka 94.00 105 20 351 339 690
MH 95.87 99 17 327 317 644
TN (incl. Chennai) 94.54 110 16 333 333 666
Key parameters for service areas of category-B
Service Area % of pre-paid in total Subscribers
ARPU
(` per month)
Total usage (from & outside HSA) per subscriber per month
Outgoing SMS
Outgoing MOU
Incoming MOU
Total MOU
Haryana 97.12 77 10 343 336 678
Kerala 97.56 95 11 270 277 547
MP 98.25 88 17 363 367 730
Punjab 96.43 94 10 348 338 687
Rajasthan 97.96 92 13 343 344 687
UP(E) 98.09 72 12 412 452 864
UP(W) 97.99 84 13 360 365 725
WB 99.46 90 17 388 410 798
Key parameters for service areas of category-C
Service Area % of pre-paid in total subscribers
ARPU
(` per month)
Total usage (from & outside HSA) per subscriber per month
Outgoing SMS
Outgoing MOU
Incoming MOU
Total MOU
Assam 98.08 98 30 394 419 813
Bihar 99.09 82 12 472 524 996
HP 99.11 80 9 294 293 587
J&K 57.68 97 25 508 487 996
NE 98.59 102 34 353 361 714
Odisha 98.76 89 18 413 444 857
Key parameters for service areas of category-Metro
Service Area % of pre-paid in total subscribers
ARPU
(` per month)
Total usage (from & outside HSA) per subscriber per month
Outgoing SMS
Outgoing MOU
Incoming MOU
Total MOU
Kolkata 94.52 68 14 372 371 742
Delhi 84.12 60 14 452 401 852
Mumbai 79.23 83 11 445 375 819
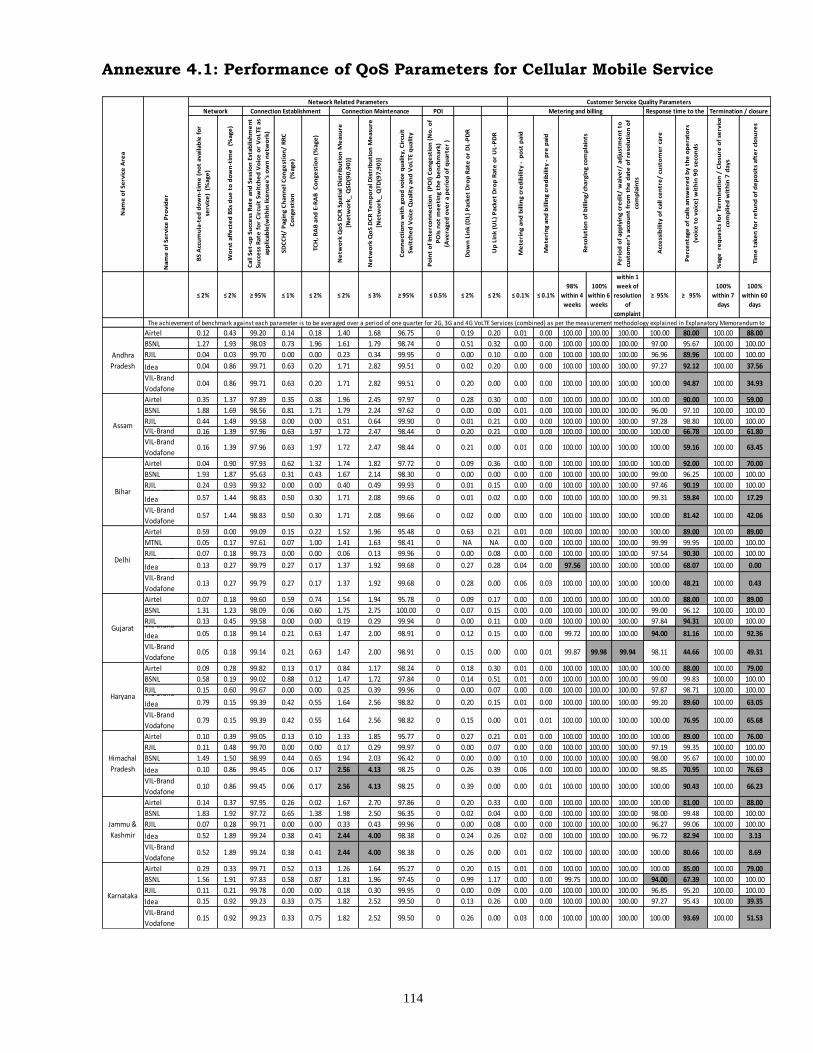
114
Annexure 4.1: Performance of QoS Parameters for Cellular Mobile Service
POI
BS
Acc
um
ula
-te
d d
ow
n-t
ime
(n
ot
av
ail
ab
le f
or
serv
ice
) (
%a
ge
)
Wo
rst
aff
ect
ed
BS
s d
ue
to
do
wn
-tim
e
(%a
ge
)
Ca
ll S
et-
up
Su
cce
ss R
ate
an
d S
ess
ion
Est
ab
lish
me
nt
Su
cce
ss R
ate
fo
r C
ircu
it S
wit
che
d V
oic
e o
r V
oL
TE
as
ap
pli
cab
le(w
ith
in l
ice
nse
e's
ow
n n
etw
ork
)
SD
CC
H/
Pa
gin
g C
ha
nn
el
Co
ng
est
ion
/ R
RC
Co
ng
est
ion
(%
ag
e)
TC
H,
RA
B a
nd
E-R
AB
C
on
ge
stio
n (
%a
ge
)
Ne
two
rk Q
oS
DC
R S
pa
tia
l D
istr
ibu
tio
n M
ea
sure
[Ne
two
rk_
QS
D(9
0,9
0)]
Ne
two
rk Q
oS
DC
R T
em
po
ral
Dis
trib
uti
on
Me
asu
re
[Ne
two
rk_
QT
D(9
7,9
0)]
Co
nn
ect
ion
s w
ith
go
od
vo
ice
qu
ali
ty,
Cir
cuit
Sw
itch
ed
Vo
ice
Qu
ali
ty a
nd
Vo
LT
E q
ua
lity
Po
int
of
Inte
rco
nn
ect
ion
(P
OI)
Co
ng
est
ion
(N
o.
of
PO
Is n
ot
me
eti
ng
th
e b
en
chm
ark
)
(Av
era
ge
d o
ve
r a
pe
rio
d o
f q
ua
rte
r )
Do
wn
Lin
k (
DL
) P
ack
et
Dro
p R
ate
or
DL
-PD
R
Up
Lin
k (
UL
) P
ack
et
Dro
p R
ate
or
UL
-PD
R
Me
teri
ng
an
d b
illi
ng
cre
dib
ilit
y -
p
ost
pa
id
Me
teri
ng
an
d b
illi
ng
cre
dib
ilit
y -
pre
pa
id
Pe
rio
d o
f a
pp
lyin
g c
red
it/
wa
ive
r/ a
dju
stm
en
t to
cust
om
er’
s a
cco
un
t fr
om
th
e d
ate
of
reso
luti
on
of
com
pla
ints
Acc
ess
ibil
ity
of
call
ce
ntr
e/
cu
sto
me
r ca
re
Pe
rce
nta
ge
of
call
s a
nsw
ere
d b
y t
he
op
era
tors
(vo
ice
to
vo
ice
) w
ith
in 9
0 s
eco
nd
s
%a
ge
re
qu
est
s fo
r T
erm
ina
tio
n /
Clo
sure
of
serv
ice
com
pli
ed
wit
hin
7 d
ay
s
Tim
e t
ak
en
fo
r re
fun
d o
f d
ep
osi
ts a
fte
r cl
osu
res
≤ 2% ≤ 2% ≥ 95% ≤ 1% ≤ 2% ≤ 2% ≤ 3% ≥ 95% ≤ 0.5% ≤ 2% ≤ 2% ≤ 0.1% ≤ 0.1%
98%
within 4
weeks
100%
within 6
weeks
within 1
week of
resolution
of
complaint
≥ 95% ≥ 95%
100%
within 7
days
100%
within 60
days
Airtel 0.12 0.43 99.20 0.14 0.18 1.40 1.68 96.75 0 0.19 0.20 0.01 0.00 100.00 100.00 100.00 100.00 80.00 100.00 88.00
BSNL 1.27 1.93 98.03 0.73 1.96 1.61 1.79 98.74 0 0.51 0.32 0.00 0.00 100.00 100.00 100.00 97.00 95.67 100.00 100.00
RJIL 0.04 0.03 99.70 0.00 0.00 0.23 0.34 99.95 0 0.00 0.10 0.00 0.00 100.00 100.00 100.00 96.96 89.96 100.00 100.00VIL-Brand
Idea 0.04 0.86 99.71 0.63 0.20 1.71 2.82 99.51 0 0.02 0.20 0.00 0.00 100.00 100.00 100.00 97.27 92.12 100.00 37.56
VIL-Brand
Vodafone0.04 0.86 99.71 0.63 0.20 1.71 2.82 99.51 0 0.20 0.00 0.00 0.00 100.00 100.00 100.00 100.00 94.87 100.00 34.93
Airtel 0.35 1.37 97.89 0.35 0.38 1.96 2.45 97.97 0 0.28 0.30 0.00 0.00 100.00 100.00 100.00 100.00 90.00 100.00 59.00
BSNL 1.88 1.69 98.56 0.81 1.71 1.79 2.24 97.62 0 0.00 0.00 0.01 0.00 100.00 100.00 100.00 96.00 97.10 100.00 100.00
RJIL 0.44 1.49 99.58 0.00 0.00 0.51 0.64 99.90 0 0.01 0.21 0.00 0.00 100.00 100.00 100.00 97.28 98.80 100.00 100.00VIL-Brand 0.16 1.39 97.96 0.63 1.97 1.72 2.47 98.44 0 0.20 0.21 0.00 0.00 100.00 100.00 100.00 100.00 66.78 100.00 61.80
VIL-Brand
Vodafone0.16 1.39 97.96 0.63 1.97 1.72 2.47 98.44 0 0.21 0.00 0.01 0.00 100.00 100.00 100.00 100.00 59.16 100.00 63.45
Airtel 0.04 0.90 97.93 0.62 1.32 1.74 1.82 97.72 0 0.09 0.36 0.00 0.00 100.00 100.00 100.00 100.00 92.00 100.00 70.00
BSNL 1.93 1.87 95.63 0.31 0.43 1.67 2.14 98.30 0 0.00 0.00 0.00 0.00 100.00 100.00 100.00 99.00 96.25 100.00 100.00
RJIL 0.24 0.93 99.32 0.00 0.00 0.40 0.49 99.93 0 0.01 0.15 0.00 0.00 100.00 100.00 100.00 97.46 90.19 100.00 100.00VIL-Brand
Idea 0.57 1.44 98.83 0.50 0.30 1.71 2.08 99.66 0 0.01 0.02 0.00 0.00 100.00 100.00 100.00 99.31 59.84 100.00 17.29
VIL-Brand
Vodafone0.57 1.44 98.83 0.50 0.30 1.71 2.08 99.66 0 0.02 0.00 0.00 0.00 100.00 100.00 100.00 100.00 81.42 100.00 42.06
Airtel 0.59 0.00 99.09 0.15 0.22 1.52 1.96 95.48 0 0.63 0.21 0.01 0.00 100.00 100.00 100.00 100.00 89.00 100.00 89.00
MTNL 0.05 0.17 97.61 0.07 1.00 1.41 1.63 98.41 0 NA NA 0.00 0.00 100.00 100.00 100.00 99.99 99.95 100.00 100.00
RJIL 0.07 0.18 99.73 0.00 0.00 0.06 0.13 99.96 0 0.00 0.08 0.00 0.00 100.00 100.00 100.00 97.54 90.30 100.00 100.00VIL-Brand
Idea 0.13 0.27 99.79 0.27 0.17 1.37 1.92 99.68 0 0.27 0.28 0.04 0.00 97.56 100.00 100.00 100.00 68.07 100.00 0.00
VIL-Brand
Vodafone0.13 0.27 99.79 0.27 0.17 1.37 1.92 99.68 0 0.28 0.00 0.06 0.03 100.00 100.00 100.00 100.00 48.21 100.00 0.43
Airtel 0.07 0.18 99.60 0.59 0.74 1.54 1.94 95.78 0 0.09 0.17 0.00 0.00 100.00 100.00 100.00 100.00 88.00 100.00 89.00
BSNL 1.31 1.23 98.09 0.06 0.60 1.75 2.75 100.00 0 0.07 0.15 0.00 0.00 100.00 100.00 100.00 99.00 96.12 100.00 100.00
RJIL 0.13 0.45 99.58 0.00 0.00 0.19 0.29 99.94 0 0.00 0.11 0.00 0.00 100.00 100.00 100.00 97.84 94.31 100.00 100.00VIL-Brand
Idea 0.05 0.18 99.14 0.21 0.63 1.47 2.00 98.91 0 0.12 0.15 0.00 0.00 99.72 100.00 100.00 94.00 81.16 100.00 92.36
VIL-Brand
Vodafone0.05 0.18 99.14 0.21 0.63 1.47 2.00 98.91 0 0.15 0.00 0.00 0.01 99.87 99.98 99.94 98.11 44.66 100.00 49.31
Airtel 0.09 0.28 99.82 0.13 0.17 0.84 1.17 98.24 0 0.18 0.30 0.01 0.00 100.00 100.00 100.00 100.00 88.00 100.00 79.00
BSNL 0.58 0.19 99.02 0.88 0.12 1.47 1.72 97.84 0 0.14 0.51 0.01 0.00 100.00 100.00 100.00 99.00 99.83 100.00 100.00
RJIL 0.15 0.60 99.67 0.00 0.00 0.25 0.39 99.96 0 0.00 0.07 0.00 0.00 100.00 100.00 100.00 97.87 98.71 100.00 100.00VIL-Brand
Idea 0.79 0.15 99.39 0.42 0.55 1.64 2.56 98.82 0 0.20 0.15 0.01 0.00 100.00 100.00 100.00 99.20 89.60 100.00 63.05
VIL-Brand
Vodafone0.79 0.15 99.39 0.42 0.55 1.64 2.56 98.82 0 0.15 0.00 0.01 0.01 100.00 100.00 100.00 100.00 76.95 100.00 65.68
Airtel 0.10 0.39 99.05 0.13 0.10 1.33 1.85 95.77 0 0.27 0.21 0.01 0.00 100.00 100.00 100.00 100.00 89.00 100.00 76.00
RJIL 0.11 0.48 99.70 0.00 0.00 0.17 0.29 99.97 0 0.00 0.07 0.00 0.00 100.00 100.00 100.00 97.19 99.35 100.00 100.00
BSNL 1.49 1.50 98.99 0.44 0.65 1.94 2.03 96.42 0 0.00 0.00 0.10 0.00 100.00 100.00 100.00 98.00 95.67 100.00 100.00VIL-Brand
Idea 0.10 0.86 99.45 0.06 0.17 2.56 4.13 98.25 0 0.26 0.39 0.06 0.00 100.00 100.00 100.00 98.85 70.95 100.00 76.63
VIL-Brand
Vodafone0.10 0.86 99.45 0.06 0.17 2.56 4.13 98.25 0 0.39 0.00 0.00 0.01 100.00 100.00 100.00 100.00 90.43 100.00 66.23
Airtel 0.14 0.37 97.95 0.26 0.02 1.67 2.70 97.86 0 0.20 0.33 0.00 0.00 100.00 100.00 100.00 100.00 81.00 100.00 88.00
BSNL 1.83 1.92 97.72 0.65 1.38 1.98 2.50 96.35 0 0.02 0.04 0.00 0.00 100.00 100.00 100.00 98.00 99.48 100.00 100.00
RJIL 0.07 0.28 99.71 0.00 0.00 0.33 0.43 99.96 0 0.00 0.08 0.00 0.00 100.00 100.00 100.00 96.27 99.06 100.00 100.00VIL-Brand
Idea 0.52 1.89 99.24 0.38 0.41 2.44 4.00 98.38 0 0.24 0.26 0.02 0.00 100.00 100.00 100.00 96.72 82.94 100.00 3.13
VIL-Brand
Vodafone0.52 1.89 99.24 0.38 0.41 2.44 4.00 98.38 0 0.26 0.00 0.01 0.02 100.00 100.00 100.00 100.00 80.66 100.00 8.69
Airtel 0.29 0.33 99.71 0.52 0.13 1.26 1.64 95.27 0 0.20 0.15 0.01 0.00 100.00 100.00 100.00 100.00 85.00 100.00 79.00
BSNL 1.56 1.91 97.83 0.58 0.87 1.81 1.96 97.45 0 0.99 1.17 0.00 0.00 99.75 100.00 100.00 94.00 67.39 100.00 100.00
RJIL 0.11 0.21 99.78 0.00 0.00 0.18 0.30 99.95 0 0.00 0.09 0.00 0.00 100.00 100.00 100.00 96.85 95.20 100.00 100.00VIL-Brand
Idea 0.15 0.92 99.23 0.33 0.75 1.82 2.52 99.50 0 0.13 0.26 0.00 0.00 100.00 100.00 100.00 97.27 95.43 100.00 39.35
VIL-Brand
Vodafone0.15 0.92 99.23 0.33 0.75 1.82 2.52 99.50 0 0.26 0.00 0.03 0.00 100.00 100.00 100.00 100.00 93.69 100.00 51.53
Haryana
Himachal
Pradesh
Jammu &
Kashmir
Karnataka
Andhra
Pradesh
Assam
Bihar
Delhi
Gujarat
Termination / closure
Re
solu
tio
n o
f b
illi
ng
/ch
arg
ing
co
mp
lain
ts
The achievement of benchmark against each parameter is to be averaged over a period of one quarter for 2G, 3G and 4G VoLTE Services (combined) as per the measurement methodology explained in Explanatory Memorandum to
Na
me
of
Se
rvic
e A
rea
Na
me
of
Se
rvic
e P
rov
ide
r
Network Related Parameters Customer Servcice Quality Parameters
Network Connection Establishment Connection Maintenance Metering and billing Response time to the

115
Annexure 4.1 (Contd.)
Airtel 0.07 0.18 97.92 0.45 0.51 1.92 2.78 98.98 0 0.16 0.44 0.00 0.00 100.00 100.00 100.00 100.00 81.00 100.00 64.00
BSNL 0.56 1.32 98.82 0.26 1.57 1.92 2.33 98.26 0 0.00 0.00 0.00 0.00 99.00 100.00 100.00 94.00 39.00 100.00 100.00
RJIL 0.06 0.07 99.73 0.00 0.00 0.14 0.42 99.94 0 0.00 0.11 0.00 0.00 100.00 100.00 100.00 97.65 96.77 100.00 100.00VIL-Brand
Idea 0.34 0.03 99.49 0.26 0.44 0.93 1.29 98.46 0 0.07 0.40 0.04 0.00 99.96 100.00 100.00 98.43 90.73 100.00 42.86
VIL-Brand
Vodafone0.95 0.06 99.62 0.17 0.18 0.96 1.45 99.50 0 0.24 0.00 0.03 0.01 100.00 100.00 100.00 100.00 87.39 100.00 66.95
Airtel 1.12 0.00 99.61 0.54 0.54 1.71 2.78 98.35 0 0.42 1.33 0.00 0.00 98.82 100.00 100.00 100.00 91.00 100.00 91.00
BSNL 1.28 1.82 98.20 0.84 0.40 1.55 2.98 96.38 0 0.00 0.00 0.00 0.01 100.00 100.00 100.00 96.00 95.83 100.00 100.00
RJIL 0.06 0.12 99.73 0.00 0.00 0.13 0.26 99.96 0 0.01 0.08 0.00 0.00 100.00 100.00 100.00 97.33 92.26 100.00 100.00VIL-Brand
Idea 0.27 1.78 98.19 0.28 0.89 1.35 2.49 98.06 0 0.09 0.18 0.01 0.00 100.00 100.00 100.00 97.71 83.03 100.00 21.17
VIL-Brand
Vodafone0.27 1.78 98.19 0.28 0.89 1.35 2.49 98.06 0 0.18 0.00 0.02 0.00 100.00 100.00 100.00 100.00 50.06 100.00 41.39
Airtel 0.09 0.17 99.13 0.32 0.40 1.94 2.30 95.84 0 0.09 0.16 0.01 0.00 100.00 100.00 100.00 100.00 91.00 100.00 81.00
RJIL 0.27 1.25 99.66 0.00 0.00 0.35 0.45 99.92 0 0.01 0.17 0.00 0.00 100.00 100.00 100.00 98.01 90.43 100.00 100.00
BSNL 1.23 1.41 98.71 0.32 1.10 1.89 2.13 98.21 0 0.00 0.00 0.00 0.00 100.00 100.00 100.00 99.00 99.42 100.00 100.00VIL-Brand
Idea 0.43 1.82 98.14 0.69 1.25 1.74 2.33 97.72 0 0.24 0.31 0.02 0.03 100.00 100.00 100.00 96.64 83.37 100.00 39.47
VIL-Brand
Vodafone0.43 1.82 98.14 0.69 1.25 1.74 2.33 97.72 0 0.31 0.00 0.04 0.01 100.00 100.00 100.00 100.00 83.29 100.00 40.43
Airtel 0.04 0.05 99.41 0.17 0.35 1.20 1.49 95.25 0 0.12 0.18 0.01 0.00 100.00 100.00 100.00 100.00 90.00 100.00 87.00
BSNL 1.68 1.95 96.98 0.79 1.28 1.94 2.65 96.25 0 0.06 0.08 0.01 0.00 100.00 100.00 100.00 100.00 95.08 100.00 100.00
RJIL 0.35 1.48 99.66 0.00 0.00 0.28 0.40 99.92 0 0.00 0.17 0.00 0.00 100.00 100.00 100.00 98.10 95.56 100.00 100.00VIL-Brand
Idea 0.47 1.95 96.59 0.91 1.89 1.75 2.95 98.45 0 0.40 0.26 0.02 0.00 99.95 100.00 100.00 98.56 89.71 100.00 70.87
VIL-Brand
Vodafone0.49 0.98 98.21 0.93 1.60 1.76 2.96 98.93 0 0.37 0.00 0.04 0.01 100.00 100.00 100.00 100.00 83.21 100.00 0.00
Airtel 0.13 0.58 98.49 0.13 0.38 1.49 1.81 95.36 0 0.12 0.17 0.00 0.00 100.00 100.00 100.00 100.00 89.00 100.00 89.00
MTNL 0.50 1.03 98.52 0.17 0.16 1.71 2.49 98.74 0 NA NA 0.00 0.01 100.00 100.00 100.00 100.00 99.35 100.00 100.00
RJIL 0.17 0.78 99.65 0.00 0.00 0.10 0.18 99.96 0 0.00 0.09 0.00 0.00 100.00 100.00 100.00 97.72 91.38 100.00 100.00VIL-Brand
Idea 0.15 0.38 99.15 0.05 0.34 1.69 2.65 97.26 0 0.17 0.32 0.00 0.00 100.00 100.00 100.00 96.94 94.18 100.00 0.13
VIL-Brand
Vodafone0.14 0.42 99.28 0.63 0.62 1.82 2.50 98.81 0 0.27 0.00 0.02 0.01 100.00 100.00 100.00 100.00 86.74 100.00 21.53
Airtel 0.70 1.53 98.02 0.53 0.37 1.95 2.27 97.79 0 0.34 0.31 0.01 0.00 100.00 100.00 100.00 100.00 86.00 100.00 50.00
BSNL 1.98 1.92 98.33 0.84 0.85 1.79 1.88 96.00 0 0.00 0.00 0.05 0.05 100.00 100.00 100.00 96.00 95.61 100.00 100.00
RJIL 1.10 1.72 99.55 0.00 0.00 0.69 0.94 99.92 0 0.01 0.16 0.00 0.00 100.00 100.00 100.00 97.26 99.17 100.00 100.00VIL-Brand
Idea 0.33 0.92 99.23 0.56 1.30 1.77 2.17 98.22 0 0.39 0.22 0.00 0.00 100.00 100.00 100.00 100.00 68.07 100.00 37.50
VIL-Brand
Vodafone0.33 0.92 99.23 0.56 1.30 1.77 2.17 98.22 0 0.22 0.00 0.00 0.00 100.00 100.00 100.00 100.00 59.00 100.00 46.95
Airtel 0.24 0.26 98.14 0.38 1.16 1.70 1.82 98.28 0 0.15 0.22 0.00 0.00 100.00 100.00 100.00 100.00 90.00 100.00 90.00
BSNL 0.84 1.95 98.15 0.66 1.15 1.98 2.68 97.00 0 0.00 0.00 0.00 0.01 100.00 100.00 100.00 95.00 96.71 100.00 100.00
RJIL 0.23 0.92 99.56 0.00 0.00 0.27 0.38 99.93 0 0.00 0.14 0.00 0.00 100.00 100.00 100.00 97.07 93.89 100.00 100.00VIL-Brand
Idea 0.37 1.42 99.57 0.25 0.40 1.75 2.40 98.74 0 0.14 0.20 0.02 0.01 100.00 100.00 100.00 97.24 58.90 100.00 76.13
VIL-Brand
Vodafone0.37 1.42 99.57 0.25 0.40 1.75 2.40 98.74 0 0.20 0.00 0.02 0.01 100.00 100.00 100.00 99.53 73.06 100.00 55.92
Airtel 0.06 0.15 99.79 0.11 0.12 0.50 0.65 98.86 0 0.12 0.38 0.01 0.00 100.00 100.00 100.00 100.00 88.00 100.00 85.00
BSNL 0.24 1.41 98.66 0.23 0.21 1.67 1.87 97.81 0 0.00 0.02 0.00 0.00 100.00 100.00 100.00 99.00 55.23 100.00 100.00
RJIL 0.08 0.26 99.63 0.00 0.00 0.10 0.18 99.97 0 0.00 0.07 0.00 0.00 100.00 100.00 100.00 97.65 93.26 100.00 100.00VIL-Brand
Idea 0.07 0.28 99.77 0.21 0.05 0.88 1.47 99.33 0 0.17 0.33 0.01 0.00 100.00 100.00 100.00 99.88 87.49 100.00 50.47
VIL-Brand
Vodafone0.07 0.28 99.77 0.21 0.05 0.88 1.47 99.33 0 0.33 0.00 0.01 0.01 100.00 100.00 100.00 100.00 87.99 100.00 61.26
Airtel 0.29 1.55 99.04 0.18 0.34 1.56 1.85 95.50 0 0.23 0.25 0.00 0.00 100.00 100.00 100.00 100.00 92.00 100.00 82.00
BSNL 1.13 1.55 98.48 0.75 1.52 1.82 2.38 98.41 0 0.00 0.00 0.02 0.00 100.00 100.00 100.00 95.00 99.80 100.00 100.00
RJIL 0.08 0.25 99.68 0.00 0.00 0.27 0.36 99.95 0 0.00 0.09 0.00 0.00 100.00 100.00 100.00 97.18 90.13 100.00 100.00VIL-Brand
Idea 0.25 1.66 99.35 0.41 0.46 1.96 2.86 99.09 0 0.16 0.25 0.01 0.00 100.00 100.00 100.00 95.37 79.25 100.00 0.00
VIL-Brand
Vodafone0.25 1.66 99.35 0.41 0.46 1.96 2.86 99.09 0 0.25 0.00 0.01 0.01 100.00 100.00 100.00 100.00 46.31 100.00 12.25
Airtel 0.04 0.09 99.74 0.27 0.29 1.11 1.54 97.63 0 0.17 0.17 0.01 0.00 100.00 100.00 100.00 100.00 62.00 100.00 77.00
BSNL 0.70 1.30 98.54 0.52 0.95 1.87 2.93 97.81 0 0.00 0.00 0.00 0.00 100.00 100.00 100.00 100.00 58.81 100.00 100.00
RJIL 0.02 0.01 99.70 0.00 0.00 0.15 0.26 99.96 0 0.00 0.08 0.00 0.00 100.00 100.00 100.00 97.38 94.08 100.00 100.00VIL-Brand
Idea 0.13 0.42 99.93 0.07 0.07 0.98 1.82 99.45 0 0.08 0.22 0.01 0.00 100.00 100.00 100.00 95.97 95.34 100.00 27.17
VIL-Brand
Vodafone0.16 0.76 98.54 0.78 1.37 1.45 2.00 98.92 0 0.16 0.00 0.06 0.00 100.00 100.00 100.00 100.00 75.72 100.00 34.24
Airtel 0.49 1.54 97.88 0.30 0.79 1.59 1.96 97.43 0 0.57 0.94 0.01 0.00 100.00 100.00 100.00 100.00 91.00 100.00 77.00
BSNL 1.35 1.53 97.42 0.95 0.82 1.75 2.17 98.65 0 0.00 0.01 0.09 0.09 98.26 100.00 100.00 98.00 43.04 100.00 100.00
RJIL 0.45 1.75 99.03 0.00 0.00 0.39 0.50 99.92 0 0.01 0.17 0.00 0.00 100.00 100.00 100.00 97.88 90.32 100.00 100.00VIL-Brand
Idea 0.29 1.15 96.56 0.85 1.97 1.92 2.91 98.53 0 0.11 0.22 0.01 0.00 100.00 100.00 100.00 99.32 85.11 100.00 30.43
VIL-Brand
Vodafone0.29 1.15 96.56 0.85 1.97 1.92 2.91 98.53 0 0.22 0.00 0.02 0.03 100.00 100.00 100.00 100.00 68.78 100.00 21.15
Airtel 0.40 0.62 99.85 0.16 0.17 1.64 2.13 95.07 0 0.17 0.16 0.01 0.00 100.00 100.00 100.00 100.00 91.00 100.00 86.00
BSNL 1.79 1.83 97.50 0.78 1.11 1.76 2.01 96.81 0 0.00 0.00 0.00 0.00 100.00 100.00 100.00 98.00 45.52 100.00 100.00
RJIL 0.18 0.86 99.36 0.00 0.00 0.35 0.45 99.94 0 0.00 0.11 0.00 0.00 100.00 100.00 100.00 98.10 89.49 100.00 100.00VIL-Brand
Idea 0.23 1.45 96.54 0.81 2.25 1.94 3.06 97.89 0 0.10 0.22 0.00 0.00 100.00 100.00 100.00 98.50 88.03 99.88 26.71
VIL-Brand
Vodafone0.23 1.45 96.54 0.81 2.25 1.94 3.06 97.89 0 0.22 0.00 0.03 0.04 100.00 100.00 100.00 100.00 84.68 100.00 25.86
Airtel 0.34 1.49 99.49 0.74 1.12 1.92 2.99 96.86 0 0.29 0.38 0.00 0.00 100.00 100.00 100.00 100.00 85.00 100.00 89.00
BSNL 0.33 0.88 97.61 0.99 1.44 8.57 10.71 97.32 0 0.15 0.85 0.02 0.02 100.00 100.00 100.00 95.00 96.00 100.00 100.00
RJIL 0.24 0.87 99.42 0.00 0.00 0.55 0.71 99.92 0 0.01 0.17 0.00 0.00 100.00 100.00 100.00 97.46 90.18 100.00 100.00VIL-Brand
Idea 0.20 1.38 98.99 0.17 0.30 1.72 2.83 97.40 0 0.09 0.17 0.00 0.00 100.00 100.00 100.00 97.81 86.64 100.00 15.22
VIL-Brand
Vodafone0.20 1.38 98.99 0.17 0.30 1.72 2.83 97.40 0 0.17 0.00 0.02 0.00 100.00 100.00 100.00 100.00 53.77 100.00 42.49
Uttar
Pradesh
(West)
West Bengal
Note VIL-Brand Idea & VIL-Brand Vodafone (Network related parameters): The highlighted circles are those circles (i.e Andhra Pradesh, Assam, Bihar, Delhi,Gujarat, Haryana, Himachal Pradesh,
Jammu&Kashmir, Kolkata, Karnataka, Madhya Pradesh, North East, Orissa, Punjab, Rajasthan,UPE,UPW and West Bengal) where radio level integration has been completed and performance have been
Odisha
Punjab
Rajasthan
Tamil Nadu
Uttar
Pradesh
(East)
Kolkata
Madhya
Pradesh
Maharashtra
Mumbai
North East
Kerala

116
Annexure 4.2 : Performance of QoS Parameters for Basic (Wire-line) Service
POI
% o
f fa
ult
s r
ep
air
ed
by
ne
xt
wo
rkin
g d
ay
% o
f fa
ult
s r
ep
air
ed
wit
hin
5
da
ys
% o
f fa
ult
s r
ep
air
ed
by
ne
xt
wo
rkin
g d
ay
% o
f fa
ult
s r
ep
air
ed
wit
hin
7
da
ys
Po
int
of
Inte
rco
nn
ec
tio
n (
PO
I)
Co
ng
es
tio
n (
No
. of
PO
Is n
ot
me
eti
ng
th
e b
en
ch
ma
rk
Me
teri
ng
an
d B
illin
gc
red
ibili
ty
- p
os
t p
aid
Me
teri
ng
an
d b
illin
g
cre
dib
ility
- p
re p
aid
Pe
rio
d o
f a
pp
lyin
g c
red
it/
wa
ive
r/ a
dju
stm
en
t to
cu
sto
me
r’s
ac
co
un
t fr
om
th
e
da
te o
f re
so
luti
on
of
co
mp
lain
ts
Ac
ce
ss
ibili
ty o
f c
all
ce
ntr
e/
cu
sto
me
r c
are
Pe
rce
nta
ge
of
ca
lls
an
sw
ere
d b
y t
he
op
era
tors
(vo
ice
to
vo
ice
) w
ith
in 9
0
se
co
nd
s
%a
ge
re
qu
es
ts f
or
Te
rmin
ati
on
/ C
los
ure
of
se
rvic
e c
om
plie
d w
ith
in 7
da
ys
Tim
e t
ak
en
fo
r re
fun
d o
f
de
po
sit
s a
fte
r c
los
ure
s
≤7 For urban
areas by
next working
day:
≥85%
For urban
areas:
≥ 100%
For rural
and hilly
areas:
≥ 75%
For rural
and hilly
areas:
≥ 100%
≤ 10 Hrs ≤0.5% ≤0.1% ≤0.1% 98% within
4 weeks
100%
within 6
weeks
1 week of
resolution of
complaint
≥95% ≥95% 100% within
7 days
100% within
60 days
1 Bharti Airtel0.43 87.24% 100.00% NA NA 340 4.91 0.00% 0.00% NA 100.00% 100.00% 100.00% 100.00% 52.00% 100.00% 89.00%
2 BSNL 3 97.00% 100.00% 96.00% 100.00% 18 6 0.00% 0.01% 0.00% 100.00% 100.00% 100.00% 80.29% 87.13% 100.00% 100.00%
3 RJIL0.00 100.00% 100.00% 100.00% 100.00% NA NA 0.00% 0.00% 0.00% NA NA NA 96.00% 97.00% 100.00% 100.00%
4 TTSL1.84 82.51% 100.00% NA NA 15 12.69 0.32% 0.00% NA 100.00% 100.00% 100.00% 97.59% 97.59% 100.00% 100.00%
5 VIL0.18 100.00% 100.00% NA NA NA 2.43 NA NA NA NA NA NA 100.00% 100.00% 100.00% NA
6 BSNL 3 86.00% 100.00% 75.00% 100.00% 961 4 0.00% 0.01% 0.00% 100.00% 100.00% 100.00% 85.76% 97.67% 100.00% 100.00%
7 RJIL0.00 100.00% 100.00% 100.00% 100.00% NA NA 0.00% 0.00% 0.00% NA NA NA 100.00% 100.00% 100.00% 100.00%
8 VIL1.31 100.00% 100.00% NA NA NA 7 NA NA NA NA NA NA 100.00% 100.00% 100.00% NA
9 BSNL 4 95.00% 100.00% 95.00% 100.00% 43 6 0.00% 0.09% 0.00% 98.00% 100.00% 100.00% 86.90% 98.67% 100.00% 100.00%
10 RJIL0.00 100.00% 100.00% 100.00% 100.00% NA NA 0.00% 0.00% 0.00% NA NA NA 100.00% 96.00% 100.00% 100.00%
11 TTSL0.14 100.00% 100.00% NA NA 0 1.60 0.00% NA NA NA NA NA 98.41% 98.41% 100.00% 100.00%
12 VIL1.88 100.00% 100.00% NA NA NA 6.4 NA NA NA NA NA NA 100.00% 100.00% 100.00% NA
13 Bharti Airtel0.71 91.24% 100.00% NA NA 357 5.27 0.00% 0.00% NA 100.00% 100.00% 100.00% 100.00% 56.00% 100.00% 79.00%
14 MTNL 2.91 66.80% 88.49% NA NA 884 17.03 0.00% 0.01% 0.00% 99.89% 100.00% 100.00% 95.00% 95.00% 100.00 100.00%
15 RJIL 0.00 100.00% 100.00% 100.00% 100.00% NA 0.5 0.00% 0.00% 0.00% NA NA NA 96.00% 98.00% 100.00% 100.00%
16 TTSL 0.26 73.21% 100.00% NA NA 6 17.27 0.22% NA NA NA NA NA 96.75% 96.75% 100.00% 100.00%
17 VIL 0.61 100.00% 100.00% NA NA NA 2.46 NA NA NA NA NA NA 100.00% 100.00% 100.00% NA
18 Bharti Airtel0.56 92.07% 100.00% NA NA 57 5.91 0.00% 0.00% NA 100.00% 100.00% 100.00% 100.00% 54.00% 100.00% 100.00%
19 BSNL 4 95.00% 100.00% 93.00% 100.00% 119 5 0.00% 0.01% 0.00% 100.00% 100.00% 100.00% 17.98% 33.75% 100.00% 100.00%
20 RJIL 0.00 100.00% 100.00% 100.00% 100.00% NA NA 0.00% 0.04% 0.00% NA NA NA 100.00% 100.00% 100.00% 100.00%
21 TTSL 0.61 77.72% 100.00% NA NA 22 13.35 0.00% 0.00% NA 100.00% 100.00% 100.00% 99.08% 99.08% 100.00% 100.00%
22 VIL 0.16 100.00% 100.00% NA NA NA 4.22 NA NA NA NA NA NA 100.00% 100.00% 100.00% NA
23 BSNL 4 90.00% 100.00% 93.00% 100.00% 221 6 0.00% 0.04% 0.00% 98.00% 100.00% 100.00% 97.32% 61.00% 100.00% 100.00%
24 RJIL 0.00 100.00% 100.00% 100.00% 100.00% NA NA 0.00% 0.05% 0.00% NA NA NA 100.00% 100.00% 100.00% 100.00%
25 VIL 0.00 100.00% 100.00% NA NA NA 0.00 NA NA NA NA NA NA 100.00% 100.00% NA NA
Sl. No. Name of
Service Area
Name of
Service
Provider
Fa
ult
s in
cid
en
ce
s (
No
. of
fau
lts
/ 10
0
Su
bs
./ m
on
th)
Fault Repair
Rent
Rebate
Mean
Time to
Repair
(MTTR)
Metering and BillingResponse time to the
customer for Assistance
Termination / Closure of
service
Re
so
luti
on
of
bill
ing
/
ch
arg
ing
/ va
lidit
y c
om
pla
ints
Benchmarks
Andhra
Pradesh
Assam
Bihar
Delhi
Gujarat
Himachal
Pradesh

117
Annexure 4.2 (Contd.)
26 Bharti Airtel1.29 89.48% 100.00% NA NA 4.71 4.71 0.00% 0.00% NA 100.00% 100.00% 100.00% 100.00% 59.00% 100.00% 82.00%
27 BSNL 5 90.00% 100.00% 89.00% 100.00% 1572 5 0.00% 0.33% 0.00% 100.00% 100.00% 100.00% 98.14% 62.00% 100.00% 100.00%
28 RJIL 0.00 100.00% 100.00% 100.00% 100.00% NA NA 0.00% 0.00% 0.00% NA NA NA 100.00% 100.00% 100.00% 100.00%
29 TTSL 0.00 NA NA NA NA 0 NA 0.00% NA NA NA NA NA 100.00% 100.00% 100.00% 100.00%
30 VIL 6.39 100.00% 100.00% NA NA NA 1.27 NA NA NA NA NA NA 100.00% 100.00% NA NA
31 BSNL 4 97.00% 100.00% 95.00% 100.00% 81 7 0.00% 0.01% 0.00% 98.00% 100.00% 100.00% 95.88% 56.33% 100.00% 100.00%
32 RJIL 0.00 100.00% 100.00% 100.00% 100.00% NA NA 0.00% 0.00% 0.00% NA NA NA 95.00% 100.00% 100.00% 100.00%
33 Bharti Airtel1.76 90.05% 100.00% NA NA 169 9.21 0.00% 0.00% NA 100.00% 100.00% 100.00% 100.00% 54.00% 100.00% 83.00%
34 BSNL 4 95.00% 100.00% 89.00% 100.00% 1080 7 0.00% 0.05% 0.00% 100.00% 100.00% 100.00% 85.75% 90.91% 100.00% 100.00%
35 RJIL 0.00 100.00% 100.00% 100.00% 100.00% NA NA 0.00% 0.00% 0.00% NA NA NA 100% 100.00% 100.00% 100.00%
36 TTSL 0.04 100.00% 100.00% NA NA 0 7.80 0.00% NA NA NA NA NA 100.00% 100.00% 100.00% 100.00%
37 VIL 0.42 100.00% 100.00% NA NA NA 4.37 NA NA NA NA NA NA 100.00% 100.00% 100.00% NA
38 Bharti Airtel0.80 90.54% 100.00% NA NA 3840 9.81 0.00% 0.00% NA 100.00% 100.00% 100.00% 100.00% 46.00% 100.00% 94.00%
39 BSNL 6 92.00% 100.00% NA NA 390 8 0.00% 0.00% 0.00% 98.00% 100.00% 100.00% 64.33% 98.33% 100.00% 100.00%
40 RJIL 0.00 100.00% 100.00% 100.00% 100.00% NA NA 0.00% 0.00% 0.00% NA NA NA 96.00% 97.00% 100.00% 100.00%
41 VIL 0.76 100.00% 100.00% NA NA NA 3.43 NA NA NA NA NA NA 100.00% 100.00% 100.00% NA
42 Bharti Airtel0.73 85.00% 100.00% NA NA 1925 6.08 0.00% 0.00% NA 100.00% 100.00% 100.00% 100.00% 63.00% 100.00% 84.00%
43 BSNL 4 99.00% 100.00% 99.00% 100.00% 2660 7 0.00% 0.09% 0.00% 98.00% 100.00% 100.00% 72.15% 79.86% 100.00% 100.00%
44 RJIL 0.00 100.00% 100.00% 100.00% 100.00% NA NA 0.00% 0.00% 0.00% NA NA NA 97.00% 95.00% 100.00% 100.00%
45 TTSL 0.08 73.44% 100.00% NA NA 4 17.42 0.38% NA NA NA NA NA 97.50% 97.50% 100.00% 100.00%
46 VIL 0.47 100.00% 100.00% NA NA NA 2.46 NA NA NA NA NA NA 100.00% 100.00% 100.00% NA
47 Bharti Airtel0.31 88.93% 100.00% NA NA 133 7.60 0.00% 0.00% NA 100.00% 100.00% 100.00% 100.00% 53.00% 100.00% 100.00%
48 BSNL 5 92.00% 100.00% 79.00% 100.00% 774 7 0.00% 0.01% 0.00% 100.00% 100.00% 100.00% 18.88% 53.79% 100.00% 100.00%
49 RJIL 0.00 100.00% 100.00% 100.00% 100.00% NA NA 0.00% 0.00% 0.00% NA NA NA 100.00% 96.00% 100.00% 100.00%
50 TTSL 0.30 73.24% 100.00% NA NA 71 16.42 0.08% NA NA NA NA NA 97.47% 97.47% 100.00% 100.00%
51 VIL 0.44 100.00% 100.00% NA NA NA 6.4 NA NA NA NA NA NA 100.00% 100.00% 100.00% NA
52 Bharti Airtel1.46 86.47% 100.00% NA NA 331 3.91 0.00% 0.00% NA 100.00% 100.00% 100.00% 100.00% 56.00% 100.00% 87.00%
53 BSNL 6 89.00% 100.00% 88.00% 100.00% 574 4 0.00% 0.06% 0.00% 100.00% 100.00% 100.00% 7.05% 2.42% 100.00% 100.00%
54 RJIL 0.00 100.00% 100.00% 100.00% 100.00% 0 0.9 0.00% 0.00% 0.00% NA NA NA 96.00% 100.00% 100.00% 100.00%
55 TTSL 1.51 100.00% 100.00% NA NA 0 3.05 0.00% NA NA NA NA NA 100.00% 100.00% 100.00% 100.00%
56 VIL 0.66 100.00% 100.00% NA NA NA 6.44 NA NA NA NA NA NA 100.00% 100.00% 100.00% NA
57 Bharti Airtel0.17 88.87% 100.00% NA NA 258 8.07 0.00% 0.00% NA 100.00% 100.00% 100.00% 100.00% 56.00% 100.00% 100.00%
58 MTNL 1 46.70% 69.20% NA NA 80,672 45.44 0.16% 0.05% NA 99.47% 100.00% 100.00% 99.37% 80.81% 89.11% 13.55%
59 RJIL 0.00 100.00% 100.00% 100.00% 100.00% NA NA 0.00% 0.00% 0.00% NA NA NA 95.00% 96.00% 100.00% 100.00%
60 TTSL 0.30 53.80% 100.00% NA NA 166 27.90 0.36% 0.00% NA 100.00% 100.00% 100.00% 98.20% 98.20% 100.00% 100.00%
61 VIL 0.25 100.00% 100.00% NA NA NA 3.4 NA NA NA NA NA NA 100.00% 100.00% 100.00% NA
Kerala
Haryana
Jammu &
Kashmir
Kolkata
Karnataka
Maharashtra
Madhya
Pradesh
Mumbai

118
Annexure 4.2 (Contd.)
62 BSNL 3 94.00% 100.00% 91.00% 100.00% 55 6 0.00% 0.01% 0.00% 99.00% 100.00% 100.00% 77.50% 96.67% 100.00% 100.00%
63 RJIL 0.00 100.00% 100.00% 100.00% 100.00% NA NA 0.00% 0.00% 0.00% NA NA NA 100.00% 100.00% 100.00% 100.00%
64 VIL 0.00 100.00% 100.00% NA NA NA 0.00 NA NA NA NA NA NA 100.00% 100.00% NA NA
65 BSNL 5 95.00% 100.00% 85.00% 100.00% 607 5 0.00% 0.09% 0.00% 99.00% 100.00% 100.00% 78.26% 98.33% 100.00% 100.00%
66 RJIL 0.00 100.00% 100.00% 100.00% 100.00% NA NA 0.00% 0.00% 0.00% NA NA NA 100.00% 100.00% 100.00% 100.00%
67 TTSL 2.38 95.38% 100.00% NA NA 1 3.62 0.00% NA NA NA NA NA 100.00% 100.00% 100.00% 100.00%
68 VIL 0.24 100.00% 100.00% NA NA NA 0.27 NA NA NA NA NA NA 100.00% 100.00% 100.00% NA
69 Bharti Airtel1.15 85.51% 100.00% NA NA 374 5.38 0.00% 0.00% NA 100.00% 100.00% 100.00% 100.00% 57.00% 100.00% 81.00%
70 BSNL 5 87.00% 100.00% 85.00% 100.00% 105 6 0.00% 0.01% 0.00% 98.00% 100.00% 100.00% 98.00% 60.00% 100.00% 100.00%
71 Quadrant 5.2 90.00% 100.00% 100.00% 100.00% 0 7.72 0.00% 0.00% 0.00% 100.00% 100.00% 100.00% 96.08% 95.20% 100.00% 100.00%
72 RJIL 0.00 100.00% 100.00% 100.00% 100.00% NA NA 0.00% 0.00% 0.00% NA NA NA 100.00% 97.00% 100.00% 100.00%
73 TTSL 0.24 100.00% 100.00% NA NA 0 0.67 0.00% NA NA NA NA NA 99.31% 99.31% 100.00% 100.00%
74 VIL 0.21 100.00% 100.00% NA NA NA 0.8 NA NA NA NA NA NA 100.00% 100.00% 100.00% NA
75 Bharti Airtel0.93 85.46% 100.00% NA NA 55 5.22 0.00% 0.00% NA 100.00% 100.00% 100.00% 100.00% 55.00% 100.00% 95.00%
76 BSNL 5 95.00% 100.00% 95.00% 100.00% 335 6 0.00% 0.00% 0.00% 100.00% 100.00% 100.00% 98.08% 60.33% 100.00% 100.00%
77 RJIL 0.00 100.00% 100.00% 100.00% 100.00% NA NA 0.00% 0.00% 0.00% NA NA NA 95.00% 96.00% 100.00% 100.00%
78 TTSL 0.35 100.00% 100.00% NA NA 0 2.36 0.00% NA NA NA NA NA 100.00% 100.00% 100.00% 100.00%
79 VIL 0.25 100.00% 100.00% NA NA NA 4.16 NA NA NA NA NA NA 100.00% 100.00% 100.00% NA
80 Bharti Airtel1.14 90.24% 100.00% NA NA 2295 9.79 0.00% 0.00% NA 100.00% 100.00% 100.00% 100.00% 59.00% 100.00% 77.00%
81 BSNL 4 89.00% 100.00% 84.00% 100.00% 1462 6 0.00% 0.09% 0.00% 100.00% 100.00% 100.00% 69.50% 64.44% 100.00% 100.00%
82 RJIL 0.00 100.00% 100.00% 100.00% 100.00% 0 NA 0.00% 0.00% 0.00% NA NA NA 96.00% 96.00% 100.00% 100.00%
83 TTSL 0.01 50.00% 100.00% NA NA 1 32.33 0.02% NA NA NA NA NA 96.90% 96.90% 100.00% 100.00%
84 VIL 0.27 100.00% 100.00% NA NA NA 4.49 NA NA NA NA NA NA 100.00% 100.00% 100.00% NA
85 Bharti Airtel0.91 91.91% 100.00% NA NA 24 4.35 0.00% 0.00% NA 100.00% 100.00% 100.00% 100.00% 57.00% 100.00% 80.00%
86 BSNL 3 93.00% 100.00% 90.00% 100.00% 1050 4 0.00% 0.09% 0.00% 100.00% 100.00% 100.00% 97.44% 62.33% 100.00% 100.00%
87 RJIL 0.00 100.00% 100.00% 100.00% 100.00% NA NA 0.00% 0.00% 0.00% NA NA NA 95.00% 98.00% 100.00% 100.00%
88 TTSL 1.06 100.00% 100.00% NA NA 0 1.83 0.00% NA NA NA NA NA 100.00% 100.00% 100.00% 100.00%
89 VIL 0.31 100.00% 100.00% NA NA NA 4.12 NA NA NA NA NA NA 100.00% 100.00% 100.00% NA
90 Bharti Airtel0.97 89.50% 100.00% NA NA 11 4.92 0.00% 0.00% NA 100.00% 100.00% 100.00% 100.00% 59.00% 100.00% 83.00%
91 BSNL 6 88.00% 100.00% 87.00% 100.00% 531 6 0.00% 0.09% 0.00% 99.00% 100.00% 100.00% 96.14% 60.67% 100.00% 100.00%
92 RJIL 0.00 100.00% 100.00% 100.00% 100.00% NA NA 0.00% 0.00% 0.00% NA NA NA 95.00% 97.00% 100.00% 100.00%
93 TTSL 0.30 100.00% 100.00% NA NA 0 3.59 0.00% NA NA NA NA NA 100.00% 100.00% 100.00% 100.00%
94 VIL 0.93 100.00% 100.00% NA NA NA 3.58 NA NA NA NA NA NA 100.00% 100.00% NA NA
95 BSNL 3 88.00% 100.00% 94.00% 100.00% 400 6 0.00% 0.00% 0.00% 99.00% 100.00% 100.00% 71.51% 97.33% 100.00% 100.00%
96 RJIL 0.00 100.00% 100.00% 100.00% 100.00% NA NA 0.00% 0.00% 0.00% NA NA NA 100.00% 100.00% 100.00% 100.00%
97 TTSL 0.13 84.62% 100.00% NA NA 7 12.50 0.00% NA NA NA NA NA 98.73% 98.73% 100.00% 100.00%
98 VIL 1.39 100.00% 100.00% NA NA NA 3.51 NA NA NA NA NA NA 100.00% 100.00% NA NA
North East
Note: NA means Not applicable
West Bengal
Odisha
Punjab
Rajasthan
Tamilnadu
UPE
UPW

119
Annexure 4.3: Quality of Service Performance of Broadband (wireline) Service Providers Service
Provisioning
Packet
Loss
%age of
connections
provided within
15 days of
registration of
demand
% of faults
repaired by
next working
day (>90%)
% of faults
repaired
within 3
working day
Rent
Rebate
%age of
bills
disputed
%age of
billing
complaints
resolved
within 4
weeks
%age of
cases to
whom
refund of
deposits is
made within
%age of calls
answered by
operator
(Voice to
voice) within
60 sec
%age of calls
answered by
operator
(Voice to
voice) within
90 sec
No. of Intra
network
links having
Bandwidth
utilisation
>90%
No. of
Upstream
links for
International
connectivity
having
%
International
bandwidth
utilization
during peak
hours (TCBH)
Broadband
Connection
Speed available
(download) from
ISP node to
user
Packet loss
(for wired
broadband
access) in
%age
User
reference
point at
POP/ISP
Gateway
node to
User
reference
point at ISP
Gateway
node to
International
User
reference
point at ISP
Gateway
node to
International
100% >90% =>99% in nos. <2% 100% 100% >60% >80% 0 0 <90% >80% >98% <1% <120 ms <350 ms <800 ms
1 Bharat Sanchar Nigam Ltd.(BSNL) All India 100.00% 93.46% 99.69% 2407 0.06% 100.00% 100.00% 64.46% 63.91% NA 0 77.50% 91.89% 99.69% 0.80% 22 174 NA2 Mahanagar Telephone Nigam Ltd. Delhi & Mumbai 83.75% 63.71% 78.11% 48069 0.01% 100.00% 53.69% 83.64% 90.31% Nil 0 85.49% 89.96% 99.68% 0.52% 44 301 NA
3 Airlink Communications Pvt. Ltd. All India 100.00% 90.77% 99.99% 0 NA 100.00% NA 93.28% 100.00% 0 0 87.68% 97.39% 98.78% 0.47% 120 350 NA
Maharashtra 1.00% 91.00% 100.00% 0 0 0.00% 0.00% 100.00% 100.00% 0 0 6.00% 100.00% 100.00% 0.45% 5 255 NA
Mumbai 100.00% 90.00% 100.00% 0 0 0.00% 0.00% 100.00% 100.00% 0 0 32.00% 100.00% 100.00% 0.52% 5 250 NA
5 Alliance Broadband Services Pvt. Ltd. All India 100.00% 92.37% 100.00% Nil 0.00% 100.00% Nil 83.33% 100.00% 0 0 73.49% 98.19% 99.45% 0.00% 67 208 200
6 ANI Network Pvt. Ltd. Delhi 100.00% 92.00% 100.00% 0 0.00% 0.00% 0.00% 99.00% 100.00% 0 0 89.00% 100.00% 99.90% 0.40% 20 288 NA
7 Asianet Satellite Communications All India 100.00% 90.42% 99.58% Nil 1.81% 100.00% 100.00% 60.53% 80.52% Nil 0 69.47% 90.00% 99.50% 1.00% 50 270 NA
8 Atria Convergence Technologies Pvt.
Ltd.
All India 100.00% 93.01% 98.43% 31345 0.97% 100.00% Nil 27.00% 30.00% 0 0 49.00% 90.00% 99.85% 1.00% 39 208 NA
Andhra Pradesh 100.00% 91.79% 99.40% 1223 0.18% 100.00% 100.00% 50.00% 57.00% 0% 0% 38.00% 100.00% 99.94% 0.00% 38 44 NA
Delhi 100.00% 91.80% 99.31% 943 0.18% 100.00% 90.00% 44.00% 53.00% 0% 0% 51.00% 100.00% 99.98% 0.00% 38 73 NA
Gujarat 100.00% 93.55% 99.38% 166 0.26% 100.00% 78.00% 49.00% 56.00% 0% NA NA 100.00% 99.98% 0.00% 22 NA NA
Haryana 100.00% 91.59% 99.19% 23 0.13% 100.00% 81.00% 47.00% 54.00% 0% NA NA 100.00% 99.97% 0.00% 69 NA NA
Karnataka 100.00% 90.03% 100.00% 6459 0.22% 100.00% 100.00% 54.00% 61.00% 0% 0% 39.00% 100.00% 99.89% 0.00% 30 45 NA
Kerala 100.00% 91.56% 99.89% 231 0.26% 100.00% 100.00% 43.00% 49.00% 0% NA NA 100.00% 99.96% 0.00% 22 NA NA
Kolkata 100.00% 91.43% 100.00% 6374 0.36% 100.00% 100.00% 43.00% 51.00% 0% 0% 36.00% 100.00% 97.07% 0.00% 66 72 NA
Jammu & Kashmir* 100.00% 91.01% 100.00% 0 0.02% 100.00% 100.00% 50.00% 58.00% 0% NA NA 100.00% 98.93% 0.00% 26 NA NA
Madhya Pradesh 100.00% 90.58% 99.09% 642 0.28% 100.00% 76.00% 46.00% 54.00% 0% 0% 41.00% 100.00% 99.96% 0.00% 45 62 NA
Maharashtra 100.00% 92.85% 99.29% 454 0.12% 100.00% 100.00% 48.00% 55.00% 0% NA NA 100.00% 99.83% 0.00% 15 NA NA
Mumbai 100.00% 94.44% 99.50% 414 0.19% 100.00% 100.00% 49.00% 57.00% 0% 0% 47.00% 100.00% 99.89% 0.00% 38 57 NA
Punjab 100.00% 90.25% 99.53% 1149 0.21% 100.00% 100.00% 56.00% 62.00% 0% 0% 59.00% 100.00% 99.97% 0.00% 57 78 NA
Rajasthan 100.00% 90.25% 99.79% 87 0.29% 100.00% 100.00% 58.00% 64.00% 0% NA NA 100.00% 99.97% 0.00% 45 NA NA
Tamilnadu 100.00% 90.18% 99.93% 6836 0.21% 100.00% 79.00% 56.00% 62.00% 0% 0% 42.00% 100.00% 99.96% 0.00% 23 34 NA
Uttar Pradesh - East 100.00% 93.38% 99.11% 58 0.25% 100.00% 100.00% 49.00% 57.00% 0% 0% 49.00% 100.00% 99.94% 0.00% 54 70 NA
Uttar Pradesh - West 100.00% 90.57% 99.08% 43 0.29% 100.00% 67.00% 47.00% 55.00% 0% NA NA 100.00% 99.95% 0.00% 24 NA NA
AP 100.00% 98.00% 99.00% NA 0.00% 100.00% 100.00% 95.00% 97.60% 0% 0% 64.00% 98.00% 98.00% 0.50% 25 280 NA
Karnataka 100.00% 98.00% 99.00% NA 0.00% 100.00% 100.00% 95.00% 97.60% 0% 0% 47.00% 98.00% 98.00% 0.50% 25 280 NA
11 DEN Broadband Pvt. Ltd. All India 100.00% 93.30% 99.63% 0 Nil Nil Nil 48.01% 52.52% 0 0 79.10% 100.00% 99.27% 0.00% NA 240 NA
Maharashtra & Goa 100.00% 90.59% 99.25% None 0.09% 100.00% Nil 62.22% 82.70% Nil 0 80.00% 80.00% 99.77% 1.00% 4 255 600
Mumbai 100.00% 97.70% 100.00% None 0.00% 100.00% Nil 73.22% 90.93% Nil 0 80.00% 80.00% 99.77% 1.00% 4 255 600
Maharashtra 100.00% 93.37% 99.35% None 0.00% 100.00% Nil 64.24% 85.59% Nil 0 80.00% 80.00% 99.73% 1.00% 4 255 600
Mumbai 100.00% 91.77% 99.45% None 0.00% 100.00% Nil 65.55% 86.41% Nil 0 80.00% 80.00% 99.73% 1.00% 4 255 600
14 DNA Infotel Pvt. Ltd. Maharashtra 100.00% 90.76% 99.22% None 0.02% 100.00% Nil 61.17% 83.24% Nil 0 80.00% 80.00% 99.77% 1.00% 4 255 600
15 D-Vois Communications Pvt.Ltd. All India 100.00% 92.54% 99.45% 0 0.00% Nil Nil 86.66% 94.33% 0 Nil Nil 90.00% 100.00% 0.10% 24 28 59
16 ESTO BORADNAD Pvt.Ltd. All India 100.00% 96.33% 100.00% 0 0.00% 0.00% 0.00% 80.00% 93.33% 0 0 60.94% 90.00% 99.00% 0.00% 40 100 720
Andhra Pradesh 100.00% 91.00% 99.00% Nil NA NA NA 75.10% 90.00% 0 Nil 79.00% 98.50% 98.48% 0.00% 12 199 NIL
Delhi 100.00% 90.10% 99.10% Nil NA NA NA 60.00% 80.00% 0 Nil 79.00% 98.50% 98.48% 0.00% 4 199 NIL
Karnataka 100.00% 90.30% 99.10% Nil NA NA NA 60.00% 80.00% 0 Nil 50.90% 98.50% 98.48% 0.00% 12 199 NIL
Rajasthan 100.00% 90.30% 99.10% Nil NA NA NA 60.00% 80.00% 0 Nil 79.00% 98.50% 98.48% 0.00% 4 199 NIL
UP(East) 100.00% 90.30% 99.10% Nil NA NA NA 60.00% 80.00% 0 Nil 79.50% 98.50% 98.48% 0.00% 4 199 NIL
Digital Satellite Connect Pvt. Ltd.13
Excitel Broadband Pvt.Ltd.17
4
12 Digital Network Associates Pvt. Ltd
9
Bharti Airtel Ltd.
10 City Online Services Ltd.
Sl.
No.
Service Provider Service area Faults Repair Billing Performance Response Time to the
Customer for
Bandwidth utilisation/throughput Service
availability
/uptime (for
all users) in
%age
Network latency (for w ired
broadband access)
Airnet Cable and Datacom Pvt.Ltd.
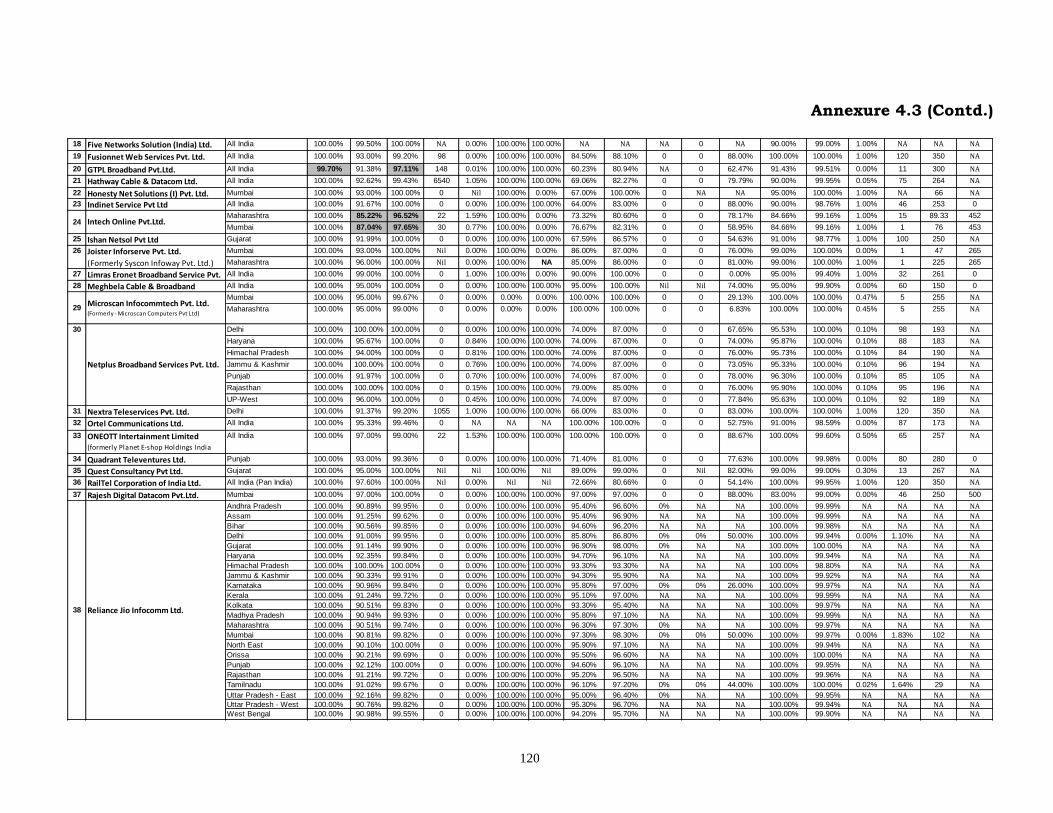
120
Annexure 4.3 (Contd.)
18 Five Networks Solution (India) Ltd. All India 100.00% 99.50% 100.00% NA 0.00% 100.00% 100.00% NA NA NA 0 NA 90.00% 99.00% 1.00% NA NA NA
19 Fusionnet Web Services Pvt. Ltd. All India 100.00% 93.00% 99.20% 98 0.00% 100.00% 100.00% 84.50% 88.10% 0 0 88.00% 100.00% 100.00% 1.00% 120 350 NA
20 GTPL Broadband Pvt.Ltd. All India 99.70% 91.38% 97.11% 148 0.01% 100.00% 100.00% 60.23% 80.94% NA 0 62.47% 91.43% 99.51% 0.00% 11 300 NA
21 Hathway Cable & Datacom Ltd. All India 100.00% 92.62% 99.43% 6540 1.05% 100.00% 100.00% 69.06% 82.27% 0 0 79.79% 90.00% 99.95% 0.05% 75 264 NA
22 Honesty Net Solutions (I) Pvt. Ltd. Mumbai 100.00% 93.00% 100.00% 0 Nil 100.00% 0.00% 67.00% 100.00% 0 NA NA 95.00% 100.00% 1.00% NA 66 NA
23 Indinet Service Pvt Ltd All India 100.00% 91.67% 100.00% 0 0.00% 100.00% 100.00% 64.00% 83.00% 0 0 88.00% 90.00% 98.76% 1.00% 46 253 0
Maharashtra 100.00% 85.22% 96.52% 22 1.59% 100.00% 0.00% 73.32% 80.60% 0 0 78.17% 84.66% 99.16% 1.00% 15 89.33 452
Mumbai 100.00% 87.04% 97.65% 30 0.77% 100.00% 0.00% 76.67% 82.31% 0 0 58.95% 84.66% 99.16% 1.00% 1 76 453
25 Ishan Netsol Pvt Ltd Gujarat 100.00% 91.99% 100.00% 0 0.00% 100.00% 100.00% 67.59% 86.57% 0 0 54.63% 91.00% 98.77% 1.00% 100 250 NA
Mumbai 100.00% 93.00% 100.00% Nil 0.00% 100.00% 0.00% 86.00% 87.00% 0 0 76.00% 99.00% 100.00% 0.00% 1 47 265
Maharashtra 100.00% 96.00% 100.00% Nil 0.00% 100.00% NA 85.00% 86.00% 0 0 81.00% 99.00% 100.00% 1.00% 1 225 265
27 Limras Eronet Broadband Service Pvt. All India 100.00% 99.00% 100.00% 0 1.00% 100.00% 0.00% 90.00% 100.00% 0 0 0.00% 95.00% 99.40% 1.00% 32 261 0
28 Meghbela Cable & Broadband All India 100.00% 95.00% 100.00% 0 0.00% 100.00% 100.00% 95.00% 100.00% Nil Nil 74.00% 95.00% 99.90% 0.00% 60 150 0
Mumbai 100.00% 95.00% 99.67% 0 0.00% 0.00% 0.00% 100.00% 100.00% 0 0 29.13% 100.00% 100.00% 0.47% 5 255 NA
Maharashtra 100.00% 95.00% 99.00% 0 0.00% 0.00% 0.00% 100.00% 100.00% 0 0 6.83% 100.00% 100.00% 0.45% 5 255 NA
Delhi 100.00% 100.00% 100.00% 0 0.00% 100.00% 100.00% 74.00% 87.00% 0 0 67.65% 95.53% 100.00% 0.10% 98 193 NA
Haryana 100.00% 95.67% 100.00% 0 0.84% 100.00% 100.00% 74.00% 87.00% 0 0 74.00% 95.87% 100.00% 0.10% 88 183 NA
Himachal Pradesh 100.00% 94.00% 100.00% 0 0.81% 100.00% 100.00% 74.00% 87.00% 0 0 76.00% 95.73% 100.00% 0.10% 84 190 NA
Jammu & Kashmir 100.00% 100.00% 100.00% 0 0.76% 100.00% 100.00% 74.00% 87.00% 0 0 73.05% 95.33% 100.00% 0.10% 96 194 NA
Punjab 100.00% 91.97% 100.00% 0 0.70% 100.00% 100.00% 74.00% 87.00% 0 0 78.00% 96.30% 100.00% 0.10% 85 105 NA
Rajasthan 100.00% 100.00% 100.00% 0 0.15% 100.00% 100.00% 79.00% 85.00% 0 0 76.00% 95.90% 100.00% 0.10% 95 196 NA
UP-West 100.00% 96.00% 100.00% 0 0.45% 100.00% 100.00% 74.00% 87.00% 0 0 77.84% 95.63% 100.00% 0.10% 92 189 NA
31 Nextra Teleservices Pvt. Ltd. Delhi 100.00% 91.37% 99.20% 1055 1.00% 100.00% 100.00% 66.00% 83.00% 0 0 83.00% 100.00% 100.00% 1.00% 120 350 NA
32 Ortel Communications Ltd. All India 100.00% 95.33% 99.46% 0 NA NA NA 100.00% 100.00% 0 0 52.75% 91.00% 98.59% 0.00% 87 173 NA
33 ONEOTT Intertainment Limited (formerly Planet E-shop Holdings India
Ltd.)
All India 100.00% 97.00% 99.00% 22 1.53% 100.00% 100.00% 100.00% 100.00% 0 0 88.67% 100.00% 99.60% 0.50% 65 257 NA
34 Quadrant Televentures Ltd. Punjab 100.00% 93.00% 99.36% 0 0.00% 100.00% 100.00% 71.40% 81.00% 0 0 77.63% 100.00% 99.98% 0.00% 80 280 0
35 Quest Consultancy Pvt Ltd. Gujarat 100.00% 95.00% 100.00% Nil Nil 100.00% Nil 89.00% 99.00% 0 Nil 82.00% 99.00% 99.00% 0.30% 13 267 NA
36 RailTel Corporation of India Ltd. All India (Pan India) 100.00% 97.60% 100.00% Nil 0.00% Nil Nil 72.66% 80.66% 0 0 54.14% 100.00% 99.95% 1.00% 120 350 NA
37 Rajesh Digital Datacom Pvt.Ltd. Mumbai 100.00% 97.00% 100.00% 0 0.00% 100.00% 100.00% 97.00% 97.00% 0 0 88.00% 83.00% 99.00% 0.00% 46 250 500
Andhra Pradesh 100.00% 90.89% 99.95% 0 0.00% 100.00% 100.00% 95.40% 96.60% 0% NA NA 100.00% 99.99% NA NA NA NA
Assam 100.00% 91.25% 99.62% 0 0.00% 100.00% 100.00% 95.40% 96.90% NA NA NA 100.00% 99.99% NA NA NA NA
Bihar 100.00% 90.56% 99.85% 0 0.00% 100.00% 100.00% 94.60% 96.20% NA NA NA 100.00% 99.98% NA NA NA NA
Delhi 100.00% 91.00% 99.95% 0 0.00% 100.00% 100.00% 85.80% 86.80% 0% 0% 50.00% 100.00% 99.94% 0.00% 1.10% NA NA
Gujarat 100.00% 91.14% 99.90% 0 0.00% 100.00% 100.00% 96.90% 98.00% 0% NA NA 100.00% 100.00% NA NA NA NA
Haryana 100.00% 92.35% 99.84% 0 0.00% 100.00% 100.00% 94.70% 96.10% NA NA NA 100.00% 99.94% NA NA NA NA
Himachal Pradesh 100.00% 100.00% 100.00% 0 0.00% 100.00% 100.00% 93.30% 93.30% NA NA NA 100.00% 98.80% NA NA NA NA
Jammu & Kashmir 100.00% 90.33% 99.91% 0 0.00% 100.00% 100.00% 94.30% 95.90% NA NA NA 100.00% 99.92% NA NA NA NA
Karnataka 100.00% 90.96% 99.84% 0 0.00% 100.00% 100.00% 95.80% 97.00% 0% 0% 26.00% 100.00% 99.97% NA NA NA NA
Kerala 100.00% 91.24% 99.72% 0 0.00% 100.00% 100.00% 95.10% 97.00% NA NA NA 100.00% 99.99% NA NA NA NA
Kolkata 100.00% 90.51% 99.83% 0 0.00% 100.00% 100.00% 93.30% 95.40% NA NA NA 100.00% 99.97% NA NA NA NA
Madhya Pradesh 100.00% 90.94% 99.93% 0 0.00% 100.00% 100.00% 95.80% 97.10% NA NA NA 100.00% 99.99% NA NA NA NA
Maharashtra 100.00% 90.51% 99.74% 0 0.00% 100.00% 100.00% 96.30% 97.30% 0% NA NA 100.00% 99.97% NA NA NA NA
Mumbai 100.00% 90.81% 99.82% 0 0.00% 100.00% 100.00% 97.30% 98.30% 0% 0% 50.00% 100.00% 99.97% 0.00% 1.83% 102 NA
North East 100.00% 90.10% 100.00% 0 0.00% 100.00% 100.00% 95.90% 97.10% NA NA NA 100.00% 99.94% NA NA NA NA
Orissa 100.00% 90.21% 99.69% 0 0.00% 100.00% 100.00% 95.50% 96.60% NA NA NA 100.00% 100.00% NA NA NA NA
Punjab 100.00% 92.12% 100.00% 0 0.00% 100.00% 100.00% 94.60% 96.10% NA NA NA 100.00% 99.95% NA NA NA NA
Rajasthan 100.00% 91.21% 99.72% 0 0.00% 100.00% 100.00% 95.20% 96.50% NA NA NA 100.00% 99.96% NA NA NA NA
Tamilnadu 100.00% 91.02% 99.67% 0 0.00% 100.00% 100.00% 96.10% 97.20% 0% 0% 44.00% 100.00% 100.00% 0.02% 1.64% 29 NA
Uttar Pradesh - East 100.00% 92.16% 99.82% 0 0.00% 100.00% 100.00% 95.00% 96.40% 0% NA NA 100.00% 99.95% NA NA NA NAUttar Pradesh - West 100.00% 90.76% 99.82% 0 0.00% 100.00% 100.00% 95.30% 96.70% NA NA NA 100.00% 99.94% NA NA NA NAWest Bengal 100.00% 90.98% 99.55% 0 0.00% 100.00% 100.00% 94.20% 95.70% NA NA NA 100.00% 99.90% NA NA NA NA
26 Joister Inforserve Pvt. Ltd.
(Formerly Syscon Infoway Pvt. Ltd.)
24 Intech Online Pvt.Ltd.
29Microscan Infocommtech Pvt. Ltd.(Formerly - Microscan Computers Pvt Ltd)
30
Netplus Broadband Services Pvt. Ltd.
38 Reliance Jio Infocomm Ltd.

121
Annexure 4.3 (Contd.)
39 Sai Prasad Internet Services Pvt.Ltd. Maharashtra 100.00% 90.44% 99.20% 0 0.00% 100.00% Nil 62.00% 82.27% Nil 0 80.00% 80.00% 99.73% 1.00% 4 255 600
40 Shree Omkar Infocom Pvt. Ltd. Mumbai 100.00% 98.00% 100.00% 11 0.00% 100.00% 100.00% 90.00% 95.00% 0 0 70.00% 94.00% 99.90% 1.00% 2 125 650
41Shyam Spectra Pvt. Ltd.
(formely Citycom Networks Pvt. Ltd.)All India 100.00% 91.69% 99.09% 662 1.25% 100.00% 100.00% 78.80% 80.30% 0 0 23.60% 96.90% 99.70% 0.00% 10 116 NA
42 Sikka Broadband(P) Ltd. UP (East) 100.00% 91.00% 99.26% 0 0.00% 0.00% 0.00% 88.00% 98.70% 0% 0% 81.48% 86.60% 99.50% 1.00% 10 290 400
43 Siti Broadband Services Pvt.Ltd. All India (Pan India) 100.00% 91.65% 99.07% 43 Nil Nil 100.00% 85.00% 99.00% 0 0 89.14% 95.00% 99.44% 0.00% 3 144 NA
44Tata Communications Ltd. (Ceased broadband services, hence NIL report)
All India NA 0.00% 0.00% 0 0.00% 0.00% 0.00 0.00% 0.00% Nil Nil 0.00% 0.00% 0.00% 0.00% 15 253 0
45 Tata Sky Broadband Pvt. Ltd. All India 100.00% 95.54% 99.36% NA NA NA NA 74.85% 77.62% 0 0 56.00% 100.00% 99.91% 0.00% 1 NA NA
46 Tata Tele.Ltd. (TTSL) All India (except MH) 100.00% 68.27% 89.12% 48 0.03% 100.00% 100.00% 93.32% 97.03% 0 0 68.10% 91.75% 99.57% 0.00% 69 65.22 Nil
47 Tata Tele.(Mah) Ltd. (TTML) Mah. & Mumbai 100.00% 48.00% 73.50% 0 0.03% 100.00% 100.00% 92.68% 95.96% 0 0 78.00% 91.00% 99.65% 0.02% 83 241 Nil
48 Vasai Cable Pvt. Ltd. Maharashtra 100.00% 95.10% 100.00% None 0.13% 100.00% Nil 63.70% 82.87% Nil 0 63.00% 90.00% 100.00% 1.00% 4 255 NA
49 Wan and Lan Internet Pvt. Ltd. Mumbai 100.00% 100.00% 100.00% 0 0.00% 100.00% 0.00% 90.00% 90.00% 0 0 90.00% 90.00% 99.90% 0.00% 20 40 80
Kolkata 100.00% 98.74% 100.00% 0 0.00% 100.00% NA 89.36% 99.00% 0 0 46.07% 100.00% 99.96% 1.00% 20 NA NA
West Bengal 100.00% 98.88% 100.00% 0 0.00% 100.00% NA 89.28% 98.53% 0 0 46.07% 100.00% 99.94% 1.00% 20 NA NA
51World Phone Internet Services Pvt
LtdAll India 100.00% 91.67% 100.00% 0 0.00% 0.00% 0.00% 99.00% 100.00% 0 NA NA 85.00% 99.83% 1.00% 25 NA NA
52 Yashash Cable Network Pvt Ltd Karnataka 100.00% 81.00% 90.00% 251 0.00% 0.00% 0.00% 55.51% 76.29% 0 0 92.61% 80.00% 99.44% 1.00% 30 301 0
53 You Broadband India Pvt. Ltd. All India 80.23% 82.99% 98.86% 49 0.00% 0.00% 0.00% 38.16% 45.30% 0 0 76.56% 87.15% 98.94% 0.00% 9 277 0
NA = Not Applicable
C/DNF= Complied the parameter
but Data is not in the required
format
50 Wish Net Pvt. Ltd.
DNF= Data not as per Format NR= Data not reported by the Service Provider

122
Annexure 5.1: List of pay channels, offered by broadcasters to subscribers as reported to TRAI (New Regulatory Framework) -as on 30th June 2020)
S.No
Name of the broadcaster
Sl. No
Name of the channel Genre as per new
Regulatory framework
Language Declared as SD or HD
1 AETN 18 Media Pvt Limited
1 The History Channel Infotainment Hindi SD
2 FY1 TV18 Infotainment English SD
3 FY1 TV18 (HD) Infotainment English HD
4 Histroy TV 18 HD Infotainment Hindi HD
2 Asianet Star
Communications Private Limited
5 Vijay TV GEC Tamil SD
6 Vijay Super GEC Tamil SD
7 Vijay HD GEC Tamil HD
8 Asianet GEC Malayalam SD
9 Asianet Plus GEC Malayalam SD
10 Asianet Movies Movies Malayalam SD
11 Suvarna Plus Movies Kannada SD
12 Star Suvarna HD GEC Kannada HD
13 Asianet HD GEC Malayalam HD
14 Star Suvarna GEC Kannada SD
3 Bangla Entertainment Private Limited
15 AATH GEC Bangla SD
16 SONY Marathi GEC Marathi SD
4 BBC Global News India Private Limited
17 BBC World News News English SD
18 Cbeebies Kids English SD
5 Bennett, Coleman & Company Limited
19 Zoom GEC Hindi SD
20 Romedy Now Movies English SD
21 MN + Movies English HD
22 Mirror Now News English/
Hindi
SD
23 ET NOW News English/ Hindi
SD
24 Times Now News English/ Hindi
SD
25 Romedy Now HD Movies English HD
26 Movies Now HD Movies English HD
27 MNX HD Movies English HD

123
Annexure 5.1(Contd.) S.No
Name of the broadcaster
Sl. No
Name of the channel Genre as per new
Regulatory framework
Language Declared as SD or HD
28 MNX Movies English SD
29 Times Now World News English HD
6 Celebrities Management Pvt Limited
30 Travel XP HD Lifestyle English HD
31 Travel XP Tamil Lifestyle Tamil SD
7 CSL Info Media Private Limited
32 JAN TV PLUS News Hindi SD
8 Direct New Private Limited
33 News X News English SD
9 Discovery Communications India
34 Animal Planet Infotainment English/ Hindi
SD
35 Discovery Channel Infotainment English/ Hindi
SD
36 DTAMIL Infotainment Tamil SD
37 Discovery Kids Channel
Kids English SD
38 Discovery Science Infotainment English/ Hindi
SD
39 Discovery Turbo Infotainment English/ Hindi
SD
40 Investigation Discovery
GEC Hindi SD
41 Discovery HD Infotainment English HD
42 Animal Planet HD World
Infotainment English/ Hindi
HD
43 TLC HD Infotainment English/ Hindi
HD
44 Investigation Discovery HD
GEC Hindi HD
45 TLC Infotainment English/ Hindi
SD
46 EUROSPORT HD (Earlier name "Dsport
HD")
Sports English HD
47 EUROSPORT (Earlier name "Dsport")
Sports English SD
10 Disney Broadcasting (India) Limited
48 Disney Junior Kids English SD
49 UTV Movies Movies Hindi SD
50 Marvel HQ Kids English/ Hindi
SD
51 Disney International HD
GEC English HD

124
Annexure 5.1(Contd.)
S.No
Name of the broadcaster
Sl. No
Name of the channel Genre as per new
Regulatory framework
Language
Declared as SD or HD
52 Hungama TV Kids English/ Hindi
SD
53 The Disney Channel Kids English/ Hindi
SD
54 UTV HD Movies Hindi HD
55 UTV Bindass GEC Hindi SD
56 UTV Action Movies Hindi SD
11 Eenadu
Televisoin Private Limited
57 ETV GEC Telugu SD
58 ETV Andhra Pradesh News Telugu SD
59 ETV - Telangana News Telugu SD
60 ETV Cinema Movies Telugu SD
61 ETV Life GEC Telugu SD
62 ETV Plus GEC Telugu SD
63 ETV Abhiruchi GEC Telugu SD
64 ETV HD GEC Telugu HD
65 ETV Plus HD GEC Telugu HD
66 ETV Cinema HD Movies Telugu HD
67 ETV Abhiruchi HD GEC Telugu HD
68 ETV Life HD GEC Telugu HD
12 IN 10 Media Private Limited
69 EPIC TV Infotainment English/ Hindi
SD
13 Fame Media Private Limited
70 4tv News News Urdu/ Hindi
SD
14 Greycells18 Media Limited
71 Topper TV Miscellaneous English SD
15 IBN Lokmat News Private Ltd
72 News 18 Lokmat News Hindi SD
16 Living
Entertainment Enterprises Private Ltd
73 Living Foodz HD Infotainment Hindi HD
74 Living Travelz Infotainment Hindi SD
17 Lifestyle and Media Broadcasting Limited
75 Good Times Lifestyle English SD
18 Lex Sportel Vision Private Limited
76 1SPORTS Sports English SD

125
S.
No
Name of the
broadcaster
Sl.
No
Name of the channel Genre as per
new Regulatory framework
Language
Declared
as SD or HD
19 Mavis Satcom Limited
77 J Movies Movies Tamil SD
78 Jaya Max Music Tamil SD
79 Jaya Plus News Tamil SD
80 Jaya TV HD GEC Tamil HD
20 MSM World Wide Factual Media Private Limited
81 SONY BBC EARTH Infotainment English/ Hindi
SD
82 SONY BBC EARTH HD
Infotainment English/ Hindi
HD
21 Media World Wide Limited
83 Travel XP Lifestyle English SD
22 New Delhi Television Limited
84 NDTV 24*7 News English SD
85 NDTV India News Hindi SD
86 NDTV Profit News English SD
23 NGC Network (India) Pvt Limited
87 Fox Life Infotainment English/ Hindi
SD
88 National Geographic Channel (NGC)
Infotainment English/ Hindi
SD
89 Fox Life HD Infotainment English/ Hindi
HD
90 Nat Geo Wild Infotainment English/ Hindi
SD
91 National Geographic HD
Infotainment English/ Hindi
HD
92 Nat Geo Wild HD Infotainment English/ Hindi
HD
93 Baby TV HD Kids English/ Hindi
HD
24 NOIDA Software Technology Park Limited
94 NHK World Premium (HD Distribution)
Infotainment Japanese HD
25 Odisha Television
Limited
95 Prarthana Devotional Odia SD
96 Tarang GEC Odia SD
97 Tarang Music Music Odia SD
98 Alankar Movies Odia SD
26 Raj Television Network Limited
99 Raj Digital Plus Movies Tamil SD
100 Raj Musix Music Tamil SD
101 Raj News News Tamil SD
102 Raj TV GEC Tamil SD

126
Annexure 5.1(Contd.) S.No
Name of the broadcaster
Sl. No
Name of the channel Genre as per new
Regulatory framework
Language
Declared as SD or HD
27 Silverstar Communications Limited
103 Mega 24 GEC Tamil SD
104 Mega Musiq Music Tamil SD
105 Mega TV GEC Tamil SD
28 Sony Pictures Networks India Private Limited
106 Sony YAY! Kids English SD
107 SET MAX Movies Hindi SD
108 SAB GEC Hindi SD
109 SONY ENTERTAINMENT CHANNEL (SET)
GEC Hindi SD
110 PIX Movies English SD
111 SIX Sports English/Hindi
SD
112 MAX 2 Movies Hindi SD
113 PAL GEC Hindi SD
114 SET HD GEC Hindi HD
115 SIX HD Sports English/Hindi
HD
116 PIX HD Movies English HD
117 MAX HD Movies Hindi HD
118 Ten 2 HD Sports English/Hindi
HD
119 Ten 3 HD Sports English/Hindi
HD
120 Ten 2 Sports English/Hindi
SD
121 Ten 1 Sports English SD
122 Ten 3 Sports English/Hindi
SD
123 Ten 1 HD Sports English HD
124 SONY Wah Movies Hindi SD
125 SAB HD GEC Hindi HD
29 Star India Private Limited
126 Star Sports 3 Sports English/Hindi
SD
127 Star Sports 1 Tamil Sports Tamil SD
128 Star Sports Select 2 Sports English/Hindi
SD

127
Annexure 5.1(Contd.) S.No
Name of the broadcaster
Sl. No
Name of the channel Genre as per new
Regulatory framework
Language Declared as SD or HD
129 Star Bharat GEC Hindi SD
130 Star Gold 2 (Movies OK)
Movies Hindi SD
131 Star Sports 1 Hindi Sports Hindi SD
132 Star Gold Movies Hindi SD
133 Star Jalsha GEC Bangla SD
134 Star Movies Movies English SD
135 Star Gold Select Movies Hindi SD
136 Star Plus GEC Hindi SD
137 Star Pravah GEC Marathi SD
138 Star Sports 1 Sports English/ Hindi
SD
139 Star Sports 2 Sports English/ Hindi
SD
140 Star World GEC English SD
141 Jalsha Movies Movies Bangla SD
142 Star Sports HD 2 Sports English/ Hindi
HD
143 Star Sports HD 1 Sports English/ Hindi
HD
144 Star Bharat HD GEC Hindi HD
145 Star Gold HD Movies Hindi HD
146 Star Movies HD Movies English HD
147 Star Plus HD GEC Hindi HD
148 Star Sports 1 HD Hindi
Sports Hindi HD
149 Star Sports Select 1 Sports English/ Hindi
SD
150 Star Movies Select HD Movies English HD
151 Star World HD GEC English HD
152 Star Sports First Sports English/ Hindi
SD
153 MAA Gold Movies Telugu SD
154 MAA Movies Movies Telugu SD
155 MAA Music Music Telugu SD

128
Annexure 5.1(Contd.)
S.No
Name of the broadcaster
Sl. No
Name of the channel Genre as per new
Regulatory framework
Language Declared as SD or HD
156 MAA TV GEC Telugu SD
157 Star Pravah HD GEC Marathi HD
158 Star Jalsha HD GEC Bangla HD
159 Jalsha Movies HD Movies Bangla HD
160 Star Sports Select HD 1 Sports English/ Hindi
HD
161 Star Sports Select HD 2 Sports English/
Hindi
HD
162 MAA HD GEC Telugu HD
163 Star Gold Select HD Movies Hindi HD
164 MAA Movies HD Movies Telugu HD
165 National Geographic Tamil Infotainment Tamil SD
166 National Geographic Telugu Infotainment Telugu SD
167 Star World Prmiere HD GEC English HD
168 Star Sport 1 Telugu Sports Telugu SD
169 Star Sport 1 Kannada Sports Kannada SD
170 Star Sports 1 Bangla Sports Bangla SD
171 Star Utsav GEC Hindi SD
172 Star Sports 1 Marathi Sports Marathi SD
173 Star Utsav Movies Movies Hindi SD
30 SUN TV Network Limited
174 Adithya TV GEC Tamil SD
175 Chintu TV Kids Kannada SD
176 Chutti TV Kids Tamil SD
177 Gemini Comedy GEC Telugu SD
178 Gemini Life GEC Telugu SD
179 Gemini Movies GEC Telugu SD
180 Gemini Music Music Telugu SD
181 Gemini News News Telugu SD
182 Gemini TV GEC Telugu SD
183 KTV GEC Tamil SD
184 Surya Movies GEC Malayalam SD
185 Kushi TV Kids Telugu SD
186 SUN Life GEC Tamil SD
187 Sun Music Music Tamil SD

129
Annexure 5.1(Contd.) S.No
Name of the broadcaster
Sl. No
Name of the channel Genre as per new
Regulatory framework
Language Declared as SD or HD
188 Sun News News Tamil SD
189 Surya Music Music Malayalam SD
190 SUN TV GEC Tamil SD
191 Surya Comedy GEC Malayalam SD
192 Surya TV GEC Malayalam SD
193 Udaya Comedy GEC Kannada SD
194 Udaya Movies GEC Kannada SD
195 Udaya Music Music Kannada SD
196 Udaya News News Kannada SD
197 Udaya TV GEC Kannada SD
198 Kochu TV Kids Malayalam SD
199 Sun TV HD GEC Tamil HD
200 KTV HD GEC Tamil HD
201 Sun Music HD Music Tamil HD
202 Gemini TV HD GEC Telugu HD
203 Gemini Music HD Music Telugu HD
204 Gemini Movies HD GEC Telugu HD
205 Surya TV HD GEC Malayalam HD
206 Udaya TV HD GEC Kannada HD
31 Suryansh Broadcasting Private Limited
207 Flowers GEC Malayalam SD
32 Turner International India Pvt Ltd
208 Cartoon Network Kids Hindi SD
209 CNN International News English SD
210 HBO Movies English SD
211 POGO Kids Hindi SD
212 Cartoon Network HD+ Kids Hindi HD
213 WB Movies English SD
214 HBO HD Movies English HD
33 TV 18 Broadcast Limited
215 CNN News 18 News English SD
216 CNBC Bajaar News Gujarati SD

130
Annexure 5.1(Contd.) S.No
Name of the broadcaster
Sl. No
Name of the channel Genre as per new
Regulatory framework
Language Declared as SD or HD
217 CNBC TV 18 Prime HD
News English HD
218 CNBC Awaaz News Hindi SD
219 News 18 Tamil Nadu News Tamil SD
220 News 18 Kerala News Malayalam SD
221 News 18 Assam / North East
News Assamese SD
222 News 18 India News Hindi SD
223 CNBC TV 18 News English SD
224 News 18 Bihar Jharkhand
News Hindi SD
225 News 18 Madhya Pradesh / Chattisgarh
News Hindi SD
226 News 18 Rajasthan News Hindi SD
227 News 18 Uttar Pradesh/ Uttaranchal
News Hindi SD
228 News 18 Urdu News Urdu SD
229 News 18 Kannada News Kannada SD
230 News 18 Bangla News Bangla SD
231 News 18 Punjab / Haryana / Himanchal Pradesh
News Punjabi SD
232 News 18 Gujarati News Gujarati SD
233 News 18 Odia News Odia SD
34 TV Today Network Limited
234 Aaj Tak News Hindi SD
235 India Today News English SD
236 AAJ Tak HD News Hindi HD
237 Aaj Tak Tez News Hindi SD
35 Viacom 18 Media Private Limited
238 Colors GEC Hindi SD
239 Comedy Central (HD ) GEC English HD
240 MTV Music Hindi SD
241 NICK Kids Hindi SD
242 NICK JR Kids English SD
243 SONIC Kids Hindi SD

131
Annexure 5.1(Contd.) S.No
Name of the broadcaster
Sl. No
Name of the channel Genre as per new
Regulatory framework
Language Declared as SD or HD
244 VH 1 (HD Distribution)
Music English HD
245 Colors Infinity HD GEC English HD
246 Colors Infinity GEC English SD
247 Colors HD GEC Hindi HD
248 NICKS HD+ Kids Hindi HD
249 Colors Cineplex Movies Hindi SD
250 MTV Beats Music Hindi SD
251 Colors Kannada HD GEC Kannada HD
252 Colors Marathi HD GEC Marathi HD
253 Colors Bangla HD GEC Bangla HD
254 Colors Super GEC Kannada SD
255 Colors Bangla GEC Bangla SD
256 Colors Gujarati GEC Gujarati SD
257 Colors Kannada GEC Kannada SD
258 Colors Marathi GEC Marathi SD
259 Colors Oriya GEC Oriya SD
260 MTV Beats HD Music Hindi HD
261 Colors Tamil GEC Tamil SD
262 Colors Cineplex HD Movies Hindi HD
263 VH 1 Music English SD
264 Colors Tamil HD GEC Tamil HD
265 MTV HD+ Music Hindi HD
266 Colors Rishtey GEC Hindi SD
267 Colors Kannada Cinema
Movies Kannada SD
268 Colors Gujarati Cinema
Movies Gujarati SD
269 Comedy Central GEC English SD
270 Colors Bangla Cinema
Movies Bangla SD
36 Zee Akaash News Private Limited
271 Zee 24 Ghanta News Bangla SD

132
Annexure 5.1(Contd.) S.No
Name of the broadcaster
Sl. No
Name of the channel Genre as per new
Regulatory framework
Language Declared as SD or HD
37 Zee Entertainment Enterprises Limited
272 Zee Bollywood Movies Hindi SD
273 Zee Action Movies Hindi SD
274 Zee Bangla Cinema Movies Bangla SD
275 Zee Café HD GEC English HD
276 Zee Café GEC English SD
277 Zee Cinema Movies Hindi SD
278 Zee Talkies Movies Marathi SD
279 Zee TV GEC Hindi SD
280 Zing Music Hindi SD
281 & Picture Movies Hindi SD
282 Zee Bangla GEC Bangla SD
283 Zee Marathi GEC Marathi SD
284 Living Foodz Infotainment English/Hindi
SD
285 Zee TV HD GEC Hindi HD
286 Zee Cinema HD Movies Hindi HD
287 & TV GEC Hindi SD
288 & TV HD GEC Hindi HD
289 Zee Kannada GEC Kannada SD
290 Zee Telugu GEC Telugu SD
291 & Pictures HD Movies English/Hindi
HD
292 Zee Cinemalu Movies Telugu SD
293 Zee Yuva GEC Marathi SD
294 Zee Marathi HD GEC Marathi HD
295 & Prive HD Movies English HD
296 Zee Bangla HD GEC Bangla HD
297 Zee Tamil HD GEC Tamil HD
298 Zee Cinemalu HD Movies Telugu HD

133
Annexure 5.1(Contd.)
S.No
Name of the broadcaster
Sl. No
Name of the channel Genre as per new
Regulatory framework
Language Declared as SD or HD
299 Zee Telugu HD GEC Telugu HD
300 Zee Tamil GEC Tamil SD
301 Zee Kannada HD GEC Kannada HD
302 Zee Anmol Cinema Movies Hindi SD
303 & Flix HD Movies English HD
304 & Flix Movies English SD
305 Zee Keralam HD GEC Malayalam HD
306 Zee Keralam GEC Malayalam SD
307 Zee ETC Music Hindi SD
308 Zee Anmol GEC Hindi SD
309 Big Magic GEC Hindi SD
310 Big Ganga GEC Bhojpuri SD
311 Zee Classic Movies Hindi SD
312 &Xplore HD Movies Hindi HD
313 ZEE Sarthak GEC Odia SD
314 Zee Talkies HD Movies Marathi HD
315 Zee Punjabi GEC Punjabi SD
316 Zee Thirai Movies Tamil SD
317 Zee Picchar Movies Kannada SD
318 Zee Biskope Movies Bhojpuri SD
38 Zee Media Corporation Limited
319 Zee 24 Taas News Marathi SD
320 Zee Odisha News Odia SD
321 Zee Business News Hindi SD
322 Zee Punjab Haryana Himachal
News Hindi SD
323 Zee Madhya Pradesh Chattisgarh
News Hindi SD
324 Zee Salaam News Urdu SD
325 Zee 24 Kalak News Hindi SD
326 WION News Hindi SD
327 Zee Uttar Pradesh Uttrakhand
News Hindi SD

134
Annexure 5.1(Contd.) S.No
Name of the broadcaster
Sl. No
Name of the channel Genre as per new
Regulatory framework
Language Declared as SD or HD
328 Zee Hindustan News Hindi SD
329 Zee Bihar Jharkhand News Hindi SD
330 Zee News News Hindi SD
331 Zee Rajasthan News News Hindi SD
39 Zoom Entertainment Network Limited
332 Movies Now Movies English SD

135
Annexure 5.2
List of Major MSOs / HITS Operators
1. M/s. Siti Networks Limited., Siti Networks Limited
1st Floor, FC-09, Gate No.03, Sector-16-A Film City, Noida-201301,
Tel: 0120-4526700 Website : www.sitinetworkslimited
Toll Free No. 1800 1234 001 2. M/s Den Networks Limited.
Den Networks Limited 236, Ground Floor, Okhla Industrial Estate,
Phase-III, New Delhi-110020 Website: www.den networks.com Toll Free No. 1800 419 2020
3. M/s Hathway Digital Private Limited.
Hathway Digital Private Limited
805/606, 8th Floor, Windsor Off CST Road, Kalina, Santacruz (East),
Mumbai-400098 (Maharashtra) PH: 022-26001306,
Fax No: 022-26001307
Website : www.hathway.com Toll Free No. 1800 4197 900
4. M/s GTPL Hathway.
GTPL Hathway 202, 2nd Floor,
Sahajanad Shopping Center Opp. Swaminarayan Mandir Shahibaug, Ahemdabad-38004
Ph: 079-30280340 / 41, 079-25626476 / 77 Website : www.gtpl.net
Toll Free No. 1800-419-0419 5. M/s NXT Digital Limited.
IndusInd Media & Communication Limited IN Centre, 49/50 MIDC 12th Road, Andheri
MUMBAI-400093 (Maharashtra) Ph: 022-28208585
Website : www.nxtdigital.co.in Toll Free No. 18602120400 18002100400

136
6. M/s Fastway Transmission Pvt. Ltd.
Fastway Transmission Pvt. Ltd.
SCO-16-17, Top Floor Sector-34-A, Chandigarh Ph: 0161-4044444
Website : www.fastway.in Toll Free No. 18001026602
7. M/s Tamil Nadu ARASU Cable TV Corporation Ltd.
Tamil Nadu ARASU Cable TV Corporation Ltd.
11/22, Mangadusamy Street, Nungambakkam, Chennai-600034 Ph: 044-2843 2911
Fax : 044-2843 2913 Website : www.tactv.in
Toll Free No. 1800 425 2911
8. M/s Kerala Communicators Cable Ltd.
Kerala Communicators Cable Ltd. CC -22/491, Girnar, Kadavanthara,
Cochin-682020 (Kerala) Ph: 0484-2316441 Website : www.kccl.tv
Toll Free No. 18004195755
9. M/s Thamizhaga Cable TV Communication Pvt. Ltd.
Thamizhaga Cable TV Communication Pvt. Ltd. Old No. 150, New No. 48, Sami Naicken Street,
Chinthadripet, Chennai-6000002 (T.N.) Ph: 044-49272222 Website : www.tccl.co.in
Toll Free No. 1800-102-9845
10. M/s Asianet Digital Network Pvt. Network Asianet Digital Network Pvt. Network 2A, 2nd Floor, Leela Infopark
Technopark, Kazahakuttom, Thiruvanathapuram-695581 (Kerala) Ph: 0471-2700995
Fax : 0471-2527878 Website : www.asianetdigital.co.in
Toll Free No. 1800 425 4725

137
11. M/s Kal Cable Private Ltd.
Kal Cable Private Ltd.
No. 229, Kutchery Road, Mylapore, Chennai-600004 (T.N.) Ph: 044-49616161
Fax : 044-49616171 Website : www.scv.in
Toll Free No. 1800-102-0728 13. M/s V.K. Digital Network Pvt. Ltd.
V.K. Digital Network Pvt. Ltd. 3-A-29, Willow Crest, 6th Main Road, R.A. Puram,
Chennai-600029 (T.N.) Ph: 044-4242 8282
Website : www.vkdigital.co.in Toll Free No. 18004199908

138
Annexure 5.3
List of Pay DTH Operators
1. M/s. Tata Sky Ltd., Tata Communications Complex,
Mandi Road, PO Chattarpur, New Delhi – 110 074
Tel: 011-6616 3000 Fax-022-6616 3030 Website : www.tatasky.com
Toll Free No. 18002086633 2. M/s Dish TV India Ltd.
FC-19, Sector-16A, Film City, Noida-201301
Tel: 91-120-2467005 / 2467000 Fax: 91-120-4357082 Toll Free No. 18002583474 (Dish), 1800212212 (d2h)
Website : www.dishtv.in
3. SUN Direct TV(P) Ltd.
Murasoli Maran Towers, 73, MRC Nagar,
Main Road, MRC Nagar, Chennai – 28 PH: 044-44676767, Fax No 044-40679191 Website : www.sundirect.in
Toll Free No. 18001037575
4. Bharti Telemedia Ltd. Airtel Centre, Plot No 16, Udyog Vihar Phase IV,
Gurgaon – 122 015 Ph: 0124-4222222
Fax : 0124-4248063 Website : www.airtel.in Toll Free No. 18001036065

139
Annexure 5.4: List of 105 existing cities with operational FM Radio Channels in India as on 30th June, 2020
Sl.No. City Category Stations
1 Agartala D 2
2 Agra B 4
3 Ahmedabad A 7
4 Ahmednagar C 3
5 Aizwal D 3
6 Ajmer C 4
7 Akola C 4
8 Alappuzha C 2
9 Aligarh C 3
10 Allahabad B 4
11 Amravati C 1
12 Amritsar B 4
13 Asansol B 3
14 Aurangabad C 4
15 Bareily C 4
16 Bengaluru A 8
17 Bharuch D 1
18 Bhavangar C 1
19 Bhopal B 4
20 Bhubaneshwar C 4
21 Bikaner C 4
22 Bilaspur C 3
23 Chandigarh C 4
24 Chennai A+ 7
25 Cochin B 4
26 Coimbatore B 4
27 Dehradun C 1
28 Delhi A+ 9
29 Dhule C 3
30 Dhubri Others 1
31 Durg-Bhillaina D 1
32 Erode C 2
33 Gangtok D 2
34 Gorakhpur C 4
35 Gulbarga C 1
36 Guwahati C 4
37 Gwalior C 4
140
Annexure 5.4 (Contd.)
Sl.No. City Category Stations
38 Haflong D 1
39 Hissar D 4
40 Hubli - Dharwad C 2
41 Hyderabad A 8
42 Indore B 4
43 Itanagar D 2
44 Jabalpur B 4
45 Jaipur A 6
46 Jalandhar C 4
47 Jalgaon C 4
48 Jammu C 3
49 Jamnagar C 1
50 Jamshedpur B 4
51 Jhansi C 4
52 Jodhpur C 4
53 Junagarh D 1
54 Kannur C 3
55 Kanpur A 6
56 Karnal D 3
57 Kolhapur C 4
58 Kolkata A+ 7
59 Kota C 4
60 Kozhikode C 4
61 Lucknow A 6
62 Madurai B 4
63 Mangalore C 3
64 Mehsana D 1
65 Mumbai A+ 9
66 Muzaffarpur C 4
67 Mysore C 3
68 Nagpur A 6
69 Nanded C 3
70 Nasik C 4
71 Nellore C 1
72 Palampur D 1
73 Panaji D 2
74 Patiala C 4
75 Patna B 4

141
Annexure 5.4 (Contd.)
Sl.No. City Category Stations
76 Puducherry C 4
77 Pune A 6
78 Raigarh D 1
79 Raipur C 3
80 Rajahmundry C 2
81 Rajkot B 4
82 Ranchi C 4
83 Rourkela C 3
84 Salem C 2
85 Sangli C 5
86 Shillong D 3
87 Shimla D 3
88 Sholapur C 4
89 Siliguri C 3
90 Srinagar C 4
91 Surat A 6
92 Thiruvananthapuram C 4
93 Thrissur C 3
94 Tiruchy C 3
95 Tirunelveli C 3
96 Tirupati C 2
97 Tuticorin C 2
98 Udaipur C 4
99 Ujjain C 1
100 Vadodra B 4
101 Varanasi B 5
102 Vellore C 2
103 Vijayawada B 2
104 Vishakapatnam B 3
105 Warrangal C 2 367
Source: As reported by Private FM Radio Service Providers to TRAI

142
Index of Tables & Charts
Tables
Table 1.1: Subscriber Base & Teledensity - Rural & Urban ....................................................... 2
Table 1.2: Service Area-wise Access (Wireless+Wireline) Subscribers base ................................. 5 Table 1.3: Service Area-wise Rural-Urban Subscribers ……………………………………………....…..6
Table 1.4: Service Area-wise Tele-density ……………….…………………………………..………..……..7
Table 1.5: State/UT-wise Subscriber Base (Wireless+Wireline)……………………………………….…9
Table 1.6: State/UT-wise Tele-density .…………………….………………………………………...….….10
Table 1.7: Service Provider-wise Growth/Decline in Subscriber base……………………….….…...11
Table 1.8: Market Share of the operators in total rural subscriber base .................................. 12 Table 1.9: List of Cellular Mobile (GSM & CDMA) Service Providers currently providing service.12
Table 1.10: Wireless Subscriber Base & Tele-density - Rural & Urban .................................... 14
Table 1.11: Growth in Wireless Subscriber Base..................................................................... 15
Table 1.12: Service Area-wise Wireless Subscriber Base ......................................................... 16
Table 1.13: Service Area-wise Wireless Rural-Urban Subscribers ............................................ 16 Table 1.14: Service Area-wise Wireless Tele-density ................................................................ 18
Table 1.15: State/UT-wise wireless subscriber base ............................................................... 19
Table 1.16: State/UT-wise wireless Tele-density .................................................................... 20
Table 1.17: Rural Wireless Subscribers and Market Share ...................................................... 21
Table 1.18: Service Providers providing Wireline services ........................................................ 23
Table 1.19: Wireline Subscriber Base & Tele-density - Rural & Urban ..................................... 25 Table 1.20: Service Provider-wise Subscribers (Rural & Urban) & Share of Rural Subscription 25
Table 1.21: Service Provider-wise growth in Wireline Subscribers ........................................... 26
Table 1.22: Service Area-wise Wireline Subscribers & Net Addition ......................................... 27
Table 1.23: Service Area-wise Wireline Rural-Urban Subscriber Base.. ................................... 28
Table 1.24: Service Area-wise Wireline Tele-density ................................................................ 28
Table 1.25: State/UT-wise Wireline Subscriber Base .............................................................. 30 Table 1.26: State/UT-wise Wireline Tele-density ..................................................................... 31
Table 1.27: Rate of change & Market share of PCOs ............................................................... 32
Table 1.28: Trend of Internet subscriber base …………………………..……………………..……...….33
Table 1.29: Break-up of Urban-Rural Internet Subscriber Base……………………………........…..37
Table 1.30: Internet Subscriber Base & Market share of top 10 SPs …………………………….....38 Table 1.31: Service area-wise number of internet subscribers per 100 population ................... 41
Table 1.32: PMRTS Subscriber base - Service Provider-wise .................................................... 46
Table 1.33: VSAT Service Providers currently providing service & their subscriber base .......... 48
Table 2.1: Key Indicators - Wireless Services .......................................................................... 50
Table 2.2: Monthly ARPU - Wireless Services .......................................................................... 51
Table 2.3: Composition of ARPU - Wireless Services ............................................................... 52 Table 2.4: MOU per subscriber per month .............................................................................. 53
Table 2.5: Outgoing SMS per subscriber per month ................................................................ 53
Table 2.6: %Break-up of Outgoing minutes from Home Service Area (HSA) ............................ 53
Table 2.7: Average revenue per outgoing minute from HSA ..................................................... 57
Table 2.8: Trends of Key Parameters - wireless Services .......................................................... 58 Table 3.1: Gross Revenue, Adjusted Gross Revenue, License Fee & Spectrum Charges ............ 60
Table 3.2: Service-wise Gross Revenue, Adjusted Gross Revenue, License Fee and Spectrum
Charges ................................................................................................................. 60
Table 3.3: Access Services - Service Provider-wise Adjusted Gross Revenue ............................ 62
Table 3.4: Category-wise share in Adjusted Gross Revenue of Access Services ........................ 63
Table 4.1: QoS Summary - Wireless Service ........................................................................... 65 Table 4.2: Parameter-wise Analysis of Non-compliance of QoS Benchmarks for Wireless Service
Providers. ............................................................................................................. 67
Table 4.3: QoS Summary - Wireline Services .......................................................................... 73

143
Table 4.4: Parameter-wise Analysis of Non-compliance of QoS Benchmarks for Wireline Service
Providers .............................................................................................................. 74
Table 4.5: Performance of Wireline Broadband Service Providers against identified parameters..81
Table 4.6: Parameter-wise Analysis of non-compliance of QoS benchmarks for Wireline
Broadband Service Providers .............................................................................. ….83 Table 5.1: Key Parameters - Broadcasting & Cable TV Services ............................................... 86
Table 5.2: Subscriber base of major MSOs/HITS (more than one million subscribers) ............. 89
Charts
Chart 1.1: Trends in Telephone Subscribers and Tele-density in India ...................................... 2
Chart 1.2: Market Share - Rural & Urban Subscribers ............................................................. 3
Chart 1.3: Composition of Access Subscriptions - Wireline & Wireless ...................................... 4
Chart 1.4: Composition of Rural - Urban Telephone Subscribers .............................................. 4
Chart 1.5: Net Addition/decline in Telephone Subscriptions ..................................................... 6 Chart 1.6: Wireless Subscriber Base and Tele-density ............................................................ 14
Chart 1.7: Wireless Market Share - Rural & Urban ................................................................. 15
Chart 1.8: Trend of Technology-wise Wireless Data Usage (in Terabyte) .................................. 21
Chart 1.9: Trend of Wireless Data Subscribers and Volume of Wireless Data Usage ................ 22
Chart 1.10: Wireline Subscriber Base and Tele-density .......................................................... 24
Chart 1.11: Composition of Wireline Subscribers - Rural & Urban .......................................... 25 Chart 1.12: Trend of Number of PCOs .................................................................................... 32
Chart 1.13: Trend of Number of VPTs .................................................................................... 33
Chart 1.14: Composition of Internet subscriptions ................................................................. 35
Chart 1.15 : Composition of Broadband & Narrowband subscriptions …………………… ........... 36
Chart 1.16 : Market share of PSUs and Private Internet Service Providers …………………… ..... 36 Chart 1.17: Subscriber Base of top ten ISPs ........................................................................... 39
Chart 1.18: Compostion of Wired Internet Subscribers ........................................................... 39
Chart 1.19: Composition of Wireless Internet Subscribers ...................................................... 40
Chart 1.20: Technology Trend for Wireless Internet Access ..................................................... 40
Chart 1.21: Technology Trend for Wired Internet Access ......................................................... 41
Chart 1.22: Trends in MOU for Internet Telephony ................................................................. 43 Chart 1.23: Composition of Broadband Subscriptions – Technology-wise ................................ 44
Chart 1.24: Composition of Narrowband Subscriptions – Technology-wise .............................. 45
Chart 1.25: Number of PMRTS subscribers & Rate of Growth (%) ........................................... 46
Chart 1.26: Number of VSAT Subscribers & Rate of Growth (%) .............................................. 47
Chart 2.1: Break-up of Outgoing minutes from Home Service Area (HSA) ................................ 50 Chart 2.2: Proportion of prepaid subscribers .......................................................................... 51
Chart 2.3: Minutes of Usage by Outroamers as a % of Total Minutes of Usage ........................ 54
Chart 2.4: Outgoing SMS Usage by Out-roamers as a % of Total No. of Outgoing SMS Usage . 55
Chart 2.5: % Subscribers who availed roaming services during the quarter ............................ 56
Chart 2.6: % Break-up of minutes of usage of out-roamers ..................................................... 56
Chart 3.1: Composition of Adjusted Gross Revenue ................................................................ 61 Chart 3.2: Trend in ARPU per month for Access Services ........................................................ 62
Chart 5.1: Quarterly growth in Satellite TV Channels (FTA & Pay) registered with MIB…….…..86
Chart 5.2 : Quarterly growth in number of satellite Pay TV Channels in India ………………..….88
Chart 5.3 : Quarterly growth in total active subscriber of Pay DTH Sector ……………….………..90
Chart 5.4 : Market share of Pay DTH Operators ……………………………………………....…………91 Chart 5.5 : Quarterly growth in Private FM Radio Stations…..……………..………………..…….….92
Chart 5.6 : Quarterly growth in FM Radio Advertisement Revenue ………………………………..…92
Chart 5.7 : Quarterly growth in number of Operational Community Radio Stations…………..…93