Report to Shareholders - About RBC
96
Report to Shareholders Royal Bank of Canada first quarter 2012 results All amounts are in Canadian dollars and are based on our unaudited Interim Condensed Consolidated Financial Statements for the quarter ended January 31, 2012 and related notes prepared in accordance with International Financial Reporting Standards (IFRS), unless otherwise noted. TORONTO, March 1, 2012 – Royal Bank of Canada (RY on TSX and NYSE) today reported net income of $1,855 million for the first quarter ended January 31, 2012. Net income from continuing operations was $1,876 million, up $267 million or 17% from last quarter. These strong results were driven by record earnings in Canadian Banking reflecting solid business growth, higher earnings in Capital Markets and continued strength in Insurance and Wealth Management. “RBC had an outstanding start to the year, earning over $1.8 billion in the first quarter of 2012. These results demonstrate the strength of our disciplined growth strategy and diversified business model which drive the earnings power of this organization. This morning, we announced a $.03 or 6% increase in our quarterly dividend,” said Gord Nixon, RBC President and CEO. “Looking ahead through 2012, we believe that we are very well positioned to continue extending our lead in Canada and building client relationships in select U.S. and international markets, while maintaining our strong capital position and strict risk and cost discipline.” Continuing operations: Q1 2012 compared to Q4 2011 • Net income of $1,876 million (up 17% from $1,609 million) • Diluted earnings per share (EPS) of $1.23 (up $.18 from $1.05) • Return on common equity (ROE) of 20.0% (up from 17.5%) • Tier 1 capital ratio of 12.2% • Announced a $.03, or 6%, increase to our quarterly dividend Continuing operations: Q1 2012 compared to Q1 2011 • Net income of $1,876 million (down 6% from $1,996 million) • Diluted EPS of $1.23 (down $.08 from $1.31) • ROE of 20.0% (down from 24.4%) Table of contents 1 First quarter highlights 2 Management’s Discussion and Analysis 2 Caution regarding forward-looking statements 2 Overview 2 About Royal Bank of Canada 3 Selected financial and other highlights 4 Economic, market and regulatory review and outlook 4 Financial performance 8 Business segment results 8 How we measure and report our business segments 9 Non-GAAP measures 9 Canadian Banking 10 Wealth Management 11 Insurance 12 International Banking 13 Capital Markets 14 Corporate Support 15 Quarterly results and trend analysis 16 Results by geographic segment 17 Financial condition 17 Condensed balance sheets 18 Off-balance sheet arrangements 20 Risk management 20 Credit risk 23 Credit quality performance 25 Market risk 27 Liquidity and funding management 28 Capital management 30 Additional financial information 30 Exposures to selected financial instruments 32 Accounting and control matters 33 Related party transactions 36 Interim Condensed Consolidated Financial Statements (unaudited) 39 Notes to the Interim Condensed Consolidated Financial Statements (unaudited) 96 Shareholder information
-
Upload
khangminh22 -
Category
Documents
-
view
0 -
download
0
Transcript of Report to Shareholders - About RBC
Report to Shareholders
Royal Bank of Canada first quarter 2012 results
All amounts are in Canadian dollars and are based on our unaudited Interim Condensed Consolidated Financial Statements for thequarter ended January 31, 2012 and related notes prepared in accordance with International Financial Reporting Standards (IFRS),unless otherwise noted.
TORONTO, March 1, 2012 – Royal Bank of Canada (RY on TSX and NYSE) today reported net income of $1,855 million for the firstquarter ended January 31, 2012. Net income from continuing operations was $1,876 million, up $267 million or 17% from lastquarter. These strong results were driven by record earnings in Canadian Banking reflecting solid business growth, higher earnings inCapital Markets and continued strength in Insurance and Wealth Management.
“RBC had an outstanding start to the year, earning over $1.8 billion in the first quarter of 2012. These results demonstrate thestrength of our disciplined growth strategy and diversified business model which drive the earnings power of this organization. Thismorning, we announced a $.03 or 6% increase in our quarterly dividend,” said Gord Nixon, RBC President and CEO. “Looking aheadthrough 2012, we believe that we are very well positioned to continue extending our lead in Canada and building client relationshipsin select U.S. and international markets, while maintaining our strong capital position and strict risk and cost discipline.”
Continuing operations: Q1 2012 compared to Q4 2011• Net income of $1,876 million (up 17% from $1,609 million)• Diluted earnings per share (EPS) of $1.23 (up $.18 from
$1.05)• Return on common equity (ROE) of 20.0% (up from 17.5%)• Tier 1 capital ratio of 12.2%• Announced a $.03, or 6%, increase to our quarterly dividend
Continuing operations: Q1 2012 compared to Q1 2011• Net income of $1,876 million (down 6% from
$1,996 million)• Diluted EPS of $1.23 (down $.08 from $1.31)• ROE of 20.0% (down from 24.4%)
Table of contents
1 First quarter highlights2 Management’s Discussion and
Analysis2 Caution regarding forward-looking
statements2 Overview
2 About Royal Bank of Canada3 Selected financial and other
highlights4 Economic, market and
regulatory review and outlook4 Financial performance8 Business segment results
8 How we measure and report ourbusiness segments
9 Non-GAAP measures9 Canadian Banking10 Wealth Management11 Insurance12 International Banking13 Capital Markets14 Corporate Support
15 Quarterly results and trend analysis16 Results by geographic segment17 Financial condition
17 Condensed balance sheets18 Off-balance sheet arrangements
20 Risk management20 Credit risk23 Credit quality performance
25 Market risk27 Liquidity and funding
management28 Capital management30 Additional financial information
30 Exposures to selected financialinstruments
32 Accounting and control matters33 Related party transactions36 Interim Condensed Consolidated
Financial Statements (unaudited)39 Notes to the Interim Condensed
Consolidated Financial Statements(unaudited)
96 Shareholder information
2 Royal Bank of Canada First Quarter 2012
Management’s Discussion and Analysis
Management’s Discussion and Analysis (MD&A) is provided to enable a reader to assess our results of operations and financialcondition for the three-month period ended or as at January 31, 2012, compared to the three-month periods ended January 31, 2011and October 31, 2011. This MD&A should be read in conjunction with our unaudited Interim Condensed Consolidated FinancialStatements for the quarter ended January 31, 2012 (unaudited Interim Condensed Consolidated Financial Statements) and relatednotes and our 2011 Annual Report to Shareholders (2011 Annual Report). This MD&A is dated February 29, 2012. All amounts are inCanadian dollars and are based on financial statements prepared in accordance with International Financial Reporting Standards(IFRS), unless otherwise noted.
Additional information about us, including our 2011 Annual Information Form, is available free of charge on our website at rbc.com/investorrelations, on the Canadian Securities Administrators’ website at sedar.com and on the EDGAR section of the United StatesSecurities and Exchange Commission’s (SEC) website at sec.gov.
Caution regarding forward-looking statements
From time to time, we make written or oral forward-looking statements within the meaning of certain securities laws, including the“safe harbour” provisions of the United States Private Securities Litigation Reform Act of 1995 and any applicable Canadian securitieslegislation. We may make forward-looking statements in this Q1 2012 Report to Shareholders, in other filings with Canadianregulators or the SEC, in reports to shareholders and in other communications. Forward-looking statements in this document include,but are not limited to, statements relating to our financial performance objectives, our vision and strategic goals, the Economic,market and regulatory review and outlook for Canadian, U.S., European and global economies, the outlook and priorities for each ofour business segments, and the risk environment including our liquidity and funding management. The forward-looking informationcontained in this document is presented for the purpose of assisting the holders of our securities and financial analysts inunderstanding our financial position and results of operations as at and for the periods ended on the dates presented and our visionand strategic goals and financial performance objectives, and may not be appropriate for other purposes. Forward-looking statementsare typically identified by words such as “believe”, “expect”, “foresee”, “forecast”, “anticipate”, “intend”, “estimate”, “goal”, “plan”and “project” and similar expressions of future or conditional verbs such as “will”, “may”, “should”, “could” or “would”.
By their very nature, forward-looking statements require us to make assumptions and are subject to inherent risks anduncertainties, which give rise to the possibility that our predictions, forecasts, projections, expectations or conclusions will not prove tobe accurate, that our assumptions may not be correct and that our financial performance objectives, vision and strategic goals will notbe achieved. We caution readers not to place undue reliance on these statements as a number of risk factors could cause our actualresults to differ materially from the expectations expressed in such forward-looking statements. These factors – many of which arebeyond our control and the effects of which can be difficult to predict – include: credit, market, operational, and liquidity and fundingrisks, and other risks discussed in the Risk management section of our 2011 Annual Report and in our Q1 2012 Report to Shareholders;general business, economic and financial market conditions in Canada, the United States and certain other countries in which weconduct business, including the effects of the European sovereign debt crisis and the lowering of the U.S. long-term sovereign creditrating by Standard & Poor’s; changes in accounting standards, policies and estimates, including changes in our estimates ofprovisions, allowances and valuations; the effects of changes in government fiscal, monetary and other policies; changes to and newinterpretations of risk-based capital and liquidity guidelines; the impact of changes in laws and regulations, including relating to thepayments system in Canada, consumer protection measures and the Dodd-Frank Wall Street Reform and Consumer Protection Act andthe regulations issued and to be issued thereunder; the effects of competition in the markets in which we operate; our ability to attractand retain employees; judicial or regulatory judgments and legal proceedings; the accuracy and completeness of informationconcerning our clients and counterparties; our ability to successfully execute our strategies and to complete and integrate strategicacquisitions and joint ventures successfully; development and integration of our distribution networks; and the impact ofenvironmental issues.
We caution that the foregoing list of risk factors is not exhaustive and other factors could also adversely affect our results. Whenrelying on our forward-looking statements to make decisions with respect to us, investors and others should carefully consider theforegoing factors and other uncertainties and potential events. Except as required by law, we do not undertake to update any forward-looking statement, whether written or oral, that may be made from time to time by us or on our behalf.
Additional information about these and other factors can be found in the Risk management and Overview of other risks sectionsof our 2011 Annual Report and in the Risk management section of our Q1 2012 Report to Shareholders.
Information contained in or otherwise accessible through the websites mentioned does not form part of this report. All references inthis report to websites are inactive textual references and are for your information only.
Overview
About Royal Bank of Canada
Royal Bank of Canada (RY on TSX and NYSE) and its subsidiaries operate under the master brand name RBC. We are Canada’s largestbank as measured by assets and market capitalization, and among the largest banks in the world, based on market capitalization. Weare one of North America’s leading diversified financial services companies, and provide personal and commercial banking, wealthmanagement services, insurance, corporate and investment banking and transaction processing services on a global basis. Weemploy approximately 74,000 full- and part-time employees who serve close to 16 million personal, business, public sector andinstitutional clients through offices in Canada, the U.S. and 51 other countries. For more information, please visit rbc.com.
Royal Bank of Canada First Quarter 2012 3
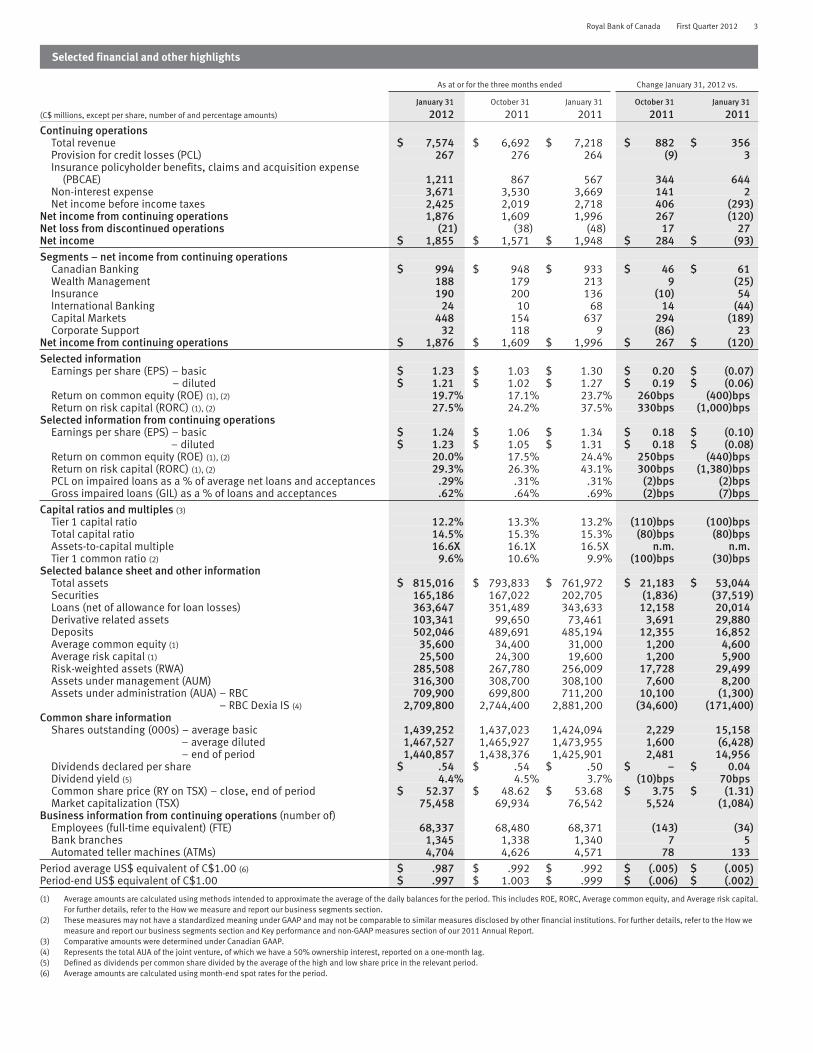
Selected financial and other highlights
As at or for the three months ended Change January 31, 2012 vs.
(C$ millions, except per share, number of and percentage amounts)
January 31
2012October 31
2011January 31
2011October 31
2011January 31
2011Continuing operations
Total revenue $ 7,574 $ 6,692 $ 7,218 $ 882 $ 356Provision for credit losses (PCL) 267 276 264 (9) 3Insurance policyholder benefits, claims and acquisition expense
(PBCAE) 1,211 867 567 344 644Non-interest expense 3,671 3,530 3,669 141 2Net income before income taxes 2,425 2,019 2,718 406 (293)
Net income from continuing operations 1,876 1,609 1,996 267 (120)Net loss from discontinued operations (21) (38) (48) 17 27Net income $ 1,855 $ 1,571 $ 1,948 $ 284 $ (93)Segments – net income from continuing operations
Canadian Banking $ 994 $ 948 $ 933 $ 46 $ 61Wealth Management 188 179 213 9 (25)Insurance 190 200 136 (10) 54International Banking 24 10 68 14 (44)Capital Markets 448 154 637 294 (189)Corporate Support 32 118 9 (86) 23
Net income from continuing operations $ 1,876 $ 1,609 $ 1,996 $ 267 $ (120)Selected information
Earnings per share (EPS) – basic $ 1.23 $ 1.03 $ 1.30 $ 0.20 $ (0.07)– diluted $ 1.21 $ 1.02 $ 1.27 $ 0.19 $ (0.06)
Return on common equity (ROE) (1), (2) 19.7% 17.1% 23.7% 260bps (400)bpsReturn on risk capital (RORC) (1), (2) 27.5% 24.2% 37.5% 330bps (1,000)bps
Selected information from continuing operationsEarnings per share (EPS) – basic $ 1.24 $ 1.06 $ 1.34 $ 0.18 $ (0.10)
– diluted $ 1.23 $ 1.05 $ 1.31 $ 0.18 $ (0.08)Return on common equity (ROE) (1), (2) 20.0% 17.5% 24.4% 250bps (440)bpsReturn on risk capital (RORC) (1), (2) 29.3% 26.3% 43.1% 300bps (1,380)bpsPCL on impaired loans as a % of average net loans and acceptances .29% .31% .31% (2)bps (2)bpsGross impaired loans (GIL) as a % of loans and acceptances .62% .64% .69% (2)bps (7)bps
Capital ratios and multiples (3)
Tier 1 capital ratio 12.2% 13.3% 13.2% (110)bps (100)bpsTotal capital ratio 14.5% 15.3% 15.3% (80)bps (80)bpsAssets-to-capital multiple 16.6X 16.1X 16.5X n.m. n.m.Tier 1 common ratio (2) 9.6% 10.6% 9.9% (100)bps (30)bps
Selected balance sheet and other informationTotal assets $ 815,016 $ 793,833 $ 761,972 $ 21,183 $ 53,044Securities 165,186 167,022 202,705 (1,836) (37,519)Loans (net of allowance for loan losses) 363,647 351,489 343,633 12,158 20,014Derivative related assets 103,341 99,650 73,461 3,691 29,880Deposits 502,046 489,691 485,194 12,355 16,852Average common equity (1) 35,600 34,400 31,000 1,200 4,600Average risk capital (1) 25,500 24,300 19,600 1,200 5,900Risk-weighted assets (RWA) 285,508 267,780 256,009 17,728 29,499Assets under management (AUM) 316,300 308,700 308,100 7,600 8,200Assets under administration (AUA) – RBC 709,900 699,800 711,200 10,100 (1,300)
– RBC Dexia IS (4) 2,709,800 2,744,400 2,881,200 (34,600) (171,400)Common share information
Shares outstanding (000s) – average basic 1,439,252 1,437,023 1,424,094 2,229 15,158– average diluted 1,467,527 1,465,927 1,473,955 1,600 (6,428)– end of period 1,440,857 1,438,376 1,425,901 2,481 14,956
Dividends declared per share $ .54 $ .54 $ .50 $ – $ 0.04Dividend yield (5) 4.4% 4.5% 3.7% (10)bps 70bpsCommon share price (RY on TSX) – close, end of period $ 52.37 $ 48.62 $ 53.68 $ 3.75 $ (1.31)Market capitalization (TSX) 75,458 69,934 76,542 5,524 (1,084)
Business information from continuing operations (number of)Employees (full-time equivalent) (FTE) 68,337 68,480 68,371 (143) (34)Bank branches 1,345 1,338 1,340 7 5Automated teller machines (ATMs) 4,704 4,626 4,571 78 133
Period average US$ equivalent of C$1.00 (6) $ .987 $ .992 $ .992 $ (.005) $ (.005)Period-end US$ equivalent of C$1.00 $ .997 $ 1.003 $ .999 $ (.006) $ (.002)
(1) Average amounts are calculated using methods intended to approximate the average of the daily balances for the period. This includes ROE, RORC, Average common equity, and Average risk capital.For further details, refer to the How we measure and report our business segments section.
(2) These measures may not have a standardized meaning under GAAP and may not be comparable to similar measures disclosed by other financial institutions. For further details, refer to the How wemeasure and report our business segments section and Key performance and non-GAAP measures section of our 2011 Annual Report.
(3) Comparative amounts were determined under Canadian GAAP.(4) Represents the total AUA of the joint venture, of which we have a 50% ownership interest, reported on a one-month lag.(5) Defined as dividends per common share divided by the average of the high and low share price in the relevant period.(6) Average amounts are calculated using month-end spot rates for the period.

4 Royal Bank of Canada First Quarter 2012
Economic, market and regulatory review and outlook – data as at February 29, 2012
CanadaThe Canadian economy slowed in the fourth calendar quarter of 2011, to an estimated growth rate of 1.5%, driven by moderatingbusiness spending and exports, reflecting global economic uncertainty. The unemployment rate increased to 7.6% in January aslabour markets slowed after prior periods of higher than expected employment growth. We expect improved economic growth in 2012of 2.3%, slightly lower than our previously forecasted estimate of 2.5%. Improved growth is expected to be driven by stronger U.S.activity and higher business investment as the global economy stabilizes. Given high consumer debt ratios, we expect home equityproduct volume growth to moderate partly offset by higher wholesale loan growth reflecting increased business spending. Due tocontinued global economic uncertainty, we now expect future interest rate increases to be delayed until early 2013, which will putfurther pressure on net interest margins.
United StatesThe U.S. economy grew in the fourth calendar quarter of 2011 at a rate of 2.8%, reflecting inventory rebuilding and slightly higherconsumer spending. Continued growth is expected in 2012 at a rate of 2.4%, although at a lower rate than our previously forecastedestimate of 2.5%. Moderate growth is expected to be mainly driven by higher business investment reflecting the low interest rateenvironment. Concerns relating to the negative economic impact from market uncertainty and sovereign debt issues remainheightened. As a result, the Federal Reserve announced a new commitment to extend interest rates at historically low levels until thelatter half of 2014.
EuropeThe Eurozone economy contracted in the fourth calendar quarter of 2011, declining at an estimated rate of -.3% as sovereign debtconcerns continued to weaken consumer and business spending. Overall for 2012, we expect contraction to continue in 2012 at arate of -.1%, weaker than our previously forecasted growth estimate of 0.9%. Contraction is expected in the first half of calendar 2012with moderate economic growth returning in the second half driven by increased business activity. Concerns remain heightenedrelating to the economic impact of government fiscal austerity plans. Interest rates decreased further to 1.0% in early 2012 and areexpected to remain low for the remainder of 2012 in order to provide additional economic stimulus.
Financial marketsGlobal capital markets remained fragile in the first fiscal quarter as client uncertainty over the global economy remained heightened.Market conditions improved slightly, mainly in fixed income, reflecting tightening credit spreads, lower market volatility and improvedclient volumes. Equity markets improved moderately during the latter part of the quarter mainly reflecting improved corporateearnings. Funding costs for financial institutions remained under pressure although coordinated efforts by global central banks toprovide additional liquidity eased global funding concerns and improved market conditions. Loan growth, mainly in wholesale, isexpected to increase driven by the low interest rate environment while origination activity is expected to moderate reflecting lowerissuance volumes, particularly in debt.
Regulatory environmentWe continue to respond to global regulatory developments such as capital and liquidity requirements under the Basel Committee onBanking Supervision global standards (Basel III), Over-the-Counter Derivatives reform, new consumer protection measures andspecific financial reforms such as the Dodd-Frank Wall Street Reform and Consumer Protection Act. We continue to monitor these andother developments and are working to ensure business impacts, if any, are minimized.
For further details on risk factors resulting from global regulatory developments which may affect our business and financialresults, refer to the Overview of other risks section of our 2011 Annual Report. For further details on our framework and activities tomanage risks, refer to the Risk management and Capital management sections of our 2011 Annual Report.
Financial performance
Adoption of IFRSOur unaudited Interim Condensed Consolidated Financial Statements have been prepared in accordance with International FinancialReporting Standards (IFRS) as issued by the International Accounting Standards Board (IASB) and are presented in compliance withInternational Accounting Standard (IAS) 34, Interim Financial Reporting. The unaudited Interim Condensed Consolidated FinancialStatements for the period ended or as at January 31, 2012 reflect our first set of financial statements prepared under IFRS and includecorresponding comparative IFRS financial information for the three-month periods ended January 31, 2011 and October 31, 2011. Forfurther details on the impacts of the adoption of IFRS including the description of accounting policies selected, refer to the Accountingand control matters section, Note 2, 3 and 19 to our unaudited Interim Condensed Consolidated Financial Statements, and theAdoption of International Financial Reporting Standards section in our 2011 Annual Report.
OverviewQ1 2012 vs. Q1 2011We reported net income of $1,855 million, down $93 million or 5% from a year ago. Diluted earnings per share (EPS) of $1.21decreased $.06 and return on common equity (ROE) of 19.7% decreased 400 basis points (bps). Our Tier 1 capital ratio was 12.2%down 100 bps from last year. For further details on our Tier 1 capital ratio, refer to the Capital management section.
Q1 2012 vs. Q4 2011Net income increased $284 million or 18% from the prior quarter. Diluted EPS increased $.19 and ROE was up 260 bps from lastquarter.

Royal Bank of Canada First Quarter 2012 5
Continuing operationsQ1 2012 vs. Q1 2011 and Q4 2011Net income from continuing operations was $1,876 million, down $120 million or 6% from a year ago. Diluted EPS from continuingoperations of $1.23 decreased $.08 and ROE from continuing operations was 20.0%, down 440 bps from the prior year. Strongbusiness growth and improved credit quality across most businesses in Canadian Banking, higher earnings in Insurance reflecting netgains on investments and business growth and a lower effective tax rate were more than offset by solid but lower earnings in CapitalMarkets compared to record earnings last year. Lower results in International Banking reflecting the continuing unfavourableeconomic conditions in the Caribbean and lower transaction volumes in Wealth Management reflecting continued investor uncertaintyalso contributed to the decrease.
Compared to the prior quarter, net income from continuing operations was up $267 million, or 17%, largely due to significantlyhigher fixed income trading revenue in Capital Markets reflecting improved market conditions compared to the challenging marketconditions of last quarter, and solid volume growth across most businesses in Canadian Banking. Improved results in WealthManagement, and International Banking, reflecting lower provision for credit losses (PCL) in our Caribbean banking business, alsocontributed to the increase. The increase was partially offset by slightly lower earnings in Insurance due to higher claims costs andlower U.K. annuity reinsurance earnings.
Canadian Banking net income was $994 million, up $61 million or 7% from last year, reflecting strong volume growth across mostbusinesses, improved credit quality as well as a lower effective tax rate. These factors were partially offset by spread compression andhigher costs in support of business growth. Compared to the prior quarter, net income was up $46 million or 5% mainly due to solidvolume growth across most businesses, as well as a lower effective tax rate and seasonally lower marketing costs. Non-interestexpense decreased despite strong volume growth, as a result of our ongoing focus on cost management.
Wealth Management net income was $188 million, down $25 million or 12% from last year, mainly due to lower transactionvolumes reflecting continued investor uncertainty and higher costs in support of business growth. These factors were partially offsetby higher average fee-based client assets. Compared to the prior quarter, net income was up $9 million or 5%, relatively flat given thecontinued market and investor uncertainty in the early part of the quarter.
Insurance net income was $190 million, up $54 million or 40% from last year, mainly due to net investment gains as compared tonet losses last year. The impact of a new U.K. annuity reinsurance contract and lower claims costs in disability and home and autoproducts also contributed to the increase. These factors were partially offset by higher claims costs in reinsurance products andunfavourable life policyholder experience. Compared to the prior quarter, net income was down $10 million or 5% mainly due tohigher claims costs in reinsurance and home and auto products, and a lower impact this quarter from the U.K. annuity reinsurancecontracts. These factors were partially offset by favourable actuarial adjustments and higher net investment gains this quarter.
International Banking net income was $24 million, down $44 million or 65% from last year, mainly driven by lower results inCaribbean banking reflecting spread compression and higher staff costs. These factors were partially offset by lower PCL in Caribbeanbanking. In addition, the prior year included a partial reversal of litigation provisions in Caribbean banking that favourably impactedresults in that year. Compared to the prior quarter, net income was up $14 million, primarily due to lower PCL and lower costs inCaribbean banking. These factors were partially offset by taxes paid on intercompany transfers in Caribbean banking and lowerearnings at RBC Dexia. In addition, the prior quarter included favourable net stamp tax and accounting adjustments in Caribbeanbanking.
Capital Markets net income was $448 million, down $189 million or 30% from last year, mainly due to lower trading results anddecreased debt and equity origination compared to record earnings last year. Trading revenue in the prior year also reflected gainsrelated to MBIA Inc. (MBIA) and a consolidated special purpose entity (SPE) from which we exited all of the third party transactionsduring the current quarter. Compared to the prior quarter, net income was up $294 million driven by significantly higher fixed incometrading results. Solid growth in debt and equity origination and loan syndication fees also contributed to the increase. Our fixedincome trading business benefitted from improved market conditions as compared to the challenging market conditions of lastquarter. Last quarter, trading results also reflected a loss related to a consolidated SPE from which we exited all of the third partytransactions during the current quarter.
Corporate Support net income was $32 million largely due to our asset/liability management activities undertaken by CorporateTreasury reflecting earnings from positioning for changes in interest rates, partially offset by an unfavourable tax adjustment.
Discontinued operationsQ1 2012 vs. Q1 2011Net loss from discontinued operations was $21 million compared to a net loss of $48 million a year ago, largely due to lower PCL inour U.S. commercial real estate and builder finance portfolios reflecting stabilizing asset quality.
Q1 2012 vs. Q4 2011Net loss from discontinued operations improved from a net loss of $38 million in the previous quarter, largely due to gains on certainsecurities compared to a loss in the previous quarter and lower professional fees and marketing costs, partially offset by higher PCL.
Balance sheet adjustments related to discontinued operations are made prospectively from the date of classification asdiscontinued operations. The classification of our U.S. retail banking operations as discontinued operations was reflected beginningin the third quarter ending July 31, 2011. The sale of Liberty Life Insurance Company announced in October 2010 was reflected asdiscontinued operations from the Transition date as at November 1, 2010.
Assets and liabilities of discontinued operations related to the announced sale of our U.S. regional retail banking operations were$26,324 million (October 31, 2011 – $27,152 million) and $19,488 million (October 31, 2011 – $20,076 million) respectively. Theseitems are presented as assets or liabilities of discontinued operations in our unaudited Interim Condensed Consolidated BalanceSheets.
Assets and liabilities of discontinued operations related to Liberty Life as at January 31, 2012 were $nil (January 31, 2011 –$5,555 million; October 31, 2011 – $nil) and $nil (January 31, 2011 – $4,822 million; October 31, 2011 – $nil) respectively.
6 Royal Bank of Canada First Quarter 2012
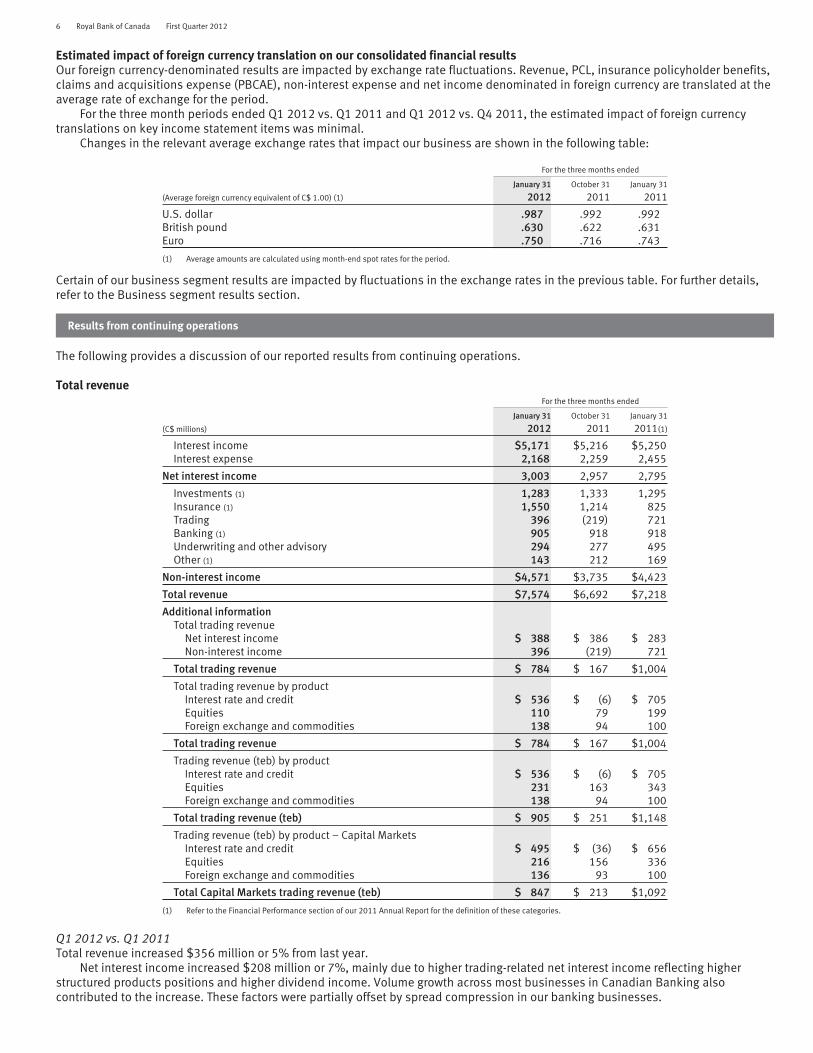
Estimated impact of foreign currency translation on our consolidated financial resultsOur foreign currency-denominated results are impacted by exchange rate fluctuations. Revenue, PCL, insurance policyholder benefits,claims and acquisitions expense (PBCAE), non-interest expense and net income denominated in foreign currency are translated at theaverage rate of exchange for the period.
For the three month periods ended Q1 2012 vs. Q1 2011 and Q1 2012 vs. Q4 2011, the estimated impact of foreign currencytranslations on key income statement items was minimal.
Changes in the relevant average exchange rates that impact our business are shown in the following table:
For the three months ended
(Average foreign currency equivalent of C$ 1.00) (1)
January 31
2012October 31
2011January 31
2011
U.S. dollar .987 .992 .992British pound .630 .622 .631Euro .750 .716 .743
(1) Average amounts are calculated using month-end spot rates for the period.
Certain of our business segment results are impacted by fluctuations in the exchange rates in the previous table. For further details,refer to the Business segment results section.
Results from continuing operations
The following provides a discussion of our reported results from continuing operations.
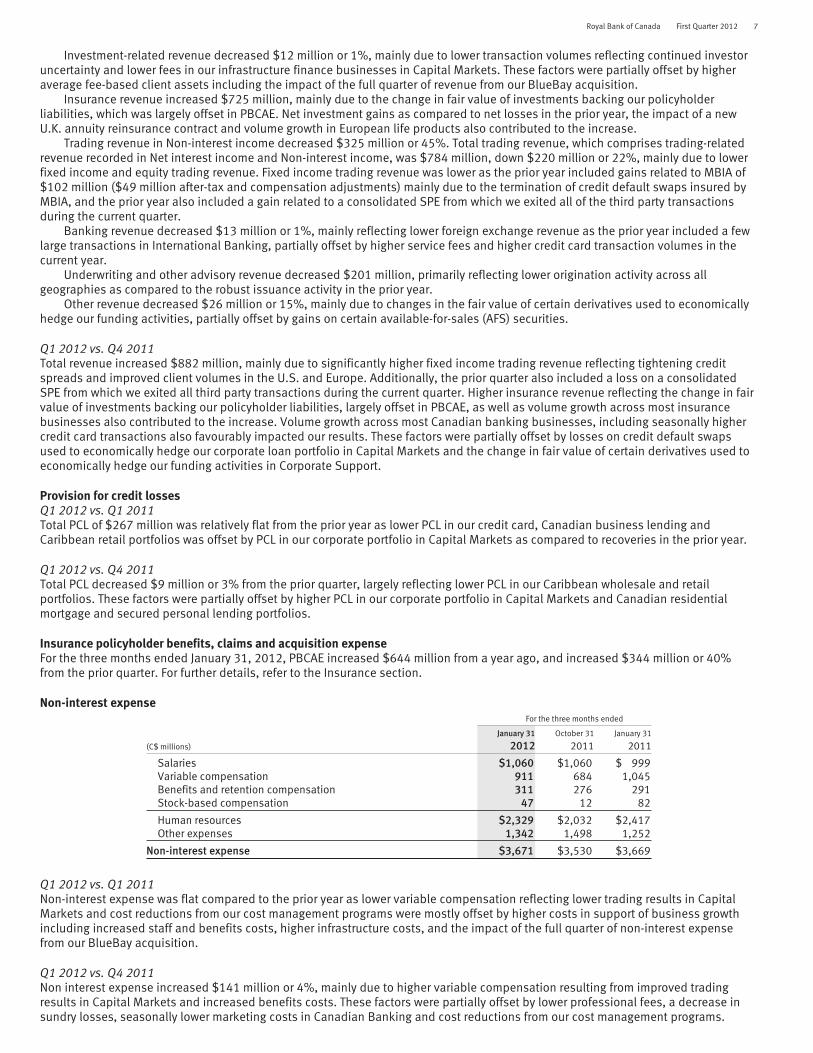
Total revenueFor the three months ended
(C$ millions)
January 31
2012October 31
2011January 31
2011(1)
Interest income $5,171 $5,216 $5,250Interest expense 2,168 2,259 2,455
Net interest income 3,003 2,957 2,795
Investments (1) 1,283 1,333 1,295Insurance (1) 1,550 1,214 825Trading 396 (219) 721Banking (1) 905 918 918Underwriting and other advisory 294 277 495Other (1) 143 212 169
Non-interest income $4,571 $3,735 $4,423
Total revenue $7,574 $6,692 $7,218
Additional informationTotal trading revenue
Net interest income $ 388 $ 386 $ 283Non-interest income 396 (219) 721
Total trading revenue $ 784 $ 167 $1,004
Total trading revenue by productInterest rate and credit $ 536 $ (6) $ 705Equities 110 79 199Foreign exchange and commodities 138 94 100
Total trading revenue $ 784 $ 167 $1,004
Trading revenue (teb) by productInterest rate and credit $ 536 $ (6) $ 705Equities 231 163 343Foreign exchange and commodities 138 94 100
Total trading revenue (teb) $ 905 $ 251 $1,148
Trading revenue (teb) by product – Capital MarketsInterest rate and credit $ 495 $ (36) $ 656Equities 216 156 336Foreign exchange and commodities 136 93 100
Total Capital Markets trading revenue (teb) $ 847 $ 213 $1,092
(1) Refer to the Financial Performance section of our 2011 Annual Report for the definition of these categories.
Q1 2012 vs. Q1 2011Total revenue increased $356 million or 5% from last year.
Net interest income increased $208 million or 7%, mainly due to higher trading-related net interest income reflecting higherstructured products positions and higher dividend income. Volume growth across most businesses in Canadian Banking alsocontributed to the increase. These factors were partially offset by spread compression in our banking businesses.
Royal Bank of Canada First Quarter 2012 7
Investment-related revenue decreased $12 million or 1%, mainly due to lower transaction volumes reflecting continued investoruncertainty and lower fees in our infrastructure finance businesses in Capital Markets. These factors were partially offset by higheraverage fee-based client assets including the impact of the full quarter of revenue from our BlueBay acquisition.
Insurance revenue increased $725 million, mainly due to the change in fair value of investments backing our policyholderliabilities, which was largely offset in PBCAE. Net investment gains as compared to net losses in the prior year, the impact of a newU.K. annuity reinsurance contract and volume growth in European life products also contributed to the increase.
Trading revenue in Non-interest income decreased $325 million or 45%. Total trading revenue, which comprises trading-relatedrevenue recorded in Net interest income and Non-interest income, was $784 million, down $220 million or 22%, mainly due to lowerfixed income and equity trading revenue. Fixed income trading revenue was lower as the prior year included gains related to MBIA of$102 million ($49 million after-tax and compensation adjustments) mainly due to the termination of credit default swaps insured byMBIA, and the prior year also included a gain related to a consolidated SPE from which we exited all of the third party transactionsduring the current quarter.
Banking revenue decreased $13 million or 1%, mainly reflecting lower foreign exchange revenue as the prior year included a fewlarge transactions in International Banking, partially offset by higher service fees and higher credit card transaction volumes in thecurrent year.
Underwriting and other advisory revenue decreased $201 million, primarily reflecting lower origination activity across allgeographies as compared to the robust issuance activity in the prior year.
Other revenue decreased $26 million or 15%, mainly due to changes in the fair value of certain derivatives used to economicallyhedge our funding activities, partially offset by gains on certain available-for-sales (AFS) securities.
Q1 2012 vs. Q4 2011Total revenue increased $882 million, mainly due to significantly higher fixed income trading revenue reflecting tightening creditspreads and improved client volumes in the U.S. and Europe. Additionally, the prior quarter also included a loss on a consolidatedSPE from which we exited all third party transactions during the current quarter. Higher insurance revenue reflecting the change in fairvalue of investments backing our policyholder liabilities, largely offset in PBCAE, as well as volume growth across most insurancebusinesses also contributed to the increase. Volume growth across most Canadian banking businesses, including seasonally highercredit card transactions also favourably impacted our results. These factors were partially offset by losses on credit default swapsused to economically hedge our corporate loan portfolio in Capital Markets and the change in fair value of certain derivatives used toeconomically hedge our funding activities in Corporate Support.
Provision for credit lossesQ1 2012 vs. Q1 2011Total PCL of $267 million was relatively flat from the prior year as lower PCL in our credit card, Canadian business lending andCaribbean retail portfolios was offset by PCL in our corporate portfolio in Capital Markets as compared to recoveries in the prior year.
Q1 2012 vs. Q4 2011Total PCL decreased $9 million or 3% from the prior quarter, largely reflecting lower PCL in our Caribbean wholesale and retailportfolios. These factors were partially offset by higher PCL in our corporate portfolio in Capital Markets and Canadian residentialmortgage and secured personal lending portfolios.
Insurance policyholder benefits, claims and acquisition expenseFor the three months ended January 31, 2012, PBCAE increased $644 million from a year ago, and increased $344 million or 40%from the prior quarter. For further details, refer to the Insurance section.
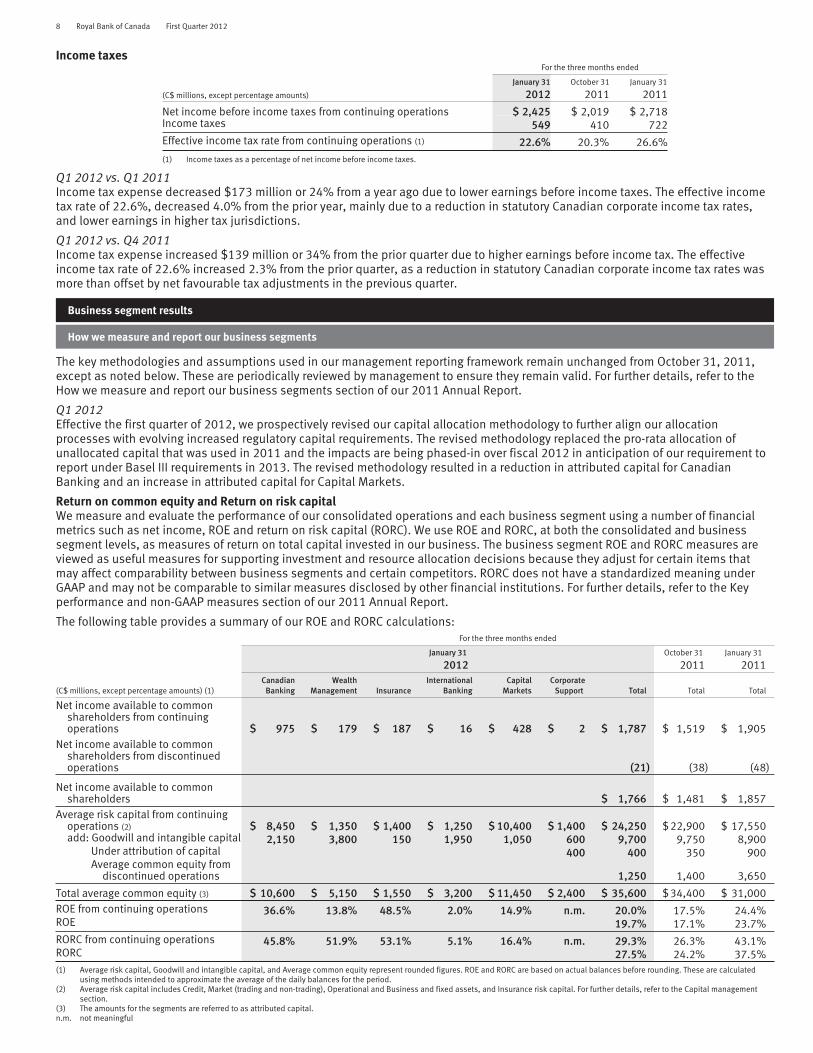
Non-interest expenseFor the three months ended
January 31 October 31 January 31
(C$ millions) 2012 2011 2011
Salaries $1,060 $1,060 $ 999Variable compensation 911 684 1,045Benefits and retention compensation 311 276 291Stock-based compensation 47 12 82
Human resources $2,329 $2,032 $2,417Other expenses 1,342 1,498 1,252
Non-interest expense $3,671 $3,530 $3,669
Q1 2012 vs. Q1 2011Non-interest expense was flat compared to the prior year as lower variable compensation reflecting lower trading results in CapitalMarkets and cost reductions from our cost management programs were mostly offset by higher costs in support of business growthincluding increased staff and benefits costs, higher infrastructure costs, and the impact of the full quarter of non-interest expensefrom our BlueBay acquisition.
Q1 2012 vs. Q4 2011Non interest expense increased $141 million or 4%, mainly due to higher variable compensation resulting from improved tradingresults in Capital Markets and increased benefits costs. These factors were partially offset by lower professional fees, a decrease insundry losses, seasonally lower marketing costs in Canadian Banking and cost reductions from our cost management programs.
8 Royal Bank of Canada First Quarter 2012
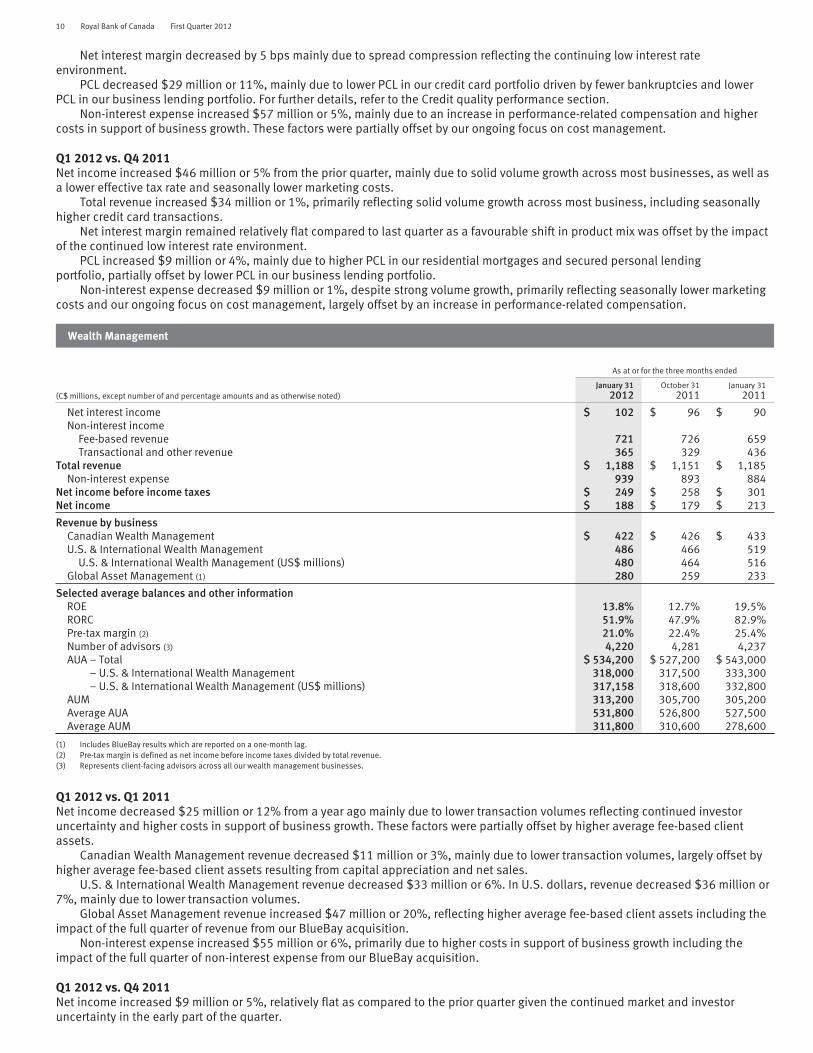
Income taxesFor the three months ended
January 31 October 31 January 31
(C$ millions, except percentage amounts) 2012 2011 2011
Net income before income taxes from continuing operations $ 2,425 $ 2,019 $ 2,718Income taxes 549 410 722Effective income tax rate from continuing operations (1) 22.6% 20.3% 26.6%
(1) Income taxes as a percentage of net income before income taxes.
Q1 2012 vs. Q1 2011Income tax expense decreased $173 million or 24% from a year ago due to lower earnings before income taxes. The effective incometax rate of 22.6%, decreased 4.0% from the prior year, mainly due to a reduction in statutory Canadian corporate income tax rates,and lower earnings in higher tax jurisdictions.
Q1 2012 vs. Q4 2011Income tax expense increased $139 million or 34% from the prior quarter due to higher earnings before income tax. The effectiveincome tax rate of 22.6% increased 2.3% from the prior quarter, as a reduction in statutory Canadian corporate income tax rates wasmore than offset by net favourable tax adjustments in the previous quarter.
Business segment results
How we measure and report our business segments
The key methodologies and assumptions used in our management reporting framework remain unchanged from October 31, 2011,except as noted below. These are periodically reviewed by management to ensure they remain valid. For further details, refer to theHow we measure and report our business segments section of our 2011 Annual Report.
Q1 2012Effective the first quarter of 2012, we prospectively revised our capital allocation methodology to further align our allocationprocesses with evolving increased regulatory capital requirements. The revised methodology replaced the pro-rata allocation ofunallocated capital that was used in 2011 and the impacts are being phased-in over fiscal 2012 in anticipation of our requirement toreport under Basel III requirements in 2013. The revised methodology resulted in a reduction in attributed capital for CanadianBanking and an increase in attributed capital for Capital Markets.
Return on common equity and Return on risk capitalWe measure and evaluate the performance of our consolidated operations and each business segment using a number of financialmetrics such as net income, ROE and return on risk capital (RORC). We use ROE and RORC, at both the consolidated and businesssegment levels, as measures of return on total capital invested in our business. The business segment ROE and RORC measures areviewed as useful measures for supporting investment and resource allocation decisions because they adjust for certain items thatmay affect comparability between business segments and certain competitors. RORC does not have a standardized meaning underGAAP and may not be comparable to similar measures disclosed by other financial institutions. For further details, refer to the Keyperformance and non-GAAP measures section of our 2011 Annual Report.
The following table provides a summary of our ROE and RORC calculations:For the three months ended
January 31 October 31 January 31
2012 2011 2011
(C$ millions, except percentage amounts) (1)Canadian
BankingWealth
Management InsuranceInternational
BankingCapital
MarketsCorporate
Support Total Total Total
Net income available to commonshareholders from continuingoperations $ 975 $ 179 $ 187 $ 16 $ 428 $ 2 $ 1,787 $ 1,519 $ 1,905
Net income available to commonshareholders from discontinuedoperations (21) (38) (48)
Net income available to commonshareholders $ 1,766 $ 1,481 $ 1,857
Average risk capital from continuingoperations (2) $ 8,450 $ 1,350 $ 1,400 $ 1,250 $ 10,400 $ 1,400 $ 24,250 $ 22,900 $ 17,550add: Goodwill and intangible capital 2,150 3,800 150 1,950 1,050 600 9,700 9,750 8,900
Under attribution of capital 400 400 350 900Average common equity from
discontinued operations 1,250 1,400 3,650
Total average common equity (3) $ 10,600 $ 5,150 $ 1,550 $ 3,200 $ 11,450 $ 2,400 $ 35,600 $ 34,400 $ 31,000ROE from continuing operations 36.6% 13.8% 48.5% 2.0% 14.9% n.m. 20.0% 17.5% 24.4%ROE 19.7% 17.1% 23.7%RORC from continuing operations 45.8% 51.9% 53.1% 5.1% 16.4% n.m. 29.3% 26.3% 43.1%RORC 27.5% 24.2% 37.5%(1) Average risk capital, Goodwill and intangible capital, and Average common equity represent rounded figures. ROE and RORC are based on actual balances before rounding. These are calculated
using methods intended to approximate the average of the daily balances for the period.(2) Average risk capital includes Credit, Market (trading and non-trading), Operational and Business and fixed assets, and Insurance risk capital. For further details, refer to the Capital management
section.(3) The amounts for the segments are referred to as attributed capital.n.m. not meaningful

Royal Bank of Canada First Quarter 2012 9
Non-GAAP measures
Economic profit on a continuing operations basisEconomic profit is net income from continuing operations excluding the after-tax effect of amortization of other intangibles less acapital charge for use of attributed capital. It measures the return generated by our businesses in excess of our cost of capital, thusenabling users to identify relative contributions by each segment to shareholder value. Economic profit is a non-GAAP measure anddoes not have a standardized meaning under GAAP and may not be comparable to similar measures disclosed by other financialinstitutions.
The capital charge includes a charge for common equity and preferred shares. We prospectively revised our cost of equity in thefirst quarter of 2012 to 9.5% from 10% in 2011.
The following table provides a summary of our Economic profit on a continuing basis:
For the three months ended
January 31,2012
October 312011
January 312011
(C$ millions)Canadian
BankingWealth
Management InsuranceInternational
BankingCapital
MarketsCorporate
Support Total Total Total
Net income from continuing operations $ 994 $ 188 $ 190 $ 24 $ 448 $ 32 $ 1,876 $ 1,609 $ 1,996add: Non-controlling interests – – – (2) 1 (24) (25) (25) (26)
After-tax effect of amortization of otherintangibles – 15 – 12 1 1 29 31 29
Cash net income $ 994 $ 203 $ 190 $ 34 $ 450 $ 9 $ 1,880 $ 1,615 $ 1,999less: Capital charge 275 133 40 82 297 55 882 892 747
Economic profit from continuing operations $ 719 $ 70 $ 150 $ (48) $ 153 $ (46) $ 998 $ 723 $ 1,252
Canadian Banking
As at or for the three months ended
(C$ millions, except number of and percentage amounts and as otherwise noted)January 31
2012October 31
2011January 31
2011
Net interest income $ 2,064 $ 2,036 $ 1,991Non-interest income 821 815 811
Total revenue 2,885 2,851 2,802PCL 243 234 272Non-interest expense 1,294 1,303 1,237
Net income before income taxes 1,348 1,314 1,293Net income 994 948 933
Revenue by businessPersonal Financial Services 1,575 1,571 1,552Business Financial Services 721 708 683Cards and Payment Solutions 589 572 567
Selected average balances and other informationROE 36.6% 33.3% 43.7%RORC 45.8% 41.5% 57.7%NIM (1) 2.75% 2.75% 2.80%Efficiency ratio 44.9% 45.7% 44.1%Operating leverage (1.6)% n.a. n.a.Effective income tax rate 26.3% 27.9% 27.8%Average total earning assets (2) 298,600 294,300 282,400Average loans and acceptances (2) 300,600 295,800 280,500Average deposits 225,500 219,500 201,200AUA $ 161,500 $ 158,000 $ 154,600PCL on impaired loans as a % of average net loans and acceptances 0.32% 0.31% 0.38%
(1) NIM is calculated as Net interest income divided by Average total earning assets.(2) Average total earnings assets and average loans and acceptances include average securitized residential mortgages and credit card loans for the three months ended January 31, 2012 of $42.2
billion and $3.9 billion, respectively (October 31, 2011 – $41.5 billion and $3.9 billion; January 31, 2011 – $40 billion and $2 billion).
Q1 2012 vs. Q1 2011Net income increased $61 million or 7% compared to the prior year, reflecting strong volume growth across most businesses,improved credit quality as well as a lower effective tax rate. These factors were partially offset by spread compression and higher costsin support of business growth.
Total revenue increased $83 million or 3% from the previous year.Personal Financial Services revenue increased $23 million or 1%, reflecting strong volume growth in personal deposits, home
equity products and personal loans, largely offset by lower spreads on deposits and loans and lower brokerage volumes.Business Financial Services revenue increased $38 million or 6%, reflecting strong volume growth in business deposits and
loans, partially offset by lower spreads on deposits and loans.Cards and Payment Solutions revenue increased $22 million or 4%, primarily reflecting higher credit card transaction volumes
and improved credit card spreads as a result of a lower level of promotional pricing. These factors were largely offset by lower loanbalances.
10 Royal Bank of Canada First Quarter 2012
Net interest margin decreased by 5 bps mainly due to spread compression reflecting the continuing low interest rateenvironment.
PCL decreased $29 million or 11%, mainly due to lower PCL in our credit card portfolio driven by fewer bankruptcies and lowerPCL in our business lending portfolio. For further details, refer to the Credit quality performance section.
Non-interest expense increased $57 million or 5%, mainly due to an increase in performance-related compensation and highercosts in support of business growth. These factors were partially offset by our ongoing focus on cost management.
Q1 2012 vs. Q4 2011Net income increased $46 million or 5% from the prior quarter, mainly due to solid volume growth across most businesses, as well asa lower effective tax rate and seasonally lower marketing costs.
Total revenue increased $34 million or 1%, primarily reflecting solid volume growth across most business, including seasonallyhigher credit card transactions.
Net interest margin remained relatively flat compared to last quarter as a favourable shift in product mix was offset by the impactof the continued low interest rate environment.
PCL increased $9 million or 4%, mainly due to higher PCL in our residential mortgages and secured personal lendingportfolio, partially offset by lower PCL in our business lending portfolio.
Non-interest expense decreased $9 million or 1%, despite strong volume growth, primarily reflecting seasonally lower marketingcosts and our ongoing focus on cost management, largely offset by an increase in performance-related compensation.
Wealth Management
As at or for the three months ended
(C$ millions, except number of and percentage amounts and as otherwise noted)January 31
2012October 31
2011January 31
2011
Net interest income $ 102 $ 96 $ 90Non-interest income
Fee-based revenue 721 726 659Transactional and other revenue 365 329 436
Total revenue $ 1,188 $ 1,151 $ 1,185Non-interest expense 939 893 884
Net income before income taxes $ 249 $ 258 $ 301Net income $ 188 $ 179 $ 213
Revenue by businessCanadian Wealth Management $ 422 $ 426 $ 433U.S. & International Wealth Management 486 466 519
U.S. & International Wealth Management (US$ millions) 480 464 516Global Asset Management (1) 280 259 233
Selected average balances and other informationROE 13.8% 12.7% 19.5%RORC 51.9% 47.9% 82.9%Pre-tax margin (2) 21.0% 22.4% 25.4%Number of advisors (3) 4,220 4,281 4,237AUA – Total $ 534,200 $ 527,200 $ 543,000
– U.S. & International Wealth Management 318,000 317,500 333,300– U.S. & International Wealth Management (US$ millions) 317,158 318,600 332,800
AUM 313,200 305,700 305,200Average AUA 531,800 526,800 527,500Average AUM 311,800 310,600 278,600
(1) Includes BlueBay results which are reported on a one-month lag.(2) Pre-tax margin is defined as net income before income taxes divided by total revenue.(3) Represents client-facing advisors across all our wealth management businesses.
Q1 2012 vs. Q1 2011Net income decreased $25 million or 12% from a year ago mainly due to lower transaction volumes reflecting continued investoruncertainty and higher costs in support of business growth. These factors were partially offset by higher average fee-based clientassets.
Canadian Wealth Management revenue decreased $11 million or 3%, mainly due to lower transaction volumes, largely offset byhigher average fee-based client assets resulting from capital appreciation and net sales.
U.S. & International Wealth Management revenue decreased $33 million or 6%. In U.S. dollars, revenue decreased $36 million or7%, mainly due to lower transaction volumes.
Global Asset Management revenue increased $47 million or 20%, reflecting higher average fee-based client assets including theimpact of the full quarter of revenue from our BlueBay acquisition.
Non-interest expense increased $55 million or 6%, primarily due to higher costs in support of business growth including theimpact of the full quarter of non-interest expense from our BlueBay acquisition.
Q1 2012 vs. Q4 2011Net income increased $9 million or 5%, relatively flat as compared to the prior quarter given the continued market and investoruncertainty in the early part of the quarter.
Royal Bank of Canada First Quarter 2012 11
Total revenue increased $37 million or 3%, mainly due to the increase in fair value of our U.S. stock-based compensation plan.Non-interest expense increased $46 million or 5%, mainly due to the increase in fair value of our U.S. stock-based compensation
plan liability, and the prior quarter also included a favourable accounting adjustment related to our deferred compensation liability.
Insurance
As at or for the three months ended
(C$ millions, except number of and percentage amounts and as otherwise noted)January 31
2012October 31
2011January 31
2011
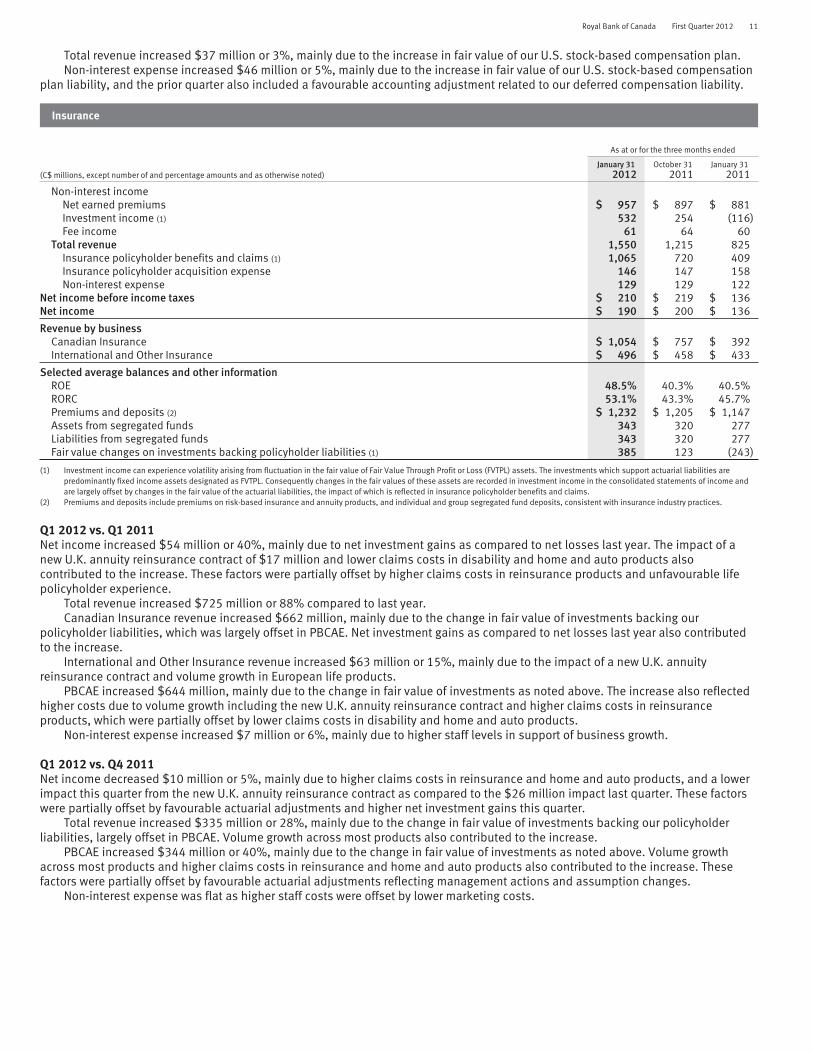
Non-interest incomeNet earned premiums $ 957 $ 897 $ 881Investment income (1) 532 254 (116)Fee income 61 64 60
Total revenue 1,550 1,215 825Insurance policyholder benefits and claims (1) 1,065 720 409Insurance policyholder acquisition expense 146 147 158Non-interest expense 129 129 122
Net income before income taxes $ 210 $ 219 $ 136Net income $ 190 $ 200 $ 136
Revenue by businessCanadian Insurance $ 1,054 $ 757 $ 392International and Other Insurance $ 496 $ 458 $ 433
Selected average balances and other informationROE 48.5% 40.3% 40.5%RORC 53.1% 43.3% 45.7%Premiums and deposits (2) $ 1,232 $ 1,205 $ 1,147Assets from segregated funds 343 320 277Liabilities from segregated funds 343 320 277Fair value changes on investments backing policyholder liabilities (1) 385 123 (243)
(1) Investment income can experience volatility arising from fluctuation in the fair value of Fair Value Through Profit or Loss (FVTPL) assets. The investments which support actuarial liabilities arepredominantly fixed income assets designated as FVTPL. Consequently changes in the fair values of these assets are recorded in investment income in the consolidated statements of income andare largely offset by changes in the fair value of the actuarial liabilities, the impact of which is reflected in insurance policyholder benefits and claims.
(2) Premiums and deposits include premiums on risk-based insurance and annuity products, and individual and group segregated fund deposits, consistent with insurance industry practices.
Q1 2012 vs. Q1 2011Net income increased $54 million or 40%, mainly due to net investment gains as compared to net losses last year. The impact of anew U.K. annuity reinsurance contract of $17 million and lower claims costs in disability and home and auto products alsocontributed to the increase. These factors were partially offset by higher claims costs in reinsurance products and unfavourable lifepolicyholder experience.
Total revenue increased $725 million or 88% compared to last year.Canadian Insurance revenue increased $662 million, mainly due to the change in fair value of investments backing our
policyholder liabilities, which was largely offset in PBCAE. Net investment gains as compared to net losses last year also contributedto the increase.
International and Other Insurance revenue increased $63 million or 15%, mainly due to the impact of a new U.K. annuityreinsurance contract and volume growth in European life products.
PBCAE increased $644 million, mainly due to the change in fair value of investments as noted above. The increase also reflectedhigher costs due to volume growth including the new U.K. annuity reinsurance contract and higher claims costs in reinsuranceproducts, which were partially offset by lower claims costs in disability and home and auto products.
Non-interest expense increased $7 million or 6%, mainly due to higher staff levels in support of business growth.
Q1 2012 vs. Q4 2011Net income decreased $10 million or 5%, mainly due to higher claims costs in reinsurance and home and auto products, and a lowerimpact this quarter from the new U.K. annuity reinsurance contract as compared to the $26 million impact last quarter. These factorswere partially offset by favourable actuarial adjustments and higher net investment gains this quarter.
Total revenue increased $335 million or 28%, mainly due to the change in fair value of investments backing our policyholderliabilities, largely offset in PBCAE. Volume growth across most products also contributed to the increase.
PBCAE increased $344 million or 40%, mainly due to the change in fair value of investments as noted above. Volume growthacross most products and higher claims costs in reinsurance and home and auto products also contributed to the increase. Thesefactors were partially offset by favourable actuarial adjustments reflecting management actions and assumption changes.
Non-interest expense was flat as higher staff costs were offset by lower marketing costs.
12 Royal Bank of Canada First Quarter 2012
International Banking
As at or for the three months ended
(C$ millions, except number of and percentage amounts and as otherwise noted)January 31
2012October 31
2011January 31
2011
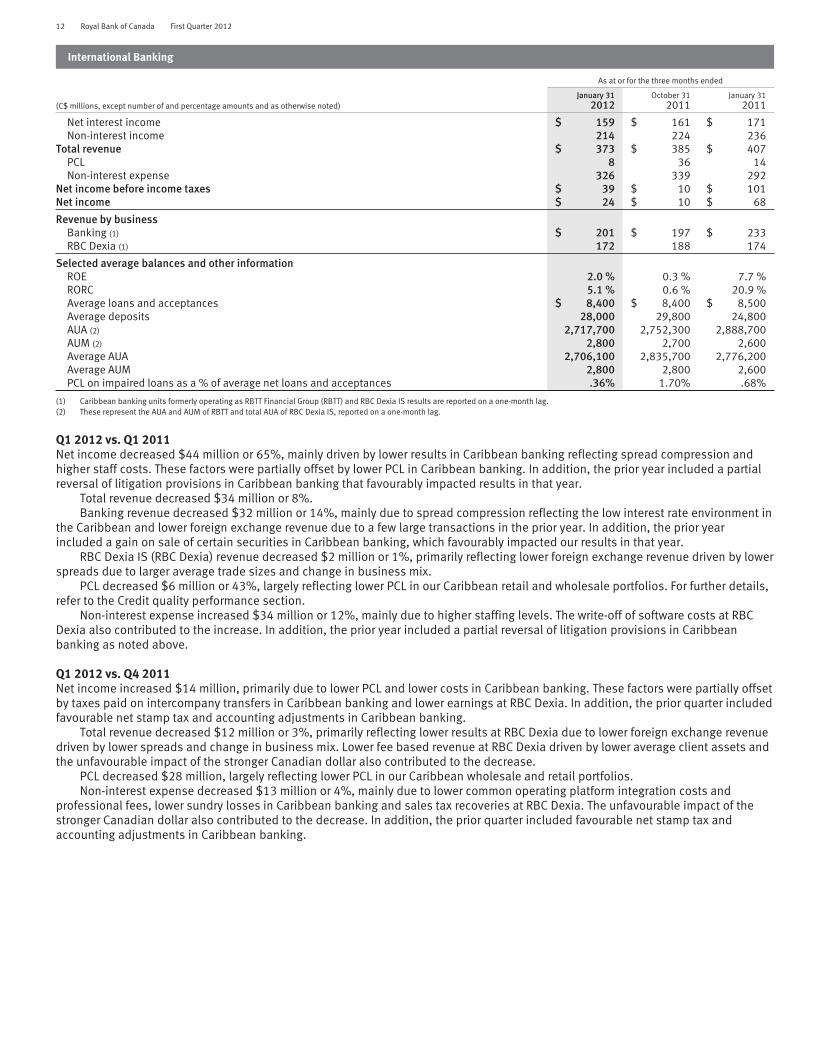
Net interest income $ 159 $ 161 $ 171Non-interest income 214 224 236
Total revenue $ 373 $ 385 $ 407PCL 8 36 14Non-interest expense 326 339 292
Net income before income taxes $ 39 $ 10 $ 101Net income $ 24 $ 10 $ 68
Revenue by businessBanking (1) $ 201 $ 197 $ 233RBC Dexia (1) 172 188 174
Selected average balances and other informationROE 2.0 % 0.3 % 7.7 %RORC 5.1 % 0.6 % 20.9 %Average loans and acceptances $ 8,400 $ 8,400 $ 8,500Average deposits 28,000 29,800 24,800AUA (2) 2,717,700 2,752,300 2,888,700AUM (2) 2,800 2,700 2,600Average AUA 2,706,100 2,835,700 2,776,200Average AUM 2,800 2,800 2,600PCL on impaired loans as a % of average net loans and acceptances .36% 1.70% .68%
(1) Caribbean banking units formerly operating as RBTT Financial Group (RBTT) and RBC Dexia IS results are reported on a one-month lag.(2) These represent the AUA and AUM of RBTT and total AUA of RBC Dexia IS, reported on a one-month lag.
Q1 2012 vs. Q1 2011Net income decreased $44 million or 65%, mainly driven by lower results in Caribbean banking reflecting spread compression andhigher staff costs. These factors were partially offset by lower PCL in Caribbean banking. In addition, the prior year included a partialreversal of litigation provisions in Caribbean banking that favourably impacted results in that year.
Total revenue decreased $34 million or 8%.Banking revenue decreased $32 million or 14%, mainly due to spread compression reflecting the low interest rate environment in
the Caribbean and lower foreign exchange revenue due to a few large transactions in the prior year. In addition, the prior yearincluded a gain on sale of certain securities in Caribbean banking, which favourably impacted our results in that year.
RBC Dexia IS (RBC Dexia) revenue decreased $2 million or 1%, primarily reflecting lower foreign exchange revenue driven by lowerspreads due to larger average trade sizes and change in business mix.
PCL decreased $6 million or 43%, largely reflecting lower PCL in our Caribbean retail and wholesale portfolios. For further details,refer to the Credit quality performance section.
Non-interest expense increased $34 million or 12%, mainly due to higher staffing levels. The write-off of software costs at RBCDexia also contributed to the increase. In addition, the prior year included a partial reversal of litigation provisions in Caribbeanbanking as noted above.
Q1 2012 vs. Q4 2011Net income increased $14 million, primarily due to lower PCL and lower costs in Caribbean banking. These factors were partially offsetby taxes paid on intercompany transfers in Caribbean banking and lower earnings at RBC Dexia. In addition, the prior quarter includedfavourable net stamp tax and accounting adjustments in Caribbean banking.
Total revenue decreased $12 million or 3%, primarily reflecting lower results at RBC Dexia due to lower foreign exchange revenuedriven by lower spreads and change in business mix. Lower fee based revenue at RBC Dexia driven by lower average client assets andthe unfavourable impact of the stronger Canadian dollar also contributed to the decrease.
PCL decreased $28 million, largely reflecting lower PCL in our Caribbean wholesale and retail portfolios.Non-interest expense decreased $13 million or 4%, mainly due to lower common operating platform integration costs and
professional fees, lower sundry losses in Caribbean banking and sales tax recoveries at RBC Dexia. The unfavourable impact of thestronger Canadian dollar also contributed to the decrease. In addition, the prior quarter included favourable net stamp tax andaccounting adjustments in Caribbean banking.
Royal Bank of Canada First Quarter 2012 13
Capital Markets
As at or for the three months ended
(C$ millions, except percentage amounts)January 31
2012October 31
2011January 31
2011
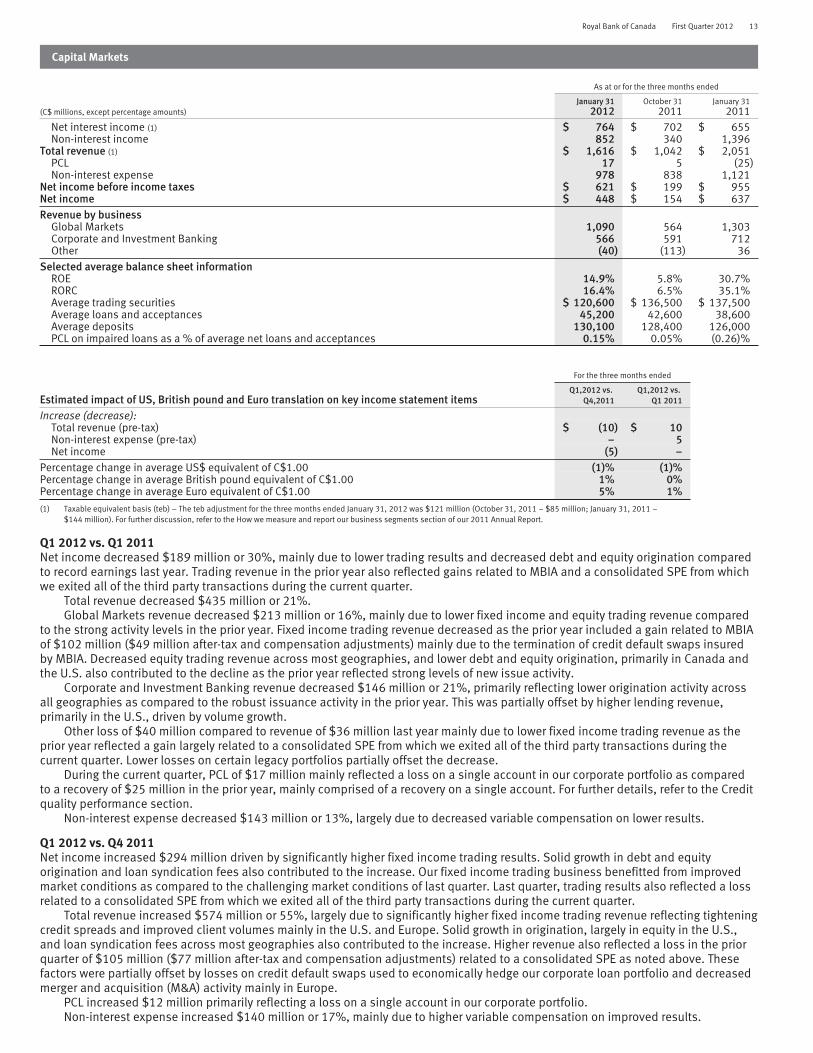
Net interest income (1) $ 764 $ 702 $ 655Non-interest income 852 340 1,396
Total revenue (1) $ 1,616 $ 1,042 $ 2,051PCL 17 5 (25)Non-interest expense 978 838 1,121
Net income before income taxes $ 621 $ 199 $ 955Net income $ 448 $ 154 $ 637Revenue by business
Global Markets 1,090 564 1,303Corporate and Investment Banking 566 591 712Other (40) (113) 36
Selected average balance sheet informationROE 14.9% 5.8% 30.7%RORC 16.4% 6.5% 35.1%Average trading securities $ 120,600 $ 136,500 $ 137,500Average loans and acceptances 45,200 42,600 38,600Average deposits 130,100 128,400 126,000PCL on impaired loans as a % of average net loans and acceptances 0.15% 0.05% (0.26)%
For the three months ended
Estimated impact of US, British pound and Euro translation on key income statement itemsQ1,2012 vs.
Q4,2011Q1,2012 vs.
Q1 2011
Increase (decrease):Total revenue (pre-tax) $ (10) $ 10Non-interest expense (pre-tax) – 5Net income (5) –
Percentage change in average US$ equivalent of C$1.00 (1)% (1)%Percentage change in average British pound equivalent of C$1.00 1% 0%Percentage change in average Euro equivalent of C$1.00 5% 1%(1) Taxable equivalent basis (teb) – The teb adjustment for the three months ended January 31, 2012 was $121 million (October 31, 2011 – $85 million; January 31, 2011 –
$144 million). For further discussion, refer to the How we measure and report our business segments section of our 2011 Annual Report.
Q1 2012 vs. Q1 2011Net income decreased $189 million or 30%, mainly due to lower trading results and decreased debt and equity origination comparedto record earnings last year. Trading revenue in the prior year also reflected gains related to MBIA and a consolidated SPE from whichwe exited all of the third party transactions during the current quarter.
Total revenue decreased $435 million or 21%.Global Markets revenue decreased $213 million or 16%, mainly due to lower fixed income and equity trading revenue compared
to the strong activity levels in the prior year. Fixed income trading revenue decreased as the prior year included a gain related to MBIAof $102 million ($49 million after-tax and compensation adjustments) mainly due to the termination of credit default swaps insuredby MBIA. Decreased equity trading revenue across most geographies, and lower debt and equity origination, primarily in Canada andthe U.S. also contributed to the decline as the prior year reflected strong levels of new issue activity.
Corporate and Investment Banking revenue decreased $146 million or 21%, primarily reflecting lower origination activity acrossall geographies as compared to the robust issuance activity in the prior year. This was partially offset by higher lending revenue,primarily in the U.S., driven by volume growth.
Other loss of $40 million compared to revenue of $36 million last year mainly due to lower fixed income trading revenue as theprior year reflected a gain largely related to a consolidated SPE from which we exited all of the third party transactions during thecurrent quarter. Lower losses on certain legacy portfolios partially offset the decrease.
During the current quarter, PCL of $17 million mainly reflected a loss on a single account in our corporate portfolio as comparedto a recovery of $25 million in the prior year, mainly comprised of a recovery on a single account. For further details, refer to the Creditquality performance section.
Non-interest expense decreased $143 million or 13%, largely due to decreased variable compensation on lower results.
Q1 2012 vs. Q4 2011Net income increased $294 million driven by significantly higher fixed income trading results. Solid growth in debt and equityorigination and loan syndication fees also contributed to the increase. Our fixed income trading business benefitted from improvedmarket conditions as compared to the challenging market conditions of last quarter. Last quarter, trading results also reflected a lossrelated to a consolidated SPE from which we exited all of the third party transactions during the current quarter.
Total revenue increased $574 million or 55%, largely due to significantly higher fixed income trading revenue reflecting tighteningcredit spreads and improved client volumes mainly in the U.S. and Europe. Solid growth in origination, largely in equity in the U.S.,and loan syndication fees across most geographies also contributed to the increase. Higher revenue also reflected a loss in the priorquarter of $105 million ($77 million after-tax and compensation adjustments) related to a consolidated SPE as noted above. Thesefactors were partially offset by losses on credit default swaps used to economically hedge our corporate loan portfolio and decreasedmerger and acquisition (M&A) activity mainly in Europe.
PCL increased $12 million primarily reflecting a loss on a single account in our corporate portfolio.Non-interest expense increased $140 million or 17%, mainly due to higher variable compensation on improved results.

14 Royal Bank of Canada First Quarter 2012
Corporate Support
As at or for the three months ended
(C$ millions)
January 31
2012October 31
2011January 31
2011
Net interest (loss) (1) $ (86) $ (38) $ (112)Non-interest income 48 86 60
Total revenue (1) $ (38) $ 48 $ (52)PCL (1) 1 3Non-interest expense 5 28 13
Net (loss) income before income taxes $ (42) $ 19 $ (68)Net income (2) $ 32 $ 118 $ 9
(1) Teb adjusted.(2) Net income reflects income attributable to both shareholders and NCI. Net income attributable to NCI for the three months ended January 31, 2012 was $24 million (October 31, 2011 – $23 million;
January 31, 2011 – $22 million).
Due to the nature of activities and consolidated adjustments reported in this segment, we believe that a comparative period analysisis not relevant. The following identifies material items affecting the reported results in each period.
Net interest loss and income taxes (recoveries) in each quarter in Corporate Support include the deduction of the teb adjustmentsrelated to the gross-up of income from Canadian taxable corporate dividends recorded in Capital Markets. The amount deducted fromnet interest income (loss) was offset by an equivalent increase in income taxes (recoveries). The teb amount for the three monthsended January 31, 2012 was $121 million as compared to $85 million in the prior quarter and $144 million in the prior year. Forfurther discussion, refer to the How we measure and report our business segments section of our 2011 Annual Report toShareholders.
In addition to teb impacts noted above, the following identifies the other material items affecting the reported results in eachquarter.
Q1 2012Net income was $32 million largely due to our asset/liability management activities undertaken by Corporate Treasury reflectingearnings from positioning for changes in interest rates, partially offset by an unfavourable tax adjustment.
Q4 2011Net income was $118 million largely due to our asset/liability management activities undertaken by Corporate Treasury reflectingearnings from positioning for changes in interest rates, gains of $26 million ($19 million after-tax) related to the change in the fairvalue of certain derivatives used to economically hedge our funding activities, gains related to the fair value adjustments of RBC debtand net favourable income tax adjustments. These factors were partially offset by losses of $15 million after-tax attributed to aninvestment accounted for under the equity method.
Q1 2011Net income was $9 million largely due to our asset/liability management activities undertaken by Corporate Treasury reflectingearnings from positioning for changes in interest rates, partially offset by an unfavourable tax adjustment.
Royal Bank of Canada First Quarter 2012 15
Quarterly results and trend analysis
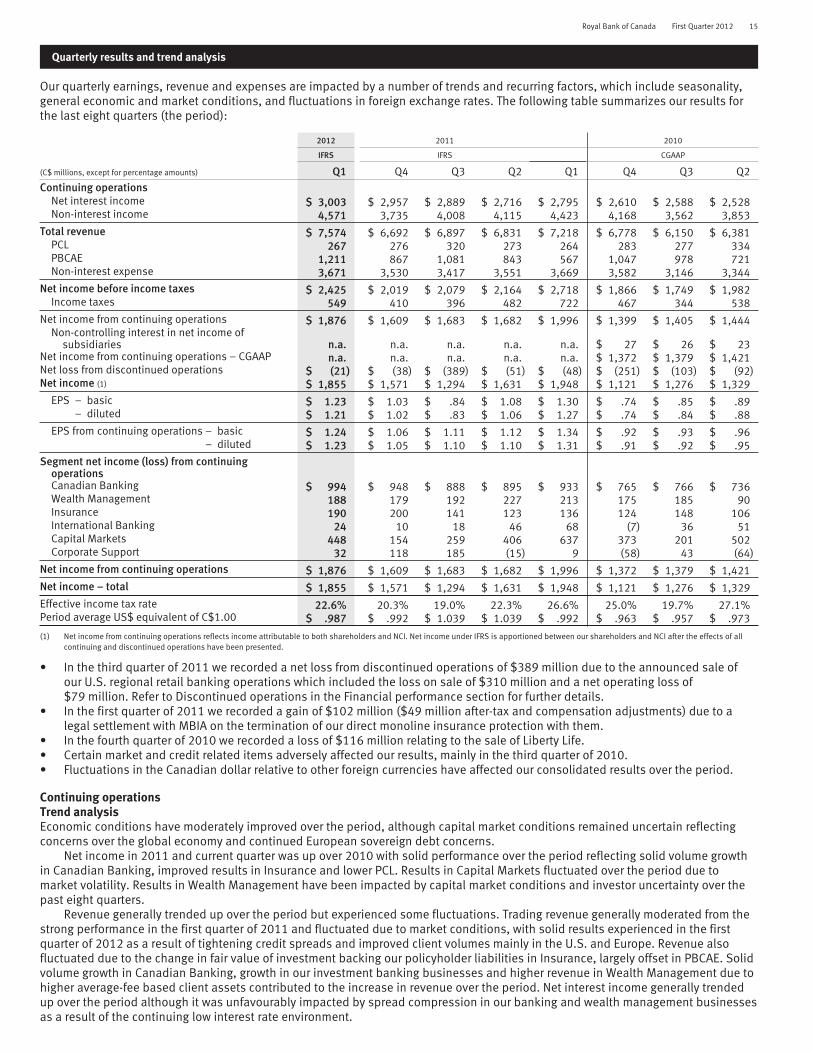
Our quarterly earnings, revenue and expenses are impacted by a number of trends and recurring factors, which include seasonality,general economic and market conditions, and fluctuations in foreign exchange rates. The following table summarizes our results forthe last eight quarters (the period):
2012 2011 2010
IFRS IFRS CGAAP
(C$ millions, except for percentage amounts) Q1 Q4 Q3 Q2 Q1 Q4 Q3 Q2Continuing operations
Net interest income $ 3,003 $ 2,957 $ 2,889 $ 2,716 $ 2,795 $ 2,610 $ 2,588 $ 2,528Non-interest income 4,571 3,735 4,008 4,115 4,423 4,168 3,562 3,853
Total revenue $ 7,574 $ 6,692 $ 6,897 $ 6,831 $ 7,218 $ 6,778 $ 6,150 $ 6,381PCL 267 276 320 273 264 283 277 334PBCAE 1,211 867 1,081 843 567 1,047 978 721Non-interest expense 3,671 3,530 3,417 3,551 3,669 3,582 3,146 3,344
Net income before income taxes $ 2,425 $ 2,019 $ 2,079 $ 2,164 $ 2,718 $ 1,866 $ 1,749 $ 1,982Income taxes 549 410 396 482 722 467 344 538
Net income from continuing operations $ 1,876 $ 1,609 $ 1,683 $ 1,682 $ 1,996 $ 1,399 $ 1,405 $ 1,444Non-controlling interest in net income of
subsidiaries n.a. n.a. n.a. n.a. n.a. $ 27 $ 26 $ 23Net income from continuing operations – CGAAP n.a. n.a. n.a. n.a. n.a. $ 1,372 $ 1,379 $ 1,421Net loss from discontinued operations $ (21) $ (38) $ (389) $ (51) $ (48) $ (251) $ (103) $ (92)Net income (1) $ 1,855 $ 1,571 $ 1,294 $ 1,631 $ 1,948 $ 1,121 $ 1,276 $ 1,329
EPS – basic $ 1.23 $ 1.03 $ .84 $ 1.08 $ 1.30 $ .74 $ .85 $ .89– diluted $ 1.21 $ 1.02 $ .83 $ 1.06 $ 1.27 $ .74 $ .84 $ .88
EPS from continuing operations – basic $ 1.24 $ 1.06 $ 1.11 $ 1.12 $ 1.34 $ .92 $ .93 $ .96– diluted $ 1.23 $ 1.05 $ 1.10 $ 1.10 $ 1.31 $ .91 $ .92 $ .95
Segment net income (loss) from continuingoperationsCanadian Banking $ 994 $ 948 $ 888 $ 895 $ 933 $ 765 $ 766 $ 736Wealth Management 188 179 192 227 213 175 185 90Insurance 190 200 141 123 136 124 148 106International Banking 24 10 18 46 68 (7) 36 51Capital Markets 448 154 259 406 637 373 201 502Corporate Support 32 118 185 (15) 9 (58) 43 (64)
Net income from continuing operations $ 1,876 $ 1,609 $ 1,683 $ 1,682 $ 1,996 $ 1,372 $ 1,379 $ 1,421Net income – total $ 1,855 $ 1,571 $ 1,294 $ 1,631 $ 1,948 $ 1,121 $ 1,276 $ 1,329Effective income tax rate 22.6% 20.3% 19.0% 22.3% 26.6% 25.0% 19.7% 27.1%Period average US$ equivalent of C$1.00 $ .987 $ .992 $ 1.039 $ 1.039 $ .992 $ .963 $ .957 $ .973
(1) Net income from continuing operations reflects income attributable to both shareholders and NCI. Net income under IFRS is apportioned between our shareholders and NCI after the effects of allcontinuing and discontinued operations have been presented.
• In the third quarter of 2011 we recorded a net loss from discontinued operations of $389 million due to the announced sale ofour U.S. regional retail banking operations which included the loss on sale of $310 million and a net operating loss of$79 million. Refer to Discontinued operations in the Financial performance section for further details.
• In the first quarter of 2011 we recorded a gain of $102 million ($49 million after-tax and compensation adjustments) due to alegal settlement with MBIA on the termination of our direct monoline insurance protection with them.
• In the fourth quarter of 2010 we recorded a loss of $116 million relating to the sale of Liberty Life.• Certain market and credit related items adversely affected our results, mainly in the third quarter of 2010.• Fluctuations in the Canadian dollar relative to other foreign currencies have affected our consolidated results over the period.
Continuing operationsTrend analysisEconomic conditions have moderately improved over the period, although capital market conditions remained uncertain reflectingconcerns over the global economy and continued European sovereign debt concerns.
Net income in 2011 and current quarter was up over 2010 with solid performance over the period reflecting solid volume growthin Canadian Banking, improved results in Insurance and lower PCL. Results in Capital Markets fluctuated over the period due tomarket volatility. Results in Wealth Management have been impacted by capital market conditions and investor uncertainty over thepast eight quarters.
Revenue generally trended up over the period but experienced some fluctuations. Trading revenue generally moderated from thestrong performance in the first quarter of 2011 and fluctuated due to market conditions, with solid results experienced in the firstquarter of 2012 as a result of tightening credit spreads and improved client volumes mainly in the U.S. and Europe. Revenue alsofluctuated due to the change in fair value of investment backing our policyholder liabilities in Insurance, largely offset in PBCAE. Solidvolume growth in Canadian Banking, growth in our investment banking businesses and higher revenue in Wealth Management due tohigher average-fee based client assets contributed to the increase in revenue over the period. Net interest income generally trendedup over the period although it was unfavourably impacted by spread compression in our banking and wealth management businessesas a result of the continuing low interest rate environment.
16 Royal Bank of Canada First Quarter 2012
PCL generally decreased over the period, reflecting continued stabilizing asset quality.PBCAE has been subject to quarterly fluctuations. Generally over the period there have been movements in the fair value of
investments backing our policyholder liabilities, largely offset in revenue, which can cause volatility quarter to quarter, higher costsdue to volume growth, actuarial liability adjustments and generally lower claims costs during the period.
Non-interest expense has generally trended upward mainly due to increased costs in support of business growth as well asoverall higher variable compensation in Capital Markets and Wealth Management driven by higher revenue. Pension expense,primarily in Canadian Banking, decreased under IFRS. For further details on employee benefits costs refer to Note 3 to our unauditedInterim Condensed Consolidated Financial Statements.
Our effective income tax rate has generally fluctuated over the period, reflecting a varying portion of income being reported by oursubsidiaries operating in jurisdictions with differing income tax rates, a fluctuating level of income from tax-advantaged sources(Canadian taxable corporate dividends), and tax adjustments. The reduction in statutory Canadian corporate income tax rates over theperiod has generally lowered our effective income tax rate.
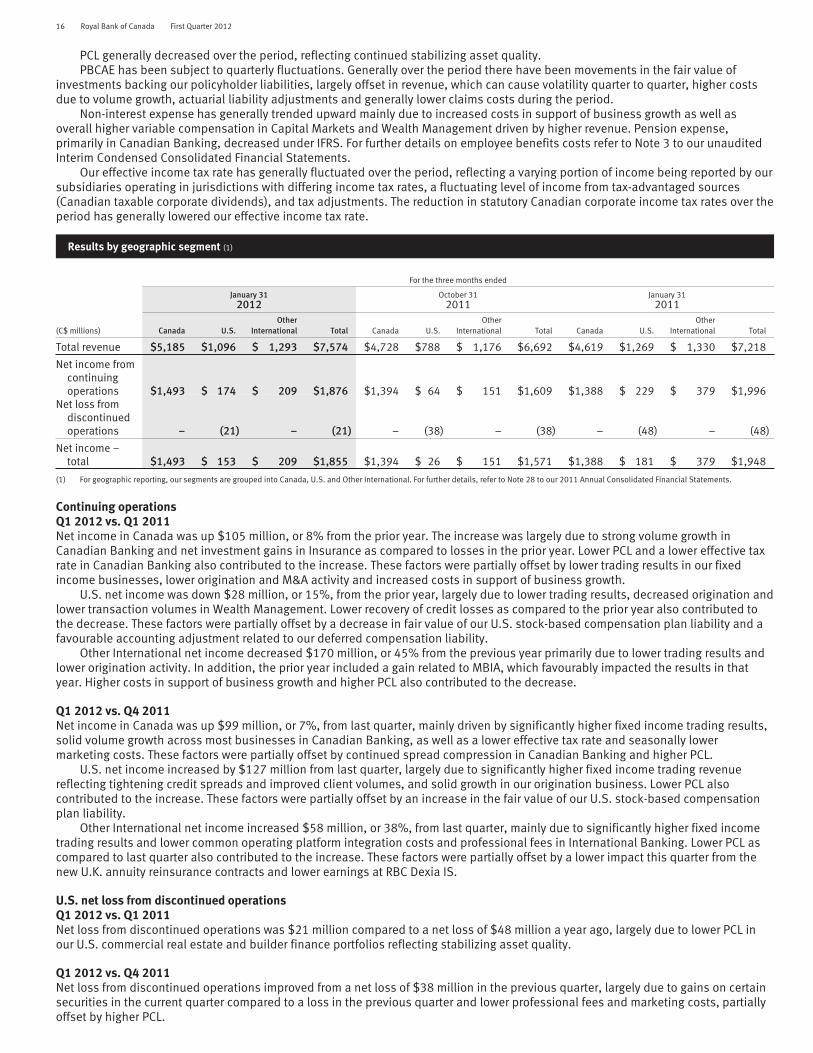
Results by geographic segment (1)
For the three months ended
January 312012
October 312011
January 312011
(C$ millions) Canada U.S.Other
International Total Canada U.S.Other
International Total Canada U.S.Other
International Total
Total revenue $5,185 $1,096 $ 1,293 $7,574 $4,728 $788 $ 1,176 $6,692 $4,619 $1,269 $ 1,330 $7,218
Net income fromcontinuingoperations $1,493 $ 174 $ 209 $1,876 $1,394 $ 64 $ 151 $1,609 $1,388 $ 229 $ 379 $1,996
Net loss fromdiscontinuedoperations – (21) – (21) – (38) – (38) – (48) – (48)
Net income –total $1,493 $ 153 $ 209 $1,855 $1,394 $ 26 $ 151 $1,571 $1,388 $ 181 $ 379 $1,948
(1) For geographic reporting, our segments are grouped into Canada, U.S. and Other International. For further details, refer to Note 28 to our 2011 Annual Consolidated Financial Statements.
Continuing operationsQ1 2012 vs. Q1 2011Net income in Canada was up $105 million, or 8% from the prior year. The increase was largely due to strong volume growth inCanadian Banking and net investment gains in Insurance as compared to losses in the prior year. Lower PCL and a lower effective taxrate in Canadian Banking also contributed to the increase. These factors were partially offset by lower trading results in our fixedincome businesses, lower origination and M&A activity and increased costs in support of business growth.
U.S. net income was down $28 million, or 15%, from the prior year, largely due to lower trading results, decreased origination andlower transaction volumes in Wealth Management. Lower recovery of credit losses as compared to the prior year also contributed tothe decrease. These factors were partially offset by a decrease in fair value of our U.S. stock-based compensation plan liability and afavourable accounting adjustment related to our deferred compensation liability.
Other International net income decreased $170 million, or 45% from the previous year primarily due to lower trading results andlower origination activity. In addition, the prior year included a gain related to MBIA, which favourably impacted the results in thatyear. Higher costs in support of business growth and higher PCL also contributed to the decrease.
Q1 2012 vs. Q4 2011Net income in Canada was up $99 million, or 7%, from last quarter, mainly driven by significantly higher fixed income trading results,solid volume growth across most businesses in Canadian Banking, as well as a lower effective tax rate and seasonally lowermarketing costs. These factors were partially offset by continued spread compression in Canadian Banking and higher PCL.
U.S. net income increased by $127 million from last quarter, largely due to significantly higher fixed income trading revenuereflecting tightening credit spreads and improved client volumes, and solid growth in our origination business. Lower PCL alsocontributed to the increase. These factors were partially offset by an increase in the fair value of our U.S. stock-based compensationplan liability.
Other International net income increased $58 million, or 38%, from last quarter, mainly due to significantly higher fixed incometrading results and lower common operating platform integration costs and professional fees in International Banking. Lower PCL ascompared to last quarter also contributed to the increase. These factors were partially offset by a lower impact this quarter from thenew U.K. annuity reinsurance contracts and lower earnings at RBC Dexia IS.
U.S. net loss from discontinued operationsQ1 2012 vs. Q1 2011Net loss from discontinued operations was $21 million compared to a net loss of $48 million a year ago, largely due to lower PCL inour U.S. commercial real estate and builder finance portfolios reflecting stabilizing asset quality.
Q1 2012 vs. Q4 2011Net loss from discontinued operations improved from a net loss of $38 million in the previous quarter, largely due to gains on certainsecurities in the current quarter compared to a loss in the previous quarter and lower professional fees and marketing costs, partiallyoffset by higher PCL.
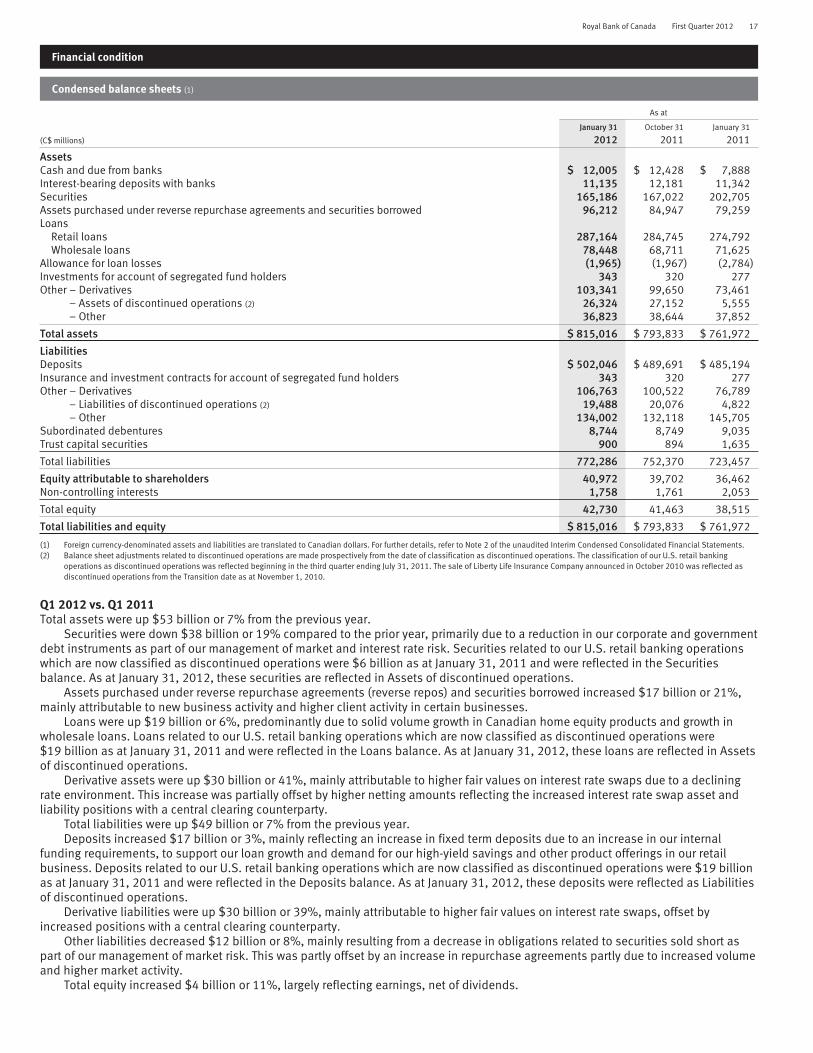
Royal Bank of Canada First Quarter 2012 17
Financial condition
Condensed balance sheets (1)
As at
(C$ millions)
January 31
2012October 31
2011January 31
2011
AssetsCash and due from banks $ 12,005 $ 12,428 $ 7,888Interest-bearing deposits with banks 11,135 12,181 11,342Securities 165,186 167,022 202,705Assets purchased under reverse repurchase agreements and securities borrowed 96,212 84,947 79,259Loans
Retail loans 287,164 284,745 274,792Wholesale loans 78,448 68,711 71,625
Allowance for loan losses (1,965) (1,967) (2,784)Investments for account of segregated fund holders 343 320 277Other – Derivatives 103,341 99,650 73,461
– Assets of discontinued operations (2) 26,324 27,152 5,555– Other 36,823 38,644 37,852
Total assets $ 815,016 $ 793,833 $ 761,972
LiabilitiesDeposits $ 502,046 $ 489,691 $ 485,194Insurance and investment contracts for account of segregated fund holders 343 320 277Other – Derivatives 106,763 100,522 76,789
– Liabilities of discontinued operations (2) 19,488 20,076 4,822– Other 134,002 132,118 145,705
Subordinated debentures 8,744 8,749 9,035Trust capital securities 900 894 1,635
Total liabilities 772,286 752,370 723,457
Equity attributable to shareholders 40,972 39,702 36,462Non-controlling interests 1,758 1,761 2,053
Total equity 42,730 41,463 38,515
Total liabilities and equity $ 815,016 $ 793,833 $ 761,972
(1) Foreign currency-denominated assets and liabilities are translated to Canadian dollars. For further details, refer to Note 2 of the unaudited Interim Condensed Consolidated Financial Statements.(2) Balance sheet adjustments related to discontinued operations are made prospectively from the date of classification as discontinued operations. The classification of our U.S. retail banking
operations as discontinued operations was reflected beginning in the third quarter ending July 31, 2011. The sale of Liberty Life Insurance Company announced in October 2010 was reflected asdiscontinued operations from the Transition date as at November 1, 2010.
Q1 2012 vs. Q1 2011Total assets were up $53 billion or 7% from the previous year.
Securities were down $38 billion or 19% compared to the prior year, primarily due to a reduction in our corporate and governmentdebt instruments as part of our management of market and interest rate risk. Securities related to our U.S. retail banking operationswhich are now classified as discontinued operations were $6 billion as at January 31, 2011 and were reflected in the Securitiesbalance. As at January 31, 2012, these securities are reflected in Assets of discontinued operations.
Assets purchased under reverse repurchase agreements (reverse repos) and securities borrowed increased $17 billion or 21%,mainly attributable to new business activity and higher client activity in certain businesses.
Loans were up $19 billion or 6%, predominantly due to solid volume growth in Canadian home equity products and growth inwholesale loans. Loans related to our U.S. retail banking operations which are now classified as discontinued operations were$19 billion as at January 31, 2011 and were reflected in the Loans balance. As at January 31, 2012, these loans are reflected in Assetsof discontinued operations.
Derivative assets were up $30 billion or 41%, mainly attributable to higher fair values on interest rate swaps due to a decliningrate environment. This increase was partially offset by higher netting amounts reflecting the increased interest rate swap asset andliability positions with a central clearing counterparty.
Total liabilities were up $49 billion or 7% from the previous year.Deposits increased $17 billion or 3%, mainly reflecting an increase in fixed term deposits due to an increase in our internal
funding requirements, to support our loan growth and demand for our high-yield savings and other product offerings in our retailbusiness. Deposits related to our U.S. retail banking operations which are now classified as discontinued operations were $19 billionas at January 31, 2011 and were reflected in the Deposits balance. As at January 31, 2012, these deposits were reflected as Liabilitiesof discontinued operations.
Derivative liabilities were up $30 billion or 39%, mainly attributable to higher fair values on interest rate swaps, offset byincreased positions with a central clearing counterparty.
Other liabilities decreased $12 billion or 8%, mainly resulting from a decrease in obligations related to securities sold short aspart of our management of market risk. This was partly offset by an increase in repurchase agreements partly due to increased volumeand higher market activity.
Total equity increased $4 billion or 11%, largely reflecting earnings, net of dividends.
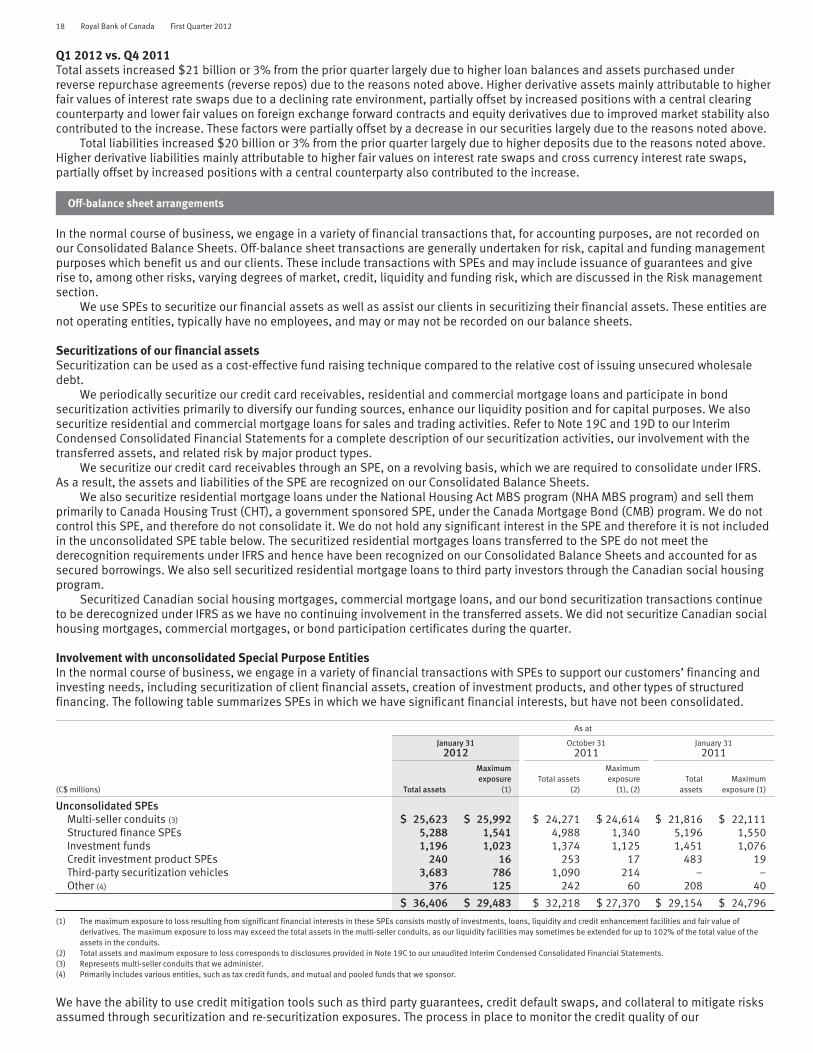
18 Royal Bank of Canada First Quarter 2012
Q1 2012 vs. Q4 2011Total assets increased $21 billion or 3% from the prior quarter largely due to higher loan balances and assets purchased underreverse repurchase agreements (reverse repos) due to the reasons noted above. Higher derivative assets mainly attributable to higherfair values of interest rate swaps due to a declining rate environment, partially offset by increased positions with a central clearingcounterparty and lower fair values on foreign exchange forward contracts and equity derivatives due to improved market stability alsocontributed to the increase. These factors were partially offset by a decrease in our securities largely due to the reasons noted above.
Total liabilities increased $20 billion or 3% from the prior quarter largely due to higher deposits due to the reasons noted above.Higher derivative liabilities mainly attributable to higher fair values on interest rate swaps and cross currency interest rate swaps,partially offset by increased positions with a central counterparty also contributed to the increase.
Off-balance sheet arrangements
In the normal course of business, we engage in a variety of financial transactions that, for accounting purposes, are not recorded onour Consolidated Balance Sheets. Off-balance sheet transactions are generally undertaken for risk, capital and funding managementpurposes which benefit us and our clients. These include transactions with SPEs and may include issuance of guarantees and giverise to, among other risks, varying degrees of market, credit, liquidity and funding risk, which are discussed in the Risk managementsection.
We use SPEs to securitize our financial assets as well as assist our clients in securitizing their financial assets. These entities arenot operating entities, typically have no employees, and may or may not be recorded on our balance sheets.
Securitizations of our financial assetsSecuritization can be used as a cost-effective fund raising technique compared to the relative cost of issuing unsecured wholesaledebt.
We periodically securitize our credit card receivables, residential and commercial mortgage loans and participate in bondsecuritization activities primarily to diversify our funding sources, enhance our liquidity position and for capital purposes. We alsosecuritize residential and commercial mortgage loans for sales and trading activities. Refer to Note 19C and 19D to our InterimCondensed Consolidated Financial Statements for a complete description of our securitization activities, our involvement with thetransferred assets, and related risk by major product types.
We securitize our credit card receivables through an SPE, on a revolving basis, which we are required to consolidate under IFRS.As a result, the assets and liabilities of the SPE are recognized on our Consolidated Balance Sheets.
We also securitize residential mortgage loans under the National Housing Act MBS program (NHA MBS program) and sell themprimarily to Canada Housing Trust (CHT), a government sponsored SPE, under the Canada Mortgage Bond (CMB) program. We do notcontrol this SPE, and therefore do not consolidate it. We do not hold any significant interest in the SPE and therefore it is not includedin the unconsolidated SPE table below. The securitized residential mortgages loans transferred to the SPE do not meet thederecognition requirements under IFRS and hence have been recognized on our Consolidated Balance Sheets and accounted for assecured borrowings. We also sell securitized residential mortgage loans to third party investors through the Canadian social housingprogram.
Securitized Canadian social housing mortgages, commercial mortgage loans, and our bond securitization transactions continueto be derecognized under IFRS as we have no continuing involvement in the transferred assets. We did not securitize Canadian socialhousing mortgages, commercial mortgages, or bond participation certificates during the quarter.
Involvement with unconsolidated Special Purpose EntitiesIn the normal course of business, we engage in a variety of financial transactions with SPEs to support our customers’ financing andinvesting needs, including securitization of client financial assets, creation of investment products, and other types of structuredfinancing. The following table summarizes SPEs in which we have significant financial interests, but have not been consolidated.
As at
January 312012
October 312011
January 312011
(C$ millions) Total assets
Maximumexposure
(1)Total assets
(2)
Maximumexposure
(1), (2)Total
assetsMaximum
exposure (1)
Unconsolidated SPEsMulti-seller conduits (3) $ 25,623 $ 25,992 $ 24,271 $ 24,614 $ 21,816 $ 22,111Structured finance SPEs 5,288 1,541 4,988 1,340 5,196 1,550Investment funds 1,196 1,023 1,374 1,125 1,451 1,076Credit investment product SPEs 240 16 253 17 483 19Third-party securitization vehicles 3,683 786 1,090 214 – –Other (4) 376 125 242 60 208 40
$ 36,406 $ 29,483 $ 32,218 $ 27,370 $ 29,154 $ 24,796
(1) The maximum exposure to loss resulting from significant financial interests in these SPEs consists mostly of investments, loans, liquidity and credit enhancement facilities and fair value ofderivatives. The maximum exposure to loss may exceed the total assets in the multi-seller conduits, as our liquidity facilities may sometimes be extended for up to 102% of the total value of theassets in the conduits.
(2) Total assets and maximum exposure to loss corresponds to disclosures provided in Note 19C to our unaudited Interim Condensed Consolidated Financial Statements.(3) Represents multi-seller conduits that we administer.(4) Primarily includes various entities, such as tax credit funds, and mutual and pooled funds that we sponsor.
We have the ability to use credit mitigation tools such as third party guarantees, credit default swaps, and collateral to mitigate risksassumed through securitization and re-securitization exposures. The process in place to monitor the credit quality of our

Royal Bank of Canada First Quarter 2012 19
securitization and re-securitization exposures involves reviewing the performance data of the underlying assets. We affirm our ratingseach quarter and formally confirm or assign a new rating at least annually. For further details on our activities to manage risks, refer tothe Risk management section.
Approximately 84% of assets in unconsolidated SPE’s in which we have significant financial interests were internally rated A orabove, compared to 88% in the prior year and 91% in the prior quarter. For multi-seller conduits, 99% of assets were internally rated Aor above compared to 97% in the prior year and 99% in the prior quarter. All transactions funded by the unconsolidated multi-sellerconduits are internally rated using a rating system which is largely consistent with that of the external rating agencies.
The assets in unconsolidated SPEs as at January 31, 2012 have varying maturities and a remaining expected weighted averagelife of approximately 3.9 years.
RBC-administered multi-seller conduitsWe administer multi-seller conduits which are used primarily for the securitization of our clients’ financial assets. There are no asset-backed securities in the Canadian multi-seller conduits and $1.7 billion in our U.S. multi-seller conduits.
We are exposed to credit risk as a result of the backstop liquidity facilities and partial credit enhancements provided to the multi-seller conduits. Our backstop liquidity and credit enhancement facilities are explained in Note 6 and 31 to our 2011 AnnualConsolidated Financial Statements and Note 19C to our Interim Condensed Consolidated Financial Statements.
As at January 31, 2012, the notional amount of backstop liquidity facilities we provide totalled $26.1 billion, an increase of $3.9billion or 17% from the prior year and an increase of $1.4 billion or 6% from the prior quarter. Total loans extended to the multi-sellerconduits under the backstop liquidity facilities amounted to $1.4 billion, a decrease of $45 million from the prior year and an increaseof $6 million from the prior quarter due primarily to exchange rate fluctuations. The partial credit enhancement facilities we providetotalled $2.5 billion, an increase of $291 million from the prior year and an increase of $135 million from the prior quarter. Theincrease in the amount of backstop liquidity facilities and partial credit enhancement facilities provided to the multi-seller conduitscompared to the prior year and prior quarter primarily reflects improved business conditions during the period which has led to aslight expansion of the outstanding securitized assets of the multi-seller conduits.
Multiple independent debt rating agencies review all of the transactions in the multi-seller conduits. Transactions financed in ourU.S. multi-seller conduits are reviewed by Moody’s Investors Service (Moody’s), Standard & Poor’s (S&P) and Fitch Ratings (Fitch).Transactions in our Canadian multi-seller conduits are also reviewed by Dominion Bond Rating Services (DBRS). Each applicablerating agency also reviews ongoing transaction performance on a monthly basis and may publish reports detailing portfolio andprogram information related to the conduits.
As at January 31, 2012, the total asset-backed commercial paper (ABCP) issued by the conduits amounted to $16.8 billion, anincrease of $1.7 billion or 12% since the prior year and an increase $487 million, or 3% from the prior quarter. The rating agenciesthat rate the ABCP rated 66% of the total amount issued within the top ratings category and the remaining amount in the secondhighest ratings category compared with 67% in the prior year and 68% in the prior quarter. The increase in the amount of ABCP issuedby the multi-seller conduits compared to the prior year and prior quarter is primarily due to increased client usage.
We sometimes purchase ABCPs issued by the multi-seller conduits in our capacity as a placement agent in order to facilitateoverall program liquidity. The fair value of our inventory was $5 million, a decrease of $29 million from the prior year and $105 millionfrom the prior quarter. The fluctuations in inventory held reflects normal trading activity. This inventory is classified as Securities –Trading on our Consolidated Balance Sheets.
Structured finance SPEsWe invest in U.S. auction rate securities (ARS) of entities which fund their long-term investments in student loans by issuing short-term senior and subordinated notes. As at January 31, 2012, the total assets of the unconsolidated ARS SPEs in which we havesignificant investments were $4.9 billion (October 31, 2011 – $4.9 billion). Our maximum exposure to loss in these ARS SPEs as atJanuary 31, 2012 was $1.3 billion (October 31, 2011 – $1.3 billion). As at January 31, 2012, approximately 69% of these investmentswere AAA rated.
Investment fundsWe enter into fee-based equity derivative transactions with third parties including mutual funds, unit investment trusts and otherinvestment funds. These transactions provide their investors with the desired exposure to the referenced funds, and we economicallyhedge our exposure from these derivatives by investing in those third party managed referenced funds. The decrease in the totalassets of these funds and our maximum exposure to loss relative to the prior quarter and prior year reflect the negative performanceof the reference funds and redemptions of capital by RBC and third-party investors of the funds.
Third-party securitization vehiclesWe hold significant interests in certain unconsolidated third-party securitization vehicles, which are SPEs. We, as well as otherfinancial institutions, are obligated to provide funding up to our maximum commitment level and are exposed to credit losses on theunderlying assets after various credit enhancements. The increases in the total assets of these funds and our maximum exposure toloss relative to the prior quarter and prior year reflect new investments made during 2011 and the first quarter of 2012.
Credit investment product SPEs and OthersWe use SPEs to create customized credit products to meet investors’ specific requirements and we manage assets in mutual andpooled funds and created tax credit funds. Refer to Note 19C to our Interim Condensed Consolidated Financial Statements for moredetail on these SPEs.

20 Royal Bank of Canada First Quarter 2012
GuaranteesOur maximum potential amount of future payments in relation to our guarantee products as at January 31, 2012 amounted to$72.6 billion compared to $69 billion in the prior year and $70.8 billion in the prior quarter. The increase compared to the prior yearrelates primarily to higher backstop liquidity facilities. For further details on Guarantees, refer to Note 15 to our Interim CondensedConsolidated Financial Statements.
Risk management
Credit risk
Gross (excluding allowance for loan losses) credit risk exposure by portfolio and sector – consolidated basisAs at
January 31
2012October 31
2011Lending-related and other Trading-related
Loans and acceptances Over-the-counter
derivatives (1)(C$ millions) OutstandingUndrawn
commitments OtherRepo-style
transactionsTotal
exposure (2)Total
exposure (2)
Residential mortgages $ 191,758 $ 25 $ 8 $191,791 $ 190,325Personal (3) 86,437 67,119 45 153,601 160,590Credit cards 12,971 25,031 – 38,002 40,230Small business (4) 2,448 3,697 41 6,186 6,691
Retail $ 293,614 $ 95,872 $ 94 $ – $ – $ 389,580 $397,836
Business (4)
Agriculture $ 5,127 $ 657 $ 29 $ – $ 18 $ 5,831 $ 5,644Automotive 3,616 2,464 203 – 477 6,760 6,400Consumer goods 5,770 3,197 530 – 169 9,666 9,800Energy 7,265 13,704 2,552 – 2,017 25,538 25,058Non-bank financial services 2,184 6,106 10,289 114,243 6,913 139,735 114,857Forest products 857 439 112 – 19 1,427 1,333Industrial products 3,963 2,918 367 – 204 7,452 6,800Mining & metals 967 2,281 687 – 137 4,072 3,922Real estate & related 21,300 4,035 1,228 – 369 26,932 24,602Technology & media 3,482 3,998 222 – 317 8,019 7,263Transportation and environment 5,248 2,228 955 – 889 9,320 9,040Other 22,183 7,071 6,989 11,447 4,203 51,893 54,490
Sovereign (4) 3,807 3,738 30,978 14,681 8,941 62,145 55,997Bank (4) 1,469 327 53,842 85,189 31,697 172,524 162,003
Wholesale $ 87,238 $ 53,163 $ 108,983 $ 225,560 $ 56,370 $ 531,314 $ 487,209
Total exposure $ 380,852 $ 149,035 $ 109,077 $ 225,560 $ 56,370 $ 920,894 $ 885,045
(1) Credit equivalent amount after factoring in master netting agreements. Derivative exposure is measured at fair value.(2) Gross credit risk exposure is before allowance for loan losses and represents consolidated (combined continuing and discontinued) operations. Exposure under Basel II asset classes of qualifying
revolving retail and other retail are largely included within Personal and Credit cards, while home equity lines of credit are included in Personal.(3) Home equity lines of credit reported primarily in Canadian Banking comprised $42 billion or 48%, of our outstanding personal loan portfolio as at January 31, 2012 (October 31, 2011 – $41 billion
or 48%). More than 95% of home equity lines of credit (October 31, 2011 – 95%) are secured by a first lien on real estate. Of the clients that have home equity lines of credit, less than 7%(October 31, 2011 – 7%), pay the scheduled interest payment only.
(4) Refer to Note 4 of our 2011 Annual Consolidated Financial Statements for the definition of these terms.
Gross credit risk exposure is calculated based on the definitions provided under the Basel II framework. Under this method, riskexposure is calculated before taking into account any collateral and inclusive of an estimate of potential future changes to that creditexposure. Gross credit risk is categorized into Lending-related and other, and Trading-related.
Q1 2012 vs. Q4 2011Total gross credit risk exposure increased $36 billion, or 4% from the prior quarter, reflecting an increase in the wholesale portfolio,partially offset by a decrease in the retail portfolio. Wholesale exposure increased $44 billion, or 9%, reflecting increases largely inrepo-style transactions and other exposures. Repo-style transactions increased $35 billion, largely in non-bank financial services andbank, attributable to new business activity and higher client activity in certain businesses. Other exposure increased $9 billion largelydue to higher guarantees and securities related exposures. Undrawn commitments increased $2 billion with the largest increase inthe technology & media, real estate and related and industrial products sectors, partially offset by a decrease in the energy sector.Wholesale loans and acceptances outstanding was flat with increases largely in the real estate & related and other sectors, offset bydecreases in the non-bank financial services, bank and sovereign sectors. The loan utilization of 40% decreased 1% from the priorquarter. Retail exposure decreased $8 billion, or 2%, largely driven by the implementation of updated risk parameters for undrawncommitments reflecting recent credit experience in the first quarter of 2012. The use of guarantees and collateral represents anintegral part of our credit risk mitigation in our retail portfolio. Insured mortgages accounted for 41% of our residential mortgageportfolio as of January 31, 2012 as compared to 42% the prior quarter. Secured personal lending represented 56% of personal loansoutstanding as of January 31, 2012, unchanged from the prior quarter.

Royal Bank of Canada First Quarter 2012 21
Gross (excluding allowance for loan losses) credit risk exposure by geographyAs at
January 312012
October 312011
Lending–related and other Trading–related
Loans and acceptances Over-the-counter
derivatives (1)(C$ millions) OutstandingUndrawn
commitments OtherRepo-style
transactionsTotal exposure
(2)Total exposure
(2)
Canada $ 326,203 $ 116,817 $ 41,014 $ 64,455 $ 10,858 $ 559,347 $561,269USA 33,564 23,154 23,563 72,589 12,406 165,276 147,324Europe 8,140 6,968 27,536 72,767 26,780 142,191 129,212Other International 12,945 2,096 16,964 15,749 6,326 54,080 47,240
Total exposure (3) $ 380,852 $ 149,035 $ 109,077 $ 225,560 $ 56,370 $ 920,894 $ 885,045
(1) Credit equivalent amount after factoring in master netting agreements. Derivative exposure is measured at fair value.(2) Gross credit risk exposure is before allowance for loan losses and represents consolidated (combined continuing and discontinued) operations. Exposure under Basel II asset classes of qualifying
revolving retail and other retail are largely included within Personal and Credit cards, while home equity lines of credit are included in Personal.(3) Geographic profile is based on country of residence of the borrower.
Q1 2012 vs. Q4 2011The geographic mix of our gross credit risk did not change significantly from the prior quarter with Canada, U.S., Europe and Otherinternational reflecting 61%, 18%, 15% and 6% of our exposure respectively. Growth in our gross credit risk exposure reflected higherexposure in the U.S., Europe and Other international of $18 billion, $13 billion and $7 billion respectively. Growth in Europe waslargely driven by higher levels of repo-style transactions. Growth in the U.S. was driven by growth across all exposure types, largelyrepo-style transactions and undrawn commitments. Growth in Other international was largely driven by higher levels of repo-styletransactions. Exposure in Canada decreased $2 billion as increases in repo-style transactions and other exposures were more thanoffset by a decrease in undrawn commitments related to updated risk parameters as discussed above.
European exposureAs at
January 312012
October 312011
Loans and Acceptances Other
(C$ millions) OutstandingUndrawn
commitments (1) Securities (2)
Letters ofcredit and
guaranteesRepo-style
transactions
Over-the–counter
derivatives (3)
TotalEuropeanexposure
TotalEuropeanexposure
Gross exposure to Europe $ 8,140 $ 6,968 $ 18,237 $ 9,299 $ 72,767 $ 26,780 $142,191 $ 129,212Less: Collateral held against repo–style
transactions – – – – 71,353 – 71,353 58,379Potential future credit exposureadd-on amount – – – – – 14,664 14,664 18,329Undrawn commitments – 6,968 – 9,299 – – 16,267 15,616
Gross drawn exposure to Europe (4) $ 8,140 $ – $ 18,237 $ – $ 1,414 $ 12,116 $ 39,907 $ 36,888
Less: Collateral applied againstderivatives – – – – – 7,879 7,879 5,461
Add: Trading securities – – 9,127 – – – 9,127 11,826
Net exposure to Europe (5) $ 8,140 $ – $ 27,364 $ – $ 1,414 $ 4,237 $ 41,155 $ 43,253
(1) Comprised of undrawn commitments of $5,163 million to corporate entities, $1,743 million to financial entities and $62 million to sovereign entities. On a country basis, exposure is comprised of$3.1 billion to U.K., $1.3 billion to France, $492 million to Germany, $198 million to Ireland, $80 million to Spain and $17 million to Italy. Of the undrawn commitments, over 90% are to investmentgrade entities.
(2) Securities include $9 billion of AFS securities (October 31, 2011 – $10 billion), $9 billion of trading securities (October 31, 2011 – $12 billion) and $9 billion of deposits (October 31, 2011 –$10 billion).
(3) Derivative exposures are measured at fair value.(4) Based on our interpretation of gross funded exposures as reported by certain U.S. banks, which excludes undrawn commitments, potential future credit exposure amount and collateral.(5) Excludes $0.6 billion (October 31, 2011 – $1.5 billion) of exposures to supra-national agencies.
Q1 2012 vs. Q4 2011As noted above, our gross credit risk exposure is calculated based on the definitions provided under the Basel II framework wherebyrisk exposure is calculated before taking into account any collateral and inclusive of an estimate of potential future changes to thatcredit exposure. On that basis, our total European exposure as at January 31, 2012 was $142 billion. Our gross drawn exposure toEurope was $40 billion, after taking into account collateral held against repo-style transactions of $71 billion, undrawn commitmentsfor loans and letters of credit of $16 billion and potential future credit exposure to OTC derivatives of $15 billion. Our net exposure toEurope was $41 billion, after taking into account $8 billion of collateral (primarily cash) we hold against OTC derivatives and theaddition of trading securities of $9 billion held in our trading book, as these are addressed through market risk. Our net exposure toEurope also reflects $0.6 billion of mitigation through credit default swaps, which are largely used to hedge single name exposure andmarket risk. This net exposure also includes our proportionate share of RBC Dexia IS exposures.
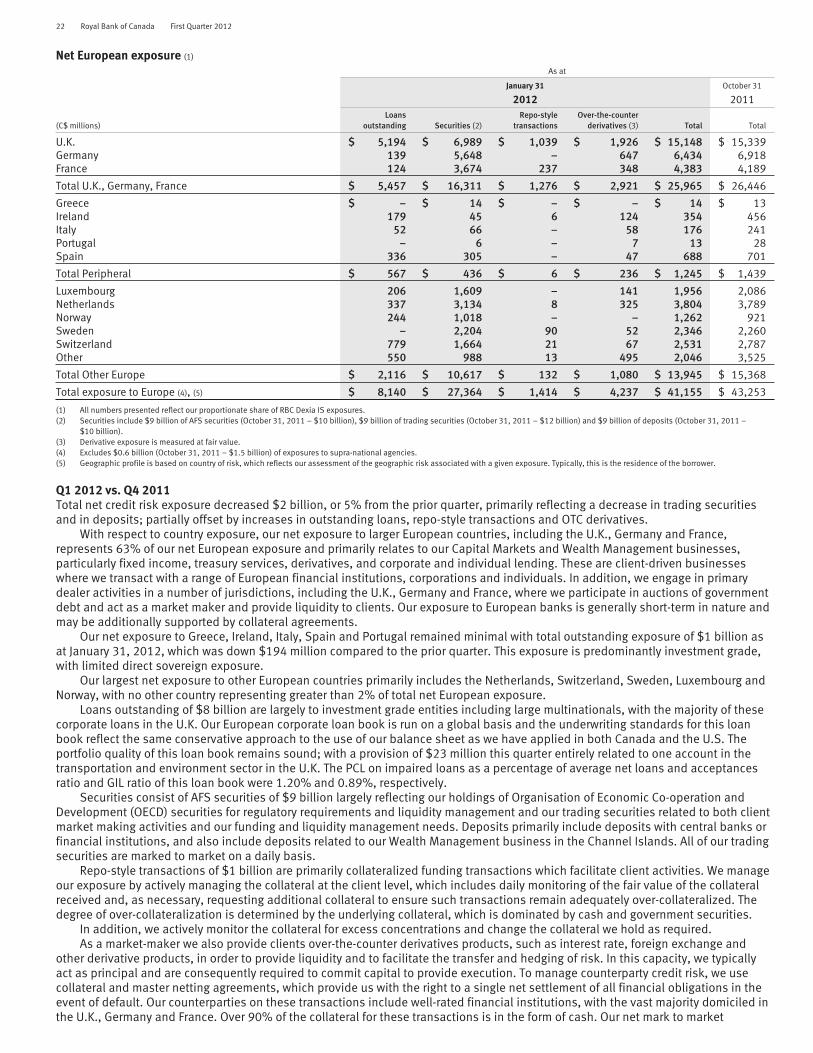
22 Royal Bank of Canada First Quarter 2012
Net European exposure (1)
As at
January 31 October 31
2012 2011
(C$ millions)Loans
outstanding Securities (2)Repo-style
transactionsOver-the-counter
derivatives (3) Total Total
U.K. $ 5,194 $ 6,989 $ 1,039 $ 1,926 $ 15,148 $ 15,339Germany 139 5,648 – 647 6,434 6,918France 124 3,674 237 348 4,383 4,189
Total U.K., Germany, France $ 5,457 $ 16,311 $ 1,276 $ 2,921 $ 25,965 $ 26,446
Greece $ – $ 14 $ – $ – $ 14 $ 13Ireland 179 45 6 124 354 456Italy 52 66 – 58 176 241Portugal – 6 – 7 13 28Spain 336 305 – 47 688 701
Total Peripheral $ 567 $ 436 $ 6 $ 236 $ 1,245 $ 1,439
Luxembourg 206 1,609 – 141 1,956 2,086Netherlands 337 3,134 8 325 3,804 3,789Norway 244 1,018 – – 1,262 921Sweden – 2,204 90 52 2,346 2,260Switzerland 779 1,664 21 67 2,531 2,787Other 550 988 13 495 2,046 3,525
Total Other Europe $ 2,116 $ 10,617 $ 132 $ 1,080 $ 13,945 $ 15,368
Total exposure to Europe (4), (5) $ 8,140 $ 27,364 $ 1,414 $ 4,237 $ 41,155 $ 43,253
(1) All numbers presented reflect our proportionate share of RBC Dexia IS exposures.(2) Securities include $9 billion of AFS securities (October 31, 2011 – $10 billion), $9 billion of trading securities (October 31, 2011 – $12 billion) and $9 billion of deposits (October 31, 2011 –
$10 billion).(3) Derivative exposure is measured at fair value.(4) Excludes $0.6 billion (October 31, 2011 – $1.5 billion) of exposures to supra-national agencies.(5) Geographic profile is based on country of risk, which reflects our assessment of the geographic risk associated with a given exposure. Typically, this is the residence of the borrower.
Q1 2012 vs. Q4 2011Total net credit risk exposure decreased $2 billion, or 5% from the prior quarter, primarily reflecting a decrease in trading securitiesand in deposits; partially offset by increases in outstanding loans, repo-style transactions and OTC derivatives.
With respect to country exposure, our net exposure to larger European countries, including the U.K., Germany and France,represents 63% of our net European exposure and primarily relates to our Capital Markets and Wealth Management businesses,particularly fixed income, treasury services, derivatives, and corporate and individual lending. These are client-driven businesseswhere we transact with a range of European financial institutions, corporations and individuals. In addition, we engage in primarydealer activities in a number of jurisdictions, including the U.K., Germany and France, where we participate in auctions of governmentdebt and act as a market maker and provide liquidity to clients. Our exposure to European banks is generally short-term in nature andmay be additionally supported by collateral agreements.
Our net exposure to Greece, Ireland, Italy, Spain and Portugal remained minimal with total outstanding exposure of $1 billion asat January 31, 2012, which was down $194 million compared to the prior quarter. This exposure is predominantly investment grade,with limited direct sovereign exposure.
Our largest net exposure to other European countries primarily includes the Netherlands, Switzerland, Sweden, Luxembourg andNorway, with no other country representing greater than 2% of total net European exposure.
Loans outstanding of $8 billion are largely to investment grade entities including large multinationals, with the majority of thesecorporate loans in the U.K. Our European corporate loan book is run on a global basis and the underwriting standards for this loanbook reflect the same conservative approach to the use of our balance sheet as we have applied in both Canada and the U.S. Theportfolio quality of this loan book remains sound; with a provision of $23 million this quarter entirely related to one account in thetransportation and environment sector in the U.K. The PCL on impaired loans as a percentage of average net loans and acceptancesratio and GIL ratio of this loan book were 1.20% and 0.89%, respectively.
Securities consist of AFS securities of $9 billion largely reflecting our holdings of Organisation of Economic Co-operation andDevelopment (OECD) securities for regulatory requirements and liquidity management and our trading securities related to both clientmarket making activities and our funding and liquidity management needs. Deposits primarily include deposits with central banks orfinancial institutions, and also include deposits related to our Wealth Management business in the Channel Islands. All of our tradingsecurities are marked to market on a daily basis.
Repo-style transactions of $1 billion are primarily collateralized funding transactions which facilitate client activities. We manageour exposure by actively managing the collateral at the client level, which includes daily monitoring of the fair value of the collateralreceived and, as necessary, requesting additional collateral to ensure such transactions remain adequately over-collateralized. Thedegree of over-collateralization is determined by the underlying collateral, which is dominated by cash and government securities.
In addition, we actively monitor the collateral for excess concentrations and change the collateral we hold as required.As a market-maker we also provide clients over-the-counter derivatives products, such as interest rate, foreign exchange and
other derivative products, in order to provide liquidity and to facilitate the transfer and hedging of risk. In this capacity, we typicallyact as principal and are consequently required to commit capital to provide execution. To manage counterparty credit risk, we usecollateral and master netting agreements, which provide us with the right to a single net settlement of all financial obligations in theevent of default. Our counterparties on these transactions include well-rated financial institutions, with the vast majority domiciled inthe U.K., Germany and France. Over 90% of the collateral for these transactions is in the form of cash. Our net mark to market
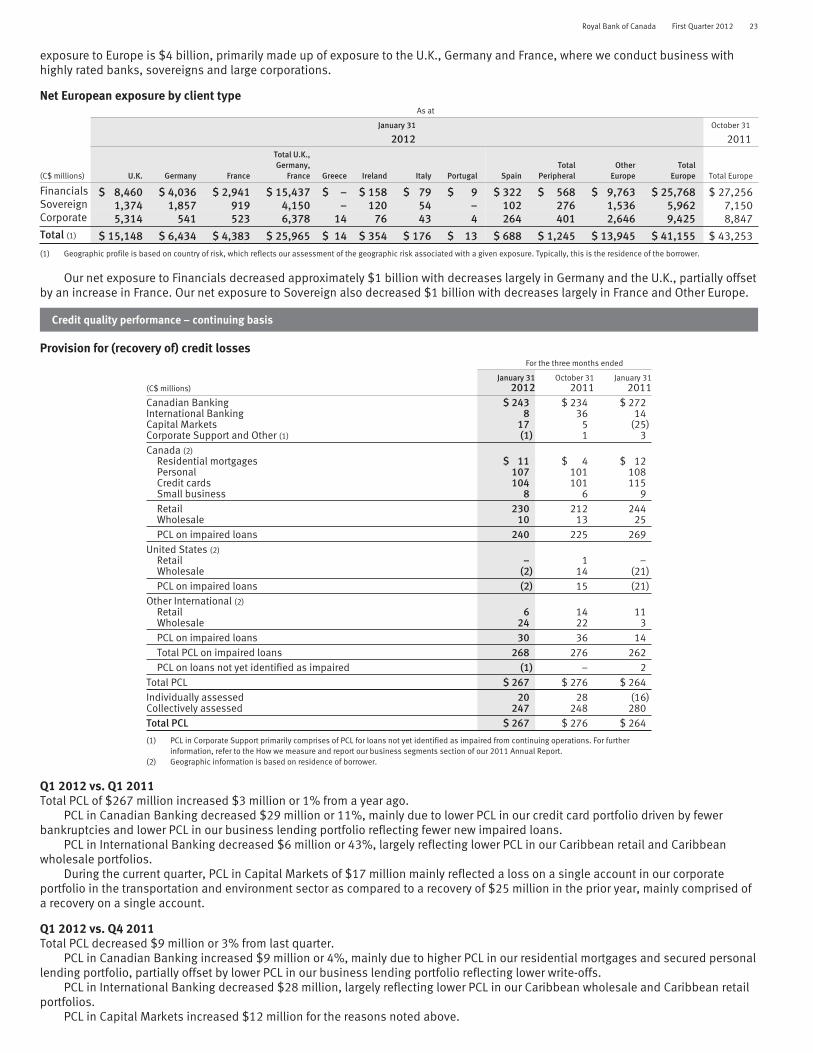
Royal Bank of Canada First Quarter 2012 23
exposure to Europe is $4 billion, primarily made up of exposure to the U.K., Germany and France, where we conduct business withhighly rated banks, sovereigns and large corporations.
Net European exposure by client typeAs at
January 31 October 31
2012 2011
(C$ millions) U.K. Germany France
Total U.K.,Germany,
France Greece Ireland Italy Portugal SpainTotal
PeripheralOther
EuropeTotal
Europe Total Europe
Financials $ 8,460 $ 4,036 $ 2,941 $ 15,437 $ – $ 158 $ 79 $ 9 $ 322 $ 568 $ 9,763 $ 25,768 $ 27,256Sovereign 1,374 1,857 919 4,150 – 120 54 – 102 276 1,536 5,962 7,150Corporate 5,314 541 523 6,378 14 76 43 4 264 401 2,646 9,425 8,847Total (1) $ 15,148 $ 6,434 $ 4,383 $ 25,965 $ 14 $ 354 $ 176 $ 13 $ 688 $ 1,245 $ 13,945 $ 41,155 $ 43,253
(1) Geographic profile is based on country of risk, which reflects our assessment of the geographic risk associated with a given exposure. Typically, this is the residence of the borrower.
Our net exposure to Financials decreased approximately $1 billion with decreases largely in Germany and the U.K., partially offsetby an increase in France. Our net exposure to Sovereign also decreased $1 billion with decreases largely in France and Other Europe.
Credit quality performance – continuing basis
Provision for (recovery of) credit lossesFor the three months ended
(C$ millions)January 31
2012October 31
2011January 31
2011Canadian Banking $ 243 $ 234 $ 272International Banking 8 36 14Capital Markets 17 5 (25)Corporate Support and Other (1) (1) 1 3Canada (2)
Residential mortgages $ 11 $ 4 $ 12Personal 107 101 108Credit cards 104 101 115Small business 8 6 9Retail 230 212 244Wholesale 10 13 25PCL on impaired loans 240 225 269
United States (2)Retail – 1 –Wholesale (2) 14 (21)PCL on impaired loans (2) 15 (21)
Other International (2)Retail 6 14 11Wholesale 24 22 3PCL on impaired loans 30 36 14Total PCL on impaired loans 268 276 262PCL on loans not yet identified as impaired (1) – 2
Total PCL $ 267 $ 276 $ 264Individually assessed 20 28 (16)Collectively assessed 247 248 280Total PCL $ 267 $ 276 $ 264
(1) PCL in Corporate Support primarily comprises of PCL for loans not yet identified as impaired from continuing operations. For furtherinformation, refer to the How we measure and report our business segments section of our 2011 Annual Report.
(2) Geographic information is based on residence of borrower.
Q1 2012 vs. Q1 2011Total PCL of $267 million increased $3 million or 1% from a year ago.
PCL in Canadian Banking decreased $29 million or 11%, mainly due to lower PCL in our credit card portfolio driven by fewerbankruptcies and lower PCL in our business lending portfolio reflecting fewer new impaired loans.
PCL in International Banking decreased $6 million or 43%, largely reflecting lower PCL in our Caribbean retail and Caribbeanwholesale portfolios.
During the current quarter, PCL in Capital Markets of $17 million mainly reflected a loss on a single account in our corporateportfolio in the transportation and environment sector as compared to a recovery of $25 million in the prior year, mainly comprised ofa recovery on a single account.
Q1 2012 vs. Q4 2011Total PCL decreased $9 million or 3% from last quarter.
PCL in Canadian Banking increased $9 million or 4%, mainly due to higher PCL in our residential mortgages and secured personallending portfolio, partially offset by lower PCL in our business lending portfolio reflecting lower write-offs.
PCL in International Banking decreased $28 million, largely reflecting lower PCL in our Caribbean wholesale and Caribbean retailportfolios.
PCL in Capital Markets increased $12 million for the reasons noted above.
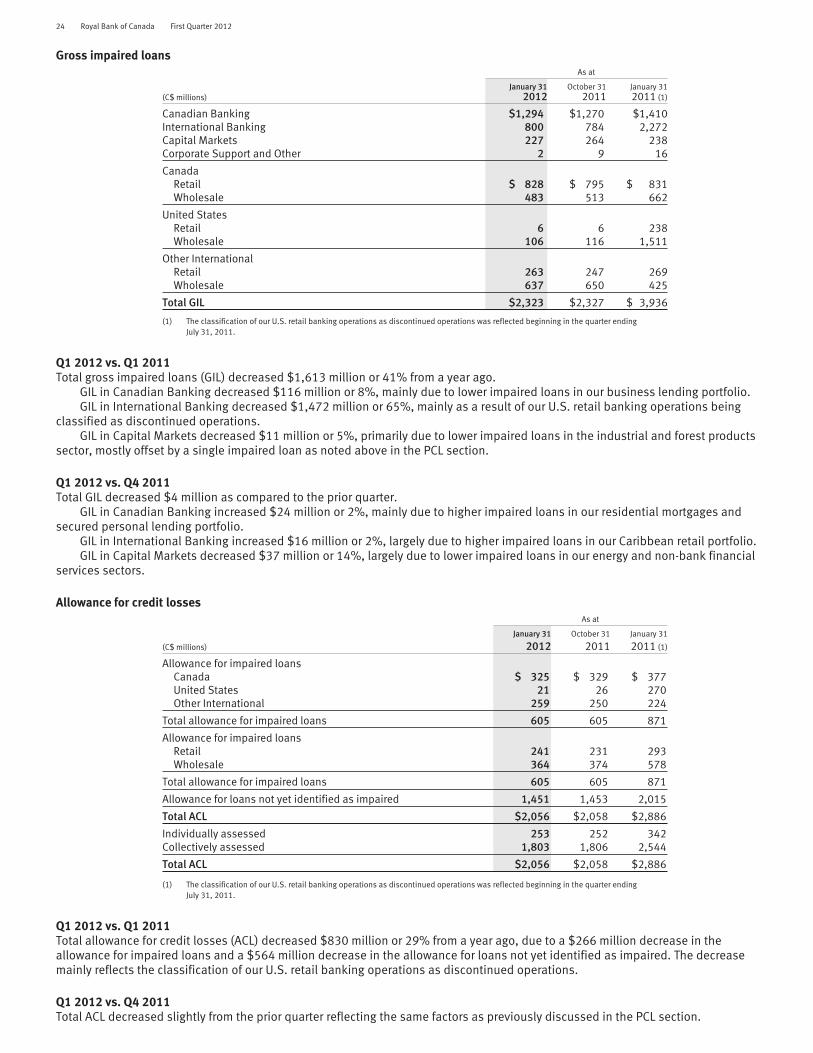
24 Royal Bank of Canada First Quarter 2012
Gross impaired loansAs at
(C$ millions)January 31
2012October 31
2011January 312011 (1)
Canadian Banking $1,294 $1,270 $1,410International Banking 800 784 2,272Capital Markets 227 264 238Corporate Support and Other 2 9 16
CanadaRetail $ 828 $ 795 $ 831Wholesale 483 513 662
United StatesRetail 6 6 238Wholesale 106 116 1,511
Other InternationalRetail 263 247 269Wholesale 637 650 425
Total GIL $2,323 $2,327 $ 3,936
(1) The classification of our U.S. retail banking operations as discontinued operations was reflected beginning in the quarter endingJuly 31, 2011.
Q1 2012 vs. Q1 2011Total gross impaired loans (GIL) decreased $1,613 million or 41% from a year ago.
GIL in Canadian Banking decreased $116 million or 8%, mainly due to lower impaired loans in our business lending portfolio.GIL in International Banking decreased $1,472 million or 65%, mainly as a result of our U.S. retail banking operations being
classified as discontinued operations.GIL in Capital Markets decreased $11 million or 5%, primarily due to lower impaired loans in the industrial and forest products
sector, mostly offset by a single impaired loan as noted above in the PCL section.
Q1 2012 vs. Q4 2011Total GIL decreased $4 million as compared to the prior quarter.
GIL in Canadian Banking increased $24 million or 2%, mainly due to higher impaired loans in our residential mortgages andsecured personal lending portfolio.
GIL in International Banking increased $16 million or 2%, largely due to higher impaired loans in our Caribbean retail portfolio.GIL in Capital Markets decreased $37 million or 14%, largely due to lower impaired loans in our energy and non-bank financial
services sectors.
Allowance for credit lossesAs at
(C$ millions)
January 31
2012October 31
2011January 31
2011 (1)
Allowance for impaired loansCanada $ 325 $ 329 $ 377United States 21 26 270Other International 259 250 224
Total allowance for impaired loans 605 605 871
Allowance for impaired loansRetail 241 231 293Wholesale 364 374 578
Total allowance for impaired loans 605 605 871
Allowance for loans not yet identified as impaired 1,451 1,453 2,015
Total ACL $2,056 $2,058 $2,886
Individually assessed 253 252 342Collectively assessed 1,803 1,806 2,544
Total ACL $2,056 $2,058 $2,886
(1) The classification of our U.S. retail banking operations as discontinued operations was reflected beginning in the quarter endingJuly 31, 2011.
Q1 2012 vs. Q1 2011Total allowance for credit losses (ACL) decreased $830 million or 29% from a year ago, due to a $266 million decrease in theallowance for impaired loans and a $564 million decrease in the allowance for loans not yet identified as impaired. The decreasemainly reflects the classification of our U.S. retail banking operations as discontinued operations.
Q1 2012 vs. Q4 2011Total ACL decreased slightly from the prior quarter reflecting the same factors as previously discussed in the PCL section.

Royal Bank of Canada First Quarter 2012 25
Market risk
In July 2009, the Basel Committee on Banking Supervision announced an amendment to the current market risk framework, which iseffective in the first quarter of 2012. In accordance with the Market Risk Amendment (MRA), a stressed VaR regulatory capitalrequirement was introduced this quarter. Stressed VaR is calculated using the same methodology as the regular trading VaR exceptthat the historical data used in the stressed VaR calculation is taken from a one-year observation period of significant marketvolatility. Currently we use a historical window from September 2008 to August 2009, reflecting the volatility of the financial crisis.Regular trading VaR is based on the most recent two-year observation period.
For further details related to our approach to the management of trading market risk, refer to pages 49 -51 of our 2011 AnnualReport.
The following table shows VaR and stressed VaR for trading activities under the internal models-based approach, for which we havebeen granted approval by OSFI. Regulatory capital for market risk is allocated based on VaR and stressed VaR only for those activitiesthat have approval to use the internal models based approach. The table also shows the diversification effect, which is calculated asthe difference between the VaR and the sum of the separate risk factor VaR values.
VaR for credit valuation adjustments and for products that are not considered part of the trading book are not captured under theinternal models-based approach.
Internal models-based approachJanuary 31, 2012 October 31, 2011 January 31, 2011
As atJan. 31
For the threemonths ended As at
Oct. 31
For the threemonths ended As at
Jan. 31
For the threemonths ended
(C$ millions) Average High Low Average Average
Equity $ 4 $ 6 $ 11 $ 4 $ 4 $ 9 $ 20 $ 17Foreign exchange 3 4 6 2 5 3 1 2Commodities 2 2 3 1 3 3 4 2Interest rate 18 20 24 17 22 23 31 33Credit specific 8 9 10 8 15 17 20 20Diversification (15) (20) (25) (16) (23) (26) (39) (36)
VaR $ 20 $ 21 $ 26 $ 17 $ 26 $ 29 $ 37 $ 38
Stressed VaR $ 32 $ 38 $ 45 $ 31 n.a. n.a. n.a. n.a.
Internal models-based approachQ1 2012 vs. Q1 2011Average VaR of $21 million decreased by $17 million compared to a year ago, largely due to the decrease in interest rate risk, equityrisk and credit specific risk. The decrease in interest rate risk and equity risk was mainly driven by the ongoing risk reduction activitiesand the runoff of the historical scenarios from late 2008 from the VaR model. The decrease in credit specific risk was due to a changeof methodology used to capture single name credit spread risk during the current quarter.
Stressed VaR, which includes the historical scenarios from late 2008, averaged $38 million.
Q1 2012 vs. Q4 2011Average VaR decreased by $8 million, primarily due to the ongoing interest rate and equity trading risk reduction activities. Thedecrease was also driven by the decrease of credit specific risk driven by the adoption of a new methodology used to capture singlename credit spread risk this quarter.
Management VaRIn addition, for management purposes we calculate VaR for all of our trading positions, including those under the standardizedapproach for capital as prescribed by OSFI. Products subject to the standardized approach for regulatory capital that are capturedunder Management VaR include Agency and non-Agency mortgage-backed securities, Bank-owned life insurance (BOLI), certaincommodity positions and certain structured equity and interest rate derivatives. VaR for these positions, and the diversificationeffects with the rest of the portfolio, can be subject to additional limitations and may not be calculated using the same techniquesapplied to positions under the internal models-based approach for regulatory capital purposes. Management VaR, therefore, includesall of our trading activities, regardless of capital treatment. It is being disclosed to ensure alignment between external disclosure andinternal management measures that incorporate all trading activities.

26 Royal Bank of Canada First Quarter 2012
As is the case for the internal models-based approach, VaR for credit valuation adjustments and for products that are notconsidered part of the trading book are not captured under the Management VaR.
January 31, 2012 October 31, 2011 January 31, 2011
As atJan. 31
For the threemonths ended As at
Oct. 31
For the threemonths ended As at
Jan. 31
For the threemonths ended
(C$ millions) Average High Low Average Average
Equity $ 9 $ 10 $ 21 $ 5 $ 7 $ 11 $ 11 $ 12Foreign exchange 3 4 6 2 5 3 1 2Commodities 4 3 4 2 3 3 6 4Interest rate 34 34 42 31 36 39 53 52Credit specific 8 9 10 8 15 17 20 20Diversification (21) (20) (36) (21) (22) (26) (31) (30)
VaR $ 37 $ 40 $ 46 $ 33 $ 44 $ 47 $ 60 $ 60
Stressed VaR $ 55 $ 64 $ 77 $ 54 n.a. n.a. n.a. n.a.
Q1 2012 vs. Q1 2011Average Management VaR of $40 million decreased by $20 million from the prior year largely due to the decrease in interest rate riskdriven by the ongoing risk reduction activities and the impact of the runoff of the historical scenarios from late 2008 from the VaRmodel. Credit specific risk was down due to the change of methodology used to capture single name credit spread risk implementedin the current quarter.
Management stressed VaR was $55 million at the end of the quarter, which was at the low end of the range mainly due to the riskreduction activities as noted above.
Q1 2012 vs. Q4 2011Average Management VaR was down $7 million, mainly driven by the ongoing risk reduction activities. The decrease was also due tothe change of methodology used to capture single name credit spread risk implemented this quarter.
Trading revenue and VaR (1), (C$ millions)
-80
-40
0
40
80
Daily Trading Revenue Global trading VAR (Internal Models-Based Approach) Global trading VaR (Management)
Jan-2011
Apr-2011
Jul-2
011
Oct-2011
Jan-2012
(1) Trading revenue on a teb excluding revenue related to consolidated VIEs.
During the quarter, there were five days with net trading loss, with no loss exceeding VaR. The largest loss occurred on November 17,2011, totaling $12 million. This was mainly driven by wider credit spreads, lower equity prices and the movement in interest rates.The largest gain occurred on November 30, 2011, totaling $63 million. This was primarily driven by month-end credit valuationadjustments, including tighter counterparty credit spreads, a widening in our credit spread and other credit-related gains. This wasalso due to a favourable foreign exchange impact and movements in interest rates.
Incremental risk chargeEffective in the first quarter of 2012, as part of the revisions to the Basel framework, is a market risk capital requirement based on theincremental risk charge (IRC). The IRC is a supplemental market risk capital charge that is meant to capture the credit rating migrationand default risk of the held for trading positions. We calculate the IRC for all cash and credit derivative positions that attract models-based regulatory capital including sovereign issuers. The implementation of the IRC increased risk weighted assets and reducedcapital ratios in the quarter. For further details refer to the Capital management section.
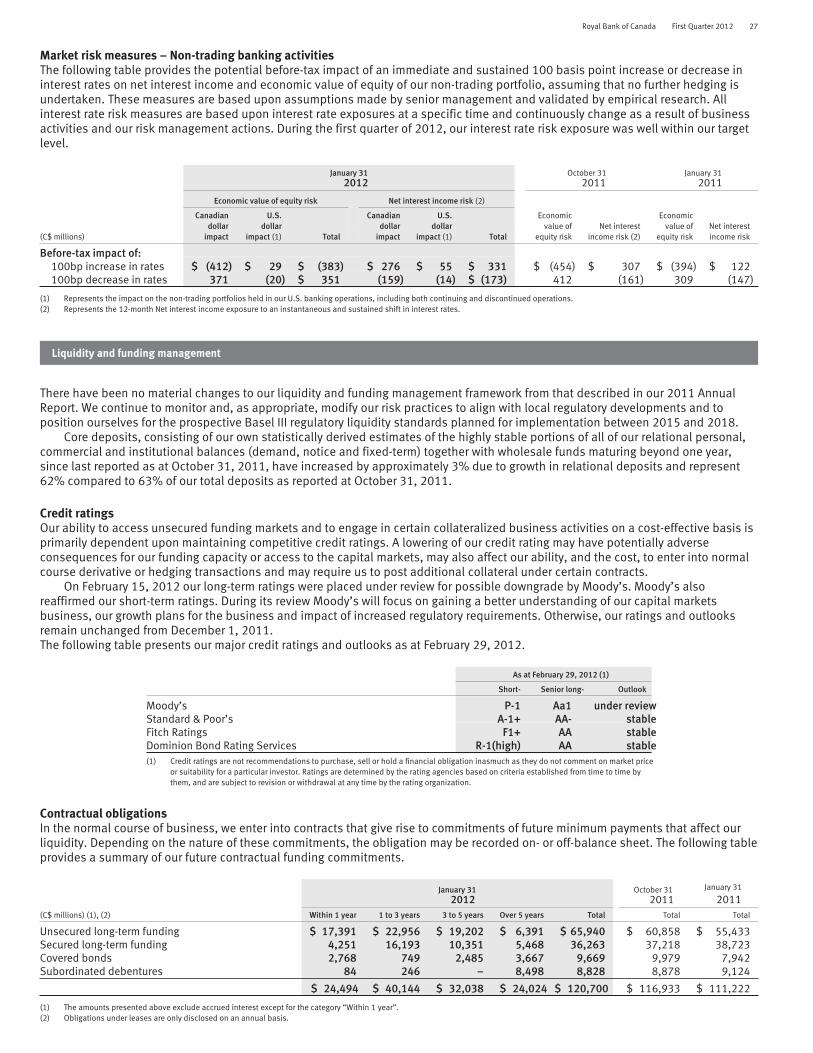
Royal Bank of Canada First Quarter 2012 27
Market risk measures – Non-trading banking activitiesThe following table provides the potential before-tax impact of an immediate and sustained 100 basis point increase or decrease ininterest rates on net interest income and economic value of equity of our non-trading portfolio, assuming that no further hedging isundertaken. These measures are based upon assumptions made by senior management and validated by empirical research. Allinterest rate risk measures are based upon interest rate exposures at a specific time and continuously change as a result of businessactivities and our risk management actions. During the first quarter of 2012, our interest rate risk exposure was well within our targetlevel.
January 312012
October 312011
January 312011
Economic value of equity risk Net interest income risk (2)
Economicvalue of
equity riskNet interest
income risk (2)
Economicvalue of
equity riskNet interestincome risk
Canadiandollar
impact
U.S.dollar
impact (1) Total
Canadiandollar
impact
U.S.dollar
impact (1) Total(C$ millions)
Before-tax impact of:100bp increase in rates $ (412) $ 29 $ (383) $ 276 $ 55 $ 331 $ (454) $ 307 $ (394) $ 122100bp decrease in rates 371 (20) $ 351 (159) (14) $ (173) 412 (161) 309 (147)
(1) Represents the impact on the non-trading portfolios held in our U.S. banking operations, including both continuing and discontinued operations.(2) Represents the 12-month Net interest income exposure to an instantaneous and sustained shift in interest rates.
Liquidity and funding management
There have been no material changes to our liquidity and funding management framework from that described in our 2011 AnnualReport. We continue to monitor and, as appropriate, modify our risk practices to align with local regulatory developments and toposition ourselves for the prospective Basel III regulatory liquidity standards planned for implementation between 2015 and 2018.
Core deposits, consisting of our own statistically derived estimates of the highly stable portions of all of our relational personal,commercial and institutional balances (demand, notice and fixed-term) together with wholesale funds maturing beyond one year,since last reported as at October 31, 2011, have increased by approximately 3% due to growth in relational deposits and represent62% compared to 63% of our total deposits as reported at October 31, 2011.
Credit ratingsOur ability to access unsecured funding markets and to engage in certain collateralized business activities on a cost-effective basis isprimarily dependent upon maintaining competitive credit ratings. A lowering of our credit rating may have potentially adverseconsequences for our funding capacity or access to the capital markets, may also affect our ability, and the cost, to enter into normalcourse derivative or hedging transactions and may require us to post additional collateral under certain contracts.
On February 15, 2012 our long-term ratings were placed under review for possible downgrade by Moody’s. Moody’s alsoreaffirmed our short-term ratings. During its review Moody’s will focus on gaining a better understanding of our capital marketsbusiness, our growth plans for the business and impact of increased regulatory requirements. Otherwise, our ratings and outlooksremain unchanged from December 1, 2011.The following table presents our major credit ratings and outlooks as at February 29, 2012.
As at February 29, 2012 (1)
Short- Senior long- Outlook
Moody’s P-1 Aa1 under reviewStandard & Poor’s A-1+ AA- stableFitch Ratings F1+ AA stableDominion Bond Rating Services R-1(high) AA stable(1) Credit ratings are not recommendations to purchase, sell or hold a financial obligation inasmuch as they do not comment on market price
or suitability for a particular investor. Ratings are determined by the rating agencies based on criteria established from time to time bythem, and are subject to revision or withdrawal at any time by the rating organization.
Contractual obligationsIn the normal course of business, we enter into contracts that give rise to commitments of future minimum payments that affect ourliquidity. Depending on the nature of these commitments, the obligation may be recorded on- or off-balance sheet. The following tableprovides a summary of our future contractual funding commitments.
January 312012
October 312011
January 31
2011(C$ millions) (1), (2) Within 1 year 1 to 3 years 3 to 5 years Over 5 years Total Total Total
Unsecured long-term funding $ 17,391 $ 22,956 $ 19,202 $ 6,391 $ 65,940 $ 60,858 $ 55,433Secured long-term funding 4,251 16,193 10,351 5,468 36,263 37,218 38,723Covered bonds 2,768 749 2,485 3,667 9,669 9,979 7,942Subordinated debentures 84 246 – 8,498 8,828 8,878 9,124
$ 24,494 $ 40,144 $ 32,038 $ 24,024 $ 120,700 $ 116,933 $ 111,222
(1) The amounts presented above exclude accrued interest except for the category “Within 1 year”.(2) Obligations under leases are only disclosed on an annual basis.
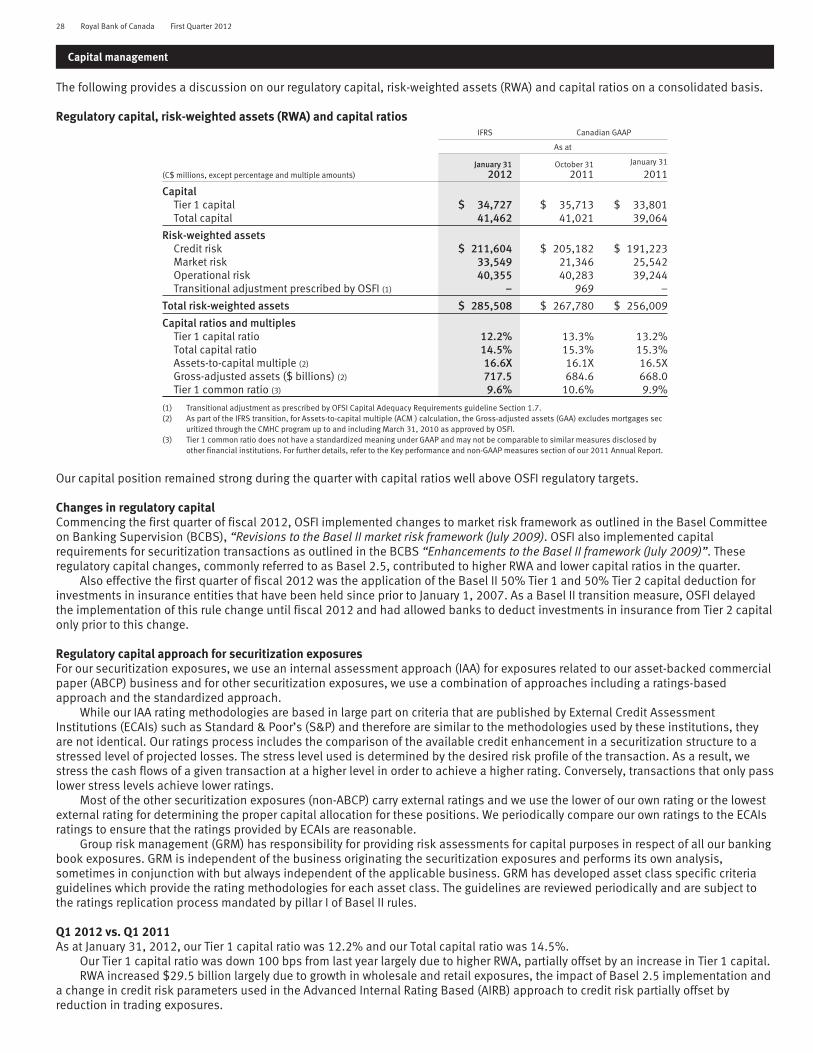
28 Royal Bank of Canada First Quarter 2012
Capital management
The following provides a discussion on our regulatory capital, risk-weighted assets (RWA) and capital ratios on a consolidated basis.
Regulatory capital, risk-weighted assets (RWA) and capital ratiosIFRS Canadian GAAP
As at
(C$ millions, except percentage and multiple amounts)January 31
2012October 31
2011January 31
2011
CapitalTier 1 capital $ 34,727 $ 35,713 $ 33,801Total capital 41,462 41,021 39,064
Risk-weighted assetsCredit risk $ 211,604 $ 205,182 $ 191,223Market risk 33,549 21,346 25,542Operational risk 40,355 40,283 39,244Transitional adjustment prescribed by OSFI (1) – 969 –
Total risk-weighted assets $ 285,508 $ 267,780 $ 256,009
Capital ratios and multiplesTier 1 capital ratio 12.2% 13.3% 13.2%Total capital ratio 14.5% 15.3% 15.3%Assets-to-capital multiple (2) 16.6X 16.1X 16.5XGross-adjusted assets ($ billions) (2) 717.5 684.6 668.0Tier 1 common ratio (3) 9.6% 10.6% 9.9%
(1) Transitional adjustment as prescribed by OFSI Capital Adequacy Requirements guideline Section 1.7.(2) As part of the IFRS transition, for Assets-to-capital multiple (ACM ) calculation, the Gross-adjusted assets (GAA) excludes mortgages sec
uritized through the CMHC program up to and including March 31, 2010 as approved by OSFI.(3) Tier 1 common ratio does not have a standardized meaning under GAAP and may not be comparable to similar measures disclosed by
other financial institutions. For further details, refer to the Key performance and non-GAAP measures section of our 2011 Annual Report.
Our capital position remained strong during the quarter with capital ratios well above OSFI regulatory targets.
Changes in regulatory capitalCommencing the first quarter of fiscal 2012, OSFI implemented changes to market risk framework as outlined in the Basel Committeeon Banking Supervision (BCBS), “Revisions to the Basel II market risk framework (July 2009). OSFI also implemented capitalrequirements for securitization transactions as outlined in the BCBS “Enhancements to the Basel II framework (July 2009)”. Theseregulatory capital changes, commonly referred to as Basel 2.5, contributed to higher RWA and lower capital ratios in the quarter.
Also effective the first quarter of fiscal 2012 was the application of the Basel II 50% Tier 1 and 50% Tier 2 capital deduction forinvestments in insurance entities that have been held since prior to January 1, 2007. As a Basel II transition measure, OSFI delayedthe implementation of this rule change until fiscal 2012 and had allowed banks to deduct investments in insurance from Tier 2 capitalonly prior to this change.
Regulatory capital approach for securitization exposuresFor our securitization exposures, we use an internal assessment approach (IAA) for exposures related to our asset-backed commercialpaper (ABCP) business and for other securitization exposures, we use a combination of approaches including a ratings-basedapproach and the standardized approach.
While our IAA rating methodologies are based in large part on criteria that are published by External Credit AssessmentInstitutions (ECAIs) such as Standard & Poor’s (S&P) and therefore are similar to the methodologies used by these institutions, theyare not identical. Our ratings process includes the comparison of the available credit enhancement in a securitization structure to astressed level of projected losses. The stress level used is determined by the desired risk profile of the transaction. As a result, westress the cash flows of a given transaction at a higher level in order to achieve a higher rating. Conversely, transactions that only passlower stress levels achieve lower ratings.
Most of the other securitization exposures (non-ABCP) carry external ratings and we use the lower of our own rating or the lowestexternal rating for determining the proper capital allocation for these positions. We periodically compare our own ratings to the ECAIsratings to ensure that the ratings provided by ECAIs are reasonable.
Group risk management (GRM) has responsibility for providing risk assessments for capital purposes in respect of all our bankingbook exposures. GRM is independent of the business originating the securitization exposures and performs its own analysis,sometimes in conjunction with but always independent of the applicable business. GRM has developed asset class specific criteriaguidelines which provide the rating methodologies for each asset class. The guidelines are reviewed periodically and are subject tothe ratings replication process mandated by pillar I of Basel II rules.
Q1 2012 vs. Q1 2011As at January 31, 2012, our Tier 1 capital ratio was 12.2% and our Total capital ratio was 14.5%.
Our Tier 1 capital ratio was down 100 bps from last year largely due to higher RWA, partially offset by an increase in Tier 1 capital.RWA increased $29.5 billion largely due to growth in wholesale and retail exposures, the impact of Basel 2.5 implementation and
a change in credit risk parameters used in the Advanced Internal Rating Based (AIRB) approach to credit risk partially offset byreduction in trading exposures.
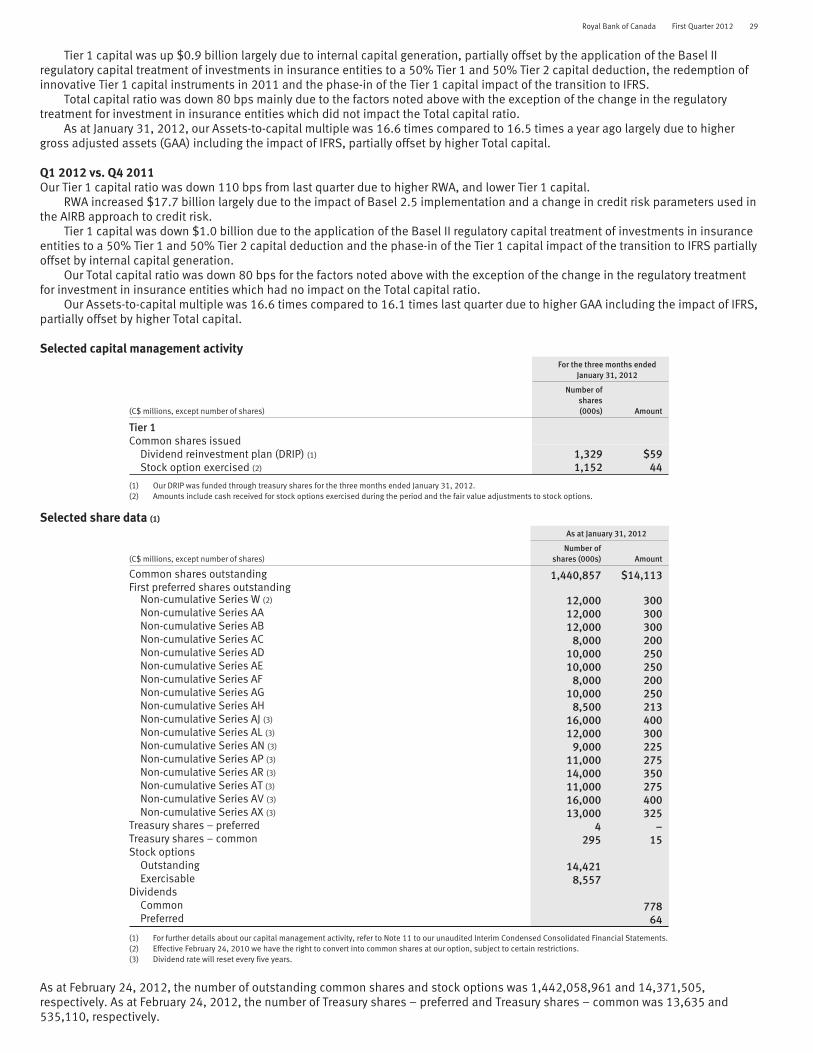
Royal Bank of Canada First Quarter 2012 29
Tier 1 capital was up $0.9 billion largely due to internal capital generation, partially offset by the application of the Basel IIregulatory capital treatment of investments in insurance entities to a 50% Tier 1 and 50% Tier 2 capital deduction, the redemption ofinnovative Tier 1 capital instruments in 2011 and the phase-in of the Tier 1 capital impact of the transition to IFRS.
Total capital ratio was down 80 bps mainly due to the factors noted above with the exception of the change in the regulatorytreatment for investment in insurance entities which did not impact the Total capital ratio.
As at January 31, 2012, our Assets-to-capital multiple was 16.6 times compared to 16.5 times a year ago largely due to highergross adjusted assets (GAA) including the impact of IFRS, partially offset by higher Total capital.
Q1 2012 vs. Q4 2011Our Tier 1 capital ratio was down 110 bps from last quarter due to higher RWA, and lower Tier 1 capital.
RWA increased $17.7 billion largely due to the impact of Basel 2.5 implementation and a change in credit risk parameters used inthe AIRB approach to credit risk.
Tier 1 capital was down $1.0 billion due to the application of the Basel II regulatory capital treatment of investments in insuranceentities to a 50% Tier 1 and 50% Tier 2 capital deduction and the phase-in of the Tier 1 capital impact of the transition to IFRS partiallyoffset by internal capital generation.
Our Total capital ratio was down 80 bps for the factors noted above with the exception of the change in the regulatory treatmentfor investment in insurance entities which had no impact on the Total capital ratio.
Our Assets-to-capital multiple was 16.6 times compared to 16.1 times last quarter due to higher GAA including the impact of IFRS,partially offset by higher Total capital.
Selected capital management activityFor the three months ended
January 31, 2012
(C$ millions, except number of shares)
Number ofshares(000s) Amount
Tier 1Common shares issued
Dividend reinvestment plan (DRIP) (1) 1,329 $59Stock option exercised (2) 1,152 44
(1) Our DRIP was funded through treasury shares for the three months ended January 31, 2012.(2) Amounts include cash received for stock options exercised during the period and the fair value adjustments to stock options.
Selected share data (1)
As at January 31, 2012
(C$ millions, except number of shares)Number of
shares (000s) Amount
Common shares outstanding 1,440,857 $14,113First preferred shares outstanding
Non-cumulative Series W (2) 12,000 300Non-cumulative Series AA 12,000 300Non-cumulative Series AB 12,000 300Non-cumulative Series AC 8,000 200Non-cumulative Series AD 10,000 250Non-cumulative Series AE 10,000 250Non-cumulative Series AF 8,000 200Non-cumulative Series AG 10,000 250Non-cumulative Series AH 8,500 213Non-cumulative Series AJ (3) 16,000 400Non-cumulative Series AL (3) 12,000 300Non-cumulative Series AN (3) 9,000 225Non-cumulative Series AP (3) 11,000 275Non-cumulative Series AR (3) 14,000 350Non-cumulative Series AT (3) 11,000 275Non-cumulative Series AV (3) 16,000 400Non-cumulative Series AX (3) 13,000 325
Treasury shares – preferred 4 –Treasury shares – common 295 15Stock options
Outstanding 14,421Exercisable 8,557
DividendsCommon 778Preferred 64
(1) For further details about our capital management activity, refer to Note 11 to our unaudited Interim Condensed Consolidated Financial Statements.(2) Effective February 24, 2010 we have the right to convert into common shares at our option, subject to certain restrictions.(3) Dividend rate will reset every five years.
As at February 24, 2012, the number of outstanding common shares and stock options was 1,442,058,961 and 14,371,505,respectively. As at February 24, 2012, the number of Treasury shares – preferred and Treasury shares – common was 13,635 and535,110, respectively.
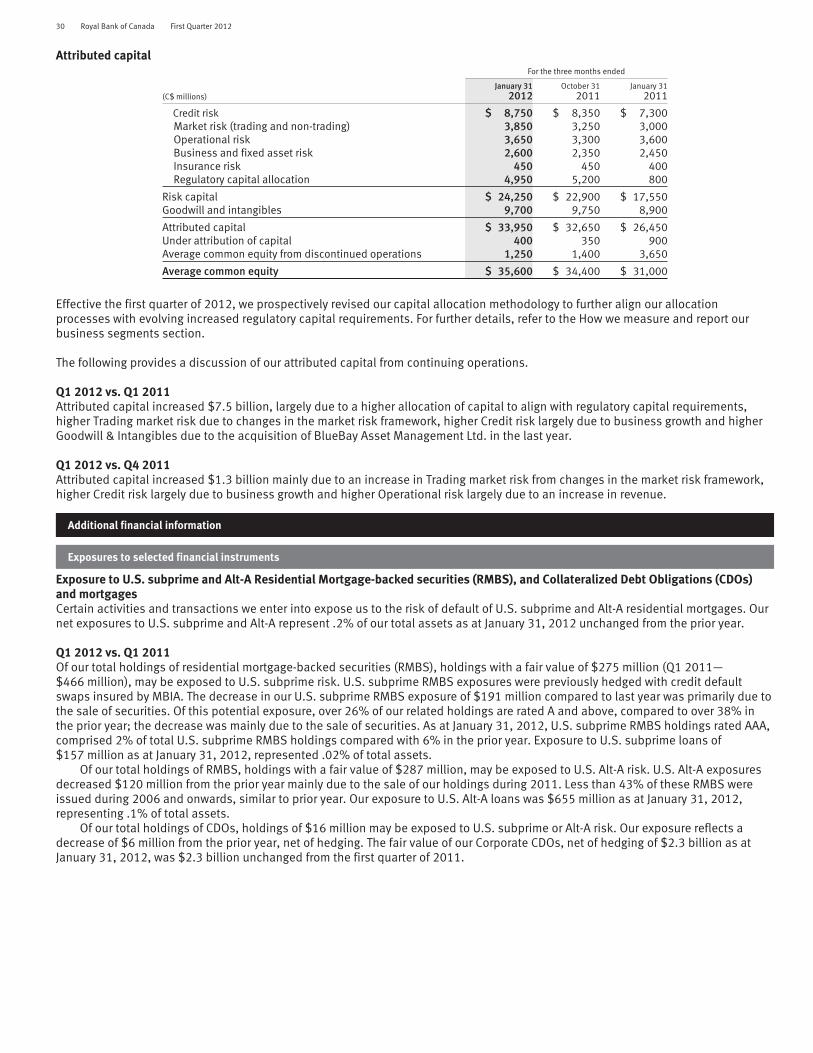
30 Royal Bank of Canada First Quarter 2012
Attributed capitalFor the three months ended
(C$ millions)January 31
2012October 31
2011January 31
2011
Credit risk $ 8,750 $ 8,350 $ 7,300Market risk (trading and non-trading) 3,850 3,250 3,000Operational risk 3,650 3,300 3,600Business and fixed asset risk 2,600 2,350 2,450Insurance risk 450 450 400Regulatory capital allocation 4,950 5,200 800
Risk capital $ 24,250 $ 22,900 $ 17,550Goodwill and intangibles 9,700 9,750 8,900
Attributed capital $ 33,950 $ 32,650 $ 26,450Under attribution of capital 400 350 900Average common equity from discontinued operations 1,250 1,400 3,650
Average common equity $ 35,600 $ 34,400 $ 31,000
Effective the first quarter of 2012, we prospectively revised our capital allocation methodology to further align our allocationprocesses with evolving increased regulatory capital requirements. For further details, refer to the How we measure and report ourbusiness segments section.
The following provides a discussion of our attributed capital from continuing operations.
Q1 2012 vs. Q1 2011Attributed capital increased $7.5 billion, largely due to a higher allocation of capital to align with regulatory capital requirements,higher Trading market risk due to changes in the market risk framework, higher Credit risk largely due to business growth and higherGoodwill & Intangibles due to the acquisition of BlueBay Asset Management Ltd. in the last year.
Q1 2012 vs. Q4 2011Attributed capital increased $1.3 billion mainly due to an increase in Trading market risk from changes in the market risk framework,higher Credit risk largely due to business growth and higher Operational risk largely due to an increase in revenue.
Additional financial information
Exposures to selected financial instruments
Exposure to U.S. subprime and Alt-A Residential Mortgage-backed securities (RMBS), and Collateralized Debt Obligations (CDOs)and mortgagesCertain activities and transactions we enter into expose us to the risk of default of U.S. subprime and Alt-A residential mortgages. Ournet exposures to U.S. subprime and Alt-A represent .2% of our total assets as at January 31, 2012 unchanged from the prior year.
Q1 2012 vs. Q1 2011Of our total holdings of residential mortgage-backed securities (RMBS), holdings with a fair value of $275 million (Q1 2011—$466 million), may be exposed to U.S. subprime risk. U.S. subprime RMBS exposures were previously hedged with credit defaultswaps insured by MBIA. The decrease in our U.S. subprime RMBS exposure of $191 million compared to last year was primarily due tothe sale of securities. Of this potential exposure, over 26% of our related holdings are rated A and above, compared to over 38% inthe prior year; the decrease was mainly due to the sale of securities. As at January 31, 2012, U.S. subprime RMBS holdings rated AAA,comprised 2% of total U.S. subprime RMBS holdings compared with 6% in the prior year. Exposure to U.S. subprime loans of$157 million as at January 31, 2012, represented .02% of total assets.
Of our total holdings of RMBS, holdings with a fair value of $287 million, may be exposed to U.S. Alt-A risk. U.S. Alt-A exposuresdecreased $120 million from the prior year mainly due to the sale of our holdings during 2011. Less than 43% of these RMBS wereissued during 2006 and onwards, similar to prior year. Our exposure to U.S. Alt-A loans was $655 million as at January 31, 2012,representing .1% of total assets.
Of our total holdings of CDOs, holdings of $16 million may be exposed to U.S. subprime or Alt-A risk. Our exposure reflects adecrease of $6 million from the prior year, net of hedging. The fair value of our Corporate CDOs, net of hedging of $2.3 billion as atJanuary 31, 2012, was $2.3 billion unchanged from the first quarter of 2011.

Royal Bank of Canada First Quarter 2012 31
Net exposure to U.S. subprime and Alt-A through RMBS, CDOs and mortgagesAs at January 31, 2012
(C$ millions)Subprime
RMBSAlt-A
RMBS
CDOs thatmay contain
subprimeor Alt-A Total
Fair value of securities before hedging $ 275 $ 287 $ 16 $ 578
Fair value of securities net of hedging by ratingAAA $ 5 $ 26 $ –AA 40 14 –A 28 35 –BBB 15 19 –Below BBB- 187 193 16
Total $ 275 $ 287 $ 16 $ 578
Fair value of securities net of hedging by vintage2003 (or before) $ 15 $ 4 $ –2004 52 54 –2005 139 107 162006 55 57 –2007 and greater 14 65 –
Total $ 275 $ 287 $ 16 $ 578
Amortized cost of subprime/Alt-A mortgages (whole loans) $ 157 $ 655 $ – $ 812
Total subprime and Alt-A exposures, net of hedging $ 432 $ 942 $ 16 $ 1,390
Sensitivities of fair value of securities, net of hedging, to changes inassumptions:
100bp increase in credit spread $ (6) $ (6)100bp increase in interest rates (2) (3)20% increase in default rates (8) (2)25% decrease in pre-payment rates (5) (4)
Off-balance sheet arrangementsFor our off-balance sheet arrangements including multi-seller conduits, structured investment vehicles and other variable interestentities as at January 31, 2012, refer to the Off-balance sheet arrangements section.
Leveraged financeLeveraged finance comprises infrastructure finance, essential services and other types of finance. It excludes investment gradefinancing and non-investment grade financing where there is no private equity sponsor involvement. Our total commitments,combined funded and unfunded, as at January 31, 2012 were $7,004 million which was .9% of our total assets.
Commercial mortgage-backed securities disclosureThe fair value of our total direct holdings of commercial mortgage-backed securities was $215 million as at January 31, 2012.
Assets and liabilities measured at fair valueThere were significant transfers in or out of levels 1, 2 or 3 in the current quarter, as classified by the fair value hierarchy set out inIFRS 7, Financial Instruments – Disclosures. For further details, refer to Note 4 to our unaudited Interim Condensed ConsolidatedFinancial Statements.
As at January 31, 2012
(C$ millions, except percentage amounts) Fair value (1) Level 1 (1) Level 2 (1) Level 3 (1) Total
Financial assetsSecurities at FVTPL $123,565 45% 54% 1% 100%Available-for-sale 41,124 17% 64% 19% 100%Loans – Wholesale 4,543 0% 84% 16% 100%Derivatives 130,156 1% 98% 1% 100%Other assets 518 73% 27% 0% 100%
Financial liabilitiesDeposits $ 71,218 0% 90% 10% 100%Derivatives 132,863 1% 97% 2% 100%
(1) Fair value of assets and liabilities as a percentage of total assets and liabilities measured at fair value on a recurring basis for categoriespresented in the table above and does not reflect the impact of netting.
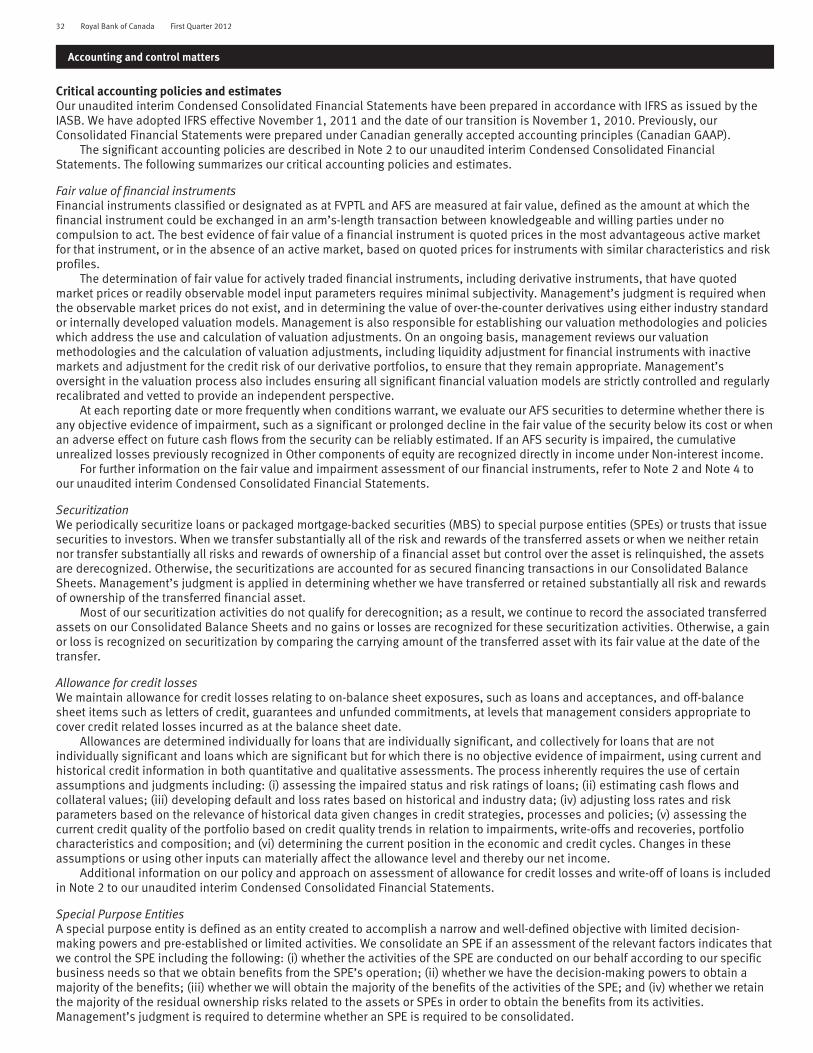
32 Royal Bank of Canada First Quarter 2012
Accounting and control matters
Critical accounting policies and estimatesOur unaudited interim Condensed Consolidated Financial Statements have been prepared in accordance with IFRS as issued by theIASB. We have adopted IFRS effective November 1, 2011 and the date of our transition is November 1, 2010. Previously, ourConsolidated Financial Statements were prepared under Canadian generally accepted accounting principles (Canadian GAAP).
The significant accounting policies are described in Note 2 to our unaudited interim Condensed Consolidated FinancialStatements. The following summarizes our critical accounting policies and estimates.
Fair value of financial instrumentsFinancial instruments classified or designated as at FVPTL and AFS are measured at fair value, defined as the amount at which thefinancial instrument could be exchanged in an arm’s-length transaction between knowledgeable and willing parties under nocompulsion to act. The best evidence of fair value of a financial instrument is quoted prices in the most advantageous active marketfor that instrument, or in the absence of an active market, based on quoted prices for instruments with similar characteristics and riskprofiles.
The determination of fair value for actively traded financial instruments, including derivative instruments, that have quotedmarket prices or readily observable model input parameters requires minimal subjectivity. Management’s judgment is required whenthe observable market prices do not exist, and in determining the value of over-the-counter derivatives using either industry standardor internally developed valuation models. Management is also responsible for establishing our valuation methodologies and policieswhich address the use and calculation of valuation adjustments. On an ongoing basis, management reviews our valuationmethodologies and the calculation of valuation adjustments, including liquidity adjustment for financial instruments with inactivemarkets and adjustment for the credit risk of our derivative portfolios, to ensure that they remain appropriate. Management’soversight in the valuation process also includes ensuring all significant financial valuation models are strictly controlled and regularlyrecalibrated and vetted to provide an independent perspective.
At each reporting date or more frequently when conditions warrant, we evaluate our AFS securities to determine whether there isany objective evidence of impairment, such as a significant or prolonged decline in the fair value of the security below its cost or whenan adverse effect on future cash flows from the security can be reliably estimated. If an AFS security is impaired, the cumulativeunrealized losses previously recognized in Other components of equity are recognized directly in income under Non-interest income.
For further information on the fair value and impairment assessment of our financial instruments, refer to Note 2 and Note 4 toour unaudited interim Condensed Consolidated Financial Statements.
SecuritizationWe periodically securitize loans or packaged mortgage-backed securities (MBS) to special purpose entities (SPEs) or trusts that issuesecurities to investors. When we transfer substantially all of the risk and rewards of the transferred assets or when we neither retainnor transfer substantially all risks and rewards of ownership of a financial asset but control over the asset is relinquished, the assetsare derecognized. Otherwise, the securitizations are accounted for as secured financing transactions in our Consolidated BalanceSheets. Management’s judgment is applied in determining whether we have transferred or retained substantially all risk and rewardsof ownership of the transferred financial asset.
Most of our securitization activities do not qualify for derecognition; as a result, we continue to record the associated transferredassets on our Consolidated Balance Sheets and no gains or losses are recognized for these securitization activities. Otherwise, a gainor loss is recognized on securitization by comparing the carrying amount of the transferred asset with its fair value at the date of thetransfer.
Allowance for credit lossesWe maintain allowance for credit losses relating to on-balance sheet exposures, such as loans and acceptances, and off-balancesheet items such as letters of credit, guarantees and unfunded commitments, at levels that management considers appropriate tocover credit related losses incurred as at the balance sheet date.
Allowances are determined individually for loans that are individually significant, and collectively for loans that are notindividually significant and loans which are significant but for which there is no objective evidence of impairment, using current andhistorical credit information in both quantitative and qualitative assessments. The process inherently requires the use of certainassumptions and judgments including: (i) assessing the impaired status and risk ratings of loans; (ii) estimating cash flows andcollateral values; (iii) developing default and loss rates based on historical and industry data; (iv) adjusting loss rates and riskparameters based on the relevance of historical data given changes in credit strategies, processes and policies; (v) assessing thecurrent credit quality of the portfolio based on credit quality trends in relation to impairments, write-offs and recoveries, portfoliocharacteristics and composition; and (vi) determining the current position in the economic and credit cycles. Changes in theseassumptions or using other inputs can materially affect the allowance level and thereby our net income.
Additional information on our policy and approach on assessment of allowance for credit losses and write-off of loans is includedin Note 2 to our unaudited interim Condensed Consolidated Financial Statements.
Special Purpose EntitiesA special purpose entity is defined as an entity created to accomplish a narrow and well-defined objective with limited decision-making powers and pre-established or limited activities. We consolidate an SPE if an assessment of the relevant factors indicates thatwe control the SPE including the following: (i) whether the activities of the SPE are conducted on our behalf according to our specificbusiness needs so that we obtain benefits from the SPE’s operation; (ii) whether we have the decision-making powers to obtain amajority of the benefits; (iii) whether we will obtain the majority of the benefits of the activities of the SPE; and (iv) whether we retainthe majority of the residual ownership risks related to the assets or SPEs in order to obtain the benefits from its activities.Management’s judgment is required to determine whether an SPE is required to be consolidated.
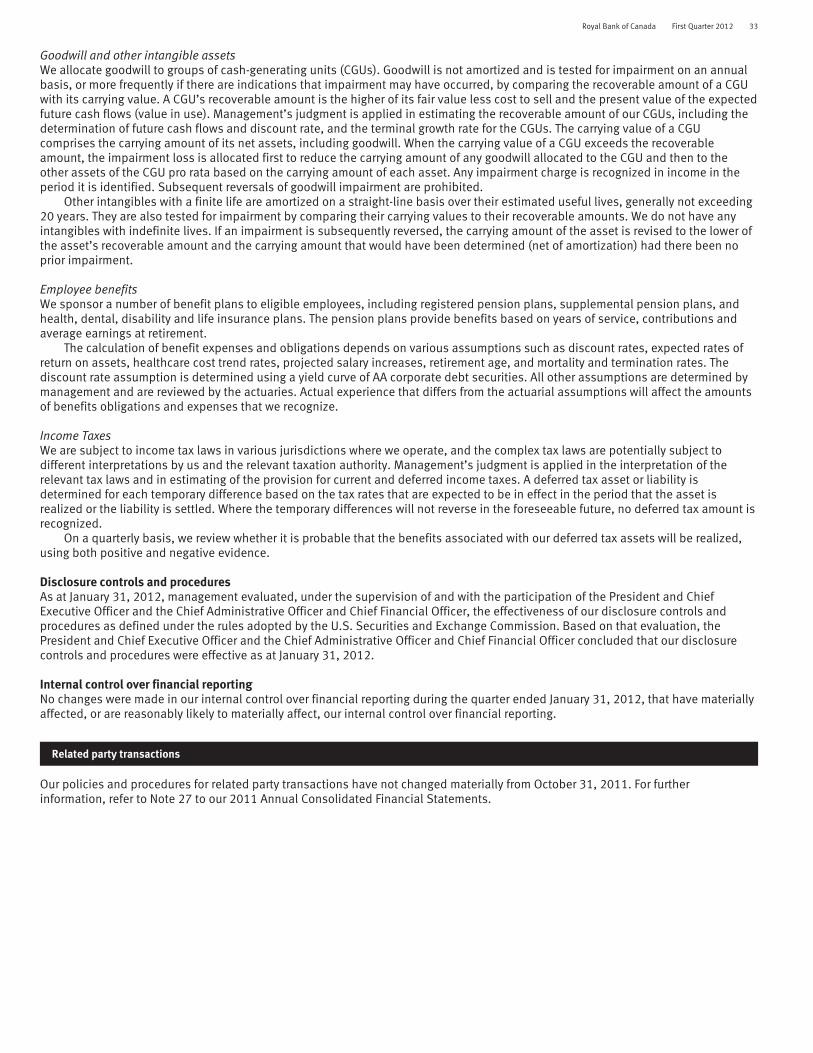
Royal Bank of Canada First Quarter 2012 33
Goodwill and other intangible assetsWe allocate goodwill to groups of cash-generating units (CGUs). Goodwill is not amortized and is tested for impairment on an annualbasis, or more frequently if there are indications that impairment may have occurred, by comparing the recoverable amount of a CGUwith its carrying value. A CGU’s recoverable amount is the higher of its fair value less cost to sell and the present value of the expectedfuture cash flows (value in use). Management’s judgment is applied in estimating the recoverable amount of our CGUs, including thedetermination of future cash flows and discount rate, and the terminal growth rate for the CGUs. The carrying value of a CGUcomprises the carrying amount of its net assets, including goodwill. When the carrying value of a CGU exceeds the recoverableamount, the impairment loss is allocated first to reduce the carrying amount of any goodwill allocated to the CGU and then to theother assets of the CGU pro rata based on the carrying amount of each asset. Any impairment charge is recognized in income in theperiod it is identified. Subsequent reversals of goodwill impairment are prohibited.
Other intangibles with a finite life are amortized on a straight-line basis over their estimated useful lives, generally not exceeding20 years. They are also tested for impairment by comparing their carrying values to their recoverable amounts. We do not have anyintangibles with indefinite lives. If an impairment is subsequently reversed, the carrying amount of the asset is revised to the lower ofthe asset’s recoverable amount and the carrying amount that would have been determined (net of amortization) had there been noprior impairment.
Employee benefitsWe sponsor a number of benefit plans to eligible employees, including registered pension plans, supplemental pension plans, andhealth, dental, disability and life insurance plans. The pension plans provide benefits based on years of service, contributions andaverage earnings at retirement.
The calculation of benefit expenses and obligations depends on various assumptions such as discount rates, expected rates ofreturn on assets, healthcare cost trend rates, projected salary increases, retirement age, and mortality and termination rates. Thediscount rate assumption is determined using a yield curve of AA corporate debt securities. All other assumptions are determined bymanagement and are reviewed by the actuaries. Actual experience that differs from the actuarial assumptions will affect the amountsof benefits obligations and expenses that we recognize.
Income TaxesWe are subject to income tax laws in various jurisdictions where we operate, and the complex tax laws are potentially subject todifferent interpretations by us and the relevant taxation authority. Management’s judgment is applied in the interpretation of therelevant tax laws and in estimating of the provision for current and deferred income taxes. A deferred tax asset or liability isdetermined for each temporary difference based on the tax rates that are expected to be in effect in the period that the asset isrealized or the liability is settled. Where the temporary differences will not reverse in the foreseeable future, no deferred tax amount isrecognized.
On a quarterly basis, we review whether it is probable that the benefits associated with our deferred tax assets will be realized,using both positive and negative evidence.
Disclosure controls and proceduresAs at January 31, 2012, management evaluated, under the supervision of and with the participation of the President and ChiefExecutive Officer and the Chief Administrative Officer and Chief Financial Officer, the effectiveness of our disclosure controls andprocedures as defined under the rules adopted by the U.S. Securities and Exchange Commission. Based on that evaluation, thePresident and Chief Executive Officer and the Chief Administrative Officer and Chief Financial Officer concluded that our disclosurecontrols and procedures were effective as at January 31, 2012.
Internal control over financial reportingNo changes were made in our internal control over financial reporting during the quarter ended January 31, 2012, that have materiallyaffected, or are reasonably likely to materially affect, our internal control over financial reporting.
Related party transactions
Our policies and procedures for related party transactions have not changed materially from October 31, 2011. For furtherinformation, refer to Note 27 to our 2011 Annual Consolidated Financial Statements.
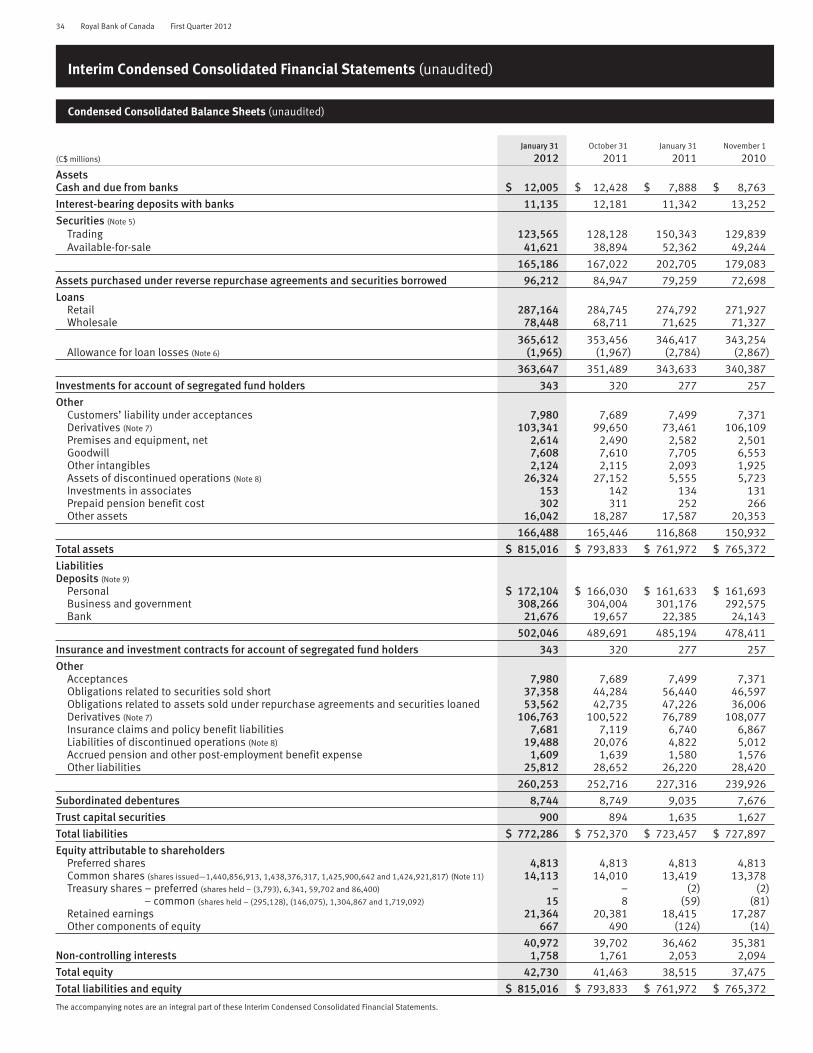
34 Royal Bank of Canada First Quarter 2012
Interim Condensed Consolidated Financial Statements (unaudited)
Condensed Consolidated Balance Sheets (unaudited)
(C$ millions)
January 31
2012October 31
2011January 31
2011November 1
2010
AssetsCash and due from banks $ 12,005 $ 12,428 $ 7,888 $ 8,763
Interest-bearing deposits with banks 11,135 12,181 11,342 13,252
Securities (Note 5)
Trading 123,565 128,128 150,343 129,839Available-for-sale 41,621 38,894 52,362 49,244
165,186 167,022 202,705 179,083
Assets purchased under reverse repurchase agreements and securities borrowed 96,212 84,947 79,259 72,698
LoansRetail 287,164 284,745 274,792 271,927Wholesale 78,448 68,711 71,625 71,327
365,612 353,456 346,417 343,254Allowance for loan losses (Note 6) (1,965) (1,967) (2,784) (2,867)
363,647 351,489 343,633 340,387
Investments for account of segregated fund holders 343 320 277 257
OtherCustomers’ liability under acceptances 7,980 7,689 7,499 7,371Derivatives (Note 7) 103,341 99,650 73,461 106,109Premises and equipment, net 2,614 2,490 2,582 2,501Goodwill 7,608 7,610 7,705 6,553Other intangibles 2,124 2,115 2,093 1,925Assets of discontinued operations (Note 8) 26,324 27,152 5,555 5,723Investments in associates 153 142 134 131Prepaid pension benefit cost 302 311 252 266Other assets 16,042 18,287 17,587 20,353
166,488 165,446 116,868 150,932
Total assets $ 815,016 $ 793,833 $ 761,972 $ 765,372
LiabilitiesDeposits (Note 9)
Personal $ 172,104 $ 166,030 $ 161,633 $ 161,693Business and government 308,266 304,004 301,176 292,575Bank 21,676 19,657 22,385 24,143
502,046 489,691 485,194 478,411
Insurance and investment contracts for account of segregated fund holders 343 320 277 257
OtherAcceptances 7,980 7,689 7,499 7,371Obligations related to securities sold short 37,358 44,284 56,440 46,597Obligations related to assets sold under repurchase agreements and securities loaned 53,562 42,735 47,226 36,006Derivatives (Note 7) 106,763 100,522 76,789 108,077Insurance claims and policy benefit liabilities 7,681 7,119 6,740 6,867Liabilities of discontinued operations (Note 8) 19,488 20,076 4,822 5,012Accrued pension and other post-employment benefit expense 1,609 1,639 1,580 1,576Other liabilities 25,812 28,652 26,220 28,420
260,253 252,716 227,316 239,926
Subordinated debentures 8,744 8,749 9,035 7,676
Trust capital securities 900 894 1,635 1,627
Total liabilities $ 772,286 $ 752,370 $ 723,457 $ 727,897
Equity attributable to shareholdersPreferred shares 4,813 4,813 4,813 4,813Common shares (shares issued—1,440,856,913, 1,438,376,317, 1,425,900,642 and 1,424,921,817) (Note 11) 14,113 14,010 13,419 13,378Treasury shares – preferred (shares held – (3,793), 6,341, 59,702 and 86,400) – – (2) (2)
– common (shares held – (295,128), (146,075), 1,304,867 and 1,719,092) 15 8 (59) (81)Retained earnings 21,364 20,381 18,415 17,287Other components of equity 667 490 (124) (14)
40,972 39,702 36,462 35,381Non-controlling interests 1,758 1,761 2,053 2,094
Total equity 42,730 41,463 38,515 37,475
Total liabilities and equity $ 815,016 $ 793,833 $ 761,972 $ 765,372
The accompanying notes are an integral part of these Interim Condensed Consolidated Financial Statements.

Royal Bank of Canada First Quarter 2012 35
Condensed Consolidated Statements of Income (unaudited)
For the three months ended
(C$ millions)January 31
2012October 31
2011January 31
2011
Interest incomeLoans $ 3,907 $ 3,874 $ 3,889Securities 1,031 1,124 1,162Assets purchased under reverse repurchase agreements and securities borrowed 217 200 171Deposits with banks 16 18 28
5,171 5,216 5,250
Interest expenseDeposits 1,544 1,527 1,682Other liabilities 527 635 670Subordinated debentures 97 97 103
2,168 2,259 2,455
Net interest income 3,003 2,957 2,795
Non-interest incomeInsurance premiums, investment and fee income 1,550 1,214 825Trading revenue (Note 12) 396 (219) 721Investment management and custodial fees 497 497 505Mutual fund revenue 499 505 441Securities brokerage commissions 287 331 349Service charges 334 343 327Underwriting and other advisory fees 294 277 495Foreign exchange revenue, other than trading 146 181 169Card service revenue 237 221 234Credit fees 188 173 188Securitization revenue (1) (1) –Net gain (loss) on available-for-sale securities (Note 5) 15 (2) (16)Share of profit in associates 10 (12) –Other 119 227 185
Non-interest income 4,571 3,735 4,423
Total revenue 7,574 6,692 7,218
Provision for credit losses (Note 6) 267 276 264
Insurance policyholder benefits, claims and acquisition expense 1,211 867 567
Non-interest expenseHuman resources 2,329 2,032 2,417Equipment 258 264 243Occupancy 264 268 240Communications 177 203 161Professional fees 154 213 163Outsourced item processing 65 64 66Amortization of other intangibles 129 126 112Other 295 360 267
3,671 3,530 3,669
Income before income taxes from continuing operations 2,425 2,019 2,718Income taxes (Note 13) 549 410 722
Net income from continuing operations 1,876 1,609 1,996Net loss from discontinued operations (Note 8) (21) (38) (48)
Net income $ 1,855 $ 1,571 $ 1,948
Net income attributable to:Shareholders $ 1,830 $ 1,546 $ 1,922Non-controlling interests 25 25 26
$ 1,855 $ 1,571 $ 1,948
Basic earnings per share (in dollars) (Note 14) $ 1.23 $ 1.03 $ 1.30Basic earnings per share from continuing operations (in dollars) $ 1.24 $ 1.06 $ 1.34Basic loss per share from discontinued operations (in dollars) $ (0.01) $ (0.03) $ (0.04)Diluted earnings per share (in dollars) (Note 14) $ 1.21 $ 1.02 $ 1.27Diluted earnings per share from continuing operations (in dollars) $ 1.23 $ 1.05 $ 1.31Diluted loss per share from discontinued operations (in dollars) $ (0.02) $ (0.03) $ (0.04)
Dividends per common share (in dollars) $ 0.54 $ 0.54 $ 0.50
The accompanying notes are an integral part of these Interim Condensed Consolidated Financial Statements.

36 Royal Bank of Canada First Quarter 2012
Condensed Consolidated Statements of Comprehensive Income (unaudited)
For the three months ended
(C$ millions)
January 31
2012October 31
2011January 31
2011
Net income $ 1,855 $ 1,571 $ 1,948
Other comprehensive income, net of taxes (Note 13)
Net change in unrealized gains (losses) on available-for-sale securitiesNet unrealized gains (losses) on available-for-sale securities 57 (52) (198)Reclassification of net (gains) losses on available-for-sale securities to income (14) (2) 33
43 (54) (165)
Foreign currency translation adjustmentsUnrealized foreign currency translation gains (losses) 51 1,132 (496)Net foreign currency translation (losses) gains from hedging activities (3) (647) 484Reclassification of losses (gains) on foreign currency translation to income 1 (1) –
49 484 (12)
Net change in cash flow hedgesNet gains on derivatives designated as cash flow hedges 67 142 42Reclassification of losses on derivatives designated as cash flow hedges to income 19 47 25
86 189 67
Other comprehensive income (loss), net of taxes 178 619 (110)
Total comprehensive income $ 2,033 $ 2,190 $ 1,838
Total comprehensive income attributable to:Shareholders $ 2,007 $ 2,164 $ 1,813Non-controlling interests 26 26 25
$ 2,033 $ 2,190 $ 1,838
The accompanying notes are an integral part of these Interim Condensed Consolidated Financial Statements.
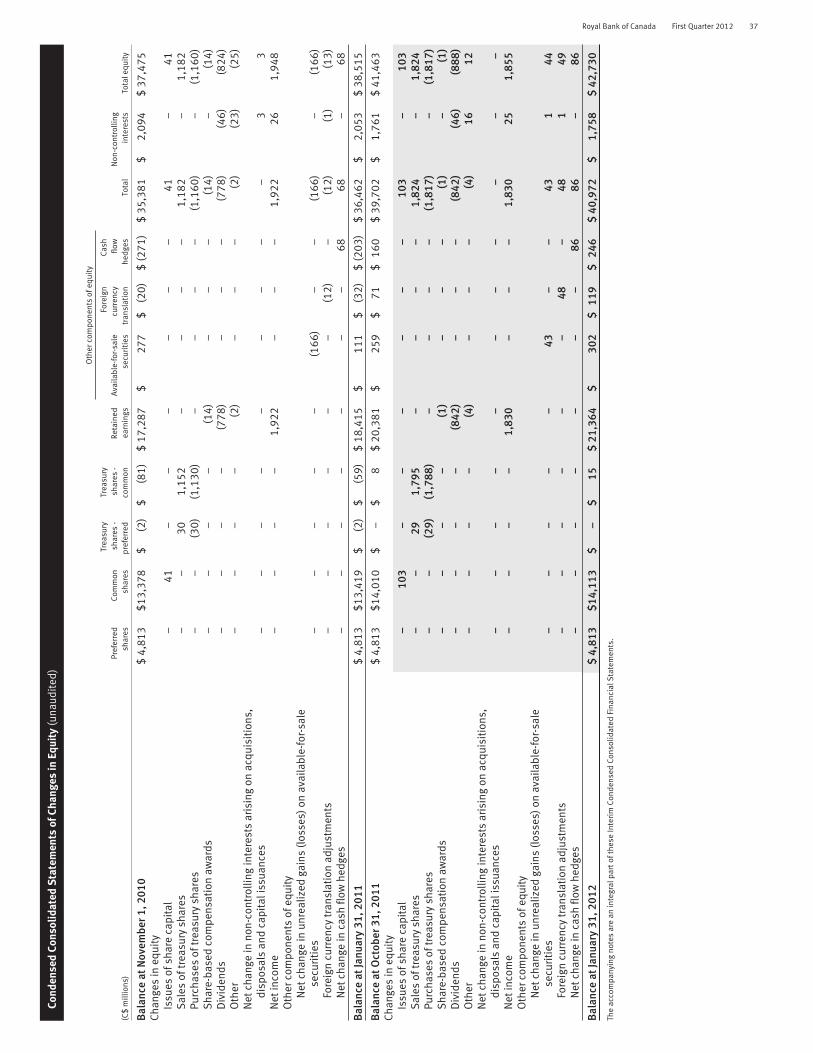
Royal Bank of Canada First Quarter 2012 37
Cond
ense
dCo
nsol
idat
edS
tate
men
tsof
Chan
ges
inEq
uity
(una
udit
ed)
Oth
erco
mpo
nent
sof
equi
ty
(C$
mill
ions
)Pr
efer
red
shar
esCo
mm
onsh
ares
Trea
sury
shar
es-
pref
erre
d
Trea
sury
shar
es-
com
mon
Reta
ined
earn
ings
Ava
ilabl
e-fo
r-sa
lese
curi
ties
Fore
ign
curr
ency
tran
slat
ion
Cash
flow
hedg
esTo
tal
Non
-con
trol
ling
inte
rest
sTo
tale
quit
y
Bala
nce
atN
ovem
ber1
,201
0$
4,81
3$
13,3
78$
(2)
$(8
1)$
17,2
87$
277
$(2
0)$
(271
)$
35,3
81$
2,09
4$
37,4
75Ch
ange
sin
equi
tyIs
sues
ofsh
are
capi
tal
–41
––
––
––
41–
41S
ales
oftr
easu
rysh
ares
––
301,
152
––
––
1,18
2–
1,18
2Pu
rcha
ses
oftr
easu
rysh
ares
––
(30)
(1,1
30)
––
––
(1,1
60)
–(1
,160
)S
hare
-bas
edco
mpe
nsat
ion
awar
ds–
––
–(1
4)–
––
(14)
–(1
4)D
ivid
ends
––
––
(778
)–
––
(778
)(4
6)(8
24)
Oth
er–
––
–(2
)–
––
(2)
(23)
(25)
Net
chan
gein
non-
cont
rolli
ngin
tere
sts
aris
ing
onac
quis
itio
ns,
disp
osal
san
dca
pita
liss
uanc
es–
––
––
––
––
33
Net
inco
me
––
––
1,92
2–
––
1,92
226
1,94
8O
ther
com
pone
nts
ofeq
uity
Net
chan
gein
unre
aliz
edga
ins
(los
ses)
onav
aila
ble-
for-
sale
secu
riti
es–
––
––
(166
)–
–(1
66)
–(1
66)
Fore
ign
curr
ency
tran
slat
ion
adju
stm
ents
––
––
––
(12)
–(1
2)(1
)(1
3)N
etch
ange
inca
shflo
whe
dges
––
––
––
–68
68–
68
Bala
nce
atJa
nuar
y31
,201
1$
4,81
3$
13,4
19$
(2)
$(5
9)$
18,4
15$
111
$(3
2)$
(203
)$
36,4
62$
2,05
3$
38,5
15
Bala
nce
atO
ctob
er31
,201
1$
4,81
3$
14,0
10$
–$
8$
20,3
81$
259
$71
$16
0$
39,7
02$
1,76
1$
41,4
63Ch
ange
sin
equi
tyIs
sues
ofsh
are
capi
tal
–10
3–
––
––
–10
3–
103
Sal
esof
trea
sury
shar
es–
–29
1,79
5–
––
–1,
824
–1,
824
Purc
hase
sof
trea
sury
shar
es–
–(2
9)(1
,788
)–
––
–(1
,817
)–
(1,8
17)
Sha
re-b
ased
com
pens
atio
naw
ards
––
––
(1)
––
–(1
)–
(1)
Div
iden
ds–
––
–(8
42)
––
–(8
42)
(46)
(888
)O
ther
––
––
(4)
––
–(4
)16
12N
etch
ange
inno
n-co
ntro
lling
inte
rest
sar
isin
gon
acqu
isit
ions
,di
spos
als
and
capi
tali
ssua
nces
––
––
––
––
––
–N
etin
com
e–
––
–1,
830
––
–1,
830
251,
855
Oth
erco
mpo
nent
sof
equi
tyN
etch
ange
inun
real
ized
gain
s(l
osse
s)on
avai
labl
e-fo
r-sa
lese
curi
ties
––
––
–43
––
431
44Fo
reig
ncu
rren
cytr
ansl
atio
nad
just
men
ts–
––
––
–48
–48
149
Net
chan
gein
cash
flow
hedg
es–
––
––
––
8686
–86
Bala
nce
atJa
nuar
y31
,201
2$
4,81
3$1
4,11
3$
–$
15$
21,3
64$
302
$11
9$
246
$40
,972
$1,
758
$42
,730
The
acco
mpa
nyin
gno
tes
are
anin
tegr
alpa
rtof
thes
eIn
teri
mCo
nden
sed
Cons
olid
ated
Fina
ncia
lSta
tem
ents
.
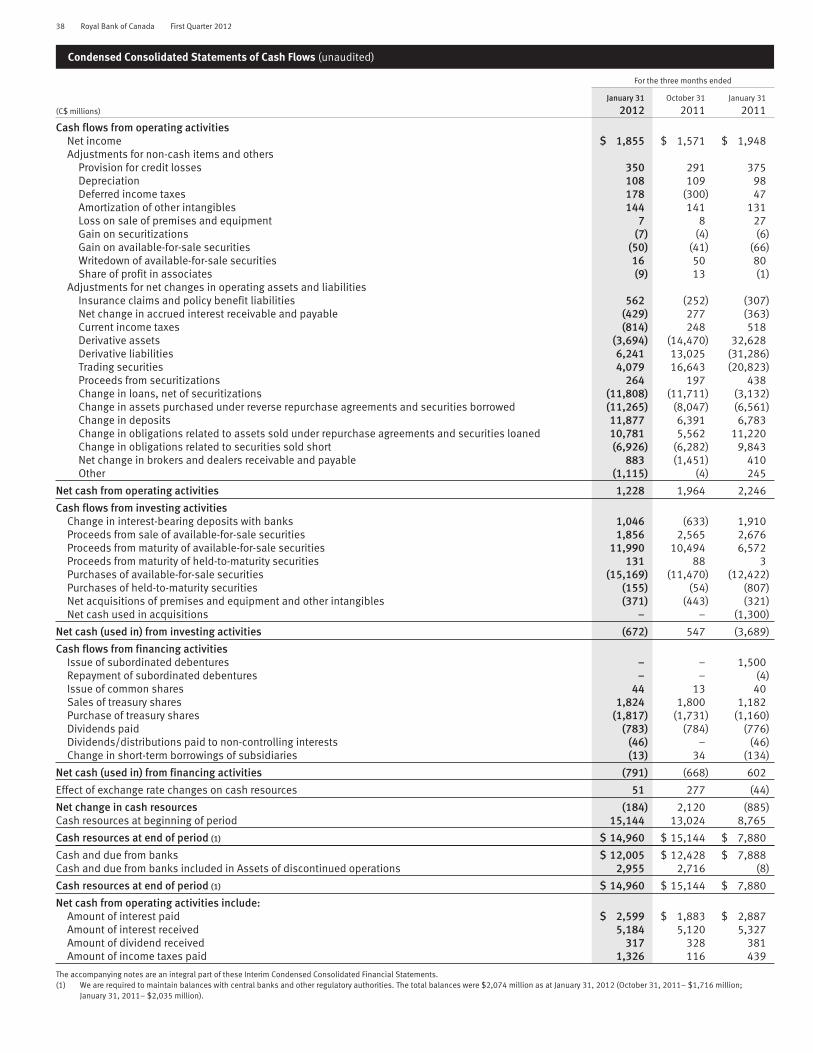
38 Royal Bank of Canada First Quarter 2012
Condensed Consolidated Statements of Cash Flows (unaudited)
For the three months ended
(C$ millions)
January 31
2012October 31
2011January 31
2011
Cash flows from operating activitiesNet income $ 1,855 $ 1,571 $ 1,948Adjustments for non-cash items and others
Provision for credit losses 350 291 375Depreciation 108 109 98Deferred income taxes 178 (300) 47Amortization of other intangibles 144 141 131Loss on sale of premises and equipment 7 8 27Gain on securitizations (7) (4) (6)Gain on available-for-sale securities (50) (41) (66)Writedown of available-for-sale securities 16 50 80Share of profit in associates (9) 13 (1)
Adjustments for net changes in operating assets and liabilitiesInsurance claims and policy benefit liabilities 562 (252) (307)Net change in accrued interest receivable and payable (429) 277 (363)Current income taxes (814) 248 518Derivative assets (3,694) (14,470) 32,628Derivative liabilities 6,241 13,025 (31,286)Trading securities 4,079 16,643 (20,823)Proceeds from securitizations 264 197 438Change in loans, net of securitizations (11,808) (11,711) (3,132)Change in assets purchased under reverse repurchase agreements and securities borrowed (11,265) (8,047) (6,561)Change in deposits 11,877 6,391 6,783Change in obligations related to assets sold under repurchase agreements and securities loaned 10,781 5,562 11,220Change in obligations related to securities sold short (6,926) (6,282) 9,843Net change in brokers and dealers receivable and payable 883 (1,451) 410Other (1,115) (4) 245
Net cash from operating activities 1,228 1,964 2,246
Cash flows from investing activitiesChange in interest-bearing deposits with banks 1,046 (633) 1,910Proceeds from sale of available-for-sale securities 1,856 2,565 2,676Proceeds from maturity of available-for-sale securities 11,990 10,494 6,572Proceeds from maturity of held-to-maturity securities 131 88 3Purchases of available-for-sale securities (15,169) (11,470) (12,422)Purchases of held-to-maturity securities (155) (54) (807)Net acquisitions of premises and equipment and other intangibles (371) (443) (321)Net cash used in acquisitions – – (1,300)
Net cash (used in) from investing activities (672) 547 (3,689)
Cash flows from financing activitiesIssue of subordinated debentures – – 1,500Repayment of subordinated debentures – – (4)Issue of common shares 44 13 40Sales of treasury shares 1,824 1,800 1,182Purchase of treasury shares (1,817) (1,731) (1,160)Dividends paid (783) (784) (776)Dividends/distributions paid to non-controlling interests (46) – (46)Change in short-term borrowings of subsidiaries (13) 34 (134)
Net cash (used in) from financing activities (791) (668) 602
Effect of exchange rate changes on cash resources 51 277 (44)
Net change in cash resources (184) 2,120 (885)Cash resources at beginning of period 15,144 13,024 8,765
Cash resources at end of period (1) $ 14,960 $ 15,144 $ 7,880
Cash and due from banks $ 12,005 $ 12,428 $ 7,888Cash and due from banks included in Assets of discontinued operations 2,955 2,716 (8)
Cash resources at end of period (1) $ 14,960 $ 15,144 $ 7,880
Net cash from operating activities include:Amount of interest paid $ 2,599 $ 1,883 $ 2,887Amount of interest received 5,184 5,120 5,327Amount of dividend received 317 328 381Amount of income taxes paid 1,326 116 439
The accompanying notes are an integral part of these Interim Condensed Consolidated Financial Statements.(1) We are required to maintain balances with central banks and other regulatory authorities. The total balances were $2,074 million as at January 31, 2012 (October 31, 2011– $1,716 million;
January 31, 2011– $2,035 million).
Royal Bank of Canada First Quarter 2012 39
Note 1 General information
Royal Bank of Canada and its subsidiaries operate under the master brand name RBC. We provide diversified financial servicesincluding personal and commercial banking, wealth management, insurance, corporate and investment banking and transactionprocessing on a global basis. Refer to Note 16 for further details on our business segments.
The parent bank, Royal Bank of Canada, is a Schedule I Bank under the Bank Act (Canada) incorporated and domiciled in Canada.Our corporate headquarters are located at Royal Bank Plaza, 200 Bay Street, Toronto, Ontario, Canada and our head office is locatedat 1 Place Ville-Marie, Montreal, Quebec, Canada. We are listed on the Toronto Stock Exchange (TSX) and New York Stock Exchange(NYSE) with the ticker symbol RY.
Our unaudited Interim Condensed Consolidated Financial Statements (Consolidated Financial Statements) have been prepared inaccordance with International Financial Reporting Standards (IFRS) as issued by the International Accounting Standards Board (IASB)and are presented in compliance with International Accounting Standard (IAS) 34, Interim Financial Reporting. The accompanyingConsolidated Financial Statements are stated in Canadian dollars and have been prepared in accordance with all IFRS issued andoutstanding as at January 31, 2012. These financial statements are condensed because they do not include all of the informationrequired by the IASB for our Annual Consolidated Financial Statements.
These are our first Consolidated Financial Statements prepared in accordance with IFRS. Previously, our Consolidated FinancialStatements were prepared under Canadian generally accepted accounting principles (Canadian GAAP). IFRS 1, First-time Adoption ofInternational Reporting Standards (IFRS 1), has been applied. The accounting policies set out below were consistently applied to allperiods presented, including our Consolidated Balance Sheets as at November 1, 2010 (the Transition date) for the purpose oftransition to IFRS as required by IFRS 1. The main differences between our IFRS and Canadian GAAP accounting policies, relevantexceptions and exemptions, and reconciliations on how our transition to IFRS from Canadian GAAP has affected our assets, liabilities,equity, comprehensive income and cash flows are included in Note 3.
On February 29, 2012, the Board of Directors authorized the financial statements for issue.
Note 2 Summary of significant accounting policies
The significant accounting policies used in the preparation of these financial statements are summarized below.
GeneralBasis of consolidationOur Consolidated Financial Statements include the assets and liabilities and results of operations of the parent company, Royal Bankof Canada, and its subsidiaries including certain Special Purpose Entities (SPEs), after elimination of intercompany transactions andbalances.
Continuing operationsAs described in Note 8, during the second quarter in 2011, we completed the sale of Liberty Life Insurance Company (Liberty Life), ourU.S. life insurance business and during the third quarter in 2011, we announced the sale of substantially all of our U.S. regional retailbanking operations. The sale of Liberty Life is reflected as discontinued operations on our Consolidated Balance Sheets andConsolidated Statements of Income for all periods presented. The sale of our U.S. regional retail operations and other assets arereflected as discontinued operations on our Consolidated Balance Sheets beginning in the third quarter of 2011 and in ourConsolidated Statements of Income for all periods presented.
Non-current assets held for sale and discontinued operationsNon-current assets (and disposal groups) are classified as held for sale if their carrying amounts will be recovered principally througha sale transaction rather than through continuing use. This condition is satisfied when the asset is available for immediate sale in itspresent condition, management is committed to the sale, and it is highly probable to occur within 1 year. Non-current assets (anddisposal groups) classified as held for sale are measured at the lower of their previous carrying amount and fair value less costs tosell and are presented separately from other non-current assets on our Consolidated Balance Sheets.
A disposal group is classified as a discontinued operation if it meets the following conditions: (a) it is a component that can bedistinguished operationally and financially from the rest of our operations, and (b) it represents either a separate major line ofbusiness or is part of a single co-ordinated plan to dispose of a separate major line of business or geographical area of operations.Disposal groups classified as discontinued operations are presented separately from our continuing operations in our ConsolidatedStatements of Income.
Subsidiaries and SPEsSubsidiaries are those entities over which we have control, where control is defined as the power to govern the financial andoperating policies so as to obtain benefits from the entity’s activities. We consolidate our subsidiaries from the date control istransferred to us, and cease consolidation when they are no longer controlled by us.
We also consolidate SPEs that are controlled by us. These include SPEs that are sponsored for various reasons, including thosewhich were formed to allow clients to invest in alternative assets, for asset securitization transactions, and for buying and sellingcredit protection. In assessing whether we have control over an SPE, we consider the following factors: (a) whether the activities of theSPE are conducted according to our specific business needs so that we obtain the benefits from the SPE’s operations, (b) whether wehave the decision-making powers to obtain majority of the benefits, (c) whether we will obtain the majority of the benefits of theactivities of the SPE, and (d) whether we retain the majority of the residual ownership risks related to the assets or SPE in order toobtain the benefits from its activities. The exercise of judgment is required in determining control based on these factors. Weconsolidate an SPE if, based on an assessment of the relevant factors and management’s judgment, we determine that we control theSPE.

40 Royal Bank of Canada First Quarter 2012
Note 2 Summary of significant accounting policies (continued)
Non-controlling interests in subsidiaries and SPEs that we consolidate are shown on our Consolidated Balance Sheets as aseparate component of equity which is distinct from our shareholders’ equity. The net income attributable to non-controlling interestsis separately disclosed on the face of the Consolidated Statements of Income.
Investments in associatesThe equity method is used to account for investments in associated corporations and limited partnerships over which we havesignificant influence. Under the equity method of accounting, investments are initially recorded at cost, and the carrying amount isincreased or decreased to recognize our share of the investee’s net profit or loss (including net profit or loss recognized directly inequity) subsequent to the date of acquisition.
Interests in joint venturesThe proportionate consolidation method is used to account for our interests in jointly controlled entities, whereby our pro rata share ofassets, liabilities, income and expenses is consolidated.
Use of estimates and assumptionsIn preparing our Consolidated Financial Statements, management is required to make subjective estimates and assumptions thataffect the reported amount of assets, liabilities, net income and related disclosures. Estimates made by management are based onhistorical experience and other assumptions that are believed to be reasonable. Key sources of estimation uncertainty include; theallowance for credit losses, determination of fair value of financial instruments, litigation provisions, insurance claims and policybenefit liabilities, pensions and other post-employment benefits, carrying value of goodwill and finite-life intangible assets, deferredrevenue under the credit card customer loyalty reward program, income taxes, consolidation of SPEs and derecognition of financialassets. Accordingly, actual results may differ from these and other estimates thereby impacting our future Consolidated FinancialStatements. Refer to the relevant accounting policies in this Note for details on our use of estimates and assumptions.
Critical judgmentsIn preparation of these Consolidated Financial Statements, management is required to make critical judgments that affect the carryingamounts of certain assets and liabilities, and the reported amounts of revenues and expenses recorded during the period. Criticaljudgments have been made in the following areas: SPEs, securities impairment, fair value of financial instruments, securitization, theallowance for credit losses, employee benefits, income taxes, and goodwill. Refer to the relevant accounting policies in this Note fordetails on our critical judgments.
Financial instruments – Recognition and measurementSecuritiesSecurities are classified at inception, based on management’s intention, as at fair value through profit or loss (FVTPL),available-for-sale (AFS) or held-to-maturity. Certain debt securities with fixed or determinable payments and which are not quoted inan active market may be classified as loans and receivables.
Trading securities include securities purchased for sale in the near term which are classified as at FVTPL by nature and securitiesdesignated as at FVTPL under the fair value option. Obligations to deliver trading securities sold but not yet purchased are recorded asliabilities and carried at fair value. Realized and unrealized gains and losses on these securities are recorded as Trading revenue inNon-interest income. Dividends and interest income accruing on Trading securities are recorded in Interest income. Interest anddividends accrued on interest-bearing and equity securities sold short are recorded in Interest expense.
AFS securities include: (i) securities which may be sold in response to or in anticipation of changes in interest rates and resultingprepayment risk, changes in foreign currency risk, changes in funding sources or terms, or to meet liquidity needs; and (ii) loansubstitute securities which are client financings that have been structured as after-tax investments rather than conventional loans inorder to provide the clients with a borrowing rate advantage. AFS securities are measured at fair value. Unrealized gains and lossesarising from changes in fair value are included in Other components of equity. Changes in foreign exchange rates for AFS equitysecurities are recognized in Other components of equity, while changes in foreign exchange rates for AFS debt securities arerecognized in Foreign exchange revenue, other than trading in Non-interest income. When the security is sold the cumulative gain orloss recorded in Other components of equity is included as Net gain (loss) on AFS securities in Non-interest income. Purchasepremiums or discounts on AFS debt securities are amortized over the life of the security using the effective interest method and arerecognized in Net interest income.
At each reporting date, and more frequently when conditions warrant, we evaluate our AFS securities to determine whether thereis any objective evidence of impairment. Such evidence includes a significant or prolonged decline in the fair value of the investmentbelow its cost, or when an adverse effect on future cash flows from the asset or group of assets can be reliably estimated. Significantjudgment is required in assessing whether certain events or circumstances constitute objective evidence of impairment, includingwhether a significant or prolonged decline in fair value constitutes an impairment and the estimation and timing of future cash flows.If an AFS security is impaired, the cumulative unrealized loss previously recognized in Other components of equity is removed fromequity and recognized in Net gain (loss) on AFS securities under Non–interest income. This amount is determined as the differencebetween the amortized cost and current fair value of the security less any impairment loss previously recognized. Subsequent toimpairment, further declines in fair value are recorded in Non-interest income, while increases in fair value are recognized in Othercomponents of equity until sold. For AFS debt securities, reversal of previously recognized impairment losses is recognized in ourConsolidated Statements of Income if the recovery is objectively related to a specific event occurring after recognition of theimpairment loss.
Held-to-maturity securities are debt securities where we have the intention and the ability to hold the investment until its maturitydate. These securities are initially recorded at fair value and are subsequently measured at amortized cost using the effective interest
Royal Bank of Canada First Quarter 2012 41
method, less any impairment losses which we assess using the same impairment model as for loans. Interest income andamortization of premiums and discounts on debt securities are recorded in Net interest income. We hold a nominal amount ofheld-to-maturity securities. All held-to-maturity securities have been included with AFS securities on our Consolidated BalanceSheets.
We account for all of our securities using settlement date accounting and changes in fair value between the trade date andsettlement date are reflected in income for securities classified or designated as at FVTPL, and changes in the fair value of AFSsecurities between the trade and settlement dates are recorded in Other comprehensive income (OCI) except for changes in foreignexchange rates on debt securities, which are recorded in Non-interest income.
Fair value optionA financial instrument can be designated as at FVTPL (the fair value option) on its initial recognition even if the financial instrumentwas not acquired or incurred principally for the purpose of selling or repurchasing it in the near term. An instrument that is designatedas at FVTPL by way of this fair value option must have a reliably measurable fair value and satisfy one of the following criteria: (i) iteliminates or significantly reduces a measurement or recognition inconsistency that would otherwise arise from measuring assets orliabilities, or recognizing gains and losses on them on a different basis; (ii) it belongs to a group of financial assets or financialliabilities or both that are managed, evaluated, and reported to senior management on a fair value basis in accordance with our riskmanagement strategy, and we can demonstrate that significant financial risks are eliminated or significantly reduced or (iii) there isan embedded derivative in the financial or non-financial host contract and the derivative is not closely related to the host contract.
Financial instruments designated as at FVTPL are recorded at fair value and any unrealized gain or loss arising due to changes infair value is included in Trading revenue or Other. These instruments cannot be reclassified out of the FVTPL category while they areheld or issued.
To determine the fair value adjustments on our debt designated as at FVTPL, we calculate the present value of the instrumentsbased on the contractual cash flows over the term of the arrangement by using our effective funding rate at the beginning and end ofthe period with the change in present value recorded in Trading revenue or Other.
Determination of fair valueThe fair value of a financial instrument is the amount at which the financial instrument could be exchanged in an arm’s-lengthtransaction between knowledgeable and willing parties under no compulsion to act. Fair values of identical instruments traded in activemarkets are determined by reference to last quoted prices in the most advantageous active market for that instrument. In the absenceof an active market, we determine fair values based on quoted prices for instruments with similar characteristics and risk profiles.
Fair values of financial instruments not traded in active markets are determined using information from pricing services orvaluation models that require the use of inputs. Valuation model inputs are either observable or unobservable. We look primarily toexternal, readily observable market inputs, when available. Observable inputs to valuation models for financial instruments includecertain prices and rates for shorter dated G7 (Canada, U.S., U.K., Italy, France, Germany and Japan) and non-G7 interest-rate-yieldcurves, currency rates and price and rate volatilities. Unobservable inputs include certain prices and rates for longer dated G7 andnon-G7 interest-rate-yield curves, prepayment rates, credit spreads, probability of defaults, recovery rates, equity volatility andcorrelations of probability of defaults or baskets of common stock. In some circumstances, we may adjust model values to reflect thevaluation uncertainty (model and parameter valuation adjustments) in order to determine fair value based on the assumptions thatmarket participants would use in pricing the financial instrument.
The majority of our financial instruments classified as at FVTPL (other than derivatives) and as AFS comprise actively traded debtand equity securities and are carried at fair value based on available quoted prices. All of our derivative transactions are accountedfor on a fair value basis. Fair values of exchange-traded derivatives are based on last exchange prices. Over-the-counter derivativesare valued using either industry standard or internally developed valuation models. Valuation model inputs are either observable orunobservable.
For some securities that are not quoted in an active market, we may record valuation adjustments for liquidity when we believethat the amount realized on sale may be less than the estimated fair value due to insufficient liquidity in the market over a reasonableamount of time. We also include valuation adjustments calculated when market prices are not observable due to insufficient tradingvolume or a lack of recent trades in an inactive market.
We also make valuation adjustments for the credit risk of our derivative portfolios in order to arrive at their fair values. Theseadjustments take into account our own creditworthiness and that of our counterparties, the current and potential futuremark-to-market of the transactions, and the effects of credit mitigants such as master netting agreements and collateral agreements.Credit valuation adjustments are frequently updated due to the changes in derivative values and counterparty performance risk.Changes to credit valuation adjustments are recorded in current-period income.
For financial liabilities, including deposits designated as at FVTPL, fair values are based on present value of the instruments’contractual cash flows discounted at the appropriate market interest rates. Appropriate market interest rates comprise observablebenchmark interest rates and credit spreads which are either observable or unobservable.
We have documented our internal policies that detail our processes for determining fair value, including the methodologies usedin establishing our valuation adjustments. These methodologies are consistently applied and periodically reviewed by Finance andGroup Risk Management. Significant judgment is required where we apply unobservable inputs in valuation models and in applicationof valuation adjustments. A breakdown of fair values of financial instruments measured on the basis of quoted market prices in activemarkets (Level 1), valuation techniques reflecting market observable inputs (Level 2), and valuation techniques reflecting significantnon-market-observable inputs (Level 3) is provided in Note 4. A discussion of the aspects of valuation that require the mostsignificant judgments, including changes in our fair value hierarchy, developing our reasonably possible alternative assumptions, andunrealized gains and losses on AFS securities is included in Note 4 and Note 5.

42 Royal Bank of Canada First Quarter 2012
Note 2 Summary of significant accounting policies (continued)
Transaction costsTransaction costs are expensed as incurred for financial instruments classified or designated as at FVTPL. For other financialinstruments, transaction costs are capitalized on initial recognition. For financial assets and financial liabilities measured atamortized cost, capitalized transaction costs are amortized through Net income over the estimated life of the instrument using theeffective interest method. For AFS financial assets measured at fair value that do not have fixed or determinable payments and nofixed maturity, capitalized transaction costs are recognized in Net income when the asset is derecognized or becomes impaired.
Assets purchased under reverse repurchase agreements and sold under repurchase agreementsWe purchase securities under agreements to resell (reverse repurchase agreement) and take possession of these securities. Reverserepurchase agreements are treated as collateralized lending transactions whereby we monitor the market value of the securitiespurchased and additional collateral is obtained when appropriate. We have the right to liquidate the collateral held in the event ofcounterparty default. We also sell securities under agreements to repurchase (repurchase agreements), which are treated ascollateralized borrowing transactions. The securities received under reverse repurchase agreements and securities delivered underrepurchase agreements are not recognized on, or derecognized from, our Consolidated Balance Sheets, respectively, unless the risksand rewards of ownership are obtained or relinquished.
Reverse repurchase agreements and repurchase agreements are carried on our Consolidated Balance Sheets at the amounts atwhich the securities were initially acquired or sold plus accrued interest, except when they are designated as at FVTPL and arerecorded at fair value. Interest earned on reverse repurchase agreements is included in Interest income, and interest incurred onrepurchase agreements is included in Interest expense in our Consolidated Statements of Income. Changes in fair value for reverserepurchase agreements and repurchase agreements designated as at FVTPL are included in Trading revenue or Other in Non–interestincome.
SecuritizationsOur various securitization activities generally consist of the transfer of financial assets such as loans or packaged mortgage-backedsecurities (MBS) to independent SPEs or trusts that issue securities to investors.
We apply the policies for basis of consolidation and derecognition, respectively, in determining whether the respective SPEshould be consolidated and whether the transferred assets qualify for derecognition in full or in part. The assets are derecognizedfrom our Consolidated Balance Sheets when we transfer substantially all of the risks and rewards of the transferred assets. When weretain control over substantially all of the risks and rewards of the transferred assets, the transferred assets are not derecognized fromour Consolidated Balance Sheets and are accounted for as secured financing transactions. When we neither retain nor transfersubstantially all risks and rewards of ownership of a financial asset, we derecognize the financial asset if control over the asset isrelinquished. Significant judgment is applied in determining whether we have transferred or retained substantially all of the risks andrewards of ownership of the transferred financial asset. The rights and obligations retained in the transfer, such as servicing assetsand liabilities, are recognized separately as assets and liabilities, as appropriate.
We remove a financial liability from our Consolidated Balance Sheets when our obligation specified in the contract expires, or isdischarged or cancelled. We recognize the difference between the carrying amount of a financial liability transferred and theconsideration paid in our Consolidated Statements of Income.
AcceptancesAcceptances are short–term negotiable instruments issued by our clients to third parties which we guarantee. The potential liabilityunder acceptances is reported in Other – Acceptances on our Consolidated Balance Sheets. The recourse against our clients in thecase of a call on these commitments is reported as a corresponding asset of the same amount in Other – Customers’ liability underacceptances. Fees earned are reported in Non-interest income.
DerivativesDerivatives are primarily used in sales and trading activities. Derivatives are also used to manage our exposure to interest, currency,credit and other market risks. The most frequently used derivative products are interest rate swaps, interest rate futures, forward rateagreements, interest rate options, foreign exchange forward contracts, currency swaps, foreign currency futures, foreign currencyoptions, equity swaps and credit derivatives. All derivative instruments are recorded on our Consolidated Balance Sheets at fair value,including those derivatives that are embedded in financial or non-financial contracts and are not closely related to the host contracts.
When derivatives are embedded in other financial instruments or host contracts, such combinations are known as hybridinstruments with the effect that some of the cash flows of a hybrid instrument vary in a way similar to a stand-alone derivative. If thehost contract is not carried at fair value with changes in fair value reported in our Consolidated Statements of Income, the embeddedderivative is generally required to be separated from the host contract and accounted for separately at FVTPL if the economiccharacteristics and risks of the embedded derivative are not closely related to those of the host contract. All embedded derivativesare presented on a combined basis with the host contracts although they are separated for measurement purposes when conditionsrequiring separation are met.
When derivatives are used in sales and trading activities, the realized and unrealized gains and losses on these derivatives arerecognized in Trading revenue in Non–interest income. Derivatives with a positive fair value are reported as Derivative assets andderivatives with a negative fair value are reported as Derivative liabilities. In accordance with our policy for offsetting financial assetsand financial liabilities, as outlined below, the net fair value of certain derivative assets and liabilities are reported as an asset orliability, as appropriate. Market and credit valuation adjustments, and premiums paid are also included in Derivative assets, whilepremiums received are shown in Derivative liabilities.

Royal Bank of Canada First Quarter 2012 43
When derivatives are used to manage our own exposures, we determine for each derivative whether hedge accounting can beapplied, as discussed in the Hedge accounting section below.
Hedge accountingWe use derivatives and non-derivatives in our hedging strategies to manage our exposure to interest rate, currency, credit and othermarket risks. Where hedge accounting can be applied, a hedge relationship is designated and documented at inception to detail theparticular risk management objective and the strategy for undertaking the hedge transaction. The documentation identifies thespecific asset, liability or anticipated cash flows being hedged, the risk that is being hedged, the type of hedging instrument used andhow effectiveness will be assessed. We assess, both at the inception of the hedge and on an ongoing basis, whether the hedginginstruments have been ‘highly effective’ in offsetting changes in the fair value or cash flows of the hedged items. A hedge is regardedas highly effective only if the following criteria are met: (i) at inception of the hedge and throughout its life, the hedge is expected tobe highly effective in achieving offsetting changes in fair value or cash flows attributable to the hedged risk, and (ii) actual results ofthe hedge are within a pre-determined range. In the case of hedging a forecast transaction, the transaction must have a highprobability of occurring and must present an exposure to variations in cash flows that could ultimately affect the reported net profit orloss. Hedge accounting is discontinued prospectively when it is determined that the hedging instrument is no longer effective as ahedge, the hedging instrument is terminated or sold, upon the sale or early termination of the hedged item, or when the forecasttransaction is no longer deemed highly probable. Refer to Note 7 for the fair value of derivatives and non-derivative instrumentscategorized by their hedging relationships, as well as derivatives that are not designated in hedging relationships.
Fair value hedgesIn a fair value hedging relationship, the carrying value of the hedged item is adjusted for changes in fair value attributable to thehedged risk and recognized in Non–interest income. Changes in fair value of the hedged item, to the extent that the hedgingrelationship is effective, are offset by changes in the fair value of the hedging derivative, which are also recognized in Non–interestincome. When hedge accounting is discontinued, the carrying value of the hedged item is no longer adjusted and the cumulative fairvalue adjustments to the carrying value of the hedged items are amortized to Net income over the remaining life of the hedged items.
We predominantly use interest rate swaps to hedge our exposure to the changes in a fixed interest rate instrument’s fair valuecaused by changes in interest rates.
Cash flow hedgesIn a cash flow hedging relationship, the effective portion of the change in the fair value of the hedging derivative, net of taxes, isrecognized in OCI while the ineffective portion is recognized in Non–interest income. When hedge accounting is discontinued, thecumulative amounts previously recognized in Other components of equity are reclassified to Net interest income during the periodswhen the variability in the cash flows of the hedged item affects Net interest income. Gains and losses on derivatives are reclassifiedimmediately to Net income when the hedged item is sold or terminated early. We predominantly use interest rate swaps to hedge thevariability in cash flows related to a variable-rate asset or liability.
Net investment hedgesIn hedging a foreign currency exposure of a net investment in a foreign operation, the effective portion of foreign exchange gains andlosses on the hedging instruments, net of applicable taxes, is recognized in OCI and the ineffective portion is recognized in Non–interest income. The amounts, or a portion thereof, previously recognized in Other components of equity are recognized in Net incomeon the disposal, or partial disposal, of the foreign operation.
We use foreign exchange contracts and foreign currency-denominated liabilities to manage our foreign currency exposures to netinvestments in foreign operations having a functional currency other than the Canadian dollar.
LoansLoans are non-derivative financial assets with fixed or determinable payments that are not quoted in an active market and which arenot classified as AFS. Loans are initially recognized at fair value. When the loan is issued at a market rate, fair value is represented bythe cash advanced to the borrower plus direct and incremental costs. Loans are subsequently measured at amortized cost using theeffective interest method less impairment, unless we intend to sell them in the near future upon origination or they have beendesignated as at FVTPL, in which case they are carried at fair value.
We assess at each balance sheet date whether there is objective evidence that the loans are impaired. Evidence of impairmentmay include indications that the borrower is experiencing significant financial difficulty, probability of bankruptcy or other financialreorganization, as well as measurable decrease in the estimated future cash flows evidenced by the adverse changes in the paymentsstatus of the borrower or economic conditions that correlate with defaults. Whenever a payment is 90 days past due, loans other thancredit card balances and loans guaranteed or insured by a Canadian government (Federal or Provincial) or a Canadian governmentagency (collectively, Canadian government) are classified as impaired unless they are fully secured and collection efforts arereasonably expected to result in repayment of debt within 180 days of the loans becoming past due. Credit card balances are writtenoff when a payment is 180 days in arrears. Loans guaranteed by a Canadian government are classified as impaired when the loan iscontractually 365 days in arrears.
Assets acquired in respect of problem loans are recorded at their fair value less costs to sell. Fair value is determined based oneither current market value where available or discounted cash flows. Any excess of the carrying value of the loan over the recordedfair value of the assets acquired is recognized by a charge to Impairment losses on loans and other off-balance sheet items.
Interest on loans is included in Interest income–Loans and is recognized on an accrual basis. Fees that relate to activities such asoriginating, restructuring or renegotiating loans are deferred and recognized as Interest income over the expected term of such loansusing the effective interest method. Where there is reasonable expectation that a loan will result, commitment and standby fees arealso recognized as interest income over the expected term of the resulting loans using the effective interest method. Otherwise, suchfees are recorded as other liabilities and amortized into non-interest income over the commitment or standby period.
44 Royal Bank of Canada First Quarter 2012
Note 2 Summary of significant accounting policies (continued)
Allowance for credit lossesAn allowance for credit losses is established if there is objective evidence that we will be unable to collect all amounts due on ourloans portfolio according to the original contractual terms or the equivalent value. This portfolio includes on-balance sheet exposures,such as loans and acceptances, and off-balance sheet items such as letters of credit, guarantees and unfunded commitments.
The allowance is increased by the impairment losses recognized and decreased by the amount of write-offs, net of recoveries. Theallowance for credit losses for on-balance sheet items is included as a reduction to assets, and the allowance relating to off-balancesheet items is included in Other liabilities.
We assess whether objective evidence of impairment exists individually for loans that are individually significant and collectivelyfor loans that are not individually significant. If we determine that no objective evidence of impairment exists for an individuallyassessed loan, whether significant or not, the loan is included in a group of loans with similar credit risk characteristics andcollectively assessed for impairment. Loans that are individually assessed for impairment and for which an impairment loss isrecognized are not included in a collective assessment of impairment.
Individually assessed loansLoans which are individually significant are assessed individually for objective indicators of impairment. A loan is consideredimpaired when management determines that it will not be able to collect all amounts due according to the original contractual termsor the equivalent value.
Credit exposures of individually significant loans are evaluated based on factors including the borrower’s overall financialcondition, resources and payment record, and where applicable, the realizable value of any collateral. If there is evidence ofimpairment leading to an impairment loss, then the amount of the loss is determined as the difference between the carrying amountof the loan, including accrued interest, and the estimated recoverable amount. The estimated recoverable amount is measured as thepresent value of expected future cash flows discounted at the loan’s original effective interest rate, including cash flows that mayresult from the realization of collateral less costs to sell. Significant judgment is required in assessing evidence of impairment, andonce a loan is determined to be impaired, the timing and amount of future cash flows related to the loan and collateral. The carryingamount of the loan is reduced by the use of an allowance account and the amount of the loss is recognized in Provision for creditlosses in our Consolidated Statements of Income.
Following impairment, interest income is recognised on the unwinding of the discount from the initial recognition of impairment.
Collectively assessed loansLoans which are not individually significant, or which are individually assessed and not determined to be impaired, are collectivelyassessed for impairment. For the purposes of a collective evaluation of impairment, loans are grouped on the basis of similar riskcharacteristics, taking into account loan type, industry, geographic location, collateral type, past due status and other relevantfactors.
The collective impairment allowance is determined by reviewing factors including: (i) historical loss experience in portfolios ofsimilar credit risk characteristics, and (ii) management’s judgment on the level of impairment losses based on historical experiencerelative to the actual level as reported at the balance sheet date, taking into consideration the current portfolio credit quality trends,business and economic and credit conditions, the impact of policy and process changes, and other supporting factors. Future cashflows for a group of loans are collectively evaluated for impairment on the basis of the contractual cash flows of the assets in thegroup and historical loss experience for assets with credit risk characteristics similar to those in the group. Historical loss experienceis adjusted based on current observable data to reflect the effects of current conditions that did not affect the period on which thehistorical loss experience is based and to remove the effects of conditions in the historical period that do not currently exist. Themethodology and assumptions used for estimating future cash flows are reviewed regularly to reduce any differences between lossestimates and actual loss experience. Significant judgment is required in assessing historical loss experience and its relationship tocurrent portfolios (including delinquency, loan balances, and credit scores) and current business, economic and credit conditions(including industry specific performance, unemployment and country risks).
Allowances from collective assessment of impairment are recognized as an offset to the aggregated loan position and asProvision for credit losses.
Write–off of loansLoans and the related impairment allowance accounts are written off, either partially or in full, when there is no realistic prospect ofrecovery. Where loans are secured, they are generally written off after receipt of any proceeds from the realization of the collateral. Incircumstances where the net realizable value of any collateral has been determined and there is no reasonable expectation of furtherrecovery, write off may be earlier. For credit cards, the balances and related allowances are written off when payment is 180 days inarrears. Personal loans are generally written off at 150 days past due.
GuaranteesFinancial guarantee contracts are contracts that contingently require us to make specified payments (in cash, other assets, our ownshares or provision of services) to reimburse the holder for a loss it incurs because a specified debtor fails to make payment when duein accordance with the original or modified terms of a debt instrument. Liabilities are recognized on our Consolidated Balance Sheetsat the inception of a guarantee for the fair value of the obligation undertaken in issuing the guarantee. Financial guarantees aresubsequently remeasured at the higher of (a) the amount initially recognized and (b) our best estimate of the present value of theexpenditure required to settle the present obligation at the end of the reporting period.
If the financial guarantee meets the definition of a derivative, it is measured at fair value at each balance sheet date and reportedunder Derivatives on our Consolidated Balance Sheets.

Royal Bank of Canada First Quarter 2012 45
Offsetting financial assets and financial liabilitiesFinancial assets and financial liabilities are presented net when we have a legally enforceable right to set off the recognized amountsand intend to either settle on a net basis or to realize the asset and settle the liability simultaneously.
InsurancePremiums from long-duration contracts, primarily life insurance, are recognized when due in Non-interest income – Insurancepremiums, investment and fee income. Premiums from short-duration contracts, primarily property and casualty, and fees foradministrative services are recognized in Insurance premiums, investment and fee income over the related contract period. Unearnedpremiums of the short-duration contracts, representing the unexpired portion of premiums, are reported in Other liabilities.Investments made by our insurance operations are classified as AFS or loans and receivables, except for investments supporting thepolicy benefit liabilities on life and health insurance contracts and a portion of property and casualty contracts. These are designatedas at FVTPL with changes in fair value reported in Insurance premiums, investment and fee income.
Insurance claims and policy benefit liabilities represent current claims and estimates for future insurance policy benefits.Liabilities for life insurance contracts are determined using the Canadian Asset Liability Method (CALM), which incorporatesassumptions for mortality, morbidity, policy lapses and surrenders, investment yields, policy dividends, operating and policymaintenance expenses, and provisions for adverse deviation. These assumptions are reviewed at least annually and updated inresponse to actual experience and market conditions. Liabilities for property and casualty insurance represent estimated provisionsfor reported and unreported claims. Liabilities for life and property and casualty insurance are included in Insurance claims and policybenefit liabilities. Changes in Insurance claims and policy benefit liabilities are included in the Insurance policyholder benefits,claims and acquisition expense in our Consolidated Statements of Income in the period in which the estimates changed.
Premiums ceded for reinsurance and reinsurance recoveries on policyholder benefits and claims incurred are reported in incomeand expense as appropriate. Reinsurance recoverables, which relate to paid benefits and unpaid claims, are included in Other assets.
Acquisition costs for new insurance business consist of commissions, premium taxes, certain underwriting costs and other coststhat vary with the acquisition of new business. Deferred acquisition costs for life insurance products are implicitly recognized ininsurance claims and policy benefit liabilities by CALM. For property and casualty insurance, these costs are classified as Other assetsand amortized over the policy term.
Segregated funds are lines of business in which we issue an insurance contract where the benefit amount is directly linked to themarket value of the investments held in the underlying fund. The contractual arrangement is such that the underlying segregated fundassets are registered in our name but the segregated fund policyholders bear the risks and rewards of the funds’ investmentperformance. Liabilities for these contracts are calculated based on contractual obligations using actuarial assumptions and are atleast equivalent to the surrender or transfer value calculated by reference to the value of the relevant underlying funds or indices.Segregated funds’ assets and liabilities are separately presented on our Consolidated Balance Sheets. Fee income from segregatedfunds includes management fees, mortality, policy, administration and surrender charges. We provide minimum death benefit andmaturity value guarantees on segregated funds. The liability associated with these minimum guarantees is recorded in Insuranceclaims and policy benefit liabilities.
Liability adequacy tests are performed for all insurance contract portfolios at each balance sheet date to ensure the adequacy ofinsurance contract liabilities. Current best estimates of future contractual cash flows, claims handling and administration costs, andinvestment returns from the assets backing the liabilities are taken into account in the tests. When the test results indicate that thereis a deficiency in liabilities, the deficiency is charged immediately to our Consolidated Statements of Income by writing down thedeferred acquisition costs in Other assets and/or increasing Insurance claims and policy benefit liabilities.
Employee benefits – Pensions and other post–employment benefitsWe offer a number of benefit plans which provide pension and other benefits to eligible employees. These plans include registereddefined benefit pension plans, supplemental pension plans, defined contribution plans and health, dental, disability and lifeinsurance plans.
Investments held by the pension funds primarily comprise equity and fixed income securities and are valued at fair value. Definedbenefit pension costs and the present value of accrued pension and other post–employment benefit obligations are calculated by theplans’ actuaries using the Projected Unit Credit Method. Our defined benefit pension expense, which is included in Non–interestexpense – Human resources, consists of the cost of employee pension benefits for the current year’s service, interest cost on theliability, and expected return on plan assets. Actuarial gains and losses are recognized in profit or loss using the deferral (corridor)approach. Past service costs are charged immediately to income to the extent that the benefits have vested, and are otherwiserecognised on a straight-line basis over the average period until the benefits vest. Gains and losses on curtailment or settlement ofdefined benefit plans are recognized in income when the curtailment or settlement occurs.
For each defined benefit plan, we recognize the present value of our defined benefit obligations less the fair value of the plan,together with adjustments for any unrecognized actuarial gains and losses and unrecognized past service costs, as a defined benefitliability reported in Accrued pension and other post-employment benefits on our Consolidated Balance Sheets. For plans where thedefined benefit liability is negative (i.e. defined benefit asset), the amount is reported as an asset in Prepaid pension benefit cost. Themeasurement of the asset is limited to the lower of (a) the defined benefit asset and (b) the sum of actuarial losses and past servicecosts not yet recognized, and the present value of any refunds from the plan or reductions in the future contributions to the plan.
The calculation of defined benefit expenses and obligations depends on various assumptions such as discount rates, expectedrates of return on assets, healthcare cost trend rates, projected salary increases, retirement age, and mortality and termination rates.The discount rate assumption is determined using a yield curve of AA corporate debt securities. All other assumptions are determinedby management, applying significant judgment, and are reviewed by actuaries. Due to the long-term nature of these plans, suchestimates and assumptions are subject to significant uncertainty. Actual experience that differs from the actuarial assumptions willaffect the amounts of benefits obligations and expenses that we recognize.
46 Royal Bank of Canada First Quarter 2012
Note 2 Summary of significant accounting policies (continued)
Our contribution to defined contribution plans are expensed when employees have rendered services in exchange for suchcontributions, generally in the year of contribution. Defined contribution plan expense is included in Non–interest expense – Humanresources.
Share–based compensationWe offer share–based compensation plans to certain key employees and to our non-employee directors.
To account for stock options granted to employees, compensation expense is recognized over the applicable vesting period witha corresponding increase in equity. Fair value is determined by using option valuation models, which take into account the exerciseprice of the option, the current share price, the risk free interest rate, the expected volatility of the share price over the life of theoption and other relevant factors. When the options are exercised, the exercise price proceeds together with the amount initiallyrecorded in equity are credited to common shares.
Our other compensation plans include performance deferred share plans and deferred share unit plans for key employees (thePlans). The Plans are settled in cash. The obligations for the Plans are accrued over their vesting periods. For share-settled awards,our accrued obligations are based on the fair value of our common shares at the date of grant. For cash-settled awards, our accruedobligations are adjusted to their fair value at each balance sheet date. Changes in our obligations under the Plans, net of relatedhedges, are recorded as Non–interest expense – Human resources in our Consolidated Statements of Income with a correspondingincrease in Other liabilities or Share-based compensation awards in Retained earnings on our Consolidated Balance Sheets.
The compensation cost attributable to options and awards, granted to employees who are eligible to retire or will become eligibleto retire during the vesting period, is recognized immediately if the employee is eligible to retire on the grant date or over the periodbetween the grant date and the date the employee becomes eligible to retire.
Our contributions to the employee savings and share ownership plans are expensed as incurred.
Income taxesIncome tax comprises current tax and deferred tax and is recognized in our Consolidated Statements of Income except to the extentthat it relates to items recognized directly in equity, in which case it is recognized in equity.
Current income tax payable on profits is recognized as an expense based on the applicable tax laws in each jurisdiction in theperiod in which profits arise, calculated using tax rates enacted or substantively enacted by the balance sheet date. Deferred tax isrecognized on temporary differences between the carrying amounts of assets and liabilities for accounting purposes compared withtax purposes. A deferred income tax asset or liability is determined for each temporary difference, except for earnings related to ourforeign operations and associates and interests in joint ventures and associates where the temporary differences will not reverse inthe foreseeable future and we have the ability to control the timing of reversal. Deferred tax assets and liabilities are determinedbased on the tax rates that are expected to be in effect in the period that the asset is realized or the liability is settled, based on taxrates and tax laws that have been enacted or substantially enacted at the balance sheet date. Both current and deferred tax assetsand liabilities are offset when they are levied by the same taxation authority on either the same taxable entity or different taxableentities within the same tax reporting group (which intends to settle on a net basis), and when there is a legal right to offset. OurConsolidated Statements of Income include items that are non-taxable or non-deductible for income tax purposes and, accordingly,caused the income tax provision to be different from what it would be if based on statutory rates.
Deferred income taxes accumulated as a result of temporary differences and tax loss carryfowards are included in Other assetsand Other liabilities. On a quarterly basis, we review our deferred income tax assets to determine whether it is probable that thebenefits associated with these assets will be realized; this review involves evaluating both positive and negative evidence.
We are subject to income tax laws in various jurisdictions where we operate, and the complex tax laws are potentially subject todifferent interpretations by us and the relevant taxation authority. Significant judgment is required in the interpretation of the relevanttax laws and in estimating the provision for current and deferred income taxes due to uncertainty in timing of taxable income and inthe design and ability to implement tax planning strategies.
Business combinations, goodwill and other intangiblesAll business combinations are accounted for using the acquisition method. Identifiable intangible assets are recognized separatelyfrom goodwill and included in Other intangibles. Goodwill represents the excess of the price paid for the business acquired over thefair value of the net identifiable assets acquired on the date of acquisition.
Goodwill is allocated to cash-generating units or groups of cash-generating units (CGUs) for the purpose of impairment testing,which is undertaken at the lowest level at which goodwill is monitored for internal management purposes. Impairment testing isperformed annually as at August 1, or more frequently if there are indications that impairment may have occurred, by comparing therecoverable amount of a CGU with its carrying amount. The recoverable amount of a CGU is the higher of its fair value less cost to sell,and its value in use. Value in use is the present value of the expected future cash flows from a CGU. Significant judgment is requiredin estimating the fair value and value in use of our CGUs, including the determination of future cash flows (uncertainty in timing andamount), discount rates (based on CGU-specific risks) and terminal growth rates. CGU-specific risks include country risk, business/operational risk, geographic risk (including political risk, devaluation risk, and government regulation), currency risk, and price risk(including product pricing risk and inflation). The carrying amount of a CGU includes the carrying amount of assets and goodwillallocated to the CGU. If the recoverable amount is less than the carrying value, the impairment loss is allocated first to reduce thecarrying amount of any goodwill allocated to the CGU and then to the other assets of the CGU pro rata based on the carrying amount ofeach asset. Any impairment loss is charged to income in the period in which the impairment is identified. Goodwill is stated at costless accumulated impairment losses. Subsequent reversals of goodwill impairment are prohibited.

Royal Bank of Canada First Quarter 2012 47
Upon disposal of a portion of a CGU, the carrying amount of goodwill relating to the portion of CGU sold is included in thedetermination of gains or losses on disposal. The carrying amount is determined based on the relative fair value of the disposedportion to the total CGU.
Intangible assets are recognized separately from goodwill when they are separable or arise from contractual or other legal rights,and their fair value can be measured reliably. Intangible assets with a finite life are amortized on a straight-line basis over theirestimated useful lives, generally not exceeding 20 years, and are assessed for indicators of impairment at each reporting period. Ifthere is an indication that a finite life intangible asset may be impaired, an impairment test is performed by comparing the asset’scarrying amount to its recoverable amount. If any impairment is subsequently reversed, the carrying amount of the asset is revised tothe lower of the asset’s recoverable amount and the carrying amount that would have been determined (net of amortization) had therebeen no prior impairment. Significant judgment is required in estimating the useful lives and recoverable amounts of our intangibleassets, and assessing whether certain events or circumstances constitute objective evidence of impairment.
OtherTranslation of foreign currenciesMonetary assets and liabilities denominated in foreign currencies are translated into Canadian dollars at rates prevailing at thebalance sheet date. Foreign exchange gains and losses resulting from the translation and settlement of these items are recognized inNon-interest income in the Consolidated Statements of Income.
Non-monetary assets and liabilities that are measured at historical cost are translated into Canadian dollars at historical rates.Non-monetary financial assets classified as AFS securities, such as equity instruments, that are measured at fair value are translatedinto Canadian dollars at rates prevailing at the balance sheet date, and the resulting foreign exchange gains and losses are recordedin Other components of equity until the asset is sold or becomes impaired.
Assets and liabilities of our foreign operations with functional currencies other than the Canadian dollars are translated intoCanadian dollar at rates prevailing at the balance sheet date, and income and expenses of these foreign operations are translated ataverage rates of exchange for the reporting period.
Unrealized gains or losses arising as a result of the translation of our foreign operations along with the effective portion of relatedhedges are reported in Other components of equity on an after-tax basis. Upon disposal or partial disposal of a foreign operation, anappropriate portion of the accumulated net translation gains or losses is included in Non-interest income.
Premises and equipmentPremises and equipment includes land, buildings, leasehold improvements, computer equipment, furniture, fixtures and otherequipment, and are stated at cost less accumulated depreciation and accumulated impairment losses. Depreciation is recordedprincipally on a straight–line basis over the estimated useful lives of the assets, which are 25 to 50 years for buildings, 3 to 10 yearsfor computer equipment, and 7 to 10 years for furniture, fixtures and other equipment. The amortization period for leaseholdimprovements is the lesser of the useful life of the leasehold improvements or the lease term plus the first renewal period, ifreasonably assured of renewal, up to a maximum of 10 years. Land is not depreciated. Gains and losses on disposal are recorded inNon–interest income.
Premises and equipment are assessed for indicators of impairment at each reporting period. If there is an indication that an assetmay be impaired, an impairment test is performed by comparing the asset’s carrying amount to its recoverable amount. Animpairment charge is recorded to the extent the recoverable amount of an asset, which is the higher of fair value less costs to sell andvalue in use, is less than its carrying amount. Value in use is the present value of the future cash flows expected to be derived fromthe asset. After the recognition of impairment of an asset, the depreciation charge is adjusted in future periods to reflect the asset’srevised carrying amount. If an impairment is later reversed, the carrying amount of the asset is revised to the lower of the asset’srecoverable amount and the carrying amount that would have been determined (net of depreciation) had there been no priorimpairment loss. The depreciation charge in future periods is adjusted to reflect the revised carrying amount.
ProvisionsProvisions are liabilities of uncertain timing or amount. Provisions are recognized when we have a present legal or constructiveobligation as a result of past event, it is probable that an outflow of resources will be required to settle the obligation and a reliableestimate can be made of the amount of the obligation. Provisions are reflected under Other liabilities on our Consolidated BalanceSheets.
When some or all of the economic benefits required to settle a provision are expected to be recovered from a third party, such asan insurer, a separate asset is recognized if it is virtually certain that reimbursement will be received.
Interest, commissions and feesInterestInterest is recognized in Interest income and Interest expense in the Consolidated Statements of Income for all interest bearingfinancial instruments using the effective interest method.
Commission and fee incomeFees and commissions related to the acquisition of loans or securities are included in determination of their effective interest rate.However, if the financial instrument is carried at FVTPL, any associated fees are recognized in income when the instrument is initiallyrecognized, provided there are no significant unobservable inputs used in determining fair value, in which case the fees are includedas part of the cost of the instrument. Portfolio management and other management advisory and service fees are recognized based onthe applicable service contracts. Fees related to provision of services including asset management, wealth management, financialplanning and custody services that cover a specified service period, are recognized over the period the service is provided. Fees suchas underwriting fees and brokerage fees that are related to the provision of specific transaction type services are recognized when theservice has been completed.

48 Royal Bank of Canada First Quarter 2012
Note 2 Summary of significant accounting policies (continued)
Dividend incomeDividend income is recognised when the right to receive payment is established. This is the ex-dividend date for listed equitysecurities, and usually the date when shareholders have approved the dividend for unlisted equity securities.
LeasingA lease is an agreement whereby the lessor conveys to the lessee the right to use an asset for an agreed upon period of time in returnfor a payment or series of payments. A finance lease is a lease that transfers substantially all the risks and rewards incidental toownership of the leased asset to the lessee, where title may or may not eventually be transferred. An operating lease is a lease otherthan a finance lease.
Operating leasesWhen we are the lessee in an operating lease, we record rental payments on a straight-line basis over the lease term in Non-interestexpense.
Finance leasesWhen we are the lessee in a finance lease, we initially record both the leased asset and the related lease obligation on ourConsolidated Balance Sheets at an amount equal to the fair value of the leased asset or, if lower, the present value of the minimumlease payments, each determined at the date of inception of the lease. Initial direct costs directly attributed to the lease arerecognized as an asset under the finance lease.
Earnings per shareEarnings per share is computed by dividing Net income available to common shareholders by the weighted average number ofcommon shares outstanding for the period, net of treasury shares. Net income available to common shareholders is determined afterdeducting dividend entitlements of preferred shareholders, any gain (loss) on redemption of preferred shares net of related incometaxes and the net income attributable to non-controlling interests.
Diluted earnings per share reflects the potential dilution that could occur if additional common shares are assumed to be issuedunder securities or contracts that entitle their holders to obtain common shares in the future, to the extent such entitlement is notsubject to unresolved contingencies. For contracts that may be settled in cash or in common shares at our option, diluted earnings pershare is calculated based on the assumption that such contracts will be settled in shares. Income and expenses associated withthese types of contracts are excluded from the Net income available to common shareholders, and the additional number of sharesthat would be issued is included in the diluted earnings per share calculation. These contracts include our convertible PreferredShares and Trust Capital Securities. For stock options whose exercise price is less than the average market price of our commonshares, they are assumed to be exercised and the proceeds are used to repurchase common shares at the average market price forthe period. The incremental number of common shares issued under stock options and repurchased from proceeds is included in thecalculation of diluted earnings per share.
Share capitalWe classify a financial instrument that we issue as a financial asset, financial liability or an equity instrument in accordance with thesubstance of the contractual arrangement.
Our common shares held by us are classified as treasury shares in equity and accounted for at weighted average cost. Upon thesale of treasury shares, the difference between the sale proceeds and the cost of the shares is recognized in Retained earnings.Financial instruments issued by us are classified as equity instruments when there is no contractual obligation to transfer cash orother financial assets. Incremental costs directly attributable to the issue of equity instruments are included in equity as a deductionfrom the proceeds, net of tax. Financial instruments that will be settled by a variable number of our common shares upon theirconversion by the holders as well as the related accrued distributions are classified as liabilities on our Consolidated Balance Sheets.Dividends and yield distributions on these instruments are classified as Interest expense in our Consolidated Statements of Income.
Future accounting changesWe are currently assessing the impact of adopting the following standards on our consolidated financial statements:
IFRS 9 Financial Instruments (IFRS 9)In November 2009, the IASB issued IFRS 9 as part of their plan to replace IAS 39, Financial Instruments: Recognition and Measurement(IAS 39). IFRS 9 requires financial assets, including hybrid contracts, to be measured at either fair value or amortized cost, on thebasis of the entity’s business model for managing the financial asset and the contractual cash flow characteristics of the financialasset. A financial asset that is held by an entity for the purpose of collecting contractual cash flows on specified dates per contractualterms should be measured at amortized cost. All other financial assets should be measured at fair value. When the entity changes itsbusiness model, which is expected to be an infrequent occurrence, it is required to reclassify the affected financial assetsprospectively. For equity instruments, management has an option on initial recognition to irrevocably designate on an instrument–by–instrument basis to present the changes in their fair value directly in equity. There is no subsequent recycling of fair value gains andlosses from equity to our Consolidated Statements of Income; however, dividends from such equity investments will continue to berecognized in profit or loss.
In October 2010, the IASB added to IFRS 9 the requirements for classification and measurement of financial liabilities previouslyincluded in IAS 39. IFRS 9 also eliminated the exception from fair value measurement for derivative liabilities that are linked to andmust be settled by delivery of an unquoted equity instrument, and require the changes in own credit risk for financial liabilitiesdesignated as at FVTPL to be reported in other comprehensive income. In December 2011, the IASB amended the effective date ofIFRS 9 to annual periods beginning on or after January 1, 2015. Accordingly, IFRS 9 will be effective for us on November 1, 2015.
Royal Bank of Canada First Quarter 2012 49
IAS 1 Presentation of Financial Statements (IAS 1)In June 2010, the IASB issued amendments to IAS 1 regarding the presentation of OCI. The amendments will be effective for us onNovember 1, 2012.
IAS 12 Income Taxes (IAS 12)In December 2010, the IASB issued amendments to IAS 12 regarding deferred tax and the recovery of underlying assets. Theamendments will be effective for us on November 1, 2012.
Consolidation and disclosure standardsIn May 2011, the IASB issued IFRS 10, Consolidated Financial Statements (IFRS 10), IFRS 11, Joint Arrangements (IFRS 11), and IFRS12, Disclosure of Interests in Other Entities (IFRS 12). IFRS 10 replaces the consolidation requirements in SIC-12 Consolidation—Special Purpose Entities and amends IAS 27 Consolidated and Separate Financial Statements. IFRS 10 builds on existing principles byidentifying the concept of control as the determining factor in whether an entity should be included within the consolidated financialstatements of the parent company and establishes principles for the presentation and preparation of consolidated financialstatements when an entity controls one or more other entities. IFRS 11 focuses on the classification of joint arrangements based onthe rights and obligations of the arrangement, rather than its legal form, and addresses reporting inconsistencies by requiring a singlemethod (equity method) to account for interests in joint ventures. IFRS 12 is a new and comprehensive standard on disclosurerequirements for all forms of interests in other entities, including subsidiaries, joint arrangements, associates and unconsolidatedstructured entities. As a consequence of these new IFRSs, the IASB also issued amended and retitled IAS 27, Separate FinancialStatements and IAS 28 Investments in Associates and Joint Ventures. The new requirements are effective for us on November 1, 2013.
IFRS 13 Fair Value Measurement (IFRS 13)In May 2011, the IASB issued IFRS 13, which defines fair value and sets out a framework for measuring fair value in a single IFRS. IFRS13 also requires disclosures about fair value measurements for non-financial assets. The measurement and disclosure requirementsof IFRS 13 apply when another IFRS requires or permits the item to be measured at fair value with limited exceptions. IFRS 13 will beeffective for us on November 1, 2013.
IAS 19 Employee Benefits (IAS 19)In June 2011, the IASB issued amendments to IAS 19 regarding the recognition and measurement of defined benefit pension expenseand termination benefits, including the elimination of the deferral and amortization of net actuarial gains or losses, and to thedisclosures for all employee benefits. The amendments will be effective for us on November 1, 2013.
IFRS 7 Financial Instruments: Disclosures (IFRS 7)In December 2011, the IASB issued amendments to IFRS 7 regarding disclosure of offsetting financial assets and financial liabilities.The amendments are intended to help investors and other users to better assess the effect or potential effect of offsettingarrangements on a company’s financial position. The amendments will be effective for us on November 1, 2013.
IAS 32 Financial Instruments: Presentation (IAS 32)In December 2011, the IASB issued amendments to IAS 32 which clarify the existing requirements for offsetting financial assets andfinancial liabilities. The amendments will be effective for us on November 1, 2014.
Note 3 First time adoption of IFRS
Transition to IFRSThe Canadian Accounting Standards Board (AcSB) has replaced Canadian GAAP with IFRS for all publically accountable enterprises forinterim and annual financial statements relating to annual periods beginning on or after January 1, 2011. We have adopted IFRSeffective November 1, 2011 and the date of transition is November 1, 2010.
Our accounting policies presented in Note 2 have been applied in preparing the Consolidated Financial Statements for the threemonths ended January 31, 2012, the comparative information for the period ended January 31, 2011, the year ended October 31,2011 and the opening IFRS financial statements as at November 1, 2010. In our transition from Canadian GAAP to IFRS, we followedthe provisions of IFRS 1. The effects of transition to IFRS were recognized directly through retained earnings, or another category ofequity, where appropriate as presented in this note. References below in parentheses (Ref. x) refers to the corresponding columns inour reconciliations of our Consolidated Balance Sheets, Consolidated Statements of Income (Loss), and Consolidated Statements ofComprehensive Income between Canadian GAAP and IFRS, presented below.
Principal exemptions under IFRS 1IFRS 1 provides guidance to first-time adopters of IFRS on how to account for items on transition to IFRS. Generally, IFRS 1 requires anentity to apply IFRS retrospectively upon transition. It also offers some exemptions and requires certain exceptions from retrospectiveapplication. Our first-time adoption decisions regarding the exemptions are discussed below. Other exemptions available underIFRS 1, which are not discussed here, are either not material or not relevant to our business.
Mandatory exceptionsDerecognitionThe derecognition requirements of IAS 39 have been applied prospectively to transactions occurring on or after January 1, 2004.
Hedge accountingHedge accounting has been applied from the Transition date only to hedging relationships that satisfy the hedge accounting criteria inIAS 39, as described in Note 2, at that date.
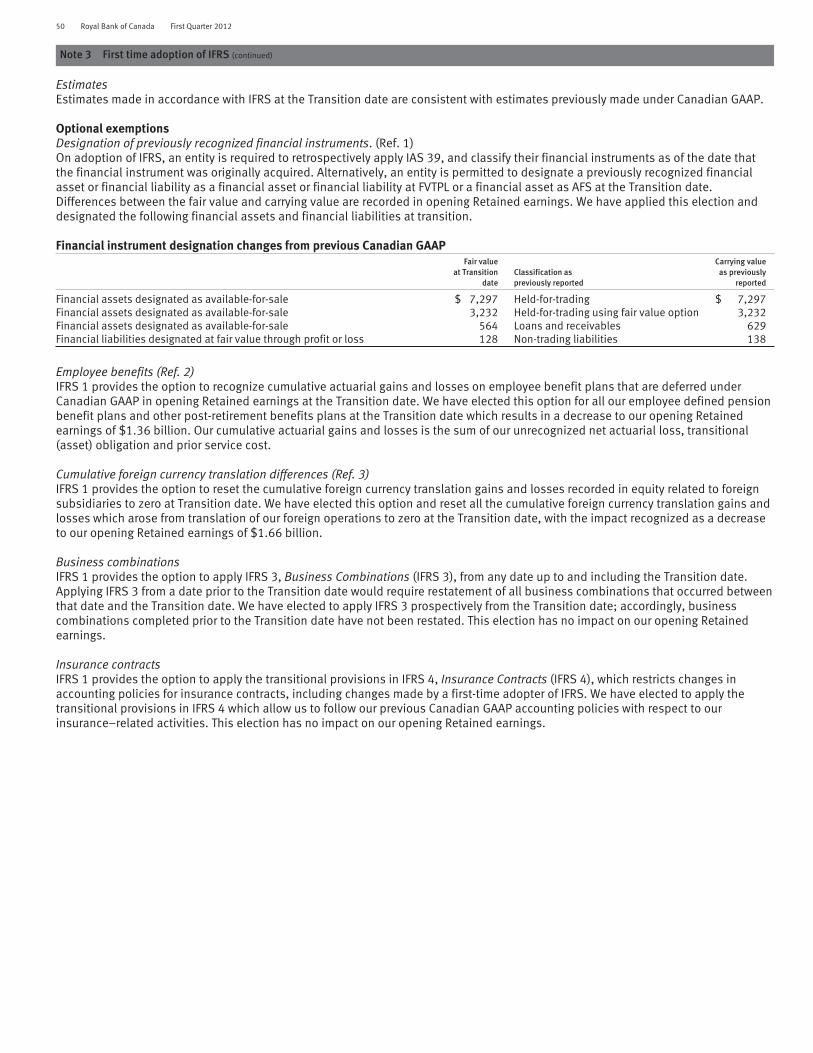
50 Royal Bank of Canada First Quarter 2012
Note 3 First time adoption of IFRS (continued)
EstimatesEstimates made in accordance with IFRS at the Transition date are consistent with estimates previously made under Canadian GAAP.
Optional exemptionsDesignation of previously recognized financial instruments. (Ref. 1)On adoption of IFRS, an entity is required to retrospectively apply IAS 39, and classify their financial instruments as of the date thatthe financial instrument was originally acquired. Alternatively, an entity is permitted to designate a previously recognized financialasset or financial liability as a financial asset or financial liability at FVTPL or a financial asset as AFS at the Transition date.Differences between the fair value and carrying value are recorded in opening Retained earnings. We have applied this election anddesignated the following financial assets and financial liabilities at transition.
Financial instrument designation changes from previous Canadian GAAPFair value
at Transitiondate
Classification aspreviously reported
Carrying valueas previously
reported
Financial assets designated as available-for-sale $ 7,297 Held-for-trading $ 7,297Financial assets designated as available-for-sale 3,232 Held-for-trading using fair value option 3,232Financial assets designated as available-for-sale 564 Loans and receivables 629Financial liabilities designated at fair value through profit or loss 128 Non-trading liabilities 138
Employee benefits (Ref. 2)IFRS 1 provides the option to recognize cumulative actuarial gains and losses on employee benefit plans that are deferred underCanadian GAAP in opening Retained earnings at the Transition date. We have elected this option for all our employee defined pensionbenefit plans and other post-retirement benefits plans at the Transition date which results in a decrease to our opening Retainedearnings of $1.36 billion. Our cumulative actuarial gains and losses is the sum of our unrecognized net actuarial loss, transitional(asset) obligation and prior service cost.
Cumulative foreign currency translation differences (Ref. 3)IFRS 1 provides the option to reset the cumulative foreign currency translation gains and losses recorded in equity related to foreignsubsidiaries to zero at Transition date. We have elected this option and reset all the cumulative foreign currency translation gains andlosses which arose from translation of our foreign operations to zero at the Transition date, with the impact recognized as a decreaseto our opening Retained earnings of $1.66 billion.
Business combinationsIFRS 1 provides the option to apply IFRS 3, Business Combinations (IFRS 3), from any date up to and including the Transition date.Applying IFRS 3 from a date prior to the Transition date would require restatement of all business combinations that occurred betweenthat date and the Transition date. We have elected to apply IFRS 3 prospectively from the Transition date; accordingly, businesscombinations completed prior to the Transition date have not been restated. This election has no impact on our opening Retainedearnings.
Insurance contractsIFRS 1 provides the option to apply the transitional provisions in IFRS 4, Insurance Contracts (IFRS 4), which restricts changes inaccounting policies for insurance contracts, including changes made by a first-time adopter of IFRS. We have elected to apply thetransitional provisions in IFRS 4 which allow us to follow our previous Canadian GAAP accounting policies with respect to ourinsurance–related activities. This election has no impact on our opening Retained earnings.

Royal Bank of Canada First Quarter 2012 51
Impact on transition to IFRSA summary of the material differences that are applicable to us is presented below.
Item Canadian GAAP IFRS Impact on Transition
Ref. 4 GoodwillIAS 36, Impairment of Assets
Goodwill is allocated to reporting units(RUs) that are expected to benefit fromthe synergies of the businesscombination from which it arose. A RUis defined as an identified operatingsegment or one level below anidentified operating segment. We hadeight RUs under Canadian GAAP.
For impairment testing purposes,goodwill is assessed first by comparinga RU’s carrying amount to its fair value.If the carrying value of a RU exceeds itsfair value, the fair value of the RU’sgoodwill is imputed by determining thefair value of the assets and liabilities ofthe RU and allocating the residual fairvalue to goodwill. An impairment lossis recorded to the extent that thecarrying value of a RU’s goodwillexceeds its imputed fair value. There isno reversal of an impairment loss.
Goodwill is allocated to cashgenerating units or groups of cashgenerating units (CGUs) that areexpected to benefit from thesynergies of the businesscombination from which it arose.We have 10 CGUs under IFRS.
Goodwill is impaired whenthe carrying value of a CGUexceeds its recoverable amount.Impairment cannot be reversed.An impairment test must beperformed as at the date oftransition to IFRS.
Our goodwill allocation under CanadianGAAP, which was presented in Note 10 toour 2011 Annual Consolidated FinancialStatements, was realigned to the newCGUs we have identified. OurInternational Banking reporting unitresides in two CGUs, U.S. Banking andCaribbean Banking. Our Global AssetManagement reporting unit also resides intwo CGUs: Canadian Wealth Managementand Global Asset Management.
We performed our impairment test asat the Transition date on the basis of theCGUs identified. Our cash flow modelscalculated recoverable amounts usingdiscount rates ranging from 9.5% to11.5%, with ending terminal growth ratesfrom 3.0% to 4.0%. The results indicatedthat the goodwill of our U.S. Banking CGUwas impaired and accordingly was writtendown to zero. This reduced our openingRetained earnings by $1.26 billion.
Ref. 5 Securitization (Derecognition)IAS 39
Derecognition of financial assets isprimarily based on the legal form of thetransaction and an analysis of whetherthe seller retains control of the assetsand whether the assets are legallyisolated from the seller and itscreditors, even in the event of abankruptcy.
Derecognition is based on transferof risks and rewards; control isonly considered whensubstantially all risks and rewardshave been neither transferred norretained.
Most assets transferred in oursecuritization transactions do not qualifyfor derecognition. As a result, the assetsand associated liabilities are recognizedon our Consolidated Balance Sheets. Thegains previously recognized underCanadian GAAP were recorded as atransition adjustment which decreasedour opening Retained earnings by $415million.
Although this policy changesignificantly impacts our opening IFRSbalance sheets and reduces our openingRetained earnings, we will recognize thenet income generated by the assets overtheir remaining lives.
Ref. 6 Consolidation of Specific Purpose EntitiesIAS 27, Consolidated and Separate Financial StatementsStanding Interpretations Committee (SIC)-12, Consolidation – Special Purpose Entities
Consolidation is based on a controllingfinancial interest model. For variableinterest entities (VIEs), consolidation isassessed based on an analysis ofeconomic risks and rewards, and isconsolidated by the party that absorbsa majority of the entity’s expectedlosses or has the right to receive amajority of the expected residualreturns.
Special Purpose Entities (SPEs)created to accomplish a narrowand well-defined objective areconsolidated based on a controlmodel, which is broader than theconcepts applied under CanadianGAAP. Control encompasses bothdecision making ability and theeconomic consequence of thoseabilities (i.e. benefits and risks).IFRS does not have a concept ofVIEs.
Certain entities which we previously didnot consolidate are consolidated andothers which we consolidated have beendeconsolidated. The associated assetsand liabilities were adjusted on ourConsolidated Balance Sheets and theprofits (losses) previously recognized orunrecognized were included as atransition adjustment which decreasedour opening Retained earnings by $226million.
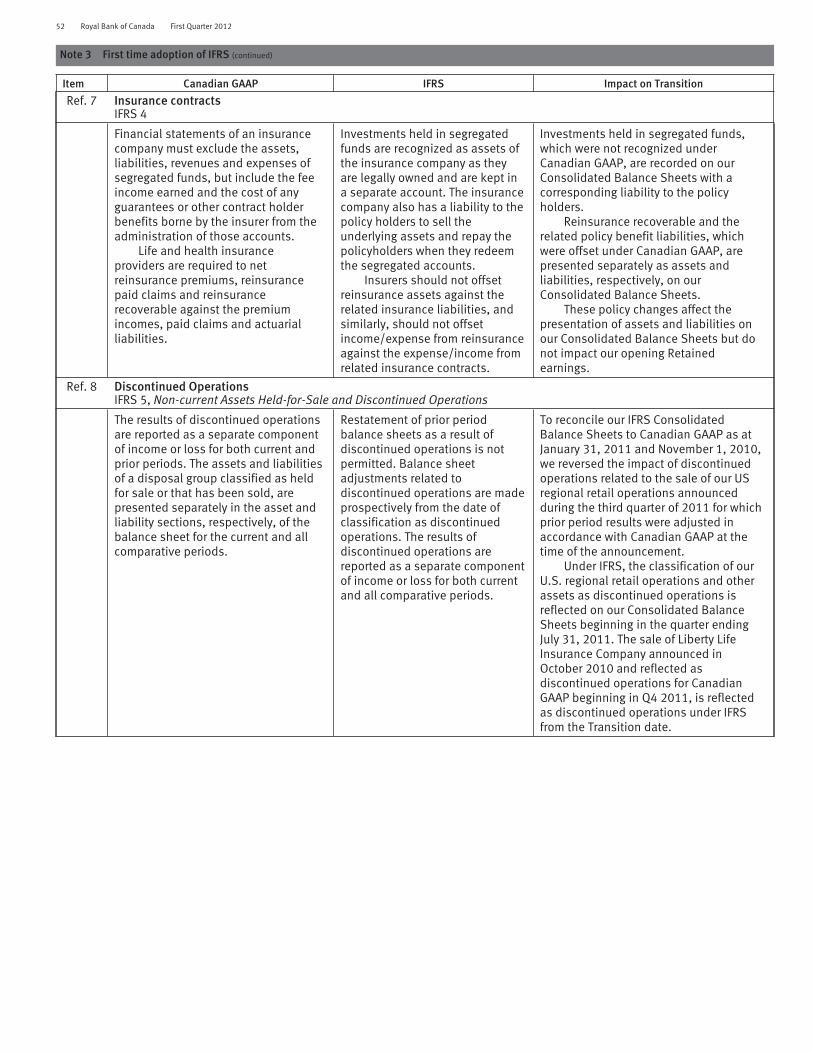
52 Royal Bank of Canada First Quarter 2012
Note 3 First time adoption of IFRS (continued)
Item Canadian GAAP IFRS Impact on Transition
Ref. 7 Insurance contractsIFRS 4
Financial statements of an insurancecompany must exclude the assets,liabilities, revenues and expenses ofsegregated funds, but include the feeincome earned and the cost of anyguarantees or other contract holderbenefits borne by the insurer from theadministration of those accounts.
Life and health insuranceproviders are required to netreinsurance premiums, reinsurancepaid claims and reinsurancerecoverable against the premiumincomes, paid claims and actuarialliabilities.
Investments held in segregatedfunds are recognized as assets ofthe insurance company as theyare legally owned and are kept ina separate account. The insurancecompany also has a liability to thepolicy holders to sell theunderlying assets and repay thepolicyholders when they redeemthe segregated accounts.
Insurers should not offsetreinsurance assets against therelated insurance liabilities, andsimilarly, should not offsetincome/expense from reinsuranceagainst the expense/income fromrelated insurance contracts.
Investments held in segregated funds,which were not recognized underCanadian GAAP, are recorded on ourConsolidated Balance Sheets with acorresponding liability to the policyholders.
Reinsurance recoverable and therelated policy benefit liabilities, whichwere offset under Canadian GAAP, arepresented separately as assets andliabilities, respectively, on ourConsolidated Balance Sheets.
These policy changes affect thepresentation of assets and liabilities onour Consolidated Balance Sheets but donot impact our opening Retainedearnings.
Ref. 8 Discontinued OperationsIFRS 5, Non-current Assets Held-for-Sale and Discontinued Operations
The results of discontinued operationsare reported as a separate componentof income or loss for both current andprior periods. The assets and liabilitiesof a disposal group classified as heldfor sale or that has been sold, arepresented separately in the asset andliability sections, respectively, of thebalance sheet for the current and allcomparative periods.
Restatement of prior periodbalance sheets as a result ofdiscontinued operations is notpermitted. Balance sheetadjustments related todiscontinued operations are madeprospectively from the date ofclassification as discontinuedoperations. The results ofdiscontinued operations arereported as a separate componentof income or loss for both currentand all comparative periods.
To reconcile our IFRS ConsolidatedBalance Sheets to Canadian GAAP as atJanuary 31, 2011 and November 1, 2010,we reversed the impact of discontinuedoperations related to the sale of our USregional retail operations announcedduring the third quarter of 2011 for whichprior period results were adjusted inaccordance with Canadian GAAP at thetime of the announcement.
Under IFRS, the classification of ourU.S. regional retail operations and otherassets as discontinued operations isreflected on our Consolidated BalanceSheets beginning in the quarter endingJuly 31, 2011. The sale of Liberty LifeInsurance Company announced inOctober 2010 and reflected asdiscontinued operations for CanadianGAAP beginning in Q4 2011, is reflectedas discontinued operations under IFRSfrom the Transition date.

Royal Bank of Canada First Quarter 2012 53
Item Canadian GAAP IFRS Impact on Transition
Ref.9
Hedging and OtherIAS 39
In a qualifying hedge relationship, allor a portion of a recognized asset orliability can be designated as thehedged item. A portion of the hedgeditem is defined as either (a) apercentage of the entire recognizedasset or liability, (b) all or a percentageof one or more selected cash flows, or(c) an embedded derivative that is notaccounted for separately.
A portion of the cash flows of afinancial asset or liability can bedesignated as the hedged itemonly if the selected cash flows areless than the total cash flows ofthe asset or liability.
For liabilities whose effectiveinterest rate is below thebenchmark interest rate, we arenot permitted to selectbenchmark-based cash flows asthe hedged item because thesecash flows would be greater thanthe total cash flows of the liability.
Hedge accounting has been applied only tohedging relationships that satisfy the hedgeaccounting criteria in IAS 39 at theTransition date. Certain cash flow hedgeswhich qualify for hedge accounting underCanadian GAAP do not qualify under IFRSbecause the hedged items are portions ofdeposit liabilities whose cash flows arebelow the benchmark interest rate. Theamounts accumulated in equity relating tothese hedges have been reduced to zerowith the impact recognized as a reduction toour opening Retained earnings ofapproximately $350 million.
Although this policy changesignificantly impacts our opening IFRSbalance sheet and reduces our openingRetained earnings, the amortization oflosses previously deferred in OCI will nolonger be recognized in net income in futureperiods.
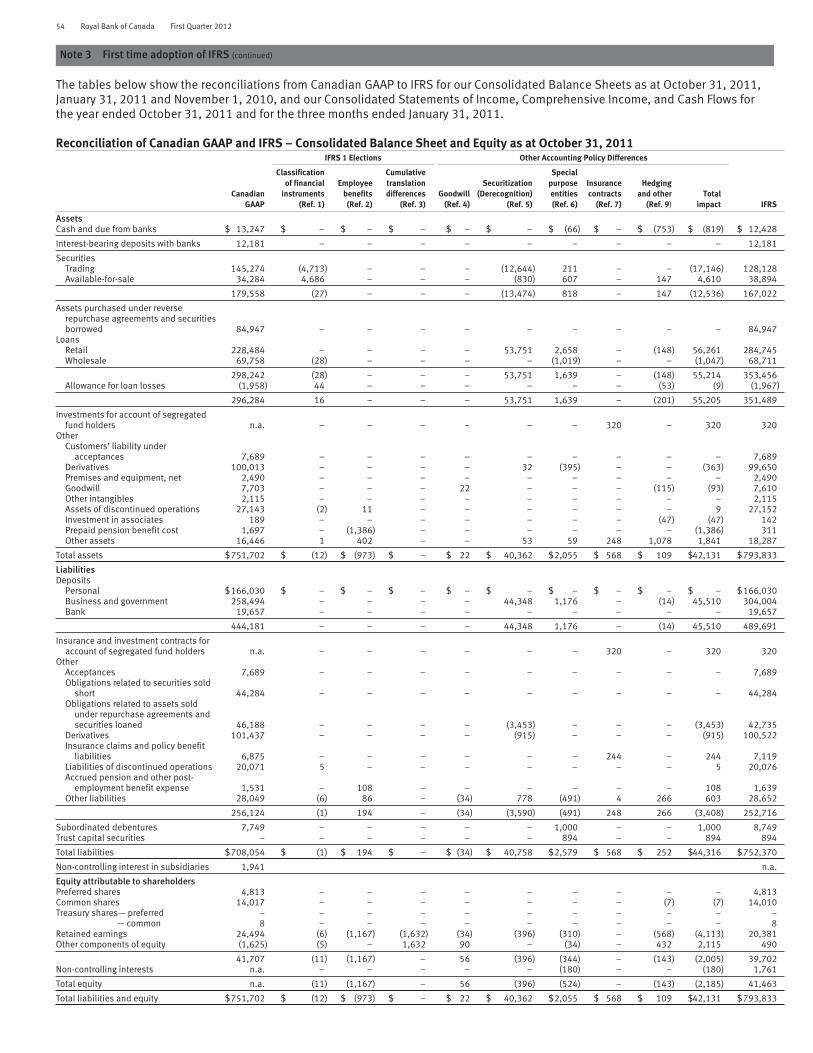
54 Royal Bank of Canada First Quarter 2012
Note 3 First time adoption of IFRS (continued)
The tables below show the reconciliations from Canadian GAAP to IFRS for our Consolidated Balance Sheets as at October 31, 2011,January 31, 2011 and November 1, 2010, and our Consolidated Statements of Income, Comprehensive Income, and Cash Flows forthe year ended October 31, 2011 and for the three months ended January 31, 2011.
Reconciliation of Canadian GAAP and IFRS – Consolidated Balance Sheet and Equity as at October 31, 2011
CanadianGAAP
IFRS 1 Elections Other Accounting Policy Differences
IFRS
Classificationof financial
instruments(Ref. 1)
Employeebenefits(Ref. 2)
Cumulativetranslationdifferences
(Ref. 3)Goodwill
(Ref. 4)
Securitization(Derecognition)
(Ref. 5)
Specialpurposeentities(Ref. 6)
Insurancecontracts
(Ref. 7)
Hedgingand other
(Ref. 9)Total
impact
AssetsCash and due from banks $ 13,247 $ – $ – $ – $ – $ – $ (66) $ – $ (753) $ (819) $ 12,428
Interest-bearing deposits with banks 12,181 – – – – – – – – – 12,181
SecuritiesTrading 145,274 (4,713) – – – (12,644) 211 – – (17,146) 128,128Available-for-sale 34,284 4,686 – – – (830) 607 – 147 4,610 38,894
179,558 (27) – – – (13,474) 818 – 147 (12,536) 167,022
Assets purchased under reverserepurchase agreements and securitiesborrowed 84,947 – – – – – – – – – 84,947
LoansRetail 228,484 – – – – 53,751 2,658 – (148) 56,261 284,745Wholesale 69,758 (28) – – – – (1,019) – – (1,047) 68,711
298,242 (28) – – – 53,751 1,639 – (148) 55,214 353,456Allowance for loan losses (1,958) 44 – – – – – – (53) (9) (1,967)
296,284 16 – – – 53,751 1,639 – (201) 55,205 351,489
Investments for account of segregatedfund holders n.a. – – – – – – 320 – 320 320
OtherCustomers’ liability under
acceptances 7,689 – – – – – – – – – 7,689Derivatives 100,013 – – – – 32 (395) – – (363) 99,650Premises and equipment, net 2,490 – – – – – – – – – 2,490Goodwill 7,703 – – – 22 – – – (115) (93) 7,610Other intangibles 2,115 – – – – – – – – – 2,115Assets of discontinued operations 27,143 (2) 11 – – – – – – 9 27,152Investment in associates 189 – – – – – – – (47) (47) 142Prepaid pension benefit cost 1,697 – (1,386) – – – – – – (1,386) 311Other assets 16,446 1 402 – – 53 59 248 1,078 1,841 18,287
Total assets $751,702 $ (12) $ (973) $ – $ 22 $ 40,362 $2,055 $ 568 $ 109 $42,131 $793,833
LiabilitiesDeposits
Personal $166,030 $ – $ – $ – $ – $ – $ – $ – $ – $ – $166,030Business and government 258,494 – – – – 44,348 1,176 – (14) 45,510 304,004Bank 19,657 – – – – – – – – – 19,657
444,181 – – – – 44,348 1,176 – (14) 45,510 489,691
Insurance and investment contracts foraccount of segregated fund holders n.a. – – – – – – 320 – 320 320
OtherAcceptances 7,689 – – – – – – – – – 7,689Obligations related to securities sold
short 44,284 – – – – – – – – – 44,284Obligations related to assets sold
under repurchase agreements andsecurities loaned 46,188 – – – – (3,453) – – – (3,453) 42,735
Derivatives 101,437 – – – – (915) – – – (915) 100,522Insurance claims and policy benefit
liabilities 6,875 – – – – – – 244 – 244 7,119Liabilities of discontinued operations 20,071 5 – – – – – – – 5 20,076Accrued pension and other post-
employment benefit expense 1,531 – 108 – – – – – – 108 1,639Other liabilities 28,049 (6) 86 – (34) 778 (491) 4 266 603 28,652
256,124 (1) 194 – (34) (3,590) (491) 248 266 (3,408) 252,716
Subordinated debentures 7,749 – – – – – 1,000 – – 1,000 8,749Trust capital securities – – – – – – 894 – – 894 894
Total liabilities $708,054 $ (1) $ 194 $ – $ (34) $ 40,758 $2,579 $ 568 $ 252 $44,316 $752,370
Non-controlling interest in subsidiaries 1,941 n.a.
Equity attributable to shareholdersPreferred shares 4,813 – – – – – – – – – 4,813Common shares 14,017 – – – – – – – (7) (7) 14,010Treasury shares— preferred – – – – – – – – – – –
— common 8 – – – – – – – – – 8Retained earnings 24,494 (6) (1,167) (1,632) (34) (396) (310) – (568) (4,113) 20,381Other components of equity (1,625) (5) – 1,632 90 – (34) – 432 2,115 490
41,707 (11) (1,167) – 56 (396) (344) – (143) (2,005) 39,702Non-controlling interests n.a. – – – – – (180) – – (180) 1,761
Total equity n.a. (11) (1,167) – 56 (396) (524) – (143) (2,185) 41,463
Total liabilities and equity $751,702 $ (12) $ (973) $ – $ 22 $ 40,362 $2,055 $ 568 $ 109 $42,131 $793,833

Royal Bank of Canada First Quarter 2012 55
Reconciliation of Canadian GAAP and IFRS – Consolidated Balance Sheets and Equity as at January 31, 2011
CanadianGAAP
IFRS 1 Elections Other Accounting Policy Differences
IFRS
Classificationof financial
instruments(Ref. 1)
Employeebenefits(Ref. 2)
Cumulativetranslationdifferences
(Ref. 3)Goodwill
(Ref. 4)
Securitization(Derecognition)
(Ref. 5)
Specialpurposeentities(Ref. 6)
Insurancecontracts
(Ref. 7)
Discontinuedoperations
(Ref. 8)
Hedgingand other
(Ref. 9)Total
impact
AssetsCash and due from banks $ 7,674 $ – $ – $ – $ – $ – $ (53) $ – $ 537 $ (270) $ 214 $ 7,888
Interest-bearing deposits withbanks 11,342 – – – – – – – – – – 11,342
SecuritiesTrading 165,946 (3,592) – – – (12,863) 739 – 113 – (15,603) 150,343Available-for-sale 40,561 4,114 – – – 676 1,495 – 5,405 111 11,801 52,362
206,507 522 – – – (12,187) 2,234 – 5,518 111 (3,802) 202,705
Assets purchased under reverserepurchase agreements andsecurities borrowed 79,258 – – – – – 1 – – – 1 79,259
LoansRetail 216,618 – – – – 50,670 1,012 – 6,623 (131) 58,174 274,792Wholesale 60,752 (723) – – – – (801) – 12,397 – 10,873 71,625
277,370 (723) – – – 50,670 211 – 19,020 (131) 69,047 346,417Allowance for loan losses (1,993) 175 – – – – – – (914) (52) (791) (2,784)
275,377 (548) – – – 50,670 211 – 18,106 (183) 68,256 343,633
Investments for account ofsegregated fund holders n.a. – – – – – – 299 (22) – 277 277
OtherCustomers’ liability under
acceptances 7,492 – – – – – – – 7 – 7 7,499Derivatives 73,563 – – – – (118) (32) – 48 – (102) 73,461Premises and equipment, net 2,235 – – – – – – – 347 – 347 2,582Goodwill 7,820 – – – (1,378) – – – 1,378 (115) (115) 7,705Other intangibles 1,889 – – – – – – – 204 – 204 2,093Assets of discontinued
operations 33,331 – – – – – – – (27,776) – (27,776) 5,555Investment in associates 174 – – – – – – – – (40) (40) 134Prepaid pension benefit cost 1,905 – (1,654) – – – – – – 1 (1,653) 252Other assets 12,543 22 458 – 140 170 (121) 954 1,653 1,768 5,044 17,587
Total assets $721,110 $ (4) $ (1,196) $ – $(1,238) $ 38,535 $2,240 $ 1,253 $ – $ 1,272 $ 40,862 $761,972
LiabilitiesDeposits
Personal $151,619 $ – $ – $ – $ – $ – $ – $ – $ 10,014 $ – $ 10,014 $161,633Business and government 245,113 – – – – 45,585 2,577 – 7,883 18 56,063 301,176Bank 22,285 – – – – – – – 205 (105) 100 22,385
419,017 – – – – 45,585 2,577 – 18,102 (87) 66,177 485,194
Insurance and investmentcontracts for account ofsegregated fund holders n.a. – – – – – – 299 (22) – 277 277
OtherAcceptances 7,492 – – – – – – – 7 – 7 7,499Obligations related to
securities sold short 56,440 – – – – – – – – – – 56,440Obligations related to assets
sold under repurchaseagreements and securitiesloaned 53,352 – – – – (6,501) – – 375 – (6,126) 47,226
Derivatives 77,357 – – – – (576) 6 – 2 – (568) 76,789Insurance claims and policy
benefit liabilities 6,156 – – – – – – 952 (368) – 584 6,740Liabilities of discontinued
operations 23,781 – – – – – – – (18,959) – (18,959) 4,822Accrued pension and other
post-employment benefitexpense 1,479 – 101 – – – – – – – 101 1,580
Other liabilities 24,945 (29) 4 (1) – 704 (1,823) 2 863 1,555 1,275 26,220
251,002 (29) 105 (1) – (6,373) (1,817) 954 (18,080) 1,555 (23,686) 227,316
Subordinated debentures 8,041 – – – – – 994 – – – 994 9,035Trust capital securities 735 – – – – – 900 – – – 900 1,635
Total liabilities 678,795 (29) 105 (1) – 39,212 2,654 1,253 – 1,468 44,662 723,457
Non-controlling interest insubsidiaries 2,250 n.a.
Equity attributable toshareholders
Preferred shares 4,813 – – – – – – – – – – 4,813Common shares 13,419 – – – – – – – – – – 13,419Treasury shares – preferred (2) – – – – – – – – – – (2)
– common (59) – – – – – – – – – – (59)Retained earnings 23,988 (40) (1,304) (1,664) (1,261) (457) (192) – – (655) (5,573) 18,415Other components of equity (2,094) 65 3 1,665 23 (220) (32) – – 466 1,970 (124)
40,065 25 (1,301) 1 (1,238) (677) (224) – – (189) (3,603) 36,462Non-controlling interests n.a. – – – – – (190) – – (7) (197) 2,053
Total equity n.a. 25 (1,301) 1 (1,238) (677) (414) – – (196) (3,800) 38,515
Total liabilities and equity $721,110 $ (4) $ (1,196) $ – $(1,238) $ 38,535 $2,240 $ 1,253 $ – $ 1,272 $ 40,862 $761,972

56 Royal Bank of Canada First Quarter 2012
Note 3 First time adoption of IFRS (continued)
Reconciliation of Canadian GAAP and IFRS – Consolidated Balance Sheet and Equity as at November 1, 2010
CanadianGAAP
IFRS 1 Elections Other Accounting Policy Differences
IFRS
Classificationof financial
instruments(Ref. 1)
Employeebenefits(Ref. 2)
Cumulativetranslationdifferences
(Ref. 3)Goodwill
(Ref. 4)
Securitization(Derecognition)
(Ref. 5)
Specialpurposeentities(Ref. 6)
Insurancecontracts
(Ref. 7)
Discontinuedoperations
(Ref. 8)
Hedgingand Other
(Ref. 9)Total
impact
AssetsCash and due from banks $ 8,440 $ – $ – $ – $ – $ – $ (30) $ – $ 888 $ (535) $ 323 $ 8,763
Interest-bearing deposits with banks 13,254 – – – – – – – (2) – (2) 13,252
SecuritiesTrading 144,925 (3,274) – – – (12,550) 615 – 124 (1) (15,086) 129,839Available-for-sale 38,594 3,795 – – – 817 821 – 5,076 141 10,650 49,244
183,519 521 – – – (11,733) 1,436 – 5,200 140 (4,436) 179,083
Assets purchased under reverserepurchase agreements andsecurities borrowed 72,698 – – – – – – – – – – 72,698
LoansRetail 214,937 – – – – 48,311 1,920 – 6,892 (133) 56,990 271,927Wholesale 60,107 (775) – – – – (793) – 12,789 (1) 11,220 71,327
275,044 (775) – – – 48,311 1,127 – 19,681 (134) 68,210 343,254Allowance for loan losses (2,038) 179 – – – – – – (958) (50) (829) (2,867)
273,006 (596) – – – 48,311 1,127 – 18,723 (184) 67,381 340,387
Investments for account ofsegregated fund holders n.a. – – – – – – 279 (22) – 257 257
OtherCustomers’ liability under
acceptances 7,371 – – – – – – – – – – 7,371Derivatives 106,155 – – – – (24) (90) – 68 – (46) 106,109Premises and equipment, net 2,139 – – – – – – – 362 – 362 2,501Goodwill 6,660 – – – (1,404) – – – 1,404 (107) (107) 6,553Other intangibles 1,710 – – – – – – – 216 (1) 215 1,925Assets of discontinued
operations 34,364 – – – – – – – (28,641) – (28,641) 5,723Investment in associates 171 – – – – – – – – (40) (40) 131Prepaid pension benefit cost 1,992 – (1,740) – – – – – – 14 (1,726) 266Other assets 14,727 (19) 474 – 143 116 (22) 977 1,804 2,153 5,626 20,353
Total assets $726,206 $ (94) $(1,266) $ – $ (1,261) $ 36,670 $ 2,421 $1,256 $ – $ 1,440 $ 39,166 $765,372
LiabilitiesDeposits
Personal $151,347 $ – $ – $ – $ – $ – $ – $ – $ 10,346 $ – $ 10,346 161,693Business and government 239,233 – – – – 42,820 2,568 – 7,964 (10) 53,342 292,575Bank 23,981 – – – – – – – 162 – 162 24,143
414,561 – – – – 42,820 2,568 – 18,472 (10) 63,850 478,411
Insurance and investmentcontracts for account ofsegregated fund holders n.a. – – – – – – 279 (22) – 257 257
OtherAcceptances 7,371 – – – – – – – – – – 7,371Obligations related to securities
sold short 46,597 – – – – – – – – – – 46,597Obligations related to assets
sold under repurchaseagreements and securitiesloaned 41,207 – – – – (5,577) – – 376 – (5,201) 36,006
Derivatives 108,908 – – – – (843) 10 – 2 – (831) 108,077Insurance claims and policy
benefit liabilities 6,273 – – – – – – 977 (381) (2) 594 6,867Liabilities of discontinued
operations 24,454 – – – – – – – (19,442) – (19,442) 5,012Accrued pension and other post-
employment benefit expense 1,477 – 98 – – – – – – 1 99 1,576Other liabilities 26,743 (40) – – – 758 (1,642) – 995 1,606 1,677 28,420
263,030 (40) 98 – – (5,662) (1,632) 977 (18,450) 1,605 (23,104) 239,926
Subordinated debentures 6,681 – – – – – 995 – – – 995 7,676Trust capital securities 727 – – – – – 900 – – – 900 1,627
Total liabilities 684,999 (40) 98 – – 37,158 2,831 1,256 – 1,595 42,898 727,897
Non-controlling interest insubsidiaries 2,256 n.a.
Equity attributable to shareholdersPreferred shares 4,813 – – – – – – – – – – 4,813Common shares 13,378 – – – – – – – – – – 13,378Treasury shares – preferred (2) – – – – – – – – – – (2)
– common (81) – – – – – – – – – – (81)Retained earnings 22,942 (57) (1,364) (1,664) (1,261) (415) (226) – – (668) (5,655) 17,287Other components of equity (2,099) 3 – 1,664 – (73) (29) – – 520 2,085 (14)
38,951 (54) (1,364) – (1,261) (488) (255) – – (148) (3,570) 35,381Non-controlling interests n.a. – – – – – (155) – – (7) (162) 2,094
Total equity n.a. $ (54) $(1,364) $ – $ (1,261) $ (488) $ (410) $ – $ – $ (155) $ (3,732) $ 37,475
Total liabilities and equity $726,206 $ (94) $(1,266) $ – $ (1,261) $ 36,670 $ 2,421 $1,256 $ – $ 1,440 $ 39,166 $765,372
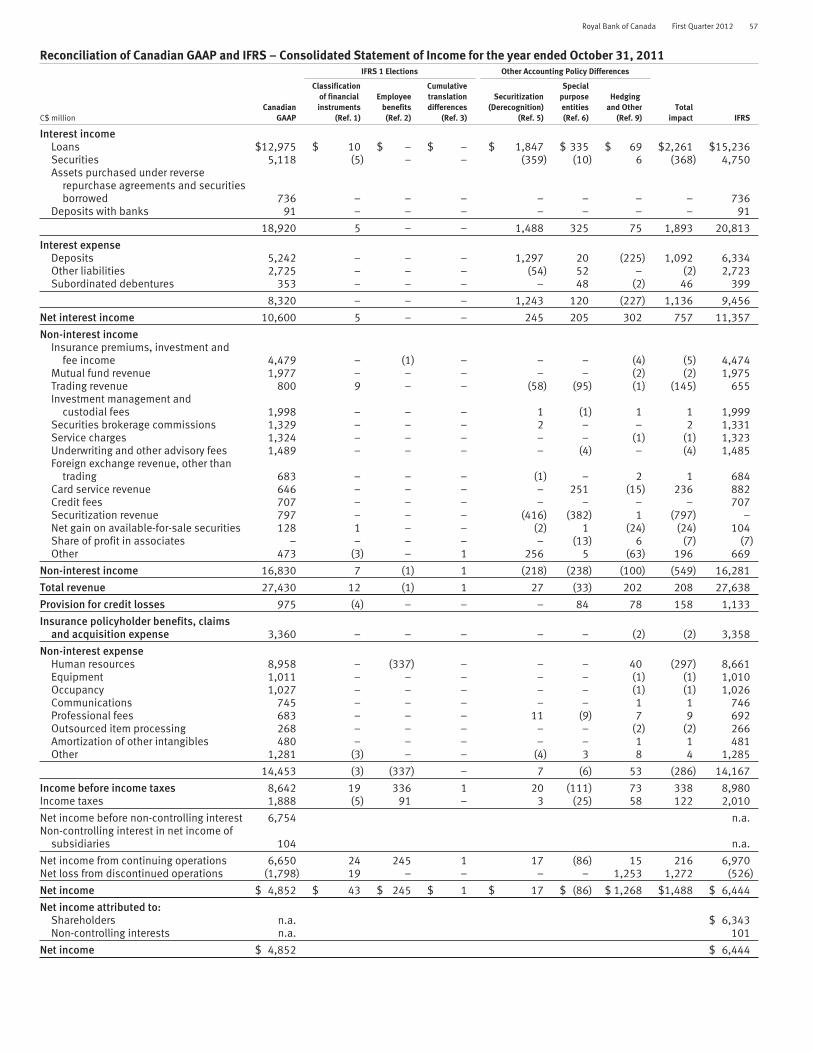
Royal Bank of Canada First Quarter 2012 57
Reconciliation of Canadian GAAP and IFRS – Consolidated Statement of Income for the year ended October 31, 2011
C$ million
IFRS 1 Elections Other Accounting Policy Differences
CanadianGAAP
Classificationof financialinstruments
(Ref. 1)
Employeebenefits(Ref. 2)
Cumulativetranslationdifferences
(Ref. 3)
Securitization(Derecognition)
(Ref. 5)
Specialpurposeentities(Ref. 6)
Hedgingand Other
(Ref. 9)Total
impact IFRS
Interest incomeLoans $12,975 $ 10 $ – $ – $ 1,847 $ 335 $ 69 $2,261 $15,236Securities 5,118 (5) – – (359) (10) 6 (368) 4,750Assets purchased under reverse
repurchase agreements and securitiesborrowed 736 – – – – – – – 736
Deposits with banks 91 – – – – – – – 91
18,920 5 – – 1,488 325 75 1,893 20,813
Interest expenseDeposits 5,242 – – – 1,297 20 (225) 1,092 6,334Other liabilities 2,725 – – – (54) 52 – (2) 2,723Subordinated debentures 353 – – – – 48 (2) 46 399
8,320 – – – 1,243 120 (227) 1,136 9,456
Net interest income 10,600 5 – – 245 205 302 757 11,357
Non-interest incomeInsurance premiums, investment and
fee income 4,479 – (1) – – – (4) (5) 4,474Mutual fund revenue 1,977 – – – – – (2) (2) 1,975Trading revenue 800 9 – – (58) (95) (1) (145) 655Investment management and
custodial fees 1,998 – – – 1 (1) 1 1 1,999Securities brokerage commissions 1,329 – – – 2 – – 2 1,331Service charges 1,324 – – – – – (1) (1) 1,323Underwriting and other advisory fees 1,489 – – – – (4) – (4) 1,485Foreign exchange revenue, other than
trading 683 – – – (1) – 2 1 684Card service revenue 646 – – – – 251 (15) 236 882Credit fees 707 – – – – – – – 707Securitization revenue 797 – – – (416) (382) 1 (797) –Net gain on available-for-sale securities 128 1 – – (2) 1 (24) (24) 104Share of profit in associates – – – – – (13) 6 (7) (7)Other 473 (3) – 1 256 5 (63) 196 669
Non-interest income 16,830 7 (1) 1 (218) (238) (100) (549) 16,281
Total revenue 27,430 12 (1) 1 27 (33) 202 208 27,638
Provision for credit losses 975 (4) – – – 84 78 158 1,133
Insurance policyholder benefits, claimsand acquisition expense 3,360 – – – – – (2) (2) 3,358
Non-interest expenseHuman resources 8,958 – (337) – – – 40 (297) 8,661Equipment 1,011 – – – – – (1) (1) 1,010Occupancy 1,027 – – – – – (1) (1) 1,026Communications 745 – – – – – 1 1 746Professional fees 683 – – – 11 (9) 7 9 692Outsourced item processing 268 – – – – – (2) (2) 266Amortization of other intangibles 480 – – – – – 1 1 481Other 1,281 (3) – – (4) 3 8 4 1,285
14,453 (3) (337) – 7 (6) 53 (286) 14,167
Income before income taxes 8,642 19 336 1 20 (111) 73 338 8,980Income taxes 1,888 (5) 91 – 3 (25) 58 122 2,010
Net income before non-controlling interest 6,754 n.a.Non-controlling interest in net income of
subsidiaries 104 n.a.
Net income from continuing operations 6,650 24 245 1 17 (86) 15 216 6,970Net loss from discontinued operations (1,798) 19 – – – – 1,253 1,272 (526)
Net income $ 4,852 $ 43 $ 245 $ 1 $ 17 $ (86) $ 1,268 $1,488 $ 6,444
Net income attributed to:Shareholders n.a. $ 6,343Non-controlling interests n.a. 101
Net income $ 4,852 $ 6,444
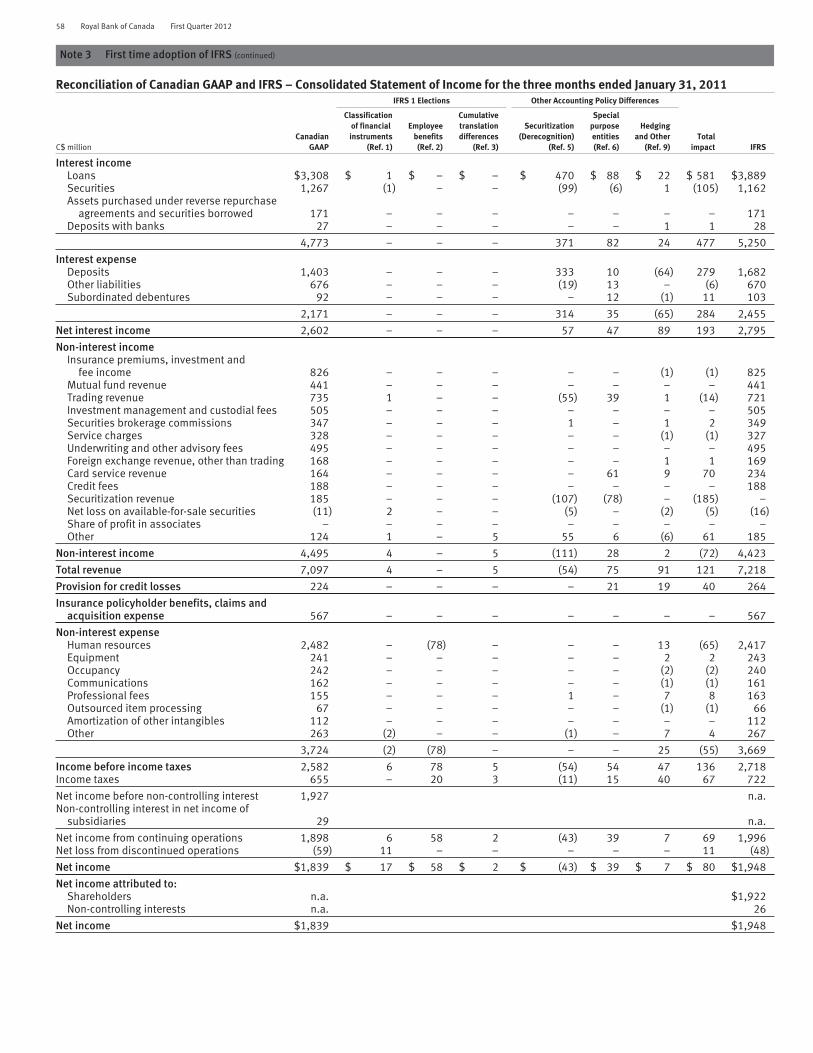
58 Royal Bank of Canada First Quarter 2012
Note 3 First time adoption of IFRS (continued)
Reconciliation of Canadian GAAP and IFRS – Consolidated Statement of Income for the three months ended January 31, 2011IFRS 1 Elections Other Accounting Policy Differences
IFRSC$ millionCanadian
GAAP
Classificationof financialinstruments
(Ref. 1)
Employeebenefits(Ref. 2)
Cumulativetranslationdifferences
(Ref. 3)
Securitization(Derecognition)
(Ref. 5)
Specialpurposeentities(Ref. 6)
Hedgingand Other
(Ref. 9)Total
impact
Interest incomeLoans $3,308 $ 1 $ – $ – $ 470 $ 88 $ 22 $ 581 $3,889Securities 1,267 (1) – – (99) (6) 1 (105) 1,162Assets purchased under reverse repurchase
agreements and securities borrowed 171 – – – – – – – 171Deposits with banks 27 – – – – – 1 1 28
4,773 – – – 371 82 24 477 5,250
Interest expenseDeposits 1,403 – – – 333 10 (64) 279 1,682Other liabilities 676 – – – (19) 13 – (6) 670Subordinated debentures 92 – – – – 12 (1) 11 103
2,171 – – – 314 35 (65) 284 2,455
Net interest income 2,602 – – – 57 47 89 193 2,795
Non-interest incomeInsurance premiums, investment and
fee income 826 – – – – – (1) (1) 825Mutual fund revenue 441 – – – – – – – 441Trading revenue 735 1 – – (55) 39 1 (14) 721Investment management and custodial fees 505 – – – – – – – 505Securities brokerage commissions 347 – – – 1 – 1 2 349Service charges 328 – – – – – (1) (1) 327Underwriting and other advisory fees 495 – – – – – – – 495Foreign exchange revenue, other than trading 168 – – – – – 1 1 169Card service revenue 164 – – – – 61 9 70 234Credit fees 188 – – – – – – – 188Securitization revenue 185 – – – (107) (78) – (185) –Net loss on available-for-sale securities (11) 2 – – (5) – (2) (5) (16)Share of profit in associates – – – – – – – – –Other 124 1 – 5 55 6 (6) 61 185
Non-interest income 4,495 4 – 5 (111) 28 2 (72) 4,423
Total revenue 7,097 4 – 5 (54) 75 91 121 7,218
Provision for credit losses 224 – – – – 21 19 40 264
Insurance policyholder benefits, claims andacquisition expense 567 – – – – – – – 567
Non-interest expenseHuman resources 2,482 – (78) – – – 13 (65) 2,417Equipment 241 – – – – – 2 2 243Occupancy 242 – – – – – (2) (2) 240Communications 162 – – – – – (1) (1) 161Professional fees 155 – – – 1 – 7 8 163Outsourced item processing 67 – – – – – (1) (1) 66Amortization of other intangibles 112 – – – – – – – 112Other 263 (2) – – (1) – 7 4 267
3,724 (2) (78) – – – 25 (55) 3,669
Income before income taxes 2,582 6 78 5 (54) 54 47 136 2,718Income taxes 655 – 20 3 (11) 15 40 67 722
Net income before non-controlling interest 1,927 n.a.Non-controlling interest in net income of
subsidiaries 29 n.a.
Net income from continuing operations 1,898 6 58 2 (43) 39 7 69 1,996Net loss from discontinued operations (59) 11 – – – – – 11 (48)
Net income $1,839 $ 17 $ 58 $ 2 $ (43) $ 39 $ 7 $ 80 $1,948
Net income attributed to:Shareholders n.a. $1,922Non-controlling interests n.a. 26
Net income $1,839 $1,948
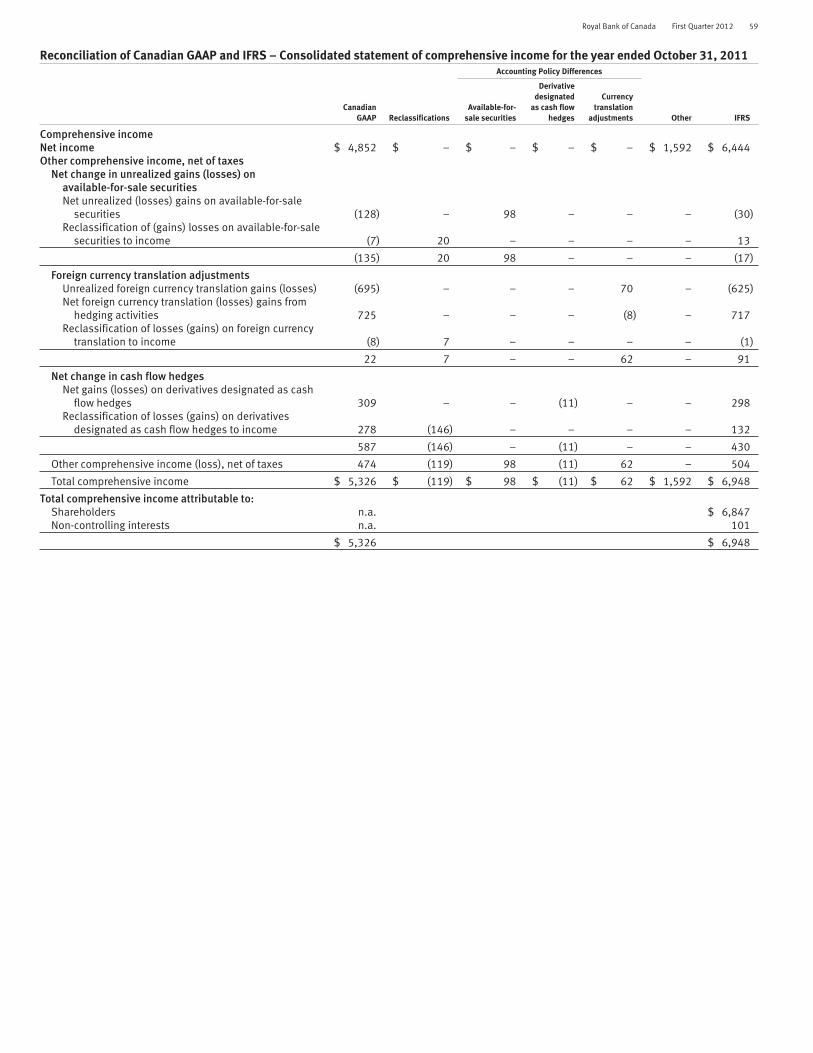
Royal Bank of Canada First Quarter 2012 59
Reconciliation of Canadian GAAP and IFRS – Consolidated statement of comprehensive income for the year ended October 31, 2011Accounting Policy Differences
CanadianGAAP Reclassifications
Available-for-sale securities
Derivativedesignated
as cash flowhedges
Currencytranslation
adjustments Other IFRS
Comprehensive incomeNet income $ 4,852 $ – $ – $ – $ – $ 1,592 $ 6,444Other comprehensive income, net of taxes
Net change in unrealized gains (losses) onavailable-for-sale securitiesNet unrealized (losses) gains on available-for-sale
securities (128) – 98 – – – (30)Reclassification of (gains) losses on available-for-sale
securities to income (7) 20 – – – – 13
(135) 20 98 – – – (17)
Foreign currency translation adjustmentsUnrealized foreign currency translation gains (losses) (695) – – – 70 – (625)Net foreign currency translation (losses) gains from
hedging activities 725 – – – (8) – 717Reclassification of losses (gains) on foreign currency
translation to income (8) 7 – – – – (1)
22 7 – – 62 – 91
Net change in cash flow hedgesNet gains (losses) on derivatives designated as cash
flow hedges 309 – – (11) – – 298Reclassification of losses (gains) on derivatives
designated as cash flow hedges to income 278 (146) – – – – 132
587 (146) – (11) – – 430
Other comprehensive income (loss), net of taxes 474 (119) 98 (11) 62 – 504
Total comprehensive income $ 5,326 $ (119) $ 98 $ (11) $ 62 $ 1,592 $ 6,948
Total comprehensive income attributable to:Shareholders n.a. $ 6,847Non-controlling interests n.a. 101
$ 5,326 $ 6,948

60 Royal Bank of Canada First Quarter 2012
Note 3 First time adoption of IFRS (continued)
Reconciliation of Canadian GAAP and IFRS – Consolidated statement of comprehensive income for the three months endedJanuary 31, 2011
Accounting Policy Differences
CanadianGAAP Reclassifications
Available-for-sale
securities
Derivativedesignated
as cashflow hedges
Currencytranslation
adjustments Other IFRS
Comprehensive incomeNet income $ 1,839 $ – $ – $ – $ – $ 109 $ 1,948Other comprehensive income, net of taxes
Net change in unrealized gains (losses) onavailable-for-sale securitiesNet unrealized (losses) gains on available-for-sale
securities (93) – (105) – – – (198)Reclassification of (gains) losses on available-for-sale
securities to income 18 15 – – – – 33
(75) 15 (105) – – – (165)
Foreign currency translation adjustmentsUnrealized foreign currency translation gains (losses) (520) – – – 24 – (496)Net foreign currency translation (losses) gains from
hedging activities 492 – – – (8) – 484Reclassification of losses (gains) on foreign currency
translation to income (6) 6 – – – – –
(34) 6 – – 16 – (12)
Net change in cash flow hedgesNet gains (losses) on derivatives designated as cash
flow hedges 45 – – (3) – – 42Reclassification of losses (gains) on derivatives
designated as cash flow hedges to income 69 (44) – – – – 25
114 (44) – (3) – – 67
Other comprehensive income (loss), net of taxes 5 (23) (105) (3) 16 – (110)
Total comprehensive income $ 1,844 $ (23) $ (105) $ (3) $ 16 $ 109 $ 1,838
Total comprehensive income attributable to:Shareholders n.a. $ 1,813Non-controlling interests n.a. 25
$ 1,844 $ 1,838
Significant adjustments to the statements of cash flowsOn transition to IFRS, the following lines have been reclassified in the Consolidated Statements of Cash Flows from investing activities to operatingactivities: Change in loans, net of securitizations; Proceeds from securitizations; and Change in assets purchased under reverse repurchaseagreements and securities borrowed. Additionally, the following lines have been reclassified from financing activities to operating activities: Changein deposits; Change in obligations related to assets sold under repurchase agreements and securities loaned; and Change in obligations related tosecurities sold short. The effects of these reclassifications on our net cash from (used in) operating, investing, and financing activities are presentedin the table below:
Reconciliation of Canadian GAAP and IFRS - Consolidated statement of cash flows for the three-months ended January 31, 2011Three months ended January 31, 2011
CanadianGAAP
Reclassificationadjustments
Other transitionimpacts IFRS
Net cash (used in) from operating activities $ (15,860) $ 15,723 $ 2,383 $ 2,246Net cash (used in) investing activities (11,891) 10,352 (2,150) (3,689)Net cash from financing activities 26,671 (26,075) 6 602Effect of exchange rate changes on cash resources (47) – 3 (44)
Net change in cash resources (1,127) – 242 (885)Cash resources at beginning of period (1) 9,330 – (565) 8,765
Cash resources at end of period $ 8,203 $ – $ (323) $ 7,880
(1) Cash resources represent our total Cash and due from banks relating to continuing operations, as presented on our Consolidated Balance Sheets, and Cash and due from banks relating todiscontinued operations.

Royal Bank of Canada First Quarter 2012 61
Reconciliation of Canadian GAAP and IFRS – Consolidated Statement of Cash Flows for the year ended October 31, 2011Year ended October 31, 2011
CanadianGAAP
Reclassificationadjustments
Other transitionimpacts IFRS
Net cash from operating activities $ 10,338 $ (9,475) $ 3,099 $ 3,962Net cash (used in) from investing activities (32,936) 41,823 (3,395) 5,492Net cash from (used in) financing activities 29,174 (32,348) 23 (3,151)Effect of exchange rate changes on cash resources 57 – 19 76
Net change in cash resources 6,633 – (254) 6,379Cash resources at beginning of year (1) 9,330 – (565) 8,765
Cash resources at end of year $ 15,963 $ – $ (819) $ 15,144
(1) Cash resources represent our total Cash and due from banks relating to continuing operations, as presented on our Consolidated Balance Sheets, and Cash and due from banks relating todiscontinued operations.
Note 4 Fair value of financial instruments
Carrying value and fair value of selected financial instrumentsThe following tables provide a comparison of the carrying and fair values for each classification of financial instruments.
As at January 31, 2012
Carrying value and fair value of Carrying value Fair value
Financialinstruments
required to beclassified as at
FVTPL by nature
Financialinstruments
designated asat FVTPL under
the fair value option
Available-for-sale
instrumentsmeasured at
fair value
Loans andreceivables and
non-tradingliabilities
Loans andreceivables and
non-tradingliabilities
Held-to-maturityinvestmentsmeasured at
amortized costTotal carrying
amountTotal
fair value
Financial assetsSecurities
Trading $ 113,230 $ 10,335 $ – $ – $ – $ – $ 123,565 $ 123,565Available-for-sale – – 41,138 – – 483 41,621 41,621
Total securities 113,230 10,335 41,138 – – 483 165,186 165,186
Assets purchased underreverse repurchaseagreements and securitiesborrowed – 68,538 – 27,674 27,674 – 96,212 96,212
LoansRetail – – – 285,998 284,573 – 285,998 284,573Wholesale 319 4,224 – 73,106 71,673 – 77,649 76,216
Total loans 319 4,224 – 359,104 356,246 – 363,647 360,789
OtherDerivatives 103,341 – – – – – 103,341 103,341Other assets – 518 – 16,908 16,908 – 17,426 17,426
Financial liabilitiesDeposits
Personal $ – $ 5,127 $ – $ 166,977 $ 167,360 $ – $ 172,104 $ 172,487Business and government
(1) – 59,344 – 248,922 249,241 – 308,266 308,585Bank (2) – 6,747 – 14,929 14,929 – 21,676 21,676
Total deposits – 71,218 – 430,828 431,530 – 502,046 502,748
OtherObligations related to
securities sold short 37,358 – – – – – 37,358 37,358Obligations related to
assets sold underrepurchase agreementsand securities loaned – 46,169 – 7,393 7,393 – 53,562 53,562
Derivatives (3) 106,763 – – – – – 106,763 106,763Other liabilities 84 9 – 31,293 31,293 – 31,386 31,386
Subordinated debentures – 115 – 8,629 8,453 – 8,744 8,568Trust capital securities – – – 900 958 – 900 958
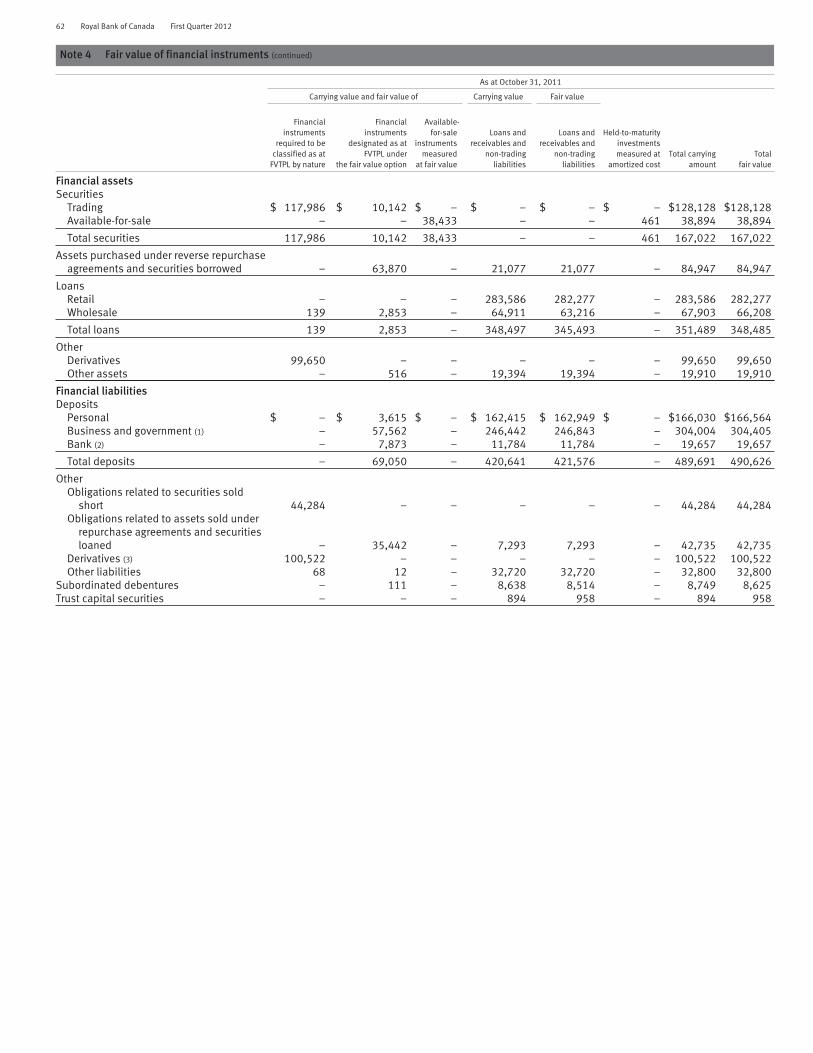
62 Royal Bank of Canada First Quarter 2012
Note 4 Fair value of financial instruments (continued)
As at October 31, 2011
Carrying value and fair value of Carrying value Fair value
Financialinstruments
required to beclassified as at
FVTPL by nature
Financialinstruments
designated as atFVTPL under
the fair value option
Available-for-sale
instrumentsmeasured
at fair value
Loans andreceivables and
non-tradingliabilities
Loans andreceivables and
non-tradingliabilities
Held-to-maturityinvestmentsmeasured at
amortized costTotal carrying
amountTotal
fair value
Financial assetsSecurities
Trading $ 117,986 $ 10,142 $ – $ – $ – $ – $128,128 $128,128Available-for-sale – – 38,433 – – 461 38,894 38,894
Total securities 117,986 10,142 38,433 – – 461 167,022 167,022
Assets purchased under reverse repurchaseagreements and securities borrowed – 63,870 – 21,077 21,077 – 84,947 84,947
LoansRetail – – – 283,586 282,277 – 283,586 282,277Wholesale 139 2,853 – 64,911 63,216 – 67,903 66,208
Total loans 139 2,853 – 348,497 345,493 – 351,489 348,485
OtherDerivatives 99,650 – – – – – 99,650 99,650Other assets – 516 – 19,394 19,394 – 19,910 19,910
Financial liabilitiesDeposits
Personal $ – $ 3,615 $ – $ 162,415 $ 162,949 $ – $166,030 $166,564Business and government (1) – 57,562 – 246,442 246,843 – 304,004 304,405Bank (2) – 7,873 – 11,784 11,784 – 19,657 19,657
Total deposits – 69,050 – 420,641 421,576 – 489,691 490,626
OtherObligations related to securities sold
short 44,284 – – – – – 44,284 44,284Obligations related to assets sold under
repurchase agreements and securitiesloaned – 35,442 – 7,293 7,293 – 42,735 42,735
Derivatives (3) 100,522 – – – – – 100,522 100,522Other liabilities 68 12 – 32,720 32,720 – 32,800 32,800
Subordinated debentures – 111 – 8,638 8,514 – 8,749 8,625Trust capital securities – – – 894 958 – 894 958

Royal Bank of Canada First Quarter 2012 63
As at January 31, 2011
Carrying value and fair value of Carrying value Fair value
Financialinstruments
required to beclassified as at
FVTPL bynature
Financialinstruments
designated asat FVTPL under
the fair valueoption
Available-for-sale
instrumentsmeasured at
fair value
Loans andreceivables
andnon-trading
liabilities
Loans andreceivables
andnon-trading
liabilities
Held-to-maturityinvestmentsmeasured at
amortized costTotal carrying
amount Total fair value
Financial assetsSecurities
Trading $ 140,583 $ 9,760 $ – $ – $ – $ – $ 150,343 $ 150,343Available-for-sale – 50,905 – – 1,457 52,362 52,362
Total securities 140,583 9,760 50,905 – – 1,457 202,705 202,705
Assets purchased under reverserepurchase agreements andsecurities borrowed – 52,266 – 26,993 26,993 – 79,259 79,259
LoansRetail – – – 273,262 271,550 – 273,262 271,550Wholesale – 2,277 – 68,094 64,682 – 70,371 66,959
Total loans – 2,277 – 341,356 336,232 – 343,633 338,509
OtherDerivatives 73,461 – – – – – 73,461 73,461Other assets – 324 – 16,884 16,789 – 17,208 17,113
Financial liabilitiesDeposits
Personal $ – $ 3,190 $ – $ 158,443 $ 158,890 $ – $ 161,633 $ 162,080Business and government (1) – 53,802 – 247,374 248,172 – 301,176 301,974Bank (2) – 10,220 – 12,165 12,165 – 22,385 22,385
Total deposits – 67,212 – 417,982 419,227 – 485,194 486,439
OtherObligations related to
securities sold short 56,440 – – – – – 56,440 56,440Obligations related to assets
sold under repurchaseagreements and securitiesloaned – 30,263 – 16,963 16,963 – 47,226 47,226
Derivatives (3) 76,789 – – – – – 76,789 76,789Other liabilities (206) 129 – 30,017 30,025 – 29,940 29,948
Subordinated debentures – 116 – 8,919 8,859 – 9,035 8,975Trust capital securities – – – 1,635 1,722 – 1,635 1,722

64 Royal Bank of Canada First Quarter 2012
Note 4 Fair value of financial instruments (continued)
November 1, 2010
Carrying value and fair value of Carrying value Fair value
Financialinstruments
required to beclassified as at
FVTPL bynature
Financialinstruments
designated asat FVTPL under
the fair valueoption
Available-for-saleinstruments
measured at fairvalue
Loans andreceivables
andnon-trading
liabilities
Loans andreceivables
andnon-trading
liabilities
Held-to-maturityinvestmentsmeasured at
amortized costTotal carrying
amountTotal fair
value
Financial assetsSecurities
Trading $ 120,322 $ 9,517 $ – $ – $ – $ – $129,839 $129,839Available-for-sale – 48,588 – – 656 49,244 49,244
Total securities 120,322 9,517 48,588 – – 656 179,083 179,083
Assets purchased under reverse repurchaseagreements and securities borrowed – 51,713 – 20,985 20,985 – 72,698 72,698
LoansRetail – – – 270,370 269,950 – 270,370 269,950Wholesale – 2,899 – 67,118 65,647 – 70,017 68,546
Total loans – 2,899 – 337,488 335,597 – 340,387 338,496
OtherDerivatives 106,109 – – – – – 106,109 106,109Other assets – 296 – 18,984 18,984 – 19,280 19,280
Financial liabilitiesDeposits
Personal $ – $ 3,237 $ – $ 158,456 $159,255 $ – $161,693 $162,492Business and government (1) – 62,880 – 229,695 229,863 – 292,575 292,743Bank (2) – 9,479 – 14,664 14,664 – 24,143 24,143
Total deposits – 75,596 – 402,815 403,782 – 478,411 479,378
OtherObligations related to securities sold short 46,597 – – – – – 46,597 46,597Obligations related to assets sold under
repurchase agreements and securitiesloaned – 25,695 – 10,311 10,311 – 36,006 36,006
Derivatives (3) 108,077 – – – – – 108,077 108,077Other liabilities (509) 127 – 32,756 32,435 – 32,374 32,053
Subordinated debentures – 119 – 7,557 7,522 – 7,676 7,641Trust capital securities – – – 1,627 1,734 – 1,627 1,734
(1) Business and government includes deposits from regulated deposit-taking institutions other than regulated banks.(2) Bank refers to regulated banks.(3) Includes stable value contracts for $320 million (October 31, 2011 – $283 million; January 31, 2011 – $164 million; November 1, 2010 – $170 million ) of bank-owned life insurance (BOLI) policies
and a nominal amount (October 31, 2011 – $1 million; January 31, 2011 – a nominal amount; November 1, 2010 – $2 million ) of 401(k) plans.
The following tables present information on loans and receivables designated as at FVTPL, the maximum exposure to credit risk, the extent to whichthe risk is mitigated by credit derivatives and similar instruments, and changes in the fair value of these assets.
As at January 31, 2012
Loans and receivables designated as at FVTPL
Carryingamount ofloans and
receivablesdesignatedas at FVTPL
Maximumexposureto credit
risk
Change infair value
for theperiod
attributableto changes
in credit risk
Cumulativechange infair value
since initialrecognitionattributableto changes
in credit risk
Extent towhichcredit
derivativesor similar
instrumentsmitigate
credit risk
Change infair value of
creditderivatives
or similarinstruments
for theperiod
Cumulativechange in fair
value of creditderivatives or
similarinstruments (1)
Interest-bearing deposits with banks $ 6,457 $ 6,457 $ – $ – $ – $ – $ –Assets purchased under reverse repurchase agreements
and securities borrowed 68,538 68,538 – – – – –Loans – Wholesale 4,224 4,224 1 (12) 287 (1) 2Other Assets 139 139 – – – – –
Total $79,358 $79,358 $ 1 $ (12) $ 287 $ (1) $ 2
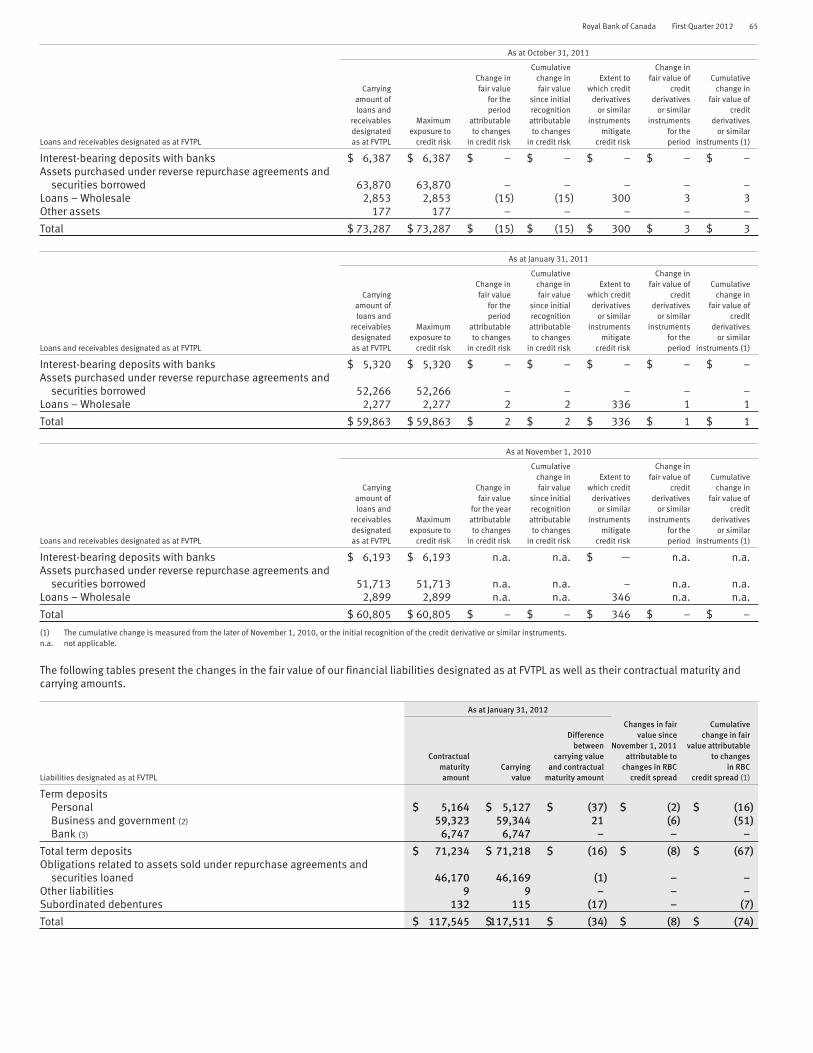
Royal Bank of Canada First Quarter 2012 65
As at October 31, 2011
Loans and receivables designated as at FVTPL
Carryingamount ofloans and
receivablesdesignatedas at FVTPL
Maximumexposure to
credit risk
Change infair value
for theperiod
attributableto changes
in credit risk
Cumulativechange infair value
since initialrecognitionattributableto changes
in credit risk
Extent towhich credit
derivativesor similar
instrumentsmitigate
credit risk
Change infair value of
creditderivatives
or similarinstruments
for theperiod
Cumulativechange in
fair value ofcredit
derivativesor similar
instruments (1)
Interest-bearing deposits with banks $ 6,387 $ 6,387 $ – $ – $ – $ – $ –Assets purchased under reverse repurchase agreements and
securities borrowed 63,870 63,870 – – – – –Loans – Wholesale 2,853 2,853 (15) (15) 300 3 3Other assets 177 177 – – – – –
Total $ 73,287 $ 73,287 $ (15) $ (15) $ 300 $ 3 $ 3
As at January 31, 2011
Loans and receivables designated as at FVTPL
Carryingamount ofloans and
receivablesdesignatedas at FVTPL
Maximumexposure to
credit risk
Change infair value
for theperiod
attributableto changes
in credit risk
Cumulativechange infair value
since initialrecognitionattributableto changes
in credit risk
Extent towhich credit
derivativesor similar
instrumentsmitigate
credit risk
Change infair value of
creditderivatives
or similarinstruments
for theperiod
Cumulativechange in
fair value ofcredit
derivativesor similar
instruments (1)
Interest-bearing deposits with banks $ 5,320 $ 5,320 $ – $ – $ – $ – $ –Assets purchased under reverse repurchase agreements and
securities borrowed 52,266 52,266 – – – – –Loans – Wholesale 2,277 2,277 2 2 336 1 1
Total $ 59,863 $ 59,863 $ 2 $ 2 $ 336 $ 1 $ 1
As at November 1, 2010
Loans and receivables designated as at FVTPL
Carryingamount ofloans and
receivablesdesignatedas at FVTPL
Maximumexposure to
credit risk
Change infair value
for the yearattributableto changes
in credit risk
Cumulativechange infair value
since initialrecognitionattributableto changes
in credit risk
Extent towhich credit
derivativesor similar
instrumentsmitigate
credit risk
Change infair value of
creditderivatives
or similarinstruments
for theperiod
Cumulativechange in
fair value ofcredit
derivativesor similar
instruments (1)
Interest-bearing deposits with banks $ 6,193 $ 6,193 n.a. n.a. $ — n.a. n.a.Assets purchased under reverse repurchase agreements and
securities borrowed 51,713 51,713 n.a. n.a. – n.a. n.a.Loans – Wholesale 2,899 2,899 n.a. n.a. 346 n.a. n.a.
Total $ 60,805 $ 60,805 $ – $ – $ 346 $ – $ –
(1) The cumulative change is measured from the later of November 1, 2010, or the initial recognition of the credit derivative or similar instruments.n.a. not applicable.
The following tables present the changes in the fair value of our financial liabilities designated as at FVTPL as well as their contractual maturity andcarrying amounts.
As at January 31, 2012
Liabilities designated as at FVTPL
Contractualmaturityamount
Carryingvalue
Differencebetween
carrying valueand contractual
maturity amount
Changes in fairvalue since
November 1, 2011attributable to
changes in RBCcredit spread
Cumulativechange in fair
value attributableto changes
in RBCcredit spread (1)
Term depositsPersonal $ 5,164 $ 5,127 $ (37) $ (2) $ (16)Business and government (2) 59,323 59,344 21 (6) (51)Bank (3) 6,747 6,747 – – –
Total term deposits $ 71,234 $ 71,218 $ (16) $ (8) $ (67)Obligations related to assets sold under repurchase agreements and
securities loaned 46,170 46,169 (1) – –Other liabilities 9 9 – – –Subordinated debentures 132 115 (17) – (7)
Total $ 117,545 $117,511 $ (34) $ (8) $ (74)

66 Royal Bank of Canada First Quarter 2012
Note 4 Fair value of financial instruments (continued)
As at October 31, 2011
Liabilities designated as at FVTPL
Contractualmaturityamount
Carryingvalue
Differencebetween
carrying valueand contractual
maturity amount
Changes in fairvalue since
November 1, 2010attributable to
changes in RBCcredit spread
Cumulativechange in fair
value attributableto changes
in RBCcredit spread (1)
Term depositsPersonal $ 3,598 $ 3,615 $ 17 $ (14) $ (14)Business and government (2) 57,733 57,562 (171) (45) (45)Bank (3) 7,873 7,873 – – –
Total term deposits $ 69,204 $ 69,050 $ (154) $ (59) $ (59)Obligations related to assets sold under repurchase agreements and
securities loaned 35,444 35,442 (2) – –Other liabilities 12 12 – – –Subordinated debentures 128 111 (17) (7) (7)
Total $ 104,788 $104,615 $ (173) $ (66) $ (66)
As at January 31, 2011
Liabilities designated as at FVTPL
Contractualmaturityamount
Carryingvalue
Differencebetween
carrying valueand contractual
maturity amount
Changes in fairvalue since
November 1, 2010attributable to
changes in RBCcredit spread
Cumulativechange in fair
value attributableto changes
in RBCcredit spread (1)
Term depositsPersonal $ 3,152 $ 3,190 $ 38 $ (1) $ (1)Business and government (2) 53,933 53,802 (132) (25) (25)Bank (3) 10,220 10,220 – – –
Total term deposits $ 67,305 $ 67,212 $ (94) $ (26) $ (26)Obligations related to assets sold under repurchase agreements and
securities loaned 30,264 30,263 (1) – –Other liabilities 129 129 – – –Subordinated debentures 122 116 (6) 4 4
Total $ 97,820 $ 97,720 $ (101) $ (22) $ (22)
As at November 1, 2010
Liabilities designated as at FVTPL
Contractualmaturityamount
Carryingvalue
Differencebetween
carrying valueand contractual
maturity amount
Changes in fairvalue since
November 1, 2010attributable to
changes in RBCcredit spread
Cumulativechange in fair
value attributableto changes
in RBCcredit spread (1)
Term depositsPersonal $ 3,300 $ 3,237 $ (63) n.a. n.a.Business and government (2) 62,966 62,880 (86) n.a. n.a.Bank (3) 9,479 9,479 – n.a. n.a.
Total term deposits $ 75,745 $ 75,596 $ (149) n.a. n.a.Obligations related to assets sold under repurchase agreements and
securities loaned 25,697 25,695 (2) n.a. n.a.Other liabilities 127 127 – n.a. n.a.Subordinated debentures 127 119 (8) n.a. n.a.
Total $ 101,696 $101,537 $ (159) n.a. n.a.
(1) The cumulative change is measured from the later of November 1, 2010, or the initial recognition of the liabilities designated as at FVTPL.(2) Business and government includes deposits from regulated deposit-taking institutions other than regulated banks.(3) Bank refers to regulated banks.n.a. not applicable.
Fair value of assets and liabilities classified using the fair value hierarchyThe following table presents the financial instruments measured at fair value classified by the fair value hierarchy set out in IFRS 7 – FinancialInstruments: Disclosures. IFRS 7 requires that all financial instruments measured at fair value be categorized into one of three hierarchy levels, asdescribed below, for disclosure purposes. Each level is based on the transparency of the inputs used to measure the fair values of assets andliabilities:
• Level 1 – inputs are unadjusted quoted prices of identical instruments in active markets.• Level 2 – inputs other than quoted prices included in Level 1 that are observable for the asset or liability, either directly or indirectly.• Level 3 – one or more significant inputs used in a valuation technique are unobservable in determining fair values of the instruments.

Royal Bank of Canada First Quarter 2012 67
Determination of fair value and the resulting hierarchy requires the use of observable market data whenever available. The classification of a financialinstrument in the hierarchy is based upon the lowest level of input that is significant to the measurement of fair value.
As at January 31, 2012 As at October 31, 2011
Fair value measurements using (1)Total
gross fairvalue
Nettingadjustments (2)
Assets/liabilities
at fair value
Fair value measurements using (1)Total
gross fairvalue
Nettingadjustments (2)
Assets/liabilities
at fair valueLevel 1 Level 2 Level 3 Level 1 Level 2 Level 3
Financial assetsInterest bearing deposits with banks $ – $ 6,457 $ – $ 6,457 $ – $ 6,457 $ – $ 6,387 $ – $ 6,387 $ – $ 6,387Securities
TradingCanadian government debt (3)
Federal 8,171 9,200 – 17,371 – 17,371 8,165 9,267 – $ 17,432 – 17,432Provincial and municipal – 8,351 3 8,354 – 8,354 – 6,929 4 6,933 – 6,933
U.S. state, municipal andagencies debt (3) 4,260 13,968 38 18,266 – 18,266 2,270 17,195 86 19,551 – 19,551
Other OECD government debt (4) 4,144 9,410 – 13,554 – 13,554 6,204 11,854 47 18,105 – 18,105Mortgage-backed securities (3) – 411 42 453 – 453 – 371 45 416 – 416Asset-backed securities
CDOs (5) – – 150 150 – 150 – – 371 371 – 371Non-CDO securities – 656 102 758 – 758 – 780 138 918 – 918
Corporate debt and other debt 2,761 22,280 504 25,545 – 25,545 1,126 24,182 720 26,028 – 26,028Equities 36,349 2,473 292 39,114 – 39,114 35,406 2,616 352 38,374 – 38,374
55,685 66,749 1,131 123,565 – 123,565 53,171 73,194 1,763 128,128 – 128,128Available-for-sale (6)
Canadian government debt (3)Federal 852 10,357 – 11,209 – 11,209 1,058 8,473 – 9,531 – 9,531Provincial and municipal – 1,228 – 1,228 – 1,228 – 1,561 – 1,561 – 1,561
U.S. state, municipal andagencies debt (3) 25 2,393 2,084 4,502 – 4,502 119 2,083 2,305 4,507 – 4,507
Other OECD government debt (4) 5,834 2,861 – 8,695 – 8,695 4,017 3,016 – 7,033 – 7,033Mortgage-backed securities (3) – 164 177 341 – 341 – 126 184 310 – 310Asset-backed securities – –
CDOs – – 2,161 2,161 – 2,161 – – 1,932 1,932 – 1,932Non-CDO securities – 190 1,117 1,307 – 1,307 – 322 1,059 1,381 – 1,381
Corporate debt and other debt – 8,659 1,467 10,126 – 10,126 – 9,080 1,478 10,558 – 10,558Equities 158 331 845 1,334 – 1,334 158 372 863 1,393 – 1,393Loan substitute securities 195 26 – 221 – 221 187 35 – 222 – 222
7,064 26,209 7,851 41,124 – 41,124 5,539 25,068 7,821 38,428 – 38,428Assets purchased under reverse
repurchase agreements andsecurities borrowed – 68,538 – 68,538 – 68,538 – 63,870 – 63,870 – 63,870
Loans – 3,811 732 4,543 – 4,543 – 2,429 563 2,992 – 2,992Other
Derivatives – – – – – – – – – – – –Interest rate contracts 7 99,758 592 100,357 – 100,357 5 85,149 666 85,820 – 85,820Foreign exchange contracts – 24,600 70 24,670 – 24,670 – 27,068 81 27,149 – 27,149Credit derivatives – 273 247 520 – 520 – 349 291 640 640Other contracts 1,147 3,662 397 5,206 – 5,206 1,671 4,129 428 6,228 – 6,228Valuation adjustments
determined on a pooled basis (47) (263) (287) (597) – (597) (48) (248) (451) (747) – (747)Total gross derivatives 1,107 128,030 1,019 130,156 – 130,156 1,628 116,447 1,015 119,090 119,090Netting adjustments (2) – – – – (26,815) (26,815) – – – – (19,440) (19,440)Total derivatives 1,107 128,030 1,019 130,156 (26,815) 103,341 1,628 116,447 1,015 119,090 (19,440) 99,650
Other assets 379 139 – 518 518 340 176 – 516 516$64,235 $299,933 $10,733 $374,901 $ (26,815)$348,086 $60,678 $287,571 $11,162 $359,411 $ (19,440)$339,971
Financial LiabilitiesDeposits
Personal $ – $ 146 $ 4,981 $ 5,127 $ – $ 5,127 $ – $ – $ 3,615 $ 3,615 $ – $ 3,615Business and government – 57,056 2,288 59,344 – 59,344 – 54,127 3,435 57,562 – 57,562Bank – 6,747 – 6,747 – 6,747 – 7,873 – 7,873 – 7,873
OtherObligations related to securities
sold short 24,382 12,976 – 37,358 – 37,358 31,416 12,868 – 44,284 – 44,284Obligations related to assets sold
under repurchase agreementsand securities loaned – 46,169 – 46,169 – 46,169 – 35,442 – 35,442 – 35,442
Derivatives – – – – – –Interest rate contracts 2 91,908 863 92,773 – 92,773 2 78,274 841 79,117 – 79,117Foreign exchange contracts – 31,637 48 31,685 – 31,685 – 30,975 41 31,016 – 31,016Credit derivatives – 237 301 538 – 538 – 260 573 833 – 833Other contracts 1,077 5,266 1,524 7,867 – 7,867 1,824 5,149 1,496 8,469 – 8,469Total gross derivatives 1,079 129,048 2,736 132,863 132,863 1,826 114,658 2,951 119,435 119,435Netting adjustments (2) (26,100) (26,100) (18,913) (18,913)Total derivatives 1,079 129,048 2,736 132,863 (26,100) 106,763 1,826 114,658 2,951 119,435 (18,913) 100,522
Other liabilities – 9 84 93 – 93 – 12 68 80 – 80Subordinated debentures – – 115 115 – 115 – – 111 111 – 111
$25,461 $252,151 $10,204 $287,816 $ (26,100)$261,716 $33,242 $224,980 $10,180 $268,402 $ (18,913)$249,489
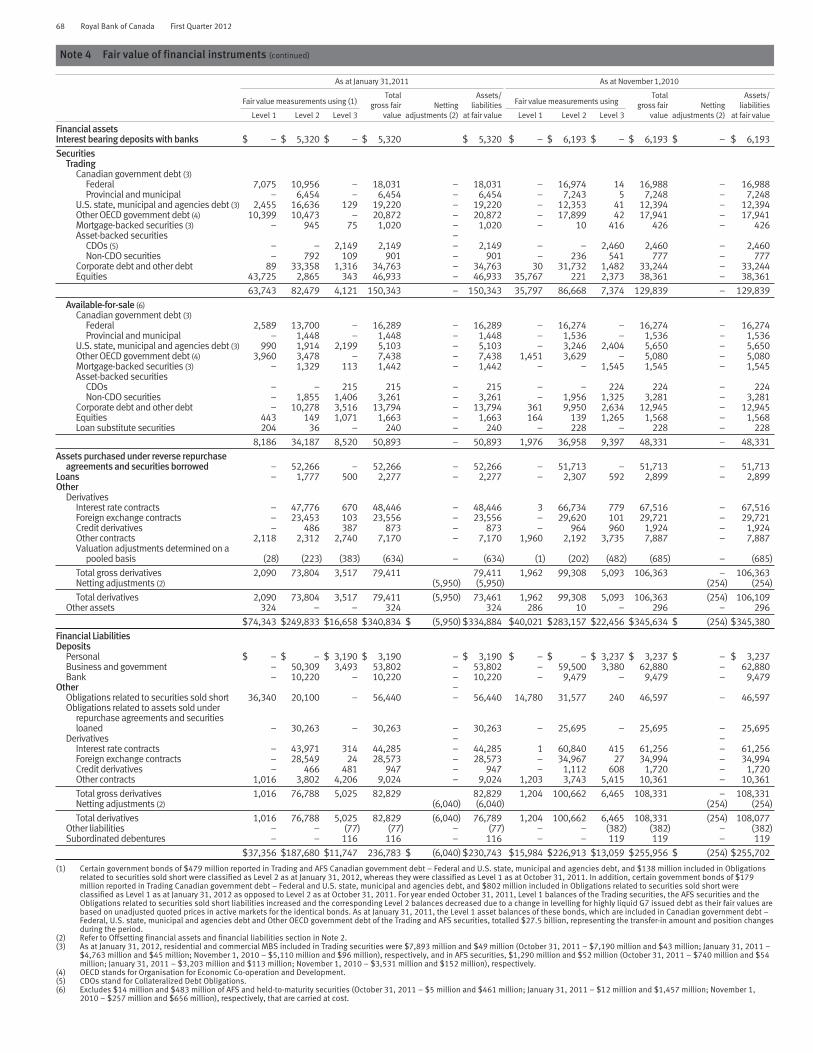
68 Royal Bank of Canada First Quarter 2012
Note 4 Fair value of financial instruments (continued)
As at January 31,2011 As at November 1,2010
Fair value measurements using (1)Total
gross fairvalue
Nettingadjustments (2)
Assets/liabilities
at fair value
Fair value measurements usingTotal
gross fairvalue
Nettingadjustments (2)
Assets/liabilities
at fair valueLevel 1 Level 2 Level 3 Level 1 Level 2 Level 3
Financial assetsInterest bearing deposits with banks $ – $ 5,320 $ – $ 5,320 $ 5,320 $ – $ 6,193 $ – $ 6,193 $ – $ 6,193
SecuritiesTrading
Canadian government debt (3)Federal 7,075 10,956 – 18,031 – 18,031 – 16,974 14 16,988 – 16,988Provincial and municipal – 6,454 – 6,454 – 6,454 – 7,243 5 7,248 – 7,248
U.S. state, municipal and agencies debt (3) 2,455 16,636 129 19,220 – 19,220 – 12,353 41 12,394 – 12,394Other OECD government debt (4) 10,399 10,473 – 20,872 – 20,872 – 17,899 42 17,941 – 17,941Mortgage-backed securities (3) – 945 75 1,020 – 1,020 – 10 416 426 – 426Asset-backed securities –
CDOs (5) – – 2,149 2,149 – 2,149 – – 2,460 2,460 – 2,460Non-CDO securities – 792 109 901 – 901 – 236 541 777 – 777
Corporate debt and other debt 89 33,358 1,316 34,763 – 34,763 30 31,732 1,482 33,244 – 33,244Equities 43,725 2,865 343 46,933 – 46,933 35,767 221 2,373 38,361 – 38,361
63,743 82,479 4,121 150,343 – 150,343 35,797 86,668 7,374 129,839 – 129,839
Available-for-sale (6)Canadian government debt (3)
Federal 2,589 13,700 – 16,289 – 16,289 – 16,274 – 16,274 – 16,274Provincial and municipal – 1,448 – 1,448 – 1,448 – 1,536 – 1,536 – 1,536
U.S. state, municipal and agencies debt (3) 990 1,914 2,199 5,103 – 5,103 – 3,246 2,404 5,650 – 5,650Other OECD government debt (4) 3,960 3,478 – 7,438 – 7,438 1,451 3,629 – 5,080 – 5,080Mortgage-backed securities (3) – 1,329 113 1,442 – 1,442 – – 1,545 1,545 – 1,545Asset-backed securities
CDOs – – 215 215 – 215 – – 224 224 – 224Non-CDO securities – 1,855 1,406 3,261 – 3,261 – 1,956 1,325 3,281 – 3,281
Corporate debt and other debt – 10,278 3,516 13,794 – 13,794 361 9,950 2,634 12,945 – 12,945Equities 443 149 1,071 1,663 – 1,663 164 139 1,265 1,568 – 1,568Loan substitute securities 204 36 – 240 – 240 – 228 – 228 – 228
8,186 34,187 8,520 50,893 – 50,893 1,976 36,958 9,397 48,331 – 48,331
Assets purchased under reverse repurchaseagreements and securities borrowed – 52,266 – 52,266 – 52,266 – 51,713 – 51,713 – 51,713
Loans – 1,777 500 2,277 – 2,277 – 2,307 592 2,899 – 2,899Other
DerivativesInterest rate contracts – 47,776 670 48,446 – 48,446 3 66,734 779 67,516 – 67,516Foreign exchange contracts – 23,453 103 23,556 – 23,556 – 29,620 101 29,721 – 29,721Credit derivatives – 486 387 873 – 873 – 964 960 1,924 – 1,924Other contracts 2,118 2,312 2,740 7,170 – 7,170 1,960 2,192 3,735 7,887 – 7,887Valuation adjustments determined on a
pooled basis (28) (223) (383) (634) – (634) (1) (202) (482) (685) – (685)
Total gross derivatives 2,090 73,804 3,517 79,411 79,411 1,962 99,308 5,093 106,363 – 106,363Netting adjustments (2) (5,950) (5,950) (254) (254)
Total derivatives 2,090 73,804 3,517 79,411 (5,950) 73,461 1,962 99,308 5,093 106,363 (254) 106,109Other assets 324 – – 324 324 286 10 – 296 – 296
$74,343 $249,833 $16,658 $340,834 $ (5,950) $334,884 $40,021 $283,157 $22,456 $345,634 $ (254) $345,380
Financial LiabilitiesDeposits
Personal $ – $ – $ 3,190 $ 3,190 – $ 3,190 $ – $ – $ 3,237 $ 3,237 $ – $ 3,237Business and government – 50,309 3,493 53,802 – 53,802 – 59,500 3,380 62,880 – 62,880Bank – 10,220 – 10,220 – 10,220 – 9,479 – 9,479 – 9,479
Other –Obligations related to securities sold short 36,340 20,100 – 56,440 – 56,440 14,780 31,577 240 46,597 – 46,597Obligations related to assets sold under
repurchase agreements and securitiesloaned – 30,263 – 30,263 – 30,263 – 25,695 – 25,695 – 25,695
Derivatives – –Interest rate contracts – 43,971 314 44,285 – 44,285 1 60,840 415 61,256 – 61,256Foreign exchange contracts – 28,549 24 28,573 – 28,573 – 34,967 27 34,994 – 34,994Credit derivatives – 466 481 947 – 947 – 1,112 608 1,720 – 1,720Other contracts 1,016 3,802 4,206 9,024 – 9,024 1,203 3,743 5,415 10,361 – 10,361
Total gross derivatives 1,016 76,788 5,025 82,829 82,829 1,204 100,662 6,465 108,331 – 108,331Netting adjustments (2) (6,040) (6,040) (254) (254)
Total derivatives 1,016 76,788 5,025 82,829 (6,040) 76,789 1,204 100,662 6,465 108,331 (254) 108,077Other liabilities – – (77) (77) – (77) – – (382) (382) – (382)Subordinated debentures – – 116 116 – 116 – – 119 119 – 119
$37,356 $187,680 $11,747 236,783 $ (6,040) $230,743 $15,984 $226,913 $13,059 $255,956 $ (254) $255,702
(1) Certain government bonds of $479 million reported in Trading and AFS Canadian government debt – Federal and U.S. state, municipal and agencies debt, and $138 million included in Obligationsrelated to securities sold short were classified as Level 2 as at January 31, 2012, whereas they were classified as Level 1 as at October 31, 2011. In addition, certain government bonds of $179million reported in Trading Canadian government debt – Federal and U.S. state, municipal and agencies debt, and $802 million included in Obligations related to securities sold short wereclassified as Level 1 as at January 31, 2012 as opposed to Level 2 as at October 31, 2011. For year ended October 31, 2011, Level 1 balances of the Trading securities, the AFS securities and theObligations related to securities sold short liabilities increased and the corresponding Level 2 balances decreased due to a change in levelling for highly liquid G7 issued debt as their fair values arebased on unadjusted quoted prices in active markets for the identical bonds. As at January 31, 2011, the Level 1 asset balances of these bonds, which are included in Canadian government debt –Federal, U.S. state, municipal and agencies debt and Other OECD government debt of the Trading and AFS securities, totalled $27.5 billion, representing the transfer-in amount and position changesduring the period.
(2) Refer to Offsetting financial assets and financial liabilities section in Note 2.(3) As at January 31, 2012, residential and commercial MBS included in Trading securities were $7,893 million and $49 million (October 31, 2011 – $7,190 million and $43 million; January 31, 2011 –
$4,763 million and $45 million; November 1, 2010 – $5,110 million and $96 million), respectively, and in AFS securities, $1,290 million and $52 million (October 31, 2011 – $740 million and $54million; January 31, 2011 – $3,203 million and $113 million; November 1, 2010 – $3,531 million and $152 million), respectively.
(4) OECD stands for Organisation for Economic Co-operation and Development.(5) CDOs stand for Collateralized Debt Obligations.(6) Excludes $14 million and $483 million of AFS and held-to-maturity securities (October 31, 2011 – $5 million and $461 million; January 31, 2011 – $12 million and $1,457 million; November 1,
2010 – $257 million and $656 million), respectively, that are carried at cost.
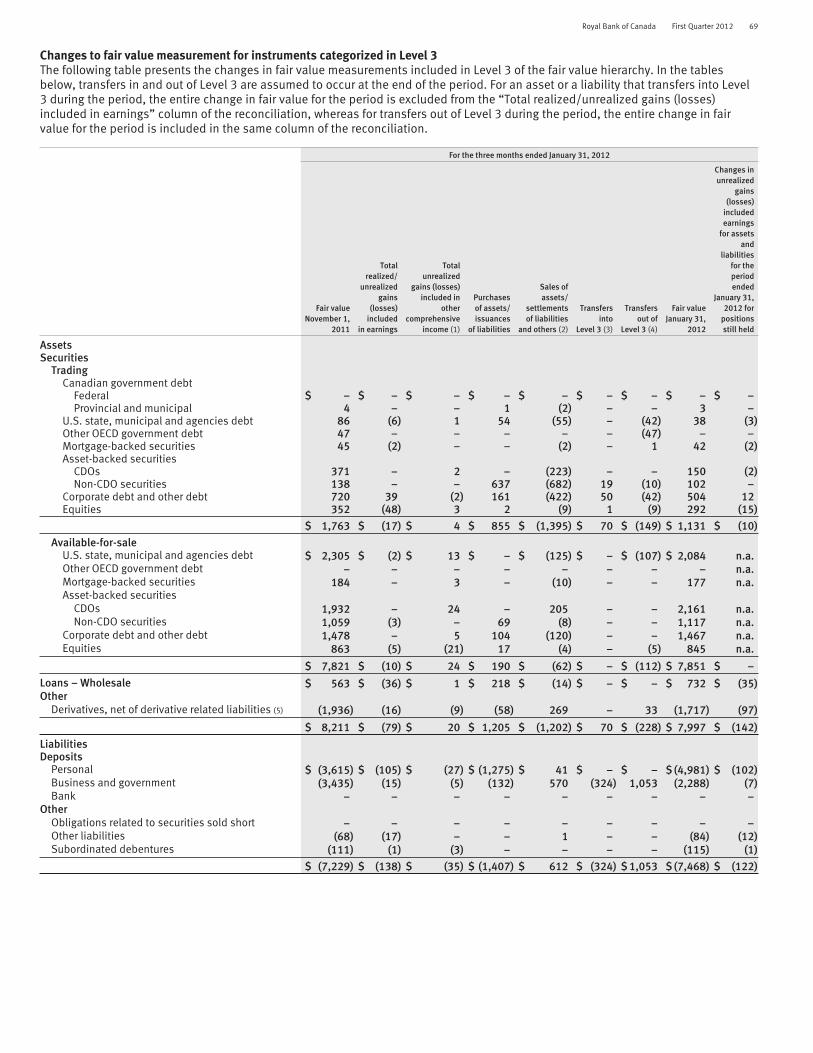
Royal Bank of Canada First Quarter 2012 69
Changes to fair value measurement for instruments categorized in Level 3The following table presents the changes in fair value measurements included in Level 3 of the fair value hierarchy. In the tablesbelow, transfers in and out of Level 3 are assumed to occur at the end of the period. For an asset or a liability that transfers into Level3 during the period, the entire change in fair value for the period is excluded from the “Total realized/unrealized gains (losses)included in earnings” column of the reconciliation, whereas for transfers out of Level 3 during the period, the entire change in fairvalue for the period is included in the same column of the reconciliation.
For the three months ended January 31, 2012
Fair valueNovember 1,
2011
Totalrealized/
unrealizedgains
(losses)included
in earnings
Totalunrealized
gains (losses)included in
othercomprehensive
income (1)
Purchasesof assets/issuances
of liabilities
Sales ofassets/
settlementsof liabilities
and others (2)
Transfersinto
Level 3 (3)
Transfersout of
Level 3 (4)
Fair valueJanuary 31,
2012
Changes inunrealized
gains(losses)
includedearnings
for assetsand
liabilitiesfor theperiodended
January 31,2012 for
positionsstill held
AssetsSecurities
TradingCanadian government debt
Federal $ – $ – $ – $ – $ – $ – $ – $ – $ –Provincial and municipal 4 – – 1 (2) – – 3 –
U.S. state, municipal and agencies debt 86 (6) 1 54 (55) – (42) 38 (3)Other OECD government debt 47 – – – – – (47) – –Mortgage-backed securities 45 (2) – – (2) – 1 42 (2)Asset-backed securities
CDOs 371 – 2 – (223) – – 150 (2)Non-CDO securities 138 – – 637 (682) 19 (10) 102 –
Corporate debt and other debt 720 39 (2) 161 (422) 50 (42) 504 12Equities 352 (48) 3 2 (9) 1 (9) 292 (15)
$ 1,763 $ (17) $ 4 $ 855 $ (1,395) $ 70 $ (149) $ 1,131 $ (10)Available-for-sale
U.S. state, municipal and agencies debt $ 2,305 $ (2) $ 13 $ – $ (125) $ – $ (107) $ 2,084 n.a.Other OECD government debt – – – – – – – – n.a.Mortgage-backed securities 184 – 3 – (10) – – 177 n.a.Asset-backed securities
CDOs 1,932 – 24 – 205 – – 2,161 n.a.Non-CDO securities 1,059 (3) – 69 (8) – – 1,117 n.a.
Corporate debt and other debt 1,478 – 5 104 (120) – – 1,467 n.a.Equities 863 (5) (21) 17 (4) – (5) 845 n.a.
$ 7,821 $ (10) $ 24 $ 190 $ (62) $ – $ (112) $ 7,851 $ –Loans – Wholesale $ 563 $ (36) $ 1 $ 218 $ (14) $ – $ – $ 732 $ (35)Other
Derivatives, net of derivative related liabilities (5) (1,936) (16) (9) (58) 269 – 33 (1,717) (97)
$ 8,211 $ (79) $ 20 $ 1,205 $ (1,202) $ 70 $ (228) $ 7,997 $ (142)LiabilitiesDeposits
Personal $ (3,615) $ (105) $ (27) $ (1,275) $ 41 $ – $ – $ (4,981) $ (102)Business and government (3,435) (15) (5) (132) 570 (324) 1,053 (2,288) (7)Bank – – – – – – – – –
OtherObligations related to securities sold short – – – – – – – – –Other liabilities (68) (17) – – 1 – – (84) (12)Subordinated debentures (111) (1) (3) – – – – (115) (1)
$ (7,229) $ (138) $ (35) $ (1,407) $ 612 $ (324) $ 1,053 $ (7,468) $ (122)
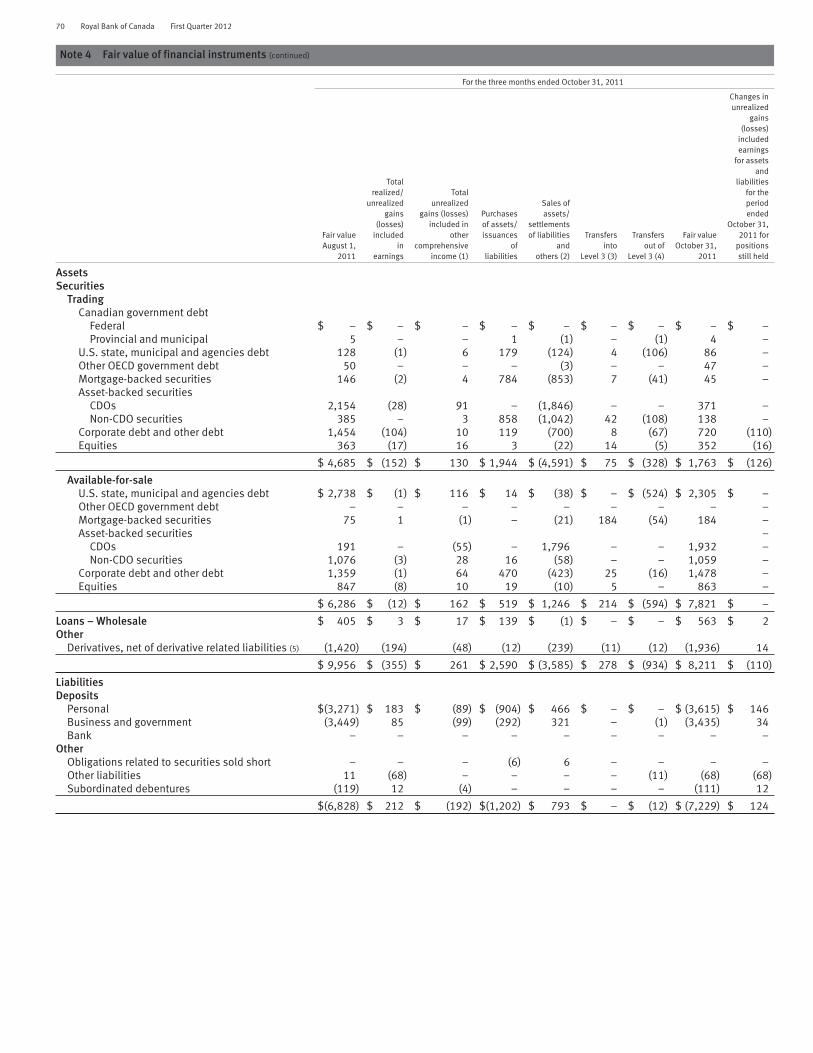
70 Royal Bank of Canada First Quarter 2012
Note 4 Fair value of financial instruments (continued)
For the three months ended October 31, 2011
Fair valueAugust 1,
2011
Totalrealized/
unrealizedgains
(losses)included
inearnings
Totalunrealized
gains (losses)included in
othercomprehensive
income (1)
Purchasesof assets/issuances
ofliabilities
Sales ofassets/
settlementsof liabilities
andothers (2)
Transfersinto
Level 3 (3)
Transfersout of
Level 3 (4)
Fair valueOctober 31,
2011
Changes inunrealized
gains(losses)
includedearnings
for assetsand
liabilitiesfor theperiodended
October 31,2011 for
positionsstill held
AssetsSecurities
TradingCanadian government debt
Federal $ – $ – $ – $ – $ – $ – $ – $ – $ –Provincial and municipal 5 – – 1 (1) – (1) 4 –
U.S. state, municipal and agencies debt 128 (1) 6 179 (124) 4 (106) 86 –Other OECD government debt 50 – – – (3) – – 47 –Mortgage-backed securities 146 (2) 4 784 (853) 7 (41) 45 –Asset-backed securities
CDOs 2,154 (28) 91 – (1,846) – – 371 –Non-CDO securities 385 – 3 858 (1,042) 42 (108) 138 –
Corporate debt and other debt 1,454 (104) 10 119 (700) 8 (67) 720 (110)Equities 363 (17) 16 3 (22) 14 (5) 352 (16)
$ 4,685 $ (152) $ 130 $ 1,944 $ (4,591) $ 75 $ (328) $ 1,763 $ (126)
Available-for-saleU.S. state, municipal and agencies debt $ 2,738 $ (1) $ 116 $ 14 $ (38) $ – $ (524) $ 2,305 $ –Other OECD government debt – – – – – – – – –Mortgage-backed securities 75 1 (1) – (21) 184 (54) 184 –Asset-backed securities –
CDOs 191 – (55) – 1,796 – – 1,932 –Non-CDO securities 1,076 (3) 28 16 (58) – – 1,059 –
Corporate debt and other debt 1,359 (1) 64 470 (423) 25 (16) 1,478 –Equities 847 (8) 10 19 (10) 5 – 863 –
$ 6,286 $ (12) $ 162 $ 519 $ 1,246 $ 214 $ (594) $ 7,821 $ –
Loans – Wholesale $ 405 $ 3 $ 17 $ 139 $ (1) $ – $ – $ 563 $ 2Other
Derivatives, net of derivative related liabilities (5) (1,420) (194) (48) (12) (239) (11) (12) (1,936) 14
$ 9,956 $ (355) $ 261 $ 2,590 $ (3,585) $ 278 $ (934) $ 8,211 $ (110)
LiabilitiesDeposits
Personal $(3,271) $ 183 $ (89) $ (904) $ 466 $ – $ – $ (3,615) $ 146Business and government (3,449) 85 (99) (292) 321 – (1) (3,435) 34Bank – – – – – – – – –
OtherObligations related to securities sold short – – – (6) 6 – – – –Other liabilities 11 (68) – – – – (11) (68) (68)Subordinated debentures (119) 12 (4) – – – – (111) 12
$(6,828) $ 212 $ (192) $(1,202) $ 793 $ – $ (12) $ (7,229) $ 124
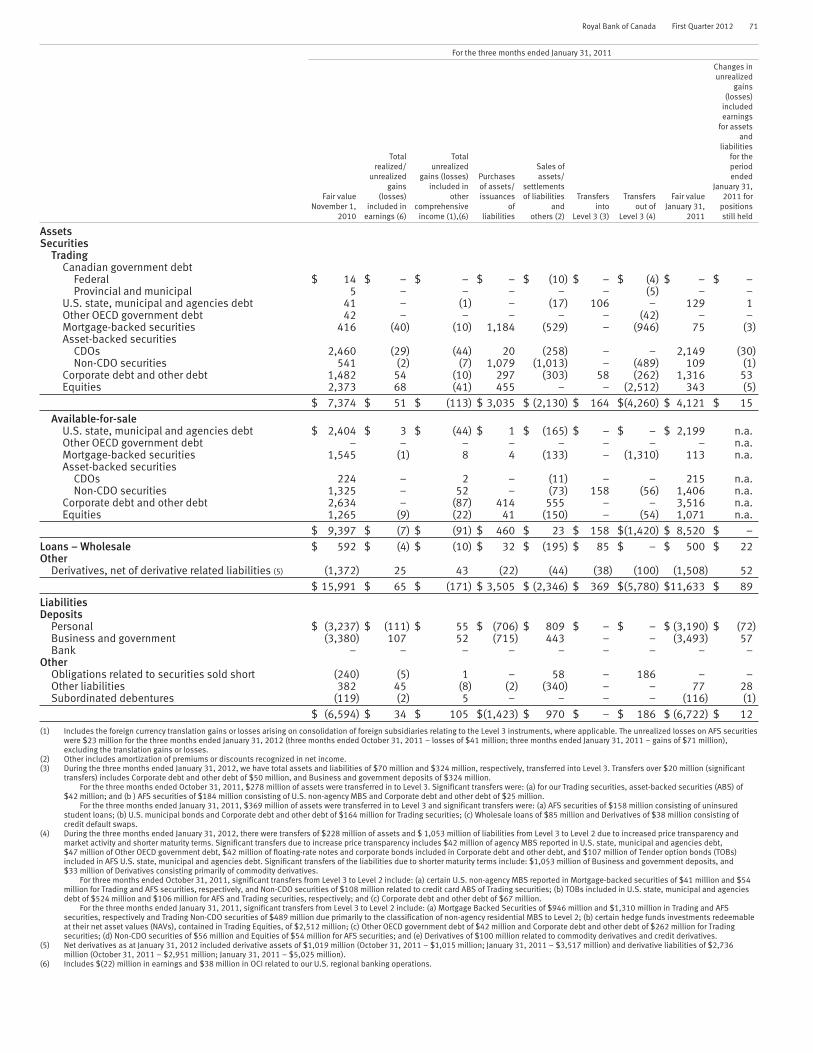
Royal Bank of Canada First Quarter 2012 71
For the three months ended January 31, 2011
Fair valueNovember 1,
2010
Totalrealized/
unrealizedgains
(losses)included in
earnings (6)
Totalunrealized
gains (losses)included in
othercomprehensive
income (1),(6)
Purchasesof assets/issuances
ofliabilities
Sales ofassets/
settlementsof liabilities
andothers (2)
Transfersinto
Level 3 (3)
Transfersout of
Level 3 (4)
Fair valueJanuary 31,
2011
Changes inunrealized
gains(losses)
includedearnings
for assetsand
liabilitiesfor theperiodended
January 31,2011 for
positionsstill held
AssetsSecurities
TradingCanadian government debt
Federal $ 14 $ – $ – $ – $ (10) $ – $ (4) $ – $ –Provincial and municipal 5 – – – – – (5) – –
U.S. state, municipal and agencies debt 41 – (1) – (17) 106 – 129 1Other OECD government debt 42 – – – – – (42) – –Mortgage-backed securities 416 (40) (10) 1,184 (529) – (946) 75 (3)Asset-backed securities
CDOs 2,460 (29) (44) 20 (258) – – 2,149 (30)Non-CDO securities 541 (2) (7) 1,079 (1,013) – (489) 109 (1)
Corporate debt and other debt 1,482 54 (10) 297 (303) 58 (262) 1,316 53Equities 2,373 68 (41) 455 – – (2,512) 343 (5)
$ 7,374 $ 51 $ (113) $ 3,035 $ (2,130) $ 164 $(4,260) $ 4,121 $ 15Available-for-sale
U.S. state, municipal and agencies debt $ 2,404 $ 3 $ (44) $ 1 $ (165) $ – $ – $ 2,199 n.a.Other OECD government debt – – – – – – – – n.a.Mortgage-backed securities 1,545 (1) 8 4 (133) – (1,310) 113 n.a.Asset-backed securities
CDOs 224 – 2 – (11) – – 215 n.a.Non-CDO securities 1,325 – 52 – (73) 158 (56) 1,406 n.a.
Corporate debt and other debt 2,634 – (87) 414 555 – – 3,516 n.a.Equities 1,265 (9) (22) 41 (150) – (54) 1,071 n.a.
$ 9,397 $ (7) $ (91) $ 460 $ 23 $ 158 $(1,420) $ 8,520 $ –Loans – Wholesale $ 592 $ (4) $ (10) $ 32 $ (195) $ 85 $ – $ 500 $ 22Other
Derivatives, net of derivative related liabilities (5) (1,372) 25 43 (22) (44) (38) (100) (1,508) 52$ 15,991 $ 65 $ (171) $ 3,505 $ (2,346) $ 369 $(5,780) $11,633 $ 89
LiabilitiesDeposits
Personal $ (3,237) $ (111) $ 55 $ (706) $ 809 $ – $ – $ (3,190) $ (72)Business and government (3,380) 107 52 (715) 443 – – (3,493) 57Bank – – – – – – – – –
OtherObligations related to securities sold short (240) (5) 1 – 58 – 186 – –Other liabilities 382 45 (8) (2) (340) – – 77 28Subordinated debentures (119) (2) 5 – – – – (116) (1)
$ (6,594) $ 34 $ 105 $(1,423) $ 970 $ – $ 186 $ (6,722) $ 12(1) Includes the foreign currency translation gains or losses arising on consolidation of foreign subsidiaries relating to the Level 3 instruments, where applicable. The unrealized losses on AFS securities
were $23 million for the three months ended January 31, 2012 (three months ended October 31, 2011 – losses of $41 million; three months ended January 31, 2011 – gains of $71 million),excluding the translation gains or losses.
(2) Other includes amortization of premiums or discounts recognized in net income.(3) During the three months ended January 31, 2012, we have total assets and liabilities of $70 million and $324 million, respectively, transferred into Level 3. Transfers over $20 million (significant
transfers) includes Corporate debt and other debt of $50 million, and Business and government deposits of $324 million.For the three months ended October 31, 2011, $278 million of assets were transferred in to Level 3. Significant transfers were: (a) for our Trading securities, asset-backed securities (ABS) of
$42 million; and (b ) AFS securities of $184 million consisting of U.S. non-agency MBS and Corporate debt and other debt of $25 million.For the three months ended January 31, 2011, $369 million of assets were transferred in to Level 3 and significant transfers were: (a) AFS securities of $158 million consisting of uninsured
student loans; (b) U.S. municipal bonds and Corporate debt and other debt of $164 million for Trading securities; (c) Wholesale loans of $85 million and Derivatives of $38 million consisting ofcredit default swaps.
(4) During the three months ended January 31, 2012, there were transfers of $228 million of assets and $ 1,053 million of liabilities from Level 3 to Level 2 due to increased price transparency andmarket activity and shorter maturity terms. Significant transfers due to increase price transparency includes $42 million of agency MBS reported in U.S. state, municipal and agencies debt,$47 million of Other OECD government debt, $42 million of floating-rate notes and corporate bonds included in Corporate debt and other debt, and $107 million of Tender option bonds (TOBs)included in AFS U.S. state, municipal and agencies debt. Significant transfers of the liabilities due to shorter maturity terms include: $1,053 million of Business and government deposits, and$33 million of Derivatives consisting primarily of commodity derivatives.
For three months ended October 31, 2011, significant transfers from Level 3 to Level 2 include: (a) certain U.S. non-agency MBS reported in Mortgage-backed securities of $41 million and $54million for Trading and AFS securities, respectively, and Non-CDO securities of $108 million related to credit card ABS of Trading securities; (b) TOBs included in U.S. state, municipal and agenciesdebt of $524 million and $106 million for AFS and Trading securities, respectively; and (c) Corporate debt and other debt of $67 million.
For the three months ended January 31, 2011, significant transfers from Level 3 to Level 2 include: (a) Mortgage Backed Securities of $946 million and $1,310 million in Trading and AFSsecurities, respectively and Trading Non-CDO securities of $489 million due primarily to the classification of non-agency residential MBS to Level 2; (b) certain hedge funds investments redeemableat their net asset values (NAVs), contained in Trading Equities, of $2,512 million; (c) Other OECD government debt of $42 million and Corporate debt and other debt of $262 million for Tradingsecurities; (d) Non-CDO securities of $56 million and Equities of $54 million for AFS securities; and (e) Derivatives of $100 million related to commodity derivatives and credit derivatives.
(5) Net derivatives as at January 31, 2012 included derivative assets of $1,019 million (October 31, 2011 – $1,015 million; January 31, 2011 – $3,517 million) and derivative liabilities of $2,736million (October 31, 2011 – $2,951 million; January 31, 2011 – $5,025 million).
(6) Includes $(22) million in earnings and $38 million in OCI related to our U.S. regional banking operations.

72 Royal Bank of Canada First Quarter 2012
Note 4 Fair value of financial instruments (continued)
Positive and negative fair value movement of Level 3 financial instruments from using reasonably possible alternative assumptionsA financial instrument is classified as Level 3 in the fair value hierarchy if one or more of its unobservable inputs may significantly affect themeasurement of the fair value. In preparing the financial statements, appropriate levels for these unobservable input parameters are chosen so thatthey are consistent with prevailing market evidence or management judgment. Due to the unobservable nature of the prices or rates, there may beuncertainty about valuation of these Level 3 financial instruments.
The following table summarizes the impact to fair values of Level 3 financial instruments using reasonably possible alternative assumptions. Thissensitivity disclosure is intended to illustrate the potential impact of the relative uncertainty in the fair value of Level 3 financial instruments. Inreporting the sensitivities below, we have considered offsetting balances in instances when: (i) the move in valuation factor caused an equal positiveand negative fair value movement, (ii) both offsetting instruments are in Level 3, and (iii) when exposures are managed and reported on a net basis.With respect to overall sensitivity, it is unlikely in practice that all reasonably possible alternative assumptions would be simultaneously realized.
As at January 31, 2012 As at October 31, 2011
Level 3 fair value
Positive fair valuemovement from
using reasonablypossible
alternatives
Negative fair valuemovement from
using reasonablypossible
alternatives Level 3 fair value
Positive fair valuemovement from
using reasonablypossible
alternatives
Negative fair valuemovement from
using reasonablypossible
alternatives
Securities (1)
TradingU.S. state, municipal and agencies debt $ 38 $ – $ – $ 86 – –Mortgage-backed securities 42 – – 45 – –Asset-backed securities 252 6 (5) 509 3 (3)Corporate debt and other debt 504 26 (22) 720 20 (17)Equities 292 – – 352 – –
Available-for-saleU.S. state, municipal and agencies debt 2,084 20 (45) 2,305 31 (60)Mortgage-backed securities 177 3 (3) 184 3 (3)Asset-backed securities 3,278 42 (70) 2,991 41 (68)Corporate debt and other debt 1,467 13 (11) 1,478 12 (11)Equities 845 13 (13) 863 3 (2)
Loans 732 14 (15) 563 9 (11)Derivatives 1,019 120 (135) 1,015 171 (151)
Total $ 10,730 $ 257 $ (319) $ 11,111 $ 293 $ (326)
Deposits (7,269) 67 (68) (7,050) 61 (59)Derivatives (2,736) 193 (166) (2,951) 208 (178)Other, other liabilities and subordinated
debentures (199) 1 (1) (179) 1 (1)
Total $ (10,204) $ 261 $ (235) $ (10,180) $ 270 $ (238)
As at January 31, 2011 As at November 1, 2010
Level 3 fair value
Positive fair valuemovement from
using reasonablypossible
alternatives
Negative fair valuemovement from
using reasonablypossible
alternatives Level 3 fair value
Positive fair valuemovement from
using reasonablypossible
alternatives
Negative fair valuemovement from
using reasonablypossible
alternatives
Securities (1)
TradingU.S. state, municipal and agencies debt $ 129 $ 1 $ (1) $ 41 – –Mortgage-backed securities 75 1 (1) 416 37 (33)Asset-backed securities 2,258 37 (37) 3,001 20 (31)Corporate debt and other debt 1,316 23 (22) 1,482 26 (21)Equities 343 1 (1) 2,373 – –
Available-for-saleU.S. state, municipal and agencies debt 2,199 30 (56) 2,404 32 (67)Mortgage-backed securities 113 1 (1) 1,545 67 (92)Asset-backed securities 1,621 40 (57) 1,549 25 (56)Corporate debt and other debt 3,516 48 (55) 2,634 39 (31)Equities 1,071 – (6) 1,265 – –
Loans 500 1 (11) 592 3 (2)Derivatives 3,517 87 (75) 5,093 194 (170)
Total $ 16,658 $ 270 $ (323) $ 22,395 $ 443 $ (503)
Deposits (6,683) 51 (39) (6,617) 10 (10)Derivatives (5,025) 142 (137) (6,465) 81 (87)Other, other liabilities and subordinated
debentures (39) 1 (1) 23 – –
Total $ (11,747) $ 194 $ (177) $ (13,059) $ 91 $ (97)
(1) Excludes Trading securities – Canadian government debt and Other OECD government debt as their Level 3 balances were not material for the periods.
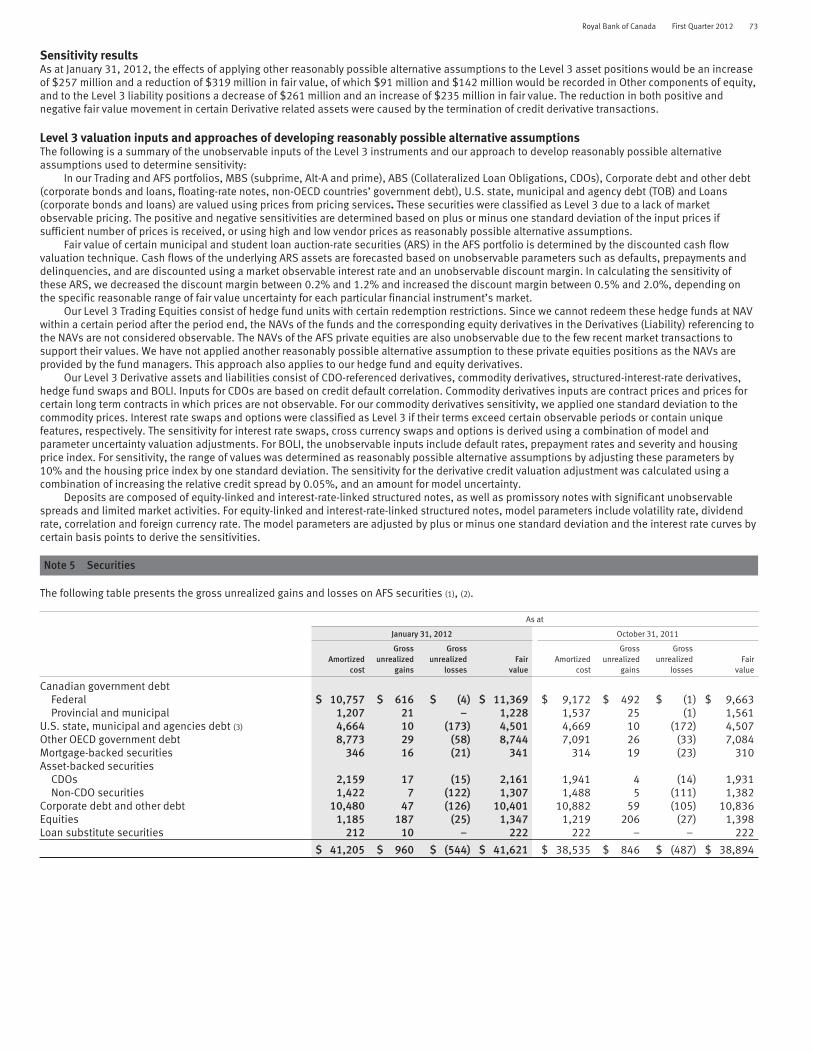
Royal Bank of Canada First Quarter 2012 73
Sensitivity resultsAs at January 31, 2012, the effects of applying other reasonably possible alternative assumptions to the Level 3 asset positions would be an increaseof $257 million and a reduction of $319 million in fair value, of which $91 million and $142 million would be recorded in Other components of equity,and to the Level 3 liability positions a decrease of $261 million and an increase of $235 million in fair value. The reduction in both positive andnegative fair value movement in certain Derivative related assets were caused by the termination of credit derivative transactions.
Level 3 valuation inputs and approaches of developing reasonably possible alternative assumptionsThe following is a summary of the unobservable inputs of the Level 3 instruments and our approach to develop reasonably possible alternativeassumptions used to determine sensitivity:
In our Trading and AFS portfolios, MBS (subprime, Alt-A and prime), ABS (Collateralized Loan Obligations, CDOs), Corporate debt and other debt(corporate bonds and loans, floating-rate notes, non-OECD countries’ government debt), U.S. state, municipal and agency debt (TOB) and Loans(corporate bonds and loans) are valued using prices from pricing services. These securities were classified as Level 3 due to a lack of marketobservable pricing. The positive and negative sensitivities are determined based on plus or minus one standard deviation of the input prices ifsufficient number of prices is received, or using high and low vendor prices as reasonably possible alternative assumptions.
Fair value of certain municipal and student loan auction-rate securities (ARS) in the AFS portfolio is determined by the discounted cash flowvaluation technique. Cash flows of the underlying ARS assets are forecasted based on unobservable parameters such as defaults, prepayments anddelinquencies, and are discounted using a market observable interest rate and an unobservable discount margin. In calculating the sensitivity ofthese ARS, we decreased the discount margin between 0.2% and 1.2% and increased the discount margin between 0.5% and 2.0%, depending onthe specific reasonable range of fair value uncertainty for each particular financial instrument’s market.
Our Level 3 Trading Equities consist of hedge fund units with certain redemption restrictions. Since we cannot redeem these hedge funds at NAVwithin a certain period after the period end, the NAVs of the funds and the corresponding equity derivatives in the Derivatives (Liability) referencing tothe NAVs are not considered observable. The NAVs of the AFS private equities are also unobservable due to the few recent market transactions tosupport their values. We have not applied another reasonably possible alternative assumption to these private equities positions as the NAVs areprovided by the fund managers. This approach also applies to our hedge fund and equity derivatives.
Our Level 3 Derivative assets and liabilities consist of CDO-referenced derivatives, commodity derivatives, structured-interest-rate derivatives,hedge fund swaps and BOLI. Inputs for CDOs are based on credit default correlation. Commodity derivatives inputs are contract prices and prices forcertain long term contracts in which prices are not observable. For our commodity derivatives sensitivity, we applied one standard deviation to thecommodity prices. Interest rate swaps and options were classified as Level 3 if their terms exceed certain observable periods or contain uniquefeatures, respectively. The sensitivity for interest rate swaps, cross currency swaps and options is derived using a combination of model andparameter uncertainty valuation adjustments. For BOLI, the unobservable inputs include default rates, prepayment rates and severity and housingprice index. For sensitivity, the range of values was determined as reasonably possible alternative assumptions by adjusting these parameters by10% and the housing price index by one standard deviation. The sensitivity for the derivative credit valuation adjustment was calculated using acombination of increasing the relative credit spread by 0.05%, and an amount for model uncertainty.
Deposits are composed of equity-linked and interest-rate-linked structured notes, as well as promissory notes with significant unobservablespreads and limited market activities. For equity-linked and interest-rate-linked structured notes, model parameters include volatility rate, dividendrate, correlation and foreign currency rate. The model parameters are adjusted by plus or minus one standard deviation and the interest rate curves bycertain basis points to derive the sensitivities.
Note 5 Securities
The following table presents the gross unrealized gains and losses on AFS securities (1), (2).
As at
January 31, 2012 October 31, 2011
Amortizedcost
Grossunrealized
gains
Grossunrealized
lossesFair
valueAmortized
cost
Grossunrealized
gains
Grossunrealized
lossesFair
value
Canadian government debtFederal $ 10,757 $ 616 $ (4) $ 11,369 $ 9,172 $ 492 $ (1) $ 9,663Provincial and municipal 1,207 21 – 1,228 1,537 25 (1) 1,561
U.S. state, municipal and agencies debt (3) 4,664 10 (173) 4,501 4,669 10 (172) 4,507Other OECD government debt 8,773 29 (58) 8,744 7,091 26 (33) 7,084Mortgage-backed securities 346 16 (21) 341 314 19 (23) 310Asset-backed securities
CDOs 2,159 17 (15) 2,161 1,941 4 (14) 1,931Non-CDO securities 1,422 7 (122) 1,307 1,488 5 (111) 1,382
Corporate debt and other debt 10,480 47 (126) 10,401 10,882 59 (105) 10,836Equities 1,185 187 (25) 1,347 1,219 206 (27) 1,398Loan substitute securities 212 10 – 222 222 – – 222
$ 41,205 $ 960 $ (544) $ 41,621 $ 38,535 $ 846 $ (487) $ 38,894

74 Royal Bank of Canada First Quarter 2012
Note 5 Securities (continued)
As at
January 31, 2011 November 1, 2010
Amortizedcost
Grossunrealized
gains
Grossunrealized
lossesFair
valueAmortized
cost
Grossunrealized
gains
Grossunrealized
lossesFair
value
Canadian government debtFederal $ 16,171 $ 234 $ (36) $ 16,369 $ 15,871 $ 436 $ (1) $ 16,306Provincial and municipal 1,422 27 (1) 1,448 1,493 44 (1) 1,536
U.S. state, municipal and agencies debt (3) 5,126 52 (76) 5,102 5,659 66 (75) 5,650Other OECD government debt 7,436 24 (18) 7,442 5,068 24 (8) 5,084Mortgage-backed securities 1,441 49 (48) 1,442 1,590 24 (69) 1,545Asset-backed securities
CDOs 215 13 (13) 215 221 20 (17) 224Non-CDO securities 3,331 19 (89) 3,261 3,423 25 (167) 3,281
Corporate debt and other debt 15,283 100 (214) 15,169 13,612 188 (233) 13,567Equities 1,502 204 (32) 1,674 1,646 200 (23) 1,823Loan substitute securities 228 12 – 240 228 – – 228
$ 52,155 $ 734 $ (527) $ 52,362 $ 48,811 $ 1,027 $ (594) $ 49,244
(1) Includes $483 million held-to-maturity securities at January 31, 2012 ( October 31, 2011 – $461 million, January 31, 2011 – $1,457 million, November 1, 2010 – $656 million).(2) The majority of the MBS are residential. Amortized cost, gross unrealized gains, gross unrealized losses and fair value related to commercial MBS are $50 million, $2 million, $nil and $52 million as
at January 31, 2012, respectively (October 31, 2011 – $52 million, $2 million, $nil, and $54 million, January 31, 2011 – $110 million, $3 million, $nil, and $113 million, November 1, 2010 –$148 million, $4 million, $nil, and $152 million).
(3) Includes securities issued by non-U.S. agencies backed by government issued assets, and MBS and ABS issued by U.S. government agencies.
Realized gains and losses on available-for-sale securities (1)
For the three months ended
January 312012
October 312011
January 312011
Realized gains $ 38 $ 31 $ 68Realized losses and writedowns (17) (25) (89)
Net gains (losses) on available-for-sale securities $ 21 $ 6 $ (21)
(1) The following related to our insurance operations are included in the Insurance premiums, investment and fee income line in our Consolidated Statements of Income: Realized gains – three monthsended January 31, 2012 – $6 million (three months ended October 31, 2011 – $8 million; three months ended January 31, 2011 – $9 million). Realized losses and writedowns – three monthsended January 31, 2012 – $nil (three months ended October 31, 2011 – $nil; three months ended January 31, 2011 – $(14) million).
AFS securities are assessed for objective indicators of impairment at each reporting date and more frequently when conditions warrant. Ourimpairment review is primarily based on the factors described in Note 2. Depending on the nature of the securities under review we apply specificmethodology to assess whether it is probable that the amortized cost of the security would be recovered. As at January 31, 2012, our gross unrealizedlosses on AFS securities were $544 million (October 31, 2011 – $487 million, January 31, 2011 – $527 million, November 1, 2010 – $594 million).
When assessing impairment for debt instruments we primarily considered counterparty ratings and security-specific factors, including collateral,external ratings, subordination and other market factors. For complex debt instruments including U.S. non-agency MBS, ABS and other structuredproducts, we also use cash flow projection models which incorporate actual and projected cash flows for each security using a number ofassumptions and inputs that are based on security specific factors. The inputs and assumptions used such as default, prepayment and recovery ratesare based on current market data. For U.S. non-agency MBS, recovery rates are largely dependent upon forecasted property prices which wereassessed at the municipal level and provided by a third-party vendor. In addition, we also consider the transaction structure and credit enhancementfor the structured securities. If the model predicts that it is probable that we will not be able to recover the entire principal and interest amount, we doa further review of the security in order to assess whether a loss would ultimately be realized.
With respect to debt securities where, based on management’s judgment, it was not probable that all the principal and interest would berecovered, the securities are deemed impaired and are written down to their fair value.
As equity securities do not have contractual cash flows, they are assessed differently than debt securities. For equity securities with unrealizedlosses, we assess whether there is any objective evidence that suggests that the security is impaired. The factors we consider include the length oftime and extent the fair value has been below the cost and the financial condition and near term prospects of the issuer. We conduct further analysisfor securities where the fair value had been below cost for greater than twelve months. Equity securities which have an unrealized loss for a prolongedperiod of time or the unrealized loss is significant, were deemed to be impaired and were written down to their fair value.
The total amortized cost of the AFS portfolio increased by $2.7 billion during the three months ended January 31, 2012. The increase largelyreflects purchases of Other OECD government debt and Canadian government guaranteed debt. Compared to January 31, 2011, the total amortizedcost decreased by $11 billion mainly reflecting AFS securities held by our U.S. regional retail banking operations which were reclassified todiscontinued operations during the year, as well as the sales and maturities of certain Canadian government guaranteed debt. This decrease waspartially offset by purchases of short-term OECD government debt as well as certain CDOs which were reclassified from FVTPL to AFS.
Gross unrealized gains increased by $114 million or 13% to $960 million during the three months ended January 31, 2012 and $226 million or31% compared to January 31, 2011, mainly reflecting an increase in the fair values for Canadian government guaranteed debt primarily due to theimpact of decreasing interest rates.
Gross unrealized losses increased by $57 million or 12% to $544 million during the three months ended January 31, 2012 mainly reflecting adecrease in the fair values for Other OECD Government debt and Corporate debt and other debt due to widening of credit spreads for securities issuedby European entities. Compared to the prior year, gross unrealized losses increased by $17 million or 3%, mainly reflecting a decrease in the fairvalues for Other OECD government debt and U.S. ARS due to widening of credit spreads. This increase was partially offset by AFS securities held byour U.S. regional retail banking operations which were reclassified to discontinued operations.

Royal Bank of Canada First Quarter 2012 75
Management believes that the unrealized losses on the above-mentioned securities as at January 31, 2012, are not associated with objectiveevidence of impairment.
Held-to-maturity securitiesHeld-to-maturity securities stated at amortized costs are subject to periodic impairment review and are classified as impaired when, in management’sopinion, there is no longer reasonable assurance of the timely collection of the full amount of principal and interest. The impairment review ofheld-to-maturity securities is primarily based on the impairment model for loans as described in Note 2. Management is of the view that there is noimpairment on held-to-maturity investments as at January 31, 2012.
Net gain (loss) on available-for-sale securitiesWhen we determine that a security is impaired, the cumulative unrealized loss in Other components of equity is classified as Net gain (loss) onavailable-for-sale securities in Non-interest income. During the three months ended January 31, 2012, $21 million of net gains (losses) on AFS wererecognized in Non-interest income (October 31, 2011 – $6 million, January 31, 2011 – $(21) million). The net gains in the current period largely reflectgains of $32 million primarily due to sales and capital distributions from certain private equities, as well as sales of certain Canadian governmentsecurities and quoted equities. These gains were partially offset by losses of $11 million primarily on securities that were deemed impaired such ascertain U.S. ARS and private equities. This compares to realized gains on sale for the three months ended October 31, 2011 of $26 million andJanuary 31, 2011 of $57 million which were partially offset by impairment losses for three months ended October 31, 2011 of $20 million andJanuary 31, 2011 of $78 million.
Included in the net gains is $6 million of gains mainly on the sale of Canadian government securities relating to our insurance operations whichhas been reflected in the Insurance premiums, investment and fee income line in our Consolidated Statements of Income (October 31, 2011 –$8 million, January 31, 2011 – $(5) million).
Reclassification of financial instrumentsThe following table provides information regarding certain securities that we reclassified in prior reporting periods:
As at and for the three-months ended
January 31, 2012 October 31, 2011 (2)
Financial assets
Totalcarrying value
andfair value
Change infair value
during theperiod (1)
Interestincome/gains
(losses)recognized in
net incomeduring the
period
Totalcarrying value
andfair value
Change infair value
during theperiod (1)
Interestincome/gains
(losses)recognized in
net incomeduring the
period
FVTPL reclassified to available-for-saleCDOs $ 1,755 $ 6 $ 16 $ 1,738 $ (4) $ 5Mortgage-backed securities 30 (1) 1 31 – –
$ 1,785 $ 5 $ 17 $ 1,769 $ (4) $ 5
(1) This change represents the fair value gain or loss that would have been recognized in profit or loss had the assets not been reclassified.(2) On October 31, 2011 we reclassified $1,872 million from FVTPL to AFS for certain CDOs and U.S. non-agency MBS.
On November 1, 2011, we reclassified $255 million FVTPL to AFS for certain CDOs and U.S. non-agency MBS as these securities meet the definition ofloans and receivables and we no longer have the intention to sell the portfolio in the near term. The following table provides the information regardingthe reclassification.
Financial assets
Totalcarrying
value andfair value
as atreclassification
Changes infair value
recognized innet income
prior toreclassification
Changes infair value
recognized innet incomeduring the
period
Effectiveinterest
rate atreclassification
Estimatedcash flows
expected to berecovered at
reclassification
Total carryingvalue and
fair value atJanuary 31, 2012
Changes infair value after
reclassification
Interestincome/gains
(losses)recognized in
net income afterreclassification (1)
CDOs $ 208 $ – $ – 4.9% $ 244 $ 209 $ 4 $ 3Mortgage-backed
securities 47 12.5% 61 45 (1) 2
$ 255 $ – $ – $ 305 $ 254 $ 3 $ 5
(1) The balance excludes the impact of foreign exchange gains or losses.

76 Royal Bank of Canada First Quarter 2012
Note 6 Allowance for credit losses and impaired loans
For the three months ended January 31, 2012
Balance atbeginning of
period
Provisionfor credit
losses Write-offs RecoveriesUnwind of
discount
Exchangerate changes/
other
Balanceat end
of period
RetailResidential mortgages $ 112 $ 9 $ (3) $ – $ (9) $ 3 $ 112Personal 557 111 (120) 20 (4) (1) 563Credit cards 415 104 (129) 25 – – 415Small business 75 8 (8) 2 – (1) 76
1,159 232 (260) 47 (13) 1 1,166
WholesaleBusiness (1) 775 35 (45) 11 (9) (1) 766Bank (2) 33 – – – – – 33
808 35 (45) 11 (9) (1) 799
Total allowance for loan losses 1,967 267 (305) 58 (22) – 1,965
Allowance for off-balance sheet and other items (3) 91 – – – – – 91
Total allowance for credit losses $ 2,058 $ 267 $ (305) $ 58 $ (22) $ – $ 2,056
For the three months ended October 31, 2011
Balance atbeginningof period
Provisionfor credit
losses Write-offs RecoveriesUnwind of
discount
Exchangerate changes/
other
Balanceat end
of period
RetailResidential mortgages $ 111 $ 9 $ (6) $ – $ (7) $ 5 $ 112Personal 560 111 (134) 19 (3) 4 557Credit cards 414 101 (126) 25 – 1 415Small business 77 6 (10) 2 – – 75
1,162 227 (276) 46 (10) 10 1,159
WholesaleBusiness (1) 791 49 (69) 10 (8) 2 775Bank (2) 31 – – – – 2 33
822 49 (69) 10 (8) 4 808
Total allowance for loan losses 1,984 276 (345) 56 (18) 14 1,967
Allowance for off-balance sheet and other items (3) 91 – – – – – 91
Total allowance for credit losses $ 2,075 $ 276 $ (345) $ 56 $ (18) $ 14 $ 2,058
For the three months ended January 31, 2011
Balance atbeginningof period
Provisionfor credit
losses (5) Write-offs RecoveriesUnwind of
discount
Exchangerate changes/
other
Balanceat end
of period
RetailResidential mortgages $ 154 $ 29 $ (12) $ 1 $ (8) $ 9 $ 173Personal 891 146 (160) 22 (3) (50) 846Credit cards 434 119 (141) 23 – (1) 434Small business 78 9 (12) 2 – – 77
1,557 303 (325) 48 (11) (42) 1,530
WholesaleBusiness (1) 1,267 72 (162) 34 (9) 18 1,220Sovereign (4) 9 – (9) – – – –Bank (2) 34 – – – – – 34
1,310 72 (171) 34 (9) 18 1,254
Total allowance for loan losses 2,867 375 (496) 82 (20) (24) 2,784
Allowance for off-balance sheet and other items (3) 99 – – – – 3 102
Total allowance for credit losses $ 2,966 $ 375 $ (496) $ 82 $ (20) $ (21) $ 2,886
(1) Includes $4 million of provisions related to loans extended under liquidity facilities drawn on by RBC-administered multi-seller asset-backed commercial paper conduit programs as at January 31,2012 (October 31, 2011 – $4 million, January 31, 2011 – $2 million, November 1, 2010 – $2 million).
(2) Bank refers primarily to regulated deposit-taking institutions and securities firms.(3) The allowance for off-balance sheet and other items is reported separately under Other liabilities.(4) Sovereign refers to all central governments and agencies, central banks, as well as other qualifying public sector entities and multilateral development banks.(5) Includes $111 million related to our U.S. regional banking operations.
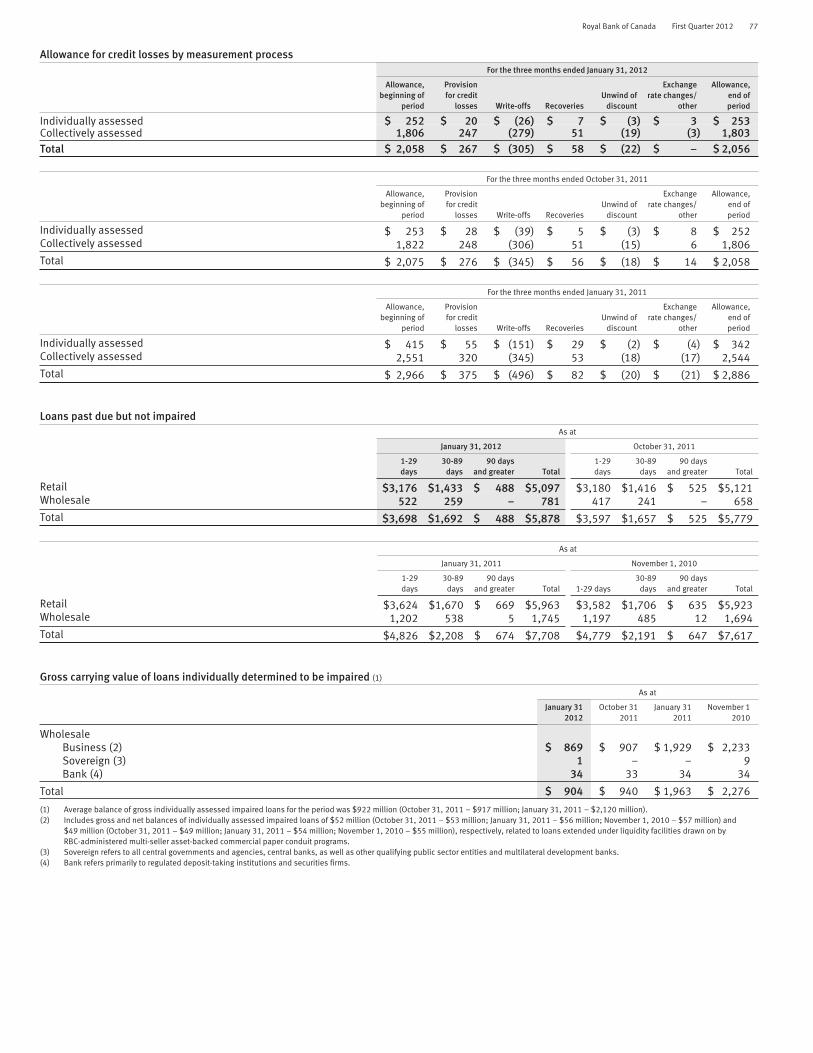
Royal Bank of Canada First Quarter 2012 77
Allowance for credit losses by measurement processFor the three months ended January 31, 2012
Allowance,beginning of
period
Provisionfor credit
losses Write-offs RecoveriesUnwind of
discount
Exchangerate changes/
other
Allowance,end ofperiod
Individually assessed $ 252 $ 20 $ (26) $ 7 $ (3) $ 3 $ 253Collectively assessed 1,806 247 (279) 51 (19) (3) 1,803Total $ 2,058 $ 267 $ (305) $ 58 $ (22) $ – $ 2,056
For the three months ended October 31, 2011
Allowance,beginning of
period
Provisionfor credit
losses Write-offs RecoveriesUnwind of
discount
Exchangerate changes/
other
Allowance,end ofperiod
Individually assessed $ 253 $ 28 $ (39) $ 5 $ (3) $ 8 $ 252Collectively assessed 1,822 248 (306) 51 (15) 6 1,806Total $ 2,075 $ 276 $ (345) $ 56 $ (18) $ 14 $ 2,058
For the three months ended January 31, 2011
Allowance,beginning of
period
Provisionfor credit
losses Write-offs RecoveriesUnwind of
discount
Exchangerate changes/
other
Allowance,end ofperiod
Individually assessed $ 415 $ 55 $ (151) $ 29 $ (2) $ (4) $ 342Collectively assessed 2,551 320 (345) 53 (18) (17) 2,544Total $ 2,966 $ 375 $ (496) $ 82 $ (20) $ (21) $ 2,886
Loans past due but not impairedAs at
January 31, 2012 October 31, 2011
1-29days
30-89days
90 daysand greater Total
1-29days
30-89days
90 daysand greater Total
Retail $3,176 $1,433 $ 488 $5,097 $3,180 $1,416 $ 525 $5,121Wholesale 522 259 – 781 417 241 – 658Total $3,698 $1,692 $ 488 $5,878 $3,597 $1,657 $ 525 $5,779
As at
January 31, 2011 November 1, 2010
1-29days
30-89days
90 daysand greater Total 1-29 days
30-89days
90 daysand greater Total
Retail $3,624 $1,670 $ 669 $5,963 $3,582 $1,706 $ 635 $5,923Wholesale 1,202 538 5 1,745 1,197 485 12 1,694Total $4,826 $2,208 $ 674 $7,708 $4,779 $2,191 $ 647 $7,617
Gross carrying value of loans individually determined to be impaired (1)
As at
January 312012
October 312011
January 312011
November 12010
WholesaleBusiness (2) $ 869 $ 907 $ 1,929 $ 2,233Sovereign (3) 1 – – 9Bank (4) 34 33 34 34
Total $ 904 $ 940 $ 1,963 $ 2,276
(1) Average balance of gross individually assessed impaired loans for the period was $922 million (October 31, 2011 – $917 million; January 31, 2011 – $2,120 million).(2) Includes gross and net balances of individually assessed impaired loans of $52 million (October 31, 2011 – $53 million; January 31, 2011 – $56 million; November 1, 2010 – $57 million) and
$49 million (October 31, 2011 – $49 million; January 31, 2011 – $54 million; November 1, 2010 – $55 million), respectively, related to loans extended under liquidity facilities drawn on byRBC-administered multi-seller asset-backed commercial paper conduit programs.
(3) Sovereign refers to all central governments and agencies, central banks, as well as other qualifying public sector entities and multilateral development banks.(4) Bank refers primarily to regulated deposit-taking institutions and securities firms.
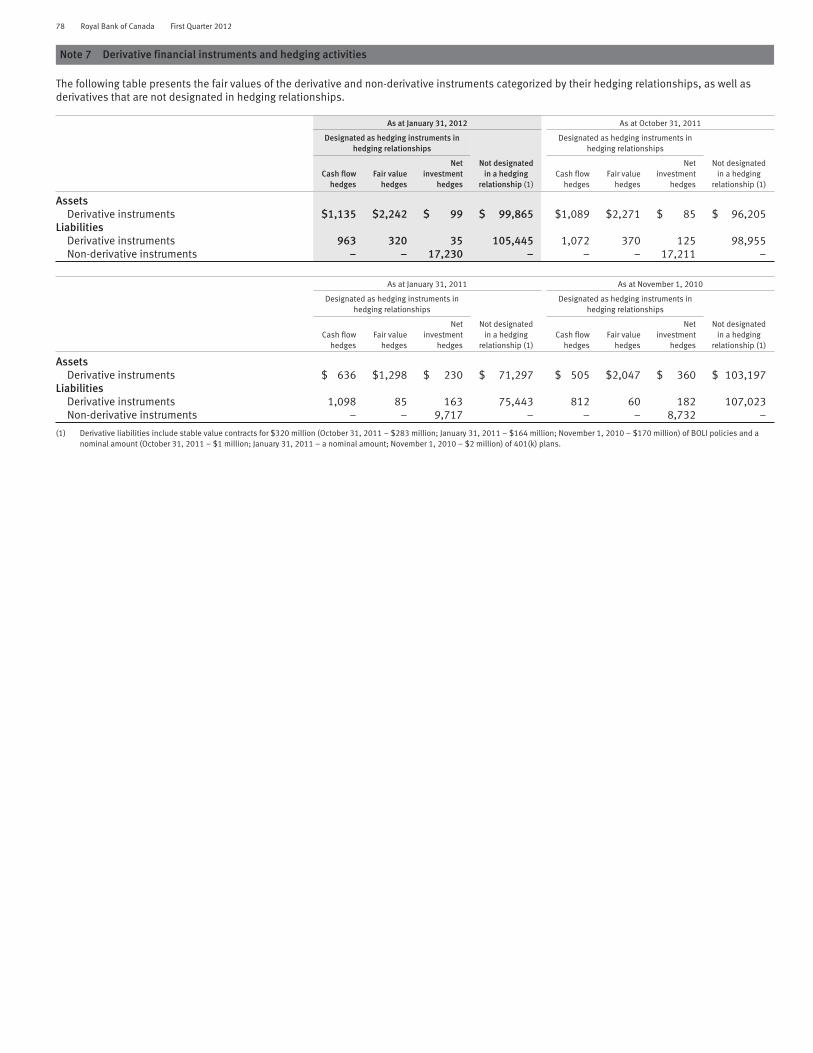
78 Royal Bank of Canada First Quarter 2012
Note 7 Derivative financial instruments and hedging activities
The following table presents the fair values of the derivative and non-derivative instruments categorized by their hedging relationships, as well asderivatives that are not designated in hedging relationships.
As at January 31, 2012 As at October 31, 2011
Designated as hedging instruments inhedging relationships
Not designatedin a hedging
relationship (1)
Designated as hedging instruments inhedging relationships
Not designatedin a hedging
relationship (1)Cash flow
hedgesFair value
hedges
Netinvestment
hedgesCash flow
hedgesFair value
hedges
Netinvestment
hedges
AssetsDerivative instruments $1,135 $2,242 $ 99 $ 99,865 $1,089 $2,271 $ 85 $ 96,205
LiabilitiesDerivative instruments 963 320 35 105,445 1,072 370 125 98,955Non-derivative instruments – – 17,230 – – – 17,211 –
As at January 31, 2011 As at November 1, 2010
Designated as hedging instruments inhedging relationships
Not designatedin a hedging
relationship (1)
Designated as hedging instruments inhedging relationships
Not designatedin a hedging
relationship (1)Cash flow
hedgesFair value
hedges
Netinvestment
hedgesCash flow
hedgesFair value
hedges
Netinvestment
hedges
AssetsDerivative instruments $ 636 $1,298 $ 230 $ 71,297 $ 505 $2,047 $ 360 $ 103,197
LiabilitiesDerivative instruments 1,098 85 163 75,443 812 60 182 107,023Non-derivative instruments – – 9,717 – – – 8,732 –
(1) Derivative liabilities include stable value contracts for $320 million (October 31, 2011 – $283 million; January 31, 2011 – $164 million; November 1, 2010 – $170 million) of BOLI policies and anominal amount (October 31, 2011 – $1 million; January 31, 2011 – a nominal amount; November 1, 2010 – $2 million) of 401(k) plans.
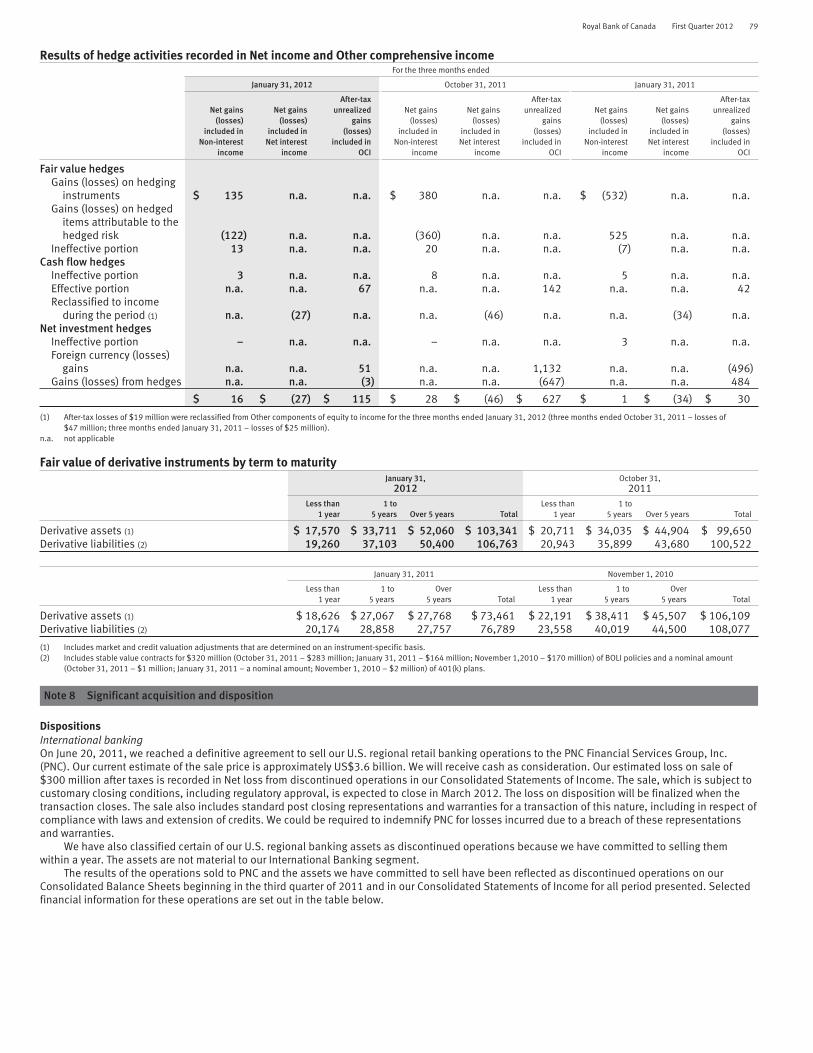
Royal Bank of Canada First Quarter 2012 79
Results of hedge activities recorded in Net income and Other comprehensive incomeFor the three months ended
January 31, 2012 October 31, 2011 January 31, 2011
Net gains(losses)
included inNon-interest
income
Net gains(losses)
included inNet interest
income
After-taxunrealized
gains(losses)
included inOCI
Net gains(losses)
included inNon-interest
income
Net gains(losses)
included inNet interest
income
After-taxunrealized
gains(losses)
included inOCI
Net gains(losses)
included inNon-interest
income
Net gains(losses)
included inNet interest
income
After-taxunrealized
gains(losses)
included inOCI
Fair value hedgesGains (losses) on hedging
instruments $ 135 n.a. n.a. $ 380 n.a. n.a. $ (532) n.a. n.a.Gains (losses) on hedged
items attributable to thehedged risk (122) n.a. n.a. (360) n.a. n.a. 525 n.a. n.a.
Ineffective portion 13 n.a. n.a. 20 n.a. n.a. (7) n.a. n.a.Cash flow hedges
Ineffective portion 3 n.a. n.a. 8 n.a. n.a. 5 n.a. n.a.Effective portion n.a. n.a. 67 n.a. n.a. 142 n.a. n.a. 42Reclassified to income
during the period (1) n.a. (27) n.a. n.a. (46) n.a. n.a. (34) n.a.Net investment hedges
Ineffective portion – n.a. n.a. – n.a. n.a. 3 n.a. n.a.Foreign currency (losses)
gains n.a. n.a. 51 n.a. n.a. 1,132 n.a. n.a. (496)Gains (losses) from hedges n.a. n.a. (3) n.a. n.a. (647) n.a. n.a. 484
$ 16 $ (27) $ 115 $ 28 $ (46) $ 627 $ 1 $ (34) $ 30
(1) After-tax losses of $19 million were reclassified from Other components of equity to income for the three months ended January 31, 2012 (three months ended October 31, 2011 – losses of$47 million; three months ended January 31, 2011 – losses of $25 million).
n.a. not applicable
Fair value of derivative instruments by term to maturityJanuary 31,
2012October 31,
2011Less than
1 year1 to
5 years Over 5 years TotalLess than
1 year1 to
5 years Over 5 years Total
Derivative assets (1) $ 17,570 $ 33,711 $ 52,060 $ 103,341 $ 20,711 $ 34,035 $ 44,904 $ 99,650Derivative liabilities (2) 19,260 37,103 50,400 106,763 20,943 35,899 43,680 100,522
January 31, 2011 November 1, 2010
Less than1 year
1 to5 years
Over5 years Total
Less than1 year
1 to5 years
Over5 years Total
Derivative assets (1) $ 18,626 $ 27,067 $ 27,768 $ 73,461 $ 22,191 $ 38,411 $ 45,507 $ 106,109Derivative liabilities (2) 20,174 28,858 27,757 76,789 23,558 40,019 44,500 108,077
(1) Includes market and credit valuation adjustments that are determined on an instrument-specific basis.(2) Includes stable value contracts for $320 million (October 31, 2011 – $283 million; January 31, 2011 – $164 million; November 1,2010 – $170 million) of BOLI policies and a nominal amount
(October 31, 2011 – $1 million; January 31, 2011 – a nominal amount; November 1, 2010 – $2 million) of 401(k) plans.
Note 8 Significant acquisition and disposition
DispositionsInternational bankingOn June 20, 2011, we reached a definitive agreement to sell our U.S. regional retail banking operations to the PNC Financial Services Group, Inc.(PNC). Our current estimate of the sale price is approximately US$3.6 billion. We will receive cash as consideration. Our estimated loss on sale of$300 million after taxes is recorded in Net loss from discontinued operations in our Consolidated Statements of Income. The sale, which is subject tocustomary closing conditions, including regulatory approval, is expected to close in March 2012. The loss on disposition will be finalized when thetransaction closes. The sale also includes standard post closing representations and warranties for a transaction of this nature, including in respect ofcompliance with laws and extension of credits. We could be required to indemnify PNC for losses incurred due to a breach of these representationsand warranties.
We have also classified certain of our U.S. regional banking assets as discontinued operations because we have committed to selling themwithin a year. The assets are not material to our International Banking segment.
The results of the operations sold to PNC and the assets we have committed to sell have been reflected as discontinued operations on ourConsolidated Balance Sheets beginning in the third quarter of 2011 and in our Consolidated Statements of Income for all period presented. Selectedfinancial information for these operations are set out in the table below.

80 Royal Bank of Canada First Quarter 2012
Note 8 Significant acquisition and disposition (continued)
InsuranceOn April 29, 2011, we completed the sale of Liberty Life, our U.S. life insurance business, to Athene Holding Ltd. The loss on sale after taxes was $104million. The results of operations of Liberty Life sold to Athene Holding Ltd. have been presented in our Condensed Consolidated Financial Statementsas discontinued operations for periods presented. Select financial information is set out in the tables below.
U.S. regional retail operationsand other assets Liberty Life Total
As at
January 312012
October 312011
January 312011
November 12010
January 312012
October 312011
January 312011
November 12010
January 312012
October 312011
January 312011
November 12010
Total Assets (1)
Securities $ 4,364 $ 5,253 $ – $ – $ – $ – $ 4,501 $ 4,612 $ 4,364 $ 5,253 $ 4,501 $ 4,612Loans 16,318 16,593 – – – – 458 477 16,318 16,593 458 477Other (2) 5,642 5,306 – – – – 596 634 5,642 5,306 596 634
$ 26,324 $ 27,152 $ – $ – $ – $ – $ 5,555 $ 5,723 $ 26,324 $ 27,152 $ 5,555 $ 5,723
Total LiabilitiesDeposits $ 17,992 $ 18,470 $ – $ – $ – $ – $ – $ – $ 17,992 $ 18,470 $ – $ –Insurance claims
and policybenefitliabilities – – – – – – 4,678 4,858 – – 4,678 4,858
Other 1,496 1,606 – – – – 144 154 1,496 1,606 144 154
$ 19,488 $ 20,076 $ – $ – $ – $ – $ 4,822 $ 5,012 $ 19,488 $ 20,076 $ 4,822 $ 5,012(1) Total other U.S. regional banking assets are nominal(2) Includes deferred tax assets of $1,049 million (October 31, 2011 – $1,029 million).
U.S. regional retail operationsand other assets Liberty Life Total
For the three months ended
January 312012
October 312011
January 312011
January 312012
October 312011
January 312011
January 312012
October 312011
January 312011
Net interest income $ 154 $ 160 $ 189 $ – $ – $ – $ 154 $ 160 $ 189Non–interest income 58 (10) 22 – – 98 58 (10) 120
Total Revenue 212 150 211 – – 98 212 150 309
Provision for credit losses 83 15 111 – – – 83 15 111Insurance policyholder benefits, claims and
actuarial expenses – – – – – 62 – – 62Non-interest expense 185 199 196 – – 25 185 199 221Goodwill impairment charge – – – – – – – – –
Net (loss) income before income taxes (56) (64) (96) – – 11 (56) (64) (85)
Net (loss) income (28) (44) (55) – – 7 (28) (44) (48)Gain on sale 7 6 – – – – 7 6 –
Net (loss) gain from discontinued operationsU.S. regional retail banking operations sold to
PNC (11) (16) (38) – – – (11) (16) (38)Other U.S. regional banking assets (10) (22) (17) – – – (10) (22) (17)Liberty Life sold to Athene Holding Ltd. – – – – – 7 – – 7
Total $ (21) $ (38) $ (55) $ – $ – $ 7 $ (21) $ (38) $ (48)
U.S. regional retail operationsand other assets Liberty Life Total
For the three months ended
January 312012
October 312011
January 312011
January 312012
October 312011
January 312011
January 312012
October 312011
January 312011
Net cash (used in) from operating activities $ (666) $ 116 $ 314 $ – $ – $ (11) $ (666) $ 116 $ 303Net cash from (used in) investing activities 904 1,192 (616) – – 1 904 1,192 (615)Net cash (used in) from financing activities (13) 37 (35) – – – (13) 37 (35)Effect of exchange rate changes on cash and
due from banks 14 42 (14) – – – 14 42 (14)
Net change in cash and due from banks 239 1,387 (351) – – (10) 239 1,387 (361)Cash and due from banks at beginning of period 2,716 1,329 888 – – 2 2,716 1,329 890
Cash and due from banks at end of period $ 2,955 $ 2,716 $ 537 $ – $ – $ (8) $ 2,955 $ 2,716 $ 529
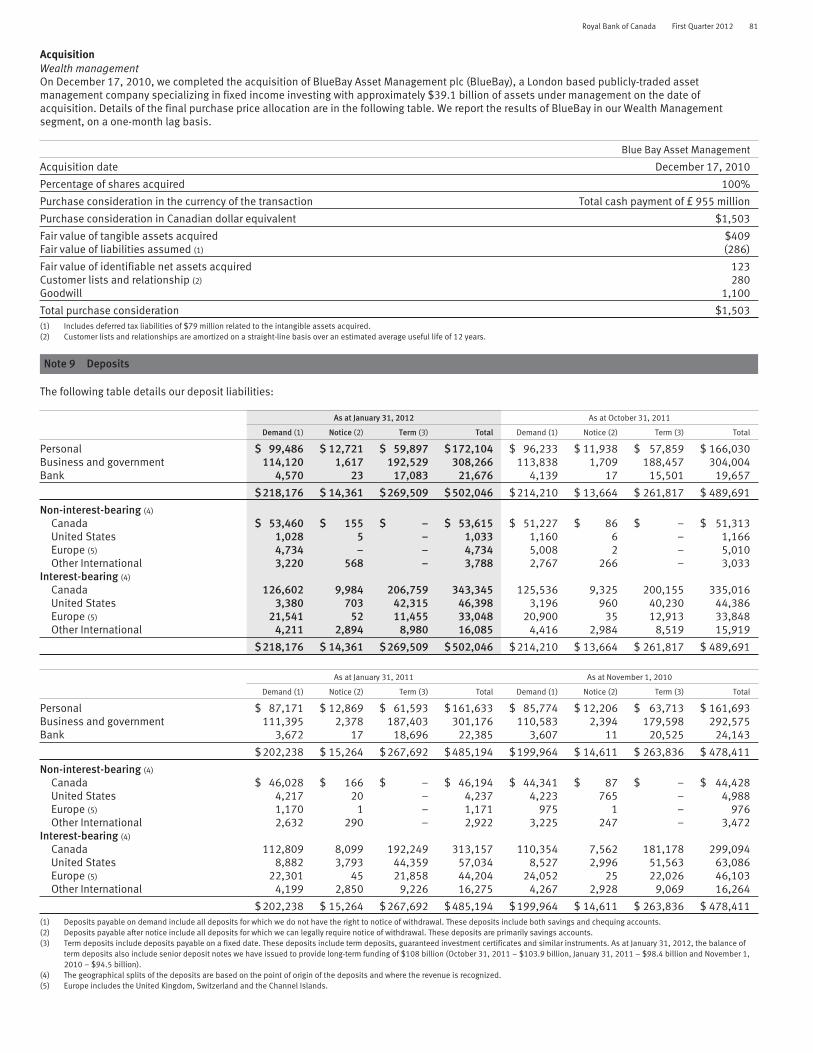
Royal Bank of Canada First Quarter 2012 81
AcquisitionWealth managementOn December 17, 2010, we completed the acquisition of BlueBay Asset Management plc (BlueBay), a London based publicly-traded assetmanagement company specializing in fixed income investing with approximately $39.1 billion of assets under management on the date ofacquisition. Details of the final purchase price allocation are in the following table. We report the results of BlueBay in our Wealth Managementsegment, on a one-month lag basis.
Blue Bay Asset Management
Acquisition date December 17, 2010
Percentage of shares acquired 100%
Purchase consideration in the currency of the transaction Total cash payment of £ 955 million
Purchase consideration in Canadian dollar equivalent $1,503
Fair value of tangible assets acquired $409Fair value of liabilities assumed (1) (286)
Fair value of identifiable net assets acquired 123Customer lists and relationship (2) 280Goodwill 1,100
Total purchase consideration $1,503(1) Includes deferred tax liabilities of $79 million related to the intangible assets acquired.(2) Customer lists and relationships are amortized on a straight-line basis over an estimated average useful life of 12 years.
Note 9 Deposits
The following table details our deposit liabilities:
As at January 31, 2012 As at October 31, 2011
Demand (1) Notice (2) Term (3) Total Demand (1) Notice (2) Term (3) Total
Personal $ 99,486 $ 12,721 $ 59,897 $172,104 $ 96,233 $ 11,938 $ 57,859 $ 166,030Business and government 114,120 1,617 192,529 308,266 113,838 1,709 188,457 304,004Bank 4,570 23 17,083 21,676 4,139 17 15,501 19,657
$218,176 $ 14,361 $269,509 $502,046 $ 214,210 $ 13,664 $ 261,817 $ 489,691
Non-interest-bearing (4)
Canada $ 53,460 $ 155 $ – $ 53,615 $ 51,227 $ 86 $ – $ 51,313United States 1,028 5 – 1,033 1,160 6 – 1,166Europe (5) 4,734 – – 4,734 5,008 2 – 5,010Other International 3,220 568 – 3,788 2,767 266 – 3,033
Interest-bearing (4)
Canada 126,602 9,984 206,759 343,345 125,536 9,325 200,155 335,016United States 3,380 703 42,315 46,398 3,196 960 40,230 44,386Europe (5) 21,541 52 11,455 33,048 20,900 35 12,913 33,848Other International 4,211 2,894 8,980 16,085 4,416 2,984 8,519 15,919
$218,176 $ 14,361 $269,509 $502,046 $ 214,210 $ 13,664 $ 261,817 $ 489,691
As at January 31, 2011 As at November 1, 2010
Demand (1) Notice (2) Term (3) Total Demand (1) Notice (2) Term (3) Total
Personal $ 87,171 $ 12,869 $ 61,593 $ 161,633 $ 85,774 $ 12,206 $ 63,713 $ 161,693Business and government 111,395 2,378 187,403 301,176 110,583 2,394 179,598 292,575Bank 3,672 17 18,696 22,385 3,607 11 20,525 24,143
$ 202,238 $ 15,264 $ 267,692 $ 485,194 $ 199,964 $ 14,611 $ 263,836 $ 478,411
Non-interest-bearing (4)
Canada $ 46,028 $ 166 $ – $ 46,194 $ 44,341 $ 87 $ – $ 44,428United States 4,217 20 – 4,237 4,223 765 – 4,988Europe (5) 1,170 1 – 1,171 975 1 – 976Other International 2,632 290 – 2,922 3,225 247 – 3,472
Interest-bearing (4)
Canada 112,809 8,099 192,249 313,157 110,354 7,562 181,178 299,094United States 8,882 3,793 44,359 57,034 8,527 2,996 51,563 63,086Europe (5) 22,301 45 21,858 44,204 24,052 25 22,026 46,103Other International 4,199 2,850 9,226 16,275 4,267 2,928 9,069 16,264
$ 202,238 $ 15,264 $ 267,692 $ 485,194 $ 199,964 $ 14,611 $ 263,836 $ 478,411(1) Deposits payable on demand include all deposits for which we do not have the right to notice of withdrawal. These deposits include both savings and chequing accounts.(2) Deposits payable after notice include all deposits for which we can legally require notice of withdrawal. These deposits are primarily savings accounts.(3) Term deposits include deposits payable on a fixed date. These deposits include term deposits, guaranteed investment certificates and similar instruments. As at January 31, 2012, the balance of
term deposits also include senior deposit notes we have issued to provide long-term funding of $108 billion (October 31, 2011 – $103.9 billion, January 31, 2011 – $98.4 billion and November 1,2010 – $94.5 billion).
(4) The geographical splits of the deposits are based on the point of origin of the deposits and where the revenue is recognized.(5) Europe includes the United Kingdom, Switzerland and the Channel Islands.
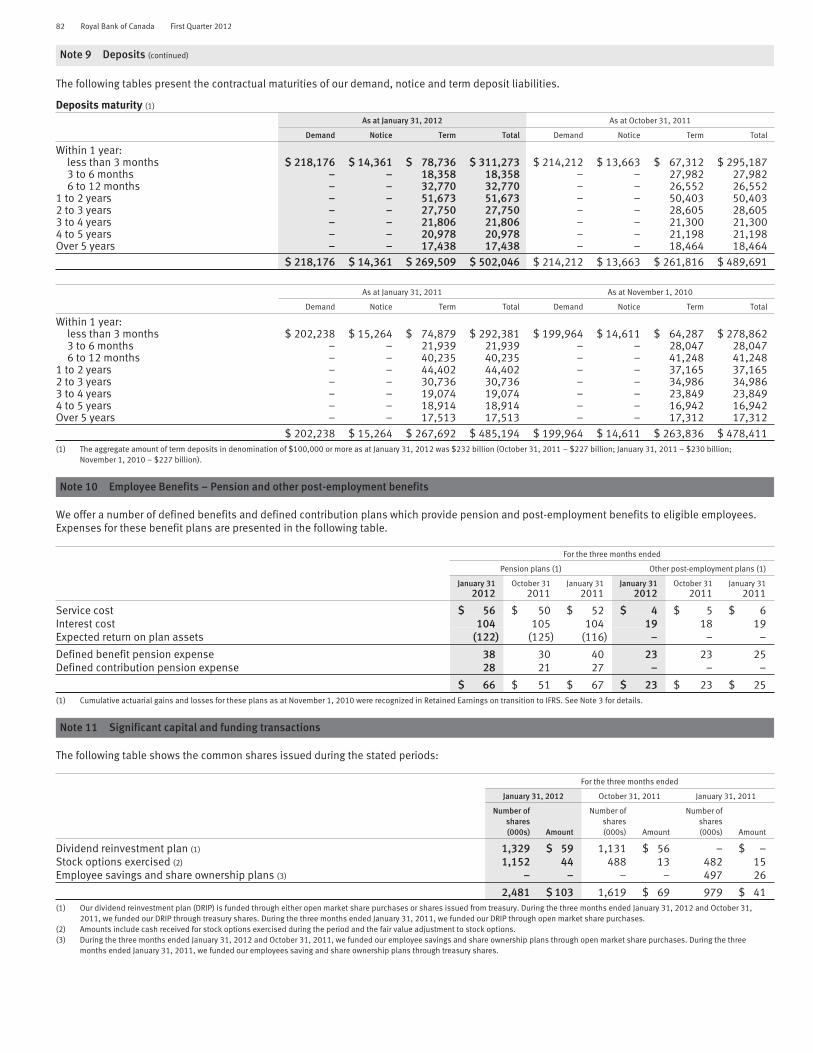
82 Royal Bank of Canada First Quarter 2012
Note 9 Deposits (continued)
The following tables present the contractual maturities of our demand, notice and term deposit liabilities.
Deposits maturity (1)
As at January 31, 2012 As at October 31, 2011
Demand Notice Term Total Demand Notice Term Total
Within 1 year:less than 3 months $ 218,176 $ 14,361 $ 78,736 $ 311,273 $ 214,212 $ 13,663 $ 67,312 $ 295,1873 to 6 months – – 18,358 18,358 – – 27,982 27,9826 to 12 months – – 32,770 32,770 – – 26,552 26,552
1 to 2 years – – 51,673 51,673 – – 50,403 50,4032 to 3 years – – 27,750 27,750 – – 28,605 28,6053 to 4 years – – 21,806 21,806 – – 21,300 21,3004 to 5 years – – 20,978 20,978 – – 21,198 21,198Over 5 years – – 17,438 17,438 – – 18,464 18,464
$ 218,176 $ 14,361 $ 269,509 $ 502,046 $ 214,212 $ 13,663 $ 261,816 $ 489,691
As at January 31, 2011 As at November 1, 2010
Demand Notice Term Total Demand Notice Term Total
Within 1 year:less than 3 months $ 202,238 $ 15,264 $ 74,879 $ 292,381 $ 199,964 $ 14,611 $ 64,287 $ 278,8623 to 6 months – – 21,939 21,939 – – 28,047 28,0476 to 12 months – – 40,235 40,235 – – 41,248 41,248
1 to 2 years – – 44,402 44,402 – – 37,165 37,1652 to 3 years – – 30,736 30,736 – – 34,986 34,9863 to 4 years – – 19,074 19,074 – – 23,849 23,8494 to 5 years – – 18,914 18,914 – – 16,942 16,942Over 5 years – – 17,513 17,513 – – 17,312 17,312
$ 202,238 $ 15,264 $ 267,692 $ 485,194 $ 199,964 $ 14,611 $ 263,836 $ 478,411(1) The aggregate amount of term deposits in denomination of $100,000 or more as at January 31, 2012 was $232 billion (October 31, 2011 – $227 billion; January 31, 2011 – $230 billion;
November 1, 2010 – $227 billion).
Note 10 Employee Benefits – Pension and other post-employment benefits
We offer a number of defined benefits and defined contribution plans which provide pension and post-employment benefits to eligible employees.Expenses for these benefit plans are presented in the following table.
For the three months ended
Pension plans (1) Other post-employment plans (1)
January 312012
October 312011
January 312011
January 312012
October 312011
January 312011
Service cost $ 56 $ 50 $ 52 $ 4 $ 5 $ 6Interest cost 104 105 104 19 18 19Expected return on plan assets (122) (125) (116) – – –
Defined benefit pension expense 38 30 40 23 23 25Defined contribution pension expense 28 21 27 – – –
$ 66 $ 51 $ 67 $ 23 $ 23 $ 25(1) Cumulative actuarial gains and losses for these plans as at November 1, 2010 were recognized in Retained Earnings on transition to IFRS. See Note 3 for details.
Note 11 Significant capital and funding transactions
The following table shows the common shares issued during the stated periods:
For the three months ended
January 31, 2012 October 31, 2011 January 31, 2011
Number ofshares(000s) Amount
Number ofshares(000s) Amount
Number ofshares(000s) Amount
Dividend reinvestment plan (1) 1,329 $ 59 1,131 $ 56 – $ –Stock options exercised (2) 1,152 44 488 13 482 15Employee savings and share ownership plans (3) – – – – 497 26
2,481 $ 103 1,619 $ 69 979 $ 41(1) Our dividend reinvestment plan (DRIP) is funded through either open market share purchases or shares issued from treasury. During the three months ended January 31, 2012 and October 31,
2011, we funded our DRIP through treasury shares. During the three months ended January 31, 2011, we funded our DRIP through open market share purchases.(2) Amounts include cash received for stock options exercised during the period and the fair value adjustment to stock options.(3) During the three months ended January 31, 2012 and October 31, 2011, we funded our employee savings and share ownership plans through open market share purchases. During the three
months ended January 31, 2011, we funded our employees saving and share ownership plans through treasury shares.

Royal Bank of Canada First Quarter 2012 83
Note 12 Revenue from trading and selected non-trading financial instruments
Total trading revenue arising on financial instruments classified as at FVTPL includes both trading-related net interest income and trading revenuereported in Non-interest income. Net interest income arises from interest income and dividends recognized on trading assets and liabilities.
For the three months ended
January 312012
October 312011
January 312011
Net interest income $ 388 $ 386 $ 283Non-interest income (expense) 396 (219) 721
Total $ 784 $ 167 $ 1,004
By product lineInterest rate and credit $ 536 $ (6) $ 705Equities 110 79 199Foreign exchange and commodities 138 94 100
Total $ 784 $ 167 $ 1,004
Financial Instruments classified as at FVTPLNon-interest Income includes a $500 million increase in fair values of our financial assets classified as at FVTPL for the three months endedJanuary 31, 2012 (three months ended October 31, 2011 – decreased by $501 million; three months ended January 31, 2011 – increased by $627million).
Financial instruments designated as at FVTPLThe net gain (loss) on financial assets and financial liabilities designated as at FVTPL for the three months ended January 31, 2012 was $217 million(three months ended October 31, 2011 – $448 million; three months ended January 31, 2011 – $(102) million).
Other categories of financial instrumentsThe following were recognized in income during the year:
For the three months ended
January 312012
October 312011
January 312011
Net losses arising from financial instruments measured at amortized costs $ (2) $ (1) $ –Net interest income calculated using the effective interest method, excluding interest on financial instruments
classified or designated as at FVTPL 2,615 2,571 2,512Net fee income which does not form an integral part of the effective interest rate of financial assets and liabilities 904 899 902Net fee income arising from trust and other fiduciary activities 1,577 1,621 1,780
Total $ 5,094 $ 5,090 $ 5,194
Note 13 Income taxes
Recoverability of Deferred Tax AssetOn a quarterly basis, we review our deferred tax asset, which is included in Other assets on our Consolidated Balance Sheets, to determine whether itprobable that the benefits associated with this asset will be realized; this review involves evaluating both positive and negative evidence. Ourdeferred tax asset represents temporary differences between the financial reporting and tax bases of certain of our assets and liabilities in addition tothe tax benefit of net operating loss carry-forwards. Our review regarding the realizability of our deferred tax asset as at January 31, 2012 included anassessment of the tax benefit associated with our U.S. regional banking operation, which we have entered into an agreement to sell (refer to Note 8).We concluded that there is sufficient positive evidence to overcome the negative evidence that the deferred tax asset associated with our U.S.regional banking operations is realizable. Overall, we believe that, based on all available evidence, it is probable that the consolidated deferredincome tax assets will be realized through a combination of future reversals of temporary differences and taxable income.
Income taxes on components of other comprehensive incomeThe income tax expense or benefit allocated to each component of Other comprehensive income and changes in equity is presented in the followingtable:
For the three months ended
January 312012
October 312011
January 312011
Income taxes (recoveries) in Consolidated Statements of Comprehensive Income and Changes in EquityOther comprehensive income
Net unrealized gains (losses) on available-for-sale securities $ 15 $ 2 $ (71)Reclassification of (gains) losses on available-for-sale securities to income (7) 4 21Net foreign currency translation gains (losses), net of hedging activities 13 (250) 200Net unrealized gains (losses) on derivatives designated as cash flow hedges 23 74 14Reclassification of losses (gains) on derivatives designated as cash flow hedges to income 8 (1) 9
Total income (recoveries) taxes $ 52 $ (171) $ 173
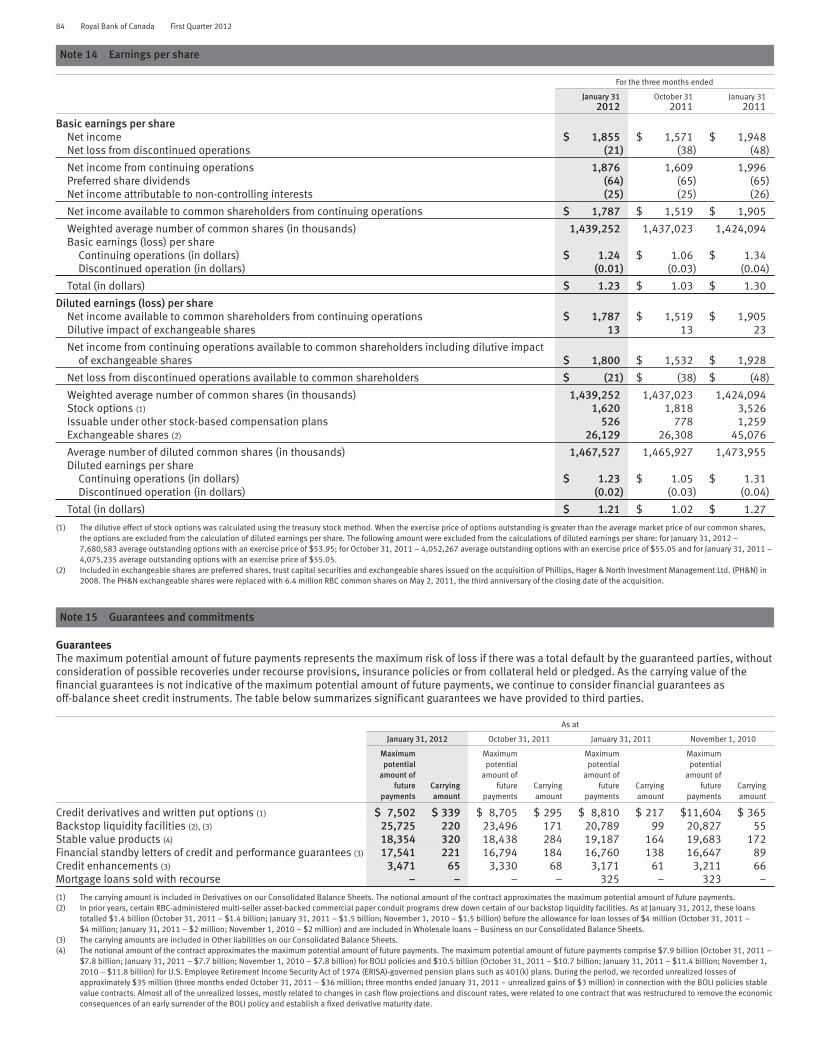
84 Royal Bank of Canada First Quarter 2012
Note 14 Earnings per share
For the three months ended
January 312012
October 312011
January 312011
Basic earnings per shareNet income $ 1,855 $ 1,571 $ 1,948Net loss from discontinued operations (21) (38) (48)
Net income from continuing operations 1,876 1,609 1,996Preferred share dividends (64) (65) (65)Net income attributable to non-controlling interests (25) (25) (26)
Net income available to common shareholders from continuing operations $ 1,787 $ 1,519 $ 1,905
Weighted average number of common shares (in thousands) 1,439,252 1,437,023 1,424,094Basic earnings (loss) per share
Continuing operations (in dollars) $ 1.24 $ 1.06 $ 1.34Discontinued operation (in dollars) (0.01) (0.03) (0.04)
Total (in dollars) $ 1.23 $ 1.03 $ 1.30
Diluted earnings (loss) per shareNet income available to common shareholders from continuing operations $ 1,787 $ 1,519 $ 1,905Dilutive impact of exchangeable shares 13 13 23
Net income from continuing operations available to common shareholders including dilutive impactof exchangeable shares $ 1,800 $ 1,532 $ 1,928
Net loss from discontinued operations available to common shareholders $ (21) $ (38) $ (48)
Weighted average number of common shares (in thousands) 1,439,252 1,437,023 1,424,094Stock options (1) 1,620 1,818 3,526Issuable under other stock-based compensation plans 526 778 1,259Exchangeable shares (2) 26,129 26,308 45,076
Average number of diluted common shares (in thousands) 1,467,527 1,465,927 1,473,955Diluted earnings per share
Continuing operations (in dollars) $ 1.23 $ 1.05 $ 1.31Discontinued operation (in dollars) (0.02) (0.03) (0.04)
Total (in dollars) $ 1.21 $ 1.02 $ 1.27
(1) The dilutive effect of stock options was calculated using the treasury stock method. When the exercise price of options outstanding is greater than the average market price of our common shares,the options are excluded from the calculation of diluted earnings per share. The following amount were excluded from the calculations of diluted earnings per share: for January 31, 2012 –7,680,583 average outstanding options with an exercise price of $53.95; for October 31, 2011 – 4,052,267 average outstanding options with an exercise price of $55.05 and for January 31, 2011 –4,075,235 average outstanding options with an exercise price of $55.05.
(2) Included in exchangeable shares are preferred shares, trust capital securities and exchangeable shares issued on the acquisition of Phillips, Hager & North Investment Management Ltd. (PH&N) in2008. The PH&N exchangeable shares were replaced with 6.4 million RBC common shares on May 2, 2011, the third anniversary of the closing date of the acquisition.
Note 15 Guarantees and commitments
GuaranteesThe maximum potential amount of future payments represents the maximum risk of loss if there was a total default by the guaranteed parties, withoutconsideration of possible recoveries under recourse provisions, insurance policies or from collateral held or pledged. As the carrying value of thefinancial guarantees is not indicative of the maximum potential amount of future payments, we continue to consider financial guarantees asoff-balance sheet credit instruments. The table below summarizes significant guarantees we have provided to third parties.
As at
January 31, 2012 October 31, 2011 January 31, 2011 November 1, 2010
Maximumpotential
amount offuture
paymentsCarryingamount
Maximumpotential
amount offuture
paymentsCarryingamount
Maximumpotential
amount offuture
paymentsCarryingamount
Maximumpotential
amount offuture
paymentsCarryingamount
Credit derivatives and written put options (1) $ 7,502 $ 339 $ 8,705 $ 295 $ 8,810 $ 217 $11,604 $ 365Backstop liquidity facilities (2), (3) 25,725 220 23,496 171 20,789 99 20,827 55Stable value products (4) 18,354 320 18,438 284 19,187 164 19,683 172Financial standby letters of credit and performance guarantees (3) 17,541 221 16,794 184 16,760 138 16,647 89Credit enhancements (3) 3,471 65 3,330 68 3,171 61 3,211 66Mortgage loans sold with recourse – – – – 325 – 323 –
(1) The carrying amount is included in Derivatives on our Consolidated Balance Sheets. The notional amount of the contract approximates the maximum potential amount of future payments.(2) In prior years, certain RBC-administered multi-seller asset-backed commercial paper conduit programs drew down certain of our backstop liquidity facilities. As at January 31, 2012, these loans
totalled $1.4 billion (October 31, 2011 – $1.4 billion; January 31, 2011 – $1.5 billion; November 1, 2010 – $1.5 billion) before the allowance for loan losses of $4 million (October 31, 2011 –$4 million; January 31, 2011 – $2 million; November 1, 2010 – $2 million) and are included in Wholesale loans – Business on our Consolidated Balance Sheets.
(3) The carrying amounts are included in Other liabilities on our Consolidated Balance Sheets.(4) The notional amount of the contract approximates the maximum potential amount of future payments. The maximum potential amount of future payments comprise $7.9 billion (October 31, 2011 –
$7.8 billion; January 31, 2011 – $7.7 billion; November 1, 2010 – $7.8 billion) for BOLI policies and $10.5 billion (October 31, 2011 – $10.7 billion; January 31, 2011 – $11.4 billion; November 1,2010 – $11.8 billion) for U.S. Employee Retirement Income Security Act of 1974 (ERISA)-governed pension plans such as 401(k) plans. During the period, we recorded unrealized losses ofapproximately $35 million (three months ended October 31, 2011 – $36 million; three months ended January 31, 2011 – unrealized gains of $3 million) in connection with the BOLI policies stablevalue contracts. Almost all of the unrealized losses, mostly related to changes in cash flow projections and discount rates, were related to one contract that was restructured to remove the economicconsequences of an early surrender of the BOLI policy and establish a fixed derivative maturity date.
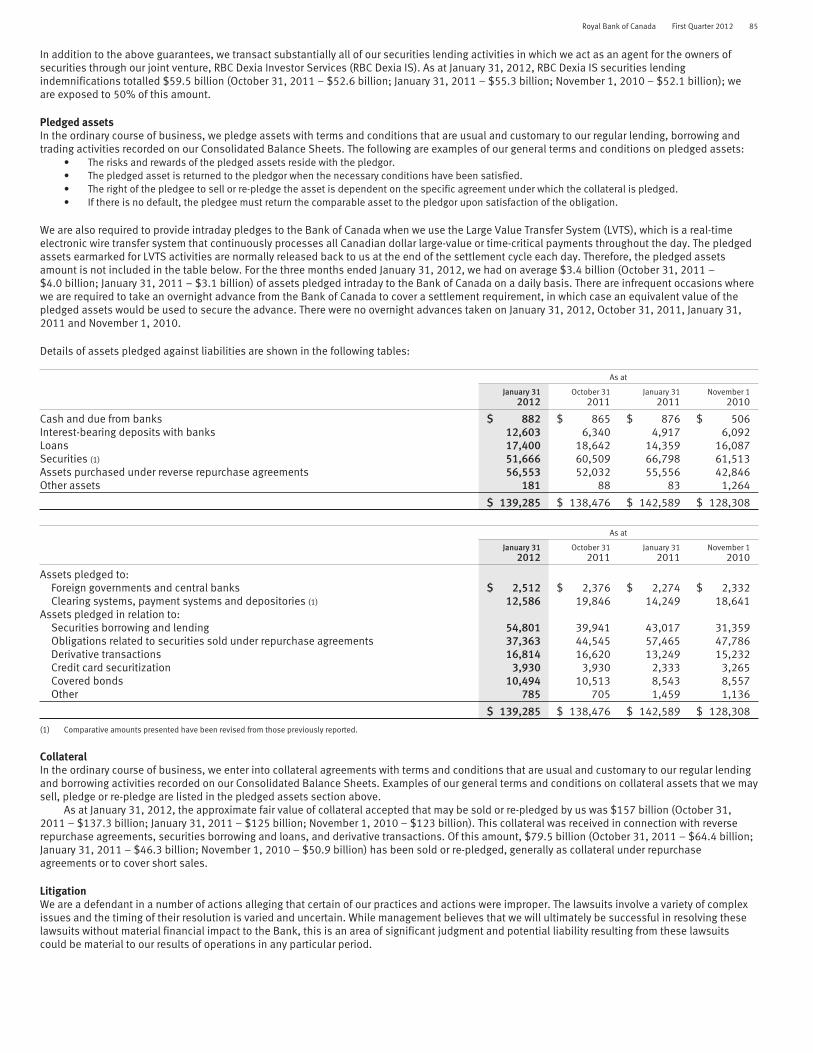
Royal Bank of Canada First Quarter 2012 85
In addition to the above guarantees, we transact substantially all of our securities lending activities in which we act as an agent for the owners ofsecurities through our joint venture, RBC Dexia Investor Services (RBC Dexia IS). As at January 31, 2012, RBC Dexia IS securities lendingindemnifications totalled $59.5 billion (October 31, 2011 – $52.6 billion; January 31, 2011 – $55.3 billion; November 1, 2010 – $52.1 billion); weare exposed to 50% of this amount.
Pledged assetsIn the ordinary course of business, we pledge assets with terms and conditions that are usual and customary to our regular lending, borrowing andtrading activities recorded on our Consolidated Balance Sheets. The following are examples of our general terms and conditions on pledged assets:
• The risks and rewards of the pledged assets reside with the pledgor.• The pledged asset is returned to the pledgor when the necessary conditions have been satisfied.• The right of the pledgee to sell or re-pledge the asset is dependent on the specific agreement under which the collateral is pledged.• If there is no default, the pledgee must return the comparable asset to the pledgor upon satisfaction of the obligation.
We are also required to provide intraday pledges to the Bank of Canada when we use the Large Value Transfer System (LVTS), which is a real-timeelectronic wire transfer system that continuously processes all Canadian dollar large-value or time-critical payments throughout the day. The pledgedassets earmarked for LVTS activities are normally released back to us at the end of the settlement cycle each day. Therefore, the pledged assetsamount is not included in the table below. For the three months ended January 31, 2012, we had on average $3.4 billion (October 31, 2011 –$4.0 billion; January 31, 2011 – $3.1 billion) of assets pledged intraday to the Bank of Canada on a daily basis. There are infrequent occasions wherewe are required to take an overnight advance from the Bank of Canada to cover a settlement requirement, in which case an equivalent value of thepledged assets would be used to secure the advance. There were no overnight advances taken on January 31, 2012, October 31, 2011, January 31,2011 and November 1, 2010.
Details of assets pledged against liabilities are shown in the following tables:
As at
January 312012
October 312011
January 312011
November 12010
Cash and due from banks $ 882 $ 865 $ 876 $ 506Interest-bearing deposits with banks 12,603 6,340 4,917 6,092Loans 17,400 18,642 14,359 16,087Securities (1) 51,666 60,509 66,798 61,513Assets purchased under reverse repurchase agreements 56,553 52,032 55,556 42,846Other assets 181 88 83 1,264
$ 139,285 $ 138,476 $ 142,589 $ 128,308
As at
January 312012
October 312011
January 312011
November 12010
Assets pledged to:Foreign governments and central banks $ 2,512 $ 2,376 $ 2,274 $ 2,332Clearing systems, payment systems and depositories (1) 12,586 19,846 14,249 18,641
Assets pledged in relation to:Securities borrowing and lending 54,801 39,941 43,017 31,359Obligations related to securities sold under repurchase agreements 37,363 44,545 57,465 47,786Derivative transactions 16,814 16,620 13,249 15,232Credit card securitization 3,930 3,930 2,333 3,265Covered bonds 10,494 10,513 8,543 8,557Other 785 705 1,459 1,136
$ 139,285 $ 138,476 $ 142,589 $ 128,308
(1) Comparative amounts presented have been revised from those previously reported.
CollateralIn the ordinary course of business, we enter into collateral agreements with terms and conditions that are usual and customary to our regular lendingand borrowing activities recorded on our Consolidated Balance Sheets. Examples of our general terms and conditions on collateral assets that we maysell, pledge or re-pledge are listed in the pledged assets section above.
As at January 31, 2012, the approximate fair value of collateral accepted that may be sold or re-pledged by us was $157 billion (October 31,2011 – $137.3 billion; January 31, 2011 – $125 billion; November 1, 2010 – $123 billion). This collateral was received in connection with reverserepurchase agreements, securities borrowing and loans, and derivative transactions. Of this amount, $79.5 billion (October 31, 2011 – $64.4 billion;January 31, 2011 – $46.3 billion; November 1, 2010 – $50.9 billion) has been sold or re-pledged, generally as collateral under repurchaseagreements or to cover short sales.
LitigationWe are a defendant in a number of actions alleging that certain of our practices and actions were improper. The lawsuits involve a variety of complexissues and the timing of their resolution is varied and uncertain. While management believes that we will ultimately be successful in resolving theselawsuits without material financial impact to the Bank, this is an area of significant judgment and potential liability resulting from these lawsuitscould be material to our results of operations in any particular period.
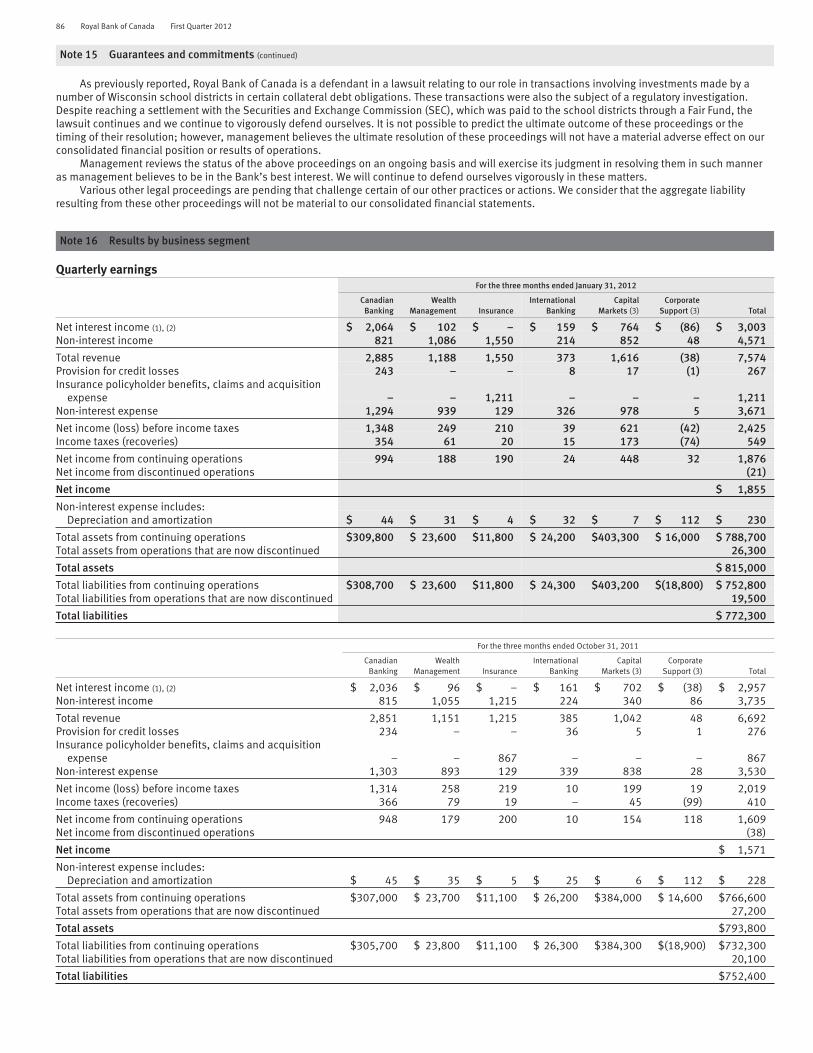
86 Royal Bank of Canada First Quarter 2012
Note 15 Guarantees and commitments (continued)
As previously reported, Royal Bank of Canada is a defendant in a lawsuit relating to our role in transactions involving investments made by anumber of Wisconsin school districts in certain collateral debt obligations. These transactions were also the subject of a regulatory investigation.Despite reaching a settlement with the Securities and Exchange Commission (SEC), which was paid to the school districts through a Fair Fund, thelawsuit continues and we continue to vigorously defend ourselves. It is not possible to predict the ultimate outcome of these proceedings or thetiming of their resolution; however, management believes the ultimate resolution of these proceedings will not have a material adverse effect on ourconsolidated financial position or results of operations.
Management reviews the status of the above proceedings on an ongoing basis and will exercise its judgment in resolving them in such manneras management believes to be in the Bank’s best interest. We will continue to defend ourselves vigorously in these matters.
Various other legal proceedings are pending that challenge certain of our other practices or actions. We consider that the aggregate liabilityresulting from these other proceedings will not be material to our consolidated financial statements.
Note 16 Results by business segment
Quarterly earningsFor the three months ended January 31, 2012
CanadianBanking
WealthManagement Insurance
InternationalBanking
CapitalMarkets (3)
CorporateSupport (3) Total
Net interest income (1), (2) $ 2,064 $ 102 $ – $ 159 $ 764 $ (86) $ 3,003Non-interest income 821 1,086 1,550 214 852 48 4,571
Total revenue 2,885 1,188 1,550 373 1,616 (38) 7,574Provision for credit losses 243 – – 8 17 (1) 267Insurance policyholder benefits, claims and acquisition
expense – – 1,211 – – – 1,211Non-interest expense 1,294 939 129 326 978 5 3,671
Net income (loss) before income taxes 1,348 249 210 39 621 (42) 2,425Income taxes (recoveries) 354 61 20 15 173 (74) 549
Net income from continuing operations 994 188 190 24 448 32 1,876Net income from discontinued operations (21)
Net income $ 1,855
Non-interest expense includes:Depreciation and amortization $ 44 $ 31 $ 4 $ 32 $ 7 $ 112 $ 230
Total assets from continuing operations $309,800 $ 23,600 $11,800 $ 24,200 $403,300 $ 16,000 $ 788,700Total assets from operations that are now discontinued 26,300
Total assets $ 815,000
Total liabilities from continuing operations $308,700 $ 23,600 $11,800 $ 24,300 $403,200 $(18,800) $ 752,800Total liabilities from operations that are now discontinued 19,500
Total liabilities $ 772,300
For the three months ended October 31, 2011
CanadianBanking
WealthManagement Insurance
InternationalBanking
CapitalMarkets (3)
CorporateSupport (3) Total
Net interest income (1), (2) $ 2,036 $ 96 $ – $ 161 $ 702 $ (38) $ 2,957Non-interest income 815 1,055 1,215 224 340 86 3,735
Total revenue 2,851 1,151 1,215 385 1,042 48 6,692Provision for credit losses 234 – – 36 5 1 276Insurance policyholder benefits, claims and acquisition
expense – – 867 – – – 867Non-interest expense 1,303 893 129 339 838 28 3,530
Net income (loss) before income taxes 1,314 258 219 10 199 19 2,019Income taxes (recoveries) 366 79 19 – 45 (99) 410
Net income from continuing operations 948 179 200 10 154 118 1,609Net income from discontinued operations (38)
Net income $ 1,571
Non-interest expense includes:Depreciation and amortization $ 45 $ 35 $ 5 $ 25 $ 6 $ 112 $ 228
Total assets from continuing operations $307,000 $ 23,700 $11,100 $ 26,200 $384,000 $ 14,600 $766,600Total assets from operations that are now discontinued 27,200
Total assets $793,800
Total liabilities from continuing operations $305,700 $ 23,800 $11,100 $ 26,300 $384,300 $(18,900) $732,300Total liabilities from operations that are now discontinued 20,100
Total liabilities $752,400
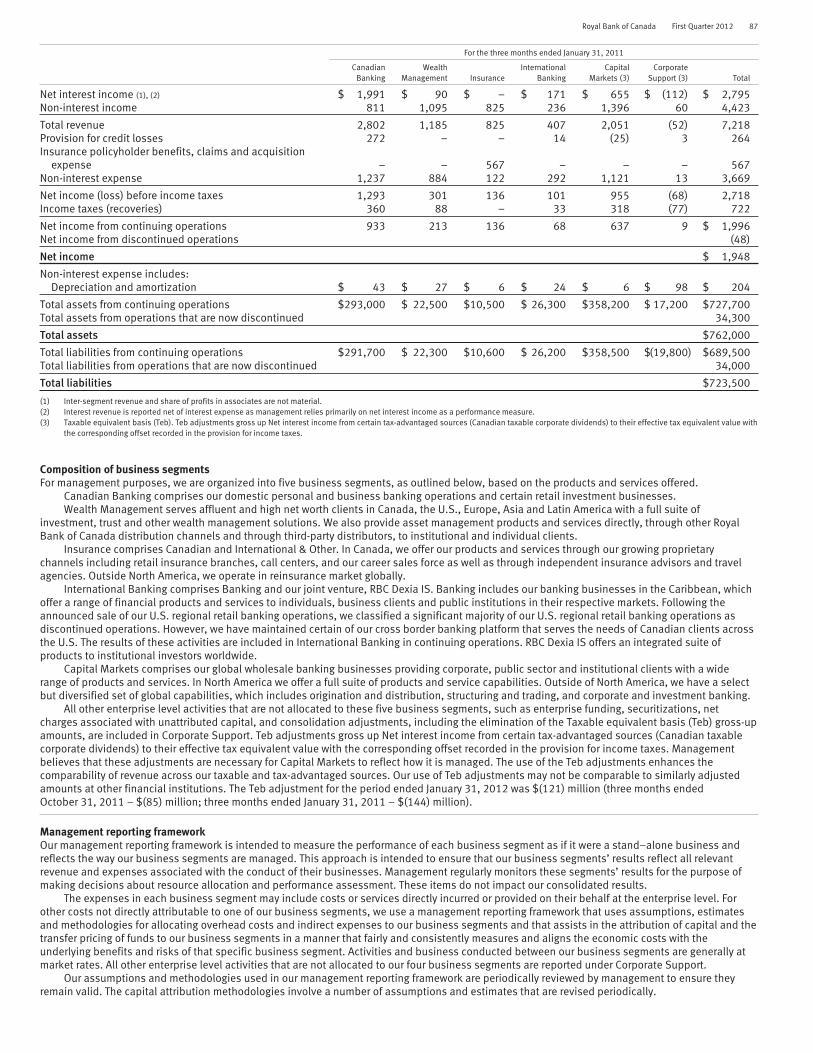
Royal Bank of Canada First Quarter 2012 87
For the three months ended January 31, 2011
CanadianBanking
WealthManagement Insurance
InternationalBanking
CapitalMarkets (3)
CorporateSupport (3) Total
Net interest income (1), (2) $ 1,991 $ 90 $ – $ 171 $ 655 $ (112) $ 2,795Non-interest income 811 1,095 825 236 1,396 60 4,423
Total revenue 2,802 1,185 825 407 2,051 (52) 7,218Provision for credit losses 272 – – 14 (25) 3 264Insurance policyholder benefits, claims and acquisition
expense – – 567 – – – 567Non-interest expense 1,237 884 122 292 1,121 13 3,669
Net income (loss) before income taxes 1,293 301 136 101 955 (68) 2,718Income taxes (recoveries) 360 88 – 33 318 (77) 722
Net income from continuing operations 933 213 136 68 637 9 $ 1,996Net income from discontinued operations (48)
Net income $ 1,948
Non-interest expense includes:Depreciation and amortization $ 43 $ 27 $ 6 $ 24 $ 6 $ 98 $ 204
Total assets from continuing operations $293,000 $ 22,500 $10,500 $ 26,300 $358,200 $ 17,200 $727,700Total assets from operations that are now discontinued 34,300
Total assets $762,000
Total liabilities from continuing operations $291,700 $ 22,300 $10,600 $ 26,200 $358,500 $(19,800) $689,500Total liabilities from operations that are now discontinued 34,000
Total liabilities $723,500
(1) Inter-segment revenue and share of profits in associates are not material.(2) Interest revenue is reported net of interest expense as management relies primarily on net interest income as a performance measure.(3) Taxable equivalent basis (Teb). Teb adjustments gross up Net interest income from certain tax-advantaged sources (Canadian taxable corporate dividends) to their effective tax equivalent value with
the corresponding offset recorded in the provision for income taxes.
Composition of business segmentsFor management purposes, we are organized into five business segments, as outlined below, based on the products and services offered.
Canadian Banking comprises our domestic personal and business banking operations and certain retail investment businesses.Wealth Management serves affluent and high net worth clients in Canada, the U.S., Europe, Asia and Latin America with a full suite of
investment, trust and other wealth management solutions. We also provide asset management products and services directly, through other RoyalBank of Canada distribution channels and through third-party distributors, to institutional and individual clients.
Insurance comprises Canadian and International & Other. In Canada, we offer our products and services through our growing proprietarychannels including retail insurance branches, call centers, and our career sales force as well as through independent insurance advisors and travelagencies. Outside North America, we operate in reinsurance market globally.
International Banking comprises Banking and our joint venture, RBC Dexia IS. Banking includes our banking businesses in the Caribbean, whichoffer a range of financial products and services to individuals, business clients and public institutions in their respective markets. Following theannounced sale of our U.S. regional retail banking operations, we classified a significant majority of our U.S. regional retail banking operations asdiscontinued operations. However, we have maintained certain of our cross border banking platform that serves the needs of Canadian clients acrossthe U.S. The results of these activities are included in International Banking in continuing operations. RBC Dexia IS offers an integrated suite ofproducts to institutional investors worldwide.
Capital Markets comprises our global wholesale banking businesses providing corporate, public sector and institutional clients with a widerange of products and services. In North America we offer a full suite of products and service capabilities. Outside of North America, we have a selectbut diversified set of global capabilities, which includes origination and distribution, structuring and trading, and corporate and investment banking.
All other enterprise level activities that are not allocated to these five business segments, such as enterprise funding, securitizations, netcharges associated with unattributed capital, and consolidation adjustments, including the elimination of the Taxable equivalent basis (Teb) gross-upamounts, are included in Corporate Support. Teb adjustments gross up Net interest income from certain tax-advantaged sources (Canadian taxablecorporate dividends) to their effective tax equivalent value with the corresponding offset recorded in the provision for income taxes. Managementbelieves that these adjustments are necessary for Capital Markets to reflect how it is managed. The use of the Teb adjustments enhances thecomparability of revenue across our taxable and tax-advantaged sources. Our use of Teb adjustments may not be comparable to similarly adjustedamounts at other financial institutions. The Teb adjustment for the period ended January 31, 2012 was $(121) million (three months endedOctober 31, 2011 – $(85) million; three months ended January 31, 2011 – $(144) million).
Management reporting frameworkOur management reporting framework is intended to measure the performance of each business segment as if it were a stand–alone business andreflects the way our business segments are managed. This approach is intended to ensure that our business segments’ results reflect all relevantrevenue and expenses associated with the conduct of their businesses. Management regularly monitors these segments’ results for the purpose ofmaking decisions about resource allocation and performance assessment. These items do not impact our consolidated results.
The expenses in each business segment may include costs or services directly incurred or provided on their behalf at the enterprise level. Forother costs not directly attributable to one of our business segments, we use a management reporting framework that uses assumptions, estimatesand methodologies for allocating overhead costs and indirect expenses to our business segments and that assists in the attribution of capital and thetransfer pricing of funds to our business segments in a manner that fairly and consistently measures and aligns the economic costs with theunderlying benefits and risks of that specific business segment. Activities and business conducted between our business segments are generally atmarket rates. All other enterprise level activities that are not allocated to our four business segments are reported under Corporate Support.
Our assumptions and methodologies used in our management reporting framework are periodically reviewed by management to ensure theyremain valid. The capital attribution methodologies involve a number of assumptions and estimates that are revised periodically.
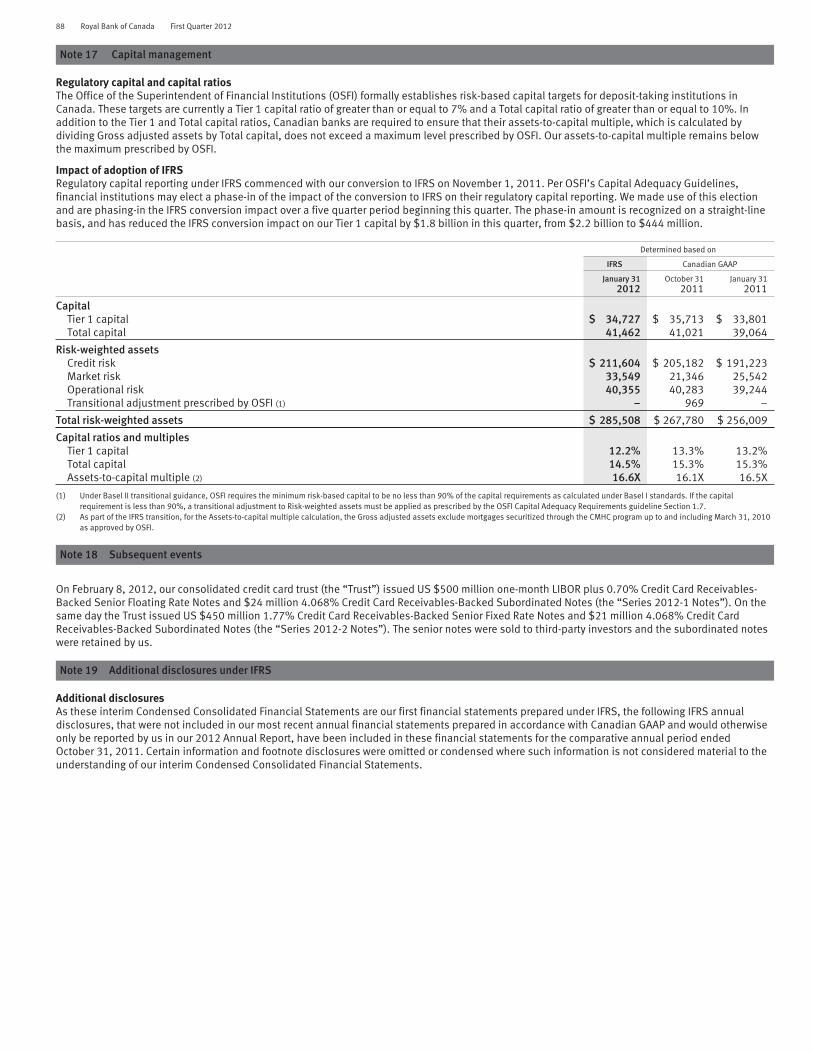
88 Royal Bank of Canada First Quarter 2012
Note 17 Capital management
Regulatory capital and capital ratiosThe Office of the Superintendent of Financial Institutions (OSFI) formally establishes risk-based capital targets for deposit-taking institutions inCanada. These targets are currently a Tier 1 capital ratio of greater than or equal to 7% and a Total capital ratio of greater than or equal to 10%. Inaddition to the Tier 1 and Total capital ratios, Canadian banks are required to ensure that their assets-to-capital multiple, which is calculated bydividing Gross adjusted assets by Total capital, does not exceed a maximum level prescribed by OSFI. Our assets-to-capital multiple remains belowthe maximum prescribed by OSFI.
Impact of adoption of IFRSRegulatory capital reporting under IFRS commenced with our conversion to IFRS on November 1, 2011. Per OSFI’s Capital Adequacy Guidelines,financial institutions may elect a phase-in of the impact of the conversion to IFRS on their regulatory capital reporting. We made use of this electionand are phasing-in the IFRS conversion impact over a five quarter period beginning this quarter. The phase-in amount is recognized on a straight-linebasis, and has reduced the IFRS conversion impact on our Tier 1 capital by $1.8 billion in this quarter, from $2.2 billion to $444 million.
Determined based on
IFRS Canadian GAAP
January 312012
October 312011
January 312011
CapitalTier 1 capital $ 34,727 $ 35,713 $ 33,801Total capital 41,462 41,021 39,064
Risk-weighted assetsCredit risk $ 211,604 $ 205,182 $ 191,223Market risk 33,549 21,346 25,542Operational risk 40,355 40,283 39,244Transitional adjustment prescribed by OSFI (1) – 969 –
Total risk-weighted assets $ 285,508 $ 267,780 $ 256,009
Capital ratios and multiplesTier 1 capital 12.2% 13.3% 13.2%Total capital 14.5% 15.3% 15.3%Assets-to-capital multiple (2) 16.6X 16.1X 16.5X
(1) Under Basel II transitional guidance, OSFI requires the minimum risk-based capital to be no less than 90% of the capital requirements as calculated under Basel I standards. If the capitalrequirement is less than 90%, a transitional adjustment to Risk-weighted assets must be applied as prescribed by the OSFI Capital Adequacy Requirements guideline Section 1.7.
(2) As part of the IFRS transition, for the Assets-to-capital multiple calculation, the Gross adjusted assets exclude mortgages securitized through the CMHC program up to and including March 31, 2010as approved by OSFI.
Note 18 Subsequent events
On February 8, 2012, our consolidated credit card trust (the “Trust”) issued US $500 million one-month LIBOR plus 0.70% Credit Card Receivables-Backed Senior Floating Rate Notes and $24 million 4.068% Credit Card Receivables-Backed Subordinated Notes (the “Series 2012-1 Notes”). On thesame day the Trust issued US $450 million 1.77% Credit Card Receivables-Backed Senior Fixed Rate Notes and $21 million 4.068% Credit CardReceivables-Backed Subordinated Notes (the “Series 2012-2 Notes”). The senior notes were sold to third-party investors and the subordinated noteswere retained by us.
Note 19 Additional disclosures under IFRS
Additional disclosuresAs these interim Condensed Consolidated Financial Statements are our first financial statements prepared under IFRS, the following IFRS annualdisclosures, that were not included in our most recent annual financial statements prepared in accordance with Canadian GAAP and would otherwiseonly be reported by us in our 2012 Annual Report, have been included in these financial statements for the comparative annual period endedOctober 31, 2011. Certain information and footnote disclosures were omitted or condensed where such information is not considered material to theunderstanding of our interim Condensed Consolidated Financial Statements.

Royal Bank of Canada First Quarter 2012 89
A: Securities
Carrying value of securitiesThe following table presents the financial instruments that we held at the end of the period, measured at carrying value:
Term to maturity (2)
Within 3months
3 monthsto 1 year 1 to 5 years
Over 5 yearsto 10 years
Over 10years
With nospecific
maturityOctober 31, 2011
Total
Trading account (1)
Canadian government debt $ 1,902 $ 8,000 $ 8,768 $ 1,569 $ 4,126 $ – $ 24,365U.S. government debt 313 5,594 4,659 1,485 7,500 – 19,551Other OECD government debt (3) 2,109 5,144 5,333 3,957 1,562 – 18,105Mortgage-backed securities (4) – 3 97 39 277 – 416Asset-backed securities (4) 160 44 422 237 426 – 1,289Corporate debt and other debt (4)
Bankers’ acceptances 582 287 – – – – 869Certificates of deposit 3 974 352 7 12 – 1,348Other 2,175 4,876 10,369 1,873 3,493 1,025 23,811
Equities – – – – – 38,374 38,374
7,244 24,922 30,000 9,167 17,396 39,399 128,128
Available-for-sale securities (1)
Canadian government debtFederal
Amortized cost 284 353 7,697 680 26 – 9,040Fair value 284 360 8,156 703 28 – 9,531Yield (5) 0.5% 4.3% 3.1% 2.6% 4.1% – 3.0%
Provincial and municipalAmortized cost 301 89 1,112 14 21 – 1,537Fair value 302 91 1,131 15 22 – 1,561Yield (5) 4.9% 3.6% 2.6% 5.4% 4.9% – 3.1%
U.S. state, municipal and agencies debtAmortized cost 60 51 53 6 4,499 – 4,669Fair value 60 51 55 7 4,334 – 4,507Yield (5) 1.1% 1.7% 1.3% 5.9% 2.0% – 1.9%
Other OECD government debt (3)
Amortized cost 4,006 1,108 1,736 190 – – 7,040Fair value 4,005 1,105 1,730 193 – – 7,033Yield (5) .2% 1.8% 1.8% 3.7% – – 1.0%
Mortgage-backed securities (5)
Amortized cost – – 20 26 268 – 314Fair value – – 21 28 261 – 310Yield (5) – – 4.6% 4.2% 2.6% – 2.9%
Asset-backed securitiesAmortized cost 128 30 270 1,588 1,413 – 3,429Fair value 128 31 269 1,576 1,309 – 3,313Yield (5) 2.0% 5.1% 0.8% 0.7% 1.6% – 1.2%
Corporate debt and other debtAmortized cost 5,793 1,917 2,073 388 380 53 10,604Fair value 5,803 1,920 2,049 361 361 64 10,558Yield (5) 2.2% 2.1% 2.0% 5.9% 4.8% – 2.3%
EquitiesCost – – – – – 1,219 1,219Fair value – – – – – 1,398 1,398
Loan substituteCost – – – – – 222 222Fair value – – – – – 222 222Yield (5) – – – – – 3.7% 3.7%
Amortized cost 10,572 3,548 12,961 2,892 6,607 1,494 38,074Fair value 10,582 3,558 13,411 2,883 6,315 1,684 38,433
Held-to-maturity securities (1)
Amortized cost 129 57 193 81 1 – 461Fair value 129 57 193 81 1 – 461
Total carrying value of securities (1) $10,711 $ 3,615 $13,604 $ 2,964 $ 6,316 $ 1,684 $ 38,894
(1) Trading securities and AFS securities are recorded at fair value. Held-to-maturity securities are recorded at amortized cost.(2) Actual maturities may differ from contractual maturities shown above since borrowers may have the right to prepay obligations with or without prepayment penalties.(3) OECD stands for Organization for Economic Co-operation and Development.(4) Includes CDOs which are presented as Asset-backed securities – CDOs in the table entitled “Fair value of assets and liabilities classified using the fair value hierarchy” in Note 4.(5) The weighted average yield is derived using the contractual interest rate and the carrying value at the end of the period for the respective securities.

90 Royal Bank of Canada First Quarter 2012
Note 19 Additional disclosures under IFRS (continued)
B: Loans
Loan maturity and rate sensitivityOctober 31, 2011
Maturity term (1) Rate sensitivity
Under1 year (2), (3)
1 to 5years
Over 5years Total Floating Fixed Rate
Non-rate-sensitive Total
Retail $ 122,634 $ 149,075 $ 13,036 $ 284,745 $ 176,319 $ 104,276 $ 4,150 $ 284,745Wholesale 35,783 24,043 8,885 68,711 40,185 27,247 1,279 68,711
Total loans 158,417 173,118 21,921 353,456 216,504 131,523 5,429 353,456Allowance for loan losses – – – (1,967) – – – (1,967)
Total loans net of allowance for loan losses $ 158,417 $ 173,118 $ 21,921 $ 351,489 $ 216,504 $ 131,523 $ 5,429 $ 351,489
(1) Generally, based on the earlier of contractual repricing or maturity date.(2) Included in Wholesale are loans totalling $1.4 billion to SPEs administered by us. All of the loans reprice monthly or quarterly.(3) Includes variable rate loans that can be repriced at the clients’ discretion without penalty.
C: Special purpose entities
Consolidated special purpose entitiesThe following table presents the assets and liabilities of consolidated special purpose entities recorded on our Consolidated Balance Sheets.
October 31, 2011
Credit cardsecuritization
vehicle (1)Structured
finance
Creditinvestment
productSPEs
Investmentfunds Other (1) Total
Consolidated assets (2), (3)
Cash $ – $ 28 $ – $ 2 $ 6 $ 36Securities – Trading and Available-for-sale – 3,740 – 252 27 4,019Loans – Retail and Wholesale – 214 75 – 2,597 2,886Other assets 11 47 – – 18 76
$ 11 $ 4,029 $ 75 $ 254 $ 2,648 $ 7,017
Consolidated liabilitiesDeposit $ 3,747 $ 216 $ 99 $ – $ – $ 4,062Other liabilities (4) 41 3,254 – – 88 3,383Non-controlling interests – – – – 1,863 1,863
$ 3,788 $ 3,470 $ 99 $ – $ 1,951 $ 9,308
(1) We transferred credit card receivables to a securitization vehicle and mortgages to RBC Capital Trust and RBC Covered Bond Guarantor Limited Partnership (Guarantor LP). These transferred assetswere not derecognized from our Consolidated Balance Sheets and the consideration received was recorded as liabilities to the SPEs, as we retain control over substantially all of the risks andrewards of the transferred assets. Upon consolidation of the SPEs, only the notes and the innovative capital instruments issued to the third-party investors are reported in the above table.
(2) As at October 31, 2011, our compensation vehicles held $29 million of our common shares, which are reported as Treasury shares and this amount represents the total assets of these vehicles. Theobligation to provide our common shares to employees is recorded as an increase to Retained earnings as the expense for the corresponding stock-based compensation plan is recognized.
(3) Investors have recourse only to the assets of the related consolidated special purpose entities and do not have recourse to our general assets unless we breach our contractual obligations relatingto those special purpose entities, provide liquidity facilities or credit enhancement facilities to, or enter into derivative transactions with, the special purpose entities. In the ordinary course ofbusiness, the assets of each consolidated special purpose entity can generally only be used to settle the obligations of the special purpose entity. Upon the occurrence of certain credit events, theassets of Guarantor LP, which are mortgages, will be used to settle the covered bonds issued by RBC. The loan provided by us to Guarantor LP to purchase the mortgages is eliminated uponconsolidation.
(4) Other liabilities generally represent notes issued by the special purpose entities.
We also hold significant interests in certain SPEs that we do not consolidate but in respect of which, we have recorded on our Consolidated BalanceSheets assets and liabilities arising from our transactions and involvement with these SPEs. This information is set forth in the table below. Inaddition, we may be a sponsor of certain SPEs in which we have interests. In determining whether we are a sponsor of an SPE, we consider bothqualitative and quantitative factors, including the purpose and nature of the special purpose entity, our continuing involvement in the SPE andwhether we hold subordinated interests in the SPE. This table also includes SPEs that we sponsor.

Royal Bank of Canada First Quarter 2012 91
Unconsolidated special purpose entitiesOctober 31, 2011
Multi-sellerconduits (1)
Structuredfinance
Creditinvestment
productSPEs (2)
Investmentfunds
Third-partysecuritization
vehicles Other (3) Total
Total assets of unconsolidated special purpose entities $24,271 $ 4,988 $ 508 $ 1,374 $ 1,090 $137,358 $169,589On-balance sheet assets
Securities – Trading and Available-for-sale 111 – – 1,090 – 130 1,331Loans – Retail and Wholesale 1,413 – – – – – 1,413Other assets – 870 – – – 208 1,078
Total $ 1,524 $ 870 $ – $ 1,090 $ – $ 338 $ 3,822
On-balance sheet liabilitiesOther liabilities 190 – – – – 36 226
Total $ 190 $ – $ – $ – $ – $ 36 $ 226
Maximum exposure to loss (4) $24,614 $ 1,340 $ 17 $ 1,125 $ 214 $ 60 $ 27,370
(1) Total assets represent maximum assets that may have to be purchased by the conduits under purchase commitments outstanding as at October 31, 2011. Actual assets held by these conduits as atOctober 31, 2011, were $16.3 billion .
(2) Excluded from this table are trading securities that we have transferred to these special purpose entities as collateral for the funded notes issued by the special purpose entities as at October 31,2011. The transfers do not result in de-recognition; as a result, these assets remain on our Consolidated Balance Sheets and are accounted for as secured borrowings. See subsequent discussionon credit investment products.
(3) Includes tax credit funds and mutual funds that we sponsor which are described in our Other significant vehicles discussion.(4) The maximum exposure to loss resulting from our significant interests in these SPEs consists mostly of investments, loans, fair value of derivatives, liquidity and credit enhancement facilities. The
maximum exposure to loss of the multi-seller conduits is higher than the on-balance sheet assets primarily by the notional amounts of the liquidity and credit enhancement facilities. Refer to Note15 for the amounts of the liquidity and credit enhancement facilities.
Credit card securitization vehicleWe securitize a portion of our credit card receivables through an SPE on a revolving basis. The SPE is financed through the issuance of senior andsubordinated notes collateralized by the underlying credit card receivables. The senior notes are issued to third-party investors and the subordinatednotes are owned by us. The third-party investors have recourse only to the transferred assets.
We continue to service the credit card receivables sold to the SPE and perform an administrative role for the SPE. We also provide first-lossprotection to the SPE through our ownership of all the subordinated notes issued by the SPE and our interest in the excess spread (residual netinterest income after all trust expenses) which is subordinated to the SPE’s obligations to the ABS noteholders.
Additionally, we may own some senior notes as investments or for market-making activities; we retain a cash reserve account of the SPE fromtime to time; we provide subordinated loans to the SPE to pay upfront expenses; and we act as counterparty to interest rate and cross currency swapagreements which hedge the SPE’s interest rate and currency risk exposure.
We consolidate the SPE because we have the decision making powers to obtain the majority of the benefits of the SPE and are exposed to themajority of the residual ownership risks.
Structured financeU.S. ARS SPEsWe purchased U.S. ARS from certain SPEs (U.S. ARS SPEs) which fund their long-term investments in student loans by issuing short-term senior andsubordinated notes. We are subject to losses on these U.S. ARS SPEs if defaults are experienced on the underlying student loans; however, theprincipal and accrued interest on the student loans is generally guaranteed by U.S. government agencies. We act as auction remarketing agent forsome of these entities but have no legal obligation to purchase the notes issued by these entities in the auction process.
We do not consolidate those U.S. ARS SPEs where we do not have decision making power to obtain the majority of the benefits of the SPE. Wehave significant interests in these entities through our note holdings.
ARS TOB programsWe also sold ARS into TOB programs, where each program consists of a credit enhancement (CE) trust and a TOB trust. Each ARS sold to the TOBprogram is supported by a letter of credit and liquidity facility issued by us, which requires us to extend funding if there are any credit losses on theARS. The CE trust certificate is deposited into a TOB trust which provides the financing of the purchase of the underlying security through the issuanceof floating-rate certificates to short-term investors and a residual certificate to a single third-party investor. Both the CE and the TOB trusts are SPEs.We are the remarketing agent for the floating-rate certificates and we provide liquidity facilities to each of the ARS TOB programs to purchase anyfloating-rate certificates that have been tendered but not successfully remarketed. We receive market-based fees for acting as the remarketing agentand providing the letters of credit and liquidity facilities.
We consolidate these ARS TOB programs as we control the CE trust and are exposed to the majority of the residual ownership risks of theunderlying ARS through our provision of the credit enhancement and the liquidity facility.
Non-ARS TOB programsWe utilize the TOB funding vehicle to finance other non-ARS assets within our Capital Markets platform. The structure of other non-ARS TOB programsthat we are involved with is similar to the structure of the ARS TOB programs described above. However, in certain non-ARS TOB programs, we alsopurchase the residual certificates issued by these TOB vehicles which exposes us to credit risk of the underlying bonds as well as interest rate risk ofthe structure. Where we own the residual certificate, the assets transferred into the TOB vehicle continue to be recorded on our Consolidated BalanceSheets as we have not transferred substantially all of the risks and rewards of ownership. We consolidate programs in which we are the holder of theresidual certificate as we have the decision making power to obtain the majority of the benefits of the SPEs and are exposed to the majority of theresidual ownership risks.
In certain other non-ARS TOB programs, the residual certificates are held by third-parties and we do not provide credit enhancement of theunderlying assets but only provide liquidity facilities on the floating-rate certificates; therefore, we do not consolidate these programs. The assetstransferred into these programs are derecognized from our Consolidated Balance Sheets.

92 Royal Bank of Canada First Quarter 2012
Note 19 Additional disclosures under IFRS (continued)
Credit investment productsWe use SPEs to generally transform credit derivatives into cash instruments, to distribute credit risk and to create customized credit products to meetinvestors’ specific requirements. We enter into derivative contracts, including credit derivatives, to purchase protection from these SPEs (creditprotection) and convert various risk factors such as yield, currency or credit risk of underlying assets to meet the needs of the investors. We maytransfer assets to these SPEs as collateral for notes issued; however, these assets continue to be recorded on our Consolidated Balance Sheets as wehave not transferred substantially all of the risks and rewards of ownership.
These SPEs issue funded notes. In certain instances, we invest in the funded notes issued by these SPEs. Some of the SPEs also issue unfundednotes in the form of senior credit derivatives or funding commitments and we may be an investor of these unfunded notes. The investors of the fundednotes are not exposed to the credit or market risks of the collateral assets as we are required to repurchase the assets at their par value. Theunfunded notes are in a senior position to the funded notes. The investors in these funded and unfunded notes are exposed to credit risk as a resultof the credit protection provided by the SPEs, subject to their level of seniority. In our role as derivative counterparty to the SPEs, we also assume theassociated counterparty credit risk of the SPEs. Currently, we act as sole arranger and swap provider for certain SPEs and, in some cases, act as thepaying and issuing agent as well. Other independent third parties fulfill the remainder of the functions required for such a product.
We consolidate those credit investment product SPEs in which we have the decision making power to obtain the majority of the benefits of theSPE.
Investment fundsWe enter into fee-based equity derivative transactions with third parties including mutual funds, unit investment trusts and other investment funds.These transactions provide their investors with the desired exposure to the reference funds, and we economically hedge our exposure from thesederivatives by investing in those third-party managed reference funds. We also act as custodian or administrator for several funds. Our investments inreference funds may expose us to the market risk of the underlying investments. We may also be exposed to counterparty risk due to the equityderivative transactions. We do not consolidate these third-party managed reference funds as we do not have power to direct their investing activities.
We also enter into certain fee-based equity derivative transactions similar to those described above except that our investments in the referencefunds are held by an intermediate limited partnership entity (intermediate entity), a SPE subsidiary. We consolidate the intermediate entity becausewe have the decision making power to obtain the majority of the benefits of the SPE and are exposed to a majority of the residual ownership risk.
Multi-seller conduitsWe administer five multi-seller ABCP conduit programs (multi-seller conduits) – two in Canada and three in the U.S. These conduits primarily purchasefinancial assets from clients and finance those purchases by issuing ABCP.
We do not maintain any ownership or retained interests in the multi-seller conduits that we administer and have no rights to, or control of, theirassets. As the administrative agent, we earn a residual fee for providing services such as coordinating funding activities, transaction structuring,documentation, execution and monitoring of transactions. The ABCP issued by each multi-seller conduit is in the conduit’s own name with recourse tothe financial assets owned by each multi-seller conduit, and is non-recourse to us except through our participation in liquidity and/or creditenhancement facilities. We may purchase ABCP issued by our multi-seller conduits from time to time in our capacity as placement agent in order tofacilitate the overall program liquidity.
We provide transaction-specific and program-wide liquidity facilities to the multi-seller conduits. In addition, we provide program-wide creditenhancement to the multi-seller conduits which obligate us to purchase assets or advance funds in the event the multi-seller conduit does nototherwise have funds from other sources, such as from the liquidity facilities, to settle maturing ABCP. In some cases, we or another third party mayprovide transaction-specific credit enhancement which can take various forms. We receive market-based fees for providing these liquidity and creditfacilities.
Each transaction is structured with transaction-specific first loss protection provided by the third-party seller. This enhancement can take variousforms, including but not limited to overcollateralization, excess spread, subordinated classes of financial assets, guarantees or letters of credit. Theamount of this enhancement varies but is generally sized to cover a multiple of loss experience.
An unrelated third party (expected loss investor) absorbs credit losses, up to a maximum contractual amount, that may occur in the future on theassets in the multi-seller conduits before the multi-seller conduits’ debt holders and us. In return for assuming this multi-seller conduit first-lossposition, each multi-seller conduit pays the expected loss investor a return commensurate with its risk position. The expected loss investor hassubstantive power to direct the majority of the activities which significantly impact the conduit’s economic performance, including initial selectionand approval of the asset purchase commitments and liquidity facilities, approval of renewal and amendment of these transactions and facilities, saleor transfer of assets, ongoing monitoring of asset performance, and mitigation of credit losses.
We do not consolidate these multi-seller conduits as we do not have the decision-making power to obtain the majority of the benefits of the SPE.
Third-party securitization vehiclesWe hold significant interests in certain third-party securitization vehicles which are SPEs. We, as well as other financial institutions, are obligated toprovide funding up to our maximum commitment level and are exposed to credit losses on the underlying assets after various credit enhancements.Enhancement can take various forms, including but not limited to overcollateralization, excess spread, subordinated classes of financial assets,guarantees or letters of credit. The amount of this enhancement varies but is generally sized to cover a multiple of loss experience. We do notconsolidate these entities as we do not have the decision making power to obtain the majority of the benefits of these SPEs and are not exposed to amajority of the residual ownership risks.
OtherFunding vehiclesRBC Capital Trust (Trust), RBC Capital Trust II (Trust II), RBC Subordinated Notes Trust (Trust III) and Guarantor LP were created to issue innovativecapital instruments, subordinated notes or covered bonds. With the proceeds, we issued senior deposit notes to Trust II and Trust III and transferredour mortgages to the Trust and Guarantor LP. These mortgages were not derecognised from our Consolidated Balance Sheets and the transfers areaccounted for as secured financing transactions as we retain control over substantially all of the risks and rewards of the transferred assets. Weconsolidate the trusts and Guarantor LP as, through our roles as trustee, administrative agent and equity investor, we have the decision making powerto retain the majority of the benefits of the trusts and Guarantor LP. Upon consolidation of the SPEs, all the intercompany balances are eliminatedexcept for the notes and innovative capital instruments issued to the third-party investors.
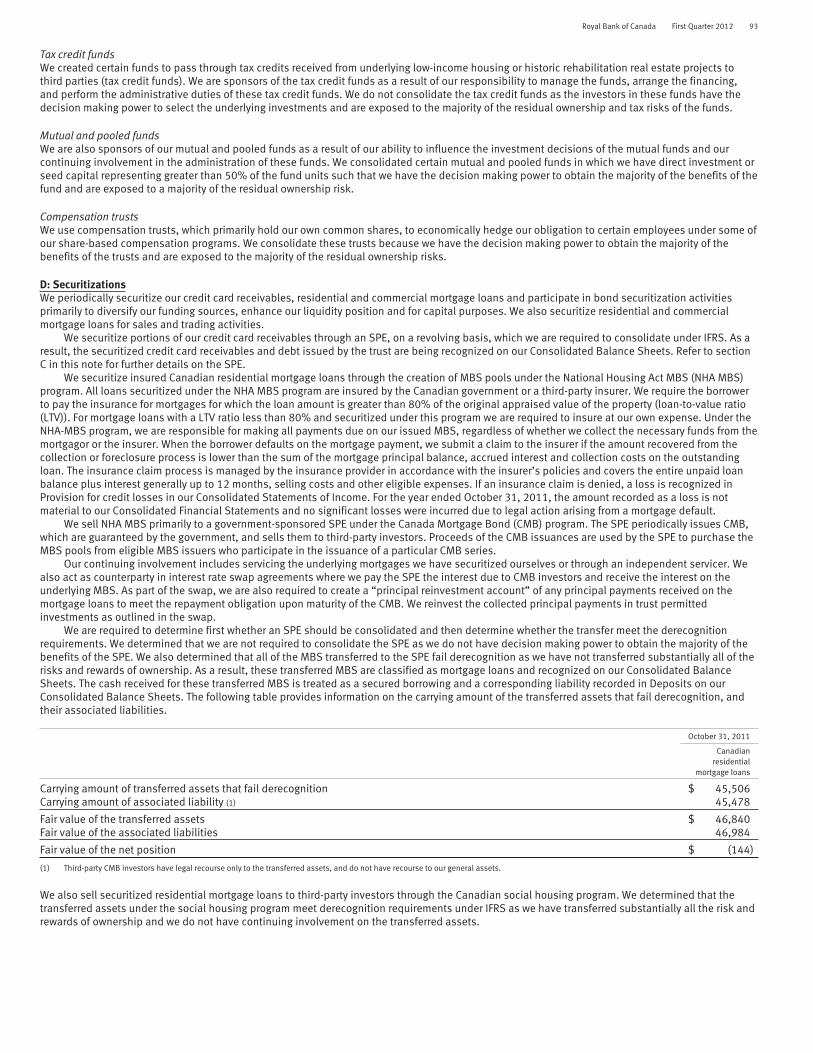
Royal Bank of Canada First Quarter 2012 93
Tax credit fundsWe created certain funds to pass through tax credits received from underlying low-income housing or historic rehabilitation real estate projects tothird parties (tax credit funds). We are sponsors of the tax credit funds as a result of our responsibility to manage the funds, arrange the financing,and perform the administrative duties of these tax credit funds. We do not consolidate the tax credit funds as the investors in these funds have thedecision making power to select the underlying investments and are exposed to the majority of the residual ownership and tax risks of the funds.
Mutual and pooled fundsWe are also sponsors of our mutual and pooled funds as a result of our ability to influence the investment decisions of the mutual funds and ourcontinuing involvement in the administration of these funds. We consolidated certain mutual and pooled funds in which we have direct investment orseed capital representing greater than 50% of the fund units such that we have the decision making power to obtain the majority of the benefits of thefund and are exposed to a majority of the residual ownership risk.
Compensation trustsWe use compensation trusts, which primarily hold our own common shares, to economically hedge our obligation to certain employees under some ofour share-based compensation programs. We consolidate these trusts because we have the decision making power to obtain the majority of thebenefits of the trusts and are exposed to the majority of the residual ownership risks.
D: SecuritizationsWe periodically securitize our credit card receivables, residential and commercial mortgage loans and participate in bond securitization activitiesprimarily to diversify our funding sources, enhance our liquidity position and for capital purposes. We also securitize residential and commercialmortgage loans for sales and trading activities.
We securitize portions of our credit card receivables through an SPE, on a revolving basis, which we are required to consolidate under IFRS. As aresult, the securitized credit card receivables and debt issued by the trust are being recognized on our Consolidated Balance Sheets. Refer to sectionC in this note for further details on the SPE.
We securitize insured Canadian residential mortgage loans through the creation of MBS pools under the National Housing Act MBS (NHA MBS)program. All loans securitized under the NHA MBS program are insured by the Canadian government or a third-party insurer. We require the borrowerto pay the insurance for mortgages for which the loan amount is greater than 80% of the original appraised value of the property (loan-to-value ratio(LTV)). For mortgage loans with a LTV ratio less than 80% and securitized under this program we are required to insure at our own expense. Under theNHA-MBS program, we are responsible for making all payments due on our issued MBS, regardless of whether we collect the necessary funds from themortgagor or the insurer. When the borrower defaults on the mortgage payment, we submit a claim to the insurer if the amount recovered from thecollection or foreclosure process is lower than the sum of the mortgage principal balance, accrued interest and collection costs on the outstandingloan. The insurance claim process is managed by the insurance provider in accordance with the insurer’s policies and covers the entire unpaid loanbalance plus interest generally up to 12 months, selling costs and other eligible expenses. If an insurance claim is denied, a loss is recognized inProvision for credit losses in our Consolidated Statements of Income. For the year ended October 31, 2011, the amount recorded as a loss is notmaterial to our Consolidated Financial Statements and no significant losses were incurred due to legal action arising from a mortgage default.
We sell NHA MBS primarily to a government-sponsored SPE under the Canada Mortgage Bond (CMB) program. The SPE periodically issues CMB,which are guaranteed by the government, and sells them to third-party investors. Proceeds of the CMB issuances are used by the SPE to purchase theMBS pools from eligible MBS issuers who participate in the issuance of a particular CMB series.
Our continuing involvement includes servicing the underlying mortgages we have securitized ourselves or through an independent servicer. Wealso act as counterparty in interest rate swap agreements where we pay the SPE the interest due to CMB investors and receive the interest on theunderlying MBS. As part of the swap, we are also required to create a “principal reinvestment account” of any principal payments received on themortgage loans to meet the repayment obligation upon maturity of the CMB. We reinvest the collected principal payments in trust permittedinvestments as outlined in the swap.
We are required to determine first whether an SPE should be consolidated and then determine whether the transfer meet the derecognitionrequirements. We determined that we are not required to consolidate the SPE as we do not have decision making power to obtain the majority of thebenefits of the SPE. We also determined that all of the MBS transferred to the SPE fail derecognition as we have not transferred substantially all of therisks and rewards of ownership. As a result, these transferred MBS are classified as mortgage loans and recognized on our Consolidated BalanceSheets. The cash received for these transferred MBS is treated as a secured borrowing and a corresponding liability recorded in Deposits on ourConsolidated Balance Sheets. The following table provides information on the carrying amount of the transferred assets that fail derecognition, andtheir associated liabilities.
October 31, 2011
Canadianresidential
mortgage loans
Carrying amount of transferred assets that fail derecognition $ 45,506Carrying amount of associated liability (1) 45,478
Fair value of the transferred assets $ 46,840Fair value of the associated liabilities 46,984
Fair value of the net position $ (144)
(1) Third-party CMB investors have legal recourse only to the transferred assets, and do not have recourse to our general assets.
We also sell securitized residential mortgage loans to third-party investors through the Canadian social housing program. We determined that thetransferred assets under the social housing program meet derecognition requirements under IFRS as we have transferred substantially all the risk andrewards of ownership and we do not have continuing involvement on the transferred assets.
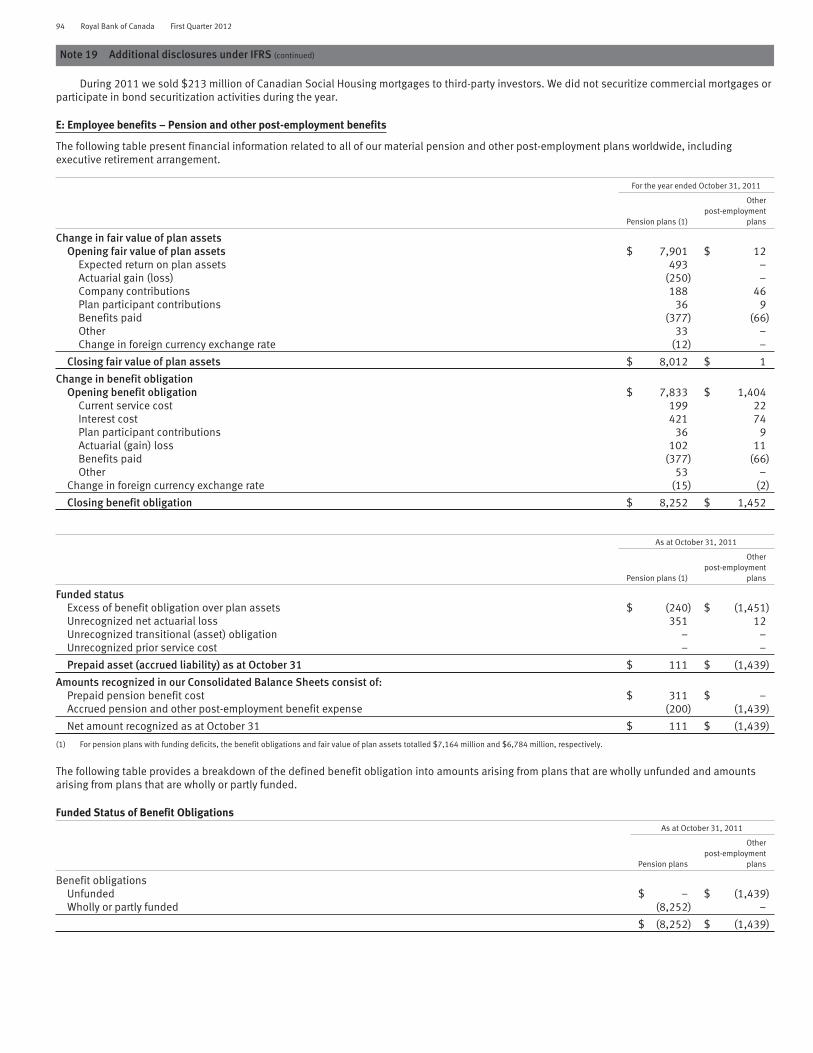
94 Royal Bank of Canada First Quarter 2012
Note 19 Additional disclosures under IFRS (continued)
During 2011 we sold $213 million of Canadian Social Housing mortgages to third-party investors. We did not securitize commercial mortgages orparticipate in bond securitization activities during the year.
E: Employee benefits – Pension and other post-employment benefits
The following table present financial information related to all of our material pension and other post-employment plans worldwide, includingexecutive retirement arrangement.
For the year ended October 31, 2011
Pension plans (1)
Otherpost-employment
plans
Change in fair value of plan assetsOpening fair value of plan assets $ 7,901 $ 12
Expected return on plan assets 493 –Actuarial gain (loss) (250) –Company contributions 188 46Plan participant contributions 36 9Benefits paid (377) (66)Other 33 –Change in foreign currency exchange rate (12) –
Closing fair value of plan assets $ 8,012 $ 1
Change in benefit obligationOpening benefit obligation $ 7,833 $ 1,404
Current service cost 199 22Interest cost 421 74Plan participant contributions 36 9Actuarial (gain) loss 102 11Benefits paid (377) (66)Other 53 –
Change in foreign currency exchange rate (15) (2)
Closing benefit obligation $ 8,252 $ 1,452
As at October 31, 2011
Pension plans (1)
Otherpost-employment
plans
Funded statusExcess of benefit obligation over plan assets $ (240) $ (1,451)Unrecognized net actuarial loss 351 12Unrecognized transitional (asset) obligation – –Unrecognized prior service cost – –
Prepaid asset (accrued liability) as at October 31 $ 111 $ (1,439)
Amounts recognized in our Consolidated Balance Sheets consist of:Prepaid pension benefit cost $ 311 $ –Accrued pension and other post-employment benefit expense (200) (1,439)
Net amount recognized as at October 31 $ 111 $ (1,439)
(1) For pension plans with funding deficits, the benefit obligations and fair value of plan assets totalled $7,164 million and $6,784 million, respectively.
The following table provides a breakdown of the defined benefit obligation into amounts arising from plans that are wholly unfunded and amountsarising from plans that are wholly or partly funded.
Funded Status of Benefit ObligationsAs at October 31, 2011
Pension plans
Otherpost-employment
plans
Benefit obligationsUnfunded $ – $ (1,439)Wholly or partly funded (8,252) –
$ (8,252) $ (1,439)
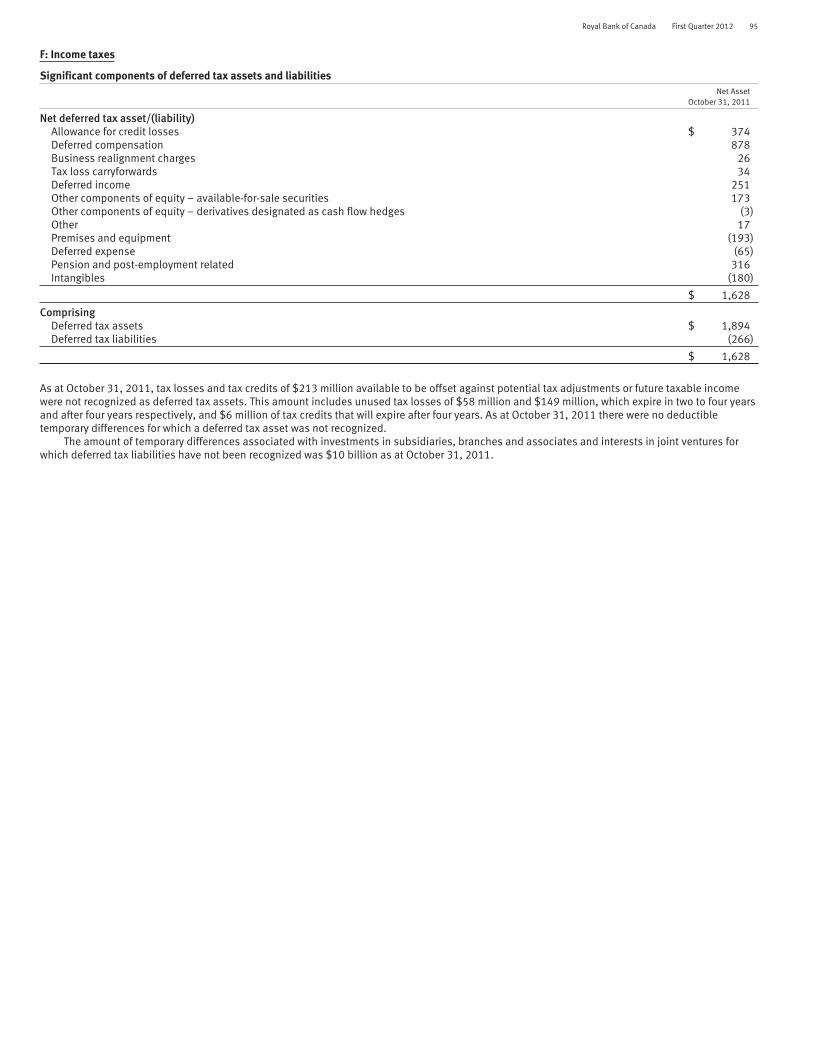
Royal Bank of Canada First Quarter 2012 95
F: Income taxes
Significant components of deferred tax assets and liabilitiesNet Asset
October 31, 2011
Net deferred tax asset/(liability)Allowance for credit losses $ 374Deferred compensation 878Business realignment charges 26Tax loss carryforwards 34Deferred income 251Other components of equity – available-for-sale securities 173Other components of equity – derivatives designated as cash flow hedges (3)Other 17Premises and equipment (193)Deferred expense (65)Pension and post-employment related 316Intangibles (180)
$ 1,628
ComprisingDeferred tax assets $ 1,894Deferred tax liabilities (266)
$ 1,628
As at October 31, 2011, tax losses and tax credits of $213 million available to be offset against potential tax adjustments or future taxable incomewere not recognized as deferred tax assets. This amount includes unused tax losses of $58 million and $149 million, which expire in two to four yearsand after four years respectively, and $6 million of tax credits that will expire after four years. As at October 31, 2011 there were no deductibletemporary differences for which a deferred tax asset was not recognized.
The amount of temporary differences associated with investments in subsidiaries, branches and associates and interests in joint ventures forwhich deferred tax liabilities have not been recognized was $10 billion as at October 31, 2011.

96 Royal Bank of Canada First Quarter 2012
Shareholder information
Corporate headquartersStreet address:Royal Bank of Canada200 Bay StreetToronto, Ontario M5J 2J5CanadaTel: 416-974-5151Fax: 416-955-7800
Mailing address:P.O. Box 1Royal Bank PlazaToronto, Ontario M5J 2J5Canadawebsite: rbc.com
Transfer Agent and RegistrarMain Agent:Computershare Trust Company ofCanada1500 University StreetSuite 700Montreal, Quebec H3A 3S8CanadaTel: 1-866-586-7635 (Canada andthe U.S.) or 514-982-7555(International)Fax: 514-982-7580website: computershare.com\rbc
Co-Transfer Agent (U.S.):Computershare Trust Company,N.A.250 Royall StreetCanton, Massachusetts 02021U.S.A.
Co-Transfer Agent (U. K.):Computershare Investor ServicesPLCSecurities Services – RegistrarsP.O. Box 82, The Pavilions,Bridgwater Road, Bristol BS997NHU.K.
Stock exchange listings(Symbol: RY)
Common shares are listed on:Canada – Toronto StockExchange (TSX)U.S. – New York Stock Exchange(NYSE)Switzerland – Swiss Exchange(SIX)
All preferred shares are listed onthe TSX.
Valuation Day priceFor capital gains purposes, theValuation Day (December 22,1971) cost base for our commonshares is $7.38 per share. Thisamount has been adjusted toreflect the two-for- one share splitof March 1981 and the two-for-one share split of February 1990.The one-for- one share dividendspaid in October 2000 and April2006 did not affect the ValuationDay value for our commonshares.
Shareholder contactsFor dividend information, changein share registration or address,lost stock certificates, tax forms,estate transfers or dividendreinvestment, please contact:Computershare Trust Company ofCanada100 University Avenue, 9th FloorToronto, Ontario M5J 2Y1CanadaTel: 1-866-586-7635 (Canada andthe U.S.) or 514-982-7555(International)Fax: 1-888-453-0330 (Canada andthe U.S.) or 416-263-9394
For other shareholder inquiries,please contact:Shareholder RelationsRoyal Bank of Canada200 Bay Street9th Floor, South TowerToronto, Ontario M5J 2J5CanadaTel: 416-955-7806Fax: 416-974-3535
Financial analysts, portfoliomanagers, institutionalinvestorsFor financial informationinquiries, please contact:Investor RelationsRoyal Bank of Canada200 Bay Street4th Floor, North TowerToronto, Ontario M5J 2W7CanadaTel: 416-955-7802Fax: 416-955-7800or visit our website atrbc.com/investorrelations
Direct deposit serviceShareholders in Canada and theU.S. may have their RBCcommon share dividendsdeposited directly to their bankaccount by electronic fundstransfer. To arrange for thisservice, please contact ourTransfer Agent and Registrar,Computershare Trust Companyof Canada.
Eligible dividend designationFor purposes of the enhanceddividend tax credit rulescontained in the Income Tax Act(Canada) and any correspondingprovincial and territorial taxlegislation, all dividends (anddeemed dividends) paid by us toCanadian residents on ourcommon and preferred sharesafter December 31, 2005, aredesignated as “eligibledividends.” Unless statedotherwise, all dividends (anddeemed dividends) paid by ushereafter are designated as“eligible dividends” for thepurposes of such rules.
2012 Quarterly earnings releasedatesFirst quarter March 1Second quarter May 24Third quarter August 30Fourth quarter November 29
(International)e-mail: [email protected]
Dividend dates for 2012Subject to approval by the Board of Directors
Ex-dividenddates
Recorddates
Paymentdates
Common and preferred January 24 January 26 February 24shares series W, AA, AB, AC,AD, AE, AF, AG, AH, AJ, AL, AN,AP, AR, AT, AV and AX
April 23July 24October 23
April 25July 26October 25
May 24August 24November 23
Information contained in or otherwise accessible through the websites mentioned in this report to shareholders does not form a part of this report. All references to websites are inactive textual referencesand are for your information only.
Trademarks used in this report include the LION & GLOBE Symbol, ROYAL BANK OF CANADA, RBC, RBC CAPITAL TRUST and RBC SUBORDINATED NOTES TRUST which are trademarks of Royal Bank of Canada
used by Royal Bank of Canada and/or by its subsidiaries under license. RBC Dexia IS and affiliated Dexia companies are licensed users of the RBC trademark.
40868 (02/2012)