Report on Study on power purchase/sale/surrender of power ...
179
Report on Study on power purchase/sale/surrender of power along with drawal/sales under UI and Transmission System Improvement for Punjab State Power Corporation Limited from April 1, 2010 to March 31, 2013. Submitted to Punjab State Electricity Regulatory Commission Prepared by: ABPS Infrastructure Advisory Pvt. Ltd January 2014
-
Upload
khangminh22 -
Category
Documents
-
view
0 -
download
0
Transcript of Report on Study on power purchase/sale/surrender of power ...

Report on Study on power purchase/sale/surrender of power along with drawal/sales under UI and Transmission System
Improvement for Punjab State Power Corporation Limited from April 1, 2010 to March 31, 2013.
Submitted to
Punjab State Electricity Regulatory Commission
Prepared by:
ABPS Infrastructure Advisory Pvt. Ltd
January 2014

Report on Study on power purchase/sale for PSPCL for FY 2010-11 to FY 2012-13 Page i
Executive Summary
Background
The total capacity available to State of Punjab is 7943 MW with major dependence on the coal fired thermal generating stations and hydel generating stations. The demand supply scenario in Punjab suggests that despite the increase in generation capacity, there have been acute power shortages. The peak demand has been around 11520 MW whereas the peak demand met has been around 9074 MW in FY 2012-13 with peak deficit of around 21%. Similarly, the total energy requirement for the State of Punjab has been around 48 BU whereas energy availability has been around 45 BU in FY 2012-13 with energy shortage of around 5.4%.
PSERC engaged ABPS Infrastructure Advisory Private to carry out a study on power purchase/ sales/ surrender of power along with drawal/sales under Unscheduled Interchange for Punjab State Power Corporation Limited for the period of April 1, 2010 to March 31, 2013.
Based on the analysis of the information collected from the Commission’s office and information available in public domain, the list of additional data and information required for carrying out the study was prepared for obtaining the same from PSPCL and PSTCL. Three rounds of discussions were also held with PSPCL and PSTCL along with Commission officials to discuss in detail the information required and on the information submitted by PSPCL. Based on the information available with the Commission, information received from PSPCL and PSTCL till date and the information available in the public domain, detailed analysis has been carried out on various aspects of the Study for FY 2010-11 to FY 2012-13.
The brief overview of the various aspects pertaining to the power purchase/sale/surrender of power along with drawl/sales under UI and Transmission system improvement for PSTCL as covered in this study along with the key findings and recommendations are summarised in Executive Summary.
Analysis of Sales
The major contribution to energy sales in the State of Punjab is from the Industrial and Agricultural Consumers. During the analysis, it is observed that the methodology adopted for projecting the energy sales for the ensuing year is based on trend analysis i.e., three year CAGR. Prima-facie, this methodology appears to be appropriate, however, variations were observed in the approved annual energy sales and the actual energy sales.
A detailed analysis has been carried out to assess the reasons behind the variations in growth rate considered for projecting category wise actual energy sales and the actual

Report on Study on power purchase/sale for PSPCL for FY 2010-11 to FY 2012-13 Page ii
growth rate as compared to actual sales for previous years. It is observed that these variations were occurring because of the non-consideration of the category-wise variations in number of consumers, connected load, specific consumption, load factor and sudden spurt in energy demand due to changed economic and regulatory scenario.
The analysis of category-wise variation indicates that the major variations have been mainly in Large Supply, Railway traction and medium supply categories. The variation in Domestic Category, Large Supply and Agricultural categories substantially affects the total quantum of sales and thus the energy requirement. Further, it is observed that with the implementation of Open Access there has been a sharp variation in the energy sales as the consumers have opted for other sources of power.
The approved and actual sales along with variations for FY 2010-11 to FY 2012-13 is as shown in the table below:
Table : Summary of Approved and Actual Sales for FY 2010-11 to FY 2012-13
SL No Category
FY 2010-11 FY 2011-12 FY 2012-13
Approved Sales (MU)
Actual Sales (MU)
Variation (%)
Approved Sales (MU)
Actual Sales (MU)
Variation (%)
Approved
Sales (MU)
Actual
Sales (MU)
Variation (%)
1 Domestic 7865 8176 3.95% 8854 8818 -0.41% 9642 9285 -3.70%
2 Non residential 2405 2468 2.62% 2623 2682 2.24% 2838 2712 -4.43%
3 Small power 759 841 10.75% 835 884 5.83% 891 876 -1.65%
4 Medium Supply 1541 1768 14.75% 1755 1823 3.85% 1815 1768 -2.57%
5 Large Supply 9093 8522 -6.27% 9607 8996 -6.36% 7856 9475 20.61%
6 Public Lighting 136 131 -3.65% 137 139 1.53% 135 146 8.02%
7 Bulk Supply 496 540 8.78% 539 560 3.88% 552 566 2.48%
8 Railway Traction 138 144 4.39% 181 138 -23.63% 184 135 -26.73%
9 Agricultural Cons. 10305 10150 -1.50% 10843 10256 -5.41% 11003 10779 -2.04%
Total within the State
32738 32749 0.01% 35374 34295 -3.05% 34916 35742 2.37%
Based on these findings, it is recommended that:

Report on Study on power purchase/sale for PSPCL for FY 2010-11 to FY 2012-13 Page iii
• The methodology of energy sales projection based on the historical trends i.e., 3 years CAGR appears to be appropriate for categories such as Domestic, Non Residential, Small Power, Public Lighting and Bulk Supply.
• For projecting energy sales, variation in other variables such as number of consumers (Domestic Category), connected load, specific consumption (Domestic Category) and load factor may also be analysed as their growth may depend upon different factors and the quantum of impact is different on these variables to improve the projections of energy sales.
• Any change in policy and Regulations that may impact the energy sales especially in the industrial category may be considered by taking suitable assumptions and incorporating the same. In addition, the impact of pending applications and industrial growth in the State may be considered for more accurate projection of sales.
• The Commission in its Tariff Order for FY 2013-14 has approved the implementation of Time of Day Tariff, the same shall also have a bearing on the consumption pattern and therefore needs to be analysed for projecting the sales.
• The data submitted by PSPCL varied at certain instances. It is suggested that uniformity of the data for submission to the Commission shall be maintained so that errors in actual audited data can be avoided.
Energy Availability from Own Generating Stations
PSPCL has three thermal generating stations namely, Guru Gobind Singh Super Thermal Plant at Ropar, Guru Nanak Dev Thermal Plant at Bathinda, Guru Hargobind Thermal Plant at Lehra Mohabbat. The Hydel Power Plants under PSPCL are Shanan Power house, Ranjit Sagar DAM, UBDC power houses, Mukerian Hydel Project, Anand Pur Sahib Hydel Channel, Mini and Micro Hydro Power Plants.
It is observed that PSPCL projects the net energy availability from own thermal generating stations based on the operational parameters, like Plant Availability, Scheduled Renovation & Modernisation, Plant Load Factor and Auxiliary Consumption. Further, PSPCL projects the hydel generation from own hydel generating stations on the basis of average of the actual hydel generation for last three years barring the immediately preceding year. The Commission for projecting the generation from the PSPCL’s thermal generating stations considers the average of actual availability and generation from the thermal generating

Report on Study on power purchase/sale for PSPCL for FY 2010-11 to FY 2012-13 Page iv
stations for the past three years barring the immediately preceding year and Planned Maintenance Schedules and Scheduled R&M. Further, The Commission projects the net hydel generation from the PSPCL’s own hydel generating stations by taking an average of the actual hydel generation for last three years barring the immediately preceding year. The methodology of projected quantum of power generation from PSPCL’s Generating Stations appear to be appropriate, however, variations were observed in the actual energy availability and the energy availability approved by the Commission.
A detailed analysis has been carried out to assess the reasons behind these variations and these variations were occurring on account of the following:
• Variations in actual availability and PLF of the generating stations and due to the variations in the actual and approved Maintenance and R&M schedule.
• Backing down of thermal generating stations due to less power demand in some hours in some months.
During the analysis, it is observed that the actual generation from thermal generating stations for all three years was lower than the generation approved by the Commission. Apart from the variation in planned and actual maintenance schedule, the other reason submitted by PSPCL for reduction in net generation is backing down due to less power demand during some of the hours in some months. Based on the analysis of generation loss due to backing down as shown, it is observed that for all the three years from FY 2010-11 to FY 2012-13, the Generation loss due to backing down as % of net generation for GHTP is higher than GGSSTP while the cost of power of GHTP is less than that of GGSSTP. Based on this it appears that PSPCL has not followed merit order strictly while backing down its own generating stations.
Further, it is observed that the total actual power availability from hydel sources has been more than the power projected by PSPCL as well as projected by the Commission for all the three years from FY 2010-11 to FY 2012-13. However it is observed that the gross generation from Shanan HEP has reduced by only around 17% inspite of 50 MW of its capacity being shut down for almost entire year of FY 2012-13 on account of rehabilitation work.
On the basis of the above analysis, to minimise variations and for better management of own generating stations following are the recommendations:
1) The projections for availability and PLF for thermal stations appears to be on a higher side as the actual availability and PLF for the last few years had continuously

Report on Study on power purchase/sale for PSPCL for FY 2010-11 to FY 2012-13 Page v
been on the lower side than the values projected by the Commission. It is therefore suggested that the projections for availability and PLF of the State Generating Stations may be made considering the actual generation during last 3 years in addition to planned maintenance schedules. This kind of projection will help in reducing variations in the power purchase quantum from short term sources.
2) It is suggested that PSPCL may be asked to record the instances wherein it has to back down its own generating stations both thermal and hydro generating stations along with the duration for which such backing down was done with appropriate justification with regard to circumstances leading to such backing down of its own generating stations. The Commission may ask PSPCL to furnish daily report for instances wherein the State Generating Stations were backed down with reasons leading to such backing down.
3) The Commission may ask PSPCL to submit the details of Station wise daily generation data from its own generating stations including hydro stations to the Commission on regular basis.
Quantum of Power Procurement from CGS and other sources
The State of Punjab is unique in a way that it is an agricultural State and hence faces the problem of shortfall/gap in demand and supply of electricity, especially during the paddy period (June to October). In order to bridge this demand supply gap and to cater to the electricity demand of its consumers, PSPCL procures power from the various sources other than the state generating stations namely, Central Generating Stations, Energy Banking Arrangements, BBMB and Short term Power Purchase through traders.
PSPCL projects energy availability from the Central Generating Stations on the basis of the average of energy received from these stations for the last 3 years barring the immediately preceding year. In order to estimate the energy entitlement of PSPCL from different Central Generating Stations, the Commission considers the average of the actual energy purchased by PSPCL from these stations for the last three years barring the immediately preceding year. Prima-facie the above methodology appears to be appropriate, however, variations were observed in the actual energy availability and the energy availability approved by the Commission from the Central Generating Stations.
Further, for new generating stations it is observed that the quantum of power purchase projected by PSPCL was in not in accordance with the actual progress of these projects which resulted in variations in power purchase quantum from those approved by the

Report on Study on power purchase/sale for PSPCL for FY 2010-11 to FY 2012-13 Page vi
Commission. The delay in commissioning of new generating stations and failure to accurately assess the availability of power from these stations led to increase in short term power purchase and resulted into a financial implication of Rs. 745.62 crore in FY 2010-11, Rs. 229.62 in 2011-12 and Rs. 491.59 crore in FY 2012-13 with the cumulative implication of Rs. 1466.83 crore for FY 2010-11 to FY 2012-13.
The summary of variations in power purchase quantum, total cost of power purchase and average cost of power purchase per unit for FY 2010-11, FY 2011-12 and FY 2012-13 is as shown in the table:
Table: Approved and Actual Power Purchase Cost for FY 2010-11
Source Quantum (MU) Cost (Rs Crore) Avg. Cost (Rs/kWh) Variations
(Avg Cost) Approved Actual Approved Actual Approved Actual NTPC 7787 6795 1648 1770 2.12 2.60 22.64% NHPC 2534 2513 361 531 1.42 2.11 48.59% NPC 845 1269 235 335 2.78 2.64 -5.04% Other Sources 4453 4884 1391 2514 3.12 5.15 65.06% Total 15619 15461 3635 5149 2.33 3.33 42.92%
Table: Approved and Actual Power Purchase Cost for FY 2011-12
Source Quantum (MU) Cost (Rs Crore) Avg. Cost (Rs/kWh) Variations
(Avg Cost) Approved Actual Approved Actual Approved Actual NTPC 7888 6552 2168 2052 2.75 3.13 13.82%
NHPC 2580 2519 455 511 1.76 2.03 15.34%
NPC 800 1446 213 420 2.66 2.91 9.40%
Other Sources 7220 4840 2768 1904 3.83 3.93 2.61%
Total 18488 15357 5603 4888 3.03 3.18 4.95%
Table: Approved and Actual Power Purchase Cost for FY 2012-13
Source Quantum (MU) Cost (Rs Crore) Avg. Cost (Rs/kWh) Variations
(Avg. Cost) Approved Actual Approved Actual Approved Actual NTPC 7899 6332 2558 1883 3.24 2.97 -8.33%
NHPC 2835 2558 631 621 2.22 2.43 9.46%
NPC 794 1499 208 433 2.62 2.89 10.31%
Other Sources 5623 9433 1732 3735 3.08 3.96 28.57%
Total 17151 19821 5128 6673 2.99 3.37 12.71%
It is observed that the actual average rate of power purchase during FY 2010-11 from other sources is Rs. 5.15/kWh which is considerably higher than the Commission approved rate of
Report on Study on power purchase/sale for PSPCL for FY 2010-11 to FY 2012-13 Page vii
power purchase of Rs. 3.12/kWh. Further, there was also substantial increase in average power purchase rate of NTPC and NHPC which is due to revision in tariffs by CERC based on Tariff Regulations applicable for FY 2009-10 to FY 2013-14. The reasons for reduction in quantum of power purchase from the Central Generating Stations are elaborated in the Table 22, Table 25 and Table 28. Further, the reason for higher power purchase cost from other sources is due to the reason that the actual power purchase from the New Generating Stations was substantially lower than the projected power purchase from new sources and hence PSPCL has to procure power from other sources.
It is observed that these variations were occurring on account of the following:
• Variations in the generation considered and the actual generation from the central generating station.
• The entitlement of PSPCL in the Central Generating Stations considered for projecting power purchase varies from the actual entitlement of PSPCL in the Central Generating Stations.
• In some of the stations the difference in the power purchase quantum was not completely attributable to the above two reasons.
On the basis of these findings it is suggested that the following additional aspects may also be considered by PSPCL while projecting the energy available from the existing Central Generating Stations:
• Analysis of Actual Generation by the station during the last three years as the energy received by PSPCL during the last 3 years also includes the impact of less scheduling of power by PSPCL at some instances by applying merit order dispatch.
• Details of major outages due to Renovation & Modernisation may be factored while projecting the quantum of energy available from these stations.
• For New Generating stations, it is suggested that before projecting availability of power from new generating stations actual work progress of such projects be factored in.
• Demand fluctuations due to frequent shifting of open access consumers makes it difficult to project power purchase requirement and so it is suggested that the

Report on Study on power purchase/sale for PSPCL for FY 2010-11 to FY 2012-13 Page viii
Commission may approve the Two Part Tariff specifying demand charges and energy charges for large industrial consumers so that even when the large industrial consumers are drawing power under Open Access, they will be paying the Demand Charges.
Power Procurement Cost
It is observed during the analysis that the Commission projects the power purchase cost in two parts namely Fixed Charges (FC) and Variable Charges (VC). The Commission projects the fixed charges for power procured from the Central Generating Stations on the basis of the Annual Fixed Charges (AFC) of the Central Generating Stations approved by the CERC and the percentage allocation of PSPCL in these Central Generating Stations. The Commission projects the Variable Charges for power procured from the Central Generating Stations on the basis of the bills of September month of the previous year. Prima-facie, the approach appears to be appropriate; however, variations were observed in the actual FC and VC of the Central Generating Station and FC and VC as approved by the Commission.
Based on analysis, it is recommended that:
• The variable charges of the power purchase from Central Generating Stations may be projected on the basis of the variable cost for last three or six months so as to capture the recent trend. PSPCL may consider the average of three months or six months actual variable charges to average out the impact of adjustments etc.,.
• In case the Petition filed by any of Central Generating Stations is pending with CERC for approval of tariff based on new Regulations, PSPCL while projecting the power purchase cost may consider certain percentage of tariff increase sought by CGS on provisional basis while projecting the power purchase cost to avoid substantial variation in power purchase cost.
Short Term Power Purchase
As stated earlier, PSPCL procures power from various sources including the short term power purchase through traders which generally results into huge financial implications. It is observed that in order to avail short term power purchase, PSPCL follows the Competitive Bidding Mechanism wherein first of all, PSPCL makes an estimation of the shortfall in demand and supply of electricity after considering availability from all the other sources. Afterwards, PSPCL generally projects that 80% of this shortfall to be procured under the short term power purchase route and with this submits its application to the Short Term Power Purchase Committee (STPP) which approves a certain amount of power to be procured under the said route of short term power purchase. The Competitive Bidding

Report on Study on power purchase/sale for PSPCL for FY 2010-11 to FY 2012-13 Page ix
Process is then carried out to procure the approved quantum of power under short term purchase.
The bid evaluation reports submitted by PSPCL for procurement of power on short term basis were analysed and it is observed that on an average 20-30 bids were received for every month (June to October) for short term power purchase in each of the three Financial Years, i.e. FY 2010-11, 2011-12 and FY 2012-13. Based on the analysis, it is observed that PSPCL has made short term power purchase Agreements with the Bidders providing power at the lowest rates at the Punjab Periphery. After detailed analysis of the tender specifications, bid evaluation reports and agreements signed by PSPCL, it appears that Competitive bidding process has been adopted for procuring power on short term basis.
In FY 2010-11, PSPCL in its application to the Short Term Power Purchase Committee had projected the ratio of power procured through short term agreements to the power procured under spot purchase including UI overdrawal as 60:40 whereas the ratio of actual power procured under short term agreements to the spot purchase including net UI overdrawal works out to around 73:27.
In FY 2011-12, PSPCL in its application to the Short Term Power Purchase Committee had projected the ratio of power procured through short term agreements to the power procured under spot purchase including UI overdrawal as 80:20 whereas the ratio of actual power procured under short term agreements to the spot purchase including net UI overdrawal works out to around 96:4.
In FY 2012-13, PSPCL in its application to the Short Term Power Purchase Committee had projected the ratio of power procured through short term agreements to the power procured under spot purchase as 80:20 whereas the ratio of actual power procured under short term agreements to the spot purchase including net UI overdrawal works out to around 67:33.
Further, it is observed that the need to procure power under the short term purchase route arose because the power purchase from the New Generating Stations as projected by PSPCL for various years was not achieved in actual and the actual power purchase from the New Generating Stations was substantially lower.
Based on these findings, it is recommended that:
• PSPCL may consider the availability of power from the New Generating Stations on the basis of the actual current status of the project as well as the realistic date of Commercial Operation rather than considering the Scheduled date of Commercial Operation. It is suggested that PSPCL may directly ask the Generators about the likely Commercial Operation Date for new Generating stations and the same can be further cross-checked with the information available with CEA on progress of new

Report on Study on power purchase/sale for PSPCL for FY 2010-11 to FY 2012-13 Page x
projects. This will allow PSPCL to plan for purchase of deficit power which if known before hand can be better planned through other sources.
• The Commission may ask PSPCL to prepare monthly sales plan based on historical monthly sales and the annual sales approved by the Commission and on this basis shall prepare monthly power purchase plan including short term power purchase and banking. The Commission may also ask PSPCL to submit the monthly budget for procurement of power based on its power procurement plan. The Commission may ask PSPCL to adhere to this plan and in case of any variation observed which could lead to increase in the budget; the same to be informed to the Commission with appropriate justification and actions to be taken so that the impact is absorbed in the next monthly budgets.
• The Commission may specify the limit on additional procurement of power in terms of both quantum and cost and in case either of the factors is likely to increase beyond the limit, PSPCL may be asked to obtain prior approval of the Commission.
Costly Power Procurement
PSPCL has been sourcing expensive power from RLNG and liquid fuel based stations for all the years i.e. FY 2010-11 to FY 2012-13, whose average variable cost exceeded Rs. 8.00/kWh. It is observed that the State of Punjab has been continuously reeling under acute power deficit scenario and hence it has been procuring this power.
It is observed that at times PSPCL is required to purchase such power on directions of the load despatch center; however option of procurement of cheaper power through power exchanges may be explored.
UI Transactions
The UI transactions and its financial implication have been analyzed considering the data provided by PSPCL and obtained from various sources like NRPC and NRLDC. PSPCL has incurred the following additional cost in FY 2010-11 to FY 2012-13 in the form of Additional UI charges and interest charges on UI amount owing to its failure to adhere to grid discipline:
Table: Financial Implication due to UI Transaction
Financial Implication due to UI Transactions (Rs. Crore) Parameter FY 2010-11 FY 2011-12 FY 2012-13
UI Charges 507.54 -48.98 284.09

Report on Study on power purchase/sale for PSPCL for FY 2010-11 to FY 2012-13 Page xi
Financial Implication due to UI Transactions (Rs. Crore) Parameter FY 2010-11 FY 2011-12 FY 2012-13
Payable/Receivable (+/-) Additional UI Payable 63.51 23.56 23.63 Interest Charges due to Delay in Payment
24.09 15.85 20.27
It is observed that PSPCL had to pay Rs. 507.54 crore for FY 2010-11 and Rs. 284.09 crore for FY 2012-13 on account of UI whereas it received UI of Rs. 48.98 crore in FY 2011-12. Thus the overall financial impact on account of UI is Rs. 742.65 crore for FY 2010-11 to FY 2012-13.
On the basis of the findings it is recommended that for days wherein additional UI is paid by PSPCL, the same to be documented with appropriate justification with circumstances leading to such over-drawal. Based on the detailed analysis, it is observed that during the months of February 2011, January, 2012 and February 2013 although the net UI quantum was negative but PSPCL had paid amounts of Rs. 481.72 lakh, Rs. 478.82 lakh and Rs. 231.66 lakh respectively during these months. The same indicates that substantial improvement in power procurement planning is required. PSPCL may be asked to take adequate steps to avoid such instances in future.
Drawal/Surrender of Power under UI Mechanism
The drawal/surrender of power is analyzed on a sample basis and the months of April and September of each year are considered based on the energy sales, load shedding and UI charges paid. The injection schedule, implemented schedule and drawal schedules obtained from NRPC and NRLDC is used to analyze the same.
Most of the days in the months considered for the study namely May 2010, September 2010, April 2011, September 2011, April 2012 and September 2012 shows a deviation in the actual drawal from the actual generation. Hence it appears PSPCL has drawn less power.
On the basis of these findings it is suggested that:
• The reason for improper decision making with regards to power purchase and scheduling was the variation in reading of tele-metered data and SEM data. It is recommended that whenever such variation is observed, the same to be properly documented along with steps taken to improve the tele-metered reading. Such reports to be submitted to the Commission on monthly basis.
Report on Study on power purchase/sale for PSPCL for FY 2010-11 to FY 2012-13 Page xii
• In order to bring in more transparency in the power purchase procurement, the Commission may ask PSPCL to prepare the following daily and monthly reports and submit the same on regular basis:
o Daily Reports (i) Station wise daily generation data from its own generating stations including
hydro stations. (ii) Final Drawal Schedule (Day ahead scheduling) submitted to NRLDC from
Inter State Generating Stations (ISGS). (iii) Instances wherein State Generating Stations were Backed Down with reasons
leading to such backing down. (iv) Instances wherein low cost Central Generating Stations were Backed Down
(not as per merit Order) with justification along with circumstances leading to backing down.
(v) Quantum and Cost of short term power purchase (vi) Hourly Load shedding along with the reasons for the same.
o Monthly Reports (i) Daily Time block wise UI Injection/Drawl for the previous month including
following details: • Time block wise UI Drawal both in units and Amount • Time block wise UI Injection both in units and Amount • Time block wise Additional UI paid including reasons for same • Time block wise load shedding carried out, if any
(ii) Monthly Power Purchase plan versus actual power purchase done with reasons for variations in quantum and cost.
Energy Banking
PSPCL enters into banking arrangements every year to manage its peak demand during the paddy season when demand is high owing to agricultural load. An analysis of banking arrangements for the period from FY 2010-11 to FY 2012-13 was carried out to study the overall approach of banking, methodology; quantum of energy banked each year and other implications of the arrangement. The practice is beneficial for better management of surplus and deficit power but the same has not be planned judiciously as is evident from the UI charges imposed on PSPCL during the period when energy was being banked. The summary of quantum of energy banked is as follows:

Report on Study on power purchase/sale for PSPCL for FY 2010-11 to FY 2012-13 Page xiii
Table: Import/Export of Banked Power
Month FY 2010-11 FY 2011-12 FY 2012-13
Import (MU)
Export (MU)
Import (MU)
Export (MU)
Import (MU)
Export (MU)
April 1.20 187.00 0.00 142.45 10.97 71.72 May 0.00 55.80 14.40 0.00 28.20 0.00 June 256.87 0.00 364.43 2.94 261.78 0.00 July 379.19 0.00 656.69 2.99 458.69 0.00 August 361.93 0.00 643.49 0.00 355.06 0.00 September 231.25 0.00 509.64 0.00 401.67 0.00 October 36.51 12.12 45.67 47.49 15.48 34.23 November 0.00 415.88 0.00 343.02 0.00 260.11 December 0.00 447.93 3.70 328.08 3.46 362.69 January 0.00 493.55 0.00 238.08 0.00 310.72 February 0.00 303.93 0.00 190.53 0.00 232.79 March 0.00 303.93 0.00 114.79 0.00 183.36
It is observed that PSPCL had committed outward banking in months when it actually faced acute shortage of power due to which it had to overdraw from the grid paying UI charges and additional UI charges. The total financial impact on account of mis-management in the banking schedules is estimated to be approximately Rs. 104.07 crore for FY 2010-11 to FY 2012-13.
It is observed that most of the banking agreements are signed at an average of two to three months prior to the date of delivery inspite of which a deficit condition is not anticipated as is evident from the situation in FY 2010-11. During the period, PSPCL had been over-drawing from the grid and resorting to load shedding when simultaneously power was being exported under banking obligations. These types of situations can be avoided through proper planning while entering into banking arrangements.
Further, most of the banking agreements have been signed through intermediary traders, who receive the trading margin of 3 paise/kWh. This trading margin is being paid by both the parties individually and is paid in the instance when the power is consumed by each of them. It is suggested that this can be avoided through direct banking as PSPCL has the requisite expertise to carry out the same.
Financial Implication of Power Purchase
The financial implication of power purchase cost that may have been optimised by proper planning is summarised in table below:

Report on Study on power purchase/sale for PSPCL for FY 2010-11 to FY 2012-13 Page xiv
Table: Total Loss incurred by PSPCL due to inefficient planning of power purchase
Particulars
FY 2010-11 FY 2011-12 FY 2012-13
MU
Financial impact
(Rs. Crore)
MU
Financial impact
(Rs. Crore)
MU
Financial impact
(Rs. Crore)
Short Term Power Purchase on account of projecting higher generation from new Generating Stations
2492.79 745.62 2613.20 229.62 4602.92 491.59
Banking of Power 242.80 41.09 233.03 58.57 9.41 4.41 Additional UI - 63.52 - 23.56 - 23.63 Interest on UI - 24.09 - 15.85 - 20.27 Total (Rs. Crore) 874.32 327.60 539.90
Transmission Infrastructure
A detailed analysis of the steps taken by PSPCL and PSTCL to improve inter as well as intra transmission system of the State to relieve network constraints and to provide system strengthening has been carried out. PSTCL has been coordinating with entities like PGCIL/CEA for improvement in inter-state transmission constraints. It appears that the import of power from Western region is constrained due to the overloading of 765 kV Gwalior-Agra line. It appears that the import of power from Eastern region is constrained due to delay in commissioning of Gaya Pooling Station and delay in commencement of construction of Lucknow- Bareilly-Meerut line. Additionally it may not be possible to import more power from Sasan to Punjab (more generating units commissioned at Sasan) as Gwalior-Agra 765 kV line is overloaded. PSTCL has submitted that expedition of work in the augmentation of ICTs at Moga, Ludhiana and Amritsar stations along with addition of new sub-station at Patran will enable to improve the inter-state transfer capacity by 500MW. In the intra-state transmission, capacity addition has been observed more at higher voltages i.e. 400 kV and 220 kV and comparatively less in the lower voltages. Sub-stations addition has also been observed along with augmentation/up-gradation to higher voltages to improve transfer capacity.
The reactive energy charges incurred by PSPCL have been analyzed from data provided by PSPCL and obtained from NRPC. PSPCL has been incurring reactive energy charges during the paddy period i.e. during June to September each year.

Report on Study on power purchase/sale for PSPCL for FY 2010-11 to FY 2012-13
Table of Contents
1 Background and Context ............................................................................................................ 1
1.1 Over view of Punjab Power Sector .................................................................................... 1
1.2 Background of the Study .................................................................................................... 3
1.3 Scope of Work ....................................................................................................................... 4
1.4 Aspects covered in the Study ............................................................................................. 5
1.5 Approach and Methodology for Carrying Out the Study ............................................. 6
1.6 Structure of the Report ........................................................................................................ 9
2 Analysis of Energy Sales ........................................................................................................... 10
2.1 Methodology adopted by PSPCL for Projecting Energy Sales .................................... 10
2.2 Methodology adopted by Commission for Approving Energy Sales ........................ 10
2.3 Analysis of Variation in Actual Energy Sales for FY 2010-11 ...................................... 10
2.4 Analysis of Variation in Actual Energy Sales for FY 2011-12 ...................................... 17
2.5 Analysis of Variation in Energy Sales for FY 2012-13 ................................................... 21
2.6 Summary of Sales Approved and Actual Sales for FY 2010-11, FY 2011-12 and FY 2012-13 ............................................................................................................................................. 25
2.7 Recommendations for Projecting Sales and Energy Requirement .............................. 27
3 Analysis of Quantum of Generation from PSPCL Own Generating Stations including analysis of Planned and Actual Outages ........................................................................................ 29
3.1 Methodology adopted by PSPCL for Assessment of Power Available from Own Generating Stations: ....................................................................................................................... 29
3.2 Methodology adopted by the Commission for Assessment of Power Available from Own Generating Stations: ............................................................................................................. 29
3.3 Analysis of Variation in Actual Generation for Thermal Generating Stations for FY 2010-11 ............................................................................................................................................. 30
3.4 Variation in Planned and Actual Maintenance Schedules ........................................... 31
3.5 Analysis of Variation in Actual Generation for Thermal Stations for FY 2011-12 .... 34
3.6 Variation in Planned and Actual Maintenance Schedules for FY 2011-12 ................. 35
3.7 Analysis of Generation for Hydel Stations for FY 2011-12 ........................................... 36
3.8 Analysis of Variation in Actual Generation for Thermal Stations for FY 2012-13 .... 37
3.9 Variation in Planned and Actual Maintenance Schedules for FY 2012-13 ................. 38
3.10 Analysis of Generation for Hydel Stations for FY 2012-13 ........................................... 40
3.11 Recommendations with respect to PSPCL’s Own Generation .................................... 42

Report on Study on power purchase/sale for PSPCL for FY 2010-11 to FY 2012-13
4 Analysis of Power Purchase ..................................................................................................... 43
4.1 Analysis of variation in Power Purchase Quantum ...................................................... 43
4.2 Power Purchase Cost ......................................................................................................... 74
4.3 PSERC (Power Purchase and Procurement Process of Licensee) Regulations, 2012 92
4.4 Recommendations : ............................................................................................................ 94
5 Analysis of Banking Agreements, UI (Sale/Purchase), Surrender of Power and Transmission System Improvement .............................................................................................. 102
5.1 Procurement of Costly Power ........................................................................................ 102
5.2 UI (Sale/Purchase) and Additional UI: ........................................................................ 106
5.3 Drawal /Surrender of Power under UI Mechanism ................................................... 112
5.4 Energy Banking Arrangement by PSPCL ..................................................................... 128
5.5 Reactive Energy Charges ................................................................................................ 135
5.6 Transmission Infrastructure ........................................................................................... 136
5.7 Recommendations ............................................................................................................ 150
6 Summary of Recommendations ............................................................................................. 152

Report on Study on power purchase/sale for PSPCL for FY 2010-11 to FY 2012-13
List of Figures
Figure 1: Source Wise Installed Capacity for Punjab ...................................................................... 1 Figure 2: Peak Demand vs. Peak Met for Punjab ............................................................................ 2 Figure 3: Energy Requirement and Availability .............................................................................. 3

Report on Study on power purchase/sale for PSPCL for FY 2010-11 to FY 2012-13
List of Tables Table 1: Source-Wise Available Capacity (MW) including allocated Shares in Joint and Central Sector Utilities as on March 31, 2013 ................................................................................... 1 Table 2: Computation of Net Energy Sales as submitted by PSPCL .......................................... 11 Table 3: Analysis of Sales for FY 2010-11 ........................................................................................ 12 Table 4: Variation in Number of Consumers, Connected Load, Specific Consumption/Load Factor and Sales for FY 2010-11 vis-à-vis FY 2009-10 .................................................................... 13 Table 5: Analysis of Sales for FY 2011-12 ........................................................................................ 17 Table 6: Variation in Number of Consumers, Connected Load, Specific Consumption/Load Factor and Sales for FY 2011-12 vis-à-vis FY 2010-11 .................................................................... 18 Table 7: Analysis of Sales for FY 2012-13 ........................................................................................ 22 Table 8: Variation in Number of Consumers, Connected Load, Specific Consumption/Load Factor and Sales for FY 2012-13 vis-à-vis FY 2011-12 .................................................................... 23 Table 9: Summary of Approved and Actual Sales for FY 2010-11 to FY 2012-13 ...................... 26 Table 10: Variation in Actual vis-à-vis Commission Approved Net Generation (MU) for Thermal Generating Stations for FY 2010-11.................................................................................. 30 Table 11: Planned Vs Actual Maintenance Schedules for FY 2010-11 ........................................ 31 Table 12: Generation Loss due to backing down for FY 2010-11 (MU) ...................................... 32 Table 13: Hydel Generation for FY 2010-11 .................................................................................... 33 Table 14: Variation in Actual vis-à-vis Commission Approved Net Generation (MU) for Thermal Generating Stations for FY 2011-12.................................................................................. 34 Table 15: Planned Vs Actual Maintenance Schedules for FY 2011-12 ........................................ 35 Table 16: Generation Loss due to backing down for FY 2011-12 ................................................ 36 Table 17: Hydel Generation for FY 2011-12 .................................................................................... 36 Table 18: Variation in Actual vis-à-vis Commission Approved Net Generation (MU) for Thermal Generating Stations for FY 2012-13.................................................................................. 37 Table 19: Planned Vs Actual Maintenance Schedules for FY 2012-13 ........................................ 39 Table 20: Generation Loss due to backing down for FY 2012-13 ................................................ 40 Table 21: Hydel Generation for FY 2012-13 .................................................................................... 41 Table 22: Variation in Actual vis-à-vis Commission Approved Power Purchase Quantum from Central Generating Stations for FY 2010-11 .......................................................................... 44 Table 23: Variation in Actual vis-à-vis Commission Approved Power Purchase Quantum for New Generating Stations for FY 2010-11 ........................................................................................ 51 Table 24: Break up of Variation in Actual vis-à-vis Commission Approved Power Purchase Quantum for Central Generating Stations for FY 2010-11 ........................................................... 52 Table 25: Variation in Actual vis-à-vis Commission Approved Power Purchase Quantum for Central Generating Stations for FY 2011-12 ................................................................................... 53 Table 26: Variation in Actual vis-à-vis Commission Approved Power Purchase Quantum for New Generating Stations for FY 2011-12 ........................................................................................ 61

Report on Study on power purchase/sale for PSPCL for FY 2010-11 to FY 2012-13
Table 27: Break up of Variation in Actual vis-à-vis Commission Approved Power Purchase Quantum for Central Generating Stations for FY 2011-12 ........................................................... 62 Table 28: Variation in Actual vis-à-vis Commission Approved Power Purchase Quantum for Central Generating Stations for FY 2012-13 ................................................................................... 63 Table 29: Variation in Actual vis-à-vis Commission Approved Power Purchase Quantum for New Generating Stations for FY 2012-13 ........................................................................................ 69 Table 30: Break up of Variation in Actual vis-à-vis Commission Approved Power Purchase Quantum for Central Generating Stations for FY 2012-13 ........................................................... 73 Table 31: Analysis for variation in actual AFC vis-à-vis Commission Approved AFC ........... 75 Table 32: Variation in Actual vis-à-vis Commission Approved Variable Cost for Central Generating Stations ............................................................................................................................ 80 Table 33: Variation in Actual vis-à-vis Commission Approved Power Purchase Cost for NPC .............................................................................................................................................................. 81 Table 34: Analysis of Short Term Power Procurement ................................................................. 85 Table 35: Variation in Actual vis-a-vis Commission Approved Transmission Charges to PGCIL .................................................................................................................................................. 86 Table 36: Summary of Variation in Power Purchase for FY 2010-11 .......................................... 87 Table 37: Summary of Variation in Power Purchase for FY 2011-12 .......................................... 87 Table 38: Summary of Variation in Power Purchase for FY 2012-13 .......................................... 87 Table 39: Total Financial Impact of Variation in Power Purchase Cost including PGCIL Charges ................................................................................................................................................ 88 Table 40: Actual Power Purchase vis-à-vis Commission Approved from New Generating Stations ................................................................................................................................................ 88 Table 41: Financial Implication on account of short term power purchase for FY 2010-11 ..... 89 Table 42: Financial Implication on account of short term power purchase for FY 2011-12 ..... 90 Table 43: Financial Implication on account of short term power purchase for FY 2012-13 ..... 91 Table 44: Demand Charges for other States ................................................................................... 99 Table 45: Power Procurement for FY 2010-11 from RLNG/Liquid fired Stations .................. 102 Table 46: Demand Supply Scenario in FY 2010-11 ...................................................................... 102 Table 47: Power Procurement for FY 2011-12 from RLNG/Liquid fired Stations .................. 103 Table 48: Demand Supply Scenario in FY 2011-12 ...................................................................... 104 Table 49: Power Procurement for FY 2012-13 from RLNG/Liquid fired Stations .................. 105 Table 50: Demand Supply Scenario in FY 2012-13 ...................................................................... 105 Table 51: Net UI drawal/surrender .............................................................................................. 106 Table 52: Additional UI paid by PSPCL in FY 2010-11 ............................................................... 108 Table 53: Additional UI paid by PSPCL in FY 2011-12 ............................................................... 109 Table 54: Additional UI paid by PSPCL in FY 2012-13 ............................................................... 109 Table 55: Interest Charges on un-paid UI amount ...................................................................... 111 Table 56: Monthly Energy Sales as submitted by PSPCL (MU) ................................................ 112 Table 57: Load Shedding carried out by PSPCL (MW) ............................................................... 112 Table 58: Injection and Drawl from ISGS for May 2010 ............................................................. 114 Table 59: Injection and Drawl from ISGS for September 2010 ................................................... 115
Report on Study on power purchase/sale for PSPCL for FY 2010-11 to FY 2012-13
Table 60: Days for which drawal was higher than ISGS scheduled generation for September, 2010 .................................................................................................................................................... 116 Table 61: Days for which UI paid inspite of under-drawal by PSPCL for September, 2010 . 117 Table 62: Injection and Drawl from ISGS for April 2011 ............................................................ 117 Table 63: Days for which drawal was higher than ISGS scheduled generation for April, 2011 ............................................................................................................................................................ 119 Table 64: Injection and Drawl from ISGS for September 2011 ................................................... 120 Table 65: Days on which ISGS Actual Generation deviates from Scheduled Generation for September, 2011 ................................................................................................................................ 121 Table 66: Days for which drawal was higher than ISGS scheduled generation for September, 2011 .................................................................................................................................................... 121 Table 67: Deviation on September 27, 2011 .................................................................................. 122 Table 68: Injection and Drawl from ISGS for April 2012 ............................................................ 122 Table 69: Days for which drawal was higher than ISGS scheduled generation for April, 2012 ............................................................................................................................................................ 124 Table 70: Days for which UI paid inspite of under-drawal by PSPCL for April, 2012........... 124 Table 71: Injection and Drawl from ISGS for September 2012 ................................................... 125 Table 72: Day on which actual gross drawal was higher than ISGS actual generation for September, 2012 ................................................................................................................................ 126 Table 73: Days for which drawal was higher than ISGS scheduled generation for September, 2012 .................................................................................................................................................... 127 Table 74 : Days for which UI paid inspite of under-drawal by PSPCL for September, 2012 127 Table 75 : Energy Banking (FY 2010-11) ........................................................................................ 130 Table 76 : Energy Banking (FY 2011-12) ........................................................................................ 131 Table 77: Energy Banking (FY 2012-13) ......................................................................................... 132 Table 78: Power Banked for Paddy period ................................................................................... 133 Table 79: Energy Banked in MW .................................................................................................... 134 Table 80: Reactive Energy Charges ................................................................................................ 135 Table 81: Installation of capacitors for Reactive energy Compensation ................................... 136 Table 82: Measures to improve inter-state transmission constraints ........................................ 137 Table 83: Transmission Capacity Addition in Ckt. km ............................................................... 138 Table 84: Transmission Capacity Addition in MW ..................................................................... 138 Table 85: Transmission Capacity Addition in MVA (FY 2010-11) ............................................ 139 Table 86: Transmission Capacity Addition in MVA (FY 2011-12) ............................................ 139 Table 87: Transmission Capacity Addition in MVA (FY 2012-13) ............................................ 140 Table 88: Sub-stations Capacity Addition in MVA ..................................................................... 140 Table 89: Improvement Measures in Sub-Stations ...................................................................... 141 Table 90: Improvement Measures in 132kV and 220kV Lines ................................................... 145

Report on Study on power purchase/sale for PSPCL for FY 2010-11 to FY 2012-13 Page | 1
1 Background and Context
1.1 Over view of Punjab Power Sector Available Capacity
The source-wise breakup of total capacity available to the State of Punjab as on March 31, 2013 is as shown below:
Table 1: Source-Wise Available Capacity (MW) including allocated Shares in Joint and Central Sector Utilities as on March 31, 2013
Sector
Thermal
Nuclear Hydro RES
(MNRE) Total
Coal Gas Liquid
Fuel Total
Thermal
State 2620 0 0 2620 0 995 250 3864
Central 1232 0 0 1232 197 1922 0 3351
Private 475 137 0 612 0 116 0 728
Total 4327 137 0 4464 197 3033 250 7943
Source: PSPCL’s Submissions
Source: PSPCL’s Submissions
Figure 1: Source Wise Installed Capacity for Punjab

Report on Study on power purchase/sale for PSPCL for FY 2010-11 to FY 2012-13 Page | 2
As observed from the above figure, the main source of power generation in Punjab has been Coal fired thermal Power Plants and Hydro Power Plants.
Demand Supply Scenario for Punjab
The demand supply scenario in Punjab suggests that despite the increase in generation capacity, there has been acute power shortages and the peak demand has increased from 8672 MW in FY 2007-08 to 11520 MW in FY 2012-13 whereas peak demand met has increased from 7340 MW in FY 2007-08 to 9074 MW in FY 2012-13 with peak deficit of around 21% in FY 2012-13.
Source: PSPCL’s Submission
Figure 2: Peak Demand vs. Peak Met for Punjab The total energy requirement for the State of Punjab has increased from around 43 BU in FY 2007-08 to around 48 BU in 2012-13 whereas energy availability has increased from 39 BU in FY 2007-08 to 45 BU in FY 2012-13 with energy shortage of around 5.4% in FY 2012-13.

Report on Study on power purchase/sale for PSPCL for FY 2010-11 to FY 2012-13 Page | 3
Source: PSPCL’s Submission
Figure 3: Energy Requirement and Availability
1.2 Background of the Study Punjab State Power Corporation Ltd. (PSPCL) erstwhile Punjab State Electricity Board (PSEB) submitted Petition for Approval of Aggregate Revenue Requirement (ARR) for FY 2010-11 on November 30, 2009 wherein it proposed a revenue requirement of Rs 19471.84 crore. Out of the total ARR of Rs 19471.84 crore, PSPCL proposed Power Purchase cost of Rs. 5137.61 crore. Subsequently, the Commission issued Tariff Order for FY 2010-11 dated April 23, 2010 in which the Commission approved the aggregate revenue requirement of Rs 13618.02 crore including power purchase cost of Rs 3774.21 crore.
For FY 2011-12, PSPCL submitted Petition for Approval of ARR for FY 2011-12 on December 16, 2010 wherein it proposed an aggregate revenue requirement of Rs 18447.62 crore including power purchase cost of Rs 6349.74 crore. Subsequently, the Commission issued Tariff Order for FY 2011-12 dated May 9, 2011 in which the Commission approved an aggregate revenue requirement of Rs 14925.00 crore including power purchase cost of Rs 5751.26 crore.
For FY 2012-13, PSPCL submitted Petition for Approval of ARR for FY 2012-13 on December 1, 2011 wherein it proposed an aggregate revenue requirement of Rs 19715.46 crore which included power purchase cost of Rs 7207.38 crore. Subsequently, the Commission issued Tariff Order for FY 2012-13 dated July 16, 2012 in which the Commission approved an aggregate revenue requirement of Rs 15967.13 crore including power purchase cost of Rs 5717.04 crore.

Report on Study on power purchase/sale for PSPCL for FY 2010-11 to FY 2012-13 Page | 4
PSERC has appointed ABPS Infrastructure Advisory Private Ltd. to carry out a study on power purchase/sales/surrender of power along with drawal/sales under UI for Punjab State Power Corporation Limited for the period of April 1, 2010 to March 31, 2013.
1.3 Scope of Work The scope of work includes analysis of issues related to power purchase and sales for FY 2010-11 to FY 2012-13. Further, the study requires in depth analysis of variations in quantum and cost approved for Power Purchase, Sales vis-à-vis actuals now submitted by PSPCL and suggest improvements in the practices followed by PSPCL with regards to purchase/surrender of power and give recommendations to accurately forecast power purchase quantum and cost and sales associated with the consumers. The study to include the following:
1. Methodology adopted by the Distribution Licensee (PSPCL) with regards to assessment of Demand & Energy Requirement and Availability of Power from all contracted sources and whether it is as per the Regulations laid down in the notified PSERC Determination of Tariff Regulations.
2. Whether Maintenance Schedules of own generating units as finalized by PSPCL with CEA were adhered to and in case of variation, whether reasons were justified.
3. Impact of variation in Power Purchase Cost approved in Tariff Order on the tariff determination for retail supply for the next year.
4. Forecast of energy availability from new generating plants versus actual availability and the financial impact of measures taken by PSPCL to meet the variation forecast and actual availability.
5. In depth study of PSPCL’s practice of Banking of Power, defaults made by the entities which were parties to the Banking, financial benefit/loss of swapping power through Banking vis-à-vis short term power purchase through traders or Power Exchange etc.
6. Purchase of costly RLNG and Liquid Fired power from Gas Based stations. Purchase of costly power from Jhajjar Thermal Plant and Pragati Gas Thermal Plant also to be examined.
7. Study of PSPCL’s procedure to draw/surrender of power under UI mechanism, defaults of over-drawal under low frequency conditions and its financial impact.

Report on Study on power purchase/sale for PSPCL for FY 2010-11 to FY 2012-13 Page | 5
8. Steps taken by PSTCL and PSPCL to improve the Total Transfer Capacity of the Punjab
State to address the issues of inter-State/intra-State Transmission constraints and low power factor/low voltage of the grid resulting in heavy import of Reactive Power by Punjab during paddy season.
9. Whether transparent open competitive bidding process and negotiations held with bidders for the purchase of power, as per guidelines issued by Govt. of India and Regulations notified by PSERC.
10. Whether PSPCL adhered to the principle of least cost plan/merit order principle while effecting power purchase in case of shortage or surrender of power in case of surplus.
11. Whether power cut was imposed on any category when the power was being surrendered by PSPCL.
12. Merit order dispatch of power from Thermal Plants of PSPCL need to be examined.
13. Methodology adopted by PSPCL to meet the emergency situation of shortage of power due to outage of Central Sector/PSPCL’s generators etc. and its financial impact on cost of power purchase.
14. Recommendations with regards the followings:
• Methodology for accurate assessment of demand and energy requirement to be adopted by PSPCL, so that there is least variation between the assessment and the actuals.
• Methodology for accurate assessment of PSPCL's own generation and long-term and
short-term power purchase by PSPCL, so that power is purchased in most economical manner by PSPCL.
• Probability and the details of replacement of contracts entered by PSPCL for
purchase of power generated using fossil fuels with hydro power.
1.4 Aspects covered in the Study Accordingly, the aspects that are covered in the report are as shown below:

Report on Study on power purchase/sale for PSPCL for FY 2010-11 to FY 2012-13 Page | 6
1.5 Approach and Methodology for Carrying Out the Study
Overall Approach and Methodology
Based on the analysis of the information collected from the Commission’s office and information available in public domain, the list of additional data and information required for carrying out the study was prepared for obtaining the same from PSPCL and PSTCL.
Three rounds of discussions were also held with PSPCL and PSTCL along with Commission officials to discuss in detail the information required and on the information submitted by PSPCL.
Based on the information available with the Commission, information received from PSPCL and PSTCL till date and the information available in the public domain, detailed analysis

Report on Study on power purchase/sale for PSPCL for FY 2010-11 to FY 2012-13 Page | 7
has been carried out on various aspects of the Study for FY 2010-11 to FY 2012-13. The approach adopted for carrying out the analysis of various aspects is discussed below:
Analysis of Sales Projections
This includes analysis of methodology adopted by PSPCL for estimation of category wise sales along with the basis of growth rates considered for FY 2010-11 to FY 2012-13 and methodology adopted by the Commission for approving category-wise sales for FY 2010-11 to FY 2012-13. The growth rates and sales projected by PSPCL and approved by the Commission have been compared with actual sales and actual variation in sales with respect to previous year. The reasons towards the variation in actual category wise sales with respect to the sales approved by the Commission have been analysed.
Analysis of Generation from PSPCL’s Generating Stations
This includes analysis of methodology adopted by PSPCL for estimation of available power from its own generating stations. The variation in quantum of actual generation with the net generation approved by the Commission have been analysed to find out the reason behind such variation including variations in maintenance schedules.
Analysis of Power Purchase Quantum
This includes analysis of methodology adopted by PSPCL for estimation of available power from various contracted sources along with the basis for projecting energy available from these sources including projection from new generating stations. As the actual data is now available, PSPCL projections, Commission approved values and the actual power purchase quantum have been compared to assess the variation in the power purchase. The variation in power purchase have been analysed to find out the reason behind such variation including detailed analysis of actual scheduled generation of Central Generating Stations and steps taken by PSPCL to meet the variation in forecast and actual availability.
Analysis of Power Purchase Cost
This includes analysis of methodology adopted by PSPCL for projecting power purchase cost and methodology adopted by Commission for approving power purchase cost. As the actual data is now available, the Commission approved value has now been compared to actuals to determine the variation in the power purchase cost. The variation is then analysed to find out the reason behind such variation. For assessing the variation in power purchase cost, Orders issued by Central Electricity Regulatory Commission (CERC) for Central Generating Stations are considered. Based on above, the financial impact of variations in power purchase cost on account of variation in approved power purchase cost and actual power purchase cost has been assessed.

Report on Study on power purchase/sale for PSPCL for FY 2010-11 to FY 2012-13 Page | 8
Purchase of Costly RLNG and Liquid Fired Power from Gas based Stations
Analysis on power purchase from RLNG and liquid fired power stations has been carried out to assess the quantum of such power purchased, reasons behind such purchase of power and co-relating it with the prevailing demand supply scenario for FY 2010-11 to FY 2012-13.
UI Transactions
Analysis of UI charges along with additional UI charges and interest on non payment of UI charges for PSPCL has been carried out. Apart from the data provided by PSPCL on Additional UI Charges, the data available on NRLDC and NRPC websites have been analysed for this aspect of the study. The data collected and analysed from NRLDC and NRPC website includes:
i. Northern Region allocation orders for FY 2010-11, FY 2011-12 and FY 2012-13 ii. UI Account for FY 2010-11, FY 2011-12 and FY 2012-13
iii. ISGS Injection Schedule iv. State Drawal Schedule v. ISGS and State Implemented Schedules (Form –A, Form –B and Form –C of
Implemented Schedules)
The reasons behind over-drawal has been analysed to understand the circumstances leading to such over-drawal which resulted in payment of UI charges and additional UI charges. Further, analysis has been carried out to see whether PSPCL has surrendered power for a given period and has to overdraw due to surrendering of power or has carried out load shedding.
Banking of Power
The State enters into banking arrangements every year to manage peak demand during the paddy season when demand is high due to agricultural demand. Detailed Analysis of banking of Power in State of Punjab for the period FY 2010-11 to FY 2012-13 was carried out to study the overall approach of banking, its methodology, rationale and month-wise capacity tied up through banking.
Short term Power Purchase
This aspect includes the analysis of the process adopted by PSPCL for entering into short term power purchase contracts and analysis of year-wise short term power purchase. Further, reasons behind procurement of short term power has been analysed and the financial impact arising out of such short term power purchase has been assessed.
Transmission System Capacity
This aspect includes analysis of the steps taken by PSTCL to improve inter as well as intra transmission system of the State to relieve network constraints and to provide system

Report on Study on power purchase/sale for PSPCL for FY 2010-11 to FY 2012-13 Page | 9
strengthening. Further, the steps taken for minimising reactive power import especially during paddy season has been analysed.
1.6 Structure of the Report This report is structured in total 5 Sections as follows:
• This Section (Section 1) “Background and Context” includes overview of Punjab Power Sector, Scope of work for the study and Approach & Methodology adopted for carrying out the study.
• Section 2 “Analysis of Energy Sales” includes the detailed analysis of the variation in the Commission approved vis-a-vis actual sale of energy to different categories of consumers in the State of Punjab.
• Section 3 “Analysis of PSPCL’s Own Generating Stations” includes the detailed analysis of the quantum of power generation from the PSPCL’s own generating stations (Thermal and Hydel) including the analysis of planned and actual maintenance schedules.
• Section 4 “Analysis of Power Purchase” includes the detailed analysis of the quantum and cost of power purchase carried out by PSPCL
• The analysis of Energy Banking Agreements, UI (Sale/Purchase), Surrender of Power and Transmission System Improvements, is carried out in Section 5.
• Section 6 includes the recommendations, categorised on the basis of time frame required for their implementation.

Report on Study on power purchase/sale for PSPCL for FY 2010-11 to FY 2012-13 Page | 10
2 Analysis of Energy Sales
2.1 Methodology adopted by PSPCL for Projecting Energy Sales PSPCL in its Petitions has been projecting the metered energy sales by computing the category-wise Compounded Annual Growth Rate (CAGR) of audited/actual metered energy sales for the last three years barring the immediately preceding year (e.g. CAGR from FY 2005-06 to FY 2008-09 for projecting energy sales of FY 2010-11). PSPCL then applies this 3-year CAGR to the revised estimates of the metered sales for the immediately preceding year for projecting the energy sales for the ensuing year (e.g. 3 year CAGR till FY 2008-09 applied on revised estimates of FY 2009-10 for projecting energy sales of FY 2010-11).
The revised estimates for any financial year is projected by PSPCL by considering the actual energy sales for the first half of the respective year and projecting the energy sales for the second half of that year by considering CAGR for the second half of the last three years.
2.2 Methodology adopted by Commission for Approving Energy Sales The Commission also broadly adopts the similar methodology as adopted by PSPCL for approving the energy sales for any financial year. The Commission first of all determines and approves the revised estimates for the energy sales of immediately preceding year and then applies three year CAGR on this approved revised estimate to arrive at the projections for energy sales for the following year.
2.3 Analysis of Variation in Actual Energy Sales for FY 2010-11
A. Category-wise Sales within State except AP Consumption
PSPCL submitted category wise actual sales for FY 2010-11 as a part of ARR and Tariff Petition for FY 2013-14. Further, as part of this study, PSPCL submitted the month-wise actual sales for each category for FY 2010-11. There is a variation in category-wise actual sales for FY 2010-11 as submitted by PSPCL as a part of ARR and Tariff Petition for FY 2013-14 and month wise actual sales submitted for each category for FY 2010-11. For analysing the variation in actual sales, the actual annual sales for each category as submitted by PSPCL in its ARR and Tariff petition for FY 2013-14, has been considered.
With regards to the variation in category-wise actual annual sales for FY 2010-11 as submitted by PSPCL as a part of ARR and Tariff Petition for FY 2013-14 and month wise actual sales submitted as a part of additional information sought during this study, PSPCL submitted that the annual sales figures also includes the units corresponding to

Report on Study on power purchase/sale for PSPCL for FY 2010-11 to FY 2012-13 Page | 11
energy pilferage, unbilled units and short assessment by CA and in order to compensate the affect of these units, PSPCL proportionately adds these units amongst the annual energy sales for various categories.
PSPCL also submitted computation of total annual energy consumption for FY 2010-11 as shown in the table below:
Table 2: Computation of Net Energy Sales as submitted by PSPCL S. No. Particulars FY 2010-11
(MU) 1 Total Energy Input into the Punjab State 42422 2 Open Access Transaction (Purchased by Punjab Consumers) 2513 3 Net Input Energy into the Punjab State 39909 4(i) Metered Sale of Energy (Except total AP) 22115 (ii) Eq. Units of Energy Pilferage detected by Op. Org. 191 (iii) Eq. Units of Energy Pilferage detected by Enf. Org. 202 (iv) Eq. Units of Energy of Short Assessment by CA 116 (v) Unbilled Units (Figs as received from CAO Revenue) -1 5 Total Metered Sale 4(i+ii+iii+iv+v) 22623 6 (i) Agriculture Consumption (Assessed) 9957 (ii) Agriculture Consumption Metered & AP, SP 160 7 Total Agriculture Consumption 6(i+ii) 10117 8 Total Consumption (5+7) 32740 9 Consumption as %age of net Energy Input (8/3*100) 82 10 T&D losses (3-8) 7169 11 T&D Losses (in % age) (3-8)/3 * 100 18
It may be observed from the above table that the annual metered sale of energy for FY 2010-11 is 22115 MU. However, PSPCL booked around 508 MU on account of pilferage, short assessment by CA and unbilled units. PSPCL has added this 508 MU to the metered sale of energy to arrive at the total metered sale of around 22623 MU for FY 2010-11. However, the total metered sales figures submitted by PSPCL for FY
2010-11 as a part of ARR and Tariff Petition for FY 2013-14 is 22590 MU which is marginally different than the metered sales as submitted by PSPCL in above table while reconciling the total annual sales with monthly sales. These aspects of data mismatch in actual audited figures shall be avoided and uniformity of the data shall be maintained for submission to the Commission.
The summary of growth rates considered by PSPCL for projecting category wise sales for FY 2010-11, category wise sales projected by PSPCL, growth rates considered by the Commission for projecting category wise sales for FY 2010-11 in its Order, category wise

Report on Study on power purchase/sale for PSPCL for FY 2010-11 to FY 2012-13 Page | 12
sales projected by the Commission, actual sales submitted by PSPCL for FY 2010-11 and growth in actual sales of each category with respect to sales for FY 2009-10 is summarised in Table below:
Table 3: Analysis of Sales for FY 2010-11
SL No Category
Actual Sales as
per Petition
(MU) (FY 2009-10)
CAGR considered by PSPCL
for projection
Sales Projected by PSPCL
(MU)
CAGR considered by Commission
Approved Sales
(MU)
Actual Sales as
per Petition
(MU) (FY
2010-11)
Variation in actual sales w.r.t. actual
sales of previous year
(%)
1 2 3 4 5 6 7 8 (8-3)/3 1 Domestic 7310 7.61% 7894 7.74% 7865 8176 11.84% 2 Non residential 2147 10.30% 2355 10.42% 2405 2468 14.97% 3 Small power 775 2.15% 784 2.25% 759 841 8.46% 4 Medium Supply 1619 1.98% 1639 2.10% 1541 1768 9.24%
5 Large Supply 8795 5.39% 9212 5.50% 9093 8522 -3.10%
6 Public Lighting 137 6.12% 157 6.41% 136 131 -4.20%
7 Bulk Supply 499 2.56% 508 2.56% 496 540 8.19%
8 Railway Traction 148 4.32% 155 4.32% 138 144 -2.77%
Total 21429 22704 22433 22590
As it may be observed from the above table, there is marginal variation in CAGR considered by PSPCL for projecting the sales for FY 2010-11 and CAGR considered by the Commission for approving sales for FY 2010-11. However, relatively higher variations can be observed in growth rate in actual sales for FY 2010-11 with respect to actual sales for FY 2009-10 as compared to the growth rates considered by PSPCL for projecting the sales and growth rates considered by the Commission for approving the energy sales for FY 2010-11. The reasons for variation can be attributable to the following reasons:
• Variation in Number of consumers, Connected Load and Specific Consumption or Load Factor
• Sudden spurt in demand due to increased economic activities. • Consumers shifting from Utility to other sources of power (Captive, IPP, Traders and
other bilateral purchase of power)

Report on Study on power purchase/sale for PSPCL for FY 2010-11 to FY 2012-13 Page | 13
To assess the reason for variation, analysis has been carried out with regards to growth in number of consumers, connected load, specific consumption (for Domestic Consumers) and load factor for other categories which is as shown in the table below:
Table 4: Variation in Number of Consumers, Connected Load, Specific Consumption/Load Factor and Sales for FY 2010-11 vis-à-vis FY 2009-10
S. No
Category of Consumer
Variation in No. of
Consumers for FY 2010-11
Variation in Connected Load for FY
2010-11
Variation in Specific
Consumption/Load Factor for FY 2010-
11
Variation in Actual Energy
Sales for FY 2010-11
1 Domestic 6.52% 5.79% 5.00% 11.84%
2 Commercial (NRS) 5.29% 8.19% 6.26% 14.97%
Industrial 3 Small Supply 2.54% -4.69% 13.80% 8.46% 4 Medium Supply 3.72% 4.86% 4.18% 9.24% 5 Large Supply 5.43% 6.10% -8.67% -3.10% Sub-Total 2.93% 4.43% -4.73% -0.51% 6 Street Lighting 10.75% 4.60% -8.41% -4.20% 7 Bulk Supply 0.81% 2.27% 5.79% 8.19% 8 Railway Traction 0.00% 0.00% -2.77% -2.77% *Increase in Specific Consumption of Domestic Consumers for FY 2010-11
PSPCL as well as Commission while projecting sales for FY 2010-11 had considered three year CAGR on the basis of which sales for FY 2010-11 were projected. PSPCL and Commission while projecting the sales has considered past years data which represents a different percentage in increase/decrease in number of consumers or connected load and increase/decrease in specific consumption or load factor for a particular category. Whereas, in actual terms, these parameters have been at variance with the growth based on past years data and therefore has resulted in variations in actual sales vis-à-vis that approved by the Commission.
The analysis of variation in category-wise actual sales in FY 2010-11 with respect to sales for FY 2009-10 and as compared to sales approved by the Commission is discussed in this section.
1. Domestic Consumers: The increase in the actual energy sales for FY 2010-11 vis-à-vis FY 2009-10 is around 11.84%. The increase in actual energy sales for this category of consumer is marginally higher than the 7.74% considered by the Commission. The

Report on Study on power purchase/sale for PSPCL for FY 2010-11 to FY 2012-13 Page | 14
above increase vis-à-vis FY 2009-10 can be attributed to increase in the number of Consumers which was around 6.52% and further to this the Specific Consumption of each consumer increased by 5.00%. This has resulted in the increase in the sales for the domestic consumers.
2. Commercial (Non-Residential) Consumers: The increase in the actual energy sales for FY 2010-11 vis-à-vis FY 2009-10 is around 14.97%. The increase in actual energy sales for this category of consumer is relatively higher than 10.42% considered by the Commission. This increase in actual energy sales vis-à-vis FY 2009-10 for this category of consumer can be attributed to increase in the actual Connected Load which was 8.19% and further there was an increase in Load Factor (computed on the basis of connected load) by 6.26%.
3. Industrial Consumers: The overall actual energy sale for industrial consumers has
reduced by 0.51%. The analysis of same is presented below:
a. Small Supply: The increase in the actual energy sales for FY 2010-11 vis-à-vis FY 2009-10 is around 8.46%. The increase in actual energy sales for this category of consumer is relatively higher than 2.25% considered by the Commission. Though there has been increase in the sales, as per the data submitted by PSPCL, reduction in connection load by 4.69% (902209 kW in FY 2009-10 and 859900 KW in FY 2010-11) has been observed which does not appears to be correct as the number of consumers in FY 2010-11 vis-a-vis FY 2009-10 has increased by 2.54%. Further, this aspect was also checked with statistical data of PSPCL and in the statistical data, the connected load figure for this category for FY 2009-10 is mentioned as 837824 kW instead of 902209 kW submitted in ARR Petition for FY 2013-14. The connected load figure for this category for FY 2010-11 in statistical data as well as in the ARR Petition for FY 2013-14 is mentioned as 859900 kW. There appears to be some difference in methodology while presenting the actual connected load data for this category in ARR Petition for FY 2009-10 and FY 2010-11. It is suggested that uniformity of the data for submission to the Commission shall be maintained so that this types of mis-matches in actual audited data shall be avoided.
b. Medium Supply: The increase in the actual energy sales for FY 2010-11 vis-à-vis FY 2009-10 is around 9.24%. The increase in actual energy sales for this category of consumer is relatively higher than 2.10% that the Commission considered. This high

Report on Study on power purchase/sale for PSPCL for FY 2010-11 to FY 2012-13 Page | 15
increase in actual energy sales with respect to FY 2009-10 for this category of consumer can be attributed to an increase in actual Connected Load by 4.86% and an increase in actual Load Factor by 4.18%.
c. Large Supply: There is a reduction in actual energy sales for FY 2010-11 vis-à-vis FY
2009-10 by 3.10%. This decrease in actual energy sales for this category of consumer is in contrary to the increase of 5.50% considered by the Commission. Though there has been increase in the actual Connected Load for this category by 6.10% which is to the contrary to the reduction in sales. However, the load factor for this category has reduced by around 8.67% in FY 2010-11. The reduction in load factor is very high, which is the prime reason for the reduction in total energy sales under this category for FY 2010-11 vis-à-vis FY 2009-10.
The reduction in the load factor for large supply consumers can be attributed to implementation of Open Access in the State which resulted in purchase of 2513 MU power through Open Access by the consumers of the State for FY 2010-11. This is the major reason for reduction in the load factor for industrial consumers as large supply consumers have procured power from other sources which has resulted in reduction in sales for this category.
4. Street Lighting: There is reduction in actual energy sales for FY 2010-11 vis-à-vis FY
2009-10 by 4.20%. The reduction in actual energy sales for this category of consumer is contrary to increase of 6.41% considered by the Commission. Though there has been an increase in the actual Connected Load for this category by 4.60% which is to the contrary to the reduction in sales. However, the load factor for this category has reduced by 8.41%. The reduction in load factor is very high, which is the prime reason for the decrease in total energy sales under this category for FY 2010-11 vis-à-vis FY 2009-10.
5. Bulk Supply: The increase in the actual energy sales under this category for FY 2010-11 vis-a-vis FY 2009-10 is around 8.19%. The increase in actual energy sales for this category of consumer is relatively higher than 2.56% considered by the Commission. This high increase in actual energy sales for this category of consumer can be attributed to an increase in the actual connected load by 2.27% and an increase in actual Load Factor by 5.79%.
6. Railway Traction: There is reduction in actual energy sales for FY 2010-11 vis-à-vis FY
2009-10 by 2.77%. The decrease in actual energy sales for this category of consumer is in

Report on Study on power purchase/sale for PSPCL for FY 2010-11 to FY 2012-13 Page | 16
contrary to the increase of 4.32% considered by the Commission. Though, the actual Connected Load for this category has remained same, the load factor for this category has reduced by 2.77%. The reduction in load factor is the prime reason for the decrease in total energy sales under this category for FY 2010-11 vis-à-vis FY 2009-10.
B. Agricultural Consumption
As regards agriculture consumption, PSPCL in its Tariff Petition has projected sales as 11245 MU for FY 2010-11 considering the CAGR of 8.51% of FY 2006-07 to FY 2008-09. The Commission approved the sales for FY 2010-11 as 10305 MU by applying 5% increase over revised sales of approved for FY 2009-10. PSPCL has submitted actual sales as 10150 MU which is less than the sales approved by the Commission on account of good rainfall during the monsoon season. Further, PSPCL in this regard has submitted the detailed information to the Commission and the Commission after taking into cognizance the readings of substation meters of AP feedershas assessed the AP Consumption for the State as 9726 MU for FY 2010-11.
C. Sales Outside State
PSPCL in its petition for tariff determination for FY 2010-11 had considered sale outside State as 125 MU based on the actuals for FY 2008-09 which included free share of 72 MU of Himachal Pradesh at the rate of 4.6% of gross generation from Ranjit Sagar Dam hydro electric project (HEP) and royalty of 53 MU to HP from Shanan HEP. In addition to above PSPCL had projected sale of 302 MU as sale outside State based on the actual sales for FY 2008-09. The Commission while approving sale outside the State for FY 2010-11 had only considered sale pertaining to royalty of 53 MU to HP from Shanan HEP and had not considered free share of 72 MU of Himachal Pradesh from Ranjit Sagar Dam (RSD) hydro electric project (HEP) stating that 72 MU is free share from RSD. The Commission apart from the sale outside the State has separately allowed sale of 302 MU to common pool consumers. Further, as per the current submissions of PSPCL the actual sale outside State has been 128 MU (53MU Shanan Royalty and 76 MU RSD Share) and the sale through exchange has been 309 MU.

Report on Study on power purchase/sale for PSPCL for FY 2010-11 to FY 2012-13 Page | 17
There is a no variation in the sale quantum approved pertaining to royalty of 53 MU to HP from Shanan HEP and there is a marginal variation in actual sales vis-à-vis that approved by the Commission.
2.4 Analysis of Variation in Actual Energy Sales for FY 2011-12
A. Metered Sales within the State
PSPCL submitted category wise actual sales for FY 2011-12 as a part of ARR and Tariff Petition for FY 2013-14. Further, as part of this study, PSPCL submitted the month-wise actual sales for each category for FY 2011-12. There is a variation in category-wise actual sales for FY 2011-12 as submitted by PSPCL as a part of ARR and Tariff Petition for FY 2013-14 and month wise actual sales submitted as a part of additional information sought for this study. The reasons for the variation in month-wise sales and annual sales has already been discussed in the previous section and therefore for analysing the variation in actual sales, the actual annual sales for each category as submitted by PSPCL in its ARR and Tariff petition for FY 2013-14 has been considered.
The summary of growth rates considered by PSPCL for projecting category wise sales for FY 2011-12, category wise sales projected by PSPCL, growth rates considered by the Commission for projecting category wise sales for FY 2011-12 in its Order, category wise sales projected by the Commission, actual sales submitted by PSPCL for FY 2011-12 and growth in actual sales of each category with respect to sales for FY 2010-11 is summarised in Table below:
Table 5: Analysis of Sales for FY 2011-12
S. No Category
Actual Sales as
per Petition
(MU) (FY 2010-11)
CAGR considere
d by PSPCL for projection
Sales Projecte
d by PSPCL (MU)
CAGR considered
by Commission
Approved Sales
(MU)
Actual Sales as
per Petition
(MU) (FY 2011-12)
Variation in actual sales w.r.t. actual
sales of previous year
(%) 1 2 3 4 5 6 7 8 (8-3)/3
1 Domestic 8176 8.30% 8836 8.48% 8854 8818 7.85% 2 Non residential 2468 9.00% 2618 9.26% 2623 2682 8.66% 3 Small power 841 2.50% 835 2.67% 835 884 5.13%
4 Medium Supply 1768 2.50% 1752 2.71% 1755 1823 3.07%
5 Large Supply 8522 0.00% 8600 3.22% 9607 8996 5.56%
6 Public Lighting 131 1.70% 136 2.03% 137 139 6.16%

Report on Study on power purchase/sale for PSPCL for FY 2010-11 to FY 2012-13 Page | 18
S. No Category
Actual Sales as
per Petition
(MU) (FY 2010-11)
CAGR considere
d by PSPCL for projection
Sales Projecte
d by PSPCL (MU)
CAGR considered
by Commission
Approved Sales
(MU)
Actual Sales as
per Petition
(MU) (FY 2011-12)
Variation in actual sales w.r.t. actual
sales of previous year
(%) 1 2 3 4 5 6 7 8 (8-3)/3
7 Bulk Supply 540 2.70% 537 2.97% 539 560 3.78%
8 Railway Traction 144 11.80% 181 11.77% 181 138 -4.04%
Total 22590 23495 24531 24039
As it may be observed from the above table, there is marginal variation in CAGR considered by PSPCL for projecting the sales for FY 2011-12 and CAGR considered by the Commission for approving sales for FY 2011-12.
The variation in growth rate in actual sales for FY 2011-12 with respect to actual sales for FY 2010-11 is marginal for Domestic, Non residential, Large Supply and Bulk Supply categories as compared to the growth rates considered by PSPCL for projecting the sales and growth rates considered by the Commission for approving the energy sales for FY 2011-12.
To assess the reason for variation, analysis has been carried out with regards to growth in number of consumers, connected load, specific consumption (for Domestic Consumers) and load factor for other categories which is as shown in the table below:
Table 6: Variation in Number of Consumers, Connected Load, Specific Consumption/Load Factor
and Sales for FY 2011-12 vis-à-vis FY 2010-11
S. No
Category of Consumer
Growth in No. of Consumers for FY 2011-12
Growth in Connected Load for FY
2011-12
Growth in Specific Consumption/Load Factor for FY 2011-
12
Growth in Actual Energy
Sales for FY 2011-12
1 Domestic 4.46% 4.69% *3.25% 7.85% 2 Commercial (NRS) 3.35% 7.53% 1.05% 8.66%
Industrial
3 Small Supply 2.62% 12.21% -6.31% 5.13% 4 Medium Supply 3.19% 3.70% -0.61% 3.07% 5 Large Supply 4.85% 5.14% 0.39% 5.56% Sub-Total 2.85% 5.69% -0.53% 5.13% 6 Street Lighting 9.59% 4.46% 1.63% 6.16%

Report on Study on power purchase/sale for PSPCL for FY 2010-11 to FY 2012-13 Page | 19
S. No
Category of Consumer
Growth in No. of Consumers for FY 2011-12
Growth in Connected Load for FY
2011-12
Growth in Specific Consumption/Load Factor for FY 2011-
12
Growth in Actual Energy
Sales for FY 2011-12
7 Bulk Supply 1.01% 4.89% -1.06% 3.78% 8 Railway Traction 0.00% 0.00% -4.04% -4.04% *Increase in Specific Consumption for 2011-12 for domestic consumers
1. Domestic Consumers: The increase in the actual energy sales under this category for FY 2011-12 vis-à-vis FY 2010-11 is around 7.85%. The increase in actual energy sales for this category of consumer is fractionally lower than 8.48% considered by the Commission. The increase in actual energy sales for this category of consumer vis-à-vis FY 2010-11 can be attributed to an increase in the actual number of Consumers by 4.46% and further to this the Specific Consumption of each consumer increased by 3.25%.
2. Commercial (Non-Residential) Consumers: The increase in the actual energy sales under this category for FY 2011-12 vis-a-vis FY 2010-11 is 8.66%. The increase in actual energy sales for this category of consumer is fractionally lower than the 9.26% considered by the Commission. The increase in actual energy sales vis-à-vis FY 2010-11 for this category of consumer can be attributed to an increase in the Actual Connected Load by 7.53% and an increase in actual Load Factor (computed on the basis of connected load) by 1.05%.
3. Industrial Consumers: The overall actual energy sales for industrial consumers has
increased by 5.13%. The justification and detailed analysis is explained below:
a. Small Supply: The increase in the actual energy sales under this category for FY 2011-12 vis-à-vis FY 2010-11 is 5.13%. The increase in actual energy sales for this category of consumer is relatively higher than 2.67% considered by the Commission. The Load Factor for this category has decreased by 6.31%. However, the Connected Load for this category has increased considerably by 12.21% which explains the increase in actual energy sales under this category by around 5.13%.
b. Medium Supply: The increase in the actual energy sales under this category for FY 2011-12 vis-à-vis FY 2010-11 is 3.07%. The increase in actual energy sales for this category of consumer is fractionally higher than the 2.71% considered by the Commission. This increase in actual energy sales vis-à-vis FY 2010-11 for this

Report on Study on power purchase/sale for PSPCL for FY 2010-11 to FY 2012-13 Page | 20
category of consumer can be attributed to an increase in the actual Connected Load by 3.70% and a decrease in the actual Load Factor by 0.61%.
c. Large Supply: The increase in the actual energy sales under this category for FY 2011-12 vis-à-vis FY 2010-11 is 5.56%. The increase in actual energy sales for this category of consumer is relatively higher than 3.22% considered by the Commission. The increase in actual energy sales for this category of consumer vis-à-vis FY 2010-11 can be attributed to an increase in the actual Connected Load by 5.14% and an increase in the actual Load Factor by 0.39% having a consolidated impact of around 5.56%.
4. Street Lighting: The increase in the actual energy sales under this category for FY 2011-12 vis-à-vis FY 2010-11 is 6.16%. The increase in actual energy sales for this category of consumer is relatively higher than 2.03% considered by the Commission. This increase in actual energy sales in FY 2011-12 vis-à-vis FY 2010-11 for this category of consumer can be attributed to an increase in the actual Connected Load by 4.46% and increase in the actual Load Factor by 1.63%.
5. Bulk Supply: The increase in the actual energy sales under this category for FY 2011-12 vis-à-vis FY 2010-11 is 3.78%. The increase in actual energy sales for this category of consumer is fractionally higher than the 2.97% considered by the Commission. This increase in actual energy sales for this category of consumer vis-à-vis actual sale for FY 2010-11 can be attributed to an increase in the actual Connected Load by 4.89% however there was a decrease in the actual Load Factor by 1.06%.
6. Railway Traction: There is a decrease in actual energy sales for FY 2011-12 vis-à-vis FY 2010-11 by 4.04%. This decrease in actual energy sales for this category of consumer is in contrary to CAGR of 11.77% considered by the Commission. Though there has been no increase in the actual connected load under this category, however, that the load factor for this category has reduced by around 4.04% vis-à-vis FY 2010-11. The reduction in load factor is the prime reason for the reduction in total energy sales under this category for FY 2011-12.

Report on Study on power purchase/sale for PSPCL for FY 2010-11 to FY 2012-13 Page | 21
B. AP Consumption As regards agriculture consumption, PSPCL in its Tariff Petition for FY 2011-12 has projected sales as 10505 MU for FY 2011-12 considering an increase of 8% twice on actual sales for FY 2009-10. The Commission approved the sales for FY 2011-12 as 10843 MU by applying 5% increase over approved sales for FY 2010-11. PSPCL has submitted actual sales as 10256 MU which is less than the sales approved by the Commission. Further, PSPCL in this regard has submitted the detailed information to the Commission and the Commission after taking into cognizance the readings of substation meters of AP feedershas assessed the AP Consumption for the State as 9502 MU for FY 2011-12.
C. Sales Outside State
It is observed that the Commission for FY 2011-12 had considered the actual sales to common pool consumers for past three years for projecting the sales to Common Pool Consumers. Further, PSPCL in its petition for tariff determination for FY 2011-12 considered the sale to outside state as 115 MU (free share of 62 MU of Himachal Pradesh at the rate of 4.6% of gross generation from RSD hydro electric project (HEP) and royalty of 53 MU to HP from Shanan HEP). PSPCL further proposed 302 MU sale to common pool consumers as a part of sale outside the State.
The Commission in its Order for FY 2011-12 had not approved any outside State sale. The Commission however, approved sale of 302 MU to common pool consumers. Further, as per the current submissions of PSPCL the actual sale to outside state has been 139 MU (53MU Shanan Royalty and 76 MU RSD Share) and the sale through exchange has been 306 MU.
Thus, there is marginal variation in actual sales vis-à-vis that approved by the Commission.
2.5 Analysis of Variation in Energy Sales for FY 2012-13
A. Metered Sales within the State
The summary of growth rates considered by PSPCL for projecting category wise sales for FY 2012-13, category wise sales projected by PSPCL, growth rates considered by the Commission for projecting category wise sales for FY 2012-13 in its Order, category wise sales projected by the Commission, actual sales submitted by PSPCL for FY 2012-13 and

Report on Study on power purchase/sale for PSPCL for FY 2010-11 to FY 2012-13 Page | 22
growth in actual sales of each category with respect to sales for FY 2011-12 is summarised in Table below:
Table 7: Analysis of Sales for FY 2012-13
S.No. Category
Actual Sales
(MU) (FY 2011-12)
CAGR considere
d by PSPCL for projection
Sales Projecte
d by PSPCL (MU)
CAGR considered
by Commissio
n
Approved Sales (MU)
Actual Sales (MU) (FY
2012-13)
Increase in actual
sales w.r.t. actual
sales of previous year (%)
1 2 3 4 5 6 7 8 (8-3)/3
1 Domestic (incl others) 8818 12.71% 10082 7.93% 9642 9285 5.30% 2 Non residential 2682 14.57% 3126 7.76% 2838 2712 1.14% 3 Small power 884 4.40% 939 3.28% 891 876 -0.84% 4 Medium Supply 1823 3.80% 1918 2.67% 1815 1768 -2.98%
5 Large Supply (including PLEC) 8996 -0.80% 7856 0.00% 7856 9475 5.32%
6 Public Lighting 139 -2.20% 129 -1.45% 135 146 4.83%
7 Bulk Supply & Grid Supply 560 2.50% 576 1.44% 552 566 1.03%
8 Railway Traction 138 8.40% 156 12.76% 184 135 -2.47% Total 24039 24782 23913 24963
As it may be observed from the above table, there is variation in CAGR considered by PSPCL for projecting the sales for FY 2012-13 and CAGR considered by the Commission for some of the categories for approving sales for FY 2012-13.
The variation in growth rate in actual sales for FY 2012-13 with respect to actual sales for FY 2011-12 is marginal for Domestic category as compared to the growth rate considered by the Commission for approving the energy sales for FY 2012-13.

Report on Study on power purchase/sale for PSPCL for FY 2010-11 to FY 2012-13 Page | 23
To assess the reason for variation, analysis has been carried out with regards to growth in number of consumers, connected load, specific consumption (for Domestic Consumers) and load factor for other categories which is as shown in the table below:
Table 8: Variation in Number of Consumers, Connected Load, Specific Consumption/Load Factor
and Sales for FY 2012-13 vis-à-vis FY 2011-12
S. No
Category of Consumer
Growth in No. Of Consumers for FY 2012-13
Growth in Connected Load for FY
2012-13
Growth in Specific Consumption/Load Factor for FY 2012-
13
Growth in Actual
Energy Sales for FY 2012-
13 1 Domestic 4.09% 4.19% *1.15% 5.30%
2 Commercial (NRS)
3.11% 6.08% -4.66% 1.14%
Industrial
3 Small Supply 1.26% 1.78% -2.57% -0.84%
4 Medium Supply 2.75% 3.06% -5.86% -2.98%
5 Large Supply 6.18% 5.58% -0.24% 5.32%
Sub-Total 1.83% 4.58% -0.97% 3.57% 6 Street Lighting 8.14% 4.28% 0.53% 4.83% 7 Bulk Supply 2.00% 13.81% -11.23% 1.03% 8 Railway Traction 0.00% 0.00% -2.47% -2.47% *Increase in Specific Consumption for Domestic Consumers for FY 2012-13
1. Domestic Consumers: The increase in the actual energy sales under this category for FY 2012-13 vis-à-vis FY 2011-12 is 5.30%. The increase in actual energy sales for this category of consumer is relatively lower than the 7.93% considered by the Commission. The increase in actual energy sales for this category of consumer can be attributed to an increase in the actual number of Consumers by 4.09% and an increase in actual Specific Consumption by 1.15%.
2. Commercial (Non-Residential) Consumers: The increase in the actual energy sales under this category for FY 2012-13 vis-à-vis FY 2011-12 is 1.14%. The increase in actual energy sales for this category of consumer is relatively lower than growth rate of 7.76% considered by the Commission. The year on year increase in actual energy sales under

Report on Study on power purchase/sale for PSPCL for FY 2010-11 to FY 2012-13 Page | 24
this category of consumer can be attributed to an increase in the actual Connected Load by 6.08% and reduction in actual Load Factor by 4.66%.
3. Industrial Consumers: The overall actual energy sale for industrial consumers has increased by 3.57%. The justification and detailed analysis is explained below:
a. Small Supply: There is a marginal reduction in the actual energy sales under this category for FY 2012-13 vis-à-vis FY 2011-12 is 0.84%. The reduction in actual energy sales for this category of consumer is in contrary to the growth rate of 3.28% considered by the Commission. The reduction in actual energy sales under this category of consumer can be attributed to the reduction in load factor by 2.57%.
b. Medium Supply: There has been a marginal reduction in the actual energy sales under this category for FY 2012-13 vis-à-vis FY 2011-12 i.e. 2.98%. The decrease in actual energy sales for this category of consumer is in contrary to the growth rate of 2.67% considered by the Commission. The reduction in actual energy sales under this category of consumer can be attributed reduction in load factor by 5.86%.
c. Large Supply: The increase in the actual energy sales under this category for FY 2012-13 vis-à-vis FY 2011-12 is 5.32%. This high increase in actual energy sales under this category of consumer can be attributed to an increase in the actual Connected Load by 5.58%.
4. Street Lighting: The increase in the actual energy sales under this category for FY 2012-13 vis-à-vis FY 2011-12 is 4.83%. The increase in actual energy sales for this category of consumer is in contrary to the negative growth rate of 1.45% considered by the Commission. This increase in actual energy sales under this category of consumer can be attributed to an increase in the actual Connected Load by 4.28% and an increase in load factor by 0.53%
5. Bulk Supply: The increase in the actual energy sales under this category for FY 2012-13 vis-à-vis FY 2011-12 is 1.03%. The increase in actual energy sales for this category of consumer is fractionally lower than the growth rate of 1.44% considered by the Commission. This increase in actual energy sales for this category of consumer can be

Report on Study on power purchase/sale for PSPCL for FY 2010-11 to FY 2012-13 Page | 25
attributed to an increase in the actual Connected Load by 13.81% and a reduction in load factor by 11.23%.
6. Railway Traction: There is a reduction in the energy sales by 2.47% under this category of consumers for FY 2012-13 vis-à-vis FY 2011-12. The decrease in energy sales for this category of consumer is in contrary to the growth rate of 12.76% considered by the Commission. Though the connected load has remained unchanged for this year, the decrease in actual energy sales for this category of consumer can be attributed to a reduction in load factor by 2.47%.
B. AP Consumption
As regards agriculture consumption, PSPCL in its Tariff Petition has projected sales as 11922 MU for FY 2012-13 considering the CAGR of 8.45% of FY 2007-08 to FY 2008-09. The Commission approved the sales for FY 2012-13 as 11003 MU by applying 5% increase over revised sales approved for FY 2011-12. PSPCL has submitted actual sales as 10779 MU which is lower than the sales approved by the Commission. Further, PSPCL in this regard has submitted the detailed information to the Commission and the Commission after taking into cognizance the readings of substation meters of AP feeders has assessed the AP Consumption for the State as 9800 MU for FY 2012-13.
C. Sales Outside State It is observed that PSPCL in its petition had projected sale to Common Pool Consumers as 305 MU and sale to the Outside State as 111 MU (including free share of Himachal Pradesh in RSD (63 MU) and royalty in Shanan (48 MU)). The Commission in its Order for FY 2012-13 had approved Outside State sale at ‘Nil’ and the sale of 305 MU to common pool consumers. Further, as per the current submissions of PSPCL, the actual sale to outside state has been 113 MU (53MU Shanan Royalty and 60 MU RSD Share) and there has been no sale to common pool consumers.
2.6 Summary of Sales Approved and Actual Sales for FY 2010-11, FY 2011-12 and FY 2012-13
The summary of Category wise approved sales, actual sales and variation in actual sales with respect to approved sales for FY 2010-11, FY 2011-12 and FY 2012-13 is given in following Table:

Report on Study on power purchase/sale for PSPCL for FY 2010-11 to FY 2012-13 Page | 26
Table 9: Summary of Approved and Actual Sales for FY 2010-11 to FY 2012-13
SL No Category
FY 2010-11 FY 2011-12 FY 2012-13
Approved Sales (MU)
Actual Sales (MU)
Variation (%)
Approved Sales (MU)
Actual Sales (MU)
Variation (%)
Approved
Sales (MU)
Actual
Sales (MU)
Variation (%)
1 Domestic (incl others) 7865 8176 3.95% 8854 8818 -0.41% 9642 9285 -3.70%
2 Non residential 2405 2468 2.62% 2623 2682 2.24% 2838 2712 -4.43%
3 Small power 759 841 10.75% 835 884 5.83% 891 876 -1.65%
4 Medium Supply 1541 1768 14.75% 1755 1823 3.85% 1815 1768 -2.57%
5
Large Supply (including PLEC)
9093 8522 -6.27% 9607 8996 -6.36% 7856 9475 20.61%
6 Public Lighting 136 131 -3.65% 137 139 1.53% 135 146 8.02%
7
Bulk Supply & Grid Supply
496 540 8.78% 539 560 3.88% 552 566 2.48%
8 Railway Traction 138 144 4.39% 181 138 -23.63% 184 135 -26.73%
9 Agricultural Cons. 10305 10150 -1.50% 10843 10256 -5.41% 11003 10779 -2.04%
Total within the State
32738 32749 0.01% 35374 34295 -3.05% 34916 35742 2.37%
As it may be observed from the above table, the overall variation in actual sales with the approved sales in FY 2011-12 is marginal with the variation being slightly higher in FY 2010-11 and FY 2012-13. The analysis of category-wise variation indicates that the major variations have been mainly in Large Supply, Railway traction and medium supply categories. As the quantum of Railway Traction sales is very marginal to the extent of around 0.4% of total sales, the variation in Railway Traction sales does not substantially affect the total quantum of sales and thus the energy requirement. On the other hand, the variation in Domestic Category, Large Supply and Agricultural categories substantially affects the total quantum of sales and thus the energy requirement.

Report on Study on power purchase/sale for PSPCL for FY 2010-11 to FY 2012-13 Page | 27
2.7 Recommendations for Projecting Sales and Energy Requirement
i. The methodology of past trends or historical trends i.e., 3 years CAGR appears to be appropriate for categories such as Domestic, Non Residential, Small Power, Public Lighting and Bulk Supply. However, it is suggested that for projecting sales variation in other variables such as number of consumers (Domestic Category), connected load, specific consumption (Domestic Category) and load factor may also be analysed as their growth may depend upon different factors and the quantum of impact is different on these variables to improve the projections of energy sales.
ii. For projecting sales of industrial category mainly Medium and Large supply, the change in policies and Regulations also plays a pivotal role. It is observed during the analysis that with the implementation of Open Access there has been a sharp variation in the energy sales as the consumers have opted for other sources of power. Further, the sales to industrial category may get affected due to change in
Industrial policies of the State Govt. Thus the impact of any change in policy and Regulations that may have impact on sales may be incorporated by taking suitable assumptions and incorporating the same.
iii. The Commission in its Tariff Order for FY 2013-14 has approved the proposal
of implementation of Time of Day Tariff. The relevant extract of the Order is given below:
“5.3 Introduction of Time of Day (ToD) Tariff:
....
....
In the above circumstances, the Commission holds that there is sufficient justification for introduction of ToD Tariff for the Large Supply industry and the Act also allows charging differential tariff.
The Commission, therefore, approves the proposal of PSPCL for introduction of Time of Day (ToD) Tariff for six months (October to March) of the year, during off peak hours from 22:00 hrs to 06:00 hrs for Large Supply industrial category, and approves rebate of Rs.1/unit on the normal tariff for this category. There will not be any change in the duration of peak load hours restrictions which will not be for

Report on Study on power purchase/sale for PSPCL for FY 2010-11 to FY 2012-13 Page | 28
more than 3 hours in the evening between 18:00 hours to 22:00 hours and will continue to be governed as per existing instructions. The Commission also directs PSPCL to submit a detailed report about the financial and technical impact of introducing ToD Tariff by 01.03.2014.”
As the Commission has approved the proposal of implementing Time of Day Tariff, the same shall also have a bearing on the consumption pattern and therefore the same needs to be analysed for projecting the sales. In this regard, PSPCL may be given appropriate direction to monitor the changes in the consumption pattern on account of introduction of this ToD tariff on sample basis which can be factored in while projecting the sales.
iv. Further, for industrial category mainly large industrial category, the impact of pending applications and industrial growth in the State may be incorporated while projecting the sales for more accurate projection of sales. Similarly for Railway Traction category as it is a single consumer, the discussions can be held with them and their views may be incorporated for projecting the sale for Railway Traction category.
v. While carrying out the analysis of variation in sales, it is observed that at certain instances the data submitted by PSPCL in one submission is different than the other submission. One such variation is observed in actual metered energy sales for FY 2010-11 as submitted by PSPCL in the ARR Petition for FY 2010-11 and as submitted towards reconciliation of annual sales with metered sales. The other data mis-match is observed in actual connected load figure for FY 2010-11 as submitted in ARR Petition and as per statistical information. It is suggested that uniformity of the data for submission to the Commission shall be maintained so that this types of mis-matches in actual audited data can be avoided.

Report on Study on power purchase/sale for PSPCL for FY 2010-11 to FY 2012-13 Page | 29
3 Analysis of Quantum of Generation from PSPCL Own Generating Stations including analysis of Planned and Actual Outages
3.1 Methodology adopted by PSPCL for Assessment of Power Available from Own Generating Stations:
The projections of net energy available for the ensuing year and the revised estimate of the generation (MU) from State’s own thermal generating stations, namely, GNDTP Bathinda, GGSSTP Ropar and GHTP Lehra Mohabbat are made by PSPCL based on the following parameters:
• Plant Availability considering the planned maintenance schedules • Scheduled Renovation & Modernisation • Plant Load Factor • Auxiliary Consumption
Similarly, the hydel generation in the State for ensuing year is projected by PSPCL based on average of the actual hydel generation for last three years barring the immediately preceding year.
3.2 Methodology adopted by the Commission for Assessment of Power Available from Own Generating Stations:
The Commission while projecting the gross generation and availability of the PSPCL’s own Generating Stations for ensuring year considers the average of actual availability and generation from these stations for the past three years barring the immediately preceding year (e.g. average of gross generation and availability for FY 2006-07, FY 2007-08 and FY 2008-09 for projecting availability of own generating stations for FY 2011-12). Further, the Commission also considers the Planned Maintenance Schedules and Scheduled R&M while projecting the energy available from thermal stations. For projecting the power available from the PSPCL’s own generating stations, the Commission analyses the average availability and generation for three years from these stations. The Commission then assesses the availability as per the maintenance schedules for the ensuing year. Based on above, the Commission works out the gross generation by applying the following formula:

Report on Study on power purchase/sale for PSPCL for FY 2010-11 to FY 2012-13 Page | 30
The Commission projects the net hydel generation of the PSPCL’s own generating stations for any financial year by taking an average of the actual hydel generation for last three years barring the immediately preceding year.
3.3 Analysis of Variation in Actual Generation for Thermal Generating Stations for FY 2010-11
The following table summarises the net-generation projected by PSPCL, net generation approved by the Commission and actual net generation with variation in actual net generation vis-à-vis Commission approved values along with the probable reasons for variations:
Table 10: Variation in Actual vis-à-vis Commission Approved Net Generation (MU) for Thermal Generating Stations for FY 2010-11
Stations
PSPCL Projection
in ARR and Tariff
Petition
Approved in T.O.
2010-11
Actual
Variation in Actual vis-a-
vis Commission
Approved
Remarks
Thermal Power Plants
GNDTP Bathinda
2016 2233 1566 -29.87%
Actual Availability and PLF were 58.58% and 46.06% respectively whereas Commission approved on basis of availability and PLF of 75.07% and 65.09% respectively. The actual Maintenance took 19 more days than the planned maintenance which is the main reason for reduction in generation.
GHTP Lehra Mohabbat
5974 6621 6280 -5.14%
Actual Availability and PLF were 88% and 85% respectively whereas Commission approved on basis of availability and PLF of 95.48% and 92.90%

Report on Study on power purchase/sale for PSPCL for FY 2010-11 to FY 2012-13 Page | 31
Stations
PSPCL Projection
in ARR and Tariff
Petition
Approved in T.O.
2010-11
Actual
Variation in Actual vis-a-
vis Commission
Approved
Remarks
respectively.
GGSSTP Ropar
8692 9382 8929 -4.82%
Actual Availability and PLF were 92.69% and 88.04% respectively whereas Commission approved on basis of availability and PLF of 88.22% and 88.17% respectively.
Total 16682 18236 16776 -8.00%
To assess the variation in net generation projected by PSPCL, net generation approved by the Commission and actual net generation, analysis has been carried out of variation in planned and actual maintenance schedules.
3.4 Variation in Planned and Actual Maintenance Schedules PSPCL plans maintenance schedules in advance and on the basis of the maintenance schedules projects the energy availability from these generating stations. Accordingly, PSPCL had planned maintenance for its generating stations from FY 2010-11 to FY 2012-13 which was approved by the Commission as planned by PSPCL. Analysis has been carried out comparing the planned maintenance schedule and approved maintenance schedule and reasons for variation has been analysed. The planned and actual maintenance schedule for FY 2010-11 along with the reasons wherein there has been delay in completion of maintenance as scheduled is as discussed below.
The following table shows the planned maintenance schedule and the actual maintenance schedule for FY 2010-11 along with reasons wherein there has been substantial delay from the planned duration.
Table 11: Planned Vs Actual Maintenance Schedules for FY 2010-11
SL No Plant Planned
Maintenance Schedule
(Days)
Actual Maintenance
Schedule (Days)
Deviation (Days) Reason for Deviation
1 GNDTP

Report on Study on power purchase/sale for PSPCL for FY 2010-11 to FY 2012-13 Page | 32
SL No Plant Planned
Maintenance Schedule
(Days)
Actual Maintenance
Schedule (Days)
Deviation (Days) Reason for Deviation
Unit-1 30.00 30.00 0.00
Unit-2 30.00 30.00 0.00
Unit-3 195.00 365.00 170.00
Completion of R&M got delayed due to delay in supply
2 GHTP
Unit-1 43.00 33.91 -9.09
Unit-2 20.00 19.25 -0.75
Unit-3 38.00 37.70 -0.30
3 GGSTP
Unit-1 26.00 41.00 15.00
Unit-3 43.00 0.00 Maintenance not taken
Unit-5 30.00 23.00 -7.00
As shown above Unit # 3 of GNDTP was under Renovation and Modernisation and there was substantial delay in R&M due to delay in supply of materials, which is the major reason for reduction in net generation from GNDTP power station.
Apart from the variation in planned and actual maintenance schedule, the other reason submitted by PSPCL for reduction in net generation is backing down due to less power demand during some of the hours in some months. The month-wise details of generation loss due to backing down as submitted by PSPCL are given in Table below:
Table 12: Generation Loss due to backing down for FY 2010-11 (MU)
Month GNDTP GHTP GGSSTP Total
April 0.00 0.00 0.00 0 May 0.00 2.28 5.51 7.79 June 2.46 17.45 18.48 38.39 July 22.85 56.60 19.62 99.07 August 29.17 27.09 33.07 89.33 September 60.69 161.58 35.58 257.85

Report on Study on power purchase/sale for PSPCL for FY 2010-11 to FY 2012-13 Page | 33
Month GNDTP GHTP GGSSTP Total October 6.71 26.36 25.40 58.47 November 0.04 22.14 40.55 62.73 December 4.24 14.19 14.61 33.04 January 4.74 9.15 14.44 28.33 February 5.29 11.03 31.97 48.29 March 16.59 10.80 21.14 48.53 Total 152.79 358.68 260.37 771.84 % of Net Generation 9.8% 5.7% 2.9% 4.6%
The total generation loss due to backing down as % of net generation for FY 2010-11 works out to around 4.6% with maximum backing down for all three stations in the month of September 2010.
In the subsequent sections, it has been suggested that the Commission may direct PSPCL to record the reasons for backing down and submit the same to the Commission on regular basis.
Analysis of Generation for Hydel Stations for FY 2010-11
The summary of hydel generation projected by PSPCL, hydel generation approved by the Commission and actual hydel generation for FY 2010-11 is given in table below:
Table 13: Hydel Generation for FY 2010-11
HYDEL STATION
FY 2010-11
PSPCL Projection in
Petition for FY 2010-11
Approved in TO 2010-11
Actual for FY
2010-11
Variation (Actual vs. Approved)
Actual for FY 2009-10
YOY Variation
(FY 2010-11 vis-à-vis 2009-10)
Gross Generation(MU) Shanan HEP 522 523 597.97 14.34% 511 17.02% UBDC Hydel Project 384 384 410.01 6.77% 337 21.66% Mukerian Hydel Project 1222 1222 1069.73 -12.46% 886 20.74% Anandpur Sahib Hydel Project 688 688 741.68 7.80% 574 29.21% Ranjit Sagar Project 1564 1564 1737.67 11.10% 1069 62.55% Micro Hydel Projects 8 8 10.48 30.99% 13 -19.38% Total 4388 4389 4567.55 4.07% 3390 34.74% Aux Consumption (MU) & Transformation Losses (MU) 47 36 47.74 32.60% 27 76.81%

Report on Study on power purchase/sale for PSPCL for FY 2010-11 to FY 2012-13 Page | 34
HYDEL STATION
FY 2010-11
PSPCL Projection in
Petition for FY 2010-11
Approved in TO 2010-11
Actual for FY
2010-11
Variation (Actual vs. Approved)
Actual for FY 2009-10
YOY Variation
(FY 2010-11 vis-à-vis 2009-10)
Net Hydel Generation (MU) 4342 4353 4519.82 3.83% 3363 34.40% BBMB (MU)
PSEB/PSPCL Share excluding Common Pool Share (Net)
4102 4102 4570.88 11.43% 3674 24.41% Common Pool Share (Net) 302 302 303.13 0.37% 303 0.04% Availability from BBMB 4404 4404 4874.01 10.67% 3977 22.55% Total Hydel Availability (MU) 8746 8757 9393.83 7.27% 7340 27.98%
3.5 Analysis of Variation in Actual Generation for Thermal Stations for FY 2011-12 The following table summarises the net-generation projected by PSPCL, net generation approved by the Commission and actual net generation with variation in actual net generation vis-à-vis Commission approved values along with the probable reasons for variations:
Table 14: Variation in Actual vis-à-vis Commission Approved Net Generation (MU) for Thermal Generating Stations for FY 2011-12
Station
PSPCL Projection in Petition for FY 2011-12
Approved in TO 2011-12 Actual Variatio
n Remarks
Thermal Power Plants
GNDTP Bathinda 2043 2075 1673 -19.38%
Actual Availability and PLF were 59.93% and 48.72% respectively whereas Commission approved on basis of availability and PLF of 75.14% and 60.34% respectively.
GHTP Lehra Mohabbat
6402 6941 7022 1.16% Marginal Variation
GGSSTP Ropar 8921 9112 8756 -3.90%
Actual Availability and PLF were 91.36% and 86.41% respectively

Report on Study on power purchase/sale for PSPCL for FY 2010-11 to FY 2012-13 Page | 35
Station
PSPCL Projection in Petition for FY 2011-12
Approved in TO 2011-12 Actual Variatio
n Remarks
whereas Commission approved on basis of availability and PLF of 95.90% and 89.98% respectively.
Total 17366 18128 17451 -3.73%
As also discussed earlier, to assess the variation in net generation projected by PSPCL, net generation approved by the Commission and actual net generation, analysis has been carried out of variation in planned and actual maintenance schedules.
3.6 Variation in Planned and Actual Maintenance Schedules for FY 2011-12 The planned and actual maintenance schedule for FY 2011-12 along with the reasons wherein there has been delay in completion of maintenance as scheduled is as discussed below.
The following table shows the planned maintenance schedule and the actual maintenance schedule for FY 2011-12 along with reasons wherein there has been substantial delay from the planned duration.
Table 15: Planned Vs Actual Maintenance Schedules for FY 2011-12
SL No Plant Planned
Maintenance Schedule
(Days)
Actual Maintenance
Schedule (Days)
Deviation (Days) Reason for Deviation
1 GNDTP
Unit-3 365 365 0 Due to R&M
Unit-4 147 147 0 Due To R&M
2 GHTP
Unit-4 30 25.66 -4.34
3 GGSTP
Unit-2 23 24 1
Unit-3 38 39 1
Unit-4 45 33 -12
Unit-6 22 21 -1

Report on Study on power purchase/sale for PSPCL for FY 2010-11 to FY 2012-13 Page | 36
Apart from the variation in planned and actual maintenance schedule, the other reason submitted by PSPCL for reduction in net generation is backing down due to less power demand during some of the hours in some months. The month-wise details of generation loss due to backing down as submitted by PSPCL is given in Table below:
Table 16: Generation Loss due to backing down for FY 2011-12 (MU) Month GNDTP GHTP GGSSTP Total
April 27.65 14.54 18.75 60.94 May 3.58 38.05 25.07 66.7 June 54.74 131.31 33.94 219.99 July 8.48 21.80 14.37 44.65 August 20.25 53.41 21.02 94.68 September 60.30 96.46 27.26 184.02 October 0.00 0.52 3.52 4.04 November 0.00 2.16 5.18 7.34 December 0.00 1.52 4.82 6.34 January 0.44 14.21 23.54 38.19 February 0.05 4.11 8.90 13.06 March 8.44 7.05 15.08 30.57 Total 183.94 385.14 201.45 770.53 % of Net Generation
11.0% 5.5% 2.3% 4.4%
The total generation loss due to backing down as % of net generation for FY 2011-12 works out to around 4.4% with maximum backing down for all three stations in the month of September 2011.
In the subsequent sections, it has been suggested that the Commission may direct PSPCL to record the reasons for backing down and submit the same to the Commission on regular basis.
3.7 Analysis of Generation for Hydel Stations for FY 2011-12 The summary of hydel generation projected by PSPCL, hydel generation approved by the Commission and actual hydel generation for FY 2011-12 is given in table below:
Table 17: Hydel Generation for FY 2011-12
HYDEL STATION
FY 2011-12 PSPCL
Projection in
Petition for FY
2011-12
Approved in TO
2011-12
Actual for FY 2011-
12
Variation (Actual vs. Approved)
Actual for FY 2010-
11
YOY Variation (FY 2011-12 vis-à-vis 2010-
11) Gross Generation(MU)

Report on Study on power purchase/sale for PSPCL for FY 2010-11 to FY 2012-13 Page | 37
HYDEL STATION
FY 2011-12 PSPCL
Projection in
Petition for FY
2011-12
Approved in TO
2011-12
Actual for FY 2011-
12
Variation (Actual vs. Approved)
Actual for FY 2010-
11
YOY Variation (FY 2011-12 vis-à-vis 2010-
11) Shanan HEP 527 528 517 -2.03% 597.97 -13.54%
UBDC Hydel Project 368 368 295 -19.71% 410.01 -28.05%
Mukerian Hydel Project 1127 1127 1358 20.47% 1069.73 26.95%
Anandpur Sahib Hydel Project 658 658 807 22.66% 741.68 8.81%
Ranjit Sagar Project 1360 1360 1928 41.74% 1737.67 10.95%
Micro Hydel Projects 10 10 4 -55.10% 10.48 -61.83%
Total 4050 4051 4910 21.20% 4567.55 7.50% Aux Consumption (MU) & Transformation Losses (MU)
47 33 47 43.58% 47.74 -1.55% Net Hydel Generation (MU) 4003 4018 4862 21.02% 4519.82 7.57% BBMB (MU)
PSEB/PSPCL Share excluding Common Pool Share (Net)
4047 4047 4750 17.37% 3674 29.29% Common Pool Share (Net) 303 302 305 0.99% 303 0.66% Availability from BBMB 4350 4349 5055 16.24% 3977 27.11% Total Hydel Availability (MU) 8352 8367 9918 18.53% 8496.82 16.73%
3.8 Analysis of Variation in Actual Generation for Thermal Stations for FY 2012-13 The following table summarises the net generation projected by PSPCL, net generation approved by the Commission and actual net generation with variation in actual net generation vis-à-vis Commission approved values along with the probable reasons for variations:
Table 18: Variation in Actual vis-à-vis Commission Approved Net Generation (MU) for Thermal Generating Stations for FY 2012-13
Station
PSPCL Projection in Petition for FY 2011-12
(MU)
Approved in TO 2011-12
(MU)
Actual (MU)
Variation (%) Remarks

Report on Study on power purchase/sale for PSPCL for FY 2010-11 to FY 2012-13 Page | 38
Station
PSPCL Projection in Petition for FY 2011-12
(MU)
Approved in TO 2011-12
(MU)
Actual (MU)
Variation (%) Remarks
GNDTP Bathinda 2505 2271 1588 -30.09%
Actual Plant Availability and PLF in first Half of the Year have been 46.22% and 37.62% respectively and for second half are projected as 59.38% and 53.77% respectively. However, Commission approved on the basis of availability and PLF of 91.78% and 73.94% respectively. Clearly low PLF and availability explain the variation in power procured.
GHTP Lehra Mohabbat
6360 6933 6745 -2.71% Marginal Variation
GGSSTP Ropar
8509 9025 8856 -1.87% Marginal Variation
Total 17374 18229 17189 -5.71%
As also discussed earlier, to assess the variation in net generation projected by PSPCL, net generation approved by the Commission and actual net generation, analysis has been carried out of variation in planned and actual maintenance schedules.
3.9 Variation in Planned and Actual Maintenance Schedules for FY 2012-13 The following table shows the planned maintenance schedule and the actual maintenance schedule for FY 2012-13 along with reasons wherein there has been substantial delay from the planned duration.

Report on Study on power purchase/sale for PSPCL for FY 2010-11 to FY 2012-13 Page | 39
Table 19: Planned Vs Actual Maintenance Schedules for FY 2012-13
SL No Plant Planned
Maintenance Schedule
(Days)
Actual Maintenance
Schedule (Days)
Deviation (Days) Reason for Deviation
1 GNDTP
Unit-1 30 33 4
Replacement of about 1000 meters water wall tubes on the recommendation of OEM, M/s ALSTOM and Replacement of Rim Gear of coal mill 1-C
Unit-2 30 30 0
Generator was opened for mandatory electrical inspection but after its box-up, air leakage test failed. Additional time was required to attend the leakage.
Unit-3 365 249 -116 R&M
Unit-4 94 365 271 Completion of R&M got delayed due to delay in supply.
2 GHTP
Unit-1 20 23.78 3.78
Unit 1 was test synchronised on 27.02.2013 at 17:39 hours but again boxed up due to LPT bearing problem. Unit was finally synchronised on 08.03.2013.
Unit-2 40 30.58 -9.42
Unit-3 20 16.97 -3.03 3 GGSTP
Unit-1 35 35 0
Unit-3 30 28 -2
Unit-5 38 34 -4

Report on Study on power purchase/sale for PSPCL for FY 2010-11 to FY 2012-13 Page | 40
Apart from the variation in planned and actual maintenance schedule, the other reason submitted by PSPCL for reduction in net generation is backing down due to less power demand during some of the hours in some months. The month-wise details of generation loss due to backing down as submitted by PSPCL are given in Table below:
Table 20: Generation Loss due to backing down for FY 2012-13 (MU) Month GNDTP GHTP GGSSTP Total
April 34.44 21.32 28.56 84.32 May 9.28 20.57 12.68 42.53 June 1.14 3.89 7.96 12.99 July 0.73 2.51 7.53 10.77 August 17.93 17.19 29.68 64.8 September 46.08 60.53 29.44 136.05 October 3.71 10.78 18.13 32.62 November 15.03 23.01 47.04 85.08 December 33.26 33.93 57.61 124.8 January 12.04 34.75 49.74 96.53 February 138.72 116.27 47.53 302.52 March 71.13 147.33 57.23 275.69 Total 383.49 492.07 393.13 1268.69 % of Net Generation 24.15% 7.30% 4.44% 7.38%
The total generation loss due to backing down as % of net generation for FY 2012-13 works out to around 7.4% with maximum backing down in the month of February 2013.
In the subsequent sections, it has been suggested that the Commission may direct PSPCL to record the reasons for backing down and submit the same to the Commission on regular basis.
3.10 Analysis of Generation for Hydel Stations for FY 2012-13 The summary of hydel generation projected by PSPCL, hydel generation approved by the Commission and actual hydel generation for FY 2012-13 is given in table below:

Report on Study on power purchase/sale for PSPCL for FY 2010-11 to FY 2012-13 Page | 41
Table 21: Hydel Generation for FY 2012-13
HYDEL STATION
FY 2012-13 PSPCL
Projection in
Petition for FY
2012-13 (MU)
Approved in TO
2012-13 (MU)
Actual for FY 2012-
13 (MU)
Variation (Actual vs. Approved)
Actual for FY 2011-
12
YOY Variation (FY 2012-13 vis-à-vis 2011-
12) Gross Generation(MU)
Shanan HEP 545 528 439 -16.86% 517 -17.77%
UBDC Hydel Project 378 368 326 -11.33% 295 9.51%
Mukerian Hydel Project 1112 1127 1289 14.37% 1358 -5.35%
Anandpur Sahib Hydel Project 679 658 706 7.33% 807 -14.31%
Ranjit Sagar Project 1455 1360 1401 3.01% 1928 -37.62%
Micro Hydel Projects 9 10 8 -16.50% 4 50.00%
Total 4179 4051 4169 3.11% 4910 -17.77% Aux Consumption (MU) & Transformation Losses (MU)
155 33 41 25.67% 47 -14.63% Net Hydel Generation (MU) 4024 4018 4128 2.92% 4862 -17.78% BBMB (MU)
PSEB/PSPCL Share excluding Common Pool Share (Net)
3905 3905 4074 4% 4750 -16.59% Common Pool Share (Net) 305 305 305 0% 305 0.00% Availability from BBMB 4210 4210 4378 4% 5055 -15.46% Total Hydel Availability (MU) 8345 8228 8506 3% 9918 -16.60%
The Unit 5 (50 MW) of Shanan HEP was shut down for almost entire year on account of rehabilitation work. Around 50% of the total capacity of the station was taken off-stream
during FY 2012-13, inspite of which the gross generation of the station has reduced by only around 17%.
Based on the analysis, it is observed that the total actual power availability from hydel sources has been more than the power projected by PSPCL as well as projected power purchase approved by the Commission for all the three years from FY 2010-11 to FY 2012-13.

Report on Study on power purchase/sale for PSPCL for FY 2010-11 to FY 2012-13 Page | 42
3.11 Recommendations with respect to PSPCL’s Own Generation 1) The projections for availability and PLF appears to be on a higher side as the actual
availability and PLF for the last few years had continuously been on the lower side than the values projected by the Commission. It is therefore suggested that the projections for availability and PLF of the State Generating Stations may be made considering the actual generation during last 3 years in addition to planned maintenance schedules. This kind of projection will help in reducing variations in the power purchase quantum from short term sources.
2) It is suggested that PSPCL may be asked to record the instances wherein it has to back down its own generating stations both thermal and hydro generating stations along with the duration for which such backing down was done with appropriate justification with regard to circumstances leading to such backing down of its own generating stations. The Commission may ask PSPCL to furnish daily report for instances wherein the State Generating Stations were backed down with reasons leading to such backing down.
3) The Commission may ask PSPCL to submit the details of Station wise daily generation data from its own generating stations including hydro stations to the Commission on regular basis.

Report on Study on power purchase/sale for PSPCL for FY 2010-11 to FY 2012-13 Page | 43
4 Analysis of Power Purchase
4.1 Analysis of variation in Power Purchase Quantum
4.1.1 Methodology adopted by PSPCL for Assessment of Availability of Power from Central Generating Stations:
PSPCL projects energy from the Central Generating Stations on the basis of the average of energy received from these stations for the last 3 years barring the immediately preceding year (e.g. average of energy received for FY 2007-08, FY 2008-09 and FY 2009-10 for projecting availability of generating stations for FY 2011-12).
4.1.2 Methodology adopted by the Commission for Assessment of Availability of Power from Central Generating Stations:
In order to estimate the energy entitlement of PSPCL from different Central Generating Stations (CGSs), the Commission considers the average of the actual energy purchased by PSPCL for the last three years barring the immediately preceding year (e.g. average of energy received for FY 2007-08, FY 2008-09 and FY 2009-10 for projecting the availability of central generating stations for FY 2011-12). Based on the above, the plant-wise energy available from central generating stations vis. NTPC, NHPC and NPC stations is projected by the Commission.
4.1.3 Approach and Methodology for Analysis of Variation in Power Purchase Quantum
As discussed earlier, PSPCL is entitled to procure power from various central generating sources. The Commission approves the quantum of power to be procured from each of these sources considering the projections made by PSPCL. It is observed in the analysis that there have been variations in the actual quantum of power procured from the sources vis-à-vis Commission approved quantum.
As also discussed earlier, the Commission considers the average of the energy purchased in last three years (barring the immediately preceding year), for projecting the energy availability from the generating sources for a given year. Whereas, in actual, there may have been issues not foreseen at the time of tariff determination that may have above normal variations in actual generation affecting the power procurement from these sources. The variation in Quantum of power purchase could be on account of the following reasons:

Report on Study on power purchase/sale for PSPCL for FY 2010-11 to FY 2012-13 Page | 44
1. Change in actual availability and PLF vis-à-vis availability and PLF considered based on average of energy purchased during past years.
2. Change in the actual entitlement/allocation to PSPCL in Central Generating Stations from the entitlement considered by the Commission.
3. Change in the actual Maintenance Schedules for the generating stations.
For the analysis of variation, past years’ average considered by the Commission is compared with the actual values and further the actual generation from the Stations and PSPCL entitlement has also been analysed to assess the reasons of variations in quantum of actual power purchase vis-à-vis Commission approved values.
4.1.4 Analysis of Variation in Power Purchase Quantum for FY 2010-11
(a) Variation in Actual vis-à-vis Commission Approved Power Purchase Quantum from Existing Central Generating Stations for FY 2010-11:
The following table provides the power purchase quantum projected by PSPCL, power purchase quantum approved by the Commission, actual power purchase quantum and the difference in actual quantum vis-à-vis Commission approved values along with the probable reasons for variations for Central Generating Stations:
Table 22: Variation in Actual vis-à-vis Commission Approved Power Purchase Quantum from Central Generating Stations for FY 2010-11
Station
PSPCL Projectio
ns in Tariff
Petition of FY
2010-11
Approved in T.O. 2010-11 (MU)
Actual (MU)
Variation in actual power
purchase vis-à-vis
approved by the
Commission
Variation in Actual
Generation Remarks
NTPC
Singrauli 1618.80 1619.00 1771.71 9.43% 9.83%
Generation has been higher by around 9.83%. Further, Entitlement has increased from 11.49% considered by Commission to 11.95% for FY 2010-11.

Report on Study on power purchase/sale for PSPCL for FY 2010-11 to FY 2012-13 Page | 45
Station
PSPCL Projectio
ns in Tariff
Petition of FY
2010-11
Approved in T.O. 2010-11 (MU)
Actual (MU)
Variation in actual power
purchase vis-à-vis
approved by the
Commission
Variation in Actual
Generation Remarks
Rihand-I 916.70 917.00 831.68 -9.30% -4.76%
Scheduled generation from the plant has reduced by around 4.76%.
Rihand-II 913.60 914.00 889.98 -2.63% 1.19% Marginal Variation
Anta(GF) 284.60 297.00 226.52 -23.73% -13.63%
Scheduled generation from the plant has reduced by around 13.63% however, the actual purchase has reduced by 23.73% which suggests that PSPCL may not have scheduled power on continuous basis on account of high cost of generation.
Anta (RF) 19.40 20.00 49.41 147.05% 136.66%
Scheduled generation has been higher by around 136.66% which may be the reason for variation.
Anta (LF) 37.50 42.00 1.81 -95.70% -90.73%
Scheduled generation has been lower by around 90.73% which may be the reason for variation.
Auraiya(GF) 444.10 468.00 383.29 -18.10% -8.33%
The scheduled generation from the plant has reduced by around 13.63% however, the actual purchase has reduced by

Report on Study on power purchase/sale for PSPCL for FY 2010-11 to FY 2012-13 Page | 46
Station
PSPCL Projectio
ns in Tariff
Petition of FY
2010-11
Approved in T.O. 2010-11 (MU)
Actual (MU)
Variation in actual power
purchase vis-à-vis
approved by the
Commission
Variation in Actual
Generation Remarks
23.73% which suggests that PSPCL may not have scheduled power from these source on continuous basis on account of high cost of generation.
Auraiya (RF) 29.00 29.00 93.04 220.82% 173.65% Scheduled generation has been higher by around 173.65%.
Auraiya (LF) 60.60 62.00 2.25 -96.37% -86.98% Scheduled generation has been lower by around 87%.
Dadri(GF) 647.40 684.00 615.61 -10.00% 0.34%
The scheduled generation from the plant was almost the same however, the actual purchase has reduced by 10% which suggests that PSPCL may not have scheduled power from these sources on continuous basis on account of high cost of generation.
Dadri (RF) 30.5 31.00 117.47 278.95% 256.03%
Scheduled generation has been higher by the Commission by around 256.03% which may be the reason for variation.
Dadri (LF) 153.1 179.00 4.06 -97.73% -92.92% Scheduled generation has been lower by around 92.92% which may be the

Report on Study on power purchase/sale for PSPCL for FY 2010-11 to FY 2012-13 Page | 47
Station
PSPCL Projectio
ns in Tariff
Petition of FY
2010-11
Approved in T.O. 2010-11 (MU)
Actual (MU)
Variation in actual power
purchase vis-à-vis
approved by the
Commission
Variation in Actual
Generation Remarks
reason for variation.
Unchahar-I 284.10 284.00 236.25 -16.81% 0.19%
Scheduled generation from the plant has been almost the same. However, the actual purchase has reduced by 16.81%. .
Unchahar-II 500.20 500.00 432.89 -13.42% -3.23%
Scheduled generation from the plant has reduced by around 3.23%. However, the actual purchase has reduced by 13.42%. .
Unchahar-III 155.70 156.00 127.74 -18.12% -1.36%
Scheduled generation from the plant has reduced by around 1.36%. However, the actual purchase has reduced by 18.12%.
Farakha (ER) 207.40 296.00 139.31 -52.94%
The share allocation considered by the Commission was 9.73% whereas actual share allocation has been 1.39% which has resulted in reduction in power purchase quantum.
Kahalgaon (ER)
443.60 588.00 273.19 -53.54%
The share allocation considered by the Commission was 14.33% whereas actual share allocation has been 6.07%.

Report on Study on power purchase/sale for PSPCL for FY 2010-11 to FY 2012-13 Page | 48
Station
PSPCL Projectio
ns in Tariff
Petition of FY
2010-11
Approved in T.O. 2010-11 (MU)
Actual (MU)
Variation in actual power
purchase vis-à-vis
approved by the
Commission
Variation in Actual
Generation Remarks
Kahalgaon-II (ER)
700.80 701.00 594.37 -15.21%
The share allocation considered by the Commission was 8.31% whereas actual share allocation has been 8.02% which has resulted in reduction in power purchase quantum.
NHPC
Bairasiul 302.00 302.00 324.88 7.57% 9.49%
Entitlement from the plant has not changed. Scheduled generation has been higher by around 9.49%.
Salal 854.60 854.00 862.37 0.98% 1.10% Marginal Variation
Tanakpur 66.70 67.00 65.40 -2.40% 10.53%
The scheduled generation from the plant though increased by 10.53% however, the actual purchase has reduced by 2.40%.
Chamera-I 222.80 223.00 245.97 10.30% 19.19%
Scheduled generation has been higher by around 19.19%.
Chamera-II 168.00 168.00 185.10 10.18% 9.76%
Scheduled generation has been higher by around 9.76%. Further, the entitlement has reduced from 12.85% considered by

Report on Study on power purchase/sale for PSPCL for FY 2010-11 to FY 2012-13 Page | 49
Station
PSPCL Projectio
ns in Tariff
Petition of FY
2010-11
Approved in T.O. 2010-11 (MU)
Actual (MU)
Variation in actual power
purchase vis-à-vis
approved by the
Commission
Variation in Actual
Generation Remarks
the Commission to 12.34%.
Uri 382.00 382.00 416.26 8.97% 2.62%
The scheduled generation from the plant has increased by around 2.62%.
Dhauliganga 132.50 138.00 140.29 1.66% -1.34% Marginal Variation
Dulhasti 247.50 248.00 233.58 -5.81% -3.05%
The scheduled generation has been lower by around 3.05%. Further, Entitlement has decreased from 11.43% considered by the Commission to 10.23% for FY 2010-11 which may be the reasons for variation.
NPC
NAPP 86.70 87.00 212.00 143.68% 136.75%
The scheduled generation has increased significantly by around 136.75% which may be the reason for variation.
RAPP B 468.70 462.00 735.00 59.09% 54.92%
The scheduled generation has increased significantly by around 54.92% which may be the reason for variation.
RAPP C 295.70 296.00 322.00 8.78% 109.61%
Scheduled generation has been higher than that considered by the Commission by around

Report on Study on power purchase/sale for PSPCL for FY 2010-11 to FY 2012-13 Page | 50
Station
PSPCL Projectio
ns in Tariff
Petition of FY
2010-11
Approved in T.O. 2010-11 (MU)
Actual (MU)
Variation in actual power
purchase vis-à-vis
approved by the
Commission
Variation in Actual
Generation Remarks
109.61%. However, the entitlement has reduced from 24.83% to 15.35% which may be the reasons for variation.
Other Sources
NJPC 706.00 706.00 830.59 17.82% 46.66%
Scheduled generation has been higher by around 46.66%. Further, the Entitlement has reduced from 12.82% considered by the Commission to 11.42% for FY 2010-11 which may be the reasons for the variation.
Tehri 232.0 253.00 287.97 13.82% 8.46%
Scheduled generation has been higher by around 8.46%. Further, the Entitlement has increased from 8.86% considered by Commission to 8.98% in FY 2010-11 which may be the reasons for variation.
(b) Variation in Actual vis-à-vis Commission Approved Power Purchase Quantum for New Generating Stations for FY 2010-11:
The following table presents the quantum of power purchase projected by PSPCL, quantum of power purchase approved by the Commission, actual power purchase and variation in

Report on Study on power purchase/sale for PSPCL for FY 2010-11 to FY 2012-13 Page | 51
actual quantum of power vis-à-vis Commission approved values along with the probable reasons for variations for New Generating Stations:
Table 23: Variation in Actual vis-à-vis Commission Approved Power Purchase Quantum for New Generating Stations for FY 2010-11
Station
PSPCL Projections
in Tariff Petition of FY 2010-11
Approved in TO 2010-
11 Actual
Variation in actual vis-à-vis
Commission
Approved
Remarks
SEWA II 75.60 75.58 38.99 -48.69%
Commission approved energy from the station considering all the three units will get commission by March 2010. However, the actual commission got delayed and the generation started from June 2010 and all the three units started generating from August 2010 onwards. This has resulted in lower procurement of power from the Station.
Uri II 50.40 50.41 00.0 -100%
The commissioning of these stations got delayed on account of which no power was procured from these stations.
Parbati III 14.70 14.67 00.0 -100% Chamera III 10.50 10.52 00.0 -100% Koteshwar HEP 30.10 30.1 00.0 -100% Durgapur Steel TPS (DVC)
367.20 367.2 00.0 -100%
Raghunathpura TPS (DVC)
47.40 47.43 00.0 -100%
Malana II (PTC) - 250.85 00.0 -100% Udipi TPP (UPCL) - 439.95 00.0 -100% Pragati III Gas plant 826.70 826.66 00.0 -100%

Report on Study on power purchase/sale for PSPCL for FY 2010-11 to FY 2012-13 Page | 52
Station
PSPCL Projections
in Tariff Petition of FY 2010-11
Approved in TO 2010-
11 Actual
Variation in actual vis-à-vis
Commission
Approved
Remarks
Bawana Maithon (TATA) - 370.26 00.0 -100%
Out of the total variations observed in the power purchase quantum from Central generating stations further analysis has been done to quantify the variations that occurred due to variation in entitlement and on account of variation in actual generation vis a vis projected generation. The net variations on account of various reasons as discussed above is as shown below:
Table 24: Break up of Variation in Actual vis-à-vis Commission Approved Power Purchase Quantum for Central Generating Stations for FY 2010-11
Name of Generating Stations
Variation Analysis (MU)
Total Variation in power purchase
Due to change in Entitlement
Due to variation in Generation Other Reasons
NTPC Total -992 -278 -70 -644 NHPC Total -21 -30 105 -96 NPC – Total 424 -352 733 43
Total -589 -660 768 -697
As evident from the above table out of the total reduction in power purchase of 589 MU, the variation on account of reduction in entitlement was around 660 MU however the quantum of power purchase increase from these sources due to higher generation is by around 768 MU. Accordingly, considering the actual generation from these sources and actual entitlement, the power procured is around 697 MU less than the power based on actual generation and entitlement, out of which around 274 MU was procured less from gas and liquid fuel generation.
4.1.5 Analysis of Variation in Power Purchase Quantum for FY 2011-12: A detailed analysis was carried out for quantum of Power Purchase during FY 2011-12 as shown in the table below:

Report on Study on power purchase/sale for PSPCL for FY 2010-11 to FY 2012-13 Page | 53
(a) Variation in Actual vis-à-vis Commission Approved Power Purchase Quantum from Existing Central Generating Stations for FY 2011-12:
The following table summarises the power purchase quantum projected by PSPCL, power purchase quantum approved by the Commission, actual power purchase quantum and the difference in actual quantum vis-à-vis Commission approved values along with the probable reasons for variations for Central Generating Stations:
Table 25: Variation in Actual vis-à-vis Commission Approved Power Purchase Quantum for Central Generating Stations for FY 2011-12
Station
PSPCL Projectio
ns in Tariff
Petition of FY
2011-12
Approved in T.O. 2011-12 (MU)
Actual (MU)
Variation in Actual vis-à-
vis Commission
Approved
Variation in Actual
Generation vis-à-vis average considered by
the Commission
Remarks
NTPC
Singrauli 1731.68 1732.00 1589.80 -8.21% -3.40%
Scheduled generation has been lower by around 3.40%.
Rihand-I 988.68 989.00 899.73 -9.03% -4.16%
Scheduled generation has been lower by around 4.16%.
Rihand-II 926.31 926.00 821.25 -11.31% -5.53%
Scheduled generation has been lower by around 5.53%.

Report on Study on power purchase/sale for PSPCL for FY 2010-11 to FY 2012-13 Page | 54
Station
PSPCL Projectio
ns in Tariff
Petition of FY
2011-12
Approved in T.O. 2011-12 (MU)
Actual (MU)
Variation in Actual vis-à-
vis Commission
Approved
Variation in Actual
Generation vis-à-vis average considered by
the Commission
Remarks
Anta(GF) 242.65 243.00 219.32 -9.74% 14.28%
The Entitlement has reduced from 13.68% considered by the Commission to 13.45% in FY 2011-12. Further, scheduled generation has been higher.
Anta (RF) 50.47 51.00 66.27 29.95% 38.90%
Scheduled generation has been higher by around 38.90%.
Anta (LF) 30.91 31.00 0.05 -99.84% -99.39%
Scheduled generation has been lower by around 99.39% which may be the reason for variation.
Auraiya(GPP) 443.16 443.00 315.46 -28.79% -21.27%
The Entitlement has decreased from 13.66% considered by the Commission to 13.45% for FY 2011-12. Scheduled generation has been lower by around 21.27% which may be the reasons for variation.
Auraiya (RF) 28.41 28.00 102.00 264.30% 228.16% Scheduled

Report on Study on power purchase/sale for PSPCL for FY 2010-11 to FY 2012-13 Page | 55
Station
PSPCL Projectio
ns in Tariff
Petition of FY
2011-12
Approved in T.O. 2011-12 (MU)
Actual (MU)
Variation in Actual vis-à-
vis Commission
Approved
Variation in Actual
Generation vis-à-vis average considered by
the Commission
Remarks
generation has been higher by around 228.16% which may be the reason for variation.
Auraiya (LF) 49.39 49.00 0.53 -98.93% -93.92%
Scheduled generation has been lower by around 93.92% which may be the reason for variation.
Dadri (GF) 629.37 630.00 567.56 -9.91% 11.51%
Entitlement has increased from 16.69% to 16.72% in FY 2011-12. Scheduled generation has been higher by around 11.51%.
Dadri (RF) 39.69 40.00 145.50 263.75% 229.72%
Scheduled generation has been higher by around 229.72% which may be the reason for variation.
Dadri (LF) 138.02 138.00 0.00 -100.00% -99.57%
Scheduled generation has been lower by around 99.57% which may be the reason for

Report on Study on power purchase/sale for PSPCL for FY 2010-11 to FY 2012-13 Page | 56
Station
PSPCL Projectio
ns in Tariff
Petition of FY
2011-12
Approved in T.O. 2011-12 (MU)
Actual (MU)
Variation in Actual vis-à-
vis Commission
Approved
Variation in Actual
Generation vis-à-vis average considered by
the Commission
Remarks
variation.
Unchahar-I 288.01 288.00 228.76 -20.57% -5.36%
Scheduled generation has been lower by around 5.36%.
Unchahar-II 520.00 520.00 391.05 -24.80% -11.27%
Scheduled generation has been lower by around 11.27%.
Unchahar-III 162.06 162.00 132.25 -18.36% -3.69%
Entitlement has increased from 9.76% considered by the Commission to 9.805% in FY 2011-12. Scheduled generation has been lower by around 3.69%.
Farakka (ER) 151.94 277.00 125.68 -54.63%
The share allocation considered by the Commission was 9.35% whereas actual share allocation has been 1.39% which may be the reason for variation.
Kahalgaon 348.34 519.00 262.81 -49.36% The share allocation

Report on Study on power purchase/sale for PSPCL for FY 2010-11 to FY 2012-13 Page | 57
Station
PSPCL Projectio
ns in Tariff
Petition of FY
2011-12
Approved in T.O. 2011-12 (MU)
Actual (MU)
Variation in Actual vis-à-
vis Commission
Approved
Variation in Actual
Generation vis-à-vis average considered by
the Commission
Remarks
(ER) considered by the Commission was 14.32% whereas actual share allocation has been 6.07% which may be the reason for variation.
Kahalgaon-II (ER)
821.86 822.00 528.92 -35.65%
The share allocation considered by the Commission was 8.31% whereas actual share allocation has been 8.02% which may be the reason for variation.
IGSTPS Jhajjar
- - 21.49 - New Generating Station.
NCTPS- 2C (DADRI II)
- - 133.36 - New Generating Station
NHPC
Bairasul 290.42 290.00 333.16 14.88% 14.74%
Scheduled generation has been higher by around 14.74% which may be the reason for variation.

Report on Study on power purchase/sale for PSPCL for FY 2010-11 to FY 2012-13 Page | 58
Station
PSPCL Projectio
ns in Tariff
Petition of FY
2011-12
Approved in T.O. 2011-12 (MU)
Actual (MU)
Variation in Actual vis-à-
vis Commission
Approved
Variation in Actual
Generation vis-à-vis average considered by
the Commission
Remarks
Salal 818.20 818.00 860.36 5.18% 5.09%
Scheduled generation has been higher by around 5.09% which may be the reason for variation.
Tanakpur 68.46 69.00 71.66 3.86%
Marginal Variation
Chamera-I 213.55 213.00 270.29 26.90% 26.99%
Scheduled generation has been higher by around 26.99%.
Chamera-II 172.62 173.00 191.97 10.97% 9.98%
Entitlement has decreased from 12.56% considered by the Commission to 12.106% in FY 2011-12. Scheduled generation has been higher by around 9.98%.
Uri 377.47 377.00 369.67 -1.94% -2.22%
Scheduled generation has been lower by around 2.22% which may be the reason for variation.
Dhauliganga 138.94 139.00 140.48 1.06%
Marginal Variation

Report on Study on power purchase/sale for PSPCL for FY 2010-11 to FY 2012-13 Page | 59
Station
PSPCL Projectio
ns in Tariff
Petition of FY
2011-12
Approved in T.O. 2011-12 (MU)
Actual (MU)
Variation in Actual vis-à-
vis Commission
Approved
Variation in Actual
Generation vis-à-vis average considered by
the Commission
Remarks
Dulhasti 244.21 244.00 225.83 -7.45% -10.48%
Entitlement has decreased from 11.16% considered by the Commission to 10.03% in FY 2011-12. Actual generation has been lower by around 10.48% which may be the reasons for variation.
NPC
NAPP 79.87 80.00 220.19 175.24% 180.32%
Scheduled generation has been higher by around 180.32% which may be the reason for variation.
RAPP B 462.51 463.00 791.69 70.99% 70.66%
Scheduled generation has been higher by around 70.66% which may be the reason for variation.
RAPP C 256.93 257.00 434.19 68.95% 36.48% Other Sources

Report on Study on power purchase/sale for PSPCL for FY 2010-11 to FY 2012-13 Page | 60
Station
PSPCL Projectio
ns in Tariff
Petition of FY
2011-12
Approved in T.O. 2011-12 (MU)
Actual (MU)
Variation in Actual vis-à-
vis Commission
Approved
Variation in Actual
Generation vis-à-vis average considered by
the Commission
Remarks
NJPC 765.92 766.00 877.33 14.53% 13.98%
Scheduled generation has been higher by around 13.98% which may be the reason for variation.
Tehri 228.94 229.00 356.27 55.58% 52.22%
Scheduled generation has been higher than by around 52.22%. Further, Entitlement has increased from 8.81% considered by the Commission to 8.860% in FY 2011-12 which may be the reasons for variation.
(b) Variation in Actual vis-à-vis Commission Approved Power Purchase Quantum for New Generating Stations for FY 2011-12:
The following table summarises the quantum of power purchase projected by PSPCL, quantum of power purchase approved by the Commission, actual power purchase and variation in actual quantum of power vis-à-vis Commission approved values along with the probable reasons for variations for New Generating Stations:

Report on Study on power purchase/sale for PSPCL for FY 2010-11 to FY 2012-13 Page | 61
Table 26: Variation in Actual vis-à-vis Commission Approved Power Purchase Quantum for New Generating Stations for FY 2011-12
Station
PSPCL Projections in Tariff Petition of FY 2011-12
Approved in T.O.
2011-12
Actual
Variation in Actual vis-à-
vis Commission
Approved
Remarks
SEWA II 103.07 103.07 00.0 -100.00%
Scheduled Commissioning delayed for the stations. Hence no purchase of power from these stations.
Parbati III
23.96 23.96 00.0 -100.00%
Chamera III
86.01 86.01 00.0 -100.00%
Koteshwar HEP
52.35 52.35 40.34 -22.42%
Availability has been 76.989% which is on lower side and reason for variation.
Durgapur Steel TPS (DVC)
569.28 569.28 00.0 -100.00%
Scheduled Commissioning delayed for the stations. Hence no purchase of power from these stations during the year.
Malana II (PTC)
394.48 394.48 00.0 -100.00%
Udipi TPP (UPCL)
696.84 696.84 00.0 -100.00%
Pragati III Gas plant Bawana
840.46 840.46 00.0 -100.00%
Karcham Wangtoo (PTC)
57.87 57.87 00.0 -100.00%
Teesta III 8.24 8.24 00.0 -100.00%
Out of the total variations observed in the power purchase quantum from Central generating stations further analysis has been done to quantify the variations that occurred due to variation in entitlement and on account of variation in actual generation vis-à-vis

Report on Study on power purchase/sale for PSPCL for FY 2010-11 to FY 2012-13 Page | 62
projected generation. The net variations on account of various reasons as discussed above is as shown below:
Table 27: Break up of Variation in Actual vis-à-vis Commission Approved Power Purchase Quantum for Central Generating Stations for FY 2011-12
Name of Generating Stations
Variation Analysis (MU)
Total Variation in power purchase
Due to change in Entitlement
Due to variation in Generation Other Reasons
NTPC Total -1336 -943 -257 -136 NHPC Total -61 31 132 -224 NPC – Total 646 115 534 -3 Total -751 -797 409 -363
As evident from the above table out of the total reduction in power purchase of 751 MU, the variation on account of reduction in entitlement was around 797 MU however the quantum of power purchase increase from these sources due to higher generation is by around 409 MU. Accordingly, considering the actual generation from these sources and actual entitlement, the power procured is around 363 MU less than the power based on actual generation and entitlement.
4.1.6 Analysis of Variation in Power Purchase Quantum for FY 2012-13:
(a) Variation in Actual vis-à-vis Commission Approved Power Purchase Quantum for Existing Central Generating Stations for FY 2012-13:
The following table summarises the power purchase quantum projected by PSPCL, power purchase quantum approved by the Commission, actual power purchase quantum and the difference in actual quantum vis-à-vis Commission approved values along with the probable reasons for variations for Central Generating Stations:

Report on Study on power purchase/sale for PSPCL for FY 2010-11 to FY 2012-13 Page | 63
Table 28: Variation in Actual vis-à-vis Commission Approved Power Purchase Quantum for Central Generating Stations for FY 2012-13
Station
PSPCL Projectio
ns in Tariff
Petition of FY
2012-13
Approved in T.O. 2012-13 (MU)
Revised Estimate
(MU)
Variation in actual vis-à-vis
Commission
Approved
Variation in Actual
Generation vis-à-vis average
considered by the
Commission
Remarks
NTPC
Singrauli 1741.69 1732.00 1657.21 -4.32% 1.49%
Scheduled generation has been higher by around 1.49%. However, the Entitlement has decreased from 11.67% considered by the Commission to 11.29% for FY 2012-13 which may be the reason for variation.
Rihand-I 949.93 989.00 756.79 -23.48% -18.62%
Scheduled generation has been lower by around 18.62%. Further, the Entitlement has decreased from 12.64% considered by the Commission to 12.27% for FY 2012-13 which may be the reasons for variation.
Rihand-II 917.22 926.00 883.78 -4.56% 1.76%
Scheduled generation has been higher by around 1.76%. However, the Entitlement has decreased from 11.85% considered by the Commission to 11.48%

Report on Study on power purchase/sale for PSPCL for FY 2010-11 to FY 2012-13 Page | 64
Station
PSPCL Projectio
ns in Tariff
Petition of FY
2012-13
Approved in T.O. 2012-13 (MU)
Revised Estimate
(MU)
Variation in actual vis-à-vis
Commission
Approved
Variation in Actual
Generation vis-à-vis average
considered by the
Commission
Remarks
for FY 2012-13 which may be the reason for variation.
Anta(GPP) 312.46 325.00 227.44 -30.02% -14.89%
Scheduled generation has been lower by around 14.89%. Further, the Entitlement has decreased from 13.68% considered by the Commission to 13.23% for FY 2012-13 which may be the reasons for variation.
Auraiya (GPP)
510.64 520.00 257.81 -50.42% -30.92%
Scheduled generation has been lower by around 30.92%. The Entitlement has decreased from 13.66% considered by the Commission to 13.59% for FY 2012-13.
Dadri(GPP) 789.63 808.00 525.81 -34.92% -15.89%
Scheduled generation has been lower by around 15.89%. Further, the Entitlement has decreased from 16.69% considered by the Commission to 16.62% for FY 2012-13 which may be the reason for variation.

Report on Study on power purchase/sale for PSPCL for FY 2010-11 to FY 2012-13 Page | 65
Station
PSPCL Projectio
ns in Tariff
Petition of FY
2012-13
Approved in T.O. 2012-13 (MU)
Revised Estimate
(MU)
Variation in actual vis-à-vis
Commission
Approved
Variation in Actual
Generation vis-à-vis average
considered by the
Commission
Remarks
Unchahar-I 275.07 288.00 234.58 -18.55% -1.03%
Scheduled generation has been lower by around 1.03%. Further, the Entitlement has decreased from 9.09% considered by the Commission to 8.97% for FY 2012-13.
Unchahar-II 498.22 520.00 418.29 -19.56% -4.56%
Scheduled generation has been lower by around 4.56%. Further, Entitlement has decreased from 15.98% considered by the Commission to 15.56% for FY 2012-13.
Unchahar-III 153.48 162.00 125.92 -22.27% -5.51%
Scheduled generation has been lower by around 5.51%. Further, Entitlement has decreased from 9.76% considered by the Commission to 9.35% for FY 2012-13.
Farakka (ER) 242.67 243.00 111.84 -53.98% -51.00%
Scheduled generation for the Station has reduced by 51% which may be the reason for variation.
Kahalgaon (ER)
457.46 457.00 298.92 -34.59% -27.40 Scheduled generation for the Station has reduced

Report on Study on power purchase/sale for PSPCL for FY 2010-11 to FY 2012-13 Page | 66
Station
PSPCL Projectio
ns in Tariff
Petition of FY
2012-13
Approved in T.O. 2012-13 (MU)
Revised Estimate
(MU)
Variation in actual vis-à-vis
Commission
Approved
Variation in Actual
Generation vis-à-vis average
considered by the
Commission
Remarks
by 27.40% which may be the reason for variation.
Kahalgaon-II (ER)
594.31 594.00 653.05 9.94% 14.87%
Scheduled generation for the Station has increased by 14.87% which may be the reason for variation.
NCTPS- 2C (DADRI II)
183.66 184.00 101.05 -45.08% -15.50
Scheduled generation has been lower by around 15.50%. The entitlement has decreased from 2.40% considered by Commission to 1.28% for FY 2012-13 which may be the reasons for variation.
NHPC
Bairasul 299.03 290.00 329.26 13.54% 13.33%
Scheduled generation has been higher by around 13.33% which may be the reason for variation.
Salal 829.26 818.00 872.14 6.62% 6.46%
Scheduled generation has been higher by around 6.46% which may be the reason for variation.
Tanakpur 67.44 69.00 67.42 -2.29% 7.03% Scheduled generation has been higher by around 7.03%.
Chamera-I 221.57 213.00 249.02 16.91% 16.86%
Scheduled generation has been higher by around 16.86% which may be the

Report on Study on power purchase/sale for PSPCL for FY 2010-11 to FY 2012-13 Page | 67
Station
PSPCL Projectio
ns in Tariff
Petition of FY
2012-13
Approved in T.O. 2012-13 (MU)
Revised Estimate
(MU)
Variation in actual vis-à-vis
Commission
Approved
Variation in Actual
Generation vis-à-vis average
considered by the
Commission
Remarks
reason for variation.
Chamera-II 175.74 173.00 176.59 2.07% 3.60%
Scheduled generation has been higher by around 3.60%. Further, Entitlement has decreased from 12.56% considered by the Commission to 11.80% in FY 2012-13 which may be the reasons for variation.
Uri 387.17 377.00 407.40 8.06% 7.32%
Scheduled generation has been higher by around 7.32% which may be the reason for variation.
Dhauliganga 139.28 139.00 136.87 -1.53% -0.89%
Scheduled generation has been lower by around 0.89%. Further, the Entitlement has decreased from 12.28% considered by the Commission to 11.54% for FY 2012-13 which may be the reasons for variation.

Report on Study on power purchase/sale for PSPCL for FY 2010-11 to FY 2012-13 Page | 68
Station
PSPCL Projectio
ns in Tariff
Petition of FY
2012-13
Approved in T.O. 2012-13 (MU)
Revised Estimate
(MU)
Variation in actual vis-à-vis
Commission
Approved
Variation in Actual
Generation vis-à-vis average
considered by the
Commission
Remarks
Dulhasti 241.55 244.00 205.92 -15.61% -6.56%
Scheduled generation has been lower by around 6.56%. Further, Entitlement has decreased from 11.16% considered by the Commission to 9.82% for FY 2012-13 which may be the reasons for variation.
NPC
NAPP 112.81 80.00 288.63 260.79% 269.25%
Scheduled generation has been higher by around 269.25% which may be the reason for variation.
RAPP B 622.97 714 1210.30 69.51% 78.34%
Scheduled generation has been higher by around 78.34% which may be the reason for variation. RAPP C
Other Sources
*NJPC 782.13 782.00 772.15 -1.26% 0.06% Marginal Variation
Tehri 243.70 244.00 272.98 11.88% 17.10%
Scheduled generation has been higher by around 17.10%. Further, Entitlement has decreased from 9.26% considered by the Commission to 8.71% in FY 2012-13 which may be

Report on Study on power purchase/sale for PSPCL for FY 2010-11 to FY 2012-13 Page | 69
Station
PSPCL Projectio
ns in Tariff
Petition of FY
2012-13
Approved in T.O. 2012-13 (MU)
Revised Estimate
(MU)
Variation in actual vis-à-vis
Commission
Approved
Variation in Actual
Generation vis-à-vis average
considered by the
Commission
Remarks
the reason for variation.
(b) Variation in Actual vis-à-vis Commission Approved Power Purchase Quantum for New Generating Stations for FY 2012-13:
The following table summarises the quantum of power purchase projected by PSPCL, quantum of power purchase approved by the Commission, actual power purchase and variation in actual quantum of power vis-à-vis Commission approved values along with the probable reasons for variations for New Generating Stations:
Table 29: Variation in Actual vis-à-vis Commission Approved Power Purchase Quantum for New Generating Stations for FY 2012-13
Station
PSPCL Projections in
Tariff Petition for FY 2012-13
Approved in TO 2012-13 Actual
Variation in Actual vis-à-
vis Commission
Approved
Remarks
Rihand III 126.13 126.13 79.22 -37.12%
Availability has been 62.651% which is on lower side. The Commissioning was scheduled to be in September 2012 whereas the actual COD occurred in November 2012. This delay in

Report on Study on power purchase/sale for PSPCL for FY 2010-11 to FY 2012-13 Page | 70
Station
PSPCL Projections in
Tariff Petition for FY 2012-13
Approved in TO 2012-13 Actual
Variation in Actual vis-à-
vis Commission
Approved
Remarks
Commissioning and lower availability appears to be reasons for variation in power procured.
SEWA II 46.56 47.00 46.70 -0.64% Marginal variation
Uri II 182.61 182.61 00.0 -100.00% Scheduled Commissioning delayed for the stations. Hence no purchase of power from these stations during the year. Parbati III 174.89 174.89 00.0 -100.00%
Chamera III 107.12 107.12 66.22 -38.11%
Scheduled Generation from the station has been lower by around 34.19%. The entitlement has decreased from 10.90% considered by the Commission to 9.48% for FY 2012-13. This explains the variation in power procured.
Koteshwar HEP 70.13 70.13 86.4 23.43% Scheduled

Report on Study on power purchase/sale for PSPCL for FY 2010-11 to FY 2012-13 Page | 71
Station
PSPCL Projections in
Tariff Petition for FY 2012-13
Approved in TO 2012-13 Actual
Variation in Actual vis-à-
vis Commission
Approved
Remarks
Generation from the station has been higher The entitlement has decreased from 7.95% considered by the Commission to 7.37% for FY 2012-13 which may be the reason for variation.
Durgapur Steel TPS (DVC)
1296.48 1296.48 367.46 -71.28%
The Commissioning was scheduled to be in April 2012 whereas the actual COD for Unit I was May 2012 and Unit II was March 2013. Clearly the delay in Commissioning explains the variation in power procured.
Raghunathpura TPS (DVC)
484.85 484.85 00.0 -100.00% Scheduled Commissioning delayed for the stations. Hence no purchase of power from these stations.
Bokaro TPS (DVC) 646.46 646.46 00.0 -100.00%
Malana II (PTC) 414.10 414.10 169.87 -58.97%
The Commissioning was scheduled to be in April 2012 whereas the actual

Report on Study on power purchase/sale for PSPCL for FY 2010-11 to FY 2012-13 Page | 72
Station
PSPCL Projections in
Tariff Petition for FY 2012-13
Approved in TO 2012-13 Actual
Variation in Actual vis-à-
vis Commission
Approved
Remarks
COD occurred in July 2012. This delay in Commissioning explains the variation in power procured.
Udipi TPP (UPCL) 657.96 657.96 00.0 -100.00%
Scheduled Commissioning delayed for the station. Hence no purchase of power from the station.
Pragati III Gas plant Bawana
931.29 931.29 98.16 -89.46%
The Commissioning was scheduled to be in April 2012 whereas the actual COD occurred in January 2013. This delay in Commissioning explains the variation in power procured.
Mundra UMPP (CGPL)
1536.97 1536.97 1413.34 -8.03%
This reduction in power procured is due to the reduction in actual generation.
Talwandi Sabo TPS (Sterlite)
1646.06 1646.06 00.0 -100.00%
Scheduled Commissioning delayed for the stations Hence no purchase of power

Report on Study on power purchase/sale for PSPCL for FY 2010-11 to FY 2012-13 Page | 73
Station
PSPCL Projections in
Tariff Petition for FY 2012-13
Approved in TO 2012-13 Actual
Variation in Actual vis-à-
vis Commission
Approved
Remarks
from the station.
Out of the total variations observed in the power purchase quantum from Central generating stations further analysis has been done to quantify the variations that occurred due to variation in entitlement and on account of variation in actual generation vis a vis projected generation. The net variations on account of various reasons as discussed above is as shown below:
Table 30: Break up of Variation in Actual vis-à-vis Commission Approved Power Purchase Quantum for Central Generating Stations for FY 2012-13
Name of Generating Stations
Variation Analysis (MU)
Total Variation in power purchase
Due to change in Entitlement
Due to variation in Generation Other Reasons
NTPC Total -1567 369 -997 -939 NHPC Total -277 39 131 -448 NPC – Total 705 22 578 105 Total -1139 430 -288 -1282
As evident from the above table out of the total reduction in power purchase of 1139 MU, the variation on account of increase in entitlement was around 430MU however the quantum of power purchase reduction from these sources due to reduction in generation is around 288 MU. Accordingly, considering the actual generation from these sources and actual entitlement, the power procured is around 1282 MU less than the power based on actual generation and entitlement, out of which around 127 MU was procured less from gas and liquid fuel generation.

Report on Study on power purchase/sale for PSPCL for FY 2010-11 to FY 2012-13 Page | 74
4.2 Power Purchase Cost
4.2.1 Merit Order Principle for Procurement of Power As discussed earlier, PSPCL receives power from its own generating stations both hydro as well as thermal. PPSCL has share from BBMB stations, central sector projects and UMPPs. Further, PSPCL has executed PPAs with some IPPs and Renewable Energy projects. During the low demand/surplus scenario for some hours of the day in certain months, PSPCL submitted that it follows the merit order to back down generation from different generating stations to minimize financial loss based on following principles:
i. Hydro and Nuclear powers are considered as must run plants and therefore are never backed down.
ii. Own Thermal Plants: The current variable cost of Ropar & Lehra Mohabbat thermal units are around Rs. 2.18/kWh and Bathinda unit is Rs. 2.39/kWh. In low demand scenario, the Powers (under short / Long term) costing more than these rates are surrendered first and then backing down of these plants follows to further scale down the generation. Due to the technical problems of thermal units, generation of own thermal units can only be backed down by 20% of the unit capacity and if need arises further the units are boxed up/ shut down.
iii. In case of reduction of Long term powers (without Hydro/Nuclear generation as the same are treated as Must Run), the principle of highest cost power first, next lower cost second and onwards lower cost-wise merit is followed.
It is observed that the merit order principles followed by PSPCL are generally in line with the industry practice of considering hydro and nuclear power plants as must run stations.
4.2.2 Analysis for variation in actual AFC vis-à-vis Commission Approved AFC The detailed analysis has been carried out for the variation in the actual Annual Fixed Charges vis-à-vis the Commission approved Annual Fixed Charges which is as shown in the table below:

Report on Study on power purchase/sale for PSPCL for FY 2010-11 to FY 2012-13 Page | 75
Table 31: Analysis for variation in actual AFC vis-à-vis Commission Approved AFC
Station
FY 2010-11 FY 2011-12 FY 2012-13
Approved in TO
2010-11 (Rs. crore)
Actual (Rs.
crore) Variation
Approved in TO 2011-12
(Rs. crore)
Actual (Rs.
crore) Variation
Approved in TO
2012-13 (Rs. crore)
Actual (R.E) (Rs.
crore) Variation
NTPC
Anta 91.16 184.64 103% 101.96 202.80 99% 193.83 207.81 7%
Auraiya 136.87 188.94 38% 136.87 239.27 75% 288.84 253.68 -12%
Dadri Gas 185.40 254.83 37% 185.40 318.25 72% 341.15 359.78 5%
Singrauli 352.49 601.01 71% 352.49 663.89 88% 759.97 693.61 -9%
Rihand-I 344.02 490.41 43% 344.02 537.75 56% 527.54 547.79 4%
Rihand-II 526.68 640.99 22% 551.89 656.38 19% 635.98 653.29 3%
Unchahar-I 142.46 228.22 60% 145.17 238.64 64% 241.72 244.71 1%
Unchahar-II
177.87 270.51 52% 177.87 287.36 62% 279.02 290.87 4%
Unchahar-III
148.10 200.28 35% 148.10 199.82 35% 198.18 198.95 0%
Farakka (ER)
518.33 795.28 53% 518.36 852.16 64% 873.62 880.53 1%
Kahalgaon-I (ER)
316.79 487.24 54% 316.39 527.86 67% 525.05 546.04 4%
Kahalgaon-II (ER)
515.38 1116.04 117% 1070.47 1186.19 11% 1214.06 1233.05 2%
DADRI II 1000.96 1062.82 1098 1089.51 -1%
IGSTPS Jhajjar
757.90 757.90 757.90 1134.04 50%
NHPC

Report on Study on power purchase/sale for PSPCL for FY 2010-11 to FY 2012-13 Page | 76
Station
FY 2010-11 FY 2011-12 FY 2012-13
Approved in TO
2010-11 (Rs. crore)
Actual (Rs.
crore) Variation
Approved in TO 2011-12
(Rs. crore)
Actual (Rs.
crore) Variation
Approved in TO
2012-13 (Rs. crore)
Actual (R.E) (Rs.
crore) Variation
Bairasiul 52.87 93.31 76% 53.01 93.01 75% 97.54 99.95 2%
Salal 176.74 252.21 43% 176.62 233.14 32% 240.49 253.96 6%
Tanakpur 46.82 83.56 78% 47.18 81.12 72% 84.47 87.18 3%
Chamera-I 199.53 285.35 43% 200.66 255.48 27% 261.92 278.34 6%
Chamera-II 347.37 348.78 0% 348.78 343.62 -1% 348.78 356.23 2%
Uri 274.26 387.48 41% 274.28 389.48 42% 333.65 355.60 7%
Dhauliganga
177.02 297.78 68% 178.58 270.16 51% 270.47 281.26 4%
Dulhasti 497.40 1101.92 122% 849.78 1088.52 28% 966.96 1011.75 5%
SEWA-II 141.53 141.53 196.15 39% 191.81 197.95 3%
As observed in the above table, there are substantial variations in the actual vis-à-vis Commission Approved Fixed Charges for Central Generating Stations. The reasons for these variations are as explained below:
The annual fixed charges for Central generating stations are approved by Central Electricity Regulatory Commission. After the completion of Control Period from FY 2004-05 to FY 2008-09, the next Control Period commenced w.e.f. April 1, 2009 for a period of five years. The tariff for second Control Period was governed by CERC regulations dated January 19, 2009. As the tariff petitions by various generators were mostly filed before CERC during FY 2009-10, its finalization by CERC took time. CERC recognizing the need for having some interim tariff for billing purpose approved provisional tariff for the generating station in FY 2010-11. However, the final tariff orders for most of NTPC and NHPC plants were issued by CERC in the year 2011-12 and FY 2012-13. During the intervening period i.e., from the end of the control period till FY 200809 and before determination of provisional tariffs for various stations, the billing was carried out as per the tariff approved for FY 2008-09.

Report on Study on power purchase/sale for PSPCL for FY 2010-11 to FY 2012-13 Page | 77
In the interim period between provisional and final tariff orders for these generating stations, the provisional tariff as approved by the Central Commission was applicable and the billing was done on the basis of same.
As detailed above, year wise analysis of AFC’s of NTPC and NHPC stations has been done for FY 2010-11 to FY 2012-13. The table shown above indicates the AFC approved by PSERC in the tariff order of respective year vis-a-vis actual AFC billed by the generators as indicated in the true up data.
(a) Analysis of Variation in actual AFC vis-à-vis Commission Approved for FY 2010-11:
The Commission issued Tariff Order for FY 2010-11 on April 23, 2010 and by that time the Control Period of FY 2009-10 to FY 2013-14 had started however, as Tariff was not approved by CERC by that time the Commission approved AFC as per bills for September 2009. The billing for September 2009 was done on the basis of AFC approved for FY 2008-09 and therefore the Commission approved the AFC amount for these stations equal to the AFC approved for FY 2008-09.
PSPCL has submitted the audited power purchase cost data for FY 2010-11. PSPCL further submitted that the account for a given year gets audited by mid of the following financial year i.e., around September. Accordingly, by the time the accounts were audited, CERC had issued provisional tariff for all NTPC stations (except for Dadri-II TPS for which final tariff Order was already approved). As far as NHPC stations were concerned, the CERC had already issued final tariff orders except for Chamera-II HEP for which earlier tariff for FY 2008-09 was only available which was also included in the audited account. On the basis of these Tariff Orders, generating stations raised their arrears for past year which was incorporated at the time of finalizing the accounts. The variation in the AFC for the year is mainly on this account.
(b) Analysis of Variation in actual AFC vis-à-vis Commission Approved for FY 2011-12:
The Commission issued Tariff Order for FY 2011-12 on May 09, 2011. The AFC for FY 2011-12 was based on the bills for September 2010. The September 2010 bills were raised on the basis of approved AFC for FY 2008-09 as neither the provisional tariff nor the final tariffs for NTPC and NHPC were issued by that time.
However, as discussed earlier the account for the year gets audited by mid of the following financial year. Accordingly, by the time the accounts were audited CERC had issued the final tariff orders for all NTPC stations (except for Dadri-II TPS for which final tariff Order was already approved). PSPCL has submitted the AFC on the basis of September Bills raised

Report on Study on power purchase/sale for PSPCL for FY 2010-11 to FY 2012-13 Page | 78
by the generating stations. These bills are raised on the basis of the final tariff orders issued by CERC for all NTPC stations.
As far as NHPC stations were concerned, the CERC had already issued final tariff orders (except for Chamera-II HEP for which earlier tariff for FY 2008-09 was only available which was also included in the audited account). On the basis of these Tariff Orders, generating stations raised their arrears for past year which was incorporated at the time of finalizing the accounts. The variation in the AFC for the year is mainly on this account.
(c) Analysis of Variation in actual AFC vis-à-vis Commission Approved for FY 2012-13:
The Commission issued Tariff Order for FY 2012-13 on July 16, 2012. The approved AFC for FY 2012-13 were based on the bills for September 2011. By September 2011 CERC had already issued the provisional tariff orders for all the NTPC stations (except for Dadri-II TPS, for which the final tariff order was already available). Therefore, the September 2011 bills were raised on the basis of these provisional tariff orders for NTPC stations.
PSPCL has submitted the AFC on the basis of September 2012 bills raised by the generating stations. These bills are raised on the basis of the final tariff orders issued by CERC for all NTPC stations till September 2012.
As far as NHPC stations were concerned, the CERC had already issued final tariff orders. The same reflected in the September 2012 bills which have been considered by PSPCL for FY 2012-13.
4.2.3 Analysis for variation in Variable Cost The Commission approves the variable cost of the power procured from central generating stations on the basis of the September bills for the previous year. Central Electricity Regulatory Commission in its Tariff Orders approves the base variable cost of the central generating stations on the basis of prevailing fuel prices at the time of issue of the Order. CERC in its Order states that the energy charge shall be billed by these stations in terms of Regulation 21(6) of CERC Tariff Regulations which states as follows:
“(6) Energy charge rate (ECR) in Rupees per kWh on ex-power plant basis shall be determined to three decimal places in accordance with the following formulae:
(a) For coal based and lignite fired stations
ECR = {(GHR – SFC x CVSF) x LPPF / CVPF + LC x LPL} x 100 / (100 – AUX)
(b) For gas and liquid fuel based stations
ECR = GHR x LPPF x 100 / {CVPF x (100 – AUX)}

Report on Study on power purchase/sale for PSPCL for FY 2010-11 to FY 2012-13 Page | 79
Where,
AUX = Normative auxiliary energy consumption in percentage.
CVPF = Gross calorific value of primary fuel as fired, in kCal per kg, per litre or per standard cubic metre, as applicable.
CVSF = Calorific value of secondary fuel, in kCal per ml.
ECR = Energy charge rate, in Rupees per kWh sent out.
GHR = Gross station heat rate, in kCal per kWh.
LC = Normative limestone consumption in kg per kWh.
LPL = Weighted average landed price of limestone in Rupees per kg.
LPPF = Weighted average landed price of primary fuel, in Rupees per kg, per litre or per standard cubic metre, as applicable, during the month.
SFC = Specific fuel oil consumption, in ml per kWh. “
Further, CERC in its Central Electricity Regulatory Commission (Terms and Conditions of Tariff) (Third Amendment) Regulations, 2012 has added following provision.
The following provisos shall be added under Clause (6) of Regulation 21 of the Principal Regulations as under, namely:
"Provided that generating company shall provide to the beneficiaries of the generating station the details of parameters of GCV and price of fuel i.e. domestic coal, imported coal, e-auction coal, lignite, natural gas, RLNG, liquid fuel etc., as per the form 15 of the Part-I of Appendix I to these regulations:
Provided further that the details of blending ratio of the imported coal with domestic coal, proportion of e-auction coal and the weighted average GCV of the fuels as received shall also be provided separately, along with the bills of the respective month:
Provided further that copies of the bills and details of parameters of GCV and price of fuel i.e. domestic coal, imported coal, e-auction coal, lignite, natural gas, RLNG, liquid fuel etc., details of blending ratio of the imported coal with domestic coal, proportion of e-auction coal shall also be displayed on the website of the generating company. The details should be available on its website on monthly basis for a period of three months."
As stated above these generating stations raise the bills on the basis of actual fuel cost and GCV and the details for the same is provided to the beneficiary and therefore any change in

Report on Study on power purchase/sale for PSPCL for FY 2010-11 to FY 2012-13 Page | 80
the variable cost with regards to the Commission approved value is only to the account of change in fuel cost and gross calorific value for these stations.
The approved variable cost, actual variable cost and variation are as shown in the table below:
Table 32: Variation in Actual vis-à-vis Commission Approved Variable Cost for Central Generating Stations
Station
Variable Cost (Ps/kWh)
FY 2010-11 FY 2011-12 FY 2012-13 Approved
in TO 2010-11
Actual Variation Approved
in TO 2011-12
Actual Variation Approved
in TO 2012-13
Actual (Provisi
onal)
Variation
Anta (G/F) 101 241 139% 229 254 11% 338.92 369 9% Anta (R/F) 322 357 11% 351 601 71%
Anta (L/F) 761 831 9% 752 811 8% Auraiya (G/F) 125 218 75% 243 247 2%
330.31 466 41% Auraiya (R/F) 374 425 14% 418 760 82%
Auraiya (L/F) 884 967 9% 879 989 13%
Dadri Gas (G/F) 123 219 78% 265 248 -6% 341.50 404 18%
Dadri Gas (R/F) 399 423 6% 424 745 76% Dadri Gas (L/F) 724 785 8% 761 795 5% Singrauli 109 134 23% 139 132 -5% 160 112 -30% Rihand-I 100 127 28% 161 144 -11% 178 116 -35% Rihand-II 105 134 28% 166 143 -14% 180 114 -37% Unchahar-I 155 188 21% 199 223 12% 224 257 15% Unchahar-II 156 186 19% 193 222 15% 224 254 13%
Unchahar-III 156 186 19% 189 222 18% 224 245 9%
Farakka (ER) 175 276 58% 324 328 1% 393 257 -35%
Kahalgaon-I (ER) 149 209 40% 198 275 39% 343 224 -35%
Kahalgaon-II (ER) 144 197 36% 192 255 33% 324 206 -36%
NCTPS- 2C (DADRI II) NA 222 NA 275 287 216 -24%

Report on Study on power purchase/sale for PSPCL for FY 2010-11 to FY 2012-13 Page | 81
4.2.4 Analysis for variation in Power Purchase Cost of NPC Stations PSPCL procures power from the two Atomic Power Stations of Nuclear Power Corporation of India Limited, namely Narora Atomic Power Plant (NAPS) and Rajasthan Atomic Power Plant (RAPS). The Commission approves the cost of the power procured from these Atomic Power Stations on the basis of the bills raised for September month of previous year. These bills are raised on the basis of the tariff which is governed by the guidelines of the Department of Atomic Energy.
The approved tariff for power purchase from NPC Stations, actual tariff for power purchase as submitted by PSPCL along with variations in percentage for all the three financial years is provided in the table below:
Table 33: Variation in Actual vis-à-vis Commission Approved Power Purchase Cost for NPC
Station FY2010-11 FY 2011-12 FY 2012-13
Approved (Ps/kWh)
Actual (Ps/kWh)
Variation (%)
Approved (Ps/kWh)
Actual (Ps/kWh)
Variation (%)
Approved (Ps/kWh)
Actual (Ps/kWh)
Variation (%)
NAPS 204.07 204.17 0% 204.07 241.47 18% 204.18 249.29 22%
RAPS-A 286.62 249.90 -13% 249.97 275.71 10% 268.33 298.40
11.21% RAPS-B 286.62 302.29 5% 302.29 341.41 13%
As can be observed from the above table, the variation in cost of power purchase from the atomic Power Stations for FY 2010-11 is marginal except for RAPS A. The Tariff for RAPS-A has been checked and the same is as per the tariff prevalent during FY 2010-11. The variations are slightly higher for the FY 2011-12 and FY 2012-13. These variations have been analysed below.
a. Variation analysis for FY 2011-12: During the analysis it is observed that the Commission approved the cost of power purchase from the above stations on the basis of the September 2010 bills which were based on the old tariff schedule. However, the actual figures submitted by PSPCL are on the basis of the revised tariff schedule as notified by the Department of Atomic Energy for the period.
b. Variation analysis for FY 2012-13: During the analysis it is observed that the Commission approved the cost of power purchase from the above stations on the basis of the September 2011 bills which were based on the old tariff schedule. However, the actual figures submitted by PSPCL are on the basis of the revised tariff schedule as notified by the Department of Atomic Energy for the period.

Report on Study on power purchase/sale for PSPCL for FY 2010-11 to FY 2012-13 Page | 82
4.2.5 Short Term Power Purchase by PSPCL Punjab is an agricultural state and hence faces the problem of shortfall/gap in demand and supply of electricity, especially during the paddy period (June to October). In order to bridge this demand supply gap and to cater to the electricity demand of its consumers, PSPCL procures power from the various sources other than the state generating stations, namely Central Generating Stations, Energy Banking Arrangements, BBMB and Short term Power Purchase through traders.
PSPCL has submitted that for the period FY 2010-11 to FY 2012-13 all the power procured through traders under short term power purchase has been through competitive bidding process. In its support, PSPCL has submitted the copies of the process followed by PSPCL.
The detailed process followed by PSPCL for procuring power under the short term power purchase is explained below. For better understanding, the process is explained in various phases.
Phase I: Projection of Availability of Power
Since, the short term power purchase is usually an expensive option; PSPCL first of all projects the availability of power from other sources which are comparatively more economical.
Phase II: Estimation of Unrestricted Demand
After projecting the availability of power from the above sources, PSPCL estimates the demand of electricity in the State by using the following two methods:
A. By assuming 5% rise in demand from last year. B. By working out average demand for last three years and applying 5% increase per
year over base year.
The results from above two methods are levelled out to work out the expected month-wise unrestricted demand.
Phase III: Shortfall/ Gap in Demand and Supply
PSPCL estimates the demand supply gap by subtracting the availability projections from expected demand. PSPCL generally adopts power regulatory measures in order to bridge this demand supply gap before going for the short term power purchase. These measures are as follows:
i. One Weekly-off day ii. Peak Load Restrictions
After considering these measures, PSPCL works out the Net Supply Demand shortage/gap.
Phase IV: Short Term Power Purchase

Report on Study on power purchase/sale for PSPCL for FY 2010-11 to FY 2012-13 Page | 83
Generally, PSPCL projects that 80% of the net demand supply gap to be tied up on advance reservation basis under short term power purchase and balance 20% to be arranged depending upon requirement on real time basis either through additional over drawal under UI or Day ahead purchase through exchange.
Phase V: Financial Implications
Finally, PSPCL estimates the total financial implications of the short term power purchase under the following options:
i. No power cut on General Consumers, no power drawn under UI, one weekly-off day on industrial consumers along with peak load restrictions and no power import by Open Access consumers.
ii. With 1-2 hours power cut on General Consumers, no power drawn under UI, one weekly-off day on industrial consumers along with peak load restrictions and expected power import by Open Access consumers.
Phase VI: Submission to Short Term Power Purchase Committee
After the completion of the above mentioned five phases, the concerned office submits the application to the Short Term Power Purchase Committee for considering the purchase of power on short term basis though traders through competitive bidding process.
Generally, the Short Term Power Purchase Committee will suggest some changes in the short term power purchase, if required, and will ask the concerned office to submit the application again with requisite changes. Once the Committee is satisfied with the application submitted by the concerned office, it will approve the procurement of power under short term purchase during the specified paddy period i.e. June to October.
The concerned office, after getting the nod of approval from the Short Term Power Purchase Committee, will upload the Notice Inviting Tender and Draft Tender Specifications on its website for power procurement under short term purchase. The bids from traders are then called for such a power purchase. The summary of bid evaluations is explained below.
Bidding Process for Short Term Power Purchase
The salient features of the bidding process adopted by PSPCL for short term Power Purchase are as follows:
• Bids are sought from the bidders who possess Inter State Trading License.
• The tenders are opened in presence of Engineer-in-chief/PP&R.
• In order to verify the trading margin and for assured availability of offered power, only the offers carrying the LOI of the respective Source(s) are considered.

Report on Study on power purchase/sale for PSPCL for FY 2010-11 to FY 2012-13 Page | 84
• The bids are then evaluated for per unit cost of power at Punjab periphery and the
statement of equated prices is prepared.
• PSPCL also submitted the month-wise comparative statements of equated prices of the qualified offers, which is used to ascertain the merit position of the eligible traders/ bidders.
• The Short Term Power Purchase Committee also holds discussions and negotiations for quoted rates before placing orders on eligible bidders/ traders.
• Finally, the LOIs are placed on the eligible traders, for the offered quantity as per the merit order, up to the merit position where requirement of PSPCL is fulfilled.
Summary of Tender Specifications
• PSPCL solicited bids for supply of energy from Inter State sources through Traders, SEBs, State Electricity Utilities, IPPs and CPPs to meet demand of Power in Punjab for the Years 2010-11, 2011-12 and 2012-13.
• Traders submitting bids must have valid License from CERC for Inter State trading of Electricity.
• The bidder was asked to bid for minimum of 25MW and for minimum of 15 days failing which bid was to be rejected.
• The bidders were asked to indicate clearly the Off-Peak (0000-1700 hrs, 2300-2400 hrs), Peak (1700-2300 hrs) and round the clock (0000-2400 hrs) rates of energy and the duration for Off-Peak and Peak if they differ from indicated blocks.
• The Bidders were asked to supply the details of sources of Supply i.e. whether the energy will be supplied from a specific generating station or portfolio of sources. The Bidders were also asked to state the transmission path that will be used and whether it has transmission rights or other transmission mechanism in place.
Assumptions for Bid Evaluation
Generally, following assumptions are considered for evaluating the bids: 1. Transmission Charges, SLDC charges, and losses of various States/Utilities from
which the Power has been offered are enquired from the SLDC/downloaded from their website.
2. The average losses for each region for the same months of the previous year are considered in the calculation of landed cost/rate at Punjab Periphery.

Report on Study on power purchase/sale for PSPCL for FY 2010-11 to FY 2012-13 Page | 85
3. Further, on the basis of these losses the losses for various routes of Power offered
by Bidders/Traders are computed.
4. The Transmission and RLDC charges for each region are considered as per the CERC Regulations.
Summary of Bid Evaluation
The bid evaluation reports submitted by PSPCL were analysed and it is observed that on an average 20-30 bids were received for every month (June to October) for short term power purchase in each of the three Financial Years, i.e. FY 2010-11, 2011-12 and FY 2012-13. During the analysis, it is observed that PSPCL has made short term power purchase Agreements with the Bidders providing power at the lowest rates at the Punjab Periphery. After detailed analysis of the tender specifications, bid evaluation reports and agreements signed by PSPCL, it appears that Competitive bidding process has been adopted for procuring power through traders on short term basis.
Analysis of Actual Short Term Power Purchase
Table 34: Analysis of Short Term Power Procurement
Particulars FY 2010-11 FY 2011-12 FY 2012-13
MU Weightage MU Weighta
ge MU Weightage
Power Procured through Traders (Short-Term)
2493 72.60% 2508 95.98% 3644 67.29%
Power Procured Through Exchange 0
27.40% 105
4.02% 958
32.71 Net UI Overdrawal 941 0 813
Total Short Term Power 3434 100.00% 2613 100.00% 5416 100.00%
In FY 2010-11, PSPCL in its application to the Short Term Power Purchase Committee had projected the ratio of power procured through short term agreements to the power procured under spot purchase including UI overdrawal as 60:40 whereas the ratio of actual power procured under short term agreements to the spot purchase including net UI overdrawal works out to around 73:27.

Report on Study on power purchase/sale for PSPCL for FY 2010-11 to FY 2012-13 Page | 86
In FY 2011-12, PSPCL in its application to the Short Term Power Purchase Committee had projected the ratio of power procured through short term agreements to the power procured under spot purchase including UI overdrawal as 80:20 whereas the ratio of actual power procured under short term agreements to the spot purchase including net UI overdrawal works out to around 96:4.
In FY 2012-13, PSPCL in its application to the Short Term Power Purchase Committee had projected the ratio of power procured through short term agreements to the power procured under spot purchase as 80:20 whereas the ratio of actual power procured under short term agreements to the spot purchase including net UI overdrawal works out to around 67:33.
4.2.6 Analysis for variation in Transmission Charges paid to PGCIL The Commission approves the transmission charges on the basis of the bills raised by PGCIL for the September month of the previous year. The approved transmission charges payable to PGCIL, actual transmission charges as submitted by PSPCL along with variations in percentage for all the three financial years is as shown in the table below:
Table 35: Variation in Actual vis-a-vis Commission Approved Transmission Charges to PGCIL FY 2010-11 FY 2011-12 FY 2012-13
Approved (Rs. crore)
Actual (Rs.
crore)
Variation (%)
Approved (Rs. crore)
Actual (Rs.
crore)
Variation (%)
Approved (Rs. crore)
Actual (Rs.
crore)
Variation (%)
276 378 36.93% 252 397 57.40% 508 528 3.86%
As can be observed from the table above there is a marginal variation in the transmission charges for FY 2012-13 whereas for the FY 2010-11 and FY 2011-12, the variations are relatively higher. The reason for such a high variation is that the Commission approved the transmission charges for these years on the basis of the September bills raised by PGCIL for the immediately preceding year. These bills were based on the tariff orders issued by CERC for FY 2008-09. However, PSPCL has submitted the actual figures for transmission charges on the basis of the final tariff orders issued by CERC for the control period 2009-14. This explains the variations in transmission charges.
4.2.7 Summary of Variation in Power Purchase Cost excluding transmission charges: As discussed earlier, there have been substantial variations in the actual quantum of power purchased from various stations vis-à-vis Commission approved values during all the three

Report on Study on power purchase/sale for PSPCL for FY 2010-11 to FY 2012-13 Page | 87
financial years. The summary of variations in power purchase quantum, total cost of power purchase and average cost of power purchase per unit for FY 2010-11, FY 2011-12 and FY 2012-13 is given in tables below:
Table 36: Summary of Variation in Power Purchase for FY 2010-11
Source Quantum (MU) Cost (Rs Crore) Avg. Cost (Rs/kWh) % Variation in Avg.
Cost Approved Actual Approved Actual Approved Actual NTPC 7787 6795 1648 1770 2.12 2.60 22.64% NHPC 2534 2513 361 531 1.42 2.11 48.59% NPC 845 1269 235 335 2.78 2.64 -5.04% Other Sources 4453 4884 1391 2514 3.12 5.15 65.06% Total 15619 15461 3635 5149 2.33 3.33 42.92%
Table 37: Summary of Variation in Power Purchase for FY 2011-12
Source
Quantum (MU) Cost (Rs Crore) Avg. Cost (Rs/kWh) % Variation in Avg. Cost Approved Actual Approved Actual Approved Actual
NTPC 7888 6552 2168 2052 2.75 3.13 13.82% NHPC 2580 2519 455 511 1.76 2.03 15.34% NPC 800 1446 213 420 2.66 2.91 9.40% Other Sources 7220 4840 2768 1904 3.83 3.93
2.61%
Total 18488 15357 5603 4888 3.03 3.18 4.95%
Table 38: Summary of Variation in Power Purchase for FY 2012-13
Source
Quantum (MU) Cost (Rs Crore) Avg. Cost (Rs/kWh) % Variation in Avg. Cost Approved Actual Approved Actual Approved Actual
NTPC 7899 6332 2558 1883 3.24 2.97 -8.33% NHPC 2835 2558 631 621 2.22 2.43 9.46% NPC 794 1499 208 433 2.62 2.89 10.31% Other Sources 5623 9433 1732 3735 3.08 3.96
28.57%
Total 17151 19821 5128 6673 2.99 3.37 12.71%
It is observed that the total financial Impact of variation in power purchase cost including PGCIL transmission charges for each year is as shown below:

Report on Study on power purchase/sale for PSPCL for FY 2010-11 to FY 2012-13 Page | 88
Table 39: Total Financial Impact of Variation in Power Purchase Cost including PGCIL Charges Financial Year Financial Impact of Power Purchase Cost(Rs. crore)
FY 2010-11 1616 FY 2011-12 -570 FY 2012-13 1564
It is observed that there is substantial increase in the average power purchase cost from other sources during FY 2010-11 and FY 2012-13. Further, there was also substantial increase in average power purchase rate of NTPC and NHPC which is due to revision in tariffs by CERC based on Tariff Regulations applicable for FY 2009-10 to FY 2013-14. The reasons for reduction in quantum of power purchase from the Central Generating Stations are elaborated in the Table 22, Table 25 and Table 28. Further, the reason for higher power purchase cost from other sources is due to the reason that the actual power purchase from the New Generating Stations was substantially lower than the approved power purchase from new sources and hence PSPCL has to procure power from other sources.
4.2.8 Financial Implications of Over-projection of Power from New Generating Stations:
The Commission in its Tariff Order for the FY 2010-11, 2011-12 and 2012-13 has approved certain quantum of Power Purchase through the new generating stations. However, due to delay in the Commissioning of these new generating stations, the allocated power from these stations was not available to PSPCL on time and due to this delay PSPCL was forced to buy power from the other sources like short term power purchase through traders/UI etc. at a comparatively high cost. This resulted into higher actual power purchase cost than the Commission approved values.
The financial implication of the over-projection of power from New Generating Stations has been assessed as shown in the table below:
Table 40: Actual Power Purchase vis-à-vis Commission Approved from New Generating Stations
Financial Year
Approved Power Purchase (MU) Actual Power Purchase (MU) Variation (MU)
FY 2010-11 2483.63 38.99 2444.64 FY 2011-12 2832.56 40.34 2792.22 FY 2012-13 8275.05 2280.67 5994.38

Report on Study on power purchase/sale for PSPCL for FY 2010-11 to FY 2012-13 Page | 89
A. Financial Implications for FY 2010-11:
As can be seen from Table above, in FY 2010-11, the Commission approved a power purchase of around 2483.63 MU from the New Generating Stations whereas due to the delay in the Commissioning of these Generating Stations the actual power purchase from these stations has been only around 38.99 MU. This resulted into a gap of around 2444.64 MU in power availability. In order to bridge this gap, PSPCL had to procure 2492.79 MU of power through short term.
This short term power purchase was made at a rate of around Rs. 5.55/kWh which is on higher side as compared to the power purchase from the firm sources at around Rs. 2.55/kWh. Had this deficit been anticipated at the time of determination of tariff, the procurement of deficit power could have been better planned and the rate of power purchase could have been lower than the actual rate of Rs 5.55/kWh.
Table 41: Financial Implication on account of short term power purchase for FY 2010-11 Rate of Power Purchase from
Short term Power purchase
(Rs./kWh)
Rate of Power Purchase from firm sources
(Rs./kWh)
Total short term power purchase
(MU)
Increase in Rate
(Rs./kWh)
Financial Implications
(Rs. crore)
5.55 2.55 2492.79 2.99 745.62
Based on the above analysis it is observed that the delay in commissioning of new generating stations led to increase in short term purchase.
B. Financial Implications for FY 2011-12:
In FY 2011-12 the Commission approved a total power purchase of around 18488 MU including the short term power purchase of around 2077 MU whereas the actual power purchase by PSPCL had been around 15356 MU including short term power purchase of around 2776.99 MU. On further analysis it is observed that this decrease in demand was due to the power purchase made by consumers through Open Access.
Clearly, the short term power purchase could have been on lower side for FY 2011-12 as the actual sales were lower than the approved sales. However, due to the unavailability of power from new Generating Stations, PSPCL had to procure power from short term power purchase through traders.

Report on Study on power purchase/sale for PSPCL for FY 2010-11 to FY 2012-13 Page | 90
As can be seen from Table above, the Commission approved a power purchase of around 2832.56 MU from the New Generating Stations whereas due to the delay in the Commissioning of these Generating Stations the actual power purchase from these stations has been only around 40.34 MU. This resulted into a gap of around 2792.22 MU in power availability. In order to bridge this gap, PSPCL was had to procure 2776.99 MU of power through short term power purchase from traders.
This short term power purchase was procured at a rate of around Rs. 3.75/kWh which is on higher side as compared to the power purchase from the firm sources at around Rs. 2.87/kWh. Though the price gap is not as much as in FY 2010-11 however, had this deficit been anticipated at the time of determination of tariff, the procurement of deficit power could have been better planned and the rate of power purchase could have been lower than the present rate of Rs 3.75/kWh.
Table 42: Financial Implication on account of short term power purchase for FY 2011-12 Rate of Power Purchase from
Short term Power purchase
(Rs./kWh)
Rate of Power Purchase from firm sources
(Rs./kWh)
Total short term power purchase
(MU)
Increase in Rate
(Rs./kWh)
Financial Implications
(Rs. crore)
3.75 2.87 2613.20 0.88 229.62
Based on the above analysis it is observed that the delay in commissioning of new generating stations led to increase in short term purchase. However, the financial implication computed is idealistic as it has been compared with long term power purchase rate. However, there could have been some saving if the same was anticipated earlier.
C. Financial Implications for FY 2012-13:
The Commission approved the total power purchase of around 17151 MU and did not approve any short term power purchase for this year. However, the actual power purchase was around 19821.33 MU.
On further analysis it is observed that the actual demand for this year had increased because of the customers shifting from power purchase through Open Access to power purchase from PSPCL.
The Commission approved a power purchase of around 8275.05 MU from the New Generating Stations whereas due to the delay in the Commissioning of these Generating Stations the actual power purchase from these stations has been only around 2280.67 MU.

Report on Study on power purchase/sale for PSPCL for FY 2010-11 to FY 2012-13 Page | 91
This resulted into a gap of around 5994.38 MU in power availability. In order to bridge this gap, PSPCL had to procure 4602.92 MU of power through short term power purchase from traders.
Table 43: Financial Implication on account of short term power purchase for FY 2012-13
Rate of Power Purchase from
Short term Power purchase
(Rs./kWh)
Rate of Power Purchase from firm sources
(Rs./kWh
Total short term power purchase
(MU)
Increase in Rate
(Rs./kWh)
Financial Implications
(Rs. crore)
3.96 2.89 4602.92 1.07 491.59
This short term power purchase was procured at a rate of around Rs. 3.96/kWh which is on higher side as compared to the power purchase from the firm sources at around Rs. 2.89/kWh. Though the price gap is not as much as in FY 2010-11 however, had this deficit been anticipated at the time of determination of tariff, the procurement of deficit power could have been better planned and the rate of power purchase could have been lower than the present rate of Rs 3.96/kWh.
Based on the above analysis it is observed that the delay in commissioning of new generating stations and failure to accurately assess the availability of power from these stations led to increase in short term power purchase and resulted into a financial implication of Rs. 745.62 crore in FY 2010-11, Rs. 229.62 in 2011-12 and Rs. 491.59 crore in FY 2012-13 with the cumulative implication of Rs. 1466.83 crore for FY 2010-11 to FY 2012-13.

Report on Study on power purchase/sale for PSPCL for FY 2010-11 to FY 2012-13 Page | 92
4.3 PSERC (Power Purchase and Procurement Process of Licensee) Regulations, 2012 The relevant extracts of the PSERC Power Purchase Regulations are reproduced below:
“7. Power Procurement Plan (1). Long-Term Power Procurement Plan ..... (2) Short-Term Power Procurement Plan Distribution Licensee(s) on the basis of demand/energy forecast and availability projections in accordance with provisions of these Regulation shall prepare a Power Procurement Plan for procuring balance power and energy for the next year. The short-term Power Procurement Plan presents assessment of availability and requirement of electricity for a period less than or equal to one year on a monthly basis. Such a plan is required to assess:- a) Short-term power purchase agreements; b) Short-term spot trade; c) Banking transactions. (i) The short-term Power Procurement Plan for purchase of power shall be the least cost
plan least financial cost to the Distribution Licensee(s)], the ultimate objective being to make available secure and reliable power supply at economically viable tariffs to all consumers while satisfying power supply planning and security standards;
(ii) The short-term Power Procurement Plan shall cover different periods of the day (peak, off
peak and seasonal) and take into account the following:-
a) Availability and Requirement worked out as per Regulation 4,5 &6 both on Peak Demand (MW) and Energy (MUs) basis;
b) Impact of the power purchase cost on the ARR for the ensuing year; c) UI drawl shall be assumed zero; d) The banking transactions; e) Transmission constraints, if any
(iii) This plan for the next year shall be submitted by 31st October and the Commission shall
approve the same by 31st December of the same year. The approved plan shall become part of the subsequent tariff order. However, the first short term Power Procurement Plan, complete in all aspects, shall be submitted by the licensee(s) within 45 days from

Report on Study on power purchase/sale for PSPCL for FY 2010-11 to FY 2012-13 Page | 93
the date of notification of these Regulations and the Commission shall approve it within 30 days of the submission by the licensee.
8. Need for Additional Power The Licensee(s) can make additional procurement of power up to 10% of the quantum approved in the Plan in case of any unforeseen circumstances such as non-availability of fuel, fall in hydro generation, unplanned/forced outage of power generating units or act of God such as failure or below normal monsoon etc which are beyond the control of the licensee(s) to meet its obligation under the Act on the conditions as may be approved by the Commission in the Plan. In case additional procurement of power beyond 10% of the quantum approved in the plan is necessitated due to conditions as referred above, the Distribution Licensee(s) shall demonstrate to the Commission’s satisfaction that there is a need for such additional power which it intends to procure and shall seek the prior approval of the Commission. It may do this by referring to its most recent Power Purchase Plan approved by the Commission. 11. Short-Term Power Procurement Procedure (i) After approval of the short term Power Procurement Plan by the Commission,
Distribution Licensee(s) shall procure required power through transparent open competitive bidding in accordance with the Guidelines dated 15.5.2012 issued by Ministry of Power, Government of India, as amended from time to time, for short term procurement of power under section 63 of the Act or through power exchange or bilateral banking arrangements. The Distribution Licensee(s) shall be free to procure power as per Power Procurement Plan approved by the Commission from any source for meeting short-term demand of power by adopting transparent bidding as per the guidelines of the (MOP) Ministry of Power, Government of India referred above and in such case the licensee need not to approach the Commission for prior approval but shall intimate about the initiation of such procurement process. These Guidelines shall be binding on the procurer [Distribution Licensee(s)]. In case there is any deviation from these Guidelines, the same shall be with the prior approval of the Commission. The Commission shall decide on the modifications to the bid documents within a reasonable time not exceeding 60 days;
(ii) In case of emergency condition arising due to outage of a generator etc. which
necessitates emergency procurement of power, efforts shall be made to carry out such emergency purchases through Power Exchange;
(iii) For additional procurement of power up to 10% over and above the quantum
approved by the Commission in the Power Procurement Plan, the licensee(s)

Report on Study on power purchase/sale for PSPCL for FY 2010-11 to FY 2012-13 Page | 94
need not to approach the Commission for prior approval provided such procurement is as per the conditions as may be approved by the Commission in the Plan. For additional power over and above this limit, licensee(s) shall seek the prior approval of the Commission;
(iv) Within 15 days from the date of entering into an agreement or arrangement of short term procurement, the Distribution Licensee(s) shall provide full details of such agreement or arrangement including quantum, duration, supplier detail, procedure adopted for supplier selection and any other detail as may be required by the Commission;
(v) Licensee(s) shall submit monthly return to the Commission on the Performa as may be specified by the Commission giving all the details of procurement/sale carried out during the month.”
4.4 Recommendations : On the basis of detailed analysis carried out for variation in Power Purchase quantum and cost incurred by PSPCL from various sources including short term power purchase and considering the provisions of PSERC (Power Purchase and Procurement Process of Licensee) Regulations, 2012, following suggestions are proposed to minimise variation in power purchase quantum and cost.
A. Methodology to Project Generation and Availability from: a) Central Generating Stations b) State Generating Stations c) New Generating Stations It is observed during the analysis that the PSPCL projects the availability of power from the central generating stations on the basis of average of energy received in the last three years. This approach appears to be appropriate as it takes care of the latest trends of actual generation. However it is suggested that the following additional aspects may also be considered while projecting the energy available from the existing Central Generating Stations:
• Analysis of Actual Generation by the station during the last three years as the energy received by PSPCL during the last 3 years also includes the impact of less scheduling of power by PSPCL at some instances by applying merit order dispatch.

Report on Study on power purchase/sale for PSPCL for FY 2010-11 to FY 2012-13 Page | 95
• Details of major outages due to Renovation & Modernisation may be factored while projecting the quantum of energy available from these stations.
The projections for availability and PLF made by the Commission for the State Generating Stations appear to be on a higher side as the actual availability and PLF for the last few years had continuously been on the lower side than the values projected by the Commission. It is therefore recommended that the projections for availability and PLF of the State Generating Stations may be made considering the actual generation during last 3 years in addition to planned maintenance schedules. This kind of projection will help in reducing variations in the power purchase quantum from short term sources. As far as New Generating Stations are concerned, it is recommended to consider the availability of power from these stations on the basis of the actual current status of the project as well as the realistic date of Commercial Operation rather than considering the Scheduled date of Commercial Operation. It is suggested that PSPCL may directly ask the Generators about the likely Commercial Operation Date for new Generating stations and the same can be further cross-checked with the information available with CEA on progress of new projects. This will allow PSPCL to plan for purchase of deficit power which if known before hand can be better planned through other sources.
B. Methodology to Project Power Purchase Cost
It is observed during the analysis that the Commission projects the power purchase cost in two parts namely Fixed Charges and Variable Charges. The Commission projects the fixed charges for power procured from the Central Generating Stations on the basis of the Annual Fixed Charges of the Central Generating Stations approved by the CERC and the percentage allocation of PSPCL in these central generating stations. The Commission projects the Variable Charges for power procured from the Central Generating Stations on the basis of the bills of September month of the previous year. As the fuel price varies due to various reasons, it is suggested that the variable charges of the power purchase from central generating stations may be projected on the basis of the variable cost for last three or six months so as to capture the recent trend. Further, it is suggested to consider average of three months or six months actual fuel prices to average out the impact of adjustments etc., while projecting cost of generation for state

Report on Study on power purchase/sale for PSPCL for FY 2010-11 to FY 2012-13 Page | 96
generating stations. This will help in reducing the variations in the power purchase cost. Further, it is suggested that in case the Petition filed by any of Central Generating Stations is pending with CERC for approval of tariff based on new Regulations, PSPCL while projecting the power purchase cost may consider certain percentage of tariff increase sought by CGS on provisional basis while projecting the power purchase cost to avoid the variation in power purchase cost.
C. Backing Down
It is suggested that PSPCL may be asked to record the instances wherein it has to back down its own generating stations both thermal and hydro generating stations along with the duration for which such backing down was done with appropriate justification with regard to circumstances leading to such backing down of its own generating stations. Further, along with the state generating stations PSPCL may be also asked to keep a record of scheduling less power from central generating stations along with appropriate justifications. PSPCL may be also asked to submit the detailed report on backing down of its own thermal generating stations.
D. Monthly Power Purchase Plan In order to control the increase in power purchase cost of PSPCL, it is recommended that PSPCL based on historical monthly sales and the annual sales approved by the Commission may be asked to prepare monthly sales plan and on the basis of the same may be asked to prepare monthly power purchase plan including short term power purchase and banking and submit its plan to the Commission. PSPCL may also be asked to submit the monthly budget for procurement of power based on its power procurement plan. PSPCL may be directed to adhere to this plan and in case of any variation observed which could lead to increase in the budget, the same to be informed to the Commission with appropriate justification and actions to be taken so that the impact is absorbed in the next monthly budgets.
E. Limit on Short Term Power Purchase without prior approval
As regards the limit on Short Term Power Purchase without prior approval from the Commission, the provisions in the existing Regulations are as follows: “For additional procurement of power up to 10% over and above the quantum approved by the Commission in the Power Procurement Plan, the licensee(s) need not to approach

Report on Study on power purchase/sale for PSPCL for FY 2010-11 to FY 2012-13 Page | 97
the Commission for prior approval provided such procurement is as per the conditions as may be approved by the Commission in the Plan. For additional power over and above this limit, licensee(s) shall seek the prior approval of the Commission;” As per the provisions of Regulations, PSPCL is required to obtain the prior approval from the Commission for additional procurement of power above 10% of the quantum approved in the Power Procurement Plan. In this regard, it is suggested the cap in terms of quantum and cost both may be specified and in case the either the quantum or overall cost is likely to increase beyond the specified cap, PSPCL may be asked to obtain the prior approval for the same. Some of the State Electricity Regulatory Commissions in their Regulations have specified the cap of power purchase quantum and cost upto which the Distribution Licensees does not have to obtain prior approval. In this regard, the provisions of Maharashtra Electricity Regulatory Commission (Multi Year Tariff) Regulations, 2011 stipulates as follows:
“26. Additional Short-term power procurement
26.1 The Distribution Licensee can undertake additional short-term power procurement during the year, over and above the power procurement plan for the Control Period approved by the Commission, in accordance with this Regulation.
26.2 Where there has been a shortfall or failure in the supply of electricity from any approved source of supply during the financial year, the Distribution Licensee may enter into additional short-term arrangement or agreement for procurement of power (short-term means up to period of one year):
Provided that if the total power purchase cost for any block of six months including such short-term power procurement exceeds 105% of the power purchase cost approved by the Commission for the respective block of six months, the Distribution Licensee shall have to obtain prior approval of the Commission; and
In this regard, the provisions of Uttarakhand Electricity Regulatory Commission (Terms and Conditions for Determination of Tariff) Regulations 2011 stipulates as follows: “80. Estimate of Power Purchase Requirement (1).... (2)Any variation during any quarter of the financial year, in the quantum or cost of power procured and any procurement from sources other than that mentioned in the power

Report on Study on power purchase/sale for PSPCL for FY 2010-11 to FY 2012-13 Page | 98
procurement plan approved by the Commission, in excess of 5 percent of the quantum or cost, as the case may be, of power procurement for such quarter, as approved by the Commission in the power procurement plan of the distribution Licensee, shall be done only with the prior approval of the Commission.”
F. Demand fluctuation on account of shifting of large consumers from PSPCL to Open Access and Vice-Versa.
At present the large consumers of PSPCL having demand in excess of 1 MW can procure power through Open Access sources depending upon the availability of cheaper power in the market. Currently these consumers who have opted for Open Access enjoy grid back up support without paying any additional charges to PSPCL. The frequent shifting of these consumers from PSPCL to Open Access and vice versa results in demand fluctuation of PSPCL and also results in stranded capacity as observed in FY 2011-12 which in turn makes it difficult to project the actual power purchase requirement as the sales keeps on fluctuating year to year. This has both financial and operational implications on PSPCL. As of now the tariff structure followed in the State of Punjab is Single Part Tariff structure. Most of the States had already adopted the Two Part Tariff Structure which involves separate fixed and variable cost for the consumers. The Commission in its Tariff Order for FY 2013-14 has deliberated on the issue of two part tariff as follows:
“5.1 Two Part Tariff for Retail Supply ... ... 5.1.4 The Commission observes that with the coming up of more accurate and sophisticated electronic metering equipment, there is hardly any possibility of manipulation of meter reading data, including maximum demand. However, in view of the complicating/divergent views expressed by various stakeholders, the Commission does not consider it appropriate to introduce Two Part Tariff during the year 2013-14 but would like to more surely prepare the ground for implementation from the next financial year. The Commission, while mindful of Tariff Policy enjoining early introduction of Two Part Tariff, is nevertheless, of the considered view that Two Part Tariff should be introduced only after attending concerns of various stakeholders of the utility

Report on Study on power purchase/sale for PSPCL for FY 2010-11 to FY 2012-13 Page | 99
through public hearings and by critically analyzing the actual billing data, to determine the impact on consumers as well as revenue of utility. PSPCL is, therefore, directed to examine the issues raised by the consumers / consumer organizations, and conduct mock trial/ parallel run of the proposed Two Part Tariff system, at least in five selected Divisions of PSPCL for 6 months, and submit a detailed report along with a more refined proposal for introduction of Two Part Tariff, addressing the concerns of the consumers/ consumer organizations expressed during the processing of ARR for FY 2013-14 and also the observations made by PSPCL during the mock trial/ parallel run.”
It is therefore suggested that based on the results of the mock trial/parallel run, the Commission may approve the Two Part specifying Demand Charges and Energy Charges for large industrial consumers so that even when the large industrial consumers are drawing power under Open Access, they will be paying the Demand Charges. The Demand Charges applicable in some of the other States in the Country are summarised below: Demand Charges: The details of the Demand charges as applicable for HT Consumers in other States for FY 2013-14 are as provided in the table below:
Table 44: Demand Charges for other States State Category Rs/kVA/Month
Uttar Pradesh
LT Consumers Urban Small and Medium
225
HT Consumers 11 kV 250 11 kV up to 66 kV 240 66 kV up to 132 kV 220 132 kV & above 220
Himachal Pradesh
LT Consumers 20kW to 100 kW 80
HT Consumers EHT 350 HT 200 HT-2 Load above 1 MW
350
Rajasthan (Jaipur Discom) LT Consumers
LT-2 Up to 500 Units Rs. 210/connection/month

Report on Study on power purchase/sale for PSPCL for FY 2010-11 to FY 2012-13 Page | 100
State Category Rs/kVA/Month LT-2 Above 500 Units Rs. 240/connection/month
HT Consumers Rs. per kVA of Billing Demand per Month
140
Chattisgarh
Heavy Industries 345 Steel Industries 345 Other EHV Consumers
345
Haryana (UHBVN)
LT Consumers 0-10 kW
Rs. 170/month/kW or Part thereof of the Connected Load
10-20 kW 20-50 kW 50-70 kW
HT Consumers For supply at 11 kV 150 For supply at 33 kV 150 For supply at 66 kV or 132 kV
150
For supply at 220 kV 150 For supply at 440 kV 150
Maharashtra (MSEDCL) (FY 2012-13)
LT Consumers 0-20 kW 190 20-50 kW 190 Above 50 kW 190
HT Consumer Continuous Industry 190 Non-Continuous Industry
190
Seasonal Industry 190
Delhi (BSES)
LT Consumers 0-10 kW 100 10-100 kW 115 Above 100 kW 150
HT Consumers Supply at 11 kV and above
125
Gujarat (MGVCL)
LT Consumers For first 40 kW of billing demand Rs. 85 per kW per month
Next 20 kW of billing demand Rs. 120 per kW per month

Report on Study on power purchase/sale for PSPCL for FY 2010-11 to FY 2012-13 Page | 101
State Category Rs/kVA/Month Above 60 kW of billing demand Rs. 185 per kW per month
HT Consumers For first 500 KVA of Billing Demand
120
For next 500 KVA of Billing Demand
230
For Billing Demand in excess of 1000 KVA
350
Andhra Pradesh (APCPDCL)
LT Consumers Industries 50/kW Seasonal Industries (off seasonal) 50/kW Pisciculture/Prawn culture 20/kW Sugarcane crushing 20/kW Poultry farms 50/kW Mushroom & Rabbit Farms 50/kW
HT Consumers 132kV and above 350 33kV 350 11 kV 350
Uttarakhand (UPCL)
LT Consumers
Up to 25 kW Rs/kW/Month
90
25 kW to 75 kW Rs/kW/Month
90
HT Consumer Up to 1000 kVA 210 Above1000 kVA 270

Report on Study on power purchase/sale for PSPCL for FY 2010-11 to FY 2012-13 Page | 102
5 Analysis of Banking Agreements, UI (Sale/Purchase), Surrender of Power and Transmission System Improvement
5.1 Procurement of Costly Power The State of Punjab continues to face acute power deficit situation and in order to meet its requirement, PSPCL has procured costly power from NTPC’s RLNG and liquid fired stations. Further PSPCL submitted that RLNG and Liquid fuel power are not scheduled /requisitioned normally. However, if the plant is running on its minimum technical parameters, as per NRLDC instructions, in rare cases full share is to be requisitioned.
5.1.1 Procurement in FY 2010-11 The quantum and cost of power procured in FY 2010-11 from RLNG and liquid fired plants is as follows:
Table 45: Power Procurement for FY 2010-11 from RLNG/Liquid fired Stations
Station Purchase (MU) V.C. (Rs. Cr.) V.C. (Rs./kWh) Anta ( R/F) 49.41 17.64 3.57 Auraiya (R/F) 93.04 39.57 4.25 Dadri Gas (R/F) 117.47 49.74 4.23 Anta (L/F) 1.81 1.50 8.31 Auraiya (L/F) 2.25 2.18 9.67 Dadri Gas (L/F) 4.06 3.19 7.85
Source: ARR of PSPCL for FY 2012-13 (Format 7H (2)) Note: R/F – RLNG Fuel & L/F- Liquid Fuel
PSPCL has been buying power from these sources as it is facing all round shortage of power throughout FY 2010-11. To substantiate the same the power supply position during FY 2010-11 is as shown below:
Table 46: Demand Supply Scenario in FY 2010-11
Power Supply Position (FY 2010-11)
Month
Power in MU
Availability (MU)
Requirement (MU)
Shortage (MU)
Energy gap for PSPCL
(%)

Report on Study on power purchase/sale for PSPCL for FY 2010-11 to FY 2012-13 Page | 103
Power Supply Position (FY 2010-11)
Month
Power in MU
Availability (MU)
Requirement (MU)
Shortage (MU)
Energy gap for PSPCL
(%) Apr-10 2774.70 3459.30 684.60 19.79% May-10 3548.88 3891.12 342.24 8.80% Jun-10 4345.20 4595.70 250.50 5.45% Jul-10 4680.38 4945.90 265.52 5.37% Aug-10 4740.00 5054.10 314.10 6.21% Sep-10 4090.80 4209.60 118.80 2.82% Oct-10 3526.87 3648.08 121.21 3.32% Nov-10 2692.50 2750.10 57.60 2.09% Dec-10 2955.23 3072.72 117.49 3.82% Jan-11 2822.24 2984.06 161.82 5.42% Feb-11 2474.92 2614.08 139.16 5.32% Mar-11 3146.50 3259.34 112.84 3.46%
Source: NRPC
As seen from the above table the State was energy deficit throughout the year. Due to higher power shortage to the tune of 19.79% in April 2010 and 6% overall for FY 2010-11, PSPCL had to schedule power from all its available sources and accordingly procured around 259.92 MU from RLNG based generation at an average rate of Rs 4.11/kWh and around 8 MU power from liquid based generation at an average rate of Rs. 8.46/kWh.
5.1.2 Power Procurement in FY 2011-12 The quantum and cost of power procured in FY 2011-12 from RNLG and liquid fired plants is as follows:
Table 47: Power Procurement for FY 2011-12 from RLNG/Liquid fired Stations
Station Purchase (MU) V.C. (Rs. Cr.) V.C. (Rs./kWh) Anta (R/F) 66.27 39.80 6.01 Auraiya (R/F) 102.00 77.55 7.60 Dadri Gas (R/F) 145.50 108.40 7.45 Anta (L/F) 0.05 0.04 8.11 Auraiya (L/F) 0.53 0.52 9.89

Report on Study on power purchase/sale for PSPCL for FY 2010-11 to FY 2012-13 Page | 104
Dadri Gas (L/F) 0.00 0.00 0.00 Source: ARR of PSPCL for FY 2012-13(Format 7E (2)) Note: R/F – RLNG Fuel & L/F- Liquid Fuel
PSPCL has been buying power from these sources as it is facing shortage of power throughout FY 2011-12. To substantiate the same the power supply position during FY 2011-12 is as shown below:
Table 48: Demand Supply Scenario in FY 2011-12
Power Supply Position (FY 2011-12)
Month
Power in MU
Availability (MU)
Requirement (MU)
Shortage (MU)
Energy gap for PSPCL (%)
Apr-11 2885.10 2939.10 54.00 1.84% May-11 3929.87 3990.63 60.76 1.52% Jun-11 4382.00 4442.00 60.00 1.40% Jul-11 5554.00 5707.00 153.00 2.70% Aug-11 5016.00 5189.00 173.00 3.30% Sep-11 4374.30 4573.50 199.20 4.36% Oct-11 3559.73 3748.52 188.79 5.04% Nov-11 2509.66 2612.83 103.17 3.95% Dec-11 2710.05 2892.89 182.84 6.32% Jan-12 2755.28 2828.44 73.16 2.59% Feb-12 2923.27 3007.36 84.09 2.80% Mar-12 3193.00 3259.00 66.00 2.02%
Source: NRPC, CEA LGBR Report
It is observed that the demand supply situation in FY 2011-12 improved considerably with lower power shortages. However, since the deficit scenario prevailed, PSPCL had to procure around 313.77 MU from RLNG based generation at an average rate of Rs 7.19/kWh and around 0.57 MU power from liquid fuel based generation at the average rate of Rs. 9.74/kWh. PSPCL had procured lesser power from liquid fuel stations in FY 2011-2 vis-à-vis FY 2010-11 owing to higher cost of generation and manageable deficit. Although power procurement from liquid fuel sources is lower, but the increase in price of RLNG based generation resulted in increased cost of power purchase.
5.1.3 Procurement in FY 2012-13 The quantum and cost of power in FY 2012-13 from RLNG and liquid fired plants is as follows:

Report on Study on power purchase/sale for PSPCL for FY 2010-11 to FY 2012-13 Page | 105
Table 49: Power Procurement for FY 2012-13 from RLNG/Liquid fired Stations
Station Purchase (MU) V.C. (Rs. Cr.) V.C. (Rs./kWh) Anta (R/F) 58.85 41.30 7.02 Auraiya (R/F) 86.46 73.50 8.50 Dadri Gas (R/F) 125.72 103.72 8.25 Anta (L/F) 6.46 5.25 8.12 Auraiya (L/F) 8.07 7.98 9.89 Dadri Gas (L/F) 12.17 9.68 7.95
Source: ARR of PSPCL for FY 2012-13(Format 7D (2)) Note: R/F – RLNG Fuel & L/F- Liquid Fuel
PSPCL has been buying power from these sources as it is facing acute shortage of power throughout FY 2012-13. To substantiate the same the power supply position during FY 2012-13 is as follows:
Table 50: Demand Supply Scenario in FY 2012-13
Power Supply Position (FY 2012-13)
Month
Power in MU
Availability (MU)
Requirement (MU)
Shortage (MU)
Energy gap for PSPCL
(%) Apr-12 2948.21 3031.33 83.12 2.74% May-12 3650.75 3762.66 111.91 2.97% Jun-12 5052.72 5437.04 384.32 7.07% Jul-12 5866.52 6611.21 744.69 11.26% Aug-12 5374.13 5923.05 548.92 9.27% Sep-12 4622.00 4745.00 123.00 2.60% Oct-12 3670.95 3813.15 142.20 3.73% Nov-12 2941.30 3040.46 99.16 3.26% Dec-12 2362.10 2517.55 155.45 6.17% Jan-13 2938.00 3055.00 117.00 3.80% Feb-13 3844.00 3917.00 73.00 1.90% Mar-13 2848.00 2872.00 24.00 0.80% Source: NRPC

Report on Study on power purchase/sale for PSPCL for FY 2010-11 to FY 2012-13 Page | 106
It is observed that the overall energy gap has widened to 5.3% in FY 2012-13. PSPCL had to procure around 271.02 MU from RLNG based generation at an average rate of Rs 8.06/kWh and around 26.70 MU power from liquid fuel based generation at the rate of Rs. 8.58/kWh.
5.2 UI (Sale/Purchase) and Additional UI: PSPCL stated that it follows the over-drawl and under-drawal of power as per UI mechanism and as per the Indian Electricity Grid Code on real time basis. Based on real time system parameters, PSPCL submitted that NRLDC also instructs Punjab SLDC to over-draw/under-draw in view of grid security issues like line overloading, excess availability etc. The competent authority for taking decision of under-drawl and over-drawl of power is the Power Controller and Assistant Power Controller.
PSPCL submitted that for estimating unrestricted demand, it has been adopting the following methodology:
• Assuming monthly 5% rise in demand over the past year • Working out the average of past three years and escalating the same by 5% over the
base year per year. • The unrestricted demand is derived by levelling out the values from the above
methods.
Considering the availability from firm sources of power, the gap for the period is determined by PSPCL. PSPCL then ties up 80% of the gap on advance reservation basis under short term power purchase and the balance 20% is arranged on real time basis depending upon requirement either through additional over-drawl under UI, if economically viable or spot purchase through exchange.
The grid parameters and drawls by distribution licensee are monitored at the SLDC and over drawl beyond specified limits are restricted by issuing directions to PSPCL.
The net UI drawl/surrender summary as submitted by PSPCL is as shown below:
Table 51: Net UI drawal/surrender
Month
FY 2010-11 FY 2011-12 FY 2012-13
Net UI (Lakh Units)
Amount (Rs. lakh) (Payable/
Receivable (+/-))
Net UI (Lakh Units)
Amount (Rs. lakh)
(Payable/ Receivable
(+/-))
Net UI (Lakh Units)
Amount (Rs. lakh)
(Payable/ Receivable
(+/-)) April 2961.78 21350.57 -2751.27 -9276.22 92.01 -51.55 May 2983.52 16726.71 -882.11 -2761.78 1157.72 4031.43

Report on Study on power purchase/sale for PSPCL for FY 2010-11 to FY 2012-13 Page | 107
Month
FY 2010-11 FY 2011-12 FY 2012-13
Net UI (Lakh Units)
Amount (Rs. lakh) (Payable/
Receivable (+/-))
Net UI (Lakh Units)
Amount (Rs. lakh)
(Payable/ Receivable
(+/-))
Net UI (Lakh Units)
Amount (Rs. lakh)
(Payable/ Receivable
(+/-)) June 1542.96 6284.91 -1157.58 -1561.42 2501.53 9920.88 July 810.17 3026.38 -220.68 62.70 1922.46 8409.54 August 1957.30 4913.86 -806.36 -1689.01 907.50 1490.68 September 728.28 487.01 -1885.68 -4455.82 181.19 584.52 October -477.62 -1013.19 214.94 1590.53 1303.16 2236.86 November -813.55 -1575.85 1176.15 6729.57 158.17 520.35 December -162.04 -62.51 939.19 6624.47 94.12 813.41 January 275.71 937.52 -144.20 478.82 -331.38 -190.35 February -50.72 481.72 244.95 1038.32 -8.76 213.66 March -325.35 -803.18 -459.18 -1678.48 156.02 429.76 Total 9430.42 50753.95 -5731.84 -4898.33 8133.75 28409.18 Source: PSPCL Reply
It is observed from the table that for FY 2010-11 and FY 2012-13, PSPCL has been overdrawing in most of months indicating an acute demand supply shortages during those years. Especially in the year FY 2010-11, PSPCL had paid around Rs 380 Crore due to heavy drawing during April-May which is very high under any circumstances. For FY 2011-12, PSPCL has received UI charges from the UI pool indicating under-drawal of power under UI. Further, it is quite clear that during the months of February 2011, January, 2012 and February 2013 although the net UI quantum was negative but PSPCL had paid amounts of Rs. 481.72 lakh, Rs. 478.82 lakh and Rs. 231.66 lakh respectively during these months. The same indicates that substantial improvement in power procurement planning is required and adequate steps may be taken by PSPCL to avoid such instances in future.
Thus PSPCL had to pay Rs. 507.54 crore for FY 2010-11 and Rs. 284.09 crore for FY 2012-13 on account of UI whereas it received UI of Rs. 48.98 crore in FY 2011-12. Thus the overall financial impact on account of UI is Rs. 742.65 crore for FY 2010-11 to FY 2012-13.
5.2.1 Additional UI and its financial impact CERC (Unscheduled Interchange charges and related matters) Regulations, 2009 which came into force on 1st April 2009 specified additional UI charges to be paid as penalty for over-drawal for frequency below 49.2 Hz at the rate equivalent to 40% of the UI Rate corresponding to frequency of 49.2 Hz and for frequency below 49.5 Hz and up to 49.2 Hz

Report on Study on power purchase/sale for PSPCL for FY 2010-11 to FY 2012-13 Page | 108
additional UI charges can be imposed by the Commission if considered necessary. These regulations were amended, wherein it imposed additional UI charges when grid frequency is below 49.5 Hz with rates being equivalent to 100% of the UI Charge of 870.0 Paise/kWh corresponding to the grid frequency of below 49.5 Hz. The amended regulation came to force from May 01, 2010.
This had a huge financial impact on PSPCL as highlighted in the following section.
A. Additional UI in FY 2010-11
The table below shows the penalty levied in the form of additional UI charge on PSPCL during FY 2010-11. In addition to that, energy gap for the month is also shown to compare the power supply position and UI over-drawal.
Table 52: Additional UI paid by PSPCL in FY 2010-11
Additional UI Charges (Rs. Cr.) for FY 2010-11
Month Penalty due to Freq below 49.2 Hz (Rs. Cr.)
Penalty due to Freq below 49.5 to 49.2 Hz (Rs. Cr.)
Energy gap for PSPCL (%)
April 31.61 0.00 19.79% May 4.97 15.41 8.80% June 0.51 3.44 5.45% July 0.83 1.97 5.37% August 0.83 2.12 6.21% September 0.01 0.04 2.82% October 0.00 0.00 3.32% November 0.00 0.00 2.09% December 0.00 0.16 3.82% Jan 0.00 0.58 5.42% Feb 0.00 0.75 5.32% March 0.00 0.27 3.46% Total (Rs. Cr) 38.77 24.74 Source: PSPCL Replies, NRPC, CEA
It is observed that in FY 2010-11, PSPCL incurred huge financial losses as penalty on account of over-drawal of power below 49.5 Hz, which is around Rs. 63.51 crore. Out of the total amount, around 50% of the Additional UI is applicable only in the month of April 2010 which is on higher side. The demand supply situation was grim during the month resulting in heavy over-drawl from the grid even at lower frequencies.

Report on Study on power purchase/sale for PSPCL for FY 2010-11 to FY 2012-13 Page | 109
B. Additional UI in FY 2011-12
The table below shows the penalty levied in the form of additional UI charge on PSPCL during FY 2011-12:
Table 53: Additional UI paid by PSPCL in FY 2011-12
Additional UI Charges (Rs. Cr.) for FY 2011-12 Energy gap for PSPCL (%)
April -11 0.12 1.84% May-11 0.07 1.52% June-11 0.68 1.40% July-11 0.75 2.70% August-11 0.18 3.30% September-11 1.02 4.36% October-11 6.05 5.04% November-11 4.28 3.95% December-11 9.09 6.32% January-12 1.13 2.59% February-12 0.17 2.80% March-12 0.01 2.02% Total (Rs. Cr) 23.56
Source: PSPCL Replies, NRPC, CEA
It is observed that the demand was high in December, 2011 and correspondingly additional UI due to over-drawl under low frequency was high in that month. Overall the Additional UI is much lower in FY 2011-12 as compared to the previous year.
C. Additional UI in FY 2012-13
The table below shows the penalty levied in the form of additional UI charge on PSPCL during FY 2012-13:
Table 54: Additional UI paid by PSPCL in FY 2012-13
Additional UI Charges (Rs. Cr.) for FY 2012-13
Energy Gap for PSPCL (%)
April-12 0.12 2.74% May-12 2.67 2.97%

Report on Study on power purchase/sale for PSPCL for FY 2010-11 to FY 2012-13 Page | 110
Additional UI Charges (Rs. Cr.) for FY 2012-13
Energy Gap for PSPCL (%)
June-12 8.43 7.07% July-12 11.33 11.26% August-12 0.34 9.27% September-12 0.04 2.60% October-12 0.02 3.73% November-12 0.05 3.26% December-12 0.41 6.17% January-13 0.20 3.80% February-13 0.02 1.90% March-13 0.03 0.80% Total (Rs. Cr.) 23.63
Source: PSPCL Replies, NRPC, CEA
It is observed that power shortage in the month of June and July, 2012 was very high and correspondingly additional UI due to over-drawl under low frequency was high in that month.
PSPCL had to pay Rs. 63.52 crore in FY 2010-11, Rs. 23.56 crore in FY 2011-12 and Rs. 23.63 crore in FY 2012-13 on account of additional UI with a net financial impact of Rs. 110.70 crore for FY 2010-11 to FY 2012-13.
As per PSPCL a portion of the excessive UI rate imposed is due to the irregular/unpredictable quantum of power imported by the industrial consumers through Open Access. Further, the quantum being purchased by the industry through Open Access has varied from zero Lakh Units (LU) per day to approximately 150 LU per day. PSPCL further stated that in the dynamic demand availability scenario, whenever the frequency falls below 49.5 Hz, PSPCL restricts its load so that there is no over drawal. PSPCL stated that it takes 20 to 25 minutes for managing/controlling the over drawal effectively and during this period over drawal may happen. The reason for over-drawal during FY 2010-11 & FY 2011-12, given by PSPCL in its tariff orders, was due to forced outage of various units of state generating stations, outages of Central Sector Generating Stations, extreme temperature, low availability from BBMB Hydro stations, obligation for supply of minimum quantum to other utilities as per banking arrangements and requirement of uninterrupted supply during the World Cup Kabbadi hosted by the State of Punjab. It also stated that for the month of April, 2010, banking arrangements were made in advance and as per the obligations in agreements, some minimum quantum had to be supplied to the other utilities.

Report on Study on power purchase/sale for PSPCL for FY 2010-11 to FY 2012-13 Page | 111
5.2.2 Interest Payment due to delayed payments to UI account In addition to the Additional UI levied on PSPCL, as per its submissions, PSPCL did not make timely payments resulting in additional interest on accumulated UI charges. The details related to interest payment on account of delayed payment to U.I account are as below:
Table 55: Interest Charges on un-paid UI amount
Year Amount of
Interest (Rs. Crore)
Details of Payment Reason for levy of Interest
FY 2010-11
5.48 Adjusted on 18th October 2010 against UI receivable
Non availability of funds
3.68 Adjusted on 29th October 2010 out of payment made against UI
Non availability of funds
1.90 Adjusted on 9th November 2010 against UI receivable
Non availability of funds
1.82 Adjusted on 15th November 2010 against UI receivable
Non availability of funds
4.39 Adjusted on 30th November 2010 against UI receivable
Non availability of funds
6.82 Adjusted on 21st December 2010 against UI receivable
Non availability of funds
Total (Rs. Crore): 24.09
FY 2011-12 16.61 Adjusted on 18th July 2011 against UI receivable
Non availability of funds
-0.76 Adjusted against UI payable Non availability of funds
Total (Rs. Crore): 15.85
FY 2012-13
20.82 Net interest payable Rs. 18.54 Cr. paid in instalments with regular UI payable bills
Non availability of funds -2.28
1.73 Paid on 9th July 2013 Non availability of funds
Total (Rs. Crore): 20.27 Gross Total for Assessment Year (Rs. Crore)
60.22
Source: PSPCL Reply

Report on Study on power purchase/sale for PSPCL for FY 2010-11 to FY 2012-13 Page | 112
Thus PSPCL had to incur additional interest burden on the amount to be paid to the UI pool on account of delay in payments.
5.3 Drawal /Surrender of Power under UI Mechanism Methodology adopted to analyse Drawal /surrender of Power by PSPCL
• Three year data for the utility was analysed on sample basis - the sample selected for detailed analysis are the months of May 2010, September 2010, April 2011, September 2011, April 2012 and September 2012 which is based on the monthly sales data, quantum of UI charges paid and load shedding done. The monthly energy sales submitted by PSPCL are as follows:
Table 56: Monthly Energy Sales as submitted by PSPCL (MU)
Month FY 2010-11 FY 2011-12 FY 2012-13 April 2329.57 2132.35 2169.01 May 2546.44 2465.47 2534.74 June 3153.65 3002.26 3688.76 July 3370.99 3659.93 4230.20 August 3499.62 3730.82 4129.18 September 3395.01 3470.10 3835.88 October 2944.66 3103.77 3182.73 November 2437.59 2622.59 2780.50 December 2255.27 2518.87 2536.65 January 2101.45 2311.84 2398.23 February 2051.40 2386.73 2076.69 March 2146.08 2401.34 2179.47 Source: PSPCL Replies
PSPCL has provided the load shedding data for specific days for the months of January, April, June and September of FY 2010-11, FY 2011-12 and FY 2012-13 respectively. The maximum load shedding done on the specified days is as follows:
Table 57: Load Shedding carried out by PSPCL (MW)
Date Time of
load shedding
Total Load (MW)
Maximum Power Cut Relief (MW)
Unrestricted Demand
(MW) April 7, 2010 20:30 3962 2793 6755 June 24, 2010 16:45 6964 2394 9358 September 1, 2010 14:30 7564 1749 9313

Report on Study on power purchase/sale for PSPCL for FY 2010-11 to FY 2012-13 Page | 113
Date Time of
load shedding
Total Load (MW)
Maximum Power Cut Relief (MW)
Unrestricted Demand
(MW) January 6, 2011 18:45 4617 1248 5865 April 29, 2011 20:15 5111 600 5711 June 24, 2011 21:15 8169 990 9159 September 27, 2011 10:30 6948 1648 8632 January 25, 2012 19:15 4793 600 5393 April 23, 2012 23:30 4255 1653 5908 June 26, 2012 21:30 8671 1817 10488 September 2, 2012 20:00 7854 600 8454 January 1, 2013 20:15 3957 709 4666
Source: PSPCL Replies
Thus from the table, as the months of September and April show consistent load shedding, the same has been considered for the analysis. • Though the maximum UI charges were paid for the month of April 2010, however, as
the implemented schedules for April 2010 were not available and hence analysis for the month of April 2010 could not be done.
• The injection schedule of Inter-State Generating Stations (ISGS) and drawl schedule of PSPCL were obtained from NRLDC. The allocation orders from NRPC were used to compute Punjab’s share in the ISGS scheduled injection. The share of Punjab from each of the ISGS was arrived from the same.
• Correspondingly the implemented schedule of ISGS and actual drawl schedule of PSPCL were obtained from NRLDC. Punjab’s entitlement with regard to implemented schedule of ISGS was computed on the basis of the allocation orders.
• The deviation in drawl of power has been arrived by comparing the computed ISGS injection schedule, actual injection by ISGS for Punjab and actual drawl by Punjab.
A. Analysis for May 2010
The details as available from NRLDC for scheduled injection by ISGS for Punjab, actual injection by ISGS, gross drawl by Punjab and UI payable/receivable for the corresponding dates of May 2010 is as below:

Report on Study on power purchase/sale for PSPCL for FY 2010-11 to FY 2012-13 Page | 114
Table 58: Injection and Drawl from ISGS for May 2010
Date
ISGS Scheduled
Entitlement (LU)
(Computed)
ISGS Actual
Generation (LU) (A)
Gross Drawal
by Punjab
(LU) (B)
Deviation in Actual
Generation and Actual Drawl (LU)
(C=A-B)
UI Paid (+)/Receive
d(-) (Rs. Lakh)
Additional UI Paid
(Rs. Lakh)
5/16/2010 472.99 506.58 505.87 0.71 1218.36 215.52 5/17/2010 413.57 511.08 510.44 0.64 998.80 214.04 5/18/2010 477.77 484.88 485.11 -0.23 918.38 391.72 5/20/2010 499.61 524.05 508.51 15.54 652.37 68.57 5/22/2010 469.48 467.22 466.66 0.56 535.70 27.80 5/27/2010 540.64 570.68 559.34 11.34 234.64 0.00 5/31/2010 516.79 527.74 527.29 0.45 171.02 18.47 Source: NRLDC, NRPC
It is observed from the table that the actual generation for the State of Punjab from ISGS is higher than the scheduled generation for all the days considered and the gross drawal by the State was higher than scheduled generation from ISGS, except for May 22, 2010 wherein the actual generation and drawal by the State was lower than the scheduled entitlement.
Further, it is observed from the table above that there is a variation in the actual drawal from the actual generation on May 20 and May 27. On these days, it appears Punjab has drawn less power. The same indicates that substantial improvement in power procurement planning is required.
B. Analysis for September 2010
The details as available from NRLDC and NRPC for scheduled injection by ISGS for Punjab, actual injection by ISGS, gross drawl by Punjab and UI payable/receivable for the corresponding dates of September 2010 is as below:

Report on Study on power purchase/sale for PSPCL for FY 2010-11 to FY 2012-13 Page | 115
Table 59: Injection and Drawl from ISGS for September 2010
Date
ISGS Scheduled
Entitlement (LU)
(Computed)
ISGS Actual
Generation (LU) (A)
Gross Drawal by
Punjab (LU) (B)
Deviation in Actual Generation and Actual Drawl
(LU) (C=A-B)
UI Paid (+)/Receive
d(-) (Rs. Lakh)
Additional UI Paid
(Rs. Lakh)
9/1/2010 616.48 639.91 620.47 19.44 228.98 0.00 9/2/2010 627.21 655.01 634.79 20.22 88.64 0.00 9/3/2010 614.94 649.03 605.75 43.29 28.21 0.00 9/4/2010 602.92 638.22 609.81 28.41 -37.59 0.00 9/5/2010 602.32 642.69 594.00 48.69 60.11 0.00 9/6/2010 605.26 639.84 610.35 29.49 -0.75 1.18 9/7/2010 612.27 652.28 621.05 31.22 26.65 0.00 9/8/2010 575.51 626.57 548.70 77.87 40.62 0.85 9/9/2010 606.15 666.09 578.10 88.00 -8.28 1.25 9/10/2010 608.10 668.16 541.92 126.24 -51.24 0.009/11/2010 601.42 678.11 504.44 173.67 -18.16 0.009/12/2010 576.24 679.55 503.12 176.43 -11.81 0.009/13/2010 570.33 653.03 488.40 164.64 3.16 0.009/14/2010 600.12 672.55 536.82 135.73 72.28 0.009/15/2010 618.21 678.92 608.20 70.72 49.56 1.24 9/16/2010 618.18 684.63 637.88 46.75 41.54 0.009/17/2010 607.60 689.82 563.12 126.70 61.01 0.009/18/2010 558.87 645.05 544.00 101.05 63.24 0.009/19/2010 566.39 653.62 602.47 51.16 85.37 0.009/20/2010 560.45 641.83 547.03 94.80 -114.63 0.009/21/2010 597.62 672.78 533.48 139.30 -113.87 0.009/22/2010 616.75 714.78 538.07 176.71 -32.66 0.009/23/2010 618.88 708.46 530.80 177.66 9.77 0.25 9/24/2010 610.62 687.68 545.71 141.97 -24.54 0.009/25/2010 623.92 710.83 577.77 133.06 16.35 0.009/26/2010 598.57 667.33 552.59 114.75 9.47 0.009/27/2010 585.94 644.81 592.16 52.65 53.16 0.009/28/2010 584.96 632.90 606.99 25.92 7.97 0.00

Report on Study on power purchase/sale for PSPCL for FY 2010-11 to FY 2012-13 Page | 116
Date
ISGS Scheduled
Entitlement (LU)
(Computed)
ISGS Actual
Generation (LU) (A)
Gross Drawal by
Punjab (LU) (B)
Deviation in Actual Generation and Actual Drawl
(LU) (C=A-B)
UI Paid (+)/Receive
d(-) (Rs. Lakh)
Additional UI Paid
(Rs. Lakh)
9/29/2010 581.34 630.03 604.88 25.15 -6.18 0.009/30/2010 585.61 629.88 606.33 23.55 -29.77 0.00Source: NRLDC, NRPC
It is observed from the table that the actual generation for the State of Punjab from ISGS is higher than the actual gross drawal. Further the actual generation for the State from ISGS is higher than the scheduled generation for all the days of the month.
The gross drawal by the State is lower than scheduled generation from ISGS for most of the days except for the days as shown below. Further, the UI paid for these days have been compared to bring the demand supply scenario in perspective with the under/over drawal from the ISGS.
Table 60: Days for which drawal was higher than ISGS scheduled generation for September, 2010
Date
ISGS Scheduled
Entitlement (LU)
(Computed)
ISGS Actual Generation
(LU)
Gross Drawal by
Punjab (LU)
UI Paid (+)/Received(-
) (Rs. Lakh)
Additional UI Paid (Rs.
Lakh)
9/1/2010 616.48 639.91 620.47 228.98 0.00 9/2/2010 627.21 655.01 634.79 88.64 0.00 9/4/2010 602.92 638.22 609.81 -37.59 0.00 9/6/2010 605.26 639.84 610.35 -0.75 1.18 9/7/2010 612.27 652.28 621.05 26.65 0.00 9/16/2010 618.18 684.63 637.88 41.54 0.00 9/19/2010 566.39 653.62 602.47 85.37 0.00 9/27/2010 585.94 644.81 592.16 53.16 0.00 9/28/2010 584.96 632.90 606.99 7.97 0.00 9/29/2010 581.34 630.03 604.88 -6.18 0.00 9/30/2010 585.61 629.88 606.33 -29.77 0.00 Source: NRLDC, NRPC
From the above table, it is observed that on September 4, September 6, September 29 and September 30 the State received UI from the pool.

Report on Study on power purchase/sale for PSPCL for FY 2010-11 to FY 2012-13 Page | 117
Further it is observed that on the days shown below, inspite of under-drawal of power by PSPCL than scheduled from ISGS; it appears that UI had to be paid to the UI pool.
Table 61: Days for which UI paid inspite of under-drawal by PSPCL for September, 2010
Date
ISGS Scheduled
Entitlement (LU)
(Computed)
ISGS Actual Generation
(LU)
Gross Drawal
by Punjab
(LU)
UI Paid (+)/Received(-)
(Rs. Lakh)
Additional UI Paid (Rs.
Lakh)
9/3/2010 614.94 649.03 605.75 28.21 0.00 9/5/2010 602.32 642.69 594.00 60.11 0.00 9/8/2010 575.51 626.57 548.70 40.62 0.85 9/13/2010 570.33 653.03 488.40 3.16 0.00 9/14/2010 600.12 672.55 536.82 72.28 0.00 9/15/2010 618.21 678.92 608.20 49.56 1.24 9/17/2010 607.60 689.82 563.12 61.01 0.00 9/18/2010 558.87 645.05 544.00 63.24 0.00 9/23/2010 618.88 708.46 530.80 9.77 0.25 9/25/2010 623.92 710.83 577.77 16.35 0.00 9/26/2010 598.57 667.33 552.59 9.47 0.00 Source: NRLDC, NRPC The same indicates that substantial improvement in power procurement planning is required.
C. Analysis for April 2011
The details as available from NRLDC and NRPC for scheduled injection by ISGS for Punjab, actual injection by ISGS, gross drawl by Punjab and UI payable/receivable for the corresponding dates of April 2011 is as below:
Table 62: Injection and Drawl from ISGS for April 2011

Report on Study on power purchase/sale for PSPCL for FY 2010-11 to FY 2012-13 Page | 118
Date
ISGS Scheduled
Entitlement (LU)
(Computed)
ISGS Actual
Generation (LU) (A)
Gross Drawal
by Punjab
(LU) (B)
Deviation in Actual
Generation and Actual Drawl (LU)
(C=A-B)
UI Paid (+)/Receive
d(-) (Rs. Lakh)
Additional UI Paid
(Rs. Lakh)
4/1/2011 421.65 461.73 318.67 143.06 -228.06 0.00 4/2/2011 418.40 456.94 372.45 84.49 -374.64 0.00 4/3/2011 389.25 443.30 268.03 175.28 -160.29 0.00 4/4/2011 379.11 420.34 287.40 132.94 -126.56 0.004/5/2011 370.37 405.17 292.82 112.35 -224.20 0.004/6/2011 372.21 402.35 358.32 44.03 -487.04 0.004/7/2011 370.77 398.14 385.78 12.36 -501.80 0.004/8/2011 372.41 397.11 380.92 16.19 -345.65 0.004/9/2011 359.62 379.04 361.74 17.30 -210.66 0.004/10/2011 350.58 382.36 318.49 63.87 -161.96 0.004/11/2011 356.88 381.71 346.98 34.73 -491.24 1.32 4/12/2011 371.32 393.90 371.36 22.54 -464.30 0.004/13/2011 390.16 411.39 367.42 43.97 -246.67 0.004/14/2011 381.16 411.95 379.44 32.50 -395.50 0.004/15/2011 405.87 426.38 398.76 27.62 -272.05 0.004/16/2011 399.56 425.62 340.68 84.94 -469.66 1.02 4/17/2011 399.39 462.34 304.02 158.32 -274.98 0.004/18/2011 408.06 451.81 352.68 99.13 -371.47 0.004/19/2011 423.82 464.90 351.16 113.74 -218.64 0.004/20/2011 417.57 452.09 368.12 83.97 -140.64 0.48 4/21/2011 422.80 447.52 421.13 26.39 -531.24 0.004/22/2011 413.49 441.68 409.35 32.32 -559.58 0.004/23/2011 424.72 453.25 427.23 26.02 -561.09 0.25 4/24/2011 425.47 457.35 402.60 54.74 -179.04 0.004/25/2011 448.07 475.77 431.11 44.66 -238.68 0.004/26/2011 438.82 470.74 406.56 64.19 -276.62 0.004/27/2011 454.47 474.05 451.20 22.85 -199.11 5.76 4/28/2011 472.41 491.64 472.89 18.76 -151.50 2.83 4/29/2011 496.49 516.30 496.84 19.46 -234.24 0.004/30/2011 502.98 518.68 497.07 21.61 -456.31 0.00
Source: NRLDC, NRPC

Report on Study on power purchase/sale for PSPCL for FY 2010-11 to FY 2012-13 Page | 119
It is observed from the table that the actual generation for the State of Punjab from ISGS is higher than the gross drawal by the State.
Further the actual generation for the State from ISGS is higher than the scheduled generation for all the days of the month.
The gross drawal by the State is lower than scheduled generation from ISGS for most of the days except for the days as shown below. Further, the UI paid/received for these days have been compared to bring the demand supply scenario in perspective with the under/over drawal from the ISGS.
Table 63: Days for which drawal was higher than ISGS scheduled generation for April,
2011
Date
ISGS Scheduled
Entitlement (LU)
(Computed)
ISGS Actual Generation
(LU)
Gross Drawal
by Punjab
(LU)
UI Paid (+)/Received(-)
(Rs. Lakh)
Additional UI Paid (Rs.
Lakh)
4/7/2011 370.77 398.14 385.78 -501.80 0.004/8/2011 372.41 397.11 380.92 -345.65 0.004/9/2011 359.62 379.04 361.74 -210.66 0.004/12/2011 371.32 393.90 371.36 -464.30 0.004/23/2011 424.72 453.25 427.23 -561.09 0.25 4/28/2011 472.41 491.64 472.89 -151.50 2.83 4/29/2011 496.49 516.30 496.84 -234.24 0.00 Source: NRLDC, NRPC It is observed that on all the days of the month of April 2011, PSPCL has been receiving UI from the pool.
D. Analysis for September 2011
The details for scheduled injection by ISGS for Punjab, actual injection by ISGS, gross drawl from ISGS and UI payable/receivable for the corresponding dates of September 2011 is as below:

Report on Study on power purchase/sale for PSPCL for FY 2010-11 to FY 2012-13 Page | 120
Table 64: Injection and Drawl from ISGS for September 2011
Date
ISGS Scheduled
Entitlement (LU)
(Computed)
ISGS Actual
Generation (LU) (A)
Gross Drawal by
Punjab (LU) (B)
Deviation in Actual
Generation and Actual Drawl (LU) (C=A-B)
UI Paid (+)/Receive
d(-) (Rs. Lakh)
Additional UI
Paid (Rs. Lakh)
9/1/2011 650.76 669.18 642.77 26.41 -78.44 0.00 9/2/2011 642.55 666.96 638.51 28.45 -134.44 0.00 9/3/2011 631.50 688.67 584.48 104.19 -32.78 0.00 9/4/2011 600.04 663.41 580.75 82.66 -44.41 0.00 9/5/2011 592.11 666.55 561.61 104.94 -80.68 0.00 9/6/2011 591.07 660.52 540.85 119.67 -117.75 0.00 9/7/2011 598.22 657.34 544.08 113.26 -109.07 0.00 9/8/2011 598.96 673.60 556.56 117.04 -194.82 0.00 9/9/2011 586.07 672.83 488.74 184.09 -444.96 0.00 9/10/2011 558.50 653.95 487.77 166.18 -448.61 0.00 9/11/2011 584.06 649.49 554.84 94.65 -144.31 0.00 9/12/2011 593.64 660.90 549.85 111.05 -153.13 0.00 9/13/2011 611.10 659.75 603.64 56.11 -249.83 0.00 9/14/2011 614.87 667.87 588.08 79.79 -125.40 1.48 9/15/2011 605.57 655.37 546.01 109.36 -266.36 0.00 9/16/2011 574.28 681.33 478.53 202.80 -139.46 0.00 9/17/2011 575.57 625.56 498.90 126.66 -134.40 0.00 9/18/2011 599.70 681.01 532.57 148.44 -166.99 0.00 9/19/2011 583.33 671.91 524.22 147.69 -253.09 0.00 9/20/2011 599.39 659.47 576.36 83.11 -197.62 0.00 9/21/2011 592.17 668.79 593.52 75.27 -63.87 0.00 9/22/2011 574.38 645.05 548.17 96.88 -127.79 0.00 9/23/2011 575.77 615.43 572.44 42.99 -301.64 0.00 9/24/2011 537.11 599.69 528.52 71.17 -223.87 11.00 9/25/2011 509.61 563.59 513.94 49.65 32.02 0.00 9/26/2011 505.12 528.99 509.49 19.50 -130.96 3.10 9/27/2011 584.49 525.26 497.13 28.13 58.09 20.46 9/28/2011 490.69 541.24 497.62 43.62 36.11 56.53 9/29/2011 583.11 529.05 495.03 34.02 -341.46 6.41

Report on Study on power purchase/sale for PSPCL for FY 2010-11 to FY 2012-13 Page | 121
Date
ISGS Scheduled
Entitlement (LU)
(Computed)
ISGS Actual
Generation (LU) (A)
Gross Drawal by
Punjab (LU) (B)
Deviation in Actual
Generation and Actual Drawl (LU) (C=A-B)
UI Paid (+)/Receive
d(-) (Rs. Lakh)
Additional UI
Paid (Rs. Lakh)
9/30/2011 490.07 535.73 495.77 39.96 -250.55 2.94 Source: NRLDC, NRPC
It is observed from the table that the actual generation for the State of Punjab from ISGS is higher than the scheduled generation for all the days except for the following days:
Table 65: Days on which ISGS Actual Generation deviates from Scheduled Generation for
September, 2011
Date Reason for deviation in Actual Generation from scheduled generation
9/27/2011 Lower Actual Generation from Bairasiul generating station than scheduled. 9/29/2011
Source: NRLDC, NRPC The gross drawal by the State is lower than scheduled generation from ISGS for most of the days except for some days as shown below. Further, the UI paid for these days have been compared to bring the demand supply scenario in perspective with the under/over drawal from the ISGS. Table 66: Days for which drawal was higher than ISGS scheduled generation for September, 2011
Date
ISGS Scheduled
Entitlement (LU)
(Computed)
ISGS Actual
Generation (LU)
Gross Drawal
by Punjab (LU)
UI Paid (+)/Received(-)
(Rs. Lakh)
Additional UI Paid (Rs. Lakh)
9/21/2011 592.17 668.79 593.52 -63.87 0.00 9/25/2011 509.61 563.59 513.94 32.02 0.00 9/26/2011 505.12 528.99 509.49 -130.96 3.10 9/28/2011 490.69 541.24 497.62 36.11 56.53 9/30/2011 490.07 535.73 495.77 -250.55 2.94 Source: NRLDC, NRPC
From the above table, it is observed that on September 21, September 26 and September 30 the State received UI from the pool.

Report on Study on power purchase/sale for PSPCL for FY 2010-11 to FY 2012-13 Page | 122
Further for September 27 inspite of under-drawal of power by PSPCL than scheduled from ISGS; it appears that UI had to be paid to the UI pool along with penalty on account of additional UI. The same indicates that substantial improvement in power procurement planning is required.
Table 67: Deviation on September 27, 2011
Date
ISGS Scheduled
Entitlement (LU)
(Computed)
ISGS Actual
Generation (LU)
Gross Drawal
by Punjab (LU)
UI Paid (+)/Received(-)
(Rs. Lakh)
Additional UI Paid (Rs. Lakh)
9/27/2011 584.49 525.26 497.13 58.09 20.46
Source: NRLDC, NRPC Further, as per the load shedding data submitted for the month for September 27 2011 it is observed that PSPCL had done load shedding on September 27. As discussed above in the month for most of the days PSPCL had been under-drawing power from the grid and in turn was receiving UI. E. Analysis for April 2012
The details as available from NRLDC and NRPC for scheduled injection by ISGS for Punjab, actual injection by ISGS, gross drawl by Punjab and UI payable/receivable for the corresponding dates of April 2012 is as below:
Table 68: Injection and Drawl from ISGS for April 2012
Date
ISGS Scheduled
Entitlement (LU)
(Computed)
ISGS Actual
Generation (LU) (A)
Gross Drawal
by Punjab
(LU) (B)
Deviation in Actual
Generation and Actual Drawl (LU)
(C=A-B)
UI Paid (+)/Receive
d(-) (Rs. Lakh)
Additional UI Paid
(Rs. Lakh)
4/1/2012 439.71 472.62 402.39 70.23 65.79 0.00 4/2/2012 435.09 458.89 420.32 38.57 70.61 3.55 4/3/2012 435.76 457.16 428.90 28.25 -68.09 1.87 4/4/2012 436.80 456.95 436.37 20.57 23.93 0.03

Report on Study on power purchase/sale for PSPCL for FY 2010-11 to FY 2012-13 Page | 123
Date
ISGS Scheduled
Entitlement (LU)
(Computed)
ISGS Actual
Generation (LU) (A)
Gross Drawal
by Punjab
(LU) (B)
Deviation in Actual
Generation and Actual Drawl (LU)
(C=A-B)
UI Paid (+)/Receive
d(-) (Rs. Lakh)
Additional UI Paid
(Rs. Lakh)
4/5/2012 431.00 455.17 425.72 29.46 19.08 0.00 4/6/2012 426.03 450.19 389.04 61.15 81.12 0.00 4/7/2012 419.03 443.59 414.86 28.73 -78.42 0.00 4/8/2012 413.13 443.26 378.29 64.97 -47.97 0.00 4/9/2012 412.21 437.29 395.33 41.96 -33.04 0.00 4/10/2012 392.88 424.96 364.01 60.94 -2.16 0.00 4/11/2012 400.65 444.04 332.73 111.31 -48.39 0.00 4/12/2012 397.85 440.81 357.56 83.26 -38.50 0.00 4/13/2012 384.75 423.41 340.57 82.84 -11.62 0.00 4/14/2012 367.41 405.84 314.39 91.45 -87.26 0.00 4/15/2012 351.78 389.27 288.84 100.43 -119.58 0.00 4/16/2012 353.33 391.94 313.97 77.98 -112.45 0.00 4/17/2012 352.99 401.02 302.66 98.36 -118.20 0.00 4/18/2012 352.54 398.78 349.39 49.39 -36.03 0.28 4/19/2012 341.76 387.86 336.06 51.80 36.01 5.81 4/20/2012 347.68 397.81 358.71 39.10 50.30 0.00 4/21/2012 360.23 411.62 375.95 35.67 70.96 0.00 4/22/2012 377.55 432.54 381.77 50.77 93.23 0.00 4/23/2012 366.46 419.12 387.64 31.48 139.23 0.00 4/24/2012 371.12 419.13 387.25 31.88 84.16 0.00 4/25/2012 367.77 414.27 378.84 35.43 106.02 0.22 4/26/2012 386.13 431.19 372.65 58.54 -113.77 0.00 4/27/2012 391.78 441.33 373.65 67.68 -27.50 0.00 4/28/2012 411.96 470.00 381.03 88.97 31.06 0.00 4/29/2012 415.37 480.63 335.90 144.73 -9.21 0.00 4/30/2012 408.02 466.74 337.90 128.84 60.57 0.00
Source: NRLDC, NRPC
It is observed from the table that the actual generation for the State of Punjab from ISGS is higher than the actual gross drawal. Further the actual generation for the State from ISGS is higher than the scheduled generation for all the days of the month.

Report on Study on power purchase/sale for PSPCL for FY 2010-11 to FY 2012-13 Page | 124
The actual gross drawal by the State is lower than scheduled generation from ISGS for most of the days except for the days as shown below. Further, the UI paid for these days have been compared to bring the demand supply scenario in perspective with the under/over drawal from the ISGS.
Table 69: Days for which drawal was higher than ISGS scheduled generation for April, 2012
Date
ISGS Scheduled
Entitlement (LU)
(Computed)
ISGS Actual Generation
(LU)
Gross Drawal by
Punjab (LU)
UI Paid (+)/Received(-
) (Rs. Lakh)
Additional UI Paid (Rs.
Lakh)
4/20/2012 347.68 397.81 358.71 50.30 0.00 4/21/2012 360.23 411.62 375.95 70.96 0.00 4/22/2012 377.55 432.54 381.77 93.23 0.00 4/23/2012 366.46 419.12 387.64 139.23 0.00 4/24/2012 371.12 419.13 387.25 84.16 0.00 4/25/2012 367.77 414.27 378.84 106.02 0.22
Source: NRLDC, NRPC
From the above table, it is observed that on the above days UI had to be paid to the pool.
Further it is observed that on the days shown below, inspite of under-drawal of power by PSPCL than scheduled from ISGS; it appears that UI had to be paid to the UI pool.
Table 70: Days for which UI paid inspite of under-drawal by PSPCL for April, 2012
Date
ISGS Scheduled
Entitlement (LU)
(Computed)
ISGS Actual Generation
(LU)
Gross Drawal by
Punjab (LU)
UI Paid (+)/Received(-
) (Rs. Lakh)
Additional UI Paid (Rs.
Lakh)
4/6/2012 426.03 450.19 389.04 81.12 0.00 4/19/2012 341.76 387.86 336.06 36.01 5.81 4/28/2012 411.96 470.00 381.03 31.06 0.00 4/30/2012 408.02 466.74 337.90 60.57 0.00
Source: NRLDC, NRPC The same reflects that substantial improvement in power procurement planning is required.

Report on Study on power purchase/sale for PSPCL for FY 2010-11 to FY 2012-13 Page | 125
F. Analysis for September 2012
The details as available from NRLDC and NRPC for scheduled injection by ISGS for Punjab, actual injection by ISGS, gross drawl by Punjab and UI payable/receivable for the corresponding dates of September 2012 is as below:
Table 71: Injection and Drawl from ISGS for September 2012
Date
ISGS Scheduled
Entitlement (LU)
(Computed)
ISGS Actual
Generation (LU) (A)
Gross Drawal
by Punjab
(LU) (B)
Deviation in Actual
Generation and Actual Drawl (LU)
(C=A-B)
UI Paid (+)/Receive
d(-) (Rs. Lakh)
Additional UI Paid
(Rs. Lakh)
9/1/2012 601.97 639.06 604.42 34.64 -2.33 0.009/2/2012 606.47 663.63 657.62 6.01 31.79 0.009/3/2012 608.64 666.33 616.72 49.61 -2.94 0.009/4/2012 606.11 669.46 583.26 86.20 -21.50 0.009/5/2012 610.84 658.19 589.93 68.26 25.74 0.82 9/6/2012 616.20 672.02 619.59 52.43 -12.64 0.009/7/2012 611.08 670.20 632.21 37.99 -19.99 0.009/8/2012 602.51 657.30 605.71 51.59 -39.91 0.009/9/2012 612.26 639.58 540.35 99.23 -13.77 0.009/10/2012 621.83 661.10 591.97 69.14 -37.88 0.009/11/2012 621.83 667.99 619.79 48.20 -35.14 0.009/12/2012 623.96 666.33 626.09 40.24 -27.92 0.009/13/2012 632.72 675.00 630.71 44.29 -7.67 0.009/14/2012 624.16 680.99 594.47 86.52 -28.71 0.009/15/2012 586.62 652.94 499.98 152.97 -5.56 0.009/16/2012 572.62 641.44 503.33 138.10 -15.58 0.009/17/2012 573.28 643.82 489.05 154.78 -10.95 0.009/18/2012 552.36 616.96 449.08 167.88 -8.95 0.009/19/2012 554.93 612.50 480.54 131.97 -2.59 0.009/20/2012 568.82 621.93 570.67 51.26 22.26 0.009/21/2012 567.98 616.48 548.11 68.37 -20.13 0.009/22/2012 552.25 601.15 531.76 69.40 62.29 0.009/23/2012 553.48 599.96 523.02 76.93 27.21 0.009/24/2012 522.45 568.11 487.72 80.39 0.91 0.00

Report on Study on power purchase/sale for PSPCL for FY 2010-11 to FY 2012-13 Page | 126
Date
ISGS Scheduled
Entitlement (LU)
(Computed)
ISGS Actual
Generation (LU) (A)
Gross Drawal
by Punjab
(LU) (B)
Deviation in Actual
Generation and Actual Drawl (LU)
(C=A-B)
UI Paid (+)/Receive
d(-) (Rs. Lakh)
Additional UI Paid
(Rs. Lakh)
9/25/2012 521.56 559.37 531.03 28.34 0.19 0.57 9/26/2012 516.53 552.44 522.47 29.97 4.50 0.85 9/27/2012 545.37 579.56 558.13 21.44 -0.64 0.009/28/2012 543.76 577.81 579.96 -2.15 -5.45 0.009/29/2012 536.12 566.12 534.46 31.66 1.41 1.36 9/30/2012 536.75 569.92 531.28 38.64 3.19 0.00 Source: NRLDC, NRPC
It is observed from the table that the actual generation for the State of Punjab from ISGS is higher than the scheduled generation for all the days of the month.
The actual generation for the State from ISGS is higher than the gross drawal for all the days except on September 28 which is as shown:
Table 72: Day on which actual gross drawal was higher than ISGS actual generation for September, 2012
Date
ISGS Scheduled
Entitlement (LU)
(Computed)
ISGS Actual Generation
(LU)
Gross Drawal by
Punjab (LU)
UI Paid (+)/Received(-)
(Rs. Lakh)
Additional UI Paid (Rs.
Lakh)
9/28/2012 543.76 577.81 579.96 -5.45 0.00
The actual gross drawal by the State is lower than scheduled generation from ISGS for most of the days except for the days as shown below. Further, the UI paid for these days have been compared to bring the demand supply scenario in perspective with the under/over drawal from the ISGS.
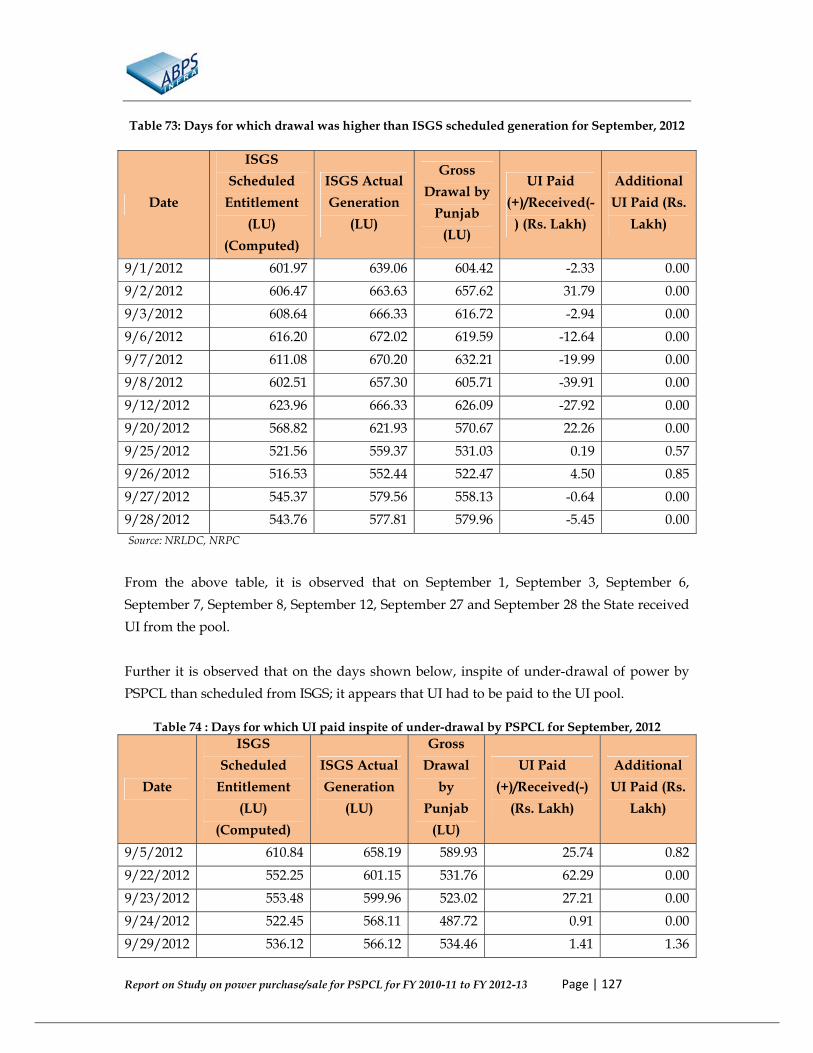
Report on Study on power purchase/sale for PSPCL for FY 2010-11 to FY 2012-13 Page | 127
Table 73: Days for which drawal was higher than ISGS scheduled generation for September, 2012
Date
ISGS Scheduled
Entitlement (LU)
(Computed)
ISGS Actual Generation
(LU)
Gross Drawal by
Punjab (LU)
UI Paid (+)/Received(-
) (Rs. Lakh)
Additional UI Paid (Rs.
Lakh)
9/1/2012 601.97 639.06 604.42 -2.33 0.00 9/2/2012 606.47 663.63 657.62 31.79 0.00 9/3/2012 608.64 666.33 616.72 -2.94 0.00 9/6/2012 616.20 672.02 619.59 -12.64 0.00 9/7/2012 611.08 670.20 632.21 -19.99 0.00 9/8/2012 602.51 657.30 605.71 -39.91 0.00 9/12/2012 623.96 666.33 626.09 -27.92 0.00 9/20/2012 568.82 621.93 570.67 22.26 0.00 9/25/2012 521.56 559.37 531.03 0.19 0.57 9/26/2012 516.53 552.44 522.47 4.50 0.85 9/27/2012 545.37 579.56 558.13 -0.64 0.00 9/28/2012 543.76 577.81 579.96 -5.45 0.00 Source: NRLDC, NRPC From the above table, it is observed that on September 1, September 3, September 6, September 7, September 8, September 12, September 27 and September 28 the State received UI from the pool. Further it is observed that on the days shown below, inspite of under-drawal of power by PSPCL than scheduled from ISGS; it appears that UI had to be paid to the UI pool.
Table 74 : Days for which UI paid inspite of under-drawal by PSPCL for September, 2012
Date
ISGS Scheduled
Entitlement (LU)
(Computed)
ISGS Actual Generation
(LU)
Gross Drawal
by Punjab
(LU)
UI Paid (+)/Received(-)
(Rs. Lakh)
Additional UI Paid (Rs.
Lakh)
9/5/2012 610.84 658.19 589.93 25.74 0.82 9/22/2012 552.25 601.15 531.76 62.29 0.00 9/23/2012 553.48 599.96 523.02 27.21 0.00 9/24/2012 522.45 568.11 487.72 0.91 0.00 9/29/2012 536.12 566.12 534.46 1.41 1.36

Report on Study on power purchase/sale for PSPCL for FY 2010-11 to FY 2012-13 Page | 128
Date
ISGS Scheduled
Entitlement (LU)
(Computed)
ISGS Actual Generation
(LU)
Gross Drawal
by Punjab
(LU)
UI Paid (+)/Received(-)
(Rs. Lakh)
Additional UI Paid (Rs.
Lakh)
9/30/2012 536.75 569.92 531.28 3.19 0.00 Source: NRLDC, NRPC
5.4 Energy Banking Arrangement by PSPCL Punjab is predominantly an agrarian economy with huge acres of land under paddy cultivation. Paddy cultivation period is from June to October, during which there is an excess demand of intermittent power. Correspondingly the demand for power is higher than the other months owing to the irrigation needs of paddy. Hence to meet the huge demand of its agricultural consumers, PSPCL has to arrange short term power to bridge the gap between demand and supply and to provide adequate supply for its agriculture/domestic/commercial/industrial consumers.
PSPCL in the past years have had banking agreements with the following entities:
A ) Direct Banking i. HPSEB
ii. RPPC iii. UPCL iv. J&K v. MSEDCL
vi. MPPTCL B ) Banking Through Traders
i. NVVNL ii. Tata Power Trading
iii. PTC iv. JSW Trading v. Lanco Trading
vi. Mittal Processors vii. Shree Cement Ltd.
viii. KISPL
5.4.1 Energy Banking Philosophy of PSPCL PSPCL submitted that the paddy cultivation period in Punjab is the period during which the neighbouring States and States in other regions have lower demand for power. The energy

Report on Study on power purchase/sale for PSPCL for FY 2010-11 to FY 2012-13 Page | 129
banking philosophy is based on the concept that the excess power from other States can be diverted to meet Punjab’s huge demand during paddy and the banked power is then returned during the other months when the State of Punjab has lower demand of power. This reduces the capital expenditure in the installation of new plants to meet the shortage during the period.
PSPCL submitted that keeping in view, the limited inter-regional corridors and to ensure its booking on advance reservation basis, it makes advance arrangement of power through power banking arrangement with other States for the period from June to October. It undertakes direct as well as indirect (through traders) banking arrangements. PSPCL submitted that banking arrangements within the northern region is done directly however, for other regions it is done through traders. The power banked in advance by PSPCL during winter is received back during next summer (Paddy) and the power received in advance from other States during summer (Paddy) is returned back during the following winter.
It has been observed that the banking arrangement done by PSPCL helps it to manage its surplus power during off-peak months and deficit situation during peak months. However, to further improve the profitability of the transaction, the banking agreements through traders could have been avoided thereby reducing the trading margins. PSPCL in its submission has provided that direct banking is done with entities within the region and for entities outside the region through traders. However, as per its banking agreements, PSPCL has carried out direct banking with MSEDCL in FY 2010-11. Thus direct banking is a more preferable route rather than through traders as PSPCL does have the required expertise to carry out banking directly.
5.4.2 Energy Banking Methodology Adopted: It is observed that PSPCL invites EOI from interested parties for banking of power by stating the power available to it in terms of quantum and duration along with the expected return of the banked power with its quantum and duration. This is done considering its own firm sources of power for a given period and the expected demand. The excess power estimated to be available during the period is banked with the entities either directly or through traders. In turn the quantum of power expected to be returned is determined considering the increase in demand for power during the paddy period and the peak shortages.
The banking arrangement done by PSPCL with other States directly or through traders approved by the Commission is considered as an important factor in the estimation of short-term power requirement.
Following are the observations on the banking contracts that PSPCL has entered into with various parties.

Report on Study on power purchase/sale for PSPCL for FY 2010-11 to FY 2012-13 Page | 130
A. Salient features of Energy Banking Transactions: • Banking Arrangements are non-monetary transactions except for payment of trading
margins wherein traders are involved. • The agreements specify the period of sale and quantum of power to be banked and
returned along with the ratio of the return. • In case of an intermediate trader in the transaction, the agreement specifies the
trading margin for the traders and his responsibility in the transaction. • The off-take of power is at the respective state periphery. E.g.: for Punjab State the
delivery of power to the other entity is at Punjab State periphery. • The transaction specifies the distribution of charges like open access charges,
CTU/STU charges, SLDC operating charges, etc. and parties responsible for its payment. In case of an intermediate trader, the transmission corridor is booked by the trader and charges for the same are booked separately to the trader.
• In case of excess power receipt by either party, the agreement has a clause for charging the excess power received as per terms agreed between the parties.
5.4.3 Quantum of Energy Banked and its Impact PSPCL undertakes banking of power to meet the short term requirement of power during the paddy season. The power requirement varies per year depending on the growth in demand.
The section deals with the quantum of power on account of banking transactions executed during FY 2010-11 to FY 2012-13. The same has been further analysed with regards to UI paid/received during the month to bring the demand supply scenario in perspective.
A. Banking in FY 2010-11
Table 75 : Energy Banking (FY 2010-11)
Month
FY 2010-11
Import (MU)
Export (MU)
UI Overdrawl/ Underdrawl (+/-)
(MU)
UI Paid (+)/Received (-
)(Rs Crore)
Net UI Rate (Rs/kWh)
April 1.2 187 296.18 213.51 7.21 May 0 55.8 298.35 167.27 5.61 June 256.87 0 154.30 62.85 4.07 July 379.19 0 81.02 30.26 3.74 August 361.93 0 195.73 49.14 2.51 September 231.25 0 72.83 4.87 0.67 October 36.51 12.12 -47.76 -10.13 2.12

Report on Study on power purchase/sale for PSPCL for FY 2010-11 to FY 2012-13 Page | 131
Month
FY 2010-11
Import (MU)
Export (MU)
UI Overdrawl/ Underdrawl (+/-)
(MU)
UI Paid (+)/Received (-
)(Rs Crore)
Net UI Rate (Rs/kWh)
November 0 415.88 -81.36 -15.76 1.94 December 0 447.93 -16.20 -0.63 0.39 January 0 493.55 27.57 9.38 3.40 February 0 303.93 -5.07 4.82 -9.50 March 0 303.93 -32.54 -8.03 2.47
From the table it is observed that PSPCL has been procuring power through banking arrangements from June to October whereas it is exporting power the rest of the year. However, as seen in the month of April and May the State was drawing power from the pool at low frequencies and the situation got aggravated due to banking commitments which suggests improvement in planning process.
Methodology Adopted for Assessing the Financial Impact of Banking
The energy banked by PSPCL is received during the paddy season. In case the banking arrangement would not have been there, it would have led to a higher power purchase cost during the paddy period when its demand is high. To assess the financial impact on account of banking for the months in which the energy was banked and PSPCL has drawn power under UI mechanism, the net UI rate paid for the month is compared with the cost of power procured from other sources in the year. The financial impact on account of banking during the months in which the energy was banked and PSPCL has drawn power under UI mechanism is assessed based on difference of net UI Rate and average power purchase cost from other sources for the year.
The average power purchase from other sources for FY 2010-11 is Rs. 5.15/kWh. Considering the instances when UI had to be paid due to excess over-drawal on account of banking being done, the net financial impact on account of banking arrangement in FY 2010-11 works out to be approximately Rs. 41.09 crore.
B. Banking in FY 2011-12
Table 76 : Energy Banking (FY 2011-12)
Month
FY 2011-12
Import (MU)
Export (MU)
UI Overdrawl/ Underdrawl (+/-)
(MU)
UI Paid (+)/Received (-
)(Rs Crore)
Net UI Rate
(Rs/kWh) April 0 142.45 -275.13 -92.76 3.37

Report on Study on power purchase/sale for PSPCL for FY 2010-11 to FY 2012-13 Page | 132
Month
FY 2011-12
Import (MU)
Export (MU)
UI Overdrawl/ Underdrawl (+/-)
(MU)
UI Paid (+)/Received (-
)(Rs Crore)
Net UI Rate
(Rs/kWh) May 14.4 0 -88.21 -27.62 3.13 June 364.43 2.94 -115.76 -15.61 1.35 July 656.69 2.99 -22.07 0.63 -0.28 August 643.49 0 -80.64 -16.89 2.09 September 509.64 0 -188.57 -44.56 2.36 October 45.67 47.49 21.49 15.91 7.4 November 0 343.02 117.62 67.30 5.72 December 3.7 328.08 93.92 66.24 7.05 January 0 238.08 -14.42 4.79 -3.32 February 0 190.53 24.50 10.38 4.24 March 0 114.79 -45.92 -16.78 3.66
From the table it is observed that PSPCL has been procuring power through banking arrangements from May to October whereas it is exporting power the rest of the year. However, in the month of October, November and December PSPCL had paid UI which is not normal as during these months the demand is generally lower in the State.
The average power purchase from other sources for FY 2011-12 is Rs. 3.93/kWh. Considering the instances when UI had to be paid due excess over-drawal on account of banking being done, the net financial impact on account of banking arrangement in FY 2011-12 works out to be approximately Rs. 58.57 crore.
C. Banking in FY 2012-13
Table 77: Energy Banking (FY 2012-13)
Month
FY 2012-13
Import (MU)
Export (MU)
UI Overdrawl/ Underdrawl (+/-)
(MU)
UI Paid (+)/Received (-
)(Rs Crore)
Net UI Rate
(Rs/kWh) April 10.97 71.72 9.20 -0.52 -0.56 May 28.2 0 115.77 40.31 3.48 June 261.78 0 250.15 99.21 3.97 July 458.69 0 192.25 84.10 4.37 August 355.06 0 90.75 14.91 1.64 September 401.67 0 18.12 5.85 3.23 October 15.48 34.23 130.32 22.37 1.72 November 0 260.11 15.82 5.20 3.29

Report on Study on power purchase/sale for PSPCL for FY 2010-11 to FY 2012-13 Page | 133
Month
FY 2012-13
Import (MU)
Export (MU)
UI Overdrawl/ Underdrawl (+/-)
(MU)
UI Paid (+)/Received (-
)(Rs Crore)
Net UI Rate
(Rs/kWh) December 3.46 362.69 9.41 8.13 8.64 January 0 310.72 -33.14 -1.90 0.57 February 0 232.79 -0.88 2.14 -24.39 March 0 183.36 15.60 4.30 2.75
From the table it is observed that PSPCL has been procuring power through banking arrangements from April to October whereas it was exporting power the rest of the year. For the month of December it is observed that the net UI exchange rate was Rs 8.64/kWh which is very high and should be avoided through better planning of banking agreements.
The average power purchase from other sources for FY 2012-13 is Rs. 3.96/kWh. Considering the instances when UI had to be paid due excess over-drawal on account of banking being done, the net financial impact on account of banking arrangement in FY 2012-13 works out to be approximately Rs. 4.41 crore.
Thus the total financial implication on account of mis-management in the banking schedules is estimated to be approximately Rs. 104.07 crore for FY 2010-11 to FY 2012-13.
Power banking is done in the case of excess power availability. PSPCL has to pay fixed cost to the generators for the firm power irrespective of whether they draw the power or not. Hence it is beneficial and advisable for the utility to bank power and draws the banked power during period of higher demand. However, care to be taken not to overdo it as has been observed for various months wherein it faced severe shortages which were further aggravated by commitment to supply power under banking arrangement.
5.4.4 Impact of Banking Agreements on Power Purchase: The banking agreements are such that there is an import of power during the paddy season and export of power during winter. PSPCL submitted that as per commitments made, the following power is banked during the period:
Table 78: Power Banked for Paddy period
Year Power Given in Advance for Paddy next year
Total Power received during paddy including advance
FY 2009-10 6451 LU (Winter FY 2010-11 up to 31st May -2010)
FY 2010-11 15083 LU (Winter FY 2010-11 up to 30th April -2011)
12489 LU (Paddy 2010)

Report on Study on power purchase/sale for PSPCL for FY 2010-11 to FY 2012-13 Page | 134
Year Power Given in Advance for Paddy next year
Total Power received during paddy including advance
FY 2011-12 17292 LU (Winter FY 2011-12 up to 30th March 2012) *
22157 LU (Paddy 2011)
FY 2012-13 12164.8 LU (Oct 2012 to 30th March 2012) *
14855 LU (Paddy 2012) *
Source: PSPCL Reply
The consolidated banking capacity signed by PSPCL as per its banking agreements in FY 2010-11 and FY 2012-13 with various entities is as shown below:
Table 79: Energy Banked in MW
Month
FY 2010-11 FY 2012-13
Estimated Maximum Exported
(MW)
Estimated Maximum Imported
(MW)
Estimated Maximum Exported
(MW)
Estimated Maximum
Imported (MW)
April 600 95 May 300
300
June
366.7 984 July
615 855
August
730 952.5 September
676.5 588.57
October
100 November 321.25 84 877.25 December 367.5
1177
January 777.5
1377 February 566.75
727.25
March 620
702.25 Source: PSPCL Banking Agreements
It has been observed that for FY 2010-11 most of the banking agreements are signed at an average of two to three months prior to the date of delivery.
The banking agreements signed for export of up to 600 MW power in the month of April 2010 advanced for paddy season of FY 2010-11 were mostly in the month of February 2010.

Report on Study on power purchase/sale for PSPCL for FY 2010-11 to FY 2012-13 Page | 135
As discussed earlier there was huge shortage in the month of April 2010 and the State had to draw heavily under UI at lower frequency incurring additional UI to the tune of Rs 31.61 crore.
The banking arrangements done by PSPCL for additional power to meet the growing demand for energy in the summer season is appreciated, however the same needs to be planned properly to avoid a situation of power shortage within the State due to banking in a given month.
5.5 Reactive Energy Charges The monthly reactive energy charges (cumulative of ISTS/BBMB and inter-constituent reactive energy charges) paid (+)/received (-) by PSPCL during FY 2010-11 to FY 2012-13 are tabulated as follows:
Table 80: Reactive Energy Charges
Month/Year FY 2010-11 (Rs. Cr)
FY 2011-12 (Rs. Cr)
FY 2012-13 (Rs. Cr)
April -0.45 -2.33 -1.33 May 0.03 -0.14 -0.12 June 1.10 0.94 3.69 July 1.32 2.88 3.70 August 0.64 0.81 1.50 September 0.54 -0.09 0.50 October -0.73 -0.98 -0.90 November -1.01 -0.73 -0.98 December -0.82 -0.35 -0.65 January -0.40 -0.29 -0.52 February -1.06 -0.63 -0.15 March -1.17 -1.16 -0.62 Total Charges (Payable (+)/Receivable (-) (Rs. Cr.)
-2.02 -2.06 4.12
Source: NRPC, PSPCL Replies
It is observed that PSPCL pays reactive energy charges into the pool during the months of June to September i.e. during the paddy period. The higher reactive energy need during the period is due to high agricultural load owing to the irrigation needs of paddy.
The reactive energy compensation measures taken by PSTCL as mentioned in Annual Report of SLDC, Punjab is as follows:

Report on Study on power purchase/sale for PSPCL for FY 2010-11 to FY 2012-13 Page | 136
Table 81: Installation of capacitors for Reactive energy Compensation
Year Capacity Installed (MVARs)
FY 2010-11 272 FY 2011-12 538
Source: Punjab SLDC Annual Report (2011-12)
In addition PSTCL has submitted that it has also taken steps to improve intra-state transmission constraints observed during paddy period as highlighted in the further sections.
5.6 Transmission Infrastructure
5.6.1 Inter State Transmission PSTCL stated that inter-state transmission constraints are planned and executed by CEA/PGCIL. In this respect it coordinates with the entities to undertake various measures to improve the inter-state transmission constraints.
The total transmission capacity (TTC) of PGCIL to transmit power is around 5600 MW and by keeping reliability margin of 300 MW, Punjab was able to import power only to the extent of 5300 MW.
It appears that import of power from Western & Eastern Region is constrained due to the following constraints:
(a) Western Region
765 kV Gwalior-Agra line (overloaded); thus import from Western Region is constrained.
(b) Eastern Region
765 kV System from Eastern Region to Northern Region is incomplete as Gaya Pooling Station is not commissioned. The incoming 765 kV supply to Gaya is missing while its outgoing lines stand commissioned.
(c) Construction of 765 kV Lucknow-Bareilly-Meerut Line awarded to Reliance is yet to start.
All this has put restraint on import of power from Eastern and Western Regions. It may not be possible to import more power from Sasan to Punjab (more generating units commissioned at Sasan) as Gwalior-Agra 765 kV line is overloaded.

Report on Study on power purchase/sale for PSPCL for FY 2010-11 to FY 2012-13 Page | 137
PSTCL submitted that the following works of PGCIL network need to be expedited to improve the transfer capacity:
Table 82: Measures to improve inter-state transmission constraints Name of PGCIL Station
Existing ICTs
(400/220kV)
Proposed Augmentation Status
Moga 2x250+1x315+1x500*
Replacement of 2×250 MVA ICTs by 2×500 MVA
* One No. ICT 500MVA energized on 08-06-2013. 2nd replacement expected next year
Ludhiana
3x315
(i)Additional 1×500 MVA ICT (ii)Three No. additional 220kV bays
(i) ICT work awarded to M/S CGL. Delivery expected in Dec/2013. (ii) 220kV line bays to be commissioned by Oct 2013.
Amritsar 2x315 (i)Additional 1×500 MVA ICT
Civil works in progress.
Patran New 400kV S/S with 2x500MVA, 400/220kV ICTs
Executing agency to be selected through tariff based competitive bidding by PGCIL. First stage bids have been opened. Total tentative time line for this s/s is 2 yrs.
Source: PSTCL Replies
5.6.2 Intra State Transmission After the unbundling of PSEB in 2010, PSTCL has been entrusted with the transmission business. PSTCL submitted that it has undertaken various steps to improve the intra-state transmission capacity which is highlighted in the subsequent sections.
5.6.2.1 Ring Fencing of SLDC As per the Punjab State SLDC report (FY 2011-12), various organizational steps has been taken like simplification of Intra-State Open Access procedures, web based IT enabled services, GIS mapping of PSTCL Transmission network, etc.
5.6.2.2 Transmission Capacity Addition The intra-state transmission capacity for each of the years as submitted by PSPCL and percentage increase in capacity over the previous year is as follows:

Report on Study on power purchase/sale for PSPCL for FY 2010-11 to FY 2012-13 Page | 138
Table 83: Transmission Capacity Addition in Ckt. km
Transmission Capacity in Ckt KM Voltage Levels
FY 2010-11 FY 2011-12 FY 2012-13 Ckt km Ckt km Increase Ckt km Increase
33kV 1321.00 1328.50 0.57% 1328.50 0.00% 66kV 7064.00 7545.22 6.81% 7978.89 5.75% 132kV 3105.00 3131.72 0.86% 3131.72 0.00% 220kV 4934.00 5279.22 7.00% 5680.93 7.61% 400kV - 150.00 - 872.20 481.50%
Source: PSPCL Replies & Punjab SLDC Annual Report (FY 2011-12)
It is observed that there has been an addition of transmission lines at higher voltages i.e. 220kV and 400kV. 400kV transmission lines was initiated in FY 2011-12 to increase the transmission capacity and substantial capacity at this voltage has been added in FY 2012-13 to keep up with the evacuation of power from new generating stations. However the transmission capacity at voltage levels of 132kV, 66kV and 33kV has remained more or less constant with little or no addition.
The intra-state transmission capacity addition in MW as submitted by PSTCL is as below:
Table 84: Transmission Capacity Addition in MW
Year Intra-State Transmission
Capacity (MW) approved by Commission
Intra-State Transmission
Capacity (MW) Actual
Increase in capacity over Previous Year
FY 2010-11 7990.18 8007 - FY 2011-12 7990.18 8834 10.33% FY 2012-13 10082 9074 2.72%
Source: PSPCL Replies & Tariff Orders of PSTCL
It is observed that the transmission capacity addition in MW is more than that approved by the Commission in the tariff orders for FY 2010-11 and FY 2011-12. However, the capacity addition in FY 2012-13 is lower than that approved by the Commission.
The targeted transmission capacity addition in MVA as submitted by PSTCL and the achieved yearly targets is as follows:
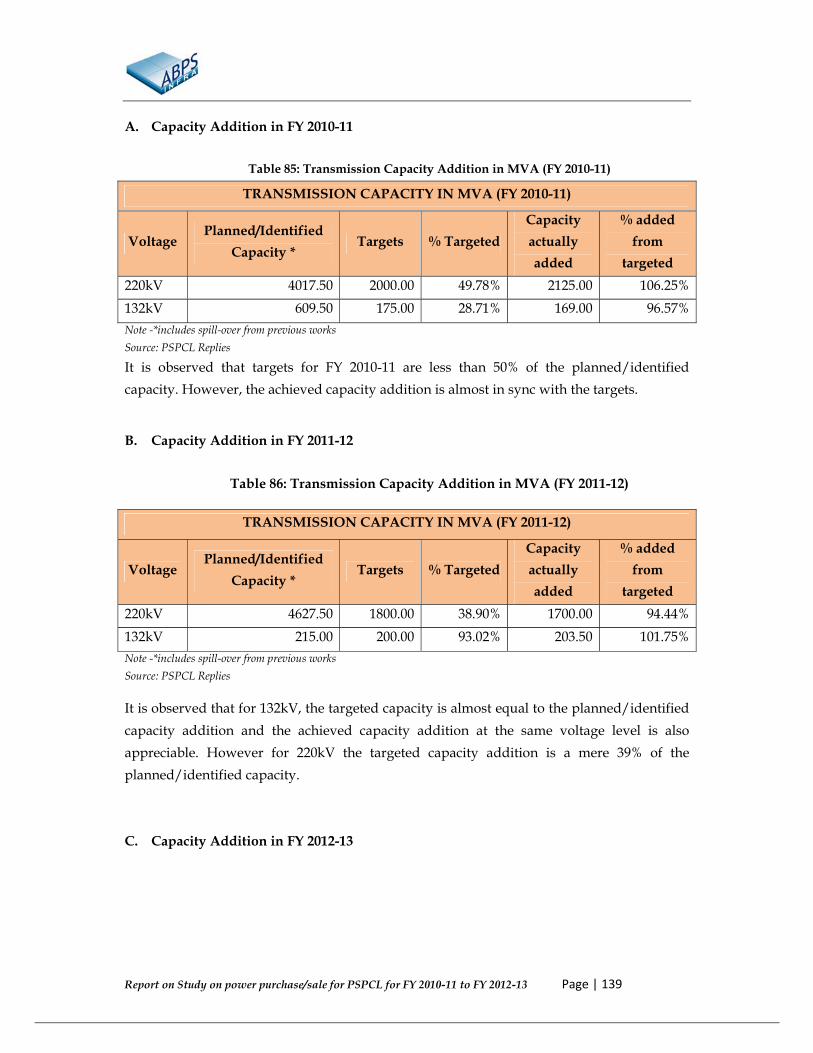
Report on Study on power purchase/sale for PSPCL for FY 2010-11 to FY 2012-13 Page | 139
A. Capacity Addition in FY 2010-11
Table 85: Transmission Capacity Addition in MVA (FY 2010-11)
TRANSMISSION CAPACITY IN MVA (FY 2010-11)
Voltage Planned/Identified Capacity * Targets % Targeted
Capacity actually added
% added from
targeted 220kV 4017.50 2000.00 49.78% 2125.00 106.25% 132kV 609.50 175.00 28.71% 169.00 96.57% Note -*includes spill-over from previous works Source: PSPCL Replies
It is observed that targets for FY 2010-11 are less than 50% of the planned/identified capacity. However, the achieved capacity addition is almost in sync with the targets.
B. Capacity Addition in FY 2011-12
Table 86: Transmission Capacity Addition in MVA (FY 2011-12)
TRANSMISSION CAPACITY IN MVA (FY 2011-12)
Voltage Planned/Identified Capacity * Targets % Targeted
Capacity actually added
% added from
targeted 220kV 4627.50 1800.00 38.90% 1700.00 94.44% 132kV 215.00 200.00 93.02% 203.50 101.75% Note -*includes spill-over from previous works Source: PSPCL Replies
It is observed that for 132kV, the targeted capacity is almost equal to the planned/identified capacity addition and the achieved capacity addition at the same voltage level is also appreciable. However for 220kV the targeted capacity addition is a mere 39% of the planned/identified capacity.
C. Capacity Addition in FY 2012-13

Report on Study on power purchase/sale for PSPCL for FY 2010-11 to FY 2012-13 Page | 140
Table 87: Transmission Capacity Addition in MVA (FY 2012-13)
TRANSMISSION CAPACITY IN MVA (FY 2012-13)
Voltage Planned/Identified Capacity * Targets % Targeted
Capacity actually added
% added from
targeted 220kV 4654.00 2100.00 45.12% 2729.50 130.98% 132kV 465.50 360.00 77.34% 195.50 54.31% Note -*includes spill-over from previous works Source: PSPCL Replies
It is observed for 132kV though the targets were 77.34% of the planned/identified capacity addition; the achieved addition was a mere 54.31% of the targets. For 220kV, the targets were 45% of the planned addition and the actual addition surpassed the targets by 130.98%.
5.6.2.1 Improvement Measures
PSTCL submitted that the various measures to improve the intra-state transmission capacity include addition of new substations and its augmentation along with improvement in loading profile of the grids and substations.
PSPCL stated that to improve the transmission capacity in the State of Punjab, regular co-ordination meetings of Transmission Planning Committee (TPC) between PSPCL and PSTCL were held to co-ordinate 66kV transmission works planned by PSPCL with the 220kV/132kV transmission works planned by PSTCL. As per submissions, new 66kV links are provided from existing 66kV S/S to upcoming 220 kV S/S or by strengthening existing lines for evacuation of power from 220kV/132kV S/S.
A. Capacity addition in Substations
The substations added during the assessment period as submitted are as follows:
Table 88: Sub-stations Capacity Addition in MVA
Substation Additions
Voltage Description FY 2010-11 FY 2011-12 FY 2012-13
No MVA No MVA No MVA 33kV New - - 1 12.50
Augmented 6 31.00 - 10 3.00 Up-gradation to 66kV 5 9.00 21 83.50 7 36.00
66kV New 31 385.00 7 98.00 33 462.00

Report on Study on power purchase/sale for PSPCL for FY 2010-11 to FY 2012-13 Page | 141
Substation Additions
Voltage Description FY 2010-11 FY 2011-12 FY 2012-13 No MVA No MVA No MVA
Augmented 133 1322.25 175 1492.45 90 895.25 132kV* New 2 32.50
Augmented 14 171.00 220kV* New 8 800.00
Augmented 9 900.00 Source: PSPCL Replies * As mentioned in Punjab SLDC Annual Report (FY 2011-12)
It is observed that 33kV S/S has been augmented to 66kV in FY 2011-12 and FY 2012-13 to improve the transfer capacity. Also new 66kV S/S has been added to the network.
With regards to improvement in loading profile of sub-stations and to overcome the intra-state transmission constraints observed during paddy season, PSTCL has submitted the following remedial measures which have been taken:
Table 89: Improvement Measures in Sub-Stations
Vtg (kV) Substation Vtg
Ratio
Details (Trf No.
and MVA)
% Loading Action Plan
220 Baghapurana 132/11 10/12.5 96.8 1x20 MVA T/F to replace 10/12.5 MVA T/F is already planned (amendment 35/12.11.12)
132 Badal 132/66 20/25 92.44 1x40 MVA T/F to replace 1x20/25 MVA T/F is already planned (amendment 37/16.11.12)
132/66 20/25 92.44
132 Muktsar 132/66 16/20 100 Matter under consideration
132 Jalalabad 132/66 12.5/16 93.75 Add. 25 MVA, 132/66kV is planned vide the Transmission work list 2013-14 at item no 7.
132 Malout 132/11 20 95 Add. 20 MVA, 132/11kV is planned (amendment no-13/22/6/12)
220 Mahilpur 132/11 20 94 To give relief to 20 MVA 132/11kV T/F 6.3/8 MVA is to be augmented to 2 MVA as per planning FY 2011-12 amendment 28/23.2.12

Report on Study on power purchase/sale for PSPCL for FY 2010-11 to FY 2012-13 Page | 142
Vtg (kV) Substation Vtg
Ratio
Details (Trf No.
and MVA)
% Loading Action Plan
220 Rehana Jattan 66/11kV
10/12.5 97 Re-adjustment of Feeders being done
132 Hoshiapur 132/11 12.5/16 100 1x16/20MVA T/F to replace 1x12.5/16 MVA T/F is already planned (amendment 44/9.1.13)
132/66-33
20/25 100 1x50MVA T/F to replace 1x20/25 MVA T/F is already planned (amendment 29/21.3.12) 132/66-
33 50 100
132 Chohal 132/66-33
12.5/16 91 1X20/25 MVA T/F to replace 12.5/16 MVA T/F is already planned (amendment 16/11/7/12)
132 Nawanshaher 132/11 16/20 97 Augmentation of 1x12.5 MVA T/F to 1x20MVA T/F is already planned (amendment 38/26.11.12)
132/11 12.5 95
132/66 40/50 98 Additional 1x20/25 MVA T/F is already planned (amendment 28/23.2.12)
132/66 12.5/16 99 1x30 MVA T/F to replace 1x12.5/16 MVA T/F is already planned (amendment 38/26.11.12)
132 Banga 132/11 16/20 95 1x20MVA T/F to replace 1x12.5 MVA is already planned (Transmission work list FY 2012-13, item 13)
132 Jadla 132/66 40/50 98 Additional 25 MVA , 132/66kV is already planned (Transmission work list F, item 18)
220 Kartarpur 66/11 20 91 Matter under consideration 220 Jamsher 66/11 10/12.5 92 Matter under consideration 132 Nakodar 66/11 10/12.5 94 Matter under consideration 132 Urban Estate 132/11 20 98 Matter under consideration

Report on Study on power purchase/sale for PSPCL for FY 2010-11 to FY 2012-13 Page | 143
Vtg (kV) Substation Vtg
Ratio
Details (Trf No.
and MVA)
% Loading Action Plan
132/11 20 93 Matter under consideration 132 Children Park
Jalandar 132/11 20 92 Matter under consideration
220 Kohara 66/11 20 100 Matter under consideration 132 Swadi Kalan 132/11 20 94 Additional 1x12.5 MVA T/F is already
planned (amendment 15/29.6.12) 220 GBR –II 66/11 16/20 95 Matter under consideration 132 Ghulal 132/11 10/12.5 99 Matter under consideration 220 Tooran 66/11 20 99 Matter under consideration
66/11 20 99 220 Himmatpura 66/11 12.5 96 Additional 1x20 MVA T/F is already
planned (amendment 22/14.8.12) 132 Dhariwal 132/66 20/25 91.25 1x50MVA T/F to replace 1x20/25
MVA T/F is already planned (amendment 44/9.1.13)
132 Verka 132/66 40/50 92.9 Load can be shifted to 220kV S/S Majitha by suitable links
132/11 20 91.5 Additional 1x20 MVA T/F is already planned (amendment 1/4.4.11)
132 Naraingarh 132/66 40/50 Load can be shifted to 220kV S/S Khassa 132/11 20
220 Patti 66/11 20 98.25 Matter under consideration 132 Bhikhiwind 132/11 10/12.5 96.96 Matter under consideration 132 Tarn Taran 132/66 40/50 91.44 Load can be shifted to 220kV S/S
Rashiana 220 Chola sahib 66/11 12.5 92.32 Matter under consideration 132 Batala 132/66 40/50 90.6 Additional 25 MVA,132/66kV is
already planned (transmission work list 2013-14 item -2)
132 S.H.G/Pur 132/66 40/50 93.62 Matter under consideration 220 Moga 220/132 100 99.23 With the up-gradation of 132kV

Report on Study on power purchase/sale for PSPCL for FY 2010-11 to FY 2012-13 Page | 144
Vtg (kV) Substation Vtg
Ratio
Details (Trf No.
and MVA)
% Loading Action Plan
220/132 100 99.23 220/132 100 99.23
220 Mansa 220/66 100 105.14 Additional 160MVA, 220/66kV T/F already purposed at 220kV S/S Mansa 220/66 100 105.14
220 Jhunir 220/66 100 109 Additional 160MVA, 220/66kV T/F already purposed at 220kV S/S Jhunir will give relief to 220kV S/S Jhunir.
220 Mukatsar 220/132 100 98 Commissioning of 220kV S/S Abohar will give relief to overloading. 220/132 100 98
220/132 100 98 220 Sultanpur 220/132 100 99 1x160MVA, 220/66kV T/F has
already been planned and under installation. This will reduce loading on both 100MVA, 220/132kV transformers at Sultanpur
220/132 100 99
220 Hambran 220/66 100 99 Under Consideration 220/66 100 99
220 Dhandari -1 220/66 100 99 Additional 100/160MVA, 220/66kV, T/F cannot be installed due to fault level constraints. However 66kV Gaunsgarh has been U/G with 160MVA, 220/66kV T/F which can give some relief to the Dhandari
220/66 100 99
220 Jagraon 220/66 100 95 Relief can be provided by: (i) By

Report on Study on power purchase/sale for PSPCL for FY 2010-11 to FY 2012-13 Page | 145
Vtg (kV) Substation Vtg
Ratio
Details (Trf No.
and MVA)
% Loading Action Plan
220/66 100 95 220 Ferozepur 220/132 100 99.23 Load of 132 kV S/S Ferozshah will be
shifted to proposed 220kV S/S Kotkamore which has already been commissioned
220/132 100 99.23
220 Ferozepur Road Ludhiana
220/66 100 99.23 With the commissioning of Additional 160MVA T/F at Ferozepur Road Ludhiana overloading problem has been solved
220 Rajla 220/66 100 98.28 66kV Kakrala near 220kV Rajla has been U/G to 220kV. Therefore considerable load of Rajla will be shifted on Kakrala.
Source: PSTCL Reply
With regards to improvement in loading profile of 132kV and 220kV lines and to overcome the intra-state transmission constraints, PSTCL has submitted the following remedial measures that it has undertaken:
Table 90: Improvement Measures in 132kV and 220kV Lines
132kV and 220kV lines Vtg
Level Line No of Circuit
Conductor Size (Sq")
% Loading Action Plan
132 Bathinda-Balluana
Single Ckt
0.2 106.45 Proposed 220kV S/S Badal to give relief to overloading
132 Balluana-gidderbaha
Single Ckt
0.2 100.04 Proposed 220kV S/S Badal to give relief to overloading
132 GNDTP Bathinda-IGC Bathinda
Single Ckt
0.2 108.76 Proposed 220kV S/S Talawandi Sabo to give relief to overloading
132 IGC Bathinda-Mour
Single Ckt
0.2 109.55 Proposed 220kV S/S Talawandi Sabo to give relief to overloading

Report on Study on power purchase/sale for PSPCL for FY 2010-11 to FY 2012-13 Page | 146
132kV and 220kV lines Vtg
Level Line No of Circuit
Conductor Size (Sq")
% Loading Action Plan
132 Mahilpur-Hoshiarpur
Single Ckt
0.2 110.81 Single Ckt. To double ckt work is near completion
132 Hoshiarpur-Bhogpur
Single Ckt
0.2 108.75 Normal demand hence double ckt line is required
132 Hoshiarpur-Chohal
Single Ckt
0.2 109.91 Temp M/D due to drawl of load by Hamitpur (H.G). Normal load on Chohal-Hamitpur =150A & Hoshiarpur-Chohal=250A
132 Hoshiarpur-Bhogpur
Single Ckt
0.2 100 M/D due to shifting of load. Normal load's 294A. On this day Bhogpur-Alawalpur line was under permit
132 Kahanpur-Bhogpur
Single Ckt
0.2 103.88 M/D due to shifting of load. Normal load's 330A. On this day Bhogpur-Alawalpur line was under permit
132 Jalandhar-Kartarpur
Single Ckt
0.2 105.16 M/D due to shifting of load. Normal load's 330A. Due to drawl by BBMB Jalandhar Normal Load on line is 225A
132 Kapurthala-Kheramandir
Single Ckt
0.2 102.86 Due to commissioning of 220kV S/S Kanjli load of 132kV Sultanpur-Kheramandir-Kapurthala line reduced due to shifting of load from 132kV S/S Kapurthala. Now normal load on 132kV Kapurthala-Kheramandir is 275A and 132kV Kheramandir-Sultanpur line is 375A.
132 Kheramandir-Sultanpur
Single Ckt
0.2 127.22
132 BBMB Jalandhar-Urban Estate
Single Ckt
0.2 114.4 To deload 132kV BBMB -Urban Estate-Nakodar line, it is proposed either to install

Report on Study on power purchase/sale for PSPCL for FY 2010-11 to FY 2012-13 Page | 147
132kV and 220kV lines Vtg
Level Line No of Circuit
Conductor Size (Sq")
% Loading Action Plan
220/132kV 100 MVA, 220kV S/S. Kotla Janga to feed 132kV S/S Nakodar through double ckt, 7km 132kV line from Kotla Janga or to feed 66kV S/S.66kV Mehalpur Parjian being fed presently from 132kV Nakodar form 220kV S/S Kotla Janga by erecting approximately 9 km link between existing 66kV S/S Shahkot to 66kV S/S Parjian
220 Moga-BajaKhana
Single Ckt
0.4 104.84 New link from 220kV S/S Baghapurana-BajaKhana line has been planned and will give relief to over-loading
220 Sunam-Patran Single Ckt
0.4 99.68 After Commissioning of 220kV Bangan the loading of this line will come down
220 Sahnewal-PGCIL,Ludhiana
Single Ckt
0.4 104 With commissioning of earlier planned network i.e. LILO of 1 Ckt LLK2-JGR2, LLK2-SNW2,LLK2-DDK2, each at 400kV PGCIL, Ludhiana this loading will come down
220 Jagraon-400kV Power Grid
Single Ckt
0.4 104 Loading will come down with the LILO of 220kV Jagraon-Moga at Himmatpura
220 Fagan Majra-PTA
Single Ckt
0.4 109 Some relief can be provided with: (i) Commissioning of 400kV Rajpura & its 220kV network. (ii) Linking of 220kV Nabha -400kV Dhuri. Works planned

Report on Study on power purchase/sale for PSPCL for FY 2010-11 to FY 2012-13 Page | 148
132kV and 220kV lines Vtg
Level Line No of Circuit
Conductor Size (Sq")
% Loading Action Plan
220 Malerkotla-Dhuri
Single Ckt
0.4 111 With the commissioning of 400kV Dhuri along with its associated 220kV Network, this loading shall come down.
220 Patiala-Rajla-Patran
Double Ckt
0.4 111 (i) Relief shall be provided with the commissioning of 400kV Patran under Northern Region System Strengthening Scheme. (ii)From 400kV Patran, various 220kV line such as 400kV Patran-220kV Patran, 400kV Patran-220kV Rajla, 400kV Patran-220kV Patiala & 400kV Patran-220kV Manda DC line which have been planned will provide relief to this section
220 PGCIL-Kartarpur
Single Ckt
0.4 106.55 LILO of 2nd Ckt of 400kV PGCIL, Jalandhar -220kV Nakodar at 220kV Kartarpur as already planned will reduce the loading
220 PGCIL-KotlaJagan
Single Ckt
0.4 103.11
Ablowal-Fagganmajra -1
Double Ckt
0.4 128 Maximum demand occurred suddenly attributed to the load management by power Controller at that point of time. However normal demand is below the current carrying capacity of the ACSR conductor. Further there will be sufficient relief with the commissioning of 400kV S/S Bhalwan
Ablowal-Fagganmajra -2
Double Ckt
0.4 128
Ablowal-Rajla Single Ckt
0.4 117.9
Ablowal-Patran Single Ckt
0.4 114.3
Sunam-Patran Single Ckt
0.4 99.3
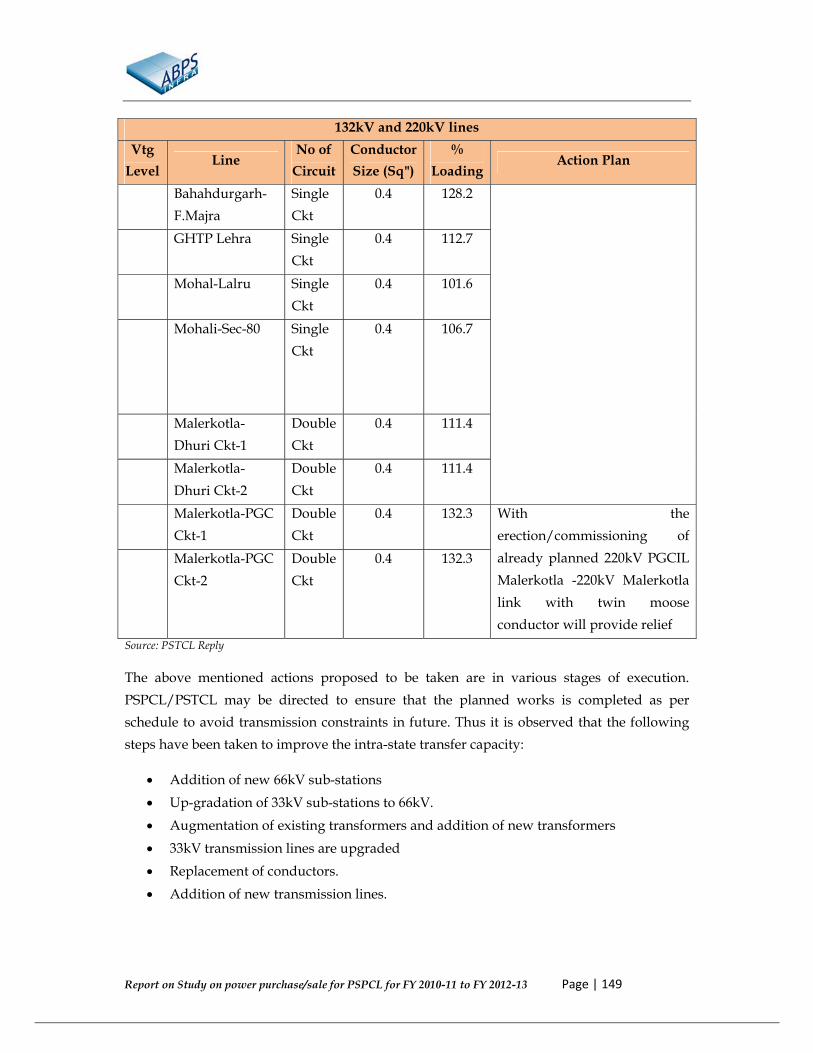
Report on Study on power purchase/sale for PSPCL for FY 2010-11 to FY 2012-13 Page | 149
132kV and 220kV lines Vtg
Level Line No of Circuit
Conductor Size (Sq")
% Loading Action Plan
Bahahdurgarh-F.Majra
Single Ckt
0.4 128.2
GHTP Lehra Single Ckt
0.4 112.7
Mohal-Lalru Single Ckt
0.4 101.6
Mohali-Sec-80 Single Ckt
0.4 106.7
Malerkotla-Dhuri Ckt-1
Double Ckt
0.4 111.4
Malerkotla-Dhuri Ckt-2
Double Ckt
0.4 111.4
Malerkotla-PGC Ckt-1
Double Ckt
0.4 132.3 With the erection/commissioning of already planned 220kV PGCIL Malerkotla -220kV Malerkotla link with twin moose conductor will provide relief
Malerkotla-PGC Ckt-2
Double Ckt
0.4 132.3
Source: PSTCL Reply
The above mentioned actions proposed to be taken are in various stages of execution. PSPCL/PSTCL may be directed to ensure that the planned works is completed as per schedule to avoid transmission constraints in future. Thus it is observed that the following steps have been taken to improve the intra-state transfer capacity:
• Addition of new 66kV sub-stations • Up-gradation of 33kV sub-stations to 66kV. • Augmentation of existing transformers and addition of new transformers • 33kV transmission lines are upgraded • Replacement of conductors. • Addition of new transmission lines.

Report on Study on power purchase/sale for PSPCL for FY 2010-11 to FY 2012-13 Page | 150
5.7 Recommendations 1. It is observed that during deficit/power shortage the Utility has been procuring
power from RLNG based stations and liquid fuel stations which in the recent years have been expensive with variable charges in excess of Rs 8/kWh. Though at times the utilities have to purchase this power on the directions of load despatch centre, however, apart from such instances the Utility may be asked to also consider procurement of power through exchanges as cheaper options may be available from the exchanges.
2. Most of the banking contracts signed is in the month of February to May 2010, for the power to be imported from July 2010. However there was an acute power deficit in the State in the month of April 2010 and May 2010 and in some months of FY 2011-12 as evident from the over drawls from the grid and load shedding relief resorted to by PSPCL. Also power to the tune of 187 MU was exported in April 2010 under banking obligations and PSPCL had to pay around Rs. 31.61 Crore as additional UI for the month. These types of situations can be avoided through proper planning while entering into banking arrangements.
3. As per the banking agreements, only 3 agreements out of 10 in FY 2010-11 and FY 2012-13 have been signed directly between PSPCL and the utility, whereas the rest have been signed through traders. The intermediary trader receives the trading margin of 3 paise/kWh which is an additional financial burden that can be avoided if the same is done through direct banking.
4. It is observed that one of the reasons cited for not so accurate decision making with regards to power purchase and scheduling was the variation in reading of tele-metered data and SEM data. Tele-metered data not matching with SEM data has resulted into improper decision making and therefore it is recommended that whenever such variation in tele-metered data and SEM data is observed the same shall be properly documented along with steps taken to improve the tele-metered reading so that the variations are minimised. Such reports may be asked to be submitted to the Commission on monthly basis.
5. For days wherein additional UI is paid by PSPCL, the same shall be documented with appropriate justification with circumstances leading to such over-drawal. The Commission may ask PSPCL to submit month wise compilation of such instances on monthly basis.

Report on Study on power purchase/sale for PSPCL for FY 2010-11 to FY 2012-13 Page | 151
6. Further, in order to bring in more transparency in the power purchase procurement, it is suggested that the Commission may ask PSPCL to prepare the following daily and monthly reports and submit the same to the Commission on regular basis. Daily Reports (i) Station wise daily generation data from its own generating stations including
hydro stations. (ii) Final Drawal Schedule (Day ahead scheduling) submitted to NRLDC from Inter
State Generating Stations (ISGS). (iii) Instances wherein State Generating Stations were Backed Down with reasons
leading to such backing down. (iv) Instances wherein low cost Central Generating Stations were Backed Down (not
as per merit Order) with justification along with circumstances leading to backing down.
(v) Quantum and Cost of short term power purchase (vi) Hourly Load shedding alongwith the reasons for the same. Monthly Reports (i) Daily Time block wise UI Injection/Drawl for the previous month including
following details: • Time block wise UI Drawal both in units and Amount • Time block wise UI Injection both in units and Amount • Time block wise Additional UI paid including reasons for same • Time block wise load shedding carried out, if any
(ii) Monthly Power Purchase plan versus actual power purchase done with reasons
for variations in quantum and cost.

Report on Study on power purchase/sale for PSPCL for FY 2010-11 to FY 2012-13 Page | 152
6 Summary of Recommendations
The recommendations as discussed in the report are summarised in this section. Most of the recommendations doesn’t require much time to implement and to implement few recommendations, time frame of around 6 months may be required. Accordingly, the recommendations given in this report has been categorised depending upon time frame required for implementation.
(A) Recommendations that can be implemented within 6 months
i. Merit Order for backing down generation It is suggested that PSPCL may be asked to record the instances wherein it has to back down its own generating stations both thermal and hydro generating stations along with the duration for which such backing down was done with appropriate justification with regard to circumstances leading to such backing down of its own generating stations. The Commission may ask PSPCL to furnish daily report for instances wherein the State Generating Stations were backed down with reasons leading to such backing down.
ii. Monthly Power Purchase Plan
In order to control the increase in power purchase cost of PSPCL, it is recommended that PSPCL based on historical monthly sales and the annual sales approved by the Commission may be asked to prepare monthly sales plan and on the basis of the same may be asked to prepare monthly power purchase plan including short term power purchase and banking and submit its plan to the Commission. PSPCL may also be asked to submit the monthly budget for procurement of power based on its power procurement plan. PSPCL may be directed to adhere to this plan and in case of any variation observed which could lead to increase in the budget, the same to be informed to the Commission with appropriate justification and actions to be taken so that the impact is absorbed in the next monthly budgets.
iii. Limit on Short Term Power Purchase without prior approval

Report on Study on power purchase/sale for PSPCL for FY 2010-11 to FY 2012-13 Page | 153
As per the provisions of Regulations, PSPCL is required to obtain the prior approval from the Commission for additional procurement of power above 10% of the quantum approved in the Power Procurement Plan. In this regard, it is suggested the cap in terms of quantum and cost both may be specified and in case the either the quantum or overall cost is likely to increase beyond the specified cap, PSPCL may be asked to obtain the prior approval for the same. iv. Costly power procurement from RLNG Liquid fuel fired stations It is observed that during deficit/power shortage the Utility has been procuring power from RLNG based stations and liquid fuel stations which in the recent years have been expensive with variable charges in excess of Rs 8/kWh. Though at times the utilities have to purchase this power on the directions of load despatch centre, however, apart from such instances the Utility may be asked to also consider procurement of power through exchanges as cheaper options may be available from the exchanges.
v. Recommendations with respect to Banking Arrangements
a. Most of the banking contracts signed is in the month of February to May 2010, for the power to be imported from July 2010. However there was an acute power deficit in the State in the month of April 2010 and May 2010 and in some months of FY 2011-12 as evident from the over drawls from the grid and load shedding relief resorted to by PSPCL. Also power to the tune of 187 MU was exported in April 2010 under banking obligations and PSPCL had to pay around Rs. 31.61 Crore as additional UI for the month. These types of situations can be avoided through proper planning while entering into banking arrangements.
b. As per the banking agreements, only 3 agreements out of 10 in FY 2010-11 and FY 2012-13 have been signed directly between PSPCL and the utility, whereas the rest have been signed through traders. The intermediary trader receives the trading margin of 3 paise/kWh which is an additional financial burden that can be avoided if the same is done through direct banking.
vi. Methodology of projecting Energy Sales to Industrial Category For projecting sales of industrial category mainly Medium and Large supply, the change in policies and Regulations also plays a pivotal role. It is observed during the analysis that with the implementation of Open Access there has been a sharp variation in the energy sales as the consumers have opted for other sources of power. Further, the sales to industrial category may get affected due to change in Industrial policies of the State

Report on Study on power purchase/sale for PSPCL for FY 2010-11 to FY 2012-13 Page | 154
Govt. Thus the impact of any change in policy and Regulations that may have impact on sales may be incorporated by taking suitable assumptions and incorporating the same.
Further, for industrial category mainly large industrial category, the impact of pending applications and industrial growth in the State may be incorporated while projecting the sales for more accurate projection of sales. Similarly for Railway Traction category as it is a single consumer, the discussions can be held with them and their views may be incorporated for projecting the sale for Railway Traction category.
vii. Methodology to Project Power Purchase Cost It is observed during the analysis that the Commission projects the power purchase cost in two parts namely Fixed Charges and Variable Charges. The Commission projects the fixed charges for power procured from the Central Generating Stations on the basis of the Annual Fixed Charges of the Central Generating Stations approved by the CERC and the percentage allocation of PSPCL in these central generating stations. The Commission projects the Variable Charges for power procured from the Central Generating Stations on the basis of the bills of September month of the previous year. As the fuel price varies due to various reasons, it is suggested that the variable charges of the power purchase from central generating stations may be projected on the basis of the variable cost for last three or six months so as to capture the recent trend. Further, it is suggested to consider average of three months or six months actual fuel prices to average out the impact of adjustments etc., while projecting cost of generation for state generating stations. This will help in reducing the variations in the power purchase cost.
Further, it is suggested that in case the Petition filed by any of Central Generating Stations is pending with CERC for approval of tariff based on new Regulations, PSPCL while projecting the power purchase cost may consider certain percentage of tariff increase sought by CGS on provisional basis while projecting the power purchase cost to avoid the variation in power purchase cost.
viii. Methodology of historical trends for projecting Energy Sales
The methodology of past trends or historical trends i.e., 3 years CAGR appears to be appropriate for categories such as Domestic, Non Residential, Small Power, Public

Report on Study on power purchase/sale for PSPCL for FY 2010-11 to FY 2012-13 Page | 155
Lighting and Bulk Supply. However, it is suggested that for projecting sales variation in other variables such as number of consumers (Domestic Category), connected load, specific consumption (Domestic Category) and load factor may also be analysed as their growth may depend upon different factors and the quantum of impact is different on these variables to improve the projections of energy sales.
ix. Consistency in Information While carrying out the analysis of variation in sales, it is observed that at certain instances the data submitted by PSPCL in one submission is different than the other submission. One such variation is observed in actual metered energy sales for FY 2010-11 as submitted by PSPCL in the ARR Petition for FY 2010-11 and as submitted towards reconciliation of annual sales with metered sales. The other data mis-match is observed in actual connected load figure for FY 2010-11 as submitted in ARR Petition and as per statistical information. It is suggested that uniformity of the data for submission to the Commission shall be maintained so that this types of mis-matches in actual audited data can be avoided.
x. Methodology to Project Generation and Availability from: a) Central Generating Stations b) State Generating Stations c) New Generating Stations
It is observed during the analysis that the PSPCL projects the availability of power from the central generating stations on the basis of average of energy received in the last three years. This approach appears to be appropriate as it takes care of the latest trends of actual generation. However it is suggested that the following additional aspects may also be considered while projecting the energy available from the existing Central Generating Stations:
• Analysis of Actual Generation by the station during the last three years as the energy received by PSPCL during the last 3 years also includes the impact of less scheduling of power by PSPCL at some instances by applying merit order dispatch.
• Details of major outages due to Renovation & Modernisation may be factored while projecting the quantum of energy available from these stations.

Report on Study on power purchase/sale for PSPCL for FY 2010-11 to FY 2012-13 Page | 156
The projections for availability and PLF made by the Commission for the State Generating Stations appear to be on a higher side as the actual availability and PLF for the last few years had continuously been on the lower side than the values projected by the Commission. It is therefore recommended that the projections for availability and PLF of the State Generating Stations may be made considering the actual generation during last 3 years in addition to planned maintenance schedules. This kind of projection will help in reducing variations in the power purchase quantum from short term sources. As far as New Generating Stations are concerned, it is recommended to consider the availability of power from these stations on the basis of the actual current status of the project as well as the realistic date of Commercial Operation rather than considering the Scheduled date of Commercial Operation. It is suggested that PSPCL may directly ask the Generators about the likely Commercial Operation Date for new Generating stations and the same can be further cross-checked with the information available with CEA on progress of new projects. This will allow PSPCL to plan for purchase of deficit power which if known before hand can be better planned through other sources.
xi. Station Wise daily generation data The Commission may ask PSPCL to submit the details of Station wise daily generation data from its own generating stations including hydro stations to the Commission on regular basis. xii. Demand fluctuation on account of shifting of large consumers from PSPCL to
Open Access and Vice-Versa. At present the large consumers of PSPCL having demand in excess of 1 MW can procure power through Open Access sources depending upon the availability of cheaper power in the market. Currently these consumers who have opted for Open Access enjoy grid back up support without paying any additional charges to PSPCL. The frequent shifting of these consumers from PSPCL to Open Access and vice versa results in demand fluctuation of PSPCL and also results in stranded capacity as observed in FY 2011-12 which in turn makes it difficult to project the actual power purchase requirement as the sales keeps on fluctuating year to year. This has both financial and operational implications on PSPCL.

Report on Study on power purchase/sale for PSPCL for FY 2010-11 to FY 2012-13 Page | 157
As of now the tariff structure followed in the State of Punjab is Single Part Tariff structure. Most of the States had already adopted the Two Part Tariff Structure which involves separate fixed and variable cost for the consumers. It is therefore suggested that based on the results of the mock trial/parallel run, the Commission may approve the Two Part specifying Demand Charges and Energy Charges for large industrial consumers so that even when the large industrial consumers are drawing power under Open Access, they will be paying the Demand Charges.
xiii. Recommendations regarding additional UI For days wherein additional UI is paid by PSPCL, the same shall be documented with appropriate justification with circumstances leading to such over-drawal. The Commission may ask PSPCL to submit month wise compilation of such instances on monthly basis.
xiv. Recommendations regarding transparency in Power Purchase Procurement Further, in order to bring in more transparency in the power purchase procurement, it is suggested that the Commission may ask PSPCL to prepare the following daily and monthly reports and submit the same to the Commission on regular basis.
Daily Reports (i) Station wise daily generation data from its own generating stations including
hydro stations. (ii) Final Drawal Schedule (Day ahead scheduling) submitted to NRLDC from Inter
State Generating Stations (ISGS). (iii) Instances wherein State Generating Stations were Backed Down with reasons
leading to such backing down. (iv) Instances wherein low cost Central Generating Stations were Backed Down (not
as per merit Order) with justification along with circumstances leading to backing down.
(v) Quantum and Cost of short term power purchase (vi) Hourly Load shedding along with the reasons for the same. Monthly Reports (i) Daily Time block wise UI Injection/Drawl for the previous month including
following details:
• Time block wise UI Drawal both in units and Amount • Time block wise UI Injection both in units and Amount

Report on Study on power purchase/sale for PSPCL for FY 2010-11 to FY 2012-13 Page | 158
• Time block wise Additional UI paid including reasons for same • Time block wise load shedding carried out, if any
(ii) Monthly Power Purchase plan versus actual power purchase done with reasons
for variations in quantum and cost.
(B). Recommendations that can be implemented within 6-12 months
i. Time of Day Tariff
The Commission in its Tariff Order for FY 2013-14 has approved the proposal of implementation of Time of Day Tariff.
As the Commission has approved the proposal of implementing Time of Day Tariff, the same shall also have a bearing on the consumption pattern and therefore the same needs to be analysed for projecting the sales. In this regard, PSPCL may be given appropriate direction to monitor the changes in the consumption pattern on account of introduction of this ToD tariff on sample basis which can be factored in while projecting the sales.
ii. Tele-metered and SEM data
It is observed that one of the reasons cited for not so accurate decision making with regards to power purchase and scheduling was the variation in reading of tele-metered data and SEM data. Tele-metered data not matching with SEM data has resulted into improper decision making and therefore it is recommended that whenever such variation in tele-metered data and SEM data is observed the same shall be properly documented along with steps taken to improve the tele-metered reading so that the variations are minimised. Such reports may be asked to be submitted to the Commission on monthly basis.