report on price policy for kharif crops - Commission for ...
114
COMMISSION FOR AGRICULTURAL COSTS AND PRICES REPORT ON PRICE POLICY FOR KHARIF CROPS OF 2007-2008 SEASON SUMMARY OF RECOMMENDATIONS In this report, the Commission for Agricultural Costs and Prices presents its views on the Price Policy for Kharif Crops of 2007-2008 Season. The Commission recommends that the minimum support prices for the kharif crops of 2007-2008 season be fixed at the following levels: Commodity Variety Quality Minimum Support Price (Rs per quintal) Paddy Common FAQ 645 Grade-A " 675 Basmati “ 1120 Jowar Hybrid - " 600 Maldandi - " 620 Bajra - " 600 Maize - " 620 Ragi - " 600 Tur (Arhar) - " 1550 Moong - " 1700 Urad - " 1700 Groundnut-in-shell - " 1550 Soyabean Black " 910 Yellow " 1050 Sunflowerseed - " 1510 Sesamum - " 1580 Nigerseed - " 1240 Cotton (Kapas) Medium Staple Length " 1800 Long Staple Length " 2030 VFC Tobacco Black soil F 2 grade " 3400 Light soil L 2 grade " 3600 (Para 4.8) ----------------------------------------------------------------------------------------------------------------
-
Upload
khangminh22 -
Category
Documents
-
view
2 -
download
0
Transcript of report on price policy for kharif crops - Commission for ...
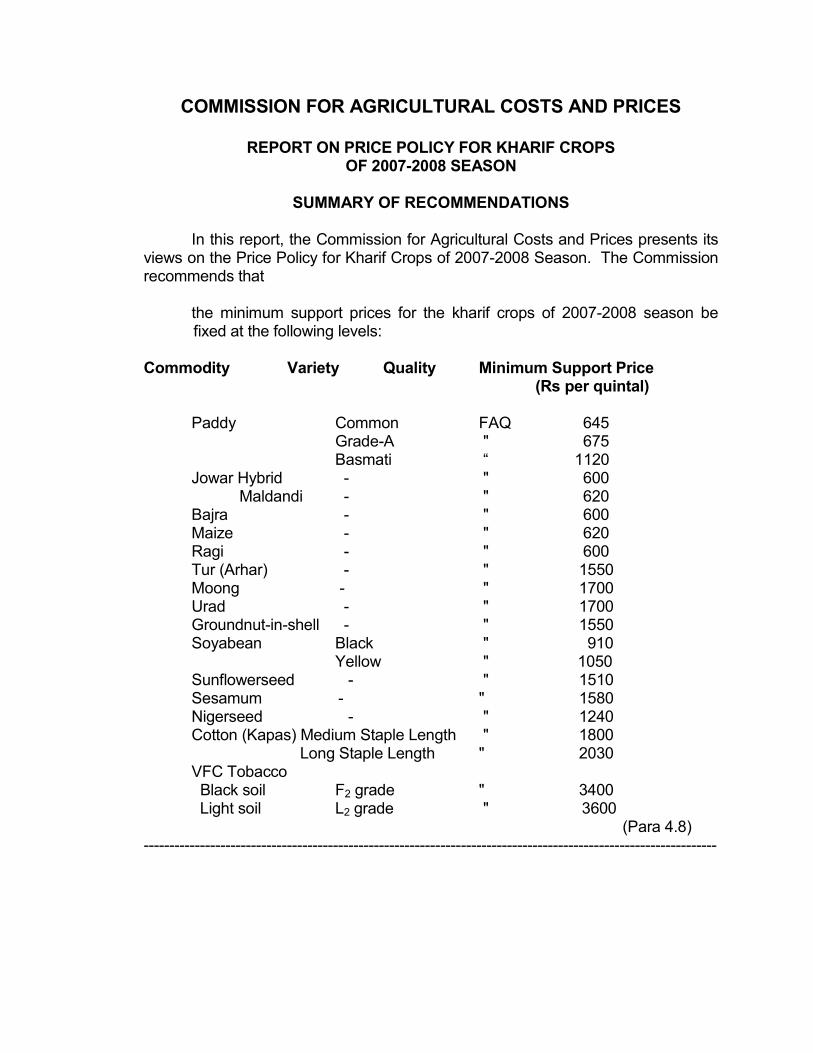
COMMISSION FOR AGRICULTURAL COSTS AND PRICES REPORT ON PRICE POLICY FOR KHARIF CROPS OF 2007-2008 SEASON SUMMARY OF RECOMMENDATIONS In this report, the Commission for Agricultural Costs and Prices presents its views on the Price Policy for Kharif Crops of 2007-2008 Season. The Commission recommends that the minimum support prices for the kharif crops of 2007-2008 season be
fixed at the following levels: Commodity Variety Quality Minimum Support Price (Rs per quintal) Paddy Common FAQ 645 Grade-A " 675 Basmati “ 1120 Jowar Hybrid - " 600 Maldandi - " 620 Bajra - " 600 Maize - " 620 Ragi - " 600 Tur (Arhar) - " 1550 Moong - " 1700 Urad - " 1700 Groundnut-in-shell - " 1550 Soyabean Black " 910 Yellow " 1050 Sunflowerseed - " 1510 Sesamum - " 1580 Nigerseed - " 1240 Cotton (Kapas) Medium Staple Length " 1800 Long Staple Length " 2030 VFC Tobacco Black soil F2 grade " 3400 Light soil L2 grade " 3600 (Para 4.8) ----------------------------------------------------------------------------------------------------------------
2
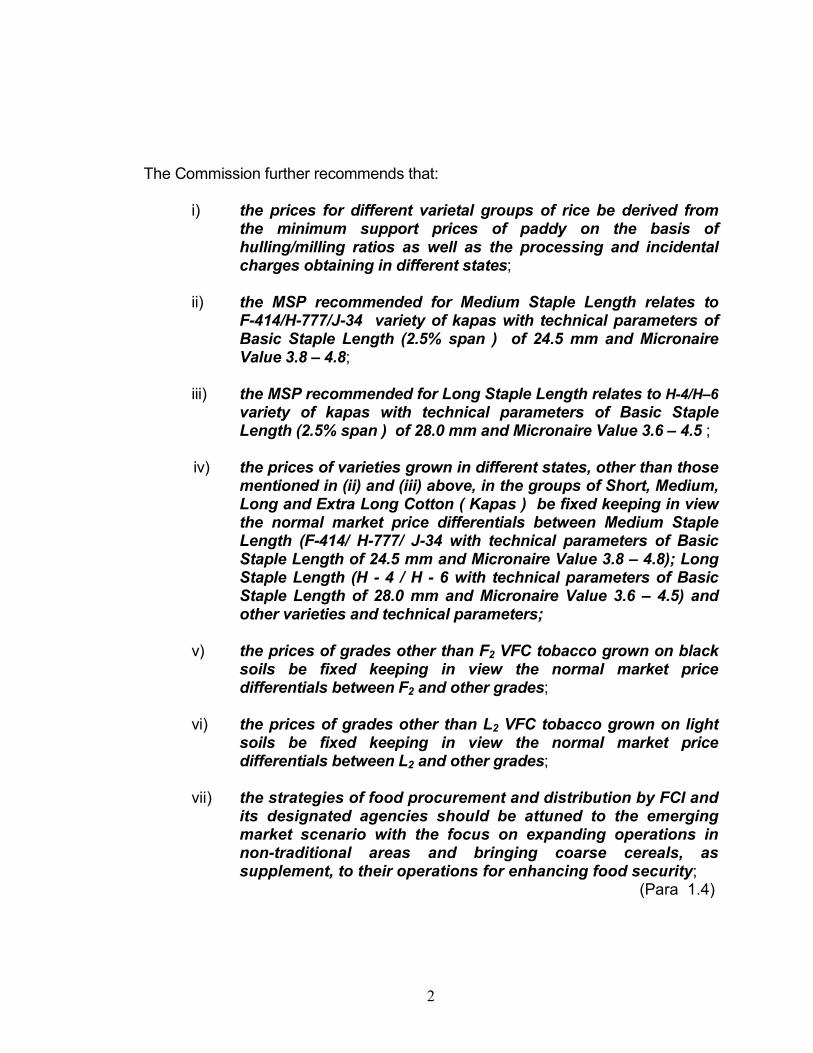
The Commission further recommends that: i) the prices for different varietal groups of rice be derived from
the minimum support prices of paddy on the basis of hulling/milling ratios as well as the processing and incidental charges obtaining in different states;
ii) the MSP recommended for Medium Staple Length relates to
F-414/H-777/J-34 variety of kapas with technical parameters of Basic Staple Length (2.5% span ) of 24.5 mm and Micronaire Value 3.8 – 4.8;
iii) the MSP recommended for Long Staple Length relates to H-4/H–6
variety of kapas with technical parameters of Basic Staple Length (2.5% span ) of 28.0 mm and Micronaire Value 3.6 – 4.5 ;
iv) the prices of varieties grown in different states, other than those
mentioned in (ii) and (iii) above, in the groups of Short, Medium, Long and Extra Long Cotton ( Kapas ) be fixed keeping in view the normal market price differentials between Medium Staple Length (F-414/ H-777/ J-34 with technical parameters of Basic Staple Length of 24.5 mm and Micronaire Value 3.8 – 4.8); Long Staple Length (H - 4 / H - 6 with technical parameters of Basic Staple Length of 28.0 mm and Micronaire Value 3.6 – 4.5) and other varieties and technical parameters;
v) the prices of grades other than F2 VFC tobacco grown on black
soils be fixed keeping in view the normal market price differentials between F2 and other grades;
vi) the prices of grades other than L2 VFC tobacco grown on light
soils be fixed keeping in view the normal market price differentials between L2 and other grades;
vii) the strategies of food procurement and distribution by FCI and
its designated agencies should be attuned to the emerging market scenario with the focus on expanding operations in non-traditional areas and bringing coarse cereals, as supplement, to their operations for enhancing food security; (Para 1.4)

3
viii) Government should step up public investment and credit disbursement to agriculture substantially, along with measures for improvement in resource use efficiency;
(Para 1.10)
ix) the present system of product based subsidy should be replaced by nutrient based subsidy for motivating the farmers to apply various macro and micro nutrients in a balanced manner. Besides, irrigation rates and irrigation subsidy should be fixed in such a manner that the farmers are induced to use scarce resource, like water, rationally and efficiently; (Para 1.11)
x) Government should promote public-private partnership for providing personalized guidance to farmers for integrated pest management, which is so crucial for sustainable agriculture, improvement in farmers’ income and environment protection; (Para 1.12)
xi) Government should set up an independent plant quarantine authority with adequate autonomy and resources to meet the growing challenges of bio-security in the wake of trade liberalization; (Para 1.13)
xii) all states must be considered on equal traction while implementing relaxations in quality norms on grounds of fairness and equity; (Para 2.4)
xiii) Government should address the issues of dissimilarity in taxes, levies, marketing laws and movement of grains among states to create a single market for agricultural produce in the country; (Para 2.5)
xiv) the Department of Food and Public Distribution should make a state-wise evaluation of the working of decentralized procurement for removal of operational hitches and smoothening the procurement operations; (Para 2.11)
xv) Government may consider announcing separate MSP for
basmati paddy with proper geographical indications in addition to MSPs for Common and Grade ‘A’ varieties of Paddy and accordingly put in place a system to defend the same in the market; (Para 2.13)
4
xvi) Government should review the existing procurement/price support operations of oilseeds and make proper marketing arrangements to ensure that the oilseeds crop of the farmers is fully protected against price uncertainty; (Para 2.77)
xvii) Government should formulate an appropriate strategy to
exploit the available potential of vegetable oils from secondary sources to augment net availability of edible oils in the country; (Para 2.89)
xviii) the Technology Mission on Oilseeds & Pulses should examine the suggestion of the oil industry to declare cultivation of oil palm as plantation and allow the public and private enterprises to enter in this field and make suitable recommendations to the Government in this regard; (Para 2.90)
xix) the Directorate of Economics and Statistics in consultation
with the Textile Commissioner should reconcile the production estimates of cotton and a single series of the same be arrived at, with effect from the next kharif season 2007-08; and
(Para 2.108) xx) Government in collaboration with ICAR Institutes should make
serious efforts to raise the domestic production of Extra Long Staple (ELS) cotton both through area expansion under the existing types and by developing new varieties of ELS cotton, so as to increase the income of farming communities and to achieve self-sufficiency. (Para 2.115)
5
I. An Overview During the year 2006-07, the performance of Indian agriculture was largely
influenced, among other factors, by the variations of monsoon around its long-
term trend. The rainfall during the 2006 South-West monsoon season (June 1 to
September 30) turned out to be close to normal, with the area weighted rainfall
during the period for the country being 99 per cent of long-period average (LPA),
although the distribution of rainfall was uneven over time and space. The initial
phase of deficiency of rainfall witnessed from the beginning of second week of
June and up to July, 2006 and again in mid-September was offset by excess
rainfall during the first three weeks of August, especially over Central India. The
uneven distribution of the rainfall during South-West monsoon of 2006 adversely
affected North-East India, North-West India and South Peninsula. Of the 36
meteorological sub-divisions in the country, monsoon rainfall was normal in 20,
excess in 6 and deficient in the remaining 10 sub-divisions. Furthermore, it led to
improvement in reservoir position at the end of the South-West monsoon season
with total live water storage at 91 per cent of the Full Reservoir Level (FRL),
which was higher than the last year’s position (81 per cent). The storage level at
the end of September, 2006 was quite favourable for rabi crops. Cumulative
rainfall during the North-East monsoon (October 1, 2006 to December 31, 2006)
was, however, 21 per cent below normal as compared with 10 per cent above
normal during the corresponding period of the previous year. Of the 36
meteorological sub-divisions, cumulative rainfall was deficient/ scanty/ no rain in
27 sub-divisions (19 sub-divisions during last year). As on January 4, 2007, the
total live water storage was 66 per cent (same as last year) of the FRL.
1.2 In view of the uneven rainfall during the South-West monsoon season, the
area coverage under kharif crops in 2006 season was around 1.9 per cent lower
than a year ago, mainly on account of shortfalls in the case of rice, coarse
cereals and oilseeds. In contrast, area sown under rabi crops so far (up to
January 5, 2007) has been about 3.4 per cent higher than a year ago. The higher
sowing under rabi crops was mainly on account of increase in area covered
6
under wheat, pulses and coarse cereals, which more than offset some decline in
area under oilseeds.
1.3 According to the Second Advance Estimates of Directorate of Economics
& Statistics (DE&S), total foodgrains production during 2006-07 is estimated at
209.2 million tonnes, marginally higher than 208.6 million tonnes in the previous
year. The total kharif foodgrains production during 2006-07, estimated at 107.2
million tonnes will be 2.5 per cent lower than 109.9 million tonnes achieved in
2005-06, mainly on account of the likely shortfalls in the production of rice (2.0
per cent) and coarse cereals (6.0 per cent). As against this, rabi foodgrains in
2006-07 is expected to record an increase of 3.3 per cent to 102.0 miilion tonnes
in 2006-07 from 98.7 million tonnes in 2005-06, largely on account of the
anticipated increase of 4.5 per cent in wheat producton from 69.4 million tonnes
in 2005-06 to 72.5 million tonnes in 2006-07. The area sown under wheat (up to
January 5, 2007) is reported to be 6.8 per cent higher than that during the
corresponding period in 2005-06. However, the production of wheat estimated
at 72.5 million tonnes would still be much less than the earlier record production
of 76.4 million tonnes in 1999-00, with an average yield of 27.8 quintals per
hectare. Similarly, the estimated production of 90.1 million tonnes of rice in
2006-07 remains below the level of rice production of 93.3 million tonnes
achieved in 2001-02. The production of pulses estimated at 14.52 million tonnes
in 2006-07 would be lower than what the country achieved in 1998-99 and 2003-
04 by producing 14.9 million tonnes of total pulses. Thus, increasing foodgrains
production in a stable manner is still a matter of concern. During 1995-96 to
2005-06, the average annual growth rate of foodgrains production was only 0.66
per cent, while the population growth rate was estimated at about 1.9 per cent.
In the case of commercial crops, production of sugarcane is estimated to go up
to 315.5 million tonnes during 2006-07, compared with 281.2 million tonnes in
2005-06. The production of cotton estimated at 209.6 lakh bales (the highest so
far) in 2006-07 would be higher by 13.3 per cent over the 185 lakh bales
produced in 2005-06. Production of jute and mesta is also expected to be higher
7
during 2006-07. Production of nine oilseeds, on the other hand, is likely to
decline by 15.7 per cent to 23.6 million tonnes from 28.0 million tonnes in the
previous year, mainly reflecting a 45 per cent decline in groundnut production
and over 6 per cent fall in the production of rapeseed & mustard.
1.4 The procurement of foodgrains (rice and wheat) during 2006-07 (up to
March 06, 2007) at 28.8 million tonnes was 18 per cent lower than that in the
corresponding period of the preceding year on account of decline in procurement
of wheat from 14.8 million tonnes to 9.2 million tonnes. The offtake of rice and
wheat during the first nine months of 2006-07 (April to December , 2006) at 26.4
million tonnes was also lower by 15.3 per cent over the offtake during the
corresponding period of the previous year, mainly due to a fall in the offtake
under Other Welfare Schemes (OWS). In view of lower procurement, the total
stock of foodgrains with the Food Corporation of India (FCI) and other
Government agencies declined to 17.8 milliion tonnes as on January 1st, 2007
from 19.3 million tonnes a year ago, reflecting declines in the stocks of wheat to
5.7 million tonnes from 6.2 million tonnes, that of rice by 0.66 million tonnes and
other foodgrains by 0.34 million tonnes. While the stocks of wheat were lower
than the buffer stock norm of 8.2 million tonnes, those of rice exceeded the
buffer norm of 11.8 million tonnes. The depletion in stock, viewed in the context
of lower offtake, raised concern about the food security of the country. This led
the Government to resort to imports of wheat to stem the rise in market prices of
wheat, especially when the wholesale market breached the psychological barrier
of Rs 10,000 per tonne. Apart from the fact that the MSP of wheat being much
lower than the price offered by some major private players in the market, the
procurement mechanism of the official agencies tends to be largely confined to
operations to traditional procurement areas. Spreading their reach to non-
traditional areas could bring additional wheat to the stocks, besides extending the
price benefit to wheat farmers in those areas. Further, while there have been
some positive developments, the scope of procurement and distribution of coarse
cereals under PDS and other welfare schemes as options for maintaining the
8
food security, still remains largely unexplored. The Commission, therefore,
reiterates its earlier recommendation that the strategies of food procurement
and distribution by FCI and its designated agencies should be attuned to
the emerging market scenario with the focus on expanding operations in
non-traditional areas and bringing coarse cereals, as supplement, to their
operations for enhancing food security.
1.5 The declines in the supply of wheat, pulses and edible oils in 2006-07 had
visible impact on prices. The Wholesale Price Index (WPI base 1993-94) for
agricultural commodities and food articles was 203.1 and 209.5 respectively for
the year 2006-07 (Upto January, 2007), increasing by 6.3 per cent and 7.3 per
cent respectively over the previous year, compared with the overall inflation of
5.1 per cent. During 2006-07, there was sharp upward trend set in case of prices
of primary articles, both food articles, and non-food articles. The WPI for January,
2007 at 208.4 was 6.2 per cent higher than the WPI of 196.3 for the
corresponding month in 2006. On a point to point basis, as on 20th January 2007,
primary articles recorded an increase of 9.8 per cent, with food articles rising by
9.3 per cent and non-food articles by 9.8 per cent. The WPI for rice in January,
2007 was higher by only 4.7 per cent, but in the case of wheat, the change in
WPI in January, 2007 over the WPI of January, 2006 was 13.9 per cent. Within
foodgrains, exceptional inflationary trend has erupted in case of pulses. The WPI
of pulses rose to 266 in December, 2006, about 29.3 per cent higher than the
corresponding WPI in December 2005. Such price buoyancy is in sharp contrast
to the subdued price trend that persisted consecutively during the past three
years. The WPI of nine major oilseeds remained generally depressed during
April-October, 2006, but there is a rising trend from November, 2006 onwards. In
the case of cotton lint, the market prices improved significantly in 2006-07. In
fact, the market prices of all varieties of cotton lint were higher in 2006-07 season
compared to 2005-06.
9
1.6 The most prominent feature of the global food and feed markets in 2006
has been the surge in the prices of cereals, in particular wheat and maize, which,
by November, had reached levels not seen for a decade. A sharp drop in world
wheat production in 2006, driven by lower outputs in nearly all major exporting
countries, has resulted in one of the tightest periods for world supply and
demand of wheat in more than two decades. As of mid-November, FAO’s latest
forecast of world output of wheat in 2006 stands at roughly 592 million tonnes,
almost 33 million tonnes, or 5.3 per cent, down from 2005. The production short-
falls in 2006 in many parts of the world are expected to result in a large
drawdown of world wheat inventories to their lowest level since the early 1980s.
Global wheat stocks for crop year ending in 2007 are currently forecast to fall to
around 147 million tonnes, nearly 28 million tonnes, or 16 per cent, below their
opening levels. The volatile but rising prices in October 2006 were followed by
more subdued price movements in early November 2006, before rising again
towards the end of the month. In November, the United States’ hard wheat export
price averaged US$219, up over US$52, or 31 per cent, from the previous year.
Given the reported increases in winter wheat plantings and favourable growing
conditions to date, world wheat production in 2007 is likely to recover, which
would improve supply and contribute to lowering price levels later this season
and into the next. Assuming 1995 as the base, the index of international wheat
price rose from 86.1 in 2005 to 108.3 in 2006, while that of rice increased from
89.7 in 2005 to 94.6 in 2006. The index of international maize prices also
increased from 79.7 in 2005 to 98.5 in 2006. The indices of cotton and
groundnut prices increased marginally from 56.1 in 2005 to 59.1 in 2006 and
from 94.2 in 2005 to 101.5 in 2006 respectively. But the index of international
prices of sunflower oil dropped from 181.2 in 2005 to 112.9 in 2006, while that of
soyabean oil improved from 84.8 in 2005 to 94.3 in 2006 (International Monetary
Fund).
1.7 A series of setbacks, in the form of typhoons, drought, flooding, diseases
and insect attacks, have marred prospects for rice crops in 2006. So virtually no
10
growth in global production is anticipated in 2006. Early indications on 2007
crops in the southern hemisphere countries are also negative. Although the
arrival of supplies from newly harvested crops could bring some respite to high
world prices, this is likely to be only temporary, and an expected tightening of the
global supply and demand portends a continuation of relatively firm rice prices
into 2007.
1.8 World markets for coarse grains are experiencing an exceptionally volatile
period as a result of a sharp decline in world production and a tightening of
supplies in the United States, the world’s largest producer and exporter. This
season’s decline in production coincides with a more rapid expansion in demand
for industrial use, ethanol in particular. Against this background, global stocks by
the end of the 2007 seasons are likely to be drawn down significantly, fuelling
price volatility and increases across the board. Looking ahead, the current strong
prices are likely to encourage higher plantings and result in larger production in
2007 compared with 2006.
1.9 Growth in global oilseeds production is forecast to slow down considerably
in 2006/07 due to declines in rapeseed, groundnut and sunflower production in
key producing countries as well as lower increase of soybean output in Latin
America. During 2006/07, the oilseed sector is expected to be increasingly
affected by expectations for oilseed and cereal crops in the subsequent 2007/08
season. The tightness currently observed in feed grain markets could lead to
lower plantings and higher prices in the oilseed sector.
1.10 In view of large imbalances in the overall domestic as well as international
demand-supply situation of many agricultural commodities, it is important that
Government of India prepares a clear road map of agricultural development,
outlining the strategies for accelerated growth of food production, agricultural
diversification and poverty reduction in the country. It is indeed gratifying to note
that the Central Government Budget Proposal for the Year 2007-08 announced
11
an increase in the central plan outlay for agriculture and allied sector from
Rs.7391 crore last year to Rs.8558 crore this year. Besides, the target for credit
disbursement to agriculture has been enhanced to Rs.2,25,000 crore which may
help increase private investment in agriculture. However, in view of the present
low investment - GDP ratio and high incremental capital - output ratio, it would be
necessary to raise the level of public investment and credit disbursement to
agriculture substantially, especially for achieving the targeted 4 per cent annual
growth rate in agriculture. Moreover, improvement in resource use efficiency at
both government and farm levels would be crucial for producing agricultural
commodity in a cost effective manner. The Commission recommends that
Government should step up public investment and credit disbursement to
agriculture substantially, along with measures for improvement in resource
use efficiency.
1.11 The role of appropriate fertilizer pricing and subsidy has been well
documented in the report of the Task Force on Balanced Use of Fertilizers,
Ministry of Agriculture, Government of India. The existing policy of
material/product based fertilizer subsidy is not at all conducive for balanced use
of nutrients. Therefore, the Commission recommends that the present system
of product based subsidy should be replaced by nutrient based subsidy for
motivating the farmers to apply various macro and micro nutrients in a
balanced manner. Besides, irrigation rates and irrigation subsidy should
be fixed in such a manner that the farmers are induced to use scarce
resource, like water, rationally and efficiently.
1.12 Integrated pest management is another area which requires immediate
attention of the Government. In recent years, injudicious and indiscriminate use
of chemical fertilizers has caused several ill-effects like development of
resistance in pests, resurgence in pests, pesticides residue in food products,
environment pollution etc. Hence promotion of integrated pest management
would be crucial for sustainable agriculture. In fact, judicious use of pesticides
12
would reduce the cost of pesticides and improve farmers’ income. It is, however,
felt that the public sector extension system cannot provide a personalized
advisory service required to promote integrated pest management. The
involvement of private sector, especially in the application of information and
communication technology will be necessary. Therefore, the Commission
recommends that Government should promote public-private partnership for
providing personalized guidance to farmers for integrated pest
management, which is so crucial for sustainable agriculture, improvement
in farmers’ income and environment protection.
1.13 Moreover, in the wake of WTO, application of sanitary and phyto-sanitary
measures based on scientific criteria has assumed great significance, because
there is a growing danger of entry of invasive pests through increased
international trade. In fact, coffee berry borer, eriophyid mite of coconut, lantana
and parthenium weeds are some of the examples of accidental entry of invasive
species due to inadequate quarantine surveillance. The present quarantine
system is highly ill-equipped to tackle these challenges and does not have the
necessary autonomy and resources at its command. The Commission
recommends that Government should set up an independent plant
quarantine authority with adequate autonomy and resources to meet the
growing challenges of bio-security in the wake of trade liberalization.
II . PRICE SUPPORT OPERATIONS, CROP SITUATION, MARKET BEHAVIOUR, PROCUREMENT, DISTRIBUTION AND STOCKS
Minimum Support Price
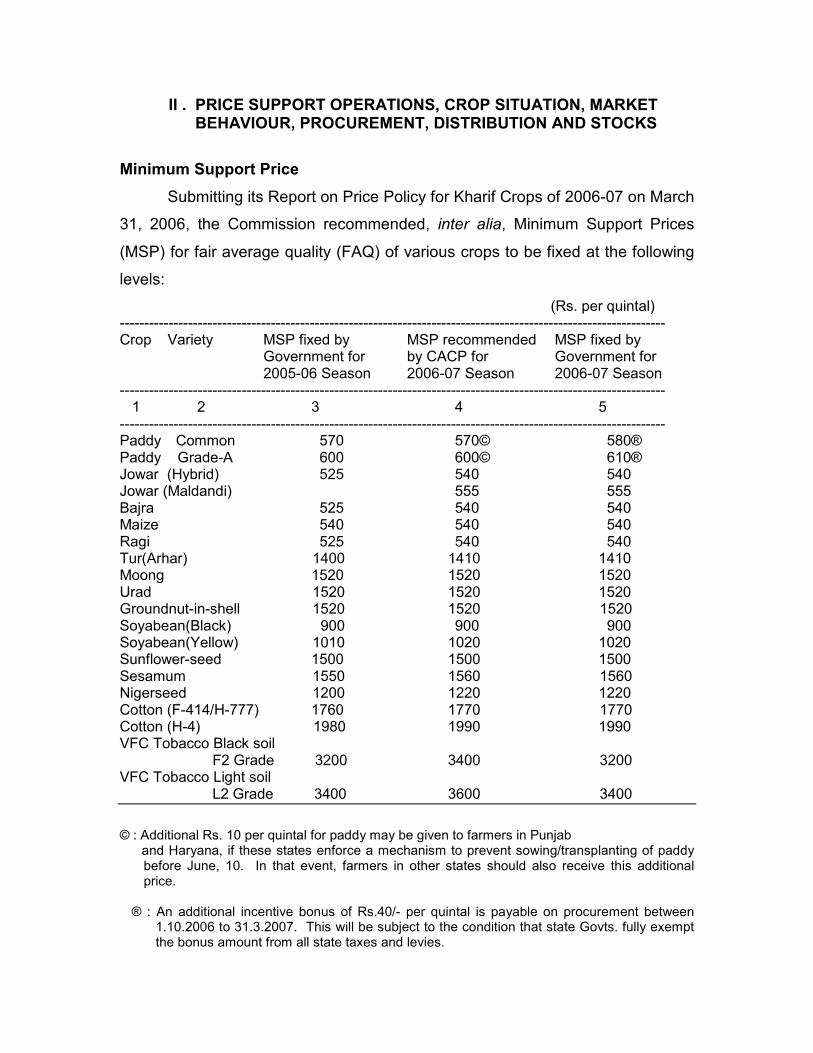
Submitting its Report on Price Policy for Kharif Crops of 2006-07 on March
31, 2006, the Commission recommended, inter alia, Minimum Support Prices
(MSP) for fair average quality (FAQ) of various crops to be fixed at the following
levels:
(Rs. per quintal) ---------------------------------------------------------------------------------------------------------------- Crop Variety MSP fixed by MSP recommended MSP fixed by Government for by CACP for Government for 2005-06 Season 2006-07 Season 2006-07 Season ---------------------------------------------------------------------------------------------------------------- 1 2 3 4 5 ---------------------------------------------------------------------------------------------------------------- Paddy Common 570 570© 580® Paddy Grade-A 600 600© 610® Jowar (Hybrid) 525 540 540 Jowar (Maldandi) 555 555 Bajra 525 540 540 Maize 540 540 540 Ragi 525 540 540 Tur(Arhar) 1400 1410 1410 Moong 1520 1520 1520 Urad 1520 1520 1520 Groundnut-in-shell 1520 1520 1520 Soyabean(Black) 900 900 900 Soyabean(Yellow) 1010 1020 1020 Sunflower-seed 1500 1500 1500 Sesamum 1550 1560 1560 Nigerseed 1200 1220 1220 Cotton (F-414/H-777) 1760 1770 1770 Cotton (H-4) 1980 1990 1990 VFC Tobacco Black soil F2 Grade 3200 3400 3200 VFC Tobacco Light soil L2 Grade 3400 3600 3400
© : Additional Rs. 10 per quintal for paddy may be given to farmers in Punjab and Haryana, if these states enforce a mechanism to prevent sowing/transplanting of paddy
before June, 10. In that event, farmers in other states should also receive this additional price.
® : An additional incentive bonus of Rs.40/- per quintal is payable on procurement between
1.10.2006 to 31.3.2007. This will be subject to the condition that state Govts. fully exempt the bonus amount from all state taxes and levies.
10
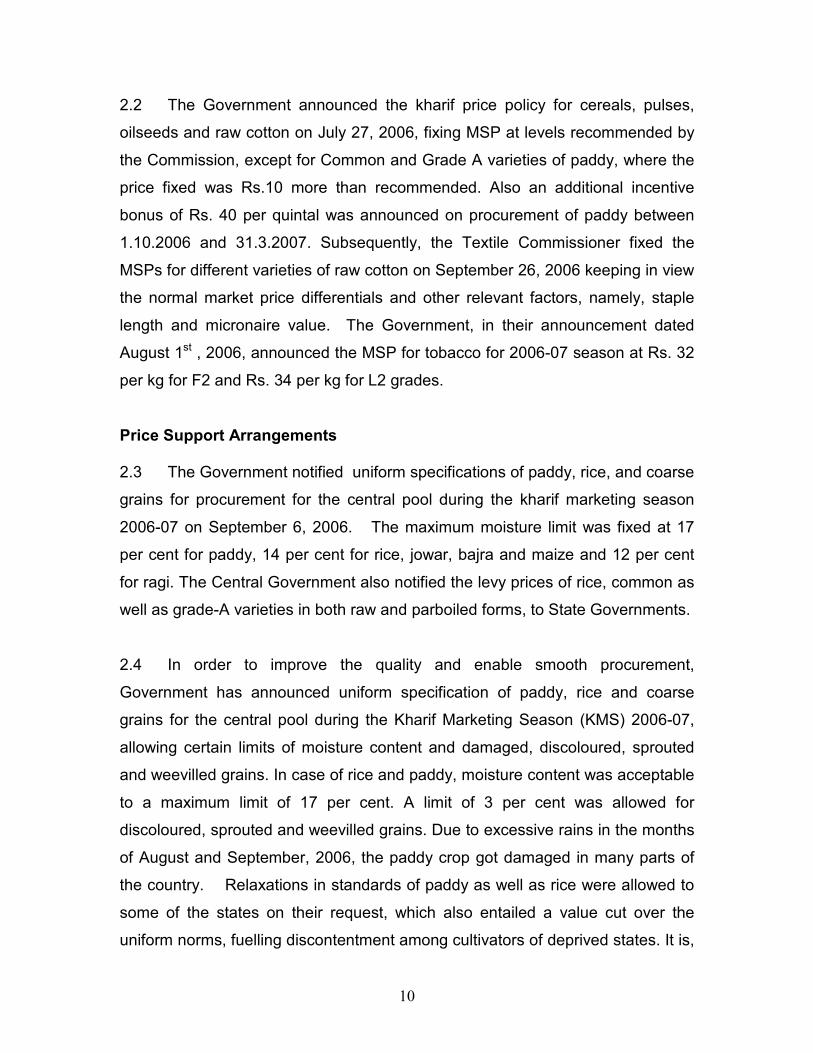
2.2 The Government announced the kharif price policy for cereals, pulses,
oilseeds and raw cotton on July 27, 2006, fixing MSP at levels recommended by
the Commission, except for Common and Grade A varieties of paddy, where the
price fixed was Rs.10 more than recommended. Also an additional incentive
bonus of Rs. 40 per quintal was announced on procurement of paddy between
1.10.2006 and 31.3.2007. Subsequently, the Textile Commissioner fixed the
MSPs for different varieties of raw cotton on September 26, 2006 keeping in view
the normal market price differentials and other relevant factors, namely, staple
length and micronaire value. The Government, in their announcement dated
August 1st , 2006, announced the MSP for tobacco for 2006-07 season at Rs. 32
per kg for F2 and Rs. 34 per kg for L2 grades.
Price Support Arrangements
2.3 The Government notified uniform specifications of paddy, rice, and coarse
grains for procurement for the central pool during the kharif marketing season
2006-07 on September 6, 2006. The maximum moisture limit was fixed at 17
per cent for paddy, 14 per cent for rice, jowar, bajra and maize and 12 per cent
for ragi. The Central Government also notified the levy prices of rice, common as
well as grade-A varieties in both raw and parboiled forms, to State Governments.
2.4 In order to improve the quality and enable smooth procurement,
Government has announced uniform specification of paddy, rice and coarse
grains for the central pool during the Kharif Marketing Season (KMS) 2006-07,
allowing certain limits of moisture content and damaged, discoloured, sprouted
and weevilled grains. In case of rice and paddy, moisture content was acceptable
to a maximum limit of 17 per cent. A limit of 3 per cent was allowed for
discoloured, sprouted and weevilled grains. Due to excessive rains in the months
of August and September, 2006, the paddy crop got damaged in many parts of
the country. Relaxations in standards of paddy as well as rice were allowed to
some of the states on their request, which also entailed a value cut over the
uniform norms, fuelling discontentment among cultivators of deprived states. It is,

11
therefore, pertinent to relax the standards uniformly for all states without
discretion, either as a measure to help farmers or to build up depleting stocks.
The Commission reiterates its earlier recommendation that all states must be
considered on equal traction while implementing relaxations in quality
norms on grounds of fairness and equity.
2.5 The promulgation of the Central Government’s order ‘Removal of
Licensing Requirements, Stock Limits and Movement Restrictions on Special
Foodstuff Order, 2002’, dated 15th February, 2002 has allowed dealers to freely
buy, use or consume, stock, sell, transport, distribute, dispose any quantity of
paddy/rice, wheat, coarse grains, sugar, edible oilseeds and edible oils without
requiring any permit or licence. Although removing restrictions has facilitated
free movement of agricultural commodities, it has helped farmers only to a limited
extent because marketing bye-laws in many states still require such commodities
to be channellised through designated mandies. Besides, state governments like
Punjab, Haryana and Andhra Pradesh impose various charges and taxes, which
get added to the procurement cost and are reimbursed by the Central
Government. The Commission, therefore, recommends that Government
should address the issues of dissimilarity in taxes, levies, marketing laws
and movement of grains among states to create a single market for
agricultural produce in the country.
Rice*
2.6 According to the Second Advance Estimates (05/02/2007) released by the
Directorate of Economics and Statistics (DES), the production of rice estimated
at 90.13 million tonnes during 2006-07 is likely to show a significant increase of
2.27 million tonnes over the Second Advance Estimates of previous year’s
production of 87.86 million tonnes; but it marks a sizeable decline of 3.21 million
tonnes against the record production of 93.34 million tonnes achieved in 2001-
* This section is focused on rice. However, for a comprehensive view of the food grains situation, wheat
situation is also discussed later in the section
12
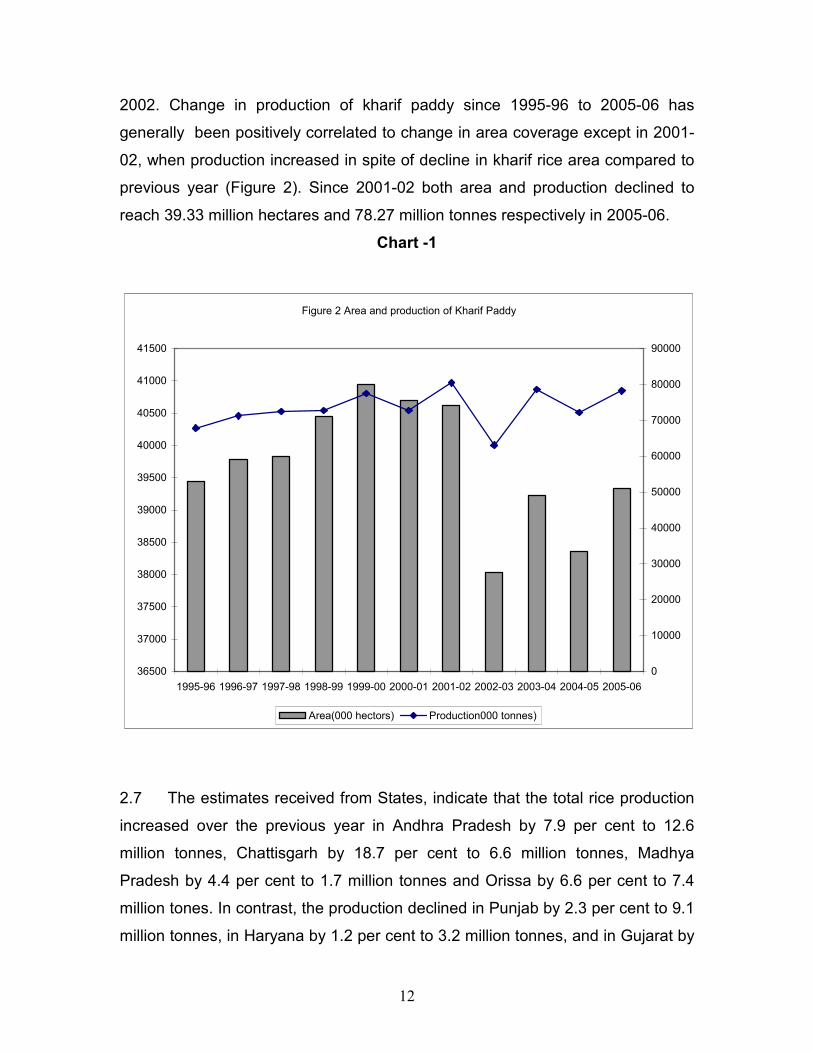
2002. Change in production of kharif paddy since 1995-96 to 2005-06 has
generally been positively correlated to change in area coverage except in 2001-
02, when production increased in spite of decline in kharif rice area compared to
previous year (Figure 2). Since 2001-02 both area and production declined to
reach 39.33 million hectares and 78.27 million tonnes respectively in 2005-06.
Chart -1
Figure 2 Area and production of Kharif Paddy
36500
37000
37500
38000
38500
39000
39500
40000
40500
41000
41500
1995-96 1996-97 1997-98 1998-99 1999-00 2000-01 2001-02 2002-03 2003-04 2004-05 2005-06
0
10000
20000
30000
40000
50000
60000
70000
80000
90000
Area(000 hectors) Production000 tonnes)
2.7 The estimates received from States, indicate that the total rice production
increased over the previous year in Andhra Pradesh by 7.9 per cent to 12.6
million tonnes, Chattisgarh by 18.7 per cent to 6.6 million tonnes, Madhya
Pradesh by 4.4 per cent to 1.7 million tonnes and Orissa by 6.6 per cent to 7.4
million tones. In contrast, the production declined in Punjab by 2.3 per cent to 9.1
million tonnes, in Haryana by 1.2 per cent to 3.2 million tonnes, and in Gujarat by

13
20.4 per cent to 3.3 million tonnes. Despite regional variations, production at the
aggregate level maintained its long-term growth momentum. The compound
annual growth rate of rice production at All India level was 1.85 per cent of which
acreage expansion accounted for 0.18 per cent and yield enhancement 1.67
per cent per annum during the period between 1985-86 and 2005-06. The
respectable growth over the two decades, however, conceals the sharp
deceleration of growth in the latter half of this period. The growth in production of
rice during 1995-96 to 2005-06 was only 0.98 per cent per annum, largely due to
Stagnation in coverage of area. (Tables 2.2)
2.8 Uneven rainfall and inadequate irrigation facility damage crops both in
the situation of flood and drought. International Rice Research Institute,
Philippines with the help of genetic engineering has developed a flood resistant
rice variety, which enables rice to survive for two weeks in water. University of
Agricultural Science, Bangalore has developed a rice variety termed as “aerobic
rice” that consumes 50 per cent less water than the conventional types and
precludes release of methane. Since it requires less water, it can be grown in
low rainfall areas and can earn carbon credit as it prevents the release of
methane. Production of organic paddy has been successful in Kerala, which
extends yield up to 2.5 tonnes per hectare by using the conventional method.
Once the produce is certified as 100 per cent organic, it would fetch higher price
than the conventional paddy. The system of rice intensification (SRI), now-a-
days, has come as a great boon to farmers, who would be required to apply less
water to the water intensive crops to get better yields. Rice yield has the
potential to increase in the range of 7 to 15 tonnes per hectare, depending upon
the region. The SRI can achieve improvement in yields and factor productivity
by changing some of the plant, soil, water and nutrient management practices. It
promotes greater root growth that is easily verifiable and more soil biological
activity. The system is independent of purchased external inputs like chemical
fertilizers and pesticides. Instead, it increases productivity of land, labour, water
and capital developed to irrigate rice production by capitalizing on existing
genetic potential and by biological processes, particularly in the soil. These
14
improved varieties of paddy cultivation should be further developed and
popularized among farmers for getting better productivity
Market Behaviour, Procurement, Distribution, Stocks, Demand & Supply Balance and Trade.
2.9 The market prices of rice showed an upward trend in 2006-07. The
average index number of wholesale prices of rice for ten months (April 2006-
January, 2007) at 178.9 showed a rise of 2.5 per cent over the corresponding
period of last year. Even so, during the post harvest months, the wholesale
prices of paddy ruled below MSP in many states. For example, against the MSP
of Rs.580 per quintal for common variety, paddy was sold at Rs.555 per quintal
at Bilashpur (Chhattisgarh) in January, 2007, Rs.497, Rs. 489 and Rs. 492 per
quintal at Mysore (Karnataka) during the months November, December,2006 and
January, 2007 respectively and in Katni, Balaghat, Sivani (Madhya Pradesh)
ranging from Rs.425-570 during October,2006. In Lucknow (U.P.) the distress
sale of rice was at Rs.570 as against the MSP of Rs.580/-. As far as defending
the MSP is concerned, several states, which have opted for decentralized
procurement, have not shown the required alertness that was expected from
them once they had formally undertaken the task of handling MSP operations.
(Table 2.14 & Annexure – I)
Procurement
2.10 Procurement of rice, recorded at 19.5 million tonnes during 2006-07 (as on
6th March, 2007), was lower than 20.2 million tonnes procured in the
corresponding period of 2005-06. Maximum procurement of 7.7 million tonnes
was made in Punjab, followed by 2.5 million tonnes in Chattisgarh, 2.4 million
tonnes in Andhra Pradesh, 1.8 million tonnes in Haryana and 2.0 million tonnes
in Uttar Pradesh. In addition, purchases of paddy/rice were also made in Assam,
Bihar, Karnataka, Kerala, Madhya Pradesh, Orissa, Rajasthan, West Bengal,
Maharashra, Tamil Nadu and Uttarakhand. (Table 2.8)
15
2.11 The Government of India took a decision in 1999 to introduce
decentralized procurement of foodgrains. Under this scheme, the designated
States are required to procure, store and also issue foodgrains as per allotment
indicated by the Central Government under PDS. The scheme of decentralized
procurement of foodgrains is presently in vogue in states of Chattisgarh,
Karnataka, Kerala, Orissa, Tamil Nadu, West Bengal, Uttar Pradesh and
Uttarakhand. The perceived advantages of decentralized procurement were that
it would avoid criss-cross movement of grains and minimize cost of transportation.
Besides, it was expected that the state governments would be vigilant in
defending MSP. The quality of procured grains would be suitable for the local
tastes. Barring few exceptions such as Chhattisgarh and Orissa, the operation of
decentralized procurement in the states was generally tardy. The state
governments reported to have experienced that the expenses incurred after
procurement on account of milling, interest payments, handling and
transportation are not reimbursed promptly by the Central Government. The
state governments also do not have adequate storage facilities. The
Commission recommends that the Department of Food and Public
Distribution should make a state-wise evaluation of the working of
decentralized procurement for removal of operational hitches and
smoothening the procurement operations.
2.12 Procurement of paddy is made either in the primary form or through levy
route of rice. Paddy procurement serves a dual purpose. It is a direct support
measure for farmers and the procured grain meets the PDS requirements and
other commitments. A distinction is required between Minimum Support Price
(MSP) and procurement price at which Government buys grains for its buffer
stocking operations and for feeding the public distribution system (PDS). This
means that the market intervention at the MSP may be intended only to prevent
distress sale by farmers, while grain procurement for PDS and various welfare
schemes be on commercial basis.
16
2.13 It has been brought to the notice of the Commission that the existing
framework of safeguarding the interest of farmers for wheat and paddy through
MSP operation is inadequate and is not tuned with emerging trade realities. The
MSP for paddy is currently recommended for two varieties viz. paddy common
and paddy Grade A and that of wheat without varietal specification. The High
Level Committee on Long Term Grain Policy had, however, recommended for
MSP fixation for only one variety of paddy. But it is also a fact that there are
certain broad varietal classifications in respect of both wheat and rice,
commanding differential price in the market on account of their specific demand
both in domestic as well as international markets. However the market prices of
these superior varieties of rice sometimes get depressed, requiring intervention
by the government. Basmati rice generally is grown in distinct cropping
conditions and enjoys a niche market. Farmers growing basmati rice in Haryana
and Jammu & Kashmir reportedly do not get a higher price because of lack of
specific MSP for superfine varieties. Basmati rice takes a longer duration of time
to grow and its cost of production is also higher because of lower yield. Further,
with the growing importance of international trade, the varieties need to be
harmonized with the varietal specification of paddy (rice) for their exports. The
Commission after reviewing the aspect of varietal specifications for MSP of
paddy recommends that the Government may consider announcing separate
MSP for basmati paddy with proper geographical indications in addition to
MSPs for Common and Grade ‘A’ varieties of Paddy and accordingly put in
place a system to defend the same in the market.
Offtake
2.14 Total offtake of foodgrains up to December, 2006 in 2006-07 was 26.39
million tonnes. Of this, the offtake of rice and wheat was 17.82 million tonnes and
8.57 million tonnes respectively. Compared to last year, the offtake of rice was
lower by 0.45 million tonnes and that of wheat was lower by 4.3 million tonnes.
The offtake of rice was 15.0 million tonnes under Targetted Public Distribution
System (TPDS) and 2.8 million tonnes under other schemes. The various
measures taken by the government to manage offtake of foodgrains include:(a)
17
Implementation of foodgrains based Sampoorna Gramin Rojgar Yojana (SGRY);
(b) Allocation of foodgrains under the Food for Work and the special component
of the SGRY programme; (c) Expansion of the scope of Antyodaya Anna Yojana,
so as to cover 2.5 crore families under below poverty line (BPL), (d)
Discontinuation of the practice of permitting export of foodgrains from
government’s stocks, (e) Continuation with open market sale of stocks of wheat
and rice. (Table 2.11)
Stock
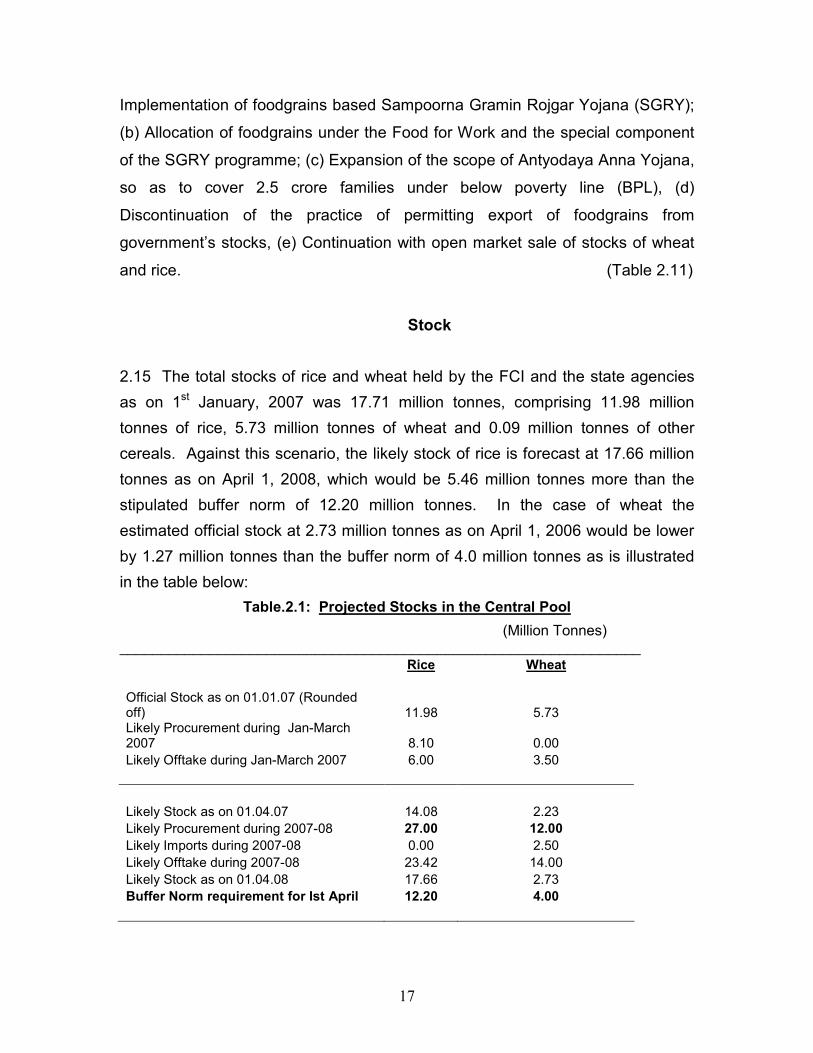
2.15 The total stocks of rice and wheat held by the FCI and the state agencies
as on 1st January, 2007 was 17.71 million tonnes, comprising 11.98 million
tonnes of rice, 5.73 million tonnes of wheat and 0.09 million tonnes of other
cereals. Against this scenario, the likely stock of rice is forecast at 17.66 million
tonnes as on April 1, 2008, which would be 5.46 million tonnes more than the
stipulated buffer norm of 12.20 million tonnes. In the case of wheat the
estimated official stock at 2.73 million tonnes as on April 1, 2006 would be lower
by 1.27 million tonnes than the buffer norm of 4.0 million tonnes as is illustrated
in the table below:
Table.2.1: Projected Stocks in the Central Pool
(Million Tonnes) ________________________________________________________________ Rice Wheat
Official Stock as on 01.01.07 (Rounded off) 11.98 5.73 Likely Procurement during Jan-March 2007 8.10 0.00
Likely Offtake during Jan-March 2007 6.00 3.50
Likely Stock as on 01.04.07 14.08 2.23
Likely Procurement during 2007-08 27.00 12.00
Likely Imports during 2007-08 0.00 2.50
Likely Offtake during 2007-08 23.42 14.00
Likely Stock as on 01.04.08 17.66 2.73
Buffer Norm requirement for Ist April 12.20 4.00
18
Demand and Supply
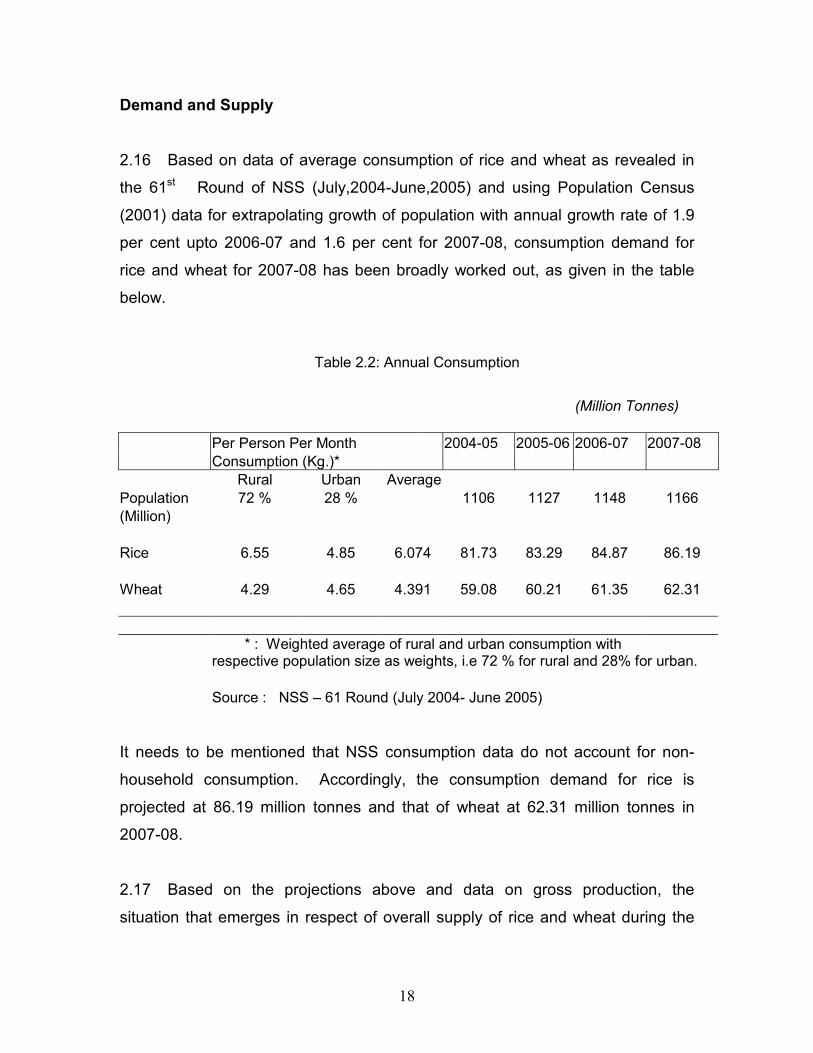
2.16 Based on data of average consumption of rice and wheat as revealed in
the 61st Round of NSS (July,2004-June,2005) and using Population Census
(2001) data for extrapolating growth of population with annual growth rate of 1.9
per cent upto 2006-07 and 1.6 per cent for 2007-08, consumption demand for
rice and wheat for 2007-08 has been broadly worked out, as given in the table
below.
Table 2.2: Annual Consumption
(Million Tonnes)
Per Person Per Month 2004-05 2005-06 2006-07 2007-08
Consumption (Kg.)*
Rural Urban Average
Population 72 % 28 % 1106 1127 1148 1166
(Million)
Rice 6.55 4.85 6.074 81.73 83.29 84.87 86.19
Wheat 4.29 4.65 4.391 59.08 60.21 61.35 62.31
* : Weighted average of rural and urban consumption with respective population size as weights, i.e 72 % for rural and 28% for urban.
Source : NSS – 61 Round (July 2004- June 2005)
It needs to be mentioned that NSS consumption data do not account for non-
household consumption. Accordingly, the consumption demand for rice is
projected at 86.19 million tonnes and that of wheat at 62.31 million tonnes in
2007-08.
2.17 Based on the projections above and data on gross production, the
situation that emerges in respect of overall supply of rice and wheat during the

19
fiscal year 2007-08 is presented below along with corresponding data for the
preceding three years:
TABLE 2.3 : DOMESTIC RICE SITUATION
(Million Tonnes)
Crop Year (July-June) 2003-04 2004-05 2005-06 2006-07
Fiscal Year (April-March) 2004-05 2005-06 2006-07 2007-08
1. Gross Production 88.53 83.13 91.79 90.13
2. Net Production 77.46 72.74 80.32 78.86
(87.5% of Gross Production)
3. Procurement 22.83 24.68 27.66 27.00
4. Offtake, of which 23.21 25.04 22.00 23.42
(a) Export Sale 4.78 4.09 3.50 3.50
(b) Open Sale 0.40 0.01 0.02 0.10
5. Addition to Stock (3-4) -0.38 -0.36 5.66 3.58
6. Supply (Gross)
[2-3+4-4(a)]or[2-5-4(a)] 73.06 69.01 71.16 71.78
7. Basmati Export 1.15 1.17 1.00 1.00
8. Supply (Net) [6-7] 71.91 67.84 70.16 70.78
9. WPI (1993-94=100) 168.20 174.50 178.90
Source : Food Bulletin, DGCI&S.
TABLE 2.4 DOMESTIC WHEAT SITUATION (Million Tonnes)
Crop Year (July-June) 2003-04 2004-05 2005-06 2006-07
Fiscal Year (April-March) 2004-05 2005-06 2006-07 2007-08
1. Gross Production 72.15 68.64 69.35 72.50
2. Net Production 63.13 60.06 60.68 63.44
(87.5% of Gross Production)
3. Procurement 16.80 14.79 9.23 15.00
4. Offtake 18.27 17.16 14.00 14.00
(a) Export 1.98 0.75 0.00 0.00
(b) Open Sale 0.24 1.05 0.01 0.01
4A. Imports 0.00 0.00 5.00 0.00
5. Addition to Stock (3-4+4A) -1.47 -2.37 0.23 1.00
6. Supply (Gross)
[2-3+4-4(a)+4A] 62.62 61.68 70.45 62.44
7. WPI (1993-94=100) 184.1 191.5 213.9
8. Consumption Demand 59.08 60.21 61.35 62.31
Source : Food Bulletin, DGCI&S.
20
2.18 The supply of rice and wheat has been estimated on the assumption that
the entire net production of a crop year is available in the following fiscal year.
This may be true in the case of wheat but only partially true in the case of rice.
Nevertheless, this procedure is useful since the purpose is not to calculate the
exact quantum of supply but only to compare supplies as obtained on the same
assumptions over time. On this basis, the supply of rice is likely to increase
marginally in 2007-08, but may still fall short of demand. However, the supply of
wheat may just meet the demand.
Trade Prospects
2.19 The world rice production estimated at 421.9 million tonnes in 2005-06
(FAO – Food Outlook December 2006) is higher than the previous year’s
production by about 15 million tonnes, while the production forecast for 2006-07
has been down by 0.2 per cent over the previous year. Global trade at 28.9
million tonnes in 2006-07 would be only 1.0 per cent higher than the previous
year. The expected lack of substantial trade growth in 2007 would mainly reflect
a relatively tight situation in exporting countries, which may push the quotations
further up in the course of 2007, thereby constraining the actual level of imports.
2.20 On the demand side, increased imports by African and South American
countries would compensate for a decline in shipment to Asian countries. Imports
of rice are predicted to increase to Africa, Latin America, Nigeria, EU, Australia
and United States. Asian countries are expected to import less than that of the
previous years.
2.21 Several major exporting countries may face supply constraints during
2006-07 due to deterioration of paddy production situation. Nevertheless, large
stocks available with Thailand, Cambodia, Egypt and Myanmar could help
sustain a modest expansion in world exports.
21
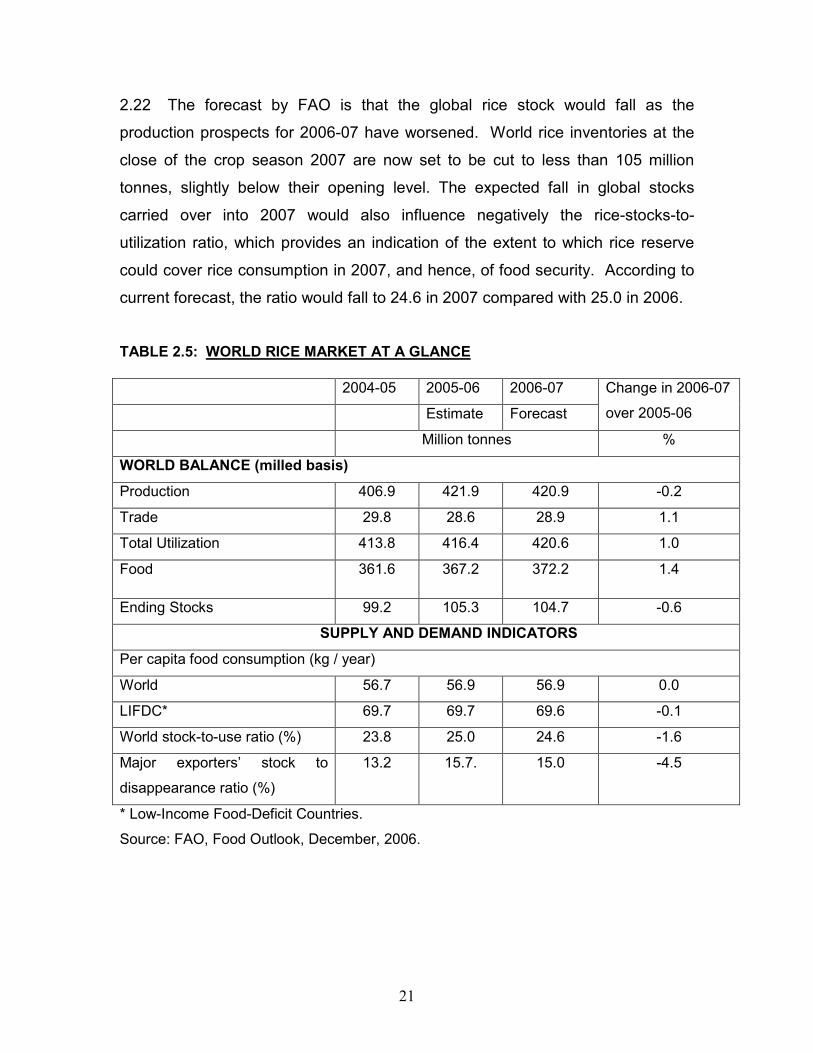
2.22 The forecast by FAO is that the global rice stock would fall as the
production prospects for 2006-07 have worsened. World rice inventories at the
close of the crop season 2007 are now set to be cut to less than 105 million
tonnes, slightly below their opening level. The expected fall in global stocks
carried over into 2007 would also influence negatively the rice-stocks-to-
utilization ratio, which provides an indication of the extent to which rice reserve
could cover rice consumption in 2007, and hence, of food security. According to
current forecast, the ratio would fall to 24.6 in 2007 compared with 25.0 in 2006.
TABLE 2.5: WORLD RICE MARKET AT A GLANCE
2004-05 2005-06 2006-07
Estimate Forecast
Change in 2006-07
over 2005-06
Million tonnes %
WORLD BALANCE (milled basis)
Production 406.9 421.9 420.9 -0.2
Trade 29.8 28.6 28.9 1.1
Total Utilization 413.8 416.4 420.6 1.0
Food 361.6 367.2 372.2 1.4
Ending Stocks 99.2 105.3 104.7 -0.6
SUPPLY AND DEMAND INDICATORS
Per capita food consumption (kg / year)
World 56.7 56.9 56.9 0.0
LIFDC* 69.7 69.7 69.6 -0.1
World stock-to-use ratio (%) 23.8 25.0 24.6 -1.6
Major exporters’ stock to
disappearance ratio (%)
13.2 15.7. 15.0 -4.5
* Low-Income Food-Deficit Countries.
Source: FAO, Food Outlook, December, 2006.
22
Coarse Cereals
2.23 According to the Second Advance Estimates (as on 05/02/2007) the
production of Kharif coarse cereals during 2006-07 is estimated to be 24.50
million tonnes which is 2.23 million tonnes lower than the final estimates for
2005-06 and 4.19 million tonnes lower against the target of 28.69 million tonnes.
The production of kharif maize is estimated to be 11.10 million tonnes as against
12.16 million tonnes in the previous year and was followed by bajra 7.54 million
tonnes, kharif jowar 3.95 million tonnes and ragi 1.49 million tonnes. With less
than 8 per cent of area under irrigation, coarse cereals like maize, jowar, bajra
are largely dependent on the vagaries of weather. The production of maize,
bajra and jowar has been affected adversely in Rajasthan because of abnormal
rains and in Andhra Pradesh and Karnataka due to scanty rains and drought
conditions. (Table 2.1)
2.24 There has been shortfall in production of coarse cereals in 2006-07 as
compared to last year. None of the coarse cereals has shown any positive trend
in production. There has been a fall of 1.51 per cent per annum in the area under
coarse cereals from 1985-86 to 2005-06. Jowar and ragi grow in harsh
environments where other crops do not grow well. Improvements in production,
availability, storage, utilization and consumption of these food crops can
significantly contribute to the household food security and nutrition requirements
of the population. For most coarse cereals, the demand is also localized with
jowar confined to Karnataka and Maharashtra and bajra being restricted to
Gujarat, Maharashtra and Rajasthan. For the procurement of coarse grains in
2006-07 there were state agencies operating in Karnataka and Madhya Pradesh.
Successive NSS surveys have shown that people are consuming lesser
quantities of coarse cereals as income rises. Even poor people have been
changing their food habits in favour of rice and wheat. Increased accessibility to
wheat and rice through PDS and rural development schemes is also considered
to be a reason for the change in dietary habits of people, particularly of those in
the target groups. The future sustainability of coarse grains production lies in
23
expanding both direct and indirect consumption in the form of processed foods,
beverages, fodder and increased industrial consumption. (Table 2.2)
2.25 The total area under coarse cereals in India is 29.3 per cent of total area
under cereals in 2005-06. The state with highest area under coarse cereal is
Maharashtra, with jowar and bajra accounting for largest share. The state with
highest production of coarse cereals in 2005-06 is Karnataka.
2.26 The state of Maharashtra has 6.9 million hectares under coarse cereals
cultivation and production of 6.08 million tonnes as against Karnataka which has
3.87 million hectares under coarse cereals and production of 6.56 million tonnes.
The yield of coarse cereals in Karnataka is 1.69 tonnes per hectare as against
0.89 tonnes per hectare, in Maharashtra. The production of coarse cereals is
about 17.4 per cent of total cereal production as against rice which forms 47.02
percent and wheat 35.5 per cent of total cereal production in the year 2005-06. It
is obvious that productivity of coarse cereals needs to be improved through
strategic planning and focused approach.
2.27 The exports of jowar, bajra, maize and ragi in the year 2005-06 were
536.93 thousand tonnes. Of which, maize exports were the highest at 419.95
thousand tonnes and ragi exports amounted to the tune of 2.52 thousand tonnes.
The highest export earnings of Rs. 316.00 crore was realised from maize,
followed by jowar Rs. 67.44 crore, bajra Rs. 40.81 crore and ragi Rs. 1.32 crore.
The import of maize in 2005-06 was 1.63 thousand tonnes and no other coarse
cereal was imported. Maize was exported at Rs 7.52 per kg and imported at
Rs 19.14 per kg.
2.28 The coarse cereals are experiencing price rise due to stagnant supplies
and growing demand in India and rest of the world. There is rise in demand for
coarse cereals because of its variety of uses. The demand pattern is also
influenced by the changing life style and demand for processed food. FAO has
noted that the high price of grain market has ripple effect on the meat and dairy
24
sectors through feed linkages. This has serious implications for food importing
developing countries. This season’s decline in production coincides with a more
rapid expansion in demand for industrial use, ethanol in particular. The recent
upward movements in international prices of most coarse grains have been
mainly set off by the prevailing supply and demand fundamentals in markets for
maize, world’s largest traded coarse grain. Poor harvests in key producing
countries and a fast growing demand for bio-fuel production have been the main
drivers of the grain markets. Coarse grain output is down by 2.1 per cent to 981
million tonnes in 2006. The high coarse cereals prices in the current year might
lead to increase in acreage in the next year but it would fail to check the increase
in prices because of the multiple uses that the coarse cereals are put in. The
current scenario of individual coarse cereals may be described as under:-
Jowar
2.29 Production of jowar in kharif 2006-07 is estimated at 3.95 million tonnes
(DES – 05/02/2007) as compared to 4.07 million tonnes in 2005-06. The total
jowar production (kharif and rabi) is estimated at 7.72 million tonnes as against
7.63 million tonnes in 2005-06. During the period between 1995-96 and 2005-
06, production of jowar declined sharply by 3.14 per cent per annum as
compared to a slower decline of 0.68 per cent per annum observed during the
period 1985-86 to 1995-96. The decline in production was attributed to
significant acreage shifts in the states of Gujarat, Haryana, Madhya Pradesh,
Karnataka and Andhra Pradesh. Jowar still forms a part of the staple diet of
households in Maharashtra and Karnataka. (Tables 2.1 & 2.2)
2.30 Jowar is grown in arid and semi-arid regions, as it is drought resistant. It
is abundantly grown in the arid tracts of Gujarat, Uttar Pradesh, Karnataka,
Maharashtra and Andhra Pradesh. The nutritional value is same as maize, hence
it is gaining importance as livestock feed, grain alcohol, starch production and
production of adhesives and paper. Jowar is meant for both food and feed apart
from the fact that it has nitrogen fixation capacity in the soil and hence can be
25
preferred as a rotation crop and the sugar in the stalk can be used for bio-fuel
production.
2.31 The yield of jowar remained stagnant at around one tonne per hectare
during the last twenty years. The yield of jowar is highest in Andhra Pradesh at
1.32 tonnes per hectare, followed by Gujarat at 1.14 tonnes, Karnataka at 1.10
tonnes and 1.09 tonnes per hectare in Madhya Pradesh. The yield of jowar has
fallen significantly by 38 per cent in Rajasthan.
2.32 Following the stagnation in production, the average WPI of jowar (base
1993-94=100) rose from 252.1 in January, 2006 to 275.5 in January, 2007, a
change of 9.3 per cent. The seed replacement rate for jowar in Gujarat is 100 per
cent and low in other states like Chattisgarh, Rajasthan, Madhya Pradesh and
Uttar Pradesh, ranging between 2.60 per cent to 12.50 per cent. (Table 2.14)
2.33 In spite of the overall favourable price scenario, there were instances of
prices ruling less than MSP in the post harvest months particularly in Madhya
Pradesh. Against the MSP of Rs.540 per quintal, jowar price in October,2006
ranged between Rs. 463 to 732 per quintal in Khargaon, Rs. 501 per quintal at
Sheopurkala in Madhya Pradesh and Rs. 530 to Rs. 805 at Wardha in
Maharashtra. Maharashtra procured 195 tonnes of jowar till 06/03/2007 under
MSP operations. (Annexure-I)
Bajra
2.34 Bajra is well adapted to production systems characterized by low rainfall,
low soil fertility and high temperature. Because of its tolerance to difficult growing
conditions it can be grown in areas where other cereal crops such as wheat or
maize would not survive. As the protein content of bajra is substantially higher
than maize, its importance as feed would increase in the future. At the all-India
level, the production of bajra, according to Second Advance Estimates, is
reported at 7.54 million tonnes in 2006-07 which is 0.14 million tonnes lower than
26
in 2005-06 and 4.57 million tonnes lower than the peak production of 12.11
million tonnes achieved in 2003-04. The important states producing bajra are
Rajasthan, Uttar Pradesh, Gujarat and Maharashtra. (Table 2.1)
2.35 At the all-India level, acreage under bajra declined by 0.82 per cent per
annum during the period 1985-86 to 2005-06. The yield of bajra is 1.5 tonnes
per hectare in Madhya Pradesh followed by 1.4 tonnes per hectare in Uttar
Pradesh and 1.2 tonnes per hectare in Gujarat. (Table 2.2)
2.36 Bajra has localised demand and also has a short shelf life which makes
its storage difficult, especially under the present methods followed in harvesting
and storage. It has been reported that farmers using traditional methods of
storage were able to store the grain for 2 to 3 years to meet household demand
during lean period. The Commission feels that the traditional methods of storage
should be studied for correcting the post harvest procedures and improving the
shelf life of the coarse grain.
2.37 The index number of wholesale prices of bajra (base 1993-94=100) in
January, 2006 was 221.0 and increased to 236.0 in January, 2007. The annual
percentage change over previous year in January, 2007 was 6.8 per cent.
(Table 2.14)
2.38 Month-end wholesale prices of bajra quoted during October, 2006-
February, 2007 ranged between Rs.640-700 per quintal in Jaipur (Rajasthan),
Rs.585-630 per quintal at Hissar (Haryana) and Rs. 630-665 per quintal at
Pachora (Maharashtra).
Maize
2.39 Area under maize increased from 5.8 million hectares in 1985-86 (TE) to
6.0 million hectares in 1995-96 (TE) and further to 7.5 million hectares in 2005-
06(TE). The production during 2005-06 is estimated to be the record 14.71
27
million tonnes, up by 0.54 million tonne or 3.8 per cent from the production in
2004-05. About 85 per cent of maize is produced in the Kharif Season and the
production of Kharif maize during 2006-07 is likely to be 11.10 million tonnes,
about 8.7 per cent lower than the 12.16 million tonnes produced in the kharif of
2005-06 and 1.44 million tonnes short of target. (Tables 2.1 & 2.2)
2.40 The production of maize recorded an annual growth of 3.83 per cent
during the period 1985-86 to 2005-06 which is higher than rice during the same
period. The annual growth rate of production was as high as 12.44 per cent in
Maharashtra, 11.2 per cent in Tamil Nadu and 9.32 per cent in Andhra Pradesh.
At the all India level the yield of maize recorded growth of 2.54 per cent per
annum and acreage has expanded by 1.25 per cent per annum. There has been
significant increase in area in the states of Karnataka, Andhra Pradesh, and
Maharashtra. The yield of maize is higher than rice in states of Andhra Pradesh,
Gujarat, Himachal Pradesh, Madhya Pradesh and Maharashtra.
2.41 Maize is the most important crop after wheat and rice with a wide variety
of uses as feed and in the production of alcoholic beverages and food
sweeteners, starch, oil and proteins and maize based ethanol production. India
produces around 2 per cent of total world produce and imports a major portion of
maize for human consumption. The local produce is primarily consumed for
industrial and cattle feed. In 2006-07, according to Food Outlook, the world
production is estimated to be 689 million tonnes and consumption can go up to
724 million tonnes. Thus there is a demand-supply mismatch and effects can be
seen in the domestic market as well. While there is fall in the production, the
demand has risen as there was no avian influenza and high international prices
have made exports attractive. The users of maize have requested the
government to regulate exports of maize and there has been waiver in import
duties. Another reason for the high prices is world wide shortage of wheat which
is being substituted by demand for maize. Maize is in the category of primary
articles which has a high weightage and is contributing to inflationary rise also.
Due to prevailing high rates FCI was unable to procure any maize. The high
28
prices prevailing in the market might lead to higher acreage of corn in the next
year but rise in prices might not be checked because of the buoyancy in demand
emanating from the variety of uses to which maize is put in.
2.42 To enhance the production and productivity of maize it has been included
in Technology Mission on Oilseeds and Pulses since 1995 and Accelerated
Maize Development Programme has been merged into centrally sponsored
Integrated Scheme of Oilseeds, Pulses, Oil palm and Maize for overall
development of these crops.
2.43 During 2006-07, like other cereals, prices have been rising and the index
of wholesale prices of maize which stood at 209.2 in May, 2006 rose to 240.5 in
January, 2007 which is 15.0 per cent higher than in January, 2006. Despite rising
prices, the price of maize in Khargaon (Madhya Pradesh) dipped below MSP to
Rs 466 per quintal. The seed replacement rate of maize in Punjab is 70 per cent,
50 per cent in Bihar, 1.42 per cent in Orissa and as low as 1.0 per cent in
Uttarkhand. (Table 2.14)
Ragi
2.44 Ragi production in 2006-07, according to Second Advance Estimates,
has declined sharply to the level of 1.49 million tonnes. During kharif 2005-06,
the production was 2.35 million tonnes. The major ragi producing states are
Karnataka and Uttar Pradesh followed by Maharashtra. (Table 2.1 )
2.45 Ragi is grown in most of the states by small and marginal farmers under
dry land conditions. There had been a significant decline in the area under ragi
in recent years. The area under ragi has declined during the period 1985-86 and
2005-06 by 2.44 per cent per annum. The fall in the area was contributed by
declines in area in the states of Andhra Pradesh, Karnataka, Bihar and
Maharashtra. (Table 2.2)
29
2.46 One of the advantages of ragi crop is that once harvested, the seeds
keep extremely well and are seldom attacked by insects or moulds. The long
storage capacity makes ragi an important crop in risk avoidance strategies for
poorer farming communities. The average yield of ragi is 1.5 tonnes per hectare.
As a cereal food, ragi has desirable properties. It is rich in protein, calcium and
methonine, an amino acid not found in most other cereals. It is easily digestible
and releases energy slowly. It is a recommended cereal diet for diabetic
patients. Ragi is consumed by poor people within the producing states of India
unlike in parts of Africa where it is considered as a rich man’s food. There exists
scope for manufacturing processed foods from ragi, but entrepreneurs are
perhaps not investing in this sector because of uncertainties in supplies. Ragi
processed products need to be promoted as a health food amongst segment of
the population that is highly health and nutrition conscious by the state
governments of Karnataka, Tamil Nadu and Maharashtra. This could translate
into better returns for farmers also.
2.47 The annual average index number of wholesale prices (Base 1993-
94=100) of ragi increased by 7.8 per cent in 2006-07 (Upto January, 2007) over
the preceding year. The monthly index on a point to point basis rose by 3.3 per
cent from January, 2006 to 13.3 per cent in January, 2007. The index stood at
213.4 in January, 2007. The yield of Ragi is highest in Karnataka at 1.8 tonnes
per hectare followed by 1.3 tonnes in Tamil Nadu and 1.2 tonnes in Uttar
Pradesh. The area under ragi has fallen at the rate of 2.44 per cent per annum
from 1985-86 to 2005-06. The seed replacement rate of ragi is very low in
Karnataka at 1.16 per cent and in Tamil Nadu it is 8 per cent. To increase
productivity the seed replacement rate needs to be improved. The production of
ragi has fallen by 1.51 per cent per annum during 1995-96 to 2005-06.
(Table 2.14)
2.48 The productivity of coarse cereals is low as there has been no break
through in technology or innovation in storage facilities. The change has
happened only in the sphere of wheat and rice. The irrigated area under coarse
30
cereals is small and use of fertilizers is also insignificant. Hence low productivity
of most coarse cereals has led to inefficient supply. The demand for coarse
cereals is expected to rise because the intake of meat and poultry is on the rise.
Consequently the demand for feed increases which needs to be matched by
supply. Owing to shortage of maize, duty free imports have been allowed for the
year 2007. The stock position of coarse grain as on 1/12/2006 was 1.13 lakh
tonnes. There was no procurement for bajra, maize and ragi and 195 tonnes of
jowar were procured till 06/03/2007. It is mentioned in Food Outlook of FAO that
the global stocks of foodgrains are likely to be drawn down significantly which
might further lead to volatility in the prices of coarse grains. (Table 2.9 b)
2.49 The coarse cereals should be given its due importance. Too much focus
on rice and wheat is leading to neglect of potential of nutritious cereals like jowar,
bajra and ragi. What is needed is that concentrated efforts aimed at increasing
production and productivity should be undertaken in order to ensure food security
for all sections of the population. Other aspects include assured and
remunerative marketing in order to boost the production. If the coarse cereals are
included in PDS it would help in nutritional security and would also lead to
promotion of farming in dry land areas which would solve the problem of water
scarcity in farming in such areas. The production of coarse cereals has been
stagnant over the years, and integrated strategy is required to increase
production and promote it as a major food crop. It requires redistribution of area
in favour of coarse cereals as the demand for coarse cereals is dual and with
increasing demand for meat and dairy development it requires to have
promotional efforts to increase production and area under coarse cereals.
Another contributory factor for the rise in demand is bio-energy consumption
which, in future, is expected to increase multifold. India can become a strong
export market by increasing the production of maize and jowar for meeting the
world’s growing demand.
31
Pulses
2.50 Pulses are the major source of protein and occupy a prominent place in
the food basket as well as consumption profile of the people in India. India is the
largest producer of pulses in the world, accounting for 13.1 million tonnes in the
world production of 61.4 million tonnes or nearly 21.3 per cent in the year 2004.
Among the continents, highest production of pulses at 29.7 million tonnes,
roughly half (48.4 per cent) of world production in 2004 was reported from Asia.
This decreased by 2.69 per cent to 28.9 million tonnes in 2005.
2.51 The record production of 14.91 million tonnes of pulses in India achieved
in 1998-99 was repeated for the second time in 2003-04 due to favourable
weather conditions, but could not be sustained in the following years, 2004-05
and 2005-06(Final estimates of DES) as it receded to 13.13 million tonnes and
13.36 million tonnes respectively. Kharif pulses amounted to 4.86 million tonnes
and Rabi pulses to 8.50 million tonnes, contributing to 36.4 per cent and 63.6 per
cent respectively to the total pulses output in 2005-06. The kharif pulses
production in 2005-06 shows a larger decline of 21.1 per cent than that of rabi
which fell by 2.8 per cent over the production in 2003-04. This has caused a fall
of 10.4 per cent in the total pulses production in this period. The production of
Tur ( Arhar – Pigeon pea), the major crop in kharif pulses is estimated at 2.74
million tonnes in 2005-06, reporting a modest rise of 16.6 per cent as compared
with the production of 2.35 million tonnes in 2004-05. As per the final estimate of
2005-06, the production of other kharif pulses at 2.13 million tonnes is lower by
44.1 per cent over 2003-04. The Second Advance Estimates of DES (dated
5.2.2007) for 2006-07 have placed the other kharif pulses, at 2.60 million tonnes,
a rise of 22.1 per cent over 2005-06. (Table 2.1)
2.52 Pulses are generally grown in rain-fed conditions, in the vast domain of
arid and semi-arid regions of Central, Western and Peninsular India. The rate of
growth of production, which was positive at 0.61 per cent during the period 1985-
86 to 1995-96, turned negative at (-) 0.08 per cent during 1995-96 to 2005-06
32
due to the continuous negative growth in the area under cultivation. The rate of
growth of production of kharif pulses however remained positive at 0.33 per cent
during 1995-96 to 2005-06, due to moderate increase in the growth of area at
0.71 per cent, even though the growth in yield was negative at (-) 0.38 per cent.
In the entire period from 1985-86 to 2005-06, the pulses production showed a
growth rate of 0.23 per cent. Even though a negative growth of 0.33 per cent was
experienced in area during this period, this was more than offset by the growth in
yield by 0.56 per cent. The rate of growth of kharif pulses production and yield in
the same period remained positive at 0.05 per cent and 0.19 per cent
respectively, but a negative growth of 0.14 per cent was experienced in area
under cultivation. (Table 2.2)
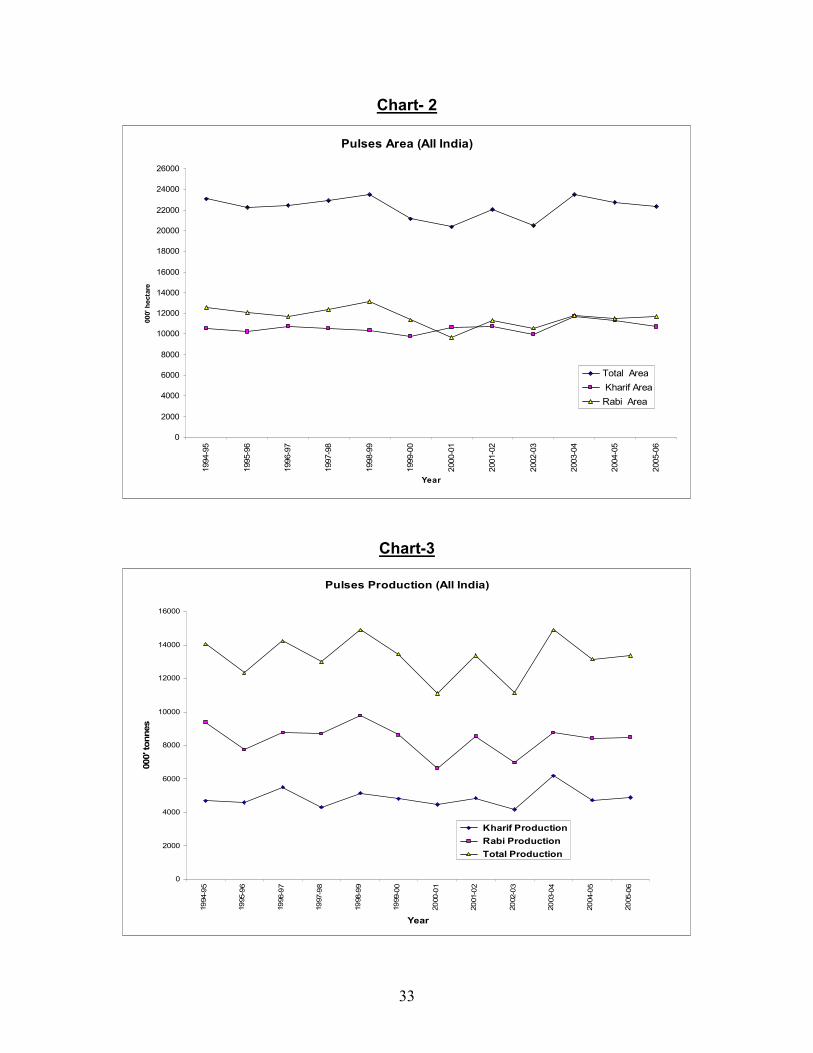
2.53 The production and area under pulses is determined by the
weather/climatic conditions, primarily the coverage of monsoon. A look at the
figures from 1990-91 up to 2005-06 reveal that production ranged between 11.07
million tonnes to 14.9 million tonnes and area under pulses cultivation between
20.34 million hectares to 24.66 million hectares. The trend in area under pulses
as shown in the chart-2 reveals wide variation in rabi crops and not much
deviation in kharif crops. The impact of weather is more pronounced on
production of rabi pulses, causing wild variations in the total pulses
production.The erratic and uncertain behaviour of monsoons affect timely sowing
of crops .The pulse growers are mostly small and marginal farmers who are
unable to make adequate investment on pulse development mainly due to (i)
high risk and (ii) financial bottleneck.Thus poor economic condition of small and
marginal farmers is another constraint on development activities relating to pulse
crops. Besides, no appreciable improvement in technology has taken place since
the introduction of the Technology Mission on Oilseeds and Pulses in 1986. The
Mission and other specialized research institutions like Indian Institute of Pulses
Development so far have not succeeded in breaking the impact of weather
thereby causing vertical and horizontal improvement in production of pulses.
(Table 2.1)
33
Chart- 2
Pulses Area (All India)
0
2000
4000
6000
8000
10000
12000
14000
16000
18000
20000
22000
24000
26000
1994-9
5
1995-9
6
1996-9
7
1997-9
8
1998-9
9
1999-0
0
2000-0
1
2001-0
2
2002-0
3
2003-0
4
2004-0
5
2005-0
6
Year
000' hectare
Total Area
Kharif Area
Rabi Area
Chart-3
Pulses Production (All India)
0
2000
4000
6000
8000
10000
12000
14000
16000
1994-9
5
1995-9
6
1996-9
7
1997-9
8
1998-9
9
1999- 0
0
2000- 0
1
2001- 0
2
2002- 0
3
2003- 0
4
2004-0
5
2005-0
6
Year
000' tonnes
Kharif Production
Rabi Production
Total Production
34
2.54 The Government has rightly expressed concern over the stagnation in
production of pulses and suggested the adoption of bio-technology and gene
transfer techniques to enhance crop productivity. The total output of pulses has
remained static at around 14 million tonnes between 1985-86 (13.36 million
tonnes) and 2005-06 (13.36 million tonnes) Expansion of area under pulses has
also shown no improvement over the past four decades. It remains static at 20.0
to 24.0 million hectares. With regard to productivity of pulses it increased with
wide fluctuations from 578 kg per hectare in 1990-91 to 635 kg per hectare in
1996-97, but again fell to 577 kg per hectare in 2004-05. Thus, area production
and yield of pulses continue to face up and down swings and stagnation.
Therefore, there is need for development of appropriate plant types, commercial
high breeds and transgenic variety of different crops to achieve globally
competitive yields. Efficient conversion of breeder seeds into foundation and
certified seeds could increase the seed replacement rate which is vital for
achieving production range. Inclusion of pulses in crop sequences should be
made compulsory to protect soil fertility and facilitate higher crop production.
Besides, effective transfer of new technology to the farmers is required for
boosting crop yield. The successful standardization, stable hybrid technology in
Pigeon pea (Tur) and the progress made recently on mitigating the menace of
pod borer pests attack on Pigeon pea and chick pea are noteworthy.
(Table 2.1)
2.55 The yield levels of pulses are also characterized by wide regional
disparity. The yield levels attained in some States are more than the national
average yield of pulses. Such states include Bihar, where the yield of kharif
pulses in 2005-06 is 981 kg. per hectare, Punjab 791 kg. per hectare, West
Bengal 638 kg. per hectare, Haryana, 757 kg. per hectare and Uttar Pradesh.
660 kg. per hectare ,much higher than the all India average yield of 456 kg. per
hectare. The area under pulses cultivation has continuously fallen over the years
from 1990-91 to 2005-06. Thus, the production and area under cultivation are
inelastic to market forces. That reflects the fact that the production of pulses can
only be augmented by way of technological advances in input application like
35
seed replacement, quality of seeds, check on incidence of pests and diseases
and suitable insurance coverage to compensate the loss in production within a
reasonable period. These measures supported by concerted extension services,
assured remunerative prices, large number of field-level demonstrations at least
in such areas of the states where the yield is much below the all India average
could raise production of pulses. Field visits of teams from the States making
handsome contribution to total pulses production and interaction with the farmers
of the highly result oriented states, will motivate the farmers and ultimately result
into increase in area, production and yield under pulses cultivation. Operational
efficiency of the extension machinery will have to improve to ensure adequate
and timely availability of essential inputs in the identified pulse block.
2.56 In Andhra Pradesh, kharif pulses production more than doubled to 538
thousand tonnes in 2003-04 from 291 thousand tonnes in 2002-03, mainly due to
increase in area from 927 thousand hectares in 2002-03 to 1.13 million hectares
in 2003-04 and yield from 314 kg. per hectare to 478 kg per hectare. This level
could not be sustained in 2004-05 as the area again fell to 887 thousand
hectares. The production scenario of Rajasthan state is peculiar. Spectacular rise
in the production of kharif pulses from 113 thousand tonnes in 2002-03 to 1.51
million tonnes in 2003-04 petered into an alarming fall to an abysmal level of
356 thousand tonnes in 2005-06, reflecting the steep rise in the productivity
from 85 kg per hectare in 2002-03 to 560 kg per hectare in 2003-04 and
declining to 154 kg per hectare in 2005-06. Rajasthan state enjoys the first place
in area under kharif pulses. Such an upheaval in production reflects the role of
the state extension machinery and specialized research institutions like
agriculture universities in the state and specially the Indian Pulses Research
Institute. There is a need to conduct a study aimed at ascertaining the reasons
for such wild fluctuations in kharif pulses production in the state like Rajasthan
and to suggest time bound result oriented measures for arresting the fall in
productivity. These institutions may have to recognize the ground realities and
the need for increasing the supply of pulses by way of establishing close linkages
with the farmers at field levels.
36
2.57 The production of urad was hampered in 2005-06 due to erratic rainfall
in Maharashtra and Madhya Pradesh, the main producing centres in India. The
output is estimated to decline by 6.18 per cent in 2005-06 to 12.45 lakh tonnes
as compared to 13.27 lakh tonnes previous year. Owing to higher demand,
lower production and the deflating stocks of urad were expected to open the
gates for imports to tide over the shortfall. Tur (Pigeon pea) due to early
harvesting escaped the unseasonal rains in major growing areas. Therefore, the
total production of Tur in 2005-06 is estimated at 2.74 million tonnes, a gain of
16.6 per cent from the output of 2.35 million tonnes last year. Production in
Maharashtra and Karnataka, the major growing centres, is expected to grow by
20.4 per cent and 50.7 per cent respectively. Other major pulses like Chana and
Urad are in short supply and hence the demand is expected to shift to Tur. It is
believed that although the net availability of tur in India would increase this
season, the prices could remain firm, because of the short supply and firmness in
prices of other pulses. Another factor helping to meet the shortfall, is the imports
from Tanzania and Australia. The Chana crop is reported to be good this year in
Tanzania. The crop is expected to be harvested around September-October.
Less weather anomalies expected in Australia this time also lends hope for a
better crop during November to January, 2006-07.
(Table 2.1)
2.58 The gains from the Green Revolution reaped in case of wheat and rice
were not extended to the Pulses sector. The area as well as yield of these crops
has remained by and large static since 1964-65. The country attained a
production level of 12.42 million tonnes from an area of 23.88 million hectares in
1964-65. There has been no significant change since then and in 2005-06, the
area under cultivation was 22.36 million hectares, giving a total production of just
13.4 million tonnes. The yield in 2005-06 was only 597 Kg. per hectare and was
not much different from the yield of 520 Kg. per hectare achieved in 1964-65.
While there are many reasons for this dismal scenario, the absence of productive
technology is one of them. Skewed Pricing Policy has transformed the food
37
crops, such as Wheat and Rice, to virtual cash crops for farmers due to assured
marketing at remunerative prices. Pulses as a result have been pushed to more
and more marginal land in rain-fed areas. Comparatively low productivity and
market risks in these crops act as disincentives for cultivators to invest in yield
enhancing inputs such as fertilizers and pesticides. This in turn often leads to
deficiency of major, secondary and micro-nutrients in the soil. Besides, pulses
crops is vulnerable to many diseases and pests namely yellow mosaic virus and
powdery mildew in moong and urad, sterility mosaic in arhar and wilt and blight in
gram. ICAR and state agricultural universities have developed new varieties of
pulse crops, but these do not have the potential to provide spectacular boosts to
crop yields as wheat and rice varieties did during the green revolution. These
varieties also do not possess wide adaptability to cover large areas. In addition,
the pulse growers hardly replace their old seeds with new ones. Hence the new
varieties fail to show results in the farmers’ fields. The extension service
agencies have also not paid enough attention towards adoption of new
production technologies by farmers. As a result, there is a wide gap between the
crop yield at the farmers’ fields and the yield sown in the front line crop
production demonstrations carried out under the All India Coordinated Crop
Improvement Projects of the ICAR and the Krishi Vigayan Kendras.
2.59 Urad (Black Matpe) prices started firming in June, 2006 on fears that
rain in Maharashtra, Gujarat and Andhra Pradesh could have damaged the kharif
crops. Fears that floods in Telengana in Andhra Pradesh and Bharuch district of
Gujarat have affected the crop and reports of heavy rainfall in Maharashtra,
particularly in the growing areas of Nanded, Parbhani and Latur further aided to
the firm sentiment in the prices. Urad prices showed a tendency to decline after
the Central Government banned exports and announced its decision to import
pulses to meet the demand.
2.60 Pulses prices witnessed a rise since July, 2006 due to spurt in demand.
The expectation that the gap in the supply is likely to widen in the coming months
due to damage to the crops in Maharashtra and Gujarat states affected by floods
38
also fuelled the sentiment. The government policy to waive the nominal 10 per
cent custom duty on imports, freezing the exports by putting ban on it, the
decision of the state governments on the level of stocks to be held with the retail
traders, and the squeeze on the requirements/demand for pulses forced on the
poor section of population by the shooting pulses prices, led to a softening of
prices from the months of August onwards. The supplies were further augmented
through imports by NAFED and other designated agencies. In addition, arrival of
the new crop also began from the early growing states.
2.61 To ease the pressure on prices, the ban on export of all types of pulses,
which was to remain in force till December 26, 2006 was extended till March 31
2007. The prices of pulses plunged after the ban on exports. The decision to
offload the imported pulses at ports in major consumption centres such as
Mumbai, Chennai and Kolkata was taken in July. National Agricultural
Cooperative Marketing Federation of India (NAFED), Projects Equipment
Corporation (PEC), and Mineral and Metal Trading Corporation (MMTC), on
being designated as the agencies for import floated the tenders for imports of
pulses such as tur, moong and urad on June18, 2006, NAFED was awarded
contracts for 25,000 tonnes of urad.
2.62 The government scrapped even the 10 per cent import duty on pulses in
June, 2006 to cool-off the sustained rise in the prices of pulses in the country.
Zero import duty on pulses was aimed at bringing down the landed cost of
pulses leading to higher imports. The wholesale price index of pulses is
presented in the Table below:
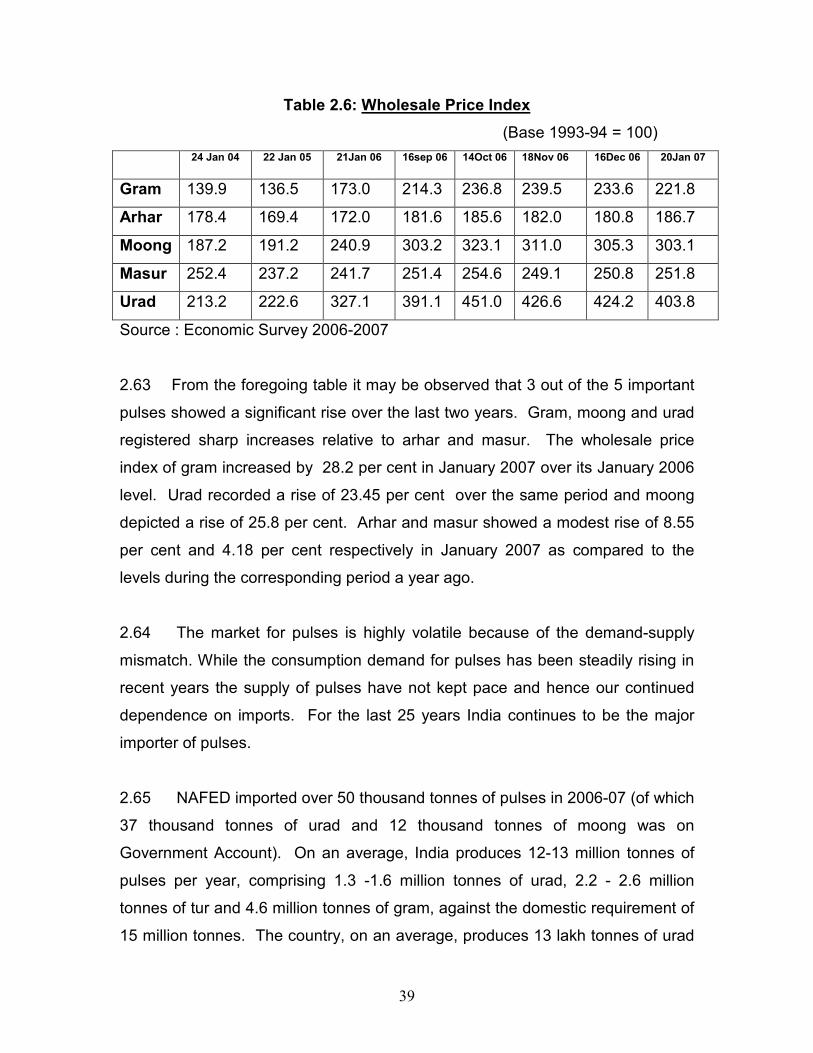
39
Table 2.6: Wholesale Price Index
(Base 1993-94 = 100)
24 Jan 04 22 Jan 05 21Jan 06 16sep 06 14Oct 06 18Nov 06 16Dec 06 20Jan 07
Gram 139.9 136.5 173.0 214.3 236.8 239.5 233.6 221.8
Arhar 178.4 169.4 172.0 181.6 185.6 182.0 180.8 186.7
Moong 187.2 191.2 240.9 303.2 323.1 311.0 305.3 303.1
Masur 252.4 237.2 241.7 251.4 254.6 249.1 250.8 251.8
Urad 213.2 222.6 327.1 391.1 451.0 426.6 424.2 403.8
Source : Economic Survey 2006-2007
2.63 From the foregoing table it may be observed that 3 out of the 5 important
pulses showed a significant rise over the last two years. Gram, moong and urad
registered sharp increases relative to arhar and masur. The wholesale price
index of gram increased by 28.2 per cent in January 2007 over its January 2006
level. Urad recorded a rise of 23.45 per cent over the same period and moong
depicted a rise of 25.8 per cent. Arhar and masur showed a modest rise of 8.55
per cent and 4.18 per cent respectively in January 2007 as compared to the
levels during the corresponding period a year ago.
2.64 The market for pulses is highly volatile because of the demand-supply
mismatch. While the consumption demand for pulses has been steadily rising in
recent years the supply of pulses have not kept pace and hence our continued
dependence on imports. For the last 25 years India continues to be the major
importer of pulses.
2.65 NAFED imported over 50 thousand tonnes of pulses in 2006-07 (of which
37 thousand tonnes of urad and 12 thousand tonnes of moong was on
Government Account). On an average, India produces 12-13 million tonnes of
pulses per year, comprising 1.3 -1.6 million tonnes of urad, 2.2 - 2.6 million
tonnes of tur and 4.6 million tonnes of gram, against the domestic requirement of
15 million tonnes. The country, on an average, produces 13 lakh tonnes of urad
40
with 20 per cent coming from Maharashtra. The acreage under Urad in Madhya
Pradesh and Karnataka seems to have declined by 20 per cent and 15 per cent
respectively over the last year. Farmers in the states of Andhra Pradesh, Orissa
and Tamil Nadu have shown an inclination for growing Urad because of the
prevailing higher prices. The outputs of pulses are estimated to be lower partly
due to drought – and partly due to floods – in the south as well in the rest of India.
Floods in two major Tur producers – Gujarat and Maharashtra - were likely to
adversely hit the crop which was passing through flowering season and required
frequent but slow rains. Sowing of Kabuli Chana and Masur is expected to
decline by more than half due to ban on exports of these two crops as these two
pulses have a big share in the export basket of pulses. More than 70 percent of
these pulses are exported. The country exported 4.52 lakh tonnes of pulses in
2005-06, of which kabuli chana and masoor accounted for nearly 3 lakh tonnes.
2.66 India imported a record quantity of 2.23 million tonnes in 2001-02 as
against 351 thousand tonnes in 2000-01. The share of imported pulses worked
out to be 23.04 per cent of net production in 2001-02, a steep hike from the
previous year’s level of 3 per cent. With the rise in domestic pulses production to
14.91 million tonnes in 2003-04, the dependence on imports correspondingly
reduced to 10.05 per cent of the net production in 2004-05. This trend was
reversed in the year 2005-06, as the imports increased from 1.31 million tonnes
to 1.70 million tonnes, it is going to be still higher than the last year’s level of
14.75 per cent of the net production. (Table-2.7 ). As no perceptible change in
the level of production has occurred in the past and chances of radical
improvement are hardly visible in the coming years, import dependence of the
pulses will remain sizeable .
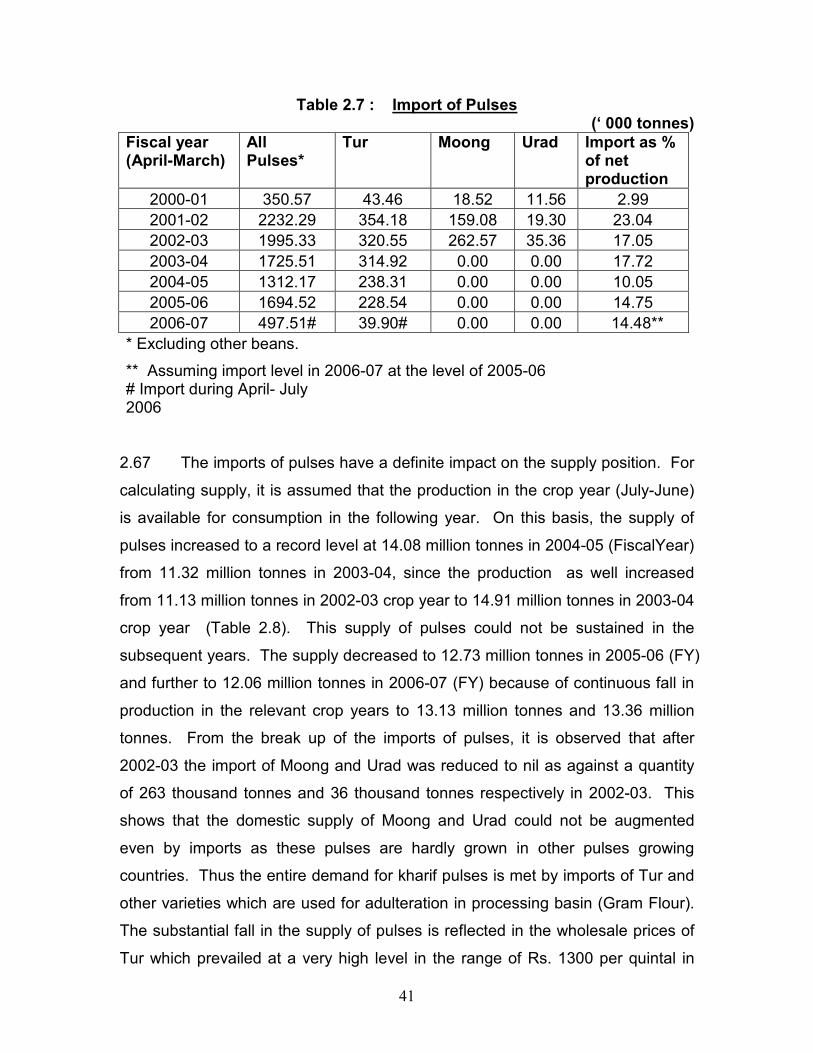
41
Table 2.7 : Import of Pulses (‘ 000 tonnes)
Fiscal year (April-March)
All Pulses*
Tur Moong Urad Import as % of net production
2000-01 350.57 43.46 18.52 11.56 2.99
2001-02 2232.29 354.18 159.08 19.30 23.04
2002-03 1995.33 320.55 262.57 35.36 17.05
2003-04 1725.51 314.92 0.00 0.00 17.72
2004-05 1312.17 238.31 0.00 0.00 10.05
2005-06 1694.52 228.54 0.00 0.00 14.75
2006-07 497.51# 39.90# 0.00 0.00 14.48**
* Excluding other beans.
** Assuming import level in 2006-07 at the level of 2005-06 # Import during April- July 2006
2.67 The imports of pulses have a definite impact on the supply position. For
calculating supply, it is assumed that the production in the crop year (July-June)
is available for consumption in the following year. On this basis, the supply of
pulses increased to a record level at 14.08 million tonnes in 2004-05 (FiscalYear)
from 11.32 million tonnes in 2003-04, since the production as well increased
from 11.13 million tonnes in 2002-03 crop year to 14.91 million tonnes in 2003-04
crop year (Table 2.8). This supply of pulses could not be sustained in the
subsequent years. The supply decreased to 12.73 million tonnes in 2005-06 (FY)
and further to 12.06 million tonnes in 2006-07 (FY) because of continuous fall in
production in the relevant crop years to 13.13 million tonnes and 13.36 million
tonnes. From the break up of the imports of pulses, it is observed that after
2002-03 the import of Moong and Urad was reduced to nil as against a quantity
of 263 thousand tonnes and 36 thousand tonnes respectively in 2002-03. This
shows that the domestic supply of Moong and Urad could not be augmented
even by imports as these pulses are hardly grown in other pulses growing
countries. Thus the entire demand for kharif pulses is met by imports of Tur and
other varieties which are used for adulteration in processing basin (Gram Flour).
The substantial fall in the supply of pulses is reflected in the wholesale prices of
Tur which prevailed at a very high level in the range of Rs. 1300 per quintal in
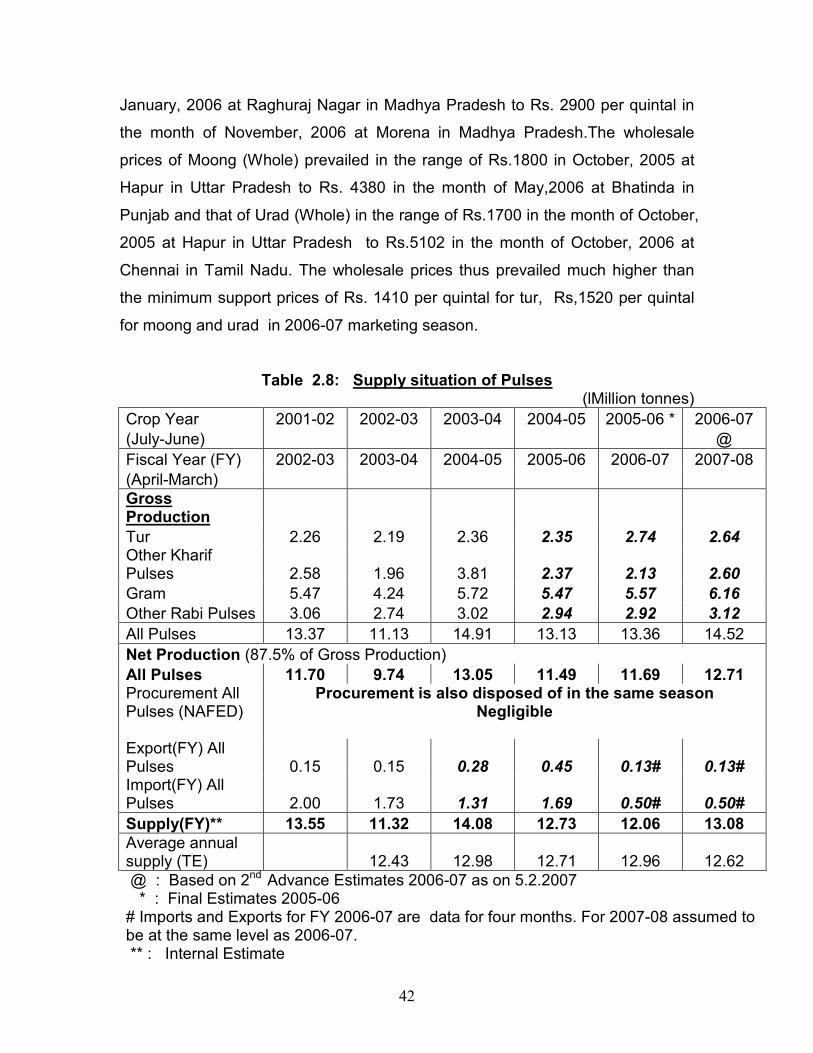
42
January, 2006 at Raghuraj Nagar in Madhya Pradesh to Rs. 2900 per quintal in
the month of November, 2006 at Morena in Madhya Pradesh.The wholesale
prices of Moong (Whole) prevailed in the range of Rs.1800 in October, 2005 at
Hapur in Uttar Pradesh to Rs. 4380 in the month of May,2006 at Bhatinda in
Punjab and that of Urad (Whole) in the range of Rs.1700 in the month of October,
2005 at Hapur in Uttar Pradesh to Rs.5102 in the month of October, 2006 at
Chennai in Tamil Nadu. The wholesale prices thus prevailed much higher than
the minimum support prices of Rs. 1410 per quintal for tur, Rs,1520 per quintal
for moong and urad in 2006-07 marketing season.
Table 2.8: Supply situation of Pulses (lMillion tonnes)
Crop Year 2001-02 2002-03 2003-04 2004-05 2005-06 * 2006-07
(July-June) @
Fiscal Year (FY) 2002-03 2003-04 2004-05 2005-06 2006-07 2007-08
(April-March) Gross Production
Tur 2.26 2.19 2.36 2.35 2.74 2.64 Other Kharif Pulses 2.58 1.96 3.81 2.37 2.13 2.60
Gram 5.47 4.24 5.72 5.47 5.57 6.16
Other Rabi Pulses 3.06 2.74 3.02 2.94 2.92 3.12
All Pulses 13.37 11.13 14.91 13.13 13.36 14.52
Net Production (87.5% of Gross Production)
All Pulses 11.70 9.74 13.05 11.49 11.69 12.71 Procurement All Pulses (NAFED)
Procurement is also disposed of in the same season Negligible
Export(FY) All Pulses 0.15 0.15 0.28 0.45 0.13# 0.13# Import(FY) All Pulses 2.00 1.73 1.31 1.69 0.50# 0.50#
Supply(FY)** 13.55 11.32 14.08 12.73 12.06 13.08 Average annual supply (TE) 12.43 12.98 12.71 12.96 12.62 @ : Based on 2nd Advance Estimates 2006-07 as on 5.2.2007 * : Final Estimates 2005-06 # Imports and Exports for FY 2006-07 are data for four months. For 2007-08 assumed to be at the same level as 2006-07. ** : Internal Estimate
43
2.68 The NAFED may not be able to procure kharif pulses (tur, moong and
urad) in 2006 kharif marketing season because the MSP of kharif pulses is
substantially lower than the prevailing market prices. NAFED could not procure
any pulses because the market prices ruled above the MSP. However, in the
2003-04 season, NAFED had procured 1.52 lakh tonnes of Urad.
(Table 2.3)
Oilseeds
2.69 India is one of the largest producers of oilseeds in the world and this
sector occupies an important position in the agricultural economy, accounting for
the estimated production of about 279.79 lakh tonnes of nine cultivated oilseeds
during the year 2005-06. India is fortunate in having a wide range of oilseeds
crops grown in its different agro-climatic zones. Groundnut, rapeseed/mustard,
seasame, safflower, linseed, nigerseed, castorseed are the major traditionally
cultivated oilseeds. Soyabean and sunflower have also assumed importance in
recent years. India contributes about 7-8 per cent of the world oilseeds
production. Its share in world production is as high as 24 per cent for groundnut,
23 per cent for sesamum, 16 per cent for rapeseed and 66 per cent for castor
seed. Groundnut in shell forms 11 per cent of world exports and sesamum forms
17 per cent. India’s productivity is, however, quite low, around 50 per cent of the
world average and even less in the case of soyabean.
2.70 The area under oilseeds cultivation has been estimated at about 27.52
million hectares in 2005-06, compared with 16.64 million hectares in 1970-71.
The oilseeds area and hence production is concentrated in central and southern
parts of India, mainly in Rajasthan, Madhya Pradesh, Gujarat, Maharashtra,
Karnataka and Andhra Pradesh. India produces nine major oilseeds, of which,
the three oilseeds, viz, groundnut, soyabean and mustard together account for
about 85 per cent of the total production. Total production of the nine oilseeds
has depicted a rise over the years from 96.30 lakh tonnes in 1970-71 to an
average of 213.44 lakh tonnes per annum during the decade ended 1999-2000.
This is attributed to expansion of area under cultivation and increase in yield, due
44
to concerted policy initiatives oriented towards achieving self sufficiency in edible
oils in the country. Oilseeds production witnessed a set-back after 1998-99 with
the production declining sharply to 148.38 lakh tonnes in 2002-03, due to failure
of monsoon, as the coverage of oilseeds area under irrigation has been in the
range of 23 to 26 per cent and the crops are mostly grown under rainfed
conditions. (Table 2.1)
2.71 Production of oilseeds staged a remarkable recovery in 2003-04 to
251.86 lakh tonnes primarily due to good, timely and evenly distributed monsoon,
and surpassed the previous record production of 247.5 lakh tonnes achieved in
1998-99 but fell to 243.64 lakh tonnes in the following year. As per the latest
estimates for 2005-06 (as on 05-02-2007), oilseeds production is estimated to
have surged to a new peak of 279.79 lakh tonnes, showing a sharp increase of
27.93 lakh tonnes (about 11.11 per cent) over the previous record level of 251.86
lakh tonnes reached in 2003-04. Despite the marginal deficiency in the overall
seasonal rainfall, kharif 2005-06 oilseeds production is estimated to have
increased by about 0.58 per cent from 166.72 lakh tonnes in 2003-04 to 167.68
lakh tonnes in 2005-06, supported by higher production of sunflower and
soyabean. Rabi oilseeds production in 2005-06 is estimated to have recorded a
large increase of 10.06 lakh tonnes (about 9.86 per cent) to 112.11 lakh tones
over the previous year, largely due to increases in production of rapeseed &
mustard, and rabi groundnut and sunflower seeds. (Table 2.1)
2.72 As per the Second Advance Estimates (05-02-2007), oilseeds
production in 2006-07 is estimated to record a sharp decline of 15.58 per cent to
236.19 lakh tonnes from the final estimate of 279.79 lakh tonnes for 2005-06.
The kharif, 2006 oilseeds production is estimated to have nose-dived by 30.54
lakh tonnes (18.21 per cent) from 167.68 lakh tonnes in 2005-06 to 137.14 lakh
tonnes in 2006-07, solely due to a decline of over 31 lakh tonnes in groundnut
production. The rabi oilseeds production is also estimated to decline by 13.06
lakh tonnes or 11.65 per cent to 99.05 lakh tonnes, largely reflecting anticipated
declines in production of groundnut and rapeseed & mustard.
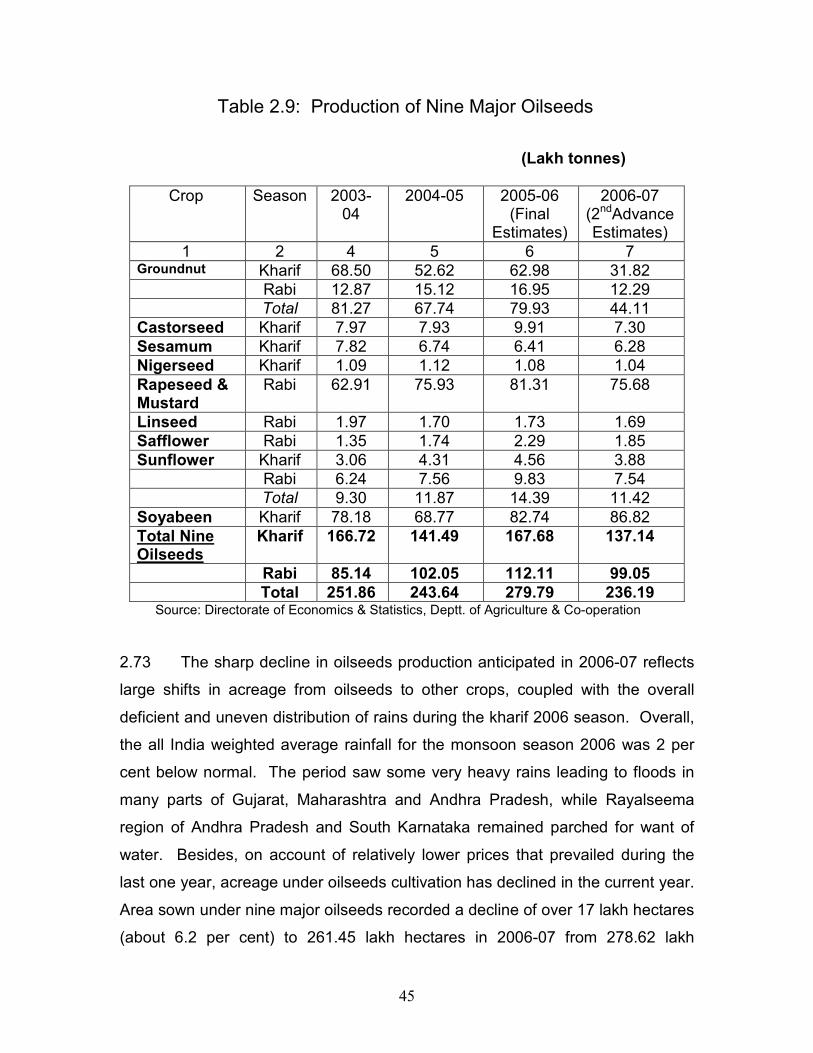
45
Table 2.9: Production of Nine Major Oilseeds
(Lakh tonnes)
Crop Season 2003-04
2004-05
2005-06 (Final
Estimates)
2006-07 (2ndAdvance Estimates)
1 2 4 5 6 7 Groundnut Kharif 68.50 52.62 62.98 31.82 Rabi 12.87 15.12 16.95 12.29 Total 81.27 67.74 79.93 44.11 Castorseed Kharif 7.97 7.93 9.91 7.30 Sesamum Kharif 7.82 6.74 6.41 6.28 Nigerseed Kharif 1.09 1.12 1.08 1.04 Rapeseed & Mustard
Rabi 62.91 75.93 81.31 75.68
Linseed Rabi 1.97 1.70 1.73 1.69 Safflower Rabi 1.35 1.74 2.29 1.85 Sunflower Kharif 3.06 4.31 4.56 3.88 Rabi 6.24 7.56 9.83 7.54 Total 9.30 11.87 14.39 11.42 Soyabeen Kharif 78.18 68.77 82.74 86.82 Total Nine Oilseeds
Kharif 166.72 141.49 167.68 137.14
Rabi 85.14 102.05 112.11 99.05 Total 251.86 243.64 279.79 236.19
Source: Directorate of Economics & Statistics, Deptt. of Agriculture & Co-operation
2.73 The sharp decline in oilseeds production anticipated in 2006-07 reflects
large shifts in acreage from oilseeds to other crops, coupled with the overall
deficient and uneven distribution of rains during the kharif 2006 season. Overall,
the all India weighted average rainfall for the monsoon season 2006 was 2 per
cent below normal. The period saw some very heavy rains leading to floods in
many parts of Gujarat, Maharashtra and Andhra Pradesh, while Rayalseema
region of Andhra Pradesh and South Karnataka remained parched for want of
water. Besides, on account of relatively lower prices that prevailed during the
last one year, acreage under oilseeds cultivation has declined in the current year.
Area sown under nine major oilseeds recorded a decline of over 17 lakh hectares
(about 6.2 per cent) to 261.45 lakh hectares in 2006-07 from 278.62 lakh
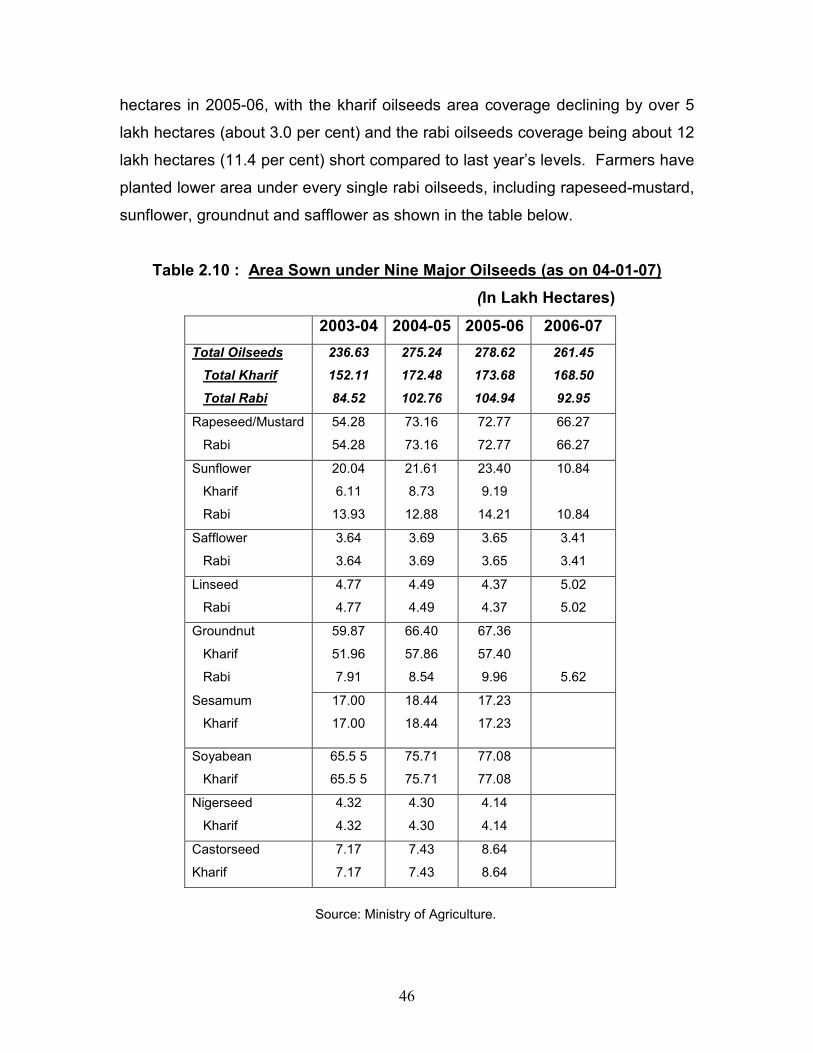
46
hectares in 2005-06, with the kharif oilseeds area coverage declining by over 5
lakh hectares (about 3.0 per cent) and the rabi oilseeds coverage being about 12
lakh hectares (11.4 per cent) short compared to last year’s levels. Farmers have
planted lower area under every single rabi oilseeds, including rapeseed-mustard,
sunflower, groundnut and safflower as shown in the table below.
Table 2.10 : Area Sown under Nine Major Oilseeds (as on 04-01-07)
(In Lakh Hectares)
2003-04 2004-05 2005-06 2006-07
Total Oilseeds
Total Kharif
Total Rabi
236.63
152.11
84.52
275.24
172.48
102.76
278.62
173.68
104.94
261.45
168.50
92.95
Rapeseed/Mustard
Rabi
54.28
54.28
73.16
73.16
72.77
72.77
66.27
66.27
Sunflower
Kharif
Rabi
20.04
6.11
13.93
21.61
8.73
12.88
23.40
9.19
14.21
10.84
10.84
Safflower
Rabi
3.64
3.64
3.69
3.69
3.65
3.65
3.41
3.41
Linseed
Rabi
4.77
4.77
4.49
4.49
4.37
4.37
5.02
5.02
Groundnut
Kharif
Rabi
59.87
51.96
7.91
66.40
57.86
8.54
67.36
57.40
9.96
5.62
Sesamum
Kharif
17.00
17.00
18.44
18.44
17.23
17.23
Soyabean
Kharif
65.5 5
65.5 5
75.71
75.71
77.08
77.08
Nigerseed
Kharif
4.32
4.32
4.30
4.30
4.14
4.14
Castorseed
Kharif
7.17
7.17
7.43
7.43
8.64
8.64
Source: Ministry of Agriculture.
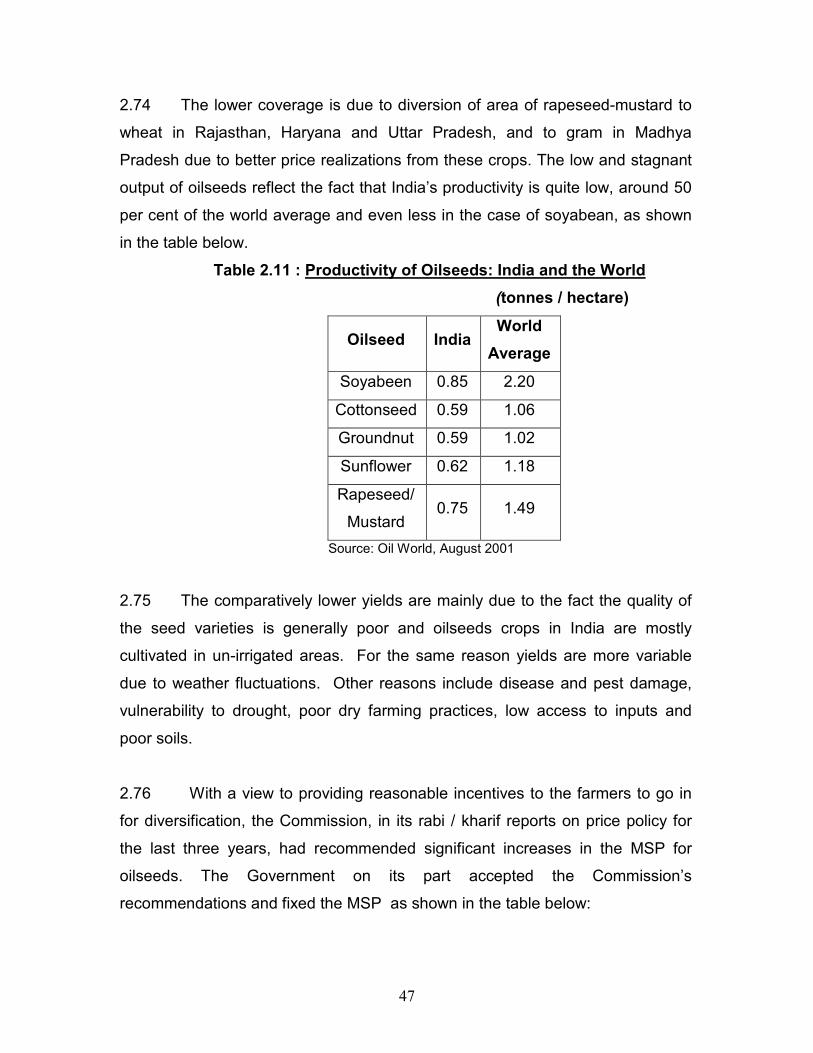
47
2.74 The lower coverage is due to diversion of area of rapeseed-mustard to
wheat in Rajasthan, Haryana and Uttar Pradesh, and to gram in Madhya
Pradesh due to better price realizations from these crops. The low and stagnant
output of oilseeds reflect the fact that India’s productivity is quite low, around 50
per cent of the world average and even less in the case of soyabean, as shown
in the table below.
Table 2.11 : Productivity of Oilseeds: India and the World
(tonnes / hectare)
Oilseed India World
Average
Soyabeen 0.85 2.20
Cottonseed 0.59 1.06
Groundnut 0.59 1.02
Sunflower 0.62 1.18
Rapeseed/
Mustard 0.75 1.49
Source: Oil World, August 2001
2.75 The comparatively lower yields are mainly due to the fact the quality of
the seed varieties is generally poor and oilseeds crops in India are mostly
cultivated in un-irrigated areas. For the same reason yields are more variable
due to weather fluctuations. Other reasons include disease and pest damage,
vulnerability to drought, poor dry farming practices, low access to inputs and
poor soils.
2.76 With a view to providing reasonable incentives to the farmers to go in
for diversification, the Commission, in its rabi / kharif reports on price policy for
the last three years, had recommended significant increases in the MSP for
oilseeds. The Government on its part accepted the Commission’s
recommendations and fixed the MSP as shown in the table below:
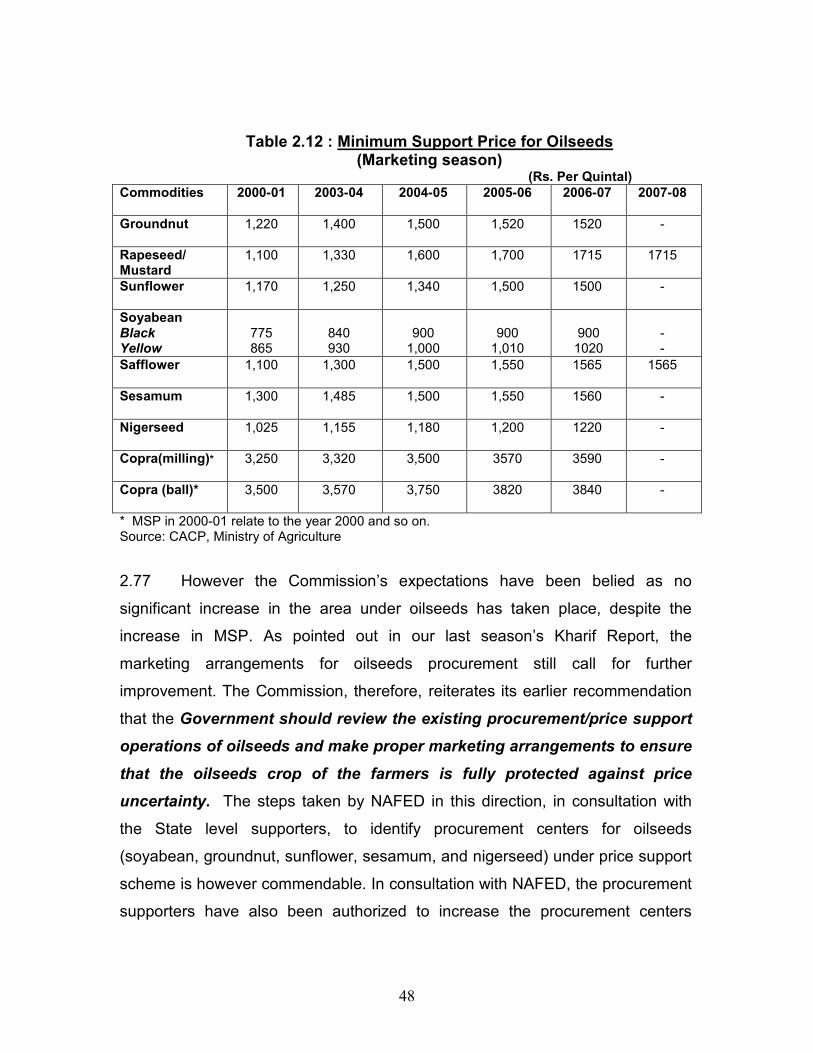
48
Table 2.12 : Minimum Support Price for Oilseeds (Marketing season)
(Rs. Per Quintal) Commodities 2000-01 2003-04 2004-05 2005-06 2006-07 2007-08
Groundnut 1,220 1,400 1,500 1,520 1520 -
Rapeseed/ Mustard
1,100 1,330 1,600 1,700 1715 1715
Sunflower 1,170 1,250 1,340 1,500 1500 -
Soyabean Black Yellow
775 865
840 930
900
1,000
900
1,010
900 1020
- -
Safflower 1,100 1,300 1,500 1,550 1565 1565
Sesamum 1,300 1,485 1,500 1,550 1560 -
Nigerseed 1,025 1,155 1,180 1,200 1220 -
Copra(milling)* 3,250 3,320 3,500 3570 3590 -
Copra (ball)* 3,500 3,570 3,750 3820 3840 -
* MSP in 2000-01 relate to the year 2000 and so on. Source: CACP, Ministry of Agriculture
2.77 However the Commission’s expectations have been belied as no
significant increase in the area under oilseeds has taken place, despite the
increase in MSP. As pointed out in our last season’s Kharif Report, the
marketing arrangements for oilseeds procurement still call for further
improvement. The Commission, therefore, reiterates its earlier recommendation
that the Government should review the existing procurement/price support
operations of oilseeds and make proper marketing arrangements to ensure
that the oilseeds crop of the farmers is fully protected against price
uncertainty. The steps taken by NAFED in this direction, in consultation with
the State level supporters, to identify procurement centers for oilseeds
(soyabean, groundnut, sunflower, sesamum, and nigerseed) under price support
scheme is however commendable. In consultation with NAFED, the procurement
supporters have also been authorized to increase the procurement centers
49
depending upon the arrivals and market situation, so as to give market support
to the growers within a distance of 10 kms from their field.
2.78 Under the Price Support Scheme, NAFED, as central nodal agency,
undertakes procurement of oil seeds as and when prices of any of the oilseeds
fall below the MSP fixed by the Government for a particular crop season. It was
pointed out by the NAFED that price support operations are carried out to protect
the interest of farmers by enabling them to sell their produce at the MSP, when
market prices fall below MSP. However as was elaborated in the last Kharif
Report, the issue of payment of taxes/cess on stocks procured or moved under
price support operations continue to pose a financial burden on NAFED. The
commission, therefore, suggests that the State Governments should consider, in
the public interest, to stop levying various types of taxes, cess, marketing fees
etc. on stocks procured under price support operations and refrain from imposing
inter-state taxes on movement of these stocks from one state to another.
2.79 Against the backdrop of bumper oilseeds crop in 2005-06 oilseeds
prices softened significantly in December, 2005 and remained subdued till April,
2006. The wholesale price of oilseeds, as given by the index, shows a decline of
about 9.45 per cent during the five months between November, 2005 and April,
2006. Since May, 2006, prices started edging up gradually following reports of a
likely lower oilseeds production in 2006-07 due to large shift in area to other
crops and the not so conducive weather conditions. During the eight months,
between April, 2006 and December, 2006, prices went up by about 16.13 per
cent, with the wholesale price index of oilseeds rising from 156.2 in April, 2006 to
181.4 in December, 2006. The movements in price of oilseeds are shared by all
the major oilseeds, as given in the table below:
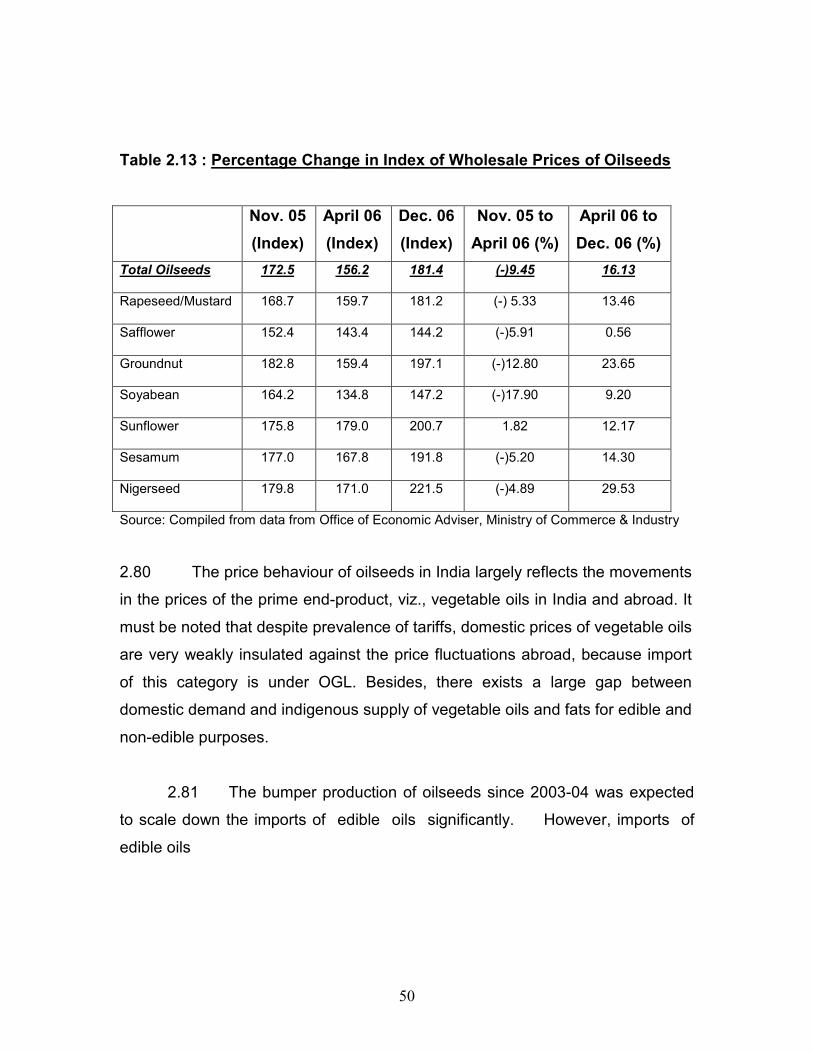
50
Table 2.13 : Percentage Change in Index of Wholesale Prices of Oilseeds
Nov. 05
(Index)
April 06
(Index)
Dec. 06
(Index)
Nov. 05 to
April 06 (%)
April 06 to
Dec. 06 (%)
Total Oilseeds 172.5 156.2 181.4 (-)9.45 16.13
Rapeseed/Mustard 168.7 159.7 181.2 (-) 5.33 13.46
Safflower 152.4 143.4 144.2 (-)5.91 0.56
Groundnut 182.8 159.4 197.1 (-)12.80 23.65
Soyabean 164.2 134.8 147.2 (-)17.90 9.20
Sunflower 175.8 179.0 200.7 1.82 12.17
Sesamum 177.0 167.8 191.8 (-)5.20 14.30
Nigerseed 179.8 171.0 221.5 (-)4.89 29.53
Source: Compiled from data from Office of Economic Adviser, Ministry of Commerce & Industry
2.80 The price behaviour of oilseeds in India largely reflects the movements
in the prices of the prime end-product, viz., vegetable oils in India and abroad. It
must be noted that despite prevalence of tariffs, domestic prices of vegetable oils
are very weakly insulated against the price fluctuations abroad, because import
of this category is under OGL. Besides, there exists a large gap between
domestic demand and indigenous supply of vegetable oils and fats for edible and
non-edible purposes.
2.81 The bumper production of oilseeds since 2003-04 was expected
to scale down the imports of edible oils significantly. However, imports of
edible oils
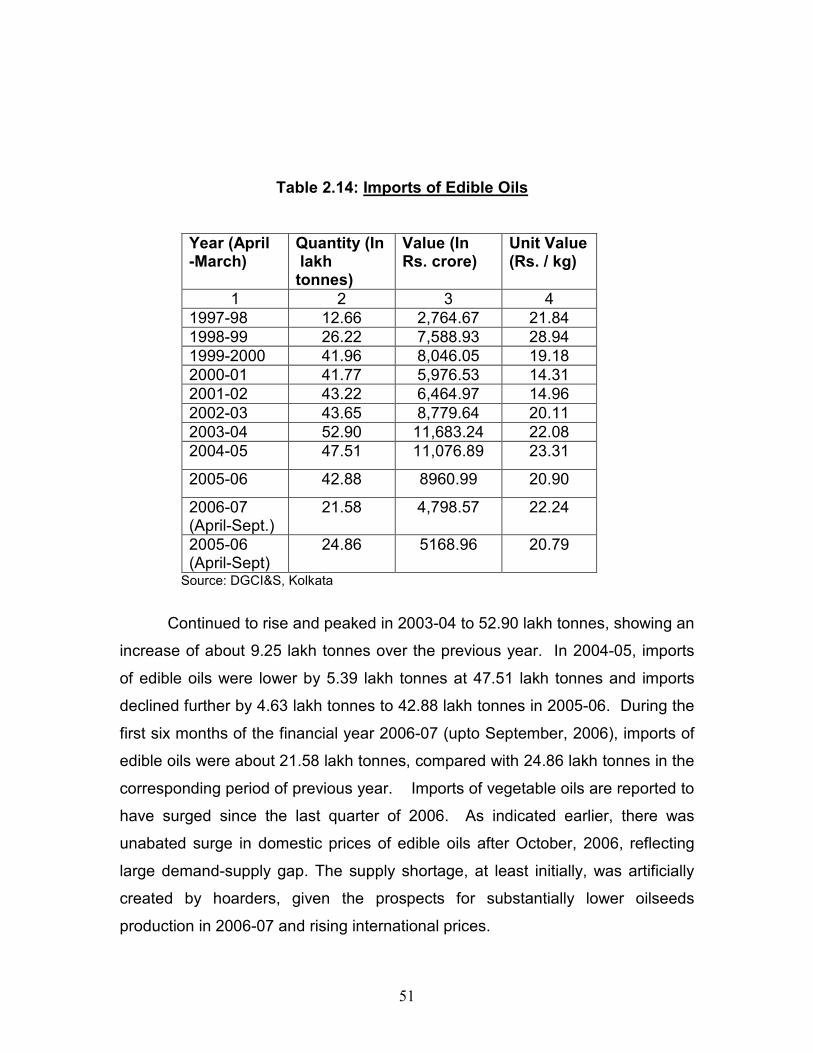
51
Table 2.14: Imports of Edible Oils
Year (April -March)
Quantity (In lakh tonnes)
Value (In Rs. crore)
Unit Value (Rs. / kg)
1 2 3 4 1997-98 12.66 2,764.67 21.84 1998-99 26.22 7,588.93 28.94 1999-2000 41.96 8,046.05 19.18 2000-01 41.77 5,976.53 14.31 2001-02 43.22 6,464.97 14.96 2002-03 43.65 8,779.64 20.11 2003-04 52.90 11,683.24 22.08 2004-05 47.51 11,076.89 23.31
2005-06 42.88 8960.99 20.90
2006-07 (April-Sept.)
21.58 4,798.57 22.24
2005-06 (April-Sept)
24.86 5168.96 20.79
Source: DGCI&S, Kolkata
Continued to rise and peaked in 2003-04 to 52.90 lakh tonnes, showing an
increase of about 9.25 lakh tonnes over the previous year. In 2004-05, imports
of edible oils were lower by 5.39 lakh tonnes at 47.51 lakh tonnes and imports
declined further by 4.63 lakh tonnes to 42.88 lakh tonnes in 2005-06. During the
first six months of the financial year 2006-07 (upto September, 2006), imports of
edible oils were about 21.58 lakh tonnes, compared with 24.86 lakh tonnes in the
corresponding period of previous year. Imports of vegetable oils are reported to
have surged since the last quarter of 2006. As indicated earlier, there was
unabated surge in domestic prices of edible oils after October, 2006, reflecting
large demand-supply gap. The supply shortage, at least initially, was artificially
created by hoarders, given the prospects for substantially lower oilseeds
production in 2006-07 and rising international prices.
52
2.82 With a view to control prices of oils, the Government has
effected a cut in the import duty on crude and refined edible oils by 10 to 12.5
percentage points with effect from 31-01-2007. Following this reduction, import
duty on crude palm oil, crude palmolein and other fractions of crude palm oil
have been brought down from 70 per cent to 60 per cent, while that on RBD
palm oil, RBD palmolein and other refined palm oils from 80 per cent to 67.5 per
cent. Import duty on crude sunflower oil has also been slashed down from 75 per
cent to 65 per cent and that for refined sunflower oil from 85 per cent to 75 per
cent. It has been further decided to keep the tariff values (the base prices on
which duties are computed) on palm oils frozen at their end-July, 2006 levels.
2.83 As a result, imports during the full year 2006-07 are likely to be
larger by about 10 lakh tonnes compared with the level in the previous year. The
rising trend in imports of edible oils, despite good harvests of oilseeds in the
country during the past few years points to the buoyancy in domestic
consumption of edible oils, which is estimated to rise by about 5 to 6 per cent per
annum, and the policy of the Government to permit this item of mass
consumption under OGL to have a rein on the domestic price situation. While
there is optimism about the small and short-term ripple effects, the customs duty
cut on edible oils is unlikely to have any long-term impact on prices, as it would
not change the demand-supply dynamics in the domestic market, on which
prices are basically determined. Therefore the long-term vision of the
government should be on increasing the yield by introducing genetically
improved seeds and provide better irrigation system and fertilizers.
2.84 Another disconcerting aspect relating to imports of edible oils is
the rising costs reflected in the unit value. As is clear from the above Table, the
unit value of imports of edible oils after declining from Rs. 28.94 per kg .during
1998-99 to Rs.14.31 per kg. in 2000-2001, increased sharply to Rs.20.11 per kg
. in 2002-03, and further to Rs. 23.31 per kg. during 2004-05. The softening of
international prices of edible oils in 2005 has reflected in the unit value of imports
declining significantly to Rs 20.90 per kg. in 2005-06. During April-Sept, 2006,
unit value of imports (at Rs.22.24) had risen by about 7 per cent, with the
53
prospects for further rise in the second half of 2006-07. As shown in the table,
the movements in quantity and unit value over the years reflect the level of
edible oil imports in value terms, rising sharply from Rs.2765 crore in 1997-98 to
Rs.11683 crore in 2003-04 and declining to Rs.8961 crore in 2005-06.
2.85 India is one of the world’s largest importers of edible oils. The trend of
generally rising cost of imports signify not only higher spending of foreign
exchange on imported edible oils, but also significant risk and uncertainty
associated with the movements in international prices of edible oils. Imports can
not be viewed as a permanent way out of the endemic shortages in this
commodity. This gives a clear mandate for policy stance that the dependence
on imported edible oils needs to be reduced in the coming years. As shown in
the table below, imports of edible oils, as a percentage of the domestic
consumption (net domestic production plus imports), increased from over 17 per
cent in 1997-98 to about 48 per cent by 2002-03. The sharp increase in
domestic production of oilseeds has helped to moderate the extent of
dependence of the country on imported edible oils. The dependence ratio came
down to about 42.5 per cent in 2003-04 and further down sharply to about 38.2
per cent in 2004-05 and about 35.0 per cent in 2005-06. The reversal in the
rising trend of dependence after 2003-04 was a matter of great satisfaction, but
gives no room for complacency in taking necessary steps towards strengthening
measures to increase oilseeds production and thus production of edible oils in
the country. This is relevant in this context of recent spurt in imports of edible oil
to control rising prices in the domestic market. The estimated imports of 45.00
million tonnes for 2006-07 raises import dependence to 39.5 per cent.
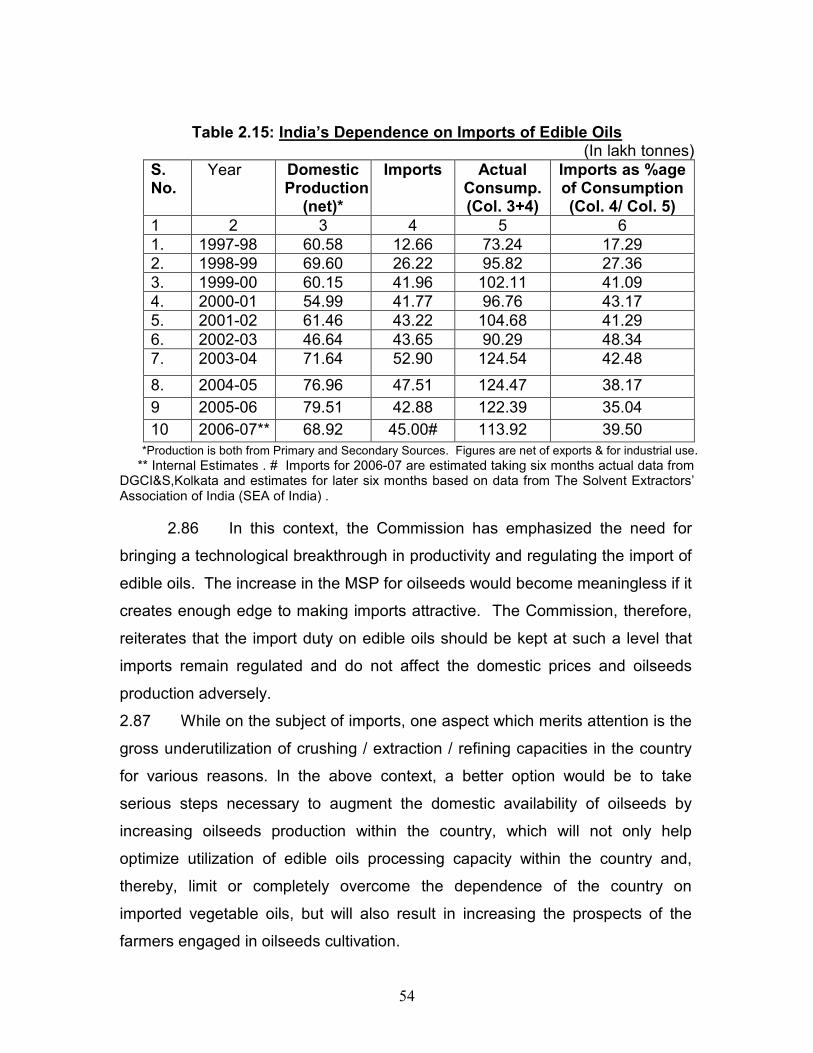
54
Table 2.15: India’s Dependence on Imports of Edible Oils (In lakh tonnes)
S. No.
Year Domestic Production (net)*
Imports
Actual Consump. (Col. 3+4)
Imports as %age of Consumption (Col. 4/ Col. 5)
1 2 3 4 5 6 1. 1997-98 60.58 12.66 73.24 17.29 2. 1998-99 69.60 26.22 95.82 27.36 3. 1999-00 60.15 41.96 102.11 41.09 4. 2000-01 54.99 41.77 96.76 43.17 5. 2001-02 61.46 43.22 104.68 41.29 6. 2002-03 46.64 43.65 90.29 48.34 7. 2003-04 71.64 52.90 124.54 42.48
8. 2004-05 76.96 47.51 124.47 38.17
9 2005-06 79.51 42.88 122.39 35.04
10 2006-07** 68.92 45.00# 113.92 39.50
*Production is both from Primary and Secondary Sources. Figures are net of exports & for industrial use. ** Internal Estimates . # Imports for 2006-07 are estimated taking six months actual data from DGCI&S,Kolkata and estimates for later six months based on data from The Solvent Extractors’ Association of India (SEA of India) .
2.86 In this context, the Commission has emphasized the need for
bringing a technological breakthrough in productivity and regulating the import of
edible oils. The increase in the MSP for oilseeds would become meaningless if it
creates enough edge to making imports attractive. The Commission, therefore,
reiterates that the import duty on edible oils should be kept at such a level that
imports remain regulated and do not affect the domestic prices and oilseeds
production adversely.
2.87 While on the subject of imports, one aspect which merits attention is the
gross underutilization of crushing / extraction / refining capacities in the country
for various reasons. In the above context, a better option would be to take
serious steps necessary to augment the domestic availability of oilseeds by
increasing oilseeds production within the country, which will not only help
optimize utilization of edible oils processing capacity within the country and,
thereby, limit or completely overcome the dependence of the country on
imported vegetable oils, but will also result in increasing the prospects of the
farmers engaged in oilseeds cultivation.
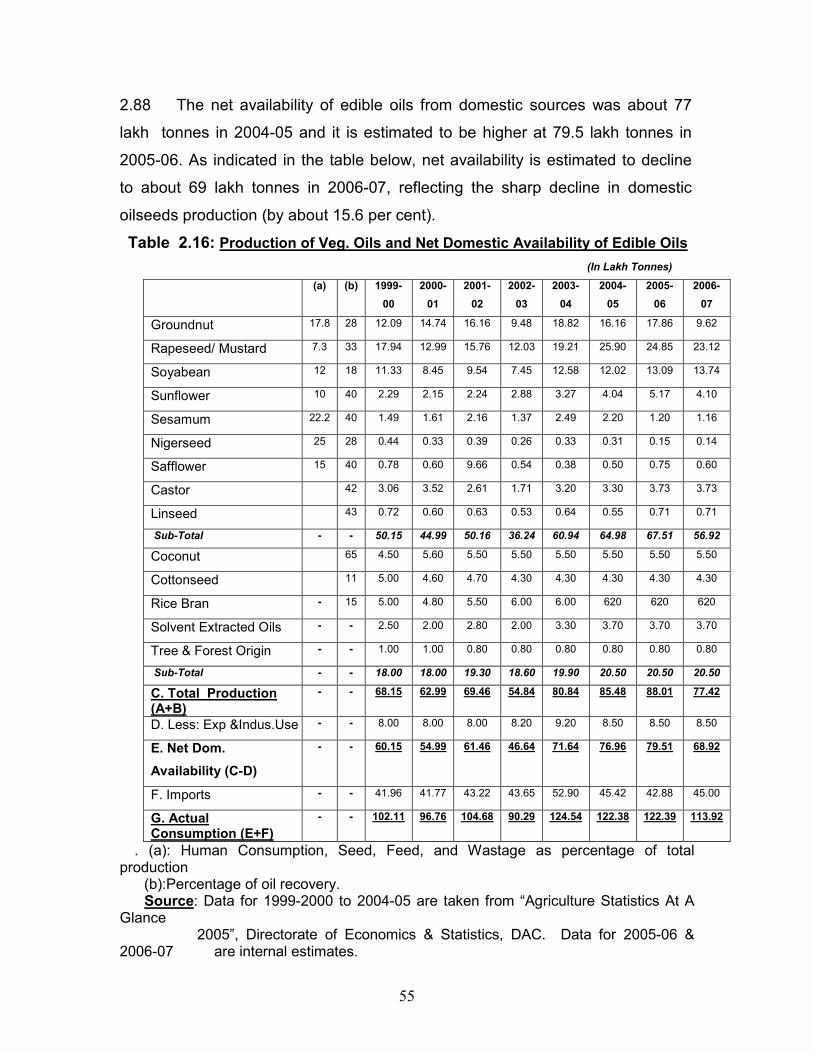
55
2.88 The net availability of edible oils from domestic sources was about 77
lakh tonnes in 2004-05 and it is estimated to be higher at 79.5 lakh tonnes in
2005-06. As indicated in the table below, net availability is estimated to decline
to about 69 lakh tonnes in 2006-07, reflecting the sharp decline in domestic
oilseeds production (by about 15.6 per cent).
Table 2.16: Production of Veg. Oils and Net Domestic Availability of Edible Oils
(In Lakh Tonnes)
(a) (b) 1999-
00
2000-
01
2001-
02
2002-
03
2003-
04
2004-
05
2005-
06
2006-
07
Groundnut 17.8 28 12.09 14.74 16.16 9.48 18.82 16.16 17.86 9.62
Rapeseed/ Mustard 7.3 33 17.94 12.99 15.76 12.03 19.21 25.90 24.85 23.12
Soyabean 12 18 11.33 8.45 9.54 7.45 12.58 12.02 13.09 13.74
Sunflower 10 40 2.29 2.15 2.24 2.88 3.27 4.04 5.17 4.10
Sesamum 22.2 40 1.49 1.61 2.16 1.37 2.49 2.20 1.20 1.16
Nigerseed 25 28 0.44 0.33 0.39 0.26 0.33 0.31 0.15 0.14
Safflower 15 40 0.78 0.60 9.66 0.54 0.38 0.50 0.75 0.60
Castor 42 3.06 3.52 2.61 1.71 3.20 3.30 3.73 3.73
Linseed 43 0.72 0.60 0.63 0.53 0.64 0.55 0.71 0.71
Sub-Total - - 50.15 44.99 50.16 36.24 60.94 64.98 67.51 56.92
Coconut 65 4.50 5.60 5.50 5.50 5.50 5.50 5.50 5.50
Cottonseed 11 5.00 4.60 4.70 4.30 4.30 4.30 4.30 4.30
Rice Bran - 15 5.00 4.80 5.50 6.00 6.00 620 620 620
Solvent Extracted Oils - - 2.50 2.00 2.80 2.00 3.30 3.70 3.70 3.70
Tree & Forest Origin - - 1.00 1.00 0.80 0.80 0.80 0.80 0.80 0.80
Sub-Total - - 18.00 18.00 19.30 18.60 19.90 20.50 20.50 20.50
C. Total Production (A+B)
- - 68.15 62.99 69.46 54.84 80.84 85.48 88.01 77.42
D. Less: Exp &Indus.Use - - 8.00 8.00 8.00 8.20 9.20 8.50 8.50 8.50
E. Net Dom.
Availability (C-D)
- - 60.15 54.99 61.46 46.64 71.64 76.96 79.51 68.92
F. Imports - - 41.96 41.77 43.22 43.65 52.90 45.42 42.88 45.00
G. Actual Consumption (E+F)
- - 102.11 96.76 104.68 90.29 124.54 122.38 122.39 113.92
. (a): Human Consumption, Seed, Feed, and Wastage as percentage of total production (b):Percentage of oil recovery. Source: Data for 1999-2000 to 2004-05 are taken from “Agriculture Statistics At A Glance 2005”, Directorate of Economics & Statistics, DAC. Data for 2005-06 & 2006-07 are internal estimates.
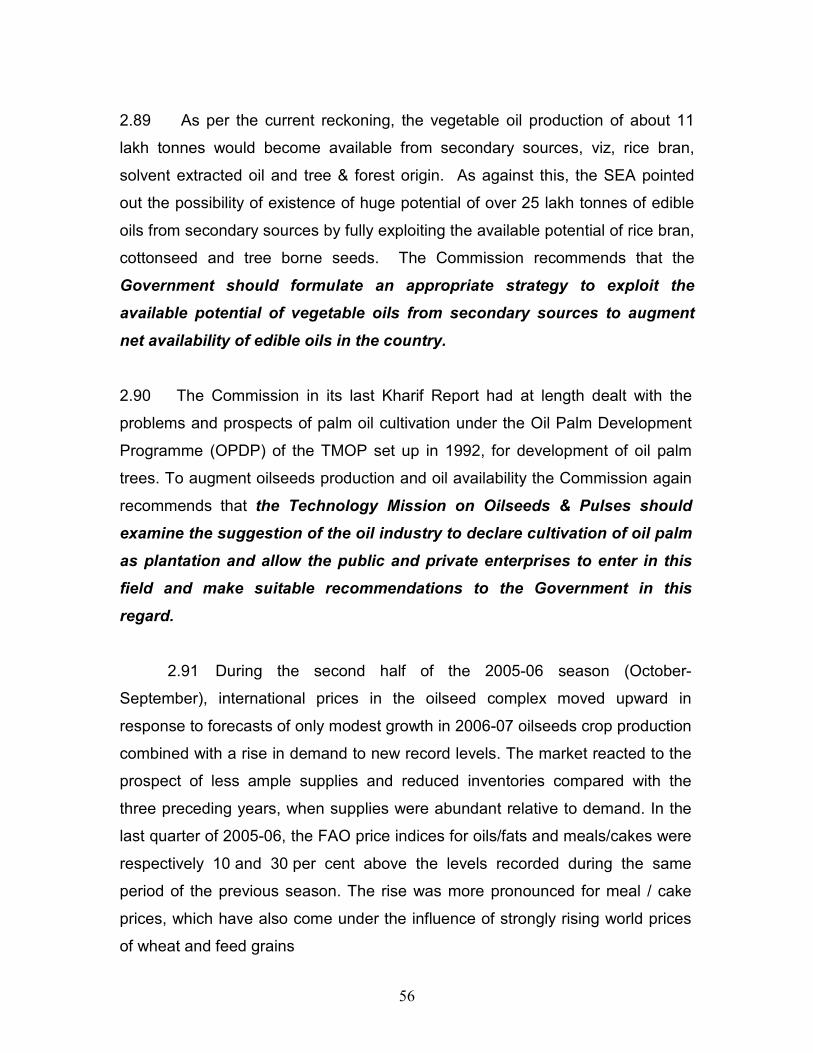
56
2.89 As per the current reckoning, the vegetable oil production of about 11
lakh tonnes would become available from secondary sources, viz, rice bran,
solvent extracted oil and tree & forest origin. As against this, the SEA pointed
out the possibility of existence of huge potential of over 25 lakh tonnes of edible
oils from secondary sources by fully exploiting the available potential of rice bran,
cottonseed and tree borne seeds. The Commission recommends that the
Government should formulate an appropriate strategy to exploit the
available potential of vegetable oils from secondary sources to augment
net availability of edible oils in the country.
2.90 The Commission in its last Kharif Report had at length dealt with the
problems and prospects of palm oil cultivation under the Oil Palm Development
Programme (OPDP) of the TMOP set up in 1992, for development of oil palm
trees. To augment oilseeds production and oil availability the Commission again
recommends that the Technology Mission on Oilseeds & Pulses should
examine the suggestion of the oil industry to declare cultivation of oil palm
as plantation and allow the public and private enterprises to enter in this
field and make suitable recommendations to the Government in this
regard.
2.91 During the second half of the 2005-06 season (October-
September), international prices in the oilseed complex moved upward in
response to forecasts of only modest growth in 2006-07 oilseeds crop production
combined with a rise in demand to new record levels. The market reacted to the
prospect of less ample supplies and reduced inventories compared with the
three preceding years, when supplies were abundant relative to demand. In the
last quarter of 2005-06, the FAO price indices for oils/fats and meals/cakes were
respectively 10 and 30 per cent above the levels recorded during the same
period of the previous season. The rise was more pronounced for meal / cake
prices, which have also come under the influence of strongly rising world prices
of wheat and feed grains
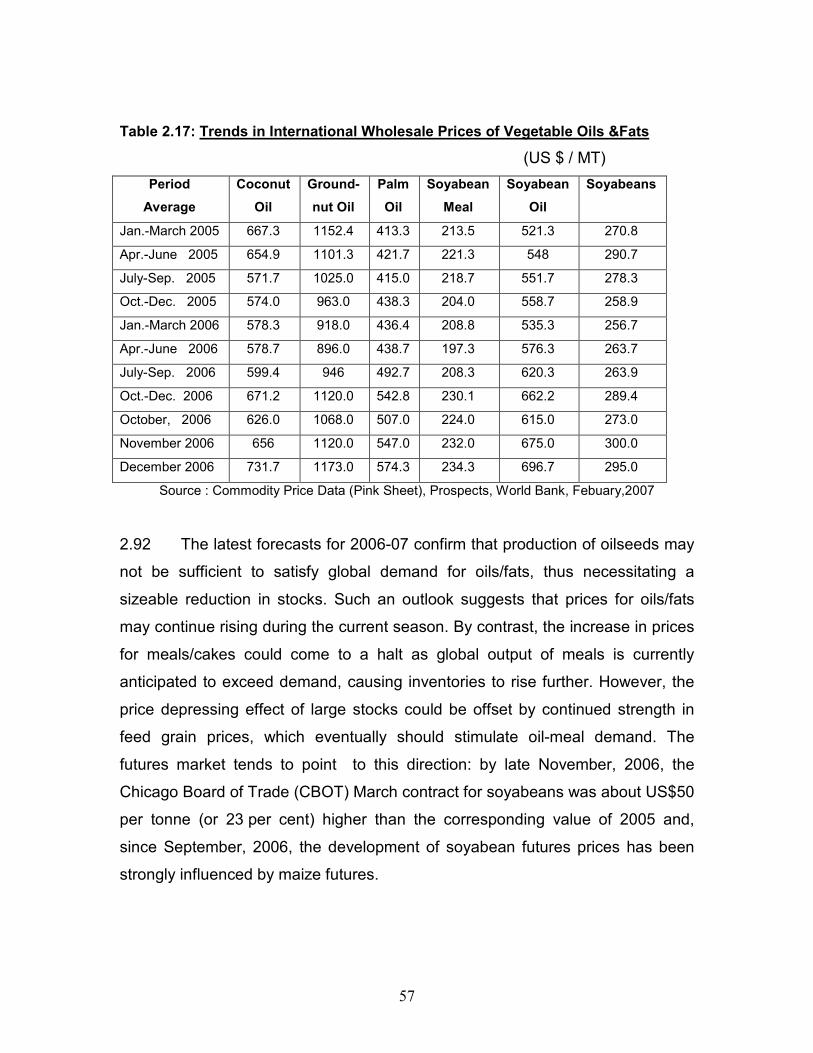
57
Table 2.17: Trends in International Wholesale Prices of Vegetable Oils &Fats
(US $ / MT)
Period
Average
Coconut
Oil
Ground-
nut Oil
Palm
Oil
Soyabean
Meal
Soyabean
Oil
Soyabeans
Jan.-March 2005 667.3 1152.4 413.3 213.5 521.3 270.8
Apr.-June 2005 654.9 1101.3 421.7 221.3 548 290.7
July-Sep. 2005 571.7 1025.0 415.0 218.7 551.7 278.3
Oct.-Dec. 2005 574.0 963.0 438.3 204.0 558.7 258.9
Jan.-March 2006 578.3 918.0 436.4 208.8 535.3 256.7
Apr.-June 2006 578.7 896.0 438.7 197.3 576.3 263.7
July-Sep. 2006 599.4 946 492.7 208.3 620.3 263.9
Oct.-Dec. 2006 671.2 1120.0 542.8 230.1 662.2 289.4
October, 2006 626.0 1068.0 507.0 224.0 615.0 273.0
November 2006 656 1120.0 547.0 232.0 675.0 300.0
December 2006 731.7 1173.0 574.3 234.3 696.7 295.0
Source : Commodity Price Data (Pink Sheet), Prospects, World Bank, Febuary,2007
2.92 The latest forecasts for 2006-07 confirm that production of oilseeds may
not be sufficient to satisfy global demand for oils/fats, thus necessitating a
sizeable reduction in stocks. Such an outlook suggests that prices for oils/fats
may continue rising during the current season. By contrast, the increase in prices
for meals/cakes could come to a halt as global output of meals is currently
anticipated to exceed demand, causing inventories to rise further. However, the
price depressing effect of large stocks could be offset by continued strength in
feed grain prices, which eventually should stimulate oil-meal demand. The
futures market tends to point to this direction: by late November, 2006, the
Chicago Board of Trade (CBOT) March contract for soyabeans was about US$50
per tonne (or 23 per cent) higher than the corresponding value of 2005 and,
since September, 2006, the development of soyabean futures prices has been
strongly influenced by maize futures.
58
2.93 Global 2006/07 oilseed production is currently forecast to increase by
less than one per cent, a considerable slow-down compared with past seasons.
World soybean output is anticipated to expand by 2-3 per cent, reaching a new
record, but this is expected to be offset by declining world production of
rapeseed, groundnut and sunflower seed.
Table 2.18: World production of major oilseeds (million tonnes)
2004/05 2005/06. 2006/07
(estimate) (forecast)
Soyabeans 216.1 218.7 224.3
Cottonseed 44.6 42.3 43.4
Rapeseed 45.9 48.8 46.5
Groundnut (unshelled) 34.7 35.4 33.8
Sunflower 25.4 30.0 29.6
Palm kernels 8.9 9.5 9.6
Copra 5.2 5.2 5.4
Total 380.8 389.9 392.6
Source: Food outlook, FAO- December,2006
Note: The split years bring together northern hemisphere annual crops harvested in the latter part of the first year shown, with southern hemisphere annual crops harvested in the early part of the second year shown. For tree crops, which are produced throughout the year, calendar year production for the second year shown is used.
2.94 Current crop forecasts translate into a below average increase of global
oils/fats production of around 2 per cent. This is due to only a modest increase
in soyabean oil production and a falling rapeseed, groundnut and sunflower oil
output. By contrast, global palm oil production is expected to again rise markedly
in 2007. The projected 7 per cent increase in output is due to a further significant
rise in the area, notably in Indonesia. However, these forecasts remain tentative
as palm oil production could be negatively affected by El Niño conditions. Global
supplies of oils/fats (i.e. 2005/06 ending stocks plus 2006/07 production) are
forecast to augment further, though they should rise markedly less than during
the last two seasons.
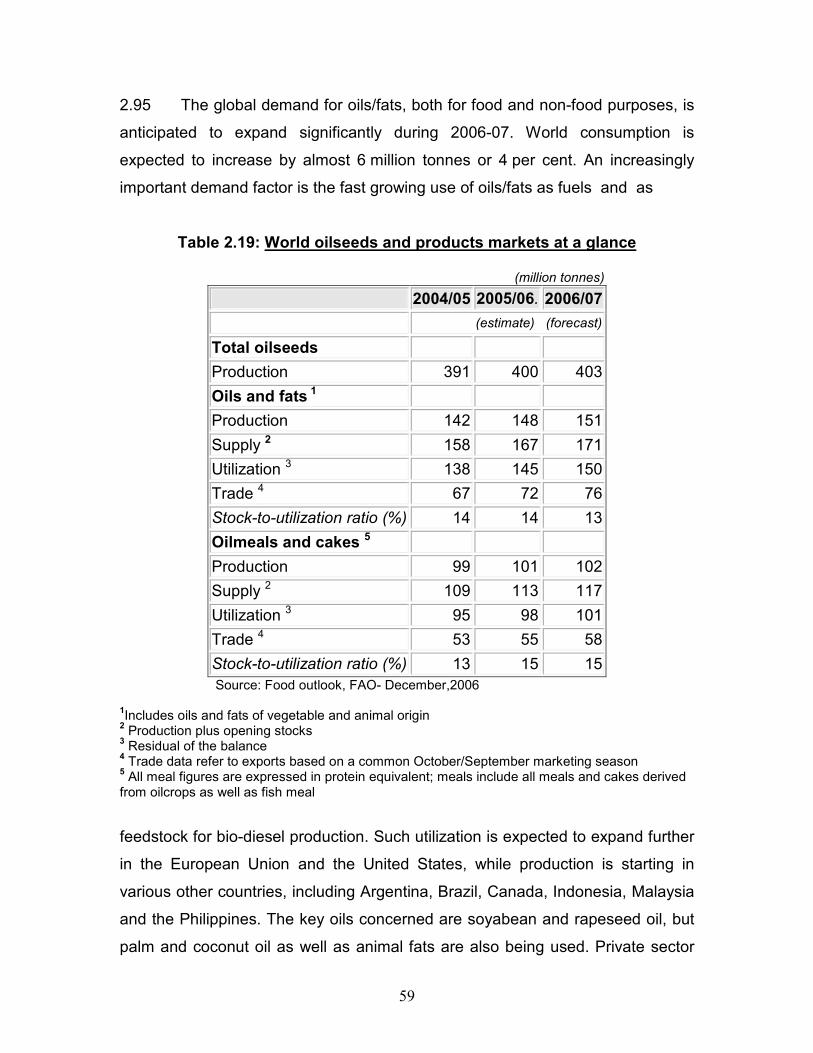
59
2.95 The global demand for oils/fats, both for food and non-food purposes, is
anticipated to expand significantly during 2006-07. World consumption is
expected to increase by almost 6 million tonnes or 4 per cent. An increasingly
important demand factor is the fast growing use of oils/fats as fuels and as
Table 2.19: World oilseeds and products markets at a glance
(million tonnes)
2004/05 2005/06. 2006/07
(estimate) (forecast)
Total oilseeds
Production 391 400 403
Oils and fats 1
Production 142 148 151
Supply 2 158 167 171
Utilization 3 138 145 150
Trade 4 67 72 76
Stock-to-utilization ratio (%) 14 14 13
Oilmeals and cakes 5
Production 99 101 102
Supply 2 109 113 117
Utilization 3 95 98 101
Trade 4 53 55 58
Stock-to-utilization ratio (%) 13 15 15
Source: Food outlook, FAO- December,2006 1Includes oils and fats of vegetable and animal origin 2 Production plus opening stocks 3 Residual of the balance 4 Trade data refer to exports based on a common October/September marketing season 5 All meal figures are expressed in protein equivalent; meals include all meals and cakes derived
from oilcrops as well as fish meal
feedstock for bio-diesel production. Such utilization is expected to expand further
in the European Union and the United States, while production is starting in
various other countries, including Argentina, Brazil, Canada, Indonesia, Malaysia
and the Philippines. The key oils concerned are soyabean and rapeseed oil, but
palm and coconut oil as well as animal fats are also being used. Private sector
60
investment into the development of bio-diesel industries continues to be strong,
irrespective of the uncertain development of mineral oil prices and
notwithstanding the possibility that plants may not be running at full capacity.
Government incentives and other public support measures, together with existing
or prospected mandatory blending requirements, explain this trend. According to
private sources, global utilization of oils/fats as bio-fuels should exceed 10 per
cent of total consumption in 2006/07.
2.96 As to total consumption of oils/fats, the anticipated reduction of
rapeseed, groundnut and sunflower oil supplies should increase the reliance on
soyabean and palm oil in 2006-07. Together the two oils should account for half
of total consumption. Traditionally, the bulk of the expansion in global demand
occurs in the developing world. However, in the last two years, sizeable growth
has also occurred among developed nations due to bio-fuel production in these
countries, a trend that is expected to continue in 2006-07.
2.97 Compared with overall demand, global supplies of oils/fats continue to
be ample, thanks to the availability of large stocks. However, 2006-07 production
per se would not be sufficient to meet demand, therefore necessitating a
reduction in global inventories of about 3 per cent. Current forecasts for 2006-07
imply a reduction in the global stock-to-utilization ratio by one full percentage
point and this suggests the reason for oil/fat prices to remain high or even
strengthen further during the course of this season. Early projections for next
season, point towards a further tightening of the supply and demand situation in
2008 and hence a firming up of prices.
The position in respect of some of the individual oilseeds is as under:
Groundnut
2.98 The area and production under groundnut showed a decline of 2.59 per
cent and 2.04 per cent per annum respectively during the period between 1990-
61
91 and 2003-04. The area, production and yield recorded at 86.7 lakh hectares,
71.0 lakh tonnes and 818 kg. per hectare respectively in 1991-92 declined to
59.36 lakh hectares, 41.21 lakh tonnes and 694 kg. per hectare respectively in
2002-03. However, the area, production and yield improved to 59.87 lakh
hectares, 81.27 lakh tonnes and 1357 kg. per hectare respectively in 2003-04
due to good, timely and evenly spread monsoon in the season. In 2005-06,
while area sown rose to 67.36 lakh hectares, production declined slightly to
79.93 lakh tonnes, reflecting slightly lower yield at 1187 kg/ha. The second
advance estimate of the Directorate of Economics & Statistics placed the
groundnut production at only 44.11 lakh tonnes in 2006-07, which is about 36
lakh tonnes lower than the final estimate for 2005-06. (Table 2.1)
Soyabean
2.99 India ranks fifth in the world production of Soyabean. The setting up of
the Technology Mission on Oilseeds in 1986 contributed substantially in raising
the area, production and yield of soyabean. The area under this crop increased
from 15.27 lakh hectares in 1986-87 to 31.85 lakh hectares in 1991-92 and
64.93 lakh hectares in 1998-99. The production increased by about eight times
from 8.91 lakh tonnes in 1986-87 to 71.43 lakh tonnes in 1998-99. The yield
also doubled to 1100 kg. per hectare in 1998-99 from 584 kg. per hectare in
1986-87. This trend lost its momentum after 1998-99 and the area, production
and yield declined to 61.06 lakh hectares, 46.55 lakh tonnes and 762 kg.
respectively in 2002-03. However, in 2003-04, the area coverage improved to
65.55 lakh hectares and the yield reached a record level of 1193 kg. per hectare
due to good, timely and evenly distributed monsoon in the season. The year
2005-06 witnessed further improvement in area and production to 77.08 lakh
hectares and 82.74 lakh tonnes respectively, but yield showed a slight decline to
1073 kg/ha. The second advance estimates of the Directorate of Economics &
Statistics put the soyabean production at 86.82 lakh tonnes in 2006-07, a rise of
about 4 lakh tonnes over last year’s production. (Table 2.1)
62
Nigerseed
2.100 Nigerseed is mainly grown in the tribal areas of Madhya Pradesh,
Chattisgarh, Orissa, Maharashtra and in small areas in Andhra Pradesh,
Karnataka and Jharkhand. The area, production and yield recorded at 6.01 lakh
hectares, 1.9 lakh tonnes and 317 kg. per hectare respectively in 1995-96
declined to 5.04 lakh hectares, 1.48 lakh tonnes and 293 kg. per hectare
respectively in 1999-00 and further to 4.14 lakh hectares, 0.86 lakh tonnes and
208 kg. per hectare respectively in 2002-03. However, the area, production and
yield again increased to 4.32 lakh hectares, 1.10 lakh tonnes and 252 kg. per
hectare respectively in 2003-04 due to good monsoon but remained lower than
the highest recorded levels of 1995-96. Although the area covered in Madhya
Pradesh (including Chhattisgarh) was the highest (1.77 lakh hectares), the yield
was very low. The yield level of 209 kg. per hectare in Madhya Pradesh in
2003-04 was lower than that of 315 kg. per hectare in Maharashtra and 393 kg.
in Andhra Pradesh. The second advance estimate of crop production put the
crop size at 1.04 lakh tonnes in 2006-07. In view of the significance of this crop
for tribal farmers, serious efforts should be made to increase its area, production
and yield. (Table 2.1)
2.101 Nigerseed is having a good potential for exports. NAFED, apart from
being procurement agency for ensuring MSP, is also exporting sizable quantities
of nigerseed. Previously, the exports were being canalized through TRIFED and
associate shippers. Now, the practice of fixing the minimum export price has
been done away with due to the sluggish demand of nigerseed in the
international market. TRIFED is now issuing only ‘No Objection Certificate
(NOC)’ to the registered exporters of nigerseed. The volume of nigerseed
exported during 2000-01 to 2006-07 (Upto July, 2006) is given below:

63
Table 2.20: Export of Nigerseed
Year Quantity (In tonnes)
Value (In Rs. Crore)
Unit value (In
Rs./kg.) 2000-01 29,490 80.35 27.25
2001-02 22,220 47.85 21.53
2002-03 36,130 77.99 21.59
2003-04 17,894 45.41 25.38
2004-05 24,601 61.14 24.85
2005-06 28,420 60.25 21.20
2006-07 (April-July) 9,040 18.44 20.40
2005-06 (April-July) 9,450 20.47 21.66
Source: DGCI&S. Kolkata
It may be observed from the above table that the exports, which were 36,130
tonnes in 2002-03, declined to 17,894 tonnes in 2003-04 ,but recovered smartly
in the following years to reach 28,420 tonnes in 2005-06. The unit value of
exports, after improving to Rs.25.38 in 2003-04 from Rs.21.59 in 2002-03, is on
the decline. During the first four months of 2006-07, it was only Rs.20.40.
Sesamum
2.102 The area, production and yield of sesamum increased from 21.64 lakh
hectares, 4.48 lakh tonnes and 207 kg. per hectare respectively in 1986-87 to
26.27 lakh hectares, 7.06 lakh tonnes and 269 kg. per hectare respectively in
1991-92. Though the area decreased sharply to 21.29 lakh hectares in 1992-93
the production and yield increased to 7.58 lakh tonnes and 356 kg. per hectare.
Thereafter, a continuous fall was observed in the area, production and yield.
The area, production and yield after falling to 14.44 lakh hectares, 4.41 lakh
tonnes and 306 kg. per hectare respectively in 2002-03, improved to 17.00 lakh
hectares, 7.82 lakh tonnes and 460 kg. per hectare respectively in 2003-04
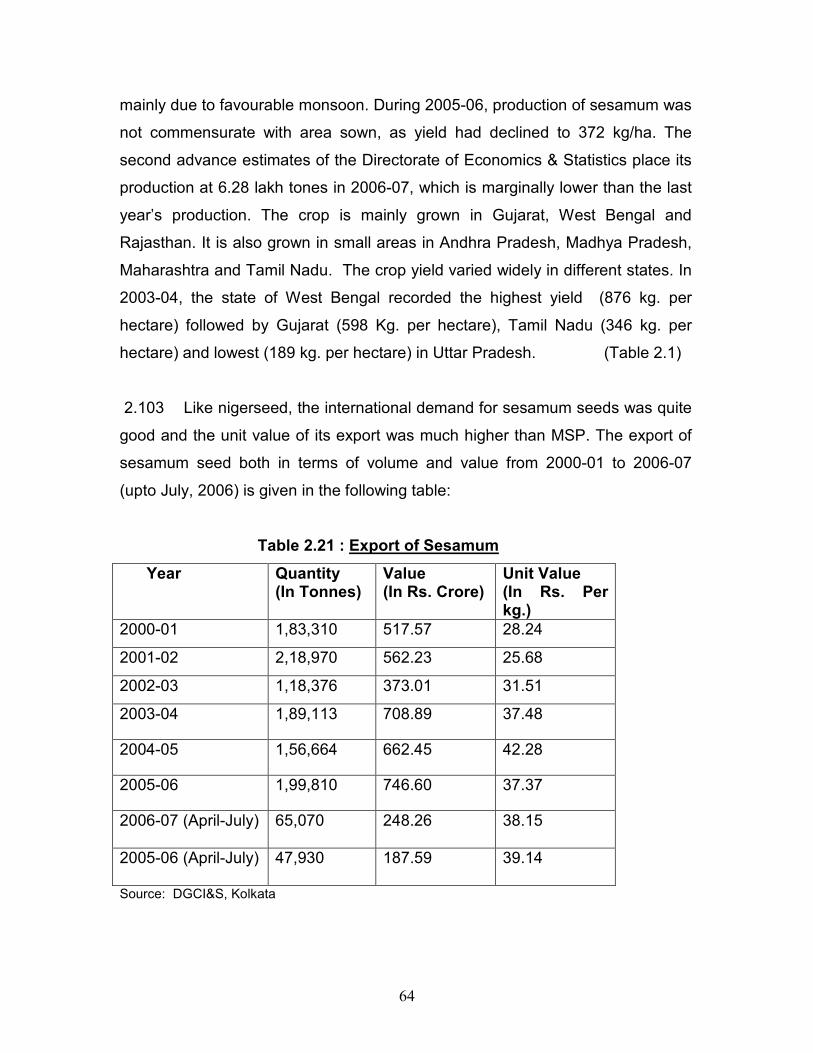
64
mainly due to favourable monsoon. During 2005-06, production of sesamum was
not commensurate with area sown, as yield had declined to 372 kg/ha. The
second advance estimates of the Directorate of Economics & Statistics place its
production at 6.28 lakh tones in 2006-07, which is marginally lower than the last
year’s production. The crop is mainly grown in Gujarat, West Bengal and
Rajasthan. It is also grown in small areas in Andhra Pradesh, Madhya Pradesh,
Maharashtra and Tamil Nadu. The crop yield varied widely in different states. In
2003-04, the state of West Bengal recorded the highest yield (876 kg. per
hectare) followed by Gujarat (598 Kg. per hectare), Tamil Nadu (346 kg. per
hectare) and lowest (189 kg. per hectare) in Uttar Pradesh. (Table 2.1)
2.103 Like nigerseed, the international demand for sesamum seeds was quite
good and the unit value of its export was much higher than MSP. The export of
sesamum seed both in terms of volume and value from 2000-01 to 2006-07
(upto July, 2006) is given in the following table:
Table 2.21 : Export of Sesamum
Year Quantity (In Tonnes)
Value (In Rs. Crore)
Unit Value (In Rs. Per kg.)
2000-01 1,83,310 517.57 28.24
2001-02 2,18,970 562.23 25.68
2002-03 1,18,376 373.01 31.51
2003-04 1,89,113 708.89 37.48
2004-05 1,56,664 662.45 42.28
2005-06 1,99,810 746.60 37.37
2006-07 (April-July)
65,070 248.26 38.15
2005-06 (April-July)
47,930 187.59 39.14
Source: DGCI&S, Kolkata
65
The figures given in the above table shows that this crop has a good potential for
its exports; Therefore serious efforts should be made to increase its area,
production and yield.
Sunflower
2.104 Like other oilseeds crops, the area, production and yield of sunflower
also increased with the setting up of the Technology Mission on Oilseeds in
1986. During the period 1985-86 to 1995-96, the area, production and yield of
this crop grew at the growth rate of 10.66 per cent, 16.68 per cent and 5.43 per
cent per annum respectively. The area, production and yield increased from
16.33 lakh hectare, 8.73 lakh tonnes and 535 kg. per hectare in 1990-91 to
21.21 lakh hectare, 12.58 lakh tonnes and 593 kg. per hectare in 1995-96. The
growth momentum was lost after 1995-96 and the area, production and yield
declined at a growth rate of 0.96 per cent, 0.40 per cent and -0.56 per cent per
annum respectively during the period 1995-96 and 2005-06. The area under this
crop increased from 11.77 lakh hectares in 2001-02 to 16.42 lakh hectares in
2002-03 and further to 20.04 lakh hectares in 2003-04. With increase in area,
the production increased from 6.8 lakh tonnes in 2001-02 to 8.73 lakh tonnes in
2002-03 and further to 9.30 lakh tonnes in 2003-04. The yield, however, declined
from 577 kg. per hectare in 2001-02 to 531 kg. per hectare in 2002-03 and
further to 464 kg. per hectare in 2003-04. The second advance estimates of the
Directorate of Economics & Statistics put the production of this crop at 14.39
lakh tonnes in 2005-06, which is higher by 2.52 lakh tonnes than last year’s
production. (Tables 2.1 & 2.2)
2.105 Sunflower is mainly grown in Karnataka, Andhra Pradesh and
Maharashtra and in small areas in Uttar Pradesh, Punjab, Haryana and Tamil
Nadu. The recorded per hectare yield of the crop in 2003-04 was highest in Uttar
Pradesh (1708 kg.) followed by Punjab (1700 kg.), Haryana (1483 kg.), Tamil
Nadu (1288 kg.), Andhra Pradesh (678 kg.), Maharashtra (362 kg.) and lowest in
66
Karnataka (321 kg.). In view of the high productivity of sunflower in Punjab,
Haryana and Uttar Pradesh, this crop can be an alternative to the paddy in these
states provided the proper marketing and processing arrangements are made on
the same scale as being made for the procurement/price support operations of
paddy.
Cotton
2.106 Cotton and India have been bound by history for centuries. Not only was
the Indian sub-continent the first to domesticate cotton and use its fibre for
spinning and weaving but has been exporting cotton textiles since very early
times. This tradition has endured. Today India has the world’s largest cotton crop
area accounting for over one fourth of the world cotton area. It also now ranks as
the second largest producer of cotton and is emerging as the third largest
exporter of cotton in the world.
2.107 Cotton plays a vital role in India’s economy. It provides direct and
indirect employment to millions of people from farmers to factory workers and in
its supply chains stretching from plain clothe to garments and retailing. It sustains
the Textile Industry, which constitutes arguably the single largest segment of
industries in the country. This industry is labour-intensive and provides gainful
employment to millions of people. The Indian textile sector contributes about 4
per cent of the GDP, 14 per cent to the total industrial production and 17 per cent
of India’s export earnings.
2.108 The cotton production estimates for the country are available from two
sources, official estimates released by the Directorate of Economics and
Statistics (DES), Ministry of Agriculture and trade estimates from Cotton Advisory
Board (CAB), Ministry of Textiles. Trade estimates for 2006-07 season is much
higher at 27.00 million bales as against the official estimate of 21.00 million
bales. The wide variation in these two different estimates does constrain policy
analysis and decision making and the Commission reiterates the need for
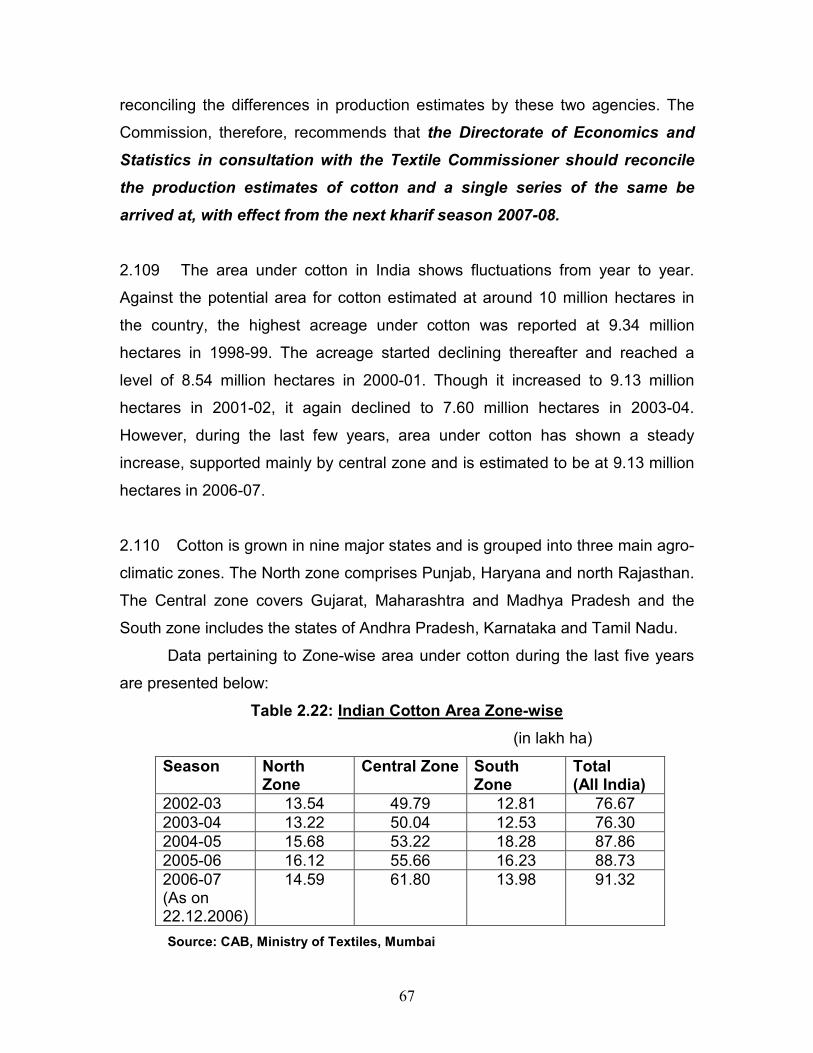
67
reconciling the differences in production estimates by these two agencies. The
Commission, therefore, recommends that the Directorate of Economics and
Statistics in consultation with the Textile Commissioner should reconcile
the production estimates of cotton and a single series of the same be
arrived at, with effect from the next kharif season 2007-08.
2.109 The area under cotton in India shows fluctuations from year to year.
Against the potential area for cotton estimated at around 10 million hectares in
the country, the highest acreage under cotton was reported at 9.34 million
hectares in 1998-99. The acreage started declining thereafter and reached a
level of 8.54 million hectares in 2000-01. Though it increased to 9.13 million
hectares in 2001-02, it again declined to 7.60 million hectares in 2003-04.
However, during the last few years, area under cotton has shown a steady
increase, supported mainly by central zone and is estimated to be at 9.13 million
hectares in 2006-07.
2.110 Cotton is grown in nine major states and is grouped into three main agro-
climatic zones. The North zone comprises Punjab, Haryana and north Rajasthan.
The Central zone covers Gujarat, Maharashtra and Madhya Pradesh and the
South zone includes the states of Andhra Pradesh, Karnataka and Tamil Nadu.
Data pertaining to Zone-wise area under cotton during the last five years
are presented below:
Table 2.22: Indian Cotton Area Zone-wise
(in lakh ha)
Season North Zone
Central Zone South Zone
Total (All India)
2002-03 13.54 49.79 12.81 76.67 2003-04 13.22 50.04 12.53 76.30 2004-05 15.68 53.22 18.28 87.86 2005-06 16.12 55.66 16.23 88.73 2006-07 (As on 22.12.2006)
14.59 61.80 13.98 91.32
Source: CAB, Ministry of Textiles, Mumbai
68
2.111 It may be noticed that area increases have taken place during 2006-07,
in the Central zone, particularly in Gujarat, due to good yields and returns
obtained by the farmers. In the North zone, the increase was in Punjab and
Rajasthan while in Haryana the area decline was attributed to inadequacy of
canal water. The three Southern States witnessed declines mainly due to lack of
timely onset of monsoons during sowings and failure of BT cotton in parts of
Andhra Pradesh and Tamil Nadu. Compared to 2004-05, there was a marginal
increase of about one percent in total cotton area in 2005-06. Due to promotion
efforts for BT cotton by seed suppliers, the area under cotton during 2006-07 is
higher at 9.13 million ha, an increase of 2.92 per cent over the previous year. As
per reports, 6.3 million ha of area was under hybrid cotton in 2006, i.e. 70 per
cent of the total area under cotton in the country and the area under BT cotton
alone was 3.5 million ha. BT cotton also occupied larger area in some states, as
may be seen from the table below:
Table 2.23: Area and Coverage under BT Cotton during 2006-07
(in lakh hectares)
State Area BT Area * Area under BT cotton (in percentage)
Punjab 6.18 2.81 45
Gujarat 23.90 4.07 17
Maharashtra 31.24 16.55 53
Madhya Pradesh 6.66 3.02 45
Andhra Pradesh 9.48 6.57 69
Total 91.48 34.61 38
Source: Directorate of Cotton Development, Mumbai
Note: * BT Area coverage as per official estimates
2.112 Coincidental to the steep increase in the adoption of BT cotton between
2002-2006, the average yield has increased from 302 kg per hectare in 2002-03
to an estimated yield of 503 kg. per hectare in 2006-07, with almost 50 per cent
69
of the increase in yield attributed to BT cotton. There exists wide inter-state
variation in the average yields amongst the different production regions of the
country. This is largely due to the diverse agro-climatic zones from arid to semi-
arid to high rainfall zones, inadequate to lack of irrigation facilities in some of the
cotton growing areas and small size of holdings. The largest concentration of
crop acreage is in Maharashtra with nearly a one-third share. But the State
contributes only one-fifth of the total production and happens to be at the bottom
in productivity which, according to trade estimate, is expected to be only 299 kg
lint/hectare during 2006-07, but 10 per cent higher than the 212 kg. lint/hectare
during 2005-06. The neighbouring state of Gujarat, having about one-fourth of
the country’s total cotton area, contributes one-third of the total production of the
country, achieved the highest yield in the country estimated at 728 kg.
lint/hectare in 2005-06 which slipped to third place with the yield of 640 kg. lint/
hectare after Tamil Nadu and Punjab during 2006-07. Tamil Nadu, which
occupied the second position with the yield of 688 kg. lint/hectare in 2005-06,
climbed to first position with the yield of 904 kg lint/hectare in 2006-07. However,
the acreage is too low at only 94,000 hectares to make a significant contribution
to supply of the cotton. The cotton productivity in Punjab, which remained
depressed during the past few years, improved to 610 kg lint/hectare in 2005-06
and reached to second highest in the country, after Tamil Nadu, to 743 kg lint /
hectare in 2006-07 due to increasing use of BT cotton seed and better farm
practices. Table below provides the distribution of cotton acreage and production
over major producing states and the inter-state variations in the productivity.
70
Table 2.24: Estimated Area, Production and Yield of Cotton during 2006-07
(Area in lakh hectares)
(Production in lakh bales of 170 kg. each) Sl. No. Name of the State Area
estimated as on
22.12.2006
Production Estimated
as on
22.12.2006
Yield Kg/ha.
1
2
3
Punjab
Haryana
Rajasthan
6.18
5.33
3.08
27.00
15.00
8.00
743
478
442
NORTHERN ZONE 14.59 50.00 583
4 5 6
Gujarat Maharashtra Madhya Pradesh
23.90 31.24 6.66
90.00 55.00 18.00
640 299 459
CENTRAL ZONE 61.80 163.00 448
7 8 9
Andhra Pradesh Karnataka Tamil Nadu
9.48 3.56 0.94
32.00 7.00 5.00
574 334 904
SOUTHERN ZONE 13.98 44.00 535
10 Others 0.35 1.00
11 Loose cotton consumed but not accounted for in state-wise production
[ 12.00
TOTAL 91.32 270.00 503
Source: Office of the Textile Commissioner, Government of India.
2.113 The phenomenal spread of hybrid and BT cotton, adoption of scientific
practices, increased area under irrigated cotton, particularly in Gujarat,
availability of quality seeds and several initiatives like launching of Technology
Mission in cotton and developmental efforts and programmes sponsored by
some State Governments and industry organizations, improvement in yield per
hectare, lower contamination and price competitiveness have led to rising
production levels in the last few years. The production of cotton which stood at
71
158 lakh bales in 2001-02 is estimated to go up to 270 lakh bales in 2006-07.
The State-wise production details are given below;
Table 2.25: State-wise Production of Cotton ( in lakh bales of 170 kgs)
State 2004-05 2005-06 2006-07
Punjab 16.50 20.00 27.00
Haryana 16.50 13.00 15.00
Rajasthan 10.00 11.00 8.00
North Zone 43.00 44.00 50.00
Gujarat 73.00 89.00 90.00
Maharashtra 52.00 36.00 55.00
Madhya Pradesh 16.00 18.00 18.00
Central Zone 141.00 143.00 163.00
Andhra Pradesh 33.00 32.00 32.00
Karnataka 8.00 6.50 7.00
Tamil Nadu 5.00 5.50 5.00
South Zone 46.00 44.00 44.00
Other States 1.00 1.00 1.00
Loose cotton 12.00 12.00 12.00
Total (All India) 243.00 244.00 270.00
Source: Office of the Textile Commissioner, Ministry of Textiles, Mumbai.
2.114 Though the cotton area, production and productivity has recorded a rise
over the years, the productivity is yet abysmally low when compared to the world
average, as seen from the table below:
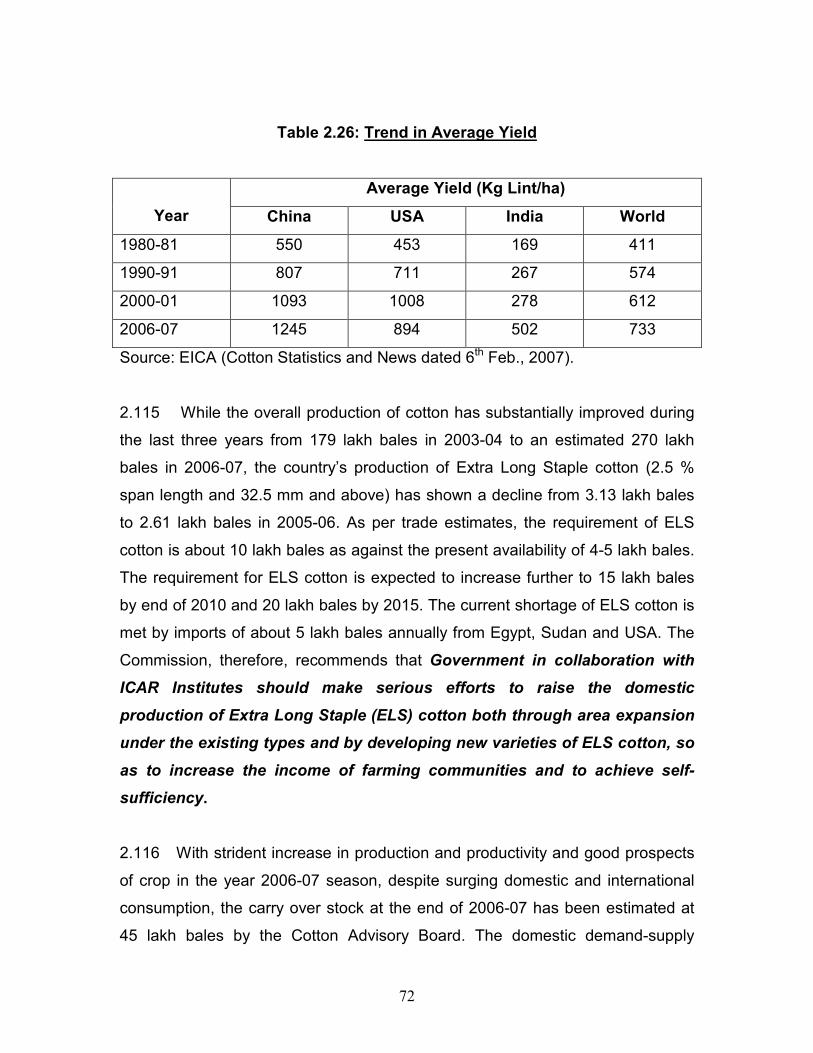
72
Table 2.26: Trend in Average Yield
Average Yield (Kg Lint/ha)
Year China USA India World
1980-81 550 453 169 411
1990-91 807 711 267 574
2000-01 1093 1008 278 612
2006-07 1245 894 502 733
Source: EICA (Cotton Statistics and News dated 6th Feb., 2007).
2.115 While the overall production of cotton has substantially improved during
the last three years from 179 lakh bales in 2003-04 to an estimated 270 lakh
bales in 2006-07, the country’s production of Extra Long Staple cotton (2.5 %
span length and 32.5 mm and above) has shown a decline from 3.13 lakh bales
to 2.61 lakh bales in 2005-06. As per trade estimates, the requirement of ELS
cotton is about 10 lakh bales as against the present availability of 4-5 lakh bales.
The requirement for ELS cotton is expected to increase further to 15 lakh bales
by end of 2010 and 20 lakh bales by 2015. The current shortage of ELS cotton is
met by imports of about 5 lakh bales annually from Egypt, Sudan and USA. The
Commission, therefore, recommends that Government in collaboration with
ICAR Institutes should make serious efforts to raise the domestic
production of Extra Long Staple (ELS) cotton both through area expansion
under the existing types and by developing new varieties of ELS cotton, so
as to increase the income of farming communities and to achieve self-
sufficiency.
2.116 With strident increase in production and productivity and good prospects
of crop in the year 2006-07 season, despite surging domestic and international
consumption, the carry over stock at the end of 2006-07 has been estimated at
45 lakh bales by the Cotton Advisory Board. The domestic demand-supply
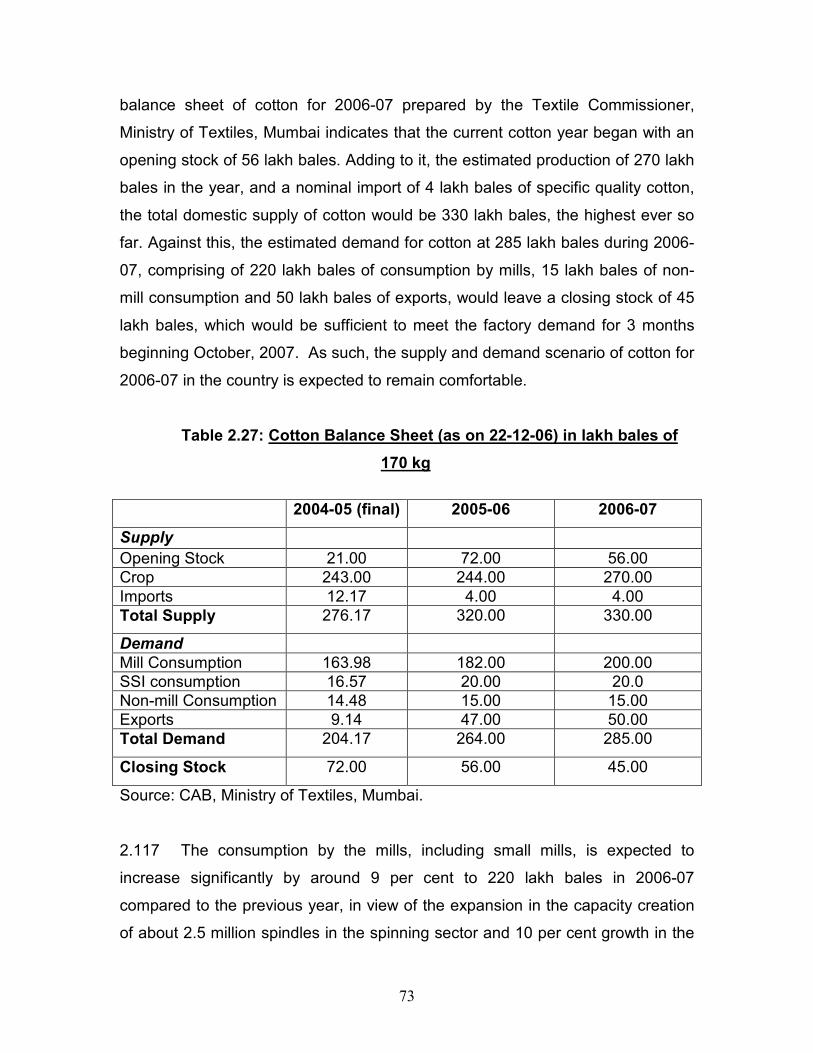
73
balance sheet of cotton for 2006-07 prepared by the Textile Commissioner,
Ministry of Textiles, Mumbai indicates that the current cotton year began with an
opening stock of 56 lakh bales. Adding to it, the estimated production of 270 lakh
bales in the year, and a nominal import of 4 lakh bales of specific quality cotton,
the total domestic supply of cotton would be 330 lakh bales, the highest ever so
far. Against this, the estimated demand for cotton at 285 lakh bales during 2006-
07, comprising of 220 lakh bales of consumption by mills, 15 lakh bales of non-
mill consumption and 50 lakh bales of exports, would leave a closing stock of 45
lakh bales, which would be sufficient to meet the factory demand for 3 months
beginning October, 2007. As such, the supply and demand scenario of cotton for
2006-07 in the country is expected to remain comfortable.
Table 2.27: Cotton Balance Sheet (as on 22-12-06) in lakh bales of
170 kg
2004-05 (final) 2005-06 2006-07
Supply
Opening Stock 21.00 72.00 56.00 Crop 243.00 244.00 270.00 Imports 12.17 4.00 4.00 Total Supply 276.17 320.00 330.00
Demand Mill Consumption 163.98 182.00 200.00 SSI consumption 16.57 20.00 20.0 Non-mill Consumption 14.48 15.00 15.00 Exports 9.14 47.00 50.00 Total Demand 204.17 264.00 285.00
Closing Stock 72.00 56.00 45.00
Source: CAB, Ministry of Textiles, Mumbai.
2.117 The consumption by the mills, including small mills, is expected to
increase significantly by around 9 per cent to 220 lakh bales in 2006-07
compared to the previous year, in view of the expansion in the capacity creation
of about 2.5 million spindles in the spinning sector and 10 per cent growth in the
74
overall textile sector. The exports of cotton is under OGL since July, 2001. Due to
easy supply situation and rising import demand, especially from China
(mainland), there was a quantum jump in the exports in 2005-06. The prospects
for 2006-07 is expected to be bright and exports from the country are estimated
to be 50.00 lakh bales.
2.118 Among the agricultural commodities, cotton has shown some promising
signs during the last few years and the developmental efforts and initiatives, like
the Technology Mission have shown remarkable results. In spite of this, one
disconcerting factor which is a subject of major concern and can hardly be
overlooked is the reports of agrarian distress in the country associated with
cotton farming. The cause and effect relationships are drawn from the
vulnerability of cotton crop to the vagaries of nature and pest infestation,
particularly in the low productivity regions. The Commission’s Kharif report for
2006-07 had brought out in some detail the problems faced by cotton farmers in
Vidarbha and the low returns they reaped during the last season which led to an
agrarian crisis and the resulting mounting indebtedness of the farmers in the
region. The water logging caused by heavy rains during the season 2005-06 and
lack of assured irrigation facilities in the region led to crop failure as the hybrid
cotton seeds purchased at a high price of Rs.1600-1750 per 450 gms proved ill-
suited to such rainfed conditions. Though there has been some shift in acreage
from cotton to soyabean in the region, yet large area is brought under BT cotton
this season due to the availability of seeds at a very cheap rate of Rs. 650- Rs.
750 per 450 gms, promise of higher yield and lower input costs due to reduced
consumption of pesticides and insecticides.
2.119 Though the prospects of the cotton crop augur well for the season, the
Commission feels that considering the topography of the region, abysmally low
irrigation potential, high run-off in the region due to inadequate water
conservation programmes, light black rocky soil with low moisture retention
75
capacity, the farmers’ adoption of BT cotton without requisite farm practices may
trigger another crisis. There are already some reports of the crisis setting in even
during the season. Therefore the Commission suggests that Research
Institutions and the TMC should come out with drought tolerant varieties of cotton
seeds that can be recycled to sustain the production and productivity in the
Vidarbha region. The problem of indebtedness of the farmers in the area should
also be addressed through provision of appropriate institutional credit and its
timely disbursement direct to farmers, for purchase of good quality seeds,
fertilizers, pesticides and fungicides. Since most of cotton grown in the area is
rainfed, irrigation potential should be increased by completing ongoing projects
besides taking up lift irrigation through wells, pumps sets and creating water
reservoirs. The coverage of crop insurance scheme should also be expanded.
2.120 Since the commencement of the current season, cotton prices have
been ruling easy in the domestic market. The sentiment continued to be bearish
in January, 2007 also and the price behaviour was in line with market
fundamentals. The supplies were comfortable with sufficient carryover of 56 lakh
bales and arrivals placed at 216 lakh bales by end of February, 2007. Lower
demand from mills and exports-mainly confined to South East Asian countries,
Pakistan and Bangladesh also contributed to the easy trend. The opening price
of J-34 in Punjab and Haryana as also that of S-6 in Gujarat in the current
cotton season ruled above the MSP level, while that of long staple cotton DCH-
32 ruled well above the MSP level in various markets of the country. Cotton
prices surged across all varieties by the end of February, 2007, due to
exponential growth in export demand and reports of a likely lower crop in
Maharashtra and Gujarat. With likely tapering of cotton arrivals in the coming
months, forecast of lower world cotton stock level and the prospects for rising
trade, the price prospects for next season are expected to provide
encouragement to the cotton growers in the country.

76
Table 2.28: Market Prices of Kapas during 2006-07 and 2005-06
(in Rs per quintal)
Desi J 34 H4 DCH 32 Date
2006-07 2005-06 2006-07 2005-06 2006-07 2005-06 2006-07 2005-06
03-10 ---- 1635 1950 1835 ------ ---- ---- ----
10-10 ----- 1655 1915 1835 ----- ------ ---- -----
17-10 1860 1650 1930 1835 2050 ----- 3300 ----
25-10 1840 1655 1925 1835 2050 ----- 3300 -----
31-10 1890 1690 1940 1835 2150 ----- 3150 -----
08-11 1820 1785 1950 1835 2120 ---- 3100 ----
13-11 1890 1800 1955 1935 2080 1980 3100 -----
30-11 1860 1830 2055 2015 1990 1980 3250 4000
08-12 1850 1830 2050 2130 1990 1980 3050 4400
15-12 1830 1820 2035 2065 1990 1980 3000 4400
29-12 1780 1760 2022 2075 1990 1980 2900 4500
04-01 1710 1760 2006 2090 1990 1980 2900 4100
11-01 1760 1775 2011 2080 1990 2100 2900 4300
18-01 1740 1775 2001 2075 1990 2100 2910 4300
25-01 1735 1765 1976 2050 1990 1980 2800 4100
01-02 1780 1700 2065 1990 2100 1980 2900 4100
08-02 1900 1705 2130 2000 2175 1980 2950 4100
17-02 1920 1725 2180 2038 2275 1980 2950 4100
28-02 1900 1695 2180 2020 2300 1980 2975 4100
MSP 1320 1310 1890 1835 1990 1980 2430 2200
Source: Cotton Corporation of India.
The price quotations of lint during the current season 2006-07 vis-a-vis the
previous season 2005-06 are as under:
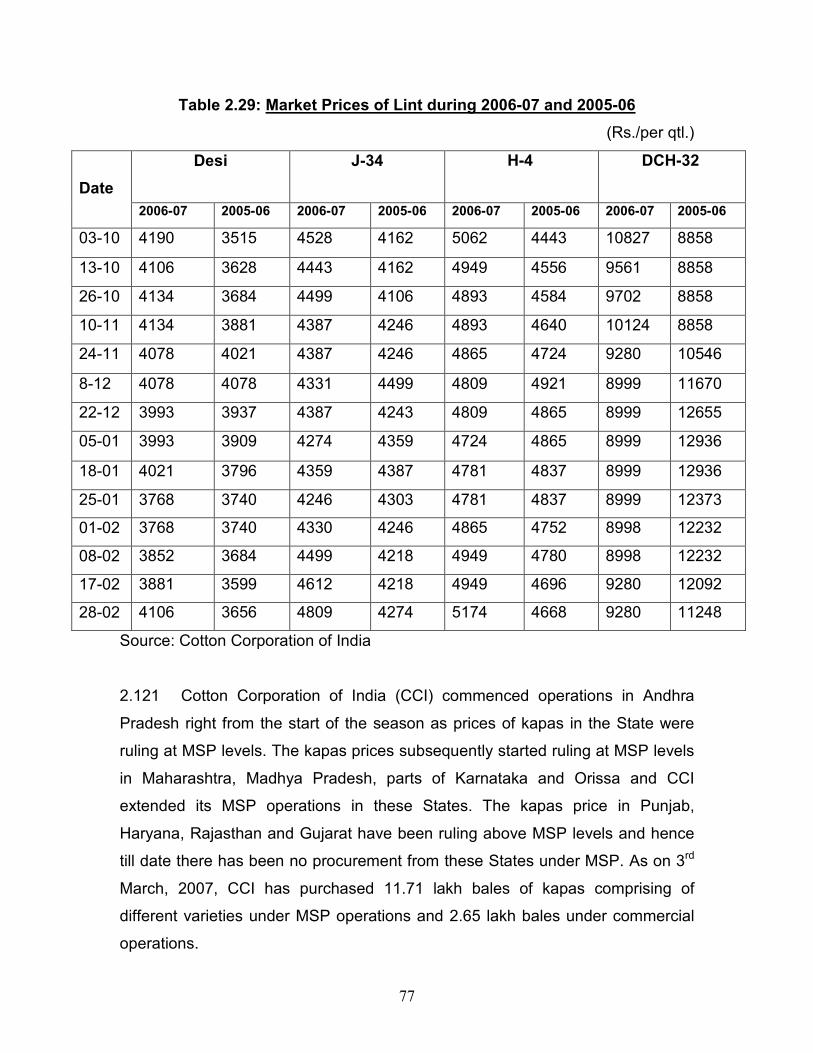
77
Table 2.29: Market Prices of Lint during 2006-07 and 2005-06
(Rs./per qtl.)
Desi J-34 H-4 DCH-32
Date
2006-07 2005-06 2006-07 2005-06 2006-07 2005-06 2006-07 2005-06
03-10 4190 3515 4528 4162 5062 4443 10827 8858
13-10 4106 3628 4443 4162 4949 4556 9561 8858
26-10 4134 3684 4499 4106 4893 4584 9702 8858
10-11 4134 3881 4387 4246 4893 4640 10124 8858
24-11 4078 4021 4387 4246 4865 4724 9280 10546
8-12 4078 4078 4331 4499 4809 4921 8999 11670
22-12 3993 3937 4387 4243 4809 4865 8999 12655
05-01 3993 3909 4274 4359 4724 4865 8999 12936
18-01 4021 3796 4359 4387 4781 4837 8999 12936
25-01 3768 3740 4246 4303 4781 4837 8999 12373
01-02 3768 3740 4330 4246 4865 4752 8998 12232
08-02 3852 3684 4499 4218 4949 4780 8998 12232
17-02 3881 3599 4612 4218 4949 4696 9280 12092
28-02 4106 3656 4809 4274 5174 4668 9280 11248
Source: Cotton Corporation of India
2.121 Cotton Corporation of India (CCI) commenced operations in Andhra
Pradesh right from the start of the season as prices of kapas in the State were
ruling at MSP levels. The kapas prices subsequently started ruling at MSP levels
in Maharashtra, Madhya Pradesh, parts of Karnataka and Orissa and CCI
extended its MSP operations in these States. The kapas price in Punjab,
Haryana, Rajasthan and Gujarat have been ruling above MSP levels and hence
till date there has been no procurement from these States under MSP. As on 3rd
March, 2007, CCI has purchased 11.71 lakh bales of kapas comprising of
different varieties under MSP operations and 2.65 lakh bales under commercial
operations.
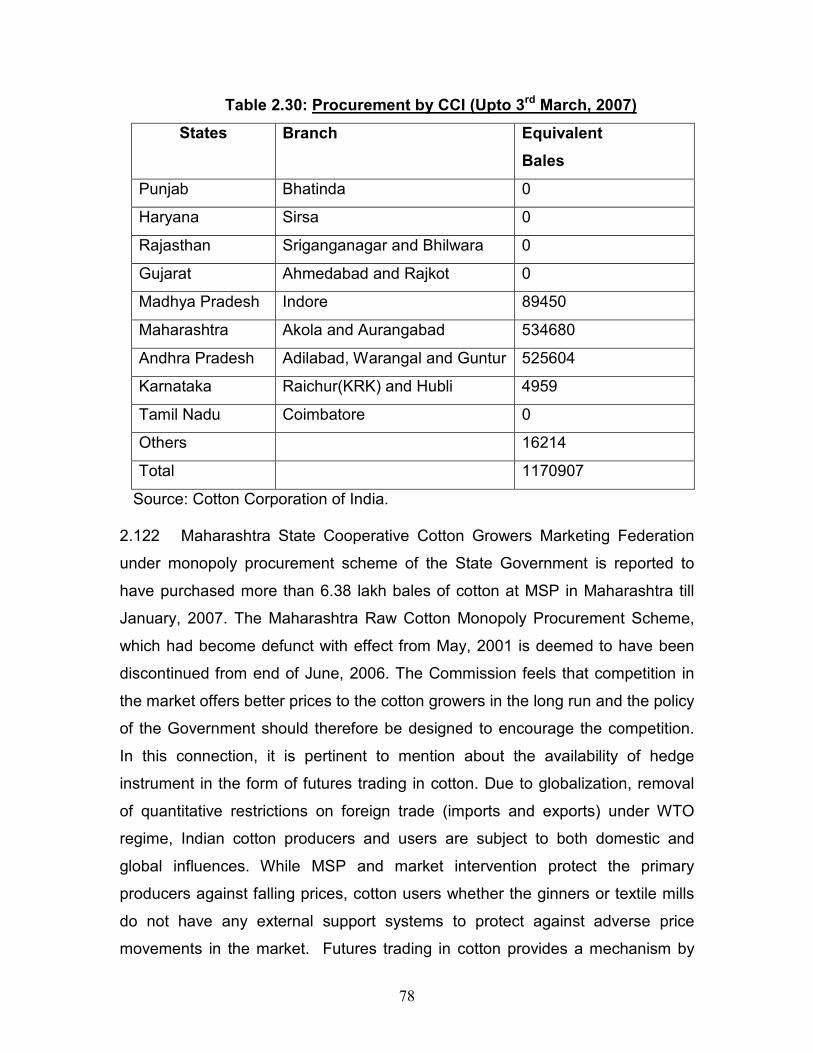
78
Table 2.30: Procurement by CCI (Upto 3rd March, 2007)
States Branch Equivalent
Bales
Punjab Bhatinda 0
Haryana Sirsa 0
Rajasthan Sriganganagar and Bhilwara 0
Gujarat Ahmedabad and Rajkot 0
Madhya Pradesh Indore 89450
Maharashtra Akola and Aurangabad 534680
Andhra Pradesh Adilabad, Warangal and Guntur 525604
Karnataka Raichur(KRK) and Hubli 4959
Tamil Nadu Coimbatore 0
Others 16214
Total 1170907
Source: Cotton Corporation of India.
2.122 Maharashtra State Cooperative Cotton Growers Marketing Federation
under monopoly procurement scheme of the State Government is reported to
have purchased more than 6.38 lakh bales of cotton at MSP in Maharashtra till
January, 2007. The Maharashtra Raw Cotton Monopoly Procurement Scheme,
which had become defunct with effect from May, 2001 is deemed to have been
discontinued from end of June, 2006. The Commission feels that competition in
the market offers better prices to the cotton growers in the long run and the policy
of the Government should therefore be designed to encourage the competition.
In this connection, it is pertinent to mention about the availability of hedge
instrument in the form of futures trading in cotton. Due to globalization, removal
of quantitative restrictions on foreign trade (imports and exports) under WTO
regime, Indian cotton producers and users are subject to both domestic and
global influences. While MSP and market intervention protect the primary
producers against falling prices, cotton users whether the ginners or textile mills
do not have any external support systems to protect against adverse price
movements in the market. Futures trading in cotton provides a mechanism by
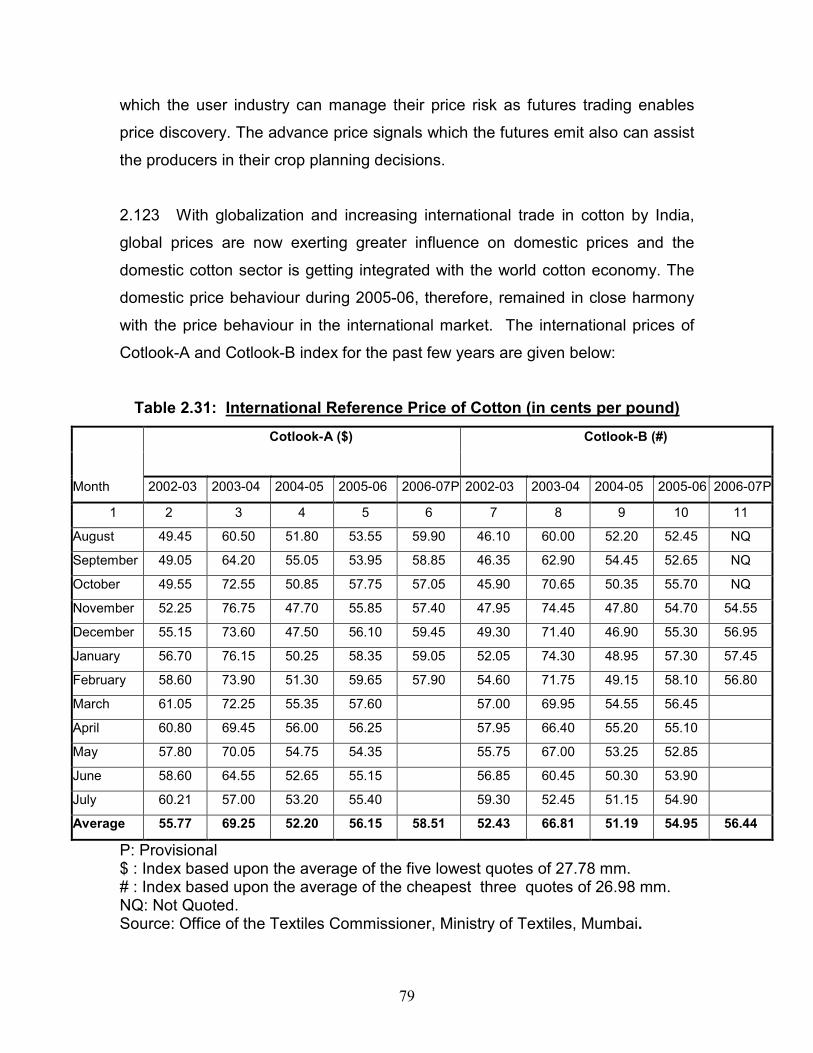
79
which the user industry can manage their price risk as futures trading enables
price discovery. The advance price signals which the futures emit also can assist
the producers in their crop planning decisions.
2.123 With globalization and increasing international trade in cotton by India,
global prices are now exerting greater influence on domestic prices and the
domestic cotton sector is getting integrated with the world cotton economy. The
domestic price behaviour during 2005-06, therefore, remained in close harmony
with the price behaviour in the international market. The international prices of
Cotlook-A and Cotlook-B index for the past few years are given below:
Table 2.31: International Reference Price of Cotton (in cents per pound)
Cotlook-A ($) Cotlook-B (#)
Month 2002-03 2003-04 2004-05 2005-06 2006-07P 2002-03 2003-04 2004-05 2005-06 2006-07P
1 2 3 4 5 6 7 8 9 10 11
August 49.45 60.50 51.80 53.55 59.90 46.10 60.00 52.20 52.45 NQ
September 49.05 64.20 55.05 53.95 58.85 46.35 62.90 54.45 52.65 NQ
October 49.55 72.55 50.85 57.75 57.05 45.90 70.65 50.35 55.70 NQ
November 52.25 76.75 47.70 55.85 57.40 47.95 74.45 47.80 54.70 54.55
December 55.15 73.60 47.50 56.10 59.45 49.30 71.40 46.90 55.30 56.95
January 56.70 76.15 50.25 58.35 59.05 52.05 74.30 48.95 57.30 57.45
February 58.60 73.90 51.30 59.65 57.90 54.60 71.75 49.15 58.10 56.80
March 61.05 72.25 55.35 57.60 57.00 69.95 54.55 56.45
April 60.80 69.45 56.00 56.25 57.95 66.40 55.20 55.10
May 57.80 70.05 54.75 54.35 55.75 67.00 53.25 52.85
June 58.60 64.55 52.65 55.15 56.85 60.45 50.30 53.90
July 60.21 57.00 53.20 55.40 59.30 52.45 51.15 54.90
Average 55.77 69.25 52.20 56.15 58.51 52.43 66.81 51.19 54.95 56.44
P: Provisional $ : Index based upon the average of the five lowest quotes of 27.78 mm. # : Index based upon the average of the cheapest three quotes of 26.98 mm. NQ: Not Quoted. Source: Office of the Textiles Commissioner, Ministry of Textiles, Mumbai.
80
2.124 In terms of Cotlook ‘A’ index, 2003-04 cotton season was one of the best
years for the farmers. The index reached a peak level of 76.75 cents per pound
in November, 2003. However, by the close of the season of the year in July, it
sunk to a level of 57 cents. The downward trend continued till December, 2004
when it reached a bottom level of 47.50 cents per pound. Thereafter, the price
index showed signs of improvement, although considerable volatility was seen in
the price behaviour during 2005-06. During 2006-07 the price rose to 59.45 cents
per pound in December, but declined to 57.90 cents in February, 2007. The
seasons average index as of 28th February, 2007 was 58.51 cents per pound or
over 4 per cent higher than the same last season. The improvement in the price
front in the current season is seen mainly due to rising aggregate demand from
China for cotton that far exceeds their domestic supply. In addition, the
elimination of quota on textile trade induced different players in the market to
increase their market share of textiles and put pressure on prices of cotton.
Market analysts suggest that Cotlook A index may average at 66 cents per
pound in 2007-08 as against the annual average of 59 cents in 2006-07, mainly
due to unchanged output, rising consumption and lower ending stocks.
2.125 World demand and supply of cotton reached its historic high in 2004-05.
The high price realization in 2003-04 helped to enhance the area under cotton by
about 11 per cent in 2004 which was reported to be the highest during the past 9
seasons. Favourable weather conditions and expansion of BT cotton technology
boosted the world yield considerably, and as a result, world production reached
an historic peak level of 26.30 million metric tonnes in 2004-05, but came down
to 24.67 in 2005-06. World consumption also increased substantially to 24.97
million metric tonnes in 2005-06 from 23.36 million metric tonnes in 2004-05
mainly due to higher consumption by mills in anticipation of increasing export of
textiles, following abolition of quotas in textile trade. Export of cotton increased
significantly over 25 per cent from 7.74 million metric tonnes in 2004-05 to 9.80
million metric tonnes in 2005-06. The closing stock reached a level of 11.91
million metric tonnes marginally lower by 0.06 million tonnes from the level at the
end of 2004-05. The current season 2006-07 is likely to register a marginal
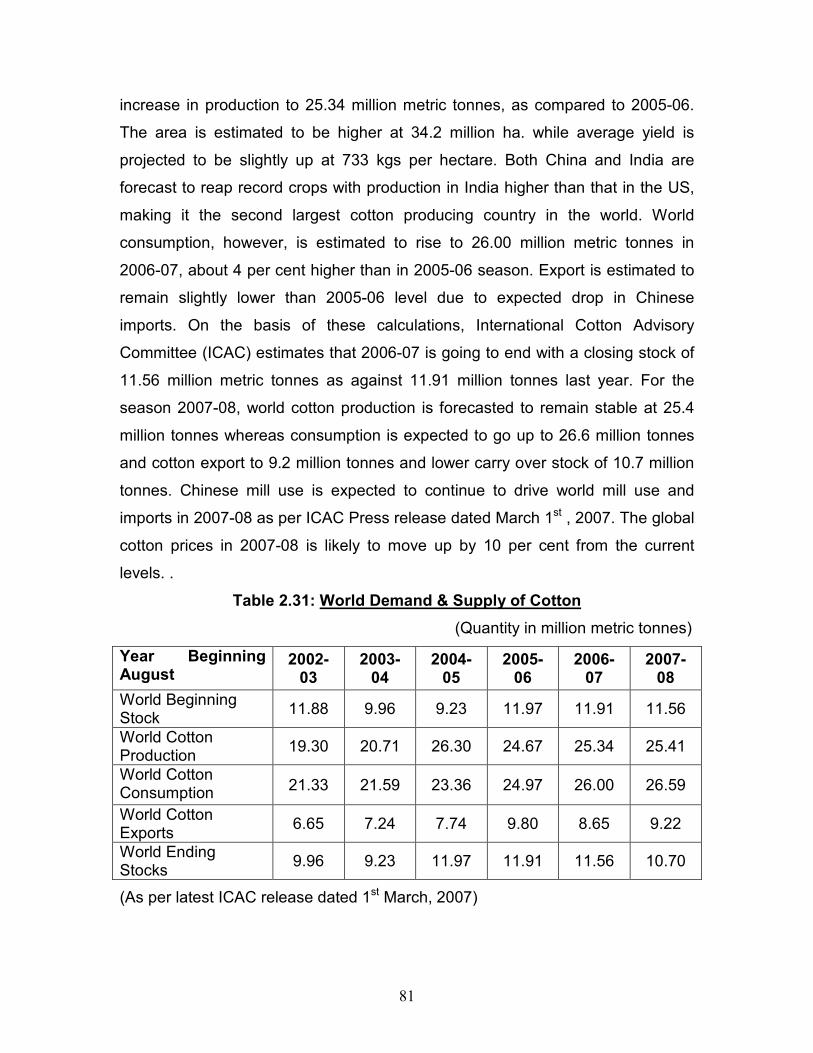
81
increase in production to 25.34 million metric tonnes, as compared to 2005-06.
The area is estimated to be higher at 34.2 million ha. while average yield is
projected to be slightly up at 733 kgs per hectare. Both China and India are
forecast to reap record crops with production in India higher than that in the US,
making it the second largest cotton producing country in the world. World
consumption, however, is estimated to rise to 26.00 million metric tonnes in
2006-07, about 4 per cent higher than in 2005-06 season. Export is estimated to
remain slightly lower than 2005-06 level due to expected drop in Chinese
imports. On the basis of these calculations, International Cotton Advisory
Committee (ICAC) estimates that 2006-07 is going to end with a closing stock of
11.56 million metric tonnes as against 11.91 million tonnes last year. For the
season 2007-08, world cotton production is forecasted to remain stable at 25.4
million tonnes whereas consumption is expected to go up to 26.6 million tonnes
and cotton export to 9.2 million tonnes and lower carry over stock of 10.7 million
tonnes. Chinese mill use is expected to continue to drive world mill use and
imports in 2007-08 as per ICAC Press release dated March 1st , 2007. The global
cotton prices in 2007-08 is likely to move up by 10 per cent from the current
levels. .
Table 2.31: World Demand & Supply of Cotton
(Quantity in million metric tonnes)
Year Beginning August
2002-03
2003-04
2004-05
2005-06
2006-07
2007-08
World Beginning Stock
11.88 9.96 9.23 11.97 11.91 11.56
World Cotton Production
19.30 20.71 26.30 24.67 25.34 25.41
World Cotton Consumption 21.33 21.59 23.36 24.97 26.00 26.59
World Cotton Exports
6.65 7.24 7.74 9.80 8.65 9.22
World Ending Stocks
9.96 9.23 11.97 11.91 11.56 10.70
(As per latest ICAC release dated 1st March, 2007)
82
2.126 With the lapse of Multi Fibre Agreement, Indian textile sector has
performed well by increasing its textiles and garment deliveries to the US and the
EU. Government had also announced number of incentives for the development
of textile sector. These incentives for promotion and growth need to be
dovetailed with the development of cotton economy of the country for its
repositioning in the global arena. This augurs well for enhancing competitiveness
of Indian cotton, which is bestowed with comparative advantages. In order to
manage globalization, costs have to be minimized to effectively compete in the
international market, the productivity of cotton need to improve further and the
major inputs essential for raising productivity of cotton, viz, seed, fertilizer,
pesticide and credit made available at reasonable rates to the farmers. Measures
for production of certified seeds of all commercial varieties need to be intensified
and proper coordination between various agencies engaged in the work be
ensured so that the production is balanced and attuned to the needs of the
industry. To step up growth and sustain production, there is a need to improve
both forward and backward linkages. Better credit delivery, improvement in
irrigation and rural infrastructure, improved farming techniques and development
of market yards and mandis are imperative. Labour accounts for a major portion
of the input cost and loan facility from banks is not available to farmers to finance
this cost unlike other inputs like seeds, fertilizers and pesticides. The cost of
hiring labour is not uniform across the States. While the minimum labour charges
fixed by Maharashtra State is Rs.65 per day, it is as high as Rs. 96 in Tamil Nadu
and Rs.120 in Kerala. Commission, therefore, feels there is need for some
rationalization of labour charges across states. With steady increase in the
production of cotton and projected increase to 400 lakh bales by 2012, the rising
labour costs could upset the growth in production, since at present no real
breakthrough has been achieved to mechanise cotton pickings. Mechanisation is
still not a viable proposition as number of pickings are spread to more than three
and as many as eight in some areas. Besides, mechanized picking involves
synchronized pickings for maximum efficiency. Commission considers that
there is an urgent need to address this issue as rising labour costs and
skilled labour could pose serious challenges in coming years. Farmers
83
need to be educated on proper methods of cotton picking through
extension activity.
2.127 In order that farmers get their rightful dues in selling to the procurement
agencies, infrastructure needs to be developed by the States such that farmers
are encouraged to sell their produce from the market yards and not from the farm
gates. CCI, the procurement agency, operates its purchases from the market
yards and the presence of other traders enables competitive bidding and this
process would ensure better price discovery and transparency. Secondly, the
middlemen in the form of commission agents need to be reduced and the system
of direct sales by farmers should be encouraged so as to ensure that farmers
realize full price for their produce. The commission agents’ charges are also fairly
high and not uniform.
2.128 In short, the need of the hour to sustain production and productivity in
cotton is timely provision of sufficient and efficient seeds, better water
management, proper institutional credit, extension services and a proper
coordination among all the agencies associated with the various segments of the
cotton industry viz, cotton growing, input supply, raw cotton processing, trade,
warehouse and research and oil crushing.
TOBACCO
2.129 India has a prominent place in the production of tobacco in the world
due to varied agro-climatic conditions. India produces different kinds of tobacco,
important among them, in terms of exports, is the Flue Cured Virginia (FCV)
tobacco. FCV Tobacco has a fairly diversified base of production, which vary in
their physical and chemical characteristics, enabling the country to export to over
80 countries across the globe. India ranks third in the world production of tobacco
with China and Brazil occupying the first and second positions. However, five
countries namely China, Brazil, India, the USA and Turkey account for almost
two-thirds of the world production. India is the twelfth largest producer of
84
cigarettes and fifth largest exporter of tobacco in the world. In the past, the Food
& Agriculture Organisation (FAO), the World Bank and Government Agencies
supported tobacco as a cash crop. However, adverse impact of tobacco on the
health realized in the recent years has been widely publicized all over the world.
Accordingly, most of the countries including India have been discouraging the
consumption of tobacco and exposure to its smoke in their countries, by initiating
requisite measures to reduce demand and supply of tobacco in the country.
2.130 FAO, in its study, has predicted an increase in consumption of tobacco
in the world until the year 2010 due to growth of population and income. However,
the rate of increase would be less than that recorded in the past. According to the
findings of the study, the smoking in developed countries would continue to
decline while the tobacco consumption in developing countries would increase. A
major part of the projected increase in demand for tobacco is expected to come
from Far East, particularly China, followed by India and Africa.
2.131 The economic implications of the tobacco cultivation in poor and
developing countries are manifold. It provides employment to a large number of
persons in rural areas, substantial amount of foreign exchange to the country and
a sizeable amount of revenue to the state for development works. In the case of
India, the total employment generated in tobacco sector, right from farm sector to
processing, manufacturing and marketing of product is more than 3 million and
the annual foreign exchange earnings from tobacco exports are estimated to be
over Rs.1400 crore.
2.132 Virginia Flue Cured (VFC) tobacco is grown in the states of Andhra
Pradesh, Maharashtra, Orissa and Karnataka. The crop is grown both in light and
black soils. Cultivation of tobacco is regulated by Tobacco Board under the
power vested with it, vide Tobacco Board Act, 1975. The Board, after assessing
both domestic and international demand, assigns crop size to each tobacco
region. There are seven soil regions in the country where tobacco is produced.
The tobacco produced in different types of soils is exported to different countries.
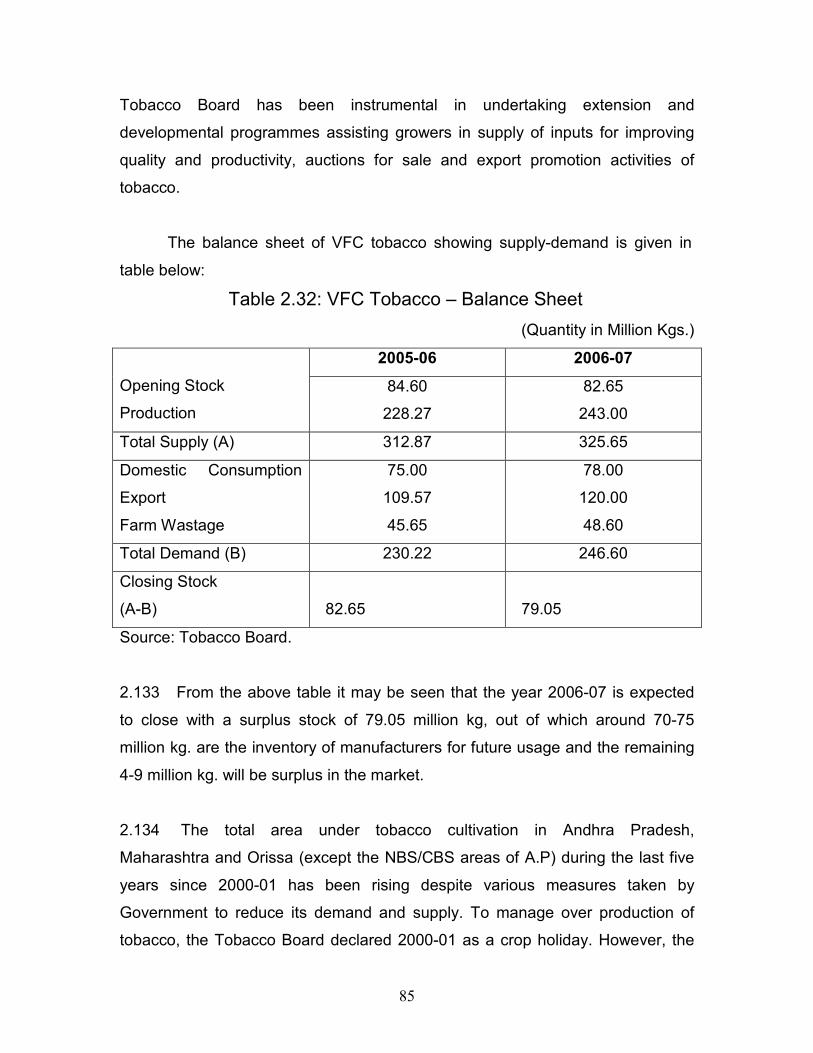
85
Tobacco Board has been instrumental in undertaking extension and
developmental programmes assisting growers in supply of inputs for improving
quality and productivity, auctions for sale and export promotion activities of
tobacco.
The balance sheet of VFC tobacco showing supply-demand is given in
table below:
Table 2.32: VFC Tobacco – Balance Sheet
(Quantity in Million Kgs.)
2005-06 2006-07
Opening Stock
Production
84.60
228.27
82.65
243.00
Total Supply (A) 312.87 325.65
Domestic Consumption
Export
Farm Wastage
75.00
109.57
45.65
78.00
120.00
48.60
Total Demand (B) 230.22 246.60
Closing Stock
(A-B)
82.65
79.05
Source: Tobacco Board.
2.133 From the above table it may be seen that the year 2006-07 is expected
to close with a surplus stock of 79.05 million kg, out of which around 70-75
million kg. are the inventory of manufacturers for future usage and the remaining
4-9 million kg. will be surplus in the market.
2.134 The total area under tobacco cultivation in Andhra Pradesh,
Maharashtra and Orissa (except the NBS/CBS areas of A.P) during the last five
years since 2000-01 has been rising despite various measures taken by
Government to reduce its demand and supply. To manage over production of
tobacco, the Tobacco Board declared 2000-01 as a crop holiday. However, the
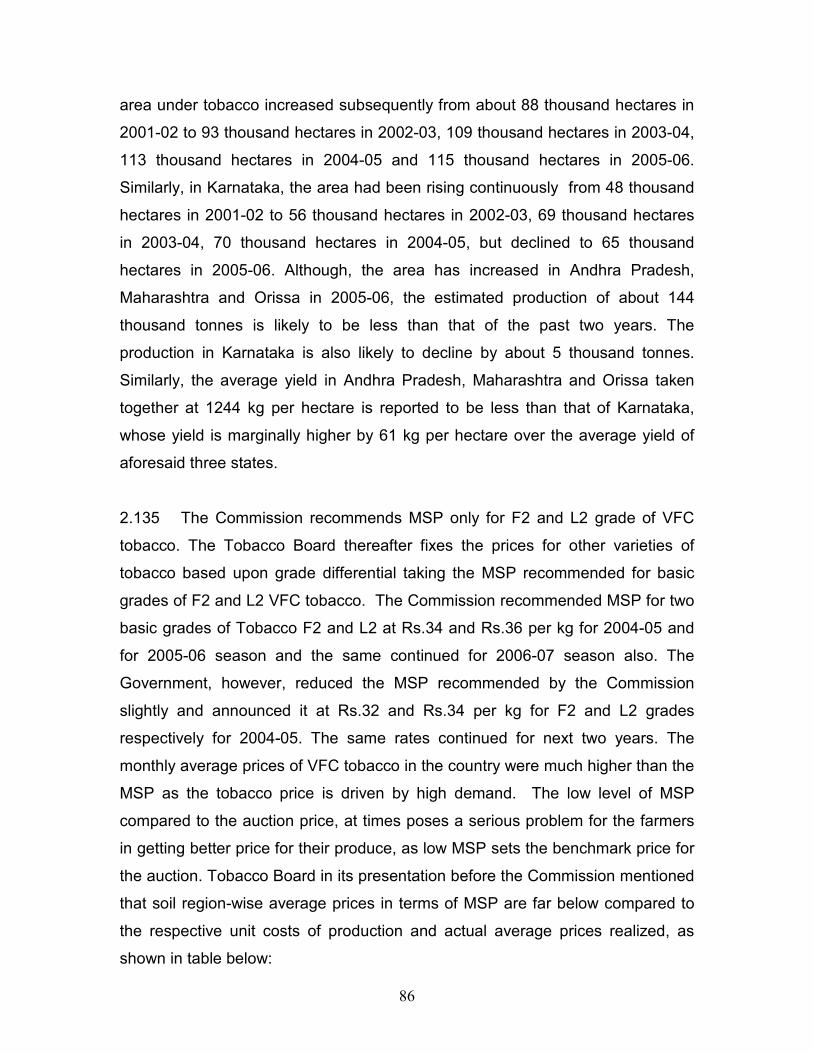
86
area under tobacco increased subsequently from about 88 thousand hectares in
2001-02 to 93 thousand hectares in 2002-03, 109 thousand hectares in 2003-04,
113 thousand hectares in 2004-05 and 115 thousand hectares in 2005-06.
Similarly, in Karnataka, the area had been rising continuously from 48 thousand
hectares in 2001-02 to 56 thousand hectares in 2002-03, 69 thousand hectares
in 2003-04, 70 thousand hectares in 2004-05, but declined to 65 thousand
hectares in 2005-06. Although, the area has increased in Andhra Pradesh,
Maharashtra and Orissa in 2005-06, the estimated production of about 144
thousand tonnes is likely to be less than that of the past two years. The
production in Karnataka is also likely to decline by about 5 thousand tonnes.
Similarly, the average yield in Andhra Pradesh, Maharashtra and Orissa taken
together at 1244 kg per hectare is reported to be less than that of Karnataka,
whose yield is marginally higher by 61 kg per hectare over the average yield of
aforesaid three states.
2.135 The Commission recommends MSP only for F2 and L2 grade of VFC
tobacco. The Tobacco Board thereafter fixes the prices for other varieties of
tobacco based upon grade differential taking the MSP recommended for basic
grades of F2 and L2 VFC tobacco. The Commission recommended MSP for two
basic grades of Tobacco F2 and L2 at Rs.34 and Rs.36 per kg for 2004-05 and
for 2005-06 season and the same continued for 2006-07 season also. The
Government, however, reduced the MSP recommended by the Commission
slightly and announced it at Rs.32 and Rs.34 per kg for F2 and L2 grades
respectively for 2004-05. The same rates continued for next two years. The
monthly average prices of VFC tobacco in the country were much higher than the
MSP as the tobacco price is driven by high demand. The low level of MSP
compared to the auction price, at times poses a serious problem for the farmers
in getting better price for their produce, as low MSP sets the benchmark price for
the auction. Tobacco Board in its presentation before the Commission mentioned
that soil region-wise average prices in terms of MSP are far below compared to
the respective unit costs of production and actual average prices realized, as
shown in table below:
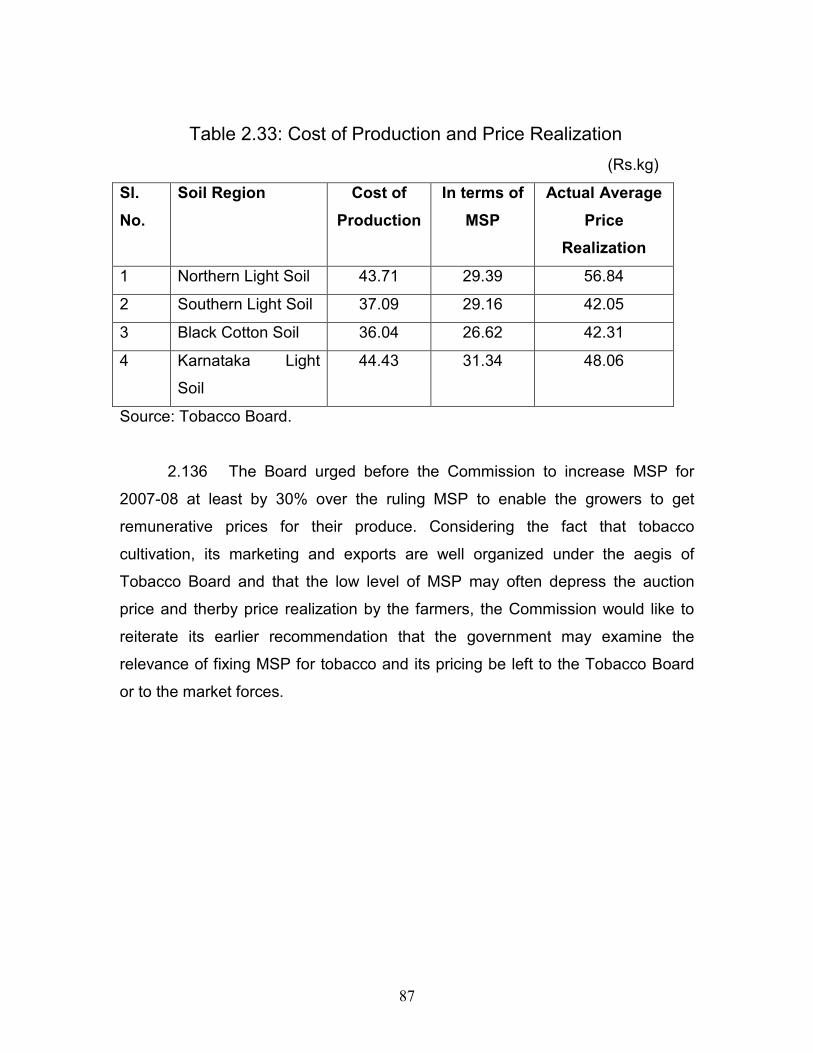
87
Table 2.33: Cost of Production and Price Realization
(Rs.kg)
Sl.
No.
Soil Region Cost of
Production
In terms of
MSP
Actual Average
Price
Realization
1 Northern Light Soil 43.71 29.39 56.84
2 Southern Light Soil 37.09 29.16 42.05
3 Black Cotton Soil 36.04 26.62 42.31
4 Karnataka Light
Soil
44.43 31.34 48.06
Source: Tobacco Board.
2.136 The Board urged before the Commission to increase MSP for
2007-08 at least by 30% over the ruling MSP to enable the growers to get
remunerative prices for their produce. Considering the fact that tobacco
cultivation, its marketing and exports are well organized under the aegis of
Tobacco Board and that the low level of MSP may often depress the auction
price and therby price realization by the farmers, the Commission would like to
reiterate its earlier recommendation that the government may examine the
relevance of fixing MSP for tobacco and its pricing be left to the Tobacco Board
or to the market forces.
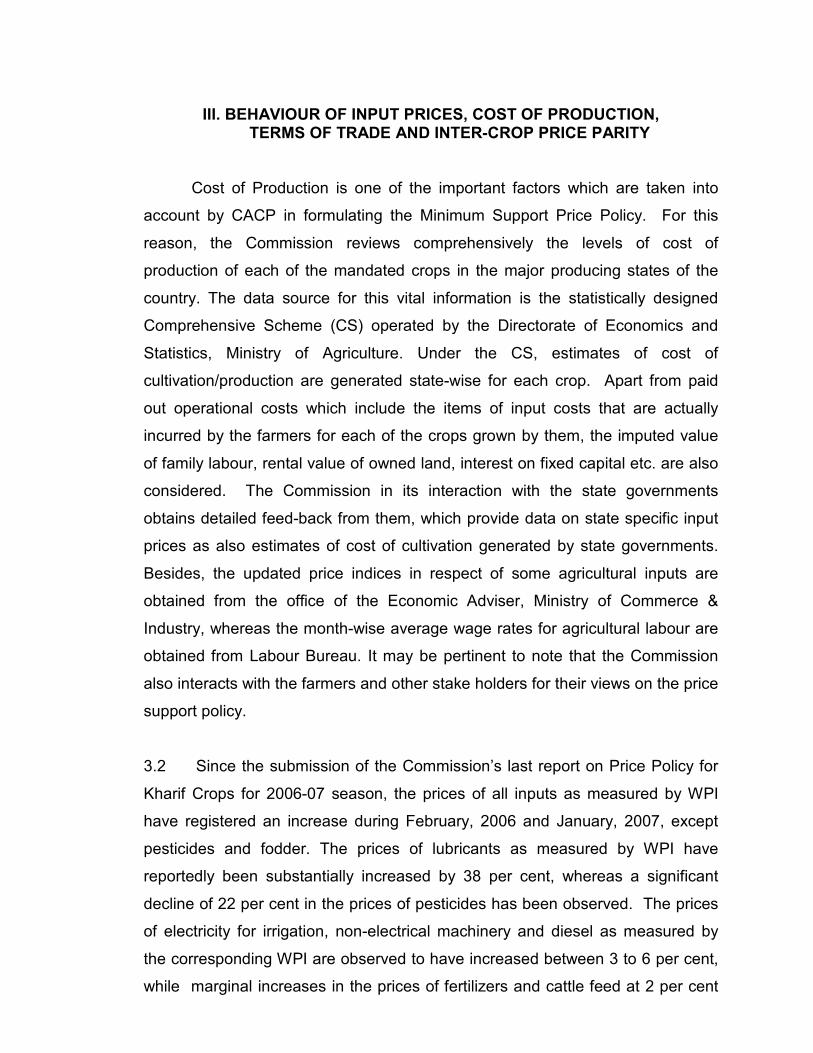
III. BEHAVIOUR OF INPUT PRICES, COST OF PRODUCTION, TERMS OF TRADE AND INTER-CROP PRICE PARITY
Cost of Production is one of the important factors which are taken into
account by CACP in formulating the Minimum Support Price Policy. For this
reason, the Commission reviews comprehensively the levels of cost of
production of each of the mandated crops in the major producing states of the
country. The data source for this vital information is the statistically designed
Comprehensive Scheme (CS) operated by the Directorate of Economics and
Statistics, Ministry of Agriculture. Under the CS, estimates of cost of
cultivation/production are generated state-wise for each crop. Apart from paid
out operational costs which include the items of input costs that are actually
incurred by the farmers for each of the crops grown by them, the imputed value
of family labour, rental value of owned land, interest on fixed capital etc. are also
considered. The Commission in its interaction with the state governments
obtains detailed feed-back from them, which provide data on state specific input
prices as also estimates of cost of cultivation generated by state governments.
Besides, the updated price indices in respect of some agricultural inputs are
obtained from the office of the Economic Adviser, Ministry of Commerce &
Industry, whereas the month-wise average wage rates for agricultural labour are
obtained from Labour Bureau. It may be pertinent to note that the Commission
also interacts with the farmers and other stake holders for their views on the price
support policy.
3.2 Since the submission of the Commission’s last report on Price Policy for
Kharif Crops for 2006-07 season, the prices of all inputs as measured by WPI
have registered an increase during February, 2006 and January, 2007, except
pesticides and fodder. The prices of lubricants as measured by WPI have
reportedly been substantially increased by 38 per cent, whereas a significant
decline of 22 per cent in the prices of pesticides has been observed. The prices
of electricity for irrigation, non-electrical machinery and diesel as measured by
the corresponding WPI are observed to have increased between 3 to 6 per cent,
while marginal increases in the prices of fertilizers and cattle feed at 2 per cent
90
and 1 per cent respectively have been registered during the same period. The
price of tractors, which is one of the important inputs of machine labour, has
increased less than a per cent.
3.3 The statutory minimum wages for agricultural labourers have been revised
upward in the states of Chhattisgarh, Haryana, Karnataka, Madhya Pradesh and
Orissa. As per data obtained from Labour Bureau, the actual average agricultural
wage rates, between the Kharif seasons (April- September) of 2005 and 2006
are observed to have increased by 1 to 4 per cent in Andhra Pradesh, Bihar,
Gujarat, Haryana, Kerala, Madhya Pradesh, Punjab, Uttar Pradesh and West
Bengal, except in Tamil Nadu where the wages have almost remained at the
same level. However in the states of Orissa and West Bengal, the increase in
the wages is higher at 6 per cent during the same period. (Tables 3.1 & 3.2)
Estimates of Cost of Cultivation and Projected Costs for 2007-08 Season
After the submission of the Commission’s last Report on Price Policy for
Kharif crops for 2006-2007 seasons, the Directorate of Economics & Statistics
(DES) provided the estimates of cost of cultivation/production for the year 2004-
2005 for different crops.
Paddy
3.4 The DES has provided the estimates of cost of cultivation/production of
paddy for the year 2004-05 in respect of Andhra Pradesh, Assam, Bihar,
Chhattisgarh, Haryana, Jharkhand, Karnataka, Kerala, Madhya Pradesh, Orissa,
Punjab, Tamil Nadu, Uttar Pradesh, Uttarakhand and West Bengal. The details of
the latest available cost estimates of paddy and also those pertaining to the
preceding year are presented in Table 3(A). It is observed that between 2003-04
and 2004-05, the C2 cost of production per quintal has moved upward in majority
of the rice producing states. However, it has declined in the states of Uttarakhand,
Karnataka and Kerala due to increase in the yield levels in most of these states.
91
Further details of cost of cultivation/production of paddy pertaining to the latest
period and for the preceding year are given in Tables 3.3 and 3.4.
3.5 The Commission has arrived at the likely levels of cost of production of
paddy in different growing states for the ensuing season of 2007-08 based on the
cost of production/cultivation available for the latest year 2004-05. In order to
make the projections consistent and realistic, each of the latest three years data
provided by the DES, wherever available, are being projected and their averages
taken. For projections, a state-specific Variable Input Price Index for each crop
has been constructed to capture the movements of input prices between the
base year and the year of projection (2007-08). (Table 3.5)
3.6 As per the above methodology, the projected per quintal paid-out cost of
production of paddy plus imputed cost of family labour (i.e. cost A2+FL) for 2007-
08 works out to an average of Rs.403 for Andhra Pradesh, Rs.462 for Assam,
Rs.401 for Bihar, Rs.394 for Chhattisgarh, Rs.528 for Haryana, Rs.514 for
Jharkhand, Rs.509 for Karnataka, Rs.644 for Kerala, Rs.540 for Madhya
Pradesh, Rs.426 for Orissa, Rs.367 for Punjab, Rs.509 for Tamil Nadu, Rs.424
for Uttar Pradesh, Rs.462 for Uttarakhand and Rs.460 for West Bengal. As
against this, the projected C2 cost of production of paddy for these states
average at Rs.587, Rs.601, Rs.559, Rs.575, Rs.756, Rs.666, Rs.663, Rs.784,
Rs.713, Rs.562, Rs.520, Rs.635, Rs.579, Rs.598 and Rs.599 per quintal
respectively for 2007-08. The weighted average cost of production of paddy for
all these states works out to Rs.439 on cost A2+FL basis and Rs.595 on cost C2
basis.
[Table 3(G)]
3.7 It is observed from the above that the average C2 cost of production of
paddy is lowest (Rs.520) in Punjab followed by Bihar (Rs.559). Projected C2 cost
of production for the year 2007-08 for both these states command a margin of
about 12 per cent and 4 per cent respectively over the MSP fixed for paddy
92
(common) for 2006-07 at Rs.580 per quintal. On the other hand, the projected
costs of production of paddy are much higher as compared to MSP in Haryana,
Jharkhand, Karnataka, Kerala, Madhya Pradesh and Tamil Nadu. While Madhya
Pradesh suffers from extremely low productivity, Kerala’s high cost is explained
mainly by the higher human labour cost. In the case of Haryana, the total cost of
cultivation of paddy per hectare at Rs.33,389 is close to that of its neighbour,
Punjab. However, Haryana produces finer quality of paddy of basmati variety in a
large area which results in lower yield levels averaging around 43 quintals per
hectare as against 65 quintals obtained in Punjab for common variety.
3.8 The Commission also receives cost of cultivation estimates from various
state governments. These are examined in detail in the Commission and
compared with the corresponding CS data and also with the projected costs of
production of various crops for the ensuing kharif season. Although these
estimates are not strictly comparable with the CS estimates because of certain
conceptual and methodological differences, the comparison exercise serves
useful purpose of cross-validation of the cost data. In some cases these state
estimates pertain to more recent years and information therein is used for the
purpose of projections.
3.9 From Table 3(H) it is observed that the cost of production of paddy
estimated by Andhra Pradesh, Bihar, Haryana and Uttar Pradesh at Rs.770,
Rs.750, Rs.725 and Rs.630 per quintal for 2004-05 are higher than those given
under CS at Rs.504, Rs.552, Rs.705 and Rs.571 per quintal respectively, mainly
due to the consideration of higher human labour cost by the state of Bihar and
lower yield levels by Andhra Pradesh and Uttar Pradesh. In the case of West
Bengal, however, the unit cost estimated by the state at Rs.502 per quintal is
much lower than the CS estimate. The estimates provided by the states of Bihar,
Gujarat, Uttar Pradesh and West Bengal for the year 2005-06 are Rs.953,
Rs.570, Rs.648 and Rs.537 per quintal respectively. The states of Haryana and
Madhya Pradesh have provided the estimates for the same season at Rs.746 per
93
quintal each. However, no comparison is possible due to non- availability of CS
data for these years.
3.10 The projected cost of production of paddy for the year 2007-08 has been
received from the states of Andhra Pradesh, Bihar, Haryana, Orissa, Punjab,
Tamil Nadu and West Bengal. It is observed that the cost of production of paddy
projected by the state of Punjab at Rs.830 per quintal is inclusive of the weather
risk, management charges etc. After excluding these, the projection works out to
Rs.653 for 2007-08, which is higher than the Commission’s projection at Rs.520
per quintal. This difference is mainly attributed to the much higher rental value of
land and lower yield level considered by the state. Andhra Pradesh, Bihar,
Haryana and Orissa have provided the projected C2 cost of production at Rs.660,
Rs.806, Rs.759 and Rs.597 per quintal respectively. These are inclusive of
managerial cost, profit margin to the farmers and also transport charges etc.
After making necessary adjustments to the projected costs to make them
comparable with the Commission’s concepts and methodologies, it is observed
that the projected costs work out to Rs.660 per quintal for Andhra Pradesh,
Rs.733 per quintal for Bihar, Rs.643 per quintal for Haryana, Rs.597 per quintal
for Orissa respectively. The adjusted projected cost for Bihar and Orissa is
higher than the Commission’s projection at Rs.559 and Rs.562 per quintal
respectively for 2007-08. In the state of Orissa a lower yield has been
considered by the state, where as higher charges on account of interest on fixed
capital and depreciation accounted by the state of Bihar. However, the projected
cost obtained from West Bengal is very close to the Commission’s projection.
[Table 3(I)]
Coarse Cereals
3.11 Jowar, bajra, maize and ragi are the major kharif coarse cereals for which
cost estimates are available under CS. For jowar, estimates of cost of
cultivation/production are available for 2004-05 in respect of Andhra Pradesh,
Karnataka, Madhya Pradesh, Maharashtra, Rajasthan and Tamil Nadu. It may be
94
observed from Table 3(C) that between 2003-04 and 2004-05, the C2 cost of
cultivation for jowar per hectare is estimated to have decreased in all the major
growing states except Maharashtra and Tamil Nadu. The yield level has
increased by 13 per cent in Rajasthan. In case of Andhra Pradesh and
Karnataka, a considerable increase of 44 per cent and 88 per cent respectively
has been observed. However, it has declined in the remaining states. The cost
estimates for bajra have been received from the states of Gujarat, Haryana,
Rajasthan, Uttar Pradesh and Maharashtra. For bajra, the C2 cost of production
is estimated to have increased in all the states except for Maharashtra, where the
same has declined. It may be noted that the yield levels in most of the states
have increased, whereas the same in the states of Rajasthan and Haryana has
declined. The state of Rajasthan has registered a significant decline of 27 per
cent as against Haryana, where it has declined by 3 per cent. In case of maize,
cost estimates have become available for Andhra Pradesh, Bihar, Chhattisgarh,
Himachal Pradesh, Jharkhand, Karnataka, Madhya Pradesh, Rajasthan, Uttar
Pradesh and Uttarakhand. The C2 cost of cultivation has come down in all the
above mentioned states except Jharkhand and Chhattisgarh. The cost estimates
with respect to Karnataka and Tamil Nadu for the year 2004-05 are available for
Ragi. It is observed that C2 cost of production has declined in these states by 2
per cent and 11 per cent respectively. There is a rise in the yield level from 11 to
11.69 quintals per hectare in Karnataka as against Tamil Nadu, where it has
marginally come down from 15.85 to 15.80 quintals per hectare.
3.12 The projected cost of production (A2+FL) for jowar for 2007-08 in respect
of Andhra Pradesh, Karnataka, Madhya Pradesh, Maharashtra, Rajasthan and
Tamil Nadu are Rs.690, Rs.622, Rs.600, Rs.495, Rs.443 and Rs.488 per quintal
respectively while the projected cost of production per quintal on C2 basis for
these states are Rs.951, Rs.802, Rs.779, Rs.652, Rs.647 and Rs.706
respectively. The weighted average A2+FL and C2 cost of production for jowar
works out to Rs.546 and Rs.724 per quintal respectively. The projected cost of
production for bajra for the year 2007-08 for the states of Gujarat, Haryana,
Rajasthan, Uttar Pradesh and Maharashtra on A2+FL basis works out to Rs.501,
95
Rs.522, Rs.380, Rs.415 and Rs.607 per quintal respectively, while the C2 cost of
production per quintal for these states are Rs.605, Rs.704, Rs.540, Rs.602 and
Rs.738 respectively. The weighted average A2+FL and C2 costs of production of
bajra for the year 2007-08 works out to Rs.444 and Rs.598 per quintal
respectively. The A2+FL projected cost of production of maize for the states of
Andhra Pradesh, Bihar, Chhattisgarh, Himachal Pradesh, Jharkhand, Karnataka,
Madhya Pradesh, Rajasthan, Uttar Pradesh and Uttarakhand are Rs.434, Rs.298,
Rs.565, Rs.417, Rs.542, Rs.383, Rs.465, Rs.557, Rs.598 and Rs.709 per quintal
respectively, while the projected C2 cost of production for these states works out
to Rs.612, Rs.421, Rs.718, Rs.585, Rs.745, Rs.507, Rs.605, Rs.700, Rs.789
and Rs.952 per quintal respectively. The weighted average A2+FL and C2 costs
of production of maize on the basis of these costs work out to Rs.449 and Rs.601
per quintal respectively. The projected A2+FL cost of production for ragi for the
year 2007-08 for the states of Andhra Pradesh, Karnataka and Tamil Nadu works
out to Rs.814, Rs.666 and Rs.664 per quintal respectively while the C2 cost of
production for these states are Rs.987, Rs.779 and Rs.929 per quintal. The
weighted average cost of production of ragi works out to Rs.673 on cost A2+FL
basis and Rs.805 on cost C2 basis respectively.
[Table 3(G)]
3.13 The cost estimates for jowar have been made available by the states of
Andhra Pradesh and Uttar Pradesh for the years 2004-05 and 2005-06 while
Gujarat and Madhya Pradesh have provided the same for the years 2004-05,
2005-06 and 2006-07. The estimate provided by Madhya Pradesh for 2004-05 at
Rs.625 is lower than the corresponding CS estimate. The state of Andhra
Pradesh has provided cost projections for jowar for the year 2007-08. As regards
bajra, the states of Gujarat and Haryana have provided cost estimates for the
years 2004-05, 2005-06 and 2006-07, whereas the states of Andhra Pradesh has
provided estimates only for the year 2004-05 and Uttar Pradesh has provided
96
the same for the years 2004-05 and 2005-06. The cost per quintal as per the
state and CS estimates in the case of Gujarat and Haryana are lower than the
CS estimates, while the state estimate in case of Uttar Pradesh is on the higher
side due to the consideration of lower yield level by the state. The states of
Andhra Pradesh and Haryana have provided projected cost for bajra for the year
2007-08. CACP’s projection for the Haryana is higher than the state
government’s projections. For maize, cost estimates have been provided for the
years 2004-05, 2005-06 and 2006-07 by the states of Bihar, Gujarat, Haryana
and Madhya Pradesh as against the Andhra Pradesh for which the same has
been received for 2004-05 only. The state of Uttar Pradesh has provided the
same for 2004-05 and 2005-06. The estimate of cost provided by Andhra
Pradesh at Rs.580 per quintal is almost at the same level to the CS estimate.
The cost projections for maize for the year 2007-08 have been received from the
states of Andhra Pradesh, Bihar, Haryana, Orissa and Tamil Nadu. CACP’s
projection for Andhra Pradesh is very close to the projected cost obtained from
the state. However, the Commission received the projected cost for ragi from
Andhra Pradesh only. These have been adjusted using the Commission’s
concepts and methodologies. The Andhra Pradesh estimate after adjustment
works out to Rs.726 per quintal. [Tables 3(H) & 3(I)]
Pulses
3.14 The latest available estimates of cost of cultivation/production for major
kharif pulses of tur (arhar), moong and urad are presented in Table 3 (D). It may
be observed that the cost of cultivation per quintal for tur is estimated to have
declined significantly in 2004-05 in Gujarat, whereas it has increased in the case
97
of Andhra Pradesh, Karnataka, Madhya Pradesh, Maharashtra, Orissa and Uttar
Pradesh over the preceding year. The projected per quintal cost of production
(A2+FL) of tur for the year 2007-08 averaged at Rs.963 for Andhra Pradesh,
Rs.1239 for Gujarat, Rs.1553 for Karnataka, Rs.949 for Madhya Pradesh,
Rs.999 for Maharashtra, Rs.1170 for Orissa and Rs.649 for Uttar Pradesh .The
corresponding C2 costs work out to Rs.1506, Rs.1620, Rs.2025, Rs.1418,
Rs.1393, Rs.1639 and Rs.1295 per quintal respectively. The weighted average
projected cost for tur for 2007-08 works out to Rs.1040 and Rs.1514 per quintal
on A2+FL and C2 basis respectively. As regards moong cost A2+FL is projected
at Rs.1283, Rs.1583, Rs.1678 and Rs.1441 per quintal for the states of Andhra
Pradesh, Maharashtra, Orissa and Rajasthan respectively and the corresponding
cost C2 at Rs.1900, Rs.1978, Rs.2268 and Rs.1987 per quintal respectively.
The weighted average cost for moong for the year 2007-08 works out to Rs.1464
and Rs.1981 per quintal respectively on cost A2+FL and C2 basis. The A2+FL
cost for urad for the states of Andhra Pradesh, Madhya Pradesh, Chhattisgarh,
Maharashtra, Orissa, Rajasthan, Tamil Nadu and Uttar Pradesh have been
projected at Rs.865, Rs.1693, Rs.563, Rs.1543, Rs.1366, Rs.1707, Rs.1377 and
Rs.868 per quintal respectively. The corresponding C2 cost of production for
these states works out to Rs.1322, Rs.2198, Rs.1042, Rs.1915, Rs.1837,
Rs.2194, Rs.2232 and Rs.1293 per quintal respectively with weighted average
A2+FL and C2 cost for urad for the year 2007-08 being placed at Rs.1269 and
Rs.1741 per quintal respectively. [Table 3(G)]
3.15 For all the kharif pulses, the estimates of costs have been provided by the
states of Andhra Pradesh, Gujarat, and Uttar Pradesh. The state cost estimates
in case of pulses are invariably higher than the CS estimates except in the case
of moong in Andhra Pradesh and urad in Uttar Pradesh for the year 2004-05.
The projections for kharif pulses have been received from the states of Andhra
Pradesh, Orissa and Tamil Nadu. The projections as provided by the states for
kharif pulses are lower than the corresponding projections made by the
Commission for the crop except for Andhra Pradesh due to lower yields
98
considered by the states as compared to the projected yield levels by CACP.
[Tables 3(H) & (I)]
Oilseeds
3.16 The latest estimates of cost of cultivation/production for groundnut for the
year 2004-05 have become available in respect of Andhra Pradesh, Gujarat,
Karnataka, Maharashtra and Tamil Nadu. (Table-3(E)). The C2 cost of cultivation
per hectare for groundnut for 2004-05 is estimated to be marginally higher than
that for the previous year in the states of Karnataka and Tamil Nadu, whereas
there has been a decline in the state of Andhra Pradesh, Gujarat and
Maharashtra. However, C2 cost of production has registered a decline in Andhra
Pradesh, Karnataka and Tamil Nadu. In the case of soyabean, cost estimates
have become available for Chhattisgarh, Madhya Pradesh, Maharashtra and
Rajasthan for the year 2004-05. The yield levels have decreased over the
preceding year in Madhya Pradesh and Maharashtra except Rajasthan and
Chhattisgarh, where the same has been increased by 23 per cent each. Cost
estimates for sunflower are available for Andhra Pradesh, Karnataka and
Maharashtra. It is observed that the yield has increased in both the states as
compared to the previous year. The cost estimates for nigerseed are available for
Orissa and Chhattisgarh.
3.17 The estimated costs of kharif oilseeds for the latest three years ending
2004-05 have been projected for the ensuing crop season of 2007-08 and their
weighted averages taken. Accordingly, the projected A2+FL cost of production for
groundnut averages at Rs.1350 per quintal for Andhra Pradesh, Rs.825 for
Gujarat, Rs.1517 for Karnataka, Rs.1612 for Maharashtra and Rs.1302 per
quintal for Tamil Nadu. The C2 cost of production for these states work out to
Rs.1885, Rs.1084, Rs.1946, Rs.1998 and Rs.1730 per quintal respectively. The
weighted average cost for groundnut works out to Rs.1120 per quintal on A2+FL
basis and Rs.1484 on cost C2 basis. For soyabean, the projected A2+FL cost
works out to Rs.1009, Rs.717 , Rs.821 and Rs.793 per quintal respectively for
99
the states of Chhattisgarh, Madhya Pradesh, Maharashtra and Rajasthan while
the C2 cost works out to Rs.1273, Rs.1049, Rs.1067 and Rs.1037 per quintal
respectively. The weighted average cost for soyabean works out to Rs.761 and
Rs.1058 per quintal respectively on cost A2+FL and C2 basis. The costs for
sunflower for 2007-08 for the states of Andhra Pradesh, Karnataka and
Maharashtra are projected at Rs.2093, Rs.2007 and Rs1823 per quintal
respectively on C2 basis. The weighted average cost on A2+FL and C2 basis
work out to Rs.1440 and Rs.2004 per quintal respectively. For sesamum, the
average projected A2+FL costs are Rs.1569, Rs.1205, Rs.2032, Rs.1373,
Rs.1690 and Rs.1546 per quintal and the corresponding C2 costs work out to
Rs.2024, Rs.1728, Rs.2871, Rs.2333, Rs.2679 and Rs.2482 per quintal for the
states for Gujarat, Madhya Pradesh, Orissa, Rajasthan, Tamil Nadu and Uttar
Pradesh respectively with the weighted average A2+FL and C2 cost at Rs.1484
and Rs.2176 per quintal respectively. The C2 cost of production of nigerseed in
respect of Orissa has been projected to an average of Rs.1661 per quintal,
whereas, the same has been estimated to an average of Rs.1498 per quintal.
The weighted average cost on A2+FL and C2 cost basis work out to Rs.1188 and
Rs.1618 per quintal respectively. [Table 3(G)]
3.18 The cost estimates for groundnut have been provided by the states of
Andhra Pradesh, Gujarat, Madhya Pradesh and Uttar Pradesh. The state
estimate in respect of Gujarat is lower than the corresponding CS estimate for
the year 2004-05. In the case of soyabean, the cost estimates have been
received from Madhya Pradesh and Uttar Pradesh. The estimate reported by the
state of Madhya Pradesh is higher for 2004-05 than the corresponding CS
estimate. In the case of sesamum, the estimate provided by Gujarat and Madhya
Pradesh are lower as compared to the corresponding CS estimates for 2004-05.
Cost projections for the year 2007-08 in respect of oilseeds have been received
from the states of Andhra Pradesh, Orissa and Tamil Nadu. These are invariably
lower than CACP’s projections for oilseeds. [Tables 3(H) & 3(I)]
100
Cotton (Kapas)
3.19 For cotton, the estimates of cost of cultivation/production for 2004-05 have
become available in respect of Andhra Pradesh, Gujarat, Haryana, Karnataka,
Madhya Pradesh, Maharashtra, Punjab, Rajasthan and Tamil Nadu. The data
presented in Table 3(B) show that the C2 cost of cultivation per hectare is
estimated to have increased over the preceding year in all the states except
Andhra Pradesh and Tamil Nadu, where it has declined by 10 and 20 per cent
respectively. However, the unit C2 cost of production of cotton has declined in all
the states except in Andhra Pradesh. There is a substantial decrease in cost of
production in the range of 20 to 26 per cent in the states of Haryana, Karnataka,
Punjab and Rajasthan, while it has declined marginally in Gujarat, Madhya
Pradesh, Maharashtra and Tamil Nadu. This may be attributed to a considerable
increase in yield levels in most of these states.
(Tables 3.6 & 3.7)
3.20 Following the same methodology, the cost A2+FL of cotton per
quintal is projected for 2007-08 to an average of Rs.1163 for Andhra Pradesh,
Rs.1421 for Gujarat, Rs.1350 for Haryana, Rs.1501 for Karnataka, Rs.1946 for
Madhya Pradesh, Rs.1842 for Maharashtra, Rs.1741 for Punjab, Rs.1362 for
Rajasthan and Rs.2010 for Tamil Nadu per quintal. The corresponding cost C2
per quintal is projected at Rs.1856, Rs.1878, Rs.1979, Rs.2178, Rs.2907,
Rs.2412, Rs.2367, and Rs.1911 and Rs.2686 per quintal respectively in these
states. The weighted average cost of production of cotton for 2007-08 works out
to Rs.1528 per quintal and Rs.2111 per quintal on cost A2+FL and C2 basis
respectively.
[Table 3(G)]
3.21 In addition, the estimates of cost of production of cotton for the year 2004-
05, 2005-06 and 2006-07 have been provided by the states of Gujarat, Haryana
and Madhya Pradesh, whereas the same have been received for Andhra
Pradesh for 2004-05 only. The estimated cost of production is lower in Gujarat
and Madhya Pradesh, whereas it is on the higher side in Haryana as compared
101
to corresponding CS estimates. The states of Andhra Pradesh, Haryana, Orissa
and Punjab have given the projected costs of cotton for the year 2007-08. After
making necessary adjustments, the projections in the states of Haryana, and
Punjab are lower than the Commission’s projection for the crop.
[Tables 3(H) & 3(I)]
VFC Tobacco
3.22 The latest estimates of cost of cultivation/production for VFC tobacco
have been made available by the DES which pertains to Andhra Pradesh for the
year 2004-05. Karnataka, the only other important VFC tobacco producing state,
is not covered under the CS. The data presented in Table 3(F) show that
between 2003-04 and 2004-05 the C2 cost of cultivation has increased. The cost
of production of tobacco in respect of Andhra Pradesh has been projected to an
average of Rs.3193 and Rs.4001 per quintal on cost A2+FL and C2 basis,
respectively. [Table 3(G)]
Terms of Trade
3.23 The Commission in its earlier reports mentioned about the deteriorating
agricultural terms of trade in recent years. The index of terms of trade (ITT) with
base TE 1990-91 (TE 1990-91=100) deteriorated from 106.6 in 1994-95 to 100.9
in 2000-01. It marginally recovered in the years 2001-02 and 2002-03, but
deteriorated again in 2003-04 and 2004-05. However, during 2005-06, there was
a marginal improvement in the ITT over the previous year, while the index of
input price parity dropped from 105.3 in 2004-05 to 103.2 in 2005-06.
(Appendix II)
Inter-Crop Price Parity
3.24 The Commission undertakes analysis of inter-crop price policy mainly with
a view to ensure that the minimum support price policy gives appropriate price
signals for sustainable and diversified growth of agriculture. During the past one
102
decade or so, the market prices of various agricultural commodities moved at
different rates. Assuming 1993-94 as the base (1993-94=100), the wholesale
price index (WPI) of rice increased to 178.92 in 2006-07, while that of wheat rose
to 213.94 and the WPI of pulses increased to 253.53 in 2006-07. The WPI of
coarse cereals like jowar, bajra, maize, ragi and barley also increased at a higher
pace than that of rice. In fact, the WPI of jowar was as high as 270.33 in 2006-
07. The WPI of raw cotton increased only to 151.05 and that of oilseeds rose to
170.03 in 2006-07. Thus there was upward movement in the market prices of
different commodities at different rates.
3.25 As regards the minimum support prices, during 1990-91 to 2006-07, there
was relatively high rate of increase in commodities like gram, moong, urad and
wheat, considering the food security situation in the country and also the need for
addressing sustainability issues through improved production of pulses. The
relative price increase in paddy was lower vis-à-vis pulses. Even though the
MSPs of oilseed crops were hiked substantially in recent years, the overall
percentage change in the MSPs of oilseed crops during 1990-91 to 2006-07
remained lower than those of cereals and pulses. In the case of cotton, the hike
in MSP was smaller as compared to those of cereals and pulses. However,
despite relatively higher increase in the MSPs of pulses, the area, production and
yield of pulses continue to stagnate, as the relative returns from competitive
crops are still higher. In fact, improved production of pulses would depend not
only on increased price and marketing support, but also on availability and
adoption of high yielding varieties of seeds. The role of research and extension
support appears crucial for raising the production of pulses in the country.
IV PRICE POLICY FOR 2007-08 KHARIF SEASON
In formulating the price policy for kharif crops of 2007-08, the Commission
considered all the relevant factors such as costs of production, demand-supply
situation-both domestic and international, market prices - both domestic and
international, agricultural terms of trade, input output price parity and inter-crop
price parity. Besides, issues like food security, resource use efficiency,
agricultural diversification and reversal of the decelerating trend in agricultural
growth and farm income were considered.
4.1 The overall demand-supply balance of foodgrains in the current year
seems to be precarious, both domestically and internationally. The domestic
supply of rice in 2007-08 would hardly meet the demand, while that of wheat
would just meet the demand. The average stocks of rice would be marginally
above the buffer norm, but that of wheat would remain below the buffer norm. At
the international level, the stocks of foodgrains have shown a declining trend.
Under the circumstances, it may be necessary to increase the minimum support
prices of paddy, coarse cereals and pulses. However, the relative increase in the
minimum support prices should be such that there is a tilt in favour of coarse
cereals and pulses. At the same time, states like Punjab and Haryana, where
the ground water table is depleting day by day under the impact of intensive
cultivation of common and fine varieties of rice, should be persuaded to shift area
in favour of basmati rice, hybrid rice and maize which will have either water
saving or land saving effects. In fact, these states can continue to produce same
or higher level of output with less area by adopting hybrid rice. Increased
production of rice and coarse cereals would be necessary for maintaining the
country’s macro level food security, especially when the international supply
situation of rice remains constrained. According to the forecast by Food and
Agriculture Organisation of the UN, the global rice stock would fall and the tight
supply situation in exporting countries is likely to push up the international prices
in 2007, thereby restraining the possibility of high imports at reasonable prices.
115
Similarly, reasonable hike in the minimum support prices of tur, moong and urad
would be required to encourage the farmers to produce more pulses, especially
at a time when the domestic supply of pulses falls short of demand and the
international supply situation is constrained and uncertain. In fact, the supply of
moong and urad cannot be augmented by imports, as these pulses are not
produced in adequate quantities in other pulses growing countries.
4.2 As regards nine major edible oilseeds, nearly 35 to 40 per cent of the
domestic demand was met from imports during the past 3 years. Imports of
edible oils in such large magnitude have depressed the domestic prices of edible
oils and oilseeds, thereby affecting the income and livelihood of millions of
farmers. Therefore, based on demand-supply situation, some increase in the
minimum support prices of oilseeds like groundnut, soyabean and sunflower oil
produced in the kharif season would be justified, even though the Commission
feels that there should be proper co-ordination between price policy, exim policy
and technology support to make the desired impact in terms of increased
production of oilseeds in the country.
4.3 In the case of cotton, there has been significant increase in the production
in recent years. The prospect for 2007-08 is also bright. However, the domestic
production of long and extra long staple cotton varieties are inadequate at
present to meet the industrial demand. Hence, it may be desirable to increase
the production of long and extra long staple cotton, for which appropriate
technology and price support would be necessary. The production of tobacco
has been estimated at 243 million kg. in 2006-07, with a closing stock of 79.05
million kg. Despite the fact that Government of India has adopted a policy of
discouraging the production and consumption of tobacco, on account of its health
hazard, the production has increased and thousands of farmers cultivate tobacco
for livelihood.
116
4.4 During 2006-07 the overall market prices of rice, coarse cereals, pulses,
cotton and tobacco in the country remained much higher than their MSPs fixed.
Therefore, the sustainability of some increase in their minimum support prices in
the market may not pose any problem. The global price situations of these
commodities look quite buoyant. During January, 2006 to January, 2007, there
was an increase of 60.8 per cent in the international prices of maize and 10.2 per
cent in that of rice. In the case of cotton, although the domestic prices during
2006-07 were higher as compared to 2005-06, the index of WPI of cotton in
2006-07 still remained lower than that in 2003-04 and 2004-05, especially during
April to October. Also during January, 2006 to January 2007, the international
prices of cotton were higher only by 0.1 per cent. The domestic prices of most of
the kharif edible oilseeds remained depressed during October/November, 2006,
but moved up a little since then. However, during January, 2006 to January,
2007 international prices of soyabean were higher by 16.6 per cent, while the
groundnut prices went up by 40.3 per cent. The domestic prices of sesamum,
however, started firming up from May, 2006 and that of nigerseed from August,
2006. The international sunflower prices were lower by about 38.3 per cent.
Thus, based on market prices, there is scope for a moderate increase in the
minimum support prices of groundnut and soyabean only, while the MSP of
sunflower seed may not merit any hike and MSPs of sesamum and nigerseed
would merit only a marginal increase. The domestic and international prices of
tobacco remained firm in recent months and hence, there may be justification for
a marginal increase in the MSP of VFC tobacco. In fact, the domestic market
prices of tobacco ruled much above the current level of minimum support price of
VFC tobacco. (Tables 2.16 & 2.19)
4.5 The index of agricultural terms of trade has shown a deteriorating trend
since 1998-99. It dropped from 105.6 in 1998-99 to 105.2 in 1997-98 and 101.3
in 2005-06. In fact, the index of output price received by farmers in 2005-06 was
273.3, while the index of prices paid for intermediate consumption and capital
formation were 275.6 and 310.5 respectively. This has caused overall depression
117
in the minds of farmers and consequently they are not taking so much interest in
farming as would be necessary to step up agricultural growth. The Commission
is indeed concerned about the deteriorating socio-economic conditions of Indian
farmers. The high incidence of poverty, and indebtedness among farm
households are reported to have resulted in increase in the number of farmers
committing suicides in recent years. (Appendix-I)
4.6 Government of India hiked the minimum support prices of pulses and
edible oilseeds quite considerably in recent years. This was intended to induce
the farmers to diversify their cropping patterns in favour of these crops. However,
due to inadequate technology and marketing support, there was no noticeable
improvement in the production of pulses, although oilseeds production
responded quite positively to price variations. The Commission believes that any
increase in the minimum support prices of pulses and oilseeds in future should
be integrated with adequate technology and marketing support and an
appropriate exim policy to prevent unduly high import of these commodities.
Besides, the current situation demands that inter-crop price parity should be fixed
in such a manner that farmers are induced to produce more coarse cereals,
pulses and cotton in place of high water consuming traditional rice varieties.
4.7 The Commission gives due importance to cost of production as one of the
determinants of minimum support prices. The all India weighted average cost of
production of paddy for 2007-08 has been projected at Rs.439 on A2+FL basis
and Rs.595 on C2 basis. This means that the current level of MSP of fine variety
of paddy fixed at Rs 610 per quintal covers the C2 cost. Besides, the
Government gave a bonus of Rs.40 per quintal. The existing MSP of maldandi
jowar covers the all India weighted average A2+FL cost, but not the C2 cost.
Similarly, in the case of maize, bajra and ragi, the existing MSP does not cover
their C2 costs of production. The weighted average A2+FL cost of production of
cotton projected at Rs.1528 is much lower than the current level of MSP of
Rs.1990 for H4 variety, but C2 cost is projected to be higher than the existing

118
MSP. As a matter of fact, the cost of production of cotton has come down in
recent years in some states due to higher yields. But states like Maharashtra,
Madhya Pradesh and Tamil Nadu continue to produce cotton at relatively very
high costs. The costs of production of cotton in these states should be brought
down through improved technology and management practices. In the case of
kharif pulses, the existing MSPs do not cover their C2 costs of production. The
existing MSP of groundnut covers the weighted average C2 cost. But in the case
of other oilseed crops like soyabean, sunflower, sesamum, and nigerseed, their
existing MSPs cover only A2+FL costs and not the C2 costs. Similar is the
situation with VFC tobacco. The C2 cost of production of Rs.4001 per quintal of
tobacco is much higher than the existing levels of MSP of Rs.3200 per quintal for
black soil F2 grade VFC tobacco and Rs.3400 per quintal for light soil L2 grade
VFC tobacco. Thus, based on C2 cost-price comparison, there is no scope for
increase in the MSP of paddy, but the weighted average C2 cost of production of
paddy has been projected to increase by Rs 26 per quintal this year and
therefore, the MSP of paddy may have to be increased to cover this increase in
cost. Besides, a bonus of Rs. 40 per quintal of paddy given last year would have
to be absorbed so that the farmers are induced to adopt new technology and
produce more rice, especially when the country’s food security situation is
precarious at present. Considering both costs of production and food security
situation, the MSPs of coarse cereals and pulses would need to be substantially
increased. Also, moderate increase in the MSPs of cotton, oilseeds and tobacco
may be justified by their high costs of production. However, while suggesting
increases in the minimum support prices of coarse cereals, pulses, oilseeds and
cotton, the Commission would also make a point that government should give top
priority to production of these crops in a cost effective manner through
appropriate research and extension support.
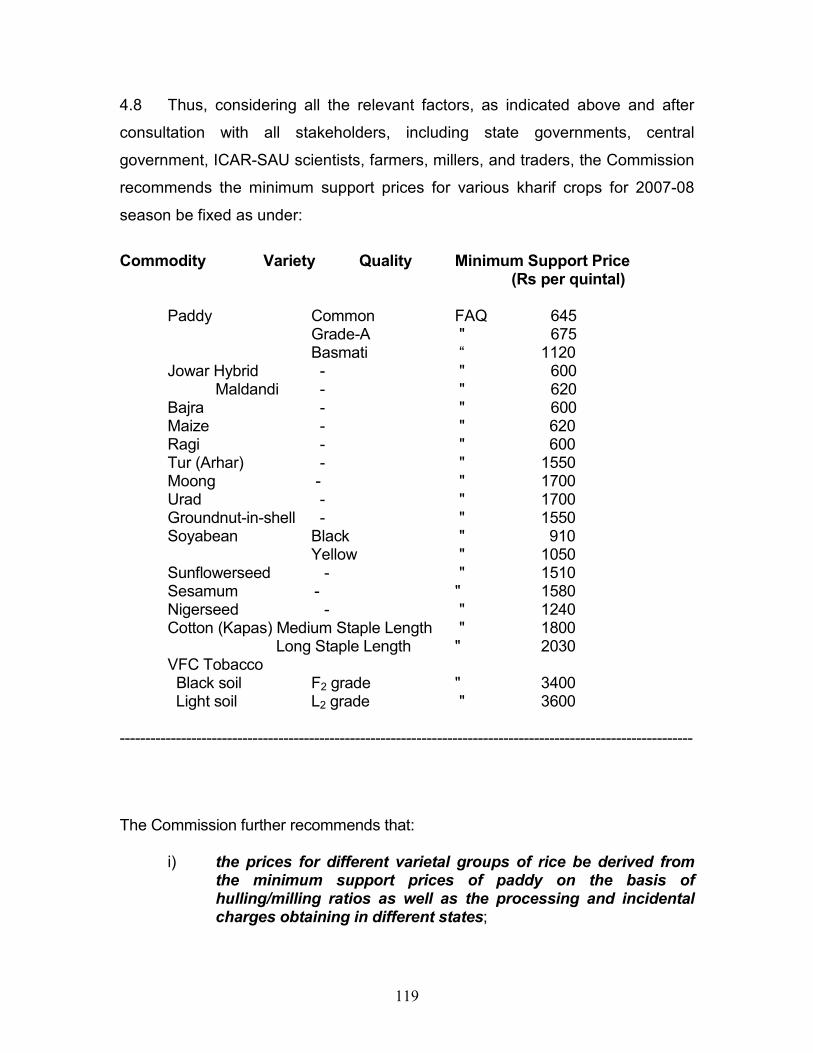
119
4.8 Thus, considering all the relevant factors, as indicated above and after
consultation with all stakeholders, including state governments, central
government, ICAR-SAU scientists, farmers, millers, and traders, the Commission
recommends the minimum support prices for various kharif crops for 2007-08
season be fixed as under:
Commodity Variety Quality Minimum Support Price (Rs per quintal) Paddy Common FAQ 645 Grade-A " 675 Basmati “ 1120 Jowar Hybrid - " 600 Maldandi - " 620 Bajra - " 600 Maize - " 620 Ragi - " 600 Tur (Arhar) - " 1550 Moong - " 1700 Urad - " 1700 Groundnut-in-shell - " 1550 Soyabean Black " 910 Yellow " 1050 Sunflowerseed - " 1510 Sesamum - " 1580 Nigerseed - " 1240 Cotton (Kapas) Medium Staple Length " 1800 Long Staple Length " 2030 VFC Tobacco Black soil F2 grade " 3400 Light soil L2 grade " 3600 ----------------------------------------------------------------------------------------------------------------
The Commission further recommends that: i) the prices for different varietal groups of rice be derived from
the minimum support prices of paddy on the basis of hulling/milling ratios as well as the processing and incidental charges obtaining in different states;
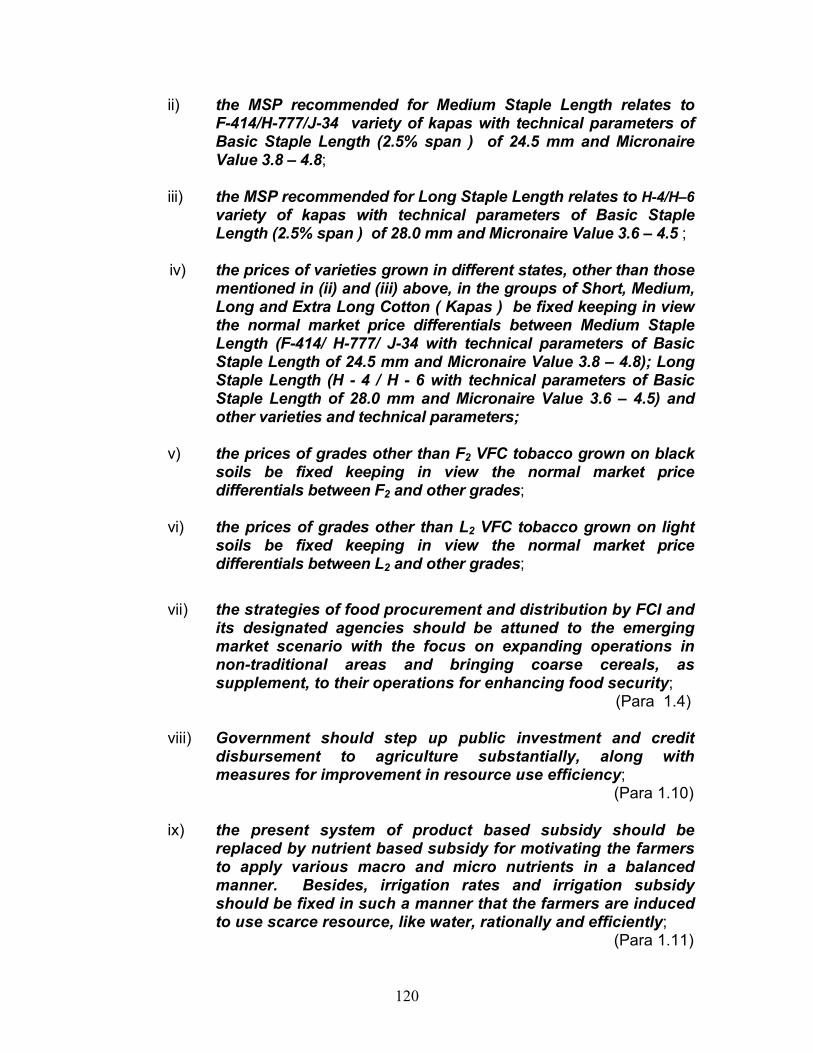
120
ii) the MSP recommended for Medium Staple Length relates to F-414/H-777/J-34 variety of kapas with technical parameters of Basic Staple Length (2.5% span ) of 24.5 mm and Micronaire Value 3.8 – 4.8;
iii) the MSP recommended for Long Staple Length relates to H-4/H–6
variety of kapas with technical parameters of Basic Staple Length (2.5% span ) of 28.0 mm and Micronaire Value 3.6 – 4.5 ;
iv) the prices of varieties grown in different states, other than those
mentioned in (ii) and (iii) above, in the groups of Short, Medium, Long and Extra Long Cotton ( Kapas ) be fixed keeping in view the normal market price differentials between Medium Staple Length (F-414/ H-777/ J-34 with technical parameters of Basic Staple Length of 24.5 mm and Micronaire Value 3.8 – 4.8); Long Staple Length (H - 4 / H - 6 with technical parameters of Basic Staple Length of 28.0 mm and Micronaire Value 3.6 – 4.5) and other varieties and technical parameters;
v) the prices of grades other than F2 VFC tobacco grown on black
soils be fixed keeping in view the normal market price differentials between F2 and other grades;
vi) the prices of grades other than L2 VFC tobacco grown on light
soils be fixed keeping in view the normal market price differentials between L2 and other grades;
vii) the strategies of food procurement and distribution by FCI and its designated agencies should be attuned to the emerging market scenario with the focus on expanding operations in non-traditional areas and bringing coarse cereals, as supplement, to their operations for enhancing food security; (Para 1.4)
viii) Government should step up public investment and credit
disbursement to agriculture substantially, along with measures for improvement in resource use efficiency;
(Para 1.10)
ix) the present system of product based subsidy should be replaced by nutrient based subsidy for motivating the farmers to apply various macro and micro nutrients in a balanced manner. Besides, irrigation rates and irrigation subsidy should be fixed in such a manner that the farmers are induced to use scarce resource, like water, rationally and efficiently; (Para 1.11)
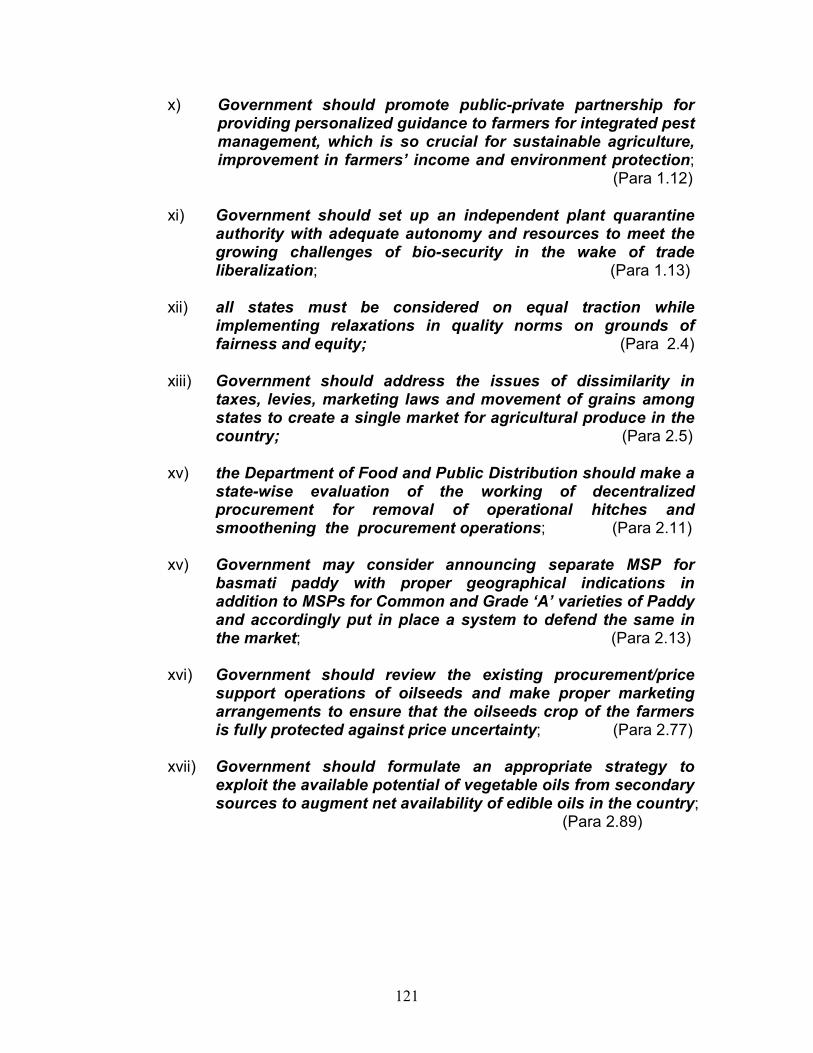
121
x) Government should promote public-private partnership for providing personalized guidance to farmers for integrated pest management, which is so crucial for sustainable agriculture, improvement in farmers’ income and environment protection; (Para 1.12)
xi) Government should set up an independent plant quarantine authority with adequate autonomy and resources to meet the growing challenges of bio-security in the wake of trade liberalization; (Para 1.13)
xii) all states must be considered on equal traction while implementing relaxations in quality norms on grounds of fairness and equity; (Para 2.4)
xiii) Government should address the issues of dissimilarity in taxes, levies, marketing laws and movement of grains among states to create a single market for agricultural produce in the country; (Para 2.5)
xv) the Department of Food and Public Distribution should make a state-wise evaluation of the working of decentralized procurement for removal of operational hitches and smoothening the procurement operations; (Para 2.11)
xv) Government may consider announcing separate MSP for
basmati paddy with proper geographical indications in addition to MSPs for Common and Grade ‘A’ varieties of Paddy and accordingly put in place a system to defend the same in the market; (Para 2.13)
xvi) Government should review the existing procurement/price
support operations of oilseeds and make proper marketing arrangements to ensure that the oilseeds crop of the farmers is fully protected against price uncertainty; (Para 2.77)
xvii) Government should formulate an appropriate strategy to
exploit the available potential of vegetable oils from secondary sources to augment net availability of edible oils in the country; (Para 2.89)
122
xviii) the Technology Mission on Oilseeds & Pulses should examine the suggestion of the oil industry to declare cultivation of oil palm as plantation and allow the public and private enterprises to enter in this field and make suitable recommendations to the Government in this regard; (Para 2.90)
xix) the Directorate of Economics and Statistics in consultation
with the Textile Commissioner should reconcile the production estimates of cotton and a single series of the same be arrived at, with effect from the next kharif season 2007-08; and
(Para 2.108) xx) Government in collaboration with ICAR Institutes should make
serious efforts to raise the domestic production of Extra Long Staple (ELS) cotton both through area expansion under the existing types and by developing new varieties of ELS cotton, so as to increase the income of farming communities and to achieve self-sufficiency. (Para 2.115)
( T. HAQUE )
CHAIRMAN
( K. PONNUKANNU ) ( M.S. GREWAL ) ( V.M. JADHAV )
MEMBER MEMBER MEMBER
( K.G. RADHAKRISHNAN )
MEMBER SECRETARY
MARCH 13, 2007